A fully traits-based approach to modeling global vegetation distribution
6
A fully traits-based approach to modeling global vegetation distribution Peter M. van Bodegom 1 , Jacob C. Douma 2 , and Lieneke M. Verheijen Department of Ecological Science, Section of Systems Ecology, VU University Amsterdam, 1081 HV, Amsterdam, The Netherlands Edited by Peter B. Reich, University of Minnesota, St. Paul, MN, and accepted by the Editorial Board October 22, 2013 (received for review May 16, 2013) Dynamic Global Vegetation Models (DGVMs) are indispensable for our understanding of climate change impacts. The application of traits in DGVMs is increasingly refined. However, a comprehensive analysis of the direct impacts of trait variation on global vegeta- tion distribution does not yet exist. Here, we present such analysis as proof of principle. We run regressions of trait observations for leaf mass per area, stem-specific density, and seed mass from a global database against multiple environmental drivers, making use of findings of global trait convergence. This analysis explained up to 52% of the global variation of traits. Global trait maps, generated by coupling the regression equations to gridded soil and climate maps, showed up to orders of magnitude variation in trait values. Subsequently, nine vegetation types were character- ized by the trait combinations that they possess using Gaussian mixture density functions. The trait maps were input to these functions to determine global occurrence probabilities for each vegetation type. We prepared vegetation maps, assuming that the most probable (and thus, most suited) vegetation type at each location will be realized. This fully traits-based vegetation map predicted 42% of the observed vegetation distribution correctly. Our results indicate that a major proportion of the predictive ability of DGVMs with respect to vegetation distribution can be attained by three traits alone if traits like stem-specific density and seed mass are included. We envision that our traits-based approach, our observation-driven trait maps, and our vegetation maps may inspire a new generation of powerful traits-based DGVMs. functional variation | global vegetation map | probabilistic model | trait-environment relationships | vegetation attributes T o understand and predict the impacts of climate change on system Earth, it is essential to predict global vegetation dis- tribution and its attributes. Vegetation determines the fluxes of energy, water, and CO 2 to and from terrestrial ecosystems. So- called Dynamic Global Vegetation Models (DGVMs) (reviewed in ref. 1) are indispensable tools to make predictions on such biosphere–climate interactions. Despite their importance, DGVMs are among the most uncertain components of earth system models when predicting climate change (2). DGVMs have been built around the concept of Plant Func- tional Types (PFTs) (3). Traditionally, various functional attrib- utes (or traits) were assumed to be constant for a given PFT. This assumption has various drawbacks (reviewed in ref. 4). For in- stance, it implies assuming that trait values used to parameterize PFTs are valid under past environmental conditions and will be valid under future conditions. As such, this assumption neglects acclimation and adaptation (5), nonrandom species extinction (6), and major differences in dispersal rates among species and within PFTs (7). Moreover, this assumption strongly hampers quantifying feedback mechanisms between vegetation and its environment. For these reasons, the application of traits in DGVMs is in- creasingly refined. Trait responses to, for example, different soil fertility conditions are described as an emergent property in relation to nutrient feedbacks (8). Also, acclimation processes are increasingly included by replacing constant photosynthesis and respiration parameters by functions of temperature or CO 2 (9, 10), with profound impacts on predicted carbon fluxes (11). Within current DGVMs, traits are varied within a PFT (12), not allowing for assessing the direct impacts of traits relative to its indirect effects (for example, through productivity, biomass, or feedbacks changing environmental conditions). A comprehen- sive analysis of the direct impacts of trait variation as such (within and between PFTs) on global vegetation functioning and distribution does not yet exist. However, the paradigm shifts from species-centered approaches to traits-based approaches (13), the rapid increase in the compilation and application of traits-based analyses (14, 15), and the associated conceptual advances (e.g., in assembly theory) (16) allow for such analyses independent of a DGVM. Our aim was to describe global trait variation and evaluate whether trait variation alone already allows for predicting the global distribution of vegetation types, which is one of the principle aims of DGVMs. We first empirically describe global trait distribution and global trait maps—independent of vegetation type—as a function of multiple environmental drivers. Sub- sequently, in a posterior calculation, we predict the occurrence probability of vegetation types. This way, we derive a DGVM- independent trait-driven estimate of global vegetation distribution. We envision that our approach may inspire a new generation of powerful traits-based DGVMs applying (fully) traits-based concepts to predict carbon, water, and energy fluxes. Results Global Maps of Traits. We selected traits that reflect plant fitness and play critical roles in common plant strategy schemes (17, 18): seed mass (in milligrams), leaf mass per area (LMA; in grams per meter 2 ), and stem-specific density (SSD; in grams per centimeter 3 ). Seed mass expresses a tradeoff between seed Significance Models on vegetation dynamics are indispensable for our un- derstanding of climate change impacts. These models contain variables describing vegetation attributes, so-called traits. However, the direct impacts of trait variation on global vege- tation distribution are unknown. We derived global trait maps based on information on environmental drivers. Subsequently, we characterized nine globally representative vegetation types based on their trait combinations and could make valid pre- dictions of their global occurrence probabilities based on trait maps. This study provides a proof of concept for the link be- tween plant traits and vegetation types, stimulating enhanced application of trait-based approaches in vegetation modeling. We envision that our approach, our observation-driven trait maps, and vegetation maps may inspire a new generation of powerful traits-based vegetation models. Author contributions: P.M.v.B. designed research; P.M.v.B., J.C.D., and L.M.V. performed research; P.M.v.B. analyzed data; and P.M.v.B., J.C.D., and L.M.V. wrote the paper. The authors declare no conflict of interest. This article is a PNAS Direct Submission. P.B.R. is a guest editor invited by the Editorial Board. 1 To whom correspondence should be addressed. Email: [email protected]. 2 Present address: Centre for Crop System Analysis, Wageningen University and Research Centre, 6700 AK, Wageningen, The Netherlands. This article contains supporting information online at www.pnas.org/lookup/suppl/doi:10. 1073/pnas.1304551110/-/DCSupplemental. www.pnas.org/cgi/doi/10.1073/pnas.1304551110 PNAS Early Edition | 1 of 6 ENVIRONMENTAL SCIENCES SPECIAL FEATURE
-
Upload
independent -
Category
Documents
-
view
0 -
download
0
Transcript of A fully traits-based approach to modeling global vegetation distribution
A fully traits-based approach to modeling globalvegetation distributionPeter M. van Bodegom1, Jacob C. Douma2, and Lieneke M. Verheijen
Department of Ecological Science, Section of Systems Ecology, VU University Amsterdam, 1081 HV, Amsterdam, The Netherlands
Edited by Peter B. Reich, University of Minnesota, St. Paul, MN, and accepted by the Editorial Board October 22, 2013 (received for review May 16, 2013)
Dynamic Global Vegetation Models (DGVMs) are indispensable forour understanding of climate change impacts. The application oftraits in DGVMs is increasingly refined. However, a comprehensiveanalysis of the direct impacts of trait variation on global vegeta-tion distribution does not yet exist. Here, we present such analysisas proof of principle. We run regressions of trait observations forleaf mass per area, stem-specific density, and seed mass from aglobal database against multiple environmental drivers, makinguse of findings of global trait convergence. This analysis explainedup to 52% of the global variation of traits. Global trait maps,generated by coupling the regression equations to gridded soiland climate maps, showed up to orders of magnitude variation intrait values. Subsequently, nine vegetation types were character-ized by the trait combinations that they possess using Gaussianmixture density functions. The trait maps were input to thesefunctions to determine global occurrence probabilities for eachvegetation type. We prepared vegetation maps, assuming that themost probable (and thus, most suited) vegetation type at eachlocation will be realized. This fully traits-based vegetation mappredicted 42% of the observed vegetation distribution correctly.Our results indicate that a major proportion of the predictive abilityof DGVMs with respect to vegetation distribution can be attainedby three traits alone if traits like stem-specific density and seed massare included. We envision that our traits-based approach, ourobservation-driven trait maps, and our vegetation maps may inspirea new generation of powerful traits-based DGVMs.
functional variation | global vegetation map | probabilistic model |trait-environment relationships | vegetation attributes
To understand and predict the impacts of climate change onsystem Earth, it is essential to predict global vegetation dis-
tribution and its attributes. Vegetation determines the fluxes ofenergy, water, and CO2 to and from terrestrial ecosystems. So-called Dynamic Global Vegetation Models (DGVMs) (reviewedin ref. 1) are indispensable tools to make predictions on suchbiosphere–climate interactions. Despite their importance, DGVMsare among the most uncertain components of earth system modelswhen predicting climate change (2).DGVMs have been built around the concept of Plant Func-
tional Types (PFTs) (3). Traditionally, various functional attrib-utes (or traits) were assumed to be constant for a given PFT. Thisassumption has various drawbacks (reviewed in ref. 4). For in-stance, it implies assuming that trait values used to parameterizePFTs are valid under past environmental conditions and will bevalid under future conditions. As such, this assumption neglectsacclimation and adaptation (5), nonrandom species extinction (6),and major differences in dispersal rates among species and withinPFTs (7). Moreover, this assumption strongly hampers quantifyingfeedback mechanisms between vegetation and its environment.For these reasons, the application of traits in DGVMs is in-
creasingly refined. Trait responses to, for example, different soilfertility conditions are described as an emergent property inrelation to nutrient feedbacks (8). Also, acclimation processesare increasingly included by replacing constant photosynthesisand respiration parameters by functions of temperature or CO2(9, 10), with profound impacts on predicted carbon fluxes (11).Within current DGVMs, traits are varied within a PFT (12), not
allowing for assessing the direct impacts of traits relative to itsindirect effects (for example, through productivity, biomass, orfeedbacks changing environmental conditions). A comprehen-sive analysis of the direct impacts of trait variation as such(within and between PFTs) on global vegetation functioning anddistribution does not yet exist. However, the paradigm shiftsfrom species-centered approaches to traits-based approaches(13), the rapid increase in the compilation and application oftraits-based analyses (14, 15), and the associated conceptualadvances (e.g., in assembly theory) (16) allow for such analysesindependent of a DGVM.Our aim was to describe global trait variation and evaluate
whether trait variation alone already allows for predicting theglobal distribution of vegetation types, which is one of theprinciple aims of DGVMs. We first empirically describe globaltrait distribution and global trait maps—independent of vegetationtype—as a function of multiple environmental drivers. Sub-sequently, in a posterior calculation, we predict the occurrenceprobability of vegetation types. This way, we derive a DGVM-independent trait-driven estimate of global vegetation distribution.We envision that our approach may inspire a new generation ofpowerful traits-based DGVMs applying (fully) traits-basedconcepts to predict carbon, water, and energy fluxes.
ResultsGlobal Maps of Traits. We selected traits that reflect plant fitnessand play critical roles in common plant strategy schemes (17,18): seed mass (in milligrams), leaf mass per area (LMA; ingrams per meter2), and stem-specific density (SSD; in grams percentimeter3). Seed mass expresses a tradeoff between seed
Significance
Models on vegetation dynamics are indispensable for our un-derstanding of climate change impacts. These models containvariables describing vegetation attributes, so-called traits.However, the direct impacts of trait variation on global vege-tation distribution are unknown. We derived global trait mapsbased on information on environmental drivers. Subsequently,we characterized nine globally representative vegetation typesbased on their trait combinations and could make valid pre-dictions of their global occurrence probabilities based on traitmaps. This study provides a proof of concept for the link be-tween plant traits and vegetation types, stimulating enhancedapplication of trait-based approaches in vegetation modeling.We envision that our approach, our observation-driven traitmaps, and vegetation maps may inspire a new generation ofpowerful traits-based vegetation models.
Author contributions: P.M.v.B. designed research; P.M.v.B., J.C.D., and L.M.V. performedresearch; P.M.v.B. analyzed data; and P.M.v.B., J.C.D., and L.M.V. wrote the paper.
The authors declare no conflict of interest.
This article is a PNAS Direct Submission. P.B.R. is a guest editor invited by the EditorialBoard.1To whom correspondence should be addressed. Email: [email protected] address: Centre for Crop System Analysis, Wageningen University and ResearchCentre, 6700 AK, Wageningen, The Netherlands.
This article contains supporting information online at www.pnas.org/lookup/suppl/doi:10.1073/pnas.1304551110/-/DCSupplemental.
www.pnas.org/cgi/doi/10.1073/pnas.1304551110 PNAS Early Edition | 1 of 6
ENVIRONMEN
TAL
SCIENCE
SSP
ECIALFEATU
RE
dispersal and seedling survival (19). Leaf traits, like LMA, in-dicate a tradeoff between fast growth and short lifespan of tis-sues to cope with available water and nutrient resources (15).SSD indicates a tradeoff between fast growth and mechanicalsupport (20). Moreover, SSD does not only relate to competitionfor light (like height), but also relates to drought tolerance (20).Available information (18, 21) shows that the selected traits arepartially independent, thus maximizing traits space available todifferentiate among vegetation types.We related community mean trait values to environmental
information from climate and soil maps in a multiple regressionanalysis to describe the effects of environmental drivers on thefunctional composition of species assemblages. This analysis buildson previous analyses that showed significant trait convergence (22)for several biomes, which was attributed to environmental differ-ences (16, 23, 24). These studies also suggest that the functionaldifferences among communities can be conveniently representedby community mean trait values (25).Indeed, a reasonably high proportion of the global variance in
traits was explained by a combination of environmental drivers(SI Appendix, section 2 and SI Appendix, Fig. S2.2). A combi-nation of soil and climate variables explained SSD best (R2
adj = 0.52)followed by seed mass (R2
adj = 0.41) and LMA (R2adj = 0.35). The
R2 values of LMA are lower than in a previous study using locallyobserved soil C and soil N (26), but the use of local observations(and the lack of such observations in concert with trait observa-tions) comes at the cost of fewer data points and a potentialselection bias.Based on the regressions, we prepared global spatially explicit
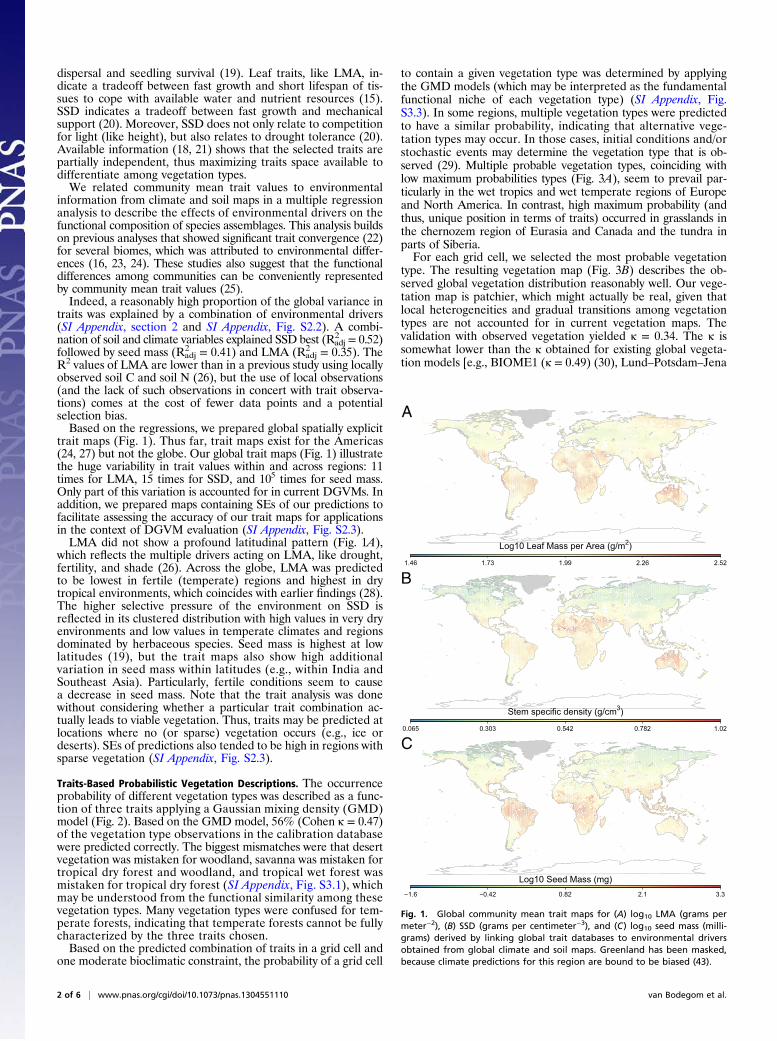
trait maps (Fig. 1). Thus far, trait maps exist for the Americas(24, 27) but not the globe. Our global trait maps (Fig. 1) illustratethe huge variability in trait values within and across regions: 11times for LMA, 15 times for SSD, and 105 times for seed mass.Only part of this variation is accounted for in current DGVMs. Inaddition, we prepared maps containing SEs of our predictions tofacilitate assessing the accuracy of our trait maps for applicationsin the context of DGVM evaluation (SI Appendix, Fig. S2.3).LMA did not show a profound latitudinal pattern (Fig. 1A),
which reflects the multiple drivers acting on LMA, like drought,fertility, and shade (26). Across the globe, LMA was predictedto be lowest in fertile (temperate) regions and highest in drytropical environments, which coincides with earlier findings (28).The higher selective pressure of the environment on SSD isreflected in its clustered distribution with high values in very dryenvironments and low values in temperate climates and regionsdominated by herbaceous species. Seed mass is highest at lowlatitudes (19), but the trait maps also show high additionalvariation in seed mass within latitudes (e.g., within India andSoutheast Asia). Particularly, fertile conditions seem to causea decrease in seed mass. Note that the trait analysis was donewithout considering whether a particular trait combination ac-tually leads to viable vegetation. Thus, traits may be predicted atlocations where no (or sparse) vegetation occurs (e.g., ice ordeserts). SEs of predictions also tended to be high in regions withsparse vegetation (SI Appendix, Fig. S2.3).
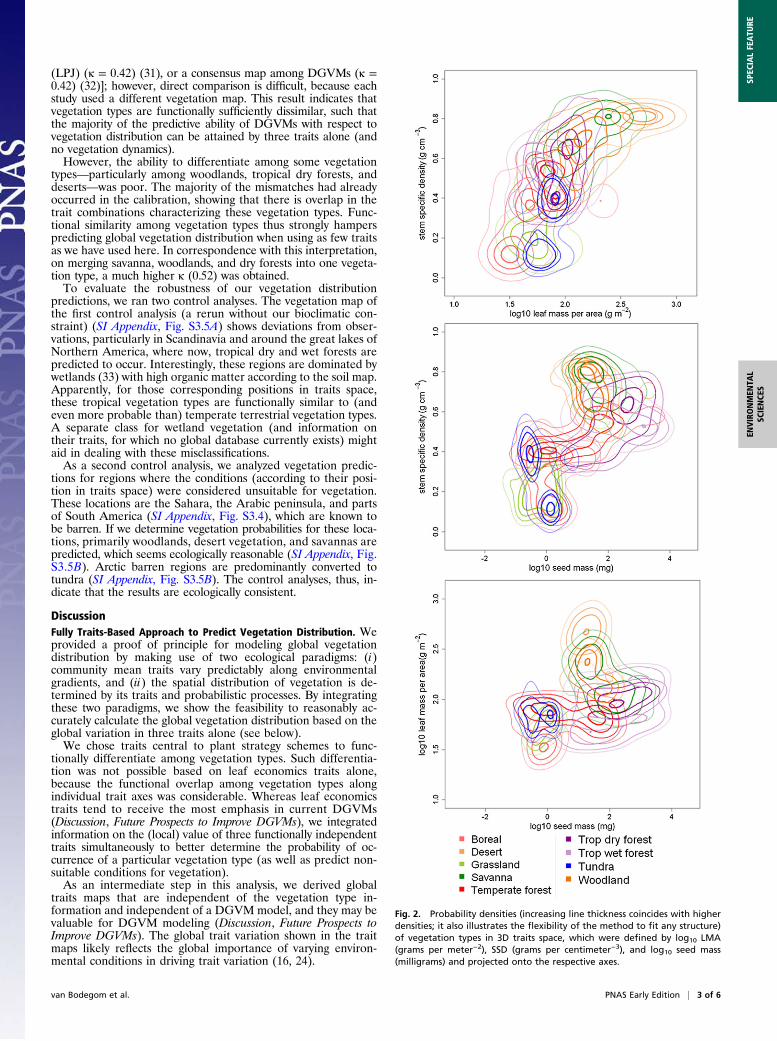
Traits-Based Probabilistic Vegetation Descriptions. The occurrenceprobability of different vegetation types was described as a func-tion of three traits applying a Gaussian mixing density (GMD)model (Fig. 2). Based on the GMD model, 56% (Cohen κ = 0.47)of the vegetation type observations in the calibration databasewere predicted correctly. The biggest mismatches were that desertvegetation was mistaken for woodland, savanna was mistaken fortropical dry forest and woodland, and tropical wet forest wasmistaken for tropical dry forest (SI Appendix, Fig. S3.1), whichmay be understood from the functional similarity among thesevegetation types. Many vegetation types were confused for tem-perate forests, indicating that temperate forests cannot be fullycharacterized by the three traits chosen.Based on the predicted combination of traits in a grid cell and
one moderate bioclimatic constraint, the probability of a grid cell
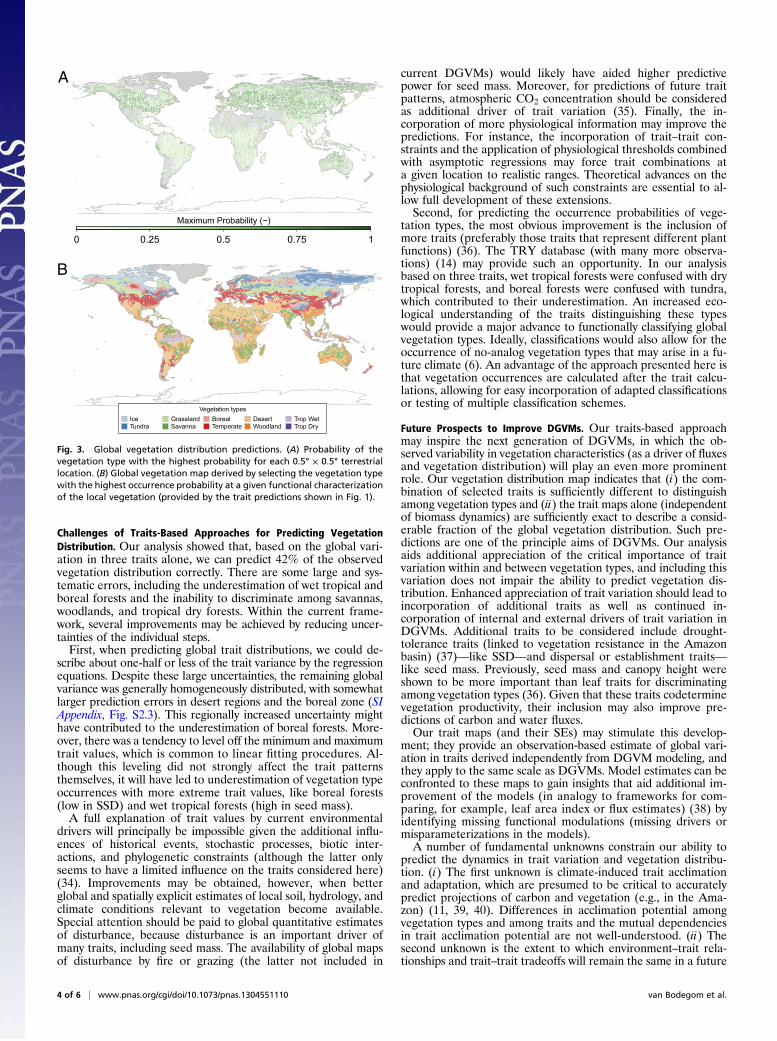
to contain a given vegetation type was determined by applyingthe GMD models (which may be interpreted as the fundamentalfunctional niche of each vegetation type) (SI Appendix, Fig.S3.3). In some regions, multiple vegetation types were predictedto have a similar probability, indicating that alternative vege-tation types may occur. In those cases, initial conditions and/orstochastic events may determine the vegetation type that is ob-served (29). Multiple probable vegetation types, coinciding withlow maximum probabilities types (Fig. 3A), seem to prevail par-ticularly in the wet tropics and wet temperate regions of Europeand North America. In contrast, high maximum probability (andthus, unique position in terms of traits) occurred in grasslands inthe chernozem region of Eurasia and Canada and the tundra inparts of Siberia.For each grid cell, we selected the most probable vegetation
type. The resulting vegetation map (Fig. 3B) describes the ob-served global vegetation distribution reasonably well. Our vege-tation map is patchier, which might actually be real, given thatlocal heterogeneities and gradual transitions among vegetationtypes are not accounted for in current vegetation maps. Thevalidation with observed vegetation yielded κ = 0.34. The κ issomewhat lower than the κ obtained for existing global vegeta-tion models [e.g., BIOME1 (κ = 0.49) (30), Lund–Potsdam–Jena
1.46 1.73 1.99 2.26 2.52
Log10 Leaf Mass per Area (g/m2)
0.065 0.303 0.542 0.782 1.02
Stem specific density (g/cm3)
−1.6 −0.42 0.82 2.1 3.3
Log10 Seed Mass (mg)
A
B
C
Fig. 1. Global community mean trait maps for (A) log10 LMA (grams permeter−2), (B) SSD (grams per centimeter−3), and (C) log10 seed mass (milli-grams) derived by linking global trait databases to environmental driversobtained from global climate and soil maps. Greenland has been masked,because climate predictions for this region are bound to be biased (43).
2 of 6 | www.pnas.org/cgi/doi/10.1073/pnas.1304551110 van Bodegom et al.
(LPJ) (κ = 0.42) (31), or a consensus map among DGVMs (κ =0.42) (32)]; however, direct comparison is difficult, because eachstudy used a different vegetation map. This result indicates thatvegetation types are functionally sufficiently dissimilar, such thatthe majority of the predictive ability of DGVMs with respect tovegetation distribution can be attained by three traits alone (andno vegetation dynamics).However, the ability to differentiate among some vegetation
types—particularly among woodlands, tropical dry forests, anddeserts—was poor. The majority of the mismatches had alreadyoccurred in the calibration, showing that there is overlap in thetrait combinations characterizing these vegetation types. Func-tional similarity among vegetation types thus strongly hamperspredicting global vegetation distribution when using as few traitsas we have used here. In correspondence with this interpretation,on merging savanna, woodlands, and dry forests into one vegeta-tion type, a much higher κ (0.52) was obtained.To evaluate the robustness of our vegetation distribution
predictions, we ran two control analyses. The vegetation map ofthe first control analysis (a rerun without our bioclimatic con-straint) (SI Appendix, Fig. S3.5A) shows deviations from obser-vations, particularly in Scandinavia and around the great lakes ofNorthern America, where now, tropical dry and wet forests arepredicted to occur. Interestingly, these regions are dominated bywetlands (33) with high organic matter according to the soil map.Apparently, for those corresponding positions in traits space,these tropical vegetation types are functionally similar to (andeven more probable than) temperate terrestrial vegetation types.A separate class for wetland vegetation (and information ontheir traits, for which no global database currently exists) mightaid in dealing with these misclassifications.As a second control analysis, we analyzed vegetation predic-
tions for regions where the conditions (according to their posi-tion in traits space) were considered unsuitable for vegetation.These locations are the Sahara, the Arabic peninsula, and partsof South America (SI Appendix, Fig. S3.4), which are known tobe barren. If we determine vegetation probabilities for these loca-tions, primarily woodlands, desert vegetation, and savannas arepredicted, which seems ecologically reasonable (SI Appendix, Fig.S3.5B). Arctic barren regions are predominantly converted totundra (SI Appendix, Fig. S3.5B). The control analyses, thus, in-dicate that the results are ecologically consistent.
DiscussionFully Traits-Based Approach to Predict Vegetation Distribution. Weprovided a proof of principle for modeling global vegetationdistribution by making use of two ecological paradigms: (i)community mean traits vary predictably along environmentalgradients, and (ii) the spatial distribution of vegetation is de-termined by its traits and probabilistic processes. By integratingthese two paradigms, we show the feasibility to reasonably ac-curately calculate the global vegetation distribution based on theglobal variation in three traits alone (see below).We chose traits central to plant strategy schemes to func-
tionally differentiate among vegetation types. Such differentia-tion was not possible based on leaf economics traits alone,because the functional overlap among vegetation types alongindividual trait axes was considerable. Whereas leaf economicstraits tend to receive the most emphasis in current DGVMs(Discussion, Future Prospects to Improve DGVMs), we integratedinformation on the (local) value of three functionally independenttraits simultaneously to better determine the probability of oc-currence of a particular vegetation type (as well as predict non-suitable conditions for vegetation).As an intermediate step in this analysis, we derived global
traits maps that are independent of the vegetation type in-formation and independent of a DGVM model, and they may bevaluable for DGVM modeling (Discussion, Future Prospects toImprove DGVMs). The global trait variation shown in the traitmaps likely reflects the global importance of varying environ-mental conditions in driving trait variation (16, 24).
Fig. 2. Probability densities (increasing line thickness coincides with higherdensities; it also illustrates the flexibility of the method to fit any structure)of vegetation types in 3D traits space, which were defined by log10 LMA(grams per meter−2), SSD (grams per centimeter−3), and log10 seed mass(milligrams) and projected onto the respective axes.
van Bodegom et al. PNAS Early Edition | 3 of 6
ENVIRONMEN
TAL
SCIENCE
SSP
ECIALFEATU
RE
Challenges of Traits-Based Approaches for Predicting VegetationDistribution. Our analysis showed that, based on the global vari-ation in three traits alone, we can predict 42% of the observedvegetation distribution correctly. There are some large and sys-tematic errors, including the underestimation of wet tropical andboreal forests and the inability to discriminate among savannas,woodlands, and tropical dry forests. Within the current frame-work, several improvements may be achieved by reducing uncer-tainties of the individual steps.First, when predicting global trait distributions, we could de-
scribe about one-half or less of the trait variance by the regressionequations. Despite these large uncertainties, the remaining globalvariance was generally homogeneously distributed, with somewhatlarger prediction errors in desert regions and the boreal zone (SIAppendix, Fig. S2.3). This regionally increased uncertainty mighthave contributed to the underestimation of boreal forests. More-over, there was a tendency to level off the minimum and maximumtrait values, which is common to linear fitting procedures. Al-though this leveling did not strongly affect the trait patternsthemselves, it will have led to underestimation of vegetation typeoccurrences with more extreme trait values, like boreal forests(low in SSD) and wet tropical forests (high in seed mass).A full explanation of trait values by current environmental
drivers will principally be impossible given the additional influ-ences of historical events, stochastic processes, biotic inter-actions, and phylogenetic constraints (although the latter onlyseems to have a limited influence on the traits considered here)(34). Improvements may be obtained, however, when betterglobal and spatially explicit estimates of local soil, hydrology, andclimate conditions relevant to vegetation become available.Special attention should be paid to global quantitative estimatesof disturbance, because disturbance is an important driver ofmany traits, including seed mass. The availability of global mapsof disturbance by fire or grazing (the latter not included in
current DGVMs) would likely have aided higher predictivepower for seed mass. Moreover, for predictions of future traitpatterns, atmospheric CO2 concentration should be consideredas additional driver of trait variation (35). Finally, the in-corporation of more physiological information may improve thepredictions. For instance, the incorporation of trait–trait con-straints and the application of physiological thresholds combinedwith asymptotic regressions may force trait combinations ata given location to realistic ranges. Theoretical advances on thephysiological background of such constraints are essential to al-low full development of these extensions.Second, for predicting the occurrence probabilities of vege-
tation types, the most obvious improvement is the inclusion ofmore traits (preferably those traits that represent different plantfunctions) (36). The TRY database (with many more observa-tions) (14) may provide such an opportunity. In our analysisbased on three traits, wet tropical forests were confused with drytropical forests, and boreal forests were confused with tundra,which contributed to their underestimation. An increased eco-logical understanding of the traits distinguishing these typeswould provide a major advance to functionally classifying globalvegetation types. Ideally, classifications would also allow for theoccurrence of no-analog vegetation types that may arise in a fu-ture climate (6). An advantage of the approach presented here isthat vegetation occurrences are calculated after the trait calcu-lations, allowing for easy incorporation of adapted classificationsor testing of multiple classification schemes.
Future Prospects to Improve DGVMs. Our traits-based approachmay inspire the next generation of DGVMs, in which the ob-served variability in vegetation characteristics (as a driver of fluxesand vegetation distribution) will play an even more prominentrole. Our vegetation distribution map indicates that (i) the com-bination of selected traits is sufficiently different to distinguishamong vegetation types and (ii) the trait maps alone (independentof biomass dynamics) are sufficiently exact to describe a consid-erable fraction of the global vegetation distribution. Such pre-dictions are one of the principle aims of DGVMs. Our analysisaids additional appreciation of the critical importance of traitvariation within and between vegetation types, and including thisvariation does not impair the ability to predict vegetation dis-tribution. Enhanced appreciation of trait variation should lead toincorporation of additional traits as well as continued in-corporation of internal and external drivers of trait variation inDGVMs. Additional traits to be considered include drought-tolerance traits (linked to vegetation resistance in the Amazonbasin) (37)—like SSD—and dispersal or establishment traits—like seed mass. Previously, seed mass and canopy height wereshown to be more important than leaf traits for discriminatingamong vegetation types (36). Given that these traits codeterminevegetation productivity, their inclusion may also improve pre-dictions of carbon and water fluxes.Our trait maps (and their SEs) may stimulate this develop-
ment; they provide an observation-based estimate of global vari-ation in traits derived independently from DGVM modeling, andthey apply to the same scale as DGVMs. Model estimates can beconfronted to these maps to gain insights that aid additional im-provement of the models (in analogy to frameworks for com-paring, for example, leaf area index or flux estimates) (38) byidentifying missing functional modulations (missing drivers ormisparameterizations in the models).A number of fundamental unknowns constrain our ability to
predict the dynamics in trait variation and vegetation distribu-tion. (i) The first unknown is climate-induced trait acclimationand adaptation, which are presumed to be critical to accuratelypredict projections of carbon and vegetation (e.g., in the Ama-zon) (11, 39, 40). Differences in acclimation potential amongvegetation types and among traits and the mutual dependenciesin trait acclimation potential are not well-understood. (ii) Thesecond unknown is the extent to which environment–trait rela-tionships and trait–trait tradeoffs will remain the same in a future
0 0.25 0.5 0.75 1
Maximum Probability (−)
A
B
Vegetation typesIceTundra
GrasslandSavanna
BorealTemperate
DesertWoodland
Trop WetTrop Dry
Fig. 3. Global vegetation distribution predictions. (A) Probability of thevegetation type with the highest probability for each 0.5° × 0.5° terrestriallocation. (B) Global vegetation map derived by selecting the vegetation typewith the highest occurrence probability at a given functional characterizationof the local vegetation (provided by the trait predictions shown in Fig. 1).
4 of 6 | www.pnas.org/cgi/doi/10.1073/pnas.1304551110 van Bodegom et al.

climate (i.e., whether they reflect fundamental tradeoffs and fil-tering processes). Fitness maximization approaches (41, 42) mayprovide useful insights on this aspect. (iii) The third unknown isthe extent to which current vegetation types reflect combinationsof functional properties in a future climate.Despite these uncertainties, by separating trait calculations
from vegetation type calculations, we aimed to pave the way forfully traits-based models of carbon, water, and energy fluxesgiven the intimate link between traits and ecosystem fluxes (42).
ConclusionsOur traits-based approach to model global vegetation distribu-tion shows that a large proportion of the predictive ability ofDGVMs with respect to vegetation distribution, which is one ofthe principle aims of DGVMS, can be attained by accounting forvariation in three traits alone. We hope this proof of principle onthe critical importance of trait variation stimulates the continuedincorporation of internal and external drivers of traits into theglobal models. Our trait maps may serve as observation-drivenestimates with which to compare such improved trait represen-tation. Ultimately, these advances are meant to inspire the nextgeneration of DGVMs to model vegetation functioning now andin a future climate.
MethodsGlobal vegetation distribution was modeled in a three-step approach (dubbedTRICYCLE). First, we ran a regression of plant traits against multiple environ-mental drivers, which was inspired by previous findings of global trait con-vergence. Second, trait combinations were used to predict the occurrenceprobability of a vegetation type, explicitly accounting for the role of sto-chasticity on vegetation distribution (29) and community assembly (43). Third,our global vegetation maps were validated against observed vegetation typedistributions (the conceptual diagram is shown in SI Appendix, Fig. S1.1).
Step 1: Predicting Traits from Climate and Soil Variables. First, we performedmultiple regression with community mean traits as dependent variables andclimate and soil variables as independent variables, with the aim to constructa global trait map. For this purpose, we compiled a database of field obser-vations of LMA, SSD, and seedmass from the literature (SI Appendix, section 2).For those sites for which all traits were available, we calculated communitymean traits values, yielding a database of community mean traits for 299 sitesin all global biomes (location map is shown in SI Appendix, Fig. S2.1).
Based on their georeferences, trait means were related to estimates ofenvironmental conditions. We selected environmental variables to representenvironmental drivers known to affect community mean traits on a globalscale (25, 28). We selected mean annual temperature (MAT), number of frostdays, mean annual precipitation (MAP), net radiation, evaporative demand,and MAP/evaporative demand as climate variables. In addition, soil pH, cationexchange capacity, soil texture, total N, soil C:N ratio, and modeled net Nmineralization rates were included to represent soil structural, chemical, andfertility impacts on plant traits (SI Appendix). Based on Akaike informationcriterion, the best regression model was determined for each trait (regressionsetup is shown in SI Appendix, section 2 and SI Appendix, Fig. S2.2).
Second, we generated global trait maps by estimating the communitymean traits for each 30-min pixel through coupling the regression equationsto gridded soil and climate maps.
Step 2: Predicting the Occurrence Probability of Vegetation Types. Based onthe combination of three traits, we estimated the occurrence probability ofvegetation types on a global scale. We identified nine vegetation types(tropical dry forest, tropical wet forest, temperate forest, boreal forest,tundra, grassland, woodland, savanna, and desert vegetation) according toinformation in ref. 44. This generic classification resembles plant functionaltypes as generally applied in DGVMs, and importantly, it can be executedbased on MAT and MAP only.
We assessed the 3D traits space—defined by LMA, SSD, and seed mass—asoccupied by each vegetation type. We used a calibration set of 2,208 traitobservations from our database. Vegetation type was estimated from MATand MAP based on the observation georeferences. If an observation oc-curred close to a climatic border according to our classification, we addi-tionally used information on categorical traits (growth form and leaf habit)of the species involved to evaluate the classified vegetation type.
The cluster of positions of a given vegetation type in 3D traits space wasquantitatively described by a probability density function using a GMDmodel(45) (SI Appendix, section 3). An important attribute of GMDs is that they donot assume any a priori distribution in traits space. This attribute requiresa large number of data points (i.e., a minimum of 20 observations per traitaxis per vegetation type; not allowing our analysis to extend to more thanthree traits given the current size of our database). At any traits combina-tion, the probability density of a vegetation type relative to the sum ofprobability densities for all vegetation types equals the probability ofa vegetation type to occur. The performance of this calibration was evalu-ated by pairwise comparison of the observed vegetation type in the databasewith the one predicted to have the highest probability using Cohen κ (43).
Next, to derive global maps of vegetation distribution, we superimposedthe trait maps (from step 1) on top of each other to derive the position of eachgrid cell in 3D traits space. The multivariate combination of traits in a grid cellwas input to the probability density functions of the vegetation types todetermine the occurrence probability for each vegetation type. This pro-cedure was repeated for all 67,420 land grid cells to provide occurrenceprobabilities of all nine vegetation types.
So far, we assumed that each grid cell contains a fully developed vege-tation in equilibrium with its local environment (neglecting the influence ofbiotic interactions). However, some regions do not foster any vegetation atall, because the environment is too extreme. Those locations will be in the tailof probability densities of any vegetation type. Thus, the density kernelsprovide a measure of the habitat suitability of that grid cell. We assumeda minimum threshold density (SI Appendix, section 3) to avoid vegetation tobe predicted in grid cells where vegetation is improbable. In our comparisonwith observed vegetation maps (step 3), we assume that nonsuitable hab-itats represent deserts or if frost days are >200, polar deserts/ice.
Finally, we prepared vegetation maps by assuming that the most probablevegetation type will be observed. The most probable vegetation type is themost suited in terms of its traits relative to the other vegetation types thatfollow assembly rules (22). Multiple vegetation types may have equal probabilityin a grid cell (i.e., have similar functional attributes and similar fit to the localenvironmental conditions), although the vegetation definition may not allowthe occurrence of one or more vegetation types. Thus, to avoid inappropriatepredictions of tropical vegetation types, we used a weak generic bioclimaticconstraint, which did not allow woodlands, savannas, and tropical dry and wetforests to occur at locations where the number of frost days exceeds 75 d.Ideally, we would have used physiological frost tolerance of species as afourth trait axis. Unfortunately, current compilations on experimental frosttolerance (46) do not yet have a sufficient species cover to allow inclusion offrost tolerance.
Step 3: Validation of Vegetation Distribution. Our vegetation map was vali-dated against observed vegetation using Cohen κ (47). To minimize biasesand uncertainties occurring in any existing vegetation map, we chose tocompare our vegetation map with a map consisting of those grid cells forwhich maps based on information in refs. 44 and 48 agree. This overlap hada κ of 0.48, with higher correspondence for deserts and lower correspon-dence for woodlands and tropical dry forest. The map in ref. 44 was derivedfrom MAT and MAP data. The map in ref. 48, based on remote sensing in-formation, was reclassified (SI Appendix, Fig. S1.1) to represent the ninevegetation types identified above.
ACKNOWLEDGMENTS. We thank Peter Reich and three anonymous reviewersfor constructive comments. This study was supported by Netherlands Organi-zation for Scientific Research (NWO) Theme Sustainable Earth Research ProjectNumber TKS09-03 and Dutch National Research Program Climate Change andSpatial Planning Project A1.
1. Prentice IC, et al. (2007) Dynamic global vegetation modeling: Quantifying terrestrial
ecosystem responses to large-scale environmental change. Terrestrial Ecosystems in
a ChangingWorld, eds Canadell J, Pitelka L, Pataki D (Springer, Heidelberg), pp 175–192.2. Sitch SC, et al. (2008) Evaluation of the terrestrial carbon cycle, future plant geog-
raphy and climate-carbon cycle feedbacks using five Dynamic Global Vegetation
Models (DGVMs). Glob Change Biol 14:2015–2039.
3. Lavorel S, McIntyre S, Landsberg J, Forbes TDA (1997) Plant functional classifications:
From general groups to specific groups based on response to disturbance. Trends Ecol
Evol 12(12):474–478.4. Van Bodegom PM, et al. (2012) Exploring the merits of trait-based concepts to im-
prove predictions of ecosystem atmosphere fluxes in dynamic global vegetation
models. Glob Ecol Biogeogr 21:625–636.
van Bodegom et al. PNAS Early Edition | 5 of 6
ENVIRONMEN
TAL
SCIENCE
SSP
ECIALFEATU
RE
5. Lavergne S, Mouquet N, Thuiller W, Ronce O (2010) Biodiversity and climate change:Integrating evolutionary and ecological responses of species and communities. AnnuRev Ecol Evol Syst 41:321–350.
6. Thuiller W, Lavorel S, Araújo MB, Sykes MT, Prentice IC (2005) Climate change threatsto plant diversity in Europe. Proc Natl Acad Sci USA 102(23):8245–8250.
7. Diaz S, Cabido M (1997) Plant functional types and ecosystem function in relation toglobal change. J Veg Sci 8:463–474.
8. Zaehle S, Friend AD (2010) Carbon and nitrogen cycle dynamics in the O-CN landsurface model: 1. Model description, site-scale evaluation, and sensitivity to param-eter estimates. Global Biogeochem Cycles 24:GB1005.
9. Atkin OK, et al. (2008) Using temperature-dependent changes in leaf scaling rela-tionships to quantitatively account for thermal acclimation of respiration in a coupledglobal climate-vegetation model. Glob Change Biol 14:2709–2726.
10. Arora VK, et al. (2009) The effect of terrestrial photosynthesis down regulation on thetwentieth-century carbon budget simulated with the CCCma earth system model.J Clim 22:6066–6088.
11. Smith NG, Dukes JS (2013) Plant respiration and photosynthesis in global-scalemodels: Incorporating acclimation to temperature and CO2. Glob Change Biol 19(1):45–63.
12. Verheijen LM, et al. (2013) Impacts of trait variation through observed trait-climaterelationships on performance of a representative Earth System model: A conceptualanalysis. Biogeosciences 10(8):5497–5515.
13. Webb CT, Hoeting JA, Ames GM, Pyne MI, LeRoy Poff N (2010) A structured anddynamic framework to advance traits-based theory and prediction in ecology. EcolLett 13(3):267–283.
14. Kattge J, et al. (2011) TRY—a global database of plant traits. Glob Change Biol 17:2905–2935.
15. Wright IJ, et al. (2004) The worldwide leaf economics spectrum. Nature 428(6985):821–827.
16. Freschet GT, et al. (2011) Global to community scale differences in the prevalence ofconvergent over divergent leaf trait distributions in plant assemblages. Glob EcolBiogeogr 20:755–765.
17. Grime JP (2001) Plant Strategies, Vegetation Processes, and Ecosystem Properties(Wiley, New York), 2nd Ed.
18. Westoby M, Falster DS, Moles AT, Vesk PA, Wright IJ (2002) Plant ecological strate-gies: Some leading dimensions of variation between species. Annu Rev Ecol Syst 33:125–159.
19. Moles AT, et al. (2007) Global patterns in seed size. Glob Ecol Biogeogr 16:109–116.20. Chave J, et al. (2009) Towards a worldwide wood economics spectrum. Ecol Lett 12(4):
351–366.21. Diaz S, et al. (2004) The plant traits that drive ecosystems: Evidence from three con-
tinents. J Veg Sci 15:295–304.22. Keddy PA (1992) Assembly and response rules—2 goals for predictive community
ecology. J Veg Sci 3:157–164.23. Kraft NJB, Valencia R, Ackerly DD (2008) Functional traits and niche-based tree
community assembly in an Amazonian forest. Science 322(5901):580–582.24. Swenson NG, et al. (2012) The biogeography and filtering of woody plant functional
diversity in North and South America. Glob Ecol Biogeogr 21:798–808.25. Ordonez JC, et al. (2009) A global study of relationships between leaf traits, climate
and soil measures of nutrient fertility. Glob Ecol Biogeogr 18:137–149.26. Ordoñez JC, et al. (2010) Plant strategies in relation to resource supply in mesic to wet
environments: Does theory mirror nature? Am Nat 175(2):225–239.
27. Swenson NG, Weiser MD (2010) Plant geography upon the basis of functional traits:An example from eastern North American trees. Ecology 91(8):2234–2241.
28. Wright IJ, et al. (2005) Modulation of leaf economic traits and trait relationships byclimate. Glob Ecol Biogeogr 14:411–421.
29. Douma JC, et al. (2012) Towards a functional basis for predicting vegetation patterns;incorporating plant traits in habitat distribution models. Ecography (Cop.) 35:294–305.
30. Prentice IC, et al. (1992) A global biome model based on plant physiology anddominance, soil properties and climate. J Biogeogr 19:117–134.
31. Hickler T, Prentice IC, Smith B, Sykes MT, Zaehle S (2006) Implementing plant hy-draulic architecture within the LPJ Dynamic Global Vegetation Model. Glob ChangeBiol 15:567–577.
32. Cramer W, et al. (2001) Global response of terrestrial ecosystem structure and func-tion to CO2 and climate change: Results from six dynamic global vegetation models.Glob Change Biol 7:357–373.
33. Lehner B, Doll P (2004) Development and validation of a global database of lakes,reservoirs and wetlands. J Hydrol (Amst) 296:1–22.
34. Donovan LA, Maherali H, Caruso CM, Huber H, de Kroon H (2011) The evolution ofthe worldwide leaf economics spectrum. Trends Ecol Evol 26(2):88–95.
35. Ainsworth EA, Rogers A (2007) The response of photosynthesis and stomatal con-ductance to rising [CO2]: Mechanisms and environmental interactions. Plant CellEnviron 30(3):258–270.
36. Douma JC, et al. (2012) A combination of functionally different plant traits providesa means to quantitatively predict a broad range of species assemblages in NW Eu-rope. Ecography (Cop.) 35:364–373.
37. Poulter B, et al. (2010) Robust dynamics of Amazon dieback to climate change withperturbed ecosystem model parameters. Glob Change Biol 16:2476–2495.
38. Luo YQ, et al. (2012) A framework for benchmarking land models. Biogeosciences9:3857–3874.
39. Galbraith D, et al. (2010) Multiple mechanisms of Amazonian forest biomass losses inthree dynamic global vegetation models under climate change. New Phytol 187(3):647–665.
40. Kleidon A, Fraedrich K, Low C (2007) Multiple steady-states in the terrestrial atmo-sphere-biosphere system: A result of a discrete vegetation classification? Bio-geosciences 4:707–714.
41. Farrior CE, Dybzinski R, Levin SA, Pacala SW (2013) Competition for water and light inclosed-canopy forests: A tractable model of carbon allocation with implications forcarbon sinks. Am Nat 181(3):314–330.
42. Falster DS, Brannstrom A, Dieckmann U, Westoby M (2011) Influence of four majorplant traits on average height, leaf-area cover, net primary productivity, and biomassdensity in single-species forests: A theoretical investigation. J Ecol 99:148–164.
43. Fukami T, Bezemer TM, Mortimer SR, van der Putten WH (2005) Species divergenceand trait convergence in experimental plant community assembly. Ecol Lett 8:1283–1290.
44. Whittaker RH (1975) Communities and Ecosystems (Macmillan, New York).45. Witte JPM, Wojcik RB, Torfs PJJF, de Haan MWH, Hennekens S (2007) Bayesian clas-
sification of vegetation types with Gaussian mixture density fitting to indicator val-ues. J Veg Sci 18:605–612.
46. Harrison SP, et al. (2010) Ecophysiological and bioclimatic foundations for a globalplant functional classification. J Veg Sci 21:300–317.
47. Cohen J (1962) The statistical power of abnormal-social psychological research: Areview. J Abnorm Soc Psychol 65:145–153.
48. Ramankutty N, Foley JA (1999) Estimating historical changes in global land cover:Croplands from 1700 to 1992. Global Biogeochem Cycles 13:997–1027.
6 of 6 | www.pnas.org/cgi/doi/10.1073/pnas.1304551110 van Bodegom et al.