A field study of the behaviour of an anticyclonic eddy on the Catalan continental shelf (NW...
15
A field study of the behaviour of an anticyclonic eddy on the Catalan continental shelf (NW Mediterranean) Anna Rubio a, * , Pedro A. Arnau b , Manuel Espino a , Marı ´a del Mar Flexas a , Gabriel Jorda ` a , Jordi Salat c , Joan Puigdefa `bregas a , Agustı ´n S.-Arcilla a a Laboratori dÕEnginyeria Marı ´tima (LIM-UPC), Gran Capita ` s/n mo ` dul D1, 08034 Barcelona, Spain b Grup de Recerca Consolidat en Geocie `ncies Marines (UB), Martı ´ i Franque `s, s/n, 08028 Barcelona, Spain c Institut de Cie `ncies de Mar (CSIC), P. Marı ´tim, 37–49, 08003 Barcelona, Spain Received 9 September 2002; received in revised form 9 September 2003; accepted 29 July 2004 Available online 3 June 2005 Abstract Through the analysis of satellite thermal images, mesoscale anticyclonic eddies have been observed to recurrently drift along the NW Mediterranean coasts. The presence of these eddies is known to cause transient ‘‘inversions’’ of the shelf–slope current. By means of an exhaustive analysis of sea surface temperature images a group of anticyclonic structures were monitored in September 2001. One of these eddy-like features was tracked and intensely surveyed by means of conductivity–temperature–depth (CTD) casts and repeated fast surveys with Nm-Shuttle (oscillating CTD) and Acoustic Doppler Current Profiler (ADCP) measurements during the ET2001 oceanographic cruise. A well devel- oped anticyclonic eddy was surveyed over the Catalan continental shelf, 60 km north of Barcelona. In situ velocity data revealed that the anticyclonic motion was characterized by surface velocities of 50 cm/s and a diameter of about 45 km. The signal of the eddy was found down to 100 m depth, well below the seasonal thermocline. The passage of the eddy modified the local flow, involving advection and subduction of surrounding waters. Ó 2005 Elsevier Ltd. All rights reserved. Keywords: NW Mediterranean; Catalan continental shelf; Mesoscale; Anticyclone; Remote sensing 1. Introduction The general circulation in the North-western Mediterranean follows a cyclonic circuit (Font, Salat, & Tintore ´, 1988; Millot, 1990). The southwestward section of this circuit is named the Northern Current 0079-6611/$ - see front matter Ó 2005 Elsevier Ltd. All rights reserved. doi:10.1016/j.pocean.2004.07.012 * Corresponding author. Tel.: +34 93 4017392; fax: +34 93 4011861. E-mail addresses: [email protected] (A. Rubio), [email protected] (P.A. Arnau), [email protected] (J. Salat). Progress in Oceanography 66 (2005) 142–156 www.elsevier.com/locate/pocean Progress in Oceanography
Transcript of A field study of the behaviour of an anticyclonic eddy on the Catalan continental shelf (NW...

Progress in Oceanography 66 (2005) 142–156
www.elsevier.com/locate/pocean
Progress inOceanography
A field study of the behaviour of an anticyclonic eddy onthe Catalan continental shelf (NW Mediterranean)
Anna Rubio a,*, Pedro A. Arnau b, Manuel Espino a, Marıa del Mar Flexas a,Gabriel Jorda a, Jordi Salat c, Joan Puigdefabregas a, Agustın S.-Arcilla a
a Laboratori d�Enginyeria Marıtima (LIM-UPC), Gran Capita s/n modul D1, 08034 Barcelona, Spainb Grup de Recerca Consolidat en Geociencies Marines (UB), Martı i Franques, s/n, 08028 Barcelona, Spain
c Institut de Ciencies de Mar (CSIC), P. Marıtim, 37–49, 08003 Barcelona, Spain
Received 9 September 2002; received in revised form 9 September 2003; accepted 29 July 2004
Available online 3 June 2005
Abstract
Through the analysis of satellite thermal images, mesoscale anticyclonic eddies have been observed to recurrently
drift along the NW Mediterranean coasts. The presence of these eddies is known to cause transient ‘‘inversions’’ of
the shelf–slope current. By means of an exhaustive analysis of sea surface temperature images a group of anticyclonic
structures were monitored in September 2001. One of these eddy-like features was tracked and intensely surveyed by
means of conductivity–temperature–depth (CTD) casts and repeated fast surveys with Nm-Shuttle (oscillating CTD)
and Acoustic Doppler Current Profiler (ADCP) measurements during the ET2001 oceanographic cruise. A well devel-
oped anticyclonic eddy was surveyed over the Catalan continental shelf, 60 km north of Barcelona. In situ velocity data
revealed that the anticyclonic motion was characterized by surface velocities of 50 cm/s and a diameter of about 45 km.
The signal of the eddy was found down to 100 m depth, well below the seasonal thermocline. The passage of the eddy
modified the local flow, involving advection and subduction of surrounding waters.
� 2005 Elsevier Ltd. All rights reserved.
Keywords: NW Mediterranean; Catalan continental shelf; Mesoscale; Anticyclone; Remote sensing
1. Introduction
The general circulation in the North-western Mediterranean follows a cyclonic circuit (Font, Salat, &
Tintore, 1988; Millot, 1990). The southwestward section of this circuit is named the Northern Current
0079-6611/$ - see front matter � 2005 Elsevier Ltd. All rights reserved.
doi:10.1016/j.pocean.2004.07.012
* Corresponding author. Tel.: +34 93 4017392; fax: +34 93 4011861.
E-mail addresses: [email protected] (A. Rubio), [email protected] (P.A. Arnau), [email protected] (J. Salat).

A. Rubio et al. / Progress in Oceanography 66 (2005) 142–156 143
(Fig. 1), following the continental slope (Millot, 1999) and leaving water of lower density at its coastal side
(Salat, 1996). This current is about 30–50 km wide and is well defined down to 300–400 m depth. In spring,
it has maximum velocities around 30 cm/s in the upper layer, with a total flux near 1 Sv (Castellon, Font, &
Garcia, 1990). The Northern Current is in geostrophic equilibrium with a shelf/slope density front, the Cat-
alan Front, which intersects the bottom slope at a depth of about 400 m. The surface signature of the frontranges between 28 and 55 km offshore. This front is associated with a salinity gradient separating the
fresher water on the continental shelf (<37.5), influenced by the Atlantic Water (AW) with the addition
of riverine inputs, and the more saline waters (>38.1) on the open sea side (Font et al., 1988).
Past observations indicate the presence of mesoscale features on the NWMediterranean continental shelf
and slope (Font, Garcıa-Ladona, & Gorriz, 1995), which may modify the local direction of the circulation
(Arnau et al., 1998; La Violette, Tintore, & Font, 1990; Maso & Tintore, 1991; Maso, Sabates, & Olivar,
1998; Pascual, Buongiorno Nardelli, Larnicol, Emelianov, & Gomis, 2002; Rojas et al., 1995; Sabates &
Maso, 1992; Salat et al., 2002; Tintore, Wang, & La Violette, 1990; Wang, Vieira, Salat, Tintore, & LaViolette, 1988). Rojas et al. (1995) found that the general southwestward flow over the shelf was reversed
below the thermocline. In the same study, the analysis of temperature time series at 70 m depth revealed
several transients. By means of AVHRR images and post-cruise trajectories of Argos drifters, Arnau
et al. (1998) concluded that those temperature signals and the inversions of the flow may be caused by south-
westward drifting mesoscale anticyclonic eddies. From the analysis of five sequences of thermal AVHRR
images obtained within the same period (1993–1997), Arnau (2000) suggested that these mesoscale structures
are generated in the Gulf of Lions, from where they are advected south-westward. The genesis and develop-
ment of these anticyclonic eddies can be related to northerly wind events. Satellite images and data collectedin the Gulf of Lions revealed that the Northern Current forms meanders and eddy-like structures, probably
due to baroclinic instability (Flexas, Durrieu de Madron, Garcia, Canals, & Arnau, 2002).
The advection of anticyclonic eddies along the Catalan continental shelf is recurrent throughout the
year, however, there are seasonal and interannual differences in the development of these mesoscale struc-
tures. Through sea surface temperature (SST) images, the mesoscale activity in the Catalan Sea is observed
Fig. 1. Study area in the northwestern Mediterranean (isobaths: 500, 1000 and 1500 m).

144 A. Rubio et al. / Progress in Oceanography 66 (2005) 142–156
to be high in summer (Arnau, 2000), being able to modify the boundary flow in particularly active situa-
tions. Arnau (2000) characterizes the different mesoscale patterns, and relates their development stage and
their geometric properties to the northerly wind regime and to the latitudinal water heating.
Although general aspects of mesoscale variability on the Catalan continental shelf have been studied
from satellite images and hydrographic data, there are few specific experimental designs devoted to a de-tailed study of one of these structures. On the basis of these arguments, the project ‘‘Genesis, temporary
evolution, translation and effects of mesoscale eddies on the Catalan continental shelf (MAR1999–
1010)’’ was proposed with the main objective of identifying and monitoring one of these eddies. For the
first time in this area, the analysis of SST images is used to predict the position of one of these anticyclonic
eddies in order to perform a full survey of the targeted structure by means of an oceanographic cruise which
combines different current and hydrographic sampling methods.
2. Experimental design
The ET2001 (�Eddy Tracking�) oceanographic cruise was carried out between September 24th and Sep-
tember 28th 2001 from the R/V Garcia del Cid (UTM-CSIC). During the weeks prior to the cruise, SST
images were analysed (Figs. 2 and 3). A chain of anticyclonic structures was drifting south-westwards with
an estimated speed of about 6–8 km/day, inferred from the drift observed of eddy A4 (Fig. 3) between Sep-
tember 2nd and 9th. Applying this rate of displacement to the September 12th ATSR image (Fig. 3) an anti-
cyclonic eddy was expected to be located between the Blanes and Palamos canyons at the beginning of theET2001 oceanographic cruise. The September 21st SST/ATSR image allowed us to define the sampling
area. During the cruise, a real-time image analysis was also carried out and transmitted to the operating
ship in order to accurately follow the targeted eddy. The September 24th SST/AVHRR image (Fig. 3) ob-
tained at the beginning of the cruise confirmed the predicted position of the anticyclonic structure.
An area of 2500 km2 centred over around the eddy was covered by seven transects 37 km long, and sep-
arated by 11 km (Fig. 4). The cruise was divided into three phases using different measuring instruments
and covering three times the same study area. Phase I consisted on a fast Nm-Shuttle (oscillating CTD) sur-
vey that covered six transects (from A1 to G6) in 14 h. Simultaneously, currents were measured with a ves-sel-mounted Acoustic Doppler Current Profiler (ADCP). Phase II consisted of conductivity–temperature–
depth (CTD) sampling, at 42 stations located over the same six transects (from G6 to A1). ADCP data were
also acquired at every CTD station. The CTD stations were covered in 48 h, providing more detailed
hydrographic information. At the end of phase II, and in order to check the evolution of the measured
parameters, the Nm-Shuttle and ADCP surveys were repeated (phase III), following the same gridding as
in phase I. An additional transect was added to the southwestern side of the area to cover the foreseen
south-westward drift of the eddy. The whole study area was covered, this time, in 21 h. The fast Nm-Shuttleand ADCP surveys were done at the beginning and at the end of the cruise (phases I and III) to obtain themost synoptic information about the evolution and movement of the eddy although limited in depth to the
upper layer.
3. Data set
The set of SST images included 10 ATSR-2 images (ERS-2) from August 25th to September 25th, 2002
(obtained from the European Space Agency), 60 AVHRR/NOAA images from August to October 2002(from the Intelligent Satellite Data Information System of the German Remote Sensing Data Center
DFD and also from HZTI, a Spanish local HRPT reception station from AZTI Foundation) and 30
MODIS images from September 15th to October 1st, 2002 (from the Goddard DAAC/NASA). The selec-

Fig. 2. August 22nd and 28th SST images of the Gulf of Lions. Wind series from July 1st to October 31st registered in Portbou and
Malgrat de Mar stations.
A. Rubio et al. / Progress in Oceanography 66 (2005) 142–156 145
tion of a suitable anticyclonic eddy was carried out through the comparison of the satellite ATSR images of
September 12th and 15th, 2001. The atmospheric effect on SST data was corrected by a split-window algo-
rithm that takes into account the zenithal angle. The images were georeferenced from several control points
using the satellite image processing software ERMapper 6.3. from ESRI.
The CTD (General Oceanics Mark III) equipped with a fluorometer, a transmissometer and an oxygensensor covered the area enclosing the whole structure from 5 m until depths reaching the 1200 m isobath.
Water samples, at three levels (bottom, intermediate and surface), were also obtained at each station for the
conductivity sensor calibration. The Nm-Shuttle (Chelsea Instruments) was equipped with CTD, fluorom-
eter and transmissometer and covered a range of depths from 25 to 140 m. Post-processing of hydrographic
data and salinity/density calculations were performed using standard software, obtaining final profiles with
1-m vertical resolution.
The ADCP RDI 150 KHZ vessel-mounted narrowband system covered 47 layers of 8 m from 16.5 to
392.5 m depth. Current profiles were collected at a mean cruise velocity of 9 knots in phases I and III ofthe survey, and on stations during phase II. Data were averaged every 5-min and were processed according
to the Data Quality Checking Protocol for vessel mounted ADCP described in Garcıa-Gorriz, Font, and
Candela (1997). When correctly detected, the bottom was taken as the no-motion reference level for the
calculation; otherwise, the reference considered was the ship velocity as measured by the 3DF ASTHECH

Fig. 3. Sequence of images of the northwestern Mediterranean, from September 2nd to September 24th. Main mesoscale structures are
labelled.
146 A. Rubio et al. / Progress in Oceanography 66 (2005) 142–156

Fig. 4. Bathymetric chart with CTD stations position. The rectangle indicates the frame of the grid used for interpolating fields, shown
in Figs. 6, 8–11 and 12. The dashed line across the rectangle indicates the vertical section in Fig. 8.
A. Rubio et al. / Progress in Oceanography 66 (2005) 142–156 147
GPS system when available, or by the differential GPS. Heading values from the ship�s gyro compass, to
which the ADCP is referenced, were corrected using the heading given by the 3DF ASTHECH. Actual
velocity fields have been obtained with errors below 4.3 cm/s for 130� courses and below 1.75 cm/s for
315� courses. Absolute velocity current profiles reach maximum depths of 320 m.An optimal interpolation scheme has been used for interpolating ADCP data on a regular grid of 38 · 65
km, starting from G6 station. The same optimal interpolation scheme has been used for generating the hor-
izontal fields of hydrographic (CTD) data. For the CTD data analysis, an horizontal filter has been applied,
with a cut-off wavelength of 15 km, in order to remove unresolved structures. In both cases, the grid has
been rotated in order to carry out the optimal interpolation. For the estimation of the geostrophic velocities
the method described by Rudnick (1996) was used, that combines CTD data with simultaneous velocity
measurements. In this method, the dynamic topography computed from hydrographic data relative to
the deepest common layer is corrected under the criteria of minimizing the differences between geostrophicand the non-divergent ADCP velocities along the whole water column.
4. Results
The main features that characterize the surface circulation in this part of the western Mediterranean can
be inferred by means of a detailed post-survey analysis of SST images (e.g. Figs. 2 and 3). Cooling of sur-
face water in the Gulf of Lions, due to the northwesterlies that blow in this area, generates a surface tem-perature front. The differences in temperatures allows to follow the advection of colder waters from the

148 A. Rubio et al. / Progress in Oceanography 66 (2005) 142–156
Gulf of Lions into the Catalan Sea by the Northern Current. From satellite images, this mean flow appears
modified by a chain of mesoscale eddy-like anticyclonic features that propagate southwestwards along the
continental shelf.
On August 22nd, the development of an anticyclonic structure (named A4) in the eastern part of the Gulf
of Lions is observed (Fig. 2). Previous SST images (not shown) show the evolution of coastal upwelling offMarseille during the second week of August, which can be related to the strong and persistent north-wes-
terly winds (Tramuntana) that were blowing in the Gulf of Lions area (as registered in Portbou Station) at
the beginning of August (Fig. 2). During the two first weeks of September, it can also be observed the com-
ing out of a chain of anticyclonic structures close to the coast in the western part of the Gulf of Lions.
Another anticyclonic structure (eddy A0) is observed to develop north of Barcelona. This eddy was pres-
ent before these wind events started, and it was probably related to previous strong Tramuntana winds
blowing in the Gulf of Lions at the end of July. While strong northwesterlies blew at the Gulf of Lions
at Malgrat de Mar Station (south of the Pyrenees), the prevailing component was from south. This wasprobably associated with a strong wind curl that generated eddy A0.
From the end of August until the first two weeks of September eddy A4 moved towards the southwest
coinciding with the development of an anticyclonic circulation in the western part of the Gulf of Lions (Fig.
3). The coming days other eddy-like structures are observed in the thermal images: eddies A41 (12th–15th
September) and A42 (18th–21th September). Moreover, on September 12th, a tongue of warm water gain-
ing negative vorticity and coinciding with a strong northwesterly pulse registered in Portbou station was
seen. The image of September 24th at the beginning of the 5-days survey showed that an anticyclonic struc-
ture (eddy A?) was placed between Blanes and Palamos canyons. Finally, around 3.2� E-41.2� N also thecentre of a larger eddy (A1) is identified which remains more or less stagnant during the last days of
September.
The measured velocity field reveals a good agreement with the SST signal, showing a well defined anti-
cyclonic circulation around 3.2� E–41.6� N over the Catalan continental shelf (Fig. 5). During phase II, the
actual velocity field shows maximum velocities around 50 cm/s at 20 m depth and defines a clear anticy-
clonic eddy of about 45 km diameter (Fig. 6). This anticyclonic pattern can be detected down to 100 m
Fig. 5. SST Image of September 26th. The ADCP velocity field at 24.5 m, registered in Phase II, is superimposed to the image
(maximum velocities of 43.5 m/s).

Fig. 6. Optimal interpolated ADCP velocity field at 20, 80 and 120 m. Isobaths: 100, 200, 500. Axes: distance to the first grid point in
km. Coast: upper border of the figure.
A. Rubio et al. / Progress in Oceanography 66 (2005) 142–156 149
depth where maximum velocities were of about 25 cm/s. At deeper layers, only the signal of the slope cur-
rent was detected. At the southwesternmost part of the domain seaward flow is detected by the ADCP
above 40 m. This flow apparently corresponds to the aforementioned eddy A1.
The temperature distribution at 20 m shows that the northeast part of the study area is occupied by low
temperature surface waters, with minimum values of 18 �C (Fig. 7). In the southwest, waters are much war-
mer, with temperatures above 22.5 �C. This difference in surface temperatures, with a maximum around 5�C, can also be observed in the satellite images, where a tongue of colder waters from the Gulf of Lions
appears, reaching the Catalan continental shelf. In general, low temperature is associated with low-salinity
Fig. 7. Temperature (�C), Salinity (psu) and Sigma T (Kg/m3) fields at 20, 80 and 120 m obtained through the CTD casts (phase II).
Axes: distance to the first grid point in km. Coast: upper border of the figure.

150 A. Rubio et al. / Progress in Oceanography 66 (2005) 142–156
waters characterized by values below 38. This indicates the presence of river influenced waters confirming
the southwestward spreading of shelf waters from the Gulf of Lions. At deeper levels, central signals of high
temperature and low salinity basically reflect the deepening of isothermals generated by the anticyclonic
motion.
Vertical distributions of density and salinity at the top 150 db along the SW–NE section, which crossedthe eddy-like feature core (corresponding to the centre of the ADCP recorded anticyclonic movement), are
shown in Fig. 8. The structure of the isopycnals is typical for an anticyclonic eddy, showing a symmetrical
deepening. This tendency can be seen in the upper 250 m of the water column. As usual in that season, the
vertical density distribution basically reflects the vertical distribution of temperature. However, vertical
profiles of salinity show frequent inversions above the thermocline, which can be identified at about 40
m depth. At the northern part of the domain, the vertical salinity distribution (Fig. 8) shows the signature
Fig. 8. (a) Sigma T (Kg/m3) and (b) Salinity (psu) sections obtained through the CTD casts (phase II). Alongshore vertical section
marked in Fig. 4.

A. Rubio et al. / Progress in Oceanography 66 (2005) 142–156 151
of a surface tongue of low salinity shelf waters coming from the Gulf of Lions. In spite of that, the surface
signal of this shallow water is lost in the central profiles due to the appearance of locally less dense waters
(saltier but warmer) that could have been introduced by the anticyclonic movement.
The core of the eddy (A?) is identified at 20 m depth, being characterised by larger values of dynamic
height (Fig. 9). The geostrophic stream function shows the anticyclonic motion to be in agreement withthe ADCP velocity measurements. Maximum geostrophic velocities around 50 cm/s are found at this level.
The eddy core can be identified in the dynamic topography down to depths of 80 m. At levels below 100 m
(Fig. 9) the dynamic topography only shows the shelf–slope current, which presents a meandering structure
of around 50 km wavelength.
The non-geostrophic component of the velocity field has been obtained as the difference between ADCP
and geostrophic velocity fields (Fig. 10). This component is characterized by maximum velocities around 20
cm/s at all levels and shows a reverse tendency over the shelf. The differences between ADCP and geo-
strophic velocity fields can be due to the cyclostrophic acceleration, which in this case is estimated to besignificant, and it is not included in the geostrophic balance.
In order to study the evolution of the eddy, the velocity fields corresponding to the two fast Nm-Shuttle-ADCP surveys (phases I and III) and the data obtained through the CTD-ADCP stations (phase II) were
Fig. 9. Dynamic topography (dynamic cm) and geostrophic velocity fields (m/s) at 20, 80 and 120 m depth during phase II (CTD
survey). Isobaths: 100, 200, 500. Axes: distance to the first grid point in km. Coast: upper border of the figure.
Fig. 10. Ageostrophic field (m/s) at 20, 80 and 120 m depth during phase II (CTD survey). Isobaths: 100, 200, 500. Axes: distance to
the first grid point in km. Coast: upper border of the figure.

152 A. Rubio et al. / Progress in Oceanography 66 (2005) 142–156
compared. Maximum values of negative vorticity are observed in phase I associated to eddy A1 located at
the southeast of the domain. At 50 m, negative vorticity associated to the eddy A4 increases from
�5.6 · 10�5 s�1 in phase I survey to �6.4 · 10�5 s�1 in phase III.
Between phases I and II the core of the eddy A4 moved to the south, at a velocity of 9 km/day (Fig. 11).
This displacement is not as evident when considering the southern edge of the structure, which seems toremain stagnant. Moreover, considering the whole structure, the eddy shows an evolution in shape. Thus,
apart from the southwestward displacement, the structure appears rotated in clockwise direction. This evo-
lution is also evident in the temperature data. Colder waters entering from the northeast in phase I (Fig.
12), appear rotated and displaced to the south in phase II (Fig. 7). The behaviour of the eddy between phase
Fig. 12. Temperature (�C) fields at 25, 80 and 120 m obtained through the (a) first (phase I) and (b) last (phase III) Nm-Shuttle fast
surveys. Axes: distance to the first grid point in km. Coast: upper border of the figure.
Fig. 11. Interpotated velocity fields (m/s) at 50 m depth registered during phases I, II and III. Isobaths: 100, 200, 500. Axes: distance to
the first grid point in km. Coast: upper border of the figure.

A. Rubio et al. / Progress in Oceanography 66 (2005) 142–156 153
II and phase III is slightly different. During this time, the eddy continues its clockwise evolution, but with-
out showing any clear displacement to the south.
5. Discussion
Mesoscale structures in the Catalan sea are characterised by high spatial and temporal variability, which
is relevant for the design of an efficient survey strategy. The combined use of remote sensing with in situ
measurements has shown to be an appropriate approach to the survey of an anticyclonic eddy on the Cat-
alan continental shelf. The use of satellite data allows the determination of the best location for the in situ
survey, while the combination of Nm-Shuttle, CTD and ADCP measurements give a synoptic and compre-
hensive vision of the structure�s properties and their evolution.
Although thermal images just provide information of the first millimetres of the water column, the goodcorrelation found between the sea surface signal and the structure surveyed through CTD and ADCP in the
upper 100 m validates the use of SST images to follow the evolution of the structure described in this work
(Fig. 5).
The anticyclonic structure located between the Palamos and the Blanes canyons found in September
2001 is characterized by a diameter of 45 km, reaching depths of 100 m. The velocity field shows a closed
anticyclonic eddy motion with velocities around 50 cm/s which interacts with the surrounding waters of dif-
ferent properties (fresher cold waters from north and saltier warm waters in the south) and modifies the
surface field, as can be observed both in the SST (Fig. 5) images and the hydrographic fields (Fig. 7). More-over, the convergence associated to both, the surface front and the anticyclonic motion, is assisting the sub-
duction of a denser low-salinity water plume which remains trapped above the thermocline. Subduction of
shelf waters in this region has been already reported in previous studies, as e.g. Wang et al. (1988), who
observed this process associated to a strong flow convergence near the head of a filament.
The size and strength of the surveyed eddy suggest this structure to play a role in shelf–slope exchanges.
An estimate considering the first 100 m of the water column gives an across-slope transport of 0.15–0.3 Sv.
This transport enhances exchanges between shelf waters and open sea waters. In fact, previous studies have
shown how this mixing might help to explain anomalous distribution of biota. Sabates and Maso (1992)described the presence of larvae abnormally located close to the coast associated with an anticyclonic gyre.
Comparing the ADCP data from the three different phases, a decrease in the drifting velocity of the eddy
is observed. This attenuation in the eddy drifting velocity can be explained by the presence of a second anti-
cyclonic eddy (A1) at the southwest of the domain which blocks the south-westward displacement of eddy
A?. It is important to consider the lack of synopticity achieved during the time-consuming CTD survey
(phase II), which was performed against the direction of translation of the anticyclonic structure. Neverthe-
less, in our case, the comparison between the fast surveys in phases I and III (both performed from north-
east to southwest) confirms both, the eddy displacement and its shape evolution.Concerning the generation and evolution of the structure, two hypotheses arise from the thermal images
analysis. The first hypothesis, based in the previous work of Arnau (2000), is that the surveyed structure in
the ET2001 cruise was generated outside the experiment site, more precisely at the easternmost part of the
Gulf of Lions. In this case, the structures A4, A41, A42 and A? in previous sections are the same sole struc-
ture evolving from the eastern part of the Gulf of Lions into the Catalan Sea.
The joint analysis of remote sensing information and meteorological data points out that the eddies gen-
eration and development can be related to intense Tramontana wind events occurring in the Gulf of Lions.
Strong northwesterlies in this area, are responsible for upwelling of water along the coast and induce anti-cyclonic patterns over the continental shelf (Millot, 1990). The change in the density distribution associated
with the upwelling phenomena at the outer part of the Gulf of Lions continental shelf can trigger baroclinic
instability in the Northern Current leading to the generation of meanders and eddies in the current�s coastal
154 A. Rubio et al. / Progress in Oceanography 66 (2005) 142–156
side. After its generation in the eastern part of the Gulf of Lions they are advected by the Northern Current
to the southwest reaching the surveyed site. In fact, drifting velocities of 6–8 km/day are observed through
SST images and confirmed by the evolution revealed in in situ data. According to Flexas et al. (2002), the
Northern Current along the slope in the Gulf of Lions presents a clear meandering structure with a wave-
length larger than 40 km that embrace smaller scale structures. Meanders of about 30–40 km propagatingat phase speeds of 5–15 km/day have also been reported by other authors in the area (Sabates, Salat, &
Olivar, 2001; Sammari, Millot, & Prieur, 1995). These meander propagation along the slope plays a key
role on the observed eddy drift.
A second hypothesis for the interpretation of the thermal images is that the eddy was generated locally.
In that case the structures A2 and A? would be the same one. The local generation of similar structures
found in the Catalan sea has been previously discussed by several authors. Tintore et al. (1990) observed
an anticyclonic eddy off Barcelona associated with the spreading of fresh waters from the Gulf of Lions.
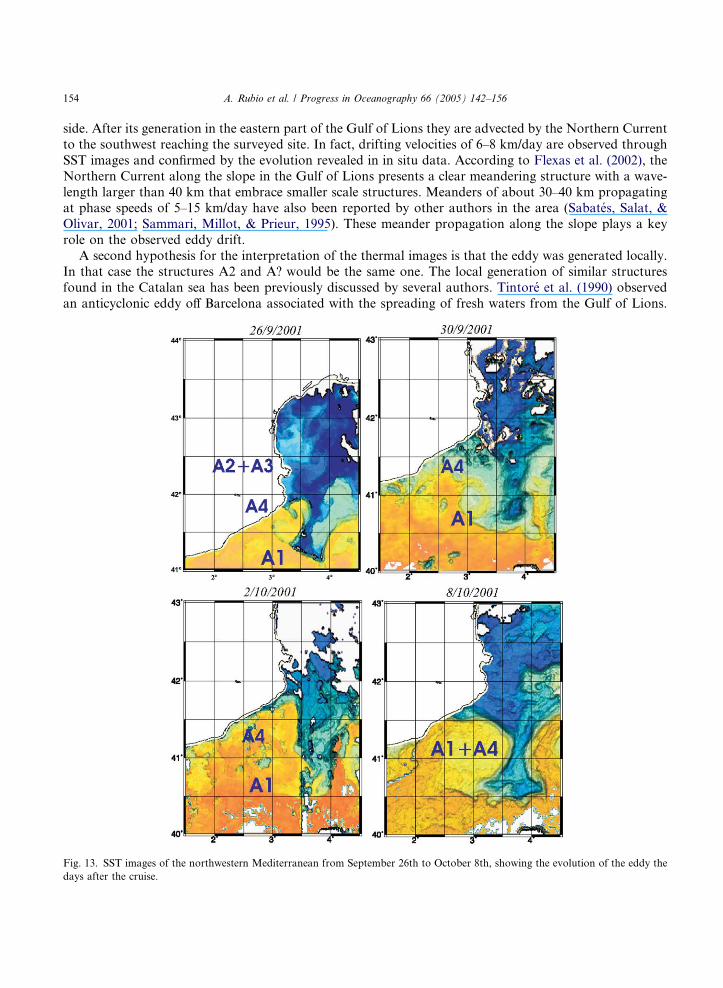
Fig. 13. SST images of the northwestern Mediterranean from September 26th to October 8th, showing the evolution of the eddy the
days after the cruise.

A. Rubio et al. / Progress in Oceanography 66 (2005) 142–156 155
The authors state that the eddy is related to vorticity balances or to the interaction of the flow with the local
bathymetry. Font et al. (1988) proposed the baroclinic instability as the mechanism of formation of mean-
ders in the Catalan Current giving rise to cyclonic and anticyclonic eddies. In our case, the generation of
this eddy may be explained by the direct effect of the wind curl, strong in the area as observed from the
comparison of the wind series in the Portbou and Malgrat stations. The eddy can be generated by the directeffect of the wind, making the warm water tongue to gain negative vorticity, and thus following a similar
mechanism as discussed by Pascual et al. (2002) concerning the development of a warm core eddy.
The evolution of the eddy after the hydrographic survey (from September 30th to October 8th) is fol-
lowed from SST images (Fig. 13). It seems that eddy A4 presented an important development, slowly mov-
ing southwestwards and merging with eddy A1 located off Barcelona.
6. Conclusions
The good correlation between remote information from sea surface and the in situ measurements of the
velocity field and the effectiveness in the surveying process of this anticyclone have shown the utility of SST
satellite images in the preliminary diagnosis and tracking of this kind of mesoscale features. In situ velocity
data revealed an anticyclonic motion, characterized by surface velocities around 50 cm/s and by a diameter
of almost 45 km, whose signal reached to 100 m depth. The surveyed anticyclonic pattern is a dynamical
structure which is modifying the dynamics of surface surrounding waters. The passage of the eddy is also
observed to favour the subduction of colder waters from the Gulf of Lions continental shelf.The mechanism of generation of the surveyed eddy has not been completely elucidated but two hypoth-
esis arised from the analysis of the SST data set. The first one is that the eddy was generated outside of the
surveyed site, in the eastern part of the Gulf of Lions, and then advected to the southwest by the slope cur-
rent. The second one is that it was locally generated by the wind curl. More in depth studies should be car-
ried on to characterize the origin and evolution of the structures found in this area.
Acknowledgements
This study forms part of the project ‘‘Genesis, evolucion temporal, translacion y efectos de remolinos de
mesoescala sobre la plataforma continental catalana’’ (MAR1999–1010), which has been funded by the
Comision Interministerial de Ciencia y Tecnologıa (CYCIT). The works of A. Rubio and G. Jorda are
funded by a grant from the Spanish Ministerio de Educacion, Cultura y Deportes and the work of
M.M. Flexas was funded by a FI grant from the Generalitat de Catalunya. The contribution of P. Arnau
has been developed in Concerted Action Proposal for the 5th EU Framework Program ‘‘European Co-
ordination on Mediterranean and Black Sea Prodeltas’’ (EURODELTA; EVK3-CT-2002-20001), sup-ported by the EU. The optimal interpolation scheme used this work for interpolating hydrographic and
velocity data has been developed by D. Gomis and S. Ruiz. We thank ESA Agency (‘‘Genesis and temporal
evolution of eddies over catalan shelf’’; Project Category-1 1094) for providing near real time ATSR images
to track eddies; to ISIS of the German Remote Sensing Data Center and AZTI Foundation for the
AVHRR images. We thank to Goddard DAAC/NASA for the MODIS images. Finally, the authors thank
to Servei Meteorologic from the Generalitat de Catalunya for providing the wind series.
References
Arnau, P., Garcıa, M. A., & S.-Arcilla, A. (1998). Combined satellite and field observations of the fate and effects of mesoscale eddies
on the Catalan continental shelf (NW Mediterranean). In Proceedings of the international symposium on satellite-based observation:
a tool for the study of the Mediterranean basin, Tunis, 23–27 November 1998 (pp. 2.29–2.34).

156 A. Rubio et al. / Progress in Oceanography 66 (2005) 142–156
Arnau, P. A. (2000). Aspectos de la variabilidad de mesoescala de la circulacion marina en la plataforma continental catalana. Ph.D.
Thesis. Universidad Politecnica de Cataluna, 600 p.
Castellon, A., Font, J., & Garcia, E. (1990). The Liguro-Provencal catalan current (NWMediterranean) observed by Doppler profiling
in the Balearic sea. Scientia Marina, 54(3), 269–276.
Flexas, M. M., Durrieu de Madron, X., Garcia, M. A., Canals, M., & Arnau, P. (2002). Flow variability in the Gulf of Lions during
the Mater HFF Experiment (March–May 1997). Journal of Marine Systems, 33/34, 197–214.
Font, J., Garcıa-Ladona, E., & Gorriz, G. E. (1995). The seasonality of mesoscale motion in the Northern Current of the western
Mediterranean: several years of evidence. Oceanologica Acta, 18, 207–219.
Font, J., Salat, J., & Tintore, J. (1988). Permanent features of the circulation in the Catalan Sea. In: H. J. Minas, & P. Nival (Eds.),
Oceanographie pelagique Mediterraneenne, Oceanologica Acta n. sp. 9, 51–57.
Garcıa-Gorriz, E., Font, J., & Candela, J. (1997). Data quality control for vessel mounted acoustic doppler current profiler.
Applications for the western mediterranean sea. Scientia Marina, 61(4), 417–430.
La Violette, P. E., Tintore, J., & Font, J. (1990). The surface circulation of the Balearic Sea. Journal of Geophysical Research, 95(C2),
1559–1568.
Maso, M., & Tintore, J. (1991). Variability of the shelf water off the northeast Spanish coast. Journal of Marine Systems, 1, 441–450.
Maso, M., Sabates, A., & Olivar, M. P. (1998). Short-term physical and biological variability in the shelf–slope region of the NW
Mediterranean during the spring transition period. Continental Shelf Research, 18, 661–675.
Millot, C. (1990). The Gulf of Lions� hydrodynamics. Continental Shelf Research, 10(9–11), 885–894.
Millot, C. (1999). Circulation in the Western Mediterranean sea. Journal of Marine Systems, 20, 423–442.
Pascual, A., Buongiorno Nardelli, B., Larnicol, G., Emelianov, M., & Gomis, D. (2002). A case of an intense anticyclonic eddy in the
Balearic Sea (western Mediterranean). Journal of Geophysical Research, 107(C11).
Rojas, P., Garcia, M. A., Sospedra, J., Figa, J., Puigdefabregas, J., Lopez, O., et al. (1995). On the structure of the mean flow in the
Blanes canyon area (NW Mediterranean) during summer. Oceanologica Acta, 18(4), 443–454.
Rudnick, D. L. (1996). Intensive surveys of the Azores front, 2. Inferring the geostrophic and vertical velocity fields. Journal of
Geophysical Research, 101(C7), 16.291–16.303.
Sabates, A., & Maso, M. (1992). Unusual larval fish distribution pattern in a coastal zone of the western Mediterranean. Limnology
and Oceanography, 37(6), 1252–1260.
Sabates, A., Salat, J., & Olivar, M. P. (2001). Advection of continental water as an export mechanism for anchovy, Engraulis
encrasicolus, larvae. Scientia Marina, 65(Suppl. 1), 77–88.
Salat, J. (1996). Review of hydrographic environmental factors that may influence anchovy habitats in northwestern Mediterranean. In
I. Palomera, & P. Rubies (Eds.), The European anchovy and its environment. Scientia Marina, 60(Suppl. 2), 21–32.
Salat, J., Garcia, M. A., Cruzado, A., Palanques, A., Arın, L., Gomis, D., et al. (2002). Seasonal changes of water mass structure and
shelf–slope exchanges at the Ebro shelf (NW Mediterranean). Continental Shelf Research, 22, 327–348.
Sammari, C., Millot, C., & Prieur, L. (1995). Aspects of the seasonal and mesoscale variabilities of the Northern current in the western
Mediterranean sea inferred from the PROLIG-2 and PROS-6 experiments. Deep Sea Research I, 42(6), 893–917.
Tintore, J., Wang, D. P., & La Violette, P. E. (1990). Eddies and thermohaline intrusions of the shelf/slope front off the northeast
Spanish coast. Journal of Geophysical Research, 95(C2), 1627–1633.
Wang, D. P., Vieira, M., Salat, J., Tintore, J., & La Violette, P. E. (1988). A shelf/slope frontal filament off the northeast Spanish
Coast. Journal of Marine Research, 46, 321–332.