A Disaggregated and Macro-consistent Social Accounting Matrix for Pakistan
25
Journal of Economic Structures (2013) 2:4 DOI 10.1186/2193-2409-2-4 RESEARCH Open Access A Disaggregated and Macro-consistent Social Accounting Matrix for Pakistan Darío Debowicz · Paul Dorosh · Hamza Syed Haider · Sherman Robinson Received: 27 August 2012 / Accepted: 19 March 2013 / Published online: 22 March 2013 © 2013 D. Debowicz et al.; licensee Springer. This is an Open Access article distributed under the terms of the Creative Commons Attribution License (http://creativecommons.org/licenses/by/2.0), which permits unrestricted use, distribution, and reproduction in any medium, provided the original work is properly cited. Abstract This paper provides future researchers of economic structure with a model for building a social accounting matrix (SAM), that is, a unique countrywide database for use in structural analysis, and applies this model to the empirical investigation of the economic structure of Pakistan. Our proposed approach to building SAMs is mo- tivated by an information theoretic approach to estimation that takes a Bayesian view of the efficient use of information: “Use all the information you have, but do not assume any information you do not have.” The methodology used to develop this SAM, unlike previous approaches, ensures that it is perfectly consistent with the na- tional accounts. The SAM provides a high degree of detail on the economic structure of the country, with 51 sectors of activity, 27 factors of production, and 18 house- hold groups, allowing the tracing of direct and indirect effects of potential scenarios through production and consumption linkages and the capture of distributional ef- fects. Output multipliers in Pakistan, accounting for supply constraints, range from 1.1 to 1.4, and shocks to livestock and industry have the largest spillover effects. These shocks lead to income changes that differ significantly across domestic socioe- conomic groups, a direct result of the heterogeneity in the generation of income of these groups that our countrywide database captures. Keywords Social accounting matrix (SAM) · Multiplier analysis · Pakistan · Economic structure D. Debowicz ( ) · P. Dorosh · H.S. Haider · S. Robinson 2033 K Street NW, Washington DC, USA e-mail: [email protected] P. Dorosh e-mail: [email protected] H.S. Haider e-mail: [email protected] S. Robinson e-mail: [email protected]
-
Upload
comsatsabbottabad -
Category
Documents
-
view
0 -
download
0
Transcript of A Disaggregated and Macro-consistent Social Accounting Matrix for Pakistan

Journal of Economic Structures (2013) 2:4DOI 10.1186/2193-2409-2-4
R E S E A R C H Open Access
A Disaggregated and Macro-consistent SocialAccounting Matrix for Pakistan
Darío Debowicz · Paul Dorosh ·Hamza Syed Haider · Sherman Robinson
Received: 27 August 2012 / Accepted: 19 March 2013 / Published online: 22 March 2013© 2013 D. Debowicz et al.; licensee Springer. This is an Open Access article distributed under the termsof the Creative Commons Attribution License (http://creativecommons.org/licenses/by/2.0), whichpermits unrestricted use, distribution, and reproduction in any medium, provided the original work isproperly cited.
Abstract This paper provides future researchers of economic structure with a modelfor building a social accounting matrix (SAM), that is, a unique countrywide databasefor use in structural analysis, and applies this model to the empirical investigation ofthe economic structure of Pakistan. Our proposed approach to building SAMs is mo-tivated by an information theoretic approach to estimation that takes a Bayesian viewof the efficient use of information: “Use all the information you have, but do notassume any information you do not have.” The methodology used to develop thisSAM, unlike previous approaches, ensures that it is perfectly consistent with the na-tional accounts. The SAM provides a high degree of detail on the economic structureof the country, with 51 sectors of activity, 27 factors of production, and 18 house-hold groups, allowing the tracing of direct and indirect effects of potential scenariosthrough production and consumption linkages and the capture of distributional ef-fects. Output multipliers in Pakistan, accounting for supply constraints, range from1.1 to 1.4, and shocks to livestock and industry have the largest spillover effects.These shocks lead to income changes that differ significantly across domestic socioe-conomic groups, a direct result of the heterogeneity in the generation of income ofthese groups that our countrywide database captures.
Keywords Social accounting matrix (SAM) · Multiplier analysis · Pakistan ·Economic structure
D. Debowicz (�) · P. Dorosh · H.S. Haider · S. Robinson2033 K Street NW, Washington DC, USAe-mail: [email protected]
P. Doroshe-mail: [email protected]
H.S. Haidere-mail: [email protected]
S. Robinsone-mail: [email protected]

Page 2 of 25 D. Debowicz et al.
JEL Classification E160 · E170
1 Introduction
A social accounting matrix (SAM) is an internally consistent single-entry account-ing system that documents all the economic transactions within an economy. SAMssupport the continuing need to use recent and consistent multisectoral economic datafor policy analysis and the development of economy wide models (Robinson et al.2001). A SAM is an extended set of national accounts that disaggregates the valueadded in each production activity into payments to various factors such as land, la-bor, and capital, and disaggregates household incomes and expenditures according tovarious household types. Mathematically, a SAM is a square matrix in which eachaccount is represented by a row and a column. Each cell shows the payment fromthe account of its column to the account of its row. Thus, the incomes of an accountappear along its row and its expenditures along its column. The underlying principleof double-entry accounting requires that, for each account in the SAM, total revenue(row total) equals total expenditure (column total).
Data typically used to build SAMs include an input–output (IO) matrix of theeconomy, national accounts, fiscal accounts, trade data, other balance-of-paymentsinformation, and surveys providing information on the composition of household in-come and expenditures. Given its ability to capture interindustry linkages and house-hold income and expenditure composition while being consistent with macroeco-nomic accounts, a SAM can serve as a unique economic database for structural anal-ysis. However, in order for academics to be able to fruitfully employ a SAM to per-form up-to-date structural analysis, the SAM needs to provide rich and current detailon the income and expenditure patterns of the production sectors, production factors,and households of an economy: only a SAM with a rich disaggregation of accountsallows the heterogeneity of the income and expenditure composition among house-holds to be reflected in a significant way and, as a result, allows the distributionaleffects of changes in the composition of output in the economy to be identified.
This paper provides a model for future researchers looking to build a SAM and ap-plies the model to Pakistan, creating a highly disaggregated and updated SAM. ThisSAM is then used to describe the structure of the Pakistani economy through multi-plier analysis in an attempt to provide a useful reference and resource for academicsconcerned with the structure of Pakistan’s economy.
The Pakistani economy has undergone marked changes during the last decade,which call for an updated countrywide database. In only 10 years, the share of thecountry’s service sector increased from 50.7 % (2000) to 54.6 % (2010); the share ofthe textile sector in total exports decreased from 64.8 % (2000) to 53.0 % (2010); andthe labor force grew significantly, due not so much to the annual population growthrate of around 2 %, but more to an impressive increase in the labor participation rate,which though still low by international standards, grew from 28.9 % (2000) to 45.7 %(2010) (State Bank of Pakistan 2010).
Our paper is organized as follows. In Sect. 2, we review past SAMs for Pakistanand highlight their relative strengths and weaknesses in capturing sector, factor, and

Journal of Economic Structures (2013) 2:4 Page 3 of 25
Table 1 Previous SAMs for Pakistan
No. Name of researchers ororganization
Salient features
1 Pakistan Institute ofDevelopment Economics(1985)
Base year: 1979
2 Federal Bureau of Statistics(1993)
Base year: 1984/1985
Households: 1
3 Siddiqui and Iqbal (1999) Base year: 1989/1990
Sectors (5): agriculture, industry, education, health, othersectors
Factors (2): labor and capital
Agents: households (8), firms, government, rest of the world
4 Dorosh et al. (2004) (DNN) Base year: 2001/2002
Sectors (34): agriculture (12), industry (16), services (6)
Factors: 27
Agents: households (19), enterprises, government, rest of theworld
5 Waheed and Ezaki (2008) Base year: 1999/2000
Sectors (6): agriculture; mining and quarrying; manufacturing;electricity, water, and gas; construction; other sectors
Factors (2): labor and capital
Agents: households (1), firms, government, commercial banks,central bank, rest of the world
We were unable to obtain access to SAMs Nos. 1 and 2. Source: Authors’ literature review
household detail. In Sect. 3, we explain our approach to building a SAM and how weapply the model to Pakistan. Based on the resulting SAM, in Sect. 4 we analyze thestructure of the Pakistani economy, and in Sect. 5 we conduct income multiplier anal-ysis to further illuminate the economic structure of the country. Section 6 concludes.
2 Previous Social Accounting Matrixes for Pakistan
A limited number of SAMs have been constructed for Pakistan (Table 1). The firstrepresented the Pakistani economy in the year 1979 and was constructed in 1985 bythe Pakistan Institute of Development Economics. It was followed by a SAM for theyear 1984/1985, created by the Federal Bureau of Statistics (FBS) with collaborationfrom the Dutch government under the Improvement of National Accounting Systemproject. Because this SAM had a single household group, it was not suitable foranalyzing distributional effects across households.
Siddiqui and Iqbal (1999) developed another SAM for 1989/1990, aggregatingthe IO matrix industry classifications into five activity accounts and disaggregatinghousehold income and expenditures into eight household groups, allowing for distri-butional analysis among households. In 2004, Dorosh et al. (2004) (DNN henceforth)
Page 4 of 25 D. Debowicz et al.
produced an additional SAM of Pakistan for the year 2001/2002, which even whenrelying on the same IO matrix as Siddiqui and Iqbal, allowed for much larger disag-gregation, containing 19 household groups and 34 production sectors. The suitabilityfor analyzing the effects of shocks in specific industries on different socioeconomicgroups improved significantly with this SAM, as households were disaggregated byprovince (Sindh, Pakistan, and rest of Pakistan) and the number of commodities waslarger than in Siddiqui and Iqbal (1999). The DNN SAM is at present informing theGlobal Trade and Analysis Project SAM for Pakistan, which has five factors and 57sectors but a single representative household and is therefore not suitable for distri-butional analysis among household groups. More recently, and relying on the sameIO matrix (still the most recent matrix available for the country), Waheed and Ezaki(2008) provided a bridge between the real and the financial sides of the Pakistanieconomy, reflecting the growing importance of capital flows and the availability ofthe associated data, by creating a real/financial SAM for the year 1999/2000. How-ever, in this case, production sectors were aggregated into only six accounts, with nodisaggregation into different household groups.
3 Methodology for Developing the SAM
In designing the accounts for our SAM, we take as a base the accounts of the SAMdeveloped by DNN, as it is the most disaggregated one created thus far for the coun-try. Starting from this base, we further increase the disaggregation of the SAM ac-counts and use more updated information in many spheres. While the textile industrywas aggregated into a single account in DNN, we disaggregate it into knitwear, gar-ments, and other textiles—all relevant textile activities in Pakistan. We disaggregatecotton into ginning, spinning, and weaving, and chemicals into fertilizers and otherchemicals. Reflecting the growth of the service sector in the country, we substantiallydisaggregate this sector: trade (a single account in DNN) is split into wholesale, re-tail, and other trade; transport into road, rail, air, water, and other transport; housinginto rented and owned; and other private-sector services into education, healthcare,business services, personal services, and other private services. As in DNN, house-holds are disaggregated according to province, among other criteria. Out of the 18household groups, 12 represent agricultural households. Agricultural households areclassified by farm ownership and size (small vs. medium/large),1 enabling an in-depth analysis of the distributional effects of changes in the agricultural sector andits linkages with other industries. Nonagricultural households are classified as urbanor rural. While in DNN these groups are disaggregated into two subgroups (poorest20 % and rest), we disaggregate them into three subgroups according to per capitaexpenditure: quintile 1, quintile 2, and rest.
Our proposed approach to developing SAMs is motivated by an information the-oretic approach to estimation (Judge and Mittelhammer 2012) that takes a Bayesianview of the efficient use of information: “Use all the information you have, but do not
1Medium/large farm households are defined as those owning 12.5 acres or more of land. Small farmhouseholds are those owning less than 12.5 acres of land.

Journal of Economic Structures (2013) 2:4 Page 5 of 25
assume any information you do not have.” Previous work on SAM estimation usingthis approach includes Judge and Mittelhammer (2012), Golan et al. (1994, 1996),Robinson et al. (2001), Debowicz (2010), and Zellner (2004).
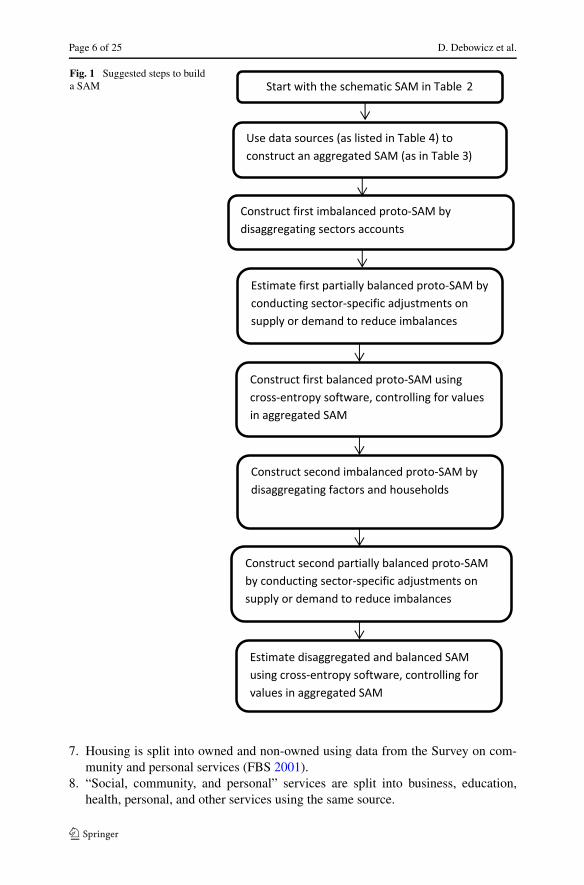
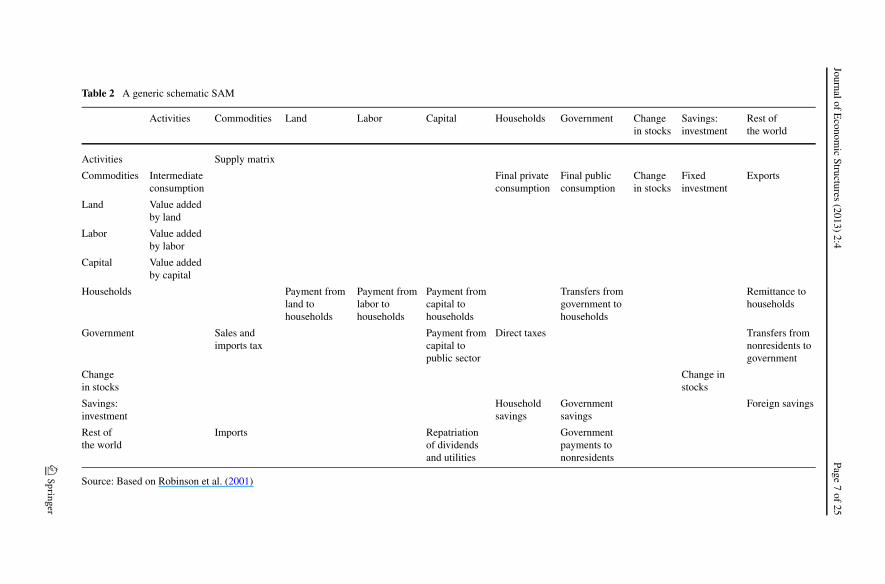
In this spirit, we have designed a series of major steps that we list in Fig. 1 that leadto an estimated macro-consistent and disaggregated SAM for a countrywide econ-omy. The steps, which are explained in detail below, start from a schematic SAM(Table 2) and, using a variety of data sources and balancing the accounts of the SAMwith the use of a cross-entropy technique, lead to a macro-consistent and disaggre-gated SAM. In particular, after constructing an aggregated SAM based on macrofigures, parsimonious disaggregation of the accounts allows the researcher estimat-ing the SAM to keep sight of the role that different types of information play. Rightafter each disaggregation, the accounts of the SAM are balanced, using informationfrom local experts on which values are to be trusted in the case of major imbalances,and with the use of a cross-entropy technique that allows to perfectly balance theaccounts while keeping the information on the SAM consistent with macro figurespublicly available for the country.
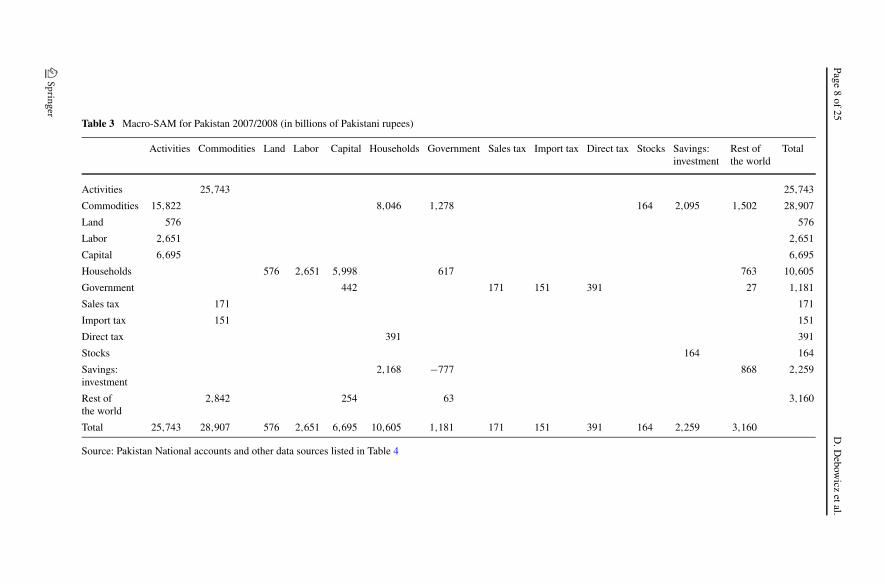
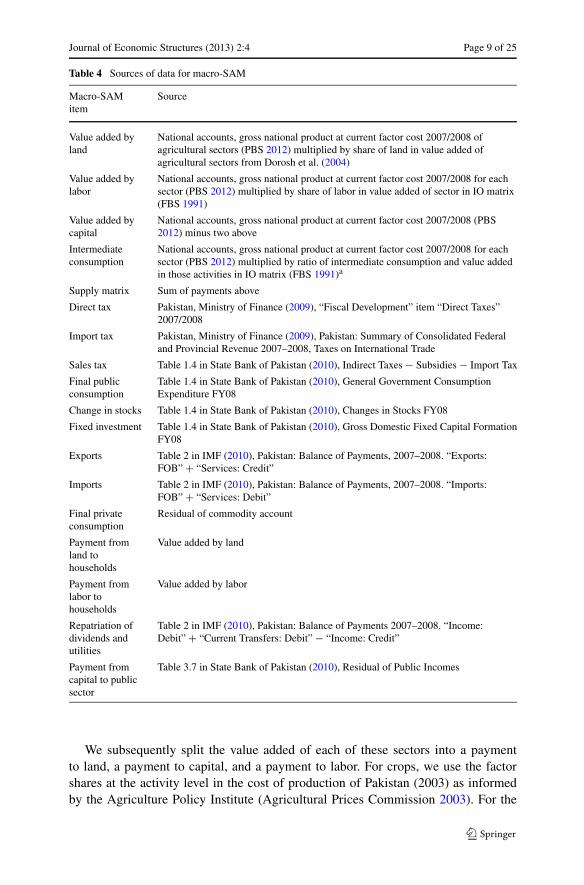
Table 3 shows the numerical macro-SAM that we obtain in domestic currency forPakistan after step 2, and Table 4 shows the data sources that need to be used in orderto estimate it.
3.1 Construction of the First Imbalanced Proto-SAM
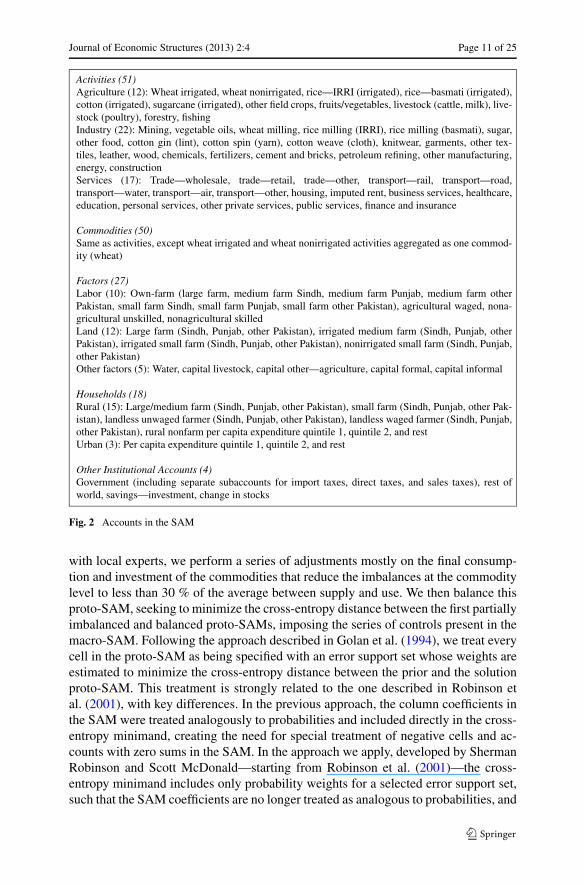
After estimating an aggregated SAM, the next step is to split the domestic value addedinto multiple sectors (51 sectors in the case at hand, as listed in the SAM accounts inFig. 2). In doing this, we start from the value added by each major sector (2007/2008gross national product at current factor cost), which sums to the value added in themacro-SAM, and split the sectors as follows:
1. Major and minor crops are disaggregated into wheat, rice, cotton, sugarcane, fruitsand vegetables, and other field crops using the 2007/2008 data from Agriculturalstatistics of Pakistan, “Gross Value Addition of Major Crops at Current FactorCost” and “Gross Value Addition of Minor Crops at Current Factor Cost” (Pak-istan, Ministry of Food and Agriculture 2009).
2. Rice and wheat are further split using production of rice varieties and irrigated andnonirrigated wheat from Agricultural statistics of Pakistan.
3. Livestock is split into poultry and other livestock using the value of their outputas identified by Agricultural statistics of Pakistan.
4. Manufacturing is split into vegetable oil, wheat milling, IRRI rice milling, basmatirice milling, refinement of sugar, other food, lint, yarn, cloth, knitwear, garments,other textiles, leather, wood, fertilizer, other chemicals, cement, petroleum refin-ing, and other manufacturing using the most recent available Census of manufac-turing industries (CMI) (FBS 2006).
5. Trade is split into wholesale, retail, and other using the Study on wholesale andretail trade, hotels and restaurants in Pakistan (FBS 2002).
6. Transport is split into road, rail, water, air, and other, such as transport by tubes,using National accounts of Pakistan: rebasing from 1980–81 to 1999–2000 (FBS2004).
Page 6 of 25 D. Debowicz et al.
Fig. 1 Suggested steps to builda SAM
7. Housing is split into owned and non-owned using data from the Survey on com-munity and personal services (FBS 2001).
8. “Social, community, and personal” services are split into business, education,health, personal, and other services using the same source.
JournalofE
conomic
Structures(2013)
2:4Page
7of
25
Table 2 A generic schematic SAM
Activities Commodities Land Labor Capital Households Government Changein stocks
Savings:investment
Rest ofthe world
Activities Supply matrix
Commodities Intermediateconsumption
Final privateconsumption
Final publicconsumption
Changein stocks
Fixedinvestment
Exports
Land Value addedby land
Labor Value addedby labor
Capital Value addedby capital
Households Payment fromland tohouseholds
Payment fromlabor tohouseholds
Payment fromcapital tohouseholds
Transfers fromgovernment tohouseholds
Remittance tohouseholds
Government Sales andimports tax
Payment fromcapital topublic sector
Direct taxes Transfers fromnonresidents togovernment
Changein stocks
Change instocks
Savings:investment
Householdsavings
Governmentsavings
Foreign savings
Rest ofthe world
Imports Repatriationof dividendsand utilities
Governmentpayments tononresidents
Source: Based on Robinson et al. (2001)
Page8
of25
D.D
ebowicz
etal.
Table 3 Macro-SAM for Pakistan 2007/2008 (in billions of Pakistani rupees)
Activities Commodities Land Labor Capital Households Government Sales tax Import tax Direct tax Stocks Savings:investment
Rest ofthe world
Total
Activities 25,743 25,743
Commodities 15,822 8,046 1,278 164 2,095 1,502 28,907
Land 576 576
Labor 2,651 2,651
Capital 6,695 6,695
Households 576 2,651 5,998 617 763 10,605
Government 442 171 151 391 27 1,181
Sales tax 171 171
Import tax 151 151
Direct tax 391 391
Stocks 164 164
Savings:investment
2,168 −777 868 2,259
Rest ofthe world
2,842 254 63 3,160
Total 25,743 28,907 576 2,651 6,695 10,605 1,181 171 151 391 164 2,259 3,160
Source: Pakistan National accounts and other data sources listed in Table 4
Journal of Economic Structures (2013) 2:4 Page 9 of 25
Table 4 Sources of data for macro-SAM
Macro-SAMitem
Source
Value added byland
National accounts, gross national product at current factor cost 2007/2008 ofagricultural sectors (PBS 2012) multiplied by share of land in value added ofagricultural sectors from Dorosh et al. (2004)
Value added bylabor
National accounts, gross national product at current factor cost 2007/2008 for eachsector (PBS 2012) multiplied by share of labor in value added of sector in IO matrix(FBS 1991)
Value added bycapital
National accounts, gross national product at current factor cost 2007/2008 (PBS2012) minus two above
Intermediateconsumption
National accounts, gross national product at current factor cost 2007/2008 for eachsector (PBS 2012) multiplied by ratio of intermediate consumption and value addedin those activities in IO matrix (FBS 1991)a
Supply matrix Sum of payments above
Direct tax Pakistan, Ministry of Finance (2009), “Fiscal Development” item “Direct Taxes”2007/2008
Import tax Pakistan, Ministry of Finance (2009), Pakistan: Summary of Consolidated Federaland Provincial Revenue 2007–2008, Taxes on International Trade
Sales tax Table 1.4 in State Bank of Pakistan (2010), Indirect Taxes − Subsidies − Import Tax
Final publicconsumption
Table 1.4 in State Bank of Pakistan (2010), General Government ConsumptionExpenditure FY08
Change in stocks Table 1.4 in State Bank of Pakistan (2010), Changes in Stocks FY08
Fixed investment Table 1.4 in State Bank of Pakistan (2010), Gross Domestic Fixed Capital FormationFY08
Exports Table 2 in IMF (2010), Pakistan: Balance of Payments, 2007–2008. “Exports:FOB” + “Services: Credit”
Imports Table 2 in IMF (2010), Pakistan: Balance of Payments, 2007–2008. “Imports:FOB” + “Services: Debit”
Final privateconsumption
Residual of commodity account
Payment fromland tohouseholds
Value added by land
Payment fromlabor tohouseholds
Value added by labor
Repatriation ofdividends andutilities
Table 2 in IMF (2010), Pakistan: Balance of Payments 2007–2008. “Income:Debit” + “Current Transfers: Debit” − “Income: Credit”
Payment fromcapital to publicsector
Table 3.7 in State Bank of Pakistan (2010), Residual of Public Incomes
We subsequently split the value added of each of these sectors into a paymentto land, a payment to capital, and a payment to labor. For crops, we use the factorshares at the activity level in the cost of production of Pakistan (2003) as informedby the Agriculture Policy Institute (Agricultural Prices Commission 2003). For the

Page 10 of 25 D. Debowicz et al.
Table 4 (Continued)
Macro-SAMitem
Source
Governmentsavings
Pakistan, Ministry of Finance (2009), Pakistan: Summary of Consolidated Federaland Provincial Budgetary Operations, Provisional, Table 1, Budget Deficit2007–2008
Governmentpayments tononresidents
Table 3a in IMF (2010), Share of Foreign into Total Payment of Interest by GOP2008–2009 (not available for 2007–2008) multiplied by Table 3.7 in State Bank ofPakistan (2010), Interest Payment FY08 Consolidated Federal and ProvincialGovernments
Transfer fromnonresidents togovernment
Table 7.2 in State Bank of Pakistan (2010), Net Current Transfers of GeneralGovernment in Balance of Payments FY08
Transfer fromgovernment tohouseholds
Residual in government account
aThe classification of activities in the IO matrix (IO91) is presented in the Appendix
remaining activities, where land does not add value, the shares of labor and capitalare identified by the most updated IO matrix (FBS 1991) and the sectors in the IOmatrix are mapped to those in the SAM using Table 5. Then we split the intermediateuse of each activity among commodities using recent information on the productioncosts of crops (Agricultural Prices Commission 2009) and the IO matrix.
The supply of each activity sector is allocated to its corresponding commodity.2
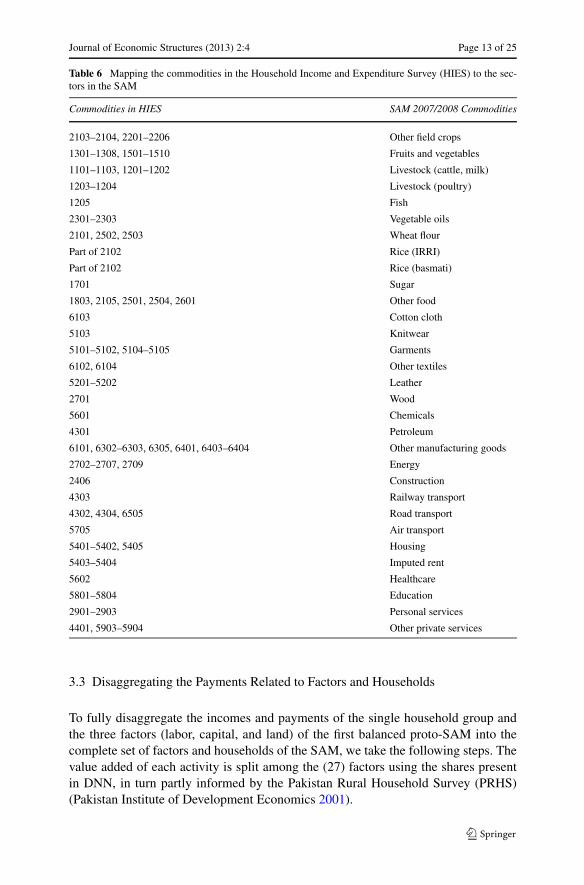
The sector composition of private final consumption is informed by expenditurespresent in the Household Income and Expenditure Survey (HIES) (FBS 2008), ex-panded with the sample household weights, and using Table 6. The sector composi-tion of fixed investment, changes in stocks, and public final consumption is informedby the IO matrix and the respective mapping into SAM accounts (Table 5). The sec-tor composition of imports and exports is informed mainly by 2007/2008 trade datafrom the Pakistan Economic Survey (Pakistan, Ministry of Finance 2009), and 2008import data from the Pakistani Ministry of Commerce (Pakistan, Ministry of Com-merce 2011) and United Nations Conference on Trade and Development (UNCTAD2008). Commodity-specific import revenue is estimated by multiplying the value ofimports of each commodity and the associated tariff rates available for Pakistan fromthe Federal Board of Revenue (FBR 2008). The sales tax is split among commoditiesin proportion to the already calculated production value of each commodity.
3.2 Balancing the First Proto-SAM
At this stage, relatively large imbalances are found in lint, mining, construction, andbusiness services. Relying on supply information provided by CMI and consultation
2Given data availability, secondary production is ignored. A slight modification in the procedure would beneeded if data on secondary production were available.
Journal of Economic Structures (2013) 2:4 Page 11 of 25
Activities (51)Agriculture (12): Wheat irrigated, wheat nonirrigated, rice—IRRI (irrigated), rice—basmati (irrigated),cotton (irrigated), sugarcane (irrigated), other field crops, fruits/vegetables, livestock (cattle, milk), live-stock (poultry), forestry, fishingIndustry (22): Mining, vegetable oils, wheat milling, rice milling (IRRI), rice milling (basmati), sugar,other food, cotton gin (lint), cotton spin (yarn), cotton weave (cloth), knitwear, garments, other tex-tiles, leather, wood, chemicals, fertilizers, cement and bricks, petroleum refining, other manufacturing,energy, constructionServices (17): Trade—wholesale, trade—retail, trade—other, transport—rail, transport—road,transport—water, transport—air, transport—other, housing, imputed rent, business services, healthcare,education, personal services, other private services, public services, finance and insurance
Commodities (50)Same as activities, except wheat irrigated and wheat nonirrigated activities aggregated as one commod-ity (wheat)
Factors (27)Labor (10): Own-farm (large farm, medium farm Sindh, medium farm Punjab, medium farm otherPakistan, small farm Sindh, small farm Punjab, small farm other Pakistan), agricultural waged, nona-gricultural unskilled, nonagricultural skilledLand (12): Large farm (Sindh, Punjab, other Pakistan), irrigated medium farm (Sindh, Punjab, otherPakistan), irrigated small farm (Sindh, Punjab, other Pakistan), nonirrigated small farm (Sindh, Punjab,other Pakistan)Other factors (5): Water, capital livestock, capital other—agriculture, capital formal, capital informal
Households (18)Rural (15): Large/medium farm (Sindh, Punjab, other Pakistan), small farm (Sindh, Punjab, other Pak-istan), landless unwaged farmer (Sindh, Punjab, other Pakistan), landless waged farmer (Sindh, Punjab,other Pakistan), rural nonfarm per capita expenditure quintile 1, quintile 2, and restUrban (3): Per capita expenditure quintile 1, quintile 2, and rest
Other Institutional Accounts (4)Government (including separate subaccounts for import taxes, direct taxes, and sales taxes), rest ofworld, savings—investment, change in stocks
Fig. 2 Accounts in the SAM
with local experts, we perform a series of adjustments mostly on the final consump-tion and investment of the commodities that reduce the imbalances at the commoditylevel to less than 30 % of the average between supply and use. We then balance thisproto-SAM, seeking to minimize the cross-entropy distance between the first partiallyimbalanced and balanced proto-SAMs, imposing the series of controls present in themacro-SAM. Following the approach described in Golan et al. (1994), we treat everycell in the proto-SAM as being specified with an error support set whose weights areestimated to minimize the cross-entropy distance between the prior and the solutionproto-SAM. This treatment is strongly related to the one described in Robinson etal. (2001), with key differences. In the previous approach, the column coefficients inthe SAM were treated analogously to probabilities and included directly in the cross-entropy minimand, creating the need for special treatment of negative cells and ac-counts with zero sums in the SAM. In the approach we apply, developed by ShermanRobinson and Scott McDonald—starting from Robinson et al. (2001)—the cross-entropy minimand includes only probability weights for a selected error support set,such that the SAM coefficients are no longer treated as analogous to probabilities, and

Page 12 of 25 D. Debowicz et al.
Table 5 Mapping of the sectors in the input–output matrix (IO91) to those in the SAM
Sectors in IO91 SAM 2007/2008 Sectors
2 Wheat (irrigated)
2 Wheat (nonirrigated)
1 Rice (IRRI)
1 Rice (basmati)
3 Cotton
4 Sugarcane
6, 7, 11, 12 Other field crops
8, 9, 10 Fruits and vegetables
13 Livestock (cattle, milk)
13 Livestock (poultry)
14 Forestry
15 Fishing
16, 17, 18 Mining
19 Vegetable oils
20 Wheat milling
20 Rice milling (IRRI)
20 Rice milling (basmati)
22 Sugar
5, 21, 23, 24, 25 Other food
26 Cotton gin (lint)
27 Cotton spin (yarn)
28 Cotton weave (cloth)
31 Knitwear
32, 33, 34 Garments
29, 30 Other textiles
35, 36 Leather
Sectors in IO91 SAM 2007/2008 Sectors
37 Wood
39, 41, 44 Chemicals
40 Fertilizers
45, 46 Cement and bricks
42 Petroleum refining
38, 43, 47–57 Other manufacturing
58, 59 Energy
60 Construction
61 Wholesale trade
62 Retail trade
63 Other trade
64, 69 Railway transport
65 Road transport
66 Water transport
67 Air transport
68 Other transport
75 Housing
76 Imputed rent
77 Business services
80 Healthcare
79 Education
82 Personal services
81 Other private services
70, 78 Public services
71, 72, 74 Finance and insurance
negative entries and accounts with zero sums do not require any special treatment.3
The present approach allows specification of a prior estimate of the mean and stan-dard error of selected cell entries (expressed either as values or column coefficients),column sums, and macro aggregates. These errors can be specified as additive ormultiplicative-exponential. For the aggregates present in the Pakistan macro-SAM,we set a zero standard error. This, unlike previous approaches, allows us to arrive at aSAM that is perfectly consistent with the macro-SAM, such that the sum of the valueadded in the solution SAM is exactly equal to the gross national product at factor costin the macro-SAM; the private final consumption in the solution SAM sums exactlythe private final consumption in the macro-SAM, and similarly for public consump-tion in goods and services, investment, total exports, and total imports.
3The associated GAMS (General Algebraic Modeling System) code is available from the authors uponrequest.
Journal of Economic Structures (2013) 2:4 Page 13 of 25
Table 6 Mapping the commodities in the Household Income and Expenditure Survey (HIES) to the sec-tors in the SAM
Commodities in HIES SAM 2007/2008 Commodities
2103–2104, 2201–2206 Other field crops
1301–1308, 1501–1510 Fruits and vegetables
1101–1103, 1201–1202 Livestock (cattle, milk)
1203–1204 Livestock (poultry)
1205 Fish
2301–2303 Vegetable oils
2101, 2502, 2503 Wheat flour
Part of 2102 Rice (IRRI)
Part of 2102 Rice (basmati)
1701 Sugar
1803, 2105, 2501, 2504, 2601 Other food
6103 Cotton cloth
5103 Knitwear
5101–5102, 5104–5105 Garments
6102, 6104 Other textiles
5201–5202 Leather
2701 Wood
5601 Chemicals
4301 Petroleum
6101, 6302–6303, 6305, 6401, 6403–6404 Other manufacturing goods
2702–2707, 2709 Energy
2406 Construction
4303 Railway transport
4302, 4304, 6505 Road transport
5705 Air transport
5401–5402, 5405 Housing
5403–5404 Imputed rent
5602 Healthcare
5801–5804 Education
2901–2903 Personal services
4401, 5903–5904 Other private services
3.3 Disaggregating the Payments Related to Factors and Households
To fully disaggregate the incomes and payments of the single household group andthe three factors (labor, capital, and land) of the first balanced proto-SAM into thecomplete set of factors and households of the SAM, we take the following steps. Thevalue added of each activity is split among the (27) factors using the shares presentin DNN, in turn partly informed by the Pakistan Rural Household Survey (PRHS)(Pakistan Institute of Development Economics 2001).
Page 14 of 25 D. Debowicz et al.
After this, regarding payments from factors to institutions, payments from capi-tal to government and to nonresidents are taken directly from the macro-SAM andattributed to formal capital. The matrix of household incomes is split as follows.Household income from labor, agricultural capital, and nonagricultural formal capitalis split among households following household incomes in HIES; livestock income issplit following the value of the livestock capital stock owned by households in HIES;and land and water income is split among households following DNN.
Income from informal nonagricultural capital (which includes returns to self-employed labor in informal-sector activities) is split between rural and urban house-holds, using as proxy the share of rural population in total population as informedby HIES (67 %). The further split across rural households uses reported incomesfrom nonfarm enterprises in a rural household survey (PRHS) and updated house-hold population totals (HIES). The remaining (33 %) nonagricultural wage incomeis allocated between urban nonpoor and poor households following DNN.4 In theabsence of detailed and reliable information, returns to agricultural capital are splitamong households in proportion to their land income, and public transfers and remit-tances to households informed in the macro-SAM are allocated among households inproportion to their total expenditures.
Final private consumption of each commodity is split among the (18) householdgroups using HIES. We assume that the more disadvantaged households are able tosave a lower share of their income. A relatively high (15 %) savings rate is usedas a prior for medium/large farms and nonfarm households (quintiles 3 to 5), anda relatively low (7 %) savings rate is assumed for the remaining households exceptfor the “other urban” households (quintiles 3 to 5), an account that also capturesenterprise savings. For this last household category, the savings rate is determinedresidually from the domestic private savings figure in the macro-SAM (37.5 %).
3.4 Balancing the Final SAM
After a series of adjustments to the less reliable parts of the household accounts(informal capital household income and nonfood household expenditures) based onconsultation with local experts to reduce the imbalances at the household level toless than 30 percent of the average between their total income and total expenditure,the cross-entropy balancing code is run, imposing once again the series of controlspresent in the macro-SAM. This is the last step in the estimation of a balanced, macro-consistent, and largely disaggregated SAM that captures the economic structure of thecountry in an updated way and with a significant degree of detail.
4 Structure of the Pakistani Economy: Observations from the SAM
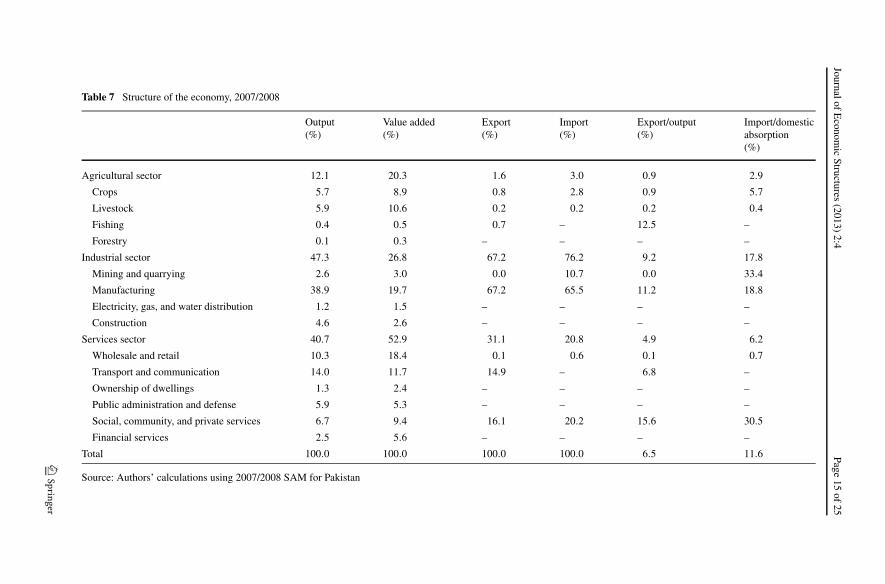
The structure of value added (Table 7) is characteristic of a semi-industrialized econ-omy with a relatively low share of agriculture (20 %) and large shares of industry and
4Estimates of earnings from informal enterprises are perhaps the most uncertain figures in the SAM.Income data from the PRHS 2001/2002 appear to seriously underreport these earnings for rural households.If per capita informal-sector earnings from the PRHS 2001/2002 are used as the basis for calculating totalearnings in rural areas, the share of rural households in total informal-sector earnings is only 7.2 percent.
JournalofE
conomic
Structures(2013)
2:4Page
15of
25
Table 7 Structure of the economy, 2007/2008
Output(%)
Value added(%)
Export(%)
Import(%)
Export/output(%)
Import/domesticabsorption(%)
Agricultural sector 12.1 20.3 1.6 3.0 0.9 2.9
Crops 5.7 8.9 0.8 2.8 0.9 5.7
Livestock 5.9 10.6 0.2 0.2 0.2 0.4
Fishing 0.4 0.5 0.7 – 12.5 –
Forestry 0.1 0.3 – – – –
Industrial sector 47.3 26.8 67.2 76.2 9.2 17.8
Mining and quarrying 2.6 3.0 0.0 10.7 0.0 33.4
Manufacturing 38.9 19.7 67.2 65.5 11.2 18.8
Electricity, gas, and water distribution 1.2 1.5 – – – –
Construction 4.6 2.6 – – – –
Services sector 40.7 52.9 31.1 20.8 4.9 6.2
Wholesale and retail 10.3 18.4 0.1 0.6 0.1 0.7
Transport and communication 14.0 11.7 14.9 – 6.8 –
Ownership of dwellings 1.3 2.4 – – – –
Public administration and defense 5.9 5.3 – – – –
Social, community, and private services 6.7 9.4 16.1 20.2 15.6 30.5
Financial services 2.5 5.6 – – – –
Total 100.0 100.0 100.0 100.0 6.5 11.6
Source: Authors’ calculations using 2007/2008 SAM for Pakistan

Page 16 of 25 D. Debowicz et al.
services (27 % and 53 %, respectively). Livestock accounts for more than half of thevalue added in the agricultural sector. Much of the industrial production is stronglylinked to agriculture, including wheat, rice and sugar milling, and textile production(linked to cotton).5 Trade (wholesale and retail) and transport generate more thanhalf of the value added in services. Exports are a relatively low share of total output(6.5 %); imports are concentrated in the industrial sector (including petroleum prod-ucts, part of the mining sector) and in private services (particularly business services).
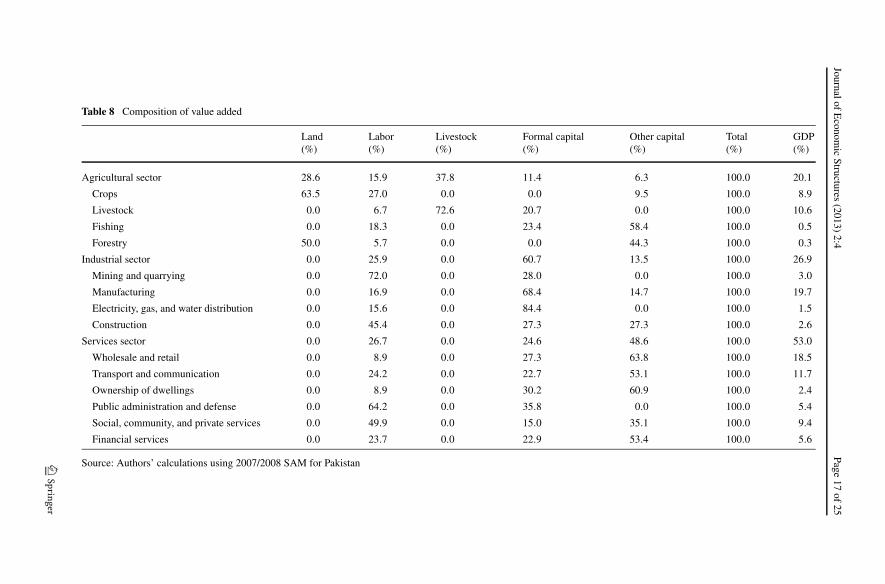
Table 8 shows the composition of value added across sectors. For agriculturalproducts, land is the largest component of value added. Manufacturing activities de-pend heavily on formal capital, while labor and other capital are important for mostservices.
Large and medium farmers in Pakistan earn a large share of their income fromland (Table 9). However, small and landless farmers rely on labor, livestock, and othercapital for most of their income. Rural nonfarm and urban households rely mostly ontheir labor and other capital as sources of income.
The importance of agricultural income by household group is generally lower inthe recent SAM than in the PRHS of 2001/2002, suggesting that households havemore diversified income sources than are revealed by PRHS data (Table 10). This isconsistent with the tendency toward diversification of rural incomes found using dif-ferent spans of HIES: income from crop production as a share of total income in ruralPakistan was 22.9 % in HIES 2001/2002 and 21.5 % in HIES 2007/2008. In addition,PRHS 2000/2001 had a relatively detailed module on agricultural production, whichmay have allowed it to capture the existing agricultural income to a larger extent. TheSAM also shows that agricultural income accounts for a large share of the incomeof farmers—especially for medium and large farms—which is consistent with PRHSdata.
5 Income Multiplier Analysis
To illustrate the use of the SAM, we use income multiplier analysis. To capturethe production and consumption linkages, taking into account the supply rigiditiespresent in Pakistan, we use a semi-input–output model with constrained linear rela-tionships among quantities in the model and fixed prices. In this approach, sectorsare classified into two groups: those that are supply constrained and those that aresupply responsive. Output responses are permitted only in supply-responsive sectors.For this model to produce a suitable approximation of reality, the supply-constrainedsectors must correspond to tradable goods. Therefore, in the approach we follow, theimbalances between supply and demand in these sectors are solved via changes in netexports.
The starting point is the sector-specific equilibrium conditions, that is, xc(1 +tcc) = ∑
c′ zcc′ +∑h cch + gc + ic + ec, where xc is precommodity-tax gross output,
tcc is commodity tax rate, zcc′ is intermediate demand of good c by sector c′, cch
is household consumption of good c by household h, gc is public consumption of
5Not tabulated.
JournalofE
conomic
Structures(2013)
2:4Page
17of
25
Table 8 Composition of value added
Land(%)
Labor(%)
Livestock(%)
Formal capital(%)
Other capital(%)
Total(%)
GDP(%)
Agricultural sector 28.6 15.9 37.8 11.4 6.3 100.0 20.1
Crops 63.5 27.0 0.0 0.0 9.5 100.0 8.9
Livestock 0.0 6.7 72.6 20.7 0.0 100.0 10.6
Fishing 0.0 18.3 0.0 23.4 58.4 100.0 0.5
Forestry 50.0 5.7 0.0 0.0 44.3 100.0 0.3
Industrial sector 0.0 25.9 0.0 60.7 13.5 100.0 26.9
Mining and quarrying 0.0 72.0 0.0 28.0 0.0 100.0 3.0
Manufacturing 0.0 16.9 0.0 68.4 14.7 100.0 19.7
Electricity, gas, and water distribution 0.0 15.6 0.0 84.4 0.0 100.0 1.5
Construction 0.0 45.4 0.0 27.3 27.3 100.0 2.6
Services sector 0.0 26.7 0.0 24.6 48.6 100.0 53.0
Wholesale and retail 0.0 8.9 0.0 27.3 63.8 100.0 18.5
Transport and communication 0.0 24.2 0.0 22.7 53.1 100.0 11.7
Ownership of dwellings 0.0 8.9 0.0 30.2 60.9 100.0 2.4
Public administration and defense 0.0 64.2 0.0 35.8 0.0 100.0 5.4
Social, community, and private services 0.0 49.9 0.0 15.0 35.1 100.0 9.4
Financial services 0.0 23.7 0.0 22.9 53.4 100.0 5.6
Source: Authors’ calculations using 2007/2008 SAM for Pakistan

Page18
of25
D.D
ebowicz
etal.
Table 9 Household income shares
Land(%)
Labor(%)
Livestock(%)
Formal capital(%)
Other capital(%)
Government(%)
Nonresidents(%)
Total(%)
National income(%)
Large and medium farm—Sindh 57.7 11.0 7.4 0.0 16.0 4.8 3.2 100.0 1.5
Large and medium farm—Punjab 31.8 9.2 14.0 0.0 37.3 4.2 3.5 100.0 6.2
Large and medium farm—other 42.5 19.7 4.2 0.0 27.9 2.8 3.0 100.0 0.8
Small farm—Sindh 15.1 12.2 18.4 0.0 37.6 8.5 8.3 100.0 1.8
Small farm—Punjab 11.4 9.6 24.1 0.0 39.0 7.8 8.1 100.0 11.5
Small farm—other 9.3 16.9 11.1 0.0 47.9 7.0 7.9 100.0 3.3
Landless farmer—Sindh 11.5 10.0 21.1 0.0 41.8 7.0 8.5 100.0 1.4
Landless farmer—Punjab 8.2 13.9 37.1 0.0 25.5 7.3 8.0 100.0 1.8
Landless farmer—other 5.7 16.5 18.1 0.0 43.8 7.1 8.6 100.0 0.8
Landless agricultural laborers—Sindh 0.0 21.7 3.5 0.0 59.7 6.6 8.6 100.0 1.5
Landless agricultural laborers—Punjab 0.0 21.0 11.9 0.0 53.4 6.1 7.7 100.0 1.4
Landless agricultural laborers—other 0.0 33.7 1.8 0.0 49.8 6.3 8.4 100.0 0.2
Rural nonfarm quintile 1 0.0 36.1 6.7 0.0 46.3 4.9 6.0 100.0 2.8
Rural nonfarm quintile 2 0.0 38.9 8.5 0.0 39.3 6.1 7.3 100.0 3.3
Rural nonfarm other 0.0 36.3 5.4 0.0 42.7 7.3 8.3 100.0 17.3
Urban quintile 1 0.0 59.8 0.0 0.0 25.3 6.9 8.0 100.0 2.6
Urban quintile 2 0.0 63.2 0.0 0.0 21.2 7.2 8.4 100.0 3.4
Urban other 0.0 16.8 0.0 59.7 12.2 4.4 6.9 100.0 38.5
Rural farm subtotal 16.9 12.3 18.1 0.0 39.2 6.6 6.9 100.0 32.1
Rural nonfarm subtotal 0.0 36.7 6.0 0.0 42.7 6.8 7.9 100.0 23.4
Urban subtotal 0.0 22.9 0.0 51.7 13.6 4.8 7.1 100.0 44.5
Total households 5.4 22.7 7.2 23.0 28.6 5.8 7.2 100.0 100.0
Source: Authors’ calculations using 2007/2008 SAM for Pakistan

Journal of Economic Structures (2013) 2:4 Page 19 of 25
Table 10 Rural agricultural incomes
Household group Share of agriculturalincome in PRHS(%)
Share of agriculturalincome in SAM(%)
Medium and large farms 83.5 66.0
Small farms 67.9 41.2
Landless farmers 87.7 45.6
Rural agricultural workers 53.1 22.2
Rural nonfarm nonpoor 1.9 6.7
Rural nonfarm poor 6.3 9.7
Rural agricultural 74.8 46.5
Rural 69.7 30.1
Source: Authors’ calculations using PRHS 2001/2002 and 2007/2008 SAM for Pakistan
good c, ic is investment (fixed and change in stock) demand for good c, and ec isnet export of good c. Intermediate and factor demand are assumed to be proportionalto output production, that is, zcc′ = acc′xc′ and vf c′ = af c′xc′ , where acc′ and af c′are the requirements of intermediate input c′ and factor f to produce a unit of c.Household consumption is given by cch = θch(1− thh)yh, where yh is pretax incomeof household h, thh is the corresponding tax rate, and θch is the share of post-taxincome of household h spent on commodity c. Finally, pretax household income is thesum of factor income and transfers received by the household from other agents, thatis, yh = ∑
f ahf vf + trh, with vf = ∑c vf c, and ahf being the share of household h
in the income of factor f .Replacing the intermediate and factor demand and household demand function
in the equilibrium condition, we find that xc(1 + tcc) = ∑c′(acc′xc′) + ∑
h{θch(1 −thh)[∑f (ahf (
∑c′ af c′xc′)) + trh]} + gc + ic + ec, which can be solved either for
xc (demand-constrained sector) or for ec (supply-constrained sector), fixing either ec
(demand-constrained sector) or xc (supply-constrained sector).We conduct a series of simulations in which a constant injection is applied to the
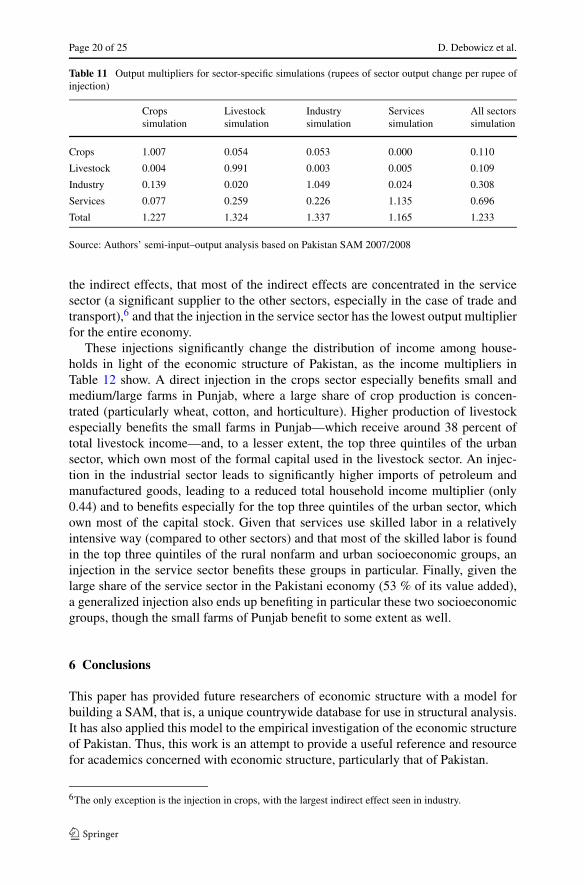
economy (100 billion rupees during the year), either to supply (supply-constrainedsector) or to net export demand (remaining sectors). We run a simulation focusing theinjection only on crops, where each crop receives the proportion of the total injectionbased on its share in the total value added of crops. We then do the same for live-stock, industry, services, and all sectors, totaling five simulations. Finally, we dividethe absolute changes in output values by the injection, obtaining the output multi-pliers shown in Table 11. All aggregate output multipliers are in the 1.1–1.4 range,with livestock and industry having the highest output multipliers. These multipliersare significantly below the multipliers found for India by Pal et al. (2012), probablyreflecting the fact that their analysis assumes the absence of supply rigidities, whichwe seek to capture here. Our estimates are aligned with the 1.5 value-added multi-plier reported in Dorosh et al. (2003), Haggblade et al. (1991), and Mellor (1995).As expected, the output multipliers are largest in the sectors where the injection takesplace (main diagonal of the table). We also find that the direct effects are larger than
Page 20 of 25 D. Debowicz et al.
Table 11 Output multipliers for sector-specific simulations (rupees of sector output change per rupee ofinjection)
Cropssimulation
Livestocksimulation
Industrysimulation
Servicessimulation
All sectorssimulation
Crops 1.007 0.054 0.053 0.000 0.110
Livestock 0.004 0.991 0.003 0.005 0.109
Industry 0.139 0.020 1.049 0.024 0.308
Services 0.077 0.259 0.226 1.135 0.696
Total 1.227 1.324 1.337 1.165 1.233
Source: Authors’ semi-input–output analysis based on Pakistan SAM 2007/2008
the indirect effects, that most of the indirect effects are concentrated in the servicesector (a significant supplier to the other sectors, especially in the case of trade andtransport),6 and that the injection in the service sector has the lowest output multiplierfor the entire economy.
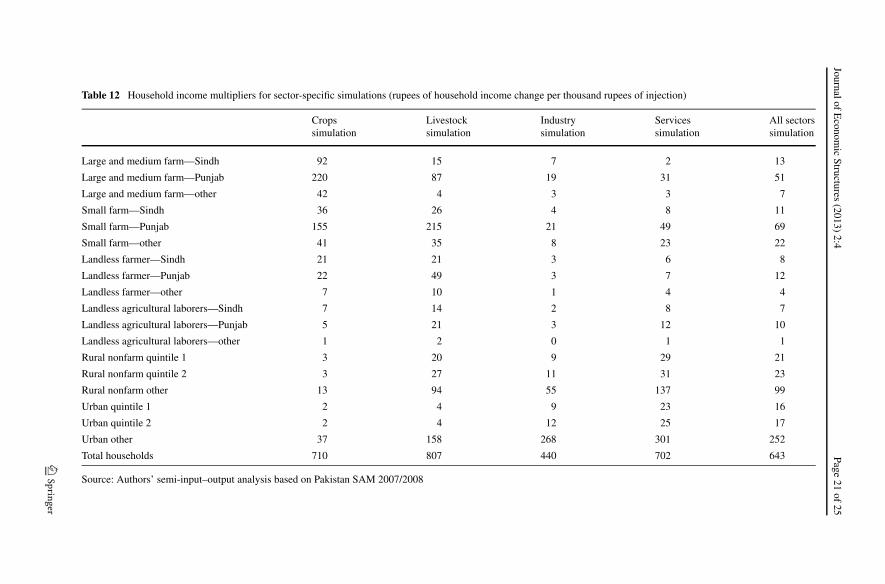
These injections significantly change the distribution of income among house-holds in light of the economic structure of Pakistan, as the income multipliers inTable 12 show. A direct injection in the crops sector especially benefits small andmedium/large farms in Punjab, where a large share of crop production is concen-trated (particularly wheat, cotton, and horticulture). Higher production of livestockespecially benefits the small farms in Punjab—which receive around 38 percent oftotal livestock income—and, to a lesser extent, the top three quintiles of the urbansector, which own most of the formal capital used in the livestock sector. An injec-tion in the industrial sector leads to significantly higher imports of petroleum andmanufactured goods, leading to a reduced total household income multiplier (only0.44) and to benefits especially for the top three quintiles of the urban sector, whichown most of the capital stock. Given that services use skilled labor in a relativelyintensive way (compared to other sectors) and that most of the skilled labor is foundin the top three quintiles of the rural nonfarm and urban socioeconomic groups, aninjection in the service sector benefits these groups in particular. Finally, given thelarge share of the service sector in the Pakistani economy (53 % of its value added),a generalized injection also ends up benefiting in particular these two socioeconomicgroups, though the small farms of Punjab benefit to some extent as well.
6 Conclusions
This paper has provided future researchers of economic structure with a model forbuilding a SAM, that is, a unique countrywide database for use in structural analysis.It has also applied this model to the empirical investigation of the economic structureof Pakistan. Thus, this work is an attempt to provide a useful reference and resourcefor academics concerned with economic structure, particularly that of Pakistan.
6The only exception is the injection in crops, with the largest indirect effect seen in industry.
JournalofE
conomic
Structures(2013)
2:4Page
21of
25
Table 12 Household income multipliers for sector-specific simulations (rupees of household income change per thousand rupees of injection)
Cropssimulation
Livestocksimulation
Industrysimulation
Servicessimulation
All sectorssimulation
Large and medium farm—Sindh 92 15 7 2 13
Large and medium farm—Punjab 220 87 19 31 51
Large and medium farm—other 42 4 3 3 7
Small farm—Sindh 36 26 4 8 11
Small farm—Punjab 155 215 21 49 69
Small farm—other 41 35 8 23 22
Landless farmer—Sindh 21 21 3 6 8
Landless farmer—Punjab 22 49 3 7 12
Landless farmer—other 7 10 1 4 4
Landless agricultural laborers—Sindh 7 14 2 8 7
Landless agricultural laborers—Punjab 5 21 3 12 10
Landless agricultural laborers—other 1 2 0 1 1
Rural nonfarm quintile 1 3 20 9 29 21
Rural nonfarm quintile 2 3 27 11 31 23
Rural nonfarm other 13 94 55 137 99
Urban quintile 1 2 4 9 23 16
Urban quintile 2 2 4 12 25 17
Urban other 37 158 268 301 252
Total households 710 807 440 702 643
Source: Authors’ semi-input–output analysis based on Pakistan SAM 2007/2008

Page 22 of 25 D. Debowicz et al.
Using a variety of information sources, we have built an updated SAM for Pakistanthat is perfectly consistent with the macroeconomic figures for the country and thatis highly disaggregated, allowing for detailed distributional analysis of the economicstructure of the country.7 The presented approach to building SAMs is motivated byan information theoretic approach to estimation (Judge and Mittelhammer 2012) thattakes a Bayesian view of the efficient use of information: “Use all the informationyou have, but do not assume any information you do not have.”
This SAM provides rich and updated detail on the income and expenditure pat-terns of the production sectors, production factors, and households of the Pakistanieconomy, reflecting in a significant way the heterogeneity of the income and expendi-ture compositions of domestic households and, as a result, allowing the distributionaleffects of changes in the composition of economic output to be traced. The SAMhighlights a series of relevant characteristics of the Pakistani economy. The livestock(10.5 % of the economy) and trade (18.4 % of the economy) sectors are shown tobe significant contributors to the total domestic value added. For agricultural prod-ucts, land is, unsurprisingly, the largest component of value added. Manufacturingactivities depend heavily on formal capital, while labor and other capital are impor-tant for most services. Large and medium farmers in Pakistan earn a large share oftheir income from land. However, small and landless farmers rely on labor, livestock,and other capital for most of their income. Rural nonfarm and urban households relymostly on their labor and other capital as income sources.
The income multiplier analysis we subsequently conduct captures the productionand consumption linkages in the economy. Taking into account the supply rigiditiespresent in Pakistan, we use the semi-input–output model. Results suggest that the di-rect effects are larger than the indirect effects and that most of the indirect effects areconcentrated in the services sector.8 The injection in the services sector has the lowestoutput multiplier for the entire economy. Finally, our analysis suggests that the injec-tions lead to income changes that differ across socioeconomic groups, a direct resultof the heterogeneity in the income generation of these groups that the countrywidedatabase we estimated captures.
Competing interests
The authors declare that they have no competing interests.
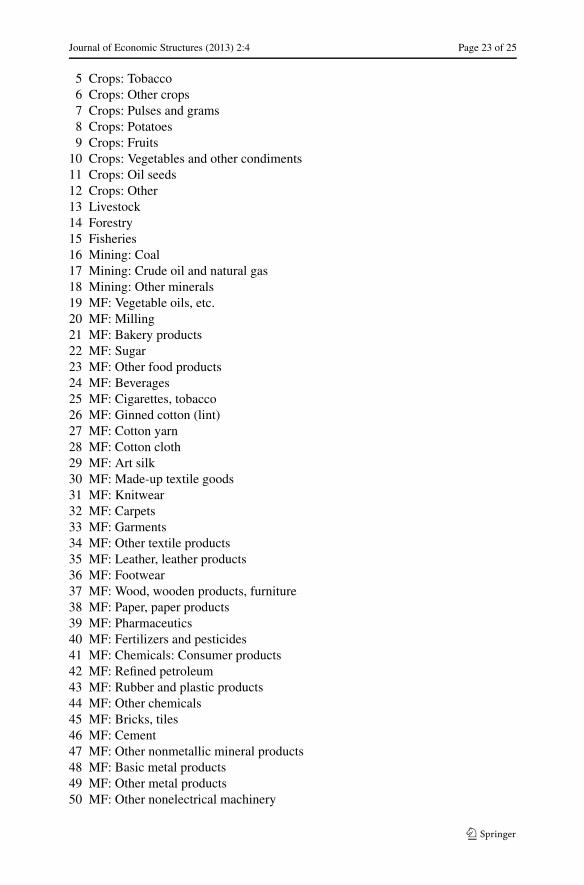
Appendix: Sectors in the Input–Output Matrix
1 Crops: Rice (paddy)2 Crops: Wheat3 Crops: Cotton (seed cotton)4 Crops: Sugarcane
7The resulting SAM is available at www.ifpri.org.8The only exception is the injection in crops, with the largest indirect effect seen in industry.
Journal of Economic Structures (2013) 2:4 Page 23 of 25
5 Crops: Tobacco6 Crops: Other crops7 Crops: Pulses and grams8 Crops: Potatoes9 Crops: Fruits
10 Crops: Vegetables and other condiments11 Crops: Oil seeds12 Crops: Other13 Livestock14 Forestry15 Fisheries16 Mining: Coal17 Mining: Crude oil and natural gas18 Mining: Other minerals19 MF: Vegetable oils, etc.20 MF: Milling21 MF: Bakery products22 MF: Sugar23 MF: Other food products24 MF: Beverages25 MF: Cigarettes, tobacco26 MF: Ginned cotton (lint)27 MF: Cotton yarn28 MF: Cotton cloth29 MF: Art silk30 MF: Made-up textile goods31 MF: Knitwear32 MF: Carpets33 MF: Garments34 MF: Other textile products35 MF: Leather, leather products36 MF: Footwear37 MF: Wood, wooden products, furniture38 MF: Paper, paper products39 MF: Pharmaceutics40 MF: Fertilizers and pesticides41 MF: Chemicals: Consumer products42 MF: Refined petroleum43 MF: Rubber and plastic products44 MF: Other chemicals45 MF: Bricks, tiles46 MF: Cement47 MF: Other nonmetallic mineral products48 MF: Basic metal products49 MF: Other metal products50 MF: Other nonelectrical machinery

Page 24 of 25 D. Debowicz et al.
51 MF: Electrical equipment, etc.52 MF: Other transport equipment53 MF: Surgical instruments54 MF: Handicrafts55 MF: Sports goods56 MF: Jewelry (precious metal)57 MF: Other manufacturing products58 Electricity and water works59 Gas supply60 Construction: Buildings and land improvement61 Trade: Wholesale62 Trade: Retail63 Hotel and restaurant services64 Transport: Railway65 Transport: Road66 Transport: Water67 Transport: Air68 Transport: Other and storage69 Communication services70 Banking: Central monetary authority71 Banking: Other monetary institutions72 Banking: Other credit institutions73 Banking: Nominal product74 Insurance75 Real estate services76 Imputed rent (owner-occupied dwellings)77 Business services78 Public administration and defense79 Education80 Healthcare81 Other social and cultural services82 Personal and household services
References
Agricultural Prices Commission (2003) Pakistan price statistics 2002–03. Agricultural Prices Commission,Islamabad, Pakistan
Agricultural Prices Commission (2009) Pakistan price statistics 2008–09. Agricultural Prices Commission,Islamabad, Pakistan
Debowicz D (2010) Modelling trade and financial liberalisation effects for Argentina. PhD thesis, Univer-sity of Sussex, UK
Dorosh P, Niazi MK, Nazli H (2003) Distributional impacts of agricultural growth in Pakistan: a multiplieranalysis. Pak Dev Rev 42(3):249–275
Dorosh P, Niazi MK, Nazli H (2004) A social accounting matrix for Pakistan, 2001-02: methodology andresults. Pakistan Institute of Development Economics, Islamabad, Pakistan
FBR (Federal Board of Revenue) (2008) Pakistan customs tariff 2007–08. http://download1.fbr.gov.pk/Docs/20101181511252278TarrifChapter1-972007-2008.pdf and http://download1.fbr.gov.pk/Docs/201011815112643390TarrifChapter98-992007-2008.pdf. Accessed February 15, 2012

Journal of Economic Structures (2013) 2:4 Page 25 of 25
FBS (Federal Bureau of Statistics) (1991) Input–output matrix 1991. Federal Bureau of Statistics, Islam-abad, Pakistan
FBS (Federal Bureau of Statistics) (1993) Social accounting matrix for 1984–85. Federal Bureau of Statis-tics, Islamabad, Pakistan
FBS (Federal Bureau of Statistics) (2001) Survey on community and personal services. Federal Bureau ofStatistics, Islamabad, Pakistan
FBS (Federal Bureau of Statistics) (2002) Study on wholesale and retail trade, hotels and restaurants inPakistan. Federal Bureau of Statistics, Islamabad, Pakistan
FBS (Federal Bureau of Statistics) (2004) National accounts of Pakistan: rebasing from 1980–81 to 1999–2000. Federal Bureau of Statistics, Islamabad, Pakistan
FBS (Federal Bureau of Statistics) (2006) Census of manufacturing industries 2005–06. Federal Bureauof Statistics, Islamabad, Pakistan
FBS (Federal Bureau of Statistics) (2008) Household Income and Expenditure Survey (HIES) 2007–08.Federal Bureau of Statistics, Islamabad, Pakistan
Golan A, Judge G, Miller D (1996) Maximum entropy econometrics: robust estimation with limited data.Wiley, New York
Golan A, Judge G, Robinson S (1994) Recovering information from incomplete or partial multisectoraleconomic data. Rev Econ Stat 76(3):541–549
Haggblade S, Hammer J, Hazell P (1991) Modeling agricultural growth multipliers. Am J Agric Econ73(2):361–374
IMF (International Monetary Fund) (2010) Pakistan. IMF country report no. 10/158, IMF, Washington,DC
Judge G, Mittelhammer R (2012) An information theoretic approach to econometrics. Cambridge Univer-sity Press, Cambridge
Mellor JW (1995) Agriculture on the road to industrialization. Johns Hopkins University Press, BaltimorePakistan Institute of Development Economics (1985) A social accounting matrix of Pakistan for 1979–80.
Pakistan Institute of Development Economics, Islamabad, PakistanPakistan Institute of Development Economics (2001) Pakistan rural household survey 2001. Pakistan In-
stitute of Development Economics, Islamabad, PakistanPakistan, Ministry of Commerce (2011) Monthly statements showing exports and imports of select com-
modities 2010–11. http://www.commerce.gov.pk/trade-statistics. Accessed February 15, 2012Pakistan, Ministry of Finance (2009) Economic survey 2008–09. Ministry of Finance, Islamabad, PakistanPakistan, Ministry of Food and Agriculture (2009) Agricultural statistics of Pakistan 2008–09. Ministry of
Food and Agriculture, Islamabad, PakistanPal BD, Pohit S, Roy J (2012) Social accounting matrix for India. Econ Syst Res 24(1):77–99PBS (Pakistan Bureau of Statistics) (2012) Gross national product of Pakistan (at current factor cost) 2007–
08 data. http://pbs.gov.pk/sites/default/files/national_accounts/tables/table4.pdf. Accessed February15, 2012
Robinson S, Cattaneo A, El-Said M (2001) Updating and estimating a social accounting matrix using crossentropy methods. Econ Syst Res 13(1):47–64
Siddiqui R, Iqbal Z (1999) Social accounting matrix of Pakistan for 1989–90. Pakistan Institute of Devel-opment Economics, Islamabad, Pakistan
State Bank of Pakistan (2010) Handbook of statistics on Pakistan economy. State Bank of Pakistan,Karachi, Pakistan
UNCTAD (United Nations Conference on Trade and Development) (2008) Statistics. http://unctad.org/en/Pages/Statistics.aspx. Accessed March 20, 2012
Waheed A, Ezaki M (2008) Aggregated and compact disaggregated financial social accounting matricesfor Pakistan. J Econ Coop Among Islam Ctries 29(4):17–36
Zellner A (2004) Statistics, econometrics, and forecasting. Cambridge University Press, Cambridge