A Dietary Assessment of the US Food Supply - USDA ERS
55
A Dietary Assessment of the U.S. Food Supply: Comparing Per Capita Food Consumption with Food Guide Pyramid Serving Recommendations . By Linda Scott Kantor, Food and Rural Economics Division, Economic Research Service, U.S. Department of Agriculture, Agricultural Economic Report No. 772. Abstract Most American diets do not meet Federal Food Guide Pyramid dietary recom- mendations. On average, people consume too many servings of added fats and sugars and too few servings of fruits, vegetables, dairy products, lean meats, and foods made from whole grains compared with a reference set of Food Guide Pyramid serving recommendations appropriate to the age and gender composi- tion of the U.S. population. In addition, while the healthfulness of diets has improved over time, the pace of improvement has been uneven. For example, while Americans consumed record amounts of fruits and vegetables in 1996, consumption of caloric sweeteners also reached a 27-year high. This report is the first dietary assessment to use ERSs time-series food supply data to com- pare average diets with Federal dietary recommendations depicted in the Food Guide Pyramid. Food Guide Pyramid servings were estimated for more than 250 agricultural commodities for 1970-96. New techniques were developed to adjust the data for food spoilage and other losses accumulated throughout the marketing system and the home. Keywords: Food, food consumption, CSFII, Food Guide Pyramid, Dietary Guidelines for Americans Acknowledgments The author would like to thank Jane Allshouse, Jim Blaylock, Tom Carlin, Betsy Frazao, Judy Putnam, and David Smallwood from ERS for their valuable assis- tance in guiding this research and reviewing this manuscript. Linda Cleveland with USDAs Agricultural Research Service and Shirley Gerrior, USDAs Center for Nutrition Policy and Promotion, also provided valuable reviews and comments. 1800 M Street, NW Washington, DC 20036-5831 December 1998
-
Upload
khangminh22 -
Category
Documents
-
view
0 -
download
0
Transcript of A Dietary Assessment of the US Food Supply - USDA ERS

A Dietary Assessment of the U.S. Food Supply: Comparing Per CapitaFood Consumption with Food Guide Pyramid Serving Recommendations.By Linda Scott Kantor, Food and Rural Economics Division, EconomicResearch Service, U.S. Department of Agriculture, Agricultural EconomicReport No. 772.
Abstract
Most American diets do not meet Federal Food Guide Pyramid dietary recom-mendations. On average, people consume too many servings of added fats andsugars and too few servings of fruits, vegetables, dairy products, lean meats, andfoods made from whole grains compared with a reference set of Food GuidePyramid serving recommendations appropriate to the age and gender composi-tion of the U.S. population. In addition, while the healthfulness of diets hasimproved over time, the pace of improvement has been uneven. For example,while Americans consumed record amounts of fruits and vegetables in 1996,consumption of caloric sweeteners also reached a 27-year high. This report isthe first dietary assessment to use ERS�s time-series food supply data to com-pare average diets with Federal dietary recommendations depicted in the FoodGuide Pyramid. Food Guide Pyramid servings were estimated for more than250 agricultural commodities for 1970-96. New techniques were developed toadjust the data for food spoilage and other losses accumulated throughout themarketing system and the home.
Keywords: Food, food consumption, CSFII, Food Guide Pyramid, DietaryGuidelines for Americans
Acknowledgments
The author would like to thank Jane Allshouse, Jim Blaylock, Tom Carlin, BetsyFrazao, Judy Putnam, and David Smallwood from ERS for their valuable assis-tance in guiding this research and reviewing this manuscript. Linda Clevelandwith USDA�s Agricultural Research Service and Shirley Gerrior, USDA�s Centerfor Nutrition Policy and Promotion, also provided valuable reviews and comments.
1800 M Street, NWWashington, DC 20036-5831 December 1998

Contents
Summary.............................................................................................................iii
Federal Dietary Guidance Promotes Healthy Eating ...........................................1
Monitoring Food Consumption Relative to Dietary Guidance ...........................5The Food Guide Pyramid as a Dietary Assessment Tool ..................................5
Data and Methods ................................................................................................7The Food Supply Data .......................................................................................7Translating Food Supply Data into Food Servings ...........................................9Estimation of Serving Weights ..........................................................................9Comparison with Food Guide Pyramid Serving Recommendations.................9
Findings..............................................................................................................14Bread, Cereals, Rice, and Pasta Group............................................................14Vegetable Group...............................................................................................15Fruit Group ......................................................................................................18Milk, Yogurt, and Cheese Group .....................................................................19Meat, Poultry, Fish, Dry Beans, Eggs, and Nuts Group..................................20The Pyramid Tip: Added Fats and Oils ...........................................................23The Pyramid Tip: Added Sugars......................................................................24
Discussion ..........................................................................................................26Comparing CSFII Servings Estimates .............................................................26Caloric Intake...................................................................................................26Other Methodological Issues Related to the Food Supply Estimates .............28
Conclusions ........................................................................................................31
References ..........................................................................................................32
Appendix 1: Foods Measured in Food Supply Servings Estimates and CSFII Servings Data .........................................................................................35
Appendix 2: Estimation of Serving Weights for Individual Commodities .......38
ii A Dietary Assessment of the U.S. Food Supply / AER-772 Economic Research Service/USDA

Summary
Most American diets do not meet Federal Food Guide Pyramid dietary recom-mendations. On average, people consume too many servings of added fats andsugars and too few servings of fruits, vegetables, dairy products, lean meats, andfoods made from whole grains compared with a reference set of Food GuidePyramid serving recommendations appropriate to the age and gender composi-tion of the U.S. population. In addition, while the healthfulness of diets hasimproved over time, the pace of improvement has been uneven. For example,while Americans consumed record amounts of fruits and vegetables in 1996,consumption of caloric sweeteners also reached a 27-year high.
This report is the first dietary assessment to use ERS�s time-series food supplydata to compare average diets with Federal dietary recommendations depicted inthe Food Guide Pyramid. Food Guide Pyramid servings were estimated formore than 250 agricultural commodities for 1970-96. New techniques weredeveloped to adjust the data for food spoilage and other losses accumulatedthroughout the marketing system and the home.
Information on how diets differ from Federal dietary recommendations is key toFederal efforts to monitor the dietary and nutritional status of the populationunder the Ten-Year Comprehensive Plan for National Nutrition Monitoring andRelated Research Program mandated by the National Nutrition and RelatedResearch Act of 1990.
This study contributes to the existing dietary assessment literature by providingresearchers and policymakers with the ability to measure changes in food con-sumption behavior over time relative to major nutrition education or policy ini-tiatives. Also, because the servings estimates reported here are derived fromconsumption data for raw and semi-processed agricultural commodities, ratherthan for final food products, food servings can be readily converted back tofarm-level data, easing the translation of dietary recommendations into produc-tion and supply goals for farmers and the food industry. Finally, the time-seriesestimates reported here can be used as a baseline to project future trends in fooddemand and for comparing these trends against Food Guide Pyramid servingrecommendations.
The data are also useful for helping researchers better understand the differencesand similarities between the food supply data and USDA�s Continuing Survey ofFood Intakes by Individuals (CSFII), which measures food products actuallyeaten by individuals. The servings estimates provided in this report allowresearchers, for the first time, to compare the amount and types of food avail-able in the food supply with information on actual food intakes by Americans.
Economic Research Service/USDA A Dietary Assessment of the U.S. Food Supply / AER-772 iii
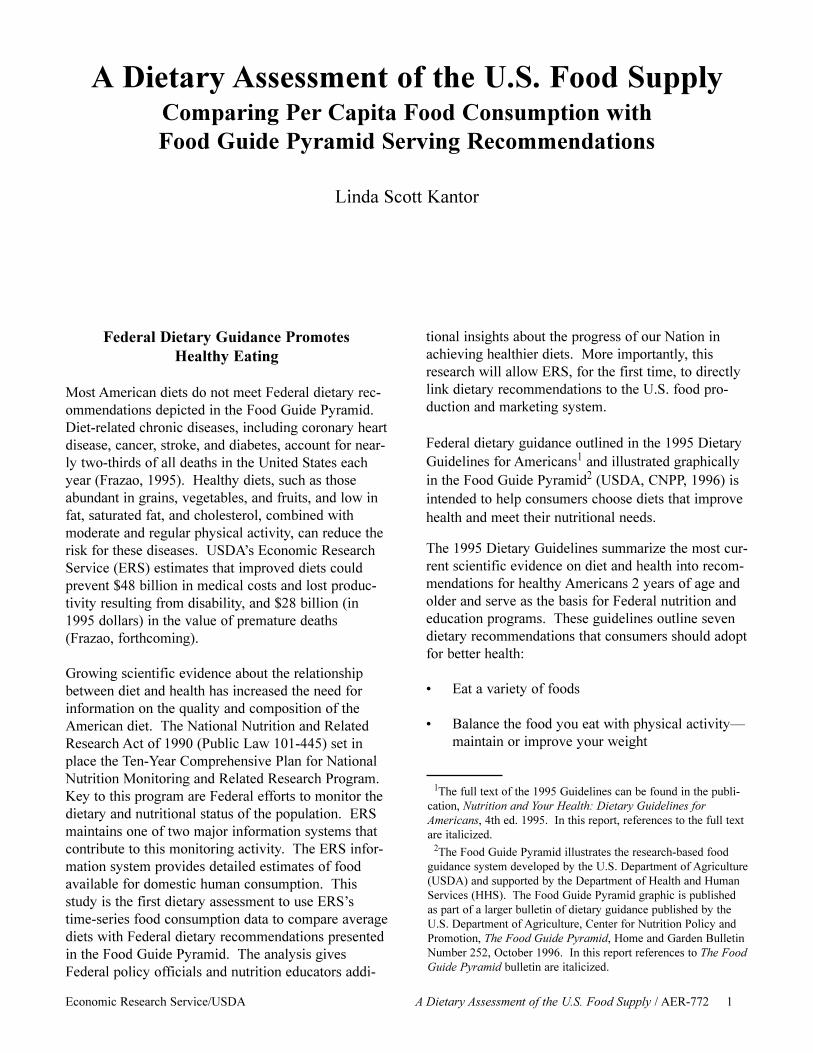
Federal Dietary Guidance PromotesHealthy Eating
Most American diets do not meet Federal dietary rec-ommendations depicted in the Food Guide Pyramid.Diet-related chronic diseases, including coronary heartdisease, cancer, stroke, and diabetes, account for near-ly two-thirds of all deaths in the United States eachyear (Frazao, 1995). Healthy diets, such as thoseabundant in grains, vegetables, and fruits, and low infat, saturated fat, and cholesterol, combined withmoderate and regular physical activity, can reduce therisk for these diseases. USDA�s Economic ResearchService (ERS) estimates that improved diets couldprevent $48 billion in medical costs and lost produc-tivity resulting from disability, and $28 billion (in1995 dollars) in the value of premature deaths(Frazao, forthcoming).
Growing scientific evidence about the relationshipbetween diet and health has increased the need forinformation on the quality and composition of theAmerican diet. The National Nutrition and RelatedResearch Act of 1990 (Public Law 101-445) set inplace the Ten-Year Comprehensive Plan for NationalNutrition Monitoring and Related Research Program.Key to this program are Federal efforts to monitor thedietary and nutritional status of the population. ERSmaintains one of two major information systems thatcontribute to this monitoring activity. The ERS infor-mation system provides detailed estimates of foodavailable for domestic human consumption. Thisstudy is the first dietary assessment to use ERS�stime-series food consumption data to compare averagediets with Federal dietary recommendations presentedin the Food Guide Pyramid. The analysis givesFederal policy officials and nutrition educators addi-
tional insights about the progress of our Nation inachieving healthier diets. More importantly, thisresearch will allow ERS, for the first time, to directlylink dietary recommendations to the U.S. food pro-duction and marketing system.
Federal dietary guidance outlined in the 1995 DietaryGuidelines for Americans1 and illustrated graphicallyin the Food Guide Pyramid2 (USDA, CNPP, 1996) isintended to help consumers choose diets that improvehealth and meet their nutritional needs.
The 1995 Dietary Guidelines summarize the most cur-rent scientific evidence on diet and health into recom-mendations for healthy Americans 2 years of age andolder and serve as the basis for Federal nutrition andeducation programs. These guidelines outline sevendietary recommendations that consumers should adoptfor better health:
� Eat a variety of foods
� Balance the food you eat with physical activity�maintain or improve your weight
Economic Research Service/USDA A Dietary Assessment of the U.S. Food Supply / AER-772 1
A Dietary Assessment of the U.S. Food SupplyComparing Per Capita Food Consumption withFood Guide Pyramid Serving Recommendations
Linda Scott Kantor
1The full text of the 1995 Guidelines can be found in the publi-cation, Nutrition and Your Health: Dietary Guidelines forAmericans, 4th ed. 1995. In this report, references to the full textare italicized.
2The Food Guide Pyramid illustrates the research-based foodguidance system developed by the U.S. Department of Agriculture(USDA) and supported by the Department of Health and HumanServices (HHS). The Food Guide Pyramid graphic is publishedas part of a larger bulletin of dietary guidance published by theU.S. Department of Agriculture, Center for Nutrition Policy andPromotion, The Food Guide Pyramid, Home and Garden BulletinNumber 252, October 1996. In this report references to The FoodGuide Pyramid bulletin are italicized.

� Choose a diet with plenty of grain products,vegetables, and fruits
� Choose a diet low in fat, saturated fat, and cholesterol
� Choose a diet moderate in sugars
� Choose a diet moderate in salt and sodium
� If you drink alcoholic beverages, do so in moderation
The Food Guide Pyramid helps consumers put theseguidelines into practice by recommending the typeand quantity of foods to eat from five major foodgroups�bread, cereals, rice, and pasta; vegetables;fruit; milk, yogurt, and cheese; and meat, poultry, fish,dry beans, eggs, and nuts. It also suggests that con-sumers use fats, oils, and sweets sparingly (USDA,CNPP, 1996). The Dietary Guidelines recommendthat Americans limit total fat intake to 30 percent ofcalories. A diet low in fat will reduce consumers�chances of getting certain diseases and help con-sumers to maintain a healthy weight. To avoid getting
2 A Dietary Assessment of the U.S. Food Supply / AER-772 Economic Research Service/USDA

too many calories from sugars, The DietaryGuidelines suggest that consumers use sugars in mod-eration�and sparingly for persons whose calorieneeds are low.
The Food Guide Pyramid shows a range of servingsfor each major food group (fig. 1). The number of
servings that are right for any one person variesdepending on age, sex, and physiological status (table1). Almost everyone should have at least the lowestnumber of servings in the ranges, except for preschoolchildren who can eat smaller servings based on theirlower calorie requirements. Sample serving sizes foreach food group are listed in box 1.
Economic Research Service/USDA A Dietary Assessment of the U.S. Food Supply / AER-772 3
Table 1�The Food Guide Pyramid serving recommendations vary with age, sex, and physiological status
Meat, poultry,Daily calorie Bread, cereals, Milk, yogurt, fish, dry beans, Total Addedintake1 rice, and pasta Vegetables Fruit and cheese2 eggs, and nuts fats3 sugars4
- - - - - - - - - - -Number of daily servings- - - - - - - - - - - Ounces Grams Teaspoons
1,600 calories:Many sedentarywomen, and someolder adults 6 3 2 2-3 5 53 6
2,200 calories:Most children,teenage girls, activewomen, and manysedentary men 9 4 3 2-3 6 73 12
2,800 calories:Teenage boys, manyactive men, and somevery active women 11 5 4 2-3 7 93 18
1Sample diets for a day at three calorie levels. Calorie levels are based on Recommended Energy Allowances (National Research Council, 1989) and aver-age calorie intake reported in national food consumption surveys.
2Three servings of milk, yogurt, and cheese are appropriate for teenagers and young adults to age 24 and for pregnant and breastfeeding women. Two serv-ings are recommended for other adults and children.
3The 1995 Dietary Guidelines recommend that consumers choose a diet that provides no more than 30 percent of total calories from fat. The upper limit onthe grams of fat in a consumer's diet will depend on calorie intake. For example, for a person consuming 2,200 calories per day, the upper limit on total dailyfat intake is 660 calories. Seventy-three grams of fat contribute about 660 calories (73 grams x 9 calories per gram of fat = 660 calories).
4To avoid getting too many calories from sugar, dietary guidance suggests that consumers try to limit added sugars to the daily quantities listed.Source: The Food Guide Pyramid, USDA/CNPP, Home and Garden Bulletin Number 252, October 1996.

4 A Dietary Assessment of the U.S. Food Supply / AER-772 Economic Research Service/USDA
Box 1�What Is a Recommended Serving?
To guide consumers in their daily food choices, The Food Guide Pyramid bulletin suggests a range of serv-ings for different levels of calorie intake. Most consumers should have at least the minimum number of serv-ings each day, except for preschool children who can eat smaller servings based on their lower calorierequirements. Sample serving sizes for each food group are listed below.
Bread, cereal, rice, and pasta Vegetables1 slice of bread 1 cup of raw leafy vegetables½ cup cooked cereal, rice, or pasta ½ cup cooked or canned vegetables1 oz. ready-to-eat cereal 7-8 carrot sticks½ English muffin or bagel 1 medium potato1 tortilla 3/4 cup vegetable juice3-4 small crackers2 4� pancakes
Fruit Milk, yogurt, and cheese1 whole fruit (medium apple, orange, banana) 1 cup milk½ cup chopped, cooked, or canned fruit 8 oz. plain or flavored yogurt3/4 cup fruit juice 1-1/2 oz. natural cheese½ grapefruit 2 oz. process cheese1/4 cup dried fruit½ cup berries
Meat, poultry, fish, dry beans, eggs, and nuts2-3 oz. cooked lean meat, poultry, or fish are 1 serving;1 egg; 2 tablespoons of peanut butter; ½ cup cooked dry beans, peas, or lentils; 1/3 cup of nuts count as 1 oz.of meat (about 1/3 serving)
Sources: Adapted from USDA, CNPP, The Food Guide Pyramid, Home and Garden Bulletin No. 252,October 1996; Choose a Diet with Plenty of Vegetables, Fruits, and Grain Products, Home and GardenBulletin No. 253-5, July 1993; and Eat a Variety of Foods, Home and Garden Bulletin No. 253-2, July 1993.

Monitoring Food Consumption Relative toDietary Guidance
Information on how eating patterns differ fromFederal dietary guidance is useful to many.For example, consumers use this information to makedietary adjustments, while policymakers and nutritioneducators use it to target educational messages to spe-cific audiences. Federal researchers use this informa-tion to monitor the dietary and nutritional status of thepopulation under the Ten-Year Comprehensive Planfor National Nutrition Monitoring and RelatedResearch Program (mandated by the NationalNutrition and Related Research Act of 1990 (PublicLaw 101-445)) (Life Sciences Research Office, 1995).
The Food Guide Pyramid as a Dietary Assessment Tool
Researchers are using the Food Guide Pyramid as atool for assessing U.S. dietary health�one that goesbeyond the traditional approach which emphasized theadequacy of individual nutrients�to a food-basedapproach that recognizes the link between diet andchronic disease risk (Krebs-Smith and others, 1997;Cleveland and others, April 1997). This newapproach led to the development of methods forassessing food consumption data in terms of FoodGuide Pyramid serving recommendations. To date,researchers have used these methods to assess food-intake data from USDA�s Continuing Survey of FoodIntake by Individuals (CSFII) (Bowman and others,1998; Cleveland and others, January 1995, April1997; Krebs-Smith and others, 1995, 1996, 1997;Munoz and others, 1997; USDA, CNPP, 1995).
Intake-based Dietary Assessment
The CSFII measures foods eaten by individuals. Thesurvey records food intake over a specific period oftime (2 nonconsecutive days in the 1994-96 survey)and collects demographic information, such as house-hold size, income, race, age, and sex, in addition tofood-intake data (USDA, ARS, March 1997). It is akey component of Federal efforts to monitor nutrition(such as the National Nutrition Monitoring Plan).The demographic information is particularly valuablebecause it allows researchers to assess dietary statusamong population subgroups, which helps policymak-ers to develop effective nutrition policies, and nutri-tion educators to target nutrition education programsfor specific socioeconomic groups.
Numerous studies have suggested that food-intakesurveys, such as the CSFII, which collect food con-sumption data through recalls or food records overshort periods of time, are subject to underreporting ofconsumption when measured in terms of energyintake (Bingham, 1994; Black and others, 1993; Mertzand others, 1991; Schoeller, 1990). Little is knownabout how much underreporting varies across foodgroups. However, in one study of 79 people inCambridge, England, Bingham reported that thosesubjects that underreported energy intake also had sig-nificantly lower intakes of fat, total sugar, and addedsugars, but not Vitamin C, starch, and fiber, comparedwith nonunderreporters (Bingham, 1994). Clevelandand others report that this finding �lends some supportto the idea that nutrient-dense food groups may beless likely to be underreported than the foods in thetip of the pyramid� (Cleveland and others, April1997). A 1995 study conducted by the United FreshFruit and Vegetable Association that compared fooddiaries from 2,000 households with consumers� self-reported food intake found that consumers overesti-mated fruit and vegetable consumption by up to one-third and underestimated consumption of fats andsweets by one-half (United Fresh Fruit and VegetableAssociation, 1995).
While improved probing methods in the 1994-96CSFII may have reduced underreporting comparedwith previous surveys, food-intake surveys, and hencethe dietary assessments on which they are based,probably reflect a lower limit on actual food intake.Consequently, these assessments may also tend tounderstate the number of Food Guide Pyramid serv-ings actually consumed by individuals at least forsome food groups. In addition, because the CSFIIreports cross-sectional data, which measure food con-sumption at one specific point in time, using method-ologies that differ by survey period, it is difficult toseparate methodological effects from true consump-tion changes.
Food Supply Dietary Assessment
Federal efforts to monitor nutrition (such as theNational Nutrition Monitoring Plan) rely on food sup-ply and use data that are collected and publishedannually by ERS. The food supply series estimatesthe quantity of food available for human consumptionin the U.S. food marketing system by tracking com-modity flows from production to end uses (Putnamand Allshouse, 1997). The series is the only continu-
Economic Research Service/USDA A Dietary Assessment of the U.S. Food Supply / AER-772 5

ous source of food and nutrient availability in theUnited States with data extended back to 1909 formost commodities. The data are developed usingsimilar methods across years, and thus complementthe single point in time estimates reported in theCSFII.
Like most time series data, the food supply estimatesare most often used as indicators of trends over time.They are typically used to measure the average annuallevel of food available for consumption in the country,to determine the approximate nutrient content of thefood supply, and to show year-to-year variations in thequantity of particular foods available for consumption.
Up to now, however, the usefulness of the food supplydata for comparing food consumption with Federaldietary guidance has been limited. The food supplydata measure commodity supplies as they movethrough marketing channels for domestic consump-
tion. Consequently, the data overstate the amount offood actually ingested by humans by capturing sub-stantial quantities of nonedible food portions and foodlost to human use through waste and spoilage in thehome and marketing system. The series also includesunknown quantities of foods that are used as ingredi-ents in processed foods that are exported�soft drinks,baked goods, cereal products. For example, the foodsupply series for caloric sweeteners includes somehigh fructose corn syrup used by U.S. beverage manu-facturers to make soft drinks for export (see�Discussion� on page 26). As a result of this andother overcounting, the average calories provided bythe food supply are well-above those needed to meetthe energy needs of the U.S. population. In 1994, forexample, the food supply provided 3,800 calories percapita compared to a population-weightedRecommended Energy Allowance (REA) of 2,247calories for the U.S. population (National ResearchCouncil, 1989).
6 A Dietary Assessment of the U.S. Food Supply / AER-772 Economic Research Service/USDA
Data and Methods
ERS has developed new methods to adjust the foodsupply series for some of the data limitations men-tioned in the previous chapter and to convert theaggregate food consumption estimates into food serv-ings comparable with those in The Food GuidePyramid. ERS can now use food supply data to com-pare diets with Food Guide Pyramid serving recom-mendations over a continuous time period. Also,because the food supply series is commodity-based,servings estimates developed from this data set can bereadily converted back to the farm level, easing thetranslation of dietary recommendations into produc-tion and supply goals for the agricultural sector(Young and Kantor, forthcoming). This overcomesthe difficulties�encountered in food-intake surveys�of separating foods as eaten (like lasagna) into thefood commodities that they are made from (tomatoes,beef, cheese, wheat flour).
This study describes the data and methodology behindthese conversion techniques, reports servings esti-mates generated from 1970 to 1996 food supply data,and compares these estimates with CSFII servingsdata for 1996.
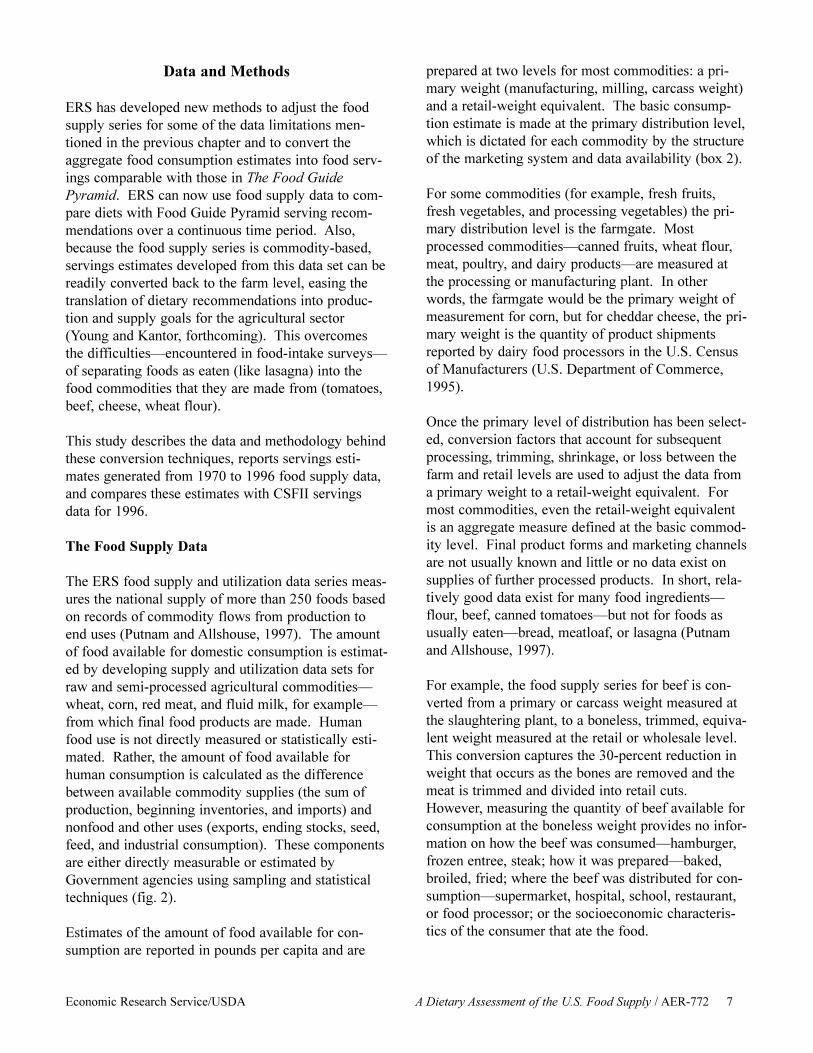
The Food Supply Data
The ERS food supply and utilization data series meas-ures the national supply of more than 250 foods basedon records of commodity flows from production toend uses (Putnam and Allshouse, 1997). The amountof food available for domestic consumption is estimat-ed by developing supply and utilization data sets forraw and semi-processed agricultural commodities�wheat, corn, red meat, and fluid milk, for example�from which final food products are made. Humanfood use is not directly measured or statistically esti-mated. Rather, the amount of food available forhuman consumption is calculated as the differencebetween available commodity supplies (the sum ofproduction, beginning inventories, and imports) andnonfood and other uses (exports, ending stocks, seed,feed, and industrial consumption). These componentsare either directly measurable or estimated byGovernment agencies using sampling and statisticaltechniques (fig. 2).
Estimates of the amount of food available for con-sumption are reported in pounds per capita and are
prepared at two levels for most commodities: a pri-mary weight (manufacturing, milling, carcass weight)and a retail-weight equivalent. The basic consump-tion estimate is made at the primary distribution level,which is dictated for each commodity by the structureof the marketing system and data availability (box 2).
For some commodities (for example, fresh fruits,fresh vegetables, and processing vegetables) the pri-mary distribution level is the farmgate. Mostprocessed commodities�canned fruits, wheat flour,meat, poultry, and dairy products�are measured atthe processing or manufacturing plant. In otherwords, the farmgate would be the primary weight ofmeasurement for corn, but for cheddar cheese, the pri-mary weight is the quantity of product shipmentsreported by dairy food processors in the U.S. Censusof Manufacturers (U.S. Department of Commerce,1995).
Once the primary level of distribution has been select-ed, conversion factors that account for subsequentprocessing, trimming, shrinkage, or loss between thefarm and retail levels are used to adjust the data froma primary weight to a retail-weight equivalent. Formost commodities, even the retail-weight equivalentis an aggregate measure defined at the basic commod-ity level. Final product forms and marketing channelsare not usually known and little or no data exist onsupplies of further processed products. In short, rela-tively good data exist for many food ingredients�flour, beef, canned tomatoes�but not for foods asusually eaten�bread, meatloaf, or lasagna (Putnamand Allshouse, 1997).
For example, the food supply series for beef is con-verted from a primary or carcass weight measured atthe slaughtering plant, to a boneless, trimmed, equiva-lent weight measured at the retail or wholesale level.This conversion captures the 30-percent reduction inweight that occurs as the bones are removed and themeat is trimmed and divided into retail cuts.However, measuring the quantity of beef available forconsumption at the boneless weight provides no infor-mation on how the beef was consumed�hamburger,frozen entree, steak; how it was prepared�baked,broiled, fried; where the beef was distributed for con-sumption�supermarket, hospital, school, restaurant,or food processor; or the socioeconomic characteris-tics of the consumer that ate the food.
Economic Research Service/USDA A Dietary Assessment of the U.S. Food Supply / AER-772 7

8 A Dietary Assessment of the U.S. Food Supply / AER-772 Economic Research Service/USDA
Box 2�Final Marketing Stage at which FoodSupplies Are Measured
Grains: white and whole wheat flour, durum flour, rye flour; corn, oat, and barley products (manufacturedweight); rice (milled basis).
Vegetables: fresh (retail-weight equivalent); freezing and canned (farm-weight), dehydrated (farm-weight); drybeans, peas, and lentils (cleaned basis).
Fruit: fresh (retail-weight equivalent); frozen and canned (product weight); dried (processed weight); fruitjuices (single-strength equivalent).
Milk, yogurt, and cheese: product-basis, manufactured weight.
Meat, poultry, fish, dry beans, eggs, and nuts: meat, poultry, fish (boneless-weight equivalent); eggs (retailweight equivalent); peanuts (kernel basis); peanut butter (product weight); tree nuts (shelled weight).
Fats and oils: fat basis, manufactured weight.
Added sugars: dry-basis, manufactured weight.
Production + Beginning Inventories + Imports
Exports + Farm and Industrial Use + Ending Stocks
U.S. Per Capita Food Consumption(food supply)
Annual supplyminus
Figure 2
Estimating U.S. food consumption
Source: Putnam and Allshouse, 1997.
Also, since many farm-to-retail conversion factors areunchanged since 1970, the food supply data may notcapture some changes in quality, marketing, and yieldof product that have occurred since then. For example,food supply data for margarine assume an 80-percentfat content despite the proliferation of low and reduced-fat margarine and spreads in retail markets in recentyears (Allshouse, Putnam, and Sanford, forthcoming).Although ERS is continually conducting research onthese issues and annually adjusts the food supply seriesfor changes of this type when data availability permits,all such changes are not reflected in current food sup-ply estimates (Putnam and Allshouse, 1997).
Translating Food Supply Data into Food Servings
A multistage process was used to convert aggregatefood supply estimates into food servings comparablewith those specified in The Food Guide Pyramid.Servings were estimated for more than 250 individualfood commodities or commodity groups that weredivided into the five major Pyramid food groups orseparate groups for fats and oils and added sugars(box 3).
Annual per capita food supply estimates were thenconverted into daily servings and compared with theserving recommendations depicted in the Food GuidePyramid. The food supply data were converted frompounds and ounces into grams to ease comparisonwith serving weights for different foods identified inUSDA�s Nutrient Database for Standard Reference,Release 11-1 (Nutrient Data Base) (USDA, ARS,October 1997).
Next, the food supply data were adjusted for spoilageand other waste by subtracting food losses from thefinal marketing weight (primary or retail-equivalent)reported for that commodity in the food supply series(box 4). Depending on the commodity, several differ-ent types of losses were identified and estimatedincluding retail and foodservice and consumer losses,changes in weight due to cooking, and the discard ofnonedible food parts. Losses averaged 27 percentacross all food groups and were assumed to be con-stant over time. Loss rates varied among subsets ofsome food groups�for example, loss rates for freshvegetables were different from loss rates for processedvegetables�but loss shares were the same for individ-ual foods within subgroups; that is, loss shares forfresh broccoli were the same as loss shares for freshsnap beans.
Estimation of Serving Weights
A single serving weight, consistent with sample serv-ings identified in The Food Guide Pyramid bulletinFood Choices Chart (USDA, CNPP, 1996) and otherUSDA dietary guidance materials, was defined foreach food supply commodity, using serving weightsidentified in the Nutrient Data Base. For each com-modity, the selected food portion was that which mostclosely resembled the serving size defined for thatcommodity or commodity type (for example, freshfruit, cooked vegetables, fluid milk) in the FoodGuide Pyramid.
For most commodities, serving weights were dictatedby data availability and the marketing level at whichconsumption was reported in the food supply series.For some commodity groups�milk, yogurt, andcheese, fruits, vegetables, and added sugars�servingweights matched those defined in The Food GuidePyramid bulletin. On the other hand, because someFood Guide Pyramid serving recommendations�par-ticularly those in the grains and meat groups�areproduct-based, rather than ingredient-based, thismeant that serving weights for some foods were notconsistent with standard serving sizes defined bydietary guidance. Additional detail on the methodsused to estimate serving weights for individual com-modities is available in Appendix 2.
Comparison with Food Guide PyramidServing Recommendations
Once representative serving weights were identifiedfor each food supply commodity, daily per capita con-sumption was divided by the assigned serving weightto calculate average servings for that commodity.Individual food servings were then aggregated todetermine total daily servings for each Pyramid foodgroup. The difference between the total number ofdaily servings provided by the food supply and FoodGuide Pyramid serving recommendations was meas-ured by comparing the total number of edible servingsprovided for each food group, with recommendedintake.
The recommended servings used in this study werethe midpoint of the recommended Pyramid servingsfor each food group, which are based on a sample dietof 2,200 calories. A 2,200-calorie diet was chosen asa standard because it approximates the dailyRecommended Energy Allowance (REA) of 2,247
Economic Research Service/USDA A Dietary Assessment of the U.S. Food Supply / AER-772 9

10 A Dietary Assessment of the U.S. Food Supply / AER-772 Economic Research Service/USDA
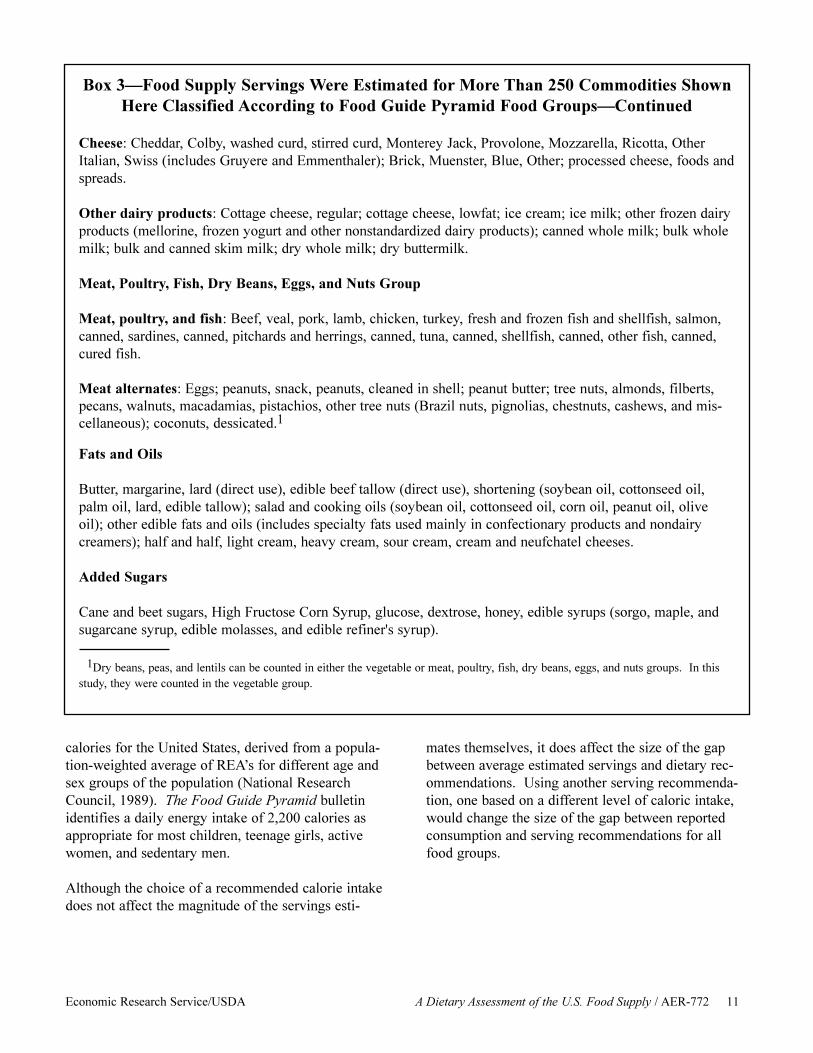
Box 3�Food Supply Servings Were Estimated for More Than 250 Commodities ShownHere Classified According to Food Guide Pyramid Food Groups
Bread, Cereals, Rice, and Pasta Group
White and whole wheat flour; durum flour; rye flour; rice; corn flour and meal; corn hominy and grits; cornstarch; oat products (rolled oats, ready-to-eat-cereals, oat flour, and oat bran); barley products (barley flour,pearl barley, and malt and malt extract used in food processing).
Vegetable Group
Fresh: Artichokes, asparagus, bell peppers, broccoli, Brussels sprouts, cabbage, carrots, cauliflower, celery,sweet corn, cucumbers, eggplant, escarole, endive, garlic, head lettuce, romaine and leaf lettuce, mushrooms,onions, potatoes, radishes, snap beans, spinach, sweet potatoes, and tomatoes.
For freezing: Asparagus, snap beans, broccoli, carrots, cauliflower, sweet corn, green peas, potatoes, other(blackeyed peas, collards, kale, mustard greens, okra, pumpkin, rhubarb, summer squash, turnip greens,turnips, and other miscellaneous vegetables).
For canning: Asparagus, snap beans, cabbage (for sauerkraut), chile peppers, carrots, sweet corn, cucumbers,green peas, mushrooms, potatoes, tomatoes, other (beets, lima beans, and spinach).
Legumes and vegetables for dehydrating and chips: Dry edible beans (black beans, blackeyed peas, cran-berry, garbanzo, Great Northern, light and dark red kidney beans, large and baby lima, navy, pinto, small red,small white, other), dry field peas and lentils (Austrian winter peas, split green peas, whole green peas, regularlentils, other lentils, split yellow peas, whole yellow peas); dehydrating (onions and potatoes), for chips andshoestrings (potatoes).1
Fruit Group
Fresh: Apples, apricots, avocados, bananas, cantaloupe, cherries, cranberries, grapes, grapefruit, honeydew,kiwifruit, lemons, limes, mangos, nectarines, oranges and temples, peaches, pears, pineapples, papayas, plums,prunes, strawberries, tangelos, tangerines, and watermelon.
Frozen: Apples, apricots, blackberries, blueberries, cherries, peaches, raspberries, strawberries, other berries(boysenberries, loganberries).
Canned: Apples and applesauce, apricots, cherries (tart and sweet), olives, peaches, pears, pineapples, plumsand prunes.
Dried: Apples, apricots, dates, figs, peaches, pears, prunes, raisins.
Fruit juices: Apple, grape, grapefruit, lemon, lime, orange, pineapple, and prune.
Milk, Yogurt, and Cheese Group
Fluid milk products: Whole, plain; 2-percent reduced fat, plain; light (0.5-1 percent), plain; fat-free (skim),plain; whole, flavored; lower fat, flavored; buttermilk; yogurt, and eggnog.
calories for the United States, derived from a popula-tion-weighted average of REA�s for different age andsex groups of the population (National ResearchCouncil, 1989). The Food Guide Pyramid bulletinidentifies a daily energy intake of 2,200 calories asappropriate for most children, teenage girls, activewomen, and sedentary men.
Although the choice of a recommended calorie intakedoes not affect the magnitude of the servings esti-
mates themselves, it does affect the size of the gapbetween average estimated servings and dietary rec-ommendations. Using another serving recommenda-tion, one based on a different level of caloric intake,would change the size of the gap between reportedconsumption and serving recommendations for allfood groups.
Economic Research Service/USDA A Dietary Assessment of the U.S. Food Supply / AER-772 11
Box 3�Food Supply Servings Were Estimated for More Than 250 Commodities ShownHere Classified According to Food Guide Pyramid Food Groups�Continued
Cheese: Cheddar, Colby, washed curd, stirred curd, Monterey Jack, Provolone, Mozzarella, Ricotta, OtherItalian, Swiss (includes Gruyere and Emmenthaler); Brick, Muenster, Blue, Other; processed cheese, foods andspreads.
Other dairy products: Cottage cheese, regular; cottage cheese, lowfat; ice cream; ice milk; other frozen dairyproducts (mellorine, frozen yogurt and other nonstandardized dairy products); canned whole milk; bulk wholemilk; bulk and canned skim milk; dry whole milk; dry buttermilk.
Meat, Poultry, Fish, Dry Beans, Eggs, and Nuts Group
Meat, poultry, and fish: Beef, veal, pork, lamb, chicken, turkey, fresh and frozen fish and shellfish, salmon,canned, sardines, canned, pitchards and herrings, canned, tuna, canned, shellfish, canned, other fish, canned,cured fish.
Meat alternates: Eggs; peanuts, snack, peanuts, cleaned in shell; peanut butter; tree nuts, almonds, filberts,pecans, walnuts, macadamias, pistachios, other tree nuts (Brazil nuts, pignolias, chestnuts, cashews, and mis-cellaneous); coconuts, dessicated.1
Fats and Oils
Butter, margarine, lard (direct use), edible beef tallow (direct use), shortening (soybean oil, cottonseed oil,palm oil, lard, edible tallow); salad and cooking oils (soybean oil, cottonseed oil, corn oil, peanut oil, oliveoil); other edible fats and oils (includes specialty fats used mainly in confectionary products and nondairycreamers); half and half, light cream, heavy cream, sour cream, cream and neufchatel cheeses.
Added Sugars
Cane and beet sugars, High Fructose Corn Syrup, glucose, dextrose, honey, edible syrups (sorgo, maple, andsugarcane syrup, edible molasses, and edible refiner's syrup).
1Dry beans, peas, and lentils can be counted in either the vegetable or meat, poultry, fish, dry beans, eggs, and nuts groups. In thisstudy, they were counted in the vegetable group.

12 A Dietary Assessment of the U.S. Food Supply / AER-772 Economic Research Service/USDA
Box 4�Estimating Food Losses
The accuracy of the food supply servings estimates reported in this study depends in part on the estimatedamount of available food supplies that are wasted, spoiled, or otherwise not eaten by consumers. See"Discussion� on page 26 for additional detail on the impact of alternative loss rates on the food supply serv-ings estimates.
In this study, food loss was defined as the average reduction in weight that occurs to an agricultural commodi-ty as that commodity leaves the farm, is processed into final food products, and purchased for consumption insupermarkets and eating places. Food loss was estimated by applying existing loss coefficients, gathered frompublished literature and discussions with commodity experts, to the amount of food available for human con-sumption in the United States in 1970-96. Losses were estimated for the more than 250 individual foods listedin box 3. They are itemized by food group in Appendix 2. The causes and nature of food losses and loss esti-mates for aggregate food groups for the retail, consumer, and foodservice sectors, have been previously report-ed (Kantor and others, 1997).
Where appropriate, the data were also adjusted for changes in weight due to cooking. Cooking adjustmentswere made for meat, poultry, fish, processed vegetables, and fresh vegetables not normally eaten raw�aspara-gus, artichokes, Brussels sprouts, eggplant, onions, potatoes, snap beans, sweet corn, and sweet potatoes�andwere based on cooking yields identified by USDA (USDA, ARS, 1975). Average changes in weight due tocooking were 25 percent for meat, poultry, and fish and ranged from 3 to 36 percent for fresh and processedvegetables.
The data were also adjusted for the discard of nonedible food parts�peels, rinds, seeds, skins, cores, andstems�which were estimated for most commodities using the average refuse share for each commodity identi-fied in USDA's Nutrient Data Base. Figure 3 illustrates an example for fresh apples.
Food supply estimates for shortening, lard, and edible beef tallow were adjusted for the discard of deep-fryingfats by foodservice establishments. A 1987 study by SRI International indicated that used frying fat disposedof by restaurants and processed by renderers for use in animal feeds, pet foods, and industrial operations andfor export amounts to about 6 pounds per capita, or about 9 percent of the total amount of fats and oils avail-able for human consumption in 1995. A 1993 study estimated that 50 percent or more of the deep frying fatsused by fast food places and other foodservice establishments were eventually discarded after use and were notavailable for human consumption (Hunter and Applewhite, 1993).
ERS does not know the share of total frying fats foodservice establishments use. Some of these products, forexample, are sold at the retail level for home baking or are used by manufacturers of prepared bakery prod-ucts. For this study, ERS overestimated losses of fats and oils by foodservice establishments by assuming that100 percent of the total shortening, lard, and tallow provided in the food supply was used by foodserviceestablishments for deep-fat frying. Thus, total foodservice losses for these three commodities were assumed tobe 50 percent.

Economic Research Service/USDA A Dietary Assessment of the U.S. Food Supply / AER-772 13
Farm weight: 18.8 lbs.
(per capita per year)
Retail weight: 18.1 lbs.
Edible weight: 16.3 lbs.
Farm-to-retail loss: 4%
Retail loss: 2%Nonedible share: 8%
Foodservice, andconsumer loss: 30%
Average serving weight(medium fresh apple):4.0 oz. or 138 grams
Quantity consumed annually:11.4 lbs.
Figure 3
Estimating food supply servings for fresh apples
Quantity consumeddaily: 0.5 oz. or
14.2 grams
Average daily servings = (0.5 oz or 14.2 grams) / (4.9 oz. or 138 grams) = 0.10 servingsSource: U.S. Department of Agriculture, Economic Research Service.

Findings
Estimated food supply servings for 1996 suggest thatthe average American diet is out of balance with FoodGuide Pyramid serving recommendations (fig. 4).Average consumption is heavily weighted toward theadded fats and added sugars at the tip of the Pyramidwhile falling short of serving recommendations forfruits, vegetables, dairy products, and lean meats. Atthe same time, the mix of foods provided by thebread, cereals, rice, and pasta groups may need tochange for most consumers to meet recommendationsfor dietary variety and selected food components suchas fiber, total fat, saturated fat, and cholesterol.
Comparing food supply servings over 27 years withFood Guide Pyramid serving recommendations alsosuggests that while many consumers have made posi-tive dietary changes, the pace of change has beenslow (table 2). While the average number of servingsfor several food groups�grains, vegetables, andfruits�has moved closer to Food Guide Pyramidserving recommendations since 1970, the grains groupis the only food group where total servings met rec-ommendations for a 2,200-calorie diet in 1996.Limited movement in the average consumption of
dairy products and fruits since 1970 contrasts with asharper increase in servings of added fats and sugarsover the same time period.
Bread, Cereals, Rice, and Pasta Group
The food supply provided an estimated 9.7 daily serv-ings of grain products in 1996, at the mid-range of the6-11 daily servings recommended for all Americansaged 2 and older (table 3). This result suggests thatmany consumers met the Food Guide Pyramid servingrecommendation for this group appropriate to a 2,200-calorie diet. Total daily servings were more than athird higher�or the flour equivalent of about 2.5servings of bread�than the 6.8 servings consumed in1970. This result suggests that many consumers areheeding nutrition education messages to increase theirconsumption of grain products (fig. 5).
Almost half of the 20-year serving increase wasaccounted for by higher consumption of white andwhole wheat flour. A twofold increase in durum flour(used for pasta) and corn products (mostly corn mealand corn flour probably used for snack chips andMexican-style foods such as tortillas), and a threefoldincrease in rice consumption, accounted for the
14 A Dietary Assessment of the U.S. Food Supply / AER-772 Economic Research Service/USDA
Grain group 1/
Vegetable group
Fruit group
Dairy group
Meat group
Added sugars
Added fats and oils
-100 -50 0 50 100 150
Percent
1/ Grain group servings meet the recommendation for a 2,200-calorie diet.Source: U.S. Department of Agriculture, Economic Research Service.
Figure 4
Change in food supply servings needed to meet Food Guide Pyramidserving recommendations for a 2,200-calorie diet, 1996

Economic Research Service/USDA A Dietary Assessment of the U.S. Food Supply / AER-772 15
remainder of the increased grain groupservings.
While the food supply data suggest that average grainconsumption meets Food Guide Pyramid serving rec-ommendations, many consumers may need to changethe type of foods selected from this group to meetdietary recommendations for fiber, fat, cholesterol,and added sugars. The Food Guide Pyramid bulletinrecommends that consumers choose several servingsper day of foods made from whole grains such as
whole-wheat breads and whole-grain cereals (USDA,CNPP, 1996). However, many grain products are rel-atively high in fats, oils, and added sugars depicted atthe tip of the Pyramid and contribute little in the wayof fiber and micronutrients found in whole-grainbreads, cereals, and other grain products.
In 1992, for example, the latest year for which data onselected whole grains are available for the food supply,3 whole wheat flour accounted for less than 2percent of total white and wheat flour provided by thefood supply, or the flour equivalent of about one-tenthof a slice of bread per person per day. While the foodsupply data does not report consumption of otherwhole-grain products, brown rice for example, theCSFII servings data confirm that consumption of foodsmade with whole grains is indeed low. Mean dailyintake of foods made from whole grains was 1 servingin 1996, well-below the several daily servings suggest-ed by dietary guidance (USDA, ARS, Oct. 1998).
Vegetable Group
The food supply provided a daily average of 3.8 serv-ings of fresh, frozen, canned vegetables, and drybeans, peas, and lentils in 1996, close to the 4 dailyservings recommended for a 2,200-calorie diet (table 4).
Table 2�Average food supply servings for 1970-96 compared with Food Guide Pyramid serving recommendations
Servings Food Guide Pyramid Food group 1970-75 1980-85 1990-95 1996 serving recommendation1
Grains 6.8 7.5 9.2 9.7 9Vegetables 3.1 3.2 3.6 3.8 4Fruits 1.1 1.2 1.3 1.3 3
Milk, yogurt, and cheese2 1.6 1.5 1.6 1.7 2.2Meat, poultry, fish, dry beans,eggs, and nuts (ounces) 5.4 5.5 5.6 5.6 6.0
Added fats and oils (grams of fat)3 49 55 62 60 38
Added sugars (teaspoons)4 27 26 31 32 12
1Recommendation based on a 2,200-calorie diet. A 2,200-calorie diet is close to the 2,247 calories recommended as an average caloric intake for the popula-tion in 1995. Recommended servings for other years may differ.
2Three servings of milk, yogurt, and cheese are appropriate for teenagers and young adults to age 24 and for pregnant and breastfeeding women. Two serv-ings are recommended for other adults.
3The 1995 Dietary Guidelines recommend that consumers choose a diet that provides no more than 30 percent of total calories from fat. The upper limit onthe grams of fat in a consumer�s diet will depend on calorie intake. For example, a person consuming 2,200 calories per day, the upper limit on total daily fatintake is 660 calories. Seventy-three grams of fat contribute about 660 calories (73 grams x 9 calories per gram of fat = 660 calories). According to foodsupply data for 1994, added fats and oils account for 52 percent of the total fat provided by the food supply in that year. The recommendation shown hereassumes that added fats and oils account for 52 percent of total fat intake for a daily upper limit of 38 grams of added fats and oils (73 * 0.52) = 38.
4To avoid getting too many calories from sugar, dietary guidance suggests that consumers on a 2,200-calorie diet try to limit added sugars to the daily quanti-ty listed.Source: USDA, Economic Research Service.
Table 3�Food supply bread, cereals, rice, and pastagroup servings, 1996
Item Servings
Total grains 9.7
White and wheat flour 7.2Durum flour .4Rice .5Rye flour *Corn products 1.3
Corn flour and meal .9Corn grits and hominy .1Cornstarch .3
Oat products .3Barley products *
* = less than 0.1 servings. Totals may not add due to rounding.Source: USDA, Economic Research Service.
3Data for whole wheat flour is from the 1992 U.S. Census ofManufacturers (U.S. Department of Commerce, 1995).

Average consumption grew by about 20 percent, orhalf a daily vegetable serving between 1970 and 1996(fig. 6). Half a daily vegetable serving is equivalentto about a one-quarter cup of cooked vegetables, one-quarter of a baked potato, or about five french fries.Supporting documentation for the Food GuidePyramid suggests that consumers should divide theirdaily vegetable servings into three vegetable sub-groups�dark-green leafy and deep yellow vegetables;starchy vegetables, including dry beans, peas, andlentils; and other vegetables (Cronin and others, 1987).Thus, for a 2,200-calorie diet with a minimum servingrecommendation of 4 servings daily, consumption
would be expected to be evenly divided at 1.3 servingsfor each subgroup. Within these groups, dark-greenleafy vegetables and dry beans, peas, and lentils shouldaccount for 0.6 servings or about three-sevenths oftotal subgroup consumption and deep yellow and otherstarchy vegetables should account for 0.8 servings orfour-sevenths of their subgroups, respectively.
However, in 1996, average vegetable consumption dif-fered from these recommendations with vegetableservings heavily weighted toward other starchy vegeta-bles, especially white potatoes. Consumption of dark-green and deep yellow vegetables, and dry beans, peas,and lentils was well below recommendations.
The concentration of consumption in a small numberof foods within these groups also suggests that con-sumers may not be incorporating adequate variety intotheir daily vegetable choices. Although the food sup-ply data for this group include consumption estimatesfor about 80 different vegetables, only 5 commodities(head lettuce, potatoes for freezing, fresh potatoes,potatoes for chips and shoestrings, and tomatoes forcanning) accounted for half of total 1996 vegetableservings (fig. 7). Another 15 percent of total veg-etable servings came from potatoes for dehydration,fresh tomatoes, fresh garlic, and fresh carrots. Dry
16 A Dietary Assessment of the U.S. Food Supply / AER-772 Economic Research Service/USDA
1970 72 74 76 78 80 82 84 86 88 90 92 94 960
2
4
6
8
10
12Other
Oat products
Corn products
Rice
Durum flour
Wheat flour
Servings per person daily
Recommendation: 9 servings*
Figure 5
Bread, cereals, rice, and pasta group: Food supply servings,1970-96
*Recommended servings for a 2,200-calorie diet.Source: U.S. Department of Agriculture, Economic Research Service.
Table 4�Food supply vegetable group servings, 1996
Item Servings
Total vegetables 3.8
Dark-green vegetables .1Deep yellow vegetables .2Dry beans, peas, and lentils .2Other starchy vegetables 1.4
Fresh potatoes .4Potatoes for freezing .5Potatoes for chips/shoestrings .2
Other vegetables 1.9
Source: USDA, Economic Research Service.

Economic Research Service/USDA A Dietary Assessment of the U.S. Food Supply / AER-772 17
1970 72 74 76 78 80 82 84 86 88 90 92 94 960
1
2
3
4
5Legumes
Deep yellow
Dark green
Other
Starchy
Servings per person daily
Recommendation: 4 servings*
Figure 6
Vegetable group: Food suppy servings, 1970-96
*Recommended servings for a 2,200-calorie diet.Source: U.S. Department of Agriculture, Economic Research Service.
Source: U.S. Department of Agriculture, Economic Research Service.
Other 36.3%
Dark green 3%
Deep yellow 5.1%
Dry beans, peas, and lentils 5.9%
Potatoes for chips 6.1%
Canned tomatoes 5.9%
Head lettuce 16.3%
Fresh potatoes 10%
Frozen potatoes 11.4%
Percent of total vegetable servings
Figure 7
Five foods accounted for half of total vegetable servings in 1996
beans, peas, and lentils combined made up a 6-percentshare of total consumption. No other single commod-ity accounted for more than 3 percent of total veg-etable servings or 0.1 servings.
Dark-Green Leafy and Deep Yellow Vegetables
Consumers are not incorporating dark-green leafyvegetables into their daily vegetable choices. In 1996,for example, the food supply provided just one-tenthof a daily serving of dark-green leafy vegetables,including broccoli, spinach, Romaine, and other leafylettuce, less than one-quarter of recommended dailyservings.
The shortfall in dark-green leafy vegetable consump-tion occurred despite a threefold increase in broccoliconsumption since 1970. Broccoli and Romaine let-tuce accounted for most of the total dark-green leafyvegetable servings provided by the food supply in1996. Several other vegetables of this type, includingfresh collards, kale, chard, mustard, turnip, and beetgreens, and frozen and canned spinach, are either notreported at all or are grouped together in an �other�category in the food supply data�suggesting thatactual use of these foods may be higher than reportedhere (see Appendix 2). Efforts are currently under-way at ERS to improve these data.
Despite these data limitations, food-intake data con-firm that total consumption of dark-green leafy veg-etables is below recommendations. According to the1996 CSFII servings data, mean daily intake of dark-green leafy vegetables was about 0.2 daily servings,or about 6 percent of total vegetable servings (USDA,ARS, Oct. 1998).
The food supply provided less than one-fourth of adaily serving of deep yellow vegetables, or about one-third of recommended servings. More than three-quarters of deep yellow vegetable servings were fromfresh, frozen, and canned carrots.
Dry Beans, Peas, and Lentils and Other Starchy Vegetables
The food supply provided 1.6 servings of starchy veg-etables (potatoes, corn, dry beans, peas, and lentils,and green peas) in 1996, 19 percent above recom-mended servings for this subgroup. Consumption washeavily weighted toward white potatoes and otherstarchy vegetables, which together accounted for 1.4
servings daily. Frozen potatoes�used mainly forfrench fries�and potatoes for potato chips and shoe-strings, accounted for more than one-third of totalstarchy vegetable servings and along with dehydratedpotatoes, accounted for most of the growth in starchyvegetable consumption between 1980 and 1996.
Average consumption of dry beans, peas, and lentilswas one-third of recommended levels with the foodsupply providing about one-quarter serving of cookedlegumes per day. More than 90 percent of total serv-ings were from dry beans, with recent growth led byincreased consumption of pinto beans for Mexican-style foods (USDA, ERS, June 1997).
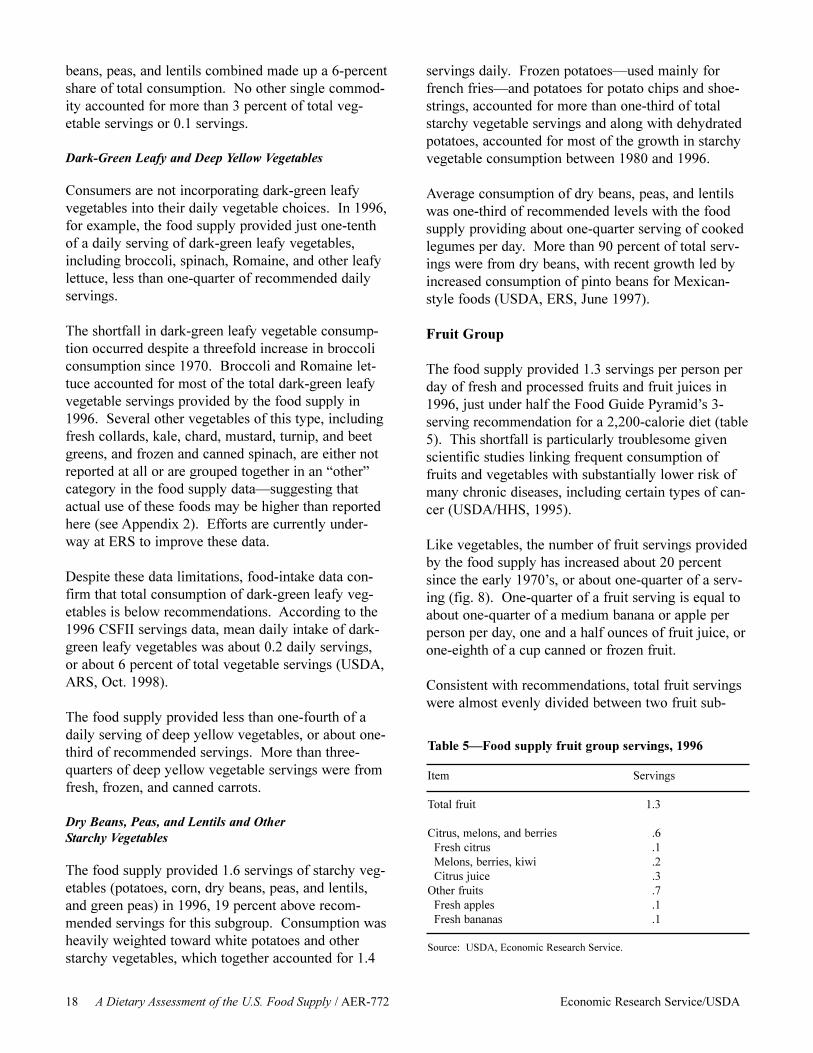
Fruit Group
The food supply provided 1.3 servings per person perday of fresh and processed fruits and fruit juices in1996, just under half the Food Guide Pyramid�s 3-serving recommendation for a 2,200-calorie diet (table5). This shortfall is particularly troublesome givenscientific studies linking frequent consumption offruits and vegetables with substantially lower risk ofmany chronic diseases, including certain types of can-cer (USDA/HHS, 1995).
Like vegetables, the number of fruit servings providedby the food supply has increased about 20 percentsince the early 1970�s, or about one-quarter of a serv-ing (fig. 8). One-quarter of a fruit serving is equal toabout one-quarter of a medium banana or apple perperson per day, one and a half ounces of fruit juice, orone-eighth of a cup canned or frozen fruit.
Consistent with recommendations, total fruit servingswere almost evenly divided between two fruit sub-
18 A Dietary Assessment of the U.S. Food Supply / AER-772 Economic Research Service/USDA
Table 5�Food supply fruit group servings, 1996
Item Servings
Total fruit 1.3
Citrus, melons, and berries .6Fresh citrus .1Melons, berries, kiwi .2Citrus juice .3
Other fruits .7Fresh apples .1Fresh bananas .1
Source: USDA, Economic Research Service.

groups�citrus, melons, and berries, includingkiwifruit (0.6 servings) and other fruit (0.7 servings).However, with half of total fruit servings coming fromsix foods�orange juice (18 percent), bananas (9.8percent), fresh apples (7.9 percent), watermelon (6.5percent), apple juice (5.8 percent), and fresh grapes(5.1 percent)�the data suggest that many consumersmay not be incorporating adequate variety into theirdaily fruit choices.
Milk, Yogurt, and Cheese Group
Milk, yogurt, cheese, and other dairy products are theprimary source of calcium in most people�s diets,accounting for 73 percent of the calcium available inthe food supply in 1994 (USDA, CNPP, 1997). Othersources of dietary calcium included fruits and vegeta-bles (9 percent), grain products (5 percent), and otherfoods (12 percent). Calcium is essential for the for-mation of bones and teeth, and requirements increasesignificantly during adolescence, early adulthood,pregnancy, and lactation. Inadequate calcium intakeappears to be an important risk factor for osteoporo-sis, a disease that weakens the body�s bone structureand is responsible for more than 1 million fractures ofthe hip, wrist, and spine each year (Frazao, 1995).
As a result, the dairy group is the only food group forwhich Food Guide Pyramid serving recommendationsare based on age and physiological status rather thanenergy intake. Three servings�the equivalent ofthree 8-ounce glasses of milk per day�are suggestedfor teenagers, young adults up to 24 years of age, andpregnant and lactating women. Two daily servings ofdairy foods are recommended for children and mostother adults.
In this study, average servings were compared with adaily recommended intake of 2.2 servings. This targetwas based on a weighted average of recommendedservings for different age groups of the U.S. popula-tion (excluding the higher needs of pregnant and lac-tating women). In 1996, the food supply provided 1.7servings of dairy foods (excluding cream cheese andfluid cream which are counted as added fats depictedat the top of the Pyramid), suggesting that mostAmericans are not meeting this target (table 6). Totalservings have remained nearly constant since 1970(fig. 9).
Many dairy foods, however, are naturally high in fatand saturated fat. Thus, consumers may need to bal-ance any increased dairy consumption with total fatintake. More than half of the dairy servings in the
Economic Research Service/USDA A Dietary Assessment of the U.S. Food Supply / AER-772 19
1970 72 74 76 78 80 82 84 86 88 90 92 94 960
1
2
3
4Other fruit
Melons, berries, kiwi
Fresh citrus
Citrus juice
Fresh apples
Bananas
Servings per person daily
Recommendation: 3 servings*
Figure 8
Fruit group: Food suppy servings, 1970-96
*Recommended servings for a 2,200-calorie diet.Source: U.S. Department of Agriculture, Economic Research Service.

food supply in 1996 came from two dairy productsthat are naturally high in fat�cheese (natural andprocessed) (38 percent) and whole milk (including dryand condensed) (16 percent), while skim milk (includ-ing dry and condensed) (16 percent), 1-percent milk(5 percent), and buttermilk and yogurt (mostly lowfat)(2 percent) accounted for nearly one-quarter of totaldairy servings. Reduced-fat, 2-percent milk account-ed for 15 percent of dairy servings, while ice creamand other frozen dairy desserts made up another 4 per-cent of the total.
Sharp changes over time in consumption patterns forfluid milk and cheese also suggest that many con-sumers may simply be substituting one high-fat dairyfood for another with little net reduction in total dairyfat intake (fig. 10). For example, between 1982-86and 1992-96, Americans reduced their average dailyconsumption of whole milk by more than one-third tojust over one-quarter cups. Consumption of lowfatmilk (skim and 1-percent) nearly doubled during thissame period, but consumption is still relatively low, atless than one-fifth of a cup per person daily.Consumption of reduced-fat, 2-percent milk increasedby 13 percent to just over one-quarter cups. However,during the same time period, declining whole milkconsumption was accompanied by a sharp 20-percentincrease in per capita consumption of cheese, most ofwhich is nearly as high or higher in total and saturatedfat per serving as whole milk. This is consistent withfood supply nutrient data that show that total fat andsaturated fat from dairy products remained constantbetween 1970 and 1994 (USDA, CNPP, 1997).
The food supply data do not measure how much risingcheese consumption is due to the increased use ofreduced-fat and nonfat cheese. However, a recentERS study of supermarket scanner data reported that
consumption of nutritionally improved cheeseincreased from 12 to 19 percent of total cheese volumebetween 1989 and 1993 (Frazao and Allshouse, 1996),suggesting that more than three-fourths of total cheeseservings continue to come from full fat products. Thisis consistent with servings estimates from the 1989-91CSFII, which indicated that 80 percent of total cheeseservings consumed by adults were regular, rather thanlow-fat products (Cleveland and others, 1995).
Meat, Poultry, Fish, Dry Beans, Eggs, andNuts Group
Total consumption of foods in the meat, poultry, fish,dry beans, eggs, and nuts group (meat group) in 1996was close to the level needed to provide most con-sumers with their recommended intake for this groupfor a 2,200-calorie diet. The Food Guide Pyramidrecommends that average meat group consumptionshould equal 6 ounces of cooked lean meat per personper day for a 2,200-calorie diet. According to TheFood Guide Pyramid bulletin, consumers shouldcount meat, poultry, and fish in total ounces. Otherfoods in this group�1 egg, 2 tablespoons of peanutbutter, or one-third cup of nuts�are counted as theequivalent of 1 ounce of cooked lean meat.
After adjusting for waste and cooking losses, the foodsupply provided the equivalent of 5.6 ounces ofcooked meat (lean and fat portion) per day�unchanged since the mid 1980�s (fig. 11). Eventhough total meat group servings were close to therecommended 6 daily ounces, many people may needto adjust the type of foods consumed from this groupin order to choose diets with less total fat, saturatedfat, and cholesterol (USDA/HHS, 1995). Accordingto the 1995 Dietary Guidelines, choosing lower fatoptions among foods in the meat and dairy groupsallows consumers to eat the recommended servingsfrom these groups and increase the amount and vari-ety of grain products, fruits, and vegetables in theirdiets without going over their calorie needs(USDA/HHS, 1995).
Because the food supply estimates for meat and poul-try include both the lean and fat portion of these prod-ucts, they likely overstate lean meat consumption andare not directly comparable with the Food GuidePyramid recommendation (table 7). Also, the foodsupply series does not report supplies of individualmeat products such as steaks or hot dogs, or theamount of lean meat vs. meat fat consumed.
20 A Dietary Assessment of the U.S. Food Supply / AER-772 Economic Research Service/USDA
Table 6�Food supply servings for the milk, yogurt, andcheese group, 1996
Item Servings
Total milk, yogurt, and cheese 1.7
Fluid milk .8Cheese .6Yogurt *Frozen dairy .1Condensed and evaporated milk *Dry milk .1
* = less than 0.1 servings.Source: USDA, Economic Research Service.

Economic Research Service/USDA A Dietary Assessment of the U.S. Food Supply / AER-772 21
1970 72 74 76 78 80 82 84 86 88 90 92 94 960
1
2
3Dry milk
Condensed/evaporated
Frozen dairy
Yogurt
Cheese
Fluid milk
Servings per person daily
Recommendation: 2.2 servings*
Figure 9
Milk, yogurt, and cheese group: Food suppy servings, 1970-96
*Recommended servings based on weighted average of recommended servings for different age groups of the U.S. population, excluding the higher needs of pregnant and lactating women.Source: U.S. Department of Agriculture, Economic Research Service.
0.0
0.2
0.4
0.6
0.8
1.0
1970 75 80 85 90 95
Total milk
Whole milk
2% milk
1% and skim milk
0.0
0.2
0.4
0.6
0.8
1.0
1970 75 80 85 90 95
Total cheese
American cheese
Mozzarella cheese
Source: U.S. Department of Agriculture, Economic Research Service.
Figure 10
Selected dairy products: Food supply servings, 1970-96
Servings per person daily

However, the aggregate commodity data suggest thaton average, the food supply provided larger quantitiesof foods, that relative to others in the group, are natu-rally high in fat, saturated fat, and cholesterol. Forexample, despite a nearly 36-percent increase in poul-try meat (chicken and turkey) servings since 1982-86,red meat (beef, veal, pork, and lamb) accounted for 52percent of total meat equivalent servings in 1996,double the 27-percent poultry share. Fish and shell-fish accounted for 7 percent of total supplies, while
about 9 percent of meat group servings came fromeggs. Another 2 percent of meat group servings camefrom peanut butter.
In recent years, meat producers and meatpackers,responding to consumer demand for lower fat meats,have made strides in reducing the fat content of theirproducts. Production practices that incorporateadvanced breeding techniques are resulting in leanercattle and hogs. Meatpackers and food retailers aretrimming more external fat, often leaving only one-quarter inch or less on the retail product, comparedwith an average of one-half inch to 1 inch 10 yearsago. As a result, beef and pork are now significantlyleaner than they were in 1980. Although thesechanges in fat trim are reflected in the food supplydata (Duewer, Krause, and Nelson, 1993; Putnam andAllshouse, 1997; Putnam and Duewer, 1995), redmeat�s fat content is widely variable; only the leanestcuts are as low in fat as broiled fish or skinless chick-en breast.
The addition of dry beans, peas, and lentils to themeat group would increase total daily meat groupservings slightly from 5.6 to 5.8 ounces. The FoodGuide Pyramid bulletin states that consumers shouldchoose several servings per week of these foods as
22 A Dietary Assessment of the U.S. Food Supply / AER-772 Economic Research Service/USDA
1970 72 74 76 78 80 82 84 86 88 90 92 94 960
1
2
3
4
5
6
7
8 Tree nuts
Peanuts/peanut butter
Eggs
Fish and seafood
Poultry
Red meatRecommendation: 6 ounces of lean meat equivalents*
Figure 11
Meat, poultry, fish, dry beans, eggs, and nuts group: Food suppy servings, 1970-96
Ounces of cooked meat equivalents per person daily
*Recommended servings for a 2,200-calorie diet. Source: U.S. Department of Agriculture, Economic Research Service.
Table 7�Food supply servings for the meat, poultry,fish, dry beans, eggs, and nuts group, 1996
Item Ounces
Total meat group 5.6
Meat, poultry, and fish 4.9Red meat 2.9Poultry 1.6Fish and seafood .4
Eggs .5Peanuts and peanut butter .1Tree nuts .1
Dry beans, peas, and lentils1
1Counted in the vegetable group.Source: USDA, Economic Research Service.

vegetable servings and select them often as choicesfrom the meat group (USDA, CNPP, 1996). Previousdietary assessments have implied that the �several�recommendation is equal to about one-seventh of totaldaily vegetable servings, or about 0.6 daily servingsfor a 2,200-calorie diet (Cleveland and others, 1997)(see �Vegetable Group,� page 15). However, withtotal daily consumption of less than one-quarter of adaily serving, supplies were well below the 0.6 dailyservings to meet the vegetable group recommendationand were even further short of the combined quantityneeded to also supply regular servings of these foodsas a protein choice from the meat group.
Dry beans, peas, and lentils offer consumers a rela-tively low-cost, low-fat, and high-fiber alternative tomeat, poultry, and fish. Together with nuts and seeds,these products are naturally high in several vitaminsand minerals, including magnesium and folate, whichare present in relatively small quantities in animalproducts and seafood.
The Pyramid Tip: Added Fats and Oils
After adjusting for waste, the food supply provided 60fat grams of added fats and oils in 1996, a 6-percentincrease from the 56 grams available for consumptiondaily in 1982-86 (table 8).
Added fats and oils are added in cooking and at thetable and food manufacturers use them in manyprocessed food products, including baked goods,french fries, snack foods, and peanut butter. Theyinclude margarine, shortening, salad oils and dress-ings, lard, edible tallow, and dairy fats (butter, sourcream, cream and neufchatel cheese, light cream,heavy cream, and half and half). These fats are con-sumed in addition to those that occur naturally infoods like meats, fish, nuts, eggs, and dairy foods.
Although some dietary fat is essential for good health,excessive fat intake is associated with increased bloodcholesterol, heart disease, and some cancers. The1995 Dietary Guidelines recommend that people limittotal fat consumption to no more than 30 percent ofdaily energy intake�about 73 grams for a 2,200-calo-rie diet (USDA/HHS, 1995). Mono- and polyunsatu-rated fats, such as those found in high quantities inmost vegetable oils, should account for at least two-thirds of this intake. Saturated fats�which are foundin larger amounts in animal fats such as butter, lard,
and fluid cream products�should account for nomore than one-third of total fat consumption.
The food supply data suggest that most consumers arenot meeting these recommendations. In 1996, fatgrams from added fats and oils alone accounted for 82percent of the recommended upper daily limit for totalfat intake�or about 33 percent of total calories for a2,200-calorie diet. Salad and cooking oils and short-ening accounted for more than two-thirds of totaladded fat and oil servings and for nearly all of theincrease in added fat and oil consumption since theearly-1980�s (fig. 12). Animal fats�butter and otherdairy fats, lard (direct use), and edible tallow�accounted for 16 percent of total servings. Lard andedible tallow, together with shortening, are used large-ly for deep-fat frying by fast-food restaurants andother foodservice establishments.
According to food supply nutrient data for 1994,added fats and oils accounted for 52 percent of thetotal fat provided by the food supply (Putnam andAllshouse, 1997). Assuming that added fats continueto account for about 52 percent of the total fat provid-ed daily by the food supply, the quantity of added fatsand oils available for human consumption would haveto decline by more than one-third to bring added fatconsumption to 38 grams (73 grams of total fat x 0.52= 38 grams of added fats) and total fat consumptionclose to the recommended upper limit of 30 percent ofcalories per day.
Economic Research Service/USDA A Dietary Assessment of the U.S. Food Supply / AER-772 23
Table 8�Food supply servings of added fats and oils,1996
Item Fat grams
Total nutrient fat fromadded fats and oils 60.2
Margarine 7.1Shortening 17.8Salad and cooking oils 25.6Lard 1.4Edible tallow 1.4Other 1.6
Dairy fats 5.3Butter 3.3Heavy cream .5Light cream .1Sour cream .5Half and half .3Cream and neufchatel cheese .6
Source: USDA, Economic Research Service.

The Pyramid Tip: Added Sugars
The food supply data for added sugars and othercaloric sweeteners measure the delivery of caloricsweeteners (refined cane and beet sugar, corn sweet-eners, and edible syrups) to U.S. food and beveragemanufacturers (table 9).
These sweeteners are subsequently used in processedproducts such as baked goods, breakfast cereals,candy, and soft drinks, and are distributed by foodwholesalers and retailers for individual and householduse. Except for table sugar, the data do not measurethe consumption of individual products, like cola orchocolate bars, identified as �sweets,� in The FoodGuide Pyramid bulletin.
The food supply provided an average of 32 teaspoonsof caloric sweeteners (dry-weight basis) daily in 1996,or the sweetener equivalent of about three and one-half 12-ounce regular soft drinks per person per day(table 10). Average consumption was more than twoand one-half times the 12 teaspoons of added sugarssuggested as an upper limit for a 2,200-calorie diet inThe Food Guide Pyramid bulletin. A sharp rise in theuse of High Fructose Corn Syrup and other sweeten-ers beginning in the mid-1980�s was largely offset bydeclining use of refined cane and beet sugar, resulting
in a 16-percent increase in caloric sweetener con-sumption from the 27 teaspoons provided by the foodsupply in 1982-86 (fig. 13).
Although the human body cannot distinguish betweennaturally occurring and added sugars, dietary guid-
24 A Dietary Assessment of the U.S. Food Supply / AER-772 Economic Research Service/USDA
1970 72 74 76 78 80 82 84 86 88 90 92 94 960
10
20
30
40
50
60
70
80
90 Other dairy fats
Lard/edible tallow
Salad and cooking
Shortening
Margarine
ButterImplied upper limit on addedfat and oil consumption 1/
Fat grams per person per day
Figure 12
Added fats and oils: Food suppy servings, 1970-96
1/Implied upper limit assumes 2,200-calorie diet and that added fats account for 52 percent of suggested upper limit on total fat intake of 73 grams or 30 percent of calories.Source: U.S. Department of Agriculture, Economic Research Service.
Table 9�U.S. sweetener deliveries for human consump-tion by type of user, 1995
Item Million pounds
Cane and beet sugar (refined value):*Bakery, cereal, and allied products 3,810Confectionary and related products 2,744Ice cream and dairy products 904Beverages 338Canned and bottled and frozen foods 558All other food uses 1,726
Corn sweeteners (dry-weight basis):**Cereal and bakery products 910Confectionary and related products 112Processed foods 1,640Dairy products 474Beverages 11,274All other food uses 1,054
*Includes refined, liquid, edible molasses, sugar and cane syrups.**HFCS-42, HFCS-55.Source: USDA, Economic Research Service, Sugar and SweetenerYearbook, 1996.

ance focuses on added sugars because foods high inadded sugars often supply additional calories but fewnutrients. For example, the 1995 Dietary Guidelinescaution consumers about eating sugars in largeamounts and about frequent snacks of food and bever-ages containing sugars that supply unnecessary calo-ries and few nutrients (USDA/HHS, 1995; USDA,CNPP, 1996). To the extent that consumers substitutethe calories from less nutrient dense sugary snacks,
sweetened soft drinks, and baked goods, for nutrient-rich foods like fruits, vegetables, and whole grains,dietary intake of fiber, and vitamins, minerals, andother nutrients found in these foods may be reduced.To maintain nutritious diets and healthy weights, the1995 Dietary Guidelines suggest that sugars be usedin moderation by most healthy people and sparinglyby people with low caloric needs (USDA/HHS, 1995).
Consumers� ability to moderately consume foods highin sugars and to limit amounts of added sugars to lev-els suggested by dietary guidance is complicatedbecause many added sugars are likely to be �hidden�in prepared foods. Although the new food label man-dated by the National Nutrition Labeling andEducation Act (U.S. Department of Health andHuman Services, Food and Drug Administration,1997) requires manufacturers to disclose the totalsugar content of food, the label does not distinguishtotal from added sugars, which may sometimes makeit difficult for consumers to determine how muchadded sugar they are actually consuming.
Economic Research Service/USDA A Dietary Assessment of the U.S. Food Supply / AER-772 25
Table 10�Food supply servings of added sugars, 1996
Item Teaspoons
Total caloric sweeteners 32
Cane and beet sugar 14High Fructose Corn Syrup 13Glucose 4Dextrose .8Edible syrups .1Honey .2
Source: USDA, Economic Research Service.
1970 72 74 76 78 80 82 84 86 88 90 92 94 960
5
10
15
20
25
30
35
40 Honey and edible syrups
Corn sweeteners
Cane and beet sugar
Teaspoons per person per day
Suggested upper daily consumption limit: 12 daily teaspoons*
Figure 13
Added sugars: Food suppy servings, 1970-96
*Recommended upper limit for a 2,200-calorie diet.Source: U.S. Department of Agriculture, Economic Research Service.

26 A Dietary Assessment of the U.S. Food Supply / AER-772 Economic Research Service/USDA
Discussion
As mentioned earlier in this report, the ERS food sup-ply data is only one component of the FederalGovernment�s efforts to monitor nutrition. USDA�sContinuing Survey of Food Intakes by Individuals(CSFII) is the Government�s main source of data onindividual food intakes. Comparing the similaritiesand differences between the food supply and CSFIIservings estimates may lead to improved understand-ing of both data series and therefore the populations�food and nutrient intake. Such information, may, forexample, improve the food supply data by (1) helpingto refine estimates of food loss and other factors usedto generate the food supply servings, (2) highlightingdata gaps for certain food sub-groups, including dark-green and deep yellow vegetables, and (3) identifyingfood groups for which underreporting of energy intakeby CSFII respondents may impact intake estimates.
Comparing CSFII Servings Estimates
Comparing servings estimates generated from the1996 CSFII with food supply data for the same yearyields conflicting results about the number of servingsconsumed from each food group (table 11). Thelargest differences were observed for the grains andmeat groups and added sugars while smaller differ-ences were observed for the vegetable, fruit, and dairygroups. However, the consumption of various sub-sets of foods�dark-green leafy vegetables, whitepotatoes, dry beans, peas, and lentils, and citrus, mel-ons, and berries�within most of these groups wassimilar. Within the meat group, red meat, poultry, andfish accounted for a similar share of total servings forboth data sets. Data for fats and oils were not compa-rable because of methodological differences.
A portion of the gap between the food supply andCSFII servings estimates is attributed to methodologi-cal differences such as the choice of serving weightsfor some foods�especially grain products�and theextent to which ingredient use of foods�especiallydairy products�was measured. For the meat, poul-try, fish, dry beans, eggs, and nuts group, for example,most of the difference between the two servings esti-mates can likely be explained by the way in whichmeat servings were estimated. The food supply serv-ings estimates for meat, poultry, and fish include boththe lean and fat portions (poultry skin, trimmable fat).The CSFII servings estimates, however, include the
lean meat only, with the fat portion counted as discre-tionary fat (USDA, ARS, March 1997).
Some of the differences in dairy servings between thetwo data sets may be explained because the CSFIIservings data omitted small quantities of dairy prod-ucts used as ingredients in other products, and classi-fied some dairy products in other food groups. In theCSFII servings data, for example, milk ingredients(including nonfat dry milk solids) used in home orcommercially prepared grain products were counted inthe grains group, while dairy products used inprocessed meats and meat analogs were not measureddue to data limitations.
Differences between the two servings estimates foradded sugars are more difficult to explain. The CSFII servings data for added sugars omit sweet-eners used in cream substitutes, soy-based imitationmilk, processed meats such as cured ham and lunch-eon meats, meat analogs, and processed cheesesbecause recipes for these foods were not availablewhen the CSFII data files were developed (USDA,ARS, March 1997). However, since total consump-tion of these foods is small, this methodological dif-ference is not sufficient to explain the large gapbetween the added sugar servings reported in the twodata sets.
Caloric Intake
Differences in daily energy intake reported by the twodata sets may also explain some of the gap betweenthe food supply and CSFII servings estimates forsome foods. For example, the mean intake of 1,969calories reported for individuals aged 2 and older inthe CSFII servings data is two-thirds of the 2,666daily calories imputed from the food supply data afteradjusting the data for waste, cooking, and the discardof nonedible portions (see Appendix 2 for caloriesimplied by the adjusted food supply data). Given thedifferences in caloric intake reported in the two dataseries, one would expect that average food supplyservings, at least for some food groups, would behigher than those reported for the lower levels ofaverage caloric intake reported in the CSFII servingsdata. The number of Food Guide Pyramid servingsthat are right for any one person varies depending onage, sex, and physiological status.
Although the food supply servings estimates imply atotal caloric intake substantially higher than the 2,247

Economic Research Service/USDA A Dietary Assessment of the U.S. Food Supply / AER-772 27
Table 11--Food supply servings compared with intake data from the Continuing Survey of Food Intakes by Individuals(CSFII), 19961
Food group Food supply CSFII
Servings
Bread, cereals, rice, and pasta group 9.7 6.8Whole-grain products -- 1.0Nonwhole grain products -- 5.8
Vegetable group 3.8 3.4Dark green leafy 0.1 .2Deep yellow .2 .2Dry beans, peas, and lentils .2 .2Starchy vegetables 1.4 1.3
White potatoes 1.0 1.1Other starchy .4 .2
Tomatoes .4 .5Other vegetables 1.5 1.0
Fruit group 1.3 1.5Citrus fruits, melons, berries .6 .7Other fruits .7 .8
Milk, yogurt, cheese 1.7 1.5Milk .9 1.0Yogurt * *Cheese .6 .5
OuncesMeat, poultry, fish, dry beans, eggs
and nuts group 5.6 4.5Meat 2.9 1.9Poultry 1.6 1.0Fish .4 .4Organ meat -- --Frankfurters and luncheon meat -- .7Eggs .5 .3Soybean products -- *Nuts and seeds .2 .1
Fat grams
Fats and oils�Total fat -- --Discretionary fat -- 55.7Added fats and oils 60.2 --
Teaspoons
Added sugars 32.0 20.1
-- = not available.* = less than 0.1 servings.1Differences in methodology may affect comparability of the servings estimates.
Sources: USDA, Economic Research Service; USDA, ARS, 1998.

calories estimated as the Recommended EnergyAllowance for the population, the data suggest thatmost consumers could meet the Food Guide Pyramidserving recommendations for a 2,200-calorie dietwhile maintaining energy intake close to suggestedlevels. Reducing average added fat and sugar con-sumption to target levels, for example, would reducetotal energy intake to about 2,150. While a portion ofthis reduction would be offset by increased servingsfrom other food groups, were these increased servingsto come mostly from lowfat choices within eachgroup, as suggested by The Food Guide Pyramid bul-letin, the data suggest that the calorie goal could beachieved.
The higher total caloric intake implied by the foodsupply servings estimates, however, does not explainwhy differences in servings estimates between the twodata sets are larger for some food groups than for oth-ers. One possible explanation may be that underre-porting by food-intake survey respondents is greaterfor some foods or food groups�added sugars forexample�than for other food groups for which foodsupply and CSFII servings estimates are similar. Forexample, if the excess added sugar servings estimatedfrom the food supply data represent consumption ofless nutrient-dense foods such as candy bars or softdrinks, this could support previously reported researchthat suggests that food-intake survey respondents areless likely to report intake of such foods accuratelycompared with foods like fruits and vegetables per-ceived as more �healthy� or nutrient-dense.
Other Methodological Issues Related to the FoodSupply Estimates
In calculating food supply servings for certain foodgroups, like grains and added sugars, in which manyof the commodities are consumed indirectly as ingre-dients in processed food products, there was a concernthat the servings estimates may be overstated due tothe use of some of these commodities in food prod-ucts that are exported. Examples of such foods mayinclude flour, fats, and sweeteners used in cookies,crackers, and other baked goods and added sweetenersused in candy, confectionary products, and regularsoft drinks.
Export Use
Many exported foods are excluded from the food sup-ply consumption series and are not counted in the
servings estimates reported here (Putnam andAllshouse, 1997). These foods include red meat,poultry, and fish; milk, cheese, and most other dairyproducts; fresh and processed fruits and vegetables(including potatoes for french fries and potato chipsand tomato products); and durum flour used in maca-roni and other pasta products.
Consumption of many other foods, however, is esti-mated at the primary or semi-processed level (flourmills, sugar beet processors, oilseed crushers) beforethe commodities are released into the marketing sys-tem for additional processing. Since ingredient use ofthese foods at additional manufacturing stages is notmeasured, it is not possible to determine what share ofthese products eventually end up in the export marketand should thus be excluded from the food supplyservings estimates measuring domestic consumption.
Although a precise measure of export ingredient usewas not available, trade data were examined in anattempt to determine the impact that these exports mayhave on the food supply servings estimates. Tradedata were examined for food categories most likely toaccount for exported ingredients�all grain products,jams and jellies, confectionary products (includingchocolate and chewing gum), carbonated soft drinks,sweetened waters, other nonalcoholic beveragesincluding fruit drinks, and ready-to-eat puddings(USDA, ERS, unpublished, 1997). These data wereexamined for approximate sugar and grain content.
Carbonated soft drinks and other nonalcoholic bever-ages excluding fruit juice were assumed to contain 1teaspoon of sweetener per fluid ounce based on addedsugar contents for fruit ades and colas listed in TheFood Guide Pyramid bulletin. To estimate an extremelevel of sweetener use, grain products were assumedto contain 50-percent sweetener. Using this method,the total impact on food supply servings estimates wasjudged to be small. For example, the total sweetenercontent of the food exports reported in the trade cate-gories listed above was estimated to be less than 2teaspoons per person per day. Grain use in exportedfoods was estimated at less than half of a grain serv-ing by ERS commodity experts. However, these esti-mates lack precision and additional research is neededto completely understand the effect of unmeasuredfood exports on food supply consumption and serv-ings estimates. In addition, fat ingredient use inexported foods was not measured.
28 A Dietary Assessment of the U.S. Food Supply / AER-772 Economic Research Service/USDA

Food Loss
The food supply servings estimates reported in thisstudy are in part determined by the assumptions usedto estimate the amount of available food supplies lostto human consumption because of waste, cooking, andother discard. However, such losses, particularly fooddiscard at the consumer level, are by nature difficultto measure. Previous studies of food loss have report-ed consumer waste rates ranging from 7 to 35 percent(Gallo, 1980). Differences in the way that waste isdefined, differences in study methodology, and differ-ences in characteristics of sample households partiallyexplain the wide range of these estimates.
A recent ERS study reported that 27 percent of avail-able food supplies are lost at the retail, consumer, andfoodservice levels (Kantor and others, 1997).However, most existing studies of food waste datefrom the 1970�s or before, and the more recent ERSestimates rely largely on coefficients generated fromthese older studies. The U.S. marketing system hasdramatically changed since these coefficients wereoriginally estimated, suggesting that actual wasterates, and hence the servings estimates on which theydepend, may differ from those reported here.
These same data limitations also meant that the lossestimates were held constant across the entire timeseries of data. However, loss rates may have changeddramatically over time for some food groups. Forexample, there is evidence that the waste portion ofadded fats and oils has increased during the past twodecades with the growth in consumption of foodaway-from-home. Foodservice establishments thatdeep-fry foods can generate significant amounts ofwaste grease known as �restaurant grease.� Many ofthese used frying fats are disposed of by restaurantsand processed by renderers for use in animal feeds,pet foods, and industrial operations. While ERS isworking with industry groups, including the prepared-foods and fast-food industries, to improve the addedfats and oils data, the old coefficients used to measurelosses of added fats and oils in this paper may notaccurately reflect current consumption and marketingpatterns.
Due to the uncertainties associated with these wasteestimates, a sensitivity analysis was conducted to
evaluate the impact of the selected waste factors onthe food supply servings estimates. For the threegroups where the food supply servings estimates dif-fered the most from the CSFII servings data�bread,cereals, rice, and pasta; meat, poultry, fish, dry beans,eggs, and nuts; and added sugars�it was also deter-mined how much the loss factors would have tochange in order to reconcile the differences betweenthe two servings estimates.
To close the gap between the food supply and CSFIIservings estimates for these food groups, an additional2.9 servings of grain products, 12 teaspoons of caloricsweeteners, and about three-quarters of an ounce ofmeat or meat equivalents per person would have to belost from the food supply each day. This is the flourequivalent of about three slices of bread, the caloricsweetener in one 16-ounce regular soft drink, or aboutone egg or one slice of luncheon meat per persondaily. Total grain group losses would have to grow to50-percent of edible food supplies. A total of 20 per-cent of the edible meat and meat alternates (bonelessweight equivalent) provided by the food supply wouldhave to be thrown away or otherwise lost to humanuse for food supply servings to approach the CSFIIservings estimates, however, some of this �loss� islikely to be fat trim not counted in the CSFII esti-mates. Total caloric sweetener losses would need toincrease to nearly 55 percent of available food sup-plies for food supply servings to decline to the 20 tea-spoons reported in the 1996 CSFII.
To further test the validity of the waste and other lossfactors used in this study, food supply servings werecalculated without adjusting the data for retail, house-hold, or institutional losses. Adding these losses backto the food supply consumption series moves the serv-ings estimates for several food groups�meats, veg-etables, and dairy products�from below to aboveFood Guide Pyramid serving recommendations for a2,200-calorie diet (fig. 14). However, average fruitservings remain well-below minimum recommendedintake at 1.8 servings. Total energy intake implied bythe servings estimates increases by nearly 40 percentto about 3,700 calories.
Economic Research Service/USDA A Dietary Assessment of the U.S. Food Supply / AER-772 29

30 A Dietary Assessment of the U.S. Food Supply / AER-772 Economic Research Service/USDA
Grains group
Vegetable group
Fruit group
Dairy group
Meat group (ounces)
Added sugar (tsp.)
Added fats (grams)
0 10 20 30 40 50 60 70 80 90 100
With adjustment
Without adjustment
Figure 14
Food supply servings measured with and without loss adjustment*
*Losses include retail, household, and institutional losses of edible food portions.Source: U.S. Department of Agriculture, Economic Research Service.
Servings per person daily

Conclusions
Despite the numerous data limitations discussedthroughout this study, the food supply servings esti-mates reported here represent the first attempt tomeasure changes in food consumption over a continu-ous time period using the Food Guide Pyramid as adietary assessment tool. These results build on recentsimilar research which estimated Food Guide Pyramidservings from food-intake data collected from individ-uals over 2 nonconsecutive days during 1994-96.Both studies consistently conclude that most con-sumers have a long way to go in bringing their dietscloser to Food Guide Pyramid serving recommenda-tions. However, substantial differences between theservings estimates for the two data sets for some foodgroups suggest the need for additional research todetermine the reasons behind these differences.
Information on how much average diets differ fromFederal dietary recommendations is key to Federalefforts to monitor the dietary and nutritional status ofthe population under the Ten-Year ComprehensivePlan for National Nutrition Monitoring and RelatedResearch Program mandated by the National Nutritionand Related Research Act of 1990. Also, because theservings estimates reported in this study are generatedfrom commodity-based food supply data, food serv-ings can be readily converted back to farm-level data,easing the translation of dietary recommendations intoproduction and supply goals for farmers and the foodindustry. Finally, the time-series estimates reportedhere can be used as a baseline to project future trendsin food demand and for comparing those trendsagainst Federal dietary recommendations.
Economic Research Service/USDA A Dietary Assessment of the U.S. Food Supply / AER-772 31

32 A Dietary Assessment of the U.S. Food Supply / AER-772 Economic Research Service/USDA
References
Allshouse, Jane E., Judy Putnam, and Scott Sanford.�Trends in Fats and Oils Consumption,� FoodReview.U.S. Department of Agriculture, Economic ResearchService, forthcoming.
Bingham, Sheila A. �The Use of 24-h Urine Samplesand Energy Expenditure to Validate DietaryAssessments,� American Journal of ClinicalNutrition. 59 (suppl): 227S-31S. 1994.
Black, Alison E., Andrew Prentice, Gail Goldberg,Susan Jebb, Sheila Bingham, M. Barbara Livingstone,and W. Andrew Coward. �Measurements of TotalEnergy Expenditure Provide Insights Into the Validityof Dietary Measurements of Energy Intake,� Journalof the American Dietetic Association. Vol. 93, No. 5.pp. 572-579. May 1993.
Bowman, S.A., M. Lino, S.A. Gerrior, P.P. Basiotis.The Healthy Eating Index: 1994-96. U.S. Departmentof Agriculture, Center for Nutrition Policy andPromotion, July 1998.
Cleveland, L.E., S.M. Krebs-Smith, D.A. Cook, J.Friday, and L. Kahle. Assessing Food Intake in Termsof Food Guidance Based Servings. Presented at theSecond International Conference on DietaryAssessment Methods, Boston, MA, January 24, 1995.
Cleveland, L.E., S.M. Krebs-Smith, D.A. Cook, J.Friday, L. Kahle. �Method for Assessing Food Intakesin Terms of Food Guidance,� American Journal ofClinical Nutrition. 1997; 65 (supplement): April 1997.
Cronin, Frances J., Anne M. Shaw, Susan M. Krebs-Smith, Patricia M. Marsland, and Luise Light.�Developing a Food Guidance System to Implementthe Dietary Guidelines,� Journal of NutritionEducation. 19(6), 1987.
Duewer, Lawrence A., Kenneth R. Krause, andKenneth E. Nelson. U.S. Poultry and Red MeatConsumption, Prices, Spreads, and Margins. AIB-684. U.S. Department of Agriculture, EconomicResearch Service. October 1993.
Frazao, Elizabeth. The American Diet: Health andEconomic Consequences. AIB-711. U.S. Departmentof Agriculture, Economic Research Service.February 1995.
Frazao, Elizabeth. �The Health and EconomicConsequences of the American Diet,� in America�sEating Habits: Changes and Consequences, ElizabethFrazao, ed., U.S. Department of Agriculture,Economic Research Service, forthcoming.
Frazao, Elizabeth, and Jane E. Allshouse. Size andGrowth of the Nutritionally Improved Foods Market.AIB-723. U.S. Department of Agriculture, EconomicResearch Service. April 1996.
Gallo, Anthony E. �Consumer Food Waste in theUnited States,� National Food Review. Fall 1980.
Hunter, J. Edward, and Thomas H. Applewhite.�Correction of Dietary Fat Availability Estimates forWastage of Food Service Deep-Frying Fats,� Journalof the American Oil Chemists� Society, 70 (6): June1993.
Kantor, Linda Scott. �Comparison with the FoodGuide Pyramid,� in America�s Eating Habits:Changes and Consequences, Elizabeth Frazao, ed.,U.S. Department of Agriculture, Economic ResearchService, forthcoming.
Kantor, Linda Scott, Kathryn Lipton, AldenManchester, and Victor Oliveira. �Estimating andAddressing America�s Food Losses,� FoodReview,Vol. 20, Issue 1, Jan-April, 1997, pp. 2-12.
Krebs-Smith, S.M., D.A. Cook, A.F. Subar, L.Cleveland, and J. Friday. �US Adults� Fruit andVegetable Intakes, 1989 to 1991: A Revised Baselinefor the Healthy People 2000 Objective,� AmericanJournal of Public Health. Vol. 85, No. 12. pp. 1623-29. December 1995.
Krebs-Smith, S.M., D.A. Cook, A.F. Subar, L.Cleveland, J. Friday, L.L. Kahle. �Fruit and VegetableIntakes of Children and Adolescents in the UnitedStates,� Archives of Pediatric Adolescent Medicine.1996; 150: 81-86.
Krebs-Smith, S.M., L.E. Cleveland, R. Ballard-Barbash, D.A. Cook, and L.L. Kahle. �CharacterizingFood Intake Patterns of American Adults,� AmericanJournal of Clinical Nutrition. 65(suppl): 1264S-8S,1997.
Life Sciences Research Office, Federation ofAmerican Societies for Experimental Biology. ThirdReport on Nutrition Monitoring in the United States.Interagency Board for Nutrition Monitoring andRelated Research, December 1995.
Mertz, W., J.C. Tsui, J.T. Judd, S. Reiser, J. Hallfrisch,E.R. Morris, P.D. Steele, and E. Lashley. �What arepeople really eating? The relation between energyintake derived from estimated diet records and intakedetermined to maintain body weight,� AmericanJournal of Clinical Nutrition. 1991; 54:291-5.
Munoz, Kathryn A., Susan M. Krebs-Smith, RachelBallard-Barbash, and Linda E. Cleveland. �FoodIntakes of US Children and Adolescents Comparedwith Recommendations,� Pediatrics. 100 (3),September 1997, pp. 323-329.
National Research Council, Recommended DietaryAllowances, 10th ed., National Academy Press,Washington, DC, 1989.
O�Brien, Patrick. �Dietary Shifts and Implications forU.S. Agriculture,� American Journal of ClinicalNutrition. Vol. 61 (suppl.), pp. 1390S-6S, 1995.
Putnam, Judith Jones, and Jane E. Allshouse, FoodConsumption, Prices, and Expenditures, 1970-95, SB-939. U.S. Department of Agriculture, EconomicResearch Service. August 1997.
Putnam, Judith Jones, and Lawrence A. Duewer. �U.S.Per Capita Food Consumption: Record-High Meatand Sugars in 1994,� FoodReview. Vol. 18 (2), May-August 1995.
Schoeller, Dale A. �How Accurate is Self-ReportedDietary Energy Intake,� Nutrition Reviews. Vol. 48No. 10. pp. 373-79. October 1990.
United Fresh Fruit and Vegetable Association. Fruitand Vegetable Consumption: Consumer Attitudes vs.Behavior, 1995.
United States Department of Agriculture, AgricultureResearch Service (ARS). Food Yields Summarized byDifferent Stages of Preparation. AgricultureHandbook No. 102. Revised September 1975.
United States Department of Agriculture, AgricultureResearch Service. 1994 Continuing Survey of FoodIntakes by Individuals and the 1994 Diet and HealthKnowledge Survey. National Technical InformationService, Springfield, VA. CD-ROM. Accession No.PB97-502058. 1996.
United States Department of Agriculture, AgricultureResearch Service. 1994 Continuing Survey of FoodIntakes by Individuals and Pyramid Servings.National Technical Information Service, Springfield,VA. CD-ROM. Accession No. PB96-501010. March1997.
United States Department of Agriculture, AgricultureResearch Service. Nutrient Database for StandardReference Release 11-1. <http://www.nal.usda.gov/-fnic/foodcomp/>, October 1997.
United States Department of Agriculture, AgricultureResearch Service. Pyramid Servings Data: Resultsfrom 1995 and 1996 Continuing Survey of FoodIntakes by Individuals and Pyramid Servings.[Online]. ARS Food Surveys Research Group.Available (under �Releases�): <http://www.barc.usda.-gov/bhnrc/foodsurvey/home.htm>[1998, October 30].
United States Department of Agriculture, Center forNutrition Policy and Promotion (CNPP). The HealthyEating Index. CNPP-1, October 1995.
United States Department of Agriculture, Center forNutrition Policy and Promotion. The Food GuidePyramid. Home and Garden Bulletin Number 252.October 1996.
United States Department of Agriculture, Center forNutrition Policy and Promotion. Nutrient Content ofthe U.S. Food Supply, 1909-1994. Home EconomicsResearch Report No. 53, October 1997.
United States Department of Agriculture, EconomicResearch Service. �Foreign Agricultural Trade of theUnited States,� unpublished data, 1997.
United States Department of Agriculture, EconomicResearch Service. �U.S. Dry Edible Bean BriefingRoom.� <http://www.econ.ag.gov/Briefing/drybean/>June 13, 1997.
Economic Research Service/USDA A Dietary Assessment of the U.S. Food Supply / AER-772 33

United States Department of Agriculture and U.S.Department of Health and Human Services (HHS).Nutrition and Your Health: Dietary Guidelines forAmericans, Fourth edition, Home and GardenBulletin, No. 232. 1995.
United States Department of Commerce, Economicsand Statistics Administration, Bureau of the Census.1992 Census of Manufacturers, Industry Series: GrainMill Products, MC921-1-20D, June 1995.
United States Department of Health and HumanServices, Food and Drug Administration. The NewFood Label. <http://vm.cfsan.fda.gov/~lrd/newla-bel.html>. 1997.
Young, C. Edwin, and Linda Scott Kantor. �WhatHealthy Diets Could Mean for Agriculture,� U.S.Department of Agriculture, Economic ResearchService, forthcoming.
34 A Dietary Assessment of the U.S. Food Supply / AER-772 Economic Research Service/USDA

Economic Research Service/USDA A Dietary Assessment of the U.S. Food Supply / AER-772 35
Appendix 1: Foods Measured in FoodSupply Servings Estimates and CSFII
Servings Data
Grains
Food supply servings:
White and whole wheat flour; durum flour; rye flour;rice; corn flour and meal; corn hominy and grits; cornstarch; oat products (rolled oats, ready-to-eat cereals,oat flour, and oat bran); and barley products (barleyflour, pearl barley, and malt and malt extract used infood processing).
CSFII servings:
Yeast breads and rolls; quick breads such as muffins,biscuits, pancakes, and tortillas; rice; pasta; breakfastcereals; grain-based snacks; such as crackers, pretzels,popcorn, and corn chips; and baked goods made fromflour, such as cakes, cookies, croissants, doughnuts,pastries, and pie crust.
Vegetables
Food supply servings:
Fresh: Artichokes, asparagus, bell peppers, broccoli,Brussels sprouts, cabbage, carrots, cauliflower, celery,sweet corn, cucumbers, eggplant, escarole/endive, gar-lic, head lettuce, romaine and leaf lettuce, mushrooms,onions, potatoes, radishes, snap beans, spinach, sweetpotatoes, and tomatoes.
For freezing: Asparagus, snap beans, broccoli, car-rots, cauliflower, sweet corn, green peas, potatoes,other (lima beans, spinach, collards, kale, mustardgreens, okra, blackeyed peas, pumpkin, and rhubarb,summer squash, turnip greens, turnips, and other mis-cellaneous vegetables).
For canning: Asparagus, snap beans, cabbage (forsauerkraut), carrots, chile peppers, sweet corn, cucum-bers, green peas, mushrooms, potatoes, tomatoes, andother (lima beans, beets, and spinach).
Legumes, and vegetables for dehydrating andchips: Dry edible beans (large and baby lima, navy,Great Northern, small white, pinto, light and dark redkidney, pink, small red, cranberry, black beans, black-
eyed peas, garbanzo, other), dry field peas and lentils(whole green peas, split green peas, whole yellowpeas, split yellow peas, Austrian winter peas, regularlentils, other lentils); and dehydrating (onions, pota-toes), for chips and shoestrings (potatoes).
CSFII servings:
Dark-green leafy vegetables: Arugula, beet greens,broccoli, chard, chicory, collard greens, dandeliongreens, endive, escarole, grape leaves, kale, lambs-quarters, mustard greens, parsley, poke greens,romaine lettuce, spinach, taro leaves, turnip greens,and watercress.
Deep-yellow vegetables: Carrots, carrot juice, pump-kin, sweetpotato, and winter squash.
Starchy vegetables: Blackeyed peas (not dried),breadfruit, cassava, sweet corn, cowpeas (not dried),green peas, hominy, lima beans (immature), parsnips,white potato, rutabaga, and taro.
Dry beans and peas: Bayo beans, black beans, black-eyed peas, broadbeans, calico beans, chickpeas (gar-banzos), cowpeas, kidney beans, lentils, lima beans(mature), mung beans, navy beans, pinto beans, pinkbeans, red Mexican beans, split peas, soybeans(mature), and white beans.
Other vegetables: Artichoke, asparagus, balsam-pearpods, bamboo shoots, bean and alfalfa sprouts, broc-coflower, beets, Brussels sprouts, cabbage (green andred), cactus, capers, cauliflower, celery, chayote,Chinese cabbage, chives, christophene, coriander,cucumber, eggplant, garlic, ginger root, green beans,horseradish, leek, lettuce, mushrooms, okra, olives,onions (mature and green), peppers (green, red, hot,banana), pimiento, radicchio, radishes, sauerkraut,seaweed, snow peas, summer squash, tomatillos,tomatoes, tomato juice, turnips, water chestnuts, waxbeans, and zucchini.
Fruit
Food supply servings:
Fresh: Apples, apricots, avocados, bananas, can-taloupe, cherries, cranberries, grapes, grapefruit, hon-eydew, kiwifruit, lemons, limes, mangoes, nectarines,oranges and temples, peaches, pears, pineapples,

papayas, plums, prunes, strawberries, tangerines, andwatermelon.
Frozen: Apples, apricots, blackberries, blueberries,cherries, peaches, raspberries, strawberries, and otherberries (boysenberries, loganberries).
Canned: Apples and applesauce, apricots, cherries(tart and sweet), olives, peaches, pears, pineapples,and plums and prunes.
Dried: Apples, apricots, dates, figs, peaches, pears,prunes, and raisins.
Fruit juices: Orange, grapefruit, lemon, lime, apple,grape, pineapple, and prune.
CSFII servings:
Citrus fruits, melons, and berries: Acerola, black-berries, blueberries, boysenberries, calamondin, can-taloupe, cassaba, melon, cranberries, elderberries,gooseberries, grapefruit, honeydew melon, juneber-ries, kiwifruit, kumquat, lemon, lime, loganberries,mulberries, orange, raspberries, strawberries, tangelo,tangerine, ugli fruit, watermelon, and juices madefrom these fruits.
Other fruits: Apple, apricot, asian pear, avocado,banana, cherries, currants, dates, figs, genip, guava,quince, grapes, jackfruit, japanese pear, jobo, lychee,mamey, mango, nectarine, papaya, passion fruit,peach, pear, persimmon, plantain, pineapple, plum,pomegranate, prickly pear, prunes, raisins, rhubarb,sapodilla, soursop, star fruit sweetsop, tamarind, wi-apple, and juices made from these fruits.
Milk, Yogurt, and Cheese
Food supply servings:
Fluid milk products: Whole, plain; 2% reduced fat,plain; light (0.5 - 1%), plain; fat free (skim), plain;whole, flavored; lower fat, flavored; buttermilk, andyogurt.
Cheese: Cheddar, Colby, washed curd, stirred curd,Monterey Jack, Provolone, Mozzarella, Ricotta, OtherItalian; Swiss (includes Gruyere and Emmenthaler);Brick, Muenster, Blue, Other Misc; and processedcheese, foods and spreads.
Other dairy products: Cottage cheese, regular; cot-tage cheese, lowfat; ice cream, ice milk; sherbet; otherfrozen dairy products (mellorine, frozen yogurt andother nonstandardized dairy products); canned wholemilk; bulk whole milk; bulk and canned skim milk;dry whole milk; and dry buttermilk.
CSFII servings:
Includes most dairy foods except those that are prima-rily fat�butter, cream, sour cream, and cream cheese.
Meat, Poultry, Fish, Dry Beans, Eggs, and Nuts
Food supply servings:
Meat, poultry, and fish: Beef; veal; pork; lamb;chicken; turkey; fish, fresh and frozen; fresh andfrozen shellfish; salmon, canned; sardines, pitchardsand herrings, canned; tuna, canned; shellfish, canned;other fish, canned; and cured fish.
Eggs and nuts: Eggs (fresh and shell-egg equivalentof processed eggs); peanuts, snack; peanuts cleaned inshell; peanut butter; almonds; filberts; pecans; wal-nuts; macadamias; pistachios; other tree nuts (Brazilnuts, pignolias, chestnuts, cashews, and miscella-neous); and coconuts, desssicated.
CSFII servings:
Meat, poultry, fish/shellfish, organ meat, frankfurters,luncheon meats, eggs, tofu, and simulated meat prod-ucts made from soy, nuts, seeds.
Fats and Oils
Food supply servings:
Dairy and animal fats: Butter, lard (direct use and inbaking and frying fats), edible beef tallow (direct useand in baking and frying fats), half and half, lightcream, heavy cream, sour cream, cream cheese, andbaking and frying fats (lard and edible tallow, indirectuse).
Vegetable fats: Margarine, baking and frying fats(soybean oil, cottonseed oil, palm oil), salad andcooking oils (soybean oil, cottonseed oil, canola oil,corn oil, peanut oil, olive oil), other edible fats andoils (includes specialty fats used mainly in confec-tionary products and nondairy creamers).
36 A Dietary Assessment of the U.S. Food Supply / AER-772 Economic Research Service/USDA

CSFII servings:
All �excess� fat from the five major Pyramid foodgroups beyond amounts that would be consumed ifonly the lowest fat forms were eaten and fats added tofoods in preparation or at the table, including cream,butter, margarine, regular or lowfat cream cheese, oil,lard, meat drippings, cocoa, and chocolate.
Added Sugars
Food supply servings:
Cane and beet sugars, high fructose corn syrup, glu-cose, dextrose, honey, and edible syrups (sorgo, maple
and sugarcane syrup, edible molasses, and ediblerefiner�s syrup).
CSFII servings:
Brown sugar, raw sugar, corn syrup, corn syrup solids,high fructose corn syrup, malt syrup, maple syrup,pancake syrup, fructose sweetener, liquid fructose,honey, molasses, anhydrous dextrose, crystal dextrose,saccahrin, and aspartame.
Economic Research Service/USDA A Dietary Assessment of the U.S. Food Supply / AER-772 37

38 A Dietary Assessment of the U.S. Food Supply / AER-772 Economic Research Service/USDA
Appendix 2: Estimation of ServingWeights for Individual Commodities
A single serving weight, consistent with sample serv-ings identified in The Food Guide Pyramid bulletinFood Choices Chart and other USDA dietary guidancematerials (USDA, CNPP, 1996; USDA, March 1997)was defined for each food supply commodity, usingserving weights identified in the USDA Nutrient DataBase (NDB) (USDA, ARS, October 1997). For eachcommodity, the selected food portion was that whichmost closely resembled the serving size defined forthat commodity or commodity type (for example,fresh fruit, cooked vegetables, fluid milk) in the FoodGuide Pyramid.
For most commodities, serving weights were dictatedby data availability and the marketing level at whichconsumption was reported in the food supply series.For some commodity groups�milk, yogurt, andcheese; fruits; vegetables; and added sugars�servingweights closely matched those defined in The FoodGuide Pyramid bulletin. On the other hand, becausesome Food Guide Pyramid serving recommenda-tions�particularly those in the grains and meatgroups�are product-based, rather than ingredient-based, this meant that serving weights for some foodswere not consistent with standard serving sizesdefined by dietary guidance.
Grains
The food supply data for foods in the bread, cereals,rice, and pasta group are a mixture of semi-processedingredients and final food products, making it difficultto identify serving weights consistent with FoodGuide Pyramid definitions. The Food Guide Pyramidbulletin defines a serving from this food group interms of final products�one slice of bread, 1 ounceof breakfast cereal, two 4-inch pancakes, or two medi-um cookies. However, food supply consumption esti-mates are reported mostly for semi-processed com-modities�white and wheat flour, durum flour (usedfor pasta and couscous), rice (milled basis), oat prod-ucts (rolled oats, ready-to-eat oat cereals, oat flour,and oat bran), corn products (corn flour and meal,hominy and grits, corn starch), barley (barley flour,pearl barley, barley malt and malt extract used in foodprocessing), and rye flour. Changes in weight due tocooking and processing are particularly difficult toidentify.
Since it is not possible to determine the end uses ofthese semi-processed commodities, serving weightswere determined using a �grain-equivalent� approach;that is, a serving was defined as the average weight ofthe grain-ingredient used to make an end product(appendix table 1). For example, the serving weightfor white and wheat flour (excluding durum flour usedfor pasta) was 16 grams, or the average quantity offlour in a regular slice of commercial white bread.Servings of flour used in all other flour-based prod-ucts (cakes, cookies, hamburger rolls, doughnuts)were thus indirectly measured as a fraction of a breadserving. Servings of all other ingredients used tomake bread or other bakery products�including eggs,milk, fats and oils, and sweeteners�were measured intheir respective food groups (meat, dairy, fats and oils,and added sugars).
For ready-to-cook products like rice, barley, and oat-meal, a food supply serving was defined as the dryamount that would yield 1/2 cup of the productcooked; about 32 grams for rice, 20 grams for oat-meal, and 25 grams for pearl barley. For semolinaand durum flour (used in pasta and couscous), a serv-ing was defined as the amount of dry pasta that wouldyield a half cup of macaroni cooked, about 29 grams.For corn products, serving weights were assigned foreach of the three product types identified in the foodsupply data. For corn flour and meal and cornstarch,a serving was the amount of product that had the sameamount of carbohydrate as a serving of wheat flour,16 grams for corn flour and meal and about 20 gramsfor cornstarch. The serving weight for corn hominyand grits was the dry weight of 1/2 cup of cookedgrits.
Vegetables
Vegetable group serving weights were based on sam-ple serving sizes defined in The Food Guide Pyramidbulletin Food Choices Chart, 1/2 cup cooked vegeta-bles, 1 cup raw leafy vegetables, 1/2 cup raw,chopped, nonleafy vegetables (USDA, CNPP, 1996).These serving sizes were then used as the basis forselecting appropriate serving weights for differentuses of vegetables reported in the food supply data�fresh, canning, freezing, chips and shoestrings, anddehydrating (appendix table 2).
For most fresh vegetables, serving weights weredefined as the weight of 1/2 cup of the product, raw,except for dark-green leafy vegetables for which a

Economic Research Service/USDA A Dietary Assessment of the U.S. Food Supply / AER-772 39
App
endi
x ta
ble
1�Se
rvin
g w
eigh
ts f
orth
e gr
ains
gro
up
Nut
rien
tL
oss
from
Food
serv
ice
data
base
Serv
ing
prim
ary
toN
oned
ible
Coo
king
Ret
ail
and
Cal
orie
sFo
od s
uppl
y co
mm
odity
num
ber1
Serv
ing
desc
ript
ion
wei
ght
cons
umer
wei
ght2
shar
e (r
efus
e)lo
ss
loss
cons
umer
loss
pe
r se
rvin
g
Gra
ms
- -
- -
- -
- -
- -
- -
- -
- -
- -
- -
- -
-Per
cent
- -
- -
- -
- -
- -
- -
- -
- -
-C
alor
ies
Whi
te a
nd w
hole
whe
at f
lour
2008
1Fl
our
in o
ne r
egul
ar s
lice
16--
----
220
58of
com
mer
cial
ly p
repa
red
whi
te b
read
Dur
um f
lour
2009
9D
ry w
eigh
t of
1/2-
cup
mac
aron
i, co
oked
29--
----
220
106
Rye
flo
ur20
064
Med
ium
rye
flo
ur in
one
slic
e of
rye
bre
ad16
----
--2
2057
Ric
e (m
illed
bas
is)
2004
4,
Dry
wei
ght o
f 1/
2-cu
p w
hite
long
gra
in,
2005
0,m
ediu
m g
rain
, or
shor
t gra
in, c
ooke
d32
----
--2
2011
720
052
Cor
n pr
oduc
ts:
Cor
n fl
our
and
mea
l320
022,
Cor
n fl
our
or m
eal,
enri
ched
or
16--
----
220
5820
016,
unen
rich
ed20
017,
2001
8,20
020
Cor
n ho
min
y an
d gr
its4
0815
9D
ry w
eigh
t of
1/2-
cup
corn
gri
ts, c
ooke
d20
----
--2
2074
Cor
nsta
rch5
2002
713
----
--2
2050
Oat
pro
duct
s08
120
Dry
wei
ght o
f 1/
2-cu
p co
oked
, reg
ular
,20
----
--2
2077
quic
k or
inst
ant
Bar
ley
prod
ucts
2000
5D
ry w
eigh
t of
1/2-
cup
cook
ed b
arle
y25
----
--2
2088
-- =
not
est
imat
ed.
1 USD
A, A
RS,
Oct
ober
199
7.2 G
rain
gro
up f
ood
supp
ly d
ata
are
all o
n a
cons
umer
wei
ght o
r pr
oduc
t bas
is.
3 Cor
n fl
our
and
mea
l are
use
d in
a v
arie
ty o
f gr
ain
prod
ucts
incl
udin
g co
rn b
read
, tor
tilla
s, c
orn
chip
s�se
rvin
gs w
ere
calc
ulat
ed b
ased
on
a gr
ain
equi
vale
nt.
4 Dry
wei
ght o
f 1/
2-cu
p co
oked
cor
n gr
its.
5 Qua
ntity
equ
al to
car
bohy
drat
es in
one
slic
e of
bre
ad.
Sour
ce:
U.S
. Dep
artm
ent o
f Agr
icul
ture
, Eco
nom
ic R
esea
rch
Serv
ice.
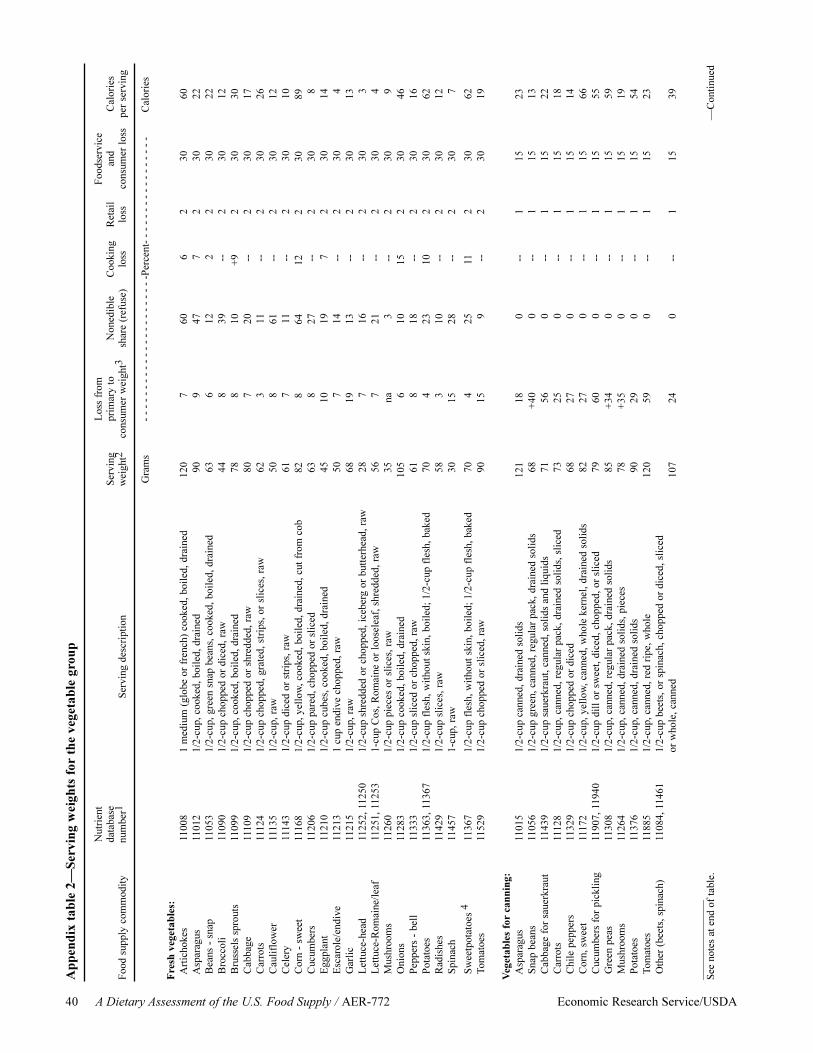
40 A Dietary Assessment of the U.S. Food Supply / AER-772 Economic Research Service/USDA
App
endi
x ta
ble
2�Se
rvin
g w
eigh
ts f
orth
e ve
geta
ble
grou
p
Nut
rien
tL
oss
from
Food
serv
ice
data
base
Serv
ing
prim
ary
toN
oned
ible
Coo
king
Ret
ail
and
Cal
orie
sFo
od s
uppl
y co
mm
odity
num
ber1
Serv
ing
desc
ript
ion
wei
ght2
cons
umer
wei
ght3
shar
e (r
efus
e)lo
ss
loss
cons
umer
loss
pe
r se
rvin
g
Gra
ms
- -
- -
- -
- -
- -
- -
- -
- -
- -
- -
- -
-Per
cent
- -
- -
- -
- -
- -
- -
- -
- -
-C
alor
ies
Fre
sh v
eget
able
s:A
rtic
hoke
s11
008
1 m
ediu
m (
glob
e or
fre
nch)
coo
ked,
boi
led,
dra
ined
120
760
62
3060
Asp
arag
us11
012
1/2-
cup,
coo
ked,
boi
led,
dra
ined
909
477
230
22B
eans
- s
nap
1105
31/
2-cu
p, g
reen
sna
p be
ans,
coo
ked,
boi
led,
dra
ined
636
122
230
22B
rocc
oli
1109
01/
2-cu
p ch
oppe
d or
dic
ed, r
aw44
839
--2
3012
Bru
ssel
s sp
rout
s11
099
1/2-
cup,
coo
ked,
boi
led,
dra
ined
788
10+9
230
30C
abba
ge11
109
1/2-
cup
chop
ped
or s
hred
ded,
raw
807
20--
230
17C
arro
ts11
124
1/2-
cup
chop
ped,
gra
ted,
str
ips,
or
slic
es, r
aw62
311
--2
3026
Cau
liflo
wer
1113
51/
2-cu
p, r
aw50
861
--2
3012
Cel
ery
1114
31/
2-cu
p di
ced
or s
trip
s, r
aw61
711
--2
3010
Cor
n -
swee
t 11
168
1/2-
cup,
yel
low
, coo
ked,
boi
led,
dra
ined
, cut
fro
m c
ob82
864
122
3089
Cuc
umbe
rs11
206
1/2-
cup
pare
d, c
hopp
ed o
r sl
iced
638
27--
230
8E
ggpl
ant
1121
01/
2-cu
p cu
bes,
coo
ked,
boi
led,
dra
ined
4510
197
230
14E
scar
ole/
endi
ve11
213
1 cu
p en
dive
cho
pped
, raw
507
14--
230
4G
arlic
1121
51/
2-cu
p, r
aw68
1913
--2
3013
Let
tuce
-hea
d11
252,
112
501/
2-cu
p sh
redd
ed o
r ch
oppe
d, ic
eber
g or
but
terh
ead,
raw
287
16--
230
3L
ettu
ce-R
omai
ne/le
af11
251,
112
531-
cup
Cos
, Rom
aine
or
loos
elea
f, s
hred
ded,
raw
567
21--
230
4M
ushr
oom
s11
260
1/2-
cup
piec
es o
r sl
ices
, raw
35na
3--
230
9O
nion
s11
283
1/2-
cup
cook
ed, b
oile
d, d
rain
ed10
56
1015
230
46Pe
pper
s -
bell
1133
31/
2-cu
p sl
iced
or
chop
ped,
raw
618
18--
230
16Po
tato
es11
363,
113
671/
2-cu
p fl
esh,
with
out s
kin,
boi
led;
1/2
-cup
fle
sh, b
aked
704
2310
230
62R
adis
hes
1142
91/
2-cu
p sl
ices
, raw
583
10--
230
12Sp
inac
h11
457
1-cu
p, r
aw30
1528
--2
307
Swee
tpot
atoe
s 4
1136
71/
2-cu
p fl
esh,
with
out s
kin,
boi
led;
1/2
-cup
fle
sh, b
aked
704
2511
230
62To
mat
oes
1152
91/
2-cu
p ch
oppe
d or
slic
ed, r
aw90
159
--2
3019
Veg
etab
les
for
cann
ing:
Asp
arag
us11
015
1/2-
cup
cann
ed, d
rain
ed s
olid
s12
118
0--
115
23Sn
ap b
eans
1105
61/
2-cu
p gr
een,
can
ned,
reg
ular
pac
k, d
rain
ed s
olid
s68
+40
0--
115
13C
abba
ge f
or s
auer
krau
t11
439
1/2-
cup
saue
rkra
ut, c
anne
d, s
olid
s an
d liq
uids
7156
0--
115
22C
arro
ts11
128
1/2-
cup,
can
ned,
reg
ular
pac
k, d
rain
ed s
olid
s, s
liced
7325
0--
115
18C
hile
pep
pers
1132
91/
2-cu
p ch
oppe
d or
dic
ed68
270
--1
1514
Cor
n, s
wee
t11
172
1/2-
cup,
yel
low
, can
ned,
who
le k
erne
l, dr
aine
d so
lids
8227
0--
115
66C
ucum
bers
for
pic
klin
g11
907,
119
401/
2-cu
p di
ll or
sw
eet,
dice
d, c
hopp
ed, o
r sl
iced
7960
0--
115
55G
reen
pea
s11
308
1/2-
cup,
can
ned,
reg
ular
pac
k, d
rain
ed s
olid
s85
+34
0--
115
59M
ushr
oom
s11
264
1/2-
cup,
can
ned,
dra
ined
sol
ids,
pie
ces
78+3
50
--1
1519
Pota
toes
1137
61/
2-cu
p, c
anne
d, d
rain
ed s
olid
s90
290
--1
1554
Tom
atoe
s11
885
1/2-
cup,
can
ned,
red
rip
e, w
hole
120
590
--1
1523
Oth
er (
beet
s, s
pina
ch)
1108
4, 1
1461
1/2-
cup
beet
s, o
r sp
inac
h, c
hopp
ed o
r di
ced,
slic
edor
who
le, c
anne
d10
724
0--
115
39
____
____
____
___
See
note
s at
end
of
tabl
e.
�C
ontin
ued

Economic Research Service/USDA A Dietary Assessment of the U.S. Food Supply / AER-772 41
App
endi
x ta
ble
2�Se
rvin
g w
eigh
ts f
orth
e ve
geta
ble
grou
p�C
onti
nued
Nut
rien
tL
oss
from
Food
serv
ice
data
base
Serv
ing
prim
ary
toN
oned
ible
Coo
king
Ret
ail
and
Cal
orie
sFo
od s
uppl
y co
mm
odity
num
ber1
Serv
ing
desc
ript
ion
wei
ght2
cons
umer
wei
ght3
shar
e (r
efus
e)lo
ss
loss
cons
umer
loss
pe
r se
rvin
g
Gra
ms
- -
- -
- -
- -
- -
- -
- -
- -
- -
- -
- -
-Per
cent
- -
- -
- -
- -
- -
- -
- -
- -
-C
alor
ies
Veg
etab
les
for
free
zing
:A
spar
agus
1101
81/
2-cu
p, f
roze
n, c
ooke
d, b
oile
d, d
rain
ed90
480
201
1525
Bea
ns -
sna
p11
061
1/2-
cup
gree
n, f
roze
n, c
ooke
d, b
oile
d, d
rain
ed68
150
101
1519
Bro
ccol
i11
093
1/2-
cup,
fro
zen,
coo
ked,
boi
led,
dra
ined
, cho
pped
9225
06
115
26C
arro
ts11
131
1/2-
cup,
fro
zen,
coo
ked,
boi
led,
dra
ined
, slic
ed73
450
21
1526
Cau
liflo
wer
1113
81/
2-cu
p, f
roze
n, c
ooke
d, b
oile
d, d
rain
ed, p
iece
s90
300
71
1517
Cor
n -
swee
t11
179
1/2-
cup,
yel
low
, fro
zen
kern
els
cut o
ff th
e co
b,82
730
41
1566
boile
d, d
rain
edPe
as, g
reen
1131
31/
2-cu
p, f
roze
n, c
ooke
d, b
oile
d, d
rain
ed80
700
71
1562
Pota
toes
1140
3C
ooke
d po
tato
por
tion
of 1
0 st
rips
, fro
zen,
5050
022
115
66ho
me-
prep
ared
, hea
ted
in o
ven,
w/o
sal
tO
ther
1103
8, 1
1164
,1/
2-cu
p, f
roze
n, c
ooke
d, b
oile
d, d
rain
ed, c
hopp
ed,
8730
013
115
3911
196,
1127
3,sl
iced
, or
mas
hed;
lim
a be
ans;
col
lard
s; b
lack
eyed
pea
s;11
281,
114
64,
mus
tard
gre
ens;
okr
a; s
pina
ch; s
umm
er s
quas
h;
1147
4, 1
1567
,cr
ookn
eck
and
stra
ight
; tur
nips
; tur
nip
gree
ns; k
ale;
11
575,
117
91,
win
ter
squa
sh, b
utte
rnut
1186
7
Veg
etab
les
for
dehy
drat
ing
and
chip
s an
d sh
oest
ring
s:O
nion
s (d
ehyd
rate
d)11
284
1/4-
cup
dehy
drat
ed f
lake
s14
890
--1
1549
Pota
toes
(de
hydr
ated
)11
378
1/4-
cup
dehy
drat
ed f
lake
s12
860
--1
1542
Pota
toes
for
chi
ps a
ndsh
oest
ring
s19
410
Pota
to p
ortio
n in
1 o
unce
of
pota
to c
hips
1875
0--
115
60
Dry
bea
ns, p
eas,
and
lent
ils:
Dry
edi
ble
bean
s16
015,
160
25,
Dry
-wei
ght o
f 1/
2-cu
p co
oked
, boi
led,
dra
ined
370
0--
115
126
1603
3, 1
6041
1604
3, 1
6046
, 16
057,
160
72,
1607
5, 1
1192
Dry
pea
s an
d le
ntils
1607
0, 1
6086
D
ry-w
eigh
t of
1/2-
cup
cook
ed, b
oile
d, d
rain
ed37
00
--1
1512
6
na =
not
ava
ilabl
e.--
= n
ot e
stim
ated
.1 U
SDA
, AR
S, O
ctob
er 1
997.
2 All
serv
ing
wei
ghts
are
with
out r
efus
e un
less
oth
erw
ise
note
d.3
Prim
ary
wei
ghts
are
far
m w
eigh
ts f
or f
resh
, can
ned,
fro
zen,
and
deh
ydra
ted
vege
tabl
es.
Prim
ary
wei
ght i
s �c
lean
ed b
asis
� fo
r dr
y be
ans,
pea
s, a
nd le
ntils
. C
onsu
mer
wei
ghts
are
ret
ail w
eigh
t for
fre
sh, c
anne
d, f
roze
n, a
nd d
ehyd
rate
d ve
geta
bles
. C
onsu
mer
wei
ght f
or d
ry b
eans
, pea
s, a
nd le
ntils
is �
clea
ned
basi
s.�
4 Ser
ving
wei
ght w
as n
ot a
vaila
ble
for
swee
tpot
atoe
s, s
ervi
ng w
eigh
t for
fre
sh p
otat
oes
was
use
d.So
urce
: U
.S. D
epar
tmen
t of A
gric
ultu
re, E
cono
mic
Res
earc
h Se
rvic
e.

42 A Dietary Assessment of the U.S. Food Supply / AER-772 Economic Research Service/USDA
serving is defined as 1 cup, raw. The raw-value serv-ing weight was chosen to eliminate the need to esti-mate changes in weight due to cooking which canvary markedly for vegetables depending on prepara-tion methods. However, an exception was made fornine vegetables that, while purchased fresh by theconsumer in the supermarket, are normally cookedprior to consumption. Serving weights for eight ofthese vegetables�asparagus, Brussels sprouts, egg-plant, onions, potatoes, snap beans, sweet corn, andsweet potatoes�were defined as the weight of 1/2cup of these products, cooked. An artichoke servingwas one medium artichoke, cooked.
A serving weight for vegetables for canning wasdefined as 1/2 cup of drained solids. The servingweight for most vegetables for freezing was theweight of 1/2 cup, cooked. A serving of dehydratedvegetables was the dry weight that would yield 1/2cup of the product cooked. In some cases, the weightfor a 1/2 cup portion of the same vegetable varieddepending on whether the vegetables had beenchopped, sliced, cubed, etc. For these commodities,the serving weight was an average of these multipleportion weights. The case of potatoes illustrates theway that servings were calculated for all vegetables.
The food supply series reports five different sets ofconsumption data for potatoes; potatoes for fresh use,potatoes for canning, potatoes for freezing, potatoesfor dehydrating, and potatoes for chips and shoe-strings. The selection of serving weights for each ofthese commodities was dictated by the manner inwhich consumption was reported. For example, theserving weight for fresh potatoes was the weight of1/2 cup of the product cooked, or 70 grams. Thisserving weight reflects an average of two differentcooking methods for fresh potatoes listed in theNutrient Data Base�fresh potatoes boiled, flesh only,or fresh potatoes, baked, flesh only. For canningpotatoes, a serving was the weight of 1/2 cup ofdrained canned potatoes. Since most potatoes forfreezing are made into french fries, a serving wasdefined as the weight of 10 (2-3 ½-inch) frozen strips,oven-baked, minus the added fat. The serving weightfor dehydrated potatoes was the dry weight of 1/2 cupcooked, or 12 grams, while for potato chips and shoe-strings, a serving was equal to the amount of potatoused in 1 ounce of potato chips, minus the added fat,or 18 grams. Fat added during the manufacture of
potato chips or french fries is captured in the servingsestimates for added fats and oils.
Dry Beans, Peas, and Lentils
Dry beans, peas, and lentils are unique commoditiesin that they can be counted as either a vegetable serv-ing or a protein serving in the meat, poultry, fish, drybeans, eggs, and nuts group. Like other vegetables,dry beans, peas, and lentils are valuable sources ofstarch, dietary fiber, and other nutrients frequentlylow in American diets, B-6, folacin, iron, and magne-sium. However, they are also good sources of proteinand in earlier dietary guidance had been grouped withmeat and other animal proteins in the meat group.Since most Americans consume meat, dietary guid-ance encouraged the use of these foods as a starchyvegetable (Cronin and others, 1987). The Food GuidePyramid bulletin suggests that consumers eat drybeans, peas, and lentils several times per week as partof their regular vegetable servings. However, the bul-letin also suggests that consumers include them oftenas protein choices from the meat group (USDA,CNPP, 1996).
For consistency with the methods used in the CSFIIservings estimates, dry beans, peas, and lentils werecounted as vegetable servings in this study. A servingof dry beans, peas, and lentils was defined as the dryweight needed to yield 1/2 cup of the product cooked,or about 37 grams.
Fruit
Serving weights for fruit were based on serving sizesdefined in the Food Guide Pyramid bulletin�onemedium whole fruit, 1/2 cup of raw or canned fruit, or3/4 cup of unsweetened fruit juice (USDA, CNPP,1996). For each commodity, appropriate servingweights were identified based on the form in whichconsumption was reported in the food supply series�fresh, canned, frozen, dried, or single-strength equiva-lent juice (appendix table 3).
For fresh fruits, serving weights were defined as onemedium whole fruit or 1/2 cup of chopped or dicedfruit, raw. For whole fruits where several servingsizes were defined in the Nutrient Data Base�that is,small, medium, large�a serving was the weight ofone medium-sized fruit. This method is consistentwith serving sizes for whole fruits defined in The

Economic Research Service/USDA A Dietary Assessment of the U.S. Food Supply / AER-772 43
App
endi
x ta
ble
3�Se
rvin
g w
eigh
ts f
orth
e fr
uit
grou
p
Nut
rien
tL
oss
from
Food
serv
ice
data
base
Serv
ing
prim
ary
toN
oned
ible
Coo
king
Ret
ail
and
Cal
orie
sFo
od s
uppl
y co
mm
odity
num
ber1
Serv
ing
desc
ript
ion
wei
ght2
cons
umer
wei
ght3
shar
e (r
efus
e)lo
ss
loss
cons
umer
loss
pe
r se
rvin
g
Gra
ms
- -
- -
- -
- -
- -
- -
- -
- -
- -
- -
- -
-Per
cent
- -
- -
- -
- -
- -
- -
- -
- -
-C
alor
ies
Fre
sh f
ruit
:Fr
esh
citr
us f
ruit�
Ora
nges
/tem
ples
0920
0R
aw, a
ll co
mm
erci
al v
arie
ties;
1 m
ediu
m f
ruit
(2
5/8"
)13
13
270
230
62Ta
nger
ines
/tang
elos
0921
8R
aw, 1
/2-c
up s
ectio
ns98
528
02
3043
Gra
pefr
uits
0911
1R
aw, a
ll va
riet
ies;
1/2
med
ium
fru
it (4
1/2
")12
83
500
230
41L
emon
s09
150
Raw
, 1/2
-cup
sec
tions
106
447
02
3031
Lim
es09
159
Raw
, 1 f
ruit
(2")
675
160
230
20Fr
esh
nonc
itrus
fru
it�A
pple
s09
003
Raw
, med
ium
with
ski
n (2
3/4
")13
84
80
230
81A
pric
ots
0902
1R
aw, 1
/2-c
up h
alve
s; 1
/2-c
up s
liced
809
70
230
38A
voca
dos
0903
7R
aw, a
ll co
mm
erci
al v
arie
ties;
1/2
-cup
cub
es; 1
/2-c
up s
liced
746
260
230
119
Ban
anas
0904
0R
aw, 1
med
ium
(7-
7 7/
8" lo
ng)
118
036
02
3010
9C
anta
loup
e09
181
Raw
, 1/2
-cup
bal
ls; 1
/2-c
up c
ubes
; 1/2
-cup
dic
ed p
iece
s82
849
02
3029
Che
rrie
s09
070
Raw
, 1/2
-cup
sw
eet,
who
le, p
itted
738
100
230
52C
ranb
erri
es09
078
Raw
, 1/2
-cup
cho
pped
554
50
230
27G
rape
s09
131
Raw
, E
urop
ean
type
(ad
here
nt s
kin)
, 1/2
-cup
see
dles
s80
94
02
3057
Hon
eyde
w m
elon
0918
4R
aw, 1
/2-c
up b
alls
, 1/2
-cup
dic
ed p
iece
s87
854
02
3030
Kiw
ifru
it09
405
Raw
, 1 m
ediu
m f
ruit
with
out s
kin
760
140
230
46M
ango
es09
176
Raw
, 1/2
-cup
slic
ed83
031
02
3054
Peac
hes/
nect
arin
es09
191
Raw
, 1 m
ediu
m (
2 1/
2")
peac
h; 1
med
ium
(2
1/2"
) ne
ctar
ine
117
511
02
3054
Pear
s09
252
Raw
, 1 m
ediu
m (
2 1/
2")
frui
t 16
65
80
230
98Pi
neap
ple
0926
6R
aw, 1
/2-c
up d
iced
, pie
ces
785
480
230
38Pa
paya
s09
226
Raw
, 1/2
-cup
cub
ed p
iece
s70
033
02
3027
Plum
s/pr
unes
0927
9R
aw, 1
fru
it (2
1/8
")
665
60
230
36St
raw
berr
ies
0931
6R
aw, 1
/2-c
up h
alve
s; 1
/2-c
up s
liced
; 1/2
-cup
who
le77
86
02
3023
Wat
erm
elon
0932
6R
aw, 1
/2-c
up b
alls
; 1/2
-cup
dic
ed77
1048
02
3024
Fru
it f
orca
nnin
g:A
pple
s an
d ap
ples
auce
0940
11/
2-cu
p ap
ples
auce
, uns
wee
tene
d, c
anne
d12
20
00
115
52A
pric
ots
0902
31/
2-cu
p ca
nned
, wat
er p
acke
d w
ithou
t ski
n or
pits
, so
lid a
nd li
quid
s11
40
00
115
25C
herr
ies
(sw
eet &
tart
)09
071
1/2-
cup
swee
t, ca
nned
, wat
er p
ack,
sol
ids
and
liqui
d, p
itted
124
00
01
1557
Peac
hes
(exc
lude
s sp
iced
)09
237
1/2-
cup
cann
ed, w
ater
pac
k, s
olid
s an
d liq
uids
, hal
ves
or s
lices
122
00
01
1529
Pear
s (i
ncl.
fr. c
ockt
ail)
0925
31/
2-cu
p ca
nned
, wat
er p
ack,
coo
ked,
dra
ined
sol
ids
122
00
01
1535
Pine
appl
es09
267
1/2-
cup
cann
ed, w
ater
pac
k, s
olid
s an
d liq
uids
, cru
shed
, sl
iced
, or
in c
hunk
s12
30
00
115
39Pl
ums
and
prun
es09
281
1/2-
cup
cann
ed, p
urpl
e, w
ater
pac
k, s
olid
s an
d liq
uids
, pitt
ed12
50
00
115
51
____
____
____
___
See
note
s at
end
of
tabl
e.
�C
ontin
ued

44 A Dietary Assessment of the U.S. Food Supply / AER-772 Economic Research Service/USDA
App
endi
x ta
ble
3�Se
rvin
g w
eigh
ts f
orth
e fr
uit
grou
p�C
onti
nued
Nut
rien
tL
oss
from
Food
serv
ice
data
base
Serv
ing
prim
ary
toN
oned
ible
Coo
king
Ret
ail
and
Cal
orie
sFo
od s
uppl
y co
mm
odity
num
ber1
Serv
ing
desc
ript
ion
wei
ght2
cons
umer
wei
ght3
shar
e (r
efus
e)lo
ss
loss
cons
umer
loss
pe
r se
rvin
g
Gra
ms
- -
- -
- -
- -
- -
- -
- -
- -
- -
- -
- -
-Per
cent
- -
- -
- -
- -
- -
- -
- -
- -
-C
alor
ies
Fru
its
for
free
zing
:B
erri
es�
Bla
ckbe
rrie
s09
048
1/2-
cup,
fro
zen,
uns
wee
tene
d76
00
01
1548
Ras
pber
ries
409
048
1/2-
cup,
fro
zen,
uns
wee
tene
d76
00
01
1548
Stra
wbe
rrie
s09
318
1/2-
cup,
fro
zen,
uns
wee
tene
d, u
ntha
wed
750
00
115
26B
lueb
erri
es09
054
1/2-
cup,
fro
zen,
uns
wee
tene
d, u
ntha
wed
780
00
115
39O
ther
ber
ries
509
048
1/2-
cup,
fro
zen,
uns
wee
tene
d76
00
01
1548
Oth
er f
ruits
for
fre
ezin
g�A
pple
s09
014
1/2-
cup,
fro
zen,
uns
wee
tene
d, u
nhea
ted
870
00
115
41A
pric
ots6
0901
41/
2-cu
p, f
roze
n, u
nsw
eete
ned,
unh
eate
d87
00
01
1541
Che
rrie
s09
068
1/2-
cup,
fro
zen,
sou
r re
d, u
nsw
eete
ned,
unt
haw
ed78
00
01
1536
Peac
hes6
0901
41/
2-cu
p, f
roze
n, u
nsw
eete
ned,
unh
eate
d87
00
01
1541
Dri
ed f
ruit
:A
pple
s09
011
1/4-
cup,
dri
ed, s
ulfu
red,
unc
ooke
d22
00
01
1552
Apr
icot
s09
032
1/4-
cup,
dri
ed, s
ulfu
red
halv
es, u
ncoo
ked
330
00
115
77D
ates
(pi
ts-i
n ba
sis)
0908
71/
4-cu
p, d
omes
tic, n
atur
al, d
ry, p
itted
450
00
115
122
Figs
0909
41/
4-cu
p, d
ried
, unc
ooke
d50
00
01
1512
7Pe
ache
s09
246
1/4-
cup,
dri
ed, s
ulph
ured
, unc
ooke
d ha
lves
400
00
115
96Pe
ars
0925
91/
4-cu
p, d
ried
, unc
ooke
d ha
lves
450
00
115
118
Prun
es09
291
1/4-
cup,
dri
ed, u
ncoo
ked,
pitt
ed43
00
01
1510
2R
aisi
ns09
298
1/4-
cup,
see
dles
s, p
acke
d; s
eedl
ess,
unp
acke
d39
00
01
1511
6
Fru
it j
uice
s:C
itrus
juic
es�
Ora
nge
0920
73/
4-cu
p, c
anne
d, u
nsw
eete
ned
187
00
01
1578
Gra
pefr
uit
0912
33/
4-cu
p, c
anne
d, u
nsw
eete
ned
185
00
01
1570
Lem
on09
153
3/4-
cup,
can
ned
or b
ottle
d, u
nsw
eete
ned
183
00
01
1538
Lim
e09
161
3/4-
cup,
can
ned
or b
ottle
d, u
nsw
eete
ned
185
00
01
1538
Oth
er ju
ices
�A
pple
0901
63/
4-cu
p, c
anne
d or
bot
tled,
uns
wee
tene
d18
60
00
115
87G
rape
0913
53/
4-cu
p, c
anne
d or
bot
tled,
uns
wee
tene
d19
00
00
115
116
Pine
appl
e09
273
3/4-
cup,
can
ned,
uns
wee
tene
d18
80
00
115
105
Prun
e09
294
3/4-
cup,
can
ned,
uns
wee
tene
d19
20
00
115
136
1 USD
A, A
RS,
Oct
ober
, 199
7.2 A
ll se
rvin
g w
eigh
ts a
re w
ithou
t ref
use
unle
ss o
ther
wis
e no
ted.
3 Pri
mar
y w
eigh
t for
fre
sh v
eget
able
s is
far
m w
eigh
t, co
nsum
er w
eigh
t is
reta
il w
eigh
t. P
rim
ary
and
cons
umer
wei
ghts
for
can
ned
and
froz
en f
ruits
are
pro
duct
wei
ght.
Pri
mar
y an
d co
nsum
er w
eigh
ts f
or d
ried
frui
ts a
re p
roce
ssed
wei
ght.
Pri
mar
y an
d co
nsum
er w
eigh
ts f
or f
ruit
juic
es a
re s
ingl
e-st
reng
th e
quiv
alen
ts.
4 Uns
wee
tene
d va
lue
for
rasp
berr
ies
not a
vaila
ble,
val
ue is
for
bla
ckbe
rrie
s.5 S
ervi
ng w
eigh
ts f
or o
ther
fro
zen
berr
ies
(boy
senb
erri
es, l
ogan
berr
ies)
are
for
bla
ckbe
rrie
s.6 S
ervi
ng w
eigh
ts a
re f
or f
roze
n ap
ples
, val
ues
for
apri
cots
and
pea
ches
incl
ude
swee
tene
r.So
urce
: U
.S. D
epar
tmen
t of A
gric
ultu
re, E
cono
mic
Res
earc
h Se
rvic
e.

Food Guide Pyramid bulletin Food Choices Chart. Inthe case of smaller sized fresh fruit�plums, grapes,apricots, etc.�where the weight of an individual fruitwas less than 1/2 cup, a serving was defined as theweight of 1/2 cup.
In the case of raw fruits where several different prepa-ration methods were available for a 1/2 cup serving�chopped, sliced, diced, etc.�the serving weight wasan average of the available options. For example, theNutrient Data Base defines three different serving por-tions for fresh cantaloupe�balled, cubes, andpieces�each with a different serving weight. A serv-ing of fresh cantaloupe was thus assigned a weight of82 grams, or an average of the three portion weights.
A serving of canned fruit was the weight of 1/2 cup,water-pack. This is consistent with the product-weight basis for which consumption of these foods isreported in the food supply. A serving of frozen fruit,also reported on a product-weight basis, was 1/2 cup,unthawed and unsweetened. Dried fruits wereassigned a serving weight of 1/4 cup while a servingof fruit juice was about 185 grams (single-strengthequivalent) or 3/4 cup.
Dairy
Food supply data for dairy foods is reported on aproduct-weight basis, directly comparable with serv-ing sizes identified in The Food Guide Pyramid bul-letin or other dietary guidance materials (USDA,CNPP, 1996). Thus for this group, serving weightsmatched those identified in The Food Guide Pyramidbulletin�8 ounces of fluid milk or yogurt, 1.5 ouncesof natural cheese, 2 ounces of processed cheese, 2cups of cottage cheese, and 1-1/2 cups of ice cream,ice milk or other frozen dairy dessert (appendix table4). For dry milk, a serving was defined as the dryweight that would yield 1 cup of fluid milk. Forevaporated and condensed milk, a serving was one-half cup, or the quantity needed to yield 1 fluid cup ofmilk, when diluted.
The product-weight nature of the food supply data fordairy products means that a small quantity of nondairyingredients, mostly added sweeteners, are included inthe dairy servings total. Data on sweetener deliveriesto the dairy industry (see table 9, page 24) suggestthat the total amount of added sweeteners included inthe consumption weight for dairy products is less than
1/2 of 1 percent of the total weight of dairy productconsumption and would thus have a minimal impacton the food supply servings for dairy products.However, servings for dairy products that typicallycontain the most added sweeteners�ice cream andother frozen dairy desserts, yogurt, and flavored bev-erage milk�may be overstated.
While the food supply data for dairy foods are report-ed on a product-weight basis, many of the productsare widely used as ingredients in other foods. Muchof the nonfat dry milk, for example, is consumed indi-rectly as an ingredient in other food products such asbread, cake mixes, processed meat products, and bev-erage mixes. Some fluid milk is also used in the bak-ery and confectionary industries and for home bakingin cakes, cookies, pies, and breads. The total dairyservings reported in this monograph reflect theseingredient uses.
Meat, Poultry, Fish, Dry Beans, Eggs, and Nuts
For the meat, poultry, fish, dry beans, eggs, and nutsgroup, total servings were estimated on a lean meatequivalent basis (appendix table 5). The Food GuidePyramid suggests that consumers choose two to threeservings each day from foods in this group, dependingon calorie intake (USDA, CNPP, 1996). The totalamount of these servings should be the equivalent of 5to 7 ounces of cooked lean meat, poultry, or fish.Two to 3 ounces of cooked lean meat, poultry, or fishare counted as a serving. Servings of other foods inthis group�1 egg, 2 tablespoons of peanut butter, or1/3 cup of nuts�are counted as the equivalent of1ounce of cooked lean meat, or about 1/3 of a serving.
The food supply data for red meat (beef, pork, andlamb and mutton), poultry (chicken and turkey), andfish are reported on a boneless, trimmed, equivalentweight, which estimates the uncooked weight of vari-ous meats available for human ingestion (Duewer,Krause, and Nelson, 1993). Because it includes boththe fat and lean portion of meat, poultry, and fish, theboneless weight equivalent is not directly comparablewith the lean meat serving identified in The FoodGuide Pyramid bulletin or the CSFII servings data.For example, the food supply data includes poultryskin, 1/4-inch external trim on red meat products, andall other naturally occurring fat that exists in meat,poultry, and fish products. As a result, the total meatgroup servings discussed in the �Findings� section of
Economic Research Service/USDA A Dietary Assessment of the U.S. Food Supply / AER-772 45
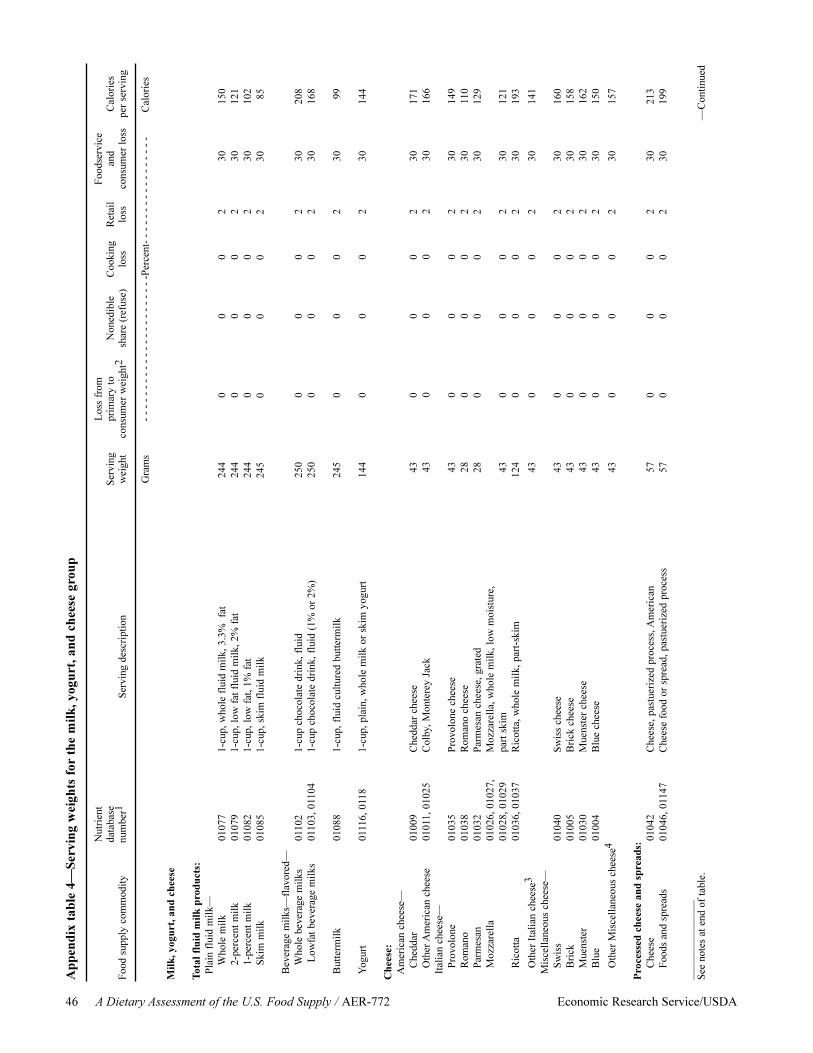
46 A Dietary Assessment of the U.S. Food Supply / AER-772 Economic Research Service/USDA
App
endi
x ta
ble
4�Se
rvin
g w
eigh
ts f
orth
e m
ilk, y
ogur
t, a
nd c
hees
e gr
oup
Nut
rien
tL
oss
from
Food
serv
ice
data
base
Serv
ing
prim
ary
toN
oned
ible
Coo
king
Ret
ail
and
Cal
orie
sFo
od s
uppl
y co
mm
odity
num
ber1
Serv
ing
desc
ript
ion
wei
ght
cons
umer
wei
ght2
shar
e (r
efus
e)lo
ss
loss
cons
umer
loss
pe
r se
rvin
g
Gra
ms
- -
- -
- -
- -
- -
- -
- -
- -
- -
- -
- -
-Per
cent
- -
- -
- -
- -
- -
- -
- -
- -
-C
alor
ies
Milk
, yog
urt,
and
che
ese
Tot
al f
luid
milk
pro
duct
s:Pl
ain
flui
d m
ilk�
Who
le m
ilk
0107
71-
cup,
who
le f
luid
milk
, 3.3
% f
at24
40
00
230
150
2-pe
rcen
t milk
0107
91-
cup,
low
fat
flu
id m
ilk, 2
% f
at24
40
00
230
121
1-pe
rcen
t milk
0108
21-
cup,
low
fat
, 1%
fat
244
00
02
3010
2Sk
im m
ilk01
085
1-cu
p, s
kim
flu
id m
ilk24
50
00
230
85
Bev
erag
e m
ilks�
flav
ored
�W
hole
bev
erag
e m
ilks
0110
21-
cup
choc
olat
e dr
ink,
flu
id25
00
00
230
208
Low
fat b
ever
age
milk
s01
103,
011
041-
cup
choc
olat
e dr
ink,
flu
id (
1% o
r 2%
)25
00
00
230
168
But
term
ilk01
088
1-cu
p, f
luid
cul
ture
d bu
tterm
ilk24
50
00
230
99
Yog
urt
0111
6, 0
118
1-cu
p, p
lain
, who
le m
ilk o
r sk
im y
ogur
t14
40
00
230
144
Che
ese:
Am
eric
an c
hees
e�C
hedd
ar01
009
Che
ddar
che
ese
430
00
230
171
Oth
er A
mer
ican
che
ese
0101
1, 0
1025
Col
by, M
onte
rey
Jack
430
00
230
166
Ital
ian
chee
se�
Prov
olon
e01
035
Prov
olon
e ch
eese
430
00
230
149
Rom
ano
0103
8R
oman
o ch
eese
280
00
230
110
Parm
esan
0103
2Pa
rmes
an c
hees
e, g
rate
d28
00
02
3012
9M
ozza
rella
0102
6, 0
1027
, M
ozza
rella
, who
le m
ilk, l
ow m
oist
ure,
01
028,
010
29pa
rt s
kim
430
00
230
121
Ric
otta
0103
6, 0
1037
Ric
otta
, who
le m
ilk, p
art-
skim
124
00
02
3019
3
Oth
er I
talia
n ch
eese
343
00
02
3014
1M
isce
llane
ous
chee
se�
Swis
s01
040
Swis
s ch
eese
430
00
230
160
Bri
ck01
005
Bri
ck c
hees
e43
00
02
3015
8M
uens
ter
0103
0M
uens
ter
chee
se43
00
02
3016
2B
lue
0100
4B
lue
chee
se43
00
02
3015
0
Oth
er M
isce
llane
ous
chee
se4
430
00
230
157
Pro
cess
ed c
hees
e an
d sp
read
s:C
hees
e01
042
Che
ese,
pas
tuer
ized
pro
cess
, Am
eric
an57
00
02
3021
3Fo
ods
and
spre
ads
0104
6, 0
1147
Che
ese
food
or
spre
ad, p
astu
eriz
ed p
roce
ss57
00
02
3019
9
____
____
____
___
See
note
s at
end
of
tabl
e.
�C
ontin
ued

Economic Research Service/USDA A Dietary Assessment of the U.S. Food Supply / AER-772 47
App
endi
x ta
ble
4�Se
rvin
g w
eigh
ts f
orth
e m
ilk, y
ogur
t, a
nd c
hees
e gr
oup�
Con
tinu
ed
Nut
rien
tL
oss
from
Food
serv
ice
data
base
Serv
ing
prim
ary
toN
oned
ible
Coo
king
Ret
ail
and
Cal
orie
sFo
od s
uppl
y co
mm
odity
num
ber1
Serv
ing
desc
ript
ion
wei
ght
cons
umer
wei
ght2
shar
e (r
efus
e)lo
ss
loss
cons
umer
loss
pe
r se
rvin
g
Gra
ms
- -
- -
- -
- -
- -
- -
- -
- -
- -
- -
- -
-Per
cent
- -
- -
- -
- -
- -
- -
- -
- -
-C
alor
ies
Cot
tage
che
ese:
Reg
ular
cot
tage
che
ese
0101
52-
cups
cot
tage
che
ese,
2%
fat
452
00
02
3040
5L
owfa
t cot
tage
che
ese
0101
62-
cups
cot
tage
che
ese,
1%
fat
452
00
02
3032
7
Fro
zen
dair
y pr
oduc
ts:
Ice
crea
m19
095
1.5-
cups
fro
zen
vani
lla ic
e cr
eam
198
00
02
3039
8Ic
e m
ilk19
088
1.5-
cups
fro
zen
vani
lla ic
e m
ilk19
80
00
230
275
Oth
er, i
nclu
ding
fro
zen
yogu
rt
1929
31.
5-cu
ps v
anill
a so
ft-s
erve
yog
urt
216
00
02
3034
3
Eva
pora
ted
and
cond
ense
d m
ilk:
Can
ned
who
le m
ilk01
096
1/2-
cup
cann
ed, e
vapo
rate
d, w
hole
milk
126
00
02
3016
9B
ulk
who
le m
ilk01
096
1/2-
cup
cann
ed, e
vapo
rate
d, w
hole
milk
126
00
02
3016
9B
ulk
and
cann
ed s
kim
milk
0109
71/
2-cu
p, c
anne
d, e
vapo
rate
d sk
im m
ilk12
80
00
230
100
Dry
milk
pro
duct
s:D
ry w
hole
milk
0109
01/
4-cu
p w
hole
dry
milk
320
00
230
159
Non
fat d
ry m
ilk01
091
1/4-
cup
dry
skim
, non
fat m
ilk s
olid
s30
00
02
3010
9D
ry b
utte
rmilk
0109
41/
4-cu
p dr
ied
butte
rmilk
300
00
230
116
1 USD
A, A
RS,
Oct
ober
199
7.2 C
onsu
mer
wei
ght f
or d
airy
pro
duct
s is
at p
rodu
ct o
r re
tail
leve
l.3 S
ervi
ng w
eigh
t for
Oth
er I
talia
n ch
eese
s w
as a
n av
erag
e of
all
Ital
ian
chee
ses.
4 Ser
ving
wei
ght f
or O
ther
Mis
cella
neou
s ch
eese
s w
as a
n av
erag
e of
Sw
iss,
Bri
ck, M
uens
ter,
and
Blu
e ch
eese
s.So
urce
: U
.S. D
epar
tmen
t of A
gric
ultu
re, E
cono
mic
Res
earc
h Se
rvic
e.

48 A Dietary Assessment of the U.S. Food Supply / AER-772 Economic Research Service/USDA
App
endi
x ta
ble
5�Se
rvin
gs w
eigh
ts f
orth
e m
eat,
pou
ltry
, fis
h, d
ry b
eans
, egg
s, a
nd n
uts
grou
p
Nut
rien
tL
oss
from
Food
serv
ice
data
base
Serv
ing
prim
ary
toN
oned
ible
Coo
king
Ret
ail
and
Cal
orie
sFo
od s
uppl
y co
mm
odity
num
ber1
Serv
ing
desc
ript
ion
wei
ght
cons
umer
wei
ght2
shar
e (r
efus
e)lo
ss
loss
cons
umer
loss
pe
r se
rvin
g
Gra
ms
- -
- -
- -
- -
- -
- -
- -
- -
- -
- -
- -
-Per
cent
- -
- -
- -
- -
- -
- -
- -
- -
-C
alor
ies
Mea
t, p
oult
ry, f
ish,
dry
bea
ns,
eggs
, nut
s, a
nd c
hees
e
Mea
t, p
oult
ry, a
nd f
ish
Red
mea
t:3
Bee
f13
004
Bee
f co
mpo
site
of
trim
med
and
ret
ail c
uts,
sep
arab
le le
an
and
fat,
trim
med
to 1
/4-i
nch
fat,
all g
rade
s, c
ooke
dna
00
222
1525
9
Vea
l17
089
Vea
l, co
mpo
site
of
trim
med
ret
ail c
uts,
sep
arab
le le
an
and
fat,
cook
edna
00
252
1519
6Po
rk10
188
Pork
, fre
sh, c
ompo
site
of
trim
med
ret
ail c
uts
(leg
, loi
n,
shou
lder
, and
spa
reri
bs),
sep
arab
le le
an a
nd f
at, c
ooke
dna
00
392
1523
2
Lam
b an
d m
utto
n17
002
Lam
b, d
omes
tic, c
ompo
site
of
trim
med
ret
ail c
uts,
sep
arab
lele
an a
nd f
at, t
rim
med
to 1
/4-i
nch
fat,
choi
ce, c
ooke
dna
00
262
1525
0
Chi
cken
and
pou
ltry
:4
Chi
cken
0500
4C
ooke
d�bo
nele
ss tr
imm
ed e
quiv
alen
tna
00
302
1519
9T
urke
y05
164
Coo
ked�
bone
less
trim
med
equ
ival
ent
na0
022
215
174
Fis
h an
d sh
ellf
ish:
Fres
h an
d fr
ozen
�Fi
sh5
Coo
ked
- ed
ible
wei
ght
na0
023
215
108
Shel
lfis
h15
243
Coo
ked
- ed
ible
wei
ght
na0
023
215
74C
anne
d�Sa
lmon
1508
4E
dibl
e w
eigh
tna
00
01
1511
8Sa
rdin
es15
089
Edi
ble
wei
ght
na0
00
115
151
Tun
a15
121,
151
26E
dibl
e w
eigh
tna
00
01
1510
4Sh
ellf
ish
Edi
ble
wei
ght
na0
00
115
93O
ther
Edi
ble
wei
ght
na0
00
115
117
Cur
ed15
179
Edi
ble
wei
ght
na0
00
115
99
Egg
s601
129
One
larg
e eg
g, c
ooki
ng m
etho
d no
t spe
cifi
ed, w
ithou
t she
llna
120
02
3078
____
____
____
___
See
note
s at
end
of
tabl
e.
�C
ontin
ued

Economic Research Service/USDA A Dietary Assessment of the U.S. Food Supply / AER-772 49
App
endi
x ta
ble
5�Se
rvin
gs w
eigh
ts f
orth
e m
eat,
pou
ltry
, fis
h, d
ry b
eans
, egg
s, a
nd n
uts
grou
p �
Con
tinu
ed
Nut
rien
tL
oss
from
Food
serv
ice
data
base
Serv
ing
prim
ary
toN
oned
ible
Coo
king
Ret
ail
and
Cal
orie
sFo
od s
uppl
y co
mm
odity
num
ber1
Serv
ing
desc
ript
ion
wei
ght
cons
umer
wei
ght2
shar
e (r
efus
e)lo
ss
loss
cons
umer
loss
pe
r se
rvin
g
Gra
ms
- -
- -
- -
- -
- -
- -
- -
- -
- -
- -
- -
-Per
cent
- -
- -
- -
- -
- -
- -
- -
- -
-C
alor
ies
Tre
enut
s, p
eanu
ts, a
nd c
ocon
uts:
Tre
enut
s�A
lmon
ds12
061
1/3-
cup
alm
onds
, gro
und,
slic
ed, s
liver
ed, w
hole
360
00
115
224
Filb
erts
1212
01/
3-cu
p ha
zeln
uts,
cho
pped
, gro
und,
who
le36
00
01
1525
4Pe
cans
1214
21/
3-cu
p pe
cans
, cho
pped
or
halv
es37
00
01
1525
0W
alnu
ts12
155
1/3-
cup
engl
ish
or p
ersi
an w
alnu
ts, c
hopp
ed, g
roun
d,ha
lves
, pie
ces,
or
chip
s 35
00
01
1523
3M
acad
amia
nut
s12
131
1/3-
cup
who
le o
r ha
lves
440
00
115
310
Pist
achi
os12
151
1/3-
pist
achi
o nu
ts, d
ried
420
00
115
244
Oth
er12
078,
121
47,
1/3-
cup
braz
ilnut
s, p
ine
nuts
, or
cash
ew n
uts,
dri
ed45
00
01
1527
212
085
Pean
uts�
Cle
aned
in s
hell,
she
lled
equi
vale
nt16
087
1/3-
cup,
all
type
s, r
aw w
ithou
t she
ll48
00
01
1527
3Pe
anut
but
ter
1639
7, 1
6398
2 ta
bles
poon
s sm
ooth
or
chun
k st
yle,
with
out s
alt
320
00
115
189
Snac
k16
087
1/3-
cup,
all
type
s, r
aw48
00
01
1527
3O
ther
1608
71/
3-cu
p, a
ll ty
pes,
raw
480
00
115
273
Coc
onut
(de
ssic
ated
)12
108
1/3-
cup
drie
d, u
nsw
eete
ned
coco
nut
760
00
115
486
na =
not
app
licab
le.
Mea
t, po
ultr
y, a
nd f
ish
cons
umpt
ion
was
mea
sure
d in
term
s of
tota
l oun
ces,
not
ser
ving
s.1 U
SDA
, AR
S, O
ctob
er, 1
997.
2 Pri
mar
y an
d co
nsum
er w
eigh
ts f
or r
ed m
eat,
poul
try
and
fish
are
bon
eles
s, tr
imm
ed, e
quiv
alen
t. P
rim
ary
and
cons
umer
wei
ghts
for
tree
nut
s ar
e sh
elle
d ba
sis.
Pri
mar
y an
d co
nsum
er w
eigh
ts f
or p
eanu
ts a
reke
rnel
bas
is.
Prim
ary
wei
ght f
or e
ggs
is f
arm
wei
ght.
Con
sum
er w
eigh
t for
egg
s is
ret
ail w
eigh
t.3 B
onel
ess
trim
med
equ
ival
ent i
nclu
des
1/4-
inch
trim
mab
le f
at o
n re
d m
eat a
nd s
kin,
nec
k m
eat,
and
gibl
ets
for
poul
try
prod
ucts
.4 E
dibl
e w
eigh
t inc
lude
s ra
w e
dibl
e m
eat,
excl
udin
g bo
nes,
vis
cera
, and
she
lls.
5 150
09, 1
5016
, 150
29, 1
5032
, 150
34, 1
5037
, 150
61, 1
5063
, 150
67, 1
5086
, 150
92, 1
5102
, 151
16, 1
5118
, 151
33.
6 Egg
ser
ving
s w
ere
mea
sure
d by
num
ber
rath
er th
an w
eigh
t.So
urce
: U
.S. D
epar
tmen
t of A
gric
ultu
re, E
cono
mic
Res
earc
h Se
rvic
e.

50 A Dietary Assessment of the U.S. Food Supply / AER-772 Economic Research Service/USDA
this report are likely to overstate the number of leanmeat servings available in the food supply.
For purposes of this study, dry beans, peas, and lentilswere counted in the vegetable group and wereassigned a serving weight of half a cup of the productcooked (see �Vegetable Group,� page 15). However,these foods can also be counted in the meat group. Inthe meat group, 1/2 cup of cooked dry beans, peas, orlentils is equal to 1 ounce of lean meat, cooked.
Added Fats and Oils
In this study, fat servings were measured for addedfats and oils only. Added fats and oils include short-ening, salad oils and dressings, lard, edible tallow,margarine and dairy fats (butter, sour cream, creamcheese, half and half, light cream, and heavy cream)(appendix table 6). Total servings for this groupreflect both direct use and indirect ingredient use offats and oils in other food products. For example, thefood servings for shortening include fats used directlyfor deep-fat frying as well as shortenings used asingredients in home-prepared and commercial bakedgoods.
Fat grams were counted on a nutrient-fat basis. Butterand margarine were assumed to be 80 percent fat.Sour cream, light cream, heavy cream, half and half,
cream cheese, and eggnog were assumed to be 21 per-cent fat; 19 percent fat; 37 percent fat; 12 percent fat;35 percent fat; and 8 percent fat; respectively.However, to account for the growth of reduced-fatdairy products in the food supply, fat contents for sourcream and cream cheese were reduced for 1990-96.This reduction assumes that reduced-fat productsaccounted for 25 percent of total sour cream con-sumption and 31 percent of total cream cheese sup-plies in these years (Frazao and Allshouse, 1996).Naturally occurring fats, such as those found in meat,eggs, cheese, fluid milk, and nuts were not countedbecause of the difficulty in making waste adjustmentsfor these nutrients.
Added Sugars
Servings of added sugars were measured for the fol-lowing caloric sweeteners: cane and beet sugar, HighFructose Corn Syrup, dextrose, glucose, honey, andedible syrups (appendix table 7). Consumption wasmeasured on a dry-weight basis and includes sweeten-ers consumed both directly and as food ingredients.Consumption was measured in both grams and tea-spoons. Naturally occurring sugars, such as thosefound in milk and fruits, were not included. Also, dueto data limitations, servings were not estimated forlow calorie sweeteners (aspartame, saccharin, etc.).

Economic Research Service/USDA A Dietary Assessment of the U.S. Food Supply / AER-772 51
App
endi
x ta
ble
6�Se
rvin
g w
eigh
ts f
orth
e ad
ded
fats
and
oils
gro
up
Nut
rien
tL
oss
from
Food
serv
ice
data
base
Serv
ing
prim
ary
toN
oned
ible
Coo
king
Ret
ail
and
Cal
orie
sFo
od s
uppl
y co
mm
odity
num
ber1
Serv
ing
desc
ript
ion
wei
ght2
cons
umer
wei
ght3
shar
e (r
efus
e)lo
ss
loss
cons
umer
loss
pe
r gr
am
Gra
ms
- -
- -
- -
- -
- -
- -
- -
- -
- -
- -
- -
-Per
cent
- -
- -
- -
- -
- -
- -
- -
- -
-C
alor
ies
Ani
mal
and
veg
etab
le f
ats:
Mar
gari
ne4
42
00
01
209
Shor
teni
ng4
42
00
01
509
Sala
d an
d co
okin
g oi
ls4
42
00
01
209
Lar
d4
42
00
01
509
Edi
ble
tallo
w4
42
00
01
509
Oth
er e
dibl
e fa
ts a
nd o
ils
44
20
00
120
9
Dai
ry f
ats:
But
ter
44
20
00
230
9
Hal
f an
d ha
lf5
0104
9Fl
uid
crea
m, h
alf
and
half
20
00
230
9
Lig
ht c
ream
601
050
Flui
d cr
eam
, lig
ht, c
offe
e or
tabl
e2
00
02
309
Hea
vy c
ream
701
053
Flui
d cr
eam
, hea
vy w
hipp
ing
20
00
230
9
Sour
cre
am8
0105
6, 0
1055
Sour
cre
am, c
ultu
red;
Sou
r cr
eam
, hal
f an
d ha
lf, c
ultu
red
20
00
230
9C
ream
and
neu
fcha
tel
chee
se9
0103
7, 0
1031
Cre
am c
hees
e, n
eufc
hate
l che
ese
20
00
230
9
Egg
nog1
001
057
Egg
nog
20
00
230
9
1 USD
A, A
RS,
Oct
ober
, 199
7.2 S
ervi
ng w
eigh
ts a
re to
tal f
at g
ram
s.3 P
rim
ary
and
cons
umer
wei
ghts
are
pro
duct
or
reta
il w
eigh
t for
all
adde
d fa
ts a
nd o
ils.
4 Fat
gra
ms
wer
e ba
sed
on to
tal p
rodu
ct w
eigh
t and
per
cent
fat
; fat
con
tent
of
mar
gari
ne a
nd b
utte
r is
80
perc
ent o
f pr
oduc
t wei
ght;
fat c
onte
nt o
f sh
orte
ning
, sal
ad a
nd c
ooki
ng o
ils, l
ard,
edi
ble
tallo
w, a
nd o
ther
edib
le f
ats
and
oils
is 1
00 p
erce
nt o
f pr
oduc
t wei
ght.
5 Fat
con
tent
, 12
gram
s pe
r 10
0 gr
ams
of p
rodu
ct w
eigh
t.6 F
at c
onte
nt, 1
9 gr
ams
per
100
gram
s of
pro
duct
wei
ght.
7 Fat
con
tent
, 37
gram
s pe
r 10
0 gr
ams
of p
rodu
ct w
eigh
t.8 F
at c
onte
nt, 2
1 gr
ams
per
100
gram
s of
pro
duct
wei
ght f
or 1
970-
89; 2
5 pe
rcen
t of
prod
uct w
eigh
t was
ass
umed
to b
e re
duce
d fa
t at 1
2 gr
ams
per
100
gram
s of
ser
ving
wei
ght f
or 1
990-
96.
9 Fat
con
tent
, 35
gram
s pe
r 10
0 gr
ams
of p
rodu
ct w
eigh
t for
197
0-89
; 31
perc
ent o
f pr
oduc
t wei
ght w
as a
ssum
ed to
be
redu
ced
fat a
t 23
gram
s pe
r 10
0 gr
ams
of s
ervi
ng w
eigh
t for
199
0-96
.10
Fat c
onte
nt, 8
gra
ms
per
100
gram
s of
pro
duct
wei
ght.
Sour
ce:
U.S
. Dep
artm
ent o
f Agr
icul
ture
, Eco
nom
ic R
esea
rch
Serv
ice.

52 A Dietary Assessment of the U.S. Food Supply / AER-772 Economic Research Service/USDA
App
endi
x ta
ble
7�Se
rvin
g w
eigh
ts f
orth
e ad
ded
suga
rs g
roup
Nut
rien
tL
oss
from
Food
serv
ice
data
base
Serv
ing
prim
ary
toN
oned
ible
Coo
king
Ret
ail
and
Cal
orie
sFo
od s
uppl
y co
mm
odity
num
ber
Serv
ing
desc
ript
ion
wei
ght1
cons
umer
wei
ght1
shar
e (r
efus
e)lo
ss
loss
cons
umer
loss
pe
r gr
am
Gra
ms
- -
- -
- -
- -
- -
- -
- -
- -
- -
- -
- -
-Per
cent
- -
- -
- -
- -
- -
- -
- -
- -
-C
alor
ies
Ref
ined
can
e an
d be
et s
ugar
22
20
00
130
4
Cor
n sw
eete
ners
:H
igh
Fruc
tose
22
20
00
130
4
Glu
cose
22
20
00
130
4
Dex
tros
e2
22
00
01
304
Oth
erca
lori
c sw
eete
ners
:
Edi
ble
syru
ps 3
22
20
00
130
4H
oney
22
20
00
130
4
1 Pri
mar
y an
d co
nsum
er w
eigh
ts f
or a
dded
sug
ars
are
on a
pro
duct
or
reta
il ba
sis.
2 Gra
ms
of s
ugar
wer
e es
timat
ed o
n a
prod
uct d
ry-w
eigh
t bas
is.
3 Inc
lude
s so
rgo,
map
le a
nd s
ugar
cane
syr
up, e
dibl
e m
olas
ses,
and
edi
ble
refi
ner's
syr
up.
Sour
ce:
U.S
. Dep
artm
ent o
f Agr
icul
ture
, Eco
nom
ic R
esea
rch
Serv
ice.