A cost-oriented approach for the design of IT architectures
20
A cost-oriented approach for the design of IT architectures Danilo Ardagna, Chiara Francalanci Dipartimento di Elettronica e Informazione, Politecnico di Milano, Milano, Italy Correspondence: C Francalanci, Dipartimento di Elettronica e Informazione, Politecnico di Milano, Piazza Leonardo Da Vinci, 32, 20133, Milano, Italy. Tel: þ 39 2 23993457 Fax: þ 39 2 23993411 E-mail: [email protected], [email protected] Abstract Multiple combinations of hardware and network components can be selected to design an information technology (IT) infrastructure that satisfies organizational requirements. The professional criterion to deal with these degrees of freedom is cost minimization. However, a scientific approach has been rarely applied to cost minimization and a rigorous verification of professional design guidelines is still lacking. The methodological contribution of this paper is the representation of complex infrastructural design issues as a single cost-minimization problem. The approach to cost-minimization is empirically verified with a database of costs that has also been built as part of this research. The paper shows how an overall cost-minimization approach can provide significant cost reductions and indicates that infrastructural design rules previously identified by the professional literature can lead to sub-optimal solutions. Journal of Information Technology (2005) 20, 32–51. doi:10.1057/palgrave.jit.2000032 Keywords: IT Costs; Distributed systems; Distributed networks Introduction T he information technology (IT) infrastructure is comprised of the hardware and network components of a computer system (Menasce ´ and Almeida, 2000). Since hardware and network components cooperatively interact with each other, the design of the IT infrastructure is a systemic problem. The systemic objective of infra- structural design is the minimization of the costs required to satisfy the computing and communication requirements of a given group of users (Jain, 1987). In most cases, multiple combinations of infrastructural components can satisfy requirements and, accordingly, each combination satisfies requirements with infrastructural components of different individual capacity (Menasce ´ and Almeida, 2000). These degrees of freedom generate two infrastructural design steps: the selection of a combination of hardware and network components and their individual sizing. Cost analyses are executed at both steps (Lazowska et al., 1984; Menasce ´ and Almeida, 2000). This paper proposes an approach to support the selection of a combination of hardware and network components that minimizes overall infrastructural costs. Cost analyses have been primarily addressed by the professional litera- ture, which evaluates selected infrastructural choices to provide cost benchmarks and practical design rules (Red- man et al., 1998; Vijayan, 2001). In contrast, a scientific approach has been rarely applied to cost analyses and a rigorous methodological support to the cost side of the infrastructural design process is still lacking. A likely reason for this lack of attention is the empirical nature of costs (Willcocks, 1992, Alter et al., 2000). Each infrastruc- tural component is characterized by a specific cost function which, furthermore, is subject to substantial change over a short period of time. This makes the scientific verification of methodological approaches to cost minimization parti- cularly cumbersome, as it requires empirical data. A methodological contribution of this paper is the representation of complex infrastructural design issues as a single cost-minimization problem. The approach is empirically verified with a database of costs that has also been built as part of this research. Multiple sources of cost data have been combined, including previous professional literature, vendors’ documentation and ad hoc surveys with companies to enable the statistical estimate of specific cost functions. With respect to the past, this methodo- logical contribution is enabled by a greater standardiza- tion and corresponding interoperability of infrastructural Journal of Information Technology (2005) 20, 32–51 & 2005 JIT Palgrave Macmillan Ltd. All rights reserved 0268-3962/05 $30.00 palgrave-journals.com/jit
Transcript of A cost-oriented approach for the design of IT architectures
A cost-oriented approach for the design
of IT architecturesDanilo Ardagna, Chiara Francalanci
Dipartimento di Elettronica e Informazione, Politecnico di Milano, Milano, Italy
Correspondence:C Francalanci, Dipartimento di Elettronica e Informazione, Politecnico di Milano, Piazza Leonardo Da Vinci, 32, 20133,Milano, Italy.Tel: þ 39 2 23993457Fax: þ 39 2 23993411E-mail: [email protected], [email protected]
AbstractMultiple combinations of hardware and network components can be selected to design aninformation technology (IT) infrastructure that satisfies organizational requirements. Theprofessional criterion to deal with these degrees of freedom is cost minimization. However,a scientific approach has been rarely applied to cost minimization and a rigorousverification of professional design guidelines is still lacking. The methodologicalcontribution of this paper is the representation of complex infrastructural design issuesas a single cost-minimization problem. The approach to cost-minimization is empiricallyverified with a database of costs that has also been built as part of this research. Thepaper shows how an overall cost-minimization approach can provide significant costreductions and indicates that infrastructural design rules previously identified by theprofessional literature can lead to sub-optimal solutions.Journal of Information Technology (2005) 20, 32–51. doi:10.1057/palgrave.jit.2000032Keywords: IT Costs; Distributed systems; Distributed networks
Introduction
The information technology (IT) infrastructure iscomprised of the hardware and network componentsof a computer system (Menasce and Almeida, 2000).
Since hardware and network components cooperativelyinteract with each other, the design of the IT infrastructureis a systemic problem. The systemic objective of infra-structural design is the minimization of the costs requiredto satisfy the computing and communication requirementsof a given group of users (Jain, 1987). In most cases,multiple combinations of infrastructural components cansatisfy requirements and, accordingly, each combinationsatisfies requirements with infrastructural components ofdifferent individual capacity (Menasce and Almeida, 2000).These degrees of freedom generate two infrastructuraldesign steps: the selection of a combination of hardwareand network components and their individual sizing. Costanalyses are executed at both steps (Lazowska et al., 1984;Menasce and Almeida, 2000).
This paper proposes an approach to support the selectionof a combination of hardware and network componentsthat minimizes overall infrastructural costs. Cost analyseshave been primarily addressed by the professional litera-ture, which evaluates selected infrastructural choices to
provide cost benchmarks and practical design rules (Red-man et al., 1998; Vijayan, 2001). In contrast, a scientificapproach has been rarely applied to cost analyses and arigorous methodological support to the cost side of theinfrastructural design process is still lacking. A likelyreason for this lack of attention is the empirical nature ofcosts (Willcocks, 1992, Alter et al., 2000). Each infrastruc-tural component is characterized by a specific cost functionwhich, furthermore, is subject to substantial change over ashort period of time. This makes the scientific verificationof methodological approaches to cost minimization parti-cularly cumbersome, as it requires empirical data.
A methodological contribution of this paper is therepresentation of complex infrastructural design issues asa single cost-minimization problem. The approach isempirically verified with a database of costs that has alsobeen built as part of this research. Multiple sources of costdata have been combined, including previous professionalliterature, vendors’ documentation and ad hoc surveys withcompanies to enable the statistical estimate of specificcost functions. With respect to the past, this methodo-logical contribution is enabled by a greater standardiza-tion and corresponding interoperability of infrastructural
Journal of Information Technology (2005) 20, 32–51& 2005 JIT Palgrave Macmillan Ltd. All rights reserved 0268-3962/05 $30.00
palgrave-journals.com/jit
components. On one hand, standardization has increasedthe number of compatible design alternatives and, as aconsequence, has made an overall optimization effortmeaningful and potentially advantageous. On the otherhand, it has decreased the data collection effort, byreducing the variance of costs across hardware and networkcomponents. The paper shows how an overall cost-minimization approach can provide significant savingsand indicates how corresponding infrastructural solutionscan substantially differ from those obtained by applyingprofessional design rules.
The next section reviews the literature and highlightsthe main organizational and technical variables of interest.The subsequent section presents the phases of our designapproach and the corresponding design models. Thesection thereafter discusses the experimental results ofcost analyses for different infrastructural design choices.Conclusions are drawn in the last section.
Research background and motivationInfrastructural costs represent about 20% of the overall costof a computer system (Alter et al., 2000). To minimize thesecost figures, the professional literature focuses on theselection of a combination of infrastructural components,while the cost-minimizing design of individual componentsis considered less consequential (Zachman, 1999). Agenerally accepted rule of thumb is that over-sizing acomponent has a minor cost impact and, in fact, isrecommended whenever performance requirements aresubject to uncertainty or variability (Alter et al., 2000).
At a system level, two design alternatives are studied,related to the selection of hardware and network compo-nents, respectively (see Table 1). The first alternative is howto distribute the overall computing load of a system ontomultiple machines (Gavish and Pirkul, 1986; Jain, 1987; Aueand Breu, 1994). The second is where to locate machinesthat need to exchange information in order to minimizenetwork costs (Ingham et al., 2000). Design decisions onboth alternatives are strongly inter-related. Intuitively,different allocations of computing load can change thecommunication patterns among machines and modify theeconomics of corresponding network structures. Costs havebeen consistently found to be highly dependent on overalldecisions on these two alternatives, both historically andcurrently.
The historical design principle was centralization, whichwas advocated to take advantage of hardware scaleeconomies according to Grosch’s law (Ein-Dor, 1985). Inthe late 1970s, Grosch’s law was controverted by Parkin-son’s law (Parkinson, 1955), introducing a critical capacitylevel above which scale economies are not verified andcentralization becomes cost inefficient. As a consequence ofParkinson’s findings, neither centralization nor decentrali-zation could be considered a general design principle toobtain cost minimization. However, a further attempt toformulate a general design principle has been made in themid-1980s, when Grosch’s law has been revised as ‘It ismost cost effective to accomplish any task on the leastpowerful type of computer capable of performing it’ (Ein-Dor, 1985). Decentralization and its operating rule, referredto as downsizing, became the methodological imperative for
cost-oriented infrastructural design. The correspondinginfrastructural design guideline, which has been effectivelysummarized as ‘think big, but build small’, is stillconsidered valid (Scheier, 2001). Although academicstudies have challenged the generality of the decentraliza-tion principle (Gavish and Pirkul, 1986; Jain, 1987), theempirical recognition of the cost disadvantages of decen-tralization has only occurred in the 1990s with theobservation of client–server costs. From an infrastructuralperspective, client–server can be seen as an applicationparadigm that allows personal computers (PCs) to sharecomputing load with mainframes. This sharing has reducedmainframes’ computing load and has facilitated theirreplacement with cheaper mini-computers, in compliancewith the downsizing principle. But the expected reductionsof infrastructural costs have not been verified. It has beenobserved that while decentralization reduces acquisitionand, thus, investment costs, it increases management costs,due to a more cumbersome administration of a greaternumber of infrastructural components. The concept of‘Total Cost of Ownership’ (TCO) has therefore beenintroduced and defined as the summation of investmentsand management costs, including acquisition, installation,maintenance and retirement costs of any infrastructuralcomponent (Redman et al., 1998; Vijayan, 2001). Hence,decentralization may result in an increase, as opposed to areduction of TCO, depending on the overall trade-offbetween the investment and management costs of allcomponents.
Recentralization has been thereafter considered to reducemanagement costs since the management of a centralizedinfrastructure is simplified and personnel can be furtherreduced by exploiting scale economies (Nortel Networks,2001). The rationale for recentralization is that the client–server paradigm can be extended to allow multiplemachines to share computing load (Ingham et al., 2000).Applications can be splitted into multiple modules, calledtiers, each of which can be allocated on a different machine(Ingham et al., 2000; Menasce and Almeida, 2000). Multi-tier applications give rise to multi-tier infrastructures thatoffer greater flexibility to implement the most convenientload sharing among multiple machines.
Thin clients are currently proposed as a less expensivealternative to personal computers that can be exploitedthrough a recentralization initiative (Molta, 1999a). Thinclients have lower computing capacity than PCs, which issufficient for the execution or the emulation of thepresentation tier, but require the recentralization of theapplication logic on a server. It has been empiricallyverified that thin clients have management costs 20–35%lower than PCs (Molta, 1999b). Furthermore, the Inde-pendent Computing Architecture (ICA) and RemoteDesktop Protocol (RDP) standards allow remote accessto the application logic by traditional PCs as well as newhand-held devices. This translates into hybrid configura-tions of PCs that execute only a subset of clientapplications, called hybrid fat clients. It is reported thatthe remote execution of applications can significantlyreduce TCO even if PCs are adopted and can represent aninteresting infrastructural solution when one or multipleapplications require a PC and prevent the use of thinclients (Molta, 1999b). In these cases, the management
Cost-oriented approach for IT D Ardagna and C Francalanci
33
cost of each application that is executed remotely isreduced by 20–35% (Molta, 1999b).
An application tier can also be simultaneously allocatedon multiple coordinated machines, known as server farm(Menasce and Almeida, 2000). Each computer within aserver farm autonomously responds to a subset of servicerequests, thus sharing the overall computing load withother computers within the same farm. This load sharingallows greater downsizing and reduces acquisition costs.Furthermore, it has limited negative effects on managementcosts, since server farms are equipped with software tools
that allow the remote management and simultaneousadministration of all servers (Scheier, 2001).
Technology also supports recentralization from a datastandpoint through storage networking (Nortel Networks,2001), which, contrary to server farms, is reported toincrease hardware costs, but to reduce management costsand enable the design of large-scale centralized systems(Nortel Networks, 2001; Alvarez et al., 2002; Ward et al.,2002). Through storage networking, which includes StorageArea Network (SAN) and Network Attached Storage (NAS)technologies, disks, tapes and optical drives can be shared
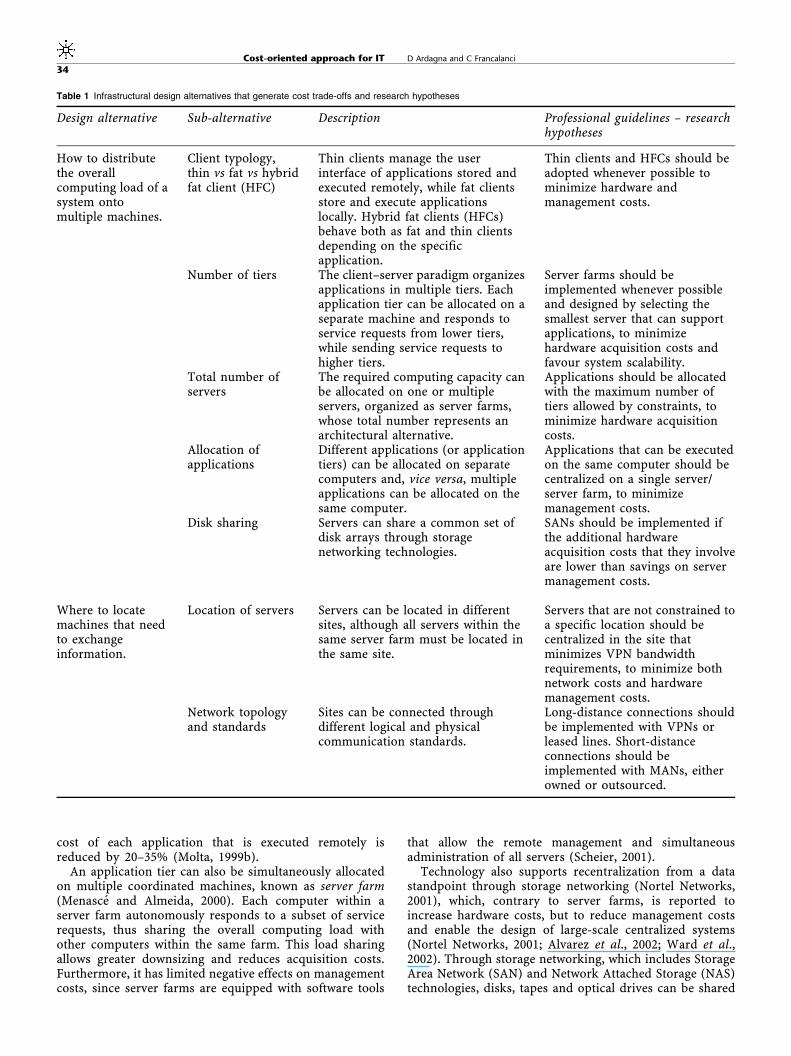
Table 1 Infrastructural design alternatives that generate cost trade-offs and research hypotheses
Design alternative Sub-alternative Description Professional guidelines – researchhypotheses
How to distributethe overallcomputing load of asystem ontomultiple machines.
Client typology,thin vs fat vs hybridfat client (HFC)
Thin clients manage the userinterface of applications stored andexecuted remotely, while fat clientsstore and execute applicationslocally. Hybrid fat clients (HFCs)behave both as fat and thin clientsdepending on the specificapplication.
Thin clients and HFCs should beadopted whenever possible tominimize hardware andmanagement costs.
Number of tiers The client–server paradigm organizesapplications in multiple tiers. Eachapplication tier can be allocated on aseparate machine and responds toservice requests from lower tiers,while sending service requests tohigher tiers.
Server farms should beimplemented whenever possibleand designed by selecting thesmallest server that can supportapplications, to minimizehardware acquisition costs andfavour system scalability.
Total number ofservers
The required computing capacity canbe allocated on one or multipleservers, organized as server farms,whose total number represents anarchitectural alternative.
Applications should be allocatedwith the maximum number oftiers allowed by constraints, tominimize hardware acquisitioncosts.
Allocation ofapplications
Different applications (or applicationtiers) can be allocated on separatecomputers and, vice versa, multipleapplications can be allocated on thesame computer.
Applications that can be executedon the same computer should becentralized on a single server/server farm, to minimizemanagement costs.
Disk sharing Servers can share a common set ofdisk arrays through storagenetworking technologies.
SANs should be implemented ifthe additional hardwareacquisition costs that they involveare lower than savings on servermanagement costs.
Where to locatemachines that needto exchangeinformation.
Location of servers Servers can be located in differentsites, although all servers within thesame server farm must be located inthe same site.
Servers that are not constrained toa specific location should becentralized in the site thatminimizes VPN bandwidthrequirements, to minimize bothnetwork costs and hardwaremanagement costs.
Network topologyand standards
Sites can be connected throughdifferent logical and physicalcommunication standards.
Long-distance connections shouldbe implemented with VPNs orleased lines. Short-distanceconnections should beimplemented with MANs, eitherowned or outsourced.
Cost-oriented approach for IT D Ardagna and C Francalanci
34
among multiple servers and accessed through opticalnetworks extending over a metropolitan area. Practitionersforecast that centralization can reduce data managementcosts by a factor of 5, primarily due to personnel reduction,increasing fault tolerance and a less cumbersome disasterrecovery (Nortel Networks, 2001).
Communication expenses are likely to increase as eitherdata or applications are centralized and could favourdecentralization to position data sources and applicationsclose to users (Nec, 2002). However, current trends innetwork technologies represent an enabling factor for amore centralized infrastructural design, through broad-band networks, such as Metropolitan Area Networks(MANs) and their connection with SAN and NAS systems.On the other hand, they also favour network scalability, asInternet-based virtual private networks make all-to-allconnections straightforward (Yuan and Strayer, 2001).Since, over time, the ratio of communication costs tocapacity has experienced continuous reductions, centrali-zation is broadly encouraged in the professional literaturealso from a network standpoint (Ishizuka et al., 1999).
Table 1 summarizes the infrastructural design alterna-tives that have been found to generate centralization–decentralization cost trade-offs and related research hy-potheses to be empirically verified. Current professionalguidelines generally recommend solutions to individualdesign alternatives that translate into an overall recentra-lization of hardware components (Molta, 1999b; Scheier,2001; Betts, 2002; IBM, 2002). However, most researchefforts addressing centralization–decentralization issueslack scientific rigour. Only a few academic studies haveattempted a more systematic analysis of cost issues ininfrastructural design (Gavish and Pirkul, 1986; Jain, 1987).It is interesting to note that previous academic contribu-tions have been initiated by the first wave of professionalstudies challenging the initial centralization design para-digm and promoting decentralization as a cost-minimizingalternative. In the past, both Gavish and Pirkul (1986) andJain (1987) have found that infrastructural design raisescomplex cost trade-offs that are difficult to provide generalsolutions. Similarly, the goal of this paper is to supportcost-oriented infrastructural design with a scientific ap-proach and verify current professional design guidelinessuggesting recentralization as a general paradigm for costminimization. Professional design guidelines will beconsidered as the research hypotheses of this paper to beempirically verified (Table 1).
A cost-oriented design approachFrom a methodological standpoint, revisiting centraliza-tion–decentralization trade-offs requires the representationof design alternatives in Table 1 as a single cost-minimization problem. This paper’s model draws fromJain (1987) the approach to the representation of infra-structural design alternatives as a single cost-minimizationproblem (see the section ‘Cost-minimization algorithm’).However, design variables and steps have been significantlyextended to account for the complexity of moderncomputer systems. Furthermore, this paper’s model pro-vides variables with a more complete representation that
allows the empirical evaluation of infrastructural costs, asdiscussed in the remainder of this section.
In this paper, LANs that connect different buildingswithin the same site are constrained to the extended-startopology and WANs are constrained to be connectedthrough an IP-based Virtual Private Network (VPN) (Yuanand Strayer, 2001). In this way, network design isperformed by sizing link capacity and taking into accountcorresponding costs. This provides a necessary input forthe evaluation of overall infrastructural costs and allowspreliminary analyses of the impact of network costs onhardware design choices.
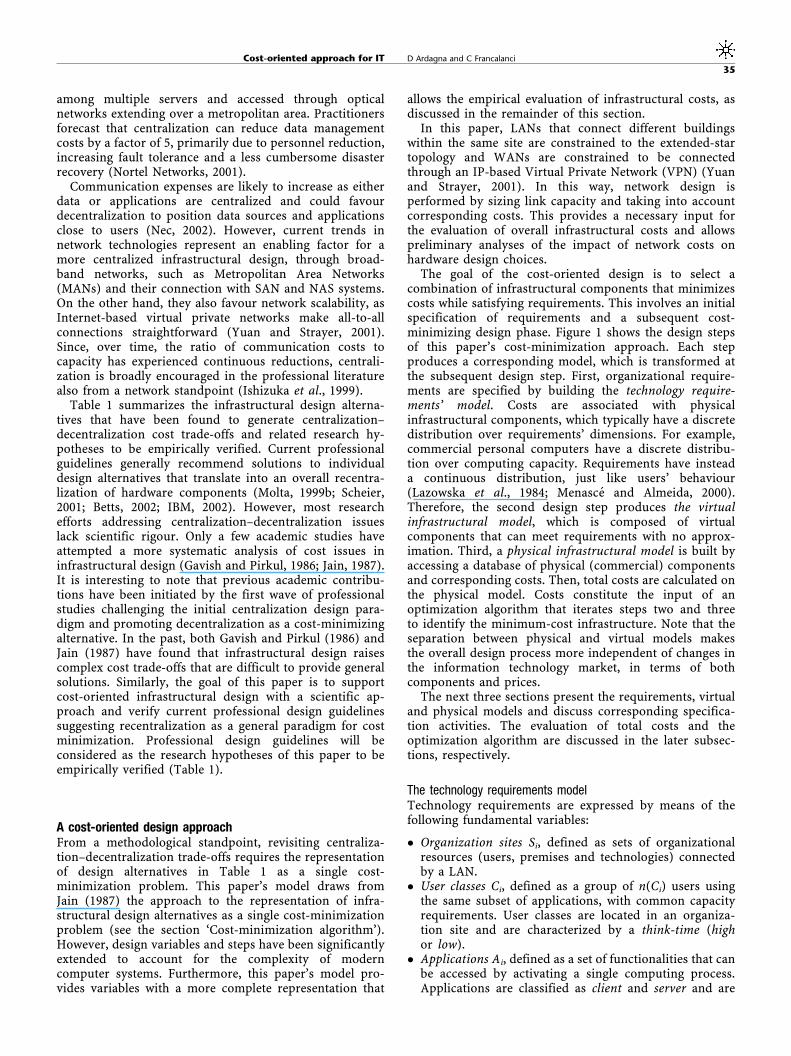
The goal of the cost-oriented design is to select acombination of infrastructural components that minimizescosts while satisfying requirements. This involves an initialspecification of requirements and a subsequent cost-minimizing design phase. Figure 1 shows the design stepsof this paper’s cost-minimization approach. Each stepproduces a corresponding model, which is transformed atthe subsequent design step. First, organizational require-ments are specified by building the technology require-ments’ model. Costs are associated with physicalinfrastructural components, which typically have a discretedistribution over requirements’ dimensions. For example,commercial personal computers have a discrete distribu-tion over computing capacity. Requirements have insteada continuous distribution, just like users’ behaviour(Lazowska et al., 1984; Menasce and Almeida, 2000).Therefore, the second design step produces the virtualinfrastructural model, which is composed of virtualcomponents that can meet requirements with no approx-imation. Third, a physical infrastructural model is built byaccessing a database of physical (commercial) componentsand corresponding costs. Then, total costs are calculated onthe physical model. Costs constitute the input of anoptimization algorithm that iterates steps two and threeto identify the minimum-cost infrastructure. Note that theseparation between physical and virtual models makesthe overall design process more independent of changes inthe information technology market, in terms of bothcomponents and prices.
The next three sections present the requirements, virtualand physical models and discuss corresponding specifica-tion activities. The evaluation of total costs and theoptimization algorithm are discussed in the later subsec-tions, respectively.
The technology requirements modelTechnology requirements are expressed by means of thefollowing fundamental variables:
� Organization sites Si, defined as sets of organizationalresources (users, premises and technologies) connectedby a LAN.
� User classes Ci, defined as a group of n(Ci) users usingthe same subset of applications, with common capacityrequirements. User classes are located in an organiza-tion site and are characterized by a think-time (highor low).
� Applications Ai, defined as a set of functionalities that canbe accessed by activating a single computing process.Applications are classified as client and server and are
Cost-oriented approach for IT D Ardagna and C Francalanci
35
characterized by computing and memory (primary andsecondary) requirements.
� Requests Ri, defined as interactions among applicationsaimed at exchanging services according to the client–server paradigm. Requests are characterized by theirfrequency, the set of supporting server applications,corresponding CPU and disk demanding times and dataexchanged for each request. Demanding times (i.e. theoverall time required to serve a single request) aresupposed to be evaluated on a tuning system (Lazowskaet al., 1984). This allows the estimate of demanding timeon a different system by means of benchmarking data(Menasce and Almeida, 2000). Requests can be initiated
from or directed to applications that do not belong to theorganization and, in this case, are called externalrequests, (for example a request directed to a serverapplication of a business partner connected through anExtranet).
� Databases Di, defined as separate sets of data that can beindependently stored, accessed and managed. Note thatDBMSs are supposed to be specified as server applica-tions and, accordingly, databases are simply described bythe size of secondary memory that they require.
A formal specification of technology requirements can befound in Ardagna and Francalanci (2002) and Ardagna et al.
Requirements
Sites Applications Userclasses
Requests Databases
Specification of a technology requirements' model
Step 1
Step 2
Step 3
Step 4
Step 5
Cost MinimizationConstraints on the virtual infrastructural model
Technology requirements' model
ClientTypology(Fat, Thinor hybrid)
Number of tires
Totalnumber
of servers
Allocationof
applications
Locationof servers
Design of a virtual infrastructural model
Virtualinfrastructuralmodel
Constraints on the physical infrastructural model
Inclusion ofspecificphysical
components
Design of a physical infrastructural model
physical infrastructural model
Evaluation of total costs
Optimization algorithm
Minimum-costphysicalinfrastructuralmodel
Figure 1 Design steps of the cost-minimization process.
Cost-oriented approach for IT D Ardagna and C Francalanci
36
(2003). The specification of sites and user classes is criticalto select network components during optimization.
Application tiers abide by the same technical definitionas applications and, accordingly, are specified as a set ofapplications exchanging requests and characterized by thesame operating system. Similarly, commercial programsmapping into multiple processes can be specified by meansof multiple applications.
Applications and requests are the main drivers of designchoices related to client and server computers. All users in auser class are supposed to use the same set of applicationswith a common think-time. Think-time is a qualitativeindicator of the frequency with which users interact withtheir client computers and is used in subsequent sizingactivities (see the following subsection and Microsoft,2000). Applications are classified as client, server orexternal. A server application can also play the role ofclient and convey requests to other server applications.Computing capacity requirements for client applicationsare expressed in MIPS (Jain, 1987; Francalanci and Piuri,1999). Irrespective of their allocation on a personalcomputer or on a server, client applications do not requirethe specification of secondary memory’s performancerequirements, since disks rarely represent a capacitybottleneck (Microsoft, 2000). MIPS and memory require-ments depend on the operating system and, in some cases,on the remote protocol and users’ think time (if think timeis low, usage of client applications is high and, accordingly,computing and memory requirements are also high). Onthe contrary, server applications require the evaluation ofresponse time (Lazowska et al., 1984; Menasce andAlmeida, 2000) and, accordingly, requests are characterizedby CPU and disk demanding times. Demanding times aredefined for a reference tuning system (see Appendix A).Note that in the physical model, applications will beassigned to physical machines belonging to the same familyof tuning systems, which are machines with the sameoperating system, processor and disk technology. Thisallows the prediction of demanding time from benchmark-ing data.
Requests are initiated by a client or external applicationand are answered by one or multiple server applications. Ifmultiple server applications are involved, they coordinateby triggering one another in a sequence and build theresponse incrementally according to the client–serverparadigm. The first server application directly triggeredby the client or external application is in charge ofconveying the response to the requesting application.
Overall our technology requirements is grounded onperformance evaluation models (Lazowska et al., 1984;Menasce and Almeida, 2000), but introduces a broader setof variables, specifically user classes and sites, in order toevaluate the TCO of the system. The details of the model arereported in Tables A1 and A2 of Appendix A.
The virtual infrastructural modelThe goal of this design step is to build a virtualinfrastructure satisfying technology requirements underthe assumption that infrastructural components can meetrequirements with no approximation. The following virtualcomponents are considered during infrastructural design:
1. Virtual servers (VSi) – These servers represent computersthat execute at least one server application for one userclass. They are described by their primary and secondarymemory and by the frequency of requests that they serve.The frequency of requests is used to evaluate thecomputing capacity of servers during physical design.
2. Virtual thin servers (VTSi) and virtual HFC servers(VHFCSi) – These servers represent computers thatexecute at least one client application for one user classassigned to thin or HFC clients. They are described bytheir computing capacity, primary and secondarymemory.
3. Virtual thin clients (VTCi) – These represent clientcomputers that execute or emulate only the presentationcomponent of applications. For the sake of simplicity thinclients are not sized, but simply associated with users.
4. Virtual fat clients (VFCi) and HFCs (VHFCi) – Theserepresent client computers that execute at least oneclient application. They are described by their comput-ing capacity, primary and secondary memory.
5. Virtual Storage Area Networks (VSANi) – A VSANrepresents a virtual SAN fabric, that is a set of opticalswitches and hubs, and a corresponding set of virtualstorage devices which allow virtual servers located in thesame site to share disks (Ward et al., 2002).
An infrastructural model is built by associating technol-ogy requirements with virtual components. In general, atechnology requirements’ model can be associated withmultiple virtual infrastructural models depending on designchoices on infrastructural alternatives. For example,different groups of applications can be assigned to thesame virtual server and different groups of user classes canbe assigned to the same virtual thin/HFC server. If thecardinality of a group is n, 2n�1 different allocations ofapplications or user classes can be created (that is, thegroup’s power set, excluding the empty set) and accord-ingly 2n�1 virtual infrastructural models can be defined.
An initial virtual infrastructural model is built and thentransformed into a physical model that represents theinitial solution of the optimization algorithm (see ‘Cost-minimization algorithm’ section). The initial virtual infra-structural model is built according to the following rules:
1. Each user class Ci is assigned n(Ci) virtual clients of thelightest type, according to the following order: thinclients, HFCs and PCs. Thin clients are consideredlighter than HFCs and PCs since they have lowercomputing capacity. HFCs are considered lighter thanPCs since they delegate the execution of a subset ofapplications to servers. Each fat client is assumed toexecute all client applications used by Ci. Each class Ci
that has been assigned thin clients is also assigned aVTSi, which is assumed to execute all client applicationsused by Ci. Each class Ci that has been assigned a hybridfat client is also assigned a virtual HFC server and clientapplications that can be indifferently executed on clientsor servers are assigned to HFCs.
2. Requests are implemented with the highest number oftiers, that is by assigning a virtual server to eachapplication involved in responding to the request,without introducing server farms.
Cost-oriented approach for IT D Ardagna and C Francalanci
37
3. Virtual servers are located at the site of the user class Ci
that maximizes the total frequency of both inbound andoutbound requests of the corresponding application tier.
4. All VTSi’s and HFC servers are located at the same site,within the same building and on the same floor as theiruser class.
5. All virtual servers have a local disk, that is, SANs are notintroduced.
Intuitively, rules 1–5 implement the professional designguidelines discussed in an earlier section. The optimizationalgorithm discussed in ‘Cost-minimization algorithm’section is in charge of changing these initial designdecisions to reduce costs.
Both the initial virtual infrastructural model andsubsequent models generated by the optimization algo-rithm are sized by accounting for the computingrequirements of all user classes, as described in AppendixB. Sizing rules of Appendix B generate infrastructuralcomponents that meet requirements with no approxima-tion (see also (Ardagna and Francalanci, 2002; Ardagnaet al., 2003)).
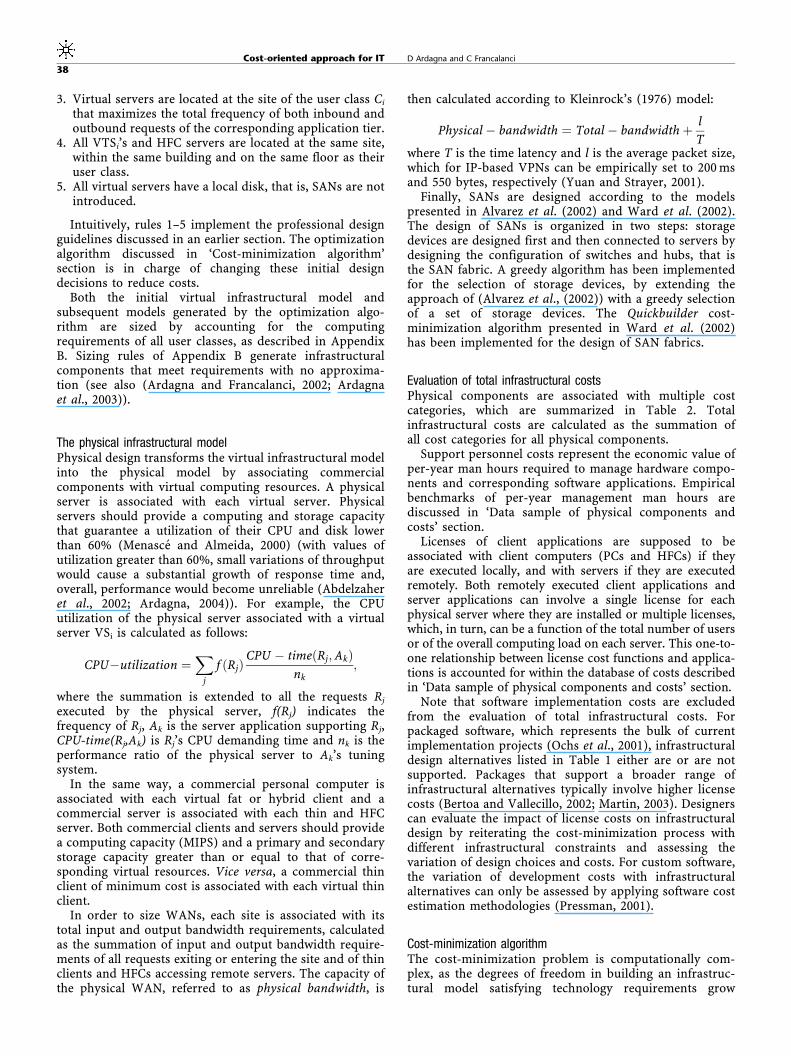
The physical infrastructural modelPhysical design transforms the virtual infrastructural modelinto the physical model by associating commercialcomponents with virtual computing resources. A physicalserver is associated with each virtual server. Physicalservers should provide a computing and storage capacitythat guarantee a utilization of their CPU and disk lowerthan 60% (Menasce and Almeida, 2000) (with values ofutilization greater than 60%, small variations of throughputwould cause a substantial growth of response time and,overall, performance would become unreliable (Abdelzaheret al., 2002; Ardagna, 2004)). For example, the CPUutilization of the physical server associated with a virtualserver VSi is calculated as follows:
CPU�utilization ¼X
j
f ðRjÞCPU � timeðRj;AkÞ
nk;
where the summation is extended to all the requests Rj
executed by the physical server, f(Rj) indicates thefrequency of Rj, Ak is the server application supporting Rj,CPU-time(Rj,Ak) is Rj’s CPU demanding time and nk is theperformance ratio of the physical server to Ak’s tuningsystem.
In the same way, a commercial personal computer isassociated with each virtual fat or hybrid client and acommercial server is associated with each thin and HFCserver. Both commercial clients and servers should providea computing capacity (MIPS) and a primary and secondarystorage capacity greater than or equal to that of corre-sponding virtual resources. Vice versa, a commercial thinclient of minimum cost is associated with each virtual thinclient.
In order to size WANs, each site is associated with itstotal input and output bandwidth requirements, calculatedas the summation of input and output bandwidth require-ments of all requests exiting or entering the site and of thinclients and HFCs accessing remote servers. The capacity ofthe physical WAN, referred to as physical bandwidth, is
then calculated according to Kleinrock’s (1976) model:
Physical � bandwidth ¼ Total � bandwidth þ l
Twhere T is the time latency and l is the average packet size,which for IP-based VPNs can be empirically set to 200 msand 550 bytes, respectively (Yuan and Strayer, 2001).
Finally, SANs are designed according to the modelspresented in Alvarez et al. (2002) and Ward et al. (2002).The design of SANs is organized in two steps: storagedevices are designed first and then connected to servers bydesigning the configuration of switches and hubs, that isthe SAN fabric. A greedy algorithm has been implementedfor the selection of storage devices, by extending theapproach of (Alvarez et al., (2002)) with a greedy selectionof a set of storage devices. The Quickbuilder cost-minimization algorithm presented in Ward et al. (2002)has been implemented for the design of SAN fabrics.
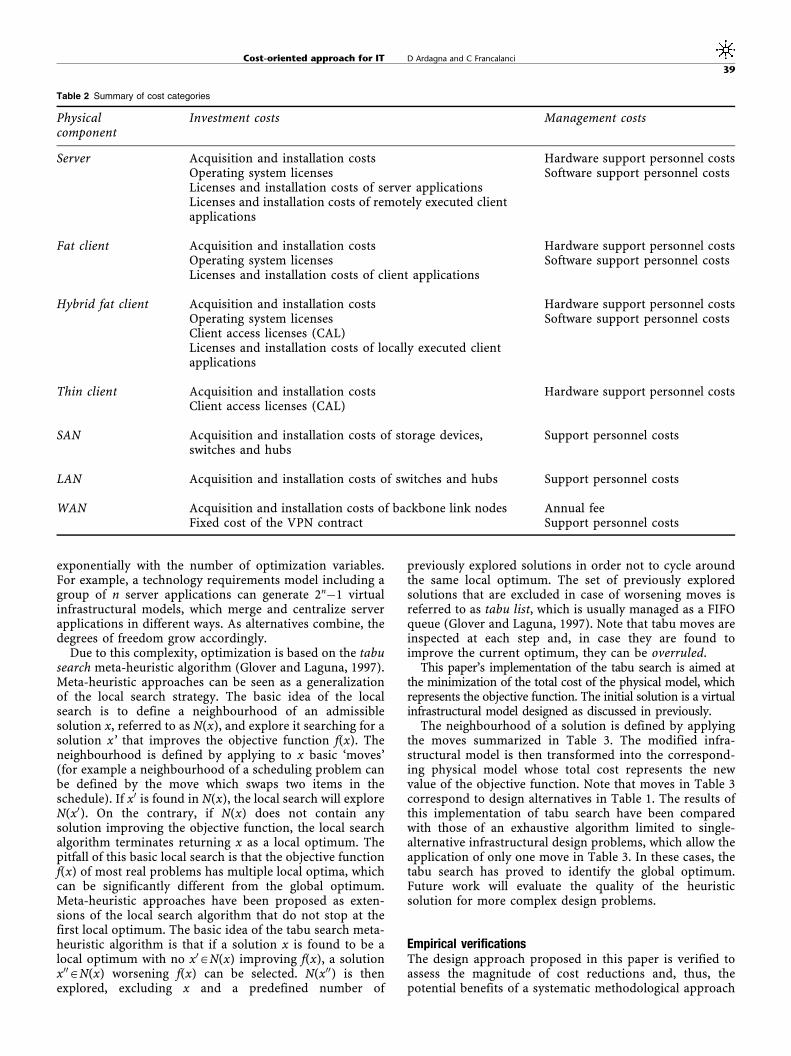
Evaluation of total infrastructural costsPhysical components are associated with multiple costcategories, which are summarized in Table 2. Totalinfrastructural costs are calculated as the summation ofall cost categories for all physical components.
Support personnel costs represent the economic value ofper-year man hours required to manage hardware compo-nents and corresponding software applications. Empiricalbenchmarks of per-year management man hours arediscussed in ‘Data sample of physical components andcosts’ section.
Licenses of client applications are supposed to beassociated with client computers (PCs and HFCs) if theyare executed locally, and with servers if they are executedremotely. Both remotely executed client applications andserver applications can involve a single license for eachphysical server where they are installed or multiple licenses,which, in turn, can be a function of the total number of usersor of the overall computing load on each server. This one-to-one relationship between license cost functions and applica-tions is accounted for within the database of costs describedin ‘Data sample of physical components and costs’ section.
Note that software implementation costs are excludedfrom the evaluation of total infrastructural costs. Forpackaged software, which represents the bulk of currentimplementation projects (Ochs et al., 2001), infrastructuraldesign alternatives listed in Table 1 either are or are notsupported. Packages that support a broader range ofinfrastructural alternatives typically involve higher licensecosts (Bertoa and Vallecillo, 2002; Martin, 2003). Designerscan evaluate the impact of license costs on infrastructuraldesign by reiterating the cost-minimization process withdifferent infrastructural constraints and assessing thevariation of design choices and costs. For custom software,the variation of development costs with infrastructuralalternatives can only be assessed by applying software costestimation methodologies (Pressman, 2001).
Cost-minimization algorithmThe cost-minimization problem is computationally com-plex, as the degrees of freedom in building an infrastruc-tural model satisfying technology requirements grow
Cost-oriented approach for IT D Ardagna and C Francalanci
38
exponentially with the number of optimization variables.For example, a technology requirements model including agroup of n server applications can generate 2n�1 virtualinfrastructural models, which merge and centralize serverapplications in different ways. As alternatives combine, thedegrees of freedom grow accordingly.
Due to this complexity, optimization is based on the tabusearch meta-heuristic algorithm (Glover and Laguna, 1997).Meta-heuristic approaches can be seen as a generalizationof the local search strategy. The basic idea of the localsearch is to define a neighbourhood of an admissiblesolution x, referred to as N(x), and explore it searching for asolution x’ that improves the objective function f(x). Theneighbourhood is defined by applying to x basic ‘moves’(for example a neighbourhood of a scheduling problem canbe defined by the move which swaps two items in theschedule). If x0 is found in N(x), the local search will exploreN(x0). On the contrary, if N(x) does not contain anysolution improving the objective function, the local searchalgorithm terminates returning x as a local optimum. Thepitfall of this basic local search is that the objective functionf(x) of most real problems has multiple local optima, whichcan be significantly different from the global optimum.Meta-heuristic approaches have been proposed as exten-sions of the local search algorithm that do not stop at thefirst local optimum. The basic idea of the tabu search meta-heuristic algorithm is that if a solution x is found to be alocal optimum with no x0AN(x) improving f(x), a solutionx00AN(x) worsening f(x) can be selected. N(x00) is thenexplored, excluding x and a predefined number of
previously explored solutions in order not to cycle aroundthe same local optimum. The set of previously exploredsolutions that are excluded in case of worsening moves isreferred to as tabu list, which is usually managed as a FIFOqueue (Glover and Laguna, 1997). Note that tabu moves areinspected at each step and, in case they are found toimprove the current optimum, they can be overruled.
This paper’s implementation of the tabu search is aimed atthe minimization of the total cost of the physical model, whichrepresents the objective function. The initial solution is a virtualinfrastructural model designed as discussed in previously.
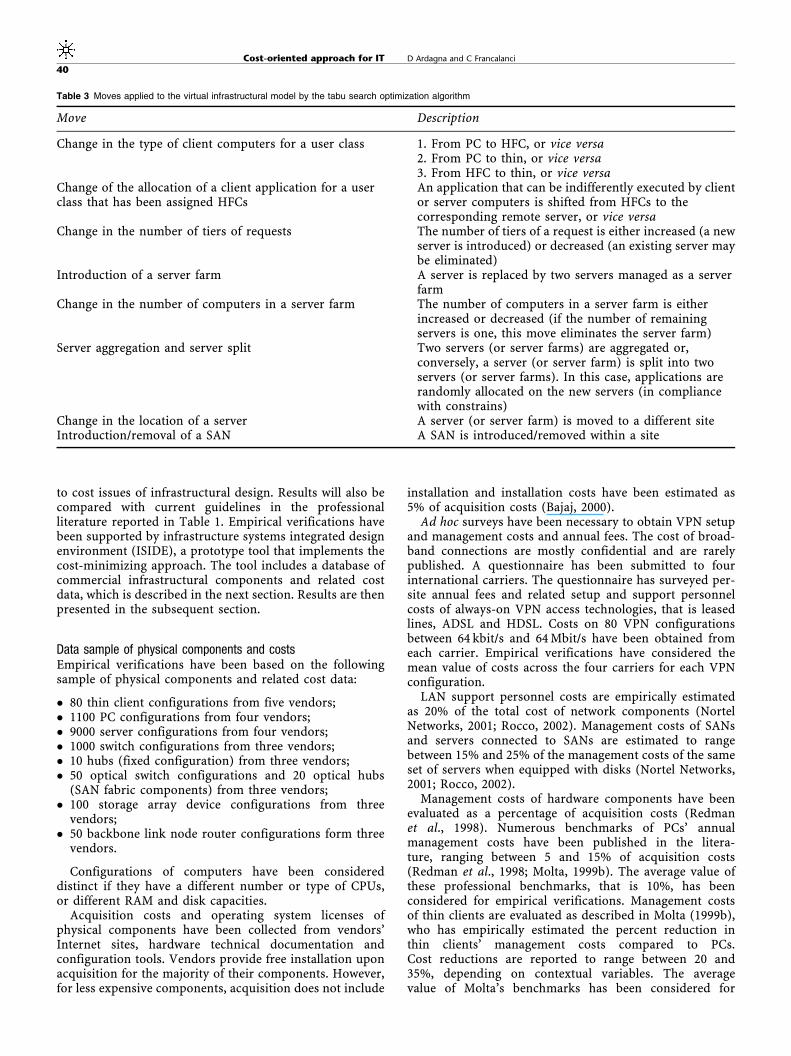
The neighbourhood of a solution is defined by applyingthe moves summarized in Table 3. The modified infra-structural model is then transformed into the correspond-ing physical model whose total cost represents the newvalue of the objective function. Note that moves in Table 3correspond to design alternatives in Table 1. The results ofthis implementation of tabu search have been comparedwith those of an exhaustive algorithm limited to single-alternative infrastructural design problems, which allow theapplication of only one move in Table 3. In these cases, thetabu search has proved to identify the global optimum.Future work will evaluate the quality of the heuristicsolution for more complex design problems.
Empirical verificationsThe design approach proposed in this paper is verified toassess the magnitude of cost reductions and, thus, thepotential benefits of a systematic methodological approach
Table 2 Summary of cost categories
Physicalcomponent
Investment costs Management costs
Server Acquisition and installation costs Hardware support personnel costsOperating system licenses Software support personnel costsLicenses and installation costs of server applicationsLicenses and installation costs of remotely executed clientapplications
Fat client Acquisition and installation costs Hardware support personnel costsOperating system licenses Software support personnel costsLicenses and installation costs of client applications
Hybrid fat client Acquisition and installation costs Hardware support personnel costsOperating system licenses Software support personnel costsClient access licenses (CAL)Licenses and installation costs of locally executed clientapplications
Thin client Acquisition and installation costs Hardware support personnel costsClient access licenses (CAL)
SAN Acquisition and installation costs of storage devices,switches and hubs
Support personnel costs
LAN Acquisition and installation costs of switches and hubs Support personnel costs
WAN Acquisition and installation costs of backbone link nodes Annual feeFixed cost of the VPN contract Support personnel costs
Cost-oriented approach for IT D Ardagna and C Francalanci
39
to cost issues of infrastructural design. Results will also becompared with current guidelines in the professionalliterature reported in Table 1. Empirical verifications havebeen supported by infrastructure systems integrated designenvironment (ISIDE), a prototype tool that implements thecost-minimizing approach. The tool includes a database ofcommercial infrastructural components and related costdata, which is described in the next section. Results are thenpresented in the subsequent section.
Data sample of physical components and costsEmpirical verifications have been based on the followingsample of physical components and related cost data:
� 80 thin client configurations from five vendors;� 1100 PC configurations from four vendors;� 9000 server configurations from four vendors;� 1000 switch configurations from three vendors;� 10 hubs (fixed configuration) from three vendors;� 50 optical switch configurations and 20 optical hubs
(SAN fabric components) from three vendors;� 100 storage array device configurations from three
vendors;� 50 backbone link node router configurations form three
vendors.
Configurations of computers have been considereddistinct if they have a different number or type of CPUs,or different RAM and disk capacities.
Acquisition costs and operating system licenses ofphysical components have been collected from vendors’Internet sites, hardware technical documentation andconfiguration tools. Vendors provide free installation uponacquisition for the majority of their components. However,for less expensive components, acquisition does not include
installation and installation costs have been estimated as5% of acquisition costs (Bajaj, 2000).
Ad hoc surveys have been necessary to obtain VPN setupand management costs and annual fees. The cost of broad-band connections are mostly confidential and are rarelypublished. A questionnaire has been submitted to fourinternational carriers. The questionnaire has surveyed per-site annual fees and related setup and support personnelcosts of always-on VPN access technologies, that is leasedlines, ADSL and HDSL. Costs on 80 VPN configurationsbetween 64 kbit/s and 64 Mbit/s have been obtained fromeach carrier. Empirical verifications have considered themean value of costs across the four carriers for each VPNconfiguration.
LAN support personnel costs are empirically estimatedas 20% of the total cost of network components (NortelNetworks, 2001; Rocco, 2002). Management costs of SANsand servers connected to SANs are estimated to rangebetween 15% and 25% of the management costs of the sameset of servers when equipped with disks (Nortel Networks,2001; Rocco, 2002).
Management costs of hardware components have beenevaluated as a percentage of acquisition costs (Redmanet al., 1998). Numerous benchmarks of PCs’ annualmanagement costs have been published in the litera-ture, ranging between 5 and 15% of acquisition costs(Redman et al., 1998; Molta, 1999b). The average value ofthese professional benchmarks, that is 10%, has beenconsidered for empirical verifications. Management costsof thin clients are evaluated as described in Molta (1999b),who has empirically estimated the percent reduction inthin clients’ management costs compared to PCs.Cost reductions are reported to range between 20 and35%, depending on contextual variables. The averagevalue of Molta’s benchmarks has been considered for
Table 3 Moves applied to the virtual infrastructural model by the tabu search optimization algorithm
Move Description
Change in the type of client computers for a user class 1. From PC to HFC, or vice versa2. From PC to thin, or vice versa3. From HFC to thin, or vice versa
Change of the allocation of a client application for a userclass that has been assigned HFCs
An application that can be indifferently executed by clientor server computers is shifted from HFCs to thecorresponding remote server, or vice versa
Change in the number of tiers of requests The number of tiers of a request is either increased (a newserver is introduced) or decreased (an existing server maybe eliminated)
Introduction of a server farm A server is replaced by two servers managed as a serverfarm
Change in the number of computers in a server farm The number of computers in a server farm is eitherincreased or decreased (if the number of remainingservers is one, this move eliminates the server farm)
Server aggregation and server split Two servers (or server farms) are aggregated or,conversely, a server (or server farm) is split into twoservers (or server farms). In this case, applications arerandomly allocated on the new servers (in compliancewith constrains)
Change in the location of a server A server (or server farm) is moved to a different siteIntroduction/removal of a SAN A SAN is introduced/removed within a site
Cost-oriented approach for IT D Ardagna and C Francalanci
40
empirical verifications (see also Schlegel, 2002). In the caseof hybrid fat clients, this reduction percentage is supposedto decrease as the fraction of locally executed applicationsincreases. Annual management costs of servers have beenestimated as in Meta Group (1999) and Redman et al.(1998), ranging from 15 to 25%. Once again, the variabilityacross empirical benchmarks has been resolved byconsidering the average 20% benchmark for empiricalverifications. Note that management costs have beencorrected for inflation and measured at the same time(year 2003).
The database of costs also includes license, installationand management costs of the following applications:
� Client applications: Lotus Notes, Office 2000, Word-perfect suite. License costs have been obtained frompublic sources of information, mostly vendors’ Internetsites. Installation and management costs have beenestimated as 5 and 15% of total license costs, respect-ively, as in (Redman et al., 1998, see also GroupeTecna, 2002).
� Server applications: Apache, DB2, Internet InformationServer, iPlanet Application and Web servers, Oracle, SQLServer, Stronghold Web server, Tomcat, Web Sphere,Zeus Web server.
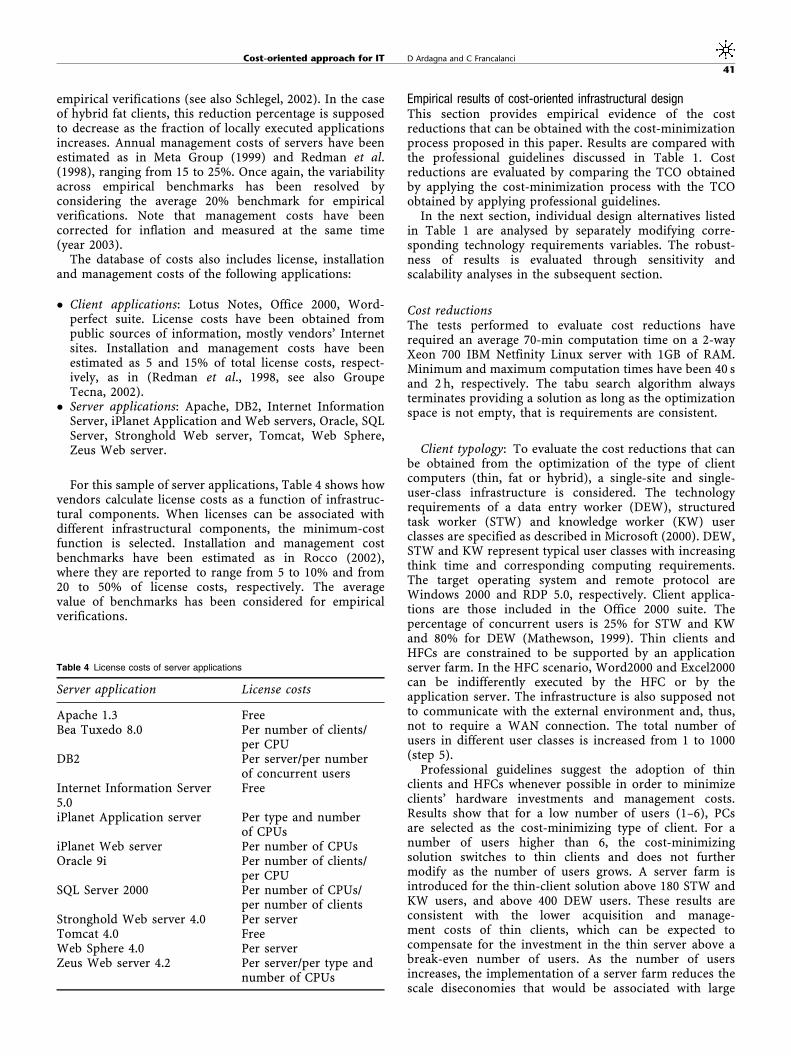
For this sample of server applications, Table 4 shows howvendors calculate license costs as a function of infrastruc-tural components. When licenses can be associated withdifferent infrastructural components, the minimum-costfunction is selected. Installation and management costbenchmarks have been estimated as in Rocco (2002),where they are reported to range from 5 to 10% and from20 to 50% of license costs, respectively. The averagevalue of benchmarks has been considered for empiricalverifications.
Empirical results of cost-oriented infrastructural designThis section provides empirical evidence of the costreductions that can be obtained with the cost-minimizationprocess proposed in this paper. Results are compared withthe professional guidelines discussed in Table 1. Costreductions are evaluated by comparing the TCO obtainedby applying the cost-minimization process with the TCOobtained by applying professional guidelines.
In the next section, individual design alternatives listedin Table 1 are analysed by separately modifying corre-sponding technology requirements variables. The robust-ness of results is evaluated through sensitivity andscalability analyses in the subsequent section.
Cost reductionsThe tests performed to evaluate cost reductions haverequired an average 70-min computation time on a 2-wayXeon 700 IBM Netfinity Linux server with 1GB of RAM.Minimum and maximum computation times have been 40 sand 2 h, respectively. The tabu search algorithm alwaysterminates providing a solution as long as the optimizationspace is not empty, that is requirements are consistent.
Client typology: To evaluate the cost reductions that canbe obtained from the optimization of the type of clientcomputers (thin, fat or hybrid), a single-site and single-user-class infrastructure is considered. The technologyrequirements of a data entry worker (DEW), structuredtask worker (STW) and knowledge worker (KW) userclasses are specified as described in Microsoft (2000). DEW,STW and KW represent typical user classes with increasingthink time and corresponding computing requirements.The target operating system and remote protocol areWindows 2000 and RDP 5.0, respectively. Client applica-tions are those included in the Office 2000 suite. Thepercentage of concurrent users is 25% for STW and KWand 80% for DEW (Mathewson, 1999). Thin clients andHFCs are constrained to be supported by an applicationserver farm. In the HFC scenario, Word2000 and Excel2000can be indifferently executed by the HFC or by theapplication server. The infrastructure is also supposed notto communicate with the external environment and, thus,not to require a WAN connection. The total number ofusers in different user classes is increased from 1 to 1000(step 5).
Professional guidelines suggest the adoption of thinclients and HFCs whenever possible in order to minimizeclients’ hardware investments and management costs.Results show that for a low number of users (1–6), PCsare selected as the cost-minimizing type of client. For anumber of users higher than 6, the cost-minimizingsolution switches to thin clients and does not furthermodify as the number of users grows. A server farm isintroduced for the thin-client solution above 180 STW andKW users, and above 400 DEW users. These results areconsistent with the lower acquisition and manage-ment costs of thin clients, which can be expected tocompensate for the investment in the thin server above abreak-even number of users. As the number of usersincreases, the implementation of a server farm reduces thescale diseconomies that would be associated with large
Table 4 License costs of server applications
Server application License costs
Apache 1.3 FreeBea Tuxedo 8.0 Per number of clients/
per CPUDB2 Per server/per number
of concurrent usersInternet Information Server5.0
Free
iPlanet Application server Per type and numberof CPUs
iPlanet Web server Per number of CPUsOracle 9i Per number of clients/
per CPUSQL Server 2000 Per number of CPUs/
per number of clientsStronghold Web server 4.0 Per serverTomcat 4.0 FreeWeb Sphere 4.0 Per serverZeus Web server 4.2 Per server/per type and
number of CPUs
Cost-oriented approach for IT D Ardagna and C Francalanci
41
servers and makes the thin-client solution steadily con-venient. Break-even values are consistent with the profes-sional literature (Precision Group, 2002). As a consequence,cost reductions from the application of the design approachare low, 2% on average and, overall, the professionalguideline for the client typology alternative is confirmed(Table 1).
It is interesting to note that TCO savings from theadoption of HFCs as opposed to PCs range between 2 and5%. This low value contradicts previous results in theprofessional literature, which presents HFCs as a potentialsource of significant cost reductions, related to manage-ment savings from the remote execution of applications(Molta, 1999b). On the contrary, results from the metho-dological solution show that TCO reductions for the remoteexecution of applications are marginal (the bulk of TCO isdue to hardware and management costs of client applica-tions installed on HFCs).
Total number of servers in a server farm: Applica-tion servers and thin-client servers are separately ana-lysed. Both analyses refer to a single-site infrastructure. Inboth cases, a single server application and a single thin-client server is considered, in order to avoid the serversharing alternative and focus on a single server farm.Professional design guidelines indicate to implement serverfarms whenever possible and to select the smallest serverthat can support applications in order to minimizehardware acquisition costs (‘build small’ paradigm, seeTable 1).
In the optimization of application server farms, two typesof server applications are considered: Internet InformationServer on a Windows 2000 system and Apache on a Sunsystem. Requests are supposed to be external. Thefrequency of requests increases from 0.01 to 37.0 req/s,with step 0.01, demanding times are 0.5 and 0.4 s evaluatedon a PIII 550 Raid-5 Ultra SCSI and on an Ultra SparcII450 Raid-0 Ultra SCSI tuning system. Average costreductions are 29.51 and 53.15%, in the IIS and Apachecase, respectively. The empirical design rule, which suggeststhe selection of smallest server supporting applications,is a cost-minimizing criterion in only 5% of all tests.The solutions provided by the tabu-search algorithmadopt mid-range servers with powerful processors whichreduce the number of installed computers and operatingsystem costs.
Thin-client server farms are analysed for STW, KW andDEW users. The number of users is increased from 5 to2000, with a 5-user step. The optimization process deliversa low average cost reduction, 1.77, 0.65 and 0.24% for STW,KW and DEW, respectively, since the bulk of TCO is due toclient management costs, which cannot be further reducedthrough optimization. However, these low percent savingson TCO correspond to a 94.4, 61.05 and 20.6% reduction ofserver hardware costs. Results suggest the implementationof server farms according to the ‘build mall’ paradigm onlyfor DEW users while STW and KW should be supported bymid-range servers.
Number of tiers: A single-site infrastructure is consid-ered. Users generate requests (R) from a browser anddynamic HTML pages are generated through the coopera-tion among four server applications: a Web server (IIS), aServlet engine (Tomcat), an application server (WebSphere4) and a DBMS (SQL Server). Demanding times areevaluated on a W2000, PIII 550, RAID-5 Ultra SCSI tuningsystem. Requirements for RAM and demanding times aretypical for Internet/Intranet applications (Fiser, 2000).
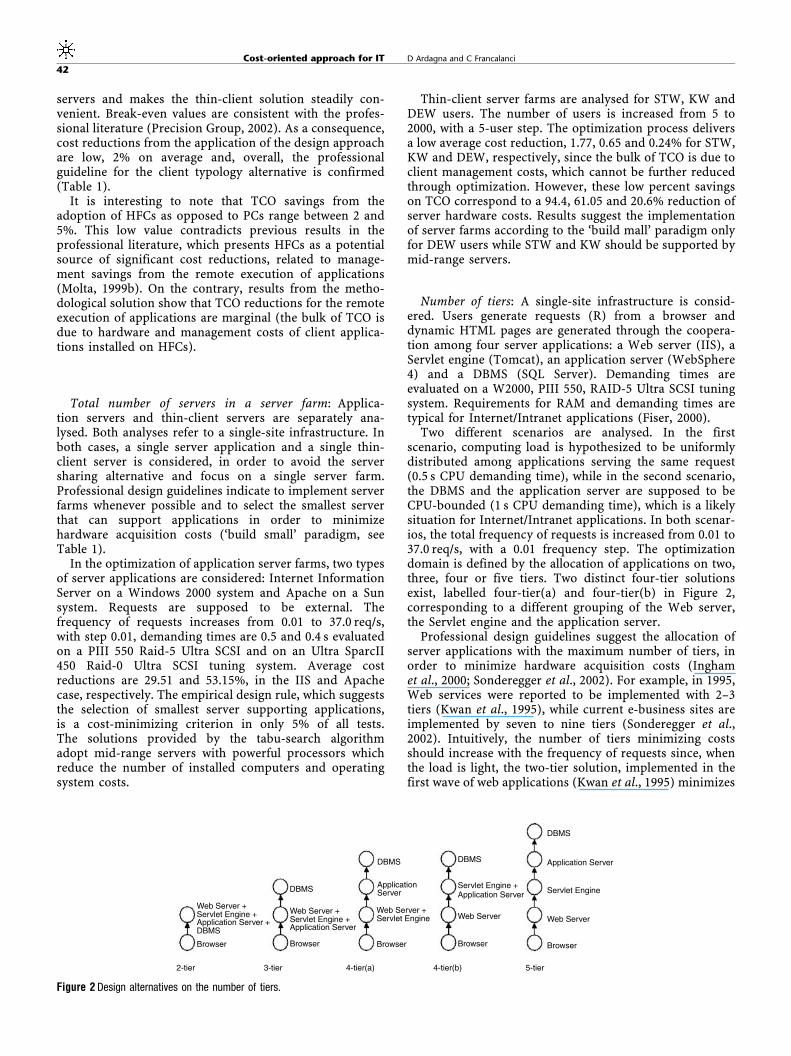
Two different scenarios are analysed. In the firstscenario, computing load is hypothesized to be uniformlydistributed among applications serving the same request(0.5 s CPU demanding time), while in the second scenario,the DBMS and the application server are supposed to beCPU-bounded (1 s CPU demanding time), which is a likelysituation for Internet/Intranet applications. In both scenar-ios, the total frequency of requests is increased from 0.01 to37.0 req/s, with a 0.01 frequency step. The optimizationdomain is defined by the allocation of applications on two,three, four or five tiers. Two distinct four-tier solutionsexist, labelled four-tier(a) and four-tier(b) in Figure 2,corresponding to a different grouping of the Web server,the Servlet engine and the application server.
Professional design guidelines suggest the allocation ofserver applications with the maximum number of tiers, inorder to minimize hardware acquisition costs (Inghamet al., 2000; Sonderegger et al., 2002). For example, in 1995,Web services were reported to be implemented with 2–3tiers (Kwan et al., 1995), while current e-business sites areimplemented by seven to nine tiers (Sonderegger et al.,2002). Intuitively, the number of tiers minimizing costsshould increase with the frequency of requests since, whenthe load is light, the two-tier solution, implemented in thefirst wave of web applications (Kwan et al., 1995) minimizes
Web Server +Servlet Engine +Application Server +
Web Server +Web Server Web Server Servlet Engine +
Web Server +Servlet Engine
Servlet Engine +Servlet Engine
Application Server
Application Server Application Server
Application Server
DBMS
DBMS
DBMS DBMS
DBMS
Browser Browser Browser Browser Browser
2-tier 3-tier 4-tier(b)4-tier(a) 5-tier
Figure 2 Design alternatives on the number of tiers.
Cost-oriented approach for IT D Ardagna and C Francalanci
42
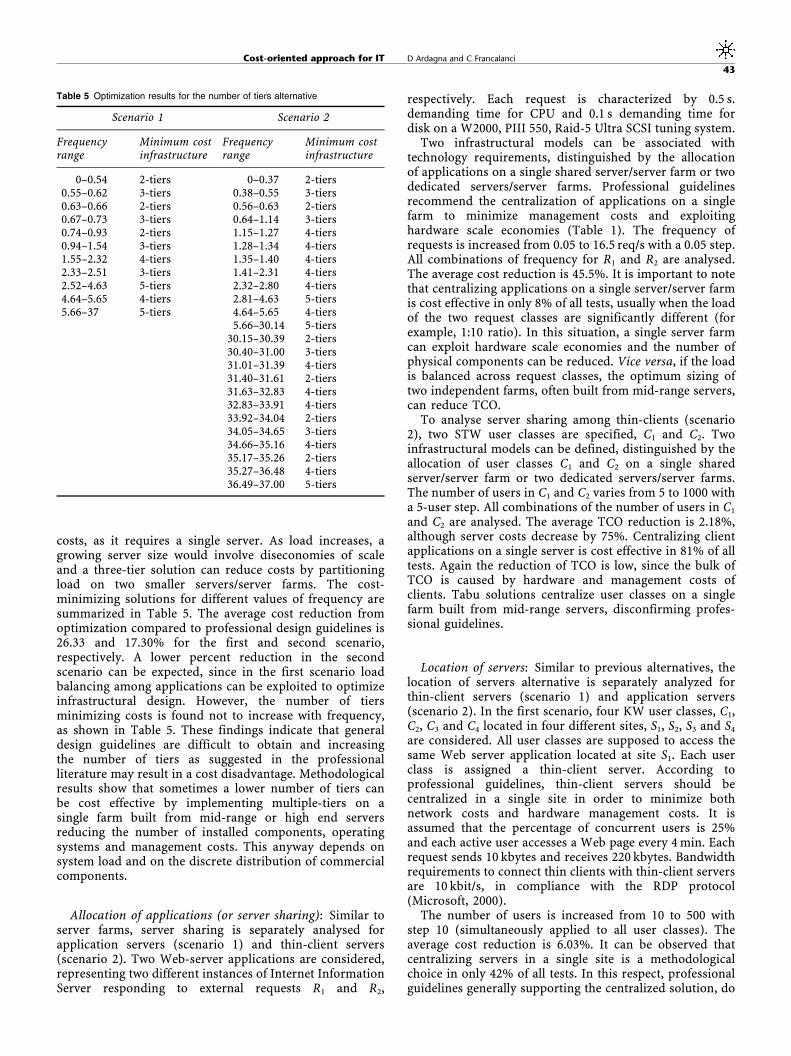
costs, as it requires a single server. As load increases, agrowing server size would involve diseconomies of scaleand a three-tier solution can reduce costs by partitioningload on two smaller servers/server farms. The cost-minimizing solutions for different values of frequency aresummarized in Table 5. The average cost reduction fromoptimization compared to professional design guidelines is26.33 and 17.30% for the first and second scenario,respectively. A lower percent reduction in the secondscenario can be expected, since in the first scenario loadbalancing among applications can be exploited to optimizeinfrastructural design. However, the number of tiersminimizing costs is found not to increase with frequency,as shown in Table 5. These findings indicate that generaldesign guidelines are difficult to obtain and increasingthe number of tiers as suggested in the professionalliterature may result in a cost disadvantage. Methodologicalresults show that sometimes a lower number of tiers canbe cost effective by implementing multiple-tiers on asingle farm built from mid-range or high end serversreducing the number of installed components, operatingsystems and management costs. This anyway depends onsystem load and on the discrete distribution of commercialcomponents.
Allocation of applications (or server sharing): Similar toserver farms, server sharing is separately analysed forapplication servers (scenario 1) and thin-client servers(scenario 2). Two Web-server applications are considered,representing two different instances of Internet InformationServer responding to external requests R1 and R2,
respectively. Each request is characterized by 0.5 s.demanding time for CPU and 0.1 s demanding time fordisk on a W2000, PIII 550, Raid-5 Ultra SCSI tuning system.
Two infrastructural models can be associated withtechnology requirements, distinguished by the allocationof applications on a single shared server/server farm or twodedicated servers/server farms. Professional guidelinesrecommend the centralization of applications on a singlefarm to minimize management costs and exploitinghardware scale economies (Table 1). The frequency ofrequests is increased from 0.05 to 16.5 req/s with a 0.05 step.All combinations of frequency for R1 and R2 are analysed.The average cost reduction is 45.5%. It is important to notethat centralizing applications on a single server/server farmis cost effective in only 8% of all tests, usually when the loadof the two request classes are significantly different (forexample, 1:10 ratio). In this situation, a single server farmcan exploit hardware scale economies and the number ofphysical components can be reduced. Vice versa, if the loadis balanced across request classes, the optimum sizing oftwo independent farms, often built from mid-range servers,can reduce TCO.
To analyse server sharing among thin-clients (scenario2), two STW user classes are specified, C1 and C2. Twoinfrastructural models can be defined, distinguished by theallocation of user classes C1 and C2 on a single sharedserver/server farm or two dedicated servers/server farms.The number of users in C1 and C2 varies from 5 to 1000 witha 5-user step. All combinations of the number of users in C1
and C2 are analysed. The average TCO reduction is 2.18%,although server costs decrease by 75%. Centralizing clientapplications on a single server is cost effective in 81% of alltests. Again the reduction of TCO is low, since the bulk ofTCO is caused by hardware and management costs ofclients. Tabu solutions centralize user classes on a singlefarm built from mid-range servers, disconfirming profes-sional guidelines.
Location of servers: Similar to previous alternatives, thelocation of servers alternative is separately analyzed forthin-client servers (scenario 1) and application servers(scenario 2). In the first scenario, four KW user classes, C1,C2, C3 and C4 located in four different sites, S1, S2, S3 and S4
are considered. All user classes are supposed to access thesame Web server application located at site S1. Each userclass is assigned a thin-client server. According toprofessional guidelines, thin-client servers should becentralized in a single site in order to minimize bothnetwork costs and hardware management costs. It isassumed that the percentage of concurrent users is 25%and each active user accesses a Web page every 4 min. Eachrequest sends 10 kbytes and receives 220 kbytes. Bandwidthrequirements to connect thin clients with thin-client serversare 10 kbit/s, in compliance with the RDP protocol(Microsoft, 2000).
The number of users is increased from 10 to 500 withstep 10 (simultaneously applied to all user classes). Theaverage cost reduction is 6.03%. It can be observed thatcentralizing servers in a single site is a methodologicalchoice in only 42% of all tests. In this respect, professionalguidelines generally supporting the centralized solution, do
Table 5 Optimization results for the number of tiers alternative
Scenario 1 Scenario 2
Frequencyrange
Minimum costinfrastructure
Frequencyrange
Minimum costinfrastructure
0–0.54 2-tiers 0–0.37 2-tiers0.55–0.62 3-tiers 0.38–0.55 3-tiers0.63–0.66 2-tiers 0.56–0.63 2-tiers0.67–0.73 3-tiers 0.64–1.14 3-tiers0.74–0.93 2-tiers 1.15–1.27 4-tiers0.94–1.54 3-tiers 1.28–1.34 4-tiers1.55–2.32 4-tiers 1.35–1.40 4-tiers2.33–2.51 3-tiers 1.41–2.31 4-tiers2.52–4.63 5-tiers 2.32–2.80 4-tiers4.64–5.65 4-tiers 2.81–4.63 5-tiers5.66–37 5-tiers 4.64–5.65 4-tiers
5.66–30.14 5-tiers30.15–30.39 2-tiers30.40–31.00 3-tiers31.01–31.39 4-tiers31.40–31.61 2-tiers31.63–32.83 4-tiers32.83–33.91 4-tiers33.92–34.04 2-tiers34.05–34.65 3-tiers34.66–35.16 4-tiers35.17–35.26 2-tiers35.27–36.48 4-tiers36.49–37.00 5-tiers
Cost-oriented approach for IT D Ardagna and C Francalanci
43
not seem confirmed by a systematic algorithmic testing(IBM, 2002), The optimization process takes advantage ofreductions of network costs that can be obtained bysearching for the optimal location of thin-client servers.
To analyse the location of application servers (scenario 2),two user classes are supposed to access a dedicated Webserver (IIS on W2000 and Apache on a Sun system) which, inturn, conveys requests to a common database server located atsite S1. The number of users ranges from 10 to 500 with (step10 simultaneously applied to both classes), demanding timesare 0.5 and 0.4 s evaluated on a PIII 550 Raid-5 Ultra SCSI andon an Ultra SparcII 450 Raid-0 Ultra SCSI tuning system.
The average cost reduction is 32.36%. It can be observedthat centralizing servers in a single site is a cost-minimizingsolution in 54% of all tests. Once again, the tabu search canreduce the TCO by reducing network costs whenever theirreduction compensates for the higher management costs ofdecentralized servers.
Sensitivity and scalability analysesThe robustness of optimization results is evaluated throughsensitivity analyses. Sensitivity measures the magnitude ofoutput changes as a consequence of variations in inputparameters. The sensitivity of the optimization function ismeasured as a percent change in the solution’s TCO as aconsequence of a variation in empirical estimates of costs,which can be subject to uncertainty. Sensitivity is analysedboth for the solution of the tabu search algorithm and forthe infrastructural solution obtained by applying profes-sional guidelines. In this way, the comparison between tabuand professional results is complemented by an assessmentof their robustness.
As discussed in the section on Data sample of physicalcomponents and costs, professional cost benchmarks varywithin a range. In previous section, TCO is evaluated for theaverage value of all cost benchmarks within their range.Sensitivity is calculated as a percent change of TCO as costbenchmarks are set to their minimum and maximum values.The tabu and professional solutions show similar values ofsensitivity across all analyses. On average, a 740% variationof cost benchmarks corresponds to a 710% variation ofTCO for both solutions (detailed results can be found inArdagna, 2004). Tests show a sensitivity of TCO lower thancorresponding cost reductions reported in the previoussection. This suggests that uncertainty on empirical bench-marks does not significantly affect the magnitude of costreductions and, thus, the robustness of results is sufficientto support an algorithmic approach to cost analyses.
From a cost perspective, an infrastructural solution isscalable if it can be upgraded to satisfy growing capacityrequirements with low additional expenses. As capacityrequirements increase, corresponding upgrades involve acost which can be measured as:
%cost�of�upgrades
¼ TCOupgraded�tabu�solution � TCOinitial�tabu�solution
TCOinitial�tabu�solution� 100
where TCOupgrade-tabu-solution indicates the total cost of own-ership of the upgraded infrastructural solution satisfyingnew requirements and TCOinitial-tabu-solution indicates the totalcost of ownership of the methodological solution that is
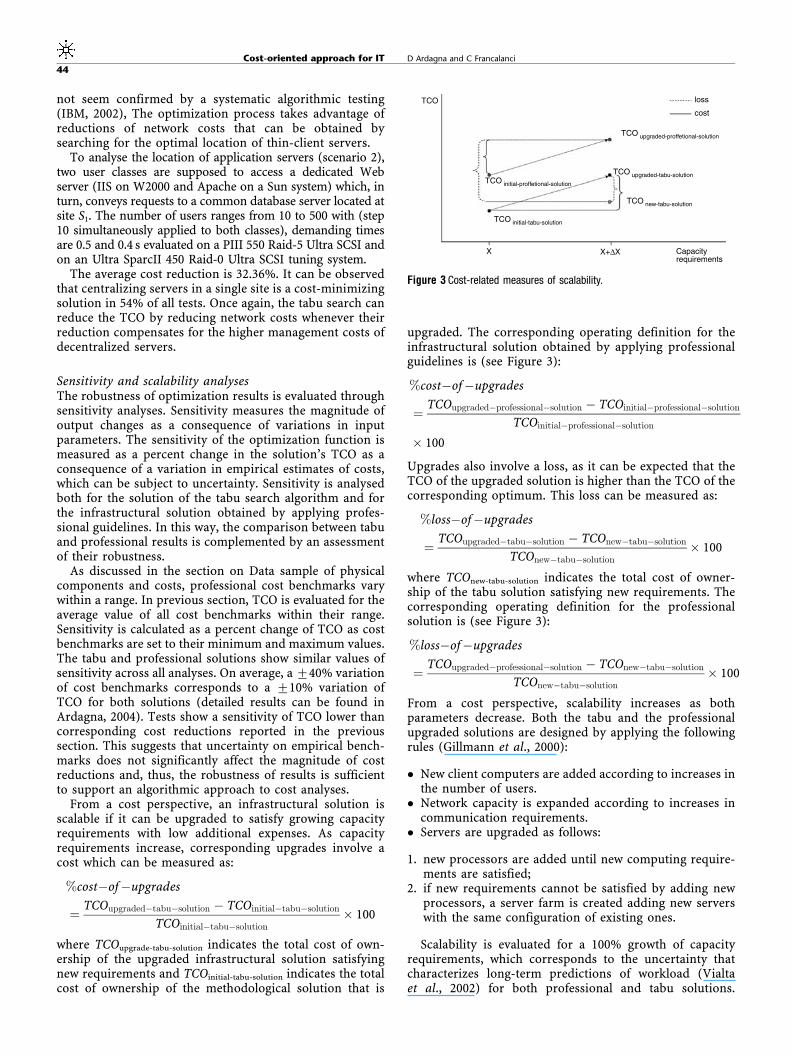
upgraded. The corresponding operating definition for theinfrastructural solution obtained by applying professionalguidelines is (see Figure 3):
%cost�of�upgrades
¼ TCOupgraded�professional�solution � TCOinitial�professional�solution
TCOinitial�professional�solution
� 100
Upgrades also involve a loss, as it can be expected that theTCO of the upgraded solution is higher than the TCO of thecorresponding optimum. This loss can be measured as:
%loss�of�upgrades
¼ TCOupgraded�tabu�solution � TCOnew�tabu�solution
TCOnew�tabu�solution� 100
where TCOnew-tabu-solution indicates the total cost of owner-ship of the tabu solution satisfying new requirements. Thecorresponding operating definition for the professionalsolution is (see Figure 3):
%loss�of�upgrades
¼ TCOupgraded�professional�solution � TCOnew�tabu�solution
TCOnew�tabu�solution� 100
From a cost perspective, scalability increases as bothparameters decrease. Both the tabu and the professionalupgraded solutions are designed by applying the followingrules (Gillmann et al., 2000):
� New client computers are added according to increases inthe number of users.
� Network capacity is expanded according to increases incommunication requirements.
� Servers are upgraded as follows:
1. new processors are added until new computing require-ments are satisfied;
2. if new requirements cannot be satisfied by adding newprocessors, a server farm is created adding new serverswith the same configuration of existing ones.
Scalability is evaluated for a 100% growth of capacityrequirements, which corresponds to the uncertainty thatcharacterizes long-term predictions of workload (Vialtaet al., 2002) for both professional and tabu solutions.
TCO
X X+∆X Capacityrequirements
TCO initial-proffetional-solution
TCO upgraded-proffetional-solution
TCO initial-tabu-solution
TCO upgraded-tabu-solution
TCO new-tabu-solution
loss
cost
Figure 3 Cost-related measures of scalability.
Cost-oriented approach for IT D Ardagna and C Francalanci
44
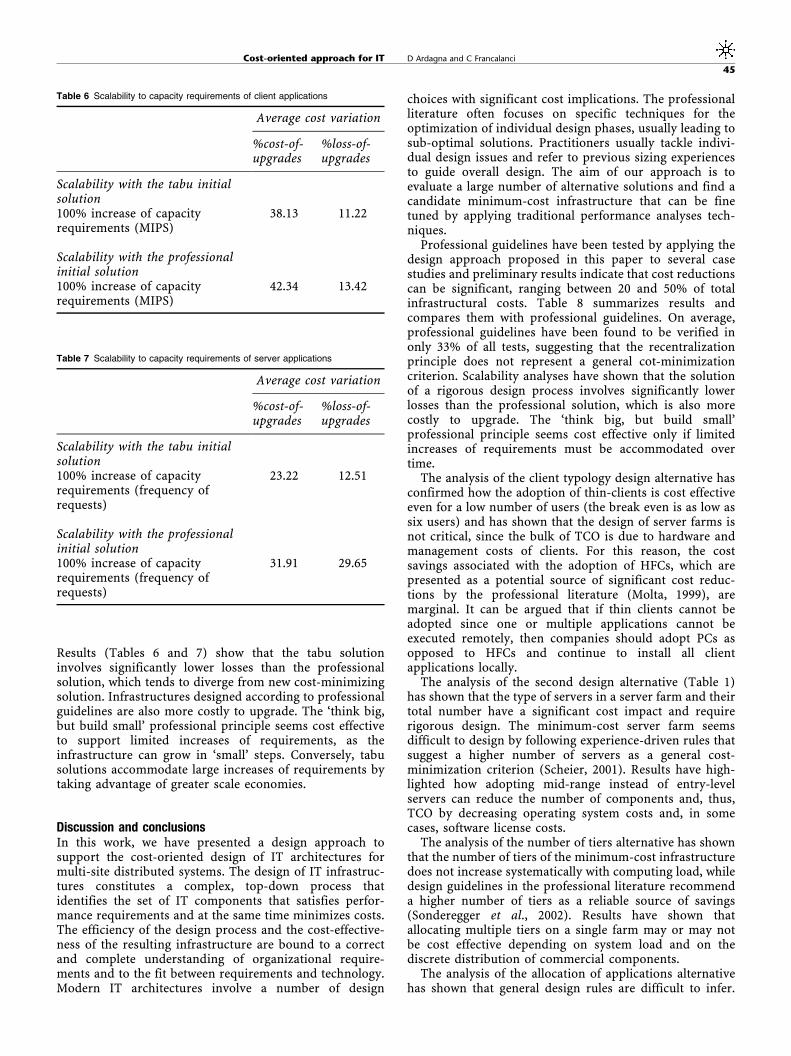
Results (Tables 6 and 7) show that the tabu solutioninvolves significantly lower losses than the professionalsolution, which tends to diverge from new cost-minimizingsolution. Infrastructures designed according to professionalguidelines are also more costly to upgrade. The ‘think big,but build small’ professional principle seems cost effectiveto support limited increases of requirements, as theinfrastructure can grow in ‘small’ steps. Conversely, tabusolutions accommodate large increases of requirements bytaking advantage of greater scale economies.
Discussion and conclusionsIn this work, we have presented a design approach tosupport the cost-oriented design of IT architectures formulti-site distributed systems. The design of IT infrastruc-tures constitutes a complex, top-down process thatidentifies the set of IT components that satisfies perfor-mance requirements and at the same time minimizes costs.The efficiency of the design process and the cost-effective-ness of the resulting infrastructure are bound to a correctand complete understanding of organizational require-ments and to the fit between requirements and technology.Modern IT architectures involve a number of design
choices with significant cost implications. The professionalliterature often focuses on specific techniques for theoptimization of individual design phases, usually leading tosub-optimal solutions. Practitioners usually tackle indivi-dual design issues and refer to previous sizing experiencesto guide overall design. The aim of our approach is toevaluate a large number of alternative solutions and find acandidate minimum-cost infrastructure that can be finetuned by applying traditional performance analyses tech-niques.
Professional guidelines have been tested by applying thedesign approach proposed in this paper to several casestudies and preliminary results indicate that cost reductionscan be significant, ranging between 20 and 50% of totalinfrastructural costs. Table 8 summarizes results andcompares them with professional guidelines. On average,professional guidelines have been found to be verified inonly 33% of all tests, suggesting that the recentralizationprinciple does not represent a general cot-minimizationcriterion. Scalability analyses have shown that the solutionof a rigorous design process involves significantly lowerlosses than the professional solution, which is also morecostly to upgrade. The ‘think big, but build small’professional principle seems cost effective only if limitedincreases of requirements must be accommodated overtime.
The analysis of the client typology design alternative hasconfirmed how the adoption of thin-clients is cost effectiveeven for a low number of users (the break even is as low assix users) and has shown that the design of server farms isnot critical, since the bulk of TCO is due to hardware andmanagement costs of clients. For this reason, the costsavings associated with the adoption of HFCs, which arepresented as a potential source of significant cost reduc-tions by the professional literature (Molta, 1999), aremarginal. It can be argued that if thin clients cannot beadopted since one or multiple applications cannot beexecuted remotely, then companies should adopt PCs asopposed to HFCs and continue to install all clientapplications locally.
The analysis of the second design alternative (Table 1)has shown that the type of servers in a server farm and theirtotal number have a significant cost impact and requirerigorous design. The minimum-cost server farm seemsdifficult to design by following experience-driven rules thatsuggest a higher number of servers as a general cost-minimization criterion (Scheier, 2001). Results have high-lighted how adopting mid-range instead of entry-levelservers can reduce the number of components and, thus,TCO by decreasing operating system costs and, in somecases, software license costs.
The analysis of the number of tiers alternative has shownthat the number of tiers of the minimum-cost infrastructuredoes not increase systematically with computing load, whiledesign guidelines in the professional literature recommenda higher number of tiers as a reliable source of savings(Sonderegger et al., 2002). Results have shown thatallocating multiple tiers on a single farm may or may notbe cost effective depending on system load and on thediscrete distribution of commercial components.
The analysis of the allocation of applications alternativehas shown that general design rules are difficult to infer.
Table 6 Scalability to capacity requirements of client applications
Average cost variation
%cost-of-upgrades
%loss-of-upgrades
Scalability with the tabu initialsolution100% increase of capacityrequirements (MIPS)
38.13 11.22
Scalability with the professionalinitial solution100% increase of capacityrequirements (MIPS)
42.34 13.42
Table 7 Scalability to capacity requirements of server applications
Average cost variation
%cost-of-upgrades
%loss-of-upgrades
Scalability with the tabu initialsolution100% increase of capacityrequirements (frequency ofrequests)
23.22 12.51
Scalability with the professionalinitial solution100% increase of capacityrequirements (frequency ofrequests)
31.91 29.65
Cost-oriented approach for IT D Ardagna and C Francalanci
45
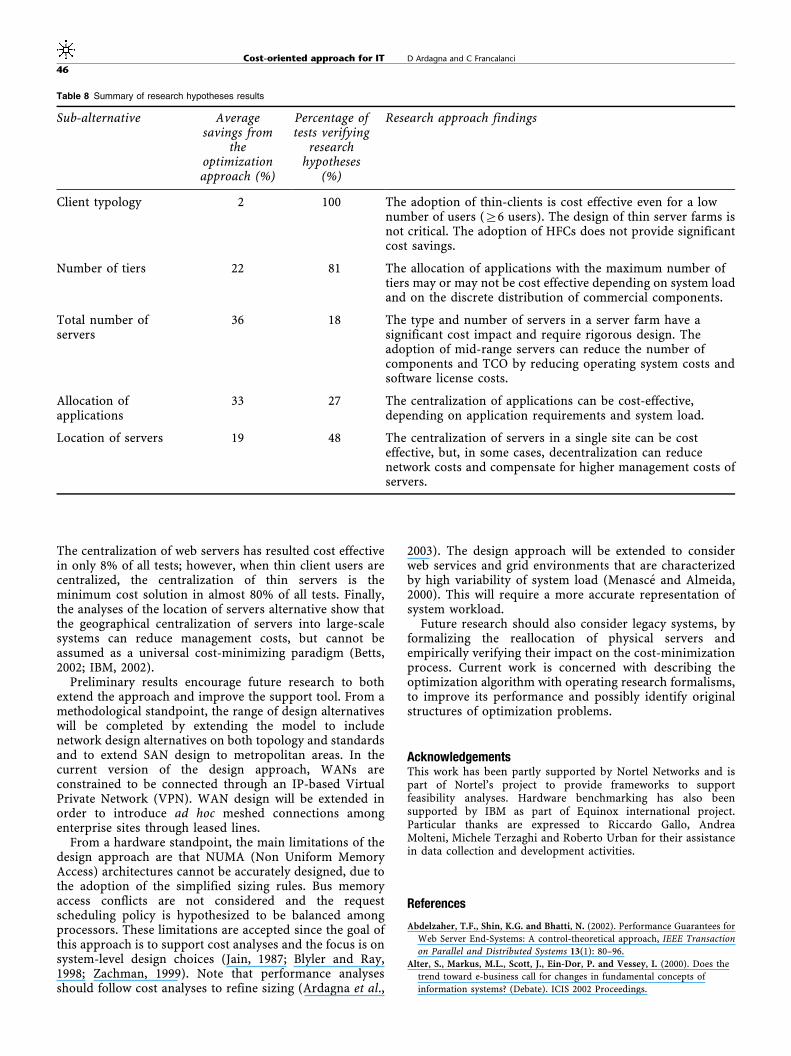
The centralization of web servers has resulted cost effectivein only 8% of all tests; however, when thin client users arecentralized, the centralization of thin servers is theminimum cost solution in almost 80% of all tests. Finally,the analyses of the location of servers alternative show thatthe geographical centralization of servers into large-scalesystems can reduce management costs, but cannot beassumed as a universal cost-minimizing paradigm (Betts,2002; IBM, 2002).
Preliminary results encourage future research to bothextend the approach and improve the support tool. From amethodological standpoint, the range of design alternativeswill be completed by extending the model to includenetwork design alternatives on both topology and standardsand to extend SAN design to metropolitan areas. In thecurrent version of the design approach, WANs areconstrained to be connected through an IP-based VirtualPrivate Network (VPN). WAN design will be extended inorder to introduce ad hoc meshed connections amongenterprise sites through leased lines.
From a hardware standpoint, the main limitations of thedesign approach are that NUMA (Non Uniform MemoryAccess) architectures cannot be accurately designed, due tothe adoption of the simplified sizing rules. Bus memoryaccess conflicts are not considered and the requestscheduling policy is hypothesized to be balanced amongprocessors. These limitations are accepted since the goal ofthis approach is to support cost analyses and the focus is onsystem-level design choices (Jain, 1987; Blyler and Ray,1998; Zachman, 1999). Note that performance analysesshould follow cost analyses to refine sizing (Ardagna et al.,
2003). The design approach will be extended to considerweb services and grid environments that are characterizedby high variability of system load (Menasce and Almeida,2000). This will require a more accurate representation ofsystem workload.
Future research should also consider legacy systems, byformalizing the reallocation of physical servers andempirically verifying their impact on the cost-minimizationprocess. Current work is concerned with describing theoptimization algorithm with operating research formalisms,to improve its performance and possibly identify originalstructures of optimization problems.
AcknowledgementsThis work has been partly supported by Nortel Networks and ispart of Nortel’s project to provide frameworks to supportfeasibility analyses. Hardware benchmarking has also beensupported by IBM as part of Equinox international project.Particular thanks are expressed to Riccardo Gallo, AndreaMolteni, Michele Terzaghi and Roberto Urban for their assistancein data collection and development activities.
References
Abdelzaher, T.F., Shin, K.G. and Bhatti, N. (2002). Performance Guarantees for
Web Server End-Systems: A control-theoretical approach, IEEE Transaction
on Parallel and Distributed Systems 13(1): 80–96.
Alter, S., Markus, M.L., Scott, J., Ein-Dor, P. and Vessey, I. (2000). Does the
trend toward e-business call for changes in fundamental concepts of
information systems? (Debate). ICIS 2002 Proceedings.
Table 8 Summary of research hypotheses results
Sub-alternative Averagesavings from
theoptimizationapproach (%)
Percentage oftests verifying
researchhypotheses
(%)
Research approach findings
Client typology 2 100 The adoption of thin-clients is cost effective even for a lownumber of users (Z6 users). The design of thin server farms isnot critical. The adoption of HFCs does not provide significantcost savings.
Number of tiers 22 81 The allocation of applications with the maximum number oftiers may or may not be cost effective depending on system loadand on the discrete distribution of commercial components.
Total number ofservers
36 18 The type and number of servers in a server farm have asignificant cost impact and require rigorous design. Theadoption of mid-range servers can reduce the number ofcomponents and TCO by reducing operating system costs andsoftware license costs.
Allocation ofapplications
33 27 The centralization of applications can be cost-effective,depending on application requirements and system load.
Location of servers 19 48 The centralization of servers in a single site can be costeffective, but, in some cases, decentralization can reducenetwork costs and compensate for higher management costs ofservers.
Cost-oriented approach for IT D Ardagna and C Francalanci
46
Alvarez, G.A., Borowsky, E., Go, S., Romer, T.H., Becker-Szendy, R.,
Golding, R., Merchant, A., Spasojevic, M., Veitch, A. and Wilkes, J.
(2002). Minerva: An automated resource provisioning tool for
large-scale storage systems, ACM Transaction on Computer Systems 19(4):
483–518.
Ardagna, D. (2004). A Cost-Oriented Methodology for the Design of
Information Technology Architectures, Ph.D. Dissertation, Politecnico di
Milano, Italy.
Ardagna, D. and Francalanci, C. (2002). A Cost-Oriented Methodology
for the Design of Web based IT Architectures, SAC2002 Proceedings
(17th ACM Symposium on Applied Computing), Madrid, March 2002,
pp 1127–1133.
Ardagna, D., Francalanci, C. and Trubian, M. (2003). A multi-model algorithm
for the cost-oriented design of the Information Technology Infrastructure,
ECIS 2003 Proceedings (11th European Conference on Information Systems);
Napoles, June 2003.
Aue, A. and Breu, M. (1994). Distributed Information Systems: An advanced
methodology, IEEE Transaction on Software Engineering 20(8): 594–605.
Bajaj, A. (2000). A Study of Senior Information Systems Managers’ Decisions
Model in Adopting New Computing Architectures, Journal of the Association
of Information Systems 1(4): 1–58.
Bertoa, M.F. and Vallecillo, A. (2002). Quality Attributes for COTS
Components, In: Proceedings of the sixth ECOOP Workshop on Quantitative
Approaches in Object Oriented Software Engineering (QAOOSE 2002),
Malaga, Spain, June 2002, pp. 54–66.
Betts, M. (2002). The next chapter. The Future of Hardware. ComputerWord
(WWW document)http://www.computerworld.com/hardwaretopics/
hardware/story/0,10801,75887,00.html (accessed 9 Nov 2004).
Blyler, J.E. and Ray, G.A. (1998). What’s Size Got to Do with It? Understanding
Computer rightsizing. IEEE Press, Understanding Science & Technology
Series. ISBN 0-7803-1096-9.
Ein-Dor, P. (1985). Grosch’s Law Revisited: CPU power and the cost of
computing, Management Communication of the ACM 28(2): 142–150.
Fiser (2000). The Premiericon Scaling test. Scalable e-commerce solution for
Internet bankers, A White Paper from Fiser and Microsoft.
Francalanci, C. and Piuri, V. (1999). Designing Information Technology
Architectures: A cost-oriented methodology, Journal of Information
Technology 14(2): 181–192.
Gavish, B. and Pirkul, H. (1986). Computer and Database Location in
Distributed Computer Systems, IEEE Transactions on Computers 35(7):
583–590.
Gillmann, M., Weissenfels, I., Weikum, G. and Kraiss, A. (2000). Performance
and availability assessment for the configuration of distributed workflow
management systems, Proceedings of the 7th International Conference on
Extending Database Technology, pp. 183–202.
Glover, F.W. and Laguna, M. (1997). Tabu Search, Dordrecht: Kluwer Academic
Publishers.
GROUPE TECNA (2002). Cost comparison advantage, http://www.gtechna.com/
e/software/advantage.Accessed on 9th November 2004.
IBM. (2002). Improve the return on your IT investment with Server
Consolidation (WWW document)http://www-1.ibm.com/servers/eserver/
iseries/australia/serv.htm (accessed 8th June 2002).
Ingham, D.B., Shrivastava, S.K. and Panzieri, F. (2000). Constructing
dependable Web services, IEEE Internet Computing 4(1): 25–33.
Ishizuka, M., Kawakatsu, M., Asai, Y., Ebisu, T., Hashizume, K. and
Matsushita, M. (1999). Market and Technical Trend on Computer
Communication, Oki (WWW document)http://www.obd.com/oki/otr/
downloads/otr-162-26.pdf (accessed 10th June 2000).
Jain, H.K. (1987). A Comprehensive Model for the Design of Distributed
Computer Systems, IEEE Transaction on software engineering 13(10):
1092–1104.
Kleinrock, L. (1976). Queueing Systems, Vol. 2: Computer Applications, New
York: John Wiley & Sons.
Kwan, T.T., McGrath, R.E. and Reed, D.A. (1995). NCSA’s World Wide Web
Server: Design and performance, IEEE Computer 28(11): 68–74.
Lazowska, E.D., Zahorjan, J., Graham, G.S. and Kenneth, C.S. (1984).
Quantitative System Performance Computer System Analysis using Queueing
Network Models, Englewood Cliffs, NJ: Prentice-Hall.
Martin, A. (2003). What Drives the Configuration of Information Technology
Projects? Exploratory research in 10 organizations, Journal of Information
Technology 18(1): 1–15.
Mathewson, M. (1999). Microsoft’s TSE Licensing Model. Thin
Planet.www.thinplanet.com/opinion/overview-TSE-licensing.asp.
Menasce, D. and Almeida, V. (2000). Scaling for E-business. Technologies,
models, performance and capacity planning, Englewood Cliffs, NJ: Prentice-
Hall.
Meta Group (1999). Next-Millennium Platform Infrastructure Strategies:
Evaluation, Consolidation, and Costing. http://www.metagroup.de/Accessed
on 6th December 1999.
Microsoft (2000). Windows 2000 Terminal Services Capacity and Scaling,
www.microsoft.com/windows2000/library/technologies/terminal/
tscaling.asp.
Molta, D. (1999a). Thin Client Computers Come of Age. Network Computing,
www.networkcomputing.com/1009/1009buyers1.html.
Molta, D. (1999b). For Client/Server, Think Thin. Network
Computing.www.networkcomputing.com/1013/1013f1.html.
Nec (2002). Network Market Trends. (WWW document)http://
www1n.mesh.ne.jp/cnpworld/english/solution/s01.html (accessed 10th
December 2002).
Nortel Networks (2001). Storage Networking Solution. Data storage networking
is key to business success.http://www.jiortel.com/Accessed on 12th
November 2001.
Ochs, M., Pfahl, D., Chrobok-Diening, G and Nothhelfer-Kolb, B. (2001). A
method for efficient measurement-based COTS assessment and selection
method description and evaluation results, Proceedings of the seventh
Symposium of Software Metrics, METRICS, 2001: 285–296.
Parkinson, C.N. (1955). Parkinson’s Law, The Economist, November 1955.
Precision Group (2002). http://precisionit.co.in/HomePage.html (accessed on
5th June 2002).
Pressman, R.S. (2001). Software Engineering: A Practitioner’s Approach, New
York: McGraw-Hill.
Redman, B., Kirwin, B. and Berg, T. (1998). TCO: A Critical Tool for Managing
IT. Gartner Group. http://www4.gartner.com/Init (accessed on 3rd August
2002).
Rocco, E. (2002). Benchmarking Hardware Service Operations. Gartner Group.
http://www4.gartner.com/Init (accessed on 3rd August 2002).
Scheier, R.L. (2001). Scaling up for e-Commerce. Computerworld. (WWW
document)http://www.computerworld.com/softwaretopics/software/appdev/
story/0,10801,59095,00.html (accessed 9th November 2004).
Schlegel, K. (2002). PC Prices Falling as Percentage of TCO. Meta Group.
(WWW document)www.metagroup.com (accessed 3rd August 2002).
Sonderegger, P., Manning, H., Gardiner, K.M. and Dorsey, M. (2002). Best
Practices For Web Site Reviews, Forrest Research. http://wwwl.forrester.com/
ER/Research/Report/Summary/0,1338,14594,FF.html (accessed on 9th
November).
Vialta, R., Apte, C.V., Hellerstein, J.L., Ma, S. and Weiss, S.M. (2002). Predictive
Algorithms in the Management of Computer Systems, IBM System Journal
41(3): 461–474.
Vijayan, J. (2001). The New TCO Metric. Computerworld (WWW
document)http://www.computerworld.com/managementtopics/
management/story/0,10801,61374,00.html(accessed 9th November 2004).
Ward, J., O’Sullivan, M., Shahoumian, T. and Wilkes, J. (2002). Appia:
Automatic storage area network fabric design, Proceedings of the Conference
on File and Storage Technologies 203–217.
Willcocks, L. (1992). Evaluating Information Technology Investments:
Research, Findings, and Reappraisal, Journal of Information Systems. 2:
243–268.
Yuan, R. and Strayer, W.T. (2001). Virtual Private Networks: Technologies and
Solutions, Reading, MA: Addison Wesley.
Zachman, J.A. (1999). A Framework for Information System Architecture, IBM
System Journal 26(3): 276–292.
About the authorsChiara Francalanci is an associate professor of informationsystems at Politecnico di Milano. She has a Master’s degreein Electronic Engineering from Politecnico di Milano,where she has also completed her Ph.D. in ComputerScience. As part of her postdoctoral studies, she has workedfor 2 years at the Harvard Business School as a VisitingResearcher. She has authored articles on the economics of
Cost-oriented approach for IT D Ardagna and C Francalanci
47
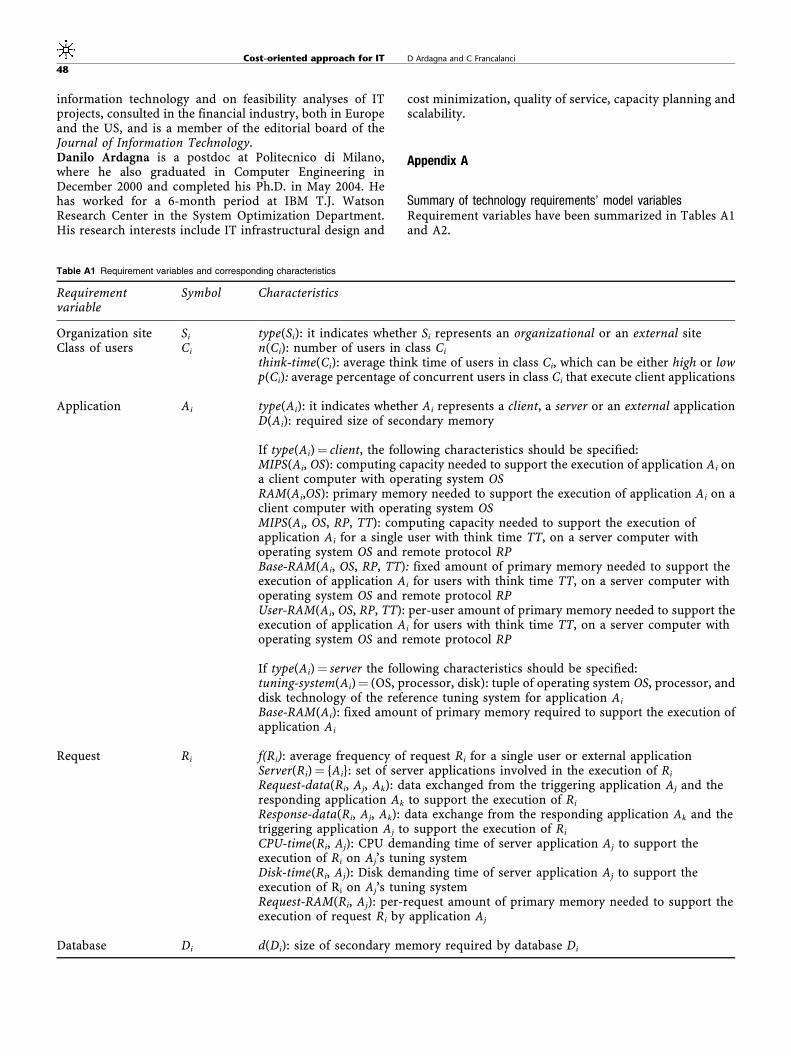
information technology and on feasibility analyses of ITprojects, consulted in the financial industry, both in Europeand the US, and is a member of the editorial board of theJournal of Information Technology.Danilo Ardagna is a postdoc at Politecnico di Milano,where he also graduated in Computer Engineering inDecember 2000 and completed his Ph.D. in May 2004. Hehas worked for a 6-month period at IBM T.J. WatsonResearch Center in the System Optimization Department.His research interests include IT infrastructural design and
cost minimization, quality of service, capacity planning andscalability.
Appendix A
Summary of technology requirements’ model variablesRequirement variables have been summarized in Tables A1and A2.
Table A1 Requirement variables and corresponding characteristics
Requirementvariable
Symbol Characteristics
Organization site Si type(Si): it indicates whether Si represents an organizational or an external siteClass of users Ci n(Ci): number of users in class Ci
think-time(Ci): average think time of users in class Ci, which can be either high or lowp(Ci): average percentage of concurrent users in class Ci that execute client applications
Application Ai type(Ai): it indicates whether Ai represents a client, a server or an external applicationD(Ai): required size of secondary memory
If type(Ai)¼ client, the following characteristics should be specified:MIPS(Ai, OS): computing capacity needed to support the execution of application Ai ona client computer with operating system OSRAM(Ai,OS): primary memory needed to support the execution of application Ai on aclient computer with operating system OSMIPS(Ai, OS, RP, TT): computing capacity needed to support the execution ofapplication Ai for a single user with think time TT, on a server computer withoperating system OS and remote protocol RPBase-RAM(Ai, OS, RP, TT): fixed amount of primary memory needed to support theexecution of application Ai for users with think time TT, on a server computer withoperating system OS and remote protocol RPUser-RAM(Ai, OS, RP, TT): per-user amount of primary memory needed to support theexecution of application Ai for users with think time TT, on a server computer withoperating system OS and remote protocol RP
If type(Ai)¼ server the following characteristics should be specified:tuning-system(Ai)¼ (OS, processor, disk): tuple of operating system OS, processor, anddisk technology of the reference tuning system for application Ai
Base-RAM(Ai): fixed amount of primary memory required to support the execution ofapplication Ai
Request Ri f(Ri): average frequency of request Ri for a single user or external applicationServer(Ri)¼ {Ai}: set of server applications involved in the execution of Ri
Request-data(Ri, Aj, Ak): data exchanged from the triggering application Aj and theresponding application Ak to support the execution of Ri
Response-data(Ri, Aj, Ak): data exchange from the responding application Ak and thetriggering application Aj to support the execution of Ri
CPU-time(Ri, Aj): CPU demanding time of server application Aj to support theexecution of Ri on Aj’s tuning systemDisk-time(Ri, Aj): Disk demanding time of server application Aj to support theexecution of Ri on Aj’s tuning systemRequest-RAM(Ri, Aj): per-request amount of primary memory needed to support theexecution of request Ri by application Aj
Database Di d(Di): size of secondary memory required by database Di
Cost-oriented approach for IT D Ardagna and C Francalanci
48
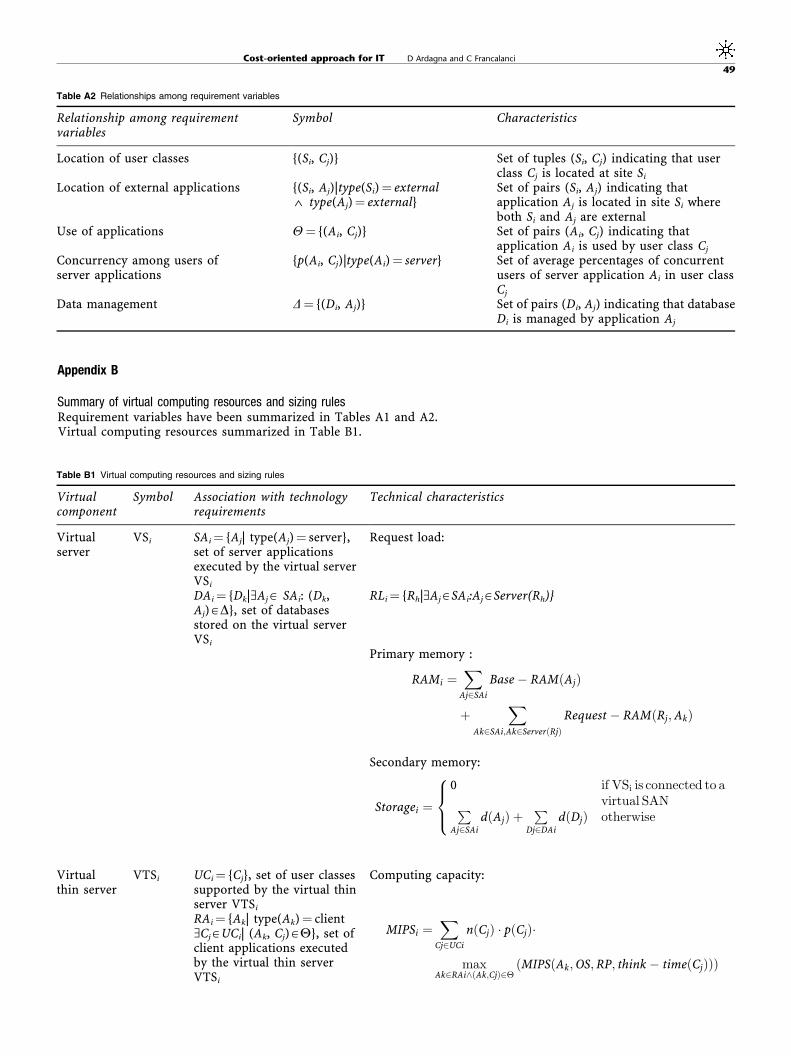
Appendix B
Summary of virtual computing resources and sizing rulesRequirement variables have been summarized in Tables A1 and A2.Virtual computing resources summarized in Table B1.
Table A2 Relationships among requirement variables
Relationship among requirementvariables
Symbol Characteristics
Location of user classes {(Si, Cj)} Set of tuples (Si, Cj) indicating that userclass Cj is located at site Si
Location of external applications {(Si, Aj)|type(Si)¼ external4 type(Aj)¼ external}
Set of pairs (Si, Aj) indicating thatapplication Aj is located in site Si whereboth Si and Aj are external
Use of applications Y¼ {(Ai, Cj)} Set of pairs (Ai, Cj) indicating thatapplication Ai is used by user class Cj
Concurrency among users ofserver applications
{p(Ai, Cj)|type(Ai)¼ server} Set of average percentages of concurrentusers of server application Ai in user classCj
Data management D¼ {(Di, Aj)} Set of pairs (Di, Aj) indicating that databaseDi is managed by application Aj
Table B1 Virtual computing resources and sizing rules
Virtualcomponent
Symbol Association with technologyrequirements
Technical characteristics
Virtualserver
VSi SAi ¼ {Aj| type(Aj)¼ server},set of server applicationsexecuted by the virtual serverVSi
Request load:
DAi ¼ {Dk|(AjA SAi: (Dk,Aj)AD}, set of databasesstored on the virtual serverVSi
RLi ¼ {Rh|(AjASAi:AjAServer(Rh)}
Primary memory :
RAMi ¼X
Aj2SAi
Base � RAMðAjÞ
þX
Ak2SAi;Ak2ServerðRjÞRequest � RAMðRj;AkÞ
Secondary memory:
Storagei ¼0 if VSi is connected to a
virtual SANPAj2SAi
dðAjÞ þP
Dj2DAi
dðDjÞ otherwise
8><>:
Virtualthin server
VTSi UCi ¼ {Cj}, set of user classessupported by the virtual thinserver VTSi
Computing capacity:
RAi ¼ {Ak| type(Ak)¼ client(CjAUCi| (Ak, Cj)AY}, set ofclient applications executedby the virtual thin serverVTSi
MIPSi ¼X
Cj2UCi
nðCjÞ pðCjÞ
maxAk2RAi^ðAk;CjÞ2�
ðMIPSðAk;OS;RP; think � timeðCjÞÞÞ
Cost-oriented approach for IT D Ardagna and C Francalanci
49
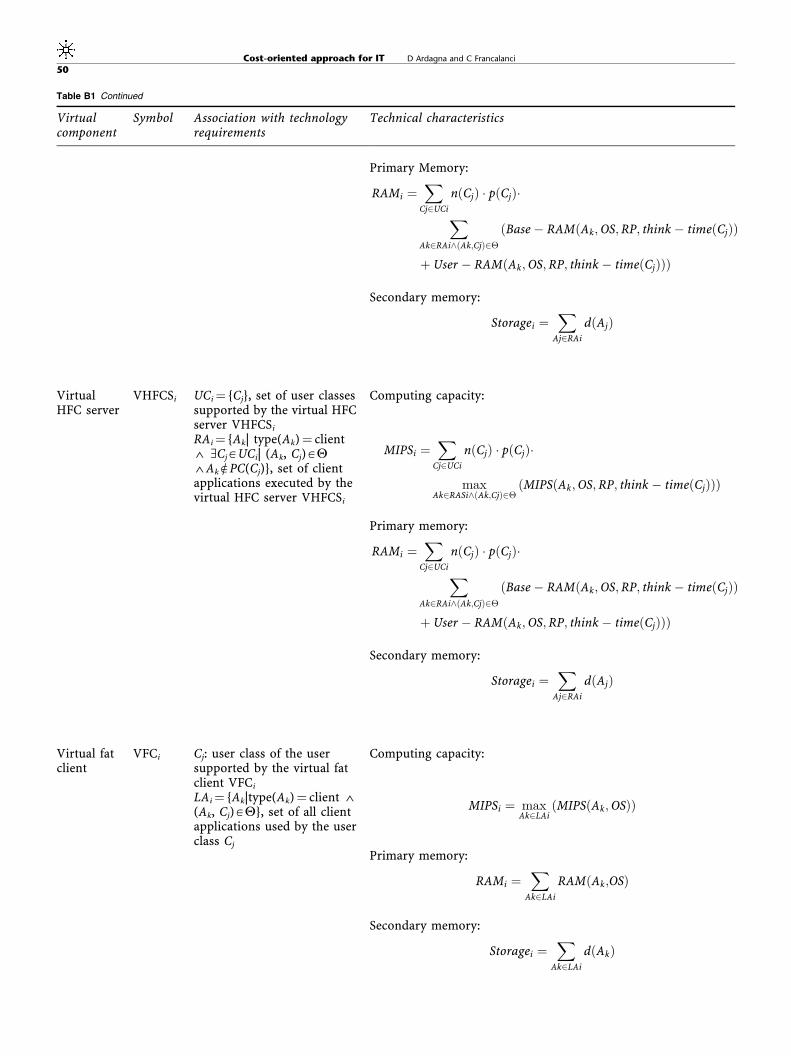
Primary Memory:
RAMi ¼X
Cj2UCi
nðCjÞ pðCjÞX
Ak2RAi^ðAk;CjÞ2�ðBase � RAMðAk;OS;RP; think � timeðCjÞÞ
þ User � RAMðAk;OS;RP; think � timeðCjÞÞÞ
Secondary memory:
Storagei ¼X
Aj2RAi
dðAjÞ
VirtualHFC server
VHFCSi UCi ¼ {Cj}, set of user classessupported by the virtual HFCserver VHFCSi
Computing capacity:
RAi ¼ {Ak| type(Ak)¼ client4 (CjAUCi| (Ak, Cj)AY4AkePC(Cj)}, set of clientapplications executed by thevirtual HFC server VHFCSi
MIPSi ¼X
Cj2UCi
nðCjÞ pðCjÞ
maxAk2RASi^ðAk;CjÞ2�
ðMIPSðAk;OS;RP; think � timeðCjÞÞÞ
Primary memory:
RAMi ¼X
Cj2UCi
nðCjÞ pðCjÞX
Ak2RAi^ðAk;CjÞ2�ðBase � RAMðAk;OS;RP; think � timeðCjÞÞ
þ User � RAMðAk;OS;RP; think � timeðCjÞÞÞ
Secondary memory:
Storagei ¼X
Aj2RAi
dðAjÞ
Virtual fatclient
VFCi Cj: user class of the usersupported by the virtual fatclient VFCi
Computing capacity:
LAi¼ {Ak|type(Ak)¼ client 4(Ak, Cj)AY}, set of all clientapplications used by the userclass Cj
MIPSi ¼ maxAk2LAi
ðMIPSðAk;OSÞÞ
Primary memory:
RAMi ¼X
Ak2LAi
RAMðAk;OSÞ
Secondary memory:
Storagei ¼X
Ak2LAi
dðAkÞ
Table B1 Continued
Virtualcomponent
Symbol Association with technologyrequirements
Technical characteristics
Cost-oriented approach for IT D Ardagna and C Francalanci
50
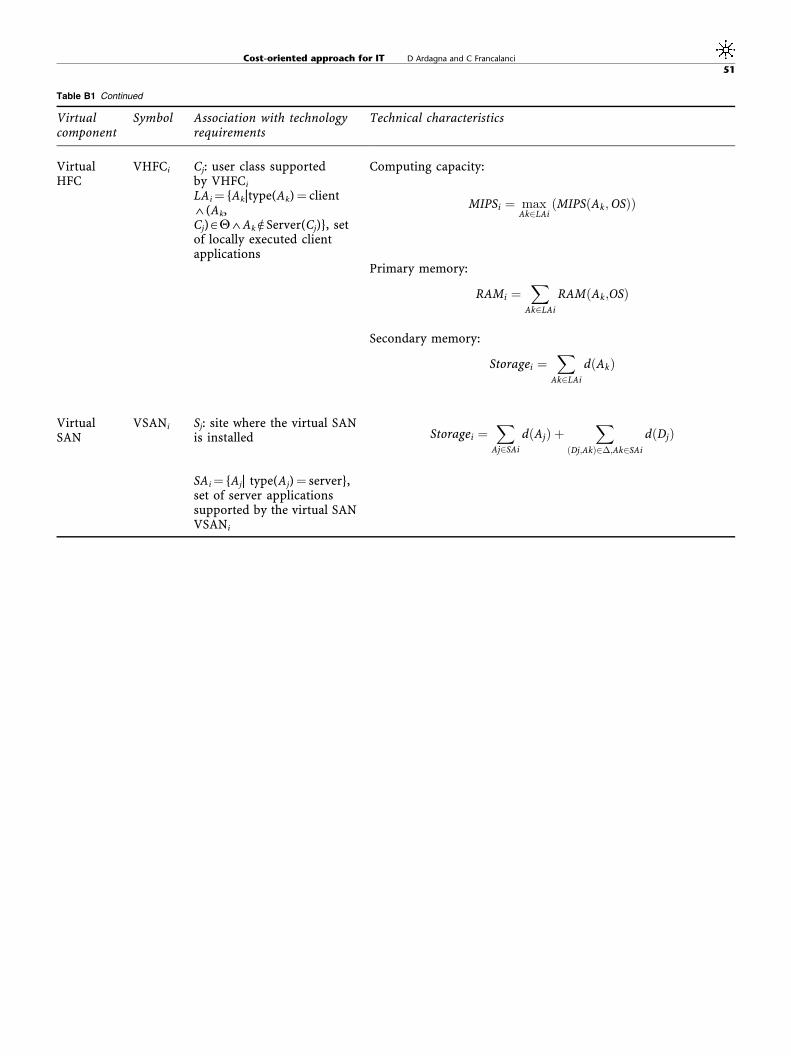
VirtualHFC
VHFCi Cj: user class supportedby VHFCi
Computing capacity:
LAi¼ {Ak|type(Ak)¼ client4(Ak,Cj)AY4AkeServer(Cj)}, setof locally executed clientapplications
MIPSi ¼ maxAk2LAi
ðMIPSðAk;OSÞÞ
Primary memory:
RAMi ¼X
Ak2LAi
RAMðAk;OSÞ
Secondary memory:
Storagei ¼X
Ak2LAi
dðAkÞ
VirtualSAN
VSANi Sj: site where the virtual SANis installed Storagei ¼
XAj2SAi
dðAjÞ þX
ðDj;AkÞ2�;Ak2SAi
dðDjÞ
SAi ¼ {Aj| type(Aj)¼ server},set of server applicationssupported by the virtual SANVSANi
Table B1 Continued
Virtualcomponent
Symbol Association with technologyrequirements
Technical characteristics
Cost-oriented approach for IT D Ardagna and C Francalanci
51