
Considerations on Domain-Specific Architectures Applicability ...
Upload
independentCategory
view
5download
0
Hindawi Publishing CorporationInternational Journal of Distributed Sensor NetworksVolume 2013, Article ID 737680, 12 pageshttp://dx.doi.org/10.1155/2013/737680
Research ArticleIntegrating Sensor Networks for Energy Monitoring withService-Oriented Architectures
C. Busemann, V. Gazis, R. Gold, P. Kikiras, A. Leonardi,J. Mirkovic, M. Walther, and H. Ziekow
AGT Group (R and D) GmbH, Hilpertstraße 35, 64295 Darmstadt, Germany
Correspondence should be addressed to A. Leonardi; [email protected]
Received 4 February 2013; Revised 27 May 2013; Accepted 28 May 2013
Academic Editor: Danny Hughes
Copyright © 2013 C. Busemann et al. This is an open access article distributed under the Creative Commons Attribution License,which permits unrestricted use, distribution, and reproduction in any medium, provided the original work is properly cited.
More accurate predictions of energy consumption are a strong motivator for utility providers to deploy a smart grid infrastructure.However, measurements which only reflect the consumption of a household lose the details associated with the behaviour ofindividual devices. Finding a flexible and efficient way to process these readings is essential. Using standard application techniquesto integrate device-oriented sensor networks and data-oriented applications is a serious challenge due to the architectural gapbetween the different approaches. Additionally, this device-level information should be shared with the end-users in a trustedmanner to increase their energy awareness.We propose a novel platform for the smart gridwhich enables the seamless integration ofsensor networks with a service-oriented architecture approach.The platform hides the device-specific details from the applicationsand transforms data into a device-independent format. Specifically, we present an in-depth description of the architecture of ourplatform and a full implementation and evaluation of it in a live residential energy management deployment.
1. Introduction
Accurate prediction of electricity consumption is a majorchallenge for utility providers. Even a small increase inaccuracy can lead to significant improvements in regulatingsupply and therefore costs for the utility provider [1]. Theswitch to using smart metering infrastructure has allowedthe utility provider to get frequent (typically around every15 minutes) updates as to the power consumption per-household. However, this information only reflects the con-sumption of the household in total, not the individual devices(e.g., DVD player, TV, fridge, washing machine, etc.). Sinceeach device has a different usage pattern, it is importantfor accurate predictions to take into account the specificcharacteristics of each device.
The convergence of consumer electronics and informa-tion technology together with the developments in com-munication systems gave rise to a new range of services,for example, building automation, smart metering, health,fine-grained demand-side management, safety and security,and so forth. In accordance with current best practices insoftware engineering, a service-oriented architecture (SOA)
approach is often used to provide the infrastructure for suchinteroperating services or applications. SOA is useful as itcreates a set of independent, loosely coupled services whichcommunicate with each other through a set of well-definedinterfaces. One of the key challenges with developing appli-cations and services that interface to sensor networks is thearchitectural gap between device-oriented sensor networksand data-oriented applications. For example, the addressablecomponent of a typical sensor network such as ZigBeeor Z-Wave is the network interface address of the sensorwhereas an application may provide electricity consumptioninformation to an end-user. Therefore, there is a significantdifference between the granularity of data produced by thesensors and the data which a SOA system can typicallyprocess.
In order to make per-device measurements available toboth the utility provider and the end-user for both energyprediction and energy awareness purposes in a trusted way,we present a platform for the smart grid based on a SOAapproach which allows the integration of sensors measuringthe energy consumption of individual devices. The platformis capable of both supporting the usage of per-device sensors
2 International Journal of Distributed Sensor Networks
and also hosting multiple applications which manipulate andvisualize the per-device sensor data for the end-users.
In order to bridge such an architectural gap, existingSOA systems typically integrate heterogeneous services byusing an Enterprise Service Bus (ESB) [2] in order to createa set of loosely coupled services. However, the protocol- ortechnology-specific parts of the ESB (also known as bindingcomponents) export data-oriented service interfaces ratherthan device-oriented interfaces. Thus, the challenge remainsof how to integrate device-oriented sensor networks into adata- or service-oriented architecture.
The main contributions of this paper are twofold:
(1) the design and implementation of a novel platform forthe smart grid which enables the integration of per-device sensor measurements with a SOA approach(Sections 3 and 4);
(2) an evaluation of our platform, used as a smartenergy monitoring system, in a number of real-worlddeployments and a selected set of experimental results(Section 5).
In addition, we also present a discussion of the relevant rela-ted work in Section 6 and a summary of our insights inSection 7.
2. PeerEnergyCloud Architecture
Sensor networks have successfully been deployed for variousand different use cases. These include controlling and mon-itoring industrial plants, supervising weather stations, andmilitary purposes. However, with declining hardware costs,sensor networks also find their way into private homes.
Corresponding research projects focus on monitoringthose homes concerning energy consumption as well as secu-rity and safety reasons [3]. Furthermore, actuators allow forhome automation based on measured sensor values or userinput.
One such project is PeerEnergyCloud (PEC) [4], whichspecifically focuses on the energy domain. The importanceof sensor networks for PEC lies in the detailed logging ofenergy consumption on a per-device level (e.g., refrigerator,television, and washing machine). Analyses of logged valuesfurthermore provide the opportunity to predict future con-sumption values and hence an in-depth planning of energyproduction on the utility provider’s side.
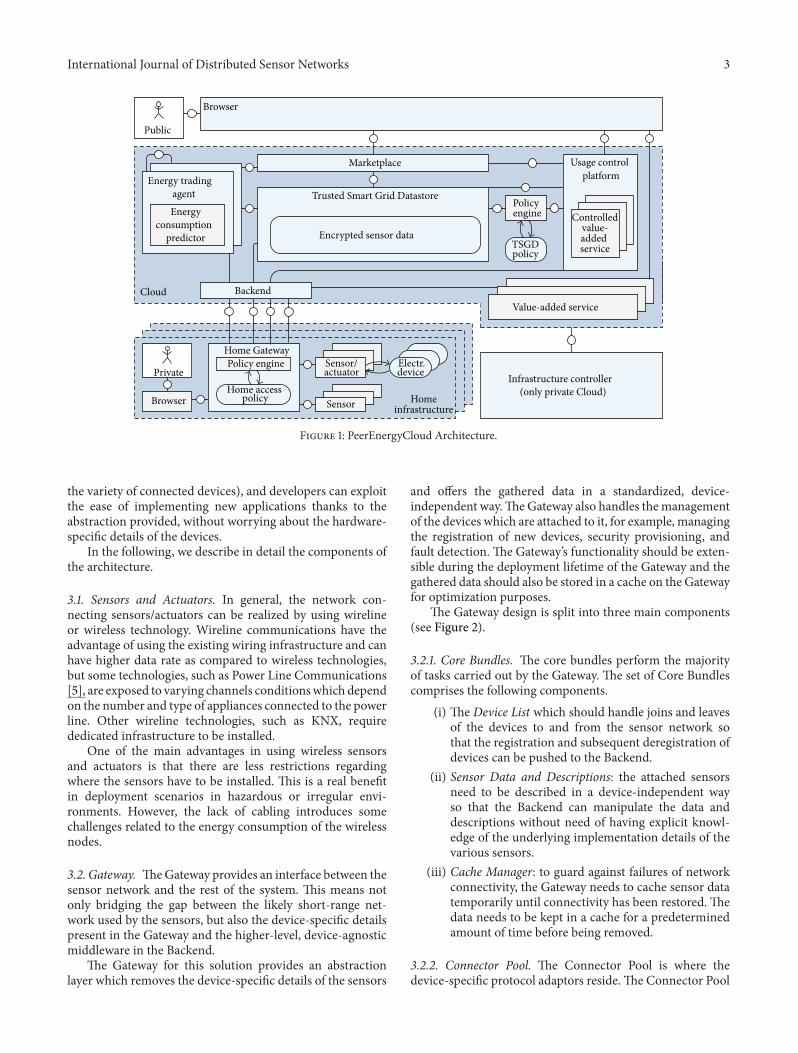
The architectural framework of PEC including the keycomponents is shown in Figure 1.
In the architecture drawing, all components except theprivate home installations are located in the Cloud. Cloudcomputing allows for the abstraction from real IT infrastruc-tures and hence supports elastic scalability for the handling ofbig data. That is, computing power and storage may be easilyincreased or decreased depending on the current sensor dataload. This is an important feature since for the describeduse case the load varies, for example, depending on thetime of day. Algorithmic frameworks such as MapReducesupport elasticity and scalability when deployed in the Cloud.
Concerning PEC, algorithms specifically attract notice whenit comes to predicting energy consumption which will beperformed by the energy trading agents.
An important component of the architecture is theBackend which represents the point of contact between theprivate home installations and the different parts of the PECarchitecture.
The private home installation is displayed on the lowerleft. It consists of a Home Gateway which represents thecoordinator between the network and sensors/actuators. Allsensors and actuators are connected to the Home Gatewayand regularly provide it with measured values. Deployedsensor types include so-called smart plugs for the energymeasurement, temperature sensors, light intensity sensors,air pressure sensors.These data will be pushed to the differentparts of the PEC architecture through the Backend.
With regard to the user’s privacy settings, the Backendpushes selected sensor data to the trusted smart grid datastore(TSGD), registered valued-added services, and its energytrading agent. The TSGD is responsible for managing datafrom all connected smart homes and provides access to thisdata for valued-added services which the user has registeredto.
Value-added services may include energy analysis tools,home security management, and intelligent automationapplications.
Energy trading agents use the detailed consumption datain order to predict future energy requirements and to placecontracts for energy purchase through the marketplace. Sucha system allows for explicit energy management and the easyintegration of customer-owned energy generators, such assolar panels or wind engines.
Figure 1 provides an outlook for the overall system com-plexity. It also shows the importance of a reliable sensornetwork with detailed measurements.
With the overall picture in mind, the following sectionswill describe the Smart Home Subsystem which includes theSensor Network, the Home Gateway, and the Backend.
3. Smart Home Subsystem Design
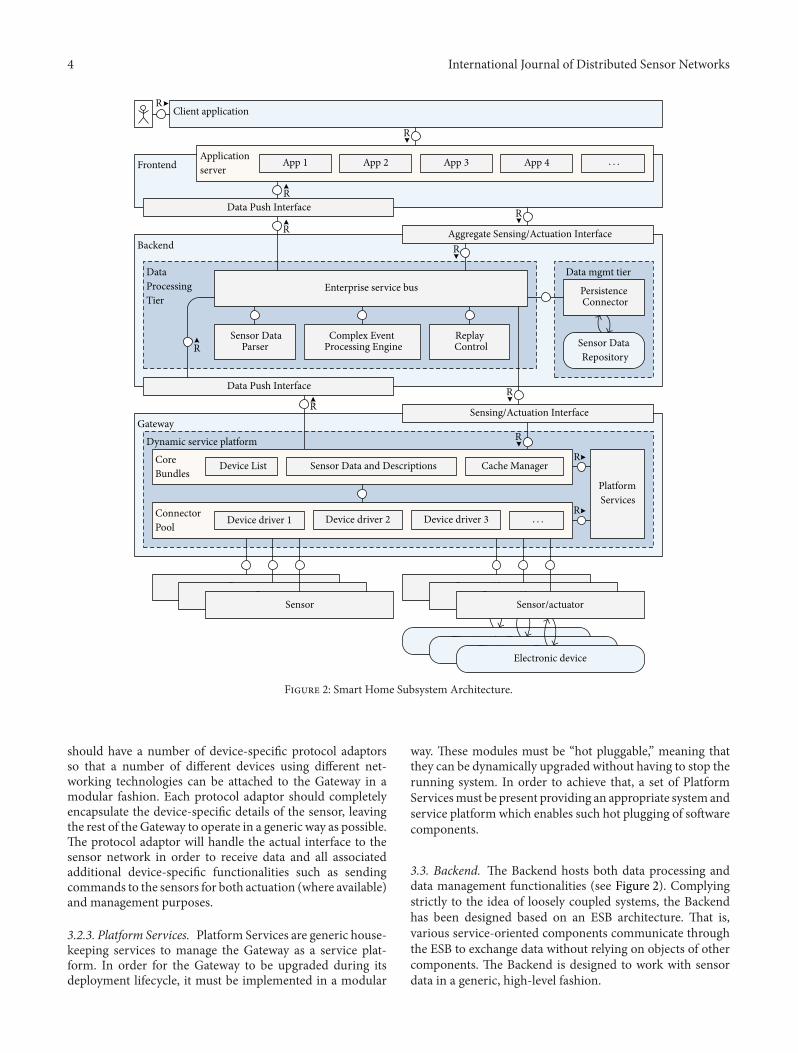
The overall Smart Home Subsystem architecture is depictedin Figure 2, whereas Figure 1 provides the deployment view ofthe end-to-end PEC architecture where the software compo-nents that comprise the Backend system have been deployedusing Cloud technologies. Figure 2 shows the componentview of the introduced platform in terms of the functionalcomponents of the system and their interconnections.
The architecture comprises a set of sensors/actuators (e.g.,smart plugs), one or more Gateways, a Backend, a Frontend,and one or more client applications. All the parts of thearchitecture are independent from each other; in this way itis possible to modify/update each of them without the needof updating or rebuilding the whole architecture.
Users can benefit from such an architecture due to the factthat it allows a simple connection of new devices (enablingin this way the possibility to increase the number and
International Journal of Distributed Sensor Networks 3
Cloud
Homeinfrastructure
Home Gateway
Marketplace
Browser
Public
Trusted Smart Grid Datastore
Encrypted sensor data
Policy engine
Policy engineInfrastructure controller
(only private Cloud)Home access policy
Energy trading agentEnergy
consumption predictor TSGD
policy
Private
Browser
Usage control platform
Controlledvalue-added service
Value-added service
Sensor/actuator
Electr.device
Sensor
Backend
Figure 1: PeerEnergyCloud Architecture.
the variety of connected devices), and developers can exploitthe ease of implementing new applications thanks to theabstraction provided, without worrying about the hardware-specific details of the devices.
In the following, we describe in detail the components ofthe architecture.
3.1. Sensors and Actuators. In general, the network con-necting sensors/actuators can be realized by using wirelineor wireless technology. Wireline communications have theadvantage of using the existing wiring infrastructure and canhave higher data rate as compared to wireless technologies,but some technologies, such as Power Line Communications[5], are exposed to varying channels conditionswhich dependon the number and type of appliances connected to the powerline. Other wireline technologies, such as KNX, requirededicated infrastructure to be installed.
One of the main advantages in using wireless sensorsand actuators is that there are less restrictions regardingwhere the sensors have to be installed. This is a real benefitin deployment scenarios in hazardous or irregular envi-ronments. However, the lack of cabling introduces somechallenges related to the energy consumption of the wirelessnodes.
3.2. Gateway. TheGateway provides an interface between thesensor network and the rest of the system. This means notonly bridging the gap between the likely short-range net-work used by the sensors, but also the device-specific detailspresent in the Gateway and the higher-level, device-agnosticmiddleware in the Backend.
The Gateway for this solution provides an abstractionlayer which removes the device-specific details of the sensors
and offers the gathered data in a standardized, device-independent way.TheGateway also handles themanagementof the devices which are attached to it, for example, managingthe registration of new devices, security provisioning, andfault detection. The Gateway’s functionality should be exten-sible during the deployment lifetime of the Gateway and thegathered data should also be stored in a cache on the Gatewayfor optimization purposes.
The Gateway design is split into three main components(see Figure 2).
3.2.1. Core Bundles. The core bundles perform the majorityof tasks carried out by the Gateway. The set of Core Bundlescomprises the following components.
(i) The Device List which should handle joins and leavesof the devices to and from the sensor network sothat the registration and subsequent deregistration ofdevices can be pushed to the Backend.
(ii) Sensor Data and Descriptions: the attached sensorsneed to be described in a device-independent wayso that the Backend can manipulate the data anddescriptions without need of having explicit knowl-edge of the underlying implementation details of thevarious sensors.
(iii) Cache Manager: to guard against failures of networkconnectivity, the Gateway needs to cache sensor datatemporarily until connectivity has been restored. Thedata needs to be kept in a cache for a predeterminedamount of time before being removed.
3.2.2. Connector Pool. The Connector Pool is where thedevice-specific protocol adaptors reside.The Connector Pool
4 International Journal of Distributed Sensor Networks
SensorSensor
Electronic Device
Sensor/Actuator
Electronic Device
Sensor/Actuator
· · ·
· · ·
GatewayDynamic service platform
Backend
DataProcessingTier
Frontend
Sensor
Electronic device
Applicationserver
App 1
ConnectorPool
Device driver 1
Aggregate Sensing/Actuation Interface
Enterprise service bus
Complex Event Processing Engine
Data mgmt tier
Sensor Data Repository
Sensing/Actuation Interface
Data Push Interface
Sensor/actuator
R
Client application
App 2 App 3 App 4
R
R
PersistenceConnector
Sensor DataParser
RR
R
Device driver 2 Device driver 3
CoreBundles
Device List Sensor Data and Descriptions Cache Manager
PlatformServices
R
R
R
Data Push Interface
R
R
RReplayControl
Figure 2: Smart Home Subsystem Architecture.
should have a number of device-specific protocol adaptorsso that a number of different devices using different net-working technologies can be attached to the Gateway in amodular fashion. Each protocol adaptor should completelyencapsulate the device-specific details of the sensor, leavingthe rest of the Gateway to operate in a generic way as possible.The protocol adaptor will handle the actual interface to thesensor network in order to receive data and all associatedadditional device-specific functionalities such as sendingcommands to the sensors for both actuation (where available)and management purposes.
3.2.3. Platform Services. Platform Services are generic house-keeping services to manage the Gateway as a service plat-form. In order for the Gateway to be upgraded during itsdeployment lifecycle, it must be implemented in a modular
way. These modules must be “hot pluggable,” meaning thatthey can be dynamically upgraded without having to stop therunning system. In order to achieve that, a set of PlatformServicesmust be present providing an appropriate system andservice platform which enables such hot plugging of softwarecomponents.
3.3. Backend. The Backend hosts both data processing anddata management functionalities (see Figure 2). Complyingstrictly to the idea of loosely coupled systems, the Backendhas been designed based on an ESB architecture. That is,various service-oriented components communicate throughthe ESB to exchange data without relying on objects of othercomponents. The Backend is designed to work with sensordata in a generic, high-level fashion.
International Journal of Distributed Sensor Networks 5
Depending on the accessing components, the Backendis typically subject to two different information processingflows.
The first information processing flow is initiated by theGateway whenever a new sensor reading comes in throughthe Backends Data Push Interface. This reading is thenpushed on the ESB and consumed by the Sensor Data Parser.The parser transforms the data into a valid format and pushesit back to the bus. Finally, the Persistence Connector accessesthe sensor data and persists it in the corresponding table ofthe Sensor Data Repository.
In addition to the persistence connector, a Complex EventProcessing (CEP) engine receives the incoming sensor data[6]. The CEP engine allows to run continuous queries on theincoming data, like filtering, aggregation, or pattern match-ing. Outputs of the CEP engine are filtered or aggregatedsensor data as well as higher level events that are derived froma set of multiple sensors values.
The aggregated sensor data and the events produced bythe CEP are again pushed on the bus. From there, they can beforwarded to the applications using the Data Push Interface.
The second information processing flow is initiated by theFrontend through the Aggregate Sensing/Actuation Inter-face. This interface allows the applications to access aggre-gated sensor data as well as events that have been producedby the CEP. Moreover, it allows the applications to access theGateway forwarding the requests from the Backend to theGateway using the ESB.This enables the applications to actu-ate and configuring devices as well as administrate the Gate-way itself. Thereby, the Aggregate Sensing/Actuation Inter-face enriches the transmitted data with data already storedin the Backend repository. If, for example, a list of all devicesconnected to a Gateway is requested, the interface addsmeta-data about the sensors taken from the repository (e.g., theunits that the sensors measure in). In addition, the interfacealso provides basic functions to administrate the CEP.
Another feature that can be activated using the AggregateSensing/Actuation Interface is the Replay Control service,which can be used for analyzing stored data and testingfeatures. It is activated when an application sends a specificreplay command (including a timestamp and a time dura-tion) through the interface. The interface then pushes thiscommand to the ESB in order to activate the Replay Control.Once this happen, the Replay Control service accesses thedatabase through the Persistence Connector and requests allthe data stored after the specified timestamp and before theend of the time duration. The Replay Control then producessensor data messages from these stored data and sends themessages in the same interval they have been received. More-over, it uses the same format and accessmechanism requestedby the Data Push Interface. Only the timestamps are updatedto the current values; this means that all of the other servicescannot distinguish the replayed data from the real currentsensor data. Thereby, every action that usually would beexecuted, including persisting the data, is executed as well.
3.4. Frontend and Client Applications. The generic access ofsensor data through the Backends Aggregate Sensing/Actu-
ation Interface allows the development of arbitrary Frontendapplications.
In the case of residential energy management, examplesof applications includemonitoring energy consumption (howmuch energy is currently consumed by the devices?), ana-lyzing energy usage history (which is the most expensivedevice?), recording temperature fluctuation (is the heaterworking well?), and switching devices on and off (comfort).
4. Smart Home Subsystem Implementation
4.1. Sensors and Actuators. In our implementation, we useZigBee devices [7]. ZigBee is a low-power wireless meshnetwork standard based on IEEE 802.15.4 standard for wire-less personal area networks, and it is commonly used inbuilding automation deployments. Compared to other com-peting technologies, such as X10 and KNX, which typicallyuse dedicated wiring for communication, ZigBee has theadvantage of being wireless. Additionally, unlike Z-Wave orEnOcean, it is an open standard and offers a high level ofconfigurability that is critical for a research project. Finally,it provides comprehensive security features compared tocompeting technologies [8].
In particular, in our deployments we have used XBeedevices, working in the 2.4GHz ISM band [9], in a meshtopology with the Personal Area Network (PAN) coordinatorlocated in the Gateway.
4.2. Gateway. In order to meet the requirements describedin the previous section and satisfy the modularity and exten-sibility needs, we chose to build the Gateway using the OSGiservice framework [10]. OSGi provides a platform whereJava modules (called bundles in OSGi) can be dynamicallyinstalled, stopped, started, updated, and uninstalled. Byoffering a service-oriented architecture, bundles can registerthemselves as services, discover existing services, and bindto listening services. These factors together mean that thefunctionality of the Gateway can be modified during itsdeployment life-cycle, thereby meeting our requirements.
We created the following services in Java on top of OSGi.The XBee protocol driver implements the XBee specific
driver and performs the following functions:
(i) device discovery: it discovers XBee devices in thenetwork;
(ii) data handling: data is received from the attacheddevices, and the payload is parsed and sent to theCache Manager and also to the Data Push Interfaceso that the data can be forwarded to the Backend forfurther processing;
(iii) actuation: if an application wishes to switch a deviceon or off, then the XBee protocol driver creates theappropriate message to be sent to the device so that itcan be activated or deactivated.
The Device List provides a dynamically updated list ofattached devices which can be queried by the Backend andthereby also provided to the applications. The Device List
6 International Journal of Distributed Sensor Networks
BRI = 391 lxTEM = 26.8CBAT = OKUBAT = 4.72V
Box 1: Sensor Data 1 unformatted sensor data.
"{\"MACADDR\": \"00:13:A2:00:40:61:B5:E4\",\"TYPE\":\"ZBS-121\",\"DATE\": \"2012-05-11 15:12:06\",\"VALUES\": {\"TEM\":27.2,\"BRI\":404,\"BAT\":\"OK\",\"UBAT\":0.0, }}"
Box 2: Sensor Data 2 formatted sensor data in JSON format.
contains metadata about each sensor that is attached, forexample, its MAC address, type and if it is a power plug,whether or not its relay is switched on or off.
The Sensor Data and Descriptions are a set of high-leveldescriptions of the sensors themselves and the data theycollect. The sensor descriptions are used by the Gateway tokeep track of which sensors are attached to the Gateway atany particular time as we typically have sensors of multipletypes in a deployment. The sensor data descriptions are usedto convert the data sent by the sensors into a formatwhich canbe used by the Backend and thereby the rest of the system.
When a message arrives from a sensor, it is processedby the Gateway and the relevant data is extracted. A singlesensor device can send messages with different types of dataas it may have multiple sensors onboard (e.g., temperature,light, humidity, etc.), so the Gateway needs to be aware of thedifferent types of data that can be expected from the sensors.
Box 1 shows an example of the unformatted sensor dataas it arrives from the sensor at the Gateway. The Gatewayparses this data and creates an internal representation of thisdata using the sensor data itself, information from the packetheader, and the time and date when the packet has beenreceived.
This internal representation is then converted into a JSONstanza which is then sent to the Backend for processing. Anexample of the JSON stanza is shown in Box 2.
The Cache Manager interacts with a local database (e.g.,PostgreSQL) to temporarily store the gathered sensor data.The database is also accessible via the Sensing/ActuationInterface so that the applications can access the cache ifnecessary.
The Representational State Transfer (REST) Interface isthe implementation of the interfaces used by the Gateway tointeract with the Backend. It provides the following features:getting the latest data from the database for a specific device,turning the relay of a device on or off (actuation capabilities),and sending gathered data from a sensor to the Backend.
The REST Interface is implemented using the JAX-RSframework [11] and formats the payload of the REST calls ina JavaScript Object Notation (JSON) format [12].
4.3. Backend. In order to implement the service-orientedarchitecture as shown in the previous section, we implemen-ted theData Processing Tier of the Backend using ServiceMix4.4.2 [13]. This allows reliable messaging using ApacheActiveMQ, routing using Apache Camel, and the relativelysimple creation of complex RESTful interfaces using ApacheCXF and JAX-RS. Thereby, the ActiveMQ allows the fasttransportation of messages using the Java Messaging Service(JMS) which enables the communication using several pro-tocols such as Stomp or OpenWire.
On top of that, ActiveMQ supports a wide number of lan-guage clients besides Java, for example, Ajax, C#, PHP, andRuby. Thanks to it, applications can easily be integrated intothe system.
The integration frameworkApacheCamel then allows thedefinition of routing and rules on top of themessaging.There-fore, several domain-specific languages, for example, Spring,Fluent API, or Scala DSL, can be used. As Apache Camel usesURIs, it can work directly with messaging models as HTTP,JMS, and ActiveMQ.
The Sensor Data Repository has been realized using aPostgreSQL 9.1 database [14]. It has been integrated into Ser-viceMix using the EclipseLink 2.3.2 implementation of theJava Persistence API. As a low-memory alternative, we alsoimplemented a Sensor Data Repository using PostgreSQLand JDBC. The chosen data exchange format is again theJSON due to its lightweight data exchange format which req-uires less resources when compared to certain XML formats.
CEP is implemented based on the open-source solutionESPER [15]. This engine provides high throughput and sup-ports an expressive declarative language for complex eventqueries. The engine is wrapped as a service and receivesall incoming sensor data from the bus in a push-basedmanner. Incoming sensor data are encoded in JSON format.The wrapper maps the data to an internal Plain Old JavaObject (POJO) representation of raw events, and a sensorstream is created for each sensor type. CEP queries can bedefined over these streams or any combination of them viathe ESPER query language. Query results are continuouslypushed to listeners, which transform the results into a JSONrepresentation and push them to the bus. Thereby, filteredsensor data and derived high level events are made availablein the Frontend.
4.4. Frontend and Applications. To enable interaction withthe overall system through a variety of end devices fromsmart phones to desktop PCs, we have decided to use a webapplication server to implement the Frontend.
The Frontend provides an interface which client appli-cations can use to access the sensor data of the system ina user-friendly way. In particular, we used the Apache [13]HTTP Server for the server-side, and we have implementedsample Web applications on the client-side using a dedicatedJavaScript framework which supports touch devices.
International Journal of Distributed Sensor Networks 7
0
0.05
0.1
0.15
0.2
0.25
0.300
:00
01:0
002
:00
03:0
004
:00
05:0
006
:00
07:0
008
:00
09:0
010
:00
11:0
012
:00
13:0
014
:00
15:0
016
:00
17:0
018
:00
19:0
020
:00
21:0
022
:00
23:0
0
Load
(kW
h)
Time of the day
Weekdays average
Figure 3: Average consumption on weekdays.
5. Smart Home Subsystem Evaluation
5.1. Deployment Description. In order to evaluate the plat-form, we have developed an energy usage managementapplication based on our architecture and tested it in a fieldtrial. Using this application, one can identify large consumersand unnecessary energy consumption in order to reduceoverall electricity consumption. It also provides an interfacefor remote monitoring and control of the appliances.
We tested this application in a field trial where the sensorswere deployed in a private household. In order to collectenergy consumption values and control the appliances, weused smart plugs withmetering and actuating capabilities. Allthe smart plugs were connected to the Gateway using ZigBee,establishing a mesh topology network, and the smart plugsreported current consumption data to the Gateway every 2seconds. Their distance to the Gateway was ranging fromless than one meter (line-of-sight connection) to around tenmeters, in which case radio signal was propagating throughtwo inner walls and one inner floor of the house. Goodradio propagation conditions resulted in a long-term stableoperation of the sensor network, in our experience.
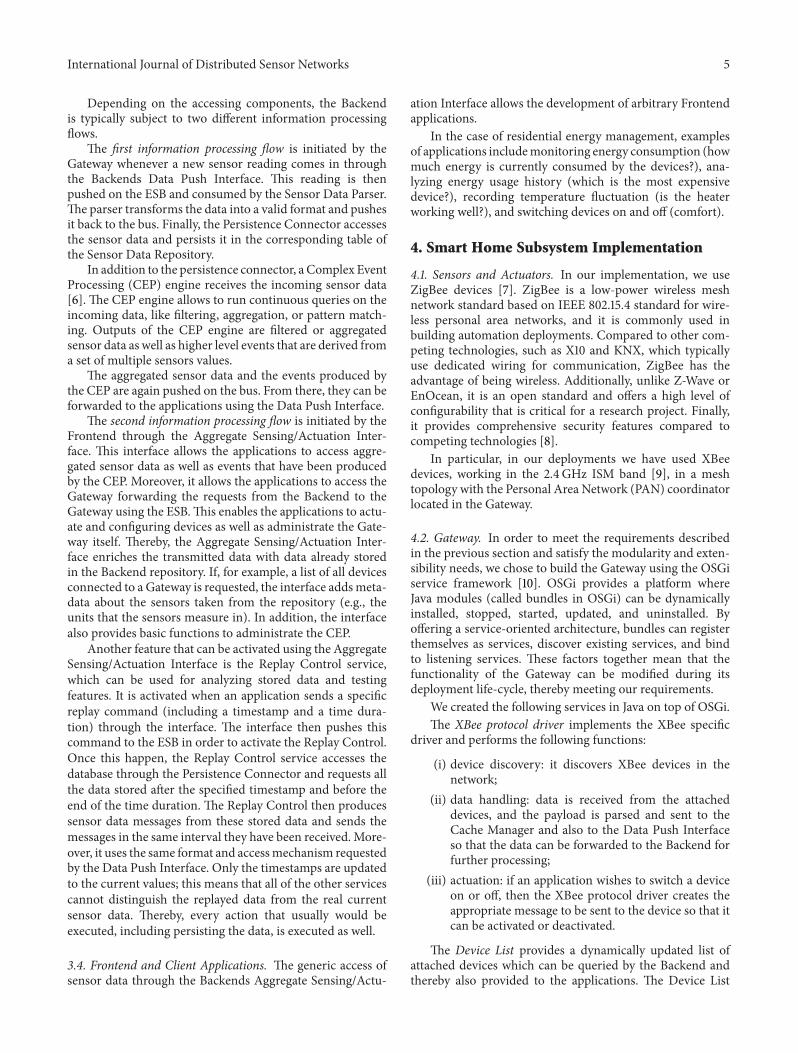
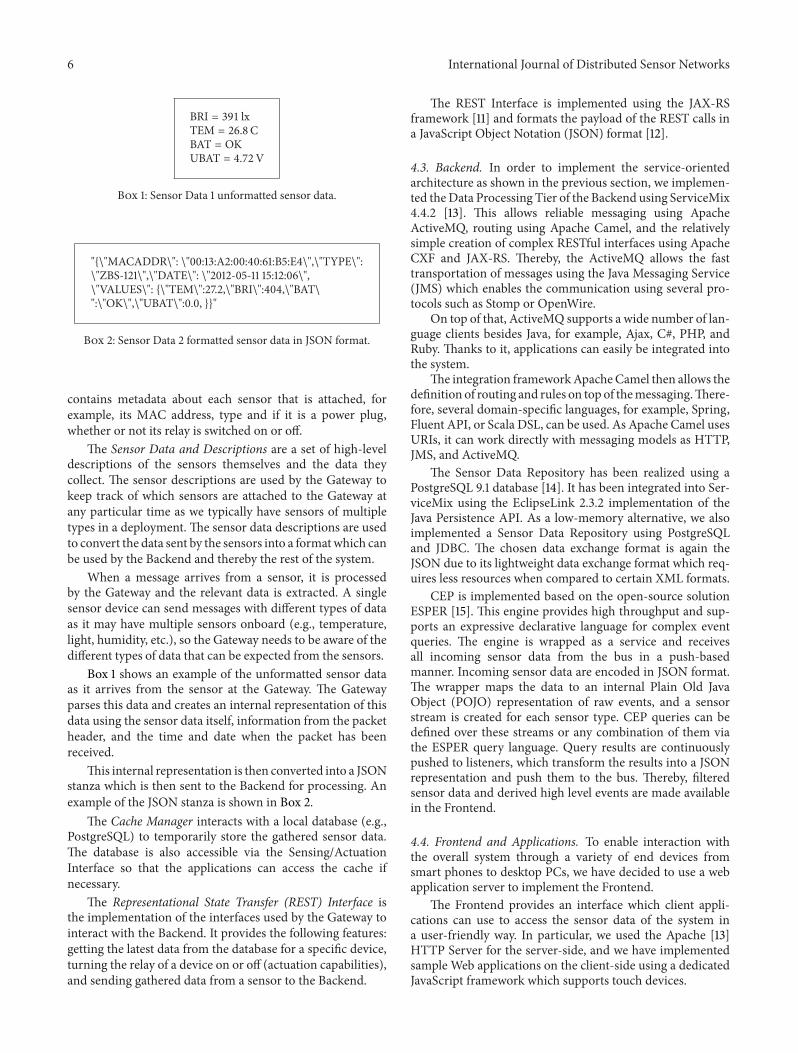
All the measurements related to the energy consumptionwere sent to the Backend which was hosted in a Cloudenvironment built with virtual machines in a remote datacenter. In addition, we implemented a web-based Frontendthat provides the user with statistics over the collected sensordata. Examples of charts reported are shown in Figures 3and 4. Specifically, Figure 3 shows the average consumptionduring days of a week at the trial household over a four-weekperiod, and Figure 4 drills down into the devices’-specificconsumption for a more detailed analysis.
Figure 3 reveals two consumption peaks, that is, onesmaller peak after lunchtime and a higher peak in theevening. Drilling down into the devices’-specific consump-tion (see Figure 4) explains these peaks. Among the observeddevices, there are a freezer and a fridge that run throughregular cooling cycles during the day and explain a large
0
0.05
0.1
0.15
0.2
0.25
0.3
00:0
0:01
01:0
0:01
02:0
0:01
03:0
0:01
04:0
0:01
05:0
0:01
06:0
0:01
07:0
0:01
08:0
0:01
09:0
0:01
10:0
0:01
11:0
0:01
12:0
0:01
13:0
0:01
14:0
0:01
15:0
0:01
16:0
0:01
17:0
0:01
18:0
0:01
19:0
0:01
20:0
0:01
21:0
0:01
22:0
0:01
23:0
0:01
Time of the day
ComputerFridgeTV1Stereo
TV2FreezerTotal
Load
(kW
h)
Figure 4: Measured consumption on one day.
percentage of the energy consumption. After lunch, a TV isswitched on for a few houses, resulting in the first peak. Asecond and bigger peak occurs in the late afternoon, when theTV is switched on in combinationwith further entertainmentelectronics (i.e., a second TV set and a stereo).
These statistics enable the user to get detailed feedbackabout the energy usage and show potential for energy saving,for example, by adapting the behavior or replacing energyconsuming devices with more efficient ones. For instance,Figure 4 shows that, among the two TV used, the less energyefficient one is used more frequently than the other andswapping the two would result in savings.
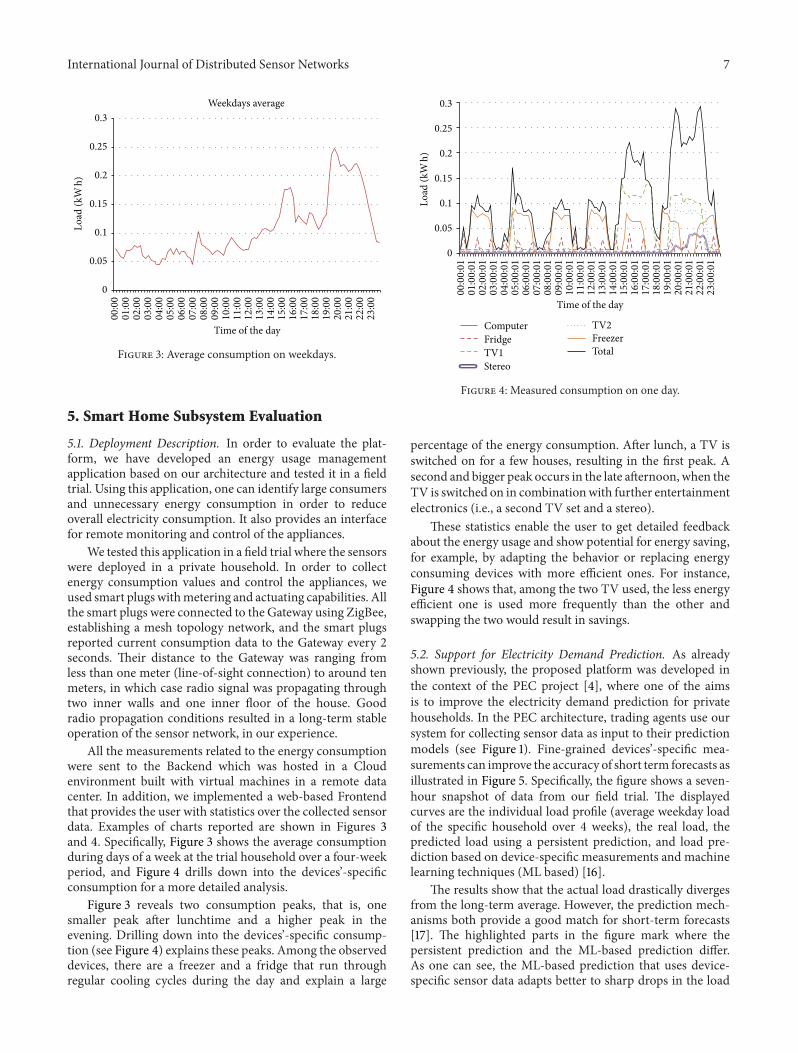
5.2. Support for Electricity Demand Prediction. As alreadyshown previously, the proposed platform was developed inthe context of the PEC project [4], where one of the aimsis to improve the electricity demand prediction for privatehouseholds. In the PEC architecture, trading agents use oursystem for collecting sensor data as input to their predictionmodels (see Figure 1). Fine-grained devices’-specific mea-surements can improve the accuracy of short term forecasts asillustrated in Figure 5. Specifically, the figure shows a seven-hour snapshot of data from our field trial. The displayedcurves are the individual load profile (average weekday loadof the specific household over 4 weeks), the real load, thepredicted load using a persistent prediction, and load pre-diction based on device-specific measurements and machinelearning techniques (ML based) [16].
The results show that the actual load drastically divergesfrom the long-term average. However, the prediction mech-anisms both provide a good match for short-term forecasts[17]. The highlighted parts in the figure mark where thepersistent prediction and the ML-based prediction differ.As one can see, the ML-based prediction that uses device-specific sensor data adapts better to sharp drops in the load
8 International Journal of Distributed Sensor Networks
0
0.02
0.04
0.06
0.08
0.1
0.12
0.14
05:0
0
05:4
5
06:3
0
07:1
5
08:0
0
08:4
5
09:3
0
10:1
5
11:0
0
11:4
5
Load
(kW
h)
Time of the dayReal loadIndividual loadprofile (average load onweekdays)
ML-based predictionPersistent prediction
Figure 5: Demand forecast with smart building sensors.
and provides better matches to short spikes. This results inan overall better prediction accuracy that is enabled by oursensing solution.
5.3. Performance EvaluationResults. Since the typical deploy-ment has multiple Gateways connected to one Backend, weexpect the Backend to be the bottleneck of the system. Forthat reason, the evaluation presented in this section focuseson this component.
Another critical component impacting on the perfor-mance of the system as a whole is the sensor network.However, its performance evaluation is not closely related tothe software architecture, but it is rather in the domain of theradio propagation, which is out of scope for this paper.
For the performance evaluation of the Backend, westudied an urban site comprising 50 households (i.e., 50Gateways), each of them equipped with 15 smart plugsreporting electricity consumption. Each message deliveringthe consumption report was 192 bytes long. We used JMeter[18] to emulate the data and signaling load going to theBackend REST interface. The JMeter engine was running ona dedicated server machine connected to the same GigabitEthernet segment as the Backend server machine. All theoperating system tasks that were irrelevant to the load testwere dormant, while network traffic on the Ethernet segmentwas monitored by Wireshark.
In the first test plan, we emulated only the traffic comingfrom theGatewaywith the updates from smart plugmeasure-ments, and in the second one, we evaluated the performanceof the system under mixed traffic coming from the Gateways
0
20
40
60
80
100
120
140
160
180
0 5 10 15 20
HTT
P tr
affic (
ms)
Time (min)
HTTP responsesTarget traffic
Figure 6: Test Plan 1: target traffic sent from the HTTP trafficemulator and the rate of HTTP responses.
and from the applications reading themeasured consumptionvalues.
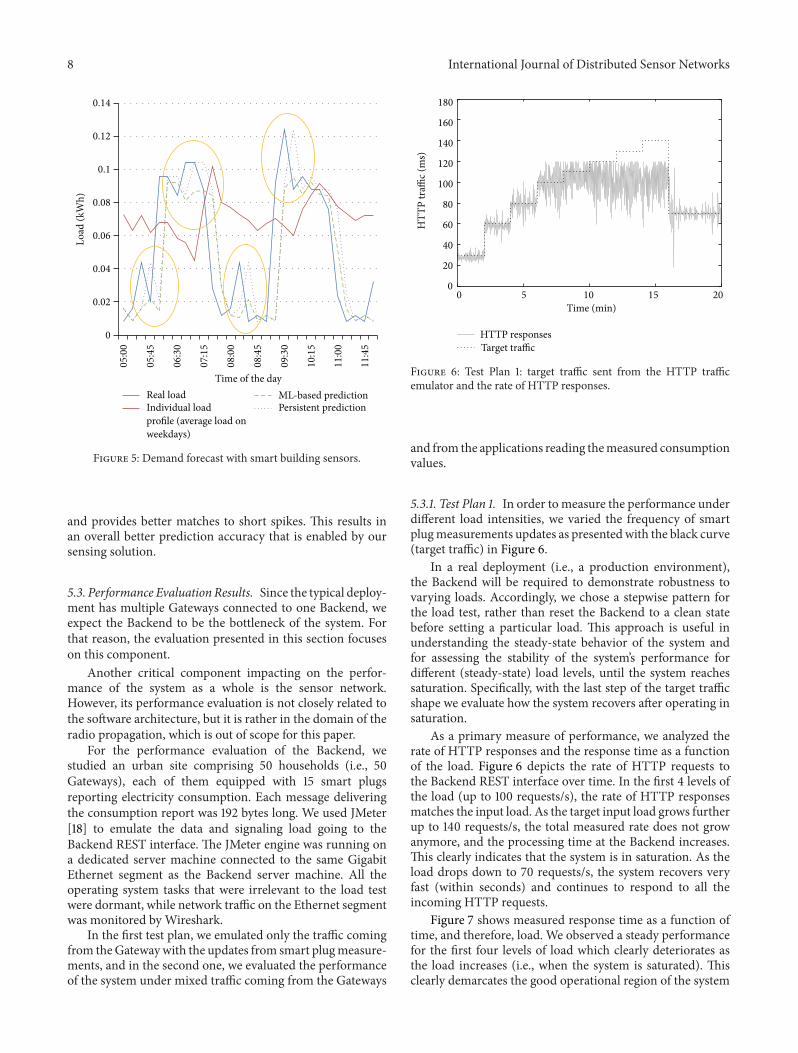
5.3.1. Test Plan 1. In order to measure the performance underdifferent load intensities, we varied the frequency of smartplugmeasurements updates as presentedwith the black curve(target traffic) in Figure 6.
In a real deployment (i.e., a production environment),the Backend will be required to demonstrate robustness tovarying loads. Accordingly, we chose a stepwise pattern forthe load test, rather than reset the Backend to a clean statebefore setting a particular load. This approach is useful inunderstanding the steady-state behavior of the system andfor assessing the stability of the system’s performance fordifferent (steady-state) load levels, until the system reachessaturation. Specifically, with the last step of the target trafficshape we evaluate how the system recovers after operating insaturation.
As a primary measure of performance, we analyzed therate of HTTP responses and the response time as a functionof the load. Figure 6 depicts the rate of HTTP requests tothe Backend REST interface over time. In the first 4 levels ofthe load (up to 100 requests/s), the rate of HTTP responsesmatches the input load. As the target input load grows furtherup to 140 requests/s, the total measured rate does not growanymore, and the processing time at the Backend increases.This clearly indicates that the system is in saturation. As theload drops down to 70 requests/s, the system recovers veryfast (within seconds) and continues to respond to all theincoming HTTP requests.
Figure 7 shows measured response time as a function oftime, and therefore, load. We observed a steady performancefor the first four levels of load which clearly deteriorates asthe load increases (i.e., when the system is saturated). Thisclearly demarcates the good operational region of the system
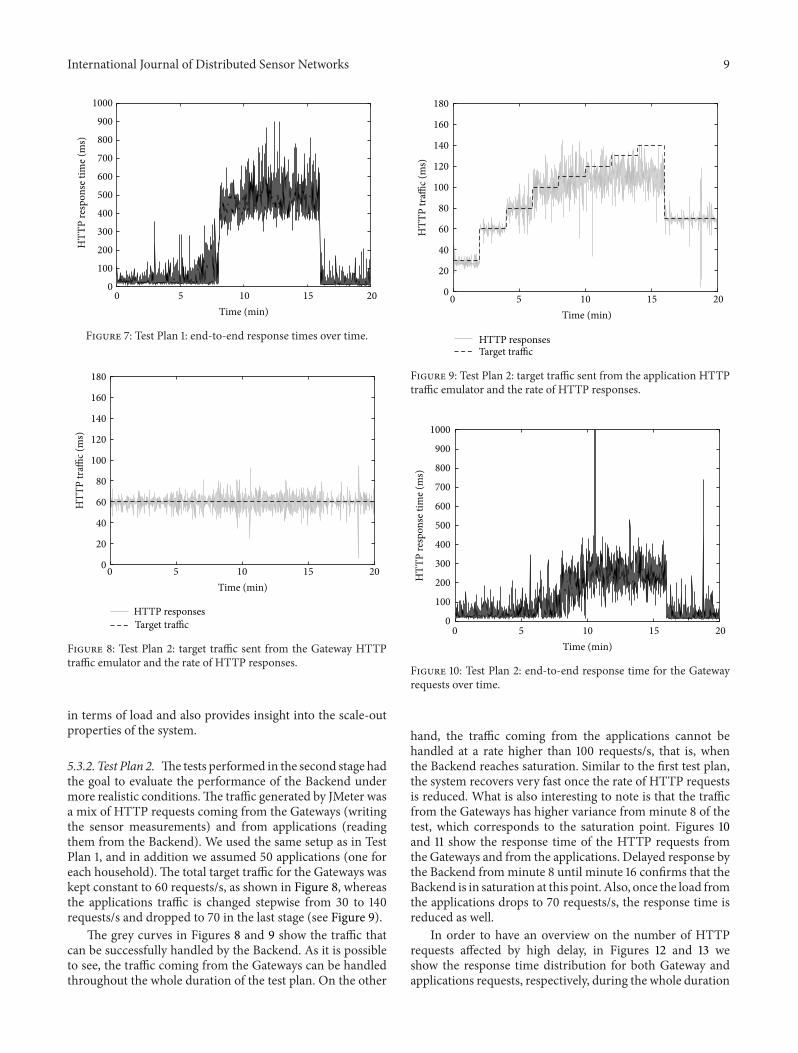
International Journal of Distributed Sensor Networks 9
0
100
200
300
400
500
600
700
800
900
1000
0 5 10 15 20
HTT
P re
spon
se ti
me (
ms)
Time (min)
Figure 7: Test Plan 1: end-to-end response times over time.
0
20
40
60
80
100
120
140
160
180
0 5 10 15 20
HTT
P tr
affic (
ms)
Time (min)
HTTP responsesTarget traffic
Figure 8: Test Plan 2: target traffic sent from the Gateway HTTPtraffic emulator and the rate of HTTP responses.
in terms of load and also provides insight into the scale-outproperties of the system.
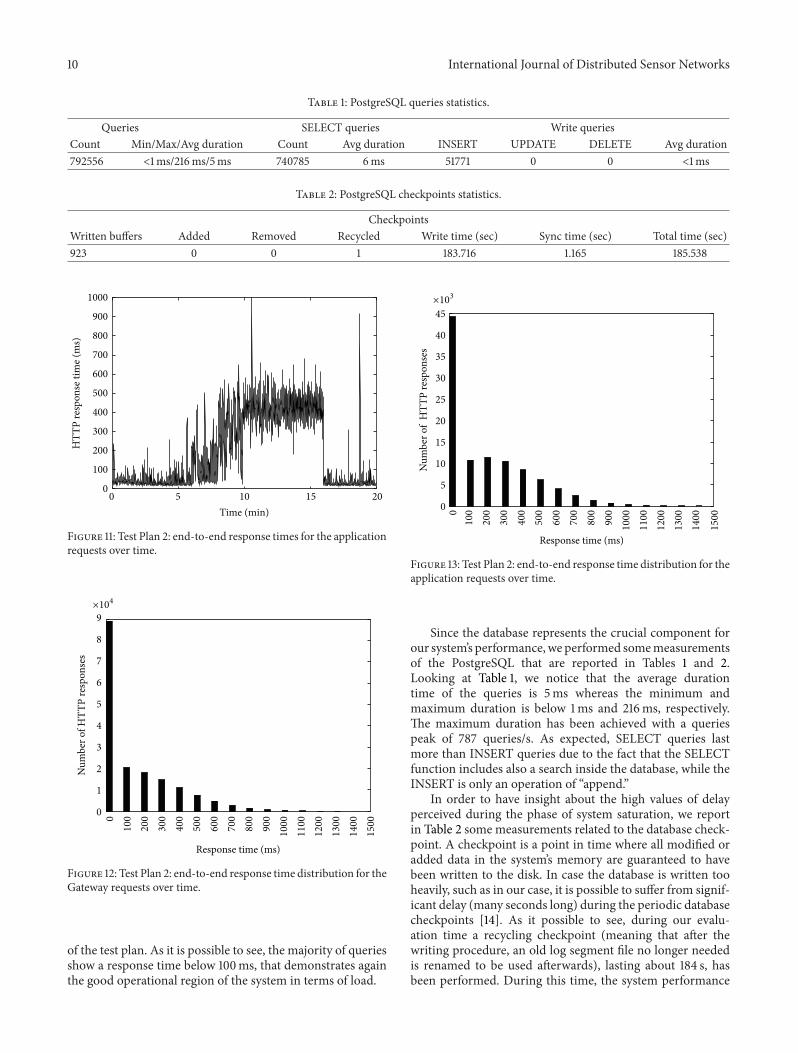
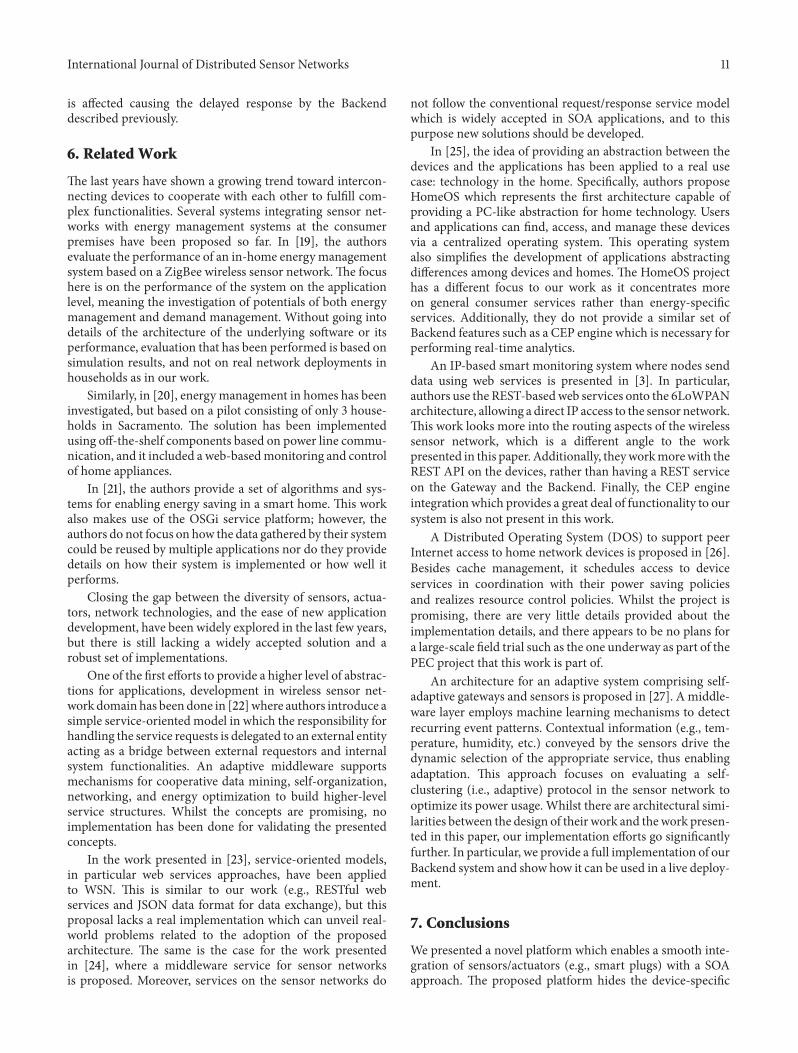
5.3.2. Test Plan 2. Thetests performed in the second stage hadthe goal to evaluate the performance of the Backend undermore realistic conditions.The traffic generated by JMeter wasa mix of HTTP requests coming from the Gateways (writingthe sensor measurements) and from applications (readingthem from the Backend). We used the same setup as in TestPlan 1, and in addition we assumed 50 applications (one foreach household). The total target traffic for the Gateways waskept constant to 60 requests/s, as shown in Figure 8, whereasthe applications traffic is changed stepwise from 30 to 140requests/s and dropped to 70 in the last stage (see Figure 9).
The grey curves in Figures 8 and 9 show the traffic thatcan be successfully handled by the Backend. As it is possibleto see, the traffic coming from the Gateways can be handledthroughout the whole duration of the test plan. On the other
0
20
40
60
80
100
120
140
160
180
0 5 10 15 20
HTT
P tr
affic (
ms)
Time (min)
HTTP responsesTarget traffic
Figure 9: Test Plan 2: target traffic sent from the application HTTPtraffic emulator and the rate of HTTP responses.
0
100
200
300
400
500
600
700
800
900
1000
0 5 10 15 20
HTT
P re
spon
se ti
me (
ms)
Time (min)
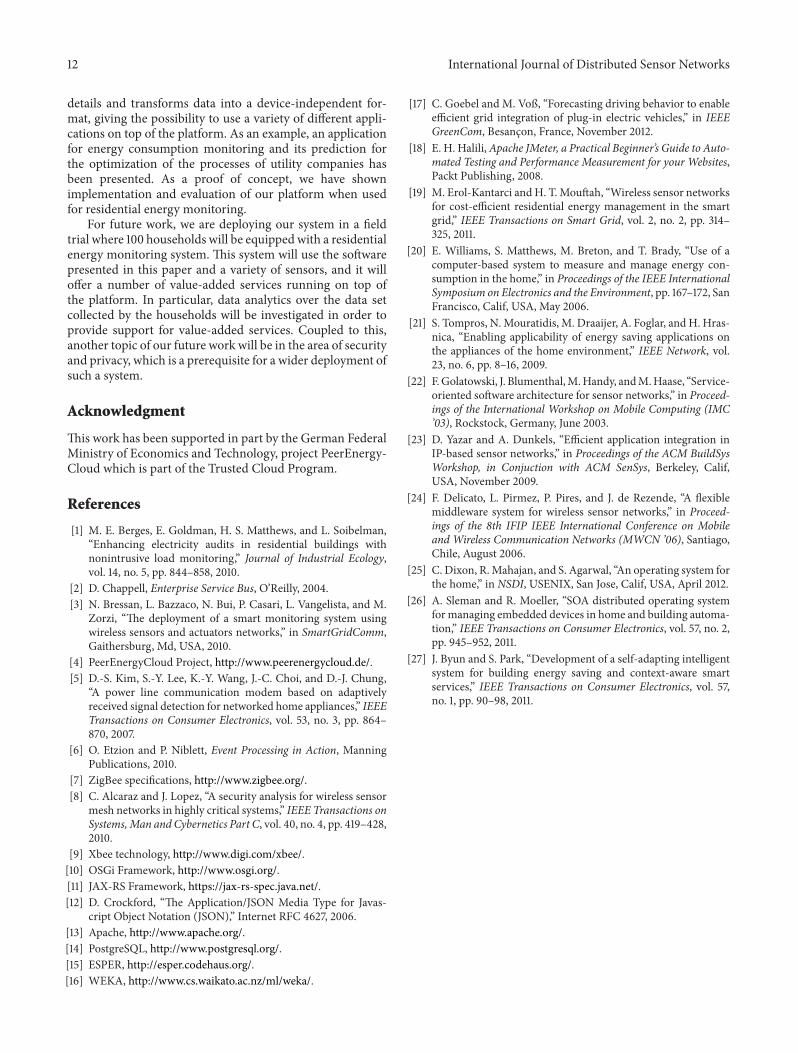
Figure 10: Test Plan 2: end-to-end response time for the Gatewayrequests over time.
hand, the traffic coming from the applications cannot behandled at a rate higher than 100 requests/s, that is, whenthe Backend reaches saturation. Similar to the first test plan,the system recovers very fast once the rate of HTTP requestsis reduced. What is also interesting to note is that the trafficfrom the Gateways has higher variance from minute 8 of thetest, which corresponds to the saturation point. Figures 10and 11 show the response time of the HTTP requests fromthe Gateways and from the applications. Delayed response bythe Backend fromminute 8 until minute 16 confirms that theBackend is in saturation at this point. Also, once the load fromthe applications drops to 70 requests/s, the response time isreduced as well.
In order to have an overview on the number of HTTPrequests affected by high delay, in Figures 12 and 13 weshow the response time distribution for both Gateway andapplications requests, respectively, during the whole duration
10 International Journal of Distributed Sensor Networks
Table 1: PostgreSQL queries statistics.
Queries SELECT queries Write queriesCount Min/Max/Avg duration Count Avg duration INSERT UPDATE DELETE Avg duration792556 <1ms/216ms/5ms 740785 6ms 51771 0 0 <1ms
Table 2: PostgreSQL checkpoints statistics.
CheckpointsWritten buffers Added Removed Recycled Write time (sec) Sync time (sec) Total time (sec)923 0 0 1 183.716 1.165 185.538
0
100
200
300
400
500
600
700
800
900
1000
0 5 10 15 20
HTT
P re
spon
se ti
me (
ms)
Time (min)
Figure 11: Test Plan 2: end-to-end response times for the applicationrequests over time.
0 010
020
030
040
050
060
070
080
090
010
0011
0012
0013
0014
0015
00
Num
ber o
f HTT
P re
spon
ses
Response time (ms)
×104
1
2
3
4
5
6
7
8
9
Figure 12: Test Plan 2: end-to-end response time distribution for theGateway requests over time.
of the test plan. As it is possible to see, the majority of queriesshow a response time below 100ms, that demonstrates againthe good operational region of the system in terms of load.
0
5
10
15
20
25
30
35
40
45
010
020
030
040
050
060
070
080
090
010
0011
0012
0013
0014
00
1500
Num
ber o
f H
TTP
resp
onse
s
Response time (ms)
×103
Figure 13: Test Plan 2: end-to-end response time distribution for theapplication requests over time.
Since the database represents the crucial component forour system’s performance,we performed somemeasurementsof the PostgreSQL that are reported in Tables 1 and 2.Looking at Table 1, we notice that the average durationtime of the queries is 5ms whereas the minimum andmaximum duration is below 1ms and 216ms, respectively.The maximum duration has been achieved with a queriespeak of 787 queries/s. As expected, SELECT queries lastmore than INSERT queries due to the fact that the SELECTfunction includes also a search inside the database, while theINSERT is only an operation of “append.”
In order to have insight about the high values of delayperceived during the phase of system saturation, we reportin Table 2 some measurements related to the database check-point. A checkpoint is a point in time where all modified oradded data in the system’s memory are guaranteed to havebeen written to the disk. In case the database is written tooheavily, such as in our case, it is possible to suffer from signif-icant delay (many seconds long) during the periodic databasecheckpoints [14]. As it possible to see, during our evalu-ation time a recycling checkpoint (meaning that after thewriting procedure, an old log segment file no longer neededis renamed to be used afterwards), lasting about 184 s, hasbeen performed. During this time, the system performance
International Journal of Distributed Sensor Networks 11
is affected causing the delayed response by the Backenddescribed previously.
6. Related Work
The last years have shown a growing trend toward intercon-necting devices to cooperate with each other to fulfill com-plex functionalities. Several systems integrating sensor net-works with energy management systems at the consumerpremises have been proposed so far. In [19], the authorsevaluate the performance of an in-home energy managementsystem based on a ZigBee wireless sensor network.The focushere is on the performance of the system on the applicationlevel, meaning the investigation of potentials of both energymanagement and demand management. Without going intodetails of the architecture of the underlying software or itsperformance, evaluation that has been performed is based onsimulation results, and not on real network deployments inhouseholds as in our work.
Similarly, in [20], energy management in homes has beeninvestigated, but based on a pilot consisting of only 3 house-holds in Sacramento. The solution has been implementedusing off-the-shelf components based on power line commu-nication, and it included a web-basedmonitoring and controlof home appliances.
In [21], the authors provide a set of algorithms and sys-tems for enabling energy saving in a smart home. This workalso makes use of the OSGi service platform; however, theauthors do not focus on how the data gathered by their systemcould be reused by multiple applications nor do they providedetails on how their system is implemented or how well itperforms.
Closing the gap between the diversity of sensors, actua-tors, network technologies, and the ease of new applicationdevelopment, have been widely explored in the last few years,but there is still lacking a widely accepted solution and arobust set of implementations.
One of the first efforts to provide a higher level of abstrac-tions for applications, development in wireless sensor net-work domain has beendone in [22]where authors introduce asimple service-oriented model in which the responsibility forhandling the service requests is delegated to an external entityacting as a bridge between external requestors and internalsystem functionalities. An adaptive middleware supportsmechanisms for cooperative data mining, self-organization,networking, and energy optimization to build higher-levelservice structures. Whilst the concepts are promising, noimplementation has been done for validating the presentedconcepts.
In the work presented in [23], service-oriented models,in particular web services approaches, have been appliedto WSN. This is similar to our work (e.g., RESTful webservices and JSON data format for data exchange), but thisproposal lacks a real implementation which can unveil real-world problems related to the adoption of the proposedarchitecture. The same is the case for the work presentedin [24], where a middleware service for sensor networksis proposed. Moreover, services on the sensor networks do
not follow the conventional request/response service modelwhich is widely accepted in SOA applications, and to thispurpose new solutions should be developed.
In [25], the idea of providing an abstraction between thedevices and the applications has been applied to a real usecase: technology in the home. Specifically, authors proposeHomeOS which represents the first architecture capable ofproviding a PC-like abstraction for home technology. Usersand applications can find, access, and manage these devicesvia a centralized operating system. This operating systemalso simplifies the development of applications abstractingdifferences among devices and homes. The HomeOS projecthas a different focus to our work as it concentrates moreon general consumer services rather than energy-specificservices. Additionally, they do not provide a similar set ofBackend features such as a CEP engine which is necessary forperforming real-time analytics.
An IP-based smart monitoring system where nodes senddata using web services is presented in [3]. In particular,authors use the REST-basedweb services onto the 6LoWPANarchitecture, allowing a direct IP access to the sensor network.This work looks more into the routing aspects of the wirelesssensor network, which is a different angle to the workpresented in this paper. Additionally, theyworkmorewith theREST API on the devices, rather than having a REST serviceon the Gateway and the Backend. Finally, the CEP engineintegration which provides a great deal of functionality to oursystem is also not present in this work.
A Distributed Operating System (DOS) to support peerInternet access to home network devices is proposed in [26].Besides cache management, it schedules access to deviceservices in coordination with their power saving policiesand realizes resource control policies. Whilst the project ispromising, there are very little details provided about theimplementation details, and there appears to be no plans fora large-scale field trial such as the one underway as part of thePEC project that this work is part of.
An architecture for an adaptive system comprising self-adaptive gateways and sensors is proposed in [27]. A middle-ware layer employs machine learning mechanisms to detectrecurring event patterns. Contextual information (e.g., tem-perature, humidity, etc.) conveyed by the sensors drive thedynamic selection of the appropriate service, thus enablingadaptation. This approach focuses on evaluating a self-clustering (i.e., adaptive) protocol in the sensor network tooptimize its power usage. Whilst there are architectural simi-larities between the design of their work and thework presen-ted in this paper, our implementation efforts go significantlyfurther. In particular, we provide a full implementation of ourBackend system and show how it can be used in a live deploy-ment.
7. Conclusions
We presented a novel platform which enables a smooth inte-gration of sensors/actuators (e.g., smart plugs) with a SOAapproach. The proposed platform hides the device-specific
12 International Journal of Distributed Sensor Networks
details and transforms data into a device-independent for-mat, giving the possibility to use a variety of different appli-cations on top of the platform. As an example, an applicationfor energy consumption monitoring and its prediction forthe optimization of the processes of utility companies hasbeen presented. As a proof of concept, we have shownimplementation and evaluation of our platform when usedfor residential energy monitoring.
For future work, we are deploying our system in a fieldtrial where 100 households will be equipped with a residentialenergy monitoring system. This system will use the softwarepresented in this paper and a variety of sensors, and it willoffer a number of value-added services running on top ofthe platform. In particular, data analytics over the data setcollected by the households will be investigated in order toprovide support for value-added services. Coupled to this,another topic of our future work will be in the area of securityand privacy, which is a prerequisite for a wider deployment ofsuch a system.
Acknowledgment
This work has been supported in part by the German FederalMinistry of Economics and Technology, project PeerEnergy-Cloud which is part of the Trusted Cloud Program.
References
[1] M. E. Berges, E. Goldman, H. S. Matthews, and L. Soibelman,“Enhancing electricity audits in residential buildings withnonintrusive load monitoring,” Journal of Industrial Ecology,vol. 14, no. 5, pp. 844–858, 2010.
[2] D. Chappell, Enterprise Service Bus, O’Reilly, 2004.[3] N. Bressan, L. Bazzaco, N. Bui, P. Casari, L. Vangelista, and M.
Zorzi, “The deployment of a smart monitoring system usingwireless sensors and actuators networks,” in SmartGridComm,Gaithersburg, Md, USA, 2010.
[4] PeerEnergyCloud Project, http://www.peerenergycloud.de/.[5] D.-S. Kim, S.-Y. Lee, K.-Y. Wang, J.-C. Choi, and D.-J. Chung,
“A power line communication modem based on adaptivelyreceived signal detection for networked home appliances,” IEEETransactions on Consumer Electronics, vol. 53, no. 3, pp. 864–870, 2007.
[6] O. Etzion and P. Niblett, Event Processing in Action, ManningPublications, 2010.
[7] ZigBee specifications, http://www.zigbee.org/.[8] C. Alcaraz and J. Lopez, “A security analysis for wireless sensor
mesh networks in highly critical systems,” IEEE Transactions onSystems,Man and Cybernetics Part C, vol. 40, no. 4, pp. 419–428,2010.
[9] Xbee technology, http://www.digi.com/xbee/.[10] OSGi Framework, http://www.osgi.org/.[11] JAX-RS Framework, https://jax-rs-spec.java.net/.[12] D. Crockford, “The Application/JSON Media Type for Javas-
cript Object Notation (JSON),” Internet RFC 4627, 2006.[13] Apache, http://www.apache.org/.[14] PostgreSQL, http://www.postgresql.org/.[15] ESPER, http://esper.codehaus.org/.[16] WEKA, http://www.cs.waikato.ac.nz/ml/weka/.
[17] C. Goebel and M. Voß, “Forecasting driving behavior to enableefficient grid integration of plug-in electric vehicles,” in IEEEGreenCom, Besancon, France, November 2012.
[18] E. H. Halili,Apache JMeter, a Practical Beginner’s Guide to Auto-mated Testing and Performance Measurement for your Websites,Packt Publishing, 2008.
[19] M. Erol-Kantarci andH. T.Mouftah, “Wireless sensor networksfor cost-efficient residential energy management in the smartgrid,” IEEE Transactions on Smart Grid, vol. 2, no. 2, pp. 314–325, 2011.
[20] E. Williams, S. Matthews, M. Breton, and T. Brady, “Use of acomputer-based system to measure and manage energy con-sumption in the home,” in Proceedings of the IEEE InternationalSymposium on Electronics and the Environment, pp. 167–172, SanFrancisco, Calif, USA, May 2006.
[21] S. Tompros, N. Mouratidis, M. Draaijer, A. Foglar, and H. Hras-nica, “Enabling applicability of energy saving applications onthe appliances of the home environment,” IEEE Network, vol.23, no. 6, pp. 8–16, 2009.
[22] F.Golatowski, J. Blumenthal,M.Handy, andM.Haase, “Service-oriented software architecture for sensor networks,” in Proceed-ings of the International Workshop on Mobile Computing (IMC’03), Rockstock, Germany, June 2003.
[23] D. Yazar and A. Dunkels, “Efficient application integration inIP-based sensor networks,” in Proceedings of the ACM BuildSysWorkshop, in Conjuction with ACM SenSys, Berkeley, Calif,USA, November 2009.
[24] F. Delicato, L. Pirmez, P. Pires, and J. de Rezende, “A flexiblemiddleware system for wireless sensor networks,” in Proceed-ings of the 8th IFIP IEEE International Conference on Mobileand Wireless Communication Networks (MWCN ’06), Santiago,Chile, August 2006.
[25] C. Dixon, R.Mahajan, and S. Agarwal, “An operating system forthe home,” in NSDI, USENIX, San Jose, Calif, USA, April 2012.
[26] A. Sleman and R. Moeller, “SOA distributed operating systemformanaging embedded devices in home and building automa-tion,” IEEE Transactions on Consumer Electronics, vol. 57, no. 2,pp. 945–952, 2011.
[27] J. Byun and S. Park, “Development of a self-adapting intelligentsystem for building energy saving and context-aware smartservices,” IEEE Transactions on Consumer Electronics, vol. 57,no. 1, pp. 90–98, 2011.

Submit your manuscripts athttp://www.hindawi.com
Control Scienceand Engineering
Journal of
Hindawi Publishing Corporationhttp://www.hindawi.com Volume 2013
International Journal of
RotatingMachinery
Hindawi Publishing Corporationhttp://www.hindawi.com
Volume 2013Part I
VLSI Design
Hindawi Publishing Corporationhttp://www.hindawi.com Volume 2013
ISRN Signal Processing
Hindawi Publishing Corporationhttp://www.hindawi.com Volume 2013
Hindawi Publishing Corporationhttp://www.hindawi.com Volume 2013
Mechanical Engineering
Advances in
Modelling & Simulation in EngineeringHindawi Publishing Corporationhttp://www.hindawi.com Volume 2013
Advances inAcoustics &Vibration
Hindawi Publishing Corporationhttp://www.hindawi.com Volume 2013
ISRN Sensor Networks
Hindawi Publishing Corporationhttp://www.hindawi.com Volume 2013
Hindawi Publishing Corporationhttp://www.hindawi.com Volume 2013
Electrical and Computer Engineering
Journal of
Hindawi Publishing Corporationhttp://www.hindawi.com Volume 2013
DistributedSensor Networks
International Journal of
ISRN Robotics
Hindawi Publishing Corporationhttp://www.hindawi.com Volume 2013
International Journal of
Antennas andPropagation
Hindawi Publishing Corporationhttp://www.hindawi.com Volume 2013
ISRN Electronics
Hindawi Publishing Corporationhttp://www.hindawi.com Volume 2013
Advances inOptoElectronics
Hindawi Publishing Corporationhttp://www.hindawi.com
Volume 2013
Hindawi Publishing Corporation http://www.hindawi.com Volume 2013Hindawi Publishing Corporation http://www.hindawi.com Volume 2013
The Scientific World Journal
Hindawi Publishing Corporationhttp://www.hindawi.com Volume 2013
Active and Passive Electronic Components
Chemical EngineeringInternational Journal of
Hindawi Publishing Corporationhttp://www.hindawi.com Volume 2013
ISRN Civil Engineering
Hindawi Publishing Corporationhttp://www.hindawi.com Volume 2013
Hindawi Publishing Corporationhttp://www.hindawi.com Volume 2013
Journal of
Sensors
Copyright © 2022 FDOKUMEN