
A Comprehensive Study on the Dynamic Range of Wavelength Exchange and Its Impact on Exchanged Signal...
10
JOURNAL OF LIGHTWAVE TECHNOLOGY, VOL. 27, NO. 14, JULY 15, 2009 2707 A Comprehensive Study on the Dynamic Range of Wavelength Exchange and Its Impact on Exchanged Signal Performance Mengzhe Shen, Henry King Yin Cheung, RebeccaWai Lam Fung, and Kenneth Kin-Yip Wong, Member, IEEE Abstract—Effects of the incomplete signal exchange on the dy- namic range performance of type II wavelength exchange (WE II, i.e. both pumps are in anomalous dispersion region) are investi- gated analytically and experimentally. The dynamic range here is defined as the tolerable operational range of the signal power to maintain a nearly complete WE performance. We studied the case of equal signal powers (balanced signal powers) as well as the case of unequal signal powers (imbalanced signal powers). It is demon- strated that the beating between exchanged signal and residual one and the extinction ratio degradation due to the existence of residual power at original channel is the major source of the signal quality degradation after WE II. The experimental results demonstrated dynamic range 17 dB with bit-error rate (BER) could be maintained with power penalty of 2 dB in the case of balanced signal powers. In the case of imbalanced signal powers, the dy- namic range was 8 dB with the power penalty incurred of 2 dB in the worst case. Index Terms—Four-wave mixing (FWM), parametric wave- length exchange (PWE). I. INTRODUCTION W AVELENGTH exchange (WE) relies on four-wave mixing (FWM) phenomenon in highly nonlinear dis- persion-shifted fibers (HNL-DSF) and it has been extensively studied in recent research [1]–[4]. Simultaneous swapping of two signals could be achieved by a suitable choice of wave- lengths of both continuous-wave (CW) pumps either at the normal dispersion region (denoted as Type I WE or WE I) [2] or the anomalous dispersion region (denoted as Type II WE or WE II) [4]. Past results showed that the pump-induced Raman amplification introduced asymmetric power transfer that de- graded the performance of the WE I process. Such performance degradation was particularly severe when the two pumps were arranged orthogonally in the normal dispersion region [2]. Thus, WE II configuration with two pumps in the anomalous dispersion regime was presented [4]. In theory, no Raman gain is provided by pumps allocated in anomalous dispersion region. Manuscript received September 19, 2008; revised December 18, 2008 and January 15, 2009. First published April 24, 2009; current version published July 15, 2009. This work was support in part by the Grants Council of the Hong Kong Special Administrative Region, China, under Projects HKU 7172/07E and HKU 7179/08E. The authors are with the Department of Electrical and Electronic Engineering, the University of Hong Kong, Hong Kong, China (e-mail: [email protected]; [email protected]; [email protected]; [email protected]). Color versions of one or more of the figures in this paper are available online at http://ieeexplore.ieee.org. Digital Object Identifier 10.1109/JLT.2009.2014974 Therefore, it is expected that with this arrangement, signals in the normal dispersion region will exhibit symmetric power transfer characteristics and a nearly complete wavelength exchange can be achieved. We have recently investigated the tuning range of WE II in the anomalous-dispersion region [4], where we focussed on the tuning range by fixing one pump wavelength and its corresponding signal wavelength while tuning the other pump and its corresponding signal wavelength. A tuning range of 15 nm can be achieved with performance slightly degraded when one of the signals was tuned near the zero-dispersion wavelength (ZDW) of the fiber. WE II may find many applications in modern optical communication networks, such as all-optical packet switching [5], [6] and optical time-di- vision multiplexing (OTDM) [7]–[9]. Thus, it is necessary to have a comprehensive study on its performance. For the prac- tical use of WE II in the optical networks, considerations must be taken into account about the extent of signal quality perfor- mance after WE II. In [4], a bit-error rate (BER) of was recorded with power penalties of 2 dB. Previous work [2] demonstrated that the main source of the noise in the exchanged signal is the coherent crosstalk between the exchanged signal and the residual power at the same wavelength. Another factor that affects the exchanged signals’ qualities of WE II is its relatively low conversion ratio (CR), which also attributes to the existence of residual power. The highest value recorded so far is 28 dB [2]. It is evaluated by measuring the power ratio between the idler (exchanged signal at the new wavelength) and the residual signal (at the original wavelength) when there is only one signal input, as shown in Fig. 1(b) [2]. Thus, some obvious questions needed to be addressed include the existence of the residual power at the original wavelength after WE II and whether it is possible to realize complete exchange, i.e., no residual power left at the original wavelength. The next logical question is the mechanism through which the residual signal interferes with the exchanged one. Furthermore, in practical networking systems, signals arrive at the processing nodes via different routes and thus experience different condition in the transmission link, such as fiber loss, nonlinear effect, and unequal amplification of different regener- ators. Therefore, the signals may possess different power levels upon the arrival at the processing node. Thus, it is worthwhile to investigate the operational range between the signal powers to maintain a nearly complete WE performance. We define this operational range as the dynamic range, as shown in Fig. 5. In this paper, we study for the first time, to the best of our knowledge, the dynamic range of WE II with the two pumps 0733-8724/$25.00 © 2009 IEEE
-
Upload
independent -
Category
Documents
-
view
2 -
download
0
Transcript of A Comprehensive Study on the Dynamic Range of Wavelength Exchange and Its Impact on Exchanged Signal...
JOURNAL OF LIGHTWAVE TECHNOLOGY, VOL. 27, NO. 14, JULY 15, 2009 2707
A Comprehensive Study on the DynamicRange of Wavelength Exchange and Its Impact
on Exchanged Signal PerformanceMengzhe Shen, Henry King Yin Cheung, Rebecca Wai Lam Fung, and Kenneth Kin-Yip Wong, Member, IEEE
Abstract—Effects of the incomplete signal exchange on the dy-namic range performance of type II wavelength exchange (WE II,i.e. both pumps are in anomalous dispersion region) are investi-gated analytically and experimentally. The dynamic range here isdefined as the tolerable operational range of the signal power tomaintain a nearly complete WE performance. We studied the caseof equal signal powers (balanced signal powers) as well as the caseof unequal signal powers (imbalanced signal powers). It is demon-strated that the beating between exchanged signal and residual oneand the extinction ratio degradation due to the existence of residualpower at original channel is the major source of the signal qualitydegradation after WE II. The experimental results demonstrateddynamic range 17 dB with bit-error rate (BER) ��
� couldbe maintained with power penalty of 2 dB in the case of balancedsignal powers. In the case of imbalanced signal powers, the dy-namic range was 8 dB with the power penalty incurred of 2 dBin the worst case.
Index Terms—Four-wave mixing (FWM), parametric wave-length exchange (PWE).
I. INTRODUCTION
W AVELENGTH exchange (WE) relies on four-wavemixing (FWM) phenomenon in highly nonlinear dis-
persion-shifted fibers (HNL-DSF) and it has been extensivelystudied in recent research [1]–[4]. Simultaneous swapping oftwo signals could be achieved by a suitable choice of wave-lengths of both continuous-wave (CW) pumps either at thenormal dispersion region (denoted as Type I WE or WE I) [2]or the anomalous dispersion region (denoted as Type II WE orWE II) [4]. Past results showed that the pump-induced Ramanamplification introduced asymmetric power transfer that de-graded the performance of the WE I process. Such performancedegradation was particularly severe when the two pumps werearranged orthogonally in the normal dispersion region [2].Thus, WE II configuration with two pumps in the anomalousdispersion regime was presented [4]. In theory, no Raman gainis provided by pumps allocated in anomalous dispersion region.
Manuscript received September 19, 2008; revised December 18, 2008 andJanuary 15, 2009. First published April 24, 2009; current version published July15, 2009. This work was support in part by the Grants Council of the Hong KongSpecial Administrative Region, China, under Projects HKU 7172/07E and HKU7179/08E.
The authors are with the Department of Electrical and Electronic Engineering,the University of Hong Kong, Hong Kong, China (e-mail: [email protected];[email protected]; [email protected]; [email protected]).
Color versions of one or more of the figures in this paper are available onlineat http://ieeexplore.ieee.org.
Digital Object Identifier 10.1109/JLT.2009.2014974
Therefore, it is expected that with this arrangement, signalsin the normal dispersion region will exhibit symmetric powertransfer characteristics and a nearly complete wavelengthexchange can be achieved. We have recently investigated thetuning range of WE II in the anomalous-dispersion region [4],where we focussed on the tuning range by fixing one pumpwavelength and its corresponding signal wavelength whiletuning the other pump and its corresponding signal wavelength.A tuning range of 15 nm can be achieved with performanceslightly degraded when one of the signals was tuned near thezero-dispersion wavelength (ZDW) of the fiber. WE II may findmany applications in modern optical communication networks,such as all-optical packet switching [5], [6] and optical time-di-vision multiplexing (OTDM) [7]–[9]. Thus, it is necessary tohave a comprehensive study on its performance. For the prac-tical use of WE II in the optical networks, considerations mustbe taken into account about the extent of signal quality perfor-mance after WE II. In [4], a bit-error rate (BER) of wasrecorded with power penalties of 2 dB. Previous work [2]demonstrated that the main source of the noise in the exchangedsignal is the coherent crosstalk between the exchanged signaland the residual power at the same wavelength. Another factorthat affects the exchanged signals’ qualities of WE II is itsrelatively low conversion ratio (CR), which also attributes tothe existence of residual power. The highest value recorded sofar is 28 dB [2]. It is evaluated by measuring the power ratiobetween the idler (exchanged signal at the new wavelength)and the residual signal (at the original wavelength) when thereis only one signal input, as shown in Fig. 1(b) [2]. Thus, someobvious questions needed to be addressed include the existenceof the residual power at the original wavelength after WE IIand whether it is possible to realize complete exchange, i.e., noresidual power left at the original wavelength. The next logicalquestion is the mechanism through which the residual signalinterferes with the exchanged one.
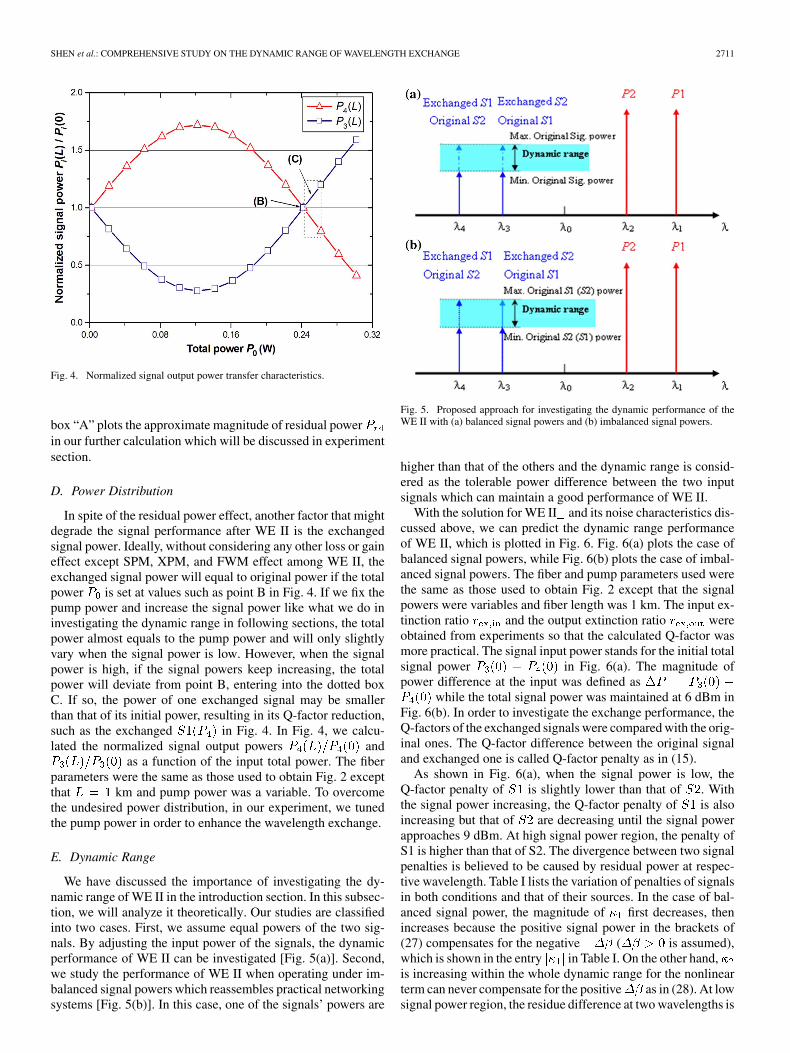
Furthermore, in practical networking systems, signals arriveat the processing nodes via different routes and thus experiencedifferent condition in the transmission link, such as fiber loss,nonlinear effect, and unequal amplification of different regener-ators. Therefore, the signals may possess different power levelsupon the arrival at the processing node. Thus, it is worthwhileto investigate the operational range between the signal powersto maintain a nearly complete WE performance. We define thisoperational range as the dynamic range, as shown in Fig. 5.
In this paper, we study for the first time, to the best of ourknowledge, the dynamic range of WE II with the two pumps
0733-8724/$25.00 © 2009 IEEE

2708 JOURNAL OF LIGHTWAVE TECHNOLOGY, VOL. 27, NO. 14, JULY 15, 2009
Fig. 1. (a) Wavelength allocation and state-of-polarization of pumps and sig-nals in WE II. (b) Wavelength notation before and after WE II.
( and ) located at the anomalous-dispersion region and thetwo signals ( and ) located at the normal-dispersion region.We investigate the residual power in WE II and its effects onthe exchanged signal quality performance after WE II. We alsoshow that the amount of residual power depend on the phasemismatch condition of WE II for both signals. In Section II, wepresent the relevant theory and investigate the dynamic rangeof WE II analytically. We then perform experiments to verifyour theoretical prediction followed by discussions in Section III.Finally, concluding remarks are presented in Section IV.
II. THEORY
A. Origin of Residual Power
The form of the basic differential equations describing theWE II was shown in [2] by considering self-phase modulation(SPM), cross-phase modulation (XPM) and four-wave mixing(FWM) interactions among four waves. Here, we consider thecase of most interest to us, i.e., when the polarization of neigh-boring waves are orthogonal with respect to each other (denotedas WE II ), as shown in Fig. 1(a). The purpose of orthogonalpolarization is to suppress the spurious FWM components. Con-sider four waves of radian frequencies , –4, and the fre-quencies satisfy . Waves 1 and 2
correspond to pumps one and two , 3and 4 are signal one and signal two . One thingnoteworthy is that and will exchange the wavelengths oftheir carriers, i.e., the exchanged and will be at Wave 4and 3, respectively, after WE II, as shown in Fig. 1(b). Thus,in the following, we will distinguish original from ex-changed for clarity. Assuming that there is no fiber lossand negligible polarization-mode dispersion (PMD) along thefiber, the coupled equations for this configuration are given by[10]
(1)
where is the slowly varying envelope of the optical fieldwith frequency and is the fiber nonlinear coefficient. Wedefine the propagation constant mismatch as
, where are the propagation constants in the fiber. Thelinear phase mismatch due to chromatic dispersion can beexpressed as [1]
(2)
In which , , denotes theth derivative of with respect to frequency around the ZDW.
To gain better insight into we limit the summation of (2)to , 2. The FWM efficiency for WE II scheme is 1/9compared with that when all waves are aligned in SOP [2].
By introducing new variables , whereand are the amplitude and the phase of the optical field ,(1) can be rewritten as
(3)
(4)
where ( , 4), 1 ( , 3) and. As can be observed from (3), while the
oscillates between and along the fiber, the powerflows from to , to and vice versa. Assuming therelative phase , the third term in (4) can be neglectedand the following approximation is valid
(5)
Considering the case that and are losing power andassuming a positive linear phase mismatch , when they aredecreasing, the right-hand side term in (5) gets larger. The flowof power will not turn its direction until approaches zero. Ide-ally, oscillates between 0 and withoutconsidering fiber loss. However, if the power flow reverses itsdirection before approaches 0, the amount of power existingat when will not be transferred to the and consti-tutes for the residual power at . The origin of residual power
( , 4) is shown in Fig. 2 such thatis the residue at and is at . In Fig. 2,we calculated the signal output powers and as afunction of fiber length by (3) and (4), in which cos ,
is the initial phase difference at .

SHEN et al.: COMPREHENSIVE STUDY ON THE DYNAMIC RANGE OF WAVELENGTH EXCHANGE 2709
Fig. 2. Signal power variation along the fiber length.
As the initial phase difference was not controlled in our ex-perimental setup, it is reasonable to set cos at its mean value.The fiber parameters used were nm,
ps/nm km, km, km . Thetwo signals were located at 1529 (original ) and 1534 nm(original ) with the initial powers of 0 dBm. The two pumppowers were located at 1549 nm and 1554 nm withthe powers of 20.8 dBm, respectively.
B. Q-Factor Penalty
After defining the residual power and its origin, now we ex-plore how it affects the exchanged signal quality. In the fol-lowing analysis, we apply the Q-factor as a gauge for the signalquality. If we neglect the thermal noise, the input signal Q-factorfor ( , 4) after detection in a receiver is written as [11]
(6)
in which the noise contributing factors can be expressed as
(7)
(8)
(9)
(10)
and the signal is
(11)
where is the responsivity of the detector with thequantum efficiency and is the electrical filter band-width. is the average power of input signal ( or 4).
is the gain of erbium-doped fiber amplifier (EDFA) with thespontaneous-emission factor . is theextinction ratio of input signal, where is the power carried
by “0” bits and is the power carried by “1” bits. Defining theextinction ratio in which the smaller the better is to avoid infinityin derivation [11]. The root mean square (RMS) noise currents
and include the contributions of both shot noise and theamplified spontaneous emission (ASE) noise from EDFA.
Sources of the input signals’ Q-factor degradation include thelowered extinction ratio due to the existence of residual powerafter WE II. They will be the most detrimental if the exchangehappens between “0” bits and “1” bits in the two wavelengthsbecause the extinction ratio falls significantly at that time in-stant. On the contrary, impact of the exchange between “1” and“1” manifests itself as the beating of residual power with ex-changed signal. The residual power mixes with the exchangedsignal and produces the current( or 4) at the photodetector with responsivity . Notingthat and oscillate at same frequency with arandom phase difference. The intensity variations after detec-tion would be
(12)
The output Q-factor can now be obtained as
(13)
and the signal is
(14)
Combining the input and output Q-factors results the penalty
(15)
C. Phase-Mismatch Condition
The impact of the imperfect phase matching on the powerconversion efficiency was discussed in [1]. In addition, howpump depletion affects the power conversion efficiency was in-vestigated in [2], in which the dependency of maximum extinc-tion ratio on signal power is attained. In this subsection, thephase-mismatch condition for WE II under the assumption ofpump depletion is investigated. In the context of WE II, thephase-mismatch condition guarantees that there is no residualpower at the original wavelength after WE II, i.e., or
. According to the analysis about the noise mechanismof WE II mentioned in Section II-B, the residual power affectsthe exchanged signal performance. To explore the phase-mis-match condition of WE II, we adopt the approach in [12], [13]to attain the exact solution for (1). Our starting point is (3) and(4). With variable transformations
(16)

2710 JOURNAL OF LIGHTWAVE TECHNOLOGY, VOL. 27, NO. 14, JULY 15, 2009
where representingthe total power. Eq. (16) converts (3) and (4) into normalizedcoupled equations
(17)
(18)
From (17) and (18) we can obtain four more invariants besidesthe conservation of total power
(19)
The solution of (3) and (4) can be acquired by the integration of
(20)
After substitution of (19) into (20), the resultant integral is
(21)
The quartic polynomial function is given by
(22)
where are normalized power of original .The polynomial function has four roots, which can beordered as .
It is shown in Fig. 2 that as the waves and propagatedown the fiber the powers transfer from to and thenback in an oscillating form with a fixed period. As shown by themathematical derivation in [12], it was claimed that the solutionfor , which is the normalized in (21), will oscillate be-tween the two lowest positive roots of the polynomialequation , i.e., satisfies .Inasmuch as the signal power is conserved in(19), , based on the def-inition of in Section II-A, and
. Consequently, is sufficient for achievingand is sufficient for achieving . Thus,
the phase-mismatch condition for original necessarilyrequires that to achieve complete WE II.After some algebra, these relations lead to
(23)
Fig. 3. Residual power � versus the phase-mismatch parameter � .
(24)
where denotes the respective initial normalized power of sig-nals and pumps. Assuming there are two signals at the input andcos , (23) and (24) can be simplified
(25)
(26)
Equations (25) and (26) provide us the phase-mismatch condi-tion for original and . If they are satisfied, there will be noresidue from original or . Generally, the more power left atthe original wavelength, the worse the quality of the exchangedsignal. Attentive readers may have noticed that if we add (25)and (26) together, an impractical equationis raised. It demonstrates that and cannot be completelyexchanged in theory, but we can obtain a much better under-standing on the dynamic range of WE through the conditionwe attain. The mathematical forms of (25) and (26) are verymuch alike the phase-mismatch condition introduced in fiberoptical parametric amplifier (FOPA) [14] because WE II andFOPA are based on similar underlying principle. We can definethe left-hand side of (25) and (26) as the phase-mismatch pa-rameter for original and , respectively, as
(27)
(28)
Numerical calculations reveal that the larger and deviatefrom zero, the larger the residual power at the correspondingwavelength, as is shown in Fig. 3. In Fig. 3, pump powers andfiber parameters were the same as those used in Fig. 2 exceptthat the fiber length was 1 km. It shows the residual poweras a function of phase-mismatch parameter . Note that it isan even function of . It also compares the residual poweramong various signal input power. For signals having the same
, higher initial power will result in higher residue. The dotted
SHEN et al.: COMPREHENSIVE STUDY ON THE DYNAMIC RANGE OF WAVELENGTH EXCHANGE 2711
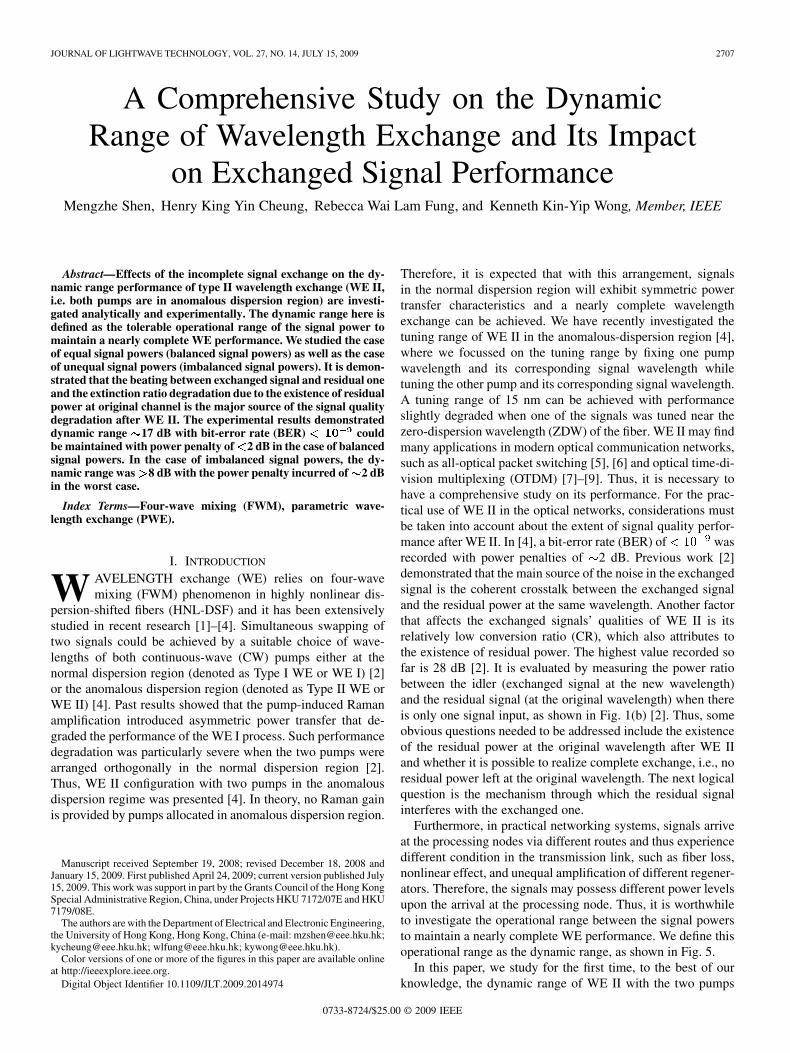
Fig. 4. Normalized signal output power transfer characteristics.
box “A” plots the approximate magnitude of residual powerin our further calculation which will be discussed in experimentsection.
D. Power Distribution
In spite of the residual power effect, another factor that mightdegrade the signal performance after WE II is the exchangedsignal power. Ideally, without considering any other loss or gaineffect except SPM, XPM, and FWM effect among WE II, theexchanged signal power will equal to original power if the totalpower is set at values such as point B in Fig. 4. If we fix thepump power and increase the signal power like what we do ininvestigating the dynamic range in following sections, the totalpower almost equals to the pump power and will only slightlyvary when the signal power is low. However, when the signalpower is high, if the signal powers keep increasing, the totalpower will deviate from point B, entering into the dotted boxC. If so, the power of one exchanged signal may be smallerthan that of its initial power, resulting in its Q-factor reduction,such as the exchanged in Fig. 4. In Fig. 4, we calcu-lated the normalized signal output powers and
as a function of the input total power. The fiberparameters were the same as those used to obtain Fig. 2 exceptthat km and pump power was a variable. To overcomethe undesired power distribution, in our experiment, we tunedthe pump power in order to enhance the wavelength exchange.
E. Dynamic Range
We have discussed the importance of investigating the dy-namic range of WE II in the introduction section. In this subsec-tion, we will analyze it theoretically. Our studies are classifiedinto two cases. First, we assume equal powers of the two sig-nals. By adjusting the input power of the signals, the dynamicperformance of WE II can be investigated [Fig. 5(a)]. Second,we study the performance of WE II when operating under im-balanced signal powers which reassembles practical networkingsystems [Fig. 5(b)]. In this case, one of the signals’ powers are
Fig. 5. Proposed approach for investigating the dynamic performance of theWE II with (a) balanced signal powers and (b) imbalanced signal powers.
higher than that of the others and the dynamic range is consid-ered as the tolerable power difference between the two inputsignals which can maintain a good performance of WE II.
With the solution for WE II and its noise characteristics dis-cussed above, we can predict the dynamic range performanceof WE II, which is plotted in Fig. 6. Fig. 6(a) plots the case ofbalanced signal powers, while Fig. 6(b) plots the case of imbal-anced signal powers. The fiber and pump parameters used werethe same as those used to obtain Fig. 2 except that the signalpowers were variables and fiber length was 1 km. The input ex-tinction ratio and the output extinction ratio wereobtained from experiments so that the calculated Q-factor wasmore practical. The signal input power stands for the initial totalsignal power in Fig. 6(a). The magnitude ofpower difference at the input was defined as
while the total signal power was maintained at 6 dBm inFig. 6(b). In order to investigate the exchange performance, theQ-factors of the exchanged signals were compared with the orig-inal ones. The Q-factor difference between the original signaland exchanged one is called Q-factor penalty as in (15).
As shown in Fig. 6(a), when the signal power is low, theQ-factor penalty of is slightly lower than that of . Withthe signal power increasing, the Q-factor penalty of is alsoincreasing but that of are decreasing until the signal powerapproaches 9 dBm. At high signal power region, the penalty ofS1 is higher than that of S2. The divergence between two signalpenalties is believed to be caused by residual power at respec-tive wavelength. Table I lists the variation of penalties of signalsin both conditions and that of their sources. In the case of bal-anced signal power, the magnitude of first decreases, thenincreases because the positive signal power in the brackets of(27) compensates for the negative ( is assumed),which is shown in the entry in Table I. On the other hand,is increasing within the whole dynamic range for the nonlinearterm can never compensate for the positive as in (28). At lowsignal power region, the residue difference at two wavelengths is

2712 JOURNAL OF LIGHTWAVE TECHNOLOGY, VOL. 27, NO. 14, JULY 15, 2009
Fig. 6. Calculated Q-factor penalties among exchanged signals with (a) bal-anced and (b) imbalanced input powers.
TABLE ITHE VARIATION OF PENALTIES AND THEIR SOURCES
not obvious due to the fact that the magnitudes of and arealmost the same (i.e., or ). Consequently,the penalty of nearly equals to that of until the total signalinput power is around 3 dBm. When the signal power is high, es-pecially when the phase-mismatch parameter almost equalsto zero (at around 6 dBm), is quite low, which contributes tothe lower penalty of . On the contrary, the residue risesover the whole dynamic range due to the increasing . This ex-plains the rising trend behavior of the penalty of .
In Fig. 6(b), we noticed that when increases, the penaltyof is decreasing but that of is slightly increasing. Thesetwo penalty curves are almost converged from 2 to 3 dBm.Similar analysis centered on residual power can be applied toclarify the exchange performance in the imbalanced signal case.
One difference from the balanced signal case is that andare constant because the total signal power isfixed, so the variation of residual power and is domi-nated by input signal power and as the three dis-crete signal power we compared in Fig. 3. Consequently, ’spenalty decreases; whereas, the penalty of does not varymuch because the choice of signal power (around 6 dBm) makes
very small over the dynamic range.Despite of the above detailed investigation about the ex-
change performance at both signal wavelengths, these theoret-ical predictions demonstrate that the performance of WE II doesnot degrade greatly over the dynamic range we investigated.These results, which strengthen our confidence on the practicalusage of wavelength exchange, will be verified experimentallyin the following section.
III. EXPERIMENT
A. Experimental Setup
We now investigate the dynamic range of WE II by exper-iments and compare it with the theoretical value in the pre-vious section. The experimental setup is shown in Fig. 7. Thewavelength exchange consisted of a 1 km of HNL-DSF witha of 1541 nm, a dispersion slope of 0.03 km anda fiber nonlinearity coefficient of 12 km . The twopumps were prepared by two tunable laser sources, TLS 1 andTLS 2, which were fixed at 1549 and 1554 nm, respectively.They were phase-modulated (PM) by 10 Gb/s pseudo-random bit sequence (PRBS) to suppress stimulated Brillouinscattering (SBS) [15]. EDFA 1 served as the preamplifier to abooster EDFA 2. Two tuneable bandpass filters (TBPF) with2-nm bandwidth were inserted after EDFA 1 so as to filter outthe two pumps separately and reduce ASE noise. Two polariza-tion controllers (PC 3 and 4) were used to control the SOP ofthe two pumps such that orthogonal pump configuration couldbe maintained by minimizing the power of the spurious FWMcomponents. The two pumps were then combined with the useof a WDM coupler. Wavelengths of the two signals, preparedby TLS 3 and TLS 4, were fixed at 1534 and 1529 nm, respec-tively. They were amplitude-modulated with a 10 Gb/s
PRBS. PC 6 and 8 aligned the signals with the orthogonalpumps. EDFA 3, with a gain bandwidth of 1528–1560 nm, wasused to compensate for the insertion losses of the amplitudemodulators (AMs) and 50/50 coupler. VOA 1 was inserted afterEDFA 2 to adjust the input pump powers; while VOA 2 was usedto control the input signal powers launching into the HNL-DSFto investigate the dynamic range performance of WE II .
An 80/20 coupler combined 80% of the pump powers and20% of the signal powers. In our experiment, the input powers ofthe two pumps were measured to be 20 and 20.4 dBm, while thepowers of the two signals were varied between 5 and 12 dBm.The reason why the pump power in experiment is slightly lowerthan that of theoretical value is probably due to the reason thatthe initial neighboring waves were not strictly orthogonal toeach other or the birefringence within the fiber, which slightlyenhance the FWM efficiency. A TBPF was used at the fiberoutput to filter out the exchanged signals. They were then sent

SHEN et al.: COMPREHENSIVE STUDY ON THE DYNAMIC RANGE OF WAVELENGTH EXCHANGE 2713
Fig. 7. Experimental setup of the wavelength exchange.
to the digital communication analyzer (DCA) and BER tester(BERT) for eye diagrams and BER measurements, respectively.
B. Balanced Signal Powers
The Q-factors and extinction ratios (ERs) of the exchangedsignals over the dynamic range are plotted in Fig. 8. The signalinput power at the -axis stands for the total input signal power
. It shows that good performance of WE can besuccessfully maintained over a wide dynamic range of 17 dB( 5 to 12 dBm) with Q-factors 15 dB and ERs of the eyes
10 dB. The dynamic range was limited by the output powerof EDFA 3 and the sensitivity of the photodetector in our ex-periment, otherwise a wider dynamic range of WE could berecorded. It can be observed that the Q-factor curves qualita-tively match with our calculated curves as shown in Fig. 6(a).It verifies our analysis about the mechanisms through whichresidual signal interfere with the exchanged one. In the experi-ment, the performance of WE was also degraded at relative highor low signal levels due to stronger spurious FWM terms andpoor signal-to-noise ratio (SNR), respectively, that had not beenaccounted in the analysis.
The receiver sensitivities of the exchanged signals weremeasured and compared with their corresponding originalsignals. We considered three cases, they were signal powers at1) 5 dBm, 2) 6 dBm, and 3) 12 dBm, which correspondedto the best (case 2) and the worst cases (cases 1 and 3) at theedges of the available dynamic range. The calculated residualpower from original at these three power cases arealready shown in Fig. 3. Their eye diagrams are shown inFig. 9. They illustrate that clear eye openings are observed inall cases. The measured BER curves for the exchanged signalsare plotted in Fig. 10. At BER of , the receiver sensitivitiesof the original signals at 1534 and 1529 nm are 27.2 and
27.8 dBm, respectively, while that of the exchanged signalwere measured to be 26.5 and 27 dBm, respectively, inthe best case (i.e. case 2). The power penalties incurred in thewavelength exchange are 1 dB. In cases 1 and 3, the powerpenalties slightly increased to 2 dB.
Fig. 8. (a) ERs and (b) Q-factors among exchanged signals with balanced inputpowers.
C. Imbalanced Signal Powers
We then investigated the dynamic range under imbalancedsignal powers condition. The power differences between the twoinput signals at 1534 (original ) and 1529 nm (original )

2714 JOURNAL OF LIGHTWAVE TECHNOLOGY, VOL. 27, NO. 14, JULY 15, 2009
Fig. 9. Measured eye diagrams of the exchanged signals in the three cases.
Fig. 10. Measured BER curves for the exchanged signals before and after WEin the three cases.
were defined as which were measured atthe fiber input. It was done by varying the signal power outputfrom TLS 3, keeping the output power of TLS 4 constant; whilemaintained the total signal power after EDFA at 6 dBm. The ERsand Q-factors of the exchanged signals over the tuning rangeare plotted in Fig. 11. The experimental Q-factor penalties canbe maintained below 5 dB over a dynamic range of 8 dB ( 5to 3 dB), which showed a good agreement with the calculatedpenalty as shown in Fig. 6(b).
The receiver sensitivities of the two exchanged signals atof 5 dB are measured. Error-free WE could not be recordedbeyond this value ( 5 dB) due to poor SNR of EDFA 3and severe crosstalk between the exchanged signals resided atthe wavelength possessing high input signal power. The eyediagrams of exchanged signals in this condition are shown inFig. 12. The measured BER curves are plotted in Fig. 13. AtBER of , the receiver sensitivity of the exchanged signal at1529 nm was around 22 dBm. The power penalty incurred is
2 dB; while negligible power penalty was recoded at the ex-changed signal at 1534 nm owing to low crosstalk between thestrong signal and weak residue. Similar performance was ob-served at of 3 dB.
Fig. 11. (a) ERs and (b) Q-factors among exchanged signals with imbalancedinput powers.
Fig. 12. Measured eye diagrams of the exchanged signals after WE with apower difference of �5 dB.
IV. CONCLUSION
In conclusion, the residual powers at the original wavelengthconstitute a major limiting factor for the exchanged signalquality in WE II. We have investigated its influence on theperformance of WE II both analytically and experimentallyover a wide dynamic range for both balanced and imbalancedsignal power. Experimental results show that when the WEII was operated under balanced signal powers, the Q-factorpenalty could be maintained below 5 dB over a dynamic rangearound 17 dB. BERs of were maintained with powerpenalties of at most 2 dB. In the case of imbalanced signalpowers, the Q-factor penalty could be maintained below 5 dB

SHEN et al.: COMPREHENSIVE STUDY ON THE DYNAMIC RANGE OF WAVELENGTH EXCHANGE 2715
Fig. 13. Measured BER curves for the exchanged signals before and after WEwith a power difference of �5 dB.
over a dynamic range wider than 8 dB. The results verifiedour analysis about the mechanisms through which the residualsignals mix with exchanged one. It provides a more comprehen-sive insight into the performance of WE II when operated underpractical conditions. The theory shed light on the origin ofresidual power and the condition for complete exchange whenconsidering only SPM, XPM, and FWM effect. The incompletesignal exchange problem can be solved to a large extent bysatisfying phase mismatch condition which is analogous withthat of FOPA. This theoretical model does not cover any ZDWfluctuation. It will render random and transform (3) and (4)into two stochastic differential equations with multiplicativenoise whose solution generally requires a numerical approach[16]–[18]. This will be the subject of further research.
ACKNOWLEDGMENT
The authors would like to acknowledge Sumitomo ElectricIndustries for providing the HNL-DSF.
REFERENCES
[1] M. E. Marhic, Y. Parker, F. S. Yang, and L. G. Kazovsky, “Widelytunable spectrum translation and wavelength exchange by four-wavemixing in optical fibers,” Opt. Lett., vol. 21, no. 23, pp. 1906–1908,1996.
[2] K. Uesaka, K. K. Y. Wong, M. E. Marhic, and L. G. Kazovsky, “Wave-length exchange in a highly nonlinear dispersion-shifted fiber: Theoryand experiments,” IEEE J. Sel. Topics Quantum Electron., vol. 8, no.3, pp. 560–568, May/Jun. 2002.
[3] K. K. Y. Wong, M. E. Marhic, K. Uesaka, and L. G. Kazovsky, “Wave-length exchange: A novel function for optical networks,” Inf. Sci., no.149, pp. 161–169, 2003.
[4] R. W. L. Fung, H. K. Y. Cheung, and K. K. Y. Wong, “Widely tunablewavelength exchange in anomalous-dispersion regime,” IEEE Photon.Technol. Lett., vol. 19, no. 22, pp. 1846–1848, Nov.15 2007.
[5] H. K. Y. Cheung, R. W. L. Fung, C. H. Kwok, and K. K. Y. Wong,“All-optical packet switching by pulsed-pump wavelength exchangein a highly nonlinear dispersion-shifted fiber,” presented at the Proc.OFC, 2007, Paper OTuB4.
[6] O. F. Yilmaz, L. Christen, X. Wu, S. R. Nuccio, I. Fazal, and A. E.Willner, “Time-slot interchange of 40 Gbits/s variable length opticalpackets using conversion-dispersion-based tunable delays,” Opt. Lett.,vol. 33, no. 17, pp. 1954–1956, 2008.
[7] S. Radic, C. J. Mcknstrie, R. M. Jopson, A. H. Gnauck, J. C. Centanni,and A. R. Chraplyvy, “Multiple-band bit-level switching in two-pumpfiber parametric devices,” IEEE Photon. Technol. Lett., vol. 16, no. 3,pp. 852–854, Mar. 2004.
[8] Q. Lin, R. Jiang, C. F. Marki, C. J. Mckinstrie, R. Jopson, J. Ford, G.P. Agrawal, and S. Radic, “40-Gb/s optical switching and wavelengthmulticasting in a two-pump parametric device,” IEEE Photon. Technol.Lett., vol. 17, no. 11, pp. 2376–2378, Nov. 2005.
[9] C. H. Kwok, P. P. Kuo, and K. K. Y. Wong, “Pulsed pump wavelengthexchange for high speed signal de-multiplexing,” Opt. Express., vol.16, no. 15, pp. 10894–10899, 2008.
[10] M. E. Marhic, Fiber Optical Parametric Amplifiers, Oscillators and Re-lated Devices. Cambridge, U.K.: Cambridge Univ. Press, 2008, ch. 3.
[11] G. P. Agrawal, Fiber-Optic Communication Systems, 3rd ed. SanDiego, CA: Academic, 2001, ch. 4.
[12] Y. J. Chen, “Four-wave mixing in optical fibers: Exact solution,” J. Opt.Soc. Amer. B, vol. 6, no. 11, pp. 1986–1993, 1989.
[13] G. Cappellini and S. Trillo, “Third-order three-wave mixing in single-mode fibers: Exact solutions and spatial instability effects,” J. Opt. Soc.Amer. B, vol. 8, no. 4, pp. 824–838, 1991.
[14] J. Hansryd, P. A. Andrekson, M. Westlund, J. Li, and P. O. Hedekvis,“Fiber-based optical parametric amplifiers and their applicaitons,”IEEE J. Sel. Topics Quantum Electron., vol. 8, no. 3, pp. 506–519,Mar. 2002.
[15] S. K. Korotky, P. B. Hansen, L. Eskildsen, and J. J. Veselka, “Ef-ficient phase modulation scheme for suppression of stimulated Bril-louin scattering,” presented at the IOOC 1995, 1995, paper WD2-1,109-111.
[16] F. Yaman, Q. Lin, S. Radic, and G. P. Agrawal, “Impact of dispersionfluctuations on dual-pump fiber-optic parametric amplifiers,” IEEEPhoton. Technol. Lett., vol. 16, no. 5, pp. 1292–1294, May 2004.
[17] M. Karlsson, “Four-wave mixing in fibers with randomly varyingzero-dispersion wavelength,” J. Opt. Soc. Amer. B, vol. 15, no. 8, pp.2269–2275, 1998.
[18] C. W. Gardiner, Handbook of Stochastic Methods, 2nd ed. New York:Springer-Verlag, 1985, ch. 4.
Mengzhe Shen received the B.S. degree in physicsfrom the Shanghai Jiaotong University, Shanghai,China, in 2007. He is currently working towardsthe M.Phil. degree in electronic engineering at theUniversity of Hong Kong.
His current research interests include applicationsof fiber-optical parametric effect and fiber nonlin-earity in optical communication systems.
Henry King Yin Cheung, photograph and biography not available at the timeof publication.
Rebecca Wai Lam Fung, photograph and biography not available at the timeof publication.

2716 JOURNAL OF LIGHTWAVE TECHNOLOGY, VOL. 27, NO. 14, JULY 15, 2009
Kenneth Kin-Yip Wong (M’03) received combinedB.E. (first-class honors with medal award) degreein electrical engineering and B.S. degree in physicsfrom the University of Queensland, Brisbane, Aus-tralia, in 1997 and the M.S. and Ph.D. degrees inelectrical engineering, from Stanford University,Stanford, CA, in 1998 and 2003, respectively.
He is currently an Assistant Professor in the De-partment of Electrical and Electronic Engineering,University of Hong Kong. He was a member of thePhotonics and Networking Research Laboratory,
Stanford University. His research field included DWDM systems, SCM opticalsystems, fiber nonlinearity, fiber-optical parametric amplifiers, and photoniccrystal fibers. He is author or coauthor of over 100 journal and conference
papers. He was with Hewlett-Packard Laboratories as Research Engineer andcontributed in projects included parallel optics and VCSEL from 1998–1999.He also was an independent consultant with Innovation CORE (a SumitomoElectric Company), CA, in 2004. He is a reviewer for Optics Letters, JOSA B,and Optics Express, IEE Electronics Letters, and Optics Communications.
Dr. Wong was the recipient of OSA New Focus Student Award and IEEE/LEOS Graduate Student Fellowship, both in 2003. He is a reviewer for the IEEEPHOTONICS TECHNOLOGY LETTERS and IEEE/OSA JOURNAL OF LIGHTWAVE
TECHNOLOGY. He won the Best Teacher Award in 2005 and 2006 while with theDepartment of Electrical and Electronic Engineering, University of Hong Kong.He is a member of the OSA and the IEEE Lasers and Electro-Optic Society(LEOS).