A comparison of vertical scanning interferometry (VSI) and atomic force microscopy (AFM) for...
8
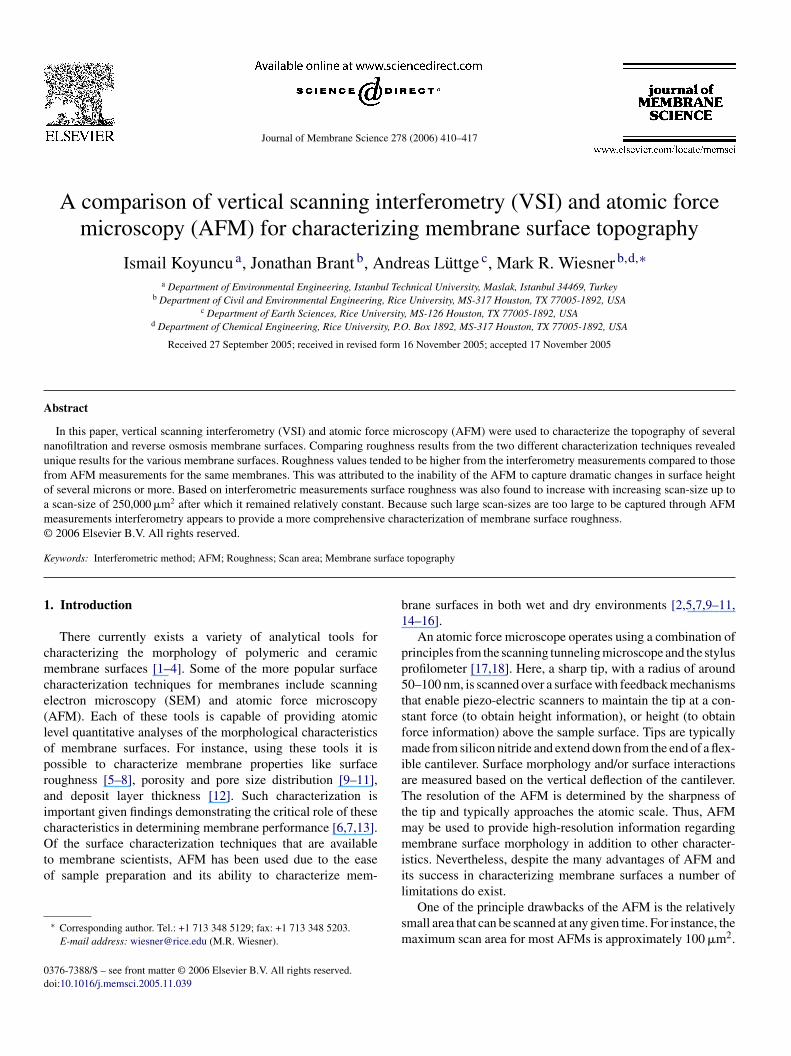
Journal of Membrane Science 278 (2006) 410–417 A comparison of vertical scanning interferometry (VSI) and atomic force microscopy (AFM) for characterizing membrane surface topography Ismail Koyuncu a , Jonathan Brant b , Andreas L ¨ uttge c , Mark R. Wiesner b,d,∗ a Department of Environmental Engineering, Istanbul Technical University, Maslak, Istanbul 34469, Turkey b Department of Civil and Environmental Engineering, Rice University, MS-317 Houston, TX 77005-1892, USA c Department of Earth Sciences, Rice University, MS-126 Houston, TX 77005-1892, USA d Department of Chemical Engineering, Rice University, P.O. Box 1892, MS-317 Houston, TX 77005-1892, USA Received 27 September 2005; received in revised form 16 November 2005; accepted 17 November 2005 Abstract In this paper, vertical scanning interferometry (VSI) and atomic force microscopy (AFM) were used to characterize the topography of several nanofiltration and reverse osmosis membrane surfaces. Comparing roughness results from the two different characterization techniques revealed unique results for the various membrane surfaces. Roughness values tended to be higher from the interferometry measurements compared to those from AFM measurements for the same membranes. This was attributed to the inability of the AFM to capture dramatic changes in surface height of several microns or more. Based on interferometric measurements surface roughness was also found to increase with increasing scan-size up to a scan-size of 250,000 m 2 after which it remained relatively constant. Because such large scan-sizes are too large to be captured through AFM measurements interferometry appears to provide a more comprehensive characterization of membrane surface roughness. © 2006 Elsevier B.V. All rights reserved. Keywords: Interferometric method; AFM; Roughness; Scan area; Membrane surface topography 1. Introduction There currently exists a variety of analytical tools for characterizing the morphology of polymeric and ceramic membrane surfaces [1–4]. Some of the more popular surface characterization techniques for membranes include scanning electron microscopy (SEM) and atomic force microscopy (AFM). Each of these tools is capable of providing atomic level quantitative analyses of the morphological characteristics of membrane surfaces. For instance, using these tools it is possible to characterize membrane properties like surface roughness [5–8], porosity and pore size distribution [9–11], and deposit layer thickness [12]. Such characterization is important given findings demonstrating the critical role of these characteristics in determining membrane performance [6,7,13]. Of the surface characterization techniques that are available to membrane scientists, AFM has been used due to the ease of sample preparation and its ability to characterize mem- ∗ Corresponding author. Tel.: +1 713 348 5129; fax: +1 713 348 5203. E-mail address: [email protected] (M.R. Wiesner). brane surfaces in both wet and dry environments [2,5,7,9–11, 14–16]. An atomic force microscope operates using a combination of principles from the scanning tunneling microscope and the stylus profilometer [17,18]. Here, a sharp tip, with a radius of around 50–100 nm, is scanned over a surface with feedback mechanisms that enable piezo-electric scanners to maintain the tip at a con- stant force (to obtain height information), or height (to obtain force information) above the sample surface. Tips are typically made from silicon nitride and extend down from the end of a flex- ible cantilever. Surface morphology and/or surface interactions are measured based on the vertical deflection of the cantilever. The resolution of the AFM is determined by the sharpness of the tip and typically approaches the atomic scale. Thus, AFM may be used to provide high-resolution information regarding membrane surface morphology in addition to other character- istics. Nevertheless, despite the many advantages of AFM and its success in characterizing membrane surfaces a number of limitations do exist. One of the principle drawbacks of the AFM is the relatively small area that can be scanned at any given time. For instance, the maximum scan area for most AFMs is approximately 100 m 2 . 0376-7388/$ – see front matter © 2006 Elsevier B.V. All rights reserved. doi:10.1016/j.memsci.2005.11.039
Transcript of A comparison of vertical scanning interferometry (VSI) and atomic force microscopy (AFM) for...
Journal of Membrane Science 278 (2006) 410–417
A comparison of vertical scanning interferometry (VSI) and atomic forcemicroscopy (AFM) for characterizing membrane surface topography
Ismail Koyuncu a, Jonathan Brant b, Andreas Luttge c, Mark R. Wiesner b,d,∗a Department of Environmental Engineering, Istanbul Technical University, Maslak, Istanbul 34469, Turkey
b Department of Civil and Environmental Engineering, Rice University, MS-317 Houston, TX 77005-1892, USAc Department of Earth Sciences, Rice University, MS-126 Houston, TX 77005-1892, USA
d Department of Chemical Engineering, Rice University, P.O. Box 1892, MS-317 Houston, TX 77005-1892, USA
Received 27 September 2005; received in revised form 16 November 2005; accepted 17 November 2005
Abstract
In this paper, vertical scanning interferometry (VSI) and atomic force microscopy (AFM) were used to characterize the topography of severalnanofiltration and reverse osmosis membrane surfaces. Comparing roughness results from the two different characterization techniques revealedufoam©
K
1
cmce(lopraicOto
0d
nique results for the various membrane surfaces. Roughness values tended to be higher from the interferometry measurements compared to thoserom AFM measurements for the same membranes. This was attributed to the inability of the AFM to capture dramatic changes in surface heightf several microns or more. Based on interferometric measurements surface roughness was also found to increase with increasing scan-size up toscan-size of 250,000 �m2 after which it remained relatively constant. Because such large scan-sizes are too large to be captured through AFMeasurements interferometry appears to provide a more comprehensive characterization of membrane surface roughness.2006 Elsevier B.V. All rights reserved.
eywords: Interferometric method; AFM; Roughness; Scan area; Membrane surface topography
. Introduction
There currently exists a variety of analytical tools forharacterizing the morphology of polymeric and ceramicembrane surfaces [1–4]. Some of the more popular surface
haracterization techniques for membranes include scanninglectron microscopy (SEM) and atomic force microscopyAFM). Each of these tools is capable of providing atomicevel quantitative analyses of the morphological characteristicsf membrane surfaces. For instance, using these tools it isossible to characterize membrane properties like surfaceoughness [5–8], porosity and pore size distribution [9–11],nd deposit layer thickness [12]. Such characterization ismportant given findings demonstrating the critical role of theseharacteristics in determining membrane performance [6,7,13].f the surface characterization techniques that are available
o membrane scientists, AFM has been used due to the easef sample preparation and its ability to characterize mem-
∗ Corresponding author. Tel.: +1 713 348 5129; fax: +1 713 348 5203.
brane surfaces in both wet and dry environments [2,5,7,9–11,14–16].
An atomic force microscope operates using a combination ofprinciples from the scanning tunneling microscope and the stylusprofilometer [17,18]. Here, a sharp tip, with a radius of around50–100 nm, is scanned over a surface with feedback mechanismsthat enable piezo-electric scanners to maintain the tip at a con-stant force (to obtain height information), or height (to obtainforce information) above the sample surface. Tips are typicallymade from silicon nitride and extend down from the end of a flex-ible cantilever. Surface morphology and/or surface interactionsare measured based on the vertical deflection of the cantilever.The resolution of the AFM is determined by the sharpness ofthe tip and typically approaches the atomic scale. Thus, AFMmay be used to provide high-resolution information regardingmembrane surface morphology in addition to other character-istics. Nevertheless, despite the many advantages of AFM andits success in characterizing membrane surfaces a number oflimitations do exist.
One of the principle drawbacks of the AFM is the relativelysmall area that can be scanned at any given time. For instance, themaximum scan area for most AFMs is approximately 100 �m2.
E-mail address: [email protected] (M.R. Wiesner).376-7388/$ – see front matter © 2006 Elsevier B.V. All rights reserved.oi:10.1016/j.memsci.2005.11.039

I. Koyuncu et al. / Journal of Membrane Science 278 (2006) 410–417 411
This limitation is principally due to the operational set up ofthe AFM and the size of the single cantilever used to producethe AFM image. Such a limited scan-size makes it difficult todetermine how representative the measured image may be ofthe surface at large. For instance, Boussu et al. [9] found thatmembrane surface roughness increased with increasing scan-size, suggesting that roughness statistics derived from relativelysmall scan areas may be misleading. Another issue pertains tothe distortion of surfaces features as a result of tip convolution.Additionally, it is difficult to characterize surfaces where thechanges in height are dramatic (∆ > 5 �m) in which contact maybe lost between the tips and sample, on the tip may become dam-aged. Further drawbacks of the AFM include the time requiredto obtain an image and the operation of the instrument, whichare both rather intensive.
Optical interferometry is a rather new technique that maybe used to characterize membrane surfaces with regard to sur-face morphology and structure [19]. Optical interferometry is atype of microscopy where nanometer level characteristics of asample surface may be characterized through the interpretationof light reflected from a surface. With optical interferometryit is possible to obtain scan-sizes of up to a square millime-ter with a vertical resolution of approximately 2 nm. The largerscan-size made possible with optical interferometry, allows for amore comprehensive analysis of surface roughness and is dras-tic improvement of the small scan-sizes (typically 100 �m2) thataoidg
s
ferometry for several nanofiltration and reverse osmosis mem-branes. The impact of scan-size on the calculated roughnessstatistics is used to evaluate the ability of AFM to fully char-acterize membrane surface roughness as a function of lengthscale. The role of optical interferometry as a characteriza-tion technique for membrane surface is compared with thatof AFM.
2. Experimental
2.1. Membranes
This study examined three commercially available nanofiltra-tion (NF) and reverse osmosis (RO) membranes; GE OsmonicsHL (Minnetonka, MN), the DOW Film Tec NF70 (Minneapo-lis, MN) nanofiltration membranes, and the Hydranautics LFC-1(Oceanside, CA) reverse osmosis membrane. These membraneswere selected as they represent a range of surface morphologiesas determined in previous investigations [13,20,21]. Each mem-brane was supplied as dry flat sheets and was stored accordinglyuntil used.
2.2. AFM analysis
All AFM experiments were carried out using a Park Scien-tmstVmie
F b) Des
re possible with an AFM. In this respect, the impact of scan-sizen calculated roughness statistics may be determined, provid-ng new insight and perspective into the interpretation of valueserived from much smaller scan-sizes, as is the case for AFMenerated values.
In this paper, roughness statistics generated by AFM mea-urements are compared to those determined using optical inter-
ig. 1. (a) Sketch of a double-beam Mirau interferometer with CCD camera. (urface [19].
ific Instruments (Sunnyvale, CA) Autoprobe CP atomic forceicroscope. Measurements were performed on dry membrane
amples under ambient atmospheric conditions. Silicon can-ilevers with integrated pyramidal tips (Model #: MPP-11100,EECO Instruments Inc., Fremont, CA) were used to imageembrane surface topography. The membrane surfaces were
maged in tapping mode. At least five separate scans, each cov-ring an area of 100 �m2, were acquired on each membrane to
tails of (a) showing the light path in the Mirau interferometer and to a sample

412 I. Koyuncu et al. / Journal of Membrane Science 278 (2006) 410–417
determine mean roughness values and their associated standarddeviations. Roughness is reported as average roughness (Ra),root mean square roughness (Rq), and surface area difference(SAD).
2.3. Interferometric analysis
Optical interferometry measurements were carried out usinga MicroXam vertical scanning interferometer (ADE-phase ShiftTechnology, Tucson, AZ). The basic operating principles ofthe interferometer are illustrated in Fig. 1 [19,22]. Here whitelight is emitted by a conventional light source and is split intotwo beams by beam splitter housed inside the Mirau doublebeam interferometer objective. The reference beam is directedto a mirror located in the objective, which serves as the refer-ence surface. Conversely, the sample-beam travels directly tothe sample surface. A high precision ceramic piezo (ZSCANDSP) allows 7 �m of vertical relief to be imaged per second.As a consequence, the actual interferogram shows only a smallrange of fringes that moves across the sample surface dur-ing the scan process. Up to 100 �m of relief can be scannedin this manner. The interferograms are digitized with a CCDcamera and converted into a topographic map with MAPVUEsoftware (ADE-Phase Shift Technologies, Tuczon, AZ)[19].
The interferometer was operated on a vibration-dampeningtmsftaam
Table 1Mean membrane surface roughness statistics and associated standard deviationsdetermined using AFM and interferometry
Membrane Rq (nm) Ra (nm) SAD (%)
AFM analyses at scan-size of 100 �m2
HL 21.2 ± 23.85 14.8 ± 17.14 3.1 ± 3.97LFC1 105.3 ± 12.58 84.7 ± 10.39 61.4 ± 24.27NF70 64.6 ± 3.59 51.0 ± 2.99 29.4 ± 8.80
Interferometric analyses at scan-size of 64 �m2
HL 106.6 ± 56.78 86.2 ± 48.03 –LFC1 42.7 ± 31.51 35.9 ± 27.19 –NF70 74.8 ± 46.64 61.8 ± 41.35 –
Interferometric analyses at scan-size of 0.5 mm2
HL 873.3 ± 180 693.5 ± 154.7 0.9 ± 0.49LFC1 1051.2 ± 186 821.1 ± 168.2 3.4 ± 1.75NF70 1643.6 ± 418.2 1320.9 ± 345.9 6.1 ± 1.69
The scan-size was 100 �m2 for the AFM and 64 �m2 and 0.5 mm2 for interfer-ometric measurements. All membranes were imaged dry and in air.
3. Results and discussion
Mean roughness statistics determined using AFM and inter-ferometric analysis are reported for each membrane in Table 1.For the AFM measurements, the roughness parameters weredetermined for a scan area of 100 �m2, while those reportedfor the interferometric measurements were determined for the64 �m2 and maximum allowable scan-size for that instrument,0.5 mm2, respectively. According to the AFM measurements theLFC1 membrane has the roughest surface followed by that forthe NF70 and HL membranes, respectively. However, accord-ing to the interferometric analysis the NF70 membrane surfacewas the roughest followed by the LFC1 and HL membranesurfaces, respectively. Topographic renderings of the three mem-brane surfaces determined from the AFM and interferometric
F tric tes
able to reduce noise and optimize image quality. Measure-ents were performed on at least 10 different locations on each
ample membrane surface. Additionally, at each location 10 dif-erent scan-sizes were evaluated, ranging in size from 64 �m2
o 0.5 mm2 (Fig. 2). Results are reported for each membranes average roughness (Ra), root mean square roughness (Rq),nd surface area difference (SAD). All interferometric measure-ents were carried out on dry membrane samples.
ig. 2. Representative surface scan of a membrane surface using the interferometatistics as a function of scan-size in the interferometric measurements.
chnique illustrating the different scan-sizes used to calculate surface roughness
I. Koyuncu et al. / Journal of Membrane Science 278 (2006) 410–417 413
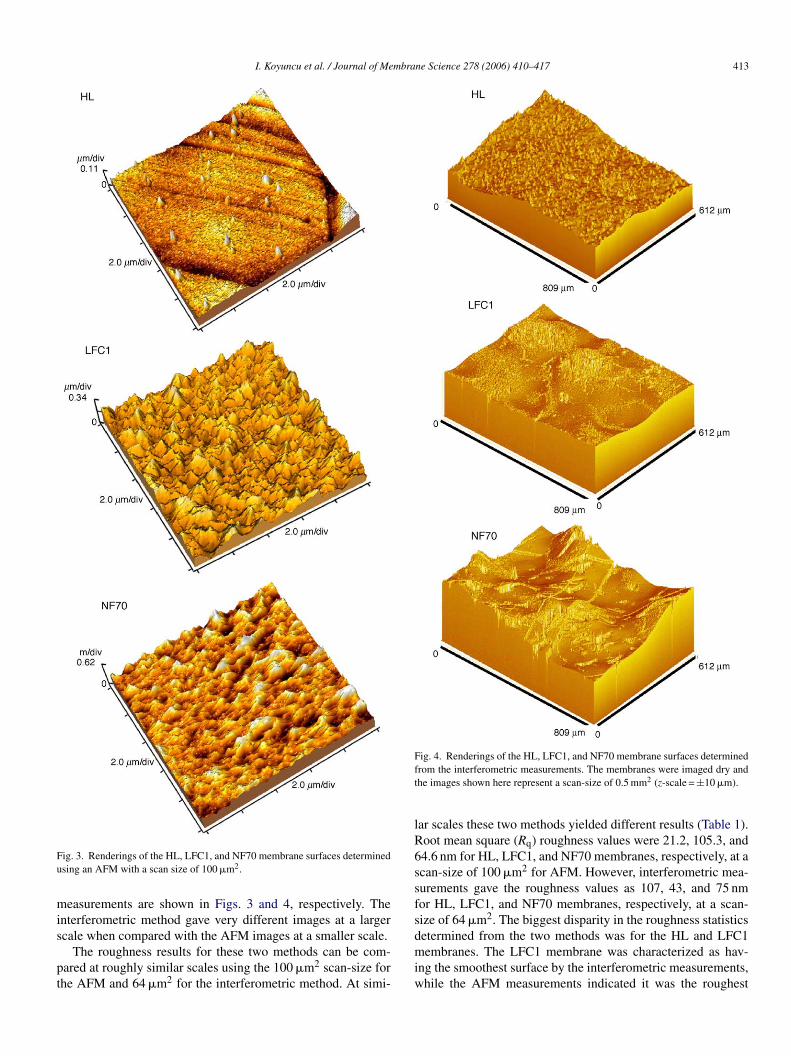
Fig. 3. Renderings of the HL, LFC1, and NF70 membrane surfaces determinedusing an AFM with a scan size of 100 �m2.
measurements are shown in Figs. 3 and 4, respectively. Theinterferometric method gave very different images at a largerscale when compared with the AFM images at a smaller scale.
The roughness results for these two methods can be com-pared at roughly similar scales using the 100 �m2 scan-size forthe AFM and 64 �m2 for the interferometric method. At simi-
Fig. 4. Renderings of the HL, LFC1, and NF70 membrane surfaces determinedfrom the interferometric measurements. The membranes were imaged dry andthe images shown here represent a scan-size of 0.5 mm2 (z-scale = ±10 �m).
lar scales these two methods yielded different results (Table 1).Root mean square (Rq) roughness values were 21.2, 105.3, and64.6 nm for HL, LFC1, and NF70 membranes, respectively, at ascan-size of 100 �m2 for AFM. However, interferometric mea-surements gave the roughness values as 107, 43, and 75 nmfor HL, LFC1, and NF70 membranes, respectively, at a scan-size of 64 �m2. The biggest disparity in the roughness statisticsdetermined from the two methods was for the HL and LFC1membranes. The LFC1 membrane was characterized as hav-ing the smoothest surface by the interferometric measurements,while the AFM measurements indicated it was the roughest

414 I. Koyuncu et al. / Journal of Membrane Science 278 (2006) 410–417
surface at similar scan-sizes. However, the HL membrane wascharacterized as the roughest surface by the interferometric mea-surements, while the AFM measurements indicated it was thesmoothest surface at the same scan-size. For the LFC1 mem-brane the standard deviation in the roughness statistics was highfor the interferometric measurements, particularly when com-pared to that calculated for the AFM generated values (Table 1).This may account for the disparity in the two sets of resultsin which the LFC1 was determined to be rough according tothe AFM measurements and smoother via interferometry anal-ysis. In fact, for all of the membranes the standard deviationwas substantially higher for the interferometric measurementsat the smaller scan-size of 64 �m2 compared to those determinedby the AFM at 100 �m2 (Table 1). Thus, for the interferomet-ric measurements the roughness statistics generated at smallerscan-sizes were highly variable and may in fact represent mini-mum scan-size that is appropriate to obtain statistically accuratemeasurements. For the LFC1 membrane then, the difference inthe AFM and interferometric results may be due to the differencein scan-size used by the two techniques.
Fo
For the HL membrane the disparity in the two sets of resultsmay be explained by the appearance of sharp peaks (h ∼ 4 �m)in the interferometric scans of the HL membrane surface (Fig. 4).Notably, these peak-like features appeared in both the inter-ferometric and AFM images of the HL membrane surface(Figs. 3 and 4), thus confirming that they are actually presenton the surface and not merely instrument noise. However, inthe AFM scans these peaks on average approached a heightof approximately 0.1 �m. The discrepancy in the height ofthese features as determined by the different techniques maybe attributed to the operating principles of the AFM. In tappingmode AFM the tip that is scanned across the membrane sur-face oscillates at a set distance above the membrane surface. If afeature were to be higher than the height of this separation dis-tance than the AFM would not be able to accurately determineits height and would either skip around the feature or lose con-tact with the surface at which point it would no longer producean image of the surface. If the former scenario were to occur
ig. 5. (a) Average (Ra) and (b) root mean square (Rq) roughness as a functionf scan-size obtained with the interferometric method.
FoM
ig. 6. (a) Average (Ra) and (b) root mean square (Rq) roughness as a functionf scan-size for the HL, NF70, and LFC1 membranes plotted on a log–log scale.easurements were carried out using an interferometer.
I. Koyuncu et al. / Journal of Membrane Science 278 (2006) 410–417 415
then the AFM may erroneously interpret the signal or change incantilever oscillation as a smaller feature. Therefore, for mem-brane surfaces with substantially large features (up to 100 �m)the interferometric method appears to be a more robust charac-terization technique compared with AFM.
The ability of the interferometer to examine relatively largescan area provides a basis from which the impact of scan-sizeon the magnitude of surface roughness may be examined. Theroughness statistics for each membrane (Ra and Rq) as deter-mined from the interferometric measurements were plotted as afunction of scan-size in a in a normal and log–log format and arereported in Figs. 5 and 6, respectively. For each membrane, bothRa and Rq increased with increasing scan-size in a logarithmicfashion. Initially, roughness increased linearly with scan-sizeuntil a scan-size of approximately 60,000 �m2 was reached.After this point, the slope of the curve was much lower andthe increase in roughness with increasing scan-size was muchlower. The onset of this plateau occurred at a scan-size of approx-imately 250,000 �m2 for both Ra and Rq for each of the threemembranes. As each membrane had a similar inflection pointat approximately 250,000 �m2 it would seem that this value isstatistical and not physical in origin. In other words, this scan-size appears to represent the necessary sample size for which toobtain statistically sufficient results. However, this point requiresfurther examination using surfaces with controlled surface struc-tures. The onset of this plateau indicates the maximum lengthswbw
Table 2Power law constants (a and b) obtained from data fit for roughness as a functionof scan-size
Membrane Region Ra Rq
a b R2 a b R2
HL 1 33.33 0.25 0.98 39.22 0.26 0.992 121.97 0.13 0.93 155.98 0.13 0.96
NF70 1 12.04 0.43 0.97 13.72 0.46 0.962 115.84 0.19 0.99 211.87 0.16 0.99
LFC1 1 5.34 0.46 0.99 5.79 0.51 0.992 74.41 0.18 0.99 174.49 0.14 0.99
Regions 1 and 2 correspond to the two separate regions of linearity shown inFig. 5.
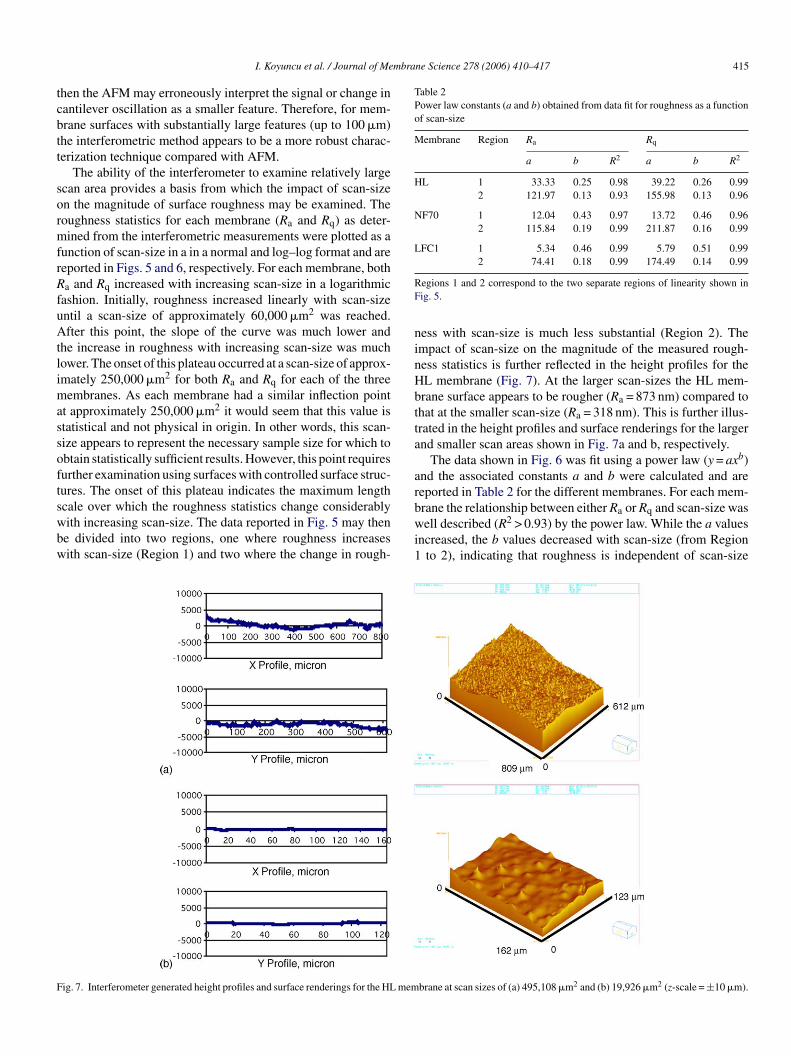
ness with scan-size is much less substantial (Region 2). Theimpact of scan-size on the magnitude of the measured rough-ness statistics is further reflected in the height profiles for theHL membrane (Fig. 7). At the larger scan-sizes the HL mem-brane surface appears to be rougher (Ra = 873 nm) compared tothat at the smaller scan-size (Ra = 318 nm). This is further illus-trated in the height profiles and surface renderings for the largerand smaller scan areas shown in Fig. 7a and b, respectively.
The data shown in Fig. 6 was fit using a power law (y = axb)and the associated constants a and b were calculated and arereported in Table 2 for the different membranes. For each mem-brane the relationship between either Ra or Rq and scan-size waswell described (R2 > 0.93) by the power law. While the a valuesincreased, the b values decreased with scan-size (from Region1 to 2), indicating that roughness is independent of scan-size
F
cale over which the roughness statistics change considerablyith increasing scan-size. The data reported in Fig. 5 may thene divided into two regions, one where roughness increasesith scan-size (Region 1) and two where the change in rough-
ig. 7. Interferometer generated height profiles and surface renderings for the HL mem
brane at scan sizes of (a) 495,108 �m2 and (b) 19,926 �m2 (z-scale = ±10 �m).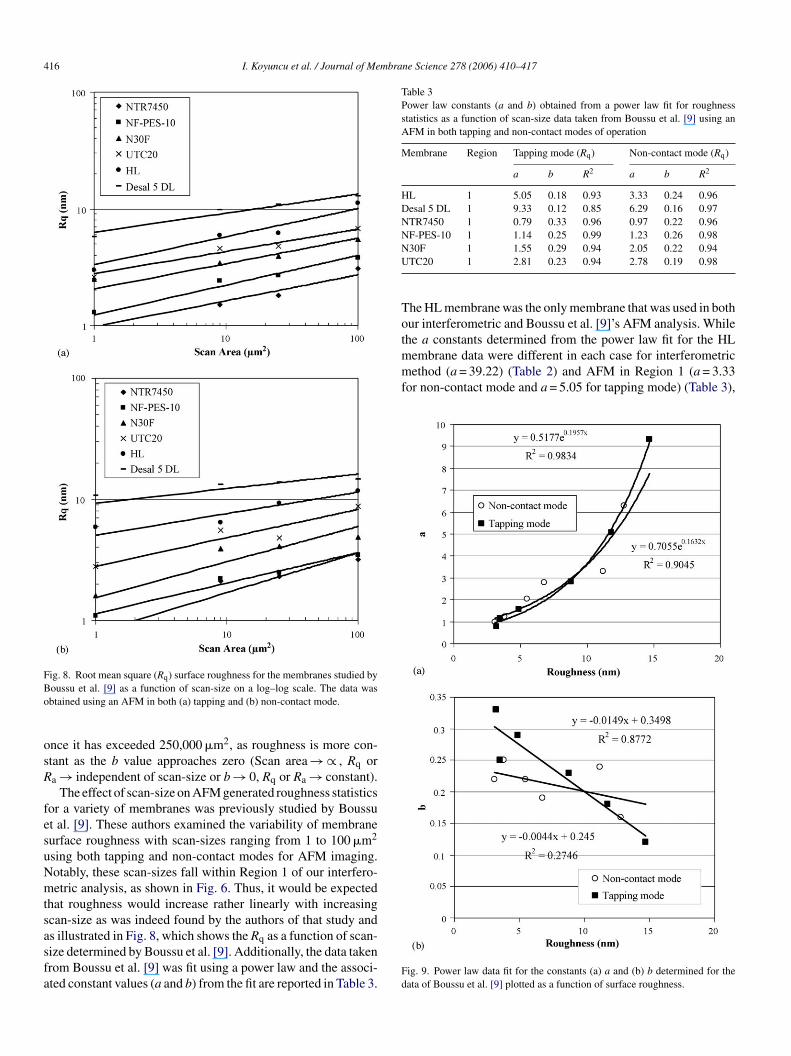
416 I. Koyuncu et al. / Journal of Membrane Science 278 (2006) 410–417
Fig. 8. Root mean square (Rq) surface roughness for the membranes studied byBoussu et al. [9] as a function of scan-size on a log–log scale. The data wasobtained using an AFM in both (a) tapping and (b) non-contact mode.
once it has exceeded 250,000 �m2, as roughness is more con-stant as the b value approaches zero (Scan area → ∝ , Rq orRa → independent of scan-size or b → 0, Rq or Ra → constant).
The effect of scan-size on AFM generated roughness statisticsfor a variety of membranes was previously studied by Boussuet al. [9]. These authors examined the variability of membranesurface roughness with scan-sizes ranging from 1 to 100 �m2
using both tapping and non-contact modes for AFM imaging.Notably, these scan-sizes fall within Region 1 of our interfero-metric analysis, as shown in Fig. 6. Thus, it would be expectedthat roughness would increase rather linearly with increasingscan-size as was indeed found by the authors of that study andas illustrated in Fig. 8, which shows the Rq as a function of scan-size determined by Boussu et al. [9]. Additionally, the data takenfrom Boussu et al. [9] was fit using a power law and the associ-ated constant values (a and b) from the fit are reported in Table 3.
Table 3Power law constants (a and b) obtained from a power law fit for roughnessstatistics as a function of scan-size data taken from Boussu et al. [9] using anAFM in both tapping and non-contact modes of operation
Membrane Region Tapping mode (Rq) Non-contact mode (Rq)
a b R2 a b R2
HL 1 5.05 0.18 0.93 3.33 0.24 0.96Desal 5 DL 1 9.33 0.12 0.85 6.29 0.16 0.97NTR7450 1 0.79 0.33 0.96 0.97 0.22 0.96NF-PES-10 1 1.14 0.25 0.99 1.23 0.26 0.98N30F 1 1.55 0.29 0.94 2.05 0.22 0.94UTC20 1 2.81 0.23 0.94 2.78 0.19 0.98
The HL membrane was the only membrane that was used in bothour interferometric and Boussu et al. [9]’s AFM analysis. Whilethe a constants determined from the power law fit for the HLmembrane data were different in each case for interferometricmethod (a = 39.22) (Table 2) and AFM in Region 1 (a = 3.33for non-contact mode and a = 5.05 for tapping mode) (Table 3),
Fig. 9. Power law data fit for the constants (a) a and (b) b determined for thedata of Boussu et al. [9] plotted as a function of surface roughness.

I. Koyuncu et al. / Journal of Membrane Science 278 (2006) 410–417 417
similar results were obtained for b constants for interferomet-ric method (b = 0.26) (Table 2) and AFM in Region 1 (b = 0.24for non-contact mode and b = 0.18 for tapping mode) (Table 3).The different results between the a values could be due to thedifferent scan-sizes. Additionally, the a and b values determinedfrom the power law fits to the Boussu et al. [9] data followedthe same trend as that observed for the interferometric measure-ments (Fig. 9). Here, the magnitude of a tended to increase withincreasing surface roughness while b decreased with increasingroughness, indicating that roughness was increasing with scan-size. A plateau was not reached in this case as the scan-sizes werewell below the critical size (250,000 �m2) that was determinedin the current investigation.
4. Conclusions
Membrane surface roughness increases with increasing scan-size until a critical scan-size is reached. This critical scan-sizeappears to be similar for all the polymeric membrane surfacesstudied here. Because this value is significantly larger than thatwhich can be obtained with an AFM suggests that AFM derivedroughness statistics provide an incomplete assessment of mem-brane morphology. Conversely, interferometry allows for rapidand accurate characterization of membrane roughness, at sub-stantially larger scan-sizes. Finally, for a complete evaluation ofmembrane surface roughness scan-sizes of at least 250,000 �m2
s
R
[6] E.M.V. Hoek, S. Bhattacharjee, M. Elimelech, Effect of membrane sur-face roughness on colloid-membrane DLVO interactions, Langmuir 19(2003) 4836–4847.
[7] M. Elimelech, X. Zhu, A.E. Childress, S. Hong, Role of membrane sur-face morphology in colloidal fouling of cellulose acetate and compositearomatic polyamide reverse osmosis membranes, J. Membr. Sci. 127 (1)(1997) 101–109.
[8] W.R. Bowen, N. Hilal, R.W. Lovitt, P.M. Williams, Visualization ofan ultrafiltration membrane by non-contact atomic force microscopy atsingle pore resolution, J. Membr. Sci. 110 (1996) 229.
[9] K. Boussu, B. van der Bruggen, A. Volodin, J. Snauwaert, C. VanHaesendonck, C. Vandecasteele, Roughness and hydrophobicity studiesof nanofiltration membranes using different modes of AFM, J. ColloidInterface Sci. (2005).
[10] W.R. Bowen, J.S. Welfoot, Modelling of membrane nanofiltration—poresize distribution effects, Chem. Eng. Sci. 57 (2002) 1393–1407.
[11] W.R. Bowen, N. Hilal, R.W. Lovitt, P.M. Williams, Atomic force micro-scope studies of membranes: surface pore structures of cyclopore andanopore membranes, J. Membr. Sci. 110 (1996) 233.
[12] V.V. Tarabara, I. Koyuncu, M.R. Wiesner, Effect of hydrodynamics andsolution chemistry on permeate flux in crossflow filtration: direct exper-imental observation of filter cake cross sections, J. Membr. Sci. 241(2004) 65–78.
[13] E.M. Vrijenhoek, S. Hong, M. Elimelech, Influence of membrane sur-face properties on initial rate of colloidal fouling of reverse osmo-sis and nanofiltration membranes, J. Membr. Sci. 188 (2001) 115–128.
[14] A. Chahboun, R. Coratger, F. Ajustron, J. Beauvillain, P. Aimar, V.Sanchez, Comparative study of micro- and ultrafiltration membranesusing STM, AFM, and SEM techniques, Ultramicroscopy 41 (1992)235.
[
[
[
[
[
[
[
[
hould be used.
eferences
[1] F.P. Cuperus, C.A. Smolders, Characterization of UF membranes—membrane characteristics and characterization techniques, Adv. ColloidInterface Sci. 34 (1991) 135.
[2] P. Pradanos, M.L. Rodrigues, J.I. Calvo, A. Hernandez, F. Tejerina,Structural characterization of an UF membrane by gas adsorption-desorption and AFM measurements, J. Membr. Sci. 117 (1–2) (1996)291–302.
[3] D. Raghavan, X. Gu, T. Nguyen, M. Vanlandingham, Characterization ofchemical heterogeneity in polymer systems using hydrolysis and tapping-mode atomic force microscopy, J. Polym. Sci. B: Polym. Phys. 39 (2001)1460–1470.
[4] S.-C. Tu, V. Ravindran, H.-H. Tsai, M. Pirbazari, Surface characteri-zation of nanofiltration membranes in water treatment applications, in:AIChE 1997 Annual Meeting, Los Angeles, CA, November 21, 1997,1997.
[5] W.R. Bowen, T.A. Doneva, Atomic force microscopy studies of mem-branes: effect of surface roughness on double-layer interactions andparticle adhesion, J. Colloid Interface Sci. 229 (2000) 544–549.
15] T. Gumi, M. Valiente, K.C. Khulbe, C. Palet, T. Matsuura, Character-ization of activated composite membranes by solute transport, contactangle measurement, AFM and ESR, J. Membr. Sci. 212 (2003) 123–134.
16] Q.G. Li, M. Elimelech, Organic fouling and chemical cleaning ofnanofiltration membranes: measurements and mechanisms, Environ. Sci.Technol. (2004).
17] D.F. Stamatialis, C.R. Dias, M.N. de Pinho, Atomic force microscopy ofdense and asymmetric cellulose-based membranes, J. Membr. Sci. 160(1999) 235–242.
18] B. Cappella, G. Dietler, Force–distance curves by atomic forcemicroscopy, Surf. Sci. Rep. 34 (1999) 1–104.
19] A. Luttge, E.W. Bolton, A.C. Lasaga, An interferometric study of thedissolution kinetics of anorthite: the role of reactive surface area, Am.J. Sci. 299 (1999) 652–678.
20] J.A. Brant, A.E. Childress, Colloidal adhesion to hydrophilic membranesurfaces, J. Membr. Sci. 241 (2) (2004) 235–248.
21] J.A. Brant, A.E. Childress, Membrane-colloid interactions: comparisonof extended DLVO predictions with AFM force measurements, Environ.Eng. Sci. 19 (6) (2002) 413–427.
22] A. Luttge, U. Winkler, A.C. Lasaga, Interferometric study of thedolomite dissolution: a new conceptual model for mineral dissolution,Geochim. Cosochim. Acta 67 (6) (2003) 1099–1116.