a comparison of the costs of sentinel lymph node biopsy and of
193
A COMPARISON OF THE COSTS OF SENTINEL LYMPH NODE BIOPSY AND OF AXILLARY LYMPH NODE DISSECTION IN THE MANAGEMENT OF EARLY-STAGE BREAST CANCER IN ONTARIO by Bryan John Wells A thesis submitted in conformity with the requirements for the degree of Master of Science in Health Technology Assessment & Management Graduate Department of Health Policy, Management and Evaluation in the University of Toronto © Copyright by Bryan John Wells 2009
-
Upload
khangminh22 -
Category
Documents
-
view
3 -
download
0
Transcript of a comparison of the costs of sentinel lymph node biopsy and of

A COMPARISON OF THE COSTS OF SENTINEL LYMPH NODE BIOPSY AND OF
AXILLARY LYMPH NODE DISSECTION IN THE MANAGEMENT OF EARLY-STAGE
BREAST CANCER IN ONTARIO
by
Bryan John Wells
A thesis submitted in conformity with the requirements
for the degree of Master of Science in Health Technology Assessment & Management
Graduate Department of Health Policy, Management and Evaluation
in the University of Toronto
© Copyright by Bryan John Wells 2009

ii
A comparison of the costs of sentinel lymph node biopsy and of axillary lymph node dissection in the management of early-stage breast cancer in Ontario
Bryan John Wells
Master of Science in Health Technology Assessment & Management Department of Health Policy Management and Evaluation
University of Toronto 2009
Abstract
Objective: To complete a cost-minimization analysis (CMA) of the cost of sentinel lymph node
biopsy (SLNB) and axillary lymph node dissection (ALND) in the management of early-stage
breast cancer (ESBC) in a hypothetical Ontario hospital setting.
Methods: Decision-analysis modeling, with a decision-tree and Markov states, was used to
estimate hospital costs for the two treatment options. The model was populated with data from
the literature and costs from the Ontario Case Costing Initiative, a publicly accessible,
government-sponsored, costing database. Model variability and parameter uncertainty were
quantified by probabilistic sensitivity analysis (PSA).
Results: The SLNB treatment algorithm was cost-minimizing compared to the ALND-only
treatment option. The costs of treating postoperative complications did not contribute to the
incremental average cost.
Conclusion: A treatment algorithm that involves SLNB as the initial axillary-staging procedure
in the setting of ESBC offers a cost-savings over the ALND-only option. This result is
generalizable to all Ontario hospitals.

iii
Acknowledgments
I would like to acknowledge the Department of Surgery at Sunnybrook Health Sciences
Centre and the Department of Health Policy, Management and Evaluation at the University of
Toronto, for all their support and encouragement while I completed my Master’s curriculum and
throughout all my thesis work. I would also like to acknowledge the financial support of the
University of Toronto’s Department of Surgery that I have received through the Surgeon
Scientist Program during my Master’s program.
On a more personal level I would like to thank my primary co-supervisors: Dr. Peter
Coyte, for his steadfast encouragement and sound advice throughout this project; and Dr. May
Lynn Quan, whose guidance, insight, and relentless encouragement fostered my continued
academic development as well as ensuring the successful completion of this project.

iv
Dedication
To my wonderful wife Megan,
for keeping me motivated, focused, and sane. I’d be lost without you.

v
Table of contents
Thesis title page……………………………………………………………………………….......i
Abstract………………………………………………………………………………...................ii
Acknowledgements……………………………………………………………….......................iii
Dedication………………………………………………………………………………..............iv
Table of contents….………………………………………………………………………………v
List of tables……………………………………………………………………………………..ix
List of figures………………………………………………………………..…………………...xi
List of appendices…………………………………………………………………...………….xiv
I. INTRODUCTION………………………………………………………………..............1
1. Overview……………………………………………………………………………...1
2. Background…………………………………………………………………………...2
A. Surgical management of early-stage breast cancer (ESBC)……….................2
B. Sentinel-lymph node biopsy (SLNB) as a new standard of care…..................2
C. Canadian SLNB practice patterns…………………………………………….5
i. SLNB dissemination………………………………………………….5 ii. Barriers to SLNB implementation……………………………………6 iii. Implications…………………………....…………………..................7
3. An economic evaluation of SLNB and ALND…………………………..…………...7
A. Theoretical model of SLNB hospital costs…………………………………...8
B. Brief overview of the types of economic evaluations…………….................11
C. Review of existing literature………………………………………………...12
i. Gemignani et al……………………………………………………...13 ii. Chirikos et al………………………………………………………...14 iii. Ronka et al…………………………………………………..............15 iv. Perrier et al…………………………………………………..............15 v. Summary and conclusions…………………………………..............16

vi
D. Rationale for a cost-minimization analysis (CMA)………………................17
E. Overview of the Ontario Case Costing Initiative (OCCI)……..…................19
i. Conceptual model of case-costing…………………………..............19 ii. Allocation of direct and indirect costs……………………................21 iii. Linking costs to patients…………………………………………….22 iv. Costing-analysis tool (CAT)………………………………………...23 v. Physician and equipment costs……………………………...............26
vi. Nature of the OCCI costing data…………………………................26 vii. Summary and significance of OCCI………………………………...27
F. Research question…………………………………………………...............27
G. Research hypothesis…………………………………………………………27
H. Research objective…………………………………………………..............28
4. Summary and significance…………………………………………………..............28
II. RESEARCH METHODS……………………………………………………………….29
A. Study design………………………………………………………………................29
i. Overview…………………………………………………………………….29
ii. Target population…………………………………………………................30
iii. Study comparators…………………………………………………..............30
iv. Study perspective…………………………………………………................31
v. Analytic horizon…………………………………………………….............33
vi. Discounting and inflation…………………………………………...............33
B. Framework for the decision-analysis……..………………………………................34
i. Overview of The Model……………………………………………..............34
ii. Comprehensive literature review…………………………………................37
i. Purpose and rationale………………………………………..............37 ii. Framework for the literature review………………………………...38 iii. Inclusion and exclusion criteria……………………………..............40 iv. Search strategy………………………………………………………41 v. Literature review methodology……………………………………...42
vi. Critical appraisal…………………………………………………….42

vii
vii. Data synthesis……………………………………………………….44 viii. Summary of the comprehensive literature review………..................45
iii. Determination of costs……………………………………………................45
i. SLNB and ALND procedure-related costs………………………….47 ii. The NucMed adjustments…..……………………………………….49 iii. Morbidity-related treatment costs…………………………………...52
iv. Building The Model…………………….…………………………...............55
i. Modelling of the treatment pathways……………..………………...55
ii. Markov states and transitional probabilities………………………...58 iii. Modelling of costs………………………...………………...............62 iv. Global variables……………………………………………..............63
v. Evaluating The Model………………………………………………………65
i. The roll-back analysis: the base case expected value (EV)
output………………………………………………………..............65 ii. Standard deviation and the payoff range………….………………...67
iii. Sensitivity analysis and Tornado diagrams………………................67 iv. Model variability and parameter uncertainty………………..............68 v. Probabilistic sensitivity analysis (PSA)……………………..............71
vi. A novel use of Monte Carlo microsimulation……………................72
vi. Justification of the initial SLNB capital investment.…..……………………75
C. Summary of methods………………………………………………………..............78
III. RESULTS……………………………………………………………………………….79
1. Overview…………………………………………………………………………….79
2. Comprehensive literature review…………………………………………................79
A. Search results and the critical appraisal………..…………………................79
i. The GIVOM trial……………………………………………………84 ii. The Cambridge study (Purushotham et al.)…………………………85 iii. The ALMANAC trial……………………………………….............86 iv. Technical results of the NSABP B-32 (Krag et al.)………................87
B. Morbidity data……………………………………………………………….88
C. Treatment uncertainty…………………………………………….................91
i. Probability distributions……………………………………..............91

viii
3. The Model…………………………………………………………………………...93
4. Costing data and cost distributions………………………………………………….96
5. The cost-minimization analysis (CMA)…………………………………….............98
A. The roll-back analysis………………………………………..……………...98
B. Sensitivity analyses………………………………………………...............100
C. Probabilistic sensitivity analysis (PSA)……..……………………..............105
D. Microsimulation trials (McSim)…………………………………………...106
E. Estimating a ‘threshold’ case-volume as justification for SLNB capital investment………………………………………….........................107
IV. DISCUSSION………………………………………………………………………….111
1. Overview…………………………………………………………………………...111
2. Interpretation of the results………………………………………………...............111
A. Overview……...……………………………………………………………111
B. In the context of the existing literature…………………………………….113
C. Summary…………………………………………………………………...124
3. Study strengths and weaknesses…………………………………………………...125
A. Model building: the clinical data…………………………………..............125
B. Model building: the cost data………………………………………………128
C. Model building: the decision-tree structure………………………..............132
D. Model evaluation…………………………………………………..............133
4. Conclusion.………………………………………………………………………...136
5. Implications and future research……..………………………………..…………...136
V. REFERENCES………………………………………………………………………...139
VI. APPENDICES……………………………………………………………....................148

ix
List of tables Table 1. The inclusion and exclusion criteria for critical appraisal of articles identified as
part of the comprehensive literature review (organized according to the ‘PICOS’ framework)…………………………………………………..………...………..40
Table 2. An overview of the critical appraisal methodology used in the comprehensive
literature review; where articles were assigned bias scores across four different bias categories……………………………...........................................................44
Table 3. A summary of the OCCI search criteria used to identify the procedure
and morbidity-related costs for incorporation into the decision-tree model……54 Table 4. A summary of the values and calculations used to calculate the equivalent
annual cost, E, for a new SLNB hand-held gamma probe…................................77 Table 5. A summary of all the articles identified by the comprehensive literature review
and included for critical appraisal……………………………………………….82 Table 6. A summary of the critical appraisal results of those articles identified by the
comprehensive literature review……………………...........................................83 Table 7. A summary of the probability of recurrent, short-term, postoperative
complications following either SLNB or ALND; modelled with Markov states in the decision-tree model………………………………………..………….89-90
Table 8. A summary of the percentages of patients who developed an axillary seroma in
the immediate postoperative period following ALND and SLNB procedures, as reported in the Cambridge study and modelled with single subtree branch probabilities in The Model…................................................................................90
Table 9. A summary of the SLNB treatment uncertainties derived from the GIVOM and
NSABP B-32 trial results……………………………………….……………….91 Table 10a. A summary of all the costs identified from the initial search of the OCCI
database. Note that the ‘Morbidity costs’ values displayed here were used as-is in The Model, whereas the ‘Procedure costs’ values were subject to the NucMed adjustments (see Table 10b)…..............................................................96
Table 10b. The SLNB- and ALND-related procedure costs updated to include the NucMed
adjustments described earlier (see Research Methods chapter). Note that these cost values were the final ones used in The Model……………………………..97
Table 11. A summary of The Model’s reference or base case; identifying the Alternative
treatment pathway as the cost-minimizing option………………………...…….98 Table 12. A summary of the threshold cost values, as identified by means of one-way
sensitivity analyses, for the two cost variables to which The Model is sensitive………..…..…………………………………………………………..104

x
Table 13. A summary of the results of the standard probabilistic sensitivity analysis (PSA)……………..………..…………………………………………………..106
Table 14. A summary of the results of the microsimulation analysis (McSim) ….……...107 Table 15. A summary of the results of the subgroup analyses within the existing SLNB vs.
ALND cost-comparison literature……………………………………….…….116 Appendix D Table D1. A summary table of the ALND-associated treatment-pathway Markov process
transition probabilities and the resulting cost values; used to validate the programming of the Markov processes……...………………………………...167

xi
List of figures Figure 1. A schematic of the theory of metastatic spread of breast cancer cells by way of
axillary lymphatics (adapted from Benson et al.)………………………………...3 Figure 2. A diffusion of innovation curve as it relates to the adoption of SLNB for breast
cancer in Canada (adapted from Rogers 2003, Quan 2008)……………………...6 Figure 3a. A graph of the total cost functions of the treatment algorithms that include either
an initial SLNB or an ALND only, as a function of the number of ESBC patients, QESBC.…………..…………………………............................................................9
Figure 3b. A graph of the average cost functions for the treatment algorithms that include
either an initial SLNB or an ALND only, as a function of the number of ESBC patients, Q. Note that the label ‘Incr. AC’ refers to the incremental average cost value.…………………………………….............................................................11
Figure 4. A flow-diagram depicting how the production of hospital services are categorized
and allocated to patients (adapted from the Ontario Guide to Case Costing manual)………………………...……….……………………………………….20
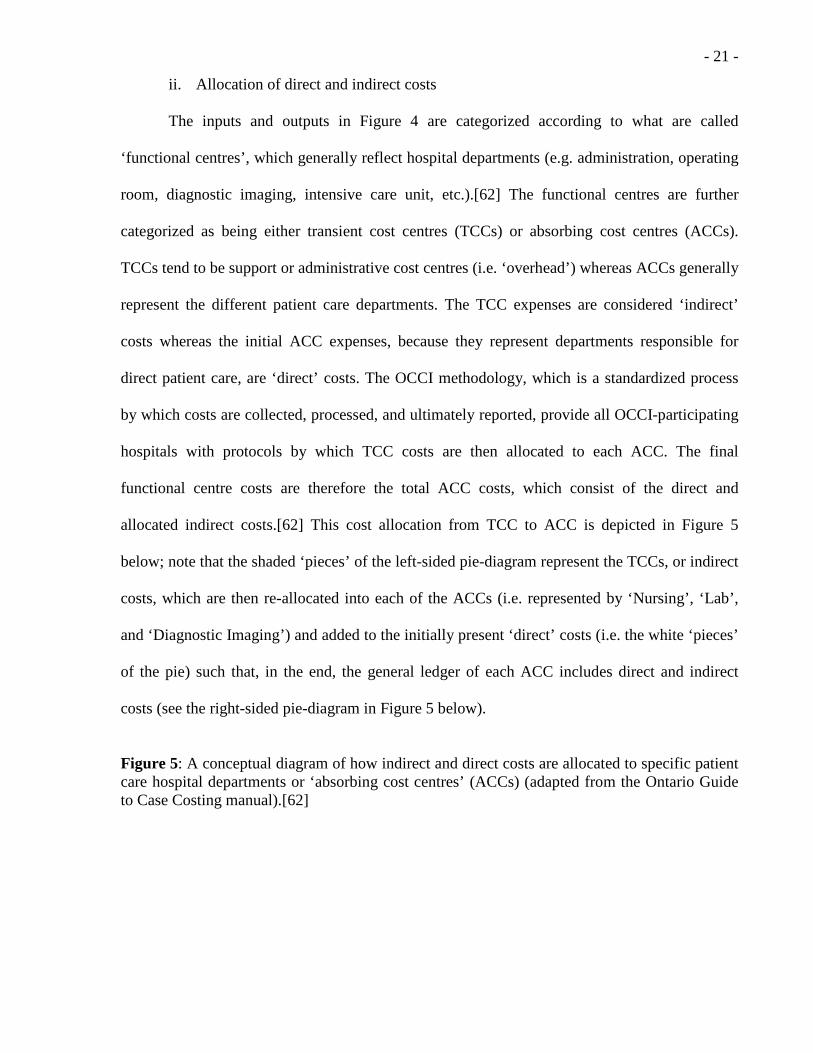
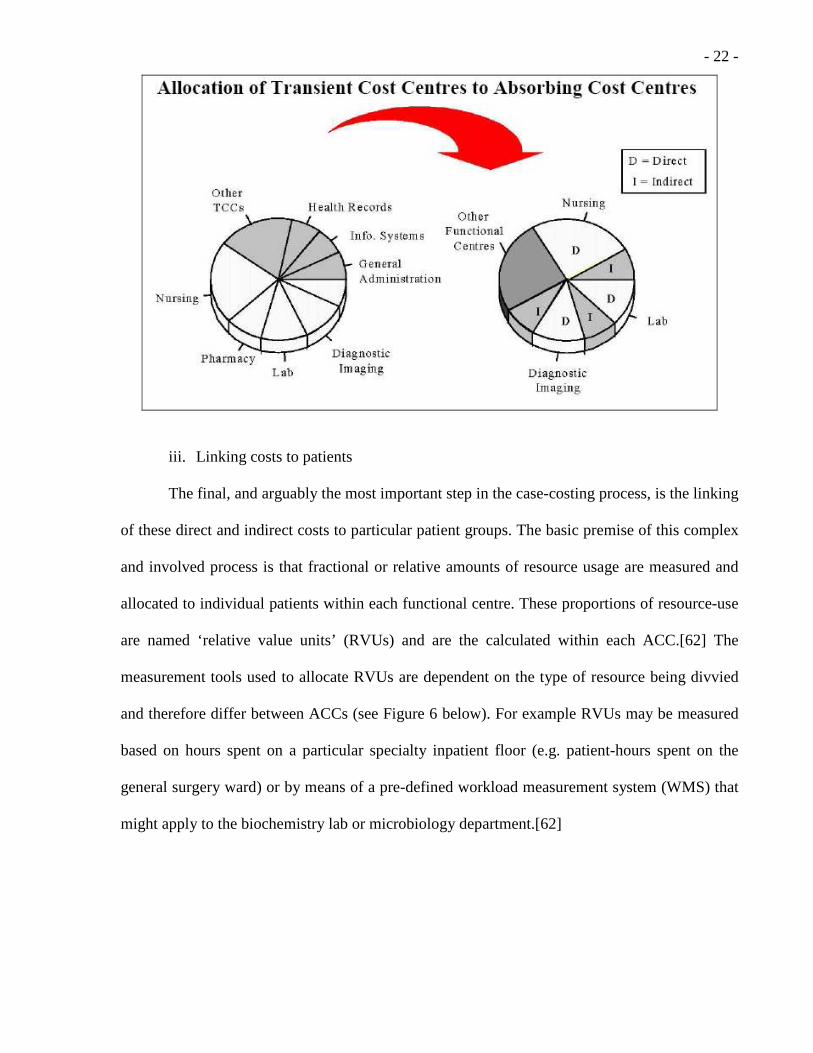
Figure 5. A conceptual diagram of how indirect and direct costs are allocated to specific
patient care hospital departments or ‘absorbing cost centres’ (ACCs) (adapted from the Ontario Guide to Case Costing manual)…………………………...21-22
Figure 6. A conceptual diagram of how costs are assigned to patients, within each
functional centre (i.e. ACC) and on a per-visit basis (adapted from the Ontario Guide to Case Costing manual)…...…………………………………………….23
Figure 7a. The first of two ‘snapshots’ of the costing analysis tool (CAT) web-user interface
at www.occp.com where the highlighted link in Figure 7a below leads to website depicted in Figure 7b……...…………………………………………………….25
Figure 7b. A depiction of the parameter setting options for the costing analysis tool (CAT)
web-user interface at www.occp.com............... ………………………………...25 Figure 8. The Alternative treatment pathway; the basic treatment algorithm for surgical
management of ESBC using SLNB to initially stage the axilla...........................36 Figure 9. The Standard treatment pathway; the basic treatment algorithm for surgical
management of ESBC using ALND to stage the axilla………............................37 Figure 10. A probability distribution that describes the parameter uncertainty surrounding
the probability of failing to identify SLNs during a SLNB; and is also an example of the probability distributions used to define chance nodes or branch probabilities that represent treatment uncertainty in the Alternative treatment pathway within The Model (see also Appendix C)…..........................................92

xii
Figure 11. The Model; note the location of the ‘cloned’ Markov processes, as designated by the ‘Clone 2’ labels within the subtrees………...……….....................................94
Figure 12. A magnified display of the structure of the Markov process within the ALND
treatment pathway……………………………………………...……………......95 Figure 13. An example of a cost distribution used to define the cost of the ALND procedure;
note that in the roll-back analysis the EV is used, however in the probabilistic sensitivity analysis and microsimulation trials, a cost value is selected at random from the distribution.……………………............................................................97
Figure 14. The roll-back analysis as displayed in TreeAge Pro®; note that the Alternative
pathway is shown to be cost-minimizing………………………………...……...99 Figure 15. A Tornado diagram summarizing the results of the one-way sensitivity analyses
of all the treatment uncertainty and morbidity variables; note that no band crosses $0 on the x-axis……………….………………………………………………..101
Figure 16. A Tornado diagram summarizing the results of the one-way sensitivity analyses
of all the cost variables; note that there are portions of the horizontal bands that straddle the vertical line (i.e. where incremental cost = 0) indicating that for those cost variables The Model is sensitive……...…………………………………..102
Figure 17. A one-way sensitivity analysis, where the average treatment pathway costs are
plotted against the cost of the ALND procedure; the point of intersection is the ‘threshold’ cost of the ALND procedure at which point The Model’s cost-minimizing solution changes…….…………………………………………….102
Figure 18. A one-way sensitivity analysis, where the average treatment pathway costs are
plotted against the cost of the SLNB procedure; the point of intersection is the ‘threshold’ cost of the SLNB procedure at which point The Model’s cost-minimizing solution changes.……..…………………………………………...103
Figure 19. A two-way sensitivity analysis where the average SLNB and ALND procedure
costs are varied simultaneously. Note that the combination of procedure costs for which either the Alternative or Standard treatment pathway proves cost-minimizing are marked areas or “domains” on the graph……………………..104
Figure 20. The simulated total cost functions for both the Alternative and Standard
competing treatment pathways in this cost-minimization analysis……………108 Figure 21. The simulated avg. cost functions for the Alternative and Standard treatment
pathways; where the two SLNB avg. cost functions are defined by two different TCi estimates…………………………………………………………………..110

xiii
Appendix C Figures C1-6. The probability distributions of all variables used in The Model model to
approximate treatment uncertainty and one-time post-operative morbidity rates……………………...………………………………………………..162-164
Appendix D Figure D1. A graphical representation of the transitional probabilities affecting the
postoperative health states of the Markov cohort within The Model………….165 Figure D2. A graphical representation of the cumulative costs associated with treating all
four recurring complications following ALND; as modelled by the Markov process of the ALND pathway within The Model……………………………..166
Appendix E Figure E1-7. Probability distributions of all variables used in The Model to approximate the
cost of the procedures and of treating the postoperative complications…168-171 Appendix F Figures F1-2. Copies of the OCCI CAT’s output for the SLNB-associated procedure-related
costs, itemized by direct, indirect and average total cost per case, and then stratified by functional centre…………...……………………………………..172
Figures F3-4. Copies of the OCCI CAT’s output for the ALND-associated procedure-related
costs, itemized by direct, indirect and average total cost per case, and then stratified by functional centre………………………….....................................174
Appendix G Figure G1. Average cost as a function of relatively low patient volume (i.e. Q < 25); note the
intersecting functions within the frame of this figure, where the SLNB-associated treatment pathways become less costly, on average, than their ALND-associated counterpart……………………………………………………………………..176
Figure G2. Average cost as a function of relatively high patient volume (i.e. Q > 100). Note
the near-parallel functions within the frame of this figure, where the SLNB-associated treatment pathways are consistently less costly, on average, than their ALND-associated counterpart…………………………………………………176
Appendix H Figures H1-3. Reconstructed copies (using TreeAge Pro®) of a portion of the decision-analysis
model developed by Ronka et al., in their study comparing SLNB and ALND costs……………………………………………………………………….177-179

xiv
List of appendices APPENDIX A. A mathematical framework of the theoretical model of hospital costs
associated with axillary staging of ESBC patients…………………….148 APPENDIX B. A literature review to identify and examine the existing economic
evaluations that compare SLNB and ALND……..…………………....151 APPENDIX C. The probability distributions of all variables used in The Model to
approximate treatment uncertainty and one-time postoperative morbidity……………………………………………………………….162
APPENDIX D. An analysis of the ALND-associated treatment pathway Markov process;
measuring per-cycle transitional probabilities and costs as a means of validating the Markov cohort structure and programming………...…..165
APPENDIX E. The probability distributions of all variables used in The Model to
approximate uncertainty in the cost of the procedures and the treatment costs of the postoperative complications................................................168
APPENDIX F. Examples of the reports generated from the CAT-facilitated search of the
OCCI database……................................................................................172 APPENDIX G. Magnifications of selected sections of Figure 21; plotting average cost vs.
simulated patient volume for both competing treatment pathways in The Model…………………………………………………………………..176
APPENDIX H. An in-depth analysis of a section of the decision-analysis pathway
employed by Ronka et al., to model the costs of treating ESBC patients with SLNB……………………………………………………………..177

- 1 -
I. INTRODUCTION
1. Overview
An awareness of rising health care costs, constrained health care resources, and the aging
of an increasingly sophisticated patient population that is placing enormous demands on an
already taxed system, has grown steadily in the medical literature and the popular media now for
decades.[1-3] While these issues are playing out to different degrees in countries all over the
world; Canada, subject to Western-world demographics and having a largely public, single-
payer, health care system is particularly sensitive to the broad challenges mentioned above.[3; 4]
Certainly then, within every health care field, the goal of making resource utilization more
efficient while maintaining health care standards is highly coveted, even paramount. The field of
breast cancer is no exception; a disease that demands enormous resources to manage at a
population level.[4; 5]
As a response to this complex issue of resource constraint, health policy-makers and
administrators have been forced to balance the decision-making process with consideration of
the economic outcomes, while trying to meet growing clinical demands.[3] New tools of
varying complexity, meant to aid administrators with these difficult decisions, have therefore
emerged.[1; 2; 4; 6-10] Formal economic evaluations, are just one broad category of health
economic research tools that are used in this context; sometimes as stand-alone projects[11; 12]
or as part of a broader research endeavour.[2] This study is a formal cost-minimization analysis
(CMA) that consists of a decision-analysis that examines the in-hospital treatment costs
concerning a particular aspect of the surgical management of early-stage breast cancer; and was
undertaken with a goal towards potentially informing decision-making in this area. The scope
and the rationale for this study are presented in the chapters that follow.

- 2 -
2. Background
A. Surgical management of early-stage breast cancer (ESBC)
Breast cancer is the most common cancer among Canadian women with an estimated
22,900 new diagnoses occurring in 2009.[5] Surgery is an integral part of breast cancer
treatment, providing local tumour control and staging information used to guide adjuvant
therapy. While the removal of the primary tumour via either a mastectomy or breast conserving
surgery (BCS) is the first goal of surgical intervention, the proper surgical management of the
patient’s axilla is also of concern. Specifically, in the setting of ESBC (i.e. TMN Stage I or II;
T1/2, N0, M0)[13] axillary lymph node status remains the single most prognostic indicator of
cancer recurrence and death.[14-19]
B. Sentinel lymph node biopsy (SLNB) as a new standard of care
Historically, the surgical standard of care for determining lymph node status in the
setting of ESBC involved an axillary lymph node dissection (ALND) performed alongside the
resection of the primary tumour.[17; 20] An ALND in the setting of ESBC involves the removal
of nearly all lymph nodes in the axillary basin; specifically, those nodes that are lateral and
posterior to the pectoralis minor muscle are removed (a level I-II dissection).[17; 21] However,
approximately only 25% to 35% of all ESBC patients will have had cancer spread to these
nodes, and as an ALND is associated with significant morbidity (including pain, dysasthesias,
decreased shoulder range of motion, and lymphedema), a majority of women have traditionally
undergone this operation without realizing any benefit.[14; 15; 17; 17; 20-23] In the past
decade, across Europe and North America, SLNB has emerged as a minimally invasive
alternative to ALND, providing enhanced axillary staging with less surgical morbidity.[14; 15;
17; 18; 21; 24-27]

- 3 -
The underlying theory that spurred SLNB development, presupposes a sequential and
orderly spread of cancer cells from the primary tumour to the first-draining group of axillary
nodes or ‘sentinel’ nodes by either direct or ‘collateral’ lymphatic channels (see Figure 1
below).[21]
Figure 1: A schematic of the theory of metastatic spread of breast cancer cells by way of axillary lymphatics (adapted from Benson et al.).[21]
The SLNB procedure consists of injecting a blue dye or a radioisotope, or both, into the
diseased breast (usually in a periareolar or subdermal fashion) such that these agents travel
along those lymphatic channels that drain the primary tumour.[17; 21] The sentinel lymph nodes
(SLNs) can then be identified visually by their blue colour, or in terms of radioactivity as
detected by a hand-held gamma probe.[15; 17; 21; 28; 29] These nodes are then surgically

- 4 -
excised and examined by a pathologist. Since fewer lymph nodes are removed during a SLNB
(as compared to an ALND) the pathologist proceeds with a more thorough and detailed
examination of the excised nodes than is otherwise routinely done following an ALND.[14; 15;
21] The assumption is that if the sentinel node is negative for tumour cells, the remaining
axillary nodes are also considered negative, otherwise if positive SLNs are identified then the
patient may then undergo a full ALND.[14; 17; 21] A properly performed SLNB therefore
identifies the minority of ESBC patients that require a full ALND, while providing (at least)
equivalent prognostic data without the need for a full ALND in a majority of ESBC patients.[14;
15; 17; 18; 21; 30; 31] While the concept of SLNB is straightforward, accurately locating,
harvesting and analyzing the sentinel node(s) is a complex multidisciplinary process, associated
with a recognized learning curve.[14; 15; 31-37] Despite these technical challenges the
feasibility and accuracy of SLNB in identifying axillary metastases in the treatment of ESBC is
widely acknowledged.[14; 18; 20; 21; 26; 31]
While the accuracy of the SLNB procedure in staging the axilla has gained broad
acceptance within the surgical community, recent randomized trials have also shown that SLNB,
as compared to ALND, causes fewer post-operative complications and is associated with
improved patient quality of life (QoL),[24; 38-41] while not compromising short-term survival
or recurrence rates1.[41; 45; 46] Due to these recognized benefits, SLNB has been progressively
adopted as an alternative to ALND by European and North American surgeons, emerging as the
standard of care in Europe and the United States, as well as most recently here in Canada.[14;
15; 18; 26; 31; 47; 48; 48]
1 Some critics argue however that these results are not adequate given that the study with the longest median follow-up (79 months) is a single institution study with a relatively small number of patients (n=516) and was effectively underpowered to detect differences in survival.[14; 41] Knowing that a significant portion (>10%) of breast cancers will recur more than 10 years after initial management,[17; 42] there are many within the surgical community that are awaiting conclusive long-term efficacy data from the National Surgical Adjuvant Breast and Bowel Project (NSABP trial, protocol B-32) comparing SLNB and ALND.[19; 43; 44]

- 5 -
C. Canadian SLNB practice patterns
i. SLNB dissemination
The actual implementation and use of SLNB by Canadian surgeons has lagged behind its
rise in the surgical literature. A 2002 survey of Canadian general surgeons by Porter et al.
revealed that 27% of respondents performed SLNB in some capacity.[49] This was substantially
less than the 77% of American surgeons reported by Lucci et al. in a contemporary study. By
2006 however, 61% of Canadian breast cancer surgeons were performing SLNB, as discovered
by Quan et al. in their 2006 survey of Canadian general surgeons.[50; 51] This increase in
SLNB adoption over the five-year period is largely attributed to the increase in the acceptance,
by Canadian surgeons, of the efficacy of SLNB (87% of the respondents felt that ALND was the
standard of care in 2001 versus 96% believing SLNB to be the standard of care or an acceptable
equivalent to ALND in 2006).[49; 51] The increase in the number of SLNB-performing
surgeons reflects that, despite initially lagging behind their American colleagues, most Canadian
surgeons have now embraced SLNB. This pattern of SLNB adoption is modelled effectively by
the diffusion of innovation curve, developed by Rogers and adapted by Quan, to depict the level
of SLNB dissemination in Canada (see Figure 2).[51; 52]
A closer look at the results from the survey by Quan et al. shows that the adoption of
SLNB has not been uniform across different types of surgical practices. Quan et al. reported that
263 (52%) of all breast cancer surgeons were self-described community surgeons2, and 161
(32%) of survey respondents performed two or fewer breast cases per month (hereafter referred
to as ‘low-volume3); the implication being that a significant amount of low-volume breast
surgery is done in a community setting.[51] Interestingly, in the same survey the proportion of 2 The survey offered no formal definition of a ‘community’ hospital, however this was one of three options in answering a question concerning the type of hospital where the surgeon practiced; the other two options were a) University centre and b) a community hospital with a formal academic affiliation.[51] 3 For the entirety of this dissertation ‘low-volume’ refers to a case-load of less than 30 cases per year. While it is acknowledged that this is somewhat of an arbitrary definition, it is made on the basis of designations found in the literature[35; 53] and in consultation with local experts.[54]

- 6 -
non-SLNB performing surgeons identifying themselves as either being community surgeons or
having low-volume practices were 59% and 62%, respectively.[51] These results suggest that
the remaining capacity for the growth and dissemination of SLNB in Canada, what Rogers
referred to as the ‘late adopters’ (i.e. the remaining 30% to 40% on the diffusion of innovation
curve as displayed in Figure 2 below), exists among community surgeons with low-volume
breast cancer practices.[52] Given the geography and population distribution of Canada, this is
not a trivial group of surgeons, as they provide crucial access to surgical care to the rural patient
populations.
Figure 2: A diffusion of innovation curve as it relates to the adoption of SLNB for breast cancer in Canada (adapted from Rogers 2003,[52] Quan 2008).[51]
ii. Barriers to SLNB implementation
Another point of concern emerged from the results of the survey by Quan et al., namely
that of the 197 (39%) of surgeons not performing SLNB the majority (53%) stated “lack of
resources” as the primary barrier to SLNB implementation.[51] The resources cited included a
physical hand-held gamma-probe device (72%), on-site nuclear medicine facilities (70%), and
access to a breast pathologist (38%).[51] With regard to the nuclear medicine and pathology
- 7 -
resources, the study by Quan et al. did not address whether the resource shortfall was due to
either a lack of access to physicians, or due to the poor organization of existing infrastructure, or
both.[51] With regard to gamma-probe availability however, within the Canadian health care
system the purchase and use of such a technology falls within the purview of the hospital’s
operating room budget, and is therefore an issue of cost.[51; 55]
iii. Implications
The results of the recent survey by Quan et al. concerning SLNB practice patterns
among Canadian surgeons raise a number of important issues; first, despite its emergence as the
standard of care in axillary staging in the setting of ESBC, SLNB has not been fully or
uniformly disseminated, especially among community surgeons with low-volume practices; and
second, the lack of SLNB usage among some surgeons seems to be due to both a lack of
resources and deficiencies in the proper allocation of those resources. Optimization of SLNB
delivery may potentially be directed by such factors as existing SLNB delivery, population
distribution, and the regionalization of nuclear medicine and pathology facilities. It may be
important however, to first determine the cost of SLNB delivery (versus the status quo) prior to
finalizing any resource allocation strategy. Specifically, knowing the cost of providing SLNB in
an Ontario hospital may help direct the subsequent organization of SLNB services; for example
if in low-volume community hospitals, the cost of SLNB care was determined to be
prohibitively high then consideration of a strategy to regionalize SLNB services away from low-
volume community centres may be justified.
3. An economic evaluation of SLNB and ALND
While the results of the Quan et al. survey demonstrate that there is a need to
characterize the costs of providing SLNB capabilities, a theoretical discussion is needed to
frame the research question and provide a basis for a research hypothesis and objective.

- 8 -
A. Theoretical model of SLNB hospital costs
The results of the survey by Quan et al. have been presented as evidence that the initial
capital costs of the hand-held gamma-probe are seen as a prohibitive expense to hospitals and
surgeons who may otherwise be willing to perform SLNB for breast cancer. As previously
discussed, SLNB is a minimally invasive and accurate method for staging the axilla in the
setting of ESBC, and is used to identify those patients that do not need to undergo the more
morbid ALND (i.e. the default axillary staging procedure).[14; 15; 17; 21; 24; 38; 48] Within a
given ESBC patient population, use of SLNB would therefore result in an overall decrease in
morbidity that would conceivably translate into lower health care costs, which may be enough to
justify the initial capital investment in SLNB equipment. Said in economic terms; despite
starting from a higher cost basis (due to the initial capital investment in predominantly the
purchase of the hand-held gamma probe), the difference in morbidity between the two
procedures, may result in an overall total cost savings.[11] The suggested cost savings for the
treatment strategy involving an initial SLNB (hereafter referred to as the ‘Alternative’ treatment
option) versus a treatment pathway that involves only an ALND (hereafter referred to as the
‘Standard’ treatment option) may be a result of the lower cost of treating the next ESBC patient
(i.e. termed the marginal cost, MC)4 once the cost of treating postoperative morbidities is
considered. Therefore, despite initially higher total costs, once a certain number of patients
(QESBC) have been treated with an initial SLNB, the total costs would be lower than the costs
associated with the Standard treatment option. It is therefore hypothesized that there exists a
certain threshold number of cases (QESBC = Q*) where the total cost of the SLNB-associated
4 MC = marginal cost and is equal to the slope of the cost function at a given point Q. Note that in the hypothetical model depicted in Figure 3b, MCS < MCA; where a decreasing marginal cost of the SLNB treatment pathway is less than the constant marginal cost of the ALND treatment pathway. The decreasing MCS is meant to reflect the learning curve and decrease in morbidity associated with SLNB.[14; 24; 35; 53] Simplifying assumptions that apply throughout the remainder of this dissertation include a disregard of the effect of the SLNB learning curve (i.e. an assumption of linearity in the SLNB-related total cost function, see Appendix A), as well as the assumption of no initial capital costs associated with ALND given that it is the ‘standard’ procedure and would already be in place at a given hospital that offers breast cancer surgery.

- 9 -
cases (TCS) may be equal to the total cost associated with performing an equivalent amount of
ALND cases (TCA) (i.e. at Q*: TCS = TCA); thereafter however, due to a lower SLNB marginal
cost (i.e. at Q*: MCS < MCA), SLNB becomes the less costly procedure (i.e. at Q* + 1: TCS <
TCA). The implication is therefore that as a result of following a treatment algorithm that
involves an initial SLNB as opposed to an ALND, a cost-savings is eventually realized after
treating a certain ‘threshold’ number of patients, thereby justifying the initial capital investment,
TCi. This theoretical narrative is depicted in Figure 3a and is mathematically outlined and
solved in Appendix A. Note that Figure 3a represents an optimization problem (see Appendix
A); whereby the hospital’s total costs associated with this patient population are minimized if
one treatment pathway or the other is followed (i.e. either the Alternative or the Standard
treatment pathway). An estimate of the point Q* in Figure 3a can be generated if values for TCi,
MCS and MCA can be determined (see equation 3 in Appendix A).
Figure 3a: A graph of the total cost functions of the treatment algorithms that include either an initial SLNB or an ALND only, as a function of the number of ESBC patients, QESBC.

- 10 -
Another consequence of having up front capital costs is that the average cost of treating
patients is initially very high. This is illustrated in Figure 3b below, where the average cost
functions of the SLNB- and ALND-associated treatment pathways (i.e. ACS and ACA,
respectively) are plotted. These two functions were determined, under an assumption of
linearity, by dividing the corresponding total cost functions (i.e. TCS and TCA) by Q (see
Appendix A). Note that in Figure 3b, the resulting ALND-associated average cost function is a
horizontal line, where ACA = MCA = constant (see Appendix A). The same cannot be said
however, for the average cost function for the SLNB-associated treatment pathway (i.e. ACS in
Figure 3b). The initial SLNB-specific capital investment (i.e. TCi in Figure 3a above) causes
ACS to be initially very elevated while relatively few patients have been treated (i.e. there is a
small number of cases, Q, over which to average out the capital investment). The resulting
SLNB-associated average cost function is decreasing and non-linear, as represented in Figure 3b
below. The argument that due to the decrease in morbidity, SLNB-associated surgical care may
result in an eventual cost savings is therefore demonstrated in Figure 3b by the SLNB-related
average cost function (ACS) becoming smaller than the ALND-related average cost function
(ACA) as the number of cases increases beyond a ‘threshold’ value, Q*. This point Q* in Figure
3b, is where the average cost curves intersect and is the same hypothetical point that is depicted
in Figure 3a; which is expected since at Q* TCA = TCS and therefore ACS = TCS / Q* = TCA /
Q* = ACA. Finally, note that as the number of cases (Q) increases ACS flattens; asymptotically
approaches a constant value and becoming nearly linear (see Figure 3b and Appendix A). It is in
this ‘linear portion’ of the graph that the incremental average cost (i.e. labelled as ‘Incr. AC’ in
Figure 3b below) or the difference between the two average cost function is assumed to be
constant.
A formal economic evaluation can be used to model the costs associated with the
competing SLNB- and ALND-associated treatment pathways and thereby provide confirmation

- 11 -
of the above theoretical arguments. Specifically, decision analysis can be used to determine
estimates of average costs (i.e. an estimate of ACA and an estimate of the value that ACS
approaches in Figure 3b). The four main types of formal economic evaluations that may use
decision-analysis to evaluate these costs, are outlined briefly below.[11; 12; 56]
Figure 3b: A graph of the average cost functions for the treatment algorithms that include either an initial SLNB or an ALND only, as a function of the number of ESBC patients, Q. Note that the label ‘Incr. AC’ refers to the incremental average cost value.
B. Brief overview of the types of economic evaluations
While all types of economic evaluations compare costs, it is the way in which outcomes
are considered and measured that differentiates one type of economic analysis from another.[11;
12] The most common type of economic evaluation is the cost-effectiveness analysis (CEA),
which compares the costs per an outcome that is shared between treatment pathways (e.g. a
CEA may compare the cost per 10 mmHg drop in systolic blood pressure between two anti-
hypertensive medications).[11] A cost-utility analysis (CUA) is a modified version of a CEA
that defines the shared outcome in terms of a measure that incorporates patient preference (i.e.

- 12 -
utility) for a given health outcome.[11; 12] The unit most commonly used in a CUA is the
‘QALY’ or ‘Quality-Adjusted Life Year’5, which serves as a means of standardizing the health
outcomes across different illnesses, and resulting from different interventions.[11] In this way
CUAs are broader forms of CEAs, allowing for cost comparisons across departments based on
changes to the more generalizable measure of a QALY (e.g. the costs per QALY of a new renal
dialysis unit versus a cardiac catheterization suite).[57] A less-utilized form of economic
evaluation is the cost-benefit analysis (CBA), which monetizes the health outcome (e.g.
disability days avoided is converted into a dollar value), such that a net monetary benefit (or
loss) can be compared across treatment pathways. Finally, a cost-minimization analysis (CMA)
requires that an assumption of equivalence in outcomes between the competing treatment
alternatives is made; thus simplifying the analysis to a strict comparison of costs.[11; 12] Since
only costs are of concern in a CMA (also sometimes called a ‘cost-comparison’ or ‘cost-
consequence’ study), CMAs are sometimes referred to as ‘partial’ economic evaluations,
whereas a CEA, CUA, or CBA are all ‘full’ economic evaluations.[12]
Prior to undertaking a formal economic evaluation to investigate the theoretical
arguments presented above (see Figures 3a and 3b), a literature review was performed in an
attempt to identify pre-existing studies that formally compared SLNB and ALND costs and
outcomes.
C. Review of existing literature
An outline of the literature review, the initial search strategy results, and the critical
appraisal methodology are described in Appendix B. The search strategy identified a paucity of
formal evaluations concerning SLNB. A total of four studies were identified; two American
5 Where the QALY for a given health outcome is calculated by multiplying the period of time spent (usually years) in a given state of health (e.g. alive and well, alive but disabled, alive with chronic pain, alive but needing dialysis, etc.) by a preference value (i.e. utility) for being in the given health state.[12; 57]

- 13 -
studies, [58; 59] a French study, [60] and a Finnish study.[61] All four studies were critically
appraised using a checklist developed by Drummond et al. (see Appendix B).[11] All four
articles were cost-comparison studies, as no costs per outcome associated with either SLNB or
ALND were reported.[58-61] While three of the studies did not include any patient follow-up
beyond the perioperative period, the American study by Chirikos et al. did examine costs
incurred over a follow-up period of 44 months.[59] The four studies were each conducted at
large single institutions, using proprietary accounting databases and microcosting methodologies
that considered only in-hospital costs. The results of the studies differed, as discussed below.
i. Gemignani et al.
The first of the four studies to be completed, by Gemignani et al., was a retrospective
chart review that compared average hospital charges (not costs) associated with SLNB and
ALND matched cohorts at Memorial Sloan-Kettering Cancer Centre (MSKCC) in New York
City. The authors made use of a large institutional database to identify charges and outlined a
straightforward cost-comparison model that considered the average hospital charges for the two
patient groups, as well as for three commonly identified subgroups within the SLNB cohort.
Gemignani et al. found no significant difference in the average hospital-related charges between
the two groups.[58] The generalizability of the study results are somewhat marginalized for two
reasons; first, hospital charges are subject to US market forces and do not reflect actual
procedural costs and second, only patients with very small tumours (T1) were considered,
ignoring a significant group of patients (i.e. those with T2 tumours) whom, from a practical
clinical standpoint and as recommended by current guidelines, are eligible for and are offered
SLNB.[14; 18]

- 14 -
ii. Chirikos et al.
The second American study, by Chirikos et al. was similar to the study by Gemignani et
al., in that the authors also considered hospital charges and reported equivocal results;
concluding that SLNB neither increased nor decreased cumulative per-patient breast cancer
treatment-related charges.[59] As in the MSKCC study by Gemignani et al., the patient
population was identified by means of a large institutional database that housed demographic,
disease, and billing-related data. In contrast to the MSKCC analysis however, Chirikos et al.
identified all patients treated with a diagnosis of invasive breast cancer (note, that all cancer
stages except for stage IV disease were included) and divided them into two groups: a SLNB
and non-SLNB group (as opposed to making a strict comparison of a SLNB versus an ALND
cohort).[59] The authors used univariate and multivariate regression analysis to determine if
those patients who underwent SLNB incurred a greater average charge amount for care relative
to the non-SLNB group.[59] The authors acknowledged however that there was a risk their
results were subject to confounding since the comparison groups were not matched with respect
to all other treatment and disease factors (other than whether or not SLNB had been
performed).[59] Despite this novel approach to determine the impact of the cost of SLNB on the
overall breast cancer treatment costs, the authors found no significant difference in the per-
patient cumulative charges between the groups.
It is conceivable that due to the complex way in which staging procedures such as SLNB
or ALND are incorporated into the overall algorithm of breast cancer care, that perhaps a more
generalized methodology (such as this one put forth by Chirikos et al.), is more meaningful and
has greater applicability for hospital administrators then an isolated cost-comparison of SLNB
and ALND.[59] Another interesting finding reported by the authors was that despite the
upwards of 44 months of available follow-up data, the average costs between the two
comparison groups were never significantly different, as measured at three different follow-up

- 15 -
intervals. Assuming that some element of the theoretical cost-savings attributed to SLNB (i.e.
due to the procedure’s decreased morbidity) was captured within this follow-up period, an
expectation that treating the SLNB group would be less costly is certainly expected. While there
was a trend towards lower cumulative charges within the SLNB group, it was not large enough
to prove significant.[59] Given the extended 44-month follow-up period, the results by Chirikos
et al., suggest that either the theorized cost-savings associated with SLNB is not that large or
that their results were indeed subject to confounding.[59]
iii. Ronka et al.
The results of a well-conceived Finnish study by Ronka et al. differed significantly from
the results reported by the two American studies; concluding that SLNB was significantly more
expensive, in terms of average cost, as compared to conventional ALND.[61] The authors
describe evaluating SLNB in an appropriate ESBC patient population, having access to precise
microcosting data, and having constructed a thorough decision-analysis model to cost out
alternative theoretical treatment algorithms (such as a SLNB treatment arm with intraoperative
frozen section). The SLNB treatment arm proved to be more expensive than conventional
ALND largely due to the adherence to potentially unique and very hospital-specific treatment
algorithms, which decreased the generalizability of the results of the study (see Appendix B)6.
iv. Perrier et al.
Although their results showed SLNB to be significantly more expensive than ALND,
Ronka et al. hypothesized that if longer follow-up data were gathered, the lower SLNB
complication rate may translate into significant cost-savings.[61] The MSKCC study authors
make a similar claim, and yet the results of the Chirikos study seem to contradict this
6 Note that due to the extensiveness of the critical appraisal carried out in the case of this article, the full details of the analysis were not included here but are reproduced in entirety in Appendix B.

- 16 -
prediction.[58; 59] In stark contrast to all the results discussed thus far, the French cost-
comparison by Perrier et al., supported a tremendous cost-advantage for SLNB.[60] Perrier et
al., conducted a retrospective study that used very precise microcosting methodology to
compare the average in-hospital costs incurred from treating an ESBC patient population with
either SLNB or ALND at a single institution. As in the study by Gemignani et al., the authors of
this French study also examined the breakdown of the SLNB cohort costs by subgroups. The
reported cost-advantage associated with SLNB use was attributable to the large cost of
hospitalization among ALND patients, which accounted for 57% of total ALND costs.[60] The
authors reported the median length of hospital stay to be nine and three days, for ALND and
SLNB patients, respectively.[60] These numbers represent an extraordinarily lengthy hospital
stay for these procedures, challenging the generalizability of the findings by Perrier et al.7
v. Summary and conclusions
The results from the four partial economic evaluations comparing SLNB to ALND
conducted to date are not directly applicable to the issue of SLNB implementation in the context
of the Canadian health care system. Not only do the conclusions of all four studies reviewed
above differ, but their methodology is varied; first, each rely on proprietary costing data that is
inherently not-generalizable, [11] and second the patient populations and the costing models are
not readily comparable. Furthermore, as the authors argue in their respective discussion sections
of each publication reviewed above, the economic case for SLNB is somewhat hampered
because the most compelling advantages of SLNB (decreased morbidity and quality of life
improvements) are not clearly accounted for in any SLNB cost-comparison.[24; 41; 58-61] As a
consequence, there may be a role for undertaking another economic evaluation of SLNB and 7 A number of studies have reported shorter hospital lengths of stay (LOS) for patients undergoing SLNB as compared to ALND[15; 17; 20; 39]; while the actual lengths of stay vary within a range amongst theses studies (i.e. 0-3 days for SLNB and 1-6 days for ALND), these values are all generally less than the results reported by Perrier et al.[60] Furthermore, it is generally accepted that in Canada, SLNB is performed as an outpatient procedure and ALND patients are usually only kept in hospital overnight.[54]

- 17 -
ALND that is generalizable within the Canadian health care system and addresses the primary
issue of accounting for differences in SLNB and ALND postoperative morbidity.
D. Rationale for a cost-minimization analysis (CMA)
Survey results from the literature have been described, identifying at the level of the
individual hospital that cost is a barrier to SLNB implementation; thereby demonstrating a need
to quantify the costs of the SLNB procedure in the context of treating ESBC.[51] A theoretical
framework for a cost-comparison was developed based on the argument that incorporation of
SLNB into the ESBC treatment algorithm may provide a total cost-savings as evidenced by an
(eventual) lower average cost value when compared to the ALND-only treatment option if
procedure-related morbidity costs are included (see Figures 3a and 3b). Finally, a literature
review demonstrated that although cost-comparison studies of SLNB and ALND do exist, none
of the identified studies satisfactorily address the issue of postoperative morbidity, nor are any
of these studies readily generalizable to the Canadian health care setting. Pursuit of a Canadian-
relevant CMA is therefore justified, and fortunately there is the means to tailor the analysis to
the Canadian setting using Canadian-specific costing data in the form of the Ontario Case
Costing Initiative (OCCI) costing database.[62] A cost-minimization analysis that were to
account for the rates and costs of post-operative ALND and SLNB complications, using
Ontario-based costing data, would therefore seem to be feasible and of value.
An economic evaluation that were to go a step further than a CMA however, one that
incorporated the known quality-of-life advantages of SLNB over ALND [20; 24; 38; 39], as
well as the morbidity differences between the two procedures, into the cost-analysis (i.e. a
CUA) would represent an ideal tool for influencing policy. However, a CMA represents a
simpler, more conservative (but potentially just as informative) ‘first step’ analysis that may
preclude a further CUA. Specifically, if the average SLNB costs are shown to be less than the

- 18 -
ALND-associated costs, than an analysis that incorporates the improved utility associated with
SLNB over ALND, would prove redundant, serving only to amplify the already-established
SLNB cost-savings.[11] If however, a CMA were to show that SLNB is indeed more costly than
using ALND alone to stage ESBC, the analysis would be beneficial in that it may motivate
further study to determine if the added cost of SLNB is justified based on improved utility (i.e. a
CUA) or on a particular clinical outcome (i.e. a CEA).
It must be reiterated that the underlying assumption that allows for the undertaking of a
CMA in the first place, is that the overall efficacy and effectiveness of the SLNB and ALND
procedures, in terms of the most meaningful clinical markers of cancer-related survival and
recurrence, are equivalent.[12; 56] This assumption was re-affirmed by a recent systematic
review[14] and meta-analysis[63] conducted as part of the development of the 2005 American
Society of Clinical Oncology (ASCO) SLNB clinical practice guidelines.[14] Since the
publication of these guidelines, the results from a handful of large randomized or prospective
trials have also been made available, which have also demonstrated the short-term clinical
equivalence of SLNB and ALND. However, as previously mentioned, due to the prolonged
course that breast cancer can take, these trials still do not have the necessary length of follow-up
to detect small long-term differences in mortality or axillary recurrence.[41; 44-46; 48; 64] The
morbidities considered in this cost-minimization analysis, are therefore temporary postoperative
complications associated directly with the axillary surgery, or outcomes that have not been
shown to influence overall and disease-free survival.[24] Furthermore, the costs will not be
reported in terms of a given complication, but rather the costs of treating these complications
will simply be added to the cumulative total of per-patient costs for each of the ALND- and
SLNB-associated treatment algorithms. In this sense, a comprehensive CMA is being
undertaken, one that considers postoperative outcomes, but does not violate the underlying
assumptions inherent to this type of analysis.[11]

- 19 -
E. Overview of the Ontario Case Costing Initiative (OCCI)
Case-costing is a particular, but versatile costing methodology that links resource use
directly to patient groups and then categorizes patients in terms of specific markers.[11; 62] In
this way, case-costing is a resource-accounting methodology that aims to provide more insight
into how hospital resources are allocated.[62] Having a more precise idea of which patient
groups use which resources is intended to improve such things as; hospital fiscal forecasting and
budgetary planning, identification of resource allocation inefficiencies, analysis of high-cost
centres, and the ability to assess the feasibility or impact of adding a new program (e.g. new
SLNB capabilities).[62] All of these objectives are part of an effort to inform decision-making,
helping health administrators to develop better hospital policy.
There are twelve Ontario hospitals that have adopted the case-costing methodology and
have contributed to the most recent year of case-costing information (fiscal year 2007/2008).
These hospitals vary in terms of size, their patient population, services offered, budget, patient
and procedural volumes, etc; ranging from the large high-specialized academic centres (e.g.
University Health Network in Toronto) to the smaller community-based health centres (e.g.
Arnprior & District Memorial Hospital).[62] Despite the variability between hospitals, costs are
submitted by each centre according to a strict costing methodology that ensures that cost data is
of high quality and comparable between participating health centres.[62] The result is a database
of highly detailed costing data that is representative of in-hospital health care costs across the
province of Ontario.
i. Conceptual model of case-costing
Ontario hospitals have a (relatively) fixed budget to pay for a number ‘inputs’ in order to
produce a number of ‘outputs’.[55; 62] The inputs include such things as labour, physical
supplies, capital, etc., whereas the outputs include diagnostic tests, laboratory investigations,
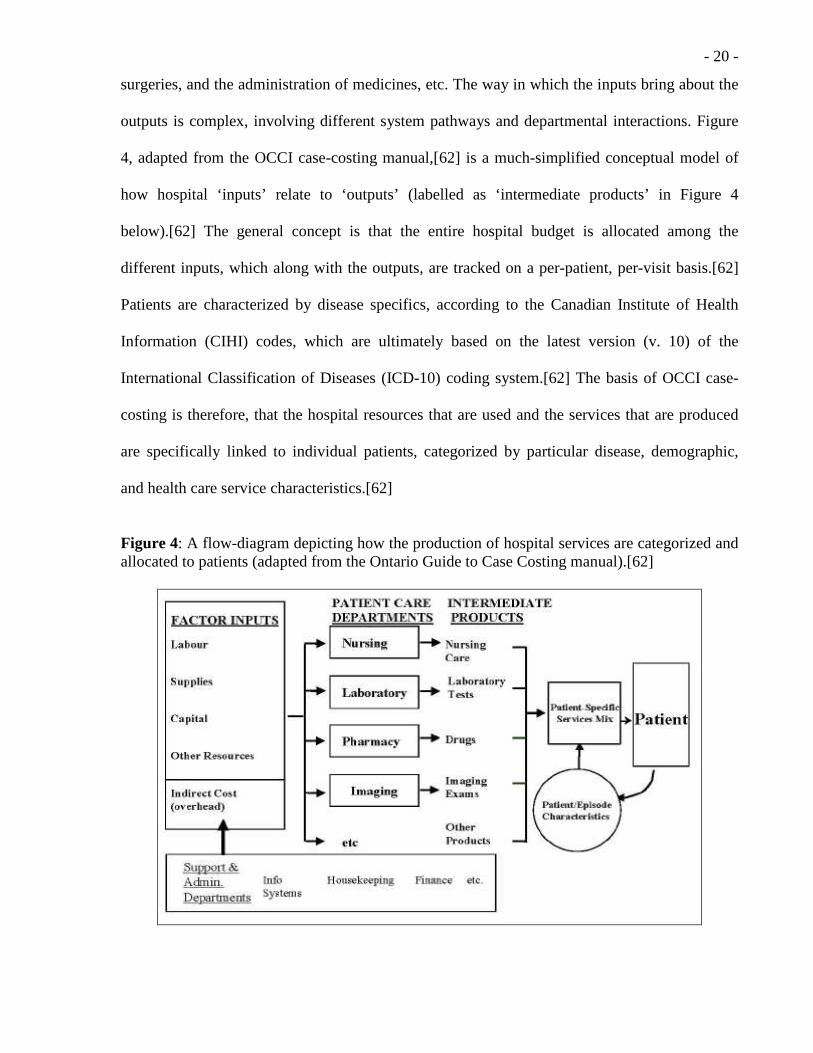
- 20 -
surgeries, and the administration of medicines, etc. The way in which the inputs bring about the
outputs is complex, involving different system pathways and departmental interactions. Figure
4, adapted from the OCCI case-costing manual,[62] is a much-simplified conceptual model of
how hospital ‘inputs’ relate to ‘outputs’ (labelled as ‘intermediate products’ in Figure 4
below).[62] The general concept is that the entire hospital budget is allocated among the
different inputs, which along with the outputs, are tracked on a per-patient, per-visit basis.[62]
Patients are characterized by disease specifics, according to the Canadian Institute of Health
Information (CIHI) codes, which are ultimately based on the latest version (v. 10) of the
International Classification of Diseases (ICD-10) coding system.[62] The basis of OCCI case-
costing is therefore, that the hospital resources that are used and the services that are produced
are specifically linked to individual patients, categorized by particular disease, demographic,
and health care service characteristics.[62]
Figure 4: A flow-diagram depicting how the production of hospital services are categorized and allocated to patients (adapted from the Ontario Guide to Case Costing manual).[62]
- 21 -
ii. Allocation of direct and indirect costs
The inputs and outputs in Figure 4 are categorized according to what are called
‘functional centres’, which generally reflect hospital departments (e.g. administration, operating
room, diagnostic imaging, intensive care unit, etc.).[62] The functional centres are further
categorized as being either transient cost centres (TCCs) or absorbing cost centres (ACCs).
TCCs tend to be support or administrative cost centres (i.e. ‘overhead’) whereas ACCs generally
represent the different patient care departments. The TCC expenses are considered ‘indirect’
costs whereas the initial ACC expenses, because they represent departments responsible for
direct patient care, are ‘direct’ costs. The OCCI methodology, which is a standardized process
by which costs are collected, processed, and ultimately reported, provide all OCCI-participating
hospitals with protocols by which TCC costs are then allocated to each ACC. The final
functional centre costs are therefore the total ACC costs, which consist of the direct and
allocated indirect costs.[62] This cost allocation from TCC to ACC is depicted in Figure 5
below; note that the shaded ‘pieces’ of the left-sided pie-diagram represent the TCCs, or indirect
costs, which are then re-allocated into each of the ACCs (i.e. represented by ‘Nursing’, ‘Lab’,
and ‘Diagnostic Imaging’) and added to the initially present ‘direct’ costs (i.e. the white ‘pieces’
of the pie) such that, in the end, the general ledger of each ACC includes direct and indirect
costs (see the right-sided pie-diagram in Figure 5 below).
Figure 5: A conceptual diagram of how indirect and direct costs are allocated to specific patient care hospital departments or ‘absorbing cost centres’ (ACCs) (adapted from the Ontario Guide to Case Costing manual).[62]
- 22 -
iii. Linking costs to patients
The final, and arguably the most important step in the case-costing process, is the linking
of these direct and indirect costs to particular patient groups. The basic premise of this complex
and involved process is that fractional or relative amounts of resource usage are measured and
allocated to individual patients within each functional centre. These proportions of resource-use
are named ‘relative value units’ (RVUs) and are the calculated within each ACC.[62] The
measurement tools used to allocate RVUs are dependent on the type of resource being divvied
and therefore differ between ACCs (see Figure 6 below). For example RVUs may be measured
based on hours spent on a particular specialty inpatient floor (e.g. patient-hours spent on the
general surgery ward) or by means of a pre-defined workload measurement system (WMS) that
might apply to the biochemistry lab or microbiology department.[62]

- 23 -
Figure 6: A conceptual diagram of how costs are assigned to patients, within each functional centre (i.e. ACC) and on a per-visit basis (adapted from the Ontario Guide to Case Costing manual).[62]
The data needed to measure RVUs are again collected and processed according to strict
protocols that have been standardized across all OCCI-participating hospitals.[62] The RVUs
for a given functional centre, are correlated, as per-patient and per-visit measures, to the budget
of that functional centre; thus allocating cost that is directly proportional to the amount of
resources consumed by each patient.[62] The end result is a rigorous, reproducible, and
standardized assignment of resource-utilization as defined by actual Ontario hospital costs (i.e.
not charges) across functional centres and linked to all patients that use hospital resources.[62]
iv. Costing-analysis tool (CAT)
As stated, hospital costs are ultimately linked to every patient, where each patient is
further characterized by disease-specific coding based on CIHI modifications to the ICD-10
coding system.[62] While many patients will have multiple diagnoses associated with a
particular hospital visit, there is always a primary diagnosis associated with each case file

- 24 -
(hereafter referred to as the ‘most responsible diagnosis’ or MRD). Furthermore, the disease-
specific coding is such that individual diagnoses are further organized into either one of the
following broader, more general classification systems; the Case-Mixed Group (CMG) Grouper
(for inpatients) or Comprehensive Ambulatory Classification System (CACS) (for day surgery
or an ambulatory care setting that includes clinic and emergency room visits).[62] Lastly, as part
of the cost-allocation process by means of the RVU measurements within each ACC; all
procedures that a patient undergoes are also linked to that particular hospital visit. The result is
that the costing information for each patient visit, while anonymous in terms of demographic
information, is identifiable in terms of the three above mentioned distinctive pieces of
information, namely; a) the MRD, b) the CACS or CMG grouper, and c) the principal procedure
linked to each patient visit. OCCI data can therefore be searched for in terms of these three data
points. The search engine used to facilitate this process is a simple web-interface, as depicted
below in Figures 7a and 7b, that is named the Costing-Analysis Tool (CAT).[62] The CAT
enables the user to search the OCCI database through a public website (www.occp.com)8, such
that an average of total per-patient costs, for a cohort of patients (i.e. cases) identified by a
particular diagnosis and subject to a certain surgery, can be readily determined.
8 The Ontario Case Costing Initiative was originally entitled the Ontario Case Costing Project (OCCP), hence the internet address of www.occp.com.

- 25 -
Figure 7a: The first of two ‘snapshots’ of the costing analysis tool (CAT) web-user interface at www.occp.com where the highlighted link in Figure 7a below leads to website depicted in Figure 7b.
Figure 7b: A depiction of the parameter setting options for the costing analysis tool (CAT) web-user interface at www.occp.com.

- 26 -
While the CAT uses only a handful of search fields to search for case costs (see Figure
7b), the results can be reported in a number of ways, including; by underlying ACC or
functional centre (see Figure E2 and E4 in Appendix F); useful tools when trying to gain further
insight into how costs are allocated and of the composition of the underlying group of patients
that make up the searched-for cohort of case-costs (hereafter referred to as the ‘cost-cohort’).
v. Physician and equipment costs
The conceptual framework for Ontario case-costing outlined above does not explicitly
address two cost considerations that are important to a discussion involving specific surgical
procedures such as SLNB and ALND, namely; how to account for physician and equipment
costs. Briefly, for only those physicians that normally have contracts with the hospital and
where the costs associated with their employment are wholly linked to a single functional centre
(e.g. pathologists and radiology groups), are their fees and salaries incorporated into the OCCI
database. For physicians who are compensated through the Ministry of Health and Long-Term
Care (MOHLTC) via Ontario Health Insurance Plan (OHIP) billings (e.g. surgeons) their
salaries are not included in the final case costs.[62; 65]
With regard to equipment, any non-labour (i.e. equipment) costs that exceed $250 are re-
allocated to a separate, functional centre devoted solely to high-cost equipment.[62] Within this
functional centre, RVUs and costs are determined separately, and requires the amortization of
equipment according to predetermined depreciation rates for fixed assets.[62] Therefore it can
be safely assumed that the annual costs for equipment such as a hand-held gamma-probe used
for SLNB, are incorporated into the case-cohorts. [62]
vi. Nature of the OCCI costing data
It is important to emphasize that the cost value returned by a CAT-enabled search of the
OCCI database are numerical averages of the total hospital costs incurred for each case that

- 27 -
satisfies the search parameters specified using the CAT.[62] Different searches will return
different costs, which can then be tallied and a cumulative per-patient cost estimate can be
determined; reflecting the total cost of taking care of a particular type of patient, subject to a
number of hospital visits or multiple procedures.
vii. Summary and significance of the OCCI
The Ontario Case Costing Initiative is a comprehensive project by which Ontario-
specific health care costs are carefully categorized and ultimately allocated according to
utilization. With costing data drawn from a breadth of hospitals across the province of Ontario,
the OCCI is a valuable resource whereby generalizable costing data can be accessed through a
publicly available, easy-to-use search engine. The availability of such a source of Ontario-
specific costing data provides the means to conduct an Ontario-specific cost-minimization
analysis of SLNB and ALND-related in-hospital treatment costs.
F. Research question
From the perspective of the administration of an Ontario hospital, is the implementation
of a surgical algorithm for treating women with ESBC that includes an initial sentinel lymph
node biopsy (SLNB) for axillary staging as compared to offering only axillary lymph node
dissection (ALND), less costly, in terms of average in-hospital costs, when the costs of treating
the associated short-term postoperative complications are considered?
G. Research hypothesis
The average cost of the Alternative treatment pathway (i.e. involves a SLNB as the
initial axillary staging procedure in the management of ESBC) is less than the average cost of
the Standard treatment pathway (i.e. the ALND-only treatment option) when the cost of treating
short-term procedure-related complications is considered; such that the total hospital costs

- 28 -
associated with the Alternative treatment pathway are less than those of the Standard pathway
after a reasonable number of patients have been treated.9
H. Research objective
To undertake a cost-minimization analysis (CMA), by means of a decision-analysis
model that utilizes Ontario-specific costing data and treatment algorithms that adhere to
Canadian-accepted clinical practice guidelines, such that the results of comparing the average
in-hospital costs of the two treatment pathways will be generalizable and potentially useful to
any Ontario hospital that may consider implementing SLNB for axillary staging in ESBC
patients.
4. Summary and significance
SLNB is a minimally-invasive alternative to ALND for axillary staging in the setting of
ESBC [15], and has emerged as the standard of care in this regard.[14; 26; 31; 48] Knowledge
of Canadian SLNB practice patterns has demonstrated that SLNB dissemination is not uniform
across Canada.[51] One barrier to SLNB implementation is the perceived costs associated with
the procedure. In an effort to inform decision-making, a formal comparison of SLNB and
ALND-associated average in-hospital costs is being proposed.
9 The reference to a ‘reasonable number of patients’ refers to Q* in Figures 3a and 3b, and is vague out of necessity as it can only be determined and then evaluated once estimates of the marginal cost values for each treatment pathway (i.e. MCS and MCA Figure 3a) and an approximation of the initial SLNB-associated capital investment (i.e. TCi in Figure 3a) are determined.
- 29 -
II. RESEARCH METHODS 1. Study design
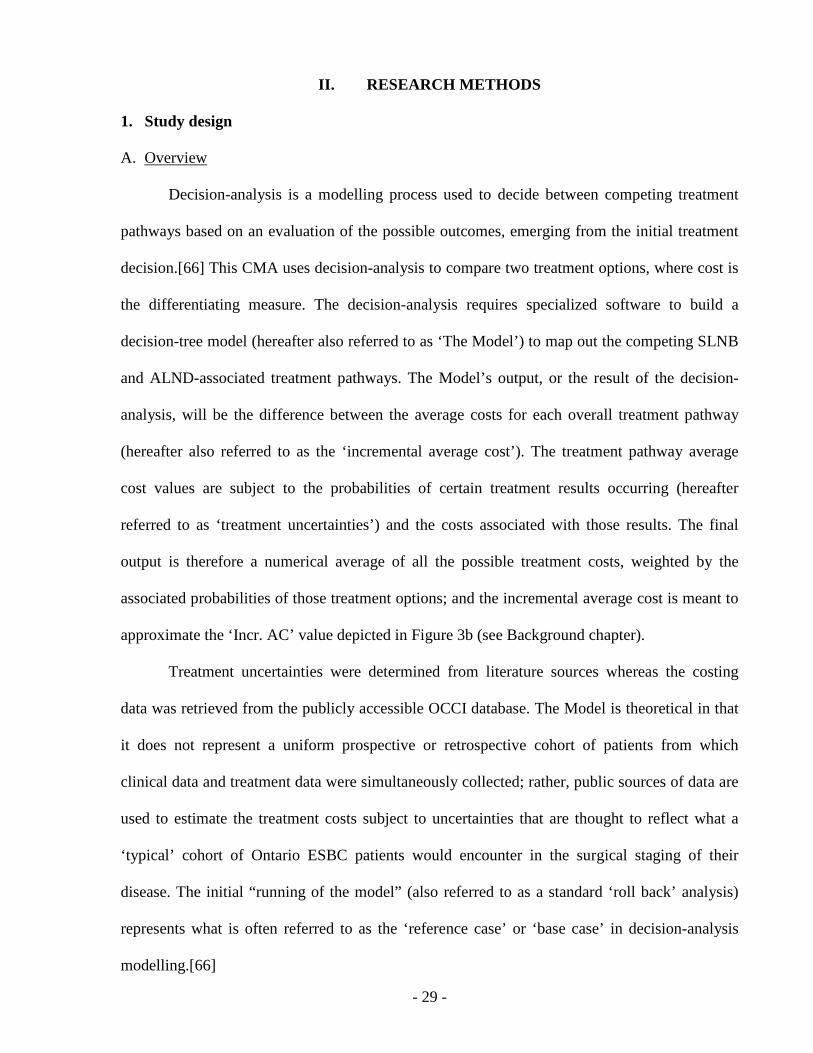
A. Overview
Decision-analysis is a modelling process used to decide between competing treatment
pathways based on an evaluation of the possible outcomes, emerging from the initial treatment
decision.[66] This CMA uses decision-analysis to compare two treatment options, where cost is
the differentiating measure. The decision-analysis requires specialized software to build a
decision-tree model (hereafter also referred to as ‘The Model’) to map out the competing SLNB
and ALND-associated treatment pathways. The Model’s output, or the result of the decision-
analysis, will be the difference between the average costs for each overall treatment pathway
(hereafter also referred to as the ‘incremental average cost’). The treatment pathway average
cost values are subject to the probabilities of certain treatment results occurring (hereafter
referred to as ‘treatment uncertainties’) and the costs associated with those results. The final
output is therefore a numerical average of all the possible treatment costs, weighted by the
associated probabilities of those treatment options; and the incremental average cost is meant to
approximate the ‘Incr. AC’ value depicted in Figure 3b (see Background chapter).
Treatment uncertainties were determined from literature sources whereas the costing
data was retrieved from the publicly accessible OCCI database. The Model is theoretical in that
it does not represent a uniform prospective or retrospective cohort of patients from which
clinical data and treatment data were simultaneously collected; rather, public sources of data are
used to estimate the treatment costs subject to uncertainties that are thought to reflect what a
‘typical’ cohort of Ontario ESBC patients would encounter in the surgical staging of their
disease. The initial “running of the model” (also referred to as a standard ‘roll back’ analysis)
represents what is often referred to as the ‘reference case’ or ‘base case’ in decision-analysis
modelling.[66]

- 30 -
B. Target population
Despite not studying an actual cohort of patients, the results of this study are meant to
contribute to a body of literature that may potentially affect an actual group of breast cancer
patients. As previously implied, the intended target population are patients with a diagnosis of
early-stage breast cancer (stage I or II disease)10 in whom SLNB is indicated for axillary staging
and not subject to any of the common exclusion criteria, in agreement with the most recent
North American SLNB clinical practice guidelines, and reproduced below: [14; 18; 48]
1. A patient with a diagnosis of ESBC, stage I or II by TMN staging criteria (i.e. the primary tumour is < 5 cm and the patient has clinically node-negative disease).
2. A patient with a diagnosis of ductal carcinoma in-situ (DCIS) with microinvasion or DCIS in the setting of a planned mastectomy.
3. A patient with no evidence of inflammatory or locally advanced breast cancer (i.e. T3 and T4 disease where primary tumours are > 5cm).
4. A patient with no evidence of previous significant ipsilateral axillary surgery. 5. A patient with no previous ipsilateral breast reconstructive surgery or previous breast
irradiation. 6. A patient that is not pregnant. C. Study comparators
The costs being compared are the average in-hospital costs incurred in the surgical
management of ESBC by way of two alternative treatment pathways; with and without a SLNB
as the initial procedure for axillary staging. To reiterate, in the absence of an initial SLNB,
patients follow the Standard treatment option and undergo an ALND. By comparison, the
Alternative pathway begins with a SLNB, with subsequent treatment events developing based
on the results of the initial SLNB. The probabilities of each step in each treatment pathway (for
example, the probability of intraoperative SLNB failure necessitating an immediate
intraoperative completion ALND) are probabilities that were gathered by means of a
comprehensive literature review (discussed in the sections that follow).
10 As per the AJCC; the American Joint Committee on Cancer.[13]

- 31 -
The comparison of a SLNB pathway to the Standard pathway, despite the broad
acceptance of SLNB in many Ontario hospitals, is justified since in the absence of SLNB
capabilities, the default procedure must be an ALND. The reverse cannot be said, as evidenced
by the results of Quan et al.’s survey where ALND remains the only option in many of Ontario’s
community hospitals.[51]
D. Study perspective
The perspective being adopted for this economic evaluation is that of the administration
of an Ontario hospital; and specifically a hospital that is looking to add SLNB to its list of
offered surgical services. While this might suggest the hospital is considering a major
reorganization of services involving significant capital acquisitions, a number of simplifying
assumptions accompany the adoption of this perspective. First, it is assumed that the hospital
has access to nuclear medicine facilities, a breast pathologist and a surgeon trained to perform
SLNB. As discussed in the background section of this report, the issue of access to professional
resources was raised in the commentary of the Quan et al. study, however it is not the focus of
this analysis and is therefore being considered a non-issue. A somewhat realistic manifestation
of these assumptions might be a community hospital that is already providing ‘standard’
surgical breast cancer care (i.e. there is a breast pathologist already staffed), has hired a recent
surgical graduate (i.e. a surgeon who has therefore been exposed extensively to SLNB as part of
his/her training11), and is located relatively close to a larger surgical centre where the necessary
nuclear medicine facilities can be made available to patients.12 The consequence of these
assumptions is that the costing within the model is simplified, minimizing the number of
11 This is a realistic assumptions since all large teaching hospitals in Ontario perform SLNB as part of routine breast cancer surgical care and thus recent surgical residency graduates are thought to have had sufficient exposure to SLNB as part of their training.[15; 54] 12 Indeed this could potentially be a model of how resources might be organized in the future.
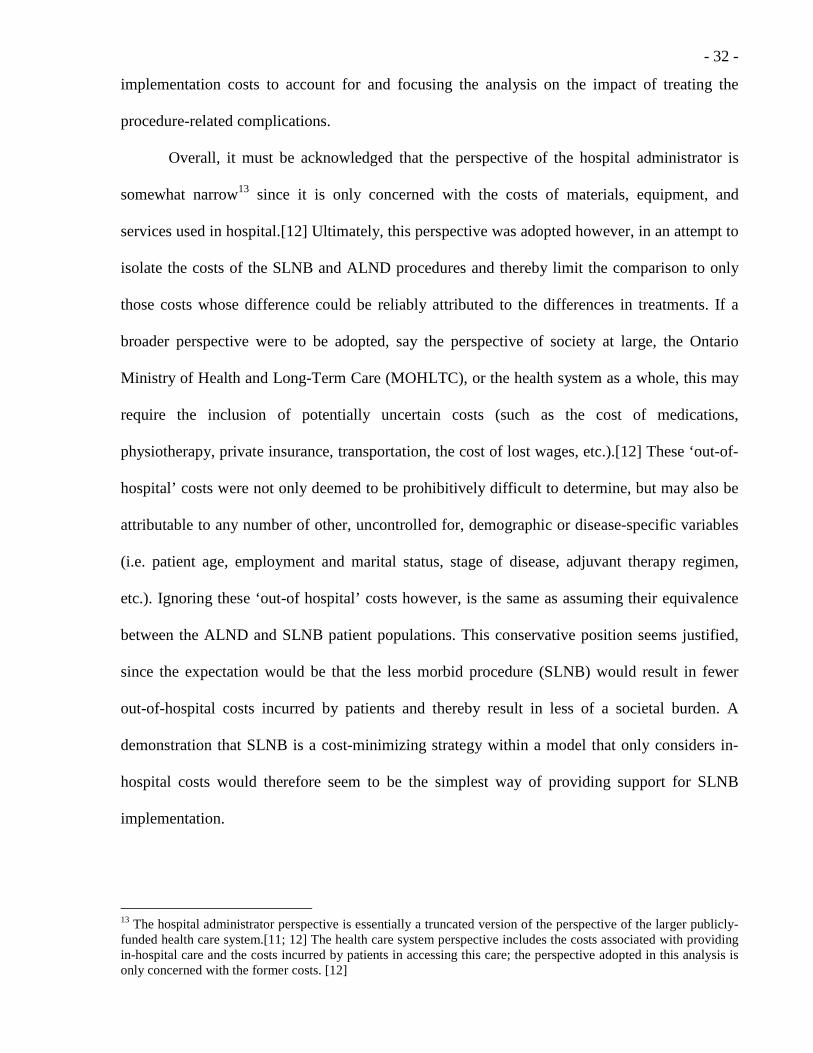
- 32 -
implementation costs to account for and focusing the analysis on the impact of treating the
procedure-related complications.
Overall, it must be acknowledged that the perspective of the hospital administrator is
somewhat narrow13 since it is only concerned with the costs of materials, equipment, and
services used in hospital.[12] Ultimately, this perspective was adopted however, in an attempt to
isolate the costs of the SLNB and ALND procedures and thereby limit the comparison to only
those costs whose difference could be reliably attributed to the differences in treatments. If a
broader perspective were to be adopted, say the perspective of society at large, the Ontario
Ministry of Health and Long-Term Care (MOHLTC), or the health system as a whole, this may
require the inclusion of potentially uncertain costs (such as the cost of medications,
physiotherapy, private insurance, transportation, the cost of lost wages, etc.).[12] These ‘out-of-
hospital’ costs were not only deemed to be prohibitively difficult to determine, but may also be
attributable to any number of other, uncontrolled for, demographic or disease-specific variables
(i.e. patient age, employment and marital status, stage of disease, adjuvant therapy regimen,
etc.). Ignoring these ‘out-of hospital’ costs however, is the same as assuming their equivalence
between the ALND and SLNB patient populations. This conservative position seems justified,
since the expectation would be that the less morbid procedure (SLNB) would result in fewer
out-of-hospital costs incurred by patients and thereby result in less of a societal burden. A
demonstration that SLNB is a cost-minimizing strategy within a model that only considers in-
hospital costs would therefore seem to be the simplest way of providing support for SLNB
implementation.
13 The hospital administrator perspective is essentially a truncated version of the perspective of the larger publicly-funded health care system.[11; 12] The health care system perspective includes the costs associated with providing in-hospital care and the costs incurred by patients in accessing this care; the perspective adopted in this analysis is only concerned with the former costs. [12]

- 33 -
E. Analytic horizon
The analytic horizon for this study is two years. This arbitrarily chosen threshold reflects
the expectation that differences in complication rates that are directly attributable to the axillary
procedures occur relatively soon after surgery and could not be reliably linked to either the
SLNB or ALND procedure beyond the 24-month period;[14; 24; 41; 63] since with longer
follow-up it becomes increasingly difficult to identify outcomes as being directly attributable to
either SLNB or ALND due to the multidisciplinary and overlapping nature of ongoing breast
cancer treatment and follow-up.[17; 21] To a degree the focus on shorter-term morbidity is also
reflected in the literature since some of the largest and most comprehensive studies comparing
SLNB and ALND available to date, have followed patients anywhere from 1 to 24 months.[24;
39-41; 46] Consequently, only the perioperative and short-term postoperative complications,
defined as those complications occurring immediately following, and within 24 months of
surgery, were incorporated into the CMA.
F. Discounting and inflation
The practice of discounting in economic evaluations is meant to quantify the future costs
within a model in terms of today’s monetary value; this calculation is also termed present-
valuing (PV).[11; 66] The rationale for PV is that in order to accurately represent time-
dependent costs, the time-value of money must be acknowledged. This can be further explained
using a layman’s example; assuming a 3% interest rate in a standard savings account, only 97.1
cents need be invested today in order to pay for a $1 expense a year from now. As in many
economic evaluations the discount rate (r) used in this CMA was set at 3% per year then varied
between 0 and 5% as part of the sensitivity analyses.[11; 12]
Inflation is a measure of the lost purchasing power of money. According to the Bank of
Canada, $114.20 is needed to buy today what could have been bought for $100 in 2002, due to

- 34 -
an annualized rate of inflation 2.13%.[67] In many economic evaluations, adjustments for
inflation are not incorporated into a model because only present-day or discounted future costs
are considered. In the case of this CMA however, historical data14 is being relied upon and
therefore an inflationary adjustment to convert the historical cost values into today’s terms was
added to The Model. The inflationary adjustment was applied equally to the cost values for both
treatment pathways under comparison; and so did not contribute to identifying one treatment as
being less-costly, but did ensure that The Model’s results accurately reflected today’s prices.
2. Framework for the decision-analysis
A. Overview of The Model
The basic structures of the treatment algorithms for axillary staging by either an initial
SLNB or ALND in the setting of ESBC are depicted below in Figure 8 (the Alternative
pathway) and Figure 9 (the Standard pathway), respectively. These algorithms are meant to
reflect the clinical reality of treating ESBC in Ontario and are in agreement with the most recent
North American clinical guidelines.[14; 18; 31; 48] The percent signs (V%, W%, X%, Y%, and
Z%) posted at pathway intersections in Figure 8 correspond to treatment uncertainties in the
algorithm (also termed ‘branch probability’ when referring to the actual structure of the
decision-tree model); where progression along the next step in the pathway is defined by the
relative frequencies of two complementary events. These branch probabilities have the
following specific labels and descriptions:
a. V% = Blue dye anaphylaxis rate; the proportion of patients who have a severe non-fatal drug reaction (i.e. systemic hypotension) following blue dye injection during the initial part of the SLNB procedure.15
14 Note that fiscal year 2007/2008 is the most recent full fiscal year for which the OCCI has complete costing data.[62] 15 Note that because blue dye anaphylaxis is both a complication of SLNB surgery and is assumed to have the immediate impact of removing patients from the treatment pathway, it is referred to here as both a ‘treatment uncertainty’ and also (in later discussions) a ‘one-time’ perioperative complication.

- 35 -
b. W% = SLNB failure rate; the percentage of patients in whom a sentinel lymph node(s) or SLN(s) is not identified intraoperatively, necessitating an immediate intraoperative conversion to a completion ALND.
c. X% = Intraoperative SLN positivity; is the percentage of patients in whom the SLN(s) is
found to be positive on intraoperative evaluation, necessitating an immediate intraoperative conversion to a completion ALND.
d. Y% = Intraoperative false-negative rate (iFNR); is the percentage of SLNB cases that were
initially believed to be negative based on an intraoperative pathological assessment, but are then found to be positive on final pathological analysis, necessitating a completion ALND at a second surgical date (i.e. a ‘delayed’ completion ALND).
e. Z% = Completion ALND refusal rate; is the proportion of patients subject to intraoperative
false negative SLNBs who refuse to have a delayed completion ALND.
The ‘++’ mark at the end of the algorithms in Figures 8 and 9 refers to the treatment
uncertainties that define the probability of a patient suffering from a given postoperative
complication (hereafter referred to as ‘morbidity rates’). A comprehensive literature review was
undertaken to first and foremost define the types of postoperative complications and to quantify
their associated probabilities of occurring (i.e. morbidity rates), and second to determine the V-
Z% branch probabilities defined above. The treatment pathways of Figures 8 and 9 were then
“operationalized”; meaning The Model was created by incorporating the results from the
literature review into a functional decision-tree structure that mimicked the pathways of Figures
8 and 9. All of this modelling was done using TreeAge Pro® decision-analysis software
(TreeAge Software, Inc. Williamstown, MA, USA. v2008).

- 36 -
Figure 8: The Alternative treatment pathway; the basic treatment algorithm for surgical management of ESBC using SLNB to initially stage the axilla.
Patients with known early-stage breast cancer
SLN(s) POSITIVE for metastatic disease on
intraoperative pathology
Preoperative procedure:
radioisotope injection +/- lymphoscintigraphy
FAILED SLN identification
Patient undergoes an immediate completion
ALND
Enter Standard pathway; see Figure 9
SLN(s) NEGATIVE for metastatic disease on
intraoperative pathology
SLNB procedure:
Begins with periareolar or subdermal blue dye injection, and is usually
done alongside resection of primary breast tumour
Successful SLN(s) identification
SLN(s) undergo final pathological examination
SLN(s) POSITIVE for metastatic disease
Patient refuses further surgical therapy,
forgoing a delayed completion ALND
SLN(s) NEGATIVE for metastatic disease
SLNB post-operative recovery
Postoperative Complications
No complications
++
Z%
X%
W%
Anaphylactic shock: Patient has an extreme reaction to
the blue dye; the operation is cancelled and supportive therapy
is commenced
Patient undergoes a completion ALND
(delayed) at a later date
Enter Standard pathway; see Figure 9
V%
Y%
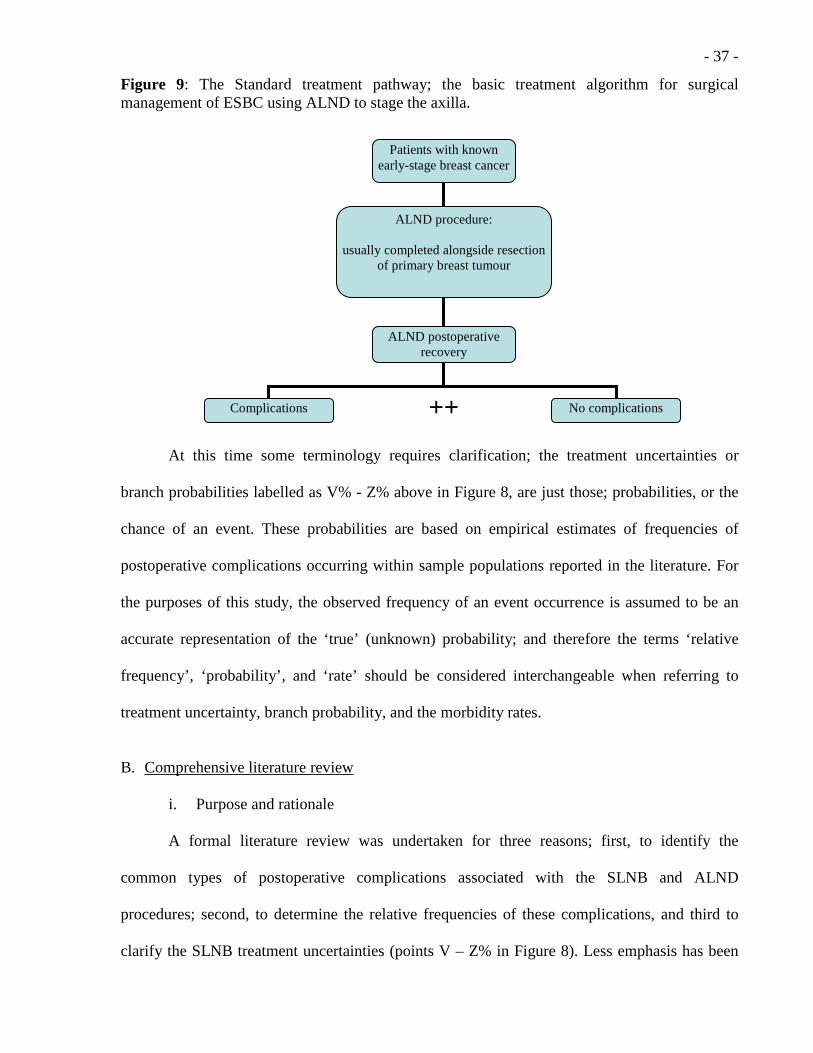
- 37 -
Figure 9: The Standard treatment pathway; the basic treatment algorithm for surgical management of ESBC using ALND to stage the axilla.
At this time some terminology requires clarification; the treatment uncertainties or
branch probabilities labelled as V% - Z% above in Figure 8, are just those; probabilities, or the
chance of an event. These probabilities are based on empirical estimates of frequencies of
postoperative complications occurring within sample populations reported in the literature. For
the purposes of this study, the observed frequency of an event occurrence is assumed to be an
accurate representation of the ‘true’ (unknown) probability; and therefore the terms ‘relative
frequency’, ‘probability’, and ‘rate’ should be considered interchangeable when referring to
treatment uncertainty, branch probability, and the morbidity rates.
B. Comprehensive literature review
i. Purpose and rationale
A formal literature review was undertaken for three reasons; first, to identify the
common types of postoperative complications associated with the SLNB and ALND
procedures; second, to determine the relative frequencies of these complications, and third to
clarify the SLNB treatment uncertainties (points V – Z% in Figure 8). Less emphasis has been
Patients with known early-stage breast cancer
ALND procedure:
usually completed alongside resection of primary breast tumour
Complications No complications ++
ALND postoperative recovery

- 38 -
placed on the third objective of the comprehensive literature review because generally accepted
values for treatment uncertainty (e.g. a 0 – 15% SLNB failure rate) have already been generated
by numerous studies concerned with reporting the technical results of SLNB
implementation.[34; 37; 40; 63; 68-71] The literature review is therefore only meant to provide
more precise estimates of generally known parameters.
On the other hand, the morbidity rates for a potentially broad range of ALND and
SLNB-associated postoperative complications are more vaguely described and generally less
well known then the treatment uncertainties.[17] There are already a number of published
systematic and narrative reviews concerning SLNB and ALND, [14-18; 63] however the
objectives of these reviews, was either to summarize the clinical efficacy and effectiveness of
SLNB versus ALND (i.e. the primary and secondary endpoints were survival and axillary
recurrence),[15-18] or to report on the technical aspects of the SLNB procedure (i.e. the
endpoints were SLNB identification rates, SLNB false-negative rates, etc.),[14; 15; 63] and/or to
establish clinical practice guidelines.[14; 18] While some of these reviews do mention that
SLNB is less morbid than ALND, it has not been the focus of such reviews to provide an
explicit summary of SLNB and ALND complication rates.[14; 15; 17; 21] Therefore, in order to
meet the research objective and determine if differences in postoperative morbidity have any
significant impact the total cost functions of SLNB and ALND; a comprehensive literature
review was completed in order to provide the best possible estimates of postoperative morbidity
and to be incorporated into The Model.
ii. Framework for the literature review
The oft-cited ‘Populations, Interventions, Comparisons, Outcomes, and Study types’
(PICOS) is a conceptual structure used in systematic reviews to formulate and articulate a
comprehensive search strategy, and was employed for this literature review.[72-75]

- 39 -
The search targeted studies that involved patients that most closely matched the
previously described target population (see page 28). The interventions were of course a SLNB
and an ALND used for axillary staging in the setting of ESBC. It was critical that studies
involved a comparison of postoperative complications between the two intervention groups; and
that the specific outcomes of interest were complications attributable to the axillary surgery
having occurred within two years of the operative date (consistent with the proposed analytical
horizon of the CMA). Not all complications for consideration were defined a priori, since part
of the purpose of the review was to identify all clinically relevant postoperative SLNB and
ALND morbidity. In this case ‘clinical relevant’ referred to complications commonly associated
with each procedure where patients would potentially seek out further medical care in order to
have the complication assessed and treated (e.g. a wound infection that prompts the patient to
visit the emergency department for treatment). A listing of those complications that were
identified a priori follows immediately below; it must be stated however that this list was
modified following completion of the literature review.
a. Axillary seroma formation b. Axillary wound infection c. Neurological complications; axillary paraesthesia, dysaethesia, or hyperaesthesia d. Axillary pain e. Lymphedema f. Blue-dye anaphylaxis16 g. Shoulder dysmobility or decreased shoulder range of motion (sROM)
It was important to identify articles where the ALND and SLNB patient groups being
studied were not significantly different in terms of disease characteristics and demographics,
since imbalances between the groups, in terms of the mean age or stage of disease for example,
could conceivably confound the observed incidence of a given postoperative complication (i.e. a 16 Note that this is an extremely rare perioperative complication encountered during SLNB due to unidentified allergy to the blue dye used in SLN localization. Despite this being a strictly perioperative (as opposed to postoperative) occurrence, this complication was included because of its potentially large impact on total cost and direct association with the Alternative intervention in question. Furthermore, because this complication is assumed to cause patients to be removed from the SLNB treatment pathway, it is also being interchangeably referred to as a ‘treatment uncertainty’ (labelled V% in Figure 8).

- 40 -
reduction in study validity due to selection bias).[74; 76] As a result, studies that used a
methodology that minimized selection bias (such as randomized clinical trials, RCTs) were
preferentially selected, though in the interest of ensuring that enough morbidity data was
captured, large prospective cohort studies were also considered.
iii. Inclusion and exclusion criteria
Articles selected for critical appraisal had to meet all of the inclusion criteria and none of
the exclusion criteria (following from the ‘PICOS’ framework) as outlined in Table 1 below.
Table 1: The inclusion and exclusion criteria for critical appraisal of articles identified as part of the comprehensive literature review (organized according to the ‘PICOS’ framework).
Inclusion criteria Exclusion criteria
Population
Adult patients with a pre-operative diagnosis of ESBC
Diagnosis of LABC or inflammatory breast cancer; previous ipsilateral breast/axillary surgery; pregnancy
Interventions
Two intervention groups: one undergoing an initial SLNB (+/- completion ALND); the other is subject to only an ALND
The absence of either a SLNB or ALND intervention group
Comparisons
An examination of the differences in postoperative complications between the intervention groups
The absence of any kind of comparison or reporting on postoperative morbidity among the intervention groups
Outcomes
Quantitative reporting of incidence of post-operative complications
Narrative or qualitative reporting of morbidity
Study design
Systematic reviews or meta-analyses of RCTs; primary RCTs; prospective cohort trials
Case series; retrospective studies; single-arm observational studies; case-control trials

- 41 -
iv. Search strategy
The MEDLINE and EMBASE health-related electronic databases were searched from
the beginning of 1993 to the final week of January 2009. As was the case with the review of the
economic evaluation literature (see Appendix B) the search was limited by the year 1993 as this
corresponds to the initial publication of the SLNB technique used in treating breast cancer by
Krag et al.[77] Only the two mentioned databases were searched as they constituted the
minimum requirement for an adequate review according to the Cochrane Collaboration
guidelines for conducting systematic reviews;[74] and the search was not expanded to include
other electronic databases due to the high volume of high quality articles identified in the
MEDLINE and EMBASE search. The search was also limited to the English language; a
practical limitation and one that follows directly from the search strategy used by the American
Society of Clinical Oncology (ASCO) Expert Panel in completing a systematic review and
developing practice guidelines for the use of SLNB in clinical practice.[14] The search strategy
used to identify articles was based on the PICOS framework and is reproduced below (note that
since the MEDLINE and EMBASE syntax is nearly identical, a single list of search terms is
listed here).
MEDLINE and EMBASE (1993 – January 2009) search terms
1. exp breast neoplasm/ OR (breast neoplasm$).tw. OR (breast cancer$).tw. 2. exp sentinel lymph node biopsy/ OR (sentinel lymph node biopsy).tw. OR (sentinel
node biopsy).tw. OR (lymphatic mapping).tw. 3. (axillary lymph node dissection).tw. OR (axillary node dissection).tw. OR (axillary
dissection).tw. 4. 3 AND 2 5. exp postoperative complications/ OR (postoperative complications.tw.) OR exp
morbidity/ OR morbidity.tw. OR exp treatment outcome/ OR (treatment outcome$).tw.
6. 5 AND 1 AND 4 7. exp clinical trial/ OR exp controlled clinical trial/ OR exp randomized controlled
trial/ OR exp meta-analysis/ OR systematic review.tw. OR (prospective study).tw. OR (prospective trial).tw.
8. 6 AND 7 9. Limit 8 to (English language and humans and yr=”1993-2009”)
- 42 -
As an adjunct to the searching of the electronic databases, the bibliographies of those articles
identified from the database search as meeting inclusion criteria were hand-searched in an effort
to identify an exhaustive list of relevant publications for review.
v. Literature review methodology
A single reviewer completed the electronic search and hand-searching of identified
articles for review. An iterative process of review was employed whereby the titles, abstracts,
and then manuscripts of studies were repeatedly reviewed before a decision to include or
exclude was definitively made. Manuscripts were assessed for meeting all inclusion criteria and
no exclusion criteria, and were only discarded if this was clearly the case. Any remaining
manuscripts were critically appraised. The bibliographies of all reviewed manuscripts were
hand-searched. Titles identified by handsearching went through the same iterative process as
had the titles initially identified from the database searches. The pertinent details of all
manuscripts that met criteria for critical appraisal were recorded in a large spreadsheet using
Microsoft Excel® (Microsoft Corporation, Redmond, WA. v2003).
vi. Critical appraisal
Study quality was determined by assessing the degree to which the published
methodology and results were thought to be valid (i.e. reflect clinical reality), as measured by
the perceived amount of bias inherent in the undertaking of the underlying study.[76] A
reminder that SLNB and ALND are invasive, potentially harmful, procedures where axillary
tissue is sampled for the purpose of identifying metastatic breast cancer. The presence and
characteristics of metastatic disease alters a patient’s prognosis and directs further adjuvant
therapy (i.e. chemotherapy, radiation, and hormone therapy).[14; 17; 21] Furthermore, there is
the (somewhat controversial) view that clearance of axillary disease may confer a survival
benefit.[15; 17; 42] From an appraisal point of view, SLNB and ALND may therefore be

- 43 -
evaluated either as screening tests, therapeutic interventions, or in terms of the degree of patient
harm conferred.[76] Given that the purpose of this review is to describe postoperative morbidity
and to accurately determine the incidence of SLNB and ALND complications, the latter view
was adopted in conducting the appraisal. As such, articles were evaluated in terms of whether;
a) the patient populations allocated to the different intervention groups were equivalent in all
other aspects (i.e. a measure of selection bias), b) there was uniformity in the treatments
received within each intervention group (i.e. a measure of performance bias), c) there was
adequate patient follow-up or any loss of follow-up was satisfactorily explained (i.e. a measure
of attrition bias), and d) the methods for detecting, assessing and measuring patient morbidity
were reasonable and transparent (i.e. a measure of detection bias). The results of each study
were scored, within each bias category, as having either, ‘minimal’, ‘moderate’, or a
‘significant’ risk of bias (hereafter referred to as a ‘bias score’). A bias score of ‘unclear’ was
assigned when the trial in question failed to provide enough information for a satisfactory
assessment to be made with respect to that bias category. A summary grade of overall bias risk
was then assigned to each study as; low, medium, or high depending on the scores within each
bias category (hereafter referred to as the ‘bias grade’)17. Four bias scores of ‘minimal’ or at
most one bias score of ‘moderate’ yielded a bias grade of ‘low’; a score of ‘unclear’ or two
‘moderate’ scores (with the other bias categories scored as ‘minimal’) resulted in a bias grade of
‘medium’. Finally, three or more ‘moderate’ bias scores or a bias score of ‘significant’ in any
category was given a bias grade of ‘high’. The results from articles critically appraised by this
method as having an overall bias grade of either ‘medium’ or ‘high’ were not included in The
Model. This approach to critical appraisal was adapted from the recommendations made by the
Cochrane Collaboration in assessing the bias in both experimental (i.e. randomized controlled
trials) and non-experimental studies (i.e. observational studies), when conducting a systematic
17 Note that a bias score of ‘unclear’ was considered equivalent to ‘moderate’ in determining a final bias grade.

- 44 -
review.[73; 74; 76] An overview of the details regarding this critical appraisal methodology is
presented in Table 2 below.
Table 2: An overview of the critical appraisal methodology used in the comprehensive literature review; where articles were assigned bias scores across four different bias categories.
Bias Score
Selection Bias Performance Bias Attrition Bias Detection Bias
High
The demographics or disease-specific characteristics of the patients in the control group (ALND) are significantly different from patients in the experimental group (SLNB).
Clear evidence of great variation in surgical technique; or deviations from protocol by the multidisciplinary team within either or both of the intervention groups.
Greater than 30% of patients lost to follow-up at 12 months without any explanation given; or a significant difference in loss of patients between intervention groups.
No clear morbidity assessment protocols in place; follow-up time is highly variable between patients; use of non-validated subjective tools and no objective measurements were performed.
Moderate
A non-RCT but prospective trial where the control group is adequately similar to the experimental group as clearly depicted in the article’s Table 1 and subject to a statistical test of significance.
A small number of surgeons performing SLNB and ALND that were not required to follow a protocol; a large number of performing surgeons despite the implementation of surgical protocol.
15 to 30% of patients lost to follow-up at 12 months; greater or somewhat imbalanced loss of follow up between groups may be acceptable if satisfactory explanations are provided.
No evidence of a pre-operative assessment; reliance on either validated subjective assessment tools or an objective measurement method, but not both.
Minimal
A RCT with a centralized allocation process and the resulting patient groups are equivalent in terms of all demographic and cancer-specific categories.
The experience of surgeons performing SLNB and ALND is described and deemed adequate; evidence is given that surgical protocols have been followed and implemented.
Less than 10% of patients lost to follow-up at 12 months; greater loss may be acceptable if adequate explanation is provided.
Assessment protocols are clearly stated; pre-operative assessment completed; use of validated subjective tools; use of an accepted technique for objective measurement.
Unclear A RCT that does not specify the allocation process.
Number and experience of performing surgeons is not provided; no evidence of surgical protocols being followed.
15 to 30% of patients lost to follow-up with no explanation provided.
No mention of assessment protocols or methods of objective measurement (but not both, which would be graded as ‘high’ risk).
vii. Data synthesis
A descriptive summary of all the critically appraised articles was incorporated into a
spreadsheet table using Microsoft Excel®. The tabulated data consisted of a synopsis of the

- 45 -
underlying characteristics of each study, including; a description of the patient groups and
intervention techniques, cohort sizes, the study’s primary and secondary outcomes, the
complications that were assessed and measured, the length of follow-up, and a summary of the
significant results. Finally, the critical assessment, with the individual bias scores and grades,
complete with comments, was reported in a separate table. The data summary tables helped to
describe the extent of evidence gathered, while providing the framework necessary to analyze
the degree of data heterogeneity.[73; 74; 76]
Morbidity rates were taken from trials of suitable quality as identified by the
comprehensive literature review, and were reported in tabular form with 95% confidence
intervals (95% CIs) as provided in the results sections of the published trials. The 95% CIs
serves as a range within which those values that were eventually used in The Model were varied
as part of the sensitivity analyses and a formal assessment of model variability and parameter
uncertainty.[66]
viii. Summary of the comprehensive literature review
The purpose of this comprehensive literature review was to define as accurately as
possible, using rigorous methodology, the probability of a typical ESBC patient, encountering
certain postoperative complications following axillary surgery. The organized and deliberate
manner in which this review was conducted, was meant to ensure that the most precise
estimations of morbidity available in the literature were used in The Model; thereby maximizing
the quality and validity of the results of the CMA.
C. Determination of costs
Since the perspective being adopted by this CMA is that of the hospital administrator,
only those costs that would have impact on the hospital budget were included in The Model.
The background description of the OCCI methodology was meant to demonstrate that all of the

- 46 -
costing data required for the purpose of building The Model, is accounted for in the OCCI
database and can be identified using the previously described costing-analysis tool (CAT).[62] It
is important to emphasize that these OCCI case costs include the SLNB and ALND-relevant
physician expenses that would appear in a hospital’s budget (e.g. physicians that routinely have
salaried components to their compensation), and fortunately these costs are allocated to the
Nuclear Medicine, Pathology, and Radiology functional centres as part of the OCCI costing
process (see Figures F2 and F4 in Appendix F), which is entirely appropriate given the type of
treatments being considered in this CMA. Surgeon fees and other physician fees do not come
out of a hospital’s budget and these expenses are not considered by the OCCI. Furthermore,
because the stated perspective of this analysis is narrow, out-of-pocket and broader societal
costs are not being considered. In other words, since the content of the OCCI database
complements the intended perspective adopted for this CMA, it was the only source of costing
data used in The Model.
A subtle yet crucial attribute of the OCCI’s costing-analysis tool (CAT) is that case costs
can be identified by a principal (but not secondary) procedure performed during a hospital
visit18. In the case of both ALND and SLNB procedures this has significant implications
because these are inherently secondary procedures; as previously stated, the vast majority of
axillary surgery is performed alongside the resection of the primary breast cancer.[14; 51; 78]
Consequently, searching by a primary breast procedure has the potential to ‘blend’ ALND and
SLNB costs together, rather than identifying a difference. The specifics of how SLNB and
ALND procedural costs were determined are outlined below.
18 In this case ‘primary’ refers to that procedure that is directly linked to the primary reason for the patient’s visit to hospital, whereas a ‘secondary’ procedure is one that is an adjunct to the primary procedure.
- 47 -
i. SLNB and ALND procedure-related costs
An iterative and thorough search strategy was used to identify the SLNB and ALND
OCCI cost-cohorts; or groups of ALND and SLNB-associated cases for which averaged total
costs per case were identified from the OCCI database. Since the decision-analysis is meant to
determine if a cost-advantage exists between two competing treatment options, the underlying
assumption is that these two procedures are interchangeable within an ESBC patient population.
The general premise of the OCCI search strategy was therefore that the ALND and SLNB cost-
cohorts would be identical across as many search parameters as possible, save one, single,
differentiating item (i.e. the type of axillary surgery undertaken). Ideally, this would have been a
search field within the costing-analysis tool (CAT) that allowed for stratification of a cost-
cohort by the type of secondary procedure, but as explained above this capability does not
exist.[62] A surrogate search parameter was therefore employed to differentiate between the two
intervention groups and the cost-cohorts were stratified by hospital length of stay (see point ‘A’
below); where cases of patients undergoing resection of their primary breast tumour were
categorized as either inpatients or day surgical patients, and assumed to have had in
concordance with their primary surgery, either an ALND or SLNB, respectively. A further
simplification of the search strategy required limiting the primary surgery to breast conserving
surgery (BCS) only (see point ‘C’ below). The specifics of the five steps taken to identify these
cost-cohorts are outlined below (note that the search strategies designated by the OCCI search
parameters, are also summarized in Table 3).
A. Two sets of search parameters were created, differing only in that the costing-analysis tool (CAT) ‘Patient Type’ search criterion was set to ‘Acute Inpatient’ to distinguish the ALND from the SLNB cost-cohort, for which the parameter was set to ‘Day Surgery’ (see Figure 7b). Hereafter the remaining search criteria were set to nearly identical values for both cost-cohorts.
B. All invasive breast cancer diagnostic codes were selected for within the ‘most responsible diagnosis (MRD) search field in the CAT (see Figure 7b). Note that these codes specify breast cancer by location in the breast as opposed to histological type of invasive cancer. Only diagnostic codes that specified invasive cancer were included although this was

- 48 -
contrary to the initial description of the target population (see page 30). Ductal carcinoma-in-situ (DCIS) codes were excluded since patients with DCIS undergo SLNB if the DCIS is extensive enough to warrant a concurrent mastectomy;[21; 79] and since having a mastectomy would necessitate a hospital admission, the mastectomy and SLNB cases would not be differentiable from the ALND-associated cases, since hospital length of stay is being used as a proxy search parameter to distinguish the ALND and SLNB-associated patient groups.
C. The Principal Procedure was set to ‘Partial excision of the breast using open approach’
(code: 1YM87LA) and ‘Partial excision of the breast using open approach and guide wire for tumour localization’ (code: 1YM87UT). These two procedures were chosen because they constitute the vast majority of partial mastectomies being done in the setting of ESBC [54]; to remove small palpable tumours (hence the 1YM87LA code) or non-palpable tumours (hence the 1YM87UT code), and given that all the cases were tagged with an invasive breast cancer diagnosis (point ‘B’ immediately above) and that total or modified radical mastectomies were not selected.
D. The CMG grouper code was set to ‘Subtotal mastectomy and other breast procedures for
malignancy’ (code: 432) while the CACS parameter was set to ‘Partial mastectomy’ (code: 2105); this was deemed to be sufficiently similar despite the inherent (and unavoidably) different coding systems19.
E. The OCCI search was then run repeatedly with the SLNB search parameters (i.e. with the
Patient Type set to ‘Day Surgery’) with a different hospital being selected for each new iteration (i.e. the ‘Hospital’ search criterion was set to a different OCCI-participating centre each time). The results of the search were stratified by Functional Centre in order to identify the hospitals where it could be confirmed that SLNBs were being performed using radioisotope localization methods (identified by the ‘DI Nuclear Medicine’ functional centre having allocated costs). In this manner four hospitals (codes: 731, 842, 949, 957) were identified as ‘SLNB hospitals’. In order to minimize variability in the CMA, the same four hospitals were selected for as part of the ALND cost-cohort identification.
To summarize, the intent of the above five-step search strategy was to clearly identify
two patient cohorts and their associated costs, deemed to be different largely on the basis of the
differences in resource use attributed to whether the patient underwent a SLNB or an ALND
alongside their breast conserving surgery. Said another way, the CAT search parameters were
set in such a way as to identify a cohort of patients whose disease characteristics where
significant enough to warrant an axillary staging procedure, but not extensive enough to warrant
hospital admission on the basis of the primary resection alone, so that admission must be solely
19 The CMG grouper (i.e. ‘case-mix group’ identifier) is associated with the Acute Inpatient cases, whereas the CACS grouper (i.e. the Comprehensive Ambulatory Classification System identifier) is associated with day surgical and ambulatory care patients.
- 49 -
due to the extent of the axillary procedure (i.e. SLNB = day surgery, and ALND = inpatient). To
reiterate, the criterion of admission is acting as the desired ‘search by secondary procedure’
parameter. Note, that additional global parameters were set in identifying both the SLNB and
ALND cost-cohorts, namely; only cost data from the most recent fiscal year (2007/2008) was
included in this analysis, and all age-groups were searched for.20 Finally, only those cases
designated as ‘Typical’21 were captured, and the outputs were sorted by ‘Code’ (see Figure 7b).
An informal ‘validation’ of this (admittedly complex) cost determination strategy was
undertaken and involved evaluating the cost breakdown of each of the SLNB- and ALND-
procedure related per-case costs by functional centre (see Appendix F). This analysis revealed
the need to include ‘an adjustment’, directly attributable the reporting of the Nuclear Medicine
functional centre costs (labelled ‘DI Nuclear Medicine’ in Figures F2 and F4 in Appendix F). A
description of how this adjustment was derived, interpreted, and incorporated into The Model is
given below and is hereafter referred to as the ‘NucMed adjustments’.
ii. The NucMed adjustments
Table 10a in the Results chapter displays the SLNB- and ALND-procedure related per-
case costs that were initially identified using the five step OCCI cost determination strategy
outlined above and summarized in Table 3 below (see page 54).
Initial examination of the particular characteristics of the SLNB and ALND cost-cohorts
offers some small indications that this five-step cost determination strategy may have been
somewhat appropriate in determining the SLNB- and ALND-procedure related per-case costs.
In looking at Table 10a, overall there was 498 day surgical cases of segmental mastectomy or
breast conserving surgery +/- wire localization versus the 61 acute inpatient cases returned using 20 Selecting the ‘All’ age designation really constituted identifying cases of patients from the two age groups 18 – 69 and 70+, since there were no case costs returned when the age search field was set to ‘0 – 17’ and all of the above search fields were kept constant. 21 Typical cases were those cases that excluded outliers such as unexpected death, transfers to other facilities, and patients signing-out against medical advice (AMA).[62]

- 50 -
the otherwise identical OCCI search parameters (see Tables 3 and 10a). This unbalanced day
surgery-acute inpatient split of cases is not unexpected given that SLNB is the standard of care,
and so long as hospitals have the resources to offer SLNB, then a majority of patients would be
expected to select SLNB over ALND.[15; 17; 20] Given that two of the four underlying
hospitals from which the cost data was sampled are high-volume centres located in an urban
area, and the third is a large academic hospital (and that together these three hospitals provided
over 90% of the cases that contributed to procedure-associated cost-cohorts) it is confidently
presumed that these hospitals have the necessary resources to offer SLNBs to patients; and that
the day surgical cost-cohort of 498 patients is in fact a cohort of SLNB patients, and likewise the
inpatient cost-cohort of 61 patients represents a group of patients treated by ALND. The above
argument is meant to validate the bulk of the OCCI cost determination strategy, demonstrating
that the proper cases and costs were captured within each cost cohort. Examination of a
breakdown of the cost-cohorts by functional centres (Figures F2 and F4, in Appendix F) seems
to indicate however that the actual total cost per SLNB case, as represented in Table 10a (see
Results) may be slightly under-estimated, while the ALND costs are similarly over-estimated.
Specifically, the breakdown of SLNB procedure costs by functional centre (see Figure
F2) shows there are a total of 123 cases (i.e. 25% of 498) where costs have been allocated to the
diagnostic imaging nuclear medicine functional centre (‘DI Nuclear Medicine’) at an average
total expense per case of $360. The fact that costs have been allocated to the DI Nuclear
Medicine functional centre confirms that at least 25% of cases definitively involved a
radioisotope injection and by extension, an SLNB. While this is not a high percentage, the
compensatory assumption must be that a significant portion of the remaining cases also involved
SLNB and that the radioisotope injection was done, as is often the case, the day before surgery
(i.e. during a separate hospital visit and therefore subject to different case-costing
categorizations) and the costs are therefore not captured in this cohort. Since the cost of pre-

- 51 -
operative radioisotope injection (+/- lymphoscintigraphy) is one that is uniquely attributable to
the patient undergoing SLNB it is a cost that should be included in all SLNB cases. Efforts to
search for and isolate these cases of radioisotope injection as separate case-costs that could
potentially be added to the overall SLNB procedure costs proved fruitless. Therefore, if it is
assumed that the entire nuclear medicine-related costs are captured in the DI Nuclear Medicine
functional centre cost allocation and if it is assumed that the entire cohort of 498 patients
underwent a SLNB alongside a primary breast cancer procedure; then the average total cost per
patient of $2,374.11 returned by the initial OCCI search (see Table 10a), is an underestimation
of the ‘true’ cost by at least $270 (i.e. $360 x 75%, the ‘SLNB NucMed adjustment’) increasing
the SLNB-procedure related case cost estimation to $2,644.11 (see Table 10b on page 97), since
this accounts for the ‘missing’ DI Nuclear Medicine functional centre cost allocations. It is
possible that there are additional costs that are allocated to other functional centres as part of the
process of delivering preoperative radioisotope injection and/or lymphoscintigraphy. These
functional centres were not immediately obvious however, and therefore no other modifications
were made based on this informal analysis of the breakdown of costs by functional centre.
In repeating the above process for the 61 cases that constitute the ALND cost-cohort (see
Tables 3 and 9a), it was noted that there were 19 (31%) cases where costs were allocated to the
DI Nuclear Medicine functional centre (see Figure F4, in Appendix F). While these 19 cases
represent a higher percentage of the total cases involving nuclear medicine than seen in the
SLNB cost-cohort, this was not interpreted as there being a greater likelihood that the inpatient
segmental mastectomy or breast conserving surgery +/- wire localization cost-cohort actually
involves a greater proportion of SLNB cases than the day surgery cohort, rather this was
interpreted as evidence that cases that initially begin as SLNB cases and were converted
intraoperatively to completion ALNDs (i.e. due to failure to localize SLNs, or intraoperative
SLN positivity) are being properly costed. If this is indeed the case, these 19 cases are

- 52 -
artificially inflating the total average cost per patient of this cohort of cases which is meant to
represent the cost of primary breast surgery with ALND alone. In this case, the 19 cases are
costed at an average expense of $205 (see Figure F4 in Appendix F), which if eliminated would
reduce the estimation for the ALND-procedure related case cost by $205 x 31% = $63.55 (i.e.
the ‘ALND NucMed adjustment’) or from $3486.56 to $3423.01; not a significant reduction
(i.e. only 2%) but a reduction nonetheless (see Table 10b). In both cases, the final cost values
used in The Model for both the SLNB- and ALND-related procedure costs reflected the
incorporation of the NucMed adjustments (see Table 10b).
iii. Morbidity-related treatment costs
Similar to how the ALND and SLNB procedure-related case costs were determined,
proxy cost-cohorts were identified within the OCCI database and used in this decision-analysis
to model the costs of treating the postoperative complications from either axillary procedure.
While the SLNB and ALND procedure-related case costs could be approximated by means of
the above mentioned OCCI search strategy, the costs of treating the common postoperative
complications (as identified from the comprehensive literature review) could not be as precisely
determined because the diagnostic codes necessary to define these very specific patient cohorts
could not be identified.[62] An informal search process, equally as deliberative as the search for
the SLNB and ALND-related in-hospital costs, was undertaken in order to find cost estimates
for treating the postoperative morbidities. For the sake of brevity, the step-by-step process by
which the proxy morbidity-related cost-cohorts were identified is omitted here, but the search
terms are summarized in Table 3 below. To be clear, specification of those parameter search
terms, as displayed in Table 3, within the OCCI costing analysis tool (CAT) will generate those
per-case costs used in The Model and displayed in Tables 9a and 9b (see Results section). Note
that a few general assumptions were made regarding the morbidity-related costs; first, the

- 53 -
complication of blue dye anaphylaxis during a SLNB was considered severe enough that the
patient would require admission (i.e. the patient type = acute inpatient), and second, all other
complications were considered mild enough that they could be treated in an ambulatory care
setting (i.e. patient type = ambulatory care).
Overall, the morbidity-related treatment costs are even more opaque in terms of content
and less precisely defined by OCCI search criteria than were the procedure-related costs (see
Table 3 below). This is not surprising given the very specific clinical situations for which
costing is being attempted. The same informal validation process was undertaken with each of
the morbidity-related treatment costs (i.e. cost breakdowns by functional centres and other
criteria were examined) as was described above for the procedure-related costs, however, no
‘adjustments’ were made. Generally speaking, the morbidity-related treatment costs utilized in
The Model were deemed to be reasonable estimates of the clinical situation being modelled.
While that may seem to be an inadequate justification for using non-validated costing data
within a cost-comparison model, it was presumed that the parameter uncertainty that exists
would be adequately quantified by means of the probabilistic sensitivity analysis (PSA),
undertaken as part of evaluation of The Model (see Results).

- 54 -
Table 3: A summary of the OCCI search criteria used to identify the procedure and morbidity-related costs for incorporation into the decision-tree model.
ALNDAcute
InpatientSubtotal mastectomy and other breast procedures (432)
SLNB Day surgery Mastectomy - partial (2105)
Morbidity Costs
Anaphylactic shockAcute
inpatientDrug reactions (813) None (void)
Poisoning 'other' by NOS drugs/medications/biological substances (T509); Anaphylactic shock secondary to proper drug administration (T886); NOS adverse drug/medication effect (T887)
Axillary seromaAmbulatory
care
None (void); application of percutaneous drainage from under skin on abdomen or trunk (1YS52HA); pharmacological anti-infective treatment for percutaneous drainage (1ZZ35HAK0); etc. (16 in total)
Localized swelling/mass in upper limb (R223); Localized swelling/mass NOS (R229)
Axillary paraesthesiaAmbulatory
care
General assessment (2ZZ02ZZ); ECG NOS (2HZ24JAXJ, …JAXJ); specimen collection by veinopuncture (2ZZ13RA); pharmacological treatments (1ZZ35HHZ9, …HAA2, …HAN1, …HAP2) (8 in total)
Paraesthesia of skin (R202)
LymphedemaAmbulatory
care
None (void); general assessment (2ZZ02ZZ); specimen collection by veinopuncture (2ZZ13RA); pharmacological antibiotic treatment (1ZZ35HAK4-7); ultrasound of arm (3JM30DA); chest xray NOS (3GY10VA)
Lymphedema NOS (i890); non-infectious disorder of lymph vessels and nodes NOS (i899)
Axillay painAmbulatory
care
None (void); dress skin of arm with a surgical dressing (1YT14JAT6); specimen collection by veinopuncture (2ZZ13RA); ECG NOS (2HZ24JAXJ); pharmacological anti-inflamm. treatment (1ZZ35HAN1); etc. (26 in total)
Pain in upper limb (M7960); pain in limb, unspecified (M7969)
Shoulder dysmobility (decr. ROM)
Ambulatory care
None (void); general assessment (2ZZ02ZZ); dress skin of arm with a surgical dressing (1YT14JAT6)
Stiffness of shoulder joint NOS (M2561); stiffness of joint NOS (2569); other specified disorders of the shoulder joint (M2581); joint disorder NOS in the shoulder region (2591)
Notes: ROM = Range of motion; NOS = Not otherwise specified; ECG = electrocardiogram; MSK = musculoskeletal; decr. = decreased; N/A = not applicable
Procedure Costs Case type Most Responsible Diagnosis (MRD OCCI code)Patient typeCACS/CMG grouper descriptions
(OCCI code)Fiscal Year
Malignant neoplasm - right/left nipple & areola (C5000/C5001); Malignant neoplasm - unspecified side (C5009); Malignant neoplasm - central portion of right/left breast (C5010/C5011); etc. (27 diagnostic codes in total)
Principal Procedure labels (OCCI code)
2007/200818 - 69 and
70+ yrsTypical only
OCCI Hospitals (OCCI code)
Credit Valley Hospital (731) Mt. Sinai Hospital (842) Trillium Health Centre (949) Quinte Health Care (957)
Excision, partial breast - open approach (1YM87LA); Excision, partial breast with localization needle/guidewire (1YM87UT)
Age
Typical only2007/2008
Other MSK and connective tissue complaints (6246); other MSK and connective tissue complaints with minor investigative technology (6248)
18 - 69 and 70+ yrs
All OCCI-participating hospitals
Skin and subcutaneous tissue complaint (6276); Skin and subcutaneous tissue complaint with minor investigative technology (6277)
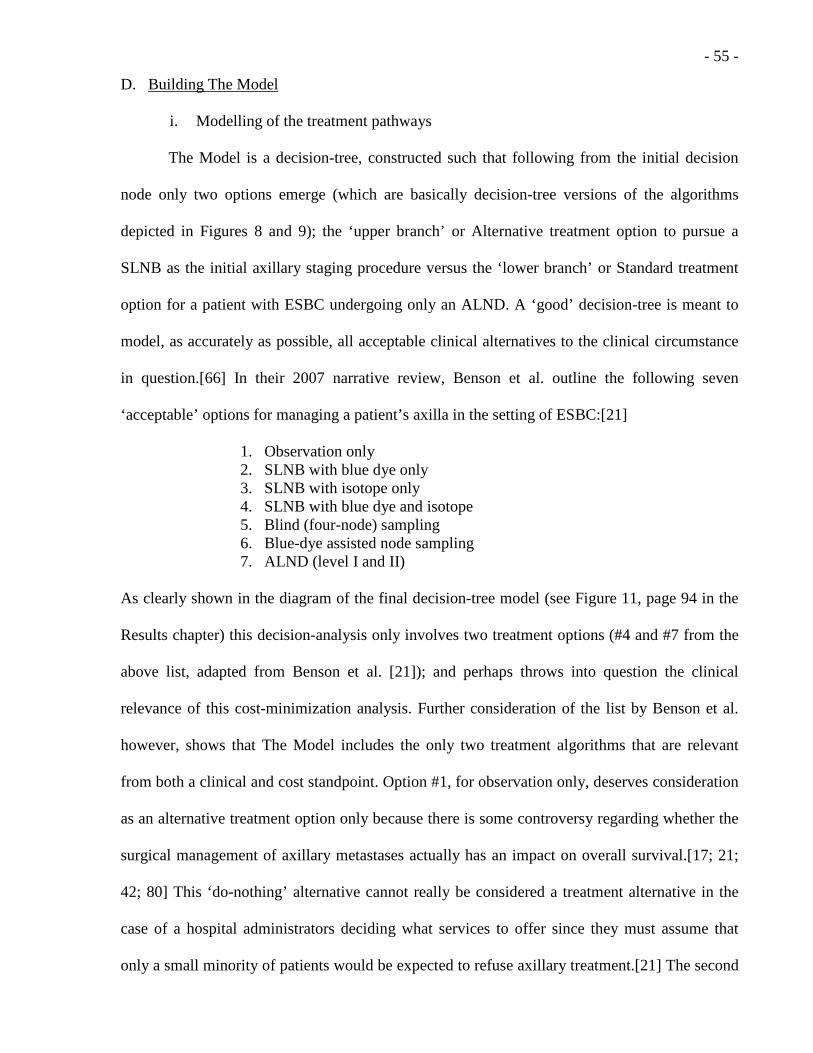
- 55 -
D. Building The Model
i. Modelling of the treatment pathways
The Model is a decision-tree, constructed such that following from the initial decision
node only two options emerge (which are basically decision-tree versions of the algorithms
depicted in Figures 8 and 9); the ‘upper branch’ or Alternative treatment option to pursue a
SLNB as the initial axillary staging procedure versus the ‘lower branch’ or Standard treatment
option for a patient with ESBC undergoing only an ALND. A ‘good’ decision-tree is meant to
model, as accurately as possible, all acceptable clinical alternatives to the clinical circumstance
in question.[66] In their 2007 narrative review, Benson et al. outline the following seven
‘acceptable’ options for managing a patient’s axilla in the setting of ESBC:[21]
1. Observation only 2. SLNB with blue dye only 3. SLNB with isotope only 4. SLNB with blue dye and isotope 5. Blind (four-node) sampling 6. Blue-dye assisted node sampling 7. ALND (level I and II)
As clearly shown in the diagram of the final decision-tree model (see Figure 11, page 94 in the
Results chapter) this decision-analysis only involves two treatment options (#4 and #7 from the
above list, adapted from Benson et al. [21]); and perhaps throws into question the clinical
relevance of this cost-minimization analysis. Further consideration of the list by Benson et al.
however, shows that The Model includes the only two treatment algorithms that are relevant
from both a clinical and cost standpoint. Option #1, for observation only, deserves consideration
as an alternative treatment option only because there is some controversy regarding whether the
surgical management of axillary metastases actually has an impact on overall survival.[17; 21;
42; 80] This ‘do-nothing’ alternative cannot really be considered a treatment alternative in the
case of a hospital administrators deciding what services to offer since they must assume that
only a small minority of patients would be expected to refuse axillary treatment.[21] The second

- 56 -
and third options listed above are both less-expensive versions of option #4, which is the
Alternative treatment pathway being considered. Note that from a structural standpoint, the
decision-tree would remain unchanged regardless of which options (#2 through #4) were
modelled, the only difference in these treatment options would be the costs associated with the
different SLN localization techniques. In the context of a CMA however, if option #4 proves to
be cost-minimizing as compared to option #7, then formally modelling either option #2 or #3
becomes moot. Moreover, given the extent of the cost data available through the OCCI database
it would have been impossible to model either option #2 or #3; since the costs associated with
either the blue dye or the radioisotope injection are absorbed into the nuclear medicine and
operating room functional centre costs and cannot be further differentiated (see Appendix F).
Finally, options #5 and #6, despite their use in parts of the United Kingdom [20; 24; 46], these
procedures are not considered viable treatment alternatives here in North America.[15; 20; 54]
The end result is that the developed decision-tree structure of this CMA (as shown in
Figure 11 in the Results chapter) is comprehensive because it compares the only two treatment
algorithms that are clinically relevant to the Ontario ESBC patient population and, from a cost
perspective, are measurable. Moreover, these treatment pathways do not contradict the
recommendations from the current clinical practice guidelines,[14; 18; 48] and are in agreement
with the treatment protocols of the three studies retained from the comprehensive literature
review (see Results chapter).[38; 39; 44; 45] The incorporation of the axillary seroma as a
complication modelled with a single pair of subtree braches within The Model (see Figure 11),
is also justified based on the assumption that it is a non-recurrent complication for which there is
no evidence of its occurrence influencing the likelihood that any of the subsequent
complications would occur.[17; 81-83]
The probabilities assigned to each chance node, represent treatment uncertainty (i.e.
labelled as V – Z% in Figure 8) and were determined from the results of the comprehensive
- 57 -
literature review (see Results chapter). The mean or ‘expected value’ of each chance node is
identified by the simple proportions reported in the published articles of the literature review,
however the ranges within which these proportions vary, were defined by Beta probability
distributions, as opposed to simple 95% confidence intervals. These Beta distributions were
derived with a TreeAge Pro® function that uses the characteristics (i.e. mean value, and sample
size) of the underlying cohorts from the published studies (see Appendix C).[84] Beta
probability distributions are particular probability density functions used to describe binomial
variables with a corresponding range in values from 0 to 1 and whose shape can be defined
using two input parameters (termed alpha and beta).[85] The resulting curve is a slightly-skewed
distribution curve that is meant to approximate, in this case, the variation in the point estimate of
the branch probability with respect to the ‘true’ value.[11] The use of Beta distributions to
represent uncertainty in the point estimate of a chance node reflects an attempt to provide a
more realistic approximation of parameter uncertainty and is a practice that is accepted in the
decision-analysis literature.[86-88] To be clear, the mean or ‘expected value’ of each Beta
probability distribution matches the corresponding proportions reported in the published studies,
but the range through which those proportions are made to vary (i.e. in the probabilistic
sensitivity analysis, PSA) are defined by the probability distribution and not simply by the 95%
confidence intervals. Each Beta probability distribution was assigned a variable name linked to
the appropriate decision-tree chance node (see Appendix C); the variation in value of each
chance node within the defined distribution was a necessary step in order to fully characterize
The Model’s uncertainty and variability by means of a probabilistic sensitivity analysis (PSA) as
described in the following sections.
As alluded to already, the types of postoperative complications were categorized
according to postoperative time course; where complications like blue dye anaphylaxis and
seroma formation were considered ‘one-time’ complications, whereas axillary neurological
- 58 -
complaints (i.e. paraesthesias, dysasthesias, etc.), decreased ipsilateral shoulder range of motion
(sROM), axillary pain, and arm lymphedema were considered ‘recurrent’ complications. The
decision-tree was built such that the treatment pathways included complementary singular
branches for the one-time complications (i.e. one branch to designate encountering the
complication and the other being the no-complication or ‘healthy’ branch). All pathways
however (except the pathway involving anaphylaxis22), were terminated with a Markov cohort
that modelled the recurrent complications. The probability of a patient having an axillary seroma
was subject to a probability distribution in the same way that the treatment uncertainty branches
were designed; whereas those complications that were modelled by Markov states were subject
to transitional probabilities that could only be uniformly varied within their 95% confidence
intervals due to programming limitations in constructing the Markov model.[84]
ii. Markov states and transitional probabilities
While the decision to use Markov modelling was partially based on the type of data
available to describe the postoperative complications as well as the nature of the morbidities
being modelled, it was also one of convenience. To address the first two points; as stated
previously, the analytic horizon for this model was 24 months as was consistent with many of
the follow-up periods in some of the larger SLNB and ALND morbidity-reporting clinical
trials.[24; 38; 39; 45; 46] The expectation of the results from the comprehensive literature
review was that the relative frequencies of a number of postoperative complications would be
reported at progressive time intervals following the axillary surgery, and that these relative
22 This was a simplifying assumption within The Model. The degree of anaphylaxis was assumed to be severe enough to warrant immediate cessation of the surgery and the initiation of supportive care (i.e. including intubation, ventilation and admission to the intensive care unit). Due to the presumed severity of the drug reaction, the patient’s breast surgery was assumed to be delayed indefinitely (pending the patient’s full recovery). In order to minimize the resulting uncertainty with respect to how this treatment pathway would terminate, the costs of treating the a patient’s anaphylaxis was included in The Model, however all subsequent hospital visits (that may or may not have involved a resumption of the patient’s breast surgery) were now considered separate from the initial cohort and therefore not included.

- 59 -
frequencies would vary with time from surgery. It was decided a priori that this repetitive, time-
dependent risk of postoperative complication would best be modelled using Markov states;
where each state is characterized by a given complication and the relative frequency of that
complication was modelled by transitional probabilities between Markov states (linked Markov
states are hereafter referred to as a ‘Markov cohort’).[84] The relative frequencies of the
complications at a given postoperative time interval (e.g. 6, 12, 18 months, etc.) were used to
define the transitional probabilities within each Markov cohort. The number of time intervals at
which data was collected and reported in the literature (within the two-year analytic time
horizon) dictated the number of times that a patient was theoretically cycled from one Markov
state to another (e.g. 6-month follow-up intervals results in four ‘Markov cycles’).[38; 45; 86]
Secondly, all of the postoperative complications were modelled as mutually exclusive, non-
permanent, and non-fatal complications (consistent with their clinical course)[17; 22; 81; 83; 89;
90]. The assumption of non-permanence is based largely on the early clinical course of the
postoperative complications following axillary surgery, and is also a function of limits in the
available data; not only in terms of reporting, but also in terms of actual measurement. Consider,
for the purpose of illustration, the dreaded complication of lymphedema; a devastating disorder
of lymphatic drainage of the arm that can progress insidiously over years following axillary
treatment.[22; 83] There is controversy surrounding the measurement and assessment
techniques that lead to a diagnosis of lymphedema, such that a ‘positive’ test for lymphedema,
especially in the early-postoperative period, does not necessarily translate into the permanent
condition characterized by distressing arm dysfunction.[22] The Gruppo Interdisciplinare
Veneto di Oncologia Mammaria (GIVOM) trial investigators used a comparative arm
measurement technique23, one of the more common and accepted methods for diagnosing
23 Specifically, in the GIVOM trial, lymphedema was evaluated by comparing the arm circumference of the treated arm to the untreated arm at 15cm above the lateral epichondyle; a 2cm increase constituted a positive diagnosis.[38]

- 60 -
lymphedema, and reported the incidence at six-month postoperative follow-up intervals.[38; 45]
The authors did not however specify what percentage of patients, from one follow-up period to
another, had arm measurements that were persistently positive for lymphedema, nor was there
sufficient follow-up in the study to conclude with patients with initially ‘positive’ measurements
for lymphedema went on to develop the devastating chronic condition.[38; 45] As a
consequence, lymphedema, despite being a potentially chronic disorder, was modelled as a
temporary, and potentially ‘recurrent’, postoperative complication. The same assumptions apply
to the other three recurrent complications (i.e. axillary pain, paraesthesia and shoulder
dysmobility). Thus, the Markov cohorts were programmed without an absorbing state and with
transition probabilities that accurately reflected the percentage of patients diagnosed as having a
given complication during a given follow-up period.
The assumption of mutual exclusivity was a practical consideration based on the
underlying morbidity data from the GIVOM trial (see the Results chapter). The authors did not
report a degree of morbidity overlap among patients.[38; 45] While it is not clear that knowing
how many patients had two or more complications at any one time would have favoured either
treatment pathway, it is likely that the morbidity rates for both treatment options, and by
extension the cumulative costs generated within the Markov processes (see Figure D2 and Table
D1, Appendix D), are somewhat inflated. Intuitively, there must have been some patients that
reported two or more complications at any given follow-up interval, and if they were to seek
medical care for these complications, then the cost of treating, say a patient with an axillary
seroma and axillary pain would have been some weighted average of the costs listed in Table
10a, as opposed to a sum of each cost value.
To summarize the first two Markov modelling specifications; no absorbing state within
the Markov cohort was created, and occupancy within a given Markov state during a given
iteration, did not influence the transitional probability to a new Markov state during the next

- 61 -
cycle. TreeAge Pro® software was therefore used to build nested Markov iterations (where one
Markov cohort is embedded within another, hereafter referred to as a ‘Markov process’), to
accurately model these repetitive and relatively unrestricted relationships between postoperative
complications.[84] A comprehensive report, entitled a ‘Markov cohort analysis’, that details the
values of each variable through each cycle, is a tool for confirming that the associations and
formulas that governed the Markov process were correct (see Table D1 in Appendix D).
As stated, the decision to use Markov modelling was also one of convenience; any
attempt to model recurrent postoperative complications using only an increasing number of
branching subtrees instead of Markov processes would have made the final model unwieldy and
unmanageable (i.e. the number of tree branches would have exceeded the computational
capacity of the underlying TreeAge software program).[84] Furthermore, the Markov processes
allowed for a more rigorous characterization of parameter uncertainty by means of the Monte
Carlo techniques of probabilistic sensitivity analysis (PSA).[66] To that end, some final
technical TreeAge Pro® programming specifications deserve mention. First, the Markov cycling
process was adjusted, using a built-in TreeAge Pro® function, with a ‘half-cycle correction’
factor. This correction has the effect that instead of all costs being assigned at the end of each
cycle (subject to the instantaneous change in transitional probabilities at cycle termination) a
portion of the costs are assigned mid-cycle.[84] Use of the half-cycle correction is consistent
with current decision-analysis modelling guidelines [66; 86] and is meant to improve the
accuracy of the model’s approximations; since patients suffer through complications on a
continuous basis at various times in their follow-up, as opposed to in a discreet fashion subject
to a three-, six-, nine-month, etc., time schedule.[86] Lastly, unlike the uncertainties surrounding
treatment pathways and one-time morbidity which were defined and varied according to Beta
probability distributions, it was more efficient (from a computational standpoint)
- 62 -
to have the Markov transition probabilities varied uniformly within their 95% confidence
intervals.24
iii. Modelling of costs
The previously outlined strategy for searching the OCCI case-costing database generates
four cost values for each cost-cohort: an average of the total costs per patient, a standard
deviation, and the minimum/maximum total cost values. A quick inspection of the four
statistical cost values revealed that the distribution of costs across a given cost-cohort was
highly skewed; meaning, by way of example, a single standard deviation below the average cost
would result in a negative cost value. Consequently, when cost values were incorporated into the
decision-tree model, they were approximated by Gamma distributions, as a means of estimating
the uncertainty surrounding the ‘true’ average cost value. As had been done with the chance
node-associated Beta distributions, a TreeAge Pro® function was used to create this Gamma
distribution, based on the OCCI-derived per patient cost and standard deviation values. An
added TreeAge Pro® ‘trimming’ function was used to ensure that more realistic costs (i.e.
values between the OCCI-derived minimum and maximum total per-patient costs) were sampled
from each distribution. Gamma distributions were selected to define the per-patient cost
probability distributions because they are inherently skewed distributions, that can be defined
(similarly to the Beta distributions) by just two parameters; the average cost value and standard
deviation generated from the search of the OCCI database. Note that Gamma distributions have
been used elsewhere to approximate the parameter uncertainty surrounding cost data in breast
24 The details of these programming efficiencies have to do with how within The Model, TreeAge® accesses a table of values stored in Excel® (i.e. similar to Table 7, see Results chapter) in order to determine the transition probabilities used in the Markov cohort. In order to define probability distributions for each of the transition probabilities the distributions would have to be stored as a series of n values (e.g. 1000) in tabular format. While possible, this was not pursued due to the extensive data modelling requirements that would have been involved. Moreover, inclusion of procedure-related postoperative complications proved to be insignificant to The Model’s final cost outcomes (see Results section); had the reverse been the case then this more precise method of modelling transition probability uncertainty might have been undertaken.[84]

- 63 -
cancer-related economic models and decision-analyses.[91] Inspection of plots of these
distributions (see Appendix E) also revealed that the mean or expected value of each distribution
most closely matched the actual OCCI-generated per-patient cost values25; thereby further
justifying the use of Gamma distributions in this decision-analysis model. As had been done
with the branch probability Beta distributions, the cost Gamma distributions were given variable
names and assigned to the corresponding cost variables (see Appendix E).
iv. Global variables
From the above discussion, it should be clear that wherever possible The Model was
populated by variables subject to a probability distribution or a 95% confidence interval at the
very least as a means of quantifying the uncertainty inherent in that variable. In addition to the
cost, treatment, and morbidity probabilities, three ‘global’ variables were created; each
addressing a particular value that impacted the entire model as opposed to only a particular
treatment pathway. As previously discussed, variables were created to model the impact of
inflation and the discount rate; with each of these variables being assigned an expected value,
however only the latter was assigned a range (0 to 5%)26. A third variable, meant to quantify the
likelihood that patients with a given complication would actually seek out medical attention
(variable name: prob_SeekMedical) at the hospital where they had their operation (i.e. where the
treatment of the complication would therefore be counted as a cost to the hospital) was defined
and assigned a mean value of 0.5, subject to a range of 0 to 1. This variable was created because
25 This is in stark comparison to other skewed distributions (e.g. log-normal, triangular, etc.) that were explored for use in defining the parameter uncertainty surrounding the per-patient cost variables. These other distributions generated mean values that deviated significantly from the OCCI-generated per-patient cost values (which were considered ‘real’ cost values and therefore every attempt was made to model these values closely). 26 Remembering that the cost data generated from the search of the OCCI database is based on the 2007/2008 fiscal year of each hospital that provides costing data; hence a variable to adjust for the past year’s inflation was created. The variable’s value was set equal to the official percentage increase in the consumer price index (CPI) as reported by the Bank of Canada. Given that the CPI is a widely accepted marker of inflation, and is not subject to any reported range of uncertainty, its value was not varied or subject to a probability distribution in The Model. Ultimately the purpose of introducing a variable for inflation into The Model was simply to put the cost values into today’s prices.

- 64 -
intuitively it was unreasonable to think that every patient (or conversely that no patients) with
axillary pain or shoulder dysmobility, for example, would seek medical care. The value of the
discount rate and prob_SeekMedical variables were varied within their predefined ranges as part
the sensitivity analyses.
Cumulative cost variables, designed to be running totals of a) the costs associated with
the established treatments inherent to each pathway (variable name: cost_Surgery) and b) to the
costs of treating the encountered morbidities (variable name: cost_Morbidity), were also
defined27. These two variables are assigned cost values through a recursive process, whereby the
variable adds to itself at different points along the subtrees and within the Markov processes that
comprise both competing treatment pathways. At the terminal nodes of every subtree, these two
cost variables are then added, yielding a cost value (variable name: Total_Cost) that is a
cumulative total of all of the per-patient costs incurred along the particular pathway leading to
that particular terminal node. It should be clarified here, that along the SLNB treatment
pathways, there are two instances where an initial SLNB is converted to an ALND
intraoperatively (i.e. when there is a failure to identify a sentinel lymph node (SLN) or when the
intraoperative pathology evaluation is positive for axillary metastases). In both of these
instances, the cost_Surgery variable has the SLNB procedure cost subtracted and the ALND
procedural cost added to its recursive total. This may seem like something of a ‘fudge’ within
The Model, since it appears that the initial SLNB-associated costs (i.e. lymphoscintigraphy, the
depreciation on the gamma probe, etc.) are being ignored. This is not the case however, since
the OCCI costing methodology allows for this conversion; the resource allocation process
remains the same and the case is just reclassified under the ‘Acute Inpatient’ patient type
criterion.[62] This is a subtle but important point; the OCCI methodology ensures that a fraction
27 Defining variables within a TreeAge Pro® decision-tree means that the variable name is created and is assigned a value (in the case of the cumulative cost variables their values are the results of formulas involving other variables) and is also assigned to one or many branches within the tree.[84]
- 65 -
of the cases within the ALND procedure cost-cohort are likely cases that started out as SLNB
cases and were converted (i.e. see ALND cost in Table 10a).28 In following from this, it would
therefore be inaccurate to add the SLNB and ALND procedure costs together at those two points
along the decision-tree where an intraoperative completion ALND is performed; instead the
ALND-associated costs have been substituted for the SLNB procedure costs and added to
running total cost value contained within the cost_Surgery variable.
E. Evaluating The Model
i. The roll-back analysis: the base case expected value (EV) output
The simplest output from any decision-tree analysis is the ‘expected value’ (EV), and
determination of a decision-tree model’s EV is termed a ‘roll back’ analysis.[66; 84]
Furthermore, the EV determined from the roll back analysis that uses all of the mean values (i.e.
point estimates) for all the model variables is often referred to as the ‘base case’ or ‘reference
case’.[84; 92] It is important to emphasize that the roll back analysis is deterministic in nature29,
and therefore does not offer a meaningful quantification of uncertainty.[66; 84; 86; 87; 93] In
the case of The Model, because it is meant to be a cost-minimizing analysis, the base case EV,
represents the average cost differential between the weighted average of the Total_Cost values
at each terminal node for both the Alternative or Standard treatment pathways (i.e. the
‘incremental average cost’). To be clear, the average cost values of the overall competing
treatment pathways, consist of the weighted average of all the Total_Cost values from each
terminal node at the end of all the subtrees, weighted by the probability of each treatment
pathway ending at those terminal nodes.[84] Since the dollar values obtained from the OCCI
database and used to populate the decision-tree model are averages of total in-hospital per-
28 As noted previously when discussing the inclusion of the NucMed adjustments to the costing data. 29 A reminder that a deterministic approach uses the weighted average of point estimates (without acknowledging the uncertainty in these estimates) to arrive at a result. This is also sometimes called the ‘cohort’ approach since it serves as an estimation of the expected outcome in an infinitely large population.
- 66 -
patient costs, the EV is a weighted average of the cumulative total of those average cost values
along each subtree within each treatment pathway. It is important to recognize that this EV
value is an average cost value that is analogous to the cost values that would make up the
average cost function introduced in Figure 3b. Remembering from Figure 3b that the SLNB-
associated treatment pathway average cost function approaches a constant average cost value as
the number of cases, Q, increase while the ALND-associated treatment pathway average cost
function is always a constant. It is therefore assumed that the average cost values or EVs, for
both the competing treatment pathways, are approximations of the values of ACS and ACA as Q
increases, and the difference between the values is the incremental average cost or ‘Incr. AC’ as
labelled in Figure 3b. This assumption is based on the fact that a roll-back analysis approximates
the outcome that would be seen in a population that is infinitely large.[66; 84] The consequence
of this assumption being if the incremental average cost value is negative, then there exists a
‘threshold’ number of patients Q* where the two average cost functions intersect, otherwise if
ACA < ACS and the incremental average cost value is positive and Q* cannot be calculated.30
The reference case is determined first and foremost to make sure that the decision-tree
model ‘works’, serving as the most basic step towards ensuring the model’s output is consistent
by making sure that all the branch probabilities within a given subtree add to one and that no
variables remain undefined. In doing a roll back analysis, the EV also serves as a quick litmus
test as to whether the model is reasonable, meaning that a base case EV that was widely
different from what might be expected would initiate a review of the underlying assumptions,
associations, and values that went into making the model. For the sake of completeness, a roll
back analysis was performed and a reference case EV was reported along with the standard
outputs that accompany a roll back analysis (see the following section). A more thorough
30 As can be inferred from this discussion, the incremental average cost is a value that is always defined in terms of an alternative value relative to the standard value; a negative value therefore means the Alternative pathway provides an average cost savings, whereas a positive value suggests the Standard pathway is cost-minimizing.

- 67 -
evaluation of The Model was also undertaken however; in an effort to fully characterize the
impact of different parameters within the decision-tree model on the EV, multivariate sensitivity
analyses were performed. Finally, in order to properly quantify the inherent model variability
and parameter uncertainty, a probabilistic sensitivity analysis (PSA) was performed (see the
sections that follow below).[66; 84; 86; 87; 93]
ii. Standard deviation and the payoff range
As part of the roll back analysis where the reference case EV is returned and the cost-
minimizing path is highlighted, a simple but limited characterization of uncertainty is made in
the form of the standard deviation and the payoff range for both of the competing treatment
pathways. The standard deviation values are generated by calculating the square root of the
squared differences between the total cost of each terminal node and the overall average cost
value for each competing treatment pathway.[84] The payoff range is defined by the minimum
and maximum terminal node total cost values for each competing pathway. Both the standard
deviation and payoff range values calculated by this method are narrow descriptions of model
uncertainty since ultimately only the point-estimates of the cost, treatment uncertainties, and
morbidity rates are used in their calculation.
iii. Sensitivity analysis and Tornado diagrams
Sensitivity analysis was undertaken to explore the influence of a single parameter on a
model’s base case EV.[66; 86] A one-way sensitivity analysis requires that a single variable is
varied while all other model variables’ point-estimates are held constant, whereas varying the
values of two or N variables simultaneously (where N > 2) is termed N-way or multivariate
sensitivity analysis.[66; 86] The change in The Model’s EV is recorded while each variable
being analyzed is uniformly varied, one at a time, between two set values (the upper and lower
95% confidence limits in the case of the branch probabilities and the minimum and maximum
- 68 -
values in the case of the cost variables).[66] TreeAge Pro® was used to summarize the results of
many one-way sensitivity analyses simultaneously, in the form of Tornado diagrams [84] (see
Figures 15 and 16 in the Results chapter), in order to provide an idea of those cost and
probability variables that have the greatest influence on The Model’s EV. Those variables, for
which the one-way sensitivity analysis demonstrated that The Model’s EV changed significantly
or was ‘sensitive’ were then varied together and simultaneously as part of a N-way sensitivity
analysis31. Graphical representations of these N-way sensitivity analyses consist of the ranges
over which the variables’ values are altered plotted against one another, and overlaid with the
change in The Model EV; thereby mapping out, in two-dimensions, the area where either the
Alternative or the Standard treatment pathways are cost-minimizing (see the Results chapter).
iv. Model variability and parameter uncertainty
In the deterministic roll back analysis each parameter in the decision-tree model
constitutes a point-estimate subject to zero variation. Consequently, the base case EV is static;
remaining constant no matter how many times the analysis is run (while using the same point-
estimates).[84] The sensitivity analyses, while useful in identifying which variables may have
the greatest impact on a model’s EV, are limited to varying one (or only a handful) of variables
at a time. Both of these analyses provide an initial impression of the result of the decision-
analysis but do not quantify the variability and uncertainty inherent to the clinical circumstances
being modelled.[86; 92]
It is important to clarify the distinction between the terms variability and uncertainty in
decision-analysis modelling. First, model uncertainty, which refers to the overall variation
inherent in a model due to the cumulative effect of the uncertainties in the estimations of the
31 In this study a significant change in the EV constituted a change in sign; whereby the incremental average cost changed from favouring the SLNB-associated treatment pathway to the ALND-associated treatment pathway, or vice versa.

- 69 -
model parameters (also commonly referred to as ‘parameter uncertainty’).[66] Parameter
uncertainty may be stochastic (i.e. due to random differences between individuals within a
sample or between each application of the treatments being studied) or parametric (i.e.
attributable to small sample sizes or due to measurement error).[11; 66; 85] In this cost-
minimization analysis, all of the decision-tree variables (i.e. costs, treatment uncertainties, and
morbidity rates) are subject to some degree of stochastic uncertainty because they consist of
values that are ultimately based on measurements taken from a cohort of patients; and there is
inherent heterogeneity between individuals in any population including those undergoing
axillary staging for ESBC. These unpredictable (i.e. random) differences between patients may
have resulted in small variations in the clinical responses to treatments, and by extension, the
costs of those treatments. A degree of parametric uncertainty also exists because of the variation
in how even the ‘same’ treatments are applied and measured in a study or costed in a hospital’s
accounting department. This would be especially true in this CMA for two reasons; first, a
multidisciplinary process of care, such as is involved with SLNB, is being modeled which
allows for more opportunities in the course of treatment where random variation in one step
could affect the outcome of the next, thereby resulting in a range (as opposed to a single point-
estimate) of measurements for a given parameter. Second, the use of parameter estimates that
reflect the inherent (and unknown) differences between populations or locations where these
procedures are undertaken certainly contribute to the parameter uncertainty within The Model
(i.e. inter-cohort variation as opposed to the intra-cohort variation described by stochastic
parameter uncertainty);[11] after all, The Model uses treatment uncertainty and morbidity rates
obtained from different RCTs, using different patient populations in different countries (i.e.
Italy, the United Kingdom, and the United States)(see Results chapter).[38; 39; 44; 45]
Moreover, these parameter estimates are combined with Ontario-specific costing data obtained
from different hospital sites, in an effort to approximate the reality of treating ESBC within

- 70 -
Ontario. Therefore, despite obtaining all the treatment and morbidity data from randomized
clinical trials, and all of the cost data from a methodologically rigorous costing source, the
parameters used in The Model are assumed to be subject to uncertainty (i.e. both stochastic and
parametric), and as is recommended in the literature, probability distributions (i.e. the previously
discussed Gamma and Beta distributions) were incorporated into The Model as best
representations of the uncertainty within each variable.[11; 66; 86; 87; 93] A Monte Carlo
methodology, termed probabilistic sensitivity analysis (PSA), was then used to consolidate the
uncertainty within each variable and generate a cumulative estimate for the uncertainty inherent
to The Model as a whole (see the following section).[11; 66; 86; 87; 93]
A few words must now be spared for a brief discussion of model variability, a concept
that refers more to how the model is actually built, as opposed to the individual parameters.
Specifically, model variability is concerned with the variation that results from the structural and
methodological assumptions made when the model was constructed.[66; 86; 93] First, with
respect to the model structure; it is recommended that in order to quantify the variability, a
model should be evaluated (i.e. the EV should be determined) for each plausible structural
variant of the clinical algorithm under comparison (meaning the decision tree branches should
be varied in those cases where simplifying assumptions have been made and the model should
be re-evaluated following each significant change to the decision-tree structure).[66] As
previously discussed (see the ‘Building The Model’ section above), it was argued that for the
purpose of this CMA there are only two treatment options worth comparing, and the structure of
these treatment algorithms are justified as they follow from the results of the comprehensive
literature review and published clinical practice guidelines.[14; 17; 38; 39; 45] Consequently, as
part of the Model’s evaluation, variability was not quantified by making any structural changes
to the decision-tree. Second, The Model’s methodological assumptions pertain to how certain
global variables (i.e. discount rate, etc.) are incorporated.[86; 93] Again, as discussed

- 71 -
previously, a range of values was assigned to The Model’s global variables and varied as part of
the sensitivity analyses and PSA. As such, whatever variability did exist as part of the use of
those global variables it assumed to have been adequately quantified as part of the same
probabilistic sensitivity analysis used to quantify model uncertainty (see the following section).
v. Probabilistic sensitivity analysis (PSA)
Although the justification for performing a probabilistic sensitivity analysis (PSA) has
already been provided, the specifics for completing a PSA are briefly outlined here. A PSA
involves determining a decision-tree model EV in the same manner as is done by a roll back
analysis, except that values for each variable in the model are simultaneously and randomly
selected32 from the probability distributions associated with each variable.[66; 84] A total of n-
iterations of this process were repeated, such that an average of n average cost values with an
associated standard deviation and minimum/maximum total cost values for both competing
decision-tree pathways could be determined and reported. For this CMA, n was set equal to
values of n = 100, 500, 1000, and 10000, in an attempt to demonstrate the consistency of The
Model’s output.33 Furthermore, the distribution of incremental average costs was plotted.
Finally, the proportion of n trials where the Alternative and the Standard treatment pathways
proved to be cost-minimizing was also determined (see Results chapter). While the results of the
probabilistic sensitivity analyses constitute the formal, most comprehensive evaluation of this
cost-minimization analysis, an additional non-standard evaluation of The Model was undertaken
in order to (potentially) provide hospital administrators with added insight into the cost of
providing SLNB services at their hospital.
32 The process of randomly selecting each step in the decision-tree pathway, subject to a specified number of iterations, is akin to playing a casino game; hence the naming of this methodology after the famous Monte Carlo casinos.[66] 33 These values for n within the context of the PSA are somewhat arbitrarily chosen, however they do reflect values commonly used in the literature [88; 91] and are also meant to demonstrate model reliability through the generation of consistent results across the different n values.[86; 87; 93]

- 72 -
vi. A novel use of Monte Carlo microsimulation
As stated in the research objective, a goal of this CMA was to provide hospital
administrators with a costing model that might help to inform decision making surrounding
SLNB implementation in Ontario. While the probabilistic sensitivity analysis provides a
comprehensive assessment of model uncertainty it may not necessarily model the actual clinical
situations and associated costs that might be encountered. By way of example, a more realistic
clinical setting within a relatively small community hospital may involve a handful of ESBC
patients that have unlikely clinical courses and incur improbable, and potentially elevated,
hospital expenses (e.g. two patients experience blue dye anaphylaxis). The result of this
hypothetical scenario would be that the total and average cost functions for that small cohort
would be more expensive than what would necessarily have been predicted by The Model. The
hospital administrator is therefore better served by having access to a decision-analysis model
that provides a more accurate approximation, at a patient level, of the clinical reality of treating
ESBC. An attempt to provide the intended audience with more a more insightful modelling
analysis was undertaken using another Monte Carlo technique, termed microsimulation.
Microsimulation involves a series of n trials where each trial represents a ‘random walk’
through the decision-tree model. [11; 66; 84; 86] The ‘random walk’ consists of simulating a
patient’s progress through the decision-tree where at every chance node, the next step in the
simulated progression is determined randomly (subject to the probabilities of each pathway and
is therefore akin to the “flipping of a weighted coin”).[66; 84] The walk terminates when a
terminal node is reached, at which point the cost associated with the entire simulated path is
calculated.[84] The process is best thought of as the clinical course for a single patient, subject
to the ultimately random developments of each treatment event. This process is repeated such
that following n trials, an average of n total per-patient costs is calculated (i.e. along with
standard deviation and minimum/maximum total per-patient cost values). A final technical point

- 73 -
is that in this CMA, each trial really consists of two random walks, where a simulated walk
through the Alternative treatment pathway is always compared against a walk through the
Standard treatment pathway. In the TreeAge Pro® modelling software, a random-number
generator is used to facilitate every random walk.[84] To reiterate and to emphasize the
interpretation of the microsimulation process is that summary statistics can be generated for a
cohort of n individuals that are simulated as having ‘walked through’ the decision-tree model,
subject to the unknown or random outcomes at each chance node.[66; 88] By contrast
probabilistic sensitivity analysis is a form of cohort analysis (since it consists of a series of n
trials where the EV for the entire model is determined for each trial). In this manner,
microsimulation, as compared to the probabilistic sensitivity analysis, may provide a more
intuitive analysis of the decision-tree; where hospital administrators may be able to model out
the costs of delivering SLNB-involved axillary staging as compared to ALND-only services for
a specific or an anticipated size of a group of ESBC patients. For instance, an administrator at a
smaller community hospital might choose to run a microsimulation and set n = 25; modelling
out the costs of a small cohort of 25 patients that she knows represents a good approximation of
the number of ESBC patients treated at her hospital each year. With this idea of approximating
case volumes in mind, microsimulation trials with n set equal to 25, 50, 75, 100, and 125 were
completed as part of this added evaluation of The Model (see results section).
The manner in which microsimulation trials have been used to evaluate The Model as
part of this CMA is not what is customarily seen in the literature.[86; 87; 93] Microsimulation
methods are generally used to explore first-order uncertainty (i.e. the variability between
individuals) and are therefore reserved to studies that draw patient-level input parameters from a
distribution or table of values.[66] To be clear, traditional microsimulation involves randomly
assigning one or more input parameters (e.g. Age) to the ‘patient’ that is to be ‘walked through’
the decision-tree. Based on this value, the chance node probabilities would vary within a

- 74 -
predefined relationship between a given node and the input value (e.g. for illustrative purposes
only: the probability of all-cause mortality increases by 10% with each five-year increase in the
Age input parameter within a survival model). Microsimulation is also often used when a model
has Markov states that have transition probabilities that depend on the previous Markov state
occupancy (e.g. for illustrative purposes only: the probability of entering the death absorbing
state is higher if a patient’s CD4 count falls in a HIV-based population survival model).[11; 81]
Since the decision-tree model that has been constructed for this cost-minimization analysis does
not employ any input parameters and uses Markov states that are assumed to be temporary and
mutually exclusive, there would appear to be no need for conducting a microsimulation analysis.
While the intuitive argument for performing microsimulation has been provided above, the use
of this modelling technique may also be justified when one reconsiders the nature of the data
used to populate the The Model.
All of the probabilities within The Model that serve as point estimates for the branch
probabilities at each chance node and transitional probabilities within each Markov process were
taken from published randomized controlled trials (RCTs).[38; 39; 44; 45] As discussed
previously, the parameter estimates taken from these trials are subject to a degree of stochastic
uncertainty, some of which must constitute the variability between individuals within the trial.
Since microsimulation is a technique meant to quantify this intra-cohort variability, it may
therefore be reasonable to run microsimulations that, while based on a series of random pathway
selections at each chance node, also draw upon the probability distributions of these point
estimates during the simulated random walk through the decision-tree model (i.e. this is akin to
randomly drawing a weighted coin from a bucket of possible coins – the bucket represents a
given chance node’s associated probability distribution – and then flipping the chosen weighted
coin to determine the next step in the decision-tree pathway). The overall effect of this type of
evaluation is one where microsimulation techniques are combined with those normally reserved

- 75 -
for a standard probabilistic sensitivity analysis (i.e. the act of using a probability distribution to
quantify the uncertainty in the point estimate). While this is certainly a rare method of
evaluating and analyzing a decision-tree model, it is not totally without precedent,[88] and
based on the above discussion, is justified at a conceptual level. The end result of this analysis is
that in addition to determining an EV for The Model and describing the uncertainty with
summary statistics generated by means of a standard probabilistic sensitivity analysis (PSA), a
second evaluation was completed that generated similar statistical values by means of a
unconventional use of Monte Carlo microsimulation.
F. Justification of the initial SLNB capital investment
A simplifying assumption of this cost-minimization analysis has been that the cost of the
hand-held gamma probe represents the bulk of the capital investment required to provide the
SLNB surgical service at a given Ontario hospital (see Background chapter).[51] It has been
further argued that the SLNB-related total and average cost functions would prove to be less
costly than the ALND-associated functions once a certain threshold number of ESBC patients
(Q*) were treated (see Figures 3a and 3b, and Appendix A). Finally, it was proposed that this
threshold case-volume value could be determined if estimates of the initial SLNB capital
investment (TCi) and SLNB and ALND marginal costs (MCS and MCA, respectively) could be
derived, as indicated by Equation 3 (see Appendix A). An ‘add-hoc’ analysis was therefore
undertaken, employing microsimulation methods and the constructed decision-tree model (see
Figure 11 in Results chapter), in order to estimate the number of cases (Q*) required to justify
the SLNB capital investment.
A cohort of n = 125 microsimulation trials of The Model was completed. The total
treatment cost for each simulated ‘patient’ were recursively added to one another, effectively
keeping a running total of simulated costs associated with treating 125 consecutive ESBC

- 76 -
patients at an Ontario hospital. By plotting these costs against the number of cases, approximate
total cost functions for both the SLNB and ALND-associated treatment pathways were
constructed (see Figure 20 in the Results chapter). These plots proved to be linear, allowing for
the determination of trendline equations for each total cost function. The trendlines’ slopes (i.e.
equivalent to the marginal costs) were determined along with the intercepts (i.e. in the case of
the SLNB total cost function, intercept = TCi, see Equation 2 in Appendix A). Using these
simulated values as estimates of the values in Equation 3, a value for Q* was determined.
While the intercept generated by the trendline equation for the simulated SLNB-
associated total cost function provides an estimate of TCi (referred to as ‘1st-TCi’ in the
discussion that follows) it is not one that can be easily validated since transparency as to the
exact manner by which equipment or capital investments are accounted for in the OCCI
database is lacking.[62] A second estimate of TCi (hereafter referred to as ‘2nd-TCi’) was
therefore generated from separate sources for two reasons; first as an attempt to determine the
validity of the above ‘add-hoc’ analysis by comparing the two TCi estimates; and second in
order to generate a second estimate of Q* using the previous marginal cost estimates and
Equation 3.34 Specifically, a quick internet search was conducted and confirmed that there are a
number of SLNB hand-held gamma probes on the market35, ranging in price from $18,400 to
$25,000 USD.[95] Conservatively, the CDN/USD exchange rate was approximated at $1 CDN
= $0.75 USD, and the higher price was used as an estimation of the cost of a new gamma probe,
therefore; $25,000 USD / 0.75 = $33,000 CDN, which was rounded to $35,000 to account for
taxation and to simplify the calculations that follow.
34 The reason to generate a second estimate of Q* is to simply provide a range consisting of two Q* estimates within which it is expected the ‘true’ Q* value may lie. 35 Navigator probe, USSC, RMD Waterton, MA; C-Track, Care Wise Medical Products Corp., Morgan Hill, CA; Neoprobe, Ethicon Endo-Surgery, Johnson & Johnson, Cincinnati, OH.[94]

- 77 -
Capital costs (i.e. equipment costs) are generally not accounted for as lump sums on a
balance sheet during the year of their purchase, rather these assets are subject to depreciation
(i.e. loss of value over time) such that the cost of the capital outlay is recorded as a function of
the depreciated value and the opportunity cost36 of having spent that capital.[11] While there are
many ways of depreciating assets, for the purposes of this exercise, a straight-line (i.e. equal
annual amounts) depreciation schedule was adopted, with the other assumptions being that the
equipment has a five-year shelf life and no-resale value, and that all calculations are subject to
an annual interest rate of 3%.[11] Thus, Table 4 displays how the ‘equivalent annual cost’, E,
for the $35,000 gamma probe was calculated, using the following equation, where;
E = NPV / AF5 at 3% (Eq. 6)
and NPV refers to ‘net present value’ and equals the cumulative sum of the discounted annual
depreciation and opportunity cost of the capital in question, while AF5 at 3% refers to an annuity
factor (of five years at a 3% interest rate) which is a constant that can be read directly from
publicly available annuity tables (note: AF5 at 3% = 4.5797).[11] The equivalent annual cost, E,
serves as the second TCi estimate, or 2nd-TCi, and was then plugged into Equation 3 (see
Appendix A) in order to provide a second estimate for Q*.
Table 4: A summary of the values and calculations used to calculate the equivalent annual cost, E, for a new SLNB hand-held gamma probe.
Year 1 2 3 4 5Straight line depreciation value 7,000.00$ 7,000.00$ 7,000.00$ 7,000.00$ 7,000.00$
Undepreciated value at start of year 35,000.00$ 28,000.00$ 21,000.00$ 14,000.00$ 7,000.00$ Opportunity cost 1,050.00$ 840.00$ 630.00$ 420.00$ 210.00$
Depreciation + Opportunity cost 8,050.00$ 7,840.00$ 7,630.00$ 7,420.00$ 7,210.00$ Annual present value (aPV) 7,815.53$ 7,389.95$ 6,982.53$ 6,592.57$ 6,219.41$
Net present value (sum of aPVs) AF(5yr; 3%) Discount rate35,000.00$ Constants: 4.5797 3.0%
Equivalent Annual Cost (E) = 7,642.42$
36 Opportunity cost is the value of the monetary benefits that could have been achieved had the capital been invested elsewhere.[11] For the purposes of this exercise the opportunity cost is being calculated on an annual basis using a 3% rate of return.

- 78 -
3. Summary of methods
Decision-analysis modelling was undertaken in order to carry out a cost-minimization
analysis of competing axillary surgeries for staging ESBC. A decision-tree model, with
imbedded Markov processes, was constructed and populated with probabilities identified by
means of a comprehensive literature review. Average costs of different treatment events within
the decision-tree model were obtained from a publicly accessible case-costing database. The
methods used to evaluate the model and to quantify uncertainty were outlined, with particular
emphasis being placed on the Monte Carlo methods of probabilistic sensitivity analysis and
microsimulation.

- 79 -
III. RESULTS 1. Overview
The Results chapter is divided into two general sections. The first part addresses the
results of the comprehensive literature review and the use of those findings to finalize the
structure and programming of the decision-tree model (i.e. hereafter also referred to as ‘The
Model’). The final costing data is also presented in the first section of this chapter. The second
part of the chapter concerns the evaluation of The Model including a formal analysis of model
uncertainty by means of a probabilistic sensitivity analysis. The second section also includes the
results of the somewhat novel methods for evaluating a decision-tree model; involving a series
of microsimulation trials and an ‘add-hoc’ analysis meant to determine an approximation of the
minimum volume of patients needed to justify a SLNB-related capital investment.
2. Comprehensive literature review
A. Search results and the critical appraisal
The MEDLINE and EMBASE search strategies identified 48 and 60 article titles for
review, respectively. Fifty-eight of the 108 titles were immediately identified as fulfilling one or
more of the exclusion criteria, leaving 50 abstracts for review. A review of these abstracts
eliminated all but sixteen studies; fifteen of which were identified in both the EMBASE and
MEDLINE databases [24; 38; 39; 41; 45; 63; 64; 82; 94; 96-101] and a single article that was
identified only by the EMBASE search.[102] The full manuscripts for each of these sixteen
studies were reviewed and evaluated in terms of strict adherence to the inclusion criteria (see
page 38). Four manuscripts were eliminated for not meeting all of the inclusion criteria; the first
being a meta-analysis by Kim et al.,[63] which is a systematic review of SLNB technical results
(i.e. SLNB failure rate, SLNB FNR, SLN positivity, etc.) and does not report any morbidity
data; whereas both the second (Goyal et al.)[99] and third (Olson et al.)[64] articles were

- 80 -
concerned with morbidity differences between groups of patients undergoing immediate
completion ALND versus a delayed completion ALND for positive SLNs. The study by Goyal
et al., is a secondary analysis of a subgroup of patients from the ALMANAC trial37 whereas the
work by Olson et al., represents a similar analysis of patients taken from the ACOSOG Z0010 &
Z0011 trials38.[64; 99] Both of these studies were discarded because they address a subgroup of
ESBC patients whom have already been self-selected because they have been found to have
positive SLNs, which is a more narrowly defined group of ESBC patients and not the ESBC
cohort that is of interest to this CMA (see ‘Target Population’, page 30). A fourth article
published by Madsen et al. was similarly eliminated from further review because the
comparison of SLNB and ALND patients was stratified by node positivity, effectively creating
four groups across which comparisons were made, groups that reflected treatment algorithms
that ultimately did not match the Alternative or Standard pathways depicted in Figures 8 and
9.[100]
The SLNB and ALND-related morbidity data of the remaining twelve articles was
extracted and tabulated and the articles were critically appraised by assigning bias grades. Hand-
searching of the bibliographies of this initial cohort of 12 articles identified an additional 23
article titles that were initially thought to meet the inclusion criteria (hereafter referred to as the
‘hand-search’ articles). A review of the 23 hand-search abstracts revealed seven retrospective
ALND versus SLNB comparisons, and three other studies that also met exclusion criteria; one
article was the 2005 ASCO guidelines published by Lyman et al.,[14] a narrative complement to
the earlier discarded meta-analysis by Kim et al.;[63] a second study proved to be a review of
the quality of life following breast cancer surgery in general;[103] and a third article reported
the technical results in using SLNB in a population of patients with T3 (>5cm) tumours.[68]
37 The Axillary Lymphatic Mapping Against Nodal Axillary Clearance trial.[17] 38 The American College of Surgeons Oncology Group trials.[17]

- 81 -
The manuscripts of the resulting thirteen hand-search articles were reviewed and another three
studies were identified as not meeting inclusion criteria; the first being the publication by Wilke
et al. of the results from the ACOSOG Z0010 trial,[81] which was a large prospective multi-
institutional observational study of SLNB patients that was discarded as there was no
comparison to an ALND cohort. The second, in this latest triad of articles to be discarded, was
the publication by Lucci et al. of the results of ACOSOG Z0011 trial, a study meant to measure
mortality and morbidity differences between SLN-positive patients who undergo further ALND
or are just observed [104] (i.e. fundamentally not the population of interest for the CMA given
that all patients were node-positive). Finally, a publication of the initial technical results from
the Australia- and New Zealand-based Sentinel Node versus Axillary Clearance (SNAC) RCT,
was set aside since no morbidity data were reported within the publication.[105] Just as had
been done with the ‘original’ twelve articles identified in this review, the morbidity data was
extracted from the remaining hand-search articles and all ten were critically appraised by
evaluating the degree of reporting bias.[40; 43; 46; 83; 89; 104; 106-110] Of the final 22
publications there were four pairs and one triad of articles that were found to report on the same
underlying patient cohort.39 The results of these ‘redundant’ articles were combined and
reported together under the following single headings (see Tables 5 and 6); ‘the ALMANAC
trial’,[24; 46] ‘the GIVOM trial’,[38; 45] ‘the Milan study’,[40; 41] ‘a Dutch study’,[96-98] and
‘a Finnish study’.[106; 107] The final tally of 22 publications reporting on 16 distinct patient
cohorts, were analyzed in order to characterize the types and relative frequencies of SLNB and
ALND complications (see Table 5). Table 6 below outlines the results of the critical appraisal.
39 Although the results reported between studies were gathered from the same underlying cohort of patients, the actual data that was reported was somewhat different, usually in terms of the length of follow-up data being reported [40; 41; 96-98] or the reporting of additional quality of life data.[24; 38; 45; 46]

- 82 -
Table 5: A summary of all the articles identified by the comprehensive literature review and included for critical appraisal.
No. Referenced Study Year Study TypeCentre
(n)N
Patient population
Study Group (n) Control Group (n)SLNB
procedure
Level of
ALND
Primary Outcomes
Secondary Outcomes
Morbidities Assessed
Methods of Assessment
Follow-up interval
(months)
Significant Results; study vs. control (time points in months)
1The GIVOM trial (Zavagno et al.)
2008 RCT; 2 armsMulti (18)
677ESBC; T<3cm; age<80yrs
SLNB only & SLNB + cALND (for +ve SLNs) (336)
SLNB + immediate cALND (341)
LPhoScin; isotope
I - III DFSOS, morbidity, QoL
QoL; Lymph; sROM; Para; Pain
P/E, measurement protocols, valid Q&A
6, 12, 18, 24decr. Lymph (6, 12); decr. Para (all); incr. sROM (6); incr. QoL (6, 12, 18); decr. Pain (6)
2The NSABP B-32 (technical results)
2007 RCT; 2 armsMulti (80)
5611 ESBC; no menSLNB only & SLNB + cALND (for +ve SLNs) (2804)
SLNB + immediate cALND (2807)
LPhoScin; blue dye + isotope
I - IIIOS, DFS, ax recurrence, morbidity
Technical; FNR, SLNid
Anaphylaxis NOSPeri-
operativeN/A
3The ALMANAC trial (Mansel et al.)
2006 RCT; 2 armsMulti (11)
991ESBC; age<80yrs
SLNB only & SLNB + cALND or AxRad (for +ve SLNs) (495)
ALND or 4-NS (496)
LPhoScin; blue dye + isotope
I - III & 4-NS
Morbidity, QoL
Ax recurrence
QoL; Axiety; Lymph; sROM; Para; pain; WI
P/E, measurement protocols, Q&A
1, 3, 6, 12, 18
decr. Lymph (all); decr. Para (all); decr. pain (1, 3, 12); incr. sROM (1, 3); incr. QoL (all)
4A Cambridge study (Purushotham et al.)
2005 RCT; 2 armsMulti (3)
298 ESBC; T<3cmSLNB only & SLNB + cALND (for +ve SLNs) (143)
ALND (155)blue dye + isotope
I - II Morbidity NOSPara; Lymph; sROM; AxS
P/E, measurement protocols
1, 3, 6, 12decr. Lymph (all); decr. Para (all); incr. sROM (12); incr. QoL (1)
5The Milan study (Veronesi et al.)
2003 RCT; 2 arms Single 516ESBC; T<2cm; age 40-75yrs; BCS only
SLNB only & SLNB + cALND (for +ve SLNs) (259)
SLNB + immediate cALND (257)
LPhoScin; isotope
I - III PPV of SLNBMorbidity, DFS, OS, ax recurrence
Pain; Para; sROM; Lymph
P/E, non-valid Q&A
6, 24No tests of significance provided for morbidity comparison between groups
6A Swiss study (Langer et al.)
2007Prospective, cohort
Multi (13)
635 ESBC; T<3cm SLNB only (431)SLNB + cALND (for +ve SLNs) (204)
blue dye + isotope
I - II MorbidityAx recurrence
AxS; WI; Pain; Para; Lymph; sROM
P/E, measurement protocols, non-valid Q&A
0 - 62decr. Lymph (all); incr. sROM (all); decr. Pain (all); decr. Para (all)
7A French study (Barranger et al.)
2005Prospective, cohort
Single 115 ESBC; BCS only SLNB only (54)ALND (+/- prior SLNB) (61)
blue dye + isotope
I - IIMorbidity, QoL
NOSQoL; pain; Para; Lymph
Telephone Q&A 10 - 31decr. Pain (overall); decr. Para (overall); decr. Lymph (overall)
8A Dutch study (Rietman et al.)
2004Prospective, cohort
Multi (2)
204 ESBC SLNB only (66)ALND & SLNB + cALND (for +ve SLNs) (138)
LPhoScin; blue dye + isotope
I - IIMorbidity and ADLs
Predictors of morbidity
Pain; sROM; Para; Lymph; ADLs; strength
P/E, measurement protocols, valid Q&A
1.5, 12decr. Pain (12); incr. sROM (12); decr. Para (12); decr. Lymph (12);
9A Finnish study (Ronka et al.)
2004Prospective, cohort
Single 83 ESBC SLNB only (43)SLNB + cALND (for +ve SLNs) (40)
LPhoScin; blue dye +/- isotope
I - II MorbidityImpact on daily life
Lymph; sROM; life-interference; Para; pain
P/E; measurement protocols
1, 3, 6, 12incr. sROM (1, 12); decr. Pain (12); decr. Para (12); decr. Lymph (12)
10Mayo Clinic study (Blanchard et al.)
2003Prospective, cohort
Single 776 ESBC; pN0 only SLNB only (685)SLNB + cALND (for surgeon training) (91)
LPhoScin; blue dye + isotope
NOS MorbidityAx recurrence, survival
Lymph; WI; AxS; pain
Mail and phone Q&A
18 - 40decr. Lymph (overall); decr. Pain (overall); decr. WI & AxS
11An Austrian study (Peintinger et al.)
2003Prospective, cohort
Single 56ESBC; age 18-80yrs; BCS only
SLNB only (25)SLNB + cALND (for +ve SLNs) (31)
blue dye + isotope
I - IIMorbidity, QoL
NOSPain; sROM; Para; QoL
Valid Q&A 0.25, 9-12decr. Pain (9-12); incr. sROM (all); decr. Para (all);
12A Minnesota trial (Swenson et al.)
2002Prospective, cohort
Multi (2)
247 ESBC SLNB only (169)SLNB + cALND (for +ve SLNs) (78)
blue dye + isotope
I - II Morbidity NOSLymph; Para; pain; sROM; AxS; WI
Mailed non-valid Q&A
1, 6, 12incr. sROM (1, 12); decr. Pain (1, 6); decr. Para (1, 6, 12); decr. AxS (1); Lymph (6, 12)
13MSKCC study (Temple et al.)
2002Prospective, cohort
Single 233ESBC; age>18yrs; BCS only
SLNB only (171)SLNB + cALND (for +ve SLNs) (62)
NOS I - II Morbidity NOSLymph; Para; pain
Measurement protocols, valid Q&A
3, 6, 12 decr. Para (all); decr. Pain (all);
14Ohio State Univ. (Burak et al.)
2002Prospective, cohort
Multi (2)
96ESBC; T<4cm; BCS only
SLNB only (48)SLNB + cALND (training, failed & +ve SLNs) (48)
blue dye + isotope
I - II MorbidityReturn to work
Lymph; Para; pain; WI; return to work
P/E, measurement protocols, valid Q&A
8 - 29decr. Para (overall); earlier return-to-work; decr. Lymph
15Northwestern Univ. (Sener et al.)
2001Prospective, cohort
Single 420 ESBC SLNB only (303)SLNB + cALND (for +ve SLNs) (117)
LPhoScin; isotope
I - II Morbidity NOS LymphP/E, non-valid Q&A
1 - 15 decr. Lymph (overall)
16An Austrian study (Schrenk et al.)
1999Prospective, cohort
Single 70 ESBC; pN0 only SLNB only (35) ALND only (35)LPhoScin; blue dye +/- isotope
I - II Morbidity NOSLymph; AxS; Para; pain; sROM
P/E; measurement protocols
4 - 28decr. Lymph (overall); decr. Para (overall); decr. Pain (overall)
RCT=randomized clinical trial; ESBC=early-stage breast cancer; T=tumour; cALND=completion ALND; LPhoScin=lymphoscintigraphy; DFS=disease-free survival; OS=overall survival; QoL=quality of life, Lymph=lymphedema; sROM=shoulder range of motion; Para=paraesthesia; P/E=physical exam; Q&A=questionnaire; NOS=not otherwise specified; BCS=breast conserving surgery; ax recurrence=axillary recurrence; ADLs=activities of daily living; pN0=pathologically node-negative disease; WI=wound infection; AxS=axillary seroma; decr.=decreased; incr.=increased; 4-NS=four node sampling; N/A=not available

- 83 -
Table 6: A summary of the critical appraisal results of those articles identified by the comprehensive literature review.
No. Referenced StudyPreoperative
morbidity assessment
Follow-up int.
(months)
Selection Bias Score
CommentsPerformance
Bias ScoreComments
Attrition Bias Score
CommentsDetection Bias Score
CommentsOverall
Bias Grade
Conclusion Final comments
1The GIVOM trial (Zavagno et al.)
None6, 12, 18,
24Minimal
Centralized and rigorous randomization; similar patient groups
MinimalProtocolized treatments
Minimal10% of pts LTFU at 18 mo.
ModerateNo pre-op. assessment
LOW INCLUDEPatient cohort resembles clinical reality; extensive morbidity data; rates calculated from odds ratios; ITT analysis
2The NSABP B-32 (technical results)
NonePeri-
operativeMinimal
Centralized and rigorous randomization; similar patient groups
MinimalExtensive protocolized treatments
MinimalNo lost data regarding anaphylaxis
MinimalNo protocol needed to dx. anaphylaxis
LOW INCLUDEStudy included only for anaphylaxis data; is the 'gold-standard' for defining branch probabilities; ITT analysis
3The ALMANAC trial (Mansel et al.)
P/E, measurement protocols, Q&A
1, 3, 6, 12, 18
MinimalCentralized and rigorous randomization; similar patient groups
MinimalProtocolized treatments
Moderate10-15% of pts LTFU at 12 mo. but equal btwn groups
MinimalPre-op. assessment done
LOW INCLUDEApprox. 25% of 'ALND' pts had 4-NS (effectively deflates ALND morbidity); extensive morbidity data; ITT analysis
4A Cambridge study (Purushotham et al.)
P/E, measurement protocols, Q&A
1, 3, 6, 12 ModerateRandomization protocol, but done by a study investigator
MinimalProtocolized treatments
Minimal5% of pts LTFU at 12 mo.
MinimalPre-op. assessment done
LOW INCLUDESome of the morbidity data reported by changes in mean score (not rates) and therefore cannot be used in CMA
5The Milan study (Veronesi et al.)
None 6, 24 MinimalCentralized and rigorous randomization; similar patient groups
MinimalSingle-centre; protocolized treatments
UnclearMorbidity sub-group analysis was done
ModerateNo pre-op. assessment
MEDIUM EXCLUDEA subgroup of the cohort was selected for morbidity analysis; no significance tests in morbidity analysis
6A Swiss study (Langer et al.)
P/E, measurement protocols, Q&A
0 - 62 SignificantInherent treatment selection bias since larger, aggressive tumours get ALND
MinimalSingle-centre; protocolized treatments
MinimalLess than 5% of pts LTFU at 24 mo.
MinimalPre-op. assessment done
HIGH EXCLUDEResults are not given by discreet follow-up intervals; median follow-up > 1 year;
7A French study (Barranger et al.)
None 10 - 31 SignificantInherent treatment selection bias since larger, disimilar patient groups
MinimalSingle-centre; protocolized treatments
UnclearNot a continuous cohort of pts; LTFU not mentioned
SignificantNo pre-op.; assessments done by phone
HIGH EXCLUDENo ITT analysis possible since pts with cALND for +ve SLNs make up the ALND cohort
8A Dutch study (Rietman et al.)
Measurement protocols
1.5, 12 SignificantInherent treatment selection bias since larger, aggressive tumours get ALND
MinimalProtocolized treatments
MinimalLess than 10% of pts LTFU at 12 mo.
MinimalPre-op. assessment done
HIGH EXCLUDENo ITT analysis possible, exemplifying the selection treatment bias
9A Finnish study (Ronka et al.)
P/E, measurement protocols, Q&A
1, 3, 6, 12 ModerateSmall consecutive patient cohort; patients groups well matched despite non-RCT
MinimalSingle-centre; protocolized treatments
MinimalNo patients reported LTFU
MinimalPre-op. assessment done
LOW EXCLUDEDespite low bias grade study results will not be used due to small sample size and availability of data from larger RCTs
10Mayo Clinic study (Blanchard et al.)
None 18 - 40 SignificantInherent treatment selection bias since larger, aggressive tumours get ALND
MinimalSingle-centre; protocolized treatments
Moderate13% of patients LTFU by 12 mo.
SignificantNo pre-op.; recall bias likely
HIGH EXCLUDEResults may be useful for a discussion of longer-term post-operative data
11An Austrian study (Peintinger et al.)
Q&A 0.25, 9-12 ModerateSmall consecutive patient cohort; patients groups well matched despite non-RCT
MinimalSingle-centre; protocolized treatments
MinimalNo patients reported LTFU
MinimalPre-op. assessment done
LOW EXCLUDEAll results are reported in terms of mean Q&A scores and are therefore not useful in the decision-analysis model
12A Minnesota trial (Swenson et al.)
Q&A 1, 6, 12 SignificantInherent treatment selection bias since larger, aggressive tumours get ALND
MinimalProtocolized treatments
Moderate19% of pts LTFU at 12 mo.
ModeratePre-op. done, but recall bias likely
HIGH EXCLUDEThe study's table 1 shows significant differences btwn pt groups in terms of demographics and tumour characteristics
13MSKCC study (Temple et al.)
Q&A 3, 6, 12 SignificantInherent treatment selection bias since larger, aggressive tumours get ALND
MinimalSingle-centre; protocolized treatments
Moderate16% of pts LTFU at 12 mo.
ModeratePre-op. done, but recall bias likely
HIGH EXCLUDERegardless of high bias grade, the results are reported in terms of means (not frequencies or rates)
14Ohio State Univ. (Burak et al.)
None 8 - 29 SignificantInherent treatment selection bias since larger, aggressive tumours get ALND
MinimalProtocolized treatments
Minimal Only two pts LTFU SignificantNo pre-op.; assessed at diff. F/U time
HIGH EXCLUDENotwithstanding high bias grade, study mean follow-up period falls outside of 12 mo. analytic horizon
15Northwestern Univ. (Sener et al.)
P/E, measurement protocols
1 - 15 UnclearLarge consecutive patient cohort, but non-RCT and typical Table 1 not provided
MinimalSingle-centre; protocolized treatments
UnclearContinuous cohort but pts LTFU not clear
MinimalPre-op. assessment done
MEDIUM EXCLUDENon-RCT study, but large cohort with focus being reporting of lymphedema; non-intervaled F/U
16An Austrian study (Schrenk et al.)
P/E, measurement protocols
4 - 28 ModerateSmall consecutive patient cohort; patients groups well matched despite non-RCT
MinimalSingle-centre; protocolized treatments
MinimalNo patients reported LTFU
MinimalPre-op. assessment done
LOW EXCLUDEDespite low bias grade, the post-operative results are combined not reported by interval
LTFU=lost to follow-up; mo.=month; dx.=diagnosis; Q&A=questionnaires; ITT=intention-to-treat analysis; Pre-op.=preoperative; pts=patients; CMA=cost-minimization analysis; cALND=completion ALND; RCT=randomized clinical trial; F/U=follow-up; diff.=different

- 84 -
As can be seen from the ‘Conclusion’ column in Table 6 above, the morbidity results
from only those studies considered to have a low risk of bias and to have provided data in
useable form (i.e. a proportion, relative risk, or odds ratio) were included for the purposes of
populating The Model. Brief descriptions of the content and of the data relevant to this analysis
from those publications marked for inclusion, are provided in the following sections.
i. The GIVOM trial
The morbidity data from the Gruppo Interdisciplinare Veneto di Oncologia Mammaria
(GIVOM) trial was retrieved from two publications, one authored by Zavagno et al.[45] and the
other by Del Bianco et al.,[38] both of which report the same morbidity data, but the latter
publication includes additional quality of life data. The morbidity rates from this trial were used
in this CMA for the following reasons: first, because the patient cohort and surgical protocols
closely reflect what is outlined in the most recent SLNB clinical practice guidelines;[14; 38; 45;
48] second, the authors reported complication rates with confidence intervals that could be used
to define the transition probabilities of the Markov cohorts within The Model; third, the trial
reports an extensive amount of morbidity data up to 24 months postoperatively (at six-month
intervals); and finally, the authors evaluated the relative frequencies of postoperative
complications of axillary surgery by treatment group on an intention-to-treat (ITT) basis. The
ITT approach ensures that the value of randomization (i.e. the minimization of bias) was
preserved40.[76] Moreover, the ITT perspective simplifies how the decision-tree model is
40 The ITT approach means that patients that were initially randomly allocated to a given treatment group remain in that treatment group for the purpose of analysis; thus preserving the presumed balancing of group characteristics achieved through randomization. This helps to ensure that any perceived differences in outcome may be attributable to the interventions under study as opposed to shared characteristics (i.e. either disease-related or demographic) within one of the groups.[76] By way of example, if in the GIVOM trial, patients in the SLNB-arm who underwent a completion ALND following a SLNB (i.e. either intraoperatively due to failure to localize a sentinel lymph node (SLN) or at a later date due to a positive SLNB) had been grouped during the analysis of the trial data with the patients in the ALND-arm; then the reported morbidity rates within the ALND group may have been falsely elevated due to the bias of introducing patients with abnormal axillary anatomy (i.e. more likely to result in a failed SLN localization) and more advanced disease (i.e. more likely to have positive SLNs).[38; 45]

- 85 -
populated with treatment uncertainties and morbidity rates. To be clear, The Model subtrees of
both competing pathways reflect the SLNB and ALND-associated treatment protocols of the
GIVOM trial, therefore the trial’s SLNB and ALND morbidity rates can be uniformly applied to
the Markov states at the terminal ends of the model branches, within each competing subtrees
(see Figure 11). In other words, The Model is also evaluating ALND and SLNB costs on an ITT
basis since beyond the initial decision node there is no crossover between the subsequent
subtrees. This avoids having to find trials of specific patient subgroups (e.g. delayed vs.
immediate completion ALND) to match the subtrees within The Model, and also reduces model
uncertainty by reducing the number of trials needed to populate the decision-tree.[66] The
morbidity rates, as reported in the GIVOM trial publications, are reproduced in Table 7
below;[38; 45] the p-values from the Chi-square (Χ2) tests of significance (as reported by the
trial authors) are included only for the sake of completeness, since even morbidity rates that
were not significantly different would still have been included in the decision-analysis model
due to the need to populate the branch probabilities and Markov states.
ii. The Cambridge study (Purushotham et al.)
This was a moderately sized (N=298), U.K.-based three-centre RCT that, like the
GIVOM trial, evaluated patients with primary tumours less than 3cm, subjected to either a
SLNB or ALND for axillary staging.[39] Furthermore, the general trial protocols of the two
studies were very similar, including an analysis of the results on an ITT basis. Although
Purushotham et al., calculated and reported postoperative morbidity in terms of mean scores of
measurements, and did not report on axillary pain or paraesthesia whatsoever, the authors did
report the proportions of patients who developed axillary seromas.[39] Due to the concordance
between the GIVOM and Cambridge studies in terms of the underlying patient populations and

- 86 -
treatment protocols, the axillary seroma data from the Cambridge study (see Table 8 below) was
included in The Model.
iii. The ALMANAC trial
The Axillary Lymphatic Mapping Against Nodal Axillary Clearance (ALMANAC) trial,
was a large, U.K.-based, multi-centre randomized clinical trial that reported extensive morbidity
data as part of a comparison of different types of axillary staging procedures for ESBC.[24; 46]
The plethora of morbidity data could not be included in this cost-minimization analysis
however, since the study’s treatment protocols differed fundamentally and significantly from
Canadian practice patterns and the most recently published North American clinical practice
guidelines.[14; 15; 48; 51] The ‘control’ or ALND group in the ALMANAC trial consisted of a
large cohort of patients who received either an extensive level I-III ALND or axillary four-node
sampling (4-NS).[24; 46] Four-node sampling involves the resection of the first four lymph
nodes encountered in the axilla, without the aid of any localization process, and has served as an
accepted axillary staging procedure in early-stage breast cancer in some parts of the United
Kingdom.[17; 20; 21] In the ALMANAC trial approximately 25% of patients in the ALND
group underwent 4-NS, potentially under-representing the true morbidity of the ALND cohort as
it is a less-invasive procedure than a standard ALND.[20; 21; 24; 46] Furthermore, in the SLNB
group, patients who were found to have positive SLNs were offered either a completion ALND
or a course of axillary radiation;[24; 46] which is not recommended standard treatment for
axillary metastases according to either Cancer Care Ontario (CCO)[18; 48] or the American
Society of Clinical Oncology (ASCO).[14] Consequently, despite being a source of extensive
morbidity data, the published results of the ALMANAC trial were not included in the final
decision-analysis due to questions regarding the use of non-standard protocols and the difficulty
of being able to estimate how either 4-NS or axillary radiation might influence the ‘true’

- 87 -
probability of postoperative complications within cohorts of patients subject to either the ALND
or SLNB procedures.
iv. Technical results of the NSABP B-32 (Krag et al.)
The NSABP B-32 is a large, ongoing, North American-based multi-centre phase-III
randomized clinical trial comparing the use of SLNB and ALND axillary staging procedures in
patients with early-stage invasive breast cancer.[43; 111] The trial involves over 230 surgeons
across 75 participating institutions and more than 5500 clinically node-negative patients who
were randomized to receive either a SLNB followed by an immediate level I-II ALND or a
SLNB followed by an ALND only in the setting of failure to identify a SLN(s) or a positive
SLN(s) (by either intraoperative or final pathological examination).[43; 44; 112]
Krag et al., reported as part of the trial’s initial technical results, a 2.8% (2.4 – 3.3%)
SLNB failure rate, an intraoperative positivity rate of 16.2% (14.8 – 17.6%), and an
intraoperative FNR of 11.9% (10.5 – 13.2%).[44] The 95% confidence intervals were
determined from subgroup sample sizes and the assumption that the variance of this large
sample of patients was normally distributed.[43; 113] Due to the methodological quality and the
size of the NSABP B-32 it was anticipated that the three percentages just mentioned (which
correspond to the W%, X%, and Y% labels in Figure 8) would be used to define the
corresponding decision-tree branch probabilities. However, given that the GIVOM trial is the
source of the majority of postoperative morbidity data being used in this model, an opportunity
to use the treatment uncertainty results from the GIVOM trial to also define the branch
probabilities was explored. As stated previously, minimizing the number of data sources to
define the majority of the variables in a decision-analysis model has the advantage of
minimizing the model uncertainty. The ‘substitution’ of the GIVOM for the NSABP B-32 trial
data to define the treatment uncertainty was therefore undertaken given that the SLNB failure

- 88 -
rate, intraoperative positivity rate and intraoperative false negative rate between the NSABP and
GIVOM trials were not significantly different based on a simple test for significance between
two independent sample proportions (see Table 9).[113] Furthermore, there was the added
advantage of having an estimate of the proportion of patients who refused delayed ALND
following an intraoperative false negative (iFNR) SLNB that could be gathered from the
GIVOM trial data (and was not available from the NSABP B-32 publication) and incorporated
into the decision-tree model.[45] Note that the overall axillary positivity rate depicted in Table 9
is not a value that is needed for The Model but is included here as a quick ‘visual check’ of the
similarity in the underlying cancer populations of the two trials.[38; 43; 45] Finally, the
likelihood of blue dye anaphylaxis, as determined from the NSABP B-32 trial is the sixth (and
final) complication rate used in the decision-tree (and has also been referred to as the treatment
uncertainty parameter labelled as V% in Figure 8), and is included below in Table 9 below.
B. Morbidity data
The list of SLNB and ALND complications, which was defined a priori (see page 39),
remained largely unchanged upon completion of the comprehensive literature review. The
majority of the articles under review addressed one or more of the seven a priori-listed
complications, however none of the sixteen reviewed studies measured all seven and no other
complications were consistently measured across different studies to warrant being added to the
list for consideration and incorporation into The Model. There was no study that met all of the
inclusion criteria as well as having a low risk of bias that reported rates of postoperative axillary
wound infections. Consequently, wound infection rates were not included in the final analysis,
leaving blue dye anaphylaxis and the formation of postoperative axillary seromas as the two
one-time complications and the development of axillary pain, paraesthesia, shoulder
dysmobility, and lymphedema as the four (Markov-modelled) recurrent complications.

- 89 -
Many of the articles that were reviewed did not report complications in terms of relative
frequencies or proportions; instead authors presented the mean or median morbidity ‘scores’
concerning a complication measured by a particular metric (e.g. mean arm volume change as
determined by circumferential arm measurements at 4cm intervals),[39] which could not be
converted to a rate for use in the decision-tree model. To reiterate, the GIVOM trial data was
used to populate the model’s Markov states (see Table 7)[38; 45] whereas, the publication of the
technical results of the NSABP B-32 trial provided the percentage of cases involving blue-dye
anaphylaxis among patients subject to SLNB (see Table 9),[43] and finally the results of a
smaller RCT, published by Purushotham et al., were used to define the probability of developing
a postoperative axillary seroma (see Table 8).[39] Note that in the Tables 7 – 9, the morbidity
rates are reported alongside their corresponding variable names, as defined in The Model.
Table 7: A summary of the probability of recurrent, short-term, postoperative complications following either SLNB or ALND; modelled with Markov states in the decision-tree model.

- 90 -
Te s t o f
S ign if ic a nc e
Pa in (p ro b _ Marko v _ Pa in )
% % p v a lu e
6 10 .2 % 6 .8 % 1 3 .6 % 1 8 .2 % 1 3 .9% 2 2 .5 % 0 .0 0 6
1 2 9 .2 % 6 .0 % 1 2 .4 % 1 1 .8 % 8 .2% 1 5 .4 % 0.3
1 8 7 .6 % 4 .6 % 1 0 .5 % 8 .9 % 5 .7% 1 2 .1 % 0 .5 5
2 4 8 .4 % 5 .0 % 1 1 .8 % 9 .3 % 5 .8% 1 2 .8 % 0 .7 3
Numb n e s s (p ro b _ Marko v _ Nu mb )
% % p v a lu e
6 21 .7 % 1 7 .1 % 2 6 .3 % 3 0 .3 % 2 5 .2% 3 5 .4 % 0 .0 1 6
1 2 12 .2 % 8 .5 % 1 5 .9 % 2 0 .7 % 1 6 .2% 2 5 .2 % 0 .0 0 4
1 8 6 .9 % 4 .0 % 9 .8 % 1 6 .6 % 1 2 .5% 2 0 .7 % 0 .00 0 2
2 4 8 .8 % 5 .1 % 1 2 .5 % 1 5 .0 % 1 0 .7% 1 9 .5 % 0 .0 3
S h o u lde r RO M (p ro b _ Marko v _ s RO M)
% % p v a lu e
6 7 .2 % 4 .3 % 1 0 .1 % 1 4 .0 % 1 0 .1% 1 7 .9 % 0 .0 0 5
1 2 5 .6 % 3 .0 % 8 .2 % 7 .3 % 4 .4% 1 0 .2 % 0 .3 3
1 8 3 .6 % 1 .5 % 5 .7 % 5 .7 % 3 .1% 8 .3% 0 .2 1
2 4 3 .2 % 1 .0 % 5 .4 % 7 .0 % 3 .9% 1 0 .0 % 0 .0 4
L y mph e d e ma (p ro b _ Ma rko v _ L y mp h )
% % p v a lu e
6 4 .1 % 1 .9 % 6 .3 % 9 .9 % 6 .5% 1 3 .3 % 0 .0 0 5
1 2 4 .3 % 2 .0 % 6 .6 % 8 .6 % 5 .4% 1 1 .8 % 0 .0 3
1 8 4 .6 % 2 .2 % 7 .0 % 7 .6 % 4 .7% 1 0 .5 % 0 .1 4
2 4 4 .4 % 1 .9 % 6 .9 % 8 .2 % 4 .9% 1 1 .5 % 0 .0 7
N o t es :
D escr ip t io ns o f mo r b id i t y assessment :
Pain: d eg r ee o f ax i l lar y o r ar m p ain, w as r ep o r t ed b y p at ient s and r eco r d ed o n a f o ur - p o int scale.
S o u rc e : th e G IV O M tr ia l (Z a v ag n o e t a l. & De l B ia n c o e t a l.)
S L NB G ro up ** A L ND Gro u p ++
9 5% CI 95 % CI
9 5% CI 95 % CI
9 5% CI 95 % CI
9 5% CI 95 % CI
**Pat ient s und er w ent SLN B w it h f ro zen sect io n examinat io n; a s t and ar d ( levels I- II) co mp let io n A LN D w as p er f o r med f o r a f ai led SLN B o r i f ei t her t he f r o zen sec t io n o r f inal p at ho lo g y w as p o s it ive ( t umo ur d ep o s it >0 .2 mm) f o r met as t at ic d isease.
(N = 3 0 4)
Mo rb id ity & F/U in te rv a l (Tre e A ge v a r iab le ) (N = 31 4 )
++Pat ient s und er w ent SLN B f o l lo w ed b y immed iat e s t and ar d ( levels I- II) A LN D .
Lymp hed ema: assessed b y co mp ar ing c ir cumf er ence o f t he ip s i lat er al ar m, measured 15cm ab o ve t he ep ico nd y le and co r r ec t ed f o r any chang es in t he co nt r alat er al ar m.
Th e p ro b a b ility o f rec u r r ing , p o s top e ra tiv e S L NB a n d A L ND c omp lic a tio ns
Sho uld er R O M : an assessment o f p ass ive and ac t ive mo vement o f al l sho uld er musc le g r o up s b y t he sur g eo n and g r ad ed o n a f o ur - p o int scale.
N umb ness : d eg r ee o f sk in sens it iv it y in and ar o und t he o p er at ive s i t e, as measur ed o n a f o ur - p o int scale b y t he sur g eo n.
Table 8: A summary of the percentages of patients who developed an axillary seroma in the immediate postoperative period following ALND and SLNB procedures, as reported in the Cambridge study and modelled with single subtree branch probabilities in The Model.
Test of
Significance
n % n % p value
20 14.0% 8.3% 19.7% 33 21.3% 14.6% 28.0% 0.1
Notes:
The probability of (one-time) postoperative axillary seroma formation following SLNB and ALND
SLNB Group** ALND Group++Morbidity, perioperative f/u only (TreeAge variable name)
**Patients underwent SLNB without frozen section examination; a standard (levels I-II) completion ALND was performed for a failed SLNB or if either the frozen section or final pathology was positive (tumour deposit >0.2mm) for metastatic disease.
Axillary Seroma (prob_ALND/SLNB_AxSeroma
++Patients underwent SLNB followed by immediate standard (levels I-II) ALND.
(N=143) (N=155)
Source: the Cambridge study (Purushotham et al.)
95% CI 95% CI

- 91 -
C. Treatment uncertainty
A secondary objective of the comprehensive literature review was to identify probability
values that would define treatment uncertainty, corresponding to the branch divisions in the
treatment pathways labelled in Figure 8. As discussed in the summaries of the GIVOM and
NSABP B-32 trial results the treatment uncertainties used in The Model were taken from the
former trial despite the latter trial being considered the ‘gold standard’.[38; 44; 45]
Table 9: A summary of the SLNB treatment uncertainties derived from the GIVOM and NSABP B-32 trial results.
Test of signficance
% N % N p value
SLNB Failure rate (prob_Failed_SLN_ID)
2.8% 2.4% 3.3% 5536 5.0% 3.4% 6.6% 697 NS
Intraoperative SLN positivity (prob_SLNB_IntraopPath_POS)
16.2% 14.8% 17.6% 2697 22.3% 17.8% 26.8% 328 NS
Intraoperative FNR (prob_SLNB_FinalPath_POS)
11.9% 10.5% 13.2% 2260 9.6% 5.9% 13.2% 251 NS
Refusal of completion ALND (prob_delayed_ALND_Refusal)
20.8% 4.6% 37.1% 24 N/A
Overall axillary positivity 27.7% 26.5% 28.9% 5316 30.0% 26.6% 33.4% 697 NS
Blue dye anaphylaxis (prob_Anaphylaxis)
0.66% 0.4% 0.9% 5588 *NS = not significant
N/A
Treatment Uncertainties (TreeAge variable name)
95% CI 95% CI
NSABP B-32 (Krag et al.) The GIVOM trial (Zavagno et al.)
i. Probability distributions
As described in the research methods sections, the published trial data was converted
into probability distributions for the purpose of being able to more accurately represent
parameter uncertainty. The Beta probability distributions used in the decision-tree model to
represent treatment uncertainty have been graphed and reproduced in Appendix C; however as
an example, the probability distribution for the variable that quantified the rate of failure to

- 92 -
identify a SLN during the SLNB is displayed in Figure 10 below.41 The name of the distribution
and its variable name within The Model programming is also labelled on Figure 10 below.
Figure 10: A probability distribution that describes the parameter uncertainty surrounding the probability of failing to identify SLNs during a SLNB; and is also an example of the probability distributions used to define chance nodes or branch probabilities that represent treatment uncertainty in the Alternative treatment pathway within The Model (see also Appendix C).
Probability distribution of failing to identify one SLN(Distribution name: prob_SLNid_Failure)
[Distribution type: Beta; Integer parameters; n = 697; r = 35; EV = 0.050]
0
0.05
0.1
0.15
0.2
0.025 0.035 0.045 0.055 0.065 0.075 0.085
Value of TreeAge variable: prob_Failed_SLN_ID
Pro
babi
lity
of s
elec
ting
a gi
ven
valu
e
A mean value of any probability distribution is labelled by TreeAge Pro® as the
expected value (EV) for that distribution, and is equal to the corresponding value taken from the
comprehensive literature review (see Tables 7 – 9). While the probability distributions EVs
serve as point-estimates in the roll-back analysis, for the probabilistic sensitivity analysis and
the microsimulation trials, point-estimates are randomly chosen from each variable’s
distribution (e.g. the point-estimate for the prob_Failed_SLN_ID variable is selected from the
prob_SLNid_Failure distribution).[84]
41 Note that the distribution was constructed using a TreeAge Pro® function that repetitive recalculates (i = 1000) the Beta probability density function that is customized by two inputs (i.e. n and r) taken from the published GIVOM trial results (and labelled on the graph, see Figure 10) in order to plot the distribution of probabilities.[84] Note that the mean value of the distribution (labelled as the expected value or EV on the graph) is equal to the value reported in the GIVOM trial results and serves as the point-estimate for the prob_SLNid_Failure variable in the standard roll-back analysis.

- 93 -
3. The Model
The final decision-tree model is displayed below as Figure 11. Brief descriptions of each
section of the treatment pathways sit above each branch in the decision-tree, whereas the
corresponding probabilities sit below the branches.42 While the majority of probability variables
are displayed in the figure, the cost variables were not shown because of space limitations; as
most of the cost variables are subject to lengthy calculations. The nested Markov structure (i.e.
Markov process) is marked by the two bold branches in Figure 11 and is cloned throughout the
tree; where a cloned Markov process is identical to the ‘master’ Markov process (and therefore
any change to the master structure is updated automatically in the cloned structures), and the
probabilities in each cloned Markov processes change depending on the clinical circumstances
being modelled (i.e. the Markov process imbedded within the Standard pathway subtrees is
populated with different transitional probabilities than those within the Markov processes
imbedded within the Alternative treatment pathway). The Standard pathway Markov process is
magnified in Figure 12 below. Note that the Markov process consists of an ‘inner’ Markov
cohort (the subtree with the five terminal nodes), which is cloned four times within the ‘outer’
Markov cohort (i.e. note the “Clone 1:” labels within the Markov cohort depicted in Figure 12).
The transition probabilities are defined by the ‘inner’ Markov cohort, thereby dictating the
transition from one Markov state to another, which are defined as part of the ‘outer’ cohort. The
cumulative cost functions are defined and calculated within the ‘outer’ Markov cohort as well.
As a means of verifying the validity of the Markov process, graphical representations of the
transitional probabilities and cumulative costs, along with tables of their underlying values were
produced and examined, and are reproduced in Appendix D.
42 Note that the ‘#’ sign is a TreeAge Pro® function that automatically calculates that branch probability as equal to 1 – the probability of the complementary branch.[84]
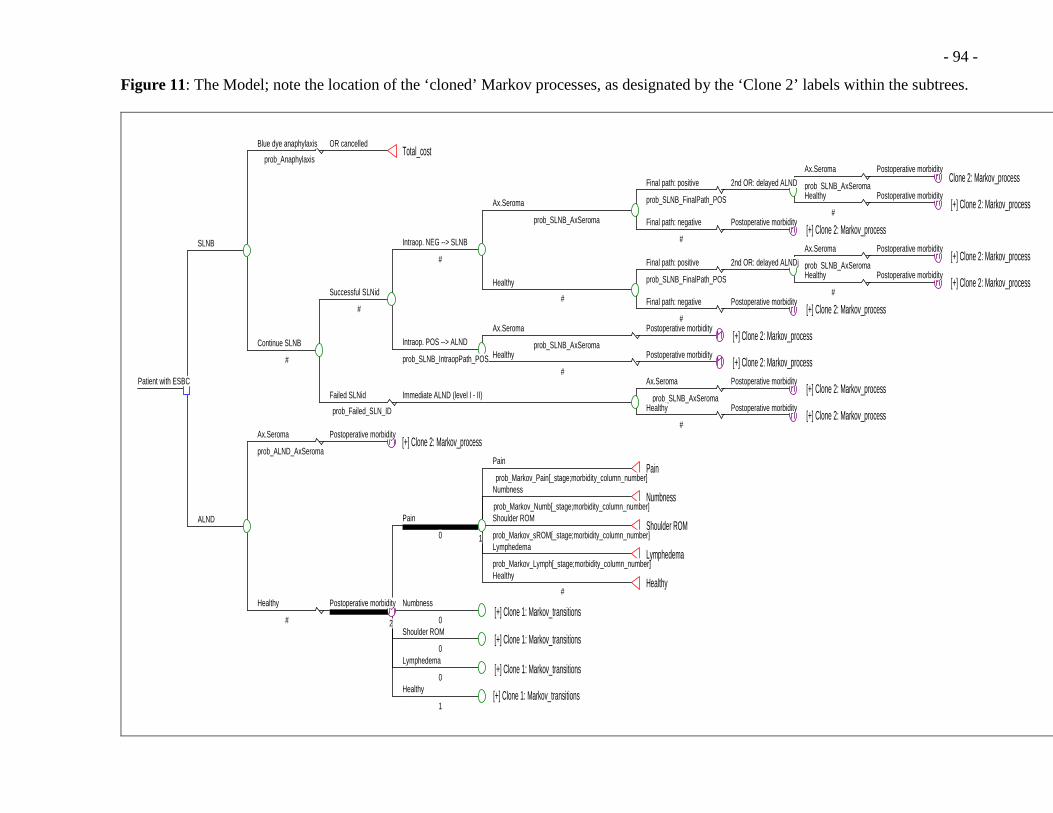
- 94 -
Figure 11: The Model; note the location of the ‘cloned’ Markov processes, as designated by the ‘Clone 2’ labels within the subtrees.
OR cancelledTotal_cost
Blue dye anaphylaxis
prob_AnaphylaxisPostoperative morbidity
Clone 2: Markov_process Ax.Seroma
prob_SLNB_AxSeromaPostoperative morbidity
[+] Clone 2: Markov_process Healthy
#
2nd OR: delayed ALNDFinal path: positive
prob_SLNB_FinalPath_POS
Postoperative morbidity [+] Clone 2: Markov_process
Final path: negative
#
Ax.Seroma
prob_SLNB_AxSeroma
Postoperative morbidity [+] Clone 2: Markov_process
Ax.Seroma
prob_SLNB_AxSeromaPostoperative morbidity
[+] Clone 2: Markov_process Healthy
#
2nd OR: delayed ALNDjFinal path: positive
prob_SLNB_FinalPath_POS
Postoperative morbidity [+] Clone 2: Markov_process
Final path: negative
#
Healthy
#
Intraop. NEG --> SLNB
#
Postoperative morbidity [+] Clone 2: Markov_process
Ax.Seroma
prob_SLNB_AxSeromaPostoperative morbidity
[+] Clone 2: Markov_process Healthy
#
Intraop. POS --> ALND
prob_SLNB_IntraopPath_POS
Successful SLNid
#
Postoperative morbidity [+] Clone 2: Markov_process
Ax.Seroma
prob_SLNB_AxSeromaPostoperative morbidity
[+] Clone 2: Markov_process Healthy
#
Immediate ALND (level I - II)Failed SLNid
prob_Failed_SLN_ID
Continue SLNB
#
SLNB
Postoperative morbidity [+] Clone 2: Markov_process
Ax.Seroma
prob_ALND_AxSeromaPain
prob_Markov_Pain[_stage;morbidity_column_number]Pain
Numbness
prob_Markov_Numb[_stage;morbidity_column_number]Numbness
Shoulder ROM
prob_Markov_sROM[_stage;morbidity_column_number]Shoulder ROM
Lymphedema
prob_Markov_Lymph[_stage;morbidity_column_number]Lymphedema
Healthy
#Healthy
1
Pain
0
Numbness
0 [+] Clone 1: Markov_transitions
Shoulder ROM
0 [+] Clone 1: Markov_transitions
Lymphedema
0 [+] Clone 1: Markov_transitions
Healthy
1 [+] Clone 1: Markov_transitions
2
Postoperative morbidityHealthy
#
ALND
Patient with ESBC

- 95 -
Figure 12: A magnified display of the structure of the Markov process within the ALND treatment pathway.
Pain
prob_Markov_Pain[_stage;morbidity_column_number]Pain
Numbness
prob_Markov_Numb[_stage;morbidity_column_number]Numbness
Shoulder ROM
prob_Markov_sROM[_stage;morbidity_column_number]Shoulder ROM
Lymphedema
prob_Markov_Lymph[_stage;morbidity_column_number]Lymphedema
Healthy
#Healthy
1
Pain
0
--- Markov InformationInit Rwd: 0.5 * ( Discount(cost_Pain_Ambu*prob_SeekMedical;rate_discount;_stage/2) )Incr Rwd: Discount(cost_Pain_Ambu*prob_SeekMedical;rate_discount;_stage/2)Final Rwd: rate_inflation*(cost_Surgery+cost_Morbidity+_total_reward+0.5 * ( Discount(cost_Pain_Ambu*prob_SeekMedical;rate_discount;_stage/2) ))
Numbness
0
--- Markov InformationInit Rwd: 0.5 * ( Discount(cost_Numb_Ambu*prob_SeekMedical;rate_discount;_stage/2) )Incr Rwd: Discount(cost_Numb_Ambu*prob_SeekMedical;rate_discount;_stage/2)Final Rwd: rate_inflation*(cost_Surgery+cost_Morbidity+_total_reward+0.5 * ( Discount(cost_Numb_Ambu*prob_SeekMedical;rate_discount;_stage/2) ))
[+] Clone 1: Markov_transitions
Shoulder ROM
0
--- Markov InformationInit Rwd: 0.5 * ( Discount(cost_sROM_Ambu*prob_SeekMedical;rate_discount;_stage/2) )Incr Rwd: Discount(cost_sROM_Ambu*prob_SeekMedical;rate_discount;_stage/2)Final Rwd: rate_inflation*(cost_Surgery+cost_Morbidity+_total_reward+0.5 * ( Discount(cost_sROM_Ambu*prob_SeekMedical;rate_discount;_stage/2) ))
[+] Clone 1: Markov_transitions
Lymphedema
0
--- Markov InformationInit Rwd: 0.5 * ( Discount(cost_Lymph_Ambu*prob_SeekMedical;rate_discount;_stage/2) )Incr Rwd: Discount(cost_Lymph_Ambu*prob_SeekMedical;rate_discount;_stage/2)Final Rwd: rate_inflation*(cost_Surgery+cost_Morbidity+_total_reward+0.5 * ( Discount(cost_Lymph_Ambu*prob_SeekMedical;rate_discount;_stage/2) ))
[+] Clone 1: Markov_transitions
Healthy
1
--- Markov InformationInit Rwd: 0Incr Rwd: 0Final Rwd: rate_inflation*(cost_Surgery+cost_Morbidity+_total_reward)
[+] Clone 1: Markov_transitions
2
Postoperative morbidity
--- Uncertainty (Branch probabilities) --- Morbidities --- Misc (for Markov process) morbidity_column_number=ALND_column_number--- Markov InformationTerm: _stage=4

- 96 -
4. Costing data and cost distributions
Averages of the total costs per-case for patients undergoing either of the procedures
under comparison and the costs for treating the six postoperative complications were retrieved
from the OCCI database using the costing-analysis tool (CAT) and the search criteria described
previously (see Table 3). The cost values generated from the initial search of the database (i.e.
prior to including the NucMed adjustments) are displayed in Table 10a below, alongside their
corresponding TreeAge Pro® variable names. Note that the average cost and standard deviation
values were used to define the cost probability distributions; all of which were modelled as
Gamma probability distributions, one of which, by way of example, is reproduced in Figure 13
below (note that the Gamma distributions for all the cost variables are plotted in Appendix E).43
Table 10a: A summary of all the costs identified from the initial search of the OCCI database. Note that the ‘Morbidity costs’ values displayed here were used as-is in The Model, whereas the ‘Procedure costs’ values were subject to the NucMed adjustments (see Table 10b).
ALND cost_ALND_Inptcost_ALND_
procedure61 3,486.56$ 856.84$ 2,043.17$ 6,610.79$
SLNB cost_SLNB_DaySxcost_SLNB_ procedure
428 2,374.11$ 802.21$ 836.10$ 5,731.91$
Anaphylactic shock cost_Anaphylaxis_Inpt cost_Anaphylaxis 17 3,878.00$ 3,186.00$ 876.00$ 14,442.00$
Axillary seroma cost_Seroma_Ambu cost_Seroma 344 149.71$ 133.33$ 24.00$ 1,533.00$
Axillary paraesthesia cost_Numb_Ambu cost_Numb 405 195.16$ 113.03$ 40.00$ 868.00$
Lymphedema cost_Lymph_Ambu cost_Lymph 20 192.90$ 134.62$ 45.00$ 692.00$
Axillary pain cost_Pain_Ambu cost_Pain 1417 177.09$ 127.33$ 19.00$ 1,183.00$
Shoulder dysmobility (decr. ROM)
cost_sROM_Ambu cost_sROM 8 125.35$ 48.54$ 55.30$ 185.43$
Procedure costs Name of TreeAge variable Standard deviationAvg. Total Cost
per CaseName of TreeAge cost distribution
Morbidity costs
Notes: ROM = Range of motion; NOS = Not otherwise specified; decr. = decreased; N/A = not applicable
Number of cases
Minimum Maximum
43 As was the case for the treatment uncertainty Beta probability distributions, the graphs of the cost Gamma distributions were generated by using a TreeAge Pro® function involving the repetitive recalculation (i = 1000) of the Gamma probability density function that was customized using two parameter inputs (avg. cost and standard deviation values from the OCCI-search results).[84]

- 97 -
Table 10b: The SLNB- and ALND-related procedure costs updated to include the NucMed adjustments described earlier (see Research Methods chapter). Note that these cost values were the final ones used in The Model.
ALND cost_ALND_Inptcost_ALND_
procedure61 3,423.01$ 856.84$ 1,979.62$ 6,547.24$
SLNB cost_SLNB_DaySxcost_SLNB_ procedure
428 2,644.11$ 802.21$ 1,106.10$ 6,001.91$
Number of cases
Minimum MaximumProcedure costs Name of TreeAge variable Standard deviationAvg. Total Cost
per CaseName of TreeAge cost distribution
Figure 13: An example of a cost distribution used to define the cost of the ALND procedure; note that in the roll-back analysis the EV is used, however in the probabilistic sensitivity analysis and microsimulation trials, a cost value is selected at random from the distribution.
Probability distribution of the average total cost per patient of the
ALND procedure(Distribution name: cost_ALND_procedure)
Distribution type: Gamma; approximated by a Mean (EV) = $3,423.01 and a Std. Dev. = $856.84]
0
0.04
0.08
0.12
0.16
0.2
$1,000 $2,000 $3,000 $4,000 $5,000 $6,000
Value of TreeAge variable: cost_ALND_Inpt
Pro
babi
lity
of a
giv
en c
ost
Minimum of $1,979.62
Maximum of $6,547.24
Mean (EV)
While the above figure is of a distribution of entirely positive costs, some of the
distributions reproduced in Appendix E venture into negative cost territory. A reminder that in
order to avoid sampling these negative (i.e. unrealistic) costs, all cost Gamma distributions were
subject to a TreeAge Pro® ‘trimming’ function such that only cost values that fell between the
minimum and maximum costs that were originally identified from the OCCI database search
(see Tables 10a and 10b) were sampled from the distributions.

- 98 -
5. The cost-minimization analysis (CMA)
A number of different outputs, of increasing degrees of complexity, were generated from
‘running’ the decision-tree model and are presented below. For all outputs, the costs of the
Alternative and Standard treatment pathways are compared; such that incremental average cost
values are reported.
A. The roll-back analysis
Figure 14 below offers a view of the result of The Model’s standard roll-back analysis or
reference case determination. The Model’s EV displayed in Table 11 below is negative, thus
demonstrating that the average cost of the SLNB-associated treatment pathway is less than the
competing ALND-associated treatment pathway. These results suggest that these average cost
values fall far enough along of the theoretical average cost functions for each pathway, such that
they lie beyond the ‘threshold’ number of cases, Q* (see Figure 3b, in Background chapter).
Given the negative incremental average cost value, the SLNB pathway is considered the cost-
minimizing treatment option. This is indicated in the TreeAge Pro® output displayed in Figure
14 by; a) the label indicating the SLNB pathway probability as being one (i.e. P = 1.000), and b)
the two angled dashes crossing the branch connecting the decision node to the ALND pathway.
Table 11: A summary of The Model’s reference or base case; identifying the Alternative treatment pathway as the cost-minimizing option.
Minimum Maximum
Standard (ALND) 3,784.48$ 31.08$ 3,768.32$ 3,844.24$
Alternative (SLNB) 3,295.21$ 743.55$ 2,862.35$ 5,762.84$
Incremental average cost
-$489.27 N/A -$905.97 $1,918.60
Note: a negative incremental cost favours the Alternative treatment option
A roll-back analysis of The Model: the reference ca se
Average CostStandard deviation
Payoff rangePathway

- 99 -
Figure 14: The roll-back analysis as displayed in TreeAge Pro®; note that the Alternative pathway is shown to be cost-minimizing.
OR cancelled$3,878.00; P = 0.007
Blue dye anaphylaxis
0.007Postoperative morbidity
Clone 2: Markov_process $5,762.84; P = 0.001Ax.Seroma
0.140Postoperative morbidity
[+] Clone 2: Markov_process $5,686.91; P = 0.008Healthy
0.860
2nd OR: delayed ALND
$5,697.53; P = 0.010
Final path: positive
0.096
Postoperative morbidity [+] Clone 2: Markov_process $2,938.28; P = 0.093
Final path: negative
0.904
Ax.Seroma
0.140
$3,202.11; P = 0.103
Postoperative morbidity [+] Clone 2: Markov_process $5,686.91; P = 0.008
Ax.Seroma
0.140Postoperative morbidity
[+] Clone 2: Markov_process $5,610.99; P = 0.052Healthy
0.860
2nd OR: delayed ALNDj
$5,621.60; P = 0.060
Final path: positive
0.096
Postoperative morbidityClone 2: Markov_process $2,862.35; P = 0.571
Final path: negative
0.904
Healthy
0.860
$3,126.18; P = 0.631
Intraop. NEG --> SLNB
0.777$3,136.80; P = 0.734
Postoperative morbidity [+] Clone 2: Markov_process $3,792.77; P = 0.029
Ax.Seroma
0.140Postoperative morbidity
[+] Clone 2: Markov_process $3,716.85; P = 0.181Healthy
0.860
Intraop. POS --> ALND
0.223$3,727.47; P = 0.210
Successful SLNid
0.950$3,268.26; P = 0.943
Postoperative morbidity [+] Clone 2: Markov_process $3,792.77; P = 0.007
Ax.Seroma
0.140Postoperative morbidity
[+] Clone 2: Markov_process $3,716.85; P = 0.043Healthy
0.860
Immediate ALND (level I - II) $3,727.47; P = 0.050Failed SLNid
0.050
Continue SLNB
0.993 $3,291.32; P = 0.993
SLNB$3,295.21; P = 1.000
Postoperative morbidity [+] Clone 2: Markov_process $3,844.24
Ax.Seroma
0.213Pain
prob_Markov_Pain[_stage;morbidity_column_number]Pain
Numbness
prob_Markov_Numb[_stage;morbidity_column_number]Numbness
Shoulder ROM
prob_Markov_sROM[_stage;morbidity_column_number]Shoulder ROM
Lymphedema
prob_Markov_Lymph[_stage;morbidity_column_number]Lymphedema
Healthy
#Healthy
1
Pain
0$373.48; FP = 0.093
Numbness
0 [+] Clone 1: Markov_transitions $613.15; FP = 0.150
Shoulder ROM
0 [+] Clone 1: Markov_transitions $271.49; FP = 0.070
Lymphedema
0 [+] Clone 1: Markov_transitions $324.50; FP = 0.082
Healthy
1 [+] Clone 1: Markov_transitions $2,185.70; FP = 0.605
2
Postoperative morbidity
$3,768.32Healthy
0.787
ALND$3,784.48
Patient with ESBCSLNB : $3,295.21; P = 1.000

- 100 -
B. Sensitivity analyses
One-way sensitivity analyses were conducted for all variables and the results are
summarized graphically in two Tornado diagrams, Figures 15 and 16 shown below.
Specifically, the impact of all the treatment uncertainty variables (see Table 9) and morbidity
variables (see Tables 7 and 8) on The Model’s incremental average cost value, is graphically
summarized in the ‘treatment/morbidity’ Tornado diagram shown in Figure 15. Similarly, one-
way sensitivity analyses for all the cost variables were also generated and then all plotted
together with the incremental average cost of The Model on the horizontal axis in a ‘cost’
Tornado diagram shown in Figure 16. As part of the sensitivity analyses, the discount rate was
varied from 0 to 5% and plotted alongside the other cost variables in Figure 16, whereas the
variable that estimates the probability that a patient would seek medical attention (i.e.
prob_SeekMedical) was varied from 0 to 1 and plotted in Figure 15.
In looking at both Tornado diagrams, note that the reference case incremental average
cost is represented by a vertical dashed line, and that the impact of changing a given variable’s
value on the base case incremental average cost, is graphically represented by the different-
textured horizontal bands; where the wider the band, the greater the variation in the incremental
average cost caused by variation of that single variable. Wider variable bands indicate that The
Model is more ‘sensitive’ to the value of that variable (relative to others).44 In Figure 15, there
are no horizontal bands that are wide enough to cross zero along the x-axis; meaning that despite
the maximum variation of each treatment uncertainty or morbidity variable45 SLNB remains the
cost-minimizing pathway. As can be seen in Figure 16 however, the same can not be said for all
the cost variables; if the costs of either the ALND or SLNB procedures are varied between their
44 Hence the name of the figures being ‘Tornado’ diagrams; with the widest bands on top, and successively narrower bands (representing those variables to which the model’s output is least sensitive) towards the bottom, the diagram has a ‘tornado-like’ appearance. 45 Note that the range across which each variable is varied is listed in the legend of Figure 15 and corresponds to the 95% confidence limits displayed in Tables 7 – 9.

- 101 -
minimum and maximum values, The Model’s incremental average cost value changes sign. That
is to say that if the SLNB-related procedural costs (i.e. the horizontal band second from the top
in Figure 16) were to increase beyond a certain threshold value, The Model’s incremental
average cost becomes positive, thereby favouring the ALND treatment pathway.
Understandably, the reverse is true for the ALND cost variable (i.e. the top horizontal band in
Figure 16); as the ALND procedure costs decrease, the base case incremental average cost of -
$489.27 (see Table 11) disappears and the Alternative treatment pathway becomes the more
expensive option. Since The Model is sensitive to these two cost variables, two individual one-
way sensitivity analyses and a two-way sensitivity analysis of both cost variables together were
completed (see Figures 17 – 19 below). These added analyses determined the exact threshold
values that cause The Model’s cost-minimizing solution to change sign (see Table 12 below),
and in the case of the two-way sensitivity analysis, the effect of simultaneously varying both
procedure cost variables on the incremental average cost is elucidated.
Figure 15: A Tornado diagram summarizing the results of the one-way sensitivity analyses of all the treatment uncertainty and morbidity variables; note that no band crosses $0 on the x-axis.
The 'treatment/morbidity' Tornado diagram summarizing on e-way sensitivity analyses of treatment uncertainty p robabilities and morbidity rate variables:A measure of the sensitivity of The Model's increment al average cost value to each variable
Incremental average cost value of the Alternative vs. Standard treatment pathways
-$650 -$600 -$550 -$500 -$450 -$400 -$350
Probability of a patient seeking medical care: 0% to 100%
All ALND Markov transitional probabilities: varied between 95% conf. limits
Intraoperative false negative rate: 5.9% to 13.2%
All SLNB Markov transitional probabilities: varied between 95% conf. limits
Probability of a patient refusing a completion ALND: 4.6% to 37.1%
Intraoperative rate of SLN positivity: 17.8% to 26.8%
Probability of failure of finding a SLN: 3.4% to 6.6%
Probability of an axillary seroma after ALND: 14.6% to 28.0%
Probability of an axillary seroma after SLNB: 8.3% to 19.7%
Probability of anaphylactic shock: 0.4% to 0.9%The reference case incremental average cost is: - $489.27
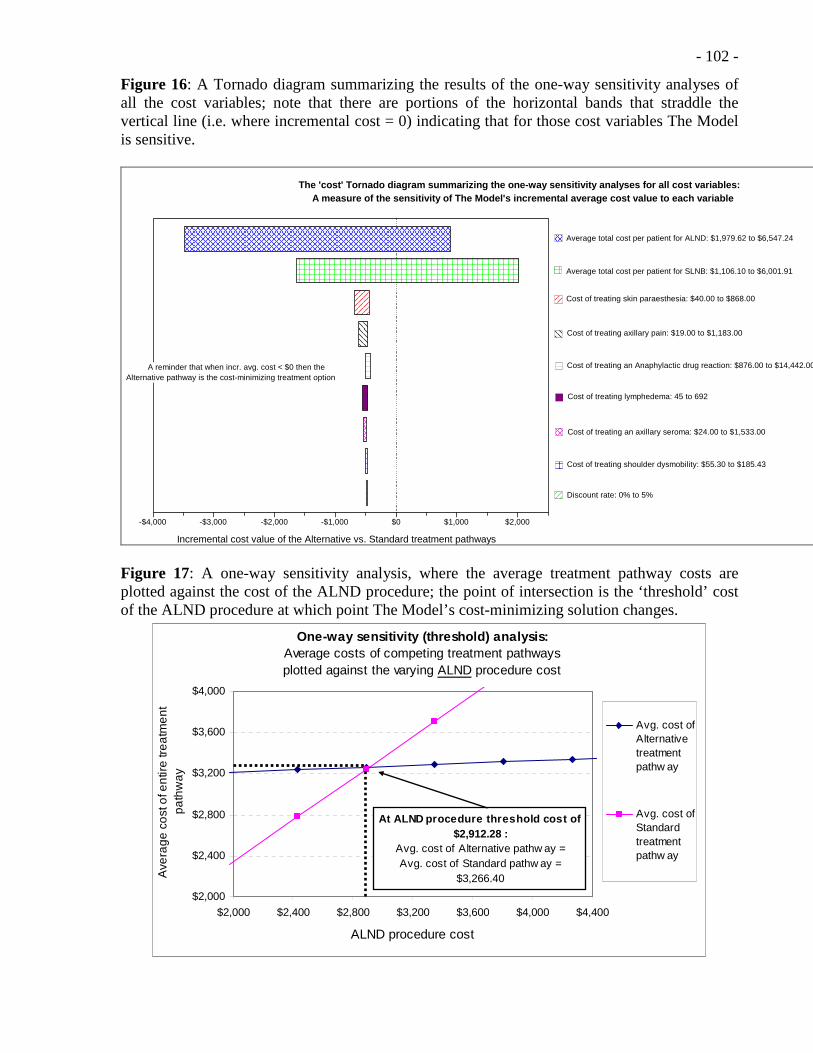
- 102 -
Figure 16: A Tornado diagram summarizing the results of the one-way sensitivity analyses of all the cost variables; note that there are portions of the horizontal bands that straddle the vertical line (i.e. where incremental cost = 0) indicating that for those cost variables The Model is sensitive.
The 'cost' Tornado diagram summarizing the one-way sensitivity analyses for all cost variables:A measure of the sensitivity of The Model's increme ntal average cost value to each variable
Incremental cost value of the Alternative vs. Standard treatment pathways
-$4,000 -$3,000 -$2,000 -$1,000 $0 $1,000 $2,000
Average total cost per patient for ALND: $1,979.62 to $6,547.24
Average total cost per patient for SLNB: $1,106.10 to $6,001.91
Cost of treating skin paraesthesia: $40.00 to $868.00
Cost of treating axillary pain: $19.00 to $1,183.00
Cost of treating an Anaphylactic drug reaction: $876.00 to $14,442.00
Cost of treating lymphedema: 45 to 692
Cost of treating an axillary seroma: $24.00 to $1,533.00
Cost of treating shoulder dysmobility: $55.30 to $185.43
Discount rate: 0% to 5%
A reminder that when incr. avg. cost < $0 then theAlternative pathway is the cost-minimizing treatment option
Figure 17: A one-way sensitivity analysis, where the average treatment pathway costs are plotted against the cost of the ALND procedure; the point of intersection is the ‘threshold’ cost of the ALND procedure at which point The Model’s cost-minimizing solution changes.
One-way sensitivity (threshold) analysis:Average costs of competing treatment pathways plotted against the varying ALND procedure cost
$2,000
$2,400
$2,800
$3,200
$3,600
$4,000
$2,000 $2,400 $2,800 $3,200 $3,600 $4,000 $4,400
ALND procedure cost
Ave
rage
co
st o
f en
tire
tre
atm
ent
pa
thw
ay
Avg. cost ofAlternativetreatmentpathw ay
Avg. cost ofStandardtreatmentpathw ay
At ALND procedure threshold cost of $2,912.28 :
Avg. cost of Alternative pathw ay = Avg. cost of Standard pathw ay =
$3,266.40

- 103 -
Note that in Figure 17, the intersection point between the SLNB and ALND cost
functions is the ‘indifference’ point; where the average cost of the Alternative treatment
pathway equals the average cost of the Standard treatment pathway, and where to either side of
this point one pathway becomes less costly than the other (i.e. cost-minimizing). If, as is
assumed in a one-way sensitivity analysis, all other variables are kept constant, then the
indifference point of $3,266.40 occurs at the ALND procedure threshold cost value of
$2,912.28.46 It is interesting to note that the ALND procedure threshold cost value is $510.73
cheaper than the ALND procedure cost of $3,423.01 (see Table 10b) used to populate The
Model; demonstrating that a near-15% decrease in the ALND procedure cost would reverse the
result of the roll-back analysis (see Table 12 below).
Figure 18: A one-way sensitivity analysis, where the average treatment pathway costs are plotted against the cost of the SLNB procedure; the point of intersection is the ‘threshold’ cost of the SLNB procedure at which point The Model’s cost-minimizing solution changes.
One-way sensitivity (threshold) analysis:Average costs of competing treatment pathways plotted against the varying SLNB procedure cost
$2,500
$3,000
$3,500
$4,000
$4,500
$2,500 $3,000 $3,500 $4,000 $4,500 $5,000
SLNB procedure cost
Ave
rage
cos
t of e
ntire
trea
tmen
t pa
thw
ay
Avg. cost ofAlternativetreatmentpathway
Avg. cost ofStandardtreatmentpathway
At SLNB procedure threshold cost of $3,301.74 :
Avg. cost of Alternative pathw ay = Avg. cost of Standard pathw ay = $3,784.48
46 Because threshold values are generated, this type of one-way sensitivity analysis is also termed a ‘threshold’ analysis.[66]

- 104 -
The point of indifference, where the cost-minimizing treatment option switches, is
$3,784.48 at the SLNB procedure threshold cost of $3,301.74 in Figure 18. Once again it is
interesting to note that, assuming all other variables are kept constant, the SLNB procedure cost
would have to increase by $657.63 (i.e. nearly 25%, see Table 12) from the OCCI-search
generated cost of $2,644.11 (see Table 10b) to reach the threshold cost level. Note that the
results of both one-way (threshold) sensitivity analyses are summarized in Table 12.
Table 12: A summary of the threshold cost values, as identified by means of one-way sensitivity analyses, for the two cost variables to which The Model is sensitive.
Cost_ALND_Inpt 3,423.01$ $1,979.62 to $6,547.24
2,912.28$ 510.73-$ -14.9%
cost_SLNB_DaySx 2,644.11$ $1,106.10 to $6,001.91
3,301.74$ 657.63$ 24.9%
Variable nameBaseline cost
valueRange of variance
% change from baseline
Threshold value
Absolute change in cost
Figure 19: A two-way sensitivity analysis where the average SLNB and ALND procedure costs are varied simultaneously. Note that the combination of procedure costs for which either the Alternative or Standard treatment pathway prove cost-minimizing are marked areas or “domains” on the graph.
Two-way sensitivity analysis: A plot of "domains"
Where each treatment option is cost-minimizing as a function of SLNB and ALND procedure costs
Average ALND-procedure related costs
Ave
rage
SLN
B-p
roce
dure
rel
ated
cos
ts
$2,500 $2,650 $2,800 $2,950 $3,100 $3,250 $3,400 $3,550 $3,700 $3,850 $4,000
$3,500
$3,350
$3,200
$3,050
$2,900
$2,750
$2,600
$2,450
$2,300
$2,150
$2,000
Alternative treatment pathway is cost-minimizing
Standard treatment pathway is cost-minimizing
Intersection of avg. SLNB and ALNDprocedure costs in base case
"ALND Domain" :
"SLNB Domain" :
SLNB approx. = $3,000ALND approx. = $3,200
"Frontier Point" is where :

- 105 -
The results of the two-way sensitivity analysis simply reinforce what was already determined
from the two individual one-way sensitivity analyses of the average SLNB and ALND
procedure costs (see Figures 17, 18, and Table 11); that relatively small changes in the average
cost of either procedure (in terms of absolute dollar amounts) will have a significant impact on
which treatment pathway is predicted to be cost-minimizing by The Model. The two-way
sensitivity analysis in Figure 19 adds to this observation by simply demonstrating that when
both procedure costs are varied, an increase of only approximately $350 (13%) in the average
procedure-related SLNB costs coupled with a decrease of about $200 (6%) in the ALND
procedure costs would result in a reversal of the reference case result (labelled as the “Frontier
Point” in Figure 19 above). Figure 19 therefore offers a poignant visual representation of the
degree of simultaneous variation in either of these two cost variables that would be required for
the SLNB treatment pathway to no longer be the cost-minimizing option as predicted by The
Model in the roll-back analysis.
C. Probabilistic sensitivity analysis (PSA)
In order to fully assess the decision-tree model uncertainty and variability, a standard
probabilistic sensitivity analysis was undertaken. A reminder that a PSA consists of multiple
iterations (n) of a roll-back analysis, where the point-estimates for each chance node and
variable in The Model are randomly sampled from their associated probability distributions
during each iteration, n (where n = 100, 500, 1000, and 10,000). In this way a mean incremental
average cost value was determined for each of the four cohorts of iterations, and the overall
model uncertainty was quantified and described by a standard deviation as well as minimum and
maximum per-patient cost values.[84; 86; 87; 92; 93] In addition to the reporting of these
descriptive statistics, Table 13 below also displays the ‘SLNB pathway selection freq.’ which is

- 106 -
a measure of the frequency with which the SLNB-associated treatment option was cost-
minimizing within a given iterative cohort.
Table 13: A summary of the results of the standard probabilistic sensitivity analysis (PSA).
Average cost Std. Dev. Minimum Maximum Average cost Std. Dev. Minimum Maximum
100 $ 3,319.17 $ 617.01 $ 2,251.19 $ 5,005.93 -$ 691.16 $ 4,010.33 $ 1,018.78 $ 2,222.03 $ 6,470.68 74.0%
500 $ 3,301.70 $ 621.84 $ 1,925.66 $ 5,597.27 -$ 474.14 $ 3,775.84 $ 792.59 $ 2,209.41 $ 6,740.14 69.4%
1000 3,312.69$ 633.31$ 1,819.55$ 5,558.15$ -$ 499.48 3,812.17$ 820.03$ 2,262.98$ 6,883.98$ 69.6%
10000 3,321.18$ 628.50$ 1,811.89$ 5,885.03$ -$ 516.68 3,837.86$ 836.19$ 2,177.36$ 6,987.13$ 69.0%
No. of iterations (n)
Alternative (i.e. SLNB-associated) pathwayIncremental
avg. cost
Standard (i.e. ALND-associated) pathway SLNB pathway selection
freq.
It is important to note that the incremental average cost values, for all four iterative trials
displayed in Table 13 above, are negative and are therefore indicative of the Alternative
treatment pathway being, on average, less costly than the Standard or ALND-associated
treatment pathway. The standard deviations associated with each pathway-specific average cost
value is, as described previously in the Research Methods chapter, indicative of predominantly
the cumulative effect of the uncertainty of all of the parameters estimated from the
literature.[87; 93]
D. Microsimulation trials (McSim)
Justification for conducting a series of microsimulation trials was based on the notion
that the intended audience (i.e. hospital administration) may find an analysis that is meant to
simulate a specific volume of patients, while still capturing much of the inherent model
uncertainty through chance node-specific random sampling, useful from a decision-making
perspective (see Research Methods chapter). Table 14 below summarizes the results of this
somewhat novel microsimulation analysis in much the same format as was used to report the
results of the PSA in Table 14 above. Note that eight microsimulation trials were conducted,
with each cohort meant to be a rough approximation of the case-volumes seen across a wide
variety of Ontario hospitals (i.e. low-volume community hospitals where n = 25, to higher-

- 107 -
volume academic institutions where n = 200).[51; 54] Note that as was the case with the
probabilistic sensitivity analysis, all of the incremental average cost values in Table 14 are
negative, thereby favouring the Alternative treatment pathway (the incremental average cost
value that was closest to zero has been highlighted in the Table below).
Table 14: A summary of the results of the microsimulation analysis (McSim).
Average cost Std. Dev. Minimum Maximum Average cost Std. Dev. Minimum Maximum
25 3,181.05$ 1,014.09$ 1,488.53$ 5,292.36$ -$ 777.75 3,958.80$ 867.19$ 2,631.12$ 5,704.38$ 72.0%
50 2,960.75$ 876.50$ 1,588.49$ 5,305.04$ -$ 899.37 3,860.12$ 869.70$ 2,759.56$ 6,500.28$ 80.0%
75 3,209.86$ 846.55$ 1,489.47$ 6,441.10$ -$ 576.99 3,786.85$ 809.79$ 2,322.00$ 5,772.41$ 74.7%
100 3,273.07$ 1,069.80$ 1,137.28$ 7,586.39$ -$ 743.24 4,016.31$ 889.18$ 2,373.80$ 5,904.64$ 72.0%
125 3,098.92$ 1,056.68$ 1,405.23$ 7,071.48$ -$ 807.60 3,906.52$ 690.58$ 2,396.27$ 6,168.83$ 79.2%
150 3,764.57$ 1,178.18$ 2,052.73$ 8,053.16$ -$ 318.40 4,082.97$ 858.10$ 2,441.57$ 5,857.25$ 65.3%
175 3,432.65$ 1,143.29$ 1,600.15$ 8,639.36$ -$ 441.34 3,873.99$ 826.91$ 2,406.37$ 5,719.70$ 64.6%
200 3,237.31$ 1,147.40$ 1,201.83$ 8,592.56$ -$ 669.01 3,906.32$ 615.27$ 2,687.93$ 5,421.12$ 70.5%
Standard (i.e. ALND-associated) pathway SLNB pathway selection
freq.
No. of iterations (n)
Alternative (i.e. SLNB-associated) pathwayIncremental
avg. cost
E. Estimating a ‘threshold’ case-volume as justification for SLNB capital investment
The theoretical rationale for conducting this cost-minimization analysis, rested on the
premise that, despite the upfront costs associated with purchase of necessary SLNB equipment,
the marginal cost of the SLNB-associated (i.e. Alternative) treatment pathway was less than that
of the ALND-associated (i.e. Standard) treatment pathway, such that after treating a ‘threshold’
number of patients (Q*), both the total and average costs of the Alternative treatment pathway
would prove to be less than those of the Standard pathway (see Figures 3a and 3b, and Appendix
A). Due to the limited transparency with which OCCI data can be searched, it is impossible to
determine the value of the initial SLNB-related investment from the OCCI search report alone.
However, as first explained in the Research Methods chapter, total cost functions for both
competing pathways were plotted using TreeAge Pro® simulation techniques and fitted with
linear functions. Under the premise of linearity (i.e. d = 1 in Equation 2 in Appendix A), the
intercept of the Alternative total cost function is equal to the SLNB-associated capital

- 108 -
investment, TCi. Moreover, the slopes of both lines are estimates of the marginal cost of each
treatment pathway. Figure 20 below displays both the plotted data fitted with linear functions
and the equations of those lines. Note, that as predicted by Equations 1 and 2 (see Appendix A),
the Standard total cost function intercept is relatively small (nearly zero) as compared to the
Alternative treatment pathway. Furthermore, it would appear that the assumption of linearity for
both total cost functions (see Figure 3a) is justified given the regression coefficients (R2) for
each function are equal to one (or very close to one in the case of the Alternative total cost
function). Finally, note that the Standard treatment pathway marginal cost is equal to the slope
of the fitted Standard pathway total cost function in Figure 20 (i.e. MCS = $3,784) which is
virtually identical to the average cost value for the Standard treatment pathway returned from
the reference case determination (see Table 11); this is expected and lends validity to the
underlying assumptions of the theoretical framework developed in Appendix A, since in the
case of a linear total cost function that passes through the origin, marginal cost equals average
cost (i.e. MCA = ACA).[11]
Figure 20: The simulated total cost functions for both the Alternative and Standard competing treatment pathways in this cost-minimization analysis.
Total ALND and SLNB costs as a function of case vol ume
y = 3218.8x + 2616.5
R2 = 0.9998
y = 3784x + 181
R2 = 1
$0
$100,000
$200,000
$300,000
$400,000
$500,000
0 25 50 75 100 125
Case volume, Q
Tot
al c
ost
SLNB costfunction
ALND costfunction

- 109 -
By using the slope and intercept values47 from the linear equations in Figure 20, and
inserting them into Equation 3 (see Appendix A); a value for the ‘threshold’ number of patients
needed to justify the initial SLNB capital investment (i.e. TCi in Figure 3a) can be determined:
a) MCA = $3,784.00 and MCS = $3,218.80
b) TCi = $2,616.5048
c) Therefore Q1* = $2,616.50 / ($3,784.00 - $3,218.80) = 4.6 ≈ 5 patients.
This constitutes a first estimate of the threshold case-volume value, Q1*. As noted in the
Methods chapter, a more conservative estimate of TCi was developed; a ‘2nd-TCi’ that was set
equal to an equivalent annual cost value, derived from public cost sources for the SLNB hand-
held gamma probe and conservative accounting assumptions (see Table 4 in Research Methods
chapter). Using this second TCi estimate of $7,642.42 along with the above marginal cost
estimates, a second estimate of the threshold case-volume value Q2* is found by again plugging
these values into Equation 3:
d) Therefore Q2* = $7,642.42 / ($3,784.00 - $3,218.80) = 13.5 ≈ 14 patients.
While the above analysis is rather informal and constitutes a very rough approximation of
threshold patient volumes; at face value, patient-volume numbers of five to fourteen are
certainly small enough, even for the more rural Ontario community hospitals to justify the initial
capital investment in the SLNB equipment. Furthermore, the underlying calculation lends some
validity to the results of The Model; since model-generated values are used to satisfy and verify
a theoretical construct.
As a means of further validating the theoretical framework of this dissertation, TreeAge
Pro® simulation functions were used to generate average cost functions for both the Alternative
47 Note that while the intercept for the Standard treatment pathway is 181 in the equation given in Figure 20 it is simply considered to be small enough to validate the theoretical assumption that there is no initial investment required for treating patients along the Standard treatment pathway, but is ignored and assumed to be zero for the purposes of any approximation of threshold case-volume calculations that follow. 48 As outlined in the Research Methods chapter, this first estimate of TCi is appropriately labeled ‘1st-TCi’.

- 110 -
and Standard treatment pathways. Specifically, the total cost functions (depicted in Figure 20
above) were divided through by the growing (albeit simulated and arbitrarily sized) cohort of
125 patients; but in the case of the Alternative treatment option two average cost functions were
generated, with each of function using one of the two estimates for TCi discussed above. The
resulting average cost functions are depicted in Figure 21 below; note the similarity between
these simulated functions and the theoretical model of Figure 3b; the SLNB-associated average
cost functions clearly intercept with the ALND-associated average cost function and, as Q
increases, approach linearity and the SLNB-associated average cost function is persistently
below the Standard average cost function. In this way, The Model is shown to generate results
similar to those predicted in Figure 3b; thereby providing a quick visual check that again adds
some validity to The Model’s output. Furthermore, the two marked sections of Figure 21 are
magnified and displayed as separate figures as shown in Appendix G; providing visual
confirmation that the Q* estimates calculated above are in general agreement with the plotted
data (see Figure G1), as well as demonstrating that ACS < ACA as Q increases (see Figure G2).
Figure 21: The simulated avg. cost functions for the Alternative and Standard treatment pathways; where the two SLNB avg. cost functions are defined by two different TCi estimates.
Simulated average cost functions for competing trea tment pathways
$2,000
$3,000
$4,000
$5,000
$6,000
$7,000
$8,000
0 25 50 75 100 125
Case-volume, No. of patients (Q)
Ave
rage
Cos
t, T
otal
cos
t/Q (
$)
Alt path avg. cost (TCi = $2,615.50)
Alt. path avg. cost (TCi = $7,642.42)
Standard path avg. cost
Areas of magnification(see Appendix G)
- 111 -
IV. DISCUSSION
1. Overview
This discussion consists of four main sections; first, an overview of the results of this
cost-minimization analysis is provided and then interpreted in the context of the existing
literature; second, the strengths and limitations of this study are detailed; third, a concluding
summary is provided; and finally suggestions for future potential research are outlined.
2. Interpretation of the results
A. Overview
The overall result of this cost-minimization analysis (CMA) is that the average cost of a
surgical protocol that includes a sentinel lymph node biopsy (SLNB) as the initial axillary
staging procedure (i.e. the Alternative treatment option) in the context of managing early-stage
breast cancer (ESBC), is less than the average cost of a treatment pathway that includes only an
axillary lymph node dissection (ALND) (i.e. the Standard treatment option). This result was
obtained by comparing two treatment pathways, using decision-analysis, that satisfied Canadian
clinical standards for performing SLNB and ALND within an ESBC patient population.[14; 15;
18; 48] The results were robust in that the calculated incremental average costs were
consistently negative across three different methods of evaluating a decision-tree analytical
model, namely; a roll-back analysis that generated the base case value of -$489.27 (see Table
11), as well as a probabilistic sensitivity analysis (PSA) (see Table 13), and a series of
microsimulation trials (see Table 14). To that end, the most robust (and recommended) manner
of reporting the results of a cost-analysis that uses decision-analysis is in terms of the results of
the PSA, preferably subject to a large number of iterations (i.e. n = 10,000).[86; 87; 93] The
overall results reported from this CMA are therefore that the average cost of the Alternative
treatment pathway was $3,321.18 (SD: $628.50) as compared to an average cost of $3,837.86
- 112 - (SD: $836.19),49 resulting in a negative incremental average cost of -$516.68, which identifies
the Alternative treatment pathway as being the cost-minimizing option.
The successful creation of a cost-minimization analysis by means of a decision-analysis
model that incorporated the rate of post-operative complications associated with axillary surgery
in the setting of early-stage breast cancer, and employed Ontario-specific costing data, is
evidence that the stated research objective has been fulfilled. Evidence that SLNB-related cost-
savings were the result of the acknowledged lower morbidity rates associated with the less
invasive SLNB staging procedure (as stated in the research hypothesis) was not demonstrated by
this CMA. In fact, thorough sensitivity analyses demonstrated that The Model’s cost-
minimizing outcome was sensitive only to either of the SLNB- or ALND-associated procedural
costs (see Figures 15 and 16 in the Results chapter). A comprehensive characterization of model
uncertainty in the form of a probabilistic sensitivity analysis that randomly sampled
appropriately defined probability distributions over the course of n iterations did show however,
that despite The Model’s apparent sensitivity to the procedural costs variables, the Alternative
treatment pathway was less costly than the Standard pathway approximately 70% of the time.
The structure of the decision-tree model was assumed to be of reasonable quality given
the use of randomized clinical trial data, identified by means of a comprehensive literature
review, to populate the decision-tree branch probabilities, as well as define a number of The
Model’s clinical variables. This assumption, coupled with The Model’s consistent output
throughout the roll-back analysis and PSA, is taken as justification for then using The Model to
undertake two further ‘add-hoc’ analyses of the SLNB- and ALND-associated cost data, with
the intent of providing hospital administrators with added inputs for decision-making purposes.
First, a somewhat novel use of Monte Carlo microsimulation trials was used to provide
49 Where “SD” refers to the standard deviation.

- 113 - administrators added insight into how specific case-volumes might influence average cost-
calculations; and second, total and average cost functions for both treatment options were
plotted in order to determine a ‘threshold’ case-volume number (approximated as being
anywhere from five to fourteen patients) whereby the realized incremental average cost gained
in treating those ESBC patients initially with SLNB would recoup the cost of the SLNB hand-
held gamma probe, and thereby justify the bulk of the initial SLNB capital investment necessary
for SLNB implementation.
B. In the context of the existing literature
As introduced in the Background chapter, there is a dearth of SLNB vs. ALND cost-
comparison studies that exist in the literature, all of which are not readily generalizable to a
Canadian health-care setting.[58-61] Differences in costing methodology, the use of proprietary
costing data, and variations in the course of clinical treatments offered between studies, makes
direct comparison of the results of each study (either to the results of this CMA or in
comparison to one another) impossible.[11; 12] Similarities between the studies do exist
however, such that conclusions can be drawn from comparisons of some aspects of this cost-
minimization analysis to sections of each of the four published reports. Moreover trends within
the data can still be evaluated, in particular cost-comparisons between subgroups can be made,
which may provide insight into some of the cost considerations that affect SLNB
implementation (e.g. cost of increased pathological services, importance of a low failure rate of
sentinel lymph node identification, etc.,).[11; 14; 58] The decision-tree model used in this CMA,
allows for; first, a comparison of The Model’s theoretical subgroup costs with the reported
subgroup costs from the studies by Perrier et al., Gemignani et al, and Ronka et al. (see Table 15
below); and second an evaluation of some modelling assumptions made in the decision-analysis
conducted by Ronka et al; and finally, a comparison of the costs associated with a patient’s

- 114 - postoperative course as modelled by the Markov cohorts in this CMA and compared to the one-
and two-year follow-up analyses reported by Chirikos et al.[58-61]
Note that when discussing ‘subgroups’ within a cohort of SLNB-treated early-stage
breast cancer patients, there are three main ‘subgroups’ of patients that are commonly
considered in the literature; first, the group of patients that presumably derive the greatest
clinical benefit from undergoing a SLNB procedure (i.e. the ‘SLNB only’ subgroup) as they are
ultimately found to have negative sentinel lymph nodes (SLNs) and require no further axillary
surgery; second, the group of patients that require an immediate ALND (i.e. the ‘immediate
ALND’ subgroup) due to either the failure to localize a SLN or the identification of metastases
in one or more SLNs submitted for intraoperative pathological evaluation (i.e. frozen section or
imprint cytology); and third, the group of patients that undergo an ALND, as a second surgery
on a date following their initial SLNB (i.e. the ‘delayed ALND’ subgroup) due to a submitted
SLN that was initially found to be negative for metastatic disease on intraoperative pathological
assessment later being found to harbour metastases on final pathological examination (i.e.
contributing to the intraoperative false negative rate, or ‘iFNR’).[14; 17] These subgroups are
outlined below in Table 15 for three of the four published cost-comparison studies50 alongside
the subgroup data from this CMA. A reminder that The Model-derived subgroups are termed
‘theoretical’ because they are part of a decision-analysis that is modelling costs and clinical
outcomes of a ‘typical’ population of ESBC as opposed to the published studies, which are
reporting on actual patient populations treated at particular institutions.
50 Note that the published article by Chirikos et al., does not identify or detail the results of any subgroup analyses and is therefore not included in Table 15. Moreover, in considering the definitions of the three subgroups commonly identified within a SLNB patient cohort, it is unlikely that such subgroups could be identified from the analysis by Chirikos et al., due primarily to the fact that the authors did not make a comparison strictly between a SLNB-associated and an ALND-associated patient group, but rather a SLNB-associated and non-SLNB-associated groups of breast cancer patients.[59]

- 115 -
It should also be noted that, first; the reference case (as determined from the roll-back
analysis, see Table 11 or Figure 14 in the Results chapter) is being used to simplify the
subsequent subgroup comparisons. While it has already been extensively argued that a properly
conducted probabilistic sensitivity analysis (PSA) is a better representation of the results of a
decision-analysis, [86; 87; 93] the expected values of the reference case, as pertains to each
subgroup, are being used here because; a) the average cost values from the other studies are
point-estimates as well, b) as stated above the point of this subgroup comparison is to compare
trends in the data, in an attempt to gain insight into which subgroups are (if any) the primary
drivers of overall average costs and why, and c) because the result from The Model’s PSA,
where n = 10,000, was an incremental average cost of -$516.68 and is reasonably near to the
base case incremental average cost of -$489.27. Second, in order to determine the average cost
values for each theoretical subgroup within the decision-tree model of this CMA, a weighted
average of costs from the relevant decision-tree branches and subtrees of The Model were
calculated.51 Finally, in addition to the final SLNB- and ALND-associated average cost values
as reported in each trial, the following four pieces of subgroup-related cost data are displayed in
Table 15 below; in order to provide insight into the extent with which each subgroup contributes
to the reported SLNB average cost values.
���� the percentage of patients from the overall SLNB cohort in each SLNB subgroup
���� the average cost associated with each subgroup
���� the percentage difference between the subgroup and overall SLNB cohort costs
���� the absolute cost amount that each subgroup contributes to the reported incremental average cost value (IAC)
51 A reminder that during the ‘roll-back’ analysis of a decision-tree, the proportions reported for each terminal node (see Figure 14 in the Results chapter) is indicative of the expected number of patients from a cohort of infinite size that would complete their particular treatment pathway at that terminal node.[84] The cumulative proportions of similar patients from different terminal nodes can therefore be determined by simply adding these terminal proportions together. Moreover, the average cost for such a ‘summed’ subgroup of patients is simply the weighted average of the terminal costs associated with the terminal nodes whose proportions were added.
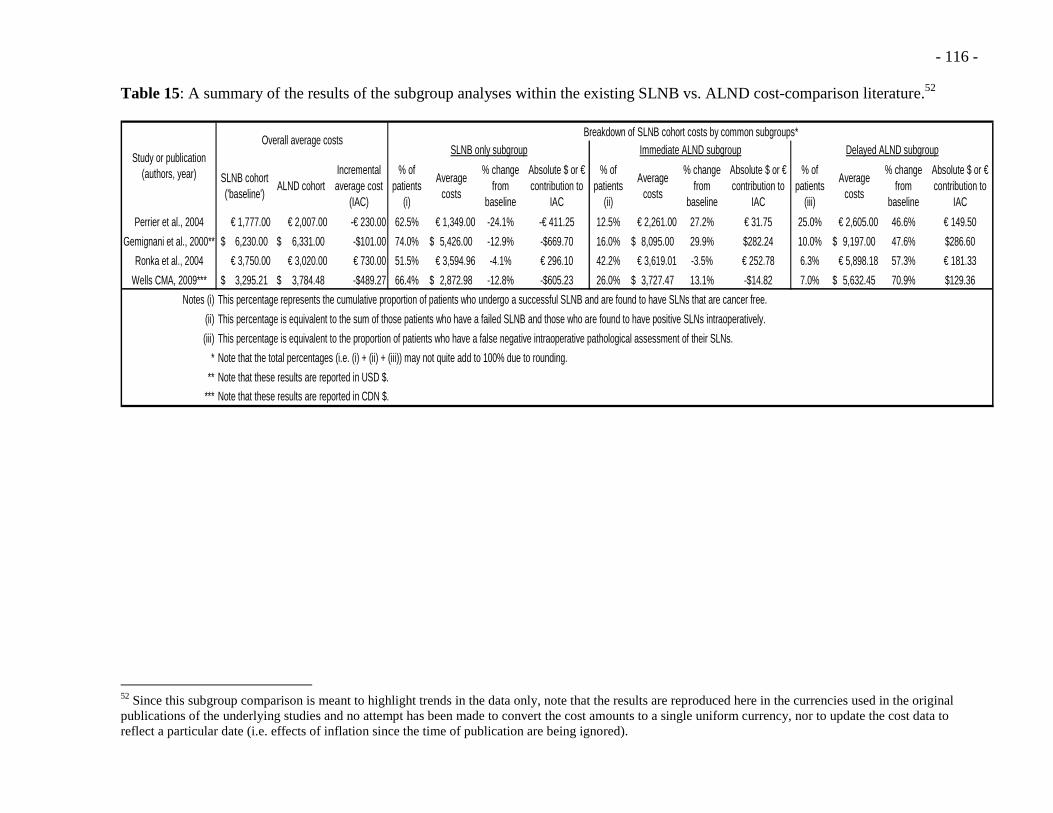
- 116 - Table 15: A summary of the results of the subgroup analyses within the existing SLNB vs. ALND cost-comparison literature.52
SLNB cohort ('baseline')
ALND cohortIncremental average cost
(IAC)
% of patients
(i)
Average costs
% change from
baseline
Absolute $ or € contribution to
IAC
% of patients
(ii)
Average costs
% change from
baseline
Absolute $ or € contribution to
IAC
% of patients
(iii)
Average costs
% change from
baseline
Absolute $ or € contribution to
IAC
Perrier et al., 2004 € 1,777.00 € 2,007.00 -€ 230.00 62.5% € 1,349.00 -24.1% -€ 411.25 12.5% € 2,261.00 27.2% € 31.75 25.0% € 2,605.00 46.6% € 149.50
Gemignani et al., 2000** 6,230.00$ 6,331.00$ -$101.00 74.0% 5,426.00$ -12.9% -$669.70 16.0% 8,095.00$ 29.9% $282.24 10.0% 9,197.00$ 47.6% $286.60
Ronka et al., 2004 € 3,750.00 € 3,020.00 € 730.00 51.5% € 3,594.96 -4.1% € 296.10 42.2% € 3,619.01 -3.5% € 252.78 6.3% € 5,898.18 57.3% € 181.33
Wells CMA, 2009*** 3,295.21$ 3,784.48$ -$489.27 66.4% 2,872.98$ -12.8% -$605.23 26.0% 3,727.47$ 13.1% -$14.82 7.0% 5,632.45$ 70.9% $129.36
Notes (i)
(ii)
(iii)
*
**
***
Note that the total percentages (i.e. (i) + (ii) + (iii)) may not quite add to 100% due to rounding.
Note that these results are reported in CDN $.
Note that these results are reported in USD $.
Breakdown of SLNB cohort costs by common subgroups*SLNB only subgroup Immediate ALND subgroup Delayed ALND subgroup
This percentage represents the cumulative proportion of patients who undergo a successful SLNB and are found to have SLNs that are cancer free.
This percentage is equivalent to the sum of those patients who have a failed SLNB and those who are found to have positive SLNs intraoperatively.
This percentage is equivalent to the proportion of patients who have a false negative intraoperative pathological assessment of their SLNs.
Study or publication (authors, year)
Overall average costs
52 Since this subgroup comparison is meant to highlight trends in the data only, note that the results are reproduced here in the currencies used in the original publications of the underlying studies and no attempt has been made to convert the cost amounts to a single uniform currency, nor to update the cost data to reflect a particular date (i.e. effects of inflation since the time of publication are being ignored).
- 117 -
The first thing to note when examining Table 15 is that the total proportion of patients in
the ‘immediate’ and ‘delayed’ ALND subgroups is equal to one minus the proportion in the
‘SLNB only’ subgroup (i.e. 1 – ‘SLNB only’%). This highlights how important the SLNB
failure rate and axillary node positivity rate (i.e. both rates define the patients within the
‘immediate ALND’ subgroup) and the intraoperative false negative rate (iFNR) (which defines
the patients within the ‘delayed ALND’ subgroup) are in terms of contributing towards overall
SLNB costs.
The incremental average cost reported in this CMA is closest in value to the overall
result of the French-based SLNB vs. ALND cost-comparison, published by Perrier et al. in
2004.[60] As can be seen Table 15, the bulk of the SLNB-associated cost-savings for both
studies is attributable to the relatively low costs incurred by the SLNB-only subgroup; that is to
say as soon as an ALND procedure is introduced into the SLNB-treatment pathway (i.e. as
occurs within the ‘immediate’ and ‘delayed’ ALND subgroups) the cost-advantage diminishes.
In examining the microcosting strategy used by Perrier et al., it was determined that the mean
cost differential of €230, was entirely due to the significant difference in median hospital stay
between the two groups (nine days vs. three days, p < 0.0001, at a cost of €125/day).[60] While
it would be unusual to keep ALND and SLNB patients in hospital for such an extended length
of time here in Ontario, [54; 79] the results generated by this CMA, parallel the findings by
Perrier et al.; in that the length of hospital stay was found to be the primary driver of The
Model’s negative incremental average cost value.53 This is confirmed in looking at the
breakdown of costs by functional centre for both the OCCI-generated SLNB and ALND-
associated procedure costs (see Appendix F); where an average total cost per case of $718 has
53 A reminder that the ‘patient type’ search parameter within the OCCI costing-analysis tool (CAT) was set to ‘Acute Inpatient’ for the ALND cost-cohort versus ‘Day Surgery’ for the SLNB cost-cohort (see Table 3, in the Research Methods chapter) and as argued here was in fact the only differentiating factor between the two cost-cohorts.

- 118 - been costed to the ‘IP Surgical Inpatient Services’ (where ‘IP’ refers to ‘in-patient’) (i.e. note
that this value alone more than accounts for the observed incremental average cost value of
$489.27 generated from the reference case roll-back analysis (see Table 11).[62]
Examination of the breakdown of SLNB costs by subgroup within the trial conducted by
Gemignani et al., reveals a SLNB-only subgroup that offers similar savings to the overall
SLNB-cohort costs, as noted by the similar percentage changes of the SLNB-only subgroup
costs from the SLNB-cohort baseline values (i.e. -12.9% and -12.8%, respectively). It is
therefore of interest that the impact of the costs from the remaining two subgroups, particularly
the ‘immediate ALND’ subgroup are substantially larger in the Gemignani et al. trial, as
compared to the contributions of the same (theoretical) subgroups from within The Model (see
Table 15). A breakdown of the mean in-hospital charges within the ‘immediate ALND’
subgroup from the Gemignani et al. trial, demonstrates that the nearly 30% increase in the
‘immediate ALND’ subgroup’s average cost over the reported baseline is almost entirely due to
a doubling of the charges associated with the hospital stay.[58] This result raises three issues;
first, with reference to the dollar amounts reported in the Gemignani et al. study, a reminder that
despite the repeated references to ‘costs’ it is actually hospital charges (as opposed to costs) that
are being evaluated; second, as the authors openly acknowledge in their discussion, reporting of
charges introduces a significant amount of uncertainty into how the results from their study may
be interpreted due to the fact that full payment of the charges was not guaranteed nor could it be
verified;[58]and third, if such a large increase in hospital charges are realized with an increase in
the length of stay due to having a completion ALND performed, then the average in-hospital
charges subscribed to the ALND cohort must include an offsetting cost-savings relative to the
SLNB cohort costs since the reported incremental average cost (IAC) for the trial is a relatively
small USD $101.[58] In re-examining the breakdown of the overall SLNB cohort and SLNB-

- 119 - affiliated subgroup costs within the Gemignani trial it is evident that there are substantial SLNB-
associated charges related to pathological examinations that counter any of the hospital-stay
cost-savings. Intuitively, an increase in pathologic-related charges or costs in an SLNB group of
patients is expected due to the need for an intraoperative pathological assessment (i.e. frozen
sections or imprint cytology) as well as the increased time required to examine SLNs (i.e. due to
serial sectioning of SLNs into 2-5mm slices as opposed to the bi-valve method traditionally used
in examining lymph nodes resected by ALND).[13] The pathology-related increase in hospital
charges within the Gemignani trial’s SLNB subgroups brings into stark contrast the noted lack
of increase in pathology related costs that would be attributed to the ‘LAB Anatomical
Pathology’ functional centre within the OCCI-generated cost-cohorts of The Model’s SLNB-
affiliated subgroups. Specifically, there is an average total cost per case of $989 (SD: $383)
assigned to the ‘LAB Anatomical Pathology’ functional centre within the ALND-associated
procedure cost-cohort as compared to the smaller cost of $708 (SD: $336) assigned to the same
functional centre within the SLNB-associated procedure cost cohort (see Appendix F). The
smaller SLNB-related pathology costs may reflect differences in the professional fees paid to
pathologists for conducting the two different types of examinations,54 but this cannot be
determined based on the current level of detail provided in the costing-analysis tool (CAT)-
enabled search reports of the OCCI database (see Appendix F).[62] Alternatively, the costs
assigned to these functional centres may in fact be an accurate reflection of the ‘true’ pathology-
related costs of the two procedures and it is instead the hospital charge data from the Gemignani
trial that is flawed. While it is certainly acknowledged in the literature that undertaking cost-
analyses using charges may be fraught with uncertainty, serving to inflate estimates of ‘true’
costs, it is also acknowledged that the costing trends, despite the use of charges, tend to be
54 A reminder that pathology-related professional fees are some of the few physician-related fees that are incorporated into the OCCI costing methodology.[62]

- 120 - preserved.[11; 12] Consequently, the comparison of the SLNB-associated subgroup charges
from the Gemignani trial with the costs generated from a roll-back analysis of The Model, once
again highlight the lack of transparency in the OCCI-derived cost data, an acknowledged
weakness of this cost-minimization analysis (see next section in this Discussion).
At first blush it would seem that the positive incremental average cost (IAC) as reported
by Ronka et al. (where the IACs for the other tree studies, including this CMA, are negative)
was primarily due to the fact that approximately only half of the 237 ESBC patients evaluated
by Ronka et al., obtained the expected cost benefit of enduring only one SLNB operation.[61] In
a close examination of the Ronka et al. study’s methods and results however, this proved not to
be the case. As reported by the authors, the relatively low patient participation in the ‘SLNB
only’ subgroup was primarily driven by the high SLNB failure rate of 14% at the time the study
was undertaken.[61] The authors did note in their discussion however that in treating their most
recent ESBC patients with SLNB, the SLN identification failure rate had dropped significantly,
to a more appropriate level below 5% (as recommended in SLNB practice guidelines).[14; 18;
48] In reworking the decision-analysis outlined in their publication using this lower SLNB
failure rate of 5% (see Appendix H), the average costs of the SLNB-only and overall SLNB
cohort actually increase (albeit very slightly) to €3,595.76 and €3,789.03, increases of €0.80 and
€39.05, respectively. The more significant increase was in terms of the percentage of patients
that would occupy the ‘SLNB only’ subgroup using the lower SLNB failure rate of 5%, to
56.9% (an increase of 5.4%), which in turn increased the contribution to the positive IAC by the
‘SLNB only’ subgroup to €327.61 from €296.10 (a reminder that a positive IAC translates into a
realized cost-savings from within the ALND cohort). All of this is to say, that the primary driver
of increased SLNB-associated costs in the Ronka et al., study has nothing to do with how many
patients undergo a completion ALNDs (which is contrary to the results of this CMA), but are
- 121 - rather the result of assumptions made regarding the subsequent subtrees and the costing of those
branches by the authors.[61]
A reminder that the study by Ronka et al., is a decision-analysis that uses microcosting
data taken from 237 consecutive ESBC patients treated with SLNB as part of a treatment
protocol that uses intraoperative frozen section analysis.[61] The decision-analysis consists of
four competing treatment pathways modelled using decision-analysis software similar to what
was employed to build The Model for this CMA. Only two of the modelled treatment options
however are clinically relevant to a Canadian health care setting (i.e. an ‘ALND only’ and a
‘SLNB with frozen section’ treatment pathway since these algorithms follow Western clinical
practice guidelines and are akin to what is commonly practiced in some noted Ontario
institutions).[14; 15; 54; 79; 114] These two pathways are also comparable to the competing
Alternative and Standard treatment pathways in The Model. It was the second ‘SLNB with
frozen section’ subtree that has been reproduced in Appendix H (using all of the authors’
original variable names and values) in order to determine the driver of costs within their SLNB
cohort. In referring back to their original article and in looking at Figure H1 (see Appendix H) it
is noted that the majority of the labels for the terminal nodes refer to more extensive secondary
operations that would appear to have been very particular treatment protocols used that Finnish
hospital (i.e. MARABLN2 refers to having a mastectomy as a second operation due to
insufficient margins, and MULEVN1 refers to having an ALND at a second operation due to a
diagnosis of multi-focal carcinoma, which is no longer standard practice here in Ontario,[48; 54]
etc.,). As noted in the roll-back analyses depicted in Figures H2 and H3 (see Appendix H) these
terminal nodes contribute substantial costs to the base case average cost for the entire SLNB
cohort, thereby leading to the observed increase in SLNB-associated costs when the SLNB
failure rate is actually lowered from 14% to 5%.[61]

- 122 -
This rather in-depth analysis of the decision-tree modelling used in the study by Ronka
et al., as a basis for comparing the structure of The Model constructed for this CMA, highlights
some of the simplifying assumptions made in building The Model, as well as providing a
reminder that scepticism should be exercised before accepting the results of a decision-analysis
outright. Specifically, it should be stated that conclusions drawn from the results of The Model
presented in this dissertation must be made cautiously if there are any anticipated differences
between The Model’s treatment pathways and the treatment protocols at a particular institution.
That is to say, that a hospital administrator at a given Ontario hospital should be wary of the
results of this CMA if he or she knows the surgeons at the hospital are known to deviate
somewhat from the treatment pathways of The Model. By way of example, if a particular
surgeon were to regularly perform completion ALNDs in patients who are discovered to have
only isolated tumour cells (ITCs) in the SLNs on final pathology (considered ‘negative’ by
current pathologic staging standards and therefore not included in the calculation of SLN
positivity or iFNR, and yet not subject to any official recommendations from current guidelines
regarding definitive operative management).[13; 15; 48; 78] then the actual average cost of
SLNB at that hospital would be higher than what is predicted by The Model. The study by
Ronka et al., is analogous to this example in that a decision-analysis that models treatment
pathways that are very specific to a single centre may help to direct single-centre administrative
policy but the results of the analysis are consequently not generalizable. The fact that The Model
in this CMA is constructed using clinical data from large randomized controlled trials that
follow treatment protocols endorsed by published clinical guidelines, contributes significantly to
the overall generalizability of the results.
The results of this cost-minimization analysis (CMA) have thus far been discussed on
the basis of insights gained from comparing the average costs incurred within SLNB-associated

- 123 - subgroups from published trials and equivalent ‘theoretical’ subgroups identified by certain
subtrees within The Model’s roll-back analysis. The cost-comparison study published by
Chirikos et al., does not provide any subgroup analysis, but is the only published trial that
incorporated a period of postoperative follow-up (i.e. upward of 44 months following a
diagnosis of breast cancer) into the cost-analysis.[59] Notwithstanding the previously identified
barriers (see Background chapter) to making a direct comparison of the results of the Chirikos
study and the results of this CMA. The study authors performed comparisons of cumulative in-
hospital charges at three different follow-up periods (i.e. follow-up > 365 days, > 730 days, and
all follow-up data) and found no difference between the charges to the SLNB and non-SLNB
groups.[59] Although specific procedure-related complications were not targeted by Chirikos et
al., given the substantial decrease in post-operative morbidity associated with SLNB use across
the ESBC patient population, [24; 38; 45; 46] then the lack of cost-savings seen on a cumulative
basis across an inclusive population as reported by Chirikos et al.[59] would seem to support a
primary finding of this CMA; namely, that the costs associated with treating postoperative
complications following axillary surgery are not significant.
It is possible that a reason for the insignificance of morbidity costs, certainly in terms of
the evaluation of The Model, is likely due to a combination of the procedure-related morbidity
having a fairly low rate of occurrence (see Table 7) and also being assigned lower in-hospital
treatment costs, relative to the procedure-related services (see Tables 10a and 10b).[62] A
reasonable concern may be raised that not including the common complication of an axillary
wound infection in The Model55 might have contributed to a lack of model sensitivity to either
the morbidity rates or their associated treatment costs (as evidenced from the thorough one-way
sensitivity analyses detailed in the Results chapter, see Figures 15 and 16). Although not
55 A reminder that the morbidity of postoperative wound infections were not modelled with this decision-analysis because the relevant data of suitable quality was not identified during the comprehensive literature review.

- 124 - obtained from a randomized controlled trial, investigators from the large prospective case series
of SLNBs performed in a U.S.-based ESBC patient population, known as the Z0010 trial,
reported a 1.0% (0.7 to 1.3%) wound infection rate.[81] With such a low rate of occurrence and
assuming that the costing estimate is similar to that for treating an axillary seroma, it is unlikely
that inclusion of wound infection data (that had met the inclusion criteria of the comprehensive
review) would have significantly affected the outcome of this cost-minimization analysis.
A more plausible explanation for the insignificance of the morbidity costing data is that
in considering only in-hospital costs, both the analysis by Chirikos et al., as well as this CMA,
did not capture the significant costs associated with these complications. Certainly, as noted in
the case of chronic lymphedema, the bulk of the costs associated with the handling of the illness
falls to the patient and is likely incurred out-of-hospital (i.e. time off work, physiotherapy costs,
massage treatments, the costs of purchasing sleeves and other aids, etc.,).[22; 47; 83] This line
of thinking can be extended further to suggest that the significant impact of all morbidity
associated with axillary surgery is likely understated if only costs are considered. A number of
studies have demonstrated significant improvements in patient quality of life associated with
SLNB [24; 38; 45; 46] and it is likely that in order to quantify the full impact of the decrease in
morbidity that SLNB offers the ESBC patient population, a study such as a cost-utility analysis
(CUA) that incorporates patient preference measures and is undertaken with a broader
perspective in mind (i.e. the health system as a whole or societal perspective), may be needed.
C. Summary
The results of this cost-minimization analysis have been clearly summarized and
thoroughly analyzed within the context of the existing literature. While output from the
decision-analytic model is consistent and appears robust, contextualization of the results
revealed some interesting findings. First, the result that the Alternative treatment pathway is

- 125 - cost-minimizing is likely entirely due to the increased cost associated with patient admission in
the Standard treatment arm, and has very little to do with cost-savings realized from having to
treat fewer post-operative complications (as had been hypothesized). Second, the
generalizability of the decision-tree model was reinforced following an in-depth examination of
a similar decision-analytic model used in one of the previously published cost-comparison
studies. Finally, a comparison between this CMA and one of the published microcosting trials,
highlighted the uncertainty inherent in case cost estimates (specifically those concerning the
pathology-related functional centres) obtained from the search of the Ontario Case Costing
Initiative (OCCI) database. While some of these insights into the methodology and results of
this study translate into real strengths and weaknesses for this CMA; additional limitations and
advantages exist however, as discussed below.
3. Study strengths and weaknesses
A. Model building: the clinical data
The results from the GIVOM trial are the most extensively used in The Model, and while
the appraisal of the high quality of the data has already been discussed (see Results chapter)
there is however a subtle concern regarding the SLNB treatment protocols used by the GIVOM
trial investigators; namely that the GIVOM trial surgeons used a single method of SLN
localization (i.e. radioisotope injection, but no blue dye), which is notably contrary to both the
current North American clinical practice guidelines [14; 18; 48] and the protocols used in other
studies from the literature review (i.e. NSABP B-32, the Cambridge study, see Table 4). It is
therefore not surprising that the GIVOM trial SLN identification failure rate of 5% (95% CI:
3.4% to 6.6%) was ‘inflated’ to nearly twice the 2.8% reported in the NSABP B-32 technical
results publication (see Table 9).[38; 44; 45] While it might seem that the single SLN
localization protocol utilized in the GIVOM trial might constitute enough of a deviation away

- 126 - from the preferred method to warrant using another study’s data to populate the decision-tree
model chance nodes, use of this ‘inflated’ SLN identification failure rate turned out to be a
strength of this study. As noted in the comparison of The Model to the decision-tree model used
by Ronka et al., (and notably contrary to the output from the latter decision-tree model), in this
CMA a higher SLNB failure rate results in fewer patients that require only a SLNB and more
patients that require an immediate ALNDs and therefore incur higher costs due to hospital
admission. Consequently, use of a potentially ‘inflated’ SLNB failure rate within The Model,
actually biases the results of this decision-analysis against SLNB being the cost-minimizing
pathway, thereby adding weight to the actual results of this study. In other words, assuming that
an Ontario hospital uses two SLN-localization methods and can achieve a SLN failure rate of at
worst 5%, then (all other things being equal) the hospital administrators may be reasonably
comfortable with the implications of the results of this CMA. Preliminary results from an audit
of 497 SLNB cases performed at an academic institution in Ontario over a three-year period
(2005 to 2007) revealed only 13 (2.7%) failed SLN localizations, [79] suggesting that the 5.0%
point-estimate used in The Model, as taken from the results of the GIVOM trial, is an
appropriately conservative estimate of the SLNB failure rate, generalizable to Ontario.
The idea that the clinical data taken from the GIVOM trial, the Cambridge study, and the
technical results report of the NSABP B-32 trial, and used to populate and construct The Model
is appropriate for the purposes of modelling SLNB- and ALND-related treatment costs for use
in an Ontario health care setting, is an assumption that deserves mention. To be clear, it is not
the quality of the data that is in question, since the rigour with which the comprehensive
literature review was conducted ensured that only the highest quality randomized clinical trial
(RCT) data was used in developing the decision-tree model, rather it is simply a question of
whether the treatment uncertainties and morbidity rates witnessed and recorded in these trials,
- 127 - from Italian, British and (mostly) US citizens, are applicable to a Canadian ESBC patient
population. As a quick answer, it is important to note that many of the hospitals participating in
the NSABP B-32 trial are located in Canada, and given that the NSABP-B32 trial results
resemble closely the treatment uncertainties described in the GIVOM trial (see Table 9 in the
Results chapter), this is taken as face validity that in using the results of the previously
mentioned RCTs to populate The Model, there is probably minimal misrepresentation of the
‘true’ Ontario-specific SLNB-related treatment uncertainties.
A final and significant limitation regarding the clinical data used in this cost-
minimization analysis proved to be the recurrent morbidity data; and specifically it being limited
in terms of only being representative of a two-year period of follow-up. Initially, one of the
assumptions in constructing the decision-tree model was that a two-year analytic horizon was
appropriately long, as it would capture the incidence of the morbidity that could be reliably
attributed to either of the axillary procedures beings modelled; and fortunately, morbidity data
was found in the literature review that accommodated that assumption.[38; 45] The results of
the sensitivity analyses demonstrated however, that the morbidity data was a non-factor in this
cost-minimization analysis. Following from the discussion initiated in the ‘Interpretation of the
results’ section above, where a number of reasons why modelling postoperative morbidity was
likely to be non-contributory were presented, the bottom line is that the real limitation exists in
terms of the perspective and scope adopted in this cost-analysis. In order to determine a better
estimate of the true economic and clinical impact of postoperative morbidity following axillary
surgery in the breast cancer patient population, an analysis that incorporates a measure of patient
preference (i.e. a quality-adjusted life year or ‘QALY’), an analytic perspective that includes a
broader range of costs (i.e. from the perspective of the government so that the impact of time off
work is considered for example), and a greater scope (i.e. multi-year follow up, such that the

- 128 - true impact of chronic postoperative conditions such as lymphedema can be fully assessed),
would need to be undertaken.[11; 12; 59] This idea is revisited again in the discussion below
regarding potential future research efforts.
B. Model building: the cost data
Without question, the values that were the most difficult to determine with any certainty
and yet were integral to this CMA were the estimations of cost using the Ontario Case Costing
Initiative (OCCI) database. Drummond et al., describe microcosting strategies, where very
specific resource use is estimated and assigned a unit value which is then allocated
appropriately, as the most precise form of costing.[11] Case-mix and disease-specific costing
strategies are inherently less precise, but more generalizable, than microcosting strategies since
individual patient costs are grouped and averaged.[11] While the OCCI methodology ensures
that hospitals monitor and allocate all of their costs (as is done with microcosting databases) in
order for the costs to be comparable across hospitals, the individual patient-level costs are
grouped together according to varying classifications (i.e. principal procedure, CMG code,
diagnostic code, etc.) and the hospital data is then pooled.[62] The purpose of this portion of the
discussion is not meant to revisit how cost estimates were determined (see Methods), but rather
to explore the validity of these cost estimations as they were used in The Model, since concerns
regarding the accuracy of the OCCI-generated procedure and morbidity-related costs have
emerged.56 Unfortunately though, a greater understanding of the cost-content of the OCCI-
derived cost-cohorts (see Table 3) is hindered by a lack of transparency in the reporting of OCCI
costing data.[62]
56 Note the previous discussion requiring justification for a ‘NucMed adjustment’ to the SLNB- and ALND-related procedure costs (see page 50 in the Research Methods chapter), or the discussion of the counter-intuitive increase in costs allocated to the ‘LAB Anatomical Pathology’ functional centre within the ALND cost-cohort as compared to the SLNB cost-cohort (see pages 118-119 in the above Discussion chapter).

- 129 -
Specifically, the ‘lack of transparency’ refers to first, the difficulty in knowing how
precisely the search criteria identify a desired patient cohort; and second, how costs are
specifically allocated within that patient cohort. While the OCCI case-costing manual provides
an excellent conceptual overview of the case-costing process (as presented in the Methods
chapter), the specific costing methodology needed to fully appreciate the cost-allocation process
within any of the very specific cost-cohorts searched for in this study (see Table 3), is
undertaken within the OCCI-participating hospital accounting departments. It is likely that an
in-depth evaluation or knowledge of the in-hospital costing process is needed in order to
validate what is described in the model. The fact that no such evaluation was part of this cost-
minimization study means that the validity of the costing data has only been verified insofar as it
can be explained from the limited output provided by the costing analysis tool (CAT)-enabled
search of the OCCI database (see Appendix F). Specifically, the OCCI-identified cost-cohorts
were judged to be reasonable estimates of the ‘true’ costs for use in The Model (see Tables 3, 9a
and 9b) based largely on an inspection of the underlying cost allocation to the functional centres
(see Appendix F). While accepted quantitative methods were used in an attempt to fully
characterize the uncertainty in the cost data (i.e. gamma distributions were created and sampled
within the scope of a probabilistic sensitivity analysis) it is unlikely that the uncertainty
surrounding the OCCI-derived cost-cohorts was fully mitigated; it therefore remains a
significant weakness in the methodology of this cost-minimization analysis. This is of particular
concern given that the one-way sensitivity analyses (see Figure 16 in the Results chapter)
demonstrated that The Model was sensitive to only two cost variables (i.e. cost_ALND_Inpt and
cost_SLNB_DaySx).
Having just reiterated in general terms above, the efforts undertaken to verify the validity
of the cost-cohorts, it is now important to revisit, in more specific terms, the final criteria used to

- 130 - identify the cost-cohorts (see Table 3) and the implications the use of such criteria have on the
final SLNB and ALND procedural costs (see Table 10a). Specifically, the criterion of hospital
admission (i.e. the ‘Patient type’ category in Table 3) was used as a proxy to differentiate
patients undergoing ALND from those undergoing SLNB; and this is fundamentally flawed.
Admittedly the limitations in the OCCI costing-analysis tool (CAT) forced that such a proxy
measure be used, however use of this proxy is problematic insofar that hospital admission does
not necessarily have a direct link to performance of an ALND. This raises the real possibility
that the underlying cost-cohorts are not representing the costs accrued in the intended population
and that this CMA is not a ‘pure’ comparison of SLNB-related and ALND-related costs. To put
this dilemma into a clinical context, consider the example that it may be a surgeon’s or
hospital’s protocol that all breast cancer patients with a body-mass-index (BMI) over 3057 be
admitted for overnight observation, regardless of the type of axillary surgery being done. Based
on the criteria used in this CMA to identify the ALND and SLNB-associated case cohorts, such
patients would all be (falsely) categorized within the ALND cost-cohort. Thus, instead of simply
being differentiated by the type of surgical intervention, uncontrolled-for clinical criteria may be
having an effect on the make-up of the costs being used; in other words the cost-cohorts are
likely biased. The particular biases would be a selection bias (on the part of the surgeons and/or
hospitals that may admit or discharge patients based on preference or protocol) or sorting biases
(where patients self-select for hospital admission based on their clinical characteristics). This
hypothetical example therefore highlights how cost-cohort identification based on the limited
number of available input OCCI criteria is problematic, since The Model risks (as a worse case
scenario) becoming irrelevant to the research question at hand, serving instead as a means of
quantifying the obvious differences in costs generated by inpatients and outpatients.
57 Widely acknowledged as the medical threshold for ‘obesity’ and a known risk factor for surgical complications.[115]

- 131 -
While the concluding statement in the above paragraph was perhaps overly dramatic and
negative, it is meant to be a fair acknowledgement of the likelihood of bias having been
introduced into the composition of the costing data. Before throwing out the results of this entire
cost-analysis however, it is important to acknowledge that (as previously discussed) inspection
of the costs allocated to the functional centres (see Appendix F) does provide some assurance
that the bulk of the OCCI cases categorized to the SLNB and ALND procedural cost-cohorts are
in fact representative of early-stage breast cancer patients who actually underwent SLNB or
ALND, respectively (see Methods). Furthermore, there is something to be said for clinical
standards as represented in the literature, which clearly demonstrate that SLNB patients are
routinely sent home far earlier than their ALND counterparts.[14; 38; 45; 63] Finally, it is not
clear how such biases would impact on the stated results; meaning that although some
uncertainty in the composition of the cost-cohorts must be acknowledged it is not clear that the
reported incremental average cost values would change appreciably. This is because both the
selection and sorting biases do not necessarily work in one ‘direction’, consider the following;
for every obese SLNB patient that a surgeon admits for observation, there may be a young and
healthy ALND patient that is sent home on the same day of her surgery. In effect, these clinical
scenarios would cancel one-another out from a cost-cohort standpoint. Assuming that there is
some ‘crossover’ (i.e. some SLNB patients are accounted for in the ALND-associated procedure
cost-cohort, and vice-versa) there is probably a degree of convergence in the cost estimates used
for the two procedure cost-cohorts. Consequently, while the admitted uncertainty in the validity
of the composition of the cost-cohorts requires that the results of this CMA be interpreted with
some caution, it would be rash to qualify the conclusions as being totally invalid and without
merit.

- 132 - Notwithstanding the (extensively acknowledged) shortcomings of the OCCI-derived cost
estimates, it should be mentioned that this study is one of only two known cost-analyses that has
uses OCCI data58.[116] As such, use of OCCI data in cost-analyses is a very new undertaking,
that may yet have great potential in terms of contributing to future Ontario-specific economic
evaluations.
C. Model building: the decision-tree structure
One of the perceived strengths of this study is the actual structure of this decision-
analysis model. Although other SLNB-related decision analyses exist in the literature, [33; 117]
it is the only known decision-analysis to model SLNB- and ALND-associated treatment
pathways that incorporate postoperative complications using Markov processes.
Notwithstanding the acknowledged lack of model sensitivity with respect to the morbidity data,
the actual Markov processes were appropriately created using sound decision-analysis
techniques as confirmed by the Markov cohort analysis (see Appendix D).[66; 84] Moreover the
decision-tree structure followed from the clinical pathways recommended in widely accepted
clinical practice guidelines [14; 17; 18; 26; 31] and the corresponding chance nodes (or branch
probabilities) were populated with clinical data from high quality randomized clinical trials
(RCTs) identified by means of a methodologically sound comprehensive literature review. The
decision-tree model, from a structural standpoint, is therefore considered to be an accurate
representation of the clinical pathways being compared.
58 The authors of the article entitled “Estimates of the lifetime costs of breast cancer treatment in Canada” and published in 2000, actually used data from the institutional precursor to the Ontario Case Costing Initiative, namely the Ontario Case Costing Programme (OCCP) which at the time of the publication had fewer participating hospitals.[62]

- 133 - D. Model evaluation
Determination of the ‘base’ or ‘reference’ case incremental average cost value by means
of the initial roll-back analysis (see Table 11 in the Results chapter) provided a quick result, a
straightforward evaluation of the decision-tree model.[66] The roll-back analysis also generated
a much larger standard deviation value associated with the Alternative treatment pathway as
compared to the Standard treatment option (i.e. 743.55 vs. 31.08, again see Table 11). It is
important to note that these standard deviation values are the result of calculating the square root
of the summed squared differences between the cumulative per-patient treatment costs
calculated at each terminal node and the average cost reported for each competing decision-tree
pathway.59 As such, each terminal node cost is therefore treated equally within the calculation,
and since the SLNB-associated treatment pathway has more branches, resulting in more
treatment pathway possibilities than the ALND-associated pathway, a larger standard deviation
is generated during the roll-back analysis. Consequently, the significantly larger standard
deviation and wider payoff range attributed to the Alternative treatment pathway is simply a
reflection of the structure of the decision tree and not a true measure of the clinical uncertainty
inherent to the treatment pathways being modelled. This result emphasizes how important
proper characterization of model uncertainty, as a measure of the uncertainty in the clinical
pathways, is necessary in any decision-analysis.[86; 87; 93]. A hospital administrator is best
served by having a measure of the uncertainty in the output from a decision-analytic model that
reflects the actual underlying clinical uncertainty since it is the clinical outcomes that have
practical cost implications.[11; 86; 118] A probabilistic sensitivity analysis (PSA) provides a
comprehensive quantification of model uncertainty, and as a consequence is now the
59 This calculation for determining standard deviation as the square root of the variance within any series of continuous data, can be found in any introductory statistical textbook.[113]

- 134 - recommended standard by which uncertainty should be characterized in decision-analysis
reporting.[86; 87; 93]
In this cost-minimization analysis, four PSA trials were undertaken (see Table 13 in the
Results chapter), each of which sampled values for all applicable model variables from clearly
defined probability distributions, a certain number (n) of times (where n was set equal to 100,
500, 1000 and 10,000, in agreement with how other probabilistic sensitivity analyses have been
reported in the literature).[88; 91; 119] As has been already been noted the results of the four
PSAs were consistent, both in terms the final incremental average cost values that favoured the
Alternative treatment pathway; a general comment should be made however, with regard to how
the associated standard deviations generated from the PSA are being interpreted. Given that the
standard deviations associated with each average cost estimate generated from the probabilistic
sensitivity analysis do in fact overlap (i.e. Alternative average cost + standard deviation >
Standard average cost – standard deviation) would suggest that the assertion that one treatment
pathway is cost-minimizing cannot be made with any confidence. The important consideration
here is that these average values generated by means of decision analysis should not be treated
as traditional statistical means to be compared using the standard tests for significance.[66; 86;
87; 93] Instead, as argued in the literature, decisions should be based on net mean result of the
decision analysis, using quantification of variance (i.e. standard deviation) to inform on the
range of possible outcomes, for the preferred treatment pathway, but not on whether one mean is
significantly different from the other.[86; 93; 118] To this end, the fact that the frequency with
which the average cost of the Alternative treatment pathway proves to be less than that of the
Standard treatment pathway (see the ‘SLNB pathway selection freq’ column in Table 13)
consistently around 70% for each PSA trial, is accepted as a persuasive indicator of The

- 135 - Model’s cost-minimizing result; and is therefore used to justify the repeated assertion that the
Alternative treatment pathway is, on average, less costly than the Standard treatment option.
A final comment is reserved for the interpretation of the somewhat novel use of
microsimulation trials to evaluate The Model, and the subsequent ‘add-hoc’ analysis meant to
estimate a ‘threshold’ or minimum number of ESBC patients that need to be treated with SLNB
in order to recoup the necessary capital investment. Both analyses are basically without
precedent in the literature60 (certainly the ‘add-hoc’ analysis is completely novel), however the
conceptual reasoning for each analysis has already been provided and is considered sound. The
bottom line is that both of these analyses are dependent on the confidence or perceived validity
in the output of The Model. If the cost-advantage of the Alternative treatment pathway is
accepted, then the series of eight microsimulation trials (where n = 25, 50,…,175, 200) is a
relatively straightforward determination of the incremental average cost for a simulated volume
of patients. Likewise the ‘add-hoc’ analysis is an (albeit very rough) approximation that is
ultimately determined by plotting total cost functions for each treatment pathway, and by
assuming that the cost-advantage of the Alternative treatment pathway as determined from The
Model, is consistent and persists indefinitely. So long as the basic result of this cost-
minimization analysis is accepted, then both of these ‘alternative’ analyses are meant to be
added tools in an administrator’s decision-making armamentarium.61
60 A trial conducted by Barton et al., looking at the cost-effectiveness of managing dyspepsia in the United states, seem to describe a similar method of microsimulation analysis was proposed in this study, however the microsimulation was conducted using the unfamiliar programming language of Borland Delphi, making interpretation of the methods and results difficult.[88] 61 As the ultimate purpose of decision-analysis is meant to inform decision-making, it seemed appropriate (given the theoretical justification provided and regardless of how ‘informal’ these analyses might be perceived to be) to include both analyses in this dissertation.

- 136 - 4. Conclusion
This study used a detailed decision-tree model complete with nested Markov processes,
populated with current clinical data that was identified by means of a comprehensive literature
review, and Ontario-specific costing data to perform a cost-minimization analysis comparing the
use of SLNB to ALND as the initial axillary staging procedure in the setting of early-stage
breast cancer. The decision-tree model was evaluated by means of a standard roll-back analysis
and probabilistic sensitivity analysis, both of which consistently demonstrated that the SLNB-
associated treatment pathway incurred lower costs on average, and was therefore the cost-
minimizing treatment option. Model uncertainty was quantified by means of a probabilistic
sensitivity analysis. The outcome of this analysis has the potential to inform decision-making at
a hospital’s administrative level.
5. Implications and further research
The most significant implication of the results of this CMA is that, from a hospital
perspective, the cost of providing SLNB services should not be a barrier to SLNB
implementation. Currently, Cancer Care Ontario, in conjunction with the development of
updated and soon-to-be-published clinical practice guidelines regarding the role of SLNB in the
management of ESBC,[48] is investigating the status of SLNB care in Ontario with an aim
towards developing a comprehensive SLNB implementation strategy across the province.[120]
Given that one of the perceived barriers to SLNB implementation is the capital investment to
purchase the necessary equipment, then the completion of a CMA that demonstrates an apparent
cost-savings with the delivery of SLNB services, may be timely and useful within the context of
a larger strategic initiative.
Admittedly, the perspective adopted by this study (i.e. that of the hospital administrator)
is unusual within the context of the broader published literature concerning economic

- 137 - evaluations,[12] though it is entirely consistent with regard to the other studies that have
compared SLNB and ALND costs. Generally speaking, the more common perspective to adopt
when conducting an economic evaluation is that of the payer, in this case it would therefore be
the Ontario government’s perspective. The immediate consequence of having adopted the
somewhat narrow perspective of the hospital administrator is that the potential impact of this
analysis may be somewhat muted. After all, armed with the results of this CMA a hospital
administrator might be more inclined to help bring about the provision of SLNB services, but
ultimately, since hospitals are reimbursed by the government (i.e. the single payer) then a study
that evaluated costs from the payer’s perspective might in turn embolden the government to
work with hospitals to improve delivery of SLNB services across the province. In broadening
the categories of costs that would be considered in a cost-analysis that took on a payer’s
perspective, the intended audience may be better served by a similar broadening of the outcomes
being considered. The inclusion of Markov processes in this decision-analysis as a means of
modelling postoperative axillary complications demonstrated that cost alone is not a good
measure of the impact that SLNB has on the ESBC patient population as the less morbid
alternative to ALND. A formal cost-utility analysis (CUA) may therefore be a more appropriate
study design given that it allows for the inclusion of a patient preference measure. There is
abundant utility data that has already been developed and published in the breast cancer
literature,[56] however if the utilities specific to the ESBC patient in a short-term, post-
operative following SLNB, health state cannot be easily identified and primary research is not
an option, then good short-term quality of life data does exist [38; 45] which might be useful for
estimating specific SLNB and ALND-related postoperative utilities, as has been done in the
past.[11; 117]

- 138 -
An alternative to conducting a cost-utility study may be to complete a cost-effectiveness
analysis (CEA), where a single outcome of significance (e.g. chronic lymphedema) is modelled
alongside costs. While not as generalizable as the cost-utility analysis, a CEA is would allow for
a broader assessment of costs then the current CMA and provide insight into the impact of one
of the dreaded complications associated with axillary surgery.[12; 22; 47] In the case of either a
CUA or CEA, this CMA provides a base upon which the broader economic evaluations can be
built. Given that an SLNB-affiliated treatment pathway is in fact cost-minimizing, and knowing
that performing SLNBs results in less morbidity than ALNDs performed in an equivalent
population,[24; 38; 45; 46; 64; 104] it is likely that the CUA or CEA would report results even
in greater support of SLNB treatment. An anticipated difficulty in terms of further modelling
would potentially be how the costs associated with allocating resources such as entire Nuclear
medicine suites or SLNB-trained surgeons would be accounted for. Regardless, the current
CMA provides a well-conceived and thoroughly evaluated decision-tree, complete with Markov
processes already in place, which would serve as a good starting point for these suggested and
more involved economic evaluations.
- 139 -
V. REFERENCES
(1) National Information Center on Health Services Research & Health Care Technology (NICHSR). Introduction to Health Care Technology Assessment. National Library of Medicine; 1998. Report No.: TA 101.
(2) Busse R, Orvain J, Velasco M et al. Best practice in undertaking and reporting health technology assessments: working group 4 report. Int J Technol Assess Health Care 2002;18(2):361-422.
(3) Kanavos P, Trueman P, Bosilevac A. Can economic evaluation guidelines improve efficiency in resource allocation? The cases of Portugal, The Netherlands, Finland, and the United Kingdom. Int J Technol Assess Health Care 2000;16(4):1179-92.
(4) Will BP, Berthelot JM, Nobrega KM, Flanagan W, Evans WK. Canada's Population Health Model (POHEM): a tool for performing economic evaluations of cancer control interventions. Eur J Cancer 2001 September;37(14):1797-804.
(5) Canadian Cancer Society. Canadian breast cancer statistics. Internet Communication. www.cancer.ca. 2008.
(6) Mitton C, Patten S. Evidence-based priority-setting: what do the decision-makers think? J Health Serv Res Policy 2004 July;9(3):146-52.
(7) Mitton C, Patten S, Waldner H, Donaldson C. Priority setting in health authorities: a novel approach to a historical activity. Soc Sci Med 2003 November;57(9):1653-63.
(8) McGregor M, Brophy JM. End-user involvement in health technology assessment (HTA) development: a way to increase impact. Int J Technol Assess Health Care 2005;21(2):263-7.
(9) Ehlers L, Vestergaard M, Kidholm K et al. Doing mini-health technology assessments in hospitals: a new concept of decision support in health care? Int J Technol Assess Health Care 2006;22(3):295-301.
(10) Draborg E, Gyrd-Hansen D, Poulsen PB, Horder M. International comparison of the definition and the practical application of health technology assessment. Int J Technol Assess Health Care 2005;21(1):89-95.
(11) Drummond MF, Sculpher MJ, Torrance GW, O'Brien B, Stoddart GL. Methods for economic evaluation of health care programmes. Third. 2005. Oxford, Oxford University Press.
(12) (CADTH) Canadian Agency for Drugs and Technologies in Health. Guidelines for the economic evaluation of health technologies. Ottawa; 2006. Report No.: Third edition.
(13) Greene FL, Page DL, Fleming ID. AJCC cancer staging manual. 6th ed. New York: Springer; 2002.

- 140 -
(14) Lyman GH, Giuliano AE, Somerfield MR et al. American Society of Clinical Oncology guideline recommendations for sentinel lymph node biopsy in early-stage breast cancer. J Clin Oncol 2005 October 20;23(30):7703-20.
(15) Quan ML, McCready D. The evolution of lymph node assessment in breast cancer. J Surg Oncol 2008 November 19.
(16) Amersi F, Hansen NM. The benefits and limitations of sentinel lymph node biopsy. Curr Treat Options Oncol 2006 March;7(2):141-51.
(17) Rivers A, Hansen N. Axillary management after sentinel lymph node biopsy in breast cancer patients. Surg Clin North Am 2007 April;87(2):365-77, ix.
(18) McCready D, Holloway C, Shelley W et al. Surgical management of early stage invasive breast cancer: a practice guideline. Can J Surg 2005 June;48(3):185-94.
(19) Krag DN, Ashikaga T. The design of trials comparing sentinel-node surgery and axillary resection. N Engl J Med 2003 August 7;349(6):603-5.
(20) Samphao S, Eremin JM, El-Sheemy M, Eremin O. Management of the axilla in women with breast cancer: current clinical practice and a new selective targeted approach. Ann Surg Oncol 2008 May;15(5):1282-96.
(21) Benson JR, Querci della Rovere G. Management of the axilla in women with breast cancer. Lancet Oncol 2007;8:331-46.
(22) Petrek JA, Pressman PI, Smith RA. Lymphedema: current issues in research and management. CA Cancer J Clin 2000 September;50(5):292-307.
(23) Gerber L, Lampert M, Wood C, et al. Comparison of pain, motion, and edema after modified radical mastectomy vs. local excision with axillary dissection and radiation. Breast Cancer Res Treat 1992;21:139-45.
(24) Fleissig A, Fallowfield LJ, Langridge CI et al. Post-operative arm morbidity and quality of life. Results of the ALMANAC randomised trial comparing sentinel node biopsy with standard axillary treatment in the management of patients with early breast cancer. Breast Cancer Res Treat 2006 February;95(3):279-93.
(25) Goyal A, Mansel RE. Recent advances in sentinel lymph node biopsy for breast cancer. Curr Opin Oncol 2008 November;20(6):621-6.
(26) Rutgers EJ. Guidelines to assure quality in breast cancer surgery. Eur J Surg Oncol 2005;31(6):568-76.
(27) de Kanter AY, van Geel AN, Paul MA, et al. Controlled introduction of the sentinel node biopsy in breast cancer in a multi-centre setting: the role of a coordinator for quality control. Eur J Surg Oncol 2000;26(7):652-6.
(28) Quan ML, McCready D, Temple WJ, McKinnon JG. Biology of lymphatic metastases in breast cancer: lessons learned from sentinel node biopsy. Ann Surg Oncol 2002 June;9(5):467-71.

- 141 -
(29) Tafra L, Lannin DR, Swanson MS et al. Multicenter trial of sentinel node biopsy for breast cancer using both technetium sulfur colloid and isosulfan blue dye. Ann Surg 2001 January;233(1):51-9.
(30) Giuliano AE, Haigh PI, Brennan MB et al. Prospective observational study of sentinel lymphadenectomy without further axillary dissection in patients with sentinel node-negative breast cancer. J Clin Oncol 2000 July;18(13):2553-9.
(31) Schwartz GF, Giuliano AE, Veronesi U. Proceedings of the consensus conference on the role of sentinel lymph node biopsy in carcinoma of the breast April 19 to 22, 2001, Philadelphia, Pennsylvania. Hum Pathol 2002 June;33(6):579-89.
(32) Giuliano AE. See one, do twenty-five, teach one: the implementation of sentinel node dissection in breast cancer. Ann Surg Oncol 1999 September;6(6):520-1.
(33) Wong SL, Abell TD, Chao C, Edwards MJ, McMasters KM. Optimal use of sentinel lymph node biopsy versus axillary lymph node dissection in patients with breast carcinoma: a decision analysis. Cancer 2002 August 1;95(3):478-87.
(34) McMasters KM, Tuttle TM, Carlson DJ et al. Sentinel lymph node biopsy for breast cancer: a suitable alternative to routine axillary dissection in multi-institutional practice when optimal technique is used. J Clin Oncol 2000 July;18(13):2560-6.
(35) McMasters KM, Wong SL, Chao C et al. Defining the optimal surgeon experience for breast cancer sentinel lymph node biopsy: a model for implementation of new surgical techniques. Ann Surg 2001 September;234(3):292-9.
(36) Cody HS, III, Hill AD, Tran KN, Brennan MF, Borgen PI. Credentialing for breast lymphatic mapping: how many cases are enough? Ann Surg 1999 May;229(5):723-6.
(37) Cody HS, Fey J, Akhurst T, et al. Complementarity of blue dye and isotope in sentinel node localization for breast cancer: univariate and multivariate analysis of 966 procedures. Ann Surg Oncol 2001;8:13-9.
(38) Del BP, Zavagno G, Burelli P et al. Morbidity comparison of sentinel lymph node biopsy versus conventional axillary lymph node dissection for breast cancer patients: results of the sentinella-GIVOM Italian randomised clinical trial. Eur J Surg Oncol 2008 May;34(5):508-13.
(39) Purushotham AD, Upponi S, Klevesath MB et al. Morbidity after sentinel lymph node biopsy in primary breast cancer: results from a randomized controlled trial. Journal of Clinical Oncology 2005 July 1;23(19):4312-21.
(40) Veronesi U, Paganelli G, Viale G et al. A randomized comparison of sentinel-node biopsy with routine axillary dissection in breast cancer. N Engl J Med 2003 August 7;349(6):546-53.
(41) Veronesi U, Paganelli G, Viale G et al. Sentinel-lymph-node biopsy as a staging procedure in breast cancer: update of a randomised controlled study. Lancet Oncol 2006 December;7(12):983-90.

- 142 -
(42) Fisher B, Anderson S, Bryant J et al. Twenty-year follow-up of a randomized trial comparing total mastectomy, lumpectomy, and lumpectomy plus irradiation for the treatment of invasive breast cancer. N Engl J Med 2002 October 17;347(16):1233-41.
(43) Krag DN, Julian TB, Harlow SP et al. NSABP-32: Phase III, randomized trial comparing axillary resection with sentinal lymph node dissection: a description of the trial. Ann Surg Oncol 2004 March;11(3 Suppl):208S-10S.
(44) Krag DN, Anderson SJ, Julian TB et al. Technical outcomes of sentinel-lymph-node resection and conventional axillary-lymph-node dissection in patients with clinically node-negative breast cancer: results from the NSABP B-32 randomised phase III trial. Lancet Oncol 2007 October;8(10):881-8.
(45) Zavagno G, De Salvo GL, Scalco G et al. A randomized clinical trial on sentinel lymph node biopsy versus axillary lymph node dissection in breast cancer: results of the Sentinella/GIVOM trial. Ann Surg 2008 February;247(2):207-13.
(46) Mansel RE, Fallowfield L, Kissin M et al. Randomized multicenter trial of sentinel node biopsy versus standard axillary treatment in operable breast cancer: the ALMANAC Trial. J Natl Cancer Inst 2006 May 3;98(9):599-609.
(47) Kligman L, Wong RK, Johnston M, Laetsch NS. The treatment of lymphedema related to breast cancer: a systematic review and evidence summary. Support Care Cancer 2004 June;12(6):421-31.
(48) George R, Quan ML, McCready D, Rumble RB, Freeman E, McLeod R. Sentinel lymph node biopsy in early-stage breast cancer. Cancer Care Ontario, editor. 2009.
(49) Porter GA, McMulkin H, Lovrics PJ. Sentinel lymph node biopsy in breast cancer: Canadian practice patterns. Ann Surg Oncol 2003 April;10(3):255-60.
(50) Lucci A, Kelemen PR, Miller C, III, Chardkoff L, Wilson L. National practice patterns of sentinel lymph node dissection for breast carcinoma. J Am Coll Surg 2001 April;192(4):453-8.
(51) Quan ML, Hodgson N, Lovrics P, Porter G, Poirier B, Wright FC. National adoption of sentinel node biopsy for breast cancer: lessons learned from the Canadian experience. Breast J 2008 September;14(5):421-7.
(52) Rogers EM. Diffusion of Innovations. New York: Free Press; 2003.
(53) Cox CE, Salud CJ, Cantor A et al. Learning curves for breast cancer sentinel lymph node mapping based on surgical volume analysis. J Am Coll Surg 2001 December;193(6):593-600.
(54) Quan, M. L. SLNB trends in Canada (personal communication). 2009.
(55) Ontario Ministry of Health and Long-Term Care (MOHLTC). Ontario hospital reimbursement. Internet Communication. www.health.gov.on.ca. 2008.

- 143 -
(56) NHS Centre for Reviews and Dissemination (CRD). NHS Economic Evaluation Database Handbook. York, UK: University of York; 2007 Apr 1.
(57) Sinnott PG, Joyce VR, Barnett PG. Preference Measurement in Economic Analysis: A Guidebook. Menlo Park, CA: Health Economics Resource Centre; 2007 Mar 1.
(58) Gemignani ML, Cody HS, III, Fey JV, Tran KN, Venkatraman E, Borgen PI. Impact of sentinel lymph node mapping on relative charges in patients with early-stage breast cancer. Ann Surg Oncol 2000 September;7(8):575-80.
(59) Chirikos TN, Berman CG, Luther SL, Clark RA. Cost consequences of sentinel lymph node biopsy in the treatment of breast cancer. A preliminary analysis. Int J Technol Assess Health Care 2001;17(4):626-31.
(60) Perrier L, Nessah K, Morelle M, Mignotte H, Carrere MO, Bremond A. Cost comparison of two surgical strategies in the treatment of breast cancer: sentinel lymph node biopsy versus axillary lymph node dissection. Int J Technol Assess Health Care 2004;20(4):449-54.
(61) Ronka R, Smitten K, Sintonen H et al. The impact of sentinel node biopsy and axillary staging strategy on hospital costs. Ann Oncol 2004 January;15(1):88-94.
(62) Ontario Ministry of Health and Long-Term Care (MOHLTC). Ontario Case Costing Initiative (OCCI). Internet Communication. www.occp.com. 2008.
(63) Kim T, Giuliano AE, Lyman GH. Lymphatic mapping and sentinel lymph node biopsy in early-stage breast carcinoma: a metaanalysis. Cancer 2006 January 1;106(1):4-16.
(64) Olson JA, Jr., McCall LM, Beitsch P et al. Impact of immediate versus delayed axillary node dissection on surgical outcomes in breast cancer patients with positive sentinel nodes: results from American College of Surgeons Oncology Group Trials Z0010 and Z0011. J Clin Oncol 2008 July 20;26(21):3530-5.
(65) Government of Ontario's Ministry of Health and Long-term Care (MOHLTC). Schedule of Physician Benefits. Internet Communication. www.health.gov.on.ca. 2008.
(66) Hunink M, Glasziou P, Siegel J et al. Decision making in health and medicine: integrating evidence and values. New York: Cambridge University Press; 2005.
(67) Bank of Canada. Canadian consumer price index and inflation calculations. Internet Communication. www.bankofcanada.ca. 2009.
(68) Wong SL, Chao C, Edwards MJ et al. Accuracy of sentinel lymph node biopsy for patients with T2 and T3 breast cancers. Am Surg 2001 June;67(6):522-6.
(69) Veronesi U, Paganelli G, Viale G, et al. Sentinel lymph node biopsy and axillary dissection in breast cancer: results in a large series. J Natl Cancer Inst 1999;91:368-73.

- 144 -
(70) Bergkvist L, Frisell J, Liljegren G, Celebroglu F, Damm S, Thorn M. Multicentre study of detection and false-negative rates in sentinel node biopsy for breast cancer. British Journal of Surgery 2001;88:1644-8.
(71) Krag DN, Weaver D, Ashikaga T et al. The sentinel node in breast cancer--a multicenter validation study. N Engl J Med 1998 October 1;339(14):941-6.
(72) Khan KS, Kunz R, Kleijnen J, Antes G. Five steps to conducting a systematic review. J R Soc Med 2003 March;96(3):118-21.
(73) Khan KS, Kunz R, Kleijnen J, Antes G. Systematic Reviews to Support Evidence-based Medicine: How to review and apply findings of healthcare research. 2005. London, UK, Royal Society of Medicine Press.
(74) Higgins J.P.T., Green S. Cochrane Handbook for Systematic Reviews of Interventions. Chichester, UK: John Wiley & Sons, Ltd.; 2006 Sep 1. Report No.: Issue 4.2.6.
(75) Undertaking systematic reviews of research effectiveness: CRD's guidance for those carrying out or commissioning reviews. York, UK: University of York; 2001.
(76) Straus SE, Richardson WS, Glasziou P, Hayes RB. Evidence-Based Medicine: How to Practice and Teach EBM. Third. 2005. Edinburgh, Churchill Livingston.
(77) Krag DN, Weaver DL, Alex JC, Fairbank JT. Surgical resection and radiolocalization of the sentinel lymph node in breast cancer using a gamma probe. Surg Oncol 1993 December;2(6):335-9.
(78) Quan ML, Wells BJ, Wright FC, Fraser N, McCready D, Gagilardi AR. Beyond the false negative rate: development of quality indicators for sentinel lymph node biopsy in breast cancer. Submitted 2009.
(79) Wells BJ, Gagilardi AR, Wright FC et al. Beyond the false negative rate: the feasibility of measuring quality indicators for sentinel lymph node biopsy in breast cancer. 2009.
(80) Fisher B, Montague E, Redmond C et al. Comparison of radical mastectomy with alternative treatments for primary breast cancer. A first report of results from a prospective randomized clinical trial. Cancer 1977 June;39(6 Suppl):2827-39.
(81) Wilke LG, McCall LM, Posther KE et al. Surgical complications associated with sentinel lymph node biopsy: results from a prospective international cooperative group trial. Ann Surg Oncol 2006 April;13(4):491-500.
(82) Temple LK, Baron R, Cody HS, III et al. Sensory morbidity after sentinel lymph node biopsy and axillary dissection: a prospective study of 233 women. Ann Surg Oncol 2002 August;9(7):654-62.
(83) Sener SF, Winchester DJ, Martz CH et al. Lymphedema after sentinel lymphadenectomy for breast carcinoma. Cancer 2001 August 15;92(4):748-52.
(84) TreeAge Pro User's Manual. v2008 ed. TreeAge Software, Inc.; 2008.

- 145 -
(85) Bland M. An Introduction to Medical Statistics. Second ed. New York: Oxford Medical Publications, Oxford University Press; 1996.
(86) Philips Z, Ginnelly L, Sculpher M et al. Review of guidelines for good practice in decision-analytic modelling in health technology assessment. Health Technol Assess 2004;8(36).
(87) Claxton K, Sculpher M, McCabe C et al. Probabilistic sensitivity analysis for NICE technology assessment: not an optional extra. Health Econ 2005 April;14(4):339-47.
(88) Barton PM, Moayyedi P, Talley NJ, Vakil NB, Delaney BC. A second-order simulation model of the cost-effectiveness of managing dyspepsia in the United States. Med Decis Making 2008 January;28(1):44-55.
(89) Schrenk P, Rieger R, Shamiyeh A, Wayand W. Morbidity following sentinel lymph node biopsy versus axillary lymph node dissection for patients with breast carcinoma. Cancer 2000 February 1;88(3):608-14.
(90) Rockson SG, Miller LT, Senie R et al. American Cancer Society Lymphedema Workshop. Workgroup III: Diagnosis and management of lymphedema. Cancer 1998 December 15;83(12 Suppl American):2882-5.
(91) Sher DJ, Wittenberg E, Suh WW, Taghian AG, Punglia RS. Partial-breast irradiation versus whole-breast irradiation for early-stage breast cancer: a cost-effectiveness analysis. Int J Radiat Oncol Biol Phys 2009 June 1;74(2):440-6.
(92) Barton P, Bryan S, Robinson S. Modelling in the economic evaluation of health care: selecting the appropriate approach. J Health Serv Res Policy 2004 April;9(2):110-8.
(93) O'Hagan A, McCabe C, Akehurst R et al. Incorporation of uncertainty in health economic modelling studies. Pharmacoeconomics 2005;23(6):529-36.
(94) Langer I, Guller U, Berclaz G et al. Morbidity of sentinel lymph node biopsy (SLN) alone versus SLN and completion axillary lymph node dissection after breast cancer surgery: a prospective Swiss multicenter study on 659 patients. Ann Surg 2007 March;245(3):452-61.
(95) Crystal Probe Systems. SLNB hand-held gamma probe. Internet Communication. www.surgicalprobe.com. 2009.
(96) Rietman JS, Dijkstra PU, Geertzen JH et al. Treatment-related upper limb morbidity 1 year after sentinel lymph node biopsy or axillary lymph node dissection for stage I or II breast cancer. Ann Surg Oncol 2004 November;11(11):1018-24.
(97) Rietman JS, Geertzen JH, Hoekstra HJ et al. Long term treatment related upper limb morbidity and quality of life after sentinel lymph node biopsy for stage I or II breast cancer. Eur J Surg Oncol 2006 March;32(2):148-52.

- 146 -
(98) Rietman JS, Dijkstra PU, Geertzen JH et al. Short-term morbidity of the upper limb after sentinel lymph node biopsy or axillary lymph node dissection for Stage I or II breast carcinoma. Cancer 2003 August 15;98(4):690-6.
(99) Goyal A, Newcombe RG, Chhabra A, Mansel RE. Morbidity in breast cancer patients with sentinel node metastases undergoing delayed axillary lymph node dissection (ALND) compared with immediate ALND. Ann Surg Oncol 2008 January;15(1):262-7.
(100) Madsen A.H., Haugaard K, Soerensen J et al. Arm morbidity following sentinel lymph node biopsy or axillary lymph node dissection: a study from the Danish Breast Cancer Cooperative Group. Breast 2008 April;17(2):138-47.
(101) Peintinger F, Reitsamer R, Stranzl H, Ralph G. Comparison of quality of life and arm complaints after axillary lymph node dissection vs sentinel lymph node biopsy in breast cancer patients. Br J Cancer 2003 August 18;89(4):648-52.
(102) Burak WE, Hollenbeck ST, Zervos EE, Hock KL, Kemp LC, Young DC. Sentinel lymph node biopsy results in less postoperative morbidity compared with axillary lymph node dissection for breast cancer. Am J Surg 2002 January;183(1):23-7.
(103) Rietman JS, Dijkstra PU, Hoekstra HJ et al. Late morbidity after treatment of breast cancer in relation to daily activities and quality of life: a systematic review. Eur J Surg Oncol 2003 April;29(3):229-38.
(104) Lucci A, McCall LM, Beitsch PD et al. Surgical complications associated with sentinel lymph node dissection (SLND) plus axillary lymph node dissection compared with SLND alone in the American College of Surgeons Oncology Group Trial Z0011. J Clin Oncol 2007 August 20;25(24):3657-63.
(105) Gill PG. Sentinel lymph node biopsy versus axillary clearance in operable breast cancer: The RACS SNAC trial, a multicenter randomized trial of the Royal Australian College of Surgeons (RACS) Section of Breast Surgery, in collaboration with the National Health and Medical Research Council Clinical Trials Center. Ann Surg Oncol 2004 March;11(3 Suppl):216S-21S.
(106) Ronka R, von SK, Tasmuth T, Leidenius M. One-year morbidity after sentinel node biopsy and breast surgery. Breast 2005 February;14(1):28-36.
(107) Leidenius M, Leppanen E, Krogerus L, von SK. Motion restriction and axillary web syndrome after sentinel node biopsy and axillary clearance in breast cancer. Am J Surg 2003 February;185(2):127-30.
(108) Barranger E, Dubernard G, Fleurence J, Antoine M, Darai E, Uzan S. Subjective morbidity and quality of life after sentinel node biopsy and axillary lymph node dissection for breast cancer. J Surg Oncol 2005 October 1;92(1):17-22.
(109) Blanchard DK, Donohue JH, Reynolds C, Grant CS. Relapse and morbidity in patients undergoing sentinel lymph node biopsy alone or with axillary dissection for breast cancer. Arch Surg 2003 May;138(5):482-7.

- 147 -
(110) Swenson KK, Nissen MJ, Ceronsky C, Swenson L, Lee MW, Tuttle TM. Comparison of side effects between sentinel lymph node and axillary lymph node dissection for breast cancer. Ann Surg Oncol 2002 October;9(8):745-53.
(111) Newman LA, Mamounas EP. Review of breast cancer clinical trials conducted by the National Surgical Adjuvant Breast Project. Surg Clin North Am 2007 April;87(2):279-305.
(112) Harlow SP, Krag DN, Julian TB et al. Prerandomization Surgical Training for the National Surgical Adjuvant Breast and Bowel Project (NSABP) B-32 trial: a randomized phase III clinical trial to compare sentinel node resection to conventional axillary dissection in clinically node-negative breast cancer. Ann Surg 2005 January;241(1):48-54.
(113) Corey, P. Introductory biostatistics for clinician scientists. 2007.
(114) Quan ML, Wright FC, Gagilardi AR, Urbach D, McCready D. Evaluating the quality of sentinel lymph node biopsy practice in Ontario. 2007.
(115) Benotti P, Wood GC, Still C, Petrick A, Strodel W. Obesity disease burden and surgical risk. Surgery for Obesity and Related Diseases 2006;2(6):600-6.
(116) Will BP, Berthelot JM, Le PC, Tomiak EM, Verma S, Evans WK. Estimates of the lifetime costs of breast cancer treatment in Canada. Eur J Cancer 2000 April;36(6):724-35.
(117) Jani AB, Basu A, Heimann R, Hellman S. Sentinel lymph node versus axillary lymph node dissection for early-stage breast carcinoma: a comparison using a utility-adjusted number needed to treat analysis. Cancer 2003 January 15;97(2):359-66.
(118) Claxton K. The irrelevance of inference: a decision-making approach to the stochastic evaluation of health care technologies. J Health Econ 1999 June;18(3):341-64.
(119) Karnon J. Alternative decision modelling techniques for the evaluation of health care technologies: Markov processes versus discrete event simulation. Health Econ 2003 October;12(10):837-48.
(120) Cancer Care Ontario - Surgical Oncology Group. SLNB current status report. 2009.
(121) Aubin, R. Medical databases and search strategies. 15-10-2007.

- 148 -
VI. APPENDICES
APPENDIX A
A mathematical framework of the theoretical model of hospital costs associated with axillary staging of ESBC patients
As depicted in Figure 3a (see Introduction chapter), note that if: QA = quantity of patients in the Standard treatment pathway (i.e. ALND-only) cases, then; Let the total cost of the ALND procedure be defined as:
TCA = c * QA (Eq. 1) where, c > 0.
Equation 1 represents the total cost of staging ESBC patients by ALND only, and describes the
cost function (TCA) in Figure 3a as a function of QA. The marginal cost of QA is the constant c,
equal to the derivative of Equation 1 with respect to QA or equivalently equal to the slope of the
TCA function, labelled as MCA in Figure 3a (see page 9).
Marginal cost of QA = dTCA/ dQA = c (Eq. 1a)
Similarly, with respect to SLNB, if:
QS = quantity of patients in the Alternative treatment pathway (i.e. treated initially with SLNB) cases, then; Let the total cost of the SLNB procedure be defined as:
TCS = TCi + b * (QS)d (Eq. 2) where, TCi, b, and d > 0.
Equation 2 represents the total cost of staging patients initially with SLNB, and describes the
SLNB total cost function (TCS) in Figure 3a as a function of QS, where TCi is the initial capital
cost. The derivative of this function, with respect to Q, results in a decreasing marginal cost
(MCS) for the Alternative pathway (to account for the initial SLNB learning curve) and is
mathematically represented by the stipulation that d < 1. Therefore, as shown by the differential
equation below, as QS increases the marginal cost of SLNB (MCS) decreases [14; 48]:
Marginal cost of QS = dTCS / dQS = b * d * (QS)d-1 (Eq. 2a)

- 149 -
It must be emphasized at this point that Figure 3a represents a comparison between two separate
treatment pathways or algorithms (and not simply two different procedures); where the
Alternative pathway involves having all ESBC patients treated initially with SLNB, some of
whom may go on to have an ALND (QS), whereas SLNB is not offered as part of the ‘Standard’
pathway and all ESBC patients are treated with only ALND (QA). The total costs to the hospital
will therefore be due to following one pathway or the other (i.e. the pathways are mutually
exclusive even though, as stated previously, approximately 25% to 35% of patients subject to
the Alternative treatment algorithm will have a positive SLNB and therefore undergo a
completion ALND).[14; 21] Therefore, in order to select the cost-minimizing function, in
mathematical terms the following optimization problem requires a solution:
Minimize Total Hospital Costs { c * QA, TCi + b * (QS)d },
There are three potential solutions to this problem, either:
1. When the total quantity of patients to be staged is relatively small, therefore QESBC < Q*, then due to the comparative cost advantage of ALND, QS = 0 and QA >0.
2. When the total quantity of patients to be staged is relatively large, therefore when QESBC
> Q*, then the lower marginal cost of the Alternative pathway compensates for the higher initial capital investment in the hand-held gamma probe and, QS > 0 and QA = 0.
3. If the quantity of patients equals the ‘threshold’ number of patients, therefore where
QESBC = Q* and TCS = TCA, then from a cost standpoint the treatment pathways are equivalent and either QA or QS = Q*.
In an attempt to quantify the unknown patient threshold quantity Q*, the third solution can be
represented by, the following equation:
c * Q* = TCi + b * (Q*)d
Assuming that Q* is large enough such that there is little residual effect of the SLNB learning
curve on cost (i.e. assuming Q* is large enough such that d approaches 1, d � 1), making TCS
nearly a straight line with a slope that approaches b (i.e. MCS � b) then Q* can be
approximated by the following equation:
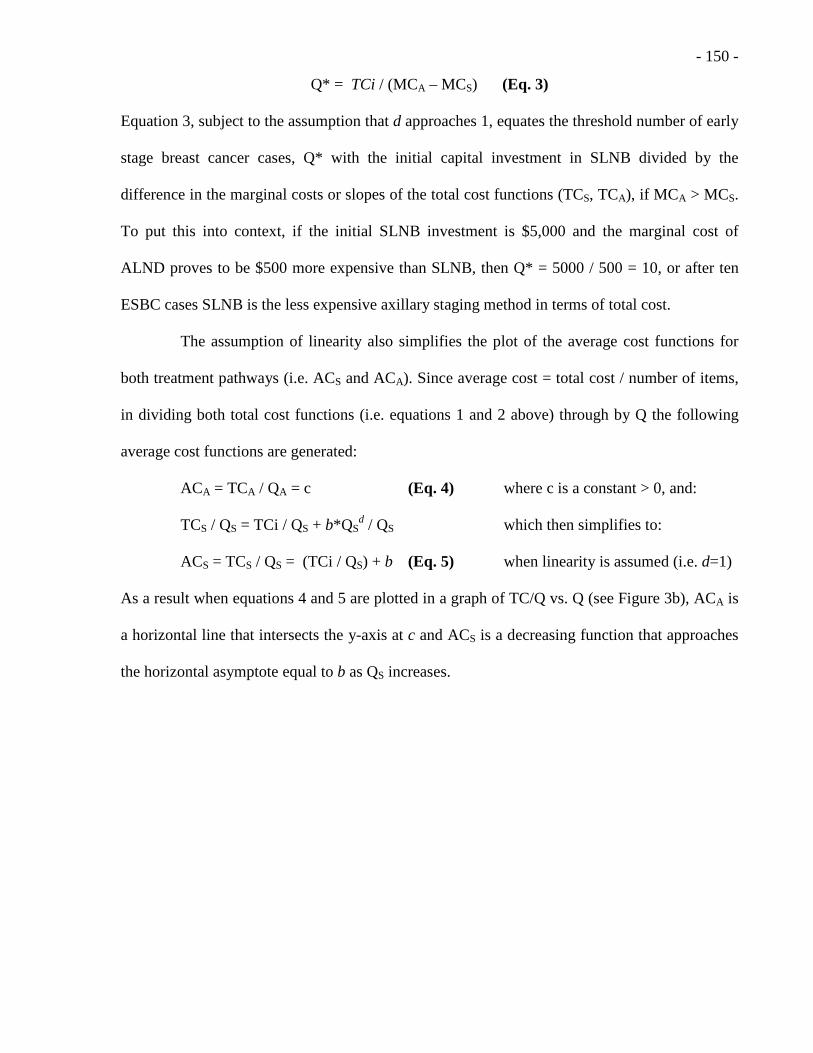
- 150 -
Q* = TCi / (MCA – MCS) (Eq. 3)
Equation 3, subject to the assumption that d approaches 1, equates the threshold number of early
stage breast cancer cases, Q* with the initial capital investment in SLNB divided by the
difference in the marginal costs or slopes of the total cost functions (TCS, TCA), if MCA > MCS.
To put this into context, if the initial SLNB investment is $5,000 and the marginal cost of
ALND proves to be $500 more expensive than SLNB, then Q* = 5000 / 500 = 10, or after ten
ESBC cases SLNB is the less expensive axillary staging method in terms of total cost.
The assumption of linearity also simplifies the plot of the average cost functions for
both treatment pathways (i.e. ACS and ACA). Since average cost = total cost / number of items,
in dividing both total cost functions (i.e. equations 1 and 2 above) through by Q the following
average cost functions are generated:
ACA = TCA / QA = c (Eq. 4) where c is a constant > 0, and:
TCS / QS = TCi / QS + b*QSd / QS which then simplifies to:
ACS = TCS / QS = (TCi / QS) + b (Eq. 5) when linearity is assumed (i.e. d=1)
As a result when equations 4 and 5 are plotted in a graph of TC/Q vs. Q (see Figure 3b), ACA is
a horizontal line that intersects the y-axis at c and ACS is a decreasing function that approaches
the horizontal asymptote equal to b as QS increases.
- 151 -
APPENDIX B
A literature review to identify and examine the existing economic evaluations that compare SLNB and ALND
Objective and overview
To provide a preliminary assessment and critical appraisal of the available literature
concerning any economic evaluations of SLNB and ALND. The outline, methods and results of
a literature review of economic evaluations comparing ALND and SLNB used in the
management of ESBC are described here.
Inclusion and exclusion criteria
English abstracts were included in the review if they described partial (i.e. CMA) or full
(i.e. CBA, CEA, and CUA) economic evaluations comparing SLNB and ALND. Trials that did
not explicitly cost out the SLNB and ALND procedures or studies that considered either
procedure in isolation without making a comparison were not included for review. Excluded
study types included; narrative analysis of SLNB and/or ALND costs and benefits,
methodological papers, review articles, feasibility studies, technical analyses of SLNB, clinical
effectiveness studies, editorials, and letters to journal editors, etc. Furthermore, articles that did
not specifically address the topic of SLNB and ALND in the setting of ESBC were not
reviewed.
Method of review
The titles of all studies identified by the search strategy (see below) were reviewed by a
single reviewer and the abstracts for only those titles that seemed relevant were retained for
further consideration. All such abstracts were then assessed to determine, at a minimum, that the
exclusion criteria were not met. The full manuscripts of those abstracts that were not excluded
were then reviewed to explicitly determine if the inclusion criteria were met.

- 152 -
Search strategy
The MEDLINE and EMBASE electronic databases were searched for articles published
between January 1993 and December 2008. For the sake of brevity only the MEDLINE search
string is included below (note that the EMBASE search terms were very similar).
MEDLINE (1993 – Present) 1. exp Economics/ 2. exp “Costs and Cost Analysis”/ 3. exp Economics, Hospital/ 4. exp Economics, Medical/ 5. or/1-4 6. (econom$ or cost or cost$ or price or prices or pricing).tw. 7. (expenditure$ not energy).tw. 8. (value adj1 money).tw. 9. budget$.tw. 10. or/6-9 11. 5 or 10 12. letter.pt. or editorial.pt. or historical article.pt. or comment.pt. 13. 11 not 12 14. exp breast neoplasm/ or (breast adj neoplasm$).tw. 15. exp sentinel lymph node biopsy/ or (sentinel adj lymph adj node adj biop$).tw. 16. (axillary adj node adj dissection).tw. 17. (axillary adj lymph adj node adj dissection).tw. 18. 14 and (or/15-17) 19. 18 and 13 20. Animals/ 21. Humans/ 22. 20 not (20 and 21) 23. 19 not 22 24. limit 23 to English language 25. limit 24 to yr = “1993 – 2009”
Justification of search strategy
Having only a single reviewer to examine the search results, titles, abstracts, and
manuscripts was admittedly, not ideal. This review strategy has the potential for having
delivering a marginalized result due to the personal bias of the single reviewer in the study
selection process, as well as being limited by the reviewer’s particular area of expertise and
background knowledge.[75] The justification for having a single reviewer was one of practical

- 153 -
consideration; as this review is only a small part of a larger research project and is therefore an
endeavour that is subject to time and fiscal constraint.
In terms of having limited the literature review to only two medical databases, it is
generally accepted that MEDLINE houses original medical articles with a North American
publication bias, whereas EMBASE contains articles of similar content except with a European
bias.[74; 121] The sentinel lymph node biopsy procedure is a Western-developed medical
technology that has been extensively researched in the Western-world. Given the interest in
researching SLNB use within a Canadian context, it follows that any economic evaluations
comparing SLNB and ALND that are relevant to this project would have been conducted in the
Western setting and therefore most likely to have been published in a journal identified through
either the MEDLINE or EMBASE database.
The health databases were searched from 1993 to the present day because use of SLNB
for breast cancer patients was first introduced in 1993 by Krag et al., thereby guaranteeing that
any subsequent economic evaluations would be included.[77] The search terms are adopted
from the search strategies used by the Centre for Reviews and Dissemination at the University
of York in developing and maintaining their rigorous National Health System-sponsored
Economic Evaluation Database (NHS EED).[56; 75] The NHS EED search terms were
developed specifically for identifying economic evaluations in all of the well-known electronic
health databases (e.g. MEDLINE, EMBASE, CINAHL, PsycINFO, etc.).[56] The strategies
listed above were modified slightly in order to be certain that partial economic evaluations were
captured by the search.
Search results
The MEDLINE search strategy yielded 101 results. Review of the article titles identified
eight studies that were relevant and did not obviously meet any exclusion criteria. The abstracts

- 154 -
of all eight studies were reviewed, and a list of these titles is included below. Article #1 was
rejected as the abstract described an epidemiological study without any economic evaluation.
Article #2 was rejected because a cost-analysis of only SLNB (without comparison to ALND)
was described in the abstract. The abstract for article #4 described a methodological study and
was therefore excluded. Finally, article #8 detailed a cost-comparison of different discharge
strategies for patients treated with ALND, and was therefore rejected. The remaining four
abstracts described partial economic evaluations and did not meet any exclusion criteria and
were therefore retained for critical appraisal.
The EMBASE search strategy generated 322 results; there was significant overlap of a
number of titles generated from the MEDLINE search. All 322 titles were reviewed and in
addition to the eight abstracts identified in MEDLINE, an additional four abstracts were
identified and examined (the titles of these latter four articles are also listed below). Article #10
proved to be a methodological narrative, whereas article #11 was a review of axillary
management in breast cancer. Article #12 proved to be an economic evaluation that did not
compare SLNB with ALND. Finally, article #9 proved to be only an economic narrative and as
such all four of the articles that were identified by the EMBASE search alone were rejected for
analysis in the final review.
Below is a reference list of the abstracts deemed acceptable for review following
examination of the article titles, as part of the literature search described above. Articles # 1 – 8
were identified from a search of both MEDLINE and EMBASE databases, whereas articles 9 –
12 were identified solely from EMBASE. Note that the bolded references below refer to those
manuscripts that met the inclusion criteria and were critically appraised.
1. Chen AY, Halpern MT, Schrag NM, Stewart A, Leitch M, Ward E. Disparities and trends in sentinel lymph node biopsy among early-stage breast cancer patients (1998-2005). Journal of the National Cancer Institute. 100(7):462-74, 2008 Apr.

- 155 -
2. Genta F, Zanon E, Camanni M, Deltetto F, Drogo M, Gallo R, Gilardi C. Cost/accuracy ratio analysis in beast cancer patients undergoing ultrasound-guided fine-needle aspiration cytology, sentinel node biopsy, and frozen section of node. World Journal of Surgery. 31(6):1115-63, 2007 Jun.
3. Perrier L, Nessah K, Morelle M, Mignotte H, Carrere MO, Bremond A. Cost
comparison of two surgical strategies in the treatment of breast cancer: sentinel lymph node biopsy versus axillary lymph node dissection. International Journal of Technology Assessment in Health Care. 20(4):449-54, 2004.
4. Fenaroli P, Merson M, Giuliano L, Bonasegale A, Virotta G, Pericotti S, Valentini M,
Poletti P, Labianca R, Personeni A, Tondini C. Population-based sentinel lymph node biopsy in early invasive breast cancer. European Journal of Surgical Oncology. 30(6):618-23, 2004 Aug.
5. Ronka R, Smitten K, Sintonen H, Kotmaki T, Krogerus L, Leppanen E, Leidenius M.
The impact of sentinel node biopsy and axillary staging strategy on hospital costs. Annals of Oncology. 15(1):88-94, 2004 Jan.
6. Chirikos TN, Berman CG, Luther SL, Clark RA. Cost consequences of sentinel lymph
node biopsy in the treatment of breast cancer. A preliminary analysis. International Journal of Technology Assessment in Health Care. 17(4):626-31, 2001.
7. Gemignani ML, Cody HS III, Fey JV, Tran KN, Venkatraman D, Borgen PI. Impact
of sentinel lymph node mapping on relative charges in patients with early-stage breast cancer. Annals of Surgical Oncology. 7(8):575-80, 2000 Sep.
8. Kambouris A. Physical, psychological, and economic advantages of accelerated discharge
after surgical treatment for breast cancer. American Surgeon. 62(2):123-7, 1996 Feb. 9. Chirikos TN, French DD, Luther SL. Potential economic effects of volume-outcome
relationships in the treatment of three common cancers. Cancer Control. 11(4):258-264, 2004 Jul.
10. Ng KKC, Chow LWC. Sentinel node biopsies in breast cancer. Annals of the College of
Surgeons of Hong Kong. 5(3):116-120, 2001. 11. Cserni G. Axillary staging of breast cancer and the sentinel node. Journal of Clinical
Pathology. 53(10):733-741, 2000. 12. Orr RK, Col NF, Kuntz KM, A cost-effectiveness analysis of axillary node dissection in
postmenopausal women with estrogen receptor-positive breast cancer and clinically negative axillary nodes. Surgery. 126(3):568-576, 1999.

- 156 -
Critical appraisal of an economic evaluation
A checklist for assessing economic evaluations as developed by Drummond et al., was
modified and used to appraise the four economic evaluations identified by the literature
search.[11] Although all four economic evaluations were appraised using this checklist, for the
sake of brevity only the appraisal of the study by Ronka et al., (Article #5) is reproduced here.
The checklist questions are reproduced, with minor modifications from the Drummond text, and
interspersed with the critical appraisal responses below.[11]
Critical appraisal checklist 1. Was a well-defined question posed in answerable form?
a. Did the study examine both costs and effects of services or programmes? b. Did the study involve a comparison of alternatives? c. Was a viewpoint for the analysis stated and was the study placed in any particular
decision-making context? The study’s purpose is clearly stated within the introduction of the manuscript and
identifies the intent of comparing the total per-patient in-hospital costs (i.e. average costs)
associated with SLNB and ALND treatments. The stated purpose and scope of the costing data
used implies the study was undertaken from a hospital-level perspective, though this is not
explicitly stated.[61] The study does not concern itself with measuring and comparing outcomes
of SLNB and ALND; the study is therefore not a full economic evaluation but rather a cost-
comparison, or a ‘partial’ economic evaluation.
2. Was a comprehensive description of the competing alternatives given? a. Where any relevant alternatives omitted? b. Was (should) a ‘do-nothing’ alternative (be) considered?
Ronka et al., provide very detailed descriptions of both surgical procedures in the
methods section of their article; being clear to delineate methodology as well as to describe the
materials and equipment that were used. The clinical methodology described by Ronka et al.,
are consistent with current Western guidelines.[14; 26] The steps in the care of each patient

- 157 -
were carefully reported by the authors and then used to generate treatment alternatives in line
with their stated secondary objectives. The average costs incurred by the actual cohort of 237
SLNB-treated patients were modelled against three other theoretical treatment algorithms (one
being the ALND treatment algorithm) by means of a decision-analysis.[61] The authors do not
describe a ‘do-nothing’ alternative treatment plan, and rightly so given the comparison of a new
technology, SLNB, with the widely accepted ‘gold’ standard for axillary staging, ALND.
3. Was the effectiveness of the programmes or services established? a. Was this done through a randomized, controlled clinical trial? b. Were effectiveness data collected and summarized through a systematic overview of
clinical studies? c. Were observational data or assumptions used to establish effectiveness? If so what
are the potential biases in results? As the authors state in the article’s discussion section, the study is a cost-comparison and
does not address the clinical outcomes (i.e. efficacy and effectiveness) associated with either
SLNB or ALND-related care. As discussed previously, due to the pathophysiology of breast
cancer, tremendously long follow-up periods would be required to determine traditional
measures of effectiveness (i.e. mortality, disease-free survival, and axillary recurrence).[42]
This makes the prospect of measuring costs alongside a randomized controlled trial comparing
SLNB to ALND understandably prohibitive for most surgical centres.62 Ronka et al, have
however reported the short-term pathological outcome of their breast cancer staging procedures
such that their methods can be better evaluated and the quality of the surgical practice inferred.
Specifically, Ronka et al., report a sentinel lymph node identification rate of 86%, which is at
the bottom end of the acceptable range according to published clinical guideline
recommendations63.[14; 18] By offering detailed disclosure of their methodology and providing
short-term pathological results that can be compared to published standards, the authors are 62 A reminder that the surgical world is patiently awaiting the results from a number of large, well-funded, multi-institutional randomized controlled clinical trials with long-term follow-up (e.g. NSABP B-32, ACOSOG Z0010/11, SNAC trial, etc.) comparing SLNB to ALND.[17; 111] 63 A SLNB false negative rate <5% is the other often cited marker of high-quality surgical technique and process.[14; 63]

- 158 -
minimizing the inherent single-centre bias of their study and maximizing the generalizability of
the results.
4. Were all the important and relevant costs for each alternative identified? a. Was the range wide enough for the research question at hand? b. Did it cover all relevant viewpoints (e.g. community, patient, etc.)? c. Were capital costs as well as operating costs included? It should be restated that in this interpretation of Ronka et al.’s study, the perspective is
solely that of the hospital. The appropriate unit costs for each step in the treatment algorithms
are outlined and reported by the authors for both the ALND and SLNB procedures.[61] What is
not clear however, is the make-up of the unit costs; specifically, how capital and operating costs
are incorporated into each unit cost. For example, the capital cost associated with the gamma-
probe, should be included in the unit cost of the SLNB operating room costs; it is not clear from
the reading of the article if this is the case. Further confusion along this topic is raised from the
definitions of some of the unit costs. For example, the variable “breast resection and
SLNB/ALND” was associated with a single unit cost. It is therefore unclear how use of this
variable allows for a different cost calculation for a breast resection involving either a SLNB or
ALND (and not both). The costs of these two procedures can only be equal if the operating
room time and materials are treated as equal for both procedures; which not only deviates from
Ronka et al’s., methodological description of the different treatment algorithms but again raises
the question of how the capital costs associated with SLNB equipment (such as the gamma
probe) are incorporated into the analysis.
5. Were costs measured accurately in appropriate physical units? a. Were the sources of resource utilization described and justified? b. Were any of the identified items omitted from measurement? c. Were there any special circumstances (for example joint use of resources) that made
measurement difficult? 6. Were costs valued credibly?
a. Were the sources of all values clearly identified? b. Were market values employed?
7. Were costs adjusted for differential timing? a. Were costs that occur in the future discounted to present values?

- 159 -
8. Was an incremental analysis of costs of alternatives performed?
A brief discussion addressing all of the above four critical appraisal questions is
contained in this paragraph. All costs were measured in Euros, €. The identified source or these
values (i.e. “…detailed internal accounting system of Helsinki University Hospital.”) is
identified but not well-described. The authors mention that some of the costs “…are averages
based on a large number of cases…” but the specifics are not given.[61] Despite this, the source
of cost information was deemed reputable and therefore the values are assumed to be accurate
and credible. It is not readily apparent that the costs reflected current market values (versus
subsidized values). All identified costs were used in the subsequent analysis as listed, however
as previously discussed there is some confusion as to how the results were generated from the
use of the unit costs in question. Finally, because this study did not concern itself with future
costs and outcomes there was no discounting requirement. No incremental cost analysis was
performed.
9. Was allowance made for uncertainty in the estimate of costs? a. If patient-level data on costs were available, were appropriate statistical analyses
performed? b. If a sensitivity analysis was employed, was justification provided for the ranges or
distributions of values (for key study parameters), and the form of sensitivity analysis used?
c. Were the conclusions of the study sensitive to the uncertainty in the results, as quantified by the statistical and/or sensitivity analysis?
The authors made little allowance for uncertainty in the cost values they used (or if they
did this wasn’t explained or documented). It was reported that some of the cost values were
estimates derived from “…a large number of cases…” but greater transparency is to be expected
on this topic.[61] The authors state that a sensitivity analysis was conducted and describe it in
narrative form only; specifically reporting the changes in costs associated from varying the
intraoperative frozen section false negative rate. Unfortunately, neither the range of values for
- 160 -
the frozen section false negative rate nor the methods of the sensitivity analysis were disclosed.
Finally, details concerning any statistical analysis were notably absent.
10. Did the presentation and discussion of study results include all issues of concern to users? a. Were the conclusions of the analysis based on some overall index of costs? b. Were the results compared with those of others who have investigated the same
question? If so, were allowances made for potential differences in study methodology?
c. Did the study discuss the generalizability of the results to other settings and patient groups?
d. Did the study discuss issues of implementation, such as the feasibility of adopting the ‘preferred’ programme given existing financial or other constraints?
The conclusions presented by Ronka et al., reflect the comparative nature of their
analysis (i.e. they conclude that SLNB is more costly than ALND) and do not make use of any
standardized metric (e.g. range of indifference).[11] Much of the discussion concerns potential
areas of future SLNB cost-savings as a means of economic justification for the continued
adoption of the procedure; in this way the authors did address continued implementation of
SLNB. The authors also discuss the generalizability of their results, noting the inherent
limitations to a single-centre study of this nature, while also comparing their results to that of
their peers.[61]
Critical appraisal summary and conclusions
Ronka et al., presented a well-conceived and a methodologically well-described cost-
minimization analysis of SLNB and ALND at their home hospital in Finland. While the authors
seem to make use of a wealth of costing data, it is not entirely clear how certain unit costs are
structured. This confusion is amplified by the seemingly complete and complex, yet
reproducible costing-model (see Appendix H). The authors do present a thoughtful discussion,
identifying many of the limitations of their study and also highlighting some important
considerations for future research, unfortunately, the generalizability of their results is

- 161 -
diminished due to the lack of transparency in their proprietary costing data and the omission of
an evaluation of model uncertainty.
Review summary and conclusions
A formal, albeit somewhat limited, literature review of economic evaluations concerning
ALND and SLNB was conducted. Of the 423 titles generated by searching EMBASE and
MEDLINE databases using a rigorous search strategy, only four articles were found to meet
inclusion criteria. This result demonstrates that the search strategy was highly sensitive and had
correspondingly poor specificity in identifying articles of relevance64. Given the purpose of this
review, a more sensitive search strategy is preferable despite being more time consuming for the
reviewer. While the final four manuscripts were critically appraised and a discussion of the
findings is included in the main text of this thesis manuscript, none of these partial economic
evaluations provided definitive conclusions as to whether a treatment algorithm involving
SLNB, as opposed to only ALND, would be less costly in the context of managing ESBC in the
context of the Canadian health care setting.
64 Note that specificity in this case is defined as the number of relevant articles identified by a search strategy expressed as a percentage of all articles identified by that search method (i.e. 4/423 = 0.95%) whereas sensitivity is the proportion of relevant articles expressed as a percentage of all relevant articles on a given topic. It is virtually impossible to know the exact number of all relevant articles on a given topic (i.e. the denominator) but given the extremely low specificity, sensitivity must be assumed to approach 100%.[56]

- 162 -
APPENDIX C
The probability distributions of all variables used in The Model to approximate treatment uncertainty and one-time postoperative morbidity
Figure C1: The probability distribution used to define the probability of a patient suffering (non-fatal) anaphylactic shock due to blue dye injection during a SLNB.
Probability of blue dye causing anaphylactic reacti on during SLNB
(Distribution name: prob_Anaphylaxis_dist)
[Distribution type: Beta; Integer parameters; n = 5588, r = 37; EV = 0.0066]
0
0.05
0.1
0.15
0.2
0.0035 0.0045 0.0055 0.0065 0.0075 0.0085 0.0095 0.0105Value of TreeAge variable: prob_Anaphylaxis
Pro
babi
lity
of a
giv
en v
alue
Figure C2: The probability distribution used to define the probability of a patient having an axillary seroma develop in the immediate postoperative period following ALND.
Probability of developing a seroma following ALND(Distribution name: prob_ALND_seroma)
[Distribution type: Beta; Integer parameters; n = 155; r = 33; EV=0.213]
0
0.05
0.1
0.15
0.2
0.25
0.1 0.15 0.2 0.25 0.3 0.35
Value of TreeAge variable: prob_ALND_AxSeroma
Pro
babi
lity
of a
giv
en v
alue

- 163 -
Figure C3: The probability distribution used to define the probability of a patient having an axillary seroma develop in the immediate postoperative period following SLNB.
Probability that a seroma develops following SLNB(Distribution name: prob_SLNB_Seroma
[Distribution type: Beta; Integer parameters; n = 143, r = 20; EV = 0.140
0
0.04
0.08
0.12
0.16
0.06 0.09 0.12 0.15 0.18 0.21 0.24Value of TreeAge variable: prob_SLNB_AxSeroma
Pro
babi
lity
of a
giv
en
valu
e
Figure C4: The probability distribution used to define the probability of a patient having a positive SLN on intraoperative examination during SLNB.
Probability of SLN positivity on intraoperative ass essment(Distribution name: prob_PositiveSLN_intraop)
[Distribution type: Beta; Integer parameters; n = 328; r = 73; EV = 0.223]
0
0.03
0.06
0.09
0.12
0.15
0.18
0.16 0.18 0.2 0.22 0.24 0.26 0.28 0.3
Value of TreeAge variable: prob_SLNb_IntraopPath_PO S
Pro
babi
lity
of a
giv
en v
alue

- 164 -
Figure C5: The probability distribution used to define the probability of a patient having a positive SLN on final pathological examination following a negative intraoperative SLNB.
Probability of finding positive SLNs on final patho logy (following a negative intraoperative pathology asse ssment)
(Distribution name: prob_IntraoperativeFNR)
[Distribution type: Beta; Integer parameters; n = 251; r = 24; EV = 0.096]
0
0.03
0.06
0.09
0.12
0.15
0.18
0.04 0.06 0.08 0.1 0.12 0.14 0.16
Value of TreeAge variable: prob_SLNB_FinalPath_POS
Pro
bab
ility
of a
giv
en
valu
e
Figure C6: The probability distribution used to define the probability of a patient refusing a delayed completion ALND for a positive SLN on final pathology.
Probability of a patient refusing a completion ALND for positive SLN(s)(Distribution name: prob_cALND_refusal)
[Distribution type: Beta; Integer parameters; n = 24; r = 5; EV = 0.208]
0
0.04
0.08
0.12
0.16
0.02 0.06 0.1 0.14 0.18 0.22 0.26 0.3 0.34 0.38 0.42 0.46
Value of TreeAge variable: prob_delayed_ALND_refusa l
Pro
babi
lity

- 165 -
APPENDIX D
An analysis of the ALND-associated treatment pathway Markov process; measuring the per-cycle transitional probabilities and costs as a means of validating the Markov cohort
structure and programming
Figure D1: A graphical representation of the transitional probabilities affecting the postoperative health states of the Markov cohort within The Model.
Evaluation of Markov process morbidity probabilities by cycle
15%
0%
100%
61%
0
0.2
0.4
0.6
0.8
1
0 1 2 3 4Markov cycle
(where 1 cycle = 6 months of postoperative time)
Pro
babi
lity
of m
orbi
dity
(tr
ansi
tiona
l pro
babi
litie
s)
Pain
Numbness
Shoulder ROM
Lymphedema
Healthy
Note that in Figure D1, prior to the first Markov cycle (i.e. stage zero, postoperative time
= 0), all patients occupy the ‘Healthy’ Markov state, as they are considered to be healthy
immediately following surgery (and immediately following resolution of their axillary seroma,
if applicable) but then ‘travel’ to the other Markov states during each cycle as dictated by the
transitional probabilities. The probability of the occupying any of the four morbidity Markov
states decreases following the first cycle, consistent with the results published in the GIVOM
trial which demonstrates that fewer patients suffer from most complications as the postoperative
recovery period lengthens (see Table 6).[38; 45] Finally, it should be reiterated that each cycle
represents a 6-month post-operative period, again consistent with the data available from the
GIVOM trial publications.[38; 45]

- 166 -
In Figure D2 the cumulative costs of treating all postoperative recurrent complications
through four cycles of the Markov cohorts are displayed. The large increase in cost that is
evident in the final cycle, is an expected consequence of some of the programming properties of
the decision-tree model. Specifically, the total cost of each treatment pathway is determined by a
recursively defined variable; which requires, when encountered at a terminal node (i.e. such as
the Markov nodes during the fourth and final cycle) TreeAge Pro® to look to the previous node
(i.e. the node that preceded it, to the left, in the decision-tree) for a non-recursive definition of
the variable.[84] In the case of the Markov processes, the total cost variable is always set equal
to the cost of one of the core procedures (SLNB: cost_SLNB_DaySx, or ALND:
cost_ALND_Inpt) further up the decision-tree. As a result, when the final cost value of the
Markov process is returned (as it must be at the end of the final cycle)[84] the incremental costs
incurred within the Markov process are added to the previous value of the defined cost variable;
and since the cost of the core procedures are large compared to the costs of treating the
complications, there is a large increase in cost assigned at the end of the final Markov cycle.
Figure D2: A graphical representation of the cumulative costs associated with treating all four recurring complications following ALND; as modelled by a Markov process.
A running total of the cost of treating postoperati ve morbidity; across four types of complications following ALND
(Note: calculated with mean transitional probabilities; prob_SeekMedical = 0.5)
$3,768.32
$138.78$105.32$63.07$0.00
$0
$1,000
$2,000
$3,000
$4,000
0 1 2 3 4Markov cycle
(where 1 cycle = 6 months of postoperative time)
Cum
ulat
ive
cost
of
com
plic
atio
ns

- 167 -
Table D1 below lists out the numerical values used to plot Figures D1 and D2 above;
allowing for verification of the values through hand calculation.
Table D1: A summary table of the ALND-associated treatment pathway Markov process transitional probabilities and the resulting cost values; used to validate the programming of the Markov process.
Cost per cycle
Cumulative cost
prob (Pain)
prob (Para.)
prob (sROM)
prob (Lymph.)
prob (Healthy)
cost (Pain)cost
(Para.)cost
(sROM)cost
(Lymph.)cost
(Healthy)
0 -$ -$ 0.0% 0.0% 0.0% 0.0% 100.0% -$ -$ -$ -$ -$
1 63.07$ 63.07$ 18.2% 30.3% 14.0% 9.9% 27.6% 15.88$ 29.13$ 8.65$ 9.41$ -$
2 42.25$ 105.32$ 11.8% 20.7% 7.3% 8.6% 51.6% 10.14$ 19.61$ 4.44$ 8.05$ -$
3 33.46$ 138.78$ 8.9% 16.6% 5.7% 7.6% 61.2% 7.54$ 15.50$ 3.42$ 7.01$ -$
4 3,629.54$ 3,768.32$ 9.3% 15.0% 7.0% 8.2% 60.5% 339.92$ 548.91$ 254.99$ 300.02$ 2,185.70$
Note:
sROM = Decrease in shoulder range of motion (i.e. shoulder dysmobility)
Para. = Paraesthesia; Lymph. = Lymphedema
Probability of being in a given health state = prob(state)
Proportional cost of treating a given complication = cost(state)
Cost FunctionsMarkov cycle

- 168 -
APPENDIX E
The probability distributions of all variables used in The Model to approximate uncertainty in the cost of the procedures and of treating the postoperative complications
Figure E1: The probability distribution used to define and vary the cost of the SLNB procedure.
Probability distribution of the cost per patient fo r the SLNB procedure
(Distribution name: cost_SLNB_procedure)
[Distribution type: Gamma; approximated by a Mean (EV) = $2,644.11 and a Std. Dev. = $802.21]
0
0.04
0.08
0.12
0.16
$1,000 $2,000 $3,000 $4,000 $5,000 $6,000
Value of TreeAge variable: cost_SLNB_DaySx
Pro
babi
lity
of a
giv
en
cost
Minimum of $1106.10
Maximum of $6001.91
Mean (EV)
Figure E2: The probability distribution used to define and vary the cost of treating (non-fatal) anaphylactic shock secondary to blue dye injection during the SLNB procedure.
Probability distribution of the cost per patient of treating
anaphylactic shock(Distribution name: cost_Anaphylaxis_dist)
[Distribution type: Gamma; approximated by a Mean (EV) = $3,878.00 and a Std. Dev. = $3,186.00]
0
0.04
0.08
0.12
0.16
0.2
$0 $3,000 $6,000 $9,000 $12,000 $15,000
Value of TreeAge variable: cost_Anaphylaxis_Inpt
Pro
babi
lity
of a
giv
en c
ost
Minimum of $876.00
Maximum of $14,442.00
Mean (Expected Value)

- 169 -
Figure E3: The probability distribution used to define and vary the cost of treating axillary seroma.
Probability distribution of the cost per patient of treating a
postoperative axillary seroma in an ambulatory care setting(Distribution name: cost_Seroma)
[Distribution type: Gamma; approximated by a Mean (EV) = $149.71 and a Std. Dev. = $133.33]
0
0.05
0.1
0.15
0.2
0.25
0 150 300 450 600 750
Value of TreeAge variable: cost_Seroma_Ambu
Pro
babi
lity
of a
giv
en c
ost
Minimum of$24.00
Maximum of $1,533.00
Mean (Expected Value)
Figure E4: The probability distribution used to define and vary the cost of treating axillary pain.
Probability distribution of the average total cost per patient of
treating postoperative axillary pain in an ambulato ry setting(Distribution name: cost_Pain)
[Distribution type: Gamma; approximated by a Mean (EV) = $177.09 and a Std. Dev. = $127.33]
0
0.05
0.1
0.15
0.2
0.25
$0 $150 $300 $450 $600 $750
Value of the TreeAge variable: cost_Pain_Ambu
Pro
babi
lity
of a
giv
en c
ost
Minimum of $19.00
Maximum of $1,183.00
Mean (Expected Value)

- 170 -
Figure E5: The probability distribution used to define and vary the cost of treating axillary paraesthesia.
Probability distribution of the cost per patient of treating
postoperative arm paraesthesia in an ambulatory car e setting(Distribution name: cost_Numb)
[Distribution type: Gamma; approximated by a Mean (EV) = $195.16 and a Std. Dev. = $113.03]
0
0.05
0.1
0.15
0.2
0.25
$0 $150 $300 $450 $600 $750 $900
Value of the TreeAge variable: cost_Numb_Ambu
Pro
babi
lity
of a
giv
en c
ost
Minimum of $40.00
Maximum of $849.10
Mean (Expected Value)
Figure E6: The probability distribution used to define and vary the cost of treating shoulder dysmobility.
Probability distribution of the cost per patient fo r treating
postoperative shoulder dysmobility in an ambulatory care setting(Distribution name: cost_Shoulder)
[Distribution type: Gamma; approximated by a Mean (EV) = $125.35 and a Std. Dev. = $48.54]
0
0.05
0.1
0.15
0.2
$0 $75 $150 $225 $300 $375
Value of the TreeAge variable: cost_sROM_Ambu
Pro
babi
lity
of a
giv
en c
ost
Minimum of $55.03
Maximum of $185.43
Mean (EV)

- 171 -
Figure E7: The probability distribution used to define and vary the cost of treating lymphedema in the short-term postoperative period.
Probability distribution of the cost of treating po stoperative lymph-
related complaints in an ambulatory care setting(Distribution name: cost_Lymph)
[Distribution type: Gamma; approximated by a Mean (EV) = $192.90 and a Std. Dev. = $134.62]
0
0.05
0.1
0.15
0.2
0.25
$0 $200 $400 $600 $800
Value of the TreeAge variable: cost_Lymph_Ambu
Pro
babi
lity
of a
giv
en c
ost
Minimum of $45.00
Maximum of $692.00
Mean (Expected Value)

- 172 -
APPENDIX F
Examples of the reports generated from the CAT-facilitated search of the OCCI database
Figure F1: A copy of the OCCI’s CAT output; a breakdown of the average total per patient costs, by direct and indirect costs, of a partial mastectomy procedure (+/- wire localization) for breast cancer. Note that this cost-cohort is categorized as a day surgical procedure and is therefore meant to be a proxy for the SLNB-associated procedure-related costs.
Report By Procedure
Std Dev Max Avg Std Dev Max Avg Min Max$751 $5,542 $464 $277 $1,322 $2,374 $836 $5,732
Day Surgery 2007/2008
Selection Criteria:
Hospitals: 731,842,949,957
CACS Grouper: 2105
Diagnosis: C5000,C5001,C5009,C5010,C5011,C5019,C5020,C5021,C5029,C5030,C5031,C5039,C5040,C5041,C5049,C5050,C5051,C5059,C5060,C5061,C5069,C5080,C5081,C5089,C5090,C5091,C5099
Procedure: 1YM87UT,1YM87LA
Age Group: All
Total Cost Per Case ($)
Report By Hospital Report By Functional Centre Report By CACS Report By Diagnosis
Min Min
Direct Cost Per Case ($) Indirect Cost Per Case ($)
Note:
1. Total costs include direct costs and indirect costs.2. Direct costs are costs that are directly related to the provision of care to the patient and include Nursing (incl. Operating Room, ICU), Diagnostic Imaging, Pharmacy and Labs.3. Indirect costs are overhead expense relating to the running of hospitals and include administration, finance, human resources, plant operations etc.4. Cost information for codes with 5 or less cases will be suppressed in order to comply with Freedom of Information (FOI) directives.5. A case may appear in more than one Functional Centre and will be included only in the Functional Centres where the care was provided. Average costs are calculated using only the cases that use that particular Functional Centre.
Std Dev498 $1,910 $640 $58 $802
# Cases Avg

- 173 -
Figure F2: A copy of the output depicted in Figure E1, itemized by functional centre (i.e. by department or absorbing costing centre). Note the ‘DI Nuclear Medicine’ functional centre (marked with a circle below) refers to the diagnostic imaging nuclear medicine department where the costs of preoperative radioisotope injections are allocated.
# Cases Avg Std Dev Min Max Avg Std Dev Min Max Avg Std Dev Max78 $29 $0 $29 $29 $11 $0 $11 $11 $40 $0 $40
120 $1,114 $574 $292 $2,958 $51 $26 $13 $135 $1,165 $600 $3,093
377 $697 $259 $280 $1,739 $330 $174 $84 $1,121 $1,026 $428 $2,860
FOI FOI FOI FOI FOI FOI FOI FOI FOI FOI FOI FOI
198 $197 $58 $133 $546 $47 $42 $14 $212 $243 $97 $758
288 $143 $51 $51 $336 $39 $14 $14 $91 $182 $65 $427
319 $128 $43 $45 $283 $56 $37 $15 $179 $184 $77 $462
120 $126 $0 $126 $126 $0 $0 $0 $0 $126 $0 $126
FOI FOI FOI FOI FOI FOI FOI FOI FOI FOI FOI FOI
9 $24 $5 $10 $26 $8 $3 $0 $10 $32 $9 $35
116 $12 $9 $2 $84 $0 $0 $0 $2 $13 $9 $86
115 $14 $8 $4 $49 $1 $0 $0 $3 $14 $9 $51
8 $35 $0 $35 $35 $3 $0 $3 $3 $38 $0 $38
495 $625 $304 $85 $2,861 $82 $72 $1 $574 $708 $336 $2,897
FOI FOI FOI FOI FOI FOI FOI FOI FOI FOI FOI FOI
9 $9 $15 $0 $40 $3 $5 $0 $12 $12 $20 $52
FOI FOI FOI FOI FOI FOI FOI FOI FOI FOI FOI FOI
9 $59 $33 $18 $99 $17 $8 $6 $32 $76 $41 $131
183 $182 $128 $22 $514 $30 $20 $2 $115 $212 $134 $543
118 $198 $82 $45 $355 $48 $33 $2 $106 $246 $112 $458
123 $360 $247 $133 $821 $70 $78 $15 $217 $430 $323 $1,038
FOI FOI FOI FOI FOI FOI FOI FOI FOI FOI FOI FOI
FOI FOI FOI FOI FOI FOI FOI FOI FOI FOI FOI FOI
FOI FOI FOI FOI FOI FOI FOI FOI FOI FOI FOI FOI
103 $4 $4 $0 $24 $0 $0 $0 $1 $4 $4 $24
FOI FOI FOI FOI FOI FOI FOI FOI FOI FOI FOI FOI
Day Surgery 2007/2008 by Functional Centre
714500000 TH Physiotherapy FOI
714400000 PH Pharmacy FOI
714400500 PH General Pharmacy $0
714302099 NV Non - Invasive Cardiology - Combined FOI
714350000 RS Respiratory Services FOI
714153000 DI Diagnostic Ultrasound $47
714154000 DI Nuclear Medicine $179
714151800 DI Radiography $24
714152000 DI Mammography $30
714106500 LAB Stat Laboratory $1
714109900 LAB Combined Functions FOI
714104000 LAB Anatomical Pathology $86
714104500 LAB Microbiology FOI
714103000 LAB Hematology $4
714103500 LAB Transfusion Services $38
714102000 LAB Specimen Procurement, Dispatch $10
714102500 LAB Clinical Chemistry $2
713501545 AC Clinic Surgical - Pre-Admission - $126
713506605 AC Clinic Onc. - Systemic - Pre and Post Treatment FOI
712652000 PARR General $64
713402000 AC Day/Night Care Pre & Post Operative Care (OR/PARR Excl.)
$64
712620000 IP OR/PARR Combined FOI
712650000 IP Post-Anesthetic Recovery Rooms (PARR) $170
712600000 IP Operating Room (OR) $305
712602000 OR General Surgical $364
Functional Centres Min711950000 AS Food Services $40
Direct Cost Per Case ($) Indirect Cost Per Case ($) Total Cost Per Case ($)
CACS Grouper: 2105
Diagnosis: C5000,C5001,C5009,C5010,C5011,C5019,C5020,C5021,C5029,C5030,C5031,C5039,C5040,C5041,C5049,C5050,C5051,C5059,C5060,C5061,C5069,C5080,C5081,C5089,C5090,C5091,C5099 Procedure: 1YM87UT,1YM87LA
Age Group: All
Selection Criteria:
Hospitals: 731,842,949,957

- 174 -
Figure F3: A copy of the OCCI’s CAT output; a breakdown of the average total per patient costs, by direct and indirect costs, of a partial mastectomy procedure (+/- wire localization) for breast cancer. Note that this cost-cohort is categorized as an inpatient procedure and is therefore meant to be a proxy for the ALND-associated core procedure costs.
Std Dev Avg Std Dev Max Avg Max Avg Min Max$625 $969 $241 $1,914 $3,487 $6,611 1.0 1 2
Selection Criteria:
Hospitals: 731,842,949,957
Acute Inpatient 2007/2008
CMG Grouper: 432
Diagnosis: C5000,C5001,C5009,C5010,C5011,C5019,C5020,C5021,C5029,C5030,C5031,C5039,C5040,C5041,C5049,C5050,C5051,C5059,C5060,C5061,C5069,C5080,C5081,C5089,C5090,C5091,C5099
Procedure: 1YM87LA,1YM87UT
Age Group: All Case Type: Typical
Report By Procedure
Direct Cost Per Case ($) Indirect Cost Per Case ($) Total Cost Per Case ($) Length of Stay (days)
Report By Hospital Report By Functional Centre Report By CMG Grouper Report By Diagnosis
# Cases Avg Min Max Min Std Dev Min Std Dev
Note:
1. Total costs include direct costs and indirect costs.2. Direct costs are costs that are directly related to the provision of care to the patient and include Nursing (incl. Operating Room, ICU), Diagnostic Imaging, Pharmacy and Labs.3. Indirect costs are overhead expense relating to the running of hospitals and include administration, finance, human resources, plant operations etc.4. Cost information for codes with 5 or less cases will be suppressed in order to comply with Freedom of Information (FOI) directives.5. A case may appear in more than one Functional Centre and will be included only in the Functional Centres where the care was provided. Average costs are calculated using only the cases that use that particular Functional Centre.
$565 $857 $2,043 0.261 $2,517 $1,479 $4,696
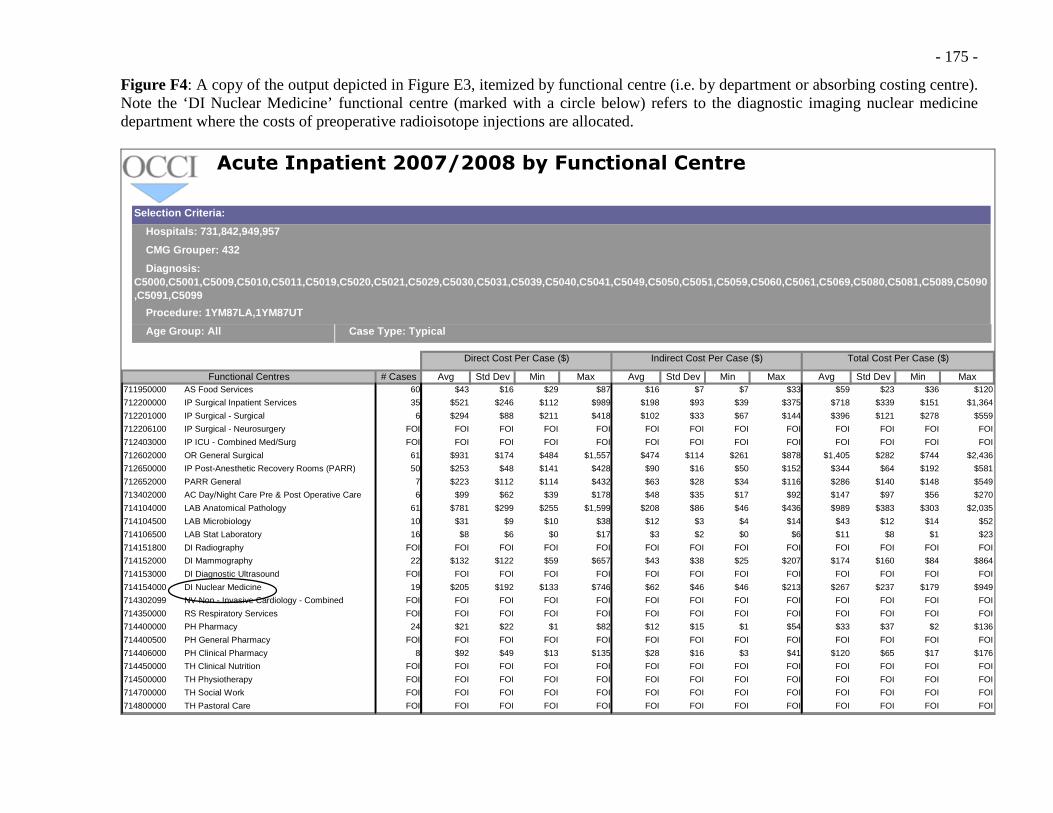
- 175 -
Figure F4: A copy of the output depicted in Figure E3, itemized by functional centre (i.e. by department or absorbing costing centre). Note the ‘DI Nuclear Medicine’ functional centre (marked with a circle below) refers to the diagnostic imaging nuclear medicine department where the costs of preoperative radioisotope injections are allocated.
# Cases Avg Std Dev Min Max Avg Std Dev Min Max Avg Std Dev Min60 $43 $16 $29 $87 $16 $7 $7 $33 $59 $23 $36
35 $521 $246 $112 $989 $198 $93 $39 $375 $718 $339 $151
6 $294 $88 $211 $418 $102 $33 $67 $144 $396 $121 $278
FOI FOI FOI FOI FOI FOI FOI FOI FOI FOI FOI FOI
FOI FOI FOI FOI FOI FOI FOI FOI FOI FOI FOI FOI
61 $931 $174 $484 $1,557 $474 $114 $261 $878 $1,405 $282 $744
50 $253 $48 $141 $428 $90 $16 $50 $152 $344 $64 $192
7 $223 $112 $114 $432 $63 $28 $34 $116 $286 $140 $148
6 $99 $62 $39 $178 $48 $35 $17 $92 $147 $97 $56
61 $781 $299 $255 $1,599 $208 $86 $46 $436 $989 $383 $303
10 $31 $9 $10 $38 $12 $3 $4 $14 $43 $12 $14
16 $8 $6 $0 $17 $3 $2 $0 $6 $11 $8 $1
FOI FOI FOI FOI FOI FOI FOI FOI FOI FOI FOI FOI
22 $132 $122 $59 $657 $43 $38 $25 $207 $174 $160 $84
FOI FOI FOI FOI FOI FOI FOI FOI FOI FOI FOI FOI
19 $205 $192 $133 $746 $62 $46 $46 $213 $267 $237 $179
FOI FOI FOI FOI FOI FOI FOI FOI FOI FOI FOI FOI
FOI FOI FOI FOI FOI FOI FOI FOI FOI FOI FOI FOI
24 $21 $22 $1 $82 $12 $15 $1 $54 $33 $37 $2
FOI FOI FOI FOI FOI FOI FOI FOI FOI FOI FOI FOI
8 $92 $49 $13 $135 $28 $16 $3 $41 $120 $65 $17
FOI FOI FOI FOI FOI FOI FOI FOI FOI FOI FOI FOI
FOI FOI FOI FOI FOI FOI FOI FOI FOI FOI FOI FOI
FOI FOI FOI FOI FOI FOI FOI FOI FOI FOI FOI FOI
FOI FOI FOI FOI FOI FOI FOI FOI FOI FOI FOI FOI
Selection Criteria:
Hospitals: 731,842,949,957
Acute Inpatient 2007/2008 by Functional Centre
CMG Grouper: 432
Diagnosis: C5000,C5001,C5009,C5010,C5011,C5019,C5020,C5021,C5029,C5030,C5031,C5039,C5040,C5041,C5049,C5050,C5051,C5059,C5060,C5061,C5069,C5080,C5081,C5089,C5090,C5091,C5099
Procedure: 1YM87LA,1YM87UT
Age Group: All Case Type: Typical
Functional Centres Max711950000 AS Food Services $120
Direct Cost Per Case ($) Indirect Cost Per Case ($) Total Cost Per Case ($)
712200000 IP Surgical Inpatient Services $1,364
712201000 IP Surgical - Surgical $559
712206100 IP Surgical - Neurosurgery FOI
712403000 IP ICU - Combined Med/Surg FOI
712602000 OR General Surgical $2,436
712650000 IP Post-Anesthetic Recovery Rooms (PARR) $581
712652000 PARR General $549
713402000 AC Day/Night Care Pre & Post Operative Care (OR/PARR Excl.)
$270
714104000 LAB Anatomical Pathology $2,035
714104500 LAB Microbiology $52
714106500 LAB Stat Laboratory $23
714151800 DI Radiography FOI
714152000 DI Mammography $864
714153000 DI Diagnostic Ultrasound FOI
714154000 DI Nuclear Medicine $949
714302099 NV Non - Invasive Cardiology - Combined FOI
714350000 RS Respiratory Services FOI
714400000 PH Pharmacy $136
714400500 PH General Pharmacy FOI
714406000 PH Clinical Pharmacy $176
714450000 TH Clinical Nutrition FOI
714500000 TH Physiotherapy FOI
714700000 TH Social Work FOI
714800000 TH Pastoral Care FOI

- 176 -
APPENDIX G
Magnifications of selected sections of Figure 21; plotting average cost vs. simulated patient volume for both competing treatment pathways in The Model
Figure G1: Average cost as a function of relatively low patient volume (i.e. Q < 25). Note the intersecting functions within the frame of this figure, where the SLNB-associated treatment pathways become less costly, on average, than their ALND-associated counterpart.
Simulated average cost functions for competing trea tment pathways (magnification of area designated by Q = 0 to 25)
$3,000
$4,000
$5,000
$6,000
$7,000
$8,000
0 5 10 15 20 25
Case-volume, No. of patients (Q)
Ave
rage
Cos
t, T
otal
cos
t/Q (
$) Alt path avg. cost (TCi = $2,615.50)
Alt. path avg. cost (TCi = $7,642.42)
Standard path avg. cost
Figure G2: Average cost as a function of relatively high patient volume (i.e. Q > 100). Note the near-parallel functions within the frame of this figure, where the SLNB-associated treatment pathways are consistently less costly, on average, than their ALND-associated counterpart.
Simulated average cost functions for competing trea tment pathways (magnification of area designated by Q = 100 to 125 )
$3,200
$3,400
$3,600
$3,800
$4,000
100 105 110 115 120 125
Case-volume, No. of patients (Q
Ave
rage
Cos
t, T
otal
cos
t/Q (
$)
Alt path avg. cost (TCi = $2,615.50)
Alt. path avg. cost (TCi = $7,642.42)
Standard path avg. cost

- 177 -
APPENDIX H
An in-depth analysis of a section of the decision-analysis pathway employed by Ronka et al., to model the costs of treating ESBC patients with SLNB
Figure H1: A reconstructed copy using TreeAge Pro® of the second treatment option (i.e. the SLNB with frozen section) from the decision-analysis published by Ronka et al.[61] Note that the chance node labelled ‘SNLOYN2’ refers to the probability of a successful sentinel lymph node identification (i.e. pSNLOY initially set to 0.8608 in the initial decision-tree analysis).[61]
LISABLN2
pLISABLN25*HP+2*PKL+LS+PAT1+PAT3+RESEV+PAT5+ABL
EUT2
#3*HP+PKL+LS+PAT1+PAT3+RESEV
RESEVN2
pRESEVN2
ABLEVN2
pABLEVN23*HP+PKL+LS+PAT1+PAT3+ABLEV
MUULEIN2
#3*HP+PKL+LS+PAT1+PAT4+KAI
JLPOSN2
pJLPOSN2
MARABLN2
pMARABLN24*HP+2*PKL+LS+PAT2+PAT3+RESEV+PAT5+ABL
MULAEVN2
pMULAEVN25*HP+2*PKL+LS+PAT2+PAT3+RESEV+PAT5+ABLEV
EUT3
#2*HP+PKL+LS+PAT2+PAT3+RESEV
SNRESN2
pSNRESN2
MULEVN1
pMULEVN15*HP+2*PKL+LS+PAT2+PAT3+ABLEV+PAT4+KAI
EUT4
#2*HP+PKL+LS+PAT2+PAT3+ABLEV
SNABLN1
#
JLTN
pJLTN
SNRESN2
pSNRESN95*HP+2*PKL+LS+PAT2+PAT3+RESEV+PAT4+KAI
SNABLN1
pSNABLN15*HP+2*PKL+LS+PAT2+PAT3+ABLEV+PAT4+KAI
MUUSNB
#5*HP+2*PKL+LS+PAT2+2*KAI+PAT4
JLFN
#
JLNEGN2
#
SNLOYN2
pSNLOY
RESEVN3
pRESEVN33*HP+PKL+LS+PAT3+RESEV
ABLEVN2
#3*HP+PKL+LS+PAT3+ABLEV
SNELON2
#
SNB with frozen section
ABL=1127.34ABLEV=1474.79HP=299.79KAI=1116.93LS=403.04pABLEVN2=0.3235PAT1=365.30PAT2=454.50PAT3=490.10PAT4=117.80PAT5=214.00pJLPOSN2=0.3333pJLTN=0.9338PKL=159.58pLISABLN2=0.0222pMARABLN2=0.037pMULAEVN2=0.037pMULEVN1=0.0526pRESEVN2=0.6618pRESEVN3=0.8182pSNABLN1=0.3333pSNLOY=0.95pSNRESN2=0.8504pSNRESN9=0.5556RES=785.59RESEV=1409.13

- 178 -
Figure H2: The base-case or roll-back analysis for Ronka et al.’s ‘SLNB with frozen section’ only treatment pathway option. Note that the expected value or overall cohort average cost is $3,749.9865 when the sentinel lymph node identification failure rate is set at 14% (i.e. pSNLOY = 0.8608).[61]
LISABLN2
0.022$5,827.02; P = 0.004
EUT2
0.978$3,726.52; P = 0.186
RESEVN2
0.662$3,773.15; P = 0.190
ABLEVN2
0.324$3,792.18; P = 0.093
MUULEIN2
0.015$3,062.02; P = 0.004
JLPOSN2
0.333$3,768.85; P = 0.287
MARABLN2
0.037$5,616.43; P = 0.017
MULAEVN2
0.037$6,263.67; P = 0.017
EUT3
0.926$3,515.93; P = 0.422
SNRESN2
0.850 $3,695.31; P = 0.456
MULEVN1
0.053$5,875.27; P = 0.004
EUT4
0.947$3,581.59; P = 0.076
SNABLN1
0.150$3,702.24; P = 0.080
JLTN
0.934$3,696.35; P = 0.536
SNRESN2
0.556$5,809.61; P = 0.021
SNABLN1
0.333$5,875.27; P = 0.013
MUUSNB
0.111$5,027.31; P = 0.004
JLFN
0.066$5,744.58; P = 0.038
JLNEGN2
0.667$3,831.94; P = 0.574
SNLOYN2
0.861$3,810.92; P = 0.861
RESEVN3
0.818$3,361.22; P = 0.114
ABLEVN2
0.182$3,426.88; P = 0.025
SNELON2
0.139$3,373.16; P = 0.139
SNB with frozen section
ABL=1127.34ABLEV=1474.79HP=299.79KAI=1116.93LS=403.04pABLEVN2=0.3235PAT1=365.30PAT2=454.50PAT3=490.10PAT4=117.80PAT5=214.00pJLPOSN2=0.3333pJLTN=0.9338PKL=159.58pLISABLN2=0.0222pMARABLN2=0.037pMULAEVN2=0.037pMULEVN1=0.0526pRESEVN2=0.6618pRESEVN3=0.8182pSNABLN1=0.3333pSNLOY=0.8608pSNRESN2=0.8504pSNRESN9=0.5556RES=785.59RESEV=1409.13
$3,749.98; P = 1.000
65 The version of TreeAge Pro® used to construct the decision-tree does not have a ‘Euro’ conversion function; hence the results of the reconstructed model match those values reported in the original publication by Ronka et al., but are reported in dollars.

- 179 -
Figure H3: The updated base-case or roll-back analysis for Ronka et al.’s ‘SLNB with frozen section’ only treatment pathway option subject to the modification of the sentinel lymph node identification failure rate now set to 5% (i.e. pSNLOY = 0.95).[61] Note that the expected value or overall cohort average cost is now $3,789.03.
LISABLN2
0.022$5,827.02; P = 0.005
EUT2
0.978$3,726.52; P = 0.205
RESEVN2
0.662$3,773.15; P = 0.210
ABLEVN2
0.324$3,792.18; P = 0.102
MUULEIN2
0.015$3,062.02; P = 0.005
JLPOSN2
0.333$3,768.85; P = 0.317
MARABLN2
0.037$5,616.43; P = 0.019
MULAEVN2
0.037$6,263.67; P = 0.019
EUT3
0.926$3,515.93; P = 0.466
SNRESN2
0.850 $3,695.31; P = 0.503
MULEVN1
0.053$5,875.27; P = 0.005
EUT4
0.947$3,581.59; P = 0.084
SNABLN1
0.150$3,702.24; P = 0.088
JLTN
0.934$3,696.35; P = 0.591
SNRESN2
0.556$5,809.61; P = 0.023
SNABLN1
0.333$5,875.27; P = 0.014
MUUSNB
0.111$5,027.31; P = 0.005
JLFN
0.066$5,744.58; P = 0.042
JLNEGN2
0.667$3,831.94; P = 0.633
SNLOYN2
0.950$3,810.92; P = 0.950
RESEVN3
0.818$3,361.22; P = 0.041
ABLEVN2
0.182$3,426.88; P = 0.009
SNELON2
0.050$3,373.16; P = 0.050
SNB with frozen section
ABL=1127.34ABLEV=1474.79HP=299.79KAI=1116.93LS=403.04pABLEVN2=0.3235PAT1=365.30PAT2=454.50PAT3=490.10PAT4=117.80PAT5=214.00pJLPOSN2=0.3333pJLTN=0.9338PKL=159.58pLISABLN2=0.0222pMARABLN2=0.037pMULAEVN2=0.037pMULEVN1=0.0526pRESEVN2=0.6618pRESEVN3=0.8182pSNABLN1=0.3333pSNLOY=0.95pSNRESN2=0.8504pSNRESN9=0.5556RES=785.59RESEV=1409.13
$3,789.03; P = 1.000