Annual HIV Sentinel Surveillance - NACO
200
National Institute of Health and Family Welfare Munirka, New Delhi-110067 & National AIDS Control Organisation (NACO) Ministry of Health & Family Welfare New Delhi-110001 NIHFW N CO A Annual HIV Sentinel Surveillance Country Report 2008-09
-
Upload
khangminh22 -
Category
Documents
-
view
3 -
download
0
Transcript of Annual HIV Sentinel Surveillance - NACO

National Institute of Health and Family WelfareMunirka, New Delhi-110067
&National AIDS Control Organisation (NACO)
Ministry of Health & Family WelfareNew Delhi-110001
NIHFW
N COA
Annual HIV Sentinel Surveillance
Country Report 2008-09

National Institute of Health and Family WelfareMunirka, New Delhi-110067
NIHFW
Annual HIV Sentinel Surveillance
Country Report 2008-09
N COA
© 2011 by the National Institute of Health and family Welfare, New Delhi and National AIDS Control Organization.
Prof. M. Bhattacharya Project CoordinatorHead,Deptt. of CHA
Prof. Deoki NandanDirector, NIHFW
National AIDS Control Organisation (NACO)Ministry of Health & Family Welfare
New Delhi-110001


Acknowledgements
The Annual Sentinel Surveillance for HIV infection has been conducted in the country each year since 1998. This effort focuses on generating scientific data for ascertaining the status of the epidemic, for programme planning, including inter¬vention projects, and for the estimation of the burden of HIV infection in the country. The sentinel surveillance is a joint effort of the National AIDS Control Organization (NACO), National Institute of Health Family Welfare (NIHFW), National Institute of Medical Statistics (NIMS) with the State AIDS Control Societies (SACS), and reputed regional institutes across the country. This report, based on the data of 2008–09, in conjunction with the past data, provides an insight into the epidemiology of HIV in the country.
I would like to express my sincere gratitude to Mr Sayan Chatterjee, Secretary, Department of AIDS Control and Director General, NACO, for reposing his faith in us. I also thank Dr S. Venkatesh, DDG, NACO, and Dr P. Yujwal Raj, Technical Officer, Surveillance, for untiringly facilitating us in all our activities as and when we needed assistance.
My heartfelt thanks go to the members of the regional institutes, central team, State AIDS Control Societies and state surveillance teams for conducting extensive training supervision and monitoring to maintain the quality of the surveillance activities.
I would like to express my gratitude to Dr D.C.S. Reddy, NPO, WHO Country Office, for providing continuous technical guidance and Dr T. Bakkali, Senior Monitoring and Evaluation Adviser, UNAIDS India, for reviewing and giving valuable suggestions during the finalization of the report. I thank Dr Arvind Pandey, Director, NIMS, for his constant support and advice.
I appreciate the assistance provided by Professor Madhulekha Bhattacharya, Head, Department of Community Heath Administration, NIHFW, and her team, consisting of Mr Subhash Chand, ARO, and Ms Rashmi Khandelwal, Project Associ¬ate, Department of Community Heath Administration, in the preparation of the report.
Special thanks are due to all those who have contributed and cooperated with the NIHFW in this mammoth venture.
Prof. Deoki Nandan
Director, NIHFW


Abbreviations and AcronymsAIDS Acquired Immuno Deficiency SyndromeANC Antenatal ClinicASHA Accredited Social Health ActivistART Anti Retroviral TherapyAWW Anganwadri WorkerBSS Behavioural Surveillance SurveyCHC Community Health CentreCI Confidence IntervalCMO Chief Medical OfficerCBO Community Based OrganizationFSW Female Sex WorkerHSS HIV Sentinel SurveillanceHIV Human Immunodeficiency VirusHRG High Risk GroupIBBS Integrated Biological and Behavioural SurveysICTC Integrated Counseling and Testing CenterIDU Injecting Drug UsersMARP Most At Risk PopulationsMCH Maternal and Child HealthMSM Men who have Sex with MenNACO National AIDS Control OrganizationNIHFW National Institute of Health and Family WelfareNGO Non-Government OrganizationPHC Primary Health CentrePPTCT Prevention of Parent-to-Child TransmissionRI Regional InstituteRCH Reproductive and Child HealthSACS State AIDS Control SocietySEARO South East Asia Regional Office (of WHO)SST State Surveillance TeamsSTD Sexually Transmitted DiseaseTB TuberculosisTC Testing CentreTI Targeted InterventionVCTC Voluntary Counseling and Testing CentreWHO World Health OrganizationCTM Central Team MemberMRG MigrantsTRK TruckersEUN EunuchsMP Madhya Pradesh

TN Tamil NaduAP Andhra PradeshUP Uttar PradeshWB West BengalA & N Islands Andaman & Nicobar IslandsJ & K Jammu & KashmirUNAIDS United Nations Programme on HIV/AIDSNIMS National Institute of Medical StatisticsVDRL Venereal Disease Research LaboratoryELISA Enzyme Linked Immuno Sorbent AssayEQUAS External Quality Assurance SystemDBS Dried Blood SpotsICMR Indian Council of Medical Research RRL Regional Reference LaboratoriesSPSS Statistical Package for the Social SciencesUT Union Territory

Contents
Executive Summary i-vii
Chapter-1: Introduction 1-2
Chapter-2: Methodology 3-14
2.1. Planning for 2008-09 HIV Sentinel Surveillance 3-6
2.2. Methodology 6-13
2.3. Certain factors affecting the pace of HSS Implementation 13-14
Chapter-3: Results 15-67
3.1. Status of sites and samples 16-17
3.2. Overview of HIV Status 17-29
3.3. Antenatal Clinic Attendees 30-32
3.4. Southern High HIV Prevalence states 33-34
3.5. North Eastern States 34-35
3.6. Moderate and Low HIV Prevalence States 45-40
3.7. STD Clinic Attendees 40-46
3.8. Migrants and Truckers (Bridge Population) 46-47
3.9. High Risk Groups (IDUs, MSMs and FSWs) 47-67
Chapter-4: Conclusion 69-74
References 75
Annexures
Annexure I: Central Team Members 77-79
Annexure II: Table SS-1 to 35: State-wise Summary Tables 2008-09 80-151
Annexure III: Random Sampling Method 152
Annexure IV: Checklists for monitoring of sentinel sites 153-158
Annexure V: Individual forms 159-172
Annexure VI: State-wise distribution of Sentinel sites by Type in 2008-2009 173-174


List of Figures
Fig. 2.1: Implementation of 2008-09 Annual Sentinel Surveillance 6Fig. 2.2: Number of Antenatal Sentinel Sites by Location, India, 2003-2008 9Fig. 2.3: Problems Identified during the Supervisory visit in ANC/STD Clinics,
2008-0914
Fig 3.1 Trends in Various Zones according to HIV % Prevalence in Antenatal Clinic Attendees
31
Fig 3.2- Zone wise HIV prevalence among Antenatal clinic Attendees by Age group, 2008-09
32
Fig. 3.3: State wise HIV % prevalence in Antenatal Clinic Attendees of age 15-19 years for 2007 and 2008-09
32
Fig. 3.4: HIV Prevalence among Antenatal Clinic Attendees in Southern States, 2003 to 2008-09
33
Fig. 3.5: HIV Prevalence among Antenatal Clinic Attendees in Southern States by Age Group, India, 2003 to 2008-09
33
Fig. 3.6: Trends of HIV Prevalence among Antenatal Clinic Attendees in the States of Manipur, Nagaland and Mizoram, India, 2003 to 2008-09
34
Fig. 3.7: HIV Prevalence among Antenatal Clinic Attendees in Selected Sites of Manipur, 2003 to 2008-09
35
Fig. 3.8: HIV Prevalence among Antenatal Clinic Attendees in Selected Sites of Nagaland, 2003 to 2008-09
35
Fig. 3.9: HIV Prevalence among Antenatal Clinic Attendees in Manipur and Nagaland (Combined) by Age Group, 2003 to 2008-09
36
Fig 3.10: HIV Prevalence among Antenatal Clinic Attendees in Low Prevalence States by Age Group, India, 2003 to 2008-09
36
Fig. 3.11: HIV Prevalence among Antenatal Clinic Attendees in Chhattisgarh and Haryana from 2003 to 2008- 09
37
Fig.3.12: HIV Prevalence among Antenatal Clinic Attendees in Orissa, Jharkhand and Assam from 2003 to 2008-09
37
Fig. 3.13: Proportion Tested for HIV by Source of Referral to Antenatal Clinic Attendees in India, 2008-09
38
Fig. 3.14: Trend in VDRL positivity age wise among Antenatal Clinic Attendees in India, 2003 to 2008-09
40
Fig.3.15: Trends in Patients with Sexually Transmitted Diseases in Various Zones
41
Fig 3.16: HIV Prevalence among STD Patients by States, India, 2007 and 2008-09
41
Fig. 3.17: Trends for HIV Positivity among STD Clinic Attendees in Maharashtra and Karnataka (Combined) and India, from 2003 to 2008-09
42
Fig. 3.18: Trends for HIV Positivity among STD Clinic Attendees in Gujarat and Mizoram, from 2003 to 2008-09
42
Fig. 3.19: HIV Prevalence among STD Patients in Goa and Manipur, 2005 to 2008-09
43
Fig. 3.20: Distribution of Sources of Referral of STD Patients, India, 2008-09 45Fig 3.21: State wise HIV% Prevalence among Migrants at Migrant Sites, India,
2007 to 2008-0946

Fig 3.22: Proportion of Migrants tested by age and education in selected sites India, 2008-09
46
Fig 3.23: HIV Prevalence among Trucker sites for India, 2007 to 2008-09 47Fig. 3.24: HIV Prevalence among Injecting Drug Users in India, 2004 to 2008-
0948
Fig. 3.25: HIV prevalence among Injecting Drug Users by State, India, 2007 and 2008
48
Fig. 3.26: HIV Prevalence Trends among Injecting Drug Users in states of Maharashtra and Tamil Nadu 2005-08
49
Fig. 3.27: Age-Wise Persons Tested for HIV in Southern States among Injecting Drug Users, 2008
49
Fig. 3.28: Proportion Tested for HIV by Occupation in Southern States among Injecting Drug Users, 2008
50
Fig. 3.29: HIV Prevalence among Injecting Drug Users in the States of Manipur, Mizoram and Nagaland, 2003 to 2008-09
50
Fig. 3.30: HIV Prevalence among Injecting Drug Users in the States of Manipur, Mizoram and Nagaland (Combined) by Age Group, 2003 to 2008-09
51
Fig. 3.31: Proportion % of IDUs Tested for HIV by Occupation (Manipur, Nagaland and Mizoram), 2008-09
52
Fig 3.32: Sites with ≥ 5% HIV Prevalence among Injecting Drug Users in Low Prevalence States, 2007 and 2008-09
53
Fig. 3.33: HIV Prevalence among Injecting Drug Users in West Bengal, 2003 to 2008-09
53
Fig 3.34: Proportion % of IDUs Tested for HIV by Occupation, India 2008-09 54Fig. 3.35: HIV prevalence among Men having sex with Men by States, 2007
and 2008-0955
Fig. 3.36: Age wise HIV Prevalence among Men Having Sex with Men (MSM) in Consistent Sites of India, 2003 to 2008-09
56
Fig. 3.37: HIV Prevalence among Men Having Sex with Men in India, Southern States and Low Prevalence States, 2004 to 2008-09
56
Fig. 3.38: Trend in HIV Prevalence among Men Having Sex with Men in Andhra Pradesh and Maharashtra, 2003 to 2008-09
57
Fig. 3.39: Proportion % of MSM tested for HIV by Occupation in Southern States 2008-09
57
Fig. 3.40: Trend in HIV Prevalence among Men Having Sex with Men in Manipur, 2003 to 2008-09
58
Fig. 3.41: Districts with ≥ 5% HIV Prevalence among Men Having Sex with Men in Northern states, Moderate and Low Prevalence States, 2008
58
Fig.3.42: HIV prevalence among Men Having Sex with Men in consistent sites of Goa & Gujarat, 2005 to 2008-09
59
Fig. 3.43: HIV Prevalence among Men Having Sex with Men in Consistent Sites of Bihar, Chandigarh and Pondicherry, 2005 to 2008-09
59
Fig 3.44: Proportion % of MSM Tested for HIV by Occupation in India, 2008-09 59Fig. 3.45: HIV prevalence among Female Sex Workers by State, India, 2007
and 200861

Fig. 3.46: Trend in HIV Prevalence in Consistent Sites among Female Sex Workers in India 2003 to 2008-09
61
Fig. 3.47: Age-wise trend in HIV Prevalence in Consistent Sites among Female Sex Workers in India, 2003 to 2008-09
62
Fig. 3.48: Proportion % of Female Sex Workers tested for HIV by Age Group India, 2008
62
Fig.3.49: HIV prevalence Trends among Female Sex Workers in southern states, 2005-08
63
Fig. 3.50: Age-wise trend in HIV Prevalence in Consistent Sites among Female Sex Workers in Andhra Pradesh, 2003 to 2008- 09
64
Fig. 3.51: Trend in HIV Prevalence in Consistent Sites among Female Sex Workers in Manipur, 2003 to 2008-09
64
Fig. 3.52: Trend in HIV Prevalence in Consistent Sites among Female Sex Workers in Nagaland, 2003 to 2008-09
65
Fig. 3.53: Trend in HIV Prevalence in Consistent Sites among Female Sex Workers in Low Prevalence states, 2003 to 2008-09
65
Fig. 3.54: Trend in HIV Prevalence in Consistent Sites among Female Sex Workers in West Bengal, 2004 to 2008-09
65
Fig. 3.55: Trend in HIV Prevalence in Consistent Sites among Female Sex Workers in Chandigarh, Delhi and Uttar Pradesh (combined) 2003 to 2008-09
66
Fig. 3.56: Trend in HIV Prevalence in Consistent Sites among Female Sex Workers in Bihar and Himachal Pradesh, 2003 to 2008-09
66
Fig. 3.57: Trend in HIV Prevalence among Female Sex Workers for those sites which have increasing trend 2006-08 in Low HIV Prevalence States
67


List of Tables
Table 2.1: Number of Sentinel Sites by Year and Type from 2003 to 2008, India 8
Table 3.1: Prevalence of HIV among Different Risk Groups, India 2008-09 17
Table 3.1a: Trends in HIV percent Prevalence, 2003-2008, India 17
Table 3.1b: Prevalence of HIV among High Risk Groups by locality, India 2008-09 18
Table 3.2: Zone wise HIV Prevalence among Antenatal Clinic Attendees in different Age groups in 2008
30
Table 3.3: Trend in Sites with HIV Prevalence ≥ 3% among Antenatal Clinic Attendees from 2003 to 2008-09
34
Table 3.4: HIV Prevalence among Antenatal Clinic Attendees by Spouse Occupation, India, 2008
38
Table 3.5: VDRL % Prevalence amongst Antenatal Clinic Attendees by Age group 39
Table 3.6: Zone Wise HIV Prevalence of STD Patients for Sentinel Surveillance 2008-09
40
Table 3.7: Zone Wise VDRL Prevalence of STD Patients for Sentinel Surveillance 2008-09
40
Table 3.8: STD Sites with HIV Prevalence ≥ 10% from 2003 to 2008-09 43
Table 3.9: HIV Prevalence by Age and Sex among Patients Attending STD Clinics, India 2008
44
Table 3.10: HIV Prevalence among STD Patients by Locality and Literacy Status, India, 2008
44
Table 3.11: HIV Prevalence among STD Patients (both Male and Female) by Locality and Occupation, India, 2008
44
Table 3.12: HIV Prevalence among Patients with Sexually Transmitted Diseases by Type of Sexually Transmitted Diseases and Gender, India, 2008
45
Table 3.13: Site-wise Table of Injecting Drug Users with HIV Prevalence more than 5% in Manipur, Nagaland and Mizoram from 2003 to 2008- 09
51
Table 3.14: HIV Prevalence among Injecting Drug Users by Literacy and Residence (Manipur & Nagaland), 2008-09
52
Table 3.15: HIV Prevalence among Injecting Drug Users by Occupation and Residence, India, 2008-09
54
Table 3.16: HIV Prevalence among Men having Sex with Men by Occupation, 2008-09, in India
60
Table 3.17: Site-wise Table with HIV Prevalence more than 10% among Female Sex Workers in 2008-09
63


List of Maps
Map 2.1: District wise distribution of Sites (India) (districts as per 2001 Census)
9
Map 3.1: State wise HIV % Prevalence in Antenatal Women, IDU, MSM and FSW for 2008-09
19
Map 3.2: ANC Sentinel Sites Located in Urban Areas 21Map 3.3: ANC Sentinel Sites in Rural Areas 22Map 3.4 HIV Prevalence among STD Patients, All India 2008-09 24Map 3.5: HIV Prevalence among Injecting Drug Users, India 26Map 3.6: HIV prevalence among Men who have Sex with Men, India 27Map 3.7: HIV % Prevalence among Female Sex Workers, India 2008-09 28
List of Boxes
Box 2.1: Regional Institutes for HIV Sentinel Surveillance 2008 5Box 2.2: List of Reference Laboratories and states allotted to them 11Box 3.1: Summary of HIV % prevalence for All Sites “Annual Sentinel
Surveillance” 2008-0918
Box 3.2: State wise summary of HIV% prevalence in Antenatal Clinic Attendees and HRGs, 2008-09
20
Box 3.3: Summary of Results of Sentinel Surveillance in Antenatal Clinics, 2008-09
23
Box 3.4: Summary of Findings among STD Patients 25Box 3.5: Summary of Findings among HRGs, 2008-09 29


Annual HIV Sentinel Surveillance - Country Report 2008-2009 i
Executive Summary
The national response to the HIV epidemic is guided by data obtained through HIV sentinel surveillance. The HIV Sentinel Surveillance, conducted annually since 1998, generates data to improve tracking of HIV trends, as well as improves the understanding of the epidemic’s characteristics and its level of proliferation
across geographical areas. Surveillance data not only guide the planning of programmes for HIV prevention, treatment, care and support and resource allocation in India, but also inform advocacy efforts to mobilize political commitment. For this reason, the surveillance system has been tailored to the pattern of the epidemic in India and aims to concentrate data collection in populations considered vulnerable to HIV. Resources for HIV surveillance are thus concentrated where they will yield information most useful for reducing the spread of HIV and providing care for those affected.
The HIV Sentinel Surveillance is conducted annually by NACO/SACS, together with the National Institute of Health and Family Welfare (NIHFW) and National Institute of Medical Statistics (NIMS), and in collaboration with seven regional institutes (RIs), central team members (CTMs), and state surveillance teams (SSTs). HIV Sentinel Surveillance is implemented with the technical oversight and support of a surveillance working group, which includes representatives from the government organizations mentioned above and the technical partners, WHO and UNAIDS.
This report presents the methodology adopted by the surveillance working group to implement the 2008–09 HIV Sentinel Surveillance—a process which included training, supervisory visits, monitoring, data collection analysis, the writing of reports, and steps for quality assurance—along with the key findings on the epidemic, and recommendations for the next surveillance round.
Methodology
The 2008–09 annual sentinel surveillance was conducted from 1 October 2008 to July 2009 in 35 states and Union Territories of India. The methodology adopted was more or less similar to that utilized during the previous round, although significant revisions were incorporated to overcome the weaknesses noted, as mentioned later.
Sampling frame and methodology
The HIV Sentinel Surveillance was conducted among the following population groups at urban and rural sites: (i), the antenatal clinic (ANC) attendees who were representative of the general population; (ii) the key populations vulnerable to HIV, including men who have sex with men (MSM), transgender (TG), female sex workers (FSWs) and injecting drug users (IDUs) (these groups are collectively categorized as high-risk groups [HRG]); and (iii) population groups likely to act as a bridge for HIV transmission from the HRGs to the general population through unprotected sex or unsafe injecting drug use. The bridge population includes patients attending STI clinics, migrants and truckers.
The sampling frame encompassed all individuals attending the designated sentinel sites during the surveillance period. The sample size for ANC attendees was 400, while that for the HRGs and bridge population was 250. For ensuring sex-disaggregated data for the STI clinic attendees, the total sample size was broken down to 150 males and 100 female patients. The sampling units for ANC attendees, HRGs and the bridge population consisted of people between 15 and 49 years of age.
The unlinked anonymous method of sample collection was utilized at each ANC and STI surveillance site, that is, the sampling units were selected according to the inclusion criteria by consecutive sampling for a period of three months or until the sample size was completed. At the HRG and bridge population sites, the method used

ii Annual HIV Sentinel Surveillance - Country Report 2008-2009
was either random sampling or consecutive sampling. The approach depended on the data available for the HRGs. At selected HRG sites, and wherever line lists were available, the method used was random sampling. Line lists were obtained from non-governmental organizations. This method was adopted at surveillance sites in Gujarat, where the line list of all the registered HRGs was available. In the majority of the remainder of the HRG and bridge population sites in the country, the consecutive sampling method was utilized.
The following background characteristics of the sampling frame were collected from the ANC, HRG and bridge population groups on an individual proforma: age, sex, residence, literacy status, occupation of self and spouse, order of pregnancy, migrant status, and diagnosis of STIs based on a ‘syndromic approach’. Additional information on risk behaviours, such as the number of sex partners, needle-sharing behaviour and typology of MSM, and the reasons for attending the targeted intervention (TI) site were also obtained from all.
The process used for venous blood collection and testing at the ANC, STI and HRG sites was as follows. At the ANC and STI clinics, venous blood was collected from the sampling frame. The serum was separated from the whole blood, coded and forwarded to recognized laboratories—ensuring that the temperature was regulated during transportation—for HIV and VDRL testing. At the HRG sites, to overcome the practical problems encountered under the previous surveillance rounds in serum separation, storage and transport of blood samples—particularly for sites in geographically inaccessible areas—the dried blood spot (DBS) method was introduced. In DBS testing, the specimens are collected by applying a few drops of blood, through a finger prick, onto specially manufactured filter papers. With the method of processing specimens via DBS—which includes air drying for several hours, storage in low gas-permeability plastic bags with the addition of desiccant to reduce humidity—the specimen may be kept at ambient temperature, even in tropical climates. The samples have a longer lifespan and the need for refrigeration is reduced. The specimens were collected with informed consent, which was obtained in the case of all TI site-based HRG groups. The process was voluntary but unlinked anonymous, i.e. after the participants’ consent was obtained, the identifying information was not included in the DBS cards which were sent to the testing site. The cards mentioned only the age, sex and code. The results of the HIV test were communicated through sample codes.
Under the sentinel surveillance, the samples were tested through two ELISA / rapid tests or a combination of these. ANC and STI attendees’ samples were tested at designated laboratories identified by NACO, while the DBS samples of the HRGs were tested at the National Institute of Virology, Pune (Maharashtra).
Surveillance sites
For more comprehensive generation of information on the nature of the HIV epidemic across the country, the number of HIV sentinel surveillance sites was expanded from 1134 in 2007 to 1190 in 2008. Thus, geographical coverage as well as the representation of the various population groups increased. This scale-up was effected in continuation of the sustained initiative over the previous rounds to increase the participation of the states in the surveillance process beyond the six high-prevalence states where sites were previously concentrated, and to achieve adequate representation of the various population groups, particularly those in rural areas and the HRGs.
The number of sites increased particularly in the case of HRGs as new sites were instituted in states that previously had no sites for one or all of the three HRGs. The number of FSW sites increased by 51, from 137 in 2007 to 188 in 2008, while that of MSM sites increased by 29, from 40 in 2007 to 69 in 2008. The number of sites for IDUs increased by 5, from 52 in 2007 to 57 in 2008. As for the bridge populations, an increase was noted only among the migrant sites—8 were instituted in 2008, which was an increase by 5 sites from the previous round. The number of truckers and transgender sites remained at 7 and 1, respectively. The total number of ANC sites (648) was comparable to the number in previous rounds. Of these, 486 were urban ANC sites in the high- and low-prevalence states and 162 were rural sites. Of the latter, 126 were in six high-prevalence states and 36 in the low-prevalence states.
STI sites were considered redundant in certain of the southern high-prevalence states, where TI sites through

Annual HIV Sentinel Surveillance - Country Report 2008-2009 iii
NGOs for the HRGs had increased, and were thus closed under the 2008–09 surveillance round. The total number of STI sites under the 2008–09 round was 212.
Despite the fact that the number of sites has increased, it has been recognized that the population and geographical coverage of these sites is not uniform across the states. For example, there are no HRG sites in Meghalaya, Uttarakhand and Chhattisgarh. Rajasthan does not have any MSM or IDU sites, while Goa and Gujarat have no IDU sites. There is only one TG site in the country. The focus of the subsequent surveillance rounds will be on rectifying this state of affairs.
Steps taken to assure quality in the surveillance process
A stringent process was adopted for ensuring quality of the HIV Sentinel Surveillance, and during the stages of planning, implementation and data analysis. The principle steps taken included adherence to the latest WHO / UNAIDS guidelines on HIV sentinel surveillance to guide national policy on strengthened application of surveillance and the technical aspects of the various processes involved in surveillance. Secondly, operational guidelines were developed for the surveillance coordinators, programmers and health professionals involved in the sentinel surveillance to clarify the method and approach for implementing the surveillance activities effectively. The guidelines included recommendations on the identification of the sampling frame, the sampling methodology, blood collection, testing and storage, and the need for quality assurance. Thirdly, all stakeholders supporting the implementation of the HIV Sentinel Surveillance were imparted technical training on the surveillance process following a participatory approach, such as through workshop discussions.
Fourthly, close oversight and monitoring functions were performed by the members of the RIs, central team, SACS and the SSTs. Supervisory visits to the field—to each sentinel site and testing centre—were made to support all programmers and health professionals implementing the surveillance activities. The surveillance working group provided close mentoring to trouble-shoot and address problems or challenges arising in the field. Fifthly, for ensuring the quality of venous testing, the laboratories adhered to internal and external quality control mechanisms (EQAS). They were monitored by the reference laboratories, which provided regular feedback to institute corrective measures as and when required.
Sixthly, data verification was facilitated through corroboration of the data entered by the RIs and SACS. This ensured the correctness and completeness of the data. This task was performed by the NIFHW. Finally, technical guidance was provided by the Task Force on Surveillance, WHO and UNAIDS. These agencies also lent their support for the preparation of this report.
HIV epidemic trends
India’s HIV epidemic continues to be concentrated among the high-risk population groups and is not yet well established among the general population. This is confirmed by the 2008–09 HIV Sentinel Surveillance data, which shows that the prevalence of HIV among the HRGs is over 5% and that among ANC attendees is below 1%. Active networks of risk exist within and between sub-populations, particularly via the bridge populations. Whilst this overarching characteristics is translated to sub-national or state level, the trends are clearly not consistent and are changing rapidly, as described below.
HIV prevalence among ANC attendees at national level and across sites
HIV prevalence at the national level is stable to declining among the general population. HIV testing of the 252,650 ANC attendees at 648 ANC sites revealed a national prevalence rate of 0.47% (unadjusted). However, the prevalence was not low in all the Indian states. There were certain high-prevalence states where the prevalence of HIV was over 1%. For example, Andhra Pradesh and Nagaland had a prevalence rate of 1.22% and 1.12%, respectively. The high-prevalence state of Manipur, however, reported an HIV prevalence of less than 1% for the first time since 1998.

iv Annual HIV Sentinel Surveillance - Country Report 2008-2009
In terms of site-wise prevalence, a total of 105 sites—in rural and urban areas—reported a seropositivity rate of between 1% and 1.99%. Whilst the majority of the sites were in the states categorized as high-prevalence states (Andhra Pradesh, Karnataka, Maharashtra, Manipur, Nagaland and Tamil Nadu), a quarter or 27 of the 105 sites were in moderate- to low-prevalence states. Fifteen ANC sites had an HIV prevalence rate of between 2% and 2.99%, while 6 had an HIV seropositivity rate of over 3%. The districts with a prevalence of over 3% included Guntur, Ramanathanpur and Tuensang. HIV prevalence was found to be increasing at ANC sites—particularly in comparison with previous years—in the states categorized as moderate- to low-prevalence states, i.e. Assam, Chhattisgarh, Haryana, Jharkhand and Orissa.
An analysis of increased vulnerability to HIV according to the characteristics of the population makes it evident that women who have had school education are more informed, and thus better able to protect themselves from HIV. This was apparent in Manipur and Nagaland, where educated women comprised a lower proportion of the total number of seropositive ANC attendees than their illiterate counterparts. The surveillance data reflected the susceptibility to HIV of illiterate urban women between the ages of 15 and 49 years. This was particularly the case if they were married to truck drivers, auto drivers and skilled/semi-skilled workers. The highest rate of VDRL positivity in the country was reported among young mothers from the rural areas of Manipur and Nagaland.
HIV prevalence among HRGs at national level and across sites
HIV remained concentrated among the HRGs in India, the prevalence among these groups being over 5%. The prevalence trend, however, was not uniform across all the HRGs, both in India and across the states. A total of 69,276 individuals were tested at 284 HRG sites. Of these sites, 56 reported an HIV prevalence of between 5% and 9.99%, while 44 had an HIV prevalence rate equivalent to 10%.
At the national level, HIV prevalence among FSWs was stable to slightly declining and was at 4.8% in 2008–09. The sentinel surveillance, however, found a slight increase in HIV prevalence among the IDU and MSM population groups (9.86% and 6.9%, respectively).
Considering state prevalence trends, HIV prevalence among the FSWs in Andhra Pradesh, Karnataka, Maharashtra, Manipur and Nagaland was over 10%. It was the highest (14.2%) in Karnataka, followed by Nagaland, Andhra Pradesh and Manipur (14.1%, 11.5% and 10.9%, respectively). Seropositivity increased in 12 of the states with moderate to low prevalence in 2008 in comparison with 2007. Considering site-wise seropositivity, two FSW sites in Maharashtra (Pune and Mumbai) and one in Karnataka (Bagalkot) had a prevalence rate of over 30%. Five sites in Maharashtra and Andhra Pradesh each and two sites in Karantaka and Tamil Nadu each reported a seropositivity rate between 10% and 30%.
Surveillance was conducted among IDUs across 24 states, including Madhya Pradesh and Jharkhand, where IDU sites were instituted under the 2008–09 surveillance round. Forty per cent of the IDU sites reported an HIV prevalence rate of more than or equal to 5%. The sentinel surveillance found that HIV prevalence was increasing among the IDU population—particularly in states with moderate and low prevalence—whilst it was declining in certain -prevalence states, such as Maharashtra and Tamil Nadu. An increasing trajectory was noted predominantly in Punjab, Delhi, Chandigarh, Andhra Pradesh and Assam. Clearly, the epidemic among the IDUs is no longer restricted to the north-eastern states. The prevalence is over 5% in 10 states in India, which are Madhya Pradesh (39.6%), Manipur (28.3%), followed by Punjab, Maharashtra, Delhi, Orissa, West Bengal, Bihar, Assam, and Mizoram with seropositivity rates of 27.6%, 20%, 18.6%, 6.6%, 5.6%, 5.5%, 5.3% and 5.0%, respectively.
HIV surveillance was conducted at MSM sites across 21 states, with new sites instituted in Andhra Pradesh, Bihar, Himachal Pradesh, Jharkhand and Madhya Pradesh. Approximately 35% of the districts and 28 sites in 10 of the 21 states recorded an HIV prevalence of over 5%. HIV prevalence was comparatively higher among MSM than FSWs in Andhra Pradesh, Manipur, Maharashtra and Madhya Pradesh. The prevalence among MSM in these states was 22.1%, 17.2%, 11.9% and 11.6%, respectively. It was reportedly higher among MSM in urban

Annual HIV Sentinel Surveillance - Country Report 2008-2009 v
rather than rural areas of the country, such as in north-east Delhi, Pune, Bangalore, Surat, Rajkot and Kolkata. Regarding the occupation profile, the prevalence of HIV was the highest among MSM in service (government/private) in urban areas and those working as non-agricultural labourers in rural areas. Surveillance at the TG site in Mumbai found that the seropositivity rate among this population was over 16%. A trend cannot be established since 2005, although a slight increase was observed from the time of the 2007 surveillance round.
HIV prevalence among bridge population groups
Surveillance was conducted at eight migrant sites in India. There were two sites in Gujarat and Maharashtra each and one each in Mizoram, Orissa, Himachal Pradesh and West Bengal. A total of 1742 migrants were tested for HIV under the 2008–09 sentinel surveillance round. As five of these sites were instituted under the 2008–09 round, establishing a prevalence trend was not possible across all sites. It can, however, be stated that the prevalence of HIV was the highest at the MRG site in Thane, the seropositivity rate among the 250 migrants tested being 5.2%. Thane was one of the newly established sites. The prevalence of HIV was between 1% and 4% at the two sites in Gujarat and one site in Orissa. Whilst the prevalence among MRG declined from the 2007 to the 2008–09 round in the West Bengal site from 9.27% to 2.48%, it increased at the site in Mumbai (Maharashtra).
The prevalence of HIV was stable to declining among the trucker population in the majority of the sites where surveillance was conducted. Of the seven sites in existence for truckers in 2008–09, five were in West Bengal and one each in Kerala and Himachal Pradesh. The HIV prevalence rate for this population declined in five of the seven sites. The rate varied across districts from nil to 2.8% in Burdwan, which recorded the highest seropositivity rate.
HIV and VDRL prevalence among STI clinic attendees
Surveillance was conducted amongst 3005 individuals at valid STI sites in the high-prevalence states and 42,993 individuals at sites in states with moderate and low prevalence. While the seropositivity rate was 11.19% in the high-prevalence states and 1.70% in the moderate and low-prevalence states, the trend at the national level was stable to declining. At the state level, it was increasing slightly, more notably among the states with moderate and low prevalence. Two sites in Gujarat, one site in Mizoram and one in West Bengal reported a prevalence of over 10%.
VDRL prevalence was 1.08% in the high-prevalence states and 0.70% in the states with moderate to low prevalence.
State-level analysis
As mentioned above, the trend of HIV prevalence was not consistent across states—whether high-prevalence or moderate- to low-prevalence—and across population groups.
HIV prevalence among ANC attendees in the high-prevalence states was stable to declining, considering the moving average of the previous surveillance data. It was, however, stable to increasing among specific age groups—particularly among people between 15 and 19 years of age—in certain high-prevalence states, including Nagaland and Andhra Pradesh. It was also found that HIV prevalence was increasing in rural areas. At surveillance sites in Karnataka, Tamil Nadu and Andhra Pradesh, the prevalence was above 3%. HIV prevalence among the IDU and MSM populations was the highest in Andhra Pradesh and Manipur, where the seropositivity rates were between 10% and 28%. The prevalence of HIV among FSWs and MSM was above 10% and among IDUs, above 20%, in Maharashtra. In Nagaland, the prevalence among FSWs was over 14% and among IDUs, 4%. HIV prevalence among ANC and STI clinic attendees, IDUs and FSWs was stable to increasing in Mizoram.
In Goa and Gujarat, states with moderate to low prevalence, HIV prevalence among ANC attendees was below 1%,

vi Annual HIV Sentinel Surveillance - Country Report 2008-2009
whilst it was above 5% among MSM and FSWs. Due to the absence of any IDU site in the state, determining the prevalence among this population, as well as the trajectory of the epidemic, to guide programme interventions was not possible.
It was not possible to gain a comprehensive understanding of the nature of the epidemic in the northern low-prevalence states, considering the few surveillance sites for HRGs. This was particularly true in the case of Orissa, Mizoram, West Bengal, Delhi, Chandigarh, Kerala, Jharkhand, Haryana, Uttar Pradesh and Assam, where there are known ‘hot spots’. Recent evidence coming in following the creation of new surveillance sites for HRGs under the 2008–09 round revealed a high prevalence rate among them. For example, HIV prevalence among IDUs at the new sites in Madhya Pradesh and Punjab was 40% and 28%, respectively. Wherever sites were instituted under the previous surveillance rounds to make a comparative assessment possible, the trend was stable to increasing among the various sub-populations. A slight increase was seen in the prevalence among ANC attendees.
Recommendations for next round of surveillance
We make two overarching recommendations for the next Annual HIV Sentinel Surveillance. Firstly, foreseeable operational challenges must be avoided through timely preparation and secondly, the number of surveillance sites should be expanded to achieve increased geographical and population coverage. These two points are elaborated upon in the following paragraphs.
Smooth implementation of HIV sentinel surveillance is possible if any foreseeable logistical, administrative and procedural delays are avoided prior to the surveillance. All supplies—for example, HIV kits and DBS cards—should be procured and forwarded to the relevant organizations and bodies prior to the set time-line. States should prepare themselves in advance by ensuring the availability of human resources for the implementation of surveillance within the time-line. Ideally, each state should designate an officer in-charge who is to be responsible for overseeing and coordinating the activities in the state.
To gain a comprehensive understanding of the epidemic across all states and population groups, it is necessary to expand the number and type of sites. At least one site for FSWs, MSM and IDUs should be instituted in each of the high-priority districts (A and B category districts in the country, as classified by NACO)—based on mapping data—across all high- and moderate- to low-prevalence states. This is particularly essential for the states that currently do not have any such sites, including Gujarat, Goa, Chhattisgarh, Jharkhand, Madhya Pradesh, Jammu and Kashmir, and Rajasthan, where there is a high level of migration out of and into the state and tourism is flourishing.
There is a need to expand the number of TG sites, particularly in the states with moderate and low prevalence. The creation of additional ANC sites in rural areas and sites for the bridge population at source and destination sites is also recommended. It is essential to set up such sites in Uttar Pradesh, Bihar, Madhya Pradesh, Orissa and Jharkhand, which have a high level of out-migration and where access to healthcare is inequitable.
Conclusion and recommendations for HIV programme
Considering the trajectory and spread of the HIV epidemic in the states and among sub-populations, the following recommendations are made for the national and state programmes:
It is essential to increase awareness and knowledge among the general population, HRGs and bridge • population through IEC, BCC, life skills education in schools and colleges, and counselling. This will empower them to protect not only themselves against HIV, but also their partners and children.
The access of women and children to HIV treatment and care services should be expanded through increased • programmatic referrals and linkages. Also, support must be extended particularly to those belonging to the lower socioeconomic strata.

Annual HIV Sentinel Surveillance - Country Report 2008-2009 vii
There is a need to empower adolescent girls and street children, who are especially vulnerable to HIV. •
Efforts are required to strengthen HIV and STI syndrome management, particularly for syphilis.•
Comprehensive counselling services need to be provided at all STI clinics and gynaecology OPDs for HIV/• AIDS and all STI/reproductive infections.
Targeted interventions for HRGs should be sustained, and coverage of migrants and truckers must be • expanded. More NGOs and CBOs need to be identified and supported for initiating TIs among MSM, IDUs and FSWs. Transgenders deserve a separate intervention strategy.
There is a need to strengthen strategic information generation—surveillance, data generation, data analysis • and operations research—by increasing linkages and collaboration between the monitoring and evaluation units between SACS and with the NIHFW, NIMS, RIs and Department of Biostatistics. The surveillance unit at NACO, together with the Task Force on Surveillance, could play the leading role in the coordination of strategic information generation, with technical support from WHO and UNAIDS.
Partnerships with the private sector and civil society could be forged to strengthen the response to AIDS. •
There should be greater convergence between the National AIDS Control and Prevention Programme and • the National Rural Health Mission.


1Annual HIV Sentinel Surveillance - Country Report 2008-2009
Chapter 1Introduction
HIV sentinel surveillance (HSS) is the core focus of India’s National AIDS Control Programme (NACP) and response strategy. Since the detection of the first AIDS case at Chennai in 1986, the initial focus of the Government of India was on sero-surveillance. India built its surveillance system on the basis of the
early sero-surveillance initiatives undertaken during the epidemic’s first decade, coupled with the introduction of standardized and globally accepted methodologies. By 1998, annual HIV sentinel surveillance was initiated in India among the antenatal clinic (ANC) attendees and sexually transmitted infection (STI) clinic attendees.
In the initial years, comprehensive data on high-risk population groups were not available owing to the few sites and limited mapping information on these sub-populations. In the beginning, there were four high-risk group sites each for injecting drug users (IDU) and female sex workers (FSW), while there were none for men who have sex with men (MSM). The concept of targeted intervention (TI) sites under the NACP II and NACP III, however, opened up avenues for increasing surveillance among these groups. Ever since, there is an increased representation of sub-populations and constant efforts are being made to expand it even further.
This introductory chapter highlights the importance accorded by India to HSS. The second chapter deals with the methodology adopted for the implementation of the 2008–09 HSS. Chapter 3 includes a detailed presentation and analysis of the key findings emerging from surveillance according to sub-population and geography. The recommendations for the programme and the next round of annual HSS are presented in Chapter 4. Detailed state-wise surveillance data are presented in the annexures.
Centrality of annual HIV sentinel surveillance for AIDS response HIV sentinel surveillance has been imperative for generating public response to HIV in India, particularly when the epidemic was in its nascent stage and not visible across country and population groups. In India, national leaders seized the opportunity to formulate a response strategy as soon as the first AIDS case was detected in 1986. This early intervention was followed by more comprehensive and improved policy and strategic interventions to help contain the epidemic in the country, under the NACP II and NACP III.
One of the many factors contributing to India’s effective AIDS programme is the use of surveillance data to direct efforts appropriately and thereby enable a slowdown of the spread of HIV. Surveillance data have demonstrated which population group, in which geographical location, is vulnerable to HIV. They have helped to identify sub-populations which must be the target of especially designed interventions. They have also helped in planning interventions for reducing the impact of HIV and AIDS.
Since HIV typically takes many years to develop into symptomatic illness, the impact of the epidemic is not visible for some time, until or after the infection levels begin to rise. Surveillance data provided inputs for models from which national estimates and projection of infections, AIDS-related deaths and treatment needs were derived. National estimates and projections have been useful in India for planning how to mitigate the impact of the epidemic by providing evidence to help direct resources efficiently. HSS data have also been of use in monitoring HIV infection trends over a period of time. Coupled with behaviour surveillance survey data, the data have provided an indication of the impact of national efforts to reduce HIV infection and increase safe behaviour.
Despite having much strength in HSS, there is scope for achieving greater advantage through the surveillance system. A central focus of sentinel surveillance has been tracking HIV by recording infections that have already taken place. The very nature of HSS leads to missed opportunity of providing early warning of the potential for

2 Annual HIV Sentinel Surveillance - Country Report 2008-2009
infection. Early warning systems are based mainly on data that record risk, such as the number of partners, condom use or the use of unsterilized injecting equipment. Such data, however, may come from other sources, including behavioural surveillance survey. Thus, inter-linkage between HSS and behavioural surveillance survey is essential and is being considered by India.
Realizing the need for HSS to provide greater coverage for high-risk population groups, the number and location of surveillance sites were expanded under the 2008–09 round. Sites were introduced in states that were previously without a site for one or all the high-risk populations. This was a significant measure, firstly because of the concentrated nature of the epidemic among key population groups. Secondly, the trends in infection in these populations would not be captured by HSS designed to track infection in the general population. While sufficient coverage for high-risk groups has not been ensured with sites not established across all high-priority districts, the scale-up has nevertheless been notable. More details on the increased surveillance sites introduced under HSS 2008–09 may be found in the second chapter.
Objectives of 2008–09 HIV sentinel surveillanceHSS 2008–09 was conducted on the basis of the realization that HIV infections are not uniformly distributed in a population group. The distribution depends on the prevalence of behavioural and biological factors associated with an increased risk of HIV transmission. There are a number of modes of HIV transmission, which include sexual transmission—through vaginal and anal intercourse, parenteral transmission, mother-to-child transmission during pregnancy, birth or breastfeeding, and transmission through contact equipment contaminated by infected blood. HIV infection enters different geographical areas and populations at different times and spreads at different rates.
The objectives of HSS 2008–09 were to firstly, assess the prevalence of HIV among the general population, high-risk groups—FSW, MSM, transgender (TG) and IDU, and bridge population, i.e. migrants and truckers. The second objective was to assess the magnitude of the epidemic at the country and state levels and across sites. The third aim was to monitor trends in HIV prevalence over time and the fourth, to identify behaviours and risk factors for HIV transmission, such as syphilis infection.
The data generated under HSS 2008–09 will assist in public health decision-making and effective and efficient programme planning. More specifically, HSS data will be relevant for advocacy and mobilizing political commitment, targeting and prioritizing prevention and care programmes, monitoring and evaluating prevention and care programmes, resource allocation, programme planning and guiding scientific research. HSS data will be required for making estimates and projections for new and total HIV infections, AIDS cases, AIDS deaths and treatment needs through mathematical modelling and the use of statistical software.
ConclusionHSS 2008–09 was implemented in India through collective partnership between the staff of sentinel sites—from the site-in-charge to the nurse /counsellor and laboratory technicians—who are responsible for arranging and implementing surveillance activities at the site, along with state surveillance teams, regional institutes, and central team members (CTMs) from National AIDS Control Organization (NACO), National Institute of Health and Family Welfare (NIHFW), National Institute of Medical Statistics (NIMS), WHO and UNAIDS.
The following chapter specifies the methodology adopted for implementing HSS 2008–09.

3Annual HIV Sentinel Surveillance - Country Report 2008-2009
Chapter 2Methodology
Annual HSS is a joint effort of NACO, which acts as the central coordinating authority of the National HIV-AIDS Prevention and Control Programme, and the Task Force on Surveillance and Estimation, and the Working Group on Surveillance and Estimation. Their central focus for the 2008–09 round of annual HSS
was to define a comprehensive methodology that considered country requirements and the current surveillance system in an effort to overcome previous weaknesses in HSS. Moreover, it aimed to generate surveillance data that were of improved quality.
A significant part of the pre-surveillance phase thus was devoted to planning and preparing for HSS execution. The Task Force and the Working Group on Surveillance and Estimation collaborated closely with national and international experts, starting in mid-2008, to strengthen the surveillance network for increased geographical and population coverage. Remedial measures for addressing the challenges noted during the previous round, such as transportation of blood samples in geographically inaccessible areas, were identified. By reviewing the latest methodologies for conducting HSS and reviewing the application of methodologies under the previous HSS round, the Working Group on Surveillance and Estimation developed the strategy and plan for the execution of HSS 2008–09 at the national, state and district levels.
This chapter focuses on the process and methodology applied for conducting HSS 2008–09 and data analysis. It is divided into three broad sections. The first section highlights the planning process for conducting HSS 2008–09 and the role of national partners in HSS implementation and oversight. The second section details the sample population, sampling frame, sampling methodology and size. Analysis of surveillance data and interpretation is included in section three. The weaknesses noted during the implementation of HSS are also summarized here.
2.1 Planning for 2008–09 HIV sentinel surveillance
HSS is the principal method for collecting information on the geographical, demographic and temporal distribution of HIV in India. It is an expansive technical process, particularly considering the geographical coverage and density of population across the 35 states and Union Territories of the country. It requires, firstly, sufficient infrastructure in terms of manpower, laboratory support and logistics. Secondly, adequate attention must be given to training and supervision at all levels. Thirdly, maintenance of quality assurance procedures is required during data collection and analysis at all levels, including HIV testing.
As stated above, the foremost steps undertaken by NACO and NIHFW for the execution of HSS 2008–09 were to finalize the process and methodology in close consultation with the Task Force and Working Group on Surveillance and Estimates. Rounds of pre-surveillance consultations were conducted to, firstly, review the methodology and process of the previous HSS round, taking into account the weaknesses and best practices. Secondly, the rounds aimed to review the epidemic’s pattern on the basis of strategic information and programme data. The third objective was to discuss the type of epidemiological surveillance data needed for planning and monitoring HIV control activities. Fourthly, the rounds aimed to develop a consensus on the methodologies for executing surveillance from sample collection, to testing, analysing surveillance data and reporting. The methodologies were identified considering internationally prescribed norms and country-level requirements. A fifth objective was to agree on the roles and responsibilities of the primary stakeholders responsible for executing HSS or supporting it and the flow of information. Sixthly, requirements for HSS implementation and infrastructure

4 Annual HIV Sentinel Surveillance - Country Report 2008-2009
requirements, including human resources, were identified for the formulation of appropriate directions and recommendations to states. Finally, India’s strategy and plan for HSS 2008–2009 were developed with set time-lines.
2.1.1 Role of partners
For the successful execution of HSS, NACO and the Working Group on Surveillance and Estimation focused on multi-level stakeholder ownership through comprehensive partnership coupled with close supportive supervision and mentoring by national, sub-regional and state institutes and organizations. At the helm of the HSS 2008–09 process was the NIHFW, which was given the responsibility by NACO of providing oversight for the overall implementation of HSS. The key responsibilities assigned to the NIHFW included collaborating with NACO and the Working Group on Surveillance and Estimation to finalize the process and methodology for HSS, with a focus on improving the quality of data as well as ensuring timely and complete reporting. Secondly, the NIHFW was to orient members from regional institutes, state AIDS control societies and CTMs on the HSS methodology and process, and guide them on implementation of HSS. Performing coordination functions with stakeholders at the national, state and district levels was another of the responsibilities given to the NIHFW. Further, it was to monitor the implementation of the HSS and troubleshoot emerging problems. It was also made responsible for compiling and reviewing supervisory visit reports received from regional institutes and CTMs for quality. The NIHFW was to update the data entry software, as well as train manpower for data collection and entry, using web-based software. Finally, it was entrusted with the job of preparing the country report on HSS.
Closely supporting the NIHFW in the task of oversight and data quality control functions was the NIMS. The main responsibilities of NIMS included the provision of supportive supervision to HSS sites and the testing centres, as well as mentoring functions. The NIMS analysed surveillance data for estimating the HIV burden at the national and state levels, and also analysed adult HIV prevalence, the number of people living with HIV, the incidence of HIV, AIDS-related deaths and treatment needs for India.
Senior epidemiologists and microbiologists from national medical colleges and national institutes were identified by NACO and the NIHFW to form a central support team (CST). The CST members assisted in supervising the functioning of sentinel sites and testing centres. Their responsibilities included supervisory visits and preparation of reports on the quality of the surveillance activities at sites for review and compilation by the NIHFW. Annexure 1 lists the CTMs .
As soon as the HSS 2008–09 operational guidelines were finalized by NACO and the NIHFW completed the process of HSS orientation, the regional institutes (RIs) had to commence with their functions and responsibilities. The RIs identified new sites to be included under HSS 2008–09. Following the finalization of sites for HSS, together with the state support team, they undertook the responsibility of building up the capacity of the personnel in charge of sentinel sites and testing centres through training workshops. The RIs closely supervised HSS implementation in the states to ensure the quality of activities. These institutes also supported in double data entry—in coordination with NACO, the State AIDS Control Society (SACS) and NIHFW— under HSS 2008–09.
Seven RIs were identified to support HSS 2008–09. Five of them had been engaged in HSS activities since 2005. These were the National Institute of Epidemiology, Chennai; All India Institute of Hygiene and Public Health, Kolkata; Post-Graduate Institute of Medical Education and Research, Chandigarh; National AIDS Research Institute (NARI), Pune; and All India Institute of Medical Sciences, New Delhi. Two new RIs were identified to support surveillance in the north-eastern and eastern states under the 2008–09 round. These were the Regional Institute of Medical Sciences, Imphal and National Institute of Cholera and Enteric Diseases, Kolkata. Box 2.1 provides details of the states falling under each of the RIs’ purview.

5Annual HIV Sentinel Surveillance - Country Report 2008-2009
Box 2.1Regional Institutes for HIV Sentinel Surveillance 2008
Name of Regional Institutes StatesNational Institute of Epidemiology, ICMR, Chennai
Orissa, Andhra Pradesh, Tamil Nadu, Karnataka, Kerala, Pondicherry and Lakshadweep
All India Institute of Hygiene and Public Health, Kolkata
Assam, Arunachal Pradesh, Meghalaya and Nagaland
Post-graduate Institute of Medical Education and Research, Chandigarh
Haryana, Himachal Pradesh, Jammu and Kashmir, Punjab and Chandigarh
National AIDS Research Institute, Pune Maharashtra, Mumbai, Gujarat, Goa, Madhya Pradesh, Rajasthan, Daman & Diu, and Dadar & Nagar Haveli
All India Institute of Medical Science, New Delhi Uttar Pradesh, Bihar, Jharkhand, Uttaranchal and Delhi
National Institute of Cholera and Enteric Diseases West Bengal, Chhattisgarh, Sikkim and Andaman & Nicobar Islands
Regional Institute of Medical Sciences Manipur, Mizoram and Tripura
The RIs and SACS were closely supported by the state surveillance teams (SSTs) in the supervision of sentinel sites and testing centres, as well as the provision of feedback.
2.1.2 Supportive supervision for HSS implementation
As highlighted in Fig. 2.1, certain mechanisms were employed to improve the quality of the surveillance data generated under the 2008–09 round. Principal among them were the protocols and guidelines that were developed and disseminated. Further, a series of training sessions were conducted to build the capacity of human resource personnel in the technical and operational aspects of HSS. For example, all staff and medical officers engaged in HSS received induction training on HSS, including training on the process, methodology, data entry formats, data reporting and forwarding. Practical training was also provided to medical and technical staff on the dried blood spot (DBS) testing method.
Infrastructure availability was ensured through forwarding of directives and instructions for timely procurement and or supply of equipment necessary for surveillance and testing. This included testing kits and laboratory supplies. The testing laboratories were monitored to ensure adherence to internal quality control and external quality assessment via implementation of External Quality Assessment System (EQAS). The names of external reference laboratories and the states allotted to them for quality control are presented in Box 2.2.
Finally, the multi-tiered supervisory structure instituted across India—and as highlighted earlier—provided oversight and monitoring to HSS implementation. Supervisory teams ensured all units’ compliance with HSS guidelines and standard protocols for surveillance and testing. All surveillance sites were visited at least one time—or more depending on the requirement—for constant mentoring and supportive supervision. Supervisory teams ensured that the emergent bottlenecks or practical problems were addressed on the spot through application of corrective measures. A two way communication channel ensured that information flowed both ways.
Data was screened at two levels for quality. The supervisory teams at the RIs and SACS ensured data accuracy, data validity and data completeness prior to its upload to the NIHFW website. (Annexure II) The data was re-checked by NIHFW before analysis and use. Technical inputs from WHO and UNAIDS were consistently sought through HSS implementation; and particularly data analysis for presentation to the other members of Task Force on Surveillance and Estimation.

6 Annual HIV Sentinel Surveillance - Country Report 2008-2009
2.2 Methodology
HIV sentinel surveillance is a core activity of HIV sero-surveillance in India. This section highlights the methodology adopted under the HSS 2008–09 round, including the selection of sentinel populations, sites, the sampling process, method for HIV testing and ensuring reliability of the results of tests, data collection and analysis.
2.2.1 Sentinel populationUnder HSS 2008–09, information on prevalence was collected for the general population as well as populations considered to be at higher risk for infection and transmission. Blood specimens were taken consensually from the sample of ANC attendees (as proxy for the general population), STI clinic attendees, FSWs, IDUs, MSM, TGs, migrants and truckers, and screened for HIV. Information on certain demographic characteristics and limited data on risk behaviour were also collected.
Measuring HIV prevalence in ANCs was essential for detecting the bridging of infection to the general population. At the same time, given the concentrated nature of the HIV epidemic, India is increasingly focused on measuring
Figure 2.1Implementation of 2008-09 Annual Sentinel Surveillance
NIHFW: National Institute of Health and Family Welfare RI: Regional InstituteNIMS: National Institute of Medical Statistics. NACO: National AIDS Control OrganizationSACS: State AIDS Control Society. EQAS: External Quality Assessment System SST: State Surveillance Team * Operational Guidelines
Report on HIV
estimation
Ori
enta
tion
and
Coo
rdin
atio
n
Country report of HIV sentinel surveillance
Orientation, training
coordination
Clinic site 1. Inclusion criteria followed for
recruitment of individual * 2. Filling individual pro forma
completely and correctly
Laboratory site 1. Testing and reporting as
per NACO guidelines 2. EQAS complemented
RIs SST RRL
Role of SACS 1. Training 2. Double data entry for validity 3. Uploading to the online NIHFW website 4. Analysis and preparation of state reports
NIHFW NIMS
NACO
Training and supervision Laboratory testing quality Training
Supervision
Central team members
Data cleaning & analysis Supervision

7Annual HIV Sentinel Surveillance - Country Report 2008-2009
HIV prevalence among higher risk groups (HRGs) and bridge populations. The number and type of sentinel sites for these sub-populations increased under the HSS 2008–09 round, while the number of ANC sites was stable. Details of the number and type of sites are given in the sub-section below.
Access to HRGs is challenging given that certain behaviours of theirs may be considered illegal or else highly stigmatized. Increased access to them was obtained via the STI facilities and TI. STI clinics are a useful source for accessing these sub-populations as a large number of sexually active adults—male and female—belonging to the HRGs and bridge population seek treatment there. STI clinics provide referrals to HIV care. Moreover, testing can be accomplished on an unlinked, anonymous basis as blood specimens are taken for other purposes, such as syphilis screening. This was a particularly useful method for reaching HRGs in the moderate-to-low prevalence states.
NACO is collaborating with non-governmental organizations (NGOs) for implementing TI projects, and through these, HIV sero-surveillance data on HRGs were collected. The method for surveillance was unlinked anonymous testing for the HRGs attending the drop-in centres and drug de-addiction centres for IDUs. Pregnant women attending ANCs in government and some private sector hospitals were tested for HIV via the unlinked anonymous method.
As HIV is not uniformly distributed among the population, HSS focused on three variables to obtain a more comprehensive measurement of HIV prevalence. These were person variables of the sample population, i.e. their sex and age; the place variable, i.e. the rural and urban population across states; and the time variable, which was necessary for determining a trend. HSS did not involve a single method but instead, a collection of methods based on certain principles for tracking the infection. To monitor trends in HIV infection over person, place and time, HSS was conducted among the same population groups as consistently as possible with previous years and in the same manner, although the methodologies were updated and the number of sites increased. Further, better understanding of behaviours that drive the epidemic was tried to put on analysis for explaining trend and distribution of epidemic in the country.. Finally, there was a focus on sub-populations which are at a higher risk for HIV, including FSWs, MSM, TGs, IDUs, and migrants and truckers.
2.2.2 HIV sentinel surveillance sites The number of HSS sites under the 2008–09 round was 1190, compared to 1134 in 2007. The sites for HSS 2008–09 were identified according to a list of selection criteria. The RIs took into consideration the recommendations of the respective SACS and the final decision was made in consultation with NACO, the NIHFW and Technical Resource Group (TRG) members. The factors taken into account included whether the sites provided information on the select sentinel population, whether information on the client make-up of the site was available to achieve the required sample size, whether blood was drawn from patients as part of routine care, whether reliable laboratories were available on site or if a reference laboratory was available at a motorable distance to send specimens, and whether the on-site staff was cooperative and capable of conducting surveillance.
Under the 2008–09 HSS round, composite sites were introduced in select geographical locations where the recommended sample size was not likely to be achieved at a select location because the target population was spread among multiple facilities. Thus, sub-sites were included that together constituted a composite site at a geographical location.
As Table 2.1 shows, it was primarily the number of HRG sites that increased, and the increase in the number of sites for FSWs and MSM was greater than that for IDUs. Specifically, the number of sites for FSWs increased from 137 in 2007 to 188 in 2008–09, while in the case of MSM, it increased from 40 to 69 in the same period. The number of IDU sites increased by 5 (52 in 2007 to 57 in 2008–09). The number of TG sites remained static at 1. Regarding the bridge populations, the number of migrant sites increased by 5 (3 in 2007 to 8 in 2008–09), while the number of trucker sites remained static at 7. As several STI sites were closed in the southern states categorized as high-prevalence states—where TI sites through NGOs for the HRG had increased—the total number stood at 212 under HSS 2008–09.

8 Annual HIV Sentinel Surveillance - Country Report 2008-2009
While HRG sites under the 2008–09 round comprised a near quarter of the total sites, there were certain states that had no HRG sites. These included Uttarakhand, Jammu and Kashmir, the Andaman and Nicobar Islands, Chhattisgarh, Meghalaya and smaller Union Territories. Rajasthan, with its sizable population and large tourist influx, had only one FSW site and no IDU or MSM sites.
Of the six high-prevalence states of Andhra Pradesh, Karnataka, Maharasthra, Manipur, Nagaland and Tamil Nadu, only Maharashtra had sites for truckers and migrants. Andhra Pradesh had 72 sites, of which 12 were FSW sites, 6 MSM sites and 2 IDU sites. The total number of ANC (urban and rural) sites was 52. STI sites were closed down in the state during this HSS. Karnataka, with a total 75 sites, had 6 FSW sites, 3 MSM sites, 1 IDU site and 7 STI sites. The number of ANC (urban and rural) sites in Karnataka was 58. Maharashtra had 98 HSS sites. While there was a total of 6 STI sites, the number of FSW and MSM sites was 16 and 3, respectively. There were no IDU sites in the state. There were 66 ANC (urban and rural) sitesin Maharashtra. The number of HSS sites in Manipur was 24, of which 3 were FSW sites, 4 IDU sites and 1 an MSM site. Nagaland had 29 HSS sites. There were 8 IDU sites, 1 FSW site and no MSM site. The number of ANC (urban and rural) sites was 19 in Nagaland. Of the total of 110 HSS sites in Tamil Nadu, the number of FSW, MSM and IDU sites was 28, 17 and 2, respectively. Most of the remaining sites were ANC (urban and rural) sites. Further state-wise details are given in Annexure II.
Of the ANC sites under HSS 2008–09, the number of urban sites was 486 and that of rural sites, 162. Certain states in north-east India, Jammu and Kashmir, Himachal Pradesh, Punjab, Uttar Pradesh, Bihar, Madhya Pradesh and Jharkhand had districts with no ANC sites. This was on account of practical challenges, particularly in rural areas without health facilities, with an inadequate client load at ANC clinics or without properly functioning NGOs. The TRG for surveillance recommends that greater population coverage and more nuanced understanding of the epidemic can be achieved with an increase in the number and type of sites—particularly HRG, bridge population and ANC rural sites in states with a low HIV prevalence.
Table 2.1Number of Sentinel Sites by Year and Type from 2003 to 2008, India
Site type/Year 2003 2004 2005 2006 2007 2008STD 163 171 175 251 248 212ANC 266 268 267 470 484 486ANC ( R ) 210 122 124 158 162 162IDU 18 24 30 51 52 57MSM 9 15 18 31 40 69FSW 32 42 83 138 137 188TB - 7 4 - -Migrant - - 1 6 3 8EUN - - 1 1 1 1TRK - - - 15 7 7Fisher folk - - - 1 -Others (seamen)
1 - - - -
Total 699 649 703 1122 1134 1190
Note: The state-wise distribution of sites and site-wise prevalence are given in Annexure II, Fig. 2.2 and Map 2.1.

9Annual HIV Sentinel Surveillance - Country Report 2008-2009
Figure 2.2Number of Antenatal Sentinel Sites by Location, India, 2003-2008
2.2.3 Sampling For each HSS site, the sample size (or the number of individuals included in the sample) and the sampling scheme (or procedure for choosing individuals to be included in the sample) were factored in. Each of these is briefly highlighted below.
Map 2.1District wise distribution of Sites (India) (districts as per 2001 Census)

10 Annual HIV Sentinel Surveillance - Country Report 2008-2009
Sample size and inclusion criteriaThe number of individuals included in a sentinel surveillance sample was guided by the need to determine trends in HIV prevalence over time and identify sub-populations at an increased risk of infection. The sample size needed to be large enough to detect the difference between two prevalence estimates—for instance, between two ANC sites or between two surveillance rounds. The sample size was determined using a statistical approach that requires firstly, an estimate of HIV prevalence in the population to be surveyed. The second factor was the margin of error considered acceptable. A reasonable margin of error of ±3% was applied. The third was the level of confidence desired or the confidence intervals desired. A 95% confidence interval would mean that if the survey was conducted 100 times, the prevalence in 95 surveys out of the 100 would fall within the specified margin of error. For HSS 2008–09, a confidence interval of 90% was applied. The sample size was balanced against the technical and financial resources available for survey implementation and data collection.
A sample size of 400 for ANC sites and 250 for STI sites and HRG (TI) sites was calculated. As the focus was on ensuring adequate representation of women in the sample collected at STI sites, the sample of 250 at the STI sites was completed from two sources. A total of 150 samples were collected from the STI clinic, while 100 were from the gynaecology clinic.
The eligibility criteria for HSS included an age range of 15–49 years to facilitate comparability across sites. It was necessary to ensure that no client, especially an STI client, was sampled more than once. To avoid this, sampling was restricted to their first visit.
The duration of sampling varied according to the type of site. For ANC and STI sites, the period of sampling extended from 1 November 2008 to 31 January 2009. The duration for HRG (TI) sites was 1 May 2009 to 31 July 2009. Individuals meeting the inclusion criteria and attending the HSS sites during these specified time periods were included in the survey using a sampling scheme.
Sampling schemeThree sampling schemes were utilized for selecting individuals for inclusion in HSS. The sampling scheme varied according to the type of site. The scheme for ANC and STI sites was consecutive sampling. According to this method, all individuals who visited the clinic and who met the inclusion criteria were included in the survey until the required sample size was obtained or the survey period was over. For maintaining the quality of data collection, no more than 20–25 consecutive attendees were included per day at a site. This method was relatively easy to employ. Moreover, it was likely that consecutive sampling would minimize the probability of unintentional manipulation by clinic staff or errors due to confusion.
For the HRG (TI) sites, the proposed scheme for sampling was simple random sampling (Annexure III). Under this, the TI line list of members would be utilized to draw up random numbers to identify the clients to be included in the sample. This method, if executed correctly, would most likely produce a true sample of the total population.
As complete TI line lists of members were available only for the state of Gujarat, the sampling scheme used in the remaining states was voluntary, unlinked anonymous testing with informed consent. The sample was obtained on the basis of consent received from the clients on a consent form. Unlinked anonymous testing with informed consent reduces the probability of participation bias or the degree to which higher or lower risk persons may choose to be tested based on their individual rationale. Under this method, all personal identifying information of clients choosing to be tested is removed from specimen tubes and other records before testing for HIV. The HIV test results thus cannot be linked to an individual person. Data are recorded using codes.
2.2.4 Method for blood sample collection and HIV antibody testThe method for blood sample collection varied according to the type of HSS site.
At the ANC and STI sites, whole venous blood was collected from the sample population, using safe injection practices. The serum was separated from the whole blood and split into two parts. One part, preserved along with

11Annual HIV Sentinel Surveillance - Country Report 2008-2009
the individual identifiers, was tested for syphilis by VDRL. The test result was communicated to the individual. The second part, without personal identifiers, was coded separately such that it may not be linked back to the individual. This coded specimen, along with filled individual formats for HIV and syphilis, was sent to recognized laboratories under cold conditions for testing for HIV and syphilis. HIV antibodies were tested using two ELISA tests or rapid tests to determine whether the sample was positive or negative. ELISA is a conventional screening test for the enzyme immunoassay (EIA).
Rapid HIV testing differs from ELISA in that the results of the test become available in 5–30 minutes. Under HSS 2008–09, the DBS method for blood sample collection was introduced at the HRG (TI) sites to overcome the practical challenges faced in blood sample collection under the previous rounds. Owing to the limited blood storage facilities, the blood samples had often got spoilt and needed to be discarded. With the DBS method, samples have a longer life span and the need for refrigeration is reduced.
Under the DBS method, blood specimens are collected by applying a few drops of blood—drawn by lancet from the finger, heel or toe—onto specially manufactured absorbent filter paper. Once the blood saturates the paper, it is air-dried for several hours in low gas-permeability plastic bags, with the addition of a desiccant to reduce humidity. DBS specimens also pose less of a biohazard risk to handlers, and are easier to transport or store than liquid blood specimens. There is no scope for cross-contamination.
2.2.5 Ensuring quality of HIV testing The reliability of ELISA/rapid test results was ensured through quality control and EQAS mechanisms that were put in place at the laboratory level. A quality control method was used to assess the functionality of the laboratory’s machinery and check whether the HIV test results obtained from a specimen were correct. For this, positive and negative controls were periodically run on the machines to verify whether the test device was detecting antibodies accurately.
External quality assurance was ensured by regional reference laboratories that monitored the entire HIV testing process. This included the pre-analytical phase, before testing of the specimen; the analytical phase, during the actual testing of the specimen; and the post-analytical phase, after HIV testing.
The laboratories’ results for a specific specimen were compared with tests conducted on the specimen at the reference laboratory. All the positive samples and 5% of the negative samples were sent by the laboratories to the regional reference laboratories under appropriate conditions to ensure sample quality. The reference laboratories communicated the results back to the testing laboratories.
The names of the reference laboratories maintaining the quality of ELISA/rapid test results in the states are listed in Box 2.2. DBS samples were tested only at the designated laboratory at the NARI. This was a quality assurance mechanism.
Box 2.2List of Reference Laboratories and states allotted to them for testing of samples from ANC and STD sites
National Reference Centre StatesNational Institute of Biologicals, Noida Uttar Pradesh and UttaranchalNational Institute of Communicable Diseases, New Delhi
Delhi, Jammu and Kashmir, and Rajasthan
All India Institute of Medical Sciences, New Delhi
Himachal Pradesh, Chandigarh, Punjab
National Institute of Mental Health and Neuro Sciences, Bangalore
Karnataka
National Institute of Haematology, Mumbai Mumbai, Madhya Pradesh and Chhattisgarh

12 Annual HIV Sentinel Surveillance - Country Report 2008-2009
National AIDS Research Institute (NARI), Pune
Maharashtra, Goa, Gujarat, Daman and Diu, D and N Haveli
School of Tropical Medicine, Kolkata West Bengal, Bihar, Jharkhand and SikkimNational Institute of Cholera and Enteric Diseases, Kolkata.
Assam, Orissa, Andaman and Nicobar Islands, Meghalaya
Dr. MGR University, Chennai. Andhra PradeshMadras Medical College, Chennai Tamil Nadu, PondicherryChristian Medical College, Vellore Kerala, LakshadweepRegional Institute of Medical Sciences, Manipur
Manipur, Tripura, Arunachal Pradesh, Mizoram, Nagaland
2.2.6 Data management, analysis and interpretationA comprehensive structure for data entry and management was utilized, with the SSA-SACS overseeing the process at the state level, the RIs overseeing it at the regional level, and the NIHFW and TRG overseeing it at the national level.
Following the collection of demographic data and laboratory testing for HIV of ANC, STI and HRG (TI) site attendees, the results were collected by the respective SACS, using individual pro forma. This pro forma template may be referred to under Annexure V. Following data collation, data entry was done via the web-based data entry system at two levels—by the SACS and RIs—using an offline version. This mechanism was introduced for facilitating accuracy of data entry through cross-validation of uploaded files. The data were subsequently uploaded to the NIHFW website.
The NIHFW was the nodal government institute responsible for data cleaning and verification at the national level. It was also in charge of data analysis of sites achieving at least 75% of the recommended sample size—that is, 300 samples for ANC sites and 187 samples for HRG (TI) and STI sites—and interpretation. The process of data analysis and interpretation was guided by certain pertinent considerations, such as whether HIV prevalence was increasing, decreasing or stable at the national and state levels across and among sub-populations. The HIV prevalence trend across age brackets, particularly among young people of the age of 15–24 years, was also taken into account. An attempt was made to determine the HSS sites with the highest HIV prevalence among sub-populations and examine the trends over time, as well as to determine the HSS sites where HIV prevalence was <1%, >5% and >10%.
Along with HIV prevalence, the per cent positivity proportion for VDRL was calculated for the ANC and STI attendees.
The following tools/computer programmes were utilized to allow for statistical analysis and analysis of the geographical spread of HIV and its presentation on thematic maps: Statistical Package for the Social Sciences / SPSS (Version: 18), MS EXCEL (Version: 2007) and JT Maps (Version: 1.2). The 594 districts identified under the 2001 Census were reflected on JT maps.
TrendsThe analysis of the trends in HIV prevalence was done by person, place and time. Trends in HIV prevalence among young people between 15 and 24 years of age were of special significance as they reflect a potential increase or decrease in the number of new HIV cases, given that this age group would have become sexually active in recent years. Trends in the prevalence of HIV among HRGs and the bridge population were also of special significance. This was because of the concentrated nature of the HIV epidemic at the national level, coupled with trends from previous HSS and programme data that reflected an increased number of hotspots in areas previously classified as low-prevalence areas.
Recording the change in HIV prevalence over time is central to understanding whether there is an increasing,

13Annual HIV Sentinel Surveillance - Country Report 2008-2009
decreasing or stabilized trend. If only absolute prevalence were considered there would be an increased possibility of the surveillance data over- or underestimating the true prevalence of HIV in a population. A three-year moving average was utilized with time series data to smooth out short-term fluctuations and highlight longer-term trends in HIV prevalence.For analysing HIV prevalence among the urban and rural populations in the states, the country was divided into four zones, as follows:
High-prevalence southern states (H1 zone): This included Andhra Pradesh, Karnataka, Maharashtra and Tamil • Nadu, where HIV prevalence among ANC clinic attendees was >1% and the main mode of HIV transmission was heterosexual intercourse.High-prevalence north-eastern states (H2 zone): This included Manipur and Nagaland, where HIV prevalence • among ANC clinic attendees was >1% and the main mode of HIV transmission was unsafe injecting practices. Moderate-prevalence states: This included the three states of Goa, Gujarat and Pondicherry, where HIV is • concentrated among HRGs. Thus, while the prevalence among ANC clinic attendees was <1%, that among HRGs was 5%. Low-prevalence states: These are the states that are not included in the above three zones and where the • HIV prevalence among ANC clinic attendees and HRGs was <1% and <5%, respectively.
Analysis of variables by background characteristicsIn addition to analysis by year of survey for each sentinel site, district and state; and age group, sentinel surveillance data were also analysed by each of the variables collected and according to background characteristics. The analysis included HIV prevalence by gender, residence, marital status, demographic characteristics (e.g. education, occupation of spouse) and the presence of STIs.
The results were summarized for the entire sample population at each site level and each sub-group for which information on age and sex was collected.
2.3 Certain factors affecting the pace of HSS implementation Despite the robust mechanism and new directives issued to ensure that HSS 2008–09 was implemented without bottlenecks, certain factors affecting the pace of HSS implementation were identified during the supervisory visits. These factors have been tabulated so that appropriate remedial measures can be incorporated to overcome them and so that they are not encountered under subsequent surveillance rounds.
As Fig. 2.3 shows, the practical challenges to HSS implementation at ANC / STI clinics include inadequate logistics and supply of consumables, which was noted in 34% of the total sites. Twenty per cent of the sites did not adhere to bio-safety norms and at 15% of the sites, human resources were insufficient due to transfers. Elsewhere, untrained staff was filling the individual pro forma at the sentinel sites or testing laboratories.
Concerns over timely supply of procurement are remnant at HRG sites as well, where 49% reported the late supply of DBS cards. Human resource availability to support HSS execution was noted with 13% reporting inadequately trained staff or shortage of staff. Bio-safety norms were not adhered to at 11% of the total sites.

14 Annual HIV Sentinel Surveillance - Country Report 2008-2009
Figure 2.3Problems Identified during the Supervisory visit in ANC/STD Clinics, 2008

15Annual HIV Sentinel Surveillance - Country Report 2008-2009
Chapter 3Results
HIV surveillance has been an annual process since 1998. However, in the case of the 2008 round, which started in November, the period of three months spilled over to the next year, i.e. 2009, and got extended further due to delay in the procurement of the consumables for the DBS method introduced for the first
time in this round. Hence, the activity was completed in August 2009, leaving no scope for holding another round in 2009.
The pace of the HIV epidemic in India has slowed down and a declining trend has been noted, particularly in the southern high-prevalence states among antenatal women. The epidemic is concentrated in the HRGs, among which the prevalence continues to be >5%, though the antenatal prevalence is low. Thus the country is classified epidemiologically as having a concentrated epidemic.
The impact of the measures taken by the NGOs for FSWs was evident, as there was a decreasing trend in prevalence at the national level and in many states. But the same was not true for the other two core risk groups—MSM and IDUs, among whom there was a rising trend. It is possible that these two new emerging HRGs are hindering the rapid decline in HIV prevalence in the states. A major constraint to the efforts for control is that there are few MSM and IDU sites. The prevalence of HIV among IDUs and MSM in the high-prevalence states of Andhra Pradesh and Manipur was the highest in the country, between 10% and 28%, and may be contributing to the continued prevalence of >1% among antenatal women in these states, though Manipur recorded a prevalence of <1% in ANCs this year.
The prevalence of HIV among antenatal women in Nagaland, another high-prevalence state, was >1%, and that among FSWs and IDUs was 14% and 4%, respectively. The absence of an MSM site was a limitation and no information was available for this group. The perennial prevalence of 3%–4% among antenatal women at the Tuensang site, year after year, needs further exploration. The role of cross-border influx of foreign migrants from Myanmar has to be investigated.
Another state in the North-East which needs attention is Mizoram, where an increasing trend in the prevalence of HIV was observed among IDUs and patients attending STI clinics. The prevalence among FSWs was also high, at 9.2%.
In Maharashtra and Karnataka, the epidemic was yet to be stabilized. Though the antenatal prevalence was <1%, the prevalence among FSWs and MSMs was >10% in these states. The prevalence among IDUs in Maharashtra was very high, at 20%. It was only in Tamil Nadu that the values for each of the HRGs were close to 5%.
In Goa and Gujarat, the prevalence in ANCs was <1%, but it continued to be >5% among the core risk groups of MSM and FSWs. In the absence of any IDU sites, the situation with respect to this group was not clear. This is important, given the fact that there is a large floating population, either in the form of tourists or migrants, in both these states . This situation calls for immediate action, and neglecting intervention activities, including surveillance, for this group may change the trajectory of the epidemic there.
In the northern low-prevalence states, the aggregate prevalence of HIV infection at the state level among the risk groups masks the pockets of “hot spots” existing within each state. It is particularly important to recognize this situation in the case of the northern states, where, due to the low prevalence of HIV, efforts at programme implementation have been maintained at a low level. The result of this course of action is evident, with new

16 Annual HIV Sentinel Surveillance - Country Report 2008-2009
HRG sites or the existing sites reporting an unexpectedly high prevalence of HIV, e.g. 39.6% and 15.2% at the IDU sites of Madhya Pradesh and Punjab, respectively. HIV prevalence among HRGs is becoming high in more and more states with low HIV prevalence. This is particularly true for the states of Orissa, Mizoram, West Bengal and Assam. Prevalence among these groups is also increasing in some sites in several other low-prevalence states, such as Bihar, Uttar Pradesh, Jharkhand, Haryana and Kerala.
Particularly vulnerable were the states of Chhattisgarh, Rajasthan and Uttarakhand, where sites for HRGs were not available. These states need to identify reliable NGOs to start surveillance among HRGs in the next round. The emerging high prevalence among MSM and IDUs calls for improved coverage and for an increase in the number of surveillance sites in all the states. It was observed that the major population groups coming to the sites and infected with HIV belong to the lower socioeconomic strata. The members of these groups were employed mostly as labourers, truck/vehicle drivers or skilled workers, or were in service. They formed the bulk of the attendees at the IDU and MSM sites, and were the spouses of the infected antenatal women. Due to their risk behaviour of multi-partner/commercial sex, they form a bridge for HIV transmission from HRGs to the general population, e.g. to wives and partners. Unemployed men formed nearly 50% of IDUs and many were into MSM activity. HIV prevalence among them was on the rise.
HIV prevalence was high among the HRGs in the cities of Delhi and Chandigarh. There is a large influx of migrants seeking work as labourers in these cities. New strategies are required to control HIV infection among these hard-to-reach groups.
Overall, evidence from surveillance data indicates that the country has a grip over the HIV epidemic, but the vulnerability of the low-prevalence states raises the risk quotient, which cannot be underestimated as unknown pockets with high prevalence exist for all the risk groups.
This chapter describes the findings of the 2008–09 surveillance round. The chapter is divided into sections to make for better comprehension of the epidemic. The first section describes the situation with respect to the sites and the need for more sites. The second section provides a snapshot of HIV prevalence in the states and the sites. The third section contains details regarding the risk populations, and discusses the current status and trends for the nation, zone-wise and state-wise, as well as with respect to the sites. Annexure II contains state-wise and site-wise details of HIV prevalence from 2003 to 2008–09. The data is further disaggregated to highlight the picture as per the socioeconomic variables for the country and in different zones.
3.1 Status of sites and samples
The 2008–09 Annual Sentinel Surveillance round was conducted from 1 November 2008 to 31 January 2009 at the ANC and STI sites, and from May 2009 to August 2009 at the HRG (TI) sites, in all the states.
3.1.1 Incomplete sample sizesThe number of sites covered in India was 1190, which is the highest number for any country in the world. However, a small number of sites (64) were unable to complete the requisite sample size. Notable among the states in which the sample size could not be completed was Tamil Nadu, where the required sample size could not be completed in one-fourth of the FSW sites (total sites 28) and nearly half of the MSM sites (total sites 17). Similarly, the STI site samples fell short of the required number in four sites each in Maharashtra and Gujarat, and three sites in Karnataka, in spite of the fact that the sites were based in the big city hospitals of these states.
Lack of HRG sites: There was a total absence of sites for HRGs in four states and two Union Territories. The lack of IDU sites in the vulnerable states of Rajasthan, Goa and Chhattisgarh, and the fact that more sites are needed in all the states, restricted the ability of the surveillance system to detect the HIV epidemic in areas or groups, before their entry into the general population. This is true for the low-prevalence states, as the quantum of

17Annual HIV Sentinel Surveillance - Country Report 2008-2009
infection is likely to be picked up in the HRG population if sites are present and less likely in the ANC. An increase in HRG sites in the high-prevalence states would also help track the epidemic better.
Lack of rural sites: The ANC clinics located in urban hospitals were usually accessed by women in urban areas and those from the surrounding rural areas under surveillance. In the six states with a high HIV prevalence, besides the urban clinics, there were rural clinics for pregnant women located at the block level. In the low-prevalence states, more rural ANC sites are needed, given the inability to open HRG sites in rural areas. There were a few sites (36) in West Bengal, Punjab, Uttar Pradesh and Meghalaya, but these are inadequate to improve representation from remote parts in the rural areas. The number of rural sites has been nearly constant for the past three years (Fig. 2.3).
The state-wise distribution of sites is given in Annexure II.
Table 3.1Prevalence of HIV among Different Risk Groups, India 2008-09*
Clinic No. of samples tested Number Found HIV Positive HIV % prevalence & Confidence Interval 90%
STD 45998 1015 2.21 (2.09 - 2.32)ANC(Urban clinics)* 190101 898 0.47 (0.45 -0.50)ANC (Rural clinics)* 62549 301 0.48 (0.44 -0.53)IDU 12302 1213 9.86 (9.42 - 10.30)MSM 14825 1021 6.89 (6.54 - 7.23)FSW 42419 2022 4.77 (4.60 - 4.94)Truckers 1488 22 1.48 (0.96 -1.99)Migrants 1742 40 2.30 (1.71 - 2.89)Transgender 250 41 16.40 (12.55 - 20.25)
Note: Includes sites with sample size ≥75%. ANC prevalence on actual data.
3.2 Overview of HIV status
The prevalence of HIV among various risk groups at the country level for 2008–09 (Table 3.1) indicated that the IDU and MSM sub-groups were emerging as the groups that were increasing the intensity of HIV transmission. The only site for TG also repeatedly indicated very high HIV prevalence each year, including in 2008–09, the figure for which was 16.4%.
Table 3.1a Trends in HIV percent Prevalence, 2003-2008, India
Site type/ Year 2003 2004 2005 2006 2007 2008STD 5.68 5.54 5.6 3.73 3.59 2.21ANC (U) 0.86 0.88 0.87 0.57 0.47 0.47ANC( R) * 1.08 0.94 0.67 0.52 0.48IDU 16.73 15.94 10.16 6.9 7.23 9.86MSM 9.06 10 8.7 6.4 7.4 6.89FSW 43.72 7.08 8.4 4.8 5.06 4.77Truckers … …. 2.3 2.51 1.48Migrant … 0 1.6 3.6 2.3Transgender … 43.9 29.6 42.21 16.4

18 Annual HIV Sentinel Surveillance - Country Report 2008-2009
ANC rural has data from ANC sites in 4 high prevalence southern and two north-eastern states.
Except for the steady declining trend for the STD group, all other groups have stagnating trends since 2006 (Table 3.1a). The predominance of HIV in the urban population tested for various risk groups is notable except for an marginal increase in migrants from rural areas in table 3.1b.
Table 3.1b Prevalence of HIV among High Risk Groups by locality, India 2008-09*
Locality/ Type Urban RuralNo. of samples tested
Number Found HIV Positive
HIV prevalence
No. of samples tested
Number Found HIV Positive
HIV prevalence
IDU 9605 999 10.4 2697 214 7.9MSM 10088 750 7.43 4737 271 5.7FSW 26236 1491 5.68 16183 531 3.3Migrants 1268 27 2.13 474 13 2.7Transgender 245 41 16.73 5 0 0Truckers 272 7 2.57 1216 15 1.23
Note: The summary for all the risk groups is shown in Maps 3.1 to 3.7 and Boxes 3.1 to 3.5.
Box 3.1Summary of HIV % prevalence for All Sites “Annual Sentinel Surveillance” 2008-09
Total number of sentinel sites: 1,190*2, 52,650 women were tested for HIV at 648 ANC sentinel sites**
105 ANC sentinel sites with prevalence 1% to 2% HIV seropositivity• 15 ANC sentinel sites >2 % to < 3% HIV seropositivity• 6 ANC sentinel sites ≥3% HIV seropositivity• Rest of the sites had prevalence less than 1% at the ANC sites•
45,998 individuals were tested at 189 STD sentinel sites** 16 sites >5% to <10% HIV seropositivity• 11 sites ≥10% HIV seropositivity•
69,546 individuals were tested at 284 core risk group (MSM, FSW, and IDU) sentinel sites** 56 sites ≥5% to <10% HIV seropositivity• 44 sites ≥10% HIV seropositivity• *Valid sites, with sample size 75% or more, i.e., 300+ at ANC sites and > 187 in other sites
3230 individuals were tested at 13 (TRK, MRG) sentinel sites** 6 sites > 1% to 3% HIV seropositivity• 2 sites > 3% HIV seropositivity•
*Valid sites, with a sample size of 75% or more, i.e. 300+ at ANC sites and > 187 in other sites

19Annual HIV Sentinel Surveillance - Country Report 2008-2009
Map 3.1State wise HIV % Prevalence in Antenatal Women, IDU, MSM and FSW for 2008-09

20 Annual HIV Sentinel Surveillance - Country Report 2008-2009
Antenatal Clinic Attendees
In the four southern states, the HIV prevalence in antenatal women is high, i.e., above 1% in Andhra Pradesh and between 0.5% to 1% in the other states.
In North Eastern States, the HIV prevalence in antenatal women in Nagaland is 1.12%, Mizoram 0.72%, and Manipur is 0.54 %.
In the moderate and low HIV prevalence states the prevalence in antenatal women is less than 1%.
High Risk groups
The states of J&K, Meghalaya, Uttarakhand and Chhattisgarh did not have any surveillance site for the High Risk Groups.
In the three southern states of Andhra Pradesh, Maharashtra and Karnataka, the HIV prevalence in FSW and MSM is above 10%. (It is only in Tamil Nadu that the values in each of these groups are close to 5%.) Maharashtra has very high prevalence among IDUs (20%).
In the North East states, Manipur has high prevalence amongst all the high risk groups ie more than 10% for FSWs &, MSMs and the prevalence is 28% among IDUs . Mizoram and Nagaland have prevalence among IDUs between 3 to 5%but higher figures 9 to 14 % prevalence amongst FSWs .No MSM sites are there.
The rest of the states in the country have an increase in HIV prevalence with more than 5% for IDUs seen in states of Punjab, Kerala, Orissa, Madhya Pradesh, Bihar, Mizoram, Assam and West Bengal. HIV % prevalence amongst MSM is more than FSWs and above 5% in Goa, Gujarat, Delhi, Madhya Pradesh and West Bengal.
Box 3.2State wise summary of HIV% prevalence in Antenatal Clinic Attendees and HRGs, 2008-09
* The state wise and site wise HIV Prevalence in different risk groups is given in - State Wise and Site Wise Summary Tables-2008 (Annexure-II).

21Annual HIV Sentinel Surveillance - Country Report 2008-2009
Of a total of 486 valid urban ANC sentinel sites, as in urban areas among the 94 sites had HIV seropositivity • ≥ 1 % and 3 sites had seropositivity ≥ 3 % While majority (67) urban sites with HIV seropositivity ≥ 1% prevalence were in six high HIV prevalence • states (Maharashtra, Andhra Pradesh, Karnataka, Tamil Nadu, Nagaland and Manipur), a significant number i.e. 27 out of 94 sites were in other states.
Map 3.2ANC Sentinel Sites Located in Urban Areas
ANC sites with ≥ 3 % seropositivity 1) Nagaland Tuensang 2) Tamil Nadu Ramanathapuram 3) Andhra Pradesh Guntur
HIV % prevalence among antenatal clinic attendees at sentinel sites located in urban areas, by district, 2008

22 Annual HIV Sentinel Surveillance - Country Report 2008-2009
Out of 648 sites, a total of 162 sites were located in rural areas. At the CHCs such sites are in all the • four Southern states (Maharashtra, Andhra Pradesh, Tamil Nadu and Karnataka) and the two states of Northeast (Manipur and Nagaland) with high HIV prevalence. Besides, 33 such rural ANC sites are also located in the four states of West Bengal, Uttar Pradesh, Meghalaya and Punjab. Out of 162 sites, 33 valid sites had HIV seropositivity ≥ 1 % and at 3 sites ≥ 3 %. •
Map 3.3ANC Sentinel Sites in Rural Areas
ANC sites located in peri-urban/rural areas with ≥ 3% seropositivity 1) Karnataka
• Bijapur (Rural)
• Kodagu (Rural) 2) Andhra Pradesh
• West Godavari (Rural)
HIV % positivity among antenatal clinic attendees at sentinel sites located in peri-urban/rural areas, by district, 2008–09

23Annual HIV Sentinel Surveillance - Country Report 2008-2009
Box 3.3
Summary of Results of Sentinel Surveillance in Antenatal Clinics, 2008-09
2,52,650 women were tested for HIV at 648 (valid) ANC sentinel sites.• 97,131 antenatal women were tested in four southern high HIV prevalence states. • 12,344 pregnant women were tested for HIV in North Eastern states• 1,43,175 women were tested for HIV in Moderate & Low HIV prevalence states.• Zone wise unadjusted HIV prevalence among ANC attendees in H1 zone (Andhra Pradesh, Karnataka, • Maharashtra and Tamil Nadu) – 0.74%, H2 zone (Manipur and Nagaland) –0.86%, moderate and low prevalence states – 0.26%. Considerable differences continue to exist in the prevalence rates across different geographical regions. • Andhra Pradesh and Nagaland have HIV prevalence greater than 1% among ANC attendees and all other states have less than 1%.A total of 105 sites, that include both urban and rural sites, have shown HIV prevalence from 1% • to 1.99%. One-fourth of these (27) sites are in moderate and low prevalence states, namely Orissa (4 Sites), Madhya Pradesh(4 Sites), Gujarat(2 Sites), Chhattisgarh(4 Sites), Bihar(3 Sites), Mizoram(2 Sites), Uttar Pradesh(2 Sites), Jharkhand 2 sites, and 1 site each in Goa, Himachal Pradesh, Rajasthan and Punjab. 15 sites have shown HIV prevalence 2% to 2.99% distributed as 5 sites in Andhra Pradesh, 4 in Karnataka, • 2 sites in Nagaland and 1 site each in Maharashtra, Manipur, Jharkhand and Mizoram.Six sites have shown a very high prevalence of ≥ 3% among ANC clinic attendees. These are Tuensang • in Nagaland, Guntur and West Godavari in Andhra Pradesh, Ramananthapuram in Tamil Nadu, Kodagu & Bijapur in Karnataka.

24 Annual HIV Sentinel Surveillance - Country Report 2008-2009
Sentinel surveillance among STD patients was conducted at 212 sentinel sites; of these, 16 sentinel • sites had ≥ 5 % HIV Prevalence and 11 sites had ≥ 10 % HIV seropositivity and rest had < 5%. Ten STD sites with ≥ 5 -10% HIV seropositivity were in low prevalence states and the remaining 6 sites • were in the rest of the states.
HIV % Positivity among patients with sexually transmitted diseases, India, 2008-09
Districts with STI, HIV Seropositivity ≥ 10 %
1) Karnataka•Bangalore•Belgaum
2) Maharashtra•Akola•Chandrapur•Nagpur•Thane•Sangli
3) Gujarat•Ahmadabad•Surat
4) West Bengal•Kolkata
5) Mizoram• Aizawl
Map 3.4 HIV Prevalence among STD Patients, All India 2008-09

25Annual HIV Sentinel Surveillance - Country Report 2008-2009
Sentinel surveillance among injecting drug users was conducted at 57 sentinel sites; of these, 8 sentinel • sites had equal or more than 5% but less than 10% HIV seropositivity and 16 sentinel sites had more than 10% HIV seropositivity The majority of IDU sites have more than or equal to 5% HIV prevalence, but more than 10% HIV • seropositivity was observed in low prevalence states.
45,998 individuals were tested at 189 valid sites out of 212 STD sentinel sites.• The average HIV prevalence percentage in Maharashtra was the highest (11.52%; range –7.05% to • 14.05%), Karnataka (10.66%; range – 5.62% to 16.74%), Gujarat (7.62 %; range – 0% to 22%) and Miz-oram (6.4%; range – 2.8% to10%). 2 sites have shown very high prevalence of greater than 15%. These sites are one each in Gujarat • (22%) and Karnataka (16.74%). More than 10% HIV prevalence were found in 5 sites in Maharashtra, 2 sites each in Karnataka and • Gujarat and 1 site in Mizoram.Out of total STD sites participating in surveillance, 27 sites had HIV prevalence greater than 5% • among STD clinic attendees. Of these, 13 sites are in moderate and low prevalence states, i.e., 3 sites in Gujarat, 2 sites each in Bihar and West Bengal, and 1 site each in Chhattisgarh, Goa, Meghalaya, Mizoram, Orissa and RajasthanGoa and Manipur show a declining trend while a rising trend was noted for Mizoram and Gujarat • from 2003.
Prevalence of HIV was higher amongst those educated till 5th standard, between 25 to 49 years, and in both sexes. HIV infection was more in persons engaged in occupations as Local transport/auto drivers, truck drivers or cleaners, hotel staff and unemployed. However, men in service and Business are also into risk behaviour.
Box 3.4Summary of Findings among STD Patients

26 Annual HIV Sentinel Surveillance - Country Report 2008-2009
Districts with injecting drug users, HIV Seropositivity ≥ 10 %
•Punjaba) Amritsarb) Rupnagarc) Jalandhar
•Madhya Pradesha) Bhopal
•Manipura) Bishnupurb) Churachandpurc) Churachandpurd) Imphal West
•Maharashtraa) Mumbai(Suburban)
•Chandigarha) Chandigarh•Orissaa) Khordha•Mizorama) Aizawl•Bihara) Kaimur(Bhabua)•Nagalanda) Dimapur•West Bengala) Darjiling•Delhia) North
HIV % Prevalence among Injecting Drug Users, India 2008
Sentinel surveillance among injecting drug users was conducted at 57 sentinel sites, of these, 8 sentinel • sites had equal or more than 5% but less than 10% HIV seropositivity and 16 sentinel sites had more than 10% HIV seropositivity. The majority of IDU sites have more than or equal to 5% HIV prevalence but more than 10% HIV • seropositivity was observed in low prevalence states.
Map 3.5HIV Prevalence among Injecting Drug Users, India

27Annual HIV Sentinel Surveillance - Country Report 2008-2009
Sentinel surveillance among men who have sex with men was conducted at 69 sentinel sites of these 60 • sites were valid, 15 sentinel sites had more than or equal to 5% HIV seropositivity, and 13 sentinel sites had more than 10 % HIV seropositivity. The majority of MSM sites have more than or equal to 5% but less than 10% HIV seropositivity. •
Map 3.6HIV prevalence among Men who have Sex with Men, India

28 Annual HIV Sentinel Surveillance - Country Report 2008-2009
Sentinel surveillance among female sex workers was conducted at 188 sentinel sites; of these 173 were • valid sites, 36 sentinel sites had ≥ 5 % HIV seropositivity and 20 sentinel sites had ≥ 10 % HIV seropositiv-ity. The majority of FSW sites with ≥ 5 % HIV seropositivity were in high prevalence states.•
Map 3.7HIV % Prevalence among Female Sex Workers, India 2008-09

29Annual HIV Sentinel Surveillance - Country Report 2008-2009
Box 3.5Summary of Findings among HRGs, 2008
IDUs: 12,302 individuals tested at 51 IDU sentinel sites*The epidemic among IDUs is spreading from the North-East to more regions of the country. The • prevalence of HIV among IDUs was observed to be 39.6% in Madhya Pradesh, 28.7% in Manipur, 27.6% in Punjab, 20% in Maharashtra, 18.6% in Delhi, 6.6% in Orissa, 5.6% in West Bengal, 5.5% in Bihar, 5.3% in Assam and 5% in Mizoram. HIV prevalence among IDUs was found to be > 5% in 40% sites (22 sites). HIV prevalence among IDUs increased as compared to the previous year in Manipur, Punjab, Delhi, • Chandigarh, Andhra Pradesh and Assam.Women comprised 3.7% of the total IDUs tested in the country. • In consistent sites, in Mizoram and West Bengal, an increase was noted since 2003 .•
MSM: 14,825 individuals tested at 60 MSM sentinel sites*
The prevalence of HIV among MSM was high in Andhra Pradesh (22.1%), Manipur (17.2%), Maharashtra • (11.9%) and Madhya Pradesh (11.6%).The prevalence of HIV was found to be high—>5%—in new MSM sites established in Madhya Pradesh, • Maharashtra, West Bengal, Delhi and Gujarat, suggesting that there may be many pockets of high prevalence among MSMs in areas with no sites. These pockets need to be detected.In 35% of districts and 28 sites in 10 states, HIV prevalence was found to be >5%.• The nascent epidemic among MSM is becoming visible and may be termed the hidden driver for the • continuing high transmission trend in the already high-prevalence state of Andhra Pradesh (where the HIV positivity figure for MSM is greater than that for FSWs). HIV prevalence among MSM is higher than among FSWs in 11 low-prevalence states.•
FSWs: 42,419 individuals tested at 173 FSW sentinel sites*
Nineteen sites in 6 states had a prevalence of >10%. These included the high-prevalence states of • Maharashtra (including Mumbai) (7 sites), Andhra Pradesh (5 sites), Karnataka (2 sites), Tamil Nadu (2 sites) and Manipur and Nagaland (1 site each). In moderate and low-prevalence states, 18 sites showed an HIV prevalence of >5%. These states are • West Bengal (4 sites), Bihar (4 sites), Gujarat (2 sites), Rajasthan (2 sites), and Assam, Delhi, Goa, Haryana, Mizoram and Orissa (1 site each).
* Includes sites with sample size of ≥75%.
The state-wise and site-wise HIV prevalence in different risk groups is given in AnnexureII.
The following section contains a detailed description for each risk group.

30 Annual HIV Sentinel Surveillance - Country Report 2008-2009
3.3 Antenatal clinic attendees
HIV sentinel surveillance is done among antenatal women as a surrogate marker for the assessment of the magnitude of HIV prevalence in the general population, in the absence of any other suitable group. The surveillance system has helped unmask many antenatal sites with high HIV prevalence in states classified as moderate or low for HIV prevalence. In spite of the expansion in the number of sites, there are still a few districts that do not have any ANC site.
Table 3.2Zone wise HIV Prevalence among Antenatal Clinic Attendees in different Age groups in 2008
Zones Age Urban RuralNumberTested
NumberPositive
PercentPositive
NumberTested
NumberPositive
PercentPositive
High Prevalence 15 -24 15799 118 0.75 18591 170 0.91Southern States (H1)*
25 -49 8032 76 0.95 8374 87 1.04
High prevalence 15 -24 1556 20 1.29 1531 14 0.91(North-eastern States)**
25 -49 2673 41 1.53 2403 21 0.87
Moderate & Low Prevalence
15 -24 32203 82 0.25 39553 107 0.27
States*** 25 -49 25655 64 0.25 33731 98 0.29Total 85918 401 0.46 104183 497 0.477
Note: Prevalence data in ANCs are unadjusted.
*The states in the H1 zone are Andhra Pradesh, Karnataka, Maharashtra and Tamil Nadu.**The states in the H2 zone are Manipur and Nagaland.***The states considered to have moderate prevalence are Goa, Gujarat and Pondicherry, and the low-prevalence states are the rest of the states.
The prevalence in the age group of 25–49 years was lower in urban areas than in rural areas in the high-prevalence southern states. In the high-prevalence north-eastern states, the prevalence among both the age groups of 15–24 years and 25–49 years in urban areas was higher than in the rural areas. In the moderate- and low-prevalence states, HIV prevalence was the same for rural and urban areas (Table 3.2).There were few sites in rural areas.

31Annual HIV Sentinel Surveillance - Country Report 2008-2009
Trends in various zones according to HIV prevalence
Figure 3.1 Trends in Various Zones according to HIV % Prevalence in Antenatal Clinic Attendees
The HIV % prevalence for India is 0.47% (unadjusted). The zone-wise analysis of trends for pregnant women coming to ANCs showed a downward trend in the H1 and H2 zones, but the trends in the zone comprising states with moderate and low HIV prevalence have remained the same over time.
The HIV % prevalence figures at the ANC sites were the highest, i.e. >1%, for the age group of 15–19 years in the H2 zone. In the rest of the country, including the H1 zone, the positivity is the lowest in the age group of 15–19 years and nearly the same for the other age groups (Fig. 3.2).

32 Annual HIV Sentinel Surveillance - Country Report 2008-2009
Figure 3.3State wise HIV % prevalence in Antenatal Clinic Attendees of age 15-19 years for 2007 and 2008-09
Figure 3.2Zonewise HIV prevalence among Antenatal Clinic Attendees by AGe Group, 2008-2009
Note: HIV prevalence data are unadjusted.
The age of first infection is 15–19 years, and the prevalence of HIV in this age group provides indirect evidence of new infections. Among the southern states, Andhra Pradesh and Karnataka had a higher prevalence in 2008–09 than 2007 (Fig. 3.3). In the north-eastern states, there was an increase in prevalence only in Nagaland, other than Arunachal Pradesh. Other states in which the prevalence of HIV increased in 2008 were Himachal Pradesh, Punjab, Orissa, Goa and Jharkhand.

33Annual HIV Sentinel Surveillance - Country Report 2008-2009
3.4 Southern High HIV Prevalence States
In the southern states, the main mode of transmission was sexual and the prevalence of HIV among pregnant women was higher than in the moderate- and low-prevalence states. This year (2008-09), 97,131 antenatal women were tested for HIV in Andhra Pradesh, Karnataka, Maharashtra and Tamil Nadu. Details of state-wise and site-wise prevalence among different groups can be found in Annexure II.
State wise trends for HIV amongst antenatal clinic attendees reflects decline (Fig 3.4)
The combined age wise trends for these states show gradual decline since 2003 (Fig 3.5)
More sites in the southern states had an HIV prevalence of 1% or more compared to the rest of the country. Of the 126 sites with an HIV prevalence of 1% or more, 85 were in the southern states. In Andhra Pradesh, the HIV prevalence among ANC attendees in 32 out of 52 sites was >1%. A very high prevalence of ≥3% was observed among ANC clinic attendees in 5 sites both in the urban and rural areas of the southern states. These sites are in Guntur and West Godavari in Andhra Pradesh, Ramananthapuram in Tamil Nadu, and Kodagu and Bijapur in Karnataka. The past prevalence in these sites, since 2003, is given in Table 3.3. A sudden increase can be noted for 2008–09.
Figure 3.4HIV Prevalence among Antenatal Clinic Attendees in Southern States, 2003 to
2008-09*
Note: Number of consistent sites: 219 (Andhra Pradesh=43; Karnataka=54; Maharashtra=70; Tamil Nadu=52) Unadjusted data.
Figure 3.5HIV Prevalence among Antenatal Clinic Attendees in Southern States by Age Group, India,
2003 to 2008-09*
Note: The number of consistent sites is 219 (Andhra Pradesh=43; Karnataka=54; Maharashtra=70; Tamil Nadu=52). Both urban and rural clinics were included.The combined age-wise trends for these states show a gradual decline in prevalence since 2003 (Fig. 3.5).

34 Annual HIV Sentinel Surveillance - Country Report 2008-2009
Table 3.3Trend in Sites with HIV Prevalence ≥ 3% among Antenatal Clinic Attendees from 2003 to 2008-09
State District Clinic type 2003 2004 2005 2006 2007 2008-09Karnataka Bijapur ,G.H. Indi ANC Rural 0.75 0.75 0.00 0.73 0.50 3.00Karnataka Kodagu ,G.H. Siddapur ANC Rural 0.25 1.25 0.50 0.50 1.25 3.00Tamil Nadu Ramanathapuram Govt. Distt. Hq. Hospital
ANC 0.50 0.75 0.00 0.25 1.00 3.25
Andhra Pradesh Guntur, Guntur Medical College ANC 3.75 3.50 3.00 2.25 1.75 3.75Andhra Pradesh West Godavari CHC, Bhimavaram ANC Rural 2.53 2.00 3.00 1.76 1.25 3.75
*Samples with <75% of the total have been included.
3.5. North-eastern states
HIV prevalence among antenatal clinic attendees in selected north-eastern states (Manipur, Nagaland and Mizoram)
The burden of infection was high among ANC attendees in these three states. Although the mode of transmission was mainly through IDUs, the sexual mode of transmission was also reported. This was observed notably in the eastern border district sites in Manipur and Nagaland, which have international borders with Myanmar, and in Mizoram, to the west of which lies Bangladesh. In Nagaland, the prevalence of HIV was very high in the urban sites in the district of Tuensang—it has been greater than 3% since 2003 (Fig. 3.8). In Manipur, HIV prevalence in the urban ANC sites of Ukhrul district have been >2% year after year (Fig. 3.7). HIV prevalence among ANC attendees was ≥1% in 4 sites in Manipur, 9 sites in Nagaland and 3 sites in Mizoram. The prevalence among ANC attendees was >1%.in all districts but one in Nagaland.
The trend was one of a gradual decline in all three states till the year 2005, but there has been no change since then in Nagaland and Mizoram (Fig. 3.6).
Figure 3.6Trends of HIV Prevalence among Antenatal Clinic Attendees in the States of Manipur,
Nagaland and Mizoram, India, 2003 to 2008-09*
*Three Year moving average, based on consistent site, with 14 sites in Manipur, 5 sites in Nagaland and 4 sites in Mizoram.

35Annual HIV Sentinel Surveillance - Country Report 2008-2009
The ANC sentinel sites situated in the border districts had a high prevalence, but in 2008–09 the prevalence came down. No comments can be made about the decrease in these sites on the basis of one year’s data (Fig. 3.8). There has been an increasing trend in the site at Dimapur, where, together with Kohima, the prevalence has constantly been between 1% and 2%. Tuesang had the highest prevalence, of 4.83%, and no change in this trend has been observed.
There was a gradual decline in HIV prevalence among both age groups in the twin states of Manipur and Nagaland, and the decline noted in 2008–09 needs to be watched for next 2 rounds of surveillance before interpreting it as a decline in HIV prevalence. 3.6 Moderate- and low-prevalence states
Antenatal clinic attendees in states with moderate and low HIV prevalence
Figure 3.7HIV Prevalence among Antenatal Clinic Attendees in Selected Sites of Manipur, 2003 to 2008-09
*Three Year moving average.
Figure 3.8HIV Prevalence among Antenatal Clinic Attendees in Selected Sites of Nagaland, 2003 to 2008-09

36 Annual HIV Sentinel Surveillance - Country Report 2008-2009
The ANC sentinel surveillance was held in 370 sites, of which 362 could complete 75% of the sample size (valid sites). The data has been analysed for a population numbering 13,142 in urban sites and 12,033 in rural sites. The sentinel sites were distributed in 23 states and 6 Union Territories. The state-wise and site-wise prevalence are given in Maps 3.1 to 3.3, and the detailed table may be found in Annexure II. HIV prevalence was high (>1%) in the new sites in South Goa and Hamirpur in Himachal Pradesh.
Figure 3.9HIV Prevalence among Antenatal Clinic Attendees in Manipur and Nagaland (Combined) by Age
Group, 2003 to 2008-09*
Note: Based on three year moving average on actual data.
Figure 3.10HIV Prevalence among Antenatal Clinic Attendees in Low Prevalence States by Age Group, India, 2003
to 2008-09*
[Low-prevalence states: Andaman and Nicobar Islands, Assam, Bihar, Chandigarh, Chhattisgarh, Dadra and Nagar Haveli, Daman and Diu, Haryana, Himachal Pradesh, Jammu and Kashmir, Jharkhand, Kerala, Madhya Pradesh, Meghalaya, Orissa, Punjab, Rajasthan, Sikkim, Tripura, Uttar Pradesh and West Bengal]Note: The number of consistent sites was 86 and included only urban clinics. Sites with a sample size of ≥75% have been included.

37Annual HIV Sentinel Surveillance - Country Report 2008-2009
The trends in HIV prevalence in the antenatal sites in low-prevalence states were analysed by age group. A stable trend was observed for the past three years in the age group of 25–49 years (Fig. 3.10). The extent of positivity was found to be declining in the age group of 15–24 years.
Figure 3.11HIV Prevalence among Antenatal Clinic Attendees in Chhattisgarh and Haryana from 2003 to 2008- 09*
Note: Three year moving average has taken. Only 3 consistent sites have been included from 2003-2008 for each state.
Figure 3.12HIV Prevalence among Antenatal Clinic Attendees in Orissa, Jharkhand and Assam from 2003 to 2008-09*
Note: Three year moving average has taken. Only 5 consistent sites have been included from 2003 to 2008 for each state.
An increase in prevalence in the year 2008–09 was noted in Chandigarh, Himachal Pradesh, Jharkhand and Uttarakhand. Chandigarh is a Union Territory and the capital of Punjab and Haryana. The increased prevalence there could be explained by the fact that there is an influx of people from these two states into Chandigarh, where many come for testing or seeking medical treatment. The reasons with respect to the other states need to be explored. A marginal upward trend was noted in Gujarat (Annexure II).

38 Annual HIV Sentinel Surveillance - Country Report 2008-2009
No significant change in trend was observed in Bihar, Meghalaya, Mizoram, Pondicherry, Punjab, Rajasthan, Uttar Pradesh, Kerala, Goa and Delhi. The details of state-wise and site-wise prevalence are given in Annexure II.The surveillance at the ANC sites in the rural areas showed that HIV prevalence was the highest in Uttar Pradesh (0.29%), whereas in urban clinic sites it was 0.15%. In the rural sites of Punjab, Meghalaya and West Bengal, the prevalence, on an average, was 0.2%.
Differentials of HIV among antenatal clinic attendees The age-wise HIV prevalence among urban pregnant women was the lowest (0.12%) in the age group of 15–19 years and was, on an average, 0.3% for all the age groups from both urban and rural areas. The HIV prevalence was uniform, at 0.3%, across all levels of literacy and with all orders of pregnancy.
Figure 3.13Proportion Tested for HIV by Source of Referral to Antenatal Clinic Attendees in India, 2008-09
The source of referral for the ANC attendees tested was mainly government agencies (47%). Forty-five per cent of the ANC attendees had come by themselves or on the advice of friends and relatives (Fig. 3.13). Only 1.9% had been referred by the private sector.
Table 3.4HIV Prevalence among Antenatal Clinic Attendees by Spouse Occupation, India, 2008
Spouse Occupation Urban Rural
Number Tested
Number Positive
HIV % Positive
Number Tested
Number Positive
HIV % Positive
Agricultural labourer 8762 45 0.51 43136 197 0.46Non-agricultural labourer 17686 78 0.44 24779 116 0.47Domestic servant 1826 10 0.55 1804 15 0.83Skilled/semiskilled worker 12764 60 0.47 13245 67 0.51Petty business/small shop 14862 56 0.38 12732 41 0.32Large business/self-employed 5490 18 0.33 3693 10 0.27Service (Govt/Pvt.) 22075 97 0.44 16920 69 0.41Student 820 0 0.00 1206 3 0.25Truck driver/helper 2816 32 1.14 3927 29 0.74

39Annual HIV Sentinel Surveillance - Country Report 2008-2009
Spouse Occupation Urban Rural
Number Tested
Number Positive
HIV % Positive
Number Tested
Number Positive
HIV % Positive
Local transport worker (auto/taxi driver/handcart pullers/rickshow pullers, etc)
8213 42 0.51 7272 57 0.78
Hotel staff 2238 16 0.71 2045 20 0.98Agricultural cultivator/landholder 2630 13 0.49 15558 62 0.40Unemployed 2369 17 0.72 3509 21 0.60Not applicable (for never married/widows/widowers)
119 4 3.36 154 4 2.60
Amongst the ANC clinic attendees in urban areas (102,670), it was the wives of truck drivers/helpers (1.14%), hotel staff and the unemployed who had the highest prevalence. In rural areas (149,980), HIV prevalence was the highest among the wives of hotel staff (0.98%) followed by domestic servants (0.83%). The number of ANC attendees tested for HIV whose spouses were migrants was 660, of which 6 were positive. So, the HIV positivity percentage was 0.9.
Table 3.5VDRL*% Prevalence amongst Antenatal Clinic Attendees by Age group
Age-group Total VDRL Unadjusted% Positive
Age adjusted% positive
India 15-19 21776 68 0.31 0.3120-24 128921 388 0.30 0.325-49 101953 317 0.31 0.44Total 252650 773 0.31 0.39
H1 zone* 15-19 9792 24 0.25 0.2520-24 57477 128 0.22 0.2225-49 29862 54 0.18 0.39Total 97131 206 0.21 0.33
H2 zone** 15-19 982 15 1.53 1.5320-24 3550 56 1.58 1.5825-49 7812 82 1.05 1.32Total 12344 153 1.24 1.41
Moderate & Low Prevalence states***
15-19 11002 29 0.26 0.2620-24 67894 204 0.30 0.3025-49 64279 181 0.28 0.22Total 143175 414 0.29 0.24
Note: Sites with a sample size of ≥75% have been included. * Andhra Pradesh, Maharashtra, Tamil Nadu, Karnataka**Manipur, Nagaland***Moderate: Goa, Gujarat, PondicherryLow: Other states
The age-adjusted positivity rate for VDRL at the all-India level was 0.39%. The H2 zone had the highest value (1.41%) and also, the value for this zone was higher for all ages compared to the other zones (Table 3.5). There was a significant decline in VDRL positivity in all age groups at the all-India level (Fig. 3.14).

40 Annual HIV Sentinel Surveillance - Country Report 2008-2009
Figure 3.14Trend in VDRL positivity age wise among Antenatal Clinic Attendees in India, 2003 to 2008-09
3.7 STI clinic attendees
STI sentinel sites were opened in all states from 1998 onwards to find the level of HIV prevalence among populations engaged in multi-partner sex, e.g. the clients of sex workers. There were very few sites for HRG groups, such as FSWs, MSM and IDUs, in the initial years of surveillance, till 2006, and these sites were mainly for IDUs in the north-eastern states and FSWs in some states like Mumbai and Goa. STI sites were needed all the more because in the moderate- and low-prevalence states, HIV positivity among antenatal women was very low and nearly undetectable, and only other group, in which surveillance could be done, were the attendees at clinic-based STI sites. However, with the inclusion of TI sites (through NGOs) for the HRG populations under surveillance, the number of HRG sites increased. Given this, the STI sites were considered redundant by some of the southern states, such as Andhra Pradesh and Tamil Nadu, and no surveillance was conducted in the year 2008–09.
Table 3.6Zone Wise HIV Prevalence of STD Patients for Sentinel Surveillance 2008-09
Zones Total Positive %+veHigh HIV Prevalence southern States(H1 zone)* 2314 259 11.19High HIV Prevalence north east States(H2 zone)** 691 21 3.04Moderate and Low Prevalence States*** 42993 735 1.70
Table 3.7Zone Wise VDRL Prevalence of STD Patients for Sentinel Surveillance 2008-09
Zones Total VDRL %+veHigh HIV Prevalence southern States(H1 zone)* 2314 25 1.08High HIV Prevalence north east States(H2 zone)** 691 12 1.74Moderate and Low HIV Prevalence States*** 42993 303 0.70
The HIV prevalence does not tally with the prevalence of VDRL—in the H1 zone, the former is 11%, compared to a VDRL prevalence of 1%. VDRL prevalence is the highest in the north-eastern states, at 1.74%, while HIV prevalence is lower (Tables 3.6 and 3.7).HIV Prevalence trends in various Zones

41Annual HIV Sentinel Surveillance - Country Report 2008-2009
There was a declining trend in HIV prevalence in the H1 zone, but prevalence in the H2 zone and in zone C, consisting of Goa, Gujarat and Pondicherry, increased. There was no change in the trend in the low-prevalence states (Fig. 3.15).
14.95
14.23
13.59
12.52
11
11.5
12
12.5
13
13.5
14
14.5
15
15.5
2003-2005 2004-2006 2005-2007 2006-2008
HIV
% P
ositi
ve
3-Years Moving Average of HIV % positive among STD patients in H1 Zone, India 2003-2008
8.126.78
13.59
12.59
0
2
4
6
8
10
12
14
16
2003-2005 2004-2006 2005-2007 2006-2008
HIV
% P
ositi
ve
3-Years Moving Average of HIV % positive among STD patients in H2 Zone, India 2003-2008
3.763.61
3.92
4.31
3.2
3.4
3.6
3.8
4
4.2
4.4
2003-2005 2004-2006 2005-2007 2006-2008
HIV
% P
ositi
ve
3-Years Moving Average of HIV % positive among STD patients in C Zone, India 2003-2008
1.91.7
1.55
1.55
0
0.2
0.4
0.6
0.8
1
1.2
1.4
1.6
1.8
2
2003-2005 2004-2006 2005-2007 2006-2008
HIV
% P
ositi
ve
3-Years Moving Average of HIV % positive among STD patients in D Zone, India 2003-2008
Trends in various zones according to HIV prevalenceMajority were above 25 years and education was till 12th standard.Majority were above 25 years and education was till 12th standard.
Figure 3.15Trends in Patients with Sexually Transmitted Diseases in Various Zones
Figure 3.16HIV Prevalence among STD Patients by States, India, 2007 and 2008-09

42 Annual HIV Sentinel Surveillance - Country Report 2008-2009
In the absence of STI sites in Andhra Pradesh and Tamil Nadu, the percentage of sites with an HIV prevalence of >5% decreased from 12% in 2007 to 8% in 2008–09, but the majority of the increases in prevalence in sites were in the states with moderate and low HIV prevalence (Fig. 3.16). An increase occurred in 11 states, though many states had values below 5%.
Trends among STI clinic attendeesFigure 3.17
Trends for HIV Positivity among STD Clinic Attendees in Maharashtra and Karnataka (Combined) and India, from 2003 to 2008-09
Note: A three-year moving average has been used, based on consistent sites—India: 91 sites; south: 10 sites (Karnataka: 3, Maharashtra: 7).
HIV prevalence in STI sites at the country level showed a gradually declining trend from 2003 to 2008–09 (Fig. 3.17), with a significant decline in the two southern states. Though there was a downward trend in prevalence in STI sites in Maharashtra and Karnataka, the values were still high, being 14.05% (range: 7.05%–14.05%) in the former and 16.74% (range: 5.62%–16.74%) in the latter.
Figure 3.18Trends for HIV Positivity among STD Clinic Attendees in Gujarat and Mizoram, from 2003 to 2008-09
Note: A three-year moving average has been used. Only consistent sites have been included—3 in Gujarat and 1 in Mizoram. Samples with <75% of the total have been excluded.

43Annual HIV Sentinel Surveillance - Country Report 2008-2009
In Gujarat and Mizoram, states with moderate to low HIV prevalence, a marked increase was noted (Fig. 3.18). There was no significant increasing trend in the rest of the states (Table 3.8). A consistently declining trend was observed in Goa and Manipur (Fig. 3.19), something which was not noted in the other states.
Figure 3.19HIV Prevalence among STD Patients in Goa and Manipur, 2005 to 2008-09
Note: Only consistent sites have been included—Manipur: 2 sites; Goa: 2 sites. Samples with <75% of the total have been excluded.
States in the moderate and low prevalence category have shown an increasing trend and have sites with an HIV prevalence of >10%. Examples are Gujarat, Mizoram and West Bengal (Table 3.8).
Table 3.8STD Sites with HIV Prevalence ≥ 10% from 2003 to 2008-09
State District 2003 2004 2005 2006 2007 2008
Total %+ve Total %+ve Total %+ve Total %+ve Total %+ve Total %+ve
Gujarat Ahmadabad 243 5.76 250 4.80 250 4.80 250 18.00 NA NA 250 22.00
Gujarat Surat 243 n/a 185 8.11 229 11.79 250 8.80 250 8.00 242 13.22
Karnataka Bangalore 250 10.40 250 12.00 250 13.20 250 5.60 250 1.60 221 16.74
Karnataka Belgaum 250 27.20 250 29.60 250 23.60 250 3.60 250 10.80 210 14.76
Maharashtra Akola 250 8.80 250 8.80 250 10.00 250 9.20 250 13.20 227 11.01
Maharashtra Chandrapur 250 8.80 250 11.20 250 15.20 250 8.40 250 16.80 244 11.89
Maharashtra Nagpur 250 22.00 250 18.80 250 20.40 250 20.40 250 13.60 244 13.11
Maharashtra Sangli 250 15.60 250 32.80 250 25.20 250 28.40 250 30.00 242 14.05
Maharashtra Thane 250 14.40 250 4.00 250 8.00 250 6.00 250 7.20 248 11.69
Mizoram Aizawl 250 6.00 250 1.20 250 4.00 250 6.80 250 6.80 250 10.00
West Bengal Kolkata 250 9.60 233 19.74 250 4.80 250 3.60 222 4.95 188 11.17
Differentials for HIV prevalence among STI patients
The age-related HIV prevalence was the highest beyond the age of 25 years among both sexes. No significant difference was observed between the sexes among those attending STI clinics (Table 3.9) for the ages of 20–24 years, but prevalence was higher among males in the age group of 25–49 years. In the age group of 15–19 years, prevalence among females was double that among males.

44 Annual HIV Sentinel Surveillance - Country Report 2008-2009
Table 3.9HIV Prevalence by Age and Sex among Patients Attending STD Clinics, India 2008
Age SexMale Female
Total HIV %+ve Total HIV %+ve15-19 1844 13 0.7 1136 17 1.520-24 4414 69 1.6 5803 79 1.425-49 15834 478 3.0 16967 359 2.1Total 22092 560 2.5 23906 455 1.9
Note: Only valid sites have been included.
Those who were illiterate or literate till the 5th standard and were from urban areas had higher HIV infection rates. The rates of infection declined with an increase in the literacy status in both urban and rural areas (Table 3.10).
Table 3.10HIV Prevalence among STD Patients by Locality and Literacy Status, India, 2008
Education LocalityUrban(Municipal Corporation/Council/
Cantonment)Rural
Total HIV %+ve Total HIV %+veIlliterate 3630 94 2.6 7218 150 2.1Literate and till 5th standard
5870 165 2.8 7706 176 2.3
Till 12th standard 7735 185 2.4 7133 132 1.9Till Graduation 3397 62 1.8 1708 28 1.6Graduate and above 1122 17 1.5 479 6 1.3Total 21754 523 2.4 24244 492 2.0
Note: Only valid sites have been included.
The prevalence of HIV in the urban areas was the highest among those working as local transport workers, non-agricultural labourers or hotel staff, or those who were unemployed. In the rural areas, it was high among truck drivers and local transporters (Table 3.11). Skilled and semi-skilled workers from urban and rural areas were equally at risk. HIV rates among housewives were the same (1.6%) in both rural and urban areas.
Table 3.11HIV Prevalence among STD Patients (both Male and Female) by Locality and Occupation, India, 2008
Self Occupation LocalityUrban(Municipal Corporation/Council/
Cantonment)Rural(Peri urban)
Total Positive %+ve Total Positive %+veAgricultural labourer 581 8 1.4 3915 87 2.2Non-agricultural labourer 1188 57 4.8 1700 41 2.4Domestic servant 458 11 2.4 477 7 1.5Skilled/semiskilled worker 1528 65 4.3 954 43 4.5Petty business/small shop 1625 45 2.8 1011 24 2.4

45Annual HIV Sentinel Surveillance - Country Report 2008-2009
Large business/self employed 491 9 1.8 316 9 2.8Service (Govt/Pvt.) 3625 88 2.4 1692 25 1.5Student 2231 25 1.1 1548 14 0.9Truck driver/helper 334 12 3.6 476 28 5.9Local transport worker (auto/taxi driver/handcart pullers/rickshow pullers etc)
634 33 5.2 416 24 5.8
Hotel staff 354 17 4.8 292 8 2.7Agricultural cultivator/landholder
126 2 1.6 756 9 1.2
Unemployed 548 24 4.4 589 16 2.7Housewife 8031 127 1.6 10102 157 1.6Total 21754 523 2.4 24244 492 2.0
Note: Only valid sites have been included.
Table 3.12HIV Prevalence among Patients with Sexually Transmitted Diseases by Type of Sexually Transmitted Diseases
and Gender, India, 2008
Type of sexually transmitted diseases
SexMale Female Total
Total HIV %+ve Total HIV %+ve Total HIV %+veAno-genital Ulcer 6853 232 3.4 1527 59 3.86 8380 291 3.5Urethral/Cervical Discharge 9196 166 1.8 17103 263 1.54 26299 429 1.6B o t h ( G e n i t a l - U r e t h r a l Discharge)/Cervical discharge
3710 83 2.2 4270 97 2.27 7980 180 2.3
Ano-genital Warts 2089 75 3.6 759 32 4.22 2848 107 4Total 21848 556 3 23659 451 2 45507 1007 2.2
Note: Only valid sites have been included.
At the country level, HIV infection rates were high among both sexes and the highest among those with genital warts and anal or genital ulcer. They were the lowest among those with urethral or cervical discharge. Females with genital ulcer were more likely than males to be HIV-positive (Table 3.12).
Figure 3.20Distribution of Sources of Referral of STD Patients, India, 2008

46 Annual HIV Sentinel Surveillance - Country Report 2008-2009
Self-referral accounted for the majority (52%) of patients. Twenty-eight per cent of patients were referred from other OPDs, indicating that these patients were unaware of their disease. NGO referral was low, at only 3%.
3.8 Migrants and truckers (bridge population)
Migrants
There were 7 sites for migrants in India—2 each in Gujarat and Maharashtra, and 1 each in Mizoram, Orissa and West Bengal. In the sentinel surveillance programme of 2008–09, 1742 migrants were tested for HIV.
Figure 3.21State wise HIV% Prevalence among Migrants at Migrant Sites, India, 2007 to 2008-09
Note: In 2008, all the migrant sites, except the West Bengal (Kolkata) and Maharashtra (Mumbai) sites, were new sites.
The HIV prevalence rate among the 250 migrants tested in the newly established site at Thane was as high as 5.2%, while the site at Mumbai showed a decrease in prevalence from 1.6% in 2007 to 0.8% in 2008–09. The prevalence in Kolkata was very high (9.27%) in 2007, and decreased to 2.48% in 2008–09. In the rest of the sites, HIV prevalence was below 5% (Fig. 3.21).
Figure 3.22Proportion of Migrants tested by age and education in selected sites India, 2008-09
Very few migrated in their teens. The majority (70%) of migrants were above the age of 25 years. The majority (44%) were educated till Standard 12. Skilled and semi-skilled migrants constituted the biggest group among the migrants. As for the occupational profile of the migrants in different states, 76% were agricultural labourers in Kolkata, 56% and 70% were skilled/semi-skilled workers in Maharashtra and Mizoram, respectively, and 71% were employed in petty business in Orissa.
9.27
1.60
2.483.20
0.80
1.20
2.40
0.80
5.20
0 2 4 6 8 10
West Bengal(Kolkata)
Orissa(Anugul)
Mizoram(Aizawl)
Gujarat(Surat)
Gujarat(Surat)
Maharashtra(Mumbai)
Maharashtra(Thane)
HIV % Prevalence
Stat
es 2008
2007

47Annual HIV Sentinel Surveillance - Country Report 2008-2009
In Mizoram, Orissa and Maharashtra, the majority of migrants were educated till the secondary level. In West Bengal, 43% had studied till the primary level. It was difficult to access the migrants as none of them had come to the service point for the treatment of STIs and very few had come for other medical reasons.
Truckers
There were 7 sites for truckers in 2008–09. Of these, 5 were in West Bengal and 1 each in Kerala and Madhya Pradesh (Fig. 3.23). The HIV prevalence rate among truckers dropped in 5 out of 7 sites from 2007 to 2008–09 (Fig. 3.23). It varied from 0 in the site in Kolkata to 2.8% at Bardhaman, with the values for the other sites falling in between. The majority of the truckers were above 25 years of age and educated up to the 12th standard. Out of the total of 1488 who were tested, only 208 had come for treatment of STIs and these had the highest prevalence. About the same number had come for other medical reasons.
Figure 3.23HIV Prevalence among Trucker sites for India, 2007 to 2008-09
3.9 High-risk groups (IDUs, MSM and FSWs)
The epidemic in an area is driven by three groups—IDUs, MSM and FSWs. The epidemic in India was initially attributed to commercial sex work by FSWs. However, now the IDUs and MSM have also been included in the ambit of populations requiring intervention to prevent the spread of HIV.
HIV prevalence among injecting drug usersThe prevalence of HIV among IDUs at the country level is 9.9%. The trend for consistent sites at the all-India level has been stationary since 2004, with a gradual increase between 2006 and 2008 (Fig. 3.24). At the all-India level, 3.7% of the IDUs tested for HIV were women. The figure was 4.9% in the high-prevalence states of the North-East, 2.7% in the states with moderate and low prevalence, and only 1.2% in the southern high-prevalence states. The majority of those tested across the country were between the ages of 25 and 49 years.

48 Annual HIV Sentinel Surveillance - Country Report 2008-2009
Figure 3.24HIV Prevalence among Injecting Drug Users in India, 2004 to 2008-09*
Note: A three-year moving average has been taken and 13 consistent sites have been included from 2004–2008—Nagaland: 5; Manipur: 3; Mizoram: 1; Maharashtra: 1; Delhi: 1; West Bengal: 1; and Chandigarh: 1.
HIV prevalence among IDUs in the states
HIV prevalence among IDUs was >5% at nearly 50% of the sites in 2008 (Fig. 3.25). The same trend was observed in 2007.
Figure 3.25HIV prevalence among Injecting Drug Users by State, India, 2007 and 2008
Note: The values in parentheses are the number of sentinel sites for each state. Sites with a sample size of ≥75% are included.

49Annual HIV Sentinel Surveillance - Country Report 2008-2009
Southern states with high HIV prevalence
The IDUs in the four southern high-prevalence states continued to be a problem. Positivity was the highest (20%) among them in Maharashtra. In Tamil Nadu and Karnataka, the prevalence of HIV among IDUs was <5%, but in Andhra Pradesh, there was an increasing trend and the prevalence had doubled compared to the previous year, crossing 5% .The increase could be observed particularly in the site at Chitoor. In Tamil Nadu there was a declining trend (Fig. 3.26). Consistent sites with an adequate sample size are not available for Andhra Pradesh and Karnataka to draw the trend lines.
Figure 3.26HIV Prevalence Trends among Injecting Drug Users in states of Maharashtra and Tamil Nadu 2005-08*
Note: Only those sites from which there was consistent data available from 2005 to 2008 have been included. Two consistent sites each for Maharashtra and Tamil Nadu are included.
Figure 3.27Age-Wise Persons Tested for HIV in Southern States among Injecting Drug Users, 2008
The IDUs belong predominantly to the age group of 20–29 years. Only 6% of those tested were below 19 years of age (Fig. 3.27). Most people tested were illiterate and a majority were injecting two to three times a week.

50 Annual HIV Sentinel Surveillance - Country Report 2008-2009
Figure 3.28Proportion Tested for HIV by Occupation in Southern States among Injecting Drug Users, 2008
Of the total population of IDUs tested at these centres, 50% comprised local transport drivers or rickshaw pullers, labourers and unemployed people. Other segments, like those in service and students, who constituted 22% of the population tested, were also taking drugs (Fig. 3.28). The de-addiction or drop-in centres were utilized by this population mainly for the needle exchange programme or substitution therapy, and very few came for treatment of STIs or for other facilities.
North-eastern region
The prevalence of HIV among IDUs in Manipur was much higher than that in Nagaland and Mizoram (Fig. 3.29). The trend of increase in prevalence was the most marked in Manipur. There was a rising trend in Mizoram and a gradual decline was observed in Nagaland (Fig. 3.29). The problem of HIV continues to be one of considerable magnitude in the North-East, with 4 sites in Manipur showing a range of prevalence of 17%–34% and prevalence at the new site in Bishnupur being 34% (Table 3.13). Two sites in Nagaland had an HIV prevalence of >5% (range 5%–10%) and the rate had not decreased since 2004 (Table 3.13). There was no decline (to <5%) in the Mizoram sites of Aizwal and Champhai (Table 3.13).
Figure 3.29HIV Prevalence among Injecting Drug Users in the States of Manipur, Mizoram and Nagaland, 2003 to 2008-
09*
Note: A three-year moving average was taken. Only consistent sites were included from 2003 to 2008—Manipur: 2 sites; Mizoram:1 site; and Nagaland: 4 sites.

51Annual HIV Sentinel Surveillance - Country Report 2008-2009
Figure 3.30HIV Prevalence among Injecting Drug Users in the States of Manipur, Mizoram and Nagaland (Combined) by
Age Group, 2003 to 2008-09*
Note: A three-year moving average was taken. Only consistent sites were included from 2003 to 2008—Manipur: 2 sites; Mizoram: 1site; and Nagaland: 4 sites.
There has been no significant change in the trend in HIV prevalence among IDUs in the age groups of 15–24 years and 25–49 years since 2004 (Fig. 3.30) in the north-eastern states.
Table 3.13Site-wise Table of Injecting Drug Users with HIV Prevalence more than 5% in Manipur, Nagaland and
Mizoram from 2003 to 2008- 09
State District / Site name 2003 2004 2005 2006 2007 2008
Total %+ve Total %+ve Total %+ve Total %+ve Total %+ve Total %+ve
Manipur Churachandpur DDAC, SHALOM
249 32.9 250 29.2 250 20 250 24 250 28 244 28.3
Manipur Churachandpur DDAC, LLRC
N/A N/A 250 29.2 250 33.6 250 17.2 250 18 235 34
Manipur BishnupurESEWOSA, Moirang [New 08]
248 34.3
Manipur Imphal West (DDAC),
249 18.1 250 14.8 250 14.8 250 22.8 250 13.2 240 17.9
Mizoram Aizawl Aizwal, SHALOM
250 8.8 250 6.8 250 8.4 250 9.6 249 16.1 249 13.3
Mizoram (TNT) Champhai / RTCT, Champhai
N/A N/A 250 6.8 N/A N/A 250 4.8 250 14.4 250 8.4
Nagaland (Kirpa) Kohima N/A N/A 250 4 250 4 250 6 250 2 232 5.6
Nagaland Dimapur Dimapur Civil Hospital
249 10.4 245 4.5 250 8.4 250 3.2 250 5.2 236 10.2
In Manipur, Nagaland and Mizoram, unemployed persons (44%), people in service (13%) and students (12%) formed the bulk of those accessing the drop-in centres, though other groups were also involved in injecting drugs (Fig. 3.31).

52 Annual HIV Sentinel Surveillance - Country Report 2008-2009
Figure 3.31Proportion % of IDUs Tested for HIV by Occupation (Manipur, Nagaland and Mizoram), 2008-09
Table 3.14HIV Prevalence among Injecting Drug Users by Literacy and Residence (Manipur & Nagaland), 2008-09
Literacy Urban RuralTotal HIV %+ve Total HIV %+ve
Illiterate 47 11 23.4 23 4 17.4Literate and till 5th standard 795 85 10.7 396 41 10.4Till 12th standard 1375 155 11.3 469 37 7.9Till Graduation 289 36 12.5 76 7 9.2Graduate and above 99 12 12.1 23 4 17.4Total 2605 299 11.5 987 93 9.4
The majority of the population coming to the centres was either literate or educated up to the 12th standard and the range of HIV positivity among those both from an urban and rural background in this population was 8%–11% (Table 3.14). Very few illiterate people came to the centres.
States with moderate and low HIV prevalence
Sixteen states in this category conducted surveillance among IDUs and of them, Madhya Pradesh and Jharkhand did it for the first time. Very high prevalence (39%) was noted in Madhya Pradesh at the site in Bhopal. There was an increase in prevalence in 10 of the states with moderate and low prevalence, the values being higher than in 2007. In Punjab, HIV positivity was 13% in 2007 and this doubled to 27% in 2008, there being an alarming increase at the sites in Amritsar (56%) and Rupnagar/Ropar (35%). Prevalence was >5% in 10 sites.
In West Bengal, a significant linear increase was seen in HIV prevalence amongst IDUs since 2003, with HIV prevalence above 5% in one consistent site (Fig 3.33). Consistent sites were not available from 2003 for other states in this region. Details of site wise prevalence given in Annexure II.

53Annual HIV Sentinel Surveillance - Country Report 2008-2009
Figure 3.32Sites with ≥ 5% HIV Prevalence among Injecting Drug Users in Low Prevalence States, 2007 and 2008-09
In West Bengal, there has been a significant linear increase in HIV prevalence among IDUs since 2003, with the prevalence being >5% in one consistent site (Fig. 3.33). Consistent sites were not available from 2003 for other states in this category.
Figure 3.33HIV Prevalence among Injecting Drug Users in West Bengal, 2003 to 2008-09*
Note: A three-year moving average has been taken. Only 1 consistent site has been included from 2003 to 2008 (1 site in West Bengal).
Differentials at the all-India level
The IDUs visiting NGOs were usually unemployed and formed 25% of the total number of those visiting these sites. Others coming to the sites were labourers, truckers and local transporters, who formed nearly 16% of the total, followed by those in business (14%).

54 Annual HIV Sentinel Surveillance - Country Report 2008-2009
At the country level, the majority of the IDUs attending intervention centres were unemployed persons, local transport workers, non-agricultural labourers or those in service from urban areas (Table 3.15). The prevalence of HIV was high among the unemployed (12%) and labourers (13%), but it was the highest among skilled and semi-skilled workers from both the urban (18.81%) and rural areas (11.43%). Prevalence was lower among those from the rural areas, except among those in business (petty and large business).
Figure 3.34Proportion % of IDUs Tested for HIV by Occupation, India 2008-09
Table 3.15HIV Prevalence among Injecting Drug Users by Occupation and Residence, India, 2008-09
Self Occupation
Urban RuralNumber Tested
Number Positive
HIV % Positive
Number Tested
Number Positive
HIV % Positive
Agricultural labourer 145 15 10.34 253 26 10.28Non-agricultural labourer 1189 156 13.12 285 34 11.93Domestic servant 52 2 3.85 29 0 0Skilled/semiskilled worker 808 152 18.81 175 20 11.43Petty business/small shop 828 89 10.75 238 16 6.72Large business/self employed 448 21 4.69 127 13 10.24Service (Govt/Pvt.) 1034 93 8.99 267 20 7.49Student 709 4 0.56 161 2 1.24Truck driver/helper 224 15 6.7 66 5 7.58Local transport worker (auto/taxi driver/handcart pullers/rickshaw pullers etc)
1454 137 9.42 145 8 5.52
Hotel staff 184 11 5.98 15 1 6.67Agricultural cultivator/landholder
31 2 6.45 166 7 4.22
Unemployed 2414 295 12.22 572 48 8.39Housewife 40 1 2.5 1 0 0Unknown 27 5 18.52 16 0 0Total 9587 998 10.4 2516 200 7.95

55Annual HIV Sentinel Surveillance - Country Report 2008-2009
HIV prevalence among MSM
There were MSM sites in 21 states. The sites may not give an adequate picture of the epidemic in this group across the country, but they are suffice to draw attention for the intervention (unclear). HIV among MSM has added to the HIV burden in nearly all the states of the country (Fig. 3.35). It may be noted that HIV was detected among the population at all the new sites started, e.g. in Andhra Pradesh, Madhya Pradesh, Bihar, Himachal Pradesh and Jharkhand.
The prevalence of HIV increased in 7 states compared to the 2007 values. Nearly half the sites had a prevalence of >5% and of these, 11 had a prevalence of ≥10% (Fig. 3.35).
Figure 3.35HIV prevalence among Men having sex with Men by States, 2007 and 2008-09
Note: The values in parentheses are the number of sentinel sites for each state. Sites with a sample size of ≥75% have been included.

56 Annual HIV Sentinel Surveillance - Country Report 2008-2009
At the all-India level, there was no significant change in the trend of HIV infection among MSM, even by age differentiation (Fig. 3.36). The trend has been the same for the four southern states and the low-prevalence states since 2004 (Fig. 3.37). HIV prevalence has not declined since 2004 among MSM in the consistent sites of the high-prevalence southern states and the low-prevalence states.
Figure 3.36Age wise HIV Prevalence among Men Having Sex with Men (MSM) in Consistent Sites of India, 2003 to 2008-
09
Figure 3.37HIV Prevalence among Men Having Sex with Men in India, Southern States and Low Prevalence States, 2004
to 2008-09
Sites in India: Tamil Nadu 1, Manipur 1,Andhra Pradesh 1, Maharashtra 2, Chandigarh 1,Bihar 1, Gujarat 1, • Pondicherry 1Sites in southern states: Tamil Nadu 1, Andhra Pradesh 1, Maharashtra 2• Sites in low-prevalence states: Chandigarh 1, Bihar 1• Karnataka had a sample size of <75% and Nagaland did not have any sites.•
Maharashtra, Tamil Nadu, Andhra Pradesh and Karnataka
MSM are emerging as an important group in Andhra Pradesh, with the prevalence of HIV among them almost doubling (22%). There was a significant increase in prevalence at three sites—Adilabad, Ananatpur and Kadapa—in 2008 compared to 2007, and the trend of HIV prevalence continued to be high in consistent sites since 2005 (Fig. 3.37). In both Karnataka and Maharashtra, the prevalence was >10%. Only Tamil Nadu had a prevalence of <10%, though it was >5%.

57Annual HIV Sentinel Surveillance - Country Report 2008-2009
Figure 3.38Trend in HIV Prevalence among Men Having Sex with Men in Andhra Pradesh and Maharashtra, 2003 to
2008-09*
Note: A three-year moving average has been taken and only consistent sites have been included from 2003–2008—1 each in Andhra Pradesh and Maharashtra. Sites with a sample size of ≥75% have been included.
Andhra Pradesh and Maharashtra show gradual increase since 2004 trend (Fig 3.38).
Figure 3.39Proportion % of MSM tested for HIV by Occupation in Southern States 2008-09
The occupations of the population coming for testing were varied, but the biggest group comprised labourers and those in business or service (Fig. 3.39). HIV prevalence among this population ranged from 8% to14%. Most of the MSM were kothis. Though the unemployed formed only 10% of those tested, HIV positivity was the highest among them (16%).
North-eastern states
The only site in Manipur registered a slow increase in prevalence (Fig. 3.40) and in 2008–09, the figure stood at 17% (Annexure II).
MSM in states with moderate and low prevalence
Surveillance for MSM was held in sites situated in 14 states with moderate and low prevalence. In 2008–09, no state except Punjab and Bihar had crossed the prevalence level of 2007. A new site in Bhopal, Madhya Pradesh, registered a prevalence of 11%, while prevalence was 2% at the new site in Jharkhand. The presence of sites with an HIV prevalence of >5% (Fig. 3.40) indicates that MSM are gradually emerging as a problem, especially in

58 Annual HIV Sentinel Surveillance - Country Report 2008-2009
Gujarat, Delhi and Orissa, with pockets of high prevalence in Punjab and Goa.
Figure 3.41Districts with ≥ 5% HIV Prevalence among Men Having Sex with Men in Northern states, Moderate and Low
Prevalence States, 2008
In the states of Gujarat and Goa, with concentrated epidemic, the trends have yet to take a definite direction (Fig. 3.42). Similarly, in the three low prevalence states the trends do not suggest a definite decline (Fig. 3.43).
Figure 3.40Trend in HIV Prevalence among Men Having Sex with Men in Manipur, 2003 to 2008-09*
Note: Three-year moving average is taken and only 1consistent site have been included from 2003-2008. Includes sites with sample size of ≥75%.

59Annual HIV Sentinel Surveillance - Country Report 2008-2009
Figure 3.42HIV prevalence among Men Having Sex with Men in consistent sites of Goa & Gujarat, 2005 to 2008-09
Note:*Includes only those sites from which there was consistent data available from 2005 to 2008. 4 consistent sites were included, 3 sites in Gujarat & 1 site in Goa.
Figure 3.43HIV Prevalence among Men Having Sex with Men in Consistent Sites of Bihar, Chandigarh and
Pondicherry, 2005 to 2008-09
Note:*Includes Consistent sites, 1 site each in Bihar, Chandigarh and Pondicherry.
Figure 3.44Proportion % of MSM Tested for HIV by Occupation in India, 2008-09

60 Annual HIV Sentinel Surveillance - Country Report 2008-2009
Table 3.16HIV Prevalence among Men having Sex with Men by Occupation, 2008-09, in India
Self Occupation Urban Rural
Number Tested
Number Positive
HIV Positive
Number Tested
Number Positive
HIV Positive
Agricultural labourer 241 24 9.96 633 41 6.48Non-agricultural labourer 1256 82 6.53 756 39 5.16Domestic servant 307 15 4.89 168 9 5.36Skilled/semiskilled worker 1413 100 7.08 461 18 3.9Petty business/small shop 1262 101 8 414 25 6.04Large business/self employed 233 17 7.3 117 4 3.42Service (Govt/Pvt.) 1925 162 8.42 303 31 10.23Student 912 46 5.04 429 12 2.8Truck driver/helper 245 13 5.31 112 5 4.46Local transport worker (auto/taxi driver/handcart pullers/rickshaw pullers, etc)
728 40 5.49 208 9 4.33
Hotel staff 492 36 7.32 235 8 3.4Agricultural cultivator/landholder 28 2 7.14 96 2 2.08Unemployed 1030 110 10.68 379 27 7.12Not applicable(for never married/widows/widowers)
13 1 7.69 1 0 0
Total 10085 749 7.4 4312 230 5.33
In urban areas the prevalence among MSMs is observed to be higher (all above 5%) in various groups than in those from the rural areas. The highest number of attendees belongs to service class in urban areas and non agricultural labourer in rural areas. High prevalence is observed amongst unemployed (10.7%) in urban areas and the service class in rural areas.
Transgender: The HIV prevalence among eunuchs in Mumbai is showing a significant increase since last year, but no clear trend is seen since 2005. This group, amongst MSM, has a very high HIV prevalence (nearly 16.40 %) but do not attract attention for extensive intervention though they indulge in commercial sex.
HIV Prevalence among Female Sex Workers
FSW sites are maximum in number amongst the high risk group (188) but majority of the sites are distributed in states of Maharashtra, Tamil Nadu, Bihar, Assam, Andhra Pradesh, Jharkhand, Kerala, Orissa and West Bengal. In 2008 -09, HIV prevalence among FSWs was highest in Karnataka (14.2%) and Nagaland (14.1%), followed by Andhra Pradesh (11.5%), Manipur (10.9%) and Maharashtra (10.8%) (Fig 3.45).
There has been no change in the percentage of sites with HIV prevalence more than 5% compared to last year (36% in 2007 and 34% in 2008). Karnataka, Andhra Pradesh, Nagaland and Tamil Nadu have exceeded the 2007 HIV prevalence values and have HIV prevalence above 12% in 2008-09. Twelve states with moderate and low HIV prevalence have registered an increase in 2008-09 compared to 2007 (Fig 3.45). Details of state wise and site wise prevalence given in Annexure II.

61Annual HIV Sentinel Surveillance - Country Report 2008-2009
Figure 3.46Trend in HIV Prevalence in Consistent Sites among Female Sex Workers in India 2003 to 2008-09
Note: A three-year moving average has been taken and 18 consistent sites have been included from 2003 to 2008—6 sites in West Bengal, 4 in Andhra Pradesh, 2 in Chandigarh, and 1 each in Bihar, Delhi, Himachal Pradesh, Manipur, Nagaland and Uttar Pradesh.
At the country level, the trend of HIV infection amongst FSWs has a declining trend at the consistent sites existing since 2003 for all the age groups (Fig 3.47) but the maximum decline has occurred in those above 25 years and least amongst 15-19 years.
Figure 3.45HIV prevalence among Female Sex Workers by State, India, 2007 and 2008
Note: Values in parentheses are the number of sentinel sites for each state. Includes sites with sample size of ≥75%.

62 Annual HIV Sentinel Surveillance - Country Report 2008-2009
Figure 3.48Proportion % of Female Sex Workers tested for HIV by Age Group India, 2008
The majority (25%) of FSWs getting tested belonged to the age group of 25–29 years; 17.4% were in the age group of 20–24 years and only 5.7% were <19 years old.
FSWs in Maharashtra, Tamil Nadu, Andhra Pradesh and Karnataka
The FSWs were the risk group which was considered as the conduit for the spread of HIV in the country and they were the first among whom TIs were started in Tamil Nadu and Maharashtra. Given this, the HIV prevalence in these two states decreased and a distinct decline can be noted in the case of Maharashtra, though the intensity of HIV prevalence is higher than that in Tamil Nadu and Andhra Pradesh. However, no declining trend was noted for the latter two states (Fig. 3.49).
Figure 3.47Age-wise trend in HIV Prevalence in Consistent Sites among Female Sex Workers in India, 2003 to
2008-09
Note: A three-year moving average has been taken and 18 consistent sites have been included from 2003 to 2008—6 sites in West Bengal, 4 in Andhra Pradesh, 2 in Chandigarh, and 1 each in Bihar, Delhi, Himachal Pradesh, Manipur, Nagaland and Uttar Pradesh.

63Annual HIV Sentinel Surveillance - Country Report 2008-2009
Table 3.17Site-wise Table with HIV Prevalence more than 10% among Female Sex Workers in 2008-09
State District Site name Total HIV %+veMaharashtra Pune Pune Saheli NGO 250 102 40.80Karnataka Bagalkot Mudhol (New 08) 232 79 34.05Maharashtra Mumbai Gaurabai CHCU 250 75 30.00Andhra Pradesh Khammam JAGRUTI (New 07) 247 66 26.72Maharashtra Kolhapur Muslim Samaj Probodhan Va Shikshan
Sanstha250 65 26.00
Karnataka Bangalore Avalahalli (New 08) 250 46 18.40Andhra Pradesh East Godavari East Godawari/ CHANGES, Kakinada 244 44 18.03Maharashtra Nagpur Nagpur (New 08) 250 43 17.20Andhra Pradesh Adilabad AIRTDS, Mancherial (New 07) 248 42 16.94Karnataka Belgaum BIRDS, NGO, Belgaum (New08) 251 41 16.33Andhra Pradesh Hyderabad Chaitanya Mahila Mandali/ Hyderabad 249 37 14.86Maharashtra Ahmadnagar Snehalaya Project 250 37 14.80Maharashtra Yavatmal Yawatmal (New 08) 250 36 14.40Andhra Pradesh West Godavari Action for Development, Bhimavaram (New
07)247 35 14.17
Tamil Nadu Salem Village Reconstruction and Dev. Project (New08)
249 33 13.25
Tamil Nadu Erode Centre For Action & Rural Edu.,CARE TAI (New 08)
247 30 12.15
Maharashtra Bid Beed-Ambejogai (New 08) 250 29 11.60
Note: Only those sites from which consistent data were available from 2005 to 2008 have been included. The consistent sites included 9 sites in Maharashtra, 5 in Andhra Pradesh and 2 in Tamil Nadu. No consistent sites were found in Karnataka.
Seventeen sites had an HIV prevalence of >10%. Of these, 7 were in Maharashtra and 5 in Andhra Pradesh. All these sites were situated in the high-prevalence states. In Maharashtra, the prevalence of HIV decreased
Note:*Includes only those sites from which there was consistent data available from 2005 to 2008. Consistent sites included 9 sites in Maharashtra, 5 sites in Andhra Pradesh & 2 sites in Tamil Nadu. No consistent sites found in Karnataka.
Figure 3.49HIV prevalence Trends among Female Sex Workers in southern states, 2005-08*

64 Annual HIV Sentinel Surveillance - Country Report 2008-2009
significantly in Jalgaon, Pune, Chandrapur, Parbhani and Akola, while there was an increase in Ahmednagar and Kolhapur compared to 2007. Pockets of high prevalence persist in Pune, and even after a decrease, the prevalence is 41%. In Mumbai, (Gaurabai Hospital), it is 30% (see Table 3.17 and Annexure II). In Tamil Nadu, Salem and Theni witnessed a significant increase and the prevalence was higher than in 2007.
The state of Karnataka introduced 5 new sites in 2008. Of these, 3 FSW sites in Bangalore were replaced with NGO sites and the HIV positivity at these sites rose three-fold, with the prevalence among the Bagalkot FSWs being 30%. No trend could be elicited due to change in sites. It is difficult to comment on one year’s data, but definitely there is a high prevalence of HIV among this group in Bangalore.
Andhra Pradesh has yet to get a grip over the spread of HIV among FSWs, with an increase in prevalence compared to 2007. An analysis of the trends indicated that HIV prevalence among FSWs was exhibiting a gradual downward trend, especially in the consistent sites of Andhra Pradesh with the maximum number of sites for FSWs.
Figure 3.50Age-wise trend in HIV Prevalence in Consistent Sites among Female Sex Workers in Andhra Pradesh, 2003 to
2008- 09*
Note: A three-year moving average has been taken and 4 consistent sites have been included from 2003 to 2008.
In Andhra Pradesh, an increase in HIV prevalence was observed among FSWs in the age group of 20–24 years in 2006–08. However, there was a gradually decreasing trend for other age groups.
North-eastern states
There was a significant downward trend in HIV prevalence among FSWs in Manipur (Fig. 3.51). Nagaland exhibited a consistent upward trend (Fig. 3.52). HIV prevalence of >10% was noted at 1 site each in Manipur and Nagaland.
Figure 3.51Trend in HIV Prevalence in Consistent Sites among Female Sex Workers in Manipur, 2003 to 2008-09*
Note: Three year moving average is taken and 1 consistent site have been included from 2003 to 2008-09.

65Annual HIV Sentinel Surveillance - Country Report 2008-2009
Figure 3.52Trend in HIV Prevalence in Consistent Sites among Female Sex Workers in Nagaland, 2003 to 2008-09*
Note: A three-year moving average has been taken and 1 consistent site has been included from 2003 to 2008–09.
Figure 3.53Trend in HIV Prevalence in Consistent Sites among Female Sex Workers in Low Prevalence states, 2003 to
2008-09*
Note: Three year moving average is taken and 12 consistent site have been included from 2003 to 2008-09. West Bengal-6 sites Chandigarh-2 sites, 1 site each in Delhi, Uttar Pradesh, Bihar and Himachal Pradesh.
Figure 3.54Trend in HIV Prevalence in Consistent Sites among Female Sex Workers in West Bengal, 2004 to 2008-09*
Note: Three year moving average is taken and 7 consistent sites have been included from 2004 to 2008-09.

66 Annual HIV Sentinel Surveillance - Country Report 2008-2009
Figure 3.55Trend in HIV Prevalence in Consistent Sites among Female Sex Workers in Chandigarh, Delhi and Uttar
Pradesh (combined) 2003 to 2008-09*
Note: Three year moving average is taken and only consistent sites have been included from 2003-2008. Chandigarh-2 sites, 1 site each in Delhi and Uttar Pradesh.
States with moderate and low HIV prevalence
Assam, Delhi, Bihar, Madhya Pradesh and Punjab experienced an increase in HIV prevalence compared to 2007, though prevalence among FSWs showed a downward trend (Fig. 3.53) in 2008–09. A strict watch must be kept to prevent HIV infection rates from flaring up, especially in states with a prevalence of >5%, e.g. in West Bengal, Gujarat and Bihar. A significant downward trend in prevalence was observed for the combined consistent sites of Chandigarh, Delhi and Uttar Pradesh (Fig. 3.55), whereas an upward trend was noted in Bihar and Himachal Pradesh (Fig. 3.56).
Figure 3.56Trend in HIV Prevalence in Consistent Sites among Female Sex Workers in Bihar and Himachal Pradesh, 2003
to 2008-09*
Note: A three-year moving average has been taken and only consistent sites have been included from 2003–2008—1 site each in Bihar and Himachal Pradesh.
HIV prevalence among FSWs in the three districts of Bihar showed an increasing trend from 2006–08. These were pockets of high prevalence, with prevalence being >5% in 16 sites.

67Annual HIV Sentinel Surveillance - Country Report 2008-2009
Figure 3.57Trend in HIV Prevalence among Female Sex Workers for those sites which have increasing trend 2006-08 in
Low HIV Prevalence States

68 Annual HIV Sentinel Surveillance - Country Report 2008-2009

69Annual HIV Sentinel Surveillance - Country Report 2008-2009
Chapter 4Conclusion
Surveillance is the tool to determine the extent of the HIV/AIDS epidemic in India and to track the changes or trends over time. The data generated by the Annual Sentinel Surveillance for HIV identify the risk groups with their risk behaviours and their area of location. This, in turn, guides programme planning and acts as
a surrogate measure for the evaluation of programme responses at various levels.
The Annual Sentinel Surveillance for HIV held in 2008–09 was similar to the one held in the previous year. Active steps were taken to improve the quality to meet international standards. The activity extended from 2008 to 2009; hence, it was not possible to hold another round of surveillance in 2009 and the next round was shifted to 2010.
In 2007, an international journal conducted an assessment of the HIV surveillance systems across the world, and India’s system was described as a ‘fully implemented surveillance system’. This signifies that according to their criteria, India’s HIV surveillance system is of good quality.
HSS in India is well institutionalized and has been consistent over the years. It is flexible enough to accommodate an evolving epidemic and incorporate new surveillance technologies. The following are the key strengths of the system.
The sentinel surveillance system is self-sufficient, both technically and financially.• A task force of national and international experts on HIV surveillance is in place.• Documented guidelines for site selection, client sampling, blood collection and other operations have been • prepared and disseminated by NACO. A supportive network of technical partners from national institutes has been identified and their roles have also been identified.Site coverage has expanded over time to represent various risk groups.• The concept of composite sites with fixed samples to complete the sample sizes is being implement.• All site managers and testing personnel, including NGOs and laboratory personnel, receive extensive pre-• surveillance training.There is internal and external quality assurance in HIV testing laboratories.• The DBS method of blood collection has been introduced at NGO sites.• ‘Unlinked anonymous’ testing is being carried out, whereby the persons sampled are not aware that they • are being tested for HIV and the surveillance staff cannot identify them. The advantage of this is that it prevents selection and participation biases.Web based data double entry. • Multi-layered supervision is conducted so that immediate corrective action can be taken.• On-job training is conducted.• There is regular monitoring of activities.• A budget has been identified for all the partners.•
However, a few constraints remain, such as the lack of trained staff at a few sites, delay in the delivery of supplies and choosing participants not based on eligibility criteria in STI clinics. Some of the sites were unable to complete the sample size, but but these comprise only 5% of the total sample of the 1190 sites.HIV surveillance has provided an evidence base for HIV infections at the country, state and site levels. A clear picture has emerged of the current prevalence, together with the profile of the groups that are the most

70 Annual HIV Sentinel Surveillance - Country Report 2008-2009
vulnerable and their geographical distribution. The extent of HIV infection is not uniform and varies not only from state to state, but also within a state between districts and between talukas, depending on the type of risk groups and the risk behaviour networks. The pattern of the epidemic is of a concentrated nature, with pockets of high prevalence among HRGs and/or pregnant women in the districts of many states. The prevalence among pregnant women in some districts is not commensurate with the intensity of infection among the HRGs, and this needs to be explored.
Tamil Nadu and Maharashtra may be taken off the list of southern high-prevalence states as the prevalence in ANCs was noted to be <1% among antenatal women from 2006 to 2009. Thus they do not fulfil the qualifying criteria of >1% prevalence in the ANCs. They can be placed in a separate category of a waning epidemic, and the successful strategies employed in these states should be identified for replication in the moderate- and low-prevalence states to stop the progression of the epidemic.
The report on the global AIDS epidemic by UNAIDS in 2008 states that several modes of HIV transmission make Asia’s epidemic one of the world’s most diverse. Among the many risk factors, injecting drug use is a major risk factor in the epidemics of several Asian countries (Slightly, 2006). These observations match the findings of this report, which has noted that prevalence among IDUs continues unabated in India, starting from Manipur, Mizoram and Assam in the north-east, and extending to West Bengal and Orissa in the east, Punjab, Chandigarh and Delhi in the north, Jharkhand and Madhya Pradesh in central India, and Maharashtra and Kerala in the south. The presence of IDUs with HIV is also being reported from other states. The UNAIDS report has further underlined the threat due to overlap of injecting drug use and sex work. This applies particularly to Manipur, Maharashtra, Mizoram and Nagaland, where the rate of sexual transmission of HIV is increasing parallel to a high rate of infection among IDUs.
MSM may also be driving the HIV epidemic as the prevalence rates among them are high not only in many conventional high-prevalence states of southern India, such as Andhra Pradesh and Maharashtra, and Manipur in the north-east, but also in states with moderate and low prevalence, such as Delhi, Gujarat, Goa, Orissa and Madhya Pradesh. There are similar concerns regarding MSM in most other regions in Asia, where unprotected anal sex between men and between men and female partners is a potentially significant factor in driving the HIV epidemic, though adequate research has not been carried out in this area (UNAIDS 2008). Moving from place to place for work increases the risk of exposure to HIV in several ways. Individuals move from areas of low prevalence to areas of higher prevalence, increasing the risk of contracting HIV. An example is the migrants of Uttar Pradesh, Bihar and Orissa who go to higher-prevalence states, such as Maharashtra, Andhra Pradesh, Tamil Nadu and Gujarat, in search of work. Cut off from their families or social support networks and with limited access to prevention services, they engage in high levels of risk behaviour. The high prevalence in migrants has also been observed by White (2003) and Khan et al. (2007). Frequent movement away from the home provides opportunities to indulge in risky behaviour, as has been observed in the case of truckers and those in business. Unemployment has also emerged as an important factor that predisposes people to indulge in risky behaviour and needs to be addressed urgently. Many of the unemployed are into injecting drug use or are MSM. HIV is gradually becoming entrenched in the local population and the high prevalence among those in service provides evidence. The UN report suggests that the strategy in countries with low-level and concentrated HIV/AIDS epidemics should be to have a central prevention focus on populations at the greatest risk. To reduce the likelihood of a low-level or concentrated epidemic becoming generalized, prevention programmes should also focus on potential epidemiological bridges, such as the sexual partners of IDUs or MSM, with FSW and other female partners. These observations are very much relevant for India in the light of this report, which highlights that the magnitude of HIV infection among populations at the greatest risk (core risk groups) is >5%, and among the population visiting STI clinics in the states with moderate and low prevalence, too, it is >5% in 14 sites.
Prevention programmes will not be optimally effective unless they are supported by initiatives to address the social factors that increase risk and vulnerability. Societal factors that affect the risk of and vulnerability to HIV are gender inequality and lack of empowerment of women and girls. The data collected under the surveillance round strongly highlight a high level of positivity among the wives of labourers and skilled workers, transporters

71Annual HIV Sentinel Surveillance - Country Report 2008-2009
like truckers or auto-rickshaw drivers, and men in government or private service, besides others. These poor women, though mainly monogamous, are contracting the infection and have no social support to take care of their needs in the future. Long-term success in responding to the HIV epidemic will require sustained progress in addressing gender inequality, stigma and discrimination, especially in the case of women from the lower socioeconomic strata.
Efforts should be more strategically focused and based on the evidence generated by surveillance. Indications are that workplace intervention strategies are important for HIV prevention services (including HIV testing). Truck drivers, local transport workers and those in service may be approached through their professional associations. The unorganized labour sector is the most vulnerable, and intensive IEC and BCC are urgently required in the case of this population to close gaps in the utilization of the critical prevention services. Not to be overlooked is the mass of unemployed men testing positive, as they are not easily accessible and thus pose a challenge to the programme.
Key findings
1) Number and type of sitesSurveillance was held in 1190 sites, the largest number in the world. Only 162 ANC (R) sites were included, • mostly in six high-prevalence southern and north-eastern states. There were only 36 such sites in other states. Many first-time ANC sites in the low-prevalence states yielded an HIV prevalence of >1%, indicating the • need for more sites. The HRG sites comprised 26% of the total sites. • There were few sites for populations like truckers and migrants, who act as a bridge between the HRGs and • the population with a low risk.More sites are needed for transgenders as the prevalence among them was consistently high (16%) in the • 2008–09 round.
2) Surveillance process During supervisory visits to the surveillance sites and testing centres, it was observed that late supply of • consumables was the major issue (34%), followed by procedural issues, such as consecutive sampling not being done, trained staff not doing surveillance work and staff being transferred (11%) during surveillance.There were delays in the procurement of DBS cards by NACO for sample collection through the DBS method, • resulting in a delay in the commencement of surveillance at the HRG sites.Lack of coordination between NACO, SACS and the Indian Postal Service resulted in delays in the transfer of • the samples of DBS cards from the HRG sentinel sites to the testing centres. In each state, there were some sites which were experiencing problems in the implementation of • surveillance.Officers were not deputed by SACS for the supervision of surveillance activities. •
3) HIV status The HIV epidemic in India is a concentrated epidemic, with prevalence being low among ANC (<1%) but >5% • among HRGs.The changing pattern of the epidemic is different in different states. HIV prevalence among ANC has fallen • to <1% in Karnataka, Maharashtra and Manipur, but pockets of high prevalence are still present. Prevalence among IDUs and MSM is increasing. A decline was observed only in the case of FSWs.• Hot spots for all risk groups exist in the low-prevalence northern and eastern states. For example, HIV • prevalence at the new sites was >1% among ANC at Hamirpur (Himachal Pradesh) and West Nimar (Madhya Pradesh) , and 39% among IDUs in Bhopal in Madhya Pradesh.There was a declining trend in HIV prevalence in the ANCs in six high-prevalence states, but the trends • remained static in the states with low and moderate prevalence.Significantly low levels of HIV prevalence were noted consistently among all groups in Tamil Nadu.•

72 Annual HIV Sentinel Surveillance - Country Report 2008-2009
3.1) HIV prevalence among antenatal clinic attendees252,650 women were tested for HIV at 639 (valid) ANC sentinel sites.• There were downward trends in prevalence in six high-prevalence states, but the trends were static in the • states with low and moderate prevalence.HIV prevalence was the highest in the age group of 15–19 years in Manipur and Nagaland, but not in the • other states.HIV prevalence ranged from 1% to 1.99% in 105 sites, including both urban and rural sites. One-fourth of • these (27) were in the states with moderate and low prevalence. HIV prevalence among antenatal women was 0.47% at the all-India level (unadjusted). It was the highest in • Andhra Pradesh (1.22%) and Nagaland (1.12%). Tuensang, Ramanathpuram and Guntur had a prevalence of >3%.Prevalence in ANCs in the district of Tuensang in Nagaland has been >3% for the past 5 years. There is a need • to explore cross-border HIV transmission from Myanmar. A significant increasing trend has been observed for the past three years in Haryana, Chhattisgarh, Assam, • Jharkhand and Orissa.Urban illiterate women between the ages of 15 and 49 years were more vulnerable than their rural • counterparts. Education of women in the north-eastern states plays a protective role as the prevalence of HIV was the lowest among graduate women. The prevalence of HIV was the lowest in the age group of 15–24 years in all parts of India. This trend is more • apparent in urban than rural areas. The wives of truck drivers, auto drivers, etc., skilled/unskilled workers/labourers and hotel staff were • particularly vulnerable. HIV prevalence was very high among the wives of the unemployed.• VDRL positivity was higher among young mothers in the North-East than in the rest of the country. •
3.2) HIV prevalence among STI clinic attendees The prevalence of HIV among STI patients was 2.21% at the all-India level.• HIV prevalence among STI patients was the highest (>10%) in the south Indian states of Maharashtra and • Karnataka (Tamil Nadu and Andhra Pradesh did not conduct STI surveillance), followed by Mizoram and Gujarat. Rising trends were observed in Gujarat and Mizoram. • At the district level, 27 sites had an HIV prevalence of more than or equal to 5% among STI clinic attendees. • Thirteen of these sites were in states with moderate and low prevalence. The prevalence of HIV was the highest among those with ano-genital ulcer and warts. • Housewives formed the bulk of the attendees and the prevalence among them was >1%.• Those in service and students also came to the clinics in large numbers and were observed to be HIV-positive, • though the prevalence among them was lower than that among labourers, skilled workers, truckers, hotel staff, etc.
3.3) Truckers and migrants sitesThe HIV prevalence rates among truckers at these sites were found to be decreasing compared to 2007. The • prevalence ranged between 0% and 3%.The HIV prevalence rate among 250 migrants tested in the newly established site at Thane was as high as • 5.2%. HIV prevalence among migrants in Kolkata was very high (9.27%) in 2007, but the value fell to 2.48% in • 2008–09. The rest of the sites had a prevalence of <5%.The majority of truckers and migrants were above 25 years of age and their level of education varied from • primary to secondary.
3.4) Injecting drug users The HIV prevalence among IDUs was 9.86%—the highest among all HRGs at the all-India level. The trend • has been stationary since 2003. The situation in 2008–09 had not improved over the previous year. The HIV prevalence among IDUs in •

73Annual HIV Sentinel Surveillance - Country Report 2008-2009
nearly 50% of the sites was >5%. The same was observed in 2007.A significant increase in prevalence was observed in Maharashtra, Manipur, Madhya Pradesh and Punjab. • High prevalence persists among IDUs in Chandigarh, Delhi, Orissa, Kerala and West Bengal. There is a rising trend among IDUs in states with low and moderate prevalence.Women IDUs form 3.7% of the total IDUs tested at the country level.• The trend in Manipur has been stable and that in Mizoram rising since 2003.• Most of the IDUs are labourers, persons in service, students and unemployed persons, but HIV prevalence • is the highest among labourers, skilled/semi-skilled workers and truckers.
3.5) HIV prevalence among MSMThe HIV prevalence among MSM was 6.9% at the all-India level, with the prevalence in 11 states being • >5%. There was evidence of HIV infection among MSM in new sites in Andhra Pradesh, Madhya Pradesh, Bihar, • Himachal Pradesh and Jharkhand. There may be hidden pockets in each state.The trends across all zones have been stationary since 2004.• Urban areas in the country, such as north-east Delhi, Pune, Bangalore, Surat, Rajkot and Kolkata, recorded • very high HIV prevalence rates among MSM in 2008–09.HIV prevalence among this group and other HRGs was high in Andhra Pradesh and Maharashtra. MSM are • potential transmitters to wives and female partners.The majority of MSM were labourers, in business or in service.•
3.6) HIV prevalence among FSWsThe trend of HIV infection among FSWs has been one of gradual decline at the all-India level.• HIV prevalence among FSWs at the all-India level was 4.8% lower than the rate for MSM. Five high-prevalence • states had a prevalence of >10%. Tamil Nadu was an exception. The range of HIV prevalence in 4 sites in Andhra Pradesh (Khamann), Maharashtra (Pune, Kolhapur), Mumbai (Gaurabai CHCU) and Karnataka (Bagalkot) was 20%–40%.The trend in the low-prevalence states was stationary.• There was no change in the percentage of sites with a prevalence of >5% in 2008–09 compared to 2007.•
Recommendations for the surveillance strategy
Continue with the strategy employed in the 2008–09 round, with improvements in implementation.• Problems with logistics and staff may be reduced by starting activities during a fixed time period so that states • are prepared for the surveillance on time and can arrange for the trained staff to conduct the activities. Participatory planning by NACO and SACS is recommended so as to iron out the gaps in communication • regarding funds, HIV kits and the number of sites. An officer should be designated for surveillance activities. He should be responsible for overseeing and • coordinating the activities in each state. Absence of supervision and ad hoc arrangements created problems in the 2008–09 round. The procurement process at NACO for HIV kits and DBS cards can be planned for execution in time.• The number of HRG sites should be increased and all states should have sites for all the HRGs.• Many more sites for transgenders are required in the low-prevalence states as they indulge in commercial • sex at low rates.More sites for vulnerable population groups, like migrants, may be considered for surveillance so that TIs • for these groups can be prioritized in the programme on a wider scale.
Recommendations for programme based on evidence from surveillance .For women
Specific strategies are needed to address housewives with a low socioeconomic status, especially those • whose husbands are migrants. Steps should be taken to empower them with knowledge and negotiation skills

74 Annual HIV Sentinel Surveillance - Country Report 2008-2009
o Stronger convergence with the NRHM programme is required to improve antenatal care and increase PPTCT coverage. Multipurpose female workers may be trained jointly to refer women to ICTCs.
Comprehensive counselling services should be made available at all STI clinics and gynaecology OPDs for • not only HIV/AIDS but also reproductive health, to enhance attendance of both males and females.Measures should be taken for the social rehabilitation of FSWs.•
For high-risk groups The prevention programme for IDUs should be strengthened across the country.• Focused attention should be given to women IDUs and the partners of MSM.• There is a need to identify NGOs and CBOs to undertake TI among MSM and IDUs, and to support their • efforts. TI sites should be increased to enhance the access to and effectiveness of prevention programmes for • MSM. Transgenders deserve a separate intervention strategy because of their unique customs and because so • many of them are providers of commercial sex.The interventions for FSWs should be sustained in all states to help bring down the prevalence further. • The mass media should be involved to spread messages that would help to reduce stigma and create an • enabling environment for people living with HIV/AIDS (PLHA). Such efforts would encourage voluntary testing among those indulging in high-risk behaviour.There is a need to strengthen partner testing, as well as the treatment of HIV-positive people and those • with STIs.The sustainability of surveillance activities should be ensured by fostering ownership and commitment • at all levels—national, state and district—and identifying synergies with integrated disease surveillance systems.
Recommendations for research
The Task Force on Surveillance should review the status, and all the organizations involved in surveillance, • such as the NIHFW, NIMS and RIs, may be allotted different states to track the HIV epidemic and recommend research in accordance with their observations. The surveillance unit at NACO can coordinate and the external members of the Task Force may advise. WHO/UNAIDS may facilitate this process technically.More behavioural research is required to assess the transmission of HIV by bisexual MSM and by • transgenders.Research is required on cultural factors, sexual networks and HIV.•

75Annual HIV Sentinel Surveillance - Country Report 2008-2009
References
Lyerla R, Gouws E, Garcia-Calleja JM. The quality of sero-surveillance in low- and middle income countries: • status and trends through 2007. Sex Transm Infect 2008;84(Suppl I):i85–i91.
Walker N, Garcia-Calleja JM, Asamoah-Odei E, Poumerol G, Lazzari S, Ghys PD, et al. Epidemiological • analysis of the quality of HIV sero-surveillance in the world: how well do we track the epidemic. AIDS 2001;15(12):1545–54.
UNAIDS: 2008 Report on the global AIDS epidemic.•

76 Annual HIV Sentinel Surveillance - Country Report 2008-2009

77Annual HIV Sentinel Surveillance - Country Report 2008-2009
Annexure I
Annual Sentinel Surveillance for HIV Infection-2008List of Members for the Central Surveillance Team-2008
S.No Name States allotted for visits to TI
sites in 2008 Phone/Fax/Email
1
Prof. Deoki NandanDirectorNational Institute of Health & Family Welfare,New Mehrauli Road, Munirka, New Delhi-110067
Problem sites in any state
997110466691-11-26165959, 26166441 Ext. 302(Fax): [email protected]
2
Dr. DCS ReddyNPO WHO Representative (INDIA)5th Floor, Shri Ram Bharatiya Kala Kendra, 1 Copernicus Marg, Near Mandi House, New Delhi
Goa
9313104974 (M)Fax: 011 – [email protected]@gmail.com
3
Dr. A.K. KheraJoint Director (BSD)National AIDS Control Organization9th Floor, Chanderlok Building 36, Janpath, New Delhi – 110001
Delhi
011 – 23736851011 – 435099169810206150 (M)[email protected]@gmail.com
4
Dr. H.K. KarConsultant & Head, Deptt. of Dermatology, STD & LeprosyPGIMER, Dr. Ram Manohar Lohia Hospital, Baba Kharag Singh Marg, New Delhi - 110001
Karnataka
[email protected] 9212409060 (M), 9213551047, 26836372 (R)23404406 (O)23365501 (O)
5
Dr. Arvind Pandey DirectorInstitute for Research in medical Statistics (IRMS), ICMR Campus, Ansari Nagar, New Delhi – 110029
Uttar Pradesh
9818253969 (M), 26514903 (O)91-11-26588803 (O)Telefax: 91-11-26589635, Fax [email protected] 8803, Tel. 011-2658 8803 (new)
6
Dr. M. ThomasConsultant, NACOICMR Campus, Ansari NagarNew Delhi – 110029Phone No. 9958597717
Kerala (8 sites) [email protected] No. 9958597717
7
Dr. Renu GargEpidemiologistWorld Health Organization, South East Asia, Regional office, Indraprastha Estate, Mahatma Gandhi Marg, New Delhi – 110002
Problem sites in any state
Tel: 011-2337 0804 (Extn: 26641)Cell: [email protected]
8
Dr. R. MuraliHead, Deptt. of Community MedicineChettinad Hospital and Research Institute, IT Highway, Kelambakkam, Tamil Nadu – 603103
Andhra Pradesh 044-27475970 (Fax)[email protected] (O)
9
Dr. Prakash L. GattaniAssociate professor, Dept.of P.S.M., Govt.Medical College, Aurangabad- 431 001(MS), Maharashtra
Kerala (7 sites) [email protected]
10
Dr. S.K. GargProfessorDeptt. of Community MedicineLLRM Medical College, Meerut, Uttar Pradesh
Haryana [email protected]. No. 9412837112
11
Prof. B.C. DasProfessor & HeadDeptt. of Community Medicine& Director Kalinga Institute of Medical SciencesKIIT University, Campus No. 5, Bhubaneswar – 751024Orissa
Gujarat
[email protected]@kit.ac.in9437003336 (M)0674 – 2725313 (O)

78 Annual HIV Sentinel Surveillance - Country Report 2008-2009
12
Dr. G. SasikalaProf. of MicrobiologyGandhi Medical College, Hyderabad6-3-1119/C , C Bock 203, Aditya Elite BS Maktha Somajigude, Hyderabad, Andhra Pradesh
Orissa
[email protected] (O)09390464545040 – 23407677 (R)040 – 23304110 (Fax)09440055990 (M)
13
Dr. S.C. MathurProfessorDeptt. of Preventive & Social Medicine, SMS Medical College, Jaipur – 302004, RajasthanResidential address:408 Rani Sati NagarNirman NagarJaipur - 302019
Arunachal Pradesh (all TI sites) & Assam (6 sites)
[email protected] 941405560791-141-2706534 (O)
14
Prof. (BRIG.) Sunder Lal House No. 1046, sector – 17, HUDA -Jagdari Road, Yamuna Nagar, Haryana135003
Rajasthan
[email protected]@79.rediffmail.com0171-2445261M:- 9996005095 9896305095
15
Dr. Uday MohanProf., Deptt. of Community Medicine, CSM Medical University UP(Formerly King George’s Medical College)LUCKNOW - 226003 Uttar Pradesh
Bihar (11 sites)
0522 – 2237571(R)0522-2257343 (O)09415408926 (M)
16
Dr. Deepak Rout, MBBS, MD, FIPHAProfessor & HeadDepartment of Community MedicineRoom No. 428, 4th Floor,VM Medical College & Safdarjung HospitalNew Delhi - 110029
Tamil Nadu (15 sites)
[email protected] [email protected](new no. 9911367336)26714819 (O)26257911 (R)
17
Dr. V.K. SrivastavaProfessorDeptt. of Hospital AdministrationK.G. Medical CollegeLucknowU.P. - 226003
Jharkhand [email protected]: 09415101095
18
Dr. Partho HaldarNational Consultant- Epidemiology and Surveillance (HIV/AIDS) WHO-India; 5th Floor, Shri Ram Bharatiya Kala Kendra 1, Copernicus Marg, New Delhi –110001
Himachal Pradesh and J&K 011-42595600 Ext: [email protected]
19Dr. Sanjay DixitProf. & Head, Deptt. of Preventive & Social Medicine, M.G.M. Medical College, Indore, M.P. – 452001
Maharashtra (12 SITES)[email protected]
20Dr. M. BhattacharyaProf. & Head, Dept. of CHANIHFW, New Delhi
Mumbai & Chhattisgarh [email protected]
21
Dr. U. DuttaProfessor & Acting Head of Deptt.Deptt. of Education & Trg.NIHFW, New Delhi
West Bengal [email protected]
22Dr. Gyan SinghCMO, NFSG, Deptt. of RBM, NIHFWNew Delhi
Mizoram [email protected]
23Dr. Sanjay GuptaReader, Dept. of CHA, NIHFWNew Delhi-67
Madhya [email protected] [email protected]
24
Dr. J. V. SinghProf. & Head, Upgraded Deptt. of Community Medicine, Chhatrapati Shahuji Maharaj Medical University, Chowk, Lucknow, Uttar Pradesh- 226003
Assam (10 sites) [email protected],
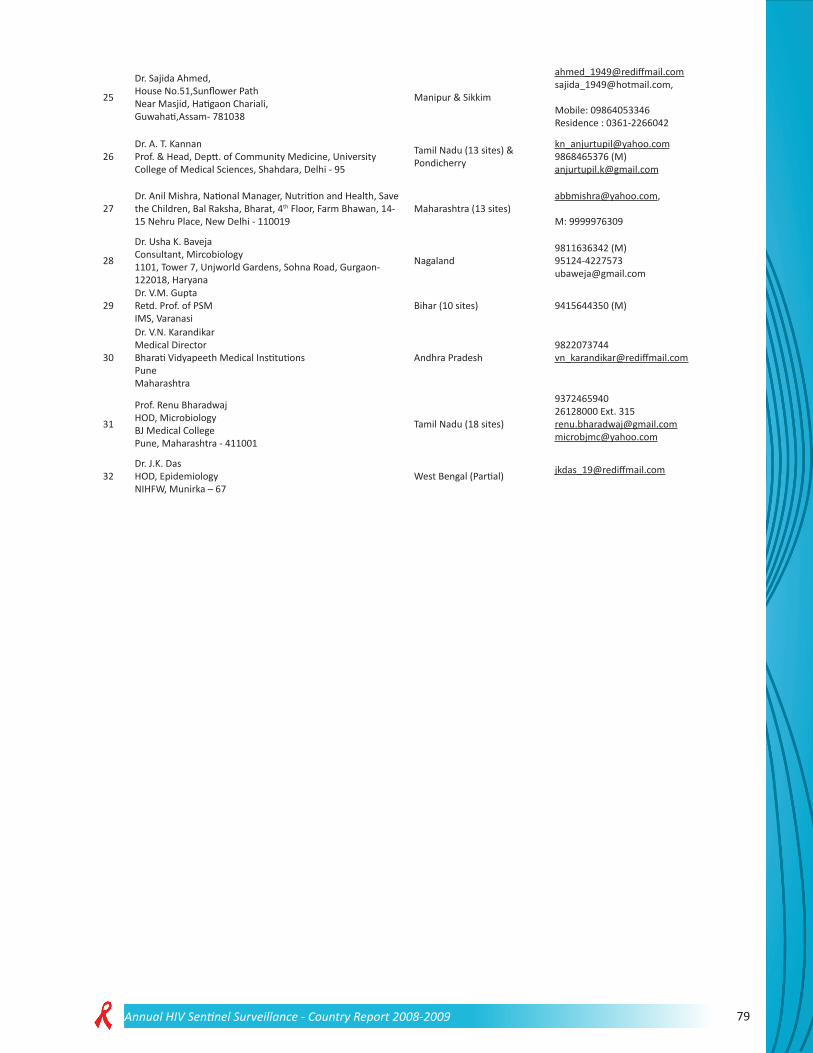
79Annual HIV Sentinel Surveillance - Country Report 2008-2009
25
Dr. Sajida Ahmed, House No.51,Sunflower Path Near Masjid, Hatigaon Chariali, Guwahati,Assam- 781038
Manipur & Sikkim
[email protected][email protected],
Mobile: 09864053346Residence : 0361-2266042
26Dr. A. T. KannanProf. & Head, Deptt. of Community Medicine, University College of Medical Sciences, Shahdara, Delhi - 95
Tamil Nadu (13 sites) & Pondicherry
[email protected] (M)[email protected]
27Dr. Anil Mishra, National Manager, Nutrition and Health, Save the Children, Bal Raksha, Bharat, 4th Floor, Farm Bhawan, 14-15 Nehru Place, New Delhi - 110019
Maharashtra (13 sites)[email protected],
M: 9999976309
28
Dr. Usha K. BavejaConsultant, Mircobiology1101, Tower 7, Unjworld Gardens, Sohna Road, Gurgaon- 122018, Haryana
Nagaland9811636342 (M)[email protected]
29Dr. V.M. GuptaRetd. Prof. of PSMIMS, Varanasi
Bihar (10 sites) 9415644350 (M)
30
Dr. V.N. KarandikarMedical DirectorBharati Vidyapeeth Medical InstitutionsPuneMaharashtra
Andhra [email protected]
31
Prof. Renu BharadwajHOD, MicrobiologyBJ Medical College Pune, Maharashtra - 411001
Tamil Nadu (18 sites)
937246594026128000 Ext. [email protected]@yahoo.com
32Dr. J.K. DasHOD, EpidemiologyNIHFW, Munirka – 67
West Bengal (Partial) [email protected]

80 Annual HIV Sentinel Surveillance - Country Report 2008-2009
Annexure II
State-wise summary tables, 2008–09
TABLE SS 1a Andaman and Nicobar Islands (2008 summary) *HIV prevalence among antenatal attendees
Trends in ANC, 2003–08
Group Number
tested HIV % positive (90%
CI)
All women 1593 0.06 (-0.04–-0.17) Urban women 1593 0.06 (-0.04–-0.17)
Rural women
* HIV prevalence is given for valid sites (≥75% sample size).
Andaman and Nicobar Islands ANC attendees
District Site name Population group 2003 2004 2005 2006 2007 2008
Andamans Diglipur, Port Blair (R) ANC 0.00 n/a n/a n/a n/a n/a
Andamans Port Blair, GB Pant Hospital ANC 0.50 0.00 0.00 0.50 0.50 0.00
Andamans Rangat (R) ANC 0.50 n/a n/a n/a n/a 0.00 Andamans Rangat CHC Hospital ANC 0.50 n/a n/a 0.00 0.00 0.00
Andamans PHC Garacharma, Port Blair (New 08) ANC n/a n/a n/a n/a n/a 0.00
Nicobar Car Nicobar BJR Hospital ANC 0.75 0.00 0.00 0.00 0.25 0.25 TABLE SS 1b
Andaman and Nicobar Islands (2008 summary) *HIV prevalence among populations with high-risk behaviours
Group Number HIV % positive
(90% CI) Remarks tested All STI patients 249 3.61 (1.67–5.56)
Total number of sentinel sites 1 0 sites (≥75% sample size) had prevalence ≥5% 0 sites (≥75% sample size) had prevalence ≥10%
* HIV prevalence is given for valid sites (≥75% sample size).
0.21 0.13 0.21 0.260.000.200.40
2003-2005 2004-2006 2005-2007 2006-2008HI
V%Po
sitiv
e
Years

81Annual HIV Sentinel Surveillance - Country Report 2008-2009
Populations with high-risk behaviours
District Site name Population group 2003 2004 2005 2006 2007 2008
Andamans NGO SEEDS, Port Blair FSW n/a n/a 0.50 0.40 n/a n/a Andamans Haddo MSM 1.25 n/a n/a n/a n/a n/a
Andamans Port Blair, GB Pant Hospital STI 0.00 1.20 0.40 0.80 1.60 3.61
Andamans Port Blair district jail STI 3.60 2.00 0.40 0.80 1.00 n/a
TABLE SS 2a Andhra Pradesh (2008 summary)
*HIV prevalence among antenatal attendees Trends in ANC, 2003–08
Group Number
HIV % positive (90% CI)
tested All women 20,800 1.22 (1.10–1.35) Urban women 10,400 1.37 (1.18–1.55) Rural women 10,400 1.08 (0.91–1.24) * HIV prevalence is given for valid sites (≥75% sample size).
ANC attendees
District Site name Population group 2003 2004 2005 2006 2007 2008
Adilabad Adilabad District Headquarters Hospital ANC 0.75 0.75 1.75 0.50 1.50 1.75
Adilabad Area hospital, Mancherial ANC (R) 1.50 0.25 1.00 0.25 1.75 1
Anantapur Ananthapur Medical College ANC 1.25 1.75 1.75 2.25 1.75 1.5
Anantapur Area hospital, Guntakal ANC (R) 0.75 1.25 1.00 0.50 0.25 0.25
Chittoor Chittoor District Headquarters Hospital ANC 0.00 1.25 1.25 0.25 1.00 1.5
Chittoor Area hospital, Srikalahasti ANC (R) 1.50 2.00 2.00 0.50 0.25 1.75
Cuddapah Cuddapah DH ANC 2.50 2.75 0.75 1.50 1.25 2
Cuddapah Area hospital, Rajampeta ANC (R) 1.25 1.25 0.50 1.75 0.50 2.5
East Godavari Kakinada Rangaraya Medical College ANC 2.50 3.00 2.75 1.25 2.00 2.5
East Godavari Area hospital, Ramachandrapuram ANC (R) 3.75 1.75 2.25 2.25 1.75 0.5
Guntur PHCs Guntur (New 07) ANC - PHC n/a n/a n/a n/a 1.52 n/a Guntur Guntur Medical College ANC 3.75 3.50 3.00 2.25 1.75 3.75 Guntur Area hospital, ANC (R) 2.76 1.50 2.50 1.25 2.25 2.5
1.62 1.60 1.40 1.300.002.00
2003-2005 2004-2006 2005-2007 2006-2008
HIV%
Posi
tive
Years

82 Annual HIV Sentinel Surveillance - Country Report 2008-2009
ANC attendees Narsorapet
Guntur PHC, Pedanandipadu (New 08) ANC (R) n/a n/a n/a n/a n/a 1.25
Hyderabad St Theresa Hospital (New 07) ANC - Pvt. n/a n/a n/a n/a 1.00 1.5
Hyderabad Hyderabad Gandhi Medical College ANC 1.00 0.75 2.00 2.00 1.50 0.75
Karimnagar Karimnagar DH ANC 2.00 3.50 2.25 0.50 1.00 1.5 Karimnagar Area hospital, Jagitial ANC (R) 2.01 1.50 0.57 1.50 2.00 1.5
Khammam Area hospital, Kothagudem ANC 1.50 2.00 3.50 2.75 2.25 1.5
Khammam Area hospital, Bhadrachalam ANC (R) 1.50 2.00 3.50 2.75 0.25 1
Khammam PHCs Khammam (New 07) ANC - PHC n/a n/a n/a n/a 0.00 n/a
Khammam PHC, Julurupadu (New 08) ANC (R) n/a n/a n/a n/a n/a 0.75
Krishna Machilipatnam DH ANC 1.75 2.25 2.00 1.75 2.25 1.25 Krishna Area hospital, Nuzividu ANC (R) 1.00 1.50 1.50 1.27 3.50 0.5
Krishna St.Ann’s Hospital/ American Hospital (New 07)
ANC - Pvt. n/a n/a n/a n/a 0.00 0.25
Kurnool Kurnool Medical College ANC 0.50 0.75 1.50 0.75 1.00 1.5
Kurnool Women and Child Hospital, Adoni ANC (R) 0.25 0.25 0.00 1.00 0.00 1
Mahbubnagar Mehboobnagar DH ANC 0.25 0.75 0.25 3.02 0.75 1.75 Mahbubnagar Area hospital, Gadwal ANC (R) 0.50 0.75 0.25 0.75 0.00 0.5 Medak Sangareddy DH ANC 0.50 1.00 2.00 2.00 0.25 2.25 Medak CHC, Narsapur ANC (R) 0.00 0.50 0.72 1.50 1.50 1 Nalgonda Nalgonda DH ANC 1.50 2.25 2.75 2.00 0.75 1.5 Nalgonda Area hospital, Bhongir ANC (R) 0.75 0.75 1.00 1.00 1.00 1.25 Nellore Nellore GMH Hospital ANC 2.50 2.75 1.50 2.00 2.25 0.5 Nellore Area hospital, Kavali ANC (R) 0.50 2.25 0.75 1.50 0.75 1.5
Nizamabad PHCs Nizamabad (New 07) ANC - PHC n/a n/a n/a n/a 0.25 n/a
Nizamabad Nizamabad DH ANC 1.00 2.25 0.75 0.50 0.75 0.25
Nizamabad Area hospital, Kamareddy ANC (R) 1.00 1.75 2.50 3.00 1.26 0.75
Nizamabad CHC, Madnoor (New 08) ANC (R) n/a n/a n/a n/a n/a 0.5
Prakasam PHCs Prakasam (New 07) ANC - PHC n/a n/a n/a n/a 1.00 n/a
Prakasam Ongole Maternal and Child Health Hospital ANC 3.00 4.00 2.50 3.02 1.75 1.5
Prakasam Area hospital, Chirala ANC (R) 2.50 1.75 3.25 2.25 1.25 1
Prakasam PHC, Santhanuthalapadu (New 08)
ANC (R) n/a n/a n/a n/a n/a 0.75
Rangareddi Rangareddy DH ANC 0.50 0.50 1.75 1.25 0.50 0.5

83Annual HIV Sentinel Surveillance - Country Report 2008-2009
ANC attendees Srikakulam Srikakulam DH ANC 1.00 4.00 1.50 1.75 0.25 0.75 Srikakulam CHC, Tekkali ANC (R) 0.75 1.00 0.25 1.02 0.25 0
Visakhapatnam Apurva Hospital, Seetaampeta (New 07) ANC - Pvt. n/a n/a n/a n/a 0.39 0.25
Visakhapatnam Ankapalli DH ANC 1.00 1.50 2.50 0.50 0.25 1 Visakhapatnam CHC, Aganampudi ANC (R) 2.25 0.75 0.50 0.25 0.50 0.5 Vizianagaram Vizianagaram DH ANC 1.25 1.75 1.25 1.25 1.00 1.25
Vizianagaram Area hospital, Parvathipuram ANC (R) 1.00 0.50 2.00 0.50 0.25 0.5
Warangal GMH, Hanumakonda ANC 1.50 2.50 2.50 0.75 0.50 1 Warangal Area hospital, Jangaon ANC (R) 1.00 1.25 0.75 0.25 0.25 0.75
West Godavari PHCs West Godavari (New 07) ANC - PHC n/a n/a n/a n/a 2.25 n/a
West Godavari Eluru DH ANC 1.00 1.25 0.75 0.25 2.01 1.75 West Godavari CHC, Bhimavaram ANC (R) 2.53 2.00 3.00 1.76 1.25 3.75
West Godavari PHC, Ganapavaram (New 08) ANC (R) n/a n/a n/a n/a n/a 0.75
TABLE SS 2b Andhra Pradesh (2008 summary)
*HIV prevalence among populations with high-risk behaviours
Group Number HIV % positive (90% CI) Remarks tested
Total number of sentinel sites 20
Female sex workers 2938 11.47 (10.50–12.44) 5 sites (≥75% sample size) had prevalence ≥5% Injecting drug users 492 6.91 (5.03–8.79) 11 sites (≥75% sample size) had prevalence ≥10% Men who have sex with men 1240 22.10 (20.16–24.03) * HIV prevalence is given for valid sites (≥75% sample size).
Andhra Pradesh Populations with high-risk behaviours
District Site name Population group 2003 2004 2005 2006 2007 2008
Adilabad AIRTDS, Mancherial (New 07) FSW n/a n/a n/a n/a 4.60 16.94 East Godavari East Godavari FSW 45.2 40.8 26.8 9.2 15.60 17.96
Guntur Needs Society, Chilakaluripet, Guntur FSW n/a 14.4 13.2 6 12.80 8.05
Hyderabad Hyderabad FSW 16 10 12 9.6 7.23 14.81 Khammam JAGRUTI (New 07) FSW n/a n/a n/a n/a 15.60 26.72 Kurnool Parameswari, Kurnool FSW 8.8 10 3.2 2.41 3.61 4.82 Nalgonda ANKITA (New 07) FSW n/a n/a n/a n/a 10.00 8.68
Prakasam Lakshmi Development Society, Ongle, Prakasam FSW 24.4 10.8 7.2 4.4 7.20 6.88
Srikakulam Swageti Project,Youth Club of Bejjipuram (New 07) FSW n/a n/a n/a n/a 6.00 4.12

84 Annual HIV Sentinel Surveillance - Country Report 2008-2009
Andhra Pradesh
Visakhapatnam
Priyadarshini Service Organization, Vishakhapatnam
FSW 12.8 14 15.6 10.8 8.80 9.27
Warangal Warangal FSW 12.8 18.8 12.8 8.84 n/a 4.82 West Godavari
Action for Development, Bhimavaram (New 07) FSW n/a n/a n/a n/a 16.47 14.11
Chittoor PASS, Tirupati (New 07) IDU n/a n/a n/a n/a 3.85 9.5 Visakhapatnam
Priyadarsini Service Organization (New 07) IDU n/a n/a n/a n/a 3.60 4.4
Adilabad Adilep, Nirmal (New 07) MSM (Alliance) n/a n/a n/a n/a 9.95 18.4
Anantapur HANDS, Gooty (New 07) MSM n/a n/a n/a n/a 9.20 17.6 Hyderabad MITRUDU (New 07) MSM n/a n/a n/a n/a 41.22 41.1 Kadapa PAID (New 07) MSM n/a n/a n/a n/a 17.20 33.2 Krishna Saathi, Vijayawada, Krishna MSM 13.2 16 6.45 10.25 15.45 14.5 Warangal MARI, Hanmakonda (New 07) MSM n/a n/a n/a n/a 17.54 26.8
Chittoor Tirupati SV Medical College and Hospital STI 37.8 31.2 22.8 16.8 17.20 n/a
East Godavari
Rajahmundry District Hospital STI 25.2 16 14.8 14 18.80 n/a
Hyderabad Hyderabad Osmania Medical College and Hospital STI 34.4 36 32.4 36.95 28.23 n/a
Karimnagar Area hospital, Ramagundam STI 4.8 5.6 20.4 13.2 12.40 n/a
Khammam Khammam District Headquarters Hospital STI 10 16 31.2 26.4 11.60 n/a
Krishna Vijayawada GGH STI n/a 28.8 26.4 24.4 17.20 n/a Kurnool Kurnool GGH STI n/a 7.2 15.2 8.4 7.60 n/a Medak Sangareddy District Hospital STI 2 6 4 5.6 13.60 n/a
Prakasam Ongole District Hospital STI 17.74 14.4 19.6 36.8 39.20 n/a
Visakhapatnam
Vishakhapatnam Andhra Medical College and Hospital STI 29.7
2 35.6 32 30 34.40 n/a
Warangal Warangal MGM Hospital STI n/a 31.2 23.74 30.4 16.80 n/a Guntur Guntur district TB centre TUB n/a 11 16.75 n/a n/a n/a
TABLE SS 3a Arunachal Pradesh (2008 summary)
*HIV prevalence among antenatal attendees Group Number HIV % positive (90% CI) tested All women 1510 0.33 (0.09–0.57) Urban women 1510 0.33 (0.09–0.57) Rural women
* HIV prevalence is given for valid sites (≥75% sample size).

85Annual HIV Sentinel Surveillance - Country Report 2008-2009
ANC attendees
District Site name Population group 2003 2004 2005 2006 2007 2008
Bomdila ANC (R) 0.00 n/a n/a n/a n/a n/a Lohit Tezu DH ANC n/a 0.34 0.87 1.27 0 0
Lower Dibang Valley DH Roing,Lower Dibang Valley (New) ANC n/a n/a n/a 0.00
0 0.56
Lower Subansiri Ziro DH ANC n/a n/a n/a 0.00 0 n/a
Papum Pare RK Mission Hospital, Itanagar ANC n/a n/a n/a 0.00
0 0.75
Tezu CHC ANC (R) 0.00 n/a n/a n/a n/a n/a
Uppur Siang Yingkiong DH (New 07) ANC n/a n/a n/a n/a 0 n/a
West Kameng Bomdila DH ANC 0.00 0.00 0.00 0.00 0 0
Arunachal Pradesh (2008 summary) *HIV prevalence among populations with high-risk behaviours
Group Number HIV % positive (90% CI) Remarks Tested All STI patients 951 2.10 (1.34–2.87) Total number of sentinel sites 12 Female sex workers 393 0.0 (0.0–0.0) 1 site (≥75% sample size) had prevalence ≥5% Injecting drug users 429 0.23 (-0.15–0.62) 1 site (≥75% sample size) had prevalence ≥10%
* HIV prevalence is given for valid sites (≥75% sample size).
Arunachal Pradesh Populations with high-risk behaviours
District Site name Population group 2003 2004 2005 2006 2007 2008
Lohit
Arun Pali Vidhyapith Society, Tezu (New 08) FSW n/a n/a n/a n/a n/a 0
Papum Pare Turbu Daleh MPC Society, Naharlagun (New 08) FSW n/a n/a n/a n/a n/a 0
Papum Pare TI, Banderdewa FSW n/a n/a n/a 0.00 n/a n/a
Papum Pare Voluntary Health Association of India,Itanagar (New 09)
IDU n/a n/a n/a n/a n/a 0.49
Papum Pare TI, Naharlagun IDU n/a n/a n/a 0.00 n/a n/a
Papum Pare Hidden Land Exploration Society (New 07) IDU TI n/a n/a n/a n/a 0.00 0
Changlang Changlang DH STI n/a n/a n/a 1.21 0.00 n/a East Siang Pasighat General Hospital STI 0.00 0.00 0.00 0.00 0.00 8.57 Lohit Tezu DH STI n/a n/a n/a 2.33 0.00 0
Papum Pare Naharlagun General Hospital STI 0.63 1.24 2.00 0.80 1.26 0.83
Tawang Tawang DH STI n/a 0.00 0.00 0.00 0.00 n/a Tirap Khonsa DH STI n/a n/a n/a 0.42 0.00 0 West Siang Along DH STI 1.02 0.00 0.00 0.00 0.00 n/a

86 Annual HIV Sentinel Surveillance - Country Report 2008-2009
TABLE SS 4a Assam (2008 summary) *HIV prevalence among antenatal attendees Trends in ANC, 2003–08
Group Number HIV % positive (90% CI)
tested
All women 6370 0.13 (0.05–0.20)
Urban women 6370 0.13 (0.05–0.20)
Rural women * HIV prevalence is given for valid sites (≥75% sample size).
ANC attendees
District Site name Population group 2003 2004 2005 2006 2007 2008
Bongaigaon Bongaigaon Civil Hospital ANC 0.00 0.00 0.00 0.00 0.00 0.25
Darrang Mangaldoi Civil Hospital ANC n/a n/a n/a 0.00 0.00 0
DHemaji Demaji Civil Hospital ANC n/a n/a n/a 0.00 0.00 0 Goalpara Goalpara Civil Hospital ANC n/a n/a n/a 0.00 0.00 0
Hailakandi Hailakandi Civil Hospital ANC n/a n/a n/a 0.36 0.00 0
Jorhat Jorhat Civil Hospital ANC 0.00 0.00 0.00 0.00 0.00 0.75 Jorhat CHC, Teok ANC (R) 0.00 n/a n/a n/a n/a n/a
Kamrup Mahendra Mohan Chaudhary Civil Hospital
ANC n/a n/a n/a 0.00 0.00 0.25
Karbi Anglong Diphu Civil Hospital ANC n/a n/a n/a 0.00 0.34 0
Karimganj Karimganj Civil Hospital ANC n/a n/a n/a 0.00 0.00 0.25
Lakhimpur Lakhimpur Civil Hospital ANC 0.00 0.00 0.00 0.00 0.75 0
Marigaon Morigan Civil Hospital ANC n/a n/a n/a 0.00 0.26 0.25 Nagaon CHC, Dhing ANC (R) 0.00 n/a n/a n/a n/a n/a Nagaon Nagaon Civil Hospital ANC 0.00 0.62 0.00 0.25 0.00 0 Nalbari Nalbari Civil Hospital ANC n/a n/a n/a 0.00 0.00 0 North Lakhimpur CHC, Naobcicha ANC (R) 0.00 n/a n/a n/a n/a n/a Sibsagar Sibsagar Civil Hospital ANC n/a n/a n/a 0.00 0.25 0 Tinsukia Tinsukia Civil Hospital ANC n/a n/a n/a 0.00 0.00 0.25
Udalguri/Darrang Udalguri CHC (New 07) ANC n/a n/a n/a n/a n/a 0
0.06 0.09 0.11 0.190.000.200.40
2003-2005 2004-2006 2005-2007 2006-2008
HIV%
Posi
tive
Years

87Annual HIV Sentinel Surveillance - Country Report 2008-2009
TABLE SS 4b Assam (2008 summary) *HIV prevalence among populations with high-risk behaviours
Group Number HIV % positive (90% CI) Remarks tested All STI patients 2086 1.05 (0.69–1.42) Total number of sentinel sites 26 Female sex workers 2838 0.99 (0.68–1.29) 2 sites (≥75% sample size) had prevalence ≥5% Injecting drug users 437 5.26 (3.51–7.02) 0 sites (≥75% sample size) had prevalence ≥10% Men who have sex with men 242 2.48 (0.84–4.12) * HIV prevalence is given for valid sites (≥75% sample size).
Assam Populations with high-risk behaviours
District Site name Population group 2003 2004 2005 2006 2007 2008
Barpeta Gauhati Youth Society (New 07) FSW n/a n/a n/a n/a 0.89 0 Barpeta NEVARD FSW n/a n/a 0.88 0.00 n/a n/a
Baska/ Nalbari Weavers Development Society (New 07) FSW n/a n/a n/a n/a 0.00 n/a
Bongaigaon Nagen Sarmah Memorial Society FSW n/a n/a n/a 0.00 n/a n/a
Bongaigaon Progotishil Janakalayan Samity (New 07) FSW n/a n/a n/a n/a 0.40 0
Cachar Silchar Nibedita Nari Sangtha FSW 0.00 0.00 2.40 2.29 n/a n/a
Cachar Deshbandhu Club (New 07) FSW n/a n/a n/a n/a 0.40 0.82
Darrang North-East Regional Instittute of Management FSW n/a n/a n/a 0.40 0.39 0.88
Dibrugarh Socio-Educational Welfare Association FSW n/a n/a n/a 0.00 1.96 1.69
Goalpara Ramdia Youth Centre (New 07) FSW n/a n/a n/a n/a 0.38 0.45
Goalpara Society for Appropriate Technology FSW n/a n/a 0.00 0.00 n/a n/a
Golaghat North-East Nature Club FSW n/a n/a n/a 0.75 n/a n/a Kamrup Bhoruka Public Welfare Trust FSW n/a n/a n/a 0.95 0.00 2.94 Marigaon Progoti FSW n/a n/a n/a 0.65 n/a n/a
Marigaon Zeal Thrill Friendship Group (New 07) FSW n/a n/a n/a n/a 0.00 0
Nalbari Nalbari Yubasammanay FSW n/a 0.00 0.00 0.00 n/a n/a Nalibari DREESTEE (New 07) FSW n/a n/a n/a n/a 0.00 n/a
Tinsukia Socio-Economic and Development Organization FSW n/a n/a n/a 0.43 n/a n/a
Dhubri NEVARD (New 08) FSW n/a n/a n/a n/a n/a 5.17 Jorhat IMPACT NE (New 08) FSW n/a n/a n/a n/a n/a 0 Sibsagar SHAPE (New 08) FSW n/a n/a n/a n/a n/a 0 Sonitpur SNEH (New 08) FSW n/a n/a n/a n/a n/a 0

88 Annual HIV Sentinel Surveillance - Country Report 2008-2009
Assam
Kamrup Global Organization for Life Development IVDU n/a n/a n/a 1.18 1.90 6.42
Kamrup Guwahati AIDS Prevention Society IVDU 5.56 4.48 9.84 n/a n/a n/a
Sonitpur/Karbi Anglong DAIPARC IVDU n/a n/a 7.14 4.00 2.38 4.11
Kamrup Association for Sociocultural and Environmental Development MSM n/a n/a n/a 0.78 n/a n/a
Kamrup Rural Multimedia Publicity and Promotion (New 07) MSM n/a n/a n/a n/a 2.78 2.48
Barpeta Barpeta Civil Hospital STI n/a n/a n/a 0.40 0.00 0 Cachar Silchar Medical College STI 0.00 2.65 2.36 2.00 3.60 2.26 Dibrugarh Dibrugarh Assam Medical College STI 0.80 0.80 0.89 0.40 0.80 1.65 Dhubri Dhubri Civil Hospital STI 1.20 0.00 0.00 0.40 0.40 0.51 Golaghat Golaghat Civil Hospital STI n/a n/a n/a 1.20 0.80 0.4
Kamrup Guwahati Medical College, Guwahati STI 1.72 1.34 4.40 1.82 1.75 3.6
Kokrajhar Kokrajhar Civil Hospital STI n/a n/a n/a 0.50 0.39 0.86 North Cachar Hills Haflong Civil Hospital STI n/a n/a n/a 0.50 0.50 0
Sonitpur Kanak Lata Civil Hospital Tezpur STI 1.20 0.00 0.40 2.00 0.00 0
TABLE SS 5a Bihar (2008 summary)
*HIV prevalence among antenatal attendees Trends in ANC, 2003–08
Group Number
HIV % positive (90% CI)
tested
All women 8693 0.31 (0.21–0.41) Urban women 8693 0.31 (0.21–0.41)
Rural women * HIV prevalence is given for valid sites (≥75% sample size).
ANC attendees
District Site name Population group
2003 2004 2005 2006 2007 2008 Araria Araria Sadar Hospital ANC 0.00 0.00 1.75 0.00 0.00 0
Aurangabad Aurangabad Sadar Hospital ANC n/a n/a n/a 0.50 0.00 0
Banka Banka Sadar Hospital ANC n/a n/a n/a 0.75 1.23 0.25
Begusarai Begusarai Sadar Hospital ANC 0.25 0.50 0.50 0.50 0
0.21 0.29 0.33 0.29
0.000.200.40
2003-20052004-20062005-20072006-2008
HIV%
Posi
tive
Years

89Annual HIV Sentinel Surveillance - Country Report 2008-2009
ANC attendees
Bhagalpur Bhagalpur Jawahar Lal Nehru Medical College Hospital
ANC 0.00 0.25 0.50 0.25 0.00 0
Darbhanga Laheriasarai Darbhanga Medical College Hospital
ANC n/a n/a n/a 0.25 0.25 1
Khagaria Khagaria Sadar Hospital ANC n/a n/a n/a 0.00 0.25 n/a
Kishanganj Mata Gujri Memorial Medical College Hospital
ANC n/a n/a n/a 0.00 0.00 1.25
Lakhisarai Lakhisarai Sadar Hospital ANC n/a n/a n/a 1.00 0.50 0.33
Madhepura Madhepura Sadar Hospital ANC n/a n/a n/a 0.58 0.00 0
Madhubani Madhubani Sadar Hospital ANC n/a n/a n/a 0.00 0.00 0.5
Muzaffarpur Muzaffarpur Sri Krishna Medical College Hospital
ANC 0.00 0.00 0.00 0.00 0.00 0
Nalanda Biharsharif Sadar Hospital ANC n/a n/a n/a 0.25 0.25 0
Nawada Nawada Sadar Hospital ANC n/a n/a n/a 0.25 0.50 0.75
Pashchim Champaran Betiah MJK Hospital ANC n/a n/a n/a 0.00 0.00 0
Patna Patna Patna Medical College Hospital ANC 0.50 0.75 0.00 0.75 1.00 1
Purba Champaran Raxaul Duncan Hospital ANC 0.00 0.00 0.00 0.50 0.00 0.5
Rohtas Rohtas Sadar Hospital/ Sasaran Sadar Hospital
ANC 0.00 0.00 0.00 0.50 0.50 0
Saharsa Saharsa Sadar Hospital ANC n/a n/a n/a 1.14 0.00 0.25
Samastipur Samastipur Sadar Hospital ANC n/a n/a n/a 0.75 0.50 0
Sheohar Sheohar Sadar Hospital ANC n/a n/a n/a 0.00 0.00 0.25
Sitamarhi Sitamarhi Sadar Hospital ANC n/a n/a n/a 0.50 2.20 0.75
Vaishali Hajipur Sadar Hospital ANC n/a n/a n/a 0.50 0.75 0
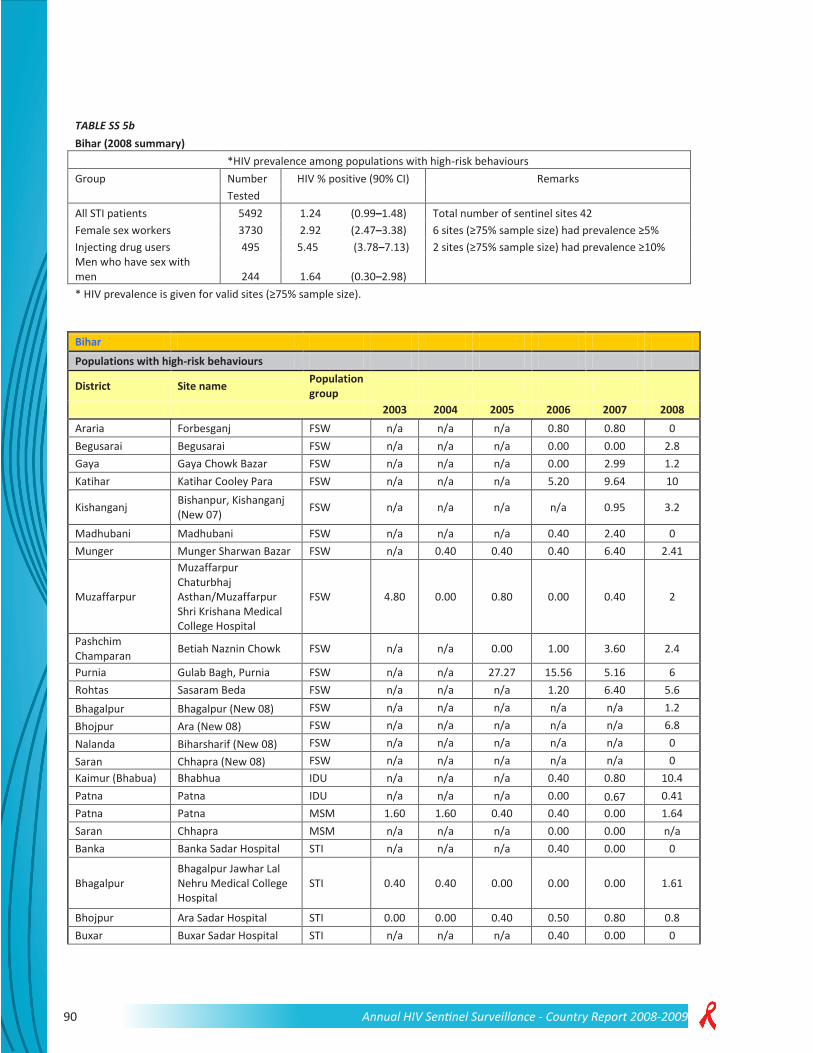
90 Annual HIV Sentinel Surveillance - Country Report 2008-2009
TABLE SS 5b Bihar (2008 summary)
*HIV prevalence among populations with high-risk behaviours Group Number HIV % positive (90% CI) Remarks Tested All STI patients 5492 1.24 (0.99–1.48) Total number of sentinel sites 42 Female sex workers 3730 2.92 (2.47–3.38) 6 sites (≥75% sample size) had prevalence ≥5% Injecting drug users 495 5.45 (3.78–7.13) 2 sites (≥75% sample size) had prevalence ≥10% Men who have sex with men 244 1.64 (0.30–2.98) * HIV prevalence is given for valid sites (≥75% sample size).
Bihar Populations with high-risk behaviours
District Site name Population group
2003 2004 2005 2006 2007 2008 Araria Forbesganj FSW n/a n/a n/a 0.80 0.80 0 Begusarai Begusarai FSW n/a n/a n/a 0.00 0.00 2.8 Gaya Gaya Chowk Bazar FSW n/a n/a n/a 0.00 2.99 1.2 Katihar Katihar Cooley Para FSW n/a n/a n/a 5.20 9.64 10
Kishanganj Bishanpur, Kishanganj (New 07) FSW n/a n/a n/a n/a 0.95 3.2
Madhubani Madhubani FSW n/a n/a n/a 0.40 2.40 0 Munger Munger Sharwan Bazar FSW n/a 0.40 0.40 0.40 6.40 2.41
Muzaffarpur
Muzaffarpur Chaturbhaj Asthan/Muzaffarpur Shri Krishana Medical College Hospital
FSW 4.80 0.00 0.80 0.00 0.40 2
Pashchim Champaran Betiah Naznin Chowk FSW n/a n/a 0.00 1.00 3.60 2.4
Purnia Gulab Bagh, Purnia FSW n/a n/a 27.27 15.56 5.16 6 Rohtas Sasaram Beda FSW n/a n/a n/a 1.20 6.40 5.6 Bhagalpur Bhagalpur (New 08) FSW n/a n/a n/a n/a n/a 1.2 Bhojpur Ara (New 08) FSW n/a n/a n/a n/a n/a 6.8 Nalanda Biharsharif (New 08) FSW n/a n/a n/a n/a n/a 0 Saran Chhapra (New 08) FSW n/a n/a n/a n/a n/a 0 Kaimur (Bhabua) Bhabhua IDU n/a n/a n/a 0.40 0.80 10.4 Patna Patna IDU n/a n/a n/a 0.00 0.67 0.41 Patna Patna MSM 1.60 1.60 0.40 0.40 0.00 1.64 Saran Chhapra MSM n/a n/a n/a 0.00 0.00 n/a Banka Banka Sadar Hospital STI n/a n/a n/a 0.40 0.00 0
Bhagalpur Bhagalpur Jawhar Lal Nehru Medical College Hospital
STI 0.40 0.40 0.00 0.00 0.00 1.61
Bhojpur Ara Sadar Hospital STI 0.00 0.00 0.40 0.50 0.80 0.8 Buxar Buxar Sadar Hospital STI n/a n/a n/a 0.40 0.00 0

91Annual HIV Sentinel Surveillance - Country Report 2008-2009
Bihar
Darbhanga Laheriasarai Darbanga Medical College Hospital
STI 0.40 2.00 0.40 0.00 0.00 0.4
Gaya Gaya Anurag Narain Magadh Medical College Hospital
STI 0.40 2.80 0.00 0.40 0.85 0
Gopalganj Gopalganj Sadar Hospital STI n/a n/a n/a 1.60 0.00 0.4
Jamui Jamui Sadar Hospital STI n/a n/a n/a 2.00 0.67 0.4
Jehanabad Jehanabad Sadar Hospital STI n/a n/a n/a 1.20 1.1.8 0.4
Kaimur (Bhabua) Bhabhua Sadar Hospital STI n/a n/a n/a 0.00 0.65 0 Katihar Katihar Sadar Hospital STI 9.20 2.40 0.00 2.50 0.00 0.4 Khagaria Khagaria Sadar Hospital STI n/a n/a n/a 0.00 0.00 n/a
Kishanganj Sadar Hospital, Kishanganj STI n/a n/a 0.00 0.00 3.20 1.2
Madhubani Madhubani Sadar Hospital STI n/a n/a n/a 0.00 0.80 5.2
Muzaffarpur Muzaffarpur Sri Krishna Medical College Hospital
STI 0.00 0.40 0.00 0.40 0.00 2.02
Nalanda Biharsharif Sadar Hospital STI n/a n/a n/a 1.33 0.47 0
Pashchim Champaran Betiah MJK Hospital STI n/a n/a n/a 1.20 1.20 3.2
Patna Patna Patna Medical College Hospital STI 1.60 0.40 0.80 3.20 2.00 1.2
Purba Champaran Raxaul Duncan Hospital STI 7.20 2.13 3.07 1.60 2.67 n/a Purnia Purnia Sadar Hospital STI n/a n/a n/a 0.40 0.00 2.42 Saran Chhapra Sadar Hospital STI n/a n/a n/a 0.00 0.00 0
Sitamarhi Sitamarhi Sadar Hospital STI n/a n/a n/a 2.01 4.00 5.6
Siwan Siwan Sadar Hospital STI n/a n/a n/a 4.76 1.10 1.6 Supaul Supaul Sadar Hospital STI n/a n/a n/a 0.40 0.00 0.4
TABLE SS 6a Chandigarh (2008 summary)
*HIV prevalence among antenatal attendees Trends in ANC, 2003–08
Group Number
HIV % positive (90% CI)
tested All women 400 0.25 (-0.16–0.66) Urban women 400 0.25 (-0.16–0.66)
Rural women * HIV prevalence is given for valid sites (≥75% sample size).
0.30.3
0.20.3
0.00.10.20.30.4
2003-2005 2004-2006 2005-2007 2006-2008
HIV%
Posi
tive
Years

92 Annual HIV Sentinel Surveillance - Country Report 2008-2009
ANC attendees
District Site name Population group
2003 2004 2005 2006 2007 2008 Chandigarh CHC, PGIMER ANC (R) 0.00 n/a n/a n/a n/a n/a
Chandigarh Sector 16 General Hospital ANC 0.50 0.50 0.00 0.25 0.25 0.25
Chandigarh CHC-II, PGIMER ANC (R) 0.00 n/a n/a n/a n/a n/a TABLE SS 6b
Chandigarh (2008 summary) *HIV prevalence among populations with high-risk behaviours
Group Number HIV % positive (90% CI) Remarks tested All STI patients 485 2.89 (1.64–4.14) Total number of sentinel sites 7 Female sex workers 701 0.57 (0.10–1.04) 0 sites (≥75% sample size) had prevalence ≥5% Injecting drug users 250 14.40 (10.75–18.05) 1 site (≥75% sample size) had prevalence ≥10% Men who have sex with men 250 3.20 (1.37–5.03) * HIV prevalence is given for valid sites (≥75% sample size).
Populations with high-risk behaviours
District Site name Population group
2003 2004 2005 2006 2007 2008 Chandigarh Chandigarh slums-I FSW 0.00 0.40 0.00 1.60 0.80 0 Chandigarh Chandigarh slums-II FSW 1.20 0.80 1.20 0.00 0.00 0.4 Chandigarh Chandigarh slums-III FSW n/a 1.20 0.80 0.40 0.40 1.49 Chandigarh Chandigarh slums IDU n/a 4.80 9.20 17.60 8.64 14.4 Chandigarh Chandigarh slums MSM n/a 1.36 1.60 4.80 3.60 3.2 Chandigarh Sector 16 General Hospital STI 0.00 2.00 0.40 0.80 0.40 2 Chandigarh PGIMER STI 1.62 1.60 1.60 2.60 0.45 3.83
TABLE SS 7a Chhattisgarh (2008 summary)
*HIV prevalence among antenatal attendees Trends in ANC, 2003–08
Group Number HIV % positive (90%
CI)
tested All women 7126 0.41 (0.28–0.53) Urban women 7126 0.41(0.28–0.53)
Rural women * HIV prevalence is given for valid sites (≥75% sample size).

93Annual HIV Sentinel Surveillance - Country Report 2008-2009
ANC attendees
District Site name Population group
2003 2004 2005 2006 2007 2008 Baster Jagdalpur DH ANC 1.26 0.00 0.00 0.32 0.25 1
Bilaspur Medical College, Bilaspur ANC n/a n/a n/a 0.00 0.50 0
Bilaspur Bilaspur ANC (R) 1.25 n/a n/a n/a n/a n/a Bilaspur Bilaspur DH ANC 0.00 0.00 0.25 0.00 0.50 0 Bilaspur CIMS (New 08) ANC n/a n/a n/a n/a n/a 0
Bilaspur SEC Railway Hospital, Bilaspur ANC n/a n/a n/a 0.25 0.00 n/a
Dantewada Dantewada DH ANC 0.40 n/a 0.75 0.75 0.25 0.75 Dantewada CHC, Geedam ANC n/a n/a n/a 0.00 n/a n/a Dhamtari Dhamtari DH ANC n/a n/a n/a 0.00 0.00 0.25 Durg Bhilai Steel Plant Sail ANC n/a n/a n/a 1.15 n/a 0 Jangir-Champa Jangir DH ANC n/a n/a n/a 0.00 1.00 0.25
Jashpur Jashpur DH ANC n/a n/a n/a 0.00 0.00 0 Kanker Kanker DH ANC n/a n/a n/a 0.25 0.75 0.25 Kawardha Kawardha DH ANC n/a n/a n/a 0.00 0.00 0.25 Korba SECL Gevra ANC n/a n/a n/a 0.00 0.00 n/a Korba Korba DH ANC n/a n/a n/a n/a n/a 0.25 Koriya Koriya DH ANC n/a n/a n/a 0.55 0.00 1.26 Mahasamund Mahasamund DH ANC n/a n/a n/a 0.75 0.00 0.25 Raigarh kharsia ANC n/a n/a n/a 0.00 0.25 0 Raigarh Raigarh DH ANC 2.25 0.00 0.28 0.50 0.00 1.26 Raigarh Raigarh ANC (R) 0.00 n/a n/a n/a n/a n/a Raipur Raipur DH ANC n/a n/a n/a 0.00 0.50 1.25 Rajnandgaon Rajnandgaon DH ANC 0.75 0.00 0.25 0.75 0.25 0.26 Rajnanga Rajnanga ANC (R) 0.00 n/a n/a n/a n/a n/a Surguja Surguja DH ANC n/a n/a n/a n/a n/a 0
TABLE SS 7b Chhattisgarh (2008 summary)
*HIV prevalence among populations with high-risk behaviours Group Number HIV % positive (90% CI) Remarks tested
All STI patients 988 2.13 (1.37–2.88) Total number of sentinel sites 4
1 site (≥75% sample size) had prevalence ≥5%
0 sites (≥75% sample size) had prevalence ≥10%
* HIV prevalence is given for valid sites (≥75% sample size).

94 Annual HIV Sentinel Surveillance - Country Report 2008-2009
Chattishgarh Populations with high-risk behaviors
District Site name Population group 2003 2004 2005 2006 2007 2008
Bilaspur Bilaspur DH/Bilaspur Chhattisgarh Rangers FSW n/a n/a n/a 1.20 3.45 n/a
Bilaspur Mungeli Bilaspur FSW n/a n/a n/a 2.09 0.00 n/a Durg Bhilai NGO FSW n/a n/a n/a 2.14 n/a n/a
Raipur Urla Industrial Area, Raipur FSW n/a n/a n/a 1.00 n/a n/a
Dantewada NMDC Bacheli STI n/a n/a n/a 2.76 3.33 n/a Durg Durg DH STI 3.60 4.00 3.50 2.85 6.40 0 Korba Korba DH STI 0.80 1.20 2.00 2.40 5.18 1.6 Korba NTPC STI n/a n/a n/a 3.79 n/a n/a
Raipur Raipur Pandit JNM Medical College STI 2.00 3.20 3.00 1.65 1.20 n/a
Raipur RaipurDH STI n/a n/a n/a n/a n/a 6.56 Sarguja Sarguja DH, Ambikapur STI n/a n/a n/a 2.40 0.00 0.4
TABLE SS 8a Dadra Nagar Haveli (2008 summary)
*HIV prevalence among antenatal attendees Group Number HIV % positive (90% CI) tested All women 400 0.0 (0.0–0.0) Urban women 400 0.0 (0.0–0.0) Rural women
* HIV prevalence is given for valid sites (≥75% sample size).
2007 summary—ANC attendees
District Site name Population group 2003 2004 2005 2006 2007 2008
Dadra and Nagar Haveli
Silvasa Civil Hospital/ VB Civil Hospital ANC 0.25 0.00 0.25 0.00 0.50 0
Khanvel ANC (R) 0.00 n/a n/a n/a n/a n/a TABLE SS 8b
Dadra and Nagar Haveli Populations with high-risk behaviours
District Site name Population group 2003 2004 2005 2006 2007 2008
Dadra and Nagar Haveli
Areas of TI for migrants MRG n/a n/a 0.00 n/a n/a n/a

95Annual HIV Sentinel Surveillance - Country Report 2008-2009
TABLE SS 9a Daman and Diu (2008 summary)
*HIV prevalence among antenatal attendees Trends in ANC, 2003–08
Group Number HIV % positive (90%
CI)
tested All women 800 0.38 (0.02–0.73) Urban women 800 0.38 (0.02–0.73)
Rural women * HIV prevalence is given for valid sites (≥75% sample size).
TABLE SS-9 b Daman and Diu
ANC attendees
District Site name Population group 2003 2004 2005 2006 2007 2008
Daman Daman Civil Hospital ANC 0.25 0.50 0.25 0 0.25 0 Diu Diu Civil Hospital ANC 0.46 0.25 0.00 0 0.00 0.75 Diu Kachigam ANC (R) 0.41 n/a n/a n/a n/a n/a Diu Vanakbar ANC (R) 0 n/a n/a n/a n/a n/a
TABLE SS 10a
Delhi (2008 summary)
*HIV prevalence in antenatal attendees Trends in ANC, 2003–08
Group Number HIV % positive (90% CI)
tested
All women 1997 0.20 (0.04–0.36)
Urban women 1997 0.20 (0.04–0.36)
Rural women
* HIV prevalence is given for valid sites (≥75% sample size).
0.3 0.3 0.2 0.20.00.20.4
2003-2005 2004-2006 2005-2007 2006-2008
HIV%
Posi
tive
Years

96 Annual HIV Sentinel Surveillance - Country Report 2008-2009
ANC attendees
District Site name Population group
2003 2004 2005 2006 2007
New Delhi LHMC ANC n/a n/a n/a 0.00 0.25
North Delhi Kasturba Hospital ANC 0.25 0.50 0.25 0.00 0.25
North East GTB Hospital ANC 0.00 0.00 0.25 0.00 0.00
North West New Delhi Sanjay Gandhi Memorial Hospital, Mongolp
ANC 0.25 0.25 0.75 0.25 0.50
South Safdarjung Hospital ANC 0.00 0.50 0.00 0.25 0.00
Delhi (2008 summary)
*HIV prevalence among populations with high-risk behaviours
Group Number HIV % positive (90% CI) Remarks
tested
All STI patients 924 2.92 (2.01–3.83) Total number of sentinel sites 17
Female sex workers 1244 2.17 (1.49–2.85) 6 sites (≥ 75% sample size) had prevalence ≥ 5%
Injecting drug users 500 18.60 (15.74–21.46) 3 sites (≥ 75% sample size) had prevalence ≥ 10%
Men who have sex with men 745 7.92 (6.29–9.55)
* HIV prevalence is given for valid sites (≥75% sample size).
TABLE SS 10b Delhi
Populations with high-risk behaviours
District Site name Population group 2003 2004 2005 2006 2007 2008
North IMDT FSW n/a n/a n/a 7.33 9.96 5.69 North Shakti Vahini FSW n/a 8.00 8.43 14.00 n/a n/a North East Jagriti Yuva Manch FSW n/a n/a 1.60 1.60 1.60 0.8 North West GDS Society FSW n/a n/a n/a 1.20 0.40 2.4
South West ALAMB FSW n/a n/a n/a 0.40 0.00 1.61
West MRYDO FSW 1.61 1.20 1.20 0.80 0.80 0.4 South West SPYM IDU n/a n/a n/a 1.20 0.39 6.8
South West New Delhi DDU Hospital IDU 14.40 n/a n/a n/a n/a n/a
North Sharan IVDU n/a 17.60 22.80 18.80 20.00 30.4 North East SAHARA MSM 27.42 6.67 39.60 32.80 30.00 n/a

97Annual HIV Sentinel Surveillance - Country Report 2008-2009
North West ARADHYA MSM n/a n/a n/a 2.00 3.20 7.29
West Akansha Samiti MSM n/a n/a 1.20 2.00 2.00 n/a Central BARD (New 08) MSM n/a n/a n/a n/a n/a 7.6 West Mitr (New 08) MSM n/a n/a n/a n/a n/a 8.87 Central LNJP Hospital STI 7.20 9.20 9.20 8.80 5.60 3.14 East ESI Hospital STI 7.77 8.46 9.09 2.00 1.79 2.99 North East GTB Hospital STI 5.85 7.50 10.00 6.40 5.31 n/a South Safdarjung Hospital STI 2.40 4.80 3.20 2.00 5.20 1.6 West DDU STI n/a n/a n/a 1.20 3.27 4
TABLE SS 11a Goa (2008 summary) *HIV prevalence among antenatal attendees Trends in ANC, 2003–08
Group Number HIV % positive (90%
CI) tested All women 1180 0.68 (0.29–1.07) Urban women 1180 0.68 (0.29–1.07)
Rural women * HIV prevalence is given for valid sites (≥75% sample size).
ANC Attendees
District Site name Population group 2003 2004 2005 2006 2007 2008
North Goa Mapusa Asilo Hospital ANC 0.25 1.00 0.00 0.75 0.25 0.25
North Goa Ponda Community Health Centre ANC 0.75 1.25 0.00 0.25 0.00 0.51
North Goa Curchore ANC(R) 1.12 n/a n/a n/a n/a n/a North Goa Valpoi/P ANC(R) 0.00 n/a n/a n/a n/a n/a
South Goa Hospicio Hospital,Margao(New08) ANC n/a n/a n/a n/a n/a 1.29
TABLE SS-11 b Goa (2008 Summary) *HIV Prevalence of populations with high-risk behaviors
Group Number
HIV % Positive & 90% C.I. Remarks
Tested
All STD patients 494 4.45 (2.93 ,
5.98) Total number sentinel sites 4
Female sex workers 250 6.40 (3.85 ,
8.95) 4 sites (≥ 75 % sample size) had prevalence ≥ 5%
Injecting drug users
0 sites (≥ 75 % sample size) had prevalence ≥ 10%
Men who have sex with men 250
6.40 (3.85 , 8.95)
* HIV Prevalence is given for valid sites (≥ 75 % sample size)

98 Annual HIV Sentinel Surveillance - Country Report 2008-2009
Goa Populations with high-risk behaviours
District Site name Population group 2003 2004 2005 2006 2007 2008
South Goa Desterro Eves Mahila Mandal, Vasco da Gama (New 08)
FSW n/a n/a n/a n/a n/a 6.4
Baina Vasco D' Gama FSW 30.15 n/a n/a n/a n/a n/a South Goa Vasco The Humsafar Trust MSM n/a 1.68 4.9 4.8 7.93 6.4
North Goa Bambolim Goa Medical College STI n/a 12.04 16.45 8.85 8
6.05 Panaji Hospicio Hospital STI 15.18 n/a n/a n/a n/a n/a South Goa Margao Hospicio Hospital STI 14.29 19.51 11.05 8.4 3.2 2.85 South Goa Margao 9.09 n/a n/a n/a n/a n/a
TABLE SS 12a Gujarat (2008 summary)
*HIV prevalence among antenatal attendees Trends in ANC, 2003–08
Group Number HIV % positive (90%
CI)
tested All women 9046 0.39 (0.28–0.49) Urban women 9046 0.39 (0.28–0.49) Rural women * HIV prevalence is given for valid sites (≥75% sample size).
ANC attendees
District Site name Population group 2003 2004 2005 2006 2007 2008
Ahmedabad VS Hospital, Ahmedabad ANC 0.75 0.25 0.00 0.00 0.00 0.25
Amreli Civil Hospital, Amreli ANC n/a n/a n/a 0.00 1.00 0.52
Anand Krishna Hospital, Karamsad ANC n/a n/a n/a 0.25 0.25 n/a
Anand Civil Hospital, Petlad ANC 0.25 Banas Kantha Civil Hospital, Palanpur ANC n/a n/a n/a 1.00 0.00 0 Bharuch Civil Hospital ANC n/a n/a n/a 0.75 0.00 0 Bhavnagar Sir T Hospital ANC n/a n/a n/a 0.75 0.00 0 Dohad Government Hospital ANC n/a n/a n/a 1.38 0.75 1.5 Gandhinagar Civil Hospital ANC n/a n/a n/a 0.50 0.00 0.75
Jamnagar Civil Hospital, Jam Khambhalia ANC n/a n/a n/a 0.50 1.00 0
Junagadh Junagadh DH ANC 0.25 0.00 0.25 0.50 0.25 0.25 Kachchh Bhuj DH ANC 0.50 0.25 0.00 0.50 0.00 0

99Annual HIV Sentinel Surveillance - Country Report 2008-2009
ANC attendees Kheda Civil Hospital, Nadiad ANC n/a n/a n/a 0.00 0.50 0 Mahesana Mahesana DH ANC 1.00 0.25 1.00 1.00 0.00 1.5 Narmada Ref. Hospital, Raipjpla ANC n/a n/a n/a 0.00 0.25 0.25 Navsari General Hospital ANC n/a n/a n/a 1.00 0.75 0.5 Panch Mahals Civil Hospital, Godhara ANC n/a n/a n/a 0.00 0.00 n/a Patan General Hospital ANC n/a n/a n/a 0.50 0.25 0 Porbandar MGG Hospital ANC n/a n/a n/a 0.00 1.25 0.5 Rajkot Civil Hospital, Rajkot ANC 0.00 0.00 0.00 0.75 0.50 0.5 Sabar Kantha Himmatnagar DH ANC 0.25 0.00 0.25 0.75 0.25 0.25
Surat
New Civil Hospital, Surat / Municipal Institute of Medical Education and Research (SMIMER)
ANC 1.00 0.75 1.25 1.25 1.50 0.76
Surendranagar C.J. General Hospital, Surendranagar ANC n/a n/a n/a 1.75 0.25
The Dangs Civil Hospital, Ahwa ANC n/a n/a n/a 0.00 0.00 0.27
Vadodara Jamnabai Hospital, Vadodara ANC 0.00 0.00 0.25 0.25 0.50 n/a
Valsad CHC Bhilad,Vapi ANC (R) n/a n/a n/a 0.00 0.50 0.76 Valsad Anjar ANC (R) 0.50 n/a n/a n/a n/a n/a Valsad Dabhoi ANC (R) 0.75 n/a n/a n/a n/a n/a Valsad Devgadhb ANC (R) 0.25 n/a n/a n/a n/a n/a
Valsad Government Hospital, Visnagar, Ahmedabad ANC (R) 0.50 n/a n/a n/a n/a n/a
Valsad Government Hospital, Dakor,Kheda, Ahmedabad
ANC (R) 0.00 n/a n/a n/a n/a n/a
Valsad Keshod ANC (R) 0.25 n/a n/a n/a n/a n/a Valsad Morbi ANC (R) 0.00 n/a n/a n/a n/a n/a Valsad Sangodh ANC (R) 0.00 n/a n/a n/a n/a n/a
Gujarat (2008 summary) *HIV prevalence among populations with high-risk behaviours Remarks
Group Number HIV % positive (90% CI) tested Total number of sentinel sites 25 All STI patients 1444 7.62 (6.47–8.77) 7 sites (≥75% sample size) had prevalence ≥5% Female sex workers 1494 3.75 (2.94–4.56) 3 sites (≥75% sample size) had prevalence ≥10%
Male Migrants 500 1.80 (0.82–2.78) Men who have sex with men 1732 5.37 (4.48–6.26) * HIV prevalence is given for valid sites (≥75% sample size).

100 Annual HIV Sentinel Surveillance - Country Report 2008-2009
TABLE SS 12b Gujarat
Populations with high-risk behaviours
District Site name Population group 2003 2004 2005 2006 2007 2008
Rajkot Life Line Health, Rajkot FSW n/a n/a 4.4 2.8 2.8 2 Surat Paras PSM PSH, Surat FSW n/a n/a 13.2 8 7.2 4.4 Vadodara Vikas Jyot Trust, Vadodara FSW n/a 9.20 6.8 8.4 9.6 7.2 Rajkot Lakshaya Trust, Rajkot MSM n/a n/a 12.4 14 15.6 6.4 Surat Lakshaya Trust, Surat MSM n/a n/a 15.6 12.8 7.6 10 Vadodara Lakshaya Trust, Vadodara MSM n/a n/a 4 6.8 2 3.35 Ahmedabad Chuwal Gram
Trust,Ahmedabad (New 08) MSM n/a n/a n/a n/a n/a 3.6
Bhavnagar Sardar Patel Snatak Mitra Mandal,Bhavnagar (New 08) MSM n/a n/a n/a n/a n/a 5.62
Jamnagar Shree Sarvoday Mahila Udyog Mandal (New 08) MSM n/a n/a n/a n/a n/a 5.6
Mahesana Young Citizen of India Charitable Trust (New 08) MSM n/a n/a n/a n/a n/a 2.87
Ahmedabad Civil Hospital, Ahmedabad STI 5.76 4.80 4.8 18 15.6 22
Banas Kantha General Hospital Palanpur/Banaskantha District
STI 0.81 0.80 0.4 2 0.95 n/a
Bhavnagar Sir T Hospital, Bhavnagar STI 6.73 5.00 4.69 7.34 6.9 5.94 Jamnagar GG Hospital, Jamnagar STI 4.4 3.60 1.6 1.2 2.4 0 Junagadh Civil Hospital, Junagadh STI n/a n/a n/a 1.2 2.4 3.2 Navsari General Hospital STI n/a n/a n/a 4 2 1.2 Panch Mahals Godhara DH STI 2.4 2.40 1.2 0.4 4.9 n/a Surat New Civil Hospital, Surat STI 6.28 8.11 11.79 8.8 8 13.22
Surendranagar C.U. Shah Medical College, Surendranagar STI 2.31 2.40 0 3.27 1.8 n/a
Vadodara SSG Hospital, Vadodara STI 4.55 3.60 2.4 3.35 2.21 n/a
Surat
Sanjivni Hospital, Surat (New 08) MRG n/a n/a n/a n/a n/a 1.2
Surat
Surat Diamond Association, Surat (New 08) MRG n/a n/a n/a n/a n/a 2.4
TABLE SS 13a Haryana (2008 summary)
*HIV prevalence among antenatal attendees Trends in ANC, 2003–08
Group Number HIV % positive (90%
CI)
tested All women 4799 0.15 (0.06–0.24) Urban women 4799 0.15 (0.06–0.24)
Rural women
0.11 0.060.17 0.19
0.000.100.200.30
2003-2005 2004-2006 2005-2007 2006-2008HIV%
Posi
tive
Years

101Annual HIV Sentinel Surveillance - Country Report 2008-2009
* HIV prevalence is given for valid sites (≥75% sample size).
ANC attendees
District Site name Population group 2003 2004 2005 2006 2007 2008
Bhiwani CHC Tosham ANC n/a n/a n/a 1.10 0.25 0 Faridabad Palwal General Hospital ANC 0.50 0.00 0.00 0.00 0.50 0.5 Fatehabad GH Fatehabad ANC n/a n/a n/a 0.25 0.00 0 Gurgaon CHC Nuh, Mewat (New) ANC n/a n/a n/a 0.31 0.00 0 Hissar Hissar General Hospital ANC 0.00 0.00 0.00 0.25 0.25 0 Hissar CHC, Mangali ANC (R) 0.00 n/a n/a n/a n/a n/a Jhajjar GH Jhajjar ANC n/a n/a n/a 0.26 0.00 0.25 Jind CHC, Julana ANC (R) 0.67 n/a n/a n/a n/a n/a Jind Jind General Hospital ANC 0.26 0.00 0.50 0.25 3.00 0.5 Kaithal GH Kaithal ANC n/a n/a n/a 0.00 0.00 0.25 Karnal Karnal General Hospital ANC 0.25 0.00 0.25 0.00 0.25 0 Karnal CHC, Nilokheri ANC (R) 0.41 n/a n/a n/a n/a n/a Kurukshetra LNJP Hospital ANC n/a n/a n/a 0.00 0.00 0.25 Panchkula CHC Raipurani ANC (R) n/a n/a n/a 0.00 0.50 0 Panipat GH Panipat ANC n/a n/a n/a 0.00 0.00 0 TABLE SS 13b
Haryana (2008 summary)
*HIV prevalence of populations with high-risk behaviours Group Number HIV % positive (90% CI) Remarks tested All STI patients 2195 0.87 (0.54–1.19)
Total number of sentinel sites 18
Female sex workers 1742 1.55 (1.06–2.04)
1 site (≥75% sample size) had prevalence ≥5%
Injecting drug users 249 2.01 (0.55–3.47)
0 sites (≥75% sample size) had prevalence ≥10%
* HIV prevalence is given for valid sites (≥75% sample size).
Haryana Summary—Populations with high-risk behaviours
District Site name Population group 2003 2004 2005 2006 2007 2008
Ambala/Panchkula Ambala (NGO) FSW n/a n/a n/a 0.00 0.00 1.2 Gurgaon Gurgaon (NGO) FSW n/a n/a n/a 0.37 1.16 6 Hissar Hissar (NGO) FSW n/a n/a n/a 1.98 0.00 0 Jind Jind (NGO) FSW n/a n/a n/a 0.40 1.60 1.2 Rewari Rewari (NGO) FSW n/a n/a n/a 0.41 0.00 0.41 Rohtak Rohtak (NGO) FSW n/a n/a n/a 4.76 2.38 2 Yamunanagar FSW site Yamunanagar FSW n/a n/a 2.00 0.00 0.00 0

102 Annual HIV Sentinel Surveillance - Country Report 2008-2009
Haryana Faridabad Faridabad (NGO) IDU n/a n/a n/a 0.00 0.80 2.01
Panchkula Panchkula (NGO) MSM n/a n/a n/a 0.00 5.39 2.81
Ambala Ambala General Hospital STI 0.00 0.00 0.99 0.00 0.00 0.8
Bhiwani Bhiwani General Hospital STI 2.37 2.08 1.60 3.21 0.40 1.6
Faridabad BK Hospital STI n/a n/a n/a 0.41 0.00 2
Gurgaon Gurgaon General Hospital STI 0.40 4.88 1.71 0.41 0.80 0.8
Panchkula GH Panchkula STI n/a n/a n/a 1.20 0.00 0
Rohtak Rohtak Medical College Hospital STI 2.06 0.00 1.30 3.01 1.49 0.85
Sirsa Sirsa General Hospital STI 1.20 0.93 0.83 0.40 0.00 0.8 Sonipat GH Sonipat STI n/a n/a n/a 2.00 0.00 0.4 Yamunanagar GH Yamunanagar STI n/a n/a n/a 0.81 0.75 0.47
TABLE SS 14a Himachal Pradesh (2008 summary)
*HIV prevalence among antenatal attendees Trends in ANC, 2003–08
Group Number HIV % positive (90%
CI)
tested All women 3135 0.51 (0.30–0.72) Urban women 3135 0.51 (0.30–0.72)
Rural women * HIV prevalence is given for valid sites (≥75% sample size).
ANC attendees
District Site name Population group 2003 2004 2005 2006 2007 2008
Hamirpur CHC Barsar ANC (R) 0.00 n/a n/a 0.00 0.50 n/a Hamirpur Hamirpur Zonal Hospital ANC 1.00 0.50 0.75 0.00 0.00 0.75 Hamirpur Nadaun CHC (New 08) ANC n/a n/a n/a n/a n/a 1.25
Kangra Dharamshala Zonal Hospital ANC 0.77 0.00 0.25 0.25 0.00 0.75
Kangra Palampur/Jawalamukhi ANC (R) 0.25 n/a n/a n/a n/a Kinnar Nichar/Sangala/Pooh ANC (R) 0.00 n/a n/a n/a n/a Kinnaur Kinnaur Zonal Hospital ANC 0.00 0.00 0.00 0.00 0 Lahaul and Spiti Kelong Zonal Hospital ANC 0.00 n/a n/a 0.00 0.00 n/a
Lahaul and Spiti Udaipur Kaza ANC (R) 0.00 n/a n/a 0.00 n/a
Mandi Mandi Zonal Hospital ANC 0.00 0.25 0.00 0.00 0.00 0.25 Mandi Karsog/Jnagar ANC (R) 0.26 n/a n/a n/a n/a Mandi ANC (R) n/a n/a n/a n/a n/a
0.300.22
0.13 0.20
0.00
0.20
0.40
2003-2005 2004-2006 2005-2007 2006-2008HIV%
Posi
tive
Years
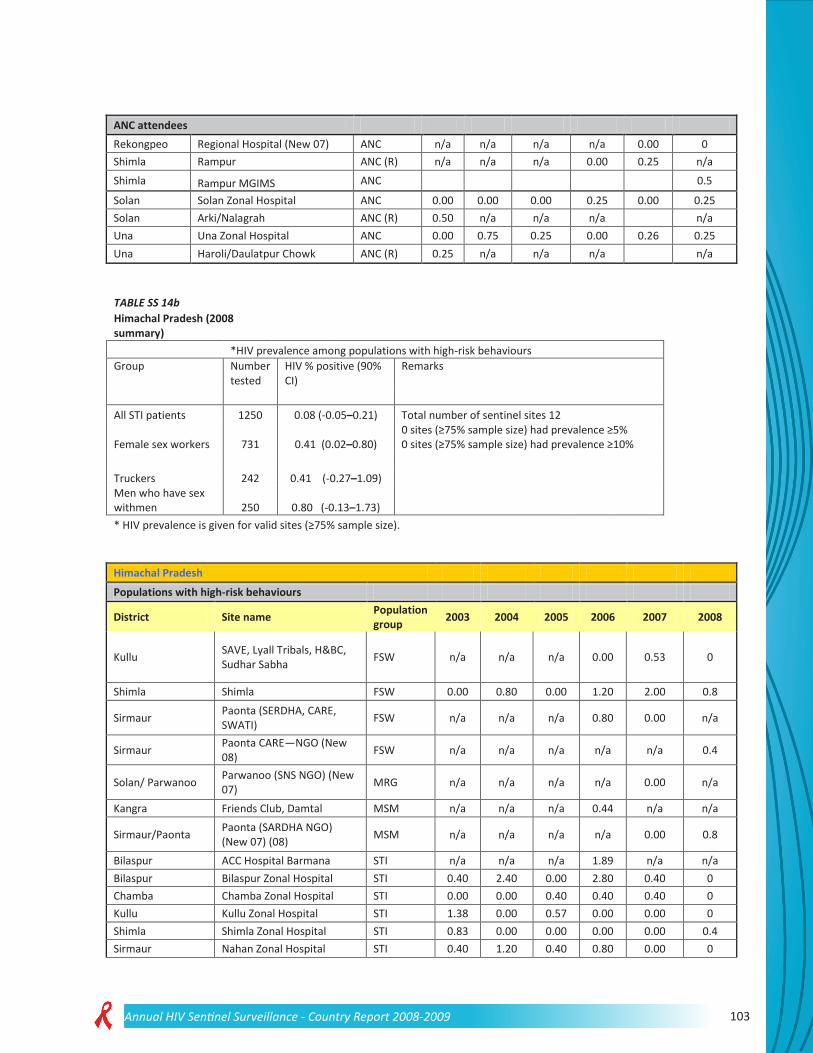
103Annual HIV Sentinel Surveillance - Country Report 2008-2009
ANC attendees Rekongpeo Regional Hospital (New 07) ANC n/a n/a n/a n/a 0.00 0 Shimla Rampur ANC (R) n/a n/a n/a 0.00 0.25 n/a Shimla Rampur MGIMS ANC 0.5
Solan Solan Zonal Hospital ANC 0.00 0.00 0.00 0.25 0.00 0.25 Solan Arki/Nalagrah ANC (R) 0.50 n/a n/a n/a n/a Una Una Zonal Hospital ANC 0.00 0.75 0.25 0.00 0.26 0.25 Una Haroli/Daulatpur Chowk ANC (R) 0.25 n/a n/a n/a n/a
TABLE SS 14b Himachal Pradesh (2008
summary) *HIV prevalence among populations with high-risk behaviours
Group Number tested
HIV % positive (90% CI)
Remarks
All STI patients 1250 0.08 (-0.05–0.21) Total number of sentinel sites 12
Female sex workers 731 0.41 (0.02–0.80) 0 sites (≥75% sample size) had prevalence ≥5% 0 sites (≥75% sample size) had prevalence ≥10%
Truckers 242 0.41 (-0.27–1.09) Men who have sex withmen 250 0.80 (-0.13–1.73) * HIV prevalence is given for valid sites (≥75% sample size).
Himachal Pradesh Populations with high-risk behaviours
District Site name Population group 2003 2004 2005 2006 2007 2008
Kullu SAVE, Lyall Tribals, H&BC, Sudhar Sabha FSW n/a n/a n/a 0.00 0.53 0
Shimla Shimla FSW 0.00 0.80 0.00 1.20 2.00 0.8
Sirmaur Paonta (SERDHA, CARE, SWATI) FSW n/a n/a n/a 0.80 0.00 n/a
Sirmaur Paonta CARE—NGO (New 08) FSW n/a n/a n/a n/a n/a 0.4
Solan/ Parwanoo Parwanoo (SNS NGO) (New 07) MRG n/a n/a n/a n/a 0.00 n/a
Kangra Friends Club, Damtal MSM n/a n/a n/a 0.44 n/a n/a
Sirmaur/Paonta Paonta (SARDHA NGO) (New 07) (08) MSM n/a n/a n/a n/a 0.00 0.8
Bilaspur ACC Hospital Barmana STI n/a n/a n/a 1.89 n/a n/a Bilaspur Bilaspur Zonal Hospital STI 0.40 2.40 0.00 2.80 0.40 0 Chamba Chamba Zonal Hospital STI 0.00 0.00 0.40 0.40 0.40 0 Kullu Kullu Zonal Hospital STI 1.38 0.00 0.57 0.00 0.00 0 Shimla Shimla Zonal Hospital STI 0.83 0.00 0.00 0.00 0.00 0.4 Sirmaur Nahan Zonal Hospital STI 0.40 1.20 0.40 0.80 0.00 0

104 Annual HIV Sentinel Surveillance - Country Report 2008-2009
Bilaspur/Barmana Barmana (HPVHA NGO) (New 07) Truckers n/a n/a n/a n/a 0.40 0.41
TABLE SS 15a Jammu and Kashmir (2008 summary)
*HIV prevalence among antenatal attendees Trends in ANC, 2003–08
Group
Number tested
HIV % positive (90% CI)
All women 5589
0.0 (0.0–0.0)
Urban women 5589
0.0 (0.0–0.0)
Rural women
* HIV prevalence is given for valid sites (≥75% sample size).
ANC attendees
District Site name Population group 2003 2004 2005 2006 2007 2008
Anantnag Anatnag DH ANC n/a n/a n/a 0.00 0.00 0 Badgam Budgam DH ANC n/a n/a n/a 0.00 0.00 0 Baramula Baramulla DH ANC n/a n/a n/a 0.00 0.00 0 Doda Doda DH ANC n/a n/a n/a 0.00 0.00 0
Jammu 166 Military Hospital- ANC n/a n/a n/a 0.00 n/a n/a
Jammu CHC, RS Pma/Bisna ANC (R) 0.00 n/a n/a n/a n/a n/a
Jammu Jammu General Hospital / SMGS Hospital Jammu ANC 0.00 0.00 0.00 0.50 0.00 0
Kargil Kargil DH ANC n/a n/a n/a 0.00 0.00 n/a Kathua Kathua DH ANC n/a n/a n/a 0.00 0.50 0 Kupwara Kupwara DH ANC n/a n/a n/a 0.00 0.00 0 Leh (Ladakh) Leh DH ANC 0.00 0.00 0.00 0.00 0.00 0 Pulwama Pulwama DH ANC n/a n/a n/a 0.00 0.00 0 Poonch Poonch DH ANC n/a n/a n/a 0.00 0.00 0 Rajauri Rajouri DH ANC n/a n/a n/a 0.00 0.25 0 Srinagar CHC, Ganderbal Harvan ANC n/a n/a n/a 0.00 0.00 0 Srinagar CHC, Ganderbal Harvan ANC (R) 0.00 n/a n/a n/a n/a n/a Srinagar Srinagar Lal Ded Hospital ANC 0.00 0.25 0.00 0.00 0.00 0 Udhampur Udhampur DH ANC n/a n/a n/a 0.00 0.00 0
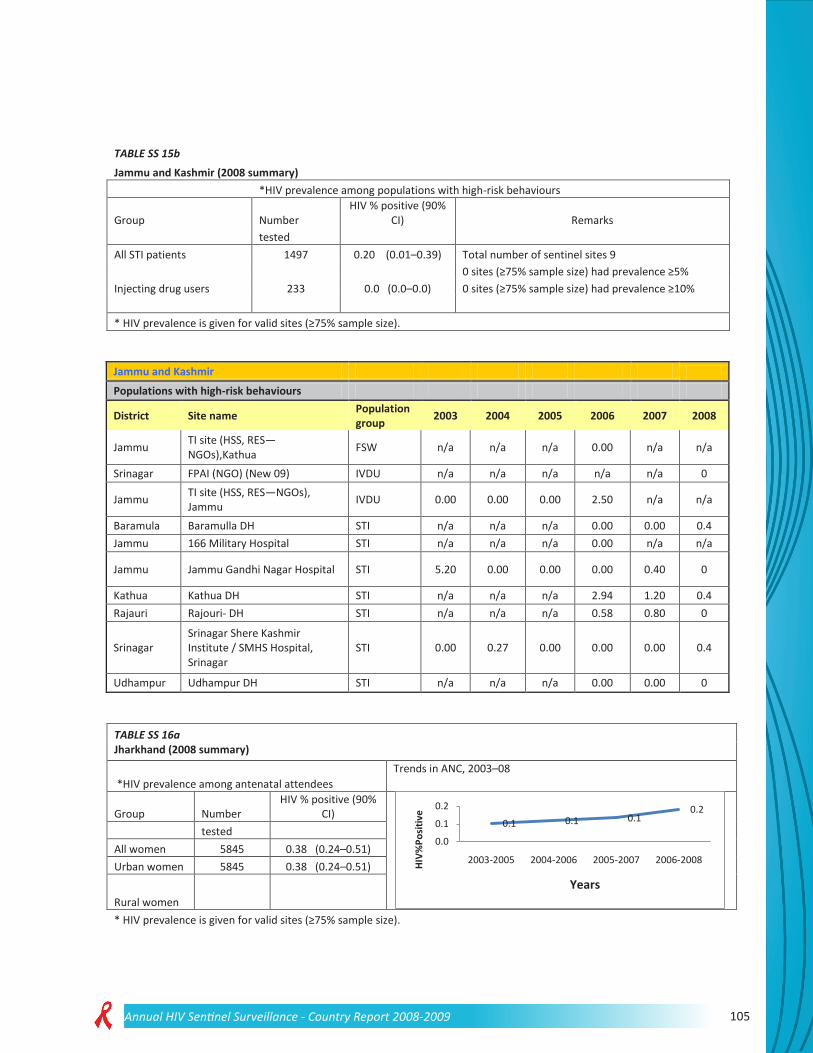
105Annual HIV Sentinel Surveillance - Country Report 2008-2009
TABLE SS 15b Jammu and Kashmir (2008 summary)
*HIV prevalence among populations with high-risk behaviours
Group Number HIV % positive (90%
CI) Remarks tested All STI patients 1497 0.20 (0.01–0.39) Total number of sentinel sites 9
0 sites (≥75% sample size) had prevalence ≥5%
Injecting drug users 233 0.0 (0.0–0.0) 0 sites (≥75% sample size) had prevalence ≥10%
* HIV prevalence is given for valid sites (≥75% sample size).
Jammu and Kashmir Populations with high-risk behaviours
District Site name Population group 2003 2004 2005 2006 2007 2008
Jammu TI site (HSS, RES—NGOs),Kathua FSW n/a n/a n/a 0.00 n/a n/a
Srinagar FPAI (NGO) (New 09) IVDU n/a n/a n/a n/a n/a 0
Jammu TI site (HSS, RES—NGOs), Jammu IVDU 0.00 0.00 0.00 2.50 n/a n/a
Baramula Baramulla DH STI n/a n/a n/a 0.00 0.00 0.4 Jammu 166 Military Hospital STI n/a n/a n/a 0.00 n/a n/a
Jammu Jammu Gandhi Nagar Hospital STI 5.20 0.00 0.00 0.00 0.40 0
Kathua Kathua DH STI n/a n/a n/a 2.94 1.20 0.4 Rajauri Rajouri- DH STI n/a n/a n/a 0.58 0.80 0
Srinagar Srinagar Shere Kashmir Institute / SMHS Hospital, Srinagar
STI 0.00 0.27 0.00 0.00 0.00 0.4
Udhampur Udhampur DH STI n/a n/a n/a 0.00 0.00 0
TABLE SS 16a Jharkhand (2008 summary)
*HIV prevalence among antenatal attendees Trends in ANC, 2003–08
Group Number HIV % positive (90%
CI)
tested All women 5845 0.38 (0.24–0.51) Urban women 5845 0.38 (0.24–0.51)
Rural women * HIV prevalence is given for valid sites (≥75% sample size).
0.1 0.1 0.10.2
0.0
0.1
0.2
2003-2005 2004-2006 2005-2007 2006-2008HIV%
Posi
tive
Years

106 Annual HIV Sentinel Surveillance - Country Report 2008-2009
ANC attendees
District Site name Population group 2003 2004 2005 2006 2007 2008
Bokaro Bokaro General Hospital ANC n/a n/a n/a 0.28 0.00 0 Deogarh SDH, Madhupur ANC(R) 0.00 n/a n/a n/a n/a n/a Deoghar Deogarh Sadar Hospital ANC 0.00 0.00 0.00 0.00 0.00 0 Dhanbad B.C.C.L. Dhanbad ANC n/a n/a n/a 0.88 0.00 0
Dhanbad Patliputra Medical College Hospital, Dhanbad ANC n/a n/a n/a 0.00 0.25 0.25
Garhwa Garhwa Sadar Hospital ANC 0.62 0.00 0.00 0.00 0.00 0 Garhwa RH, Nagaruntari ANC (R) 0.00 n/a n/a n/a n/a n/a Godda Sadar Hospital, Godda ANC n/a n/a n/a 0.25 0.25 2.25 Gumla Sadar Hospital, Gumla ANC n/a n/a n/a 0.00 0.00 0
Gumla Sadar Hospital, Simdega Tehsil (New) ANC n/a n/a n/a 0.00 0.00 0
JSR RH, Polka ANC (R) 0.00 n/a n/a n/a n/a n/a
Kodarma Holy Family Hospital, Kodarma ANC 0.00 0.00 0.63* 0.00 0.00
0.75
Kodarma RH, Domchand ANC (R) 0.00 n/a n/a n/a n/a n/a Lohardaga Sadar Hospital, Lohardaga ANC n/a n/a n/a 0.00 0.00 0.25 Purbi Singhbhum Mercy Hospital, Jamshedpur ANC n/a n/a n/a 0.00 0.50 1
Purbi Singhbhum Tata Main Hospital ANC n/a n/a n/a 0.00 0.00 0.25
Purbi Singhbhum E. Singhbhum Sadar Hospital ANC 0.00 0.00 0.00 0.25 0.51 1
Ranchi C.C.L. Hospital, Ranchi ANC n/a n/a n/a 0.00 n/a n/a Ranchi RH, Bundu ANC (R) 0.00 n/a n/a n/a n/a n/a
Ranchi Ranchi Rajendra Institute of Medical Sciences ANC 0.25 0.25 0.25 0.25 0.00 0.25
Sahebganj RH, Raj Mahal ANC (R) 0.00 n/a n/a n/a n/a n/a Sahibganj Sahibganj Sadar Hospital ANC 0.00 0.00 0.25 0.50 0.00 0 *Sample size is <75%.
TABLE SS 16b Jharkhand (2008 summary)
*HIV prevalence among populations with high-risk behaviours Group Number HIV % positive (90% CI) Remarks tested All STI patients 2727 0.99 (0.68–1.30) Total number of sentinel sites 25 Female sex workers 2708 1.00 (0.68–1.31) 0 sites (≥75% sample size) had prevalence ≥5% Injecting drug users 250 1.60 (0.29–2.91) 0 sites (≥75% sample size) had prevalence ≥10% Men who have sex with men 250 2.00 (0.54–3.46) * HIV prevalence is given for valid sites (≥75% sample size).

107Annual HIV Sentinel Surveillance - Country Report 2008-2009
Jharkhand Populations with high-risk behaviours
District Site name Population group 2003 2004 2005 2006 2007 2008
Bokaro RUPAYANI FSW n/a n/a n/a 0.87 1.95 n/a
Dhanbad Helping Hand Foundation, Dhanbad FSW n/a n/a n/a 0.40 0.00 n/a
Pakur SKVSS (New 07) FSW n/a n/a n/a n/a 1.58 2 Purbi Singhbhum Samarpan, Behragoda FSW n/a n/a n/a 1.20 0.00 2 Purbi Singhbhum TSFIF and Samarpan FSW n/a 0.00 0.00 1.20 n/a n/a Ranchi Krishi Gram Vikas Kendra FSW n/a n/a n/a 0.40 0.80 0.4
Ranchi Birsa Seva Sansthan and KGVK, Ranchi FSW n/a 0.00 1.20 0.00 1.20 n/a
Sahibganj Gram Praudyogik Vikas Sansthan FSW n/a n/a 1.20 2.00 n/a n/a
Chatra Integrated Development through Effective Approach (New 08)
FSW n/a n/a n/a n/a n/a 0.4
Deoghar Lok Prerana, Deoghar (New 08) FSW n/a n/a n/a n/a n/a 0.86
Dumka Jan Jagriti Kendra (New 08) FSW n/a n/a n/a n/a n/a 2 Giridih Rural Area Development
Society (New 08) FSW n/a n/a n/a n/a n/a 0
Hazaribag Jan Jagran Kendra (Bishnugarh) (New 08) FSW n/a n/a n/a n/a n/a 1.66
Lohardaga Society for Integrated Development (New 08) FSW n/a n/a n/a n/a n/a 1.25
Palamau Maa Durga Vikas Samiti,Palamau (New 08) FSW n/a n/a n/a n/a n/a 0
Sahibganj Bharatiya ManavVikas Seva Sansthan,Sahibganj (New 08) FSW n/a n/a n/a n/a n/a 0.4
Purbi Singhbhum Tata Steel Family Initiative Foundation IDU n/a n/a n/a 0.40 n/a 1.6
Bokaro Mahila Janswasthya Shishu Kalyan Kendra MSM
2
Bokaro Bokaro General Hospital, Bokaro STI n/a n/a n/a 0.80 0.00 0
Deoghar Sadar Hospital, Deoghar STI n/a n/a n/a 0.00 1.60 0.4
Dhanbad Dhanbad Patliputra Medical College and Hospital STI 0.00 0.00 0.00 0.40 0.40 1.66
Dumka Sadar Hospital, Dumka STI n/a n/a n/a 0.40 0.00 0 Giridih Sadar Hospital, Giridih STI n/a n/a n/a 1.78 0.40 4.4 Hazaribag Hazaribagh Sadar Hospital STI n/a n/a 0.00 1.00 0.79 0.4 Palamau Palamau Sadar Hospital STI 0.00 0.00 0.00 0.00 0.00 0.4 Pashchimi Singhbhum Sadar Hospital, Chaibasa STI n/a n/a n/a 3.13 0.40 0.8

108 Annual HIV Sentinel Surveillance - Country Report 2008-2009
Jharkhand
Purbi Singhbhum M.G. Memorial Medical College Hospital, Jamshedpur
STI n/a n/a n/a 0.40 1.20482
1.22
Ranchi Sadar Hospital, Ranchi STI n/a n/a n/a 0.00 0.00 0.41
Ranchi Ranchi Rajendra Institute of Medical Sciences STI 0.40 0.40 0.00 1.20 0.00 1.2
TABLE SS 17a Karnataka (2008 summary)
*HIV prevalence among antenatal attendees Trends in ANC, 2003–08
Group Number HIV % positive (90%
CI)
tested All women 23 192 0.89 (0.79–0.99) Urban women 11 596 1.08 (0.92–1.24)
Rural women 11 596 0.70 (0.57–0.83) * HIV prevalence is given for valid sites (≥75% sample size).
Karnataka ANC attendees
District Site name Population group 2003 2004 2005 2006 2007 2008
Bagalkot Bagalkot DH ANC 2.00 2.75 3.25 2.00 0.25 1.75 Bagalkot G.H. Jamkhandi ANC (R) 3.50 2.50 2.50 2.25 1.00 2.5
Bangalore Bangalore Vani Vilas Hospital ANC 1.00 1.25 1.00 1.50 2.00 1.5
Bangalore G.H.K R Puram ANC (R) 1.50 0.00 0.00 1.25 0.50 0
Bangalore Rural General Hospital, Kanakapura ANC (R) 2.75 2.25 0.25 0.00 0.00 n/a
Bangalore Rural General Hospital, Channapatna ANC 1.00 2.75 1.50 1.00 0.25 0.5
Belgaum Belgaum DH ANC 3.75 3.75 3.50 3.00 1.75 1.75 Belgaum G.H. Gokak ANC(R) 5.13 4.75 3.75 3.25 2.25 1.25 Bellary VMIS Hospital, Bellary ANC 1.50 1.00 0.75 1.00 0.00 1.75 Bellary G.H. Hospet ANC (R) 1.75 1.25 1.00 1.75 0.75 0.5 Bidar Bidar DH ANC 1.25 0.75 0.50 1.00 1.00 0.25 Bidar G.H. Hummabad ANC (R) 1.54 1.00 1.25 0.75 1.25 0 Bijapur Bijapur DH ANC 2.50 2.00 4.25 1.75 1.50 1.0 Bijapur G.H. Indi ANC (R) 0.75 0.75 0.00 0.73 0.50 3 Chamrajnagar Chamarajnagar DH ANC 0.50 0.75 1.75 2.50 2.00 1.01 Chamrajnagar G.H. Kollegal ANC (R) 0.51 1.25 1.50 0.25 0.00 0 Chikmagalur Chikmagalur DH ANC 0.25 0.50 1.25 2.25 3.50 1.25 Chikmagalur G.H. Mudigere ANC (R) 0.75 1.50 0.50 0.75 1.25 0.25 Chitradurga Chitradurga DH ANC 0.50 0.75 0.75 0.50 0.50 1.0 Chitradurga G.H. Challekere ANC (R) 0.25 0.75 0.50 0.00 0.00 0
1.5 1.4 1.2 1.00.0
1.0
2.0
2003-2005 2004-2006 2005-2007 2006-2008HIV%
Posi
tive
Years

109Annual HIV Sentinel Surveillance - Country Report 2008-2009
Karnataka
Dakshina Kannada
Mangalore Women and Children Hospital/ Mangalore Kasturba Medical College
ANC 1.25 2.50 0.25 0.25 0.25 1.25
Dakshina Kannada G.H. Bantwal ANC (R) 0.50 0.25 0.50 1.25 0.00 0.25
Davangere Devangere DH ANC 1.00 1.00 1.75 2.00 0.50 1.25 Davangere G.H. Channagiri ANC (R) 0.75 3.25 1.00 0.75 1.00 2.75 Dharwad Hubli KIMS ANC 3.00 1.75 6.25 1.00 0.50 0.75 Dharwad G.H. Navalgund ANC (R) 3.00 4.00 7.25 0.75 0.25 0.5 Gadag Gadag DH ANC 1.50 1.50 1.50 0.75 0.25 0.75 Gadag G.H. Laxmeswara ANC (R) 0.25 0.75 0.75 1.00 0.75 0.25 Gulbarga Gulbarga DH ANC 1.25 2.00 2.00 1.75 5.00 2.25 Gulbarga G.H. Sedum ANC (R) 2.00 2.50 3.25 0.00 0.50 0.25 Hassan Hassan DH ANC 0.50 0.75 1.75 4.00 2.50 1 Hassan G.H. Sakaleshpur ANC (R) 1.00 1.25 1.00 0.75 0.00 0.75 Haveri Haveri DH ANC 1.03 0.75 0.25 0.25 0.25 1 Haveri G.H. Ranibennur ANC (R) 1.75 0.50 0.50 1.00 0.25 0.25 Kodagu Madikeri DH ANC 0.25 0.25 1.00 0.50 0.25 2.3 Kodagu G.H. Siddapur ANC (R) 0.25 1.25 0.50 0.50 1.25 3 Kolar Kolar DH ANC 1.25 1.25 1.00 1.50 0.25 1.0 Kolar G.H. Chikkaballapura ANC (R) 0.75 0.25 0.50 0.00 0.50 0.75
Kolar Kolar KGF Hospital (New 08) ANC (R) n/a n/a n/a n/a n/a 0
Kolar General Hospital, Gowri Bidnur (New 08) ANC (R) n/a n/a n/a n/a n/a 1.75
Koppal Koppal DH ANC 2.75 1.75 2.25 1.50 1.50 0 Koppal G.H. Gangavathi ANC (R) 5.51 4.25 3.50 1.75 1.00 0 Mandya Mandya DH ANC 1.25 1.25 1.25 0.25 2.25 0.25 Mandya G.H. Malavalli ANC (R) 1.00 1.00 0.75 0.25 0.25 0
Mysore Mysore Cheluvamba Hospital / K.R. Hospital, Mysore
ANC 0.75 3.75 2.00 1.00 1.25 1.25
Mysore G.H. Hunsur ANC (R) 0.25 1.00 0.25 1.00 0.50 0.5 Raichur Raichur DH ANC 1.50 1.25 0.75 1.25 1.00 0.5 Raichur G.H. SinDHanur ANC (R) 1.75 1.00 2.50 1.50 0.00 0.5 Shimoga Shimoga DH ANC 0.25 0.50 1.25 1.00 0.00 1.75 Shimoga G.H. Sagar ANC (R) 1.25 0.50 0.50 0.00 0.75 0.25 Tumkur Tumkur DH ANC 1.25 1.25 0.75 0.50 2.25 1.75 Tumkur General Hospital, Tiptur ANC (R) 2.50 1.75 1.25 1.00 0.00 0.5 Udupi Udupi DH ANC 1.25 1.50 0.50 1.50 0.00 1 Udupi G.H. Kundapur ANC (R) 0.50 0.50 0.75 0.00 0.25 0.25 Uttara Kannada Karwar DH ANC 1.75 1.25 0.00 1.50 1.00 0 Uttara Kannada G.H. Dandeli ANC (R) 0.25 1.50 1.50 1.20 0.00 0.25

110 Annual HIV Sentinel Surveillance - Country Report 2008-2009
TABLE SS 17b Karnataka (2008 summary)
*HIV prevalence among populations with high-risk behaviours Group Number HIV % positive (90% CI) Remarks tested All STI patients 882 10.66 (8.95–12.37) Total number of sentinel sites 17 Female sex workers 1437 14.20 (12.68–15.71) 6 sites (≥75% sample size) had prevalence ≥5% Injecting drug users 249 2.01 (0.55–3.47) 8 sites (≥75% sample size) had prevalence ≥10% Men who have sex with men 750 12.67 (10.67–14.66) * HIV prevalence is given for valid sites (≥75% sample size).
Populations with high-risk behaviours
District Site name Population group 2003 2004 2005 2006 2007 2008
Bangalore Society for People’s Action for Development FSW n/a n/a n/a 12.40 6.00 n/a
Bangalore Bhoruka Charitable Trust FSW n/a n/a n/a 9.60 7.60 n/a
Bangalore Swathi Mahila Sangha (New 07) FSW n/a n/a n/a n/a 2.40 n/a
Bangalore Bangalore KIMS FSW n/a n/a 20.80 5.60 n/a n/a
Bangalore Samraksha, Bangalore FSW 14.40 21.60 37.93
* n/a n/a n/a
Dakshina Kannada Mangalore KMC Attawar FSW n/a n/a 10.9* 6.64 5.20 3.7 Belgaum BIRDS, NGO, Belgaum (New 08) FSW n/a n/a n/a n/a n/a 16.4 Bagalkot Mudhol (New 08) FSW n/a n/a n/a n/a n/a 34.1 Bangalore Avalahalli (New 08) FSW n/a n/a n/a n/a n/a 18.4 Bangalore APMC (New 08) FSW n/a n/a n/a n/a n/a 7.6 Bangalore Sheshadripuram (New 08) FSW n/a n/a n/a n/a n/a 4.6 Bangalore Serenity, NGO IDU n/a n/a n/a 3.60 2.00 2.01
Bangalore Bangalore NIMHANS IDU 2.80 0.00 n/a n/a n/a n/a
Bangalore Jagruthi, NGO / Sangama, NGO MSM 10.80 10.00 11.61 19.20 n/a n/a
Bangalore Sangama, NGO (New 07) MSM n/a n/a n/a n/a 17.60 16.4 Belgaum BIRDS, NGO, Belgaum (New 08) MSM n/a n/a n/a n/a n/a 6.3 Dharwad Hubli MSM n/a n/a n/a n/a n/a 15.2
Bangalore Bangalore Victoria Hospital STI 10.40 12.00 13.20 5.60 1.60 16.7
Belgaum Belgaum DH STI 27.20 29.60 23.60 3.60 10.80 14.8
Bellary Bellary VIMS Hospital STI 10.00 11.20 4.40 16.40 13.29 8.3
Dakshina Kannada Mangalore Kasturba Medical College STI 3.20 4.00 4.00 3.60 3.04
5.9
Dharwad Hubli KIMS STI 16.00 15.20 30.40 13.60 8.40 n/a
Gulbarga Gulbarga DH STI 17.20 24.40 20.40 7.57 5.20 5.6
Mysore Mysore KR Hospital STI 9.33 12.00 13.60 14.00 10.00 0.0
Davangere Davangere District T.B. Centre TB n/a 12.50 11.27* n/a n/a n/a
*Sample size is <75%.

111Annual HIV Sentinel Surveillance - Country Report 2008-2009
TABLE SS 18a Kerala (2008 summary)
*HIV prevalence among antenatal attendees Trends in ANC, 2003–08
Group Number HIV % positive (90%
CI)
tested All women 2399 0.21 (0.06–0.36) Urban women 2399 0.21 (0.06–0.36)
Rural women 11 596 0.70 (0.57–0.83) * HIV prevalence is given for valid sites (≥75% sample size).
ANC attendees
District Site name Population group 2003 2004 2005 2006 2007 2008
Idukki Thodupuzha Taluk Hospital ANC 0.00 0.26 0.78 0.25 0.00 0 Kannur Kannur DH ANC 0.00 0.25 0.00 0.00 0.25 0.25 Kasaragode THQ Hospital, Kasargode ANC n/a n/a n/a 0.00 1.25 0.25
Kottayam Kottayam Medical College Hospital ANC 0.00 0.40 0.00 0.50 0.50 0.5
Salem Kodungal ANC (R) 0.00 n/a n/a n/a n/a n/a Salem Thalipar ANC (R) 0.00 n/a n/a n/a n/a n/a
Thiruvananthapuram W&C Hospital, Thycaud, Thiruvananthapuram ANC n/a n/a n/a 0.00 0.25 0.25
Thrissur Thrissur Medical College Hospital ANC 0.50 0.75 0.50 0.50 0.50 0
Thrissur Kajirapa ANC (R) 0.00 n/a n/a n/a n/a n/a
TABLE SS 18b Kerala (2008 summary)
*HIV prevalence among populations with high-risk behaviours
Group Number HIV % positive (90% CI) Remarks tested All STI patients 470 0.85 (0.15–1.55) Total number of sentinel sites 17 Female sex workers 1481 0.74 (0.38–1.11) 1 site (≥75% sample size) had prevalence ≥5% Injecting drug users 749 5.34 (3.99–6.69) 0 sites (≥75% sample size) had prevalence ≥10% Truckers 250 0.80 (-0.13–1.73) Men who have sex with men 1242 0.72 (0.33–1.12) * HIV prevalence is given for valid sites (≥75% sample size).
0.3 0.3 0.3 0.3
0.0
0.2
0.4
2003-2005 2004-2006 2005-2007 2006-2008HIV%
Posi
tive
Years

112 Annual HIV Sentinel Surveillance - Country Report 2008-2009
Kerala Populations with high-risk behaviours
District Site name Population group 2003 2004 2005 2006 2007 2008
Alappuzha JKS PSH, Alappuzha FSW n/a n/a n/a 0.00 0.00 0.4 Ernakulam Ernakulam FSW 0.00 n/a n/a n/a n/a n/a Idukki AVS PSH, Idukki FSW n/a n/a n/a 0.80 0.80 0 Kozhikode Kozhikode FSW 4.60 n/a n/a n/a n/a n/a Palakkad LIONS PSH (New 07) FSW n/a n/a n/a n/a 2.80 3.83 Pathanamthitta NRDS, Pathanamthitta FSW n/a n/a n/a 0.00 0.00 0 Thrissur BON PSH, Thrissur FSW n/a n/a n/a 0.80 1.60 0.4 Trivandrum Trivandrum FSW 0.00 n/a n/a n/a n/a n/a Wayanad HILDA, Wayanad FSW n/a n/a n/a 0.00 0.00 0 Ernakulam CAPS, Ernakulam IDU n/a n/a n/a 25.00 12.68 8.4 Thiruvananthapuram FPAI, Thiruvananthapuram IDU n/a n/a n/a 4.12 5.20 4.82
Kozhikode Kozhikode IDU n/a 2.58 5.19 1.91 6.40 2.8 Ernakulam Ernakulam MSM n/a n/a 3.20 0.40 1.20 0 Kasaragode IAD,Kasargode MSM n/a n/a n/a 0.40 1.20 0.8 Kollam KRDA, Kollam MSM n/a n/a n/a 0.82 1.20 0.4 Kannur Jeevana Samskriti, Kannur MSM n/a n/a n/a 1.60 1.20 2.42
Malappuram Kudumbasree PSH, Malappuram MSM n/a n/a n/a 0.00 0.00 0
Kozhikode Kozhikode MSM n/a 0.89 n/a n/a n/a n/a Allappuzha Allappuzha Medical College STI 0.66 1.95 2.82 1.23 0.42 n/a
Ernakulam Ernakulam General Hospital STI 2.06 6.33 4.52 1.50 2.40 0.8
Kozhikode Kozhikode Medical College STI 1.71 1.85 0.00 0.00 0.00 n/a Thiruvananthapuram Trivandrum Medical College STI 5.80 3.61 2.82 1.26 1.60 0.9
Kottayam Medical College Hospital, Kottayam STI n/a n/a n/a 0.93 1.62 n/a
Palakkad LIONS PSH, Palakkad TRK n/a n/a n/a 2.40 3.60 0.8

113Annual HIV Sentinel Surveillance - Country Report 2008-2009
TABLE SS 19 Lakshadweep
ANC attendees
District Site name Population group
2003 2004 2005 2006 2007 2008 Lakshadweep Kavaratti IG Hospital ANC 0.00 0.00 0.00 0.00 0.00 n/a
Lakshadweep Minicoy Government Hospital ANC 0.00 0.00 0.00 0.00 0.00
n/a Populations with high-risk behaviours
District Site name Population group
2003 2004 2005 2006 2007 2008 Lakshadweep Kavaratti Civil Hospital STI 0.00 0.00 0.00 0.00 0.00 n/a
TABLE SS 20a Madhya Pradesh (2008 summary)
*HIV prevalence among antenatal attendees Trends in ANC, 2003–08
Group Number HIV % positive (90%
CI)
tested All women 14 379 0.26 (0.19–0.33) Urban women 14 379 0.26 (0.19–0.33)
Rural women * HIV prevalence is given for valid sites (≥75% sample size).
ANC attendees
District Site name Population group 2003 2004 2005 2006 2007 2008
Balaghat Balaghat DH ANC n/a n/a n/a 1.25 0.50 0 Barwani Badwani DH ANC (R) 0.00 n/a n/a n/a n/a n/a Barwani Badwani DH ANC 0.00 0.50 0.00 0.00 0.50 0.25 Betul Betual DH ANC (R) 1.08 n/a n/a n/a n/a n/a Betul Betual DH ANC 0.00 0.25 0.00 0.25 0.00 0.25 Bhind Bhind Civil Hospital ANC (R) 0.00 n/a n/a n/a n/a n/a Bhind Bhind Civil Hospital ANC 0.00 0.00 0.00 0.00 0.00 0.25 Bhopal Bhopal DH ANC n/a n/a n/a 0.00 0.25 0 Chhindwara Chhindwara DH ANC (R) 0.52 n/a n/a n/a n/a n/a Chhindwara Chhindwara DH ANC 0.85 0.25 0.25 0.50 0.00 0 Damoh Damoh DH ANC n/a n/a n/a 0.25 0.00 0.25 Datia Datia DH ANC n/a n/a n/a 0.00 0.25 0 Dewas Dewas DH ANC (R) 0.00 n/a n/a n/a n/a n/a Dewas Dewas DH ANC 0.00 0.25 0.25 2.00 0.25 0.25
0.39 0.35 0.28 0.230
0.20.40.6
2003-2005 2004-2006 2005-2007 2006-2008HIV%
Posi
tive
Years

114 Annual HIV Sentinel Surveillance - Country Report 2008-2009
ANC attendees Dhar Dhar DH ANC n/a n/a n/a 0.00 0.00 0 East Nimar/Burhanpur Burhanpur DH (New) ANC n/a n/a n/a 0.00 0.25 0.75
East Nimar/Khandwa Khandwa DH (New) ANC n/a n/a n/a 0.25 0.00 0.25
Guna Guna DH ANC n/a n/a n/a 0.00 0.25 0 Guna/Ashoknagar Ashok Nagar DH ANC n/a n/a n/a 0.00 0.00 1 Harda Harda DH ANC (R) 0.00 n/a n/a n/a n/a n/a Harda Harda DH ANC 0.00 0.25 0.75 1.50 0.25 0 Indore Indore DH ANC n/a n/a n/a 0.50 0.00 1 Jabalpur MC Jabalpur ANC n/a n/a n/a 0.00 0.00 0 Katni Katni DH ANC (R) 0.00 n/a n/a n/a n/a n/a Katni Katni DH ANC 1.75 0.00 0.25 0.00 0.25 0 Mandla Mandla DH ANC n/a n/a n/a 0.25 0.25 0.25 Mandsaur Mandsaur DH ANC (R) 1.75 n/a n/a n/a n/a n/a Mandsaur Mandsaur DH ANC 3.25 1.00 0.75 0.00 0.25 0.75 Narsimhapur Narsimhapur DH ANC n/a n/a n/a 0.00 0.00 0.25 Panna Panna DH ANC n/a n/a n/a 1.25 0.00 0 Raisen/Barelli CHC BARELY ANC n/a n/a n/a 0.00 0.31 0 Rajgarh CHC Bioara ANC n/a n/a n/a 0.00 1.24 0 Ratlam Ratlam DH ANC (R) 0.00 n/a n/a n/a n/a n/a Ratlam Ratlam DH ANC 0.49 0.00 0.00 0.50 0.00 0
Rewa Rewa S.S. Medical College Hospital ANC (R) 0.00 n/a n/a n/a n/a n/a
Rewa Rewa S.S. Medical College Hospital ANC 0.00 1.00 0.00 0.50 0.00 0
Sagar Sagar DH ANC (R) 0.00 n/a n/a n/a n/a n/a Sagar Sagar DH ANC 0.25 0.50 0.75 0.00 0.00 0 Sehore Sehore DH ANC n/a n/a n/a 0.00 0.00 0.5 Seoni Seoni DH ANC n/a n/a n/a 0.25 0.00 1.25 Shahdol Shahdol DH ANC (R) 0.00 n/a n/a n/a n/a n/a Shahdol Shahdol DH ANC 0.00 0.50 0.25 0.00 0.00 0 Sheopur Sheopur DH ANC n/a n/a n/a 0.00 0.00 0.25 Shivpuri Shivpuri DH ANC (R) 0.00 n/a n/a n/a n/a n/a Shivpuri Shivpuri DH ANC 0.25 0.50 0.25 0.00 0.00 0 Sidhi Sidhi DH ANC n/a n/a n/a 0.25 0.00 0.25 Tikamgarh Tikamgarh DH ANC n/a n/a n/a 0.00 0.00 0 Vidisha Vidisha DH ANC n/a n/a n/a 0.00 0.00 0 West Nimar/Khargone Khargone DH (New) ANC n/a n/a n/a 0.00 0.25 1.5

115Annual HIV Sentinel Surveillance - Country Report 2008-2009
TABLE SS 20b Madhya Pradesh (2008 summary)
*HIV prevalence among populations with high-risk behaviours Group Number HIV % positive (90% CI) Remarks tested All STI patients 2732 1.50 (1.12–1.88) Total number of sentinel sites 18 Female sex workers 750 2.53 (1.59–3.48) 2 sites (≥75% sample size) had prevalence ≥5% Injecting drug users 250 39.60 (34.51–44.69) 2 sites (≥75% sample size) had prevalence ≥10% Men who have sex with men 250 11.60 (8.27–14.93) * HIV prevalence is given for valid sites (≥75% sample size).
Madhya Pradesh
Populations with high-risk behaviours
District Site name Population group 2003 2004 2005 2006 2007 2008
Bhopal Gandhi Bhawan Trust (New 08) IVDU n/a n/a n/a n/a n/a 39.6
Bhopal FSW site, Bhopal FSW n/a n/a 0.40 n/a n/a n/a Chhatarpur Chhatarpur FSW n/a n/a n/a 0.40 0.40 3.6 Mandsaur FSW site, Mandsaur FSW n/a n/a 5.73 n/a n/a n/a Morena FSW site, Morena FSW n/a n/a 0.51 n/a n/a n/a Raisen Raisen FSW n/a n/a n/a 2.80 1.20 2 Sagar Sagar FSW n/a n/a n/a 0.00 0.00 2 Bhopal Rajeev Smruti Gas Pidit
Punarwas Kendra (New 08) MSM n/a n/a n/a n/a n/a 11.6
Bhopal Bhopal Gandhi Medical College and Hospital STI 3.25 3.40 0.00 5.56 0.58 n/a
Chhatarpur Chattarpur DH STI 1.80 0.00 0.44 0.80 0.00 0.4
Gwalior Gwalior Gajra Raja Medical College Hospital STI 2.99 0.00 0.49 0.80 1.20 0.8
Hoshangabad Hoshangabad Civil Hospital STI 1.20 2.80 1.60 0.00 0.00 1.61 Indore Indore MY Hospital STI 8.80 4.20 5.20 6.00 5.20 6.75 Jabalpur Jabalpur Victoria Hospital STI 1.83 1.60 0.00 0.00 0.00 1.2 Jhabua Jhabua DH STI n/a n/a n/a 0.00 1.72 n/a Morena Morena DH STI 0.63 0.00 0.00 0.47 1.46 0.4 Neemuch Neemuch DH STI n/a n/a n/a 0.00 2.00 0.4 Satna Satna Civil Hospital STI 1.82 1.60 4.00 3.60 0.74 3.61 Seoni Seoni DH STI 0.80 2.00 3.60 0.00 1.20 1.6 Shajapur Shajapur DH STI n/a n/a n/a 1.21 0.40 0 Ujjain Ujjain DH STI 0.40 2.00 0.00 0.40 0.00 0

116 Annual HIV Sentinel Surveillance - Country Report 2008-2009
TABLE SS 21a Maharashtra (2008 summary)
*HIV prevalence among antenatal attendees Trends in ANC, 2003–08
Group Number HIV % positive (90%
CI)
tested All women 27 940 0.60 (0.52–0.67) Urban women 15 201 0.76 (0.64–0.84)
Rural women 12 739 0.41 (0.32–0.50) * HIV prevalence is given for valid sites (≥75% sample size).
ANC attendees
District Site name Population group 2003 2004 2005 2006 2007 2008
Ahmadnagar Ahmadnagar Civil Hospital ANC 2.25 1.50 2.50 1.25 1.25 0.76 Ahmadnagar CHC, Pathradi ANC (R) 1.00 0.25 0.75 0.25 0.75 0.26 Akola Akola Women Hospital ANC 0.75 0.25 0.00 1.00 0.00 0.77 Akola CHC, Murtizapur ANC (R) 0.36 0.00 0.00 0.25 1.25 0.25 Amravati Amravati Civil Hospital ANC 0.75 0.75 1.00 0.50 1.00 0 Amravati CHC, Achalpur ANC (R) 0.25 0.25 0.25 0.00 0.25 0.26
Aurangabad Aurangabad Government Medical College ANC 0.25 0.25 0.00 1.25 0.50 0.29
Aurangabad CHC, Sillod ANC (R) 0.00 0.00 0.00 0.25 0.00 0.27 Bhandara Bhandara Civil Hospital ANC 1.25 0.50 1.25 0.25 1.00 0.75 Bhandara CHC, Tumsar ANC (R) 0.75 0.75 1.00 0.50 0.50 0 Beed Beed Civil Hospital ANC 2.25 0.25 1.25 0.50 0.75 0.75 Beed CHC, Parali ANC (R) 0.75 0.75 0.50 1.00 0.50 0.5 Buldhana Buldhana Civil Hospital ANC 0.25 0.25 0.50 1.00 0.25 1.32 Buldhana CHC, Khamgav ANC (R) 0.25 0.00 0.25 0.75 0.25 0.29 Chandrapur Chandrapur Civil Hospital ANC 2.75 3 3.5 3.5 2.00 1.79 Chandrapur CHC, Mul ANC (R) 0.25 0.75 1.75 0.00 0.25 1.03
Dhule Government Medical College ANC 1.50 0.50 0.75 1.00 1.50 0.75
Dhule CHC, Shirpur ANC (R) 0.51 1.00 0.50 1.25 0.75 0.5 Gadchiroli Gadchiroli Civil Hospital ANC 0.50 1.00 0.50 0.50 0.00 0 Gadchiroli CHC, Armori ANC (R) 0.00 0.00 0.25 0.00 0.00 0 Gondiya Gondiya Civil Hospital ANC 0.75 0.25 0.50 0.75 0.25 0.25 Gondiya CHC, Deori ANC (R) 1.00 0.25 0.25 0.50 0.50 0.26 Hingoli Hingoli Civil Hospital ANC 0.25 1.50 1.00 1.25 0.50 0.25 Hingoli CHC, Vasmat ANC (R) 0.51 1.00 1.75 2.00 0.00 0.26 Jalgaon Jalgaon Civil Hospital ANC 1.75 1.75 1.75 1.75 2.00 0.79 Jalgaon CHC, Edlabad ANC (R) 1.25 1.25 1.75 1.25 1.50 0 Jalna Jalna Civil Hospital ANC 0.25 1.00 1.25 0.75 0.50 0.77 Jalna CHC, Ambad ANC (R) n/a 0.50 0.50 1.50 0.75 0
0.39 0.35 0.28 0.230
0.20.40.6
2003-2005 2004-2006 2005-2007 2006-2008HIV%
Posi
tive
Years

117Annual HIV Sentinel Surveillance - Country Report 2008-2009
ANC attendees
Kolhapur Kolhapur Government Medical College ANC 2.50 2.00 2.75 2.25 1.50 0.75
Kolhapur CHC, Gargoti ANC (R) 0.50 1.25 1.00 0.50 1.25 0 Latur Latur Women Hospital ANC 2.01 2.25 1.50 1.50 1.25 1.01 Latur CHC, Murud ANC (R) 1.00 0.25 0.50 0.25 0.25 0.75 Mumbai Mumbai Cama Hospital ANC 2.26 1.25 1.25 2.25 1.75 1.75 Mumbai (Suburban) *
Ashwini/Parekh Maternity and Surgical Hospital ANC n/a n/a n/a 0 1.27 n/a
Mumbai (Suburban) *
Mumbai Bhagwati Hospital ANC 1 1.75 2 1.75 2.00 1.75
Mumbai (Suburban) * Govandi Shatabdi Hospital ANC 1.25 1 0.25 1 1.75 1.25
Mumbai (Suburban) * Kurla KB Bhabha Hospital ANC 0.75 0.75 0.75 1.25 1.00 0.25
Mumbai (Suburban) *
Mumbai M.W. Desai Hospital ANC 1.5 0.5 0.75 0.5 0.50 0
Mumbai (Suburban) *
Rajawadi Peripheral Hospital ANC 1.25 1.25 1.75 0.5 1.25 1.25
Nagpur Nagpur IGMC ANC 2.75 1.25 1.50 0.50 1.25 0.77 Nagpur CHC, Umred ANC (R) 0.75 1.25 0.25 1.25 1.00 0
Nanded Nanded Government Medical College ANC 1.25 1.25 1.00 0.75 0.50 1.38
Nanded CHC, Khandhar ANC (R) 0.00 0.50 0.25 0.25 0.25 0 Nandurbar Nandurbar Civil Hospital ANC 2.25 0.25 1.00 0.75 0.75 0.25 Nandurbar CHC, Navapur ANC (R) 0.25 0.00 0.25 0.00 0.00 0
Nashik Nashik Government Hospital ANC 1.25 2.25 2.25 0.75 0.50 0
Nashik CHC, Kalwan ANC (R) 0.50 0.50 1.25 0.50 0.25 0.75 Osmanabad Osmanabad Civil Hospital ANC 0.75 1.75 1.50 1.50 0.50 1.1 Osmanabad CHC, Omerga ANC (R) 0.75 1.00 1.25 1.50 0.00 0.52 Parbhani Parbhani Civil Hospital ANC 1.25 0.50 0.50 0.25 1.25 0.79 Parbhani CHC, Selu ANC (R) 1.50 1.00 0.50 1.50 1.00 0.26
Pune Pune BJ Medical College / Pune Chest General Hospital, Aundh (Urban)
ANC 2.50 3.25 3.25 0.50 0.50 0.51
Pune CHC, Narayangaon ANC (R) 0.25 1.50 0.50 0.50 0.00 0 Raigarh Raigarh Civil Hospital ANC 0.50 1.00 0.75 0.50 0.25 0.26 Raigarh CHC, Mangaon ANC (R) 0.25 0.25 1.00 1.25 0.25 0.26
Ratnagiri Ratnagiri Government Hospital ANC 1.50 0.75 1.00 0.50 0.50 0.52
Ratnagiri CHC, Dapoli ANC (R) 0.50 0.75 1.00 0.00 0.00 0.27
Sangli Sangli Government Hospital ANC 4.00 2.50 3.25 3.00 3.25 1.81
Sangli CHC, Islampur ANC (R) 4.00 3.75 2.25 1.00 1.25 1.09
Satara Satara Government Hospital ANC 3.00 2.00 2.25 2.00 2.25 0.27
Satara CHC, Karad ANC (R) 2.50 1.25 1.50 1.00 1.00 0 Sindhudurg Sindhudurg Civil Hospital ANC 0.25 0.50 0.00 0.25 0.00 0 Sindhudurg CHC, Sawantwadi ANC (R) 0.00 0.00 0.50 0.00 0.25 0.25

118 Annual HIV Sentinel Surveillance - Country Report 2008-2009
ANC attendees
Solapur Solapur Government Medical College ANC 2.00 2.00 2.75 0.50 1.50 0.75
Solapur CHC, Akluj ANC (R) 0.50 0.25 0.75 1.50 0.50 2.55 Thane Thane Civil Hospital ANC 4.25 1.50 2.00 0.75 1.75 1.02 Thane CHC, Shahapur ANC (R) 1.50 0.75 0.75 1.00 0.00 0.26 Wardha Wardha Civil Hospital ANC 0.25 1.25 0.00 0.50 0.00 0.77 Wardha CHC, Pulgaon ANC (R) 0.50 0.50 0.75 0.00 0.50 1 Washim Washim Civil Hospital ANC 0.00 0.25 0.75 0.25 0.50 0.5 Washim CHC, Manglurpir ANC (R) 0.00 0.00 0.00 0.00 0.25 0.25
Yavatmal Yavatmal Government Medical College ANC 2.25 1.50 1.25 1.50 1.00 1.55
Yavatmal CHC, Pusad ANC (R) n/a 1.25 1.25 1.25 0.50 1.56
TABLE SS 21b Maharashtra (2008 summary)
*HIV prevalence among populations with high-risk behaviours Group Number HIV % positive (90% CI) Remarks tested All STI patients 1432 11.52 (10.13–12.91) Total number of sentinel sites 32 Female sex workers 5000 10.82 (10.10–11.54) 10 sites (≥75% sample size) had prevalence ≥5% Injecting drug users 250 20.0 (15.84–24.16) 18 sites (≥75% sample size) had prevalence ≥10% Male migrants 500 3.0 (1.75–4.25) Eunuch/ transgenders 250 15.40 (12.55–20.25) Men who have sex with men 1000 11.90 (10.22–13.58) * HIV prevalence is given for valid sites (≥75% sample size).
Maharashtra Populations with high-risk behaviours
District Site name Population group 2003 2004 2005 2006 2007 2008
Mumbai Dai Welfare Society, SION Hospital EUN n/a n/a 43.9 29.6 42.21 16.4
Ahmadnagar Snehalaya Project FSW n/a n/a 16.40 26.80 8.80 14.80 Akola Priyadarshini, Akola FSW n/a n/a 5.20 14.80 6 Chandrapur Noble Shikshan Sanstha FSW n/a n/a 22.00 20.80 12.80 8.4
Jalgaon Adhar Babu-uddeshiya Sanstha FSW n/a n/a 21.60 11.20 6.40 1.6
Kolhapur Muslim Samaj Probodhan Va Shikshan Sanstha FSW n/a n/a 29.20 29.60 18.00 26
Latur Shri Ganesh Bahuddeshiya Shikshan Prasarak, Mndal FSW n/a n/a 14.80 8.80 6.40 4.8
Mumbai Gaurabai CHCU FSW 54.29 44.76 50.2 36.8 42.40 30
Mumbai (Suburban) * Aditi - Source of Inspiration (NGO) FSW n/a n/a n/a 12.8 11.24 4
Mumbai (Suburban) * Malvani Urban Health Centre FSW n/a n/a 11.2 4 4.40 3.2

119Annual HIV Sentinel Surveillance - Country Report 2008-2009
Maharashtra
Mumbai (Suburban) * Vijay Krida Mandal (New 08) FSW n/a n/a n/a n/a n/a 4
Nagpur Nagpur (New 08) FSW n/a n/a n/a n/a n/a 17.2
Nashik Late Dr G.M. Bhavsar Charitable Trust FSW n/a n/a 18.40 9.60 7.20 9.6
Parbhani Setu Charitable Trust FSW n/a n/a 15.60 10.40 8.80 4.4 Pune Pune Saheli NGO FSW n/a 42.80 43.15 50.00 59.20 41.2 Raigarh Lok Parishad FSW n/a n/a 16.40 n/a n/a 2.8 Thane Thane, Sathi (NGO) FSW n/a 38.80 25.20 28.40 32.40 n/a Amravati Amrawati (New 08) FSW n/a n/a n/a n/a n/a 4 Beed Beed-Ambejogai (New 08) FSW n/a n/a n/a n/a n/a 11.6 Aurangabad Aurangabad (New 08) FSW n/a n/a n/a n/a n/a 2 Solapur Solapur (New 08) FSW n/a n/a n/a n/a n/a 6.4 Yavatmal Yavatmal (New 08) FSW n/a n/a n/a n/a n/a 14.4
Mumbai (Suburban) * Mumbai Mukti Sadan Foundation Project IDU n/a 29.2 12.8 20.4 24.40 20
Mumbai (Suburban) * SANKALP IDU 22.89 n/a n/a n/a n/a n/a Thane Thane (New 08) MRG 5.2 Mumbai (Suburban) * RSP and Nirman (NGO) MRG n/a n/a n/a 2.4 1.60 0.8 Mumbai (Suburban) * Mumbai HAMSAFAR Trust MSM 18.8 9.60 6 7.6 8.40 9.2 Pune Pune, Samabhavana (NGO) MSM n/a 12.80 14.80 23.60 15.20 12.80 Kolhapur Kolhapur (New 08) MSM n/a n/a n/a n/a n/a 16 Latur MSM Latur-Udgir (New 08) MSM n/a n/a n/a n/a n/a 9.6
Akola Akola Government Hospital STI 8.80 8.80 10.00 9.20 13.20 11.01
Aurangabad Aurangabad Government Medical College and Hospital
STI 14.00 5.60 6.80 10.00 10.04 n/a
Chandrapur Chandrapur Government Hospital STI 8.80 11.20 15.20 8.40 16.80 11.89
Jalgaon Jalgaon Government Hospital STI 7.60 10.40 7.20 10.80 8.00 7.05
Latur Latur Government Hospital STI 10.00 8.40 10.40 10.00 7.20 n/a
Mumbai Mumbai GT Hospital and St George STI 37.5 23.75 32.51 21.2 34.64 n/a
Mumbai (Suburban) * Dr R.N. Cooper Hospital STI 7.79 9.27 9.68 6.58 4.35 n/a
Mumbai (Suburban) * Mumbai MT Agarwal Hospital STI 31,33 15.65 16 11.17 0.00 n/a
Nagpur Nagpur IGMC STI 22.00 18.80 20.40 20.40 13.60 13.11 Pune Pune AF Medical College STI 8.40 16.40 17.20 n/a n/a n/a
Pune Pune BJ Medical College (New 07) STI n/a n/a n/a n/a 32.20 n/a
Sangli Sangli Government Medical College STI 15.60 32.80 25.20 28.40 30.00 14.05
Thane Thane Government Hospital STI 14.40 4.00 8.00 6.00 7.20 11.69
Nashik Nashik T.B. site TB n/a 5.75 4.25 n/a n/a n/a Mumbai GTB-RDTB Clinic TUB n/a 11 n/a n/a 24.4 n/a

120 Annual HIV Sentinel Surveillance - Country Report 2008-2009
TABLE SS 22a Manipur (2008 summary)
*HIV prevalence among antenatal attendees Trends in ANC, 2003–08
Group Number HIV % positive
(90% CI)
tested All women 5541 0.54 (0.38–0.70) Urban women 3969 0.76 (0.53–0.98)
Rural women 1572 0.0 (0.0– 0.0) * HIV prevalence is given for valid sites (≥75% sample size).
ANC attendees
District Site name Population group 2003 2004 2005 2006 2007 2008
Bishnupur Bishnupur DH ANC 1.75 1.25 0.75 0.00 1.00 0.5 Bishnupur PHC, Moirang ANC (R) 1.50 1.25 1.75 0.75 0.00 0
Chandel Moreh CHC Hospital ANC 1.75 1.50 3.50 1.75 3.00 1
Churachandpur Churachandpur DH ANC 5.00 2.75 1.50 2.25 3.00 0.75
Imphal East Imphal J.N. Hospital ANC 1.00 2.50 1.00 0.75 1.00 0.5
Imphal East Jiribam CHC ANC 0.00 0.25 0.25 1.25 1.00 1 Imphal West Lamphelpat RIMS ANC 1.50 1.50 1.50 2.25 0.75 1 Imphal West CHC, Wangoi ANC (R) 0.50 0.75 0.00 0.25 0.50 0 Imphal West CHC, Khumbong ANC (R) 0.00 0.50 0.50 0.25 0.75 0 Senapati Senapati DH ANC 0.75 0.50 1.00 1.75 0.00 0.25 Tamenglong Tamenglong DH ANC 0.75 1.50 1.75 2.50 0.00 0.5 Thoubal Thoubal DH ANC 1.00 4.00 0.75 1.25 0.75 0 Thoubal CHC, Kakching ANC (R) 0.25 0.50 1.00 0.50 0.50 0 Ukhrul Ukhrul DH ANC 3.00 4.50 3.00 4.00 6.00 2.17
TABLE SS 22b Manipur (2008 summary) *HIV prevalence among populations with high-risk behaviours
Group Number HIV % positive (90% CI) Remarks tested All STI patients 450 2.89 (1.59–4.19) Total number of sentinel sites 10 Female sex workers 745 10.87 (9.00–12.75) 3sites (≥75% sample size) had prevalence ≥5% Injecting drug users 967 28.65 (26.25–31.04) 6 sites (≥75% sample size) had prevalence ≥10% Men who have sex with men 244 17.21 (13.24–21.19) * HIV prevalence is given for valid sites (≥75% sample size).
1.4 1.5 1.3 1.10.01.02.0
2003-2005 2004-2006 2005-2007 2006-2008
HIV%
Posi
tive
Years

121Annual HIV Sentinel Surveillance - Country Report 2008-2009
Manipur Populations with high-risk behaviours
District Site name Population group 2003 2004 2005 2006 2007 2008
Chandel FSW, New Generation, Moreh FSW n/a n/a 4.00 10.40
12.00 5.69
Churachandpur FSW, PPO FSW n/a n/a 12.80 16.00 19.60 17.6 Imphal West FSW, MLSS FSW 12.80 12.40 13.20 8.40 7.60 9.24 Bishnupur Bishnupur DH DDAC IDU 22.40 10.80 28.00 15.20 12.40 34.27
Churachandpur Churachandpur DDAC, SHALOM IDU 32.93 29.20 20.00 24.00 28.00 28.28
Churachandpur DDAC, LRRC IDU n/a 29.20 33.60 17.20 18.00 34.04 Imphal West DDAC, Imphal IDU 18.07 14.80 14.80 22.80 13.20 17.92 Imphal West Imphal SASO RIMS Road MSM 29.20 14.00 15.60 10.40 16.40 17.21 Churachandpur Churachandpur DH STI 18.40 8.40 15.60 6.80 4.00 0.8 Imphal East Imphal JN Hospital STI 7.60 6.00 8.80 2.80 4.17 5.5
Imphal West Imphal District TB Hospital, Chingmeirong TUB n/a 18.75 n/a n/a n/a n/a
TABLE SS 23a Meghalaya (2008 summary)
*HIV prevalence among antenatal attendees Trends in ANC, 2003–08
Group Number HIV % positive (90%
CI)
tested All women 1969 0.05 (-0.03–0.13) Urban women 399 0.0 (0.0–0.0)
Rural women 1570 0.06 (-0.04–0.17) * HIV prevalence is given for valid sites (≥75% sample size).
ANC attendees
District Site name Population group 2003 2004 2005 2006 2007 2008
East Garo Hills CHC, Resubelpara ANC (R) n/a n/a n/a 0.00 0.00 0.00 East Garo Hills Wiilam Nagar CHC ANC (R) n/a n/a n/a 0.00 0.00 0.26
East Khasi Hills Shillong Ganesh Das Hospital ANC 0.25 0.00 0.00 0.24 0.00 0
Garo Hills ANC 0.59 n/a n/a n/a n/a n/a Ri Bhoi Nongpoh CHC ANC (R) n/a n/a n/a 0.29 0.00 0 South Garo Hills Bagmara CHC ANC (R) n/a n/a n/a 0.00 0.00 n/a West Garo Hills Phulbari CHC ANC (R) n/a n/a n/a 0.00 0.00 0 West Khasi Hills Nongstoin CHC ANC (R) n/a n/a n/a 0.00 0.00 0
0.1 0.1 0.1 0.1
0.00.10.1
2003-2005 2004-2006 2005-2007 2006-2008
HIV%
Posi
tive
Years
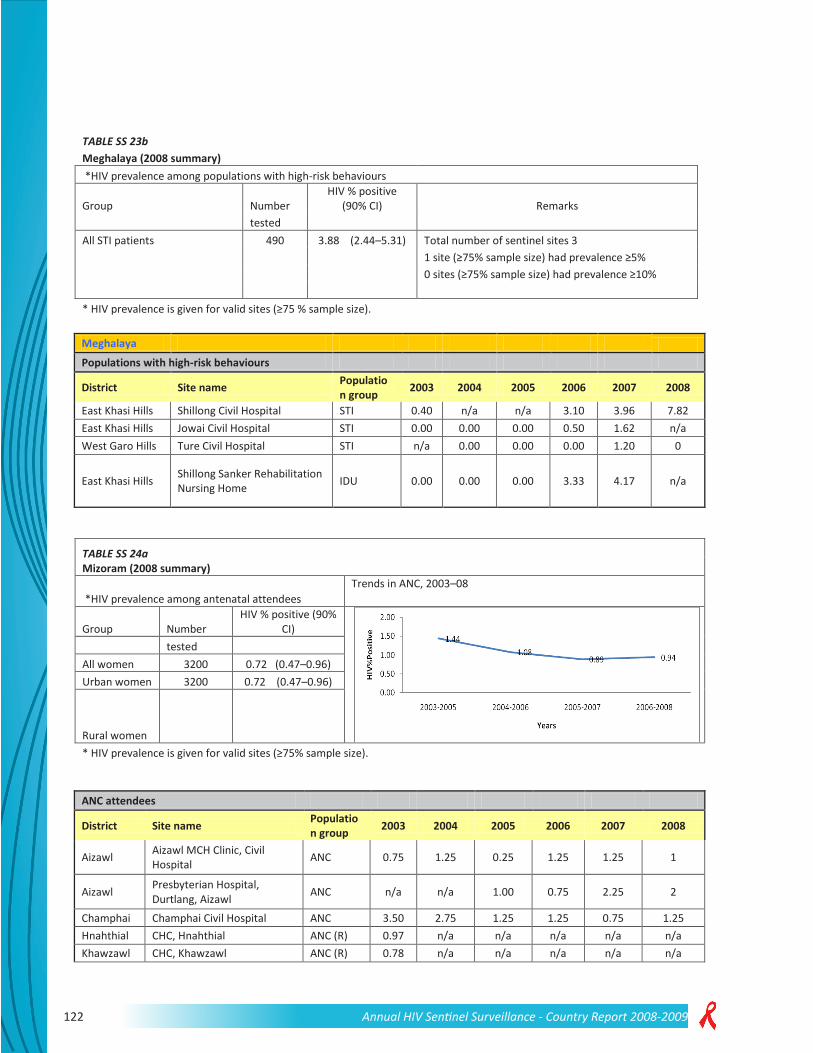
122 Annual HIV Sentinel Surveillance - Country Report 2008-2009
TABLE SS 23b Meghalaya (2008 summary)
*HIV prevalence among populations with high-risk behaviours
Group Number HIV % positive
(90% CI) Remarks tested All STI patients 490 3.88 (2.44–5.31) Total number of sentinel sites 3
1 site (≥75% sample size) had prevalence ≥5%
0 sites (≥75% sample size) had prevalence ≥10%
* HIV prevalence is given for valid sites (≥75 % sample size).
Meghalaya Populations with high-risk behaviours
District Site name Population group 2003 2004 2005 2006 2007 2008
East Khasi Hills Shillong Civil Hospital STI 0.40 n/a n/a 3.10 3.96 7.82 East Khasi Hills Jowai Civil Hospital STI 0.00 0.00 0.00 0.50 1.62 n/a West Garo Hills Ture Civil Hospital STI n/a 0.00 0.00 0.00 1.20 0
East Khasi Hills Shillong Sanker Rehabilitation Nursing Home IDU 0.00 0.00 0.00 3.33 4.17 n/a
TABLE SS 24a Mizoram (2008 summary)
*HIV prevalence among antenatal attendees Trends in ANC, 2003–08
Group Number HIV % positive (90%
CI)
tested All women 3200 0.72 (0.47–0.96) Urban women 3200 0.72 (0.47–0.96)
Rural women * HIV prevalence is given for valid sites (≥75% sample size).
ANC attendees
District Site name Population group 2003 2004 2005 2006 2007 2008
Aizawl Aizawl MCH Clinic, Civil Hospital ANC 0.75 1.25 0.25 1.25 1.25 1
Aizawl Presbyterian Hospital, Durtlang, Aizawl ANC n/a n/a 1.00 0.75 2.25 2
Champhai Champhai Civil Hospital ANC 3.50 2.75 1.25 1.25 0.75 1.25 Hnahthial CHC, Hnahthial ANC (R) 0.97 n/a n/a n/a n/a n/a Khawzawl CHC, Khawzawl ANC (R) 0.78 n/a n/a n/a n/a n/a

123Annual HIV Sentinel Surveillance - Country Report 2008-2009
ANC attendees
Kolasib Kolasib Civil Hospital (New 07) ANC n/a n/a n/a n/a 0.50 0.25
Lunglei Lunglei CHC Hospital ANC 2.00 0.50 0.75 0.50 0.75 0.5
Mamit Mamit Civil Hospital (New 07) ANC n/a n/a n/a n/a 0.81 0
Saiha Saiha Civil Hospital (New 07) ANC n/a n/a n/a n/a 0.25 0.25
Serchhip Serchhip Civil Hospital (New 07) ANC n/a n/a n/a n/a 0.25 0.5
TABLE SS 24b Mizoram (2008 summary) *HIV prevalence among populations with high-risk behaviours
Group Number HIV % positive (90% CI) Remarks tested All STI patients 500 6.40 (4.60–8.20) Total number of sentinel sites 9 Female sex workers 250 9.20 (6.19–12.21) 2 sites (≥75% sample size) had prevalence ≥5% Injecting drug users 1249 5.04 (4.03–6.06) 2 sites (≥75% sample size) had prevalence ≥10% Male migrants 250 0.80 (-0.13–1.73)
* HIV prevalence is given for valid sites (≥75% sample size).
Mizoram Populations with high-risk behaviours
District Site name Population group 2003 2004 2005 2006 2007 2008
Saiha Saiha Civil Hospital STI 1.60 0.80 2.00 0.80 n/a n/a Aizawl Aizawl Civil Hospital STI 6.00 1.20 4.00 6.80 6.80 10 Aizawl Samaritan, Aizawl STI n/a n/a n/a 1.60 9.60 n/a
Lunglei Christian Hospital, Serkawn Lunglei (New 07) STI n/a n/a n/a n/a 1.94 2.8
Aizawl Aizawl, SHALOM IDU 8.80 6.80 8.40 9.60 16.06 13.25
Champhai TNT, Champhai / RTCT, Champhai IDU n/a 6.80 4.80 14.40 8.4
Kolasib Drug de-addiction center.Sethawn / World Vision, Kolasib
IDU n/a n/a 3.20 3.20 4.40 n/a
Lunglei WADA, Lunglei IDU n/a n/a 2.80 2.00 2.00 2 Mamit Bethany, Mamit IDU n/a n/a n/a 1.20 n/a n/a Kolasib MHIP, Lawngtlai IDU n/a n/a n/a 1.20 n/a n/a Serchhip MHIP, Serchhip IDU n/a n/a n/a 1.20 n/a n/a Saiha M.Ch.Py, Saiha IDU n/a n/a n/a 1.20 0.80 0 Aizawl IDU 4.00 n/a n/a n/a n/a n/a
Kolasib Agape Moral Reformation Organization (New 08) IDU n/a n/a n/a n/a n/a 1.6
Aizawl Chan. Aizawl FSW n/a 13.69 n/a n/a n/a n/a
Aizawl Volunteers for Community Mental Health
FSW n/a n/a n/a n/a n/a 9.2
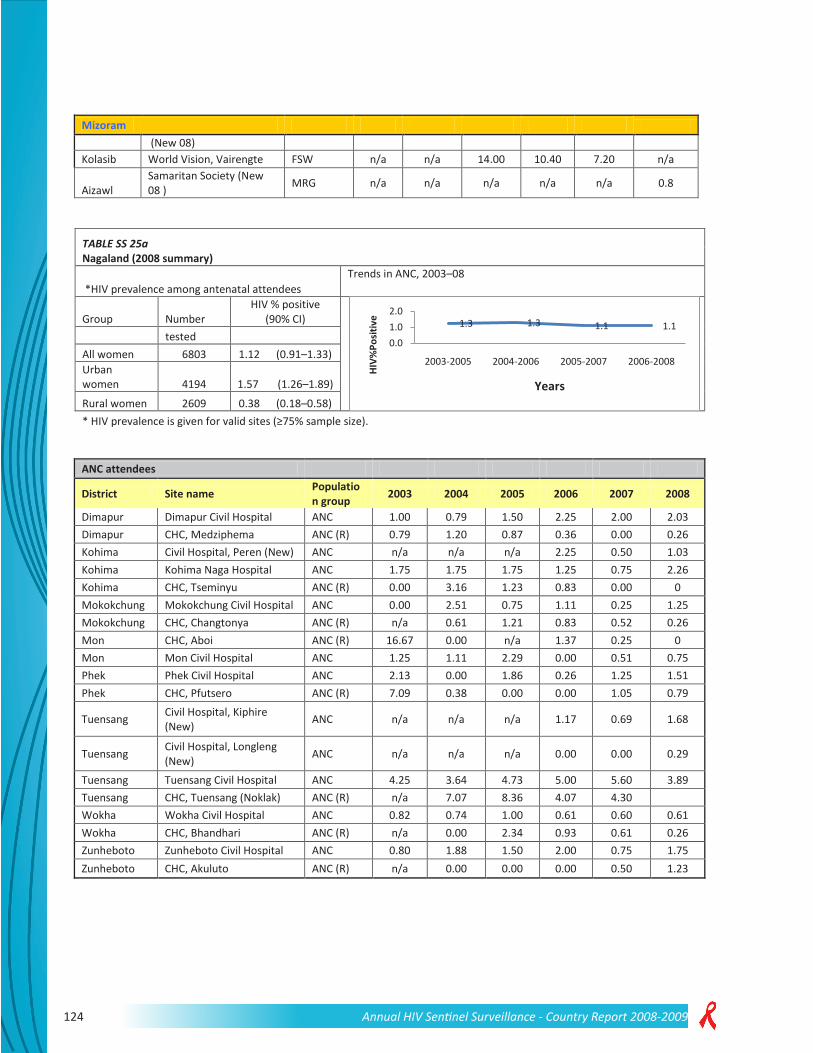
124 Annual HIV Sentinel Surveillance - Country Report 2008-2009
Mizoram
(New 08) Kolasib World Vision, Vairengte FSW n/a n/a 14.00 10.40 7.20 n/a
Aizawl Samaritan Society (New 08 ) MRG n/a n/a n/a n/a n/a 0.8
TABLE SS 25a Nagaland (2008 summary)
*HIV prevalence among antenatal attendees Trends in ANC, 2003–08
Group Number HIV % positive
(90% CI)
tested All women 6803 1.12 (0.91–1.33) Urban women 4194 1.57 (1.26–1.89)
Rural women 2609 0.38 (0.18–0.58) * HIV prevalence is given for valid sites (≥75% sample size).
ANC attendees
District Site name Population group 2003 2004 2005 2006 2007 2008
Dimapur Dimapur Civil Hospital ANC 1.00 0.79 1.50 2.25 2.00 2.03 Dimapur CHC, Medziphema ANC (R) 0.79 1.20 0.87 0.36 0.00 0.26 Kohima Civil Hospital, Peren (New) ANC n/a n/a n/a 2.25 0.50 1.03 Kohima Kohima Naga Hospital ANC 1.75 1.75 1.75 1.25 0.75 2.26 Kohima CHC, Tseminyu ANC (R) 0.00 3.16 1.23 0.83 0.00 0 Mokokchung Mokokchung Civil Hospital ANC 0.00 2.51 0.75 1.11 0.25 1.25 Mokokchung CHC, Changtonya ANC (R) n/a 0.61 1.21 0.83 0.52 0.26 Mon CHC, Aboi ANC (R) 16.67 0.00 n/a 1.37 0.25 0 Mon Mon Civil Hospital ANC 1.25 1.11 2.29 0.00 0.51 0.75 Phek Phek Civil Hospital ANC 2.13 0.00 1.86 0.26 1.25 1.51 Phek CHC, Pfutsero ANC (R) 7.09 0.38 0.00 0.00 1.05 0.79
Tuensang Civil Hospital, Kiphire (New) ANC n/a n/a n/a 1.17 0.69 1.68
Tuensang Civil Hospital, Longleng (New) ANC n/a n/a n/a 0.00 0.00 0.29
Tuensang Tuensang Civil Hospital ANC 4.25 3.64 4.73 5.00 5.60 3.89 Tuensang CHC, Tuensang (Noklak) ANC (R) n/a 7.07 8.36 4.07 4.30 Wokha Wokha Civil Hospital ANC 0.82 0.74 1.00 0.61 0.60 0.61 Wokha CHC, Bhandhari ANC (R) n/a 0.00 2.34 0.93 0.61 0.26 Zunheboto Zunheboto Civil Hospital ANC 0.80 1.88 1.50 2.00 0.75 1.75 Zunheboto CHC, Akuluto ANC (R) n/a 0.00 0.00 0.00 0.50 1.23
1.3 1.3 1.1 1.10.01.02.0
2003-2005 2004-2006 2005-2007 2006-2008HI
V%Po
sitiv
eYears

125Annual HIV Sentinel Surveillance - Country Report 2008-2009
TABLE SS 25b Nagaland (2008
summary) *HIV prevalence of populations with high-risk behaviours
Group
Number
HIV % positive (90% CI) Remarks
tested
All STI patients 241 3.32 (1.42–
5.22) Total number of sentinel sites 10
Female sex workers 249
14.06 (10.43–17.68)
1 site (≥75% sample size) had prevalence ≥5%
Injecting drug users 1385
3.83 (2.98–4.67)
3 sites (≥75% sample size) had prevalence ≥10%
* HIV prevalence is given for valid sites (≥75% sample size).
Nagaland
Populations with high-risk behaviours
District Site name Population group 2003 2004 2005 2006 2007 2008
Dimapur Akimbo Dimapur FSW 4.40 4.44 10.80 16.40 8.91 14.06 Dimapur Dimapur Civil Hospital IDU 10.44 4.49 8.40 3.20 5.20 10.17 Kohima Kirpa Kohima IDU n/a 4.00 4.00 6.00 2.00 5.6 Kohima Kohima Naga Hospital STI 0.98 1.72 3.48 0.00 3.42 3.32 Mokokchung
Tuli, NEDHIV/ NEDHIV Mokokchung IDU 2.69 2.93 4.80 1.42 1.17 3.17
Mokokchung Mokokchung TB Hospital TUB n/a 7.19 n/a n/a n/a n/a
Mon Mon Civil Hospital IDU 0.00 0.41 2.00 0.40 0.00 n/a Phek Bethesda Phek IDU n/a 1.00 0.89 1.08 1.71 0.89 Tuensang Tuensang Civil Hospital IDU 23.66 8.80 10.80 5.20 2.80 2 Wokha Agape, Wokha IDU 0.80 0.40 0.39 0.82 1.23 0.9
Zunheboto Civil Hospital, Zunheboto (New) IDU n/a n/a n/a 0.85 0.89 n/a
TABLE SS 26a Orissa (2008 summary)
*HIV prevalence among antenatal attendees Trends in ANC, 2003–08
Group Number HIV % positive
(90% CI)
tested All women 12 400 0.40 (0.30–0.49) Urban women 12 400 0.40 (0.30–0.49)
Rural women * HIV prevalence is given for valid sites (≥75% sample size).
0.40.7 0.6 0.7
0.00.51.0
2003-2005 2004-2006 2005-2007 2006-2008
HIV%
Posi
tive
Years

126 Annual HIV Sentinel Surveillance - Country Report 2008-2009
ANC attendees
District Site name Population group 2003 2004 2005 2006 2007 2008
Anugul Dept of O&G, District Headquarter Hospital ANC n/a n/a n/a 1.75 1.74 0.5
Balangir Dept of O&G, District Headquarter Hospital ANC n/a n/a n/a 1.25 0.00 0.5
Balasore Dept of O&G, District Headquarter Hospital, Balasore (New 07)
ANC n/a n/a n/a n/a 0.25 0.5
Bargarh Dept of O&G, District Headquarter Hospital ANC n/a n/a n/a 0.25 0.50 0.5
Baudh Dept of O&G, District Headquarter Hospital ANC n/a n/a n/a 0.00 0.00 0
Bhadrak Dept of O&G, District Headquarter Hospital ANC n/a n/a n/a 1.00 0.25 0
Cuttack Cuttack SCB Medical College ANC 0.00 0.50 0.50 0.75 0.00 1
Deogarh Dept of O&G, District Headquarter Hospital, Deogarh (New 07)
ANC n/a n/a n/a n/a 1.00 0
Denkanal Dept of O&G, District Headquarter Hospital ANC n/a n/a n/a 0.00 0.25 0
Gajapati Dept of O&G, District Headquarter Hospital, Gajapati (New 07)
ANC n/a n/a n/a n/a 0.00 0.25
Ganjam Berhampur City Hospital ANC 0.00 1.50 2.25 3.25 0.25 1.25
Ganjam
Area Hospital, Aska, Ganjam/ Hinjilikatu Ganjam (composite) (New 07)
ANC (R) n/a n/a n/a n/a 0.50 0.75
Jagatsinghapur Jagatsinghpur District Headquarter Hospital ANC 0.00 0.00 0.00 0.50 0.00 0.25
Jajapur Dept of O&G, District Headquarter Hospital ANC n/a n/a n/a 0.25 0.50 0.25
Jharsuguda Dept of O&G, District Headquarter Hospital ANC n/a n/a n/a 0.00 0.00 1.5
Kalahandi Dept of O&G, District Headquarter Hospital ANC n/a n/a n/a 0.00 0.00 0
Kandhamal Dept of O&G, District Headquarter Hospital ANC n/a n/a n/a 0.00 0.00 0.75
Kendrapara Dept of O&G, District Headquarter Hospital ANC n/a n/a n/a 0.00 0.00 0.75
Kendujhar Dept of O&G, District Headquarter Hospital ANC n/a n/a n/a 0.50 0.00 0
Khorda Dept of O&G, Capital Hospital ANC n/a n/a n/a 0.25 0.00 0
Koraput Dept of O&G, District Headquarter Hospital, Koraput (New 07)
ANC n/a n/a n/a n/a 0.00 0

127Annual HIV Sentinel Surveillance - Country Report 2008-2009
ANC attendees
Malkangiri Dept of O&G, District Headquarter Hospital, Malkangiri (New 07)
ANC n/a n/a n/a n/a 0.00 0
Mayurbhanj Dept of O&G, District Headquarter Hospital ANC n/a n/a n/a 0.50 0.00 0.25
Nawarangpur Dept of O&G, District Headquarter Hospital, Nawarangpur (New 07)
ANC n/a n/a n/a n/a 0.25 0.5
Nayagarh Dept of O&G, District Headquarter Hospital ANC n/a n/a n/a 0.75 0.25 0
Nuapada Dept of O&G, District Headquarter Hospital, Nuapada (New 07)
ANC n/a n/a n/a n/a 0.00 0
Puri Dept of O&G, District Headquarter Hospital ANC n/a n/a n/a 0.50 0.25 0.5
Rayagada Dept of O&G, District Headquarter Hospital ANC n/a n/a n/a 0.50 0.25 0.25
Sambalpur Burla VSS Medical College ANC 0.00 0.50 0.00 0.50 0.75 0
Sonapur Dept of O&G, District Headquarter Hospital ANC n/a n/a n/a 0.00 0.00 1.75
Sundargarh Rourkela RG Hospital ANC 0.00 0.00 0.25 0.25 0.00 0.25
TABLE SS 26b Orissa (2008 summary) *HIV prevalence among populations with high-risk behaviours
Group Number HIV % positive (90% CI) Remarks tested All STI patients 1464 1.64 (1.09–2.19) Total number of sentinel sites 21
Female sex workers 1497 2.34 (1.70–2.98) 6 sites (≥75% sample size) had prevalence ≥5%
Injecting drug users 725 6.62 (5.10–8.14) 1 site (≥75% sample size) had prevalence ≥10%
Male Migrants 250 3.20 (1.37–5.03) Men who have sex with men 969 3.92 (2.90–4.95) * HIV prevalence is given for valid sites (≥75% sample size).
Orissa Summary—Populations with high-risk behaviours
District Site name Population group 2003 2004 2005 2006 2007 2008
Puri PENCODE, Puri Fisher-folk n/a n/a n/a 3.20 n/a n/a Balasore Balasore (New 07) FSW n/a n/a n/a n/a 4.00 4.8 Jajpur TSRDS, Jajpur (New 07) FSW n/a n/a n/a n/a 0.00 0.4 Khorda Bhubaneshwar OPUS FSW n/a 7.57 2.80 0.80 0.00 0.81 Rayagada Rayagada USO FSW n/a 2.79 2.40 1.20 0.00 2.81
Sundergarh SGUP, Lahunipada, Sundergarh (New 07) FSW n/a n/a n/a n/a 0.00 n/a
Bhadrak Fellowship, Tarini Bhawan (New 08) FSW n/a n/a n/a n/a n/a 5.2

128 Annual HIV Sentinel Surveillance - Country Report 2008-2009
Orissa Jagatsinghapur Institute of Rural
Development and Management Studies (New 09)
FSW n/a n/a n/a n/a n/a 0
Baragarh HDI, Baragarh (New 07) IDU n/a n/a n/a n/a 5.60 5.33 Khorda Lepra Society (NGO) IDU n/a n/a n/a 10.40 9.60 13.6 Puri AVA, Puri (New 07) IDU n/a n/a n/a n/a 6.80 n/a Cuttack Orissa Institute of Medical
Research and Health Services (New 09)
IDU n/a n/a n/a n/a n/a 0.8
Balangir RYS (NGO), near old fire station, MRG n/a n/a n/a 0.80 n/a n/a
Gajapati SWSS (NGO) MRG n/a n/a n/a 0.40 n/a n/a Ganjam ARUNA (NGO) MRG n/a n/a n/a 5.60 n/a n/a Malkangiri TSRD (NGO) MRG n/a n/a n/a 0.00 n/a n/a Anugul Society for Advancement of
Rural Community (New 09) MRG n/a n/a n/a n/a n/a 3.2
Nabarangapur CGL (NGO) MRG n/a n/a n/a 0.40 n/a n/a Bolangir RYS, Bolangir (New 07) MSM n/a n/a n/a n/a 6.37 5.78
Anugul The Medics, Similipada, Angul (New 07) MSM n/a n/a n/a n/a 8.37 7.2
Khordha Viswa Jeevan Seva Sangha (VJSS) (New 09) MSM n/a n/a n/a n/a n/a 2
Sambalpur Arun Institute of rural affairs (AIRA) (New 08) MSM n/a n/a n/a n/a n/a 0.82
Baleshwar Balasore DHH STI 3.20 2.80 6.80 3.20 1.60 0
Cuttack Cuttack SCB Medical College STI 2.80 2.39 1.20 2.80 0.00 0.8
Ganjam Berhampur MKCG Medical College STI 6.85 3.98 5.20 3.60 1.62 6.7
Khorda Bhubaneshwar Capital Hospital STI 0.40 6.40 5.20 2.00 3.61 0.41
Koraput Koraput DHH STI 2.40 5.20 4.00 3.20 1.60 1.62 Puri Puri DHH STI 1.60 1.60 2.40 1.20 0.81 n/a Sambalpur Sambalpur DHH STI 0.40 0.00 0.40 0.40 1.20 0.8
Anugul The Medics (NGO), Similipada TRK n/a n/a n/a 2.80 n/a n/a
Debagarh HDI, D31, BJB Nagar (NGO) TRK n/a n/a n/a 3.60 n/a n/a
Kendrapara VAARAT TRK n/a n/a n/a 1.60 n/a n/a Kendujhar The Medics (NGO) TRK n/a n/a n/a 3.60 n/a n/a Mayurbhanj RRDC (NGO) TRK n/a n/a n/a 1.20 n/a n/a
Nuapada Mahila Vikash (NGO) TRK n/a n/a n/a 3.60 n/a n/a

129Annual HIV Sentinel Surveillance - Country Report 2008-2009
TABLE SS 27a Pondicherry (2008 summary)
*HIV prevalence among antenatal attendees Trends in ANC, 2003–08
Group Number HIV % positive
(90% CI)
tested All women 800 0.25 (-0.04–0.54) Urban women 800 0.25 (-0.04–0.54)
Rural women * HIV prevalence is given for valid sites (≥75% sample size).
ANC attendees
District Site name Population group 2003 2004 2005 2006 2007 2008
Karaikal Karaikal General Hospital ANC 0.25 0.25 0.50 0.50 0.00 0.25 Karaikal Karaikal ANC 0.26 n/a n/a n/a n/a n/a
Pondicherry Pondicherry Maternity Hospital ANC (R) 0.00 0.25 0.00 0.00 0.00 n/a
Pondicherry Pondicherry Maternity Hospital ANC n/a n/a n/a n/a n/a 0.25
Pondicherry ANC (R) 0.00 n/a n/a n/a n/a n/a
TABLE SS 27b Pondicherry (2008 summary)
*HIV prevalence among populations with high-risk behaviours
Group Number HIV % positive (90%
CI) Remarks tested All STI patients 692 3.18 (2.08–4.28) Total number of sentinel sites 8 Female sex workers 740 2.57 (1.61–3.52) 0 sites (≥75% sample size) had prevalence ≥5%
0 sites (≥75% sample size) had prevalence ≥10%
Men who have sex with men 490 2.65 (1.46–3.85) * HIV prevalence is given for valid sites (≥75% sample size).
0.2 0.3 0.2 0.20.00.20.4
2003-2005 2004-2006 2005-2007 2006-2008
HIV%
Posi
tive
Years
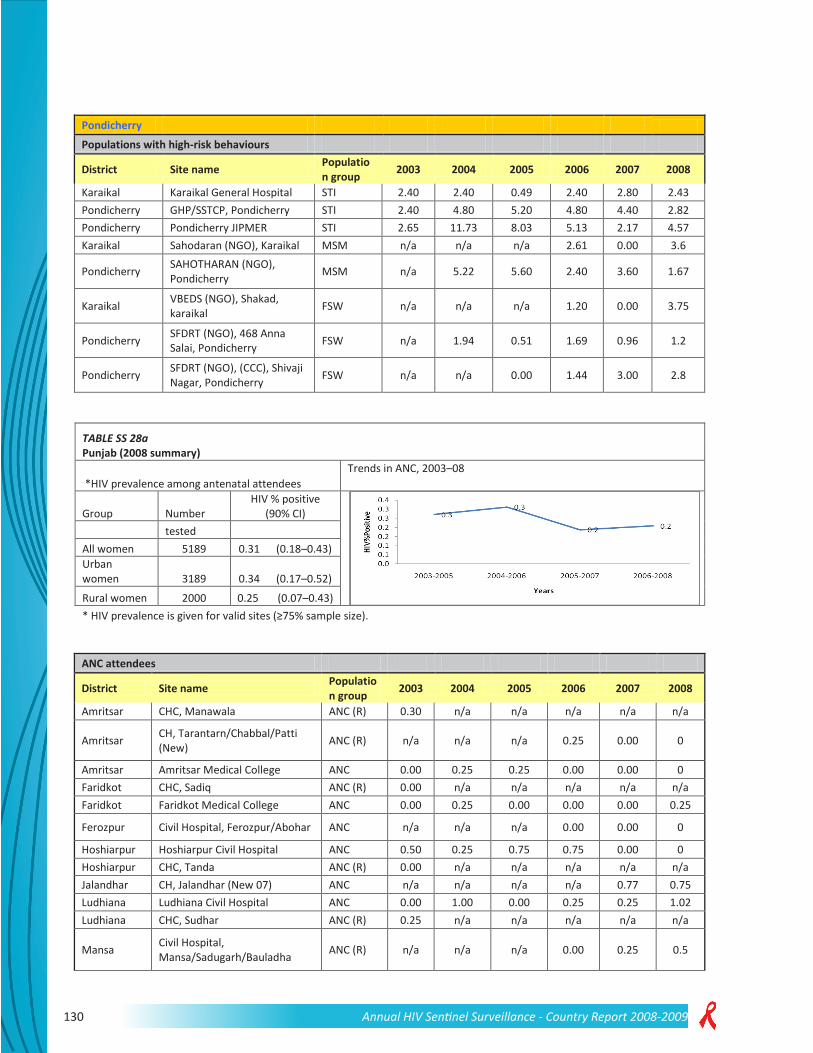
130 Annual HIV Sentinel Surveillance - Country Report 2008-2009
Pondicherry Populations with high-risk behaviours
District Site name Population group 2003 2004 2005 2006 2007 2008
Karaikal Karaikal General Hospital STI 2.40 2.40 0.49 2.40 2.80 2.43 Pondicherry GHP/SSTCP, Pondicherry STI 2.40 4.80 5.20 4.80 4.40 2.82 Pondicherry Pondicherry JIPMER STI 2.65 11.73 8.03 5.13 2.17 4.57 Karaikal Sahodaran (NGO), Karaikal MSM n/a n/a n/a 2.61 0.00 3.6
Pondicherry SAHOTHARAN (NGO), Pondicherry MSM n/a 5.22 5.60 2.40 3.60 1.67
Karaikal VBEDS (NGO), Shakad, karaikal FSW n/a n/a n/a 1.20 0.00 3.75
Pondicherry SFDRT (NGO), 468 Anna Salai, Pondicherry FSW n/a 1.94 0.51 1.69 0.96 1.2
Pondicherry SFDRT (NGO), (CCC), Shivaji Nagar, Pondicherry FSW n/a n/a 0.00 1.44 3.00 2.8
TABLE SS 28a Punjab (2008 summary)
*HIV prevalence among antenatal attendees Trends in ANC, 2003–08
Group Number HIV % positive
(90% CI)
tested All women 5189 0.31 (0.18–0.43) Urban women 3189 0.34 (0.17–0.52)
Rural women 2000 0.25 (0.07–0.43) * HIV prevalence is given for valid sites (≥75% sample size).
ANC attendees
District Site name Population group 2003 2004 2005 2006 2007 2008
Amritsar CHC, Manawala ANC (R) 0.30 n/a n/a n/a n/a n/a
Amritsar CH, Tarantarn/Chabbal/Patti (New) ANC (R) n/a n/a n/a 0.25 0.00 0
Amritsar Amritsar Medical College ANC 0.00 0.25 0.25 0.00 0.00 0 Faridkot CHC, Sadiq ANC (R) 0.00 n/a n/a n/a n/a n/a Faridkot Faridkot Medical College ANC 0.00 0.25 0.00 0.00 0.00 0.25
Ferozpur Civil Hospital, Ferozpur/Abohar ANC n/a n/a n/a 0.00 0.00 0
Hoshiarpur Hoshiarpur Civil Hospital ANC 0.50 0.25 0.75 0.75 0.00 0 Hoshiarpur CHC, Tanda ANC (R) 0.00 n/a n/a n/a n/a n/a Jalandhar CH, Jalandhar (New 07) ANC n/a n/a n/a n/a 0.77 0.75 Ludhiana Ludhiana Civil Hospital ANC 0.00 1.00 0.00 0.25 0.25 1.02 Ludhiana CHC, Sudhar ANC (R) 0.25 n/a n/a n/a n/a n/a
Mansa Civil Hospital, Mansa/Sadugarh/Bauladha ANC (R) n/a n/a n/a 0.00 0.25 0.5
0.2 0.3 0.2 0.20.00.20.4
2003-2005 2004-2006 2005-2007 2006-2008
HIV%
Posi
tive
Years

131Annual HIV Sentinel Surveillance - Country Report 2008-2009
ANC attendees
Moga Civil Hospital, Moga/Khothi/Thathibhai ANC (R) n/a n/a n/a 0.75 0.00 0.75
Muktsar CHC/CH, Muktsar/Malout ANC (R) n/a n/a n/a 0.25 0.00 0
Nawanshahr CHC/CH, Balachaur/Mazaffarpur/Sujjon ANC (R) n/a n/a n/a 0.00 0.00 0
Sangrur CH, Sangrur/Malerkotla/Barnala ANC n/a n/a n/a 0.00 0.00 0.75
Sangrur/ Barnala Civil Hospital, Barnala (New 07) ANC n/a n/a n/a n/a 0.25 0
Punjab (2008 summary) *HIV prevalence among populations with high-risk behaviours
Group Number HIV % positive (90% CI) Remarks tested All STI patients 747 1.07 (0.45–1.69) Total number of sentinel sites 18 Female sex workers 1749 1.03 (0.63–1.43) 1 site (≥75% sample size) had prevalence ≥5% Injecting drug users 1000 27.60 (25.27– 29.93) 3 sites (≥75% sample size) had prevalence ≥10% Men who have sex with men 750 3.20 (2.14– 4.26) * HIV prevalence is given for valid sites (≥75% sample size).
TABLE SS 28b Punjab
Populations with high-risk behaviours
District Site name Population group 2003 2004 2005 2006 2007 2008
Rupnagar/ Ropar
Ambuja Cement Ropar, NYDC Talwara, VVSS Batala (New 07)
Composite TI IDU n/a n/a n/a n/a 10.12 35.2
Jalandhar Sharan (New 08 ) IVDU 15.2
Amritsar Swami Vivekanand Medical Mission (New 07)
Composite TI IDU n/a n/a n/a n/a 30.40 56.4
Rupnagar/ Mohali
Family Planning Association of India (FPAI) (New 07)
Composite TI IDU n/a n/a n/a n/a 0.80 3.6
Amritsar All India Women’s Conference (New 08) FSW 1.2
Patiala Progressive Youth Forum FSW 0.00 n/a n/a 0.80 n/a n/a Jalandhar Swach FSW n/a n/a n/a 2.40 n/a n/a Rupnagar FPAI ( SAS Nagar) (New) FSW n/a n/a n/a 1.60 n/a n/a
Amritsar Swami Vivekanand Medical Mission FSW n/a n/a n/a 1.60 n/a n/a
Fatehgarh Sahib
S.S. Mem Edu.Trust, Mandi, Gobind Garh FSW n/a n/a n/a 0.40 n/a n/a
Rupnagar/ Mohali FPAI, Mohali (New 07) FSW n/a n/a n/a n/a 0.00 0

132 Annual HIV Sentinel Surveillance - Country Report 2008-2009
Rupnagar/ Ropar
Ambuja Cement, Ropar (New 07) FSW n/a n/a n/a n/a 0.00 1.2
Gurdaspur/Batala
Vahoo Vahoo Sewak Sabha, Batala (New 07) FSW n/a n/a n/a n/a 2.43 2
Bathinda Ambuja Cement Bathinda (New 07) FSW n/a n/a n/a n/a 0.81 1.6
Talwara/ Hoshiarpur NYDC, Talwara (New 07) FSW n/a n/a n/a n/a 0.00 0.4
Ludhiana Guru Gobind Singh Study Circle, Ludhiana (New 08)
FSW 0.8
Bathinda DEWS IDU n/a n/a n/a 6.40 n/a n/a Ludhiana Swach IDU n/a n/a n/a 21.20 n/a n/a
Rupnagar Ambuja Cement, Ropar (New) MSM n/a n/a n/a 4.80 0.40 2
Bathinda Ambuja Cement, Bathinda (New 07) MSM n/a n/a n/a n/a 2.05 2.4
Gurdaspur
VVSS and Sudeep Memorial Charitable Trust (New 08)
MSM 5.2
Amritsar Amritsar Government Medical College STI 2.00 2.00 2.40 0.00 3.63 2
Patiala Patiala Medical College STI 1.60 1.09 0.80 0.80 0.40 0.4 Bathinda Bhatinda Civil Hospital STI 1.20 0.40 0.00 0.00 0.80 0.8
Gurdaspur Vaho Vaho Sewak Sabha, Batala, Gurdaspur TRK n/a n/a n/a 0.80 n/a n/a
Kapurthala Yuvasatta Phagwara TRK n/a n/a n/a 0.00 n/a n/a
Rupnagar Ambuja Cement, Ropar (New) TRK n/a n/a n/a 2.40 n/a n/a
TABLE SS 29a Rajasthan (2008 summary)
*HIV prevalence among antenatal attendees Trends in ANC, 2003–08
Group Number HIV % positive
(90% CI)
tested All women 9995 0.17 (0.10–0.24) Urban women 9995 0.17 (0.10–0.24)
Rural women * HIV prevalence is given for valid sites (≥75% sample size).
0.2 0.3 0.2 0.20.00.20.4
2003-2005 2004-2006 2005-2007 2006-2008
HIV%
Posi
tive
Years

133Annual HIV Sentinel Surveillance - Country Report 2008-2009
ANC Attendees
District Site name Population group 2003 2004 2005 2006 2007 2008
Ajmer Government Mahila Chikitshalay ANC n/a n/a n/a 0.00 0.00 0.25
Alwar Rajiv Gandhi Government General Hospital ANC n/a n/a n/a 0.50 0.50 0
Banswara Mahatma Gandhi Hospital ANC n/a n/a n/a 0.00 0.25 0 Baran Government Hospital ANC n/a n/a n/a 0.00 0.00 0 Barmer General Hospital ANC n/a n/a n/a 0.00 1.00 0.25 Bharatpur Bharatpur DH (New 07) ANC n/a n/a n/a n/a 0.25 0.25
Bhilwara Bhilwara District MG Hospital ANC 0.25 0.00 0.25 0.25 0.51 0
Bhilwara CHC, Jahajpur ANC (R) 0.75 n/a n/a n/a n/a n/a Bundi P.B.S.S. General Hospital ANC n/a n/a n/a 0.00 0.00 0 Chittaurgarh General Hospital ANC n/a n/a n/a 0.25 1.00 0.25
Churu D.B. Government Hospital ANC n/a n/a n/a 0.00 0.00 0 Dausa Government DH ANC n/a n/a n/a 0.00 0.00 0 Dungarpur Dungarpur DH ANC 0.00 0.66 0.00 0.00 0.26 n/a Dungarpur CHC, Sagwara ANC (R) 0.25 n/a n/a n/a n/a n/a Ganganagar CHC, Anoopharh ANC (R) 0.44 n/a n/a n/a n/a n/a Ganganagar Sriganganagar DH ANC 0.25 0.00 2.25 3.00 0.00 0.25 Jaipur Jaipur Zanana Hospital ANC 0.00 0.75 0.00 0.25 0.00 0.25 Jaipur CHC, Chomu ANC (R) 0.00 n/a n/a n/a n/a n/a Jaisalmer Sh. Jawahar Hospital ANC n/a n/a n/a 0.25 0.00 0
Jalor Bhandari Sarvajanik Hospital ANC n/a n/a n/a 0.25 0.25 1
Jhalawar Jhalawar DH ANC 0.00 0.00 0.50 0.00 0.00 0 Jhalawar CHC, Khanpur ANC (R) 0.00 n/a n/a n/a n/a n/a
Jhunjhunun B.D.K. Government Hospital ANC n/a n/a n/a 0.00 0.00 0
Jodhpur Umaid Hospital, Jodhpur Medical College ANC 0.00 0.00 0.00 0.00 0.75 0.25
Jodhpur Pipar City ANC (R) 0.00 n/a n/a n/a n/a n/a
Karauli Government General Hospital ANC n/a n/a n/a 0.00 0.25 0
Kota Jay Ka lone Hospital ANC n/a n/a n/a 0.00 0.25 0 Nagaur Government Hospital ANC n/a n/a n/a 0.75 0.00 0.5 Pali Government Vagad Hospital ANC n/a n/a n/a 0.50 0.00 0.25 Rajsamand General Hospital ANC n/a n/a n/a 0.50 0.86 0.5
Sikar Shree Kalyan Government Hospital ANC n/a n/a n/a 0.25 0.00 0
Sirohi Government General Hospital ANC n/a n/a n/a 0.50 0.50 0.25

134 Annual HIV Sentinel Surveillance - Country Report 2008-2009
TABLE SS 29b Rajasthan (2008 summary)
*HIV prevalence among populations with high-risk behaviours Group Number HIV % positive (90% CI) Remarks tested All STI patients 3634 2.20 (1.80–2.60) Total number of sentinel sites 20 Female sex workers 1000 3.20 (2.28–4.12) 3 sites (≥75% sample size) had prevalence ≥5%
0 sites (≥75% sample size) had prevalence ≥10%
* HIV prevalence is given for valid sites (≥75% sample size).
Rajasthan Populations with high-risk behaviours
District Site name Population group 2003 2004 2005 2006 2007 2008
Ajmer Ajmer JLN Hospital FSW n/a n/a 4.00 1.60 2.80 7.2 Alwar Alwar FSW 3.92 2.31 3.23 4.00 4.80 n/a Banswara Mahatma Gandhi Hospital FSW n/a n/a n/a 0.40 n/a 1.2 Bharatpur Bharatpur DH FSW n/a n/a 4.69 0.00 n/a n/a Dhaulpur Dholpur FSW n/a n/a 3.28 1.20 4.80 n/a Ganganagar Maharshi Dayanand Vikas
Samiti,Sri Ganganagar (New 08)
FSW n/a n/a n/a n/a n/a 0
Nagaur Government Hospital FSW n/a n/a n/a 0.80 1.75 n/a
Tonk Government Saadat Hospital FSW n/a n/a n/a 7.60 4.80 4.4
Churu DB Government Hospital MSM n/a n/a n/a 0.00 n/a n/a
Ajmer Ajmer JLN Medical Collge and Hospital STI 6.08 10.46 11.11 7.20 2.00 8.8
Alwar Alwar DH STI 0.40 1.24 8.64 2.80 1.20 0.5 Barmer Barmer DH STI 6.80 9.80 5.60 2.40 3.60 3.6 Bikaner Bikaner PBM Hospital STI 0.00 1.27 0.40 0.40 1.20 0 Chittaurgarh General Hospital STI n/a n/a n/a 1.60 4.42 4.4 Ganganagar Government Hospital STI n/a n/a n/a 1.20 0.00 0 Hanumangarh
Mahatama Gandhi Memorial Hospital STI n/a n/a n/a 0.40 0.00 0
Jaipur Jaipur SMS Medical College STI 14.00 4.65 7.72 3.60 4.80 4.98
Jhunjhunun BDK Government Hospital STI n/a n/a n/a 1.60 0.40 0
Karauli Government General Hospital STI n/a n/a n/a 2.00 3.20 0
Kota Kota District MBS Hospital STI 0.40 0.00 1.20 0.00 0.00 0.5 Rajsamand General Hospital STI n/a n/a n/a 1.60 2.00 1.61 Sawai Madhopur General Hospital STI n/a n/a n/a 0.40 0.80 0.8
Sikar Shree Kalyan Government Hospital STI n/a n/a n/a 1.20 2.40 4.8
Udaipur Udaipur Medical College and General Hospital STI 7.21 2.92 2.48 6.00 2.09 2.4

135Annual HIV Sentinel Surveillance - Country Report 2008-2009
TABLE SS 30a Sikkim (2008 summary)
*HIV prevalence among antenatal attendees Trends in ANC, 2003–08
Group Number HIV % positive
(90% CI)
tested All women 1130 0.0 (0.0–0.0) Urban women 1130 0.0 (0.0– 0.0)
Rural women * HIV prevalence is given for valid sites (≥75% sample size).
ANC attendees
District Site name Population group 2003 2004 2005 2006 2007 2008
East Gangtok STNM Hospital ANC 0.25 0.00 0.25 0.00 0.25 0
East Pakyong Primary Health Centre ANC n/a n/a n/a 0.00 0.00 0
North Antenatal clinic, Mangan ANC n/a n/a n/a 0.37 0.00 0
Pakyong CHC, DH ANC (R) 0.00 n/a n/a n/a n/a n/a Simgtam CHC, DH ANC (R) 0.25 n/a n/a n/a n/a n/a
TABLE SS 30b Sikkim (2008 summary) *HIV prevalence among populations with high-risk behaviours
Group Number HIV % positive (90%
CI) Remarks tested All STI patients
Total number of sentinel sites 4
Female sex workers 227 0.44 (-0.28–1.16) 0 sites (≥75% sample size) had prevalence ≥5% Injecting drug users 228 2.19 (0.60–3.79) 0 sites (≥75% sample size) had prevalence ≥10%
* HIV prevalence is given for valid sites (≥75% sample size).
Sikkim Populations with high-risk behaviours
District Site name Population group 2003 2004 2005 2006 2007 2008
East Gangtok (New 07) FSW n/a n/a n/a n/a 0.00 0.44 East Gangtok STNM Hospital STI 0.00 0.00 0.86 0.00 0.00 n/a East Gangtok, East Sikkim IDU n/a n/a 0.48 0.40 0.00 2.19 South Hope Centre, Namchi IDU n/a n/a n/a 0.00 1.12 n/a
0.2 0.3 0.2 0.20.00.20.4
2003-2005 2004-2006 2005-2007 2006-2008
HIV%
Posi
tive
Years

136 Annual HIV Sentinel Surveillance - Country Report 2008-2009
TABLE SS 31a Tamil Nadu (2008 summary)
*HIV prevalence among antenatal attendees Trends in ANC, 2003–08
Group Number HIV % positive (90%
CI)
tested All women 25 199 0.35 (0.29–0.41) Urban women 13 599 0.51 (0.41–0.61) Rural women 11 600 0.16 (0.10–0.23) * HIV prevalence is given for valid sites (≥75% sample size).
ANC attendees
District Site name Population group
2003 2004 2005 2006 2007 2008 Ariyalur Ariyalur ANC 1.25 n/a n/a n/a n/a
Chennai Chennai Institute of Obstetrics and Gynaecology
ANC 0.00 0.00 0.50 0.25 1.00 0.25
Chennai St Isabels Hospital ANC n/a 0.25 0.00 0.00 0.00 0
Coimbatore Government Medical College Hospital
ANC 0.75 0.50 0.75 1.00 0.75 1
Coimbatore Sheila Hospital ANC n/a 0.75 n/a 0.00 0.00 0 Coimbatore Sheila Hospital ANC (R) n/a n/a 0.25 n/a n/a n/a Coimbatore GH, Pollachi ANC (R) 0.50 0.75 0.00 0.75 0.00 0
Cuddalore
Government District Headquarter Hospital
ANC 0.25 0.50 0.25 0.00 0.00 0.25
Cuddalore GH, Panruti ANC (R) 1.00 1.00 1.00 0.00 0.50 0
Dharmapuri
Government District Headquarter Hospital
ANC n/a 1.25 0.75 0.50 0.00 0.25
Dharmapuri FRU, Harur ANC (R) 0.50 0.25 0.25 0.75 0.25
Dharmapuri ANC FRU, Hosur (Krishnagiri) ANC (R) 1.25 0.58 0.50 1.25 1.75 0
Dharmapuri/ Krishnagiri ANC, Krishnagiri ANC 1.50 1.00 1.00 1.00 0.50 0
Dindigul
Government District Headquarter Hospital
ANC 1.25 0.75 0.25 0.25 0.75 0.25
Dindigul GH, Palani ANC (R) 0.25 0.75 0.75 0.50 0.00 0.25
Erode Government District Headquarter
ANC 0.00 0.50 1.00 0.75 0.25 1
0.2 0.3 0.2 0.20.00.20.4
2003-2005 2004-2006 2005-2007 2006-2008
HIV%
Posi
tive
Years

137Annual HIV Sentinel Surveillance - Country Report 2008-2009
ANC attendees Hospital
Erode GH, Gobichettipalayam ANC (R) 0.25 0.50 0.25 0.75 0.50 0
Kancheepuram
Government District Headquarter Hospital
ANC 0.25 0.00 0.00 0.00 0.00 0.5
Kancheepuram GH, Maduranthagam ANC (R) 0.25 0.75 0.00 0.00 0.00 0
Kanyakumari Government Medical College Hospital, Nagercoil
ANC 0.00 1.00 0.00 0.00 0.00 0
Kanyakumari Jeyasekaran Hospital, Nagercoil ANC n/a 0.00 0.00 0.00 0.00 0
Kanniyakumari Government Hospital, Padmanabapuram
ANC (R) n/a 0.50 0.00 0.25 0.50 0
Karur
Government District Headquarter Hospital
ANC 1.00 2.75 2.00 1.25 0.50 1
Karur GH, Kulithali ANC (R) 0.50 3.25 0.25 0.50 0.25 1
Madurai
Government Madurai Medical College Rajaji Hospital
ANC 0.75 0.25 1.50 0.25 0.00 0.25
Madurai GH, Melur ANC (R) 1.26 3.70 1.00 0.25 0.00 0.75 Nagapattinam Arthur Hospital ANC n/a n/a n/a 0.25 n/a Nagapattinam Arthur Hospital ANC (R) n/a n/a 0.00 n/a n/a 0
Nagapattinam
Government District Headquarter Hospital
ANC 0.25 0.50 0.00 0.00 0.00 0
Nagapattinam Government Hospital, Mayiladuthurai
ANC (R) n/a 0.50 0.00 0.50 0.25 0
Namakkal
Government District Headquarter Hospital
ANC 5.76 2.50 3.50 3.00 3.25 1
Namakkal GH, Tiruchengode ANC (R) 0.50 0.75 0.00 0.50 0.75 0.25
Perambalur
Government District Headquarter Hospital
ANC 0.50 1.25 1.50 1.00 1.00 1
Perambalur GH, Ariyalur ANC (R) 1.28 1.00 0.00 0.50 0.75 0
Pudukkottai
Government District Headquarter Hospital, Pudukottai
ANC 2.00 0.75 0.75 1.00 1.25 0.75
Pudukkottai GH, Aranthangi ANC (R) 0.00 0.50 0.50 0.50 0.00 0

138 Annual HIV Sentinel Surveillance - Country Report 2008-2009
ANC attendees
Ramanathapuram
Government District Headquarter Hospital
ANC 0.50 0.75 0.00 0.25 1.00 3.25
Ramanathapuram GH, Paramakudi ANC (R) 0.50 0.50 1.00 0.00 1.00 0
Salem
Government Mohan Kumarmangalam Medical College Hospital
ANC 0.25 2.00 0.75 3.00 4.25 1
Salem GH, Attur ANC (R) 0.50 1.25 0.50 1.50 0.25 0
Sivaganga
Government District Headquarter Hospital
ANC 0.25 0.75 0.50 0.50 0.25 0.5
Sivaganga Government Hospital, Karaikudi ANC (R) n/a 1.75 0.00 0.50 1.00 1
Thanjavur
Government District Headquarter Hospital, Kumbakonam
ANC 3.25 0.75 0.00 0.00 0.00 0
Thanjavur GH, Pattukkottai ANC (R) 0.50 0.50 0.00 0.75 0.25 0
The Nilgiris
Government District Headquarter Hospital, Ooty
ANC 0.25 0.50 1.00 0.50 0.25 0.75
The Nilgiris GH, Coonoor ANC (R) 0.25 0.75 0.50 0.25 0.25 0
Theni
Government District Headquarter Hospital, Periyakulam
ANC 1.00 1.50 0.50 1.75 0.50 0.5
Theni GH, Cumbum ANC (R) 1.50 1.25 0.75 0.50 2.00 0
Thiruvallur
Government District Headquarter Hospital
ANC 0.50 0.50 0.50 1.25 0.00 0.25
Thiruvallur GH, Thiruthani ANC (R) 0.50 1.00 0.50 0.25 0.50 1
Thiruvarur
Government District Headquarter Hospital
ANC 0.50 0.25 0.00 0.00 0.00 0.5
Thiruvarur Government Hospital, Mannargudi
ANC (R) n/a 0.00 0.50 0.00 0.00 0
Thoothukkudi Government Medical College Hospital
ANC 0.77 0.50 0.00 0.25 0.25 0.75
Thoothukkudi GH, Kovilpatti ANC (R) 0.75 1.00 0.25 0.25 0.50 0 Tiruchirappalli CSI Hospital ANC n/a 0.50 n/a 0.25 0.00 0 Tiruchirappalli CSI Hospital ANC (R) n/a n/a 0.25 n/a n/a Tiruchirappalli Government
Medical College ANC 1.50 1.25 1.50 2.50 2.25 1

139Annual HIV Sentinel Surveillance - Country Report 2008-2009
ANC attendees Hospital
Tiruchirappalli GH, Manapparai ANC (R) 0.75 0.50 0.50 1.25 0.25 0.25
Tirunelveli Government Medical College Hospital
ANC 2.25 0.25 0.75 0.25 0.00 0
Tirunelveli GH, Ambasamudram ANC (R) 0.25 0.25 0.25 0.25 0.00 0
Tiruvannamalai
Government District Headquarter Hospital
ANC 1.25 1.50 1.25 0.50 2.00 0.25
Tiruvannamalai ANC n/a 0.00 n/a n/a n/a
Tiruvannamalai Government Hospital, Vandawasi
ANC (R) n/a 1.25 0.50 0.25 0.00 0
Vellore Vellore Government Hospital
ANC 1.25 0.75 0.25 0.00 1.00 0.75
Vellore GH, Vaniambadi ANC (R) 0.51 0.50 1.50 0.25 0.75 0
Viluppuram District Headquarter Hospital
ANC 1.00 0.50 0.50 0.25 0.25 0
Viluppuram District Hospital, Kallakurichi ANC (R) 1.00 0.25 0.50 0.25 0.50 0
Virudhunagar
Government District Headquarter Hospital
ANC 0.00 0.25 1.00 0.00 1.00 0.25
Virudhunagar GH, Rajapalayam ANC (R) 0.00 0.25 0.00 0.25 0.25 0
TABLE SS 31b Tamil Nadu (2008 summary)
*HIV prevalence among populations with high-risk behaviours Group Number HIV % positive (90% CI) Remarks tested All STI patients
Total number of sentinel sites 47
Female sex workers 5134 4.93 (4.43–5.42) 14 sites (≥75% sample size) had prevalence ≥5% Injecting drug users 250 3.60 (1.66–5.54) 7 sites (≥75% sample size) had prevalence ≥10% Men who have sex with men 2435 4.85 (4.13–5.56) * HIV prevalence is given for valid sites (≥75% sample size).

140 Annual HIV Sentinel Surveillance - Country Report 2008-2009
Tamil Nadu Populations with high-risk behaviours
District Site name Popula-tion group
2003 2004 2005 2006 2007 2008
Chennai Madras Christian Council of Social Services Project FSW 8.80 4.00 5.60 3.60 3.20 n/a
Dharmapuri Arcod CSW Project FSW n/a n/a 8.80 14.00 7.20 n/a
Dharmapuri
Rural Interdisciplinary Development Society,RIDS TAI (New 08) FSW n/a n/a n/a n/a n/a 6.22
Kanyakumari CSR FSW, Kanyakumari FSW n/a n/a 2.00 0.40 0.40 0.81 Madurai Merry Trust CSW Project FSW n/a n/a 3.60 5.60 10.00 8 Salem PSI CSW Project FSW n/a n/a 12.80 12.00 6.00 n/a
Theni Green Medic Trust CSW Project FSW n/a n/a 4.80 2.00 1.60 7.63
Thiruvallur MSDS CSW Project FSW n/a n/a 6.40 1.60 0.40 n/a Thiruvarur Bharathi CSW Project FSW n/a n/a 4.00 0.80 n/a n/a Tiruchirappalli Anbalayam CSW Project FSW n/a n/a 8.40 5.60 13.20 7.6 Tirunelveli CAST CSW Project FSW n/a n/a 2.80 0.80 4.00 2.02
Dindigul
Dindigul Women TAI Vizhudugal Trust (New 08) FSW n/a n/a n/a n/a n/a 7.29
Erode
Centre for Action and Rural Education, CARE TAI (New 08)
FSW n/a n/a n/a n/a n/a 12.15
Kanyakumari CSR FSW, Kanyakumari FSW n/a n/a n/a n/a n/a 0.81 Karur Gramium (New 08) FSW n/a n/a n/a n/a n/a 6.8 Madurai Merry Trust CSW Project FSW n/a n/a n/a n/a n/a 8 Perambalur Andimuthu Chinnappillai
Charitable Trust (New 08) FSW n/a n/a n/a n/a n/a 2
Pudukkottai Gramodaya (New 08) FSW n/a n/a n/a n/a n/a 1.26 Ramanatha-puram
Association for Integrated Rural Development (New 08)
FSW n/a n/a n/a n/a n/a 0
Salem
Village Reconstruction and Development Project (New 08)
FSW n/a n/a n/a n/a n/a 13.25
Sivaganga ANGEL (New 08) FSW n/a n/a n/a n/a n/a 0.44
Thanjavur
Margret Social Development Society(MSDS_TAI) (New 08)
FSW n/a n/a n/a n/a n/a 6.4
The Nilgiris Saras Trust, Ooty (New 08) FSW n/a n/a n/a n/a n/a 0.43 Thiruvallur Deepam Education Society
for Health, DESH?TAI (New 08)
FSW n/a n/a n/a n/a n/a 4.8
Thiruvarur Sheilas Unit for Health and Social Affairs (New 08) FSW n/a n/a n/a n/a n/a 3.6
Thoothukkudi Empower (New 08) FSW n/a n/a n/a n/a n/a 4.13
Viluppuram Association for Rural Mass India (New 08) FSW n/a n/a n/a n/a n/a 7.23
Virudhunagar Annai Orphanage FSW FSW n/a n/a 1.20 4.40 0.80 0.41

141Annual HIV Sentinel Surveillance - Country Report 2008-2009
Tamil Nadu
Chennai IVDU Project, TTK Hospital, Chennai IDU 63.81 39.92 33.20 31.60 27.20 n/a
Madurai IDU Project (NGO)—Pache Trust IDU n/a n/a 2.80 16.80 6.40 3.6
Chennai MSM Project, ICWO, Chennai MSM 6.80 6.80 4.40 4.40 7.60 3.61
Viluppuram MSM Project ARM MSM 1.60 6.80 8.00 6.80 5.60 2.82
Kanniyakumari Centre for Social Reconstruction (New 08) MSM n/a n/a n/a n/a n/a 0.85
Karur Gramium (New 08) MSM n/a n/a n/a n/a n/a 2.81 Ramanathapuram
Rural Education and Economic Development Association (New 08)
MSM n/a n/a n/a n/a n/a 2.01
Sivaganga Rural Education and Economic Development Association (New 08)
MSM n/a n/a n/a n/a n/a 1.62
Thiruvallur
Community Health Education Society,CHES?TAI (New 08)
MSM n/a n/a n/a n/a n/a 22
Thoothukkudi
Tuticorin District HIV +ve People Welfare Society (New 08)
MSM n/a n/a n/a n/a n/a 3.66
Tirunelveli Pache Trust (New 08) MSM n/a n/a n/a n/a n/a 3.78
Virudhunagar
Virucham Mahalir Munnetra Kalangiyam (New 08)
MSM n/a n/a n/a n/a n/a 4.89
Chennai Government Stanley Medical College Hospital STI 7.26 8.00 4.80 12.40 7.60 n/a
Coimbatore Government Medical College Hospital STI 9.64 8.40 17.11 8.00 17.20 n/a
Kancheepuram Chengalpat Government Hospital STI 5.20 6.00 3.60 4.00 1.60 n/a
Karur Government District Headquarter Hospital STI 8.40 13.20 23.20 9.20 8.00 n/a
Madurai Government Madurai Medical College Rajaji Hospital
STI 20.80 30.40 30.00 24.80 38.40 n/a
Ramanathapuram
Government District Headquarter Hospital STI 5.91 5.20 7.60 2.80 2.80 n/a
Salem Government Mohan Kumarmangalam Medical College Hospital
STI 11.60 8.40 5.60 4.80 9.60 n/a
Thanjavur Government Medical College Hospital STI 14.40. 14.80 12.00 10.80 19.20 n/a
Tiruchirappalli Government Medical College Hospital STI 21.60 20.40 5.20 7.60 8.00 n/a
Tirunchalli STI 33.60 n/a n/a n/a n/a n/a
Tirunelveli Government Medical College Hospital STI n/a 14.00 17.20 19.60 14.00 n/a
Vellore Government Medical College Hospital STI 6.00 4.00 9.20 6.00 6.80 n/a
Tiruvannamalai Tiruvannamalai Hospital TB n/a 6.90 6.29 n/a n/a n/a

142 Annual HIV Sentinel Surveillance - Country Report 2008-2009
TABLE SS 32a Tripura (2008 summary) *HIV prevalence among antenatal attendees
Group Number HIV % positive (90% CI) tested All women 800 0.0 (0.0–0.0) Urban women 800 0.0 (0.0–0.0) Rural women
* HIV prevalence is given for valid sites (≥75% sample size).
ANC attendees
District Site name Population group 2003 2004 2005 2006 2007 2008
West Tripura Agartala IGM Hospital ANC 0.00 0.25 n/a 0.00 0.00 0
West Tripura AGMC and GBP Hospital ANC n/a n/a 0.00 0.97 0.50 0
TABLE SS 32b Tripura (2008 summary)
*HIV prevalence among populations with high-risk behaviours Remarks
Group Number HIV % positive (90%
CI) tested Total number of sentinel sites 8 All STI patients 1743 1.09 (0.68–1.50) 0 sites (≥75% sample size) had prevalence ≥5%
0 sites (≥75% sample size) had prevalence ≥10%
Injecting drug users 239 0.42 (-0.27–1.11)
* HIV prevalence is given for valid sites (≥75% sample size).
Tripura Populations with high-risk behaviours
District Site name Population group 2003 2004 2005 2006 2007 2008
North Tripura Kumarghat Rural Hospital IDU n/a n/a 10.92 0.00 0.00 0.42 Dhalai BSM Hospital, Kamalpur STI n/a n/a n/a 0.45 0.00 0.82
North Tripura Dharmanagar Sub-divisional Hospital STI n/a n/a n/a 0.81 0.40 1.6
North Tripura Kailashahar RGM Hospital STI 0.00 0.00 0.80 0.00 0.40 1.21
South Tripura Belonia Sub-divisional Hospital STI n/a n/a n/a 0.46 0.00 0
South Tripura Udaipur TSD Hospital STI n/a 0.00 2.80 0.00 0.00 1.2 West Tripura AGMC and GBP Hospital STI 5.60 2.02 0.00 3.11 1.60 2
West Tripura Khowai Sub-divisional Hospital STI n/a n/a n/a 0.00 0.40 0.8

143Annual HIV Sentinel Surveillance - Country Report 2008-2009
TABLE SS 33a Uttar Pradesh (2008 summary)
*HIV prevalence among antenatal attendees Trends in ANC, 2003–08
Group Number HIV % positive
(90% CI)
tested All women 20 659 0.18 (0.13–0.23) Urban women 16 916 0.15 (0.10–0.20)
Rural women 3743 0.29 (0.15–0.44) * HIV prevalence is given for valid sites (≥75% sample size).
ANC attendees
District Site name Population group 2003 2004 2005 2006 2007 2008
Aligarh Aligarh Mahila Hospital ANC 0.00 0.25 0.00 0.00 0.00 0 Aligarh MH ANC (R) 0.00 n/a n/a n/a n/a n/a Allahabad CHC, Handia ANC (R) n/a n/a n/a 1.50 0.50 0.53 Ambedkar Nagar District Mahila Hospital ANC n/a n/a n/a 0.00 0.00 0
Auraiya District Mahila Hospital ANC n/a n/a n/a 0.36 0.00 0.5 Baghpat District Mahila Hospital ANC n/a n/a n/a 0.33 0.00 0 Bahraich CHC, Nanpara ANC (R) 0.00 n/a n/a 0.00 0.00 n/a Bahraich Bahraich Mahila Hospital ANC 0.00 0.50 0.37 0.75 0.75 0 Ballia CHC, Sikandarpur ANC (R) n/a n/a n/a 0.00 n/a n/a Ballia CHC, IMS ANC (R) 0.00 n/a n/a n/a n/a n/a Ballia Balia Mahila Hospital ANC 0.00 0.53 0.00 0.00 0.25 0.27 Banda Banda Mahila Hospital ANC 0.00 1.75 0.00 0.00 0.00 0.75 Barabanki CHC, Haidergarh ANC (R) n/a n/a n/a 0.00 2.63 n/a Barabanki CHC, KGMU, Fatehpur ANC (R) 0.00 n/a n/a n/a n/a n/a Barabanki Barabanki Mahila Hospital ANC 0.00 0.75 0.00 0.50 0.00 0 Bareilly Clara Swain Hospital ANC n/a n/a n/a 0.00 0.00 n/a
Bijnor Nazibabad/Najibabad CHC Hospital ANC (R) n/a n/a n/a 0.00 0.00 0
Bijnor Bijnore Mahila Hospital ANC 0.00 0.00 0.00 0.00 0.00 0 Budaun CHC, Ujhani ANC (R) n/a n/a n/a 0.00 0.00 0 Bulandshahr District Mahila Hospital ANC n/a n/a n/a 0.25 0.00 0.25 Chandauli District Mahila Hospital ANC n/a n/a n/a 0.78 0.00 n/a Chitrakoot District Mahila Hospital ANC n/a n/a n/a 0.00 0.00 1.45 Deoria District Mahila Hospital ANC n/a n/a n/a 1.25 0.00 0 Etah District Mahila Hospital ANC n/a n/a n/a 0.25 0.00 0.25 Etawah Etawah Mahila Hospital ANC 0.00 1.25 0.25 0.00 0.00 0.25 Faizabad District Mahila Hospital ANC n/a n/a n/a 0.50 0.25 0 Fatehpur District Mahila Hospital ANC n/a n/a n/a 0.00 0.00 0 Firozabad District Mahila Hospital ANC n/a n/a n/a 0.00 0.00 0 Gautam Buddha Nagar * District Mahila Hospital ANC n/a n/a n/a 0.00 0.00 0
Gonda CHC, Mankapur ANC (R) n/a n/a n/a 0.95 0.30 n/a
0.2 0.3 0.2 0.20.00.20.4
2003-2005 2004-2006 2005-2007 2006-2008
HIV%
Posi
tive
Years

144 Annual HIV Sentinel Surveillance - Country Report 2008-2009
ANC attendees Gorakhpur CHC, Pipriach ANC (R) 2.90 n/a n/a 0.00 0.00 0.3
Gorakhpur Gorakhpur Mahila Hospital ANC 0.00 0.75 0.00 0.25 0.00 0
Hardoi CHC, Sandila ANC (R) n/a n/a n/a 0.00 n/a 0 Hathras District Mahila Hospital ANC n/a n/a n/a 0.25 0.00 0.5 J.P.Nagar District Mahila Hospital ANC n/a n/a n/a 0.00 0.00 n/a Jalaun District Mahila Hospital ANC n/a n/a n/a 0.00 0.00 0 Jaunpur CHC, Madiyaon ANC (R) n/a n/a n/a 0.00 0.00 0 Jaunpur CHC, IMS ANC (R) 4.26 n/a n/a n/a n/a n/a Jaunpur Jaunpur Mahila Hospital ANC 0.25 0.25 0.00 0.25 0.25 0 Jyotiba Phule Nagar District Mahila Hospital ANC 0
Kannauj District Mahila Hospital ANC n/a n/a n/a 0.00 0.31 0 Kanpur Dehat District Mahila Hospital ANC n/a n/a n/a 0.25 0.00 0.25 Kanpur Nagar Kanpur Medical College ANC 0.25 0.25 0.25 0.25 0.25 0.5 Kaushambi District Mahila Hospital ANC n/a n/a n/a 3.39 2.04 0 Lalitpur Lalitpur Mahila Hospital ANC 1.00 0.00 0.25 0.00 0.00 0 Lalitpur CHC, MLBMC, Jhansi ANC (R) 0.00 n/a n/a n/a n/a n/a Lucknow CHC, Mohanlalganj ANC (R) n/a n/a n/a 0.00 0.00 1.02 Lucknow CHC, DH, Chinhat ANC (R) 0.00 n/a n/a n/a n/a n/a
Lucknow Lucknow Queens Mary Hospital ANC 0.00 0.50 0.25 0.50 0.25 0
Mahoba District Mahila Hospital ANC n/a n/a n/a 0.00 0.00 0 Mainpuri District Mahila Hospital ANC n/a n/a n/a 0.00 0.00 0 Mathura District Mahila Hospital ANC n/a n/a n/a 0.75 0.00 0
Mathura Ramkrishna Mission Hospital, Vrindavan ANC n/a n/a n/a 0.50 0.25 0
Mau District Mahila Hospital ANC n/a n/a n/a 1.46 0.86 0.5 Meerut Meerut Mahila Hospital ANC n/a n/a n/a 0.00 0.00 0.5 Mirzapur Mirzapur Mahila Hospital ANC 0.75 0.00 0.25 0.00 0.00 0 Mirzapur CHC, IMS ANC (R) 0.00 n/a n/a n/a n/a n/a
Moradabad Vivekanand Hospital and Research Centre ANC n/a n/a n/a 0.00 1.00 n/a
Muzaffarnagar CHC, Shamli ANC (R) 0.00 n/a Nazibabad Nazibabad ANC 0.00 n/a n/a n/a n/a n/a Pilibhit Pilibhit Mahila Hospital ANC 0.00 0.00 0.00 0.00 0.00 0.25 Pilibhit CHC, KGMU, Puranpur ANC (R) 0.00 n/a n/a n/a n/a n/a Pratapgarh CHC, Kunda ANC (R) n/a n/a n/a 0.00 1.95 n/a Pratapgarh CHC Patti ANC (R) n/a n/a n/a 0.00 0.00 0.75 Pratapgarh CHC, KNMH ANC (R) 0.00 n/a n/a n/a n/a n/a
Pratapgarh Pratapgarh Mahila Hospital ANC 0.50 0.00 0.50 0.00 0.00 0.25
Rae Bareli CHC, Bachrawa ANC (R) n/a n/a n/a 0.00 0.00 0.25 Rae Bareli Rae Bareli ANC n/a n/a 0.00 0.25 2.50 0 Rampur District Mahila Hospital ANC n/a n/a n/a 0.00 0.00 0
Saharanpur Saharanpur Mahila Hospital ANC 0.50 0.25 0.50 0.00 0.25 0.25
Sant Kabir Nagar District Mahila Hospital ANC n/a n/a n/a 0.00 0.00 n/a

145Annual HIV Sentinel Surveillance - Country Report 2008-2009
ANC attendees Shahjahanpur District Mahila Hospital ANC n/a n/a n/a 0.00 0.00 0 Siddharthnagar Sidharth ANC n/a n/a n/a n/a n/a n/a Sitapur District Mahila Hospital ANC n/a n/a n/a 0.00 0.00 0 Sonbhadra DH ANC (R) n/a n/a n/a 0.00 0.49 n/a Sonbhadra CHC, Robertgang ANC (R) n/a n/a n/a n/a n/a 0
TABLE SS 33b Uttar Pradesh (2008 summary)
*HIV prevalence among populations with high-risk behaviours Group Number HIV % positive (90% CI) Remarks tested All STI patients 6179 0.81 (0.62–1.00) Total number of sentinel sites 32
Female sex workers 726 0.83 (0.27–1.38) 0 sites (≥75% sample size) had prevalence ≥5%
Injecting drug users 489 2.45 (1.30–3.60)
0 sites (≥75% sample size) had prevalence ≥10%
Men who have sex with men 246 4.07 (1.99–6.14)
* HIV prevalence is given for valid sites (≥75% sample size).
Uttar Pradesh Populations with high-risk behaviours
District Site name Population group 2003 2004 2005 2006 2007 2008
Aligarh Sarvhara Kalyan Samiti FSW n/a n/a n/a 0 n/a n/a Allahabad SKS, Allahabad FSW 11.96 20.00 10.8 1.6 1.60 1.63
Bahraich Krishi Evam Gramodyog Vikas Sansthan FSW n/a n/a n/a 2.75 0.00 n/a
Basti Basti Global Science Academi, Malaviya Road FSW n/a 2.42 2.00 4.00 2.00 0
Kanpur Nagar Pragati Sewa Sansthan FSW n/a n/a 0.40 0.00 0.00 0.82
Kheri Chitranshu Samaj Kalyan Parishad, Lakhimpur (New) FSW n/a n/a n/a 0.40 0.40 n/a
Maharajganj Shri Bharadwaj Gramodyog Seva Sansthan FSW n/a n/a n/a 3.60 0.00 n/a
Varanasi Sarvjan Kalyan Samiti, Varanasi FSW 1 0.00 0.80 0.00 n/a n/a
Kanpur Nagar Hazrat Chauhani Charitable Society IDU n/a n/a n/a 4.63 3.81 2.07
Varanasi Manav Seva Sansthan Evam Mahila Bal Vikas Sansthan (New 07)
IDU n/a n/a n/a n/a 0.00 2.82
Lucknow Bharosa (New 07) MSM n/a n/a n/a n/a 0.40 4.06 Agra Agra DH STI 2.00 0.40 0.40 0.40 1.60 0.8 Allahabad Allahabad DH STI 0.40 2.00 0.00 0.00 0.00 0 Azamgarh Azamgarh DH STI 0.81 1.60 2.69 1.20 0.80 0.42 Balrampur DH STI n/a n/a n/a 1.63 0.00 0.81

146 Annual HIV Sentinel Surveillance - Country Report 2008-2009
Uttar Pradesh Bareilly Bareilly DH STI 0.00 0.00 0.00 0.80 0.52 1.21 Basti Basti DH STI 0.80 1.20 2.80 4.40 0.00 0 Budaun DH STI n/a n/a n/a 0.00 0.40 n/a Farrukhabad Farrukhabad DH STI 0.90 0.81 0.00 1.20 0.00 0 Ghaziabad Ghaziabad DH STI 0.00 0.80 0.40 0.40 0.40 0.41 Ghazipur DH STI n/a n/a n/a 0.00 0.44 2.02 Gonda Gonda DH STI 7.50 1.60 0.00 0.44 0.00 0.45 Gorakhpur Gorakhpur DH STI 1.60 0.40 0.80 0.40 0.80 1.2 Hamirpur Hamirpur DH STI 0.00 0.00 0.00 0.80 0.40 0.8 Hardoi DH STI n/a n/a n/a 0.00 0.00 0 Jhansi Jhansi DH STI 0.00 1.60 0.40 0.40 2.80 0.8 Kheri Lakhimpur DH (New) STI n/a n/a n/a 0.93 0.80 1.2 Kushinagar DH STI n/a n/a n/a 4.63 0.68 n/a Lucknow Lucknow Balrampur Hospital STI 0.40 0.80 0.80 0.40 2.03 0 Maharajganj DH STI n/a n/a n/a 1.60 0.00 0 Mirzapur Mirzapur DH STI 0.55 0.00 0.00 1.68 0.40 n/a Moradabad Moradabad DH STI 0.40 0.00 0.50 2.40 3.23 4.4 Muzaffarnagar Muzaffarnagar DH STI 0.00 0.00 1.20 0.40 0.81 0.4 Shrawasti DH STI n/a n/a n/a 1.60 1.20 1.6 Siddharthnagar DH STI n/a n/a n/a 1.20 0.40 0 Sonbhadra DH STI n/a n/a n/a 0.00 0.80 3.29 Sultanpur Sultanpur DH STI 1.20 2.80 2.00 0.40 0.40 0 Unnao DH STI n/a n/a n/a 0.40 1.20 0.41
Varanasi Varanasi DH STI 4.80 0.40 1.20 0.80 1.21 0
TABLE SS 34a Uttarakhand (2008 summary)
*HIV prevalence among antenatal attendees Trends in ANC, 2003–08
Group Number HIV % positive
(90% CI)
tested All women 3576 0.22 (0.09–0.35) Urban women 3576 0.22 (0.09–0.35)
Rural women * HIV prevalence is given for valid sites (≥75% sample size).
0.2 0.3 0.2 0.20.00.20.4
2003-2005 2004-2006 2005-2007 2006-2008
HIV%
Posi
tive
Years

147Annual HIV Sentinel Surveillance - Country Report 2008-2009
ANC attendees
District Site name Population group 2003 2004 2005 2006 2007 2008
Champawat CHC, Lohaghat Champawat ANC n/a n/a n/a 0.25 0.00 0.25
Dehradun Combine Hospital, Rishikesh ANC n/a n/a n/a 0 0.00 0
Garhwal/Pauri Combine Hospital, Kotdwar ANC n/a n/a n/a 0 0.00 0
Haldwani CHC, Ramnagar/BD Pandey ANC (R) 0.3 n/a n/a n/a n/a n/a
Haridwar Combine Hospital, Roorkee ANC n/a n/a n/a 0 0.00 0.25
Haridwar Haridwar Mahila Hospital ANC 0 0 0 0.25 0.00 0
Haridwar CHC, Roorkee ANC (R) 0 n/a n/a n/a n/a n/a
Nainital Combine Hospital, Ramnagar ANC n/a n/a n/a 0 0.00 0
Nainital Haldwani Mahila Hospital ANC 0 0 0 0 0.00 0
Pithoragarh Pithoragarh Mahila Hospital ANC 0 0 0 0 0.00 0.75
Pithoragarh CHC, Didihat ANC (R) 0 n/a n/a n/a n/a n/a
Udham Singh Nagar *
District (Female) Hospital, Rudrapur, US Nagar
ANC n/a n/a n/a 0.5 0.50 0.75
Uttarakhand (2008 summary)
*HIV prevalence among populations with high-risk behaviours Group Number HIV % positive (90% CI) tested All STI patients 1468 0.41 (0.13–0.68)
Injecting drug users
* HIV prevalence is given for valid sites (≥75% sample size).

148 Annual HIV Sentinel Surveillance - Country Report 2008-2009
TABLE SS 34b
Uttaranchal Summary—Populations with high-risk behaviours
District Site name Population group 2003 2004 2005 2006 2007 2008
Almora Almora DH STI 0.4 0 0 0 0.00 n/a Chamoli Chamoli DH (male) STI n/a n/a n/a 0 0.00 0.4 Dehradun Dehradun DH STI 0 1.2 2 0.8 0.40 0.8 Garhwal Pauri DH (male) STI n/a n/a n/a 0 0.00 0.8 Nainital Nainital DH (male) STI n/a n/a n/a 0 0.00 0.4 Tehri Garhwal Tehri Garhwal DH STI 0 0 0 0.4 0.00 0 Uttarkashi Uttarkashi DH STI 0 0.74 0 0 0.00 0
TABLE SS 35a West Bengal (2008 summary)
*HIV prevalence among antenatal attendees Trends in ANC, 2003–08
Group Number HIV % positive
(90% CI)
tested All women 8196 0.21 (0.12–0.29) Urban women 3476 0.20 (0.08–0.33)
Rural women 4720 0.21 (0.10–0.32) * HIV prevalence is given for valid sites (≥75% sample size).
ANC attendees
District Site name Population group 2003 2004 2005 2006 2007 2008
Burdwan Durgapur SD Hospital ANC 0.50 1.00 1.25 0.25 0.75 0
Bankura
Bishnupur Sub-divisional Hospital (New 08)
ANC n/a n/a n/a n/a n/a 0
Birbhum Suri DH ANC (R) n/a n/a n/a 0.00 n/a 0 Burdwan CHC, Panagarh ANC (R) 0.58 n/a n/a n/a n/a n/a Burdwan CHC, Mankar 1.23 n/a n/a n/a n/a n/a
Dakshin Dinajpur
Gangarampur Sub-divisional Hospital (New 08)
ANC n/a n/a n/a n/a n/a 0.26
Darjeeling Kalimgpong SDH (New 07) ANC n/a n/a n/a n/a 2.00 0
Darjeeling CHC, SDH, Siliguri ANC (R) 0.25 n/a n/a 0.00 0.50 0.75 Darjeeling CHC, Kurseong ANC (R) 0.28 n/a n/a n/a n/a n/a Darjeeling Darjeeling DH ANC n/a 0.50 0.84 n/a n/a n/a
Howrah Uluberia Sub-divisional Hospital (New 08) ANC n/a n/a n/a n/a n/a 0.5
Hooghly Khanakul Rural Hospital (New 08) ANC (R) n/a n/a n/a n/a n/a 0.25
0.2 0.3 0.2 0.20.00.20.4
2003-2005 2004-2006 2005-2007 2006-2008
HIV%
Posi
tive
Years

149Annual HIV Sentinel Surveillance - Country Report 2008-2009
ANC attendees Jalpaiguri Alipur Duar Sub-
divisional Hospital(New 08)
ANC n/a n/a n/a n/a n/a 0.25
Cooch Behar Mathabhanga SDH ANC (R) n/a n/a 0.00 0.25 0.55
Cooch Behar Cooch Behar MJN Hospital ANC n/a 0.00 0.26 n/a n/a n/a
Kolkata Abinash Dutta Maternity Home ANC n/a 1.25 2.25 1.76 1.50 0
Kolkata BSGH ANC 0.75 n/a n/a n/a n/a n/a
Kolkata Bidya Sagar SDH (New 07) ANC (R) n/a n/a n/a n/a 0.00 0
Malda Malda ANC 0.00 0.00 0.25 n/a n/a n/a Malda CHC, Manikchak Milki ANC (R) 0.66 n/a n/a 0.00 0.00 0.5
Medinipur CHC, Mahishadal Basulia ANC (R) 0.56 n/a n/a 0.00 0.00 n/a
Midnapore Contai Sub-divisional Hospital ANC (R) n/a n/a n/a 0.00 n/a 0
Midnapore Kharagpur SDH (New 08) ANC n/a n/a n/a n/a n/a 0.5
Midnapore Midnapore Tamluk DH ANC 0.75 0.00 0.00 n/a n/a n/a
Murshidabad Jangipur Sub-divisional Hospital (New 08) ANC (R) n/a n/a n/a n/a n/a 0
Nadia
Nabadwip State General Hospital (New 08)
ANC n/a n/a n/a n/a n/a 0
North 24 Parganas CHC, Madhyamgram ANC (R) 0.25 n/a n/a 0.25 0.00 0.51
Purba Medinipur Egra SDH (New 07) ANC (R) n/a n/a n/a n/a 0.00 n/a
Purulia CHC, Raghunathpur ANC (R) 0.75 n/a n/a 0.25 0.00 0 Purulia Purulia DH ANC 0.00 0.50 1.50 n/a n/a n/a Kolkata RGKMCH ANC 0.50 n/a n/a n/a n/a n/a Siliguri Siliguri DH ANC 0.25 n/a n/a n/a n/a n/a South 24 Parganas
Bijaygarh State Hospital ANC n/a 0.65 2.25 0.00 n/a n/a
South 24 Parganas CHC, Baruipur ANC (R) 0.25 n/a n/a 0.00 0.00 0
Uttar Dinajpur CHC, Kaliaganj ANC (R) 0.50 n/a n/a 2.25 0.00 0
Uttar Dinajpur Uttar Dinajpur Raiganj Hospital ANC 0.74 0.00 0.49 n/a n/a n/a

150 Annual HIV Sentinel Surveillance - Country Report 2008-2009
TABLE SS 35b West Bengal (2008 summary)
*HIV prevalence of populations with high-risk behaviours
Group Number tested HIV % positive (90% CI) Remarks
All STI patients 2092 3.20 (2.57–3.84) Total number of sentinel sites 34 Female sex workers 2665 4.13 (3.49–4.76) 7 sites (≥75% sample size) had prevalence ≥5% Injecting drug users 937 5.55 (4.32–6.78) 2 sites (≥75% sample size) had prevalence ≥10% Male migrants 242 2.48 (0.84–4.12) Truckers 996 1.91 (1.19–2.62) Men who have sex with men 997 5.02 (3.88–6.15)
* HIV prevalence is given for valid sites (≥75% sample size).
West Bengal Populations with high-risk behaviours
District Site name Population group 2003 2004 2005 2006 2007 2008
Burdwan Durgapur TI project FSW 8.00 4.40 6.80 8.00 6.00 3.25 Darjiling DMSC Khalpara FSW n/a n/a n/a 7.56 8.00 0.8 Jalpaiguri Jalpaiguri FSW 9.20 5.60 6.00 8.93 5.20 0 Kolkata Kolkata SHIP FSW 9.60 3.60 10.40 7.60 5.20 8.84 Kolkata DMSC Kolkata FSW 5.67 2.00 2.33 n/a n/a n/a Midnapore Haldia TI project FSW 2.00 9.60 8.00 8.80 5.20 6.8 Murshidabad Behrampur TI project FSW 6.05 2.00 2.54 2.00 1.20 1.2 North 24 Parganas SBMS TI , Basirhat FSW n/a n/a n/a 3.23 4.84 9.83
South 24 Parganas
Diamond Harbour TI project FSW 4.40 1.60 8.00 3.20 5.20 1.6
Uttar Dinajpur
DMSC Islampur/Panjipara (New 07) FSW n/a n/a n/a n/a 12.40 7.41
Burdwan DISHA Janakalyan Kendra, Asansol (New 08) FSW n/a n/a n/a n/a n/a 3
Birbhum Suri, EICS (New 08) FSW n/a n/a n/a n/a n/a 2.87 Darjeeling Indian Red Cross, Kurseong IDU n/a n/a 10.00 3.20 8.00 3.24 Howrah SKBS TI IDU n/a n/a 4.00 10.00 n/a Kolkata Kolkata NGO TI IDU n/a 5.48 n/a n/a n/a n/a Kolkata SCIR, Kolkata IDU 2.61 2.22 2.80 5.20 6.80 n/a Darjeeling SCIR, Siliguri IDU n/a n/a 16.00 10.00 11.60 n/a Murshidabad SCIR, Lalgola IDU n/a n/a 0.81 0.80 2.40 2.09
Darjeeling SCIR, Jhankar More (New 08) IDU n/a n/a n/a n/a n/a 10
Kolkata SCIR, Park Circus (New 08) IDU n/a n/a n/a n/a n/a 7.36 Kolkata HDRI, Kolkata (New 07) MRG n/a n/a n/a n/a 9.27 2.48 Darjeeling Manas Bangla, Siliguri MSM n/a n/a n/a 4.80 4.80 3.63
Hooghly Manas Bangla, Hooghly (New 07) MSM n/a n/a n/a n/a 5.65 4
Kolkata Manas Bangla MSM n/a 1.33 0.54 8.40 6.40 n/a Burdwan Manas Bangla (New 08) MSM n/a n/a n/a n/a n/a 3.2

151Annual HIV Sentinel Surveillance - Country Report 2008-2009
West Bengal Kolkata Manas Bangla Kasba (New
08) MSM n/a n/a n/a n/a n/a 9.24
Bankura Bankura Medical College STI 1.60 0.00 1.51 0.40 0.00 0.49 Burdwan Burdwan Medical College STI 0.43 0.82 2.04 0.40 0.40 7.66 Dakshin Dinajpur Balurghat Sadar Hospital STI 1.26 0.41 2.27 1.20 0.80 1.63
Darjeeling Darjeeling DH STI n/a n/a n/a 2.17 n/a Hooghly Hooghly DH STI n/a 3.40 3.20 2.40 1.71 Jalpaiguri Jalpaiguri DH STI n/a 0.00 0.00 0.80 2.00 n/a Kolkata Howrah DH STI n/a 0.94 3.02 1.79 0.00 n/a
Kolkata Kolkata Medical College and Hospital STI 9.60 19.74 4.80 3.60 4.95 11.17
Midnapore Mednipur Medical College STI n/a 2.46 1.00 0.81 1.20 1.61 Midnapore Haldia SD Hospital STI 1.61 n/a 1.60 n/a n/a n/a
Murshidabad Behrampur/Berhampore DH STI 4.00 1.65 4.80 4.80 5.20 4.9
Nadia Krishnagar Sadar Hospital STI n/a 0.82 0.93 0.80 0.00 0.86 South 24 Parganas MR Bangura Hospital STI 4.00 1.20 3.24 0.40 0.80 0
Burdwan SSSS TI TRK n/a n/a n/a 2.40 3.21 2.81 Dakshin Dinajpur NMMS TI Hilli TRK n/a n/a n/a 2.40 1.20 2.42
Jalpaiguri GUP TI TRK n/a n/a n/a 2.02 3.20 0.8 Kolkata BPWT TI, KPT TRK n/a n/a n/a 4.40 2.80 n/a
Midnapore HVP TI, Haldia, Purba Medinipur TRK n/a n/a n/a 2.40 3.20 1.61

152 Annual HIV Sentinel Surveillance - Country Report 2008-2009
Annexure III
Random sampling method
Terminology—master list, line list, random list and PE-wise list
Preparatory work at RI and SACS
− Obtain validated, updated line list from the TI division/TSU of SACS
− Exclude the ineligible HRI by age
− Select 325 names randomly, using random numbers
− Provide the random list to SACS
− SACS should, in turn, provide the first 250 names from the random list to the TI
Random sampling method at site
Obtain random list of 250 names from SACS
Prepare PE-wise lists
Organize PE meeting (instructions)
Emphasize on PE talking points
Fix different dates for different PEs
PE to make attempts to contact the listed HRI (at least 3 attempts should be made)
PE to communicate exactly in accordance with the PE talking points
PE to accompany the selected HRI to the DIC on a fixed date
Scenarios when the PE attempts to contact the HRI
HRI is contacted and comes to the DIC along with the PE: Follow the steps mentioned in
consecutive sampling, starting with enrolment in HSS register
HRI is contacted and agrees to come to the DIC on his own
− Comes to the DIC within one month: Follow the steps mentioned in consecutive
sampling, starting with enrolment in HSS register
− Does not come to the DIC within one month: Document in HSS register
HRI is contacted but refuses to come to the DIC for participation in HSS: Enquire into the reason
for refusal
HRI could not be contacted even after 3 attempts: Document in HSS register
Document the outcome of the PE attempts in the HSS register when he comes to the DIC on the
date fixed

153Annual HIV Sentinel Surveillance - Country Report 2008-2009
Annexure IV Checklist
Annexure IVA (Part A)
CHECKLIST FOR MONITORING OF SENTINEL SITES
PART A I. General information
1. Names and designations of coordinators a) b)
2. Date of supervisory visit 3. State City Institute 4. Type of sentinel site ANC /STI/IVDU/MSM/FSW/Any other—specify 5. Location of site Urban / Rural 6. Days of service Daily/Once a week /Twice a week /Thrice a week 7. Since when functioning as
sentinel site Year
II. Personnel involved in HIV sentinel surveillance S.No.
Name Designation Experience Trained for HSS 2007
Yes/No 1. 2. 3. 4.
III. Facilities at the clinic site 1. General infrastructure
a. Reception and waiting space
Adequate/Inadequate
b. Separate examination room Yes/No c. If no, then curtained-off area for examination of
patients Yes/No
d. Privacy maintained Yes/No e. Examination table Yes/No f. Adequate light Yes/No g. Electric supply Regular / Irregular h. Stand-by generator Yes/No
Functioning / Not functioning i. IEC material Available /Not available
Displayed /Not displayed j. Blood collection facilities available in the clinic site Yes/No k. If no, then how far is the laboratory from the sentinel
site?
Nearby/Far away

154 Annual HIV Sentinel Surveillance - Country Report 2008-2009
2. Facilities for blood collection, separation and storage at collection centre l. Individual request formats for report Available/ Not available m. Number of formats Adequate/Inadequate n. Personal protective devices (aprons/ gloves) in
adequate number Yes/No
o. Disposable needles and syringes Available/Not available p. Number of needles and syringes available:
ANC (500), STI, FSW, MSM, IDU, etc. (300) Yes/No
q. Needle destroyer used Yes/No r. If no, why? State reasons. s. Disinfectants (1% sodium hypochlorite solution/bleach)
available for decontamination Yes/No
t. Sterile, plastic screw-capped 10-ml blood collection tubes available in adequate number
Yes/No
u. Sterile, plastic screw-capped 2-ml storage vials available in adequate number
Yes/No
v. Plastic/glass Pasteur pipettes/micropipettes with plastic tips available
Yes/No
w. Centrifuge machine Present / Absent Functioning / Not functioning
x. Centrifuge tubes of 15 ml capacity available Yes/No y. Refrigerator Present / Absent
Functioning / Not Functioning

155Annual HIV Sentinel Surveillance - Country Report 2008-2009
Annexure IVA (Part B)
CHECKLIST FOR MONITORING OF SENTINEL SITES PART B IV. Practices followed at clinic sites
1. Selection of new attendees based on inclusion criteria Yes/No
2. Daily attendance at clinic of STI/ANC /IDU/MSM/FSW attendees (each counted once during surveillance)
(Specify number).
3. Total attendees since start of HSS activity (Specify number). 4. Blood sample taken from all consecutive attendees. If no,
why? Give reasons. Yes/No
5. Formats filled up for all first-time attendees during September 1 to November 30. If no, why? Give reasons.
Yes/No
6. Who is fills up the forms? Trained /Untrained
7. Whether properly filled. If no, give reasons. Yes/No
8. Blood collected at Clinic site /Hospital laboratory/Testing centre
9. Amount of blood collected—5 ml Yes/No 10. Blood collected by Laboratory technician /Nurse 11. Time taken between collection of blood and serum
separation 3 hours/6 hours/18 hours/ >18 hours
12. Storage of serum sample Refrigerator/Deep freezer 13. Labelling/coding of serum samples done Yes/No 14. Frequency of dispatch Daily/ Once a week/ Twice a
week / Whenever convenient/ Other (specify)
15. Mode of dispatch Vaccine carrier/ Other / without cold chain
16. Method of decontamination used Bleach solution/ 1% hypo consumables chlorite solution/ 2% cidex solution
17. Needle destroyer used. If no, why? Yes/No 18. Method of final disposal of used syringes and needles Burnt/ Buried/ Incinerated/
Others 19 a) Proper records maintained at clinic site. If no, why?
Give reasons. Yes/No
b) Reports. Confidentiality of reports maintained Yes/No 20. Support system Adequate / Inadequate
Suggestions for improvement:
Name (Member of supervisory team)
Signature

156 Annual HIV Sentinel Surveillance - Country Report 2008-2009
Annexure IVB (Part A)
CHECKLIST FOR MONITORING AT HIV TESTING CENTRE
PART A
I General information 1. Name of centre
2. Number and name of sentinel sites attached to the centre
II Personnel involved in HIV testing S.No. Name Designation Experience Training status for HSS
2007 a. b. c. d. e.
III Facilities at the testing site 1. General infrastructure
a. Reception and waiting space Adequate/ Inadequate b. Collection area Yes/No c. Testing area Yes/No d. Area for washing and disposal Yes/No e. Illumination sufficient Yes/No f. Adequate water supply Yes/No g. Alternate arrangement for electricity Yes/No 2. HIV and syphilis serologic testing A Equipments Available Not available Functioning Non functioning a. Micropipettes b. Sterilizers c. Refrigerator d. Centrifuge e. Deep freezer (-20 °C) f. ELISA reader and washer g. VDRL rotator h. Microscope i. Timer B Consumables a. Disposable syringes and needles Adequate / Inadequate b. Disinfectants available—name and
concentration Adequate / Inadequate / Used / Not used
c. Masks Adequate/Inadequate / Used / Not used d. Gloves Adequate/ Inadequate / Used / Not used e. Aprons (plastic) Adequate/ Inadequate/ Used/ Not used f. Screw-capped plastic vials for collection
and storage Adequate /Inadequate / Used / Not used
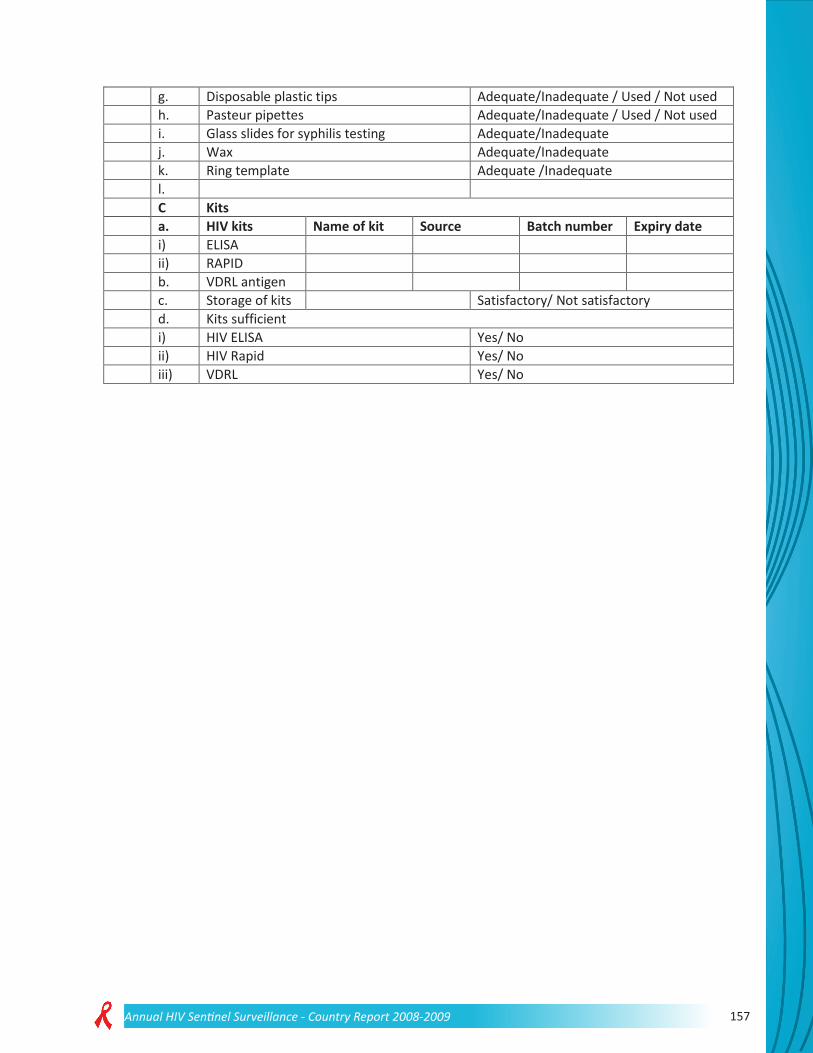
157Annual HIV Sentinel Surveillance - Country Report 2008-2009
g. Disposable plastic tips Adequate/Inadequate / Used / Not used h. Pasteur pipettes Adequate/Inadequate / Used / Not used i. Glass slides for syphilis testing Adequate/Inadequate j. Wax Adequate/Inadequate k. Ring template Adequate /Inadequate l. C Kits a. HIV kits Name of kit Source Batch number Expiry date i) ELISA ii) RAPID b. VDRL antigen c. Storage of kits Satisfactory/ Not satisfactory d. Kits sufficient i) HIV ELISA Yes/ No ii) HIV Rapid Yes/ No iii) VDRL Yes/ No

158 Annual HIV Sentinel Surveillance - Country Report 2008-2009
Annexure IVB (Part B)
CHECKLIST FOR MONITORING AT HIV TESTING CENTRE
PART B IV Practices followed at laboratory A. HIV testing methodology
a. Standard procedure followed (2ER) Yes/ No b. ELISA/ Rapid test Test 1/ Test 2 c. Quality control—control in house Yes/ No d. Reading of results by microbiologist Yes/ No e. Ext. Quality assurance guidelines followed Yes/ No f. Panel sera received (from reference
laboratory) Yes/ No
B. Syphilis serology testing methodology a. Whether VDRL/RPR used Specify b. Standard procedure followed Yes/No c. Whether 2 VDRL/RPR done Yes/No d. Qualitative or quantitative test done Specify e. Quantitative test done on how many sera Specify number
C. Universal precautions followed a. Handling sharps Proper/ Improper b. Handling spillage of blood Proper/ Improper c. Washing of hands Proper/ Improper d. Pipette technique Proper/ Improper e. Decontamination before disposal Yes/No f. Final waste disposal Burning/Incineration/Deep burial
V Details of HSS a. Samples received Daily/ Once a week/ Any other (specify) b. Cold chain maintained during transport Yes/No c. Nature of sample Serum/Whole blood d. Quantity of serum Adequate/Inadequate e. Condition of sample on day of visit Haemolyzed/ Contaminated f. Number of unsatisfactory samples, and
total samples
g. Unsatisfactory samples discarded Yes/No h. Mode of storage of sera Refrigerator/Deep freezer i. Duration of storage before testing Immediate/1 week/2 weeks/1 month/
other j. Tests done Daily/ Twice a week/ Any other (specify)
VI Record maintenance Maintained/ Not maintained VII Problems faced VIII Suggestions for improvement
Name (Member of supervisory team)
Signature

159Annual HIV Sentinel Surveillance - Country Report 2008-2009
Annexure V Proforma
HSS 2008: DATA FORM FOR PATIENTS ATTENDING STI/ GYNAECOLOGICAL CLINICS (Circle appropriate options, complete where options are not available.)
Date: __ __ /__ __ /__ __ __ __ State:_____________________ District:_______________________ 1. Name of sentinel site: ___________________________________________________________________ 2.1 Sentinel site code: ________ 2.2 Sub-site number: 0, 1, 2, 3, 4, 5
(Circle the allotted sub-site number. Circle 0 if the site is not a part of a composite site.)
3.1 Sample number: __________ 3.2 Sentinel site type: 1. STI clinic 2. Gynaecological clinic
4.1 Age (in completed years): __________ 4.2 Sex: 1. Male 2. Female 5. Marital status: 1. Never married 2. Married 3. Divorced/Separated/Widowed 6. Education: 1. Illiterate 2. Literate and till 5th standard 3. Till 12th standard 4. Till graduation 5. Graduate and above 7. Source of referral to STI clinic 1. Self-referral 2. ICTC/ VCTC 3. NGO 4. Private doctors 5. ART centre 6. Other OPDs 7. Referred by spouse with STI 8. Current place of residence of the respondent 1. Urban (municipal corporation/council/cantonment)
2. Rural
9. Duration of stay at current place of residence _______ years _______ months 10. Current occupation of the respondent 1. Agricultural labourer 2. Non-agricultural labourer 3. Domestic servant 4. Skilled/ Semi-skilled worker 5. Petty business/ Small shop 6. Large business/Self-employed 7. Service (Government/Private) 8. Student 9. Truck driver/helper 10. Local transport worker (auto/ taxi driver, handcart puller, rickshaw puller, etc.)
11. Hotel staff 12. Agricultural cultivator/ landholder
13. Unemployed 14. Housewife 11. Current occupation of the spouse 1. Agricultural labourer 2. Non-agricultural labourer 3. Domestic servant 4. Skilled/ Semi-skilled worker 5. Petty business/ Small shop 6. Large business/Self-employed 7. Service (Government/Private) 8. Student 9. Truck driver/helper 10. Local transport worker (auto/ taxi driver, handcart puller, rickshaw puller, etc.)
11. Hotel staff 12. Agricultural cultivator/ landholder
13. Unemployed 14. Housewife 99. Not applicable (for never married/ Widows/ Widowers)

160 Annual HIV Sentinel Surveillance - Country Report 2008-2009
12. Syndromic diagnosis of STI Ano-genital ulcer 1 Urethral discharge/ Cervical discharge 2 Genital ulcer and urethral discharge/ Cervical discharge
3
Ano-genital warts 4 (This question has to be asked ONLY FOR FEMALE RESPONDENTS. For male respondents, circle ‘99’.) 13. Does husband reside alone in another place/town away from wife for work for longer than 6 months? 1. Yes
2. No 99. Not applicable (for never married/ Widows/ Male respondents)
Signature___________ Signature______________ Name _______________ Name ________________ (Person completing the form) (In-charge of the surveillance site)

161Annual HIV Sentinel Surveillance - Country Report 2008-2009
HSS 2008: DATA FORM FOR ANTENATAL CLINIC ATTENDEES (Circle appropriate options, complete where options are not available.)
To be completed at the testing laboratory Date: __ __ /__ __ /__ __ __ __
State:________________ District:___________
1. Name of sentinel site: ___________________________________________________________________ 2.1 Sentinel site code:____________ 2.2 Sub-site number: 0, 1, 2, 3, 4, 5 (Circle the allotted
sub-site number. Circle 0 if the site is not a part of a composite site.)
3. Sample number: ___________ 4. Age in completed years:__________ 5. Education 1. Illiterate 2. Literate and till 5th standard 3. Till 12th standard 4. Till graduation 5. Graduate and above 6. Order of current pregnancy 1. First 2. Second 3. Third 4. Fourth 5. Greater than
fourth 7. Source of referral to ANC clinic 1. Self-referral 2. Family/Relatives/ Neighbours
Friends 3. NGO/ Out-reach workers
4. Private doctor/ Private health centre
5. Government doctor/ ANM/ ASHA/ Government health centre
6. ICTC/ ART centre
8. Current place of residence 1. Urban (municipal corporation/Council/Cantonment)
2. Rural
9. Duration of stay at current place of residence: _______ years _______ months 10. Current occupation of the respondent 1. Agricultural labourer 2. Non-agricultural labourer 3. Domestic servant 4. Skilled/ Semi-skilled worker 5. Petty business/ Small shop 6. Large business/Self-employed 7. Service (Government/Private) 8. Student 9. Truck driver/helper 10. Local transport worker (auto/ taxi driver, handcart puller, rickshaw puller, etc.)
11. Hotel staff 12. Agricultural cultivator/ landholder
14. Housewife 11. Current occupation of the spouse 1. Agricultural labourer 2. Non-agricultural labourer 3. Domestic servant 4. Skilled/ Semi-skilled worker 5. Petty business/ Small shop 6. Large business/Self-employed 7. Service (Government/Private) 8. Student 9. Truck driver/helper 10. Local transport worker (auto/ taxi driver, handcart puller, rickshaw puller, etc.)
11. Hotel staff 12. Agricultural cultivator/ landholder
13. Unemployed 99. Not applicable (for never married/ widows) 12. Does spouse reside alone in another place/ town away from wife for work for longer than 6 months? 1. Yes 2. No 99. Not applicable (for never
married/ widows) Signature___________ Signature______________ Name _______________ Name ________________ (Person completing the form) (In-charge of the sentinel site)

162 Annual HIV Sentinel Surveillance - Country Report 2008-2009
HSS 2008: DATA FORM FOR INJECTING DRUG USERS (Circle appropriate options, complete where options are not available.)
Date: __ __ /__ __ /__ __ State:____________________ District:_______________ 1. Name of sentinel site:_________________________________________________________ 2.1 Sentinel site code: ______ 2.2 Sub-site Number: 0, 1, 2, 3, 4, 5
(Circle the allotted sub-site number. Circle 0 if the site is not a composite site.) 3. Sample number: ________________ 4. Age (in completed years): ________ 5. Gender: 1. Male 2. Female 6. Marital status: 1. Never married 2. Married 3. Divorced/separated/widowed 7. Education 1. Illiterate 2. Literate and till 5th standard 3. Till 12th standard 4. Till graduation 5. Graduate and above 8. Reason for coming to the service point 1. STI treatment 2. Other medical care 3. Other 4. Needle exchange programme 5. Oral substitution therapy/
De-addiction
9. Current place of residence of the respondent 1. Urban (Municipal corporation/Council/Cantonment)
2. Rural
10. Current occupation of the respondent 1. Agricultural labourer 2. Non-agricultural labourer 3. Domestic servant 4. Skilled/ Semi-skilled worker 5. Petty business/ Small shop 6. Large business/Self-employed 7. Service (Government/Private) 8. Student 9. Truck driver/helper 10. Local transport worker (auto/
taxi driver, handcart puller, rickshaw puller, etc.)
11.Hotel staff 12. Agricultural cultivator/ landholder
13. Unemployed 14. Housewife 11. Is the respondent a shadow user*? 1. Yes 2. No *Shadow users: IDUs who switch over to injectable drugs from oral or inhalational and have injected in the last six
months
12. Average frequency of injecting drugs 1. Once a week or less 2. Twice a week 3. Thrice a week 4.More than thrice a week 13. Duration of injecting drug use 1. < 6 months 2. 6 months to 1 year 3. 1–3 years 4. 3–5 years 5. >5 years Signature___________ Signature______________ Name _______________ Name ________________ (Person completing the form) (In-charge of the surveillance site)
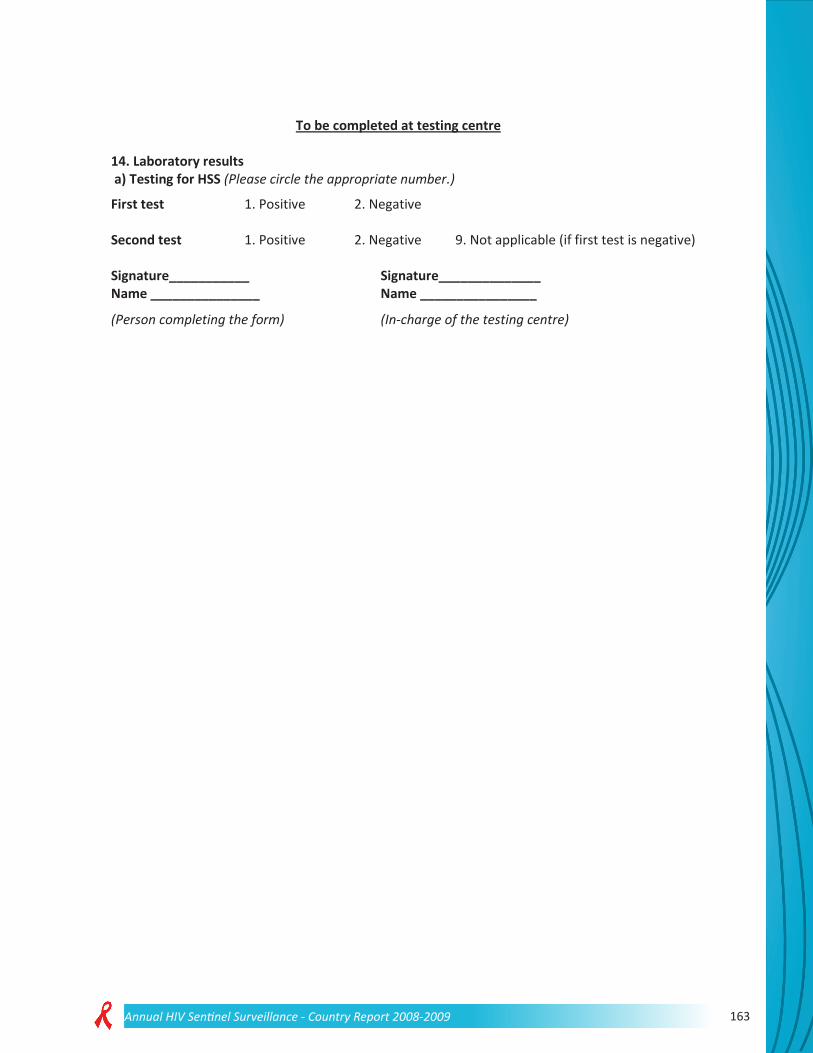
163Annual HIV Sentinel Surveillance - Country Report 2008-2009
To be completed at testing centre 14. Laboratory results a) Testing for HSS (Please circle the appropriate number.)
First test 1. Positive 2. Negative Second test 1. Positive 2. Negative 9. Not applicable (if first test is negative) Signature___________ Signature______________ Name _______________ Name ________________
(Person completing the form) (In-charge of the testing centre)

164 Annual HIV Sentinel Surveillance - Country Report 2008-2009
HSS 2008: DATA FORM FOR MEN WHO HAVE SEX WITH MEN (Circle appropriate options, complete where options are not available.)
Date: __ __ /__ __ /__ __ __ __ State:___________________________ District:_________________ 1. Name of sentinel site: __________________________________________________________________ 2.1 Sentinel site code: _________________ 2.2 Sub-site number: 0, 1, 2, 3, 4, 5
(Circle the allotted sub-site number. Circle 0 if the site is not a composite site.)
3. Sample number: ____________________ 4. Age (in completed years): ____________ 5. Education 1. Illiterate 2. Literate and till 5th standard 3. Till 12th standard 4. Till graduation 5. Graduate and above 6. Reason for coming to the service point 1. STI treatment 2. Other medical care 3. Other 7. Current place of residence of the respondent 1. Urban (Municipal corporation /Council /Cantonment) 2. Rural 8. Duration of stay at current place of residence: _______ years _______ months 9. Current occupation of the respondent 1. Agricultural labourer 2. Non-agricultural labourer 3. Domestic servant 4. Skilled/ Semi-skilled worker 5. Petty business/ Small shop 6. Large business/Self-employed 7. Service (Government/Private) 8. Student 9. Truck driver/helper
10. Local transport worker (auto/ taxi driver, handcart puller, rickshaw puller, etc.)
11. Hotel staff 12. Agricultural cultivator/ landholder
13. Unemployed 10. Type of MSM 1. Kothi 2. Panthi 3. Double-decker 4. No response
11. Did the respondent have any sexual intercourse with any female partner in the last 6 months? 1. Yes 2. No 12. Has the respondent ever received money or payment in kind for sex? 1. Yes 2. No 3. No response 13. Has he ever injected a drug for pleasure without a prescription? 1. Yes 2. No Signature___________ Signature______________ Name _______________ Name ________________ (Person completing the form) (In-charge of the surveillance site)

165Annual HIV Sentinel Surveillance - Country Report 2008-2009
To be completed at testing centre
14. Laboratory results a) Testing for HSS (Please circle the appropriate number.) First test 1. Positive 2. Negative Second test 1. Positive 2. Negative 9. Not applicable (if first test is negative) Signature___________
Signature______________
Name _______________ Name ________________ (Person completing the form) (In-charge of the testing centre)

166 Annual HIV Sentinel Surveillance - Country Report 2008-2009
HSS 2008: DATA FORM FOR FEMALE SEX WORKERS (Circle appropriate options, complete where options are not available.)
Date: __ __ /__ __ /__ __ __ 2. State:__________________ 3. District:________________ 1. Name of sentinel site: ________________________________________________________
2.1 Sentinel site code:_______ 2.2 Sub-site number: 0, 1, 2, 3, 4, 5 (Circle the allotted sub-site number. Circle 0 if the site is not a composite site.)
3. Sample number:___________________
4. Age (in completed years):___________
5. Education
1. Illiterate 2. Literate and till 5th standard 3. Till 12th standard
4. Till graduation 5. Graduate and above
6. Reason for coming to the service point
1. STI treatment 2. Other medical care 3. Other
7. Current place of residence
1. Urban (Municipal corporation /Council
/Cantonment)
2. Rural
8. Duration of stay at current place of residence: _______ years _______ months
9. Type of sex work involved in (Multiple options are allowed.)
1. Brothel-based 2. Street-based
3. Home-based 4. Others
10. Duration of involvement in sex work
1. < 6 months 2. 6 months to 1 year 3. 1–3 years
4. 3–5 years 5. >5 years
11. Any other source of income, apart from sex work?
1. Yes 2. No
If yes, specify _____________
12. Has she ever injected a drug for pleasure without a prescription?
1. Yes 2. No
Signature___________ Signature______________
Name _______________ Name ________________
(Person completing the form) (In-charge of the surveillance site)

167Annual HIV Sentinel Surveillance - Country Report 2008-2009
To be completed at testing centre
13. Laboratory results a) Testing for HSS (Please circle the appropriate number.) First test 1. Positive 2. Negative Second test 1. Positive 2. Negative 9. Not applicable (if first test is negative) Signature___________
Signature______________
Name _______________ Name ________________ (Person completing the form) (In-charge of the testing centre)

168 Annual HIV Sentinel Surveillance - Country Report 2008-2009
HSS 2008: DATA FORM FOR MALE MIGRANTS (Circle appropriate options, complete where options are not available.)
Date: _ __ /__ __ /__ __ __ State:__________________ District:_____________ 1. Name of sentinel site: ______________________________________________ 2.1 Sentinel site code:______ 2.2 Sub-site number: 0, 1, 2, 3, 4, 5
(Circle the allotted sub-site number. Circle 0 if the site is not a composite site.)
3. Sample number: ________________ 4. Age (in completed years): _________ 5. Marital status: 1. Never married 2. Married 3. Divorced/Separated/Widowed 6. Education 1. Illiterate 2. Literate and till 5th standard 3. Till 12th standard 4. Till graduation 5. Graduate and above 7. Reason for coming to the service point 1. STI treatment 2. Other medical care 3. Other 8. Current place of residence of the respondent 1. Urban (Municipal corporation/Council/Cantonment)
2. Rural
9. When did the respondent migrate to the current place? _______ years _______ months 10.1. State of origin 10.2. District of origin 10.3. Place of origin 1. Urban (Municipal corporation/Council/Cantonment)
2. Rural
11. Current occupation of the respondent 1. Agricultural labourer 2. Non-agricultural labourer 3. Domestic servant 4. Skilled/ Semi-skilled worker 5. Petty business/ Small shop 6. Large business/Self-employed 7. Service (Government/Private)
8. Student 9. Truck driver/helper
10. Local transport worker (auto/ taxi driver, handcart puller, rickshaw puller, etc.)
11. Hotel staff
Signature___________ Signature____________ Name _______________ Name _______________ (Person completing the form) (In-charge of the surveillance site)

169Annual HIV Sentinel Surveillance - Country Report 2008-2009
To be completed at testing centre 12. Laboratory results a) Testing for HSS (Please circle the appropriate number.) First test 1. Positive 2. Negative Second test 1. Positive 2. Negative 9. Not applicable (if first test is negative) Signature___________ Signature______________ Name _______________ Name ________________ (Person completing the form) (In-charge of the testing centre)

170 Annual HIV Sentinel Surveillance - Country Report 2008-2009
HSS 2008: DATA FORM FOR TRUCKERS (Circle appropriate options, complete where options are not available.)
Date: _ __ /__ __ /__ __ __ _ State: ________________ District:___________________
1. Name of sentinel site: ______________________________________________________
2. 1 Sentinel site code: _____ 2.2 Sub-site number: 0, 1, 2, 3, 4, 5 (Circle the allotted sub-site number. Circle 0 if the site is not a composite site.)
3. Sample number: __________________
4. Age (in completed years): __________
5. Marital status : 1. Never married 2. Married 3. Divorced/Separated/Widowed
6. Education 1. Illiterate 2. Literate and till 5th standard 3. Till 12th standard 4. Till graduation 5. Graduate and above 7. Reason for coming to the site
1. STI treatment 2. Other medical care 3. Other 8. Current place of residence of the respondent
1. Urban (Municipal corporation/Council/Cantonment)
2. Rural
9. Average number of days in a month that are spent at home with family? _______ days Signature___________ Signature______________ Name _______________ Name ________________
(Person completing the form) (In-charge of the surveillance site)
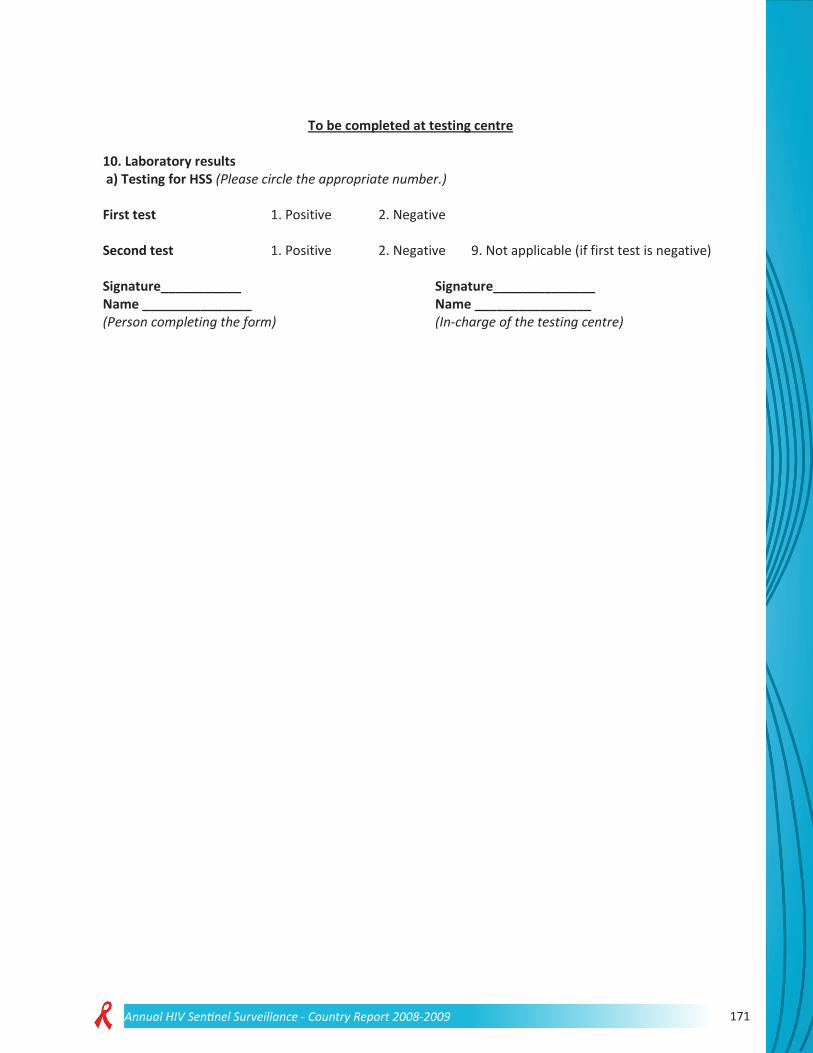
171Annual HIV Sentinel Surveillance - Country Report 2008-2009
To be completed at testing centre
10. Laboratory results a) Testing for HSS (Please circle the appropriate number.) First test 1. Positive 2. Negative Second test 1. Positive 2. Negative 9. Not applicable (if first test is negative) Signature___________ Signature______________ Name _______________ Name ________________ (Person completing the form)
(In-charge of the testing centre)

172 Annual HIV Sentinel Surveillance - Country Report 2008-2009
HSS 2008: DATA FORM FOR EUNUCHS/ TRANSGENDERS (Circle appropriate options, complete where options are not available.)
Date: __ __ /__ __ /__ __ __ __ State:_____________________ District:____________________ 1. Name of sentinel site: _______________________________________________________________ 2.1 Sentinel site code: _____________ 2.2 Sub-site Number: 0, 1, 2, 3, 4, 5
(Circle the allotted sub-site number. Circle 0 if the site is not a composite site.)
3. Sample number: ____________________________ 4. Age (in completed years): ____________________ 5. Education 1. Illiterate 2. Literate and till 5th standard 3. Till 12th standard 4. Till graduation 5. Graduate and above 6. Reason for coming to the service point 1. STI treatment 2. Other medical care 3. Other 7. Current place of residence of the respondent 1. Urban (Municipal corporation/Council/Cantonment)
2. Rural
8. Duration of stay at current place of residence: _______ years _______ months 9. Current occupation of the respondent 1. Agricultural labourer 2. Non-agricultural labourer 3. Domestic servant 4. Skilled/ Semi-skilled worker 5. Petty business/ Small shop 6. Large business/Self-employed 7. Service (Government/Private) 8. Student 9. Truck driver/helper 10. Local transport worker (auto/
taxi driver, handcart puller, rickshaw puller, etc.)
11. Hotel staff 12. Agricultural cultivator/ landholder
13. Unemployed 10. Has the respondent ever received money or payment in kind for sex? 1. Yes 2. No 3. No response 11. Has the respondent ever injected a drug for pleasure without a prescription? 1. Yes 2. No Signature___________ Signature______________ Name _______________ Name ________________ (Person completing the form) (In-charge of the surveillance site)

173Annual HIV Sentinel Surveillance - Country Report 2008-2009
Annexure VI
State-wise distribution of sentinel sites by type in 2008
States STI ANC ANC (R ) FSW IDU MSM TRK MRG EUN Total
Andaman & Nicobar Islands
1 4 5
Andhra Pradesh
26 26 12 2 6 72
Arunachal Pradesh
7 6 3 2 18
Assam 9 16 14 2 1 42 Bihar 24 23 15 2 1 65
Chandigarh 2 1 3 1 1 8
Chhattisgarh 4 18 22
Daman & Diu
2 2
Dadra &Nagar Haveli
1 1
Delhi 5 5 6 2 4 22 Goa 2 3 1 1 7
Gujarat 10 25 6 7 2 50 Haryana 9 12 7 1 1 30 Himachal Pradesh
5 8 3 1 1 1 1 20
Jammu & Kashmir
6 14 2 1 23
Jharkhand 11 15 12 1 1 40
Karnataka 7 29 29 6 1 3 75
Kerala 2 6 6 3 5 1 23 Madhya Pradesh
13 36 3 1 1 54
Maharashtra 9 33 33 16 3 2 1 98
Mumbai 1 6 0 4 1 1 12

174 Annual HIV Sentinel Surveillance - Country Report 2008-2009
Manipur 2 10 4 3 4 1 24 Meghalaya 3 1 6 10
Mizoram 2 8 1 5 1 17 Nagaland 1 11 8 1 8 29
Orissa 7 31 6 3 4 1 52 Pondicherry 3 2 3 2 10
Punjab 3 8 5 7 5 3 31 Rajasthan 15 26 5 46
Sikkim 1 3 1 2 7 Tamil Nadu 34 29 28 2 17 110
Tripura 7 2 1 10 Uttar
Pradesh 26 43 10 3 2 1 85
Uttaranchal 6 9 15
West Bengal 9 9 12 11 4 4 5 1 55
India 212 486 162 188 57 69 7 8 1 1190

National Institute of Health and Family WelfareMunirka, New Delhi-110067
NIHFW
N COA
National AIDS Control Organisation (NACO)Ministry of Health & Family Welfare
New Delhi-110001