Improved pharmacological properties for superoxide dismutase modified with mannan

www.elsevier.com/locate/jphotobiol
Journal of Photochemistry and Photobiology B: Biology 87 (2007) 218–226
A comparison of quantitative and qualitative superoxidedismutase assays for application to low temperature microalgae
Paul J. Janknegt a,*, Jan W. Rijstenbil b, Willem H. van de Poll a, Tsanko S. Gechev c,Anita G.J. Buma a
a Department of Ocean Ecosystems, Centre for Ecological and Evolutionary Studies, University of Groningen, Kerklaan 30, 9750 AA Haren, The Netherlandsb Netherlands Institute of Ecological Research – Royal Dutch Academy of Sciences, Centre for Estuarine and Marine Ecology, Korringaweg 7, 4401 NT
Yerseke, The Netherlandsc Department of Plant Physiology and Plant Molecular Biology, University of Plovdiv, 24 Tsar Assen Street, Plovdiv 4000, Plovdiv, Bulgaria
Received 21 December 2006; received in revised form 28 March 2007; accepted 2 April 2007Available online 24 April 2007
Abstract
Antioxidant enzymes such as superoxide dismutase (SOD) play a key role in the removal of reactive oxygen species produced duringvisible and ultraviolet irradiance stress in microalgae and plants. However, little is known about the enzymatic antioxidative stressresponses in ecologically important Antarctic marine microalgae. SOD in particular is difficult to analyze, possibly due to problemsin obtaining sufficient quantities necessary for reliable and reproducible enzymatic assays. The aim of the present work was to createa sensitive, easy-to-use and reliable method for SOD determination in Antarctic microalgal material by comparing and optimizing exist-ing protein extraction procedures and SOD assays in the marine Antarctic diatom Chaetoceros brevis. Optimization was achieved in celldisruption (sonication) and protein extraction procedures, extraction buffers, SOD assay methods (xanthine/xanthine oxidase and NBT/riboflavin photometric quantitative methods and native gel electrophoresis qualitative method) and the assay temperature. Proteinextraction was optimal at low sonication amplitudes after a few pulses, irrespective of the type of buffer used. Extraction efficiency variedhighly between the tested buffers; most protein was extracted in the presence of 1% of Triton X-100. SOD activity was best quantifiedusing the NBT/riboflavin method in combination with a buffer containing potassium phosphate and Triton X-100. Moreover, the NBT/riboflavin method was demonstrated to be the most reliable and sensitive method at low temperatures (5 �C).� 2007 Elsevier B.V. All rights reserved.
Keywords: Superoxide dismutase; Xanthine/xanthine oxidase assay; NBT/riboflavin assay; Native gel electrophoresis; Marine Antarctic diatom
1. Introduction
Antarctic marine microalgae are known to experiencehigh irradiance stress in situ. The extent to which microal-gae are subjected to excess irradiance depends on factorslike the intensity and spectral composition of incomingirradiance, position in the water column and the associatedattenuation of irradiance [1–3]. Natural solar ultravioletradiation (UVR: 280–400 nm) can reduce water column
1011-1344/$ - see front matter � 2007 Elsevier B.V. All rights reserved.
doi:10.1016/j.jphotobiol.2007.04.002
* Corresponding author. Tel.: +31 50 363 7856; fax: +31 50 363 2261.E-mail address: [email protected] (P.J. Janknegt).
productivity in Antarctic marine waters by more than50% [1,4]. Springtime Antarctic stratospheric ozone deple-tion causes an additional integrated productivity lossbetween 4% and 12% [1,5,6].
The detrimental effects of UVR-driven photoreactionsto essential biomolecules can interrupt metabolic pathwaysand cause an overreduction of electron transport chains(ETC). When the consumption of reduced equivalents can-not match the production, electrons from ETCs can leak tomolecular oxygen (O2) and initiate formation of reactiveoxygen species (ROS) [7–9]. ROS may damage photosys-tem II reaction center proteins by which photosynthesiscould decrease and cause viability loss [10].

P.J. Janknegt et al. / Journal of Photochemistry and Photobiology B: Biology 87 (2007) 218–226 219
Microalgae have developed mechanisms that offer pro-tection against high levels of solar radiation to preventoverreduction of ETCs. Yet, when these protection systemsare not adequate, ETCs become overreduced and ROS willaccumulate rapidly. As a response, cells can counteractROS by using a sophisticated network of antioxidantenzymes which actively scavenge the various ROS interme-diates [12].
The first reactive oxygen species (ROS) formed is thesuperoxide anion ðO��2 Þ. Through a series of uncontrolledunivalent reductions, O��2 can be converted into the hydro-xyl radical (HO�) which is among the most reactive oxygenspecies known to chemistry [13]. To prevent production ofHO� and oxidation of biomolecules, O��2 is converted intohydrogen peroxide (H2O2) by the enzyme superoxide dis-mutase (SOD; [14,15]). SOD is not only the first line ofdefence but also the only enzyme capable of catalyzing thisreaction. Therefore SOD holds a key position within theantioxidant network.
SOD has been shown to be present in all aerobic cells[16]. In plants, SOD varies in response to environmentalstressors such as chilling [17–19], metal exposure [20],hypersalinity [21,22] and UVR [23]. In contrast, relativelylittle information is available on SOD activity in marinemicroalgae. Most of the studies are conducted with temper-ate marine microalgae, demonstrating alterations in SODactivity in response to metal exposure [24–26], salinity[27,28], change in visible irradiance [29–31] and UVR[32–35]. Studies describing SOD responses in marine Ant-arctic microalgae are very scarce [36,11], which is surprisingbecause of the ecological significance of the mentionedexcess irradiance responses.
The limited information on SOD activity in marine Ant-arctic microalgae is possibly related with the difficulties inobtaining sufficient biomass for reliable and reproduciblemeasurements. Methods so far used to measure SOD activ-ity in microalgae are the xanthine/xanthine oxidase (X–XOD) [37] and the NitroBlue Tetrozolium/Riboflavin(NBT/RF). The first one is used for photometric measure-ments only while the second is used also for Native-PAGE[38]. The commonly used X–XOD method [37] requiressuch high quantities of biomass that obtaining reliableSOD assessments is virtually impossible for microalgal fieldmaterial. In contrast, this method works fine for low tem-perature macroalgae as was demonstrated by Aguileraet al. [39,40] and Dummermuth et al. [41]. Own preliminaryexperiments with Antarctic microalgae showed, first of all,that standard cell disruption and protein extraction tech-niques were not satisfactory in terms of extraction effi-ciency. Secondly, the X–XOD assay did not seem suitablefor application at the low temperatures required for analyz-ing Antarctic microalgal material. Therefore, it was the aimof the present work to find the optimal combination of celldisruption, protein extraction and SOD activity proceduresat low temperature. To this end we tested a combination ofvarious sonication procedures, protein extraction buffersand SOD assays. The material we used was derived from
experiments with the common Antarctic diatom Chaetoc-
eros brevis.
2. Materials and methods
2.1. Experimental procedures
Experiments were done using extracts of the marineAntarctic diatom C. brevis (isolate CCMP 163). C. brevis
was grown at 4 �C and 25 lmol m�2 s�1 PAR (14L:10Dcycle) in modified f/2 medium [42]. Samples were harvestedby filtration or centrifugation (see below for procedures)when the cultures contained approximately 1 · 105 cells/ml. Samples were stored at �80 �C and analyzed withintwo months. A comparison between filtration and centrifu-gation for harvesting biomass had shown that filtrationonto 47 mm polycarbonate filters (2.0 lm pore size;Osmonics, USA) yielded 25% more material than centrifu-gation (1500g) for 20 min at 4 �C (Falcan 6/300) (ownunpublished results). Therefore, unless indicatedotherwise (experimental series no. 1), cells were harvestedby filtration.
The following type of experiments were done: (1) effectsof disruption procedures on protein extraction efficiency;(2) effects of four extraction buffers on protein extractionefficiency; (3) effects of four extraction buffers on SODactivity and (4) temperature dependence of SOD activityassays.
2.2. Cell disruption and protein extraction efficiency
To study disruption procedures, 48 tubes containing50 ml of C. brevis culture were centrifuged after whichsupernatants were discarded. Twenty four cellular pelletswere resuspended in 1.5 ml buffer A containing 50 mMKH2PO4 (Merck, Darmstadt, Germany), pH 7 and0.1 mM EDTA (Merck, Darmstadt, Germany) [43] andtransferred to a 60 ml glass beaker. The other 24 cellularpellets were resuspended in buffer X containing 50 mMKH2PO4, pH 7.8, 0.1 mM EDTA, 1% Triton X-100(Aldrich, Steinheim, Germany) and 2% PVP (Acros,NJ, USA), modified from Gechev et al. [44] and alsotransferred to a 60 ml glass beaker. To determine theeffect of pulse frequency on protein extraction, duplicatesof 1 ml from both cell suspensions were sonicated apply-ing a range between 1 and 5 pulses with 30 s intervals ata fixed amplitude of 25 lm (100 W High Intensity Ultra-sonic processor, Sonics and Materials, Inc., Newtown,USA). The optimal disruption was determined for 1 mlduplicates by sonication at amplitudes between 30 nmand 90 nm with 2 pulses and 30 s intervals. Samples werekept on ice throughout the disruption procedures, yetimmediately after sonication the temperature of theextract was registered (Thermotime, Cresta, The Nether-lands) and the protein content of the extracts were mea-sured according to Bradford using BSA as proteinstandard [45].

220 P.J. Janknegt et al. / Journal of Photochemistry and Photobiology B: Biology 87 (2007) 218–226
2.3. Comparison of extraction buffers
To compare protein extraction efficiency, four extrac-tion buffers were tested: buffer A (50 mM KH2PO4, pH7.8 and 0.1 mM EDTA [43]; buffer B (50 mM KH2PO4,pH 7.8, 0.1 mM EDTA, 1% Triton X-100); buffer X(50 mM KH2PO4, pH 7.8 and 0.1 mM EDTA, 1% TritonX-100, 2% PVP and complete protease inhibitor cocktail(Roche, Mannheim, Germany)); and buffer Y (50 mMKH2PO4, pH 7.8 and 0.1 mM EDTA, 1% Triton X-100,2% PVPP (Sigma, Steinheim, Germany) and completeprotease inhibitor cocktail [44]). For this experiment aswell as experiments 3 and 4, approximately 2 · 106 cellswere harvested by filtration (polycarbonate filters,2.0 lm pore size; Osmonics, USA). The cells were dis-rupted by sonication (2 · 30 s, at A = 30) at 4 �C in1.5 ml of one of the four buffers. All crude extracts werecentrifuged for 20 min (20,000g) at 4 �C after which thesupernatants were collected (n = 3). One hundred and fiftymicroliter of the supernatant was used for quantifying theprotein concentration in triplicate according to Bradford[45].
2.4. Comparison of four different protein extraction buffers
on SOD activity
Aliquots of supernatants obtained as described in Sec-tion 2.3 were used for determining SOD activity applyingboth the xanthine/xanthine oxidase (X–XOD) assay [37]and the Riboflavin/NitroBlue Tetrazolium (RF/NBT)assay [38,46]. Both indirect methods involve the inhibitionof, respectively, Cyt-c and NBT reduction. In the X–XODmethod, SOD competes with Cyt-c for O��2 generated bythe xanthine/xanthine oxidase system. SOD activity isdefined as the amount of sample required for 50% inhibi-tion. Cyt-c reduction was measured for 3 min at 4 �C in a1.5 ml assay mix containing SOD buffer 1 (50 mMKH2PO4 and 0.1 mM EDTA at pH 7.8) 10 lM Cyt-c(Sigma), 50 mM xanthine (Sigma, Steinheim, Germany))and XOD (Sigma, Steinheim, Germany) at 550 nm on aCary 3E UV/vis double beam spectrophotometer (Varian,Middelburg, The Netherlands) equipped with a tempera-ture controlled cell attached to a water bath. Theblanc coloration slope was 0.025 AU/min. For activitydetermination in extracts, extract volumes of sample(Vsample) were added such that an inhibition (I) between45% and 65% was achieved. The volume of sample neededto obtain 50% inhibition (V50) was then calculated accord-ing to V50 = Vsample * 50%/I. Specific activity (SA) was cal-culated as 1/(V50 * [protein]). In the NBT/RF method,SOD competes with NBT for O��2 generated by the RFunder illumination. NBT reduction was measured (induplicate) in five reaction mixtures containing 0, 12.5 ll,25 ll, 50 ll and 100 ll extract. The 1.5 ml reaction mixturescontained SOD buffer 2 (50 mM KH2PO4, pH 7.8, 0.1 mMEDTA, and 0.25% Triton X-100), 2 mM riboflavin (Sigma,Steinheim, Germany) and 57 lM NBT (Sigma, Steinheim,
Germany). The reaction mixtures were incubated in thedark for 30 min at 4 �C. Since generation of superoxideradicals in the NBT/RF assay is driven by light, sampleswere subsequently illuminated from above for 15 min by4 fluorescence tubes (Philips TLD/18 W, 30 cm distance)giving 199 lmol photons m2 s�1. Afterwards, absorbancewas measured at 560 nm on a Cary 3E UV/vis double beamspectrophotometer. Fifty percent inhibition was calculatedby regression using the linear part of a natural semi-logcurve after which the SA was calculated as described forthe X–XOD method.
SOD activity was visualized using native 12% polyacryl-amide gel electrophoresis (Native-PAGE). Samples con-taining 15 lg protein were loaded onto a gel using 5 llprotein loading buffer. After electrophoresis (80 V), activityof SOD in the gel was visualized by the staining proceduredescribed by Beauchamps and Fridovich [38] and Paridaet al. [21]. The gels were soaked in 35 ml staining buffercontaining 0.25 mM RF, 5 mM NBT, and 0.5 mMTEMED (Amresco, Solon USA) for 30 min. in the darkat 4 �C and subsequently illuminated from above for15 min by 4 fluorescent tubes (18 W each, 30 cm distance)giving 199 lmol photons m2 s�1. SOD bands appeared aslight bands on a blue/purple background. The reactionwas stopped by rinsing with Milli Q.
2.5. SOD activity assays at different temperatures
Both quantitative assays were performed as described inSection 2.4 at temperatures of 6 �C, 12 �C, 18 �C, 24 �Cand 30 �C. Regarding the X–XOD method, temperaturedependence was determined by the activity of XODrequired to obtain a blanc slope of 0.025 AU/min. Themeasurements were done in triplicate. Generation of super-oxide radicals in the NBT/RF assay is driven by light. Todetermine the effect of light intensity besides the effect oftemperature, SOD measurements were performed underthree different light intensities for each of the five differenttemperatures. Therefore, the reaction mixtures were incu-bated at the designated temperature in a water bath for10 min prior to irradiation and kept within the water bathduring illumination from above with 133, 166 and199 lmol photons m�2 s�1. The three irradiance intensitieswere applied by positioning the reaction mixtures at threedifferent distances from the 4 fluorescent tubes. Irradiancewas measured with a spherical light meter (QSL-100, Bio-spherical Instruments) in air. Measurements were doneon four replicates. Statistical analyses were done on allresults using standard One way ANOVA significance tests.Error bars represent standard deviations.
3. Results
3.1. Disruption of cells
Applying an increasing range of sonication amplitudesresulted in enhanced extract temperatures regardless of

X-XOD
V50
(u
l)
0
100
200
300
400
NBT/RF
V50
(u
l)
0
10
20
30
40
Protein
rote
in]
(gr/
l)0.2
0.3
0.4
a
b
a
b
c
d
e e
P.J. Janknegt et al. / Journal of Photochemistry and Photobiology B: Biology 87 (2007) 218–226 221
the buffer used. Despite the fact that extracts were soni-cated on ice, temperatures increased dramatically withincreasing pulses, frequency and amplitude up to 25 and50 �C at the highest pulse frequency and amplitude levels,respectively (Fig. 1). At the same time, the concentrationof protein did not increase with increasing amplitude irre-spective of the buffer used. Moreover, the protein concen-tration decreased significantly when applying sonicationamplitudes of 60 lm or higher, probably due to thedestructive effects of heat on protein integrity. Applying 2sonication pulses of 30 s at 30 lm amplitude alreadyresulted in obtaining a maximum amount of extractedprotein.
3.2. Extraction buffer
Because of its membrane dissolving capacity, the pres-ence of Triton X-100 in buffers B, X and Y contributed sig-nificantly (p < 0.05) to the protein extraction efficiency(Figs. 1 and 2c). On average, Triton X-100 (buffer X)yielded between 2 and 2.5 times more protein than thephosphate buffer (buffer A) alone and was efficient withoutcell disruption by sonication (Fig. 1a). Addition of thematrix forming molecules PVP and PVPP decreased theextraction efficiency of proteins significantly (p < 0.05) byapproximately 20% (Fig. 2c).
Number of sonication pulses0 1 2 3 5
[pro
tein
] (m
g/m
l)
0.00
0.03
0.06
0.09
0.12
0.15
0.18
Tem
per
atu
re (
°C)
0
6
12
18
24
30Buffer ABuffer X
Sonication amplitude (µm)20 30 40 50 60 70 80 90
[pro
tein
] (m
g/m
l)
0.00
0.03
0.06
0.09
0.12
0.15
0.18
Tem
per
atu
re (
°C)
0
12
24
36
48
60
Fig. 1. Effects of sonication on cell disruption efficiency and extracttemperature: (a) effect of sonication pulses and (b) effect of sonicationamplitude. Cell disruption procedures were tested in extraction buffers A(dark bars) and X (white bars) and expressed in amount of proteinextracted. Extract temperature is indicated by the black dots.
BufferA B X Y
[p
0.0
0.1
Fig. 2. Effect of extraction buffers A (sole phosphate buffer), B (phosphateand Triton X-100), X (phosphate, Triton X-100 and PVP) and Y(phosphate, Triton X-100 and PVPP) on the amount of protein requiredfor 50% inhibition (V50) and protein extraction efficiency. V50 values usingthe xanthine–xanthine oxidase (X–XOD) method (a). V50 values using theRiboflavine/NitroBlue Tetrazolium (NBT/RF) method (b). Effect ofextraction buffer on protein extraction efficiency (c). a: differs significantlyfrom buffers B and Y (p > 0.0005); b: differs significantly from buffers Aand X (p > 0.0005); c: differs significantly from buffers B, X and Y(p > 0.0005); d: differs significantly from buffers A, X and Y (p > 0.0005);and e: differs significantly from buffers A and B (p > 0.0005).
3.3. Protein extraction buffer and SOD activity
V50 values of the X–XOD method were nearly 10 timeshigher than the V50 values of the NBT/RF method, regard-less of the buffer used (Fig. 2a and b). The differencesbetween the V50 values within each assay were small whenthe four protein extraction buffers were compared, butwere only significant (p < 0.05) in combination with theNBT/RF method. Despite these differences, they wereminor compared to the differences between the proteinextraction efficiency of the four buffers. As a result, thelarge variation in specific SOD activities (SA) could ratherbe explained by differences in protein extraction efficiencybetween the four buffers (Fig. 2c), than by differences in
NBT/RF
S.A
. of
SO
D (
U/m
g p
rot)
0
50
100
150
200
250
300
X-XODS
.A. o
f S
OD
(U
/mg
pro
t)
0
5
10
15
20
25
30
35a
b
c d
e
f g
h
Native-PA gel
A B X Y Buffer
Fig. 3. Effect of protein extraction buffers A (phosphate buffer), B(phosphate and Triton X-100), X (phosphate, Triton X-100 and PVP) andY (phosphate, Triton X-100 and PVPP) on specific activity of SODmeasured by the xanthine–xanthine oxidase (X–XOD) method (a), theRiboflavine/NitroBlue Tetrazolium (RF/NBT) method (b) and visualizedon native polyacrylamide (Native PA) gel (c). Twenty microgram ofprotein was applied on gel. a: differs significantly from buffers B, X and Y(p > 0.005); b: differs significantly from buffers A and X (p > 0.05); c:differs significantly from buffers A and B (p > 0.05); d: differs significantlyfrom buffer A (p > 0.0005); e: differs significantly from buffers B, X and Y(p > 0.001); f: differs significantly from buffers A and Y (p > 0.05); g:differs significantly from buffer A (p > 0.0005); and h: differs significantlyfrom buffers A and B (p > 0.05).
Temperature ( oC)
XO
D a
ctiv
ity
(U/m
g p
rot)
0
4
8
12
16
20
6 12 18 24 30
Ab
s. 5
60n
m (
A.U
./min
)
0.0
0.2
0.4
0.6
0.8
199 µmol.m-2.s-1
166 µmol.m-2.s-1
133 µmol.m-2.s-1
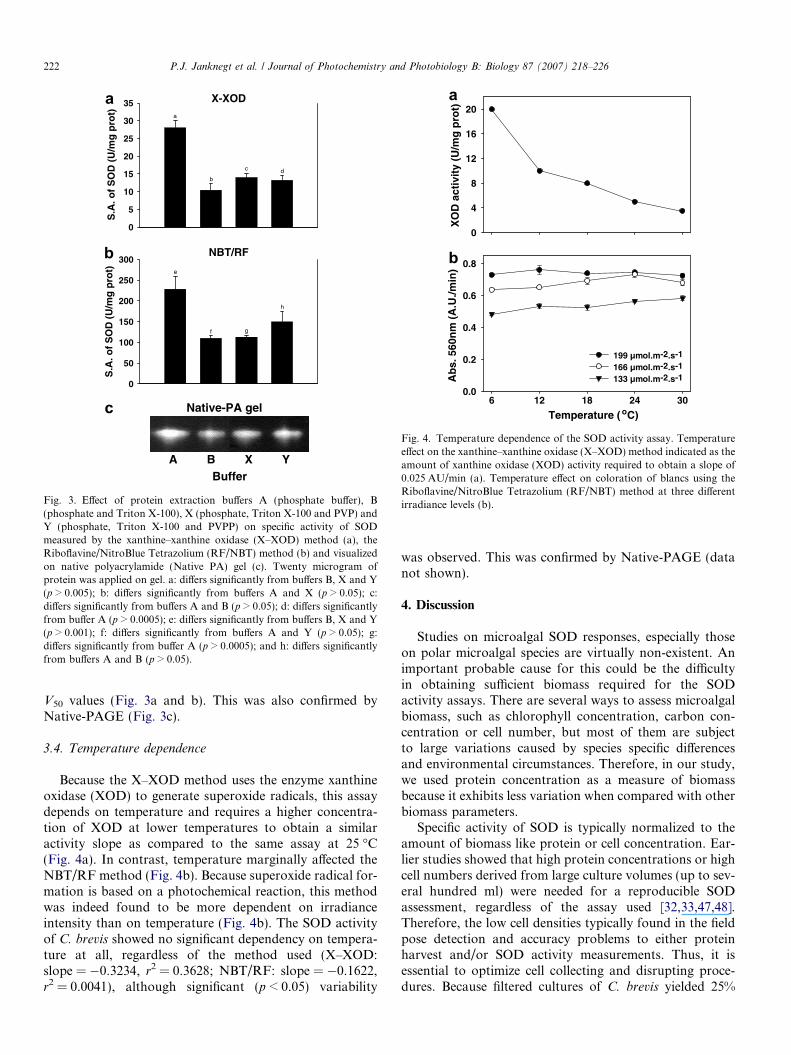
Fig. 4. Temperature dependence of the SOD activity assay. Temperatureeffect on the xanthine–xanthine oxidase (X–XOD) method indicated as theamount of xanthine oxidase (XOD) activity required to obtain a slope of0.025 AU/min (a). Temperature effect on coloration of blancs using theRiboflavine/NitroBlue Tetrazolium (RF/NBT) method at three differentirradiance levels (b).
222 P.J. Janknegt et al. / Journal of Photochemistry and Photobiology B: Biology 87 (2007) 218–226
V50 values (Fig. 3a and b). This was also confirmed byNative-PAGE (Fig. 3c).
3.4. Temperature dependence
Because the X–XOD method uses the enzyme xanthineoxidase (XOD) to generate superoxide radicals, this assaydepends on temperature and requires a higher concentra-tion of XOD at lower temperatures to obtain a similaractivity slope as compared to the same assay at 25 �C(Fig. 4a). In contrast, temperature marginally affected theNBT/RF method (Fig. 4b). Because superoxide radical for-mation is based on a photochemical reaction, this methodwas indeed found to be more dependent on irradianceintensity than on temperature (Fig. 4b). The SOD activityof C. brevis showed no significant dependency on tempera-ture at all, regardless of the method used (X–XOD:slope = �0.3234, r2 = 0.3628; NBT/RF: slope = �0.1622,r2 = 0.0041), although significant (p < 0.05) variability
was observed. This was confirmed by Native-PAGE (datanot shown).
4. Discussion
Studies on microalgal SOD responses, especially thoseon polar microalgal species are virtually non-existent. Animportant probable cause for this could be the difficultyin obtaining sufficient biomass required for the SODactivity assays. There are several ways to assess microalgalbiomass, such as chlorophyll concentration, carbon con-centration or cell number, but most of them are subjectto large variations caused by species specific differencesand environmental circumstances. Therefore, in our study,we used protein concentration as a measure of biomassbecause it exhibits less variation when compared with otherbiomass parameters.
Specific activity of SOD is typically normalized to theamount of biomass like protein or cell concentration. Ear-lier studies showed that high protein concentrations or highcell numbers derived from large culture volumes (up to sev-eral hundred ml) were needed for a reproducible SODassessment, regardless of the assay used [32,33,47,48].Therefore, the low cell densities typically found in the fieldpose detection and accuracy problems to either proteinharvest and/or SOD activity measurements. Thus, it isessential to optimize cell collecting and disrupting proce-dures. Because filtered cultures of C. brevis yielded 25%

P.J. Janknegt et al. / Journal of Photochemistry and Photobiology B: Biology 87 (2007) 218–226 223
more protein than centrifuged cultures (data not shown)cells were standardly harvested by means of filtration,except in the case of the cell disruption experiments. Here,cells were harvested by centrifugation after which the pel-lets were resuspended and joint together in the designatedextraction buffer. In this way identical cell concentrations,as required for the cell disruption tests were obtained. Thiswas not possible using filter derived material that showed aslight variability in cell concentration. For the cell disrup-tion experiment, only buffers A (a simple phosphate buffer)and X (protease inhibitor, Triton X-100 and PVP), werecompared which differed most in composition. Proteinextraction was shown to be most effective using buffer Xapplying 2 sonication pulses at an amplitude of 25 lm(Fig. 1). Although buffer X yielded higher protein concen-trations applying 2 pulses at an amplitude of 60 lm or 5pulses at an amplitude of 25 lm, the temperature of theextract raised as well (up to 35 and 25 �C, respectively).In general, an increased number of pulses did notresult in increased extraction efficiency. Moreover, anincrease in sonication amplitude even reduced protein con-centrations: in buffer A this was initiated by amplitudesover 40 lm whereas for buffer X this was initiated byamplitudes over 70 lm. Likely, increased extract tempera-tures at elevated amplitudes cause denaturation, followedby aggregation and precipitation, especially of low temper-ature proteins. In addition, because buffer X contains Tri-ton X-100, denaturated proteins remain in solution, even athigher temperatures that would otherwise cause aggrega-tion and precipitation.
Concerning the efficiency of the tested protein extractionbuffers, buffer B was most efficient yielding 60% more pro-tein than buffer A and 20% more than buffers X and Y.This can be explained by the presence of Triton X-100which enables buffers B, X and Y to dissolve membraneousstructures to release membrane associated or enclosed pro-teins. It must be emphasized that the Triton X-100 strengthneeds to be well below 0.5% (in this study 0.1%) in order toavoid interference with Coomassie dye. In contrast to Tri-ton X-100, the presence of PVP and PVPP had a negativeeffect on the amount of extracted protein. Their purpose isto indiscriminately abstract phenolic and polyphenolicimpurities from protein extracts which could otherwiseaffect activity assays. However, PVP/PVPP not only pre-cipitates interfering phenols but also proteins containingamino acids with phenolic residues (i.e. tyrosine and phen-ylalanine). On the other hand, although buffers B, X and Yyielded more protein, the presence of more chemical con-stituents (compared with buffer A) could also affect SODfunctioning and activity. Therefore, SOD assays weretested for all four buffers. These tests showed that theamount of extract required to obtain 50% inhibition (V50)were rather similar (discussed below) when consideringthe four buffers (Fig. 2a and b). Evidently, SOD is (almost)entirely present in the cytosolic fraction of the cell. As aresult, calculated specific SOD activities, typically normal-ized to protein, revealed lower values when applying more
efficient protein extraction buffers, such as buffers B, X andY, simply because of higher protein concentrationsobtained in these buffers (Fig. 2c). So, it is important torealize that Triton X-100 does not stimulate SOD extrac-tion but it enhances overall protein extraction efficiencyand therewith the accuracy of SOD activity calculation oflow biomass samples.
Both qualitative SOD assays measure activity in an indi-rect way, using a reducible coloration agent as an activityreporter. This makes both methods highly susceptible forinterference with non-SOD substances which are able toreact with O��2 radicals or reduced as well as oxidized color-ation agents. Because SOD activity is measured differentlyin both assays, the interference of non-SOD substances isalso expressed in a different way. Since most non-enzymaticsuperoxide scavengers interfere with the SOD activity assayimmediately after superoxides are generated, the cyto-chrome-c inhibition slope started very irregular and wasdetermined after 30 s following xanthine oxidase addition.Therefore, despite the presence of reactive substances, theseSOD activity values were found to have very low standarddeviations. The RF/NBT method on the other hand mea-sures SOD activity via the inhibition of NBT reductionagainst the sample concentration. Here, accumulatedreduced NBT is measured by which these values not onlyrepresent SOD activity but include non-enzymatic scaveng-ing of superoxide radicals as well. Uptil now it seemsunfeasible to distinguish between enzymatic and non-enzy-matic inhibition of NBT reduction. Therefore, to minimizethe contribution of non-enzymatic substances (i.e. metalions and reducing equivalents), the amount of sample usedis kept relatively low (compared to the X–XOD method).Also, because non-enzymatic superoxide scavengers reactwith the generated O��2 radicals immediately after its pro-duction, the reaction time is set on 15 min by which theenzymatic proportion is increased. As a result of both con-ditions, the contribution of the enzymatic superoxide scav-enging activity is optimized while the inhibition of NBTreduction stays within its detection limits. Finally,(poly)phenolic compounds are able to produce O��2 orreduce NBT and thereby could strongly interfere withSOD activity. This would underline the significance of add-ing PVP or PVPP to the extraction buffer. However, thiswas not supported by our experiments, because the appli-cation of buffers X and Y (containing PVP or PVPP) inboth SOD assays, did not significantly reduce V50 values.(Fig. 2a and b). Therefore, buffer B, containing TritonX-100 only, is most suitable for SOD activity measure-ments in C. brevis. Yet, it is advisable to test the need forPVP/PVPP when using other (microalgal) species.
The V50 values did not significantly differ between thefour buffers, when using the X–XOD method. The V50 val-ues for the NBT/RF method on the other hand variedslightly but significantly, with highest values for buffers Aand X. Generally, the X–XOD method required higherextraction volumes (275–300 ll) for a V50 inhibition thanthe NBT/RF method (27–34 ll). In terms of C. brevis
224 P.J. Janknegt et al. / Journal of Photochemistry and Photobiology B: Biology 87 (2007) 218–226
protein this means that the X–XOD method required atleast 36 lg protein to obtain 50% inhibition while theRF/NBT method was accurate when applying 3.5 lg pro-tein or less. Thus, reliable and sensitive SOD activity mea-surements were more dependent on the assay used than onthe applied protein extraction buffer. Because of the abovementioned difficulties in obtaining sufficiently high micro-algal biomass, their SOD activity is best measured usingthe NBT/RF method. This method was also found to beless sensitive to temperature than the X–XOD method,although the observed lower XOD activity at lower tem-peratures could simply be counteracted by increasing theamount of XOD (Fig. 4). Surprisingly, regardless of themethod used, the enzyme activity of C. brevis SOD didnot reveal an optimum at lower temperatures pursuant toits growth optimum (data not shown).
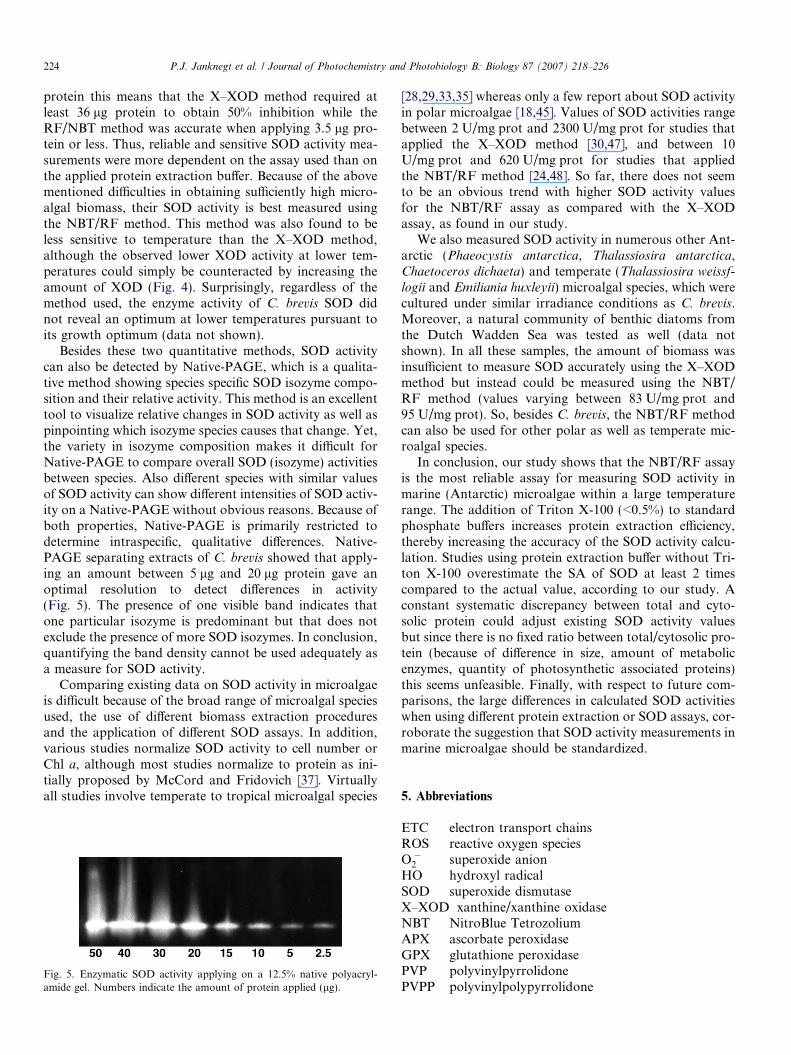
Besides these two quantitative methods, SOD activitycan also be detected by Native-PAGE, which is a qualita-tive method showing species specific SOD isozyme compo-sition and their relative activity. This method is an excellenttool to visualize relative changes in SOD activity as well aspinpointing which isozyme species causes that change. Yet,the variety in isozyme composition makes it difficult forNative-PAGE to compare overall SOD (isozyme) activitiesbetween species. Also different species with similar valuesof SOD activity can show different intensities of SOD activ-ity on a Native-PAGE without obvious reasons. Because ofboth properties, Native-PAGE is primarily restricted todetermine intraspecific, qualitative differences. Native-PAGE separating extracts of C. brevis showed that apply-ing an amount between 5 lg and 20 lg protein gave anoptimal resolution to detect differences in activity(Fig. 5). The presence of one visible band indicates thatone particular isozyme is predominant but that does notexclude the presence of more SOD isozymes. In conclusion,quantifying the band density cannot be used adequately asa measure for SOD activity.
Comparing existing data on SOD activity in microalgaeis difficult because of the broad range of microalgal speciesused, the use of different biomass extraction proceduresand the application of different SOD assays. In addition,various studies normalize SOD activity to cell number orChl a, although most studies normalize to protein as ini-tially proposed by McCord and Fridovich [37]. Virtuallyall studies involve temperate to tropical microalgal species
Fig. 5. Enzymatic SOD activity applying on a 12.5% native polyacryl-amide gel. Numbers indicate the amount of protein applied (lg).
[28,29,33,35] whereas only a few report about SOD activityin polar microalgae [18,45]. Values of SOD activities rangebetween 2 U/mg prot and 2300 U/mg prot for studies thatapplied the X–XOD method [30,47], and between 10U/mg prot and 620 U/mg prot for studies that appliedthe NBT/RF method [24,48]. So far, there does not seemto be an obvious trend with higher SOD activity valuesfor the NBT/RF assay as compared with the X–XODassay, as found in our study.
We also measured SOD activity in numerous other Ant-arctic (Phaeocystis antarctica, Thalassiosira antarctica,Chaetoceros dichaeta) and temperate (Thalassiosira weissf-
logii and Emiliania huxleyii) microalgal species, which werecultured under similar irradiance conditions as C. brevis.Moreover, a natural community of benthic diatoms fromthe Dutch Wadden Sea was tested as well (data notshown). In all these samples, the amount of biomass wasinsufficient to measure SOD accurately using the X–XODmethod but instead could be measured using the NBT/RF method (values varying between 83 U/mg prot and95 U/mg prot). So, besides C. brevis, the NBT/RF methodcan also be used for other polar as well as temperate mic-roalgal species.
In conclusion, our study shows that the NBT/RF assayis the most reliable assay for measuring SOD activity inmarine (Antarctic) microalgae within a large temperaturerange. The addition of Triton X-100 (<0.5%) to standardphosphate buffers increases protein extraction efficiency,thereby increasing the accuracy of the SOD activity calcu-lation. Studies using protein extraction buffer without Tri-ton X-100 overestimate the SA of SOD at least 2 timescompared to the actual value, according to our study. Aconstant systematic discrepancy between total and cyto-solic protein could adjust existing SOD activity valuesbut since there is no fixed ratio between total/cytosolic pro-tein (because of difference in size, amount of metabolicenzymes, quantity of photosynthetic associated proteins)this seems unfeasible. Finally, with respect to future com-parisons, the large differences in calculated SOD activitieswhen using different protein extraction or SOD assays, cor-roborate the suggestion that SOD activity measurements inmarine microalgae should be standardized.
5. Abbreviations
ETC electron transport chainsROS reactive oxygen speciesO��2 superoxide anionHO� hydroxyl radicalSOD superoxide dismutaseX–XOD xanthine/xanthine oxidaseNBT NitroBlue TetrozoliumAPX ascorbate peroxidaseGPX glutathione peroxidasePVP polyvinylpyrrolidonePVPP polyvinylpolypyrrolidone

P.J. Janknegt et al. / Journal of Photochemistry and Photobiology B: Biology 87 (2007) 218–226 225
Acknowledgements
The authors would like to thank the two anonymousreviewers for their comments and suggestions.
References
[1] E.W. Helbling, V. Villafane, O. Holm-Hansen, Effects of ultravioletradiation on Antarctic marine phytoplankton photosynthesis withparticular attention to the influence of mixing, in: C.S. Weiler, P.A.Phenhale (Eds.), Ultraviolet radiation in Antarctica: measurementsand biological effects, American Geophysical Union, Washington,DC, USA, 1994, pp. 207–227.
[2] P.J. Neale, R.F. Davis, J.J. Cullen, Interactive effects of ozonedepletion and vertical mixing on photosynthesis of Antarctic phyto-plankton, Nature 392 (1998) 585–589.
[3] P.J. Neale, E.W. Helbling, H.E. Zagarese, Modulation of UVRexposure and effects by vertical mixing and advection, in: E.W.Helbling, H. Zagarese (Eds.), UV Effects in Aquatic Organisms andEcosystems, The Royal Society of Chemistry, Cambridge, UK, 2003,pp. 107–134.
[4] N.P. Boucher, B.B. Prezelin, Spectral modeling of UV inhibitionof in situ Antarctic primary production using a field derivedbiological weighting function, Photochem. Photobiol. 64 (1996)407–418.
[5] R.C. Smith, B.B. Prezelin, K.S. Kaker, R.R. Bidigare, N.P. Boucher,T. Coley, D. Karenz, S. MacIntyre, H.A. Matlick, D. Menzies, M.Ondrusek, Z. Wan, K.J. Waters, Ozone depletion: ultravioletradiation and phytoplankton biology in Antarctic waters, Science255 (1992) 952–959.
[6] O. Holm-Hansen, D. Lubin, E.W. Helbling, Ultraviolet radiation andits effects on organisms in aquatic environments, in: A.R. Younget al. (Eds.), Environmental UR Photobiology, Plenum Press, NewYork, USA, 1993, pp. 379–425.
[7] T.S. Gechev, F. Van Breusegem, J.M. Stone, I. Denev, C. Laloi,Reactive oxygen species as signals that modulate plant stressresponses and programmed cell death, BioEssays 28 (2006) 1091–1101.
[8] A.H. Mehler, Studies on reactions of illuminated chloroplasts. I.Mechanism of the reduction of oxygen and other Hill reagents, Arch.Biochem. Biophys. 33 (1951) 65–77.
[9] K. Asada, K. Kiso, K. Yoshikawa, Univalent reduction of molecularoxygen by Spinach chloroplasts on illumination, J. Biol. Chem. 249(1974) 2175–2181.
[10] W.H. Van de Poll, M.A. van Leeuwe, J. Roggeveld, A.G.J. Buma,Nutrient limitation and high irradiance acclimation reduce PAR andUV-induced viability loss in the Antarctic diatom Chaetoceros brevis
(Bacillariophyceae), J. Phycol. 41 (2005) 840–850.[11] W.H. Van de Poll, A.C. Alderkamp, P.J. Janknegt, J. Roggeveld,
A.G.J. Buma, Photoacclimation modulates excessive photosyn-thetically active and ultraviolet radiation effects in a temperateand Antarctic marine diatom, Limnol. Oceanogr. 51 (2006) 1239–1248.
[12] R. Mittler, S. Vanderauwera, M. Gollery, F. Van Breusegem,Reactive oxygen gene network of plants, Trends Plant Sci. 79(2004) 490–498.
[13] J.P. Kehrer, The Haber–Weiss reaction and mechanisms of toxicity,Toxicology 149 (2000) 43–50.
[14] E.M. Gregory, I. Fridovich, Oxygen toxicity and the superoxidedismutase, J. Bacteriol. 114 (1973) 1193–1197.
[15] E.M. Gregory, I. Fridovich, Induction of superoxide dismutase bymolecular oxygen, J. Bacteriol. 114 (1973) 543–548.
[16] I. Fridovich, Superoxide radical and superoxide dismutases, Annu.Rev. Biochem. 64 (1995) 97–112.
[17] D.H. Lee, C.B. Lee, Chilling stress-induced changes of antioxidantenzymes in the leaves of cucumber: in gel enzyme activity assays,Plant Sci. 159 (2000) 75–85.
[18] D. Peltzer, E. Dreyer, A. Polle, Differential temperature dependenciesof antioxidative enzymes in two contrasting species: Fagus sylvatica
and Coleus blumei, Plant Physiol. Biochem. 40 (2002) 141–150.[19] Y.I. Kuk, J.S. Shin, N.R. Burgos, T.E. Hwang, O. Han, B.H. Cho, S.
Jung, J.O. Guh, Antioxidative enzymes offer protection from chillingdamage in rice plants, Crop Sci. 43 (2003) 2109–2117.
[20] I. Iturbe-Ormaetxe, J.F. Moran, C. Arrese-Igor, Y. Gogorcena, R.V.Klucas, M. Becana, Activated oxygen and antioxidant defences iniron-deficient pea plants, Plant Cell Environ. 18 (1995) 421–429.
[21] A.K. Parida, A.B. Das, P. Mohanty, Defense potentials to NaCl in amangrove Bruguiera parviflora: differential changes of isoform ofsome antioxidative enzymes, J. Plant Physiol. 161 (2004) 531–542.
[22] J.M. Gomez, A. Jimenez, E. Olmos, F. Sevilla, Location and effects oflong-term NaCl stress on superoxide dismutase and ascorbateperoxidase isoenzymes of pea (Pisum sativum cv Puget) chloroplasts,J. Exp. Bot. 55 (2004) 119–130.
[23] I. Santos, J. Almeida, R. Salema, The influence of UV-B radiation onthe superoxide dismutase of maize potato sorghum and wheat leaves,Can. J. Bot. 77 (1999) 70–76.
[24] O.K. Okamoto, C.S. Asano, E. Aidar, P. Colepicolo, Effects ofcadmium on growth and superoxide dismutase activity of the marinemicroalgae Tetrasemis gracilis (Prasinophyceae), J. Phycol. 32 (1996)74–79.
[25] O.K. Okamoto, P. Colepicolo, Response of Superoxide dismutase topollutant metal stress in the marine dinoflagellate Gonyaulax polye-
dra, Comp. Biochem. Physiol. 1 (1998) 67–73.[26] M. Li, C. Hu, Q. Zhu, L. Chen, Z. Kong, Z. Liu, Copper and zinc
induction of lipid peroxidation and effects on antioxidant enzymeactivities in the microalgae Pavlova viridis (Prymnesiophyceae),Chemosphere 62 (2005) 565–572.
[27] L.S. Jahnke, A.L. White, Long-term hyposaline and hypersalinestresses produce distinct antioxidant responses in the marine algaDunaliella tertiolecta, J. Plant Physiol. 160 (2003) 1193–1202.
[28] J.W. Rijstenbil, Effects of UVB radiation and salt stress on growthpigments and antioxidative defence of the marine diatom Cylindrot-
heca closterium, Mar. Ecol. Prog. Ser. 254 (2003) 37–48.[29] T.C.S. Sigaud-Kutner, A.M.P. Neto, E. Pinto, P. Colepicolo, Diel
activities of antioxidant enzymes photosynthetic pigments andmalondialdehyde content in stationary-phase cells of Tetraselmis
gracilis (Prasinophyceae), Aquat. Bot. 82 (2005) 239–249.[30] B.J. Butow, D. Wynne, E. Tel-Or, Antioxidative protection of
Peridinium gatunense in Lake Kinneret: seasonal and daily variation,J. Phycol. 33 (1997) 780–786.
[31] M.P. Lesser, J.M. Shick, Effects of irradiance and ultravioletradiation on photoadaptation in the zooxanthellae of Aiptasia pallida:primary production photoinhibition and enzymic defenses againstoxygen toxicity, Mar. Biol. 102 (1989) 243–255.
[32] J.W. Rijstenbil, Assessment of oxidative stress in the planktonicdiatom Thalassiosira pseudonana in response to UVA and UVBradiation, J. Plankton Res. 24 (2002) 1277–1288.
[33] M.P. Lesser, Acclimation of phytoplankton to UV-B radiation:oxidative stress and photoinhibition of photosynthesis are notprevented by UV-absorbing compounds in the dinoflagellate Proro-
centrum micans, Mar. Ecol. Prog. Ser. 132 (1996) 287–297.[34] P.-Y. Zhang, J. Yu, X.-X. Tang, UV-B radiation suppresses the
growth and antioxidant systems of two marine micoralgae Plathyno-
mas subcordiformis (Wille) Hazen and Nitzchia closterium (Ehrenb.)W. Sm, J. Integrat. Plant. Biol. 47 (2005) 683–991.
[35] G. Malanga, S. Puntarulo, Oxidative stress and antioxidant contentin Chlorella vulgaris after exposure to ultraviolet-B radiation, Physiol.Plant. 94 (1995) 672–679.
[36] R. Schriek, Effects of light and temperature on the enzymaticantioxidative defense systems in the antarctic ice diatom Entom-
oneis kufferathii manguin, Rep. Polar Res. 349 (2000), ISSN 0176-5027.
[37] J.M. McCord, I. Fridovich, Superoxide dismutase an enzymaticfunction for erythrocuprein (hemocuprein), J. Biol. Chem. 244 (1969)6049–6055.

226 P.J. Janknegt et al. / Journal of Photochemistry and Photobiology B: Biology 87 (2007) 218–226
[38] C. Beauchamp, I. Fridovich, Superoxide dismutase: improved assaysand an assay applicable to acrylamide gels, Anal. Biochem. 44 (1971)276–287.
[39] J. Aguilera, K. Bischof, U. Karsten, D. Hanelt, C. Wiencke, Seasonalvariation in ecophysiological patterns in macroalgae from an Arcticfjord. II. Pigment accumulation and biochemical defence systemsagainst high light stress, Mar. Biol. 140 (2002) 1087–1095.
[40] J. Aguilera, A.L. Dummermuth, U. Karsten, R. Schriek, C. Wiencke,Enzymatic defences against photooxidative stress induced by ultra-violet radiation in Arctic marine macroalgae, Polar Biol. 25 (2002)432–441.
[41] A.L. Dummermuth, U. Karsten, K.M. Fisch, G.M. Konig,C. Wiencke, Responses of marine macroalgae to hydrogen-peroxidestress, J. Exp. Mar. Biol. Ecol. 289 (2003) 103–121.
[42] M.J.W. Veldhuis, W. Admiraal, The influence of phosphate depletionon the growth and colony formation of Phaeocystis pouchetii, Mar.Biol. 95 (1987) 47–54.
[43] J.W. Rijstenbil, J.W.M. Derksen, L.J.A. Gerringa, T.C.W. Poortvliet,A. Sandee, M. van den Berg, J. van Drie, J.A. Wijnholds, Oxidativestress induced by copper: defense and damage in the marine
planktonic diatom Ditylum brightwellii grown in continuous cultureswith high and low zinc levels, Mar. Biol. 119 (1994) 583–590.
[44] T.S. Gechev, H. Willekens, M. Van Montagu, D. Inze, W. VanCamp, V. Toneva, I. Minkov, Different responses of tobaccoantioxidant enzymes to light and chilling stress, J. Plant Physiol.160 (2003) 509–515.
[45] M.M. Bradford, A rapid and sensitive method for the quantificationof microgram quantities of protein utilizing the principle of protein-dye binding, Anal. Biochem. 180 (1976) 136–139.
[46] M.J. Fryer, J.R. Andrews, K. Oxborough, D.A. Blowers, N.R. Baker,Relationship between CO2 assimilation photosynthetic electrontransport and active O2 metabolism in leaves of maize in the fieldduring periods of low temperature, Plant Physiol. 116 (1998) 571–580.
[47] G. Peers, N.M. Price, A role for manganese in superoxide dismutasesand growth of iron-deficient diatoms, Limnol. Oceanogr. 49 (2004)1774–1783.
[48] T.C.S. Sigaud-Kutner, E. Pinto, O.K. Okamoto, L.R. Latorre, P.Colepicolo, Changes in superoxide dismutase activity and photosyn-thetic pigment content during growth of marine phytoplankters inbatch-cultures, Physiol. Plant. 114 (2002) 566–571.
Copyright © 2022 FDOKUMEN