CONTRAST ENHANCEMENT USING DOMINANT BRIGHTNESS LEVEL ANALYSIS ADAPTIVE INTENSITY TRANSFORM

IEEE TRANSACTIONS ON GEOSCIENCE AND REMOTE SENSING, VOL. 47, NO. 3, MARCH 2009 965
A Comparison of Airborne Microwave BrightnessTemperatures and Snowpack Properties Across the
Boreal Forests of Finland and Western CanadaJuha Lemmetyinen, Chris Derksen, Jouni Pulliainen, Senior Member, IEEE, Walter Strapp,
Peter Toose, Anne Walker, Member, IEEE, Simo Tauriainen, Jörgen Pihlflyckt,Juha-Petri Kärnä, and Martti T. Hallikainen, Fellow, IEEE
Abstract—The seasonal snowpack across the boreal forest isan important national resource in both Canada and Finland,contributing freshwater for agriculture, human consumption, andhydropower generation. In both countries, satellite passive mi-crowave data are utilized to provide operational information onsnow depth and snow water equivalent (SWE) throughout thesnow cover season. Airborne passive microwave surveys conductedindependently across Finland and western Canada during Marchand April 2005 and March 2006 provided the opportunity toassess the level of similarity in snowpack physical properties andbrightness temperature response to snowpack qualities using twoindependent data sets. The primary objectives of these campaignswere to determine the influence of small-scale heterogeneity onsatellite data, using relatively high resolution airborne measure-ments, and to assess the Helsinki University of Technology (HUT)snow emission model capability of predicting emitted brightnesstemperatures under varying snowpack and landscape conditions.Comparisons of brightness temperature emissions over differentland cover types showed a clear distinction of wetlands and snow-covered ice from forested and open areas. This is reflected also as astrong relationship between 6.9-GHz measurements and fractionallake cover in both Canada and Finland, with relationships at 18and 37 GHz being less consistent between data sets. Comparisonsof experimental data versus HUT snow emission model predictionsshowed relatively good agreement between the simulations andairborne data, specifically for the Finnish data set.
Manuscript received April 25, 2008; revised July 30, 2008 andAugust 22, 2008. First published January 23, 2009; current version publishedFebruary 19, 2009.
J. Lemmetyinen was with the Department of Radio Science and Engineering,Helsinki University of Technology, 02015 Espoo, Finland. He is now withthe Arctic Research Centre, Finnish Meteorological Institute (FMI), 00101Helsinki, Finland (e-mail: [email protected]).
C. Derksen, W. Strapp, P. Toose, and A. Walker are with the ClimateResearch Division, Science and Technology Branch, Environment Canada,Toronto, ON M3H 5T4, Canada.
J. Pulliainen is with the Arctic Research Centre, Finnish MeteorologicalInstitute (FMI), 99600 Sodankylä, Finland (e-mail: [email protected]).
S. Tauriainen was with the Laboratory of Space Technology, Helsinki Uni-versity of Technology (TKK), 02015 Espoo, Finland. He is now with FincommAirlines, 01530 Vantaa, Finland (e-mail: [email protected]).
J. Pihlflyckt was with the Laboratory of Space Technology, Helsinki Univer-sity of Technology (TKK), 02015 Espoo, Finland. He is currently with AjecoOy, 02210 Espoo, Finland (e-mail: [email protected]).
J.-P. Kärnä is with the Department of Radio Science and Engineering,Helsinki University of Technology (TKK), 02015 Espoo, Finland, and also withthe Finnish Environment Institute (SYKE), 00251 Helsinki, Finland (e-mail:[email protected]).
M. T. Hallikainen is with the Department of Radio Science and Engi-neering, Helsinki University of Technology, 02015 Espoo, Finland (e-mail:[email protected]).
Color versions of one or more of the figures in this paper are available onlineat http://ieeexplore.ieee.org.
Digital Object Identifier 10.1109/TGRS.2008.2006358
Index Terms—Radiometry, remote sensing, snow water equiva-lent (SWE).
I. INTRODUCTION
THE WINTER season land cover in Finland and large por-tions of northern Canada is very similar: a latitudinal tran-
sition from closed-canopy forest to open-canopy forest to opentundra, all with a persistent snow cover. It is similarly importantto both nations to retrieve temporally and spatially continuousinformation on snow water equivalent (SWE) for issues suchas flood forecasting and reservoir management for hydropowergeneration. In situ networks for snow cover measurements aredrastically different between the two countries—Finland has arelatively small land mass with a dense observation networkof long-transect (∼4 km) snow survey sites, while Canada isa relatively large country with a comparatively sparse networkof measurement sites composed mainly of automated single-point snow depth (SD) measurements. A common source ofinformation on SWE in both Finland and Canada is passivemicrowave satellite data [1], [2]. In Canada, regional SWEretrieval algorithms are operationally applied to prairie andboreal forest regions of Manitoba, Saskatchewan, and Alberta.In the case of Finland, satellite estimates are derived for thewhole country. Microwave brightness temperatures exhibit afrequency-dependent sensitivity to snowpack volume scatterthat allows the estimation of SWE, but which is also sensitiveto both the physical structure of the pack (density, grain size,snow wetness, and stratigraphy) and land cover characteristics(vegetation properties and fractional lake cover). The generalsimilarity in these properties between Finland and Canadaprovides an excellent opportunity to compare data sets andmethodological approaches to the estimation of SWE fromsatellite passive microwave data.
The Climate Research Division of Environment Canada (EC)has a long-standing research program in the development ofspaceborne passive microwave SWE data sets for specific land-scape regions in Canada. Algorithms of an empirical nature[3], [4] were developed to retrieve SWE for open prairie andforested regions in western Canada, with a current emphasison the development of new algorithms for northern borealforest and tundra environments [5]. The Laboratory of SpaceTechnology at the Helsinki University of Technology (TKK,previously abbreviated as HUT) has developed and adopted a
0196-2892/$25.00 © 2008 IEEE
966 IEEE TRANSACTIONS ON GEOSCIENCE AND REMOTE SENSING, VOL. 47, NO. 3, MARCH 2009
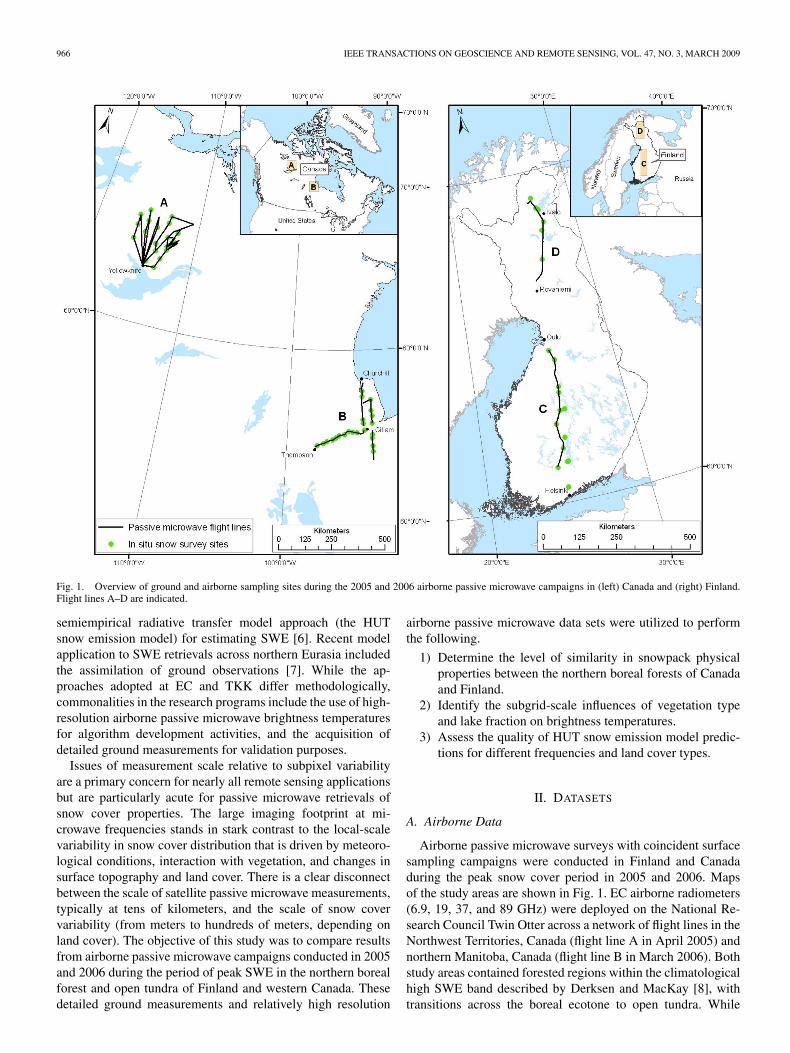
Fig. 1. Overview of ground and airborne sampling sites during the 2005 and 2006 airborne passive microwave campaigns in (left) Canada and (right) Finland.Flight lines A–D are indicated.
semiempirical radiative transfer model approach (the HUTsnow emission model) for estimating SWE [6]. Recent modelapplication to SWE retrievals across northern Eurasia includedthe assimilation of ground observations [7]. While the ap-proaches adopted at EC and TKK differ methodologically,commonalities in the research programs include the use of high-resolution airborne passive microwave brightness temperaturesfor algorithm development activities, and the acquisition ofdetailed ground measurements for validation purposes.
Issues of measurement scale relative to subpixel variabilityare a primary concern for nearly all remote sensing applicationsbut are particularly acute for passive microwave retrievals ofsnow cover properties. The large imaging footprint at mi-crowave frequencies stands in stark contrast to the local-scalevariability in snow cover distribution that is driven by meteoro-logical conditions, interaction with vegetation, and changes insurface topography and land cover. There is a clear disconnectbetween the scale of satellite passive microwave measurements,typically at tens of kilometers, and the scale of snow covervariability (from meters to hundreds of meters, depending onland cover). The objective of this study was to compare resultsfrom airborne passive microwave campaigns conducted in 2005and 2006 during the period of peak SWE in the northern borealforest and open tundra of Finland and western Canada. Thesedetailed ground measurements and relatively high resolution
airborne passive microwave data sets were utilized to performthe following.
1) Determine the level of similarity in snowpack physicalproperties between the northern boreal forests of Canadaand Finland.
2) Identify the subgrid-scale influences of vegetation typeand lake fraction on brightness temperatures.
3) Assess the quality of HUT snow emission model predic-tions for different frequencies and land cover types.
II. DATASETS
A. Airborne Data
Airborne passive microwave surveys with coincident surfacesampling campaigns were conducted in Finland and Canadaduring the peak snow cover period in 2005 and 2006. Mapsof the study areas are shown in Fig. 1. EC airborne radiometers(6.9, 19, 37, and 89 GHz) were deployed on the National Re-search Council Twin Otter across a network of flight lines in theNorthwest Territories, Canada (flight line A in April 2005) andnorthern Manitoba, Canada (flight line B in March 2006). Bothstudy areas contained forested regions within the climatologicalhigh SWE band described by Derksen and MacKay [8], withtransitions across the boreal ecotone to open tundra. While

LEMMETYINEN et al.: COMPARISON OF BRIGHTNESS TEMPERATURES AND SNOWPACK PROPERTIES 967
TABLE ISUMMARY OF INSTRUMENT CHARACTERISTICS
similar at a general level, there are land cover differencesbetween the two Canadian study areas. The Canadian shieldterrain of line A is lake rich, with areas of exposed rock, andmixed forest cover. The tundra region is topographically com-plex, with highly variable SD due to wind scour and deposition.The Hudson Bay lowland region of line B is very flat, with a lowlake fraction and highly variable forest stand density. The tun-dra region is a low-relief wetland complex, with a high fractionof small ponds. Vegetation is limited to areas surrounding thecreek beds and larger lakes.
A number of different airborne flight patterns were surveyedduring the 2005 and 2006 Canadian campaigns, including theacquisition of data in a radial pattern of three flight line seg-ments that intersected at a central point coincident to surfacemeasurement sites. Each flight line segment was approximately3 km in length. Analysis in this study was limited to this radialpattern data set because the data are readily relatable to theground measurements of snow properties, and they allow astraightforward means of comparing data from the 2005 and2006 campaigns.
The Finnish data set is composed of long flight lines flownin southern Finland in March 2005 (flight line C) and in north-ern Finland in March 2006 (flight line D). The transects arelocated on the Fennoscandian (Baltic) shield, which is similarto the Canadian shield terrain of flight line A. The HelsinkiUniversity of Technology Radiometer system (HUTRAD; 6.8,10.7, 18.7, 23.8, 36.5, and 94 GHz) was mounted on an SC-7Skyvan aircraft. A summary of both Finnish and Canadianinstrument characteristics, specifically for the frequencies usedin the comparative analysis, is provided in Table I. All theairborne data acquisition occurred during subzero ground-level temperatures, before the onset of snow melt. General
weather conditions were typically fair conditions with littleor no precipitation—necessary conditions for low-level flying.If clouds were present, flight levels were always below thecloud deck.
The 2005 study region predominantly contained conifer-dominated boreal forests with a considerable number of bogsand lakes. Flight line D for 2006 included a transition fromforest to open terrain. Summaries of all the airborne campaignsare provided in Table II.
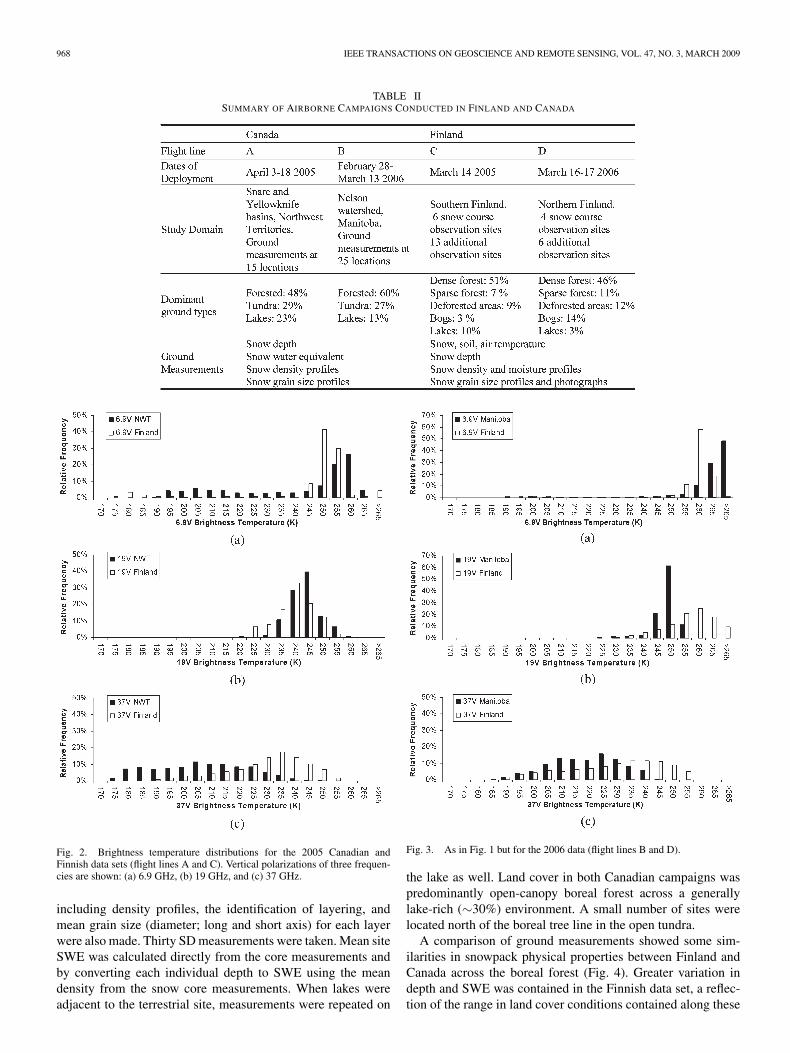
The statistical distributions of measured airborne brightnesstemperatures are shown for comparative purposes in Fig. 2(2005) and Fig. 3 (2006). A Kolmogorov–Smirnov (KS) testwas performed on these paired data sets to identify the maxi-mum difference (D) in the probability distributions at each fre-quency and season, together with the corresponding brightnesstemperature value at which the maximum difference occurred(Table III). The distributions were different at each frequency(6.9V, 19V, and 37V GHz), but the shapes at each frequencywere consistent between the Canadian and Finnish data sets.The 6.9- and 19-GHz-frequency distributions exhibited similarshapes for both seasons, but the peaks are offset in 2006, asexhibited by the higher KS D values for this season. The tail ofthe distribution at 6.9 GHz corresponds to lower brightness tem-peratures measured over mixed terrestrial and lake footprints,with homogeneous lake measurements as low as 180 K. Thisstrong (up to 70 K) difference in response over lakes versusterrestrial surfaces shows the sensitivity to fractional lake coverat 6.9 GHz, which will be presented in more detail later. Notabledifferences in the measurement distributions were observed at37 GHz due to sensitivity to both snowpack and vegetationproperties at this frequency. The generally sparser forest andlarger grain size combined to shift the center of the normallydistributed brightness temperatures lower in Canada comparedto Finland for both seasons. The maximum difference in the37 GHz distributions occurred at the same brightness tempera-ture value for both seasons (223 K).
B. Ground Observations
Snow cover measurements in Finland were made at op-erational snow courses of the Finnish Environment Institute(SYKE), as noted in Fig. 1. Ground data were also acquired bysnow pit measurements at 13 predefined locations in 2005 andsix additional sites in 2006. Land cover was generally conifer-dominated mixed forest, with some open agricultural areas,bogs, and lakes (and open tundra in 2006). Operational snowcourses consist of 2–4-km transects, with point measurementsof SD, SWE, and density. Each snow course typically containsover 100 samples, which are also classified according to landcover type. Additional snow pit measurements consisted of fiveto ten points for definition of SD and snowpack stratigraphy,with one point being used for grain size estimation in differentlayers.
Canadian ground measurement sites corresponding to loca-tions where radial patterns of airborne data were acquired areshown in Fig. 1. At each site, seven snow cores from a manualsnow sampler were taken for direct measurement of SWEand bulk density, while snowpack stratigraphy measurements
968 IEEE TRANSACTIONS ON GEOSCIENCE AND REMOTE SENSING, VOL. 47, NO. 3, MARCH 2009
TABLE IISUMMARY OF AIRBORNE CAMPAIGNS CONDUCTED IN FINLAND AND CANADA
Fig. 2. Brightness temperature distributions for the 2005 Canadian andFinnish data sets (flight lines A and C). Vertical polarizations of three frequen-cies are shown: (a) 6.9 GHz, (b) 19 GHz, and (c) 37 GHz.
including density profiles, the identification of layering, andmean grain size (diameter; long and short axis) for each layerwere also made. Thirty SD measurements were taken. Mean siteSWE was calculated directly from the core measurements andby converting each individual depth to SWE using the meandensity from the snow core measurements. When lakes wereadjacent to the terrestrial site, measurements were repeated on
Fig. 3. As in Fig. 1 but for the 2006 data (flight lines B and D).
the lake as well. Land cover in both Canadian campaigns waspredominantly open-canopy boreal forest across a generallylake-rich (∼30%) environment. A small number of sites werelocated north of the boreal tree line in the open tundra.
A comparison of ground measurements showed some sim-ilarities in snowpack physical properties between Finland andCanada across the boreal forest (Fig. 4). Greater variation indepth and SWE was contained in the Finnish data set, a reflec-tion of the range in land cover conditions contained along these

LEMMETYINEN et al.: COMPARISON OF BRIGHTNESS TEMPERATURES AND SNOWPACK PROPERTIES 969
TABLE IIIRESULTS OF KS TEST FOR BRIGHTNESS TEMPERATURE DISTRIBUTIONS
ON FLIGHT LINES IN 2005 AND 2006. MAXIMUM DIFFERENCE OF
PROBABILITY DISTRIBUTION FUNCTIONS (D-VALUES)AND POINT OF OCCURRENCE
flight lines (forested, agricultural, and wetlands) in comparisonto the Canadian sample sites that were largely open-canopy bo-real forest with a small number of tundra sites. While variablesrelated to the general properties of the pack were similar (depth,density, and SWE), the vertical stratigraphy between the datasets was different, as shown in Fig. 4(d) for mean grain size. Forboth data sets, grain size was estimated by identifying the meangrain size in each of the major layers in the snowpack. This wasdone visually by placing sample grains on a reference surface.The pack average was calculated by weighting each layer meangrain size by the proportional thickness of each layer. The coldcontinental climate across the boreal forest of central Canadaproduces ideal conditions for grain growth, in contrast to themaritime moderated climate in southern Finland (the snow clas-sification system of Sturm et al. [9] classifies most of Finlandas maritime snow). By April, the boreal snowpack in Canadacontains a depth hoar layer that can compose over 50% of thetotal SD [5]. These large depth hoar crystals can exceed 10 mm,so, although small faceted, rounded, and fresh grains in the lay-ers above the depth hoar are typically only 1–2 mm, the signi-ficant depth hoar layer increases the mean snowpack grain size.
In Finland, observed grain size also varied greatly, dependingon the layer. Observations in 2005 included up to three distinctlayers, with increasing grain size toward the bottom layer. Grainsize ranged from a typical value of 1 mm in a 5–10-cm surfacelayer to 2 mm in several bottom layers. Observations in 2006showed similar thin surface layers but mostly homogenoussnowpacks below the surface, with a mean grain size smallerthan 2 mm. It is important to note that unlike depth, SWE,and density, the determination of grain size in this study wassomewhat subjective. However, the differing snow grain proper-ties between Finland and Canada was highlighted previously byRoy et al. [10] as a major factor influencing the applicability ofthe HUT snow emission model to Canadian boreal snowpacks.
Density profiles (not shown) in the Finnish and Canadianboreal forests were characterized by increasing density withdepth due to settling and grain metamorphism. In the tundra,density maxima were observed near the surface due to well-defined wind slab layers that were typically 1–5 cm deep atthe Finnish sites, but were observed at depths up to 20 cm inCanada. Ice lenses and crusts were weak and intermittent in theboreal forest and were created by early season melt and refreezeevents. Snowpack layering in the tundra was largely the resultof old wind slabs overlain with newer snow.
Similar processes govern local-scale variability in borealforest and tundra snow cover in Canada and Finland. In forestedareas, interaction between falling snow and standing vegetationcontrols SD variability on the ground. The variability in ter-
restrial SWE was driven by variability in depth, not density.Coefficient of variation (CV: standard deviation/mean) valuesfor depth were approximately 1.6 times higher than for densityat the Canadian forested sites and were 5.9 times higher than fordensity at the Finnish forested sites. Wind redistribution is thedominant process across the tundra, with depth again control-ling SWE variability (depth CV 3.9 times higher than densityat the Canadian tundra sites; 3.1 times higher at the Finnishtundra sites).
Snow cover properties on lakes are different from those ofterrestrial surfaces ([5], [11]), so measurements were made atlake sites adjacent to the terrestrial sites when possible. Whiledepth variability governed SWE variability in terrestrial snowcover, density was the primary control on SWE for lake snow.CV values for lake snow measurements showed that densityvariability was approximately 2.5 times greater than depthvariability. Measurements in Finland also illustrated differentsnow conditions on lakes in comparison to land areas. Bothin 2005 and 2006, snow layers on ice were thinner and denserthan snowpacks on adjacent land areas, with a typical snowpackdepth of 10 cm on ice compared with 40 cm on land.
III. RESULTS
A. Brightness Temperature Versus Land Cover Type
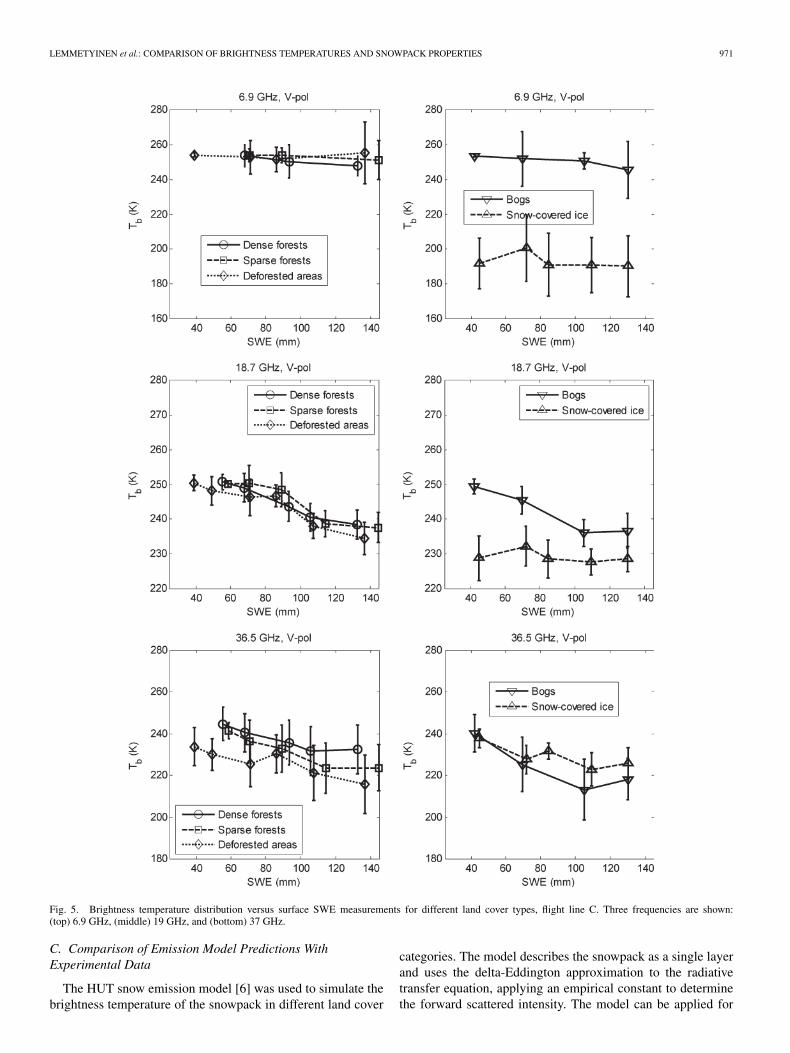
Data from flight line C, where surface sampling was mostintensive, were selected for an assessment of brightness temper-atures versus ground-measured SWE over different land covercategories. This line also had the largest variability in measuredSWE. Fig. 5 shows the response of brightness temperatures atdifferent frequencies as a function of SWE. Original data at thespatial resolution of 100 m were divided into five different landcover categories, derived from generalized CORINE2000 landuse classifications. The generalized categories were defined asdense forest, sparse forest, open areas, bogs, and lakes. Verticalerror bars indicate the standard deviation of brightness temper-atures around the SWE average (note that the mean SWE variedslightly for different land cover types). The relationship be-tween 18.7-GHz brightness temperature and SWE was strongerthan that at 36.5 GHz for all land cover categories except lakes(see correlation results in Table IV). However, the sensitivityto SWE was similar between both forested and open areas,indicating that the presence of vegetation does not severelyaffect the feasibility of SWE estimates over these land covercategories. The sensitivity to vegetation at 37 GHz is evident,however, as denser vegetation was associated with warmerbrightness temperature due to the contribution to emission fromthe vegetation. Over bogs, the relation between 36.5 GHz andSWE weakens significantly, indicating that these areas mayprove problematic for SWE retrievals.
Over lakes, 18.7-GHz brightness temperatures showed norelationship with SWE. However, at 36.5 GHz, a significant(albeit weak) relationship was identified. As satellite observa-tions with coarse spatial resolution average brightness temper-ature over large areas, the presence of lakes evidently worsensthe correlation with SWE, particularly at 18.7 GHz.
The results in Fig. 5 show that a larger range of brightnesstemperatures are associated with the same SWE at 36.5 GHz

970 IEEE TRANSACTIONS ON GEOSCIENCE AND REMOTE SENSING, VOL. 47, NO. 3, MARCH 2009
Fig. 4. Boxplots of snowpack properties on flight lines A–D: (a) SWE, (b) depth, (c) density, and (d) grain size.
(indicated by the error bars) when compared with 18.7 GHz.Contributing factors to this wider range include the effect ofsmall- and large-scale spatial variations in snow grain size andvegetation [6]. The results for 6.9 GHz do not indicate anycorrelation between SWE and brightness temperature, as can beexpected, although the distinction between lakes and terrestrialmeasurements is very large.
B. Brightness Temperature Versus Lake Fraction
Long-wavelength passive microwave radiation can be in-fluenced by the water below free-floating lake ice, resultingin a drop in brightness temperatures over lakes compared toadjacent land, while shorter wavelength radiation is largelyinfluenced by the snow overlying the ice [12]. Subsequently, theresponse of passive microwave measurements at low frequen-cies can vary significantly between land and lake surfaces duestrictly to lake ice properties instead of snow. Lake ice featuressuch as bubbles also scatter the microwave emission, furtherreducing the brightness temperatures. Over the course of theice-growing season, the growth of ice and subsequent increasein its thickness increases the brightness temperature comparedto thinly iced lakes [13]. The thicker ice reduces the influenceof the lower emissivity of liquid water below the ice and emitsits own microwave energy, thereby increasing the brightnesstemperatures over water bodies.
For this study, lake fraction across the Canadian study areaswas determined by binary classification of Landsat 7 ETM mo-saics obtained from NASA via http://zulu.ssc.nasa.gov/mrsid/.Brightness temperature versus lake fraction relationships were
then calculated along 1-km flight line segments. The segmentswere located in the vicinity of the ground measurement sitesshown in Fig. 1. Similarly, the Finnish airborne data weredivided into 1-km segments along both flight lines C and D.The lake fraction in each segment was determined from national25-m-resolution CORINE2000 data [14].
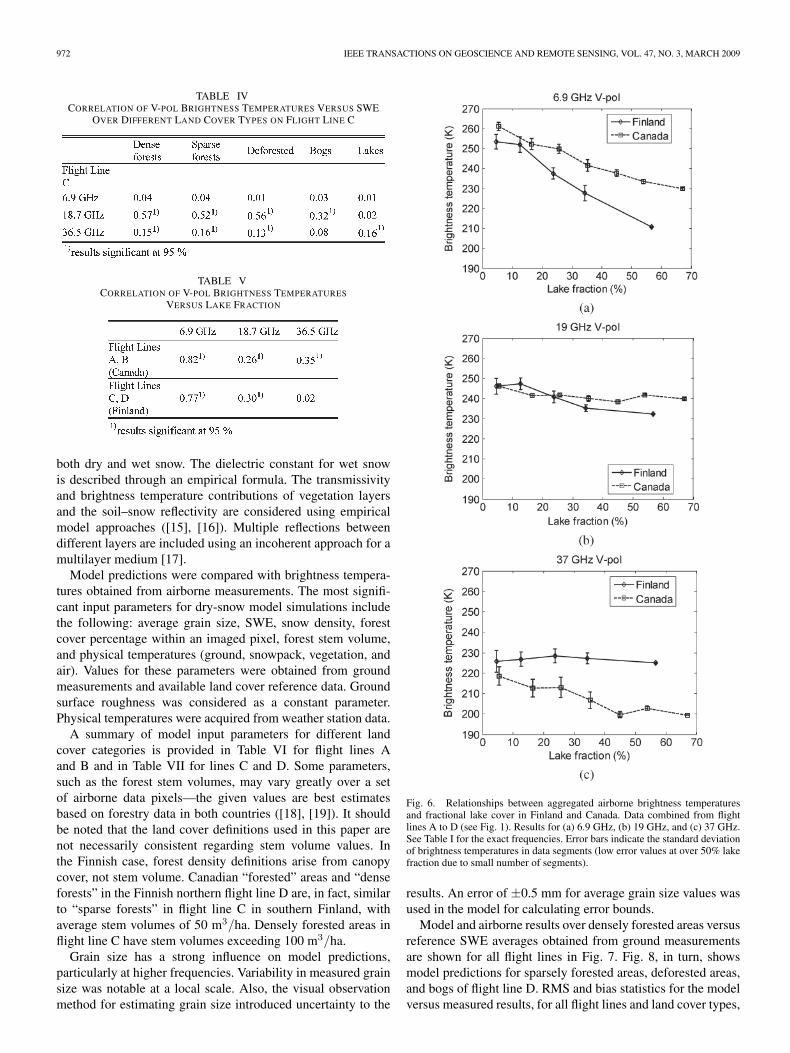
Results of a correlation analysis of the 1-km flight linesegments are shown in Table V. The response of individualfrequencies to lake fraction is shown in Fig. 6. The datasegments have been classified according to their correspond-ing average lake fraction values from 0% to 70% in 10%increments; the average measured brightness temperatures andtheir standard deviation were calculated. There was a strongdependence between 6.9V brightness temperature and frac-tional lake cover at boreal forest sites in both Canada andFinland [Fig. 6(a)]. As explained previously, this can largelybe explained by the influence of water under the ice at longerwavelengths. Measurements at 19 GHz were moderately relatedto lake fraction in both data sets, but over a very narrowrange in brightness temperatures, which illustrated a generalinsensitivity to lakes at this frequency [Fig. 6(b)]. In theCanadian data set, 37-GHz measurements were moderatelyrelated to lake fraction across a brightness temperature rangeof over 20 K [Fig. 6(c)]. On the contrary, the 37-GHz resultsin the Finnish data set more closely approximate the narrowbrightness temperature range that was observed at 19 GHz.The differing results in Canada at 37 GHz may be related tothe generally greater lake fractions, thicker ice, and greatersnow cover storage on the lake surfaces in comparison toFinland.
LEMMETYINEN et al.: COMPARISON OF BRIGHTNESS TEMPERATURES AND SNOWPACK PROPERTIES 971
Fig. 5. Brightness temperature distribution versus surface SWE measurements for different land cover types, flight line C. Three frequencies are shown:(top) 6.9 GHz, (middle) 19 GHz, and (bottom) 37 GHz.
C. Comparison of Emission Model Predictions WithExperimental Data
The HUT snow emission model [6] was used to simulate thebrightness temperature of the snowpack in different land cover
categories. The model describes the snowpack as a single layerand uses the delta-Eddington approximation to the radiativetransfer equation, applying an empirical constant to determinethe forward scattered intensity. The model can be applied for
972 IEEE TRANSACTIONS ON GEOSCIENCE AND REMOTE SENSING, VOL. 47, NO. 3, MARCH 2009
TABLE IVCORRELATION OF V-POL BRIGHTNESS TEMPERATURES VERSUS SWE
OVER DIFFERENT LAND COVER TYPES ON FLIGHT LINE C
TABLE VCORRELATION OF V-POL BRIGHTNESS TEMPERATURES
VERSUS LAKE FRACTION
both dry and wet snow. The dielectric constant for wet snowis described through an empirical formula. The transmissivityand brightness temperature contributions of vegetation layersand the soil–snow reflectivity are considered using empiricalmodel approaches ([15], [16]). Multiple reflections betweendifferent layers are included using an incoherent approach for amultilayer medium [17].
Model predictions were compared with brightness tempera-tures obtained from airborne measurements. The most signifi-cant input parameters for dry-snow model simulations includethe following: average grain size, SWE, snow density, forestcover percentage within an imaged pixel, forest stem volume,and physical temperatures (ground, snowpack, vegetation, andair). Values for these parameters were obtained from groundmeasurements and available land cover reference data. Groundsurface roughness was considered as a constant parameter.Physical temperatures were acquired from weather station data.
A summary of model input parameters for different landcover categories is provided in Table VI for flight lines Aand B and in Table VII for lines C and D. Some parameters,such as the forest stem volumes, may vary greatly over a setof airborne data pixels—the given values are best estimatesbased on forestry data in both countries ([18], [19]). It shouldbe noted that the land cover definitions used in this paper arenot necessarily consistent regarding stem volume values. Inthe Finnish case, forest density definitions arise from canopycover, not stem volume. Canadian “forested” areas and “denseforests” in the Finnish northern flight line D are, in fact, similarto “sparse forests” in flight line C in southern Finland, withaverage stem volumes of 50 m3/ha. Densely forested areas inflight line C have stem volumes exceeding 100 m3/ha.
Grain size has a strong influence on model predictions,particularly at higher frequencies. Variability in measured grainsize was notable at a local scale. Also, the visual observationmethod for estimating grain size introduced uncertainty to the
Fig. 6. Relationships between aggregated airborne brightness temperaturesand fractional lake cover in Finland and Canada. Data combined from flightlines A to D (see Fig. 1). Results for (a) 6.9 GHz, (b) 19 GHz, and (c) 37 GHz.See Table I for the exact frequencies. Error bars indicate the standard deviationof brightness temperatures in data segments (low error values at over 50% lakefraction due to small number of segments).
results. An error of ±0.5 mm for average grain size values wasused in the model for calculating error bounds.
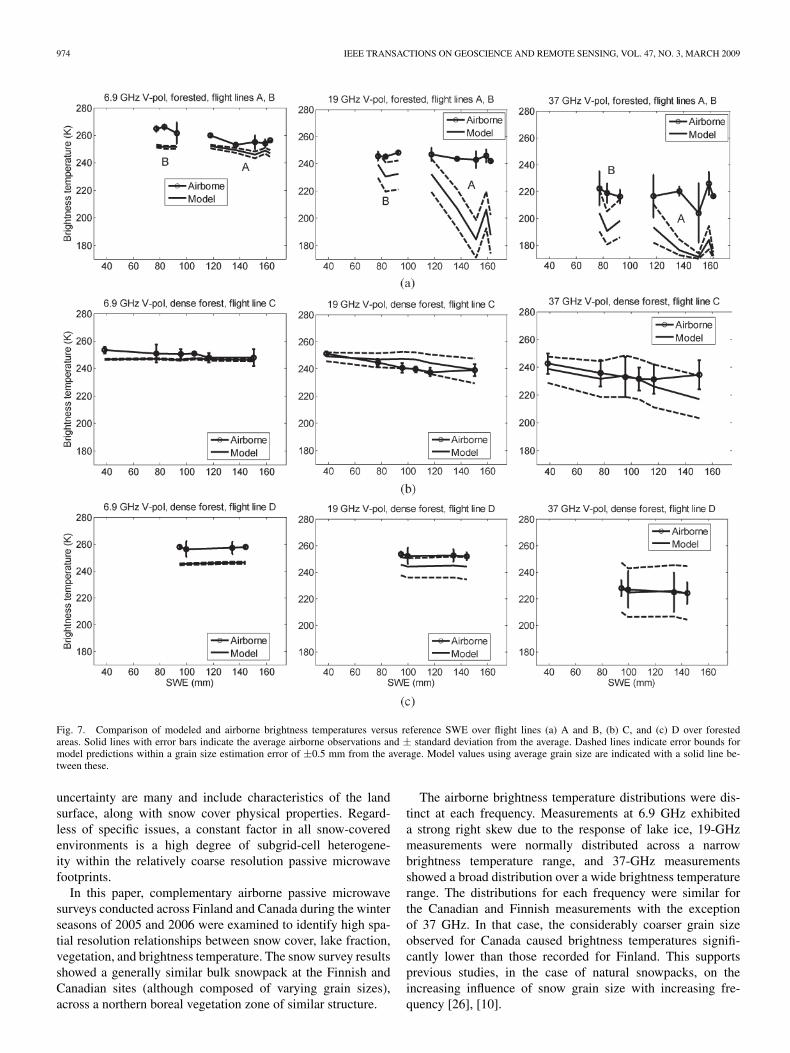
Model and airborne results over densely forested areas versusreference SWE averages obtained from ground measurementsare shown for all flight lines in Fig. 7. Fig. 8, in turn, showsmodel predictions for sparsely forested areas, deforested areas,and bogs of flight line D. RMS and bias statistics for the modelversus measured results, for all flight lines and land cover types,

LEMMETYINEN et al.: COMPARISON OF BRIGHTNESS TEMPERATURES AND SNOWPACK PROPERTIES 973
TABLE VIHUT SNOW EMISSION MODEL INPUT PARAMETERS
FOR FLIGHT LINES A AND B (CANADA)
TABLE VIIHUT SNOW EMISSION MODEL INPUT PARAMETERS
FOR FLIGHT LINES C AND D (FINLAND)
are summarized in Table VIII. Model results indicate goodagreement in densely forested areas with airborne measure-ments at 19 and 37 GHz, specifically for the Finnish transects.The model underestimates brightness temperature with bothCanadian data sets at these frequencies, particularly for thehigh SWE values of flight line A. On line A, high SWE valuescoincided with large measured grain sizes. This causes the low
brightness temperature values predicted by the model. A visualexamination of Fig. 7(a), however, indicates that changes inairborne brightness temperatures at 19 and 37 GHz are alsoreflected in the modeled values albeit with a large offset. Thechanges in modeled values are, again, largely due to varyinggrain sizes between different sites. It is likely that this grainsize effect also influenced the observed changes in the airbornemeasurements.
A revised method of calculating the extinction coefficient inthe case of large snow grains was suggested by Roy et al. [10],adapting the HUT snow emission model at 37 GHz to theCanadian boreal environment. Examination of the Canadiandata set showed improvement in the model predictions at37 GHz using this revised method. RMS errors between mod-eled and measured values (see Table VIII) dropped to 11 K and17 K, respectively, for forested areas in lines A and B whenthe method by Roy et al. was employed (from 13.5 K and24.6 K, respectively). Improved model performance for lowerfrequencies was not produced, as expected. The data sets thusfurther support the use of the modified extinction coefficientsin the case of large grain sizes and demonstrate the sensitivitiesbetween snow emission models, as also highlighted previouslyby Tedesco and Kim [20].
With the exception of flight line B, open areas (defor-ested and tundra) show poorer agreement with the model thanforested areas (note the higher rms error values evident inTable VIII). Wind-created slab layers on the top of the snow-pack are characteristic of open areas but not of forests, sothe more substantial vertical layering in open areas may havecaused the poorer model performance. For bogs, the modelpredictions significantly differed from brightness temperatureobservations at 37 GHz, which may result from a wet (partiallyunfrozen) peat surface and from an ice layer between the peatsurface and overlying snowpack.
As mentioned previously, the HUT snow model does notrequire information on multiple layers within a snowpack as aninput. Recent findings using the microwave emission model forlayered snowpacks by Durand et al. [21] showed significantlylower errors between point-scale modeled and measured resultswhen the snowpack was treated as a multilayer medium. Whileinformation on snowpack vertical layering was acquired atsnow pit sites in this paper, we did not apply these measure-ments across the long regional flight lines.
IV. CONCLUSION
SWE is a highly sought after variable for model evalua-tion (climate, numerical weather prediction, and hydrological),studies of the cryosphere–climate system, and hydrometeoro-logical applications [22]. While the potential of satellite passivemicrowave data to provide SWE estimates has been evidentsince the availability of Scanning Multichannel MicrowaveRadiometer data in the late 1970s [23], widespread use ofmicrowave-derived data sets, particularly at the hemisphericscale, is limited by high levels of uncertainty. Dynamic algo-rithmic approaches that consider evolving snow grain size showregional potential [24], but uncertainty can be very high at thehemispheric scale [25]. The potential contributing factors to this
974 IEEE TRANSACTIONS ON GEOSCIENCE AND REMOTE SENSING, VOL. 47, NO. 3, MARCH 2009
Fig. 7. Comparison of modeled and airborne brightness temperatures versus reference SWE over flight lines (a) A and B, (b) C, and (c) D over forestedareas. Solid lines with error bars indicate the average airborne observations and ± standard deviation from the average. Dashed lines indicate error bounds formodel predictions within a grain size estimation error of ±0.5 mm from the average. Model values using average grain size are indicated with a solid line be-tween these.
uncertainty are many and include characteristics of the landsurface, along with snow cover physical properties. Regard-less of specific issues, a constant factor in all snow-coveredenvironments is a high degree of subgrid-cell heterogene-ity within the relatively coarse resolution passive microwavefootprints.
In this paper, complementary airborne passive microwavesurveys conducted across Finland and Canada during the winterseasons of 2005 and 2006 were examined to identify high spa-tial resolution relationships between snow cover, lake fraction,vegetation, and brightness temperature. The snow survey resultsshowed a generally similar bulk snowpack at the Finnish andCanadian sites (although composed of varying grain sizes),across a northern boreal vegetation zone of similar structure.
The airborne brightness temperature distributions were dis-tinct at each frequency. Measurements at 6.9 GHz exhibiteda strong right skew due to the response of lake ice, 19-GHzmeasurements were normally distributed across a narrowbrightness temperature range, and 37-GHz measurementsshowed a broad distribution over a wide brightness temperaturerange. The distributions for each frequency were similar forthe Canadian and Finnish measurements with the exceptionof 37 GHz. In that case, the considerably coarser grain sizeobserved for Canada caused brightness temperatures signifi-cantly lower than those recorded for Finland. This supportsprevious studies, in the case of natural snowpacks, on theincreasing influence of snow grain size with increasing fre-quency [26], [10].

LEMMETYINEN et al.: COMPARISON OF BRIGHTNESS TEMPERATURES AND SNOWPACK PROPERTIES 975
Fig. 8. Comparison of modeled and airborne brightness temperatures versus reference SWE over flight line D for (a) sparse forests, (b) deforested areas, and(c) bogs. Meaning of error bars and model error bounds as for Fig. 7.
Measurements at 6.9 GHz showed no relationship withground-measured SWE, an expected result at this lowfrequency. Both 19- and 37-GHz brightness temperatures de-creased with increasing SWE, with the relationship beingmore tightly constrained at 19 GHz than at 37 GHz. Thiswas an unexpected result. Measurements at 19 and 37 GHzare typically used together to estimate SWE because mea-surements at 19 GHz are generally considered insensitive tothe snowpack volume scatter that occurs at 37 GHz. Theseresults suggest that when SWE exceeds approximately 100 mm,volume scatter also influences 19-GHz measurements. Thesefield measurements confirm the deep-snow scattering at 19 GHzfound in model simulations by Markus et al. [27] and satellitemeasurements by Derksen [28]. Weak relationships betweenground-measured SWE and airborne brightness temperatures
were found for wetlands and lake snow, necessitating a closerlook at the influence of lake fraction.
The examination of airborne measurements found that6.9-GHz measurements were systematically sensitive tosubgrid-scale lake fraction. Measurements at 19 GHz showedsome correlation with lake fraction in both data sets but overa very narrow brightness temperature range. A moderate statis-tical association was found at 37 GHz in Canada that was notfound in the Finnish measurements. Lake ice and snow condi-tions were regionally different: late season ice thickness overthe Canadian lakes was up to 1.5 m, and the lake snowpackswere over 30 cm in depth. In Finland, ice thickness was thinner(on the order of 50 cm in the south and 1 m in the north), andthe measured snowpack was typically shallower (approximately20 cm). These results support previous results that a high lake

976 IEEE TRANSACTIONS ON GEOSCIENCE AND REMOTE SENSING, VOL. 47, NO. 3, MARCH 2009
TABLE VIIIRMS AND BIAS OF ERROR FOR MODELED VERSUS AIRBORNE
BRIGHTNESS TEMPERATURES ON FLIGHT LINES A,B, C, AND D. VALUES IN KELVINS
fraction may significantly affect the accuracy of SWE estimatesbased on the channel difference of 19 and 37 GHz, as suggestedby Duguay et al. [29].
Model predictions versus airborne measurements showedgood agreement for the Finnish transects. In general, scatter inobservations was seen to increase when monitoring open envi-ronments such as deforested areas or bogs when compared toforested areas. Results for the Canadian data are less consistentin this regard. This may be due to reduced accuracy of themodel with larger grain sizes. Both data sets exhibited largererrors at 37 GHz than at 19 GHz in almost all cases.
This paper has shown that parameters independent of thesnowpack that vary on the sub-satellite grid-cell scale (suchas lake fraction) had a systematic impact on high-resolutionairborne brightness temperatures. Coincidentally, snowpackproperties such as grain size and SWE also influenced mea-sured and modeled brightness temperatures. These resultsillustrate the challenges in relating SWE to brightness tem-peratures at the coarse resolution of current satellite passivemicrowave measurements. A particular issue is the large mea-sured range of airborne brightness temperatures at 37 GHz,the frequency that also exhibited the largest deviations fromthe HUT snow emission model simulations. Measurementsat 37 GHz are utilized in most conventional SWE retrievalschemes due to the high theoretical sensitivity at that fre-quency to snowpack volume scatter, but these measurementsalso exhibited pronounced sensitivity to forest cover andgrain size.
Problems related to model predictions at 37 GHz suggestsome areas for further study. In particular, future models shouldbe able to include multilayer treatment in the case of snow-covered lake ice, depth hoar, and wind-induced surface slablayers. In future measurement campaigns, ground observationsshould focus on the necessary stratigraphic measurements tocontribute to modeling studies. Other areas of improvementinclude observations on the stem volume of forested pixels; sofar, this has been treated as a common average value for allpixels representing a certain forest type (dense or sparse forests,and tundra) in a certain area.
In conclusion, the combined analysis of airborne passivemicrowave and surface snow cover data sets from Canada andFinland has illustrated similar multiscale brightness tempera-ture response to fractional lake cover and SWE. In turn, thiswill allow assessment of the transferability of SWE retrievaltechniques and contribute to the future generation of timeseries of satellite data sets extending across North Americaand northern Eurasia. Future analysis will consider the seasonalbrightness temperature evolution with respect to variables suchas forest transmissivity and lake fraction. This paper only con-sidered relationships close to the timing of peak seasonal SWE.By considering the seasonal evolution, these variables can beintroduced to retrieval schemes, either to improve the SWEestimates themselves or to contribute to attaching uncertaintyestimates [30]. Treatment of uncertainty will become increas-ingly important as passive microwave information is utilized inland surface data assimilation schemes [31].
ACKNOWLEDGMENT
The authors would like to thank the National ResearchCouncil for coordinating Twin Otter aircraft logistics, A. Silis(Environment Canada) for leadership in the field, NorthwestTerritories Power Corporation (K. Dies) and Indian and North-ern Affairs Canada (B. Reid) for the in-kind support for the fieldmeasurements in Canada, and the numerous persons working atTKK, FMI, and SYKE for the support for the field measurementactivities in Finland.
REFERENCES
[1] J. Pulliainen and M. Hallikainen, “Retrieval of regional snow water equiv-alent from space-borne passive microwave observations,” Remote Sens.Environ., vol. 75, no. 1, pp. 76–85, Jan. 2001.
[2] C. Derksen, A. Walker, and B. Goodison, “A comparison of 18 winterseasons of in situ and passive microwave-derived snow water equivalentestimates in western Canada,” Remote Sens. Environ., vol. 88, no. 3,pp. 271–282, Dec. 2003.
[3] B. Goodison and A. Walker, “Canadian development and use ofsnow cover information from passive microwave satellite data,” inPassive Microwave Remote Sensing of Land–Atmosphere Interactions,B. Choudhury, Y. Kerr, E. Njoku, and P. Pampaloni, Eds. Utrecht,The Netherlands: VSP BV, 1995, pp. 245–262.
[4] K. Goita, A. Walker, and B. Goodison, “Algorithm development for theestimation of snow water equivalent in the boreal forest using passivemicrowave data,” Int. J. Remote Sens., vol. 24, no. 5, pp. 1097–1102,2003.
[5] C. Derksen, A. Walker, and B. Goodison, “Evaluation of passive mi-crowave snow water equivalent retrievals across the boreal forest/tundratransition of western Canada,” Remote Sens. Environ., vol. 96, no. 3/4,pp. 315–327, Jun. 2005.
[6] J. Pulliainen, J. Grandell, and M. Hallikainen, “HUT snow emis-sion model and its applicability to snow water equivalent retrieval,”
LEMMETYINEN et al.: COMPARISON OF BRIGHTNESS TEMPERATURES AND SNOWPACK PROPERTIES 977
IEEE Trans. Geosci. Remote Sens., vol. 37, no. 3, pp. 1378–1390,May 1999.
[7] J. Pulliainen, “Mapping of snow water equivalent and snow depth inboreal and sub-arctic zones by assimilating space-borne microwave ra-diometer data and ground-based observations,” Remote Sens. Environ.,vol. 101, no. 2, pp. 257–269, Mar. 2006.
[8] C. Derksen and M. MacKay, “The Canadian boreal snow water equivalentband,” Atmos.-Ocean, vol. 44, no. 3, pp. 305–320, Sep. 2006.
[9] M. Sturm, J. Holmgren, and G. Liston, “A seasonal snow cover classi-fication system for local to global applications,” J. Clim., vol. 8, no. 5,pp. 1261–1283, May 1995.
[10] V. Roy, K. Goita, A. Royer, A. Walker, and B. Goodison, “Snow waterequivalent retrieval in a Canadian boreal environment from microwavemeasurements using the HUT snow emission model,” IEEE Trans.Geosci. Remote Sens., vol. 42, no. 9, pp. 1850–1859, Sep. 2004.
[11] M. Sturm and G. Liston, “Snow cover on lakes of the Arctic Coastal Plainof Alaska, U.S.A.,” J. Glaciol., vol. 49, no. 166, pp. 370–380, Jun. 2003.
[12] D. Hall, J. Foster, A. Chang, and A. Rango, “Freshwater ice thicknessobservations using passive microwave sensors,” IEEE Trans. Geosci.Remote Sens., vol. GRS-19, no. 4, pp. 189–193, Oct. 1981.
[13] C. Swift, W. Jones, Jr., and R. Harrington, “Microwave radar and radio-metric remote sensing measurements of lake ice,” Geophys. Res. Lett.,vol. 7, no. 4, pp. 243–246, Apr. 1980.
[14] P. Härmä, R. Teiniranta, M. Törmä, R. Repo, E. Järvenpää, and M. Kallio,“The production of Finnish CORINE land cover 2000 classification,” inProc. XXth ISPRS Congr., Istanbul, Turkey, 2004.
[15] N. Kruopis, J. Praks, A. Arslan, H. Alasalmi, J. Koskinen, andM. Hallikainen, “Passive microwave measurements of snow-covered for-est areas in EMAC’95,” IEEE Trans. Geosci. Remote Sens., vol. 37, no. 5,pp. 2699–2705, Sep. 1999.
[16] U. Wegmuller and C. Matzler, “Rough bare soil reflectivity model,” IEEETrans. Geosci. Remote Sens., vol. 37, no. 3, pp. 1391–1395, May 1999.
[17] F. Ulaby et al., Microwave Remote Sensing, Active and Passive, vol. 1.Reading, MA: Addison-Wesley, 1981.
[18] K. T. Korhonen, A. Ihalainen, J. Heikkinen, H. Henttonen, and J. Pitkänen,“Suomen metsävarat metsäkeskuksittain 2004–2006 ja metsävarojen ke-hitys 1996–2006,” Metsätiet. Aikak., vol. 2, pp. 149–213, 2007. [Online].Available: http://www.metla.fi/aikakauskirja/full/ff07/ff072149.pdf
[19] Natural Resources Canada, Canada’s National Forest Inventory, 2007.[Online]. Available: http://nfi.cfs.nrcan.gc.ca/canfi/index_e.html
[20] M. Tedesco and E. J. Kim, “Intercomparison of electromagnetic modelsfor passive microwave remote sensing of snow,” IEEE Trans. Geosci.Remote Sens., vol. 44, no. 10, pp. 2654–2666, Oct. 2006.
[21] M. Durand, E. J. Kim, and S. A. Margulis, “Quantifying uncertainty inmodeling snow microwave radiance for a mountain snowpack at the point-scale, including stratigraphic effects,” IEEE Trans. Geosci. Remote Sens.,vol. 46, no. 6, pp. 1753–1767, Jun. 2008.
[22] IGOS Cryosphere Theme, Cryosphere Theme Report—Integrated GlobalObserving Strategy, 2007. [Online]. Available: http://cryos.ssec.wisc.edu/documents.html
[23] A. Chang, J. Foster, and D. Hall, “Nimbus-7 SMMR derived global snowcover parameters,” Ann. Glaciol., vol. 9, pp. 39–44, 1987.
[24] M. Grippa, N. Mognard, T. Le Toan, and E. Josberger, “Siberia snowdepth climatology derived from SSM/I data using a combined dynamicand static algorithm,” Remote Sens. Environ., vol. 93, no. 1/2, pp. 30–41,Oct. 2004.
[25] R. Kelly, A. Chang, L. Tsang, and J. Foster, “A prototype AMSR-E globalsnow area and snow depth algorithm,” IEEE Trans. Geosci. Remote Sens.,vol. 41, no. 2, pp. 230–242, Feb. 2003.
[26] C. Mätzler, “Passive microwave signatures of landscapes in winter,”Meteorol. Atmos. Phys., vol. 54, no. 1–4, pp. 241–260, Mar. 1994.
[27] T. Markus, D. Powell, and J. Wang, “Sensitivity of passive microwavesnow depth retrievals to weather effects and snow evolution,” IEEE Trans.Geosci. Remote Sens., vol. 44, no. 1, pp. 68–77, Jan. 2006.
[28] C. Derksen, “The contribution of AMSR-E 18.7 and 10.7 GHz measure-ments to improved boreal forest snow water equivalent retrievals,” RemoteSens. Environ., vol. 112, no. 5, pp. 2701–2710, May 2008.
[29] C. Duguay, J. Green, C. Derksen, M. English, A. Rees, M. Sturm, andA. Walker, “Preliminary assessment of the impact of lakes on passivemicrowave snow retrieval algorithms in the Arctic,” in Proc. 62nd EasternSnow Conf., Waterloo, ON, Canada, 2005, pp. 223–228.
[30] J. Foster, C. Sun, J. Walker, R. Kelly, A. Chang, J. Dong, and H. Powell,“Quantifying the uncertainty in passive microwave snow water equiva-lent observations,” Remote Sens. Environ., vol. 94, no. 2, pp. 187–203,Jan. 2005.
[31] A. Slater and M. Clark, “Snow data assimilation via an ensemble Kalmanfilter,” J. Hydrometeorol., vol. 7, no. 3, pp. 478–493, Jun. 2006.
Juha Lemmetyinen received the M.Sc.(Tech.) de-gree from the Helsinki University of Technology(TKK), Espoo, Finland, in 2004.
From 2004 to 2008, he was a Researcher with theLaboratory of Space Technology and the Departmentof Radio Science and Engineering, TKK, specializ-ing in radio meter calibration techniques and remotesensing. He is currently a Research Scientist withthe Arctic Research Centre, Finnish Meteorologi-cal Institute, Helsinki, Finland. His current researchinterests include microwave radiometry and remote
sensing of snow.
Chris Derksen received the B.E.S. degree in geography and the M.A. andPh.D. degrees from the University of Waterloo, Waterloo, ON, Canada, in 1997,1998, and 2001, respectively.
He is currently a Research Scientist with the Climate Research Division,Science and Technology Branch, Environment Canada, Toronto, ON, and holdsadjunct faculty positions with the Department of Geography and EnvironmentStudies, Wilfrid Laurier University, Waterloo, and the Department of Geog-raphy and Environmental Management, University of Waterloo. His researchactivities include remote sensing of terrestrial snow cover, and the use ofsatellite-derived data sets to identify interactions between the climate systemand the cryosphere.
Jouni Pulliainen (S’91–M’95–SM’03) receivedthe M.Sc., Licentiate in Technology, and Doctorof Science in Technology degrees from the Facultyof Electrical Engineering, Helsinki University ofTechnology (TKK), Espoo, Finland, in 1988, 1991,and 1994, respectively.
From 1993 to 1994, he was the Acting Directorof the Laboratory of Space Technology, TKK. From2001 to 2006, he was a Professor of space technol-ogy with TKK, specializing in remote sensing. Heis currently a Research Professor with the Finnish
Meteorological Institute (FMI), where he is the Head of the Arctic ResearchCentre. His research interests include direct and inverse modeling in remotesensing, and, additionally, remote sensing data assimilation and applicationdevelopment, e.g., for the needs of climate change investigations. Recently,his work has focused on the active and passive remote sensing of borealforests and snow cover, applying both microwave and optical data (includingatmospheric correction). He has been a Principal Investigator or Project Mangerfor several nationally funded and international research projects, includingseveral European Space Agency and European Commission contracts. He hasauthored about 250 scientific papers and technical reports in the field of remotesensing.
Dr. Pulliainen was a member of the ESA Advisory Committee on Education(2001–2007). He is also a member of the ESA CoreH2O MAG.
Walter Strapp, photograph and biography not available at the time of thepublication.
Peter Toose received the B.E.S. and M.E.S. degrees in geography from theUniversity of Waterloo, Waterloo, ON, Canada, in 2004 and 2007, respectively.
He is currently a Physical Scientist with the Climate Research Division,Science and Technology Branch, Environment Canada. His research interestsinclude the passive and active microwave retrieval of snow cover informationand freshwater lake ice properties.

978 IEEE TRANSACTIONS ON GEOSCIENCE AND REMOTE SENSING, VOL. 47, NO. 3, MARCH 2009
Anne Walker (M’02) received the B.A. and M.A. degrees (geography) atCarleton University, Ottawa, ON, Canada, in 1984 and 1986, respectively.
Since 1990, she has been with the Climate Research Division, Science andTechnology Branch, Environment Canada, where she is currently the Managerof the Climate Processes Section. She leads a scientific research program thatis focused on developing the use of passive microwave data to derive, analyze,and model geophysical variables (e.g., snow cover, lake ice, and soil moisture)in support of analyses of climate variability and change.
Ms. Walker has been a member of the Polar User Working Group (UWG)for the EOS Snow and Ice Distributed Active Archive Center, NSIDC, Boulder,CO, since 1999.
Simo Tauriainen was born in Oulu, Finland,in 1967. He received the M.Sc.(Tech.) andLic.Sc.(Tech.) degrees from Helsinki University ofTechnology (TKK), Espoo, Finland, in 1993 and1998, respectively.
From 1993 to May 2008, he was involved inremote sensing research at the Laboratory of SpaceTechnology, TKK, as a Research Scientist (until2002) and later as Head of research flight opera-tions responsible for scientific measurement flights.During this time, he has been a Project Manager in
several instrument development projects and responsible for numerous researchflight campaigns. Currently, he is with Finncomm Airlines as an Airline Oper-ations Systems Manager. His interests include development of spaceborne andairborne remote sensing systems, aircraft subsystems, and navigation systems.
Jörgen Pihlflyckt received the M.Sc.(Tech.) degreefrom the Faculty of Electrical Engineering, HelsinkiUniversity of Technology (TKK), Espoo, Finlandin 2007.
He was with the Laboratory of Space Technology,TKK, from 1994 to 2007. He acted as PayloadSpecialist for the Skyvan research aircraft, and tookpart in the development of remote sensing instrumen-tation and techniques for microwave radiometers.He has coauthored over ten scientific articles onremote sensing, particularly concerning microwave
radiometers. He currently works for Ajeco Oy, where his main responsibility issoftware development for telemetry and remote control applications.
Juha-Petri Kärnä received the M.Sc.(Tech.) degreefrom the Faculty of Electrical Engineering, HelsinkiUniversity of Technology (TKK), Espoo, Finland,in 1990.
He is currently with the Department of RadioScience and Engineering, TKK, and also with theFinnish Environment Institute (SYKE), Helsinki,Finland. He was a Research Scientist with the Labo-ratory of Space Technology, TKK, Espoo, from 2001to 2007. During 1994 and 2001, he was with LMEricsson Finland, working in software development
projects and holding several positions from Software Designer to QualityManager. His research interests include remote sensing of snow, particularlyusing assimilation techniques with passive and active microwave data.
Martti T. Hallikainen (F’93) received the Engineer-ing Diploma (M.Sc.) and the Doctor of Technologydegree from the Faculty of Electrical Engineering,Helsinki University of Technology (TKK), Espoo,Finland, in 1971 and 1980, respectively.
Since 1987, he has been a Professor of spacetechnology with TKK, where he is currently withthe Department of Radio Science and Engineering.He established in 1988 the Laboratory of SpaceTechnology, TKK, and serves as its Director. He wasa Visiting Scientist in 1993–1994 at the European
Union’s Joint Research Centre, Institute for Remote Sensing Applications,Italy. He was a Postdoctoral Fellow at the University of Kansas Remote SensingLaboratory from 1981 to 1983, and he was awarded an ASLA-Fulbright schol-arship for graduate studies at the University of Texas, Austin, in 1974–1975.His research interests include development of microwave sensors for airborneand spaceborne remote sensing, development of methods to retrieve the char-acteristics of geophysical targets from satellite and airborne measurements,and cryospheric applications of remote sensing. His team recently completedthe HUT-2D airborne interferometric L-band radiometer and was involved intechnical development work and scientific projects concerning the near-futureESA SMOS satellite.
Dr. Hallikainen was a member of the European Space Agency’s (ESA) EarthScience Advisory Committee (1998–2001). He has been a national delegate tothe ESA Earth Observation Data Operations Scientific and Technical AdvisoryGroup since 1995. He was the Secretary General of the European Associationof Remote Sensing Laboratories (EARSeL) in 1989–1993 and the Chairmanof the Organizing Committee for the 1989 EARSeL General Assembly andSymposium. He has been a member of the EARSeL Council since 1985. Hehas been a member of the Advisory Committee for the European MicrowaveSignature Laboratory of the European Union’s Joint Research Centre since1992. He is a recipient of three IEEE GRSS (Geoscience and Remote SensingSociety) Awards, namely, the 1999 Distinguished Achievement Award, theIGARSS’96 Interactive Paper Award, and the 1994 Outstanding Service Award.He was awarded the IEEE Third Millennium Medal in 2000 and the MicrowavePrize for the best paper in the 1992 European Microwave Conference. He hasbeen an IEEE GRSS Honorary Life Member since 2007. He was a member ofthe GRSS Administrative Committee (1988–2006) and he served as Presidentof IEEE GRSS (1996–1997). He was the General Chair of the IGARSS’91Symposium and a Guest Editor of the Special IGARSS’91 Issue of the IEEETRANSACTIONS ON GEOSCIENCE AND REMOTE SENSING (TGARS). He wasan Associate Editor of TGARS (1992–2002). He served as Chair of the GRSSNominations Committee (1999–2001 and 2003–2006). He has been the VicePresident of the International Union of Radio Science (URSI) since 2005, andhe served as Chair of URSI Commission F (2002–2005). He has been a nationalofficial member of URSI Commission F since 1988, and he was the Chair of theURSI Finnish National Committee (1997–2005). He has been the Vice Chair ofthe Finnish National Committee of COSPAR since 2000.
Copyright © 2022 FDOKUMEN