Sensitivity of SAR data to post-fire forest regrowth in Mediterranean and boreal forests
Upload
khangminh22Category
view
2download
0
Sustainable boreal forest management – challenges and opportunities for climate change mitigation
Report from an Insight Process conducted by a team appointed by the International Boreal Forest Research Association (IBFRA)
REPORT 2021/11
©Swedish Forest Agency, december 2021
PROJECT LEADERPeter Högberg
AUTHORSIBFRA INSIGHT PROCESS TEAM (AFFILIATIONS ARE GIVEN IN APPENDIX 1):
Peter Högberg (process leader)Lina Arnesson Ceder
Rasmus AstrupDan BinkleyRyan Bright
Lise DalsgaardGustaf Egnell
Andrey FilipchukHélène GenetAlexey IlintsevWerner A. Kurz
Jérôme LaganièreTony Lemprière
Mattias LundbladTomas Lundmark
Raisa MäkipääNataliya MalyshevaChristian W. Mohr
Annika NordinHans Petersson
Anna RepoDmitry Schepaschenko
Anatoly ShvidenkoGunnhild Soegaard
Florian Kraxner (President of IBFRA)
COVER PHOTOBjörn Hånell
COVER DESIGNAnn Giss
EDITIONSFor printing only
ISBN 978-91-986297-3-6
REPORTS PUBLISHED BY SWEDISH FOREST AGENCY
2012:1 Kommunikationsstrategi för Renbruksplan2012:2 Förstudierapport, dialog och samverkan
mellan skogsbruk och rennäring2012:3 Hänsyn till kulturmiljöer – resultat från P3 2008–20112012:4 Kalibrering för samsyn över myndighetsgränserna
avseende olika former av dikningsåtgärder i skogsmark2012:5 Skogsbrukets frivilliga avsättningar2012:6 Långsiktiga effekter på vattenkemi, öringbestånd och
bottenfauna efter ask- och kalkbehandling i hela avrinningsområden i brukad skogsmark – utvärdering 13 år efter åtgärder mot försurning
2012:7 Nationella skogliga produktionsmål – Uppföljning av 2005 års sektorsmål
2012:8 Kommunikationsstrategi för Renbruksplan – Är det en fungerande modell för samebyarna vid samråd?
2012:9 Ökade risker för skador på skog och åtgärder för att minska riskerna
2012:10 Hänsynsuppföljning – grunder2012:11 Virkesproduktion och inväxning i skiktad skog
efter höggallring2012:12 Tillståndet för skogsgenetiska resurser i Sverige.
Rapport till FAO
2013:1 Återväxtstöd efter stormen Gudrun2013:2 Förändringar i återväxtkvalitet, val av föryngring-
smetoder och trädslagsanvändning mellan 1999 och 2012
2013:3 Hänsyn till forn- och kulturlämningar – Resultat från Kulturpolytaxen 2012
2013:4 Hänsynsuppföljning – underlag inför detaljerad kravspecifikation, En delleverans från Dialog om miljöhänsyn
2013:5 Målbilder för god miljöhänsyn – En delleverans från Dialog om miljöhänsyn
2014:1 Effekter av kvävegödsling på skogsmark – Kunskapssammanställning utförd av SLU på begäran av Skogsstyrelsen
2014:2 Renbruksplan – från tanke till verklighet2014:3 Användning och betydelsen av RenGIS i samråds-
processen med andra markanvändare2014:4 Hänsynen till forn- och kulturlämningar
– Resultat från Hänsynsuppföljning Kulturmiljöer 20132014:5 Förstudie – systemtillsyn och systemdialog2014:6 Renbruksplankonsept – ett redskap för
samhällsplanering2014:7 Förstudie – Artskydd i skogen – Slutrapport
2015:1 Miljöövervakning på Obsytorna 1984–2013 – Beskrivning, resultat, utvärdering och framtid
2015:2 Skogsmarksgödsling med kväve – Kunskaps-sammanställning inför Skogsstyrelsens översyn av föreskrifter och allmänna råd om kvävegödsling
2015:3 Vegetativt förökat skogsodlingsmaterial2015:4 Global framtida efterfrågan på och möjligt
utbud av virkesråvara2015:5 Satellitbildskartering av lämnad miljöhänsyn
i skogsbruket – en landskapsansats2015:6 Lägsta ålder för föryngringsavverkning (LÅF)
– en analys av följder av att sänka åldrarna i norra Sverige till samma nivå som i södra Sverige
2015:7 Hänsynen till forn- och kulturlämningar – Resultat från Hänsynsuppföljning Kulturmiljöer 2014
2015:8 Uppföljning av skogliga åtgärder längs vattendrag för att gynna lövträd och lövträdsetablering.
2015:9 Ångermanälvsprojektet – förslag till miljöförbättrande åtgärder i mellersta Ångermanälven och nedre Fjällsjöälven
2015:10 Skogliga konsekvensanalyser 2015–SKA 152015:11 Analys av miljöförhållanden – SKA 152015:12 Effekter av ett förrändrat klimat–SKA 152015:13 Uppföljning av skogliga åtgärder längs vattendrag
för att gynna lövträd och lövträdsetablering
2016:1 Uppföljning av biologisk mångfald i skog med höga naturvärden – Metodik och genomförande
2016:2 Effekter av klimatförändringar på skogen och behov av anpassning i skogsbruket
2016:3 Kunskapssammanställning skogsbruk på torvmark2016:4 Alternativa skogsskötselmetoder i Vildmarksriket
– ett pilotprojekt2016:5 Hänsyn till forn- och kulturlämningar – Resultat från
Hänsynsuppföljning Kulturmiljöer 20152016:6 METOD för uppföljning av miljöhänsyn
och hänsyn till rennäringen vid stubbskörd2016:7 Nulägesbeskrivning om nyckelbiotoper2016:8 Möjligheter att minska stabilitetsrisker i raviner
och slänter vid skogsbruk och exploatering – Genomgång av ansvar vid utförande av skogliga förändringar, ansvar för tillsyn samt ansvar vid inträffad skada
2016:9 Möjligheter att minska stabilitetsrisker i raviner och slänter vid skogsbruk och exploatering – Exempelsamling
2016:10 Möjligheter att minska stabilitetsrisker i raviner och slänter vid skogsbruk och exploatering – Metodik för identifiering av slänter och raviner känsliga för vegetationsförändringar till följd av skogsbruk eller expoatering
2016:11 Möjligheter att minska stabilitetsrisker i raviner och slänter vid skogsbruk och exploatering – Slutrapport
2016:12 Nya och reviderade målbilder för god miljöhänsyn – Skogssektors gemensamma målbilder för god miljöhänsyn vid skogsbruksåtgärder
2016:13 Målanpassad ungskogsskötsel2016:14 Översyn av Skogsstyrelsens beräkningsmodell
för bruttoavverkning
2017:2 Alternativa skötselmetoder i Rånddalen – Ett projekt i Härjedalen
2017:4 Biologisk mångfald i nyckelbiotoper – Resultat från inventeringen – ”Uppföljning biologisk mångfald” 2009–2015
2017:5 Utredning av skogsvårdslagens 6 §2017:6 Skogsstyrelsens återväxtuppföljning
– Resultatet från 1999–20162017:7 Skogsträdens genetiska mångfald:
status och åtgärdesbehov2017:8 Skogsstyrelsens arbete för ökad klimatanpassning
inom skogsssektorn – Handlingsplan2017:9 Implementering av målbilder för god miljöhänsyn
– Regeringsuppdrag
2017:10 Bioenergi på rätt sätt – Om hållbar bioenergi i Sverige och andra länder – En översikt initierad av Miljömålsrådet
2017:12 Projekt Mera tall! – 2010–20162017:13 Skogens ekosystemtjänster – status och påverkan
2018:1 Produktionshöjande åtgärder – Rapport från samverkansprocess skogsproduktion
2018:2 Effektiv skogsskötsel – Delrapport inom Samverkan för ökad skogsproduktion
2018:3 Infrastruktur i skogsbruket med betydelse för skogsproduktionen: Nuläge och åtgärdsförslag – Rapport från arbetsgrupp 2 inom projekt Samverkansprocess skogsproduktion
2018:4 Åtgärder för att minska skador på skog – Rapport från samverkansprocess skogsproduktion
2018:5 Samlad tillsynsplan 20182018:6 Uppföljning av askåterföring efter spridning2018:7 En analys av styrmedel för skogens sociala värden
– Regeringsuppdrag2018:8 Tillvarata jobbpotentialen i de gröna
näringarna – Naturnära jobb – Delredovisning av regeringsuppdrag
2018:9 Slutrapport – Gemensam inlämningsfunktion för skogsägare – Regeringsuppdrag
2018:10 Nulägesbeskrivning av nordvästra Sverige2018:11 Vetenskapligt kunskapsunderlag för nyckelbiotops-
inventeringen i nordvästra Sverige2018:12 Statistik om skogsägande/Strukturstatistik2018/13 Föreskrifter för anläggning av skog
– Regeringsuppdrag2018:14 Tillvarata jobbpotentialen i de gröna
näringarna – Naturnära jobb – Delredovisning av regeringsuppdrag
2018:15 Förslag till åtgärder för att kompensera drabbade i skogsbruket för skador med anledning av skogs- bränderna sommaren 2018 – Regeringsuppdrag
2019:1 Indikatorer för miljökvalitetsmålet Levande skogar2019:2 Fördjupad utvärdering av Levande skogar 20192019:3 Den skogliga genbanken – från storhetstid till framtid2019:4 Åtgärder för en jämnställd skogssektor2019:5 Slutrapport Tillvarata jobbpotentialen i de gröna
näringarna – Naturnära jobb2019:6 Nya målbilder för god miljöhänsyn vid dikesrensning
och skyddsdikning2019:7 Återkolonisering av hjortdjur inom brandområdet i Västmanland2019:8 Samverkan Tiveden2019:9 Samlad tillsynsplan 20192019:10 Förslag till åtgärder på kort och lång sikt för att mildra
problem i områden med multiskadad ungskog i Väster-bottens- och Norrbottens län
2019:11 Föryngringsarbetet efter skogsbranden i Västmanland 2014
2019:12 Utveckling av metod för nyckelbiotopsinventering i nordvästra Sverige
2019:13 Regler och rekommendationer för skogsbränsleuttag och kompensationsåtgärder – Kunskapsunderlag
2019:14 Regler och rekommendationer för skogsbränsleuttag och kompensationsåtgärder – Vägledning
2019:15 Underlag för genomförande av direktivet om främjande av användningen av energi från förnybara energikällor
2019:16 Skogsbrukets kostnader för viltskador
2019:17 Omvärldsanalys svensk skogsnäring2019:18 Statistik om formellt skyddad skogsmark,
frivilliga avsättningar, hänsynsytor samt improduktiv skogsmark – Redovisning av regeringsuppdrag
2019:19 Attityder till nyckelbiotoper – Nulägesbeskrivning 20182019:20 Kulturmiljöer – en självklar del i skogslandskapet2019:21 Skogssektorns gemensamma målbilder för god mil-
jöhänsyn – nya och reviderade målbilder. Målbilder för kulturmiljöer/övriga kulturhistoriska lämningar
2019:22 Samlad tillsynsplan 20192019:23 Klimatanpassning av skogen och skogsbruket
– mål och förslag på åtgärder2019:24 Skogsskötsel med nya möjligheter
– Rapport från Samverkansprocess skogsproduktion 2019:25 Mera Tall 2016-2019 – Redovisning/utvärdering
(av annat projekt än regeringsuppdrag)
2020:1 Inverkan av skogsbruksåtgärder på kvicksilvers transport, omvandling och upptag i vattenlevande organismer
2020:2 Registrering av nyckelbiotoper i samband med avver-kningsanmälningar och tillståndsansökningar
Syntes och rekommendationer2020:3 The second report on The state of the world´s forest genetic resources2020:4 Forest management in Sweden
Current practice and historical background2020:5 Kontrollinventering av hänsynsuppföljningen
före avverkning – Analys2020:6 Utveckling och samverkan om nyckelbiotoper
2017-20192020:7 Skattning av avverkningsvolymer – En kvalitetsstudie2020:8 Viltskadeinventering 2020 i brandområdet från 2014
i Västmanland2020:9 Frivilliga avsättningar – förslag på system för uppföl-
jning av geografiskt läge, varaktighet och naturvårds- kvalitet
2021:1 Samlad tillsynsplan 20212021:2 Naturnära jobb – att genomföra en satsning på
naturnära jobb för personer som står långt från arbets marknaden, delrapport
2021:3 Marknaden för skogsråvara och skogsnäringens utveckling fram till 2035
2021:4 Omvärldsanalys 2020/212021:5 Behov av naturvårdande skötsel i skogar med
biotopskydd och naturvårdsavtal2021:6 Skogliga konsekvensanalyser 2022 - bakgrund och
motiv till val av scenarier2021:7 Klimatpåverkan från dikad torvtäckt skogsmark
– effekter av dikesunderhåll och återvätning2021:8 Hyggesfritt skogsbruk – Skogsstyrelsens definition2021:9 Skogsbruksåtgärder och skador på samhällsfunktioner2021:10 Effekter av skogssektorns gemensamma arbete med
målbilder för god miljöhänsyn2021:11 Sustainable boreal forest management – challenges
and opportunities for climate change mitigation
PUBLISHING AND ORDERING REPORTS FROM SWEDISH FOREST AGENCY
The Swedish Forest Agency’s reports are published as pdf files at our website: www.skogsstyrelsen.se/om-oss/publikationer/
Older publications can be ordered or downloaded from the online store: shop.skogsstyrelsen.se/sv/publikationer/
The Swedish Forest Agency also publishes brochures, books and more in various forestry subject areas. The Swedish Forest Agen-cy is also the publisher of the magazine Skogseko.
Ordering publications and printed matter:Swedish Forest Agency,Books and brochures551 83 JÖNKÖPING
Phone: + 46 36-35 93 40, 36-35 93 00 (vx)e-mail: [email protected] store: shop.skogsstyrelsen.se/sv/
MESSAGES PUBLISHED BY SWEDISH FOREST AGENCYDuring 2017, the Swedish Forest Agency’s publications Rapport and Meddelande merged into one with the name Rapport.
2012:1 Förslag på regelförenklingar i skogsvårds- lagstiftningen
2012:2 Uppdrag om nationella bestämmelser som kompletterar EU:s timmerförordning
2012:3 Beredskap vid skador på skog2013:1 Dialog och samverkan mellan skogsbruk
och rennäring2013:2 Uppdrag om förslag till ny lagstiftning
om virkesmätning2013:3 Adaptiv skogsskötsel2013:4 Ask och askskottsjukan i Sverige2013:5 Förstudie om ett nationellt skogsprogram
för Sverige – Förslag och ställningstaganden2013:6 Förstudie om ett nationellt skogsprogram
för Sverige – omvärldsanalys2013:7 Ökad jämställdhet bland skogsägare2013:8 Naturvårdsavtal för områden med sociala värden2013:9 Skogens sociala värden
– en kunskapssammanställning2014:1 Översyn av föreskrifter och allmänna
råd till 30 § SvL – Del 22014:2 Skogslandskapets vatten – en lägesbeskrivning
av arbetet med styrmedel och åtgärder2015:1 Förenkling i skogsvårdslagstiftningen
– Redovisning av regeringsuppdrag2015:2 Redovisning av arbete med skogens sociala värde2015:3 Rundvirkes- och skogsbränslebalanser
för år 2013 – SKA 152015:4 Renskogsavtal och lägesbeskrivning
i frågor om skogsbruk – rennäring2015:6 Utvärdering av ekonomiska stöd2016:1 Kunskapsplattform för skogsproduktion
– Tillståndet i skogen, problem och tänkbara insatser och åtgärder
2016:2 Analys av hur Skogsstyrelsen verkar för att miljömålen ska nås
2016:3 Delrapport – Främja anställning av nyanlända i de gröna näringarna och naturvården
2016:4 Skogliga skattningar från laserdata2016:5 Kulturarv i skogen2016:6 Sektorsdialog 2014 och 20152016:7 Adaptiv skogsskötsel 2013–20152016:8 Agenda 2030 – underlag för genomförande
– Ett regeringsuppdrag2016:9 Implementering av målbilder för god miljöhänsyn2016:10 Gemensam inlämningsfunktion för skogsägare2016:11 Samlad tillsynsplan 20172017:1 Skogens sociala värden i Skogsstyrelsens
rådgivning och information2017:2 Främja nyanländas väg till anställning
i de gröna näringarna och naturvården2017:3 Regeringsuppdrag om jämställdhet i skogsbruket2017:4 Avrapportering av regeringsuppdrag om frivilliga avsät-
tningar
REPORT 2021/11
4
Contents
Foreword by the Swedish Forest Agency _____________________________ 7
Summary ________________________________________________________ 8
1 Background _________________________________________________ 10
2 An introduction: To harvest, or not to harvest? ___________________ 13
3 The boreal forests: Areas and trends in C stocks __________________ 15
3.1 General considerations and scope ___________________________ 15
3.2 Methods of inventory (details are given in Appendix 3) _________ 16
3.3 Results ________________________________________________ 17
3.3.1 Results: areas and stocks of C in boreal forests ______________ 17
3.3.2 Results: changes in C stocks of boreal forests as a result of growth
and removals by harvests, fire and other causes ______________ 17
3.3.3 How comparable are the data from the different countries and how
do our data compare with other studies? ___________________ 21
4 Effects of management on the C balance of boreal forests _________ 23
4.1 Do un-managed forests take up more C than forests managed for wood
production? General considerations. _________________________ 23
4.2 Do un-managed forests take up more C than forests managed for wood
production? What do our data tell us? _______________________ 27
4.3 Changes in soil C stocks and emissions of other GHGs than CO2. _ 30
4.4 Can we attribute the enhanced soil C sink on mineral soils to forest
management? __________________________________________ 31
4.5 What about the possibility of forest management increasing emissions
of other GHGs? _________________________________________ 33
4.6 Can forest management decrease the albedo and hence increase
warming? ______________________________________________ 33
4.7 Could management to increase forest albedo counter warming from
increased concentration of GHGs? __________________________ 34
5 Harvested wood products (HWPs): we must look beyond the forests! _ 37
6 Future projections, conclusions and final recommendations _________ 39
7 Acknowledgements ___________________________________________ 41
8 References __________________________________________________ 42
9 Appendix ___________________________________________________ 49
9.1 Appendix 1 ____________________________________________ 49
REPORT 2021/11
5
9.2 Appendix 2. Definition of forests according to FAO 2015 ________ 50
9.3 Appendix 3. Brief country by country descriptions of the methods of
forest inventory _________________________________________ 51
9.3.1 Alaska (part of the USA) _______________________________ 51
9.3.2 Canada _____________________________________________ 53
9.3.3 Finland _____________________________________________ 55
9.3.4 Norway _____________________________________________ 55
9.3.5 Russia ______________________________________________ 56
9.3.6 Sweden _____________________________________________ 56
REPORT 2021/11
6
Foreword by IBFRA
Based on the White Sea Declaration, the International Boreal Forest Research As-
sociation (IBFRA, www.ibfra.org) was founded in 1991 to promote and coordi-
nate research and to increase the understanding of the role of the circumpolar bo-
real forests in the global environment and the effects of environmental change on
that role.
During our 30-year history, we have developed into an authoritative international
forum on comprehensive studies of boreal and temperate forests - evaluating their
role in providing stability of the Earth-climate system and the global economy.
As IBFRA, we undertake, coordinate, and promote boreal forest research across
the world’s largest land biome and through 19 IBFRA Conferences and vast col-
laborative research opportunities, we accomplish our objectives by:
• Connecting researchers, graduate students and others dedicated to boreal
forest research
• Encouraging innovation and knowledge-sharing on key boreal forest is-
sues
• Promoting a multidisciplinary approach for boreal forest research activities
• Assisting in generating partnerships and connections with boreal forest re-
search institutions across the circumboreal region to provide members
with networking opportunities
Along these guiding objectives, we developed the IBFRA Insight Process which
involves assessing and synthesizing the science related to climate change in the
boreal and - based on this review - developing evidence-based policy recommen-
dations for adaptive and sustainable boreal forest management.
This first IBFRA Insight Process on “Sustainable boreal forest management:
challenges and opportunities for climate change mitigation” addresses the im-
pacts of climate change on the forests, the role of forests in mitigating climate
change, and the ways in which the forest sector can contribute to removing emis-
sions from the atmosphere.
The outcome is a transparent and balanced scientific assessment of the potential of
the boreal forest to contribute to climate change mitigation.
As IBFRA, we would like to extend special thanks to the Swedish Forestry
Agency and the Swedish University of Agricultural Sciences for funding this
study and all voluntary co-authors and contributors under the leadership of Prof.
Peter Högberg for their dedicated efforts in determining the scientific consensus
among the six participating boreal countries Canada, Finland, Norway, Russia,
Sweden, and the United States of America.
Florian Kraxner
IBFRA President
REPORT 2021/11
7
Foreword by the Swedish Forest Agency
The boreal domain represents about 30 % of the global forest area and is the
world’s largest terrestrial carbon pool. Hence, it is a large contributor to the global
budgets of carbon dioxide and other greenhouse gases. Forests are at risk from
the impacts of climate change. At the same time forest management and the use of
wood products derived from forests can play important roles in contributing
towards national greenhouse gas emission reduction goals.
It was against this background that the International Boreal Forest Research
Association organized a science-policy workshop in conjunction with the boreal
ministerial summit 2018 in Haparanda in northern Sweden. The summit provided
an excellent opportunity for a diverse group of researchers and policy analysts
from across the circumboreal region to engage in focused discussions on
collaboration on key boreal science issues. One important result of this dialogue
was the launching of this first insight process on sustainable forest management
and climate change mitigation.
The report contains synthesized information from boreal forests in Alaska (USA),
Canada, Norway, Sweden, Finland and Russia on changes in carbon stock in liv-
ing tree biomass and a comparative analysis on how these changes are affected by
different forest management regimes.
The Swedish Forest Agency has not had an active part in the preparation of the re-
port, but still chooses to publish it in the Swedish Forest Agency's report series.
The conclusions and positions that appear in the report are thus the authors’ own.
The hope is that the report can serve as a source of inspiration in the continued
collaborative work at the circumboreal level to address knowledge gaps associated
with boreal forests and climate change. Considering the work ahead of us after the
26th UNFCCC COP the publication of this report comes at a good moment in
time to inform decision-making across the boreal domain.
We convey our great appreciation to Professor Peter Högberg and his team for ac-
complishing this first insight process.
Peter Blombäck
Head of the policy and analysis division, Swedish Forest Agency
REPORT 2021/11
8
Summary
Can the forest sector mitigate climate change through capture of atmospheric
carbon dioxide (CO2) and the subsequent use of wood products?
We assembled experts mainly from the member countries of the International
Boreal Forest Research Association (IBFRA) to synthesize information from
boreal forests in Alaska (USA), Canada, Norway, Sweden, Finland and Russia on
the carbon (C) stock in living tree biomass during the period 1990 to 2017. Thus,
we compared C stock changes in tree biomass among boreal forests with a low in-
tensity of forest management in Alaska, Canada and Russia, with a much higher
intensity of forest management in Norway, Sweden and Finland (where rotational
forestry involving clear-felling and replanting or reseeding is practiced on a large
portion of the area). The lack of comparable high quality data from the larger
countries and differences in national definitions of managed forests impedes a
strict comparison between unmanaged and managed forests across the boreal bi-
ome.
Intensive forestry in the Nordic countries has been associated with rising C stock
in the biomass of trees, which has doubled in the last century including an in-
crease by 35 % between 1990 and 2017. The rising C stock in these forests oc-
curred while cumulative harvests removed the equivalent of half of the original C
in the initial stock in 1990. In boreal forests in Canada and Russia, the stocks of C
in living trees showed no major changes. In these large countries, a lower percent-
age of the forest area was harvested annually as compared to the Nordic countries,
but forest fires affected a much higher portion of the area. The area affected by
fires was around 0.5 - 0.6 % per year in Alaska, Canada and Russia, which com-
pares with around 0.01 % in the Nordic countries, a difference by a factor 50 - 60.
Regarding soils, all countries report modest increases in C in mineral soils over
the period, with greater increases in the Nordic countries as compared to Canada
and Russia. Peat soils on drained fertile soils were large sources of emissions of
greenhouse gases in Finland and Sweden.
We conclude that intensively managed forests on upland (mineral) soils have
shown strong net uptake of C from the atmosphere by accumulating C in trees,
soils and forest products. In countries with less intense management (Canada and
Russia), where a lower percentage of the area is harvested annually, the uptake of
C from the atmosphere has been matched by wood harvests and C releases back to
the atmosphere (including from large forest fires); i.e. the C stock in living tree bi-
omass has not changed. In Alaska, where forestry is not practiced in the boreal
forests, there has been a net loss of C mainly through fires.
Forestry can obviously provide climate benefits from increased C stocks in forests
(in trees, other plants, dead wood and soils), from C stored in long-lasting wood
products and by substitution of wood for fossil fuel products and products
associated with large emissions of CO2, for example concrete. We recommend
further quantification of the opportunities for boreal forest management to main-
tain and increase forest carbon sinks. Examples include empirical studies on forest
REPORT 2021/11
9
management regimes with thinnings in Canada and Russia and on mixed-stands
vs. single-species stands and on continuous-cover forestry in comparison to rota-
tion forestry across the boreal forests.
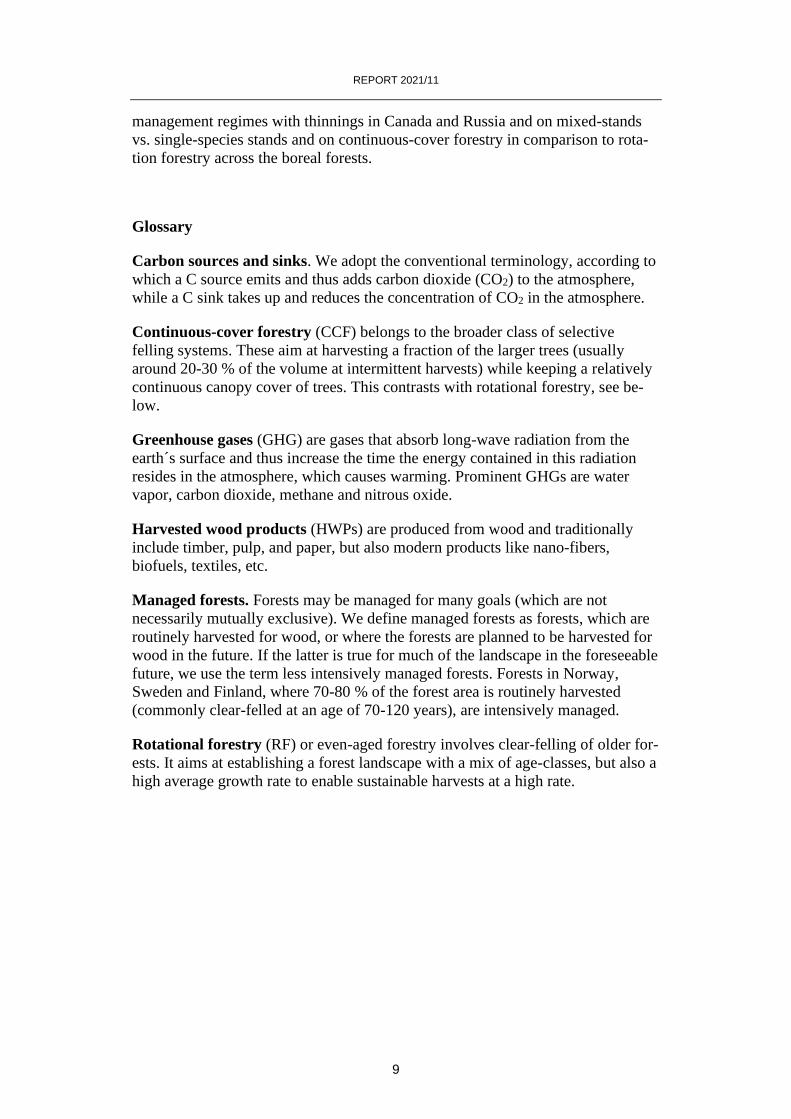
Glossary
Carbon sources and sinks. We adopt the conventional terminology, according to
which a C source emits and thus adds carbon dioxide (CO2) to the atmosphere,
while a C sink takes up and reduces the concentration of CO2 in the atmosphere.
Continuous-cover forestry (CCF) belongs to the broader class of selective
felling systems. These aim at harvesting a fraction of the larger trees (usually
around 20-30 % of the volume at intermittent harvests) while keeping a relatively
continuous canopy cover of trees. This contrasts with rotational forestry, see be-
low.
Greenhouse gases (GHG) are gases that absorb long-wave radiation from the
earth´s surface and thus increase the time the energy contained in this radiation
resides in the atmosphere, which causes warming. Prominent GHGs are water
vapor, carbon dioxide, methane and nitrous oxide.
Harvested wood products (HWPs) are produced from wood and traditionally
include timber, pulp, and paper, but also modern products like nano-fibers,
biofuels, textiles, etc.
Managed forests. Forests may be managed for many goals (which are not
necessarily mutually exclusive). We define managed forests as forests, which are
routinely harvested for wood, or where the forests are planned to be harvested for
wood in the future. If the latter is true for much of the landscape in the foreseeable
future, we use the term less intensively managed forests. Forests in Norway,
Sweden and Finland, where 70-80 % of the forest area is routinely harvested
(commonly clear-felled at an age of 70-120 years), are intensively managed.
Rotational forestry (RF) or even-aged forestry involves clear-felling of older for-
ests. It aims at establishing a forest landscape with a mix of age-classes, but also a
high average growth rate to enable sustainable harvests at a high rate.
REPORT 2021/11
10
1 Background
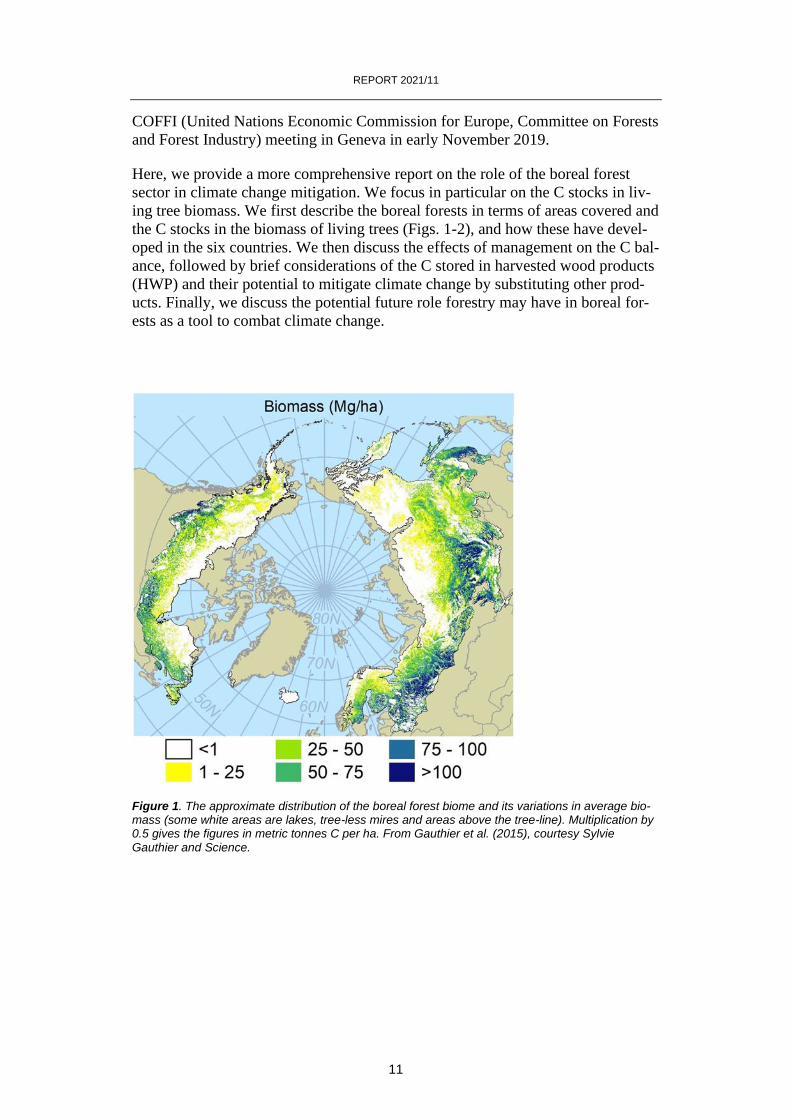
Boreal forests (Figs. 1-2) cover an area of ca.1 370 Mha (million hectares), which
is ca. 10% of the global land area and 33% of the total global area covered by
forests (Chapin et al. 2012). Boreal forests grow more slowly than temperate and
tropical forests on average, but store more carbon (C) in soils relative to in their
living biomass, (Pan et al. 2011), which is in part due to the occurrence of thick
organic soils.
In the context of the globally increasing concentrations of greenhouse gases
(GHGs) in the atmosphere, the boreal biome is projected to warm more than the
world average, a prediction, which is supported by measurements (IPCC 2013).
Thus, the question arises whether the higher temperatures will cause greater gains
of C from increased photosynthesis under warmer conditions and longer summers,
or greater losses of C through enhanced decomposition of organic matter (and
release of methane, a more potent GHG, from wetlands). Moreover, increases in
disturbance regimes, such as wildfires and insects (Kurz et al. 2008, Schaphoff et
al. 2016) have already reduced boreal forest C sinks and such disturbances are
projected to increase further with global warming (Balshi et al. 2007, 2009,
Flannigan et al. 2009, Shvidenko & Schepaschenko 2013, Schaphoff et al. 2016,
Anderegg et al. 2020).
The important question about the future role of boreal forests in the global C cycle
has no widely accepted answer. There are contrasting views on the present and
future C sink strength of boreal forests. A key policy question is whether the
forest sector can provide opportunities for climate change mitigation through
enhanced net removal of CO2 from the atmosphere, reduced emissions from the
forest sector, and avoided emissions from using wood products in place of
emissions-intensive materials or fossil fuel burning (e.g., Griscom et al. 2017, Far-
gione et al. 2018). The lack of scientific consensus on preferred mitigation activi-
ties was highlighted by the International Boreal Forest Research Association
(IBFRA) in a report to a meeting of ministers from the six major boreal countries
(Russia, Canada, USA, Sweden, Finland and Norway) in Haparanda, Sweden, in
June 2018. At the meeting, the ministers asked IBFRA to assist in organizing an
expert team to enhance science to policy linkages pertinent to the role of forestry
in boreal forests in climate change mitigation. The team was tasked with
compiling information on forest C stocks and their changes in the six boreal coun-
tries and summarizing these data in a report. Other ecological and socio-economic
aspects will be dealt with in coming reports.
Sweden provided resources to cover the costs of organizing a first workshop and
for the leadership and administration of what we call an IBFRA Insight Process.
This was carried out by a team of 25 experts (Appendix 1) primarily from the
countries concerned, but also including experts from IIASA (International
Institute for Applied Systems Analysis). A workshop was held in Stockholm
20-21 May 2019. Some preliminary findings were presented at the UNECE
REPORT 2021/11
11
COFFI (United Nations Economic Commission for Europe, Committee on Forests
and Forest Industry) meeting in Geneva in early November 2019.
Here, we provide a more comprehensive report on the role of the boreal forest
sector in climate change mitigation. We focus in particular on the C stocks in liv-
ing tree biomass. We first describe the boreal forests in terms of areas covered and
the C stocks in the biomass of living trees (Figs. 1-2), and how these have devel-
oped in the six countries. We then discuss the effects of management on the C bal-
ance, followed by brief considerations of the C stored in harvested wood products
(HWP) and their potential to mitigate climate change by substituting other prod-
ucts. Finally, we discuss the potential future role forestry may have in boreal for-
ests as a tool to combat climate change.
Figure 1. The approximate distribution of the boreal forest biome and its variations in average bio-mass (some white areas are lakes, tree-less mires and areas above the tree-line). Multiplication by 0.5 gives the figures in metric tonnes C per ha. From Gauthier et al. (2015), courtesy Sylvie Gauthier and Science.
REPORT 2021/11
12
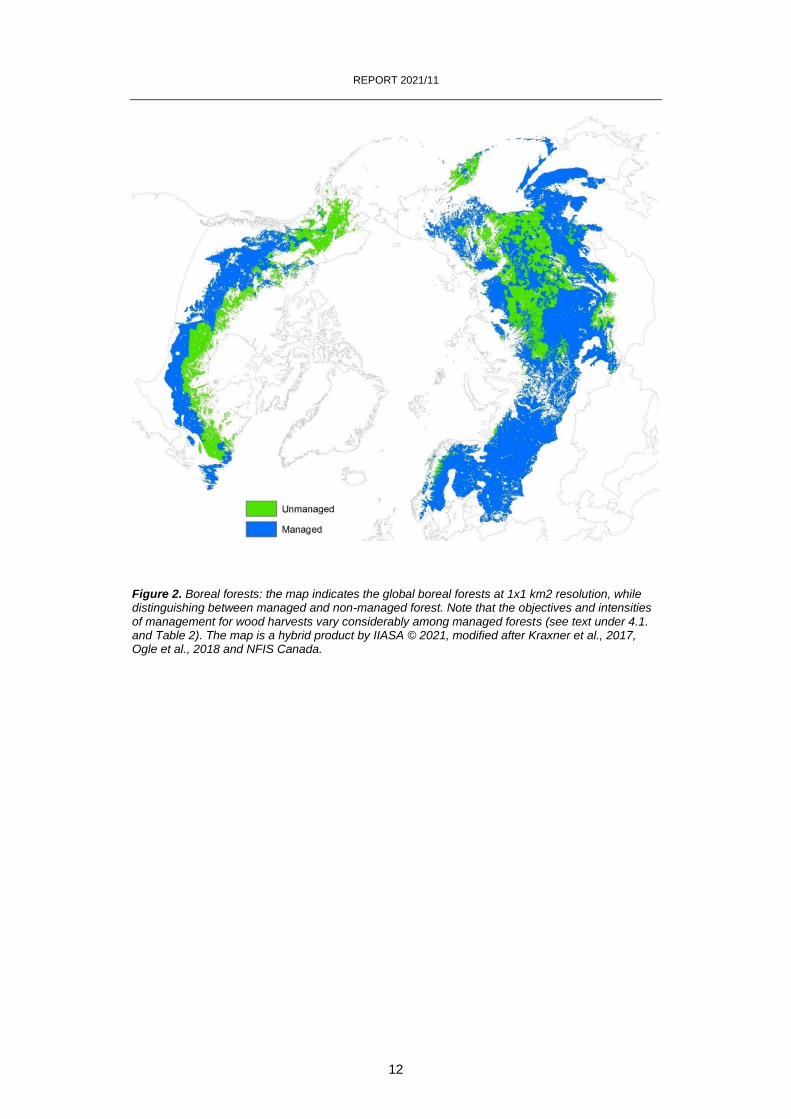
Figure 2. Boreal forests: the map indicates the global boreal forests at 1x1 km2 resolution, while distinguishing between managed and non-managed forest. Note that the objectives and intensities of management for wood harvests vary considerably among managed forests (see text under 4.1. and Table 2). The map is a hybrid product by IIASA © 2021, modified after Kraxner et al., 2017, Ogle et al., 2018 and NFIS Canada.
REPORT 2021/11
13
2 An introduction: To harvest, or not to harvest?
The goal to constrain global warming to well below 2 degrees C cannot be
achieved without significant contributions from the land sector, which is expected
to contribute towards net-negative emissions in the latter half of this century
(IPCC 2018 1.5 degree report, IPCC 2019 SRCCL). Many countries have
declared their intent to use enhanced sinks and reduced sources in the land sector
as a contribution to their GHG emission reduction goals (e.g., Forsell et al. 2016).
However, the ways in which the forest sector can contribute to net negative
emissions is debated.
The C budgets of forests vary in response to management (or absence of
management), and a clear evidence base is needed for informed discussions of
best management practices. Here, we focus the analysis on boreal forests, which
in general are managed according to country-specific strict rules and regulations
and where rates of deforestation (the conversion of forest to non-forest land uses)
and of illegal logging are much lower than in many other forest biomes, especially
tropical forests. We mainly discuss C exchanges between forests and the
atmosphere. Our discussion concerns not only how much C is stored per ha or for
the total boreal forest areas and how this has changed from 1990 to 2017, but also
the net GHG balance between the forest sector and the atmosphere. This infor-
mation is needed for discussions embracing the wider perspective that wood-
based products may replace products based on other raw materials, which are usu-
ally associated with greater emissions of GHGs.
It might perhaps be expected that a landscape of non-managed boreal forests
would store more C per hectare than a similar landscape with forests managed for
wood production. However, this hypothesis needs to be compared with available
evidence to provide a solid foundation for policy. Moreover, an effective account-
ing for C must also consider the wider implications of harvesting wood and using
wood products, since managed forests lead to sequestration of C in both the land-
scape and in wood products (e.g., Lemprière et al. 2013, Lundmark et al. 2014,
Smyth et al. 2014, Kurz et al. 2016). Complete C accounting includes total eco-
system C stocks (above- and belowground C pools and soils) and wood products,
plus the reduction in C emissions when wood products replace fossil fuels, high-
energy products (e.g., steel and concrete), the manufacturing of which causes
large emissions of CO2.
REPORT 2021/11
14
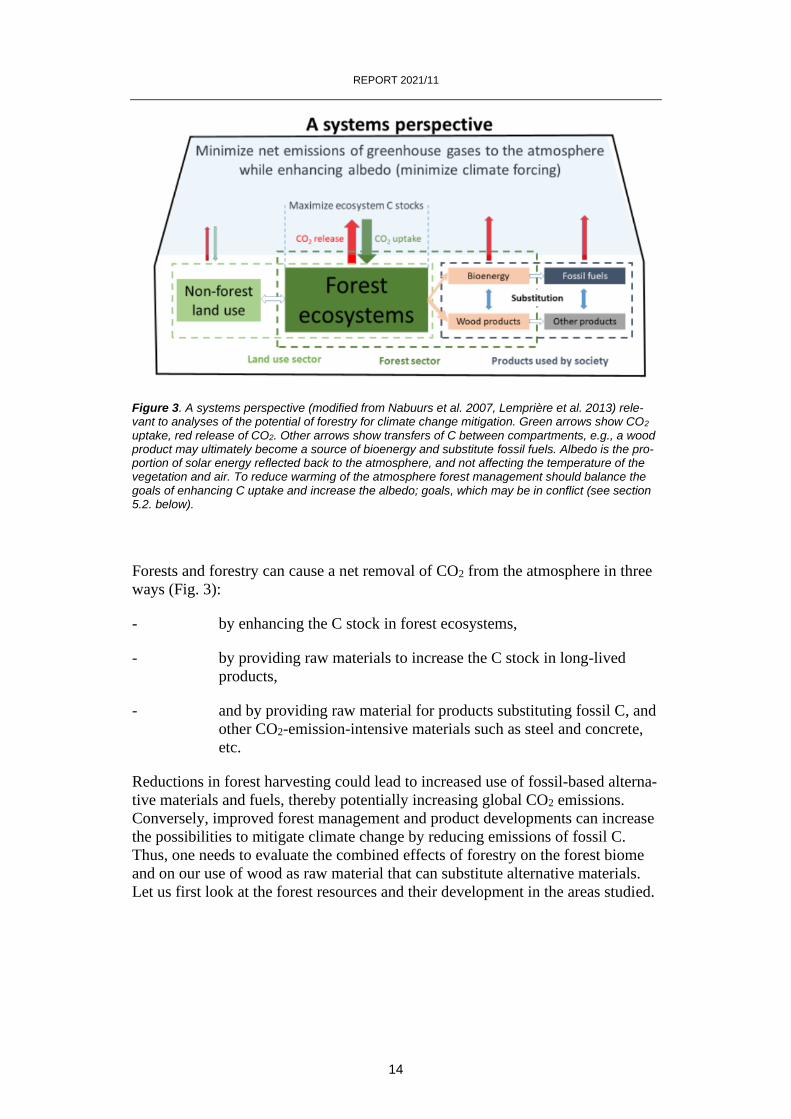
Figure 3. A systems perspective (modified from Nabuurs et al. 2007, Lemprière et al. 2013) rele-vant to analyses of the potential of forestry for climate change mitigation. Green arrows show CO2 uptake, red release of CO2. Other arrows show transfers of C between compartments, e.g., a wood product may ultimately become a source of bioenergy and substitute fossil fuels. Albedo is the pro-portion of solar energy reflected back to the atmosphere, and not affecting the temperature of the vegetation and air. To reduce warming of the atmosphere forest management should balance the goals of enhancing C uptake and increase the albedo; goals, which may be in conflict (see section 5.2. below).
Forests and forestry can cause a net removal of CO2 from the atmosphere in three
ways (Fig. 3):
- by enhancing the C stock in forest ecosystems,
- by providing raw materials to increase the C stock in long-lived
products,
- and by providing raw material for products substituting fossil C, and
other CO2-emission-intensive materials such as steel and concrete,
etc.
Reductions in forest harvesting could lead to increased use of fossil-based alterna-
tive materials and fuels, thereby potentially increasing global CO2 emissions.
Conversely, improved forest management and product developments can increase
the possibilities to mitigate climate change by reducing emissions of fossil C.
Thus, one needs to evaluate the combined effects of forestry on the forest biome
and on our use of wood as raw material that can substitute alternative materials.
Let us first look at the forest resources and their development in the areas studied.
REPORT 2021/11
15
3 The boreal forests: Areas and trends in C stocks
3.1 General considerations and scope
Here, we focus on the boreal forests in the USA, Canada, Norway, Sweden, Fin-
land and Russia (Figs. 1-2). Regarding the USA, we focus on the boreal forest in
Alaska and exclude the boreal forests in northern conterminous USA (as well as
the maritime forests along the Pacific in Alaska). In the following, we thus write
Alaska rather than the USA. In case of the three Nordic countries, we treat all
forests as boreal forests, although small areas in the south are nemo-boreal (and
even nemoral) rather than true boreal forests. With regard to Canada and Russia,
the countries with the largest expanses of boreal and other forests, we consider
only the boreal forests per se; in the case of Canada the managed southern 160
Mha part of the Canadian boreal forests (which in all cover 280 Mha, i.e., we ex-
clude the 120 Mha considered as un-managed boreal forests). In Russia, we study
the 720-810 Mha of boreal forest (Table 1); the lower and higher estimates may
partly reflect differences in the delineation of forest types between the national
system and that used by IIASA. Throughout, we use the FAO definition of forest
land (see Appendix 2).
The objectives of forest management vary considerably across the boreal forests.
In Norway, Sweden and Finland, most forests are intensively managed for wood
production by rotational silviculture. The majority of the forest land is owned by
individuals or private forest companies, i.e. 86 % in Norway, 78 % in Sweden and
80 % in Finland. Forestry is practiced in most of the forests (e.g., 73 % in
Sweden). Forest land not used for wood harvests includes national parks, nature
reserves, voluntary set asides and low-productive forest land. Importantly,
effective regeneration is mandatory after harvests (should be carried out within 3
years in Norway and Sweden, while similar strict rules have recently been re-
moved in Finland). In Finland and Sweden a few thinnings are conducted per
rotation, while thinnings are uncommon in Norway. Forest fires are effectively
prevented in all three countries.
In Alaska, industrial forestry is confined to the maritime forests along the Pacific
Ocean, which are not treated here. In the boreal forests of Alaska, cutting for do-
mestic purposes (fire wood, timber) occurs, but is very limited. Hence, we
consider the boreal forests in Alaska as un-managed in the sense that management
for wood production is not an objective. Forests are almost exclusively state- and
federal-owned. Attempts to extinguish fires are made to the extent possible, but
frequent fires started by lightning and challenges of fighting forest fires in vast
expanses of inaccessible areas leads to large areas burned.
This latter challenge is also most prominent in the boreal forests of Canada and
Russia. However, forestry is more significant than in Alaska, but a much smaller
proportion of the total standing stock of wood is harvested as compared to in
Norway, Sweden and Finland (Table 2).
REPORT 2021/11
16
The 160 Mha of boreal forests denoted as managed in Canada cannot be directly
compared with the managed forests in the Nordic countries, with a denser network
of roads and good access to most forests. In Canada, forest operations are mainly
by companies commissioned to harvest timber on public forest land. They need
approval of a plan for regeneration, but meeting the required regeneration stand-
ards does not have the narrow time limit used in the Nordic countries. Natural re-
generation or planting with native species only are methods for regeneration after
harvests in Canada's boreal forests. Around 0.7 Mha is harvested per year of
which 0.4 Mha are planted or reseeded. The remaining harvested forests and
forests after natural disturbances are subject to natural regeneration. A small
proportion of naturally disturbed areas are planted (but it is one climate mitigation
activity that is now supported by Federal Government funding). Thinning is
rarely practiced in Canadian boreal forests.
In Russia, forests are almost exclusively state property and the government issues
medium or long term leasing agreements with companies or individuals to
manage forests. The term exploitable forests (cover ca. 50 %) is used, but most of
these boreal forests are in reality not exploited for timber harvests, because of
inaccessibility. Forests west of the Ural Mountains are in general more exploited
than those to the east in terms of percentages of land harvested (Fig. 2). Protected
forest cover around 27 % and reserve forest (not planned to be harvested within
the next 20 years) cover another 23 % of the forest land. The reserve forests
should be protected from fire. Reforestation operations in the forest areas are
planned and carried out and paid for by the lease holders. Restoration of forests
outside leased areas and on forest fund lands damaged by fires and other adverse
factors is covered by the federal budget. Forest Fund lands comprise a majority of
forests (96.9 %) with the exception of forests on the lands used for industrial and
transportation facilities and etc., national reserves and national parks, and urban
forests. As of today, the lands of the Forest Fund are under the authority of the
Federal Forestry Agency, a part of the Ministry of Natural Resources and
Environment of the Russian Federation. Almost the entire area of the forests that
has been clear-cut (ca. 1 Mha per year) is subject to reforestation, through
planting (0.2 Mha per year) or measures to promote natural regeneration (0.8 Mha
per year).
3.2 Methods of inventory (details are given in Appendix 3)
In Norway, Sweden and Finland, there is a wealth of data on tree volume and
growth from detailed national forest inventories (Tomppo et al. 2010), which have
been going on for around a century. These inventories cover annually all forests in
the three countries, e.g., in Sweden 6 000 plots across all forests are sampled
every year (Fridman et al. 2014). In contrast, such detailed data are not available
from the vast less populated boreal forests of Alaska, Canada and Russia
(Appendix 3). Hence, for these we use data mainly derived by remote sensing
methods or combinations of ground-based inventory and remote sensing. The data
we report are largely from the National Inventory Reports to UNFCCC (United
Nations Framework Convention on Climate Change).
REPORT 2021/11
17
Moreover, while data from the Nordic countries would have allowed a longer
retrospective analysis, the paucity of long-term data from the other countries re-
stricted our study to the period 1990 - 2017. The exception is Alaska, where data
for 1990 - 2009 only are available so far. Estimates for Alaska are embedded in
the reports according to international agreements for the USA for the period 1990
- 2017. However, although the data from the six countries have been available,
our Insight Process is the first concerted exercise to compile and synthesize data
for all six boreal regions.
3.3 Results
3.3.1 Results: areas and stocks of C in boreal forests
According to our assessment, the area of boreal forests has had no major changes
since 1990. The C stocks of the living biomass is correlated with the area of forest
land, i.e., the average C stock in living biomass per area varies within fairly
narrow limits (Table 1) as compared to global variations. It is highest in Canada,
where the inclusion of the unmanaged, northern boreal forests with lower biomass
(120 Mha) would have resulted in a lower average tree biomass C (Figs. 1 - 2).
This would make the Canadian data more comparable to those from the other
countries, where the northerly and least productive forests are included.
The similarities in average C stock across countries indicate that the reductions in
live-tree C stocks with harvesting in the Nordic countries do not result in much
lower average whole-rotation C stocks than in un-managed forests or less
intensively managed forest landscapes (Table 1). In these, stand-replacing forest
fires cause large local fluctuations in C stocks as they also create a mosaic of
young and old forests. The above arguments rests on the assumption that there are
no systematic differences in soil fertility, length of growing season, growing
season temperature, etc. among the countries. Given that such differences may
influence the results, we put emphasis on the changes that have occurred in each
country 1990 - 2017.
3.3.2 Results: changes in C stocks of boreal forests as a result of growth and removals by harvests, fire and other causes
In contrast to the relative similarity in average C stock in living biomass, patterns
of change in C stock in living biomass, removals by wood harvests and losses by
fire differ substantially among the countries. Note that losses by fire include C
losses from biomass, dead wood and soils, while harvests are largely removals of
stems. We first discuss the changes in biomass C and the removals by harvests in
the three Nordic countries, then in Alaska, Canada and Russia.
REPORT 2021/11
18
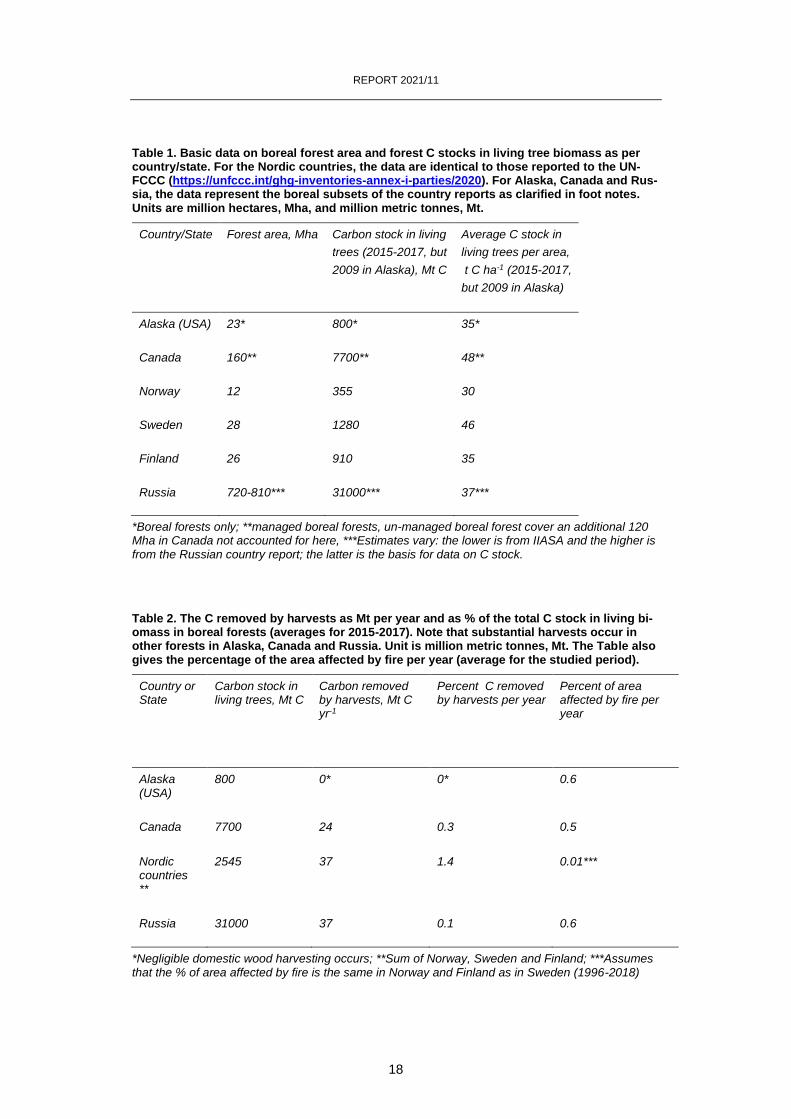
Table 1. Basic data on boreal forest area and forest C stocks in living tree biomass as per country/state. For the Nordic countries, the data are identical to those reported to the UN-FCCC (https://unfccc.int/ghg-inventories-annex-i-parties/2020). For Alaska, Canada and Rus-sia, the data represent the boreal subsets of the country reports as clarified in foot notes. Units are million hectares, Mha, and million metric tonnes, Mt.
Country/State Forest area, Mha Carbon stock in living
trees (2015-2017, but
2009 in Alaska), Mt C
Average C stock in
living trees per area,
t C ha-1 (2015-2017,
but 2009 in Alaska)
Alaska (USA) 23* 800* 35*
Canada 160** 7700** 48**
Norway 12 355 30
Sweden 28 1280 46
Finland 26 910 35
Russia 720-810*** 31000*** 37***
*Boreal forests only; **managed boreal forests, un-managed boreal forest cover an additional 120 Mha in Canada not accounted for here, ***Estimates vary: the lower is from IIASA and the higher is from the Russian country report; the latter is the basis for data on C stock.
Table 2. The C removed by harvests as Mt per year and as % of the total C stock in living bi-omass in boreal forests (averages for 2015-2017). Note that substantial harvests occur in other forests in Alaska, Canada and Russia. Unit is million metric tonnes, Mt. The Table also gives the percentage of the area affected by fire per year (average for the studied period).
Country or State
Carbon stock in living trees, Mt C
Carbon removed by harvests, Mt C yr-1
Percent C removed by harvests per year
Percent of area affected by fire per year
Alaska (USA)
800 0* 0* 0.6
Canada 7700 24 0.3 0.5
Nordic countries **
2545 37 1.4 0.01***
Russia 31000 37 0.1 0.6
*Negligible domestic wood harvesting occurs; **Sum of Norway, Sweden and Finland; ***Assumes that the % of area affected by fire is the same in Norway and Finland as in Sweden (1996-2018)
REPORT 2021/11
19
Sweden
Year
1990 1995 2000 2005 2010 2015
0
500
1000
1500
2000
Norway
Year
1990 1995 2000 2005 2010 2015
Mt C
0
500
1000
1500
2000
Finland
Year
1990 1995 2000 2005 2010 2015
0
500
1000
1500
2000
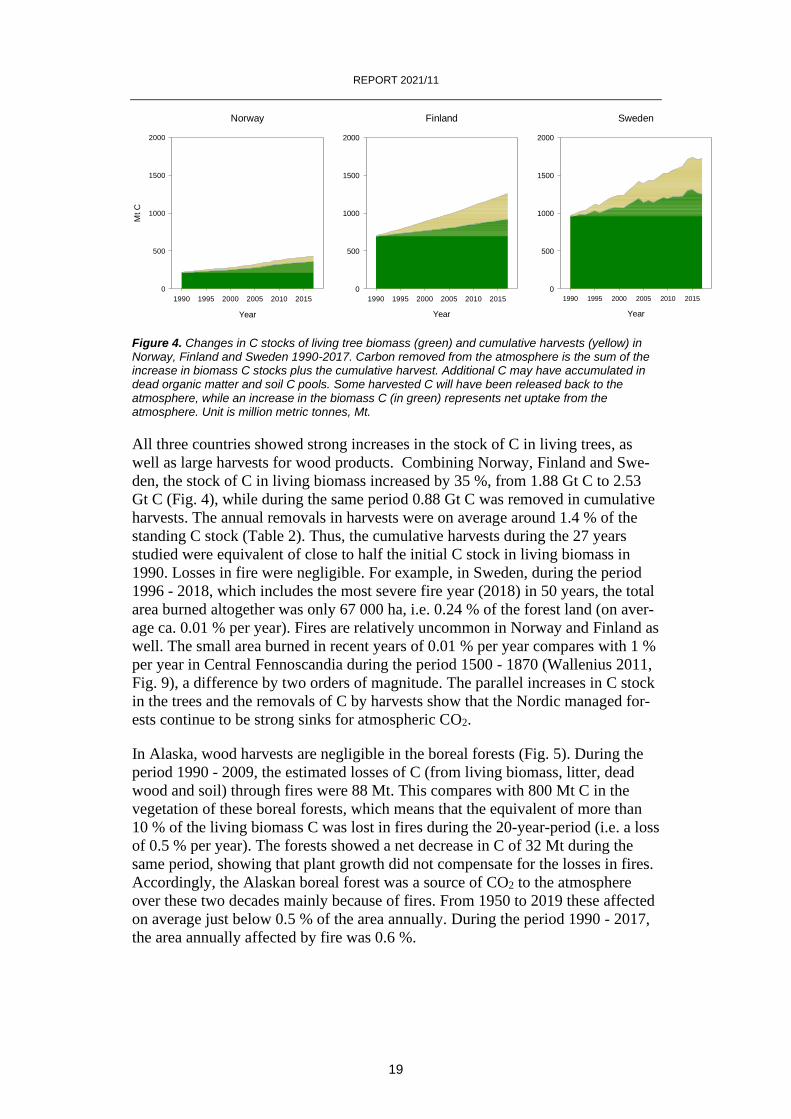
Figure 4. Changes in C stocks of living tree biomass (green) and cumulative harvests (yellow) in Norway, Finland and Sweden 1990-2017. Carbon removed from the atmosphere is the sum of the increase in biomass C stocks plus the cumulative harvest. Additional C may have accumulated in dead organic matter and soil C pools. Some harvested C will have been released back to the atmosphere, while an increase in the biomass C (in green) represents net uptake from the atmosphere. Unit is million metric tonnes, Mt.
All three countries showed strong increases in the stock of C in living trees, as
well as large harvests for wood products. Combining Norway, Finland and Swe-
den, the stock of C in living biomass increased by 35 %, from 1.88 Gt C to 2.53
Gt C (Fig. 4), while during the same period 0.88 Gt C was removed in cumulative
harvests. The annual removals in harvests were on average around 1.4 % of the
standing C stock (Table 2). Thus, the cumulative harvests during the 27 years
studied were equivalent of close to half the initial C stock in living biomass in
1990. Losses in fire were negligible. For example, in Sweden, during the period
1996 - 2018, which includes the most severe fire year (2018) in 50 years, the total
area burned altogether was only 67 000 ha, i.e. 0.24 % of the forest land (on aver-
age ca. 0.01 % per year). Fires are relatively uncommon in Norway and Finland as
well. The small area burned in recent years of 0.01 % per year compares with 1 %
per year in Central Fennoscandia during the period 1500 - 1870 (Wallenius 2011,
Fig. 9), a difference by two orders of magnitude. The parallel increases in C stock
in the trees and the removals of C by harvests show that the Nordic managed for-
ests continue to be strong sinks for atmospheric CO2.
In Alaska, wood harvests are negligible in the boreal forests (Fig. 5). During the
period 1990 - 2009, the estimated losses of C (from living biomass, litter, dead
wood and soil) through fires were 88 Mt. This compares with 800 Mt C in the
vegetation of these boreal forests, which means that the equivalent of more than
10 % of the living biomass C was lost in fires during the 20-year-period (i.e. a loss
of 0.5 % per year). The forests showed a net decrease in C of 32 Mt during the
same period, showing that plant growth did not compensate for the losses in fires.
Accordingly, the Alaskan boreal forest was a source of CO2 to the atmosphere
over these two decades mainly because of fires. From 1950 to 2019 these affected
on average just below 0.5 % of the area annually. During the period 1990 - 2017,
the area annually affected by fire was 0.6 %.
REPORT 2021/11
20
Alaska
Year
1990 1995 2000 2005 2010 2015
Mt
C
0
200
400
600
800
1000
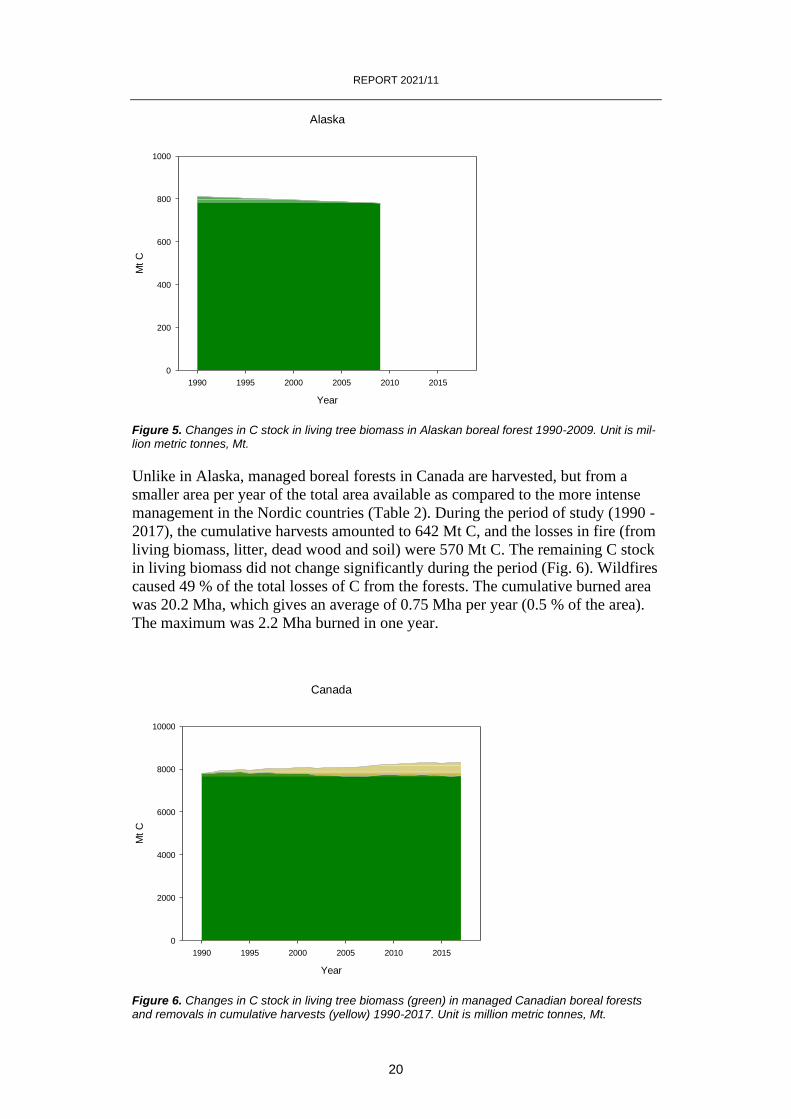
Figure 5. Changes in C stock in living tree biomass in Alaskan boreal forest 1990-2009. Unit is mil-lion metric tonnes, Mt.
Unlike in Alaska, managed boreal forests in Canada are harvested, but from a
smaller area per year of the total area available as compared to the more intense
management in the Nordic countries (Table 2). During the period of study (1990 -
2017), the cumulative harvests amounted to 642 Mt C, and the losses in fire (from
living biomass, litter, dead wood and soil) were 570 Mt C. The remaining C stock
in living biomass did not change significantly during the period (Fig. 6). Wildfires
caused 49 % of the total losses of C from the forests. The cumulative burned area
was 20.2 Mha, which gives an average of 0.75 Mha per year (0.5 % of the area).
The maximum was 2.2 Mha burned in one year.
Canada
Year
1990 1995 2000 2005 2010 2015
Mt
C
0
2000
4000
6000
8000
10000
Figure 6. Changes in C stock in living tree biomass (green) in managed Canadian boreal forests and removals in cumulative harvests (yellow) 1990-2017. Unit is million metric tonnes, Mt.

REPORT 2021/11
21
Russia has a lower intensity of forest harvesting than Canada (Table 2). Harvests
accounted for 61 % of the losses of C from the boreal forests as compared to 37 %
due to loss by fire (these data are Russian records from 2003-2016). According to
global fire data bases (GFED4.1 and 4.1s, Randerson et al. 2018) and two Russian
remote sensing sources (Space Research Institute, Moscow and Institute of
Forest, Krasnoyarsk) the average forest land area affected by fire was 4.5 - 5.5
Mha per year, which is around 0.6 % of the area per year. Outbreaks of insect
pests and other pathogens regularly occur at a similar scale (Review of Sanitary
and Forest Health State in the Russian Federation in 2018, Bartalev et al. 2017,
Schaphoff et al. 2016). Remote sensing data indicate that on average 1.8 Mha
(range 0.4 – 3.3 Mha) of forests died annually as a consequence of stand replacing
natural disturbances 2002-2011 (Krylov et al. 2014). Fire frequency especially
that of megafires has increased during the last decades. However, the C stock in
living biomass did not change significantly during the period 1990-2017 (Fig. 7).
Russia
Year
1990 1995 2000 2005 2010 2015
Mt
C
0
5000
10000
15000
20000
25000
30000
35000
Figure 7. Changes in C stock in living biomass (green) in Russian boreal forests (according to the country report) and removals in cumulative harvests (yellow) 1990-2017. Unit is million metric tonnes, Mt.
3.3.3 How comparable are the data from the different countries and how do our data compare with other studies?
Do our data allow valid comparisons among the countries involved in this study?
The data we show are the most up-to-date data available at the time of this study
from the different countries. However, as discussed above, the methods differ
with long-term detailed field measurements available for the Nordic countries as
compared to mainly remote sensing data combined with data on disturbances and
management activities integrated in models for Alaska and Canada.
Assessment of boreal forest resources in Russia is especially challenging because
of the size of the forest area and vast areas that are inaccessible. Colleagues based
REPORT 2021/11
22
in Russia and at IIASA (where Russian experts are active) have both provided
data. The Russian data are partly from older field inventories; modern inventory
data are currently not available for all of Russian boreal forests. The data on
Russia reported by IIASA are based on remote sensing. There are differences be-
tween these estimates, which we so far have not been able to reconcile (Table 1).
However, we find that these differences are not large enough to invalidate our ma-
jor conclusions about trends in living biomass C stocks.
One may also ask how the data presented above compare with other assessments
pertinent to the C dynamics of boreal forests. For example, Song et al. (2018)
recently reported an increase in forest area in Russia, but this mainly occurred
outside the boreal forests. Moreover, we have concentrated on the living biomass,
while some other reports provide estimates for the ecosystem, which includes also
the components dead wood, litter and soil. We find that more accurate estimates
of these components are not available for most of the boreal region.
We note that inclusion of the northern, un-managed Canadian boreal forests, i.e.
forests without harvests, would make the Canadian data more comparable to those
from the other countries. For example, in Finland the northern half of their forests
has a tree biomass which is 60 % of that in the south. A similar difference in the
Canadian boreal forests would result in an estimate of 40 t C ha-1. On the other
hand, Pan et al. (2011) provide a higher estimate for Canadian boreal forest than
we do in this report, because they classified all of Canada’s forests as boreal.
Regarding the three Nordic countries the data shown by us and by Pan et al.
(2011) are directly comparable.
Over the last three decades, plenty of reports based on modelling, remote sensing
of vegetation or atmospheric inversions (studies based on large-scale temporal and
spatial variations in atmospheric CO2) have addressed the state and change of
boreal forests. Several of these reports have suggested that northerly forests are a
continuing and significant sink for atmospheric CO2 (e.g., Ciais et al. 2019). Our
data on living biomass C indicate that in the largest areas of boreal forests, i.e. in
Canada and Russia, the forests are a relatively weak sink for C (Figs. 6-7), while
the unmanaged boreal forest in Alaska are a source of C (Fig. 5). The develop-
ment of the Nordic boreal forests does support the idea of a strong northerly sink
(Fig. 4), but their area is too small to make the large imprint needed to affect the
atmospheric inversion calculations. On the other hand, our data from the Nordic
countries very clearly refute the proposition that the Nordic forests were a source
of C 2010 - 2015 (Scholze et al. 2019). Such discrepancies point at the urgent
need to reconcile global-model estimates and country reports (e.g., Grassi et al.
2018). The detailed and reliable inventory data from the Nordic countries are
suitable for tests of the global models.
REPORT 2021/11
23
4 Effects of management on the C balance of boreal forests
4.1 Do un-managed forests take up more C than forests man-aged for wood production? General considerations.
This seemingly simple question hides considerable complexity. Un-managed
forests are also dynamic (non-static), as they are subject to frequent natural
disturbances. An intense, stand-replacing fire can release as much CO2 in a day as
the forest accumulated over a period of decades or centuries. Thus, landscapes of
unmanaged forests are composed of larger and smaller areas of forests regener-
ated after severe fires, windstorms, and outbreaks of insects. Some portions of
landscapes may avoid major disturbances allowing trees to become hundreds of
years old. The average age across a landscape or region is typically less, as patchy
disturbances reinitiate young stands.
Managed forests also vary in age across landscapes. Rotational forestry
dominates in managed forests in the boreal zone, where mature forests (commonly
70 - 120 years old) are clear-felled and replaced by planted seedlings or seedlings
emerging from natural regeneration. In such settings, older trees or forests occur
in national parks, nature reserves, or more informal set-asides, including occa-
sional retention trees (Gustafsson et al. 2012). Moreover, rotational forestry in
Finland and Sweden also involves thinnings. Usually this is “from below”, i.e.
removes trees that grow more slowly than the dominant trees.
In the absence of disturbance, forests are sinks for atmospheric CO2 when their
uptake of CO2 through photosynthesis exceeds its release from plant respiratory
processes and the microbial decomposition of organic matter. This is a dynamic
balance; boreal forests are sinks during days from late spring to early autumn.
They are sources at night and even during the day for the coldest portions of the
year (albeit a small source because decomposition is reduced at low tempera-
tures). Rates of photosynthesis during summer days are so large that CO2 uptake
across the course of the year can exceed respiration releases despite long hours
and even months when photosynthesis is not occurring.
When the majority of trees in a forest are killed by natural disturbances or clear-
felling, the forest becomes a net source of CO2 back to the atmosphere. The
re-growing forest becomes a net sink again when the forest canopy re-establishes
and photosynthesis once again exceeds respiration. The sink (the rate of net
uptake of CO2) is stronger in young to middle-aged forests as compared to in
older forests, but the exact time of maximum sink strength varies among forests
and sites.
Would an area covered by an old forest be a stronger sink if the forest remained
unharvested (and would not burn) for another century or if the old forest was
harvested and the site managed as a century-long rotational stand? Harvesting
drops photosynthesis and may increase decomposition, so post-harvest sites are
REPORT 2021/11
24
net sources of C to the atmosphere. The re-establishment of the forest canopy
takes one or more decades, and eddy-flux studies (where the net flux of C is
measured in towers above forests) indicate that boreal sites become net sinks
again after 5-20 years (Amiro et al. 2010, Coursolle et al. 2012, Taylor et al. 2014,
Gao et al. 2018, Rebane et al. 2019). The length of time a site spends as a net
source to the atmosphere varies with the intensity of disturbances, forest manage-
ment and soil fertility. Most studies of recent clear-fellings in boreal forests have
been in N. America, where laws allow a slower artificial or natural regeneration to
take place as compared to in the Nordic countries. Requirements for more rapid
forest regeneration in the Nordic countries shorten the time necessary for forests
to re-establish as CO2 sinks.
These rates of change vary across sites, and there may not be a useful, universal
answer to the question posed at the beginning of this paragraph. The available
evidence clearly indicates that rotational forests would have higher wood accumu-
lation rates than forests older than a century (see section 5.2., esp. Fig. 10), and
the available soil inventory trends do not show a decline in soil C with rotational
forestry (Stendahl 2017). This combination would indicate rotational forests
would sequester C at a faster rate than old forests, but this issue would benefit
from a great deal more research that aimed to capture the range of outcomes
across locations in the boreal forest zone.
Stand thinning and other selective felling methods (including continuous-cover
forestry) remove a fraction of the stem volume at a time, with harvesting opera-
tions recurring at time scales of one or more decades. Thus, selective felling
methods have a smaller effect on forest C balance at the scale of a stand in the
shorter term, but a larger land area must be harvested to meet the same demand,
which means that the total effect in terms of the amount of CO2 released from the
landscape may differ less. In the longer term, the differences in productivity
between selective felling and rotational felling systems is the most important
factor to consider. In a recent review, Lundqvist (2017) concluded that uneven-
aged Norway spruce forests grow 10 – 20 % less than even-aged (rotational)
stands, with larger differences when the harvest intensity is high in the uneven-
aged stands. In a recent comprehensive study in Finland, Hynynen et al. (2019)
found a similar difference in growth between uneven-aged forests and rotational
forests.
The profitability of forest practices depends on markets, characteristics of tree
species used and site-specific details. Continuous-cover forest management may
be a more profitable option than rotational systems when the initial stand diameter
distribution is wide (Juutinen et al. 2018; Juutinen et al. 2020). Moreover, it is
possible that continuous-cover forestry has a more favourable GHG balance com-
pared to rotational forestry on nitrogen-rich organic soils (Korkiakoski et al.
2020), where there is a greater release of the potent GHG N2O after clear-felling.
More direct investigation would be needed to inform the magnitude and extent of
any GHG-balance patterns in relation to site N status.
In the context of rotational forestry, there is consensus that middle-aged forests
are stronger C sinks than old forests (e.g., Pregitzer & Euskirchen 2004; Luyssaert
et al. 2008; Coursolle et al. 2012; Kashian et al. 2013). However, old forests may
REPORT 2021/11
25
continue to function as weak sinks (Luyssaert et al. 2008), but may flip to sources
in some years (Wharton & Falk 2016) or most years.
The ecophysiology that drives the age-related trends in the strength of forest sinks
remains somewhat unclear. An early speculation was that old trees required higher
respiration rates to sustain large biomass (Odum 1969), but evidence shows that
tree respiration declines in older forests, but not as much as the decline in photo-
synthesis (Ryan et al. 1997, Tang et al. 2014). Importantly, the amount of C stored
in the live biomass and the soil can become comparatively large if the forest is not
disturbed, but the net rate of C uptake, the sink strength, clearly decreases in aging
forests (Kashian et al. 2013).
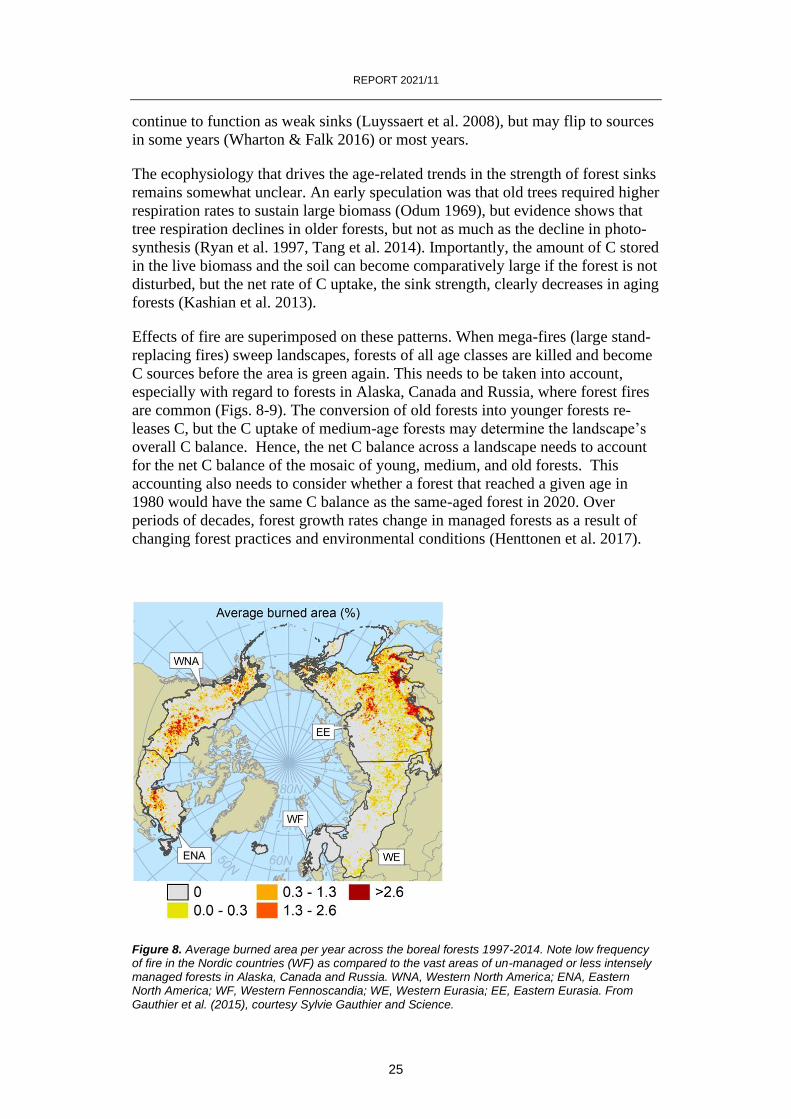
Effects of fire are superimposed on these patterns. When mega-fires (large stand-
replacing fires) sweep landscapes, forests of all age classes are killed and become
C sources before the area is green again. This needs to be taken into account,
especially with regard to forests in Alaska, Canada and Russia, where forest fires
are common (Figs. 8-9). The conversion of old forests into younger forests re-
leases C, but the C uptake of medium-age forests may determine the landscape’s
overall C balance. Hence, the net C balance across a landscape needs to account
for the net C balance of the mosaic of young, medium, and old forests. This
accounting also needs to consider whether a forest that reached a given age in
1980 would have the same C balance as the same-aged forest in 2020. Over
periods of decades, forest growth rates change in managed forests as a result of
changing forest practices and environmental conditions (Henttonen et al. 2017).
Figure 8. Average burned area per year across the boreal forests 1997-2014. Note low frequency of fire in the Nordic countries (WF) as compared to the vast areas of un-managed or less intensely managed forests in Alaska, Canada and Russia. WNA, Western North America; ENA, Eastern North America; WF, Western Fennoscandia; WE, Western Eurasia; EE, Eastern Eurasia. From Gauthier et al. (2015), courtesy Sylvie Gauthier and Science.
REPORT 2021/11
26
It is sometimes claimed that leaving forests as they are would lead to the highest
long-term C sink based on the observation that old forests can still act as sinks
(e.g., Luyssaert et al. 2008). However, old forests are most often much weaker
sinks than middle-aged forests (e.g., Kashian et al. 2013). Moreover, studies com-
paring old forests with younger may not be appropriate if they overlook the fact
that some forests belonging to the same initial age-cohort as the remaining old
forests are now young forests as a consequence of a natural disturbance event.
The state of today´s old forests may not be reached by all young forests today
even in the absence of forest harvests. Landscape-scale inferences on C balances
need to account for the range of forests within a landscape, including the age
distributions for both managed and unmanaged forests. While conserving forests
is positive from many perspectives, e.g. maintaining biodiversity, forests are
vulnerable to the risk of damage by fire or pathogens, and hence loss of C.
Fires lead to a direct loss of C to the atmosphere. Unless salvage logging is
possible, fires result in lost opportunities to produce wood products and substitute
other products, with a negative effect on the global C balance. Another
fundamental difference between harvests and fires is that the former removes
most often stem wood only (sometimes in the Nordic countries tree tops and
branches are used for district heating), while fires consume C in the organic
mor-layer of the soil and tree foliage, branches and stems; the loss of C increases
with the severity of the burn. In cases where dead trunks are around after the fire,
these and stumps will decompose quite slowly. Common to both fire and clear-
felling is that fine roots and mycorrhizal fungal mycelium will start to decompose
directly after the disturbance. Remote sensing observations in Canada documented
more consistent and faster forest recovery after harvest compared to wildfire
(White et al. 2017).
Fires in Asian Russia can result in a situation where 15-20 % of the land affected
is not naturally regenerated in the shorter term (Vaschuk & Shvidenko 2006). In
critical situations (zonal and altitudinal ecotones, steep slopes, on permafrost),
forest areas may completely lose productive potential for reforestation for a long
time after mega-fires (Yefremov & Shvidenko 2004, Schaphoff et al. 2016).
Infrequent seed years further delay the regrowth of forests by natural regeneration.
What is then the combined results of management versus non-management in a
larger landscape perspective and over a longer time scale? In some quarters, the
assumption is held that natural ecosystems by definition will always store more C
than managed systems. For example, Erb et al. (2018) modelled and made maps
of potential biomass, which were compared with actual biomass stocks. They
“adjusted the maps where necessary, so that the actual biomass would not surpass
the potential biomass stocks”. By assuming that C stocks of the managed systems
could never become higher than the modelled potential stock, these authors
prevented a test of this question. An un-biased assessment should recognize that
managed boreal forests can be a stronger C sink and have a larger C stock than
un-managed boreal forests. Furthermore, the impact of the natural disturbance
regime must also be considered (Figs. 8-9). This is especially important since cli-
mate change is predicted to increase the risk of losses of C by fires (Anderegg et
al. 2020).
REPORT 2021/11
27
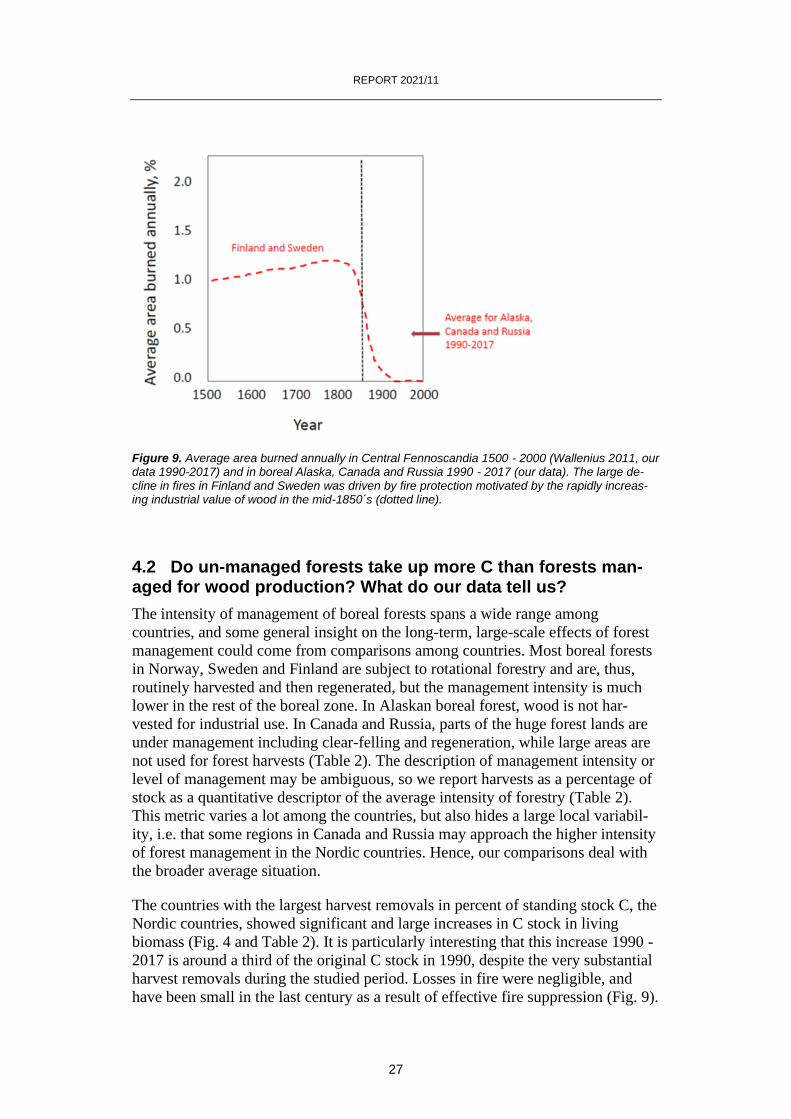
Figure 9. Average area burned annually in Central Fennoscandia 1500 - 2000 (Wallenius 2011, our data 1990-2017) and in boreal Alaska, Canada and Russia 1990 - 2017 (our data). The large de-cline in fires in Finland and Sweden was driven by fire protection motivated by the rapidly increas-ing industrial value of wood in the mid-1850´s (dotted line).
4.2 Do un-managed forests take up more C than forests man-aged for wood production? What do our data tell us?
The intensity of management of boreal forests spans a wide range among
countries, and some general insight on the long-term, large-scale effects of forest
management could come from comparisons among countries. Most boreal forests
in Norway, Sweden and Finland are subject to rotational forestry and are, thus,
routinely harvested and then regenerated, but the management intensity is much
lower in the rest of the boreal zone. In Alaskan boreal forest, wood is not har-
vested for industrial use. In Canada and Russia, parts of the huge forest lands are
under management including clear-felling and regeneration, while large areas are
not used for forest harvests (Table 2). The description of management intensity or
level of management may be ambiguous, so we report harvests as a percentage of
stock as a quantitative descriptor of the average intensity of forestry (Table 2).
This metric varies a lot among the countries, but also hides a large local variabil-
ity, i.e. that some regions in Canada and Russia may approach the higher intensity
of forest management in the Nordic countries. Hence, our comparisons deal with
the broader average situation.
The countries with the largest harvest removals in percent of standing stock C, the
Nordic countries, showed significant and large increases in C stock in living
biomass (Fig. 4 and Table 2). It is particularly interesting that this increase 1990 -
2017 is around a third of the original C stock in 1990, despite the very substantial
harvest removals during the studied period. Losses in fire were negligible, and
have been small in the last century as a result of effective fire suppression (Fig. 9).
REPORT 2021/11
28
Changes in the content of C of a region’s forests might come from increased for-
est coverage, increased average stand age, and increased growth rates. In the
Nordic countries, the major change since 1990 was increased growth rates of
managed forests, not expansion of forest areas or increases in stand age across
landscapes.
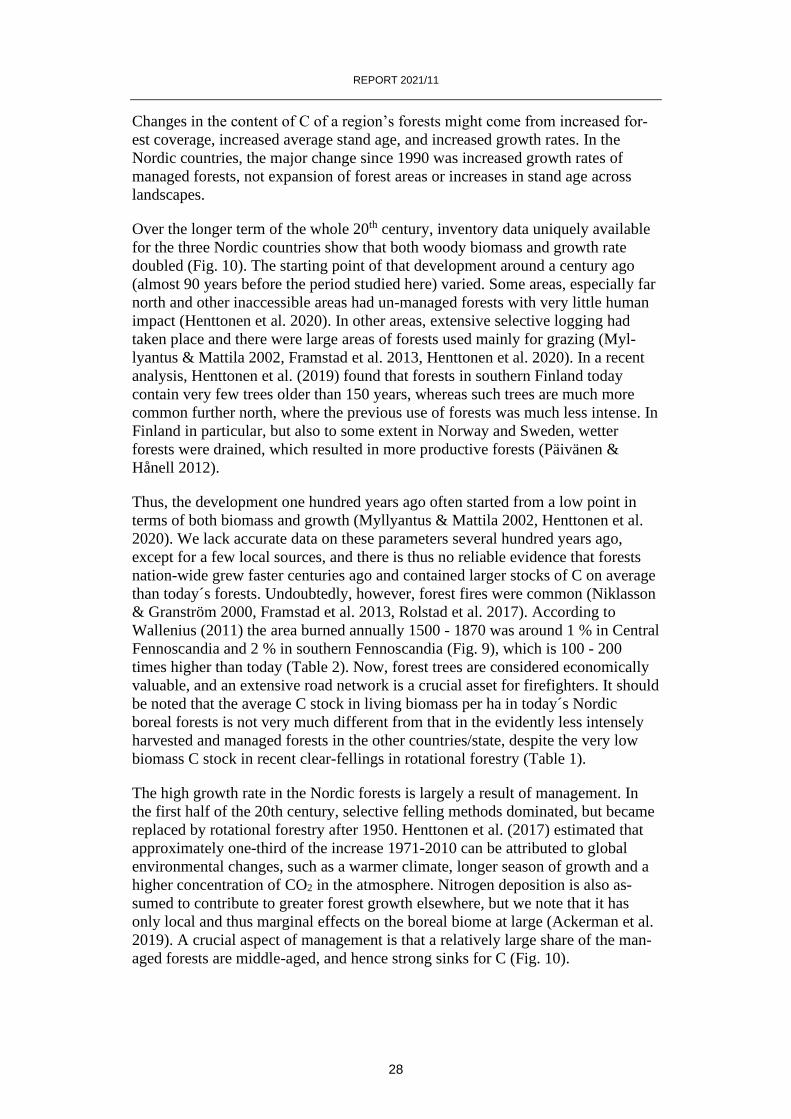
Over the longer term of the whole 20th century, inventory data uniquely available
for the three Nordic countries show that both woody biomass and growth rate
doubled (Fig. 10). The starting point of that development around a century ago
(almost 90 years before the period studied here) varied. Some areas, especially far
north and other inaccessible areas had un-managed forests with very little human
impact (Henttonen et al. 2020). In other areas, extensive selective logging had
taken place and there were large areas of forests used mainly for grazing (Myl-
lyantus & Mattila 2002, Framstad et al. 2013, Henttonen et al. 2020). In a recent
analysis, Henttonen et al. (2019) found that forests in southern Finland today
contain very few trees older than 150 years, whereas such trees are much more
common further north, where the previous use of forests was much less intense. In
Finland in particular, but also to some extent in Norway and Sweden, wetter
forests were drained, which resulted in more productive forests (Päivänen &
Hånell 2012).
Thus, the development one hundred years ago often started from a low point in
terms of both biomass and growth (Myllyantus & Mattila 2002, Henttonen et al.
2020). We lack accurate data on these parameters several hundred years ago,
except for a few local sources, and there is thus no reliable evidence that forests
nation-wide grew faster centuries ago and contained larger stocks of C on average
than today´s forests. Undoubtedly, however, forest fires were common (Niklasson
& Granström 2000, Framstad et al. 2013, Rolstad et al. 2017). According to
Wallenius (2011) the area burned annually 1500 - 1870 was around 1 % in Central
Fennoscandia and 2 % in southern Fennoscandia (Fig. 9), which is 100 - 200
times higher than today (Table 2). Now, forest trees are considered economically
valuable, and an extensive road network is a crucial asset for firefighters. It should
be noted that the average C stock in living biomass per ha in today´s Nordic
boreal forests is not very much different from that in the evidently less intensely
harvested and managed forests in the other countries/state, despite the very low
biomass C stock in recent clear-fellings in rotational forestry (Table 1).
The high growth rate in the Nordic forests is largely a result of management. In
the first half of the 20th century, selective felling methods dominated, but became
replaced by rotational forestry after 1950. Henttonen et al. (2017) estimated that
approximately one-third of the increase 1971-2010 can be attributed to global
environmental changes, such as a warmer climate, longer season of growth and a
higher concentration of CO2 in the atmosphere. Nitrogen deposition is also as-
sumed to contribute to greater forest growth elsewhere, but we note that it has
only local and thus marginal effects on the boreal biome at large (Ackerman et al.
2019). A crucial aspect of management is that a relatively large share of the man-
aged forests are middle-aged, and hence strong sinks for C (Fig. 10).
REPORT 2021/11
29
Figure 10. The development of total stem volume (left, green circles) of forests and their mean an-nual increment (right, green circles) in Finland the last hundred years and the change in average stand age the last 40 years in northern (hatched bars) and southern (unfilled bars) Finland. Rota-tional forestry replaced selective felling forestry around 1960. Note that stem volume increased by close to 70 % from 1960 to 2018, while the average forest stand age declined by 10 years in the north and by 20 years in the south. Data from official Finnish Forest Statistics (https://stat.luke.fi/su-omen-mets%C3%A4tilastot-2019-2019_fi).
For example, in Finland the volume of living trees increased, while management
resulted in progressively younger stands and the average mean annual growth rate
increased in 1960 – 2016 (Fig. 10). Another important aspect is the requirement
by law to promptly establish a new productive stand after clear-felling. Further-
more, planting after clear-felling allows introduction of genetically selected seed-
ling material.
Countries where much less of the forests are managed for wood harvests, Alaska,
Canada and Russia (Table 2), showed little or no increase in C stocks in living
biomass 1990 - 2017 (Figs. 5-7). Their boreal forests are on average either small
sources (Alaska) or very small sinks (Canada and Russia) when fluxes are ex-
pressed on an area basis. Losses of C from aboveground biomass by fire constitute
90, 49 and 37 % of the total losses (due to harvests, fire, pathogens) in Alaska,
Canada and Russia, respectively (the data for Russia are from the country report).
This compares with close to nil in the Nordic countries, where removals by har-
vests prevail (along with a substantial build-up of the C stock). The percentage
forest area burned annually on average, roughly 0.6 %, 0.5 % and 0.6 % in
Alaska, Canada and Russia, respectively, compares with 0.01 % in Sweden, a
difference by a factor 50 - 60 (Table 2, Fig. 9). Importantly, the available inven-
tory data for the boreal forests in Alaska, Canada and Russia show no substantial
increase in tree biomass in response to a warmer climate, earlier spring thaw and
increasing concentration of CO2 in the atmosphere. These factors have been in-
ferred to contribute to the increased tree growth in the Nordic context (Henttonen
et al. 2017), where standing stock C has increased in all three countries (Fig. 4), as
has harvests in Finland and Sweden, in particular. Canadian data from permanent
REPORT 2021/11
30
sample plots and tree rings are inconclusive and show regional differences in for-
est responses to environmental changes (Girardin et al. 2016, Hember et al. 2017,
2019).
Unmanaged forests contain more dead wood, which thus constitutes an important
storage of C. Not all countries report changes in C in dead wood to UNFCCC.
Canada and Russia do, but show differences; in Canada there was a decreasing
accumulation rate of C in dead wood 1990-2017, while there was an increase in
dead wood in Russia. Norway and Sweden report substantial increases in percent
in the accumulation rate of C in dead wood, but still very low amounts.
The data on C in living trees from the Nordic countries clearly show that managed
boreal forests can provide large quantities of wood as raw material to the society,
while at the same time their capacity as C sink increases significantly (Fig. 4).
Forest management for wood production enhanced the C stock in living biomass
and wood products that stored additional C and provided substitution benefits (see
section 6). Unmanaged forests do not provide C storage in wood products and
substitution benefits for other materials.
The C stocks in living biomass are only part of the overall C balance across forest
landscapes, and the C balance is only part of the total effect of forests on the
atmosphere and climate. Hence, we must ask if there are other aspects relevant to
climate change mitigation we need to consider. Prominent among these are po-
tential effects of harvesting, fires and other disturbances on:
- Losses of soil C as an effect of forest operations and natural disturb-
ances
- Releases of more potent greenhouse gases (GHGs)
- Albedo, i.e. chiefly a transformation from mixed forests to conifer-
dominated forests with lower albedo
4.3 Changes in soil C stocks and emissions of other GHGs than CO2.
Canada, Norway, Sweden, Finland and Russia all report to UNFCCC modest in-
creases in C in mineral soils over the period, which range from 20-30 kg C ha-1
yr-1 in Russia and Canada (where the data refer also to other forests than just bo-
real forests in both countries) to above 100 kg C ha-1 yr-1 in the Nordic countries.
For all countries except Sweden, these estimates are based on modelling. Sweden
has a long-term Forest Soil Inventory, which has sampled forest soils along with
the Swedish Forest Inventory (Nilsson et al. 2015). This large sustained effort
allows monitoring of changes in soil C including the uppermost organic mor-layer
(O-horizon) and the mineral soil down to 50 cm soil depth. This sampling applies
to the 85 % of the forest land that is on mineral soils, but not to peatlands (organic
soils with an organic horizon > 30 cm thick). For the peat soils, repeated measure-
ments of the soil C stock are not available and estimates are based on modelling in
REPORT 2021/11
31
all countries, which also includes modelled emissions of methane (CH4) and
nitrous oxide (N2O), much more potent GHGs than CO2.
The predominant mineral soils in Sweden have a C stock of on average 73 t per ha
(in the mor-layer and the mineral soil down to 50 cm depth). Given that Sweden
was de-glaciated around 10 000 years ago, the average increase in soil C was a
modest 7 kg C ha-1 yr-1. At century time-scales, soil C likely increased between
fires, but declined due to fires. Wardle et al. (2003) calculated an increase of 50
kg ha-1 yr-1 for centuries without a fire during the last thousands of years. Today’s
estimated or measured accumulation rates in mineral soils in Norway, Sweden and
Finland, countries with a similar glacial history, are clearly higher, 40 - 190 kg C
ha-1 yr-1 (Liski et al. 2002, Peltoniemi et al. 2004, de Wit et al. 2006, Ågren et al.
2008, Rantakari et al. 2012, Dalsgaard et al. 2016, Strand et al. 2016). These stud-
ies support the reports to UNFCCC of accumulation rates around 100 kg C ha-1
yr-1.
The net C sink in mineral soils may be offset in part by emissions of GHGs from
peat soils (e.g., Korkiakoski et al. 2020). For the purpose of the climate reporting
in relation to forestry, only emissions from drained peatlands are included. For
Sweden, modelling emissions of CH4 and N2O lead to climate-forcing estimates
on par with about 380 kg C ha-1 yr-1 in CO2 equivalent release (CO2 from decom-
position of organic matter plus the CO2-equivalent effects of other gases) if ap-
plied to all peat soils. If only the drained soils (ca. 25 % of the peat soils in forest
land) are considered, the estimate is ca. 1500 kg C ha-1 yr-1 for those soils, which
contribute 3.7 % of the total forest land. Given the much larger area of forest on
mineral soils, the average for all forest soils in Sweden is a sink of c. 100 kg C
ha-1 yr-1. Norway has less of drained organic soils than Sweden, but Finland has
considerably more. Hence, Finland has more emissions of CH4 and N2O. The
overall result for Finland is that the build-up of soil C in mineral soils compen-
sates for less of the GHG emissions from peat soils than in Norway and Sweden.
Peatlands are not drained for forest management in Canada and Alaska.
4.4 Can we attribute the enhanced soil C sink on mineral soils to forest management?
Evidence is not available to clearly separate any effects of management from
other potential factors. A common assumption is that the soil C stock should
increase with increasing inputs from the trees, but decrease if higher temperatures
enhance rates of decomposition of organic matter (Liski et al. 2002; Ågren et al.
2008). Hence, the national estimates reflect the long-term balance between inputs
and losses under the prevailing climate, management or disturbance regime. This
integrates the local spatial and temporal variability, which may be considerable.
Thus, we can conclude that mineral soils in the Nordic forests on average
sequester C, despite substantial harvests from the forests. Note also that in the
three Nordic countries the soil C stocks are almost twice the C stocks in living
tree biomass (cf. Table 1).
There has been attention to the possibility of C losses from the soil after clear-
felling, based on the ecosystem being a source of C in that context (see 5.1. above,
REPORT 2021/11
32
and Yanai et al. 2003). Losses can occur because of lower inputs or accelerated
decomposition of soil organic matter due to perturbation of the soil and changed
microclimate. In a wider global context, it is commonly held that significant
amounts of soil C are lost in the years to decades after clear-felling of forests
(Mayer et al. 2020); for tropical forests there is strong evidence for large losses
when the forests are converted to arable lands or pastures. Many local studies in
boreal forests focusing on the uppermost soil layers and period immediately after
clear-felling suggest loss of soil C, but sampling to greater depths show smaller or
no effects (Clark et al. 2015, Mayer et al. 2020). How important are such losses of
soil C in the longer term and across larger landscapes and regions?
We have already concluded that soil C is accumulating at a significant rate in the
mineral soils of the three Nordic countries, where rotational forestry involving
clear-felling is practiced on most of the forest land. This suggests that these
practices do not cause a widespread decline in soil C in the longer term.
Furthermore, Stendahl (2017) used a large data set involving 3500 sites sampled
by the soils inventory in Sweden to examine if the soil C stock changes with the
age of the forest stand (with 10 age-classes from 4 to 143 years old and on aver-
age 175 samples per age-class per region studied), e.g., if it decreases after
clear-felling. This approach is associated with the methodological problem of
substituting “space for time”, because forests of different ages (now found on
different plots, areas) have experienced different changes in environment and
management. The problem is less important if smaller rather than large differ-
ences in stand age are studied and if there are many geographical sampling points
(Stendahl used many age-classes and a large number of samples distributed over
the regions studied). In the study by Stendahl (2017), the southernmost 20 % of
Swedish forests indicated a temporary decrease after clear-felling; in the
remaining 80 % of the forests, there were no significant differences in soil C stock
depending on forest stand age. Superimposed on this, was the overall increase
mentioned of about 100 kg C ha-1 yr-1 across all forest age-classes. In southern
Finland, Peltoniemi et al. (2004) measured the soil C stock in 64 forests, spanning
a range of stand ages. They found no clear minimum in soil C in the organic layer
in young forests, no change with age in the mineral soil and overall an increase in
the organic layer by 42 kg C ha-1 yr-1 in these managed forests.
Soil scarification is a common management method, which leads to a net release
of C (partial removal of the upper soil organic layer is a method often used before
replanting). However, analysis of all ecosystem components have revealed that
decreases in soil C after soil scarification or more drastic deep plowing have been
compensated by greater uptake of C through enhanced tree growth (Egnell et al.
2015, Mjöfors et al. 2017, Mayer et al. 2020). Presumably, the disturbance leads
to greater release of soil nitrogen (the nutrient commonly limiting forest growth in
boreal forests), especially from the dying mycelium of mycorrhizal fungi
(Högberg et al. 2017). This extra N adds to the alleviation of the competition for
N experienced by tree seedlings caused by the removal of the larger trees by the
previous clear-felling.
REPORT 2021/11
33
4.5 What about the possibility of forest management increas-ing emissions of other GHGs?
As noted above, peat soils in wet areas can be major sources of the potent GHGs
CH4 and N2O. Ditching (to improve soil aeration of tree roots) and clear-felling
could have substantial effects on the releases of these gases (e.g., Korkiakoski et
al. 2020), as soil oxygen levels strongly influence their biogeochemistry. In
contrast, forests on mineral soils are commonly minor net sinks for CH4 and N2O
(e.g., Sitaula et al. 1995, Kasimir Klemedtsson & Klemedtsson 1997,
Chapuis-Lardy et al. 2007). Emissions of N2O occur transiently after clear-felling
or more continuously in local hot-spots like N-rich groundwater discharge areas.
However, most boreal forest soils are very poor in available N (Högberg et al.
2017) and the tendency seen in runoff water from larger watersheds is that leach-
ing of inorganic N is declining, despite enhanced leaching of N locally and tempo-
rarily after clear-fellings (Lucas et al. 2016). Hence, it seems the N limitation to
forest growth will prevail. This picture would change, however, if N fertilization
became more common. Nitrogen fertilization may transiently increase N2O
emissions, but also greatly increase C sequestration in both tree biomass and soils
(e.g., Johnson & Curtis 2001). There are no reports suggesting that the effect of
commercial fertilization of forests is negative in terms of the overall effect on the
GHG balance (note that N-rich organic soils should not be fertilized).
4.6 Can forest management decrease the albedo and hence in-crease warming?
About half of the sunshine falling on forests is reflected back to space, with no
effect on temperatures of trees and air. The rest of the radiation is either absorbed
by the vegetation and soils (leading to warming) or consumed in evaporation of
water. The proportion that reflects away from forests (the albedo) varies over time
as a function of the characteristics of forest canopies, ground vegetation and snow
cover (Fig. 11, Table 3). Disturbances such as clear-felling (along with subsequent
choice of tree species) and fires affect albedos at landscape scales (e.g., Astrup et
al. 2018, Bright et al. 2013, 2017, Randerson et al. 2006). Clear-felling and fire
both increase the winter-time albedo by increased exposure of snow-covered
ground. In the summer, newly burned areas will have a very low albedo, which is
true also for very dense stands. Our data on living biomass C (Table 2) indicate
that across countries there are no large differences in average living biomass C per
hectare, which suggests that the albedo may not differ much between managed
and un-managed conifer forests despite the dynamic variations after disturbances.
Regarding choice of tree species, evergreen conifers in general have a lower
albedo than deciduous broadleaves, especially when considering the annual cycle
of leaf-fall (Chapin et al. 2012). Conifers dominate boreal forest landscapes,
though deciduous trees are important in some areas. Larch, a deciduous conifer,
has a high albedo compared to other conifers. Siberian Larch (Larix sibirica) is
the most widespread tree species in Russian forests. Larch-dominated forests ac-
count for 36 % of the total forest area in Russia and is locally dominant in Siberia
and the Russian Far East. These forests are rarely harvested; but larger albedo
changes occur after fires. Broadleaved trees sometimes form stable communities,
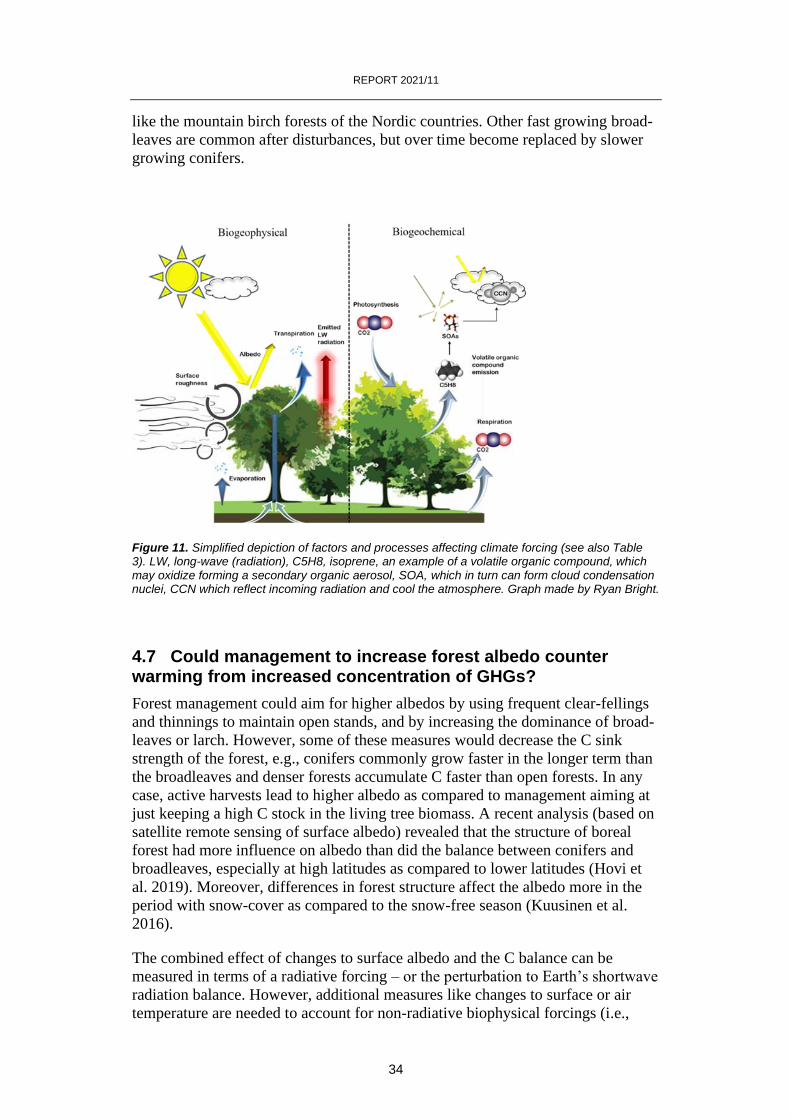
REPORT 2021/11
34
like the mountain birch forests of the Nordic countries. Other fast growing broad-
leaves are common after disturbances, but over time become replaced by slower
growing conifers.
Figure 11. Simplified depiction of factors and processes affecting climate forcing (see also Table 3). LW, long-wave (radiation), C5H8, isoprene, an example of a volatile organic compound, which may oxidize forming a secondary organic aerosol, SOA, which in turn can form cloud condensation nuclei, CCN which reflect incoming radiation and cool the atmosphere. Graph made by Ryan Bright.
4.7 Could management to increase forest albedo counter warming from increased concentration of GHGs?
Forest management could aim for higher albedos by using frequent clear-fellings
and thinnings to maintain open stands, and by increasing the dominance of broad-
leaves or larch. However, some of these measures would decrease the C sink
strength of the forest, e.g., conifers commonly grow faster in the longer term than
the broadleaves and denser forests accumulate C faster than open forests. In any
case, active harvests lead to higher albedo as compared to management aiming at
just keeping a high C stock in the living tree biomass. A recent analysis (based on
satellite remote sensing of surface albedo) revealed that the structure of boreal
forest had more influence on albedo than did the balance between conifers and
broadleaves, especially at high latitudes as compared to lower latitudes (Hovi et
al. 2019). Moreover, differences in forest structure affect the albedo more in the
period with snow-cover as compared to the snow-free season (Kuusinen et al.
2016).
The combined effect of changes to surface albedo and the C balance can be
measured in terms of a radiative forcing – or the perturbation to Earth’s shortwave
radiation balance. However, additional measures like changes to surface or air
temperature are needed to account for non-radiative biophysical forcings (i.e.,
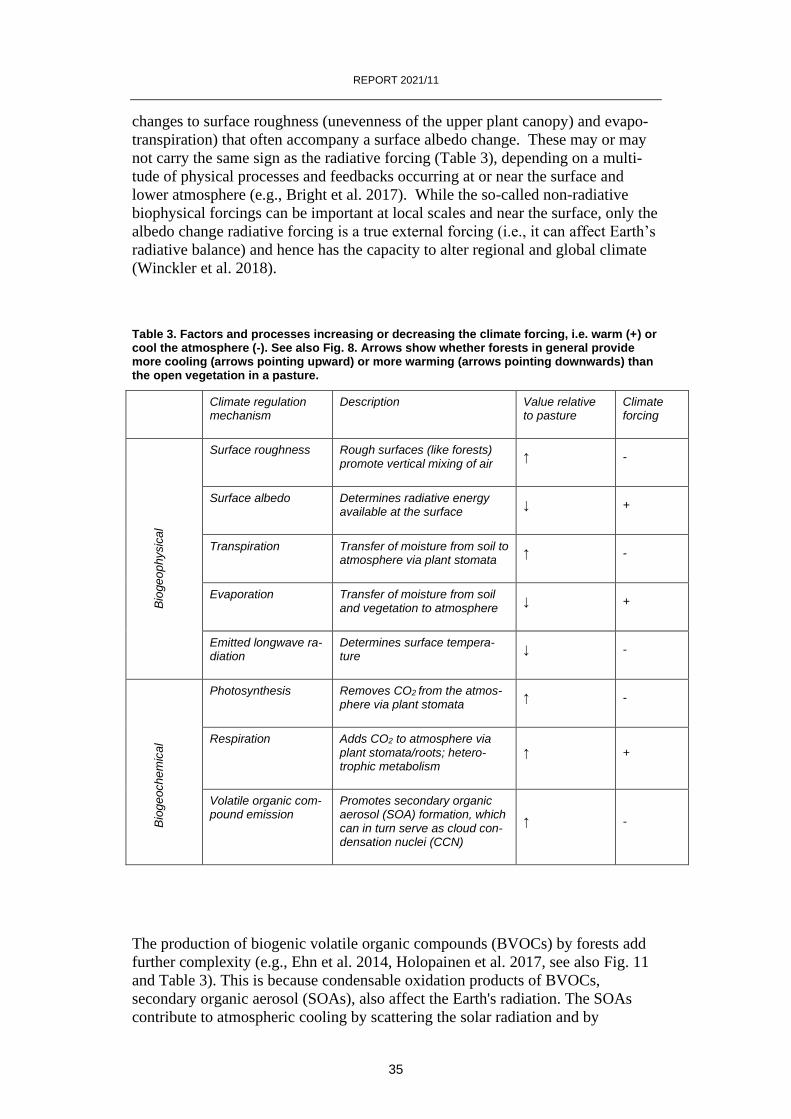
REPORT 2021/11
35
changes to surface roughness (unevenness of the upper plant canopy) and evapo-
transpiration) that often accompany a surface albedo change. These may or may
not carry the same sign as the radiative forcing (Table 3), depending on a multi-
tude of physical processes and feedbacks occurring at or near the surface and
lower atmosphere (e.g., Bright et al. 2017). While the so-called non-radiative
biophysical forcings can be important at local scales and near the surface, only the
albedo change radiative forcing is a true external forcing (i.e., it can affect Earth’s
radiative balance) and hence has the capacity to alter regional and global climate
(Winckler et al. 2018).
Table 3. Factors and processes increasing or decreasing the climate forcing, i.e. warm (+) or cool the atmosphere (-). See also Fig. 8. Arrows show whether forests in general provide more cooling (arrows pointing upward) or more warming (arrows pointing downwards) than the open vegetation in a pasture.
Climate regulation mechanism
Description Value relative to pasture
Climate forcing
B
ioge
op
hysic
al
Surface roughness Rough surfaces (like forests) promote vertical mixing of air
↑ -
Surface albedo Determines radiative energy available at the surface
↓ +
Transpiration Transfer of moisture from soil to atmosphere via plant stomata
↑ -
Evaporation Transfer of moisture from soil and vegetation to atmosphere
↓ +
Emitted longwave ra-diation
Determines surface tempera-ture
↓ -
B
iog
eoch
em
ica
l
Photosynthesis Removes CO2 from the atmos-phere via plant stomata
↑ -
Respiration Adds CO2 to atmosphere via plant stomata/roots; hetero-trophic metabolism
↑ +
Volatile organic com-pound emission
Promotes secondary organic aerosol (SOA) formation, which can in turn serve as cloud con-densation nuclei (CCN)
↑ -
The production of biogenic volatile organic compounds (BVOCs) by forests add
further complexity (e.g., Ehn et al. 2014, Holopainen et al. 2017, see also Fig. 11
and Table 3). This is because condensable oxidation products of BVOCs,
secondary organic aerosol (SOAs), also affect the Earth's radiation. The SOAs
contribute to atmospheric cooling by scattering the solar radiation and by

REPORT 2021/11
36
functioning as cloud condensation nuclei (clouds have high albedo). Importantly,
loss of production of BVOCs in clear-cuts results in an effect on the climate in the
opposite of direction to the effects of albedo and there are also differences in the
production among volatiles among tree species (Kalliokoski et al. 2020). These
complex interrelations deserve further study.
As regards the major question asked in this section (section 4), we conclude that
the choice between managing the forest for harvesting or leaving the forest must
also consider the potential for climate change mitigation by storing C in products
and substituting products associated with much higher GHG emissions. Any
accounting of a subset of the full C effect will not provide an adequate basis for
effective policy development.
REPORT 2021/11
37
5 Harvested wood products (HWPs): we must look beyond the forests!
To satisfy the demand for HWPs is a key purpose of forestry. Some wood-based
products have unique properties and cannot be replaced at present by other prod-
ucts, while other wood products may substitute products based on other raw mate-
rials (Fig. 3). One may indulge in an intricate analysis of the forest sector per se,
or restrict the analysis to what happens in the forest, but the more interesting fu-
ture societal perspectives involve the role of forestry and forest products in com-
parison to the impact on the environment of other sectors supplying alternative
products. Thus, we need to account for the C in wood products through pro-
duction, use and post-consumer treatment, as well as the use of wood products in
place of CO2-emissions-intensive materials and energy.
Forestry is a sustainable bio-economy from the C balance point of view if it does
not decrease the C stock on average across the managed forest landscapes and
given that the harvested material substitutes fossil-based products and concrete.
Our data show that in Nordic countries, forest management involving rotational
silviculture does not lead to a decrease in the C stock of living tree biomass. On
the contrary, the intensive management of the Nordic forests increased the C stock
1990 - 2017 (Fig. 4). The high economic value of these forests have motivated an
effective suppression of forest fires (Fig. 9). Only in the Alaskan boreal forests,
which are not harvested, did we see a decline in the C stock of living tree biomass
(Fig. 5).
The forest sector compares with other sectors providing alternative materials, e.g.,
the production of plastics from fossil C sources, and construction materials such
as steel and concrete. These alternatives are associated with major emissions of
CO2, and thus un-sustainable from the point of view of the global GHG balance.
Moreover, industrial and logging residues can be used to produce biofuels like
ethanol and diesel, which can substitute fossil-C based fuels. In the future, wood
will be used to make many more products than previously, e.g., textile fibers and
new composite materials, as markets adapt to a future with minimal use of
fossil-C. Political decisions may play a vital role in that development.
Various numerical factors are used to calculate the substitution effects when wood
products are used to replace other products. A recent EFI (European Forest
Institute) report (Leskinen et al. 2019) compiled information on substitution
factors (GHG emissions avoided if a wood product is used instead of another
product, per unit of product). They found a wide variation among products, but
also that on average substitution factors were >1 (a factor of 1 denotes that a unit
of C in the wood product replaces 1 unit of C in a fossil-derived product), with
reduced emissions resulting from lower production emissions and using
post-consumer wood for energy (Leskinen et al. 2019). Therefore, substitution
benefits need to be added to the forest ecosystem and HWP carbon pool tracking
to assess the overall net GHG emissions (e.g., Lempriére et al. 2013, Smyth et al.
2014, Iordan et al. 2018). There is substantial variability and uncertainty in
REPORT 2021/11
38
substitution benefits (which some state are overestimated, e.g., Harmon et al.
2019), with a strong focus on long-lived construction products and limited infor-
mation on other products (e.g. paper, textiles, and biochemicals).
The analysis of substitution benefits is commonly quite complex, especially since
a full life cycle analysis must consider that products are often re-cycled. Fibers in
paper may, for example, be used in secondary products through several cycles,
and finally be used for energy production (e.g., Lundmark et al. 2014). The C in
these products remains withdrawn from the atmosphere, and the final combustion
for energy production may substitute fossil fuel combustion. However, the inter-
national protocols used to report GHG balances do not attribute the full-life cycle
effects of all forest products to the forest sector. Where substitution benefits are
realized, these are expressed as emission reductions in other sectors. The analysis
is further complicated by the fact that use and recycling is constantly evolving.
Harvest residues are treated differently in the six countries. The climate benefits
of bioenergy production from harvest residues depend critically on the alternative
uses of the residues. If they are used for energy production, this speeds up the
forest C cycle, and leaves less C in the forest (Repo et al. 2011), but decreases
emissions of fossil C. In Finland and Sweden, treetops and branches left over
after stem harvests are to some extent used in municipal heating and power plants
together with disposals from households. The use of forest harvest residues for
energy production has expanded at the expense of the use of fossil C. In Sweden,
bio-energy constitutes 25 % of the total energy production (Statistics from
Swedish Energy Agency, data for 2017), which almost equals the energy supply
from petroleum and coal. In some Canadian provinces, tree-tops and branches are
burned on the site to abate the risk of accidental fire. In Canada at large, some
post-consumer wood material is deposited in landfills, where much of the material
can remain undecomposed for a long time, but where the more readily
decomposable portion of the material releases CO2 under aerobic conditions and
methane under anaerobic conditions. Flaring can reduce landfill methane emis-
sions, and capture, purification, and burning of landfill methane for energy
production instead of fossil fuel burning can also reduce emissions.
The further development of the use of wood as raw materials depends on technical
innovations, but also on developments within other sectors. An increase in fossil
fuel prices would make materials or fuels from wood more competitive. Political
decisions, especially with regard to the fulfillment of the Paris agreement also
have a very important role in this context.
We would like to stress, once again, that most of the discussions about the
environmental effects of forestry, including the role in the GHG balance, see
forestry in isolation and do not compare the sector and its products with other
alternative ways of supplying similar products. A more holistic analysis, which
better integrates the effects of humans on the composition of the atmosphere, has
greater relevance to the development of sustainable societies.
REPORT 2021/11
39
6 Future projections, conclusions and fi-nal recommendations
Climate change mitigation requires reduction of GHG emissions and enhancement
of C sinks. The forest sector clearly has a potential to contribute positively in this
context. However, as outlined in the last section, the use of the HWPs and their
relations to alternative products will develop in dynamic and complex ways. We
submit that this requires a separate in-depth analysis by another team of
specialists.
The major question addressed here was whether un-managed boreal forests have a
greater net uptake of C than forests managed for wood production. As shown by
the data from Alaska, Canada and Russia, un-managed boreal forests and forests
with a low intensity of management do not, on average show any increase in the C
stock in living tree biomass. In Alaska, with no major tree harvesting, the losses
of C from the forests in fires exceed the tree net C uptake and turned the forest
ecosystem into a C source. In contrast, the data from the three Nordic countries
show that intensive management involving high rates of harvesting, combined
with enhanced regeneration and other management methods including effective
fire suppression, can enhance the C stock in living tree biomass and the soil.
Moreover, intensive forest management results in additional C storage in wood
products. Intensively managed forests in the Nordic countries now carry a similar
total stock of C as in the less intensively managed boreal forests in other countries
(Table 1).
Thus, more intensive management also of larger parts of the vast forests of
Alaska, Canada and Russia could potentially increase forest growth. This would
allow larger harvests without loss of C from the average standing stock. At
present, this stock does not increase in Canada and Russia, and large losses of C
occur in wildfires. These losses are not much smaller than the removals by
harvests and represent lost opportunities to store C in wood products or use them
to substitute materials associated with large net C emissions to the atmosphere.
Future projections suggest that in the Nordic boreal forests, the increase in C stock
in living biomass will level off, but continuous removal of CO2 from the atmos-
phere can be maintained through wood harvests, which will increase C stocks in
wood products and achieve ongoing substitution benefits. As noted earlier, the
magnitude of C benefit from harvested wood products varies among types of
products. The economic revenue benefits the society at large, but in a narrower
perspective also provides the resources for effective fire suppression. In a situa-
tion without the income from forestry, other sectors need to bear the cost of
protecting the forests from devastating fires and hence drastic reductions in eco-
system C.
We found that the average standing biomass does not vary much between
un-managed and managed forests, which suggests that the albedo does not vary
much on average either, although the managed forests shift between a low albedo
REPORT 2021/11
40
in the dense older forests prior to clear-felling and a high albedo after felling. The
albedo could be increased by increasing the clear-felling harvest intensity and by
maintaining a greater cover of broad-leaved species. However, at most sites, the
latter would require very active management to exclude conifers from reaching
dominance. Moreover, recent research provided higher estimates of the cooling
effect of the SOAs above forests and the challenge to minimize the combined
climate effect on the atmosphere of the GHG balance, albedo and SOAs.
Forestry can have negative effects on biodiversity (Framstad et al. 2013), and
these effects need to be reduced. In the Nordic countries, policies have addressed
such problems over the last three decades. This has resulted in increases in
amounts of dead wood and deciduous trees in the forests, but not to the
satisfaction of all quarters in the on-going debates. However, just like the effects
on the GHG balance, the negative effects of forest management should not be
seen in isolation, but rather be compared to the impacts of the production and use
of alternative products, with associated GHG emissions and other effects on the
environment, e.g., climate impacts on biota, including effects on biodiversity.
Political decisions must, of course, also value socio-economic and cultural
dimensions.
We conclude that the forest sector can be a sustainable component of the bio-
economy. It has potentials to increase, especially in the large countries with a low
intensity of forest management. There it can become even more important in
storing C in forests and long-lived forest products, and avoiding CO2 emissions by
replacing concrete and materials and fuels based on fossil C. Moreover, opportu-
nities to increase boreal forest resilience to wildfire and to reduce future wildfire
emissions through measures such as fuel management, thinning, use of prescribed
fires and use of biomass in a bioeconomy need to be explored in the countries,
which currently practice less intensive management. The potential negative ef-
fects of intensive forest management on biodiversity will always warrant atten-
tion and appropriate prescriptions to ensure C benefits are not unduly linked with
undesirable impacts.
Finally, we also found that the countries with boreal forests have much to learn
from each other and much to gain by continued collaboration on projects
addressing the state and use of these forests.

REPORT 2021/11
41
7 Acknowledgements
Resources to cover the costs for process leadership and management were made
available by the Swedish Government through the Swedish Forest Agency, where
Peter Blombäck was helpful in organizing this financial back-up. Maureen
Whelan, Natural Resources Canada, organized the review process. We would like
to thank the reviewers Pierre Bernier, Pekka Kauppi, Viacheslav Kharuk, Ellen
MacDonald, Sten Nilsson, David Paré, Ekaterina Shorohova and Michael
Ter-Mikaelian for many insightful and constructive comments on the report. Car-
olyn Smyth and Elizaveta Kushnir provided inputs in the beginning of the pro-
cess. We are also grateful to the large number of field survey staff and analysts in-
volved in gathering the data we have used.
REPORT 2021/11
42
8 References
Ackerman, D., Millet, D.B. & Chen, X. 2019. Global estimates of inorganic nitro-
gen deposition across four decades. Global Biogeochemical Cycles 33, 100-107.
Ågren, G.I., Hyvönen, R. & Nilsson, T. 2008. Are Swedish forest soils sinks or
sources for CO2 – model analyses based on forest inventory data. Biogeochemis-
try 89, 139-149.
Amiro, B.D. et al. 2010, Ecosystem carbon dioxide fluxes after disturbance in for-
ests in N. America. Journal of Geophysical Research 115, article no. G00K02.
Anderegg, W.R.L. et al. 2020. Climate-driven risks to the climate mitigation po-
tential of forests. Science 368, Issue 6497, eaaz7005.
Balshi, M.S. et al. A. 2007. The role of historical fire disturbance in the carbon
dynamics of the pan-boreal region: A process-based analysis. Journal of Geophys-
ical Research, 112, G02029, http://doi.org/10.1029/2006JG000380.
Balshi, M.S. et al. 2009. Assessing the response of area burned to changing cli-
mate in western boreal North America using a Multivariate Adaptive Regression
Splines (MARS) approach. Global Change Biology 15, 578-600.
Bartalev, S. et al. 2017. Methodology of post-fire tree mortality monitoring and
prediction using remote sensing data. Sovremennye Problemy Distantsionnogo
Zondirovaniya Zemli iz Kosmosa. 14. 176-193. http://doi.org/10.21046/2070-
7401-2017-14-6-176-193.
Bright, R.M., Astrup, R. & Stromman, A.H. 2013. Empirical models of monthly
and annual albedo in managed boreal forests of interior Norway. Climate Change
120, 183-196.
Bright, R.M. et al. 2017. Local temperature responses to land cover and manage-
ment change driven by non-radiative processes. Nature Climate Change 7, 296-
302.
Chapin, FSIII, Matson, P.A. & Vitousek, P.M. 2012. Principles of Terrestrial Eco-
systems Ecology, 2nd edn. Springer Verlag.
Chapuis-Lardy, L. et al. 2007. Soils, a sink for N2O? A review. Global Change Bi-
ology 13, 1-17.
Ciais, P. et al. 2019. Five decades of northern land carbon uptake revealed by the
inter-hemispheric CO2 gradient. Nature 568, 221-225.
Clarke, N. et al. 2015. Influence of different tree-harvesting intensities on forest
soil carbon stocks in boreal and northern temperate forest ecosystems. Forest
Ecology and Management 351, 9-19.
REPORT 2021/11
43
Coursolle, C. et al. 2012. Influence of stand age on the magnitude and seasonality
of carbon fluxes in Canadian forests. Agricultural and Forest Meteorology 165,
136-148.
Dalsgaard, L. et al. 2016. Modeling soil carbon dynamics in northern forests: ef-
fects of spatial and temporal aggregation of climatic input data. PLOS ONE,
http://doi.org/10.1371/journal.pone.0149902.
De Wit, H.A. et al. 2006. A carbon budget of forest biomass and soils in southeast
Norway calculated using a widely applicable method. Forest Ecology and Man-
agement 225, 15-26.
Egnell, G. et al. 2015. Negative effects of stem and stump harvesting and deep
soil cultivation on the soil carbon and nitrogen pools are mitigated by enhanced
tree growth. Forest Ecology and Management 338, 57-67.
Erb, K.H. et al. 2018. Unexpectedly large impact of forest management and graz-
ing on global vegetation biomass. Nature 553, 73-76.
Fargione, J.E. et al. 2018. Natural climate solutions for the United States. Science
Advances http://doi.org/10.1126/sciadv.aat1869.
Flannigan, M. et al. 2009. Impacts of climate change on fire activity and fire man-
agement in the circumboreal forest. Global Change Biology 15, 549-560.
Forsell, N et al. 2016. Assessing the INDC´s land use, land use change, and forest
emission projections. Carbon Balance and Management 11, Article no. 26.
Framstad, E. et al. 2013. Biodiversity, carbon storage and dynamics of old-
growth forests. TemaNord 2013:507, 130 pp. Nordic Council of Ministers, Co-
penhagen.
Fridman, J. et al. 2014. Adapting national forest inventories to changing require-
ments – the case of the Swedish National Forest Inventory at the turn of the 20th
century. Silva Fennica 48, article id 1095.
Gao, B. et al. 2018. Carbon storage declines in old boreal forests irrespective of
succession pathway. Ecosystems, 21, 1–15
Gauthier, S. et al. 2015. Boreal forest health and climate change. Science 349,
819-822.
Girardin M.P. et al. 2016. No growth stimulation of Canada’s boreal forest under
half-century of combined warming and CO2 fertilization. Proceedings National
Academy of Sciences (U.S.A.). www.pnas.org/cgi/doi/10.1073/pnas.1610156113.
Grassi, G. et al. 2018. Reconciling global-model estimates and country reporting
of anthropogenic forest CO2 sinks. Nature Climate Change 8, 914-920.
Griscom, B.W. et al. 2017. Natural climate solutions. Proceedings of the National
Academy of the United States of America 114, 11645-11650.
REPORT 2021/11
44
Gustafsson L. et al. 2012. Retention forestry to maintain multifunctional forests: a
world perspective. BioScience 62, 633-645.
Harmon, M.E. 2019. Have product carbon substitution benefits been overesti-
mated? A sensitivity analysis of key assumptions. Environmental Research Let-
ters 14(2019)065008.
Hember, R.A., Kurz, W.A., Coops, N.C. 2017. Increasing net ecosystem biomass
production of Canada’s boreal and temperate forests despite decline in dry cli-
mates. Global Biogeochemical Cycles, 31, 134-158.
Hember, R. A., Kurz, W. A. & Girardin, M. P. 2019. Tree ring reconstructions of
stemwood biomass indicate increases in the growth rate of black spruce trees
across boreal forests of Canada. Journal of Geophysical Research: Biogeosci-
ences, 124, 2460–2480.
Henttonen, H.M., Nöjd, P. & Mäkinen, H. 2017. Environment-induced growth
changes in the Finnish forests during 1971-2010: An analysis based on the Na-
tional Forest Inventory. Forest Ecology & Management 386, 22-36.
Henttonen, H.M. et al. 2019. Large trees have increased greatly in Finland during
1921-2013: but recent observations on old trees tell a different story. Ecological
Indicators 99, 118-129.
Henttonen, H.M. et al. 2020. Size-class structure of the forests of Finland during
1921-2013: a recovery from centuries of exploitation, guided by forest policies.
European Journal of Forest Research https://doi.org/10.1007/s10342-019-01241-
y.
Högberg, P. et al. 2017. Tamm Review: On the nature of the nitrogen limitation to
plant growth in Fennoscandian boreal forests. Forest Ecology & Management
403, 161-185.
Hovi, A. et al. 2019. Seasonal dynamics of albedo across European boreal forests:
Analysis of MODIS albedo and structural metrics from airborne radar. Remote
Sensing of the Environment 224, 365-381.
Hynynen, J. et al. 2019. Growth responses to cuttings in Norway spruce stands
under even-aged and uneven-aged management. Forest Ecology and Management
437, 314-323.
Iordan, C.-M. et al. 2018. Contribution of forest wood products to negative emis-
sions: historical comparative analysis from 1960 to 2015 in Norway, Sweden and
Finland. Carbon Balance and Management 13:12.
IPCC. In: Climate Change 2013: The Physical Science Basis. Contribution of
Working Group I to the Fifth Assessment Report of the Intergovernmental Panel
on Climate Change (eds Stocker, T. F. et al.) 1535 (Cambridge Univ. Press).
Johnson, D.W. & Curtis, P.S. 2001. Effects of forest management on soil C and N
storage: meta analysis. Forest Ecology and Management 140, 227-238.
REPORT 2021/11
45
Juutinen, A. et al. 2018. Effect of harvest interval and intensity on the profitability
of uneven-aged management of Norway spruce stands. Forestry, 91: 589-602.
https://doi.org/10.1093/forestry/cpy018.
Juutinen, A. et al. 2020. Profitability of continuous cover forestry in Norway
spruce-dominated peatland forest and the role of water table. Canadian Journal of
Forest Research https://doi.org/10.1139/cjfr-2020-0305.
Kalliokoski, T. et al. 2020. Mitigation impacts of different harvest scenarios of
different forests that account for albedo, aerosols, and trade-offs of carbon seques-
tration and avoided emissions. Frontiers in Forests and Global Change,
https://doi.org/10.3389/ffgc.2020.562044.
Kashian, D.M. et al. 2013. Postfire changes in forest carbon storage over a 300
year chronosequence of Pinus contorta-dominated forests. Ecological Monographs
83, 49-66.
Kasimir Klemedtsson, Å. & Klemedtsson, L. 1997. Methane uptake in Swedish
forest soils in relation to liming and extra N-deposition. Biology and Fertility of
Soils 25, 296-301.
Korkiakoski, M. et al. 2020. Impact of partial harvest on CH4 and N2O balances
of a drained boreal peatland forest, Agricultural and Forest Meteorology, 295,
https://doi.org/10.1016/j.agrformet.2020.108168.
Kraxner, F. et al. 2017. Map of boreal forests. International Institute for Applied
Systems Analysis (IIASA), Center for Landscape Resilience & Management
(CLR), Vienna.
Krylov, A. et al. 2014. Remote sensing of stand-replacement fires in Russia 2002-
2011. Environmental Research Letters 9, https://doi.org/10.1088/1748-
9326/9/10/105007.
Kurz, W.A. et al. 2008. Mountain pine beetle and forest carbon feedback to cli-
mate change. Nature 452, 1987-990.
Kurz, W.A. et al. 2016. Climate change mitigation through forest sector activi-
ties: principles, potential and priorities. Unasylva 246, 61-67.
Kuusinen, N. et al. 2016. Structural factors driving boreal forest albedo in Fin-
land. Remote Sensing of the Environment 175, 43-51.
Lemprière, T.C. et al. 2013. Canadian boreal forests and climate change mitiga-
tion. Environmental Reviews 21, 293-321.
Leskinen, J. et al. 2019. Substitution effects of wood-based products in climate
change mitigation. European Forest Institute (ISBN 978-952-5980-70-7).
Liski, J., Perruchoud, D. & Karjalainen, T. 2002. Increasing carbon stocks in the
forest soils of Western Europe. Forest Ecology and Management 169, 159-175.
REPORT 2021/11
46
Lucas, R.W. et al. 2016. Long-term declines in stream and river inorganic nitro-
gen (N) export correspond to forest change. Ecological Applications 26, 545-556.
Lundmark, T. et al. 2014. Potential roles of Swedish forestry in the context of cli-
mate change mitigation. Forests 5, 557-578.
Lundqvist, L. 2017. Tamm Review: Selection system reduces long-term volume
growth in Fennoscandic uneven-aged Norway spruce forest. Forest Ecology and
Management 391, 362-375.
Luyssaert, S. et al. 2008. Old-growth forests as global carbon sinks. Nature 455,
213-215.
Mayer, M. et al. 2020. Tamm Review: Influence of forest management activities
on soil organic carbon stocks: A knowledge synthesis. Forest Ecology and Man-
agement 466, 15 June, 118127.
Mjöfors, K. et al. 2017. Indications that site preparation increases forest ecosys-
tem carbon stocks in the longer term. Scandinavian Journal of forest Research 32,
717-725.
Myllyantus, T. & Mattila, T. 2020. Decline or increase? The standing timber stock
in Finland, 1800-1997. Ecological Economics 41, 271-288.
Niklasson, M. & Granström, A. 2000. Numbers and sizes of fires: long-term spa-
tially explicit fire history in a Swedish boreal landscape. Ecology 81, 1484-1499.
Nilsson, T. et al. 2015. Soil conditions in Swedish forest soils – data from the
Swedish Forest Soil Inventory 1993-2002. Report no. 19, Department of Soil and
Environment, SLU, Uppsala.
Odum, E.P. 1969. The strategy of ecosystem development. Science 164, 262-270.
Ogle, S.M., et al. 2018. Delineating Managed Land for Reporting National Green-
house Gas Emissions and Removals to the United Nations Framework Convention
on Climate Change. Carbon Balance Management, 13:9
https://doi.org/10.1186/s13021-018-0095-3.
Päivänen, J. & Hånell, B. 2012. Peatland ecology and forestry – a sound ap-
proach. Springer, Berlin.
Pan, Y. et al. 2011. A large and persistent sink in the world´s forests. Science 333,
988-993.
Peltoniemi, M. et al. 2004. Changes in soil carbon with stand age – An evaluation
of a modelling method with empirical data. Global Change Biology 10, 2078-
2091.
Pregitzer, K.S. & Euskirchen, E.S. 2004. Carbon cycling and storage in world for-
ests: biome patterns related to forest age. Global Change Biology 10, 2052-2077.
REPORT 2021/11
47
Randerson, J.T. et al. 2006. The impact of boreal forest fire on climate warming.
Science 314, 1130-1132.
Randerson, J.T. et al. 2018. Global Fire Emissions Database, Version 4.1
(GFEDv4). ORNL DAAC, Oak Ridge, Tennessee, USA.
https://doi.org/10.3334/ORNLDAAC/1293
Rantakari M. et al. 2012. The Yasso07 soil carbon model – Testing against re-
peated soil carbon inventory. Forest Ecology and Management 286, 137-147.
Rebane, S. et al. 2019. Direct measurements of carbon exchange at forest disturb-
ance sites: a review of results with the eddy covariance method. Scandinavian
Journal of Forest Research 2019.1659849.
Repo, A. Tuomi, M. & Liski, J. 2011. Indirect carbon dioxide emissions from pro-
ducing bioenergy from forest harvest residues. Global Change Bioenergy 3, 107-
115.
Review of Sanitary and Forest Health State in the Russian Federation in 2018.
2019 [in Russian – Obzor sanitarnogo i lesopatologicheskogo sostoyaniya lesov
Rossijskoj Federacii v 2018 godu] Pushkino: Russian Center of Forest Protection.
106 p.
Rolstad, J., Blanck, Y.-L. & Storaunet, K.O. 2017. Fire history in western Fen-
noscandian boreal forest as influenced by human land use and climate. Ecological
Monographs 87, 219-245.
Ryan, M.G., Binkley, D. & Fownes, J.H. 1997. Age-related decline in forest
productivity: pattern and process. Advances in Ecological Research 27, 213-262.
Schaphoff, S. et al. 2016. Tamm Review: Observed and projected climate change
impacts on Russia´s forests and its carbon balance. Forest Ecology and Manage-
ment 361, 432-444.
Scholze, M. et al. 2019. Mean European carbon sink over 2010-2015 estimated by
simultaneous assimilation of atmospheric CO2, soil moisture, and vegetation opti-
cal depth. Geophysical Research Letters http://doi.org/10.1029/2019GL085725.
Shvidenko A.Z., Schepaschenko D.G. 2013. Climate change and wildfires in Rus-
sia. Contemporary Problems of Ecology 6, 683-692.
Sitaula, B.K., Bakken, L.R. & Abrahamsen, G. 1995. CH4 uptake by temperate
forest soil: Effect of N input and soil acidification. Soil Biology & Biochemistry
27, 871-880.
Song, X.-P. et al. 2018. Global land change from 1982 to 2016. Nature 560, 639-
643.
Stendahl, J. 2017. Tema: Skogsmarkens kolförråd (The stock of carbon in forest
soils). Pp. 15-23 in: Skogsdata 2017. Department of Forest Resource Manage-
ment, SLU, Umeå.
REPORT 2021/11
48
Strand, L.T. et al. 2016. Carbon and nitrogen stocks in Norwegian forest soils –
the importance of soil formation, climate and vegetation type for organic matter
accumulation. Canadian Journal of Forest Research 46, 1459-1473.
Tang, J. et al. 2014. Steeper declines in forest photosynthesis than respiration ex-
plain age-driven decreases in forest growth. Proceedings National Academy of
Sciences (USA) 111, 8856-8860.
Taylor, A. R. et al. 2014. Decline in net ecosystem productivity following canopy
transition to late-succession forests. Ecosystems, 17, 778–791.
Tomppo, E. et al. 2010. National forest inventories: Pathways for common report-
ing. Springer Science + Business Media, Heidelberg, New York, Dordrecht, Lon-
don.
Vaschuk, L.N. & Shvidenko, A.Z. 2006. Dynamics of Forests of Irkutsk Region.
Irkutsk Regional Agency of Forest Management, Irkutsk, 382 pp. [in Russian].
Wallenius, T. 2011. Major decline in forest fire in coniferous forests – recon-
structing the phenomenon and seeking the cause. Silva Fennica 45, 139-155.
Wharton, S. & Falk, M. 2016. Climate indices strongly influence old-growth for-
est carbon exchange. Environmental Research Letters 11(2016)044016.
White, J. C. et al. 2017. Annual characterization of 25 years of forest disturbance
and recovery in Canada with Landsat. Remote Sensing of Environment, 194, 303–
321.
Yanai, R.D., Currie, W.S. & Goodale, C.L. 2003. Soil carbon dynamics after for-
est harvest: An ecosystem paradigm reconsidered. Ecosystems 6, 197-212.
Yefremov, D.F., Shvidenko A.Z. 2014.Long-term impact of catastrophic forest
fires in Russia’s Far East and their contribution to global processes. International
Fire News (IFFN), No.32, July-December 2004, 43-49, https://gfmc.online/wp-
content/uploads/06-Yefremov-2.pdf
REPORT 2021/11
49
9 Appendix
9.1 Appendix 1
Contributing authors by country/organization
Canada
Werner Kurz
Natural Resources Canada, Canadian Forest Service, 506 Burnside Road West
Victoria, British Columbia, V8Z 1M5, Canada
Jérôme Laganière
Natural Resources Canada, Canadian Forest Service, 1055 Du P.E.P.S. Street,
P.O. Box 10380, Québec, Quebec, G1V 4C7, Canada
Tony Lemprière
Natural Resources Canada, Canadian Forest Service, Trade, Economics and In-
dustry Branch, 300 - 655 Bay Street, P.O. Box 15, Toronto, Ontario, M5G 2K4,
Canada
Finland
Raisa Mäkipää (Vice-president of IBFRA) and Anna Repo
Natural Resources Institute Finland, Latokartanonkaari 9, FI-00790 Helsinki, Fin-
land
Norway
Rasmus Astrup, Ryan Bright, Lise Dalsgaard, Christian W. Mohr, Gunnhild Soe-
gaard,
Norwegian Institute of Bioeconomy Research, PB 115, 1431 Ås, Norway
Russia
Andrey Filipchuk
All-Russian Research Institute for Silviculture and Mechanization of Forestry
(FBU VNIILM)/Federal Forestry Agency, Ministry of Natural Resources, 15 In-
stitutskaya street, Pushkino, Moscow region, Russian Federation, 141200
Alexey Ilintsev
Northern Forestry Research Institute /Federal Forestry Agency, Nikitov str. 13,
Arkhangelsk, Russia 163062
Sweden
Gustaf Egnell
SLU, Department of Forest Ecology and Management, 901 83 Umeå, Sweden
Mattias Lundblad
SLU, Department of Soil and Environment, Box 7014, 750 07 Uppsala, Sweden
Hans Petersson
SLU, Department of Forest Resource Management, 901 83 Umeå, Sweden
REPORT 2021/11
50
USA
Dan Binkley
Northern Arizona University, 200 E Pine Knoll Dr, Flagstaff, AZ 86011, USA
Hélène Genet
Institute of Arctic Biology, University of Alaska Fairbanks, Fairbanks, Alaska,
99775 USA
Future Forests
Lina Arnesson Ceder, Annika Nordin
SLU, Future Forests, Faculty of Forest Science, 901 83 Umeå, Sweden
Peter Högberg (Insight process leader), Tomas Lundmark
SLU, Department of Forest Ecology and Management, 901 83 Umeå, Sweden
IIASA
Anatoly Shvidenko, Dmitry Schepaschenko
IIASA, Schlossplatz 1, A-2361 Laxenburg, Austria
IBFRA (& IIASA)
Florian Kraxner (President of IBFRA)
IIASA, Schlossplatz 1, A-2361 Laxenburg, Austria
9.2 Appendix 2. Definition of forests according to FAO 2015
Definition of forest land and explanatory notes
Land spanning more than 0.5 hectares with trees higher than 5 meters and a can-
opy cover of more than 10 percent, or trees able to reach these thresholds in situ.
It does not include land that is predominantly under agricultural or urban land use.
Explanatory notes:
1. Forest is determined both by the presence of trees and the absence of other pre-
dominant land uses. The trees should be able to reach a minimum height of 5 me-
ters.
2. Includes areas with young trees that have not yet reached but which are ex-
pected to reach a canopy cover of at least 10 percent and tree height of 5 meters or
more. It also includes areas that are temporarily unstocked due to clear-cutting as
part of a forest management practice or natural disasters, and which are expected
to be regenerated within 5 years. Local conditions may, in exceptional cases, jus-
tify that a longer time frame is used.
3. Includes forest roads, firebreaks and other small open areas; forest in national
parks, nature reserves and other protected areas such as those of specific environ-
mental, scientific, historical, cultural or spiritual interest.
4. Includes windbreaks, shelterbelts and corridors of trees with an area of more
than 0.5 hectares and width of more than 20 meters.
REPORT 2021/11
51
5. Includes abandoned shifting cultivation land with a regeneration of trees that
have, or are expected to reach, a canopy cover of at least 10 percent and tree
height of at least 5 meters.
6. Includes areas with mangroves in tidal zones, regardless whether this area is
classified as land area or not.
7. Includes rubberwood, cork oak and Christmas tree plantations.
8. Includes areas with bamboo and palms provided that land use, height and can-
opy cover criteria are met.
9. Excludes tree stands in agricultural production systems, such as fruit tree plan-
tations, oil palm plantations, olive orchards and agroforestry systems when crops
are grown under tree cover. Note: Some agroforestry systems such as the
“Taungya” system where crops are grown only during the first years of the forest
rotation should be classified as forest.
9.3 Appendix 3. Brief country by country descriptions of the methods of forest inventory
9.3.1 Alaska (part of the USA)
The results presented are extracted from a C and GHG assessment conducted by
scientists from the U.S. Geological Survey (USGS), the U.S. Department of
Agriculture (USDA) Forest Service, and the University of Alaska-Fairbanks [1].
The assessment results partially fulfilled requirements set forth by the U.S. Con-
gress through the Energy Independence and Security Act (EISA) of 2007 for a na-
tional C sequestration and GHG flux assessment.
The methods included (1) the organization of input data for models parameteriza-
tion and simulations; (2) modeling of processes in biogeography, fire regime,
permafrost, and hydrologic dynamics; (3) syntheses of C dynamics via
biogeochemical modeling for upland and wetland ecosystems. The assessment
was prepared for a historical period (1950–2009) and a future projection period
(2010–2099). Input data were organized for soil C; soil texture; permafrost distri-
bution; active-layer thickness; vegetation C; historical forest harvest; future forest
management; land-cover distribution; fire disturbance; wetland and surface-water
distribution; historical and future climate; upland and wetland biogeochemistry;
and the transport, emission, and burial of aquatic C. The assessment uses the
Alaska Frame-Based Ecosystem Code (ALFRESCO; [2], [3]) to simulate changes
in fire regime and vegetation distribution from 2010 through 2099. ALFRESCO
was calibrated based on historical data about fire occurrence for Alaska from 1950
through 2009. The Dynamic Organic Soil version of the Terrestrial Ecosystem
Model (DOS-TEM; [4]–[7]) was used to estimate changes in ecosystem pools and
fluxes for the two time periods for upland and wetland ecosystems. DOS-TEM
used input data on soil texture, land cover, historical climate, historical fire,
historical forest harvest, and model projections of future climate, fire disturbance,
and forest management. The Methane Dynamics Module of the Terrestrial Eco-
system Model (MDM-TEM; [8], [9]) was used to estimate methane consumption
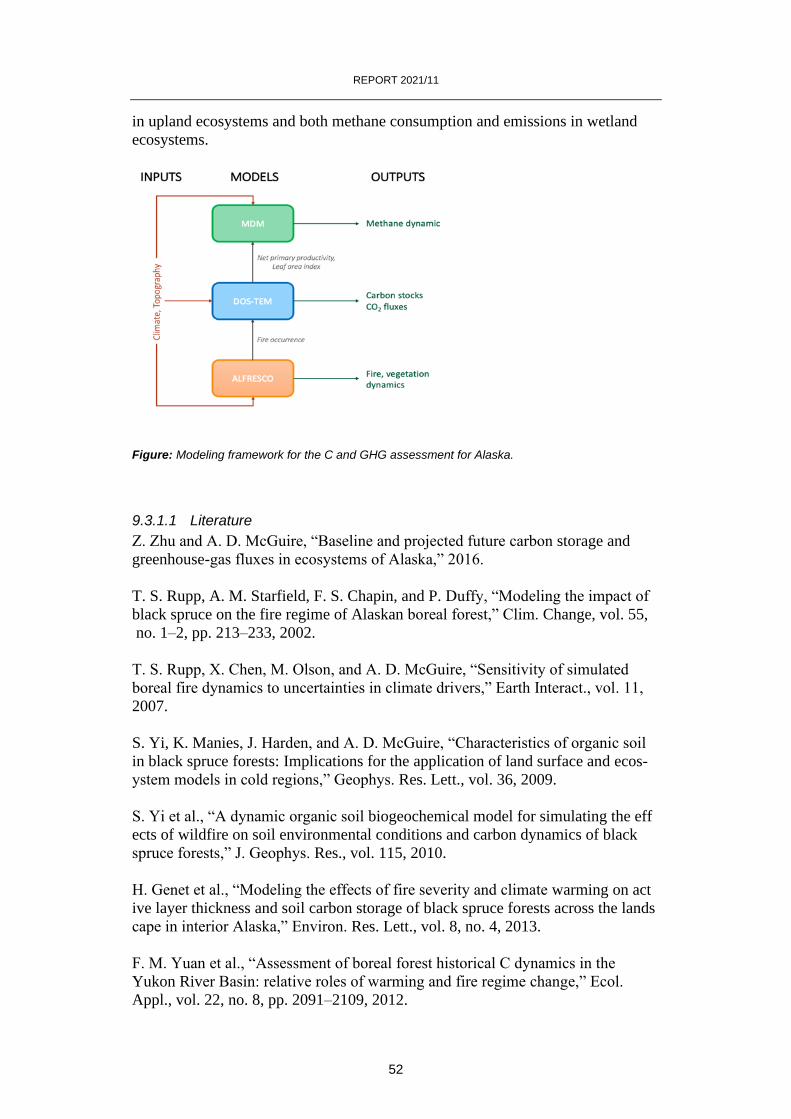
REPORT 2021/11
52
in upland ecosystems and both methane consumption and emissions in wetland
ecosystems.
Figure: Modeling framework for the C and GHG assessment for Alaska.
9.3.1.1 Literature
Z. Zhu and A. D. McGuire, “Baseline and projected future carbon storage and
greenhouse-gas fluxes in ecosystems of Alaska,” 2016.
T. S. Rupp, A. M. Starfield, F. S. Chapin, and P. Duffy, “Modeling the impact of
black spruce on the fire regime of Alaskan boreal forest,” Clim. Change, vol. 55,
no. 1–2, pp. 213–233, 2002.
T. S. Rupp, X. Chen, M. Olson, and A. D. McGuire, “Sensitivity of simulated
boreal fire dynamics to uncertainties in climate drivers,” Earth Interact., vol. 11,
2007.
S. Yi, K. Manies, J. Harden, and A. D. McGuire, “Characteristics of organic soil
in black spruce forests: Implications for the application of land surface and ecos-
ystem models in cold regions,” Geophys. Res. Lett., vol. 36, 2009.
S. Yi et al., “A dynamic organic soil biogeochemical model for simulating the eff
ects of wildfire on soil environmental conditions and carbon dynamics of black
spruce forests,” J. Geophys. Res., vol. 115, 2010.
H. Genet et al., “Modeling the effects of fire severity and climate warming on act
ive layer thickness and soil carbon storage of black spruce forests across the lands
cape in interior Alaska,” Environ. Res. Lett., vol. 8, no. 4, 2013.
F. M. Yuan et al., “Assessment of boreal forest historical C dynamics in the
Yukon River Basin: relative roles of warming and fire regime change,” Ecol.
Appl., vol. 22, no. 8, pp. 2091–2109, 2012.
REPORT 2021/11
53
Q. Zhuang et al., “Net Emissions of CH4 and CO2 in Alaska: Implications for the
Region’s Greenhouse Gas Budget,” Ecol. Appl., vol. 17, no. 1, pp. 203–212, Sep.
2007.
Q. Zhuang et al., “Methane fluxes between terrestrial ecosystems and the atmo-
phere at northern high latitudes during the past century: A retrospective analysis
with a process-based biogeochemistry model,” Global Biogeochem. Cycles, vol.
18, no. 3, p. GB3010, 2004.
9.3.2 Canada
The estimates of carbon stocks and fluxes summarised here are derived from
Canada’s National Forest Carbon Monitoring, Accounting and Reporting System
(NFCMARS). The Carbon Budget Model of the Canadian Forest Sector (CBM-
CFS3, Kurz et al. 2009) is used to combine forest inventory data, growth and
yield information, activity data on forest management, natural disturbances and
land-use change (Stinson et al. 2011, Kurz et al. 2013), to derive estimates of
carbon dynamics in natural and anthropogenic components of the GHG inventory
(Kurz et al. 2018) for Canada’s managed forest (Ogle et al. 2018) and to estimate
the uncertainties of these estimates (Metsaranta et al. 2017). Forest ecosystem and
harvested wood product carbon dynamics are provided to Environment and
Climate Change Canada for inclusion in Canada’s annual National Inventory
Report (ECCC 2020). The NFCMARS uses the IPCC “gain-loss method” that
yields annual estimates of GHG emissions and removals with attribution to their
causes (fire, harvest etc.). This approach is also suitable to make projections of
future GHG emissions and removals to support analyses of forest sector mitiga-
tion options (e.g. Smyth et al. 2014) and for Emissions Trends Reporting.
In Canada, resource management is the responsibility of provincial and territorial
governments, and their forest extensive inventory data are used to inform
NFCMARS. In addition, Canada’s new National Forest Inventory conducted its
first 10-year measurement cycle between 2008 to 2017 (Gillis et al. 2005). NFI
establishes ground plots and measures all carbon pools (biomass, dead wood, litter
and soil carbon) using nationally-consistent methodologies. These ground plot
data were used to assess the performance of the CBM-CFS3 (Shaw et al. 2014)
and to explore opportunities to refine modelling parameters (Hararuk et al. 2018).
9.3.2.1 Literature
ECCC. 2020. National Inventory Report 1990 – 2018: Greenhouse Gas sources
and sinks in Canada. Environment and Climate Change Canada, Gatineau, QC,
Canada. https://www.canada.ca/en/environment-climate-change/services/climate-
change/greenhouse-gas-emissions.html
Gillis, M.D.; Omule, A.Y.; Brierley, T. 2005. Monitoring Canada’s forests: The
National Forest Inventory. The Forestry Chronicle 81(2): 214-221.
https://doi.org/10.5558/tfc81214-2
REPORT 2021/11
54
Hararuk, O., C. Shaw, and W.A. Kurz, 2017. Constraining the organic matter de-
cay parameters in the CBM-CFS3 using Canadian National Forest Inventory data
and a Bayesian inversion technique, Ecological Modelling 364: 1-12.
http://dx.doi.org/10.1016/j.ecolmodel.2017.09.008
Kurz, W.A., Dymond, C.C., White, T.M., Stinson, G. , Shaw, C.H., Rampley,
G.J., Smyth, C., Simpson, B.N., Neilson, E.T., Trofymow, J.A., Metsaranta, J.,
Apps, M.J., 2009. CBM-CFS3: a model of carbon-dynamics in forestry and land-
use change implementing IPCC standards, Ecological Modelling 220: 480-504,
http://dx.doi.org/10.1016/j.ecolmodel.2008.10.018
Kurz, W.A., Hayne, S., Fellows, M., MacDonald, J.D., Metsaranta, J.M., Hafer,
M., Blain, D. 2018. Quantifying the impacts of human activities on reported
greenhouse gas emissions and removals in Canada’s managed forest: Conceptual
Framework and Implementation. Can. J. For. Res., 48: 1-14.
https://doi.org/10.1139/cjfr-2018-0176
Kurz, W.A., C.H. Shaw, C. Boisvenue, G. Stinson, J. Metsaranta, D. Leckie, A.
Dyk, C. Smyth, and E.T. Neilson. 2013. Carbon in Canada’s boreal forest — A
synthesis. Environmental Reviews 21: 260–292. http://dx.doi.org/10.1139/er-
2013-0041
Metsaranta, J.M., Shaw, C.H., Kurz, W.A., Boisvenue, C., Morken, S., 2017. Un-
certainty of inventory-based estimates of the carbon dynamics of Canada’s man-
aged forest (1990–2014). Can. J. For. Res. 47, 1082-1094.
http://dx.doi.org/10.1139/cjfr-2017-0088
Smyth, C.E., G. Stinson, E. Neilson, T. C. Lemprière, M. Hafer, G. J. Rampley,
and W. A. Kurz, 2014. Quantifying the biophysical climate change mitigation po-
tential of Canada's forest sector, Biogeosciences 11: 441-480.
http://dx.doi.org/10.5194/bg-11-3515-2014
Shaw, C.H., A.B. Hilger, J. Metsaranta, W.A. Kurz, G. Russo, F. Eichel, G. Stin-
son, C. Smyth, M. Filiatrault. 2014. Evaluation of simulated estimates of forest
ecosystem carbon stocks using ground plot data from Canada’s National Forest
Inventory. Ecological Modeling. 272: 323– 347.
http://dx.doi.org/10.1016/j.ecolmodel.2013.10.005
Stinson, G., W.A. Kurz, C.E. Smyth, E.T. Neilson, C.C. Dymond, J.M. Metsa-
ranta, C. Boisvenue, G.J. Rampley, Q. Li, T.M. White and D. Blain, 2011. An in-
ventory-based analysis of Canada’s managed forest carbon dynamics, 1990 to
2008. Global Change Biology 17: 2227–2244, http://dx.doi.org/10.1111/j.1365-
2486.2010.02369.x
Ogle, S.M., G. Domke, W.A. Kurz, M.T. Rocha, T. Huffman, A. Swan, J. E.
Smith, C. Woodall, and T.Krug. 2018. Delineating Managed Land for Reporting
National Greenhouse Gas Emissions and Removals to the United Nations Frame-
work Convention on Climate Change. Carbon Balance Management, 13:9
https://doi.org/10.1186/s13021-018-0095-3.
REPORT 2021/11
55
9.3.3 Finland
The National Forest Inventory in Finland (NFI) is a monitoring system with the
aim to report land use area changes, development of forest resources, increment,
silvicultural status of forests, forest health and biodiversity. The basis of NFI is
statistical sampling. The NFI sample plots cover whole Finland, and consist of
over 70 000 sampled locations. The NFI field data consist of three main
categories: stand description, tree data, and dead tree data, and the total of
registered variables is over 150 characteristics for each sample plot. The invento-
ries are repeated in 5 year intervals. The sampling intensity varies in different
parts of Finland, and the sample consists of permanent and temporary clusters.
The distance between sample plot clusters, shape of the cluster, number of field
plots in a cluster, and distance between plots within a cluster varies in different
parts of the country according to spatial variation of forests and density of roads.
Field measurements together with models, map information, cutting statistics and
household surveys provide information on land-use, forest resources, silviculture,
forest protection and biodiversity, increment and drain, and wood quality and use.
9.3.4 Norway
The National Forest Inventory (NFI) in Norway is a monitoring program, which
provides a nation-wide survey of Norway’s forest resources based on a statistical
representative sample of permanent plots (Breidenbach et al. 2020). The majority
of the plots are spread over a 3 x 3 km grid, with the remaining plots distributed
over 3 x 9 km (mountainous/high altitude regions) and 9 x 9 km grid (Finnmark
county, northern of Norway). 1/5th of the forest plots are surveyed every year,
providing full national coverage after 5 years. There are 22 008 plots, with
approx. 12 700 plots covering the land meeting the forest definition (Forest land,
but also some wooded grasslands and mires). While only areas meeting the forest
definition are physically surveyed, all other plots are monitored through aerial
photography providing land-use classification needed for the national greenhouse
gas (GHG) inventor reporting of land-use, land use change, and forestry
(LULUCF) under the UNFCCC. In addition to area representation, the NFI
further provides the tree diameter and height which – using biomass models –
supplies the biomass estimates needed for the GHG accounting of living biomass
on the scale of each NFI plot. Estimated living biomass compartments of foliage,
branches and roots multiplied with annual turn-over rates in addition to NFI-based
estimates of natural mortality and harvest residues provide input to the soil-and
decomposition model Yasso07, which is used on upland forest areas to estimate C
stock change (CSC) of mineral soil and dead organic matter (litter + dead wood).
Undrained organic soils on forest land are presumed to be in equilibrium, and
have a net emission of zero. Estimated of emissions from drained organic soils on
forest land are based on IPCC default emission factor with statistics on subsidies
for draining forest soils. Non-CO2 GHG emission estimates of forest fires are
based on areas subject to wildfires, provided by the Norwegian Directorate for
Civil Protection (DSB), and 2006 IPCC guideline Tier 1 methodology. CO2
emissions from forest fires are indirectly accounted for through living biomass
losses registered through the NFI.
REPORT 2021/11
56
9.3.4.1 Literature
Breidenbach, J. et al. 2020. A century of national forest inventory in Norway – in-
forming past, present, and future decisions. Forest Ecosystems 7, article 46
(2020).
9.3.5 Russia
At present, the quantitative estimation of the C stocks, as well as of C removals,
and emissions and C balance in Russian boreal forests are built upon the data from
the State Forest Register (SFR) (from 2008) and State Account of the Forest Fund
(SAFF) (before 2008). According to the Forest Law (Article 91, Forest Code,
2006), the State Forest Register is a documented source for information on forests,
their use, forest protection management and forest reproduction. Strictly speaking,
State Forest Register (SFR) is the annually updated forest statistical reporting
data. The input data for SFR relating to qualitative and quantitative indicators of
the forests is collected by forest inventory and planning. These data are collected,
not from sampling plots, but from forest stands during forest taxation, and the
procedure is implemented at different times. The growing stock volume, input
parameter for C assessments, have been determined with different accuracy; for
instance, acceptable standard deviations in estimating growing stock may vary
from ±15 to ±30% while systematic errors should not exceed 10%. The data
collected in the course of forest inventory and planning is consolidated by forest
species, age groups, site classes and stand density groups, and summed over
compartments, forest management units and constituent members (subjects) of the
Russian Federation, to be entered in the SFR at the end of each year. Apart from
qualitative and quantitative indicators of the forests, the SFR provides information
on all changes in forests during the reporting year, including harvest volumes
resulting from clear and selective felling, sanitary clear and selective felling; areas
damaged by forest fires and insect outbreaks, etc.
The state (national) forest inventory with the measurement of forest characteristics
on permanent sample plots gives an estimate of the growing stock volume with an
error of ±1-4 %. The first full cycle of State forest inventory in Russia should be
completed in 2020. The data obtained would make it possible to significantly
improve the assessment of C stocks in boreal forests and further harmonize the
assessments of forest C sequestration in Russian forests and other boreal zone
countries.
9.3.6 Sweden
The Swedish numbers are mainly based on data from permanent sample plots in-
ventoried by the National Forest Inventory (NFI; Fridman 2014). The NFI plots
were established 1983-1987 and are re-inventoried every fifth year. The NFI is an
annual, systematic, cluster-sample inventory of Sweden's forests. Each year
roughly a thousand survey sample clusters, or 6000 sample plots, are inventoried
in the field. The clusters are distributed all over the country in a pattern that is
denser in the southern part than that in the northern part. On each circular sample
plot, with a radius of 10 m, measurements are made on trees, thereafter allometric
REPORT 2021/11
57
models are used to estimate biomass (Marklund 1987; Petersson and Ståhl 2006).
Land use is assessed in the field and a sample plot can be delineated into more
than one land use category. Area based sampling is applied and one sample plot
represent a certain area and all sample plots together represents the total area of
Sweden. The idea is to correctly measure variables on the plots and thus most of
the uncertainty of the estimates arises from the random sampling process. The
estimated area of forest land (FAO-definition) is around 27-28 Mha and the
sample error is around 0.3 Mha (1%). The gross growth (whole tree biomass) is
around 165 M ton CO2 yr-1 and the sample error is 3.0 M ton CO2 yr-1 (2 %) for
change in stock. The model error for estimates of change in stock is around 1 %
(Peterson et al. 2017).
9.3.6.1 Literature
Fridman, J., Holm, S., Nilsson, M., Nilsson, P., Ringvall, A.H., and Ståhl, G.
2014. Adapting National Forest Inventories to changing requirements - the case of
the Swedish National Forest Inventory at the turn of the 20th century. Silva Fen-
nica, 48(3):1095.
Marklund, L.G. 1987. Biomass functions for Norway spruce (Picea abies (L.)
Karst.) in Sweden. Swedish University of Agricultural Sciences, Department of
Forest Survey, Report 43, 127p. ISSN: 0348-0496.
Petersson, H., Breidenbach, J., Ellison, D., Holm, S., Muszta, A., Lundblad, M.,
and Ståhl, G. 2017. Assessing Uncertainty–Sample Size Trade-Offs in the Devel-
opment and Application of Carbon Stock Models. Forest Science: 63(4): 402-412
Petersson, H., and Ståhl, G. 2006. Functions for below-ground biomass of Pinus
sylvestris, Picea abies, Betula pendula and B. pubescens in Sweden. Scandinavian
Journal of Forest Research, 21(Suppl 7): 84-93
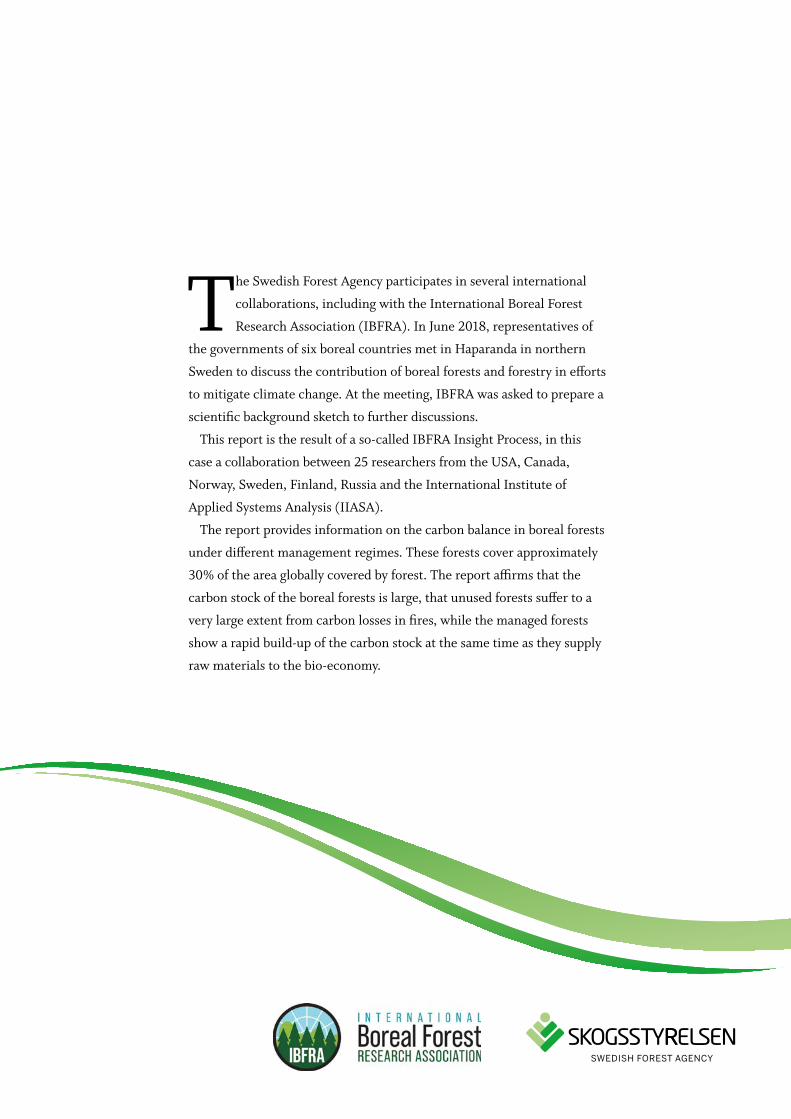
The Swedish Forest Agency participates in several international
collaborations, including with the International Boreal Forest
Research Association (IBFRA). In June 2018, representatives of
the governments of six boreal countries met in Haparanda in northern
Sweden to discuss the contribution of boreal forests and forestry in efforts
to mitigate climate change. At the meeting, IBFRA was asked to prepare a
scientific background sketch to further discussions.
This report is the result of a so-called IBFRA Insight Process, in this
case a collaboration between 25 researchers from the USA, Canada,
Norway, Sweden, Finland, Russia and the International Institute of
Applied Systems Analysis (IIASA).
The report provides information on the carbon balance in boreal forests
under different management regimes. These forests cover approximately
30% of the area globally covered by forest. The report affirms that the
carbon stock of the boreal forests is large, that unused forests suffer to a
very large extent from carbon losses in fires, while the managed forests
show a rapid build-up of the carbon stock at the same time as they supply
raw materials to the bio-economy.
Copyright © 2022 FDOKUMEN