Greenhouse gas fluxes from boreal forest soils during the snow-free period in Quebec, Canada
15
Greenhouse gas fluxes from boreal forest soils during the snow-free period in Quebec, Canada Sami Ullah, Rebeccah Frasier, Luc Pelletier, and Tim R. Moore Abstract: This paper presents soil fluxes of methane (CH 4 ), nitrous oxide (N 2 O), and carbon dioxide (CO 2 ) from 12 sites located in four major forest types, black spruce (Picea mariana (Mill.) BSP), jack pine (Pinus banksiana Lamb.), aspen (Populus spp.), and alder (Alnus spp.) stands, in the Eastmain and Chibougamau regions of Quebec. Fluxes were deter- mined with closed chambers during the snow-free period from May to October 2007. Well-drained black spruce, jack pine, and aspen forest soils were net sinks of atmospheric CH4 (–0.33 ± 0.11 mg m –2 day –1 ), while alder-dominated wet- land soils were sources of CH4 (0.45 ± 0.12 mg m –2 day –1 ). The cut-over alder wetland soil produced 131 times more CH4 than the undisturbed wetland soil. Soil moisture and temperature mainly regulated CH4 fluxes. N2O fluxes from these for- est soils were highly variable and smaller (1.6 ± 0.33 mgNm –2 h –1 ) than those from deciduous forest soils. N2O emission from the cut-over black spruce forest soil was 2.7 times greater than that from the mature black spruce forest soil. Large C/N ratios (27 to 78) and slow soil N mineralization and nitrification rates in these forest soils may have led to small N2O fluxes. CO2 emissions from these forest soils, ranging from 0.20 to 2.7 g m –2 day –1 , were mainly controlled by soil temper- ature. Re ´sume ´: Cet article porte sur les flux de me ´thane (CH 4 ), d’oxyde nitreux (N 2 O) et de dioxyde de carbone (CO 2 ) dans les sols de 12 stations situe ´es dans quatre grands types de fore ˆt : peuplements d’e ´pinette noire (Picea mariana (Mill.) BSP), de pin gris (Pinus banksiana Lamb.), de peuplier (Populus spp.) et d’aulne (Alnus spp.), dans les re ´gions d’Eastmain et de Chibougamau au Que ´bec. Les flux ont e ´te ´ mesure ´s a ` l’aide de chambres ferme ´es pendant la pe ´riode exempte de neige, de mai a ` octobre 2007. Les sols bien draine ´s des fore ˆts d’e ´pinette noire , de pin gris et de peuplier e ´taient des puits nets de CH 4 atmosphe ´rique (–0,33 ± 0,11 mgm –2 j –1 ) tandis que les sols des milieux humides domine ´s par l’aulne e ´taient des sour- ces de CH 4 (0,45 ± 0,12 mg m –2 j –1 ). Un sol en milieux humides ou ` l’aulne avait e ´te ´ coupe ´ produisait 131 fois plus de CH 4 qu’un sol en milieux humides non perturbe ´. La tempe ´rature et l’humidite ´ du sol re ´gulaient le flux de CH 4 . Le flux de N 2 O dans ces sols forestiers e ´tait tre `s variable et plus faible (1,6 ± 0,33 mgNm –2 h –1 ) que dans les dans le sol de la fore ˆt feuillue. Les e ´missions de N 2 O provenant du sol d’une fore ˆt d’e ´pinette noire coupe ´e e ´taient 2,7 fois plus e ´leve ´es que celles provenant du sol d’une fore ˆt mature d’e ´pinette noire. Un rapport C:N e ´leve ´ (27 a ` 78) et de faibles taux de mine ´ralisation et de nitrification dans le sol de ces fore ˆts pourrait avoir limite ´ le flux de N 2 O. Les e ´missions de CO 2 , qui variaient de 0,20 a ` 2,7 g C m –2 j –1 dans ces sols forestiers, e ´taient surtout fonction de la tempe ´rature du sol. [Traduit par la Re ´daction] Introduction Forests represent about 50% of the total land area in Can- ada (Lemmen and Warren 2004), and boreal forest is the dominant forest type, representing about one third of the global boreal forest cover (Stewart et al. 1998). The net car- bon (C) exchange between forest soils and the atmosphere is dominated by carbon dioxide (CO 2 ) fluxes, but within the context of global warming potentials (IPCC 2007), it is nec- essary to include methane (CH 4 ) and nitrous oxide (N 2 O) fluxes in these ecosystems. To date, estimates of national C balance of Canadian forests (Kurz and Apps 1999; Chen et al. 2000) have not taken CH 4 and N 2 O fluxes into account because of a lack of data from forest soils, particularly bor- eal forest soils. In forest soils the fluxes of CH 4 result from two microbial processes, methanogenesis and methanotrophy (Megonigal et al. 2004). When soils are wet and anaerobic, methano- genic bacteria produce CH 4 , while under aerobic soil condi- tions, methanotrophs (chemolithotrophic bacteria) oxide atmospheric CH 4 and CH 4 produced in situ (Megonigal et al. 2004). The availability of organic C as an energy source for methanogens, and soil moisture and temperature are some of the key controllers of CH 4 production, while soil porosity, moisture content, and temperature mainly control CH 4 oxidation in soils (Megonigal et al. 2004). N 2 O is pro- duced in soils by denitrification and nitrification processes (Megonigal et al. 2004). Under anaerobic conditions, denitri- fier microbes reduce nitrate (NO 3 ) to N 2 O and nitrogen (N 2 ) gases, and the relative amounts of N 2 O and N 2 produced de- pend on the availability of organic C substrate, NO 3 content, and soil moisture (Ullah et al. 2005). When soils are satu- rated with moisture, N 2 O diffusion into the atmosphere is slow, thereby allowing more time for the denitrifiers to re- Received 12 May 2008. Accepted 19 December 2008. Published on the NRC Research Press Web site at cjfr.nrc.ca on 12 March 2009. S. Ullah, R. Frasier, and T.R. Moore. 1 Department of Geography and Global Environmental and Climate Change Centre, McGill University, Montre ´al, QC H3A 2K6, Canada. L. Pelletier. Department of Geography and Geochemistry and Geodynamics Research Center (GEOTOP), Universite ´ du Que ´bec at Montre ´al, C.P. 8888, Succ. Centre-Ville, Montre ´al, QC H3C 3P8, Canada. 1 Corresponding author (e-mail: [email protected]). 666 Can. J. For. Res. 39: 666–680 (2009) doi:10.1139/X08-209 Published by NRC Research Press
-
Upload
punjablahorepakistan -
Category
Documents
-
view
2 -
download
0
Transcript of Greenhouse gas fluxes from boreal forest soils during the snow-free period in Quebec, Canada

Greenhouse gas fluxes from boreal forest soilsduring the snow-free period in Quebec, Canada
Sami Ullah, Rebeccah Frasier, Luc Pelletier, and Tim R. Moore
Abstract: This paper presents soil fluxes of methane (CH4), nitrous oxide (N2O), and carbon dioxide (CO2) from 12 siteslocated in four major forest types, black spruce (Picea mariana (Mill.) BSP), jack pine (Pinus banksiana Lamb.), aspen(Populus spp.), and alder (Alnus spp.) stands, in the Eastmain and Chibougamau regions of Quebec. Fluxes were deter-mined with closed chambers during the snow-free period from May to October 2007. Well-drained black spruce, jackpine, and aspen forest soils were net sinks of atmospheric CH4 (–0.33 ± 0.11 mg�m–2�day–1), while alder-dominated wet-land soils were sources of CH4 (0.45 ± 0.12 mg�m–2�day–1). The cut-over alder wetland soil produced 131 times more CH4
than the undisturbed wetland soil. Soil moisture and temperature mainly regulated CH4 fluxes. N2O fluxes from these for-est soils were highly variable and smaller (1.6 ± 0.33 mg N�m–2�h–1) than those from deciduous forest soils. N2O emissionfrom the cut-over black spruce forest soil was 2.7 times greater than that from the mature black spruce forest soil. LargeC/N ratios (27 to 78) and slow soil N mineralization and nitrification rates in these forest soils may have led to small N2Ofluxes. CO2 emissions from these forest soils, ranging from 0.20 to 2.7 g�m–2�day–1, were mainly controlled by soil temper-ature.
Resume : Cet article porte sur les flux de methane (CH4), d’oxyde nitreux (N2O) et de dioxyde de carbone (CO2) dans lessols de 12 stations situees dans quatre grands types de foret : peuplements d’epinette noire (Picea mariana (Mill.) BSP),de pin gris (Pinus banksiana Lamb.), de peuplier (Populus spp.) et d’aulne (Alnus spp.), dans les regions d’Eastmain et deChibougamau au Quebec. Les flux ont ete mesures a l’aide de chambres fermees pendant la periode exempte de neige, demai a octobre 2007. Les sols bien draines des forets d’epinette noire , de pin gris et de peuplier etaient des puits nets deCH4 atmospherique (–0,33 ± 0,11 mgm–2�j–1) tandis que les sols des milieux humides domines par l’aulne etaient des sour-ces de CH4 (0,45 ± 0,12 mg�m–2�j–1). Un sol en milieux humides ou l’aulne avait ete coupe produisait 131 fois plus deCH4 qu’un sol en milieux humides non perturbe. La temperature et l’humidite du sol regulaient le flux de CH4. Le flux deN2O dans ces sols forestiers etait tres variable et plus faible (1,6 ± 0,33 mg N�m–2�h–1) que dans les dans le sol de la foretfeuillue. Les emissions de N2O provenant du sol d’une foret d’epinette noire coupee etaient 2,7 fois plus elevees que cellesprovenant du sol d’une foret mature d’epinette noire. Un rapport C:N eleve (27 a 78) et de faibles taux de mineralisationet de nitrification dans le sol de ces forets pourrait avoir limite le flux de N2O. Les emissions de CO2, qui variaient de0,20 a 2,7 g C�m–2�j–1 dans ces sols forestiers, etaient surtout fonction de la temperature du sol.
[Traduit par la Redaction]
IntroductionForests represent about 50% of the total land area in Can-
ada (Lemmen and Warren 2004), and boreal forest is thedominant forest type, representing about one third of theglobal boreal forest cover (Stewart et al. 1998). The net car-bon (C) exchange between forest soils and the atmosphere isdominated by carbon dioxide (CO2) fluxes, but within thecontext of global warming potentials (IPCC 2007), it is nec-essary to include methane (CH4) and nitrous oxide (N2O)fluxes in these ecosystems. To date, estimates of national C
balance of Canadian forests (Kurz and Apps 1999; Chen etal. 2000) have not taken CH4 and N2O fluxes into accountbecause of a lack of data from forest soils, particularly bor-eal forest soils.
In forest soils the fluxes of CH4 result from two microbialprocesses, methanogenesis and methanotrophy (Megonigalet al. 2004). When soils are wet and anaerobic, methano-genic bacteria produce CH4, while under aerobic soil condi-tions, methanotrophs (chemolithotrophic bacteria) oxideatmospheric CH4 and CH4 produced in situ (Megonigal etal. 2004). The availability of organic C as an energy sourcefor methanogens, and soil moisture and temperature aresome of the key controllers of CH4 production, while soilporosity, moisture content, and temperature mainly controlCH4 oxidation in soils (Megonigal et al. 2004). N2O is pro-duced in soils by denitrification and nitrification processes(Megonigal et al. 2004). Under anaerobic conditions, denitri-fier microbes reduce nitrate (NO3) to N2O and nitrogen (N2)gases, and the relative amounts of N2O and N2 produced de-pend on the availability of organic C substrate, NO3 content,and soil moisture (Ullah et al. 2005). When soils are satu-rated with moisture, N2O diffusion into the atmosphere isslow, thereby allowing more time for the denitrifiers to re-
Received 12 May 2008. Accepted 19 December 2008. Publishedon the NRC Research Press Web site at cjfr.nrc.ca on 12 March2009.
S. Ullah, R. Frasier, and T.R. Moore.1 Department ofGeography and Global Environmental and Climate ChangeCentre, McGill University, Montreal, QC H3A 2K6, Canada.L. Pelletier. Department of Geography and Geochemistry andGeodynamics Research Center (GEOTOP), Universite duQuebec at Montreal, C.P. 8888, Succ. Centre-Ville, Montreal,QC H3C 3P8, Canada.
1Corresponding author (e-mail: [email protected]).
666
Can. J. For. Res. 39: 666–680 (2009) doi:10.1139/X08-209 Published by NRC Research Press

duce N2O to N2 gas before it escapes into the atmosphere(Ullah et al. 2005). Nitrifier microbes in soils convert am-monium (NH4) to NO3 under aerobic conditions, and duringthis process some of the mineral N is lost as N2O (Arah1997). Boreal forests in Canada consist of a mosaic of well-drained and poorly drained soils determined by topography,which can influence the microbial processes responsible forthe fluxes of CH4 and N2O and hence their net global warm-ing potentials.
Although the exchange of CH4 and N2O between borealforest soils and the atmosphere may be small, the large aer-ial extent of boreal forests in Canada means that the net ex-change rates of these two gases may be significant. Burke etal. (1997), Savage et al. (1997), and Schiller and Hastie(1996) reported CH4 fluxes from mature and burned borealforests in northern Ontario and Manitoba ranging from –1.8to 0.5 mg CH4�m–2�day–1. Schiller and Hastie (1996) reportedN2O fluxes from boreal forest soils in northern Ontario rang-ing from –7 to 25 mg N�m–2�day–1. This wide range in meas-ured CH4 and N2O fluxes from boreal forest soils is mainlyattributable to the limited number of studies undertaken andlimited investigation of the impacts of soil drainage class(Ullah et al. 2008) and of major forest disturbances such asnatural fires (Schiller and Hastie 1996) and tree harvestingon greenhouse gas fluxes. These disturbances could have asignificant influence on greenhouse gas exchanges with theatmosphere, through their effect on soil physical, chemical,and biological properties. Thus, it is critical to investigatethe influence of soil drainage class, natural fires, and forestharvesting on greenhouse gas exchanges to improve ourability to calculate and model net greenhouse gas exchangesin Canada.
Knowledge of the magnitude of and controls on green-house gas fluxes from boreal forest soils in Canada is frag-mentary (Schiller and Hastie 1996; Savage et al. 1997).Here, we make a preliminary quantification of soil CH4,N2O, and CO2 fluxes from four different boreal forest typeswith varying soil drainage classes under undisturbed condi-tions, under natural disturbance (fire), and under forest man-agement regimes in Quebec. The goal of the research was toquantify exchange rates of the three gases during the snow-free period of 2007 and identify the influence of environ-ment and forest management techniques on the fluxes.
Materials and methods
Site descriptionThe study was undertaken in two regions of Quebec: the
Eastmain River area and near the town of Chibougamau.The Eastmain River area is located within the James Bay re-gion of northern Quebec (52.208N, 76.078W), which is char-acterized by mixed boreal forests, including jack pine (Pinusbanksiana Lamb.), black spruce (Picea mariana (Mill.)BSP), trembling aspen (Populus tremuloides Michx.), andalder (Alnus rugosa Du Roi Spreng.) stands. Six forest siteswere selected: a mature black spruce dominated site, aburned black spruce site (burned naturally in 2005), a ma-ture jack pine site, a burned jack pine site (burned naturallyin 1989), a 30-year-old trembling aspen site, and a maturewetland site developed on poorly drained soils, dominatedby a black spruce tree layer and an alder shrub layer.
The mature black spruce dominated site had a groundcover of feathermoss (Pleurozium schreberi Brid.) and li-chens (Cladonia spp.), and the shrub layer was dominatedby blueberry (Vaccinium angustifolium Ait.) and sheep lau-rel (Kalmia angustifolia L.). The alder wetland site was lo-cated about 150 m down slope of this site and had a groundlayer dominated by Sphagnum moss and scattered water-filled hollows ranging in area from 0.1 to 1 m2. The burnedblack spruce site was completely burned in 2005 and wasundergoing natural regeneration, predominantly by blackspruce seedlings. The mature jack pine and the burned jackpine sites were mostly located on well-drained sandy soils.The burned site had a scattered ground cover of blueberry.The aspen-dominated site was mainly composed of 30-year-old trees, with a shrub layer of sheep laurel and Sphagnummoss in wetter areas.
The Chibougamau sites are located in central Quebec.Mature and cut-over black spruce forest sites were selectednear the eddy covariance towers of the FLUXNET/CanadianCarbon Program, located halfway between the northern andsouthern limits of boreal forest ecosystems and 250 kmsouth of the Eastmain sites (Bergeron et al. 2007). The ma-ture and cut-over sites are located about 30 km south(49.698N, 74.348W) and about 110 km southeast (49.268N,74.038W) of Chibougamau, respectively. In the mature blackspruce forest site, three plots were sampled along a transect.The high-elevation upland plot was dominated by matureblack spruce, with fewer jack pine trees, an understory com-posed of shrubs including Labrador tea (Ledum groenlandi-cum Oeder.) and sheep laurel, and a ground vegetation oflichens and feathermosses. The midelevation slope plot waslocated next to the FLUXNET tower and was dominated byblack spruce, with Labrador tea and sheep laurel as under-story shrubs and a feathermoss ground cover with Sphagnummoss occurring in scattered hollows. The low-elevation ma-ture wetland plot was dominated by black spruce, with anunderstory dominated by alder trees and a ground cover ofSphagnum moss. The cut-over forest site was clear-cut in2000 (Giasson et al. 2006), and three plots were established.The unscarified and scarified plots were located next to theFLUXNET tower on well-drained soils with saplings of al-der and black spruce regenerating and with a shrub layer do-minated by blueberry and Labrador tea. The scarified plotwas ploughed after logging to hasten regeneration (Giassonet al. 2006). The cut-over wetland plot, a forested swampbefore harvest, was located in the low-elevation area andhad a shrub layer dominated by alder. This plot remains par-tially flooded during the growing season.
Over the period 1971–2000, mean annual air temperatureat the Chapais–Chibougamau weather station of Environ-ment Canada was –0.1 8C, annual rainfall was 647 mm, an-nual snowfall was 271 cm, and total annual precipitationwas 920 mm (Environment Canada 2008). No such long-term data are available for the Eastmain area.
Greenhouse gas flux sampling and analysisFour gas flux measurement collars (472 cm2 area) were
installed at each plot using a random number table to ensurerandom placement of collars in each site. At Eastmain col-lars were installed 1 month prior to gas sampling, whilethose at Chibougamau were installed 7 months prior. The
Ullah et al. 667
Published by NRC Research Press

collars were inserted to a depth of 10 to 15 cm in the forestfloor without removing the litter layer. The Eastmain collarswere sampled six times from 10 June to 5 October 2007,while those at Chibougamau were sampled monthly fromMay to September 2007. Gas sampling followed the closed-chamber technique (Hutchinson and Mosier 1981). The col-lars had a continuous circular groove filled with water tocreate a seal between the collar and the chamber (headspaceenclosure) during gas sampling. The volume of the chamberwas 8000 cm3, and the average volume-to-area ratio (V/A)of the chamber was 17, which met the minimum V/A ratiorequired for measuring greenhouse gas fluxes without influ-encing the gas diffusion patterns that would prevail undernormal atmospheric pressure (Hutchinson and Mosier 1981).The net headspace volume was recorded for each collar andranged from 8000 to 10000 cm3 depending on the height ofthe collar above the forest floor. The chambers werewrapped with aluminum foil to avoid heating the enclosedair during gas sampling. Upon enclosure of the collars withcover chambers (starting between 9:00 and 11:00 am), gassamples were collected at 0, 30, 60, and 90 min with a sam-pling port attached to the top of the chamber. The gas sam-ples (25 cm3) were transferred to pre-evacuated, crimpedglass vials (13 cm3) and analyzed within 3 to 10 days of col-lection on a Shimadzu 14-A gas chromatograph equippedwith an electron capture detector for N2O analysis, and on aShimadzu Mini gas chromatograph equipped with an flameionization detector for CH4 and CO2 analysis, using a meth-anizer column to determine CO2 concentration. The flux ofeach gas was determined based on a linear change in gasconcentration over the 90 min incubation period. Gas con-centrations with no consistent increase or decrease over the90 min incubation period were considered to be zero flux,provided the coefficient of variation was not greater thanthat of known gas standards.
Physicochemical propertiesSoil temperature (0–10 cm soil depth) and volumetric
water contents (VWC, 0–12 cm soil depth) were measurednext to each collar during gas flux sampling using a portablesoil temperature probe (10 cm long) and a Hydro Sense soilmoisture probe (12 cm long) (Campbell Scientific, Edmon-ton, Alberta). Soil temperature and moisture probes integratemeasurements over the length of the probes inserted into thesoil. Three intact soil cores (0–15 cm depth) were collectedat each site for bulk density determination in July at East-main and in May at Chibougamau. Bulk soil samples werealso collected in June, July, and October from each East-main plot (in triplicate), and in May, June, July, August,and September from each of the Chibougamau plots for thedetermination of soil pH, NO3, NH4, total dissolved N, anddissolved organic C (DOC), following Ullah et al. (2008).Soils were homogenized manually, and roots and stoneswere removed. For the determination of net N mineraliza-tion and nitrification rates, subsamples of 25 g field-moistsoils were weighed into 250 mL Mason jars for a 28 day in-cubation at room temperature in the laboratory (Hart et al.1994). Additional subsamples of 5 g dry soil equivalentwere extracted with 2 mol/L KCl solution, using a soil-to-KCl solution ratio of 1:10, shaken for 1 h, and filteredthrough No. 42 Whatman filter paper. The filtrates were fro-
zen until analysis on a flow injection analyzer for the deter-mination of initial NO3 and NH4 concentrations. The NO3concentration included nitrite (NO2) in the samples. The in-cubated soils were extracted after the 28 day incubation toobtain final NO3 and NH4 concentrations. The differencesbetween the initial and final mineral N concentrations wereused to calculate net N mineralization and nitrification rates.
For the determination of soil C and N content, sampleswere collected in July 2007 from the upper 0–15 cm organiclayer and from the underlying mineral soil layers (0–15 cm),if the thickness of the organic layer of a site was more than15 cm. The mature black spruce, alder wetland, and aspensites at Eastmain and the mature and cut-over black spruceforest sites at Chibougamau had a thick (>15 cm) organiclayer above the mineral soil layer. The organic layerwas <15 cm thick in the mature and burned jack pine andburned black spruce sites at Eastmain and the alder wetlandsites at Chibougamau, and these sites were sampled to adepth of 15 cm, without differentiation into organic andmineral soil layers. Selected physicochemical characteristicsof the sites are shown in Table 1.
Statistical analysisThe data for CH4 and N2O fluxes and N mineralization
and nitrification rates were log transformed prior to statisti-cal analysis. Multiple linear regression analysis of CH4fluxes, CO2 fluxes, N mineralization rates, and nitrificationrates from all sites on physicochemical characteristics wasperformed using SAS version 9.3.1. A stepwise selectionmodel was chosen to identify significant predictor variablesand to avoid the inclusion of collinear variables. Since theresiduals of the N2O fluxes were not normally distributed,even after log transformation, a nonparametric Kruskal–Wallis ANOVA by ranks was run for site effects, and Spear-man rank correlation was run on N2O fluxes and relevantvariables. CH4 and CO2 fluxes and N mineralization and ni-trification rates were also compared among sites using AN-OVA to uncover the influence of site, forest type ormanagement regime, and season on gas fluxes and N miner-alization rates. To integrate N2O, CH4, and CO2 fluxes overthe snow-free period, the mean flux of two adjacent sam-pling dates was used to calculate the mean flux for the pe-riod in between these two sampling dates.
Results
CH4 fluxesWell-drained soils were sinks and wetland soils were
sources of atmospheric CH4 in Eastmain and Chibougamau.At Eastmain most plots consumed CH4 with mean fluxesranging from –0.04 mg CH4�m–2�day–1 (burned black spruce)to –0.60 mg CH4�m–2�day–1 (burned jack pine). The excep-tions to this overall result were the alder wetland and matureblack spruce plots, which were modest sources of CH4 (0.41and 0.14 mg CH4�m–2�day–1, respectively). The net efflux ofCH4 from the mature black spruce plot was caused primarilyby high emission rates of CH4 in early summer, whichswitched to an influx of CH4 later in the summer (Fig. 1).CH4 fluxes from the mature and burned black spruce siteswere not significantly different from each other for all sam-pling dates (p > 0.05; Table 2). Likewise, CH4 consumption
668 Can. J. For. Res. Vol. 39, 2009
Published by NRC Research Press

Table 1. Physicochemical soil properties at the sites (mean ± standard error, n = 3).
Chibougamau
Eastmain Mature black spruce site Cut-over black spruce site
Soil property
Matureblackspruce
Burnedblackspruce
Alderwetland
Maturejack pine
Burnedjack pine Aspen Upland Slope Wetland A Unscarified Scarified Wetland B
Bulk density 0–15 cm(g�cm–3)
0.15±0.01 0.17±0.01 0.18±0.04 0.47±0.1 0.45±0.08 0.23±0.1 0.16±0.0 0.18±0.05 0.11±0.01 0.19±0.04 0.22±0.09 0. 20±0.07
pH 4.1±0.05 4.2±0.1 4.5±0.1 4.3±0.01 4.3±0.01 4.4±0.2 4.1±0.1 4.2±0.0 4.6±0.1 4.2±0.1 4.5±0.3 5.6±0.1Total C organic layer
(kg�m–2)10.7±0.1 na 11.7±0.5 na na 16±0.2 11±0.5 11±2.1 na 13.6±0.1 12±2.8 na
Total C mineral layer(kg�m–2)
64±9 5.7±3 67±2.7 1.4±0.1 8.6±2.0 96±6 4±1.2 3.3±0.6 7.4±0.1 11.5±3.5 2.8±0.3 11.8±0.9
Total N organic layer(kg�m–2)
0.16±0.01 na 0.37±0.04 na na 0.69±0.03 0.16±0.00 0.16±0.03 na 0.25±0.03 0.23±0.04 na
Total N mineral layer(kg�m–2)
1.9±0.3 0.20±0.15 3.2±0.4 0.05±0 0.27±0.05 5.5±0.11 0.15±0.03 0.14±0.02 0.31±0.02 0.40±0.12 0.14±0.01 0.38±0.02
C/N (organic layer) 79±5 na 38±5 na na 27±1 76±4 76±4 na 65±7 61±4 naC/N (mineral layer) 38±1 63±12 25±2 33±3 36±4 21±1 39±5 27±2 28±2 34±6 32±1 36±1DOC (mg�kg–1) 390±48 467±45 424±37 178±9 303±20 375±55 498±66 456±41 156±26 366±27 515±29 269±16TDN (mg�kg–1) 9±0.6 9±0.6 12±0.9 7±0.4 8±0.5 17±2.7 12±1.0 12±1.0 12±3.1 9±0.8 16±2.7 8±0.8DOC/TDN 50 60 41 29 44 26 48 44 11 47 37 39VWC seasonal average
(m3�m–3)0.39 0.20 0.79 0.12 0.16 0.44 0.21 0.33 0.91 0.23 0.30 0.95
Note: DOC, dissolved organic carbon; TDN, total dissolved nitrogen; VWC, volumetric water content. na, not applicable, i.e., site had an organic matter layer less than 15 cm deep; these sites weresampled down to 15 cm depth for total C and N analysis without segregation into organic and mineral soil layers.
Ullah
etal.
669
Publishedby
NR
CR
esearchPress

rates at the mature and burned jack pine sites were not sig-nificantly different; however, these sites consumed signifi-cantly more CH4 than the mature and burned black sprucesites in the late summer, from 26 July through 10 Augustand 10 October sampling dates. On the 18 July samplingdate exclusively, aspen consumed more CH4 than the matureand burned black spruce sites. The alder wetland emitted CH4and was significantly different from all other sites (p < 0.05).
At Chibougamau the mature upland and slope plotsand the unscarified and scarified cut-over plots con-sumed atmospheric CH4 at rates ranging from –0.19to –0.51 mg CH4�m–2�day–1 (Fig. 1). The mature and cut-over wetland plots were net sources of atmospheric CH4
(Table 2), and net CH4 emission from the cut-over wetlandplot was significantly different from that of the remainingmature and cut-over black spruce plots (including the ma-ture wetland) over all sampling dates (p < 0.05).
When extrapolated to the 5 month sampling periodfor the Eastmain plots, fluxes were as follows: jackpine, –702 mg CH4�m–2; aspen, –272 mg CH4�m–2; burnedspruce –13 mg CH4�m–2; mature spruce, 88 mg CH4�m–2;alder wetland, 433 mg CH4�m–2. In the Chibougamauregion, fluxes were as follows: well-drained matureblack spruce, –448 mg CH4�m–2; cut-over black spruce,–252 mg CH4�m–2; mature wetland, 263 mg CH4�m–2; cut-over wetland, 33 447 mg CH4�m–2.
Fig. 1. Methane (CH4) fluxes from boreal forest soils at the Eastmain and Chibougamau sites. Error bars show the standard errors of themeans. Note that y axes in these graphs are scaled differently. The top graph shows data from Eastmain, and the lower graph shows datafrom Chibougamau. Positive values are emissions, while negative values represent consumption.
670 Can. J. For. Res. Vol. 39, 2009
Published by NRC Research Press

Stepwise multiple linear regression of individual log-transformed CH4 fluxes, from all plots and sampling dates,on physicochemical characteristics identified soil moistureand soil temperature as significant predictor variables (p <0.0001, F = 54, adjusted R2 = 0.32, n = 227; Table 3). Thestandardized regression coefficients for soil moisture andtemperature were 0.64 and 0.29, respectively, showing thatthe contribution of soil moisture in explaining variability inCH4 fluxes was higher than that of soil temperature.
N2O fluxesN2O fluxes from Eastmain and Chibougamau soils were
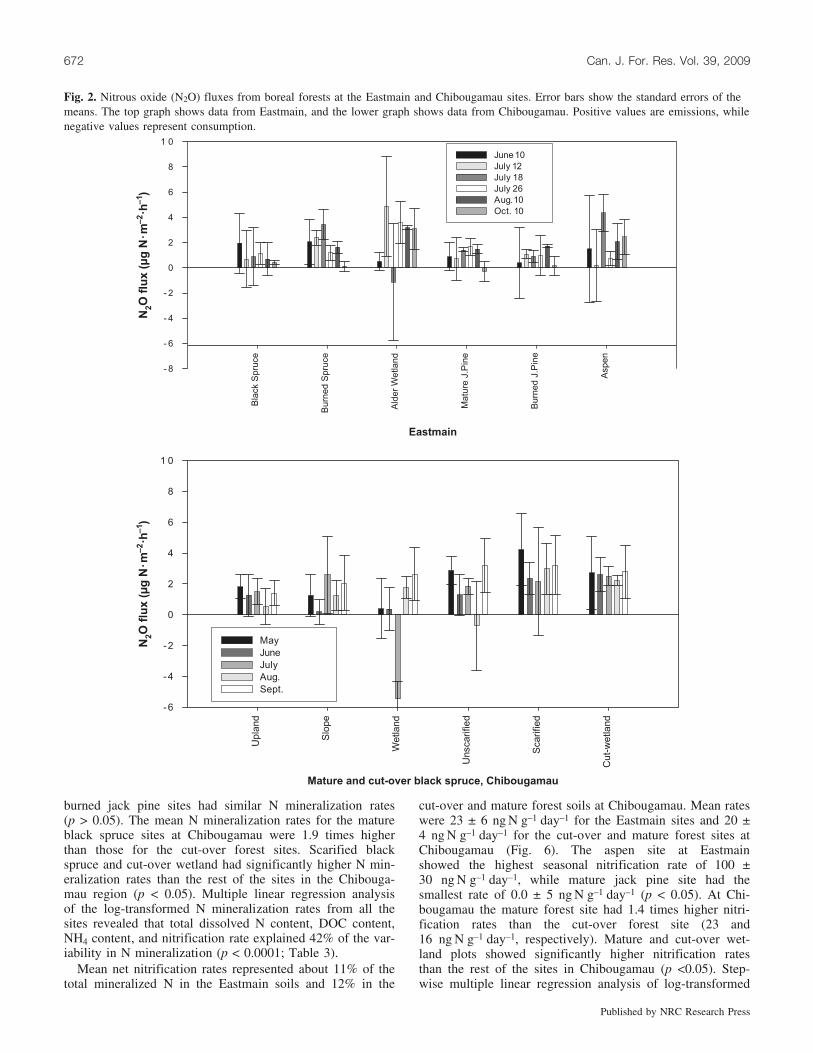
highly variable (Fig. 2). When values were averaged overthe sampling period at the Eastmain sites, the alder wetlandsoil emitted the greatest and the burned jack pine soil emit-ted the lowest net amount of N2O (Table 2). When N2Oemissions from all the Eastmain plots were extrapolatedover the 5 month sampling period, these sites emitted anaverage of 31 mg N�m–2. At the Chibougamau sites the ma-ture black spruce forest soils emitted an average of21 mg N�m–2, compared with 33 mg N2O-N�m–2 at the cut-over site. The N2O data from all sites were highly skewed,even after log transformation, and thus did not allow para-metric analysis for site effects or linear models. Accordingto the Spearman’s rank correlation analysis, the N2O fluxesdid not show significant correlations with environmental orsubstrate variables; as well, Spearman’s rank correlationand nonparametric ANOVA showed no significant differ-ence in N2O emissions among the 12 plots.
CO2 fluxesCO2 emissions from the mature black spruce forest sites
were similar at Eastmain and Chibougamau. At Eastmain
the aspen soils produced the greatest amount of CO2(1.51 ± 0.09 g C�m–2�day–1), while the burned black spruceproduced the lowest amount (0.47 ± 0.05 g C�m–2�day–1;Fig. 3; Table 2). CO2 emissions from all Eastmain sitesover the 5 month period averaged 1.07 ± 0.02 g C�m–2 day–1.In the Eastmain region mature jack pine, alder, and aspensites had significantly higher CO2 emission rates than the ma-ture and burned black spruce sites (p < 0.05). CO2 emissionsfrom the mature black spruce and cut-over sites in Chibouga-mau averaged 0.74 ± 0.03 and 0.92 ± 0.07 g C�m–2�day–1, re-spectively. CO2 emissions from the mature wetland were halfthose of the cut-over wetland site. In the Chibougamau regionmature black spruce and wetland sites had similar CO2 emis-sion rates. Scarified and cut-over wetland plots had largeremissions than the mature wetland (p < 0.05). Linear regres-sion analysis of all individual CO2 emissions from all plots inEastmain and Chibougamau found soil temperature to be themost significant predictor variable, accounting for 12% and38% of the variability, respectively (Table 2; Fig. 4).
N mineralizationMean potential net N mineralization rates for soils from
the Eastmain and Chibougamau sites were 209 ± 17 and172 ± 14 ng N�g–1�day–1 for the snow-free period, respec-tively (Fig. 5). At Eastmain the alder wetland and aspensites had the highest mean N mineralization rates of 371 ±43 and 370 ± 69 ng N�g–1�day–1, respectively, while theburned jack pine site showed the smallest rate of 50 ±36 ng N�g–1�day–1. Nitrogen mineralization rates of the aspensite were significantly different from those of the matureand burned black spruce and jack pine sites (p < 0.05). Ma-ture black spruce showed smaller N mineralization than theburned black spruce site (p < 0.05), while mature and
Table 2. Mean methane (CH4), nitrous oxide (N2O), and carbon dioxide (CO2) fluxes with standard error of means.
SitesForest type
CH4 flux(mg CH4�m–2�day–1)
N2O flux(mg N�m–2�h–1)
CO2 flux(g C�m–2�day–1)
Eastmain Mature black spruce 0.14±0.13 0.96±1.30 0.84±0.19Burned black spruce –0.04±0.18 1.80±0.84 0.47±0.12Alder wetland 0.41±0.21 2.35±2.12 1.40±0.25Mature jack pine –0.58±0.28 0.97±0.80 1.31±0.14Burned jack pine –0.60±0.39 0.87±1.20 0.87±0.18Aspen –0.19±0.29 1.88±1.99 1.51±0.17
Chibougamau Mature black spruce (upland plot) –0.51±0.19 1.30±0.28 0.81±0.14Mature black spruce (slope plot) –0.36±0.13 1.46±0.41 0.90±0.07Mature wetland A 0.48±0.12 –0.06±1.42 0.51±0.14Cut-over black spruce (unscarified) –0.14±0.54 1.73±0.69 0.94±0.14Cut-over black spruce (scarified) –0.21±0.31 2.98±0.37 0.88±0.25Cut-over wetland B 63.30±25.16 2.57±0.10 0.95±0.29
Table 3. Summary of regression analyses.
Variable Linear regression equation R2
ln CH4 flux (mg CH4�m–2�day–1) CH4 = 0.69 + 0.1VWC + 0.04 Soil Temp. 0.32CO2 (mg C�m–2�day–1) CO2 = 0.11 + 0.07 Soil Temp. 0.23ln N mineralization (ng N�g–1�day–1) ln min = 3.3 + 0.42 ln nit – 0.13NH4 + 0.05TDN + 0.9DOC 0.40ln N nitrification (ng N�g–1�day1) ln nit = 3.1 + 0.27CO2 + 0.09NH4 – 0.8NO3 – 0.009CNm – 1DOC + 0.24 ln min 0.49
Note: ln CH4, natural log of CH4; VWC, volumetric water content (%); Soil Temp., soil temperature (8C); ln min, natural log of N mineralization rate;ln nit, natural log of nitrification rate; TDN, total dissolved N (mg N�(g soil)–1); DOC, dissolved organic carbon (ng C�(g soil–1)); NH4 (mg N�(g soil)–1); NO3
(mg N�(g soil)–1); CNm, C/N ratio in mineral soil layer. All regressions were significant at p < 0.05.
Ullah et al. 671
Published by NRC Research Press
burned jack pine sites had similar N mineralization rates(p > 0.05). The mean N mineralization rates for the matureblack spruce sites at Chibougamau were 1.9 times higherthan those for the cut-over forest sites. Scarified blackspruce and cut-over wetland had significantly higher N min-eralization rates than the rest of the sites in the Chibouga-mau region (p < 0.05). Multiple linear regression analysisof the log-transformed N mineralization rates from all thesites revealed that total dissolved N content, DOC content,NH4 content, and nitrification rate explained 42% of the var-iability in N mineralization (p < 0.0001; Table 3).
Mean net nitrification rates represented about 11% of thetotal mineralized N in the Eastmain soils and 12% in the
cut-over and mature forest soils at Chibougamau. Mean rateswere 23 ± 6 ng N�g–1�day–1 for the Eastmain sites and 20 ±4 ng N�g–1�day–1 for the cut-over and mature forest sites atChibougamau (Fig. 6). The aspen site at Eastmainshowed the highest seasonal nitrification rate of 100 ±30 ng N�g–1�day–1, while mature jack pine site had thesmallest rate of 0.0 ± 5 ng N�g–1�day–1 (p < 0.05). At Chi-bougamau the mature forest site had 1.4 times higher nitri-fication rates than the cut-over forest site (23 and16 ng N�g–1�day–1, respectively). Mature and cut-over wet-land plots showed significantly higher nitrification ratesthan the rest of the sites in Chibougamau (p <0.05). Step-wise multiple linear regression analysis of log-transformed
Fig. 2. Nitrous oxide (N2O) fluxes from boreal forests at the Eastmain and Chibougamau sites. Error bars show the standard errors of themeans. The top graph shows data from Eastmain, and the lower graph shows data from Chibougamau. Positive values are emissions, whilenegative values represent consumption.
672 Can. J. For. Res. Vol. 39, 2009
Published by NRC Research Press

nitrification rates from all the sites identified six propertiesthat explained 49% of the variability in nitrification rates:CO2 emission rate, NO3 content, NH4 content, DOC con-tent, N mineralization rate, and C/N ratio of the mineralsoil layer (Table 3).
Discussion
CH4 fluxesIn general, atmospheric CH4 was consumed by forest soils
in both Eastmain (jack pine, aspen, and burned black spruce
sites) and Chibougamau (mature and cut-over well-drainedforest sites), except at the poorly drained sites. Rates ofCH4 consumption for the intact, burned, and cut-over sitesare within the ranges reported for similar forest types in theboreal region (Table 4). In Eastmain periodic CH4 emissionoccurred from black spruce and aspen forest types in Mayand June when soil moisture contents were high. Schillerand Hastie (1996) reported similar CH4 release from matureand clear-cut boreal forest soils with high soil moisture con-tent in northern Ontario. The mature and burned jack pinesoils consumed greater amounts of CH4 than the black
Fig. 3. Mean carbon dioxide (CO2) emissions from boreal forest soils in Quebec. Error bars show the standard errors of the means. The topgraph shows data from Eastmain, and the lower graph shows data from Chibougamau.
Ullah et al. 673
Published by NRC Research Press

spruce and aspen soils, due mainly to their lower water con-tents (0.12 and 0.16 m3�m–3, respectively), which may havesupported more rapid diffusion of atmospheric CH4 into ox-idation zones (Lessard et al. 1994) than in the black spruceand aspen soils (0.44 and 0.39 m3�m–3, respectively)(Table 1). Billings et al. (2000) reported that soil VWC be-low 0.20 m3�m–3 in boreal forest soils in Alaska increasedCH4 consumption rates, a finding that is in agreement withour study. Whalen and Reeburgh (1996) also observed an in-crease in CH4 oxidation rates in black spruce and aspen for-est soils when water contents fell from 0.70 to 0.40 m3�m–3.Savage et al. (1997) reported higher consumption rates indry jack pine forest soils than in mesic black spruce forestsoils in Manitoba, a result that is also in agreement withour findings. Our data suggest that VWC exerts significantcontrol over CH4 consumption rates in well-drained borealforest soils (Lessard et al. 1994).
Given the significance of soil moisture contents in regu-lating CH4 oxidation rates in boreal forest soils, it is inter-esting to note that the burned black spruce forest site atEastmain had a mean VWC of 0.20 m3�m–3, half that of themature black spruce site (0.39 m3�m–3; Table 1). However,CH4 consumption rates were not significantly different overall sampling dates (p > 0.05) in the two sites. Similarly,VWC of the upland plot of the mature black spruce forestsite in Chibougamau averaged 0.21 m3�m–3, but the CH4consumption rates were 13 times those observed at theburned black spruce forest site. Burke et al. (1997) reportedlower mean fluxes in a 1-year-old burned black spruce forest( –0.28 mg CH4�m–2�day–1) than in a mature black spruceforest in Manitoba (–0.48 mg CH4�m–2�day–1). They also ob-served that old burns (>5 years) exhibited higher CH4 con-sumption rates than mature black spruce forests (Table 4).Recent fires appear to initially suppress CH4 consumptionrates, which are eventually restored to levels that are higherthan those in mature forests (Burke et al. 1997). CH4 con-sumption rates in burned (16 years after natural burn) andmature jack pine averaged –0.60 and –0.58 mg�m–2�day–1,supporting our speculation that CH4 consumption potentialis restored several years after a natural fire.
In Chibougamau mean rates of CH4 influx for the uplandand slope plots in the mature black spruce site were 2.5times greater than those for the cut-over black spruce forestover the study period. Kahkonen et al. (2002) also observeda 40% decrease in CH4 consumption rates in clear-cutspruce forest soils in Finland. Scarification to enhance resto-ration at the cut-over site did not significantly affect CH4consumption rates; this result contrasts with the findings ofKruse and Iverson (1995), who reported higher CH4 con-sumption rates in scarified versus unscarified heathlands inDenmark.
Unlike boreal fens and bogs, which produce greateramounts of CH4 (e.g., Bubier et al. 1995; Rask et al. 2002;Pelletier et al. 2007), forested wetlands in Eastmain andChibougamau were minor net sources of atmospheric CH4,in the range of values reported from coniferous swamps atthe southern fringes of the Canadian boreal forest ecoregion(Roulet et al. 1992). The cut-over wetland produced CH4 atrates significantly greater than those of the mature wetlandin Chibougamau. Average summer soil temperatures (13 8Cin cut-over and 9 8C in mature wetland), VWC, DOC con-centrations, and soil respiration rates were higher in the cut-over than in the mature wetland, apparently leading tohigher CH4 emissions from the cut-over than from the ma-ture wetland.
In addition to soil moisture, soil temperature influencedCH4 fluxes from all sites, though soil moisture and temper-ature together explained only 32% of the variability in CH4fluxes. Increasing soil temperatures during the summermonths were accompanied by an increase in CH4 consump-tion in the upland forests and in CH4 emission from the wet-lands, results that are similar to patterns noted in borealupland soils by Savage et al. (1997) and wetland soils byBubier et al. (1995).
N2O fluxesHigh variability precluded any clear seasonal pattern in
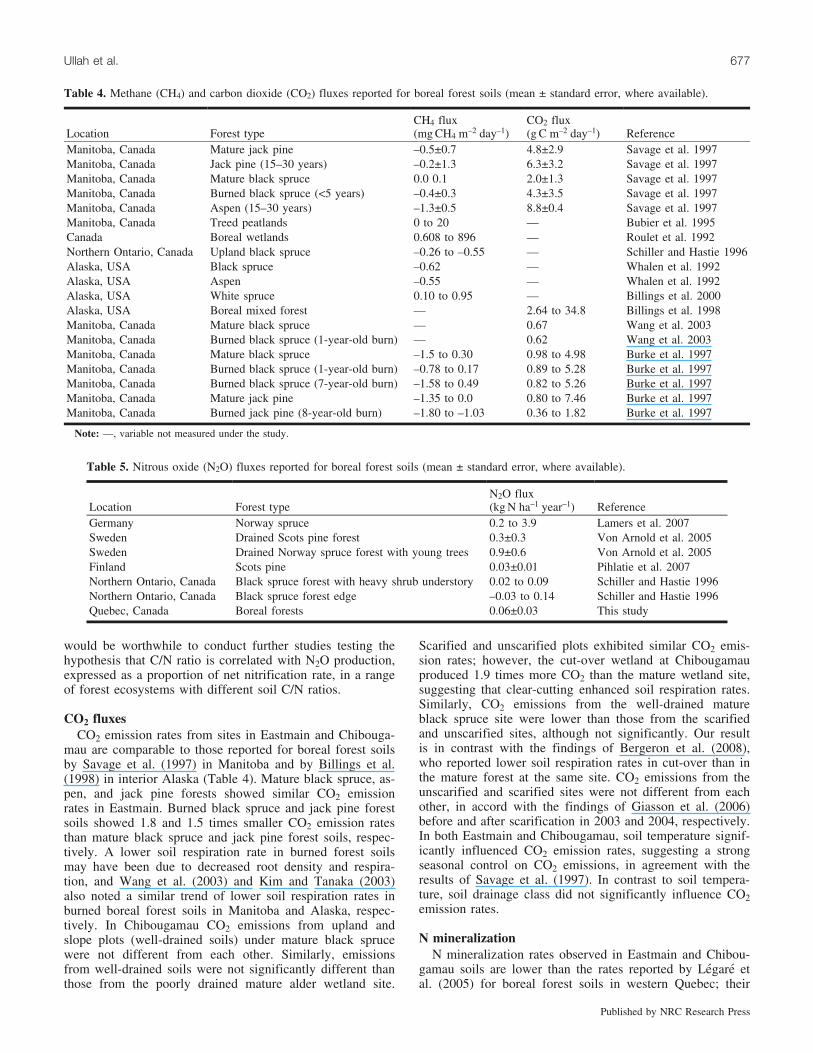
N2O fluxes from sites in Eastmain and Chibougamau. Spora-dic atmospheric N2O uptake was observed, but when all thefluxes from all the sampling dates were averaged over themeasurement period, all sites were net minor sources ofN2O. Schiller and Hastie (1996) also reported a similarrange of net N2O emission from black spruce forests innorthern Ontario (Table 5). The mean N2O emission ratesof 0.06 ± 0.03 kg N�ha–1 from all the sties in Eastmain andChibougamau were significantly lower than rates reportedfrom the N-rich Norway spruce (Picea abies (L.) Karst) for-ests in Germany (Lamers et al. 2007) and drained Scots pine(Pinus sylvestris L.) and Norway spruce forests in Sweden(Von Arnold et al. 2005) (Table 5). The range of N2O fluxesfrom the Eastmain and Chibougamau sites were similar tothose from boreal forest soils in northern Saskatchewan(0.03 to 0.1 kg N�ha–1�year–1) (A.L. Matson and D.J. Pen-nock, personal communication), black spruce forest soils innorthern Ontario (Schiller and Hastie 1996), and Scots pineforest soils in southern Finland (Pihlatie et al. 2007).
High C/N ratios in the upper 15 cm of our soils (27 to 81)may have been responsible for small N2O emissions, whencompared with low ratios in the Norway spruce and Scotspine forest soils in Germany (15 to 29) and Sweden (26 to40). Klemedtsson et al. (2005) reported a threshold C/N
Fig. 4. Relationship between carbon dioxide (CO2) emissions andsoil temperature at the Eastmain and Chibougamau sites (0–12 cmdepth).
674 Can. J. For. Res. Vol. 39, 2009
Published by NRC Research Press

value of 25 in organic soil layers above which N2O emis-sions from boreal forest soils ranged from 0.05 to0.8 kg N�ha–1�year–1. This range in N2O emissions is inagreement with our results: the organic layer C/N ratios inall sites are >25. Soils with C/N ratios above 25 have smallor negligible nitrification rates (Lovett et al. 2002; Ollingeret al. 2002; Aber et al. 2003), and the low nitrification ratesobserved in our sites may have limited the N2O productionprocesses and thus net N2O emissions, compared with thoseof temperate forest soils with C/N ratios <25 in the UnitedStates and Europe (Groffman et al. 2000; Zechmeister-Boltenstern et al. 2002; Venterea et al. 2003; Ambus and
Robertson 2006; Ullah and Zinati 2006). Interestingly, theaspen and alder wetlands at Eastmain showed the highestN mineralization and nitrification rates, apparently leadingto greater N2O emissions from these soils. Amaral andKnowles (1997) reported higher potential nitrification ac-tivity in aspen than black spruce forest soils in Manitoba.Those findings support our speculation that higher internalN cycling potentials in aspen forest soils lead to higherN2O emissions, compared with black spruce forest soils,as a result of coupled nitrification–denitrification processes.
Additionally, nitrification produces NO3 in soils, whichunder anaerobic conditions is used by denitrifiers, which
Fig. 5. Net N mineralization rates in boreal forest soils. Error bars show the standard errors of the means. The top graph shows data fromEastmain, and the lower graph shows data from Chibougamau. Positive values represent N mineralization rates, while negative values re-present N immobilization by soil microbes.
Ullah et al. 675
Published by NRC Research Press

convert it to N2O and N2 gases (Ullah and Zinati 2006).Higher nitrification rates in aspen and alder wetlands mayhave supported higher denitrifier activity through sustainedNO3 production, leading to higher N2O emissions from thesesites compared with black spruce and jack pine sites as a re-sult of both nitrification and denitrification processes. Ineastern Canada, Ullah et al. (2008) found that faster denitri-fication rates led to larger potential N2O emissions from for-ested wetland soils than from well-drained forest soils.Denitrifier activity is speculated to be significantly higherin alder wetland and aspen soils because of higher soil mois-ture content, contributing to higher N2O emission rates fromthese sites than from black spruce and jack pine sites. Therelative contribution of nitrification and denitrification proc-esses to net N2O emissions from these forests, using 15N,
could explain some of the variability associated with N2Ofluxes from boreal forests (Bedard-Haughn et al. 2006).
When averaged, net N2O emissions represented 0.24%and 0.82% of the total net nitrification rates for the East-main and Chibougamau forest soils, respectively. These val-ues are lower than those reported for birch boreal forestssoils (1.5% to 5%) in Finland (Maljanen et al. 2003). Thesoil C/N ratios in Eastmain and Chibougamau are higherthan those in the birch forests of Finland (C/N of 20), mean-ing that competition for mineral N among microbial meta-bolic, plant uptake, and denitrifier demands may have led tothese lower N2O emissions when expressed as a percentageof net nitrified N. This hypothesis raises further questions asto how N2O emissions, expressed as a proportion of net ni-trified N, vary with changes in C/N ratios of forest soils. It
Fig. 6. Net nitrification rates in boreal forest soils. Error bars show the standard errors of the means. The top graph shows data from East-main, and the lower graph shows data from Chibougamau. Positive values represent nitrification rates, while negative values represent Nimmobilization by soil microbes.
676 Can. J. For. Res. Vol. 39, 2009
Published by NRC Research Press
would be worthwhile to conduct further studies testing thehypothesis that C/N ratio is correlated with N2O production,expressed as a proportion of net nitrification rate, in a rangeof forest ecosystems with different soil C/N ratios.
CO2 fluxesCO2 emission rates from sites in Eastmain and Chibouga-
mau are comparable to those reported for boreal forest soilsby Savage et al. (1997) in Manitoba and by Billings et al.(1998) in interior Alaska (Table 4). Mature black spruce, as-pen, and jack pine forests showed similar CO2 emissionrates in Eastmain. Burned black spruce and jack pine forestsoils showed 1.8 and 1.5 times smaller CO2 emission ratesthan mature black spruce and jack pine forest soils, respec-tively. A lower soil respiration rate in burned forest soilsmay have been due to decreased root density and respira-tion, and Wang et al. (2003) and Kim and Tanaka (2003)also noted a similar trend of lower soil respiration rates inburned boreal forest soils in Manitoba and Alaska, respec-tively. In Chibougamau CO2 emissions from upland andslope plots (well-drained soils) under mature black sprucewere not different from each other. Similarly, emissionsfrom well-drained soils were not significantly different thanthose from the poorly drained mature alder wetland site.
Scarified and unscarified plots exhibited similar CO2 emis-sion rates; however, the cut-over wetland at Chibougamauproduced 1.9 times more CO2 than the mature wetland site,suggesting that clear-cutting enhanced soil respiration rates.Similarly, CO2 emissions from the well-drained matureblack spruce site were lower than those from the scarifiedand unscarified sites, although not significantly. Our resultis in contrast with the findings of Bergeron et al. (2008),who reported lower soil respiration rates in cut-over than inthe mature forest at the same site. CO2 emissions from theunscarified and scarified sites were not different from eachother, in accord with the findings of Giasson et al. (2006)before and after scarification in 2003 and 2004, respectively.In both Eastmain and Chibougamau, soil temperature signif-icantly influenced CO2 emission rates, suggesting a strongseasonal control on CO2 emissions, in agreement with theresults of Savage et al. (1997). In contrast to soil tempera-ture, soil drainage class did not significantly influence CO2emission rates.
N mineralizationN mineralization rates observed in Eastmain and Chibou-
gamau soils are lower than the rates reported by Legare etal. (2005) for boreal forest soils in western Quebec; their
Table 4. Methane (CH4) and carbon dioxide (CO2) fluxes reported for boreal forest soils (mean ± standard error, where available).
Location Forest typeCH4 flux(mg CH4�m–2�day–1)
CO2 flux(g C�m–2�day–1) Reference
Manitoba, Canada Mature jack pine –0.5±0.7 4.8±2.9 Savage et al. 1997Manitoba, Canada Jack pine (15–30 years) –0.2±1.3 6.3±3.2 Savage et al. 1997Manitoba, Canada Mature black spruce 0.0 0.1 2.0±1.3 Savage et al. 1997Manitoba, Canada Burned black spruce (<5 years) –0.4±0.3 4.3±3.5 Savage et al. 1997Manitoba, Canada Aspen (15–30 years) –1.3±0.5 8.8±0.4 Savage et al. 1997Manitoba, Canada Treed peatlands 0 to 20 — Bubier et al. 1995Canada Boreal wetlands 0.608 to 896 — Roulet et al. 1992Northern Ontario, Canada Upland black spruce –0.26 to –0.55 — Schiller and Hastie 1996Alaska, USA Black spruce –0.62 — Whalen et al. 1992Alaska, USA Aspen –0.55 — Whalen et al. 1992Alaska, USA White spruce 0.10 to 0.95 — Billings et al. 2000Alaska, USA Boreal mixed forest — 2.64 to 34.8 Billings et al. 1998Manitoba, Canada Mature black spruce — 0.67 Wang et al. 2003Manitoba, Canada Burned black spruce (1-year-old burn) — 0.62 Wang et al. 2003Manitoba, Canada Mature black spruce –1.5 to 0.30 0.98 to 4.98 Burke et al. 1997Manitoba, Canada Burned black spruce (1-year-old burn) –0.78 to 0.17 0.89 to 5.28 Burke et al. 1997Manitoba, Canada Burned black spruce (7-year-old burn) –1.58 to 0.49 0.82 to 5.26 Burke et al. 1997Manitoba, Canada Mature jack pine –1.35 to 0.0 0.80 to 7.46 Burke et al. 1997Manitoba, Canada Burned jack pine (8-year-old burn) –1.80 to –1.03 0.36 to 1.82 Burke et al. 1997
Note: —, variable not measured under the study.
Table 5. Nitrous oxide (N2O) fluxes reported for boreal forest soils (mean ± standard error, where available).
Location Forest typeN2O flux(kg N�ha–1�year–1) Reference
Germany Norway spruce 0.2 to 3.9 Lamers et al. 2007Sweden Drained Scots pine forest 0.3±0.3 Von Arnold et al. 2005Sweden Drained Norway spruce forest with young trees 0.9±0.6 Von Arnold et al. 2005Finland Scots pine 0.03±0.01 Pihlatie et al. 2007Northern Ontario, Canada Black spruce forest with heavy shrub understory 0.02 to 0.09 Schiller and Hastie 1996Northern Ontario, Canada Black spruce forest edge –0.03 to 0.14 Schiller and Hastie 1996Quebec, Canada Boreal forests 0.06±0.03 This study
Ullah et al. 677
Published by NRC Research Press

rates were determined through laboratory incubations ofsoils amended with distilled water, whereas our incubationswere done without water addition. Changes in soil moistureconditions over the incubation period in the laboratory mayhave promoted higher N mineralization rates than those ob-served for our soils. Similarly, net nitrification rates ob-served at our sites are lower than the rates reported byLegare et al. (2005) but are in good agreement with thosereported by Westbrook et al. (2006) in boreal forest soils innorthwestern Ontario. The general N limitation in thesesites, with higher C/N ratios favoring immobilization of Nby soil microbes, suggests that nitrification was substratelimited.
Eastmain aspen and alder wetland soils and mature andcut-over wetland soils at Chibougamau exhibited higher Nmineralization and nitrification rates than black spruce andjack pine forest soils. Alder, as a symbiotic atmospheric N2fixer in boreal forests, may have supported higher soil Nturnover rates than spruce and jack pine forest soils (Vogeland Gower 1998). Stottlemyer and Toczydlowski (1999)also found higher net N mineralization rates in soils of analder forest than spruce forests in northern Michigan and as-cribed higher N mineralization rates in the alder forest soilsto lower N immobilization demands than in the spruce forestsoils. Aspen, which is deciduous with an easily decompos-able leaf litter, has been shown to increase soil nutrient cy-cling, including that of N, in boreal forest soils dominatedby an understory of aspen species (Legare et al. 2005).Amaral and Knowles (1997) also observed higher potentialnitrification rates in aspen forest soils than in black spruceforest soils in Manitoba.
Carbon and N substrates appeared to control N minerali-zation and nitrification rates, and Westbrook et al. (2006)observed a similar result with no correlation between Ntransformations and microclimate variables in boreal forestsoils of northwestern Ontario. Nitrogen mineralization andnitrification rates measured under standard laboratory condi-tions, with fewer replicates at each forest site, provide an in-dex of the rates of N transformations and some of theirprimary controls, but their implications need to be inter-preted with caution, as these rates may not reflect in situconditions. Similarly, greenhouse gas fluxes were deter-mined through point measurement in these forests (four col-lars per site) on a monthly basis during the snow-free periodonly. Our study is limited by a lack of site replication but isa first attempt at quantifying trace gas fluxes from borealforests in Quebec.
ConclusionsWell-drained boreal forest soils acted as net sinks of at-
mospheric CH4, while wetlands in these forests were netsources of CH4. Jack pine forest soils consumed more CH4than black spruce and aspen forest soils. Logging of blackspruce forests reduced soil CH4 consumption rates, basedon our limited snow-free period flux data. CH4 emissionrates may increase from forested wetland soils when theyare logged. Our results are consistent with the general asser-tion that soil moisture and temperature regulate CH4 fluxesin forest soils. N2O emissions from boreal forest soils ap-peared to be controlled by soil C/N ratio and were low com-
pared with temperate deciduous forest soils, owing to thesmaller net N mineralization and nitrification rates, whichprovided less mineral N substrate for N2O production. As-pen forest soils and wetlands dominated by alder in theselandscapes exhibited higher N mineralization and nitrifica-tion rates than black spruce and jack pine forest soils andled to larger net N2O emissions. Further long-term in situN2O flux measurements from boreal forests are recom-mended to improve our understanding of the control exertedby substrate and microclimate variables over N2O fluxes.Our data suggest that CO2 emissions from burned forestsoils are smaller than those from mature forest soils, whileclear-cutting results in larger emissions.
AcknowledgementsThe authors thank Marc-Andre Giasson, Universite Laval
(Quebec); Caroline L’Heureux, Marilou Hayes, and Dr. Mi-chelle Garneau, Universite du Quebec a Montreal; and MikeDalva, Elizabeth Hoos, Helene Lesage, Helene Lalande, andAllison DeYoung, McGill University, for their help withfield sampling and laboratory analysis. We acknowledge thefinancial support of the Canadian Foundation for Climateand Atmospheric Sciences (CFCAS) and BIOCAP Canada.The financial and logistic support provided by Dr. AlainTremblay at HydroQuebec production and environment divi-sion, for research work in Eastmain, is also gratefully ac-knowledged by the authors.
ReferencesAber, J.D., Goodale, C.L., Ollinger, S.V., Smith, M.L., Magill,
A.H., Martin, M.E., Hallett, R.A., and Stoddard, J.L. 2003. Is ni-trogen deposition altering the nitrogen status of northeastern for-ests? Bioscience, 53: 375–389. doi:10.1641/0006-3568(2003)053[0375:INDATN]2.0.CO;2.
Amaral, J.A., and Knowles, R. 1997. Localization of methane con-sumption and nitrification activities in some boreal forest soilsand the stability of methane consumption on storage and distur-bance. J. Geophys. Res. 102: 29 255 – 29 260. doi:10.1029/97JD01109.
Ambus, P., and Robertson, G.P. 2006. The effect of increased Ndeposition on nitrous oxide, methane and carbon dioxide fluxesfrom unmanaged forest and grassland communities in Michigan.Biogeochemistry, 79: 315–337. doi:10.1007/s10533-005-5313-x.
Arah, J.R.M. 1997. Apportioning nitrous oxide fluxes between ni-trification and denitrification using gas-phase mass spectrome-try. Soil Biol. Biochem. 29: 1295–1299. doi:10.1016/S0038-0717(97)00027-8.
Bedard-Haughn, A., Matson, A.L., and Pennock, D.J. 2006. Landuse effects on gross nitrogen mineralization, nitrification, andN2O emissions in ephemeral wetlands. Soil Biol. Biochem. 38:3389–3406.
Bergeron, O., Margolis, H.A., Black, T.A., Coursolle, C., Dunn,A.L., and Wofsy, S. 2007. Comparison of carbon dioxide fluxesover three boreal black spruce forests in Canada. Glob. ChangeBiol. 13: 89–107. doi:10.1111/j.1365-2486.2006.01281.x.
Bergeron, O., Margolis, H.A., Coursolle, C., and Giasson, M. 2008.How does forest harvest influence carbon dioxide fluxes ofblack spruce ecosystems in eastern North America? Agric. For.Meteorol. 148: 537–548.
Billings, S.A., Richter, D.D., and Yarie, J. 1998. Soil carbon diox-ide fluxes and profile concentrations in two boreal forests. Can.J. For. Res. 28: 1773–1783. doi:10.1139/cjfr-28-12-1773.
678 Can. J. For. Res. Vol. 39, 2009
Published by NRC Research Press

Billings, S.A., Richter, D.D., and Yarie, J. 2000. Sensitivity of soilmethane fluxes to reduced precipitation in boreal forest soils.Soil Biol. Biochem. 32: 1431–1441. doi:10.1016/S0038-0717(00)00061-4.
Bubier, J.L., Moore, T.R., Bellisario, L., Comer, N., and Crill, P.1995. Ecological controls on methane emissions from a northernpeatland complex in the zone of discontinuous permafrost, Man-itoba, Canada. Global Biogeochem. Cycles, 9: 455–471. doi:10.1029/95GB02379.
Burke, R.A., Zepp, R.G., Tarr, M.A., Miller, W.L., and Stocks, B.J.1997. Effect of fire on soil–atmosphere exchange of methaneand carbon dioxide in Canadian boreal forest sites. J. Geophys.Res. 102: 29 289 – 29 300. doi:10.1029/97JD01331.
Chen, J., Chen, W., Liu, J., and Cihlar, J. 2000. Annual carbon bal-ance of Canada’s forests during 1895–1996. Global Biogeo-chem. Cycles, 14: 839–849. doi:10.1029/1999GB001207.
Environment Canada. 2008. National Climate Data and InformationArchive. Online document. Available from http://www.climate.weatheroffice.ec.gc.ca/climate_normals/stnselect_e.html [ac-cessed 12 April 2008].
Giasson, M., Coursolle, C., and Margolis, H.A. 2006. Ecosystemlevel CO2 fluxes from a boreal cut-over in eastern Canada be-fore and after scarification. Agric. For. Meteorol. 140: 23–40.doi:10.1016/j.agrformet.2006.08.001.
Groffman, P.M., Brumme, R., Butterbach-Bahl, K., Dobbie, K.E.,Mosier, A.R., Ojima, D., Papen, H., Parton, W.J., Smith, K.A.,and Wagner-Riddle, C. 2000. Evaluating annual nitrous oxidefluxes at the ecosystem scale. Global Biogeochem. Cycles, 14:1061–1070. doi:10.1029/1999GB001227.
Hart, S.C., Stark, J.M., Davidson, E.A., and Firestone, M.K. 1994.Nitrogen mineralization, immobilization and nitrification. InMethods of soil analysis, Part 2 — Microbiological and bio-chemical properties. Edited by R.W. Weaver, S. Angle, P. Bot-tomed, D. Bezdicek, S. Smith, A. Tabatabai, and A. Wollum.Soil Science Society of America Book Series No. 5, Madison,Wis. pp. 985–1018.
Hutchinson, G.L., and Mosier, A.R. 1981. Improved soil covermethod for field measurement of nitrous oxide fluxes. Soil Sci.Soc. Am. J. 45: 311–316.
IPCC. 2007. Climate Change 2007: the physical science basis.Contribution of Working Group I to the Fourth Assessment Re-port of the Intergovernmental Panel on Climate Change. Editedby S. Solomon, D. Qin, M. Manning, Z. Chen, M. Marquis, K.B.Averyt, M. Tignor, and H.L. Miller. Cambridge UniversityPress, Cambridge, UK and New York.
Kahkonen, M.A., Whittmann, C., Ilvesniemi, H., Westman, C.J.,and Salkinoja-Salonen, M.S. 2002. Mineralization of detritusand oxidation of methane in acid boreal coniferous forest soils:seasonal and vertical distribution and effects of clear cut. SoilBiol. Biochem. 34: 1191–1200. doi:10.1016/S0038-0717(02)00056-1.
Kim, Y., and Tanaka, N. 2003. Effect of forest fire on the fluxes ofCO2, CH4 and N2O in boreal forest soils, interior Alaska. J. Geo-phys. Res. 108. doi:10.1029/2001JD000663. PMID:14686320.
Klemedtsson, L., von Arnold, K., Weslien, P., and Gundersen, P.2005. Soil C:N ratio as a scalar parameter to predict nitrousoxide emissions. Glob. Change Biol. 11: 1142–1147. doi:10.1111/j.1365-2486.2005.00973.x.
Kruse, C.W., and Iverson, N. 1995. Effect of plant succession,plowing, and fertilization on the microbiological oxidation of at-mospheric methane in a heathland soil. FEMS Microbiol. Ecol.18: 121–128.
Kurz, W.A., and Apps, M.J. 1999. A 70-year retrospective analysisof carbon fluxes in the Canadian forest sector. Ecol. Appl. 9:
526–547. doi:10.1890/1051-0761(1999)009[0526:AYRAOC]2.0.CO;2.
Lamers, M., Ingwersen, J., and Streck, T. 2007. Nitrous oxideemissions from mineral and organic soils of a Norway sprucestand in south-west Germany. Atmos. Environ. 41: 1681–1688.doi:10.1016/j.atmosenv.2006.10.050.
Legare, S., Pare, D., and Bergeron, Y. 2005. Influence of aspen onforest floor properties in black spruce-dominated stands. PlantSoil, 275: 207–220. doi:10.1007/s11104-005-1482-6.
Lemmen, D.S., and Warren, F.J. 2004. Climate change impacts andadaptation: a Canadian perspective. Natural Resource Canada.Online report. Available from http://adaptation.nrcan.gc.ca/perspective_e.asp. [accessed 25 February 2008].
Lessard, R., Rochette, P., Topp, E., Pattey, E., Desjardins, R.L.,and Beaumont, G. 1994. Methane and carbon dioxide fluxesfrom poorly drained adjacent cultivated and forest sites. Can. J.Soil Sci. 74: 139–146.
Lovett, G.M., Weathers, K.C., and Arthur, M.A. 2002. Control ofN loss from forested watersheds by soil C:N ratio and tree spe-cies composition. Ecosystems (N. Y., Print), 5: 712–718. doi:10.1007/s10021-002-0153-1.
Maljanen, M., Liikanen, A., Silvola, J., and Martikainen, P.J. 2003.Nitrous oxide emissions from boreal organic soil under differentland-use. Soil Biol. Biochem. 35: 689–700. doi:10.1016/S0038-0717(03)00085-3.
Megonigal, J.P., Hines, M.E., and Visscher, P.T. 2004. Anaerobicmetabolism: linkages to trace gases and aerobic processes. InBiogeochemistry. Edited by W.H. Schlesinger. Elsevier-Perga-mon, Oxford, UK. pp. 317–424.
Ollinger, S.V., Smith, M.L., Martin, M.E., Hallett, R.A., Goodale,C.L., and Aber, J.D. 2002. Regional variation in foliar chemistryand N cycling among forests of diverse history and composition.Ecology, 83: 339–355.
Pelletier, L., Moore, T.R., Roulet, N.T., Garneau, M., and Beau-lieu-Audy, V. 2007. Methane fluxes from three peatlands in theLa Grande River watershed, James Bay lowland, Canada. J.Geophys. Res. Biogeosci. 112: G01018. doi:10.1029/2006JG000216.
Pihlatie, M., Pumpanen, J., Rinne, J., Ilvesniemi, H., Simojoki, A.,Hari, P., and Vesala, T. 2007. Gas concentration driven fluxes ofnitrous oxide and carbon dioxide in boreal forest soils. Tellus,59B: 458–468.
Rask, H., Schoenau, J., and Anderson, D. 2002. Factors influencingmethane flux from a boreal forest wetland in Saskatchewan, Ca-nada. Soil Biol. Biochem. 34: 435–443. doi:10.1016/S0038-0717(01)00197-3.
Roulet, N.T., Ash, R., and Moore, T.R. 1992. Low boreal wetlandsas a source of atmospheric methane. J. Geophys. Res. 97: 3739–3749.
Savage, K., Moore, T.R., and Crill, P. 1997. Methane and carbondioxide exchanges between the atmosphere and northern borealforest soils. J. Geophys. Res. 102: 29 278 – 29 288.
Schiller, C.L., and Hastie, D.R. 1996. Nitrous oxide and methanefluxes from perturbed and unperturbed boreal forest sites innorthern Ontario. J. Geophys. Res. 101: 22 767 – 22 774. doi:10.1029/96JD01620.
Stewart, R., Wheaton, E., and Spittlehouse, D. 1998. Climatechange: implications for the boreal forest. Saskatchewan Re-search Council, Saskatoon, Sask. SRC Publ. 10442-4D98.
Stottlemyer, R., and Toczydlowski, D. 1999. N mineralization in amature boreal forest, Isle Royale, Michigan. J. Environ. Qual.28: 709–720.
Ullah, S., and Zinati, G.M. 2006. Denitrification and nitrous oxideemissions from riparian forest soils exposed to prolonged nitro-
Ullah et al. 679
Published by NRC Research Press

gen run-off. Biogeochemistry, 81: 253–267. doi:10.1007/s10533-006-9040-8.
Ullah, S., Breitenbeck, G.A., and Faulkner, S.P. 2005. Denitrifica-tion and N2O emission from cultivated and forested alluvial claysoils. Biogeochemistry, 73: 499–513. doi:10.1007/s10533-004-1565-0.
Ullah, S., Frasier, R., King, L., Picotte-Anderson, N., and Moore,T.R. 2008. Potential fluxes of N2O and CH4 from soils of threeforest types in Eastern Canada. Soil Biol. Biochem. 40: 986–994. doi:10.1016/j.soilbio.2007.11.019.
Venterea, R.T., Groffman, P.M., Verchot, L.V., Magill, A.H., Aber,J.D., and Steudler, P.A. 2003. Nitrogen oxide emissions fromtemperate forests soils receiving long-term nitrogen inputs.Glob. Change Biol. 9: 346–357. doi:10.1046/j.1365-2486.2003.00591.x.
Vogel, J.G., and Gower, S.T. 1998. Carbon and nitrogen dynamicsof boreal jack pine stands with and without a green alder. Eco-systems (N. Y., Print), 1: 386–400. doi:10.1007/s100219900032.
Von Arnold, K., Weslien, P., Nilsson, M., Svensson, B.H., and Kle-
medtsson, L. 2005. Fluxes of CO2, CH4 and N2O from drainedconiferous forests on organic soils. For. Ecol. Manage. 210:239–254. doi:10.1016/j.foreco.2005.02.031.
Wang, C., Bond-Lamberty, B., and Gower, S.T. 2003. Soil surfaceCO2 flux in a boreal black spruce fire chronosequence. J. Geo-phys. Res. 108(D3): 8224. doi:10.1029/2001JD000861.
Westbrook, C.J., Devito, K.J., and Allan, C.J. 2006. Soil N cyclingin harvested and pristine boreal forest and peatlands. For. Ecol.Manage. 234: 227–237. doi:10.1016/j.foreco.2006.07.004.
Whalen, S.C., and Reeburgh, W.S. 1996. Moisture and temperaturesensitivity of CH4 oxidation in boreal soils. Soil Biol. Biochem.28: 1271–1281. doi:10.1016/S0038-0717(96)00139-3.
Whalen, S.C., Reeburgh, W.S., and Barber, V.A. 1992. Oxidationof methane in boreal forest soils: a comparison of seven mea-sures. Biogeochemistry, 16: 181–211. doi:10.1007/BF00002818.
Zechmeister-Boltenstern, S., Hahn, M., Meger, S., and Jandl, R.2002. Nitrous oxide emissions and nitrate leaching in relation tomicrobial biomass dynamics in a beech forest soil. Soil Biol.Biochem. 34: 823–832. doi:10.1016/S0038-0717(02)00012-3.
680 Can. J. For. Res. Vol. 39, 2009
Published by NRC Research Press