Disturbance in Boreal _,_c_ Forest Ecosystems:
437
USDA United States Department o, Disturbance in Boreal Agriculture _,_c_ Forest Ecosystems: _0_,0en,ra, Human Impacts and Research "_ t) Station Natural Processes General Technical Report NC - 209 International Boreal Forest Research Association • 1997 Annual Meeting Proceedings o
-
Upload
khangminh22 -
Category
Documents
-
view
0 -
download
0
Transcript of Disturbance in Boreal _,_c_ Forest Ecosystems:

USDA United States
Department o, Disturbance in BorealAgriculture
_,_c_ Forest Ecosystems:_0_,0en,ra,Human Impacts andResearch "_
t)
Station Natural ProcessesGeneral TechnicalReport NC - 209
International Boreal Forest Research Association
• 1997 Annual Meeting Proceedings
o

Front cover photos are by:Lower right-hand comermYegor K. KisilyakhovThe remaining three----Susan G. Conard
|
w
J
North Central Research Station
Forest Service---U.S. Department of Agriculture1992 Folwell Avenue
St. Paul, Minnesota 55108• 2000
.

" "Disturbance in Boreal Forest
Eco-systems: Human Impacts and .tJ
_.. Natural Processes
Proceedings of theIntemational Boreal Forest Research Association 1997 Annual Meeting
,.
August 4-7, 1997Duluth, Minnesota, USA
Edited bySusan G. Conard
i
I
!
J

PREFACE
Establishment of the International Boreal Forest Research Association (IBFRA) was proposed in 1990 at the InternationalConference on Northern Forests in Arkhangelsk, Russia. Theefirst organizing committee meeting was held in June, 1991,in the Ukraine, and by September, 1993, IBFRA membership included all major boreal forest countries: Russia, Canada, .the United States of America, Finland, Norway, and Sweden. The current president of IBFRA is Anatoly I. Pisarenko ofRussia.
-
The major purposes oflBFRA are:• To support sustainable development of boreal forests by promoting basic and applied research and other activities
relating to-forest ecosystems, forestry, and forest industry;• To promote and coordinate research to increase understanding ofthe role of circumpolar boreal forest in the global
environment and the effects of environmental change on that role;• To promote the dissemination and transfer of research results and new technology and the adoption of new methods
of forest use, planning, and management, with a view to ensure conservation and sustainable development of borealforests.
The primary formal activity oflBFRA is to promote exchange of research and management information throughinternational scientific conferences. The first IBFRA conference held in Anchor.age, Alaska, USA, in 1992 focussed on"Managing Forests to Meet People's Needs". Since that time, annual conferences have brought together hundreds ofScientists and managers interested in the problems of forest management in the boreal zone, Conferences have rotatedamong.the majo r boreal forest countries and topics have included: "Classification, inventory and monitoring of borealforests" (1993; Norway, Sweden); "Boreal forests and global change" (1994; Canada); "Climate change, biodiversity, andboreal forest ecosystems" (1995; Finland); and "Sustainable development of boreal forests" (1996; Russia). In responseto growing recognition of the importance of understanding disturbance processes, the 1997 conference reported in thisvolume focUssed on "Disturbance in boreal forest ecosystems: human impacts and natural processes". Over 100researchers and managers from eight countries attended the conference. The papers in this volume represent material thatwas presented at the meeting as either oral talks or poster presentations. The major conference topics were ForestDynamics and Structure, The Role of Disturbance, and Boreal Forest Management.
Many people contn'buted to the success of this conference. William Sommers (USDA FS, Washington, DC (_VO)) was• the overall meeting chairperson. Members of the program committee were: John Brissette, Susan Conard, Alan Ek, Eric
.Kasischke, Michael Lalich, Joel Levine, Roberta Balstad Miller, Jon Ranson, Charles Slaughter, Keith van Cleve, andJohn Zasada. Anatoly Shvidenko organized and chaired a panel session on International Cooperation (not reported onhere). Elizabeth Schmucker's efforts in meeting planning and coordination were extensive and invaluable. Meeting•arrangements were handled by the USDA FS North Central Research Station (NCRS) (Linda Donoghue, Mike Prouty,•Diane Veilleux), with support from the Superior National Forest (Duane Hanson, Mark van Every, and James Sanders),the Chippewa National Forest (Steve Eubanks), the Northeastern Research Station (Andrew Gillespie), the Minnesota
.. ' Department of National Resources (Jerry Rose and Joyce Nyhus), the University of Minnesota (Alan Ek), and the NaturalResources Research Institute (Michael Lalich).
Production of this volume would not have been possible without the able assistance o f Mary Peterson (NCRS) indeveloping the cover and finalizing the overall format and structure of the proceedings. Bill Bennett (WO) convl_rted the
' manuscripts to two-column format, inserted tables and figures, and typed in revisions; Sharon Parker (WO) attel_ded tomany'of the details involved in final formatting of papers. Papers were edited as necessary for format and to enhanceclarity. The overall quality and consistency of the proceedings has been improved vastly as a result of the cooperation ofthe authors in this process, but the final respons_ility for any errors that may have resulted from editing and reformattingis mine.
Readers will find that this volume contains many excellent papers and a great deal of new information on disturbance and" its management in the boreal zone. The high participation of Russian authors provides access to a number of important
papers previously referenced only in the Russian literature. Many of the personal contacts made in Duluth continue tobear fruit in growing international research cooperation on boreal forest issues.
, Susan G. Conard,editor
Washington,DC• 20 March,2000
-- Table of Contents°
PageKEYNOTE PAPERS
A
Challenges for the boreal forest zone and IBFRA ,,Sten Nilsson .......................................................................................................................................................................... 1
Global Significance of disturbances in boreal forests
Anatoly Shvidenko ............................................................................................................................................................. 17
Sustainability 0fthe boreal forest in CanadaJ. Peter Hall ....................................................................................................................................................................... 30
CHANGING LAND USE PATTERNS IN BOREAL FORESTS .................................... ...................................... 37
Degradation of forestland in land-use/cover patterns of RussiaVladimir Stolbovoi 39
Principles of nature usage in boreal forest zone of RussiaAndrey F. Tchmyr ....... ................................................................................................................................................... 49
Soil and forest forming processes and land use in boreal zoneA. Sapozhnikov .................................................................................................................................................................... 54
• Species composition and restoration of forests with different histories of economic useV.N.Korotkov ..................................................................................................................................................................... 57
..
FOREST DYNAMICS, STRUCTURE, AND LANDSCAPE PATTERNS ................................................................ 65
A digital land cover map of the former Soviet Union based upon a time series of 15 kmresolution NOAA AVHRR data •
TA. Stone, R.A. Houghton, and P. Schlesinger .................................................................................................................. 67
Effects of within-stand habitat and landscape patterns on avian distribution and abundancein northern Minnesota
Carol _ Pearson and Gerald R. Niemi ............................................................................................................................. 81
Survey of woodland key habitatsMikael Noren ..................................................................................................................................................................... 96
Forest Ecosystem Research Network of Sites (FERNS)D.A. Maclsaac and £ Wood ......................................................................................................................................... _.... 99
0Simulation of heterogeneous uneven-aged stands dynamics under human-induced disturbance
". S.L Chumachenko, V.V.Syssoouev, M.M. Palyonova, M.A. Bredikhin, and V.N. Korotkov ............................................. 104
ROLE OF DISTURBANCE IN BOREAL FORESTS ............................................................................................... 113
Disturbance By Insects .................................................................................................................................................. 113
The influence of insects on boreal ecosystems under global climate changeA.S. lsaev, T.M. Ovchinnikova, E.N. Pal'nikova, V.G. Soukhovolsky, and O. V. Tarasova ................................................ 115
1"
NOAA/AVHRR data in detection of insects induced catastrophic changes in Siberian Taiga• V.1.Kharuk, A.S. lsaev, Yu.P. Kondakov, A.G. Kozhuhovskaya, and E. V. Fedotova ......................................................... 124

Page
Characterizing spruce budworm caused disturbance regimes in Ontario" Jean-Noel Candau, Richard.4. Fleming, Anthony Hopkin, and .4jith H. Perera ............................................................. 132
Spruce bark.beetle damage within an unmanaged spruce forest during seven years
following windfellingJan Weslien and Hansjochen Schr6ter ............................................................................................................................. 140
Effects OfFire .................................................................................................................................................................. 145
Charc0al in dated lake sediments as a proxY for fire history in Jasper National Park, Canada•Jacqueline Huvane -. ........................................................................................................................................................ 147
Post fire changes of living ground cover'in the forests of central SiberiaGalina A. lvanova and V.L. Perevoznikova ...................................................................................................................... 157
Gaseous and particulate emissions from buming in the boreal forestJoel S. Levine, Wesley R. Cofer 111,Donald R. Cahoon, Jr., Edward L. Winstead,
•Brian J. Stocks, Veronica A. Krasovic, and Lawrence Mtetwa ................................................................................. 164
Impacts of Severe Weather ........................................................................................................................................... 175
Ecological approach to assessing pine forest disturbance in central SiberiaV.A. Ryzkova, El. Pleshikov, V.Y.Kaplunov, and J. V. Usoltzeva ....................................................................................... 177
Disturbances in the Scots pine forests of south Siberia caused by occasional storm windsA.I. Buzykin, LIS. Pshenichnikova, and N.M. Tchebakova .............................................................................................. 182
..
Ecophysiological response to interacting effects of drought and nitrogen, and reversibility ofdrough t effect in peatland and upland boreal spruce
Q.L. Dang, T.B. Patterson, and R.D. Guy ........................................................................................................................ 187
Modds for snow and wind damage assessments in Swedish pine, spruce, and birch forestsErik Valinger and Jonas Fridman .................................................................................................................................... 204
The mathematical model of tree's roots form and the estimation of effects windfall risk decreasingYu. V.Zakharov and V.G. Soukhovolsky ........................................................................................................................... 211
:Forest Health and Pollution ......................................................................................................................................... 219
Human impact on forest health status: estimations with the data from European forestmonitoring (ICP-Forest) program
Alexander S. Alekseev ...................................................................................................................................................... L121
Degradation of montane fir forests in the Kemerovo Oblast: search for causesVladislav A. Alexeyev ....................................................................................................................................................... 234
Evaluation of health ofPinus sylvestris trees near main local pollution sources of LithuaniaE. KupcinsMene, J. Nemaniute, D. Dailidiene, and A. Krasauskas ................................................................................. 241
"" Temporal modeling of forest damage expansion around the 'Severonickel' smelter on theKola Peninsula, northern Russia
Olga Rigina and Olle Hagner ......................................................................................................................................... 256
¢.

Page
GLOBAL CLIMATE CHANGE AND THE CARBON CYCLE .............................................................................. 265
Climate Change ..................................................................... . ....................................................................................... 266
A method for model-based reconstruction of the paleoclimate of Siberia °Robert A. Monserud and Nadja M. Tchebakova ............................................................................................................. 267
Circumpolar wanning effects on tree-line reproduction in Canada and SiberiaHarvey Nichols ............................................................................................................................................................. _..279
Consequences Of a possible future climate change for the distribution of tree species in ScandinaviaOddvar Skre ..................................................................................................................................................................... 288
,
Biomass of forest pine ecosystems of Middle Zavolgie: to the question of global warmingEldar Kitrbanov and Petr Sokolov ................................................................................................................................... 304
Forest zones of Siberia and post-fire demutations in current climateD.1. Nazimova, N.P Polikarpov, M.A. Sofronov, and N.M. Andreeva ............................................................................. 317
Boreal ecosystem response to atmospheric nitrogen inputs and climatic changeR. Stottlemyer and R. Herrmann ..................................................................................................................................... 326
Carbon Cycling and Storage ............................................................................................................... .......................... 341
. The effects of fire on activities designed to increase carbon sequestration in the boreal forestEric S. Kasischke ............................................................................................................................................................. 343..
A spatially explicit map of forest stand carbon for Russia: a first approximationT.A. Stone, P. Schlesinger, and V.A. Alexeyev ................................................................................................................... 351
: Scaling soil carbon stocks and fluxes at the BOREAS northern study areaG. Rapalee, E.A. Davidson, J. W. Harden, S.E. Trumbore, and H. Veldhuis .................................................................... 357
•BOREAL FOREST MANAGEMENT ........................................................................................................................ 363
" Fire Management and Monitoring ............................................................................................................................... 363•
Firemanagement "mapactson boreal forest processes and healthD.J. McRae and T.J. Lynham ........................................................................................................................................... 365
Using shortwave and thermal infrared satellite imagery to study the effects of fire in !an Alaskan boreal forest
' Nancy H.E French, EricS. Kasischke, Jeffrey L. Michalek, and James P. Mudd ..................................................... .._....373
On improvement of wildland fire management in Russia on the base of vegetation fuel mapsA. E Folola'tina and M.A. Sofronov ................................................................................................................................... 382
Krasnoyarsk subsystem of wildfire monitoring from space as an element of the world,, wildfire management system
A,1. Sukhinin .................................................................................................................................................................... 389
The Concept of defining the required level of fire protection intensity in boreal forests,, Yuri Z. Shut ..................... . ..................................................... ........................................................................................... 395
.
,

. Page
Use of BEHAVE for forest fires and prescribed fire experiments in SiberiaEric N. Valendik, Yegor K. Kisilyakhov, Galina A. lvanova, Valentina D. Perevoznikova,
and Serghey V. Verkhovets .................................................... _ ............................................................................... 398
D
Forest Management ....................................................................................................................................................... 403
DemonStrating sustainable forestry in central Siberia: a Russian - American partnershipd.C. Brissette, V.P. Cherkashin, R.M. Babintseva, V.V.Ivanov, and A.J.R. Gillespie ....................................................... 495.,
Treeregeneration dynamics of lowland black spruce stands following crown fireand clearcut logging
G.G. Wang and C.A. Harrison .............. . ........................................................................................................................ 409
Problems related to forest regeneration in Finnish LaplandElj'as_Pohala .. 421
INTERNATIONAL COOPERATION IN BOREAL FOREST RESEARCH ............................... .......................... 423
The IGBP northern EurasiastudyMichael A. Fosberg, Will Steffen, Anatoly Shvidenko, Johann G. Goldammer,
Frank Oldfield, and Ernst-Detlef Shulze .................................................................................................................. 425
AUTHOR INDEX .......................................................................................................................................................... 434
!
. #
t

CHALLENGES FOR THE BOREAL FOREST ZONE AND IBFRA
Sten Nilsson I 2,l
ABSTRACT.--This paper gives a simple overview of SOCIO-ECONOMIC IMPORTANCE OF THEthe boreal forest sector, and addresses a few of the BOREAL FORESTS
challenges confi'onting the boreal zone. These
challenges are: how to deal with sustainable boreal Currently, boreal forests constitute roughly one-thirdforest management, the structural changes in the (1.4 billion hectares - depending on what is includedboreal industrial sector due to globalization, and the in the definition of boreal forests) of the globalimbalance between political commitments and real forested areas (Nilsson 1996a). Forests haveactionswith respect to the boreal forest sector, historically played a vital role in the development of
the economies and societies in the boreal zone.
Settlements were only possible through the support ofwood resources. Wood was used for buildings,
BACKGROUND heating, cooking, tools and transportation. Mining,ship-building, charcoal production and tar extraction
Boreal forests are increasingly becoming a high- were major consumers until the end of the 19thprofile"topic on the international political agenda, century. The evolving timber industry during the 20thUnfortunately, there are limited possibilities to discuss century resulted in the rapid exploitation of the borealall of the problems associated with the boreal forests forests. Today, the boreal coumries are economicallyin one condensed presentation. I also do not feel that dependent on their forest sectorsthis would be a task for me to accomplish. Instead I (table l).will try to highlight a few issues which I regard crucial
withrespect to the future developmem of the boreal The forest sector's importance to the nationalforests. I am especially aiming at issues that are not economy in these countries can also be approached byon the boreal forest agenda today. But before assessing the role of the so-called forest cluster, whichaddressing these issues, I will present a very includes other industries and services that are directlyaggregated smmnm3, of some features of the boreal connected to the forest sector. An example of aforests, forest cluster is illustrated in figure 1.
Table 1.--Economic importance of the forest sector in boreal countries.
Country Percentage of Gross Percentage of Direct
Export Earnings Contribution to GDPCanada 13 4Nordic 9-34 4-7
Russia 5 3 !
, t_
1 Professor Sten Nilsson, Leader, Sustainable Boreal Forest Resources Project, International Institute for._ Applied Systems Analysis (IIASA), A-2361 Laxenburg, Austria.
2Acknowledgements: I am extremely grateful for the help I have received from Drs. Tim Williamson and Ren_
Samson, Canadian Forest Service, Dr. Sven Svensson, The Swedish National Board of Forestry, and Prof. MattiPalo, Finnish Forest Research Institute, for supplying some of the basic data. In addition, I have also used a report
t _ byZasada et al., (1997) in writing this paper and would like to thank the respective authors for the use of theirwork.
Proceedings IBFRA Assn 1997 meeting 1

Specialtyinputs Primarygoods Relatedindustries AD
ITimber iharvesting[ --I Process.. automation!
Chemicals; J Pulpby-products ,' coatings,fillings__._..___ andupgradesJPalermachineI[ clothing,cores I Power
............ generation
Machinery
;. [RberprocessingJ_- JPulpJ____
JStockpreparation] JPTrJ- _ Paperboard=]Paperandboardmachines Mechanicalforest
- industrialproducts
Sawmillmachineryi
Associatedservices BWm
• JForest Packaging1
management]JC°nsulting[ Jj Printingjindustry
I
[ResearchinstitutesJ-- [ pressesI-q[Paper/
• JLogistics] [ merchantsI ,,
Figure 1.--Example of a forest cluster. After Hernesniemi et at (/996).
Withthis approach, the forest sector's contribution to functions) and have developed an aggregated annualGDP is estimated tO be 10%-15% in Canada. The ecosystem services value of US $302 halyr 1 (1994
' forest cluster share gross export earnings is 41% in US$) for the boreal forests. This value can beFinland, compared with 34% as a direct impact by the seriously debated, since only oceans and grasslandsforest sector; and 24% in Sweden, compared to 17% have lower values of the biomes analyzed. !
' as direct impact (Lammi i994). The important factor t_is that fiet export earnings are some 80% of gross The economic importance, as a proportion of overall
export earnings as most input factors are produced economic activity, of the boreal countries' forestdomestically (Swedish Pulp and Paper Association sectors has declined since the post-war period.1996). These estimates are based on the forest Despite this decline, boreal forests continue to play a
" products' values and do not consider non-wood substantial role in the economies of these countries.functions. Hultkrantz (1992) and Solberg and There are very few, or for that matter, .any other,
"" Svensmd (1992) have estimated the contribution of sectors in the boreal countries that can provide anon-wood functions to GDP to be 35%-75% of the similar contn'bution to net export earnings as the
value of industrial products in the Nordic countries, forest sector.C0stanza et al. (1997) have tried to estimate the value
¢ ofecosystem services and functions (17 different.,
2 GTR-NC-209

An outlook on the future consumption and production depend upon it for self-perpetuation. The lebensraumof industrial roundwood based on conventional (living space) of Aboriginal people will probably beestimates is shown in table 2. These conventional degraded with increased utilization of the borealestimates indicate a stable increase in consumption of forests unless special actions are taken in the future.industrial wood. The demand will be difficult to meet "
without increased forest production, utilization and Att
higher prices on forest products. Boreal countries ECOLOGICAL IMPORTANCE OF THEsupplied some 40% of the industrial coniferous supply BOREAL FORESTSin1992 According to these conventional scenarios,the OUtput of coniferous industrial wood from boreal The boreal forests are finite whose productivity isforests will have to increase by some 140 milh'on m3- restricted by the boundaries set by their physical390 million m3within the next 25-year period, environment and the ability of biota to survive andHOweve r , the share of the world's industrial grow within that environment. Silvicultural activitiesconiferous supply has also been estimated to remain can enhance productivity within the limits ofconstant in 2010 and 2020 (Nilsson 1996b). biological constraints and economic realities.
Understanding the biotic and abiotic characteristics ofThe amount of timber resources is not a limiting the present boreal forests and their dynamics underfactor for the supply from the boreal forests estimated the current environmental conditions is necessary toabove. It should be pointed out that, even if the determine the potential for biological productivity andcalculations identifying shortages in the global wood resource management. This information is alsobalmice are accurate, realistically these shortages will critical for predicting future paradigms that will resultnever appear. A number of balancing measures will as environmental, socio-economic, and politicaloccur on.the market to achieve an equih_orium conditions evolve. In the following, I will brieflyincluding decreases in demand due to increased discuss the physical and biological factors determiningprices, introduction of new and more fiber-efficient the potential for sustainable development of the boreal
• technology, substitution of products, increased forests.supply, etc.(McNutt 1995)... Climatic Attributes
The development of the energy market will influencefuture utilization of forest resources. The All climatic attributes combined serve to distinguishcontn_oution of forests in the future to electricity, heat, boreal forests from the more temperate areas, but the
andgaseous and liquid fuels will depend on markets temperature control over above and below-grotmdand incentives, on Research and Development biological processes and the characteristics of thepi'ogress, and on environmental requirements. Today, snowpack are particularly important for thisthe costs for biornass energy production are distinction. The below-ground temperature affects allcompat_le with the cost of several traditional fuels, aspects of soil biology and nutrient cycling. Forest
. There is a large potential estimated, and strong floor conditions, overstory and understory density,political pressure (e.g. Sweden), for wood for energy and soil temperature are closely related. The amountin the future. Forest sector managers in the boreal of heat available for growth during the growingcountries have the necessary knowledge to intensify season, as well as frost events, greatly influenceutilization of forest resources for energy production, phenology and the development of vegetative and
reproductive growth. More than 50% of the annualThere are more than one milh'on Aboriginal people precipitation occurs during the growing seasons. !
, living in the boreal zone.. t_
. The cultures and economies of these people areintricately adapted to their natural environment and
f
Proceedings IBFRA Assn 1997 meeting 3

Table 2.--Global industrial wood balance, expressed in million m3, (Nilsson, 1996b).
1993 2010 2020Coniferous Non- Coniferous Non- Coniferous Non- Total
coniferous coniferous coniferous
Demand 939 540 1,210-1,680 730-990 1,400-1,540 850-1,010 2,250-2,550 A
Supply 939 540 950-1,210 545-745 1,080-1,330 585-800 1,665-2,130 "Balance .... 0 - -470 + 15 - -445 -70 - -460 -50 - -425 -120 - -885
-.
Land and Water Base contribute more to plant species diversity in a standthan do vascular plants.
Under certain conditions of evaporation anaccumulation of organic matter will take place, whichdrives the development of organic soils. Snow Biodiversitymodifies local climate through its high albedo and
_gh thermal conductivity. The boreal forests are Biological diversity may be defined as the number,mosaic' ofupland forests and wetlands with lakes and variety and variability of living organisms on the earthrivers interspersed. The current mosaic of floristic (WCED 1992), including the sum of diversities foundand foreststand patterns are maintained by the at the genetic, species, ecosystem, and landscapecombined effects of site conditions, disturbance levels (Wilson 1988). It is estimated that the boreal
fact6rs and climatic regime of the region. This mosaic forests contain over 100,000 species, 95% of whichisan extremely important landscape element in terms are arthropods and microorganisms. Viruses areofbiodiversity, particularly abundant with over 40,000 species.
Currently, only some 20% of the taxa in the borealSoils and Permafrost forests have been identified taxonomically.
Features commonly referred to in a discussion of The dominant tree species have varied from oneboreal forest soils are low temperatures with the interglacial period to another, and many species have
formation of permafrost as the maximum expression gone extinct during the Pleistocene climaticof this characteristic, poor drainage, thick organic fluctuations. There is also growing evidence that the
layers With deep organic soils in wetlands, low soil current composition of plant associations isbiological activity and low nutrient availability. Due contingent upon historical accidents.to these features productivity is often limited.
Forest Succession
Forest Composition and DistributionAs discussed earlier, boreal forests are descn_oed as a
. Although the boreal forest is otten viewed as one mosaic with relatively few tree species arranged inlarge cold-dominated area occupying the northern pure and mixed stands of various sizes and shapespart of the globe, this simplistic view is far from owing to site and soil conditions, distn_oution of lakesrealistic. Rowe (1992) identifies 45 sections of the and rivers, species characteristics, and disturbancecanadian boreal forest based on climate, history (e.g., Suffiing 1993). Within any landscape,
physiography and tree species composition, there are both long- and short-term scale processesAt the scale of the stand there can be large stand-to- that shape current vegetation and influence potent_
. stand variations in species' composition and structure, future vegetation. Here I will concentrate on theThe distribution of species within the landscape varies short-term factors (years to several centuries). T_e
. within the boreal region even if the boreal forests have primary natural short-term disturbances that influencerelatively few tree species (some 15 dominating landscape patterns in boreal forests are fire andspecies in North America and some 35 in Siberia). insects. Wind and snow breakage and diseases canSpecies composition, species diversity, and also be important, but tend to follow the first twoproductivity of shrubs and herbaceous plants also vary mentioned factors. Another group of disturbances is
"' in the boreal region. Shrubs are key elements for linked to flooding.Wildlife habitat, providing both food and cover.Nonvascular plants, such as mosses and liverworts,are ecologically important boreal plants and often
4 GTR-NC-209


Forest Productivity conflict between the ecological issues and the- pragmatic issues. •
Both the primary and secondary productivity are
important, but I will concentrate on the primary In order to achieve sustainability, all of the ecological
productivity in this discussion. It is important to take factors contributing to sustainability discussed aboveinto account the tangible values of the primary must be taken into account in a satisfactory manner
productivity such as water protection, water supply, in any future management system.soil protection and climatic roles.
..
Forest biomass and annual bioproductivity of the GLOBAL CHANGE AND THE BOREALboreal forests are of particular importance to the FORESTS ,boreal forests in the global carbon budget (Kurz et al.1993, Shvidenko et al. 1996). Total biomass, An array of global changes will influence the
distribUtion of biomass and productivity differs potential responses of the boreal forests and the waysdepending on site conditions, species composition the boreal forests will be used and managed in the
and stand age. For example, on cold sites the moss future. Many people instantly think of biophysicalcomponent may have levels of annual productivity, processes when global change is the subject ofequal to or greater than, that of the overstory woody interest, e.g., climate change. These processes arespecies, indeed central to examining the boreal forests, but of
parallel significance today, and in the future, will beMan-Made Disturbances a set of human-oriented forces or socioeconomic
forces (Forester et al. 1994). The German AdvisoryThe conversion of forests to agriculture, community Council on Global Change (1993) has stressed thedevelopment, mining, oil and gas exploitation and width of the global change concept. This concept isforest management have historically affected the illustrated in table 3 in an application revised for theboreal forests and will continue to do so in the future, boreal forests. It can be seen from this table that
' The conversion of boreal forests to agricultural land Global Change is much more than merely climatehas: decreased the area of forest, especially on rich change.soils; fragmented the forest resulting in remnant
forest patches and increased edge effects; and The meta-drivers of global change are humanchanged the forest stand community structure by population and human behavior. There has been, andintroducing new species, continues to be, a serious concem regarding an
exploding population development. But the mos)The forest management activities that have most recent results (Lutz et al. 1997) indicate that it is
influenced the boreal forests as a whole are forest unlikely that the population will be doubled by theharvesting and forest titre management. Both of these year 2050, as earlier expected. The median estimateactix,ities change forest dynamics at all scales of is a total global population of 10 billion by the yearresolution, from altering the landscape structure to 2050, compared to 5.7 billion in 1995 (Lutz et al.
microSite characteristics and have introduced 1997). Population growth will probably be most
externally operated dynamics versus natural rapid in the Middle East, sub-Saharan Africa and• dynamics. North Africa, with the population tripling by 2050 in
these regions. There will also be significant increases
Sustainability in the proportion of the population above 60 years _f' age. Western Europe, Eastem Europe and Russia a'i'e
The rational for sustainability of the boreal forests likely to experience little, if any (most likely negalive
- has both a pragmatic and a more idealistic dimension, in Eastern Europe and Russia), increases in theThe pragmatic reason is that the boreal forests are an population. But in Western Europe and Pacific
.important source of employment and economic OECD, the proportion above 60 years of age will- development, aswell as a source of food, fiber, water probably double compared to the situation today (it
and forest products upon which people depend. The could be as high as 40% of the total population). Inmore idealistic and long-term dimension is of an North America, a population increase of 25% seems
ecolog!cal nature and includes the role boreal forests likely with a substantial aging of the population, butplay in the greenhouse gas budget, maintenance of not as dramatic as in Europe. The population in
bi0diversity, wilderness, wildlife habitat and spiritual Latin America is likely to double with the proportion-: • values. The idealistic dimension is difficult to of the population above 60 years of age increasing by
substantiate to the satisfaction of the general public, 20%.politicians and policy-makers. Often there is a direct
6 GTR-NC-209

|i
high latitudes during 1981 and 1991 (Myneni 1997) .....Central Asia is estimated to grow by 37% and have an In this situation, I could argue that instead of ---
increase in the 60 and over age group fi'om 9% to worrying about protecting existing production and II25%. Southern Asia (mainly India) will double its forest resources we should worry about how to take
population by the year 2050 (Lutz et aL 1997). care of this new production in the boreal zone. I icould argue that the loss ofbiodiversity is an issue
1
This increase in population is still dramatic and the : more of the past than the future. Ausubel (1996)population development in the regions outside the reminds us that the Americans cleared forests not only •boreal region will cause transboundary effects for food production but also to keep down the snakes, Iimpacting the boreal forests. But the most dramatic chiggers and ticks. A similar pattern occurred inmessage in this new information is the high proportion Europe and Russia with clearing of forests for health,of aging people in the global population. Therefore, I safety, and mental security. Mankind has passed thiseXpeCtmuch of the demographic research in the stage by now and the snakes and bugs are back in thefuture will address problems connected with the aging forests. But I do not intend to make these statements.population instead of the population growth as of Instead I will concentrate on a few other issues.today..
Most important for boreal forests in the future will be IS SUSTAINABLE BOREAL FOREST_humanbehavior and how it affects the global MANAGEMENT POSSIBLE?environment- economic behavior (e.g., consumption
•patterns), social behavior (e.g., attitudes), and Aider reading some 50,000 titles indicated in h'brarypolitical behavior (e.g., cooperation or conflict), indexes and through the internet using the keywordHuman behavior will probably change dramatically "sustainable forest management," I should of course tover time, especially with the shit_ in age distribution be wise enough not to touch upon this topic at all, but tillustrated above, we do not know what direction I am not that bright.these changes will take.
Quite recently, Rice et al. (1997) raised the question• of"Can Sustainable Management Save Tropical
NON-STATEMENTS Forests?" They came to the conclusion that this isprobably not the case. The conclusions were that
Until now, I have taken a rather conventional current logging practices cause considerably less
approach to my presentation. In the following, I will damage than some forms of sustainable managementaddress a few issues that normally are not on the and the authors state, "substainability is, in fact, aagenda for the future of boreal forests. To give poor guide to the environmental harm caused b_ammunition to this convention (the IBFRA-meeting), timber operations." I will deviate Rice et al.'s (1997)I could state that climate change is not a major threat original question to "Is Sustainable Boreal Forestto the boreal forests. The continuing, steady Management Posslq31e?".decarbonization of energy systems means thatConcentratiom of carbon dioxide will not rise above A tremendous effort has been put into development of500 ppm. It has been stated that a climate wanning criteria and indicators for temperate and boreal forestsover the next 75 years "Will not significantly effect through the so-called Montreal and Helsinkidiet, health, income or environment. Most of the processes. Criteria is defined as: The essential
, economy has moved indoors and much that has not components of forest management against whichwill do so. Climate simply matters less and less sustainability may be assessed. Each criterion relates(Ausubel 1996)." Or I could state that the assumed to a key element and can be characterized by one Or
. climate change is only good for the boreal forests, more quantitative, qualitative, or descriptive irPerez-Garcia et al. (1996) estimate that the boreal indicators. The development of criteria and indicators
. zone will have a substantially increased net primary was identified as being one of the major tasks for the0 O•production (+15¥0-25Y.), an increased output of Intergovernmental Panel on Forests. The basic idea is
0 Oforest industrial products (+ 13 '_-20 %), increased that by monitoring these indicators the degree ofexport, and improved economics due to forecasted sustainability can be measured. FAO (1997a) statesclimate change. Mendelsolm et al. (1997) claim that that it seems plaus_le to arrive at a globally-agreed
-" the expected climate change will have positive market upon core set of national-level criteria and indicators.implications for the boreal region in the range of 15- A further step in this direction is certification.29 b'_on US$ per year. There are indications that we Roughly defined, certification is the process ofhave already started to move on this path with a establishing whether or not a particular forest area is
• significant increase in plant growth in the northern
Proceedings IBFRA Assn 1997 meeting 7

achieving objectives based upon criteria and indicators serious obstacle to a universal concept is the fact thatof sustainable forest management, human life has to deal with more than one dimension.
" Stability of our ecosystems is only one of manyThe Helsinki Process includes 6 criteria and 27 concerns.
quantitative indicators (of which 6 are difficult toimplement; FAO, 1997a) and Montreal Process : The concept is based on a social concept of harmonycontains 7 criteria and 67 indicators (of which only 9 and ignores the fact that human development is
can be measured in e.g., the USA; FAO, 1997a). driven by conflicts andfierce competition. The *Russia has developed its own preliminary set of 6 whole evolution of the human species indicates thatcriterionand 35 indicators (Strakhov 1997). we are part of the ecosystems (Behan 1997), but we
This entire development is excellent and shows a way are not just happy being part of a sustainable ,to movetowards sustainable forest management. But ecosystem. We want to dominate and grow.will it happen? _ _ Through all kinds of interventions, we try to shape
our environment for our benefit - even if at the cost
First, it is certainly necessary that the signatories of of other species and our human neighbor. By nature,the agreements monitor the indicators they have we are competitive animals.
agreed upon. Second, currently the agreements arenon-binding national indicators. There is a strong It can be demonstrated that a strategy of simple-need to demonstrate and quantify what does it mean minded cooperation will always lose in anfor the sustainable development at a sub-regional environment where the other players can gain a slightnational level in concrete form by implementing these advantage by not e.ooperating (Nowak et al. 1995).indichtors - usage of just national indicators will only Human interaction is based on bargaining, openmask the problems. To my knowledge, no one has threats, economic pressure, coercion, or a strategy ofdone this so far. Even if these two hurdles are limited retaliation against non-cooperation. This
overcome I still think there exist great difficulties with diplomacy of violence (Schelling 1966) is one of the
the entire concept, fundamental principles of all social, economic and• political development, which is neglected in the
I will use P(ussia as an illustration. I have selected one current concept. This is especially crucial at a time
•indicator from each criterion in my illustration and when the world is swept by, international, global andyou should remember that the agreements deal with neo-liberal economies.27-67 indicators. By merely overlaying my 6 selectedindicatoi's for Russia one can see that the indicators The concept reduces the analysis of social, economic,
point in different directions 3. The indicators of the cultural and political processes to a simplistic Bio-agreements are selected in a manner where there will Physical Framework. It has been demonstrated thatalways be conflict between the same. The questions the most important social processes are not at allone may ask in this situation are: what is acceptable similar to those in ecosystems (Etzioni 1968).sustainability, what is good sustainability, and what is
. bad sustainability? Who is going to decide this? In Thus, I do not think that we can achieve sustainablethe end it will, of course, be a political decision at forest development in the boreal zone as thought, duesome level and at that stage a whole array of to the fact that the current concept does not address
important socioeconomic factors or indicators (which the fundamental social problem of power imbalanceare not included in the current indicators) will be the bemeen societies and social groups. Furthermore, it
driving forces for the decision-making process, does not identify which social economic and politicalstructures and processes a society should use in older
. The problems with the sustainability concept, and by to promote sustainable development. This has beenthat the criteria and indicator approach, have been illustrated for the tropical forests by Kamari (199g)illustrated in an excellent way by Heilig (1997). I will and Rice et al. (1997) and more generally by Jaegeruse hisgapef as a platform for my further discussion. (1995), we have the same situation in the boreal zone.
The concept ignores thefu_idamental diversity of What counts is what the local society wants to happeninterests. One of the major characteristics of our in and for their forests. The moment that occurs is
"" World is that people fundamentally disagree about when we may have a sustainable boreal forest. Objectives, values and lifestyles. What is (Duinker 1997). The important task is to find the
environmentally sound may not be acceptable for our mechanism for this consensus-seeking by thesocial structure, our economy or our culture. A most
• 3Illustrations are not presented in thispaper.
8 GTR-NC-209
AO
360.
. 320 _
.5- 280 "-,.....,....tO
=
E,_ ;. 200 "-_ ""- (Paperandboarddeveloped)Q) %%
_' =........,o......,....,..,..._l_=.o......,_= ,_--_--"'_" 160 .......... %%0
II_ %%
._ 120 "- (Sawnwood%%•".,..= %%==" .. developed)
---- _.__ ___d_._anels developed)_, 80 ____-
40 _ (Paperandboarddeveloping)devel°ping)....... (Samwoo_
0 ,developing)
1,970 1980 1990 2000 2010 2020
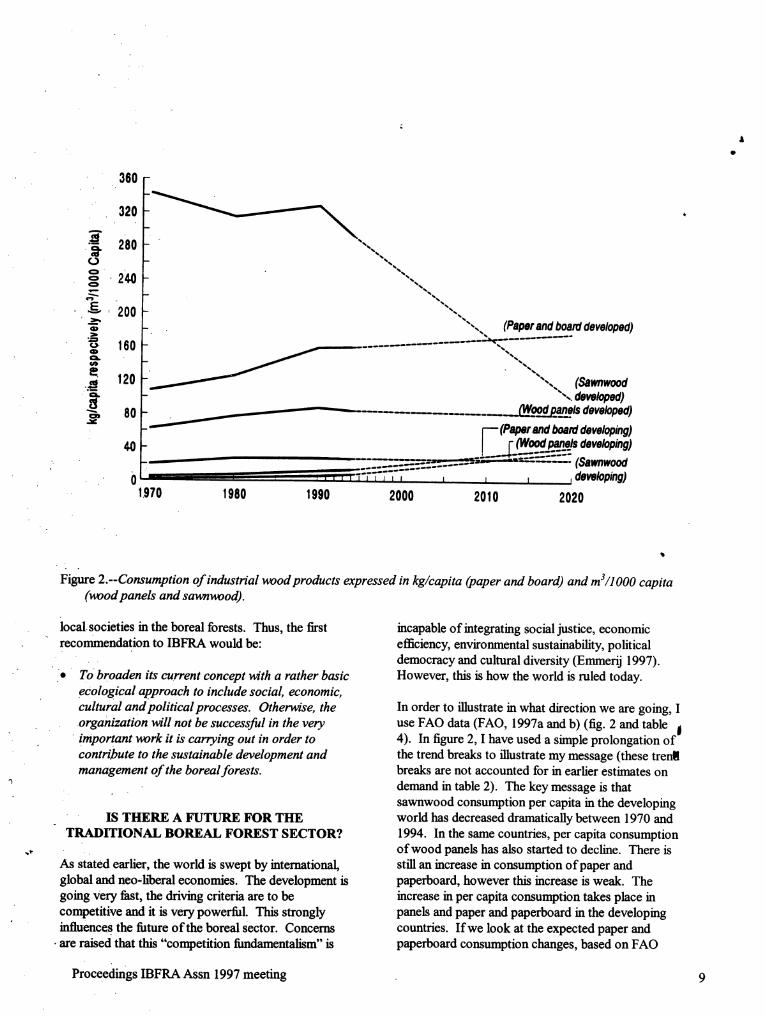
Figure 2.--Consumption of industrial wood products expressed in kg/capita (paper and board) and m3/1000 capita(wood panels and sawnwood).
local.societies in the boreal forests. Thus, the first incapable of integrating social justice, economic" recommendation to IBFRA would be: efficiency, environmental sustainability, political
• democracy and cultural diversity (Emmerij 1997).• Tobroaden its current concept u_th a rather basic However, this is how the world is ruled today.
ecological approach to include social, economic,cultural and political processes. Otherwise, the In order to illustrate in what direction we are going, I
organization u_ll not be successful in the very use FAO data (FAO, 1997a and b) (fig. 2 and table I. important work it is carrying out in order to 4). In figure 2, I have used a simple prolongation of
contrijbute to the sustainable development and the trend breaks to illustrate my message (these trenqlmanagement of the boreal forests, breaks arc not accounted for in earlier estimates on
demand in table 2). The key message is thatsawnwood consumption per capita in the developing
IS THERE A FUTURE FOR THE world has decreased dramatically between 1970 andTRADITIONAL BOREAL FOREST SECTOR? 1994. In the same countries, per capita consumption
,, of wood panels has also started to decline. There isAs stated earlier, the world is swept by international still an increase in consumption of paper andglobal and neo-h_)eral economies. The development is paperboard, however this increase is weak. Thegoing Very fast, the driving criteria are to be increase in per capita consumption takes place incompetitive and it is very powerful. This strongly panels and paper and paperboard in the developing
' iafluenccS the fiature of the boreal Sector. Concerns countries. If we look at the expected paper and•are raised that this "competition fundamentalism" is paperboard consumption changes, based on FAO
Proceedings IBFRA Assn 1997 meeting 9

estimates (1997b), we get a development as illustrated landowner, and different operators of the forests isin table 4. through sawlog production. Therefore, the overall
objective in the boreal zone has been, and still is, toWhat does this mean? It means that the pulp and produce high quality sawlogs. But the world is
paper industry in the boreal zone will move to areas , changing rapidly and it seems that very few will bewith a rapid growth in consumption, mainly Asia and interested in sawnwood in the future. A
O
South America, to be profitable. There will still be asubstantial increase in paper and paperboard • If this happens, we should work with quiteconsumption in the developed world, but in the future different objectives for the boreal forests in theit will be less dependent on virgin fiber, as increased future, which will result in quite different 6
utilization of wastepaper will take care of most of this ecological and sustainability concerns (many of
expansion. It means the boreal pulp and paper our current concerns may also disappear). A keyindustry will become increasingly more global, and issue will be who will pay for the forestry andincreaslingly less dependent on boreal fiber and as a ecological management under these newresult we will not see any new mills established. This conditions. Based on the above, I would like toprocess'has already started (e.g., Financial Times make two recommendations to IBFRA's future]997), the result will be a handful of big companies in activities:the boreal zone. At the same time we have a
domestic sawmilling industry in the boreal zone facing • To include analyses of the development of thea dramatic drop in per capita consumption and a industrial boreal forest sector in the current
stagnating aging population in traditional markets, framework. Without a strong sector I see limited ,With the non-traditional markets incapable of possibilities to achieve sustainable developmentabsorbing this difference in consumption. In in the boreal forests, andaddition, with a boreal pulp and paper industry going
abroad and becoming more and more dependent on • To expand analyses to include links to, and• wastepaper, it will decrease prices on pulplogs and impacts on, the sustainable development (both
sawmill chips. Income fi'om sawmill chips for most of from a socioeconomic and environmentalpoint ofthe Sawmilling industry constitutes a profit margin of view) of the boreal forests with the developmentabout 15% today, of the resources and forest sector at a global
level.A friend of order asks of course, what does this have
to do with sustainable forest management and the• boreal forests? The anomaly is that the overall
Objective with most boreal forestry is to make money.The way forestry brings in money to the forest
Table 4.--Estimated increase in paper and paperboard consumption and wastepaper consumption betvteen 1994 and
• 2010. Expressed in million tons.
Paper and Wastepaper Relation of Wastepaper toPaperboard Paper and Paperboard
(in percentage) !' Africa 1.9 0.8 42
' North/Central America 28.9 22.4 78 lr- South America 4.6 2.4 52
Asia 67.2 36.2 54Oceania 1.7 1.2 71
Europe 23.0 17.9 78Former USSR 2.3 1.0 42
"' Developed 66.3 49.9 75
Developin_ 63.3 32.0 51
10 GTR-NC-209

!
i
IS THERE A SUSTAINABLE FUTURE FOR Apedaile (1992) points out that understanding of theTHE.BOREAL FORESTRY COMMUNITIES? underlying order of the rural economic system and its Ii
place among other systems is a precondition to IIThe fiature of human communities in boreal forested steering the development of the rural system. He also Iregions is a growing concern among politicians, social points out that rural-urban integration changes the Loscientists, land managers, and most importantly, system-millieu, but it does not change the underlying a
among community members themselves. As features of the resource-based economy, and that over * Iillustrated earlier, the world is swept by time these underlying features worsen the economicinternationalization and neo-h'beral economies. The performance of natural resource-based activities ofresults of this merging of forest companies are lean the rural system. Without a solid background of the
operations with substantial downsizing and huge above, it will result in flawed policies for sustainable "layofR in forestry operations. This often occurs in rural development. Williamson and Annamrajutowns with only one major employer, namely the (1996) underline that an adequate of the sustainabilityforest industry. In the boreal zone, many approach is necessary to achieve forest communitycommunities will not survive without a solid forest sustainability. We, in the forestry community, havesector and vice versa, the forest sector operations can not been very successful in tackling forest community
no_tbe carded out without stable forestry communities problems in the way I have outlined above. Given the(e.g., Lundquist et al. 1997; Bradshaw and Lynn conditions we are facing in the boreal zone, i.e., a1996)_ Two different schools of thought with respect stagnating and aging population, the continual,to natural resources and regional development exist, substantial downsiz'mg of the workforce in forest
One isthat regions havingan abundance of natural communities (Financial Times 1997), the strongresources may have an advantage over less resource- structural changes expected in the boreal forest Drichregions in the form of better incomes and in sector, and the crisis situation in the Russian forest Ialternative strategies for industrialization (e.g., communities (Lundquist et al. 1997), I stronglyGerschenkron 1962; and Bradshaw and Lynn 1996). recommend the following to IBFRA:The other school, the resource-curse theory,
• highlights the. disadvantages that resource-dependent • Start a program _th the objective to find the soulregions face in their attempts to achieve long-term of the future boreal forest communities (Robsoneconomic growth (the so-called Dutch Disease). 1996). The keywords in this program should beExamples of advocates for this second school are integrated analuses, structural sociology, andSpooner (!981), Auty (1993), and The Economist communi_ institutional structures. The program(1995). must aim to produce results for sustainable
development of boreal forest communities.In order to achieve sustainable forestry communities,three aspects have to be fulfilled (Kaufman 1990):land-use aspects, industrial and employment aspects, WHERE IS THE LOGIC AND WHERE AREand the social welfare and organizational aspects. THE SCIENTISTS?
•Current analyses of forest communities (Carroll and During the last 10-15 years and especially during the- Lee 1990) suggest that ecological and economic 1990s, demands on the forest sector by society and
analyses alone are not sufficient to understand the governments have increased dramatically. Societies' adaptability of forest communities under stress. There and governments require that a new set ofprinciples
must be increased cooperation amot,g foresters, be implemented to improve social, economic and iecologists, economists and sociologists in order to environmental benefits of the forests. These demand_
' address the sustainability issue of forestry can be illustrated by the conclusions from the 7th i¢communities. Muth (1990) suggests that the most American Congress:
- productive approach to study the relationship betweenforest resources and sustainbility of forest • The forests should sustainably provide a range ofcommunities could be that provided by structural goods, services, experiences and values that
sociology. He als0 stresses that the issue of contribute to community well-being, economic
sustainable forest communities are best understood in opportunity, social and personal satisfaction,terms of a sustainable community institutional spiritual and cultural fulfillment, and recreationalstructure, rather than in terms of traditional indicators enjoyment,such as employment, resource supply, ecology,
economics, and inhabitants. • The forests should be sustainable; supportbiological diversity; maintain ecological and
Proceedings IBFRA Assn 1997 meeting 11
m
evolutionary processes; and be highly productive, service. With this simple overview the conclusion• ..
and points in that direction.And where is the scientific community in this non-
e The forests should be managed with consideration sustainable equation? Our usual attitude is that wefor global implications. : are scientists and do not get involved in policies and
politics. Therefore, the boreal scientific community is ,
This will require tremendous resources in the form of silent. But in reality, as stated by the Director •people, money and a healthy forest industry to General of UNESCO, "Science is a highly political
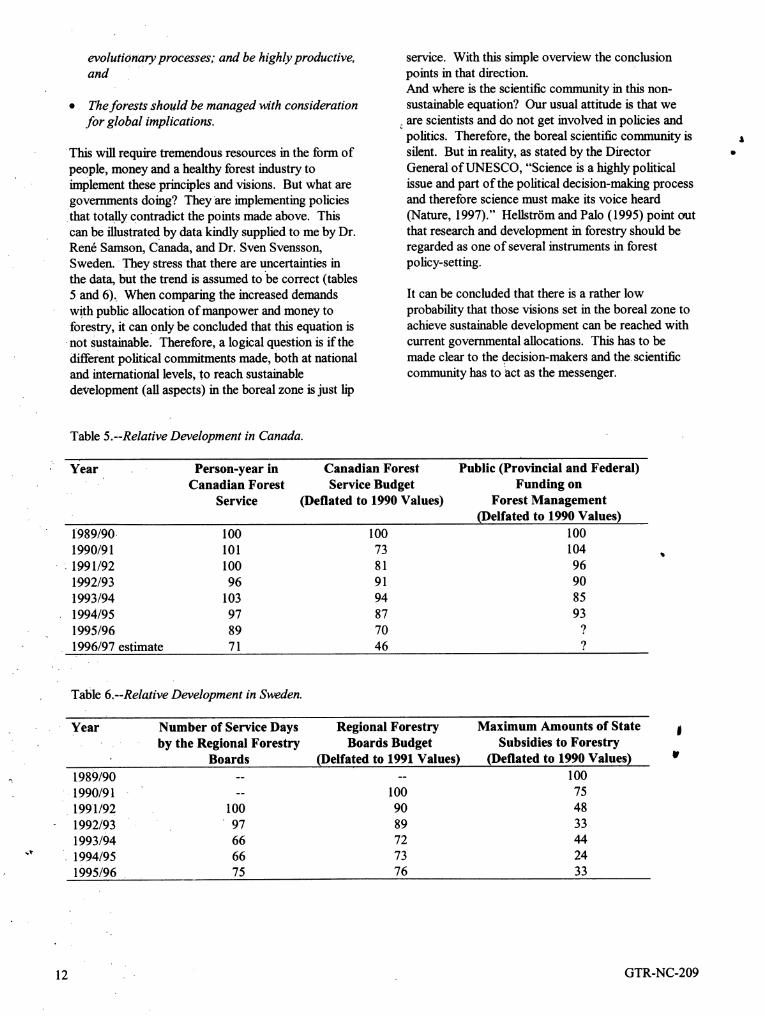
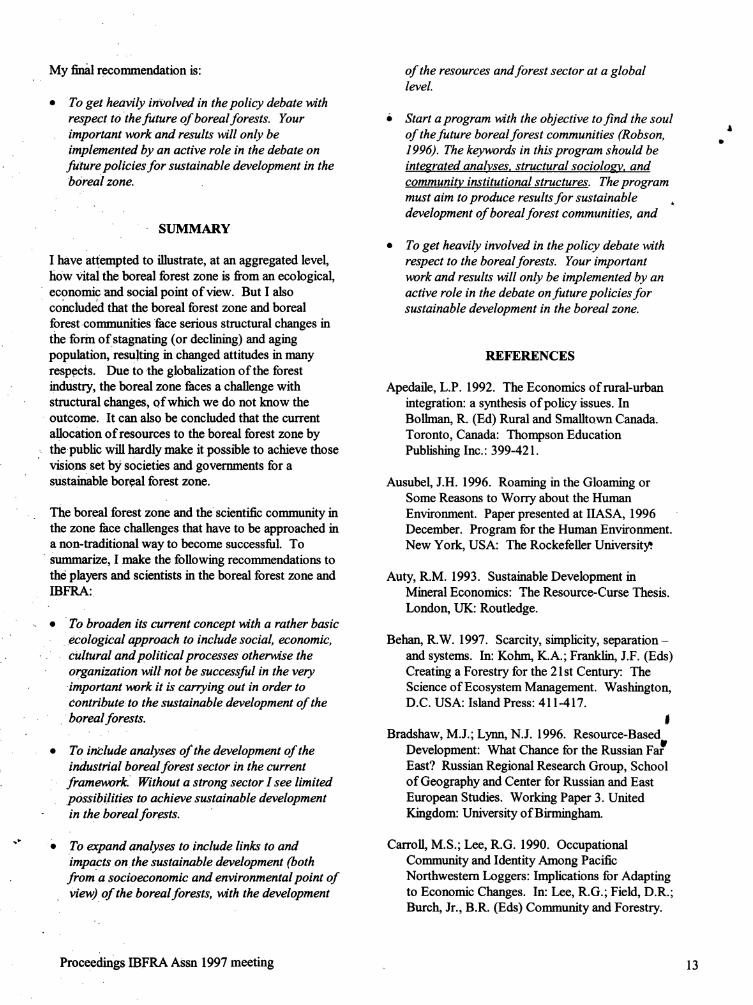
implement these principles and visions. But what are issue and part of the political decision-making processgovernments doing? Theyare implementing policies and therefore science must make its voice heardithat totally contradict the points made above. This (Nature, 1997)." Hellstr6m and Palo (1995) point outcan be illustrated by data kindly supplied to me by Dr. that research and development in forestry should beRen6 Samson, canada, and Dr. Sven Svensson, regarded as one of several instruments in forestSweden. They stress that there are uncertainties in policy-setting.the data, but the trend is assumed to be correct (tables
5 and 6). When comparing the increased demands It can be concluded that there is a rather lowwith public allocation of manpower and money to probability that those visions set in the boreal zone toforestry, it can 0nly be concluded that this equation is achieve sustainable development can be reached with
not Sustainable. Therefore, a logical question is if the current governmental allocations. This has to be
different political commitments made, both at national made clear to the decision-makers and thescientificand international levels, to reach sustainable community has to act as the messenger.development (all aspects) in the boreal zone is just lip
Table 5.--Relative Development in Canada.
Year Person-year in Canadian Forest Public (Provincial and Federal)Canadian Forest Service Budget Funding on..
Service (Deflated to 1990 Values) Forest Management(Delfated to 1990 Values)
1989/90 100 100 100
1990/91 101 73 104• 1991/92 100 81 96
1992/93 96 91 901993/94 103 94 851994/95 97 87 93
1995/9.6 89 70 ?1996/97 estimate 71 46 ?
• .
• Table 6.--Relative Development in Sweden.
Year Number of Service Days Regional Forestry Maximum Amounts of State !. by the Regional Forestry Boards Budget Subsidies to Forestry
, ' Boards (Delfated to 1991 Values) (Deflated to 1990 Values) 1¢
.. 1989/90 .... 1001990/91 -- 100 751991/92 100 90 481992/93 ' 97 89 331993/94 66 72 44
" 1994/95 66 73 241995/96 75 76 33
12 GTR-NC-209
My firml recommendation is: of the resources and forest sector at a global. .
level.
• To get heavily involved in the policy debate withrespect tOthe future of boreal forests. Your • Start a program with the objective to find the soul
important work and results will only be of the future boreal forest communities (Robson, •implemented by an active role in the debate on 1996). The keywords in this program shouM befuture policies for sustainable development in the integrated analyses, structural sociology, andbOreal zone. community institutional structures. The program
must aim to produce results for sustainabledevelopment of boreal forest communities, and
SUMMARY
• To get heavily involved in the policy debate withI have aRempted to illustrate, at an aggregated level, respect to the boreal forests. Your importanthOWvital the boreal forest zone is from an ecological, work and results will only be implemented by aneconomic and social point of view. But I also active role in the debate on future policies forconcluded that the boreal forest zone and boreal sustainable development in the boreal zone.forestcommunities face serious structural changes in
the form ofstagnating (or declining) and agingpopulation, resulting in changed attitudes in many REFERENCESrespects. Due to the globalization of the forest"industry, the boreal zone faces a challenge with Apedaile, L.P. 1992. The Economics of rural-urbanstructural changes, of which we do not know the integration: a synthesis of policy issues. Inoutcome. It can also be concluded that the current Bollman, R. (Ed) Rural and Smalltown Canada.allocation of resources to the boreal forest zone by Toronto, Canada: Thompson Education
- the public will hardly make it possible to achieve those Publishing Inc." 399-421.visions set by societies and governments for a
sUstainable boreal forest zone. Ausubel, J.H. 1996. Roaming in the Gloaming orSome Reasons to Worry about the Human
The boreal forest zone and the scientific community in Environment. Paper presented at IIASA, 1996the zone face challenges that have to be approached in December. Program for the Human Environment.a non-traditional way to become successful. To New York, USA: The Rockefeller Universit_Summarize, I make the following recommendations to
the players and scientists in the boreal forest zone and Auty, R.M. 1993. Sustainable Development inIBFRA: Mineral Economics: The Resource-Curse Thesis.
London, UK: Routledge.. • To broaden its current concept with a rather basic
ecological approach to include social economic, Behan, R.W. 1997. Scarcity, simplicity, separation-Cultural and political processes otherwise the and systems. In: Kohm, K.A.; Franklin, J.F. (Eds)organization will not be successful in the very Creating a Forestry for the 21st Century: Theimportant work it is carrying out in order to Science of Ecosystem Management. Washington,contributeto the sustainable development of the D.C. USA: Island Press: 411-417.•boreal forests. J
. Bradshaw, M.J.; Lynn, N.J. 1996. Resource-Based
• To ini:lude analyses of the development of the Development: What Chance for the Russian FarUindustrial boreal forest sector in the current East? Russian Regional Research Group, School
framen_rk. Without a strong sector I see limited of Geography and Center for Russian and Eastpossibilities to achieve sustainable development European Studies. Working Paper 3. Unitedin the boreal forests. Kingdom: University of Birmingham.
"" • To expand analyses to include links to and Carroll, M.S.; Lee, R.G. 1990. Occupational
impacts on the sustainable development (both Community and Identity Among Pacificfrom a socioeconomic and environmental point of Northwestern Loggers: Implications for AdaptingView) of the boreal forests, with the development to Economic Changes. In: Lee, R.G.; Field, D.R.;
Burch, Jr., B.R. (Eds) Community and Forestry.-
Proceedings IBFRA Assn 1997 meeting 13
(}ontinuities in the Sociology of Natural philosophy of social and economic development.Resources. Boulder, San Francisco and London: The International Journal of Sustainable
Westview Press: 140-155. Development and World Ecology. 4(1): 1-16.
,iConstanza, R.; d,Arge, R.; De Groot, R.; Farber, S.; HeUstr6m, E.; Palo, M. 1995. European Forestry ,
Grasso, M.; Hannon, B.; Limberg, K.; Naeem, S.; Research- Public and Private Involvement.O'Neill, R.V.; Pamelo, J.; Raskin, R.G.; Sutton, Journal of Forest Economics. 1(3): 365-393.P.; Van den Belt, M. 1997. The value of the
World's ecosystem services and natural capital. Hemesniemi, H.; Lammi, M.; Yl/q-Auttila, P. 1996.,Nature; 387" 253-260. Advantage Finland. The Future of Finnish
Industries. Sarja B 113 Series. The ResearchDuinker, P.N. 1997. Criteria and indicators of Institute of the Finnish Economy.
sustainable forest management: Canadian
experiences and directions. Forthcoming Interim Hultkrantz, L. 1992. National account for timber and
•Report. Laxenburg, Austria: IIASA, forest environmental resources in Sweden.' International Institute for Applied Systems Environmental and Resource Economics. 2(3):
Analysis. 283-306.Emmerij, L. 1997. The Paradox of Competition. The
United Nations Research Institute for Social Jaeger, W.K. 1995. Is sustainability optimal?Development Bulletin, Spring/Summer 1997; (16): Examining the differences between economists1-2. and environmentalists. Ecological Economics; 15:
43-57.
Etzioni, A. 1968. The Active Society. A theory ofsocietal and political processes. New York, USA: Kaufrnan, H.F. 1990. Toward the Stabilization and
? Free Press. Enrichment of a Forestry Community. In: Lee,R.G.; Field, D.R.; Burch, Jr., B.R. (Eds)
FAO. 1997a. State of the World's Forests. Rome, Community and Forestry. Continuities in theItaly: Food and Agriculture Organization of the Sociology of Natural Resources. Boulder, SanUnited Nations. Francisco and London: Westview Press: 28-38.
FAO. 1997b. FAO Provisional Outlook For Global Kumari, K. 1996. Sustainable Forestry Managdtnent:Forest Products Consumption, Production and Myth or Reality? Exploring the Prospects forTrade to 2010. Rome, Italy: FAO, Food and Malaysia. Ambio. 25(7): 459-467.Agriculture Organization of the United Nations.
Kurz, W.A.; Apps, M.J.; Webb, T.M.; McNamee, P.J.Financial Times. 1997. Pulp industry shake-out 1993. The Carbon Budget of the Canadian Forest
gathers .pace. 1997 July 10. Sector: Phase I. Information Report NOR-X-326.• Edmonton, Alberta, Canada: Northwest Region,
Forester, D. J.; Machlis, G. E.; McKendry, J. E. 1994. Northern Forestry Center, Forestry Canada.Socio-economic factors and biodiversity: a
working b_liography. Moscow, Idaho: Lammi, M. 1994. The success story of paper,Cooperative Park Studies Unit, University of machines and knowhow- the competitive !
. Idaho. advantage of the forest cluster. Report ETLAw' B99. Talousticko Oy, Helsinki, Finland: The
German Advisory Committee on Global Change. Research Institute of the Finnish Economy. 158 p.1993. World in Transition: Basic Structure of the (in Finnish).Global Man-Environment Relationship. Berlin,Germany: German Comrm'ttee on Global Change. Lundquist, B.; Nilsson, S.; Zackrisson, U. 1997.
Russian Forest Sector- Welfare Indicators.
"' Gerschenkron, A. 1962. Economic Backwardness in Interim Report 97-029. Laxenburg, Austria:Historical Perspective. Cambridge, MA, USA: IIASA, International Institute for AppliedHaiward University Press. Systems Analysis.
Heilig, G.K. 1997. Sustainable Development- ten. arguments against a biologistic "slow-down"
.,
14 GTR-NC-209

Lutz, W.; Sanderson, W.; Scherbov, S. 1997. Rice, R.E.; Gullison, R.E.; Reid, J.W. 1997. CanDoubling of world population unlikely. Nature. Sustainable Management Save Tropical Forests?387:803-8051 . Scientific American. 276(4): 34-39.
McNutt, J.A. 1995. Global F_er Symposium. In: Robson, R. 1996. Forest dependent communities in AProceedings of the TAPPI Global Fiber Canada. An interpretative overview and •Symposium; 1.995 October 5-6; Chicago, Illinois; annotated bibiliography. Working Paper. Ottawa,Atlanta, Georgia, USA: TAPPI Press: 58-65. Canada: Policy, Economics and International
Affairs Directorate, Natural Resources Canada-
Mendels0hn, R.; Morrison, W.; Schesinger, M.E.; Canadian Forest Service.Andronova N.G. 1997. Country-Specific Market
impacts of Climate Change. Albana, Illinois: Rowe, J.S. 1992. The ecosystem approach to forestIllinois University. Web source location: land management. Forest.Chron. 68: 222-224.
http://crga.atmos.uiuc.edu/public/CRG Publications/Market Impact/text.html. Schelling, T.C. 1966. Arms and Influence. New
' Haven.and London; Yale University Press. 293 p.
Muth, R.M. 1990. Community Stability as SocialStructure: The Role of Substinence Uses of Shvidenko, A.; Nilsson, S.; Roshkov, V.; Strakhov,Natural Resources in Southeast Alaska. In: Lee, V. 1996. Carbon Budget of the Russian Boreal
R.G.; Field, D.R.; Burch, Jr., B.R. (Eds) Forests: A systems analysis approach toCommunity and Forestry. Continuities in the uncertainty. In: Apps, M.; Price, D. (Eds) ForestSociology of Natural Resources. Boulder, San Ecosystems, Forest Management and the GlobalFrancisco and London: Westview Press: 211-225. Carbon Cycle. NATO ASI Series Vol. 140.
Heidelberg, Germany: Springer-Verlag: 145-162.
• Myneni, R.B.; Keelling, C.D.; Tucker, C.J.; Asrar, G.;Nemani, R.R. 1997. Increased plant growth in the Solberg, B.; Svensrud, A. 1992. Environmentalnorthern high latitudes from 1981 to 1991. factors and national account of forestry- someNature. 386: 698-702. findings from Norway. Paper presented at the
IUFRO Centennial Meeting, 1992 August 31-
Nature. 1997. The "S" in UNESCO seeks out a new September 4; Berlin-Eberswalde, Germany.role. Nature, Vol. 385, 1997 January 23. 286 p.
• Spooner, D. 1981. Mining and RegionalNil_son, S. (ed). 1996a. Boreal Forests - The Role of Development. Oxford, UK: Oxford University
Research Congress Report. In: Caring for the Press. 64 p.Forest: Research in a Changing World, Congress
. Repot, Volume II" 399-409. Proceedings of the Strakhov, V. 1997. Criteria and Indicators for1995 IUFRO XX World Congress; 1995 August Sustainable Forest Management in the Russian6-!2; Tampere, Finland. Federation. In: Nilsson, S. (Ed) Dialogue on
Sustainable Development of the Russian ForestNilsson, S. 1996b. DoWe Have Enough Forests? Sector- Volume I. Interim Report IR-97-009.
Occassional Paper 5. Vienna, Austria: IUFRO, Laxenburg, Austria: IIASA, International
•International Union of Forestry Research Institute for Applied Systems Analysis. ItOrganizations.
. Suffiing, R. 1993. Climate change and disturbance gy
Nowak, M.A.; May, R.M.; Sigmund, K. 1995. The fire in boreal and subalpine forests. In: Holsten,arithmetic Ofmutual help. Scientific American, J.I.; Paulsen, B.; Oechel, W.C. (Eds) Impacts of272(6). climate change on natural ecosystems.
Trondheim, Norway: Norwegian Institute for
Perez-Garcia, J.; Joyce, L.A.; Binkley, C.S.; McGurie, Native Resources: 105-121.-" A.D. 1996. Impacts of Climate Change on the
Global Forest Sector. An Integrated Swedish Pulp and Paper Association. 1996. PlatformEc010gical/Economic Assessment. (In press: 2000. The Forest Industry- a big industry whichEnvironmental and Resource Economics). can grow. Stockholm, Sweden: Swedish Pulp and
. Paper Association..
Proceedings IBFRA Assn 1997 meeting 15

The Economist. 1995. The Natural Resources Myth: Wilson, E.O. 1988. The Current State of biologicalDangerous Endowments. December 23, 1995- diversity. In: Wilson, E.O.; Peters, F.M. (Eds)January 5, 199_i. 89-91. National Forum on Biodiversity, 1986 Sept. 21-
25, Washington, D.C.; Washington, D.C., USA: AWCED. 1992. The Global Partnership for National Academy Press. 3-18. •
Environment and Development. Geneva,Switzerland: United Nations. Zasada, J.C.; Gordon, A.G.; Slaughter, C.W.;
Duchesne, L.C. 1997. Ecological ConsiderationsWilliamson, T.; Annamraju, S. 1996. Analysis of the for the Sustainable Management of the North •
contribution of the forest industry to the economic American Boreal Forests. Interim Report 97-024.base ofruraI communities in Canada. Working Laxenburg, Austria: IIASA, International InstitutePaper No. 43. Ottawa, Canada: Industry, for Applied Systems Analysis.EconOmics and Programs Branch, NaturalResources Canada- Canadian Forest Service.
,.
16 GTR-NC-209

GLOBAL SIGNIFICANCE OF DISTURBANCES IN BOREAL FORESTS. .
Anatoly Shvidenko I 2
ABSTRACT.--Disturbance (D) significantly impacts "Disturbance is the destruction of living biomass or
the state, structure, productivity and dynamics of accumulated detritus" (Reiners 1983). Other "definitions (Sousa 1984; Forman and Godron 1986)
boreal forests. The unified hierarchical typologicalclassification ofD and set of indicators to quantify D point out different aspects of the phenomenon. "Aare presented for the circumpolar boreal forests, disturbance is a discrete, punctuated killing, ,Basic principles of a logically complete description of displacement, or damaging of one or more individualsD are: (1) understanding that D of the forest (or colonies) that directly or indirectly creates an
opportunity for new individuals (or colonies) toecosystem is simultaneously D of the (definite)landscape, and the consistent landscape approach is become established" (Sousa 1984). "Disturbance ...
is considered as something that causes a communityone reliable method for all estimates; (2) landscapeof ecosystem characteristic ... to exceed or drop
regularities define disturbance regimes (DR); (3) DandDR are strongly dynamic processes, and below its common (homeostatic) range of variation"
(Go&on and Forman 1983). "Disturbance is an eventappropriate quantification of them should be based onthat causes a significant change from the normalsuccession regularities; (4) the set of indicators that
descn%e D has to be used as a subset of criteria and pattern in the ecological system" (Forman andindicators of sustainable development/sustainable Godron 1986).forest management. Based on the above classificationand principles, available publications, data and We do not believe that terminological discussions areresearch results, the paper presents a brief overview relevant in this paper. It is evident that: (1) there areof: (1) quantitative descriptions of D in the boreal no boreal forests, both managed and not managed,
which would be not impacted by D, and namely D is a? zone; (2) aggregated estimates of impacts of D oncurrent productivity, species distribution and age crucial factor of the current state, productivity andstructure; (3) estimates of the role of D in the dynamics of forests; (2) any definitions (andinteraction of boreal forests with global carbon classifications) should be dependent on the goals andbudget;:(4) globally significant features of predicted objectives being considered; (3) many basic types ofdynamics of D in boreal forests during the next Ds cannot be considered as a destructive factorcentury under expected global climate change, exclusively (Fmyaev 1996), and even the term
"creative destruction" (Holling 1992) could be used;(4) Ds are spatial and time dependent; (5) althoughintuitively D seems to be tied with human impact,natural Ds play a crucial role in the structure andINTRODUCTION: BASIC DEFINITIONS,function of boreal forest ecosystems; (6) the definition" CLASSIFICATION SCHEMES ANDof Ds in forests should consider specifics of forests as• INDICATORSa natural phenomenon, as well as the requirements
• and traditions of forest management. The multi-Disturbance (D) can be defined in many different faceted influence of Ds generates the major patternsways. Disturbance is mainly understood as a of the boreal forests, defines fragmentation and
•destructive impact on an ecosystem. "A disturbance mosaic of boreal landscapes, and eventually boreal !
. isanY relatively discrete event in time that disrupts vegetation structure, distribution, stability, diversity wecosystem, community, or population structure and and productivity. All of these features arechanges resources, substrate availability, or the comprehensively revealed in successions. Thus, aphysical environment" (Pickett and White 1985). relevant evaluation system of Ds is their close"D_turbance is considered to consist of the connection with an interdependence on successionmechanisms which limit the plant biomass by causing dynamics of forests.its partial or complete destruction" (Crime 1979).
lprofessor Anatoly Shvidenko, Senior Research Scholar, Sustainable Boreal Forest Resources Project,International Institute for Applied Systems Analysis (IIASA), A-2361 Laxenburg, Austria.
2The author is indebted to Drs. T. Schmidt and G. Raily for their helpful comments and information in
• preparing this paper..
Proceedings IBFRA Assn 1997 meeting 17

goals" (1) to be applicable for forest managementWe define disturbance as any (exogenic) impact, practice, and (2) to present sufficient and completeWhich changes na_ral (evolutionary) dynamics of a information for different ecological applications.forest ecosystem or a (forest) landscape. This ' Both are closely tied with criteria and indicators of Adefinition, as all others, has a shortcoming as it sustainable development (Status Report 1994; Criteria D
requires both the explicit understanding of the notion 1995; Conference 1993).and the availability of the reference base, which wouldquantify the natural (i.e., undisturbed) state and There are two basic elements in evaluating Ds': anatUral dynamics of forests. A comprehensive and forest ecosystem and a forest landscape. It is oftenformai description of the problem would require much impossl_oleto present a consistent description of D formore space than would be relevant here. We only one without considering the other. The main reasonsnote that the approach is often used in both the theory for this are: (1) any description of D as a successionof forestry and forest management practice, e.g., in even for a separate ecosystem includes basicthe classical theory of normal forests, or in some basic landscape peculiarities; (2) many Ds have a typicalprinciples implemented in yield tables of normal (fully landscape extent, genesis and magnitude; (3) any D ofstocked) stands, or in the normal (sustainable) a separate ecosystem impacts a landscape's property;structure of a landscape. (4) specifics of major Ds as well as interactions and
interdependence between different types ofD have anD usually starts from an initially short impact at the explicit landscape :nature.begintfing of a new succession. Evidently, themagnitude of this impact would exceed the threshold These interconnections make it necessary to considerof the self-organization of a forest ecosystem. Thus, disturbance regimes (DR), i.e., stable combinations ofwecan say that D .is a purely exogenic succession, types of Ds and their characteristics, as well as"Exogenic" is used to some extent as a relative term, specifics of interactions between them. DR can be
• e.g., Forman and Godron (1986) suggested not to defined (for a definite landscape) by both a major typeconsider a disturbance as any exogenic factors, which of D (e.g., pyrogenic or industrial exploitable types ofis inlaerent innatural conditions of sites. This DR), and the type of interactions expressed in termsrecommendation has a solid ecological background, of synergetic, neutral, contradictory and exclusivebut it is probably not acceptable from a practical point interactions. Generally, all DRs can be combined intoof view because based on this approach, for example, two types: digressive DR, i.e., the DR under whichwe cannot consider insect outbreaks as D. the climax state of an indigenous forest ecosystem
cannot be reached, and progressive DR where theDifferent approaches could be used to classify Ds; natural successions are maintained and the climaxcausative factors (genesis of Ds), changes of forest state is reached. In the framework of the digressivefunctions or structure, severity of consequences, etc. DR, Ds can lead to the degradation of forest
. Ds can be classified by the objects disturbed (e.g., Ds ecosystems_ Forest degradation could be defined as aof needles (leaves), individual trees, forest process that descn'bes human-induced phenomena,ecosystems, landscapes, forest cover, etc.). They can which lowers the current and/or future capacity of thebe human-induced-and natural, reversible and forest to protect the environment and to satisfy humanirreversible; stand-replacing and non-stand replacing; requirements to all benefits from the forests. Similarly
simple and composite; can occur in "infi'equent" and to Ds, degradation can be classified by types (e.g., site"multiple disturbance" ecosystems (Reiners 1983), impoverishment due to water and wind soil erosiot_
. etc. We suggest the classification in figure 1 which is "green" desertification), and be described bybased on causative factors that are closely connected quantitative indicators. The project of Global iF
with the upper level of a relevant classification of Assessment of Soil Degradation (GLASSOD)successions (Rojkov et al. 1996). Such an approach recommended identification of type, degree, extent,
is very close to the traditional understanding of D in rate and causative factor of soil degradation; a clearforest management practice 'and seems to be distinction should be made between status, .rate andapplicable to all types of disturbances in boreal forests risk. The eventual degree of forest degradation can
-' as well as to other types of natural vegetation in the be expressed in terms of the impacts offorestboreal zone. degradation on productivity. Such an approach
develops the additional link between Ds and
The set of indicators appropriate to quantify Ds degradation. Indicators of sustainable forest. shouldprovide two interconnecting and overlapping management should include an expedient unification
.
18 GTR-NC-209

ID
Ol 0 I ' ".. .O -,._
i•.Q ,m- m o"_® _'I "+C (DO F ._--_
•i_iii!+iiii_ii_iiiii',E _ m _ m =• +!_+i+l o = '="
li_i"!i!_'_+_ii'_i_l 0.=xe - -_- .I. I+++_++i+8+I ,.,-,J ,.,...J_ ,
+++ii++_+!++_i+!!i" .- .- e,,+® ,,,,++i+_++++++_+++++ _ _ m "oI++++I "
F_ c:
-" . X _ ..p, .,= +"" ® _ +- l.- O) C .
._ o ,._ ' L._".,-- _" !'-'1 _
• -f--f -I'- •
Proceedings IBFRA Assn 1997 meeting 19

of a subset of D indicators and the degradation be recommended. Russian fire protection practicesmentioned above, use a very simple and informative indicator offire
- force which is a function of the average height of fireD and DR are a geographical phenomenon. At least ' marks on the stems, and is highly correlated with both
three major gradients impact distribution, dominant forest combust_les consumed and post-fire die-back wAforest types, succession regularities and DR of the (Matveev 1992). Spatial structure of fare as a D canboreal forest: temperature, moisture (or climate be characterised by the spatial variability of itsc0ntinentality) and anthropogenic pressure, severity. Universal time and asymmetry are
theoretical estimates; the first descn_oes the
The set of indicators suggested to describe Ds in poss_ilities to reach the climax phase of theboreal forests is-presented in table 1. Several succession consequence under the definite DR, andindicators (e.g., extent, frequency) were widely used the second indicator indicates the shift, which thebefore;, some of them ("universal" time, asymmetry) current succession cycle provides in the structure andarereferred to as succession regularities. A definite productivity of its climax phase. Interaction's
type of D requires quantitative indicators expressed indicator is based on the types of D interactions in aexplicitly, We briefly illustrate the implementation of forest ecosystem, and is measured by enforcing thethe indicators" system presented in table 1 to descr_e ecological effects of different types of Ds, e.g., inforest fires as D. There have been previous attempts southern taiga ecoregions of Northern Eurasia post-made to sufficiently quantify it by Kurbatsky 1970a; fire outbreaks of secondary pests could significantlyHeitiselman 1981; Van Wagner 1983; and Furyaev increase the severity of DR. Finally, fire can1996. There are several rather complicated national significantly impact neighbouring and/or even remotefire classifications (e.g., for Russia, Kurbatsky 1970; areas of a landscape; spatial coherence is suggestedSheshukov et al. 1992); but forest fire protection in to measure it. Quantification of the two lastboreal countries eventually uses simplified indicators could be made based on a formal
• classifications which include crown fires, surface (on- description of the landscape (Rojkov et al. 1996).
grotmd ) fifes, peat (fitter, turf or ground) fires andspotting (underground) fires (Van Wagner 1983;Shetinsky 1994). The extent or size of a fire has an CURRENT IMPACT OF DISTURBANCES ONexplicit meaning, and modal area (in year t), and mean BOREAL FORESTSarea for a definite period are used widely in forestmanagement practice. The intensity of a fire is Currently, the three most important types of D_ inexpressed in units or energy released per unit area per boreal forests are: fire, insect outbreaks, and harvest.Unit time. Fire frequency is usually defined as the Some regions are impacted by air pollution and suffernumber of fires per unit time in a definite area. from the unregulated development of industrialSeveral derivative indicators could be useful. Fire infrastructure. Unfortunately, comprehensive and(return) interval is the number of years between two reliable data for all boreal zones do not exist due tosuccessive fires; mean fire interval is used as the different classifications used in different countries, andindicator of the DR. The length of time used for vast unmonitored areas, specifically in Russia.
averaging depends upon the goals of the evaluation; Nevertheless, the magnitude of Ds can be definedthe succession phase seems to be relevant for many of rather accurately. Some examples are presentedthem ....Return time orfire rotation period (natural fire below. Recurring forest fires are widespread in therotation period; Heinselman 1973, fire cycle; Van boreal world. It is very probable that there are no!
' Wagner 1978) is an indicator to describe how vegetative areas where fires have not occurred duringComplete the scope of a fire is in a given point of an Holocene, and charcoal in peat deposits is evidence of
- ecosystem. Predictability characterises the regularity this. The natural fire cycle depends upon manyof fires, andcan be estimated as variability of fire natural and anthropogenic circumstances.interval, or risk (probability) of fire.
From a theoretical point of view, a change of"" eCological efficiency could serve as an indicator of the
, Severity of a fire. However, this indicator is rathercompficated for practical purposes, and otherderivative indicators, such as the loss of live biomass
• including direct burning and post-fire die-back, could
20 GTR-NC-209

°
Table 1.--System of the Basic Disturbance Indicators.
No Indicator Object Definition and examples of units of measurement °1 Extent FE,FL Physical extent of D, area, size, volume
2 .Magnitude or intensity FE Physical force of D, units of energy, concentration, etc.3 Frequency FE, FL Recurrence of Ds, expressed in the number of Ds per unit
time in a definite area, yr _4 Return time FE, FL Average time between Ds of the same type at a particular
site (in a given point), yrl5 Severity FE, FL Ecological effect of D on a forest ecosystem6 •Spatial structure FE, FL Territorial integrity and specific of D, e.g., inverse value of
the number of patches7 Predictability FE, FL Regularity of frequency distribution8 Universal time FE Assumed (model) time required to reach the climax state
under a given regime of Ds, year9 Interaction FE Strengthening or weakening of .integrated ecological effect of
different types ofDs on forest ecosystem10 Asymmetry FE Shift of productivity/biodiversity by the climax phase of the
succession consequence
11 Spatial coherence FL Impact of D on the landscape mosaic outside of the D area
.:The average estimates for the North American (Shvidenko et al. 1995). The first remote sensingboreal forests are 50-100 years (Heinselman 1981; survey which covered all Russia estimated fire areasVireck 1983) varying from 26 years in dry at 1.5 million ha (Cahoon et al. 1995); officialdeciduous forests in interior Alaska (Yarie 1981) to statistics for protected areas were 0.9 million ha.500 years in the wet areas of eastern Canada Seasonal variability of burnt areas is very high-(Foster 1983). Data for Sweden are very similar, from 2 milh'on ha to 15 milh'on ha for differentr_ging fi'om 50 to 270 years and averaging 110- years.!55 .years (Zakrisson 1977; Englemark 1984). Data
for Russia varies greatly, from 10-15 to 250-300 Insect and disease damage is the second crucialyears depending on the location, forest types and factor of boreal forest dynamics. There is a ratherlevel o.fanthropogenic pressure (see review in corresponding opinion that the damage caused byShvidenko et al. 1995). insect and disease outbreaks is as great as forest fire
damage in the boreal countries. Annual forestAbout one-third of the boreal zone is not under any losses due to insect attacks in Canada are estimated
fire protection (e.g., 40 % of total Forest Fund area at 51 million m3 per year, or 1.5 times that due toin Russia, or about 500 milh'on ha of sparse taiga, wildfire and about one-third of annually harvestedforest tundra and tundra zones are not protected), wood (Hall and Moody 1994). Spruce budworm !
According to official data for the protected areas, (Choristoneurafumiferana) in eastern Canada' 20,000 to 40,000 forest fires occur annually, which killed 720 mln m3 wood between 1919 and 1920 lp
cover a total average area of about 4-5 million ha (Blais 1968). In 1992 budworm-related mortality of- (FAO 1995). From the total amount, stand- balsam fire and white spruce was detected on 3.94
replacing rites (crown, peat) comprise about 20 % million ha in Ontario alone (Howse and Applejohnof these areas. There exist only expert estimates for 1993). Spruce beetle (Dendroctonus rufipenis)the total boreal forests. These estimates are about causes widespread mortality in white spruce (Picea25 %-30 % higher in comparison with data for glauca) in south-central Alaska (Wemer and
"" protected areas. For example, the annual average Holsten 1983). But probably the most impressivefire area between 1988-1993 on protected areas in examples of severe defoliating insect outbreaks areRussia is 1.12 million ha, of which forested areas in Russia. According to incomplete officialwere 0.76 million ha. The estimate for all Forest statistics, the average annual area attacked by insect
• Fund areas is 3.0 respectively 1.5 million ha and disease outbreaks between 1971-1988 was 2.73
Proceedings IBFRA Assn 1997 meeting 21

million ha (Isaev 1991). The area o f forests alter crown and peat fires die within the year thedestroyed byDendrolimus sibiricus in Siberia fire occurred, and forests on roughly the same areaduring the first half of the twentieth century is ,die during the first 5 post-fire years as a result of
estimated to be 13 million ha (Katajev 1980), and other types of fires); partial mortality of trees (e.g.,fi'om the outbreak of 1954-1957 is 3 milh'on ha. on-ground fires cause mortality on 10% to 50%- *The last outbreak ofDendrolimus sibiricus in 60% of the growing stock); changes of structure,Krasnoyarsk kray between 1994-1996 damaged species composition and productivity of forests.forests on an area of more than 1 million ha, Undesirable changes of species are common in
includ'mg 0.5 million ha where more than 51% were many regions. For instance, vast post-fire and post- "destroyed (Isaev 1997). cutting areas of indigenous coniferous forests in
boreal Russian Eurasia are regenerated byHarvest is the largest human-induced disturbance in sol, leaves species (birch, aspen); such areas reach
•boreal forests. Between the 1980-1990s, annual about 30 million ha in Russian European Northremoval was between 600 and 700 million m3, of alone by the 1990s, and is predicted to increase to
_which almost 80 % were harvested in two countries 70 million ha by the year 2015. Ds (basically on-- Russia and Canada (FAO 1996). By 1995, total ground fire) are one of the main reasons for theharvest decreased to about 500 million m3 due to development of uneven-aged stands which are
decline of harvest in Russia (volume of harvested widely distr_uted ".Inboreal Eurasia (uneven-agedwood in 1996 was about one-third of the level of stands of different types comprise 40 % to 90 % of1988). the forests covered by coniferous species in the
middle and southern taiga zones of Russia). On theThe effects ofairpoUution are significant in several contrary, the general opinion is that a major part ofregiom of Russia. A special survey of forests" boreal zone forests in Canada, from forest-tundra to
damaged by pollutants (1989) and covering about the closed-crown forests of the south, is presented60 % of Russian forests estimated 0.8 million ha of by even-aged forests (Black and Bliss 1978; Cogbilldead and strongly disturbed forests. In 1993 the 1985; Momeau and Payette 1989; Sirois andarea of dead forest tundra landscape due to Payette 1989).industrial emissions around Norilsk (North Siberia)reached 2.1 million ha including 0.6 million ha The consequential impact of Ds on boreal forest is a
forested area; the earliest data from the late 1960s decrease in productivity for two basic reasons. First,• "indicated only 5,000 ha were affected (Kharuk stand-replacing Ds change the distn'bution of forest
1993). Based on recent estimates, there are 210 land cover, increasing areas of temporarymilh'on ha of forests at risk from sulphur deposition unforested lands (clear cuts, burns, etc.), andin Asian Russia. No specific symptoms or specific secondary forests of low value and low
responses on the forest ecosystems due to pollution productivity. Second, non-stand replacing Dsimpact in Canada were detected (Hall and Addison decrease productivity of actual stands. In order to
1991). quantify this impact we can express changes ofproductivity of actual forests in relative terms to
Other types of disturbances are numerous, and their non-degraded forests. Based on global vegetationtotal impact on boreal forests is significant. We models it is possible to estimate potential
limit Our review to a few typical examples in Russia. productivity, or productivity of a climax state of a !. Large areas of forests are transformed in regions forest ecosystem, although some artificial
where intensive gas and oil exploration and assumptions remain, e.g., we must assume zero irextraction have occurred, e.g., about 0.1 milh'on ha areas of stand-replacing natural Ds due to fire or
annually alone in Tjumen oblast in 1980s-1990s insect plagues. Potential or climax production of(West S_eria). Northern deer pastures in Magadan forest vegetation is only an abstract understandingoblast (the total area by 1990s, mainly in Forest of the vegetation's state if no human were to exist
Fund areas, is about 60 milh'on ha) decreased over and nothing occurred on Earth. Such an approach,, the last 20 years from 5 %-7 % for each 5-year does not include the transformation of lands, and
period (Stepanicheva and Nagibina 1988) due to consequently cannot be used as a basis for
excess gazing and fires. Many other examples degradation estimates. Much more interesting iscould be presented (Shvidenko et al. 1997). achievable productivity, or maximal possibleThe major consequences of Ds are: death of productivity under the historically stipulated
• forests due to stand-replacing DS (e.g., all forests transformation of natural landscapes. In other
22 GTR-NC-209
words, the achievable state of forests (including he defined for Canada - 1.125 kg C/m 2. Based onshare and state of temporarily unforested areas) is data, presented by Kashishke et al. (1995), the
understoodas a state corresponding to the average direct C emission for Alaska can beparadigm, Criteria and indicators of sustainable estimated at 1.70 kg C/m2. This result is very closeforest management. A comparison of forest to the average data (for all types of fire) reportedproductivity in boreal Russian Asia revealed that the for Russia- 1.66 kg C/m2 (Shvidenko et aL 1995),actual productivity of about 450 million ha is only and that were used by Seiler and Crutzen (1980) for55 %-60 % of the achievable one (Shvidenko et al. all boreal forests. Thus, probably the DF estimate
•1997). We could compare it, for example, with for boreal forests, 70 Tg C year-l, is "Austria; .the total aboveground NPP of the actual underestimated by about 30 %.vegetation was found to be 7 % less than the
potential natural vegetation, and an additional 34 % Historically, land-use changes decreased the area ofof potential production is harvested (Haberl 1997). boreal forests and carbon content in vegetation and
soils. Houghton (1996) has shown that over aperiod of 130 years (1850-1980) boreal forests have
IMPACT OF DISTURBANCES ON GLOBAL lost 9 Pg C (6 Pg C in forest vegetation and 3 Pg CCARBON BUDGET in soils). Taking into account that circumpolar
boreal forests area increased during the last twoDs generate significant additional C fluxes to the decades, it could be concluded that current land-useatmosphere for which the total value can be transformation is not a source of C uptake to theestimated as: atmosphere. Nevertheless, the regional processes
are observed.
The equation presented above has been applied toTDFp_, = _ DFp: l + _ PDFp,t<t_ - ___RGp,t<tl all basic types of Ds in Russian forests (impacts of
' "P P't<tl P't<tl the regrowth were not considered) (table 2). Annualaverage C flux generated by Ds ("pure" flux) was
Where TDFp,t, is the total C flux from a forest estimated at 377 Tg C year l for 1989-1993. The
ecosystem generated by disturbances p during the direct fluxes are estimated to 28 % of the total.
' year tl; _ DFp,t, is direct emissions of year tl This can be explained by the suppression of forest ,fire and decrease of harvest in Russian forestsp
(e.g., direct fire emissions), _ PDFp t<t, is post during the last decade. If we assume the same. magnitude of Ds in all circumpolar boreal forestsP ,t<tl
we could conclude that Ds generate a C uptake todisturbance (biogenic) flux caused by disturbances p the atmosphere of about 500-550 Tg C annually.which occur during previous years (e.g., post fireflux generated by decomposition ofuncombust_le
organic and post-fire dieback), and E RGp,t<tt is DISTURBANCE AND CLIMATE CHANGEp ,t <t !
accumulation of.C due to regrowth on areas All major GCMs (OSU, GFDL, GISS, UKMO,
disturbed during previous years t<h. The first two etc.) give rather consistent predictions of ambient !items in the equation give the "pure" C flux caused temperature change for the boreal zone
. by disturbances. Each type of disturbance requires (Ganopolsky 1994). The transient response for the wthe explicit expression of all items of the equation boreal zone estimates that the mean annual
. presented above (Shvidenko et al. 1997). temperature will increase by up to 1.5° C-2 ° C bythe year 2030 and up to 3° C-5 ° C by the end of the
There are no national publications which could next century. Significant seasonal differences are.comprehensiVely consider the impact of major types predicted. The maximal increase is expected in theof Ds to the global carbon budget. Usually, northern part of central Eurasia in the winter-
.- calculations are restricted by forest fires, harvest about 6° C-8 ° C (and only 3° C in Scandinavia).and land-use change. Stocks (1991) estimated the On the southern boundary of the boreal zone andtotal direct forest fire emission (DF in the equation) during the Scandinavian summer, the temperature-1ofboreal circumpolar countries at 70 Tg C year . will increase by 3° C-4 ° C, while for the northern
• He used the average value of consumed fuel which boundary of the boreal zone temperature increases
Proceedings IBFRA Assn 1997 meeting 23

by only2 ° C or less (Manabe et al. 1991-1992). Indirect global change consequences are much moreThe reliability of precipitation forecasts is much less dangerous and uncertain became they are stronglythan for temperature. Nevertheless, a consistent dependent on the climatic peculiarities which cannotviewpoint is that precipitation will increase over the be reliably predicted through the climatic scenariomajor part of the boreal zone for both cool and available. Moreover, a crucial point is the *warm seasons, but as a rule not significantly, except prediction of extreme events, e.g., the occurrence offor a few regions, and that increase will be greater very hot and very dry periods, storm winds, etc.in winter than m summer. The precipitation's Increased temperature and aridity of the major partincrease will be not enough to compensate the of the boreal zone, decrease ofthe water table due "temperature's increase, and the soil moisture in to melting ofpermafi'ost can generate an increasedsummer will decrease over the boreal zone by up to probability of large-scale fires, and specifically peat20 mmexcept in north-eastern Siberia (Houghton and underground fires. Taking into account huge1990; Houghton et al. 1990; Manabe et al. 1992; reserves of organic matter stored in boreal wetlandsGubashet al. 1992). The results of climate change (from 110 to 270 Pg C in different estimations) thisprojections based on paleoanalogies (Budiko 1988; factor can catastrophically accelerate fire emissionsBudiko and Groissman 1991) is in the line with the to the atmosphere.conclusions mentioned above; where an even more
stringent increase in temperature is predicted. However, such predictions cannot be validateddirectly, and only some assumptions can be
The general conclusion is that new climatic expressed. Due to expected climate change, andconditions will probably support the increase in under additional assumptions that (1) theproductivity over all boreal and temperate zones in distn'bution of extreme value of climatic indicatorsRussia. Potential shitts of northern species will be similar to the current one, and (2) the levelboundary are predicted for Larix, Pinus, Picea, of forest fire protection will be the same, we couldAbies., etc., although some decrease in humidity may expect a dramatic increase of severity and frequency•negatively influence forest productivity in the of fire. Some model calculations show that thepermafrost zones. The quantitative estimates of the probability of big fires is close to 1.0 for all majorincreased growth rate (IGR) were reported for the boreal regions of Russian Eurasia during the nextboreal zone from about 8 % to 15 % for the century (Shvidenko et al. 1997). Evidently, the
northern taiga, 5.5 %-15 % for the middle taiga and second assumption cannot be true; at least the• about 2 %-6 % for the southern taiga (e.g., Alcamo suppression of fire during last decade is evident for
t994; Kokorin and Nazarov 1994), and even 28 %- all boreal zones. In addition, large regional50 % for the total boreal zone (Budiko and Izrael variability is expected (Bergeron and Flannigan1987) during the next century. All of them are 1995).based on indirect analogies. Generally, directconsequences of climate change seem to be eitherfavorable or neutral for major areas of the borealzone.
Table 2.--C Fluxes Generated by Disturbances in Russian Forests (annual average for 1989-1993, Tg C). !
Type of disturbance Direct flux (DF) Post disturbance flux (PDF) Total flux (TDF) uFire 58 92 150Biotic 10 80 90Abiotic 15 35 50Harvest 23 64 87
• Total 106 271 377
24 GTR-NC-209

There is a high risk of a significant increase of insect uncertainties in attempting to understand the futureand disease outbreaks. There is evidence that even C budget of northern territories.short warm and dry periods coinciding with the life
rhythm 0finsects can promote large-scale outbreaks Aof dangerous insects such as Dendrolimus sibirica, INSTEAD OF CONCLUSION- RESEARCH ,,Lymantria monacha, Limantria dispar, etc. NEEDS
(II'insky 1981; Konikov 1970; Isaev and Girs 1975;Isaev 1997) in boreal Eurasia or Choristoneura Disturbances rule over the boreal world. People arefumiferana Clem. and C. pinus Free. in Canada able to manage them only to some, relatively •(Fleming and V01ney 1995; Volney 1996). modest extent, and the basic reason for that is an
Warming can promote a geographical shift of incomplete knowledge and insufficient mutualdangerous insects fi'om the northern regions to the understanding of the problem by all boreal forestssouthern regions due to a decrease in'the stability of stakeholders, forest managers, harvest companies,stands caused by climate change. Climate change scientists, politicians, and indigenous people. Therewill probably increase the widespread distffoution of are urgent circumpolar research needs in order tosome diseases, e.g., stem and root fungi decay, improve the multi-faceted benefit of the boreal
forests:
In order to avoid huge losses of forestsdue to fires
intheboreal zone and taking into account the 1. To investigate a circle of classificationirreversible character of catastrophic fires, an problems such as a unified classification of Ds
anticipatory adaptation forest management system and a relevant set of circumpolar indicators toshould be developed. One of the major parts of the describe D and DR which would be
system is the problem of forest fire protection, internationally consistent and correspond to thewhich Could be solved based on a correct requirements of national forest management
• understanding of the ecological role of forest fires, systems. The close connection of Ds with
and oncurrent and future economic poss_ilities of successions and landscape peculiarities makes ithuman society, Among others, such a system could necessary to extend the problem to consider theinclude the following strategic options: (1) Fire- relevancy of a comprehensive system of borealpreventing arrangement of forest landscapes, e.g., forest classification including a classification ofoptimal spatial interchanging of forested and forest types, forest land-use-land-cover andunforested areas, coniferous and deciduous stands; successions.
(2) Development of relevant infrastructure in the
forest fund areas: road networks, forest fire break 2. To develop a unified approach to the principleslines, etc.; (3) Hierarchical zonation of the forest of spatial partition, quantification and mapping
•protection priorities. The problem of fire protection of boreal landscapes as a basis for the" inremote and unused boreal territories requires description of forest dynamics, succession
both ecological and economic investigation. The regularities and disturbances' predictions.current fire protection paradigm, which is based onthe priority of high-value resources, has to be 3. To generate a unified DB on boreal forests and
reconsidered, corresponding GIS components includingconsistent information on state and dynamics of
There are great uncertainties regarding the future forests, disturbances, etc. !
' fate of boreal wetlands (93 % of world's total i¢wetlands). Northern ecosystems contain up to 455 4. To improve the national forest monitoringTg of C in the active soil layer and the upper levels systems, and to learn poss_ilities of developingofperma_ost, or up to 60 % of the 750 Pg C, an internationally compat_le system.which are currently in the atmosphere as CO2(Oeche! et al:, 1993). Recent measurements gave 5. To develop a regionally distributed vegetationsignificant effluxes from permafrost soils in tundra: model based on successions and landscape
"" 35 g-160 g C/m2 year over 125 summer days regularities which would describe the dynamics(Oechel et al. 1993) in Alaska, and 75 g-175 g C/m 2 of actual forests.year during the summer and 89 (83-94) g C/m2 year
during the winter in north-eastern Asia (Zimov et 6. To develop a circumpolar boreal forest carbon• al. 1993, 1996). These results increased and nitrogen model, based on the above
.,
Proceedings IBFRA Assn 1997 meeting 25
. landings, and to provide unified estimations of European Ministerial Conference on Forests,the biospheric functions of forests for all boreal 16-17 July, 1993.countries.
Criteria. 1995. Criteria and Indicators for
Preserving and Sustainable Management of JREFERENCES Temperate and Boreal Forests (Montreal
Process). Intergovernmental Working Group,Alcamo, J. (ed.). 1994. IMAGE 2.0. Integrated February 1995, Santiago.
Modelling of Global Climate Change.Dordrecht, The Netherlands: Khwer Academic Crime, J.P. 1979. Plant strategies and vegetationPress, 318 p, process, Wiley, Chichester, UK.
Bergeron, Y.; Flanningan, M.D. 1995. Predicting Danilik, V.N.; Makarenko, G.P.; Murzaeva, M.K.the effects of climate change on fire frequency in 1989. Ecological-economic estimate of forestthe sbutheastem Canadian forests. Water, Air biocenosis watershed functions changes caused
' and Soil Pollution 82: 437-444. by anthropogenic impacts. In G.M. Kozubov(ed.), Ecology of forests in the North, short
Black, R.A.; Bliss, L.S. 1978. Recovery sequence reports of I All-Union meeting, 2-7, October,ofPicea madana-Vaccinium uliginosum forest 1989, Issue 1, 34-36 (in Russian).after burning near Inuvik, Northwest Territories,Canada. Canadian Journal of Botany, 56: 2020- Dixon, R.K.; Brown, S.; Houghton, R.A.; Solomon,30. A.M.; Trexler, M.C.; Wisniewsky, J. 1994.
Carbon pools and flux of global forestBlais, J.R.. 1968. Regional variation in suscept_ility ecosystems. Science 263: 185-190.
. of eastern North American forests to budworm
attack based on history of outbreaks. Forest Engelmark, O. 1984. Forest fires in the MuddasChronicle, 44:17-23. National Park (northern Sweden) during the
past 600 years. Canadian Journal of Botany,Budiko, M.I. 1988. Climate for the End of XX1 62: 893-98.
Century. Meteorology and hydrology(Meteorologia i gidrologia) 10:5-24 (in FAO. 1995. Forest fire statistics.Russian). ECE/TIM/BULL/48/4-Timber Bulletin,
Vol.XLVIII (1995), No 4, New York andBudiko, M.I.; Groisman, P.N. 1991. Predicted Geneva, UN Economic Commission for Europe
changes of climate in the territories of the USSR and Food and Agricultural Organization, 27 p.•by 2000. Meteorology and hydrology(Meteorologia ihydrologia), 4:84-93 (in FAO. 1996. Forest products. FAO Yearbook-1994.Russian). Food and Agriculture Organization of the
United Nations, Rome, Italy. 178 p.Cahoon, D.R.; Stocks, B.J.; Levine, I.S.; Cofer III,
W.R. 1995. Monitoring the 1992 Forest Fires in Fleming, R.A.; Volney, W.J.A. 1995. Effects of
the boreal ecosystem using NOAA AVHRR climate change on insect defoliator population It' Satellite imagery. Paper presented for processes in Canada's boreal forest: some
•publication in J.S.Levine (ed.) Biomass Burning phus_le scenarios. Water, Air and Soil w- and Global Change, MIT Press, Cambridge, Pollution, 88: 445-454.
USA.
Forman, R.T.T.; Go&on, M. 1986. LandscapeCogbill, C.V. 1985. Dynanu'cs of the boreal forests Ecology, Wiley, New York, NY, 376 p.
of the lauretian Highlands, Canada. Canadian"" Journal of Forest Research, 15" 252-261. Foster, D.R. 1983. The history and pattern of fire in
, the boreal forest of southern Labrador.
Conference. 1993. European List of Criteria and Canadian Journal of Botany, 61" 2459-71.Relevant Quantitative Indictors of Sustainable
• Forest Management. Helsinki, Finland: The.
o
26 GTR-NC-209

I
Iii
_11
Furyaev, V.V. 1996. Role of fire in the forest Houghton, R.A. 1996. Land-use change and IIformation process. Nauka, Novos_irsk, 252 p. terrestrial carbon: the temporal record. In II(in Russian). M.J.Apps; D.T.Price (eds.), Forest ecosystems, n.•
forest management and the global carbon cycle,
Ganopolsky, A.V. 1994. Climate Change Scenarios NATO ASI Series, Vol. 140, Springer-Verlag, ° ifor Boreal Forest Zone. Working Document 117-134.
(Unpublished Manuscript). Laxenburg, Austria:International Institute for Applied Systems Howse, G.M.; Applejohn, M.I. 1993. Forest Insect
Analysis, 59 p. and Disease Conditions in Ontario. Fall 1992. "Survey Bulletin, Forestry Canada, 18 p.
Godron, M.i Forman, R.T.T. 1983. Landscapemodification and changing ecological Irinsky, A.I. 1981. Monitoring of Insects' "char_teristics. In H.A. Mooney arid M. Godron Infestation in Forests of the USSR. Moscow,(eds.), Disturbance and ecosystems. USSR: Forest industry, 217 p. (in Russian).
_.
Components of response, Springer-Verlag, 12- _,28. Isaev, A.S.; Girs, G.I. 1975. Interaction of tree and
insects-xyliphagus. Nauka, S_erian Branch,Gubasti, U.;. Hasselmann, H.; Hoeck, H.; Novos_irsk, Russia, 347 p. (in Russian).
Mikolajevich, U.; Santer, B.D.; Sausen, R.1992. Time-dependentgreenhouse warming Isaev A.S. (ed.). 1991. Forecast of utilization and ' OComputation with a coupled ocean-atmosphere reproduction of forest resources by economic it
model, Climate Dynamics, 8: 55-69. region of the USSR. Academy of Sciences andState Committee on Forest of the USSR. Vol. 1,
Haberl, H. 1997. Human appropriation of Net 508 pp. Vol. II, 509-994. Moscow, Russia (inPrimary Production as an Environment Russian).indicator: implications for sustainabledevelopment. Ambio (26)3" 143-146. Isaev, A.S. (ed). 1997. Program of extraordinary
measures on biological suppression of insectHall, J.P,; Addison, P.A. 1991. Response to air outbreaks in Krasnoyarsk kray. Federal Forest
pollution. ARNEWS assesses the Health of Service of Russia, Moscow, Russia, 153 p. (inCanada's forests. Inf. Pep. DPC-X-34, Ottawa: Russian).Forestry Canada, 42 p.
Kasischke, E.S.; French, N.H.F.; Bourgeau-Chavez,Hall, J.P.; Moody, B.H. 1994. Forest depletion N.L.; Christinsen, N.L. Jr., 1995. Estimating
caused by insects and diseases in Canada, 1982- release of carbon from 1990 and 1991 forest firei987. Information Report St-X-8. Ottawa: in Alaska. Journal of Geophysical Research,Canadian Forest Service, 14 p. (100) D2:2941-2951.
Heinselman, M.L. 1981. Fire and succession in the Kataev, O.A. 1980. Specifics of reproduction ofconifer forests of northern North America. In forest pests around large industrial centers ofWashington, D.C., H.H. Shugart Jr.; B.D. S_eria. In: Problems of the S_erian forestBotkin (eds.), Forest Succession, New York, industry complex, I. Novos_irsk, Russia: 200- !
. Springer Verlag, 374-405. 206 (in Russian). u0
. Holling, C.S. 1992. The role of forest insects in Khamk, V.I. 1993. Forest decline in the S_erianstructuring the boreal landscapes. In H.H. North. World Resource Review, (5) 1"72-76.Shugart; R. Leemans; G.B. Bonan (eds.) ASystem Analysis of the Global Boreal Forest. Kokorin, A.O.; Nazarov, I.M. 1994. Evaluation ofCambridge University Press, 170-195. the effect of climate warming and
-" photosynthetically-active radiation on boreal
Houghton, J.T.; Jenkins, G.J.; Ephraumus, I.I. forests. Meteorology and Hydrology, 5" 44-541990. Climate Change. The IPCC Scientific (in Russian).Assessment. Cambridge Univ. Press,
• Cambridge, IlK.
Proceedings IBFRA Assn 1997 meeting 27

Konikov, A.S. 1970. Mechanism of Regulation of Reiners, W.A. 1983. Disturbance and basicPopulation Dynamics of Insects in forest properties of ecosystems energetics. In H.A.Biogeocenos_ In: Problems of Forestry, Mooney and M. Godron (eds.), Disturbance
Krasnojarsk, USSR: Institute of Forest and : and ecosystems. Components of response, ATimber, 366-376 (in Russian). Springer-Verlag, 83-98. ,,
Kurbatsky, N.P. 1970a. Investigation on mount Rojkov, V.; Efremov, D.; Nilsson, S.; Shvidenko,and properties of forest combust_les. In A.; Sokolov, V.; Wagner, V. 1996. S_erianProblems of forest pyrology, Krasnoyarsk, Landscape Classification and a Digitized Map of,Institute of Forest and Timber, 5-58 (in S_erian Landscapes. WP-96-111. InternationalRussian). Institute for Applied Systems Analysis,
Laxenburg, Austria, 61 p.
Kurbatsky, N.P. 1970, Classification of forest fires,In A.B. Shukov (ed.), Problems of Forest Seiler, W.; Crutzen, P.J. 1980. Estimates of gross
Science, Vol. 1, Krasnoyarsk, 384-407 (in and net fluxes of carbon between the biosphereRussian). and atmosphere. Climate Change, 2: 207-247.
Manabe,.S.; Spelman, M.I.; Stuffer, R.J. 1992. Shetinsky, E.A. 1994, Forest fire protection andTransient Responses of a Coupled Ocean forest pyrology_ Ecology, Moscow, 209 p. (in
. Atmosphere Modelto Gradual Changes of Russian).Atmospheric CO2. Part 11" Seasonal Response,J. Climate, 5: 105-126. Shvidenko, A.; Nilsson, S.; Rojkov, V. 1995.
Possibilities for Increased Carbon Sequestration
Manabe, S.; Stouffer, R.J.; Spelman, M.I.; Bryan, through Improved Protection of Russian• IC 1991. Transient Responses of Coupled Forests. WP-95-86. International Institute for
OceanAtmosphere Model to a Gradual Changes Applied Systems Analysis, Laxenburg, Austria,of the Atmospheric CO2. Part 1. Annual Mean 27 p.Response. J. Climate, 4:785-818.
Shvidenko, A.; Apps, M.; Nilsson, S. 1997. Impact
Matveev, P.M. 1992. Consequences of fire in Larch of disturbances of terrestrial biota in Northern• biogeocenoses on permafrost. Joshkar-Ola, Eurasia on the Global Carbon Budget. Paper *
Russia: Marijsky Polytechnical Institute, 49 p (in presented at the 5thInternational CO2Russian). Conference, Cairns, Australia, 8-14 September,
1997.
Mooney, H.A. ; Go&on, M. (eds.), 1983.Disturbance and Ecosystems. Ecological Studies Sirois, L.; Payette, S. 1989. Post-fire black spruce44, Springer-Verlag, 292 p. establishment in boreal and subarctic Quebec.
• Canadian Journal of Forest Research, 19"
Momeau, C.; Payette, S. 1989. Post-fire lichen- 1571-1580.spruce woodland recovery at the limit of theboreal forests in northern Quebec. Canadian Sousa, W.P. 1984. The role of disturbance inJournal of Botany, 67: 2770-2782. natural communities, Annual Review of It
Ecological Systems 15" 353-391.
Oechel, W.C.; Hastings, S.J.; Vourlitis, G.; Jenkins, ir- M.; Riechers, G.; Grulke, N. 1993. Recent Status Report. 1994. Criteria and Indicators of
change of Arcyic tundra ecosystems from a net Sustainable Forest Management in Canada.Carbondioxide sink to a source. Nature 361" Presentation to the CCFM Deputy Ministers'520-523. ' Meeting, 22 June 1994.
"" Pickett, S.T.A.; White, P. 1985. The ecology of Stepanicheva, L.V.; Nagibina, M.N. 1988. Land-usenatural disturbance andpath dynamics, in Magadan oblast. In A.S. Sheingauz and V.P.Academic Press, Orlando, FL, 270 p. Korjakin (eds.). Use of land resources in the Far
East. Vladivostok, Far Eastern Branch of the
28 GTR-NC-209

Academy of Sciences of the USSR, 22-31 (in Wemer, R.A.; Holsten, E.N. 1983. Mortality ofRussian). white spruce during a spruce beetle outbreak on
the Kenai Peninsula in Alaska. Canadian
Stocks, B.J. 1991. The extent and impact of forest Yournal of Forest Research, 13: 96-101. ,fire in Northern Circumpolar Countries. In J.S.Levine (ed.) Global Biomass Burning Yarie, J. 1981. Forest fire cycles and life tables: a
(Atmospheric, Climatic and Biospheric case study from interior Alaska. CanadianImplications), MIT Press, pp. 197-202. Journal of Forest Research, 11" 554-62.
6.,
UN/FAO. 1993. Forest Fire Statistics. UN Zackrisson, O. 1977. Influence of forest fires on the
Economic Commission for Europe and FAO, north Swedish boreal forests. Oikos, 29: 22-32.New york, 1993, 24 p.
Zimov, S.A.; Davidov, S.P.; Voropaev, I.V.;Van Wagner, C.E. 1983. Fire behaviour in northern Prosyannikov, S.F.; Semiletov, I.P.; Chapin,
conifer t'orests and shrublands. In R.M. Wein M.C.; Chapin, F.S. 1996. Siberian CO2 efltux inand D.A. MacLean (ed.). The Role of Fire in winter as a CO2 source and cause of seasonalityNorthern Circumpolar Ecosystems. SCOPE 18. in atmospheric CO2. Climatic Change 33" 111-John Wiley and Sons, New York, 65-80. 120.
Vireck, L.A. 1983. The effect of fire in black spruce Zimov, S.A., Semiletov, I.P., Davidov, S.P.,ecosystems of Alaska and northern Canada. In Voropaev, I.V., Prosyannikov, S.F., Wong,R.W.Wein and D.A. MacLean (eds.) The Role C.S., and Y.-H. Chan, 1993. Wintertime CO2of Fire in Northern Orcumpolar Ecosystems, emission from soils of Northeastern Sfl_eria,Wolry, New York, 201-220. Arctic 46: 197-204.
Volney, w.J.A., 1996. Climate change andmanagement of insect defoliators in boreal forest•ecosystems. In M.J. Apps and D.T. Price (eds.)Forest ecosystems, forest management and theglobal carbon cycle, NATO ASI Series, Vol. I
• 40, Springer-Verlag, 79-87.
i
. u
Proceedings IBFRA Assn 1997 meeting 29

SUSTAINABILITY OF THE BOREAL FOREST IN CANADA
J. Peter Hall_
,tO
ABSTRACT.--Sustainable development as promoted Consequently, forest practices and use must reflectby the Brundtland commission is the "economic these values.development that meets the needs of the presentgeneration without compromising the ability of future This paper describes four science and policy ,generations to meet their own needs." This paper initiatives designed to address forest sustainability.describes four science and policy initiatives designed They are Forest Health Monitoring, Forest Science,to address forest sustainability. They are: Forest Model Forests, and Criteria and Indicators. TheHealth.Monitoring, Forest Science, Model Forests, Boreal Shield Ecozone in Canada is discussed inand Criteria and Indicators. Conventional approaches terms of these policy initiatives, and their relationship
to forest management that emphasize maximum to sustainability.sustaified yield of fibre may not fulfill the goal ofsustainability.- Sustainable forest development meansrecognizing the limits of forests to withstand APPROACHES TO SUSTAINABLEenvironmental change and to manage human DEVELOPMENT OF FORESTSacti_ties to Optimize forest benefits within biologicallimits. Forests cover half of Canada and play an important
role in local, regional and global cycling of water,carbon, oxygen and nutrients. Forest ecosystems aresubjected to many stresses associated with forestry-activities including road-building, harvesting, and
INTRODUCTION manipulation of species and cover types throughreforestation. The use of forest management
The concept of sustainable development promoted by techniques for protection against fire, insects,the Brundtland Commission is "economic diseases and competing vegetation may also stress
development that meets the needs of the present forests. Stresses are caused by non forest relatedgeneration without compromising the ability of future human activities such as air and water pollution, and
• generations to meet their own needs." The concept other global changes. Forests are unique in th,_t they.was developed for biological systems; forestry and are located within the territories of sovereign nationsagriculture particularly. This concept has captured but their environmental role extends well beyondthe imagination of the public as well as of national borders (Maini and Ullsten 1993).policymakers at local, national and international Management activities in one country may impact on
" levels since it is seen as a worthy goal for society and forests biologically similar but under differentfor the global community at large. The term has jurisdictions. The role of forests in global climaticstimulated much discussion at the conceptual level, cycles demonstrates their environmental significancehowever, there has been little elaboration on how to beyond political boundaries.
apply it. (Maini 1990).Conventional approaches to forest management that
The role of forests in the biodiversity and climate emphasize maximum sustained yield of fibre may tot
' change Conventions negotiated in the UNCED fulfill the goal of sustainability. To fulfill this go_,pr0cess demonstrates the importance of issues of an enhanced knowledge base coupled with
- forests as protectors of soft, water, and ecological fundamental changes in forest policies is needed.cycles; habitats for diverse flora and fauna. These Policymaking communities are faced with the need toissues are receiving increasing consideration by reconcile national interests with internationalscience and policymaking communities. (Maini responsibilities and to develop appropriate policy1991). The increasing commitment to environmental responses, instruments, and institutions.. Sustainable
"" Stewardship reflects the view that the environment, forest development means recognizing the limits ofparticularly its natural resources, is not an asset forests to withstand environmental change, andinherited from the past but one held in trust, managing human activities to produce the maximum
". 1j. Peter Hall Canadian Forest Service, 580 Booth Street, Ottawa, CANADA K1A OE4
30 GTR-NC-209

level of benefits obtainable within biological limits pollution or global warming and exposure to these(Maini 1992). stresses can adversely affect sustainability. These
- early warning systems enable the forest manager and
Several parameters descr_ing productive capacity, the policymaker to take preventative and remedialrenewal capacity and species and ecological diversity actions in the face of environmental stress and soare used to assess forest sustainability. Nations with protect our forests, oa significant forest sector are accelerating thedevelopment of monitoring Systems to provide timelyinformation on the state of health of forests (Hall et Forest Scienceal. 1996)_ Nations are establishing nationalecological reserves and parks of representative and An environmental forest research program isunique forest types to protect biological diversity and essential to understand the basis for a sustainableto provide baselines against which the. environmental forest (Maini 1991, Hall et al. 1990). Science mustconsequences ofhurnan activities can be determined, be developed in such a manner as to allow its
inclusion into the policymaking sphere. It is essential
Sustainable development requires systematic socio- to use the existing knowledge base to supporteconomic researchto understand and influence activities contn'buting to forest sustainability. We
decisi0n-making processes and to develop innovative need research to predict the response of forestapproaches to harmonize social, economic, and ecosystems to disturbances associated with naturalenvironmental goals. Forest managers are causes and human activities so that development indeveloping policies and frameworks for sustainable forest ecosystems occurs within an environmentalforest development strategies. An equitable perspective (Maini 1990, Hall et al. 1990).distribution of the benefits of forest ecosystems is a
prerequisite for creating the incentives needed to A series of site classifications for Canadian forestsmaintain the Earth's biological wealth (Watson et al. has been developed based on the biological
• 1996). Application ofthese measures have different characteristics of the disturbed sites (Sims 1992).impacts on various parts of our forests although the Application of the most effective forest managementgoal ofsustainability is universal. Canada has techniques ensures that forest lands can beseveral initiatives designed to promote sustainable regenerated adequately following disturbances suchdevelopment. They are discussed below, as harvesting, insect attack or blowdown. A
biological approach enables the natural successional• patterns to be encouraged resulting in the growtll of a
Monitoring Forest Health healthy, productive and diverse forest.
In 1994, as a result of predictions of damage from Biological control methods are being developed for
p0!ution, the Canadian Forest Service (CFS) initiated the control of exotic forest pests through the use of- a national program of forest monitoring called the introduced predators, and parasites. These are not
Acid Rain National Early Warning Sytem. The normally part of the parasite/predator complex• objectives of this program are to detect the early associated with pests in their native habitat. Several
symptoms of damage to forest trees and soils caused exotic pests formerly damaging to Canadian forestsby acid rain, to. identify the causes of damage to have been controlled using classical biologicalforest ecosystems, and to monitor changes in control methods. Successful control means that pestvegetation and soils (Hall and Addison 1990, Hall damage is kept at levels that do not adversely affect}
. 1995a). This is a nationalprogram; other similar sustainability, and the use of chemicals which maysystems'have been established to study conditions on harm other beneficial organisms is avoided (Hall e_a regional basis (Lachance et al. 1995). al. 1990).
Results have shown that although considerable For several decades the only available control method
damage Occurs in boreal forests, most of it is caused of indigenous insect pests was that of chemicalby known factors: insects, diseases or weather events, insecticides which adversely affected other organisms
._ Boreal forests are generally adapted to these stresses in the forest and upset natural ecological balances.and hence few adverse effects on sustainability are The encouragement of natural control systems was
' expected. Some forests have been damaged severely seen as a better approach. The naturally occurringby pollution in the past, and some are currently being bacterium Bacillus thuringiensis (Bt) which infectsdamaged (Hall 1995a). F0rest ecosystems are not defoliating insects, was developed to an operational
• Well adapted to human-caused stresses such as air stage and is now used to manage such pests. Pest,
Proceedings IBFRA Assn 1997 meeting 31

sucla as the jack pine budworm (Choristoneura In this fashion, the groundwork is laid foroccidentalis), gypsy moth (Lymantria dispar) and implementation of sustainable policies that canforest tent caterpillar (Malcosoma disstria), are now evolve over time.managed Using Bt. (Hall et al. 1990). This naturalcontrol agent has minimal effects on the forest The Model Forest partners use a variety of Aenvironment, other than the target insects, leaving approaches to develop effective decision-makingnatural insect populations intact, structures. The enthusiasm and innovative spirit that
* emerges is a more powerful force than that of groups
Large-scale reforestation programs were working against each other, or independently, forimplemented in Canada in the 1980's. In 1989, similar objectives. Social stability and protection oltapproximately 800 million seedlings were raised in peoples' livelihoods are keys to sustainable forests.nurseries for reforestation of cutover and burned The Model Forest Network is built upon a broadforest sites. Extensive seedling mortality soon range of interests; educational institutions, industry,*became common caused by a rapidly-spreading root- aboriginal groups, various levels of government, andfeeding.nematode. Research on the ecology of this community and public action groups._organism showed that it could be controlled bymod_g growing methods. This was as effective Four of the 10 Canadian Model Forests are situtatedas pesticides which had been previously used, but in the boreal forest ecozone and two others are inavoided adverse environmental impacts (Hall et al. boreal-like conditions. They cover extensive areas of1990). 1-2 million hectares each and, contain a variety of
" partners, and are actively promoting a sustainable
These few examples of science addressing forest approach to forests.biology problemsby working within the naturalsystem provide the support for sustainable forest Model Forests go a long way toward enabling forestmanagement. Research is being done in many fields, managers to determine the management planning
• and is now expanding into biodiversity and the process required to provide a sustainable supply ofmanagement of forests on a landscape basis (Hall goods and services from the forest, without1997). These fields are being explored while jeopardizing the biodiversity, ecosystem integrity, orincorporating the advances made in previous years as productive capacity of the forest. Partnerships createnewer and more complex problems are addressed, new challenges and increase the complexity of
current ones, but at the same time they offer the• opportunity to share information and to make _hoices
Model Forests between conflicting objectives. They key tosustainable forest management lies in reconciling
There is a need to develop and implement innovative diverse objectives.on-the-ground solutions to address local and globalconcerns. The task for forest managers is to try toaccommodate diverse expectations from the forest Criteria and IndicatorsWhile ensuring the economic well-being of forestdependent communities. The Model Forest Network One approach to defining and assessing sustainable
• is an initiative designed to generate ideas and development of forests is the integration of sciencesolutions for sustainable management of forests and policy in Criteria and Indicators of sustainable(Anon. 1996). Ten such forests have been forest management (Anon. 1995a, 1995b). Crite_a
. established in Canada and interest is growing in the are a category of conditions or processes by which, Concept elsewhere, sustainable forest management is assessed. The lp
Indicators are measures of the conditions or processes"3
A common feature of the Model Forest program is of a criterion to explain and demonstratethe building of local partnerships among individuals sustainability. They are scientifically based,
and organizations with an interest in sustainable nationally and internationally accepted measuresforest management. Participants collaborate to providing the basis for assessing and monitoring
-, determine approaches to sustainable forest sustainability.management appropriate to their environmental,socio-ec0nomic, cultural, and political context. The The Canadian C&I were developed by science andModel Forest partnership has no jurisdictional technical groups using a consultative and inclusive
• authority over the land base, however, all those who process by people from governments, the academicdo have such authority are participants (Hall 1996). community, industry, non-government organizations,
32 GTR-NC-209

the aboriginal community, and other groups with an BOREAL SHIELD ECOZONEinterest in forests. The result of these discussions is
the current assessment of forest sustainability This Ecozone covers the forested part of Canadarepresenting the best available scientific knowledge fi'om northeastern Alberta east to the Atlantic ,of the subject. Maritime Ecozone (Wiken 1986). The Boreal Shield ,,
Ecozone comprises about 30% of the area of forest inTheCanadian C&I reflect an approach to forest Canada. It is dominated by broadly rolling uplandsmanagement based on the need to manage forests as and lowlands. Precambrian granitic bedrock outcropsecosystems in order to maintain their natural are interspersed with glacial moraines, and fluvial •biological processes. The C&I recognize that forests deposits. Soils are mainly Podzols in the south andsimultaneously provide a wide range of Brunisols in the north. The Boreal Shield Ecozoneenvironmental, economic, and social benefits, and generally supports closed stands of conifers: whitethat an informed, aware, and participatory public is spruce (Picea glauca), black spruce (P. mariana),essential for sustainable management, balsam fir (Abies balsamea), and tamarack (Larix
laricina). Towards the south, there are moreThe C&I provide information on trends in the status broadleaf trees: trembling aspen (Populusof forests and related values over time. Much of the tremuloides), balsam poplar (P. balsamifera), anddata required for national reporting are provided white birch (Betula papyrifera). Conifers common inthrough current information systems. Some the south include white pine (Pinus strobus), red pineindicators will evolve as new data, techniques, or (P. resinosa), lodgepole pine (P. contorta), jack pineresearch results become available. Where there are (P. banksiana), and eastern white cedar (Thujano reasonable quantitative measures, qualitative or occidentalis). Lakes are common and cover aboutdescriptive indicators are used to descn'be the current 20% of the area (Lowe et al. 1996). The continentalstatus. The C&I are designed to reflect the range of climate is modified by maritime conditions in the eastforest conditions and so may be appropriate for and by cold attic air masses from the north.reporting at a national or provincial level, or for anecological zone or region. They are a flex_le The Ecozone is characterized by settlements withframework within which to capture the range of small, resource-dependent societies based on forestry,ecological, social, economic, and cultural conditions, mining, trapping, and tourism. Large-scale forest
exploitation began in the late nineteenth century withTheCanadian C&I are designed to be compatible the harvesting of conifers for the pulp and paperwith similar international processes, while providing industry. The ecozone represents a major economicmore detain and precision on our own forest values, asset with about 32% of all standing timber inNational circumstances differ in economic Canada. Disturbances occur on an extensive scale;
•development, patterns of land ownership, population, fires, insects and harvesting are the primaryforms of social and political organization, and influences on forest succession.
" expectations of how forests should contnq3ute orirelate to society. C&I will facilitate international Much of this forest regenerates naturally followingreporting, and provide the fi_amework for d_turbance, but natural regeneration is ofteninternational agreements while reflecting national adversely affected by poor harvesting practices. Ifdifferences in characteristics and descriptions of these practices leave slash and cones on the site.forests. _ instead of skidding branches and tops to roadside
then many sites will regenerate naturally (Hall et al. !' Concepts Of forest management evolve based on 1990). With the increase in mechanization, however,
scientific' knowledge of how forest ecosystems less emphasis was placed on biology than onfunction and respond to human interventions, as well economics, and regeneration problems increased.as in response to changing public demands for forest Only when former practices were resumed did theprOducts and services. The criteria and indicators are sites regenerate naturally. Harvesting practicesintended to be reviewed and refined on an ongoing although economically attractive, proved to bebasis to reflect new research, advances in technology, unsustainable.
"" enhanced capability to measure indicators, and an, improved understanding of what constitutes To ensure adequate regeneration in boreal forests, a
sustainable forest management, series of biologically-based site specific prescriptionswas developed using successional descriptions and
, empirically derived regeneration techniques. Theresults of many years of ecological studies were
Proceedings IBFRA Assn 1997 meeting 33

synthesized to develop descriptions of forest production of fibre. Is this sustainable, and if not,ecosystems (Sims 1992). This provided the what management actions must be taken to ensureframework for sustainable harvesting practices and : sustainability? The Boreal Shield Ecozone is utilizedencouraged the establishment of natural regeneration, and managed extensively and is becoming subject to Aboth requirements for sustainability, land use conflicts. The products of these forests have o
changed as a result of demand; at the same time the
Results of many years of monitoring by forest health value the public places on forests has changed. Whatpractitioners indicates that damage in boreal forests part, or parts, of the ecozone are sustainable and howwas caused by insects, disease, weather events, fire do we keep it so?etc., all ofw_ch are natural occurrences and towhich forests are adapted. Other forests in Canada What we can conclude is that a number of measures
have been and are being affected by pollutants, but to assess sustainability have been or are beingno such damage has yet been obse_ed in boreal implemented and it is now up to society to use themforests. (Hall 1995b). to ensure sustainable forest management. I remain an
optimist that we will do so.Wildfire is a characteristic feature of boreal forests
and appears tO be increasing while resources forsuppression are decreasing. Increased losses of REFERENCESwood, coupled with losses from harvesting, insects,and diseases, are increasing the pressure on forest Anon. 1995a. Defining sustainable forestUse. If these large-scale disturbances continue to management - a Canadian approach to criteria anddeplete-the forests at current rates, then sustainability indicators. Ottawa: Canadian Council of Forestmay be compromised. (Salmoni et al. 1995, Simard Ministers. 22 p.1996). The C&I integrates socioeconomics, scienceand development to promote sustainability in these Anon. 1995b. Criteria and indicators for the
forests. The Boreal Shield Ecozone forests are in a conservation and sustainable management ofrelatively early stage of exploitation, and mechanisms temperate and boreal forests. Ottawa: Theare now in place to monitor sustainability. Montreal Process, Canadian Forest Service. 27 p.
Anon. 1996. Model forest network- year in reviewCONCLUSIONS 1994-1995. Annual Report. Ottawa: Canadian
• Forest Service, Science Branch. 48 p.The importance of forests to Canada and indirectly to
the international community has initiated the Hall, J.E. 1996. Sustainable forest managementdevelopment of several measurements of practices. Paper presented at the Internationalsustainability. This development has both a Workshop on the Integrated Application ofbiologicaland ecological component and reflects a Management Practices, Nov 22-25, Kochi, Japan.growing awareness of forests as an essential part of
our environment. Forest health monitoring, science, Hall, J.P. 1995a. ARNEWS Annual Report 1994.demonstrating and testing sustainability in model Inform. RepT-X-11. Ottawa, Ontario: Naturalforests, the integration of science and policy in Resources Canada, Canadian Forest Service. 26 p.Criteria and Indicators were established to promote
, sustainability. Hall, J.P. 1995b. Forest health monitoring in Canalda:how healthy is the boreal forest? Water, Air alad
The science of forest management has evolved along Soil Pollution. 82: 77-85." with settlement, political and economic evolution,
and the demand for forest products. Society over the Hall, J.P. 1997. Science and Technology Networkssame time has evolved in terms of demands and the in the Canadian Forest Service. Forestrysophistication with which we view the forest. Chronicle 73(2): 1-4.
This overview does not lead to precise conclusions. Hall, J.P.; Addison, P.A. 1990. Response to airIs theboreal forest sustainable? The largest of pollution: ARNEWS assesses the health ofCanada's forested ecozones yields products and has Canadian forests. Inform. Rep. DPC-X-34.been exploited for the last century. Now there are Natural Resources Canada, Canadian Forest
. concerns that insects, diseases, wildfire and Service.
• harvesting are together exceeding the annual
34 GTR-NC-209

Hall, J.P.; Carlson, L.W.; Dube, D.E. 1990. A Maini, J.S. 1992. Sustainable development of forests.forestry Canada approach to environmental FAO, United Nations. Unasylva. 43(169): 3-8.forestry. Forestry Chronicle. 66:138-142.
Maini, J.S.; Ullsten, O. 1993. Conservation and AHall, J. Peter, L.; Magasi, L.W. Carleson, K. Stolte. sustainable development of forests globally: •
E.; Niebla, M.L.; de la I.de Bauer, C.; Gonzales- issues and opportunities. In: World forests for theVincente, T.; Hernandez-Tejeda. 1996. And later, future: their use and conservation. New Haven &Health of North American Forests. Ottawa, London: Yale University Press" 111-119.Canada: Canadian Forest Service. 66 p.
Salmoni, A.; Sidney, K.; Courtin, G.; Beckett, P.Lachance, D.; Hopkin, A.; Pendrel, B.; Hall, J.P. 1995. Ecotourism at the Boreal Edge.
1995. Health of sugar maple in Canada. Inform. NODA/NFP Tech. Rep. TR-9. Natural ResearchRep. ST-X-10. Ottawa, Ontario: Natural Canada, Canadian Forest Service, OntarioResources Canada, Canadian Forest Service. 27 p. Region. 18 p.
Likens, G.E.; Driscoll, C.T.; Buso, D.C. 1996. Long- Simard, A.J. 1996. Workshop on wildland fireterm effects of acid rain: response and recovery of activity in Canada policy implications; 1996 Aprila f0restecosystem. Science. 272" 244-246. 1-4; Edmonton Alta. 9 p.
Lowe,J.J.; Power, K.; Gray, S.L. 1996. Canada's Sims, R.A. 1992. Forest site classification in Canada:forest inventory:. 1994 version. Inform. Rep. BC- a current perspective. Forestry Chronicle. 69(1)"X-362F. Natural Resources Canada, Pacific 21-120.Forestry Centre. 23 p. Watson, R.T.; Heywood, V.H.; Baste, !.; Dias, B.;
Gamez, R.; Janetos, T.; Reid, W.; Ruark, G. 1996.• Maini, J.S. 1990. Sustainable development and the Global biodiversityassessment summary for
Canadian forest sector. Forestry Chronicle 66-4: policymakers. UNEP Published for the United346-349. Nations Environment Programme. Cambridge
University Press. 5 p.Maini, J.S., 1991. Guiding principles" towards a
global consensus for the conservation and Wilken, E., comp. 1986. Terrestrial ecozones ofsustainable development of all types of forests Canada. Ecological Land Classification Series, 19.
• •world-wide. Forestry Canada Int. Pub. Aug. Ottawa: Environment Canada, State of the1990. 8 p. Environment Reporting. 22 p.
i
. lp
Proceedings IBFRA Assn 1997 meeting 35

.z"
.tO
i
. W
36 GTR-NC-209

J
CHANGING LAND-USE
PATTERNS IN BOREAL FORESTS
t;
. U
37

¢.
AD
6
!
. W
38

o
DEGRADATION OF FORESTLAND IN LAND-USE/COVER PATTERNS OF RUSSIA
Vladimir Stolbovoi I
AD
ABSTRACT.--By manifesting the response of land to reassessment of the benefits that had been initiallyhuman activi_ and impacts, degradation of forestland achieved.indicates the locations where, society is in conflict with
sustaining the forest environment. The analysis of Land degradation [4,6] affects land quality and/orland degradation in various land-use/cover patterns of functioning, often indicating a negative reaction of theRussia's vast forest zone (about 1,050 miUion ha, or land to inappropriate human activity. As a concept,63% of the country) clearly demonstrates two human- land degradation was primarilydeveloped forinducedproblems, inappropriate technology and agricultural land, referring to the deterioration of landimproper management, causing land degradation on productivity. Expansion of this concept to forestland9% of the territory. The study illustrates the high recognizes that forests play a multi-functional role, forvuhlerab_ty of forest soils (in comparison to steppe instance, in land protection, hydrological andgrassland soils) after conversion to intensive geochemical cycles, climate impact, etc. This meanscultivation. Thus a balanced combination of forest that productivity decline, which is the main criterionand cropland has been found to be the most for quantifying degradation of agricultural land, doessustainable land use in the forest zone. not encompass all aspects of the negative
..
consequences for forestland. It leads to theconclusion that the concept of land degradation has tobe adapted to the complex functions of the forest
INTRODUCTION environment. This concept will be valuable for the
- assessment of technology and management systemsRussia's potentially forested territory, termed the that are applied in the forest sector. For example,forest zone, covers about 1,050 million ha or 63% of industrial harvest by clear-cutting causes replacementthe country. The territorial structure of this huge area of naturally self-maintaining forest by man-managed
comprises an intricate mosaic 0f various land-uses and ecosystems. In some regions [1] due to thisland-covers (LU/LC pattern). Land use refers to the technology, vast territories have lost the potential for
purpose for which humans exploit the land and afforestation, or planted forest can produce only l_w-includes the characteristics of the biophysical quality wood instead of real forest vegetation. Theen-eironment and socio-economic conditions. Land investigation of the dynamics of this development [2]cover refers to characteristics of the land surface, i.e., has concluded that in the next century broad-leaved
•the external features of land use. Major features of and coniferous broad-leaved forest will practically bethe LU/LC patterns are driven by a combination of replaced by anthropogenic ecosystems. Due to thisphysi0graphie peculiarities of the territory, such as perspective, to maintain the ecological balances onreliet_Vegetation, soils and a variety of land-uses this huge territory, appropriate land-use regulations
occurring in the area--for instance, cultivation, wood have to be implemented that protect the ecologicalcutting, settlements, etc. These interrelated elements functions of the forest. The alarming fact is thataffect the environment, and changes in one area may currently nobody can predict what the cost of currenthave positive or negative reactions in others, forest practices to future generations will be. It
, Applying variOus land-use systems and changing themin historical perspective, humans have actively shaped Obviously, land degradation has most severely ipthe forest environment, converting forest into developed on the territories where current land use
agricultural land, transforming natural forest into does not fit environmental conditions. Thus it couldmar!aged ecosystems, etc. However, these activities be applied as obligatory information to indicate "hot"do not always enrich natural f6rest potentials, to allow spots where society has halxnfially intruded on thethe increasing and changing human needs to be met in forest environment. It is important to implement
"" a better way. Very often, particularly in the long run preventive measures against land degradation at anperspective, they create problems in sustaining early stage in these regions to avoid irreversibleproduction or the environment, suggesting a damage. Furthermore, the analysis of degradation in
i.
•tFladimir Stolbovoi, Dolcuchaev Soil Institute, 109017, Pyzhevskey Line 7, Moscow, Russia
Proceedings IBFRA Assn 1997 meeting 39

the context of the negative effects of human impacts The database comprises of a set of spatially and
might be app_ed _ a helpful tool to find a balance temporally consistent digitized georeferenced
between human activities and nature, optimizing : coverages (reliet_ vegetation, soil including soilstructure and functioning within LU/LC patterns, degradation attn'butes, land category, etc.) handled by ASome authors have stipulated that maintenance of the GIS Arc/Info. An overlay of the coverages on land •
productive potential of land resources, and prevention categories and soil (with soil degradation attributes)0f!and degradation, are fimdamental elements of was used in the analysis.sustainable land use [7].
The LU/LC patterns relevant to the research topic •To investigate the LU/LC patterns a multi-sectoral were distinguished by aggregation of the legend of theanalysis approach has to be used. One of the digitized Land Category Map [5]. The aggregation
problems that make the task ditficult to fulfill is the was aimed at differentiating type, degree/extent oflack of a common information base. Traditionally, the human intervention for a number of broad land-inventory and analysis of the LU/LC patterns is use/cover categories. Soil and land degradationcarried out as separate compartments (cropland, attributes [9] for the newly generated LU/LC patternforest, water, etc..) and by different institutions polygons were established by overlaying with the soil(agriculture, forestry, etc.). This approach creates a coverage.narrow and fi'agmented view of the territory forho_tic understanding. The problem becomes muchmore complicated when taking into account the fact DISTRIBUTION OF LAND DEGRADATION BYthat various science disciplines and practices use LAND-COVER PATTERNdifferent methods.and terminology. Currently it
seems that these problems can be partly overcome by Land degradation types, definition and causativeapplying geographical information systems (GIS) factors are shown in table 1. Land degradation typesmethods to allow the integration of different can be grouped with regard to the distortion of major
knowledge on the basis of spatial unity, forest functions" the forest protection fimction (waterand wind erosion, terrain deformation, compaction);the hydrological function (erosion, compaction,
OBdECTIVES desertification, partly secondary salinisation andunderfloods); the local climate regulation function
• The overall goal of the present study is to improve the (desertification, surface corrosion, thermokarst_; and.understanding of the interaction between society and the biodiversity and production function (disturbancesnature. The research uses data on degradation of of soil organic horizons due to wood cutting andforestland to indicate main human-induced damage to fires). It is necessary to note that this grouping is
the forest environment occurring in the Russian forest rather simplified because in reality most degradationzone. To achieve this task the following topics have types may affect several of the land functions. Forbeen considered: instance, disturbances of the topsoil organic horizon
may aggravate erosion and affect the hydrological1• Overview of degradation of forestland within function.
• land-use/cover patterns of Russia;21 Investigation of major anthropogenic and natural Analysis of human-induced factors (table 1) causing
driving forces causing negative developments in increased land degradation shows that they can bdt' the forest zone of the country, combined into two general groups. The first dea_
basically with inappropriate technologies in harvest- processes, type of machinery and wood
MATERIALS AND APPROACH transportation. The second deals mainly with
improper management systems for forest protectionThe present study is based on a broad geographical against fires. In both cases land degradation gives a
,, analysis of a new digital georeferenced database on clear signal on the negative response of the forestthe land of Russia. The database has been created environment to human intervention. Thus it can be
' jointly by the United Nations Food and Agricultural concluded that degradation of forests could be usedOrganization (Rome, Italy), the International Institute for detecting society-forest environment conflicts.for Applied Systems Analysis (Laxenburg, Austria) This indicator can be applied as a powerful argument
' and the DOkuchaev Soil Institute (Moscow, Russia)..
,
40 GTR-NC-209

Table 1.--Land degradation types, definition and causative interpretation.
Type of degradation Definition : Causes AWater erosion Loss of topsoil by sheet erosion Inappropriate technology causes .
unobstructed flow of run-off water,weak soil structure
Water & wind erosion Combined action of water and wind Inappropriate technology causes •depending on seasons humidity ineffective seasonal protection
against water and wind action
Wind erosion 'Loss of topsoil by wind action Inappropriate technology causesinsufficient soil protection by
, vegetationJ
Terrain deformation Development of gully or rill The sameerosion or mass movements
Compaction Deterioration of soil structure by Inappropriate technology, repeatedtrampling use of heavy machinery,
overgrazing and overstocking.
Underfloods Human-induced hydromorphism Inappropriate technology causesrising water table, increasedflooding..
Secondary salinization Increase of the salt content of the Inappropriate technology causestopsoil improper irrigation
Desertification Decrease of average soil moisture Inappropriate technology causescontent changes in the local hydrology
.Disturbances due to wood cuttings Distortion of the topsoil organic Inappropriate technology, clearhorizons cutting, skidding, etc.
DiSturbances due to fires Distortion of the topsoil organic Inappropriate management,horizons insufficient forest protection
•
Surface corrosion Solifluction, landslides Inappropriate technology causes
distortion of the thermoisolating It, topsoil
. ii
Thermokarst Development of thermokarst caves Inappropriate technology causesvery often filled with water distortion of thermobalance of
subsurface permafrosti
o
Proceedings IBFRA Assn 1997 meeting 41


humid climate, where water erosion causing soil structural stability, organic matter content, nature of
detachment and transport is very high. Secondly, clay minerals, and chemical constituents, whichtraditionally cultivated land in the forest zone determine water stable structure [8]. Water-stable
occupies externally drained slopes. Flat interfluves _macro-aggregates (>0.25 mm) are formed byare covered by swamps and bogs and are unsuitable processes of adhesion of micro-aggregates (<0.25for cultivation. Slope cultivation requires land mm) and mineral particles when the soil has a high ,,
protection measures, which obviously can decrease humus content, humic acids prevailing in the soilerosion to some extent but very seldom prevent it organic composition, saturation of exchange complexcompletely. Thus, the development of compaction by calcium, etc. Forest soils have low humus content,and water erosion in the forest zone is strongly pre- dominant fulvic acids in soil organic composition, and
conditioned byphysiographic and geographic unsaturated exchange complex by calcium. Tofeatures, improve these conditions, usually large amounts of
organic fertilizers, liming, etc. have to be applied.The nature of forest soils is another important factor Macro-aggregates in forest soils are formed during
influencing erodibility. Soil erodl_oility is the the winter season. When freezing, mineral soilintegrated effect of processes that relate to the particles and micro-aggregates are compacted byresistance of the soil to particle detachment by rainfall growing ice crystals. However, the adhesion of
•and Subsequent transport. Figure 1 shows the extent macro-aggregates is provided by water films andof water erosion and compaction on the cultivated becomes unstable when additional water is supplied.soils formed under forest and steppe vegetation. As During water logging in the spring season, the macro-can be seen, 61% of cultivated soils (cropland) which aggregates are detached and the soil mass becomesformed under forest are affected by compaction, and dispersed. This leads to a decreasing infiltration rate,27% of the soil is influenced by water erosion, and an increase in both runoffand water erosion.Cultivated soils developed under steppe grassland
contain only 30% of compacted and 7% water eroded Figure 3 illustrates the composition of water-stable. soils, i.e., they are only half and one-fourth affected aggregates in forest loamy Podzoluvisols and steppe
compared to soils originating fi'om forest. These loamy Chernozems. The diagram shows thatfigures completely correspond to differences in Chemozems have much more water-stable macro-erod_ility of major arable soils of Russia (fig. 2). As aggregates as compared with Podzoluvisols. It iscan be seen, Podzoluvisols, which primarily formed important to note that the amount of micro-under forest vegetation, manifest erodibility at the aggregates is more than 5 times in Podzoluvisols aslevels between 3 t/ha and 3.5 t/ha for medium compared with Chemozems. Figure 4 shows tlfe
textured soils and fi'om 2 t/ha to 2.5 t/ha for fine dependence of the infiltration rate on the compositiontextured soils. Chemozems, originally developed of micro-aggregates (silt fi'actioni and aggregates inunder steppe vegetation, are characterized by soils. As can be seen, the infiltration rate inerod_ility from 1.5 t/ha to 2 t/ha (medium textured Chemozems containing less than 10% silt particles
soft) and 1 ffha to 1.5 t./tm (fine textured soft). These can be expected at the level of 60 mm/hour. Thevalues are about half compared with Podzoluvisols. infiltration rate of Podzoluvisols containing 50% ofGreyzems, formed in a forest-steppe environment and silt particles is estimated to be 0.6 mm/hour i.e., 100having mixed features of forest and steppe soils, times less. Thus it is absolutely clear that soildemonstrate a medium level of erodibility, erodibility of forest soils will be much more than for
Consequently, the erod_ility of medium textured soils formed under steppe grassland.Greyzems varies from 2.5 t/ha to 3 t/ha and of fine !
' textured from 1.5 t/ha to 2 t/ha. We conclude that the ugreater extent of water erosion and compaction of the
" cultivated soils primarily formed under forestcompared to soils developed under steppe vegetationcan be explained by differences in their nature. Amore detailed explanation of the mechanisms causingthis difference can be found from soil physics and
chemistry.
It is well known that soil erod$ility depends highly on
soil characteristics such as particle size distn'bution,
Proceedings IBFRA Assn 1997 meeting 45

70
60 a
50
® 40=D m Forest Before
,
= 30 oGrassland Before
oa. 20
lO
J
. Others Compaction Water Erosion
Figure l'.--Soil compaction and erosion insoils offorest and grassland origin.
3.5
3
2.5
2
1.5
__
0.5
0 _J
Podzoluvisols Greyzems Chernozems
m Medium II Fine
Figure 2.--Erodibility (t/ha) of some medium andfine textured soils of Russia. [based on 8]I
• W
_.
46 GTR-NC-209

so 4O
50
_'='°i'• ,,,, '3 -Ow
ri-O
°'_ 20J
.'10
0 j _i
>3 3.0-1.0 1.0-0.5 0.5-0.25 <0.25
Aggregatesize,mmi Podzoluvisol. loamy • Chemozem, loamy
\
Figure 3.--Water stable aggregates composition [based on 8].
A
l:: 180
1:::: -1600 -,--,-m,---
"I- 140
L_
= 120
o 100
E 80
0 40 .....
--iNN' '." =o0.6
, t= 0 .................. , t
. _<_<fq' _<> _.
Figurc 4.--Dependence of infiltration rate upon composition of microaggregates and aggregates in soils [based on
ProceedingsIBFRAAssn 1997meeting 47

CONCLUSIONS REFERENCES
It is estimated that: _ Efremov, D. F., 1997" Green desertification, Proc. ofthe IBFRA conference, Duluth USA (in j
• 93 million ha (about 9%) of the land of Russia's publication).forest zone is affected by various types of
degradation. More than 90% of the forest zone Isakov Y.A., H.S. Kazanskay, A.A. Tishkov, 1986:•is still stable and performing a very important Zonal regularities of ecosystems dynamics.environmental role. Beyond purely economic Moscow, Nauka, 150 p. •factors, more attention to the ecological functionsof forests is required when assessing the forest Land of Russia- 1995, Problems, Figures,resources. Commentaries, 1996: Moscow, 79p.
• Lao.d degradation data manifest such Lynden G.W.J. van (Ed.), 1995: Guidelines for thegeographically explicit data sets the negative Assessment of the Status of Human-Induced Soilimpacts of human-induced activities on land. Degradation in South and Southeast Asia
They allow to delineate areas, detect causes and (ASSOD), ISRIC, Wageningen, 20 p.understand mechanisms of society-forest
_environment conflicts. The information can help Map of Land Categories of USSR. Scale l:4M. 1989:to establish suitable and functional land-use Compiled by:. L.F. Yanvareva (editor-in chief),
structures in various LU/LC patterns. K.N. Martynyuk, N.M. Kiseleva. GURK,Moscow.
• Inappropriate technology and impropermanagement are major societal causes of land Oldeman, L.R., R.T.A. Hakkeling and W.G.
• degradation of the Russian forest zone. Sombroek, 1991" World Map of the Status ofImprovements in both aspects could contribute Human-Induced Soil Degradation. Anconsiderably to sustaining development of the Explanatory Note, second revised version. Globalforest zone. Assessment of Soil Degradation, 27p.
• Natural factors (climate, relief, soils, permafrost, Pieri, C., J. Dumanski, A. Hamblin, and A. Young,• etc.) are the main driving regularities of the 1995" Land Quality Indicators. World Ban_
spatial distribution of the LU/LC patterns within Discussion Paper, 315, p. 63.the forest zone, providing differentiation by typesand degree of human intervention across the Revut, I.B., 1972: Soil physics, Leningrad, Kolos,country. Due to low organic content, prevalence 368 p.of fulvic acids in humus composition, anexchange complex unsaturated by calcium, etc., Stolbovoi, V., G. Fischer, 1996: Georeferenced Soilforest soils are vulnerable to intensive agricultural Degradation Database for Russia, Proc. of 9thuse. Lacking a water-stable structure, they are Conference of the International Soil Conservation
strangely affected by compaction and water Organization (ISCO), Bonn, Germany 26-30erosion. This negative inspect of cultivation on August 1996, p. 235.
, forestland could be partly avoided by maintaining IIforests within cropping areas. 1¢
°
48 GTR-NC-209

PRINCIPLES OF NATURE USAGE IN BOREAL FOREST ZONEOF RUSSIA
Andrey F. Tchmyr 1 At
ABSTRACT.--The landscape-geographic principle of This paper addresses three aspects of the nature usageevaluating nature usage standards is different from the problem in Russian taiga forests"
6
principle for evaluating adopted sanitary-ecological 1. Development of a landscape-geographicnorms. It anowsmonitoring of natural area approach for development of nature usagecomplexes with respect to ecology within a landscape standards;
area and with consideration of the character of the 2. Methods of genetic stock and biodiversityterritory's development, accounting for ecological preservation in boreal forests;
interests in the context of solving social problems of 3. Description of technogenic pressures in regionalthe citizens. This approach is particularly important in development taking as an example the Leningradreserve and refuge establishment, national parks region.planning and for other categories of speciallyprotected areas. The study of natural ecosystemsproductivity and biodiversity, creation of cultural METHODSlandscapes and gene fund preserving in taiga
ecosysterns is only poss_le at the level of natural area The problems of ecological standards for nature usagecomplex, gave rise to increasing interest of different specialists
in recent years (Isachenko, G.A. 1991, isachenko,• A.G. 1993, Polyakova 1982, Alexandrova et al.
1988). A.G. Isachenko and G.A. Isachenko (1993)INTRODUCTION point out that the presem condition of ecological
standardization in Russia has been found
Russian boreal forests occupy 20% of the territory of unsatisfactory and without scientific foundation byglobal forests. For their structure and organization, practically all specialists.such forests are the most stable self-controllingecosystems with the largest stock of carbon pool in There is no lack of different administrative regulationsthe-Northern Hemisphere (Shubin 1994). However, limiting the impact of forestry activities on thepresent local and regional influences on boreal environment. Even 10 years ago, the USSR SystemeCosystems, as well as technogenic stresses of global of Standards for nature protection included up to 60importance, cause irreversible phenomena that can state, 40 all-European (within the system of Economicaffect considerably the global climate and living Assistance Council), and over 100 environmentalconditions. The essential influence is observed on protection standards of different enterprises. Thesemost taiga forests of the developed European part of were generally sanitary-hygiene standards forRussia. The fact. is that in the European part of acceptable concentration of pollutants (ACP),Russia for the last 130-150 years forests have not industrial outbursts (AIO) and acceptable level of
been used according to landscape principles. In this physical impact on the environmem (ALPI). !, zone, asocial'economic principle of nature usage Orientation to these separate standards provides
prevailed_ which seldom agreed with landscape neither an opportunity to account for interaction of uecology principles. Considering the present condition different pollutants nor their combined impact to theoftaiga lmads it is of vital necessity to develop environment. Furthermore as pointed out by A.G.ecological standards based on the landscape- Isachenko (1993), sanitary-hygiene standardsgeographic prin"ciple. . calculated based on the needs of the human organism
are not acceptable for the whole biota. As far as biotaare concerned, ecology standards should mainly takeinto account the weakest points of the system,
1Dr. Andrey F. Tchmyr (French transcription) Federal Forestry Service of Russia, Saint-Petersburg ForestryResearch Institute, 194021 Russia, Saint Petersburg, lnstitutsla'pr. 21. Tel: (812) 552-80-20 (812) 552-80-
.42�E-Mail: serg@forest, spb.su
Proceedings IBFRA Assn 1997 meeting 49

" considering pollutants' direct influence and indirect RESULTSinfluence through trophic chains, water migration, soiland air accumulation, etc. -- Among many dynamic deviations, there is a deviation
that helps to restore the initial conventionally-radical AIt is difficult to deny that ecology standards should be condition of the geosystem and a deviation that _'estimated fi'om human needs, and should protect completely changes its appearance and condition.people from dangerous technogenic influence. The first one can be called "normal", the second,Finally, the problem should be solved by estimating "regressionally-abnormal". Considering evaluation ofimpacts of anthropogenic pressure on geosystems, normal pressure on a geosystem it is necessary, in'anyaiming to protect them from dangerous influences that case, first of all to take into account the stability of itsprevent their natural normal functioning and lead to present condition that to some degree has beenviolation of the human life-support system. The changed by anthropogenic influence. Further it isgeographic landscape can be considered as such a important to decide whether it is necessary tosystem. Therefore, the problem of ecology standards preserve this condition or to restore "original",takes on a geographic character, which suggests new conditions or otherwise transform the system to a newproblems, such as what can be considered "standard" condition with given parameters. The last decision
for a ge0system, how it can be evaluated, and what can be fully realized by forming a cultural landscapedimensions can be used. with given characteristics and stable conventionally-
radical condition. It is also important that everyIf the focus is only on the spatial (territorial) aspect of ecology standard should be developed separately forcalculating standards, the necessary data will not be geosystems of different hierarchical levels (the scalepossible to collect. For every natural land system of ranks). For practical realization of such approach,(NLS) the conventionally-radical condition can be it is necessary to study the landscape structure ofconsidered normal, providing a stable dynamic taiga forests and map the landscapes.balance between variable landscape components
(biota, soil cover) and site factors (substrate, relief, In developing ecology standards for nature usage, ahydrothermal conditions). In this case, without problem of particular importance would be preservingdeteriorating influences on the geosystern, the NLS the north taiga genetic stock and biodiversity.can remain in conventionally-radical condition General methodological principles of databaseforever. However, with the present condition of the formation for annual agricultural cultures are _ot
• . environment, NLS can hardly be found because of the possible to use for forest ecosystems. Therefore, the•permanent or periodic influence of factors such as only way to preserve boreal forest genetic stocks is to
climate change, tectonic phenomena, and strong organize reserves, natural parks, refuges and otheranthropogenic stresses (i.e., clear felling, following types of specially protected areas. The history ofuse as storage ponds). Under the influence of such reserves in our country was not consistent and hasfactors, the condition of geosystems will definitely had dramatic events.deviate from conventionally-radical for different
periods. The period of these temporal deviations From the beginning, the network of forest reservesdepends on spatial influence (it should be considered has been formed spontaneously. Many of them werewhich components of the landscape were influenced established to preserve some rare or valuable animals
and have been changed: at the level of facies, stand or and later plants. In the initial period, this purpos_ was, site). Thehigher the altitude of the landscape justified, and even at present it is still important tor
component being influenced in the hierarchy, the realization of the goals of reserve forestry. Ho-dlt_ver,longer is the period of its original state reconstruction, presently the reserves have started to be used forTherefore, clear felling at biogeocenosis (facies) and many purposes. First of all, as mentioned above, theystand levels with subsequent species change will take are regarded as natural stores of genetic stock and
differenttimes. . laboratories for: the study ofbiodiversity of particulargeosystems, inventory and development ofbioresource regeneration, protection'of waters, etc.One of the first-rank important functions of reserveterritories is to be a standard model of natural
complexes, not only in the manner of museum exhl_oitsof undisturbed nature, but also as natural laboratoriesfor scientific research. We can note with satisfaction
50 GTR-NC-209

that such work has started in Russia in spite of the establishment, however, has not been consistent withdifficulties of researchers' life and work in our country the landscape-ecology principle. Of 28 national parksat present. This work has been carded out by a group :under the Federal Forestry Service of Russia, only half Aof scientists at the Karelian Research Center of the of them are well-organized and even they were
O
Russian Academy of Science (Volkov, Gromtsev, established according to the methods generally usedErukov, Karavaev et al. 1995). for state forest farms, which is not in accordance with
landscape-geographic principle.If a proper quantity of standard natural models(examples) of geosystems could not be preserved, we In developing ecology standards of nature usage forwould miss forever a chance to deeply investigate European Russia, our biggest worry is twonatural connections, processes and laws in their components of the environment - "developed" andmultiple appearances on the Earth. Therefore, the "man-made". The outstanding USA ecologist E.necessity of a landscape approach has become Odum (1986), analyzing nature usage models in theevident. Furthermore, the first and essential condition USA, followed a traditional way of dividingto be observed should be that main sites to be landscapes--accepted in landscape architecture--intoprotected would be geosystems existing in a complete three environmental components: "natural",natural unity. The second, but no less important, "developed" and "man-made". In this classificationproblem in establishing landscape reserves is to make "natural" is forests,meadows, bogs, and waters ofthem representative. Reserve representativeness is a lakes and rivers, "developed" - agricultural landscapesmulti-meaning notion that includes definition of the and agricultural lands, "man-made" - urbanizedtypical character of a particular reserve representing environments dependent on the fimctioning of theone landscape type. It is also important to evaluate other two components of the life-supp0rt system.optimum size and configuration of reserve area. It isnatural to expect that a larger area would be more Irrespective of the categories of environment usage
' representative and would provide more reliable described by the American ecologist, we can considerconditions for maintaining a reserve in a natural the Leningrad region area system represented bycondition, landscapes of Russian south boreal forest zone.
Nowadays more than half of the Leningrad regionTwo main criteria would be basic in defining optimum territory is covered with forests, 20% of the area isreserve size. The first criterion is that the area of the occupied by agricultural lands, and 7% by industrialreserve should encompass a definite landscape system, enterprises, roads and urban territories (table 1, fig. 1).In-other words, it should include all morphological Comparing the nature use structure of Leningradcomponents: facies, stands, and sites in their regular region with the model suggested by E.Odum it seems
•conjugated series typical for a given landscape. A full like there is nothing to worry about. However, areaslandscape profile embracing single and subordinate occupied by urban and industrial systems make upfacies should be an essential requirement for about 8% of the region--without the St. Petersburgestablishing a reserve. The second consideration is area, which is 240,000 ha and causes a severe stressthat best variant of reserve establishment is to unite a on the region within a radius of 40 km- 60 km.group of conjugated landscapes. The biggest number Without considering this technical "monster", no(19) of reserves is in east-European sub-taiga ecology standard can be effective. The region has
•landscapes. However their total area is hardly more only 3.02% of specially protected area, which is twoltthan 0.5% of the whole territory, with an average area times less than the all-Russia standards. At present,of 24,000 ha per reserve, the only regional reserve is "Vepsky Forest", which B
was established without respect to geographic
Landscape study has revealed that hill area reserves in landscape. The region desperately needs to developthe deserts and northern subtropics of Russia are in a ecology standards for nature usage as well as criteriamore favorable condition, although it is evident that and indices for sustainable forest management. At thethere are not enough landscapes embraced by same time, it is necessary to lessen the quantity ofreserves. Even fewer reserves have been established factories and industrial enterprises in St. Petersburg.in the Arctic, forest tundra, north and south taiga, andWest Siberia. In some sense, this drawback can be
compensated for by national and natural parks. Their
4 °
Proceedings IBFRA Assn 1997 meeting 51
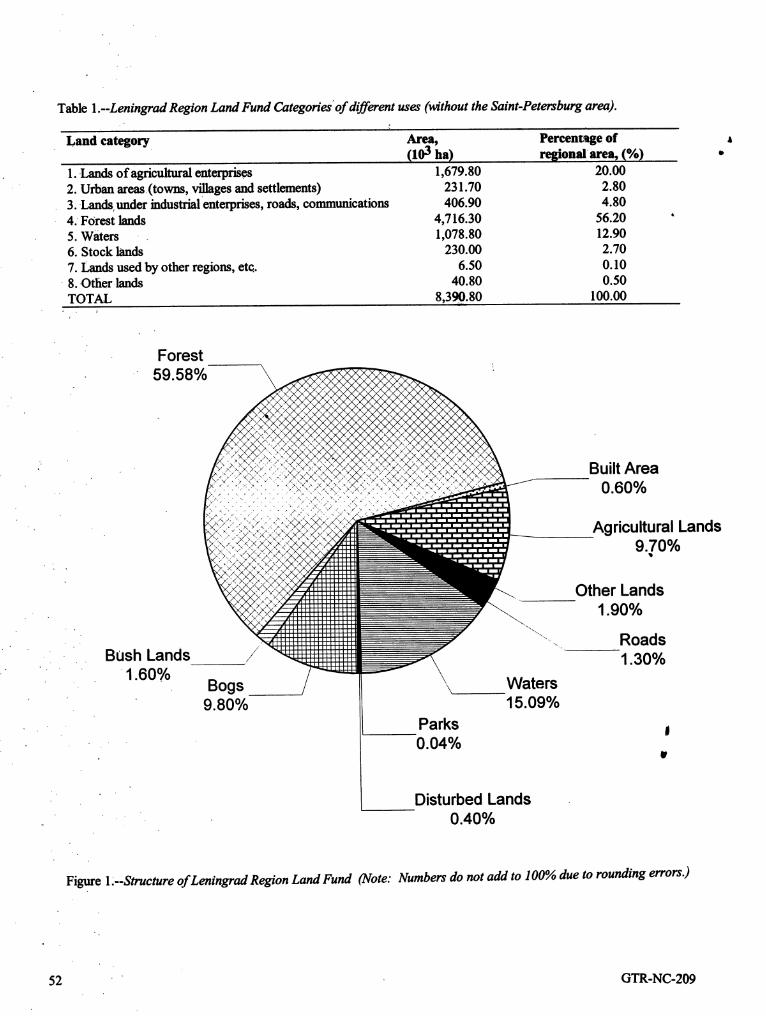
Table 1.--Leningrad Region Land Fund Categoriesof different uses (without the Saint-Petersburg area).
Land category Area, Percentage of A(103 ha) regional area, (%) •
l..Lands of agricultural enterprises 1,679.80 20.002. Urban areas (towns, villages and settlements) 231.70 2.803. Lands under industrial enterprises, roads, communications 406.90 4.804: Forest lands 4,716.30 56.20 "5. Waters 1,078.80 12.906. Stock lands 230.00 2.70
7. Lands used by other regions, etc. 6.50 0.108. Other lands 40.80 0.50TOTAL 8,390.80 100.00
;.
• Forest
59.58%
• Built Area•_ _'_:_.".. 0.60%
........ . ?, •-.. ',,. /
.,.. ,.:.. ." .....
Agricultural Lands9.70%
Other Lands1.90%
........... RoadsBUshLands // 1.30%
1.6O%Bogs \ Waters9.80% 15.09%
Parks, 0.04%
. iP
Disturbed Lands. 0.40%
Figure 1:--Structure of Leningrad Region Land Fund (Note: Numbers do not add to 100% due to rounding errors.)
52 GTR-NC-209

LITERATURE CITED
Isachenko A.G. 1989. Landscape research and refuge Qdum E. 1986. Ecology. V.2. Moscow: Mir. 376p.practical establishment. News of All-Union
Geographic Society. 121(4): 277 - 284. Polyakova G.A., Malysheva T.V., Flerov A.A. 1982. "Anthropogenic influence to pineries near Moscow.
lsachenko A.G., Isachenko G.A. 1993. Landscape- Moscow: Nauka. 143p.geographic background for ecologicalstandardization. News of All-Union Geographic Shubin V.A. 1994. Russian Forests. Moscow: "
Society. 125(1): 12- 18. VNIITSLESRESURS. 16p.
Isachenko G.A. 1991. Landscape ph_ic-geographical Volkov A.D., Gromtsev A.N., Erukov G.V. et al.
divisioning into districts. Moscow: Higher 1995. Ecosystems of north west taiga landscapesEducation P.H. 366p. (structure, dynamics). Karelian Research Center of
_ Russian Academy of Science. 139p.Isachenko G.A. 1991. Landscape-ecological mapping
of taiga territories. All-Union Scientific
cortference "The Problems of Newly DevelopingRegions Organizing ":Proceedings, part 2,Khabarovsk: 130 - 134.
I
. ir
Proceedings IBFRA Assn 1997 meeting 53

. SOIL AND FOREST FORMING PROCESSES AND LAND USE IN BOREAL ZONE
A. Sapozhnikov I
ABSTRACT.-- Determination of actuality and use system to overcome and soften inevitable AQ,
insufficiently studied aspects of forest utilazation contradictions. This is possl_olewith the realization oforganization in the boreal zone. Inthis context the strict regulation of nature use and full elimination ofterm land use is understood as ecologically or the irrevers_le decomposition of forests and soils.economically determined expediency (priority) ofconcrete land site attribution to this or that type of The extensive territory, occupied by the boreal belt,utilization (for example, forest, agrarian, built-up, etc), the diversity of forest vegetational conditions, and thewhich is determined in the first turn by ecological variety of assimilation levels and nature use traditionsconditions, suggest the potential complexity of approaches to
solving this problem in different boreal zone countries.None the less, there are common problems that I
Tile global role of boreal zone forests, thanks to its would like to comment upon.•extensive territory, lies in producing a volume of
phytomass that is able to influence substantially the The soil forming process is the aggregate of thecarbon stock of the planet. This global importance a elementary processes ofsoil formation, spontaneouslypriori produces a negative attitude to any change of connected with forest forming processes. Irreversibleproduction potential connected with disturbances of transformations of fundamental trends occur with thethe natural progress of forest and soil formation break of even one link in the complex chain ofprocesses. Even well-timed (for example, plantation) interconnections. Anthropogenic impact on theseforest regeneration is not able to compensate the lost relations, as a rule, even with spot (one moment)
. carbon storage ability of forested lands for many impact always appears to have multi-faceted spatialdecades, and temporal impacts. EspeciaUy sensitive in this
aspect are the forest soils because their formation (softWithout commenting upon the theoretical aspects of forming process) is closely connected with forestsoil and forest forming process links, independent of forming process. That is practically any impact on thethe rate (level) of forest exploitation or its forest leads to disturbance of the natural procession ofsusceptability to other types of destruction (for soil formation, which is observed during the change or
example, pyrogenic), the forest cover is constantly elimination of vegetational cover. It can occur with orunder the effect of dynamic processes - successional, without the mechanical impacts on soils. The forestage, geomorphogenic, climatogenic, hydrogenic, ecotope destruction process and its consequentpedocryogenic and so on. Correspondingly, the development are fully simulated by the multipletransformation of the active biogenic part of the soil impacts of forest fires.cover is observed. All this is integrated in naturally oranthropogenically changed structures of forest lands In the absence of essential mechanical destruction ofand, correspondingly, demands the introduction of upper soil levels, post-anthropogenic soil formation incorrections into the structure and system of forest cut and burned areas is closely connected with forest(forest resource) land use. cover successions. The following types of changes in
soil forming processes are possible with this: (1) It' Besides the global significance of the boreal forests, ecotope hydroregime change due to redistribution of
there is always utilitarian need for them, reflecting the sediments and its elements - evaporation, wregional and local (regions, inhabited localities) needs transpiration, inner and surface flow redistnqaution; thenot only for the forest production, but also for land, result is either bogging or increasing of drainageincluding the necessity of the increase of land suitable regime and as consequence podzol formation; (2)
" for agriculture. The possibility and permiss_ility of vegetation change is followed by turnover structurethis in rich forests regions earlier were introduced by change both in composition and mass of annual topL.V.Popov. In other words, the necessity of forest humus as well as in intensity of its fiirtherconservation constantly collides with the consumptive decomposition, which in the long nm is reflected oninterests ofpeople, thus invasion of human demands postpyrogenic (postanthropogenic) formation ofinto the environment appears to be inevitable, humus formation type; (3) under conditions of long-Consequently, the challenge is in directing the nature term seasonal permafrost usually as a result of
_A.Sapozhnikov, Far East Forestry Research Institute, 71, Volochaevakayo Stregt, 680020, Khabarovsk, Russia.54 GTR-NC-209

cryoregime violation, stabiliT.edby native vegetation, carbon emission increase and decrease of depositingthe ecotopic position ofedaphotope changes and functions of forest ecosystems.connected with it direction of soil formation goes to
bogging, and peat accumulation; (4) as a result of Besides anthropogenic transformations it is necessarygrass-bush layer_conversion the processes of to take into account and global processes as well. So,soddiness, meadows appearing, peating, arborization_ Plochl and Cramer (1995) on the basis of the analysis Aambustization and so on are likely to develop. Other efsimulation of the global wam_g consequences b
types of changes and prevailing of elementary showed that: (1) primary netto-productivity (PNP) ofprocesses of soil forming are poss_le, but in all cases the northern biomes can decrease; (2) but commonthe traumatism of soils indirected through vegetation PNP of this or that region can increase due to the shittis accompanied by change of dominating (and to the north oftaiga biome.correspondingly, initiating this soft) elementary soilprocess. It must be taken into account that in the Thus, under conditions of boreal zone we encounter
limits of one Soil forming process several variants of the determined rigidity of the environment, influencingformingprocess are poss_le. . the organization and planning of rational land use. It
is necessary to establish the limit below which it isForest soils development as a result of their inadmissible such an intervention in the boreal forestsexchisivdy mechanical damage or even destruction is environment, which is followed by the loss of landalso connected with the process of forest regeneration suitability for afforestation for a long period. It isin damaged sites. But, besides this, a significant possible to propose two evident signs, reflecting therestructuring of soil cover occurs with the formation ecosystem condition under watershed assessment ofof more contrast boundaries between contours of the territory: (1) the appearance in the land structurepostanthropogenic (pyrogenic) origin and not the lands which are non-forest-producing and notdamaged ones. In the temporal aspect the dominants suitable for afforestation; (2) watershed afforestationchange in soil forming process, connected with a more decrease up to the level of less than 60%.dynamic forest forming process, is catastrophic only in
• thecase of its irrevers_ility. Otherwise, these are In connection with high sensitivity of the forest coverinevitable fluctuations, connected with the the problem land use organization is actual. It issuccessional transformations of forest cover and known, that the agrarian significance of lands here isgeneraUy with the types of vegetational cover. The extremely low. Thus, it is extremely important hereperiod of fading of the stress changes in organogenic the multifunctional land use, including agroforest use.soil horizons atter clear cutting in cases of successful That is we are talking about realization in the borealintensive regeneration of cut areas depending on forest zone of agroforestry as it is understood by Kovda,formation and concrete conditions of habitat are (1984) and King (1990). In the boreal zone the onlyfluctuate from 5 to 10 years, reserve of the agro fund lands increment is ploughing
up of the forest lands. Now the similar direction must-Itmust be ascertained, that there is no general theory take into account the danger of erosion andof post anthropogenic forest soil formation, and a mountaneous rivers pollution.formulation of its principles is imposs_le without
taking into account the theory of successions and Nevertheless, the receipt of additional production•syngenesis of forest vegetation. In today's stage, without ploughing up of new lands and, moreover,
, characterized by increased, actually uncontrolled, without their serious transformation is fully possible:anthrop0genic invasion into forest, the development of (1) by the way of more rational land use, including
such a theory becomes highly actual, forested lands; (2) by creation of protective forest !. stripes system on farming lands; (3) by maximum full
ifMain types of impact on the forest and soil forming use of forest food, technical and medicinal raw. process under conditions of the Russian Far East materials; (4) by organization of regulated under
boreal zone are: forest fires, commercial forest canopy of the cattle grazing; (5) by creation ofexploitation, open mining, agriculture. The forest fires openings for the grazing; (6) by the use of openings,increase outside natural nature level as a result of open stands, clearings for getting fodder; (7) by use ofeconomic activity of man is attnqauted by us to between-strip space in the forest plantings for getting
aathropogenic impact. Intended time limitless lands agroproduction; (8) by attraction of branch feed forexpropriation for construction, communications and animal husbandry; (9) by regulated extraction of theso on isnot considered here. It is also posslqalenot to part of forest top humus and forest litter for utilizationtake into account mining because they are wittingly as compost material; (10) by introduction of fruitcatastrophic and for a long period destruct the usual underbrush under the stand canopy; (11) by
process of forest formation and convert soils into development of beekeeping; (12) by organization of' technozems. All types of the impact lead to the cell fur fanning; (13) by hunting trade and so on.
Proceedings IBFRA Assn 1997 meeting 55

The concrete choice of economic activity is connected intercormection, that is, it must answer the questions:with the necessity of forseeing (prognosis) ofposs_le what are the consequences of vegetation destructionconsequences of land assimilation. In relation with for soils, and on the contrary, the role of soilthis the classification of lands is proposed according to destruction in vegetation changes or destruction. It istheir stability.(resistivity) to any external impacts: especially important on the sites, attn'buted toSTABLE - destruction is poss_le only as a result of :ecological skeleton of the territory. Only in this caseintended mechanical impact (for example, the rational land use system organization is poss_le. Amountainous mining); uncontrolled destructions b
(erosion, windfall) are unlikely; The situation analysis along the Far East transect (135RELATIVELY STABLE - extraction of vegetational meridian) showed, that in boreal belt there is not veryresources or vegetational cover destruction is not large choice of land use systems. Mainly these are thefollowedby irreversible consequences and is restored combinations of forest resources and limited agrarian"up to original condition in a comparatively short types. Promising is the development of agroforestry,period (not more than 5 years); permitting to optimize the use of production potentialMID-STABLE - lands are rapidly restored under any of boreal zone with maintaining the global ecologicaltypes of nature use, but subjected to the impact of role of the forests.calamities - windfall, entomologic pests, influence ofchannel flows, floods and so on;
INSUFFICIENTLY STABLE- they are easily LITERATURE CITEDsubjected to postfire destructions or anthropogenicvegetation changes; however, if the destruction of Plochl M., Cramer_W. Poss_le Impacts of Globalsoils do not occur, the restoration is observed not later Warming on Tundra and Boreal Forest Ecosystems:than 20 years; Comparison of Some Biogeochemical Models. J.LOW STABLE - together with destruction of Biogeogr. 1995-22, N4-5. P.775-783vegetational cover the local (mosaic) soil destructionis registered due to which the return to original Kovda V.A. Biogechemical Turnover and Soil
. condition is difficult to forecast; Formation Processes. Proceedings of InternationalUNSTABLE - any impact leads to irreversible Symposium. Puschino. 3-8.10. 1983. Puschino, 1984.changes of the landscape; tundra permafrost P.6-14 (Kovda V.A. Biogeohimicheski Krugovorot Ilandscapes are the manifestations of this in a greater pochvoobrazovanie. Biologicheski krugovorot iextent, prozessy simposiuma. Puschino. 3-8.10. 1983.
Puschino, 1984. S.6-14.The decrease of stability level is evident in the courseofmovement to the north- if in the forest zone all King E. F.S. The History of Agroforestry.classes of stability are possible, then in tundra-forest Agroforestry Syt. Trop. --DEordrecht etc., 1989.and tundra zones there are only last three classes, P. 3-11.which testifies their high sensitivity. It is observedanalogously in high zonality.
There are different approaches to the classification oflandscape stability depending on the taken signs forthe diagnostics. There is a way, which is moresuitable for creating the Classificator of Landscape
Stability, necessary for rational selection of land use 1t' type. The evaluation of landscape stability
(se .nsitivity) according to soil signs are widely known, w- This is justified by sufficiently high level of soil
conservatism in comparison with the other activecomponents of landscape. Really, if as a result of any
" impact the vegetation suffe_:s,but soil is maintained,then the primary landscape ecotopic signs aremaintained; in case of soil destruction the irrevers_leconsequences are inevitable for vegetation with theloss by biome of initial ecotopic signs.
Correspondingly, the change of land use type isinevitable. Thus, The Classificator, actuality of which
• is mentioned above, must be based on thoroughregistration of soil and forest forming processes
56 GTR-NC-209

SPECIES COMPOSITION AND RESTORATION OF FORESTS WITH DIFFERENT HISTORIES OFECONOMIC USE
V. N. Korotkov 1 tO
ABSTRACT.--History of forest tracts of the Natural HISTORY AND TREE SPECIESHistorical Reserve "Gorki" (Moscow region, Russia) COMPOSITION OF FORESTSis revealed in the maps from the 18tnand 19th
centuries.with use of a geographic information The history of forest tract formation was investigatedsystems. The analysis has shown significant based on contemporary maps from the 18thand 19thdistinctions of floristic diversity of forest communities centuries. The analysis of the history of economic useformed on sites with different histories of human enabled us to divide the variety of current forestimpact. Long-term economic use of forests has communities of the reserve "Gorki" into two groups:resulted in significant loss of taxonomic and structural (1) forests formed as a result of repeated clearcuttingdiversity. In those forests that have lost the capability on the lands and not disturbed by ploughing at leastfor natural restoration, experiments on reconstruction during the last 200-300 years; (2) forests arising as aof gap-mosaics are conducted by combining gap result of regrowth on ploughed fields since the middlefelling with regeneration cultures of species that of the 19thcentury and then disturbed several times byoccupied dominant positions in preagricultural forests, clear cutting.
The forestry characteristics of timber stands withThe purpose of this Work is to describe and evaluate various histories of land use were analysed using athe biodiversity and the successional state of forest complex forest management information systemecosystems that have different histories of economic (DBMS+GIS), created based on stand descriptiomuse but occur in similar edaphic conditions. The made in 1991 (an attribute database) and on the forest
current state of forest communities and secondary plans at a scale of 1"10,000 (a geographic informationSuccession processes were studied in "island" system).
•anthropogenie forest tracts ofthe Natural Historical
Reserve "Gorki". The territory is located on the In the forests that were cut many times on persistentlyMoscow-Oka plain (in the south of the Moscow non-arable areas, mixed timber stands prevail, with aRegion, Russia, geographical coordinates: 55%4' - dominance of broad-leaved species (fig. 1) while the55°29 ' North and 37°45 ' - 37°53 ' East) within the area of pure timber stands is insignificant. The stands
limits ofa polydominant spruce-broadleaved forest with populations of oak (Quercus robur L.) from 2 upzone. The cover loam soils are on a carbonate to 6 units in the timber stand formula (20% to 60% of
. moraine, which acts as the substrate for soil total stem density), occupy the greatest area. Limeformation. The forests, are typical for the middle part (Tilia cordata Mill.) is rather common, and lime
of European Russia. stands of moderate relative density (up to 4 units-• 40% of stems) with admixtures of other species
• At the moment,, the "island" forest tracts are occupy the greatest area. The low relative density ofpredominantly composed of stands dominated by lime is accounted for by selective use of this species
birch (62% of the forest area). Broad-leaved forests for large-scale harvesting of bast over a long time in!, With prevalence of oak and lime cover about 14% of past centuries (Kurnaev 1980). At the moment, lime
the forest area. Each of the forest tracts of the is actively restoring its dominance owing to abundaRtreserve has a unique combination of various tree seed renewal. A characteristic feature of these forests
species in communities that is related to the is also admixtures of maple (Acer platanoides L.),peculiarities of past economic use of the land which is completely absent in the forests on former(table 1). . arable lands. Birch (Betula pendula Roth. & B.
pubescens Ehrh.) is also widely distributed.However, the area under pure birch stands isinsignificant (8.3%), and typically the share of birchreaches only two units (20%). Aspen (Populus
1Vladimir N. Korotkov, All-Russian Research and Information Centre for Forest Resources,. Novocheremuschkinskaya, 69A, Moscow, 117418, Russia, e-mail: [email protected].
Proceedings-IBFRA Assn 1997 meeting 57
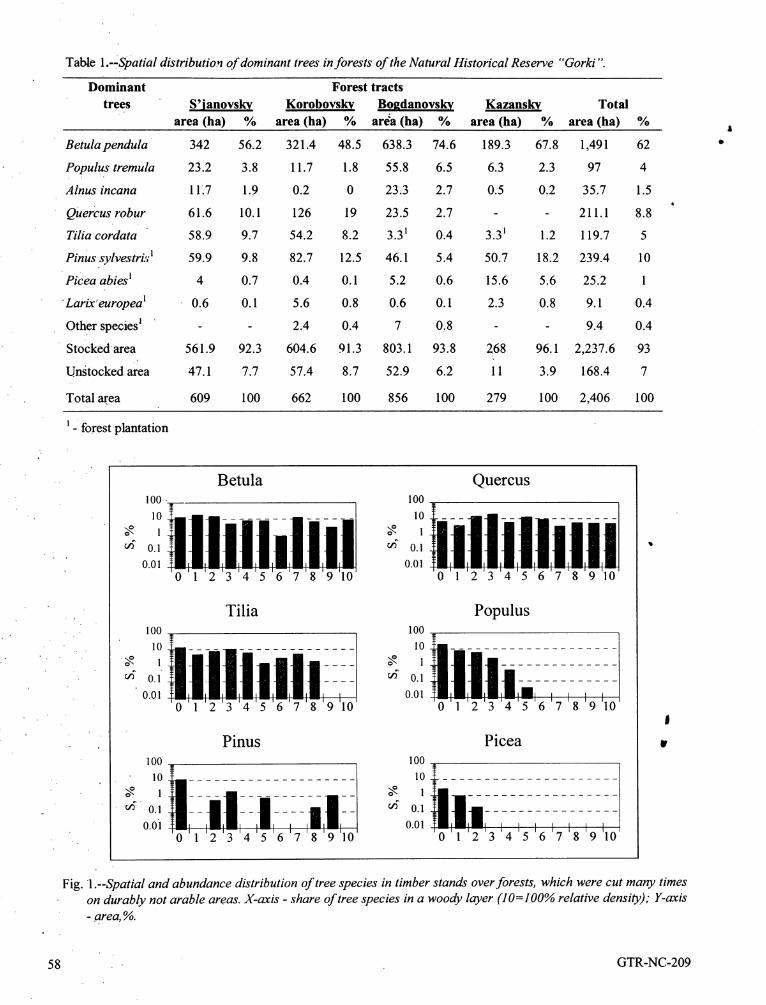
Table l.--Spatial distribution of dominant trees in forests of the Natural Historical Reserve "Gorki"
Dominant Forest tracts
trees - S'ianovskv Korobovsky Boedanovskv Kazansky Total
area (ha) % area (ha) % arda (ha) % area (ha) % area (ha) % ,
Betula pendula 342 56.2 321.4 48.5 638.3 74.6 189.3 67.8 1,491 62 •
Populus tremula 23.2 3.8 11.7 1.8 55.8 6.5 6.3 2.3 97 4
Alnus incana 11_7 1.9 0.2 0 23.3 2.7 0.5 0.2 35.7 1.5
QUercus robur 61.6 10.1 126 19 23.5 2.7 - - 211.1 8.8
Tilia cordata 58.9 9.7 54.2 8.2 3.31 0.4 3.31 1.2 119.7 5
Pinus sylvestri:, 'l 59.9 9.8 82.7 12.5 46.1 5.4 50.7 18.2 239.4 10
Picea abies I 4 0.7 0.4 0.1 5.2 0.6 15.6 5.6 25.2 1
_Larix'europea I 0.6 0.1 5.6 0.8 0.6 0.1 2.3 0.8 9.1 0.4
Other species ! - - 2.4 0.4 7 0.8 - - 9.4 0.4
Stockedarea 561.9 92.3 604.6 91.3 803.1 93.8 268 96.1 2,237.6 93
U.nstocked area 47.1 7.7 57.4 8.7 52.9 6.2 11 3.9 168.4 7
Total _ea 609 100 662 100 856 100 279 100 2,406 100
forest plantation
Betula Quercus100 100
10 10o_ 1 o_ 1t_ 0.1 r_ 0.1
0.01 0.01
Tilia Populus100 100 1
• 10 10
• _ 0.1 _ 0.10.01 0.01
i
. Pinus Picea w100 10010 10
_ o.1 uf o.1
o.oi o.ol
Fig. 1 .--Spatial and abundance distribution of tree species in timber stands over forests, which were cut many timeson durably not arable areas. X-axis - share of tree species in a woody layer (10=100% relative density); Y-axis- area, %.
58 GTR-NC-209

tremula L.) and pine (Pinus sylvestris L.) occur rarely SUCCESSIONAL STATE AND BIODIVERSITYin the stands; thus, the greatest number of
combinations is observed in stands with a share of The geobotanical description and demographicthese species varying between one and two units, analysis of tree and shrub species populations on 110 A
permanent and temporary sample quadrats of 0.04 to ,,The analysis of species composition for the first group 1 ha, were used for the analysis of successional statusof stands has shown that repeated clearcutting of forest communities.resulted in the maximum prevalence of two species:
birch and oak. The greatest variety of combinations To estimate successional state and biodiversity of •of relative species densities, as represented by the stands, the following characteristics (Zaugolnova ettimber stand formula, is formed only by these species, al. 1995) were used:Thus, most of the area is in mixed stands of a varietyofcompositions, rather than in monocflltures. 1. Degree of floristic diversity - a ratio between the
number of species in the existing flora and theIn the forests growing on the former arable lands, number of species of potential flora, expressed asmol:e than 80% of the area is occupied by birch a percentage. The potential flora includes allstands, with the Share of this species being equal to 7- vascular plant species within the Russian non-
lOunits (fig. 2). Pure birch stands (species share of chemozem zone, of which the ecological10 units), occupy the greatest area (56.5%). The amplitudes of major environment factors aremost usual admixture in birch stands is aspen. Stands related to the ranges of estimated biotopes onwith an aspen share of less than 2 units cover 50.9% ecological scales (D.N.Tsyganov 1983). Thisof this area. On more than 30% of the area, birch parameter was calculated separately for eachstands include pine as an admixture, sinusium.
For the forests on former arable land the minor 2. Number of species in a 100 m2sample.presence of broad-leaved species other than birch and
aSpen is peculiar. The greatest share in timber stand 3. Share of participation ofBetula sp. and Populuscomposition corresponds to stands with an impurity tremula (R-species) in the tree layer: the ratioof oak trees in the canopy layer (no more than 1 unit), between the projected cover of R-species and theForests with an admixture of lime occupy an total projected cover of all species within the tree
•insignificant area; and among them stands with a canopy, expressed in percentage.soh'tary admixture of lime prevail (11.6% of the area).It is necessary to note that the stands dominated by 4. Degree of dominance: the ratio betweenoak or lime in the canopy layer occupy a very small projected cover of the most abundant species andarea,, and all of them are forest cultures, total projected cover of species within a layer or
a sinusium, expressed in percentage. This•The forests growing on former arable land contain parameter was calculated separately for eachabout twice as much area of stands with coniferous sinusium.
species, i.e., pine and spruce (Picea abies (L.) Karst.)
as forests on theareas that had not been used as 5. Share of populations with complete ontogeneticarable land. This is because forest cultures of spectra (all stages of development represented):coniferous species were established mainly on arable the percentage of species with complete !
' land. ontogenetic spectra relative to the total numberBof species in the sinusium. This parameter was
" Analysis of the spatial distr_ution of stands with calculated separately for sinusia of trees andbroad-leaved species in the canopy layer, in relation to shrubs.the history of forest tract formation (fig. 3-4),confirms the inferences stated above and is of decisive 6. Share of nemoral species (shade-tolerant"map0rtance when forecasting development of forest understory species ofbroadleaf forests): the ratiotracts in the near future, between total projected cover of nemoral species
and total projected cover of herbaceous species,expressed in percentage.
,
Proceedings IBFRA Assn 1997 meeting 59

°
Betula Quercus100 100
10 10 Al _ 1 ,
o.1 _ o.1
O.Ol O.Ol
.
Tilia Populus100 100
10 10
0.1 _ 0.1
, , 0.01 0.01
Pinus Picea' 100 100
10 10
0.1 r_ 0.1
O.O1 0.01
:Fig. 2.--Spatial and abundance distribution of tree species in timber' stands over former arable land. X-axis - share
of tree species in a woody layer(l O=l O0% relative density); Y-axis - area,%.
°
60 GTR-NC-209

0 500 M|_ •
F orest area in 1784
Oak share in timber stands n 5- lo -M1-4i_1
Fig. 3.--Spatial distribution of forest contours with different abundance of Quercus robur in a woody layer in• Korobovskyforest tract.
..
U' 0 500 M
II. __ •
_ Fore_ areain 1784
Lime share in limber stands / 5- 10111-4
, Fig.. 4.--Spatial distribution of forest contours with different abundance of Tilia cordata in a woody layer inKorobovsky forest.
°
Proceedings IBFRA Assn 1997 meeting 61

The estimation of ecological regimes on Tsyganov's PRELIMINARY RESULTS OF(1983) ecological scales has not shown essential EXPERIMENTAL WORK ON RESTORATION
distinctiom.between the investigated forest ecotopes. : OF POLYDOMINANT UNEVEN-AGEDBROAD-LEAVED FORESTS .t
All variety of forest communities in the reserve ,,"Gorki" occupying watershed sites, represent One of the ways to find a compromise betweendemutation variants of one floristic association - Tilio- economic needs and nature protection requirements isCarpinetum geranietosum (Korotkov and Morozova to apply group-selective cutting aimed at imitating the1988). The following demutation variants are natural mosaic structure ofuneven-aged forests ,distinguished: (1) those occurring on forest areas of (Methodical recommendations... 1989). Using group-long standing (broad-leaved forests with domination selective cutting with subsequent planting of oak, theof lime and/or oak; nemoral birch forests); (2) those best results were obtained in secondary even-aged
occurring on former arable land (bii'ch forests rich in birch forests (Bogdanovsky forest tract). In birchherbs - natural overgrowth, nemoral pine & spruce forests, the density of tree and shrub regrowth has.forests - forest cultures), increased more than 10 times in 5 years after cutting
' of parent stands on plots of 1,200 m2 to 2,000 m2. At
Researchers have shown that the present-day present, oak dominates the young growth (9,800distinctions of successional states of forests (tree individuals per ha); the height of 8 year-old oak trees
species composition, floristic diversity, ontogenic varies from 200cm to 320cm, the increase in heightstructure of tree species population) under similar being fi'om 120cm to 140cw_
ecotopic conditions are explained by differenthistories of land use. Oak planting was done by separate biogroups, with
each biogroup covering an area fi'om 40 m2 to 750
The largest changes in species composition occur in mE. After 5 years, the tree crowns in the biogroups• the forests growing on arable areas. Mainly pure were closed, and it was necessary to perform annual
birch stands are formed there with a scanty share of weeding. The best results were observed when oak
nemoral species (table 3). In the birch forests a was established from seed.renewal of typical forest species of trees and shrubstakes place. The participation ofnemoral species in Work on restoration of populations of other broad-the herbaceous cover depends also on the distance to leaved tree species (Tilia cordata, Acer platanoides,
• broad-leaved stands, which serve as seed sources. Fraxinus excelsior) is under way.
The woody and shrub species, which are capable of Application of the proposed cutting method does notvegetative regeneration, are retained after clearcutting reduce the expense of the subsequent tending ofin. forest communities on the lands not disturbed by regrowth. At the same time, however, it creates
ploughing (table 2). The herbaceous cover is favorable conditions for the restoration ofplant•retained, With dominance by nemoral species, populations in all sinusia. The number of species
sharply increases in the depleted even-aged stands (in
Predictions of development of the "island" forest birch forests, from 35 - 40 to 50 - 60 species per 100tracts are made based on demographic analysis of m2.), and the growth 0fspecies diversity is occurring
woody andshrub species. It has been shown that the mainly due to natural species of light habitats.direction of forest secondary succession is determined !
' by Opportunities of seed dispersal and seedling lrestab_hment in those "island" forest tracts which CONCLUSION
- have been shielded from active economic use.The analysis has shown significant distinctions in
The longterm economic use of forests has resulted in floristic diversity of forest communities formed onsignificant loss of taxonomic and structural diversity territories with different histories of human impact.(table 2 and table 3). Therefore, it was necessary to Longterm economic use of forests has resulted indevelop special methods directed at restoration of significant loss of taxonomic and structural diversity.forest ecosystems. In those forests that have lost the capacity for natural
restoration, experiments on reconstruction of gap-mosaics were conducted by combining gap felling
°
62 GTR-NC-209

Table 2.--Successional state of the biotopes formed on the historically non-arable forest areas as a result of
repeated clearcutting.Biotopes Oak-forests Nemoral Birch ForestsForest tracts Koro- S'janov- Koro- S'janov- Bogdano-
bovsky sky bovsky sky vsky
Number Ofgeobotanical. Descriptions "37 16 27 4 8
Total number of vascular plant species 89 84 78 69 57 ,TREE SYNUSIUM
Share_ofpopulations with complete ontogenetic spectra,% 33.3 25 30 18.2 10
Share of R-species in tree layer,% 24.2 28.3 82.5 92.7 73.8
Degree Offloristic diversity,% 80 53.3 66.7 68.8 66.7 "
Total number of species of all geobotanical, descriptiom 12 8 10 11 10
Degree of dominance in tree layer,% 46.5 47.5 64.9 43.9 55.3
Average (maximum) number of species per 100 m2 2 (5) 2.1 (4) 2.1 (4) 2.5 (4) 2.5 (4)SHRUB SYNUSIUM
Degree of floristic diversity,% 50 50 41.2 46.7 46.7
Total number of species of all geobotanical, descriptions 8 8 7 7 7Average (maximum) number of species on 100 m2 2.8 (7) 2.9 (7) 3 (5) 5.9 (7) 6.8 (7)
Share of population with complete ontogenetic spectra,% 50 50 57.1 71.4 71.4
Degree of domitmnce in shrub sinusium,% 82 38.4 84.9 42.5 30.3HERB SINUSIUM
Degree of floristic diversity,% 44.3 46.8 41.3 39.5 34.5Share of nemoral species,% 47.8 47.4 48.3 30 44.6
Total number of species of all geobot, descriptions 62 65 57 47 40
• Average (maximum) number of species per 100 m2 14.6 (24) 23.4 (33) 15.4 (25) 19.4 (24) 26.3 (31)Degr_ ofd0minance in herb sinusium,% 14.5 38.4 12.4 42.5 11.8
Table 3.--Successional state of the biotopes formed on arable land.Biotopes Herbage Birch Forest Pine Forests/olantation)Forest tracts Koro- S'janov- Bogda- Koro- S'janov Bogda-
bovsky sky novsky bovsky-sky novskyNumber of geobotanic descriptions 35 5 9 6 2 2
Total number of species 112 70 85 66 49 66TREE SYNUSIUM
Share ofpopulation with complete ontogenetic 16,7 33,3 20 10 10 O
spectra,%Share of R-species in tree layer,% 100 95.7 100 84.8 100 100
Degree of floristic diversity,% 80 60 66.7 62.5 62.5 68.8TOtal number ofspecies of all geobotanic descriptions 12 9 10 10 10 11 !
' Degree of dominance in tree layer,% 66.4 53.1 67.7 67.3 68.7 56.2 irSHRUB' SYNUSIUM
- Degree of floristic diversity,% 56.3 50 41.2 56.3 62.5 56.3
Total number of species of all geobot, descriptions 9 8 7 9 l0 9
Share ofpopulati0n with complete ontogenetic 66.7 62.5 42.9 66.7 70 55.6spectra,%Degree of dominance in shrub sinusium,% 36.1 45.2 87.5 40.5 28 37.5HERB SINUSIUM
Degree offloristic diversity,% 55.1 43.3 41.5 31.1 24.1 28.4
Share ofnemoral species,% 28.8 25.7 21.8 19.4 24.6 19.1
. Total number of species of all geobotanic descriptions 81 52 63 42 27 40
Degree of dominance in herb sinusium,% 8.42 45.2 7.55 10.2 28 10.3
Proceedings IBFRA Assn 1997 meeting 63
. with regeneration cultures of species that occupieddominant positiom in preagricultural forests.
LITERATURE CITED b
Kumaev, S.F. 1980. Shade broad-leaved forests ofthe Russian plain and the Urals. Moscow: Nauka.312p. •
Methodical recommendations on reproduction ofuneven-aged broad-leaved forests of the Europeanpart 0fthe USSR (on the basis of populationanalysis). Moscow, 1989. 19 p.
Tsyganov, D.N. 1983. Phytoindication of ecologicalregimes in the subzone of mixed coniferous-broad-leaved forests. Moscow. 197 p.
Zaugolnova L.B., chanina L.G., Komarov A.S.,Smimova O.V. et al. 1995. Information-analitical
system for evaluation of successional state offorest commurtities. Preprint. Pushchino, PRCRAS. 50p.
!
• tw
°
64 GTR-NC-209

D
FOREST DYNAMICS,
STRUCTURE, AND
LANDSCAPE PATTERNS
!
• i¢
°
65

__
lD
qlm
.
,.
• .
It
• W
.
66

A DIGITAL LANDCOVER MAP OF THE FORMER SOVIET UNION BASED UPON A TIME SERIESOF 15 KM RESOLUTION NOAA AVHRR DATA
T. A. Stone, R. A. Houghton, and P. Schlesinger l
-.
ABSTRACT.--We have created a 15 krnresolution DATA AND METHODS
digital landcover map of the region of the former
Soviet Union b_ed on a 10 year (1984-1993) time The GVI data are a low-resolution equivalent to theseries ofNOAA AVHRR Global Vegetation Index Normalized Difference Vegetation Index or NDVI(GVI) data. We defined 60 phenology classes and (Tucker et al. 1980, Holben et al. 1980) which isthen labeled them using the Olson World Ecosystems created using satellite data from the visible red and
Map. We established 14 primary landcover types near-infrared portions of the spectrum. The visibleincluding water. The results from this research were red part of the spectrum (where plants absorb and usecompared With other, primarily Soviet or Russian, light for photosynthesis, where plants reflect lightlandcover classifications of the FSU. We also due to leaf cell structure and water content), hasexamined t-heclasses in terms of the distribution of proven useful to understanding plant growth rates,average monthly surface temperatures, estimating net primary productivity (NPP), and
estimating green leafbiomass (Tucker et al. 1985).There is an extensive literature on the meaning anduse of the NDVI (Tucker et al. 1980, Goward et al.
INTRODUCTION 1991, Prince and Goward 1995, Holben et al. 1980).
The current landcover of the region of the former The signal in GVI data is dominated by the responseSoviet Union (FSU) is not well known by the of vegetation to sunlight, temperature, and
international scientific community. Estimates of the precipitation. Essentially, a time series of the dataarea of:forests and other landcovers vary widely, represents vegetation phenology unless clouds, lowThe reasons for this include not only the "cold war," sun angle, or other atmospheric effects contaminatebut also the sheer size and geographical complexity the data. Phenology, the study of the timing of •of the region. Understanding the landcover and its recurring biological events, in our case was meant toctianges are fundamental to understanding the global include spring vegetation greenup, leaf out andcarbon cycle as the Former Soviet Union contains maturation, and fall senescence. Reed et al. (1994)more forest (approximately 8 million km 2in Russia have provided a good overview of the cautions
alone) than any other country, and more forest soil necessary in this type of work. Several other authorscarbon than _anyother country (Dixon et al. 1994). have reported using GVI data for creating large area
• Also, the largest peatlands in the world are in landcover type maps (Goward et al. 1985,Western Siberia, and probably more forest fires occur Townshend et al. 1987, Houghton et al. 1993, Stonein Russia each year than in any other country in the et al. 1994). Bradley et al. (1994) and Gaston et al.world (Stocks 1991). Finally, the extraordinary (1997) have used similar data for their analysis of theamount of land at high latitudes also makes the FSU former Soviet Union. !
' the region where the first effects of expected global irwarming are likely to occur, with some of the We assembled a 10-year GVI time series data set
- greatest effects, on forests (IPCC 1995). covering 1984 to 1993 for the region of formerSoviet Union (FSU). Data from the NOAA First
Our objective was to create a 15-km resolution Generation Weekly Composite products were re-
landcover map of the region of the former Soviet mapped from a Polar Stereographic to a Platte CarreeUnion. The new map was based on a 10 year time map projection using the algorithms in Kidwellseries of National Oceanographic and Atmospheric (1990). These data, with data from the NOAAAdministration (NOAA) Advanced Very High second-generation weekly composite product, wereResolution Radiometer (AVHRR) Global Vegetation read into a matrix of 25000 X 904 cells using bothIndex (GVI) data.
• 1Woods Hole Research Center, PO Box 296, Woods Hole, MA 02543, USA.
Proceedings IBFRA Assn 1997 meeting 67

IDRISi and ERDAS software formats. A total of region of the FSU, during which vegetation ist.02 GB of data were used. inactive.
The inverse of the standard GVI equation (p. 15,
Kidweil 1990) was used to convert the scaled NDVI Map Data _'data values to the bright-land byte range. Forinstance, the transformation converted an NDVI The following ancillary datasets were used either in
value of 0.0 to a new value of 100, creating a the evaluation of the map produced or as a guide ,minimum and maximum range from 90 to 163. during its creation.Thus, a pixel with a value of 163 is equivalent to anNDVI of 0.63. The 1990 Soviet Landcover and Potential Agriculture
MapThe resulting data set had 48 to 53 weeks for each ofthe 10 years from 1984 to 1993. The data in these The original version of this map (Institute of"5i0 Weeks were then averaged into 120 months (12 Geography 1990) was at 1:4,000,000 scale, with 374months" for 10 years). The 120 monthly data were classes of vegetation. The four panels of the mapused to create a continuous FSU land surface, which were digitized, merged, re-coded, and re-projected tocrossed the international dateline (E. and W. a latitude and longitude map projection. Thelongitude 180°) and had a size of 1,183 columns and vegetation types were combined into 74 simpler277 rows, classes.
A 12 month dataset was created from the 10 year, The 1990 Forest Cover Map of the Soviet Union
120 month dataset by averaging together, forexample, all of the Januarys to create a 10-year This map (Garsia 1990) of dominant or economicJanuary average. Then, Februarys and the following forest types at 1:2,500,000 scale was partiallymonths were averaged to create an image with 12 digitized here. The remaining portions of the mapbands. Averaging with maximum monthly GVI were obtained from the World Conservationvalues reduces the effects of inter-satellite mis- Monitoring Center (WCMC). Much of the work incalibration, sensor drift, orbital slippage, and noise in digitizing was under the direction of Dr. Igorthe data. These degrading effects upon AVHRR data Lysenko at the Russian Research Institute for lqaturehave been thoroughly documented and are well Conservation, Moscow (Billington, pets. comm.known (Goward et al. 1991, 1993; Tateishi and 1996) and Moscow State University. We convertedKajiwara 1991; Eastman and Fulk 1993). In general, the map to a latitude - longitude projection. It
using a long time series and a long averaging period consists of about 45 landcover classifications ofreduces the amount of noise in the data. which 36 are forest types. The
• remaining cover types include outcrops, tundra, open• Water pixels were deleted with a mask created from a land, sea, water, and unclassified non-forest lands.
re-projected hydrographic dataset digitized from a The latter category is the largest single class,1.:8,000,000 scale Russian base map (Main Geodesy coveting about 56% of the entire map. See table 1.and Cartography Organization for Ministries of theUSSR !990). This hydrographic dataset, containing The 1973 Forest Cover Map of the Soviet Union !
' Coastlines, islands, and major inland water bodies, lrwas selected because of its size and ease of use. A This map is from the 1973 Forest Atlas of the Soviet
comparison of coastlines between the Digital Chart Union (State Committee on Forests 1973) and is atofthe World (DCW) by ESRI (1993) and the 1"15,000,000 scale. It describes 17 forest cover1:8,000,000 scale map yielded an areal difference of types. The cover types and areas of cover type are inless than 0.1 (10%) of a GVI pixel, table 2. It has been used as the basis for a forest
carbon map of Russia (Schlesinger et al. 1997)As most of the degrading effects in the data were described elsewhere in this volume (Stone et al.related tO low winter sun angles for this boreal 1998).region, we chose to eliminate from the analysisDecember, January, and February. These months arethe times of extreme cold for the vast majority of the
0
68 GTR-NC-209

Table 1.--Areas of the landcover types according to the USSR Forest Cover Map (Garsia 1990) are in the 2ndcolumn. As Arctic tundra is not distinguished in the map, lands above 60° N have been listed separately in the3rd column. This helps in categorizing much of the "Open Lands" (Class 42) as northern open lands that are Jlikely to be tundra. Also, we can see that the majority of the spruce, burned forest, and larch are above 60° N •and that many species do not occur at higher latitudes.
Class # Area, kin2 Area N. of 60° % Total % in N. Area Map NameN Lat. Area
i 1,287,810 533,130 5.9 41.4 Scots Pine (Pinus syl.)2 5,300 4,770 <0.1 90.0 Sparse Pine3 972,970 603,020 4.5 62.0 Spruce (Picea sib.)4 2,410 600 <0.1 25.0 Sparse Spruce5 121,390 9,180 0.6 7.6 Fir (Abies sib.)
, ,6 1,000 - - - Sparse Fir7 119,680 32,220 0.6 26.9 Spruce and Fir
8 140 - - - Sparse Spruce and Fir9 3,456,400 1,960,400 16.0 56.7 Larch (Larix sp.)10 " 88,050 55,260 0.4 62.8 Sparse Larch11 404,960 133,870 1.9 33.1 Kedra (Pinus sib. & kor.)12 1,310 990 <0.1 75.7 Sparse Kedra (Pine)
13 10,280 - 0.1 - Artcha (Mtn. Cedar, Juniper)14 133,100 - 0.6 - Oak (Quercus sp.)15 980 - <0.1 - Sparse Oak16 40,130 - 0.2 - Beech (Fagus sp.)
18 11,880 - 0.1 - Hornbeam (Caprinus sp.)19 82,550 110 0.4 0.1 "Stony" birch (Betula ermanii)20 4,100 - <0.1 - Sparse Stony Birch22 1,081,500 318,610 5.0 29.5 Birch
23 1,420 50 <0.1 3.3 Sparse Birch ,
• 25 141,000 13,680 0.7 9.7 Aspen (populus trem.)26 120 - <0.1 - Sparse Aspen27 15,490 - 0.1 - Linden (tilia)28 62,620 10,910 0.3 17.4 Other
29 4,650 - <0.1 - Other w/dom. Maple (Acer)
30 500 - <0.1 - Other w/dom. Walnut (Juglans)• 31 1,770 - <0.1 - Other w/dom. Pistachio (Pistace.)
• 32 22,750 10,500 0.1 46.1 "Emik" - Dwarf Arctic Birch
33 322,400 205,320 1.5 63.7 Cedar Elfin Wood (knunholz)34 149,270 144,590 0.7 96.9 Dispersed Larch Wood35 218,320 156,060 1.0 71.5 BumedForest !
. 36 27,080 17,190 0.1 63.5 Glades (cleared lands)37 190,010 138,560 0.9 72.9 Tundra ir
. 38 267,400 50,650 1.2 18.9 Outcrops and Rocks40 96,900 40,100 0.5 41.4 Tundra and Rocks
42 12,127,180 3,850,380 55.9 31.8 Open Lands44 ' 100 100 <0.1 100.0 Sea
45 213,.130 54,660 1.0 25.7 WaterTotal 21,688,070 8,344,890 100.0 -
Forest 8,547,950 (Classes 1 to 34)Non-Sparse 8,295,830Forest
°
Proceedings IBFRA Assn 1997 meeting 69

Table Z--Forest Cover based on the Atlas of Forests USSR (State Comm. On Forests 1973). Two methods ofexamining the data are shown in this table. First, the forest types and percentages in the left half of the table
are from the summary page and pie chart in the Atlas. Second, the right half of the table shows the areaestimates and percentage of forest cover based on our digitization of the map. The percentages of forest typesshown by the two methods are in close agreement. •
Class. From original map {_raphic From our digital version of the 1973 map# % of forests # krn2 % of area % of forests
"1 Scots Pine 16.30 Scots Pine 1 1,371,040 14.70 15.20 "
2 Spruce 12.20 Spruce 2 974,840 10.50 10.803 Fir 1.80 Fir 3 134,070 1.40 1.50
4 .Spruce Fir -- Spruce Fir 4 117,420 1.30 1.305 Larch 38110 Larch 5 3,345,150 36.00 37.00
6. Kedra (Pine spp.) 5.60 Kedra 6 357,820 3.80 4.007 Creeping Cedar 0.10 Creeping Cedar 7 23,130 0.30 0.308 Knmaholz 3.80 Krumholz 8 296,090 3.20 3.309 Oak 1.40 Oak 9 181,540 2.00 2.00
10 Beech 0.50 Beech 10 64,940 0.70 0.70"12 DW_f Birch 0.80 Dwarf Birch 11 96,840 1.00 1.1016 Saxaul -- Saxaul 12 681,560 7.30 7.5011 Birch 13.30 Birch 13 1,054,390 11.30 11.70
13 Aspen 2.70 Aspen 14 115,590 1.20 1.30Water 16 259,100 2.80 -
Sparse Scots. Pine 17 10,240 0.10 0.10Sparse Spruce 18 6,680 0.10 0.10
14 Lime 0.40 Lime 31 15,820 0.10 0.20
15 Other Softwoods 2.30 Other softwoods 33 102,720 1.10 1.10
17 _arse trees 0.70 Sparse Larch 39 102,430 1.10 1.10Total 100.00 Total Area 9,311,330 100.00
Total Forest 9,052,230
Non-Sparse Forest 8,932,880
• Olson et al. World Ecosystems a global Plate Carree projection of 1/2-degree cellsyielding an array of 720 columns by 360 rows. Of
From the global data set of Olson et al. (1983, 1984), these data, an array of 720 columns by 259 rows wasWe extracted the region of the former Soviet Union extracted from the region of 55° to 75° North. Thesethat contains about 40 classes of land cover. See extracted windows were resampled via a nearest4
' tables 3 and 4. neighbor algorithm to an array consisting of 2,5_0• columns by 904 rows using IDRISI software to
- match the original array structure ofNOAA GVI
Thirty Year Average Temperature Data data. A Boolean mask was used to extract all formerUSSR territories. The mask was created by
A continuOus FSU temperature surface was extracted digitizing administrative boundaries from a 1:8from the Plate Carree projection matrix of Leemans million-scale map of USSR Physical Geography.and-Cramer (1991). The temperature data were This raster mask and the corresponding temperaturerounded to whole degrees Celsius. The original data did not match exactly on the northern border, and left
then were organized using geographic coordinates in residual flag values of-999 from the original data.
°
70 GTR-NC-209

Table 3.--Landcover types of the former Soviet Union from Olson et al. (1983,1985). The ten largest categories arein boldface.
Class Cover : km zA
20 Snowy, Rainy, Coastal Conifers (with alder etc.) 11,55021 Main Boreal Conifers 3,281,160
•. 22 Snowy, Non-Boreal Conifer Forest 758,55023 Conifer/Deciduous, snow in winter 737,89024 Semi-Evergreen Deciduous, little or no snow 10,03025 Deciduous Forest, snow in winter 154,15026 Temperate Deciduous Forest, little or no snow 80,18030 Cool Farmland / Settlements (snowy) 1,270,63031 Mild Hot Farmlands / Settlements 541,90037 Warm Irrigated crops 109,530
38 Cool Irrigated crops 74,74039 Cold Crops and pasture 82,960
: Cool Snowy Grass Shrub 1,333,67041 Mild/Warm/Hot Grass Shrub 1,295,210
42 Cold steppe Meadow 322,28044 Mire (acid bog &/or groundwater-fed fen) cold peatland/sphag. 568,51045 Marsh / Swamp (warm-hot) salt & fresh water, thicket, flooded 9,35046 Mediterranean Evergreen Tree/Shrub (winter rain) 54047 Other Dry or Highland Scrub/Tree 62,13048 Eucalyptus or Acacia, Quebracho, Saxaul 6,31050 Sand Desert, partly blowing 523,59051 Other Desert and Semi-desert 447,740
52 Cool/cold Shrub Semidesert/Steppe (sagebrush.) 496,20053 Tundra (polar, alpine) 3,083,37055 Grass/Crop +<40% woods: cool-cold, persistent snows 531,27056 Regrowing Woods + Crop/Grass 12,440
• Regrowing Woods+Crop/Grass:cool-cold, persistent snows 967,77058 Grass/Crop+<40% woods:warm,hot 78,34060 Southern Dry Taiga (and other aspen_irch, etc.) 533,33061 Siberian Larch Taiga, with other taiga-Main Boreal Conifers 308,83062 Northern or Maritime taiga/tundra 2,586,91063 Wooded tundra/margin (or mtn. Scrub, meadow) 703,010
, 65 NW quadrant near most land (mainland, large island) 16,63066 NE quadrant near most land (peninsula, small islands) 12,980
, 67 SE quadrant near most land (or isthmus) 2,82068 SW quadrant near most land 12,020069 Polar Desert (rock lichens) 103,530 !
' 70 Glaciers (other polar and alpine) 11,020' 71 Salt/soda flats lake flats. 24,740 u
. Total 21,167,790
°
Proceedings IBFRA Assn 1997 meeting 71

Table 4.--Recombination of Table 3 (from Olson et al. 1983,1985) into simpler categories to allow comparison withTable6.
Generalized Landcover T_,pes % of Area Area (km z) D
Mixed coniferous & deciduous forest 4.6 982,240Main boreal coniferous forests 15.5 3,281,160
N0rthem or maritime taiga forests 13.7 2,907,290 ,snowy non-boreal coniferous forest 3.6 758,550
Southern dry taiga forests 2.5 533,330Forested Subtotal 40.0 8,462,560
C0ol to cold shrublands 5.0 1,064,710
Cool snowy grasslands & crops 17.1 3,615,550Mild to hot grasslands, farmlands, & shrublands 14.2 3,021,030gegrowing Woodlands & croplands 5.0 1,058,550
Shrublnds, Grasslnds & Farmlnds Subtotal 41.4 8,759,840
Ttmdra 15.3 3,242,380
Wooded tundra margin 3.3 703,010Tundra Subtotal 18.6 3,945,390
Total Area 100.0 21,167,790
We eliminated the temperature files for December, Clustering and classification of the GVI data did notJanuary, and February to conform to the 9 months create unique landcover labels, but rather created aused in the 60-claSs phenology product. We summed series of classes based on phenology curves. Theall of the months and divided by 9 to create a data set next step, labeling of the curves was morewith a 9-month temporal average for each pixel challenging than the numerical clustering of the data
• location. We reclassified all no-data, and sea and required the use of ancillary data sets described.locations to 0. Then, we extracted the minimum, above, expert opinion, and the development of a set
modal, and maximum temperatures for each of the 60 of decision rules. The need to use very largephenological land cover classes. Nine monthly ancillary data sets is common in work like this
•images yielding 18 files included a minimum value because of differences among the classifications•file and a maximum value file by class for each (Nemani and Running 1997).month.
We labeled the 60-class map based on the Olson etal. (1983, 1985) World Ecosystems Map. The area
The creation of GVI Data Phenology Classes covered by the 60-class map and the Olson et al. map
were compared within the GIS. The label of thej, Using an ISODATA algorithm (ERDAS 1994), we Olson et al. class that covered the majority of th_
clustered the 9-month GVI dataset into 60 classes phenology-based class was assigned to the pheni$1ogy
. using a maximum of 100 iterations and a 95% class. For instance, if the phenology class wasconve.rgence threshold. From the clustered data, we composed of 60% spruce, 20% fir, and 10% tundra,then extracted the mean NDVI for each month for the class would be called spruce. The second andeach Of the 60 classes, and graphed the data against third most important or sub-dominant Olson et al.time (fig. 1). The distribution of the 9 month means labels (fir and tundra, in this case) were defined andwere examined for the sum, standard deviation, used later in re-combinations of the classes.coefficient of variation, minimum, median, andmaximum values.
°
72 GTR-NC-209

Proceedings IBFRA Assn 1997meeting 73

Temperature and GVI as more than one Olson-type was usually included ina phenology type. A simplification of the map based
Nemani and Running (1997) used seasonal NDVI , on the assigned primary Olson-type label reduced thedata from the NOAA AVHRR and compared it with number of classes to 12. Areal estimates of all
temperature data to develop a general model for landcovers of the FSU are shown in tables 5 and 6. •landcover vegetation. They hoped to develop
classifiCation descriptionsthat allowed labeling of The addition of the temperature data to the GVI dataclasses independently of the large volumes of allowed comparisons with the conceptual model of
ancillary data required in earlier research (Loveland Nemani and Running (1997). Our effort has appli&let al. 1991, Zhu 1994, Stone et al. 1994). Nemani their concepts (but not methodology) to the largely
and Running (1997) divided landcover into four boreal and forested realm of former USSR. Thebroad .types including (1) water limited (e.g., deserts Nemani and Running (1997) conceptual model fitand shrublands), (2) energy limited (e.g., high well with our landcover classification labels. Classeslatitude-and high altitude vegetation), (3) with the lowest mean NDVI and highest Julyatrnospherically coupled (e.g., rough canopied temperatures appear in the water-limited regionevergreen forests), and (4) atmospherically decoupled according to the Nemani and Running (1997)
(e.g_, crops that are fertilized, irrigated, and have conceptual model. The geographic location of thesesmooth canopies). They also showed the seasonal classes (nos. 1, 9_ & 11) were in Uzbekistan,distidbution of various landcover types in NDVI and Turkmentestan and Kazahkstan. Classes with very
temperaturespace using data of various landcover low mean NDVI and low July temperature shouldtypes of the USA. plot in the energy limited portion of the graph. Three
sample classes here (nos. 2, 3 and 5) are very high
We used the concepts of Nemani and Running (1997) latitude tundra or montane sites and include thewith the GVI data and the temperature data of the Taymyr Peninsula. Classes closest to theUSSR from Leemans and Cramer (1991). We atmospherically coupled portion of the graph include
def'med the July modal temperature value for each those that cover Kamchatka and the extreme RussianClass and have plotted it versus mean class NDVI. Far East near Magadan (nos. 31,42,36). These sitesEach: of the 9 months of temperature data was are moist, forested and are analogous to the US
imported into ERDAS Imagine NT. A 20 class Pacific Northwest. Sites that are closest to theIsodata unsupervised clustering operation with a atmospherically decoupled extremes include themaximum of 20 iterations and a 95% convergence wheat belts of Ukraine, the northern steppes andthreshold was run to create the 30-year temperature Samara. Although this was not meant to be a
file. The resulting file contained 21 temperature rigorous evaluation of the Nemani Running work,zones. These were compared to the phenological their conceptual model appears to work and be usefulland Cover classes using ERDAS Imagine NT to in the largely boreal realm of the region of the FSU.
derive a count by input class, where the largest value' in each listing is the majority class. As July is the
hottest month, generally, we defined the modal DISCUSSIONtemperature _¢aluefor each class and plotted it versusmean class NDVI (fig. 2). It is tempting but perhaps unwise to use the areal
estimates of landcover type from this research ar_ to
' compare these results with other estimates of th_' RESULTS landcover or forest cover of the FSU. This result and
- the Gaston et al. (1997) effort are phenology-based
We hfive made a 15 km resolution map the landcover maps. All other data sets were produced from
of the region of the former Soviet Union based on a different starting points, with different data sets, and
10 year time series of GVI data (fig. 3). In general, with different goals. And, given the low resolutionWe found 6.8 million km 2of forested lands, 4.3 of the GVI data, all pixels will be mixed pixels.million km 2of mixed forests and steppes, 6.5 million Also, very different landcovers may exhibit the same
km 2of shrublands, grasslands and farmlands and phenological characteristics in the same region and,some 3.7 million km 2 of tundra. The names of the 60 thus, with this method would be labeled the same.
classes have been assigned according to the World Finally, the size of the FSU can also mean that
Ecosystems Map of Olson et al. (1983, 1985). regions several thousand miles apart with the same. Secondary and tertiary labels have been assigned also
74 GTR-NC-209

IP
• _ _ _4 _ •
_ _ _ _ _ _
._ __
• _ _ i__5
o.... .? \ ." _ _
(opom) :3 dmoj., ,(Inf
Proceedings IBFRA Assn 1997 meeting 75

Figure 3. Landcover classes of theformer Soviet Union (FSU) JII
_" ," "-_ ".C:_'-__-_. 60 Landcover Classes of the FSU ,
f _
1
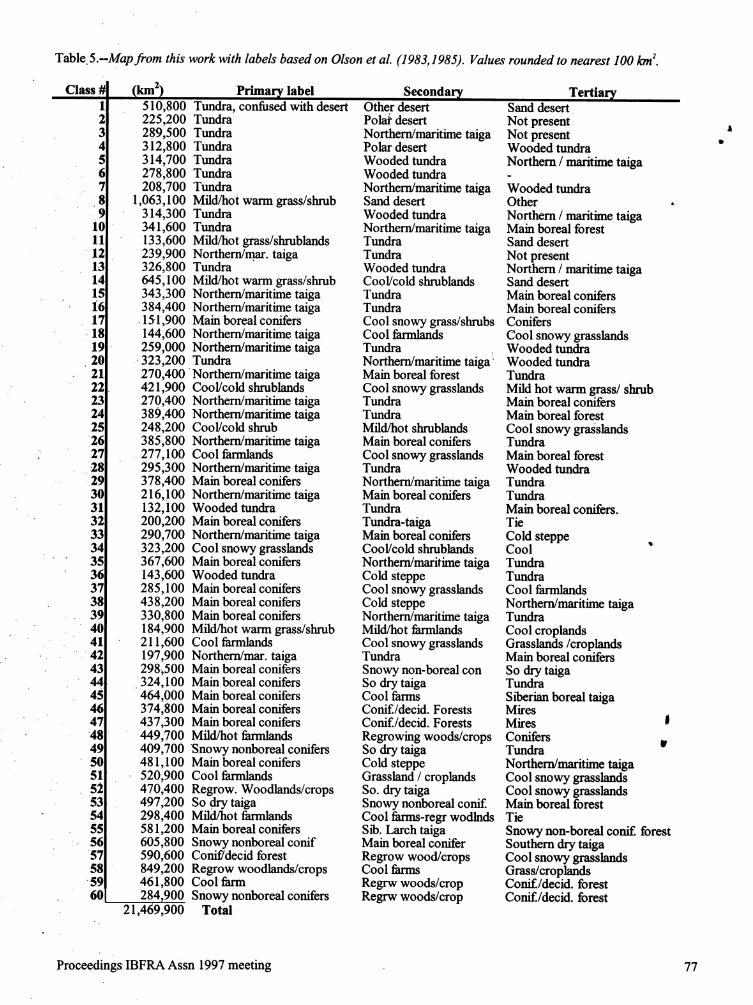
Table.5.--Map from this work with labels based on Olson et al. (1983,1985). Values rounded to nearest 100 Ion2.
Class # (km 2) Primar_ label Secondar_ Tertiar_1 510,800 Tundra, confused with desert Other desert Sand desert
2 225,200 Tundra PolaJ"desert Not present ,3 289,500 Tundra Northern/maritime taiga Not present •4 312,800 Tundra Polar desert Wooded tundra5 314,700 Tundra Wooded tundra Northern/maritime taiga6 278,800 Tundra Wooded tundra -7 208,700 Tundra Northern/maritime taiga Wooded tundra8 1,063,100 Mild/hot warm grass/shrub Sand desert Other •9 314,300 Tundra Wooded tundra Northern/maritime taiga
10 341,600 Tundra Northern/maritime taiga Main boreal forest11 133,600 Mild/hot grass/shrublands Tundra Sand desert12 239,900 Northern/mar. taiga Tundra Not present1.3 326,800 Tundra Wooded tundra Northern/maritime taiga14 645,100 Mild/hot warm grass/shrub Cool/cold shrublands Sand desert15 343,300 Northern/maritime taiga Tundra Main boreal conifers
, i6 384,400 Northern/maritime taiga Tundra Main boreal conifers17 .15.1,900 Main boreal conifers Cool snowy grass/shrubs Conifers18 144,600 Northern/maritime taiga Cool farmlands Cool snowy grasslands19 259,000 Northern/maritime taiga Tundra Wooded tundra20 .323,200 Tundra Northern/maritime taiga Wooded tundra21 270,400 Northern/maritime taiga Main boreal forest Tundra22 421,900 Cool/cold shrublands Cool snowy grasslands Mild hot warm grass/shrub23 270,400 Northern/maritime taiga Tundra Main boreal conifers24 389,400 Northern/maritime taiga Tundra Main boreal forest25 248,200 Cool/cold shrub Mild/hot shrublands Cool snowy grasslands26 385,800 Northern/maritime taiga Main boreal conifers Tundra
• 27 277,100 Cool famalands Cool snowy grasslands Main boreal forest28 295,300 Northern/maritime taiga Tundra Wooded tundra
•29 378,400 Main boreal conifers Northern/maritime taiga Tundra30 216, !00 Northern/maritime taiga Main boreal conifers Tundra31 132,100 Wooded tundra Tundra Main boreal conifers.32 200,200 Main boreal conifers Tundra-taiga Tie33 290,700 Northern/maritime taiga Main boreal conifers Cold steppe34 323,200 Cool snowy grasslands Cool/cold shrublands Cool35 367,600 Main boreal conifers Northern/maritime taiga Tundra36 143,600 Wooded tundra Cold steppe Tundra37 285,100 Main boreal conifers Cool snowy grasslands Cool farmlands38 438,200 Main boreal conifers Cold steppe Northern/maritime taiga39 330,800 Main boreal conifers Northern/maritime taiga Tundra40 184,900 Mild/hot warm grass/shrub Mild/hot farmlands Cool croplands41 211,600 Cool farmlands Cool snowy grasslands Grasslands/croplands
• 42 197,900 Northern/mar. taiga Tundra Main boreal conifers43 298;500 Main boreal conifers Snowy non-boreal con So dry taiga
, 44 324,100 Main boreal conifers So dry taiga Tundra45 464,000 Main boreal conifers Cool farms Sflaerian boreal taiga46 374,800 Main boreal conifers Conif./decid. Forests Mires47 437,300 Main boreal conifers Conif./decid. Forests Mires !
' 48 449,700 Mild/hot farmlands Regrowing woods/crops Conifers49 409,700 Snowy nonboreal conifers So dry taiga Tundra u
. 50 481,100 Main boreal conifers Cold steppe Northern/maritime taiga51 520,900 Cool famalands Grassland / croplands Cool snowy grasslands52 470,400 Regrow. Woodlands/crops So. dry taiga Cool snowy grasslands53 497,200 So dry taiga Snowy nonboreal conif. Main boreal forest54 298,400 Mild/hot farmlands Cool farms-regr wodlnds Tie55 581,200 Main boreal conifers Silo. Larch taiga Snowy non-boreal conif, forest56 605,800 Snowy nonboreal conif Main boreal conifer Southern dry taiga57 590,600 Conif/decid forest Regrow wood/crops Cool snowy grasslands58 849,200 Regrow woodlands/crops Cool farms Grass/croplands59 461,800 Cool farm Regrw woods/crop Conif./decid. forest60 284,900 Snowy nonboreal conifers Regrw woods/crop Conif./decid. forest
21,469,900 Total.
Proceedings IBFRA Assn 1997 meeting 77

Table 6.-'Simplified landcover types defined for the FSU based on this research. The 12 types listed here are themajor groupings of the 60 landcover types in the original classification (Table 5).
Landcover T_,pes % Area Area _km2)Mixed coniferous & deciduous forests : 2.8 590,600
Main boreal coniferous forests 15.3 3,292,910 •Northern or maritime taiga forests 5.4 1,162,940Snowy non-boreal coniferous forests 6.1 1,300,400Southern dry taiga forests 2.3 497,200
Forested Subtotal 31.9 6,844,050 ,
Mixed main boreal forests & steppe/grasslands 8.5 1,820,300Mixed northern or maritime taiga forests & steppe/grassland 11.8 2,524,130
Mixed Forest/Steppe Subtotal 20.3 4,344,430
Cool to cold shrublands 3.1 670,200C0ol snowy grasslands 1.5 323,200
Mild to hot grasslands, farmlands, & shrublands, 12.9 2,774,900Regr0wing woodlands & croplands 6.1 1,319,600Cool farmlands & settlements 6.9 1,471,400
Shrublands, Grasslands, & Farmlands Subtotal 30.6 6,559,300
Tundra 16.1 3,446,500Wooded tundra margin 1.3 275,700
Tundra Subtotal 17.4 3,722,200
Total Area 21,469,900.,
phenological characteristics might be labeled the NAGW 3856, The W. Alton Jones Foundation, andsame. The tremendous geographic extent of Russia The John D. and Catherine T. MacArthur
• and the FSU is not considered in the classification Foundation. We would also like to thank Dr.
technique used. With this method, the spatial Vladislav Alexeyev for his advice.proximity of pixels was not considered. Instead, themonth by month GVI values controlled the clusteringof data. This can lead to classification of sites widely LITERATURE CITED
separated as the same landcover type simply because
their phen01ogical curves are the same. Having the Bradley, P.M.; Gaston, G.; Vinson, T.; Kolchugina,same phenology does not mean having the same T. 1994. Predictions of carbon pools in the boreallandcover. Also, small regions whose phenological forest of the FSU using GVI classification of thecycle are determined by irrigation or by fiver waters vegetation and landcover region as input for
may be out of phase with surrounding regions and are forest ecosystem modeling. Proceedings ISPR_. more likelyto be mislabeled. The simple addition of Comm. VII., Symposium on Research and
temperature data assists in sorting out some of the Environmental Monitoring; Rio De Janeiro: 1i9-potential difficulties. This new map is suitable for 26.stratify hag the region of the FSU using either the 12
or 60 classes version into regions which then could Dixon, R.K; Brown, S.; Houghton, R.; Solomon, A.;
be sub-sampled by higher resolution satellite data Trexler, M.; Wisneiwski, J. 1994. Carbon poolssuch as that from NOAA AVHRR LAC, LANDSAT and flux of global forest ecosystems. Science.MSS, TM or SPOT. 263:185-190.
Eastman, R.J.; Fulk, M. 1993. Long sequence time
ACKNOWLEDGMENTS series evaluation using standardized principalcomponents. Photogrammetric Engineering and
The authors would like to thank for their support Remote Sensing. 49(8)" 1307-1312.• NASA's Office of Mission to Planet Earth, MTPE
78 GTR-NC-209

ERDAS. 1994. Field guide 3_ ed. Atlanta, GA: Kidwell, K.D., ed. 1990. Global vegetation indexERDAS. 628 p, users guide. NOAA/NESDIS. Washington, DC:
, National Climatic Data Center.ESRI. 1993. Digital chart of the world for use with A
Arc Info Software. Redlands, CA. Leemans, R.; Cramer, W.P. 1991. IIASA database t
for mean monthly values of temperature,Garsia, M.G., ed. 1990. "FORESTS OF THE USSR" precipitation, and cloudiness on a global
Scale 1:2,500,000 All-Union State Planning- terrestrial grid. Digital Raster Data in a 30-minute
Research Institute "Sojuzgiprolezhoz" GUGK, Geographic Grid, Laxenburg, Austria. In: GlobatMoscow, USSR. Ecosystems Database Version 1.0: Disc A.
Boulder, CO: NOAA Nat. Geophys. Data Ctr.Gaston, G.; Bradley, P.; Vinson, T.; Kolchugina, T.
1997. Forest ecosystem modeling in the Russian Loveland, T.R.; Merchant, J.W.; Ohlen, D.O.;Far East using vegetation and landcover identified Brown, J.F. 1991. Development of a landcover
_ by classification of GVI. Photogrammetric characteristic database for the conterminous U.S.
Engineering & Remote Sensing. 63(1)" 51-58. Photogrammetric Engineering and RemoteSensing. 57: 1453-1463.
Goward, S.N.; Tucker, C.J.; Dye, D. 1985. North
American vegetation patterns observed with the Main Geodesy and Cartography Organization for•NOAA 7 advanced very high resolution Ministries of the USSR. 1990. Physicalradiometer. Vegetatio. 64: 3-14. Geography of the Soviet Union. Map at
1"8,000,000 scale.
Goward, S.N.; Dye, D.G.; Turner, S.; Yang, J. 1993. Nemani, R.; Running, S. 1997. Landc0ver
• Objective assessment of the NOAA global characterization using multitemporal red, near-IRvegetation index data product. International and thermal IR data from NOAAA/AVHRR.Journal of Remote Sensing. 14(18): 3365-3394. Ecological Applications. 7(1): 79-90.
G0ward, S.N.; Markham, B.;Dye, D.G.; Dulaney, Olson, J.; Watts, J.S.; Allison, L.J. 1983. MajorW.; Yang, J. 1991. Normalized difference world ecosystems complexes ranked by carbon invegetation index measurements from the live vegetation. Report ORNL-5862. Oak R_dge,
• advanced very high resolution radiometer. TN: Oak Ridge Laboratory.Remote Sensing of the Environment. 35: 257-
277. Olson, J.S.; Watts, J.S.; Allison, L.J. 1985. Majorworld ecosystems complexes ranked by carbon in
. H01benB.N.; Tucker, C.J.; Fan, C-J. 1980. Spectral live vegetation: a database. NDP-017. Oak Ridge,assessment of soybean leaf area and leaf biomass. TN: CDIC, ORNL.
Photogrammetric Engineering and Remote
Sensing. 46(5): 651-656. Prince, S.; Goward, S. 1995. Global primaryproduction: a remote sensing approach. Journal of
Houghton, R.A.; Unruh, J.D.; Lefebvre, P.A. 1993. Biogeo. 22: 815-835.Current landcover in the tropics and its potential 1t
' for sequestering carbon. Global Biogeochemical. Reed, B.C.; Brown, J.F.; VanderZee, D.; LovelandtrCycles. 7(2): 305-320. T.R.; Merchant, J.W.; Ohlen, D.O. 1994.
- Measuring phenological variability from satelliteIPCC. 1995. Second assessment synthesis of imagery. Journal of Veg. Science. 5" 703-714.
scientific-technical information relevant to
interpretingarticle 2 of the UN framework Schlesinger, P.; Stone, T.; Vladislav, V.; A.
•convention on climate change. Geneva: UNEP. Alexeyev, A. 1997 A spatially extilicit map offorest carbon for Russia: a first approximation,
Institute of Geography. 1990. Vegetation of the IBRFA 1997. (abstract)Soviet Union, Siberian Department USSRAcademy of Sciences, Main Ministry of Geodesy State Committee on Forests. 1973. Atlas of forests of
and Cartography, Moscow. Scale 1:4,000,000. the USSR. Moscow. 222 p. (in Russian).o
Proceedings IBFRA Assn 1997 meeting 79
Stocks, B,J. 1991. The extent and impact of forest Townshend J.; Justice, C.; Kalb, V. 1987.fires innorthern circumpolar countries. Chapter Characteristics and classification of South
26. In: Levine, J.S., ed. Biomass burning and : American landcover types using satellite data.global change. Cambridge, MA: MIT Press: 197- International Journal of Remote Sensing. 8(8):202. 1189-1207. w
Stone, T.A.; Schlesinger, P.; Alexeyev, V.A. 1998. A Tucker C.J.; Holben, B.N.; Elgin, J.H.; McMurtrey,spatially explicit map of forest stand carbon for J.E. 1980. Relationship of spectral data to grainrussia: a first approximation. In: Conard, S.; yield variation. Photogrammetric Engineering _tndSehmucker, L. Proceedings oflBFRA conference: Remote Sensing. 46(5)" 657-666.Disturbance in boreal forest ecosystems: human
impacts and natural processes; 1997 August 4-7; Tucker, C.J.; Vanpraet, C.L.; Sharman, M.J.; Van
Duluth, MN. Gen. Tech. Rep. NC-000. St. Paul, Ittersum, G. 1985. Satellite remote sensing ofMN: U.S. Department of Agriculture, Forest total herbaceous biomass production in the
J Service. Senegalese Sahel: 1980-1984. Remote Sensing ofthe Environment. 17: 233-249.
Stone, T.A.; Schlesinger, P.; Woodwell, G.M.;
Houghton, R.A. 1994. A map of the vegetation of Zhu, Z. 1994. Forest density mapping inthe lower 48South America based on satellite imagery, states: a regression procedure. Res. Pap. SO-280.Photogrammetric Engineering and Remote New Orleans, LA: U.S. Department ofSenSing. 60(5): 541-551. Agriculture, Forest Service, Southern Forest
Experiment Station. 11 p.Tateishi, R;. Kajiwara, K. 1991. Landcover
monitoring in Asia by NOAA GVI Data.Geocarto International. 6(4): 53-64.
I
• 1/I
°
80 GTR-NC-209

EFFECTS OF WITHIN-STAND HABITAT AND LANDSCAPE PATTERNS ON AVIAN DISTRIBUTIONAND ABUNDANCE IN NORTHERN MINNESOTA
Carol W. Pearson I and _erald R. Niemi 2 ,tt
ABSTRACT. -- We studied 26 mature aspen landscapes surrounding a forest stand have only(populus tremuloides) stands to test whether both recently been considered (Ambuel and Temple 1983,within-stand habitat characteristics and landscape Wilcove 1985, Vetoer 1986, Addicott et al. 1987).patterr_, influenced breeding bird abundance in Two habitat islands of the same size, shape, quality, ,Contiguous forests of the northern U.S. Breeding and degree of isolation may be subject to differentbirds and habitatswere sampled in 1991 and 1992. conditions depending on the landscape mosaicProportions Of different forest types surrounding each surrounding them.stand were calculated for three buffers and two bands
Of different radii from the sample stand boundaries Current research suggests that vegetation patterns in(100 m, 250 rn, 500 m). Models based on multiple forest-dominated landscapes can effect theregression analyses were calculated to predict the composition of avian communities within individualrelative abundance of seven bird species. Five forest stands (Rosenberg and Raphael 1986, Urban etSpecieS, American Redstart (Setophaga ruticilla), al. 1987, Hansen et al. 1991, Hejl 1992, PearsonBlack throated Green Warbler (Dendroica virens), 1994). The objective of this study was to determineMagnolia Warbler (D. magnolia), Nashville Warbler the relative importance of vegetation patterns in the(Vermivora ruficapilla), and Blackburnian Warbler landscape surrounding a forest stand to avian(D. fusca), were correlated to varying degrees with at abundance within the stand. To accomplish this
least one of the landscape-level variables. Two objective, the study focused on .two questions: (1) dospecies, Veery (Catharusfuscescens) and Ovenbird correlations exist between the distnqaution or the(Seirus aurocapillus), were correlated only with abundance of selected species and habitat variableshabitat variables measured within the sample stands, within the surrounding landscape; or (2) are theSpecies with the most general habitat associations number of birds recorded within a forest standWithin these forests were least influenced by correlated only with habitat variables within thatlandscapes, while species that were more specific stand?(e.g., the highly conifer dependent BlackbumianWarbler) were most influenced by the surroundinglandscape. STUDY AREAS AND BIRD SPECIES
SELECTION
The study areas were 26 mature quaking aspen standsINTRODUCTION located on the Superior and Chippewa National
Forests in northern Minnesota. The sample standsOver the past 20 years, a great deal of research effort were a subset of forest stands selected as part of a
• has been directed toward studying the effects of National Forest Bird Monitoring Project (Hanowskiforest fi:agrnentation on avian communities. Because and Niemi 1994). Stands of only one forest typeof the similarities between true oceanic islands and were selected to reduce within-stand habitat
isolated forest fragments or "habitual islands," many variability and, hence, to increase the poss_leresearchers have applied the theory of island variation that could be attributed to differences in tl_
' biogeography(MacArthur and Wilson 1967) to the landscape surrounding the stands. For more detail_study of'fragmented terrestrial habitats. Most of concerning study area selection and locations see
- these studies have focused on patch size and degree Pearson (1994).of isolation to explain variations in the compositionofavian communities within forest fragments (Galli Seven bird species were selected a priori for analysiset al. 1976, Whitcomb et al. 1'977, Whitcomb 1977, using the following criteria: (1) species that wereRobbins 1979, Lynch and Whigham 1984, Blake and relatively abundant on the study sites, (2) species
Karr 1984, Haila 1986). The importance of with habitat associations along a deciduous to
• ICarol W. Pearson, Natural Resources Research Institute, 5013 Miller Trunk Highway, Duluth, MN 55811;Present address: Minnesota Department of Natural Resources, 500 Lafayette Road,St. Paul MN 55155-4025
. 2Ge_'ald J. NiemL Natural Resources Research Institute, 5013 Miller Trunk Highway, Duluth, MN 55811
Proceedings IBFRA Assn 1997 meeting 81

o
coniferous gradient, and (3) species classified as techniques to delineate the area within 100 m of theneotropical migrants. Habitat associations for birds census points (the radius within which birds wereof the region were identified using bird census data : recorded). Buffers of three different radii (100 m,collected for a National Forest Bird Monitoring 250 m, and 500 m) from the sample stand boundariesProject (Hanowski and Niemi 1994) from 1991 were then delineated. The areas, perimeters, andthrough 1993. Based on these criteria the following frequencies of forest types were calculated for eachspecies were selected: Veery and American Redstart sample stand and for each of the three buffers for(deciduous forest association); Black throated Green each stand.Warbler, Ovenbird, and Magnolia Warbler (mixedforest association); and Nashville Warbler and The landscape matrix data derived from the GISBlackburnian Warbler (coniferous forest association), analysis were imported into Paradox (Version 3.0),
and combined with the within-stand habitat data.
Two new data sets were created by subtracting theDATA COLLECTION areas of the 250 rn buffer from the areas of the 500 m
buffer, and by subtracting the areas of the 100 mThree replicate points (each 10 min in duration) were buffer from the areas of the 250 m buffer. Thesecensused wittiin each stand during a 2 week period in areas, designated as the "250 m band" and the "500 mJune of 1991 and 1992 (Reynolds et al. 1980, band," represented the matrix habitat in a bandHanowski and Niemi 1994). Five trained observers between 100 m and 250 m away from the sample(Pearson 1994) conducted the census which were stand, and between 250 m and 500 m away from theCompleted between 0.5 hours before and 4 hours after sample stand, respectively. Proportions of differentsunrise. Censuses were conducted only during good habitat types within the sample stands, buffers, andweather (i.e., wind<l 5 mph and no precipitation), bands were calculated by dividing by total area ofAll birds heard or seen within 100 m of each census each.
• point were recorded. The observers collectedinformatiOn on habitat structure and plant species All subsequent data analyses were completed usingcomposition at each census point after completing the SAS/PC, Release 6.04 (SAS 1988). The data setbird census. The within-stand habitat data were described above contained more than 100
averaged for the three points in each sample stand independent variables measured for each sampleover all observers who had sampled them (Pearson stand. To reduce the number of variables, similar age1994). classes and habitat types were combined into l_roader
• , categories. For example, two age classes-Aerial photo interpretation was used to analyze and representing regenerating forests<20 year old wereclassify the forest types within a 500 m radius of each combined. Similarly, all mature upland deciduoussample stand. Types were classified to tree species types were combined into one category. In thiswhere possible, and four size (age) classes were manner, the landscape-level forest types wereidentified (Pearson 1994). The smallest area reduced to 10 variables representing broader habitatdelineated by the aerial photo interpretation was categories (Pearson 1994). At this point, with
• about 0.1 ha. A Bausch & Lomb zoom transfer scope landscape cover types and within-stand habitatwas used to delineate the results of the aerial photo variables, 32 independent variables remained in theinterpretation on United States Geological Survey data set. Two approaches were used to further reduce•(USGS) 7.5 min topographic maps (scale - 1:24,000) the number of independent variables. First, simplefor purposes of georeferencing, and to eliminate correlations between variables were examined, ariddistort.ion in the arial photos caused by varying one of each pair correlated (r>0.50) variables w_topography (Alberts 1992). eliminated by flipping a coin. Secondly, the
- • proportion of total habitat represented by each of thematrix habitat variables within the sample stands and
GIS AND DATA ANALYSIS in each of the bands and buffers we examined.Because some habitat types were present in small
The photo interpretation results were digitized from proportions, a habitat variable was eliminated ifthe USGS topographic maps using PC ARC/INFO fewer than 10 stands had 10% of that habitat type.[Version 3.4 (ESRI 1991)] to create a digital map of After these procedures were completed 10the landscape surrounding (and including) each independent variables were retained for the multipleSamPle stand. The boundaries of the sample stands regression analysis (table 1).were •determined by locating the three census pointson the larger landscape maps and using GIS
82 GTR-NC-209

" Table l.--Description of habitat variables retained as independent variables for multiple regressionanalyses. -
f.
Within-stand Variables lO
cht = canopy height (in meters)_hce = percent high canopy cover code _uc = percent understory (1rn to 4m) cover code_gc , = percent ground (up to lm) cover code tbals = frequency of balsam recorded at the census points
(summed for three points and averaged over two years)bir = frequency of birch recorded at the census points
(summed for three points and averaged over two years)mixin = percent mature upland mixed forest (25 - 75% deciduous) within sample stands,.
Matrix Variables
mupdec • = percent mature upland deciduous forest - includes pole-sized and saw-sizedclasses of all upland deciduous forest types classified as > 75% deciduous
muprnix = percent mature upland mixed forest - includes pole-sized and saw-sizedclasses of all upland mixed forest types classified as 25 - 75% deciduous
mupcon = percent mature upland conifer forest - includes pole-sized and saw-sizedclasses of all upland conifer forest types classified as < 25% deciduous
t % cover codes: 0 = <10%, 1 = 10-40°A, 2 = 40-70%, 3 = >70%
!
• i1
.
Proceedings IBFRA Assn 1997 meeting 83

!!
!
Multiple regression analyses were completed Because the results were very similar in all bands and Iiseparately for tl_ree buffers and two bands for each of buffers, only the "best" regression model for each Ithe seven species. Dependent variables consisted of : species is presented (table 3). The "best" model wasthe census data collected for each species on the def'med as a statistically significant model (P,0.015), A
sample stands. The census data were summed for the with the highest adjusted R2(adjusted for the number • |three census points in each stand and averaged over of variables included) of the models tested, in whichthe two years of censusing. The independent all of the variables included in the model were alsovariables consisted of seven within-stand habitat significant (P<0.05). Comparisons of the results forvariables and three matrix habitat variables (table 1). the different bands and buffers are shown in figure 1.Matrix habitat variables (which were proportions)were arcsine transformed, and bird counts were Two of the seven species, Veery and Ovenbird, werelogarithmically transformed to stabilize the variance, not correlated with any of the matrix habitatThe SAS/PC "maxR" regression method (SAS 1988) variables. Because these species apparentlywas used to select the best subsets of variables to responded only to within-stand habitat variables, the
explain variation in numbers of birds recorded on the results were identical for all the buffers and bandssample stands. Residuals were tested for normality (fig. 1 a, d). Significant negative correlations wereand residualpl0ts were examined to identify outliers found between the abundance of the Veery andand non-linear trends. For a more detailed percent high canopy cover within the forest stand.description of methods, see Pearson (1994). Veery abundan¢, e was also significantly negatively
correlated with the frequency of balsam recordedwith the study sites. The model explained 52% of the b
RESULTS variation in Veery numbers recorded on the samplestands (table 3). Ovenbirds were significantly
A total of 1,605 individuals of 66 species were correlated with three within-stand habitat variables.recorded on the 26 sample stands over the 2 years of The species was positively correlated with percentcensusing (Pearson 1994). The most abundant high canopy cover and percent ground cover, andSpecies recorded on the study sites was the Ovenbird, negatively correlated with percent understory cover.which was presen t on all of the sites in both years. The model including these three variables explainedThe Veery and the Nashville Warbler were also very 46% of the total variation in Ovenbird abundancecommon and occurred on most sites in both years. (table 3).The black-throated Breen Warbler, Magnolia
. Warbler, Blackburnian Warbler and American Five species (American Redstart, Black-throatedRedstart were the least abundant of the species Green Warbler, Magnolia Warbler, Nashvillechosen for analysis. Warbler, and Blackbumian Warbler) were correlated
wih matrix habitat variables as well as within-stand
Table 2 lists the proportions of mature upland mixed variables. The proportion of variation explained byforest within the sample stands and the mean values the matrix variables (partial correlation coefficient)for habitat structure and tree species recorded at the varied among the five species, and between thecensus point. Since both balsam (Abies balsamea) different bands and buffers for individual speciesand birch (Betula papyrifera) appear frequently in the (fig. 1).regression models presented below, an explanation ofthe forest associations of these two tree species is In the 250 m band, the 250 m buffer, and the 5((_ mimportant in interpreting the results. The frequencies buffer, the abundance of American Redstarts wa_
' of both balsam and birch were negatively correlated negatively correlated with the frequency of bir011(r=--.061 and r=-.36, respectively) with the mean (recorded within the stand), and with percent mature
- percent deciduous code recorded at the census points, upland mixed forest in the landscape surrounding theThis suggests that both of these tree species were stand. In the 100 m buffer and the 500 m band,assigned with an increasing conifer component balsam was the only variable significantly correlated
- within tile stands selected 'for this study. Mature (negatively) with Redstart abundance. Model R2upland forest types represented the largest proportion values ranged from 0.19 to 0.28, and the partialof the landscape matrix surrounding the study sites, correlation coefficients for percent mature uplandLowland habitat types (e.g., marsh, water, lowland mixed forest ranged from 0.17 to 0.19 (fig. 1 b).forest), agricultural, and urban areas were poorlyrepresented. The Black-throated Green Warbler showed
significant positive correlations with canopy height in. the 100 m buffer, the 250 m band, and the 250 m
84 GTR-NC-209
m

.O
_._ tri t_ t¢3 _ O trl O O t¢_ O t¢_ t¢_ O O O O O t_ _ O O O _ t_ tr_
e,i ,--;O ,-; -; e4 N ,-; m e,i .-; e,i _ .-; _4 N c,i e4 ei e,i e4 _ N O N _
P.
,_- ._ oooooooooooooooooooooooooo_,_,oo_,ooooo_,o_,o_,_,ooo_,ooooo_N d d oe,i,--;O d m,-..;e6 eie,'i...-;d e,id e,i,--;e,'ieie,,id 0 0 d 0
_3
e4 c,i t-i t,i N e,i t,i e,i m e4 e,i o4 _; o4 t,i t,i ei N N N N m _ N -- _
._ m e,i c,i ,-; c,i e4 t,i e,i e4 e,i .- e,i ..-; e,i t,i e,i _ N _ _ _ _ _ _ N _
, _
_u
•
_° ___°o_ •
_ _'_'- _ ¢_1 _ Im -- ._ II ._- o0, , , , , , oo N ,o_-_o- -_""N'"'°°'°°°°_,o'* , , , , , , , ,,-_
_ _ ouu uuuou _g_ __. .,., _ _ _ _ _ _ _ _ _ _ _ o o _ __
Proceedings IBFRA Assn 1997 meeting 85
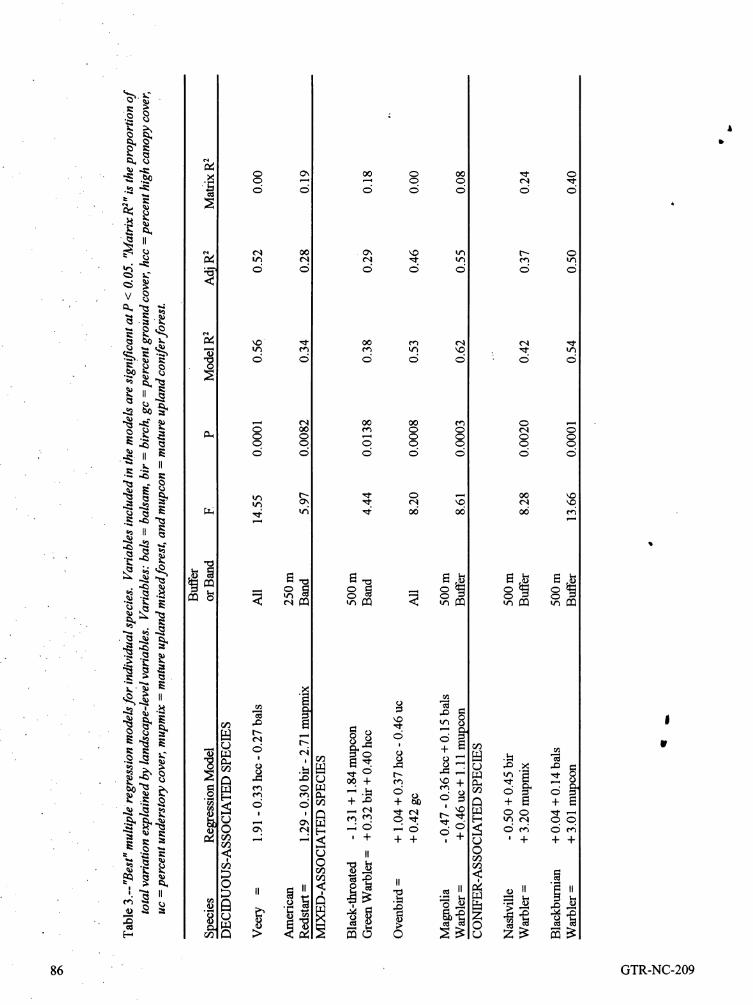
86 GTR-NC-209

a) Veery d) Ovenbird ie
I I
0.8 0.8
O.e - R2O.e •
o,°'t0 ' 0loam !11_ 2mm IIIM 2f_mlkanir SOOmlllM f_4m Ibllllr lOOmlulhr_ I__ I_llOOm lllMilOOmII_llr
e) Magnolia Warbler
b) American Redstart _ -
1 0.8 J0.8 0.6
R20:6 0.40.4 0.2
0.2 010_ IMI_ 21_ llBMI2I_ IMll.lmm I1_1 tlmm IMiw
o Nashville Warbler
. 1
c) Black-throatedGreenWarbler o.s
1 ' 0.6R2
0.8 0.4
o, o,j__l__b "R2O.4 0 1WmlldlwZ_m Ilmd2mm IMl_llmm Ilmdm0m
o.2._ g) BlackbumianWarbler0 ,oeno_,f2s_ __,f soe,o,_ s_,_,f 1|
0.8
• JaModelR2 o.e.- [mMa_R2 R2
0.f !0.2
o !lmm Ildlw2Mm Ilmd:mm Iblbrll_ IImlBl_
' Figure l.'-Comparison of results between the different bands and buffers for seven individual species: a) Veery, b) in
American Redstart, c) Black-throated Green Warbler, d) Ovenbird, e) Magnolia Warbler, )9 Nashville Warbler,
" and g) Blackburnian Warbler. "Model R _" is the adjusted R _value for the complete model "Matrix R _" is theproportion of total variation explained by landscape-level variables alone.
Proceedings IBFRA Assn 1997 meeting 87

°
- • buffer. It was significantly positively correlated with DISCUSSIONbirch in all bandsand buffers. There were significant
negative correlations with percent understory cover _ Studies conducted in the eastern United States havein the 100 m and 250 m buffers, and in the 250 m documented the detrimental effects of fragmentation Aband. In the 500 m band and the 500 m buffer, there on area sensitive species, many of which are •
were significant positive correlations with percent neotropical migrants (Galli et al. 1976; Robbinshigh canopy cover. Percent mature upland deciduous 1979; Whitcomb et al. 1981; Blake and Karr 1984;forest in the surrounding landscape was negatively Robbins et al. 1989). In northeastern Minnesota,correlated with the abundance of this species in the however, isolated forest patches are rare, and the •100 m and250 m buffers. In the remaining buffer concept of fragmentation is not as clear. In thisand bands, there were positive correlations with region, most contemporary forest changes are createdpereentmature upland conifer in the landscape by logging. Timber harvest has produced a regionalmatrix.. Model R2 values ranged from 0.24 to 0.29, landscape mosaic of different forest types and ages.and partial correlation coefficients for the matrix The effects of these landscape patterns on avian
.variables ranged from 0.07 to0.18 (fig. 1c). distribution and abundance have not been studiedpreviously. The results of the study presented here
The Magnolia Warbler was negatively correlated offer some preliminary answers to the question ofwith percent high canopy cover in all the bands and how different habitat types in the landscape matrixbuffers. It was positively correlated with percent may affect avian-populations within individual forestunderstory cover and frequency of balsam recorded stands. Two of the species tested in this study, theWithin the stands, and with percent mature upland Ovenbird and the Veery, responded only to within-conifer -forest in the landscape matrix in all bands and stand habitat variables. The remaining five species-buffers. Model R2 values ranged from 0.53 to 0.55, American Redstart, Black-throated Green Warbler,and partial correlation coefficients for mature upland Magnolia Warbler, Nashville Warbler, and
• conifer forest in the surrounding landscape ranged Blackburnian Warbler - were correlated to varyingfrom 0.06to 0.08 (fig 1e). degrees with landscape-level variables. These are all
species that appear to exhibit more specific forestIn the 100 rn buffer, the abundance of Nashville type associations in this region that the Veery and theWarblers was positively correlated with the Ovenbird.frequency of balsam and birch recorded within thestand. In the other buffers and in both bands, there Although the Veery is generally classified as
-was a positive correlation with birch and with the deciduous-associated species, a review of the"proportion of mature upland mixed forest in the literature suggests that it is found in a wide variety oflandscape matrix. Model R2 values ranged from 0.33 both deciduous and mixed forests. In the Michiganto 0.42 and the landscape-level variable explained Breeding Bird Atlas Habitat Survey, most Veeriesfrom 0%-33% of the total variation in abundance for were found in moist forest types, generally northern
this species (fig. 1f). hardwoods, but often with a conifer component• (Brewer et al. 1991). On the Chippewa National
Significant positive correlations were found in all Forest in northern Minnesota, Veeries were mostbands and buffers for the Blackbumian Warbler with abundant in mixed stands of mature balsam fir,
balsam (witlain the stand) and percent mature upland aspen, and paper birch. They were also recorded in•conifer forest in the surrounding landscape. The mature oak stands, jack pine saplings, and aspenmodels including these two variables explained form saplings (Hanowski and Niemi 1991). Probst et _tl.
' 27%-.50% of the variation in abundance of this (1992) found the Veery to be common in both IFspecies within the sample stands (fig. 1g.). Partial R2 intermediate and mature stages of aspen regeneration.
" values for mature upland conifer forest in the These results suggest that the Veery occurs in a widesurrounding landscape ranged from 0.14-0.40 (fig. variety of forest types.•1g.) In the 500 m band, a model which explained50% of the variation included two landscape-level In the present study, Veery abundance was negativelyvariables, percent mature upland conifer, and percent correlated with percent high canopy cover and withmature upland mixed forest. No within-stand habitat the frequency of balsam recorded within the samplevariables were significant, stands. Percent high canopy cover explained 12% of
the total variation in Veery abundance in the samplestands. Reduced high canopy cover suggests a
. relatively open forest, and is usually correlated with• an increase in the density of understory cover.
,
88 GTR-NC-209

Robbins et al. (1989) found a significant positive dense understory. Martin (1960) also found Venbirdscorrelation between Veery abundance and foliage in stands with dense understories in Ontario. Hanndensity from 0.3 m -1 m tall. Balsam alone (1937) recorded Ovenbirds in forests with openexplained 44% of the total variation in Veery understories in Michigan, and Titterington et al.abundance. This result seems to suggest that the (1977) found a negative correlation between •Veeryprefers deciduous habitats since the frequency Ovenbird abundance and shrub density on study plotsofba!sam was negatively correlated with the percent in Maine. Lynch and Whigham (1984), and Kahl etdeciduous component in the sample stands (r=-0.61). al. (1985) reported positive correlations with percentThe Veery may be more abundant in deciduous ground cover. The correlations found in the present "stands n0tbecause of a specific preference for study agree with the results reported in most previousdeciduous trees, but because understory cover is studies, but contradict the results of others. Because
denser (in general) in deciduous dominated stands, of the lack of standardized methodology in relatingWith its ground-nesting and ground-foraging habits, birds to their habitats and the likelihood ofdense understory cover may be among the most geographic variation in habitat preferences, simpleimportant habitat features for the Veery. explanations are difficult. In this region, however,
the Ovenbird is found in relatively mature forestsAnother possible factor influencing Veery with a high degree of canopy closure, and thedistribution is competition with other thrushes, surrounding landscape seems to make little differenceHarrison (1975) suggests that competition between in influencing its relative abundance.the Hermit Thrush and the Veery is reduced by theirdiffering habitat preferences. According to Ehrlich et Although the Veery was classified in this study as aal. (1988), the Veery expands its range of breeding deciduous-associated species and the Ovenbird as ahabitats where Hermit and Swainson's Thrushes are mixed-associated species, both species are found in aabsentl Since the Hermit Thrush and Swainson's wide variety of deciduous and mixed forests. In thisThrush are found primarily in coniferous forests in region, the Veery and the Ovenbird might bethis region and the Wood Thrush is relatively rare, described as "forest habitat generalists". This lack ofthe Veery is the primary thrush in deciduous forest specific forest habitat associations may explain whystands, neither of these species was correlated with the
proportions of different forest types in the landscapeThe Ovenbird is associated with mature forests surrounding the sample stands.throughout its range in eastern North America. Datafrom the National Forest Bird Monitoring Program A further explanation for the lack of correlations(Hanowski and Niemi 1994) and the results of studies between these species and the landscape-levelin other regions, suggest that the Ovenbird, like the variables may be related to the extent of the forestsVeery, is found in a wide range of forest types. In found in northem Minnesota. Several studies havenorthern. Minnesota, the Ovenbird was found in provided evidence suggesting that both the Veery andvirtually all habitat types and ages (Hanowski and the Ovenbird are sensitive species (Blake and KarrNiemi 1991, Person et al. 1993). On the Chippewa 1984, Robbins et al. 1989, Brewer et al. 1991). In aNational Forest, this species was recorded in stands study conducted in east-central Illinois, Blake andof jack pine red p!ne, white pine, maple and birch. In Karr (1984) did not detect Ovenbirds in forestgeneral, Ovenbirds were more abundant in mature "islands" of less than 24 ha, or Veeries in patches lessforest stands (Hanowski and Niemi 1991). than 28 ha. According to Brewer et al. (1991), the !
Veery has declined in areas in Michigan whereIn the pres.ent study, Ovenbird abundance was urbanization and agriculture have reduced previousl_positively correlated with percent high canopy cover extensive forests to isolated patches. Robbins et al.
" and percent ground cover. It was negatively (1989) found significant correlations between thecorrelated With percent understory cover (1-4 m). area of forest tracts censused, and the occurrence ofSeveral other studies have found positive correlations both the Veery and the Ovenbird. These data suggestbetween Ovenbird abundance and percent canopy that the area of a forest patch may be more importantclosure (Shugart and James 1975, Webb et al. 1977, to these species than the forest type or the habitatKahl et al. 1985). Titterington et al. (1977), Lynch structure within the stand. In the present study,and Whigham (1984) and Robbins et al. (1989) found however, habitat structure within the stand was thepositive correlations between Ovenbird abundance best predictor of abundance for both the Veery andand tree density. In contrast, Anderson and Shugart the Ovenbird. In contrast to the forest patches(19.74) characterized Ovenbird habitat in Tennessee censused in the studies cited above, none of theas having open canopy and subcanopy layers, and sample stands in the present study was isolated from
Proceedings IBFRA Assn 1997 meeting 89

other mature forest stands. The minimum forest area "would probably provide more of the upright crotches
requirement of the Veery and the ovenbird was generally required as nest sites by this species" whichprobably satisfied in the sample stands chosen for the : is a sapling nester. In the present study, saplingpresent study, and consequently, the habitat structure structure was not measured, and may have beenwithin the stands was more important in influencing another important variable in explaining the q,their distribution and abundance. Lynch and abundance of this species in the sample stands.Whigham (1984) found similar results for a numberofspecies in their study of relatively non-isolated The Black-throated Green Warbler was positivelyforest patches in Maryland. They found that correlated with birch in all the bands and buffers, andsignificantly more species responded to floristic with mature upland conifer in all but the 100 mqualities within the stands, than to the area of the buffer. In the 100 m buffer, it was negativelypatches. They concluded "above some minimum correlated with mature upland deciduous forest.
•patch size, correlations between local point density These results suggest that the Black-throated Greenand area of individual forest patches will tend to be Warbler is relatively strongly associated with
.9utweighed by the effects of habitat quality" (Lynch conifers since all of these variables represent anand Whigham 1984). increasing conifer component both within the sample
stands and in the landscape surrounding them.
The American Redstart has been reported to breed in Descriptions of Black-throated Green Warbler habitatboth deciduous and mixed forest types, as well as in from the literature support this conclusion.alder swamps and various early succession habitats. According to Collins (1983), the Black-throatedin northeastern Minnesota, Redstarts were most Green Warbler is found primarily in mixed forestsabundant in stands of mature paper birch and mature including spruce-fir-deciduous, beach-maple-birch,oak (Hanowski and Niemi 1991). They were also pine, spruce, cedar, and balsam fir. Robbins ( 1991)recorded in pole-sized jack pine, mature aspen, identifies the breeding habitat in northern Wisconsin
• mature elm-ash-red maple, and regenerating aspen as maple-hemlock-pine forest and conifer forest.(Hanowski and Niemi 1991). Probst et al. (1992) Green (1991) lists this species as preferringfound the American Redstart most abundant in the contiguous coniferous forests in Minnesota.
intermediate stages of aspen regeneration on theChippewa National Forest. In the present study, all Other correlations found for this species in theof the Variables to which the American Redstart present study were a negative correlation with
responded represented an increasing conifer percent understory cover, and positive correlationscomponent within the sample stands (balsam and with both canopy height and percent high canopy"birch) and in the landscape surrounding the stands cover. These variables, together with those(mature upland mixed forest). Moreover, all of the mentioned above, describe mature forest with acorrelations were negative, suggesting that this relatively dense canopy, and an increasing coniferspecies prefer deciduous forest, component. The Black-throated Green Warbler
seems to respond to specific within-stand habitatThe regressional models calculated for this species variables, but is partly influenced by the extent ofwere significant in all the bands and buffers (P,0.05), mature coniferous forest surrounding the stand.hOwever, they explained a relatively small proportionof total variation (19%-28%). This suggests that one The Magnolia Warbler is strongly associated with the•or more important variables may be missing from the intermediate stages of coniferous forest regenera_on.
. models. For example, according to Sherry (1979), Although it is found in some black spruce bogs aridthe Redstart prefers habitats with open areas at mid- white cedar lowlands (Green and Niemi 1978, N_miheight within the forest (i.e., open subcanopy) which and Pfannmuller 1979), young conifer transitionpermit aerial pursuit of insects. In the present study, communities with conifer trees from 5 m-10 m tallpercent subcanopy cover was not included in the final are its primary breeding habitat (Green and Niemiregressio n analyses, and it may have been an 1978, Brewer et al. 1991). In the study presentedimportant variable in explaining the distn_oution of here, the Magnolia Warbler was negatively correlatedredstarts. Bond (1957) found the highest density of with percent high canopy cover, and positivelyRedstarts in stands characterized by a diffuse canopy correlated with percent understory cover, balsam, and
O Owith-70 _-80 _ closure. There were fewer saplings in percent mature upland conifer in the landscapethese stands than in more mesic stands, but greater surrounding the sample stands. Correlations with
diversity of sapling species, and more sapling-like mature upland conifer were comparatively weakShrubs. Bond (1957) speculated that the more evenly (0.05<P<0.10) and this variable explained a relatively
. branched and foliaged saplings in these stands small proportion of total variation (6% to 8%). This
90 GTR-NC-209

. is not surprising since young conifers rather than Blackburnian Warbler habitat in the literaturemature conifers are the primary breeding habitat of confirm this conclusion. According to de Kirilinethe species in this region. Lawrence (1953), its habitat requirements in Ontario
include mature stands of white pine, white and black lIt is likely that the Magnolia Warbler was responding spruce, hemlock, and red pine in that order of *to the understory conifer component within the importance. In the Appalachians, the species willsample stands whi'ch was not measured in this study, inhabit pine-oak vegetation (Harrison 1975),but is probably correlated with the percentage of however, when it is found in mostly deciduousmature upland conifer forest in the landscape forests, it is associated primarily with mature •surrounding the stands. In a landscape where there is coniferous trees within these areas (Morse 1989). Atmore mature upland conifer forest there will probably the Hubbard Brook forest in New Hampshire,also be more young conifers. Percent high canopy Holmes and Robinson (1981) report thatcover (negative correlation) and percent understory Blackbumian Warblers "only occur where there is atcover (positive correlation) explained the largest least one large conifer or preferably a clump ofproportion "oftotal variation in abundance of this conifers (specifically spruce) which is used forspecies (34% and 14%, respectively). These nesting and some feeding. In a study conducted invariables describe open forests with relatively dense Maine, Titterington et al. (1977) found theunderst0ry development (mostly young balsam). The Blackbumian Warbler most abundant on sitesMagnolia Warbler was positively correlated with characterized by a doase softwood overstory andbalsam, in all the bands and buffers. Balsam alone open forest floor (in other words, mature coniferousexplained from 4% to 15% of total variation in forest). They found a significant positive correlationabundance of this species on the study sites, between Blackburnian Warblers and softwood
(coniferous) trees with dbh greater than 20 cmAll ofthe variables to which the Nasheville Warbler (Titterington .etal. 1977). In New York, Webb et al.
responded represented an increasing conifer (1977) found that the numbers of Blackbumian•component within the sample stands (balsam and Warblers recorded on logged plots were significantlybirch) and in the landscape surrounding the stands below the numbers recorded on unlogged control(mature upland mixed forest). The Nashville plots. The Blackbumian Warbler responded equallyWarbler is found in a variety of forested habitats negatively to all levels of crown disturbance. Webbfrom black spruce/tamarack bogs and mature et al. (1977) concluded that the Blackburniandeciduous forests to recently cut areas (Green and Warbler "must be considered an indicator ofNiemi 1978, Niemi and Pfannmuller 1979, Hanowski undisturbed forest conditions, because it gave a fullandNiemi 1991). It is most abundant in conifer- negative response even to light levels of logging."dominated habitat with suitable shrub cover (Green
and Niemi 1978). In the present study, the proportion These results suggest that the proportions of mixedof mature upland mixed forest in the landscape and conifer forests in the landscape surrounding a
" surrounding the stand explained the largest forest stand are important in explaining the presenceproportion of total variation in abundance of this of some conifer-associated species within primarilyspecieswithin the sample stands (up to 33%). For deciduous forest stands. Bird populations often occurthese stands, it appears that the regional conifer in several habitat types on the same region (PuUiamcomponent (represented by mixed forest in the and Danielson 1991), however, there is evidence tolandscape matrix) influenced the presence of this suggest that reproductive success can vary inspecies in aspen-dominated deciduous stands, different habitats (Gates and Gysel 1978, Ambuel !
' and Temple 1983, Brittingham and Temple 1983). ifOf the species analyzed in this study, the According to Pulliam and Danielson (1991),
- Blackburnian Warbler responded most strongly to the "population size and growth rate may vary aspresence ot"mature upland conifer forest in the functions of the relative proportions of differentlandscape matrix. The relative abundance of habitat types available." Pulliam (1988) suggests thatBlackburnian Warblers was positively correlated in surplus individuals form highly productive "source"all the buffers and bands with balsam recorded within habitats (i.e., habitats that produce a net increase inthe stands, and with percentage of mature upland population through successful reproduction) mayconifer forest in the landscape surrounding the disperse into less productive "sink" habitats (i.e.,
• sample stands (partial correlation coefficients 0.14- habitats in which reproductive success is insufficient0.42). These results suggest a strong association to maintain a population). In such cases, hebetween the Blackbumian Warbler and mature concludes that "alterations in the availability ofuplandconifer habitats. Descriptions of source habitat may greatly affect the size ofo
Proceedings IBFRA Assn 1997 meeting 91

populations in other nearby habitats" (Pulliam and importance of specific tree species to certain birdDanielson 1991). species.
The result of the present study may be an indication lthat the conifer forests in the landscape surrounding CONCLUSIONS •the sample stands represent source habitats fromWhich surplus individuals are immigrating into the The results of the present study suggest that thenearby deciduous stands. It is possible that proportions of different forest types within a regiondeciduous forest stands represent sink habitats for are relatively unimportant to species that have •conifer-dePendent species, although thissuggestion is generalized habitat needs (e.g., Veery and Ovenbird)speculative, and requires further study. If conifer- provided that some minimum requirement of foresteddependent species occur in deciduous stands as a area is satisfied. When sufficient forest of (almost)resUlt of immigration from conifer forests in the any type is present, habitat structure within thesurrounding landscape, then the diversity of forest individual forest stand is the best predictor of
birds within a stand is partly influenced by abundance for these "forest habitat generalists."landscape-level management. Diverse forest birdpopulations would require the development or In contrast to the above conclusion, the results of thismaintenance of diverse forest mosaics at a landscape study provide strong evidence to indicate that thelevel, proportions of different forest types in the regional
landscape mosaic are important in explaining theindividual tree species appeared frequently in the distribution of some species that exhibit moreregression models calculated for this study. The specific habitat associations with a particular forestfrequency of balsam recorded in the sample stands type, especially conifer-associatedspecies. ThisWas correlated with the relative abundance of six of conclusion is supported by the presence of conifer-the seven species analyzed. Birch appeared in the dependent species like the Blackbumian Warbler inregression models for the American Redstart, the primarily deciduous forest stands, and by their highlyBlack-throated Green Warbler, and the Nashville significant correlation with mixed and conifer forestsWarbler. In a study of tree species preferences of in the landscape surrounding the stands.foraging insectivorous birds in New Hampshire,Holmes and Robinson (1981) found that the most Given the increasing demand for wood products,abundant bird species showed the least preference for timber harvest in Minnesota is unlikely to decrease in
• . specific trees, while those birds with the strongest the foreseeable future. How Minnesota's forests arepreferences for particular tree species were the least managed will have important consequences for theabundant in the forest. Common species were future of avian biodiversity in the state (Pfannmullerrelatively evenly dispersed throughout the forest, and et al. 1993). A relatively large proportion of theused different tree species roughly in proportion to original conifer component of Minnesota's foreststheir availability (Holmes and Robinson 1981). In was lost during the late 1800's and early 1900's as acontrast,_rarer species were widely scattered, and result of logging and the fires which often followedoften very localized in their distribution. Holmes and logging (Mladenoff and Pastor 1993). The results ofRobinson (1981) suggest that for the rarer bird the study presented here demonstrate the need tospecies, "their distribution and perhaps even their develop silvicultural methods to maintain andabundances may be linked to the presence and possibly increase the conifer component of forests indistribution of particular tree species, or at least to northern Minnesota. Balsam recorded within th_
' trees With similar physical characteristics." Because sample stands was positively correlated with th_the l_resence of specific kinds of trees appeared to be relative abundance of both Magnolia and
- of major importance at least to some bird species, Blackbumian Warblers. Thus the maintenance of•Holmes and Robinson (1981) concluded that the balsam or other conifer trees as components within
• implications• for forest management were significant, deciduous stands appears to be an important factor inThey cited the Blackburnian Warbler and the solitary enhancing avian diversity within these stands.
•Vireo as examples and suggested that "the removal of Natural aspen stands are often of mixed composition,coniferous trees from the Hubbard Brook forest including other hardwoods and conifers (Graham et
would probably result in the elimination of [these al. 1963). In many cases, species such as balsamspecies] from the community" (Holmes and Robinson have been eliminated in clear-cuts with short1981). The results of the present study support rotations (Mladenoff and Pastor 1993). Even-agedHolmes and Robinson's conclusions concerning the aspen stands often differ most from natural stands by
a lack of dominant conifers (Mladenoff and Pastor
92 GTR-NC-209
1993)J Theuse of partial cutting with an extended Anderson, S.H.; Shugart, H.H., Jr. 1974. Habitatrotation and a two-phase cutting cycle would selection of breeding birds in an east Tennesseeencourage the retention of a conifer component forest. Ecology. 55" 828-837.within thesestands (Mladenoffand Pastor 1993).Moreover, the retention of conifer stands within the Blake, J.G.; Karr, J.R. 1984. Species composition of Alandscape would enhance the diversity of wildlife bird communities and the conservation benefit of "populations that depend on conifer habitats and also large versus small forests. Biologicslinfluencespecies diversity within deciduous stands in Conservation. 30:173-187.these landscapes.
Bond, R.R. 1957. Ecological distn'bution of breedingbirds in the upland forests of southern Wisconsin.
ACKNOWLEDGEMENTS Ecological Monographs. 27:351-384.
Funding for this project was appropriated by the Brewer, R.; McPeek, G.A.; Adams, R.J., Jr. 1991.Minnesota State Legislature from the Environmental The atlas of breeding birds in Michigan. EastT_st Fund as recommended by the Legislative Lansing, MI" Michigan State University Press.Commission for Minnesota Resources. Additional
funding was provided by the United States Forest Brittingham, M.C.; Temple, S.A. 1983. HaveService, N0rth-Central Forest Experiment Station, cowbirds caused forest songbirds to decline?and the Chippewa and Superior National Forests. BioScience. 33! 31-35.The research was completed aspart of Minnesota'sForest Bird Diversity Initiative, a cooperative project Collins, S.L. 1983. Geographic'variation in habitatof the Minnesota Department of Natural Resources structure of the Black-throated Breen Warblerand the Natural Resources Research Institute of the (Dendroica virens). The Auk. 100: 382-389.
UniverSity of Minnesota, Duluth.• De Kiriline Lawrence, L. 1953. Notes on the nesting
JoAnn M. Hanowski, Janet C. Green, Lee A. behavior of the blackburnian warbler. WilsonPfannmuller, David J. Mladeno_ Ronald R. Regal, Bulletin. 65" 135-144.
and Donald P. Christian all provided helpfulsuggestions at the design stages of the project. John Ehrlich, P.R.; Dobkin, D.S.; Wheye, D. 1988. TheBonde, Jim Sales, Paul Meysembourg and Tim birder's handbook: a field guide to the naturalAunan furnished invaluable assistance with the history of North American birds. New York,*NY:technical aspects of the GIS analysis. The aerial Simon & Schuster, Inc.photo interpretation was completed by Brian Allen.Special thanks to Ann Lima who devoted many hours ESRI, Inc. 1991. ARC,rlNFO user's manual.to assisting with the statistical analysis. Helpful Environmental Systems Research Institute, Inc.,
. suggestiom for improving this manuscript were Redlands, CA, USA.provided by Lee A. Pfannmuller.
• Galli, A.E.; Leck, C.F.; Forman, R.T.T. 1976. Avian, .
distribution patterns in forest islands of differentLITERATURE CITED sizes in central New Jersey. The Auk. 93" 356-
364.
Addictot, J.F.; Aho, J.M.; Antolin, M.F.; Padilla, !. D.K.; Richardson, J.S.;and Soluk, D.A. 1987. Gates, J.E.; Gysel, L.W. 1978. Avian nest disoersion
Ecological neighborhoods: scaling environmental and fledgling success in field-forest ecotones. 1¢. patterns. Oikos. 49:340 346. Ecology. 59:871-883.
Alberts,D.H. 1992. Distortion: a problem in single Graham, S.A.; Harrison, R.P.; Westell, C.E., Jr. 1963.aerial photography. GIS World, Inc. Nov: 50-51. Aspens: phoenix trees of the Great Lakes region.
Ann Arbor, MI: University of Michigan Press.
Ambuel, B.; TemPle, S.A. 1983. Area-dependentchanges in bird communities and vegetation of Green, J.C. 1991. A landscape classification forsouthern Wisconsin forests. Ecology. 64: 1057- breeding birds in Minnesota: an approach to1068. descn_oing regional biodiversity. Loon. 63" 80-91.
o
Proceedings IBFRA Assn 1997 meeting 93

.
Green, J.C.; Niemi, G.J. 1978. Birds of the Superior Lynch, J.F.; Whigham, D.F. 1984. Effects of forestNational Forest. U.S. Department of Agriculture. fragmentation on breeding bird communities inForest Service, Eastern Region. , Maryland, USA. Biological Conservation. 28:
287-324.Haila, Y. 1986.North European land birds in forest •
fragments" evidence for area effects? In: Vetoer, MacArthur, R.H.; Wilson, E.O. 1967. The theory ofJ.; Morrison, M.L.; Ralph, C.J., eds. Wildlife island biogeography. Princeton, NJ: Princeton2000: modeling habitat relationships of terrestrial University Press.vertebrates. Madison, WI: University ofWiScons'm Press" 315-319. Martin, N.D. 1960. An analysis of bird populations in
relation to forest succession in AlgonquinHann, H.W. 1937. Life history of the ovenbird in Provincial Park, Ontario. Ecology. 41" 126-140.
s0uthem Michigan. Wilson Bulletin. 49: 145-237.Mladenoff, D.J.; Pastor, J. 1993. Sustainable forest
. Hano_ski, J.M.; Niemi, G.J. 1991. Monitoring bird ecosystems in the northern hardwood and conifer' populations on National Forest lands: Chippewa forest region: concepts and management. In:
•National Forest, 1991. CNF Rep. 1, NRRI/TR- Aplet, G.H.; Johnson, N.; Olson, J.T.; Sample,91/20. Duluth, MN: Center for Water and the V.A., eds. Defining sustainable forestry.Environrnent, Natural Resources Research Washington, :DC: Island Press."Institute, University of Minnesota.
Morse, D.H. 1989. American Warblers an ecologicalHanowski, J.M.; Niemi, G.J. (1994). Experimental and behavioral perspective. Cambridge, MA:
design considerations for establishing an off-road, Harvard University Press.habitat-specific bird monitoring program using
• point counts. In: Ralph, C.J.; Sauer, J.R.; Droege, Niemi, G.J.; Pfannmuller, L. 1979. AvianS., tech. Coords. Proceedings of the symposium communities: approaches to describing theirOn monitoring bird population trends by point habitat associations. In: Proceedings of thecounts; i991 November 6-7; Beltsville, MD. Gen. workshop on management of north central andTech. Rep. Psw-. Albany, CA: U.S. Department northeastern forest for nongame birds. Gen. Tech.OfAgriculture, Forest Service, Pacific Southwest Rep. NC-51. St. Paul, MN" U.S. Department ofResearch Station. (In press). Agriculture, Forest Service: 154-178.
,
.Hansen, A.J.; Spies, T.A.; Swanson, F.J.; Ohmann, Pearson, C.W. 1994. Effects of habitat and landscapeJ.L. 1991. Conserving biodiversity in managed patterns on avian distribution and abundance in
fOrests. Bioscience. 41" 382-392. northeastern Minnesota. Unpublished master'sthesis. University of MN, Duluth.
" Harrison, H.H. 1975. A field guide to birds' nests in• the united States east of the Mississippi River. Pearson, C.W.; Hanowski, J.M.; Lima, A.R.; Niemi,
• Boston, MA: Houghton Mifflin Co. G.J. 1993. Monitoring bird populations on• National Forest lands: Superior National Forest,
Hejl, S.J. 1992. Importance of landscape patterns to 1993. SNF Rep. 3, NRRI/TR-93/51. Duluth, MN:bird diversity: a perspective from the Northern Center for Water and the Environment, NaturalRockies. NW Environmental Journal. 8:119-137. Resources Research Institute, University of !
' Minnesota.Holmes, R.T.; Robinson, S.K. 1981. Tree species
- preferences of foraging birds in a northern Pfannmuller, L.A.; Niemi, G.J.; Mladenoff, D.;hardwoods forest. Oecologia. 48" 31-35. Hanowski, J.M.; Helle, P.; Lima, A.; Polzer, P.;
White, M.; Green, J.C. 1993. Effects of change inKah !, R.Bi; Baskett, T.S.; Ellis, J.A.; Burroughs, J.N. the forest ecosystem on the biodiversity of
1985. Characteristics of summer habitats of Minnesota's northern forest birds. Technical
selected nongame birds in Missouri. Res. Bull. Report prepared for the Legislative Commission1056. Columbia, MO" University of Missouri for Minnesota Resources for the FY92-93Columbia, College Of Agriculture, Agriculture Biennium, M.L. 91, Chapter 254, Art. 1, Sec. 14,Experiment Station. Subd. 9.0.
94 GTR-NC-209

Probst, J.R.; Rakstad, D.S.; Rugg, D.J. 1992. Shugart, H.H.; James, D. 1975. Ecological successionBreeding bird communities in Lake States aspen of breeding bird populations in northwesternstands. U.S. Ddepartment of Agriculture, Forest - Arkansas. Auk. 90: 62-77.Service, North Central Forest Experiment Station.
at
Contact author for copies P.O. box 898, Titterington, R.W.; Crawford, H.S.; Burgason, B.N.Rhinelander, WI 54501. 1977. Songbird responses to commercial clear-
cutting in Maine spruce-fir forests. Journal ofPU"!liamlH.R. 1988. Sources, sinks, and population Wildlife Management. 43: 602-609.
regulation. American Naturalist. 132: 652-660.Urban, D.L.; O_eill, R.V.; Shugart, H.H., Jr. 1987.
Pulliam, H.R.; Danielson, B.J. 1991. Sources, sinks, Landscape ecology. Bioscience. 37:119-127.and habitat selection: a landscape perspective on
population dynamics. American Naturalist. 137 Vetoer, J. 1986. Summary: predicting effects of(Supplement): $50-$66. habitat patchiness and fragmentation: the
researcher's viewpoint. In: Vetoer, J.; Morrison,Reynolds, R.T.; Scott, J.M.; Nussbaum, R.A. 1980. M.L.; Ralph, C.J., eds. Wildlife 2000: modeling
A variable circular-plot method for estimating habitat relationships of terrestrial vertebrates.bird numbers. Condor. 82: 309-13. Madison, WI: University of Wisconsin Press:
327-329.
Roblsins, C.S. 1979. Effect of forest fragmentation onbird populations. In: Proceedings of the workshop Webb, W.L.; Behrend, D.F.; Saisorn, B. 1977. Effecton management of north central and northeastern of logging on songbird populations in a northernforest for nongame birds. Gen. Tech. Rep. NC-51. hardwood forest. Wildlife Monographs. 55.St. Paul, MN: U.S. Department of Agriculture,Forest Service: 198-212. Whitcomb, B.L; Whitcomb, R.F.; Bystrak, D. 1977.
' Long-term turnover and effects of selectiveRobbins, C.S.; Dawson, D.K.; DoweH, B.A. 1989. logging on the avifauna of forest fragments.
Habitat area requirements of breeding forest birds American Birds. 31:17-23.of the Middle Atlantic States. Wildlife
Monographs. 103. Whitcomb, R.F.; Lynch, J.F.; Klimkiewicz, M.K.;Robbins, C.S.; Whitcomb, B.L.; Bystrak, D. _
.Robbins, S.D., Jr. 1991. Wisconsin birdlife: 1981. Effects of forest fragmentation on avifaunapopulation and distr_ution past and present, of the eastern deciduous forest. In: Burgess, R.L.;Madison, WI: University of Wiscconsin Press. Sharpe, D.M., eds. Forest island dynamics in
man-dominated landscapes. New York, NY:Rosenberg, ICV.; Raphael, M.G. 1986. Effects of Springer-Verlag: 125-205.
forest fragmentation on vertebrates in Douglas-firforests. In: Vetoer, J.; Morrison, M.L.; Ralph, Whitcomb, R.F. 1977. Island biography and "habitatC.J., eds. Wildlife 2000: modeling habitat islands" of eastern forest Introduction, Americanrelationships of terrestrial vertebrates. Madison, Birds. 31: 3-5.WI: University of Wisconsin Press: 263-272.
Wilcove, D.S. 1985. Nest predation in forest tracts !SAS. 1988. SAS, Release 6.06, SAS/PC, Release and the decline of migratory songbirds. Ecology.
' 6.04. SAS Institute Inc., Cary, NC 27512-8000 66: 1212-1214. wU.S.A.
•Sherry , T. W. 1979. Competitive interactions andadaptive strategies of American Redstarts andLe_t Flycatchers in a northern hardwoods forest.
•Auk. 96:265 283.
°
Proceedings IBFRA Assn 1997 meeting 95

SURVEY OF WOODLAND KEY HABITATS
Mikael Nor6n _
A
WOODLANDKEY HABITATS IDENTIFIED IN competence, implement ecologically-adapted forestryTHE SWEDISH FORESTS methods, and that they are prepared to accept
responsibility, e.g., by voluntarily setting aside stands
A survey is being made Of the entire Swedish forest for free growth. Society's main task is to disseminatelandscape in searching for areas with high nature knowledge to the forest owners and to ensure that"values. These areas are called Woodland Key they comply with legislation.Habitats and yield new knowledge on the status ofthe Swedish forest. The results of the survey will Achievement of forestry policy goals requires
provide the basis for ensuring that Sweden achieves knowledge of conditions prevailing in the forests,the goal of environmentally adapted forestry, where e.g., the nature values of the forest landscapes.
_conservation of biodiversity is of great importance. Knowledge of valuable forest landscape areas hasThe survey is financed mainly by the state. In earlier been inadequate. The survey of Woodlandaddition to locating tens of thousands of key habitats Key Habitats has provided an unexpectedly rich- many Of which were totally unknown earlier- the knowledge of the nature values of the forest.work has ledto a significant raising of competencelevels both of employees and forest owners withinSwedish forestry, particularly in the areas of WHAT IS A WOODLAND KEY HABITAT?conservation biology, landscape ecology andrecognition of species. The term Woodland Key Habitat indicates a quality
in the forest landscape in terms of the high naturalvalues of an area. The definition of a Woodland Key
FORESTRY POLICY Habitat is an area where one or more red-listedspecies occur, or the very nature of the forest itself
Swedish forestry policy changed markedly in 1993. should indicate a strong likelihood of finding red-The new policy approved by parliament consists of listed species. Species are grouped on the red list astwo forestry policy goals; a production goal and an either being Critically Endangered, Endangered,environmental goal. Both are of equal importance Vulnerable, at Lower Risk. The Swedish red list isand should be given equal weight in forestry. No compiled by the Swedish Threatened Species Unit at
the Swedish University of Agricultural Sciences andcontradiction in the two goals is implied and they are,in fact, compatible with one another. The is finally approved by the Swedish Environmentalenvironmental goal, for example, states that Protection Agency. It is not economically possible tobi0diversity shall be secured and that endangered search for species whilst making the survey. Thespecies and ecosystems must be conserved. The emphasis is rather on defining and describing the
forestry policy is aligned towards maintaining valuable habitats.multiple-use.aspects of the Swedish forest.Consideration must always be paid to nature in all A Key Habitat can theoretically be of any size, withstands irrespective of the silvicultural measures being quality being the decisive factor in setting the lirrlits.taken. _Silviculture and Consideration to nature A Key Habitat may be anything from a single ancient
Should, however, be adapted to circumstances found oak tree in the south, to a larger area of several _- in the different stands, meaning that nature hundred hectares of old coniferous forest in the
conservation is significantly more far-reaching in north. The term 'Key Habitat', as used in the survey,some cases than in others, lacks legal status and consequently, there is no
automatic legal protection against felling in
The ambition is that Swedish forestry policy will be Woodland Key Habitats.achieved chiefly on a voluntary basis by the forestrysector itself. This assumes that forest owners and the
whole forest industry will raise their levels of
i
• _Swedish National Board of Forestry, 551 83 JOnk6ping, Sweden
96 GTR-NC-209

°
THE SURVEY Presence of these species indicates that the
environment may be suitable for red-listed species.Surveys are being carried out throughout the whole
of the forestry sector. The Swedish Forestry Other important grounds for assessment of possibleAdministration has been commissioned by the habitats are the history of the forest, its age, and the "
government to conduct inventories of Woodland Key degree of influence, plus the presence of certain typesHabitats on small-scale forestry areas, which of tree. An important question is whether or notcorrespond to about half the forest area. All of the there has been unbroken forest continuity on the site,County Forestry Boards throughout the country are if it has been forestland since time immemorial or "
workingonsystematic surveys. Surveys not. In general, forests of great age and with longcommissioned by the state were started in 1993 and forest continuity have higher nature values.shouldbe Completed by 1998, at a cost of about US$
t3 million. The remaining areas are surveyed and During the survey, information is registered in apaid for by the responsibility of the companies database with details of the location of the Keythemselves. This division of responsibility has been Habitat, the soil type, the habitat's tree varieties, theachieved on a voluntary basis. As a result, there is no forest structure in detail, indicator species and red-legal obligation that requires the forestry sector to listed species.carry out inventories of Key Habitats. The Swedish
Forestry Administration is responsible for training,education and support as well as follow-up of this WHAT ARE THE WOODLAND KEYpart of the survey work. Surveys of Key Habitats in HABITATS?areas with large-scale forestry are expected to be
completed by 2003. The method chosen in Sweden is principally adapted• to the managed forest landscape. Key Habitats are
The compilers Often have higher education in forestry often found as fragments or 'island' habitats, that
and are especially trained in knowledge of different often differ greatly from the surrounding landscape.species and the recognition of habitats for this They may be remains of the natural landscape or ofassignment, old forest stands, or forest stands with long forest
continuity. Many environments with long forestThe survey is conducted in two stages. First, the continuity are to be found in agricultural landscal_esCompilers search source material in different archives created by man in the transitional areas between
for'possible Key Habitats. These are then assessed in forests and farmland. Physical factors such as airthe field and sites with sufficiently high nature values humidity conditions, may also be fundamental in Keyare defined and described as Woodland Key Habitats. Habitat quality.
. Main emphasis is placed on the survey work doneon-site. Important components in the preparationstage include, forestry classification material, forestry TIIE RESULTSplans, maps, infrared-air photographs, and knowledge
that. can be obtained from landowners or voluntary So far, the results show that the Woodland Keynature conservation societies. After the preparation Habitats account for less than 1% of the total area of
work has been carefully completed, about 5% of the productive forestland. The final result of the survey !
. whole forest land area is visited on-site, may show a total number of 60,000-80,000 Key ip' Habitats spread throughout the country's 23 million
. Searcliing for Key Habitats is very much a question hectares of productive forestland. They appearof detective work. Most of the Key Habitats are unevenly in the landscape. In certain districts largeUnknown. They are often relatively small and off the areas of forest are of Key Habitat quality, while other
-beaten track in the forest. Fallim tree trunks, high sections of the landscape more or less completelystumps, stumps of broad-leaved trees, old trees, rocks lack Key Habitats. Generally speaking, Key Habitatsand rock faces, and water courses, are all examples of are larger in the north of Sweden than in the south.structures that are decisive for assessing whether or Habitats in the north also increase in size from east to
. not red-listed species can be expected or not in the west. The number of key habitats per 1,000 ha varieshabitat. Several species that indicate high nature significantly and is greatest in parts of southernvalues are used in the project. The existence of Sweden.indicator species tells us a lot about the habitat.
Proceedings tBFRA Assn 1997 meeting 97

THE ROLE OF THE LANDOWNERS
The landowner is informed as quickly as possiblewhen a Woodland Key Habitat is discovered, and
given advice on how the nature values of the Key wHabitat may be conserved. Naturally, the intention isthat nature values of the key habitat shall remain inthe future. The interest and wishes of the landownertoconserve the natural values are of fundamental
importance.
Volunta_ efforts are important for the conservation•of Key Habitats. A number of Key Habitats may fallwithin the scope of legislation on nature conservation
_according to the Forestry Act. In some cases,decisions in accordance with the Nature Conservation
Actmay be applicable. If habitat protection involvesa significant deterioration in the on-going use of theland, the landowner has the right to compensation.
Many Key Habitats have to be left totally untouchedin order to keep their values. In some cases, bufferzones may be needed, e.g., felling in an adjacentstand. In some Key Habitats, it may be possible toextract timber. Occasionally, appropriate
management inputs may be necessary in order toretain certain habitat characteristics or species on-site.
• KEY HABITATS AND THE FUTURE
The Woodland Key Habitats can be seen as coreareas for biodiversity. They account for the majorshare of biodiversity, in relation to their
comparatively small areas. The results of the surveyWill play a major role in many ways, not least inforestry planning of both real estate and in alandscape perspective. The new knowledge providedby the survey will be an important tool in our effortsto achieve environmentally adapted forestry for many !
' years to come.• i1
98 GTR-NC-209

.
- FOREST ECOSYSTEM RESEARCH NETWORK OF SITES (FERNS)
D.A. MacIsaac I and L Wood2
ABSTRACT.--The Canadian Forest Service framework for a national suite of research sites *
(CFS) has organized a national network of that are focused on the development ofresearch sites, named the Forest Ecosystem innovative forest management practices andResearch Network of Sites (FERNS). These understanding of ecosystem processes at thesites are focused on the study of sustainable stand level.forest management practices and ecosystemprocessesat the stand level. This network The overall goal or mission of FERNS is topromotes this research nationally and provide and promote a network of sites,internationally, improves linkages fimong sites, representative of major Canadian forestpreserves the long-term research investments ecosystems, for long-term multi-disciplinary
. alread3_made on these sites and provides a forum research on forest management practices.
for information exchange and data sharing. FERNS has three specific objectives: promoteWhile the CFS coordinates and promotes forest management practices research nationallyFERNS, the network consists of local and internationally, improve linkages amongautonomous partners nationwide who benefit sites, and preserve the long term researchfrom the FERNS affiliation through increased investments already made on these sites.Vis_ility for their sites.
FERNS promotes Canadian forest managementpractices research as well as the individualresearch sites both nationally and internationally,
• INTRODUCTION using traditiorial print media as well as the latestelectronic technology. Individual FERN Sites
Forests cover almost one-half of the land mass of are examples of high quality forestry practicesCanada and 10% of the global forest cover is research.located within our borders. As a result, Canadafinds itself at the center of the growing FERNS provides researchers and students with ainternational debate on the environment. Science set of well-characterized and liked sites across •
: .has a critical and increasing role to play in this Canada on which to work. By providingdebate. As a nation, Canada is being evaluated opportunities for comparative and collaborative
internationally against complex criteria such as research, FERNS also fosters partnershipseffects of forestry practices on ecosystem between governments, universities and industry,
. productivity, ecosystem processes and long term and serves as a national communication toolbiological diversity. Because of the complexity between researchers and with forest managers.of these issues, as well as the inherent The network also links researchers working atcomplexity of forest ecosystems themselves, the various sites as well as providing a forum formultidisciplinary and multi-partner approaches information exchange and data sharing. In thisto forest ecosystem management research have regard, FERNS is fostering a sense of
•become the norm in the 1990's. community among forest ecosystem 11management researchers in Canada. In addition,
' Across Canada, long-term multi-disciplinary at the national and international levels, the irforest management research sites and studies are network is linking forest managers to
" already in place, but the linkages between the researchers.individual sites has not yet been made. Thenetwork of sites, named the Forest Ecosystem FERNS is helping to protect the investmentResearch network of Sites (FERNS), is the made in the installation of long-term stand
ID.A. MacIsaac, Natural Resources Canada, Canadian Forest Service, Northern Forestry Centre,5320-122 Street, Edmonton, AB, Canada T6H 3S5 Phone: (780) 435-7332 FAX (780) 435-7359. E-Mail:dmacisaa@nrcan, gc. ca.
2j. Wood, Natural Resources Canada, Canadian Forest Service, Pacific Forestry Centre, 506 WestBurnside Road, Victoria, B.C., Canada V8Z 1M5 Phone: (250) 363-6008 FAX (250) 363-0775. E-Mail:
• [email protected], ca.
Proceedings iBFRA Assn 1997 meeting 99

manipulation studies, the gathering of extensive CFS researchers and partners in industry,biophysical databases, and the conduct of site- provinces and universities.specific studies. Although FERNS does notprovide funds, the association of each site to the The CFS will contribute to the coordination andnetwork will enhance its visibility and its ability promotion of FERNS, but it must be recognized •to attract funding from agencies or from that the network will consist of a collection ofindustrial partners, local partners across the country that have come
together freely to achieve things which exceed
A newglobal scientific culture is emerging in what any one of them, individually, could •which archiving and inter-connectivity of data achieve. As such, each site will continue tosets isbecoming increasingly important, operate autonomously. Where a benefit can beResearchers are now being encouraged to make recognized, however, sites may act together as atheir data available for wider distribution once network. Partnerships and links betweenthescientific paper has been published. In the FERNS and national and international programsfuture, FERNS may be able to play an important will be encouraged.data management role by providing a means to
synthesize and integrate the scientificinformation across a number of sites. ESTABLISHED FERN SITES
The attached map (fig. 1) indicated establishedCHARACTERISTICS AND CRITERIA FERN Sites across Canada as of August 1997,
with the numbers below corresponding to the
Each FERN Site possesses a number of numbers on the map.characteristic features. For example, theresearch conducted on FERN Sites" Pacific Maritime Ecozone
• Addresses forest harvesting options and 1. Montane Alternative Silvicultural Systemsecosystem functioning aimed at sustainable (Vancouver Island, British Columbia)forest management; Contact:
• Is multidisciplinary and multi-partnered; and Dr. AI Mitchell, Pacific Forestry Centre,• Is sound ongoing research. Canadian Forest Service, Victoria, B.C.
Phone: (250) 363-0600
FERN Sites must be: E-mail: [email protected].
• Well documented with good historical standand site information; Salal Cedar Hemlock Integrated Research
• Accessible; Program (SCHIRP) (Vancouver Island, British
• Located in a forest that is representative of Columbia)one of the major forested ecozones in Contact:
• Canada; and Dr. Cindy E. Prescott, Project Leader• Protected for long-term research values. Faculty of Forestry, University of BritishColumbia, Vancouver, B.C.
Phone: (604) 822-4700In addition, FERN Sites must include areas of
E-mail: [email protected] ttmature forest where natural successional stages Website:
can. be observed and/or investigated, http://www.forestry.ubc.ca/schirp/homepage., whtml
CANADIAN FOREST SERVICE ROLEBill Beese, MacMillan Bloedel Ltd., Nanaimo,
Tile Canadian Forest Service (CFS) is the largest B.C.national forest science organization in Canada Phone (250) 755-3422
E-mail: [email protected] has a mandate to address both national and Website:
international issues affecting forests and forestry http://www.pfc.cfs.nrcan.gc.ca/practices.mass•practices. There is a need to bring together keyresearch activities and to provide a framework Montane Cordillera Ecozonefor a more integrated Canada-wide approach to 2. Sicamous Creek Silvicultrual Systems Projectforest ecosystem management research among (southern interior, British Columbia)
100 GTR-NC-209

Proceedings iBFRA Assn 1997meeting 101

°
Contact: Contact: Dr. A1 Cameron, Great Lakes ForestryAlan Vyse, BC Ministry of Forests, Kamloops, Centre, Canadian Forest Service, Sault Ste.B.C. .Marie, ON
Phone (250) 828-4183 Phone: (705) 949-9461 A 'E-mail: [email protected] E-mail: [email protected]"
http://www.hre.for.gov.bc.ca/grops/kamloops/sic 8. Scott and Swan Lake Forest Researchrule.html Reserve
(central Ontario)3. Lodgepole Pine Management Study (southern Contact:interior, Britlsh Columbia) Dr. Bill Cole, Ontario Forest Research Institute,Contact: Ontario Ministry of Natural Resources, Sault Ste.Roger Whitehead, Pacific Forestry Centre, Marie, ONCanadian Forest Service, Victoria, B.C. Phone: (705) 946-2981 Ext. 113Phonic: (250) 363-0600 E-mail: [email protected]: [email protected]
9. White Pine Silvicultural Study (centralDr. Les Safranyik, Pacific Forestry Centre Ontario)Canadian Forest Service, Victoria, B.C. Contact:
. Phone (250) 363-0600 Steve D'Eon, Petawawa Research Forest,E-Mail: [email protected] Canadian Forest Service, Chalk River, ON DWebsite: http://nrcan.gc.ca/cfs.proj/sci- Phone: (613) 589-3009 Jtech/arena/styr_e.html E-mail: [email protected].
Taiga Plains Ecozone 10. Lac Duparquet Research and Teaching4. Muskeg River Silvicultural Study (Liard Forest (northwestern Quebec)Valley, Northwest Territories) Contact: Dr. Yves Bergeron, Universit6 duContact: Qu6bec h Montreal, PQDerek Sidders, Northern Forestry Centre, Phone: (514) 987-3000 Ext. 4872Canadian Forest Service, Edmonton, AB E-mail: [email protected]: (403) 435-7355 Website: www.pfc.cfs.ncrcan.gc.ca/practicesE-mail: [email protected].
11. Montmorency Experimental Forest (St.Boreal Plains Ecozone Lawrence Region, Quebec)5. Hotchkiss River Mixedwood Timber Contact:
Harvesting Study (northwestern Alberta) Dr. Louis Belanger, Laval Univeristy, St. FoyContact: PQDan Maclsaac, Northern Forestry Centre, Phone: (418) 656-2131 Ext. 6110Canadian Forest Service, Edmonton, AB E-mail: [email protected]: (403) 435-7332E-mail: [email protected]. Dr. Brian Harvey, Universit_ du Quebec en
Abitibi-T_miscamingue, PQBoreal Shield Ecozone Phone (819) 762-0971 ext. 2361 j6. Black Sturgeon Boreal Mixedwood Project E-Mail: [email protected](north-central Ontario) Web site: http://web2.uqat.uquebec.ca/ferld/ IFContact:AlCameron, Great Lakes Forestry Centre, 12. Glide Lake (western Newfoundland)Canadian Forest Service, Sault Ste. Marie, ON Contact: Dr. Doyle Wells, Atlantic Region,Phone: (705)949-946 f Canadian Forest Service, Comer Brook, NFE-mail: [email protected] : Phone _.(709)686-5038Website: _ E-mail: [email protected]/practices/fems/hotchkiss.htm Atlantic Maritime Ecozone
13. Acadia Experimental forest (south-central7. Turkey Lakes Silvicultural Study New Brunswick)(northeastern Ontario) Contact: Edwin Swift, Atlantic Forestry Centre,
102 GTR-NC-209

• • Canadian Forest Service, Fredericton, NB CURRENT STATUSPhone: (506)45_2-3175E-marl: eswifi@_can.gc.ca There is solid and growing support for FERNS
from research partners both inside and outside of ,14. FaUingsnow Ecosystem Project (north- the CFS. Since an initial set of FERNS sites was tcentral Ontario) announced early in 1997, there have been severalcontact: new additions to the Network.
F.W. Bell, Project Co-ordinatorPhone: (705) 946-2981 x225 In August 1997, an Interact web site was ,E-mail: [email protected] launched to profile FERNS. This web site is
access_le through the Canadian Forest Service,R.A. Lautenschlager, Co-ordinator Pacific Forestry Centre home page atPhone: (705) 946-2981 x228 . http://www.pfc.forestry.ca orE-mail: [email protected] http://www.pfc.cfs.nrcan.gc.ca.. This interact
site includes information on individual FERN
16. The Hayward Brook Project (southeastern sites, as well as linkages to collaborators.New BrunsWick)
Contact: Dr. Gerry Parker, Canadian WildlifeService, Sackville. NB TO OBTAIN MORE INFORMATIONPhOne: (506) 364-5045Website: For further information about FERNS contact
http://www.pfc.cfs.nrcan.gc.caJpractices/fems/ Chris Lee, FERNS Coordinator, Canadian Forestacadia/acadia.htm Service, Pacific Forestry Center, Victoria, British
Columbia, Canada. Phone: (250) 363-0600. E-l 6. The Date Creek Silvicultural Systems mail: [email protected]. To obtainResearch Project (north-central B.C.) information on an individual site, the specificContacts: Dave Coates, Project Leader contact person listed in this document can beB.C. Forest Service, Smithers, B.C. contacted.Phone: (250) 847-7436E-Mail: [email protected] For assistance in accessing the FERNS web sitehttp://www.pfc.cfs.nrcan.gc.ca/practices/FERNS/ contact Chris Lee (contact information listed
• date/date.htm above) or Rod Maides, Communications,Canadian Forest Service, Pacific Forestry Centre,
Phil LePage, Research Silviculturalist, Victoria, British Columbia, Canada. PhoneB.C. Forest Service, Smithers, B.C. (250) 363-0737. E-Mail:Phone (250) 847-7437 [email protected]: Phil. LePat_et_errks8. _ov.bc. ca•Website:• .
• " http://www.pfc.cfs.nrcan.gc.ca/practices/FERNS/date/date.htm
17. Fallingsnow Ecosystem Project (northcentral Ontario) I)
Comacts: F.W. Bell, Project Coordinator ip' Phone: (705) 946-2981- x225
- E-mail:
R.A. Lautenschlager, Co-ordinatorPhone; (705) 946-2981 x228E-mail: [email protected]
o
Proceedings IBFRA Assn 1997 meeting 103

SIMULATION OF HETEROGENEOUS UNEVEN-AGED STANDS DYNAMICS UNDER HUMAN-INDUCED DISTURBANCE
D
S.I. Chumachenko _V.V. Syssouev, M.M. Palyonova, M.A. Bredikhin, V.N.Korotkov 2
ABSTRACT.-- In the framework of a complex DBMS and GIS accumulate and process the attribute
information system (DBMS, GIS, MODEL) for a and spatial information for the forest object, and ,forest management unit (FMU) a simulation model MODEL develops the forest dynamics forecasting.was devel0ped, which describes the growth dynamics The most important feature of this model is the ofof heterogeneous uneven-aged stands as a function of strata position and influences between strata.their spatial and ontogenetic structure. It can be usedfor forecasting stand growth both in natural and
artificialforests in stable and disturbed habitats. The MODEL DESCRIPTIONinput and output data are represented in the form of•standard inventory descriptions and forest plans. A The per-stratum data bank and cartographic bank ofseries of simulation calculations under human- plans and cartographic materials of the forestinduced disturbance was carried out using as planning and inventory works are used as initialexamples forests in a FMU in the Moscow Region. information for the forecast module of the model.
For individual forest management units these dataexist in the form of information systems (DBMS or
Complex investigations carried out in recent years GIS). As a result of the model processes similar(Smirnova 1994, Kirikov 1979), showed that forests information is Obtained from the different databases.
• in the central part of European Russia developed To take into account bioecological processes in realessentially under human-induced disturbance and at forest communities, a large number of reference datapresent there are no undisturbed woods in the zone of bases is used within the simulation. The main onesconiferous-broad-leaved and deciduous forests. Now are listed below.
among the old forests one can see the results ofvarious anthropogenic impacts such as burning, 1. Bioeeologicai characteristics of speciesfelling, and uprooting. Better understanding of the development. The information, compiled l']aprocesses that brought contemporary forests to such a these data bases, was assembled as a result ofstate, facilitates simulation of different patterns of literature analysis and long-term natural researchtheirtransformation. The methods of mathematical studies (Smirnova et al. 1990, Smimova 1994).modeling allow us to solve the problems of stand Also the accumulated experience of mixedtransformation taking into account the historic land uneven-aged stands simulation is taken into
exploitation of the territory. The quality of these account (Chumachenko 1993). For the model• methods enables us to make long-term forecasts (one development reference bases are created for
cutting cycle and more), and, therefore, to elucidate species main bioecological parameters separatelythe results of _mthropogenic impacts that occurred far for each stage of tree development of each
in the past When compared to the duration of species. These reference bases were compileddeveloPment of tree edaphicators, proceeding from the concept of discrete !
• description of ontogenesis (Cenopopulation...i¢This paper describes simulation of the impact of 1988). The application of this concept for the
" historical land exploitation on the growth of forest simulation of complicated stands gives morecoenoses Under different silvicultural treatments, authentic results than with fixed biological
•The problem was solved within the framework of the parameters for the whole period of ontogenesis.program complex DBMS-GIS-MODEL, in which These reference bases are listed below"
|
! Sergey I. Chumachenko. Moscow State Forest UniversiO_, 1 Institutskaya, 1, MytischL 141001, Russia, e-mail: [email protected].
2 Vladislav V. Syssouev, Maria M. Palyonova, Mikhail A. Bredikhin, Vladimir N.Korotkov All-RussianResearch and Information Centre for Forest Resources, Novocheremushkinskaya, 69, Moscow, 117418, Russia, e-
mail: ¢[email protected].
104 GTR-NC-209

Im
ii!
Ii2. Crown biometrics characteristics. The crown used, the light intensity during daylight being taken []
form is approximated by a combination of into account. The differentiation of light flow is |elementary bodies of rotation: cone and determined not only by azimuth, but also by height of _"cylinder. One model peculiarity is that it takes the sun above the horizon and quantitative relation
into account the internal crown space (shadow between direct and scattered radiation. Data about • ]1cone), in which there are no photosynthetic average long-term quantity of sunny (cloudy) days inelements (Nosova et al. 1995). The comparison the region during the vegetative period; aboutOf stand development at different densities has conditions of clouds and dust in the daytime; andshown, that growth in height depends on light about weakening of natural light by general air "availability at the activegrowth zone and not at pollution were also used.the top of a tree. The active growth zone is apart of the tree crown, where the large share of There are two different approaches to calculate lightits green biomass is concentrated, in the regime under the canopy layer. At the basis of thereference base this zone is given by the position first one is the fact that in practically every forest_ofthe_shadow cone in,the tree crown. Besides there are patches of sunlight. The frequency of theirthese ones are used the following reference appearance and duration vary, depending upon standbases: density and species composition (Tsel'niker 1978).
Thus, at the basis of the approach proposed by T.3. Demand for light (shade tolerance) (Alekseev Nilson et al. (1977) tothe description of radiation
,1975 Tserniker 1978). weakening under heterogeneous plant cover there is a tcalculation made by means of random value that
4. Crown transmittance of light. (Alekseev defines whether the direction of a light beam through1975). the crown.
,5. Distance of seed dispersal (Udra 1990). The second approach is based on the idea of a"muddy" layer, i. e. solar radiation passing through
6. Sprouting ability (Udra 1990, Smirnova et al. an absorbing layer is partially weakened. In1990). numerous works (Botkin et al. 1972, Shugart et al.
1974, Karmanova and Abramov 1990), in which the
7. Yield tables (YT) (Kozlovsky and Pavlov problems of light intensity influence on tree growth_1967); local yield tables or those obtained on the are considered, different modifications of Monsi-bases of inventory descriptions are preferrable Saeki's relation are used to connect the light flow(Bredikhin 1985). with leaf surface area (Monsi and Saeki 1953).
When calculating shade density, notwithstanding theThe first stage of initial data transformation - the chosen methods, the following approaches toconstruction of a planar uniform grid - is carried out modeling stand canopy spatial heterogeneity arebY means of GIS (fig. 1). The square dimension is used: accounting for only horizontal and verticaldetermined by the geographical latitude of the district heterogeneity of stand canopy (Botkin et al. 1972,and by the height of the top stand story. So, for Shugart et al. 1974, Leemans and Prentice 1989) orexample, for Moscow latitude and stand height 30 m partial accounting for volume heterogeneitythe area is about 270 m2. As a result the complicated (Korzukhin and Ter-Mikhaelyan 1982, Pacala S.W. !
, eonfigurati0n of each stratum in the plan is et al. 1995).approximated by a set of elements, having properties wof the stratum, to which they belong. Further theelement is divided vertically into cells 2 - 2.5 m tail.
The cell (from the point of view of simulation) is aniadivisible minimum unit of the three-dimension
space. Such representation of the simulated spacepermits us to take into account both self shadowing,and shadowing from adjacent elements during thedaily solar movement.
To Calculate light availability astronomical data aboutsolar radiation at given latitudes of the district are
Proceedings IBFtLA,Assn 1997 meeting 105
m
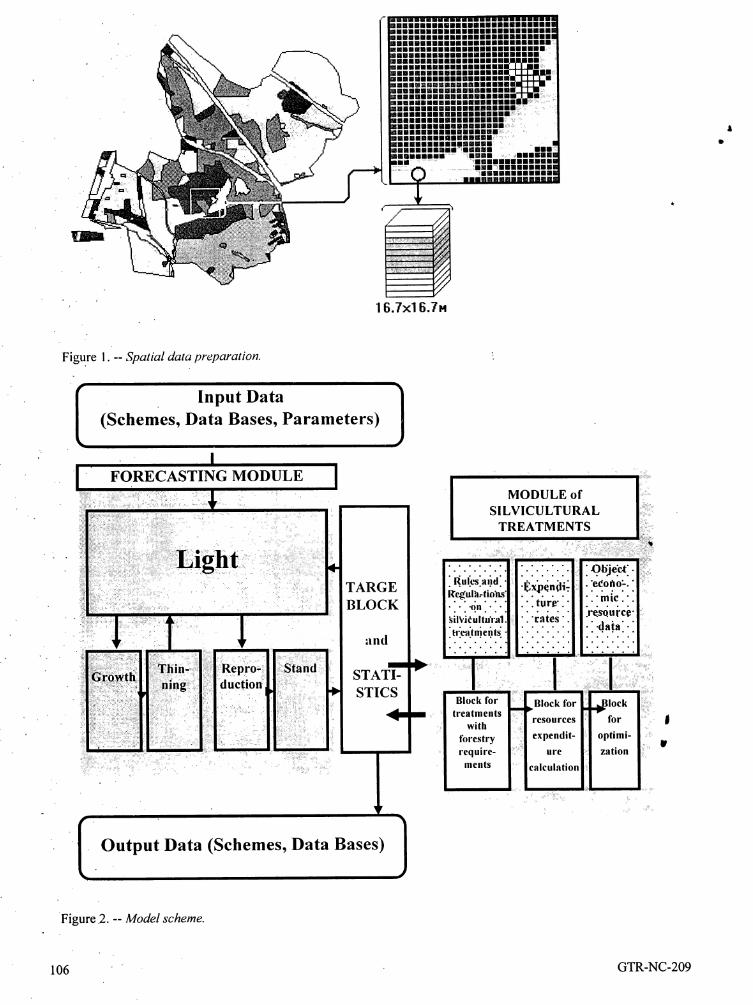
Figure I. -- Spatial data preparation.
Figure 2. -- Model scheme.
106 GTR-NC-209

In the proposed model each cell is represented by a available moisture and soil active nutrients, with the
semiopaque volume, therefore it is better to use the use of the following main assumptions.idea of a ',muddy" layer (volume), where a part of
the light is absorbed passing through it, according to The dependence of bioproductive process on habitatMonsi-Saeki's relation, conditions may be presented by a bell-form •
distribution -- schematically this dependence can beFrom the point of view of block "Light" work the described by a system of second-power equations ofstate of a cell is defined by the following parameters three variables, namely moisture amount in air
for eachspecies: their quantity, average height, drainage zone; sum of temperatures; and a "crown length, its form and penetrability. For each hydrothermic factor that describes the relationcell the shares of species and tree age present are between heat and moisture (Pusatchenko 1987). Forcalculated, thus are formed the set of "muddy" layers each kind of plant these functions have(fig. 2). approximately the same form, but differ by
appropriate constants.In the model sets of point light sources are situated at
fixed places of the firmament, which have The "Thinning" block includes two main options ofprecalculated values of solar radiation. When behavior of the model: endogenic thinning, as a
calculating the cell light availability an account is consequence of intra- and interspecific competitivetaken not only ofthe adjacent cells, but also of other relations, and thinning as a result of exogenousnear-by ones through which the light is passing at a factors. The endogenic thinning is simulated by threedefinite angle at a certain moment in the day-time, consecutive operations. First, the model searches andThus, to calculate the light regime for the lower excludes from the element those specieswhich do notcanopy 14 elements are used, and 15 if self- reach the habitus typical for a given species at a
•shadowing is to be taken into account, for a total of given age (for the lowest of site classes available).•more than 160 cells. The model also excludes species that have reached
the maximum age, according to YT data. Second,The simulation model of multispecies uneven-aged because of light being the main limiting factor in thestand dYnamics consists, of several target blocks (fig. model, for each species in the given stratum element2). The "Light" block begins each step of the a factor of increment loss during one step issimulation and determines the light availability in calculated. The factor in the model is defined as a,each cell of the modeled space (fig. 2). The ratio of the real increment to that from YT. The
calculating algorithm of light availability is described dying off criterion is the calculated factor beingthoroughly by Chumachenko (1993). reduced below the given level (in the present version
of the model-- 10 %).Using data about growth of individual species in the
stand; the "Growth" block calculates for each element Third, to maintain tree density below critical valuesthe current increment of the species by diameter and (according to biological parameters), the "Thinning"height, taking into account the element position and block executes the recalculation of tree number
its light maintenance. It is assumed in the model, that within an element. In each story the zone of bestthe main factor affecting the tree growth under the competition for space -- a cell with maximum crownforest canopy is the light availability. Other cover, and accessible area for crown growth -- is 1t
. important factors (such as available moisture and soil determined. The redistribution of area in story is ufertility) are modeled as rather stable integrated executed at the expense of intercrown clearance and
. (average for 10 year) characteristics of the element begins with shade-tolerant species. In such way,and are taken into account when species biological supersede more intolerant, changing the proportionquality are determined for each stratum. The of areas occupied by each species.-methods of defining biological 'site classes for stands,
typical in various growing conditions, are still Thinning as a result of exogenic factors includesdeveloped insufficiently. In the present version of anthropogenic, technogenic, and other externalthe model the table of greatest possible site classes effects on the simulated species. The conditions offor the prevailing species is built by an expert in additional thinning can be incorporated at any step,interactive mode on the basis of initial inventory data and they are selective ones. In the last version of theand relief Characteristics, by taking into account model they are taken out of the model into the block
• "Target blocks and statistics". After simulation of
ProceedingS IBFRA Assn 1997 meeting 107

thinning, light availability of each cell is recalculated main groups of habitats" flat and gently sloping hillywith simultaneous changes in crown height for some plains and those of ravine and fluvial valley slopes.species in the.element. The morphology of the landscape is complicated by
I_ng economic use that causes the original plantin the block "Reproduction" the quantitative structure, including the woody one.valuation of young growth appearing is made. Theintensity of germ motion occurrence depends on the The sample object area is about 600 ha. Forests,degree of remoteness of theelement from seed trees typical for the middle part of European Russia, are
of the given species and the light conditions of their growing there. On the basis of ancient maps (XVIII -development. The opportunity of coppice young XIX cc) the history of forest range formation has •growth in the element is also simulated. In view of been followed. The central part of the forest rangevarious speed of growth and ontogenesis duration, (55% of its area) is covered by broad-leaved forestsand different YTs for coppice and seedling stands, with prevalence of lime and oak of 70-100 years old,the calculations for them are carried out separately, that have appeared at durable forest lands as a result
, of repeated felling. These lands have not beenAfter processing of each step of the model, the ploughed during at least the last 200-300 years. Atelement contains characteristics for species and age the periphery of the forest range, there are birchstructure Of the stand and its biometrics parameters: forests of 60-80 years old (45% of the area), that
species, stem iquantity, age and age condition, have arisen on arable land since the middle of theaverage height of tree and average crown height, XIX century and undergone several harvest cycles.average stem diameter, crown canopy and crownform, achieved (calculated) site class. Besides theseare calculated stock and stand density. These data SIMULATION RESULTSare basic for the work of various applied blocks,external to the main model. By means of the rules In this examle stand dynamics were simulated undergiven in the model the block "Target blocks and two kinds of external forestry effects: (1) finalstatistics" carries out samples, performs statistical felling only, when the stand reaches its maturity ageprocessing, executes the assembly of elements into and (2) combined cleaning cutting and final felling.inventory strata and prepares the information for As a result of the model process per-stratum datarepresentation to DBMS and GIS. bases are obtained of the sample forest range for 10
steps of simulation (100 years) according to ttketwoThe submitted imitation model is an open one, i.e., it options of external effects.permits to add various target blocks. Such blocks(e.g., stimulating final felling of variousconfigurations, cleaning cutting, etc.) can be attached Stand Stock Dynamies for the Territoryat any step of the model work. The model permits as a WholeSimulation of the effect of various catastrophicfactors (fires, blowdowns, etc.) and forest In the first case of simulation (simulation of clearmanagement influence (final felling, cleaning cutting, final felling), the dynamics of standing crop changesforest regeneration measures, etc.), was closely connected with the dynamics of birch
stand timber volume. In consequence of this felling,
' at the 8th step of the simulation a sharp increaselof' SAMPLE OBJECT birch stock occurred. The share of valuable
- species -- spruce and seedling oak-- under sucll aFor checking the model work the forest range of regime of management remains at a very low level.Kor0bovsky forest district was chosen This is part of
" the Natural-historic reserve forest-park "Gorky". The second simulation differs, because in thisThe territory is located on the Moscow-Oka plain (in scenario the simulation of cleaning cutting is added.the south of the Moscow Region) within the spruce- The main difference of this variant from the previousbroad-leaved forest zone. The landscape structure of one is the smooth increase in the share of valuablethe territory is characteristic of the moraine- species (spruce and seedling oak) in the stand
fluvioglacial plain" flat interfluves, covered with structure. It should be noted, that when executingloam soils, divided by river and stream valleys, built cleaning cutting the birch and aspen stocks are at a
• bydeluvial and alluvial deposits. Thus, there are two lower level, than in the first case. Besides that, the
108 GTR-NC-209

i/regular execution of cleaning cutting ensures a durable forest lands the share of valuable and other
constant volume of cut wood of not less than 50 species is 59% by stock, while on arable lands it isthousand cubic m for-each step of the simulation, only 3%. The stocks of soft-wooded broad-leaved m,
II
it
slJecies on these lands are correspondingly 41% and97% (fig. 3). ,,
Stand Stock Dynamics for Territories with IDifferent Exploitation History..
In connection with the different history of presentforest territory Use we have already a different
eomp0sition (by Stock) at the zero step. So, on
; 41% 21. A • A97%
40010 019%
30/000/0 t
' 83% 91% 98%
-- 47o/° 47%
6% 17°/o0o/o 8O/olO/o 2%0%
l_.soft-wooded broadleaved // hardwood _ otherspecies
Figure. 3. -- Stand species composition (by stock) on durable forest land (1), on arable land (2):A - zero step of simulation |
B - 8-th step (with cleaning cutting andfinalfelling) lrC- 8-th step (only final felling)
Proceedings IBFRA Assn 1997 meeting 109
/

aO
1. 2.% A % A
70 70
i I •60 60 t-50 50 .,-
40 40
30 30
1.0 100-, : : , : :!, : , : , t I i 0 , , ,n,B................ I"I I I I
1 3 5 7 9 11 i3 1 3 5 7 9 11 13
7o % B 7o % C 7o % B 7o % C
60 t 60 i 60 6050 50 50 5040 40 40 40
• t.,,,. . Ii ! g• 20 • 20 20 20
10 10 10 _ 10o, ,-,.,,-,.,=,,,.,,,,,, , , , , , ,, o-,, , ,, , , ...., , ,=,=,, o , ,,-,-,,e,.,.,,,., , , , , ,,',,,_,. o,, =.,.,-==-==-,-,,=,1 4 7 10 13 1 4 7 10 13 1 4 7 10 13 1 4 7 10 13
Figure 4. -- Stand age structure (by area) on durable forest land (1), on arable land (2),the axes,of x - age class, the axes of y -percent of area
A - zero step of simulationB - 8-th step (with cleaning cutting and final felling)C - 8-th step (only final felling)
Such a distinction in initial simulation conditions Forest Age Structureinfluences the final results. Under equal scenarios offorest management, different results have been For the present stand age structure (fig. 4) a shaOObtained for territories with different pre-history. So, domination of 70-80 year old stands is typical that ison d_able forest lands the share of valuable and due to the final cutting at the beginning of the X_
" other species make up 48% under final felling and century. For regular forest the area distribution bycleaning cutting, and only 9% when cleaning cutting age classes is even. From the figures it is seen thatare absent, Just as on arable lands those shares make the model well describes the goal-oriented humanup 17% and 2%.. impact by means of cleaning cutting that leads to the
improvement of the age structure of the valuableThe simulation confirmed the observations from species. However, at first such treatments must beforestry data, that to obtain a greater share of applied on arable lands (fig. 4).valuable species, where there are none, it is necessaryto plant forest cultures, especially on arable lands.
.
110GTR-NC-209

CONCLUSION Kozlovski, V.B.; Pavlov V.M. 1967. Yield tables ofmain forest species. Moscow: Lesnaya
The exploitation history of modern forest lands is : promyshlennost. 540 p. (in Russian).essential for understanding the species composition •
of contemporary forest ranges and their age structure. Leemans, R.; Prentice, F. 1989. FORSKA a generalTherefore, for rational forestry management all forest succession model. Uppsala. 60 p.silvicultural treatment plans have to take into account
the land exploitation history. The suggested Monsi, M.; Saeki, T.1953. Uber den Lichtfactor in •
mathematical model of heterogeneous uneven-aged den Pflanzengesell-scajten und seine Bedeutungstanddynamics may be used for elaborating impacts fur die Stoffproduktion. Jap.Journal of Botany.of human disturbance (in the framework of 14" 22-52.
silvicultural treatments) and for forecasting stand
growth both in nature and artificial forests in stable Nilson, T.; Ross, V.; Ross, Yu. 1977. Some problemsand disturbi_d habitats, of plant architectonics and plant cover. In:
Transmittance of solar radiation by plant cover.Tartu" 71-144 (in Russian).
LITERATURE CITED
Nosova, L.M.; Phrantsuzov, A.V.; Chumatchenko,Alekseev, V.A. 1975. Forest light regime. Moscow: S.I. 1995. Modelling of stand biomass structure
Nauka. 228 p. (in Russian). of forest ecosystem. In" Problems of monitoringand modelling forest ecosystem dynamics.
Botkin, D.B.; Janak, J.F.; Wailis, J.R. 1972. Some Moscow: Ecos-lnform" 244-251. (in Russian).ecological consequences of a computer model of
forest growth. Journal of Ecology. 60(5)" 849- Pacala, S.W.; Canham, C.D.; Silander, J.A.; Kobe,873. Jr., R.K. 1995. Sapling growth as a function of
resources in a north temperate forest. CanadianBredikhin, M.A. 1985. Dynamics model of forest Journal of Forest Ressearch. 24:2172-2183.
growth. In: Mathematical modelling in
biogeocenology. Petrozavodsk: Karelian branch Pusatchenko, Yu.G. 1987. Some simplest problemsAcademy of Sciences of the USSR: 36-37. (in of water regime management in connection withRussian). ecosystem fuctioning. In: Influence of
hydrological regime on the structure andCoenopopulation of plants (essays on population functioning of biogeocoenosis. Syktyvkar: 5-9.
biology). 1988. Moscow: Nauka. 183 p. (in (in Russian).Russian).
Shugart, H.H.; West, D.C. 1977. Development of anChUmachenko, S.I, 1993. Basis model of dynamics Appalachian deciduons forest succession model
of muitispecies uneven-aged forest cenosis, and its application too the assessment of impactTransactions Of Moscow Forestry Institute. 248" of the chestmit blight. Journal of Environment
147-180. (in Russian). Manag. S." 161-179. !
' Kirikov, S._V.1979. Man and nature of Eastern Smirnova, O.V., ed. 1994. East European broad- ipEurope forest-steppe in the Xth - the beginning of leaved forests. Moscow: Nauka. 363 p. (in
" the XIXth centuries. Moscow: Nauka,. 181 p. (in Russian).Russian).
Smirnova, O.V.; Chistyakova, A.A.; Popadyuk, R.V.Korzukhin, M.D.; Ter-Mikhaelyan, M.T. 1983. and others. 1990. Population organization of
Model of muitispecies phytocoenosis under vegetation cover of forest territories. Pushchino:competition for light In" Investigations of Biol. Rearch Sci. Center of the USSR Acad. of
mathematical population ecology. Vladivostok: Sci. 92 p. (in Russian).100-1 15. (in Russian).
.
Proceedings IBFRA Assn 1997 meeting 111

Tserniker, Yu.L. 1978. Physiological bases of shadetolerance of woody plants. Moscow: Nauka. 212p. (in Russian)_
1
Udra, I.F. 1990. Plant population space-time •structure simulation on the basis of woody plants
dissemination peculiarities. In: Mathematicalmodelling of plant population and phytocoenosis.Moscow: Nauka: 104-105. (in Russian).
112 GTR-NC-209
m
ROLE OF DISTURBANCE IN .
BOREAL FORESTS
Disturbance by Insects
J
. i¢
°
°
113

1D
..
,.)
• .
!
• IP
-.
114
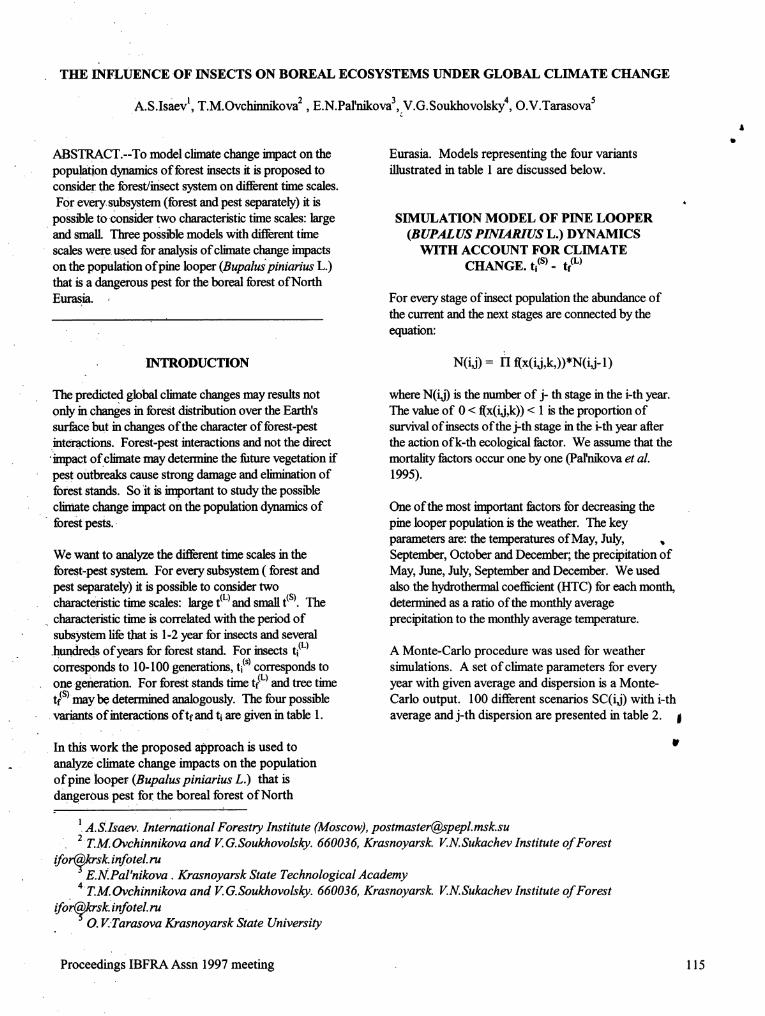
o
THE INFLUENCE OF INSECTS ON BOREAL ECOSYSTEMS UNDER GLOBAL CLIMATE CHANGE
A.S.Isaev l, T.M.Ovchinnikova 2 , E.N.Pal'nikova3,.V.G.Soukhovolsky 4, O.V.Tarasova 5
t
ABSTRACT.--To model climate change impact on the Eurasia. Models representing the four variants
population dynamics of forest insects it is proposed to illustrated in table 1 are discussed below.consider the forest/insect system on differenttime scales.For everysubsystem (forest and pest separately) it is
possible toconsider two characteristic time scales: large SIMULATION MODEL OF PINE LOOPERand small. Three possible models with different time (BUPALUS PINIARIUS L.) DYNAMICSscales were used for analysis of climate change impacts WITH ACCOUNT FOR CLIMATEon the population ofpine looper (Bupaluspiniarius L.) CHANGE. ti (s) - t(L)
that is a dangerous pest for the boreal forest of NorthEurasia. ; For every stage of insect population the abundance ofJ
the current and the next stages are connected by theequation:
INTRODUCTION N(ij) = ri f(x(ij,k,))*N(ij- 1)
The predicted, global climate changes may results not where N(i.j) is the number of j- th stage in the i-th year.0nly in changes in forest dism_outionover the Earth's The value of 0 < f(x(i.j,k)) < 1 is the proportion ofsurface but in changes of the character of forest-pest survival of insects of the j-th stage in the i-th year afterinteractions. Forest-pest interactions and not the direct the action ofk-th ecological factor. We assume that the'impact of climate may determine the future vegetation if mortality factors occur one by one (Parnikova et al.pest outbreaks cause strong damage and elimination of 1995).forest stands. So 'it is knportant to study the poss_leclimate change impact on the population dynamics of One of the most knportant factors for decreasing theforest pests, pine looper population is the weather. The key
parameters are: the ternpemtures of May, July,We want to analyze the different time scales in the September, October and December; the precipitation offorest-pest system. For every subsystem ( forest and May, June, July, September and December. We usedpest separately) it is possible to consider two also the hydrothemml coefficient (HTC) for each month,characteristic time scales: large t(L)and small t(s}.The determined as a ratio of the monthly average
. characteristic time is correlated with the period of precipitation to the monthly average temperature.subsystem life that is 1-2 year for insects and several.hundreds of years for forest stand. For insects ti(L) A Monte-Carlo procedure was used for weathercorresponds to 10-100 generations, tiCs)corresponds to simulations. A set of climate parameters for every
• , one generation. For forest stands time tf(L)and tree time year with given average and dispersion is a Monte-tf(s}may be determined analogously. The four possible Carlo output. 100 different scenarios SC(i,j) with i-th
•variants ofinteractiom oftfand ti are given in table 1. average and j-th dispersion are presented in table 2. !
In this work the proposed approach is used to ir. analyze climate change impacts on the population
of pine looper (Bupalus piniarius L.) that is
dangerous pest for the boreal forest of North
l A.Silsaev. International Forestry Institute (Moscow), [email protected] T.M..Ovchinnikova and V.G.Soukhovolsky. 660036, Krasnoyarsk. KN.Sukachev Institute of Forest
ifo_sk, infotel.ruE.N.Pal'nikova . Krasnoyarsk State Technological Academy
4 T.M. Ovchinnikova and V.G.Soukhovolsky. 660036, Krasnoyarsk. KN.Sukachev Institute of Forest
[email protected]. ruO. V..Tarasova Krasnoyarsk State University
Proceedings IBFRA Assn 1997 meeting 115

Table 1.-Differentpossible models of the climate change impact onforest-pest system.
Pest _ Forest
Small tf Large tft
ti(s) . t[ s) ti(s). tf0_)
Small ti Models of tree response to leaf Simulation models ofpopulation dynamics,damage by insects the search for analogues data in the past
ti_) . t[ s) ti0_). tft_)
Large ti Unreal Biogeographical analysis0
The values Q correlate with different climatic zones in the populations with rare occasional outbreaks. On thethe Krasnoyarsk region: North (1,2), Low Angara (3,4), contrary, this ratio is large for the populations withCentral part near Krasnoyarsk (5,6), South (7- 10). Two regular outbreaks. It is clear from fig. 4 that the warmerlocations have been used in our model: Krasnoturansk climates with higher scenario numbers experience more(South of Krasnoyarsk region) and Motygino (Low frequent outbreal_.
Angara). In Krasnoturansk the pine looper has in regularOutbreaks in.the pine forests. In Motygino there have The difference of climate in the south of the Krasnoyarskbeen no outbreaks in over a large forest area according region and the region of the city of Krasnoyarsk is clearlyto long time investigations, shown by the HTC for May (2.8 for south and 4.5 for
Krasnoyarsk). Under the warming in May of 2° C -3° C• Typical outputs of the model for Krasnoturansk and and the 20%-30% decrease in precipitation that is
Motygino are shown in fig.1. In Krasnoturansk quite proposed by some scenarios of global climatic change,regular peaks in the insect density occur with an average the central part of Krasnoyarsk region may become moreperiod of about 10 years; this model output with suscept_le to outbreaks of pests of the Central Siberia
experimental observations of cyclic outbreaks of pine forest and the outbreak areas will increase. For the pinelooper in the South of Sl_eria. For Motygino the looper the border of this area may reach 560-57° north
• average and maximum values of the insect density over a latitude._large time period are rather low and the cyclicoscillations are absent. The dispersion dependence is more complicated. For
SC(7-10j) the increasing dispersion of climateTo reveal the periodicity in the population dynamics we parameters decreases the number of outbreak years while
" have used a Fourier spectral analysis of the time series, for SC(2-4j) increasing increases the number of•In fig. 2 the spectral density of the scenario SC(10,10) outbreak years. Scenarios SC(5-6j) correspond to thewith maximal temperature and dispersion is giverL The intermediate dynamics without dependence on theclearly defined peak shows a periodic increase of dispersiorL We conclude that for warmer climates thepopulation density with a period of 10 years, the large increasing dispersion results in stabilization of population•amplitude of the peak confimas that it descnqaesthe dynamics and for colder climates it has a destabilizationoutbreaks. In fig. 3 the spectral density of the scenario role. !
' SC( 1,.1)with minimal temperature and dispersion is ugiven. The low value of spectral density in comparison
" with SC(10,10) and the smearing of the peak indicate the BIOGEOGRAPHICAL ANALYSIS OF THEabsence of regular oscillations of population density with PINE LOOPER POPULATION titL)- tftL)small deviations fi'om average number. It is explained bythe colder and wetter climate. An increasing area ofinsect habitat is one of the effects
of the climate change on the insect population. So it isA very important characteristic of the population invortant to analyze the connection of local environmentdynamics and the insect effect on forests is the ratio of and the population numbers. The data on the populationthe number of years above the critical density of dynamics ofphilophagous insects Krasnoturansk (South
population in the outbreak regime to the total time of Krasnoyarsk region) in the period 1979-1994 have• interval under investigation. This ratio is not large for been analyzed by a multidimensional statistical method.
116 GTR-NC-209

Table 2.--Climatic data for model scenarios, average (a), dispersion (b).
N Temperature (CO) Precipitation (mm) HTC
scenario July October December June July December May July Septembera) average parameters
10 20 3 -12.2 20.1 33.1 7.4 2.7 2.7 2.79' 19.6 2.4 -13.5 22.2 36.6 9 3 3 3 "8 19.2 1.8 - 14.9 24.5 40.4 11 3.3 3.3 3.37 18.8 1.2 -16.4 27.1 44.7 13.5 3.7 3.7 3.76 18.4 0.6 .-18.2 30 49.4 16.4 4.1 4.1 4.15 " 18 0 -20.1 33.1 54.6 20.1 4.5 4.5 4.54 17.6 -0.6 -22.2 36.6 60.3 24.5 5 5 5
, 3 ; 17.2 -1.2 -24.5 40.4 66.7 30 5.5 5.5 5.5
2 16.8 -1.8 -27.1 44.7 73.7 36.6 6 6 6
I 16.4 -2.4 -30 49.4 81.5 44.7 6.7 6.7 6.7II_ 19.4 2.7 -16.4 47 49.4 I0 -2.8 2.9 3.6
122 18.2 -1.4 -20.9 32.1 49.4 32.1 5.5 5 6.1
b)dispersionofIogorithmsofparametersI 1.5 3 0.01 0.2 0.6 0.I 0.2 0.2 0.2
•2 1.6 3.4 0.06 0.25 0.55 0.15 0.25 0.25 0.25
3 1.7 3.8 O.II 0.3 0.5 0.2 0.3 0.3 0.3
4 1.8 4.2 0.16 0.35 0.45 0.25 0.35 0.35 0.35
5 1.9 4.6 0.21 0.4 0.4 0.3 0.4 0.4 0.4
6 2 5 0.26 0.45 0.35 0.35 0.45 0.45 0.45
7 2.I 5.4 0.31 0.5 0.3 0.4 0.5 0.5 0.5
8 2.2 5.8 0.36 0.55 0.25 0.45 0.55 0.55 0.55
9 2.3 6.2 0.41 0.6 0.2 0.5 0.6 0.6 0.6 "
I0 2.4 6.6 0.46 0.65 0.15 0.55 0.65 0.65 0.65
IIl 2 3.4 0.27 0.46 0.56 0.54 0.6 0.55 0.59
122 1.7 5.3 0.06 0.21 0.26 0.16 0.54 0.25 0.27•l Krasnoturansk
2 . M0tygillo
• .
!
• iF
Proceedings iBFRA Assn 1997 meeting 117

8o
E 60z._ 50_= .40.
_ ,
-_. 20
• JO. _ _ - "- .... ._ ..- , .. ',- • ,, L-_-----_
0 10 20 30 40 50 60 70 80 90
Years
Figure l.--Typical outputs of the pine looper model for two climatic scenarios: Krasnoturansk (thin line), and• Motygino (thick line).
1400 .................................................................
1200
.. _ 1000' ,mm
• .
g 800' a
-_ 600 #, ,mlt_ .
u' _¢_ 400
200 i
•
O .........
0 1 2 3 4 5 6 7 8 9 10111213141516171819202122232425
Period (years)• ..
Figure 2.--Spectral anlysis: SC (10, 1O).
I 18 GTR-NC-209

310 ...................................................................................
i
2,5
___>'2,0"C_
¢,.,= .,
m i,5•
"5.® 10
• 0,5
0,0 .......................................................................0 2 4 6 8 10 12 14 16 18 20 22 24
Period(years)
Figure 3.--Spectral analysis: SC (1,1)
v
20-u ,n
15 - -- - lO•-.-_- _ _ -'---1 _-- ' ---_ ---"--'.a 9
-"'-"-""--"--'__= ------=-__. tl
10- - '=- -- -=-=.---..-__.. it II
- - ---4"...... fi; ,t-- = _ , _..........4._.--.----- _ __
• 5 "
2.5- _ - 4
- _ 3.:2.1. - - - - _ ' 7 ,. , . -
° 1 :_ _ 4 _ 6 7 8 9 16
Figure 4.--The ratio of number of years _th population of pine looperpupae above the critical density 15 p/m 2 asa fraction of scenario dispersion number. Parameters at the right indicate scenario average number.
ProceedingS iBFRA Assn 1997 meeting l 19

Table 3.--Parameters of habitat in Krasnoturanskpine forest.
N Parameter , Number of habitatof habitat I II III IV V
1 Maximum temperature of June 19 34 35 40 57 *2 Maximum temperature of July 25 30 42 44 523 * Maximum temperature of August 20 29 34 50 55
4 Maximum temperature of September 16 18 22 26 45 ,5 Relative humidity, % 84 79 68 66 666 Absolute humidity of soil, mm 124 13 5 4 37 Maximum daffy difference of temperatures I 17 17 25 27 288 Altitude above the sea level, m 330 380 450 350 4309 Exposition 2 2 1 2 3 310 Steepness of slope 3 1 2 1 2 3
' Stand parameters:11 Average diameter, cm 21 25 18 22 2312 Height, rn 20 20 17 18 1913 Stocking 0.8 0.8 0:.9 0.7 0.8ITaken on soil surface.
21-north slope, 2 - fiat surface, 3 - south slope.
31- slope <5 °, 2 -slope 5°- 10°, 3 - slope 300-40°
The experimental areas in the Krasnoturansk forest have wanning in summer-autumn months of 2° on average• been chosen in 5 different landscapes (I - bottom, II - will increase the present optimal area for the pine
gently sloping, III - narrow watersheds, IV - dunes, V - looper fi'om 660 ha up to 1,200 ha.tops and steep slopes of hills).
The group of pine pests include: pine looper (Bupalus CLIMATIC CHANGE IN THE SOUTH OFpiniarius L)., Semiothisa liturata CI., Dendrolimus pini KRASNOYARSK REGION AND ITS EFFECT
• L., Gilpinia virens Kt and Hyloicus morio Rotsch. et ON PINE LOOPER OUTBREAK. ti(s) 2 tt(L)•Gord. A number of landscapes, climatic and inventoryparameters have been studied (table 3) by the principle Anthropogeneous factors have induced some localcomponent method (Isaev et al. 1997). climate changes that influence insect populations.
The study of such territories can give information on
•Tile first principal component accounts for 59.3% of climate change impact on population dynamicsthetotal dispersion of the habitats, the second (Pal'nikova et al. 1996). One such territory is the
component accounts for 22.7%. So the two first Minusinsk valley in the South of Krasnoyarsk regionprinciple components take more than 80% of total where a large water reservoir of the 300 km lengthdispersion. The correlation of the first principal was established in 1964. The climate change due to•components for every landscape with the multiyear the reservoir is the following: the averagevalues of the abundance ofBupalus piniarius L., temperature and precipitation inperiod 1965-1988 i_
Dendr.olimuspini L., is shown in fig. 5. the same as in 1937-1965 years while the lpcharacteristics of associations between temperature
" The analysis of the contributions of different climatic and precipitation have changed greatly (fig.6). Theparameters from table 3 to the 1st and 2nd principal percent of years with both dry and warm Augustscomponents has revealed that in response to some decreased _om 44% in 1937-1964 years down tomicroclimatic changes in different landscapes due to 13%atter 1965, the percent of dry and warmglobal climate change the redismqautionof the pine Septembers decreased ti-om 37% to 21% in the samelooper to more uniform population density across time.various landscapes ispossl_ole. The increase ofsummer-autumn average tenaperature and decrease A dry and warm August-September period is one of
, of precipitation is expected to result in increasing the key factors associated with the pine looperarea of pine looper outbreaks. For example, a outbreaks. After 1937 four large outbreaks of the
120 GTR-NC-209

I
i[]m
|
, , _ ' , , , , ,, _ ] ' , .,, .............. ,.....
• 2,5 -- , ' '0• • |
• _
¢_'E- ,,L_:
< I LI 0,5 ,-_..-.--*,.._"_ _ "row iN law _I
I
-4 -3 -2 -1 0 1 - 2 3 4
First principal component
Figure 5.--The average abundance of the Bupalus piniarius L., (dashed line) and Dendrolimus pini L. (solid line) as•a function of the first principle component.
50% , i. i 1 1937-1964 rn 1965-1988 years ]
40%
30%
_20%
.10%
0%, , ,August September May-July .November-
December
Figur e 6.--The changes in the ratio of dry and warm months before and after the water reservoir construction in1964.
. o
Proceedings IBFRA Assn 1997 meeting 121

pine looper have been observed in that area: in 1944, Really pl and p2 are the parts of times, then the leafhave1954, 1962 and 1974. Since 1974, pine looper every ofthe states sl and s2.
outbreaks have not been observed. It is quite
reasonable to associate this fact with the local It's possible to calculate the number of leaves damageclimate changes that reduced the number of years, during time t: •
which were appropriate for the outbreaks.(3) N = 2pt/(2 +/z)
THE MODEL OF LEAF RESPONSE ON THE If/t ---)0, and the reparation time z _ oo, the leafagerDAMAGE BY INSECTS tits) - t_s) first insect attack has the state s2, when it zsimposs_le
for insects to consume the leaf tissue. If the process of
It is known that fast changes in chemical composition of leaf reparation is very fast, then/_ _ ooand N = At,i.e.,leaves occur in the process of interactions between trees the leaf damage number is proportional to the number of
and imects. These fast changes in leaves affect the attacks during time period t. In this case the leaf is notinsects' act'wity and decrease insect survival probability, resistant to insect attacks.Mathematically it is the case, when characteristic timeperiods of leaf state and insect state changes are equal In this model it is poss_le to simulate the influence ofand both small, climate changes on the character of"leaf-insect"
interactions by cb.anging the model parameters 2 and/t
A model has been proposed to describe "leaf-insect" in dependence of environment temperature T changes.interactions, where the effect ofleafant_iosis is taken Various trajectories of leaf damage number N(t) willinto account (Tarasova & Soukhovolsky 1996). It is exist depending on values ofd2/dT and the sign ofassumed in the model, that the leaf may have two states: dp/dT (fig.7).
. state sl, when its possible for insects to consme theleat_and state s2, when, alter increases in the levels of I. d2/dT > 0, dp/dT > 0. In this case according (3)
secondary compounds in the leat; insects do not dN/dT > 0 and with the temperature increasingconsume the lea£ the leaf damage number will be increase (fig.7,
curve 1).
The flow of insect, which attacks the leat_has the II. d2/dT < 0, d/t/dT < 0. In this case according (3)intensity 2 and we assume that two or more insects do dN/dT < 0 and with the ternpemture hacreasingnot attack one leaf simultaneously. We assume that the the leaf damage number will be decrease (fig.7,
probability of insect attack at time moment t does not curve 2).depend on past history of interaction. In this condition III. dp/dT < 0, d2/dT > 0..the distribution of attack number during time intervals (0, IV. d/t/dT > 0, d2/dT < 0.0 is desc_ by a Poisson equation.
In these cases in dependence of values 2,/t, d2/dT and
Alter insects successful attack and the same quantity of d/t/dT various behaviour of N(T) curve is poss_le, forleafbiomass withdrawal the process of reparation in the example, N(T) curve will have maximum or minimumleaf begins and for a certain time _:the insect does not (fig.7, curves 3, 4).attack the lea£ The value of the mean reparation
. intensitylt = 1/z distributed according to the equation: The analysis of"leaf-insect" interaction repamtion_odelshows that in dependence of values of model parameters,
(1) tip) =/t *exp(-pT) d2/dT and d/t/dT sign it's poss_le both the incre_ing ofleaf damage by insect and the decreasing of insect
Let p l(t) = the probability of leaf state sl in time attacks intensity.
moment t, and p2(t) = the probability of leaf state s2 intime moment t. If we study a steady state "leaf-insect" More detailed information on physiological processes in
system, it ispossible to find the values o fp 1 and p2 using leaves and insects during ten-_emture changes isthe Kolmogorov balance equation: necessary for precise estimation of the "tree-insect"
interaction. But the model shows that increasing tree
(2) p 1 =/t/(2+p); p2 = 2/(2+/t) damage level and insect outbreaks are potentiallypossl_oleduring global climate changes. This work issupported by Russian Foundation for Basic Research,
.
122 GTR-NC-209

3No
4¢
2
.
J ........ v
To T
Figure 7.--Dependence on temperature of intensity of the leaf damage by insects. See text for description ofindividual curves...
grant 96-04-48340.
LITERATURE CITED
!saev, A.S.; Ovchinmkova, T.M.; Pal'nikova, E.N.;
Soukhovolsky, V.G. 1997. Positioning ofphyllophagous insect populations related tolandscape-ecological characteristics. Lesovedenie. 3:
• 70-73, (in Russian),
• Parnikova, E.N,; Soukhovolsky, V.G.; Artem'yeva,
N.V. i996. Whether the outbreak of forest insects !, will become.more fi'equent under the global climate
change? Siberian Ecology Journal. 6: 567-571. (in wRussian)..
Pal'nikova, E.N.; S0ukhovolsky , V.G.; Artem'yeva,N.V.;Taras0va, O.V. 1995. Pine looper populationdynamics model. Krasnoyarsk state technologicalacademy. 56 p. Preprint (in Russian).
Tarasov_ O.V.; Soukhovolsky, V.G. 1996. Statisticalmodel of the leaf-insect interaction. Mathematical
methods in biology. Novosfoirsk. 1996: 4-6.(inRussiaa).
.
Proceedings IBFRA Assn 1997 meeting 123

o
NOAMAVHRR DATA IN DETECTION OF INSECTS INDUCED CATASTROPHIC CHANGES INSIBERIAN TAIGA
V. I. Khftl_ 1, A.S. Isaev 2, Yu P. Kondakov t, A. G. Kozhuhovskaya l, andE.V. Fedotova I •
ABSTRACT.--In 1992-1996 -4).7 million ha of Abies The primary enemy of Siberian forests is Dendrolimus
sibirica, Pinus sibirica, and Picea obovata stands sibiricus, or S_erian silkworm (table 1). This pestalong the Yenisey meridian were affected by affects stands of fir (Abies sibirica), Siberian pine •Dendrolimus sibiricus. Historical aspect and causes (Pinus sibirica) (the preferred species) and larchof pest outbreaks were analyzed. Temporal (1995- (Larix sibirica).1996) scenes ofNOAA/AVHRR images were usedfor armlysis of outbreak dynamics. Damaged stands At the peak of an outbreak, spruce (Picea obovata)were detected, and heavy (50%-75%) and very heavy also could be damaged. A large-scale outbreak of_(>75%) levels of defoliation were classified. Siberian silkworm was observed in the south of theSummer/winter images were used for delineation of Yenisey meridian (Niznee Priangar'e) in 1992-1997.the northern border of the outbreak region. The total outbreak area was about 700,000 ha andApplication of AVHRR images for GIS generation, includes about 30..0,000 ha of 50%-100% defoliatedinsect "food b_e" estimation, and mapping potential stands. The mosaic of damaged stands is ofrisk of outbreaks is discussed, geographic scale and lies between 57° and 59 °
parallels and the 93 o and 98 o meridians. Thecatastrophic scale of this outbreak needs adequatemethods of detection and control. The purpose of
INTRODUCTION this paper is the analysis of potential applications of• broad-view satellite images for pest monitoring.
The Yenisey fiver meridian (-_90° E) forests are thehabitat of many insect species, periodic outbreaks ofwhich caused decrease of the growth increment, STUDY SITE AND METHODSforest decline, and mortality over vast areas. Pests
are among the primary factors determining forest Historical data (1920-1995) of Siberian silkwormsuccession in Siberia. Table 1 lists the main outbreaks were used for class_g the potential levelLepidoptera species which produce outbreaks in of damage for the Yenisey meridian forests. DuringSiberian forests. The reported damage varies from the latest Dendrolimus sibiricus outbreak the main5,000 to more than 1 million ha. In table 1 the values damaged stands were concentrated in the region ofof pest danger were categorized as high (I), medium Niznee Priangar'e, between the Yenisey and the(II) and low (III). Pest danger depends on the size of Angara rivers (fig. 1). Relief of the territory is a platoaffected territories, level of defoliation, and tree with low hills. Soils are mainly podzol. Climate isspecies. Pests that damage evergreen conifers are continental. Annual precipitation is 400 mm-450 mm.considered very hannfial (grade I), as the latter are Mean annual temperature is +2.6 o Celsius withhighly sensitive to defoliation and are the source of absolute minimum -54 o (December) and maximumvaluable wood. Low-harm pests feed on broad leaf +36 o (July). Vegetative period is about 100 days,species and larch; which can survive atter 2-3 Forest covers 95% of the territory. Dominant speciesconsequent years of complete defoliation. Exceptions is S_erian fir (Abies sibirica); other species are •
. are the field protection forest strips because of their represented by Siberian pine (Pinus sibirica), spruceimportance and because they are often growing in (Picea obovata), pine (Pinus silvestris), larch (Larixextreme conditions, sibirica), aspen (Populus tremula), birch (Betula
verrucosa). Stands are of 3-4 site index with woodstock 200 m3-230m 3 and mean age 135 years. Time
I KI. Kharuk, Yu P. Kondakov, A. G. Kozhuhovskay, and E. v. Fedotova, Forest Institute, Academgorodok,
Krasnoyarsk, Russia, 660036. E-mail: ifot@_Jo'sk.infoteLru.2A.S. Isaev ,International Forestry Institute (Moscow). Email: postmaster@spepl, msk.su.
124 GTR-NC-209

series (1995-1996) of NOAA/AVHRR images on this classification were obtained using NDVI (differencearea were used for analysis. On-the-ground between second and first channels divided by its sum).resolution (pixel) of the images is about 1.1 km. The precision of classification was estimated by twoImage processing was done by IDRISI software, methods. (1) Test sites were occasionally four grades AData from all AVHRR channels (0.58-0.68; 0.725- (0%-25%, 25%-50%, 50%-75%, and >75%) for the •1.1; 3,55-3.93 _tm, and thermal IR channel) and their selected part of it. The best results of distn"outed over
combinations were analyzed. Supervised inventory map and classified image. The percentageclassification was based on Russian Federal Forest of omitted damaged sites and incorrectly includedService inventory maps. Ground truth data were undamaged sites on the image were calculated. (2) "obtained by standard technique and represent the Kappa statistic was calculated (Monserud andfollowing grades of defoliation: (A) two grades Leemans 1992).(50%-75%; and >75%) for the whole territory; (B)
Tab!e 1....Lepidoptera species which cause outbreaks in the Yenisey meridian forests.
Max. Danger levelMain outbreak
Insect species food territory, Forest zonesspecies thousand
Hectares South Mid Mountain Forest/
, taiga taiga forest steppe1. Dendrolimus sibiricus* fir, pine, > 1,000 I I I
larch,spruce..
2 Lymantria dispar* larch, 300 II IIbroadleaf
3. Orgyia antiqua larch, birch 40 III4. Dasychira abietis spruce, fir, 1,000 III III III
• pine, larch5. - Leucoma salicis* aspen, 100 III III III II
willow
6. Lymantria monacha* pine, spruce 5 II7. -Ectropis bistortata* spruce 400 II I8. Bupalus piniarius* pine 50 III I
9. Semiothisa signaria* spruce, fir 10 III II10. S'maiothisa continuaria larch 5 II III
11. Erranis jacobsoni* larch 50 II II12. Biston betularius birch 50 III
13. Phalera bucephala birch 50 III III II !. 14_ Clostera anastomosis* aspen, 10 III II
• willow w
15. Zeiraphera rufimitrana fir 100 III III
16. Coleophera dahurica larch 100 III II17. Zeiraphera griseana larch > 1,000 III III III
* Species which cause forest mortality.
Proceedings IBFRA Assn 1997 meeting 125

- very heavily damaged area (level of defoliation is>75%) increased from 884 pixels at the beginning
RESULTS _ of June 1995 to 3,053 pixels in the middle ofAugust. Omission, inclusion, and summary l
Along the Yenisey meridian Dendrolimus sibiricus errors were 7%, 10%, and 17%, respectively. •outbreaks were observed from the south border of the
Krasnoyarsk region (-52 °) till _-57° on the East side The classification procedure for figure 1 was made onof the Yenisey meridian and to 62° on the west side. the basis of a forest inventory map with two grades ofThe analysis of ecology, landscapes, and history of defoliation: heavy (50%-75%) and very heavy •outbreaks allows to delineate nine main regions of (>75%). As was shown above, two gradations couldDendrolimus sibiricus outbreaks (table 2, figure 1). be satisfactorily detected using AVHRR data. NextTheregions were ranged accordingto the following task was the following: if less defoliated stands couldcriteria: be detected? This problem was analyzed using a map
(fig. 3A) with four levels of defoliation: slight (0%-
1. The frequency ofpest outbreaks. It varies within 25%), moderate (25%-50%), heavy (50%-75%) andrange from 2 to 10 per century. Frequency range very heavy (>75%). Processed image (fig. 3B)•10-8 is grade I, range 7-5 is grade II, and range represents all levels of defoliation. There is some4-2 is grade III. visual similarity between on-ground (fig. 3A) and
2.. The size iaf the territory (S). It was classified as remotely obtained data (fig. 3B). On the other hand
small (grade III, S <10 thousand ha), big (grade only very heavy levels of damage have satisfactoryII, 100>S> 10 ha), and very big (grade I, S> 100 kappa statistics (kappa = 0.35). Poor statistics forthousand ha). heavy level may be explained by time shift between
3. The "food species." Value of fir for Dendrolimus satellite (16 August 1995) and on-ground (1 Augustsibiricus was assumed as I, Siberian pine as II, 1995) data obtained: during this period the level ofand larch as III. defoliation could increase. Moreover, the date of the
map generation evidently does not correspond to theThe total sum of these criteria was calculated and dates of on-ground measurements, since the latter was
used for the ranking the regions. Values 3-4 the durable process. All this led us to conclude thatcorrespond to the highest level of danger (I), 5-6 to the lowest detectable level of defoliation is about
the medium (II), and 7-9 to the lowest (III). Table 2 25%-50%, although it must be proved in future• wasused for generation of sketch-map of the level of investigations.
:pest outbreak danger in the Yenisey meridian forests(fig. 2). Regular application of remote sensing for pest
monitoring is based on summer images only, though
T.he latest (1992-1997) Dendrolimus sibiricus winter images have some potential advantages (e.g.,outbreak falls mainly into region 2 (table 2). AVHRR lack of errors caused by broad-leaf species and grass
images were applied for analysis of this phenomena, communities). To estimate the value of winter• It has shown that(fig. 1): images, the February 1997 image was used for
analysis; it includes the same territory as on figure 1.
1. The damaged territories could be detected. Figure 4 represents the result of its classification.2. At least two gradations of damage could be Damaged stands are clearly detectable on the snowI
•classified. The dynamics of outbreak during 1995 background, and three levels of the damage are(the year of the most intensive damage) is classified. The precision of classification was nobpresented on figure 1. Within the window on this evaluated. Visual comparison with a summer image
figure the statistic of damage size was calculated (fig. 1C) shows a similarity between them.(table 3). This table reflects dramatical changesin the size of the affected area. For example,
o
126 GTR-NC-209

Table 2.--Dendrolimus sibiricum outbreaks in the forests of the Yenisey meridian.
Regions Forest types Heights above Main species Territory of Frequency of Level of Asea level, m outbreaks outbreaks danger •
West Siberian plain region
1. Chulim-Ket south taiga 150-200 fir, S_erian pine I 10 IMid Siberian Plato region
21Priang_ south taiga 170-350 Fir I 9 I •3. Priyenisey mountain taiga 200-450 Fir I 7 I4. Kan-Birusa subtaiga- 200-350 Larch III 6 III
foreststeppe
Altai-Sayan mountain region5. Kan-Agul subtaiga- 350-500 Larch III 7 III
, ; foreststeppeblack taiga 450-800 fir, pine II 9 II
6. Kuznetz- subtaiga- 500-900 Larch I 10 IIAlatau foreststeppe
7. Sisim-Tuba black taiga 500-800 Fir II 4 II8. West Sayan black taiga 350-900 Siberian pine III 3 III
Fir
9. Usa subtaiga- 700-1,200 Larch III 7 III! foreststeppe
' I" " _. very heavily damagedstands i__ heavily damagedstands 20 kmI , II I
background
Figure 1. The dynamics of the Dendrolimus sibiricus outbreak.
Pr0ceedings IBFRA Assn 1997 meeting 127

Table 3.--The dynamics of the damage within the window onfigure 1.
Area in pixelsDate 7 June 1995 30 June 1995 16 August 1995
Very heavily damage 884 1,261 3,053 •Heavily damage 3,255 3,255 3,963Background 23,734 23,180 20,362
192° 1900
56 * 560100kmI-.-.4Level o f dangermlelir'JIII
- ,,"V Ri'n_.
5..2° 52 °.=
1920 190°
11
•Figure 2.--Sketch-map ofDendrolimus sibiricus outbreak danger in the regions along the Yenisey meridian (see alsotable 2).
A B
J
. ir
Islighntly damaged stands _ heavily damaged stands
_moderately damaged stands _ very heavily damaged stands
backgvatmd.
o
Figure 3.--Fragments of inventory map (A) and classified image (B).
128 GTR-NC-209
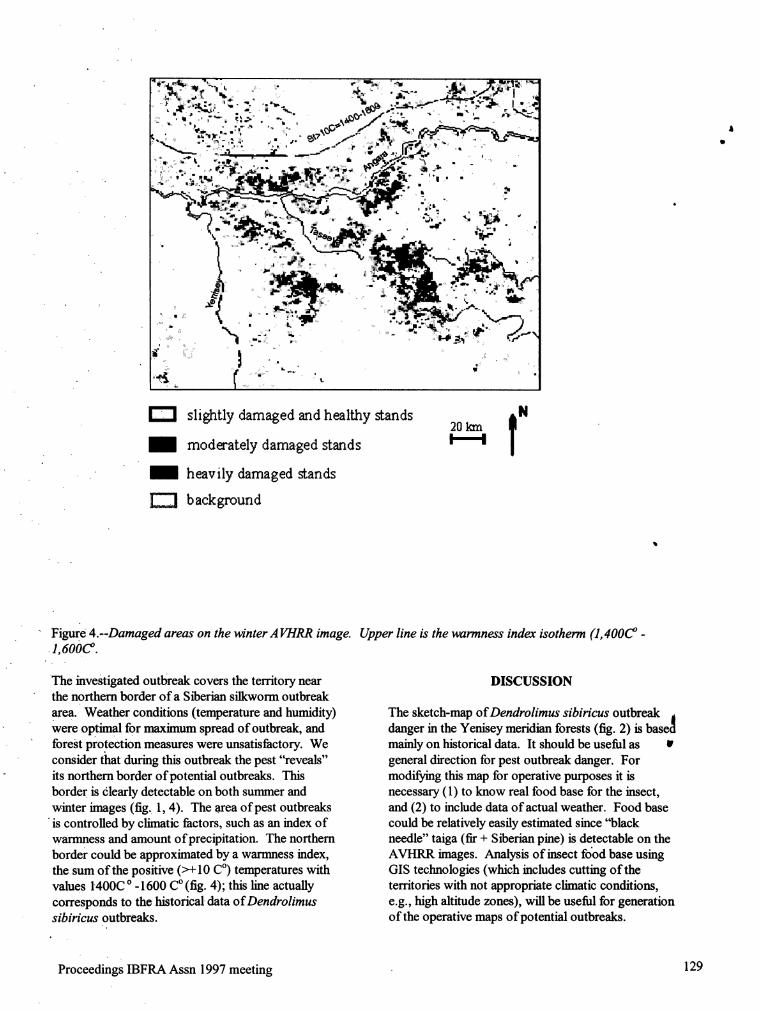
°
::.,_:.; .;,':_ ',¢ ../..... ::.... ..:_::_::: "ji'"" __./...._:_":. I J-t...._,:._:,_-.-:...:_',:. -." .,-,,, _,:_,.,_ _._-_h_,.. _I., .-__'!, ,,i". -.--.,,_,'. -. :., .,.... __r-L.,.-..-:-.... .., " _,::," ¢.__..-_..'I....... m_ ., -',-- _,,__ - ._ ".... ,(,,_:_' .,I : " .... ',, - " " _--.,.I
-.-.. ,- , ' , _. ,.._ _ • , ", , _,M'P' ,., "..
":"-_: . "'-t_::":'...:': ..-',,..'" ..._t :, .:.-_.:,:::,__:._m__:.... "-" "1-'-'--- " -"_ ..... _ • _ ; _:-_"-' _?_ " ..... I:_..... ,: -:, ....... -- : • '_'--_-- _....... .... -.... ' I• :..,.....:_:.., .... ::_...., - .... .............._> .- _ . _ :..... ..
•. .,_ ......... _r "'"_:'" _" " :" I,";:'..," '": "_::. '":....:. .",,,....... ;., . - .... :_,.._ _.......... ,, ...".... _.... ,- .. I!
-k." ___-. I__=_., __-...-...- ' " ,_L;.' •,'1
...... _,." ::. ...::.:"-....... .. : .!_ "' . .. ..
...... _:--._-'_:_-. ::_ _,'_ t__ _. :.._.':.._. :: ::...... .. *.... "r" :.......,.. ... li,. . ..,_.......: 4 , .... ......... __ I
....... ,- • " : • '-'_"' ,__;;_l_ • "_,,P-_', I......." " :' '_ "_"....... _...."":_,:'.._ J__l
slightly damaged and healthy stands &N20m. Tmoderately damaged stands ' •
heavily damaged stands
background
" Figure 4.--Damaged areas on the _nter A VHRR image. Upper line is the warmness index isotherm (1, 4006 ° -•1,600C °.
The investigated outbreak covers the territory near DISCUSSIONthe northern border of a S_erian silkworm outbreak
area. Weather conditions (temperature and humidity) The sketch-map ofDendrolimus sibiricus outbreak
were optimal for maximum spread of outbreak, and danger in the Yenisey meridian forests (fig. 2) is base_' forest protection measures were unsatisfactory. We mainly on historical data. It should be useful as
consider that during this outbreak the pest "reveals" general direction for pest outbreak danger. For- its northern border of potential outbreaks. This modifying this map for operative purposes it is
border is clearly detectable on both summer and necessary (1) to know real food base for the insect,winter images (fig. 1, 4). The .area of pest outbreaks and (2) to include data of actual weather. Food base
is controlled by climatic factors, such as an index of could be relatively easily estimated since "blackwarmness and amount of precipitation. The northern needle" taiga (fir + Siberian pine) is detectable on theborder could be approximated by a warmness index, AVHRR images. Analysis of insect food base usingthe sum of the positive (>+ 10 C°) temperatures with GIS technologies (which includes cutting of thevalues t400C °- 1600 C° (fig. 4); this line actually territories with not appropriate climatic conditions,corresponds to the historical data of Dendrolimus e.g., high altitude zones), will be useful for generationsibiricus outbreaks, of the operative maps of potential outbreaks.
o
Proceedings IBFRA Assn 1997 meeting 129

Climatic data (indexes ofwarnmess and dryness) figure 1A corresponds to the very beginning ofcould be taken from mid (3.55-3.93 mkm) and the vegetative period, when leaves and needlesthermal (10,3-11.3, 11.5-12.5 mkm) IR channels. : start to flash and grass communities start toGenerally speaking, potential AVHRR data grow. Consequently, input of spectral signaturesapplication is the analysis of ecological and climatic are considerably higher for images taken later (B,conditions of the given territory, and classification of C).the territory from the point ofview of its optimality 4. On-ground data collection takes time.for the pests. Consequently, the dates of map generation
regularly do not coincide with the dates of •
The analysis has shown that NOAA/AVHRR channels remotely obtained data. This could create1 and 2 are the most informative in detection of dramatic discrepancies between on-ground and
damagedstands. The first one (0.58 mkm-0.68 mkm) satellite data. For example, at the density of 500-corresponds to the absorption band'of chlorophyll. 600 caterpillars per tree the stand could beThe signal in the second one (0.725 mkm-1.1 mkm) is completely defoliated during 5-10 days. Thiscontrolled by reflectance/scattering on leaf density was typical of the outbreak in 1995.microstructures. Therefore, defoliation causes Maximal density reached 12,000 caterpillar/tree;
decreasing of the signal in this band. Defoliation and for comparison, in the primary reservation ofyellowing of the needles are equivalent to the loss of Siberian silkworm during period betweenchlorophyll; this process is indicated by the signal outbreak this"density is only 3 caterpillars per 10le_,el in channel 1. trees.The sources of the errors in the AVHRR analysis are All this supports an idea that actual precision of
the following: satellite generated maps is higher than it was shownby their comparison with on-ground data.
1. Forests are non-homogeneous in comparison of
" AVHRR on-ground resolution (pixel) (about 1 AVHRR information on post Dendrolimus sibiricus-km). Each pixel could include different kinds of outbreak situation is very important for estimating thethe objects, danger of secondary damage of the weakened forests
2. There are some principal differences between on- by bark beetles. One of the most dangerous species is
ground criteria and remotely obtained data: Monochamus urussovi, fir bark beetle. Outbreaks of2.1. Forest inventory is essentially a subjective this pest spreads over the territory up to 1,000,000
• process. The levels of defoliation or ha. Estimation of the "food base" for that species isdiscoloration were estimated visually, the priority task of future work.
Some important parameters of outbreakcould be missed. For example, initial phases Finally it should be noted that there is similarity inof defoliation; it's known that this process AVHRR image application to monitoring of peststarts from the tops of the trees. On the outbreaks, from one side, and pollution induced forestContrary, very heavy damage could be decline, from the other side. It was shown (Kharuk et
• precisely evaluated by on-ground al. 1995) that AVHRR images were a valuable tool ininvestigations; that's why the kappa analysis of large scale forest decline caused by Norilskstatistics is the best for that kind of the smelters. Since in both cases the general symptoms of
damage (fig. 3B). decline are similar - loss of chlorophyll and biomass -2.2, Even completely defoliated stands have similar approaches could be used for AVHRR dat_
• NDVI typical of chlorophyll containing analysis, ipobjects because of:
2.2.1. A mixture ofbroadleaf species and In the system of pest monitoring NOAA/AVHRRpine; data are "at the top" of the hierarchy. They give
2.2.2. On-ground .vegetative cover; foresters generalized information on the scale of pest212.3. Presence of chlorophyll in the bark outbreak, food resources for the insects, and
tissues. It should be noted that bark ecological-climatic parameters of the inspected
photosynthesis could be significant for territory. That these data are an adequate tool fora tree's survival aRer defoliation detectable size of outbreak depends on the level of
(Kharuk et al. 1996). defoliation and homogeneity of the damaged stands3. The analysis of the temporal row ofthe images and could be estimated as 10,000 ha-20,000 ha.
could be complicated by fenology. For example, Potentially, outbreaks of many species listed in table 1o
130 GTR-NC-209
-could be detected by AVHRR technique. First phase (loss of chlorophyll and biomass), similarof large scale outbreaks of Dendrolimus sibiricus algorithms of image processing/analysis could becover ~20,000 ha. Naturally AVHRR data should be : used in the both cases.accompanied with information of higher resolution,such as aibome, SPOT or Landsat data, and on- This work was Supported by RFFI grant 96-07-8905 •
ground observations. AVHRR data are especiallynecessary for monitoring S_erian forests which are oflarge geographic scale, and the former system of ACKNOWLEDGMENTSmonitoring w_ch has collapsed.
The authors are grateful to the personnel ofNOAA/AVHRR receiver station in Krasnoyarsk, and
CONCLUSIONS V.V. Soldatov for inventory data.
1. NOA_AVHRR images could be used for_analysis of large scale Dendrolimus sibiricus LITERATURE CITED
outbreaks. At least two levels of damage (50%-75% and >75% of defoliation) could be detected. Kharouk V.I.; Middleton E.M.; Spencer S.L.; RockSince the pattern of the damage is similar for B.N.; Willams D.L. 1995. Aspen barkdifferent pests, this method could be applied for photosynthesis arid its significance to remotemonitoring of the other species, sensing and carbon budget estimates in the boreal
2. A sketch-map ofDendrolimus sibiricus ecosystem. Journal of Water, Air and Soiloutbreaks danger in the Yenisey meridian forests Pollution. 82: 483-497.was generated. It is based on the frequency ofoutbreaks, size of the damaged territory, and tree Kharouk V.I.; Winterberger K.C.; Tzibulsky G.M.;"food species". Yahimovich A.P.; Moroz S.N. 1996. Air pollution
3, Catastrophic pest outbreaks delineated the induced damage of Norilsk valley forests.northern border of the pest outbreaks area. This Ecology. 6:424-430 (in Russian).border could be approximated by the isotherm of
index of warmness equal to 1400 C°- 1600 C°. Monserud R.L.; R. Leemans. 1992. Comparing global4. Winter images could be used for detection and vegetative maps with the Kappa statistic.
• .analysis of the damaged stands. Ecological Modeling. 62:275-293.5.. Since general phenomena of forest decline caused
by pest invasions and air pollution are similar
I
• .
!
. w
°
Proceedings IBFRA Assn 1997 meeting 131

°
CHARACTERIZING SPRUCE BUDWORM CAUSED DISTURBANCE REGIMES IN ONTARIO
Jean-NoEl Candau 1, Richard A. Fleming l, Anthony Hopkin I and Ajith H. Perera 2
ABSTRACT.--It has long been recognized that INTRODUCTION •disturbances such as insect outbreaks and fires playan "maportantrole in wild forest ecosystems. These The spruce budworm, Choristoneurafumiferananatural disturbances instill resilience and Clem. (Lepidoptera: Tortricidae) is the mostsustainability, and provide habitats and niches for damaging defoliator in the boreal North Americanrarer species. For these reasons, a central concern in forest. This insect is characterized by widespreadmanaged forests is that management practices do not outbreaks which can cause considerable treeinadvertently exceed some unrecognized natural mortality in balsam fir and white spruce stands andthreshold and thus undo or eliminate much of the sometimes cause significant damage to black spruce,positive contn"oution that natural disturbances make red spruce, and subalpine fir (Brown 1970). AtO forest health. Hence, current policy aims at variety of approaches have been used to analyze thedeveloping a thorough understanding of natural historical records of spruce budworm outbreaksdisturbance dynamics and their patterns in both time (Fleming et al. 1984). Opposing theories suggest thatand space, spruce budworm outbreaks spread contagiously
(Holling 1986, Jones 1979, Stedinger 1984) or are theThe research reported here represents a first step result of simultaneous cycles in population densitytowards developing such understanding for natural over vast areas with the amplitude of the cyclespruce budworm (Choristoneurafumiferana Clem. depending on local conditions (Roymna 1992). We[Lepidoptera: Tortricidae]) disturbances in Ontario. are in the process of developing a spatially explicitThe simplist approach to this goal might be a broad model for simulating the damage (i.e., defoliation)statistical analysis of current disturbance patterns, but patterns caused by outbreaks at the landscape level.because fire suppression and pest control activities As a first step, we have constructed a comprehensivehave been part of forest management in Ontario for spatial data set of spruce budworm defoliation. Heredecades, current disturbance patterns, like current we present the results of an initial statistical analysisforest structure, should not necessarily be considered of these data.'natural'. Nonetheless, the processes of insectoutbreak (or fire) growth and decline, spread and-dissolution, are thought to be essentially unchanged METHODS(except when and where intervention has occurred).
It is anticipated that much of the raw data forWe discuss the early stages of an approach to building the planned model will be extracted from
deriving spatially explicit simulation models of maps of aerial surveys of spruce budwormlandscape dynamics which predict the effects of these defoliation. These maps were digitized and saved inprocesses for insect disturbance systems. The focus a common geographical database to ensureison the spruce budworm, the dominant insect consistency. Other kinds of information weredisturbance factor in Ontario's boreal forest derived from the original maps using variouslandscape. The spruce budworm's disturbance computational and geographical operations.regime is descn'bed and then analyzed so as to reveal #
' Characteristics of the underlying dynamic processes. Aerial SurveysIt is siaown how these characteristics can be used to w
provide a skeleton for model development. Since 1941, FIDS (Forest Insects and DiseasesSurvey group of the Canadian Forest Service) hasbeen conducting aerial reconnaissance of large-scale
" defoliation events in all of Ontario's productive forestin the exploitable forest area. Ideally, thereconnaissance flights begin as soon as the currentseason's defoliation is completed. Depending on the
1 Canadian Forest Service. Great Lakes Forest Research Centre. 1219 Queen Street East, P.O. Box 490. SaultSte. Marie, Ontario P6A 5M7. Canada.
• 2 Ontario Forest Research Institute. 1235 Queen Street East, Sault Ste. Marie, Ontario P6A 5N5. Canada.
132 GTR-NC-209

" •weather, this is usually in mid- to late-July. Survey which ensures computations that preserve allplanes usually fly at about 170 km/h with their height information. Depending on the scale and othervarying between 360m-600m. Survey lines are factors, grid or point topologies often involve sometypically 6-10 km apart. In the aircraft, defoliation is loss of information. The main inconvenience of ldelineated on 1"125,000 or 1:250,000 maps and this polygon topology resides in the variability in polygon *information is later transferred to smaller scale base areas, and consequently, in their relative
maps (e.g., 1:500,000). Allen et al. (1984), Dorais representation. One way to overcome this difficultyand Kettela (1982), and Sanders (1980) provide is to weight each polygon's frequency of recordedadditional technical details about aerial sketch defoliation by its area. This operation leads to •mapping and describe some of the uncertainties distributions for which frequencies are not expressedassociated with this data collection technique, as numbers of polygons but as total areas of these
polygons. These distn'butions are referred to asDatabase Construction "weighted distributions".
Historical maps of defoliation were digitized and Cumulative Frequency of Defoliationsaved in a geographical information system (GIS).The complete database is organized in 56 layers of For each polygon of themap of defoliation timeannual defoliation covering the years 1941-1996. series, the cumulative frequency of defoliation was
Duringthe process of digitizing, each defoliated area calculated as the nurhber of years when the polygonwas considered as a polygon. The coordinates and was defoliated. The "weighted distribution" of thedegree of defoliation of current foliage associated cumulative frequency of defoliation is plotted aswith this polygon were recorded. Three degrees of figure 1.
defoliation of the foliage produced in the current yearwere Commonly adopted: light, moderate and severe. The cumulati_cefrequencies of defoliation range from
• Light defoliation corresponds to 11% to 25% loss of 1 to 25 years of defoliation over the 56 year periodcurrent foliage, moderate to 26% to 70%, and severe covered by the database. The "weighted distribution"tomore than 70%. Light defoliation has been (fig. 1) appears complex. Even if the primary eventinconsistently recorded in the past, due mainly to (defoliation/no-defoliation) is binary, the frequencydifficulties in surveying this type of damage, and distribution is obviously not binomial. This is nothence, usually has the highest degree of associated unexpected because outbreaks often last 5-15 years.error (MacLean 1996). For this reason, we consider Consequently, the defoliation state of a polygon in,0nly areas of moderate and severe defoliation in what year t is not independent from its state in the previousfollows, year, t-l, or from the state of neighboring polygons in
years t and t-1.The G!S database was implemented under Arc/Info
. on Unix workstations. Other layers added to the The distribution (fig. 1) may represent the sum of twodatabase include the provincial boundaries, lakes, and binomial distn'butions with different parameter
fiver contours, values. For instance, a binomial distribution with alow probability of defoliation (approximately 2%)
Derived Maps may dominate in polygons defoliated less than 3years. Polygons more frequently defoliated seem to
New maps were built from the original dataset using follow another binomial distn'bution with a higher 11. spatial operations such as those calculating the probability of defoliation (approximately 20%). The
intersection and union of several layers. The map of precise value of 2% may be an artifact of the data inwdefoliation time series was created by building the the sense that only polygons which were defoliated at
" union of the 56.layers of annual damage from 1941 to least once in the 56 years of observation (or at least1996. In this map, each polygon is associated with a 2% of the time) were considered in the analysis. Theseries of 56 numbers corresponding to the defoliation 20% applies to most of the area in our analysis, thestatus ofthe polygon each year. area in which the outbreak cycle of the. spruce
budworm presumably runs its course. In NewBrunswick, this cycle is approximately 35 years long
RESULTS and high population densities typically last 5-10 years(Royama 1992). The midpoint of this interval of
Most of the results presented here were obtained high populations (i.e., 7.5 years) is about 20% of thefrom the map of defoliation time series. The length of this cycle. It is uncertain whether these
. advantage of this map resides in its polygon topology different probability values (2% and 20%) reflect
Proceedings IBFRA Assn 1997 meeting 133

o
._--_ t_o
E "
' __0
" 1 2 3 4 5 6 7 8 9 10 11 12 13 14 15 16 17 18 19 20 21 22 23 24 25
Cumulativefrequencyofdefoliation
Figure 1.--The "weighted distribution" of the cumulative frequency of defoliationL
1-2 yearso
_ 3-6 years
7-10 years
_ 11-18 years
19-25 years |d
' ' '_ W
N
+ :w |
. s "=.
Kilometres
o loo 2oo _oo
" ' Figure 2.--A map of cumulative frequencies °fdef°liati°n"
GTR-NC-209134

only differences in the ecology of the areas Analysis of Defoliation Sequencesconcerned or whether differences in samplingintensity are involved as well. The duration and frequency of defoliation and no-
defoliation periods were calculated for each polygonFor further analysis, the cumulative defoliation of the map of defoliation time series. A defoliationfrequencies were grouped into the five classes: 1-2, period is defined by one year or several consecutive3-6, 7-10, 11-18 and 19-25 years of moderate or years of defoliation, preceded and followed by atsevere defoliation. The choice of class widths was least one year without defoliation. A no-defoliation •based onthe binomial distr_ution. If, for each period is defined conversely. The "weightedpolygon, the event _"defoliation/no-defoliation" was distributions" of these variables are plotted in figureindependent from one year to the next, then the 3.cumulative frequency would follow a binomialdistribution and the class widths defined above would The defoliation periods ranged from 1 to 17 years.ensure that the frequencies of any particular class are These periods can be compared to the 4-5significantly different (a=0.05) from those of its consecutive years of 100% current defoliation that itneighboring classes once removed. For instance, the takes to kill balsam fir. White and black spruce areclass in which defoliation was most common (19-25 less vulnerable (Morris 1963) so the longer periods ofyears) would not. be significantly different from its defoliation may be concentrated in stands of theseimmediate neighbor (11-18 years), but would be species.significantly different from the three most seldomdefoliated classes. Since the distn'bution of The "weighted distribution" of periods of nocumulative defoliation frequency is not strictly defoliation appears to be multi-modal. The shortestbinomial, our classification scheme must be viewed durations (from 1 to 6 years) can be attn'buted to
- as a first approximation, variations in the extent of defoliation during thecourse of an outbreak, whereas longer durations
Amap Of cumulative frequencies of defoliation (fig. (fi'om 23 to 44 years) probably correspond to the2) was established using the classification scheme period of time separating outbreaks. These longdiscussed above. The defoliation follows a belt periods without defoliation appear to be separatedlocated between the 45tnand the 52naparallel and into groups with peaks at 26, 36 and 42 years. Eachthere appear to be spatial patterns in the cumulative peak might correspond to a different outbreak period;defoliation frequencies within this belt. Relatively further investigations are necessary to establish this.small areas of very frequent defoliation (19-25 years) For example, the polygons corresponding to eachare surrounded by regions where frequencies decline peak could be mapped to see whether each peakapproximately with distance from these 'foci'. The corresponds to a different area in the province.
. northern and southern fifnges of the belt are rarelydefoliated. In the north-east, defoliation was On a province-wide scale, there have been two broadrecorded along the banks of the Moose fiver just time-intervals in which spruce budworm outbreaksonce, in 1979. This helps explain the unusual spatial have occurred since 1941, with peaks of defoliationextent of the class with 1-2 years defoliation in the in 1945 and 1980 (Kettela 1983). The "weighted
• north-east (fig. 2) as well as the large area defoliated distribution" of the number of defoliation periodsjust one year (fig. 1). (fig. 4) is consistent with this observation since the !
. highest "weighted frequency" was found for twoFig.2 pro.vides additional information about the periods. One and three periods of defoliation are al_results in fig. 1. The map of cumulative fi'equencies found frequently. These results are preliminary, a
" (fig. 2) shows that areas rarely defoliated (e.g., 2% of statistical analysis of the time series of defoliation isthe time) tend to located at the periphery of the needed to draw more precise conclusions.defoliation belt whereas virtually all the area of themain body of the belt is defoliated much more often.This observation supports the idea that the dynamics SUMMARY AND CONCLUSIONSOf the defoliation process may vary from one part of
the defoliation belt to another. As a result, a cred_le The map of defoliation time series proved to be amodel should allow for spatial heterogeneity in the useful starting point for the analysis. The polygonoutbreak dynamics, topology of this map permitted computations that
preserve most information. (By contrast, grid or.
Proceedings IBFRA Assn 1997 meeting 135

Jl
t
o
mm
s
(eq josUO!ll!m)eeJ¥ ._ ._
• - _• ._
B _ _ .-._
_ _- _ _._, .................................... o_ _'_
___.__ .................. __ ...................,-
0£ tj_ O_ cJL OL cj 0
(eq to $UO!ll!W) eeJv
°
136 GTR-NC-209

ut_ ..................... 11)v-
o
t_r-
omc._o
E.m
W -o
1 2 3 4 5 6 7 8 9 10
Number of defoliationperiods
Figure 4.--The "weighted distribution" of the number of defoliation periods.
Proceedings IBFRA Assn 1997 meeting 137
point topologies necessarily involve much greater Co-ordinators). Managing the Spruce Budworminformation loss). To determine how large an area in Eastern North America. USDA For. Serv.was defoliated how often, each polygon's defoliation : Agriculture Handbook No. 620. 192p.frequency was weighted by its area. This showedthat some areas were defoliated as otten as 25 of the Brown, C.E. 1970. A cartographic representation of *56 years covered by the database, spruce budworm choristoneurafumiferana
(Clem.), infestation in eastern Canada, 1909-The relationship between total area and frequency of 1966. Otawa, Department of fisheries anddefoliation is complex. It suggests the sum of two forestry.binomial distributions with different parametervalues. For instance, a binomial distribution with a Dorais, L. and E.G. Kettela 1982. A review oflow probability of defoliation (about 2%) may entomological survey and assessment techniquesdominate in polygons defoliated less than 3 years, used in regional spruce budworm, ChoristoneuraMore fi'equently defoliated polygons seem to follow fumiferana (Clem.), surveys and in theanother binomial distribution with a higher assessment of operational spray programs.probability of defoliation (about 20%). These Report of the Committee for Standardization ofprobabilities are approximately equal to the Survey and Assessment Techniques, Easternreciprocal of the 56 year length of the observation Spruce Budworm Council, Quebec City, P.Q. 43period (2%) and the proportion of the spruce p.budworm cycle when its populations are high.
Fleming, R.A., C.A. Shoemaker, and J.R. Stedinger,A map 0f cumulative fi_equencies of defoliation 1984. An assessment of the impact of large scaleshowed that the defoliation follows a belt running spraying operations on the regional dynamics ofacross Ontario between the 45thand the 52 nd parallels, spruce budworm, (Lepidoptera: Tortricidae),
• Within this belt, relatively small areas of very populations. Can. Ent. 116:633-644.frequent defoliation (19-25 years) are surrounded byregions where frequencies decline approximately Kettela, E.G. 1983. A cartographic history of sprucewith distance fromthese 'foci'. The northern and budworm defoliation 1967 to 1981 in eastern
southern fringes of the belt are rarely defoliated. North America. Canadian Forest Service.These Observations suggest that the dynamics of the Information Report DPC-X-14. Marimimesdefoliation process may vary from one part of the Forest Research Centre, Fredericton, Canada. 9p.defoliation belt to another. Comequently, a cred151emodel should allow for spatial heterogeneity in the Holling, C.S. 19086. The resilience of terrestrialoutbreak dynamics. In some polygom defoliation ecosystems: local surprise and global change. In:occurred up to 17 consecutive years. The distn'bution Sustainable Development of the Biosphere.0fthe durations of intervals when no defoliation was Cambridge University Press. Cambridge. U.K.:Observed appears to be multi-modal. The shortest 292-317.durations (fi'om 1 to 6 years) can be attn_outed tovariations in the extent of defoliation during the Jones, D.D. 1979. The budworm site model. Pestcourse of an outbreak, whereas longer durations management. G.A. Norton and C.S. HoUing.(fi'om 23 to 44 years) probably correspond to the time Oxford, United Kingdom, Pergamon Press: 9-
between outbreaks. 155. !
These results are part of a preliminary study to MacI_ean, D.A. and W.E. MacKinnon 1996. iranalyze spruce budworm defoliation patterns at the Accuracy of aerial sketch-mapping estimates oflandscape scale. Further statistical analysis is needed spruce budworm defoliation in New Brunswick.todraw more precise conclusions. Ultimately, the Canadian Journal of Forest Research. 26: 2099-information gathered will be used to model the 2108.defoliation regime.
Morris, R.F. (editor) 1963. The dynamics ofepidemic spruce budworm populations. Memoirs
LITERATURE CITED of the Entomological Society of Canada. 31" 1-332.
Allen, D.C., L. Dorais, and E.G. Kettela 1984.Survey and detection. Pages 21-36 in D.M.
• Schmitt, D.G. Grimble, and J.L. Searcy (Tech.
138 GTR-NC-209

- Roymna, T. 1992. Analytical Population Dynamics.New York, NY. Routledge, Chapman and HallInc.
Sanders, C.J. 1980. A summary of current "techniques used for sampling spruce budwormpopulations and estimating defoliation in easternCanada. Canadian Forest Service. Information
Report O-X-306. Great Lakes Forest ResearchCentre, Sault Ste. Marie, Canada. 33 p.
Stedinger J.R. 1984. A spruce budworm-forestmodel and its implications for suppressionprograms. Forest Science. 30: 597-615.
o
Proceedings IBFRA Assn 1997 meeting 139

SPRUCE BARK BEETLE DAMAGE WITHIN AN UNMANAGED SPRUCE FORESTDURING SEVEN YEARS FOLLOWING WINDFELLING
Jan Weslien I and Hansjochen SchrOter 2.
ABSTRACT.--The loss of spruce trees due to attacks In February 1990 central Europe especially Southernby sPruce bark beetles, Ips typographus, in a nature Germany, Austria, and Switzerland was hit by areserve at high altitude in Southern Germany was heavy storm. Spruce bark beetles reproduced in the"estimated. After a storm in 1990 tree mortality rose windthrown trees during 1990 and in 1991 greatconstantly. Up to 1996 ca 4,000 dominant spruce amounts of spruce trees were killed. The outbreaktrees 0r.16% of the spruce trees in ttre overstory have reached its peak in the dry summer of 1992 (SchrOterbeen killed. The bark beetle attacks have formed et al. 1994 a, b; Reindl et al. 1994). This pattern wasgaps of, _?arious size in the forest. The increasing true for the lowlands. At high altitudes, as in thenumber of gaps may lead to higher risk for additional study area "Napf' in the present study, the pattern
•storm and insect damage. Since the slopes are very seemed to be different. Few attacks were observed insteep an increased the risk for soil erosion cannot be 1990 and 1991. Thereafter an increasing trend wasexcluded. This combined with a very poor natural observed in 1992 and 1993. Thus it was not obviousregeneration of the gaps might be a serious threat to that the attacks were induced by the stormfelling.the forest reserve. This study describes temporal, and to some extent
also the spatial attack pattern by the spruce barkbeetle within the nature reserve "Napf" during sevensummers following a stormfelling.
. INTRODUCTION
Widespread outbreaks of the spruce bark beetle Ips MATERIALS AND METHODStypographus (L.) have occurred frequently in Europe.The main host of this bark beetle species is Norway Study Areaspruce. The beetles can breed in standing sprucetrees only if the number of attacking beetles is high The study area, "Napf" has been describedenough to overcome the defensive system of the thoroughly by Lopez (1985). Briefly it is an oldtrees. Otherwise they are restricted to breed in forest consisting mainly of Norway spruce, 105 hawindthrown, broken, or cut stems, usually a limited large, located on the west fe,cing slopes of Feldberg,and scattered resource. Outbreaks, during which which mounts the highest point of Schwarzwald inlarge numbers of standing trees are killed, typically southern Germany (1,493 m). The steep slope,occur after extensive stormfellings, when beetles ranging from 1,000 to 1,360 m in altitude surrounds a
have reproduced in a surplus of non-resistant basin formed during the last glacial period.breeding substrate. Due to counteractive measuresby man, there are few studies that describe the natural
spreading of attacks after a stormfelling. In recent Mappingyears there has been a growing debate about the 1t
scarcity of dead wood in managed forests. A direct The forest was inventoried during May and June iwnconflict between nature conservation and "clean 1994 and in August 1996 with regards to spruce trees
management" of forests has arisen (Sp_ith 1992, killed by Ips typographus during the preceding years.Dengler 1995). The slope was first surveyed with binoculars from the
opposite slopes. Each detected spot with killed treeswas mapped and thereafter visited. The number oftrees was counted and the year of death was
1The Forestry Research Institute of Sweden (SkogForsk), S-756 46, Uppsala, Sweden.
2 Forstliche Versuchs- und Forschungsanstalt Baden-Wiirttemberg,, D-79007 Freiburg, Germany..
140 GTR-NC-209

. |
estimated(for detailed method see below). In 1994 Attacks from 1996 were easily recognised by Iithediameter at breast height d.b.h, was measured, presence of green needles and callow Ips |While cruising through the forest, killed trees, typographus adults under bark.undetected from distance, where mapped and A
recorded as above. Since practically all of the forest Dating of Ips typographus attacks is usually difficult. " |was cruised there is very little chance of killed Killed trees develop differently depending a varietystanding trees being left undetected. These could of factors. The method used here may thus be lesseasily be spotted from quite a distance (at least 50 reliable elsewhere or under other weather conditions.m). In 1,994 recently wind-felled trees (still having In this study it was easy to distinguish previous yearstwigs and some bark) were registered, attacks from older ones, probably due to the
relatively slow development of bark beetle brood and• slow aging of trees at this high altitude. In the
Determination of Year for Attack lowlands where Ips typographus has at least twogenerations per year in Southern Europe, this
In e1994the dating was based on the following separation would be harder.variables:
1. presence of living (hibernating) Ips typographus Transect Inventoryadults in balk
2. presence of ongoing attacks (fresh boring dust) After having mapped and dated all Ips typographus _by the ambrosia beetle Trypodendron lineatum attacks an inventory was made to determine the
3. presence of brown/green needles spatial relationship between windthrown trees and4. presence of fresh phloem in root legs trees killed by Ips typographus. This was considered
5. presence of fine twigs, essential since the temporal attack pattern in "Napf"6. amount of bark still on tree could not strengthen the hypothesis that the storm in7. Color of wood February 1990 had induced the outbreak. A ca 3,0008. presence and amounts of fungi m transect was subjectively drawn to cover a variety9. amount of litterfall on bark coming from tree of storm gaps and killed trees. Along this transect all.:
windthrown trees within ca 20 m on both sides were
Any one of variables 1 or 2 was considered as direct inspected to see if they contained galleries of Ips •evidence of a 1993 attack. It was found that typographus. Also all trees killed by Ips typographusvariables 3 and 4 were strongly correlated to the first during 1990-1992 along this transect were registered.two variables. Thus after some time also the color
presence of needles and/or fresh of phloem wasconsidered as sufficient evidence for a 1993 attack. RESULTS AND DISCUSSION
No single variable could accurately indicate a 1992attack. The 1992 attacks can be described still Almost 4,000 spruce trees were killed by Ipshaving fine twigs, some bark, and brownish wood. lypographus during 1990-1996 (fig. 1). WindthrownThis was not sufficient to clearly distinguish from trees, of which most were estimated to have fallent 993 attacks. However, this in combination with the recently (probably in February 1990), amounted to cJ
, absence of variables 1-4 was regarded as sufficient. 16% of total loss. The inventory of killed spruce if. trees can be regarded as total. Few trees can have
_ Older attacks were not possible to date to the exact escaped detectionThe mean diameter of the treesyear. Based onvariables 5-9 the killed trees were killed during 1990-1993 was 46 cm at breast height,
separated in two classes 1990/1991 and 1989 and as was the mean diameter of the windfelled trees-older. Thesetrees fell in two quite distinct along the transect. The.diameter of killed trees wascategories, one recent and one older. According to not measured in 1996 but it was obvious that mostthe local foresters the recent attacks were probably killed trees were from the overstory. Lopez (1985)from 1990 and 1991 and the older ones probably estimated the total number of spruce trees in theemanating from snow-breaks before 1985. overstory in "Napf" to 24,500 in 1982 (mean d.b.h.
46 cm). Thus the trees killed by spruce bark beetles
In 1996, attacks from the previous years (1994 and since then amounts to ca 16% of the total stem1995) were dated using the same method as in 1994. number in the overstory.. o
Proceedings IBFRA Assn 1997 meeting 141

C
4000
_ .
,3000 •
I,=,,
w,-
o 2000,L_
EZ
.-lO0O
:" i _ _,
1990 1991 1992 1993 1994 1995 1996
" Figure l.--Cumulative number of trees killed by lps typographus in the forest reserve. "Napf" * marks ca 700
•spruce trees felled in the storm of February 1990.
60 _ _ Ips-kille d spru c e 1990-1992
_ [_ Windfelled spruce with Ips _,
50 i' 1 Windfelled spruce without Ips
_ 40" I
!.2" .
E •
z 20f....
!
, .10_ ---
' !o.,r- _ eO _ _ (.D I".- 00 O') O _ _ 0") _I" UD CO h.- aO_ O').,r.._O N_ _N
Figure 2.-- Number of windfelled trees and Ips typographus-killed trees in 22 gaps along a 3,000 m transect. Eachbar represents trees from the same gap.
142 GTR-NC-209

The transect inventory included 162 windthrown to "harvest from above" and this in combination with
trees and 118 trees killed by Ips typographus, the poor regeneration could be a serious long-termWindthrown trees attacked by Ips typographus had threat to the forest. Due to the steep slopes there mayalmost always been followed by attacks on the also be an increased risk for soil erosion. Napfhasstanding trees next tOthem. Windthrown trees probably increased in "value" since the storm in 1990 t
without Ips typographus did not show this pattern due to the large amounts of dead, large diameter(fig. 2). Of all 162 windthrown trees 73 (45%) had spruce wood, a very scarce resource that can harbourbeen colonised by lps typographus The spatial many threatened species. Therefore clean
correlation between windthrown trees and killed trees management is not regarded as an option. Regarding "strongly indicates that the outbreak was induced by this a more efficient game management isthe storm-felling. Windthrown trees from 1990 were recommended in order to allow the natural gapsprobablyused by a relatively sparse Ips typographus dynamics to occur. The study shows how difficult itpopulation during both 1990 and 1991. This was may be to combine conservation and naturalpossible due to the slow aging of the windthrown disturbance regimes in small protected areas.trees, Reproduction by lps typographus during 2years in trees downed at one occasion has earlier
been documented by Butovitsch (1971) in Sweden. LITERATURE CITEDApart from the cold climate in Napf, another factor,
the steep slopes, probably affected ageing Butovitsch, V. 1971. Untersuchungen tiber dassignificantly. In cases where trees had fallen uphill, Auftreten von Forstsch_idlingen in den vonroot contact was not entirely broken and the fallen Schneesttirmen heimgesuchten Fichtenw/tldemtrees could probably Stay green quite long. des Kstengebiets der Provinz Vastemorrland in
den Jahren 1967-1969. Res. Note 8. Stockholm:
At lower altitudes in Germany, much higher rates of Royal College of Forestry, Department of Forest'tree mortality has been observed than in this study. Zoology. 204 p. (in Swedish with GermanNiemeyer et al. 1995 found that 56% of the spruce Summary).stems were killed by Ips typographus during 3 years
within a 63 ha forest. SchrOter and Schelshorn Dengler, K. 1995. Ist eine Borkenk/iferbek_impfung(1994) estimated that the area with killed trees in a 10 sinnvoll? Forst und Holz. 50" 244-249.ha forest stand increased from 0.2 ha to 4,5 ha from
1991 to 1994. It might be argued that annual tree Lekander, B. 1972. A mass outbreak oflpsmortality during outbreaks is lower whereas the typographus in G_strikland, Central Sweden, inoutbreaks last longer in areas with cold climate than 1945-1952. Res. Note 10. Stockholm" Royalin areaswith warm climate. In Sweden Lekander College of Forestry, Department of Forest
. (1972) found that 16% of the spruce trees (31% of Zoology. 39 p. (in Swedish with Englishvolume) within a 300-ha forest were killed during 7 Summary)..years following a stormfelling. That outbreak
collapsed due to high within-tree mortality of lps Lopez, J.A. 1985. Analyse der Struktur und Dynamiktypographus, without any counteractive measures eines naturnahen Fichten-Tannen-Buchenwaldes
takenby man. Within-tree mortality due to natural im Hochschwarzwald (Bannwaid Napf in•enemies under bark may be important for the Naturschutzgebiet Feldberg). Schriftenreihe des !
. collapse of lps typographusoutbreaks (Weslien and Waldbau-lnstituts der Albert-Ludwigs-Regnander 1990, 1992; Weslien 1994). So far, Universit_it, Freiburg i. Br. Bd 5. IF
. however, tree mortality due to spruce bark beetle
attacks has. not shown any signs to decrease in Lopez, J.A.; Bricking, W. 1994. Textur, Waldstruktur"Napf". und Naturverjtingung im Bannwald "Napf'. Mitt.- ' Ver. Forsti. Standortskunde u.
The gaps formed in "Napf" should be regarded as a Forstpflanzenzachtung. 37: 49-59.part of the natural dynamics that should occur there.
However, according to Lopez and Bricking 1994) the Niemeyer, H.; Ackermann, J.; Watzek, G. 1995. Eine
natural regeneration of gaps is poor due browsing by ungest6rte Massenvermehrung des Buchdruckersthe very high populations of chamois (Rupicapra (lps typographus) im Hochharz Forst und Holz.rupicapra) and roedeer (Capreolus capreolus). 50" 239-243.Storms and spruce bark beetles will surely continue.
ProceedingslBFRA Assn 1997 meeting 143
Reindl; J.; Feemers, M.; Masching, E. 1994. Situationund Progose des Sch_idlingsbefalls in Bayern1993/1994. AFZ. 49: 348-353.
SchrOter, H.; Schelshorn, H. 1994. Sturmsch_iden •
1.990und nachfolgender Borkenk_iferbefall.-Eine Studie auf einer Sukzessiondflache in
Baden-Wiirttemberg. Mitt. d. BBA Bd. 301: 464.
Schr0ter, H.; Berwig, B.; Bogenschtitz, H. ; Selshorn,H.; Seeman, D. 1994a. Waldschutzsituation 1994in Rheinland-Pfalz. AFZ. 49: 340-343.
SchrOter, H.; Berwig, B.; Bogenschtitz, H.; Selshorn,H:; Seeman, D. 1994b. Waldschutzsituation 1994in Baden-Wiirttemberg. AFZ. 49: 332-339.
Sp/ith, V. 1992. Sturmwurf und Borkenk/ifer -konventionelle Aufarbeitung oder freieSukzession.- in "Naturschutz im Wald", Inst. f.
Landsch., Okologie und Natur Schutz. Biihl.
Weslien, J. 1994. Interactions within and between
• species at different densities of the bark beetle lpstypographus (Coleoptera, Scolytidae) and itspredator Thanasimusformicarius (L.)(Coleoptera, C!eridae ). Ent. Exp. Appl. 71: 133-143.
Weslien, J.; Regnander, J. 1990. Colonization• • densities and offspring production in the bark
beetle Ips typographus (L.) in standing sprucetrees. Journal of Applied Entomology. 109: 358-366.
Weslien, J.; Regnander, J. 1992. The influence of• natural enemies on brood production in lps
typographus (Coleoptera, Scolytidae) with specialreference to egg-laying and predation byThanasimusformicarius (L.) (Coleoptera,
Cleridae). Entomophaga. 37: 333-342. j
. ir
o
144 GTR-NC-209

D
Effects of Fire
!
. U
,
145

AID
..
le
• .
I
. ir
146

CHARCOAL IN DATED LAKE SEDIMENTS AS A PROXY FOR FIRE HISTORY IN JASPER
NATIONAL PARK, CANADA
Jacqueline K. Huvane l
ABSTRACT.--Parks Canada is developing a fire climates and human activities that may have affected
management plan for Jasper National Park (JNP) to fire regimes, including the recent period of firerestore the natural fire regime that occurred prior to suppression, European arrival, and the severalforest fire Suppression in the 2Oth century. While fire hundred year cold period known as the "Little Ice "
history for both the 19th and 20th centuries is well Age". Therefore, the dendrochronological fire regimedocumented, less is known about the earlier fire of only the past few hundred years (the temporal limit
tfistory ofJNP. This project utilizes paleoecological of tree-ring analyses in Jasper National Park (JNP))methods to analyze forest disturbance regimes over may not be an accurate representation of long-termthe.past ca. 300 years in the Athabasca River valley of natural fire patterns.JNP'. Freeze cores (ca. 50 cm in length) wereobtained fi'om Mina Lake in 1995 and 1996. The In the past century, the area burned by fires in JNPrecent sediments were dated by 2_°pb analyses, and has been low, and many have attn'buted this type ofthe examination of charcoal particles was used to infer phenomenon to fire suppression policies (Banff-Bowthe fire history of the Park. I tested the validity of Valley Study 1996, Woodley 1995, Kay et al. 1994).these methods by focusing on recent lake sediments However, it has also been suggested that the lack of(ca. the past 200 years) and comparing the charcoal fire may be due to a variety of factors, includinginferred fire history to the known fire history derived climate and availability of fuel (Tande 1977, 1979).fi'om tree ring and fire scar data. The results fi'om the One way to evaluate these hypotheses is to examine
• Mina Lake cores indicate that macroscopic charcoal the fire history of JNP for a time interval that includes
particle analyses can detect the major documented periods with different climatic regimes and vegetationfires in the Park. In particular, the last major fire year types. This would determine whether the fire regimein JNP occurred in 1889, and is represented by a during the era of fire suppression is unusual in thebroad peak in the macroscopic charcoal record. After context of the longer fire history in JNP. In this1889, there was little fire in JNP, and this is reflected paper, I attempt to deduce fire histories fromby low macroscopic charcoal concentrations in the temporal patterns of charcoal deposition in lake •most recent sediments. Thus, charcoal particles can sediments. If possible, this type of long-termeffectively serve as a proxy for fire history in JNP. ecological data will provide useful information to
managers interested in developing fire managementplans, and to those concerned with the effects ofglobal warming on fire regimes.
• INTRODUCTION
This paper presents preliminary findings based onDuring the past few decades, the issue of fire analyses from one lake, Mina Lake (fig. 1). Themanagement has been under debate, and fire recent charcoal deposits are compared to thesuppression policies have been questioned (Knight dendrochronological fire history in order to verify the
. and Wallace 1989, Schullery 1989). The Canadian charcoal technique. I
National. Parks Act "requires that ecological integrity ifbe a first priority when considering a parkmanagement plan" (Woodley 1993), and since 1986,Parks Canada has used prescribed burns in a fewparks to restore areas to their, natural fire regimes(Woodley 1995). One obvious question is how willnatural fire regimes be defined? The past fewcenturies encompass several periods with different
IJacqueline K.Huvane, Department of Biological Sciences, University of Alberta, Edmonton, AB T6G 2E9,Canada_ Present address" Duke University, Wetland Center, Box 90333 Nicholas School of the Environment,Durham, NC 27708-0333 USA.
Proceedings IBFRA Assn 1997 meeting 147
....

°
%Celestine I _ 53o15 '
i,
- %
•sk,_ - 53°05'Pyramid Mt. Mt. Roche Bonhomme
Town of Jasper/ 52°55 '
Mina _.t_
Cabin L,
Caledonia L,o
The Whistlers
_L._ --52°45 ' Nkm 10! I
' I l '
118020' 1 18°10' 118000' 1 17050' W
Figure 1.-- Map of Jasper National Park, Canada sho_ng the locations of the townsite and Mina Lake.• ,
RATIONALE (Tolonen 1986, Patterson 1987, Clark 1988,MacDonald et al. 1991, Clark and Royall 1995).
Charcoal produced as a result of fire is dispersed Clark (1988) theorized that smaller particles are 1t' mainly by Wind or water, and is commonly preserved preferentially transported away fi'om a fire due to
in lake sediments. Clark (1988) suggests that surface prolonged suspension in the atmosphere as corr_ared" runoff is not an important source of charcoal to lake to larger particles that tend to settle more quickly. A
sediments, and that eolian transport is more study of the fire history of Wood Buffalo National
important. Charcoal may b e transported to lakes via Park, Canada showed that microscopic charcoalstream inflows, however, sites may be chosen that do particles deposited in lake sediments were indicativenot receive inflow from streams, such as Mina Lake. of the regional fire history, while macroscopic
Accordingly, the discussion of charcoal transport here charcoal particles were more closely associated withrelates to windblown particles. Although much is local fires, although not all local fires wereunknown about charcoal dispersal, it is generally represented by macroscopic charcoal peaksassumed that larger particles are deposited close to (MacDonald et al. 1991). In another study, Clark andthe source of fire, while the smaller particles are Royall (1995) examined the correspondence between
. deposited from both local and regional sources charcoal particle size and the source area of a fire in a
148 GTR-NC-209

suite of eastern North American lakes. They found margins (Tande 1979). The climate around thethat smaller particles derive from regional sources, townsite tends to be warmer and drier than in other
while larger particles derive from local wildfires, aieas (Tande 1979). Data from the Jasper weatherHowever, again, not all local fires were represented station (52°53_ 118°04"xVat 1061 masl) for the years ,,by increases in the macroscopic charcoal record. 1926 to 1990 show a mean daily air temperature of
Similarly, Mitlspaugh and Whitlock (1995) examined 3.1 ° C, a mean maximum of 9.0° C, and a mean dailythe macroscopic charcoal record from lake sediments minimum of-2.8 ° C. The mean annual precipitationinYeHowstone National Park, U.S.A., and found a for the same time period was 393.7 mm with a mean •general correspondence between the charcoal record of 281.6 mm as rainfall and 143.9 cm as snowfalland known fire history. However, at one site not all (Environment Canada).known fires were represented by charcoal peaks. The
lack of correspondence between knowfi fire history Dendrochronological Fire Historyand the charcoal record suggests that many factors,including the amount and type of charcoal, and A study of tree ring and fire scar data by Tande
dispersal patterns are important in determining (1977) provides an excellent record of fire history inwhether a fire results in a sedimentary charcoal peak. the Athabasca River valley of JNP over the last two toAdditionally, a single fire may be represented by a three centuries. The last major fire in JNP occurred in
broad charcoal peak (Patterson 1987), the result of a 1889, when about 20% of the park burned (Vanvariety of processes including charcoal deposition, Wagner 1995).post deposition mixing (Davis 1968, Davis and Ford
1982) and sediment sampling protocols (Clark 1988). The fire history can be examined at two differentscales. The smaller, local scale concerns fires in and
These studies suggest several hypotheses concerning around the Mina Lake watershed, and the larger Park-charcoal deposition. The one discussed in this paper, wide scale concerns fires that burned large portions ofthat the targer macroscopic charcoal particles will be the entire Park.more indicative Of local fire patterns than smaller,
microscopic particles has already been examined to Large Park Fires:some extent in the literature (Clark and Royal 1995,MacDonald et al. 1991). Here I examine these ideas The last large fire in JNP occurred in 1889, whenin the context of the montane environment in JNP. I about 20% ofthe Park, including the Mina Lake area,am also concerned with distinguishing single fires burned (fig. 2) (Van Wagner 1995). The previousfrom charcoal peaks in the sediment record. Because
a single fire may produce a broad charcoal peak, J as por Nati ona I Parkperiods when fires occur infrequently will probably- " result in obvious peaks in the stratigraphy. However, Van Wagner,1995
. t_80 ........................if fires are very frequent, then there may be a vrelatively steady delivery of charcoal to lake < 70sediments, making it difficult to discern individual E 60 -fires, m 50 -
"O 40.__. 11
, -_30. METHODS _ 20 - IF
O7" 10
Study Site _ 0 1600 1650 1680 1700 1730 1889Year
-Mina Lakeis a relatively small lake, with a surface areaof 8.3 ha_, and a watershed area of 41 ha. It is located Figure 2.--A histogram of thefive largest parkfiresin the Athabasca Valley, near the Jasper, Alberta as determined by Van Wagner (1995). They Ytownsite, at an elevation of 1214 masl (fig. 1). Mina axis shows the normalized burn area as aLake has a maximum depth of 13.2 m, an average percentage of the park area. The X axis showsdepth of 5.7 m, and an outflOW,but no inflow the year of the burn. These data assume a 150-(Anderson andDonald 1980). The vegetation in the year fire frequency from 1915 back to 1735, andarea consists of Douglas-fir and lodgepole pine a 55-year cycle prior to 1735.'forests, with black spruce often occurring around lake
Proceedings IBFRA Assn 1997 meeting 149

large fire occurred in 1730, when about 18% of the Canadian Rockies, in the Kananaskis Watershed.
Park burned. Fires that occurred in the 17th century They suggested that the shift was the result of
were probably larger, burning more than 30% of JNP. ' changing climatic patterns, specifically to cooler,However, the dendrochrono-logical data for the 17th wetter conditions associated with glacial readvance, l
D
century is sparse. Luckman (1988) identified two periods of glacialadvances for the Athabasca and Dome glaciers in the
Van Wagner (1.995) reported a change from a 55-year Canadian Rockies in Alberta: the "Little Ice Age"
fire fi'equency to a 120-fire fi'equency around 1735. advance (ca. 1844) and an earlier advance in 1714.,Johnson and Larsen (1991) reported a similar shill to Thus a climatic explanation as evidenced by glacial
a longer fire frequency after 1730 in the southern advance could also explain the change in fire
frequency proposed by Van Wagner for JNP.
J
Tande, 1977Jasper townsite area
400 350
_known area
350 --0-- num scars 300
30025O
250200 o
E 200 o
150 E150 _
• , t"-
100100
50 5o
• .
0 01971 1908 1905 1901 1897 1894 1884 1869 1858 1846 1821 1780 1737 1678
Year
J
, w
Figure 3.--This graph is adapted from Tande (1977) and displays the relationship between the known area of a burnand the number of fire scars found from a particular burn year On the first Y axis is the known burn area in
. sqUarekilometers and on the second Y axis, the number offire scars for a particular burn. The X axis displays
the fire years_
150 GTR-NC-209

Small Local Fires." This method allows for the dating of sediments up toabout 150 years old. For older sediments, other
In the Jasper townsite area, the largest fires occurred techniques such as AMS 14Cdating of terrestrialin 1889, 1847, and 1758 (Tande 1977). The 1889 macrofossils maybe employed (Baer 1989, Olsson 4
fires were the most extensive and were of medium to 1986). However, in this study we will be focusing on *high intensity. Tande (1977) states that the 1847 and the recent sediments.175.8 firesbehaved similarly to the 1889 fires. The
Mina Lake watershed burned in 1889, 1847, 1837, A half section of the 1995 freeze core was
1834; 1797, 1758 and 1727. The majority of these subsampled into 1 cm intervals. Approximately 5era 3historical fires inJNP were of low intensity, and from each sample was dried and sent to Paulwould probably not be evident in the charcoal record. Wilkenson at the Department of Fisheries and OceansThere is considerably less evidence available for the in Winnipeg, Manitoba for 21°pb analyses. SimilarOlder fires (Tande 1977). For instance, 287 fire scars methods were used for the 1996 core, however, thoseprovided evidence for the 1889 fire, 34 for the 1847 results are not yet available.fire,,and 6 for the 1758 fire (fig. 3). Evidence for firesprior to 1758 were based on only one or two fire
scars. As expected, there is less information Charcoal Analysesconcerning firesprior to the 19th century.
Two categories of charcoal were analyzed:microscopic charcoal counted from pollen slides, and
Core Collection macroscopic charcoal counted fi'om sieved sedimentsamples.
Sediment cores were collected during March 1995
• andMarch 1996. In 1995, a cylindrical freeze core Microscopic charcoal analyseswas used (M_kimmin et al. 1996). Briefly, a hollow
tube is filled with dry ice and alcohol, lowered into the A quarter longitudinal section fi'om the 1995 core waslake at a site of maximum lake depth, and allowed to fine sectioned into 2.5 to 3 mm thick transverse
free fall about one meter away from the sediment sections. These samples were digested using awater interface. The corer will sink into the standard procedure for pollen preparations (Faegrisediments, which then freeze to the outside of the and Iverson 1975) to concentrate the charcoal and"
tube. Retrieved fi'om the lake bottom, the corer with pollen for enumeration. Briefly, samples were firstthefrozen sediments can be taken back to the lab for treated with 10% sodium hydroxide to break apart theanalyses. This procedure allows for the collection of material and remove humic substances. Then samplesan undisturbed sediment core. With this method we were treated with hydrochloric acid to remove any
" obtained a 51 cm long core from Mina Lake. In carbonates. This was followed by an hydrofluoric•19961 a frozen core, 42 cm in length, was obtained acid treatment to dissolve silicates. Finally, the
using a rectangular corer. This different shape samples were subjected to an acetolysis with sulfuricprovidedadditional material and allowed us to do acid to digest cellulose.more analyses (macroscopic charcoal) for this site.
Charcoal particles were counted from select samples !along with pollen grains. Microscopic charcoal
. Core Chronology particles ranged in size from less than 450 1am2 to if
over 10,000 1am2. Particles smaller than 450 tam2" In order to determine the fire history based on were not included. This smaller sized fraction
lacustrine sediment cores, it is necessary to date the probably represents long distance transport, and ottensediments. This Can be achieved by a technique based these smaller particles are difficult to positively
on 21°pb decay. Binford (1990) provides an extensive identify as charcoal. The charcoal particles counted
review of these methods. If a constant rate of supply were separated into three size classes. Small particlesof21°Pbto the sediments is assumed, then the ranged from 450-1,600 tam2, and medium rangeduppermost (youngest) sediments will have the greatest from 1,601-2,500 1am2. Particles greater than 2,50121°pb activity (Appleby and Oldfield 1978). By 1am2 were initially divided into three subclasses,
• measuring the activity of 21°pb at the sediment water however the scarcity of large particles in the samplesinterface, and at several levels throughout the core, it made it necessary to pool these subclasses. For each.is possible to derive a model for dating the sediments.
Proceedings IBFRA Assn 1997 meeting 151

sample counted, the number of charcoal particles as a
percentage of the total pollen sum was calculated Mina Lake 1995 Core(Swain 1973). These data are displayed as the
difference from the core median value. 0 t_ ff A-2 •
Macroscopic charcoal analyses -4 T /_
K -8 tThe i996 fi'eeze core was subsampled into 1.0 cm a -10 _ _ •
• • /. .I
thick transverse sections for macroscopic charcoal -12 -. ._t _--
determinations: A finer subsampling scheme was not -14 - t-
poss$1e because these determinations required larger -16 -amounts of sediment than for microscopic charcoal 1880 1900 1920 1940 1960 1980 2000
analyses. For each sample, a measured amount of Date.sedimefit between 3 and 5 crn3 (usually 5 cm3), wasrinsed through a # 100 sieve (149 ]am aperture). All
particles retained on the sieve were examined with the Figure 4.--Sediment depth versus 2]°pb date for theaid of a dissecting microscope at 150X magnification. 1995 core.Particles were enumerated and a length and width
measurement was recorded. For each sample, thetotal charcoal area was calculated and expressed as a Microscopic Charcoalconcentl"ation (charcoal area/cm 3 sediment).
The microscopic charcoal data are displayed in figure5 as the difference in the percentage from the core
• Statistics median. The Runs Test of the microscopic charcoaldata did not produce statistically significant results,
A simple Runs Test above and below the median was indicating that the sequence of peaks was random.performed on the stratigraphic charcoal data. These However, several peaks were still evident in thetests determine whether the sequence of events is stratigraphy. Small charcoal particles displayed arandom, or whether a given event is a function of the peak between 5 and 10 cm, ca. 1955- 1980, and
• Outcome of a previous event (Sokal and Rohlf 1981). another peak at 16 cm, ca. 1889. Prior to ca. 1'889.Each sample was assigned either a plus or a minus there were no obvious major peaks, only slight peaksdepending on whether it was above (+) or below (-) at 26, 35; and 40 cm. The medium size class showedthe core median. The sequence of pluses and minuses a similar distn_oution. There was a recent peak
was then subjected to the Runs Test. One obvious between ca. 1955 and 1980, and a peak ca. 1889.drawback of this method is that it only takes into There were no peaks between ca. 1889 (16 cm), and
account the direction of the change and not the 40 cm. Based on the sediment accumulation rate for• magni'tude of change. However, it provides a quick the top portion of the core and sediment bulk
method to determine whether a sequence of peaks and densities, the 40 cm level probably dates to the 17thtroughs is non-random, century.
The largest microscopic charcoal size class also I. RESULTS showed a recent peak between 8 and 10 cm ca. 16}55-
1960, and a major peak ca. 1889. Between 20-27 cm,
" Z_°PbDating there was a distinct trough in the large charcoalparticle percentages. This probably corresponds to
. The results from the 1996 fi'eeze core suggest that the the period between ca. 1845- 1800. There wereMina Lake 1995 core sediments were not appreciably peaks at 28, 34, and 40 era. The peak at 28 cm
mixed. Figure 4 shows the sediment depth versus the probably corresponds to the early 19th century and21°pb date. A constant rate of supply model gave a the later peaks to periods in the 17th century.date Of i 892 at 15.5 centimeters and an averagesedimentation rate of 1.5 mm per year for the top 16
• cm of sed'tment.
152 GTR-NC-209

M
Iio
Microscopic charcoal Ii4
_ _ _ II2.54.25 _' ....
1012.513.5
1414.25 I-- _ ' Small15.5
.c - _16.25 _,_,_,_*._,_:_,_.:_,_:_:_,_.:_>_,_-_,_,:::::::::::::::::::::::::::::::::
--a _9.2 Medium22-- ...........!_!!!,26 -
27..3 - _ Large--- I)
28.9 _ --"_ i29.831.3 --
33.8 __35.4
. 39.2 --', ................'', I I I J I J I I
-5 0 5 10 15 20 25Differencefrom median
_g_e 5.--Three size classes of microscopic charcoal versus sediment depth. The data are expressed as a differencein the percentage from the core median percentage (charcoal/pollen "100). The zero line represents the medianpercentage of charcoal.
Macroscopic Charcoal DISCUSSION
The Runs Test of the macroscopic data indicated that Although the patterns in the microscopic charcoalthe series of charcoal peaks and troughs were non- data were not statistically significant, all size classes
random (fig. 6). There were no major peaks before showed a major peak ca. 1889, when the last major !i3 Cm, where there was a broad peak until about 18 fire occurred in the park. The non-significant result
, 21cm. Although we do not have °Pb dates for this may be attributed to the fact that the test does not wcore yet, this interval likely included 1889, based on account for the magnitude of change associated withthe dates from the 1995 core. Between 18 and 26 cm the charcoal peaks.
there was period of low charcoal concentrations, andthen another peak between 26 to 30 cm. This peak All size classes also showed recent peaks, althoughprobably occurred during the mid-to-late 18th there was very little fire in JNP during this period.century. Prior to this second peak there was more This suggests that, as in other studies, the microscopicnoise in the record, with charcoal concentrations charcoal is responsive to regional fire patterns and not
oscillating about the core median, necessarily local patterns. For instance, Clark andRoyall (1995) found that microscopic charcoalparticles were common in the recent sediments ofmidwestern lakes, despite effective fire suppression in
. that region.
Proceedings IBFRA Assn 1997 meeting 153

Mina Lake The next major peak probably occurred in the mid-to-Macroscopic Charcoal , late 18th century, when there was both a major Park
- fire (1730) and a major watershed fire (1758). It will l
_ _ 1_ be impossible to distinguish these two events until the bii.,._ _ 21°pb dates are established for this core and other,o_• 193o,_ii_st:3.5 1_ indications of fire are obtained such as pollen or
= i_!]_ magnetic susceptibility data. For example, Millspaugho .... and Whitlock (1995) established the occurrence ot_23.5J
_,,_:_ local, watershed fires in Yellowstone National Park28.9_,] _-
..... _ when there were coincident peaks in macroscopicco_%':I- m=]i:_t . ' charcoal and magnetic suscepffoility. Fire in the
• 375J m
_.- ' watershed produces secondary magnetic minerals that,,oH ___ !
":'_ - _ o'_ "" ; ..... are delivered to the lake sediments via erosion; Difference from the median
(Thompson and Oldfield 1986). Therefore, increasesin magnetism may be used as another indicator oflocal fire.
Figure 6.--The macroscopic charcoal concentration The two broad peaks of increased macroscopic(area of charcoal/cc sediment) as a difference charcoal concentrations associated with JNP fires are
from the core median. The zero line represents in contrast to the single sample peaks in thethe core median of.312 ]am2 charcoal/cm 3 microscopic charcoal. This may be the result of a
sediment. Estimates of core dates are indicated variety of factors. One possibility is that as Clark• on the right, suggests, "following fire, larger fragments are moved
about locally to a greater extent than the pollen sized
There was no indication of a mid 19th century fire, charcoal.., because these particles are relatively easy
although fires occurred in the Mina Lake watershed to liR at low wind velocities" (Clark 1988).duringthis period. There was some evidence for fires Millspaugh and Whitlock (1995) also note broadin the 17th and 18th centuries as illustrated by peaks peaks in macroscopic charcoal records and attribute
,in the bottom portion of the core. However, these them to lags in deposition time, sediment mixihg, and•peaks were small suggesting that microscopic dating errors. Another important consideration is thecharcoal does not distinguish regional from localized sampling scheme employed. The microscopicfire events, charcoal samples in this study were 2-3 mm thick,
representing approximately 2-5 years, whereas the
" The macroscopic charcoal data corresponded more macroscopic samples were 10 mm thick, representingclosely tO the Park's known fire history. There were approximately 10 to 15 years. The net effect is to
• no Pronounced recent peaks, and the 1889 fire was average or smooth the macroscopic charcoal record.Clearly indicated. However, there were also no mid19th Century peaks associated with the moderate to Van Wagner (1995) identified several large JNP fires
high intensity fires that occurred around the Jasper in the 17th century, but there was little evidence fortownsite and the Mina Lake watershed in 1847. This these fires in the macroscopic charcoal stratigrap_ic
suggests that the macroscopic charcoal was not record. If there was a change to a more frequer_ firerecording smaller fires in and around the watershed, regime in this area as suggested by Van Wagner, then
" This is not unusual in charcoal studies of fire history these fires may not show up as distinct charcoal peaks
(Swam 1978, MacDonald et al. 1991, Millspaugh and in the stratigraphic record. The pattern of charcoal, Whitlock 1995). Although an extensive portion of the concentrations oscillating about the core median is
townsite area burned during the 19th century, the consistent with the notion that the fire interval became1.847 fire was not included in Van Wagner's list of the shorter at this stage. Clark (1988) suggests that at a
major fires within the Park. The macroscopic sediment accumulation rate of 0.1 cm per year and acharcoal in the Mina Lake sediments appear to sampling scheme of 1.0 cm intervals, the fire interval
provide a signal for large scale fire events that must be greater than 50 years to discern all fires. Theoccurred in the Park, but not the smaller fires that fire interval may be resolved in the Mina Lake
occurred locally around the Mina Lake watershed, sediments by examining a longer record at finer. intervals (e.g., 0.5 cm intervals as opposed to 1.0 cm),
154 GTR-NC-209

. and by obtaining a more detailed core chronology, thank Ian Campbell for loaning us the rectangularWhile there were earlier charcoal peaks found in the freeze corer. I would also like to thank Michaelmicroscopic record tl_t likely correspond to this time Hickman, David Schindler, and Charles Schweger for
period, these peaks may only reflect regional pl/oviding critical reviews of this manuscript. Aprocesses and not necessarily local or extra-localevents.
LITERATURE CITED..
CONCLUSIONS Anderson, R.S.; Donald, D.B. 1980. Limnological ,studies in Jasper National Park. Part seven.
The macroscopic Charcoal particles at Mina Lake Canadian Wildlife Service Report.provide a proxy for the large fires in JNP, but not forsmaller watershed fires. The microscopic particles Appleby, P.G.; Oldfield, F. 1978. The calculation oflikely represent a regional signal and are of less lead-210 dates assuming a constant rate of supply
interest to;.Parks managers. The data suggest that it is of unsupported 2_°pb to the sediment. Catena. 5:1-possible to derive a long-term record of major fire 8.frequency in JNP using macroscopic charcoal.Periods that Contain a "noisy" record may signal a Banff-Bow Valley Study. 1996. Banff-Bow Valley: At
Shift to a more frequent fire interval. However, these the crossroads. Technical report of the Banff-BowconclOsions must remain tentative until we have Valley Task Force (Robert Page, Suzanne Bayley,
obtained the 21°pb chronology for the 1996 core. J. Douglas Cook, Jeffrey Green, and J.R. BrentRitchie) Prep. for the Honourable Sheila Copps,
Because there is always uncertainty involved in Minister of Canadian Heritage, Ottawa, ON.
ecological studies, it is desirable to use multiple lines•of evidence to.infer fire history. In the larger study of Baer, R.L. 1989. The Holocene palaeoecology of
the fire history of JNP mentioned earlier, several other Lorraine Lake, Jasper National Park, Alberta.variables are being considered. These include an Edmonton, AB, Canada T6G 2E9: University ofexamination of pollen remains to infer vegetation Alberta.. M.S. thesis.change in the area. After a major fire, successionalvegetational changes are recorded in the lake Binford, M.W. 1990. Calculation and uncertaintysediments, such as an increase in non-arboreal pollen analysis of 21°pb dates for PIRLA project lakeand:early successional species. Magnetic sediment cores. Journal of Paleolimnology. 3"
suscept_ility is another variable being considered to 253-267.discemiocal fire events.
. Clark, J.S. 1988. Particle motion and the theory of
This study clearly shows the importance of having charcoal analysis: source area, transport,knowledge of the recent fire history in order to gain deposition and sampling. Quaternary Research.information concerning the relationship between 30: 67-80.stratigrapb.i'c char.coal and the known fire history at a
given site. This will allow for a more accurate Clark, J.S;. Royall, P.D. 1995. Particle size evidenceinterpretation of older stratigraphic data. This for source areas of charcoal accumulation in late !
. information used in conjunction with a variety of Holocene sediments of eastern North Americanindicators'should provide the best reflection of the lakes. Quaternary Research. 43: 80-89. I¢
. long-term fire history of the area.Davis, M.B.; Ford, M.S. 1982. Sediment focusing in
Mirror Lake, New Hampshire. Limnology and
- ACKNOWLEDGEMENTS Oceanography. 27" 137-150.
ThisProject was funded by a grant from Parks Faegri, K.; Iverson, J. 1975. Textbook of pollenCanada. Coring assistance was provided by Jeff analysis. 3d ed. Munksgaard, Copenhagen,Curtis, Harvey Friebe, Brenda Miskimmin and Denmark.members of the Parks Canada warden staff at JasperNational Park. John Taylor and•Steve Woodley of
Parks Canada provided additional logistical support. I
Proceedings IBFRA Assn 1997 meeting 155

Johnson, E.A.; Larsen, C.P.S. 1991. Climatically Swain, A.M. 1973. A history of fire and vegetation ininduced change in fire frequency in the southern northeastern Minnesota as recorded in lakeCanadian Rockies. Ecology. 72: 194-201. : sediments. Quaternary Research. 3" 383-396.
A
Kay, C.E.; Patton, B.;. White, C. 1994. Assessment of Swain, A.M. 1978. Environmental changes during the •long-term terrestrial ecosystem states and past 2000 years in north-central Wisconsin:processes in BanffNational Park and the Central Analysis of pollen, charcoal, and seeds fromCanadian Rockies. Part I. BanffNational Park varved lake sediments. Quaternary Research. 10:
Resource Conservation Report. 55-68.
Knight, D.H.; Wallace, L.L. 1989. The Yellowstone Tande, G.F. 1977. Forest fire history around Jasperfires: issues in landscape ecology. Bioscience. townsite, Jasper National Park, Alberta.39(10): 700-706. Edmonton: University of Alberta. Masters thesis.
Luckman, B.H. 1988. Dating the moraines and Tande, G.F. 1979. Fire history and vegetation patternrecession of Athabasca and Dome glaciers, of coniferous forests in Jasper National Park,Alberta, Canada. Arctic and Alpine Research. 20: Alberta. Canadian Journal of Botany. 57:1912-40-54. 1931.
MacDonald; G.M.; Larsen, C.P.S.; Szeicz, J.M.; Tolonen, K. 1986. Charred particle analysis. In:Moser, K.A. 1991. The reconstruction of boreal Berglund, B.E., ed. Handbook of Holocene
forest fire history from lake sediments: a Palaeoecology and Palaeohydrology. Chichester,comparison of charcoal, pollen, sedimentological, Great Britain: John Wiley and Sons Ltd." 405-496.
• and geochemical indices. Quaternary ScienceReviews. 10: 53-71. Thompson, R.; Oldfield, F. 1986. Environmental
Magnetism. London: Allen and Unwin Ltd.
Millspaugh, S.H.; Whitlock, C. 1995. A 750-year firehistory based on lake sediment records in central Van Wagner, C.E. 1995. Analysis of fire history forYellowstone National Park, U.S.A. The Holocene. Banff, Jasper, and Kootenay National Parks.
• , 5" 283-292. Report to Parks Canada, Natural Resource_Branch, Ottawa, ON KIA OH3.
Miskirnmin, B.M.; Curtis, P.J.; Schindler, D.W.;Lafaut, N. 1995. A new hammer-driven freeze Woodley, S. 1993. Monitoring and measuringcorer. Journal of Paleolimnology. 15" 265-269. ecosystem integrity in Canadian National Parks.
In: Woodley, S.; Kay, .i.; Francis, G., eds.
0!sson, U. 1986. Radiometric dating. In: Berglund, Ecological integrity and the management of•B.E., ed. Handbook ofHolocene Palaeoecology ecosystems. Del Ray Beach, FL: St. Lucie Press:• and Palaeohydrology. Chichester, Great Britain: 155-176.
John Wiley and Sons, Ltd.: 273-312.Woodley, S. 1995. Fire in protected areas. Research
Patterson, W.A.; Edwards, K.J.; Maguire, D.G. 1987. links: special fire management issue. Parks !
Microscopic charcoal as a fossil indicator of fire. Canada, Alberta and Pacific-Yukon regions _2)Quaternary Science Reviews. 6: 2-23. Fall 1995" 1.
SchuUery, P. 1989. The Fires and fire policy.Biosciencle 39(10)" 686-694.
Sokal, R.R.; Rohl_ F.J. 1981. Biometry. 2d ed. NewYork: W.H. Freeman and Co.
°
156 GTR-NC-209

" POST FIRE CHANGES OF LIVING GROUND COVERIN THE FORESTS OF CENTRAL SIBERIA
Galina A. Ivanova and V.L. Perevoznikova I
t
ABSTRACT.--Post fire observations showed that as composition and structure. At the initial stage of postmoss cover degrades, the number of vegetation fire forest regeneration, living ground covermicro-groups decreases, and both the ratio among composition is considered to be most indicative of "dominant species and their coenotic role change in both site conditions and succession. The rate oflight and dark coniferous forests with green moss, vegetation succession in burned areas can varywhich are remarkable for a pronounce d mosaic of significantly not only within stands, but also on anliving ground cover. Against the background of ecotope scale. The aim of this study was to comparehighly dynmni'c succession processes, communities the initial stage of post-fire succession in differenttend to lose species and that can eventually lead to a stands.decrease in ground vegetation diversity.
,.
STUDY AREA AND METHODS
INTRODUCTION The study area was situated in low East SayanMountains, central Angara region. For comparative
Forest fires; being a major ecological factor, investigation of succession processes, we selectedinfluence biodiversity on both a site and an ecotope pine and dark-needled stands that experiencedscale and determine vegetation. Vegetation cover surface fires. The vegetation inventory is presented
•diversity implies abundance of species and their in table 1.positiom in the vegetation hierarchy.
In each site, rate of burning was determined fi'om theFire has the most profound influence on living level of dead organic matter consumptionground cover and soil properties. The role of fire in (Khlebnikova et al. 1982): heavily burned sites (allthe formation of living ground cover of forest dead matter consumed), moderately burned sitescoenoses is very complex. Low intensity fires, (only a part of dead organic layer was burned and t_oahaving little influence on forest soil properties, result small depth), and lightly burned sites (fire consumedin only partial mineralization of dead organic matter, only the surface layer).reduce its depth, and thereby promote certain grassesand shrubs. Post fire living ground cover dynamics was studied in
. 10 In x 10m plots laid out in sites differing in the rateWithincreasing combustion intensity, fire influence of burning. The plots were divided into 2 m x 2 m0nsoils becomes more considerable to result in squares in order to make detailed mapping andchanging living ground cover regeneration patterns, description of grass cover feasible. Collected datai.e., ,_e causes changes of species composition of the were analyzed using mathematical methodslatter_ as well as coverage and abundance of each (Vasilevich 1969, Schmidt 1984, Titlanova et al.
species and population (Popova 1975, Popov 1982, 1993). Coefficient of species similarity was !, Komarova 1992, Furyaev 1996). Under repeated calculated as: K=(2c/(a+b))xl00, where a is the
fires, individual species, their groups and even number of species in the first species list, b is the ifcommunities develop various mechanisms of number of species in the second list, and c is the total,_•
adaptation. For example, fire stimulates Chamerion number of species in the two lists. Coefficient ofangustifolium over other coenotic populations, species difference was determined by: Prs = (X+Y-
Z)/(X+Y+Z), where X is the number of species ofThe trend ofp0st fire forest regeneration is largerly the first list that are absent from the second list, Y isdependent on its first stage, which in turn depends on the number of species of the second list that arethe level of ecosystem disturbance by fire, dynamics absent from the first list, and Z is the number ofof burned site colonization, and invading species species occuring in both lists. This coefficient is a
l KN. Sukachev Forest Institute, Siberian Branch, Russian Academy of Sciences, Krasnoyarsk, Russia. E-mail: ifo.r@_sk.infotel.ru.
o
Proceedings IBFRA Assn 1997 meeting 157

scale of-1 to + 1. A specific thing about this stand with V. vitis-idaea and green mosses and acoefficient is that when it ranges fi'om- 1 to 0, it larch stand with Carex and Spiraea ground cover,
indicates similarity in species composition between , although their coefficients of similarity withcommum'ties, and its variations from 0 to +1 show unburned forest were the lowest. The indicator ofdifference, species number decrease and increase (A) that ,,
reflects species diversity dynamics, shows that new
In Order to quantify succession dynamics, we used species are possible to appear in the larch stand,dynami'cs indicators (D) calculated as: D general: whereas the species composition grows poorer in theDg = (n2 + n3 + n4)/nl, where nl is species observed pine V.vitis-idaea-green moss stand (table 2). ,in a community before and after fire (persistent orsteady species);n2 is the number of newly occurred Research studies we conducted in West Sayanspecies; n3 is the number of species lost during some mountain forests show that in dark coniferous stands,period.of time; n4 is the number of fluctuated species, unlike in pine stands with green moss ground cover,and D succession: Ds = (n2 + n3)/nl. From the trees also suffer fi'om fire. Tree mortality amounts to
succession dynamics indicator, one can tell which 80%-90% in the year following a fire. Practicallyway succession occurs; ifD > 1, new species are complete degradation of mosses is observed. Deadgreater in number than pre-fire species, while at D < organic matter decreases more than 50%.1 the situation is opposite. A = n2/n3 shows an Mineralization of organic matter is, however,increase (A> 1) or a decrease (A<I) in the number of incomplete, with underbum accounting for 73% ofspecies of a community(Titlanova et aL 1993). the total dead matter and living ground cover.
According to the obtained data, living ground coverRESULTS AND DISCUSSION species composition and structure change most
vividly during the first year alter fire in stands with
Post fire regeneration of living ground cover of pine green moss ground cover, independently of what thestands in central Angara region varies with site dominant tree species is. Coenotic role of manyconditions. The rate of recovery of burned sites herbacious species also changes. Mosses fullydepends on available fuel load, because non-uniform degrade, and other species, such as Chamerionfuel distnqaution results in different fire intensity even angustifolium, Calamagrostis obtusata, Milliumwithin a relatively small site. effisium, Brachypodium pinnantum, Iris rhutenica,
Stellaria bungeana and Lathyrus humilis, becomeIn pine stands, tree mortality is usually neglig_le dominant ground cover species. Noticeableaiier surface fires. Most profound post fire changes differences occur in ground cover speciesare typical for living ground cover. For example, in a composition between burned and unburned sites.pine stand with Vaccinium vitis-idaea and mixed The coefficient of similarity of the grass-small shrubgrasses, where similarity between pre- and post fire layer composition between burned and unburned sites
" ground cover compositions was pretty high (71%) is 33%-43%. Index of dynamics (Titlanova et al.andthe oVerstory survived 100%, succession 1993) ranges from 2.40 to 4.33, which indicates theoccurred at a much slower rate compared to all other processes occuring in the ground cover are highlyforest types under study (table 2). The number of dynamic. At the same time, a trend is observed forSpecies tended to increase, fi'om which we can expect the community to loose species and this suggets asome increase in species diversity. However, the potential decrease in species diversity (table 2).
•succession appeared to be most dynamic in a pine #. 11
°
158 GTR-NC-209

Table 1.-- Inventory characteristics of studied stands.
Forest _p'e Stand Site qualit_ class Averai[e Load (m3) [Age Composition Diameter Height ,(yr.) (cm) (In) •
P.sy!vestris/E.vitis- 100 8P IL1B HI 21 22 351idaea/mixed herbs;P.sy!vestris/mixed 120 9P 1L III 23 21 330herbs
P. sylvestris/E, vitis- 100 7P2L 1S,B HI 18 19 308idaea/green moss_esP.sylvestris/mixed 160 8P2L III 27 22 435herbs/green mossesLarch with L180 5IAS 1P IH 32 26 250spruce/SjSiraea- S 120 18 20Carex
Spruee-smaU 160 6S2F2SP IH 20 21 210grass/green moss
- L (larch);- B (birch);- P (pine);- S (spruce)- SP (Siberian pine)- F (fir)
Table 2.-- Succession.dynamics in forest types after surface fire.
Forest type Number of species Coefficient Index
• of similarity Succession Specieswith dynamics number
unburned (D) (A)Total Lost New sites, %
P. sylvestris/V, vitis-idaea- 23 4 1 71 0.23 4.0green mosses
P.sylvestris/nftxed 23 6 11 60 1.31 0.55 "herbs/green mossesP.'sylvestris- V.vitis-idaea- 29 3 23 33 4.33 0.13green mossesLarch. with spruce- 6 3 3 36 3.00 1.0
. Spiraea-Carex
" Spruce-smaU grass-green 13 4 8 43 2.40 0.5moss,
• D>I - number ofnew post fire species is greater than that ofthe pre-fire speciesD< 1 - Surviving species are greater in number than new post fire speciesA>I - number of species of a community tends to increaseA< 1 - a tendency for a community to loose species !
. it
. .
°
Proceedings iBFRA Assn 1997 meeting 159

°
Vegetation is known to re-establish in two major For example, in pine V.vitis-idaea and mixed herbways in sites subject to fire: (a) fi'om remained pre- stands, where dead organic matter and soil surfacefire phytocoenoses whose population structure has are severely disturbed by fire, a distinctly mosaicchanged as a result of fire, and (b) fi'om seeds and : pattern of re-establishing ground cover is manifested
separate vegetative organs that were present in the through formation of mono-dominant microgroupssoil before a fire. Along with these, diaspores can be (Chamerion angustifolium, Maianthemum bifolium,carried fi'om the adjacent unburned forest. Our Brachypodium pinnantum, Calamagrostisinvestigation shows that reproduction from seeds arundinacea, or Carex macroura), which interchange
prevails, over other types of reproduction at the with bare patches burned down to mineral soft.earliest Stage of ground cover recovery in burnedpine sites. This type of reproduction was established Succession dynamics appears to be much higher into account for 80% of ground cover species in a pine heavily burned sites than in moderately and tightlyV.vitis-idaea mixed herb stand, with,vegetative burned sites, with the coefficient of speciesreproduction accounting for only 10%. composition similarity between heavily burned and
unburned sites being pretty low. Although theThe amount of viable seeds in soil is thus critical in coefficient of similarity tends to increase inthe formation of post fire riving ground cover moderately burned sites, the coefficient ofstructure. Seeds in soil, being an emergency reserve, discrimination shows a significant difference inbecome active after ground cover and tree layer species composition. Lightly burned sites appear todismi_bances. Our studies suggest that 2,300 to 4,200 have the highest similarity with unburned sites inof buried seeds per hectare can survive fire in a pine terms of ground cover composition and structure.stand with V. vitis-idaea and mixed herbs (Ivanova Coefficient of succession dynamics, being lower thanand Perevoznikova 1996). in moderately and heavily burned sites, shows that
the number ofpre-fire species is greater than that ofIn burned sites, ground cover can also re-establish by new species in tightly burned sites. But even with
' intensive resprouting. For example, individuals of fight burning, species loss still occurs (at A<I),•non-seed origin can prevail in pine stands with though inconsiderable (table 3).
V,vitis-idaea and mixed herbs in the second yearfollowing a fire. Reproduction by seeds slows down Coenotic role of individual species and groups ofin time, although it was observed to prevail for species also changes significantly in stands burned by
certain herbacious species (Calamagrostis surface fire. Some species demonstrate a posit_earundinacea) during early stages of post fire response to low-intensity surface fires:regeneration. Brachypodium pinnatum, lris ruthenica, Galium
boreale, Lathyrus humilis, and Trollius asiaticus.Typological structure of pine stands after surface Depending on intensity of burning, abundance offires is to a large extent determined by pre-fire living Chamerion angustifolium increases from sol to cop2-ground cover structure. According to Ivanova's and 3, with its coverage being 50%-70% (100% inPerevoznikova's data (1996), Calamagrostis heavily burned patches). Carex macroura also
arundinacea-dominated vegetation groups are responds positively to light and moderate burning. Inpromoted after fire in mosaic mixed herb-green moss general, intensive grass growing can have noticeableground coverin pine stands (fig. 1). Ground cover influence on forest regeneration in burned sites.mosaic elements change and grow bigger in standswith green mosses. As a result, the number of When comparing living ground cover regenerationl
' mosaic elements decreases considerably. Mosses die after surface fires in pine and spruce stands, theand are replaced by tall grass-dominated microgroups following things become obvious: a post fire it
" (Fabaceae and Onagraceae), which can form various decrease in the number of ground species is small inmosaic combinations, pine stands, while their number decreases almost
50% in spruce stands. Coefficient of speciesIn pine stands with V.vitis-idaea and mixed herbs, similarity with unburned forest sites is relatively highwhere living ground cover mosaic is much less clear, in both cases, although Smgren-Radulesku'sboundaries of vegetation groups are usually coefficient (coefficient of species difference orindistinct. Burned site recovery depends on the level discrimination) indicates noticeable differences inof disturbance of dead organic layer and living living ground cover composition between burned andground cover in pine stands of this type. unburned spruce sites. The most considerable
160 GTR-NC-209

°
It
, ii
i
Figure I.--Elementary plant communities (Snusia) of V.vitis-idaea mixed herb living ground cover in pine stands
.: " mixed herb; 3. Ledum-green moss; 4. Ledum; 5. V.vitis-idaea-green moss; 6. Fabaeeae (mixed herbs); 7.before (A) and after (B) fires. Elementary plant communities: 1. Mixed herb-green moss; 2. V.vitis-idaea
Mixed herbs of multi-strata
i
Proceedings !BFRA Assn 1997 meeting 161

. Table 3.-- Comparison of succession in differently burned sites in a pine stand _th Kvitis idaea and mixed herbground cover.,
Indicator _ Burned sites AHeavily, burned Moderately, burned Li{[htl_, burned •
Coefficient of species similarity 0.55 0.67 0.90with unburned sitesStugren's coefficient of difference +0.20 +0.10 -0.68in species compositionSuccession dynamics 1.60 1.10 0.28Increase or 10ss of species in a 0.13 0.18 0.20coenosis.
. Table 4.-- Dynamics of post fire succession in living ground cover.
Indieatar Pine stands Spruce standsNumber of species under the canopy of forest 25 17Number of species under the canopy in burned sites 21 9Coefficient of similarity with unburned sites 0.70 0.61Coefficient of difference -0.60 +0.11
General dynamics 0.78 1.62Succession dynamics 0.66 1.37
changes are observed in succession dynamics, which processes, the community tends to lose species, aare manifested through quantitative characteristics of process which can result in decreasing ground coversuccession process. According to our data, the diversity.number of new post fire species in living groundcover composition is much bigger than that ofpre- When considering general dynamics of succesSionfire species in spruce stands, where succession occuring during the initial stage of forest regenerationdynamics is higher (table 4). after surface fire, it becomes clear that early post fire
succession dynamics is much higher in darkconiferous forest (a case study in a spruce - small
- CONCLUSION grass - green moss stand) than in light conifers (acase study in pine stands with V. vitis-idaea and
Changes of living ground cover after low intensity mixed herbs). The high succession dynamics oftenfires are short-term in pine/K vitis-idaea/afixed herb leads to the replacement of certain pre-fire dominant
, stands. They do not influence significantly the species of living ground cover by different species.structure of the cover, while they promote spread of
forest grasses, especially Carex, which can in turn #. have some influence onforest regeneration. In sites LITERATURE CITED
where fire severely disturbed dead organic layer and IF. s0il, regeneration is noticeably slower, which is otten Furyaev, V.V. 1996. The role of fire in forest
reflected indecreases in grass species abundance and formation. Novosibirsk. Nauka: Siberiancoverage. Publishing Company, Russian Academy of
. . Science. 253 p.Post fire observations showed that as moss cover
degrades, the number of vegetation micro-groups Ivanova, G.A.; Perevoznikova, V.D. 1996. Post firedecreases, and both the proportions of dominant living ground cover recovery in pine forests ofspecies and their coenotic role change in light and central Angara region. Siberian Ecological
• dark conifer-green moss forests, which are notable Journal. 3(1): 109-116.for apronounced mosaic of living ground cover. Onthe background of highly dynamic succession
162 GTR-NC-209
Khlebnikova, I.P.; Novoseltzeva, I.F.; Shurpo, G.N." 1982. Surface fire influence on living ground
cover of pine stands of Central Angara region.Ecological and coenotical characteristics ofsl_oerianforests. Krasnoyarsk: Institute ForestPublishing: 15-23. -
Komarova, T.A. 1992. Post fire forest succession insouthern Sikhote-Alin. Vladivostok: Far East
Science Center. 222 p. *
Lukina, N.V.; Novikov, V.V. 1995. Some approachesto evaluating diversity of undisturbed ecosystemsand those under anthropogenic stress in the north.Biodiversity of Forest Ecosystems. Moscow. p.271-274.
J
Odum, Yu. 1986. Ecology (edited by V.E. Sokolov).•Moscow: Mir Publishing. Vol. 1. 238p.
Odurn, Yu. 1986. Ecology (edited by V.E. Sokolov).Moscow: Mir Publshing. Vol. 2. 376 p.
Popov, L.V. 1982. Southern taiga forests of CentralS_eria. Irkutsk: University oflrkutsk. 330 p.
Popova, E.P. 1975. Surface fire impact on forest soilproperties m Angara region. Forest resourceprotection. Krasnoyarsk: Institute of ForestPublishing: 166-168.
Schnfidt, V.M. 1984. Mathematical methods in- botany. Leningrad: University of Leningrad. 288
P.
Titlanova, A.A.; Mironicheva-Tokareva, N.P.;. Kosykh, N.P. 1993. Vegetation succession.
- Succession and biological cycling. Novos_irsk.Nauka: S_erian Publishing Company. 157 p.
Wittacker, R. Communities and ecosystems. 1980.Moscow: Progress Publishing. 326 p.
Vasilevich, V.I. 1969. Statistical methods in !geobo.tany. Leningrad: Nauka Publishing. 232 p. if
°
Proceedings IBFRA Assn 1997 meeting 163

GASEOUS AND PARTICULATE EMISSIONS FROM BURNING IN THE BOREAL FOREST
.
Joel S. Levine l, Wesley R. Corer III, Donald R. Cahoon, Jr., Edward L. Winstead2, Brian J. Stocks 3,Veronica A. Krasovic 4 alia Lawrence Mtetwa 5
D
ABSTRACT.--Biornass burning is a significant chloride (CH3C1), methyl; bromide (CH3Br) andregional and global source of gaseous and particulate various combustion particulates. If the burnedemissions to the atmosphere. These emissions impact vegetation is not regrown, such as most of the world'sthe composition and chemistry of the troposphere and burned forests, then the h_oerated carbon dioxidestratosphere and affect the transfer of both incoming remains in the atmosphere. If the burned ecosystemsolar radiation and outgoing infrared radiation, and undergoes regrowth, as do the savannas, the carbonhence,-impact global climate. Due to the unique dioxide is eventually removed from the atmospherecharacteristics of both the boreal forest and the via photosynthesis and is incorporated in the new
_composition and chemistry of the overlying boreal vegetation growth. However, the gaseous emissionsatmosphere, the gaseous and particulate missions other than carbon dioxide remain in the atmosphereresulting fi-omboreal forest fires are important for and are not reincorpo, rated in the biosphere. Longerboth the regional and global atmosphere, term effects ofbiomass burning include enhanced
biogenic soil emissions of nitric oxide and nitrousoxide following burning. Gases produced by biomassburning are environmentally significant, including
INTRODUCTION carbon dioxide and methane, which are greenhousegases that impact global climate, particulates impact
Biomass burning is the burning of the world's the global radiation budget, and hence, also impact. vegetation, including forests, savannas, and climate. Carbon monoxide, methane, non-methane
agricultural lands aRer the harvest, for land-clearing hydrocarbons, and nitric oxide are all chemicallyand land-use change. Estimates of the annual amount active gases and lead to the photochemical productionofbiomass matter Consumed by burning in these of ozone (03) in the troposphere. Methyl chloride isecosystems are given in table 1. To attest to the also produced during biomass burning. Methylgrowing importance and interest in this subject, chloride is a source of chlorine (C1) to thebiomass burning has been the subject of no less than atmosphere, which leads to the chemical destructionsix volumes over the last 6 years detailing burning in of stratospheric ozone. A single chlorine atom canthe diverse ecosystems of our planet (Levine 1991; destroy 100,000 molecules of ozone in theCrutzen and Goldammer 1993; Goldammer and stratosphere. Very recently it was discovered thatF.uryaev 1996; Levine 1996a, and 1996b; van Wilgen biomass burning is also an important global source ofet al. 1997). atmospheric bromine (Br) in the form of methyl
bromine (Mano and Andreae 1994). Bromine leads to
The immediate effect of burning is the production and the chemical destruction of ozone in the stratosphererelease into the atmosphere of gases and particulates and is about 40 times more efficient in the destructionresulting from the combustion ofbiomass matter. The of stratospheric than is than chlorine on a molecule-instantaneous combustion products of vegetation for-molecule basis.burning include carbon dioxide (CO2) , carbon 1t
monoxide (CO), methane (CH4), nonmethane uhydrocarbons (NMHCs), nitric oxide (NO), methyl
1Joel S. Levine, Wesley R. Cofer III, and Donald R. Cahoon, Jr., Atmospheric Sciences Division, NASA Langley" Research Center, Hampton, Virginia 23681-0001.
2Edward L. Winstead, SAIC/GATS, 28 Research Drive, Hampton, Virginia 236663Brian J. Stocks, Forestry Canada, Ontario Region, Sault Ste Marie, Ontario P6A 5M7 Canada4Veronica A. Krasovic, Atmospheric Sciences Program, Applied Science Department, College of William and
Mary, Williamsburg, Virginia 23187
5Lawrence Mtetm_, Atmospheric Sciences Program, Applied Science Department, College of William andMary, Williamsburg, Virginia 23187
164 GTR-NC-209

Bromine leads to the chemical destruction of ozone the sparse data base may suggest may suggest a firein the stratosphere and is about 40 times more trend. Is burning in the boreal forests increasing withefficient in the destruction of stratospheric than is time, or are satellite measurements providing morethan chlorine on a molecule-for-molecule basis, accurate data? Our feeling is that satellite A
D
measurements are providing a more accurateassessment of the extent and frequency of burning in
BIOMASS BURNING IN THE WORLD'S the world's boreal forests. However, it is important
BOREAL FORESTS to point out that as global warming becomes a reality,,predicted warmer and dryer conditions in the world's
It has generally been believed that biomass burning is boreal forests will result in more frequent and largera uniquely tropical phenomenon. This is because fires. Increased burning will have an amplifyingmost of the information that we have on the effect on global warming!geographical and temporal distribution of biomass
burning is based on tropical burning. Due to poor Calculations using the satellite derived burn area andsatellite coverage, among other things, there is very measured emission ratios of gases for boreal forestlittle information available on the geographical and fires (Cofer et al. !990 and equations 1, 2, and 3 in.temporal distribution on biomass burning in the this paper) indicate that the Chinese and Siberianworld's boreal forests, which cover about 25% of the fires of the 1987 contributed about 20% of the totalworld'.s forests. One of the largest fires ever carbon dioxide produced by savanna burning, 36% ofmeasured occurred in the boreal forests of the the total carbon monoxide produced by savannaHeilongjiang Province of Northeastern China in May burning and 69% of the total methane produced by1987. In less than 4 weeks, more than 1.3 million savanna burning (Cahoon et al. 1994). Sincehectares (1 hectare = 2.47 acres) of boreal-forest were savanna burning represents the largest component of.burned (Levine et al. 1991; Cahoon et al. 1994). At tropical burning in terms of the vegetation consumedthe same time, extensive fire activity occurred across by fire (table 1), it is apparent that the atmospherictheborder in Russia, particularly in the area east of emissions from boreal forest burning must beLake Baikal between the Amur and Lena rivers included in global species budgets.(Cahoon et al. 1994). Estimates based on NOAAAVHRR imagery indicate that 14.446 million There are several reasons that burning in the world'shectares (35.697 million acres) in China and Siberia boreal forests are very important:were burned in 1987 (Cahoon et al. 1994).
1. The boreal forests are very susceptible to globalTo illustrate how are knowledge of the geographical warming. Small changes in the surfaceextent of burning in the world's boreal forests has temperature can significantly influence the
. " increased in recent years, consider the following: ice/snow/albedo feedback. Thus, infraredEarly estimates based on surface fire records and absorption processes by fire-produced;statistics suggested that as much as 1.5 million greenhouse gases, as well as fire-inducedhectares Of boreal forests bum annual (Seiler and changes in surface albedo and infraredCrutzen 1980). Follow-on studies based on more emissivity are more environmentally significantcomprehensive surface fire records and statistics than in the tropics.indicated that earlier estimates underestimated !
' burning in.the world's boreal forests and that an 2. Computer calculations of climate change iraverage of 8 million hectares burned annually during indicate that in the world's boreal forests, global
" • the 80's, with great year to year fluctuations (Stocks warming will result in warmer and drier1991). The most recent study, this time based solely conditions. This in turn will result in anon satellitemeasurements, indicates that in 1987 enhanced frequency of fire and the
alone, approximately 14 million hectares burned in accompanying enhanced production ofthe boreal forest of eastern Asia (Cahoon et al. 1994). combustion greenhouse gases., such as carbon
While 1987 was an extreme fire year in eastern Asia,
Proceedings IBFRA Assn 1997 meeting 165

L__
Table 1. Global estimates of annual amounts of biomass burning and of the resulting release of carbon into theatmosphere (Andreae 1991).
A
Source of burning Biomass burned Carbon released(Tg dry matter/yO
Tr0pieal forests 1,260 570
Temperate and boreal forests 280 130 ,Savannas 3,690 1,660
Agricultural Waste 2,020 910Fuel wood 1,430 640CharCoal ' 21 30World total 8,700 3,940
J
dioxide and methane, that will further amplify gases, including the gases produced by firethe greenhouse effect, combustion. Hence, gases produced by burning,
such as CO, CH4, CH3CI, CH3Br and the oxides
3. Fires in the boreal forests are perhaps the most of nitrogen will have enhanced lifetimes over theenergetic in nature. The average fuel boreal forest.consumption, per unit area in the boreal forest ison the order of 25,000 kg/ha, which is about anorder of magnitude greater than in the tropics. GASEOUS AND PARTICULATE EMISSIONS
. Large boreal forest fires typically spread very FROM BIOMASS BURNING
.quickly, most often as crown fires. Large borealforest fires release enough energy to generate Knowledge of the geographical and temporalconvective smoke columns that routinely reach distribution of burning is critical to assess the
well into the troposphere, and on occasion may emissions of gases and particulates from biomassdirectly penetrate across the tropopause. The burning in to the atmosphere. More than a decade
• . height of the tropopause varies from a high of ago, Seiler and Crutzen (1980) showed that toga firstabout 18 km in the tropics to a low of about 8 approximation, the total amount of biomass (M)km near the poles. Hence, the tropopause and burned in a particular ecosystem may be given by thehence, the stratosphere is at a minimum height following equation"over the world's boreal forests. As an example,
. " a 1986 forest fire in northwestern Ontario (Red (1) M = A x B x a x b [grams dry matter per
• Lake) at times generated a convective smoke year (g dm/yr)]column 12 km to 13 km high, which penetrated
the tropopause (Stocks and Flannigan 1987). where A = total land area burned annually [m2/yr], B= the average organic matter per unit area in the
4. The cold temperature of the troposphere over the individual ecosystem [g dm/m2], a = fraction of theworld's boreal forests results in very low levels above-ground biomass relative to the total averageof tropospheric water vapor. The deficiency of biomass B, and b = the burning efficiency of th_tropospheric water vapor and the deficiency of above ground biomass. Parameters B, a, and b are
" incoming solar radiation over most of the boreal determined during biomass bum field measurementsyear results in very low photochemical in diverse ecosystems. Determination of these
. production of the hydroxyl radical (OH) over the parameters require measurements before, during, andboreal forests. The OH radical is the after burning.
overwhelming chemical scavenger in thetroposphere and controls the atmospheric Once the total amount of biomass M bumed islifetime of most tropospheric gases. The very known, the total mass of carbon M(C) (gm) released
• low concentration of the OH radical over the to the atmosphere during buming may be estimatedboreal forests will result in enhanced using the following equation:
atmospheric lifetimes for most tropospheric
166 GTR-NC-209

(2) M(C) = 0.45 M with trace amounts of nitrogen (0.3 to 3.8% bymass), sulfur (0.1 to 0.9%), phosphorous (0.01 to
since carbon comprises about 45% ofbiomass by 0_3%), potassium (0.5 to 3.4%) and still smaller
weight. The carbon released during burning takes the amounts of chlorine, and bromine. During completeform of several gaseous and particulate compounds, combustion, the burning of biomass matter produces
including carbon dioxide, carbon monoxide, carbon dioxide (CO2) and water vapor as the primarymethane, nonmethane hydrocarbons, and particulate products, according to the reactionor elemental carbon. The ratio of any carbon
compound.to CO2 produced in burning, or the ratio CH20 + 02 ..... > CO2 + H20of a nitrogen compound to CO2 produced in burning,
maybe determined by knowledge of the "emission where CH20 represents the average composition ofratio" or ER. The emission ratio is the,amount of any biomass matter. Biomass burning can be consideredcompound X produced during burning normalized as an abiotic equivalent of respiration/decay.with respeca to the amount of CO2 produced during Estimates for the release of carbon (in units ofburning. The ER is usually normalized with respect Teragrams of carbon, TgC/yr, where 1 Teragram =to CO 2 since CO2-is the overwhelming carbon species 1012grams = 106 metric tons) into the atmosphereproduced during biomass burning and it is a from biomass burning for different ecosystems arerelatively easy gas to measure. The emission ratio, summarized in table 1.ER is def'med as:
In the case of incomplete combustion in cooler(3) ER = deltaX/delta CO2 and/or oxygen-deficient fires, i.e., the smoldering
phase of burning, carbon is released in the forms ofwhere delta X is the concentration of the species X carbon monoxide, methane, nonmethane
produced by biomass burning, delta X = X* - X, hydrocarbons, and various partially oxidized organicwhere X* is tlie measured concentration of X in the compounds, including aldehydes, alcohols, ketones,bi0mass bum smoke, X is the background (out-of- and organic acids and particulate.black (soot) carbon.plume) atmospheric concentration of the species, and Nitrogen is present in biomass mostly as aminodelta CO2 is the concentration Of CO2 produced by groups (R-NH2) in the amino acids of proteins.
biomass burning, delta CO2 = CO2' - CO2, where During combustion the nitrogen is released byCO2" is the measured concentration in the biomass pyrolytic decomposition of the organic matter and"burn plume and CO2 is the background (out-of- partially or completely oxidized to various volatile
plume) atmospheric concentration of CO2. nitrogen compounds, including molecular nitrogen(N2), nitric oxide (NO), nitrous oxide (N20),
One of the important discoveries in biomass burning ammonia (NH3), hydrogen cyanide (HCN), cyanogen. - research over the last 5 years is that fires in diverse (NCCN), organic nitriles, i.e., acetonitrile (CH3CN),
ecosystems are very different in the production of acrylonitrile (CHECHCN), and propionitrilegaseoUsand particulate emissions. Gases and (CHsCH2CN), and nitrates. The sulfur in biomass is
particulate emissions depend on the type of organically bound in the form of sulfur-containingecosystem burning, i.e., the nature and distribution of amino acids in proteins. During burning the sulfur isthe vegetation (i.e., forests or grass), the moisture released mostly in the form of sulfur dioxide (SO2)
•content of the vegetation as well as on the nature, and smaller amounts of carbonyl sulfide (COS) and II' behavior_ and characteristics of the fire (i.e., flaming nonvolatile sulfate (804). About one half of the ir
or smoldering phase, fast or slow spreading), etc. It sulfur in the biomass matter is left in the bum ash,- is no longer correct to assume constant emission whereas, very little of the fuel nitrogen is left in the
ratios for all fires and for the entire lifetime of a ash.
particular fire (Cofer et al. 1990, 1991).
The gaseous and particulate emissions produced EMISSIONS FROM BURNING IN THEduring biomass burning are dependent on the nature BOREAL FOREST: THE BOR FORESTof the biomass matter, which is a _nction of the ISLAND FIRE EXPERIMENTecosystem and the temperature of the fire, which is
also ecosystem dependent. In general , biomass is An experimental high-intensity stand-replacementcomposed mostly of carbon (about 45% by weight) fire was conducted in Siberia on July 6, 1993.and hydrogen and oxygen (about 55% by weight), Science experiments designed around this fire were
Proceedings IBFRA Assn 1997 meeting 167
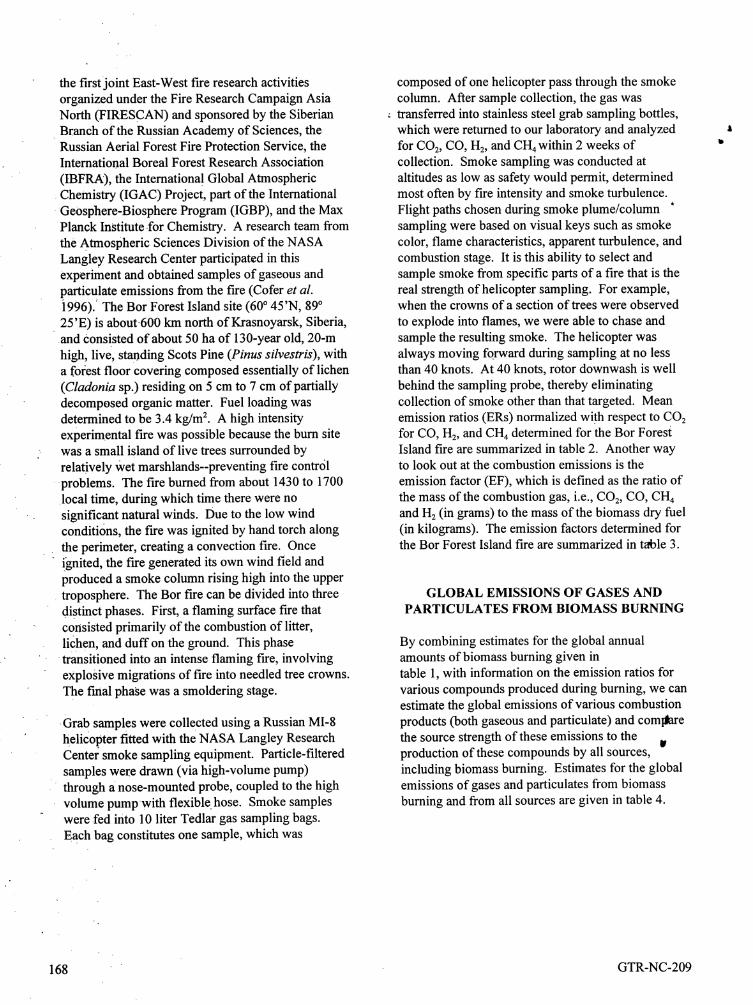
the first joint East-West fire research activities composed of one helicopter pass through the smokeorganized under the Fire Research Campaign Asia column. After sample collection, the gas wasNorth (FIRESCAN) and sponsored by the Siberian -- transferred into stainless steel grab sampling bottles,Branch of the Russian Academy of Sciences, the which were returned to our laboratory and analyzedRussian Aerial Forest Fire Protection Service, the for CO2, CO, n2, and CH 4within 2 weeks ofInternational Boreal Forest Research Association collection. Smoke sampling was conducted at
(IBFRA), the International Global Atmospheric altitudes as low as safety would permit, determinedChemistry (IGAC) Project, part of the International most often by fire intensity and smoke turbulence.
Geosphere-Biosphere Program (IGBP), and the Max Flight paths chosen during smoke plume/column "Planck Institute for Chemistry. A research team from sampling were based on visual keys such as smoke
the Atmospheric Sciences Division of the NASA color, flame characteristics, apparent turbulence, and
Langley Research Center participated in this combustion stage. It is this ability to select andexperiment and obtained samples of gaseous and sample smoke from specific parts of a fire that is theparticulate emissions from the fire (Cofer et al. real strength of helicopter sampling. For example,1996).' The Bor Forest Island site (60 ° 45'N, 89° when the crowns of a section of trees were observed25'E) is about 600 km north of Krasnoyarsk, Siberia, to explode into flames, we were able to chase and•and Consisted of about 50 ha of 130-year old, 20-m sample the resulting smoke. The helicopter was
high, live, standing Scots Pine (Pinus silvestris), with always moving forward during sampling at no lessa forest floor covering composed essentially of lichen than 40 knots. At 40 knots, rotor downwash is well(Cladonia sp.) residing on 5 cm to 7 cm of partially behind the sampling probe, thereby eliminatingdecomposed organic matter. Fuel loading was collection of smoke other than that targeted. Meandetermined to be 3.4 kg/m 2. A high intensity emission ratios (ERs) normalized with respect to CO2experimental fire was possible because the burn site for CO, H2, and CH4 determined for the Bor Foresl_
was a small island of live trees surrounded by Island fire are summarized in table 2. Another wayrelatively Wet marshlands--preventing fire control to look out at the combustion emissions is the
problems. The fire burned from about 1430 to 1700 emission factor (EF), which is defined as the ratio oflocal time, during which time there were no the mass of the combustion gas, i.e., CO2, CO, CH 4
significant natural winds. Due to the low wind and H2 (in grams) to the mass of the biomass dry fuelconditions, the fire was ignited by hand torch along (in kilograms). The emission factors determined for
the perimeter, creating a convection fire. Once the Bor Forest Island fire are summarized in table 3.
!gnited, the fire generated its own wind field andproduced a smoke column rising high into the uppertroposphere. The Bor fire can be divided into three GLOBAL EMISSIONS OF GASES ANDdistinct phases. First, a flaming surface fire that PARTICULATES FROM BIOMASS BURNING
" consiSted primarily of the combustion of litter,lichen, and duff on the ground. This phase By combining estimates for the global annual
•transitioned into an intense flaming fire, involving amounts of biomass burning given in
eXplosive migrations of fire into needled tree crowns, table 1, with information on the emission ratios forThe final phase was a smoldering stage, various compounds produced during buming, we can
estimate the global emissions of various combustion
Grab samples were collected using a Russian MI-8 products (both gaseous and particulate) and comllare
' helicopter fitted with the NASA Langley Research the source strength of these emissions to the irCenter smoke sampling equipment. Particle-filtered production of these compounds by all sources,
" samples were drawn (via high-volume pump) including biomass burning. Estimates for the globalthrough a nose-mounted probe, coupled to the high emissions of gases and particulates from biomassvolume pumpwith flexiblehose. Smoke samples burning and from all sources are given in table 4.
" were fed into 10 liter Tedlar gas sampling bags.
Each bag constitutes one sample, which was
168 GTR-NC-209

I
Table 2.--Emission ratios (ERs) (in %) normalized with respect to carbon dioxide for Bor Island forest fire (Cofer et•al. 1996) The Flaming I measurements representflaming combustion before the groundfire erupted into the
m
tree crowns, and consisted of emissions produced by burning lichen, surface litter, and duff. The Flaming 2measurements represent measurements of flaming combustion on both the ground and in the tree crowns.
" ICO/CO 2 CH4/CO 2 H2/CO_
Flaming 1(4 samples) 8.8+/-2.7 0.5+/-0.1 1.2+/-0.2Flaming 2 (5 samples) 11.3+/-2.7 0.4+/-0.1 1.6+/-0.1 .Smoldering 33.5+/-4.5 1.3+/-0.2 2.2+/-0.2
Inspection of table 4 indicates that biomass burning is CHEMISTRY OF THE HYDROXYL RADICALa significant global source of many environmentally (OH) IN THE TROPOSPHERE
significant radiatively-active and chemically-active,.
species. The hydroxyl radical (OH) is the major chemicalscavenger in the troposphere and it controls the
It is generally believed that the vast majority of atmospheric lifetime of most gases in theglobal burning is human initiated and that it has troposphere. The atmospheric lifetime, t, of any gas,significantly increased over the last few decades x_,that reacts with the OH radical is given by the(Levine 1991). During the burning of a forest, following expression"carbon dioxide that was sequestered in the forest overtime scales ranging from decades and centuries is t = 1/k [OH]suddenly released and returned to the atmosphere in a
. matter of only a few short hours. The burning of the where k is the kinetic reaction rate for the reactionforests also destroys an important sink for between OH and x_and [OH] is the concentration ofatmospheric carbon dioxide. Hence, burning has the OH radical (molecules cm3).both a short-term and long-term impact on the globalcarbon dioxide budget. The world's tropical rain The concentration of the OH radical is controlled byforests, in addition to being an important global sink the balance between its chemical production andfor atmospheric carbon dioxide, is also an important destruction. The hydroxyl radical (OH) is formed bys0u/'ce of atmospheric oxygen, which is produced as the reaction of excited atomic oxygen (O(tD)) with
a byproduct during photosynthesis, the carbon water vapor (H20):dioxide sequestering process. Yet this important andUnique ecosystem is being destroyed via burning at O(ID) + H/O ..... > 2OH, klan estimated rate of about 30 million acres per year.
Tropospheric excited atomic oxygen (O(lD)) is
•Table 3.--Emission factors (EFs): the mass of produced by the photolysis of ozone (03). In theCombustion gas to the mass of biomass fuel (in g/kg) troposphere, this photolysis reaction occurs over afor the Bor Islandforestfire (Cofer et al, 1996) very narrow spectral interval, between 290 nm and
310 nm. The production of excited atomic oxygen !C02 1475+/-40 decreases as the latitude increases, i.e., less incoming
' CO 180+/-40 solar radiation for photolysis is available. The bulk w
CH 4 4.2+/-0.8 of the water vapor in the atmosphere resides in the" H2. 0.8+/-0.3 troposphere. The amount of H20 in the atmosphere
is controlled by the saturation vapor pressure, whichdecreases with decreasing atmospheric temperature,i.e., as altitude or latitude increases.
Proceedings IBFRA Assn 1997 meeting 169

Table 4.--Comparison of global emissions from biomass burning _th emissions from all sources (including biomassburning) (Andreae 1991).
Species Biomass Burning All sources Biomass burning tTg element/yr Tg element/yr *'
Carbon dioxide 3.500 8,700 40
(Gross)Carbon dioxide 1,800 7,000 26(Net)Carbon monoxide 350 1,1O0 32Methane 38 380 10Non-methane 24 . 100 24
hydrocarbonsNitric oxide 8.5 40 21Ammonia 5.3 44 12
Sulfur gases 2.8 150 2Methyl chloride 0.51 2.3 22Hydrogen 19 75 25Tropospheric ozone 420 1,100 38Total particulate matter 104 1,530 7Particulate organic carbon 69 180 39Elemental carbon 19 <22 >86
(black soot)
The OH radical is destroyed via its reactions with CO HO2 + NO ..... > NO2 + OH (NO = nitric oxide,and CH4, both important products ofbiomass NO2 = nitrogen dioxide)bumin"g:
NO2 + hv ..... > NO + O (O = atomic oxygen)OH + CO ..... > H + CO2, k2, and •" O + O 2 + M ..... > 03 + M (02 = molecular
"OH + CH4 ..... > CH3 + H20, k3 oxygen)The concentration of the OH radical (molecules cm3)is determined by dividing the OH production term by Net Reaction: CO + 202 ..... > CO2 + 03
. ifs destruction terms: Note that the key gases in the carbon monoxide" _ oxidation chain leading to the photochemical
[OH] = 2 kl [H20]/k2 [CO] + k3 [ca4] production of tropospheric ozone, CO, and NO, areboth produced by biomass bmating.
PRODUCTION OF OZONE (O3) IN THE Methane Oxidation Chain
TROPOSPHERE #, CH4 + OH ..... > CH3 + H20 (CH3 =methyl
In addition to controlling the chemical destruction of radical) u. OH, the oxidation of CO and CH4 by OH outlined
above, initiates the carbon monoxide and methane CH3 + 02 + M ..... > CH302 + M (CH302 =oxidation schemes, which lead to the photochemical methylperoxyl radical)
- production ofO3 in the troposphereCH302 + NO ..... > CH30 + NO2 (CH30 =
Carbon Monoxide Oxidation Chain methoxy radical)
CO q- OH ..... > CO2 + H CH30 + O2 ..... > CH20 + HO2 (CH20 =formaldehyde)
, H + 02. + M ..... > HO2 + M (H = atomic
hydrogen, HO2 = hydroperoxide radical) HO2 + NO ..... > NO2 + OH
170 GTR-NC-209

2 * (NO2 ..... > NO + O) Bromine destroys stratospheric ozone via the2 * (O + 02 + M ..... > 03 + M) following three reaction cycles (World Meteorological
Organization 1995)Net Reaction: CH4 + 402 ..... > CH20 + H20 +203 Cycle 1 •
Note that the key gases in the methane oxidation BrO + C10 + hv ..... > Br + C1 + 02 (BrO =chain leading to the photochemical production of bromine monoxide, C10 = chlorine monoxide)tropospheric ozone, CH4, and NO, are both producedby biomass burning. Br + 03 ..... > BrO + 02 (Br = atomic bromine)
CI + 03 ..... > CIO + 02 (C1 = atomic chlorine)CHEMISTRY OF NITROGEN OXIDEs IN THE
TROPOSPHERE The net reaction is 203 ..... > 302
In addition to being a key player in the carbon Cycle 2monoxide and methane oxidation chains leading to thechemical production of ozone in the troposphere, NO BrO + HO2 ..... > HOBr + 02also leads to the chemical production of nitric acid HOBr + hv ..... > OH + Br(HNO3), the fastest growing component of acidicprecipitation. NO is chemically transformed to Br + O3 ..... > BrO + 02nitrogen dioxide (NO2) and then to nitric oxide via thefollowing reactions: OH + O3 ..... > HO2 + 02
' NO + 03 ..... > NO2 + 02 Cycle 3
NO + HO2 ..... > NO2 + OH BrO + NO2 + M ..... > BrONO2 + M(BrONO2= bromine nitrate)
NO + CH302 ..... > NO2 + CH30BrONO2 + M ..... > Br + NO3 (NO3 = nitrate)_
NOz+ OH + M ..... > HNO3 + M(HNO3=nitric acid) NO3 + hv ..... > NO + 02
Br + 03 ..... > BrO + 02CHEMISTRY OF THE STRATOSPHERE
NO + 03 ..... > NO2 + 02
.Appr°ximatelYg0% of the ozone in the atmosphere isfound in the stratosphere (15 - 50 km), with about There are two other channels for the reaction between10% in the troposphere (0 - 15 km). Stratospheric BrO + CIO (Wayne 1991)ozone is very important because it absorbs ultraviolet
radiation (200 nm - 300 nm) from the Sun and shields BrO + CIO ..... > Br + OCIO #the surface from this biologically lethal radiation.
' Stratospheric ozone is destroyed via a series of BrO + C10 ..... > BrCI + 02 IIchemical reactions involving chlorine and bromine.
" Chlorine dest.roys stratospheric ozone through the There is also a relevant reaction between BrO andfollowing catalytic cycle (Wayne 1991). itself (Wayne 1991)
. BrO + BrO ..... > Br + Br + 02CI + 03 ..... > C10+ O2
CIO + O ..... > CI + 02 ATMOSPHERIC NITROGEN AND OXYGEN
The net reaction is O + 03 ..... > 202 Biomass burning is both an instantaneous source(combustion ofbiomass) and a long-term source(enhanced biogenic soil emissions via increased
Proceedings-IBFRA Assn 1997 meeting 171

nitrification and denitrification in soft) of gases to the seven-channel radiometer to monitor/measure activeatmosphere: These gases impact the chemistry of the fires, fire scars, and combustion aerosols in thetroposphere and stratosphere, as outlined in this : atmosphere. FireSat can record fires with a groundpaper. In addition, biomass burning may also impact resolution of 250 m and monitor about 95% of theatmospheric concentrations and the biogeochemical Earth's surface in a single day from its 830 km orbit. •cycling ofnitrogen and oxygen, the two majorconstituents of the atmosphere. Through the process
of nitrogen fixation, molecular nitrogen (N2) is CONCLUSIONStransformed to the surface in the form of"fixed"
nitrogen, i.e., ammonium (NH4+) and nitrate (NO3). In addition to being a significant instantaneousNitrogen fixation results from both natural processes regional and global source of gases and particulates to(biological fixation in root modules in certain the atmosphere, burning also enhances the biogenicagricultural crops and atmospheric lightning) and emissions of nitrogen and carbon gases from the
humar_ processes (the production of nitrogen fertilizer world's soils to the atmosphere (Levine et al. 1997).and high temperature Combustion). The world's use In addition, biomass burning impacts the reflectivityof industrially fixed nitrogen fertilizer has increased and emissivity of the Earth's surface. Burning alsofrom about 3 Teragrams (Tg) of N/year in 1940 to affects the hydrological cycle by changing rates ofabout 75 Tg N/yr in 1990 (Levine et al. 1996b). The land evaporation and water runoff. In December"fixed" nitrogen in the forms ofNH4 + and NO3 is 1997, representatives from the countries of the worldreturned to the atmosphere mainly in the form of N2, will meet in Kyoto, Japan, to discuss global warmingwith smaller amounts of N20, and still smaller and ways to reduce the build-up of greenhouse in theamounts of NO by denitrification and in the form of atmosphere. The production of atmospheric carbonNO by nitrification. Burning or "pyro-denitrification" dioxide by global burning will be an important point
• may also be an important source of nitrogen, mostly of discussion at this international conference.in the form of N2, from the biosphere to theatmosphere (Lobert et al. 1991, Levine et al. 1996a). For the reasons discussed in this paper, it appears thatThe problem is that it is difficult to quantify the biomass burning in general, and burning in the borealamount of N2 released during burning (Lobert et al. forests, in particular, is a significant driver for global1991), however, biomass burning or change. It seems appropriate to conclude thispyrodenitrification may prove to be an important summary with a quotation from fire historian, Stephenprocess in the recycling of nitrogen compounds from J. Pyne (1991):the biosphere to the atmosphere.
We are uniquely fire creatures on a uniquely fireBurning impacts the concentration of atmospheric planet, and through fire the destiny of humans has
- oxygen in two ways. Carbon released during the bound itself to the destiny of the planet.bUrning ofbiomass combines with atmosphericoXygen to form carbon dioxide. Hence, burning is asink for atmospheric oxygen. In addition, biomass LITERATURE CITED
• burning destroys the very source of atmosphericoxygen--its production in the biosphere via the Andreae, M.O. 1991. Biomass burning: its history,process of photosynthesis in the world's forests, use, and distribution and its impact on i
' environmental quality and global climate. In:Due to its impact on the chemical composition and Levine, J.S., ed. Global biomass burning: u
- chemistry of the regional and global atmosphere and atmospheric, climatic, and biospheric implications.on global climate, biomass burning is an important Cambridge, MA: The MIT Press: 3-21.driver for global change on our planet (Levine et al.
- 1995). A majOr uncertainty in our understanding of Cahoon, D.R.; Stocks, B.J.; Levine, J.S.; Cofer,the impact of burning on the atmosphere and climate W.R.; Pierson, J.M. 1994. Satellite analysis of theisthe geographical and temporal distn'bution of fires, severe 1987 forest fires in northern China andSpace offers a unique vantage point for these southeastern Siberia. Journal of Geophysicalmeasurements. A dedicated mission, called FireSat, Research. 99:18,627-18,638.
has been developed to measure/monitor thegeographical and temporal distribution of global fires Cofer, W.R.; Levine, J.S.; Winstead, E.L.; Stocks,(Levine et al. 1996a). The FireSat instrument is a B.J. 1990. Gaseous emissions from Canadian
172 GTR-NC-209

o
boreal forest fires. Atmos. Environ., Part A, 24: Levine, J.S.; Cahoon, D.R.; Costulis, J.A.; Couch,1653-1659. R.H.; Davis, R.E.; Garn, P.A.; Jalink, A.;
McAdoo, J.A.; Robinson, D.M.; Roettker, W.A.;Cofer, W.R.; Levine, J.S.; Winstead, E.L.; Stocks, Sasamoto, W.A.; Sherill, R.T.; Smith, K.D. 4
B.J. 1991. Trace gas and particulate emissions 1996a. FireSat and global monitoring ofbiomass _'from biomass burning in temperate ecosystems. In: burning. Biomass burning and global change,Levine, J.S., ed. Global biomass burning: Volume 1. In: Levine, J.S., ed. Remote sensing,
•atmospheric, climatic, and biospheric implications, modeling and inventory development, and biomass•Cambridge, MA: The MIT Press" 203-208. burning in Africa. Cambridge, MA: The MIT "
Press: 107-129.
Corer, W.R.; Winstead, E.L.; Stocks, B.J.; Overbay,L.Wl; G01dammer, J.G.; Cahoon, D,R.; Levine, Levine, J.S.; W. R. Cofer, W.R.; Cahoon, D.R.;J.S. Emissions fi'om boreal forest fires: are the Winstead, E.L.; Sebacher, D.I.; Scholes, M.C.;atmospheric impacts underestimated? In: Levine, Parsons, D.A.B.; Scholes, R.J. 1996b. BiomassJ., ed. Biomass burning and global change, burning, biogenic soil emissions, and the globalVolume 2. Cambridge, MA: The MIT Press, Inc.: nitrogen budget. In: Levine, ed. Biomass burning834-839. and global change, Volume 1. Cambridge, MA:
The MIT Press: 370-380,Crutzen; P.J.; GOldammer, J.G., eds. 1993. Fire in the
environment: the ecological, atmospheric, and Lobert, J.M.; Scharffe, D.H.; Hao, W.M.; Kuhlbusch,climatic importance of vegetation fires. Chicester, T.A.; Seuwen, R.; Warneck, P.; Crutzen, P.J.
England: John Wiley and Sons. 400 p. 1991. Experimental evaluation ofbiomass burningemissions: nitrogen and carbon compounds. In:
Goldammer, J.G.; Furyaev, V.V., eds. 1996. Fire in Levine, J.S., ed. Global biomass burning:' ecosystems of boreal Eurasia. Dordrecht, Holland: atmospheric, climatic, and biospheric implications.
•KluWer Academic Publishers. 528 p. Cambridge, MA: The MIT Press: 289-304.
Levine, J.S., ed. 1991. Global biomass burning: Mano, S.; Andreae, M.O. 1994. Emission of methylatmospheric, climatic, and biospheric implications, bromide from biomass burning. Science. 263"Cambridge, MA: The MIT Press. 569 p. 1255 - 1257. ,
Levine, J.S., ed 1996a. Biomass burning and global Pyne, S.J. 1991. Sky of ash, earth of ash: a briefchange, Volume 1. Remote sensing, modeling and history of fire in the United States. In: Levine,
• inventory development, and biomass burning in J.S., ed. Global biomass burning: atmospheric,. Africa. Cambridge, MA: The MIT Press. 581 p. climatic, and biospheric implications. Cambridge,
- • . MA: The MIT Press: 504 - 511.
Levine, J.S., ed. 1996b. Biomass burning and globalchange, Volume 2. Biomass burning in south Seiler, W.; Crutzen, P.J. 1980. Estimates of gross and
• , America, southeast Asia, and temperate and boreal net fluxes of carbon between the biosphere andecosystems, and the oil fires of Kuwait. atmosphere from biomass burning. Climate
Cambridge, MA: The MIT Press. 351 p. Change. 2: 407-427. !
Levine, J.S•.; Cofer, W.R.; Cahoon, D.R.; Winstead, Stocks, B.J. 1991. The extent and impact offorest ifE.L. !995. Biomass burning: a driver for global fires in northern circumpolar countries. In: Levine,change. Environmental Science and Technology. J.S., ed. Global biomass burning: atmospheric,29" 120A- 125A. climatic, and biospheric implications. Cambridge,
. . MA: The MIT Press: 197-202.
Levine, J.S.; Cofer, W.R.; Winstead, E.L.; Rhinehart,R,P.; Cahoon, D.R.; Sebacher, D.I.; Sebacher, S.; Stocks, B.J.; Flannigan, M.D. 1987. Ninth conferenceStocks, B.J. 1991. Biomass burning: combustion on fire and forest meteorology. Society ofemissions, satellite imagery, and biogenic American Foresters: 23-30.emissions. In: Levine, J.S., ed. Global biomass
burning. Cambridge, MA: The MIT Press" 264- van Wilgen, B.W.; Andreae, M.O.; Goldammer, J.G.;271. Lindesay, J.A., eds. 1997. Fire in Southern African
Proceedings IBFRA Assn 1997 meeting 173

°
Savannas. Johannesburg, South Africa:Witwatersrand University Press. 256 p.
Wayne, R.P. 1991. Chemistry of atmospheres (2nd Aed.). Oxford, England: Oxford University Press:160-164.
-.
•World Meteorological Organization. 1995. Scientificassessment of ozone depletion: 1994. Report 37.Global Ozone Research and Monitoring Project:10.18. •
I
' 11'
174 GTR-NC-209

o
Impacts of Severe Weather ¢,
i
• U
175

AD
!
. IW
°
176

" ECOLOGICAL APPROACH TO ASSESSING PINE FOREST DISTURBANCEJ IN CENTRAL SIBERIA
V. A. Ryzkova, F. I. Pleshikov, V. Y. Kaplunov,and J.V. Usoltzeva l
ABSTRACT. -- Estimates are given of levels of factors and the influenceof its effects on standwind•pine stand disturbancein south CentralSiberiaby resistance. The solution of thisproblem should bethe November i994 hurricane. Majorfactors based on fullaccounting for all environmentalaccounting for decrease in stand resistance to wind factors, as well as thorough study of forest soils, ,are determined. These include: specific site conditions, stand composition, structure andenvironmental conditions (complex relief patterns, productivity specific to geomorphologicalground structure, and light soil structure), situations, and analyses of forest planting methodsinfest.ation by fungi (Heterobasidion annosum (Fr.) (Rozkov and Kozak 1989; Mitchell 1995).Bref.), and disturbance of natural conditions byhuman economic activity. Measures are suggested Our investigation encompassed the following_t0 01_timizewind resistant pine stand formation, interrelated aims:
• determine the scale of pine stand disturbancecaused by the November 1994 hurricane;
• estimate factors that influence forest resistance" INTRODUCTION to wind in relationto local environmental
I conditions;In Siberia, pine forests are widespread on big river • make recommendations on how to improveterraces and along glacial water runoffs. They are methods of wind resistant plantationUnique natural objects, which grow along the establishment.southern boundary of the forest vegetation area and
. cover some 65,000 ha. These pine stands areconsidered to be particularlyvaluable and fall in METHODSGroup I of the Forest Value ClassificationSystem.They protect soil andwater bodies, and perform Over many years, scientists of the Instituteofsanitaryandrecreational functions. Forest, SiberianBranch,Russian Academy of
Sciences, have performed complex studies in pineOver recent decades, the tendency for worsening of standsin the south of CentralSiberia dealing with ,,
• the ecological state of pine stands has become soils, site conditions, forest productivity, and thestronger. They are periodically damagedby currentecosystem state (Soil Factors Controllingdendrophilous insects, wild animals,cutting, and PineStand Productivity, 1976). The work involveshurricanes. Windfalls are a very remarkable feature representative sites, transects, landscape profiles,of the present appearance of the pine stands. Due permanent sample sites, and the use of 1"12,000 -
. .to the light mechanical composition of the softs, tree 1:200,000 aerial images.•infestation by fungi (Heterobasidion annosum (Fr.)
• ' 13ref.)the dune/hilly relief, and the high density of As for the methods used, we collected informationwoody vegetation at some sites, the pine stands are from a variety of sources, ranging from spaceregularly disturbed by strong winds, which results in imagery to ground observations, to result inconsiderable economic and environmental damage, different scales of geographic detail output. ThisIn November 1994, strong winds (more than 30m/s) involved use of available forest inventory data, 1t
' made about 300,000 cubic m of wood fall in an area ecological maps, and information on the current lrexceeding 2.5 million ha. Wind-caused tree root forest state. When working on the representative
- disturbance had led to weakening of the pine stands sites and transects, we plotted the boundaries ofover.large areas. This makes the understanding of disturbed pine stands on maps and aerial images. Inpine stand resistance to wind a very serious and addition, we used data from observation routes
- important research problem, covering the whole ofthe area of interest. Wind-induced snapping of tree trunks and windfall
An ecological approach is described for assessment structure were studied at permanent sample sites.of pine forest disturbance caused by anthropogenic
1Institute of Forest, Siberian Branch, Russian Academy of Science, 660036, Akademgorodok,Krasnoyarsk, Russia Phone: (7)0912)49-46-67 / Fax:(7)0912)43-36-86 / e-maih dndr_for.krasnoyarsk.su
.
Proceeding s !BFRA Assn 1997 meeting 177

RESULTS forest disturbance due to wind. The highestdisturbance is observed in the sites of mostly
The results of our investigation show that, in the northwest aspect with relatively fiat, slightlysouth OfCentral Siberia, the level of wind-caused : undulating or gently-sloping/small bald hilly reliefpine stand disturbance is determined by topographic (zones 1, 2, and 3), which were directly affected by A(relief, soil-ground thickness structure), biological the hurricane. In these areas, relatively rich soil and(soil richness and stand age, density, productivity, site conditions of classes I and II promote highlyand horizontal structure), and economic activity productive mature pine stands. Wind-fallen treesfactors. In figure 1, an ecological information- account for 30%-50% of their total number. Thebased map is presented of one of the studied pine sites that suffered most (wind felled up to 90% of "stands. Each zone in the map represents a certain trees) are shown in the map as areas of continuoustype of site conditions, which are relatively uniform windthrow.with respect to the complex of environmentalfactors, such as mesorelief type, general slope Zones 4, 5, and 7 represent a macroslope of theaspect, lithologic parameters, soil, and vegetation southeast aspect. Forest disturbance is considerablypattern, less here (disturbance of 10%-20% on the average).
However, individual wind-thrown trees are foundeverywhere. The factors accounting for a lower
Below is a brief description of the zone: disturbance level mightinclude not only an oppositeaspect, but also lower pine density and productivity,
1. Situation of soft slopes and bald hills with as well as the presence of mixed birch-pine standsnorthwest aspect underlain by sandy and loamy with grass ground cover and young pine stands.deposits and colonized by pine stands on well-developed loamy sand soils; site-specific stand The areas largely represented by 50-60 year-old andproductivity (SSSP) of classes II and III. young pine stands (6), where site conditions are
poor and relief is heavily broken (dunes and hills),' 2. Areas of relatively flat and undulating relief appeared to be the most resistant to wind.
mostly with northwest aspect underlain by..
three-layer deposits (loam/sand/loam) and To sum up, the highest disturbance occurs incolonized by pine forest on loamy soils; SSSP mature pine stands (SSSP classes I and II) coveringclasses Ia, I, and II. northwest slopes (more than 15°) easily affected by
wind, and with relatively fiat, softly sloping/hilly
• . 3. Areas of small hills andbald mountains with surfaces.northwest aspect underlain by two-layerdeposits (loam and sand) and colonized by pine Based on an ecological map previously created withand birch stands on loamy soils; SSSP classes I help of our original technique (Ryzkova V.A.,and II. Pleshikov F.I., Tcherkashin V.P. 1992) we could
. perform a more detailed analysis of areas with" 4. Areas characterized by soft bald hills with continuous windthrow. Fragments of a large-scale
• southeast aspect and by pine and mixed ecological map and a vegetation map were enteredbirch/pine stands on light loams; SSSP classes I into a computer, overlaid, and analyzed using aand.II, forest inventory database. Integral indicators of the
quality of site conditions are as follows: actual and5. Softly sloping erose surfaces of the potential productivity, and the percentage of
southeastern aspect underlain by two-layer realization of potential site condition by vegetation. It. deposits and colonized by pine forest on loamy i¢
sand; SSSP classes II and III. Figure 2 shows fragments of large-scale maps of" forest sites disturbed by wind and represented by
6. Heavily broken areas of dune-like relief different types of site conditions. Site A (site•underlain by sandy,deposits and colonized by condition type 2; fig. 1) is characterized by rich soils
" pine forest on immature sandy and primitive and stands of high productivity. Sites wheresoils; SSSP classes IV and V. windthrow is the highest have been subject to
7. Flat and gently sloping surfaces characterized partial logging over the last 10-15 years; this hasby stratified loamy sand soils supporting pine decreased the wood biomass amount and disturbedstands; SSSP classes II and III. the natural stand structure. For these areas, average
_ realization of site potential by vegetation is 45%-
Each zone on the map has its own specific 65%. Man-caused changes of the natural structurecombination of the above mentioned environmental of these pine stands resulted in their low resistance
' factors and is characterized by a certain level of to negative environmental factors including wind.
178 GTR-NC-209

,, 0123kxa
i[ Fig. I.--A map of disturbances of a forest managementarea (pine forest belts in the
south of Central Siberia)causedby a hurricanein November 1994.Disturbance levels:
, a- heavy, b- medium, c- light.1-7 - types of site conditions (see text for explanation).
- boundaries of site types.
-places of continuous windfall (wind-fallen trees are 80- 90 %).
!
. U
^ •
I
Proceedings IBFRA Assn 1997 meeting 179
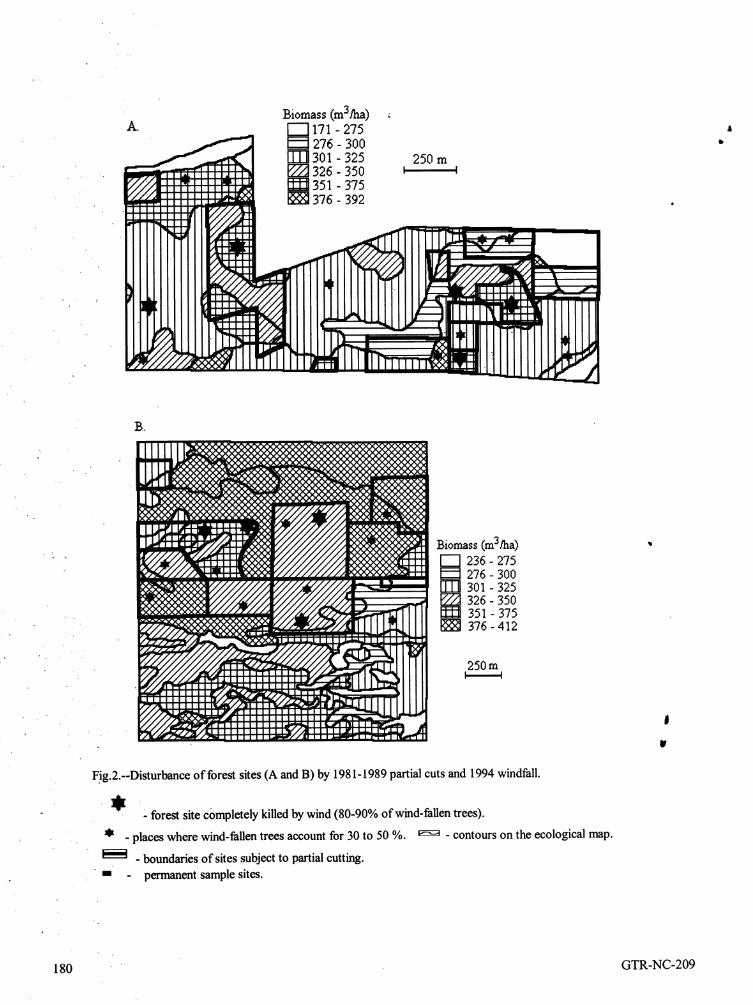
Biomass(m3/ha)A. [--]171-275 *
276- 300' _301 -325 250 m
.. .. ,i _- F_s26-sso , ,"" ' _351- 375- _ 376- 392p 6
B.
Biomass (m3/ha) "• I-"-I 236- 275
F==I276-300301-325326-350351- 375
- _ 376-412
• .
250m
i
. W
" Fig.2.--Disturbance of forest sites (A and B) by 1981-1989 partial cuts and 1994 windfall.
- - forest site completely killed by wind (80-90% of wind-fallen trees).
- places where wind-fallen trees account for 30 to 50 %. _=_ - contours on the ecological map.
i_ . boundaries of sites subject to partial cutting.
m . permanent sample sites.
180 GTR-NC-209
Site B is situated at the boundary between site the environmental conditions and disturbance ofconditions of types 1 and 6. In the upper part of the natural vegetation communities by human economicsite, mature stands prevail (SSSP classes II and II), activities. Least wind resistant are the mature, high-which have also experienced selective logging. The productivity pine stands with discontinuous ,coefficient of site potential realization by vegetation horizontal canopy closure growing on pure loamy ,,is 40%-50%. This is where the windthrow was sand deposits, which result in only surface rootextremely high. system development. Underlying loamy sand which
is reachable by tree roots improves tree resistanceThe lower part of the site _svery different from the to wind significantly due to the better development ,upper part in terms of type ofsite conditions of main roots. Infestation of the pine stands, which(shallow sandy soil, dune/small hill relief), SSSP grow densely up to the age of 50-60 years, by fungiclass (IV and V), and stand age structure. Here, a (Heterobasidion annosum (Fr.) Bref.), followingconsiderable area is covered by natural young pine intensive thinning of the stands, during partialstands. The coefficient of realization of site logging operations, also contributes to pine windpotential by vegetation is 90%-100%. That means resistance decrease.that the natural forest cover structure is only slightlydisturbed here. Single wind-thrown trees can be Pine stand resistance to wind can be improvedfound in saddles between dunes (where site SSSP through optimizing forest maintenance based onclass increases to III). In general, this part of the well-planned thinning activities. The latter shouldpine forest was let_practically unaffected by the be aimed at promotion Of strong root systems andwindthrow. One of the factors that contributed to long crowns of trees (Stoyko 1965). Whenthe high wind resistance of this area is that it had planning forestry activities dealing with increasingnot been disturbed by logging because of low stand resistance to wind, one should take intoproductivity of the stands, account site conditions, ground thickness structure,
topography, forest land structure, and the
Analysis of the vegetation inventory data obtained inventory/morphological characteristics of the• from the permanent sample sites allowed us to future vegetation communities that will in time
detemaine the reasons and identify the mechanisms replace disturbed forests.of decreasing stand resistance to wind atter partiallogging. Since there are ecological constraints forforest thinning operations in the forest-steppe zone, ACKNOWLEDGMENTSthese stands remain very dense up to the age of 50-60 years. As a rule, pine stands are intensively The work reported here was supported bythinned during partial logging operations. Krasnoyarsk Region Science Foundation, 5F0076According to our data, some 11%-38% of the total grant.stand wood biomass amount is removed by partiallogging. Since the remaining mature trees growslower, they adapt themselves to the altered LITERATURE CITEDecological situation slowly and become verySensitive to wind. Investigation of the last Mitchell Stephen J. 1995. The windthrow triangle:windthrow in the pine stands under consideration the windthrow hazard assessment procedure forshowed that some 90% of disturbed stands had forestmanagers. Forest Chron. No.4.been subject to partial thinning of different extentsin the preceding years. Rozkov A.A. and V..T. Kozak. 1989. Forest |
Resistance. Moscow, Agropromizdat Publ. 239' We failed to identify any relationship between the pp. w
space available for a tree to grow and its resistance- to wind. We can only mention one thing: the Ryzkova V.A., Pleshikov F.I., Tcherkashin V.P.
biggest'number of wind-thrown trees occurred in 1992. Ecological mapping as a method of" less dense stands, with other parameters being the estimating current forest state. Geography and
same. Natural Resources. No. 1 (137-144)..
Soil Factors Controlling Pine Stand Productivity.CONCLUSIONS 1976. Novosibirsk, Nauka Publ. 238 pp.
Pine stands of the southern part of Central Siberia Stoyko S.M. 1965. Reasons of windthrows inare remarkable for their generally low resistance to Karbap spruce stands and measures to preventstrongwind influence. The two major factors them. Forest Management 9(12-15).
. accounting for this are the specific characteristics of
Proceedings IBFRA Assn 1997 meeting 181

DISTURBANCES IN THE SCOTS PINE FORESTS OF
" SOUTH SIBERIA CAUSED BY OCCASIONAL STORM WINDS
A. I. Buzykin, L. S. Psheniclmikova, N. M. Tchebakova ]
ABSTRACT. -- Scots pine forests stretching along trees was as much as 200,000 m 3.
the sandy bands of ancient alluvial sediments and °granite outcrops in the south of Siberia are called It is a well known fact that windthrows depend on aband-like pine forests. These forests are of special number of factors such as: topography, soilvalue for protecting adjacent soils, agricultural properties, tree species, stand age and structure,fields, and rivers. The stands have become too tree diseases (Belov 1983, Skvortsova et al. 1983,
dense because of limited forestry activities. A Kenstavichyus 1984, Burenina 1988, Mitchellsignificant part of them has become weakly 1995, Ruel 1995).resistant to wind. As a result of the strong cyclonicstorm of 1994 (more than 30 m/s windspeeds), Our study showed that the main cause of weakdense stands of 90 and more years old were resistance to wind was high density of stands. ThisSignificantly damaged or killed. Now, these areas is primarily due to two factors: (1) tree rootare under threat of spreading forest fires and insect systems do not develop properly in over-stockedoutbreaks. The possible causes of the powerful stands; and (2) roots are affected by Fomitopsiswindthrow ha these forests are: (1) In dense stands, annosa (in Russian "root sponge") to a greater.theetree root systems do not develop properly to extent in dense stands than in thinned stands.
support trees under wind impacts; and (2) Dense Moist, rich, and light by mechanical compositionstands are also subject to Fomitoptis annosa soils also condition too weak root systems toinvasions, which damage the roots. Thinning band- support vigorous above-ground parts of trees.like pine forests combined with introduction of
deciduous tree species like birch is an effective One can rightfully conclude that to grow wind-measure both to form thick-set stems with vigorous resistant and productive stands for strong protective
root systems and to inhibit Fomitopsis annosa objectives, it is necessary to reduce stand densityinvasions, by regular intermediate cuttings as stands develop
and to replace mature and overmature stands byyoung generations through clear cuts.
• INTRODUCTIONMETHODS AND RESULTS
This study addresses the results of our investigationon possible causes of a catastrophic windfall of Region Characteristics
" 1994 in Scots pine forests in the south of the
Krasnoyarsk Territory, Siberia. The pine (Pinus The study was conducted in the Minusinsk forestrysylvestris) forests called band-like pine forests are management area located in the forest-steppe zone.scattered in small separated groves in steppe areas The climate of the region is characterized by warmor in band-shaped stands stretching along ancient summer (July temperature 19.6°C) and cold winteralluvial sediments and granite outcrops on sandy (January temperature -21.2°C) with little snow, andsoils in the south of Siberia. These band-like pine low annual precipitation (250-350 mm). Soils ar#
' forests are ecologically valuable because they forest gray, sandy and loamy sandy. Average a_perform important protection and recreation of the band-like pine forests is 78 years.
" functions, Only intermediate cuttings of different Productivity expressed through site quality class is /
intensities for protection against forest fire are 11.2. According to Orlov's (1929) classification /being performed in these forests. Because of used in Russian inventory, class I is good, III is
" limited forestry operations most band-like pine intermediate, and V is poor. Forest types with
forests appeared to be weakly-resistant to wind. A green moss in the ground cover dominate (75%);dramatic windthrow resulted from a cyclonic storm forest types with forbs in the ground cover amountin 1994. Pine forests were damaged over an area of to 12%. The main peculiarity of the band-like pine
, 28,000 ha, and the volume of the fallen and broken forests is their high density: according to thei i
•
1Institute of Forest, Russian Academy of Sciences (Siberian Division), Academgorodok, 660036" Krasnoyarsk, Russia. Fax: +7-3912-433686, E-mail: [email protected].
182 GTR-NC-209

standard silviculture norms for the region, dense Analysis of the Field Datastands with density 0.8 and more cover 81% of the
- forested land. The pine forests most damaged by the powerfulMethods windthrow of 1994 were examined in 1996. All
fallen trees were found to be infected byAbout 30,000 ha of the band-like pine forests have Fomitopsis annosa. The decay was detected ,been examined to evaluate the type and degree of mainly in roots and sometimes above the root neck. •damage caused by the storm wind of 1994 as well Causing destruction of the root system followed byastheir current state. Forty temporary sample plots its death, the root sponge is as a rule a cause of awere established to evaluate real densities of the massive windfall or stand drying off and mortality.band-likepine stands and correctly identify Our examination shewed that on average each "intermediate cutting regimes (intensity and hectare of the pine forest of premature age (60frequency) in them. Plot size varied from 0.02 to years and older) contained 20-25 m3 of wind-fallen0.5 ha andthe number of trees varied from 200 per wood. This phenomenon can be conditionallyplot in mature stands to 400 per plot in young called a specific "wind" method of intermediatestands. About 200 sample trees were felled and thinning. In order to prevent spontaneous damage100 stumps and 200 cores' were additionally used to of stands by occasional winds, it is necessary tocharacterize stand structures. Healthy, damaged, replace "wind" thinning by controlled purposefuland killed trees were enumerated. Standard decrease of a stand densityby regular intermediateinventory characteristics like diameter, height, cuttings while forming a stand; as well to replacenumberof trees, volume, actual stand basal area, dense mature stands (100 and over years old) byand normalized stand basal area (NSBA, a ratio of younger generations as early as possible.actual stand basal area to that of an ideal stand with
maximum crown cover) were used. For How occasional, unique, or frequent arecomparison, standard inventory data on wood windthrows in the band-like pine forests? It is.volume taken out of stands by intermediate cuttings difficult to settle this question. Obviously, there is' and stand states after intermediate cuttings were a real constant threat of windthrows. Evidence of
additionally used in the analysis, wind catastrophes reflected by such specific nano-relief elements as small bumps and depressions leftafter wind-fallen trees witness this phenomenon.Our plot data showed that high density standsdominate in fact in all age groups (table 1).
Table 1. -- Characteristics ofPinus sylvestris stands examined in the field.
Stand age Average Average Number of Actual basal Normalized Volume,
.(yr) diameter height trees area basal area, (M3/ha). - (cm) (cm) per ha (M2/ha) portion of "1"
18 2.4 3.4 37538 18.8 1.84 48.8
30 4.3 6.5 18613 27.9 1.40 141.534 8.4 10.9 5750 31.6 1.16 200.145 8.7 12.2 3850 42.6 1.46 148.2
45 6.7 10.0 5425 35.0 1.29 116.1 !45 8.7 12.2 3824 36.8 1.26 126.151 . 10.7 14.6 3593 32.3 1.13 300.0 W67 14.9 15.9 1781 32.0 0.97 250.090 23.0 21.6 1018 42.4 1.21 376.791 19.6 20.0 1274 38.5 1.12 382.2
. 96 22.3 . 20.4 1181 46.2 1.36 416.5103 27.5 25.1 846 50.3 1.38 507.6
o
Proceedings IBFRA Assn 1997 meeting 183

.Analysis.of the Inventory Data frequent or moderately frequent cuttings can be" hardly justified from forestry-ecological
According to the previous inventory of 1989-90, an considerations. Cuttings and especially taking offaverage NSBA of pine stands in the Minusinsk the wood by machines significantly damage stemsleskhoz is 0.63 with low density stands 4.2%, , and canopies if done in winter; when done in amedium density stands 85.3%, and high density warm period, tree root systems are additionallystands 10.1%. Based on the inventory data, these damaged. In any event, sanitation states of stands "
•10% high density stands are highest priority for are being worsened under frequent cuttings.intermediate cuttings. This number appeared to be The analysis of industrial intermediate cuttingsunderestimated due to groundlessness of a local made in the Lugavsk forestry district showed that adensity standard. In fact, the real average density system of low intensity cuttings dominated. They"measured byNSBA from our field data was 0.80 provide minimum interference into a natural
with dense stands (NSBA is 0.80 and greater) growth and development process of stands (tablegrowing on 80% of the pine forested area. 3). Stands are supported in dense and productive
states. From the forestry view point, such a system
For the period of 1989-99, the area subject to of intermediate cuttings based on natural treeintermediate cuttings in the leskhoz was only 4,000 mortality and favoring growth of high productiveha or 7.9% of the forested area (table 2). Too small stands is quite justified if high density does notarea and not intensive intermediate cuttings attract inhibit tree growth and decrease weak-resistance toattention. Of course, low intensity cuttings may be wind. Even in this case, the real intensity of the
. compensated by higher frequency. However, intermediate cUttings in the young stands (10-11%of volume in the Minusinsk leskhoz) and especiallythe intensity of increment cuttings (5.5% in the
Lugavsk district) seem to be extremely insufficient.More frequent intermediate cuttings in these stands
Table 2.-, Predicted volume of intermediate cuttings in the Minusinsk area (in 1990-2000 yrs.).
Characteristics of stands assigned for intermediate cuttings
Type of intermediate Stand age Total area of Stand area in need Intensity of intermediatecuttings (yr) stands aged for of intermediate cuts euts by mass
• . intermediate cuts (ha/%) (%)
After young growth before 40 2,325 880/37.9 14.3Thinning 41-60 6,555 1,538/23.5 13.8Increment after 61 41,546 1,578/3.8 11.8TOTAL 50,426 3,996/7.9 12.9
• .
Table 3. -- Average data on intermediate cuttings performed in 1970-1995 yrs. in the Lugavsk district.
Characteristics of stands assigned for intermediate cuttings
Intermediate cutting type Age, yr. Normalized basal Site quality Volume, m_ !' area, portion of class
' "1" Ir
- After young growth 20-30 0.79 11.6 105Thinning 60 0.82 II.2 225•Increment 70 0.81 II.2 256
184 GTR-NC-209

are required to grow Wind-resistant trees, although Trees in the thinned stands respond to continuousthe cuttings are less profitable from both technical strong wind impacts by changes of tnmk shapes, byand economical perspectives compared to high development of stronger root systems, and by
. intensity cuttings, forming tractive wood of the main roots. Theresult is that trees become more resistant to wind.
The Lugavsk forestry district represents a good Doing this, we inhibit a development andmodel of growing highly-productive (dense and expansion of Fomitopsis annosa. Aclosed) stands based on a full use of environmental •
resources but without taking into account a Intermediate cuttings should be carry out in winterresistance to wind. Because the band-like forests when there is no threat of affecting stumps withare occasionally subject to catastrophic storms and Fomitopsis annosa spores. To improve standwindfalls are a real threat, improving a stand sanitation conditions, healthy birch and aspen trees "resistance to wind is the main purpose of forming are desirable to leave uncut. In mature and i
stable stands. Purposeful growing up such stands is overmature stands infected by Fomitopsis annosa,possible only under a system of intermediate selective sanitation cuttings are expedient. Undercuttings of high intensity. According to our data, massive tree damage by the "root sponge",intensity of intermediate and thinning cuttings in complete sanitation cuttings are required. Ifthe young stands should be doubled and be about cuttings are not carried out in winter then it is30% of the primary stand volume, necessary to treat stumps with antiseptics or to
excavate them and bum them.
DISCUSSION If an initial high intensity thinning in young standsis conducted in two phases, then the later need for
• There are no general patterns of how intensive high intensity thinning no longer arises andintermediate cuttings should be in the band- increment cuttings may not be required at all. Thelike pine stands. Stand norms for intermediate entire cycle of forest-growing is controlled then bycuttings should be differentiated regarding several consistent ways of intermediate cuttings
' potential resistance to wind based on regarding an individual stand state.•following:
• presence/absence of previous or current• evidence of windfalls; CONCLUSION
• stand site topography regarding prevailingwind directions with emphasis to the warm To conclude, it is necessary to replace low intensity
• period, e.g., windward slopes of hills and intermediate cuttings (thinnings) with medium anddunes or leeward slopes of hills, inter-dune high intensity intermediate cuttings to form anddepressions, and other topographic elements grow stands with increased resistance to wind. Allprotected from wind; stands that are over-stocked to different extents
.. a sanitation state of a stand; should undergo high intensity intermediate" • • protective functions of the band-like stands on cuttings. In fact, this means that about 80% of the
the borders with non-forested areas, e.g., along band-like pine forests should undergo repeated• .
permanent and temporary streams and other intermediate cuttings for the forest-growing period.geomorphological elements risky from erosion We speak here about a forestry-environmentalview point, necessity of significant (several times) increase of
the area which is to undergo all types of !, In dense stands (NSBA morethan 1.0) under age intermediate cuttings and wood volume taken out it
40, high intensity cuttings are recommended to in the process of cuttings. Cuttings in prematuredecrease NSBA down to 0.6-0.7. In older stands, and mature stands where clear cuts are not allowedunder thinning and especially increment cuttings, are included as well. All these cuttings aretaking Out abig number of trees is not desirable, renovation, transformation, and sanitation-"NSBA in such stands should remain about the same reconstruction ones.
0.7-0,8. If stands thinned suddenly, at one go,there may arise a danger of wind-fallen trees Our results show that decreases of the current standbecause of their weak root systems and of broken volume on an area basis that follow apparentlytrunks because trunks are not enough set-up. In after intermediate cuttings to improve wind-this case, selection should be done in two phases, resistance in band-like pine forests do not muchThe repeated thinning should be made 5-7 years alter total stand productivity, if the volume of wood
later, taken out by intermediate cuttings is included.
Proceedings IBFRA Assn 1997 meeting 185

LITERATURE CITEDo
Belov,S.V.1983.Forestry.Moscow: Forest
IndustryPublishing.351p.(inRussian).A
Burenina, T.A. 1988. Influence of forest b
ecosystems on wind regimes. Krasnoyrsk:
Institute of Forests Publishing. 133 p. (inRussian.
.,
Kenstavichyus, I. 1984. Optimization of a standdistribution to improve their wind-resistance.Lithuanian Scientific Research Institute of
Forestry. Vol. XXIY: 193-206. (in Russian).
, Mil_chell, S.J. 1995 The windthrow hazardassessment procedure for forest managers.Forest Chronicle. 4: 446-450.
.
Skvortsova, E.B.; Ulanova, N.G.; Basevich, V.F.1983. Ecological role of windthrows. Moscow:
Forest Industry Publishing. 190 p. (in Russian).
Ruel. J.-C. 1995. Understanding windthrow:
silvicultural implications. Forest Chronicle. 4:434-445.
i
• tll
186 GTR-NC-209

q
. mlECOPHYSIOLOGICAL RESPONSE TO INTERACTING EFFECTS OF DROUGHT AND NITROGEN,AND REVERSIBILITY OF DROUGHT EFFECT IN PEATLAND AND UPLAND BOREAL SPRUCE*
: it
Q.L. Dang l, T.B. Patterson 2 and R.D. Gu3P *
" 1ABSTRACT.--Seeds ofpeatland black spruce (Picea Saugier 1989, Waiters and Reich 1989, N_tr 1992,mariana (Mill.) B.S.P.) and upland white spruce Green and Mitchell 1992, Stark 1992). Of those that(Picea glauca (Moench) Voss) were obtained from did, plants were first grown under different nitrogen
•five forest stands in the boreal forest near Fort regimes and then exposed to drought (e.g., Reich etNelson, British Columbia, Canada. Seedlings were al. 1989, Wakers and Reich 1989, Green and Mitchellgrown in a large walk-in growth chamber for two 1992), with only few exceptions (e.g., Squire et al.weeks and then subjected to factorial combinations of 1987, Stark 1992). In the natural environment,
two water regimes (drought and non-&ought) and however, water and nitrogen interact continuously.two nitrogen regimes (hi'gh and low) for sixteen They not only affect plant physiological processesweeks (28 drought, cycles). Ecophysiological directly (Hirose 1984, Hirose and Werger 1987,responses to the treatments and their interactions Seemann et al. 1987, Waiters and Reich 1987, Seilerwere examined. It was found that white spruce had and Cazell 1990, Dang et al. 1991 and 1997) but alsosignificantly higher rates of photosynthesis, mesophyll indirectly through their impact on the structure andconductance, stomatal conductance and development of plant tissues (Radin and Ackerson tphotosynthetic nitrogen-use efficiency than did black 1981, Hirose 1984, Gebauer et al. 1987, Sage et al.spruce, but the two species had similar photosynthetic 1987, MacAdam et al. 1989, Wakers and Reich 1989,water-use efficiency. White spruce was better able to N_itr 1992, Nunes et al. 1993, Penuelas et al. 1993,improve photosynthetic performance under improved Evans and von Caemmerer 1996). The effects ofwater andnitrogen regimes than black spruce. The drought and nitrogen are similar in someday after rewatering at the end of the last drought ecophysiological traits (e.g., photosynthesis andcycle, the effects of&ought on most ecophysiological growth) but are opposite in others (e.g., water-usevariables were partially reversed in both species, but efficiency). We hypothesize that similar effects will bethey were more reversible in black spruce than in additive but opposite effects will cancel each otherwhite spruce. The high nitrogen treatment increased when drought and nitrogen stress are imposed •the:stomatal sensitivity to drought but decreased the simultaneously.sensitivity of the mesophyll. Drought stress increasedthe sensitivity of ecophysiological variables to the Soil water and nitrogen conditions in the field varynitrogen treatment, seasonally and fluctuate over shorter periods of time.
For example, droughts are interspersed withtemporary relief by rainfall. The conditions are moredynamic on hummocks in wetland sites than on
INTRODUCTION upland sites. Although boreal wetlands arecharacterized by high ground water tables, tree roots,
Water and nitrogen are two common limiting factors generally grow on hummocks above the seasonalfor terrestrial plants. The effects of water and average ground water table (Lieffers and RothweU !
. nitrogen regimeson the growth, development and 1986). Hummocks consist of poorly decomposedIF
physiology of plants have been studied extensively, and/or undecomposed organic matter with low waterWhile a trade-offbetween the efficiencies of water- holding capacity and low capillary surface for liftingand nitrogen-utilization has long been recognized ground water (Paivanen 1984, M.ap.nerkoski 1985).(e.g., Field et al. 1983), relatively few studies have The moisture conditions of the hummock substrate,addressed the interacting effects of water and nitrogen therefore, fluctuate with precipitation and changes inonplant physiological processes (e.g., Ghashagaie and the ground water table and thus are less stable. A
* This experiment was conducted at the University of British Columbia
l Faculty of Forestry, Lakehead University, 955 Oliver Road, Thunder Bay, Ontario, Canada P7B 5E1• 2Botany Department, University of Wisconsin, Madison 53706, USA
• 3Faculty of Forestry, University of British Columbia, Vancouver, British Columbia, Canada V6T 1Z4
Proceedings IBFRA Assn 1997 meeting 187

o
corresponding dynamic response in ecophysiological The landscape of the region is composed of a mosaicprocesses in response to fluctuations in water regime of level lowlands (peatlands) and sloping uplandswould not 0nly allow the plant to survive the stressful , (Valentine 1971, DeLong et al. 1991). Black spruceconditions (e.g., flooding and drought) but also allow dominates peatlands while white spruce mainly growsthem to take advantage of the transiently favorable on uplands, but they do not form mixed stands. The -conditions, monthly average temperature remains below 0 °C for
5-7 months of the year, and above 10 °C for 2-4
BlaCk spruce (Picea mariana (Mill.) B.S.P.) and months. The annual rainfall is between 200 and 290white spruce (Picea glauca (Moench) Voss) both mm and total precipitation about 446 mm (DeLong:etgrow in the boreal forest region, yet they generally al. 1991).dominate On sites with distinctly different water andnutrient regimes. Black spruce ot_en forms pure Five pairs of adjacent white spruce and black sprucestands or is interspersed with tamarack (Larix populations were selected. Each pair waslaricina) on water-logged, nutrient deficient approximately 10 km away from others. Black_artieularly nitrogen)wetland sites. White spruce, spruce seeds were collected from 35 randomlyon the other hand, mainly occupies weU-drained selected trees from each population. White spruceupland sites (Hosie 1979). Although the two species seeds were obtained from the B.C. Ministry of Forestshave similar shade tolerance and their stands often Tree Seed Centre.
grow adjacent to each other, they rarely form mixedstands (Vincent 1965, DeLong et al. 1991). Being Seeds from different trees of the same population
congeneric and having similar growth form, were mixed and randomly sampled for planting in Raysignificant differences in phenology and morphology Leach Single Cell containers (Stuewe and Sons,are unlikely (Dudley 1996). Ecophysiological Corvallis, Oregon, U.S.A.). White spruce seeds wereadaptation, therefore, is likely a major mechanism for soaked for 12 hours and then stratified at 2 °C forthe different ecological distr_utions of the two three weeks before planting. Seedlings were grownspecies. We hypothesize (1) that white spruce is under the following environmental conditions: 20-physiologically more competitive than black spruce hour photoperiod, 35% day time RH, 24/14 °C
under favorable soil water and nitrogen conditions day/night temperature, and 400 I.tmol m2 sl PAR fluxand (2) that black spruce is more responsive to density.changes in water regimes and more resistant to
nitrogen stress than white spruce. The seedlings were watered four times and fertilizedtwice per week for the first two weeks after
In an earlier paper (Patterson et al. 1997), we germination. Starting from the third week, thereported the long-term, integrated effects of drought seedlings were exposed to factorial combinations of
. and nitrogen on the growth and whole-plant nitrogen- two moisture (droughted and non-droughted) and twoand water-relations of wetland black spruce and nitrogen regimes (low and high). Each treatment hadupland white spruce. In this report, we discuss the 10 replicates. The seedlings of both species were
interacting effects of drought and nitrogen on gas about 2 cm tall when the treatments were imposed.exchange and the revers_ility of drought effects under
different nitrogen regimes in the same two species. The non-droughted seedlings were watered daffy.The seedlings were weighed before and after I
. watering. The amount of water added to each. MATERIALS AND METHODS container was estimated by the amount of wate_oss
. over the last 24-hour period. The droughtedMaterials and Treatments seedlings were not watered until the soil water
potential in ten randomly selected containers of each- Seeds 0fblack spruce (Picea mariana (Mill.) B.S.P.) species dropped down about -1.0 MPa, at which time
and White spruce (Picea glauca (Moench) Voss) were seedlings in all treatments were watered to drip pointobtained from the southern edge of the boreal forest and fertilized. The treatments lasted for sixteen .,near Fort Nelson (590 latitude, 670 m elevation), weeks (28 drought cycles). The average predawn "BritiSh Columbia, Canada. The two species are water potential (W) at the end of the last droughtdominant conifers in the region (DeLong et al. 1991). cycle was -0.6 MPa in the non-droughted seedlings
and- 1.1 MPa in the droughted ones. There was nosignificant difference in W between the two species or
188 GTR-NC-209
.between the two nitrogen treatments (Patterson et alo Data Analysis and Presentation1997). More details about the experiment areprovided in Patterson et al. (1997). The effect of species, population, drought, nitrogen,
drought cycle (i.e., the beginning vs. the end of theSeedlings in all treatments received identical drought cycle), and their interactions were tested Aconcentrations of phosphorus (625 mg L "1 P), using ANOVA. Populations were considered aspotassium (94 mg L-IK), sulfur (10 mg Ll S), and nested within species and had a random effect. EachSTEM mi'cro-nutrients (1 mg Ll). The nitrogen ecophysiological variable was tested by three separateconcentrations were 25 and 225 mg L_ for the low ANOVAs: (1) Data from droughted seedlings at theand high nitrogen treatments, respectively, end of the drought cycle were tested against data "
fi'om non-droughted seedlings to examine all maineffects and interactions except the effect of drought
GasExchange Measurement and Determination of cycle; (2) Data from droughted seedlings at the end ofNitrogen Content the drought cycle were tested against data from the
. same seedlings but collected the next day after theyFoliar CO2 and H20 gas exchange was measured were watered, to examine the significance of recoveryusing an ADC LCA-3 open system and PLC C leaf in ecophysiological variables; (3) Data from
cuvette (Hoddesdon, England) at 600 l.tmol rn2 s-! droughted seedlings measured the next day atterPAR flux.density, 23-24 °C temperature, 345 + 15 watering at the end of the last drought cycle were
_mol mol l CO2, and 50 + 10 % RH. Droughted tested against data from the non-droughted ones, toseedlings were measured twice: the first measurement determine the completeness of the recovery andwas taken at the end of the last drought cycle interactions associated with rewatering. Since(referred to as the end of the drought cycle hereatter), Analysis 1 showed that population did not have athen the seedlings were watered to saturation, and the significant effect on any of the variables examined,•same foliage was.measured again on the next day population was not considered in subsequent analyses.(referred to as the beginning of the drought cyclehereatter). Treatment effects are quantified as follows: The net
effect of drought (%) was calculated within each
The projected leaf area was determined on a leaf area nitrogen treatment (i.e., high or low nitrogen) as:meter (Li-3000, Li-Cor, Inc., Lincoln, Nebraska).
Leafnitrogen content was determined using the [(W - W +) / W+] x 100 [1]micro-Kjeldahl method and expressed on a leaf areabasis (Na) and a leaf dry mass basis (Nm). where W and W+are droughted and non-droughted,
respectively. The net effect of nitrogen (%) was
Net photosynthetic rate (A), transpiration rate (E), determined within each drought treatment in the samestoma tal conductance to H20 (gsw)and intercellular fashion,CO2 concentration (Ci) were calculated according tovon Caemmerer and Farquhar (1981) and expressed [(N-- N+) / N+] x 100 [2]on a leaf area basis. Stomatal conductance to CO2was calculated as gsc gsw/ 1.6 (Coombs et al. 1987). where N and N= are low and high nitrogen treatment,Photosynthetic water-use efficiency (WUE) was respectively.
calculated as the molar ratio ofA/E. Mesophyll Itconductance (gin) was determined as A/Ci (Fites and The effect so calculated reflects the net impact of aTeskey 1988). The photosynthetic nitrogen-use treatment without the interference of other main u
" efficiency (NUE) was calculated as A/Na. effects and is comparable between treatments, species,and between different variables. For example, a valueof-50 indicates a 50% reduction (as compared tocontrol). The percentage reversal of drought effectthe next day atter rewatering was calculated as:
[(W "b- W "e) / (W +- we)] x 100 [3]
°
Proceedings IBFRA Assn 1997 meeting 189

whereW +, W 4' and W e indicate non-droughted and again the trend for black spruce was the oppositecontrol, and droughted at the beginning and the end (table 2).
of the drought cycle, respectively.Drought effects on A, gsc, Ci/CaWUE and NUE werereversed by 54%, 52%, 34%, 93%,100% and 34%, ,,
RESULTS respectively, the next day after rewatering (fig. 4, Ceffect in table 3 and W effect in table 4). The drought
Species Effect effect on A was significantly more reversible in blackspruce than in white spruce (C × S effect in table 3).
Rate0f net photosynthesis (A), mesophyll Drought effect on other variables was also moreconductance (gnO, stomatal conductance (gsc), reversible in black spruce than in white spruce (but
photosynthetic nitrogen-use efficiency (NUE) and not significantly so, P > 0.06, fig. 3, C × S in table 3).nitrogen content per unit leaf area '(Na) were generally Because there was no significant drought effect on gmgreater in white spruce than in black spruce (fig. 1 and in the high nitrogen treatment, the significant reversalfig. 2, table 1). The differences were generally more of the drought effect on gm in the low nitrogenprominent in non-droughted than in droughted treatment was reflected as a significant nitrogen byseedlings (fig. 1 and fig. 2). The Ci/Ca ratio and &ought-cycle interaction (fig. 3, N × C in table 3).photosynthetic water-use efficiency (WUE) were Drought effect on gm in the low nitrogen treatmentsimilar in the two species (figs. 1 and 2, table 1). was reversed by 42 % in response to watering.Nitrogen content per unit foliar dry mass (Nn0, on the Drought effects on A, WUE and NUE were moreother hand, was generally greater in black spruce than reversible and the effect on gscwas less reversible inin white spruce (fig. 2 and table 1). The difference in the high nitrogen treatment than in the low nitrogenNmbetween the two species was generally greater in treatment, but the difference was not significant for Athe high nitrogen than in the low nitrogen treatment and gsc(fig. 3, N x C in table 3). In fact, WUE in the
. and greater in droughted than in non-droughted droughted, high nitrogen treatment was significantlyseedlings (fig. 2, WxS and NxS effects in table 1). smaller than in the corresponding control the next day
after rewatering (fig. 3). The significant interactionsbetween species and drought (in A and gsc)at the end
Drought Effect and Its Reversibility of the drought cycle remained significant afterrewatering, but the significant interactions between
Drought significantly reduced A, gm,gse, Ci/Ca and drought and nitrogen treatment (in gsc and W_)
NUE, but increased WUE, Na and Nm, in both white became statistically insignificant after rewatering (W ×spruce and black spruce (figs. 1, 2 and 3, tables 1 and S and N × W in table 4).2). The effect ranged from-86 % (gse) to + 122 %(WUE) (fig. 3). The effect on A and gsewas
significantly greater and the effect on Na and N m was Nitrogen Effectsignificantly smaller in white spruce than in black
sPruce, but there were no significant species-drought A, gm, XVUE,Na and Nmwere significantly smaller,interactions in other variables (fig. 3, table 1 and table and NUE and Ci/Ca were significantly greater in the2). Drought effect on A, gm and NUE were low nitrogen than in the high nitrogen treatment (fig.significantly greater, while the effect on gsc, Ci/Ca and 1, fig. 2 and fig. 5, table 1 and table 2). The net
. WUE were significantly smaller in the low nitrogen effects ranged from-51% (gm) to + 107 % (NU_).treatment than in the high nitrogen treatment (fig. 3, There were also significant interactions betweelptable 1). The effect of drought on gm was almost zero nitrogen, species, drought and drought cycle (table 1
" in the high nitrogen treatment (fig. 3). and table 3). g_ was significantly greater in the lownitrogen than in the high nitrogen treatment for the
. There was a significant three-way interaction between droughted seedlings (fig. 2 and fig. 5). The nitrogendrought, nitrogen and species (table 1): Na was more effects on ,4, gm,gsc, Ci/Ca and WUE weresensitive to drought in the high nitrogen treatment significantly greater and the effect on NUE wasthan in low nitrogen treatment in white spruce, but the significantly smaller, in droughted than in non-trend was the opposite in black spruce. In contrast droughted seedlings (fig. 2 and fig. 5). In fact, theNmwas more sensitive in the low nitrogen treatment nitrogen effects on A, gm, gscand Ci/Ca werethan in the high nitrogen treatment in white spruce, negligflgle in the non-droughted seedlings (fig. 5).
Nitrogen effect on Nm was greater in non-droughted
190 GTR-NC-209

ill
m/I
6 White Spruce Black Spruce
5 - a) g)_
4J
< 3 _-- I2 .=. _ II
0 _
b) h)15-
10 _ . _=_
c) i)120 -
_ 80
0 -- _
0.8 - ---- d) _ j), 7- .-,-
o" 0.6
0.4o- 0.2
0.0 e) k) '4
,,, 3
0
4 f) I)
,,, 3:::) !z 2
' 1 t'
0N + - + - + - + - + - + _W + + -E-E -B-B + + -E -E -B-B
.
Figure 1.--Net photosynthesis (A), mesophyll conductance (gin), stomatal conductance (gsc), Ci/Ca ratio,photosynthetic water-use efficiency (WUE) and nitrogen-use efficiency (NUE) ( + s.e., n = 25) in black andwhite spruce grown under different water (W) and nitrogen (N) regimes. N: '-' indicates low nitrogen treatmentand '+'high nitrogen treatment. W: '+' indicates non-droughted; '-E' and '-B' indicate droughted at the end of the
• last drought cycle and the next day after rewatering, respectively. The units are: l.tmol CO 2 m "2 $-1 for A; mmol. CO2 ma s-l for gmand g_; gmol CO2 mraol4 H20 for WUE; gmol CO2 s"1g4 N for NUE.
Proceedings IBFRA Assn i997 meeting 191

. .
White Spruce Black Spruce4-
' a) b) "
3 --
EETJ 2 --
.
1
[ -" .
_ _ _
c) d)4o-
"7: _ 30 -
EE 20
Z
10• ,
0 _
N + - + - + - + -W + + - - + + - -
• .
Figure 2.--Foliar nitrogen content per unit leaf area (Na) and per unit dry mass (Nm) in black spruce and white spruce
grown under different water and nitrogen regimes (see Figure 1 for details). It
. ii
192 GTR-NC-209
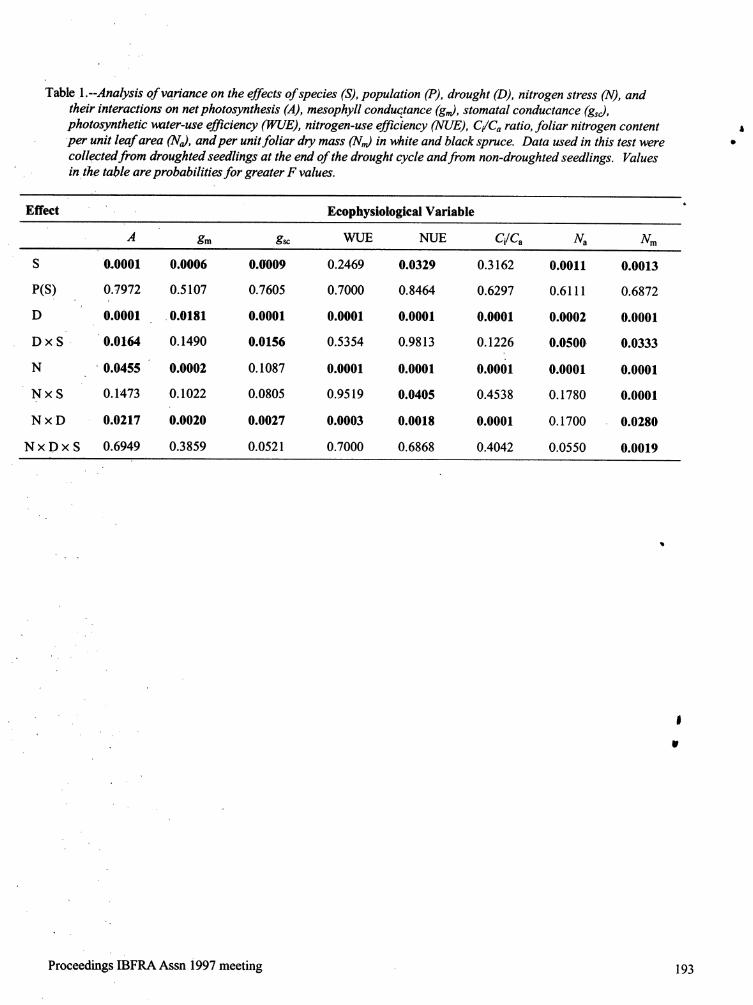
Table !.--Analysis of variance on the effects of species (S), population (P), drought (D), nitrogen stress (3[), and
their interactions on net photosynthesis (A), mesophyll conductance (gin), stomatal conductance (gsc),photosynthetic water-use efficiency (WUE), nitrogen-use efficiency (NUE), C./C a ratio, foliar nitrogen content jper unit leaf area (No.),and per unit foliar dry mass (Nm) in white and black spruce. Data used in this test were •
collected from droughted seedlings at the end of the drought cycle and from non-droughted seedlings. Valuesin the table are probabilities for greater F values.
6
Effect Ecophysiological Variable
A gm gsc "_V[.JE NUE Ci/Ca Na Nm
S 0_.0001 0.0006 0.0009 0.2469 0.0329 0.3162 0.0011 0.0013
P(S) 0.7972 0.5107 0.7605 0.7000 0.8464 0.6297 0.6111 0.6872,.
D 0.0001 0.0181 0.0001 0.0001 0.0001 0.0001 0.0002 0.0001
D × S • 0.0!64 0.1490 0.0156 0.5354 0.9813 0.1226 0.0500 0.0333
N 0.0455 0.0002 0.1087 0.0001 0.0001 0.0001 0.0001 0.0001
N x S 0.1473 0.1022 0.0805 0.9519 0.0405 0.4538 0.1780 0.0001
N x D 0.0217 0.0020 0.0027 0.0003 0.0018 0.0001 0.1700 0.0280
N x D x S 0.6949 0.3859 0.0521 0.7000 0.6868 0.4042 0.0550 0.0019
!
¢
Proceedings IBFRA Assn i997 meeting 193

White Spruce Black Spruce200 a) g)
-20< -40 - ,
LUo -60 - - "
-80 -..
-1000 b) h) •
• 040 ......... ................uJ -60 -
-80 -100
0 c) i).............................
.
-20o -40(/)ETJ
w -60-80
: -1000 d) j)
....................... __ ..........
-20'_ -40o
uJ -60o -80
-100 e) k)-_ 100
"' 50E)
UJ
-50 i0 f) i)........ i_
' _ F-" .........
_ -20"' -40Z
.w -60 -." _ -80 _-
/-100N + - + - + - + -W -E -E -B -B -E -E -B -B ,
' Figure 3.--Drought effect (DE) on A, gm, g_, Ci/Ca ratio, WUE and NUE in black spruce and white spruce. Values in. _he graph are the net effect as calculated by Equation 1 (see text for details). Other explanations are as in Figure
l.
194 GTR-NC-209

' 100a)" 80-
_- 60-< 40-
n," A20- "
" 0
b)
lOO-"_ I
E
50-
' ' 0
c)80-, _ 60-
0
40n,'
20-
0 --_ L_
• d)_ lOO-
m0
° 50rr
__
e)
100 -w
50I_.
)
0. 80 - f) I
' _ 60- ww
40Zn,'
20-0
4 + - + -Sp Sw Sb
Figure 4.--Percentage of drought effect that was reversedupon re-watering (R) inblack spruce (Sb) and white spruce(Sw) grown under low (-N) and high (+N) nitrogen regimes. Values are calculated by Equation 3 (s¢¢text for
. details). Other explanations are as inFigure I.
Proceedings BFRA Assn 1997 meeting 195

Table 2.--Effects of drought and nitrogen on leaf nitrogen content per unit area (No) and per unit dry mass (Nm) inwhite spruce and black spruce. Values in the table are net treatment effects, expressed as a percent change, ascalculated by Equation 2 (see text for details).
Variable Species Drought Effect Nitrogen Effect
(% change) (% change)
High Nitrogen Low Nitrogen Non-Drou_hted Drou[ghted"Na White Spruce 12.7 9.4 -45.2 -46.8
Black Spruce 31.4 37.9 -50.3 -47.8Nm White Spruce 15.2 31.7 -34.4 -25.0
Black Spruce, 41.9 36.3 -42.7 -44.9
Table 3.-,Analysis of variance on the effect of drought cycle (C, end of drought cycle vs. next day after rewatering)and its interactions with species (S) and nitrogen (1V)on A, gin, gso WUE, NUE and C/Ca ratio in white spruce
.and black spruce. Data used in this test were from droughted seedlings only, but collected at the end of the lastdrought cycle and the next day after rewatering. Values in the table are probabilities for greater F values.
Effect Ecophysiological Variable
,4 gm gsc WUE NUE Ci/Ca
C 0.0001 0.9983 0.0001 0.0001 0.0001 0.0001
C ×S 0.0090 0.5242 0.5867 0.3479 0.0880 0.0654
N × C 0.7593 , 0.0001 0.0478 0.0001 0.0167 0.0001
N x C × S 0.6482 0.6644 0.2826 0.4032 0.6628 0.8567
Table 4.--Analysis of variance on the effects of drought (D) the next day after rewatering as compared to the controland its interactions with species (S) and nitrogen treatment (77)on A, gin, gso WUE, NUE and C/Ca ratio inwhite and black spruce. Values in the table are probabilities for greater F values.
Effect Ecophysiological Variable
A gm gsc WUE NUE Ci/C a
D 0.0025 0.0070 0.0004 0.0797 0.0001 0.0001
D x S 0.0411 0.0557 0.0350 0.4562 0.6051 0.104_
N × D 0.0360 0.0109 0.0699 0.2787 0.0139 0.000_
N× D x S 0.6490 0.4308 0.3096 0.6141 0.8225 0.1060
196 GTR-NC-209

90
60-
30- _ lo
U.I 0 ----r ,.............Z
-30 -
-6060-
o_ 30E
0 ....W ,,.,... ,,,,., _ _ _ ,.,, ,,,, ,.. .........
Z,. -30 -
-60
60- - -
_ 300
_ 0
z -30
: -6060-
o-.o.30 -
8
I.IJ• z -30 - - "
-60
60-
30-" ILl
C}_ 0,,, ......
z -30 -
-6090- _ I
' o--,0.' _ 60 w
L.I.I• C)
z 30UJZ 0 .........
-30W + + -E -E -B -BSp Sw Sb Sw Sb Sw Sb
Figure 5.--Nitrogen effect (NE) on A, gin,gs¢, Ci/Ca ratio, WUE and NUE in black spruce (Sb) and white spruce (Sw)grown under drought and non-drought conditions. Values in the graph are the net nitrogen effect as calculated
. by Equation 2 (see text for details). Other details as in Figure 1.
Proceedings IBFRA Assn 1997 meeting 197

than droughted white spruce, but the trend was the CO2 diffusion. Increased nitrogen supply increases•opposite for black spruce (fig. 2, table 1 and table 2). chlorophyll content, and the number and size ofThe ni'trogen effects on NUE and Nm were : chloroplasts per unit leaf area (Tesarov_ and N_itrsignificantly greater in black spruce than in white 1986), the content of soluble proteins and Rubisco ispruce (fig. 5). activity (Evans and Terashima 1978 and 1988, .-
Seemann et al. 1987). Additionally, osmotic
•For droughted seedlings, nitrogen effects on gm, gsc, adjustment associated with nitrogen supply (Tan andCi/Ca and WUE were significantly smaller and the Hogan 1995) may also alter the cell environment foreffect on NUE was significantly greater at the photosynthesis.beginning than at the end of the drought cycle (fig. 5,NxC effect in table 3). The result that stomatal conductance was the primary
• limiting factor to photosynthesis in seedlings subjectedto drought stress seems to contradict recent findings
Discussion that drought decreases photosynthesis primarily by, , depressing mesophyU conductance (e.g., Osonubi and
The high nitrogen treatment significantly increased the Davies 1980, Farquhar and Sharkey 1982, Melzack etsensitivity of stomatal conductance to drought and al. 1985, Teskey et-al. 1986, Dang et al. 1991).decreased the sensitivity of mesophyll conductance, Since the sensitivity of mesophyll to droughtbut decreased stomatal conductance was the primary increased and ttie sensitivity of stomatal conductance•limiting factor to photosynthesis in both high and low decreased with decreasing nitrogen supply, it isnitrogen treated seedlings of both species (fig. 3). possible that the plants used in the above studies wereStomatal conductance is also found to be more subjected to even lower nitrogen supply than the
sensitive to drought in high nitrogen leaves than low plants in the low nitrogen treatment in this study.high nitrogen leaves in several other species (Shimshi Indeed, the trees used by Dang et al. ( 1991) were
' 1970, Morgan 1984 and 1986, Wakers and Reich from a nitrogen deficient peatland. MacDonald andi989). Ogren (1988) found that nitrogen status of Lieffers (1990) have shown that the foliage nitrogenwillow leaves affected the sensitivity of concentration of black spruce from the study site ofphotosynthesis to long-term but not short-term Dang et al. (1991) was 8 mg N/g foliage, only aboutdrought. 36% of the nitrogen concentration of the low-nitr0gen
black spruce (22 mg N/g foliage) in this study_ Our• . Decreases in root/shoot ratio associated with results support Hirose's Nitrogen/Carbon Limitation
increasing nitrogen supply (Shimshi 1970, Morgan Model (Hirose 1984) which suggests that mesophyll1984 and 1986, Waiters and Reich 1989, Penuelas et limitation to photosynthesis increases with decreasingaL 1993, Patterson et al. 1997) may be an explanation nitrogen concentration.for the increase in stomatal sensitivity to drought in
• " high nitrogen plants. High nitrogen can also decrease Water regimes affected the response of both speciesthe threshold water potential for an increase in to nitrogen treatment. Nitrogen treatment had littleendogenous ABA content and thus increase stomatal effect on photosynthesis and mesophyll conductancesensitivity to drought (Radin 1981). Hunt et al. in well-watered seedlings of both species, particularly(1985) also found that the stomatal conductance of in black spruce, but the high nitrogen treatment
high-nitrogen leaves were more sensitive to leaf-to-air significantly increased photosynthesis and mesop/hyll, vapor pressure difference. These changes can conductance in droughted seedlings (fig. 1 and fig. 5).
improve the stomatal control on transpirational water This suggests that the low nitrogen treated pla_sloss and thus water relations (Brix and Mitchell 1986, received sufficient nitrogen to support a high rate of
" Hillerdal-Hagstromer et al. 1982). photosynthesis. The extra nitrogen in the highnitrogen treatment was probably put in storage
. The decreased mesophyll sensitivity to drought with (luxury consumption) and thus resulted in much lowerincreasing nitrogen was probably more related to photosynthetic nitrogen use efficiency (fig. 1 and fig.
increases in nitrogen allocation to photosynthetic 5). However, to increase the drought resistance ofapparatus (Sheriff et al. 1986, Evans 1989) and photosynthetic machinery required addition nitrogenincreases in mesophyll cell area per unit of leaf area resource. Hence, the high nitrogen treatment
, (Nobel et al. 1975, Rovenska and N_tr 1981). Evans increased photosynthesis and mesophyU conductanceand von Caemmerer (1996) found that increased of droughted seedlings of both species (fig. 1 and fig.
• mesophyU surface decreased mesophyll resistance to 5). This is in contrast to the finding by Waiters and
198 GTR-NC-209

°
Reich (1989) that well-watered Ulmus americana was seedlings was significantly higher than in themore sensitive to nitrogen treatment than water- droughted seedlings in both species, the differencestressed ones. The conflicting results suggest that we was much more prominent in white spruce than inprobably examined a different portion of the bhick spruce (fig. 1 and fig. 3). This reflects that Aphotosynthesis-nitrogen curve than Waiters and Reich white spruce was better able to improve
t
(1-989) did. Over the whole range of leaf nitrogen photosynthetic performance under improved soil
concentration, photosynthesis is curvilinearly water conditions than black spruce. This may givecorrelated with nitrogen (Hirose 1984, Hirose and white spruce another competitive advantage overWerger 1987, Evans 1989). In the portion of curve black spruce in occupying sites with good soilwhere photosynthesis is limited by nitrogen which is moisture conditions.presurned to be the Case in the study of Waiters andReich (1989), well-watered plants should be better Black spruce appeared to be better adapted toable to use. nitrogen for photosynthesis than dynamic soil water regimes than white spruce. Thedroughted ones because the nitrogen used to increase two species were subjected to similar levels ofdrought resistance in droughted plants can be used to drought stress, the same number of drought cycles,
increase the photosynthetic capacity in well-watered and identical aboveground environmental conditions.ones. Water stress is found to affect the However, the drought effects on black spruce werephotosynthesis-nitrogen relationship in several other more revers_le than those on white spruce the secondspecies (e.g., Farquhar and von Caemmerer 1984, day after rewatering at the end of the last droughtWolfe et al. 1988, Gollan et al. 1986). cycle. For example, the drought effect on
photosynthesis was almost twice as revers_le in blackWhite spruce was more responsive to the nitrogen spruce as in white spruce (fig. 4). This may be relatedtreatments than black spruce. Although the high to the different water regimes of their natural sites.nitrogen treatment increased mesophyU conductance Black spruce primarily grows on peatlands in the
.and photosynthesis in both species, the increase in boreal forest region (DeLong et al. 1991). Whilewhitespruce was almost twice as high as that in black peatlands are characterised by high ground waterspruce (fig. 1 and fig. 5). This probably reflects the table, trees generally grow on hummocks which areinability of black spruce utilize the improved nitrogen above the average surface of the peatland (Liefferssupply inthe high nitrogen treatment. There was little and RothweU 1986). The substrate on the hummocksdifference in the rate of photosynthesis of black consists of poorly decomposed or/and undecomposedspruce between high and low nitrogen treatment organic matter and has very poor water holding •(figures 1 and 5). White spruce, on the other hand, capacity and low total capillary surface (Paivanenincreased photosynthesis in response to the high 1984, Mannerkoski 1985). Thus, the water regime ofnitrogen treatment. A similar phenomenon was found the hummocks fluctuates with precipitation andat thewhole plant level (Patterson et al. 1997). This ground water table (Dai et al. 1972, Mannerkoskiwasrelated to the natural habitat to which each 1985) and the trees growing on them experiencespecies was adapted. Black spruce seeds were periodic flooding and drought (Boggie and Miller
collected frompeatland sites where nitrogen supply 1976, Mannerkoski 1985, Dang et al. 1991). A fasterWas Verypoor (Payandeh 1973, Makitalo 1985, reversal of drought effects plus the greater capacity ofMannerkoski 1985). White spruce seeds were from anaerobic respiration of the root system under cold,
upland sites where the nitrogen supply was flooded conditions (Conlin and Lieffers 1993) shouldcomparatively better. The inability of black spruce to be an adaptive advantage for peatland black spruce. ID
' use high nitrogen supply may reflect its adaptation to White spruce, in contrast, mainly grows in welllow nitrogen habitats and this adaptation probably developed soils that can provide a more stable water U
" puts this species at a competition disadvantage in condition. In addition, the root system of whiteoccupying nitrogen-rich upland sites. Van der Weft et spruce is generally better developed than that in black
al. (i993)observed that species fi'om high spruce (Lieffers and RothweU 1986). White spruce,productivity sites had significantly higher A than therefore, may experience less fluctuations in soilspecies fi'om low productivity sites under high N water conditions at their natural sites than blacktreatment, but the both groups had similar A under spruce.low soil N conditions.
White spruce was also more responsive to waterregimes. Although photosynthesis in well-watered
.
Proceedings IBFRA Assn 1997 meeting 199

o
ACKNOWLEDGEMENTS DeLong C., Annas R.M. and Stewart A.C. 1991.Boreal white and black spruce zone. In
The author's thank Mr. Min Tsze for assistance in . Ecosystems of British Columbia (eds. Meidinger
nitrogen analysis. This research was supported by a D. and Pojar J.), pp 237-251, Ministry of Forests,Science Council of British Columbia grant to R.D. British Columbia, Canada. J
D
Guy. and N. Livingston (University of Victoria) and aNatural Sciences and Engineering Research Council Dudley S.A. 1996. Differing selection on plant(Canada) Postdoctoral Fellowship to Q.L. Dang. physiological traits in response to environmental
water availability: A test of adaptive hypotheses.Evolution 50:92-102
REFERENCES
Evans J.R. 1989. Photosynthesis and nitrogenAngdopoulos K., Dichio B. and Xiloyannis c. 1996. relationships in leaves of C3 plants. Oecologia
Inhibition of photosynthesis in Olive trees (Olea 78" 9-19.europaea L.) during water stress and rewatering.J. Exp. Bot. 47" 1093-1100. Evans J.R. and Terashima I. 1987. Effects ofnitrogen
nutrition on electron transport components andBoggie R. and Miller H.G. 1976. Growth of Pinus photosynthesis in spinach. Aust. J. Plant Physiol.
contorta at different water levels in deep blanket 14: 59-68.peat. Forestry 49: 123-131.
Evans J.R. and Terashima I. 1988. PhotosyntheticBrix H. and Mitchell A.K. 1986. Thinning and characteristics of spinach leaves grown with
nitrogen fertiliration effects on soil and tree water different nitrogen treatment. Plant Cell Physiol.stress in a Douglas-fir stand. Can. J. For. Res. 16: 29: 157-165.1334-i338.
Evans J.R. and von Caemmerer S. 1996. Carbon
Conlin T.S.S. and Lieffers V.J. 1993. Anaerobic and dioxide dit_sion inside leaves. Plant Physiol.aerobic CO2 etilux rates from boreal forest 110: 339-346.conifer roots at low temperatures. Can. J. For.Res. 23: 767-771. Farquhar G.D. mad Sharkey T.D. 1982. Stomatal
conductance and photosynthesis. Ann. Rev.Coombs J., Hall D.O., Long S.P. and Scurlock J.M.O. Plant Physiol. 33: 317-345.
1987. Techniques in Bioproductivity andPhotosynthesis, 2nd Edition (reprinted with Farquhar G.D. and von Caemmerer A. 1984. Effectscorrections). Pergamon Press, New York, 298 P. of partial defoliations, changes in irradiance
during growth, short-term water stress andDai T.S,, Haavisto V.F. and Sparling J.H. 1972. growth at enhanced p(CO2) on the
Water level fluctuation in a Northeastern Ontario photosynthetic capacity of leaves of Phaseoluspeatland. Can. J. For. Res. 4:76-81. vulgaris L. Planta 160: 320-329.
Dang Q.L., Lieffers V.J., Rothwell R.L. and Field C., Merino J. and Mooney H.A. 1983.. MacDonald S.E. 1991. Diurnal variation and Compromises between water-use efficienc_ and
• interrelations ofecophysiological parameters in nitrogen-use efficiency in five species of. three peatland woody species under different California evergreens. Oecologia 60: 38_389.
weather and soil moisture conditions. Oecologia88" 317-324. Fites J.A. and Teskey R.O. 1988. CO2 and water
- . vapor exchange ofPinus taeda in relation toDang Q.L., Margolis H.A., Coyea M.R., Sy M. and stomatal behavior: test of an optimization
Collatz G.J. 1997. Evidence concerning the hypothesis. Can. J. For. Res. 18: 150-157.effects of water potential and vapour pressuredifference on branch-level gas exchange of boreal Gebauer G., Schuhmacher M.I., Kristic B., Rehder H.tree species in northern Manitoba. Tree Physiol. and Zeigler H. 1987. Biomass production and17:521-536. nitrate metabolism ofAtriplex hotensis L. (C3 "
plant) and Amaranthus retroflexus L. (C4 plant)
200 GTR-NC-209

°
in cultures at different levels of nitrogen supply. MacDonald S.E. and Lieffers V.J. 1990.Oecologia • 72:30_3-314. Photosynthesis, water relations, and foliar
: nitrogen ofPicea mariana and Larix laricinaGhashagaie J. and Saugier B. 1989. Effects of from drained and undrained peatlands. Can. J. A
nitrogen deficiency on leaf photosynthetic For. Res. 20: 995-1000.response of tall fescue to water deficit. Plant Cell
Environm. 12: 261-271. Makitalo A. 1985. Tree growth in relation to sitecharacteristics on selected peatland sites in
Gollan R.,Passioura J.B. and Munns R. 1986. Soil central Alberta. M.Sc. thesis, Department of •water status affects the stomatal conductance of Forest Science, University of Alberta, Edmonton,fully turgid wheat and sunflower leaves. Aust. J. Alberta, Canada.Plant Physiol. 13: 459-464.
,
Mannerkoski H. 1985. Effect of water table
Green T.H. and Mitchell R.J. 1992. Effects of fluctuation on the ecology of peat soft.nitrogen on the respome ofloblolly pine to water Publications from the Department of Peatlandstress. New Phytologist 122: 627-633. Forestry, University of Helsinki 7, Helsinki.
Hillerdal-Hagstromer K., Mattson-Djos E. and Melzack R.N., Gravdo B. and Riov J. 1985. The
He!kvist J. 1982. Field studies of water relations effect of water stress on photosynthesis in Pinusand photosynthesis in Scots pine. II. Influence of halepensis. Physiol. Plant. 64: 295-300.irrigation and fertilization on needle water
potential of young pine trees. Physiol. Plant. 54: Morgan J.A. 1984. Interaction of water supply and295-301. nitrogen in wheat. Plant Physiol. 76:112-117.
Hirose T. 1984. Nitrogen use efficiency in growth of Morgan J.A. 1986. The effects of N nutrition on the
•Polygonum cuspidatum Sieb. et Zucc. Ann. Bot. water relations and gas exchange characteristics58: 479-486. of wheat (Triticum aestivum L.). Plant Physiol.
80:52-58.
Hirose T. and Werger J.A. 1987. Nitrogen use
efficiency in instantaneous and daffy Nfitr L. 1992. Mineral nutrients - a ubiquitous stress• photosynthesis of leaves in the canopy of a factor for photosynthesis. Photosynthetica 27:
Solidago altissima stand. Physiol. Plant. 70: 271-294.215-222,
Nobel P.S., Zaragoza L.J. and Smith W.K. 1975.
H0sie R.C. 1979. Native Trees of Canada, Eighth Relationship between mesophyll surface area,. " Edition. Ministry of Supply and Services photosynthetic rate, and illumination level during
Canada, 380 P. development for leaves of Plectranthusparviflorus Henchel. Plant Physiol. 55: 1067-
Hunt E.R. Jr., Weber J.A. and Gates D.M. 1985. 1070.Effects 0fnitrate application on Amaranthus
powellii wars. II. Stomatal response to vapor Nunes M.A., Ramalho J.D.C. and Dias M.A. 1993.
pressure difference is consistent with Effect of nitrogen supply on the photosynthetic II' optin_.ation ofstomatal conductance. Plant performance of leaves from coffee plants exposedw
Physiol. 79:614-618. to bright light. J. Exp. Bot. 44" 893-899.
Lieffers V.J. and Rothwell R.L. 1986. Rooting of Ogren E. 1988. Suboptimal nitrogen status sensitizespeatland black spruce and tamarack in relation to the photosynthetic apparatus in willow leaves to
" depth of water table. Can. J. Bot. 65" 817-821. long term but not short term water stress.Photosynth. Res. 18: 26.-275.
MacAdam J.W., Volenec J.J. and Nelson C.J 1989.
Effects ofnitrogen on mesophyll cell division and Osonubi O. and Davies W.J. 1980. The influence of
, epidermal cell elongation in tall fescue leaf water stress on the photosynthetic performance.blades. Plant Phsiol. 89: 549-556. and stomatal behavior of tree seedlings subjected
Proceedings tBFRA Assn 1997 meeting 201

°
to Variation in temperature and irradiance, metabolite pools in leaves of sun and shadeOecologia 45"-3-10. plants. Plant Physiol. 84" 796-802.
P_iiv_inenJ. 1984. Increasing the land base and yield Seiler J.R. and CazeU B.H. 1990. Influence of waterthrough drainage. Forestry Lecture Series stress on the physiology and growth of red spruce ,No 13, University of Alberta, Edmonton, Alberta, seedlings. Tree Physiol. 6: 69-77.Canada.
SheriffD.W., Nambiar E.K.S. and Fife D.N. 1986.
•Patterson T.B., Guy R.D. and Dang Q.L. 1997. Relationships between nutrient status, carbon •Whole plant nitrogen- and water-relations traits, assimilation and water use efficiency in Pinusand their associated trade-offs, in adjacent radiata (D. Don) needles. Tree Physiol. 2: 73-muskeg and upland boreal spruce species. 88.Oecologia 110:160-168.
Shimshi D. 1970. The effect of nitrogen supply onPayandeh B. 1973. Analysis of forest drainage some indices of plant-water relations of beans
experiment in northern Ontario. I. Growth (Phaseolus vulgaris L.). New Phytol. 69:413-analysis. Can. J. For. Res. 3: 387-398. 424.
Penuelas J., Biel C. and Estiarte M. 1993. Changes Squire R.O., Attix_ill P.M. and Neales T.F. 1987.in biomass, chlorophyll content and gas exchange Effects of changes of available water andof beans and peppers under nitrogen and water nutrients on growth, root development and waterstress. Photosynthetica 29" 535-542. use in Pinus radiata seedlings. Aust. For. Res.
17: 99-111.
Radin J.W. 1981. Water relations of cotton plants' under nitrogen deficiency. IV. Leaf senescence Stark N. 1992. The effects of water and multi-nutrient
during drought and its relation to stomatal stress on xylem sap chemistry, photosynthesisclosure. Physiol. Plant. 51" 145-149. and transpiration of seedlings of two Eucalypts.
Trees 6: 7-12.Radin R.W. and Ackerson R.C. 1981. Water
relations of cotton plants under nitrogen Tan W.X. and Hogan G.D. 1995. Effects ofnitrogendeficiency: III. Stomatal conductance, limitation on water relations ofjack pine (,_inusphotosynthesis, and abscisic acid accumulation banksiana Lamb.) seedlings. Plant Cellduring drought. Plant Physiol. 67" 115-119. Environm. 18: 757-764.
ReichP.B., Waiters M.B. and Tabone T.J. 1989. Tesarov_i J. and N_itr L. 1986. Effect of nitrogenResponses of Ulmus americana seedlings to deficiency on growth and chloroplast number in
• varying nitrogen and water status. 2. Water and spring barley. Photosynthetica 20:371-376.nitrogen use efficiency in photosynthesis. TreePhysiol. 5" 175-184. Teskey R.O., Fites J.A., Samuelson L.J. and
Bongarten B.C. 1986. Stomatal and nonstomatalRovensk_ B. and N_tr L. 1981. The effect of limitations to net photosynthesis in Pinus taeda
. nitrogen deficiency on leaf anatomy of young L. under different environmental conditions, q_ree
spring barley plants. Biol. Plant. 23" 291-295. Physiol. 2" 131-142. w
Sage R.F., Pearcy R.W. and Seemann J.R. 1987. The Vincent A.B. 1965. Black Spruce: A Review of its
, nitrogen use efficiency of C3 and C 4 plants. III Silvics, Ecology and Silviculture. Publication. Leafni'tr0gen effects on the activity of 1100, Canadian Department of Forestry, Ottawa,
carboxylating enzymes in chenopodium album Ontario, Canada, 79 pp.(L.) and Amaranthus retroflexus (L.). PlantPhysiol. 85: 355-359. Valentine ICW.G. 1971. Soils of the Fort Nelson
Area of British Columbia. Series: British
' Seemann J.R., Sharkey R.D., Wang J.L. and Osmond Columbia Soil Survey, Report 12, CanadianC.B. 1987. Environmental effects on Department of Agriculture, Research Branch,photosynthesis, nitrogen-use efficiency, ad Ottawa Canada, 60 P.
o
202 GTR-NC-209

Van der WeftA., van Nuenen M., Visser A.J. andLambers H, 1993. Contn'bution of physiologicaland morphological plant traits to a species' abilityat high and low nitrogen supply: A hypothesis for •inherently fast- and slow-growingmonocotyledonous species. Oecologia 94: 343-440.
yon Caemmerer, S. and Farquhar, G.D. 1981. Somerelationships between biochemistry of
photosynthesis and the gas exchange of leaves.Planta 153: 376-387.
yon Cae_erer, S. and Farquhar, G.D. 1984. Effectsof partial defoliation, changes of irradiance during
•growth, short-term water stress and growth atenhanced p(C02) on the photosynthetic capacityof leaves ofPhaseolus vulgaris L. Planta 160:320=329.
Waiters M.B. and Reich P.B. 1989. Responses ofUlmus americana seedlings to varying nitrogenand water status. 1. Photosynthesis and growth.
." Tree Physiol. 5" 159-172.
Wolfe D.W., Henderson D.W., Hsiao T.C. and Alvino
A. 1988. Interactive water and nitrogen effectson senescence of maize II: Photosynthetic declineand longevity of individual leaves. Agron. J. 80:
•865-870.
i
. IF
Proceedings tBFRA Assn 1997 meeting 203

MODELS FOR SNOW AND WIND DAMAGE ASSESSMENTS IN SWEDISH PINE, SPRUCE, AND. BIRCH FORESTS
Erik Valinger I and Jonas Fridman 2
ABSTRACT.--Damage to forests caused by snow reduced seed production among older trees (Nixonand wind accounts for high economic losses and Cameron 1994), it also necessitates unscheduledannually. In Europe, the scale of the problem and costly thinnings. ,amounts to hundreds of millions of US$ each year.In Sweden alone, approximately 4 million m3 are To reduce economic losses, effective methods todamaged annually by snow and wind Ill, roughly minimise damage caused by snow and wind arecorresponding to a value of 150 milh'on US$. To needed. High risk sites must be identified, andminimize these high losses, a tool for risk assessment silvicultural strategies for such sites must be tailoredwithin forest management was developed. (Hirvela and Hynynen 1990, Laiho 1997).Predictions of damage risk from snow and windusing tree, stand, and site characteristics of Scots pine Different approaches to identify stand susceptflaility(Pinus sylvestris L.), Norway spruce (Picea abies and high risk sites are already in use, e.g., the hazard(L.) Karst.) and Birch (Betula spp. L.) were made classification systems in UK (Booth 1997, Millerusingdata from permanent sample plots within the 1985). Meteorological studies have clarified theSwedish National Forest Inventory (NFI). The plots circumstances under which the combination of snowwere inventoried twice at five year intervals between and wind load is most likely to cause damage to a1983 and 1992. Measurements at first inventory of tree (Solantie 1994). Another approach has been totree characteristics for the largest sample tree, site, identify suscept_le sites using GIS with a terrainand stand data were combined with snow and wind model (Wright and Quine 1993). Other studies havedamage registrations from the second inventory, as contnqauted to the knowledge from a biomechanicalinputdata for model development. For pine and point of view (Fraser 1964, Mattheck et al. 1993,spruce stands, models were developed for three Peltola and Kellom_.ki 1993, Gardiner 1995).different regions, while one model for the wholecountry was developed for birch stands. The models All the above mentioned studies show that the
developed can be used to detect sites with high processes of snow and wind damage in forests _eprobability of damage from snow and wind, and very complex. To develop a risk classificationreduce future damage and costs in forestry, system, information from a wide range of levels is
needed;
(i) single tree data, e.g., species, biomechanicalINTRODUCTION resistance, tree form, and root structure,
(ii) stand data, e.g., species composition, standForestdamage caused by snow and wind accounts for age, mean height, and stand density, and
approximately.4 million m3 annually in Sweden (iii) site data, e.g., climatic conditions,(Valinger and Fridman 1995), corresponding roughly geographical location, soil type, moistureto a value of 150 million US$. In Europe, hundreds condition, slope and aspect.of mi!li'ons US$ are lost annually because of snow It
and wiod damage. As stem form is affected by stress factors during b_thgrowth (Jacobs 1954) and dormancy (Lundquist ahd
- Damage to stands leads not only to losses of high Valenger (1996), single trees can be used as measuresvalue timber, detrimental insect attacks on the of probability of abiotic site risk (Valinger andremaining stand (Schroeder and Eidmann 1993), and Fridman 1997). The largest tree on a plot is, most
l Swedish University of Agricultural Sciences, Faculty of Forestry, Department of Silviculture, S-901 83 Umed,Sweden. E-mail: Erik. Valinge_sko.slu.se
, 2 Swedish University of Agricultural Sciences, Faculty of Forestry, Department of Forest Resource.Management and Geomatics, S-901 83 Umett, S_eden.E-mail: Jonas.Fridman@,resgeom.slu.se
.
204 GTR-NC-209

.likely,the "treethat has been most exposed, and largest sample tree, the stand, and the site were usedtherefore the tree best adapted. According to this as independent variables. The following model forview, Single tree characteristics would be good the logit was fitted to the data using logisticindicators of susceptib_ty to snow and wind damage, regression (Agresti 1984, Anon. 1990);
The objecti_te of this study was to develop nation- ,, ,wide risk assessment models for sites dominated by Iogit ( Pl ) = In(/71//70) = _0 + _! Xl + _2 X2 +...+ _n Xn (1) *'Scots pine (Pinus sylvestris L.), Norway spruce
(Picea abies L. Karst), and Birch (Betula spp), using where P0 is the probability that an arbitrary tree is noteasily obtained tree, stand, and site characteristics as damaged by snow or wind, Xl,X2, .., Xnare
independent variables. The study is part of a independent variables, and _0-n are parameters.European Community research project (AIR 3-CT94-
2392). . The parameter estimates from (1) were used toestimate the probability of damage caused by snow or
MATERIALS AND METHODS wind for an arbitrary tree.
In this study, sample plots with different number ofData Used sample trees were used, as well as sample trees with
different probability of inclusion. To take this intoData from the Swedish National Forest Inventory consideration, the events/trials model syntax in the(NFI)were used. The NFI is a stratified systematic the SAS© PROC Logistic (Monserud 1976) was used.sampling including both permanent and temporary
plots clustered into permanent and temporary tracts Results from the logistic analyses were applied to the(Ranneby et al. 1987). Data from the period 1983 to same data as for model development. Mean values of1992 were used. estimated probabilities for the plots were calculated
for squares including at least five plots, and projectedAll sample trees from the first inventory of on maps.permanent plots were remeasured at the secondinventory. Type and cause of damage, if present,
were recorded for each sample tree. This study was Evaluation of the Modelsrestricted to damage caused by snow or wind, i.e.,uprooted, broken, or leaning trees. For description of To test goodness of fit of the models, a c-table w_stree form on each plot, the sample tree of the used (cf. table 2). The observed damage on a plot, I,dominating species (at least 70% of the total basal which was set to 1 if at least one of the sample treesarea) with the largest dbh was used. on the plot was damaged by wind or snow, and to 0
Models were developed for stands dominated by otherwise, was compared with an estimated statusAA A
Scots pine (Sp), Norway spruce (Ns) and Birch (B). variable,I. I was set to 1 if Pl exceeded the CutSp and Ns models were developed for three different A
regions; North, Mid, and South Sweden. A model for value C, otherwise I was set to 0 (Monserud 1976).the whole country was developed for B. This method allows c--omparisons between observed
and estimated binomial values.Data comprised 6,756 plots, of which 3.2% were
' damaged. Description of tree form, stand, and site Itcharacteristics, was based on data from the first Resultsinventory, while observations of damage were based B
•on the second inventory, i.e., the remeasurement. Independent variables included in the models are• , tree, stand, and site characteristics (table 1).
Statistical Method
To model the probability of damage (/71)by snow orwind for an arbitrary tree, characteristics for the
Proceedings IBFRA Assn 1997 meeting 205

Table 1.--Variables included in the models for the different regions (I-III) and species (Ns = Norway spruce, Sp =Scots pine, B - Birch). Signs in cells (+, -) refers to contribution of the variable to the estimated probability.
.
•VARIABLE REGION *v
I H HI I-IH
(N. Sweden) (M. Sweden) (S. Sweden) (Sweden)Species Species Species Species
Ns Sp Ns Sp Ns Sp B
TreeDiameter
Tree heightBole height - -Crown length +Volume on bark
Height/diameter - +Relative crown lengthUpper taper +
Stand
Stand age - +Stems ha_Mean diameter + + +Basal area + +
' Mean, height + +.Total volume + -
Proportion of spruce +Site quality - -Moisture +Sediment - +Peat +
SiteAltitude + + + + + +Latitude ......
Longitude + + + + - +Inclination +
i
' I1
0
206 GTR-NC-209

" A
Table 2.--Frequency (n) and proportion (%) of predicted damage ( I_) and observed damage (I)for Scots pine,Norway spruce, and Birch. Probabilities predicted for regions I-III using the same data as for modeldevelopment.
l
Scots pine .
. A A A
I 0 1 _ 0 1 _ 0 1 _0 n 710 353 1063 430 268 698 669 430 1099
% 66.8 33.2 95.4 61.6 38.4 93.7 60.9 39.1 92.61 n 21 30 51 20 27 47 36 52 88
% 41.2 58.8 4.6 42.6 57.4 6.3 40.9 59.1 7.4
n 731 383 1114 450 295 745 705 482 1187% 65.6 34.4 100 60.4 39.6 100 59.4 40.6 100
Norway spruce
• A A A
•LI) Loi) LI 0 1 E 0 1 Z 0 1 E0 n 516 300 816 403 107 510 869 688 1557
% 63.2 36.8 88.2 79.0 21.0 88.1 55.8 44.2 91.21 n 39 70 109 26 43 69 62 89 151
% 35.8 64.2 11.8 37.7 62.3 11.9 41.1 58.9 8.8
n 555 370 925 429 150 579 931 777 1708% 60.0 40.0 100 74.1 25.9 100 54.5 45.5 100
Birch
A qt
• . /__(I-m)I . 0 1 Y_0 n 361 120 481
% 75.1 24.9 96.61 n 8 9 17
% 47.1 52.1 3.4
n 369 129 498_
• % 74.1 25.9 100
I
. 11
Proceedings IBFRA Assn 1997 meeting 207

The probability of damage is highest in Norway be used as a means to detect high risk sites, and byspruce sites in mid Sweden (figure 1). When taking that into account, minimize future damage andprobabilities calculated for all three species are costs in forestry.mapped together the increased risk of that area is alsoevident.
LITERATURE CITED "
The joint significance of the covariates was tested Agresti, A. 1984. Analysis of ordinal categoricalusing a Score statistic (Monsemd 1976), the resulting data. New York, NY: John Wiuley & Sons, Inc.p-valuewas low (p=0.0001). The estimated 287. ISBN/ISSN 0-471-89055-3. "proportion of damaged plots was overestimated(25.9% - 45.5%), compared to the observed Anon. 1990. SAS/STAT® User" Guide, Version 6,
propo_ion of 3.4% - 11.9% (table 2). 4thed, Vol. 2" 1072-1126. Cary, NC: SASInstitute Inc. ISBN 1-55544-376-1.
, DISCUSSION Booth, T.C. 1977. Windthrow hazard classification.Infor. Note 22/77/SILN. Edinburgh:Forestry
• The use of sample trees and plots with different Commission Research. 4 p.numbers Of sample trees, makes it necessary to usethe model syntax of events�trials. This results in Fraser, A.I. 1964. Wind tunnel and other relatedurider-estimatiom of the p-values both for the models studies on coniferous trees and tree crops.and the independent variables. Therefore, a Scottish Forestry. 18: 84-92.sigaaificance level Of 0.05 for a variable to enter andremain in the model, was applied. Gardiner, B.A. 1995. The interactions of wind and.
tree movement in forest canopies. In: Coutts,' The most important factor in deciding overall M.P.; Grace, J., eds. Wind and. Cambridge
susceptibility for a site, is presence of snow and University Press: 41-59. ISBN 05-214-6037-9.wind. One way of detecting susceptible sites, is thus
to use detailed climatic measurements. Such Hirvela, H.; Hynynen, J. 1990. Effects of fertilizationmeasurements are, however, hard to obtain as on the growth, top damage and suscept_ility toclimatic stations are seldom situated in forested areas, windthrow of Scots pine stands in Lapland. Folia
• As the trees themselves register all external forces Forestalia. 764. 16 p. "acting on them, and respond to them during growth(Telewski 1995), we have used data from the largest Jacobs, M.R. 1954. The effect of wind sway on thesample tree on each plot, together with stand and site form and development ofPinus radiata D.Don.characteristics, as measure. Austgralian Journal of Botany. 2:35-51.
When the Suscept_ility for a site is known, the most Laiho, O. 1987. Suscepffoility of forest stands tocommon method of minimizing future damage from windthrow in southern Finland. Folia Forestalia.snow and wind is to avoid treatments that increase 706. 24 p.the risk for damage. Earlier studies have highlightedsilvicultural treatments that should be avoided, e.g., Lundqvist, L.; Valinger, E. 1996. Stem diameter
heavy thinning and fertilization in combination and growth of Scots pine trees after increased II' repeated fertilization (Hirvela and Hynynen 1990, mechanical load in the crown during dormancy
Laiho' 1987). In the UK, the use of risk assessment and (or) growth. Annals of Botany. 77:59-6_- models (Booth 1997, Miller 1985) has been used to
adapt silvicultural regimes to sites of different Mattheck, C.; Bethge, K.; Erb, D. 1993. Failure,susceptibilities. As the system has been found to criteria for trees. Arboricultural Journal. 17:201-
- overestimate risks, work Within the EC-project will 209.contribute to the amendment of it.
Miller, K.F. 1985. Windthrow hazard classification.This study shows that it is possl_ole to classify overall Forestry Commission Leaflet. 85. London:suscept_ility of sites to damage from snow and wind HMSO. 14p. ISBN/ISSN 0-11-710047-1.
• using a logistic analysis technique. However, modelsdeveloped are unable to predict catastrophic events of Monserud, R.A. 1976. Simulation of forest treesnow.and wind damage. The models developed can mortality. Forest Science. 22: 438-444.
208 GTR-NC-209

Scots " Norwayspruce
1
D
_ Estimated mean probability ofdamage caused by snow or wind
0-0.9%1-1.9%2-2.9°/o3-3.9*/0
• Q _.9-/0. t_! 5-5.9-1o
speci m _._,oBirch All es m .._,o• _ 8-8.9Olo
9-100%t'_ No data
Figure 1."Mean value of probabilityof damage from snow and wind for squares includingat least five sampleplots.Scotspine, Norway spruce, Birch and all species mapped together.
Proceedings IBFRA Assn 1997meeting 209

°
Nixon, C.; Camergn, E. 1994. A pilot study on theage structure and viability of the Mar Lodgepinewoods. Scottish Forestry. 48: 22-27. A
Peltola, H.; Kellom_d, S. 1993. A mechanistic model
for calculating windthrow and stem breakage ofScots pines at stand edge. Silva Fennica. 27: 99-1!1.
Rarmeby, B.; Cruse, T.; H/igglund, B.; Jonasson, H.;Sw_d, J. 1987. Designing a new national forest
survey for Sweden. Studia Forestalia Suecica.177.29 p. ISSN 0039-3150.
_Schroeder, L.M.; Eidmarm, H.H. 1993. Attacks of•bark- and wood-boring Coleoptera on snow-broken conifers over a two-year period.Scandinavian Journal of Forest Research. 8" 257-265.
Solantie, R. 1994. Effect of weather andclimatological background on snow damage offorests in southern Finland in November 1991.Silva Fenniea. 28" 203-211.
Telewski. F.W. 1995. Wind induced physiologicaland developmental responses in trees. In: Coutts,M.P.; Grace, L, eds. Trees and wind. Cambridge:Cambridge University Press: 237-263. ISBN 05-
2314-6037-9.
.Valinger, E.; Fridman, J. 1995. Vind- och sr_skador -ornfattning och moffttg_der. Skog & Forskning.3: 40-45. (In Swedish.)
" Valinger, E.; Fridman, J. 1997. Modelling probability• ofsn0w and wind damage in Scots pine stands
•- using tree characteristics. Forest Ecology andManagement. (In press.).
•Wright, J.A.; Quine, C.P. "1993. The use ofgeographical information system to investigate 1t
' storm damage to trees at Wykeham Forest, NorthYorkshire. Scottish Forestry. 47: 166-174. w
,. .
210 GTR-NC-209

A MATHEMATICAL MODEL OF TREE ROOT FORMS AND ESTIMATION OF EFFECTS ONDECREASING WINDFALL RISK
Y. V. Zakharov I and V.G. Soukhovolsky 2
D
ABSTRACT.--The tree root form is considered from crown is incapable of trapping the required lightthe viewpoint of optimization of mineral salts supply energy. To maintain the functions of a treeand safeguard against windfall. To describe tree foundation, the root system has to be extensive, but itstabili'ty under wind impact two models have been ought not to be too branched and deep because in this "considered: a rigid column on elastic substrate and case the energy consumption for matter translocationtwo types of sailing yachts. The stability of trees increases.With horizontal and vertical root systems ".iscompared. The effects of root form change under Nevertheless, trees exist and successfially stand up totheir growingon hard substrate have been wind impact. This points to the fact that aconsidered.; compromise has been attained between all the
contradictory requirements through evolution. Andwhen solving the problem of tree stability under windimpact it is essential not to consider the tree a simple
WIND AS AN ENVIRONMENTAL FACTOR mechanical system but l_otake into accountINFLUENCING THE TREE FORM environmental restrictions.
A growing tree has to solve a number of survival Optimization of tree form leads to some restrictionsproblems. First, the tree has to obtain a reasonable on tree morphological parameters. As a tree gainsquantity of light energy. In most cases (except for height, the probabilities of perishing due to windfallcreepers) this problem is resolved by lifting the [pI(H) = H/(A +H)] and energy consumption forphotosynthetic surface upward. Second, the tree has matter translocation into the crown [p2(H) =to supply a necessary quantity of water and mineral H/(C+H)] increase, and the probability of perishingsalts from the soft. This objective is accomplished due to the lack of necessary light [ps(H) = B/(B+H)]
through a branched root system, decreases. Tree height will be optimal (Hop_),whenthe product of probabilities p(H) = pI(H) p2(H) ps(H)
However elevating the tree crown, while solving the is minimized. Differentiating the function p(H) with •light trapping problem, simultaneously puts forward respect to H, and taking the first derivative equal totwo new problems. First, water and salt translocation zero, we obtain the equation for optimal tree heightto a high crown calls for a large quantity of energy, Hopt:So that the energy consumption for mattertransl0eation into the crown diminishes the gain in (1) H 3 _ kH - 2 ABC = 0light energy. Second, for a high tree with a highdense crown, the problem of the tree as stability Where k=AC+AB+BC and A, B, and C are constants.against wind impact arises. This problem is resolved
•by increased density and depth of the root system. For trees of sufficient height (more than 10 m) theThis solution is related to increased energy cubic term of this equation proves to be much greater
consumption for matter translocation from the roofs than the linear one and therefore the optimal height is !, to the stem base and further into the crown. Hopt = (ABC)I/3 when H > 10 m.
• 11
Thus, for the purpose of survival, it is essential that a Similarly after introducing the probabilities oftree's geome.tric proportions satisfy a lot of perishing in consequence of energy consumption forcontradictory requirements. On the one hand, the matter translocation [ql(L) = L/(W+L] and due totree 1_ to be not too tall, or the windfall probability small root length [q2 = S/(S+L) where L is the rootincreases. On the other hand, a low tree with a scanty length], the optimal root dimension Lopt = (SW)i/2
IY. V. Zakharov, Siberian State Technological University and Institute of Biophysics SB RAS; address: Instituteof Biophysics, Siberian Branch Russian Academy of Science (SB RAS). 660036 Krasnoyarsk, Russia; e-mail:
• [email protected].• 2V.G. SOukhovolsky, Sukachevlnstitute of Forest, SB RAS, 660036 Krasnoyarsk, Russia; e-mail:
ifor@A_sk, infotel. ru.
Proceedings IBFRA Assn1997 meeting 211

is obtained. The overall probability of tree survival When P=0 we obtain the Euler critical load
will be maximum for the tree of optimal height nopt Qc = cJ / 1.and root length Lopt. Thus the wind impacts on a treeof specific height and root length depend on
constants (fig. 1). The dependence according to Eq. (3) is correct untilthe moment when the left part of the foundation basebegins to detach from the substrate as the angle 0
STABILITY OF TREES UNDER WIND increases. This is shown in the substrate reaction
IMPACT diagram in fig. 2. The critical detachment angle forthe rectangular base of sides a and b and the moment
The comparison of influence of two distinct types of J=ba3/12 is equal to 01=2Q/caeb, and the criticalrootsystems on tree stability under wind impact is force is Pl=Qa(1-Q/Qc)/6h.made. Consider two types of root systems: thevertical system of the tree which grows up from a soil
On further increasing of the force P the relationshiplayer of sufficient depth, and the horizontal one on a between the deflection angle and the acting forcethin s0il layer with a hard rock substrate. The becomes nonlinear:stability with respect to windfall will be different for
trees with such types ofroot systems. There is a need P - (O/h)[a/2 - (1/3X2 o/Obc) 1/2-lo]to introduce a tree model for the quantitative (4)
assessment of this stability. And the dependence P(0) has the maximum (fig. 3)"
Two models descn'bing tree response to wind impact (5) Pc - (Qa/2h Ill_[' -- _/_i"_/'_c/1_1/3]can be introduced. Both models show that a stable
equili'brium o fa tree is possible up to a critical windThe corresponding angle is Oe=(Q/18 12bc)1/3. When
• force. This critical force is the instability threshold P> Pc there are no equilibrium states and the columnand is connected with the Euler load value.falls down.
..
The first model treats tree stability as the stability ofa rigid column on an elastic substrate under the In the approach above, simplifying assumptionsimpact ofa horizontal directed force P (Kramer about the small angle (0 ,_ sin 0 _ tan 0), the absolute1936; Panovko and Gubanova 1979). The physical rigidness of the column, and settling of the small base
were made. Considering these circumstancesproperties of the substrate are descn_oed by the well- properly, the curves of equilibrium states will l_e.known Winkler model, according to which the
situated below the displayed ones (fig. 3) but thissubstrate reaction at a point is proportional to thefoundation base settling at the same point (r=-cy, improvement is of a quantitative rather than awhere c is the substrate modulus), qualitative character.
•The column deflection angle 0 (fig. 2) is defined by In comparing a vertical root system to a horizontal• one, analysis of modification of the curve P(0) is of
the equation of moments: interest for our purposes. In this model such a•
(2) Ph +.QIO c0J = 0 transition from a vertical root system to a horizontalone implies an increase in the horizontal foundationsizes a and b and thus an increase in the moment of
In this equation the first term is the moment of the' horizontal force P, the second term is the moment of inertia J. The moment J is proportional to L4(orlto
the column weight Q, the approximation 0=-sin 0=- the square of a root system area if). The changes of- tan 0 is made, and the third term is the moment of the the distances I and h are proportional to the
distributed forces of the upgrade reaction with the characteristic measure of the root system L.However, the fractional changes of these distancesmodulus c. Here J is the moment of inertia for the
.... are much less than the fractional changes in the linearfoundation area with respect to the axis passing over foundation sizes. Thus it may be considered that thethe foundation base gravity center normal to the declination angle of the straight line portion of thedrawing plane.
curve P(0) [see Eq. (2)], in changing from a verticaltree root system to a horizontal one, will increase
From the equation follows the dependence of P as a proportionately to L3 (that is proportionally to S 3/2),• function of O: and the critical force Pc will increase proportionally
(3) • P = (cJ - QI)O / h to L (that is proportionally to S 1/2, where S is the
212

In general defoliation of the tree crowns and their (1)distribution over damage classes may have causes of dpi/dt-- ]_. (pjaj i - piai j),two different types- first, direct impact of air Jpollution or other damaging factors of regional scale and for stationary conditions the principle ofand, second, a large number of local ecological detailed equilibrium must be fulfilled
•factors with various effects on tree health, including (Rubin 1984): orandom ones. So, damage classes can be (2)
represented as follows: pjaij = pia_j.
, Ei = iA, It follows from equation (2) that any two ,probabilities of health state of trees in the forest are
where i = 0, 1, 2, 3 - denotes the base damage connected by the relationship below:classes: 0-no damage, 1-slightly, 2-moderately, and (3)
3-severely damaged and dead trees. E is the pj= piaij / aji -" piKi j,damage class corrected for human impact, A - is adimensionless number to characterize the intensity
or'direct human impact on forest health, if A= 1 where Kij= aij / aji "- Pj / Pi- is the constant of•then direct impact is absent. The health status of the equih'brium for migrations o f trees from damageforest is the mean corrected damage (E) class of the class i to j. For any chain of migrations we have
sampled trees (Alekseye v 1990): following relationslfip:3 (4)
E = ]_Ei PI, Pk = Pl Kli Ki jKj k,i=o
if so, then variation of the forest health status may or in logarithmic form:. be naturally presented as the sum of two (5)
•components corresponding to two kinds of reasons lnpk = lnpl + hlKli + lnKi j + lnKj k.
which determinate such a variation:
3 3 For the migration process of trees between fixeddE = E Pi dEi + lEEidpi = dW +dQ. damage classes, due to its stochastic nature the
i--0 i=0 principal is a cyclic process. For such a process "from equation (4) follows:
In this formula first component (dW) describes (6)variation in forest health status due to direct human 1 = Kk iKi jKj k
impact which is common for the trees of all damage" classes, second component (dQ) - is variation in the
forest health as a result of random migrations of the Each damage class has its own characteristics"-- trees between fixed damage classes.
ti = (Ei - E) / B,
' Consider in more detail the process of random
migrations Of the trees between damage classes, where B - multiple with dimension of damageSuch migrations will occur both to the better classes, so ti is dimensionless. #
' damage classes (with low numbers) and to the For the cyclic migration process k_ i _ j _ k, Bworse (with high numbers) according to following the sum of the damage class characteristics must be
" scheme: equal to zero:(7)
' aol al2 a23 0 = (tk - ti) + (ti- tj) + (tj - tk).
Eo ¢m E_ ¢:_E2¢=_E3,alo a21 a32
There is only one shape of the functional
here Ei- damage classes; aij- the intensity of relationship of the constant ofequih_orium Kij from. migrations of the trees from damage class i to j ti and tj which simultaneously satisfies both
(dimension- I/time). The dynamics of vital conditions of the cyclic migration process (6) and• structure of the forest in this case must follow the (7), this is the exponential function:
• below system of differential equations:
222 GTR-NC-209
1

(8) . clarified with equation (8) fi'om which it follows
Kij = exp(ti - tj). that:
B = (Ei - Ej ) / In KijAlter substitution of(8) to (5) fi'om last follows
equation which are fight for all pairs k and 1" IfB is maximum (infinity) then Kij = 1, in other ,,(9) words, ifB is maximum then the intensity of
Blnl_ + Ek = Blnpl + El. migrations of the trees due to random reasons areequal to and fi'om each damage class. So, B may beconsidered as characteristic of random transitions of
if we denote•as F the number equal to the left and the trees over damage classes. In statistical physicsfight sides of(9), then we have obtained the the analog of B is the temperature of the system
distnqaution of the trees over damage classes in which descn'bes chaotic movements of the systemcanonical Gibbs form (G_bs 1982): ' elements. This fact allows us to consider the(10) meaning of parameters F and B to be similar in
. . F = Blnpi+ Ei forest ecology and statistical physics.
Pi = exp ((F - Ei) / B). There are some usefial relationships betweendistn'bution parameters which can be easily derived
. fi'om equations (10): "From condition of standardization and (10) follows: (13)
F =- BInZ, F = E - BH
3 3
where Z = E exp(-Ei/B) - is the statistical sum of where H = - Epi In Pi- is entropy of distribution ofi=0 i=0
the trees over damage classes. From last equationthe distn'bution of the trees over damage classes, accounting for (12) it follows that:F'mally the distffoution of the trees to different (14)
damage classes can be more conveniently calculatedas follows: B = E / (H + In P0) or B/A =im / (H + In P0)(1!)
Here imis the mean damage class of the forest,Pi=(I/Z)exp(- Ei/B) = (1/Z)exp(-iA/B). calculated using base damage classes.
This distnqgution which we will call the distn'bution The second type of distribution of trees over theof the first type is very otten found in forest damage classes arises if in (7) we use for damage
•monitoring data(table 1) and describes fully healthy class characteristics the numbers ti2 instead of ti..- or slightly damaged forests. The same analysis presented above gives the
• following distribution of the trees over damage'To clarify what the number F means remember that classes"in statistical physics F is the free energy of the (15)system whose elements are distributed over energy It
' levels in accordance with (11).• Notice that fi'om Pi = (1/Z*)exp(-(Ei - E)/B) 2= (1/Z*)exp(-(i- IF(1 I) follows! im)A/B)2,
_ (12)
p0=l/Z, Z=l/p0
and F = Binp0,
so, F under constant B is determined by the
. proportion of the fully healthy (undamaged) trees inthe forest and therefore is characteristic of its
vitality. The meaning of parameter B may be,
Proceedings tBFRA Assn 1997 meeting 223
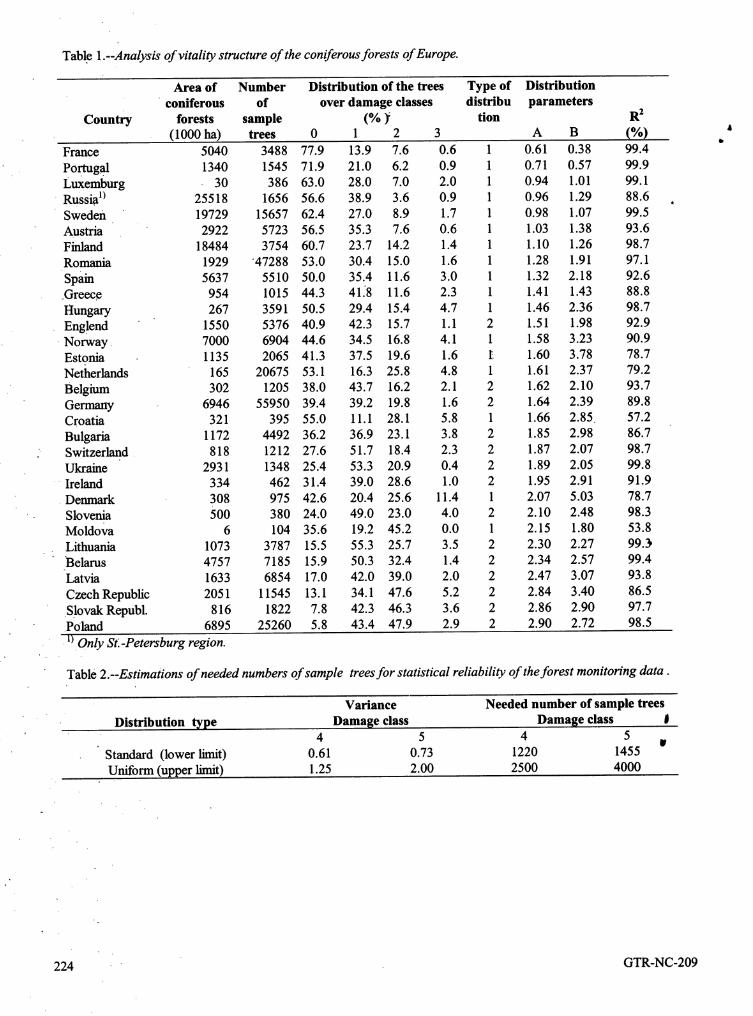
Table 1.--Analysis of vitality structure of the coniferous forests of Europe..
Area of Number Distribution of the trees Type of Distribution
coniferous of over damage classes distribu parameters
Country forests sample (%)_ tion R2( 1000 ha) trees 0 1 2 3 A B (%) *
France 5040 3488 77.9 13.9 7.6 0.6 1 0.61 0.38 99.4
Portugal 1340 1545 71.9 21.0 6.2 0.9 1 0.71 0.57 99.9Luxemburg 30 386 63.0 28.0 7.0 2.0 1 0.94 1.01 99.1Russia _) 25518 1656 56.6 38.9 3.6 0.9 1 0.96 1.29 88.6 ,Sweden 19729 15657 62.4 27.0 8.9 1.7 1 0.98 1.07 99.5Austria 2922 5723 56.5 35.3 7.6 0.6 1 1.03 1.38 93.6Finland 18484 3754 60.7 23.7 14.2 1.4 1 1.10 1.26 98.7Romania 1929 '47288 53.0 30.4 15.0 1.6 1 1.28 1.91 97.1
spain 5637 5510 50.0 35.4 11.6 3.0 1 1.32 2.18 92.6Greece 954 1015 44.3 41_8 11.6 2.3 1 1.41 1.43 88.8Hungary 267 3591 50.5 29.4 15.4 4.7 1 1.46 2.36 98.7
Englend 1550 5376 40.9 42.3 15.7 1.1 2 1.51 1.98 92.9Norway 7000 6904 44.6 34.5 16.8 4.1 1 1.58 3.23 90.9Estonia 1135 2065 41.3 37.5 19.6 1.6 I. 1.60 3.78 78.7Netherlands 165 20675 53.1 16.3 25.8 4.8 1 1.61 2.37 79.2
Belgium 302 1205 38.0 43.7 16.2 2.1 2 1.62 2.10 93.7Germany 6946 55950 39.4 39.2 19.8 1.6 2 1.64 2.39 89.8Croatia 321 395 55.0 11.1 28.1 5.8 1 1.66 2.85 57.2
Bulgaria 1172 4492 36.2 36.9 23.1 3.8 2 1.85 2.98 86.7, Switzerland 818 1212 27.6 51.7 18.4 2.3 2 1.87 2.07 98.7
Ukraine 2931 1348 25.4 53.3 20.9 0.4 2 1.89 2.05 99.8Ireland 334 462 31.4 39.0 28.6 1.0 2 1.95 2.91 91.9
Denmark 308 975 42.6 20.4 25.6 11.4 1 2.07 5.03 78.7Slovenia 500 380 24.0 49.0 23.0 4.0 2 2.10 2.48 98.3Moldova 6 104 35.6 19.2 45.2 0.0 1 2.15 1.80 53.8Lithuania 1073 3787 15.5 55.3 25.7 3.5 2 2.30 2.27 99.3Belarus 4757 7185 15.9 50.3 32.4 1.4 2 2.34 2.57 99.4Latvia 1633 6854 17.0 42.0 39.0 2.0 2 2.47 3.07 93.8
Czech Republic 2051 11545 13.1 34.1 47.6 5.2 2 2.84 3.40 86.5Slovak Republ. 816 1822 7.8 42.3 46.3 3.6 2 2.86 2.90 97.7Po!_and 6895 25260 5.8 43.4 47.9 2.9 2 2.90 2.72 98.5
1)Only St:-Petersburg region._
Table 2.--Estimations of needed numbers of sample trees for statistical reliability of the forest monitoring data.
Variance Needed number of sample trees
Distribution type Damage class Damage class J' 4 5 4 5 Ir
' Standard (lower limit) 0.61 0.73 1220 1455
", Uniform (upper limit) 1.25 2.00 2500 4000
l224 GTR-NC-209

II
a T - _(1/aij), Tl/2 = ln2/a01, nl_here Z"= _exp(-(Ei- E)/B) 2.
i=0 The third type of forest vitality structure does not nFor the second type ofdistn_oution of the trees over occur in European forest monitoring data and is ol
mum
damage classes there are equations analogous to only: found near strong pollution sources such as A(13) and (14): large chemical or smelter plants (Alekseev 1990, q,(16) Norin and Yarmishko 1990). I_
F°= 0"2- B2H, B2= (0"2-E2) ./(H + lnpo), (B/A) 2 The published forest monitoring data for European
" , = (O"21- i2m)/ (H + lnp0), countries can be very well described by these • .here o"2iis the variance of the distn'bution of trees theoretically derived distributions of trees over
over base damage classes, damage classes of the first and second type. AllEuropean Boreal countries (Norway, Sweden, _
The second type of distn'bution of trees is usual for Finland, and Russia data only for Saint-Petersburgm0demtely and severely damaged forests, in this region) have the first type of distribution of treescase the m_um number of trees are not in the full over damage classes (figs. 1 - 6). Figures 5 and 6 _health' (no damaged) class as under distn_oution of illustrate the second type of distribution of treesthe first type but in the mean damage class for over damage classes for England and Poland. Thewhole forest..Such dism_oution also often occurs in forest health in England is the best among countries
forest monitoring data (table 1). with the second type of iistnqaution, while foresthealth in Poland is the worst. ' 0
The tied type of dism'bution of the trees over Idamage classes occurs .if damaging factors are verystrong and as a result the forest decline is MEASUREMENT OF DIRECT HUMANtmrevers_le. In this case immigration of trees IMPACT ON FOREST HEALTH BYbetween damage classes follows the scheme: INTRODUCING OF STANDARD (NORMAL) '
FOREST
aOl al2 a23
Eo =:}EI=:}E2 :=}E3. The published forest monitoring data describesvitality structure by the distribution of the sample
Under such dynamics of vitality groups of trees trees over base damage classes. However this datathere is no equih'brium state, all trees become dead is not enough for determination of all vitality "in time. The decline dynamics can be descr_ed with structure parameters, first of all the intensity ofthe balance differential equations: direct human impact on forest health. In order to
solve this problem remember that all direct
dpo/dt = - aolPo, dpl/dt = aolPo - al2Pl, dp2/dt = measurement is the comparison of the object withal2Pl - a23P2, dp3/dt = a23P2, some standard (Pfanzagl 1971). The intensity of
" direct human impact on forest health status can be
The anah'tical solution of these equations has the measured only by comparison with a speciallyfollowing fOrm: introduced standard forest vitality structure
represented by a standard (normal) distribution of
pi(t) = _Ai exp(-bi t), the trees over damage classes. Such a standardi introduction is more or less voluntary but it must !
, satisfy some obvious conditions. First, the standard w
where, t- is'the time; Ai, bi- parameters which distn'bution of trees over damage classes must be of
depend on aij andvitality structure of the forest at the first type, which is usual for fully healthy forests;initial moment 0ftime - pi0 for example: second, the mean damage class for this distribution--
' calculated using base damage classes--must be equal
" p0(t) p0°exp( - aol t). to approximately 0.5 as it is for non- damagedforests; and, third, the standard distn'bution must be
If the coefficients of intensity of the trees transitions simple. There is only one simple distribution which
- aij are known then it is possible to determine the satisfies all three conditions:average life span of the forest - T and the timeneeded for a 50% decrease in the number of fullyhealthy trees as - Tl_: .-
.
Proceedings IBFRA Assn 1997 meeting 225

°
1
0,8- Rz 0,909g =,$ 0,6-
0,4 m b
0,2• !
0"-- I I ,
, 0 1 2 2 •
Damage classes
Figure 1. Distribution of the trees over damage classes for Norway (Type 1).
¢
1
0,8-__.._
R2= 0,9950,6 u
O
0,4--
• _ 0,2--
0 t t
0 1 2 3
Damage classes
• , Figure 2. Distribution of the trees over damage classes for Sweden(Type 1).
• 1
0,8 R 2 = 0,987
0,6 It
' _, 0,4 w•
_ 0,2 •
0
0 1 2 3
Damage classes
Figure 3. Distribution of the trees over damage classes for Finland(Type 1).
°
226 GTR-NC-209

1
0,8
,_ 0,6 ,,o 0,4
" ,a_ 0,2
0
0 1 2 3
Damage classes
Figure 4.Distribution of the trees over damage classes for Russia
, (Sankt-Petersburg region)(Type 1).J
1
0,8
• '_ 0,6 RE--0,929
.. _ 0,4 ii_
0,2--
0 .................... I ................... t _"
0 1 2 3
Damage classes
Figure 5. Distribution of the trees over damage classes for England(Type2).
1
, _ 0,8 -- R2=0,985 It
' _ 0,6--t
0 ........ I ...... I ....
0 1 2 3
Damage classes
Figure 6. Distribution of the trees over damage classes for Poland(Type2).
,
Proceedings 1BFRA Assn 1997 meeting 227

(17). APPLICATION OF RESULTS3
pi = exp(-i) / E exp(-i) = 0.64 exp(-i). The results obtained on principal types'ofi=0 distributions of trees over damage classes, an
ihtensity of the direct human impact on the forest
The standard (normal) distribution of trees over health status of European countries, and on intensity *v
damage classes is presented in figure 7. For this of random transitiom of the trees between damagedistribution, A=B = 1. In other words direct human classes ("temperature" of the forests) will be used inimpact is absent and the standard (normal) intensity two ways: first, for comparative analysis of theofrandom transitions of the trees between damage forest health between three groups of countries: .
classes (normal "temperature" of the forests) is boreal, industrially developed, and other, andequal to one. The mean damage class (ira) second, for analysis of statistical reliability of thecalculated using base damage classes is 0.51 In data provided by the forest monitoring system.order to distinguish this mean dam_ige class forstandard distribution from others it will be marked
"ist, SO ist = 0. 51. Comparative Analysis of the Forest HealthStatus of European Countries
Direct human impact changes the health status of ,-the whole forest at once. This is descn'bed by mean Comparative analysis will be done for Europeandamage class, therefore relative intensity of impact coniferous forests as they are more sensitive to air(A) can be calculated as follows: pollution and some other damaging factors than
broadleaf forests. All European contries are dividedA = im/ ist. into three groups: first--countries of the boreal
zone: Norway, Sweden, Finland, and Russia;
When A is known using formulas (14) or (16), second, industrially developed countries: France,. along with.data on distribution of the trees over England, and Germany; and third--other countries
damage classes, then parameter B and all other (see table 1). Inte.nsity of direct human impact and..
needed characteristics of the distribution can be random transitions of the trees between damageeasily calculated, classes for these groups of countries were calculated
as weighted averages, the area of coniferous forests
The results of measurement of direct human impacts in each country was used as a weighting factor.on forest health status and the intensity of randomtransitions of the trees between damage classes Coniferous forests of Europe are mainly located in(forest "temperature") using European forest the countries of the boreal zone. Figure 8 showsmonitoring data (Forest condition in Europe... that nearly 60% of the total area of coniferous1994) are presented in table 1. forests is in this group of countries, with 10% in
industrially developed countries and 30% in theIn table 1 countries are ordered in accordance with others.
increase of intensity of direct human impact on theforests (A). The European forest monitoring data Within the group of boreal countries only Norwayare descn'bed by theoretically derived distributions has an intensity of direct human impact on forestwith a high level of accuracy. Coefficients of health (A) an intensity of random transitions (B)
•determination are high (greater than 78%) for all significantly more than standard or normal. Forest JCountries, except Croatia and Moldova where health status of the other boreal zone countries isdetermination coefficients are 57.2% and 53.8%, approximately the same and close to normal (figs.
" respectively. This can be explained by, first, low and 10). It can be proposed that the coniferousnumber of sample trees, second, methodological forests of Norway, more than in neighboring borealmistakes in forest monitoring process, and third, countries, are subject to long-range transboundarythat forests in these countries are not in stationary air pollution.equih'brium state. Data from table 1 shows that as arule countries with the first type of tree distribution Comparison of the forest health status between theover damage classes have a low level of direct groups of countries shows that the lowest intensities
, human impact on forest health status, of direct human impact and random transitions ofthe trees between damage classes ("temperature" ofthe forest) are in the countries of boreal zone,
. highest in other countries, and middle in the
228 GTR-NC-209
l

AID
1
0,8- Y = 0'64e_| R2= 0,999
'*d 0,6_0,4 -
"_ 0,2
0 I
0 1 2 3
Damage classes
Figure 7. Standard (normal) distribution of the trees aver damageclasses (Type 1), as a base for forests health status measurements.
°
60
50
40-
30-
20-
10-
0 I I
" Boreal Industrial Other
• .
Figure 8. Shares of the groups of European countries in total
• coniferous forests area, %
j,
!
. U
,
Proceedings IBFRA Assn 1997 meeting 229

2
1,5 -
1 JO
0,5
0 I t I
Norway Sweden Finland Russ ia •
Figure 9. Direct human impact on the forest health of Boreal zone. countries (relative units, 1 - no impact)
4
3-
"2 -
1-\
O-
Norway Sweden Finland Russ ia
Figure 10. Intensity of random transitions of the trees over damage
classes ("tempereture" of the forests) for Boreal zone countries
• (relative units, 1 -normal intensity- "tempereture")
2,5
2
1,5 !
1 u
. 0,5
0 _
Boreal Industrial Other
Figure 11.Direct human impact on forest health for the groups of
European countries (relative units, 1 - no impact).
230 GTR-NC-209
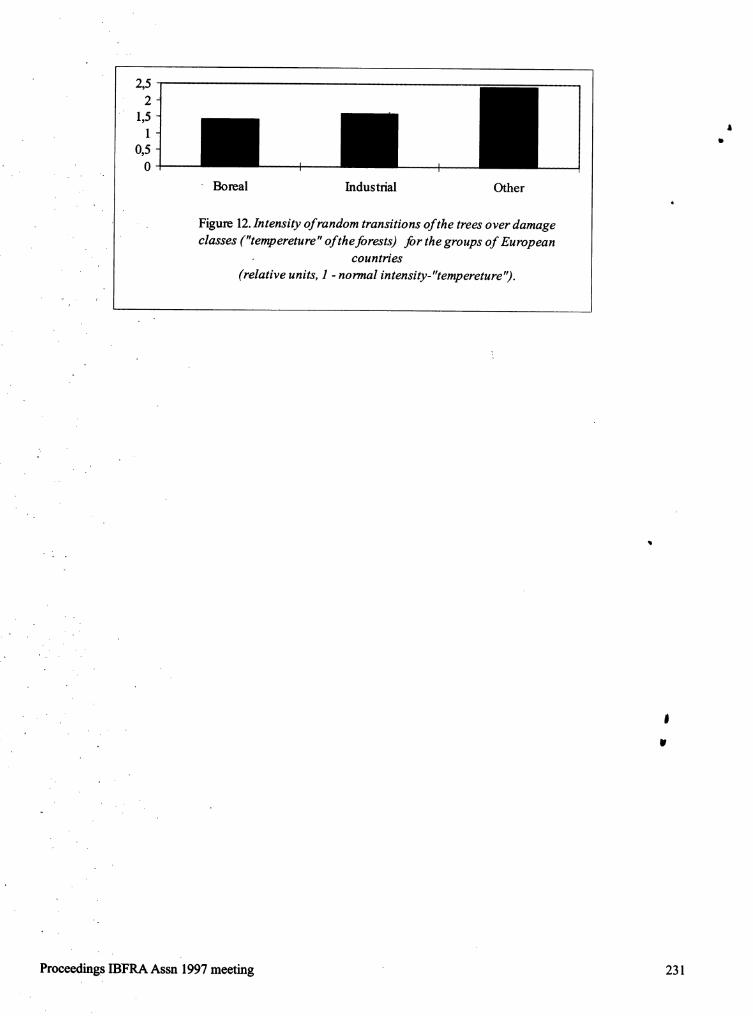
2,5
2
1,5
l J0,50 I
..
Boreal Industrial Other
Figure 12.Intensity of random transitions of the trees over damage
classes ("tempereture" of the forests) for the groups of European• countries
(relative units, 1 - normal intensity-"tempereture").
J
J
. ip
Proceedings IBFRA Assn 1997 meeting 231

industrially developed (figs. 11 and 12). The common for distributions of types 1 and 2--uniformrelatively bad forest health status of the group of or regular. Such a distribution has the highestother countries is due to such members of this group variance, and estimations of the need number ofas Poland, Czech Republic, and some others which sample trees with it can be considered as an upperhave relatively large areas of coniferous forest and limit for real number. Meanwhile a lower limit mayhigh levels of air pollution due to using coal with be based on estimation with standard (normal)
high content of sulfur. In industrially developed distn'bution of the trees over damage classes. -countries, owing to modem technologies and strong Estimations of the needed for statistical reliability ofenvironmental policy, human impacts on forest the forest monitoring data numbers of sample treeshealth are moderate. We can conclude that the are presented in table 2. Because damage to trees ishealth status of European coniferous forests specific for different species, estimations shown in "depends primarily on the health of the forests in table 2 are valid for only individual species or closeboreal zone countries, which are now in relatively groups. Table 2 demonstrates that the number ofgood condition, sample trees needed depends strongly on the
number of damage classes. Published data (Forest- Notes on Statistical Reliability of the Forest condition ... 1994) are grouped into four damage
Monitoring Data classes but usually dead trees are accounted forseparately. Furthermore, sometimes dead trees are
If the forest health status of any country is described separated into new and old mortality. Comparisonwith mean damage class of the sample trees from a of the estimated numbers of sample trees needed forregular bioindication grid then the number of sample statistical reliability with real numbers of sampletrees must be determined to give the data statistical trees (table 2) shows that in some countries realreliability. As was shown above the distribution of numbers are less than lower limit.trees over damage classes may be of three types,two ofwhich are usual for all European countries.
• Because of such a variety of distributions and LITERATURE CITEDstatistical interdependence between health status ofsample trees, wecannot base estimation of needed Alekseev, A.S. 1990. Analysis of ecologicalnumber of sample trees on the normal (Gauss) law structure of the Picea abies (Pinaceae)usually used for this purpose. In this case we must populations growing under atmosphericuse more common form of Large number low in pollution. Journal of Botany. 75 (9): 1277-1284.
• , form of Chebyshev unequality: (in Russian).
P ( [x - x*]> a ) < s2/a 2 N, Alekseyev, V.A., ed. 1990. Forest ecosystems andair pollution. Leningrad. Science Publisher. 200
here , x - mean damage class determined using N p. (in Russian).samples; x* - true mean damage class for someterritory or country; a- allowable deviation from Brooks, R.T.; Millers, I.; Dickson, D.R. 1991.
true mean damage class; s2 - variance of the Forest health monitoring in the United States:distn_oution of the trees over damage classes; P - the 1990 experience in New England. In:probability of deviation of mean damage class IUFRO Workshop on monitoring air pollutioncalcUlated using N samples from true mean more impact on permanent sample plots, data
, than on a. From the above unequality the number of processing and results interpretation. 1991 Itsample trees needed for statistical reliability is: September 2-6. Prachatice: 12-21.
N = s2/a 2 P. Careri, G. 1982. Ordine e disordine nella materia.
Laterza & Figli Spa, Roma-Bari. 232 p. (inFor calculations with this formula we must Italian).
determine the components of its right side. Letallowable deviation of calculated mean damage class Forest condition in Europe. 1994. Report on thefrom true mean- a = 0.1, and probability of more 1993 survey. UN/ECE, CEC, Geneva, Brussels,than a deviation - P = 0.05. In order to determine s2 174 p.We must know the distribution of trees over damageclasses, which is unknown before the monitoring Forest damage and air pollution. 1989. Report of
programme will be done. There is one special type the 1988 forest damage survey in Europe.• of distn'bution of trees over damage classes which is ECE/UNEP. Geneva. 87 p.
232 GTR-NC-209
G_bs, D. 19821 Thermodynamics. Statistical McArthur, R.H. 1966. The biology ofpopulatiom.physics. Moscow: Science publishers. (in NewYork: Wiley. 200 p.Russian)i
Nicolis, G.;Prigogne, I. 1989. ExploringGiller, P.S. 1984. Community structure and the cpmplexity. An introduction. New York: W.H.
niche. London, New York: Chapman and Hall. Freeman & Company. 342 p.
Glotov, N.V.; Zhivotovsky, L.A.; Hovanov, N.V.; Norin, B.N.; Yarmishko, V.T., eds. 1990. TheHromov-Borisov, N.N. 1982. Biometry. influence of industrial air pollution on pineLeningrade: State University Publisher. 264 p. forests of Kola peninsula. Leningrad. 196 p. (in(in Russian), Russian). •
Haken, H. 1978. Synergetics. Berlin. Heidelberg. Pfanzagl, J. 1971. Theory of measurement. 2nd rev.New York: Springer Verlag. ed. Wurzburg-Wien: Physica-Verlag. 248 p.
Manual on methodologies and criteria for Rubin, A.B. 1984. Thermodynamics of biologicaltiarmoriized sampling, assessment, monitoring processes. Moscow: State University Publisher.and analisys of the effects of air pollution on 290 p. (in Russian).forests. 1986. Hamburg/Geneva: ProgrammeCo-ordinating Centers/UN-ECE. 97 p. Rubin, A.B.; Pytiyeva, N.F.; Riznichenko, G.E.
Cinetics of biological processes. Moscow:Manual on methodologies and criteria for State University Publisher. 304 p. (in Russian).
harmonized sampling, assessment, monitoringand analysis of the effects of air pollution on Yablokov, A.V. 1987. Population biology.forests. 1994. Hamburg_rague: Programme Moscow: High School Publisher. 303 p. (in
• Co-ordinating Centers/UN-ECE. 177 p. Russian).
Zhivotovsky, L.A. 1991. Population biometry.Moscow: Science Publisher. 272 p.(in Russian).
Proceedings IBFRA Assn 1997 meeting 233
DEGRADATION OF MONTANE FIR FORESTS IN THE KEMEROVO OBLAST:- SEARCH FOR CAusEs
Vladislav A. Alexeyev I
iABSTRACT.--SI_oerian fir forests in mountains of the mountains ofKemerovo Oblast and development ofKemerovo Oblast (southern part of Western Siberia, management for damaged forests." In 1996 aRussia) are in decline. A field expedition of scientists research team consisting of an ecologist, a forestconducted complex research studies in 1996-1997 to inventory specialist, a soil scientist, a forestdetermine re_om for this forest decline. This work pathologist-mycologist, a geobotanist, an ,clarified that the current condition of the weakened entomologist, a lichenologist, and several chemistsstands that were studied was caused by several fungi, initiated a 3 year study on this topic. To our surprise,
including the rust fungus Melampsorella the current condition of the degraded stands wasearyophyllacearum Schroet., which is distributed on a caused by several fungi, including the rust funguspandemic scale Most of the fir trees (from 30 to Melampsorella caryophyllacearum Schroet., which is90% in' the studied stands) showed symptoms of distn_outed on a pandemic scale. In 1997 this researchfungus infection: yellow witches brooms, bole and was continued also in the Krasnoyarsk Kray.branoh cankers, and dieback of some needled twigs.The first and second signs occurred in trees of all The goal of this paper is to present the first-yearages, the thirdwas more common in mature trees, results of this study and to attract the attention of theDii-ect mortality from cankers occurs rather rarely, but international community to this phenomenon.stands weakened by cankers are more easily damagedby insects and other destructive agents; they canbecome stands at risk. The area of infected fir forests METHODOLOGYexceeds 2 million ha.
To determine reason(s) for forest decline, we used a
complex of ecosystem research methods. Standardsfor arranging sample plots and methods to estimate
.
INTRODUCTION sanitary conditions were published by; the ForestService of Russia (1992). Methods for estimation of
More than 400,000 ha out of 1,300,000 ha of Siberian forest health are reported by Alexeyev (1989, 1990);far (Abies sibirica) forests observed by forest and descriptions of forest vegetation were mad8 bypathologists are in decline in the Kuznetsk Alatau Sukachev and Zonn (1961). Samples of epiphytic andMountains of the Kemerovo Oblast in Middle Siberia. ground lichens, needles, twigs, fitter, and soils wereThese forests are distributed about 70 km to 110 km taken from healthy and damaged forest ecosystemsfrom industrial sites. The area includes 170,000 ha of for chemical analysis, which were conducted bymoderate damage, 150,000 ha of heavy damage, and standard methods (Arinushkina 1970, Tsyplenkov et80,000 ha of dying stands (Kovalev 1994). A 1994 al. 1981, Yagodin 1987, Mochalova 1975).survey disclosed a worsening of the forest condition(Kovalev 1994). Forest pathologists and ecologistssupposed that the development of forest decline in STUDY AREASmountain ecosystems would increase soil erosion,
. threaten watersheds and streams, and produce an Primary research measurements were made in the Itecological catastrophe in the region (Gritsko et al. region of the most heavily damaged stands in the1996). In spite of several studies, the causes of the Kuznetsk Alatau Mountains (the watersheds oftge,,, .
decline have remained unclear. Hypotheses for the upper reaches of the Usa and the Black Usa rivers).reasons of forest decline have included two major Plots were selected in highlands (on plateau, slopes,
. factors: (1) regional air pollution impact, and (2) and valleys) and included middle-aged, maturing, andprevalence of overmature stands in virgin mountain fir mature stands of different health. Thegnmeasurementsforests. However no reliable data was available. For were continued in the foot-hills of the mountains. A
thisreason the Forest Administration of the brief description of several plots is given in table 1.Kemerovo Oblast suggested that I organize a project,
, "The revelation of reasons of fir forest decline in
. i V.A. Alexeyev, St.-Petersburg Forestry Research Institute, 21 Instimtsldy Ave, Saint-Petersburg 194021,Russia.
234 GTR-NC-209

Sample plots 1 and 2 are on a plateau. They 10-20 years ago. Other stands had many small,. characterize Widely distnq3uted maturing and mature supressed dead trees. The appearance of new dead
stands with closed canopies. Plot 3 represents trees was negligible; the proportion of dying trees wasmiddle-aged clOsed fir-stands in valleys of high- also insignificant (table 3). These data indicate that at
mountain creeks. Plot 4 characterizes extremely th_ present time intensive processes of forest ,densemidd!e-aged firstands on the lower parts of degradation are not occurring. This important ,,lfighland slopes. Plot 5 represents a natural middle- conclusion was checked and confirmed on all
aged stand of.fir regeneration after a clearcut in the inspection routes. Thus we cannot confirm the thesis1940's in the foot-hills of the Kuznetsk Alatau of rapid worsening of forest health. NeverthelessMountair_. large portions of trees in stands are weakened •
(damaged) and heavily weakened (heavily damaged)Apart fi'om these permanent sample plots, we sampled and the average health status of stands in most casestemporary plots and several inspection routes in was weakened. Therefore a search for the reasons for
Kemerov0.Oblast with total length more than 200 km. degraded stands is valid.We could not find dying fir stands in this region.
. ;.
Air Pollution Impact on Degradation of Fir StandsRESULTS AND DISCUSSION
Investigation of fir trees on sample plots and routesHealth of Fir Forests did not show symptoms of air pollution impact on fir
. trees. Maximum life span of fir needles in mostIn accordance with the project objectives life state damaged mountain forests was 14 years and the(damage) and health condition of fir trees and stands average was 9 years. Necroses and chloroses wereof sample plots were estimated. Indices of health of not observed. Only in the vicinity of Mezhdurechenskstands varied from damaged to heavily damaged and city, needles older than one year had chloroses (lessdepend on whether estimates were based on the 10% of needle area) and small spots of necrosis (1%-number of trees or tree volume (table 2). Mature 3% of needle area).(plot 1) and maturing (plot 2) stands contained many
dead stems of different size and age which were killed
Table 1.--Brief forest inventory description of permanent sample plots.
Plot Composition Average Average Average Relative Site Type of Growingof. stands I age height diameter basal quality forest stock
area class
" _ years m cm m3/ha• .
• i 100% A 95 15 23 0.79 IV A. mh2 160
• 2 100% A • 85 13 18 0.77 IV A. mh 2 130
3 10 0%A 55 12 14 1.24 II A. mh 2 190!
, 4 100% A 50 13 14 2.03 II A. nudum 35011
5 80%A 20%B 50 15 20 0.77 I A. mh2 180,.,.
IA -- Abies sibirica; B -- Betula pendula.2Abietum _magni herbetum .
Proceedings IBFRA Assn 1997 meeting 235

Table 2.--Disturbance and sanitary conditions of fir stands on sample plots.
Disturbance of stands estimated by: Sanitary condition of stands estimated by:
N plot Number method Volume method _ Number method Volume method
Index Life state Index Life state Index Condition Index Condition .
% %..
1 28 damaged 30 damaged 2.9 heavily 3.0 heavilydamaged damaged.
2 29 damaged 38 damaged 3.2 heavily 2.8 heavilydamaged damaged
3 40 damaged 33 damaged 3.2 heavily 2.4 damageddamaged
4 14 healthy 6 healthy 2.8 heavily 1.6 damaged_ damaged
5 21 healthy 12 healthy 2.4 damaged 1.8 damagedIi
Table 3.-- Distribution of trees (percent) of various health status and sanitary condition _th and _thout acounting
of their rank.
Category of health status of trees (%)
. N plot Total Healthy Weakened Heavily Dying off This year dead Many yearsweakened trees ago dead
% trees
Estimated by volume method
1 100 24.5 27.9 18.8 2.4 0.0 26.4
2 100 11.8 38.3 34.4 0.9 0.0 14.6
3 100 20.3 46.3 23.7 1.5 0.7 7.5
•4 100 77.0 12.6 1.5 0.8 0.0 8.1
5 100 62.9 20.6 6.0 0.7 0.0 9.8• .
Estimated by number method
• 1 i00 30.0 25.9 17.1 3.5 0.0 23.5
2 100 22.6 32.0 10.7 4.0 0.0 30.7 J
3 ' 100 15.0 28.7 24.9 5.8 1.5 24.1 w
4 100 49.4 14.7 3.5 1.8 0.0 30.6
5 100 39.2 31.1 10.8 1.3 0.0 17.6
236 GTR-NC-209

Numerous analyses of fir needles for the territory of Distributions of damaged trees by age class (table 4)the Mezhd.urechemk forest farm and six other forest and diameter group (table 5) also show that agefarms of the Kemerovo Oblast were carried out. structure of fir forests is not a source of their mass
Sulfur content in the needles of damaged and healthy degradation: in a mature stand (plot 1) heavilytrees Was the same and did not exceed 0.12% of weakened and dying trees occurred in different levelsneedle dry weight. However, close to of the canopy, whereas in middle-aged (plots 3-5) and 1
Mezhdurechensk city sulfur contents were 0.17%. It maturing (plot 2) stands, they were formed mainly as ,is interesting to note that in the Lake Baikal region result of competition. Statistical analysis did not findsulfur content in fir needles is 0.17%-0.19% in clean significant correlation between the health and age oflocations (R0zhkov and Kozak 1989). tree. At the same time in sampled stands there are too
many weakened and heavily weakened trees; thisAs is well known; many species of lichens are very confirms the data of previous research about thesensitive to sulfur pollutants. Therefore special worrisome situation in these mountain fir forests.attention was paid to the condition of lichens. The
• region of most heavily damaged fir stands' was
characterized by abundant distribution of epiphytic Reasons for Disturbance of Fir Standslichem (Usnei_ ssp., Hypogimnea physodes, etc.),which Were observed on 100% of trees. Open sites At the time of estimation of health of trees, wehad a lot of well-devel0ped ground lichens" Alectoria described evident reasons for their weakening, andochroleuca, Cetraria islandica, C. laevigata, Cladina noted infected trees that were starting to lose theirrangiferina, C. stel!aris, Cladonia amaurocrala, C. health. To our surprise :.weobserved mass distributiongracilis, Stereocanlon sp., etc. According to T.N. of cankers from the rust fungus MelampsorellaOtnyuk0va 2 the morphological state of Cladina caryophyllacearum. This perennial rust fimgus israngiferina (test lichen)in the studied region has no described by many authors (Transhel 1939; Vanin
divergence from normal. Sulfur content in lichens of 1955; Peterson 1963, 1965; Scharpf 1993; Reed anddifferent species varied from 0.12%-0.42%. The Farr 1992). Trees of all ages are suscept_le to thelowest average sulfur content was observed in lichens parasite. Infected trees have stem or branch yellowfi'om opensites. Studies of forest soils and vegetation witches-brooms, trunk burls, branch swellings, andof the lower layers of open forest communities also sometimes spike tops. Indeed, many trees in theshowed no anomalies. Kuznetsk Alatau Mountains have intensive
development of the disease and different symptoms ofOn the basis Ofthese data, we conclude that the level canker can be developed on one tree. About 30of present (and recent) regional air pollution cannot percent of the fir seedlings are infected by "be the i'eason for modem degradation of fir forests in Melampsorella caryophyllacearum; some of thethe tenitory studied, young trees have systemic canker. One-year fir twigs
with microstrobiles often have dry orange needlesbefore more advanced disease symptorm appear.
- Impacts of Age of Fir Stands on Their Mass Injured twigs concentrated in the subtop of the crownDegradation can make the tree look heavily damaged, especially• .
from the air.
Sl_oerian•fir is a primary species ofKemerovo Oblast.,In the Mezhdurechensk forest farm which is the main
site for this project, fir occupies 82% of the forested Sixty years ago the portion of trees with rust cankerarea (377,800 ha). According to the last forest in this region amounted to 2%-7% (Dravert and 11
'inventory of forest farms young fir stands were Popov 1938). Now infection of Melampsorella itd/strl_Uted oia 8.5% of area, middle-aged on 12.8%, earyophyllaeearum in Kemerovo Oblast has reached
- maturing on 9.9%, mature on 68.4%, and overmature epidemic proportion: 50%-95% of the trees in eachstands on 0.4% (1,400 ha) of the fir area. So mountain and foothill fir stand had symptoms ofovermature stands cannot be the reason for mass cankers. Some examples of the canker's occurrencedegradatio n of fir stands. In addition, fir communities are shown in table 6. Canker of trees was theas a rule form uneven-aged stands (Falaleyev 1985), dominant reason for tree weakening; doubtful cases ofas can be seen in table 4. the disease are not included, and the real situation
may be more severe than our data indicate. Dense• middle-aged stands have many small trees weakened
, 2 T.N. Otnyukova, KN. Sukachev Institute for by direct or indirect damage from adjacent trees as aForest Research, Siberian Branch of Russian Ac. result of competition; we believe these are the primarySci., Academgorodok, Krasnoyarsk, 660036, Russia,personal communication, 1996.
Proceedings IBFRA Assn i997 meeting 237

Table, 4.--Distribution of trees (percent) by age classes.
Age class - Plot 1 Plot 2 Plot 3 Plot 4 Plot 5 Plot 6
years % % % % % %
<20 __1 ...... 5.6 -- b
21-40 2.7 22.7 13.8 16.7 27.3
4 t-60 10.8 25.0 56.8 79.3 44.4 45.5 .
6.1-80 35.1 32.1 18.2 6.9 27.8 18.2
81-i00 32.4 25.0 2.3 -- 5.6 9.1
101-120 8.1 7.1 ........
i21-140 5.4 10.7 ........
141-160 2.7 ..........
161-180 2.7 ..........
111otrees.
Table 5.--index of damage (percenO of fir trees of various diameter on sample plots...
•Diameter Plot 1 Plot 2 Plot 5 Diameter Plot 3 Plot 4
group , _roupcm index, % index, % index, % cm index, % index, %8 46 29 43 4 65 6312 23 33 30 6 55 60
16 21 26 20 8 52 3720 16.5 22 13 10 40 1724 29 l0 11 12 31 628 33 30 22.5 14 26 632 26 0 ..l 16 27 036 22 60 -- 18 22 040 i0 ..... 20 27 1244 30 .... 22 30 460 60 .... 24 22 0
........ 26 0 0 j
........ 28 42 ---- " ...... 32 30 __ w
" -....... 38 0 --........ 52 60 --
lno trees.
238 GTR-NC-209

reasons for supressed trees and seedlings. The group 3. The main agents of forest decline in mountainfirof"other'; reasons includes: cankers, damage from forests of the Kemerovo Oblast are fungiinsects (Monochamus urussovi, Mindarus abietinus, includingMelampsorella. Weakening of trees byAphrastasia pectinatae), wood and root rots rest fungus, Melampsorella caryophyllacearum,(Phellinus hartigii, Heterobasidion annosus, etc.), _makes them less tolerant to other factors. Wherecracks fi'omlightning,l_ost damage, etc. Each weakened stands are dism_,utedacross a huge ,individual stand had its own set of damaging factors territory, such forests are areas of risk andbut in all stands, cankers were distnSuted inepidemic potential sources of mass outbreaks of insectsproportiOn. This disease was the singlegenerally and other damaging factors.acting damagingfactor. Direct mortalityfromcankersocc_s ratherrarely. But stands weakenedby 4. In contrastto Kovalev (1993, 1994) we observedcankersaremoreeasilydamagedby insects andother no largeareasof deador dying fir standsindestructive agents. KemerovoOblast. It is poss_le that Kovalev's
• use of helicopters forvisualestimationof foresthealth led to overestimates of forest degradation
, SUMMARY because observations were mainlyof the upperparts of tree crowns.
1. The level of present and recent regional airpollution cannot be the reason for widespread fir 5. Ecological catastrophe does not threatenforest degradation in Kemerovo Oblast. Kemerovo Oblast in the near future. However it
could happen in 10-20 years as result of2. The present age of fir stands in Kemerovo Oblast outbreaks of insects in huge areas of risk formed
cannot be the reason for widespread fir forest by initialactivityof Melampsoreladegradation, caryophyllacearum and other fungi that damage
twigs.
Table6.--Reasons for weakening of Abies sibirica.i
Reason for weakening Distribution of different reasons for tree weakening, %
plot I plot 2 plot 3 plot 4 plot 5II
% % % % %
competition 24 43 41 12 __l
trees Withcankers 7 11 17 ....
other agents 76 57 59 89 100
• trees with cankers 51 40 54 83 86
•Total 1O0 1O0 1O0 1O0 1O0 !
trees with cankers 59 51 71 83 86 u
1110 trees.
°. °
Proceedings tBFRA Assn 1997 meeting 239

6. It is necessary to continue this research. Our expedition. In: Archives of Kemerovo Forestsurvey of fir stands in Krasnoyarsk Kray and Administration. 379p. [In Russian].adjacent territories shown a great distn_oution ofrust cankers, it is poss_le that this phenomenon Kovalev, B.I. 1994. Report of forest pathology surveyis more important than was supposed in the : ofMezhdurechensk, Tashtagol forest farms andbeginning. Shorsk National Park ofKemerovo Oblast.
Bryansk: Bryansk forest pathology expedition. In: bArchives of Kemerovo Forest Administration...
LITERATURE CITED 405p. [In Russian].
Alexeyev, V.A. 1989. Diagnostics of life state of trees Mochalova, A.D. 1975. Spectrophotometric methodand stands. Lesovedenie. 4:51-57. [In Russian]. of detemfination of sulphur in plants. Serskoe
khozyaistvo za rubezhom. 4: 42-45. [In Russian].Alexeyev, V.A., ed. 1990. Forest ecosystems and air
pollution. Leningrad: Nauka. 226 p. [In Russian]. Peterson, R.S. 1963. Effects of broom rusts on spruceo and fir. Research Paper INT-7. IntermountainArinushkina, E.V. 1970. Manual of soil chemical Forest and Range Experiment Station, Ogden,
analysis. Moscow: Moscow State University. 487 Utah, Department of Agriculture, Forest Service.p. [In.Russian]. 10 p.
committee on Environment and Natural Resources of Peterson, R.S. 1965. Notes on western rust fungi IV.Kemerovo Oblast. 1996. Atmospheric emission of Mycologia 57:465-471.industrial enterprises ofKemerovo Oblast in 1980-1995. Archives of The Committee on Reed, C. and D. F. Farr. 1992. Index to Saccardo'sEnvironment and Natural Resources of Kemerovo Sylloge Fungorum. Tallahassee, Florida: Rose.
. Oblast. [In Russian]. 860 p.
Dravert, V.P.; Popov, V.V. 1938. Butt rots of fir in Rozhkov, A.A.; Kozak, V.T. 1989. Toleranmess ofMontane Shoria. Reports of S_erian Research forests. Moscow: Agropromizdat.239 p. [InInstitute for Forestry. Krasnoyarsk: Krasnoyarsk Russian].Publishing House. 20 p. [In Russian].
Scharpf, Robert. F. 1993. Cankers, Diebacks, andFalaleyev, E.N. 1985. Forests of S_eria. Galls. In: Scharpf, R.F., tech. coord. Disease of
Krasnoyarsk: Krasnoyarsk State University. 136 Pacific Coast Conifers. Agriculture Handbook Nop. [In Russian]. 521. Washington, DC.Department of Agriculture,
Forest Service. 199 p.Forest Service of Russia. 1992. Sanitary regulations in
forests of Russian Federation. Moscow: Sukachev, V.N.; Zonn, S.V. 1961. Methodology for
Ecologiya. 14 p. [In Russian]. studying of forest types. Moscow: Nauka. 144 p.[In Russian].
Goscomles of the U.S.S.R. 1983. Sample plots forforest inventory. All-Union State Standard of 56- Transhel, V.G. 1939. Review of rust fungi of the
69-83. Regulations for filling. Moscow: USSR. Moscow-Leningrad: Nauka. 426 p. [I_' Goscomles of the U.S.S.R. 60 p. [In Russian]. Russian].
Gritsko, G.!.; Ovdovenko, V.I.; Barannik, L.P.; Tsyplenkov, V.P.; Bankina, T.A.; Fedorov, A.C.Stehastlivtsev, E.L. 1996. Description of 1981. Determination of ash composition in plants.ecological map ofKemerovo Oblast. Kemerovo: Leningrad: Leningrad State University. 159 p.
" Committee on Environment and Natural
Resources ofKemerovo Oblast. 53. [In Russian]. Yagodin, B.A., ed. 1987. Manual ofagrochemistry.Moscow: Agropromizdat. 512 p.
Kovalev, B.I. 1993. Report of forest pathology survey• ofMezhdurechensk forest farm of Kemerovo Vanin, S.I. 1955. Forest phytopathology. Moscow:
Oblast. Brymmk: Brymmk forest pathology Goslesbumizdat. 416 p. [In Russian].
240 GTR-NC-209

EVALUATION OF HEALTH OF PINUS SYL VESTRIS TREES NEAR MAIN LOCAL POLLUTIONSOURCES OF LITHUANIA
E. Kuprinskiene, J. Nemanifite, D. Dailidiene,A. KrasauskasIA
O
ABSTRACT,--Recent economic changes at the ruralregiom in Germany(Simonis and Weidnermain factories in Lithuaniarequireproper 1988). In a larger survey of about 20 sites coveringevaluation of the impact of industrialpollution on 9 Europeancountries annualmeanconcentrations inconifer stands. The objective of the current the range 0.5-14.4 nl/liter have been recorded for "research was to estimate pollutant effects on 1983-1985 (Schaug et al. 1987).aboveground parts of Pinus sylvestris over a 3-yearperiod. NO2 concentration was estimated as the Data concerning rural NO2 concentrations inmarker of air quality at the Scots pine sampling Lithuania are quite scarce. Average amount of NO2locations. Pinus sylvestris trees were examined in in the atmosphere of the main industrial cities ofautumn"1994-1996 near an oil refinery, a nitrogen Lithuania (1984-1988) was 0.01-0.09 mg/m3
_fertilizer plant and a cement factory. Comparison (Kairiukstis et al. 1992). Although visual forestof needle surface quality by SEM, wax amount, tree observations can show the extent of currentgravimetric characteristics and assessment of injury, they give little indication of potential futurehydroph0bic features of needles in some cases visible symptoms. They.are also to some extentrevealed significant differences between the sites, subjective, and there is need to establish objectiveData obtained show the possibility for a low level of methods of quantifying the extent of forest damage.pollutants to induce detectable damage in one-year- Plants may differ widely in the rate of production ofold needles, their total dry weight as well as separate parts. The
dry weight/fresh weight ratio difference betweencurrent and 2-year-old needles was found to show a
. significant relationship to tree damage in areasINTRODUCTION affected by forest decline (Mehlhom et al. 1988).
The largest aerial interface between forest trees andThe potential threat of acidic pollutants to natural surrounding atmosphere is formed by the plant•vegetation in East and Central Europe has been the cuticle, which covers all primary plant organs.subject of much speculation during the previous Gaseous pollutants have been reported to increasedecade. Realistic assessments of the threat posed the rate of water loss from excised leaves of trees inby these pollutants depend on a thorough controlled conditions (Mansfield and Freer-Smith"understanding of the sources and quantities emitted, 1984) and in the field (Huttunen et al. 1981).their subsequent distribution and, most important, Cuticular waxes have been shown to be solelythe typieal concentrations to which plants are responsible for the barrier properties of plant
. exposed in field environments, cuticles since an extraction of leaf surface waxeswith organic solvents increases cuticular
Sulfur dioxide is the most commonly occurring permeability by a factor of about 100 to 1,000.acidic pollutant gas found in Europe. The second Erosion of waxes of the needle surface wasmost common acidic pollutant gas is nitrogen observed as a consequence of gaseous pollutants,
• dioxide (NO2). NOx emissions have increased simulated acid rain, acid mist or acid fog and basicdramatically over the last 50 years and have not dust (Turunen and Huttunen 1990). The overall
•decreased over the last 10 years in the same way as erosion rate has usually been related to the level of It' $O2 emissions (Campbell 1988). air pollution and based on the comparison of areas ir
with different emission loads (Tuomisto 1988).- Few estimates have been made of NO2 Monitoring the fusion of wax tubes provides
concentrations except in city centers. In the United information about the direct effects of air pollutantsKingdom, rural NO2 measurements have shown on the needles. Air pollution-induced wax erosion
- annual mean values in the range of 3-12 lagNm3 resembles accelerated natural weathering of needle(Ashenden and Edge 1995). Concentrations in the surfaces, which differs from mechanical, fungal, andrange of 4.8-9.7 nl liter"_are considered typical for insect damage. In heavily polluted areas wax tubes
i Kup_inslaen_ E., Assoc.-prof., Department of Botany, Lithuanian University of Agriculture, Kaunas-' Noreikigk_s, Lithuania 4324; NemanifiteJ., M.Sc. Department of Biology, Vytautas Magnus University, Kaunas,
Daukanto 28, Lithuania 3000; Dailidiene D., B.Sc., Department of Biology, Vytautas Magnus University,Daukanto 28; Krasauskas A., Prof -assist., Department of Botany, Lithuanian University of Agriculture,
" Kaunas-Noreilagk_s, Lithuania 4324.
Proceedings IBFRA Assn 1997 meeting 241

°
may start fusing only a few weeks after needle or Vaccinio-myrtillo-Pinetum type) on a 10.5 kmflushing, the rate being 2 to 5 times faster than in line were selected. Related to the cement factory 4clean areas,- where it usually starts during the sites (A1-A4) with 40-67 year old trees (standssecond year of the needles existence. The : belonging to Carico-sphagno-Pinetum or Vaccinio-accelerated erosion of needle surfaces can be myrtillo-Pinetum type) on a 10 km transect were A
b
detected in all needle age classes and it is the most examined. Beside the nitrogen fertilizer plant 10rapid during winter (Huttunen and Laine 1983). sites (J 1-JI0) with 15-25 year old trees (stands ofThe use of the epicuticular wax structure as an Oxalido-Pinetum or Vaccinio-myrtillo-Pinetumindicator of air pollution has been mainly based on type) on a 21 km transect were chosen to evaluatedirect observations of changes in physical form as pollutant effects on pine stands. "seen with the scanning electron microscope (SEM)or on indirect methods, such as determining thewettability of needles by measuring the contact Determination of Concentrations of•angles of water droplets on needle surfaces (Cape Nitrogen Dioxide1983; Haines et al. 1985).
In order to ensure the true monitoring of NO2Air pollutants may retard the development of the pollution levels caused by the nitrogen fertilizercuticle and alter the wax synthesis, resulting in a plant, the cement factory or the oil refinery, allreduced concentration or altered composition of the monitors were located well away from otherwaxes,.both of which lead to a changed physical sources of pollution. As far as possible, that meantstructure of the waxes (Riding and Percy 1985). points at least 1 km from major trunk roads, townsThus, a variety of tests are proposed to evaluate and 100 m from minor roads and buildings. Thelatent injury of trees under air pollution, although, precise location of sites depended on the availabilitythere are many uncertainties left in early diagnosis, of secure sites. Care was taken to place monitorsand field experiment data are needed to ascertain away from obvious obstructions which could shieldvalidity of proposed tools for identification of air streams from any direction, or trees and
• invisible damage. The major objectives in setting up hedgerows which could filter pollutants from the airthe survey were to determine concentrations of NO2 being sampled. All air samplers were placed onin selected sites situated at different distances from wooden stakes at about 1.5 m above ground level.main local pollution sources in Lithuania, as well as There were 17 (JJ 1-JJ17) points in sites near thet.oevaluate Pinus sylvestris trees under the nitrogen fertilizer plant, 18 (MM1-MMI 8) points ininfluence of ambient pollution according to sites near the oil refinery and 9 (AAI-AA9) points
• . morphophysiological tests proposed to detect latent in sites near the cement factory; those are listed"m
injury. Table 1. The exposure of tubes was performedduring February-March 1994. The diffusion tubescomprised 7.2 x 1.12 cm diameter acrylic tubes
MATERIAL AND METHODS fitted with airtight polythene end-caps and weresupplied by Gradco InternationalLimitedof
Study Area Winchester, UK. Two acid-cleaned stainless steel• mesh discs were soaked in 50% v/v triethanolamine
Forest sites near an oil refinery, a cement factory, (TEA)/acetone solution and, after allowing theand a n.itrogen fertilizer plant - the main local acetone to evaporate, fitted inside one end of thepollution sources in Lithuania--were investigated, tube. These discs acted as collectors of NO2 duringDuring the study period (1994-1996) total exposure period. TEA is highly efficient in the
temissions from the oil refinery comprised 28.9-31.4 absorption of NO2. The resultant TEA-NO2
.thousand t/year, from the cement factory - 5.8-18.1 complex is stable so that trapped NO2 can be storet_thousand t/year, and from the nitrogen fertilizer for several months prior to analysis (Ashenden and
" plant - 4.9-5.8 thousand t/year (data provided by Bell 1989). During exposure, the polythene end-"Environmental Protection Ministry of Lithuania). cap at the opposite end of the tube to the mesh
Forest sites on podzo!s (in few cases on gleyic collector was removed and the tubes mounted" podzols) mainly in north-east direction from each vertically, with the open end pointing downwards to
pollution source were selected. Adjacent opened prevent the entry of rain and dust particles. At allareas in front of woods were places for aerial NO2 times except during exposure, tubes were kept inestimations. Near the oil refinery 4 sites (M l-1, sealed polythene bags. Duplicate tubes wereM1-2, M4-1, M4-2) with 43-54 year old trees exposed at each point for a period of 30 days, after(further named as middle-aged stands of Oxalido- which the open ends of the tubes were re-sealed and
, Pinetum type) in 5.5 km transects and 3 sites (M1- the tubes stored for analysis. Nitrogen dioxide2, M2-1, M3) with 15-20 year old trees (further absorbed by the collectors was determined
' named as young stands of Myrtillo-oxalido-Pinetum colorimetrically as NO2. The nitrite ion diazotized
242 GTR-NC-209

Table.NO2 concentration(inppb)nearthemainIocalpollutionsourcesofLithuania(August-Septem-ber,1994)
AD
Characteristic of point Number Tree Lati- Longi- Distance NO2of point site* tude tude (km)** ppb
'North direction MM 01 MI-1 56024, 22010' 2.0 3.8North direction MM 02 MI-1 56024, 22010, 2.7 3.9.,
North direction MM 03 M1-4 56025, 22011, 3.7 3.9North-East direction MM 04 56024, 22012, 2.2 4.1North-East direction MM 05 56023, 22012, 2.1 3.7North-East direction MM 06 56024, 22012, 3_7 4.0East direction MM 07 M1-2 56022, 22007, 2.1 3.8
o West direction MM 08 56024, 22005, 3.7 3.6' West direction MM 09 56024, 22007, 6.6 3.6
West direction MM10 56022, 22009, 3.0 3.6South direction MM 11 56022, 22014, 1.5 3,7East direction MM 12 M2-1 56023, 22°1_4' 3.9 3.0East direction MM 13 M2-2 56023, 22014, 3.9 2.9East direction MM 14 56023, 22015, 3.9 2.9East-South direction MM 15 56022, 22015, 5.4 2.7East-South direction MM 16 56021, 22012, 5.8 2.8South-East direction MM 17 56020, 22°17' 6.3 2.9
• South-East direction MM 18 M3 56019, 24021, 8.8 2.8West direction JJ 01 J1 55005, 24021, 0.5 4.1..
North-West direction JJ 02 J2 55005, 24021, 0.5 4.0North-East direction JJ 03 J3 55005, 24021, 0.5 4.1East direction JJ 04 55005, 24022, 0.5 4.3North direction JJ 05 J4 55007, 24028, 2.5 3.0
• • East direction JJ 06 J6 55006, 24030, 5.0 2.4East direction JJ 07 J5 55007, 24032, 6.0 2.3East direction JJ 08 55007, 24032, 8.5 2.5North-East direction JJ 09 J9 55009, 24030, 15.0 2.1North-East direction JJ 10 J8 55012, 24033, 19 2.5North-East direction JJ 11 55°12' 24033, 18 2.3
North-East direction JJ 12 55011, 24034, 17 2.1• North-East direction JJ 13 55o10, 24037, 17 2.5
North-East direction JJ 14 55011, 24039, 21 2.2North-East direction JJ 15 J10 55°10' 24039, 22 2.2East direction JJ 16 55004, 24030, 8 2.3 !
' East direction JJ 17 55004, 24032, 12 2.2W
North direction AA 1 56°11' 20054, 0.5 3.3
" East-South direction AA 2 A1 56019, 23055, 0.5 2.9East-South direction AA 3 A2 56019, 23055, 0.5 2.7Eastdirection AA 4 A3 56019, 23056, 1.5 2.3
" East direction AA 5 56020, 23056, 3.8 2.0• East direction AA 6 56°18' 23000, 7.8 1.5
East direction AA 7 56018, 23005, 13.0 1.6North direction AA 8 56023, 22059̀ 8.5 2.0North direction AA 9 A4 56024, 22059, 11.5 1.9
• Pinus sylvestris site located in the immediate vicinity of points for exposure of NO2 tubes' ** Point distance from the pollution source
Proceedings IBFRA Assn 1997 meeting 243

sulfanilamide and the resulting salt were coupled weight ratios (D/F) were obtainedby weighingout 20with N- 1-naphthylethylene-diamine-dihydrochloride fresh needles, and dryweights were estimated after(NEDA) to give a purple-red azo dye. The drying for 3 hours at 105° C. Dry weight/fresh weightabsorbance of the samples was measured at 520 nm ratio difference(RI-R0) was calculated by subtracting(Ashenden and Edge 1995). the ratio obtained for current-year needles from that
for one-year-old needles. 4
..
Sampling of TreesContact Angles
Scots pine (Pinus sylvestris L.), the most commonforest tree species in Lithuania, was selected for A test of water-droplet contact angles with the leaf "study. At each site eight apparently healthy trees surface was carried out using a method described bywere chosen for investigations. The selected trees Cape (1983). Contact angle measurements werewere assessed visually according to defoliation, made at room temperature, using distilled water.deehromation and needle retention (Nemaniute et 15-20 needles of every age class from each of 8al. 1997). Sampling was done in September 1994- trees per site (totally 120-180 measurements per1996. Material was collected from the middle part site) were analyzed. A 0.21,tldroplet was placed on
of the crown of young age trees or from the part of the center of the abaxial surface of needles bythe crown 6m-8m above ground. An extending means of a syringe and viewed using a binocular
, "squirrel pruner" was used to cut branches, microscope (*50) with protractor graticule. As far" Needles mainly from one-year-old (c+ 1) shoots as it was possible ttie water surface interface was
were tested and for some tests current year (c) viewed tangentially. Contact angle was assessedshoots were used. At each time all type estimations immediately after the droplet was placed on thewere taken from the same branch. In all, 168 trees needle. Measurements were carded out usingat 21 sites were sampled each year. Sites were repeating cycle of analyzing one branch per each
. always sampled in the morning. All specimens from site to avoid artifacts due to surface quality changesthe nitrogen fertilizer region were taken in one day. per time. Needles were tested within 5 days ofOne week later test material was collected from collection.
both the cement factory and oil refinery zones.
Chloroform- Extractable Wax
Epidermal Water Loss and GravimetrieCharacteristics To determine extractable wax, 10 needle pairs w_e
shaken with 40-ml chloroform (CHCI3) for 15 s asLeaf drying rate measurements were made for excised described by Cape et al. (1988). Chloroformneedles. After transportation to the laboratory, twigs extracts were decanted through a small Buchnerwere cut from the branch and cut ends placed inwater funnel under gravity into a sealable bottle. Theto allow saturation during night. Great care was taken solution was transferred to a pre-weighted
• when removing needles from the shoot that the leaves aluminum foil dish, and the remaining solvent waswould not be damaged, as cut or broken needles allowed to evaporate in a fume cupboard. Samplescompletelyruin the result. Needles were removed were weighed until a stable weight was reached tousing a.small scalpelblade, cutting the bark at the ensure the complete evaporation of solvent. Theneedle base. Subsequently the bases of cut needles washed needles were placed on aluminum dishes forwere coated in petroleum jelly to prevent water loss drying and later used for dry weight determination.
' fromthe open wounds and then 20 needles from each Amounts of wax were expressed in terms of It•shoot were placed into labeledopen aluminumplates percentage of dry weight (d.w.).
- on a laboratory bench. Each batch of needles was w•weighed immediatelyafter being excised l_omtheshoots and then at intervalsover that dayandthe Epicuticular Wax Morphology
following days. The temperature and humiditycouldnot be controlledduringtheperiodof these To preventpossible mechanicaldamageat each sitemeasurements,buttheneedles fromdifferentsites needles were excised from the middlepart of thewere all exposed to the sameconditions. Inaddition, one-year-old shoots. Onlygreen undamagedseveral other measurementswere madeof foliar needles were selected. After transportation, needles
• properties likelyto have responded to pollutants, were kept in a freezer until the assessment time.Surface moisture was allowed to evaporate at room
The ratios of dry/fresh weight for needlesof different temperature for several days. The middle part of. age classes have been proposed as indicatorsof undamaged needles was secured with the abaxial
'decline'(Mehlhom et al. 1987). Dry weight/fresh surface uppermost. The samples were coated with
244 GTR-NC-209

silver using sputter equipment (VUP-4K) and at a site in Northern Ireland, while concentrations ininvestigated with a-JEOL-JSM-IC25S scanning the range 4.8-9.7 nl litre-_are considered typical forelectron microscope (17 kV accelerating voltage), ruraJ regions in Germany (Simonis and WeidnerRepresentative areas of each needle were viewed at 1988; Ashenden and Bell 1989). Amagnifications of 100X to 10,000X. Areas Lower NO2 concentrations of background values ,,investigated were the epistomatal chamber, slopes and ones near the factories found in our study couldof the epistomatal chamber and the surface around be due to the nearly twofold decreased productivityStomata, called 'interstomatal area'. Needle surfaces of industrial units of Lithuania compared to thewere rated according to the following classes previous decade and the overall lower density of ,(Turunen et al. 1992)" class I - distribution of traffic in Lithuania compared to the countries incrystalloid waxes 100%; class II - distribution of West Europe. In our experiment the points werecrystalloid waxes 71%-99%; class III - distribution specially chosen to avoid the influence of localof crystalioid waxes 31%-70%; class IV - sources of pollution and thus the concentrationsdistribution of crystalloid waxes 1%-30%; class V- measured are considered to be minimum levels.distribution of crystalloid waxes 0%. Furthermore, all concentrations quoted are for NO2
' and no account has been taken of the other oxides
of nitrogen, in particular NO. In terms of total NOxStatistical Analysis pollution, it seems possible that the concentrations
may be up to 50% greaterthanthat shown in theANOVA analysis was used to evaluatesignificance table. In addition,it should be stressed that theof differences between data sets in sites, concentrationsdescribed are 'mean concentrations
ofNO2. In a field situation, pollutant levelsfluctuatesubstantiallyand concentrations of 10-20
RESULTS AND DISCUSSIONS times the monthly meanmay be expected to occurfor short periods. There are some difficulties when
Emissions of Nitrogen Dioxide predicting the effects of industrialemissions of NO2on forest stands andother types of vegetation. On
•NO2as a common pollutant for all 3 regions near a broad scale, NO2 will contributeto soilthe factories was selected despite the fact that it is acidificationif nitrogen is in excess of vegetationnot of greatest importance according to emission requirements. Because near the industrial units NOxamounts. The diffusion tubes were used because always exists together with the other pollutants, it isthey are a cheap and reliable method of collecting the responses of plants to the pollutants mixture •
• data on average concentrations of NO2 (Ashenden should be considered. Combination of NO2 andand Bell 1989). Results are shown in table 1. NO2 SO2 produces a highly phytotoxic atmosphere sincevalues eStimated were 2.1-4.3 ppb in the area they often interact synergistically in inducing planteffected by the nitrogen fertilizer plant, 2.7-4.1 ppb responses. Free-Smith and Mansfield (1987) havein.points near the oil refinery and 1.5-3.3 ppb in the shown exposures to 30 nl litre_ SO2 and NO2 toregion of the cement factory. Data from the present decrease the resistance of Sitka spruce to frostsurvey show that NO2 is found as a pollutant in all injury. Similarly, 10 nl litre_ of each NO2 and SO2
points investigated. In our study concentrations of has been found to reduce the capacity for stomataNOEWere found tovary across transects and to to close under conditions of severe water stressSome extent were greater at the sample points near (Mansfield et al. 1988). In 1988 critical level for
the pollution sources. The levels found in 1994 are vegetation of 10ppb NO2 and in 1992 of 30 lagm3•Comparable with those documented in a 1993 NOx (about 15ppb) as an annual mean were |
, survey (Kupeinskiene et al. 1996). Our results proposed for adverse ecophysiological effectsshow similarities with data collected by other (Ashenden and Edge 1995). iF
. researchers in Lithuania in the previous decade(Kairiukstis e.t al. 1992).
Water Loss from Excised Needles. The concentrations defined in our study were low in
comparison with the rural parts of other countries: The experiments reported here were designed tothe lowest concentrations of NO2 throughout Wales investigate the ability of detached one-year oldhad a background level below 4 nl litre_, annual needles to conserve water after prior exposure tomean concentrations of 12.2 and 11.6 nl litreq were pollution of different level. Results from sites near
, registered at 2 sites in England and 1.7 nl litreq NO2 the nitrogen fertilizer plant are shown in figure 1.
Proceedings IBFRA Assn 1997 meeting 245

a) September,1994 intervals differences were negligible. Few bigger--'--Site J2 differences between stands were detected in 1995"
"_ 100i_ _ Site J3 at the beginning of exposure of needles the most"_ 90 ! -+ SiteJ4 ,:
_ rapid evaporation was common for site J8 (p<0.0580 _ _ Site J5 |
__,:-.,_ for 12h, 24h) and later for site Jl, which was close70 -*- Site J7 •
"d 60 "<___ -,- SiteJ8 to the factory (p<0.05 for 334h, 430h and 598h)."_ -,--SiteJ]0 Determination of water loss of detached needles in. "= 50o * p<0.05 1996 year showed more significant differences40o between sites. During the 43 h-598 h interval site•_ 30
0 ]00 200 300 400 500 600 J3 (closely related to the factory) needles dried uptime(h) at significantly higher speed compared to J lO.
Comparison of 3 years data for the sites near the• nitrogen fertilizer plant did not reveal any site with a
b) September, 1995 permanent tendency for significantly increased or4- Site Jl
" _ -+-Site J2 decreased water loss from excised needles. No1 _Ji2-' - -'- - " - -'- - '- - " relationships were found between site distance from, .- 00 --, ...............
, o -_ SiteJ3
90f_ ................ !
the factory and water state of examined needles.
_:_ 80 ' . _..--- ',_. _ -,-Site J470 -_- Site J5
•"d 60[ ! if! !i! ! ! !_= -*- Site J6 Results from drying of one-year old needles from
"_ 50 - -, - - ,- - . - -,- - - - -, -*- Site J7 the oil refinery sites are shown in figures 2 and 3."_o ---40 - -, - -.- - _ - -.- - ,- - -, SiteJ8 Overall characteristics of curves obtained in this
o 30 _ Site J9 region resemble those from the nitrogen fertilizer0 100 200 300 400 500 600 _Site Jl0 plant. According to our data, at the sites closest totime(h)
• p < 0.05 the factory there was a noticeable decline in the rateof water loss, suggesting similar stomatal closurecompared to the needles from the other sites.
c) September, 1996 Comparison of middle-aged stands (fig. 2) located._ 4- Site Jl at different distances showed only a few transitional._ _ Site J2 effects in the 3-year study period (p<0.05 after 384
100,_¢_.., -.- Site J3 h in 1995 and after 17h, 25h in 1996). No one site.= 90 "_1____ -_- SiteJ4
80 . showed a clear pattern of permanently increased or70 _ _--. *___ __ -x- Site J5 decreased water loss from detached needles. A
_[__ _'__"_' �SiteJ6
= 60 "_" __i -_- Site J7 different picture was obtained from analyzing young- - _0 50"_ 40 -,,- SiteJ8 stands. The amount of needle water lost during thec_
O 300 -e- Site J9 interval of observation was equal to 50%-55% in100 200 300 400 500 600 --_SiteJl0 1994, 42%-50% in 1995, and 32%-37% in 1996.
time (h) , p <0.05 In the 5 h to 360 h period significant differenceswere found among sites, with the quickest water
Figure 1.--Annual changes infresh weight of one- removal from the needles belonging to site MI-2year-old needles over time after excision from (closest to the oil refinery stand). Similar resultstrees growing at different distances from the were obtained in the 1995 assessment, where at allnitrogen fertilizer plant, time points (6 h-598 h) needles from site MI-2
dried at the highest speed (p<O.05) compared to
Estimates of drying of excised leaves were taken at sites M3 or M2-1. In the last year of observation, #' 480 h-_i00h intervals. Despite the uncontrolled no significant differences among young stands were
temperature conditions in which needles were documented, although site 1-2 showed results in the w. observed, the extent of water loss during the whole same direction as in previous years. Behavior of the
recording time was similar in all 3 years of needles from site 3M had an inconsistent patternexperiments and in each year ranged between 38%- throughout the whole 3-year experiment, while M2-
- 50%. Generally, quicker water loss was 1 samples were in an intermediate position or lostdocumented during the first 30 h, and later drying water at the slowest speed. Results obtained fromoccurred much slower. This could be explained by the young stands near the oil refinery could beintensive stomatal closure at the beginning of the explained by either higher uptake of water by rootsobservation period. According to 1994 data or lower water retention in the needles includingsignificantly quicker water loss was characteristic increased cuticle permeability of the closest to thefor J2 (0.5 km distance from the plant) site needles factory M1-2 site trees.
compared to J4, J7 or J 10 sites after 6 h, 22 h and. 30 h period of being excised, while at other time Estimates of water loss from excised needles were
done near the cement as described above (rigA).
246 GTR-NC-209
"n
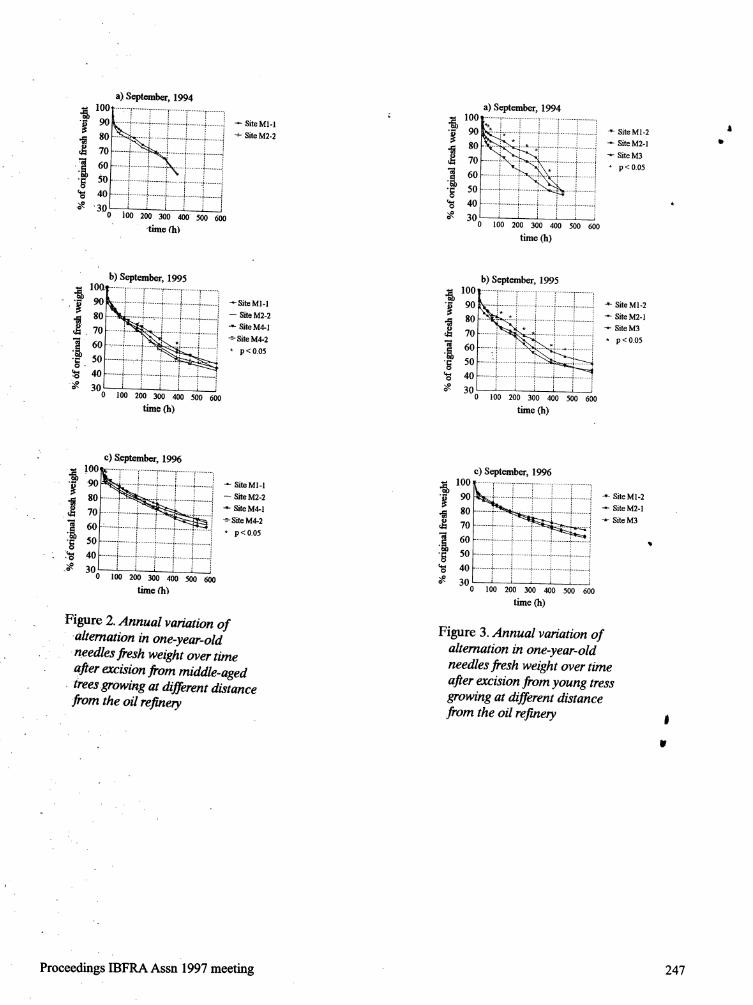
a).Scptembcr, 1994 a) September, 1994
100I"":: .........y.........r.........:..........-.........: : ._ 100 :_i ..........i........._.........i..........i.........i _,.SiteMI-2 1
8_
SiteM2-1
70 ............................... 70• 60 ......i........._-.........i 60
•_ so........i........i-.........i........i........-i..........i ._ so40-.......i.........i.........i.........i.........i.........i _ 4o.........i..........i........._.........i..........i.........! "
"_ '30 400' 5{)0 6f_ _ 300 100 200 300 400 500 600
-timeCh_ time (h)
b) September, 1995b) September, 1995
I00_--......!........._-.........[........._.........-::.........i "_b_,I0090".......3.........._.........._........._..........i..........iSiteM1-2
lk----i---......!,.........i.........i..........i.........i *-SiteMI-I "_o ...-, 90 --- SiteM2-1
_ 70 : '-i.........i.........! .........i --- SiteM4-1 _ 70 .........J...... ' *--_........._..........i........._ * p<O.05• _Site M4-2 ._ 6060 ,.i.........-i.........i.
"_)"_ 50 ! i p<0.05 ¢o"__ 4050.........i..........i.........:_.........!..........i.........!•-_ i i i i ; ;
40 ........i..........':-:.......i.........i.........4.........i _ 300 100 200 300 400 500 600
'_ 300 100 200 300 400 500 600 time(h)time (h)
: c) S.¢ptcmbcr,1996 c) September, 1996
..... ._ 100_i T [ i T i........ .................................... -'---Site "_" 90 _iii -,- SitesiteM2-1Ml'2
9°I_i ..........i.........i..........!.........i _'_'-1 _ ,oo80 ....i.........i........."._.........i M2-2 80
--SiteM4-2 _ 70
._ 60 ..... -........i. p<O.O5 ._ 60 .........i......................................................"•_ 50........i..........i.........i.........i..........i.........i:_ 40-.......i.........i.........i.........i.........i.........i -_ 50 .........i.........i..........i..........i.....................:.o i i i i i __
30 _ 300 100 200 300 4o0 500 600
time fh) time (h)
. Figure 2. Annual variation of Figure 3. Annual variation of•alternation in one-year-old alternation in one-year-old•needlesfresh weight over time needles fresh weight over time
• after excision fro m middle-aged after excision from young tresstreesgrowing at different distance growing at different distance-fromthe oil refinery from the oil refinery !
247
Proceedings IBFRA Assn 1997meeting
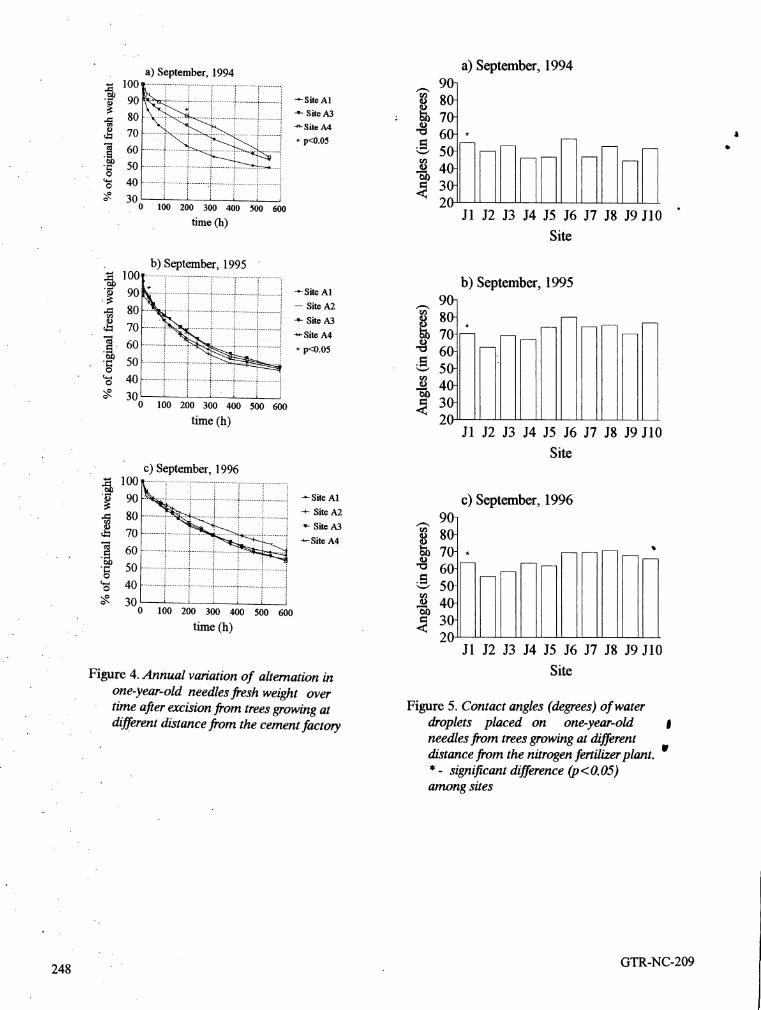
" a) September, 1994 a) September, 1994
._ 100 _. 9
._ u_
90 -'- Site AI O_ 8080 4- Site A3 : 7070 -_-SitoA4 "_ 6 *
._ _-_-_' 50
0 , i I I •
300 100 200 300 _ 5oo 6o0 J l J2 J3 J4 J5 J6 J7 J8 J9 J l0time (h)
Site
b) September, 1995-
100............................................................................ b) September, 1995.'_ 90 -'-Site A1 90_•_ 80 -- Site A2 ,_,
70 -)- Site A3 o_b 80- •-u-Site A4 70-
i 60 * p<O.05 '_ 60- "01)
•_ 50- ._ 50-40 ....................................._.......................................o . o 40-300 1;o 2;0 3oo 400 500 6oo ._ 30
time(h) 20J1 J2 J3 J4 J5 J6 J7 J8 J9 J10
. Sitec)September,1996
,_ 100.F,,I
90 -.-siteA1 C)September, 1996•_= 80 -+- SiteA2 90-
70 -*- site A3 o 80-siteA4 _-L"N
._ 60 _ 70- •"_ 60-
•_ 50 .......................................i......................................."-' 40 .......................................i....................................... "_ 50-
300 1;0 2oo i ' ' _ o 40-300 400 500 600 ='_ 30
time (h) <20
J1 J2 J3 J4 J5 J6 J7 J8 J9 J10
Figure 4. Annual variation of alternation in Siteone-year-old needles fresh weight overtime after excision from trees growing at Figure 5. Contact angles (degrees)of waterdifferent distance from the cement factory droplets placed on one-year-old j
' needles from trees growing at different' distance from the nitrogen fertilizerplant, w
" *- significant difference (p<0. 05)among sites
o
248 GTR-NC-209

Extent of water loss was alike in the sites near the weight-fresh weight ratios were not related to theoil refinery and nitrogen fertilizer plant. After a 550 speed of water loss from excised needles.h interval the weight-ofA1-A4 detached needlesdecreased 42%-50% (1994), 52%-54% (1995) and Calculationsof dryweight/l_eshweight ratio39%-45% (1996). At most sampling times differencesbetween one-year-old and current year Adifferences among Siteswere not significant needles (RI-R0) revealed significantvariations (0.029- •although showed the same tendency: the highest 0.055; p<0.05) among J1-J10 sites only in 1994speed ofdrying was common for site A1 (1994), autumn aidersevere drought, while in subsequentyearssites A1, A2 compared to A3, A4 (1995) and sites deviationswere negligible(0.022-0.039 in 1995,A1, A3 c0mpared to A2, A4 (1996). Significantly 0.029-0.059 in 1996). RI-R0 varied insignlfi"cantly •quickest drying was documented for AI needles among sitesof young trees (0.04-0.05 in 1994, 0.02-after 6h and 192hintervals (1994), 6 h and 30 h 0.03 in 1995, 0.03-0.04 in 1996) as well as amongintervals (1995). A tendency for quicker water loss middle-agedstands (0.04-0.05 in 1994-96)near the oilfrom AI. needles in the 1994-1996 autumn period refinery. Sitesnear the cement factory (AI-A4)coincides with results obtained in July-August 1994 differedaccording to RI-R0 only in 1994(0.032-
by our laboratory (unpublished data). Severe 0.047; p<0.05). Insignificantvariation was registereddrought in summer 1994'could cause significantly insubsequent years (0.038-0.044 in 1995, 0.027-0.050faster drying of needles from the A1 site, while later in 1996) similarto stands near nitrogen fertilizerplant.in theperiod which was the subject of the present Annualand regionalvariations of R1-R0 were lesspaper there were no climatic extremes. It is expressed compared to D/E values. Both D/F and R1-impot'tant to mention that in the selected regions all R0 valuesdid not have relation to water loss data adifferences among the sites obtained for one-year- well as to defoliationor aerialNO2concentrations.old needles were more expressed for current year Smalldifferencesamong sites in D/F and R1-R0needles, indicated at least equal needle supply with water
hereby differences obtained examining water losscould be related to some type of surface damage
? Dry.Weight-Fresh Weight Ratios including disturbances in stomatal closure.
:Dry Weight-fresh weight ratios (D/F) are good Polluted plantsmay have reducedtolerance toindicators for needle waterbalance. Under equal water stress. The variablesof interest are stomatalwater supply from the soil differences in this behavior and cuticular transpiration. Some kind ofparameter could be relatedto drying or wetting stomataldisruptionmight be expected to occur inthrough the needles and subsequently higher polluted conditions since guard cells and theirdefoliation. According to the literature both effects subsidiary cells are in an exposed position.c_mbe evoked by air pollutants (Mehlhom et al. Removal of leaves ofAesculus hippocastanum and1988). In the sites near the nitrogen fertilizer plant weighing them at intervals at_er excision has shownD/F ranged between 0.42-0.45 (1994), 0.36-0.39 that leaves from a polluted area dried faster than(1995), 0.39-0.45 (1996) with significant those taken from an unpolluted area, suggestingdifferences (p<0.05) among Jl-J 10 sites during all 3 either a loss of capacity for stomatal closure, oryears. Among middle-aged tree sites (MI-1, M2-2, increased cuticular transpiration (Godzik andM4-1, M4-2) near the oil refinery D/F values were Piskornik 1966). Interactions between theas follows: 0.46 (1994), 0.37-0.39 (1995), 0.34- pollutants SO2 and NO2 and water stress have been0.42 (1996). D/F estimated for older trees were found in Betula pendula and B. pubescens.similar to those registered for young (M 1-2, M2-1, Following exposure for 40 days to 20 ppb SO2+ 20M3) stands: 0.45-0.47 (1994), 0.37-0.38 (1995) ppb NO_, the ability of excised leaves to conserve |
' and 0.33-0.40 (1996). Detected differences in water under conditions of limited availability was IFwater loss among young trees near the oil refinery considerably reduced (Wright et al. 1986). A clear
" can not be explained by negligible D/F deviations dose-response relationship was demonstrated for• and suggest the possibility of surface damage rather leaves previously exposed to a number of SO2and
than disturbances in needle supply of water. The NO2 concentrations. The authors suggested that- scope of D/F (0.46-0.47 in 1994, 0.38-0.40 in 1995, exposure to SO2and NO2 had increased the
and 0.42-0.44 in 1996) for A1-A4 sites resembled permeability of the cuticle to water so that underthe other regions. In all cases gravimetric conditions of water-stress the maintenance ofturgorparameter s did not differ significantly among the oil was made more difficult. Various gaseous andrefinerYsites as well as between the cement factory aqueous pollutants have also been reported to
" sites. D/F obtained from various regions showed increase the rate of water loss from trees insimilarities in each year, while annual variations controlled conditions (Mansfield and Freer-Smithwere greater: higher values were common for 1994 1984, Mengel et al. 1989, Barnes et al. 1990) and
' and 1996 and lower ones in 1995. Generally dry in the field (Huttunen et al. 1981). Several other
Proceedings iBFRA Assn1997 meeting 249

°
papers indicate either a reverse effect or no effect of For young stands wettability varied with each yearpollution on stomata (Neighbour et al. 1988). and did not have a relationship to site distance from
the pollution source, while among middle-agedMulticomponent pollution gradients to which stands the lowest values were always documenteddifferent trees are exposed in uncontrolled for M1-1, the site closest to the oil refinery where ,conditions can cause synergistic effects. Lack of the highest concentration of NO2 (table) and theclearly expressed permanent effects of higher highest defoliation were detected.pollutant concentrations on water loss from excisedneedles in our experiment could be due to quite a Similar evaluations of contact angles on the needles ,.,
low level of pollution: There was evidence that the from the cement factory sites (fig. 7) revealedthreshold concentration for damage after the period significant differences (P<0.001) among stands in allof exposure was at or below 40 nl 1-!SO2+ NO2, 3 years, with variations in the interval of 27.3 o _while the lowest pollution treatment of 20 nl I_ of 42.0 o in 1994, 45.6 o-56.7 odegrees in 1995 andboth gases hardly affected the transpiration rate of 47.3 o -58.5 oin 1996. During the wholethe plants (Neighour et al. 1988). Under water observation period site AI had the lowest values of
_ stress conditions_ the trees that had been exposed to contact angles of water droplets on the one-year-acidic fog showed significantly higher transpiration old needles compared to the other sites.rates than the control trees (Mengel et al. 1989).The other possible reason could be moderate Different years' data from the nitrogen fertilizer, oilclimatic'conditions without expressed drought refinery, or cement factory sites showed the lowestperiods at sampling times, values of contact angles on the needle surface in
1994. As expected, the contact angles on olderneedles were significantly smaller compared to the
Needle Wettability current year's growth. Low values of contactangles on one-year-old needles are in agreement
Data for nitrogen fertilizer plant sites are shown in with short retention of needles (1.8-3.0 years) onfigure 5. Contact angles on one-year-old needle the sites of sampled trees (Nemaniute et al. 1997).surfaces significantly varied (p<0.001) from 44.7 to Comparison of data collected in 3 different regions57.4° (1994), from 62.3° to 80.1 o(1995) and from near the pollution sources (see figs. 5, 6, 7) revealed55.5° to 70.7 ° degrees (1996). In 2 of 3 years the the lowest values of contact angles for the site A1J2 site showed the lowest value and in all 3 years located near the cement factory. Needle wettabilitythe J6 site had the highest estimate. Site J 1, located had relationships to the site distance, aerialnear the factory against prevailing wind direction, concentrations of NO2 and defoliation only for olderhad higher values compared to the sites J2 and J3, stands: indicative differences were detected forwhich were adjacent to the plant but situated in the middle-aged stands near the oil refinery and theopposite direction. There was no tight relationship cement factory. In these cases the analysis ofbetween values of contact angles on the needles and variance showed a significant effect of industrial
" NO2 concentration in the sites or site distance from emissions, with smaller contact angles from thethe nitrogen fertilizer plant, trees exposed to the higher pollutants'• .
concentrations. There was no detectable effect of
• Figure 6 repi'esents data obtained estimating the nitrogen fertilizer plant on the water holding, wettability of needles taken from sites near the oil capacity of the needles. Inconsistent values of
refinery. In 1994 contact angles ranged from 55.6° water droplet angles among various young tree sitesto 63.4 o (p<0.001) for young stands and from 45.1 ° over the 3 year period may be caused by climate |
, to61.5 ° (p<0.001) for middle-aged stands. The fluctuations which can effect the presence ornext year wettability was lower for all sites and absence of leaf surface microorganisms. On the I_varied from 66.0 ° to 70.5° (p<0.001) for young other hand, emissions can produce an indirect effect,_
stands and from 65.9° to 68.2° degrees (non- through its control of leaf surface microorganisms;significant differences) for middle-aged stands. In the results could be interpreted in terms of pollution1996 contact angles in,all sites were the highest induced inhibiting or stimulating the growth ofcompared to the other year results. Estimated either hydrophilic or hydrophobic fungi or algae
• degrees ranged from 72.2 ° to 78.2° (p<0.001) for (Cape et al. 1995). Greater vitality ofyoung treeyoung stands and from 64.8° to 73.70 (p<0.001) for needles could cause more intensive exudation andmiddle-aged stands. Comparison of mean values consequently denser population of epiphylic
_- obtained from all young tree and from all middle- microorganisms. Thus, higher variation in needleaged tree needles shows significantly lower contact wettability may be caused by interaction of 3angles of water droplets on the one-year-old variables: climate fluctuations, pollutants and
needles of older trees, surface microorganisms.,
250 GTR-NC-209

a) September,1994 a) September, 1994/
_-_, 80 _ _- 80-O r_
_o 60 : _o-_ 60-ere
•_ 40 "_ t
® '_ 40-
_ 20tl) *
o 2Ji1MI-2 M2-1 M3 MI-I M2-2
Site _ "A1 A3 A4
b) September,1995 Site90-
_._
80-70 "
-8 60- b) September, 1995
'_ 50 90-o 40 "_"
o 80-" 30 o
g,°lMI-2 M2-1 M3 MI-I M2-2 M4-1 M4-2 60
Site .,N 50t * -
040t /1e) Septeniber, 1996 _ 3020
90
A1 A2 A3 A480
. 70 .
._. 60 Site50
30
20 C) September, 1996M1-2 M2-1 M3 MI-1 M2-2 M4-1 M4-2
• Site _-, 90] •
• _ 80
tFigure 6. Contact angles (degrees) of water _ 70droplets placed on one-year-old needles = 60 I
from trees growing at different distance _-_ 50J
fromtheoilrefinery.• __40ti l_M1-2- significant difference 60 < -_ 30
. O.05) among young stands. * M2-1 - 20significant difference (p < O.05) among A1 A2 A3 A4
middle-aged stands Site
!
' Figure 7. Contact angles (degrees) of water it' droplets placed on one-year-old needles
- from trees growing at different distance
from the cement factory. *- significantdifference (p < O.05) among sites
Proceedings IBFRA Assn 1997 meeting 251

. Increases in the wettability of needle surfaces could moisture on the surfaces. SEM data obtained forhave far reach_ingphysiological consequences for 1994 or 1996 year in most cases resembled 1995the whole tree (Barnes et al. 1990). Changes in year results discussed above.
wettability may affect the way in which individualneedles and the whole canopy intercept and retain bprecipitation. Increased wettability of the needlesurface induced by gaseous and aqueous pollutants Chloroform-soluble Wax Amount..
can also exacerbate the physical effects of frost onthe needle surfaces in winter and the uptake of Results on wax amount on the surface of needlespollutants from the atmosphere and provide a (August 1995) are shown in figure 9. There werefavorable microclimate for the development of significant differences among nitrogen fertilizerfungal pathogens, sites, although no effects were registered of site
• location relative to the factory on the amount ofwax relative to the needle dry weight. No oil
Microscopic Evaluation of the Needle Surface refinery effect could be detected on the total, amounts of surface wax. For sites near the cement
In september 1995 the quality of the surface of factory amount of wax and dust significantlyone-year-old needles was evaluated under SEM decreased (correspondingly p<0.001; p=0.001) with(fig, 8). The mean distribution of crystalloid waxes increasing site distance from the pollution source.in stomatal areas of needles from sites near the Quantity of wax ex_tractedfrom the needle surface
- nitrogen fertilizer plant ranged from 3.5 to 3.9 with ranged between 1.7% d.w. and 3.1% d.w. for sitesthe significantly (p<0.001) highest value (i.e., the in the nitrogen fertilizer plant region, between 1.5%highest structural degradation of wax) for site J2 d.w. and 1.7% d.w. for sites in the oil refineryclosely related to the factory. In our prev!ous SEM region and between 1.5% d.w. and 2.7% d.w. forobservations, where more precise classification of cement factory sites. These results agree with datawax structures was used, J2 showed significantly from literature, where quantity of waxes on pine•worse surface conditions compared to the J8 site or needles varies from 0.5% to over 2% dry weight.the relatively'clean' Kacergine region Data concerning changes in wax amount under(Kupcinskiene 1991, 1992; Kupcinskiene et al. conditions of simulated or field pollution are very1996). For young tree sites near the oil refinery the contradictory (Cape et al. 1988, Huttunen 1994)average surface class varied from 3.6 to 4.2 and our results obtained are in support of it.(p<0.005) while for middle-aged stands from 3.6 to Pollutant or pH treatment showed a tendency to
• , 4.6 (p<0.001). Surfaces of one-year-old needles in reduce the concentration of waxes: acid rain-the immediate vicinity of the cement factory were treated Scots pine needles had 50% less epicuticularmore degraded than needle surfaces from adjacent waxes than in the water controls; the wax quantitysites. Mean surface class values significantly varied of needles ofPicea abies was considerably reducedfrom 3.5 to 3.9 with the biggest area of eroded wax by fumigation with 300 lag m-3ozone while UV
" among needles from site A1 (p<0.005). Thus, in all radiation has been observed to increase epicuticularregions with the local pollution sources needle wax production in plants (Huttunen 1994).
' surface observations revealed significantly the worst According to our results wax synthesis of the• coverage in sites (A1, J2, MI-1, MI-2) closest to needles may have been changed so that the pines
the factories. Results concerning structural growing in the vicinity of the cement factory protectdegradation of wax in sites near the factories in the needles by producing bigger amount of waxes.most cases agreed with the lowest values of contact tt
, angles as well as with the greatest defoliation ofsampled trees and elevated to a small extent CONCLUSIONS Bconcentrations of aerial NO2. Among the worstc.ondition sites from various regions the highest 1. Some gradients of aerial NO2 concentrationsstructural degradation of wax was detected at site were found between sites located in the
. M1-1 adjacent to the oil refinery which is the immediate vicinity of pollution sources andbiggest local polluter in Lithuania. It should be those situated farther from the factories.mentioned that site A l, located near the cementfactory, had the lowest values of needle surface 2. According to water loss from excised needles.damage according to SEM and the highest values of or according to dry weight/fresh weight ratio
_- surface injury according to very low contact angles differences between one-year-old and currentof water droplets. Such discrepancy could be year needles in most cases no relationshipsexplained by factors influencing wettability of AI were found between site distance from theneedles. Presumably both dust particles as well as factory and water state of examined needles.erosion of wax contributed to the increased
252 GTR-NC-209

Nitrogen ferfiliz_ plant _. 3 -- --_
,,, 5 : ,5 2.5 l4.5 _ V--q
•3 'L'I "Z 12.5 J1 J2 J3 J4 J5 J6 J7 J8 J9 J10
II ]2 i3 I4 I5 J6 J7 J8 /9 Jl0 Site
Site
_- 3
Oil.refinery .__ 2.5
5 , o
4.5 *_ '_ 2
° _• o 1.5 "
r_ 1 -" . MI-2 M2-1 M3 MI-1 M2-2 M4-1 M4-2
2; 2.5 SiteM1-2 .M2-1 M3 MI-1 M2-2 M4-1 M4-2
Site,_. 3
•O 2.5Cement factory
• 5t I]1 L_4. o 1.5 • ' '
i 3.5 A1 A2 A3 A4
i:t /! II II I 1' Site ,
, , ,." .
AI A2 A3 A4 Figure 9. Wax amount (% of dry weight) on
Site the needles from trees growing at different
distance from the pollution source (August,
Figure 8. Mean values of surface class of 1995). * - significant difference (p< O.05)
"needles from trees growing at different among sites
distance from ihe pollution source
• (September, 1995). *- significantdifference (p <0.05) among sites
!
, iF
.. 0
Proceedings!BFRA Assn 1997 meeting 253

3. Wax amount on the needle surface was Cape, J.N. 1983. Contact angles of water droplets onsignificantly increased in trees growing in the needles of Scots pine (Pinus sylvestris) growing inneighborhood of the cement factory, polluted atmospheres. New Phytologist. 93: 293-
: 299.
4. Needle wettability had relationships to the site Adistance, aerial concentrations of NO2 and Cape, J.N., Paterson, I.S., Wellburn, A.R.,defoliation only for older stands: indicative Wolfenden, J., Mehlhorn, H., Freer-Smith, P.H.differences were detected for middle-aged pine & Fink, S. 1988. The early diagnosis of foreststands near the oil refinery and the cement decline. HMSO, London. 68 p.factory.
Cape, J.N., Sheppard, L.J. & Binnie J. 1995. Leaf5. Needle surface structure investigated by surface properties of Norway spruce needles
scanning electron microscopy was the most exposed to sulphur dioxide and ozone in ansensitive parameter among all characteristics open-air fumigation system at Liphook. Plant,tested. Cell & Environment. 18(3): 285-289.
6. According to various parameters investigated, Freer-Smith, P.H. 1984. The responses ofthe worst tree condition among sites near the broadleaved trees during long-term exposure tooil refinery was distinguished at site MI-1, SO2and NO2. New Phytologist. 97:49-61.which site A1 was the poorest among thecement factory stands selected for study. Godzik, S. & Piskornik, Z. 1966. Transpiration of
Aesculus hippocastanum L. leaves from areas ofvarious kinds of air pollution. Bulletin de
ACKNOWLEDGEMENTS I'Academie polonaise des sciences. 14:49-61.
The investigation was supported by grants from Haines, B.L., Jemstedt, J.A. and Neufield, H.S. 1985.Central European University, Hungary), ERSS Direct foliar effectsof simulatedacid rain. II.LeafContract, Project No. 91-5 (1994); J.S.C. surfacecharacteristics. New Phytologist. 99: 407-'Achema', Lithuania, Project No 4/96-074 416.MT/448F (1996); LZUU, Lithuania, Project No5M/96 (1996). The authors thank prof. Huttunen Huttunen S. 1994. Effects of air pollutants onS., prof. Ashenden, T.W., dr. Cape, N., dr. epicuticular wax structure. In: Air pollutants andArmolaitis, K., dr. Augustaitis, A., Kliucius, A. & the leaf cuticles. NATO ASI Series, Vol. G36. _dr. Grigaliunas V. for advice and assistance in Percy, K.E. et al. Springer-Verlag, Berlincarrying out this research. Heidelberg: 81-96.
Huttunen, S., Havas, P. & Laine, K.1981. Effects ofLITERATURE CITED air pollutants on the winter time water economy
of Scots pine, Pinus sylvestris. Holarctic Ecol.Ashenden, T.W. & Bell, S.A. 1989. Rural 4: 94-10 I.
concentrations of nitrogen dioxide pollutionthroughout Wales. Environmental Pollution. 58: Kairiukstis, L., Skuodiene, L., Vaicys, M., Ozolincius,179-193. R., Armolaitis,K., Petniunas,V., Stravinskiene,
V., Grigaliunas,J., Kilikevicius,G. 1992.Methods J. Ashenden, T.W. & Edge, C.P. 1995. Increasing of forest declineand environment assessment:
. concentrations of nitrogen dioxidepollution in application in regional monitoring. Kaunas, Iprural Wales. Environmental Pollution. 87:11-16. Girionys:62 p.
Barnes, J.D., Eamus, D., Davison, A.W., Ro- Kup_inskiene, E. 1991. The effects of air pollution onPoulsen, H., Mortensen, L. 1990. Persistent structure of the needlesepicuticular wax of Pinuseffects of ozone on needle water loss and sylvestris. In: Przyroda nie obroni siesama.wettability in Norway spruce. Environmental Materials of 3th InternationalEcological"Seminar.Pollution. 63: 345-363. 1991, May, 20th-24th. Grodzynska, K.
Pokrzywna, Poland. 1 (10): 1-11., Campbell, G.W. 1988.Measurements of nitrogen
dioxide concentrations in the United Kingdom Kup_,inskiene,E. 1992.The response ofepicuticularusing d_ion tubes. Environmental Pollution. 55: wax ofPinus sylvestris L. needles to industrial251-270. pollution. MESO GEE. Bulletindu Museum
' D'HistoireNaturelle De Marseille: 52: 36.
254 GTR-NC-209

.
Kup6inskiene, E., Huges, S. & Matulionis E. 1996. Schaug,J., Hansen, J.E., Nodop, K., Ottar, B. &Morphophysi-ological evaluation of Pinus Pacyna, J.M. 1987. Summaryreport fi'omthesylvestris trees near local pollution sources and : ChemicalCo-ordinatingcentre for the third pfae of Ain pollution conditions. Landschattsentwicklung EMEP. EMEP-CCC Report 3/87. Norwegianund Umweltforschung. 104:101-119. Institute for Air Research, Lillestrom. 22p.
Mansfield, T.A. & Freer-Smith, P.H. 1984. The role Simonis,U.E. & Weidner, H. 1988.The Federalof stomata in resistance mechanisms. In: Republic of Germany. In Air Pollution inEurope. .Gaseous Air Pollutants and Plant Metabolism. Volume 1"Western Europe, Rhode, B. EuropeanKoziol, M.J.& Whatley, F.R. Butterworths Coordination Centre for Research andScientific, London: 131-148. Documentation in the Social Sciences, Vienna:.
77-96.
Mansfield, T.A., Lucas, P.W. & Wright, E.A. 1988.Interactions between air pollutants and other Tuomisto, H. 1988. Use ofPicea abies needlesas"!fffiitingfactors. In: Air Pollution and Ecosystems. indicators of air pollution:epicuticular waxProc. Int. Syrup. at Grenoble. Mathy, P. Rheidol, morphology. Ann. Bot. (Fennici).25" 351-364.Dordrecht: 123-141.
Turunen, M. & Huttunen S. 1990. A review of theMehlh0rn, H..,Francis, B.J., Wellburn A.R. 1988. response of epicutieular wax of conifer needles
Prediction of the probability of forest decline to air pollution. Environmental Quality. 19: 35-damage to Norway spruce using three simple 45.site-independent diagnostic parameters. NewPhytologist. 110: 525-534. Turunen M., Huttunen S., Lamppu J., Huhtala
P. 1991. Characteristics and geographicalMengel, K., Hogrebe, M.R. & Esch, A. 1989. distribution of changes in Scots pine needle
. Effect of acidic fog on needle surface and water surfaces in Finnish Lapland and the Kolai'elations ofPicea abies. Physiol. Plant. 75" 201- Peninsula. In: Air pollutants and the Leaf207. Cuticle. NATO ASI Series: Ecological Sciences,
Vol. G 36. Percy, K.E., Cape, J.N., Jagels, R.,Neighbour, E.A., Cottam, D.A. & Mansfield, T.A. Simpson, C.J. Springer-Verlag,
1988. Effects of sulphur dioxide and nitrogen Heilderberg:.359-369.dioxide on the control of water loss by birch(Betula) spp. New Phytologist. 108" 149-157. Wright, E.A., Lucas, P.W., Cottam, D.A. &
Mansfield, T.A. 1986. Physiological responsesNemaniute, J., Kupcinskiene, E., Augustaitis, A. & of plants to SO2, NO2 and 0 3 . implications for
Kliucius, A. 1997. Comparative characteristicof drought resistance. In: Direct effects of dry andvarious parameters used to evaluatePinus wet deposition on forest ecosystems - insylvestris trees near oil refinery 'Natta'. particular canopy interactions. EEC CostEnvironment Engineering. 7(1): 25-32. Workshop, Lokeberg, Sweden, October, 1986.
58p.Riding, R.T. & Percy, K.E. 1985.Effects of SO2and
other air pollutants on the morphology ofepicuticular waxes on needles ofPinus strobus and |Pinus banksiana. New Phytologist. 99: 555-563.
. I1
Proceedings iBFRA Assn1997 meeting 255

. I .... I
TEMPORAL MODELING OF FOREST DAMAGE EXPANSION AROUND THE
'SEVERONICKEL' SMELTER ON THE KOLA PENINSULA, NORTHERN RUSSIA
Olga Rigina and _)lle Hagner Ib
ABSTRACT.--The central Kola Peninsula, Northern that the area of dead forest is steadily expanding at anRussia, is one of a few places in the world with large- annual rate of about 0.5 km in the wind directionscale forest decline attn_outable to a single source of (Tikkanen 1995). The damaged area is expanding bypollution. The study objectives were to estimate 5000 ha-7000 ha per year (Tsvetkov 1993). Theexpansion 0fthe forest damage area around the affected zone also is expanding at a rate of 2,600 ha'Severonickel' Smelter. Landsat-MSS summer per annum (Pozniakov 1993).images from 1978, 1986 and 1992 were used in thechange-detection analysis. The method applied wasiterative histogram matching and subsequent Methods to Detect Forest Damage_subtraffion. A dynamic model for forest damagetrader long-term SO2 exposure was applied for the Impacts of airborne sulphur pollution on the northern1960-1996 period. The long-term annual expansion forest ecosystems on Kola have been given muchof the damaged area in three classes: visflgle-, severe- attention during the last decades. However, usingdamage and forest-death area was estimated to be different symptoms of forest decline and different60.3 km2, 17.8 km 2 and 8.8 km 2, respectively, classifications of forest damage makes their results
incomparable. Besides, a botanical approach hasnatural limitations in this area due to the large scaleof damage and the mountainous terrain. From this
INTRODUCTION point of view, remote sensing seemsto be verypromising, allowing for temporal comparison of
Environmental Problems results, and analysis of trends produced in differentinvestigations and in temporal dynamics.
The central Kola Peninsula in Northern Russia is one
of a few places in the world with large-scale forest Remote sensing was successfully applied fordamage attn_outable to a single pollution source. The detection of forest damage areas by Pitblado and'Severonickel' smelter is one of the largest in the Amiro (1982); for Sudbary, Canada (Ard6 et al.
• world and has been in operation since 1938. Due to 1997); for the Czech Republic (Tommervik et _aL:high-sulphur ores and primitive emission filters, the 1991-1992 and Karpuz and Roberts 1992); for theoperation has caused severe environmental 'Pechenganickel' smelter on the Kola; Mikkola anddestruction in the region. Within a 100-km gradient Ritari 1992; Kravtsova et al. 1995; Rees andfrom the smelter there is a transition from Williams 1997, Hagner and Rigina 1997, for theteclmogenic barren areas to undisturbed ecosystems. 'Severonickel' smelter on the Kola).The major pollutants in the region are sulphurous gas,exerting direct foliar damage, and heavy metals, Some attempts were made to identify a correlationwhich affect mainly via soil toxification. Among between air pollution and forest health in an emissionthem, sulphur dioxide appears to be the dominating impact zone (Johansen et al. 1994; Mikkola 1996;toxicant for the forest ecosystems in this area (Lukina Litinsky 1996).and Nikonov 1993). I
In smmamry, several investigations have shown thatIn 1969 the smelter started to process the Norilsk multi-temporal satellite data can reveal forest decWline,
" sulphide copper-nickel ore (with 30% S), which caused by the metallurgical industry emission.resulted in a dramatic increase of the emission level. However, these comparisons with air pollution were
In recent year s the emission levels have decreased to of a qualitative character. The temporal dynamics of" half of the peak years because of reduced production air pollution impact still remains largely unexplored.
volume. Some attempts were also made to analyze theinterrelation between air pollution and forest decline
Almost 60 years of the smelter's operation have by means of mathematical modeling (Miikelii 1985;. made the surroundings unrecognizable. Studies show Miikelii et al. 1987; Kryuchkov et al. 1995; Boltneva
lO. Rigina, O. Hagner, Remote Sensing Lab, Faculty of Forestry, SLU, S-90183 Sweden fax: + 46 90 141915.
256 GTR-NC-209

et al. 1982; Tarko et al. 1988, Alexeev 1995). Siberian spruce (Picea obovata) and Scots pineHagner and Rigina (1_997)found that decreases in (Pinus sylvestris) and constant presence (up to 50%)near infrared and increases in visible green and red of birch (Betula pubescens).radiances correspond to increasing pollution load Apredicted (fig. 1). ' ,,
Change Detection Data
Sensitivity and Critical Levels The results from a previous study (Hagner and Rigina1997) were used as a reference to evaluate the
In a p011utedtundra/taiga environment the first sign modeling results. Landsat-MSS images from mid-ofp011ution im_pactis the deterioration of the lichen summer of 1978, 1986 and 1992 were used in thecover, and secondly, mosses, trees, shrubbery and change detection. The satellite scenes weregrasses. Broad-leaved woody plants show more georeferenced and subsequently resampled to 70x70-tolerance to the influence of pollution than coniferous m cell size by bilinear interpolation. Multispectralspecies, change images were derived for periods of 1978-
1986 and 1986-1992 by iterative histogram matchingAccording to ECE (1988), for lichens, mosses and and subsequent subtraction (Hagner & Rigina 1997)some trees an annual average SO2 concentration (fig. 3).exceeding 20 _g/m 3 will cause damage. However,damage effects 0f SO2 can also occur under lower
concentration conditions, if there are other stress Forest Impact Modelfactors, for example, low temperature. A criticallevel of 15 ktg/m3 is suggested for forests in Northern The annual average sulphur dioxide concentration isareas (Convention, 1985). In our study we used three a relevant description of the pollutant environment
•different critical levels for SO2.. The choice (M/ik/ila et al. 1987). The analysis of the relationship' corresponded to Critical levels for conifers: spruce, between forest damage and sulphur concentration
p'me (15l.tg/m3); deciduous: birch (30_tg/m3); and was guided by the dose-response approach. A simpleshrubs: willow and grasses (70-100].tg/m3). dynamic model (M/ikel/i et al. 1987) for damageAccord_g to Tikkanen (1995); an average annual development in forests under long-term exposure toSO2 concentration of 15 _tg/m3 outlines the visible- airborne sulphur was applied for calculation ofdamage zone regarding conifers. Mikkola (1996) damage accumulation since 1960 (fig. 4). The inpqtfound a correlation between the zone of severe to the model is the mean annual SO2 concentration,
damage and a mean annual SO2 concentration of 40- predicted by a Gaussian plume sector model60 l.tg/m3. (Baklanov & Rodyushkina 1993) for each year, based
on the corresponding meteorology and emission
The objective of this study was to estimate expansion levels (fig. 5).of the forest damage area around the 'Severonickel'smelter by means of the mathematical modeling in The model accounts for the regional differences in
" temporal retrospective, tolerance of trees due to climatic conditions by• making the critical dose a function of Effective
Temperature Sum (ETS). In the study area the 20-
:MATERIALS AND METHODS year-average ETS was 677.6 degree-days. Thecumulative doses and damage areas were calculated !
' . Investigation Area for the period of 1961-1996 for three critical levels uSO2 (15 ].tg/m3, 50 ktg/m3 and 80 ktg/m3),
" The area under study was a 112 km by 76 km region corresponding to different degrees of impact.in the centi, al Kola Peninsula (Lat. 67026"-67027 ,Long. 32°-34°)(fig. 2). The smelter 'Severonickel' islocated 5kin sOuth of Monchegorsk at the center of RESULTSthe study area close to the northern tree limit. The
topography is mountainous with elevations ranging Dynamic Area of Degraded Vegetationfrom 127 m to 1.200 m a.s.1. About 14.5% of the area
. is covered by water. The study area (fig. 2) belongs The areas of damaged forest as predicted by theto the northern boreal zone, mostly covered by mathematical model, along with the annual emissionconiferous forests, 12 m- 16 m height with prevailing levels, are presented in figure 6. These data
correspond rather well with reported figures on forest
Proceedings IBFRA Assn 1997 meeting 257

°
Multi- hSatellite spectral •
scenes change I11978 1978-86 [[
• 1986 i 1986_92 [1992
Figure 3. Remote sensing analysis.
' Annual
average
. -S,O_,._ _[ Effective _Forest'X_ Accumulated
]temperature _ impact )' impact
• 1 sum _ on forest
• I- so-I criticalI -.level.__
Figure 4. Forest impact model.
! Meteorol.dataAnnual
average i
Topo graphy po 11utan t u,. concentration
" Emission in airrecords
Figure 5. Gaussianplume model
°
Proceedings iBFRA Assn 1997meeting 259
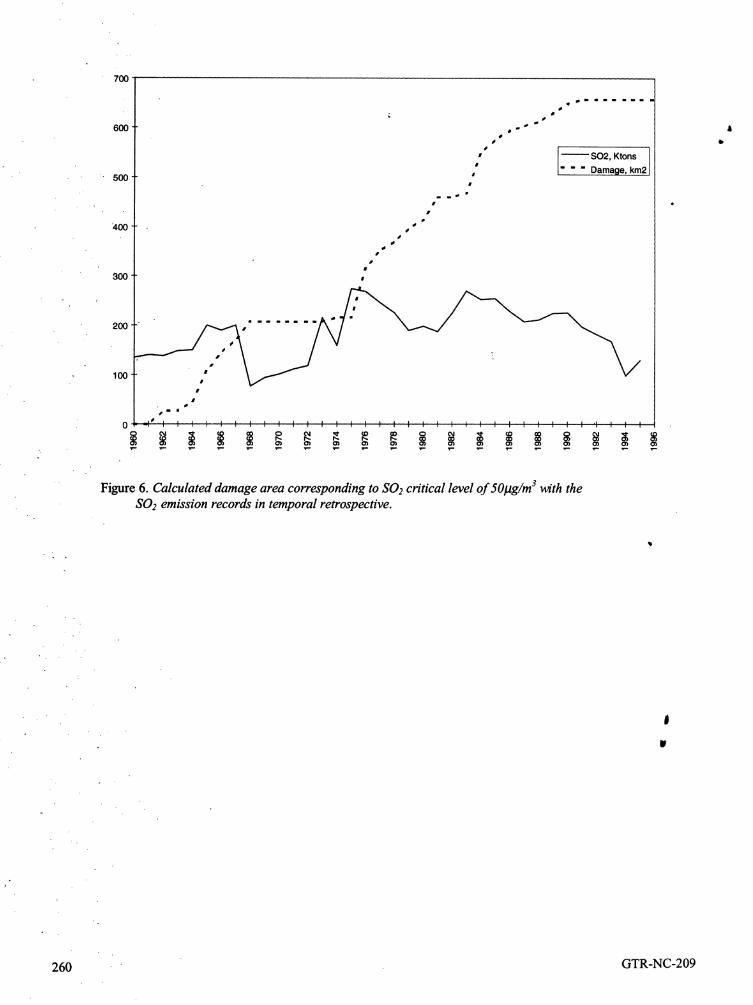
7OO
f m - i m i m i
o
of
600 ,o° J
• S02, Ktons
" 500 , " " " Damage, km2
400 , •¢¢
¢¢
i
300 •
200
-100
l "• m •
0 ,-- -,-'e 1 1 1 : ', ', : _' I I I l 1 i I I 'I I _ 1 i ' I I ......1....._ ,_ 1 _ 1 "I ', ', 1 ,I
o, o, ,_ ==
Figure 6. Calculated damage area corresponding to S02 critical level of 50]Jg/m3 with theS02 emission records in temporal retrospective.
J
. I¢
,
260 GTR-NC-209

7OO
$ m m m m m m m •$
600 ,,-° A
• S02, Ktons
" 500 • " " " Damage, km2I
m m •
400 • "
i
300 •
200
-100
• m •
,- ,_ =_ ,_ =_ .....
Figure 6. Calculated damage area corresponding to S02 critical level of 5Opg/m3 with theS02 emission records in temporal retrospective.
#
. I1
260 GTR-NC-209

. damage ofrespective years. The expansion of the Yarmishko, V.)" Proceedings, April 14-16, 1992,damage area is outlined in three classes (fig. 7)" St.-Petersburg, Apatity, KSC Press: 83-89.vis_le-, severe damage and forest-death area,
roughly corresponding to SO2 critical levels of B:oltneva, L., Ignatjeva, A., Karaban', R, Nazarov, I., A15l.tg/m3, 501.tg/m3 and 801.tg/m3. The mean annual Sisigina, T. 1982. Forecasting model of ,increases for these classes are estimated to 60.3 km2, vegetation damage owing to industrial airborne17.8 k-m2 and 8.8 km 2, correspondingly. The shape of emissions. Interaction of forest ecosystems andthe damage area modeled (fig. 7) corresponds with aerial pollutants, Tallin, pp. 163-173. (in Russian).that from the satellite data (fig. 8) that supports themodels used. Convention of long-range transboundary air
pollution. Task force on mapping criticallevels/loads. 1985. Helsinki.
DISCUSSION
ECE - Economic Commission for Europe. 1988.The results obtained are preliminary. Despite a good Critical levels workshop, Bad Hamburg,correspontlence of the modeled damage expansion Germany, 14 -18 March 1988.with the spectral changes for correspondingyear, thestatistical correlation with the Remote sensing data Hagner, O. and Rigina,.O. 1997. Detection of forestshould be estimated: In future we will continue to decline in Monche.gorsk area. Remote Sensing ofintegrate the two methods, involving other types of Environment, 62:26 pp.satellite data: spy satellite images from the 1960's andthe recent Landsat-TM data. Johansen, M.-E., Tommervik, H., Pedersen, J. 1994.
Using Arc/Info for integration of data in situ andremote-sensed data for analysis of impact of air
Acknowledgements pollution on terrestrial ecosystems in Varanger• (Norway) and Nickel (Russia), NORUT,This study was funded by the Centre for Environment IT2011/68-93, 22 pp.ReSearch, Ume_, Sweden, Director Mr. M. Ahlberg.The satellite data were Sponsored by SSC-Satellitbild Kravtsova, E., Lurje, I. and Pessle, A. 1995. Sensingin Kiruna, Sweden, Mr. A. 0skog. The authors of consequences of industrial impact onappreciate the big help of the staf_ of the Remote vegetation on a basis of multi-spectral satelliteSensing laboratory, SLU, Ume_, Sweden and the data (on example of Monchegorsk area).laboratories of Ecoinformatics and Mathematical Geography and Natural Resource4, 3:149 - 158.Modeling and Terrestrial Ecosystems, INEP, Kola (in Russian)Science Centre, Apatity, Russia. The participation inthe conference has been possible thanks to the Kryuchkov, V., Tarko, A., Byt_dorov, A. 1995.Stittelsen Fonden f'6r Skogvetenskaplig Forskning, Imitation model of atmospheric pollution impact
" Sweden. from the smelter 'Severonickel' on forest
ecosystems, Apatity, KSC Press: 18 pp. (inRussian).
•REFERENCES
Litinsky, P. 1996. Remote sensing ofAlexeev, A. 1995. Mathematical model of spatial aerotechnogenic degradation 0fboreal-taiga !
. density of plant damage caused by air pollution, forests. Forest Research Institute, Petrozavodsk, BEcology, 6 (in Russian). Russia, 22 pp. PhD dissertation. (in Russian).
ArdS, J., Lambert, N., Henzlik, V. and Rock B. 1997. Lukina, N., Nikonov, V. 1993. State of the NorthSatellite-based estimations of coniferous forest spruce biogeocenoses exposed to industrial
- cover changes: Krusne Holy; Czech Republic pollution, Apatity, KSC Press, 133 pp. (in1972-I989. Ambi0, 26 (3):158-166. Russian).
Baklanov, A. & Rodyushkina, I. 1993. Pollution of Mikkola, K. & Ritari, A. 1992. Satellite survey ofambient air by 'Severonickel' smelter complex: forest damage in the Monchegorsk area, Kola
. observations and modelling. Aerialpollution in Peninsula. Symposium on the state of theKola Peninsula (eds. Kozlov, M., Haukioja, E. & environment and environmental monitoring in
Northern Fennoscandia and the Kola Peninsula. ,
Proceedings iBFRA Assn 1997 meeting 261

• b t ,,, dl,
q,,, ql, _, ° t_ _ "4, a,
. _ . . _._
1984 1996
• . * ,,,, ..¢_ q" J_
, ql. _ L B, ,'
aS ,,,It
i
" fl °,...
_ 0
• 0 0
- Figure 7. Expansion of damage area in 1968, 1976, 1984 (peaks of emission) and 1996 correspondingto S02 critical levels of 15 (lightgrey), 50 (mediumgrey) and 80 (dark grey) _g/m3.The grid sizeis 3x3 km.
o
262 GTR-NC-209

o
Figure 8. Multispectral change detection based on Landsat-MSS image data for the periods of 1978-1986 and 1986-1992. Vegetation decline is seen as red hues corresponding to decreased IR- and
• . increased visible wavelenght reflectance.
!
. 111
Proceedings.iBFRA Assn 1997 meeting 263
(ed: Tikkanen, E.), Extended abstracts, October 6- Tikkanen, E. 1995. Conclusions (ed. Tikkanen, E. &8 1992, Rovaaiemi, Finland: 310-313. Niemel/i, I.) Final report of the Lapland Forest
: damage project, ISBN 951-40-1455-3, 72-79.Mikkola, K. 1996. A remote sensing analysis of
vegetation damage around metal smelters in the Tsvetkov, V. 1993. Threshold levels of air pollution ,Kola Peninsula, Russia. Int. 3*.Remote Sensing, and forest decline in surroundings of17(18): 3675-3690. 'Severonickel' smelter complex. Aerial pollution
in Kola Peninsula (ed. Kozlov, M., Haukioja, E.M_.kel/i A. 1985. Strategies towards scenarios of & Yammhko, V.): Proceedings, April 14-16, ,
forest damage due to air pollution. WP-85-012, 1992, St.-Petersburg, Apatity, KSC Press: 397-IIASA, Laxenburg, 41 pp. 401.
M/ikel_, A., Materna, J., SchSpp, W. 1987. Direct Tommervik, H., Johansen, B.E. & Pedersen, J.P.effects of sulphur on forest in Europe - a regional 1991. Mapping the air pollution impact of themodel of risk, WP-87-57, IIASA, Laxenburg, 38 natural environment in the border area ofpp. Norway/USSR using Satellite Remote Sensing
methods (ed. Putkonen, J.). IGARSS'91, RemotePitblado, R. and Amiro, B. 1982. Landsat mapping of Sensing, 4: 45-48.
the industrially disturbed vegetation communitiesof Sudbury, Canada. Canadian £ of Remote Tommervik, H., Johansen, B.E. 1992. Effects of airSensing, 8 (1)" 17-28. pollution on terrestrial ecosystems by means of
remote sensing analysis. Effects of air pollutantsRees, W. and W'flliams, M. 1997. Monitoring on terrestrial ecosystems in the border area
changes in land cover induced by atmospheric between Russia and Norway: Proceedings,• pollution in the Kola Peninsula, Russia, using Svanvik, Norway, 18-20 March 1992:35-47' Landsat-MSS data. Int. J. Remote Sensing, 18 (8):
1703-1723.
Tarko, A., Drozdov, A., Konovalova, E., Pisarenko,N. and Tatarinov, F. 1988. Model of influence ofacid rains on forest ecosystems, The Computing
• Centre, Moscow, 32 pp. (in Russian).
!
. IF
264 GTR-NC-209

GLOBAL CLIMATE CHANGE AND
THE CARBON CYCLE
Climate Change
265

IQ,
J
II
• IP
266

A METHOD FOR MODEL-BASED RECONSTRUCTION OF THE PALEOCLIMATE OF SIBERIA
Robert A. Monsemd I and Nadja M. Tchebakova 2t
O
ABSTRACT.--A bioclimatic vegetation model and Bryson 1972, Klimanov 1984, Kay 1979,coupledwith the paleovegetation map of Khotinsky Andrews et al. 1980, Bukreeva 1992, Guiot et al.
and the Current vegetation map of Isachenko is used: 1989, Huntley 1991, Prentice et al. 1991). These ,(1) to reconstruct the paleoclimate of Siberia during methods are based on modem pollen-climate•the mid-Holocene and (2) to compare it with the analogues to reconstruct a past climate.current climate. Climatic changes (January and Julymean temp.eratures, and annual precipitation) since the Savina and Khotinsky (1984) introduced the zonal
mid-Holocene are then displayed as anomalies by method. The correspondence between climaticlatitude and longitude. The resulting pattern of indices and vegetation zones (equivalent to biomes oranomalies is complex. On average, Siberian winters biome subdivisions) has also been used to reconstructin the mid- Holocene Were 3.7°C wanner than now, paleoclimate. First, vegetation zones are
with greater wam_g in higher latitudes. The major reconstructed from pollen data. Then, using modemwinter warming was concentrated in the Taiga zone vegetation and climate correlations, climatic indiceson theplains and tablelands 0fEast Siberia. Siberian are calculated that uniquely determine the borders
summers in the mid-Holocene were 0.7°C warmer between vegetation zones. These indices are appliedthan today. July temperature anomalies are to reconstructed paleovegetation to derivedistn'buted mostly latitudinally and increase above information on paleoclimate. The same method was
65°N, with nearly no change below 65°N. Annual applied to deduce climatic parameters directly fi'omprecipitation in Siberia was predicted to be 95 mm the reconstructed biomes using the global biomegreater in the mid-Holocene than now. Most of the model of Prentice et al. (1992) for calculatingincrease was concentrated in East S_eria (154 mm vegetation and soil carbon storage changes sinceaverage increase). This increase favored the deep 13,000 years before present (Peng et al. (1995).penetration of moisture-demanding dark-needled Theirs is basically a model-based approach, as is ours.species (Pinus sibirica, Abies sibirica, Picea
obovata ) into East Sl"oeriain the mid-Holocene, We concentrate on the mid-Holocene (Holocenewhere currently only drought-resistant light-needled climatic optimum, Late Atlantic period), 4600-6000species (Larix spp.) are found. In combination with yr B.P., when postglacial wanning in Siberia reached
•2-5°C warmer summers, moister climates in the its peak. The mid-Holocene climatic period is theTaimyr Peninsula allowed forests to advance far most relevant for a comparison with the present
northward _to what is now the Tundra zone. because the boundary conditions of ice-sheet extent
and sea level were similar, and vegetation was close.
• to equilibrium with the climate (Houghton et al.• 1990). During the mid-Holocene, broad-leaved
INTRODUCTION temperate forests expanded to the north in Europe,shade-tolerant dark-needled Taiga expanded to the I
. Paleoclimatic reconstructions are a useful complement north and east in Siberia, and thermophih'c taxa were
to atmospheric general circulation models (GCM's) common (Khotinsky 1984a). At middle to high lrand can be used to validate the GCM's ability to latitudes in the Northern Hemisphere, temperaturessimulate p_t climates. A wide variety of quantitative were 1°C-4°C higher than today (Lamb 1982, Budykomethods based on multivariate statistical procedures 1986, COHMAP Members 1988, Frenzel et al. 1992).:haVebeen applied tO reconstructing paleoclimate The Holocene climatic optimum, like nearly all thedirectly from pollen data (Howe and Webb 1977, optima of the Pleistocene interglacials, was a periodBartlein and Webb 1985, Bartlein et al. 1986, Webb of high humidity in Siberia; conditions were ideal for
' IPacific NWResearch Station and Rocky Mountain Research Station, USDA Forest Service, 1221 SW
Yamhill #200, Portland, OR 97205 USA. Fax: +1-503-808-2020, e-mail: [email protected] Forest Institute, Russian Academy of Sciences (Siberian Branch), Akademgorodok, 660036
Krasnoyarsk, Russia. Fax: + 7-3912-433-686, e-mail: [email protected])
Proceedings IBFRA Assn 1997 meeting 267

forest growth, especially for shade-tolerant and vegetation class, our method registers no climatemoisture-demanding dark-needled species, change for grid cells with no vegetation change.Evapotranspiration and precipitation were balancedover vast areas, with the ratio of precipitation to ,
evaporation near 1.0; under such conditions, Siberian Vegetation Modelbiological productivity was high (Khotinsky 1984b).
..
The Siberian vegetation model (Tchebakova et al.• 1994) is an equilibrium model based on
Objectives bioclimatological considerations. It predicts the majorvegetation classes (biome subdivisions) of Siberia
Our g0ai is to reconstruct the paleoclimate of the fi'om three climatic indices: growing degree-daysSiberian subcontinent during the last warming period, (base 5°C), dryness index, and continentality index.the mid,Holocene thermal optimum. We propose a Because these indices reflect drought resistance, coldmodel-based approach to reconstruct the paleoclimate tolerance, and plants' requirements for warmth, theyOf Siberia. We rely On three previous developments: define the main features of vegetation zonesKhotinsky's revised paleovegetation map of the (zonobiomes sensu Walter 1979) and their
mld-Holocene (1984a, p. 194-195), Isachenko's subdivisions (table 1). Climatic inputs (monthly meanlandscape map of the former USSR for modem temperature, wecipitation, vapor pressure, cloudiness,.vegetation (Isachenk0 et al. 1988), and the and albedo) were obtained from a global climaticclimatically-driven Siberian vegetation model of database (Leemans and Cramer 1991), supplementedTchebakova et al. (1994). by additional data from weather stations in Siberia and
northern Kazakhstan; resolution is 0.5 ° longitude by0.5 ° latitude.
. METHODS
Tchebakova et al. (1994) compared the model'sPaleoelimatie Reconstruction predictions with the Landscape Map of the USSR
(Isachenko et al. 1988), which was not used to
Determining the climatic limits bounding a given develop the model. Predicted vegetation generallyvegetation class is straightforward (table 1). For each matched mapped vegetation well. The generalgrid cell (0.5 ° longitude by 0.5 ° latitude) across locations ofaU vegetation classes are predictedSiberia, we determine the climatic limits correctly. Kappa statistics (Monserud and Leemans
corresponding to the paleovegetation classes of 1992) show good agreement at all scales ofKhotinsky (1984a) and the modem vegetation classes comparison (Tchebakova et al. 1994).oflsachenko et al. (1988) from the Siberian
vegetation model (Tchebakova et al. 1994). To apply We made two major modifications of the Siberianthe modem climatic indices to paleovegetation, we vegetation model (Tchebakova et al. 1994). The first
used the aggregation listed by Monserud et al. (1993). modification improved our procedure for determiningThey discuss these paleovegetation classes in detail, albedo, an important component in the calculation ofThe correspondence is based on dominant genera, radiation balance and the resulting dryness index. In
species, and physiognomy. The modem vegetation our earlier work (Tchebakova et al. 1994), we ulsedclassification is more detailed; therefore, several of its Matthews' (1985) snow-free albedo files, which wereclasses have been aggregated to properly match limited to the growing season. Instead, we wpaleovegetation classes, determined monthly albedo based on the reflectance
of different generalized surfaces during periods ofWe convert these climatic limits to January and July stable, unstable, and no snow cover (Budyko 1974).
. temperaturesand annual precipitation by using
equations 1-5 (see below). The difference between The second modification of the Siberian vegetationthe mean values of a given climatic parameter is the model was the refinement of the climatic borders used
climatic anomaly (Paleo minus Modem) for a given to predict vegetation classes in our previous workgridcell. Results are displayed as anomalies from the (Tchebakova et al. 1994). When we reconstruct
' current climate vs. latitude and longitude (figs. 1-3). paleoclimate from the climatic limits in the Siberian
Because we work at the climatic midpoints of each vegetation model, the accuracy of our predictions
268 GTR-NC-209

TABLE 1.--The limits defining the modified Siberian vegetation model (Tchebakova et al.. 1994)for the aggregatedA
vegetation classes common to Khotinsky (1984a) and Isachenko et al. (1988). GDD5 is Growing Degree-Days, •(,C), DI is Budyko's Dryness Index, and (71is Conrad's Continentality lndex. Lower bounds are greater thanor equal to the value listed, and upper bounds are less than the value listed All zones are rectangles in (DI,GDD) space.
d,
Siberian Vegetation Model
GDD5 DI CI
Vegetation Class. Lower Upper Lower Upper Lower Upper
Zone bound bound bound bound bound bound
Tundra (moist) 0 300 0.5 1.0 45 60
Tundra (.dry) 0 300 1.0 2.6 60 80Dark-needled Forest-Tundra 300 600 0.5 1.0 45 60
Light-needled Forest-Tundra 300 450 1.0 2.6 60 100
Dark-needledNorthern Taiga 600 900 0.5 1.0 45 60
Light-needled Northern Taiga 450 800 1.0 2.6 60 100
Dark-needled Middle Taiga 900 1050 0.5 1.0 45 60
Light-needled Middle Taiga 800 1150 1.0 2.6 60 100
Mixed-conifer Southern Taiga 1050 1200 0.5 2.0 45 60
Birch Subtaiga 1200 1300 0.7 1.0 45 60
Light-needled Subtaiga 1150 1300 1.0 2.0 60 80
Birch Forest-Steppe 1300 1400 0.7 1.0 45 60
Light-needled Forest-Steppe 1300 1400 1.0 2.0 60 • 80
Steppe - 1400 1650 1.0 2.0 45 60
Temperate Birch-Broadleaf Forest 1550 1900 0.7 1.2 40 50Semidesert/Desert 1650 2000 2.0 3.5 45 60
Proceedings IBFRA Assn 1997 meeting 269

270 opnl!le-I q_oN GTR-NC-209

- • epnl!lel qlJON
Proceedings IBFRA Assn. 1997 meeting 271

272 epnl!le] qQON GTR-NC-209

improves if the climatic borders defining a class have January temperature (0, °C) can then be derived
as narrow a range _aspossible. When classifying directly from Conrad's formula for continentalityvegetation (Tchebakova et al. 1994) rather than index (CO, when July temperature is known:reconstructing climate, our only concern was to A
D
accurately separate adjacent vegetation classes in tl =tz-(CI+ 14) • sin(tp+ 10)/1.7climatic space; as a result, several classes had
unboundedborders. The resulting modified model is where tp is latitude.shown in table 1, after aggregating vegetation classes
to be compatible with the paleovegetation classes of Precipitation (p, cm) can be derived from Budyko'sKhotinsky (1984a). _ formula for dryness index (D/)"
' p=B/(L*DI)Converting Climatic Indices to Paleoelimatie
, Parameters where B is radiation balance and L is latent heat of
vaporization. Using predicted radiation balance on
Paleoc "limatic studies routinely reconstruct the mean the same 151 weather stations, growing degree daystemperaau'e for January and July and annual explains 77% of the variation:precipitation (Bartlein et al. 1986). The choice of
these climatic variables is justified by their availability B=25. 068+0. O094GDD5from the meteorological record and their close
correlation with functional variables more closely The final expression to derive precipitation fromrelatedto determining.plant (and pollen) distribution dryness index and growing-degree days is then:and abundance patterns (Huntley 1991), such as
.growing season temperature sums, exposure to P=(25. 068+0. O094GDDs)/(L*DI)growing season drought, and winter minimum..
temperature. In the S_erian vegetation model, our
analogues for these variables are growing RESULTSdegree-days, dryness index, and continentality index,
respectively. To compare our reconstructed climates Paleoclimate vs. Current Climatewith results from other paleoclimatic studies, we need
to convert our climatic indices to the standard January Temperaturetemperature and precipitation parameters. We make
the strong assumption that the following climatic The pattern of January temperature anomalies (fig. 1)conversion factors have not changed much in the past shows that the main changes happened at the higher
"6,000 years., latitudes. In West Siberia, temperature differencesfi'om 0°C -5°C are primarily distributed latitudinally,
We•begin with July temperature (tz, °C), which is with anomalies generally increasing to the north; anstrongly correlated to growing degree days. A power exception is the large anomalies resulting from thefunction based ondata from 151 weather stations in disappearance of Temperate Birch-BroadleafForests
Sflaeria and northern Kazakhstan (Gidrometeoizdat in southwestern Siberia. In East Siberia, two major !. 1964-70), expla'ms95% of the variation: results are found: a large area in southeastern Siberia
' T7=5+0. 4042 GDD5049°4 with no changes (light-needled Middle Taiga in paleo irand modem times), and a large area in central and,. .
northeastern Siberia with large changes greater thanwhere GDDs was calculated by daily integration of an 5°C (dark-needled Taiga replaced by light-needled.annual temperature curve approximated by a cubic Taiga).Lagrange interpolating function (Greenspan 1971).
Proceedings IBFRA Assn 1997 meeting 273

TABLE 2.--Mean anomalies (mid-Holocene minus modern) of January and July mean temperature and annualprecipitation for Siberia. Western and Eastern Siberia are usually separated by 90°E longitude (approximatelythe Yenisey River).
Anomalies (mid-Holocene- modern) "
January July Annual
temperature temperature precipitation
Location (°C) (°C) (mm) •
-Latitude (°N):
70-76 1.8 1.0 44
65-70 ' 7.7 1.3 197
60-65 5.3 0.4 140
, ' 55-60 I.I 0.3 22
50-55 -0.4 O.I -16
60-70 6.5 0.9 " 168
50-60 0.6 0.2 9
Longitude (°E):
60-90 0.9 0.8 4
90-140 5.6 0.6 154
• Mean 3.7 0.7 95
On average, S_erian winters in the mid-Holocene large positive temperature anomalies occurs between• were 3.7°C warmer than now. Between 60 °N -65°N 55 °N and 58°N in western S_eria. This is the"
the paleoclimate was 5.3°C warmer, and between 65 location of the Temperate Birch-BroadleafForest in°N -70°N it was 7.7°C warmer (table 2). The major the mid-Holocene, which has now been completelywinter wanning was concentrated in the Taiga zone replaced by Birch Subtaiga and Birch Forest-Steppe.on the plains and tablelands of East Siberia (fig. 1).The mean temperature anomaly for East Siberia was Negative anomalies are found at the foothills of the5.6°C compared to 0.9°C for West Siberia (table 2). Altai-Sayan mountains and in Central Siberia (aboutTundra vegetation did not disappear completely in the 60°N). In the first case, more continentalmid-Holocene and was found near the Arctic coast light-needled Forest-Steppe was replaced by
(Khotinsky 1984a). This results in no changes in all moderately continental birch Forest-Steppe. In thethree climatic parameters in the far north. In the other case, Middle Taiga was replaced by Southern
. Taiga zone of West Siberia, between of 63 °N -70°N Taiga. 1tthere were major changes in the dark-needled IF
. vegetation classes, indicating winter temperatures that July Temperaturewere much warmer. South of 63°N, generally therewere only minor changes of January temperature The pattern of July temperature anomalies (fig. 2) is
- indicated by the analysis (fig. 1), a result of stable also distributed latitudinally, with greater changes atzonal vegetation borders there since the mid- higher latitudes. S_erian summers in theHolocene. However, scattered spots of positive mid-Holocene were 0.7°C warmer than now, onlyanomalies in the South do occur, indicating locations one-ftflh of the corresponding temperature increasewhere 6,000 yrs ago Steppe existed rather than reconstructed for winter. There was not much
' Forest-Steppe, or Semidesert rather than Steppe in difference in July temperatures between western andsouthwestern Sl_oeria. A noticeable concentration of eastern S_eria (0.8 °C vs. 0.7°C, respectively), which
-
274 GTR-NC-209

-contrasts With the large longitudinal differences found A second, but less dramatic area of increased
for January (0.9 °C vs_ 5.6°C; table 2). Summer was 2 precipitation (mostly 0 mm- 100 mm increase), starts°C -5°C warmer than today between 63 °N and 73°N, _West Siberia between 63 °N and 70°N and stretches
embracing much of Northern Taiga, Forest-Tun&a, along the North Siberian Depression (Severo Aand Tundra zones. A band of moderate summer Sibirskaya Nizmennost) at the base of the Taimyr *temperature anomalies (0 °C -2°C) is centered at Peninsula, and on across northern Yakutia to the65°N, and a secondband of greater anomalies (2 °C mountains in the northeast. In combination with 2 °C--5°C) is centered at 70°N. In this northern band, 5°C wanner summers, moister climates in the mid-Northern Taiga has been replaced by Forest-Tundra, Holocene allowed trees to advance far northwards
and Forest-Tundra and even Northern Taiga in the into the current Tundra zone (Khotinsky 1984a,mid-Holocene has been replaced by Tundra today. Avenarius et al. 1987). In the mountain ranges ofBelow approximately 63°N, summer was nearly the northeastern Yakutia, Northern Taiga was replaced bysame as today across the southern half of S_oeria. In Tundra.
southwest S_eria, two narrow strips of positive
anomalies _indicatethat more warmth-requiting Vegetation has remained stable over large areas ofvegetation was replaced by less warmth-requiring Siberia since the mid-Holocene. No precipitationvegetation (e.g., Steppe by Forest-Steppe, and anomalies are found in Tundra along the Arctic coastTemperate Birch-BroadleafForest replaced by Birch and the northern mountains of Yakutia, in the light-Subtaiga and Forest-Steppe). needled Middle Taiga of southeastern Yakutia and
Transbaikalia, in Southern Taiga across western andThere are several scattered patches of negative central Siberia, and the Steppes of Kazakhstan.anomalies in Central Slqaeriawhere Middle Taiga was
replaced by Southern Taiga. Two patches are found Several locations with lower annual precipitation are
in the southwest, in Kazakhstan, where Steppe was noted: the western foothills of the Altai-Sayanreplaced by Semidesert. mountains where less moist light-needled Forest-
Steppe was replaced by moister Birch Forest-Steppe;Precipitation northern Kazakhstan, where Steppe was replaced by
moister Forest-Steppe; and West Siberia near the Ural
On average, annual precipitation in Siberia was 95 Mountains, where colder Middle Taiga was replacedmm higher than now. Most of the increase was by wanner Southern Taiga. "Concentrated in East Siberia (154 mm average).Latitudinally, the precipitation anomalies are verysmall in the south (9 mm below 60°N), large between DISCUSSION60 and 70°N (168 mm), and moderate in the far north
above 70°N (44 mm) (table 2). We used a model-based approach to reconstruct theclimate of the mid-Holocene for Siberia. Our
•- The precipitation anomalies are dominated by a large procedure for climatic reconstruction differs from
increase in moisture inthe mid-Holocene in central traditional methods in several ways. First, instead of
and northeastern Slqaeria (Krasnoyarsk, Yakutia, and focusing on a palynological analysis, we begin withnorthern Irkutsk Territories of Russia). This is the the end product of such a thorough analysis:
same location of the largest January temperature Khotinsky's (1984a) paleovegetation map covering !' anomalies. This area was dominated by dark-needled most of Siberia. We refined this map slightly with w
•Northern and Middle Taiga in the mid-Holocene, additional information from the Russian literature.
" Annual precipitation in this region in the mid- Second, we rely on a bioclimatic vegetation model toH01ocene Wasmore than 197 mm higher than present specify the relationship between climate and(fig. 3, table 2). This increase in.precipitation allowed vegetation (Tchebakova et aL 1994). Thus we
moisture-demanding dark-needled species (Pinus reconstruct climate directly from vegetation, withsibirica, Abies sibirica, Picea obovata) to penetrate anomalies determined from climatic differences
deep into-East S_eria (Khotinsky 1984a). Only corresponding to different vegetation classes in the
drought-resistant light-needled species (Larix spp.) modem and paleomaps. Savina and Khotinsky (1984), are found there now (Isachenko et al. 1988). used a similar model-based approach to relate climate
to vegetation, but on a coarser grid; only positive and
Proceedings IBFRA Assn 1997 meeting 275

negative anomalies were distinguished. These paleoclimatic reconstructions are derived fromthe paleorecord using present associations between
An advantage of a model-based approach to climatic : pollen and climatic variables. There are bothreconstruction is that grid cells can be modeled similarities and differences between ourindependently, Without the need for interpolation to reconstructions and those found in literature for the °create smoothed temperature and precipitation mid-Holocene in Siberia. Our summer anomalies arecontours. The resulting anomaly maps are generally quite similar in both magnitude and pattern to thosecomplex in nature, for no attempt to reduce from the paleoatlas ofFrenzel et al. (1992). We alsoinformation through smoothing is made. Because we predict winter anomalies greater than summer ones:work at midpoints of vegetation classes, we Examining the Last Interglacial Climatic Optimumreconstruct only one value of a climatic parameter for (120,000 yr B.P.), Velichko et al. (1992) found thateachzone, with no variation. Variation of course winter temperature anomalies were greater than
exists, but of necessity must be ignored with the summer anomalies in Russia, with the greatest
current-procedure. Thus, our zero anomalies in anomalies in eastern S_eria. This is essentially the_figur6s 1-3 indicate only that the climate hasnot same result we found for the mid-Holocene Climaticchanged enoughto support an adjacent vegetation. Optimum.class in table 1.
Our reconstructions differ in several aspects. We
With such a model-based approach to paleoclimatic predict a different pattern of January temperaturereconstruction, it is important that paleo and current anomalies that are stratified longitudinally rathervegetation classes should represent the same general latitudinally as shown by Frenzel et al. (1992). Thevegetation complex, with the same climatic borders, largest January anomalies are predicted for EastThe maps of Khotinsky (1984a) and Isachenko et al. Siberia (>5°C), where the greatest anomalies of
(1988), as well as the Siberian vegetation model annual precipitation are also found. This corresponds(Tchebak0va et al. (1994), are all based on a similar to the large expanse of light-needled larch Taiga inzonal vegetation classification, and employing central and eastern Siberia known to have supportedlongitudinal sectors separating light-needled from moisture-demanding dark-needled Taiga species in the
•dark-needled classes in the same zone. mid-Holocene (Khotinsky 1984a).
Our analysis showed that paleoclimatic The Siberian vegetation model (Tchebakova er al."reconstructions are rather sensitive to the precise 1994) is driven by climatic parameters, but not by thespecification of the climatic borders. The discrete distribution ofpermal_ost. Velichko et al. (1995)nature of vegetation classes as represented in both the concluded that wanning during the Holocene thawedpaleovegetation map and the Siberian vegetation the permafrost surface layers over much of northern
- model creates an associated problem. Class borders and eastern Siberia by the mid-Holocene. This•axe sharp _anddistinct, producing extremely large and thawing was partially responsible for the advance of• .
.- rapid climatic gradients at the borders between dark-needle species to the east and north into the
Vegetation classes. Such large differences in climate current permafrost zone (Velichko et al. 1995).• over short distances are unrealistic, but the solution to Because we base our paleoclimatic reconstruction on
this problem is far from obvious as long as the the Siberian vegetation model, we associate thiseeotones represented by the borders are neither advance by the dark-needled species with an incrlase
' mapped nor continuously modeled. A ramp function in temperature and precipitation. By ignoring ir(e.g., linear interpolation) could smooth this discrete permafrost, we likely overestimate precipitation in the
" transition near the class borders, but would not alter portion of the permafrost zone that thawed to a
the main features of the anomalies displayed in figures sufficient depth in the mid-Holocene to accommodate•1-3. . the advance of dark-needled tree species, for melting
" of surface layers of permafrost makes additional
We compared the maps of January and July moisture available for plants. Ignoring permafrosttemperatures and annual precipitation anomalies for should also result in an underestimate of temperature,the mid-Holocene (figs. 1-3) to corresponding maps for enormous heat resources are required to convert
_ from the literature, primarily those found in the water from the solid to the liquid phase.' paleoatlas ofFrenzel et al. (!992, p. 65, 69, 77).
276 GTR-NC-209

ACKNOWLEDGMENTS Frenzel, B.; Pesci, M.; Velichko, A.A., eds. 1992.Atlas of Paleoclimates and Paleoenvironments of
This work was begun during Tchebakova's second : the Northern Hemisphere: Late Pleistocene-winter as a Visiting Scientist at the Intermountain Holocene. Geographical Research Institute of the AResearch Station's Forestry Sciences Laboratory in Hungarian Academy of Sciences, Budapest. *
Moscow, Idaho. We thank A1 Stage for his strong Stuttgart: Gustav Fischer Verlag. 153 p.support.
Gidrometeoizdat. 1964-1970. Reference Books on
Climate of the USSR. Vols. I (Radiation and•LITERATURE CITED sunshine), II (Temperature of air and soft), and IV
(Precipitation and snow cover). Issues 17 (OmskAndrews,.J.T.; Mode, W.M.; Davis, P.T. 1980. and Tyumen Territories), 18 (Kazakhstan), and
Holocene climate based on pollen transfer 20-24 (Novosibirsk, Krasnoyarsk, Irkutsk andfunctions, eastern Canadian Arctic. Arctic and Buryatia, and Yakutia Territories).
Alpine Research. 12: 41-64. Gidrometeoizdat, Leningrad. (in Russian).
Avenarius, I.G.; Muratova, M.V.; Spasskaya I.I. Greenspan, D. 1971. Introduction to Numerical1987. PaleogeographyofNorth Eurasia during the Analysis and Applications. Chicago: Markham.Late Glacial-Holocene and geographical 182 p.prognosis. Nauka, Moscow. 76 p. (in Russian).
Guiot, J.; Pons, A.; de Beaulieu, J. L.; Reille, M.
Bartlein, P.J.; Webb, T., III. 1985. Mean July 1989. A 140,000-year continental climatetemperature at 6,000 yr B.P. in Eastern North reconstruction from two European pollen records.America: regression equations for estimates from Nature. Vol. 338, 6213:309-313.fossil-pollen data. Syllogeus. 55: 301-342.
Houghton, J.T.; Jenkins, G.J., Ephraums, J.J., eds.Bartlein, P.J.; Prentice, I.C.; Webb, T., III. 1986. 1990. Climate change: The IPCC Scientific
Climatic response surfaces from pollen data for Assessment. Cambridge, UK: Cambridgesome eastern North American taxa. Journal of University Press. 365 p.
•Biogeography. 13: 35-57.Howe, S.E.; Webb, T., III. 1977. Testing the
Budyko, M.I. 1974. Climate and life. New York: statistical assumption ofpaleoclimatic calibrationAcademic Press. 508 p. functions. Preprint Volume: Fifth conference of
probability and statistics in atmospheric science.Budyko, M.I. 1986. The evolution of the biosphere. Boston, MA: American Meteorological Society:
Netherlands: D. Reidel. 423 p. 152-157.
Bukreeva, G.F..1992. Paleoclimatic reconstruction of Huntley, B. 1991. How plants respond to climatethe Holocene based on palynological data with the change: migration rates, individualism and thehelp of mathematical methods. Abstract of consequences for plant communities. Annals of
. dissertation. Institute for Geology and Botany. 67 (Supplement 1)" 15-22. #
Geophysics, USSR Academy of Sciences, Slqaerian wbranch, Novos_irsk, 41 p. (in Russian). Isachenko, A.G.; Shlyapnikov, A.A.; Robozertseva,
O.D.; Filipetskaya, A.Z. 1988. The Landscape
COHMAP Project Members. 1988. Climatic changes Map of the USSR. G.U.G.K. of the USSR,of the last 18;000 years: observations and model Moscow. (in Russian).•simulations. Science. 241: 1043-1052.
Kay, P.A. 1979. Multivariate statistical estimates of
Conrad, V. 1947. Usual formulas ofcontinentality and Holocene vegetation and climatic change, forest-their limits of validity. Transactions of the tundra transition zone, N.W.T., Canada.American Geophysical Union. 27(5): 663-664. Quaternary Research. 11: 125-140.
°
Proceedings IBFRA Assn 1997 meeting .277

Khotinsky, N.A. 1984a. Holocene vegetation history. America since the Last Glacial Maximum.In: Velichko, A_A., ed. Late Quaternary Ecology. 72(6): 2038-2056.Environments of the Soviet Union. Minneapolis,MN: University of Minnesota Press: 179-200. Prentice, I.C, Cramer, W.; Harrison, S.P." Leernans,
R.; Monsemd, R.A.; Solomon, A.M. 1992. A *
Khotinsky, N.A. 1984b. Holocene climate change. In: global biome model based on plant physiology andVelichko, A.A., ed. Late Quaternary dominance, soil properties and climate. Journal ofEnvironments of the Soviet Union. Minneapolis, Biogeography. 1t). 117-134.MN:University of Minnesota Press: 305-309. *
Savina, S.S.; Khotinsky, N.A. 1984. HoloceneKlimanov, V.A. 1984. Paleoclimatic reconstructions paleoclimate reconstruction based on the zonal
based on the information statistical method. In: method. In: Velichko, A.A., ed. Late QuaternaryVelichko, A.A., ed. Late Quaternary Environments of the Soviet Union. Minneapolis,Environments of the Soviet Union. Minneapolis, MN: University of Minnesota Press: 287-296.
"_ MNi University of Minnesota Press: 297-303.
Tchebakova, N.M.; Monserud, R.A.; Nazimova, D.I.Lamb, H.H. 1982. Reconstruction of the course of 1994. A Siberian Vegetation model based on
postglacia! climate over the world. In: Harding, climatic parameters. Canadian Journal of Forest.A., ed. Climate change in later prehistory. Research. 24: 1597-1607.Edinburgh: 11-32.
Velichko, A.A., ed. 1984. Late QuaternaryLeemans, R.; Cramer, W. 1991. The IIASA database Environments of the Soviet Union. Minneapolis,
for mean monthly values of temperature, MN: University of Minnesota Press. 327 p.. precipitation and cloudiness of a global terrestrial
•grid. Res. Pap. RR-91-18. Laxenburg, Austria: Velichko, A.A.; Grichuk, V.P.; Gurtovaya, E.E.;• Imemational Institute for Applied Systems Zelikson, E.M.; Borisova, O.K.; Barash, M.S.
Analysis: 105-122. 1992. The maps of January and July temperature:Last Interglacial. In: Frenzel, B.; Pecsi, M.;
Matthews, E. 1985. Atlas ofarchived vegetation, Velichko, A.A., ed. Atlas ofpaleoclimates and
land-use and seasonal albedo data sets. NASA paleoenvironments of the Northern Hemisphere:Tech. Mem. 86199. New York: Goddard Institute Late Pleistocene-Holocene. Geographical
for Space Studies. Research Institute of the Hungarian Academy ofSciences, Budapest. Stuttgart: Gustav Fischer
M0nserud, R.A.; Leemans, R. 1992. The comparison Verlag: 13 & 17." 0fglobal vegetation maps. Ecol. Model. 62: 275-
263. Velichko, A.A.; Borisova, O.K.; Zelikson, E.M.;Nechayev, V.P. 1995. Permafi'ost and vegetation
M0nserud, R.A.; Denissenko, O.V.; Tchebakova, response to global wanning in North Eurasia. pp.N.M. 1993. Comparison of Siberian 134-156, In: Woodwell, G.M.; Mackenzie, F.T.,paleovegetation to current and future vegetation eds. Biotic feedbacks in the global climatic system.under climate change. Climate Research. 3(3): New York: Oxford University Press. 416 p. 8143-159.
' ifWalter, H. 1979. Vegetation of the Earth and
" Peng, C.H.; Guiot, J.; Van Campo, E.; Cheddadi, R. Ecological Systems of the Geobiosphere, 2nd ed.1995. Temporal and spatial variations of terrestrial New York: Springer-Verlag. 318 p.
. biomes and carbon storage since 13 000 yr BP in
Europe: reconstruction from pollen data and Webb, T., III; Bryson, R.A. 1972. Late-andstatistical models. Water, Air, and Soil Pollution. postglacial climatic change in the northern82: 375-390. Midwest, U.S.A." quantitative estimates derived
from fossil pollen spectra by multivariate statistical'" Prentice, I.C.; Bartlein, P.J.; Webb, T.,III. 1991. analysis. Quaternary Research. 2" 70-115.
Vegetation and climate change in eastern North
278 GTR-NC-209

II
iI
mii
. CIRCUMPOLAR WARMING EFFECTS ON TREE-LINE REPRODUCTION IN CANADA AND SIBERIA
Harvey Nichols I m_b
A
ABSTRACT.--The arctic tree-line is sensitive to across long distances (Nichols 1967a, 1969, 1975, • nclimatic changes as indicated by paleo-ecological 1976; Pielou 1991; Ritchie 1984). The arctic tree-linestudies, and it is predicted by global circulation in Canada and probably its counterpart in Siberia canmOdels to respond strongly to greenhouse wanning, lay claim to be the most climatically sensitive ecotones "Northern Canadian studies of tree-line reproduction of any major biome. Palynological studiesspanning two decades demonstrate a widespread demonstrated that post-glacial migration of spruceswitch from infertility due to cold summers (1960s- trees in Keewatin (Northwest Territories, Canada)1970s) to pollen and cone production (|990s), in line during mid-holocene Hypsithermal warming equalledwith climatic warming predictions. Ecotonal cone or exceeded 240 rn per year (Nichols 1967b, p. 185).formation _ usually sporadic and localized, but this Similar figures have been suggested for the Northwestlarge§tale reproductive shift, along a 1,500 km Territories by Macdonald et al. (1993) and for Newtransect, suggests Widespread climatic warming since England (Davis 1983). If global warming occurs asthe 1970s across much of the Northwest Territories. predicted by global circulation models, and ifLabrador, not included in the original study, has temperatures eventually equal those of the
Dexperienced recent cooling. Hypsithermal, then these figures (above) for forest tmigration rates may be relevant to future management
In 1995 and 1996 1 tested the hypothesis by of the boreal forest. A related extrapolation fromexamining arctic tree-line in western Siberia and paleo-ecology in northern Canada is that each 1o C ofnorthern Yakutia, northeast S_eria. At all these sites mean July warming in the past eventually produced a.ecot0nal larch trees were reproducing sexually, and northward movement of up to 100 km in the arcticgreenhouse studies confirm that enough seeds are tree-line in Keewatin (Nichols 1975).viable to allow seedling colonization of the tundra.Sfl3erian colleagues noted that the age structure of Early recognition of environmental changes can bethese "tree-islands" based on tree-ring studies expected at climatically controlled ecotones such assuggested that a recent warming response was the arctic tree-line, which is limited by July 10° Cidentifiable, mean temperatures, (Nordensk61d and Mecking 1928,
Kfeppen 1936), the Arctic Front (Bryson 1966,These S_erian studies (at 27 sites) represented only a Krebs and Barry 1970), and the 800 ° day limit abovemodest fraction of the Eurasian tree-line, but the 10° C (Amo 1984, Sir6n 1997 p.c.). Thus presenceWidespread fertility at so many locations, plus the or absence ofbiospheric responses to environmentalextensive Canadian evidence, and Fenno-Scandinavian changes can be seen as a test of GCM _odel
findings, suggest that the predicted polar warming predictions of polar wanning (IPCC 1990, Nicholsmay be responsible. Whether this is due to natural or 1993).anthropogenic climatic change, or some combination,and whether it will be short or long-term, is unclear,and merits further study and long-term monitoring. A TWO-DECADE CANADIAN EXPERIMENT !
' In 1972 and 1973, I placed pollen traps in Keewatin Balong a transect from the tree-line northwards into the
- INTRODUCTION high arctic, (fig. 1) to provide data from modemvegetation and associated present-day pollen
The boreal forest is now recogniz/ed as being one of deposition. These were analogs for fossil pollen datathe earth's climatically most responsive biomes in the that allowed interpretation of past vegetational andlate Quaternary period, including the present. Paleo- climatic events (Nichols 1975). As the pollen transectecological studies have shown that both the southern moved north from the tree-line into the tundra Iand northern boundaries of the forest have responded designed it to pass through small clumps of dwarf
, to environmental changes with rapid movements black spruce (Picea mariana), where I placed pollen
. IDepartment EPO Biology, University of Colorado, Boulder, CO 80309-0334.
Proceedings IBFRA Assn 1997 meeting 279

°
traps to test for localized tree pollen release. The shaped 1,500 km transect from west of Hudson Bay,pollen collectors were placed close to the dwarf trees, beginning with Nueltin Lake and Ennadai Lake (partwhile otherswere sited at 50 m and 100 m away in ; of the 1972-1973 transect), past Great Slave Lake, toopen tundra to record the regional pollen deposition north of the Great Bear Lake close to the Artic Afrom the forest to the south. This proved that in 1972 Ocean. Pollen traps were placed in grox_esof trees •and 1973 these "tree islands" in the low arctic tundra (primarily black spruce, Picea mariana) in the easternwere not releasing pollen and they were not producing section, plus white spruce (P. glauca) in the westerncones, Palynological examination of moss section of the transect) beginning in late June 1993 iniaccumulation (polsters) nearby showed that absence order to collect evidence for presence or absence of'of pollen release from these dwarf spruce extended pollen release by groups of spruce trees isolated in theback into the past, at least throughout the 1960s. tundra, north of the woodland edge (details below).This agreed with Larsen's (1965) observations of The transect was repeated through mid-July, toinfertility and absence of seedlings along this part of collect the pollen samples and examine conethe Keewatin tree-line. Elliott (1979) also reported formation and rates of annual growth.infertility of spruce at one of these same sites. Thusthe infertility of the arctic tree-line in Keewatin, At every one of the five re-visited sites (1973/1993)
northern Canada, was noted at more than a dozen there was strong evidence of change in coniferSites overtwo decades (1960s - 1970s) by three reproduction compared to 20 years ago, and the threeinvestigators. additional sites along the east-west transect were all
sexually reproducing. In early to mid-July 1993
Cone production at long intervals in sub-arctic pollen release was noted at most of the sites visited,marginal trees has been recorded elsewhere (Larsen and by mid-July at every one of the eight sites1980, 1988, Black and Bliss 1980, Khomentovsky numerous new cones were being formed. Cones1990). My photographic records show that a few of retained from the 2 or 3 previous years were observed
• the dwarf trees visited on three transects in 1972 and on all the black spruce (Picea mariana), which is•1973 exhibited small numbers of old cones which characteristic of this species, and cone formation was..
remain in place for a number of years, but there were recognizable back to at least 1991 or 1990 (from theno developing or very recent cones at all. These degree of differential weathering of the cones stillCanadian data suggest that the infertility in the "tree attached on the trees). Small spruce seedlings wereislands" related to prolonged limitation of sexual observed at several of the locations nearest to tree-reproduction by cold summers in the 1960s and line and thus presumably warmer: site 1, Point l_ake,t970s. These observations form the baseline for the 12 miles (19 km) north of tree-line; site 3, Artillery
current studies that show widespread changes in tree Lake, at tree-line; and site 5, mid-section of Nueltinreproduction along the rim of the Canadian arctic. Lake, 12 miles (19 km) south of tree-line. They wereComParative studies were made in two regions of associated with groves of white spruce (Picea
" S_eria to test the original hypothesis of a warming glauca), with seedling heights of 15 cm or so, andeffect on tree-line (see below), estimated establishment dating back to early to mid-
1980s. The more harsh and northerly tundra
In June and July 1993 1 was able to re-visit sites I environments (sites 2, 4, 6, 7, and 8) had no seedlings.studied in 1972 and 1973 at tree-line in northern These were areas of delayed phenology as judged by
Canada and in the arctic tundra up to 250 km beyond ice on the lakes, in the eastern section of the transecttree-line (fig. 1). The objective of the most recent north of Nueltin and Ennadai Lakes. These sites l_djourney was to detect any alteration in the a mean distance north of tree-line of almost 60 mi_sreproduction of the spruce trees caused by climatic (96 km).
" change in the previous 20 years. We know thatcolder conditions cause the trees to reproduce slowly, The most northerly and exposed sites: 6, 7, and 8 (fig.
. by vegetative means as clones, with rare or occasional 1) - had not expanded the clumps of dwarf blacklocalized episodes of cone formation, and that warmer spruce (Picea mariana), at all, according to myc"limates result in pollen and cone production and photographic records from 1972-1973; they hadeventually seedlings. Additional sites to those of merely grown a little taller (< 1 m additional height).1972-t973 were examined along a northwest- By contrast, toward the southern end of Nueltin Lake,
, southeast transect along and north of the tree-line in site 5, about 40 miles (~ 65 kin) south of site 6, and ~' • Keewatin and Mackenzie, Northwest Territories (fig. 12 miles (20 kin) soutkoftree-line, the sheltered
1). Eight sampling locations were chosen along an L- Indian Camp island exbSbited clear evidence of new,
280 GTR-NC-209

11D
O ' pol[e,n sampling sites 1972.73 __llp_ i_
sca,e ,--A""_ Sampling transect 1993 d> "_--"1_
[ 500 miles = 800km 0 _ __k__,_ _1_(._1_ _z"
• 41"¢_ _ CHRISTIAN O._, "_BAFFIN _/_,
ISLAND d'" " _2"/_4/2-
......... _:_:.::_:::_:::::::!:i_ii_:-:.i!_i_!_!:i!i!illii!i.
\. P' PELLY......::":_:.\ ,° BAY
\ d 41KEEWATIN (27
\ o BAKER <O
' _LAKE __\" (TUNDRA) NUELTIN _ 0
LAKE LABRADOR
/ HUDSON lBAY (TUNDRA)
. i_
. .
Figure 1.-- Location of pollen sampling sites in 1972-1973 and 1993.
ProceedingsIBFRA Assn 1997 meeting 281

seedling establishment and substantial growth of establishment on thick peat soil and healthy growth ofexisting black spruce and larch (Larix laricina), spruce and larch.
Cone formation such as that recorded above does not By contrast, site 4 - (Ennadai Lake), site 6 - (north A
guarantee seed viability, because summer end of Nueltin Lake) and sites 7 and 8 (north of Hicks btemperatures higher than for pollen production and Lake) all produced viable seeds from dwarf blackcone initiation are needed for this stage of spruce, all from tundra locations generally fartherdevelopment, with mean summer temperatures in from tree-line. These site locations are:excess of 15° C required (Black and Bliss 1980). Astudy at one of the sites here re-investigated (Ermadai Site 4 Ermadai Lake, Aeradio Station 61° 08' N lat.,Lake, site 4) recorded 100% non-viability of spruce 100° 53' W long.seeds from old cones and soil san_les in the late1970s (Elliott 1979). Site 6 Nueltin Lake (north end) 60° 39' .94 N lat., 99 °
22' .35 W long.
, Seeds from the 1993 crop of cones were planted indifferent types of soil to test for germination in Site 7 north of Hicks Lake 61° 36' .94 N lat., 100°Colorado, and several sites exht_oitedseedling growth 08'. 04 W long.
in autumn and early winter 1993-1994. As reportedfor comparable studies elsewhere (Fraser 1976, Site 8 north of Hicks Lake 62° 02' N lat., 99° 45' .70
Alexander et al. 1982) only a minority of seeds from W long.these Stressed sites proved viable, and not all sites
produced seedlings, but these germination data may All locations quoted were determined using GPSfurther support the concept of climatic amelioration, equipment on the airplane, except for site 4 where iceThe seeds were planted in plastic cones using three prevented float plane landing on July 1, 1993,
' soil types _eat, peat plus sand, potting soft), with necessitating walking to the (de-activated) Ennadairefi'igeration but without cold stratification at sub- Aeradio Station.freezing temperatures. The test plantings were mostsuccessful in the peat and sand mixture, as compared Site 4 had a seed germination rate of 2.1%, site 6 =
to peat alone or potting soft. The peat came from my 2.1%, site 7 = 5.2%, site 8 had 8.3% viability. Thereprevious fossil peat collections in Keewatin, to most appears to be an approximate trend in these data, with
• . closely approximate the site characteristics in the an increase in viability with greater distance from theNorthwest Territories. Viability was not equally arctic tree-line. One would expect the sites with thedistn'buted across the length of the transect. The sites tallest trees and most advanced phenology (sites 1, 2,numbered 1, 2, 3, and 5 extuqaitedzero germination. 3, and 5) to produce more viable seed than those with
-These sites were mostly in the western ann of the L- dwarfed trees farther out in the tundra (sites 4, 6, 7,•shaped transect, and sites 1, 3, and 5 were closest to and 8), but the reverse has proved true. Sites 4, 6, 7,•tree-line, and recorded all the seedlings recorded in and 8 were characterized by small groups ofthe field in th£_study. The locations are: diminutive spruce trees, ranging in height from about
2 m (sites 4, 5, 6, 7) to a meter or less (site 8),
Site 1 - (Point Lake, 65° 17' .10 N lat., 113° 41.65 W proceeding from south to north.
long.) |
site. 2 - (Dismal Lake, 67° 14'. 10 N lat., I 16° 36' .80 CANADIAN DATA IMPLICATIONS
W long.) andThese phenomena of sexual activity in spruce are
Site 3 - (Artillery Lake, 62° 57' .92 N lat., 108° 15.23 consonant with the theoretical predictions of. W 10ng.). . exaggerated polar wmming due to the anthropogenic
greenhouse effect (IPCC 1990), but they do not prove
Site 5 - (Indian Camp Island on Nueltin Lake at 60° it. A natural "flickering" effect due to variability in02' N lat., 99° 51' W long.) which also produced no the summer position of the Arctic Frontviable seeds, despite there being seedling
282 GTR-NC-209

Table 1.--Distance from tree-line was derived from the map of General Land Cover Classification produced from 1km imagery by theManitoba Remote Sensing Centre and plotted at the NWT Centre for Remote Sensing,Yellowlmife. Distances were measured from the contact of tr:nsitionalforest with tundra, aided by personal
photographic records. A0
Site Distance from tree line % seed viabilitySite 1. • 12 miles (20 km) N of tree-line zeroSite 2 50 miles (80 km) N of tree-line zeroSite 3 ' at tree-line zero "
Site 4 31 miles (50 km) north of tree-line 2.1%Site 5 12 miles (20 km) south of tree-line zeroSite 6 37 miles (60 km) north of tree-line 2.1%Site7 71 miles (115 km) north oftree-line 5.2%Site 8 . 105 miles (170 km) north of tree-line 8.3%
episodically affects cone production at tree-line, as about 500,000 km2of former tundra was afforested
does nutrient and energy build-up. Overall, my during this episode, over several millenia (Nicholsimpression was tlmtthe effects of change in climate (if 1976).that was the cause) were modest and/or recent, as
registered by vegetational response over the last 2 The recognition of these phenomena along adecades. These observations will need to be repeated, substantial portion o fa continental ecotone mightand seedling establishment monitored for some time at reasonably be regarded as indicative of morethe most northern sites, for a trend to be confirmed, widespread climatic change. It is poss_le that this is' the reflection of a sub-continental shift in the upperThe changes, now apparently beginning, may atmospheric Rossby wave (the "jetstream"),eventually prove to resemble: (1) the minor wanning producing warming due to an atmospheric ridge.of the late 19th-eaxly 20th century, or (2) the more Other arctic regions "downstream" in an atmosphericsubstantial medieval warming (roughly 600-1,600 ridge and trough effect might then be expected toyears ago), both with some degree of written record exlffoit coolings, as indeed is occurring in Labradorand cultural response; or possfoly (3) the much longer currently.and more dramatic wanning of the middle of ourcurrent interglacial period, from 3,000-4,000 years
•ago back to 8,000-9,000+ years ago, known as the SIBERIAN COMPARISON.Hypsithermal episode (Lamb 1977). The former
- changes in the arctic tree-line in Canada caused by I arranged collaborative research expeditions into twothese three different warming episodes provide us areas of western Siberia and eastern Siberia for two
with along perspective fi'om which to view the months in 1995 and 1996 (fig. 2), making• , current effects (Nichols 1975). In episode (1), dwarf observations at the arctic tree-line to compare with
spruce trees developed upright leaders for several the 1993 Canadian data. We found similar effects as
decades before being forced back down to a partially in Canada, with consistent sexual reproduction of !, prostrate growth form by colder climate (Jacoby p.o., Siberian larches (Larix sibiriea in the Yamal and Taz
d'Arrigo and Jacoby 1993). During episode (2), the Peninsulas and L. kajendera in northeastern Yakutia) warctic tree-line extended some tens of kilometers in "tree islands" in the tundra. These studies lack the^ •
northwards.(Bryson et al. 1965; Nichols 1967b, p. two-decadal time perspective of the Canadian work,185, 1975, p. 66), then retreated during the late but they indicate contemporary arctic summers warmmedieval Little Ice Age. The greatest biotic effect enough to allow fertility in the "tree islands" locatedwas registered during episode (3) the Hypsithennal, over 60 miles (100 km) north of the open woodland,when summer temperatures 3 o .4 o higher than the along with some modest seedling colonization of themean pushed the central Canadian tree-line 300 km- "southern arctic" (Russian equivalent of"low arctic"400 km north 0fpresent limit, at a rate of 100 m-300 in N. America). The western Sfoerian larch trees
_ roper year (Nichols 196713,1975; Macdonald et al. yielded large numbers of mature cones representing1993). Similar forest advances were registered in the growing season of 1994; the 1995 cones were stillSiberia (Levskovskaya 1976). In Canada, an area of forming in July of that year. Approximately 20,000
o
Proceedings IBFRA Assn 1997 meeting 283

°
cones Were collected and approximately 5,000 seeds say from this data whether this reflects higherwere planted in the greenhouse at the University of temperatures in July or a longer growing season andColorado (CU). : milder winters expressed as increased degree days,
and whether this results from a natural climaticIn September 1995 these cones were placed in plastic wanning and/or an anthropogenic effect on climate. •bags in refrigerators at _ 5°C for 4 weeks and thentransferred to a freezer at -20°C for 3 months to" The three study regions I have chosen around thesimulate autumn and winter conditions. The seeds circumpolar tree-line are said to be climatological),were initially removed by manual extraction from the the most likely sites around the arctic perimeter to,cones, but we found that simply shaking the large register significant wanning (Bradley p.c. 1995). Dr.plastic cone bags released ample seed quantities. The G. Sir6n, representing sub-arctic woodland studies inseeds were sown in a standard potting soil mixture Fenno-Scandinavia, agreed that this paper's
used _itthe CU Greenhouse, and were then divided hypothesis could include his area of study, which hasinto two populations. One group was returned to the responded to regional warming (p.o. 1997). These
refrigerator for 2 months to encourage germination, findings from north central Canada, western S_eriaThe second group was immediately placed in a room and Yakutia, along with Dr. Sir6n's Finnishat the CU Greeenhouse designed to mimic a relatively experience, therefore indicates that much of thecool moist montane tropical environment, ranging circumpolar arctic tree-line is currently responding tofrom 15°c-20°c with humidity of 80%. This was not widespread intercontinental warming.exactly a northern boreal forest or arctic tree-lineenvironment, especially in terms of the high humidity,but was the nearest equivalent then available at the ACKNOWLEDGMENTSCU Greenhouse. The first group of seeds wasremoved from the refiigemtor and subjected to the The 1972-1973study that allowed the 2-decade
• same temperature and humidity regime. The two comparison was funded by the National Sciencedifferent approaches to cold stratification we Foundation (GB-33497), and the 1993 expedition was
employed did not produce markedly different rates of supported by the University of Colorado Council forgermination; both sets of larch seeds demonstrated-_ Research and Creative Work, the CU-Fund for Global11% viability. Lighting conditions were those of Change and Environmental Quality, and by thenatural daylight here at 40° N latitude with roof National Geographic Society, which also funded the
•shades to control excessive sunlight, with day length 1995 and 1996 S_erian expeditions. I am gra'teful totypical of spring, summer and autumn at this latitude, the following who helped me in this fieldwork:compared to the collecting sites at-_ 67°N lat. Jeremy Jensen, J.C. Kermy, and John Spear (1993);
Dr. V. Sedelnikov, Misha Telyatnikov, SergeiThe cones from the 1996 expedition were gathered Printyazhnyuk, Svetlana Yudina, Irina Abramova,from "tree islands" ofLarix kajendera isolated in the Charles R.D. Bushby, and Dr. Nick Johnson, (1995);tundra, along the Indigirka River and westwards Dr. N. Germagenov, Dr. A. Isaev, Dr. A. Maximov,
• towards the Lena River, about 70° N latitude (fig. 2). Dr. Allen Taylor, Terranee McManus and Mary Wisz• We recorded sexual reproduction in the form of (1996). The late Dr. James A. Larsen was most
widespread cone formation at 14 locations. The generous with advice on this project, and I thankcones' contents will be tested for viability in the new William Gould for thoughtful commentary, and Dr.alpine cold room at the university greenhouse. Tom Lemieux, director of the CU Greenhouse. /I
• IFWe know that seed viability and seedlingestablishment are limited by temperature and growingseason length at the arctic tree-line, and that seedviability "mblack spruce cones (Picea mariana) canrange down to Zero under severely limiting conditions(Larsen 1980, 1988). The finding of_ 11% seedviability reported here for S_erian larch (Larixsibirica) accompanies the field observations of limited
' , and recent larch seedling establishment in the southernS_oerian tundra, and supports the hypothesis ofwarming at the arctic tree-line. It is not poss_le to
284 GTR-NC-209

III
0
% % IcO u')
. ..., _._°_
Z • \ " _ o bo0 0 __0O-- 0 A
: " I°°0 o 0 0o
f °O-- 0,_ "/ _ --o
_ _: o'_ U.I . co o
\ 0--0,I
0
\ % g _o\ _ ,--
9," v" o- --o ,,_:,0 \o
.1==,1
w < \ _ Iw \ o° iQ_
z o_ -.. \ __o - "_I_.1c_
• (_
, - "k..f "_ _,_
.. rr - _
. ol °°. _
-I
0 " °1 d
oI °• v==,l
--- (_ _
F- m ,_m _
- -u a_ o" _" N
UJ
z c_%
°o >, ,
• • _ ._- _I t o_ _o
z < _ _ e,i
rr O0 .I!::!i!!!::!::!!!::!i!:
< iiii::i::i::ii@."• °° _::i_| "
(D :
•. % _o z _oOr) _" _ uC)
i,-
ProceedingsIBFRAAssn 1997 meeting 285

LITERATURE CITED KOeppen, W. 1936. Das geographische System derKlimate. In: K6ppen, W.; Geiger, R., eds.
Alexander, R.R.; Watkins, R.K.; Edminster, C.B. " Handbueh der Klimatologie, Vol. l, Berlin:1982. Englemann spruce seed production on the GebrOder Borntraeger.Fraser Expl. Forest, Colorado. RM-419. Fort
•Collins, CO: U.S. Department of Agriculture, Krebs, J.S., Barry, R.G. 1970. The Arctic Front andForest Service, Rocky Mountain Forest and the tundra-taiga boundary in Eurasia.Range Experiment Station: 1-6. Geographical Review. 60 (4): 548-54.
Amo, S.F. 1984. Timberline. Seattle: The Lamb, H.H. 1977. Climate: present, past and future.Mountaineers. London:Methuen.
Black, R.A.; Bliss, L.C. 1980. Reproductive ecology Larsen, J.A. 1965. Growth of spruce at Dubawntof Picea mariana (Mill.) b.s.p., at tree line near Lake, N.W.T. Arctic. 25"59.
' Inuvik, Northwest territories, Canada. Ecological
Monographs. 50"331-354. Larsen, J.A. 1980. The boreal ecosystem. New York:Academic Press.
Bryson, R.A. 1966. Air masses, streamlines, and theBoreal forest. Geographical Bulletin. 8(3): 228- Larsen, J.A. 1988. The northern forest in Canada and
269. Alaska. Springer-Verlag.
Bryson, R.A.; Irving, W.M.; Larsen, J.A. 1965. Levkovskaya, G.M. 1976. The paleographicalRadiocarbon and soil evidence of former forests boundaries of the Holocene in the Arctic,
. in the southern Canadian tundra. Science. 147: Palynology in the U.S.S.R. Papers of the Soviet46-48. palynologists to the IV International
Palynological Conference (Lucknow, India),
•D'arrigo, R.D.; Jacoby, J.C. 1993. Secular trends in Moscow, Nauka.high. northern latitude temperature reconstructionsbased on tree rings. Climatic Change. 25: 163- MacDonald, C.M.; Edwards, T.W.D.; Moser, K.A.;177. Pienetz, R.; Smol, J.P. 1993. Rapid response of
treeline vegetation and lakes to past warming.Davis, M.B. 1983. Holocene vegetational history of Nature. 361" 243-246.
the eastern United States. In: Wright, Jr, H.E., ed.Late Quaternary Environments of the United Myneni, R.B.; Keeling, C.D.; Tucker, C.J.; Asrar, G.;States. University of Minnesota Press. Nemani, R.R. 1997. Increased plant growth in the
northern high latitudes from 1981 to 1991.Eiliott, D.L. 1979. The current regenerative capacity Nature. 386:698-701.
of the northern Canadian trees, Keewatin, N.W.T.
Arctic and Alpine Research. 11" 243-251. Nichols, H. 1967(a). Pollen diagrams from sub-arcticcentral Canada. Science. 155" 1665-1668.
•Fraser, J.W. 1976. Variability of black spruce seed in J
or.0n a boreal forest seedbed. Forestry Chronicle. Nichols, H. 1967(b). The postglaeial history of w52: 229. vegetation and climate at Ennadai Lake,
" Keewatin, and Lynn Lake, Manitoba. EiszeitalterIntergovernmental Panel on Climatic Change (IPCC). und Gegenwart. 18:176-197.
1990. Climate change: the IPCC scientificassessment. Houghton, J.T., ed. Cambridge Nichols, H. 1969. The late Quaternary history ofUniversity Press. vegetation and climate at Porcupine Mountain
and Clearwater Bog, Manitoba. Arctic and Alpine
Khomentovsky, P.R.; Khomentovskaya, I. 1990. Research. 1(3): 153-167.. Geographical variability of Pinus pumila seedage
in Kamchatka. Problems of the Geography of Nichols, H. 1975. Palynological and paleoclimateKamchatka,. 10" 47-57. study of the forest-tundra ecotone in Keewatin
. and Mackenzie, N.W.T., Canada. INSTAAR
286 GTR-NC-209

Occas. Pap. 15. Boulder, CO: University ofColorado. 97 p.
ANichols, H. 1976. Historical aspects of the present
O
northern Canadian tree-line. Arctic. 29: 38-47.
Nicholsl H. 1993. Stability of the Boreal Forest-Tundra Ecotone: a test for the greenhouse effect.World Resource Review. 5(3): 360-371.
Nordenskt_ld, O.; Mecking, L. 1928. The geographyof the polar regions. Spec. Publ. 8. New York:American Geographical Society.
Pielou, E.C. 1991. After the ice age. University of
Chicago Press.."
Ritchie, J.C. 1984. Past and present vegetation of thefar northwest of Canada. University of TorontoPress.
!
,.o
Proceedings IBFRA Assn i997 meeting 287

°
cONSEQUENCES OF A POSSIBLE FUTURE CLIMATE CHANGE FOR THE DISTRIBUTION OFTREE SPECIES IN SCANDINAVIA
Oddvar Skre I ,
ABSTRACT.--The respiration rates in growing complete their life cycle and to produce viable seedsshoots 0fNorway spruce (Picea abies (L.) Karst.) and/or winter buds (e.g., Heikinheimo 1932, Langlethave been found to correlate well with the daily 1960).growthrates. Similar relationships have also beenfound in leaf discs of white birch (Betula pubescens In the present study I will present some results fromEhrh) and elm (Ulmus glabra var. scabra Huds). my own and other studies, that may indicate how theLong-term accumulated respiration rates correlate predicted global warming, caused by a doubling of thewed with the distribution limits of these species. CO2 concentration, would affect treelines and the
Predictions have been made on the consequences of distribution of plants. One of the most importantthe expected climate warming. Over time, the tree distribution limits in Fennoscandia is the arctic andlines of the investigated species are expected to rise alpine tree line. The most important tree line forming
•up to 400 m. Experiments with white birch indicate species are mountain birch (Betula pubescens),that this Species has a high potential for temperature Norway spruce (Picea abies) and Scots pine (Pinus
adaptation by different compensation mechanisms, sylvestris). According to the above-mentionedrelationships, the development of flower buds (Hagem1917) and vegetative buds (Romell 1925, Hustich1944, Junttila & Heide 1981) in spruce and pine is
TREE LINE FORMATION mainly determined by the climate of the precedingsummer. After flowering, the immature seeds start to
• The objectives of the present review article are: develop embryo and storage tissue. Hagem (1917)• to investigate how photosynthesis and dark and Heikinheimo (1921) found that the temperature
respiration may be limiting growth in some tree during seed maturation was an important restrictingspecies in Scandinavia; factor and that embryos in the seeds from tree line
• to see how summer and winter temperatures may areas were often weak and incompletely developed.influence the growth and carbon balance in trees; According to these authors, the alpine tree lines ofto predict from experiments how the expected spruce and pine in Scandinavia are mainly seed_global warming may influence tree-lines, growth maturation limits. In good seed-bearing years,and species composition, however, viable seed may be dispersed more than 100
m above the position of their mother trees, giving rise
In alpine and arctic areas where climate is constantly to individuals that are only able to reproducechanging between a cold and a warm season, most vegetatively. Scots pine lacks this ability, however,plants will have evolved different methods to survive but compensates by a high seed production.the unfavorable season, and the selection pressurewould tend to be determined by abiotic factors rather According to some authors (e.g., Michaelis 1934,than by competition (Kallio 1984). Plants whose Tranquillini 1979) reduced photosynthesis as a resultwinter buds, bark and needles have developed a high of too short a growing season may cause increased
. tolerance against freezing and drying stress will, winter desiccation in needles because of a reduce_therefore, have an advantage. During the year, plants cuticle layer. Another explanation, however, is tl_tare subjected to many kinds of damage. To repair this low temperatures during the bud differentiation periodand protect the living tissue against new damage, and in fall may produce immature buds and needlefor reproduction, growth and active uptake in roots, primordia, that are not able to survive the wintermore energy is needed and'is obtained by the (Sarvas 1972; Dormling et al. 1968).production o fATP through photosynthesis andrespiration (see fig. 1). Plants growing close to their To account for the observed requirements for highdistribution limits would therefore usually be temperature, various empirical parameters have beenrestricted by demands for high temperatures to introduced (cf. Skre 1972). The most common is the
' lOddvar Skre, Norwegian Forest Research Institute, N-5047 Fana, Norway
288 GTR-NC-209

LIGHT _ ALTERNATIVE ," RESPIRATION •
i _i PHOTOSYNTHESI S, CARBOHYDRATES ENERGYtk
LIPIDS
PROTEINS
J
STORAGE I ..... GROWTHMAINTENANCE
Sphagnumsubsecundum
...... ,
ImJ=
o) , Photosynthesiseq 00 mDark respiration
am e
E "t" ,,.
i-1 : I i _ : ......: : : i I ........I.... I I ],
-4 -2 0 2 4 6 8 10 12 14 16 18 20 22 24 IF
. , 0 c
l:igure l.--Diagram shO_ing theflow of assimilates and energy inplants (top) and rates of net photosynthesis anddark respiration in a sub-arctic moss (Sphagnumsubsecundum)(Skre & Oechel 1979) as afunction oftemperature.
ProceedingsIBFRAAssn 1997 meeting 289

heat sum w = (t-t0), i.e., the accumulated temperatures (Skre & Nes 1996). In white birch, on
temperature abovea certain threshold value. In the the other hand, high winter temperatures seem tocalculation of heat sums, growth is assumed to be a _ enhance growth in fast-growing populations (fig. 2).linear function of temperature. However, no specified Aphysiological process has yet been suggested to The daffy growth in leafbiomass was measured in bexplain the distr_utions of plants restricted to areas birch seedlings, grown at 24 hours daylength, andwith warm summers. One poss_le mechanism for the different constant temperatures (fig. 3). There was antemperature effect on plant distn'bution has been approximately exponential increase up to 15°C -20°C,suggested by Dahl & Mork (1959) and Skre (1972) in accordance with respiration rates, while at higher,based on data from Norway spruce (Picea abies), temperatures growth followed a typical optimumThrough photosynthesis, solar energy is transformed curve, similar to the photosynthesis response curve.to chemical energy and stored in different organic The figure indicates that dark respiration may becompoimds. Differentiation and growth involve the limiting growth at low temperatures andsynthesis of new plant tissue. This is an energy- photosynthesis at high temperatures. In this case, aconsuming process depending on the supply of linear relationship would be expected between dailyorganic matter fi'om photosynthesis as well as respiration and growth at low temperatures. Such a
chemical energy released through the dark respiration relationship was found by Dahl & Mork (1959) inprocess (fig. 1). The energy is released in small steps growing spruce shoots from southeastern Norway.through the pioduction of adenosine triphosphate Generally, the exponential increase in dark respiration(ATP) and other energy-rich compounds, which are rates follows Arrhenius' law (1) for thermochemicaltranslocated to sites where growth takes place. This reactions (Moore 1963):part of the respiration process, which is called growthrespiration (Penning de Vries 1972; Douce & Day (1) Re = Ce-_'mT,In Re = -_t/RT In C1985), is located in the mitochondria and is related to
• ATP production, while the light-dependent The coefficient _t/R (cal/mol) is called the activation•photorespiration (Zelitch 1966) and the alternative energy, and is a measure of the steepness of theor cyanide-resistant respiration (e.g., Lambers temperature response curve. Instead of _t/R the ratio1980) do not involve such a formation. Q_0between the respiration rate at a given
temperature and at 10°C lower temperature, is used.
Soil temperature is essential for the active uptake of In many plant species with normal growth respLration,nitrate and phosphate in roots (Karlsson & Nordell Q_0varies around 2.5, according to temperature,i 987). Also maintenance processes and protection species and tissue type. Dark respiration in growingagainst freezing and drying stress are strongly leaves of elm (fig. 4) showed a significantly lowerdependent on the supply of energy from ATP and temperature coefficient (Q_0= 2.0) than theother energy-rich compounds, throughphotosynthesis corresponding respiration rates in growing spruceand respiration processes (fig. 1). Since there is an shoots (Q_0= 2.65).exponential decrease in respiration rates withdecreasing temperatures, while photosynthesis ratesare still high, .respiration is most likely to be the RESPIRATION AND TREE LINESlimiting process at low temperatures. On the other
hand, however, if plants are grown for some time at Most Scandinavian plants are more or less restrict[d. temperatures close to their compensation temperature by their frost sensitivity as well as their high
tk, gro.wth may be limited by the supply of temperature requirement, as shown by Iversen (1_44)photosynthetic products. In the field this situation on Hedera helix and Ilex aquifolium and Faegrimay occur during exceptionally mild winters, when (1960) on a number of oceanic plants. To simplify thenet photosynthesis and tkare lowered due to light problem, Iversen (1944) introduced a new method.
_ limitation (e.g., Printz 1933, Hagem 1947). Plant distributions were shown on a diagram whereExperiments with birch and spruce seedlings, grown the mean July temperatures (tT) were plotted against
atambient and at winter temperatures 4°C above the mean January temperatures (tl) of localities, and
ambient, indicated that although spruce was able to where the species were present or absent. The authorcarry out some photosynthesis in needles even in a claimed that frost itself, as well as a too short growth
' dormant state, the shoot and biomass growth the season, might induce frost damage on the trees. Thefollowing season was lower in plants grown at high method oflversen (1944) has proved particularlywinter temperatures than in plants grown in ambient
290 GTR-NC-209

|ml
IIuseful in"studies of temperature respomes in respiration values and actual distn_outionlimits mScandinavian plants, supports the main hypothesis about dark respiration as
a limiting factor. '°When the meteorological stations were plotted on A
such diagrams and the direction of the axis was If the winter temperature is raised by 4°C and summer * IIreversed, the alpine and arctic distribution limits of a temperature by 2°C, as hypothesized in the climatenumber of species appeared as straight lines with scenario (Pedersen 1993), the distn'bution limits willfalling Slopes. The reason for the falling slope is move towards more arctic and alpine areas, in partbecause plants need a higher summer temperature to due to higher respiration rates in summer and a longer "complete their growth in a continental climate with growing season, represented by a higher January
•cold winters and a short growing season than in an temperature. The effect of a higher winteroceanic climate with mild winters and a long growing temperature will tend to be stronger in oceanic than inseason. It .may be shown (Skre 1979) that actual continental areas in terms of longer growing seasondiStn_outionlimits of spruce and elm plotted on such (H. Skre 1990). It will also be stronger in a planthermosphgi'e diagrams coincide with isolines with an oceanic distn'bution and a low temperaturerepresenting certain constant annual respiration coefficient for growth like elm (Ulmus glabra) than in "equivalents above themaintenance respiration in the plants like Norway spruce (Picea abies) or mountaintwo mentioned species (fig. 5). Because of its lower birch (Betula pubescens) with a high temperaturetemperature coefficient for respiration, elm seems to coefficient 9 (see table 1.).be a species that is more adapted to a coastal climatethan spruce. The good correlation between
Fertilized birch (NB) Fertilized birch (NB)
100 10o II
90- - T1+CO2 90I -.a-- T2+CO2
80- ---o--T1 80 "i/. --c_T2
70- --- k--- TO 70 -ii Ib
60- 60_I
so- 5o-!_
40- /,-- -_ 40_30- 304
.
0 _ I a OI i I o o I -02.04 02.05 01.06 01.07 31.07 30.08 02.04.94 02.05.9401.06.94 01.07.94 31.07.9430.08.94
Time Time
' IP
. Figure 2.--Shoot growth (length longest shoot in cm) of 1-year old white birch seedlings (Betula pubescens) duringthe 1994 season. The plants have been grown atambient (T1) and +4°C raised winter temperature (T2) thepreceding winter (1993/94), followed by treatment in open top chambers at ambient (350 ppm) and high (600ppm) C02 level. Dashed line indicates plants grown outside open top chambers at 2°C-3 °C lowertemperature. The plants originate from a subalpine stand at 750 m altitude in South Nonny.
Proceedings IBFRA Assn i997 meeting 291
L

- Betula pubescens
3O i
25 - j,_-"'__,_ *
>, 20 - _t•_ 15 -E
10 -
5 - /
0 I II I I0 5 10 15 20 25
oc
Figure 3.--Growth in leaf biomass per plant(mg/day) during the linear growth phase in white birch seedlings from,,Is, southem Norv_y (59°N, 95 m altitude) as a function of temperature at 24-hour photoperiod and 300umolm2s -_light. The observations are fitted to an exponential regression at temperatures atl5°C or lower, andto a polynomial regression at temperatures above 15°C. After Skre (1991a).
Table 1.--The temperature coefficients (Q/o) of the dark respiration curve in grougng shoots of spruce (Pieea abies),
grown at ambient temperatures (DaM & Mork 1959) and in leaf discs of elm (Ulmus glabra) and three•provenances of birch (Betula pubeseens) grown at three different temperatures (9°C, 15°C and 21°C) in 24
hours daylength (Skre 1991, 1993a). In the table is also shown optimum temperatures topt (°C) and the Ythreshold temperatures tb (°C) for growth, estimated from the relationship between daily growth and da_"k
respiration at different temperatures. The provenances are:
BM = White birch, ,4s (59°43 'N, 10°40 'E), 95 m altitudeBH = White birch, Blefiell (59°45 'N, 9°28 'E), 750 m altitudeBT = White birch, Tynset (62°13 'iV,11 °13 'E), 800 m altitudeAA = Elm, .4s (59°43 'iV,10°40'E), 95 m altitude
- NS = Norway spruce, Hirkj_len (61°14 'N, 10°52 'E), 800 m altitude
Provenance Provenance
Temp (°C) Qlo tb(°C) topt (°C) Temp (°C) Qlo tb(°C) topt(°C,)BM BT w9 . 1.74 3.2 22.5 9 2.20 2.0 17.5 W15 2.12 15 2.3921 2.22 21 1.84
BH . AAm
9 1.87 1.6 21.5 9 1.94 1.2 17.0
15 2.72 15 2.0521 1.93 21 1.86
," NSambient 2.65 2.6
292 GTR-NC-209

From figure 5 the increase in spruce respiration was increasing altitudes (Wemer-Johannessen 1960)found to be 1.47 units, corresponding to 2.6 °C higher varying from 0.4°C per 100 m in winter to 0.7°C inJuly temperature, and-in elm 1.55 units, corresponding summer. As respiration is an exponential function ofto 3.0 °C higher temperature, temperature, there must be an approximately A
exponential decrease in the annual accumulatedThe spruce diagram shows that naturally-regenerated respiration equivalent with increasing altitude.Norway spruce is absent from many localities along Because of this exponential decrease, the difference inthe coast of western Norway where it should be altitude corresponding to one annual respiration unitpresent according to the respiration hypothesis, increases with altitude (see fig. 6). As a result of the ,When planted, however, it generally shows good expected climatic wanning the spruce distn'butiongrowth (Robak 1960). Unstable snow cover that may limit is are therefore expected to be raised by aboutinfluence survival rates of spruce seedlings, may be 400 m over time, the birch limit by 450 m and the elmone reason (see Hagem 1947). It should be limit by about 350 m (Skre 1990).mentionedthat in addition to a more unfavorable
carbon balance, raised winter temperatures may alsoCause earlier dormancy breaking in some species, like GROWTH RESPONSES IN BIRCHbirch and Norwayspruce, that may leave the treesmore exposed to spring frost damage (Murray et al. To investigate the influence of the expected climatic1989, Hanninen et al. 1993). change on the respiration loss during winter and the
physiological status of the trees, some results areMethods are available for calculating long-term shown from a field experiment comparing mountain
respiration equivalent s based on data published in birch seedlings grown in fertilized peat on an oceanicmeteorological summaries (Skre 1971, 1972). There lowland site at Fana (50 m) and on a tree line site atis generally a linear decrease in temperatures with Kvamskogen (450 m altitude).
4,_ -- - " ULMUSGLABRA(Q_o=2.0)PICEAABIES(Q_o=2.7)
%
o
o
!O_
• 0 6 12 18 24 w
Temp(°C)
Figure 4.--Dark respiration rates in growing shoots of spruce (Dahl & Mork 1959) and leaf discs of elm, measuredin relative units, where the respiration at 10 °C is taken as unity. The elm leaves were grown at 15°C constanttemperature.
o
ProceedingslBFRA Assn 1997 meeting 293

., Picea abies
6b
•8 __ _ _ _ _ _ _ _ _i,,_ _ o Absent "10 oo o
o. 2 • Presentr,. • 12 o o o op. lilTromso
°oO o •3
,.14 o • oolboo • _ /Dag ali' • _ • go o°O 4
16 o • e • eoo 5
182 0 -2 -4 -6 -8 -10 -12 -14
TI°C
Ulmus glabra
9
11
13 _.cle° _ o o o 2 o Absent0 • o • Presento • o
•k.r-15 .. • • ° • • _"'""e_La- e_-_'"_ _J- ,, 3 EITromso-'-s.........._ • • • o_'6"_E_e _ iDag_i
17- . 4
19- 5 I
• 2 0 -2 -4 -6 -8 -10 -12 -14 w
TI°C
Figure 5.--The distributions ofPicea abies (top) and Ulmus glabra (bottom) shown in a thermosphere diagram wherethe mean January temperatures (7"1) are plotted against the corresponding July temperatures (T7). The presentdistribution limits (thick solid lines) coincide with isolines representing a constant accumulated annual growthrespiration equivalent to 2.70 and 3.42 units respectively, based on the figures in fig. 3. Main isolines _th arrows
' and the effects of an expected temperature rise of+2 °C in T7 and +4 °C in T1 on the distribution limits areindicated Y are shown with thin solid lines (dashed lines). The two subalpine localities Tromso and Dagali areplotted on the diagrams.
294 GTR-NC-209

. A comparison between the sites (fig. 7) shows the southern alpine (BH) ecotypes were adapted to aapproximately twice as_high growth rates at the low-growth strategy, where carbohydrates are storedformer locality. Birch seems to invest a relatively in woody tissue, mainly in roots, rather than beinglarge part of its resources into new growth of invested in new aboveground growth. This agrees AstructUral and photosynthetic tissue. By increasing well with earlier findings on alpine plants in e.g., _,their photosynthetic capacity, plants are able to Alaska (Chapin 1979). In a nutrient-poorreplace some of the carbohydrates that were environment with low competition, plants tend toconsumed in the growth process (see Thomley 1972), avoid growth rather than producing nutrient-deficientthis tendency is usually strongest in fast growing tissue. However, there is also a strong acclimation •southern ee0types (BAM) and in lowland birch effect of temperature (of. Billings et al. 1971). At(BAL). medium temperatures (10°C - 15°C) when
photosynthetic rates were high, the shoot/root ratios,The sec0nd.year (1987).growth rates at the lowland as well as the specific leaf area and leaf area ratio,site of Fana had increased to about four times the were low, indicating a higher proportion of structuralcorresponditig growth rates at Kvamskogen in tissue than when temperatures were higher and lesslowlarid birch and southern ecotypes of mountain favorable for photosynthesis (figs 8-9). By increasingbirch seedlings, while there was almost no effect of root growth, plants may be-able to absorb morealtitude On growth in the northern ecotype BJ from nutrients from the soil and increase their
Finnish Lapland. This is partly an effect of different photosynthetic capacity (c£ Thomley 1972). Thedaylength reactions, but experiments in a controlled plants grown at high temperatures also increasedenvironment also showed that the northern as well as
. Re.
6..
5 **%
• 4 • %
'_ Bm_Umit
3 _
• . _
, 1
, 0 It
' 0 200 400 600 800 1000 1200 u
" Meter
Figure 6.--Annual growth respiration in elm leaves before (solid line) and after the climate change at shelteredlocalities, as afunction of altitude in inner Troms, North Norway. The tree line of elm is indicated by thehorizontal dotted line). After Skre (1983).
Proceedings IBFRA Assn 1997 meeting 295

FAN._ l
35000-.
" 30000
¢_' 25000 """
, BJ
_i 20000 ---{_--- BH
¢_ 15000 t --.-_ .......asE 10000 . ---e---BAM
i_ .5000 t ...... _.=--_ __'/ .... _ ---x--- BAL
26.05 09.06 23.06 07.07 20.07 05.08 16.08 31.08 16.09 29.04 21.05 16.06 04.08 20.09 28.10.86 .86 .86 .86 .86 .86 .86 .86 .86 .87 .87 .87 .87 .87 .87
Date
KVAMSKOGEN
10000
9000
8000 ¢ BJ
"7000 ]__XI'_ 6000 --EJ--- BH
E 5000 --_..- BS
" ¢_ 4000
oE ' .--e--- BAM. , 3000
. m 2000 ---X--- BAL
1000
0
25.05 08.06 22.06 06.07 19.07 05.08 16.08 30.08 14.0903.05 16.05 09.06 26.07 13.09 25.10 |
•86 .86 .86 .86 .86 .86 .86 .86 .86 .87 .87 .87 .87 .87 .87 Ir
. . Date
- Figure 7.--Bi0mass (mg/p[ant) of white birch (Betula pubescens) and silver birch (B. pendula) seedlings grown infertilizedpeat from the 4-leaf stage during the 1986 and 1987 seasons at Fana (50 m) and Kvamskogen (450 m
altitude) in western Norway according to Skre (1993c). The ecotypes are." Betula pubescens. BJ:Kevo,
northern Finland (69°44"N) 200 m, BH- Blej_ell, southern Norway (59045 , N) 750 m. BS: Fana, westernNorway (60°16'N) 50 m, BAM- Linen, eastern Norway (60°51'N) 200 m. B. pendula_ BAL: L_ten, eastern
Norway (60°51'N) 200 m.
296 GTR-NC-209

-their photosynthetic rates and their optimum and pronounced in the arctic population (c£ Parker 1963,compensation temperatures for photosynthesis (fig. Volger & Heber 1975).10) relative to plants grown at lower temperatures.Respiration rates increased in leaf and stem tissue as a Aresponse to low temperature treatment, and decreased CONCLUSIONS •in roots (Skre 1993c). The arctic population (BJ) had
slightly higher photosynthesis rates that the southern In conclusion, experiments have shown that thepopulations. This is called metabolic compensation distribution limits of spruce and elm seem to coincide(Crawford 1989_ Mooney & Billings 1961) and is with their annual accumulated respiration rates, *looked at as a compemation for shorter growing indicating that dark respiration is an important limitingseason in northern areas, factor. The growth of spruce shoots and birch and
elm leaves was closely correlated with theirChemical analysis of birch tissue confirmed the results respiration rates at low temperatures.of the growth measurements (figs 11- 12). Whitebirch'seedlings increased their nitrogen and The results indicate that white birch to a certain extent
chlorophyll content/11 leaves as a response to elevated is able to compensate for decreased photosynthesistemperatures at the same time as there was a strong and source strength at elevated temperatures bydecrease in the total nitrogen and carbohydrate increasing its photosynthetic rates and optimumcontent in stem and root tissue. At low temperatures temperatures for photosynthesis. It also tends tothere Was also accumulation of soluble proteins in increase its shoot elongation rates, leaf area ratio andleaves, indicating/ncreased _ost resistance, most the nitrogen and chlorophyll content in
BH0,5
• 0,40
,_ 0,30._.0 o,20
- 0,1
0 I I ...... I ' ' ' I .................
' 0 5 10 15 20 25. IF
Temperature °C
,
Figure 8.--Shoot�root ratio _th confidence limits + 2 s.e., shown as a function of temperature in 6-week old sub-alpine white birch seedlings from Ble_ell, southern Norncy (Slcre 1991a).
Proceedings IBFRA Assn 1997 meeting 297

0,45
8
0,35 - / t,
,. o,=_., - -- --_-- SLA .
0,2 - ---o--- LAR
0,15 - .0,1- _
0,05 -;.
J
0 I I I I0 5 10 15 20 25
Temperature *C
Figure 9.--Leaf�area ratio (LAR) and specific leaf area (SLA) , Y being a function of temperature, in 6-week old sub-alpine white birch seedlings from southern Norway (Skre 1991a).
' leaves. Compared with evergreens like spruce, whitebirch seems to have a higher ability to take advantage Chapin, F.S.III. 1979. Nutrient uptake and utiliTationof increased CO2 and nitrogen content in soft, and by tundra plants. In: Comparative mechanisms ofseems to be more tolerant against elevated winter cold adaptation. Acad. press. N.Y. - London-temperatures. Toronto: 215-234.
• The results indicate that the expected global warming Crawford, R.M.M. 1989. Studies in plant survival.would result not only in much higher growth rates but Studies in Ecology vol. 11. Blackwell, Oxford.also in lower sink strength and less available energy 296 p.resources. Fast-growing species and ecotypes wouldoutcompete slow-growing ones. If the process went Dahl, E.; Mork, E. 1959. Om sambandet mellomtOOfast, the time would be too short for plants to tempemtur, _mding og vekst hos gran (Picea abiesdevelop new ecotypes that are adapted to the new (L.) Karst.). Meddr. norske SkogforsVes. 16:81-climate. Photosynthesis will take over as the growth- 93. (English summary).limiting process at ambient field temperatures andmany plants would therefore be restricted not only by Dormling, I.; Gustafson, A.; von Wettstein, D. 1968.
their upper distnSution limit but also by a lower limit. The experimental control of the life cycle in _icea. Printz (19.33) suggested that high winter temperatures abies (L.) Karst. Silvae Genet. 17" 44-63.
might restrict spruce growth _ West Norway, but his B. theory was later rejected (Hagem 1947). However, Douce, R.; Day, D.A. 1985. Higher plant cell
future climatic change might again lead to a situation respiration. Springer, Berlin- Heidelberg - Newlike the one predicted by Printz (1933). York - Tokyo. 522 pp.
Hagem, O. 1917. Furuens og granem fi'essetning iLITERATURE CITED Norge. Meddr. Vestl. forstl. ForsStn. 1,2: 1-188.
B'dlings, W.D., Godfrey, P.J., Chabot, B.F., Bourque, Hagem, O. 1947. The dry matter increase inD.F. 1971. Metabolic acclimation to temperature coniferous seedlings in winter. Meddr. Vestl.
in arctic and alpine ecotypes of Oxyria digyna, forstl. ForsStn. 8,1" 1-317.Arct. Alp. Res. 3: 277-289.
298 GTR-NC-209

Ta=21°C +t)
_ . 33 * 2.5_ "
' j •o 1 IABAM l
.0.5
n+ + 0 5 10 15 20 25 30 35
°c
Ta=15 °C
"_ 2E
. : 1.5.
-" I I"+ I""HI¢ E o.5
00 ql
•1¢ 5 10 15 20 25 30_, -0.5
°c
+
• . Te=9Oc
........................................
= 1.5 II
, " . .1 I.Bj I"_ ";'co'0.5 UI I-. __ o -..,.-..,,..-_, I''H I
>" 10 15 20 ' _'__n= .0.50 5 _5 J&BAMI
. .,_0 . -1. ' .a. -1.5 ...............
°c
Figure lO.--Photosynthetic rates (gmol C02 m2s "1)at 100tzmol m2s1photon flux density in leaf discs of matureleavesfrom three white birch populations asfunctions of temperature after gro_ngfor 3 weeks in an 18-hour
. photoperiod at 21°C, 15°C and 9°C For explanation of symbols, seefigure 7.
ProceedingstBFRA Assn 1997meeting 299

Betula pubescens
8
.. 3O.--
' 25-- "
o_e • 20 - m 9°Co !115 °C(.1= 15
_ _ 12121°C
10
5
0 _
Leaf Stem Root
Betula pubescens..
• 3,5
3
2,5-¢ D 9 °C
8, oc0
4" E]21 OC• _;1,5
1i
4
. 0,5 w
Leaf Stem Root
Figure 11.--The amounts of total non-structural carbohydrates as glucose equivalents (top) and total nitrogen(bottom) with confidence limits +2 s.e. in leaf, stem and root tissue of 6-week old sub-alpine white birch
_. seedlings from southern Norway, after growing in 9 °C, 15 °C and 21 °C, when averaged over the entirephotoperiod. After Skre (1991c).
300 GTR-NC-209

- Betulapubescens
A
• 16 *
14"1"
. ., | _
,6 tDeuIJ=0 _ 4
2
0 _ _ ---
9 15 21
Temperature °C
Betula pubescens
Figure t2.--Chlorophyll concentrations in leaves (left) and water-solubleprotein content as bovine serum albumine(BSA) equivalents (right) with confidence limits of +2 s.c. in leaves of three birch populations after growing in9 °C, i5 °C and 21 °C, when averaged over the entirephotoperiod (Skre 1991c). For explanation of symbols,see figure 7a.
Proceedings IBFRA Assn 1997meeting 301

populations of Oxyria digyna. Ecol. Monogr. 31"Heikinheimo, O. 1921. Die Waldgrenzw/ilder Finlands : 1-29.
und ihre ldinftige Nutzung. Mets/itiet. Moore, W.J. 1962. Physical Chemistry. 4. ed.Tutkimuslait. Julk. 4(3): 1-71. Longmans Green & Co. London. 844 p. ,
Hustich_ I. 1944. Nfigra synspunkter pA Murray, M.B.; Cannell, M.G.R.; Smith, R.I. 1989.skogsgr/insema i nordligste Skandinavien. Svenska Date of bud burst of fifteen tree species in Britain
•SkogsvF6r. Tidskr. 42: 132-141. following climatic warming. J. Appl. Ecol. 26: •693-700.
H_nninen, H.; Kello_ S.; Laitinen, K.; Pajari, B.;Repo, T. 1993. Effect of increased winter Parker, J. 1963. Cold resistance in woody plants. Bot.temperature on the onset of height growth of Rev. 29: 123-205.Scots pine: A field test ofa phenological model.
, Silva Fennica 27,4:251-257. Pedersen, K. 1993. Climatic models and feedback
mechanisms. Climatic scenarios.In: Impacts ofIversen, J. 1944. Viscum, Hedera and Ilex as climate climatic change on natural ecosystems with
indicators. A contribution to the study of the post- emphasis on boreal and arctic/alpine areas.glacial temperature climate. Geol. F6ren. NINA/DN, Trondheim, Norway: 9-11.F6rhandl. 66,3" 463-483.
Penning de Vries, F.W.T. 1972. Respiration andJunttila, O.; Heide, O.M. 1981. Shoot and needle growth. In: Crop processes in controlled
growth in Pinus sylvestris as related to environments. Acad. Press, N.Y.- London: 327-temperature in Northern Fennoscandia. Forest Sci. 347.
• 27,3: 423-430.
Kallio, P. 1984. The essence of biology in the North. Penning de Vries, F.W.T.; Brunsting, A.H.M.; vanNordia 18,2: 53-65. Laar, H.H. 1974. Products, requirements and
efficiency of biosynthesis: A quantitativeKarlsson, P.S., Nordell, K.O. 1987. Growth of Betula approach. J. theor. Biol. 45: 339-377.
pubescens and Pinus sylvestris seedlings inallmerm subarctic environment. Funct. Ecol. 1" 37- Printz, H. 1933. Granens og furuens fysiologi dg44. geografiske utbredelse. Nyt. Mag. Naturvid. 73:
169-219.
Lambers, H. 1980. The physiological significance ofc_de-resistant respiration in higher plants. Robak, H. 1960 Spontaneous and planted forests inPlant, Cell and Environment. 3" 293-302. West Norway. Skr. Rekk. Geogr. Avh. 7:17-34
• Lang!et, O. 1960. Mellaneuropeiska gransorter i RomeU, L.G. 1925. V/ixttidsunders6kningar hos tall
svensk skogbruk. K. Skogs- Lantbr.-Akad. och gran. Meddr. St. Skogf6rsAnst. 22" 45-124.Tidskr. 99: 259-329. (English summary).
Rutter, A.J. 1957. Studies in the growth of young. Michaelis, P. 1934a. Okologische Studien an der plant ofPinus sylvestris L.; I. The annual cycl_ of
alpinen Baumgrenze; IV. Zur Kenntnis des assimilation and growth. Ann. Bot. 21" 399-,1p25.winterlichen Wasserhaushaltes. Jahrb. Wiss. Bot.
80:169-298. Sarvas, R. 1972. Investigation on the annual cycle ofdevelopment of forest trees; I. Active period.
Michaelis, P. 1934b. ()kologische Studien an der Comm. Inst. For. Ferm. 76(3): 1-110.alpinen Baumgrenze; V. Osmotischer Wert undWassergehalt w_trend des Winters in den Skre, O. 1971. Frequency distributions of monthly airverschiedenen H6henlagen. Jahrb. Wiss. Bot. 80: temperature and their geographical and seasonal337-362. variations in Northern Europe. Meld. Norges
. Landbr.Hogsk. 50,9: 1-54.Mooney, H.A.; Billings, W.D. 1961. Comparative
physioiogocal ecology of arctic and alpine.
a02 GTR-NC-209
°
Skre, O. 1972. High temperature demands for growth Huds.) and maple (Acerplatanoides L.) leaves.and development m Norway spruce (Picea abies Medd. Skogforsk. 45,10: 1-26.(L.) Karst.)in Scandinavia. Meld. NorgesLaadbr.Hogsk. 51,7: 1-29. S_e, O. 1993b. Effects of altitude on growth in A
Skre, O. 1975. CO2 exchange in Norwegian tundra ecotypes of mountain birch (Betula pubescens "
plants studied by infiared gas analyzer technique. Ehrh.) and lowland birch (Betula pendula RotE)In: Fermoscandian Tundra Ecosystems; 1. Plants seedlings. Medd. Skogforsk. 45,11" 1-30.and Microorganisms. Springer Verlag, Berlin-Heidelberg - New York: 168-183. Skre, O. 1993c. Nutrient limitation in three birch "
populations and the poss_le function of
Skre, O. 1979. -The regional distribution of vascular alternative respiration as a growth regulatingplants in Scandinavia with requirements for high mechanism. Medd. Skogforsk. 46,8" 1-28.summer temperatures. Norw. J. Bot. 26:295-318.
Skre, O., Nes, K. 1996. Combined effects of elevated
Skre,, O. 1983. Respirasjon, vekst og fromodning som winter temperatures and CO2 on Norway spruceskoggrensextannende faktorer og basis for regional seedlings.Silva Fennica 30, 2-3: 135-142.inndeling i Skandinavia. In: Fagn_te iVegetasjonsokologi; 1983 March 7-8; Kongsvoll. Skre, O.; Oechel, W.C. 1979. Moss production in aDKNVS Rapp. Bot. Ser,; 1983-7: 33-59. black spruce (Picea mariana) forest with
Skre, O. 1990. Consequences ofposs_le climatic permafrost near Fairbanks, Alaska, as comparedtemperature changes for plant production and with two permafi'ost-free stands. Holarct. Ecol. 2:growth in alpine and subalpine areas in 249-254.Fennoscandia. In: Holten, J.I. (ed): Effects ofclimate change on terrestrial ecosystems. NINA Sveinbj6rnsson, B. 1983. Bioclimate and its effect onNotat 4: 18-37. the carbon dioxide flux ofmountain birch (Betula
pubescens Ehrh.) at its altitudinal tree line in the
Skre, O. 199 la. Temperature effects on the growth of Tometr_k area, Northern Sweden. In:mountain birch (Betula pubescens Ehrh.), elm Proceedings of the Northern Quebec Tree Line
(Ulmus glabra var. scabra Huds.) and maple Conference. Tree Line ecology. Centre d'etudes(Acerplatanoides L.) seedlings in continuous nordique, Quebec: 111-122. ,light. Medd. Skogforsk. 44,5: 1-44.
Thomley, J.H.M. 1972. A balanced quantitative
Skre, O. 1991b. Growth and development of model for root/shoot ratios in vegetative plants.mountain birch (Betula pubescens Ehrh.), elm Ann. Bot. 36:431-441.(Ulmus glabra Huds.) and maple (Acerplatanoides L.) seedlings in continuous light as a Thornley, J.H.M.; Hesketh, J.D. 1972. Growth andfunction of temperature. Medd. Skogforsk. 44,6: respiration of cotton bolls. J. appl. Ecol. 9:315-1-41. 317.
Skre, O. 1991c. Chemical composition of birch Tranquillini, W. 1979. Physiological ecology of the
seedlings, grown at varying temperature, light and alpine timberline. Tree existence at high latitudes iphotoperi0d. Medd. Skogforsk. 44,8: 1-28. with special reference to the European Alps.
' Ecological Studies 31. Springer Verlag, Berlin- w
Skre, O. 1992. Photosynthesis and dark respiration Heidelberg - New York. 137 p.rates in leaves of mountain birch (Betula
pubescens Ehrh.), silver birch (Betula pendula Volger, H.B.; Heber, U. 1975. Cryoprotective leafRoth.) and related tree species. Medd. Skogforsk. proteins. Biochim. Biophys. Acta 412" 335-349.45,6: 1-23.
Werner-Johannessen, T. 1960. Varmeutvekslingen i
Skre, 0. 1993a. Dark respiration rates and their bygninger og klimaet. Tanum, Oslo. 258 p.relationships with photosynthesis rates and (English summary).
. chemical components in mountain birch (Betulapubescens Ehrh.), elm (Ulmus glabra var. scabra
Proceedings IBFRA Assn 1997 meeting 303

BIOMASS OF FOREST PINE ECOSYSTEMS OF MIDDLE ZAVOLGIE: TO THE QUESTION OF.
GLOBAL WARMING
Eldar Kurbanov, Petr Sokolov _
ttl,
ABSTRACT.--Accurate region-wide estimates of significant changes in terrestrial carbon storage,forest biomass are the main factor in further resulting in exchange of CO2 between the land and
Understanding of carbon pools and simulations of atmosphere. The carbon that was bound in forestsfluxes. In the procedure for estimating biomass in the and in fossil fuels has been released back into the.,
MiddleZaVolgie region of Russia, we generally obtain atmosphere, and growth of the remaining forests anddata from sample plots established in the pine uptake by the oceans have not been able to absorb allecosystems. For each biomass component, analysis of the "additional" carbon (Houghton et al. 1990).suitability ofthe most common forms of simple linear Recent estimates of the global C cycle indicate thatregression equations was made. Data obtained on combustion of fossil fuels accounts for 5.5 + 0.5 Pgforest ffme biomass allows us to analyse main trends C/yr (Pg = 1015g) and changes in land use andin the dynamics of different forest ecosystem deforestation for 1.6 + 1.0 Pg C/yr of the total netfractions. The study indicates a great potential anthropogenic sources of 7.1 + 1.1 Pg C/yr (Shimelbiomass growth in normal pine stands. 1995). Uptake by the ocean is estimated to be 2.0 +
0.8 Pg C/yr, and accumulation in the atmosphere tobe 3.2 + 0.2 Pg C/yr.
INTRODUCTION It is important to study the C sequestration of forestecosystems since they contain over 75% of the carbon
The amount of carbon in the forest ecosystems of the accumulated in terrestrial vegetation (Olson et al.Earth in the near furore will be of special interest 1983), and changes in this reservoir are large enoughamong scientists. Increasing carbon dioxide (CO2) to affect global climate (Smith and Shugart 1993).concentration in the atmosphere is resulting in On the other hand, the predicted climate change mayenhanced greenhouse effect and global warming, alter the productivity of forest ecosystems, thus,which according to pessimistic prognoses could result altering their ability to sequester carbon. Increasingin more melting of polar ice and flooding over CO2 concentration in the atmosphere also tends tolowlands (Houghton and Woodwell 1989), droughts, increase the growth of vegetation, at least in the shortmad more fi'equent forest fires, term (Houghton et al. 1992).
As for the amount of carbon production and the It is well known that by improving methods of forest
duration of its sequestration, the forest ecosystems of production, optimization of age and species structurethe planet are considered to be the most reliable of forest ecosystems, and additional reforestation ofsystem which may help in mitigation of the enhancing the areas there is an opportunity of sequestering a
' greenhouse effect. In fact, several assessments (Tans certain amount of CO2 t_om the atmosphere intoetal. 1990; Kauppi and Tomppo, 1993; Dixon et al. phytomass. In connection with the above, mankind1994) show that forests in the temperate and boreal on the border of the third millennium is coming to azones have been carbon sinks for the past few new ecologically-oriented paradigm on the utilizationdecades, of forest ecosystems. That, undoubtedly, would i
, require reconsideration of some points and matters inCarbon has been accurnulating in the atmosphere the policy of forest utilization and forest production
- since the large-scale exploitation of forests began, and due to the development of new tendencies in forestduring the last 100 years carbon accumulation has management. In connection with this, at the latestbeen enhanced considerably due to increasing use of environmental conferences held by the UN much
- fossil fuels. Changes in land use and land greater attention has been paid to the Earth's forests.management, especially deforestation, cause
. 1Eldar Kurbanov, assistant professor, and Petr Sokolov, professor, Mari State Technical University,Department of forest mensuration and inventory, Yoshkar-Ola, PI. Lenina, 3, Russia. E-mail:
eldar@marstu, mari.su.
304 GTR-NC-209

INJ
|Expected Warming has been estimated to alter the extends to the south of this line. The taiga zone Ndism'bution ofvegetation over the globe, especially in includes the territory of the northern Kirovskayathe boreal and temperate zones (Smith et al. 1992, oblast. IIIMomerudet al. 1993). Because boreal forests store a Iilarge mount of carbon and are located in latitudes In general, the land surface of the territory is a hilly /predicted to undergo the greatest warming, they may plain, the height variations being almost unnoticeable _ 'play a key role in future carbon fluxes (Dixon et al. (from 45 m to 275 m above the sea level), and A
1994). transitions from the lower to the higher parts are quite " 1gradual. The highest parts are located in the
Russia has approximately 30% of the boreal forests southeast. From here the surface descends towards
(Murray 1993), and together With Canada and the the Volga River valley, and along the fiver there ,USA theseareknown to be one of the main reservoirs extends central lowland in the form of a wide bandof sequestered carbon, which is becoming an object of with a great number of lakes, marshes and rivers.the world community's attention. Above the valley of the Volga-fiver rises a high fight
bank in the form of a steep ledge with deep ravinesThe boreal forests of higher latitudes, Unlike the forest and gullies.ecosystems of the tropical and subtropical zones, are i
formed by a small number oftree species and are Soil factors rightfully have a main role in forming ofcharacterized by slow biological cycles. The amount certain types of forest ecosystems within congenericof annual fall of plant residues in such ecosystems climatic conditions. On the left bank of the Volga,exceeds average annual decomposition. In this there are mainly sandy and sandy loam soils, and in itsconnection, the boreal forests accumulate carbon not eastern part - loam, turf-carbonate, brown-gray andonly in the wooden biomass but also in litter, coarse turf-ashen-gray forest soils. The most widespreadwoody debris, soil organic matter and peat. soils in the taiga zone of Middle Zavolgie are podsol
types, which in turn divided into three subtypes: gley-The aim of this study was to examine biomass podsol, typical-podsol and humic-podsol.dynami'es with age in pure normal (fully stocked) and
'"modal (typical) pine stands under current climaticconditions at the stand level in the Middle Zavolgie Climateregion of Russia. Ecosystem components that wereconsidered in the assessment include all tree fractions The climate of Middle Zavolgie is determined by theand tmderstory (undergrowth, bushes and forest continental situation of the region, landscape relieffloor), The investigation of normal and modal pine and rotational impacts of the air mass from thestands forms the basis for understanding the dynamics Atlantic and Nordic oceans and the dry continentalof C sequestration for the conditions of Middle mass from Kazakhstan and Central Asia. The climateZavolgie and provides a baseline for further of the Marl E1 Republic is considered to besimulations of carbon cycles, moderately continental with relatively stable weather
in winter and in summer, but changeable and varyingconditions in spring and in autumn. The mean annual
FOREST GROWTH CONDITIONS IN MIDDLE temperature varies from +2.20 C in the northeasternZAVOLGIE regions, up to +3.1° C in the southwest. In recent
years, winter months have been warmer than theyTerritory used to be. An average amount of precipitation is 450
ram-500 nma, of which 200 ram-250 mm falls during !Middle Zavolgie is located in the eastern part of the the vegetation period. On the whole, Middle Zavolgie
' Russian plain. This region includes the Volgo- is located in the zone of variable moisture; years and wVyatski and Povolzskij economy areas including the seasons with sufficient and sometimes even withrepublic of MariEl and Tatarstan, Nizegorodskaya excess precipitation are interspersed with dry ones.and Kirovskaya oblasts (247 thousand km2).
Middle Zavolgie includes three forest growing zones: Progress in growth and productivity of foresttaiga (southern part), mixed forest, and forest-steppe, ecosystems depends also on the duration of theand therefore has appreciable landscape diversity, vegetation period. Its beginning and end are roughlyThe Volga fiver serves as the natural western border determined by mean daily air temperature of+ 10°C,
of physiographic and natural conditions. The territory and soil temperature of+5°C. Accordingly, annualnorth of a line formed by the Volga River (east productivity can be related to the sum of activethrough Kazan) and the fight bank of the Kama River, temperatures greater than +5°C or + 10°C, or to theand extending up to eastern Tatarstan border, belongs length of the period when the plants have green-to the mixed forest zone. The forest-steppe zone
Proceedings IBFRA Assn 1997 meeting 305

leaves. The duration of the period with mean daffy air THE STATE OF THE PROBLEM--FORESTStemperature higher than + 10°C is typically 150 days. AND GLOBAL WARMING
The latest publications and research on the subject offorests and carbon storage couM be divided into the
The Main Forest-Forming Species , following subject areas:
On the territory on the fight side of the fiver, 1. Evaluation of the carbon stock and its annual
dominant tree species are Scots pine (Pinus sequestration in the forest biomass. (KarjalainensYlvestris), birch (Betula pendula and pubescens), 1996, Kauppi et al. 1992; Alekseyev and Birdseyspruce (Picea abies and Obovata), aspen (Populus 1994; Isaev et al. 1993; Isaev et al. 1995).tremula), Oak (Quercus robur) is not as widespread. 2. The prognosis for dynamic changes under :Tree species proportion of the wood stock in Middle different climatic scenarios due to increasingZavolgie can be seen in fig. 1. atmospheric CO2 concentrations (Dixon 1994;
• Melillo 1993; Cannell 1995; Zavelskaya 1993).The main landscape background in'the natural 3. Determination of the anthropogenic emission ofcomplexes of the forest group is created by pine CO2 and opportunities for its mitigation through
_stands, which occupy 32 % of the total forest area of the photosynthesis process and carbon3,197x i 03 hectares. Pine occupies vast territories in sequestration by vegetation (Dudek 1990;Kirov and Nizegorodskaya obiasts. Birch stands Schroeder 199 f; Utkin 1995).cover 29% of the forest area, mainly young and 4. Global carbon cycles in natural ecosystemsmiddle-aged stands appearing on the vast areas of (Dixon 1991; Tarko 1994, Kobak 1988).slashes and clearings. Spruce stands occupy 5. Biological and chemical carbon emission in the
expansive territories in the north-western and form of CO2 into the atmosphere caused by forestnorthern regions Of the republic. Aspen is common in fires and forest utilization (Fosberg 1996;mature and young stands. Considerably less Furyayev 1996).widespread are lime (Tilia), alder and oak forest
. ecosystems. With respect to annual carbon Among all the areas listed, the first topic is of thesequestration, the principal species are pine, birch, most applied significance in the problem of possiblelarch, spruce, and aspen. The most promising among global warming. After determining the patterns andthem in terms of duration of the annual period of the dynamics of organic carbon sequestration by thecarb0naccumulation under the conditions of the phytomass of forest ecosystems, one could mitigateMiddle Zavolgie is Scots pine. possl_oleglobal climatic changes through enhancing
carbon sequestration in the forest ecosystems by.Among pine species Scots pine occupies the largest applying science-based methods and approaches.area and is believed to accumulate the greatest
biomass. Owing to being frost-resistant, drought- Recent assessments of the organic carbon stocks in. resistant, and hardy to a range of soil conditions, it Russia are based on several methodological
grows on the plains and in the mountains, forming approaches. Most of the researchers are known to
•island stands in the forest-steppe and steppe zones, use various maps combined with databases toScots pine's ability to grow in different climatic and differentiate all the vegetation layers of the forestsoft conditions has contributed much to the formation
ecosystems into phytomass fractions (Bazilevichof both pure stands and mixed stands with spruce and 1993).birch--which are very diverse in composition and !
. productivity. Pine possesses greater stability to wind Another group of researchers uses results from forestthan other species. In the areas near pine forests, the inventory, taking into account total areas and stoUcks
. amount of precipitation and the air humidity within of wood with respect to age groups of the mainthe vegetation period is higher than in the open species. Then, through conversion coefficients thatsteppe; which allows cultivation of agricultural crops express relationships between the volume stock of theeven in dry years. Unlike other species, which are stemwood and the mass of various tree fractions
characterized by high increment of wood and short (wood, bark, branches, roots and leaves) calculation islifespan (predominantly broadleaf softwood species), made of the total phytomass stocks per unit area.pine stands are characterized by stable growth and Determinations of the carbon have been appliedhigh quality. The pine forest type can be both through absolutely dry mass as well as throughindigenous and derivative. After harvesting and fires, conversion coefficients proposed by (Kobak 1988).' pine usually regenerates quite well.
In Russia there are lot of large research centersengaged in forest studies and investigation. But
306 GTR-NC-209
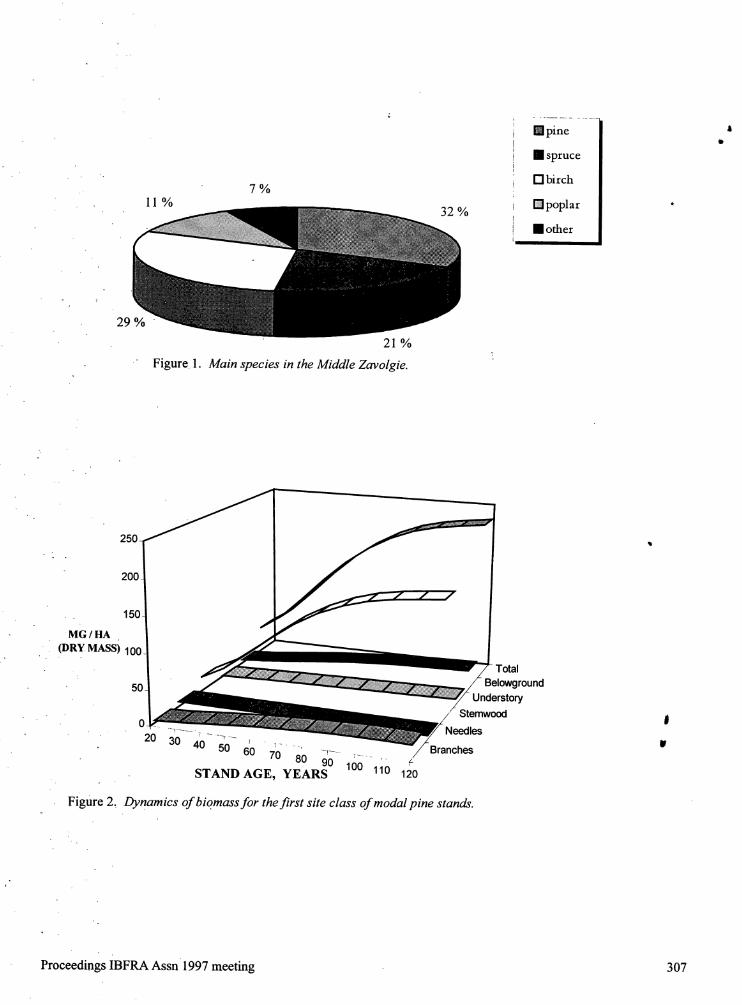
rapine AO
m spruce..
7 % V! birch
11% 32 % Qpoplar •
mother
29 %
21%
" Figure 1. Main species in the Middle Zavolgie.
200.
150
MG/HA
(DRY MASSi 1(
TotalL
50 BelowgroundUnderstory
/
0 / Stemwood |...._........... NeedlesII
200-. 30 4 -_........ r - ..., U
50 60 -,_ --!...... BranchesIu
T......... ,.. /--
80 90 100 110 '" " STAND AGE, YEARS 120
Figure 2. DYnamics of biomass for the first site class of modal pine stands.
Proceedings IBFRA Assn 1997 meeting 307

currem situations, such as lack of money, often result MATERIALS AND METHODSin irfpossl'oility of implementation and realization of
serious investigations. Nonetheless, evaluation and Experimental data were gathered from sample plotsestimation of organic carbon stocks in the forest established in normal (fully stocked) and modalecosystems'of Russia have been carded out by a : (typical) pine stands. Field material collection wasnumber of large research centers. These studies have carded out by using established sample plot methodsused various methodologies, however, and results on pine-dominant forest ecosystems. Materials for bhave often been contradictory. These divergences, in the study also included data gathered over differentour opinion, arise because calculations of the global years from sample plots established by thecarbon balance are generally carded out through Department of Forest Mensuration and Inventory ofextrapolation of data from a limited number of the Mari State Technical University. •samples to estimate phytomass over a rather vastterritory. Besides, these estimates typically do not Based on forest inventory data, we determined thetake into account the fractional phytomass distribution of areas with dominance of Pinuscomposition of the forest ecosystems, fitter, current sylvestris according to the site classes, basal area andincrement, or differences with respect to site, forest site class of the forest stands. Sample plots were
_types, and forest stands, chosen according to Standard Guidelines (1983).Complete reestimation and reevaluation sampling was
Therefore, to obtain accurate estimates of the carbon done by measuring a-minimum of 200 trees in middle-balance 0f the forest ecosystems of Russia, it is aged, maturing and mature pine stands and 400 trees
necessary to carry out research at the regional level, in young forest stands (table 1). Total height andwith accurate biomass data for individual studies diameter in each of 3 central diameter classes were
taking into account all above mentioned factors on the measured on 5 trees; forest floor cover, soils, litterterritories of different forestry enterprises. Studies of and canopy were described in detail.
this kind would contribute much to the developmentof sound, ecologically-based strategies of nature The understory of pine ecosystems includes forestutilization at the level of economic regions, floor vegetation, undergrowth and bushes. In the pine
ecosystems of Middle Zavolgie, undergrowth includesregeneration of spruce, birch, Populus and oak.Important shrubs include alder buckthom (Frangulaalnus), juniper (Juniperus communis), filbert (Corylusavellana) and Euonymus verrucosa. Forest floorvegetation is mainly represented by Vaccinium vitis-idaea , Vaccinium myrtillus, Calamagrostisarundinacea, Geranium sylvaticum, Vicia sylvatica,Majanthemum bifolium, Hieracium umbellatum,Bryophyta, Fragaria vesca, Lycopodium clavatumand Antennaria dioica.
Table 1.--Data from sample plots.
Stand Age Number of Number of Mean Mean Basal area Volume
plots model trees diameter hei[_ht I;, i
Years Cm M M2/hectare M3 Ir20- 28 25 438 6.4- 13.1 6.3- 12.8 12.6-26.4 64- 146
30-45 26 392 11.6- 16.3 11.4-17.6 24.6-33.4 138 - 242
56-.78 24 322 19.9- 31.6 17.7- 26.6 33.6-42.6 263 -451
82- 98 15 196 26.4- 35.2 18.8- 27.2 34.6-44.3 320- 524
104- 118 6 78 28.4- 36.8 20.2- 28.9 36.4-46.9 330- 590
308 GTR-NC-209

Representativesamples were taken from trees beyond But as a result of harvesting activity, the forest standsthe plot boundaries as needed to adequately typical of those used to construct these tables are notcharacterize the diameter classes. 15 to 20 trees were common. Therefore, the most complete and correct
collected per sample area for felling. To obtain this picture of accumulation index growth dynamics canmany trees from within the plot areas it would have be given by the modal forest stands as the most ,been necessary to compromise with the requirement widespread at present. *of representativeness (Sokolov 1978). Stem defectsper meter Were recorded for each sample tree.
Crown Phytomass
The crown0feachsample tree was cut and divided
into three parts: upper, middle and lower. The Correlation coefficients were calculated for regressiondiameter, weight and length of each branch was equations of interdependence between the dry crownmeasured and divided into sections knoxv-nas mass and the dendrometry of the stern. Crown massbranches (diameter of more than 0.8 cm) and wood has a very high positive linear correlation withgreenery (d'mmeter- less than 0.8 cm). Branches diameter of crown (Dcr) and diameter at breast heightwithout needles were immediately weighed on scales, (D). For crown length (lcr) this dependence can alsowith a simple comparison made between the weight of be considerable. The dependence of crown mass on
branches withneedles and those without them. To the height (H) and the:age of trees (A) has beendetermine the moisture of the branches and needles of characterised as modei'ate (Kurbanov 1994).every part of the crown, three middle-sized modelbraxaches were taken.
In recent years, the index, D2H, has become verypopular among researchers as a factor takin"g into
The moisture content of pine wood varies by location consideration the basal area and the height of the tree.in the tree and by length of time since cutting. We analyzed the relationship between this index andMoisture occurs in wood as free water in cell cavities dry crown mass. While correlation coefficients wereanda s absorbed water in the cell wall. The condition high, use of this index can be impractical because ofthat exists in a cell when the cell cavity contains no the difficulties connected with its calculation (it isfree water and the cell Wall is saturated with bound easier to use only D or H). Therefore, we used thewater is known as the fiber saturation point (Husch et dependence of the dry crown mass of the trees onal. 1982). It is customary to express the moisture crown diameter, diameter at breast height and crowncontent of wood as a percentage of dry weight. The length in studying crown biomass of pine trees for thedry weight of pine crown fractions has been obtained Middle Zavolgie Region.by drying a sample of branches and needles at 105 °C•Until a stable mass has been reached. The percentageof moisture is calculated from:
Belowground Mass
]V[C = (W w - Wd)/W d
Where: Belowground phytomass investigation is a very
Mc - moisture content as a percentage of oven-dry complicated task. Therefore we did not conductexperimental studies of the pine roots on the sample
mass plots. The phytomass of roots was calculated with !. Ww- green mass ofwood the help ofthe equation ofShvidenko et al. (1996) for
Wd - oven-dry mass of wood the European part of Russia:
The sample.areasestablished in pure
pinetum/cowbe_were characterized by density from Rv(bi) -(a 0 + a_.A + a 2 . A 2 ). A a3 . V a4 ,0.5 to 1.0. Undergrowth consisting of pine, aspen,spruce and birch is considered to be within sufficient
growth. To investigate pine forest stands, a total of where R_tb_)is belowground forest stand phytomass96 sample plots were established and 1,426 sample (megagrams of dry matter per cubic meter of greentrees were harvested (table 1). The sample plots took growing stock), A is the average age of a stand ininto account all age classes of forest stands, years, V is growing stemwood stock in m3, and a0, a_,
Currently, when carrying out forest assessment works a2, a3and a4are regression coefficients.
in.the region of the Middle Zavolgie, it is common touse normal yield and growth tables for pine stands.
Proceed'rags IBFRA Assn 1997 meeting 309

Since neither of the allocation equations considers fine where C 1'- estimated values of parameter C 1roots, it is assumed that fine roots have about one according to the 3rd degree polynomial.
third ofthe mass offoliage (Vanninen et al. 1996). 5. The estimate ofparameter C2 is then smoothedaccording to the 3rd degree polynomial.
Stem Phytomass This algorithm was used as the basis for modelling theb
dynamics of the 4 accumulation indices of the pine
Mitscherlich's function was used for pine stand forest ecosystem: the mean diameter and height, basalgrowth calculation in Middle Zavolgie (Chemilda area, and the stem volume.1992). This function meets all the necessaryrequirements for the description of general patterns of On the whole, it should be said that approximation ofthe growth of living organisms. The function is as accumulation index dynamics for pine stands showedfollows: good results with the help of the Mitscherlich
function. This was especially true while fitting stem
T =Tmax[1-e(A*Cl)]c2, volume, diameters and heights. The only drawback is, : the fact that the function has an asymptote parallel to
the age axis and, therefore, is considered to be strictlywhere T- modeled accumulation index: Indices may increasing. Therefore, its application is limited by therepresent: diameter (cm), height (In), sum of cross- age of natural maturity, when the growth decreases.sectional areas (m2), or volume stock (m3); Tma_-
a.symptotical value of the accumulation index for aConversion of stem volume (Vst, m3) to biomassgiven natural forest stand development; A - age, years;
e- base of the natural logarithm; C1 - growth components (Mst, Mg) is made by a biomass ratio (Rb,parameter; C2- parameter of curve form. Mg/m3):
' The Mitscherlich's growth function is considered to Mst= Vst R4,be non-linear as far as the parameters. To find..
optimal numerical values of the parameters C1 and C2 The biomass ratio (wood density) varies substantiallythe iteration method is used: in relation to the quality of the site, position of the
tree, tree age, and the section of stem. Wood density
I, For each point of the natural stand with respect is lower in young trees compared to mature trees, andto age for the modeled accumulation indices, C1 lower on fertile sites compared to poor sites; •i.e., fast
is calculated, for several fixed the of C2 growth rate of Scots pine leads to lower wood density(1,2,3,4... 10), according to the formula below: than slow growth rate (Kellomaki et al. 1992). The
overall mean for Scots pine of 381 kg/m 3 was appliedin calculations.
CI - Ln( 1- (Top(A)/T.._)'/c2)-A
RESULTS AND DISCUSSION
where Top(A)- actual value of the accumulation_index in the age A; i- 1,2,3,4 ..... n; n- the Analyses of suitability of the most common forms of
. quantity of observations simple regression equations were made for the J
2. A value of the parameter C2 is then chosen to determination of each component of the crowntl_ass.. minimize the error of the function. Equation types and variable transformations used to
3. At this constant value of parameter C2, smoothed linearize them for determination of correlationestimates of parameter C 1 are made for all points coefficients were:
- of the natural stand using a 3rd degreepolynomial.
4. • Parameter C2 is estimated according to thefollowing equation:
C2 = Ln (Top(A)/Tmax)
Ln(1 - e"A*cl'),
310 GTR-NC-209

" Model Variable transformations
y x_
Linear y , x
Square root-X y square root x ,O
Logarithmic-X y log x
Square root-Y square root y x..
Multiplicative log y log x
. Exponential log y x
S-curve log y 1/x
Double reciprocal 1/y 1/x
Reciprocal-X y 1/x
Selection of equations was based on the amount of 0.95, indicate a relatively strong relationship betweenexperimental data available, the statistical criteria of the variables.equations, and the distn'bution of residuals.
Multiple regression models (equations) forAfter finalysing the suitability of the equations for phytomass, including a great number of thedetermining needle mass of pine crowns, the best fit dendrometry indices, were analysed. It wasto the data is a square root-X equation, followed by determined that the combination of such dendrometrythe logarithmic and linear equations (table 2), where indices as age, diameter at breast height and crownthe independent variable is diameter at breast height, diameter are considered to have no essential' advantages over the models including only diameter at
breast height or crown diameter.Of the models fitted, the square root-X model yieldsthe highest R-squared value with 93.24%. This is the
model that we selected. There is a statistically Thus, the equation of form square root-X for pine
significant relationship (p<0.01) between needle mass needle mass and the exponential model for branchand diameter at breast height. The standard error of mass are considered to be the most acceptable for •the estimate shows the standard deviation of the calculations of the crown phytomass (dry weight
residuals for the model to be 0.67. The equation of basis) of pine stands. Therefore, fiarther calculationsthe fitted model is" Table 3 shows the results of fitting of the general crown phytomass were carried out byseveral models of dependence of mass of pine this type of equation.
-branches on diameter at breast height.
• ' In order to examine the relationships ofunderstory
Of the models fitted, the exponential model yields the and site conditions to stand age, we simulatedhighest R-squared value with 90.16 and therefore this temporal dynamics of different phytomass
• ' is the model that we selected: components using data from sampling plots.
!, branch mass = exp(0.32 + 0.08*D) For the undergrowth the best fit was a square root-Y
. regression equation: w
- Needle mass =- 2.85 + 1.92" (D) "2Undergrowth = (a + b Age) 2,
The R-squaredstatistic indicates.that the model as where a = 3.47, b = 0.42titted explains 90.16% of the variability in branchmass alter transforming to a logarithmic scale tolinearize the model. The correlation coefficient of
Proceed'lngs IBFRA Assn 1997 meeting 311

Table 2.--Comparison of alternative models relating needle mass to diameter at breast heighto
Model Correlation R-squared
= %
Square root-X 0.9656 93.24 *Linear 0.9604 92.23
Logarithmic-X 0.9428 88.90
Square root-X 0.9156 83.84
Multiplicative 0.8941 79.93
Exponential 0.8458 71.53S-curve -0.8077 65.24
Double reciprocal 0,7989 63.83
Reciprocal-X -0.7704 59.35
Table 3.--Comparison of alternative models relating branch mass to diameter at breast height.
Model Correlation R-squared
%
Exponential 0.9495 90.16
Square root-Y 0.9481 89.89
' Multiplicative 0.9396 88.28Linear 0.9117 83.13
Double reciprocal 0.8902 79.24
Square root-X 0.8767 76.85S-curve -0.8588 73.75
Logarithmic-X 0.8221 67.58
Reciprocal-X -0.6842 46.81
Since the P-value is less than 0.01, there is a linearize the model. Forest floor increases with foreststatistically significant relationship between age up tO 80-90 years. Then due to opening of theundergrowth and stand age at the 99% confidence forest canopy, which allowed more light to reach thelevel, forest floor, the accumulation was stabilized.
Mass ofbuslaes was best descn_oedby a multiplicative The total phytomass of the understory of the normalmodel: and modal pine stands increases with stand age. The
relationship between forest floor and stand age is#,
modeled as an S-curve, with growth stabilizing afterBushes = a Age b, 80-90 years. Undergrowth was better descn'bedUoy
- where a = - 4.80, b = 2.45 square root-Y and X equations with high R-squaredvalues. Accumulation ofbiomass in bushes has a
Mass of forest floor for site class 1 of pine modal multiplicative and exponential character._
stands was best described by an S-curve model"
Data on the crown mass, stem, understory andFloor = exp (a + b/Age), belowground phytornass (Mg/ha, Mg = megagram =
where a = 2.44, b = - 38.76 106g) for the modal pine ecosystems are in table 4.This composite table of forest pine biomass allows usto analyse main trends in the dynamics of different
The R-squared statistic indicates that the model as forest ecosystem fractions. As an example, dynamics. fittedexplains 95.12% of the variability in forest floor of the stem and crown fraction mass for site class 1 of
mass atter transforming to a logarithmic scale to
312 GTR-NC-209

IIP
3O
25
2O
MG/HA
(DRY.MASS) 15
10
_. 5 BelowgroundJ
Understory0
, Needles
20STAND30 40AGE,5'0yEARS6070 30 90 100 110 120 Branches
Figure 3. Dynamics of crown, understory and belowground mass for the
first site modal pine stands.
350 .........................
Normal l site' 300i
.= _ 250 , Normal2 site_ N 200 i .. - 22 -"-- ---.2._.'.2.'-'_" Modal 1 site
_ ._" 150,' ..J-..._'_ ."_" "--" _''"_ .o.._ : _ ,--.. -- Modal 2 site
_ooi_ ;':"""50 _ _._'" "• .
- O-I ..... _, _,--m--_-- I-----F-- I t J t --_• , ,
0 O 0 0 0 0 0 0 0 0 0
STAND AGE, YEARS
Figure 4. Dynamics of total biomass for the normal and modal pinestands. |
,
. it
Proceedings IBFRA Assn 1997 meeting 313

of the stem and crown fraction mass for site class 1 of Carbon pools and flux of global forest ecosystems.modal pine stands are illustrated in fig. 2 and fig. 3. Science. 263:185-190.Total stem mass over stand ages of 20-120 years hasstable growth. Total crown mass (branches and Dixon, R.K.; Turner D.P. 1991. The global carbonneedles) increases up to 90 years and then drops off , cycle and climate change: responses and feedbacksslightly. Needle mass is maximum at 20-30 years and from belowground systems. Environmental Athen has a stable rate of decrease up to 120 years. Pollution. 73: 245-262. bBranch mass reaches maximum at 100-120 years.Understory phytomass slowly increases with age. Dudek, D.J. and Le Blanc A. 1990. Offsetting new
CO2 emissions: a rational first greenhouse policy
Normal pine stands have more potential productivity step. Contemporary Policy Issues 8: 29-42. "than modal stands. As is seen from fig. 4, normal pinestands of Site class I have the higher total biomass Forest fund of Russia. 1995. Russian Federal Forest(tree phytomass and understory). Modal pine stands Survice.Moscow. 359 p.of site class 2 have the least total biomass
Productivity. At the end of 120 years normal stands Fosberg, M.A.; Stocks, B.J.; Lynham, T.J. 1996.of site class 1 accumulate 308 Mg/ha of total biomass, Risk analysis in strategic planning: fire and climatewhile site class 2 modal stands accumulate only 213 change in the boreal forest. Proceedings of theMghaa. Conference: Fire-in ecosystems of boreal Eurasia.
Kluwer Academic Publishers (Netherlands): 495-
In conclusion, it is necessary to note that the 505.
phytomass dynamics of normal and modal pine standsin the Middle Zavolgie can be used for further Furyayev, V.V. 1996. Ecological problems ofborealestimates of carbon stocks and carbon budget on the forest fires: expkience and ways of internationalstand and the regional level, collaboration. Forest management (Moscow). 3"7-9.
ACKNOWLEDGEMENTS Houghton, R.A. and Woodwell G.M. 1989. Globalclimatic Change. Scientific American. 260: 36-
The study was supported by the EFI (European 44.Forest Institute). Special thanks are extended toTimo Karjalainen for useful comments on earlier Houghton, J.T.; Callander, B.A.; Varney, S.K, 1992.
• drafts of the paper. Climate change 1992. The supplementary reportto the IPCC scientific assessment. 200 p.
LITERATURE CITED Houghton, J.T.; Jenkins, G.J.; Ephraums, J.J. 1990.Climate change. The IPCC Scientific Assessment.
Alekseyev, V.A.; Birdsey, R.A. 1994. Carbon in 364 p.• .
forest ecosystems and peatlands of Russia. Husch, B.; Miller C.I." Thomas W.B. 1982. ForestKrasnoyarsk: Akademgorodok. 170p.
mensuration. New York: John Wiley & Sons.337 p.
Basilevich, N.I. 1993. Biological productivity of theNorth Ewasia ecosistems. Moscow: Nauka. 293
Isaev, A.S.; Korovin, G.N.; Suhih, V.I.; Titov, S._.;
ill
' P" Utkin, A.I.; Golub, A.A.; Zamolodchikov, DIG.;Cannell, M. 1995. Forest and the global carbon cycle Pryaznikov, A.A. 1995. Ecological problems of
- in the past, present and future. Joensuu: EFI. 66 CO2 accumulation by reforestation in Russia.P' Moscow: Rosselhosakademiya. 155 p.
" Chernikh, V.L. 1992. Modelling stands growth on Karjalainen, T. 1996. Dynamics of the carbon flowthe PC. In: Proceedings of the conference on the through forest ecosystem and the potential ofproblems of forest biogeocenology and carbon sequestration in forests and wood productsmethodological bases of their solution, 1992; in Finland. University of Joensuu. Finland. 80 p.Yoshkar-Ola, Russia: Mary polytechnical institute D.Sc. thesis.Press: 137-138.
• Dixon, R.K.; Brown, S.; Houghton, R.A.; Solomon, Kauppi, P.E. and Tomppo, E. 1993. Impact ofA.M.; Trexler, M.C.; Wisniewski, J. 1994. forest on net national emissions of carbon dioxide
314 GTR-NC-209

.
Proceedings-IBFRA Assn 1997 meeting 315

in West Europe. Water, Air and Soil Pollution 70: Schroeder, P.; Ladd L. 1991. Slowing the increase"187- 196. of atmospheric carbon dioxide: a biological
approach. Climatic Change. 19" 283-290.
Kauppi, P.E.; Mielikainen, K.; Kuusela K. 1992.Biomass and carbon budget of European forests, : Shvidenko, A.; Venevsky, S.; Raile, G.; Nilsson, S.1971 to 1990. Science 256: 70-74. 1996. Dynamics of fully stocked stands in the A
territiry of the former soviet Union. Laxenburg; bKellomaki, S.; Vaisanen, H.; Hanninen, H.; Kolstrom, International Institute for Applied Systems
T.; Lauhanen, R.; Mattila, U.; Pajari, B. 1992. Analysis: Working paper. 69 p.Sima: a model for forest succession based on the Smith, T.M.; Shugart, H.H. 1993. The transient
carbon and nitrogen cycles with application to response of terrestrial carbon storage to asilviCultural management of the forest ecosystem, pertubed climate. Nature 361" 523-526.Joensuu. Silva Carellica 22" 85 p.
• Smith, T.M., Weishampel, J.F. and Shugart, H.H.Kobak K.I. 1988. Biocomponents of the carbon 1992. The responce of terrestrial C storage to
cycle. Leningrad: Gidrometeoizdat. 248 p. climate change modelling C dynamics at varying, _ spatial scales. Water, Air and Soil Pollution 64:Kurbanov, E.A. 1994. The regularities of growth, 307-326.
accumulation of crown phytomass and ages ofrape in the pine stands of the Mari Zavolzhie Sokolov, P.A. 1978. Status and theoretical grounds
forests, Technical University ofMari El;Yoshkar- of linden stands formation. Yoshkar-Ola (Russia):Ola; Russia. 133 p. M. Sc. thesis MariPublishing house. 207 p.
Melillo, J.M.; McGuire, A.D.; Kicklighter, D.W.; Tans, P.; Fung, I.Y.; Takahashi, T. 1990.Moore, B.; Vorosmarrty, C.J.; Schloss, A.L. Observational constraints on the global1993. Global climate change and terrestrial net atmospheric CO2 budget. Science 247:1431-primary production. Nature. 363" 234-240. 1438.
..
Monserud, R.A.; Tchebakova, N; Leemans, R. 1993. Tarko, A.M. 1994. Carbon model of global cycle.Global vegetation change predicted by the Nature (Russia). 7: 27-32.modified Budyko model. Climatic Change. 25"59-83. Utkin, A.I. 1995. Carbon circle and forestry,
• Journal of Forest (Russia). 5: 3-20.
Murray C.H. 1993. The Challenge of sustainableforest management. What future for the world's Vanninen, P.; Ylitalo, H.; Sievanen, R.; Makela, A.forests ? Rome: FAO. 128 p. 1996. Effects of age and site quality on the
. distr_ution ofbiomass in Scots pine (PinusOlson, J.S; Watts, J.A; Allison L.J. 1983. Carbon in Sylvestris L.). Trees. 10:231-238.
• live vegetation of major world ecosystems. OakRidge Nat. Lab. (ORNL-5862): Environ. Sci. Zavelskaya, N.A.; Zukert, N.V.; Poly_ova, E.Y;Div. New York. 164 p. Pryasnikov, A.A. 1993. Impact prognoses of
climate change on boreal forests of Russia.
OST 56 69 83. 1983. Sample forest inventory plots. Journal of Forestry (Russia). 3: 16-24. !. Moscow: Forest management. 50 p.
• Ir
. P0nomareva, V. V.; Plotnikova T.A. 1975.Methods for determination of Soil Humus Content
and Composition. Leningrad. 105 p.
Schimel, D.S. 1995. Terrestrial ecosystems and thecarbon cycle. Global Change Biology. 1" 77-91.
316 GTR-NC-209

!Iu
Ii" FOREST ZONES OF SIBERIA AND POST-FIRE DEMUTATIONS IN CURRENT CLIMATE
Ilil-
D.I. Nazimova, N.P. Polikarpov,M.A. Sofronov, andN.M. Andreevan IIQ
,t
ABSTRACT.-:One of the most importantfactors goal of this paper is to use a system of territorial • 1determiningthe forest cover composition in Siberia units- landscape-climaticsectors and forest zonesis forest wildfires. The characteristicsof forest for studypost-fire demutations in currentclimate.cover are given according to zones and subzones Another goal is to develop a probabilisticmodel towithin landscape - climatic sectors. On the base of determine tree species composition of potential "climatic data the probabilistic model of forest - forest_zones on the basis of the bioclimatic modelforming treespecies composition is developed. In "BIOME -96".the whole range of continentality indices the limitsof domination these species are determined. Theeffects of fire disturbances in different sectors and METHODSzones-are interpreted from the landscape-ecologicalviewpoint. Making use of forest inventory data (Atlas of
forests USSR, 1973; Forest fund of USSR,1988)and the subdivision of the Siberian territory intoforest regions (Smagin-et al. 1977, Polikarpov et al.
INTRODUCTION 1986) as well as subdivision into the pyrological I_regions (Sofronov andVolokitina 1990); the t
Forest wildfires are considered to be one of the authors classified forest regions into bioclimaticmost important natural mechanisms of climate- sectors, zones and subzones. The most informativeinduced successions. Demutation changes are the climatic parameters for the landscape-climatickind of cyclic successions that end in restoration of sectors is the continentality index Ic, the sums of
. initial or close to initial forest type after active temperatures and relative moisture, for zonesdisturbances if climate and vegetation are in (Nazimova 1995, Nazimova and Polikarpov, 1996).dynamic balance. The dynamic balance is possible The forest cover structure was considered as beingboth in a stable state and in terms of strong weather composed by zonal, extrazonal and interzonalfluctuations during comparatively short time (azonal) combinations of forest ecosystem types.intervals. The zonal positions of landscape were defined in
topography and soil mosaics and characterized first•A new element of investigation is based on the of all by mature forest stand composition, standard•landscape-ecological approach and on the of productivity, structure of lower layers and finallybioclimatic model of Siberian forest zones the trends of post-fire demutations.(Nazimova and Polikarpov 1996). According to theassumption of this approach the composition of The zones are characterized by forest-covered areapotential forest types is mainly determined by the (million hectares), mean percent of area that isregional climate and biota and - on the lower forested (%), bogging up ratio, standing volume ofhierarchical levels - by soils and origin (after fires, mature stands (m3/ha), quality class of zonal sites,insect invasions, wind falls, human impacts). In the and post-fire successions.Siberian regi6n, because of a continentalclimate theaverage duration of the fire danger period is as The landscape topography is of great significance in !much as 4 - 6 months in the south taiga and 2 -4 forest-type pattern. However, it is reasonable to
' months in the middle taiga (Valendik 1990). Fire start with ordination of forest cover zonal features udisturbance is a crucial factor determining structure determined by the climate. It is the first step to
. and dynamics of tree stands as well as forest cover future forest cover prediction in current and inof the.region (Fires in the Ecosystems 1996). future climate as well. Parallel with this step it is
necessary to describe the landscape structure of theEvery zonal ecosystem has a' specific dynamic territory and to carry out thorough landscape -balance of macroclimate and forest-forming tree ecological analysis (Forman and Gordon 1988).species structure. In most of the territory, the According to climatic data, the Nesterov index ofbalance is being kept stable due to various fire forest danger dryness FDI was calculatedregimes in different zones and altitudinal belts. The (see Sofronov and Volokitina 1990 for details).
ID. I. Nazimova, N.P. Polikarpov, M.A. Sofronov, N.M. Andreeva. Institute of Forest SB RAS, 660036,Krasnoyarsk, Academgorodok, Russia. E-mail: ifo_sl_ infotel.ru
Proceedings IBFRA Assn 1997 meeting 317

The.method is developed by one of the authors and characteristics of zonal forest type structure, andit suggests computation mean monthly estimations the major trends of post-fire successions in varioususing the ratio: forest zones (subzones) of Siberia according to
FDI t°(t°- td) * 30 ; three landscape-climatic sectors: West-Siberian,= , Middle-Siberian, East-Siberian. The West-Siberian An + 1 forest zones are classified as bog-taiga pedobiome, b
where t° - average maximal temperature, td- and West Siberia on the whole is a vast landscape-month air temperature of dew-point, and n- climatic sector with a specific system of zonalitynumber of days withprecipitation 3 mm and more due to high paludification. Nevertheless, even induring the month. Mean seasonal FDI varies from this area the features related to zonal macroclimate •
300 up to 1,800 in the course of snowless season, are revealed (table 2).
The informational model "BIOME-96" for Siberia Latitudinal zonality is vague in the most area ofhas been developed at the Institute of Forest SB Middle and East Siberia (table 3 and table 4), whichRUS using a data base on climatic stations and is defined by high amplitude of local climatic indicesv.egetation, which reveals the climate and vegetation in terms of permafrost and sharp continentality. It'relationship on the zonal and regional levels is reasonable to mention the hyperzonality of the(Andreeva et al. 1997). For zonal forest type extremely continental Siberian landscapes,complexes such features as forest-forming tree especially within mountainous regions. While inspecies composition, productivity, and dominant life Western Siberia there is the entire set of zones, andforms of ground cover are determined. The latter latitudinal regularities of demutation shitts areare informative for evaluation forest fuel materials, clearly observed, in Eastern Siberia there are noThe climate is characterized by nine parameters such latitudinal zones as south taiga and mixeddescribing the annual regime of warmth and forest, but the forest-tundra ecotone occupies a vasthumidity supply. The vegetation is presented by area. Larch forest of L. gmelinii is the onlymain forest forming tree species dominating in the formation that absolutely dominates. All the other
.- regions characterized by basic climatic stations. For species are lacking in the zonal positions, or occureacti test area under monitoring 1-4 main tree in interzonal or extrazonal sites. The secondaryspecies were determined taking into account zonal birch forest fraction is negligible. Larch dominanceclimax or subclimax (Sukhachev 1972). The term and lack of dark conifers are caused by high fire"main" suggests dominating mature forest stands of danger as well as by severity of climate, mentionedthis species in landscape zonal positions (but for above.sands and supermoistured sites).
Mountain regions of South Siberia (table 5) areOn the basis of the informational model, a considered to include three sectors of humidity andprobabilistic model of the Siberian taiga forest differ from the neighboring regions due to their lessforming species composition has been developed, continental climate. They are of interest to compareIn this model such integral climatic indices as with the other units of landscape-climatic
" warmth, humidity and continentality are interpreted subdivision of Siberia (see table 2 and table 4).• as continuous random values. The empirical The altitudinal zonal ecosystems are outside the
functions of distributions for these values are scope of table 1, but one can see some analoguesobtained. For each given interval of climatic between latitudinal and altitudinal zonal ecosystemsparameters the probability of presence each tree in Siberia. On the other hand, the mountainspecies: Siberian pine, Scotch pine, larch, fir, ecosystems are much richer in biodiversity and theyspruce, birch and aspen is estimated, include some unique zonal classes: subalpine It
' meadows and woodlands, dwarf-pine formation, w• dark coniferous herbaceous taiga (called chern
. RESULTS taiga), etc. (Shumilova 1962; Smagin et al. 1980;• Nazimova and Polikarpov 1996). As a whole, theDifferent zonal classes of landscapes are mountains belong mostly to West-Siberian and tocharacterized by specific features of natural fire Middle-Siberian sectors of continentality but theirregimes, which results in ratio of burned areas, climate is more humid. Tables 2-4 show that eachsurface and crown fire distribution, fire return landscape-climatic sector has its spectrum of forestintervals and others. The patterns of past fires zones and subzones and is characterized by adetermine the patterns of forest cover in many areas specific ratio of life forms and tree species
_- of Siberian forest cover. Table 1 represents a•system of zonal units in Siberia, some
318 GTR-NC-209

ProceedingsIBFRAAssn 1997meeting 319

320 GTR-NC-209

Proceedings IBFRA Assn 1997 meeting 321

I I
322 GTR-NC-209
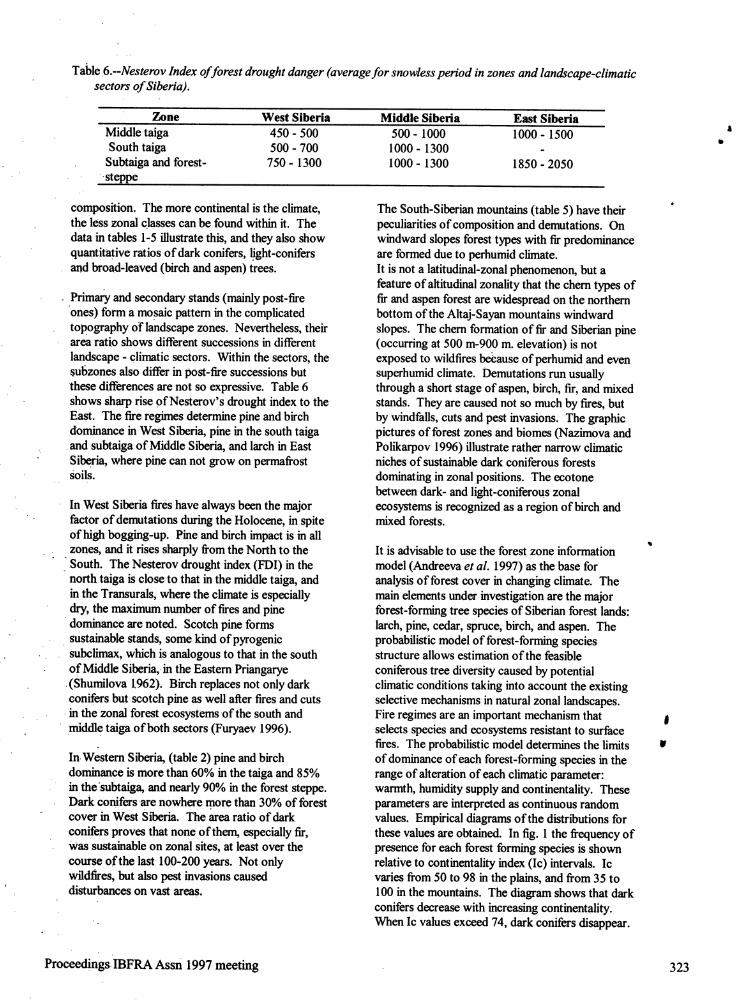
Table 6.'-Nesterov Index of forest drought danger (average for snowless period in zones and landscape-climaticsectors of Siberia).
Zone West Siberia Middle Siberia East SiberiaMiddle taiga 450 - 500 500 - 1000 1000 - 1500
O
South taiga 500 - 700 1000 - 1300 -Subtaiga and forest- 750- 1300 1000- 1300 1850- 2050
steppe
composition. The more continental is the climate, The South-Siberian mountains (table 5) have their "the less zonal classes can be found within it. The peculiarities of composition and demutations. Ondata in tables 1-5 illustrate this, and they also show windward slopes forest types with fir predominancequantitative ratios of dark conifers, h'ght-conifers are formed due to perhumid climate.and broad-leaved (birch and aspen) trees. It is not a latitudinal-zonal phenomenon, but a
feature of altitudinal zonality that the them types ofPrimary and secondary stands (mainly post-fire fir and aspen forest are widespread on the northernJ
ones) form a mosaic pattern in the complicated bottom of the Altaj-Sayan mountains windwardtopography of landscape zones. Nevertheless, their slopes. The them formation of fir and Siberian pinearea ratio shows different successions in different (occurring at 500 m-900 m. elevation) is notlandscape - climatic sectors. Within the sectors, the exposed to wildfires because of perhumid and evensubzones also differ in post-fire successions but superhumid climate. Demutations run usuallythese differences are not so expressive. Table 6 through a short stage of aspen, birch, fir, and mixedshows sharp rise ofNesterov's drought index to the stands. They are caused not so much by fires, butEast. The fire regimes determine pine and birch by windfalls, cuts and pest invasions. The graphicdominance in West Siberia, pine in the south taiga pictures of forest zones and biomes (Nazimova and•and subtaiga of Middle Siberia, and larch in East Polikarpov 1996) illustrate rather narrow climatic
' Siberia, where pine can not grow on permafrost niches of sustainable dark coniferous forestsSoils. dominating in zonal positions. The ecotone
between dark- and light-coniferous zonalIn West Siberia fires have always been the major ecosystems is recognized as a region of birch andfactor of demutations during the Holoeene, in spite mixed forests.of high bogging-up. Pine and birch impact is in allzones, and it rises sharply from the North to the It is advisable to use the forest zone informationSouth. The Nesterov drought index (FDI) in the model (Andreeva et al. 1997) as the base fornorth taiga is close to that in the middle taiga, and analysis of forest cover in changing climate. Thein the Transurals, where the climate is especially main elements under investigation are the majordry, the maximum number of fires and pine forest-forming tree species of Siberianforest lands:dominance are noted. Scotch pine forms larch, pine, cedar, spruce, birch, and aspen. Thesustainable stands, some kind of pyrogenic probabilistic model of forest-forming speciessubelimax, which is analogous to that in the south structure allows estimation of the feasible
of Middle Siberia, in the Eastern Priangarye coniferous tree diversity caused by potential(Shumilova t962). Birch replaces not only dark climatic conditions taking into account the existingconifers but scotch pine as well after fires and cuts selective mechanisms in natural zonal landscapes.
in the zonal forest ecosystems of the south and Fire regimes are an important mechanism that It. middle taiga of both sectors (Furyaev 1996). selects species and ecosystems resistant to surface
. fires. The probabilistic model determines the limits irIn Western Siberia, (table 2) pine and birch of dominance of each forest-forming species in the
" dominance is more than 60% in the taiga and 85% range of alteration of each climatic parameter:in the :subtaiga, and nearly 90% in the forest steppe, warmth, humidity supply and continentality. TheseDark conifers are nowhere more than 30%of forest parameters are interpreted as continuous randomcover in west Siberia. The area ratio of dark values. Empirical diagrams of the distributions forconifers proves that none of them, especially fir, these values are obtained. In fig. 1 the frequency ofWas sustainable on zonal sites, at least over the presence for each forest forming species is showncourse of the last 100-200 years. Not only relative to continentality index (Ic) intervals. Icwildfires, but also pest invasions caused varies from 50 to 98 in the plains, and from 35 todisturbances on vast areas. 100 in the mountains. The diagram shows that dark
conifers decrease with increasing continentality.When Ic values exceed 74, dark conifers disappear.
Proceedings IBFRA Assn 1997 meeting 323
_

All the coniferous and small-leaved species occur in 2. The work was supported by the RFFI in 1997,the ranges oflc 46-53, 53-60, and 60-67. When Ic grant 97-04-49072 and Krasnoyarsk Fund ofincreases, thefirst to disappear are fir and Siberian Science, grant 6F-0191.pine, next spruce (remaining in valleys). Then birchand pine disappear - their continentality limits are Ic74-81 and 81-88, respectively. The most resistant LITERATURE CITED "to severe climate is larch, which can dominate in theWholerange oflc, from 60-67 up to 95-100 on Andreeva, N M., Nazimova, D.I., Polikarpov, N.P.,permafrost. Sirotinina, A.V. 1997. Probabilistic model of
forest-forming species in Siberia on abase of •
The method of probabilistic modeling ishelpful in climatic parameters. Intern. Conference onany study concerning land cover prediction and Mathematical modelling and ecologicalforest management planning. It is useful for problems. Krasnoyarsk, Krasn. State Universityexploring resistance of natural forest stands to 1997 (in press).critical climatic situations. Heavy droughts andinsect invasions accompanied with forest fire may Atlas of USSR Forests. 1973, Moscow, GUGK.accelerate replacing zonal tree species (spruce, fir; 222 p.Siberian pine) by the species more resistant to fireandother disturbances: pine and birch. These Fire in Ecosystems of Boreal Eurasia. 1996. J.G.species dominate the specific subzone- Siberian Goldammer, V;.V.Furyaev (eds).- Forestrysubtaiga or mixed light coniferous - small leafed sciences, v. 48. Kluwer Acad. pubis. D.-Boston-forest, where dark conifers are not resistant (see London: 580 p. (In English).table 1 and table 2).
Forest Fund of USSR. 1990. Moscow,
However, an alternative direction of post-fire VNIIClesresurs. V. 1. 1005 p., V.2:1022 p. (insuccession is possible, if increasing humidity of Russian).
' climate is more than increasing potentialevapotranspiration. The role of dark conifers is Formann R.T.T., Gordon, M. 1986. Landscapepossible to increase to 2070 due to demutations in ecology. N.Y: Willey. 620 p.birch and aspen forests, 15%-20% of their area insouth taiga of Ob-Yenissey region (Furyaev 1996). Isachenko, A.G, Shlyapnikov, A.A. 1988. TheThe probability of fire occurrence and forest fire landscape map of the USSR. Moscow:,extent is assumed close to the current level. GUGK.(in Russian).Nevertheless, even in this case, the probability ofdark coniferous dominance will be dubious in many Furyaev V.V. 1996. Role of fires in forest-forming
regions of West and Middle Siberia due to human processes. Novosibirsk, Nauka. 251 p.activity. Fig. 1 testifies to the above-mentioned
- geographical regularities in forest zone composition Nazimova, D.I. 1995. Climatic ordination of forestand provides their ecological interpretation, ecosystems as a basis of their classification.
• Lesovedenye, 4: 63-73.
Dominating areas of forest-forming tree speciesmay be represented in parametric space of climatic Nazimova, D. I., Polikarpov, N.P. 1996. Forestaxes. This provides prediction post-fire zones of Siberia as determined by climaticdemutations under current climate. It is useful for zones and their possible transformations under
. predicting different kinds of successions under global change. - Sylva Fennica 30(2-3): 201- |different climatic trends. 208. Ir
- Polikarpov, N.P., Tchebakova, N.M. andACKNOWLEDGMENTS Nazimova, D.I. 1986. Climateand mountain
forests of South Siberia. Novosibirsk, Nauka.
1. The authorsgreatiy appreciatediscussions of 225 p.this work with colleagues in the Institute ofForest and Computer Center, SB RAS, Reference work on the climate of the USSR. 1966-Krasnoyarsk. 1970. Vol. 1-4, Issues 17-24.
Hydrometeoizdat, Leningrad.
324 GTR-NC-209
. Shumilova L.V. 1962. Botanical geography of Sofronov, M.A., Volokitina, A.V. 1996. Zone ofSiberia. Tomsk. 440 p. northern thin forests. SiberianJournalof
ecology. Novosibirsk, Publish.House of SBSmagin, V.N., Iljinskaya, S.A., Korotkov, I.A., *RAS, Vol. 1"43-50 (in English).
Nazimova, D.!, Novoseltceva, I.F., AO
Tcherednikova, J.S. 1977. Forest Stocks, B.J., Fosberg, M.A., Lynham, T.J., Mearns,regionalization of Siberia. The lth state meeting L.O., Wotton, B.M. 1996. Climate change andon Forest fund regionalization. Krasnoyarsk: 3- forest fire potential in Russian and Canadian
•11. boreal forests. Proceedings of meeting onForests, Fire, and Global Change. Aug.3-9, "
Smagin, VIN., !ljinskaya, S.A., Nazimova D.I., et 1996, Shushenskoe, RUSSIA (in press.).al. 1980. Forest types of the South-Siberianmountains. Novosibirsk: Nauka. 280 p. Sukhachev, V.N. 1972. Fundamentals of forest
typology and biogeocoenology. SelectedS0chava, V.B.(Editor). 1960. Vegetation of the works. V.2. 276 p.
USSR. (Map) (In Russian).' Valendik, E.N. 1990. Struggle with large wildfires.Soffonov, M.A. and Volokitina, A.V. 1990. Novosibirsk: Nauka S.B. 193 p.
Pyrological zonning oftaiga areas. Novos_irsk,Nauka. 204 p. (In Russian).
I
. if
Proceed'rags IBFRA Assn 1997 meeting 325

• BOREAL ECOSYSTEM RESPONSE TO ATMOSPHERIC NITROGENINPUTS AND CLIMATE CHANGE
R. Stottlemyer and R. Herrmann t
AABSTRACT.--In 1982, a network of research Thurman 1990, Stottlemyer and Toczydlowski 1991, bWatersheds was established in U.S. reserves. Four in Stottlemyer and Troendle 1992). Meltwater orMichigan, Colorado, and Alaska are northern precipitation chemistay is rapidly altered once itecosystems. One research objective is to understand enters the soil or rock substance even in sensitiveecosystem response to atmospheric inputs and alpine ecosystems (Caine 1989, Campbell et al. 1995,climate change. N inputs are >6 kg ha "_y't in Stottlemyer and Troendle 1992). A third factor inMichigan to <0.6 kg ha"_y'_ in Alaska. Sites outside systems with large snowpacks is the effect ofAlaska retain N input. Stream water NO3" peaks in unfrozen soils on winter soil processes such aswinter, soil inorganic N pools in spring. Soil N immobilization of essential nutrients, mineralizationmineralization exceeds precipitation inputs, and most and nitrification. These processes can producemeltwater/precipitation enters the soil. 5_5Nand 6 _gO seasonally large soil reservoirs of inorganic nutrientsstudies indicate stream water NO3 is the product of which further modify the chemistry of passingsoil processes. Soil N mineralization rates increase meltwater.with temperature.
Few reliable precipitation chemistry data exist beforethe late 1970s. One can only make educated guessesabout chemical conditions of the past. The study of
INTRODUCTION forested ecosystems receiving very differentatmospheric inputs can provide some resolution to
There is considerable debate about the effects of the question of how ecosystems responded to
' acidic deposition inputs on terrestrial and aquatic increased inputs (Driscoll et al. 1988).ecosystems (Driscoll et al. 1988, Murdoch andStoddard 1992). Much attention is foocused on In 1982, a network of long-term, watershed-surface water acidification as a direct result of ecosystem study sites was established in U.S.
precipitation H �input.But, most North American protected reserves (Herrmann and Stottlemyer 1991).surface waters are moderate-to-well buffered and not The network includes four northern watershed
directly sensitive to precipitation H �input(Stoddard ecosystem sites (Isle Royale, MI; Rocky Mountain1994). Many terrestrial ecosystems appear more N.P. and the U.S. Forest Serviee's Frasersensitive to chronic inputs of inorganic nitrogen (N) Experimental Forest, CO; and the Noatak Nationaland sulfer (S) (Aber et al. 19890. Whle S emissions Preserve, AK). Major research objectives are toand deposition are decreasing in many regions of understand mature ecosystem structure and function,North America (Hirsch et al. 1991), those of and the effects on processes of change in atmosphericinorganicN are not (NADP 1982-1992). Increased contaminant inputs and climate.emissions heighted concerns about the possibleeffects of inorganic N deposition on ecosystems. In this paper, we use research results from these sites
to assess watershed ecosystem response to
Trends in stream water chemistry reflect not only anthropogenic N inputs across a gradient of inputs.precipitation inputs, but also the effects of terrestrial The magnitude and seasonal distribution of stream
' ecosystem processes (Likens and Bormann 1995). water N outputs from these ecosystems suggelt they
Sfi'eam water ion concentrations reflect the products are not yet directly responding to N inputs. N outputs" of processes as soil mineral weathering, disturbance, appear to reflect seasonal trends in soil processes
biotic uptake, change in biomass, precipitation such as N mineralization and nitrification.quantity and timing, and snowmelt runoff. Where
" snowmeltdominates the annual stream hydrograph,two factors account for most seasonal variation in SITE DESCRIPTIONS
•stream water chemistry: the annual hydrologic cycle,and the degree to which snowmelt is partitioned The watersheds are study sites within the ongoingbetween overland and subsurface flow (Caine and long-term Watershed Research Program, U. S.
U.S. Geological Survey, 240 I4/.Prospect Road, Ft. Collins, CO 80526..
326 GTR-NC-209
Geological Survey or cooperating long-term The Rock Creek drainage (770 ha) is located in-watershed sites (Fraser Experimental Forest, CO, Denali National Park and Preserve, AK. The
U.S. Forest Service; Denali National Park and watershed has a south-southeastern aspect, ranges inPreserve, AK, National Park Service). elevation from 640 to 1,700 m, and is underlined with
metavolcanic quartz shist and some marble. Soils are AThe Wallace Lake watershed (115 ha) is located in not mapped, but likely are Alfic Cryochrepts. Mid- "Isle Royale National Park, Michigan, in NW Lake age (100+ years) white spruce and 50-year-oldSuperior about 120 km N of Calumet. Watershed trembling aspen dominate vegetation in the lowerelevation varies from 190 to 275 m. Watershed quarter of the watershed. At lower elevations withvegetation is dominated by trembling aspen (Populus eastern or southeastern aspects open black spruce "tremuloides), white birch (Betula papyrifera), and (Picea mariana) occurs with white spruce and BetulaWhite spruce (Picea glauca). The bedrock is glandulosa. Upstream from the coniferous andmetamorphosed voicanics covered by scattered mixed forest is a band of closed tall scrub dominatedalkaline glacial till originally derived from limestone by Alnus crispa and Salix. Mixed mesic shrubbedrock immediately south of James Bay. The soils (Betula, Ericaceae) occurs at elevations above the
are primarily Alfic Hapiorthods , sandy to coarse tall scrub. Most of the watershed is dominated byloamy; mixed, frigid, and are between 3,000 to 5,000- patches of mesic to dry Do, as tundra. About 50% ofyears old. Parent materials are sands and beachline annual precipitation occurs as snowfall.deposits laid down during the post-glacial LakeNipissing stage. About 50% of annual precipitationoccurs as snowfall. METHODS
The Fraser Experimental Forest (FEF) is 137 km There are publications from each of these siteswest of Denver, CO, west of the Continental Divide. outlining in detail the monitoring and researchLexen Creek, the study watershed (124 ha) within methods employed (Baron 1992, Stottlemyer 1992,FEF, has a prevailing easterly aspect and ranges in Stottlemyer and Troendle 1992, Stottlemyer et al.devation from 2995 m at the watershed mouth to 1995). Only the measured variables common among3,5.15 m at the summit of Bottle Peak. The all sites are presented here.watershed's bedrock includes remnants of
sedimentary sandstone at upper elevations, whilegneiss and schist parent material underlie the entire Field Procedureswatershed. Soils are mostly Inceptisols. About 18%of the.watershed is alpine meadow which generally Precipitation amount is monitored with Belfortoccurs above 3,350 m elevation. The lower and mid- recording raingauges with strip charts or dataloggers.elevation subalpine forested slopes with southerly Precipitation chemistry is generally measured byand easterly aspects are dominated by lodgepole pine NADP stations or, in the case of the FEF, using the(Pinus ¢ontorta) while upper elevations and northerly NADP protocol and analytical procedures.aspects are vegetated by Engelmann spruce (Piceaengelmannii) - subalpine fir (Abies lasiocarpa). All watersheds are gauged and continuous flow
• AboUt 70% of annual precipitation falls as snow. monitored. Stream water is generally sampledSnowpaek water equivalent (SWE) increases sharply weekly from just before snowmelt to formation of a
'with elevation (StoRlemyer et al. 1996). permanent snowpack. Stream water is sampled morefrequently during snowmelt and less frequently
The 660 ha Loch Vale drainage is east of the during winter depending on access. At all sites, !' Continental Divide NE of the FEF in Rocky stream water chemistry is measured at a number of u
Mountain National Park. Watershed elevation ranges sites upstream of the stream gauge. All watersheds- between 3,100 and 4,000 m. The watershed is are equipped with at least one meteorological station
primarily alpine, talus, and snowfields with <10% in which records wind speed and direction, solarsubalpine forest and meadow. Annual precipitation radiation, air and soil temperatures, and relativeis-about 100 cm with 70% occurring as snowfall, humidity.Bedrock is primarily Precambrian gneiss and schist
with little apparent ground water storage. Forest soil In addition to the routine precipitation and streamis a loamy-skeletal, mixed Lithic Cryoboralf. Soil water monitoring, all sites monitor snowpack
• development is very heterogenous ranging in depth amounts and chemistry, have basic data on biomassfrom <1 to >25 cm. and forest floor and nutrient content, canopy and soil
modification of incident precipitation, and generally
.
Proceedings IBFRA Assn 1997 meeting 327

net'soii N mineralization and S mineralization data. pools average >2.6 kg ha -_,and the total inorganic N- • All sites currently have some research underway pool averages >23 kg ha-_. Annual net NO3-mineral-
regarding the relationship between climate change ization averages 4 kg N ha -_,and total net inorganic Nand ecosystem function primarily nutrient cycling. : mineralization >28 kg N ha-_(Stottlemyer et al.
1995). Net N mineralization rates and soil inorganic ,N pools peak in May and June. NH4 �andtotal •
Laboratory Analyses inorganic N-mineralization increase (p<0.01) withsoil temperature indicating the potential for climate
Samples are brought immediately to a field change to enhance inorganic N availability.laboratory. For precipitation and stream watersamples, pH, specific conductance, and alkalinity(titration with 0.02 N H2SO4 to pH 4.5, stream water Gross N mineralization and nitrification rates (fig. 3)samples only) are determined as soon as samples also indicate the very high inorganic N cycling ratesreach, room temperature. Separate' filtered (pre- in this ecosystem. Mean daily N cycling rates rangerinsed, 0.45 _tm) subsamples for ion analyses are from 0.6 to about 1 kg N ha"t. With such largerefrigerated at 2° C. The filtered subsamples are cycling rates, large soil inorganic N pools, and strong'shipped in coolers to our laboratory at the Rocky ecosystem N retention, it appears likely any streamMountain Research Station, Ft. Collins, CO. water NO3" is the product of soil processes, notCalcium, Mg 2 vx’�NH4+,NO3, SO42, and Ci" snowmelt or precipitation inputs.concentrations are determined using a Dionex Model2020 ion chromatograph. Laboratory and fieldSampling procedures remained constant during the Lexen Creek, Fraser Experimental Forest,study results reported here. Colorado
" Since 1980 to the present, the period of studyRESULTS AND DISCUSSION reported here, there has been no significant trend in
annual temperature or precipitation amount (fig. 4).Wallace Lake, Isle Royale National Park The precipitation amount in May has been increasing
(p<0.05). Since 1982, the volume-weighted precipi-The: Upper Great Lakes region receives 3 - 4 kg ha-_ tation ion Chemistry or loading has not significantly
y-_of NH4 �Vof the highest wet precipitation changed except for the decline in SO42. Most highinputs in the nation (Lynch et al. 1995, NADP 1982- elevation Colorado NADP stations have shov_n an
• 1996). Wet precipitation NO 3-inputs are about 10 kg increase (p<0.05) in precipitation amount and NH4ha-_y-_. NH4 �-N input equals or exceeds NO3- N input over the last decade, and some show increases
input. Wet precipitation N inputs total >6 kg ha -_y-t. in NO 3"concentration and loading (Lynch et al.
The concentration of both NO 3-and NH4 precipi- 1995). Precipitation ion cencentrations generally. tation has significantly (p <0.05) increased over the increase in spring and early summer (fig. 5).
last decade (fig. 1). NO 3-shows little seasonalchange in concentration while NH4+ increases inspring and summer. Snowtel data indicate the length of the snowpack
season has decreased since 1982 in the Fraser region.
Annual stream water discharge is dominated by At the FEF, peak SWE has been on the decline since•spring snowmelt and precipitation input. Stream 1965 (fig. 4). Snowpack ion concentration (p<0.05)water NH4 is generally below and load increase with elevation and on NE aspects
' detection. Annual stream water NO3 concentration (p<0.01, fig. 6). wshows no trend (fig. 2). Stream water NO3
" • concentrations are highest (p<0.05) in winter and Canopy modification of incident precipitation amountearly :spring before snowmelt. Watershed retention and its chemical composition is substantial. During a
• of N inputs is >90%. decade of study in the FEF, the canopy intercepted,on average, one third of the snowfall. Snowpack K+
Precipitation NO3"- N input is small compared to soil (p<0.01), H and SO42"(p<0.05)N pools and flux. The organic N pool in the top !0 concentrations were greater beneath the canopy, andcm of soil averages 2,080 kg N ha"i. The boreal NH4+ (p<0.01) and NO3"(p<0.001) concentrationsforest floor (Oi,Oe, and Oa) contains another 550 kg greater in the opening. Snowpack NH4 �andNO3"N hal, and annual litter fall adds about 20 kg N ha_ content were also higher (p<0.001) in the open.(Rutkowski and Stottlemyer 1993). Soil NO3- N
328 GTR-NC-209

JID
50 -
40 H+•u 30u"e-_ 20
10
0 .... i . . , , I , , , , I .... I
30
Nil +4r 20_J
U'@
_" 10
0
. 5o --Wallace
4o .......NADP NO 8-
elSul ..i.. _dl,_..,,.I
=t. 20 / ...._.......... _ ............. .............. .../
• I0
050
40
_.i 30• .
_ 2O
10
0 " I . . . . , |
' . 1980 1985 1990 1995 2000
Water Year
FigureI. T_nds in annual v.olume-we_htedp_rp_cipitationchemx.ttyforNADP stationMlPP on thesouthsho_ oFLake Suoeriot.andthe WallaceLake wate_hed.IsleRoyaleNationalPark.Mich_an
Proceedings IBFRA Assn 1997 meeting 329
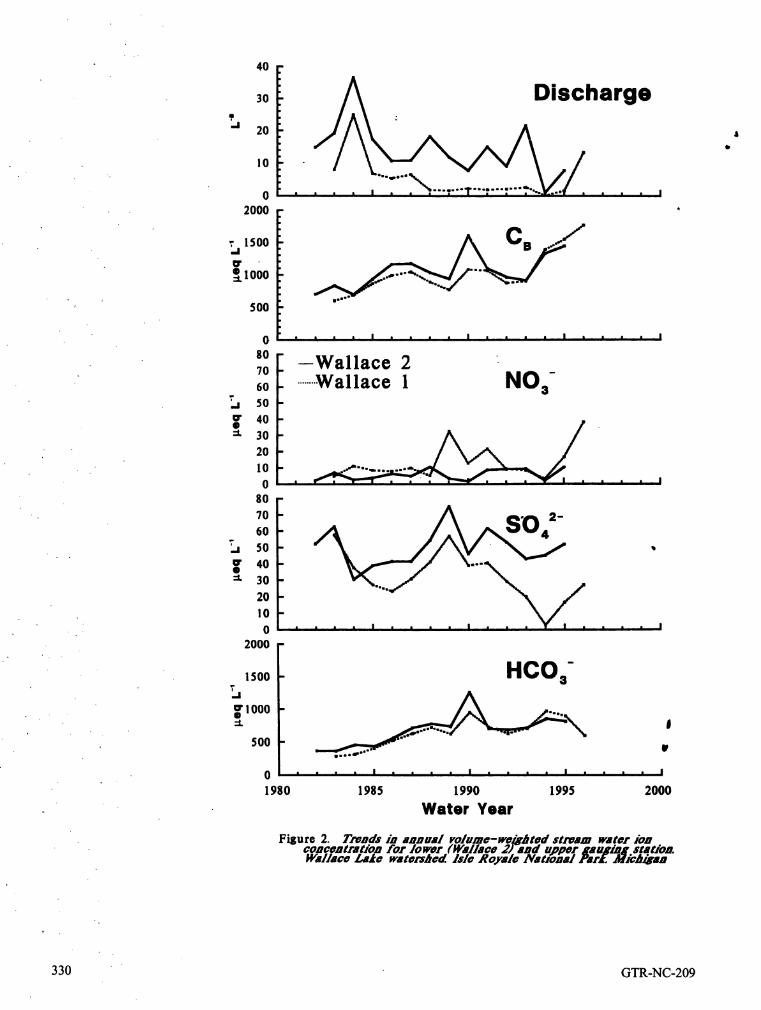
" 40
30 Discharge=
-' 20t,
I0
" _°m°_,,wwe. i=o,,=.oea
02000 -
," 1500 C B _.-'/_J
_1000
500
0 . , • • I , , a , I i i i i i .... I
so[ --Wallace 27O
60 ........Wallace 1 NO a-_, 50
40[ 3o
• 20100
80 "70 - . -60 -
T_, 50 - •w' 40 -e:::t. 30 -
20 -I0 -
0 • • • • I .... I • • • •
2000 -
,5oo- HCOs-• T
._l
w'1000 -II
• 500 - IrIlm
0 , , • • I .... ' .... i .... i
1980 1985 1990 1995 2000
Water Year
Figure2. Trendsin annual volume-we_htodstroam waterionconcentrat/onfor.Iowpr.(Wa.llacw2}-andupper. _aupin.ll,st4t/on.Wallace l.,akewmretsnea. Isle _oya/e Iv&uona//-arz._/cn_mn
330 GTR-NC-209

Mineralization Rates Nitrification Rates
200 - 200 -
. Birch Birchel T
140 l____ el
140? ? -E 110 S 110 *
z _._ zD 80 80• D •
E 50 E 50
20 I 20 I_------________________............. ].: .........
-I0 ,. I , I _ ..... , .... l , , -I0 , l , T............ T............. T............. T ,200 - 200 _ •
Spruce Sprucem ,/{\ rm
'0 140 ." "_ 140
-E 11o. //" _ , E llO
Z t " _ ZU 80 -. r '/ m 80
E 50 Gross _ E so GrossNet ...................
20Net .................. 20 " r-----..-_rI -I.
-I0 , " , , , , , , '-I , , -I0 , , , 7............ T............. T............ T ,200 - 200 -
,7o Alder ,,o AlderII
•_ 140 "0 140,,,. ,,E 11o E 11oZ . • ,. Z
E so. _ E 50 --._:____20 '" - I ''-I• " 20
• t.............Y".........!............_..................................... •.............1_...........-I0 -. , , , , , i , i i i -I0 - , , . , , , , i , , , ,
May June July Oct. June May June July Oct. June95 95 y:_ 95 96 95 95 9:J 95 96
Figure 3. Gross and net mineralization and nitrification• rates in so/Is beneath major vesetat/on types, Wallace Lake
!
• W
Proceedings IBFRA Assn 1997meeting 331

2 =,
" Temp1
t
o
..
--1 ,.., ,,,,,I...,.,,., l.,....,..I...,.....l
120 - •
100
80
E _0
40 =
20
0 .... I i I I I I ......... I ......... J ........ I
70 =
60 E !
E 40u 3o'
2o
i0
O . . i i i i i i i I . . i ...... I ......... I ......... l
300 -
Depth2O0
ql
• E_J
loo
" 0 "''''''''I'''''''I'I''IIIII''I'" "''" "''I
1.0 -
• Density• o.$
0.6
0.4 !%_ .J_ --__A_ A ,_ _ _
• 0.2 _ V _ V'_ _"q"_f__' IF
" 0.0 ......... ' ......... ' ......... ' ......... '
1960 1970 1980 I9P0 2000
Year
Figure 4. Loas-tetm treads ia t_C_Ooratu_. O._c_oita¢ioa.snow water oauivaleat (SWE). saowoack dopChand doasity.Lozoa C_ok. Praso[ E_rpetimoacalFoist
332 GTR-NC-209

. 20 -
Ho' /
@ 10 " a:I.
o
$-.
0 , I _ I I I _ I , I
20 -
NH4_ '°
, s ff
0 , I I I , I , I , J20 -
NO 3 .- -..15 / \
/ \•r / \O' I0 /'-- -_ \• / "" i'
5
0 , I , i I i I I
,o-SO__
u' 10@
$
" 0 , I , I I I I I
• . J F M A M J J A S 0 N D
Month' Figure5. 5oosonolcha_ngcin volume-wc/ghtedp_c/p/tot/on
cbcm/stty.FraserBipet/mcntolFotesi
!
. U
Proceedings tBFRA Assn 1997 meeting 333

600
' 500 Ca" 400
300.
2OO
l O0 ,
0..
20 ]"]
]5
• lO
5
0
5oI NH4 4_ 40
._ 3o
'_ 2O
IO
0
60
so NO340
30
20
10
0
60
so SO4 _.4_ 3500m¢_ 3400m
4o _ 3250m- 3125mv
3O !20
l0
0 I
4/5 4111 4118 4/25 5/2 5/9 5/16 5/23 5/30 6/7
Sample Date
Fig. 6. Trends in snowpack ion content with elevation and season,Lexen Creek watershet_ Fraser Experimental Forest
334 GTR-NC-209

Significant nitrification within the snowpack has not Where forest occurs in Loch Vale, canopybeen observed in high elevation Colorado sites, modification of incident precipitation amount and its
chemical composition is similar to the FEF and otherIn most Colorado subalpine ecosystems, soils remain sub:alpine forests (Arthur and Fahey 1993).unfrozen where a snowpack is present. For decades, Ait has been known most snowmelt in these high Alpine stream water NO3 concentrations at Loch •elevation ecosystems penetrates the soil or talus. In Vale and Niwot Ridge are higher than at the FEFboth the alpine and subalpine zones, most snowmelt (fig. 9). But soil processes appear to dominate streampasses through the soil before entering the stream, and lake water quality rather than precipitationHowever, manystudies of the relationship between quality (Denning et al. 1991, Arthur and Fahey 1993, "precipitation N inputs, snowmelt release, and stream Campbell et al. 1995). As at FEF and other sites,water chemistry have not examined the potential for studies of seasonal soil water quality show high NOa"precipitation chemistry modification by alpine and concentrations in late winter and with initiation ofsuba!pine soils. Soil modification of precipitation or snowmeit. Peaks in stream water DOC, AI, andsnowmelt chemistry can occur rapidly even in alpine nutrient species as NO_ with snowmelt indicate atalus (Campbell et al. 1995). pulse of concentrated soil solution reaching the
stream. Meltwater infiltration into soils prevents lakeAt the FEF, alpine mineral soils have a total N pool and stream water from exhibiting sharp ANC>700 kg ha "_..In situ net N mineralization rates at declines. Recent research in Loch Vale found
Niwot Ridge are >10 kg ha'ly j, and in subalpine geochemical processes:in soil, or even talus,forests-of FEF, Loch Vale, and other Colorado sites significantly modify stream water chemistry, andrange from 5 - <30 kg N hal y-I (Arthur and Fahey these processes occur on timescales of hours or days1993, Stump and Binkley 1993). Alpine soil (Campbell et al. 1995). The potential importance ofinorganic N pools are highest in winter and early soil processes on stream water chemistry duringspring at FEF and Niwot Ridge. In Colorado, the snowmelt has also been suggested for Glacier Lakeshighest recorded wet precipitation N inputs are for in Wyoming (Reuss et al. 1995) and Niwot Ridge inNiwot Ridge (3kg N ha"!y-i). Soil net mineralization Colorado (Williams et al. 1996). In Loch Vale,
rates and inorganic pools are large relative to studies using the distinct _tISOand la15Nratios inprecipitation inputs, precipitation, snowpack, and soil water, found the
NO3" increase in stream water with early melt mainlyAt the FEF, Stream water ion concentrations are comes from "old" NO3" in soil water (Kendall et al.highest in winter. During snowmelt, NO3 1995). At Loch Vale watershed N outputs are about_concentrations at the mouth (station 49) of Lexen half inputs.Creek decline to near detection levels (fig. 7). Alpine(station 49.1) stream water NO3" concentrations in
Lexen Creek remain high but unchanged through Rock Creek, Denali National Park, Alaskamost of the year. The different patterns of CBand
NO3 concentrations in alpine and subalpine stream At Rock Creek, annual precipitation NO 3 input is < 1Water indicate alpine snowmelt is well mixed before and NH4�<0.3 kg ha -_,about the lowest input of any
• reaching the stream. Watershed N outputs are <5% NADP station on the continent. NH4 �-N input about• inputs, equals NO3-- N input. Canopy modification of
incident precipitation has not been measured, but is
likely less significant than at FEF or Wallace Lake !. Loeb Vale, Rocky Mountain National Park, since only the lower portion of the watershed is
. Colorado forested, iF
" During the last decade at Loch Vale, precipitation Net soil mineralization and nitrification duringam0unt, NH4* deposition (fig. 8, station co98) and summer alone exceed 3 kg N ha"l, or 30 times annualNO3 concentration increased (p<.0.05). Winter precipitation input (Stottlemyer 1992). Seasonal soilmonthly precipitation amounts have increased with a N mineralization rates are reflected in stream watersignificant gain (p<0.05) in January. NH4 �NO3"concentration. Inorganic N outputs from thedeposition increased (p<O.05) in March and May and watershed during summer exceed annual input by 3NO3" in May. The precipitation NH4 j�Æ+Ðtimes. This is the only watershed in the network
, declined as have summer precipitation amounts and where inorganic N outputs exceed inputs. Annualion inputs, outputs also exceed those from the Wallace or Lexen
Proceedings tBFRA Assn 1997 meeting 335
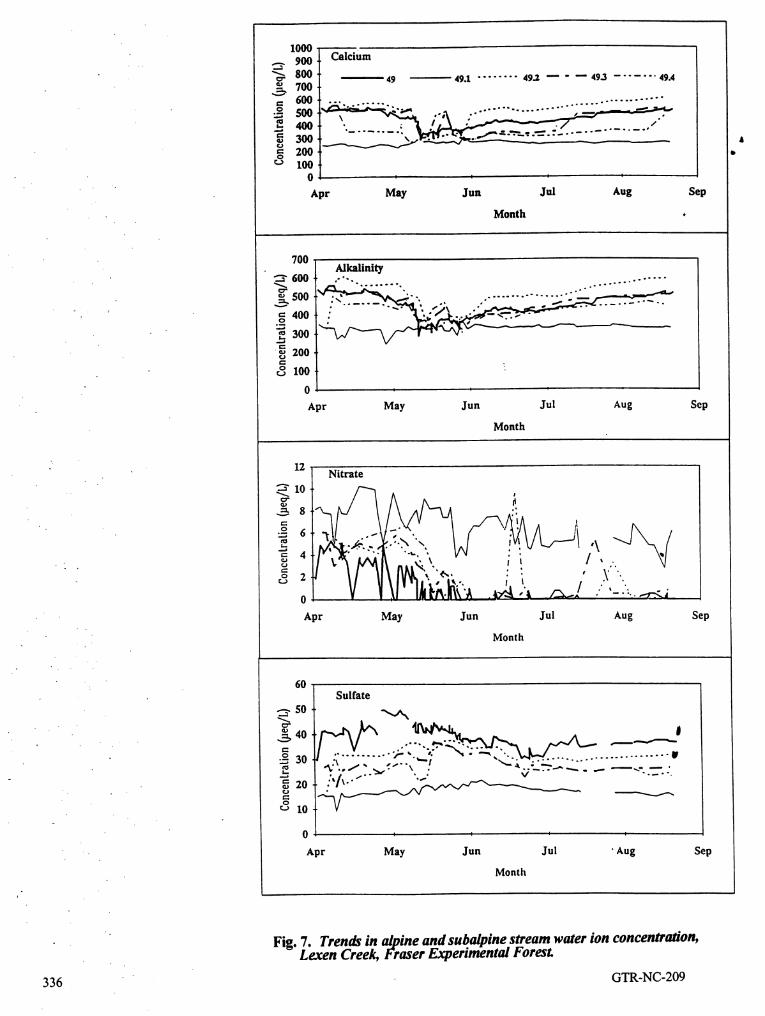
1000
900 t Calcium
" _ 800" o" _ 49 _ 49.1 ........ 49.2 --- ° "-- 49.3 ....... 49A
600 .............
_ 400° SO0 \ i'" .:" "'- .'"300 ,
_ 100I I l
..
Apr May Jun Jul Aug Sep
Month
7OO• Alkalinity
600 oo e_qt9
........ . . ....................=, SO0 :,, ....... ;--. .. . ............. -.._.-- . ..........
.o=. 400 ' ;" _" . "")
•_=2ootfJ
° t "0 ' _
Apr May Jun Jul Aug Sep
Month
. 12Nitrate
: : , \" •
V ',/__,/"• %', I l ..0 -" "'-"
Apt May Jun Jul Aug Sep
Month
• 60
I Sulfate._- 5o
' =o II ....Y...... -,_','#"-"_':'_"..__L/-" - "-- ...,,=_°I"," ...... "7 ".........................
" _ 2ot/'I"'""- L_
0 _ ! I o o
Apr May Jun Jul "Aug Sep
Month
• Fig. 7. Trends in alpine and subalpine stream water ion concentration,Lexen Creek, Fraser Experimental Forest.
336 GTR-NC-209

_o Amount200
• . 35 _
,_o .." _o NO_E " aQ o=., ,D
... ..,. /,,,,,U 1O0 . _ ..... • 25- _ e,lm_leQ111ell
"----- :c JS Kijik a50 .._ _,q__... • / •
0 IO DenaliNiwot400
C_ s Loohva,e............... _.. .-. • _ mm _ a_l_ __.
300 0_, .-
g J F M A M J J A S 0 N DZ .o,
_oo ,. Month.J
Figure 9. Snsono/ t_nds /o steam and lake water1o0 1_/0a ¢o,ncentrat/on./Wwot Rldge.and Looh V&lo.
coJotaoo,Rock Creek in Denil/ /Vat/onalForkand F_setve, and l__/lYkL_o, Lake Clark
o National Park and Pz_sotve,Alaska
28o H+ :200
TQz "1so ;" -
lU 100 • *,%
5O
0
400 NH_• ,
300
I1_ 200
100 "u
4or xT/-_ - CO02---- C0_!.9---• J._lU., C094 c;uya - - -
f a C008 _ --"_ C096 .............#
r 300 I - " --_2O0 - " A
_ t .../\ / ,__....-- _
O : _P- " If2--
,o,, SO4
/,oo,=r 2ooI" • -'-lU [ . o ,..
[ ,_ . ./.,A_._.- _..__._.,,ooI- ,.. _=.,=__=___.._g¢,,r_...._...__._
o
1977 1980 1983 1986 1989 1992 1995
Year- Figure 8. Trends in procip.ita_tioni_np.ut_s
at higher alavotidn Cdlorado IVADP stations 337
Proceedings IBFRA Assn1997 meeting
watersheds, sites which receive much higher Baron, J., ed. 1992. Biogeochemistry of a subalpine" atmospheric inorganic N inputs, ecosystem. Ecological Studies 90. New York,
NY: Springer-Verlag. 247 p.Similar results have been found in other largeAlaskan watersheds (Stednick 1981) and lakes, and : Caine, N. 1989. Hydrograph separation in a small
high stream and lake NO3 concentrations (fig. 9) are alpine basin based on inorganic solutenot unusual in the region despite low atmospheric concentrations. Journal of Hydrology. 112: 89-inPuts. 101.
Caine, N.; Thurman, E.M. 1990. Temporal andSUMMARY spatial variations in the solute content of an alpiae
stream, Colorado Front Range. Geomorphology.In most lbrested and alpine ecosystems, inorganic N 4: 55-72.is a limiting nutrient. The increase,in human-derivedatmospheric N inputs is a major concern since some Campbell, D.H.; Clow, D.W.; Ingersoll, G.P.; Mast,ecosy,stem components can take more advantage of M.A.; Spahr, N.E.; Turk, J.T. 1995. Processesthe input than others. This has potential to directly controlling the chemistry of two snowmelt-impact ecosystem biodiversity and processes. Some dominated streams in the Rocky Mountains.investigations suggest trends in stream and lake water Water Resources Research. 31 (11): 2811-2821.NO3"concen.trations are reflecting trends inprecipitation inputs. The watershed-level studies Denning, A.S.; Baron, J.; Mast, M.A." Arthur, M.reported here, and results from other similar studies, 1991. Hydrologic pathways and chemicalfor a series of Potentially sensitive sites receiving composition of runoff during snowmelt in Lochvery different atmospheric N inputs, suggest soil Vale watershed, Rocky Mountain National Park,processes likely have much more potential to Colorado, U.S.A. Water, Air, Soil Polln. 59: 107-
•determine long-term and seasonal change in stream 123.or lake water NO3" concentration. Soil processesappear sensitive to modest change in temperature, Driscoil, C.T.; Johnson, N.M.; Likens, G.E.; Feller,and climate change could increase available M.C. 1988. Effects of acidic deposition on theecosystem N. chemistry of headwater streams: A comparison
between Hubbard Brook, New Hampshire, andJamieson Creek, British Columbia. Water
ACKNOWLDEGEMENTS Resources Research. 24(2): 195-200.Herrmann, R.; Stottlemyer, R. 1991. Long-term
The authors gratefully acknowledge the long-term monitoring for environmental change in U.S.support provided by the Watershed Research National Parks, a watershed approach.
•Program, National Park Service, support provided by Environmental Monitoring Assessment. 17:51-•the U. S. Geological Survey, personnel and financial 65.assistance provided by Charles Troendle, U. S. ForestService, and the laboratory assistance of Louise Hirsch, R.M.; Alexander, R.B.; Smith, R.A. 1991.O'Deen and Jeff Braun, U. S. Forest Service. Selection of methods for the detection and
estimation of trends in water quality. WaterResources Research. 27(5): 803-813.
LITERATURE CITED
Kendall, C.; Campbell, D.H.; Bums, D.A.; Sh_ley,Ab'er, J.D •Nadelhoffer, K.J." Steudler, P.; Melillo, J.B • Livaa, S.R.; Chang, C.C. 1995. Tracing
• _ °_ o
- J.M. 1989. Nitrogen saturation in forest sources of nitrate in snowmelt runoff usmg the•ecosystems. BioScience. 39" 378-386. oxygen and nitrogen isotopic composition of
nitrate. In" Tonnessen, K.A.; Williams, M.W.,
Arthur, M.A.; Fahey, T:J. 1993. Controls on soil eds. Biogeochemistry of seasonally snow-coveredsolution chemistry in a subalpine forest in North- catchments. IAHA Publ. 228: 339-347.Central Colorado. Soil Science Society ofAmerica Journal. 57:1122-1130. Likens, G.E.; Bormann, F.H. 1995. Biogeochemistry
of a forested ecosystem. New York, NY:Springer-Verlag. 159 p.
338 GTR-NC-209

Lynch, J.A.; Bowersox, V.C.; Simmons, C. 1995. Stottlemyer, R.; Travis, B.; Toczydiowski, D. 1995.Precipitation chemistry trends in the United Nitrogen mineralization in boreal forest stands ofStates: 1980-1993.-National Atmospheric Isle Royale, Northern Michigan. Water, Air, SoilDeposition Program. Ft. Collins, CO: Colorado : Pollut. 82:191-202.State University. 103 p. A
Stottlemyer, R.; Troendle, C.A.; Markowitz, D. 1996. •Murdoch, P.S.; Stoddard, J.L. 1992. The role of Relationship of elevation and aspect to snowpack
nitrate in the acidification of streams in the loading and release in an alpine-subaipineCatskill Mountains of New York. Water ecosystem. Journal of Hydrology. (in press).Resources Research. 28(10): 2707-2720.
Stump, L.M.; Binkley, D.H. 1993. RelationshipsNADP. 1982-92. NADP NTN annual data between litter quality and nitrogen availability in
summaries, National Atmospheric Deposition Rocky Mountain forests. Canadian Journal ofprogram. Ft. Collins, CO: Colorado State Forest Research. 23: 492-502.University.
Williams, M.W.; Brooks, P.D.; Mosier, A.;Reuss, J.Oi; Vertucci, F.A.; Musselman, R.C.; Tonnessen, K.A. 1996. Mineral nitrogen
•Sommerfeid, R.A. 1995. Chemical fluxes and transformations in and under seasonal snow in a
sensitivity to acidification of two high-elevation high-elevation catchment in the Rockycatchments in southern Wyoming. Journal of Mountains, United-States. Water ResourcesHydrology. 173" 165-189. Research. 32( 10): 3161-3171.
Rutkowski, D.; Stottlemyer, R. 1993. Composition,biomass and nutrient distribution in mature
northern hardwood and boreal forest stands,Michigan. American Midland Naturalist. 130: 13-30.
..
Stednick, J.D. 198 I. Hydrochemicai balance of analpinewatershed in southeast Alaska. Arct. Alp.Res. 13"431-438.
StOddard, J.L. 1994. Long-term changes in watershedretention of nitrogen: Its causes and aquaticconsequences. In: Baker, L.A., ed. Environmentalchemistry of lakes and reservoirs. Advances inChemistry Series No. 237. Washington, DC:American Chemical Society: 23-284.
• .
Stottlemyer, R. 1992. Nitrogen mineralization andstream water chemistry, Rock Creek watershed,Denali National Park, Alaska, U.S.A. Arct. Alp.Res. 24(4): 291-303.
!
' Stottlemyer, R.; Toczydlowski, D. 1991. Stream uchemistry and hydrologic pathways during
- snowmelt in a small watershed adjacent LakeSuperior. Biogeochemistry. 13" 177-197.
Stottlemyer, R.; Tr0endle, C.A. '1992. Nutrientconcentration patterns in streams draining alpineand subalpine catchments, Fraser ExperimentalForest, Colorado. Journal of Hydrology. 140:179-208.
Proceedings iBFRA Assn 1997 meeting 339

,tIII,
!
. IF
340 GTR-NC-209

lD
Carbon Cycling and Storage
i°
. i¢
341

o
. 8
Ir
342
2i_

q11
II
THE EFFECTS OF FIRE ON ACTIVITIES DESIGNED TO INCREASE 1CARBON SEQUESTRATION IN THE BOREAL FOREST II
II
Eric S. Kasischke I A
" |ABSTRACT.-- This paper discusses the overalleffects firehas on the carbon budget of boreal forests. To support these premises, this paper is divided intoStudies on using the boreal forest as a means to four sections, including this introduction. The second
sequester carbon have not adequately accounted for section discusses the overall role of the boreal foreststhese effects, Among other approaches, it has been relative to other forests in terms of carbonsuggested that suppression of fire in the boreal forest sequestration, and also discusses how fire influencerepresent a means to increase terrestrial carbon carbon cycling in this biome. The third sectionstorage. The impracticality of this approach is discusses how future climate changes are likely to
illustrated through a discussion of the costs associated influence carbon storage in the boreal forest. Thewith, fighting fires in boreal regions, fourth section presents an example of the cost of
fighting fires in boreal forests, which clearly illustratesthe unfeasibility of usingfire suppression to increasecarbon storage. Finally, the fitch section presents the
INTRODUCTION conclusions from this study.t
Study groups within the International Panel onClimate Change (IPCC) have focused on identifying EFFECTS OF FIRE ON THE BOREAL FORESTapproaches to using the world's forest as sequesters of CARBON BUDGET
: carbon in order to offset the large amounts of carbon' dioxide being released into the atmosphere through Large amounts of carbon are presently stored in the
the burning of fossil fuels (Brown 1996). Approaches boreal region owing to two factors: (1) the presenceto increase carbon sequestration in forests focus ofpeatlands throughout the boreal forest which storeprimarily on: (1) planting more acreage in forests or enormous amounts of carbon; and (2) the presence ofimproving forest regeneration after land clearing; (2) deep organic soil profiles in many boreal forest types.increasing the productivity of existing forests; and (3) In terms of understanding carbon storage in thepreventing the clearing or destruction of existing boreal forest, the presence of these large organic soil
forests, including increasing fire suppression activities carbon pools represents unique circumstances. In(Dixon and Krankina 1993, Krankina and Dixon addition, boreal forests are different from other
1992, Nilsson and Schopfhauser 1995, Winjum et al. forested regions because of the large role natural1993); In developing carbon budgets for the boreal disturbance plays in natural processes. These naturalforest region, carbon sequestration studies to date disturbances are more important to the carbon cycle.have severely underestimated the effects of fire, both than human disturbances, such as deforestation andon current carbon budgets as well as in studies of the acid deposition.effects climate warming will have on future carbonbudgets. Figure 1 presents a relational diagram of the major
carbon pools present in the boreal forest along with !, This paper presents data and arguments to support the the factors that control the exchange of carbon u
following two premises: between these pools. The goal of carbon1. Until the effects of fire are properly accounted sequestration studies is simple: to identify approaches
for, studies on the amounts of carbon which can to decrease the amounts of carbon entering thebesequestered in boreal forests will continue to atmospheric pool by increasing the amounts of carbon
- be seriously flawed; and remaining in the other2. Suppression of fire in the boreal forest does not
represent a feas_le means to increase carbonsequestration in the boreal forest.
IEric S. Kasischke, Geography Department, 2181 LeFrak Hall University of Maryland, College Park, MD.20742. Email: [email protected].
Proceedings IBFRA Assn 1997 meeting 343

.. _ Major carbon pool, Atmospheric. exchange pathway composition
Process driving carbon
[-1_ exchange
Succession,
NPP
Living plants Moss/Lichen
Microbial
respiration
Mortality
Fire,
Wood products biomass burning
Plant detritus
Erosion,runoff
Organic soil
Leaching; biological &
cryogenic mixing
Mineral soil Sediments
Figure 1.-oA schematic diagram of the major carbon pools in the boreal forest and the processes which control theexchange of carbon betneen these pools.
pools (aboveground biomass, moss/lichen/roots,plant Annual Area Burned in Boreal Forestsdetritus, organic soil, mineral soil and sediments). It
important to note that the options for increasing the The earliest study on global biomass burning by Selleramounts of carbon residing in non-atmospheric pools and Crutzen (1981) estimated that only 1 millionrequire addressing the processes that control the hectares of boreal forest burned annually. One of theexchanges between carbon pools, difficulties in developing an accurate estimate on the
annual area burned in boreal forests is the lack of
The major shortcoming of most studies on increasing information from the Russian boreal forest. Whilecarbon sequestration in boreal forests is they focus on maps of fire sizes, locations and boundaries arethe processes controlling sequestration aboveground available for the North American boreal forest (Stockscarbon pool (e.g., increasing or maintaining et al. 1996), comparable information is not available
• production of trees) without fully accounting for the _n_a A,,aeu,,.n an
processes which control exchanges of carbon in the No,_ _, Bo,_aFo,a,.plant detritus and organic soil pools. In terms of 8
accounting for exchanges in these latter pools, fire 7 [ It
pla_ an extremely irnportant role whose effects have Ii "
_ not been fully accounted for in carbon sequestration _ 5
_ ._a • -
- In terms of the effects of fire on carbon cycling in the " 2 ........•boreal forest, there are tbxee major areas of concern:
(1) total annual area burned in the boreal forest; (2) _ .........amounts ofbiomass consumed during fires; and (3) 0 ......1940 1950 1960 1970 1980 1990 2000 2010
the effects ofbiomass burning on post-fire biogenic _,,' emissions of carbon. Figure 2.-- Summary of annual area burned in the
North American boreal forest- 1940 to• 1996.
344 GTR-NC-209
Consumption of Organic Soil during Boreal Forestfor Russia. An analysis of the North American data Firesrecord, as well as recent satellite imagery from Russiaprovides a basis to assess the level ofbiomass burning Another unique problem the boreal forest presents in
that occurs in the boreal forest, ten_s of estimating the amounts of carbon releasedinto the atmosphere during fires is the fact that the ,
Figure 2 presents a summary of the annual area large volumes organic soil present in this biome are *burned in the North American boreal forest over the quite susceptible to burning. Most estimates of the
past half century, While the accuracy of the amounts ofbiomass burned in boreal forest fires areinformation prior to the 1970's is in doubt, over the based on information obtained during controlled
past 3 decades the record keeping and mapping bums. Stocks (1991) and Cahoon et al. (1994) use •capabilities of fire monitoring agencies in Canada and an estimated biomass consumption of 12 t hal forthe United States has improved considerably. Thus, both the above and below-ground layers during firesthe estimates of annual area burned in North in the boreal forest.
American boreal forests provided since 1970 have a
high degree.of accuracy (Stocks et al. 1996). An Whi!'e these experiments have provided a basis forimportant aspect of the more recent fire record for estimating the amounts of carbon released in theNorth America is thesignificant rise in the average aboveground layer for North American boreal forest,area burned, which has risen from 1.5 million ha yrl they may not provide adequate information toin the mid- 1970s to over 3 million ha yrl in the mid- estimate the amounts of carbon released during1990's..This rise corresponds with a > 1.6° (C) rise in biomass burning in the ground layer. This observationannual temperature in detected for the North is supported by observation made on a recent forestAmerican boreal region over the past 30 years fire that occurred in a black spruce complex in interior(Hansen et al. 1996), and is consistent with Alaska. Post-fire ground observations showed thatpredictions for increased fire activity with increased the amounts ofcarbon stored in the ground layers.temperature (Flannigan and Van Wagner 1991; (which includes litter, moss, lichen and organic soft)'Wotton and Flannigan 1993). black spruce forests found within the fire affected
region ranged between 50 t ha "1 and 105 t hal. TheAnother important characteristic of fires in boreal amounts of the ground layer (in terms of total carbon)forest is their periodic nature. Most of the area consumed during fire ranged between 25% and 92%.burned inboreal regions occurs during years when Data of soil depth and percent carbon consumed fordrought conditions are present. The periodicity of three different areas in this burn are presented inhigh.fire years interspersed with low fire years is an figure 3. The amounts of carbon released during theoutcome of the periodic nature of fire weather in the fire were 25 t hal for profile I, 45 t ha l for profile II,
boreal region. Analysis of AVHRR satellite imagery and 72 t ha_ for profile III. Michalek et al. (1997)of the Russian boreal forest is entirely consistent with estimated that an average of 43 t ha_ was released
this Observation. During the extreme fire year in during this fire, which is four times the amount used1987, Cahoonet al. (1994) mapped > 11 milh'on ha of in other studies (Stocks 1991; Cahoon et al. 1994).
.burned area in Russia using AVHRR data, while in ayear of moderate fire activity (1992), Cahoon et al.(1996) mapped 2..4 million ha of fire in Russia. Post-Fire Biogenic Emissions
While most Russian authors estimate that the annual The formation of deep organic soils in boreal forests !, area burned in the boreal forest of their country is the result of several factors, including: (1) low
averages 1' to 2 million ha yrl (Korovin 1996), the average annual temperatures; and ('2) the presence of wsatellite evidence suggests that these estimates are a continuous moss layer which further restricts energylow, by a factor of three or four. If it is assumed that and water exchange between the atmosphere and landthe patterns of fire in the North American and Russian surface. These conditions often result in theboreal forest are similar (as the satellite data suggest), formation ofpermafrosr in boreal forests. Theand given the fact that northern Russia has presence of permafrost under a boreal forest is notexperienced significant temperature increases over the continuous over longer time periods. Studies havepast 30 years as well (Hansen et al. 1996), then the shown that permafrost often disappears atter theannual area burned in the boreal forest is probably occurrence of a fire because: (1) the removal of theclose to 10 million ha yrl (because Russia contains tree canopy by fire significantly increases the amounttwice as much boreal forest as North America), or an of solar radiation reaching the forest floor; (2) the
order of magnitude higher than early estimates, removal of moss and organic soil decreases theinsulating capacity of the ground layer; and (3) the
Proceedings IBFRA Assn 1997 meeting 345

removal of plant material and replacing it with charred loss of carbon due to increases in soil respiration.and uncharted orgam'c soil significantly reduces the However, such studies have not fully accounted foralbedo Or reflectivity of the ground layer, meaning the influence of the effects of climate on the fire cyclemore solar energy is absorbed by the ground (Viereck and subsequent effects of fire on carbon storage in the1983). The result of fires in boreal forests is that boreal forest.
there is a significant increase in the ground Atemperature for about 15 to 25 years atter the fire. Kasischke et al. (1995) presented a simple, but tThe severity of burning in the ground layer (organic illustrative model on these effects based on looking atsoft) significantly influences the degree of temperature several factors: (1) the relationship between fireincrease, as illustrated in-figure 3. In the area where return interval and stand age distn'butiom in borealonly 25% of the organic soil was consumed, the forests; (2) changes in patterns of carbon •ground temperature (to 100 cm depth in the mineral accumulation in aboveground vegetation and ground-soft) was2 ° C wanner than in an adjacent unburned layer biomass associated with changing climate; andstand. In contrast, in the areas where 92% of the (3) the influence of climate on fire frequency andorganicsoil was consumed, the average ground severity.temperature had risen by 6° C.
; A high percentage of fires in boreal forest kill allJ
19,_so, tem_ratmd_reaee overstory trees, e.g., they are stand replacement fires.ina site which burned in 1994
In such situations, Van Wagner (1978) and Yarie"100..........................................................................................................................................................
(1981) have shown that a We_ull distribution can be
..... I _ used to estimate: the stand age distribution for such8°i _,_,..... e_.gc [-"] forests. In essence, the shorter the fire return interval,ii 60 ........ %carbonburned
......... _ the larger number of young stands that are present
[ 20_C - humicsoi, (fig. 4). For a given forest type, it is fairly easy to• 20..:,........ _'_
i o..i i_ _ ,_so, develop aplot of changes inabove andbelow-ground
• ................................_ biomass/carbon as a function of stand age (fig. 5). By
• _ "20 "i __ moss/litter integrating the two functions of carbon versus stand• :_:::........................ age with a number stand age distr_utions for different•40 "-i................................................-t....................................................•....................................................
P.,,., P_d.,, _._,,, fire return intervals, it is possible to estimate howaverage carbon levels vary as a function of fire returninterval (fig. 6). Figure 6 illustrates a fundamental
Figure 3.-- Patterns of ground-layer biomass relationship: as the fire return interval decreases (e.g.,• consumption and effects on ground temperature as the average area burned per year increases), the
. from three test areas in a 1994forestfire near carbon storage potential of a given forest decreases.Delta Junction, Alaska. Therefore, if there is an increase in fire frequency with
increased temperatures (as predicted by all climateThe rates of soil respiration in organic soils in boreal change models for the boreal region), then the resultforests _e strongly controlled by temperature would be less carbon storage in this biome.(Schlentner and Van Cleve 1985), and the increases in
" s0il temperature following a fire results in net In addition, however, one must account for the
increases in soil respiration. Recent studies by O'Neill changes in the carbon storage depicted in figure 5.et al. (199.7) showed that the microbial soil respiration Increases in average temperature in the boreal zone
in an unburned black spruce stand was significantly will likely result in: (a) increases in the overall p_ttem. lower when compared to respiration in a stand which of aboveground carbon storage in aboveground
-had burned 5 years earlier, vegetation through shifts in forest types and inc_asesin productivity; (b) increased rates of soil respiration,
• which results in decreases in the patterns of carbonPOTENTIAL EFFECTS OF CLIMATE storage in the ground layer (figs. 7 and 8). These
CItANGE ON BOREAL FOREST CARBON changes, in turn, results in changes in the baselineSTORAGE patterns of average carbon storage, as depicted in
figures 9 and 10. If it is assumed that the fire returnMost studies of the effects of climate change on interval decreases from 125 to 100 years, then the
boreal forests have focused on influences on the increase in average aboveground carbon of 1.3 kg m2' distribution and productivity of forests (Smith et al. will be outweighed by the loss of 4.8 kg rn2 of carbon
1992), and have concluded that while increases in fi'om the ground layer.temperature would result in increases in average
' abovegrotmd biomass, they would also result in a net
346 GTR-NC-209

THE COST OF FIGHTING FIRES IN THE O.OlBOREAL FOREST- IS FIRE SUPPRESSION
AN OPTION FOR INCREASING CARBON 0.0o8_
SEQUESTRATION IN THE BOREAL FOREST?-- fire return i_ ,- 100 yeers
o.oo6 a
Recognizing the role of fires in the carbon cycle, some _researchers have suggested that additional fire 0.0o4
suppression represent a means for increasing carbonsequestration in the boreal forest (Dixon and Krankina o.0_ --flmmtumi_l=2OOyeam1993). A simple example illustrates the fallacy of thisargument, o .0 100 200 300 400 500 600
standage- t (ym)
The 1990 fire season was the most severe one on
record in Alaska, with some 1.3 million hectares being
consumed by fires. One of these fires began on I July Figure 4.--Influence of changes offire return intervalwithin 1 km of the village of Tok, which is also the on stand age distribution based on a Weibullsite Of a regional forest fire-fighting center for the Distribution.State Department of Natural Resources. In spite ofthe proximity to the fire suppression unit, because thefire was.a distance off the road, by the time that so
persotmel reached the fire it was already big enough 4s
that it could not be extinguished or contained using _ 40ground crews alone. Fortunately, a large, paved air .-,asstrip was located within 25 km of Tok and _ 3o -tot,
arrangements were made to assign a number of air _ as.tankers (both water and retardant) to battle the fire. s 20 - ground layot• g
In addition, Tok is located at the junction of two of [ 15Alaska's major highways and it was poss_le to rapidly ,odeploy additional ground crews fi'om other regions of s livingbiomassthe state. Because of an extensive drought, the fuel oconditions were extremely dry, and the fire quickly o 100 200 300 400 500 ,600stand age (yrs)
spread in spite of intensive suppression efforts. ByJuly 4, the fire had consumed over 20,000 ha of forest
and the community of Tok was evacuated. The only Figure 5.--Patterns of carbon storage as a function ofthing that saved the village from the fire was a major stand age for a typical boreal forest.wind shi'fl.
35
The fire suppression costs for the Tok fire eventuallyreached $35 million dollars for a fire whose size was 30
, 40,000 ha by the end of the fire season. The _ 25suppression costs were significantly reduced (relative "__.20
I '•to fires in other regions of the state) because of the 15
, close.proximity to an air field and a logistical support tL ucenter. This example illustrates a fact that is clear to [
10
foresters in both Alaska and Canada: that it is both 5 .._r..m.._...._..__ m ,-_
unfeas_le and impractical to suppress all fires in the 0 _-_ .....North American boreal forest. Instead, North o 100 200 300 400 500 600American foresters pra.ctice modified fire suppression, _, mtum Inllm_l(ym)
e.g., fires are actively suppressed only when they [ ca ,_,v_ o _,a,o, v _,tJ [directly threaten human life or property. I I
Figure 6.--Patterns of average carbon storage as a' function offire return interval based on carbon
storage patterns presented in Figure 5.
Proceedings IBFRA Assn 1997 meeting 347

.20 " 40 |35
-post-climate change "E
cr 30WE8,15 . .
_ 25
I '10 _ 20J_
tl
i o 15' _).
| l° ta 5
o ...... 0 _ , ,0 " -100 200 300 400 500 600
mn_aae(yrs) 0 100 200 300 400
stand age (yrs)
Fig_e 7.--Projected effects of climate change on Figure 8.--Projected effects of climate change on
patterns of aboveground carbon accumulation, ground-layer patterns of carbon accumulation.
10 "'i.................................................................................................................................................................................................10
, 6 _e 6
4_ _,_D 4
o _0
_ -4 - -4• -64 • i• i
-10 'r ..................................=--: i : ...................:::::: ......................i0 100. 200 300 400 500 600
fire return Interval (yrs) 0 100 200 300 400 500 600fire retum Interval (yrs)
[ II n° climate change C! c°mbtne effects I I . no climate change D combined effects
Figure 9.--Effects of climate change and fire return Figure l O.--Effects of climate change and fire returninterval on total carbon storage in aboveground interval on total carbon storage in belong-groundbiomass in boreal forests, biomass in boreal forests.
• .
CONCLUSIONS Fire plays a central role in the exchange of carbonbetween the terrestrial biomes of the boreal region
Understanding the effects of global climate changes and the atmosphere. While the importance of this role
and developing viable strategies and options for has only recently been recognized by the broadel, responding to these changes represents a significant scientific community, it has not been properly
challenge to the scientific and policy communities. accounted for by scientists developing carbon b_dgets
The boreal forest region is at the center of studies and approaches needed to sequester carbon ininvolved in understanding the role of the world's terrestrial ecosystems. While the pathways where fireforests in the global carbon cycle, and developing influences carbon exchange in the boreal forest haveapproaches to mitigating the effects of additions of been identified, the rates of exchange have yet to be
greenhouse gases to the atmosphere from the burning fully quantified. This quantification requires efforts inof fossil fuels through increasing the amounts of the following areas: (1) improving data bases of thecarbon stored in terrestrial biomes. The importance location and extent of fires in the Russian borealof the boreal forest stems from two facts: (1) the forest. This information can easily be provided
' large amounts of carbon stored in the boreal region,which is the world's largestreservoir of terrestrial through analysis of satellite imagery, (2) studies of thepatterns ofbiomass burning and consumption ofcarbon; and (2) the location 0fthe boreal forest in the biomass in the different forest ecosystem which
' region where the greatest increases in temperature are comprise the boreal forest. Particular attention needsexpected over the next century.
348 GTR-NC-209

to be paid to the extent of smoldering fires in organic Flannigan, M.D.; Van Wagner, C.E. 1991. Climatesoils; and (3) studies on changes in soil moisture and change and wildfire in Canada, Canadian Journalternperature the rates of soil respiration alter fires in of Forest Research 2: 61-72.different boreal_forests. :
Hansen, J.; Ruedy, R; Sato, M.; Reynolds, R. 1996. AFinally, suggestions have been made that increased Global surface air temperature in 1995: return tocarbonsequestration in the boreal forest can be pre-Pinatubo level. Geophysical Research Lettersachieved through increased fire suppression activities. 23" 1665-1668.This suggestion is totally impi'actical and undesirable
for three reasons. First, most fires in boreal forest Kasischke, E.S.; Christensen, N.L. Jr.; Stocks, B.J. 'occur in remote regions at great distances from fire 1995. Fire, global wanning and the mass balance
fighting equipment and manpower required. The cost of carbon in boreal forests, Ecologicalof deploying these resources is extremely high, and Applications 5" 437-451.suppressing all boreal forest fires would require
financial resources far beyond those that are available. Korovin, G.N. 1996. Analysis of distnqaution of forestSecond, even if unlimited.resources are available, fires in Russia. In: Fire in Ecosystems of Borealonce a fire reaches a certain size (e.g., several Eurasia, J.G. Goldammer and V.V. Furyaev,hundred-hectares), it is virtually imposs_le to editors, Kluwer Academic Publishers, Dordrecht,suppress without resources beyond those available at The Netherlands, 112-128.the time: And thii:d, because fire is an integral part of
the ecology of all boreal forests, fire suppression is Krankina, O.N.; Dixon, R.K. 1992. Forest
not a valued resource management option. In many management in Russia - challenges andcases, such as wildlife habitat management, fire is opportunities in the era ofperestroika. Journal ofviewed as an extremely valuable process. Forestry: 29-34.
' Nilsson, S; Schopflmuser, W. 1995. The carbon
LITERATURE CITED sequestration potential of a global afforestationprogram. Climatic Change 30: 267-293.
Brown, S. 1996. Management of forests for
mitigation of greenhouse gas emissions. In: O_eill, K.P.; Kasischke, E.S.; Richter, D.D.;
C"!imagechange 1995 - impacts, adaptations and Krasovic, V. 1997. Effects of fire on temperam_,mitigation of climate change: scientific-technical moisture and CO2 emissions l_om soils near Tok,analyses. R.T. Watson, M.C. Zinyowera, and R.H. Alaska. In Proceedings of the International
Moss (editors), New York, Cambridge University Symposium on Physics, Chemistry, and EcologyPress, 775-797. of Seasonally Frozen Soils, Fairbanks, Alaska,
June 10-12, 1997, 295-303.Cah0on, D.R.,_Jr.; Stocks, B.J.; Levine, J.S.; Cofer
W.R:, III; Pierson, J.M. 1994. Satellite analysis of Schlentner, R.E.; Van Cleve, IC 1985. Relationshipsthe severe 1987 forest fires in northern China and between CO2 evolution from soft, substratesoutheastern Siberia. Journal of Geophysical temperature, and substrate moisture in fourRese_ch 99" 18,627-18,638. mature forest types in interior Alaska. Canadian
Journal of Forest Research 15" 97-106. !. Cahoon, D.R., Jr.; Stocks, B.J.; Levine, J.S.; Cofer
iFW.R., tli; Barber, J.A. 1996. Monitoring the Seiler, W.; Crutzen P.J. 1980. Estimates of gross and
. 1992 forest fires in the boreal ecosystem using net fluxes of carbon between the biosphere and•NOAA.AVHRR satellite imagery. In: Biomass atmosphere. Climatic Change 2: 207-247.•Burning and Climate Change - Volume 2 -
Biomass Burning "mSouth America, Southeast Smith, T.M.; Leemans, R.; Shugart, H.H. 1992.Asia, and Temperate and Boreal Ecosystems, and Sensitivity of terrestrial carbon storage to CO2-the Off Fires of Kuwait, edited by J.L. Levine, induced climate change: comparison of fourMIT Press, Cambridge, MA. 795-802. scenarios based on general circulation models.
Climatic Change 21" 367-384.D_on, R.K.; Krankina, O.N. 1993. Forest fires in
Russia: carbon dioxide emissions to the
atmosphere. Canadian Journal of Forest Research,
23: 700-705.
Proceedings IBFRA Assn 1997 meeting 349

Stocks, BJ. 1991. The extent and impact of forest Viereck, L.A. 1983. The effects of fire in black spruce
"fires in northern circumpolar countries. In J.L. ecosystems in Alaska and northern Canada. In TheLevine, editor. Global biomass burning: Role of Fire in Northern Circumpolar Ecosystems,atmospheric; climatic and biospheric implications. Wein, R.W., and D.A. MacLean, editors, JohnThe MIT Press, Cambridge, Massachusetts, USA - Wiley and Sons, New York, 201-220.197-202.
Winjum, J.K.; Dixon, R.K.; Schroeder, P.E. 1993.Stocks, B.J.; Lee, B.S.; Martell, D.L. 1996. Some Forest management and carbon storage: an
potential carbon budget implications of fire analysis of 12 key forest nations. Water, Air andmanagement in the boreal forest. In Forest Soil Pollution 70: 239-257.Management and the Global Carbon Cycle. M.J.Apps and D.T. Price, editors, NATO ASI Series, Wotton, B.M.; Flannigan, M.D. 1993. Length of thesubseries 1, Vol. 40 "Global Environmental fire season in a changing climate, ForestChange", Springer-Verlag, Berlin, 89-96. Chronicles 69:187-192.
VanWagner, C.E. 1978. Age-class distribution and Yarie, J. 1981. Forest fire cycles and life tables: a casethe forest fire cycle, Canadian Journal of Forest study from interior Alaska, Canadian Journal ofResearch 8".220-227. Forest Research 11:554-562.
i
' IF
350 GTR-NC-209
[ - .

°
A SPATIALLY EXPLICIT MAP OF FOREST STAND CARBON FOR RUSSIA:A FIRST APPROXIMATION
T. A. Stone 1, P. Schlesinger 1, and V. A. Alexeyev 2 ,D
ABsTRAcT.--We have created a map of forest stand carbon content of the forests of Russia (Shvidenko etcarbon for Russia from data on total forest stand al. 1996; Isaev et al. 1995; Kolchugina and Vimoncarbon by administrative districts from Alexeyev and 1993, 1995; Dixon et al. 1994; Lakida et al. 1996). "Birdsey (1994, 1998) and with a 1973 forest cover Different methodologies have led to widely differentmap of the former USSR (State Committee on estimates of the C contents of forests in spite of theForests 1973). Each carbon value has b,een applied to fact that most researchers have use the same statisticalthe map by tree species or genera. The identifier of data from national inventories as a starting point.each forest polygon was a percentage of the area of Some have determined C for the entire country (Isaevfores,t species per administrative district. Carbon et al. 1993, 1995; Dixon et al. 1994) while othersvalues were applied to the map and then converted to have used eco-regiom or economic regiomtons of C ha"]. The resulting map shows forest stand (Kolchugina and Vinson 1993, 1995; Lakida et al.
C by region and tree genus in a spatially explicit form. 1996). Isaev et al. (1.995) estimated that forest. carbon was about 35,070 Tg C (35.07 Pg),
Kolchugina and Vinson (1993) estimated that forestcarbon (above ground woody phytomass) was about
INTRODUCTION 36.7 Pg and Dixon et al. (1994) estimated thevegetation carbon pool of Russia to be to be about 74
A fifth of the world's forests are in Russia (United Pg. The extreme heterogeneity and difficulty of' Nations 1992).. These forests are one of the world's access of forested Russia are also partial explanations
great repositories of terrestrial carbon. It is necessary for the disparity in these estimates.to understand the spatial distribution of this carbonfor forest managementand to help ascertain its role in The most detailed estimates of the C content ofthe global carbon cycle. If the spatial distribution of forests have been made by Alexeyev and Birdsey
carbon ( C ) were known, it would improve the (1994, 1998). They defined the C in forests for th_ 71accuracy of measuring carbon flux from land use political units of the Russian Federation (oblasts,change and help in determining the emissions of krays, and republics), for 63 eco-regions, and for eachgasses and particulates from biomass burning. Also, of the forest forming tree species and age classknowing the distribution of C would aid in defining groups.respiration values for ecosystem models, provide a
baseline for changes in C stocks, and allow forvalidation for ecological process models and dynamic METHODOLOGY
" global Vegetation models.• We constructed an area-weighted map of forest stand
In this work, we have combined forest tree stand carbon using data from Alexeyev and Birdsey (1994,carbon data with a forest cover map of Russia to 1998) and a forest cover map of the Soviet Union
. produce a map of the spatial distribution of forest digitized from the 1973 Forest Atlas of the USSR Itstand carbon. We have chosen to use the (State Committee on Forests 1973). The 1973 map lp
comprehensive carbon data ofAlexeyev and Birdsey (published at 1"15,000,000 scale) is comprised of 22" (!994, 1998)and to combine it with a map of forest different cover types: Pine, Spruce, Fir, Spruce/Fir,
cover from the Forest Atlas of USSR (State Larch, Kedra (S_erian and Korean Pine), Juniper,Committee on Forests 1973) that we digitized here. Creeping Cedar, Oak, Beech/Hornbeam, Stone Birch,
Sand/Haloxylon, Birch, Aspen, Nonforest, Water,Given the importance of the region, it is not surprising Tilia, other woody and sparse categories. The 1973that many authors have developed estimates for the map was digitized here using Roots tmsoftware and
1The Woods Hole Research Center, PO Box 296, Woods Hole, Mass., 02543, USA.
2St. Petersburg Research institute of Forestry, 21 Institutsldy Ave, St. Petersburg, 194021, Russia.
Proceedings IBFRA Assn 1997 meeting 351

.
. imported into our geographic information system 1. the different scales of the forest map we digitized(GIS). It was the best map available to us at the (1"15 million scale) and the administrative districtbeginning 0f this research, boundary file data (1:8 million);
Thereare three levels of forest maps in Russia: local, 2. the (unknown) scale of the original data used toregional, and national. Local maps have scales from create the published values of carbon; and,1:25,000 to 1:200,000. They are the most detailedmaps and are where composition, site quality class, 3. the differences between the map classificationsand age-class groups are introduced. However, the that were used.composition of stands on such maps is based ondominant species and is at the genus, not species, However, these differences accounted for less thanlevel. Regional forest maps have scales from 1% of the total carbon mapped.1:500,000 to 1"1.5 million. Such maps also showdetailed information, especially maps reproduced as During the course of this work this work, a digital
. Forest Atlases (State Committee on Forests 1973). version of the 1990 Forest Cover Map of the USSRBut, forest plots less than 500 ha cannot be shown on (Garsia 1990) became available. Consequently, thisthe maps. Information on the national-level forest effort could be redone with the higher resolution map.maps is the most generalized. We know two Russian But, before making a high-resolution forest carbonforest maps. for the whole country, the 1990 USSR map, we need to consider the scale of the forest-Forest Cover Map (Garsia 1990) at 1:2,500,000 and carbon data that has gone into the tables of Alexeyevthe 1973 USSR Forest Cover Map (State Committee and Birdsey (1994). Using the 1:2,500,000 scale mapon Forests 1973) with a scale of 1"15,000,000. The from 1990 as the basis of the carbon map wouldsmallest size of forest plot that can be displayed on provide the appearance of a higher resolution, forestthe latter map is 9,000 ha. Thus, such national-level stand carbon map. But, considering the scale ofthe
. maps can only approximate the situation, carbon data, the improvement may be deceptivelyattractive. Additionally, Shvidenko (personal
Forested polygons from the digitized 1973 forest map communication 1997) has indicated that the 1990
were assigned carbon values according to the Forest Cover map was a hasty and incompletepercentage of their area in different tree species. The updating of the maps from the 1973 Atlas.carbon values for forests (in milh'on of metric tons,
MT, of C), were taken from table C-I of Alexeyevand Birdsey (1994, 1998). These values represent the RESULTSsum of total growing stock of various forest ageclasses (young, middle-aged, maturing, mature and This newly calculated map (fig. 1) is the only map ofover-mature). These values were listed by forest stand carbon for the Russian territory of whichadministrative or political district (i.e., republic, oblast we are aware. The forest stand C mapped by thisand kray) and by forest type. effort represents approximately 96% of the total of
26,103 Tg (26.1 Pg) forest tree stand C described byCarbon was assigned to each of the 71 administrative Alexeyev and Birdsey (1994) and Alexeyev et al.districts of Russia using the formula: (1995). Of the remaining 4%, nearly half is due to
bushes, which were assumed not to be mapped in theArea-weighted Carbon = (Area of forest polygon / 1973 forest cover map.Area of forest species) x Tot. MT C per species J
' The primary drawback to this method is that ifithin" Estimat'mg carbon in this manner has certain individual administrative regions we needed to assume
drawbacks. For instance, we found some that forest density remains constant while we know
disagreement in 68 of 71 administrative districts that, generally, forest density declines as one moves" between the forest tree'species descn'bed in the 1973 up slope or farther north. For instance, the larch
map and those listed by Alexeyev and Birdsey (1994). forests of northern Krasnoyarsk Kray in centralThese disagreements accounted for 4.2% ofa S_eria contain trees that can be hundreds of yearspublished total of 26.1 x 10⁹ tons C in tree stands and old, of small diameter, and very sparsely distn_outed
. shrubs. The most likely causes for the disagreement (Bondarev 1995). But, our application of C to thewere: map assumes, in this first approximation, that the
larch forests in the north are the same as larch forests
352 GTR-NC-209

,-, Q
.o ._" Qr
_, (_
r_
, .; Iw.
k " V V V V V V V V V ^ •..,,,',\ V
, .... -_ m_mEHm/mnnm "_.l"'
Proceedings-IBFRA Assn 1997 meeting 353

m
mi# •
growing 1,500 km to the south. Thus, the map is In the regions ofPrimorskii Kray and mmost generalized in the largest administrative districts Khabarovskii Kray, the genera Quercus wereand more accurate in the smaller administrative . mapped, while the tables listed the species asdistricts. Quercus mongolica. In the same regions, the a
map showed Kedra (Pinus spp.), while the tablelisted Pinus korayensis. In Kamchatskaya, the
DISCUSSION species Larix camchatica was likely mappedsimply as Larix.
Whe n comidering the map deVeloped here, it is *important to remember that forest stand carbon is 2. Some species in the tables differed entirely from
only a fraction of the total carbon in forested those on the map. For example, in Irkutskaya .ecosYstems of Russia. Forest soils alone may store 3 (region #61) the tables showed 71.53 Tg C oftimes as much carbon as the forested stands aspen, while the map did not indicate any aspen,
(Alexeyev et al. 1995) and total soil carbon in Russia and in Magadanskaya (#69), where Chozenia _.(Rozl_ov et al. 1996) may be 10 times forest stand arbutifolia (a poplar species) accounts for 13.62 _'_carbon. Tg C, the map did not contain that genus. The
map does have an "other hardwood" class, andThis map is a static representation of a dynamic while it might be appropriate to assign carbonregion. That is, this n_p is for a point in time and fi'om Populus to that class, it is unknown whether
does not reflect the dynamic nature of the forests of the "other" class contained only poplar. ¢Russia where up to 14 million ha of forests can bumin an exceptional year (Stocks 1991) and 2. 5 million 3. The 1973 map is highly generalized, necessitatingha burns in an average year (Krankina 1993). Current careful comparisons among administrativeestimates (Korovin 1995) are that fires burn 2 to 5 regions. Generalization of both the map and C
. million ha yrl of forests in Russia or about the same table summaries do not allow for adequatemagnitude as the rates of forest harvest, differentiation between the mapped tree speciesConsequently, this map is unsuitable for use in (i.e., Picea obovata in Komi and P. ajanensis indiscussions about the sources and sinks of carbon in Sakhalinskaya), or account for the complexity ofthe forests of Russia. mixed species at the ground level,
There are a number of differences between the map Some other caveats:and the forest stand C data fi'om Alexeyev andBirdsey (1994). We explain these below. (a) None of the small-scale Russian or Soviet maps
of forest cover (e.g., Forests of the USSR 1990,1. The tree species used in the map from the USSR Garsia 1990) adequately represent the variation
Forest Atlas (State Committee On Forests 1973) encountered either in the vydel (the minimumand from the tables of Alexeyev and Birdsey forest mapping unit in Russia) level database or• .
(1994) were not identical. Only forest genera the actual forest in many locations. Forest type iswere descrl_oed in the Forest Atlas map. To seen to be constant across a polygon, whereas in
' adjust for this, we have added the most likely tree reality it is likely only the prevalent genera.
species to the C totals of the genera before Although there are maps at the leshoz- level /assignin"g the data to the map. For example, in based on vydels, they are generally not availa_ole.
' Krasnodarski Kray (region #40) and B0renburgskaya Oblast (#48), Populus tremula (b) The 1973 Forest Atlas Map is undoubtedly awas combined with Populus spp. And, in generalization of forest knowledge of an earlierChelyabinskaya Oblast (#51), where the map had time, probably the mid 1960's but perhaps evenonly a spruce-fir category, yet the tables had both earlier. It was chosen because it was the only .
" tree species listed individually, the data were digital forest cover map available at the beginningcombined and then mapped. Also, in of this research.Krasnoyarsk Kray (#60) and KamchatskayaOblast (#68), carbon for Betula spp. was not (c) The scale of the 1973 Forest Atlas map was quiteadded to Betula ermanii, small, 1"15 milh'on. At this scale, lines indicating
boundaries of polygons are approximately 15 kmwide introducing significant errors particularly for
354 GTR-NC-209

°
very small polygons. The scale of the source W. Alton Jones Foundation and the John D. andmaterials for the 1"15million map are likely the Catherine T. MacArthur Foundation for their support.1"1 - 2 milh'on scale maps of the territories in theAtlas. The quality of those source maps is Aunknown. LITERATURE CITED t
(d) It is not poss_le to ascertain now whether the Alexeyev, V.; Birdsey, R., eds. 1994. Carbon In:2% of total C which were bushes were actually Ecosystems of Forests and Peatlands of Russia,mapped as Knnnholz or class #8 on the 1973 Sukachev Institute for Forest Research and USDA'Forest Map; many of the bushes tabulated vary in Forest Service, 224 p. (in Russian).age from 50 tO 100 years.
A!exeyev, V.A.; Birdsey, R.A., 1998. Carbon Storage(e) Themap does not indicate carbon in soils, peats, In Ecosystems of Forests and Peatlands of Russia.
or mortmass (dead trees, branches, and litter). Gen. Tech. Rep. NE-224. Radnor, PA: U.S.Department of Agriculture, Forest Service,
(f) The carbon map developed here is more Northeastern Forest Experiment Station.appropriate for smaller, rather than larger regionsbecauseof the assumptions about forest density Alexeyev, V.; Birdsey, R.; Stakanov, V.; Korotkov, I.and site index or bonitet. 1995. Carbon in vegetation of Russian forests:. methods to estimate storage and geographic
distribution. Water, Air and Soil and Pollution. 82:FUTURE WORK 271-282.
This work could be repeated relatively easily with the Bondarev A.I. 1995. Structure and regulations for
. 1990 Forest Map of the USSR at 1:2.5 million scale, inventory of forest-tundra stands in northeasternAlso, this work could also be repeated with future part ofKrasnoy_sk Kray. Krasnoyarsk;maps of the forests of Russia at l-kin resolution. To Krasnoyarsk Technological University. 19 p.do this, we would use the same administrative Ph.D. thesis. (in Russian).datasets and algorithms used in the current effort. A
more reliable administrative boundary layer map Dixon, R, Brown, S.; Houghton, R.; Solomon, A.;_would help. Trexler, M.; Winiewski, C. 1994. Carbon pools
and flux of global forest ecosystems. Science. 263:Data for forest type stand volume, and increment 185-190.exists for all Russia at the local forest administrative
Unit(leshoz) level. Given that there are more than Garsia, M.G., ed. 1990. Forests of the USSR. Scale2,500 of these units in the former Soviet Union, the 1:2,500,000. Forest Geography Committee USSR,map Could be fiu'ther refined if the boundary files for Main Soviet Geography and Cartographythese management units were available. Although this Ministry, GUGK, Moscow, USSR.wouldbe a comiderable effort, using these units in asimilar manner would result in a 30-fold increase in Isaev, A.S.; Korovin, G.; Utkin, A.; Pryanishnikov,
resolution for forest stand carbon mapping. A.; Zamalodchikov, D.G. 1993. Lesovedenie. No.5: 3-10, (in Russian). II
' Finally, We are planning to merge this map with digital usoil earbori maps of Russia available through Russian Isaev, A; Korovin, G.; Zamolodchikov, D.; Utkin, A.;collaborators. This will allow us to show the spatial Pryazinkov, A. 1995. Carbon stock and depositiondistnSution of tree stand C and soil C and to examine in phytomass of Russian forests. In: Apps, M.J. et
the spatial relationship betweenthese two major C al., eds. Boreal forest in global change, p. 247-pools in Russia. 256.
Kolchugina, T.; Vinson, T. 1993. Carbon sources andACKNOWLEDGEMENTS sinks in forest biomes of the former Soviet Union.
Global Biogeochemical Cycles. 7(2): 291-304.The authors would like to thank NASA's Office of
Mission to Planet Earth (MTPE) NAGW 3856, the
°
Proceedings IBFRA Assn1997 meeting 355

Kolchugina, T.; Vinson, T. 1995. The role of Russian Shvidenko, A.S.; Nilsson, S.; Rojkov, V.; Strakhov,forests in the global carbon balance. Ambio. 24(5): V. 1996. Carbon budget of the Russian boreal258-264. forests: a system analysis approach to uncertainty.
In: Apps, M.J.; Price, D.T., eds. Forest AKorovin, G. 1995. Paper presented at a Workshop on ecosystems, forest management, and the global ,
Joint Implementation Policy in Russia. 1996 carbon cycle. Berlin" Springer-Verlag. NATO.February 5; Moscow. Synopsis by E. Stukova and ASI Series. 1(40): 145-162.A. LeBlanc.
State Committee on Forests. 1973. A 1"15,000,000
Krankina:, O. 1993, Forest fires in the former Soviet scale forest cover map of the Soviet Union. 1973Union: past _present and future greenhouse gas USSR Forest Atlas, Soviet Ministry of Geodesycontributions to the atmosphere. In: Carbon and Cartography.Cycling in Boreal Forest and Stib-ArcticEcosystems. US EPA Office of Research and Stocks. B. J. 1991. The extent and impact of forestDevelopment 600R-93/084:179-186. fires in northern circumpolar countries. In: Levine,
' J.S., ed. Global biomass burning" atmospheric,
Laki'da, P.; Nilss0n, S.; Shvidenko, A. 1996. Forest climatic and biospheric implications. Cambridge,phytomass and carbon in European Russia. WP- MA: The MIT Press" 197-202.96-28. Laxenburg, Austria: International Institutefor Applied Systems Analysis. 31 p. United Nations. 1992. The forest resources of the
temperate zones, 1992. Main findings of the
Rozhkov, V.; Wagner, V.; Kogut, B.; Konyushkov, UN-ECE/FAO 1990 Forest Resource Assessment.D.; Nilsson, S.; Sheremet, V.; Shvidenko, A. United Nations. New York. 32 p.1996. Soil carbon estimates and soil carbon map
. for Russia. IIASA WP 96-60. Laxenburg. 44 p.
!
• IF
356 GTR-NC-209

°
. SCALING SOIL CARBON STOCKS AND FLUXES AT THE BOREAS NORTHERN STUDY AREA.
G. Rapalee, E. A. Davidson, J. W. Harden, S. E. Trumbore, and H. Veldhuis It
O
ABSTRACT. - Boreal forests, currently thought to be STUDY AREAsignificant carbon sinks in global C budgets, couldbecome net C sources as the earth warms. Most of The 733 km2 study area, located between Thompsonthe carbon in boreal forests is stored in the soil and and Nelson House, Manitoba, is close to the northern "moss. We mapped soil carbon stocks, soil drainage, limit of the closed-crown boreal forest. The areaand fire history at a BOREAS (BOReal Atmosphere- includes well-drained upland jack pine stands on
Ecosystem Study under NASA's Earth Science sandy soil, black spruce dominated stands onEnterprise) study site in northern Manitoba. To moderately to imperfectly drained soils developed oncalculate C fluxes, we applied algorithms for inputs lacustrine clay, black spruce stands with abundant
•and decomposition constants based on fieldwork sphagnum moss ground cover on more poorly drainedusing radiocarbon analyses. Soil C stocks covary with soils developed on clay, and low-lying wetlandsdrainage class, wkh largest stocks occurring in poorly consisting of fens, bogs, and palsas.drained sites. While upper moss layers regrow andaccumulate carbon after fires, deep C flux in yearsbetween fires can range from a small sink to a PROJECT GOALSsignificant source large enough to nearly counter thesurface moss sink, resulting in an annual carbon flux Our goals were: (1) to estimate total carbon stocks byof nearly zero for the entire soil profile, horizon for common soil series based on soil survey
data and analyses of data from individual soil profiles;. (2) to estimate soil carbon flux based on carbon
stocks and a simple model of C turnover derived fromINTRODUCTION radiocarbon studies; (3) to generate area-weighted
maps of soft carbon stocks and flux; (4) relate patternsHigh-latitude ecosystems would be expected to of carbon stocks and flux to patterns of drainage,experience the largest temperature changes if the moss cover, and fire history.earth warms. Boreal forest soils, where most soilcarbon (C) accumulates in the moss layer and organicand humic horizons, are both an important source of METHODSand a sink for atmospheric carbon. Therefore,responses of boreal forest soils to wam_g could have To accomplish our goals, we: (1) stratified the study
" important effects on the interactions between climate area by drainage class/vegetation type (fig. 1); (2)change and terrestrial carbon storage. Drainage and determined time since last fire (fig. 2); (3) separated
incidence of fire are the factors thought to be most the soil profile into two broad layers -- surface andimportant for controlling annual accumulation rates of deep -- with distinctly different C accumulation rates;carbon. Understanding the present patterns of soil (4) estimated C stocks for surface layers based on a
carbon distribution and the soil properties that covary time-dependent model of moss growth after fire; (5) ttWith soil carbon is essential for projecting future estimated C stocks for deep layers from profile data
' changes, and soil series map; and (6) estimated annual C fluxespfor 1994 from a simple model of input (/),decomposition (k) constants, and C stocks where netannual flux = I- kC.
.
iGloria Rapalee, The Woods Hole Research Center, and Salem (MA) State College, now at Goddard SpaceFlight Center, Code 923, Greenbelt MD 20771, grapalee@[email protected]; Eric A. Davidson, The WoodsHole Research Center, Woods Hole MA 02543, [email protected]; Jennifer W. Harden, U.S. Geological Survey,
' Menlo Park CA 94025, [email protected]; Susan E. Trumbore, Dept. of Earth System Science,University of California, Irvine 927!7, [email protected]; Hugo Veldhuis, Agriculture and Agri-Food Canada,Brandon Research Centre, Manitoba Land Resource Unit, Winnipeg MB R3T 2N2, [email protected].
Proceedings IBFRA Assn 1997 meeting 357

SOIL DRAINAGE" DRAINAGE CLASS
i--7 WELL- _ MOD WELL
IMPERFECTl POOR l
VERY POOR •_ ROCK I LAKE
N
J
METERS......
5000
Figure 1. -- Soil drainage by dominant soil series of soil polygon. Five drainage classes correspond to vegetationtype. Figure is from Rapalee et al. (1998), used with permission from the American Geophysical Union.
TOTAL SOIL CARBON FLUX
I' 1-25to 0..
_0 "film > 0 to 15115 to 301 30 to 61
METERS
5000
Figure 2. -- Compiled from satellite images, fire maps, forest inventory, and tree core data, the age ranges representtime since last fire. Figure is from Rapalee et al. (1998), used with permission from the American Geophysical
• Union.
358 GTR-NC-209

The models for surfaceC flux based on fire frequency Soft C fluxes depend on both drainage class and timeand drainage class are derived from the work of since last fire, with the largest accumulations of soil C AHarden et al. (1997). The I and k values are derived in fens and in the surface mosses o f recently burned tfrom Tmmbore and Harden's (1997) radiocarbon sites. Turnover of deep soil C in these ecosystemsfield studies, and its response to expected warming and altered
drainage patterns deserve more attention..,
RESULTSACKNOWLEDGEMENTS
Our results indicate that soil carbon stocks are linked
to drainage; With the largest C stocks occurring in This material is based on work supported by NASApoorly drained sites where humic material and a under prime grant NAG5-2306, The Regents of thecharred layer derived from,fire residues lie at the base University of California, and United States GeologicalJ
of the moss layer (fig 3). Calculations of net C flux Survey Global Change Program.are sensitive to the decomposition rate for this largepool of deep s0il, which can range fi'om a Small sinkto a source. Our net flux estimates indicate the entire LITERATURE CITED
profile-is a small C sink, with the highest annual fluxesin the most recently burned areas and in the oldest, Harden, Jennifer W., K. P. O'Neill, S. E. Trumbore,more poorly drained sites (fig 4). H. Veldhuis, and B. J. Stocks. 1997. Moss and
soil contn'butions to the annual net flux of a
maturing boreal forest. Journal of Geophysical. SUMMARY Research. 102 (D24): 28,805-28,816.
The study site is a mosaic of drainage classes and Rapalee, Gloria, S. E. Trumbore, E. A. Davidson, J.stand ages, with no one class comprising more than W. Harden, and H. Veldhuis. 1998. Soil carbonabout one-third of the total area. stocks and their rates of accumulation and loss in a
boreal forest landscape. Global Biogeochemical
Area-weighted spatially referenced estimates of Cycles. 12 (4): 687-701.carbon stocks and fluxes account for inclusions andspatml variation within the soil polygons at finer Trumbore, Susan E. and J. W. Harden. 1997.scales than were previously practical. Our results Accumulation and turnover of carbon in organicindicate that soil carbon levels are tied to drainage and mineral soils of the BOREAS northern study
"with higher carbon in the more poorly drained sites, area. Journal of Geophysical Research. 102(D24): 28,817-28,830.• .
!
• ¢
Proceedings IBFRA Assn 1997 meeting 359
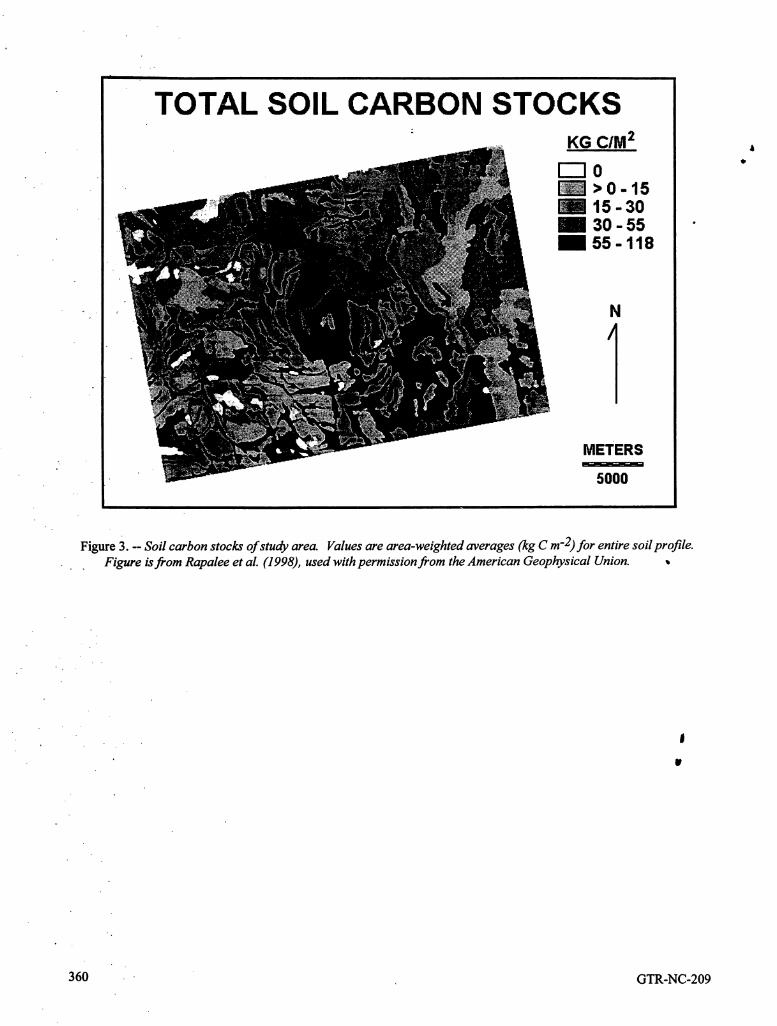
i
TOTAL SOIL CARBON STOCKS..... KG C/M 2 A
I--] o-. _>0-15
15-30• I 30 - 55 •
i 55- 118
N
METERS• , .
5000..
Figure 3. -- Soil carbon stocks of study area. Values are area-weighted averages (kg C m-2) for entire soil profile.Figure is from Rapalee et al. (1998), used with permission from the American Geophysical Union.
360 GTR-NC-209

°
TOTAL SOIL CARBON FLUX
_ G elM 2/yRI-'--]-25 to 0
, - _0_>0to15 6
_ii15to 30BB 30 to 61
N
METERS
5000..
Figure 4. -- Annual carbon flux of study area. Values are area-weighted averages (g C m -2 yr -1) for entire soilprofile. Figure is from Rapalee et al. (1998), used with permission from the American Geophysical Union. ,
i
• tp
Proceedings.IBFRA Assn 1997 meeting 361

D
!
362 GTR-NC-209

A
D
BOREAL FOREST .
MANAGEMENT
Fire Management and Monitoring
8
• I¢
363

11
D
i
. Ir
364

FIRE MANAGEMENT IMPACTS ON BOREAL FOREST PROCESSES AND HEALTH
D.J. McRae and T.J. Lynhaml
ABSTRACT.--The boreal forest is a fire-dependent r'etum intervals can produce seed cone crops as early Aecosystem that has relied on the periodic occurrence as 5 years old (Lynham and Stocks 1991). •of wildfires for maintaining important pioneer plant
specie s. Historically fire has been an important Boreal hardwoods, such as trembling aspen (Populusdisturbance agent, but modem fire suppression tremuloides Michx.) and white birch (Betulatechniques have resulted in a reduction in the number papyrifera Marsh.), can migrate into a burned area •and size of wildfires. Because fire cycles have because of light wind-blown seed. In addition, borealincreased, managers cannot depend on wildfires for hardwoods can sprout profusely from the base ofinitiating and maintaining many forest processes stems or from root systems that have been killedtoday. WithOut a renewal of the historical fire cycle, recently. In other cases, climax tree species such asserious changes will result in the forest landscape balsam fir (Abies balsamea [L.] Mill.) are delayedsince life expectancy of individual fire-dependent tree fi'om becoming re-established on the site because firespecies is much shorter than the current fire cycle, kills the parent trees and consumes the local seed
This change will als0 affect other aspects of the sources. The thin bark of the balsam fir makes itforest, Such as wildlife and insect populations, suscept_le to be killed even by low-intensity fires. InManagers need to understand the consequences of fire addition, fire can benefit individual herbaceous andexclusion to the overall health of the boreal ecosystem shrub species (Rowe 1983), as well as small mammaland the poss_le means of restoring fire as an and bird species (Fox 1983).ecosystem process.
Fire suppression efforts over the last century havecurtailed the number and size of wildfires in the boreal
. forest. This change is a result of increased harvestingINTRODUCTION pressures and the elimination of wildfires. Both
processes affect successional pathways, which in turnThe boreal forest, a fire-dependent ecosystem, has can drastically change the vegetation on a site.many important pioneer species that rely on the Artificial regeneration, where planting or direct
periodic occurrence of wildfires for their survival, seeding is applied after some form of site preparation,Typically, the mechanism for survival is not that an can often be used to help regenerate some tree speciesindi_dual tree or even an entire forest stand survives on harvested sites. However, by implementing a total
a wildfire, but rather that a process of stand fire exclusion policy, many problems are compoundedregeneration begins as the result of a lethal wildfire, for the boreal forest ecosystem. Climax species areTree species such as jack pine (Pinus banksiana favored when burning does not occur. Often, this
Lamb.) and black spruce (Picea mariana [Mill.] increase in climax species occurs in remote regionsB.S.P.) resist elimination by forest fires through the that will never be accessed for timber extraction. In
•development of serotinous cones (Cayford and other cases, areas have been specifically set aside toMcRae 1983, Viereck 1.983)whose plentiful seeds protect the fire-dependent pioneer species. Ironically,ensure regeneration after fire. These cones protect a policy that does not allow fire to occur may result inthe seed from being physically consumed by the fire a shift to late successional species. A major problem,and help maintain seed viability by protecting the seed other than pioneer species regeneration, is that some !
. from the fire's lethal temperatures (Beaufait 1960). natural processes require fire to function. UltimatelylrHowever, 'the heat from the fire is required to melt the the health of the overall ecosystem can bebonding material that cements the cone scales closed compromised by the elimination of fire. This paper is(Cameron.1953). Only after a second fire, where the an exploration of the consequences of eliminating fireinterval between fires is shorter than the time needed from the boreal forest ecosystem based on-for young saplings toproduce s'eed-bearing cones, is experiences in Ontario and neighboring parts ofthere a real danger of inadequate natural regeneration. Quebec.Adequate seed quantities for these two species maynot be present until the trees are 25-30 years old.Jack pine stands that have been exposed to short fire
IDouglas J. McRae and Timothy J. Lynham, Natural Resources Canada, Canadian Forest Service, Great Lakes
- "Forestry Centre, P.O. Box 490, Sault Ste. Marie, Ontario, Canada. P6A 5M7.
Proceedings IBFRA Assn 1997 meeting 365

HISTORICAL AND PRESENT FIRE CYCLES suppression has also had an impact on the size offorest fires in Ontario. Figure 1 is a graph of the ratio
Presettlement fire cycles in the boreal forest of of large (greater than 4 ha) fires to small fires innorthern Ontarioare poorly understood due to the Ontario from 1920-1996. Although the ratio of largelack of fire history and palaeoecology data. Jack pine _ fires was reduced during the era of modem fireand black spruce are the main conifers that colonize suppression (1950-90), the ratio has climbed in recentboreal sites following fire. Red pine (Pinus resinosa years. The increase in the ratio of large fires could beAit.) and white pine (Pinus strobus L.), which are partly the effect of higher temperatures due to climatetypical of the Great Lakes-St. Lawrence forest, are change. Average spring and summer temperatures infoUnd at the southern edge of the boreal zone where the 1980s were 0.5-1.5 o C and 0.5 o C higher,the Great Lakes-St. Lawrence forest is in transition to respectively, in the boreal forest of Ontario than rathethe boreal forest. These two tall pines provide previous 30 years (Hengeveld 1995). The increasingevidence of fires as long ago as 400 years due to their proportion of large fires could also reflect changes inlong.life spans and resistance to decay, fire management policy (Ontario Ministry of Natural
Resources 1982) that permit less aggressive attack on
Jack pine (living 100-150 years) and black spruce wildfires that pose no threat to human life or private(living 250-300 years) are far more likely to be killed property. The 1"1 ratio of large to small fires aroundby fire than either red pine or white pine because jack 1920 may be the result of a bias in the historical firepine and black spruce have thinner bark and crowns database. There is a possibility that not all wildfiresthat are closer to the ground. Fire scars, which were reported as. early as 1920. Large fires were
provide evidence of past fires, can be found on all of more likely to be reported because they would havethese species. Even though jack pine trees are killed been more noticeable on the landscape. Conversely,easily by fire, some trees usually survive a fire and the small fires were more likely to be missed becauseprovide a good source of fire scar material. A fire they may have never been seen or reported.history study (Lynham and Stocks 1991) of an Nonetheless, the data show that the ratio of large fires
isolated upland jack pine forest in northern Ontario reached a minimum after 1950 but may be increasing(153° 50_, 92 o 25'W) showed an average fire return slightly today.interval of 20 years with individual fires crossing partsof the 4 km by 11 km ridge every 5 to 30 years.Stands that were only 5 years old carried cone crops. CONSEQUENCES OF FIRE EXCLUSIONThis forest has a unique history and geology and isnot representative of jack pine stands across the The build up of fuel
boreal forest.The elimination of wildfires in a fire-dependent
Despite the lack of published data on fire cycles in the ecosystem affects fuel accumulations. Without fire,boreal forest, some recent results (Bergeron et al. fuels tend to build up making high-intensity fires more1997) for 20,000 km2 of southern boreal forest in the prevalent (Mutch 1994). In the United States, thisQuebec region of Lake Abitibi, show three fire cycles has been identified to be a major reason for recentfor three recent time periods. Prior to 1850 the cycle destructive fire seasons. A prescr_ed firewas about 60 years. From 1850-1930 the cycle was management program to help in reducing this fuelabout 120 years and from 1930-1997 the cycle was accumulation has been started to reintroduce low-roughly 600 years. Harrington and Donnelly (1978) intensity fires for reducing dangerous fuels (Anon.produced similar estimates of 20th century fire cycles 1995). Major filel problems can also exist in the 1t
. in the boreal forest of Ontario. Their analysis was boreal forest when fire is excluded. White spruce and
updated by Alexander (1981) and is updated for the balsam fir are tolerant conifer species that can e_ily- 1980s and 1990s in table 1. These data for northern become established in the understory leading to
Ontario show that the mean annual burned area unexpected fire behavior. The conifers act as ladder
fluctuated by decade; however, when averaged over fiaels that can abruptly change a fire from a slow
the periOd 1920-1996, six'of the forest sections surface fire to a fast spreading crown fire. Boreal(Rowe 1972) have similar fire cycles of about 500- hardwoods, considered fire proof except.for a short600 years. Two other sections B.4 (Northern Clay) spring window when a surface fire can carry in the dryand B.22a (Northern Coniferous) have fire cycles of leaf mat of the forest floor (L-layer of the soft), now2,000 and 233 years, respectively and the fire cycle are being reported as exh'biting fast-
' for the boreal forest region is about 525 years. Fire
366 GTR-NC-209
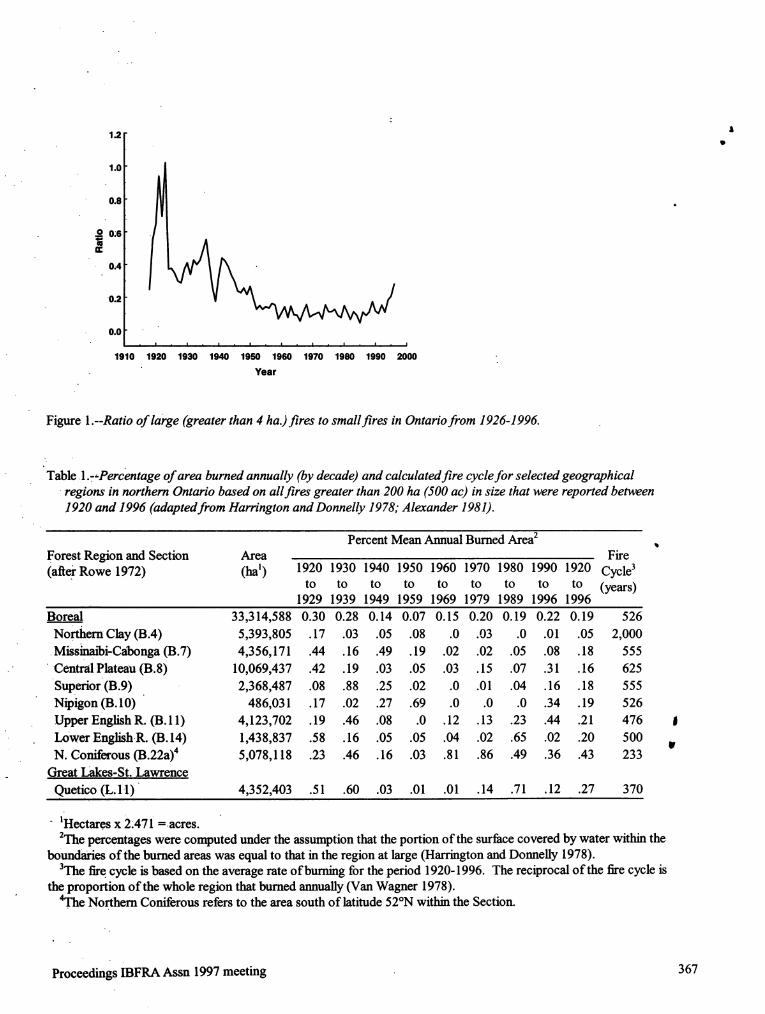
°
1.2 l0
1.0
0.8
0 0.6
0,4
0.2
0.0• i , i , i . i . i . i , i . I , i
1910 1920 1930 1940 1950 1960 1970 1980 1990 2000
Year
Figure l.--Ratio of large (greater than 4 ha.) fires to small fires in Ontario from 1926-1996.
Table 1.--Percentage of area burned annually (by decade) and calculated fire cycle for selected geographicalregions in northern Ontario based on all fires greater than 200 ha (500 ac) in size that were reported between!920 and 1996 (adapted from Harrington and Donnelly 1978; Alexander 1981).
Percent Mean Annual Burned Area2Forest Region and Section Area Fire
(alter Rowe 1972) (ha _) 1920 1930 1940 1950 1960 1970 1980 1990 1920 Cycle3to to to to to to to to to (years)
1929 1939 1949 1959 1969 1979 1989 1996 1996
Boreal 33,314,588 0.30 0.28 0.14 0.07 0.15 0.20 0.19 0.22 0.19 526
NorthemClay(B.4) 5,393,805 .17 .03 .05 .08 .0 .03 .0 .01 .05 2,000
Missinm'bi-Cabonga(B.7) 4,356,171 .44 .16 .49 .19 .02 .02 .05 .08 .18 555Central Plateau(B.8) 10,069,437 .42 .19 .03 .05 .03 .15 .07 .31 .16 625
Superior(B.9) 2,368,487 .08 .88 .25 .02 .0 .01 .04 .16 .18 555
Nipigon(B.10) 486,031 .17 .02 .27 .69 .0 .0 .0 .34 .19 526
Upper EnglishR. (B.11) 4,123,702 .19 .46 .08 .0 .12 .13 .23 .44 .21 476 !
LowerEnglishR. 03.14) 1,438,837 .58 .16 .05 .05 .04 .02 .65 .02 .20 500 U
N. Coniferous(B.22a) 4 5,078,118 .23 .46 .16 .03 .81 .86 .49 .36 .43 233Great Lakes-St. Lawrence
Quetico(L.11) 4,352,403 .51 .60 .03 .01 .01 .14 .71 .12 .27 370
•
IHectares x 2.471 =acres.
2The percentages were computed under the assumption that the portion of the surface covered by water within theboundaries of the burned areas was equal to that in the region at large (Harrington and Donnelly 1978).
3The fire cycle is based on the average rate of burning for theperiod 1920-1996. The reciprocal of the fire cycle isthe proportion of the whole region that burned annually (Van Wagner 1978).
• *the Northern Coniferous refers to the area south of latitude 52°N within the Section.
°
Proceedings IBFRA Assn 1997 meeting 367

spreading fires due largely to the increase in the they would be quickly overtopped by the older.
conifer understory. The major reason for this conifer vegetation and they would die. Often red pine andinflux can be attn_outed to harvesting over the last half white pine seedlings can be found in an unburnedcentury that hag drastically increased the mixedwood forest. As seedlings, they require low light levels andcomponent of the boreal forest in northeastern " the seedbed remains moist because it is not exposedOntario to 52% (MacDonald 1996, Spectranalysis to constant, direct sunlight. Seedlings rarely survive *
O
1994). Even when boreal hardwoods are the to the sapling stage because saplings require higher•dominant species on a site, understory species such as light levels, which is often unavailable due to thebalsam fir and white spruce (Picea glauca [Moench] hardwood competition that blocks out the sunlight.Voss) invade with time and become established at Fire exclusion prevents the proper vegetation controlhigh densities. Presently many boreal hardwood that would have occurred historically in the borealstands in Ontario are old enough that we are seeing forest. Balsam fir, cited earlier as an added source ofthis shift to a higher fire hazard due to changes in the fuel, is also a major competitor that is easilyfuel.type. The consequence for fire management is a eliminated by fire.Shift from relatively no concern to realizing that firecan be a major problem. Fire managers must realize
that the time when these hardwoods could be Plant and Wildlife Consequencesconsidered fireproof is over. Likewise, red pine and
White pine ecosystems can accumuhte massive The adoption of a fire-exclusion policy can lead to theamounts of conifer fiael in the understory. The fire elimination of .certain tree species, but many otherregime has changed from one of frequent and benign fire-dependent processes are also affected. Rowefires to a modem regime where fire is infrequent. (1983) proposed a very useful concept to deal withWhen fires do occur, they have a higher intensity that fire effects on individual plant species based on theirkills the pines easily. Unfortunately, the latter type of "vital attn'butes." These attr_utes help to explainfire has become more prevalent under a fire-exclusion how a plant reacts to fire. According to his scheme,
.. policy. By killing these trees, the fire eliminates the plant species can be classified as invaders, evaders,seed trees needed to ensure pine regeneration (MCRae avoiders, resisters, or endurers. The strategy ofet al. 1994). This example shows that while red pine invaders is one of copious production of short-livedand white pine are fire dependent, the wrong type of seeds or spores that are disseminated by wind.fire can easily eliminate these pines. Evaders, on the other hand, use the organic or mineral
substrate as a seedbank to store their seeds until a
disturbance occurs. Their strategy is to evade byTree Regeneration rapid post-fire germination when this stored seedbank
is exposed usually by a fire that burns the organicWildfire is an important factor in the renewal of the material of the forest floor away. Avoiders, such asboreal forest, especially for the shade intolerant pines, feathermoss, are species not well adapted to the•While fire is often considered important for seedbed occurrence of fire and they usually do not appear untilpreparation by exposing the mineral soft, this may not the later successional stages. Resisters are plants that
be as important as control of the competing are able to withstand fire, while endurers are plantsvegetation in an unharvested forest ecosystem. The that are able to resprout from stem bases, rhizomes,problem is that most of our forest renewal experience roots, and other below ground organs, after thestems from a period ranging from 1940 to 1980, passage of fire. Other than the avoiders, most plant
where silvicultural research on harvested sites species are in fire-dependent categories. Ther_ore. suggested that mineral soil provided the best seedbed fire exclusion can prevent these species from ever
(Chrosciewicz 1974). This is no surprise given the being prevalent in the ecosystem, thereby reducingharsh conditions experienced on a harvested site. Dry diversity.conditions are accentuated by the direct sunlight thatcreates high surface temperatures. However, fires in Fox (1983) found an increase in species diversity,•natural forests leave standing boles of live and dead species richness, numbers and consuming biomass fortrees that remain on the site to moderate the surface bird communities through succession. For small
temperatures. While complete mineral soil exposure mammal communities, numbers, biomass, andmay assist in renewal efforts, it is not required, consuming biomass were higher in the herb stage and
lower in the shrub and sapling stage than in mature_ Fire reduces the amount and vigor of the vegetation forests.
that would compete With the developing pine•seedlings. The slower growing pine seedlings require Sometimes changes are not immediately beneficial but
' less competition in their first few years, otherwise, are required for future benefits. The woodland
368 GTR-NC-209

can'bou (.Rangifera tarandus caribou Gemlin) is an nutrients that are volatilized. While nmnagers fret. example where fire can reduce the population by half; over the loss of nutrient, perhaps soil temperature
but long-term benefits allow the population to recover during the growing season is the more important(Cumming 1992). 'T h6 reindeer lichens (Cladina factor affecting site productivity.spp.) that caribOU feed upon appear to peak in
biomass at 60-70 years after a fire and begin to
seriously decline aider 100 years (Harris 1992). For Insect and Disease Relationshipscan'bou management, long-term planning of food
supplies in the forest ecosystem is required now to Wildfire can be a controlling factor for the eliminationensure that sufficient and suitable age-class structure of food supplies or sheltering areas necessary for the .is present for the future. Under fire-exclusion survival of some insects. In the absence of fire,
•policies, allowance is not being made for the natural increases occur in balsam fir, which is the primaryproduction of younger age classes that will grow to food source for the spruce budworm (Choristoneurareplace the.present 60-70 year-old age class in fumiferana [Clem.]). Spruce budworm outbreaks thatwilderness areas. While allowing fires to burn may have normally occurred on an average 40-year cycle,not be feas_le in some forests, remote areas of the may occur on more frequent cycles because the foodboreal forest should be allowed to burn to ensure the source for the insect is never eliminated as it would be
survival of the caffoou, by fire. After a budworm outbreak without fire,balsam fir becomes quickly reestablished as the seed isnot destroyed. Large fires prior to modem
Soft Considerations suppression would have eliminated the seed source
for balsam fir over vast areas providing an effectiveWithout ftre_ nutrients, from organic materials are block to the budworm outbreaks that now sweep backcycled slowly by the cool climate of the boreal forest, and forth across Ontario. Blais (1983) blames theWhile fire, can reduce the total nutrients on the site, increase in budworm to harvesting practices thatavailable nutrients can increase (Mroz et al. 1980, remove the pine and spruce but leave the balsam fir.'Viereck !973). . The increase in available nutrients is
beneficial because it occurs at a time when new The accumulation of certain organic material on theregeneration requires this influx to promote rapid forest floor can provide ideal shelter during the wintergrowth. The degree of nutrient Change depends upon for insects such as the red pine cone beetlethe mount 0forganic forest floor material removed (Conophthorus resinosae Hopk.) and the white pineby the fire. This material acts as an important nutrient cone beetle (C. coniperda [Schw.]). These two "sinLespecially on sandy sites that are nutrient poor insects cause developing pine cones to abort and fall(Methven 1973). Severe fires that expose the mineral to the ground early in the final year of conesoil will have the greatest impact on nutrients, development. The larvae pupate in fallen cones andHowever, species such as jack pine are adapted for as adults they overwinter in the cones or in the branch
. growing under poor soil conditions. On such sites, shoots. Severe cone beetle attacks can destroy entireinitial growth may be slow but after several years jack cone crops (Hedlin et al. 1981) which results in a lackpine can overcome some ofthe nutrient shortages by of adequate seed for natural regeneration. Frequentestablishing extensive root systems that may include a wildfires were probably an important controlling
, deep tap-root. Jack pine, on sandy sites, will usually factor in the past for these insects. Today, prescribedout-compete trembling.aspen because the low fire has been used to control cone beetles by removingmoisture and low nutrient levels cause inferior growth or altering the organic matter of the forest floor !
, in the aspen (Stoeckeler 1948). Rocky sites also limit (Miller 1978, Wade et al. 1989).root develop in aspen and give jack pine an advantage ir
. following fire. The loss of red pine stands has affected the feedinghabits of the red pine cone beetle. Within the range of
The major problem in the boreal forest, Where there red pine, jack pine is also attacked by a cone beetlehas been no recent fire, is that the organic layer (de Groot 1991). The cone beetle found feeding onaccumulates and locks away nutrients needed for the jack pine was thought to be a separate species butee0system to respond properly. In northern parts of taxonomic evidence has shown that it is C. resinosaethe boreal forest, this layer effectively insulates the that feeds on jack pine. The author suggested that thesoil and prevents optimum growing temperatures for attacks on jack pine were an emergency response bythe roots (Ballard and Hawkes 1989). The paradox is the cone beetles, resulting from the loss of red pinethat the organic forest floor must be burned off due to logging. Although de Groot (1991) pointedcompietely_ exposing the mineral soil, to obtain out that the red pine cone beetle is not fully adaptedoptimum soil temperatures at the expense of some to jack pine, possl_olythe loss of red pine due to
Proceedings tBFRA Assn 1997 meeting 369

longer fire return intervals couM also result in an workshop; 1981 October 20-24. Gen. Tech. Rep.. increase in red pine cone beetle attacks on jack pine. RM-81. Fort Collins, CO: U.S. Department of
Agriculture, Forest Service, Rocky MountainBenign fires, which do not damage the crowns of Forest and Range Experiment Station: 96-109.young white pine trees, help maintain the medium ssunlight levels that are required to prevent serious Anon. 1995. Federal wildland fire management policy ,attacks by the white pine weevil (Pissodes strobi and program review. Final Rep. Washington, DC"
PeCk). This advantage is created because medium U.S. Department of Interior and U.S. Departmentlight levels will induce the development of small of Agriculture. 45 p.diameter shoot leaders that are too narrow toaccommodate the adult weevil when the weevil is BaUard, T.M.; Hawkes, B.C. 1989. Effects ofburrfing
ready to lay eggs (Logan, 1959, Sullivan 1961). and mechanical site preparation on growth andUnder shaded conditions, the micro-environment is nutrition of planted white spruce. Info. Rep. BC-
also Cooler, which retards weevil development X-309. Victoria, BC: For. Can. 19 p.(Katovich 1992). The ability of white pine to grow_under;.apartial canopy also helps to protect the trees Beaufait, W.R. 1960. Some effects of highfrom white pine blister rust (Cronartium ribicola J.C. temperatures on the cones and seeds ofjack pine.Fischer), since dew formation is retarded under the Forest Science. 6: 194-199.closed canopy, reducing the chances of rust sporesfi'om germinating (Steams 1992). Bergeron, Y.; Gauthier, S.; Kate, V. 1997. Fire
history for the last 300 years in Quebec's borealforest. In: Changing ecosystems: natural and
•CONCLUSIONS human influence; 1997 August 10-14;Albuquerque, NM: Ecological Society of America
Wildfires are an important component of the boreal with the Nature Conservancy: Poster paper.forest. Without fire, major changes on a landscapelevel will Occur. The pre-settlement fire cycle in the Blais, J.R. 1983. Trends in the frequency, extent, andboreal forest was about 120 years whereas the fire severity of spruce budworm outbreaks in easternfrequency in the mid-to-late 20th century is about Canada. Canadian Journal of Forest Research. 13:500-600 years. There is a Sharp contrast between the 539-547.presettiement fire cycles and the fire cycles of the lastcentury. Most of the difference between Cameron, H. 1953. Melting point of the bondiagpresettlement and current fire cycles can be attr_uted material in lodgepole and jack pine cones. Silvic.to the effect of modem fire suppression over the past Leafl. 86. Ottawa, ON: Canadian Department of
100 years. The consequences of these changes are not Resource Development, Forestry Branch. 3 p.
only reflected by the tree composition that we ottenthink of when fire exclusion occurs, but it has Cayford, J.H.; McRae, D.J. 1983. The ecological role
implications for every living thing surviving in that of fire in jack pine forests. In: The role of fire in' landscape. The good news is that in many regions of northern circumpolar ecosystems. SCOPE 18.
the boreal forest, the fire cycle can be reestablished. New York, NY: John Wiley & Sons Ltd: 183-199.
Pioneer species regeneration is still poss_le on manyboreal sites by allowing fire to bum again, since many Chrosciewicz, Z. 1974. Evaluation of fire-producedspecies have not yet totally disappeared. Older pine seedbeds for jack pine regeneration in centrallt
' sites can be burned to provide younger age classes, Ontario. Canadian Journal of Forest Research. 4:
While'many seeds of lesser vegetation lay buried, 455-457. u. waiting for the next fire to expose them. Introducing
fire operationally will be a huge challenge to resource Cumming, H.G. 1992. Woodland car_ou: facts formanagers. However, it will not be as big an obstacle forest managers. Forestry Chronicle. 68:481-491.as the ecological challenges that lay ahead if fire is notallowed to bum. de Groot, P. 1991. Cone beetles in the boreal forest:
At the cutting edge (Coleoptera: Scolytidae:Conophthoms spp.). In: Proceedings of the
REFERENCES Entomological Society of Ontario; 1990 October19-20; Sault Ste. Marie, ON. Sault Ste. Marie,
Alexander, M.E. 1981. Forest fire research in Ontario: ON: 122" 87-100.
A problem analysis. In: Stokes, M.A.; Dieterich,,
tech. coord. Proceedings of the fire history
370 GTR-NC-209

Fox, J.F. 1983_ Post-fire succession of small-mammal Research Station: 99-109.and bird communities. In: The role of fire in
northern circumpolar ecosystems. SCOPE 18. MacDonald, G.B. 1996. The emergence of borealNew York, NY: John Wiley & Sons Ltd.: 155- mixedwood management in Ontario: background180. _and prospects. In: Advancing boreal mixedwood
management in Ontario: Proceedings of a lHarrington, J.B.; Donnelly, R.E. 1978. Fire workshop; 1995 October 17-19; Sault Ste. Marie, •
probabilities in Ontario's boreal forest. In: Preprint ON. Canadian Forest Service and OntarioVolume, Fifth joint American meteorological Minister Natural Resources: 11-20.•Society of American Foresters, fire and forest
meteorology Conference; 1978 March 14-16; MeRae, D.J.; Lynham, T.J.; Frech, R.J. 1994.
Atlantic City, NL Boston, MA: American Understory prescn'bed burning in red pine andMeteorological Society:. 1-4. white pine. Forestry Chronicle. 70:395-401.
Harris, A. I992. Post-logging regeneration of reindeer Methven, I.R. 1973. Fire, succession and communitylichens (Cladina spp.) as related to woodland structure in a red and white pine stand. Inf. Rep.can'bou winter habitat. Tech. Rep. 69. Thunder PS-X-43. Chalk River, ON: Department ofBay, ON: Ontario Minister of Natural Resources, Environment, Canadian Forest Service. 18 p.Northwest Reg. Sci. and Tech. 33 p.
Miller, W.E. 1978. Use ofprescn_oed burning in seedHedlin, A.F.; Yates III, H.O; Tovar, D.C.; Ebel, B.H.; production areas to control red pine cone beetle.
Koerber, T.W; Merkel, E.P. 1981. Cone and seed Environ. Ent. 7: 698-702.insects of North American conifers. Ottawa, ON:
Environment Canada, Canadian Forest Service. Mroz, G.D.; Jurgensen, M.F.; Harvey, A.E.; Larsen,122p. M.J. 1980. Effects of fire on nitrogen in forest
floor horizons. Soil Science Society of AmericaHengeveld, H. 1995. Understanding atmospheric Journal. 44: 395-405.
change: A survey of background science and
implications of climate change and ozone Mutch, R.W. 1994. Fighting fire with prescribed firedepletion- 2nd edition. A state of the environment - a return to ecosystem health. Journal ofreport SOE Report 95-2, Atmospheric Forestry. 92:31-33.Environment Service, Environment Canada.
Ottawa, ON: Minister of Supply and Services Ontario Ministry of Natural Resources. 1982. ForestCanada. 68 p. fire management policy. Ontario Ministry of
Natural Resources, Aviation and Fire Management•Katovich, S.A. 1992. White pine weevil and gypsy Centre, Sault Ste. Marie, ON. AFMC 126.
moth: Potential pests of eastern white pine. In: Unpublished. 16 p.White pine symposium proceedings: history,
ecology, policy and management; 1992 September Rowe, J.S. 1972. Forest regions of Canada.
16-18; St. Paul, MN. St. Paul, MN: Department Publication 1300. Ottawa, ON: Canadian Forestryof Forest Resources., University of Mirmesota: Service. 172 p. + map.126-136.
Rowe, J.S. 1983. Concepts of fire effects on plant !Logan,. ICT. 1959. Some effects of light on growth of individuals and species. In: The role of fire in
white pine seedlings. Tech. Note 82. Ottawa, ON: northern circumpolar ecosystems. SCOPE 18. w. Canadian Department of Forest Rural New York, NY: John Wiley & Sons Ltd." 135-
•Development; Forestry Branch, Forest Research 154.Division. 20 p.
Spectranalysis, Inc. 1994. Development of a spatiall_ynham, T.J.; Stocks, B.J. 1991. The natural fire data base for the eastern boreal forest region of
reg'mae of an unprotected section of the boreal Ontario. Forestry Fragmentation Biodiversity Proj.forest in Canada. In: Hennmm, S.M.; Komarek, Rep. No. 14. Sault Ste. Marie, ON: Ontario
R., Landers, J.L.; Myers, R.L.; Neel, W.L., eds. Ministry of Natural Resources, Forest LandscapeHigh intensity fire in wildlands: management Ecology Program. 22 p.challenges and options. Proceedings 17th talltimbers fire ecology conference; 1991 May 18-21;
. TaUahassee, FL. Tallahassee, FL: Tall Timbers
Proceedings IBFRA Assn1997 meeting 371

Steams, F. 1992. Ecological characteristics of white Viereck, L.A. 1973. Wildfire in the taiga of Alaska.
pin e. In: Stine, R.A.; Baughman, M.J., eds. White Quat. Res. 3: 465-495.pine symposium proceedings: history, ecology,policy and management; 1992 September 16-18; Viereck, L.A. 1983. The effect of fire in black spruceSt, Paul, MN, St. Paul MN; Department of Forest _ ecosystems of Alaska and northern Canada. In:Resources, University of Minnesota: 10-18. Wein, R.W.; MacLean, D.A., eds. The role of fire
in northern circumpolar ecosystems. SCOPE 18. *
Stoeckeler, J.H. 1948. The growth of quaking aspen New York, NY: John Wiley & Sons Ltd: 201-220.as affectedby soil properties and fire. Journal ofForestry. 46: 727-737. Wade, D.D.; DeBarr, G.L.; Barber, L.R.; Manchester,
E. 1989. Prescn'bed fire -- a cost effective conti'ol
Sullivan; C.R. 1961. The effect of light and for white pine cone beetle. In: Maclver, C.C.;
temperature on the behavior of adults of the white Auld, H.; Whitewood, R., eds. Proceedings of thepine,weevil, Pissodes strobi Peck. Canadian 10th conference on fire and forest meterology,Entomology. 91" 213-232. 1989 April 17-20; Ottawa, ON. Ottawa, ON:
Forestry Canada and Environment Canada: 117-
Van Wagner, C.E. 1978. Age-class distribution and 121.the forest fire cycle. Canadian Journal of Forest
Research. 8" 220-227.
I
. IF
372 GTR-NC-209

USING SHORTWAVE AND THERMAL INFRARED SATELLITE IMAGERY TO STUDY THEEFFECTS OF FIRE IN AN ALASKAN BOREAL FOREST
Nancy H.F. French, Eric S. Kasischke, Jeffrey L. Michalek, and James P. Mudd It
ABSTRACT.--The importance of measuring and 1997). Two main approaches have used thermalmonitoring fire related ecosystem characteristics in infrared imagery to locate active fires and multi-boreal forests is recognized and is the focus of several spectral imagery to map the location and areal extent "new Studies. In this paper we present a discussion on of fires after they have occurred. The sensor mostthe use of remote sensing for the study of boreal often used for these applications is the Advancedforest fire scar characteristics. Remote measurements Very High Resolution Radiometer (AVHRR) becauseof geophysical parameters and model inputs are of its frequent and broad area coverage. Recently,discussed, it is recognized that remote measurements research has focused on using satellite imagery from aneed to be combined with field measurements and variety of sensors to monitor additional surfacemodeling. Specific examples on recent work using characteristics at areas affected by fire (Kasischke etinfrared remote Sensing for fire scar studies are al. 1994, French et al. 1996a, French et al. 1996b,presented and discussed in detail. Results of this Michalek et al. 1998). The purpose of this paper is towork have shown that shortwave infrared systems can discuss the use of remote sensing for the study ofbe used to map fire severity. Thermal infrared boreal forest fire ecology, and more specifically, tosystems can be used to monitor surface temperature present some of our recent work related to the use ofchanges, to map thermal characteristics of the bum shortwave and thermal infrared satellite imagery.scar surface, and can potentially be used in the The paper is divided into three sections. First, is amodeling of surface energy fluxes. Generally, remote background discussion on the utility and limitations ofsensing can provide unique information at a variety of using remote sensing data for measuring importantscales for the study of fire ecology, ecological factors related to fire and estimating model
inputs. Second, we will present results of a study onthe use of shortwave infrared (SWIR) imagery formapping fire severity and estimating carbon release.
INTRODUCTION Third, a discussion, with some preliminary resultsfrom our work, on the utility of thermal infrared (I_R)
Regent recognition of the boreal forest region as one systems for measuring surface temperature andof the most important and least understood reservoirs estimating surface energy flux will be presented.of global carbon (Chapin and Matthews 1993) has ledto an increased interest in the study of boreal forest
ecology, particularly at regional and global scales BACKGROUND•(Sellers et al. _1991, Goldammer and Furyaev 1996b).An eXtremely important factor controlling ecosystem Effects of Fire on Ecosystem Functionprocesses in the boreal region is fire (Van Cleve et al.1986, Payette 1992). On average, over 5 million ha The effect of fire on boreal ecosystems is dramaticof land bum each year in the boreal region (Stocks (Rowe and Scotter 1973, Viereck 1983). Fire1991). Circumpolar studies of boreal forest fires and impacts both immediate and long-term functioning of #
. fire effects have increased due to attention from the the ecosystem. Due to very slow recovery rates in tiltworld community through the International cold climate of the boreal region, fire effects can last
. Geosphere-Biosphere Program (IGBP) and the for many decades. The obvious impacts include, theInternational Boreal Forest Research Association removal of vegetation, consumption of soil carbon,(iBFRA) (Goldammer and Furyaev 1996a). and changes in surface temperature and albedo. The
' summation of these effects results in changes in basicRemote Sensing has been found to be an important ecosystem function, including carbon cycling andt0ol for detection and mapping of fires and fire scars energy flux.in the borealregion (Cahoon Jr. et al. 1994,Kasischke and French 1995, Bourgeau-Chavez et al.
i Earth Sciences Group, ERIMInternational, P.O. Box 134008, Ann Arbor, M148113-4008
Proceedings IBFRA Assn 1997 meeting 373

.
Direct Changes from fire disturbance lead to changes French et al. 1996a, French et al. 1996b, Bourgeau-in carbon andenergy exchange. These represent both Chavez et al. 1997, Miehalek et al. 1998). One of thepositive and negative effects. For example, fire will : most important aspects of our work is to evaluateaffect carbon cycling by releasing large amounts of how information derived from remote sensing systemsCO2 during and after the fire, and it will also increase can contribute to the overall understanding of forest •carbon fixation rates due to increased net primary fire ecology and fire-affected ecosystem processes. Inproduction (NPP). The two opposing forces typically our work to date we have concluded that aresult in a net loss of carbon over a 50 to 100 year combination of data fi'om several sensors is needed totime frame, and would result in no net change over a adequately address the questions we are asking. In-longer time frame as the ecosystem recovers to its conjunction with the remote sensing data, ground-pre-bum state. If global warming predictions are based measurements are being made for these studies.accurate, however, fire may become more pervasive, This is done for two basic reasons; first, to helpleading to a decrease in carbon storage in the boreal validate our remote sensing results, and moreforest (Flannigan and VanWagner 1991, Wotton and importantly, to provide inputs to models for
_Ftannigan 1993, Kasischke et al. 1995a). Because of estimation of greenhouse gas emission and energy fluxthe uncertainty of the effects of climate change on that cannot be derived from remote measurements. Itecosystem function, it is important that improved is the combination of field measurements, remoteestimates of carbon flux and energy exchange be made sensing-derived measurements, and modeling whichover as much of the boreal landscape as possl_ole, will allow an understanding of the role of fire in
ecosystem function.
The Role of Remote Sensing in Ecosystem Studies We have used a variety of remote sensing systems inour studies to date. With this work,-we have found
Remote sensing data can be important in ecological that synthetic aperture radar (SAR) from the ERS• studies in.several ways. First, remote sensing systems systems has potential for mapping soil moisture
can directly or indirectly measure site condition, such condition (French et al. 1996). ERS SAR may alsoas biomass density or surface reflectance. Second, be helpful for determination of bum severity. Asremote sensing data can beused to help estimate mentioned above, AVHRR can be used for broad-model inputs to answer fimdamental questions on scale mapping of fire scars, as can ERS SARecosystem function (Sellers et al. 1995). When using (Bourgeau-Chavez et al. 1997). Landsat TM can be
.remote measurements it is important to keep in mind used for fine-scale mapping of surface characteristicsthe scale of the phenomenon of interest. Coarse-scale due to its relatively high spatial resolution (30 m)systems, like AVHRR, may be useful for estimates of (Michalek et al. 1998). The upcoming MODISbroad-scale phenomenon, such as the overall impact sensor will have low resolution, broad scaleof fire on a region or continent. For determination of applications similar to AVHRR, except that it will
fine-scale fire effects, or to look at phenomenon that have a much larger range of spectral channels, so itare typically directly measured in the field, it may be will provide data for improved temporal mapping ofimportant to use fine scale imagery, fi'om systems spectrally interesting phenomena.such as Landsat Thematic Mapper (TM) or aerialcameras. Remote sensing can be used as a unique To help illustrate the use of remote sensing fortool for scaling locally-derived measurements to studying fire disturbed sites we present some recent
. landscape, regional, and global scales. This work on the use of infrared imagery. Much of tl_
application is of increased interest because of recent work currently underway is taking place at a sit_attempts to extrapolate from field-derived which burned in 1994. The site is near the Gerstlemeasurements to global scales. Remote sensing can River along the Alaska Highway (63°52'N,be used to evaluate the validity of these 145°13'W) in an area adjacent to the Fort Greeley
. extrapolations, and to mor.e intelligently apply local Military Reservation.measurements to broader scale estimates.
SHORTWAVE IR FOR SURFACEOver the last several years we have been conducting a CHARACTERIZATIONseries of studies on the effects of fire on carbon
• cycling in the boreal region of Alaska (Kasischke et While shortwave IR data is available from several
al. 1994, French et al. 1995, Harrell et al. 1995, multi-spectral systems, its utility for vegetation studiesKasischke and French 1995, Kasischke et al. 1995a, has only recently become apparent to the ecological
374 GTR-NC-209

IIm
m
. iIcommunity. This is likely a result of the fact that Lanoville (1996) have used Landsat TM imagery "Ii-many multi-spectral systems lack SWIR bands (1.3 to collected over the boreal forest region of the II3.0_rn). The Landsat TM system operates two Northwest. Territories (Canada) to map older fire _''channels in the SWIR, bands 5 and 7. The Along- scars (up to 50 years old) using the SWIR and near IR
Track Scanning Radiometer (ATSR), a relatively new channels. " 1sensor on-board the European Space Agency's ERSsatellites, operates a SWIR channel, and the upcoming Besides fire boundary mapping, the fine-scaleMODIS immanent will also have several SWIR resolution of the TM sensor allows us to study thechannels, (For a more complete description of these variability of burn conditions within the scar. At the "systems and their specifications the reader is referred Gerstle River fire site we have used TM imagery forto the following w0rld-wide-web sites: For TM: within-bum characterization of surface conditionhttp://edcwww.cr.usgs.gov/Webglis; for ATSR: (Michalek et al. 1998). Variability in the fire scarhttp://atsrw3.ag.rl.ac.uk; for MODIS" signature was found to be related to burn severity.http://modarch.gsfc.nasa.gov/MODIS/) Using pre-bum imagery and field measurements we
were able to estimate pre-bum carbon density. This 'The use of coarse resolution multi-spectral satellite information used in conjunction with the TM-derivedimagery (such as that collected by AVHRR, ATSR, bum severity allowed us _o estimate carbon releaseand to be collected by MODIS) for mapping the areal from the burn at a relatively fine scale (table 1). Theextent of fires inboreal forests is well established estimate found using the information derived from
•(Cahoon et al. 1994, Kasischke and French 1995). TM gave a 52% higher amount of carbon releasedSince fires result in significant damage to or removal from this bum than estimates based on a single valueof the tree crown, fire scars are detectable on multi- for bum severity. The results show that the improvedspectral vis_le/IR imagery for several years and can spatial information available using fine-resolutioneasily be used to map the location and areal extent of remote measurements of bum severity can improve
the large fires occurring in the boreal forest. Epp and estimates of carbon release during burning.
..
Table 1.--Carbon efflux estimates during the 1994 Gerstle River fire based on pre-burn sprucedensity and fire severity mapped using Landsat TM imagery (from Michalek et at 1998).
Carbon efflux Pre-burn black
category spruce density burn severity Area Carbon efflux/ Total carbonnumber class class (ha) area (T/ha) effiux (T)
1 Sparse Light 561 27.98 15,6972 Sparse Moderate 17 68.88 1,1713 Sparse Severe 182 107.82 19,623(Subtotal) (760) (36,491)4 Medium Light 1,397 20.96 29,2815 Medium Moderate 113 51.38 5,8066 Medium Severe 561 79.98 44,869(Subtotal) (2,071) (79,956)7 Dense Light 919 15.87 14,585 It
' 8 Dense Moderate 157 38.15 5,990 w9 ' Dense Severe 731 57.84 42,281(Subtotal) (1,807) (62,856)Total 4,638 179,303
Proceedings iBFRA Assn 1997 meeting 375

° • _ :i̧
(a) (b)°
Figure 1.--Photographs taken at the Gerstle River burn site 2 years follo_ng the burn sho_ng (a) an area of severeburn _th exposed mineral soil and fallen dead trees, and (b) an area of less severe burn _th remainingOrganic soil and standing dead tree.
Derivation of burn severity was poss_le because areas THERMAL IR FOR SITE TEMPERAT_TRE•where nearly all organic soil was consumed showed MONITORINGdifferent spectral characteristics than areas whereground layer organic material remained following the Thermal IR satellite sensors in current operationburn. The signature differences are due to two include AVHRR, Landsat TM, and ATSR. Thermalfactors; the presence or absence of exposed mineral IR, also called long-wave IR (LWIR), operates in thesoil, and the presence or absence of standing dead atmospheric window between 8 and 141_m. Energy attrees, which cause shadows (fig. 1). Areas of severe these wavelengths is emitted rather than reflectedburn showed a large amount of exposed mineral soil from the Earth.and burned trees had fallen, due to consumption of
•roots. Areas of less severe burn had little exposed The energy recorded at the long wavelengths is, mineral soil, standing dead trees, and shadows from related to the temperature of the Earth's surface._
the standing dead. Since many ecosystem processes are temperaturt}dependent, there is interest in utilizing thermal IR
We found that discrimination of the burn site from the systems for ecosystem studies. Nutrient dynamics,unburned surroundings is most distinct in the near IR and in particular soil carbon efltux, is temperature
. (band 4)andparticularly the SWIR channels. Also, dependent. Warmer site conditions will typicallymost of the signal variation within the burned area cause higher rates of soil respiration, as long as otheroccurred in these channels. Although burn scar factors are not limiting (Schlentner and Van Clevemapping and some within-scar characterization of 1985). Also of interest is the effect of fire disturbanceburn condition is poss_ole with sensors lacking a on the energy balance at a site (Hall et al. 1995).SWIR channel, more information can be deduced Remote measurements of thermal conditions havefrom systems which operate in the SWIR. potential use in modeling energy flux and in
-
376 GTR-NC-209

estimate the diurnal temperature change in a burned
i .--- and unburned location. For this analysis, the imagery_4 -" "'_ as. corrected for atmospheric effects, and radiant
/
! ,,_ ",, temperature estimates were made using the split- A,_4 •,'/ x, ',i window technique (Francois and Ottle 1996) By •
o, j \',,,_'°_ analyzing the diurnal change in temperature, we maya [ .
_"i _ ./_/, . _, beable to learn more about the thermalcharacteristics. ", of the surface material. Seasonal temperature changes
°i_'" _ canalso be monitored using the AVHRR's frequent •data collection. An increase in seasonal temperature51 or the diurnal variation in temperature could be
•I0 ! ...........................k...................-.......................t_......................-......................L..........................._...
0_ ,_ ,.® ,2_, ,B_ =_ 0_ significant for soil microbial activity. Warmer soil'_'_'_._ conditions will allow more microbial activity, thereby
. "_ increasing biological production of gaseous carbon."_ The plan for this project includes further analysis ofFigtire 2. ' Plots demonstrating the diurnal
variation in temperature. Point data is AVHRR imagery to develop methods for modelingderived from A VHRR thermal imagery temporal changes in surface temperature. Aat a burned and unburned location, complimentary field experiment is also underway to
Note the higher temperature variation look at the response 0f soil microbial respiration toin the burn area. temperature and fire disturbance (O_eill et al. 1997).
The spatial resolution of the AVHRR (1.1 km) limits
determining the magnitude of fire-effects on the its utility for looking at fine-scale variability within aenergy budget, bum. Low altitude aerial photos collected one year. following the Gerstle River bum show a high amount
It _ Wel!know from field observations that the of spatial heterogeneity due to burning pattern.
ground surface temperature increases following fire Spatial heterogeneity can also be a result ofpre-bum(Brown 1983). Initial analysis of data from the vegetation pattern. Therefore, it is desirable to lookthermal IR channel of AVHRR has shown increased at these sites with higher resolution systems if
apparent temperature 2 of as much as 12°C one year possible. The TM thermal IR channel (10.5-12.5 Bmfollowing a burn in interior Alaska (French et al. wavelength) has a resolution of 120 m, which allows1996b). Further analysis is underway using a better for spatial discrimination not possible with theAVHRR data set. The AVHRR sensor collects data AVHRR sensor.
over the entire earth twice daily. Therefore, withAn initial analysis of TM imagery fi'om the GerstleAVHRR it is possible to gain an understanding of
"temporal dynam_/cs in site temperature, both daily and River fire one year following the bum showed that theseasonally . apparent temperature within the fire scar ranged from
. 12° to 19°C (fig. 3). The bum area has a higher
, An im'tial look at a day/night AVHRR image pair from apparent temperature (-_2-10°C) than the surroundingthe Gerstle River fire shows that the diurnal variation unburned area, which includes both vegetated (forest
in thermalsignature is greater in the burned area as and grass field) and non-vegetated (bare agricultural i, comp_ed to an unburned adjacent area (fig. 2). fields) areas. This indicates that TM data can also be
Using the day/night image pair it is poss_le to used to delineate burned areas, as demonstrated usinguAVHRR data but on a much finer scale. Although the
._ .
. 2Apparent temperature is also known as brightness or radiant temperature. It is the actual (la'netic)temperature of a black body which would produce the radiance equivalent to the measured radiant flux. Remotesensing systems measure radiant (apparent) temperature, while thermometers measure kinetic (actual) temperature.In general,, radiant temperature is less than kinetic temperature.
Proceedings iBFRA Assn 1997 meeting , 377

II
Figure 3. -- (a) Map sho_ng the outer boundary of the Gerstle River fire scar (solid black line), and (b) the Landsat' TM band 6 (thermal) image of the Gerstle River burn collected on 16 September 1995. The area burned is
brighter than the surrounding unburned area demonstrating the higher surface temperature (2-10°C) _vithin thej_re scar.
finer resolution of TM is helpful for spatial Some of these problems are correctable, and
• analysis,image data are readily available due to the algorithms exist for deriving temperature, but i_herentsatellite's infrequent orbit return interval and cloud factors need to be considered when looking atcover. For example, for the years between 1991 and satellite-derived temperature data (Prata 1993). Some1995 only two usable images were available over the of the important considerations are radiometricAlaska study sites. The TM imagery, therefore, cah_oration,correction for atmospheric effects (haze),cannot be used to monitor thermal characteristics over and determination of surface characteristics,
time. Theutility of the TM sensor, on the other hand, particularly surface emissivity.lies in its ability to more finely define within-sitevariation at a point in time. A likely approach for Because fire so drastically affects site conditions, it ismodeling temperature variability is to use fine-scale obvious that the energy flux from disturbed sites is'reformation from TM with coarse-scale AVHRR or also affected. Although this may seem obvious, it is
MODIS-derived temporal information. Once these difficult to adequately quantify energy flux change.
' Systems are fully operational (Landsat 7 and MODIS Initial ground-based measurements for energy an_will launch in summer 1998) this approach will be water flux modeling are underway. For a completefeas_le, understanding of the effect of fire on the energy flux
changes of an entire fire scar, remote measurements
The pre"hminaryanalyses we have conducted on will be needed since ground-based measurementsAVHRR and TM imagery to date have allowed us to would be difficult to implement at an adequate spatial
recognize that fire scars exl_'bit thermal anomalies scale.which are related to temperature conditions at thesite. Further work may lead to a better understanding The utility of remote sensing, in particular thermal IR
, of the thermal properties of the surface. However, sensors, for energy flux modeling is recognized,many problems exist in using satellite-based thermal however, important limitations for using current datasensors for determination of land surface temperature, is also apparent (Sellers et al. 1995). Several
378 GTR-NC-209

- researchers have developed ways of using thermal IR contfibutiom to the research and manuscript. Themeasurements (in conjunction with other research presented in this paper was supported by themeasurements, both remote and ground-based) using Environmental Protection Agency (EPA) under awardthis data for energy flux modeling (Goward et al. number CR 823077-01-0 to the Environmental ,
1985, Hall et al. 1991, Hall et al. 1992, Vining and Research Institute ofMichigan (ERIM) and by the •B_d !992). Although these results are not National Aeronautics and Space Administrationconsidered to be completely accurate due to data (NASA) through grants NAGW-2645 and NAGW-
limitations, approaches and models are being 4949 to ERIM. Although this research was supportedimplemented. This is encouraging for an eventual by EPA, it has not been subject to agency review and *operational ability to use remote measurements for therefore does not necessarily reflect the view of theenergy flux estimation, agency and no official endorsement should be
inferred.
CONCLUSIONS AND FUTURE RESEARCH
LITERATURE CITED
As descn'bed above, a variety of tasks are underway
to establish the utility of thermal IR data for mapping Bourgeau-Chavez, L.L.; Harrell, P.A.; Kasischke,and monitoring surface temperatures and modeling E.S.; French, N.H.F. 1997. The detection and
surface energy flux in fire-disturbed sites. Our work mapping of Alaskan wildfires using a spacebomeis preliminary, and, due to the state of knowledge and imaging radar system. International Journal ofavailability Ofdata, may take years to adequately Remote Sensing. 18: 355-373.develop. Our short-term goal, however, is to
investigate the need for remote sensing data and Brown, R.J.E. 1983. Effects of fire on the permafrostdefine the utility of that data for temperature and ground thermal regime. In: Wein, R.W.; MacLean,
.energy flux estimation. D.A., eds. The role of fire in northern circumpolarecosystems. New York: John Wiley and Sons.
Work in the shortwave IR realm is better developed
and closer to the goal of using remote measurements Cahoon, D.R., Jr.; Stocks; B.J.; Levine, J.S.; Cofer,for broadscale estimates of fire scar characteristics. W.R., III; Pierson, J.M. 1994. Satellite analysis ofWe have used Landsat TM data, with the SWIR the severe 1987 forest fires in northern China attdchannel in particular, to map fire severity. Further southeastern S_eria. Journal of Geophysicalanalysis of these data and new data sets will allow us Research. 99:18,627-18,638.to expand these methods to feed models for
estimation of carbon flux fi'om fire-disturbed sites. Chapin, F.S., III; Matthews, E. 1993. Boreal carbon
pools: approaches and constraints in globalGenerally, there is a need for improved estimates of extrapolations. In: Proceedings Intematioanlmode!inputs f0r determination of the role of fire in workshop on carbon cycling in boreal forest andiCarboncycling and effects on energy exchange. This sub-arctic ecosystems: biospheric responses andis true especially in the boreal region, since fire is so feedbacks to global climate change; Corvallis, OR;prevalent and climate change is predicted to be so 1991 September. US EPA Publication"influential. Additionally, site-specific results made at EPA/600/R-93/084: 9-20.fire-disturbed sites need to be scaled up, so that !
' results from ecosystem-level studies can become Epp, H.; Lanoville, R. 1996. Satellite data and wuseful at landscape, regional, and even global scales, geographic information systems for fire and
" By including remote sensing as a tool at several resource management in the Canadian Arctic.stages, betl:er estimates of carbon release, carbon Geocarto International. 11" 97-103.fixation, and energy flux can be made.
Flannigan, M.D.; VanWagner, C.E. 1991. Climatechange and wildfire in Canada. Canadian Journal
ACKNOWLEDGMENTS of Forest Research. 21" 61-72.
The authors would like to thank Dr. John ColweU for Francois, C.; Ottle, C. 1996. Atmospheric correctionshis,help and guidance in analysis of the multispectral in the thermal infi'ared: global and water vaporand thermal data, and Laura Bourgeau-Chavez for her Dependent split-window algorithms - applications
Proceedings-IBFRA Assn 1997 meeting 379

to ATSR and AVHRR data. IEEE Transactions Hall, F.G.; Sellers, P.J.; Strebel, D.E.; Kanemasu,on Geoscience and Remote Sensing. 34: 457-469. E.T.; Kelly, R.D.; Blad, B.L.; Markham, B.J.;
: Wang, J.R.; Huemmrick. K.F. 1991. SatelliteFrench, N.H.F.; Kasischke; E.S.; Bourgeau-Chavez, A
L.L.; Barry, D. 1995. Mapping the location of remote sensing for surface energy and mass *wildfires in Alaskan boreal forests using AVHRR balance: results from FIFE. Remote Sensing ofimagery. International Journal of Wildland Fire. 5: Environment. 35:187-199.•5-5-61.
Harrell, P.A.; Bourgeau-Chavez, L.L.; Kasischke, "French, N.H.F.; Kasischke, E.S.; Bourgeau-Chavez, E.S.; French, N.H.F.; Christensen, J.N.L. 1995.
L.L.; HarreU, P.A. 1996a. Sensitivity of ERS-1 Sensitivity of ERS-1 and JERS-I radar data toSAR to variations in soil water in fire-disturbed biomass and stand structure in Alaskan boreal
boi'eal forest ecosystems. International Journal of forest. Remote Sensing of Environment. 54: 247-Remote Sensing. 17" 3037-3053. 260.
,.
French, N.H.F.; Kasischke, E.S.; Johnson, R.D.; Kasischke, E.S.; French, N.H.F. 1995. Locating andBourgeau-Chavez, L.L.; Frick, A.L.; Ustin, S.L. estimating the areal extent of wildfires in Alaskan1996b. Using multi-sensor satellite data to boreal forests:using multiple-season AVHRRmonitor carbon flux in Alaskan boreal forests. In: NDVI composite data. Remote Sensing ofLevine, J.L., ed. Biomass burning and climate Environment. 51: 263-275.change - Volume 2: Biomass burning in SouthAmerica, Southeast Asia, and temperate and Kasischke, E.S.; Bourgeau-Chavez, L.L.; French,boreal ecosystems, and the oil fires of Kuwait. N.H.F. 1994. Observations of variations in ERS-1Cambridge, MA: MIT Press: 808-826. SAR image intensity associated with forest fires in
' Alaska. IEEE Transactions on Geoscience and
Goldammer, J.G.; Furyaev, V.V. 1996a. Fire in Remote Sensing. 32: 206-210.ecosystems of boreal Eurasia. Dordrecht, TheNetherlands: Khwer Academic. Kasischke, E.S., Christensen, Jr., N.L.; Stocks, B.J.
1995a. Fire, global warming, and the carbonGoldammer, J.G.; Fmyaev, V.V. 1996b. Fire in balance of boreal forests. Ecological Appli_tions.
• ecosystems of boreal Eurasia: ecological impacts 5" 437-451.and links to the global system. In: Goldammer,J.G.; Furyaev, V.V., eds. Fire in ecosystems of Kasischke, E.S.; French, N.H.F.; Bourgeau-Chavez,boreal Eurasia.. Dordrecht, The Netherlands: L.L.; Christensen, J.N.L. 1995b. Estimating•Kluwer Academic. 48: 1-20. release of carbon from 1990 and 1991 forest fires
in Alaska. Jpournal of Geophysical Research. 100:Goward, S.N.; Cruickshanks, G.D.; Hope, A.S. 1985. 2941-2951.
• Observed relation between thermal emission and
relected spectral radiance of a complex vegetated Michalek, J.L.; French, N.H.F.; Kasischke, E.S.;landsacpe. Remote Sensing of Environment. 18: Johnson, R.D.; Colwell, J.E. 1998. Using Landsat
137-146. TM data to estimate carbon release from burnedbiomass in an Alaskan spruce complex.
Hall, F.G.; Townsend, J.R.; Engman, E.T. 1995. International Journal of Remote Sensing (in wStatus of remote sensing algorithms for estimation review).of land surface parameters. Remote Sensing ofEnvironment. 51" 138-156. O_eill, K.P.; Kasischke, E.S.; Richter, D.D.;
Krasovic, V. 1997. Effect of fire on temperature,Hall, F.G.; Huemmrick, K.F.; Goetz, S.J.; Sellers, moisture, and CO2 emissions from soils near Tok,
P.J.; Nickeson, J.E. 1992. Satellite remote sensing Alaska: an initial assessment. InternationalOf surface energy balance: success, failures, and symposium on physics, chemistry, and ecology ofunresolved issues in FIFE. Journal of Geophysical seasonally frozen soils; Fairbanks, AK; 1997 JuneResearch. 97: 19,061-19,089. 10; U.S. Army CRREL. Special Report 97-10.
380 GTR-NC-209
°
. Payette, S. 1992. Fire as a controlling process in the Huemmrich, K.F.; Justice, C.O.; Melack, J.M.;•North American boreal forest. In: Shugart, H.H.; Roulet, N.T.; Schimel, D.S.; Try, P.D. 1995.Leemans, R.; Bonan, G.B., eds. A systems : Remote sensing of the land surface for studies ofanalysis of the global boreal forest. Cambridge, global change: models - algorithms - experiments, lEngland: University Press: 144-169. Remote Sensing of Environment. 51" 3-26. "
Prata,_A.J. 1993. Land surface temperatures derived Stocks, B.J. 1991. The extent and impact of forestfrom the advanced very high resolution radiometer fires in northern circumpolar countries. In: Levine,and the along-track scanning radiometer: 1. J.S., ed. Global Biomass Burning: Atmospheric,Theory. Journal of Geophysical Research. 98" Climatic, and Biospheric Implications. Cambridge,16,689-16,702. MA: MIT Press: 198-202.
Rowe, J.S.; Scotter, G.W. 1973. Fire in the boreal Van Cleve, K.; Chapin, III, F.S.; Flanagan, P.W.;forest. Quaternary Research. 31" 444-464. Viereck, L.A.; Dymess, C.T., eds. 1986. Forest
ecosystems in the Alaskan Taiga. EcologicalSctflentner, R.E.; Van Cleve, K. 1985. Relationships Studies. Vol. 57. New York: Springer-Verlag, 230
between CO 2 evolution from soil, substrate p.
temperature, and substrate moisture in fourmature forest types in interior Alaska. Canadian Viereck, L.A. 1983. The effects of fire in black spruceJournal of Forest Research. 15" 97-106. ecosystems of Alaska and Northern Canada. In:
Wein, R.W.; MacLean, D.A., eds. The role of fire
Sellers, P.J.; J. Cihlar; M. Apps; B. Goodison; F.G. in northern circumpolar ecosystems. Chichester:Hall; R.C. HanSss; D.L. Leckie; E. Ledrew; P.A. John Wiley & Sons: 201-220.Matson and S. Running. 1991. BOREAS -- Boreal
• EcosYstems-Atmosphere Study. Global Change Vining, R.C.; Blad, B.L. 1992. Estiamtion ofsens_leandBiosphere-Atmosphere Interaction in the heat flux l_om remotely sensed canopyBoreal Forest Biome -- Science Plan. Greenbelt, temperatures. Journal of Geophysical Research.MD, NASA/GSFC. 97:18,951-18,954.
Sellers, P.J.; Meeson, B.W.; Hall, F.G.; Asrar, G.; Wotton, B.M.; Flannigan, M.D. 1993. Length oftlae• Murphy, R.E.; Schiffer, R.A.; Bretherton, F.P.; fire season in a changing climate. Forest
.Dickinson, R.E.; Ellingson, R.G.; Field, C.B.; Chronicles. 69:187-192.
i
' ill
-, .
Proceedings IBFRA Assn 1997 meeting 381

ON IMPROVEMENT OF WILDLAND FIRE MANAGEMENT IN RUSSIA ON THE BASE OFVEGETATION FUEL MAPS
A.V. Volokitina and:M.A. Sofronov iI
I,
ABSTRACT.--The subject matter of this paper is a documents. These descriptors must be regional.new area in the field of pyrology (wildland fire The development of PCB identifiers should includescience) in Russia, the mapping of vegetation fuels descriptions of vegetation communities as typical .(VF)_ The possibility of using the VF-maps for fuel complexes, similar to the Canadian fuel types •improvement of wildland fire management is (Forestry Canada, Fire Danger Group 1992). Wepresented. A new method of surface fire prediction developed such identifiers for the Krasnoyarskon the base of VF-maps is described. In the Region, which comprises 12 typical fuel complexesclassification of vegetation fuels, some components (TFC) (Volokitina 1990). These complexes areof forest ecosystems (biogeocenoses) are used as shown in table 2.groups and typ_ of VF; their role and pyrological
' properties are taken into account in the spread and The TFC characteristics given here could be verydevelopment of fire. The necessity of improving useful for identifying TFC's on aerial photos. Thiswi!dland fire management, especially in cases of is one way to make development of fuel maps lesscritical fire situations, is indisputable. What is costly. Another way to reduce the cost ofnecessary for efficiently dealing with a wildfire? producing large-scale fuel maps is to create aFirst of all, the behavior of the fire must be database that can be used to draw operational fuelpredicted. Doing this work needs a large-scale map maps for areas of active fires, rather than fuelof vegetation fuel. mapping of the entire territory (Volokitina,
Klimushin, Sofronov 1995).
VEGETATION FUEL MAPS FIRE SPREAD PREDICTION..
Spatial mapping of vegetation fuels is a To forecast the behavior of a fire, it is necessary toprohibitively costly job. For this reason we know not only the spatial pattern of fuel complexesproposed to create such maps on the basis of the but also the fuel conditions (e.g., ignitability and the
• largest-scale forest maps produced in the process of character of burning), that depend on droughtforest inventory, by way of identification of the fire severity. Awareness of potential changes in theseproperties of the inventory plots or units. Methods conditions with time is also necessary, so a detailedfor dratting such maps based on forest inventory weather forecast must be available. Anotherdata have been developed in the Institute of Forest, important, technically difficult task is correct displaySiberian Branch of the Russian Academy of of the fire front on the fuel map. This could beSciences (Volokitina, Sofronov, Klimushin 1996; done, for example, by thermal scanning from an
. Volokitina 1996). The basis for this work was a aircraft.system of vegetation fuel (VF) classification
, (Volokjtina, Sofronov 1996). A key group of VF We have developed a simple method of fire spreadplays the leading role in fire incidence and spread, prediction, which can be applied "by hand", withoutWe named this group of VF "Prime Conductors of the use of a computer. Forecasting of fire spread isBurning" (PCB - fine fuel) and worked out its based on calculation of positions of the fire front at |
' .classification (table 1). particular points in time. This is done by calculatin_the spread of the fire front along several radial lines
A typical forest inventory map is not informative in different directions. We plan to use the method:en0ugh for fire management uses, because forest of the Canadian system (FBI) for prediction of firecruisers concentrate on the inventory of the timber, development, in particular, for transition betweenSo we proposed to improve the usefulness of forest surface fire and crown fire. With this approach,
• inventory documents for fire management purposes critical courses of fire spread can be revealed, and aby developing identifiers of the types of the prime calculation of resources necessary to control the fireconductors of burning (PCB), in order to have can be made.PCB's identified and recorded in the inventory
s
IV.N.Sukachev Institute of Forest, Siberian Branch, Russian Academy of Sciences, 660036,•Krasnoyarsk Fax:0912) 43 36 86; E-mail: ifor@_sk.infotel.ru.
382 GTR-NC-209

Table l.--The types of prime conductors of burning (PCB).
PCB type, . .. Typical areas, their attributes Non-typical Criticalcode its areas, their drought
attributes class(CDC)1 2 3 4
Mossy PCB Subgroup
Lichen 1.Lichens predominate Very dry, includingrock outcrops, I(Lc) in the forest floor with litterof pine needles
2. Lichens arepresent in the forest floor on dry soil
Dry moss Forest floor is predominatedby II(Dm) green mosses, somewhere with lichens, on drained
soil in boreal andnothem forests (green-mossandcranberry- green-mossforest types)
Moist Forestfloor is predominatedby green mosses, on In southerntaiga on drainedsoil, the IIImoss insufficientlydrainedsoil (forest types - mossy, forest floor may bepredominatedby(Mm) anlacomnium,moist billberryand similar) greenmosses. Thincover (up to 3
cm) of compactmossBog-moss Groundcover is predominatedby(Bm) SphagnumandHypnummoss species,
on boggy andbog soils (without notable presenceof sedge or grass)
Subtype Boggy forestsand small bogs amidst drainedplains, Ground cover is predominatedby IVBmI with peat layer up to 0.7 m thick Polytrichum
Subtype Large bogs and bog systems NotBm2 burnable
Litter PCBSubgroup
Cured Forest floor is predominatedby dry grass or sedge Bogs and wampsof sedge-sphagnum Igrass- (i.e. naturallycuredplants), usually in fall and and sedge-hypnumtypes, with well-(Cg) spring. Not includedaresedge forest types with developed cover of sedge in spring
ground cover of evergreen sedge and fall (in summer- Bm)
Loose 1.Forest floor is predominatedby herbs- in spring l.Forest floor is predominatedby IIlitter and fall. evergreen sedge - in springand fall(LI) 2. Forest floor is predominatedby litterof birchand 2.Matted litterof drysedge or grass
aspen fallen leaves3. Forest floor is predominatedby litter of pine andcedar fallen needles
Compact 1.Forest floor is predominatedby compact litterof Illlitter fallen needles of fir, spruceor larch - in all seasons(Ci) 2. Forest floor is predominatedby compact litterof
fallen leaves of birchor aspen,and by matted dryherbs
Non- • Surface fuel cover too scarce forfire to spread |conductor W(No)
" Subtype Fuels not providingspreadof surface fire: duff, Live grass load exceeds PCBload in IVNcl humus, tuff; usually in summer.Ground firesare summer,so spreadof surface fire is
possible, impossible
Subtype Absence orvery scarce presence of any PCB; sands, Not
Nc2 pebble, rockoutcrops,plowed fields, roads,etc. burnable
Comments: Critical droughtclass (CDC) means such lowest class of droughtwhich providesthe burningability of a particularPCB intypical environmentconditions (gentle topography,forest stand of mean stock index (0.5-0.7) with live leafing). Drought class is ratedaccordingto the fire droughtindex (or the Nesterov index, or the LenNIILHPV-I index), points: IDC - up to 300 p., II DC - 301-1000 p.,Ill DC - 1001-3000 p., IV D' - 3001-10,000 p.,V DC -over 10,000points of the fire droughtindex.
Proceedings tBFRA Assn 1997meeting 383


To draftsuch predictions of fire behavior, the from midnight. The index for each day is calculatedfollowing data are used: twice: in the morning it is estimated based on the
weather forecast, and the next morning it should be• a sketch of the fire perimeter; reference points re'calculated taking into account the factual data.
(compartment grid, rivers, lakes, etc.) should
be also marked in the sketch; The three FFDIs mentioned above are expressed in• a data bank for prompt preparation of the VF abstract units (u). Forest fire drought classes (DC)
map; are determined by the following FFDI scale: DC 1 -• fire weather data for any given day (air up to 300 u, DC 2 - 301-1,000 u, DC 3 - 1,001- '
6
temperature, and humidity, wind speed and 3,000 u, DC 4- 3,001-100,003 u, DC 5 - 10,001-direction, fire weather draught index and class) 300,001 u, DC 6 - more than 30,000 u.and a forecast of those data for the next 24
hours; (2) Pyro logical characteristics of PCB types (table• tables of characteristics of burn:ragfor PCB 3) show that the possibility of burning appears at
types available; different values of FFDI and heat discharge intensity• tables of coefficients of influence of stand (E, MJ m2). It also determines the base rate of fireJ
canopy closure on wind speed under that forest spread (V0, m/s) at standard conditions: zero windcanopy; speed, horizontal fuel bed, ambient temperature 200
• tables presenting the relative effects of the main C, air humidity 40%.factors (.wind, slope, humidity) influencing thespread rate of surface fire (Soft'on•v, (3) To estimate wind speed under the forest canopyVolokitina 1990). at a height of 2 m, the value of wind speed at the
relevant weather station should be multiplied by theEssential clarifications: coefficient Kcc, which is a function of canopy
closure (C;see tabulation below). The closure is
• (1) The drought class (DC) is determined by the indicated in the pyrological description of the' value of the forest fire drought index (FFDI). relevant taxon.
Currently, two FFDIs are used in Russia; theNesterov index and the moisture index of (4) The relative contribution of the aforementionedLenNIILKh (HI-1). We have improved those main factors to the rate of spread of surface fireindeXesby their integration and inserting (table 4) is assumed here to be independent and thecorrections accounting for hygroscopicity of fuel, same for each type of PCB. This contribution,
• and by simplifying the accounting of precipitation however, is somewhat different for layers ofeffect. We have named the index "HHI": different structures and for different types of surface
fire.
HHIn= [HHItn.n)+ (t+l 0° ) n] • ( t-td-5° ),1]• (Cr) n,The method developed to predict fire spread
Where: consists of the following steps:
0 t is the air temperature at 13:00-15:00, °C;• td is the dew point at that temperature, °C; (1) Data related to the taxon where the fire will
burn (or is burning) are selected from the data bank.• n is the number of the day for which this indexis being estimated; The boundaries of the territory for which the map is
made are sketched more accurately, a copy of a
o n-I is the number of the proceeding day; map of that territory is made from the plotting !• Cr is the factor of precipitation, determined by board, and the pyrological descriptions of the taxatotal daily precipitation (R, m) or by daffy
duration of precipitation (T, hr); in that territory are overlaid to produce a VF map irfor the area.
Cr = !.8 / (R +1) or Cr= 1.8 / (1.3 T + 1) (2) Then the VF map is colored to convert it into amap of current fire danger. To perform this, thedrought class of the current day defined by weather
Notes: If R = 0 0,5 mm or T = 0 - 0,4 hr, then Crdata is compared with critical drought classes given- 1. In terms ofpyrology, the period of 24 hours for each taxon in the pyrological description. Taxa
should be started fi'oma morning hour rather than
If C = 0 0.1 0.2 0.3 0.4 0.5 0.6 0.7 0.8 0.9 1.0then Kec= 0.77 0,70 0.60 0.48 0.38 0.30 0.23 0.16 0.11 0.07 0.05
Proceedings IBFRA Assn 1997 meeting 385

Table 3.--Pyrological characteristics of types of prime conductors of burning (PCB).
Pyrological Fire weather drought index FWDI (Nesterov's or HI-I or HHI)characteri-stics
100 200 300 400 500 700 1000 2000 3000 4000 5000t
Lichen type of PCB (Lc) ,E, MJ/sq.m 4.0 5.0 6.5 7.5 8.5 9.0 9.5 10.0 10.0 10.0. 10.0
•Vo, ni/s 0.003 0.004 0.005 0.007 0.008 0.009 0.010 0.011 0.011 0.011 0.0110.
Dry moss type (Dm)E, MJ/sq.m - - - 3.5 5.3 10.0 16.0 20.0 22.0 2,4.0Vo, m/s .... 0.002 0.002 0.003 0.004 0.004 0.005 0.005
Moist moss type (Mm)E, MJ/sq.m ...... 2.3 8.8 12.0 13.2 14.4Vo, m/s ...... 0.003 0.004 0.004 0.005 0.006
Loose litter type (Ll)E, MJ/sq.m ..... 4.0 7.5 10.0 11.0 11.5 12.0Vo, m/s ..... 0.002 0.003 0.005 0.006 0.007 0.008
Compact litter type (CI)E, MJ/sq.m - ..... 3.0 9.0 12.0 13.5 15.0.Vo, m/s ...... 0.003 0.004 0.004 0.005 0.005
Cured grass type (Cg)Vo, m/s - - 0.005 0.005 0.006 0.006 0.007 0.007 0.007 0.007 0.007
Note: Bog-moss (Bm) and Non-conductor (Nc) types never bum. E - heat discharge• intensity;
Vo - base rate of spread...
Table 4.--Coefficients of influence of wind, slope and relative humidi.tv on the rate of fire spread._
l.Effeet of wind
Wind speed, m/s 0.0 0.4- _._ 1.2 1.6 2.0 2.4 2.8 3.2 3.6 4.0 5.0(Height 2m)
K w, head fire 1.0 1.2 1.4 1.7 2.1 2.6 3.2 4.0 5.0 6.0 7.0 10.0K w, back fire, flank 1.0 1.0 1.0 1.1 1.1 1.2 1.2 1.3 1.4 1.5 1.6 1.8Kw,_high-intensity 1.0 1.1 1.2 1.4 1.6 1.8 2.0 2.2 2.5 3.0 3.5 4.5
flank
(by Konev, 1984)
2. Effect of slopeSlope, degrees -40 -30 -20 - 10 0 10 15 20 25 30 35 40
. Ks 0.7 0.7 0.7 0.9 1.0 1.2 1.5 2.0 2.5 4.0 6.0 It 12.23. Effect of humidity
Humidity, % 20 25 30 35 40 45 50 55 60 70 80 w 90
Kh 1.7 1.5 1.3 1.1 1.0 0.9 0.8 0.7 0.7 0.6 0.5
386 GTR-NC-209

for which critical drought classes are lower than the (8) If the taxon in the direction of fire spread is notdrought class of the current day are regarded ready ready to burn ("green"), the fire will stop spreadingto burn; they are _.olored red. Taxa for which in this direction if the barrier is wider than the width
critical drought classes are higher than the drought ofthe burning strip of the fire edge. In the otherclass of the current dayare considered not ready to case the fire will propagate along the barrierin Aburn for a while, and they are colored green. Taxa either one or two directions. To estimate the width t'for which critical drought classes are the same as of the burning fire edge in the direction of thethe current drought class are considered to be in barrier, the fire spread rate along neighboringuncertain burning state; they are colored yellow, directions should be predicted first. If the spreading
fire encounters a barrier (a road, a brook, a river, *(3) The perimeter of the fire is copied from its etc.) its backfire and flanks are usually stoppedsketch to the prepared map, recording the time while the head fireline, particularly a long one (overwhen this perimeter was drawn. An arrow indicates 100 m) or that of high-intensity, may overcomethe Winddirection, and the wind speed also should such barriers except rivers of_>50meters wide. Inbe indicated, summer, river's flooded lands should be added to
the width of the river as they are usually not ready'(4) The time period for which the fire spread is to to burn.be predicted is determined and ordered. In case oflarge fire, some more directions probably will need (9) As a result, a fire perimeter is drafced for theto be drawn .from its perimeter, each direction given time, taking into account: the time period fornoi'mal to the fire line; their angles to the wind which the perimeter of the fire has been drained; thedirection should be indicated, period required for fire to propagate across each
taxon in the given direction; and the final ordered(5) Four directions in which the fire is anticipated to time for which the fire perimeter is to be predicted.propagate are marked in the map by straight lines,•usually from the center of fire: 1) heading, (10) To estimate the perimeter length (i.e., length of
' downwind; 2) backing, upwind; 3) flanking, right the fireline), the predicted perimeter is drawn in theflank, and 4) flanking, left flank, (the latter two are map through the points that the fireline would reachnormal to the wind direction), by the ordered time in each direction. The length of
this perimeter is measured (taking into account the(6) Those lines may cross various taxa available in scale) and multiplied by the twist coefficient, forthe map. To estimate what time (t, hr) it will take which the average value is 1.5.fire to propagate along those directions through
•each taxon, length of the line (L, m) crossing the (l l) The rate of perimeter increase (Vp)istaxon is divided by the estimatedrate of fire spread determinedby the rate of spreadof the fire headin this taxon (V_, m/s): (V_) in the last taxon, i.e., closer to the ordered
time:T-L/V_
, V_, m / hr 25 40 70 120 200The estimated rate of spread is determined by the Vp, m / hr 200 300 400 700 l,O00
• formula:
(12) The power of the surface fire is determinedandV_ = V0 • I_o Kh• Kw, qualitativelyclassified by the intensity of heat
dischargefrom a unit of length of its head fire edgewhere Ks- factor of contribution of slope to the (Ifh), where: I _ = E • Vfhand E is taken from i
' spread rate; I_ - factor of contribution of humidity table 3 in accordance with PCB type in the last Wto fire spread rate; Kw- factor of contribution of taxon in the fire head direction, and the FFDI"
- wind speedto fire spread rate. V0 is taken fromtable 3, in accordance with the PCB type indicated Intensity Power of Surfacein the pyrological description of the taxon, and the (Ifh, kW/m) FireFFDI value. These factors are shown in table 4. Up to 35 LowWind speed should be corrected for canopy closure. 35-120 Moderate
Over 120 High(7) If there is a "yellow" taxon in the direction of
fire propagation, i.e., the possibility of burning here (13) Because data on the locality of fireperimeter,is uncertain at present, two versions of fireline its intensity and the rate of perimeter increase forspread in that place are tObe estimated: 1) the given time, as well as characteristics of taxaassuming the taxon is ready to burn,and 2) adjoining the fire, are outlined in the map, it is
' assuming it is not ready to burn.
Proceedings IBFRA Assn 1997 meeting 387
easier to draft optimumplans to control the forest ACKNOWLEDGMENTSfire.
We are thankful to the U.S. Foreign AgriculturalWe developed special schemes for a simple " Service (FAS) for grant provided our expenses tocalculation of the amount of resources necessary for participate in IBFRA97. This report was prepared Asuccessful control of fires, due to financial support from the Krasnoyarsk _,
Regional Science Foundation (Grant N 6F0028,C)...
DISCUSSIONLITERATURE CITED
TOpredict wildland fire and prescribed burningbehavior, "fuel models" and complex "fuel types" Deeming J.E., Burgan R.E., Cohen J.D. 1978 Theare used in USA and Canada (Deeming et al. 1977; national fire-danger rating system. USDA ForestForestry Canada, Fire Danger Group 1992). Their Service. General Technical Report. Int-39.pyrological characteristics are based on much Ogden, Utah. October 1977.66 p.fai_tualdata on fires. In Russia it is not poss_le to
' make such a bank of empirical data. That is why an Forestry Canada, Fire Danger Group. 1992analytical method is used in our fire behavior Development and structure of the Canadianprediction system. It is based on the vegetation fuel Forest Fire Behavior Prediction System. Scienceclassification (as components of the ecosystem) and and Sustainable Development Directorate. Inf.on studying their pyrological characteristics, which Rep. ST-X-#. Ottawa.- 63 p.depend on natural factors and the mutual influenceof.seasonal changes in ecosystem components. Sofronov M.A., A.V. Volokitina. 1990. Pyrological
regions of the taiga zone. Novosibirsk, 204 pp.In the future we plan to use American and Canadian <in Russian>.experience to improve wildfire management in
' Russia. We have analyzed the CFFDRS already Sofronov M.A., A.V.Volokitina, 1996. Canadiandue to training in Canada (Alberta University) and system of fire danger evaluation in the forests.prepared a paper (Sofronov, Volokitina 1996). We Moscow, ISSN 0234-6338. Federal forestrywould like to do the same with the NFDRS. For service of Russia. "Forestry abroad", Express-this aim we need communications with American information, vol.5, pp. 2-22 <in Russian>.scientists who study and improve the NFDRS
Volokitina A.V. 1990. Principle for developingguidelines for identification of the types of prime
CONCLUSION conductors of burning (on the example ofKrasnoyarsk Priangarie). Moscow, Dep. in
Unfortunately, because of budget shortage and the VINITY: 5352-W90, 31 pp. <in Russian>.intricate economic situation in Russia our work is
suspended. For this reason, and because of minimal Volokitina A.V., B.L.Klimushin, andforestry activity, the newest scientific achievements M.A.Sofronov. 1995. Technology of large scalecannot be introduced into the practice of forestry at vegetation fuel maps elaboration. (Practicalpresent. But we hope for the best in future. In the recommendations). Krasnoyarsk, 47 pp. <inV.N.Sukachev Institute of Forest, a GIS for the Russian>.Krasnoyarsk region is being developed through ajoint Russian-American project. This GIS Volokitina A.V. 1996. Forest Fuel Maps. - Fire in |!ncorporates our program for operative large-scale Ecosystems of Boreal Eurasia. Dordrecht / 1¢vegetation fuel (VF) map creation (Volokitina, Boston / London, p.239-252 <in English>.Sofi-onov, Klimushin 1996). So, we hope usingVF-maps for fire management in Russia will start Volokitina A.V., M.A.Sofronov. 1996.soon. Classification of Vegetation Fuel. -
- ' Lesovedenie, N 3, p.38-44 <in Russian>.At present with the financial support of theKrasnoyarsk Regional Science Foundation we are Voiokitina A.V., M.A.Sofronov, andelaborating a theoretical basis for pyrological B.L.Klimushin. 1996. GIS as the data base for
"thermal land-reclamation" for forests on vegetation fuel mapping. - GIS forpermafrost soils. The results of this project Environmental studies and mapping. Irkutsk,together with vegetation fuel maps can be used for p.35-38 <in English>.
•.improving wildfire management in these forests.o
388 GTR-NC-209

., KRASNOYARSK SUBSYSTEM OF WILDFIRE MONITORING FROM SPACE AS AN ELEMENTOF THE WORLD WILDFIRE MANAGEMENT SYSTEM
A.I. Sukhinin1
ABSTRACT.--A system being developed for the Close correlation between the Canadian FireKrasn0yarsk Region of Russia integrates satellite Weather Index (_) and the Russian (Nesterovremote sensing, Geographic Information factor) index of fire weather, along with ".Systems, and ground-based sampling to provide information from NOAA satellites such astimely information for wildfire prediction, spatial patterns of accumulated temperatures, themonitoring, and management on several scales. Normalized Difference Vegetation IndexHardware, software, and methods of data (NDVI) serves as a basis for developing aanalysis and interpretation are described. This generalized Canadian-Russian fire danger ratingapproach is proposed as a prototype for a system to cover most of the world's boreal
_p0teritial worldwide Wildfire management and forests.monitoring system.
An experimental GIS has been built for theKrasnoyarsk Aerial Forest Protection Service(KAFPS) that uses space information for
INTRODUCTION monitoring wildfires and the postfire state offorests at a regional level. It is intended for:
Wildfire as an environmental factor, especially interms of growing global change impact, - Operational assessment of spatialnecessitates development of a worldwide fire distribution of fire classes through
' management system. Current technologies computer-aided synthesis of information inconcerning main fire problem decisions such as: the near and far infrared bands,forest fire danger rating, prediction of forest fire - Large forest fire dynamics mapping and astart, spread and behavior, operational and determination of fireline energy parameters,reliable detection of forest fires, choice of - Estimation of optical and physicalstrategy and tactics of fire suppression, and parameters of zones under permanent smokeecological and economic estimation of forest fire cover during mass forest fire events,.effects are now at different stages of - Mapping of local precipitation anddevelopment in leading forest countries, estimation of storm clouds and clouds for
seeding,We propose to begin developing a world forest - Inventory of burned areas and description offire management system by building a their post fire state,•specialized Geographic Information System - Monitoring of snow cover dynamics as an(GtS) for wildfire monitoring that will require indicator of the beginning and end of the firejoint efforts of scientists and service staff from a season.number of countries. The development of anexperimental subsystem of wildfire monitoring
•based on a downlink station installed in REGIONAL SUBSYSTEM OF WILDFIRE 11
' Krasnoyarsk through the cooperation of the U.S. MONITORINGNatiohal Aeronautic and Space Administration
. (NASA) is an example of such cooperation. The subsystem of wildfire monitoring is aThis station receives data from satellites operated multilevel operational subsystem for spatialby the U.S. National Oceanographic and assessment of forest area fire danger, wildfireAtmospheric Science Administration (NOAA), detection, estimation of fire intensity, predictionand we can consider it as an element of a future of fire spread and development, assessments ofWorldwide wildfire management system, postfire effects, and recommendations for
operational decisions. It is based on the use ofmultiscale remote sensing and ground data
IKN. Sukachev Institute of Forest, Siberian Branch, Russian Academy of Sciences, Krasynoyarsk, Russia.E-mail: [email protected].
Proceedings 1BFRA Assn 1997 meeting 389

integrated in a single information system Objects of Wildfire Monitoringapplying modem computer technologies.
The three major areas of concern for remote
Organization of the wildfire monitoring " wildfire monitoring are characterization of ,subsystem operation is managed by the Regional wildfires, meteorological conditions that affect °GIS Center of the S_erian Branch of the Russian fire danger and fire behavior, and landscapeAcademy of Sciences (Krasnoym'sk) in characteristics that relate to fire behavior and firecollaboration with the Forest Committee effects. Some of the key objects for database(Krasnoyarsk), KAFPS, the Committee on development are:Nature Protection and other interested
organizations in the Krasnoyarsk Region. - Wildfires: mechanisms of ignition andcombustion of forest fuels, processes offireline spread, and turning of fire fi'om one
Purposes and Goals of the Wildfire type to another, processes of energy releaseMonitoring Subsystem including dynamics of spectral reflection,.
, and radiation characteristics, processes ofThe purposes of wildfire monitoring subsystem smoke emission and movement of smokedevelopment in the Krasnoyarsk Region are to: aerosols,
- Meteorological conditions: weather and1. Increase forest protection and wildfire climatic factors including air mass transfer,
management effectiveness, reduce and meteorological parameters with aecological and economic damage from special stress on ident_g storm andwildfire, and enhance understanding of resource clouds,processes of fire ignition and development - Landscape characterization: forestand the influence of fire on forest structure vegetation; soils, wildlife, and water in the
' and dynamics, forest ecosystems.2. Provide environmental protection and
natural resource information to regional andlocal forest management committees and Levels of Wildfire Monitoringother users.
In order to address the problems discussed here,• The subsystem is aimed at the following primary we are developing three levels of wildfire
tasks: monitoring: (1) Krasnoyarsk Territory, (2)regional and (3) local.
- Development of a multilevel informationsubsystem for spatial and temporal forest The Krasnoyarsk Territory level involves themonitoring, including technical instruments organization of wildfire danger monitoring,
• for collection, processing, analysis, and weather and active wildfire information in thestorage of remote sensing and ground data, territory of the Krasnoyarsk Region, includingand a system of prediction models areas that do not receive aerial fire protectioncombining digital and map databases, (north of about 600 latitude). It is intended for
- Spatial assessment of fire danger and general assessment and medium-term predictionprediction of fire dynamics over a large of fire situations on a broad scale across the !
forest region, Krasnoyarsk Region, for obtaining integrated w' Fire detection and determination of wildfire assessments of modes and routes of fire
- intensity in unprotected northern taiga detection flights, as well as for proper use offorests, manpower and fire fighting equipment on the
- Prediction of large wildfire behavior, basis of assessments of expected fire damage.- Analysis of weather in order to predict and The main sources of spatial information are map
suppress fires, data and data from satellites, scale 1"10 million- Inventory ofpostfire forest state, to 1:2.5 million.- Distnqaution of relevant information among
users to improve fire management decision- The regional level provides detailed estimates ofmaking at different management levels, fire situation severity in regions within the
Krasnoyarsk Territory. This is intended to besent to regional air bases and air crews, and
390 GTR-NC-209

°
includes daily recommendations on number and satellites, Krasnoyarsk Scientific Center,routes of fire detection flights and rearrangement Siberian Branch, Russian Academy ofof manpower and .facilities within regional air : Sciences),bases. Source spatial information has a scale of - Krasnoyarsk Forest Committee, A1"1 million to 1:0.5 million. - Krasnoyarsk Committee of Nature •
Protection,
The local level is implemented at the level of a - Krasnoy_sk Committee of hydrology andForest Exploitation Area (FEA). As a rule this is meteorology,used only in areas of large fires (burned areas - Krasnoyarsk Committee of Extreme •more than 200 ha). Maps and aerial and satellite Situations and Civil Defense.materials used are of the scale 1:0.1 million and
larger. Fire spread and growth are predicted, Organization and methodological control of theand; on'the basis of expected damage wildfire monitoring subsystem is carried out by aassessments, an optimum plan of fire coordinating board created from subsystemcontaimnent and suppression is worked out. leaders or branch territorial monitoring centers' and users of the Krasnoyarsk Service of
ecological monitoring.Stages of Development for the Wildf'lre
•.Monitoring Subsystem Operational control at the regional level is by achief of the Forest Area Fire Protection Service
•Stage 1 includes development of technical (FAFPS), and on the Krasnoyarsk Territory levelfacilities and an associated database, as well as by the administrator of the Krasnoyarskcalculation procedures of factors under Territory.monitoring for Krasnoyarsk Region level•subsystem by KAFPS (1996-1997). Technical
' faci!j'ties include: (1) a satellite data receiving PRACTICAL REALIZATION OF THEStation, (2) a computer-based work station for PROJECT: A SPACE WILDFIREpreprocessing satellite data, (3) a computer- MONITORING SUBSYSTEM FOR THEbased work station for a KAFPS dispatcher, (4) KRASNOYARSK REGIONnetware. The combined database contains
mapping materials (maps of forests, forest The Project is intended to establish fundamental. landscapes, relief_ hydrological system, principles of a GIS for spatial assessment of fireadministrative borders, road system, and fixed- danger in boreal forests, detection andwing aircraft and helicopter landing spots, etc.), description of wildfires, and determination of thesatellite data, weather information, and postfire state of forests using remote sensing ofinformation on fire fighting resources. Earth from satellites.
Stage 2 Willbe creation of a subsystem for The first stage of the wildfire GIS developmentwildfiremonitoring at a regional level (1997- includes the development of a functional GIS1998), and Stage 3 will be development of the and applied mathematical software for thelocal level subsystem (1998-1999). analysis of space images of forest areas, and for
solution of above mentioned tasks, as well asoperational output of thematic maps. !
' Organizational Structure of the Remote ifWildfire Monitoring Subsystem Spatial dynamics of fire danger in boreal forests
- is determined by AVHRR and TOVSThe basis ofthe organizational structure of the measurements of forest area and atmospherewildfire monitoring subsystem is regional infrared and microwave radiation from spacejurisdiction organs and a country-wide network platforms. The theoretical foundation of thisof their departments that are in charge of method is given in previous publications, and aenvironmental observations and control, such as: mathematical model of forest fire danger
dynamics descn_oing radiative and reflective- Krasnoyarsk Aerial Forest Protection characteristics of forest fuels is designed.
' Service (KAFPS),
- Regional Center for receiving satellite In order to refine useful decoding procedures forinformation (HRPT station from NOAA space images, as well as to develop and test
Proceedings IBFRA Assn 1997 meeting 391

procedures for atmospheric and terrain - Programs for data collection,corrections, a test site is being established in the preprocessing and transmission frommountain forests of the Mann river basin, the wildfire patrol aircraft.Simultaneous space, aircratt and ground - 2. Hardwareexperiments will be conducted to determine fire - A U.S. down link receiving information
danger and intensity of combustion during fi'om NOAA satellites, •experimental and wildfires and to appraise - A system of satellite data processingburned area state. (VAX-11, IVAS-Display processor),
- A system of A0, A4 format image input,output,
Structure of the Subsystem Technical - A system of data collection fi,omComplex aircraft using a radio channel and
prediction of wildfire spread,The HRPT station is equipped with a modem - Automatic complex for fire aerialcomputer complex, allowing us to carry out the detection in the infrared and microwavefirst stage of the wildfire monitoring GIS in bands.1997.
Completion of the proposed subsystem willThe Krasnoyarsk downlink station is based on require expansion of the current complex oftwo computers. A schedule of NOAA satellite technical equipment to include: an airbornepasses is done using an IBM PC Pentium 166, as large fire detection information and measuringwell as orbit tracking and other operational complex working in infrared and microwavecalculations. On-line functioning and processing bands of the spectrum; a system of informationo fAVHRR/HRPT telemetry data are performed transmission through a radio channel; and aon a Micro VAX II computer. In addition, computer-based working station for predicting
' image processing is performed on the Image wildfire spread and modeling of fire containmentVisualization and Analysis Station (IVAS) of the and suppression.International Image Systems (IIS).
Algorithms to Carry out Wildfire MonitoringIVAS permits visualization and processing of 3- Taskschannel color images (1024 by 1024 pixels).
• MicroVAX II includes digital audiostorage on Methods are under development for mapping,.4mm magnetic tapes (2.0Gb) for archiving given prediction, and analysis of cloud cover andimages. The current station complex is involved boundaries, storms, snow cover, surfacein a high-speed (receiving capacity up to 10 temperature, fire danger, and fuel moisture.megabaud) computer network that connectscomputing centers of the Krasnoyarsk Cloud DistributionCommittee of Geology and KrasnoyarskScientific Center of Siberian Branch of RAS, as Creation of a cloud cover composite image: Awell as KAFPS. This has increased computing cloud cover distribution map will be produced bycapability of the HRPT station by an order of liagmenting full-scale cross-pixel images of themagnitude. By the end of 1997, the territory in near (channel 2) and far (channel 4)administration of the Krasnoyarsk Region and infrared bands and then putting the fragments
' Committee of Hydrometeorology, Climate and together. After overlaying of the hydrologic ID
' Environmental Protection will be added to the network and coordinates, it will be convertedlF- network, into a stereographic projection.
Available programs and hardware include: Determination of storm boundaries: A map of- 1. Software programs boundaries of storms; assessment of probable
- NASA programs for obtaining data and number and location of lightning verticalsatellite information preprocessing, discharges; and predictions of the spatial and
- Software packages GIS ArclNFO 3.4.2, temporal dynamics of storm clouds will beArcVIEW 3.0, IDRISI for WINDOWS, produced. Storm clouds will be identified byEPPL-7, synthesis of information from vis_le, near IR
- Programs of wildfire spread and and thermal bands of the spectrum. Big verticaldevelopment, cumulus clouds will be recognized based on
392 GTR-NC-209

spatial and frequency characteristics of image Temperaturespectral brightness analysis. Boundaries ofstorm clouds will-be identified using cluster Construction of a radiative temperature map: A
analysis; and area, velocity and directions of nbrmalized map of surface layer temperature Astorm clouds will be calculated. Additional distribution will be derived through cah_oration •information will be incorporated from lightening and correction of satellite data. Raw temperatureloCators and from sounders of lightening vertical data fi'om the scanner is corrected for thedischarges, radiometer cah'bration and geometric distortion
• connected with the scanning method. .Determination of cloud boundaries: A map of Corrections related to limited spectral range ofdistn'bution ofclouds suitable for cloud seeding the sensor, the modulated transmission function(to produce rain in fire areas) will be produced in of the equipment, atmospheric transmission,two stages. The first is a synthesis, of cloud spectral characteristics of natural backgroundimages in vis_le, near IR and thermal bands of radiation, and reflection are taken into account.the spectrum; computer based analysis of big Joint calculation of the radiative temperature atcumulus clouds will use spatial pattern the medium and far IR ranges allows estimationrecognition on spectral and contrast fi'equency of thermodynamic temperature and areas ofsigns. The second is the identification of small-scale thermal anomalies, for detection ofboundaries of clouds suitable for artificial cloud recently started wildfires. Construction of theseeding, i.e.gclouds inthe radius of 30 kin-50 isotherms is produced by the method of radiationlcm around large fires and moving toward forest temperature averaging in the sliding window andfires, followed by thinning of isolines.
Snow cover Fire Danger
. Determination of snow cover boundaries: Determination of the beginning of the fire dangerA map of snow cover boundaries will be period: The beginning of the fire danger seasondeveloped by synthesis of underlying surface is judged from the disappearance of the snowimages in vis_le and IR bands of spectrum using cover boundary. The approach of fire dangerspectral brightness differences and radiation season is determined for each type of main foresttemperature differences. First, snow cover fuels using the sum of radiative temperaturesboundaries will be identifies through automatic corresponding to the moisture of extinctionimage processing in visible and IR bands of where combustion can occur. For each firespectrum using the standard programs of period, corresponding radiation temperatures willequalization, contrasting, binarization, and be different. It is necessary to take into accountmedian filtration. Then images will be overlain recent precipitation and drying factors, such ason the topographic map and geometric wind and solar radiation. The result is maps
•distortions corrected using the hydrological tracking spatial distribution of the beginning of- network. This approach will ensure an accuracy the fire danger period over time.
ofpositioning of 5 km-10 km in case ofclear• ' boundary ofsnow cover and 10 kin-20 km in Assessment of forest fuel moisture content:
Case ofa vague boundary of snow cover. Maps of current and predicted forest fuelmoisture content distribution for a given region It
. Movement of snow cover boundaries: Snow will be based on combining irtfi,ared images of ¢coves boundary movement will be determined by the forested area with a contour map of forest
. overlay of consequent boundary contours, fuels, overlaying the hydrologic network, andPredictionsof snow cover boundary movement recognition of precipitation areas. These mapswiU use weather forecast data and analysis of the will be modified daily by calculation of groundatmosphere using satellite images. These data cover radiation temperatures for each pixel of anwill be analyzed using mathematical models image and determination of their correlation withdescn'bing movement of boundaries of fuzzy sets forest fuel moisture content. Analysis willto predict snow cover boundary movement, include spectral brightness in the near IR band
and landscape thermal inertia factors. Fuelmoisture content predictions will be based onweather forecast information.
°
Proceedings IBFRA Assn 1997 meeting 393

CURRENT PROGRESS
1. Development o fa new information
technology of forest fire danger assessmentis continuing using remote sensing data onthe Earth received from satellites in thethermal band.
..
2. The objectives of the wildfire GIS, itsstructure, with the analysis of itscharacteristics at different levels, and the
place of remote sensing facilities in wildfiremonitoring have been determined.
' 3. A functional structure of the wildfire
monitoring GIS has been proposed,including key subsystems, such asassessment and predictions of wildlifedanger; monitoring of wildfire ignition andspread; and monitoring of wildfireprevention, detection, and suppression.
Analysis and systematization of the wildfiremonitoring GIS information stmctureare
' completed, including the organization ofdigital and map databases obtained atdifferent scales.
•4. The general structure of the wildfire
monitoring GIS software has been proposed: including the system and applied
components.
5. A high-speed (up to 10 gbaud) computernetwork has been created linking the HRPTstation receiving data from NOAA satellitesand the Krasnoyarsk Aerial Forest• .
Protection Service.
ACKNOWLEDGEMENTS!
' I Wish to thank Academician Alexander Isaev
(International Forestry Institute, RAS), Nikolay w- A. Kovalev (Krasnoyarsk Aerial Forest
Protection Service), Dr. Robert Murphy(Goddard Space Flight Center, NASA), Dr.Brian Stocks (Canadian Forest Service), Dr.
• Johann G. Goldammer (Max-Planck Institute ofFreiburg), Dr. Susan G. Conard (USDA ForestService) for their helpful activity and importantcomments. This work was supported by the
' Russian Fundamental Study Foundation, Grant96-07-89078.
,
394 GTR-NC-209
THE CONCEPT OF DEFINING THE REQUIRED LEVEL OF FIRE PROTECTION INTENSITYIN BOREAL FORESTS
Yuri Z. Shut I
ABSTRACT.--An approach to defining desired and Aactual levels of forest fire protection is considered. Every fire protection level is related to particular •The main features of an expert system used for conditions that affect the fimctioning of the FFPS.
defining_protection are described. Variables include The main factors we use to describing the functioningfire information, geographic databases, meteorological of the FFPS are fuel moisture, wind velocity, and thedata, and environmental, economic, and social period of the fire season when the fire occurs. The •considerations andm ay be quantitative or qualitative, influence of moisture on the total number of fires on aThe approach is illustrated for a hypothetical site. given day in the fire season affects fire containment
efforts. Wind velocity affects the rate of spread, one
' of the key tactical elements in fire suppression. ThereThe 1992 United Nations Conference on Environment are also wind restrictions on the ability to use aerial
and Development formulated some principles of fire protection methods. The prevailing forest fireglobal development. The main humanity-wide type is determined by forest conditions and period inproblem .was defined as preservation of natural the fire season. Forest fire moisture is characterisedbiodiversity. Taking this principle into consideration, by three Fire Danger Levels: low, medium and high.We must.point outthat sustainable management of For wind velocity we consider two levels" up to 10forest ecosystems is a major consideration for forest m.p.s, and above 10 m.p.s. The fire season is dividedlandscapes. So, preservation of landscape biodiversity into three Fire Season Periods: spring, summer, andis a main objective of forest fire protection, autumn.
Generally, the forest fire protection level in specific The geographic area used for defining the FFPS's.areas is designed to attain certain outcomes from the intensity level is a "sub-unit". By "sub-unit" we meanforest fire protection system (FFPS). We report both the existing and established elementary unit for whichthe planned fire protection level and the level actually we can characterize the functioning of theachieved. The first is defined before the fire season, interconnected complex of methods and capabilitiesThe Second is defined after the fire season. To define for detection, delivery and suppression.
the scale of fire protection level means to classify (V.Pokryvailo and Y.Shur 1992). For the purposes ofprotected areas according to the type and intensity of fire protection, Russia is divided into zones based o_n
fire protection. This scale consists of six fire- the primary means of protection: aerial protection,protection intensity levels: protection by ground forces, or unprotected. The
• zero (no fire protection); definition of sub-units will depend on the primary
0. extremely low; means of fire protection in a specific area. For• low; example, the Air Division is the sub-unit for the aerial• medium; protection service, and the Forest District is the sub-
• high; unit for ground protection.
• extremely high. The following factors are used in defining protection
The main iimitation of present methods for evaluating levels:. fire protectionlevels is a lack of calculated indices • Statistics on numbers of forest fires; It
regarding intensity levels of fire protection. We relate • Forest conditions; •. any fire protection intensity level to a calculated index • Meteorological conditions;
based on values over a certain time interval. This • Relief;index is the proportion of total fire ignitions that were • Hydrography;.contained in a timely manner. A timely containment is • Ecological significance;defined as a fire whose time from the moment of • Presence of enterprises at extreme risk from
ignition to the beginning of suppression is less or fire;equal toa certain target value. It is also assumed that . Economic activities.the number Of firefighters is adequate for successful
' fire containment.
. lYuri Z. Shur, Saint-Petersburg Forestry Research Institute, Institutsky Av. 21, St. Petersburg, 194021, Russia
Proceedings IBFRA Assn 1997 meeting 395

The decision-making process for defining fire • Index of other extra risk factors such asprotection levels is based on the use of an expert economic risk.system that incorporates these factors. This expert
system integrates the poss_ilities of computer data The indices of the second group require specialanalysis With information derived from expert : algorithms. These algorithms are subdivided into two Aknowledge and opinion. Such a system can "suggest" groups: those that use numerical input data and thosereasonable advice or solutions. An additional feature that using cartographic input data. The followingof the system is that it explains the methods used in types of algorithms are considered:searching fora reasonable solution. One must receive 1. Determination if the "elementary unit" is inside athe answer in clear and simple form. protected area. By "elementary unit" we mean
the object for which database information isAny expert system is a synthesis of three elements" a accumulated. For example, a forest fire is thedata base, a knowledge base, and a control structure. "elementary unit" for a forest fire database; a
The data base is the compilation of information about forest site is the "elementary unit" for a forestryquantitative and qualitative characteristics of an area. database; a meteorological station is theIn our case the data base is information on the factors "elementary unit" for a meteorological database.
, listed above for defining forest fire protection levels. Within the framework of our task, we defineThe knowledge base is the synthesis of conceptual whether or not a particular fire, site or station liesknowledge, described in terms ofrules of formal inside a protected area.logic, Such as "if- then". For example, if the density 2. Calculation of average index values (e.g.,of fire ignitions fires is more than 5 for a given type of calculation of average burned area for particular
conditions then the fire protection level would be conditions of functioning of FFPS);'high'. The control structure defines rules concerning 3. Construction of distribution for index values;the order in which variables are considered in the (e.g., fire distribution based according to ignitionanalysis. For example, all rules connected to radiation sources or distribution of forest district areas
• danger might be evaluated first, ones connected to based on categories of lands)ecological Significance evaluated second, etc. 4. Summing values of certain indices;
5. Dividing values of certain indices;6. Obtaining values of some indices from an
CONSTRUCTION OF A DATA BASE appropriate database;7. Average values of certain indices;
Data base indices are subdivided into two groups: 8. Average difference in values between indices;
indices that do not require special algorithms and 9. Searching certain index values for a "elementaryindices requiring special algorithms, unit" in the database;
10. Sampling of several indices from the database;The indices of the first group are introduced into the 11. Repeating one of the above mentioned algorithmsdata base from the computer screen. These include: on a region including the calculated area.
• _Fire Danger Level (low, medium, high);
• Wind velocity (up to 10 mps above 10 mps);• Fire season period (spring, summer, AN EXAMPLE
autumn);
• Level ofradiation contamination (low, An example ofthe definition of forest fire protectionmedium, high); levels (here defined before the fire season) undel
' • Level of chemical contamination (low, different levels of fire danger for a hypothetical sub-' medium, high); unit is presented in table 1. Table 2 descn_oes t_e
• Presence of atomic power stations or other proportion of fires that are expected to be containedenterprises comprising poss_le radiation risk within time guidelines for different fire protection
levels for the same hypothetical area. These tablesin dangerous proximity to the protected area.(Yes- 1, No- 2); represent an example for a specific combination of the
data base variables descn'bed above. Fire protection• Presence of other extremely dangerous orcritical production activities; levels might be changed, for example, by a
lower or higher index for economic values at risk orrisk of radioactive contamination.
396 GTR-NC-209

°
LITERATURE CITED service of forest fires. AMSE, Transaction,Scientific, S_edan, Series A. Exact Natural
Pokryvailo V.D., Shur Y.Z. 1992. Optimisation of Sciences. Vol.3. Forest Fires. AMSE Press. AD
regional system for the detection and operative Tassin. France, 105-112.
..
Table L--Definition of appropriate fire protection level. ,
Fire protection levelWorking conditions (for fire season periods)
Fire Danger Level Wind velocity(m.p.s.) Spring Summer Autumn
1 ilow) < 10 low low low
1 > 10 low low low
2 (medium) ' < 10 medium medium medium
2 > 10 high high high
3 (high) _<10 high high high
3 > 10 high extremely high high
Table 2.--Acceptable range in proportions of fires meeting the goal for timely containment under different fireprotection levels.
• Timely containmentFire protection level
(Proportion of fires)
Above Up to
Zero N.A. N.A.
Extremely Low 0.70 0.80
Low 0.80 0.90
Medium 0.90 0.95
High 0.95 0.97 It
. Extremely High 0.97 1.00 ir.,
Proceedings IBFRA Assn 1997 meeting 397
USE OF BEHAVE FOR FOREST FIRES AND PRESCRIBED FIRE EXPERIMENTS IN SIBERIA
Eric N.Valendik,Yegor IC Kisilyakhov, Galin_ A. Ivanova, Valentina D.Perevoznikova,Serghey V. Verkhovets I ,
D
ABSTRACTmPrescdbed fire was tested as a conditions. This paper presents some results of these
potential tool for site preparation and for reducing fire experimental prescn_oed fires and future plans.hazard.after clearcut logging in dark coniferousforests in S_eda. Experimental burns wereconducted on 8 sites to evaluate the practicality of fire METHODS
use and effects of prescribed fires on fuels and on site•conditions for regeneration. The BEHAVE system Description Of Experimental Sitesfor fuel.and fire behavior modeling was used
°successfially to predict fire behavior and to help In 1996 and 1997 a series of experimental plots wasdetermine prescription windows for burning. The prepared at 8 dark coniferous forest logging slashapplication of prescribed fire following clearcut clearcuts near Predivinsk (Krasnoyarsk Region).logging in Siberian forests shows considerable Experimental bu_g sites were selectedin Bolshayapromise as a management tool. Murta leskhoz (Krasnoym,sk Region) and firelines
were prepared for prescribed burns by Predivinsklespromkhoz staff immediately after logging. Slashfuels resulted from clearcut logging of the dark
INTRODUCTION coniferous forest stand (fir, spruce) on the sites 1 to 2years before burning. Logging was done in winter
' Any fire use in forests of Russia was proluq3ited until using LP49 felling machines. Clearcuts were 20 ha to1995, when a permission was given to use early spring 50 ha in area and surrounded by firelines 4 m to 6 rnbums in grass fuels near roads before the beginning of wide made by a bulldozer. Some clearcuts werethe fire season (valendik 1996). Within the further divided by firelines into small 2 ha to 3 hafi'amework of the Central Siberian Sustainable Forest plots. Advance regeneration left after logging had red
Management Project, the V.N.Sukachev Institute of needles due to sudden exposures to light in many• Forest, Siberian Branch, Russian Academy of clearcuts.
-Sciences, in collaboration with the USDA ForestService and the Russian Federal Forest Service, beganto Study experimental prescribed fires in the Fuel Sampling
Kr-asnoyarsk Region starting in 1996. The mainobjective s of these experiments in slash fuels were: Prebum sampling of all fuels was conducted on each(1) fire hazard reduction, (2) site preparation for experimental site. Fuel loads of surface fuels wereplanting and natural regeneration, and (3) developing determined at 10 m intervals along a transect, usingregulations for using prescribed fire in forestry small sampling plots (0.2 rn x 0.25 m) for 1 hr forestpractice of Russia. fuels, and larger plots (0.5 m x 0.5 m) for live forest
fuels. Fuel loads of downed woody materials were
The fire behavior prediction and fuel modeling system defined on 15 rn long transects from these samplingBEHAVE developed at the Intermountain Fire points. Surface to volume (SN) ratios were ttScience Lab., USA (Burgan and Rothermel 1984, calculated l_om transect data. Postfire sampling ofAndrews 1986, Andrews and Chase 1989, Andrews fuels was also done near the same points to determineand Bradshaw 1990) was used for planning fiaelconsumption.experimental prescribed fires in slash fuels ofclearcuts. Custom fuel models were developed forthese slash fuels and used as inputs to theRXWINDOW program for the determination of anoptimal range of weather and fuel moisture
IV.N.Sukachev Institute of Forest, Siberian Branch Russian Academy of Sciences, Krasnoyarsk 660036 Russia;. e-mai'l: ifor@__sk.infotel.ru.
398 GTR-NC-209

Def'ming Prescription Windows 1. The S/V ratio of 1-hour fuels was 76 cm2 cm3.
The custom fuel model was tested using TSTMDL,After sampling fuels and defining fuel loads, custom and the model fire behavior predictions are presentedfuel models were developed using the fuel subsystem in table 2. A fire behavior characteristics chart J
of BEHAVE (Burgan and Rothermel 1984; Burgan (Rothermel 1983) for custom fuel model 14 is "1987). After testing the models using DIRECT and presented in fig. 1.TSTMDL we defined prescription windows with thehelp of RXWINDOW (Andrews and Bradshaw, The custom fuel model 14 lies between NFFL fuel -
1990). Windows of acceptable weather and fuel models 11 and 13 (fig. 1). Using R.XWINDOW we "moisture content conditions then were used in can define windows for acceptable weather and fuel
planning and conducting prescn'bed fires, moisture conditions from table 3 for a backing fireand similar tables for head and flank fire. Alter this
comparison it was decided to use a backing fire with 1Fire Weather Monitoring hr fuel moisture content near 7%-10% and with
midflame wind speed up to 5 kin/hr.Suitable weather patterns for prescribed bum
experiments were identified using weather images Suitable weather patterns were determined usingreceived from NOAA satellites by the Krasnoy_sk images received from NOAA satellites by theNOAA.satellite downlink station (Sukhirtin 1996). Krasnoyarsk downlink" station installed by NASA inUsing these images we can plan prescribed bum the Krasnoyarsk Scientific Center, Siberian Branch,experiments so as to conduct them with minimal Russian Academy of Sciences (Sukhinin 1996). Theequipment and manpower. On each site weather weather pattern presented in table 2 was observedcharacteristics such as dry bulb temperature, relative July 19, 1996 before experimental fire number 2/96.
humidity, and mid-flame wind speed were determined Images were also used for detecting the experimental. before, during, and after the fire. fire areas. Because the slash fuels burned very
intensively, it was posslqale to detect these fires on..
small areas.Fire Behavior
Immediately after logging there were a lot of slashAlter ignition and achieving quasi-steady state at the fuels, and fuels were distributed irregularly sofire edge, fire characteristics such as forward spread intensity of burning varied. In some cases convectionrate, flame length, and width of the burning zone were columns developed, and we were able to use SPOT tomeasured by visual observation and slide and video estimate spotting distances.film recording. In some cases special methods forChanging of fireline intensity were used so it was very Fuel loads were decreased in the burned areas. Down
dit_ult tO define characteristics of the fire. But in and woody fuel loads decreased from 4.3 kg/m 2 to 0.3many cases it Was possl_ole to estimate fire kg/m 2 and initial volume of sound wood from 108.5
' characteristics ina short length of time. m 3 ha "1 to 68.6 m3ha "1 on a 60 ha clearcut (prescribedfire number 1/96) near Predivinsk. Based oninformation in Stocks (1991), we estimated emissions
RESULTS AND DISCUSSION from experimental fire number 1/96. Using emissionfactors of 445 g/kg l for carbon dioxide, 45 g/kg for It
' During the summer of 1996 and June-July 1997, 8 carbon monoxide, 4.55 g/kg l for methane and total lrclearcuts x_Titha total area of more than 300 ha were nonmethane hydrocarbons (aerosols) we estimated
" burned in dark coniferous logging slash fuels in 1,068 tons for carbon dioxide, 108 tons for carbonCentral Siberia (Krasnoy_sk Region). Presented monoxide and 10.9 tons of methane and NMHCs
below are some results of BEHAVE usage for emitted only in combustion of fuels up to 7 mmexperimental fire number 1/96 as an example. After diameter in this experimental fire. So even adefining of fuel loads, a custom fuel model was prescnqaed fire in a small area is a powerful source ofdeveloped with the help of the FUEL subsystem of energy and gas emission.BEHAVE. Fuel characteristics are presented in table
Proceedings IBFRA Assn 1997 meeting 399

" Table 1.--Fuel characteristics before burning on the site of experimentalfire number 1-96.
Fuel Loads Other Fuel Characteristics
Fuel Class T/ha Characteristic (units) Amount AO
1 hr 14.3 Depth (cm) 19.81
10 hr 7.1 Heat content (J/g) 17,989
100 hr 8.7 Moisture of extinction (%) 32.0 ,
Live herbaceous 0.0 Packing ratio (PR, v/v) 0.0295
Live woody 0.0 PR/Optimum PR 4.90
Table 2.--Predicted fire behavior under ambient environmental conditions, using the custom fuel model derived on-
site. Slope was 0%.Fuel Condition Predicted Fire Behavior
Mid-flame wind speed
Fuel Type Fuel Moisture Fire Variable (units) No wind 7 km/hr 14 km/hr(%)
1 hr 5.0 Rate of Spread (m/min) 1 4 11
10 hr 12.0 Flame length (m) 1 2 2
100 hr 17.0 Reaction intensity (kW/m2) 912 912 912
Live herb 100.0 Heat release (kJ/m2) 9,382 9,382 9,382
Live Woody 100.0 Fireline Intensity (kW/m) 80 631 1782
Table 3.--Wind speeds and weighted fuel moistures that result in fire behavior _thin prescription constraints for a
baclang fire (flame length __1 m). In cells with an "X'" fire would be in prescription for the indicated
_ndspeed, using data from table 2.Weighted Windspeed (6 m height/midflame)•
Dead Fuel (km/hr)Moisture
(%) 0.0/0.0 9.7/4.8 19.3/9.7 29.0/14.5 38.6/19.3 48.3/24.1 57.9/29.0
2 x x x x x x x !
3 x x x x x x ¢
4 X
5 X
6 'X
• 7 X
400 GTR-NC-209

S 110-1' +X
P I*+XO
R I*+X
E 91-1 * + X.- •
A I*+X
D I,+ X
73 -I* +X
R I*+ X,.
A I*+ X
T 55-1"+ X
E I*�X
I* + X
37 -I* + X
M I* + X
/ I* + X..
M 18-I * + X
I I * + X
N I * + X
0 -I ......... I......... I......... I I I I
0 5000 I0000 15000 20000 25000 30000
HEAT PER UNIT AREA, KJ/M 2• .
Figure 1.--Predicted relationships between heat release per unit area and spread rate for three fuel models. Fuel
model 13 (slash_eavy fuel loads)--X; fuel model 11 (slash fuel loads)--*," custom fuel model 14--+ .i
. ¢
- Natural regeneration after the prescn]aed fire was FUTURE PLANSsuccessful in the burned area of experimental fire
number 1/96. The burned area of experimental fire We will continue prescribed burn experiments in darkhumber 2/96 was planted in fall 1996. coniferous forest clearcuts and begin to study the use
• of prescribed fires in light coniferous forest clearcuts.in. 1997 understory burning experiments were begun Also understory burning in pine stands will be a focusin pine stands (Pinus sylvestris) to study the use of of our research.
. prescn_oed fire for t" ng of stands. Low intensitysurface fires with flame heights up to 1 rn were usedfor this purpose.
Proceedings IBFRA Assn 1997 meeting 401

CONCLUDING REMARKS Department of Agriculture, Forest Service,Intermountain Research Station. 54 p.
Prescribed fires as well as wildland fires are powerfulsources of energy and gas emissions, and if they are Andrews, Patricia L.; Chase, Carolyn H. 1989. Aincluded in a forestry practice in boreal forests of BEHAVE: fire behavior prediction and fuel •S_eria it appears that they will make some modeling system--BURN subsystem, Part 2. Gen.contn'bution to global change. BEHAVE will be a Tech. Rep. INT-260. Ogden, UT: U.S.useful tool for planning future IGBP related forest fire Department of Agriculture, Forest Service,
experiments on the S_erian IGBP transect and in the Intermountain Research Station. 93 p. •introduction o fprescnq3ed fires into the forestrypractices of Russia. Burgan, Robert E. 1987. Concepts and interpreted
examples in advanced fuel modeling. Gen. Tech.Rep. INT-238. Ogden, UT: U.S. Department of
ACKNOWLEDGEMENTS Agriculture, Forest Service, IntermountainResearch Station. 40 p.
This study was conducted under the umbrellaof the Central S_erian Sustainable Forest Burgan, Robert E.; Rothermel, Richard C. 1984.
Management Project carried out by BEHAVE: fire behavior prediction and fuelV.N.Sukachev Institute of Forest, S_erian modeling system--FUEL subsystem. Gen. Tech.Branch of RAS, Russian Federal Forest Rep. INT-167. Ogden, UT: U.S. Department ofService and USDA Forest Service. The help Agriculture, Forest Service, Intermountainof authors of BEHAVE: Pat Andrews, Bob Research Station. 126 p.
Burgan, Larry Bradshaw is very appreciated.We would like to thank Richard Lasko, Andy Rothermel, Riohard C. 1983. How to predict the
. Gillespie, John Brissette, Steve Eubanks (US spread and intensity of forest and range fires. Gen.Forest Service) for their efforts to help in Tech. Rep. INT-143. Ogden, UT: U.S.
prescribed burn experiments. Special thanks Department of Agriculture, Forest Service,are extended to Anatoly I. Sukhinin and his Intermountain Research Station. 161 p.HRPT station staff for their help in weatherforecasts for prescribed bum experiments and Stocks, Brian J. 1991. The extent and impact of
countries, p.for forest fire monitoring, forest fires in northern circumpolar ""197-202 in Global Biomass Burning:Atmospheric, Climatic, and Biospheric
LITERATURE CITED Implications (ed. J.S. Levine), MIT Press,Cambridge, Mass.
Andrews, Patricia L. 1986. BEHAVE: fire behaviorprediction and fuel modeling system--BURN Sukhinin, Anatoly I. 1996. Krasnoyarsk wildfiressubsystem, Part 1. Gen. Tech. Rep. INT-194. monitoring subsystem as an element of world wideOgden, UT: U.S. Department of Agriculture, fire management system. In Proc. UN/FAO/EECForest Sei'vice, Intermountain Research Station. Seminar on Forests, Fire and Global Change.130 p. Shushenskoye, Russia (in press).
!
Andrews, Patricia L.; Bradshaw, Larry S. 1990. Valendik, Eric N. 1996. Eurasia boreal forests w•RXWINDOW: defining windows of acceptable protection strategy. In Proc. UN/FAO/EECburning conditions based on desired fire behavior. Seminar on Forests, Fire and Global Change.Gen. Tech. Rep. INT-273. Ogden, UT: U.S. Shushenskoye, Russia (in press).
402 GTR-NC-209

lb
Forest Management
• .
!
. l¢
403

lb0
!
°
4O4

°
DEMONSTRATING SUSTAINABLE FORESTRY IN CENTRAL SIBERIA:A RUSSIAN - AMERICAN PARTNERSHIP
J.C. Brissette !, V.P. Cherkashin2, R.M. Babints_va 3, V.V. Ivanov 4, A.J.R. Gillespie 5 AO
ABSTRACT.--A USDA Forest Service team was team members include scientists of the Sukachev
establiShed in 1993 to work with Russian counterparts Institute of the Russian Academy of Sciences,on a FOrests for the Future Initiative in the managers fi'om a number of units of the Federal •Krasn0yarsk Krai of central S_eria. The goal of the Forest Service of Russia, and the directors of a state-program is tO establish pilot projects to demonstrate owned logging and sawmilling enterprise.the principles of forest conservation and sustainabledevelopme.nt. One phase of the project'in Members of the American team visited Siberia in 1994Krasnoyarsk is to provide geographic information and 1995 to become familiar with the needs for GIS
system (G!S) capability at the field level. The other technology, the ecology of the region, and the state ofphase is to establish demonstrations of sustainable research in the area. We returned to Siberia in 1996forestry in the southern taiga. This paper reports on to witness harvest operations in the area. Also inour progress so far and our plans for the future of the 1995, 1996, and 1997 delegations of Russianproject, with a focus on the role of research, researchers, managers, and industrialists visited
northern New England and the Lake States to viewoperational use of GIS, our long-term research andoperations on national forest and industrial forest
INTRODUCTION lands, and some visited California and Montana to
learn about prescribed burning.:In 1993, a team of scientists and managers from theUSDA Forest Service's Northeastern Research
Station and the Eastern Region was established to AN OVERVIEW OF KRASNOYARSK KRAIwork with Russian counterparts on a Forests for theFuture Initiative (FFI) in the Krasnoyarsk Krai Krasnoyarsk Krai is in the Asian part of the Russian(Region) of central Siberia. The goal of the FFI Federation and occupies 233 million ha or 13.6
program is to establish pilot projects to demonstrate percent of the country's territory. The krai lies "the principles of forest conservation and sustainable between 51o N and 81° N, and 78° E and 113° E, anddevelopment. The first phase of the project in includes the geographic center of Russia. Its southernKrasnoyarsk is to provide geographic information boundary is the Sayan Mountains and its northern, thesystem (GIS) capability at the field level in S_eria. Arctic Ocean. Elevation ranges from 100 m to 3,000Begun in 1995, the second phase will establish m above sea level. Its population is about 3 milliondemonstrations of sustainable forestry practices in the people, most living in cities.southern taiga. An initial report of the activities ofthis Russian- American partnership was prepared by The Yenisei River, one of the world's largest with aVaganov et al. (1997). This paper will report on our total length of more than 4,000 km, flows throughprogress and plans for the future, with an emphasis on Krasnoyarsk Krai. It starts in the Sayan Mountains
•the role of research in the project, and flows north to the Kara Sea, dividing east and !
west S_eria. The two largest hydro-electric stations wCurrently, members of the American team include in Eurasia are on the Yenisei. With its many
. scientists from the Northeastern Research Station and tributaries, the Yenisei forms an importantmanagers from Region 1, Region 5, and the transportation network for goods and passengers.Washington office of the Forest Service. Russian One of its tributaries, the Angara, is the outlet of Lake
IResearch Forester and Project Leader, USDA Forest Service, Northeastern Research Station,Durham, NH, USA
2Research Associate, V.N. Sukachev Institute of Forests, Krasnoyarsk, Russia
3Professor, V.N. Sukachev Institute of Forests, Krasnoyarsk, Russia4Senior Research Associate, V.N. Sukachev Institute of Forests, Krasnoyarsk, Russia
Proceedings IBFRA Assn 1997 meeting 405

Bail_al. Although the rivers are extremely important Furthermore, many of the stands we visited had thefor transportation within the region, they are of appearance of being uneven-aged. Trees of thelimited value for exporting goods because the outlet is forest-steppe transition are mostly birch, Betula, andto the Arctic Ocean. The Tram-Siberian Railway _ pine, Pinus. Acrosses the Krai; however, distances to commercial tcenters are vast. In a direct line it is 3,200 km west to Although they are at higher latitude, dark coniferousMoscow and 3,000 km east to Vladivostok. stands found in Bolshoya Murta are strikingly similar
to spruce-fir (Picea-Abies) forests of eastern NorthThe area within Krasnoyarsk Krai chosen for America. Siberian spruce (P. obovata) is similar to,demonstrating sustainable forestry is in the Predivinsk red spruce (P. rubens Sarg.) so common in Maine andlespromlda0z (a_timber enterprise) within Bolshoya Atlantic Canada, and to white spruce (P. glauca)Murta leskhoz (equivalent to a national forest in the (Moench Voss) which is common across the northernUnited States). Bolshoya Murta is also the name of a United States and Canada. Siberian fir (A. sibirica) isvillage and the surrounding administrative district, similar to balsam fir (A. balsamea) (L.) Mill.
similar to a county. Predivinsk is a village of about Although it is a stone pine (i.e., 5-needle fascicles,5,000 people on the east bank of the Yenisei River, short-winged or wingless seeds), Siberian pine (P.east-northeast ofBolshoya Murta. The people who sibirica) (called cedar by the local people) seems tolivein the village are entirely dependent on the timber have an ecological niche much like eastern white pineenterprise for.their livelihoods. They work either in (P. strobus L.) in.mixed conifer forests of easternthe sawmill as loggers, or in support of those North America. These are all relatively tolerantactivities, species and the stands tend to have multiple cohorts.
Natural disturbances include insect epidemics, wind,and fire. After stand-replacing disturbance, dark
PROJECT LOCATION coniferous stands are followed by the region's only
large hardwoods, birch (B. pendula) and aspenThe Bolshoya Murta leskhoz (approximately 57° N, (Populus tremula).93° E) is about 450,000 ha in size and 93% forested.The climate is continental with a mean annual Light coniferous stands of Scotch pine (Pinus
temperature of 1.0° C, and maximum and minimum sylvestris L.) are usually even-aged and appear similartemperatures of 36.9 ° C and -48.0 ° C, respectively to natural stands of red pine (P. resinosa Ait) in the
• (Vaganov et al. 1997). Precipitation averages 406 Great Lakes region of North America. With •mrn per year, the growing season averages 146 days, increasing latitude, S_erian larch (Larix sibirica)and soils typically fi'eeze to a depth Of 172 crn. The progressively replaces pine in light coniferous stands.area was not covered by the last continental glacier. However, in the area where we are working, pine is
much more common than larch.
The leskhoz is divided by the Yenisei River. Thewestern part ofBolshoya Murta is southern taiga andsubtaiga forest-steppe transition. These sites are quite PROJECT ACTIVITIF_S: GISfiat. Soils are Podzolic (Alfmol and Spodosol) andChemozem (Mollisol) (Vaganov et al. 1997). The The GIS phase of the project is the furthest along andeastern part is mountain taiga forest. The mountains much background about the development of a GISare not large and only moderate slopes are database for the Bolshoya Murta leskhoz was !
' encountered. Soils there are also Podzolic. The area presented by Vaganov et al. (1997). However,
is south of the permafrost zone. research and implementation of GIS to the field w. continue and some additional important progress was
The southern taiga and mountain taiga forests are made during the past year. GIS-generated maps,comprised of"dark coniferous", "light coniferous", which combine information fi'om older forest coverand hardwoodstands. Exc'ept for scattered trees type maps and maps of soils drainage andoccasionally harvested for local use, these stands have productivity, have been compared with conditions innever been logged. However, because of natural the field and found to be quite accurate. Testing thedisturbance, average stand age is only about 91 years accuracy of such combined maps is important to
/ (E. Vaganov, personal communication), ensure their usefulness to managers.Nevertheless, coring of individual trees when we werethere indicated some more than 200 years old.
406 GTR-NC-209

. •In the Bolsh0ya Murta leskhoz, natural regeneration is small scale, these experimental fires may demonstratethe p"nmarymeans of renewing both dark and light the value ofprescn_oedburning for regeneration andconiferous stands. Nevertheless, artificial maintenance of forest stands.regeneration is also used on some sites. Results offieldstudies were used to builda GIS mapof In the Predivinsk lespromkhoz, tracts of darkregeneration effectiveness. This map is being tested coniferous forest are clearcut with little concern foron anexperimental site to determine whether it can regeneration. Harvesting is in 50-ha units usingpredict amount and viabilityof tree regeneration, tracked feller-skidders. See Folkema and HolowaczCombiningthe regeneration potential map with a (1985) for detailed descriptions of Russian logging ,previouslydeveloped map showing methods of equipment and practices. This equipment has severalcutting will allowus to identifyareas where we should limitations: the operator can only harvest trees to theprotect advanced regeneration, as well as sites where let; the boom reach is only 5 m; and trees cannot beit will benecessary to plant. ' lited once cut--so tops are dragged across the site
before the butt of the tree is placed in a bunk at theA GIS-b_ed subsystem was developed to help back of the machine. Furthermore, skiddingmanagers decide how to _est any given forest unit. progresses in 5-m wide strips across the harvest unitIt includes a forest inventory database, standards and with each skid trail being the previously felledstrip.parameters of allowable commercial cutting, and an Thus, the whole unit is covered by skidding and allalgorithm to recommend the most appropriate harvest advanced regeneration is destroyed. Where artificialmethod_ Preliminary tests Ofthe systemhave proven regeneration is an option, such harvesting might beeffectivefor determining optimal harvesting acceptable. However, there is neither nurseryoperations. A similar,subsystem was developed to capacity nor infrastructure to ensure that all harvesthelp determine sites where salvage cutting should be units get planted, and there is no funding availabletoprescn'bed. These two subsystems,unparalleled in release established conifer seedlings from hardwoodS_oeria,are key elements in developing a much more competition.effectiveappr0ach to achievingpractical forestmanagement objectives. Ater viewing current cutting methods, an
experimentalharvest that could protect someadvanced regeneration was proposed for a dark
PROJECT ACTIVITIES: ON THE GROUND coniferous stand scheduledto be harvested. The
DEMONSTRATIONS experimentwas designed to use existing mechanicalharvesting equipment. In this demonstration harvest,
Silviculturaltreatments in the Soviet Union were 5-m wide skid trails were cut in the conventional way,mandated based on forest type, stand structure, slope, but they were alternated with 5-m strips where treesand whether the site had sufficient advanced were cut and removed while providing someregenerationofvalt_ble species. The same or similar protection for advancedregeneration. The trial wasrules Stillapply. However, because of this project, we not fullysuccessfulbut it did demonstrate the
. are able to demonstrate a number of innovative willingnessof the director of the lespromkhoz toappro_hes that previously may not have been work with our team on problems of mutual concern.allowed. The use of prescribed fire is a good Over the longer term, we hope to encourageexample, harvesting equipment manufacturers to demonstrate
their machines in the region. Under similar terrain anL
Naturalforest fireis an importantdisturbancefactor forest conditions in the industrial spruce-firforest of Uthat determinesthe composition and structureof easternNorth America,state-of-the-artfeller-
- foreststhroughoutthe worM. However, inmany bunchersoperatingon designated skid trailsdo aparts of the United States, prescn_oedfirehas only good job of protectingadvanced regeneration.recentlybeen accepted as a forest managementtool.-Similarlyin Russia, firehas traditionallybeenconsidered destructiveand prescn'bed fire is stillaradical idea. Nevertheless, in 1996, an experimentalprescribed firewas used to reduce slash in a recentclearcut in a dark coniferous stand and to preparethesite forplanting. The experimentwas successfulandled to more prescribed firesin 1997. While stillon a
Proceedings tBFRA Assn 1997meeting 407

ACCOMPLISHMENTS AND PLANS vision needed to help sustain the forests of Siberia forthe future.
Since its beginning in 1993, this project can claim a
number of accomplishments. Communications among ' ,all the partners are improving, and there is a strong LITERATURE CITED ,sense that what we are trying to accomplish is
extremely important. Undoubtedly, the greatest Folkerna, M.P.; Holowacz, J. 1985. Mechanizedaccomplishment has been bringing together the logging in the Soviet Union- 1984. Specialvarious agencies responsible for inventorying, Report No. SR-29 of the Forest Engineering ,
protecting, managing, and utilizing the forests to work Research Institute of Canada. Canadian Foresttoward a common goal. Phase One, developing local Industries, September 1985.9 p.capacity to build, maintain, and use GIS technology isoperational and nearly complete. Additional research Vaganov, E.A.; Petrenko, Yu.S.; Ivanov, V.V.;in this area will refine existing methods and the Varaksin, G.S.; Kachayev, A.V.; Furyayev, V.V.;_scientists involved will continue to work with forest Volokitina, A.V.; Cherkashin, V.P.; Pleshikov,managers to effectively use the technology. Managers F.I.; Buzykin, A.I.; Valendik, E.N.; Babintseva,of the forests around Bolshoya Murta have been R.M.; Brissette, J.C.; Vekshin, V.N.; Gillespie,authorized to experiment with treatments other than A.J.R. 1997. Russian-American demonstration ofthose normally prescribed by rule; the prescn'bed bum ecosystem-based forest management in thein 1996 is the first attempt at such innovation. This southern taiga ofKrasnoyarsk Krai. In:rule change gives us the opportunity to continue Proceedings of the 7thannual conference of theresearch on prescribed fire on an operational scale. IBFRA, Sustainable Development of BorealExchange visits between Russian and American Forests; 1996 August 19-23; St. Petersburg,partners have improved our understanding of each Russia: Federal Forest Service of Russia,
. Other and of our respective forests. These exchanges Moscow: 20-28.have shaped our annual work plans, infusing thisproject with a high degree of flexibility, and we hopethat such exchanges can continue.
We have a number of objectives for the future.Within the next year, GIS technology should becomeavailable to the lespromkhoz which will enhance theirability to locate and schedule harvest units effectively.Under Phase Two, we have two immediate objectives.
One is to plan and conduct a site preparationunderbum in a light coniferous stand to demonstrate•the potential of fire to enhance natural regeneration of
.- pine. The other is to demonstrate economically-sustainable methods of harvesting in dark coniferousstands While protecting advanced regeneration.
We hope that continued successful demonstrations of !' GIS technology and on'the-ground techniques will
lead to a willingness to consider a longer approach w
- and integrated forest management planning. Wewould like to identify some areas well before they arescheduled for harvest and prepare a thoroughsilvicultural prescription, something we have not yetaccomplished. The evaluation would consider theState of advanced regeneration and recommend
appropriate prescribed fire and cutting methods tocontrol the composition and density of the futureStand. In conclusion, the Russian-American
partnership has tangl_ole accomplishments and the
408 GTR-NC-209

TREE REGENERATION DYNAMICS OF LOWLAND BLACK SPRUCE STANDS FOLLOWINGCROWN FIRE AND CLEARCUT LOGGING
G.G. Wang and C.A._Harrison IA
O
ABSTRACT.--To determine the differences in tree these two interests, it is critical to understand the wayregeneration after fire and logging, lowland black in which forests recover after natural disturbances
spruce stands burned (by crown fire) and logged (by and after timber harvesting. Boreal forests in North 'clearcut) 6 to 13 years ago in southeastern Manitoba America have been profoundly influenced by natural "were investigated. _Black spruce regeneration was the disturbance regimes, predominately fire (Heinselmanmost abundant on both burned and logged sites, with 1981, Rowe 1983, Bonan and Shugart 1989).jack pine as ,the main associate on burned sites and Through its control on forest regeneration andtamarackand trembling aspen as main associates on succession, fire, interacting with life history traits oflogged sites. Other tree species were rarely found on tree species and local site conditions, cremes andeither burned or logged sites. A continous maintains the spatial mosaic of forest patches o frecruitment pattern was observed on both burned and different size, age, and type displayed in naturallogged sites for black spruce, with a higher number boreal forest landscape. Understanding the effect ofof black spruce seedlings recruited each year on fire on forest regeneration and succession thus holdsburned.sites. Asa result, seedling stocking and the key to the understanding of the formation of thedensity was significantly higher on burned sites, natural boreal forest landscape. With growingWhen compared to the regeneration standard of economic demand, increasing areas of southernManitoba, all burned-sites were considered boreal forests are facing timber harvesting andsatisfactory while two of the nine logged sites were subsequent silviculture treatments. Increasingunsatisfactory. Advanced regeneration was found logging and silvicultural activities, along with
, insignificant to post-disturbance (either fire or attempt in fire suppression, has raised seriouslogging) forest recovery. The total height and the concerns about possible changes in natural diversity1995 height growth of black spruce seedlings were and productivity of boreal forests (Thompson andsigniticantly higher ontogged sites, which was Welsh 1993).caused, at least in part, by the inherent difference in
site quality (measured by site index) between burned Black spruce [Picea mariana (Mill.) B.S.P.]and logged sites. Relative annual height growth dominates much of the North American boreal forests
(expressed as % of mean annual height growth) was and is a major source for pulp and paper industry inhigher at age < 5 and lower at age > 6 on burned sites Canada. Within the Manitoba Model Forest area,when compared to logged sites where it increased black spruce has been subjected to timber utilizationlinearly with age. The ratio of the 1995 height for more than 70 years. A significant portion ofgrowth of logged sites to that of burned sites black spruce stands harvested in the area weredecreased fi'om 165 % to 135 % with the increase of growing on lowland organic soils. It is generally
•- totalheight, and stabilized at 135 % when total height believed that lowland black spruce sites usuallyapproached Im. These differences in early height regenerate naturally to a black spruce-dominant
• , growth pattern suggested that black spruce seedlings stands after fire (Dix and Swan 1971, Carleton andofbumed sitesmay have encountered more Maycock 1978, Heinselman 1981) and loggingcompetition from understory plants. (Stanek 1975, Jeglum 1981). However, previous It
. observations made in the study area suggested that• natural regeneration of black spruce on some lowlan_
- INTRODUCTION sites following logging may fail to meet theprovincial regeneration standard or to restore into a
Maintaining the natural diversity of forests while at fully productive forest on some occasions (Synthem-the same time allowing timber to be harvested is an Resource Ltd. 1990).important challenge in the management of Canadianboreal forests. In searching for a balance between The main objective of the study was to determine if
fire and logging significantly differed in their effects
, ! Department of Biology, The University of Winnipeg, Winnipeg, Manitoba, Canada R3B 2E9. E-mail:wang@uu_nnipeg, ca.
Proceedings IBFRA Assn 1997 meeting 409

°
on tree regeneration. Specifically, we examined (1) vegetation types of V30, V3 l, V32, and V33 and soiltree species composition, density, age and height types ofS 12F and S 12S.growth, (2) recruitment pattern of black spruce, and(3) height growth pattern of black spruce on burned
•and logged lowland sites that previously supported Site Selection and Sampling Design Ablack spruce stands. The study is a part of a largerproject designed to investigate vegetation, soil and Using available information (cover type map,seedbank dynamics of lowland black spruce stands topography map, fire and logging record) andfoll0wing a crown fire and a clear-cut logging, through field reconnaissance, lowland black spruce'
stands that were burned or logged in past 20 years "were identified on the map within the study area. All
MATERIALS AND METHODS burned sites selected in the study were burned bycrown fires with 100 % mortality ofmature trees of
Study Area the pre-fire stands. All logged sites selected in thestudy were disturbed by small patch clearcut
The study area is located in the forest management (typically < 5 ha). As a result, six burned sitesunit31 of southeastern Manitoba, extending ranged from 7 to 13 years old and nine logged sitesapproximately from 50030 , to 51°08 , N and from ranged from 6 to 12 years old were used in the study.95°10' tO 96030 , W. Winters are cold (with mean Within each selected site, a quick reconnaissance wastemperature of-19.2 °C in January) and relatively dry conducted to exatifine the heterogeneity in soil andwhile summer are warm (with mean temperature of vegetation conditions. One or more 10xl0 m plots19.0 °C in July). Average annual rainfall is about 400 were sampled with each site depending on its sizemm with 270 mmin growing season (May to and within-site variation. Each plot was oriented inAugust). Average snowfall is about 120 era_ The the north-south direction, representing an area withmain frost-flee period is about 100 days. The study homogenous soil and vegetation characteristics.area has a relatively simple topography, with little Within each plot, five 2x2 m quadrats were sampledchange in plateau. The Canadian Shield is near the in the four comers and in the center.surface throughout the study area. Rock outcrops
typically lack of mineral soils are frequentlyencountered. Depressions between rock outcrops Data Collectioncontain mineral or organic soils depending on.drainage. Important soil orders include Dystric Individual seedling of each tree species were countedBrunisols, Grey Luvisols, Gleysols, F_risols, and on each plot (for seedling > 2 m tall) and on eachMesisols (Canada Soil Inventory 1989). According qua&at (for seedling < 2 m tall). The total height,to the data given in the 1986 Forest Resource age, and 1995 leader growth were measured for everyInventory, black spruce, jack pine (Pinus banksiana seedling. The height up to the end of the 1995Lamb) and trembling aspen (Populus tremuloides growing season was measured as total height becauseMichx) are either the primary or secondary species in the 1996 growing season was incomplete at the time• .
88% of the stands. Black spruce appeared as the of sampling. Age determination for each seedlingprimary or secondary species in 80 % of these stands, was accomplished by counting the number ofJack pine/black spruce stands were dominant on terminal bud scars from the base of the seedling toUplands except on fine-textured soils where aspen the end of the 1995 growing season. Using the
mixedwoods are common. Black spruce stands terminal bud scars allowed for accurate aging in t_e' frequently dominate on lowlands with a well absence of whorled branches. If any difficulty
developed layer of feathermoss or sphagnum and a encountered with this method, destructive samplingpoorly developed layer of vascular plants. The term was used for age determination. The distance"lowland" in this study refers specifically to those between the terminal bud scars representing the endsites with organic soils as defined by CSSC (1978). of the 1994 growing season and the end ofthe 1995
- Lowland black spruce stands are among the most growing season was measured. This distancecommonly encountered forest types in the study area represents the mount of growth that occurred duringas well as in Manitoba's boreal forests. According to the growing season of 1995 (i.e., the 199"5heightManitoba's forest ecosystem classification (Zoladeski growth).et al. 1995), lowland black spruce stands consist of
410 GTR-NC-209

Table 1. -- Summary of selected site characteristics according to disturbance type.
Disturbance type _- Fire Logging
# of sites 6 ' 9 ASite age (year) Minimum 7 6 ,
Maximum 13 12Mean 9.3 9.3
Groundwater table (era) Minimum 10 2• Maximum 65 85 ,
Mean 28 29
Major rooting zone depth Minimum 5 5(era): Maximum 27 34
Mean . 19 20
Depth of Organic layer Minimum 70 45(era): Maximum >150 > 150Soft moisture regime: Wet/very wet Wet/very wetSoil nutrient regime Very poor to medium Very poor to mediumSoil taxon FibrisoFMesisol F_risol/Mesisol
*Field identification of soil nutrient regime did not take nutrient input due to groundwater influence intoconsideration.
A soil pit was dug near the center of each plot to regeneration on each site was also assessed using theclassify and descn'be soils. Soils were classified provincial standard (Delaney 1995).
•following CSSC (1978). Important soil variables' recorded in the field including depth to ground water The relationships between total height and age andtable and/or seepage, depth of organic layer, depth of between the 1995 height growth and the total height..
the major rooting zone, and soil taxon. Soil moisture were quantified, separately, for burned and loggedand nutrient regimes of each plot were determined sites. To find the best models, scatterplots withusing a procedure modified from Wang et al. (1994). LOWESS smoothing were constructed (WilkinsonA brief summary of these site characteristics is given 1990). Logarithm transformations of dependentin table 1. variables were made to improve the homogeneity o_f
their variances. As a result, the following twomodels were selected.
Data Analysis [1] ln(HT) - a ( 1 - e b,4) c
" Thepresence of a species on each disturbance type [2] ln(GTH) - a(1 - e bnr)c
was calculated as a percent of total plots in which the where In = natural logarithm, e = the base of naturalspecies was found. The stocldng of a species on each logarithm, HT = height (cm), GTH = the 1995 heightStudysitewas calculated as a percent of total growth (era), and A = age (years). These nonlinearquadrats in which at least one individual of the models were fitted using the Quasi-Newtonspecies was found. Density of a species was procedure (Wilkinson 1990).expressed as number of individuals per hectare. A !
' simple t-test was used to compare seedling stocking, To examine growth pattern, relative annual height wdensity, age, total height, and the 1995 leader growth growth (%) were calculated using Eq. [3] and plotted
- between burned and logged sites. A separate against age for both burned and logged sites:variance t-test Was applied whenever group variances CA Gwere not equal (Wilkinson 1990). [3] RAG(%) - _x100
' MAG
Each black spruce seedling sampled was grouped where RAG, CAG, and MAG are relative (%),according to the year since disturbance, which was current (cm), and mean (cm) annual height growth,identified based on its age and the year when fire or respectively. CAG and MAG were derived from Eq.logging occurred. Stocking, density, and [1]. Similarly, the ratio of the 1995 height growth of
' accumulated density were compared on every year logged sites to that of burned sites was alsosince the disturbance. The success of black spruce calculated using values derived fi'om Eq. [2] and
plotted against seedling height.
Proceedings IBFRA Assn 1997 meeting 411

RESULTS sites, black spruce averaged 14,450 stem/ha,tamarack 900 stem/ha, and trembling aspen 1,668
Current Status of Tree Regeneration : stem/ha. Despite large variations among sites withineach disturbance type, black spruce density was
Four species were found among the six burned sites: found to be significantly different (p = 0.034)black spruce on six sites, jack pine on five sites, and between burned and logged sites.tamarack [Larix laricina(du Roi) K. Koch] and
trembling aspen on one site. Six species were found Similar ages were observed for black spruce, jack• 6
among the nine logged sites: black spruce on nine pine and trembling aspen seedlings regenerated onsites, tamarack on seven sites, trembling aspen on both burned and logged sites (table 2). However,eight sites, and paper birch, white spruce and balsam tamarack appeared younger than black spruce andfir on one site. . trembling aspen on logged sites. There was no
significant difference (p = 0.637) in the age of blackOn burned sites, black spruce and jack pine had a spruce seedlings between burned and logged sites.high Stocking levels (88.3 % and 46.7 %,respectively); tamarack and trembling aspen were Jack pine (on burned sites) and trembling aspen (onfound only in one quadrat of one site. On logged logged sites) were taller than black spruce; tamaracksites, black spruce had the highest stocking (83.8 %), (on logged sites), despite of its younger age, had afollowed bytamarack and trembling aspen (21.3 %); similar height as black spruce (table 2). Similarly,paper birch(Betula papyrifera Marsh.), white spruce jack pine, tamarack, and trembling aspen had higher[Picea glauca (Moench) Voss], and balsam fir [Abies 1995 height growth than black spruce (table 2).balsamea (L.) Mill] were found only on one quadrat Despite of the similar age, total height and the 1995of one site. No significant difference (p = 0.58 l) in height growth of black spruce seedlings on burnedthe stocking level of black spruce was found between sites were significantly (p = 0.012 and 0.013,
? burned and logged sites, respectively) lower than those on the logged sites.
On burned sites, there were 43,150 stem/ha of blackspruce and 3,168 stem/ha ofjack pine. On logged
Table 2.--Means (_ith standard error in parentheses) of age, height, and the 1995 leader growth of major tr_e
• species regenerated 6-13 years after crown fire and clearcut logging.Disturbance Sb Species* Ta At
Pj•Age (year)Fire 4.8 5.3
(1.8) (1.2)Logging 4.7 3.4 4.8
(1.4) (1.1) (1.8)Height (cm):Fire 20.0 74.4
(9.1) (5.9) !, Logging 8.2 11.7 7.7
• (3.2) (6.0) (6.0)- *Symbols for species are: Sb-black spruce; Pj-jack pine; Ta-tamamck; At-trembling aspen.
412 GTR-NC-209

°
Recruitment Pattern of Black Spruce After Fire result of a higher recruitment rate, density of blackand Logging spruce seedling on burned sites was consistently
: higher than that on logged sites when measured at
Most black spruce seedlings were established after any year since the disturbance. Significant .fire and logging. Advance regeneration was only differences (p < 0.05) were found at years five, sixfound on three logged sites (500 stem/ha) and one of and seven.the burned sites (9,000 stem/ha).
When compared to the provincial stocking criteriaBlack spruce seedlings regenerated after fire and (minimum of 55 % stocking for black spruce at yearlogging demonstrated a continuous recruitment seven), all burned sites were considered successfulpattern (table 3). There were higher %of burned while two of the nine logged sites were consideredsites with black spruce recruitment almost in any year unsuccessful (with stocking level at 40 % and 50 %aRer the disturbance when compared to logging sites, at year seven). Significant difference in black spruceEvery studied site had black spruce regeneration at stocking at year seven was found between burned (88year four since fire and at year six since logging %) and logged (70 %) sites (p = 0.026). On average,(table 3). Therecruitment level of black spruce it took only 4 and 5 years, respectively for burnedseedlings on both burned and logged sites increased and logged sites, to reach the suggested minimumwith time after disturbance, at least until year seven density of 2,746 stem/ha (Delaney 1995). When
(table3). More seedlings were recruited each year on individual sites were examined, it took only 5 yearsburned sites compared to that on logged sites, for all the six burned sites to reach the minimumSignificant differences (p - 0.047) were found at density level while it took 9 years for all the nineyears five. Because of continuous recruitment, the logged sites to reach the minimum density level.density of black spruce seedlings on both burned and However, only one logged site did not reach thelogged sites accumulated rapidly (table 3). As a minimum density level at year seven.
Table 3.--Black spruce recruitment at different years afier fire and logging.
Year after disturbance1 2 3 4 5 6 7 8 9
Presence (%) and accumulated presence (%) (in parenthesis)Fire 25 33 67 100 100 100 100 90 50
(25) (41) (67) (100) (100) (100) (100) (100) (100)Logging 0 31 50 75 50 75 79 79 69
(0) (31) (50) (75) (81) (100) (100) (100) (100)Mean and standard deviation of density (stem/ha):Fire 167 208 1433 3083 7391 6291 6416 6670 5050
• (258) (188) (1616) (2166) (5974) (5737) (6129) (9224) (9132)•Logging 0 297 833 1083 1037 1056 2250 1681 2157
• (0). (455) (1145) (1159) (1602) (1217) (1866) (1574) (2611)P value* Na** 0.61 0.453 0.077 0.047 0.076 0.161 0.295 0.525
Mean and standard deviation of accumulated density (stem/ha): !Fire 167 375 1958 5208 12583 188751 25291 29950 35000
' . (258) (262) (1600) (3152) (8323) (10701) (15358) (24343) (32595_Logging 0 297 1129 2212 3250 4306 6781 8458 11261
" (0) (455) (1582) (2408) (3672) (4426) (4302) (4890) (5474)P value* Na** 0.678 0.345 0.080 0.040 0.019 0.031 0.120 0.179
*Separate variance T test**Insufficient data for test; ha-not available
Proceedings IBFRA Assn 1997 meeting 413

°
Height Growth Pattern of Black Spruce the ratio decreased at higher rate initially and thenRegeneration After Fire and Logging leveled off when seedling height approached 1 m,
where the ratio stablized at about 135 % (fig. 2,
Age accounted approximately about 50 % (Equation _ bottom). ,[4]) and 69 % (Equation [5]) ofvariatiom in seedlingheight, respectively for burned and logged sites: DISCUSSIONS
[4] ln(HT) = 4.053(1 - e -0"192A)0.795" Species CompositionCorrected R2 = 0150 RM_ = 0.399
n = 1036p = 0.000 Our result indicated that a direct succession, in whic'la
[5] ln(HT) = 6.557(1 - e -°'°92A )0.641 the same species (i.e., black spruce) re-establish itselfCorrected R2 = 0.69 RME = 0.322 as the dominant, was evident on lowland black spruce
n = 435 p = 0.000 ' stands after either fire or logging disturbance. This iswhere In = natural logarithm, e = the base of natural in agreement with previous studies on boreal forest
logarit!m_ HT = height (era), A = age (year), and succession (Dix and Swan 1971, Carleton andRME = root mean square error. The natural Maycock 1978, Heinselman 1981). Although jacklogarithm of height was used to improve pine (on burned sites), and trembling aspen and
•homogeneity of variance of height at different age. tamarack (on logged sites) occurred as commonassociates, they did not achieve dominance in any
Although seedling height increased with age on both burned and logged site. The presence ofjack pine onburned and logged site, seedlings established on five of the six burned sites and non-existence on anylogged sites were taller at any age (fig. 1, top). On logged site can be explained by the reproductionburned sites, relative annual height growth decreased strategy ofjack pine. Fire opens the serotious conefrom year 1 to year 2, increased at relative fast rate ofjack pine, therefore provides seeds to burned sites.
• from year 2 to year 5, slowed down considerably The relative higher presence of tamarack on logged' from year 5 tO year 7, and declined somewhat from sites but not on burned sites may be due to the effect
year7 to year 8 (fig. 2, top). On logged sites, relative of fire disturbance. Crown fires destroy the seedannual height growth maintained at the similar level source of tamarack, therefore reduce its presence on
at initial two years and then increased linearly with post-fire communities. However, it was doubtful thatage (fig. 2). At age < 5 years, relative height growth fire had killed the root of trembling aspen, thuson burned sites was higher than that on logged sites, caused the lower presence of trembling aspen suckers
• The reverse was true when age > 6. on burned sites. Rowe (1983) reported that thd deathof root system due to fire only occurred on upland
Total seedling height explained approximately 31% sites with extremely shallow soils.(Equation [6]) and 30 % (Equation [7]) of the totalvariations in the 1995 height growth, respectively for Because black spruce, jack pine, and trembling aspenburned and logged sites: are well adapted to fire disturbance, they re-
established themselves quickly after fire (Bums and[6] ln(GTH) 2.014(1 e-0"0308HT)0"633= -- Honkala 1990, Sims et al. 1990). The lack of
Corrected R2 = 0.31 RME = 0.392 significant differences in the age of black sprucen = 1052P = 0.000 seedlings between burned and logged sites suggested
[7] ln(GTH) = 2.326(1 - e-°"°259_/r) 0.368 that black spruce also regenerated quickly afterlogging. The relatively late establishment of ItCorrected R2 =.0.30 RME = 0.386 tamarack on logged sites, which may not be
. n = 458 P = 0.000 biologically significant due to small difference (l-P2. where GTH = the 1995 leader growth and all others years late) despite of statistical significance, is
are previously defined, difficult to explain. One reason could be that somelogged sites were lacking in situ seed source of
Although increased with the total height on both tamarack, thus delayed tamarack regenerationburned and logged site, the 1995 height growth on because of its dependence on seed inputs.fromlogged sites was higher than that on burned sites for outside sources.any given seedling height (fig. 1, bottom). The 1995height growth ratio between the two disturbance type
: were found approximately between 135 % to 165 %(fig. 2, bottom). With the increase of seedling height,
414 GTR-NC-209

80 i a I I l
i I D
"/0- / -/ tt
• . J
60- / -
s•S/ *' & 50- , -i
ii
tuo•- 40- /" -i
30- ," -
213- -
10- -
0 I I I I .
0 2 4 6 B 10
Total age (year)
10 i i i
6-
tO
o I I I I
0 20 40 60 BO 100 |' Total height (era)
. ¢
- Figure 1.--TOP: Therelationships between total height and total age of black spruce seedlings on burned (solid
line) and logged (dashed line) sites, which are defined by Eqs. [4] and [5], respectively. BOTTOM: Therelationships beaveen the 1995 height growth and the total of black spruce seedlings on burned(solid line) andlogged (dashed line) sites, which are defined by Eqs. [6] and [7], respectively.
Proceedings tBFRA Assn 1997 meeting 415

200 I I I I _ .
i t/
• _ 150- "' -/,ca •
., _.I *
_ 100 -
o_.I s
50- ""t..... s
;.J
0 I I I I
0 2 4 6 8 10
Total age (year)
170 i i i i
,v,
160-0,P,,I
150-1=o
o1.,4I.)
140- -
• .
130 , , , ,• ' 0 20 40 60 80 100
Total height (era)!
. IF
" Figure 2.--TOP: The relationships between relative annual growth (%) and total age of black spruce seedlings on•burned (solid line) and logged (dashed line) sites, which are derived from Eqs. [4] and [5] respectively.•BOTTOM: The relationship betu_een the ratio of the 1995 leader growth on burned sites tO that on logged sites
and the total height of black spruce seedlings, which are derived from Eqs. [6] and [7], respectively.
416 GTR-NC-209
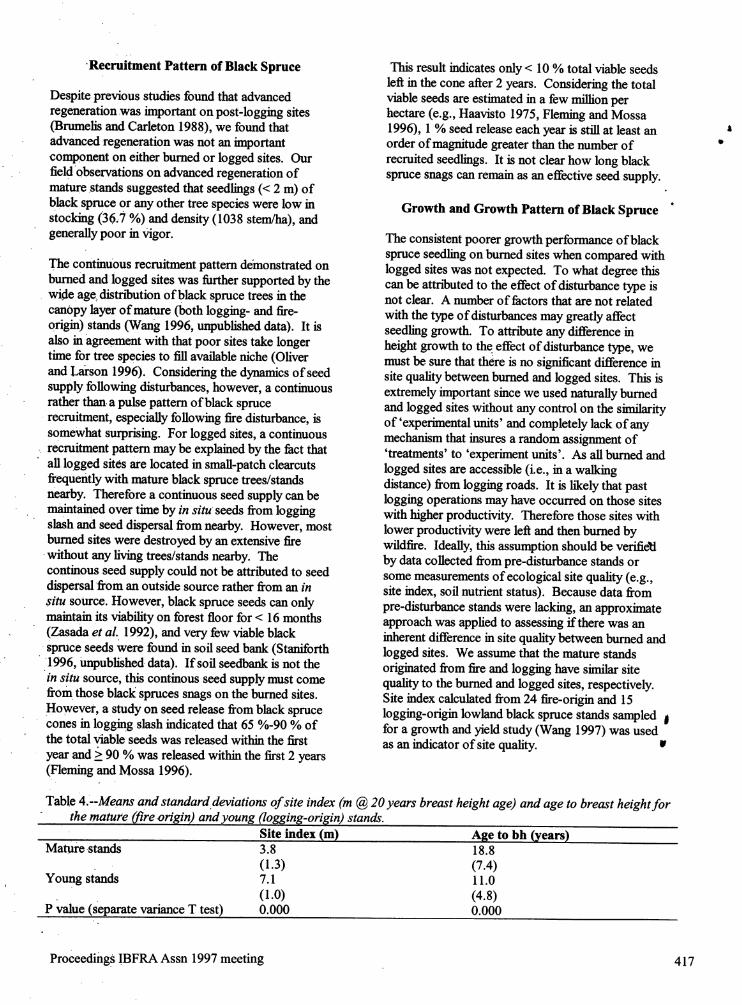
"Recruitment Pattern of Black Spruce This result indicates only < 10 % total viable seeds
left in the cone after 2 years. Considering the totalDespite previous studies found that advanced viable seeds are estimated in a few million perregeneration was important on post-logging sites hectare (e.g., Haavisto 1975, Fleming and Mossa(Brumelis and Carleton 1988), we found that 1996), 1% seed release each year is still at least an *advanced regeneration was not an important order of magnitude greater than the number of •component on either burned or logged sites. Our recruited seedlings. It is not clear how long blackfield observations on advanced regeneration of spruce snags can remain as an effective seed supply.mature stands suggested that seedlings(< 2 In) of
black spruce or any other tree species were low in Growth and Growth Pattern of Black Spruce "stocking (36.7 %) and density (1038 stem/ha), and
generally poor in vigor. The consistent poorer growth performance of blackspruce seedling on burned sites when compared with
The continuous recruitment pattern demonstrated on logged sites was not expected. To what degree thisburned and logged sites was further supported by the can be attn'buted to the effect of disturbance type iswide age distn'bution of black spruce trees in the not clear. A number of factors that are not related
canopy layer of mature (both logging- and fire- with the type of disturbances may greatly affectorigin) stands (Wang 1996, unpublished data). It is seedling growth. To attn_oute any difference inalso inagreement with that poor sites take longer height growth to the effect of disturbance type, wetime for tree species to fill available niche (Oliver must be sure that there is no significant difference inand Larson 1996). Considering the dynamics of seed site quality between burned and logged sites. This issupply following disturbances, however, a continuous extremely important since we used naturally burnedrather than.a pulse pattern of black spruce and logged sites without any control on the similarityrecruitment, especially following fire disturbance, is of'experimental units' and completely lack of anysomewhat surprising. For logged sites, a continuous mechanism that insures a random assignment ofrecruitment pattern may be explained by the fact that 'treatments' to 'experiment units'. As all burned and
all logged sites are located in small-patch clearcuts logged sites are access_le (i.e., in a walkingfrequently with mature black spruce trees/stands distance) fi'om logging roads. It is likely that pastnearby. Therefore a continuous seed supply can be logging operations may have occurred on those sitesmaintained over time by in situ seeds fi'om logging with higher productivity. Therefore those sites withslash and seed dispersal from nearby. However, most lower productivity were let_ and then burned byburned sites were destroyed by an extensive fire wildfire. Ideally, this assumption should be verifie_lwithout any living trees/stands nearby. The by data collected fi'om pre-disturbance stands orcontinous seed supply could not be attn_outed to seed some measurements of ecological site quality (e.g.,dispersal from an outside source rather fi'om an in site index, soil nutrient status). Because data fromsitu source. However, black spruce seeds can only pre-disturbance stands were lacking, an approximatemaintain its viability on forest floor for < 16 months approach was applied to assessing if there was an(Zasada et al. 1992), and very few viable black inherent difference in site quality between burned and
spruce seeds were found in soft seed bank (Staniforth logged sites. We assume that the mature stands•" 1996, Unpublished data ). If soil seedbank is not the originated from fire and logging have similar site
in situ source, this continous seed supply must come quality to the burned and logged sites, respectively.from those black spruces snags on the burned sites. Site index calculated from 24 fire-origin and 15
However, a study on seed release from black spruce logging-origin lowland black spruce stands sampled !cones in logging slash indicated that 65 %-90 % of for a growth and yield study (Wang 1997) was used
' the total viable seeds was released within the first as an indicator of site quality, wyear and > 90 % was released within the first 2 years
- (Fleming and Mossa 1996).
Table 4.'-Means and standard.deviations of site index (m @ 20 years breast height age) and age to breast height forthe mature _re origin) and young (logging-origin) stands.
Site index (m) Age to bh (years)Mature .stands 3.8 18.8
(1.3) (7.4), Young stands 7.1 11.0
(1.0) (4.8)P value (separate variance T test) 0.000 0.000
o
Proceedings !BFRA Assn 1997 meeting 417

When measured as the mean height of dominant achieve optimal growth (Jobidon 1994). Competitionblack spruce trees at breast height age (bha) of 20 fi'om understory vegetation affect the light levelyears (i.e., Si20), §ignifieant difference (p = 0.000) in received by each seedling depending on its height,site index was found between the fire-origin and : which, in turn, affect seedling height growth. Shrublogging-origin stands (table 4). The ratio of SI20of cover on burned sites (72.4 %) was high compared to t,
the logging-origin stands to SI20 of the fire-origin logged sites (47.0 %), and the dominant shrub speciesstands is 187 %. The number of years required to on both burned and logged sites was Ledumreach breast height (1.3 m) was also found groenlandicum (usually < 60 cm tall).significantly different (p = 0.000) between the fire-origin and logging-origin stands (table 4). Beforereachingbreast height, the average height growth was CONCLUSIONS12.3 cm/year for the logging-origin stands and 7.2era/year ,for the fire-origin stands, with a ratio of The composition of tree species regenerated after fire171%. Both ratios are higher when compared to the and logging on lowland black spruce stands support aratio of the 1995 height growth of logged sites to that direct succession hypothesis: black spruce re-of burned sites (135 % - 165 %), suggesting more established itself as the dominant species of futurecompetition was encountered by those seedlings that stands, and no other tree species achieved dominancedid-not become dominant trees in a mature forest on any burned and logged site.stand. Because the number of year to breast heightwas found significantly correlated with SI20 (r = 0.66, Burned sites had:significantly higher black spruce15= 0.000), the differences in the total height and the density compared to logged sites. According to the1995 height growth between burned and logged sites provincial regeneration standard, all burned siteswere resulted, atleast in part, from this inherent were considered successful in black sprucedifference in site quality. Attempting to remove the regeneration while two of the nine logged sites dideffect of different site qualities on growth, we not meet stocking criteria, and one of the two did not
? examined.relative annual height growth and the 1995 meet the recommended level of density at year seven.height growth ratio. The different patterns of relativeannual height growth displayed on burned and logged Advance regeneration was not a significant part ofsites are likely dueto the d'tfferences in competition both post-fire and post-logging stand establishment.from understory vegetation and in temporary changes Black spruce demonstrated a continous rather thanin soil nutrient regimes. It appeared that black spruce pulse regeneration pattern on both burned and loggedseedlings on burned sites were benefited fi'om initial sites. The recruitment level of burned sites we_'enutrient pulse (Kimmins 1987) and negatively consistently higher than that on logged sites at theaffected by increasing brush competition. The years examined.consistently higher ratio (> 135 %) of the 1995 height
growth (logged sites vs burned sites) indicated that Despite of similar age, black spruce seedlings onthe 1995 height growth on logged sites was faster burned sites were shorter in their total height and
•than that on burned sites for any size (height) of lower in their 1995 height growth when compared to
seedlings. This could be explained by the inherent those on logged sites. These growth differences,difference in site quality as discussed above, however, may not be entirely attn'bute to the effect ofHowever, the ratio changed with the increase of disturbance type because there was evidenceseedling height, rather than remained stable. This suggesting that logged sites may have higher site
suggested some other factors, in addition to the quality (measured by site index) compared to burlp, inherent difference in site quality, also affected the sites.
1995 'height growth. Apparently, the influence of Bthese factors depended on seedling height. For short Growth pattern analysis suggested that black spruceseedlings, these factors had more negative influence seedlings on burned sites may have encountered moreon seedling established on burned sites when competition from understory vegetation whencomparedto logged sites (as reflected by a higher compared to logged sites.ratio). As seedling become taller, the differentialinfluence of these factors become smaller, andeventually stabilized at 135 % when seedling height ACKNOWLEDGMENTSapproach 1 m tall. One of these factors may be the
, level of sunlight, which is a good surrogate of the We thank Manitoba Model Forest (MBMF) Inc. forcompetition fi'om understory vegetation. Black providing financial support to this project, and Vincespruce seedlings require > 60 % of full sunlight to
,
418 GTR-NC-209

Keenan bfPine Falls Paper Company for his properties. Gen. Tech. Rep. WO-26. Washington,assistance in locating research sites. DC: U.S. Department of Agriculture, Forest
- Service.
LITERATURE CITED Jeghm, J.K. 1981. Black spruce seedling growth and lD
nutrition on sphagnum and feather moss peatsBona_ G.B. Shugart, H.H. 1989. Environmental from a northern Ontario peatland. Can. For. Serv.
factors and ecological processes in boreal forests. Rep. O-X-326, Sault St. Marie, ON.Annual Review of Ecology Systematics. 20: 1-28.
" Jobidon, R. 1994. Light threshold for optimal black 'Brumelis, G.; Carleton, T.J. 1988. The vegetation of spruce seedling growth and development under
post-logged black spruce lowlands in central brush competition. Canadian Journal of ForestCanada. I. Trees and tall shrubs. Canadian Journal Research. 24:1629-1635.of Forest Research. 18" 1470-1478.
Kimmins, J.P. 1987. Forest ecology. New York:Bums, P.M_; Honkala, B.H., tech. coords. Silvics of Macmillan. 531 p.
North America: 1. Conifers. Agric. Handb. 654.Washington DC: U.S. Department of Agriculture, Oliver, C.D.; Larson, B.C. 1996. Forest standForest Service. dynamics. Toronto: John Wiley and Sons, Inc."
89-143.
Canada Soil Inventory. 1989. Soil landscape ofCanada- Manitoba. Publ. 5242/B. Ottawa, Rowe, J.S. 1983. Concepts of fire effects on plantOntario: Agriculture Canada, Land Resources individuals and species. In: Wein, R.W.;Research Center. MacLean, D.A., eds. The role of fire in northern
circumpolar ecosystems. Toronto" John Wiley?CSSC (Canada Soil Survey Committee). 1978. The and Sons, Ltd.: 135-154.
Canadian system of soil classification. Can. Dept.•Agrie. Publ. 1646. Ottawa, Ontario" Supply and Sims, R.A.; Kershaw, H.M.; Wickware, G.M. 1990.
Services Canada. Autecology of major tree species in north centralregion of Ontario. Tech. Rep. 48, Thunder Bay,
Carleton, TJ.; Maycock, P.F. 1978. Dynamics of the Ontario: Ontario Ministry of Natural Resources,boreal forest south of James Bay. Canadian Northwestern Ontario Forest Technology
• Journal of Botany. 56:1157-1173. Development Unit.
Delaney, J.R. 1995. Development of forest renewal Stanek, W. 1975. The role of layering in black sprucestandards for forest regeneration in Manitoba. forests on peatlands in the Clay Belt of NorthernWinnipeg, Manitoba: Manitoba Forestry Branch. Ontario. Can. For. Serv. n. Proc. O-P-4. Sault St.
, Marie, Ontario.Dk, R.L.; Swan, J.W.A. 1971. The role of
• disturbance and succession in upland forest at Synthem Resource Ltd. 1990. Environmental impactCandle Lake, Saskatchewan. Canadian Journal of assessment of Abit_i-Price Inc. FML #01" Forest
Botany. 49: 657-676. management plan 1991-1998. Pine Falls,
Manitoba. ItFleming R.L.; Mossa, D.S. 1996. Seed release fi'om
black spruce cones in logging slash. Canadian Thomson, I.D.; Welsh, D.A. 1993. Integrated irJournal of Forest Research. 26: 266-276. resource management in boreal forest ecosystems
- impediments and solutions. Forestry Chronicle.Haavisto V.F. 1978. Lowland black spruce seedfall: 69: 32-39.
viable seedfall peaks in mid-April. ForestryChronicle. 54: 213-215. Viereck, L.A. 1973. Wildfire in the taiga of Alaska.
Quatenary Research. 3: 465-495.Heinselman, M.L. 1981. Fire intensity and frequency
as factors in the distnqaution and structure of Wang, G.G.; Klinka, K.; Moss, I. 1994. Guide to,- northern ecosystems. In: Mooney, H.A.; estimating interior spruce site index from edaphic
.Bonnicksen, T.M.; Christensen, N.L.; Lotan, J.E.; factors in the Sub-boreal Spruce zone. ContractReiners, W.A., eds. Fire regimes and ecosystem
Proceedings !BFRA Assn 1997 meeting 419

Report. Prince George, BC: Northwood Pulp and Zoladeski, C.A.; Wickware, G.M.; Delorme, R.J.;Timber Ltd. 23 p. Sims, R.A.; Corns, I.G.W. 1995. Forest
ecosystem classification for Manitoba: fieldWang, G.G. 1997. Development of growth and yield : guide. Minister of Supply and Service Canada.
models for lowland black spruce ands in 205 p. •southeastern Manitoba. Pine Falls, Manitoba:Manitoba Model Forest Inc. 44 p. Zasada, J.C.; Sharik, T.L.; Nygren, M. 1992.
Reproductive process in boreal forest trees. In:Wilkinson, L. 1990. SYSTAT: The system for Shugart, H.H.; Leemans, R.; Boman, G.B., eds.'A
statistics. Evanston, IL: SYSTAT Inc. 677 p. system analysis of the global boreal forest. "Cambridge, UK: Cambridge University Press.
i
420 GTR-NC-209

" PROBLEMS RELATED TO FOREST REGENERATION IN FINNISH LAPLAND
- Eljas Pohtilal
ABSTRACT.--The severe natural conditions in confirmed this. There may have been two or threeFinnish Lapland provide many challenges to periods during the current century during which •regeneration of Scots pine. Good seed crops are Scots pine has yielded a good crop of mature seedrare, natural regeneration is slow, and planted right up to the timberline.seedlings often experience high mortality.Improved methods are being developed for site
preparation and artificial regeneration, including SLOWNESS OF NATURALseeding and use of containerized stock. REGENERATION
•Consequently, regeneration is more successfulthan it was 40 to 50 years ago. , Research has shown that the regeneration period
required for a clearing to be converted to a standof young pine in Lapland is, on an average,
, _ between 30 and 40 years. Natural regenerationNATURAL CONDITIONS can be accelerated by soil preparation.
Nevertheless, it seems that the prepared soil'sIntensive forest management is practised in Finnish capacity to become restocked deteriorates rapidly.Lapland farther north than anywhere else in the Immediate seeding is required if the landownerworld. Scots pine is the main tree species. The wishes to get full benefit of soil preparation.absolute timberline is formed by mountain birch, Maturing of the seed crop is uncertain right up tobut the outermost conifer on the timberline is the very last moment and this is why it is difficultScots pine, not Norway spruce as is the case on to correctly time the soil preparation treatment.the Kola Peninsula, NW Russia, for example. The period of time from soil preparation to natural
. Apart.from the most continental parts of Siberia, seeding may be so long that the investment in soilthe belt of contiguous coniferous forests never preparation is totally wasted.reaches as far north as it does in Finland. Becauseof variations in climate, the timberline is in a Natural regeneration is given priority in theconstant state of flux. The polar timberline may instructions for forest management. In practice,berelatively far away, but when one proceeds artificial regeneration, i.e., seeding or planting, isstraight up the alpine timberline in Lapland is today more common than natural regeneration.
• always just a few hundred meters in elevation. Besides the slowness of the natural regenerationprocess, other factors promoting this developmentare the profusion of under-productive stands and
RECURRENCE OF GOOD SEED CROPS the frequency of gales, which during the past fewdecades have undone numerous natural
in the case of Scots pine, the development of seed regeneration plans by bringing down the seed• from'flowering to maturity takes two growing trees.
•- seasons. For a good cone crop to be produced,the minimum temperature sum of the summerpreceding flowering, i.e., during the period when MORTALITY OF SEEDLINGS ANDthe flower buds are formed, should in Lapland be TRANSPLANTSat least 910 degree-days (d.d.) (threshold value It
, +5°C). ' To have 50 %of the seeds maturing It has proved to be difficult to achieve full(which is regarded to be the minimum requirement stocking of the required tree species as set out in IF
. for seed collection to be worthwhile) the total the recommendations on planting and seedingtemperature sum of the summer when the seed density (2,000 seedlings per hectare). Up to half•mature should be at least 845 d.d. If the of the initial seedlings may die as a result ofrecurrence of warm summers follows the normal unfavourable natural conditions or due to neglectdistribution pattern, the probability of a big yield in tending of young stands. The latest forestof mature seed is, according to weather statistics, inventory conducted in Finland has revealed thatfor example, in Sodankyl_i(67°22_, 26°39'E) only failures amounted to 14 %of the total area under0.18 x 0.3 = 0.06. Practical experience has artificial regeneration in Lapland, and that these
lProfi Dr. Eljas:Pohtila The Finnish Forest Research Institute Unioninkatu 40 A FINLAND. Tel: +358" 0 857051, Fax: +358 0 625 308 Email: eljas.pohtila@_,metla.fi
Proceedings IBFRA Assn 1997 meeting 421

•generally occurred on sites about 300 m above sea methods are better suited for planting than forlevel, seeding. Depending on the site conditions,
different methods are combined in workable pairs.Planting and seeding densities have now been _ During the past few years, the most commonlyraised to 2,500 and 3,000 per hectare, used treatment pair has been wing ploughing and *respectively. Campaigns are also being conducted planting because regeneration has been targeted •to improve the standard of tending of young on l_eshand peat-covered residual forests. Moststands. While it is in principle easier to increase recently, heavy ploughing has been used lessthe density in seeding than in planting; large fi'equently, partly because of the criticism broughtsupplies of seed would be required. For the forth by conservationists and environmentalists. •present, we have to rely on natural seed crops, butthings will soon be different as newer seedorchards established to meet the demand coming A CHANGING FORESTfi'om Lapland attain full prodiaetion.
Despite the difficulties, the development in theBecause of its humid climate, Lapland is basically forests of Finnish Lapland over the past decadeswell suited for'increased application of seeding as has been in a satisfactory direction. The mosta means Offorest renewal. Combined with soil essential change has been in regeneration. In the
preparation, more interest has been focused on early 1950s, only 15 % of the forests were lessbroadcast seeding. Seeding, however, requires than 60 years of age, while today it is 40 %. Theefficient advance management of young stands, proportion of Scots pine as the dominant treeincluding control of ground vegetation and species has also increased by 15 %. The annualundesirable coppice. The general public in Finland increment in stemwood is today greater than everdisapproves of the use of herbicides to control before.ground vegetation and coppice shoots, and peopleare generally opposed to the application of It seems that pristine forests no longer exist in the
. intensive forest management. It is, therefore, timber production areas of Finnish Lapland.difficult for forestry goals to be reached simply by About 30 % of all of Finnish Lapland's forest landsseeding. Chemical control techniques have been have been set aside for conservation or otherinvestigated to a great extent in Finland and these multiple use purposes.could be managed.
The adoption of containerized transplants inplanting has clearly improved the survival ofseedlings. The differences among the varioustypes of seedling stocks appear to be small. Thebigger the seedlings are, the faster is theafforestation of the regeneration area.
•
COMPATIBILITY OF DIFFERENTMETHODS
Soil preparation on regeneration sites has provento be one of the greatest advances in forest !
' . regeneration. Site preparation has been common Irpractice in the forests of Lapland since the 1950's,
- when the concerted, large-scale regeneration ofover-mature stands was begun. Wing ploughinghas proved to be a very reliable method and onethat is not significaritlyhampered by the stoninessof the glacial till softs.
Experimental research has shown that it isimportant how the soil preparation and plantingand seeding methods are combined. Generallyspeaking, prescribed burning, scalping and discploughing are better suited for seeding than for
• planting, whereas wing ploughing and other such
422 GTR-NC-209

AO
I.N'TERNATIONAL COOPERATION
IN 'B,OREAL FOREST RESEARCH
!
. 1¢
423

,2
..
• .
11
.
, .
424

.
THE IGBP NORTHERN EURASIA STUDY
Michael AI Fosberg l, Will Steffen 2, Anatoly Shvidenk93, Johann G. Goldammer 4, Frank Oldfield 5,
and Ernst-Detlef Shulze 6 ,t
ABSTRACT.--The International Geosphere ecosystems are very sensitive to changes inBiosphere Program is planning an integrated climate and land use (Steffen and Shvidenkohych',ological,atmospheric, chemical, bio- 1996). In terms of ecosystem physiology, and ,geochemical and ecological global change study soft and wetland processes, global change willin the tundra - boreal region of Northern Eurasia. have direct effects on the carbon cycle, on waterThe unifying theme of the IGBP Northern and energy exchange and on nutrient dynamics.Eurasia, Study is the terrestrialcarbon cycle and Atmospheric general circulation model scenariosits controlling factors, and how these will change suggest that warming will be greatest at highunder changing environmental conditions, latitudes. This could lead to greater soil
,Special emphasis will be placed on the role of respiration, with release of carbon dioxide, anddisturbance (fire, insect, disease, human melting of methyl hydrates in permafrost regionsactivities) in driving the hydrological and and subsequent release of methane to thebiogeoehemi.'cal cycles and in shaping the atmosphere. The boreal and tundra region Couldecosystem. This study is intended to develop an become a net source of these greenhouse gasesintegrated understanding of temporal and spatial under a doubled carbon dioxide atmosphere -processes of the carbon cycle in the Northern climate response and further accelerate wam_gEurasian landscape from paleo-records as well as (Oechel et al. 1994, Steffen and Shvidenko 1996,contemporary observations. Integrated modeling Zimov et al. 1996).studies will be used to both design the
' experiment as well as interpret findings. Close Hydrological processes play a key role in theCoordination and collaboration between the functioning of tundra and boreal ecosystems.IGBP-NES activities and the International Permafrost is widespread, and together withBoreal Forest Research Association will promote topography, play a large role in water flux ratesextended field research, wider involvement of and level of the water table. These, in turn, are
the international research community, and will critical factors in determining vegetation type,• improve our understanding of global change in carbon balance and land - atmosphere exchange
Northern Eurasia. of water, energy and carbon dioxide. Globalchange is also expected to have pronouncedeffects on the composition and structure of highlatitude ecosystems (Steffen and Shvidenko
INTRODUCTION 1996).
Much interest in Northern Eurasia, and in high Ecosystem disturbances from fire, insects andlatitudes in general, is centered on their role in disease have dominated boreal forest landscapesthe carbon cycle. High latitudes contain (Shvidenko et al. 1996). Fires in forests andapproximately 25% of the global land area, peatland impact the hydrological cycle throughcontain 800 - 900 Gt ofcarbon, or approximately changes in rate of evapotranspiration and run-off. !
' 35% of the global terrestrial carbon (fig. 1). Fire has a significant impact on the structure and ¢About two-thirds of the boreal forest and 20% of composition of forests from the stand to
- the global forests are in Northern Eurasia. landscape levels, on formation and nutrientBecause much of the region contains permafi'ost, status of soils, and on the formation and
•
1Michael A. Fosberg, IGBP BAHC, Potsdam Institute for Climate Impact Research, PotsdamGermany. Present address: 20 Ames Street, Onancock, Virginia, USA 23417.
2 Will Steffen, IGBP GCTE, CSIRO Division of Wildlife Ecology, Canberra, Australia.3 Anatoly Shvidenko, IIASA, Laxenburg, Austria.
4 Johann G. Goldammer, Max Planck Institute for Chemistry, Biogeochemistry Department, Freiburg,Germany
5Frank Oldfield, IGBP PAGES, Geographishes Institute, University of Bern, Bern, Switzerland6 Ernst-DetlefShultze, University ofBayreuth, Bayreuth, Germany.
Proceedings IBFRA Assn 1997 meeting 425

o
,tiB
,... GlobalCARBON Reservoirs,Fluxes, and Turnover Times
Terrestrial Atmosphere •NPP ' 50 _rt 750 (3 y) MarineDeforestation 1.4 y,t NPP = 50 y-1Combustion (80's) 5.4 y-t New Production = 10 y-1
Plants* IBlvers
550-680 (50 y)y._ DOC: 0.2y _Respiration30 POC: 0.2 y1 Coastal Ocean Open Ocean20 %of NPP 80 _ of NPPi ,i i •
Soils (-1 m) 1580 _._ Surface DOC 40 (? y)peat 360 :_1000 Y) _ 100 m POC 5, Living2* (0.1-1 y)mineral 1
microbial* 15-30(<10 y) _ ............ POC_I .....
POCremainder250-500600-800(<100(10"-10_y) Surface Sediments (- 1 re)m) _:: Dee 7 _r0150 (0.1 -I000 y) _k 3.8 krn DOC 700 (5000 v)Respiration 30 y'_ Y) ........ P80 % coastal " -"..... '_ POC 20-30 (10-100 y)
zu%aeepsea _ DIC 38000 (~2000 y)
Sediments _ Sedimentation
kero;gen 15xl 0'(>>I my) _ -_ Imethane clathrates 11xlO 0 1 _. limestone 60x106 "
PoolsandfluxesInGt CanclGt Cy-1Gt= 10n g,•=I_j poo_;(ttrnov_rumes)References:Hedges1992;EswaranetaL1993;SlegenthabrandSarmlerto1993;SchirneletaL1994; Dav_n eta/. 1995
Figure 1.nThe global carbon cycle: reservoirs, fluxes and turnover times.
Jo
426 GTR-NC-209

d_nics ofpeatland and permafrost water and energy, and on(Goldammer and Furyaev 1996). Fire is a groundwater hydrology.significant factor in the carbon cycle from the
release Of carbon during the fire, making _3. Predict the effects of global change on thenutrients readily available following fire composition and structure of tundra and •(Fosberg et al. 1996). Increased human activities boreal ecosystems and the interactions withat high .htitudes are becoming more important, ecosystem function, andand Couldwell rival fire. in disturbing the
landscape in the future. 4. Determine the interactions of human driven ,land cover change and changes indisturbance regimes (fire, insect outbreaks,
THE STUDY AREA thawing of permafrost) with biogeochemical• cycles and with the function, structure and
Theregion is characterized by a strong composition of tundra and borealtemperature gradient from north to south, which ecosystems.
, is tlle major determinant of the general biomestructure: tundra and four sub - zones of taiga(sparse, northern, middle, and southern). There The study is organized around sevenis strong continentality in an east - west direction components: transe.ct; network; water, energyextu'biting Strong temperature and precipitation and biogeochemical:cycles; disturbance (fire);
•gradients. The western region receives more paleo-ecology; and modeling and integration.than 400mm per year and minimumtemperatures are generally above -50C. Specific activities include:The eastern portion has 200 mm of precipitationand minimum temperatures are below -50C (fig. 1. Development and operation of north- south
' 2). transects in eastern Sl_oeriawhich includesites in tundra, tundra- forest transition, and
These climatic gradients result in a in larch, spruce, and pine forests.differentiation of vegetation with western tundraextremely wet, changing to colder and drier 2. Development and operation of a network of
observing sites throughout Northern Eurasiatundra types in the east. Permafrost is deeper in focusing on trace gas emissions and their• the east. The tundra- boreal ecotones are also
different. In the west the tundra grades into controlling factors. The network will beconcentrated on the extensive wetland in the
evergreen conifers (Picea) while in the east the west, but also should include a few sites intundra grades into deciduous conifers (Lar/x).The western taiga is mixed conifer forest and the east (including areas of permafrost), a
site in the evergreen taiga, and a site in the" swamp, while the east is monotypic stands ofLarix. _ tundra. Special attention should be given to• the wetlands in the west.
MAJOR ACTIVITIES OF THE 3. A water, energy and carbon flux study,integrated with the transect and network
NORTHERN EURASIA STUDY components. This activity is part of the iglobal FLUXNET to characterize fluxes of
. The Northern Eurasia Study will consist of an water, energy and trace gases between the wintegrated set of experiments and observational biosphere and the atmosphere, and should
. studies at a variety of scales, modeling, and include forest, wetlands, and tundra sites.aggregation activities.
4. Studies of disturbance regimes which shouldThe major goals are: ' include work on all major disturbances.
• They should include work on both gaseous•t. Predict the direct effects of global change on and aerosols emissions from fires, and on
carbon cycling, the ecological role of fire in influencing thesuccessional dynamics of the taiga and
, 2. Predict the effects of global change permafrost formation.on land- atmosphere exchange of
Proceedings tBFRA Assn 1997 meeting 427

. " West Siberia - Tobolsk (59°N) East Siberia - Yakutsk (60°N)
• R ii60 E
0_ EI--" _ A
_ 40 ...-rr" •
• _ =1 _ 112_ 20 "__. n-"
E days > 10°C > 10°C >" •
Z o
0 _/. E::
:_ -1 . 248 _ 186 -2o (0(1)r-
days > -10°C _, days> -10°Cii / -4o/
rTT_ humidmonth(rainfall> evaporation) ; /(/;" -60
-40 _ arid month(rainfall< evaporation) -80
elevation 108 m elevation 102mannual rainfall 404 mm annual rainfall 187 mmmean annual temp. -0.3 °C meanannualtemp.-10.4 °Cabsoluteminimumtemp.-46.1 °C absoluteminimumtemp.-57.06 °C
Figure 2.--Examples of West and East Siberian climate at about 60° N latitude for Tobolsk at the Irtysch River (58 °iV, 68° E) and for Yakutsk at the Lena River (62° iV, 138 ° E) (Walter 1994).
!
. IP
428 GTR-NC-209

5. Aggregation, modeling, and integration will understanding of controls of these fluxes. Theserequire a large suite of models which will be flux measurements will be a part of a globalused to help design the experimental and network of flux measurements and will lead to
Observational studies, interpret the data and an understanding of the global fluxes and the sproject the impacts of global change on high variations of these trace gas fluxes. *latitude ecosystems.
Questions that the network should address are:61 A paleo-ecological transect to
address questions of process, 1. Is the southwestern S_erian wetland region ,dynamics and change through time, unique with respect to biosphere-and which will be interactive with atmosphere exchange of water vapor, carboncontemporary monitoring and dioxide, methane, and other trace gases?.experimentation.
2. What proportion of trace gas emissions are"fossil," that is, fi'om carbon stored under
, The Transect Component decaying thermokarst lakes in easternS_eria or released by exploitation of oil and
The overall concept of transects areto use spatial natural gas deposits?gradients as.surrogates for temporal change.They are intended to address questions where a 3. What impact do trace gas emissions fromlong period of prior equih'bration is required, forested areas have on atmosphericwherespatial context is essential, identification expansion (ozone and others)?of thresholds along a continuum, and questionsof gradient driven processes. Typically, a 4. What types of fire experiments andtransect would be 1,000 km in length and a few campaigns can be usefully linked to sites
' hundred km wide. Transects would be laid out established for other purposes, for example,along a primary gradient of temperature, peat fires?precipitation or land use, and could havesecondary gradients either paraUel or normal to 5. Are the vegetation and soil factors thatthe primary gradient, influence carbon, water, and energy
exchange in the western, wetter and warmer
• The Northern Eurasia Study is one of several region, similar to those in the eastern region _IGBP transects which are designed to integrate of Sl_oeria?global change studies consisting ofdistrl"butedobservational studies and manipulative Water, Energy and Carbon Flux Componentexperiments and modeling studies. This transectapproach promotes collaborate, interdisciplinary There are two aspects of water, energy, andresearch and leads to efficient use of scientific carbon fluxes to consider. Water, energy, and
resources (Koch et al. 1995). The Northern carbon fluxes are coupled, water and energy fluxEurasia Study (fig. 3) is based on the primary studies routinely include fluxes of carbon
north- south gradient of temperature with dioxide. In fact, fluxes of carbon dioxide cannotSecondary gradients of nutrient status, be interpreted without inclusion of theprecipitation and land use change. The Northern hydrological cycle. Second, water and energy !
. Eurasia Study is in fact, composed of two fluxes between the land surface and theparallel sub-transects, one along the Yenesei atmosphere influence climate. These bi- uRiver and one along the 135th meridian in the directional interactions are a key aspect of thisLena.Rive/Basis. The Northern Eurasia Study component.is one of four high latitude transect studiesplanned for (Scandinavia and Alaska) or already The principal objectives are:operational (Canada).
1. Investigate the energy, water, and trace gas
The Network Component exchange processes in the soil- vegetation-atmosphere interface at the patch scale.
' The Network of study sites will form the basis
for characterization and quantification of trace 2. Investigate and apply methods to aggregategas fluxes from a variety of systems and fluxes and land surface parameters from
. local to continental scales.
Proceedings tBFRA Assn 1997 meeting 429
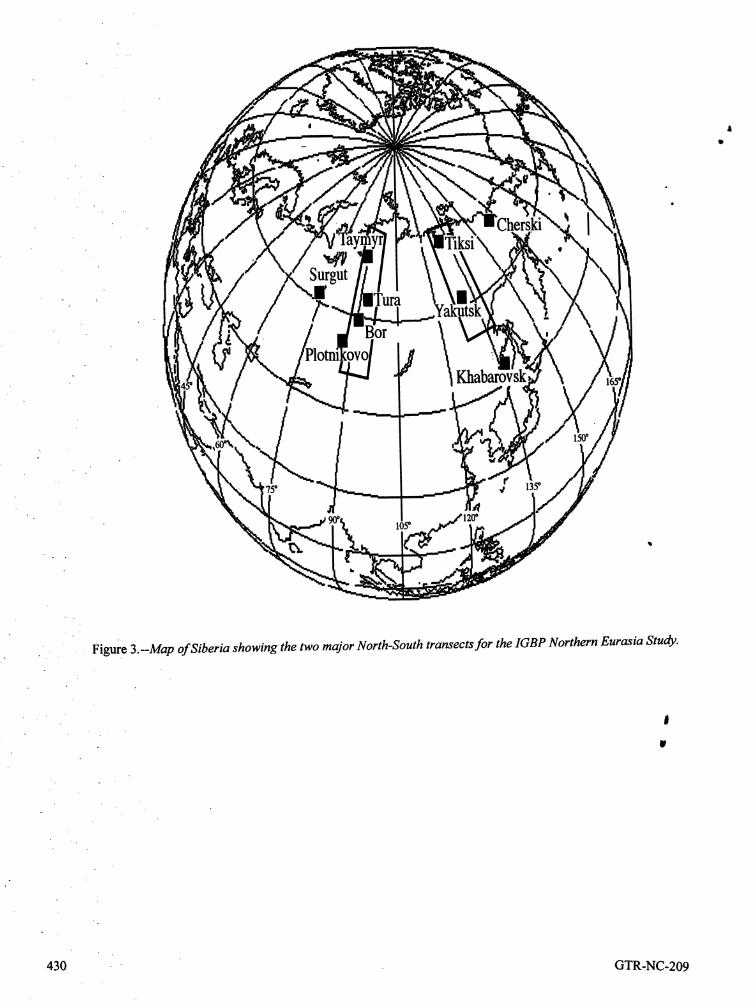
Surgut
_. 7,. rura',or
7Y 13Y
t/L20o
105°
Figure 3.--Map of Siberia showing the two major North-South transects for the IGBP Northern Eurasia Study.
J
. ¢
o
430 GTR-NC-209

3. Investigate below ground processes. Modeling and Integration
Design of the _ater, energy and carbon flux In general, there are three scales at which
component should address: haodeling will take place; the patch scale with ASVAT models, mesoscale, and continental or ,
1. Measurements should include both eddy global scale. For ecosystem dynamics,correlation measurements and nested phenomena such as fire operate at scales largereatclmaent studies of internal fluxes, than a patch, and are difficult to portray at the .
• mesoscale or continental scale. A major aim of ,2. Eddy correlation measurements should be the Northern Eurasia Study is to tackle the
made at the intensive study sites along the difficult scale of tens to hundreds of kilometers.eastern transect and at the network sites.
3. " Eddy correlation and chamber The models that _11 be considered are:
measurements of trace gas fluxes should be 1. Patch scale; trace gas flux models,, ,made simultaneously at the same locations, ecophysiological models, patch scale models
4. Eddy correlation measurements of fluxes of ecosystem dynamics and semi-empiricalshould be made at a number of locations forest growth and yield models.
around.imensive sites, representing the 2. Landscape or mesoscale models andmajor stages of forest succession. These aggregation tools consisting of; hydro-should be long term measurements, climatological aggregation techniques,
5. Surface hydrological studies should include mesoscale meteorological models, landscapecatchment experiments at a variety of scales models of ecosystem dynamics, landscapeand should be linked to GEWEX studies at hydrological models, fire models, and land
' larger Scales. use- land cover changes projections.
6. Measurement of snow fall, snowpack, and 3. Continental scale models addressing;ecosystem and regional biogeochemical
melt are essential in understanding the dynamics and cycles, models of atmospherichydrological, energy, and trace gas budgets chemistry, and models ofbi-directionalandfluxes, feedback. "
7. "Fingerprints" of current fluxes inpermafrost are essential. Paleo-ecology Component
Fire Component The paleo-science component will provide morethan just a "historic context" perspective for the
The fir e Component of the North Eurasia Study North Eurasia Study. It will address the full,- _ll havefourparts: range of science required to answer questions of
process, dynamics and change through time. The
1. Fire manipulation at individual forest sites, paleo component will address"
2. A series of campaigns based on air and 1. Time series of spatial change. !, space born research platforms.
. 2. Historic changes in terrestrial ecotones. IF
3. Construction o fa fire database relating the" .extent, frequency, and intensity of fires to 3. Recomtruction of past atmospheric
vegetation and climate conditions for both composition.
Contemporary and historic conditions. 4. Hydrological changes over time.
4. Development of aggregated models of forest5. Human impacts on terrestrial and aquaticfire frequency and extent, and response to
global change, ecosystems.
' 6. Historic reconstruction of carbon budgetsover space.
Proceedings IBFRA Assn 1997 meeting 431
COOPERATION AND INTERACTIONSAN INTEGRATED STUDY OF THE WITH THE INTERNATIONAL BOREAL
REGIONAL CARBON BUDGET FOREST RESEARCH ASSOCIATION
,tEach of the components of the Northern Eurasia The International Boreal Forest Research ,Study contributes to an understanding of the Association was established with the mission ofcarbon budget in northern Eurasia. The total promoting and coordinating research to increasep001 of carbon, in living biomass, in dead above the understanding of the role of the circumpolar .
• ground biomass as well as the soil carbon will boreal forest in the global environment and the ,change over time. Lateral transport, either effects of environment on boreal forests (Apps etthrough riverine systems or by the atmosphere in al. 1995) This mission is similar to that of theor out of the region, and release of fossil carbon International Geosphere Biosphere Program; to
preclude approaching the regional carbon budget descnq3e and understand the interactive physical,as a closed system in which carbon is just moved chemical, and biological processes that regulatefrom one pool to another. Pools of carbon, the total earth system, the unique environment
, change in those pools and the mechanisms of that is provided for life, the changes that arechange as well as the vertical and lateral fluxes occurring in these systems, and the manner in•of carbon must be addressed as a dynamic which they are influenced by human activities.problem rather than a closure problem. This
-places emphasis on understanding the A partnership between IGBP and IBFRA tomechanisms and interactions of changes in the design and implement the Northern Eurasiacarbon pools, the ecophysiological controls of Study, and other high latitude transect studies,the fluxes, the dynamics of how disturbance partnership in execution of research projects,changes the pools, and the role of nutrients and exchange of information and data, conduct ofwater availability in controlling the fluxes, joint workshops to synthesize knowledge, and to
. bring that knowledge into decision and policy for•integrated carbon assessment requires unified a will serve the mission and goals of bothapproaches for both modeling and organizations.experimentation. We will need to use the nameor compat_le primary and integrated territorialunits for all components of the study- LITERATURE CITED
• hydrology, fire and so on (Rojkov et al. 1996).Apps, M.J.; Price, D.T.; Wisniewski, J. 1995.
There is no current model at the regional level Boreal forests and global change. Kluwerthat can be applied to an integrated assessment of Academic Publishers.the carbon-vegetation-hydro logical system.Global scale models are too coarse for the Davidson, E.; Agren, G.; Daniel, O.; Emeis,heterogeneous landscape, patch scale models are K.C.; Largeau, C.; Lee, C,; Mopper, K.;• .
not easily applied because of the aggregation Oades. J.M.; Reeburgh, W.S.; Schimel.problems in incorporating disturbance, D.S.; Zepp, R.G. 1995. Group report: Whatpermafrost, among others. We will need a model are the physical, chemical and biologicalwhich incorporates such factors and which will processes that control the formation andallow us to aggregate information at the larger degradation of nonliving organic matter? In:It
. scales. A basic model of urban change, Zepp, R.G.; Sormtag, C., eds. The role of' nonliving organic matter in the Earth's w
. DC/dt=Input (0-Output(t) carbon cycle. Wiley and Sons: 305-324.
must include in-situ transfers between pools, Eswaran, H.; Van den Berg, E.; Reich, P. 1993.lateral, and vertical fluxes, the controlling Organic carbon in soils of the world. Soilmechanisms and rates of the transfers of the Science Society of America Journal. 57:fluxes, and the drivers of the processes. The 192-194.
total, or substantive change of carbon over time,must include those spatial ingredients such asproximity of disturbance, competition, and so on.
432 GTR-NC-209

Fosberg' M.A.; Stocks, B.J.; Lynham, T.J. 1996. Shvidenko, A.; Venevsky, S.; Nilsson, S. 1996.Risk ana!ys_ in strategic planning. In: Fire Impacts of disturbances on gross and netin ecosystems of boreal Eurasia. Kluwer increment of S_erian forests. In:
Academic Publishers: 4905-504. : Proceedings of the IUFRO conference on leffects and environmental factors on tree ,
Goldammer, J.G.; Furyaev, V.V. 1996. Fire in and stand growth: 219-227.
ecosystems of boreal Asia. KluwerAcademic Publishers. 528 p. Siegenthaler, U.; Sarmiento, J.L. 1993. .
Atmospheric carbon dioxide and the ocean.Hedges, LI. 1992. Global biogeochemical Nature. 365:119-125.
cycles: progress and problems. MarineChemistry. 39: 67-93. Steffen, W.L.; Shvidenko, A.Z. 1996. IGBP
Northern Eurasia Study; prospects for anKocla, G.W.; Scholes, R.J.; Steffen, W.L.; integrated global change research project.
Vitousek, P.M. ; Walker, B.H. 1995. The IGBP Report 37. 95 p.iGBP terrestrial transects science plan.IGBP Report 36. 61 p. Walker, B.H.; Steffen, W.L. 1996. Global
change and terrestrial ecosystems.
Oechel, W.C.; Hastings, S.J.; Vourlitis, G.; Cambridge University Press. 619 p.Jenkins, M.; Riechers, G.; Grulke, N. 1994.
Recent changes of Artic tundra ecosystems Waker, H. 1994. Die Vegetation Osteuopas,from a net carbon dioxide sink to a source. Nordund- Zentralasiens. Gustav FischerNature. 36i" 520-526. Verlag, Stuttgart. 425 p.
•Rohkov, V.; Efermov, D.; Nilsson, S.; Sedykh, Zimov, S.A.; Davidov, S.P.; Vorpaev, Y.V.;' V.; Shvidenko, A.; Sokolov, V.; Wagner, V. Prosiannikov, S.F.; Semiletov, I.P.; Chapin,
1996. S_erian landscape classification and M.S.; Chapin, F.S. 1996. S_erian CO2a digitized map of S_erian landscapes, eftlux in winter as a CO2 source and causeIIASA WP-96-111. 61 p. of seasonality in atmospheric CO2. Climatic
Change. 33" 111-120.
I
. lr
°
Proceedings IBFRA Assn 1997 meeting 433

-- Author Index°
Senior authors appear in bold text:
A H
Alekseev, Alexander 221 Hagner, Olle 256 "Alexeyev, Vladislav A. 234, 351 Hall, J. Peter 30Andreeva, N.M. 317 Harden, J.W. 357
Harrison, C.A. 409 "Herrmann, R. 326
B Hopkin, Anthony 132Babintseva, R.M. 405 Houghton, R.A. 67Bredikhin, M.A. 104 Huvane, Jaequeline K. 147Brissette, d.C. 405Buzykin, A. I, 182
I
Isaev, A.S. 124C Ivanov, V.V. 405
Cahoon, Donald R., Jr. 164 Ivanova, Galina A. 157, 398.Candau, Jean-Noi_l 132Cherkashin, V.P. 405Chumachenko, S.I. 104 KCoffer, Wesley R., III 164 Kasischke, Eric S. 343, 373
Kaplunov, V.Y. 177Kharuk, V.I. 124
D Kisilyakhov, Yegor K. 398Da:ilidiene, D. 241 Kondakov, Yu P. 124Dang, Q.L. 187 Korotkov, V.N. 57, 104Davidson, E.A. 357 Kozhuhovskaya, A.G. 104
Krasauskas, A. 241Krasovic, Veronica A. 164
• F Kupeinskie, E. 241Fedotova, E.V. 124 Kurbanov, Eldar 304Fleming, Richard A. 1 3 2Fosberg, Michael A. 425French, Nancy H.F. 373 L !Fridman, Jonas 203 Levine, Joel S. 164 w
. Lynham, T.J. 365
G
Gillespie, A. J.R. 405 MGoldammer, Johann G. 425 Maelsaae, D.A. 99Guy, R.D. 187 MeRae, D.J. 365
: Michalek, Jeffrey L. 373Monserud, Robert A. 267Mtetwa, Lawrence 164
• Mudd, James P. 373
434 GTR-NC-209

N Sukhinin, A.I. 389Nazimova, D.I. 317 Syssouev, V.V. 104Nemaniute, J. 241Nichols, Harvey 279Niemi, Gerald R. 81 T '
Nilsson, Sten 1 Tchebakova, N.M. 182, 267N0ren, Mikael 96 Tchmyr, Andrey F. 49
Trumbore, S.E. 357
Oldfield, Frank 425U
• Usoltzeva, J.V. 177P
Palyonova, M.M. 104 VPatterson, T.B. 187 Valendik, Erie N. 398Pearson, Carol W. 81 Valinger, Erik 204Perem, Ajith H. 132 Veldhuis, H. 357Perevoznikova, V.L. 157, 398 Verkhovets, Serghey V. 398Pleshikov, F.I. 177 Volokitina, A.V. 382Pohtila, Elias 421Polikarpov, N.P. 317
: Pshenichnikova, L.S. 182 W
Wang, G.G. 409Weslien, Jan 140
R Winstead, Edward L. 164Rapalee, G. 357 Wood, J. 99Rigina, Olga 256Ryzkova, V.A. 177
Z
Zakharov, Y.V. 211S
SaP0zhnikov, A. 54• Schlesinger, P. 67, 351
Schrrter, Hansjochen 140Shulze, Ernst-Detlef 425Shur, Yuri Z. 395 eSkre, Oddvar 288 _,
Shvidenko, Anatoly 17, 425Sofronov, M.A. 317_ 382Sokolov, Petr _ 304Soukhovolsky, V.G. 211Steffen, Will 425Stocks, Brian J. 164Stolbovoi, Vladimir 39Stone, .I'.A. 67, 351Stottlemyer, R. 326
ProceedingsIBFRAAssn 1997meeting 435

lbt
1t
. Ir

The U.S. Departmentof Agriculture (USDA) prohibitsdiscriminationin all its programsand activitieson the basisof race,color,nationalorigin,gender,religion,age, disability,politicalbeliefs,sexualorientation,andmaritalor family status. (Notallprohibitedbasesapplyto all programs.) Personswithdisabilitieswho requirealternativemeansfor communicationofprograminformation(braille,largeprint,audiotape,etc.) shouldcontactUSDA'sTARGET Centerat (202) 720-2600 (voiceand TDD).
D
To file a oomplaint of discrimination, write USDA, Director, Office of Civil Rights, Room 326-W, Whitten Building, 14th andIndependenceAvenue, SW, Washington, DC 20250-9410, or call 202-720-5964 (voice or TDD). USDAis an equalopportunity _roviderand employer.
C_ Printedon recyclablepaper.

o
a
Conard, Susan G., ed. [2000. Disturbance in boreal forest ecosystems: human impacts and natural
processes. Proceedings of the International Boreal Forest Research Association1997 annual meeting; 1997 August 4-7; Duluth, Minnesota, USA. Gen. Tech.Rep. NC-209. St. Paul, MN: U. S. Department of Agriculture, Forest Service,North Central Research Station. 435 p.
The papers in these proceedings cover a wide range of topics related to humanand natural disturbance processes in forests of the boreal zone in North Americaand Eurasia. Topics include historic and predicted landscape change; forestmanagement; disturbance by insects, fire, air pollution, severe weather, andglobal climate change; and carbon cycling.
Key Words: Boreal forest, disturbance, forest management, climate change,forest health.
!°
U
.

ILIb
It
• Ir

Ib
Our job at the North Central Forest Experiment Station is discovering andcreating new knowledge and technology in the field of natural resources andconveying this information to the people who can use it. As a new generationof forests emerges in our region, managers are confronted with two uniquechallenges" (1) Dealing with the great diversity in composition, quality, and
ownership of the forests, and (2) Reconciling the conflicting demands of thepeople v_ho use the m. Helping the forest manager meet these challengeswhile protecting the environment is what research at North Central is allabout.
i NORTHCEHTRAL_
EHPERIIllENTSTI:ITION
i
, !