The ABCflux database: Arctic–boreal CO2 flux observations ...
30
Earth Syst. Sci. Data, 14, 179–208, 2022 https://doi.org/10.5194/essd-14-179-2022 © Author(s) 2022. This work is distributed under the Creative Commons Attribution 4.0 License. The ABCflux database: Arctic–boreal CO 2 flux observations and ancillary information aggregated to monthly time steps across terrestrial ecosystems Anna-Maria Virkkala 1 , Susan M. Natali 1 , Brendan M. Rogers 1 , Jennifer D. Watts 1 , Kathleen Savage 1 , Sara June Connon 1 , Marguerite Mauritz 2 , Edward A. G. Schuur 3,4 , Darcy Peter 1 , Christina Minions 1 , Julia Nojeim 1 , Roisin Commane 5 , Craig A. Emmerton 6 , Mathias Goeckede 7 , Manuel Helbig 8,9 , David Holl 10 , Hiroki Iwata 11 , Hideki Kobayashi 12 , Pasi Kolari 13 , Efrén López-Blanco 14,15 , Maija E. Marushchak 16,17 , Mikhail Mastepanov 15,18 , Lutz Merbold 19 , Frans-Jan W. Parmentier 20,21 , Matthias Peichl 22 , Torsten Sachs 23 , Oliver Sonnentag 9 , Masahito Ueyama 24 , Carolina Voigt 16,9 , Mika Aurela 25 , Julia Boike 26,27 , Gerardo Celis 28 , Namyi Chae 29 , Torben R. Christensen 15 , M. Syndonia Bret-Harte 30 , Sigrid Dengel 31 , Han Dolman 32 , Colin W. Edgar 30 , Bo Elberling 33 , Eugenie Euskirchen 30 , Achim Grelle 34 , Juha Hatakka 25 , Elyn Humphreys 35 , Järvi Järveoja 22 , Ayumi Kotani 36 , Lars Kutzbach 10 , Tuomas Laurila 25 , Annalea Lohila 25,13 , Ivan Mammarella 13 , Yojiro Matsuura 37 , Gesa Meyer 9,38 , Mats B. Nilsson 22 , Steven F. Oberbauer 39 , Sang-Jong Park 40 , Roman Petrov 41 , Anatoly S. Prokushkin 42 , Christopher Schulze 9,43 , Vincent L. St. Louis 6 , Eeva-Stiina Tuittila 44 , Juha-Pekka Tuovinen 25 , William Quinton 45 , Andrej Varlagin 46 , Donatella Zona 47 , and Viacheslav I. Zyryanov 42 1 Woodwell Climate Research Center, 149 Woods Hole Road, Falmouth, MA 02540-1644, USA 2 Environmental Science and Engineering, University of Texas at El Paso, 500W University Rd, El Paso, TX 79902, USA 3 Center for Ecosystem Science and Society, Northern Arizona University, Flagstaff, AZ 86001, USA 4 Department of Biological Sciences, Northern Arizona University, Flagstaff, AZ 86001, USA 5 Department of Earth & Environmental Sciences, Lamont-Doherty Earth Observatory, Columbia University, Palisades, NY 10964, USA 6 Department of Biological Sciences, University of Alberta, Edmonton, Alberta, Canada 7 Department Biogeochemical Signals, Max Planck Institute for Biogeochemistry, Jena, Germany 8 Department of Physics and Atmospheric Science, Dalhousie University, Halifax, Nova Scotia, Canada 9 Departement de Geographie, Universite de Montreal, Montreal, Quebec, Canada 10 Institute of Soil Science, Center for Earth System Research and Sustainability (CEN), Universität Hamburg, Hamburg, Germany 11 Department of Environmental Science, Shinshu University, Matsumoto, Japan 12 Research Institute for Global Change, Japan Agency for Marine-Earth Science and Technology, Yokohama, Japan 13 Institute for Atmospheric and Earth System Research/Physics, Faculty of Science, University of Helsinki, Helsinki, Finland 14 Department of Environment and Minerals, Greenland Institute of Natural Resources, Kivioq 2, 3900, Nuuk, Greenland 15 Department of Bioscience, Arctic Research Center, Aarhus University, Frederiksborgvej 399, 4000 Roskilde, Denmark 16 Department of Environmental and Biological Sciences, University of Eastern Finland, Kuopio, Finland 17 Department of Biological and Environmental Science, University of Jyväskylä, Jyväskylä, Finland 18 Oulanka research station, University of Oulu, Liikasenvaarantie 134, 93900 Kuusamo, Finland Published by Copernicus Publications.
-
Upload
khangminh22 -
Category
Documents
-
view
1 -
download
0
Transcript of The ABCflux database: Arctic–boreal CO2 flux observations ...

Earth Syst. Sci. Data, 14, 179–208, 2022https://doi.org/10.5194/essd-14-179-2022© Author(s) 2022. This work is distributed underthe Creative Commons Attribution 4.0 License.
The ABCflux database: Arctic–boreal CO2 fluxobservations and ancillary information aggregated to
monthly time steps across terrestrial ecosystems
Anna-Maria Virkkala1, Susan M. Natali1, Brendan M. Rogers1, Jennifer D. Watts1, Kathleen Savage1,Sara June Connon1, Marguerite Mauritz2, Edward A. G. Schuur3,4, Darcy Peter1, Christina Minions1,
Julia Nojeim1, Roisin Commane5, Craig A. Emmerton6, Mathias Goeckede7, Manuel Helbig8,9,David Holl10, Hiroki Iwata11, Hideki Kobayashi12, Pasi Kolari13, Efrén López-Blanco14,15,
Maija E. Marushchak16,17, Mikhail Mastepanov15,18, Lutz Merbold19, Frans-Jan W. Parmentier20,21,Matthias Peichl22, Torsten Sachs23, Oliver Sonnentag9, Masahito Ueyama24, Carolina Voigt16,9,
Mika Aurela25, Julia Boike26,27, Gerardo Celis28, Namyi Chae29, Torben R. Christensen15,M. Syndonia Bret-Harte30, Sigrid Dengel31, Han Dolman32, Colin W. Edgar30, Bo Elberling33,Eugenie Euskirchen30, Achim Grelle34, Juha Hatakka25, Elyn Humphreys35, Järvi Järveoja22,
Ayumi Kotani36, Lars Kutzbach10, Tuomas Laurila25, Annalea Lohila25,13, Ivan Mammarella13,Yojiro Matsuura37, Gesa Meyer9,38, Mats B. Nilsson22, Steven F. Oberbauer39, Sang-Jong Park40,
Roman Petrov41, Anatoly S. Prokushkin42, Christopher Schulze9,43, Vincent L. St. Louis6,Eeva-Stiina Tuittila44, Juha-Pekka Tuovinen25, William Quinton45, Andrej Varlagin46, Donatella Zona47,
and Viacheslav I. Zyryanov42
1Woodwell Climate Research Center, 149 Woods Hole Road, Falmouth, MA 02540-1644, USA2Environmental Science and Engineering, University of Texas at El Paso,
500W University Rd, El Paso, TX 79902, USA3Center for Ecosystem Science and Society, Northern Arizona University, Flagstaff, AZ 86001, USA
4Department of Biological Sciences, Northern Arizona University, Flagstaff, AZ 86001, USA5Department of Earth & Environmental Sciences, Lamont-Doherty Earth Observatory,
Columbia University, Palisades, NY 10964, USA6Department of Biological Sciences, University of Alberta, Edmonton, Alberta, Canada
7Department Biogeochemical Signals, Max Planck Institute for Biogeochemistry, Jena, Germany8Department of Physics and Atmospheric Science, Dalhousie University, Halifax, Nova Scotia, Canada
9Departement de Geographie, Universite de Montreal, Montreal, Quebec, Canada10Institute of Soil Science, Center for Earth System Research and Sustainability (CEN),
Universität Hamburg, Hamburg, Germany11Department of Environmental Science, Shinshu University, Matsumoto, Japan
12Research Institute for Global Change, Japan Agency for Marine-Earth Science and Technology,Yokohama, Japan
13Institute for Atmospheric and Earth System Research/Physics, Faculty of Science,University of Helsinki, Helsinki, Finland
14Department of Environment and Minerals, Greenland Institute of Natural Resources,Kivioq 2, 3900, Nuuk, Greenland
15Department of Bioscience, Arctic Research Center, Aarhus University,Frederiksborgvej 399, 4000 Roskilde, Denmark
16Department of Environmental and Biological Sciences, University of Eastern Finland, Kuopio, Finland17Department of Biological and Environmental Science, University of Jyväskylä, Jyväskylä, Finland
18Oulanka research station, University of Oulu, Liikasenvaarantie 134, 93900 Kuusamo, Finland
Published by Copernicus Publications.
180 A.-M. Virkkala et al.: The ABCflux database
19Agroscope, Research Division Agroecology and Environment,Reckenholzstrasse 191, 8046 Zurich, Switzerland
20Center for Biogeochemistry in the Anthropocene, Department of Geosciences,University of Oslo, 0315 Oslo, Norway
21Department of Physical Geography and Ecosystem Science, Lund University, 223 62 Lund, Sweden22Department of Forest Ecology and Management, Swedish University of Agricultural Sciences,
901 83 Umeå, Sweden23GFZ German Research Centre for Geosciences, Telegrafenberg, Potsdam, Germany24Graduate School of Life and Environmental Sciences, Osaka Prefecture University,
1-1 Gakuencho, Naka-ku, Sakai, 599-8531, Japan25Finnish Meteorological Institute, Climate system research, Helsinki, Finland26Alfred Wegener Institute Helmholtz Center for Polar and Marine Research,
Telegrafenberg A45, 14473 Potsdam, Germany27Geography Department, Humboldt-Universität zu Berlin, Unter den Linden 6, 10099 Berlin, Germany
28Agronomy Department, University of Florida, Gainesville, FL, USA29Institute of Life Science and Natural Resources, Korea University, 145 Anam-ro,
Seongbuk-gu, Seoul, 02841, Republic of Korea30Institute of Arctic Biology, University of Alaska Fairbanks, Fairbanks, AK 99775, USA
31Earth and Environmental Sciences Area, Lawrence Berkeley National Lab, Berkeley, CA 94720, USA32Department of Earth Sciences, Vrije Universiteit Amsterdam, Amsterdam, the Netherlands
33Center for Permafrost, Department of Geosciences and Natural Resource Management,University of Copenhagen, Øster Voldagde 10, Copenhagen, Denmark
34Department of Ecology, Swedish University of Agricultural Sciences, Uppsala, Sweden35Department of Geography & Environmental Studies, Carleton University,
1125 Colonel By Dr., Ottawa, ON, K2B 5J5 Canada36Graduate School of Bioagricultural Sciences, Nagoya University, Nagoya, Japan
37Center for International Partnerships and Research on Climate Change, Forestry and Forest ProductsResearch Institute, 1 Matsunosato, Tsukuba, Japan
38Environment and Climate Change Canada, Climate Research Division, Victoria, BC V8N 1V8, Canada39Department of Biological Sciences and Institute of Environment, Florida International University,
Miami, FL 33199, USA40Division of Atmospheric Sciences, Korea Polar Research Institute, 26 Sondgomirae-ro Yeonsu-gu,
Incheon, Republic of Korea41Institute for Biological Problems of Cryolithozone, Siberian Branch of the Russian Academy of Sciences,
Yakutsk, Russia42VN Sukachev Institute of Forest, Siberian Branch of the Russian Academy of Sciences,
Akademgorodok 50/28, Krasnoyarsk 660036, Russia43Department of Renewable Resources, University of Alberta, Edmonton, Alberta, Canada
44School of Forest Sciences, University of Eastern Finland, Joensuu, Finland45Cold Regions Research Centre, Wilfrid Laurier University, Waterloo, Ontario, Canada
46A. N. Severtsov Institute of Ecology and Evolution, Russian Academy of Sciences, 119071,Leninsky pr.33, Moscow, Russia
47Department of Biology, San Diego State University, San Diego, California, USA
Correspondence: Anna-Maria Virkkala ([email protected])
Received: 7 July 2021 – Discussion started: 28 July 2021Revised: 26 November 2021 – Accepted: 29 November 2021 – Published: 21 January 2022
Abstract. Past efforts to synthesize and quantify the magnitude and change in carbon dioxide (CO2) fluxes interrestrial ecosystems across the rapidly warming Arctic–boreal zone (ABZ) have provided valuable informa-tion but were limited in their geographical and temporal coverage. Furthermore, these efforts have been basedon data aggregated over varying time periods, often with only minimal site ancillary data, thus limiting theirpotential to be used in large-scale carbon budget assessments. To bridge these gaps, we developed a standard-ized monthly database of Arctic–boreal CO2 fluxes (ABCflux) that aggregates in situ measurements of terres-trial net ecosystem CO2 exchange and its derived partitioned component fluxes: gross primary productivity and
Earth Syst. Sci. Data, 14, 179–208, 2022 https://doi.org/10.5194/essd-14-179-2022
A.-M. Virkkala et al.: The ABCflux database 181
ecosystem respiration. The data span from 1989 to 2020 with over 70 supporting variables that describe keysite conditions (e.g., vegetation and disturbance type), micrometeorological and environmental measurements(e.g., air and soil temperatures), and flux measurement techniques. Here, we describe these variables, the spatialand temporal distribution of observations, the main strengths and limitations of the database, and the potentialresearch opportunities it enables. In total, ABCflux includes 244 sites and 6309 monthly observations; 136 sitesand 2217 monthly observations represent tundra, and 108 sites and 4092 observations represent the boreal biome.The database includes fluxes estimated with chamber (19 % of the monthly observations), snow diffusion (3 %)and eddy covariance (78 %) techniques. The largest number of observations were collected during the climato-logical summer (June–August; 32 %), and fewer observations were available for autumn (September–October;25 %), winter (December–February; 18 %), and spring (March–May; 25 %). ABCflux can be used in a wide ar-ray of empirical, remote sensing and modeling studies to improve understanding of the regional and temporalvariability in CO2 fluxes and to better estimate the terrestrial ABZ CO2 budget. ABCflux is openly and freelyavailable online (Virkkala et al., 2021b, https://doi.org/10.3334/ORNLDAAC/1934).
1 Introduction
The Arctic–boreal zone (ABZ), comprising the northern tun-dra and boreal biomes, stores approximately half the globalsoil organic carbon pool (Hugelius et al., 2014; Tarnocai etal., 2009; Mishra et al., 2021). As indicated by this largecarbon reservoir, the ABZ has acted as a carbon sink overthe past millennia due to the cold climate and slow de-composition rates (Siewert et al., 2015; Hugelius et al.,2020; Gorham, 1991). However, these carbon stocks are in-creasingly vulnerable to climate change, which is occurringrapidly across the ABZ (Box et al., 2019). As a result, car-bon is being lost from this reservoir to the atmosphere ascarbon dioxide (CO2) through increased ecosystem respira-tion (Reco) (Schuur et al., 2015; Parker et al., 2015; Voigtet al., 2017). The impact of increased CO2 emissions onglobal warming depends on the extent to which respiratorylosses are offset by gross primary productivity (GPP), thevegetation uptake of atmospheric CO2 via photosynthesis(McGuire et al., 2016; Cahoon et al., 2016).
Carbon dioxide flux measurements provide a means tomonitor the net CO2 balance (i.e., net ecosystem exchange;NEE, a balance between GPP and Reco) across time andspace (Baldocchi, 2008; Pavelka et al., 2018). There are threemain techniques used to measure fluxes at the ecosystemlevel that represent fluxes from plants and soils to the at-mosphere: eddy covariance, automated and manual cham-bers, and snow diffusion methods (hereafter diffusion; for acomparison of the techniques, see Table 1 in McGuire et al.,2012). The eddy covariance technique estimates NEE at theecosystem scale (ca. 0.01 to 1 km2 footprint) at high temporalresolution (i.e., 1/2 h) using nondestructive and automatedmeasurements (Pastorello et al., 2020). Automated and man-ual chamber techniques measure NEE at fine spatial scales(< 1 m2) and in small-statured ecosystems, common in thetundra, where the chambers can fit over the whole plant com-munity (Järveoja et al., 2018; López-Blanco et al., 2017). Thediffusion technique, also operating at fine spatial scales, can
be used to measure the transport of CO2 within a snowpack(Björkman et al., 2010b). The eddy covariance technique hasbeen used globally for over three decades and chamber anddiffusion techniques for even longer.
Historically, the number and distribution of ABZ flux siteshas been rather limited compared to observations in tem-perate regions (Baldocchi et al., 2018). Due to these datagaps, quantifying the net annual CO2 balance across theABZ has posed a significant challenge (Natali et al., 2019a;McGuire et al., 2016; Virkkala et al., 2021a). However, overthe past decade, the availability of ABZ flux data has in-creased substantially. Many, but not all, of the ABZ eddycovariance sites are a part of broader networks, such as theglobal FLUXNET and regional AmeriFlux, Integrated Car-bon Observation System (ICOS) and the European FluxesDatabase Cluster (EuroFlux), where data are standardizedand openly available (Paris et al., 2012; Novick et al., 2018;Pastorello et al., 2020). These networks primarily includeflux and meteorological data but do not often include otherenvironmental descriptions such as soil carbon stocks, dom-inant plant species, or the disturbance history of a given site(but see, for example, Biological, Ancillary, Disturbance, andMetadata data in Ameriflux), which are important for under-standing the controls on CO2 fluxes. Moreover, even thoughsome ABZ annual chamber measurements are included in theglobal soil respiration database (SRDB) (Jian et al., 2021),and in the continuous soil respiration database (COSORE)(Bond-Lamberty et al., 2020), standardized datasets provid-ing ABZ CO2 flux measurements from eddy covariance,chambers, and diffusion, along with comprehensive meta-data, have been nonexistent. Such an effort would createpotential for a more thorough understanding of ABZ CO2fluxes. Therefore, compiling these flux measurements andtheir supporting ancillary data into one database is clearlyneeded to support future modeling, remote sensing, and em-pirical data mining efforts.
Arctic–boreal CO2 fluxes have been previously synthe-sized in a handful of regional studies (Belshe et al., 2013;
https://doi.org/10.5194/essd-14-179-2022 Earth Syst. Sci. Data, 14, 179–208, 2022

182 A.-M. Virkkala et al.: The ABCflux database
Table 1. A summary of past CO2 flux synthesis efforts. If site numbers were not provided in the paper, this was calculated as the number ofunique sets of coordinates. Note: n/a – not applicable.
Study Number Synthesized fluxes Study domain Study period Flux aggregationof sites and measurement
techniques
Luyssaert et al.(2007)
n/a GPP, Reco, and NEE mea-sured with eddy covariance
Global forests (includ-ing boreal)
n/a Annual
McGuire et al.(2012)
66 GPP, Reco, and NEE mea-sured with chambers, eddycovariance, diffusion tech-nique and soda lime
Arctic tundra Measurements from1966–2009; focus on1990–2009
Annual, growingand winter season
Belshe et al.(2013)
34 GPP, Reco, and NEE mea-sured with chambers, eddycovariance, diffusion tech-nique and soda lime
Arctic tundra Measurements from1966–2010
Annual, growingand winter season
Baldocchi et al.(2018)
9 GPP, Reco, and NEE mea-sured with eddy covariance
Global (includingboreal and tundrabiomes)
n/a (sites with 5–18 years of measure-ments)
Annual
Virkkala et al.(2018)
117 GPP, Reco, and NEE mea-sured with chambers
Arctic tundra Studies published dur-ing 2000–2016
Growing season
Natali et al.(2019a)
104 Soil respiration and NEEmeasured with chambers,eddy covariance, diffusiontechnique, and soda lime
Northern permafrostregion
Measurements from1989–2017, focus on2000–2017
Monthly or sea-sonal during winter
Virkkala et al.(2021a)
148 GPP, Reco, and NEE mea-sured with chambers andeddy covariance
Arctic tundra and bo-real biomes
1990–2015 Annual and grow-ing season
ABCfluxversion 1(this study)
244 GPP, Reco, and NEE (withsome soil respiration andforest floor fluxes) measuredwith chambers, eddy covari-ance, and diffusion tech-nique
Arctic tundra and bo-real biomes
1989–2020 Monthly (wholeyear)
McGuire et al., 2012; Luyssaert et al., 2007; Baldocchi etal., 2018; Virkkala et al., 2018, 2021a; Natali et al., 2019a)(Fig. 1 and Table 1). One of the main challenges in theseprevious efforts, in addition to the limited geographical cov-erage of ABZ sites and lack of environmental descriptions,has been the variability of the synthesized seasonal measure-ment periods. Most of these efforts have allowed the seasonaldefinitions and measurement periods to vary across the sites,creating uncertainty in the inter-site comparison of flux mea-surements. An alternative approach to define seasonality is tofocus on standard time periods such as months (Natali et al.,2019a). Although focusing on monthly fluxes may result in asmall decrease in synthesizable data, because publications,particularly older ones, often provide seasonal rather thanmonthly flux estimates (see, e.g., Euskirchen et al., 2012;Nykänen et al., 2003; Björkman et al., 2010a; Oechel etal., 2000; Merbold et al., 2009), compiling monthly fluxes
has several advantages over the seasonal fluxes. These ad-vantages include (i) better comparability of measurements,(ii) ability to bypass problems related to defining seasonsacross large regions, and (iii) ease of linking these fluxes toremote sensing and models.
Our goal is to build upon past synthesis efforts and com-pile a new database of Arctic–boreal CO2 fluxes (ABCfluxversion 1) that combines eddy covariance, chamber, and dif-fusion data at monthly timescales with supporting environ-mental information to help facilitate large-scale assessmentsof the ABZ carbon cycle. This paper provides a general de-scription of the ABCflux database by characterizing the datasources and database structure (Sect. 2), as well as describingthe characteristics of the database (Sect. 3). Additionally, wedescribe the main strengths, limitations, and opportunities ofthis database (Sect. 4) and its potential utility for future stud-ies aiming to understand terrestrial ABZ CO2 fluxes.
Earth Syst. Sci. Data, 14, 179–208, 2022 https://doi.org/10.5194/essd-14-179-2022

A.-M. Virkkala et al.: The ABCflux database 183
Figure 1. The flux site distribution in previous syntheses that fo-cused on compiling fluxes from high latitudes (McGuire et al.,2012; Belshe et al., 2013; Natali et al., 2019a; Virkkala et al., 2021a;and this study, ABCflux). The Arctic–boreal zone is highlightedin dark grey; countries are shown in the background. Based onthe unique latitude–longitude coordinate combinations in the tun-dra, there were 136 tundra sites in ABCflux, 104 tundra sites inVirkkala et al. (2021a), 68 tundra sites in Natali et al. (2019a), 34tundra sites in Belshe et al. (2013), and 66 tundra sites in McGuireet al. (2012). Observations that were included in previous studiesbut not in ABCflux represent fluxes aggregated over seasonal, notmonthly periods.
2 Data and methods
ABCflux focuses on the area covered by the northern tundraand boreal biomes (> 45◦ N), as characterized in Dinersteinet al. (2017), Fig. 2, and compiles in situ measured terrestrialecosystem-level CO2 fluxes aggregated to monthly time peri-ods (unit: gCm−2 per month). We chose this aggregation in-terval as monthly temporal frequency is a common, straight-forward, and standard interval used in many synthesis, mod-eling studies, remote sensing products, and process modeloutput (Didan, 2015; Natali et al., 2019a; Hayes et al., 2014).Furthermore, scientific papers often report monthly fluxes,facilitating accurate extraction to ABCflux. We compiledonly aggregated fluxes to allow easy usage of the databaseand to keep the database concise and cohesive. We designedthis database so that these monthly fluxes, compiled from sci-entific papers or data repositories or contributed by site prin-cipal investigators (PIs), can be explored from as many sitesas possible and across different months, regions and ecosys-tems. The database is not designed for studies exploring fluxvariability within a month, or how different methodologicaldecisions (e.g., flux filtering or partitioning approaches) in-
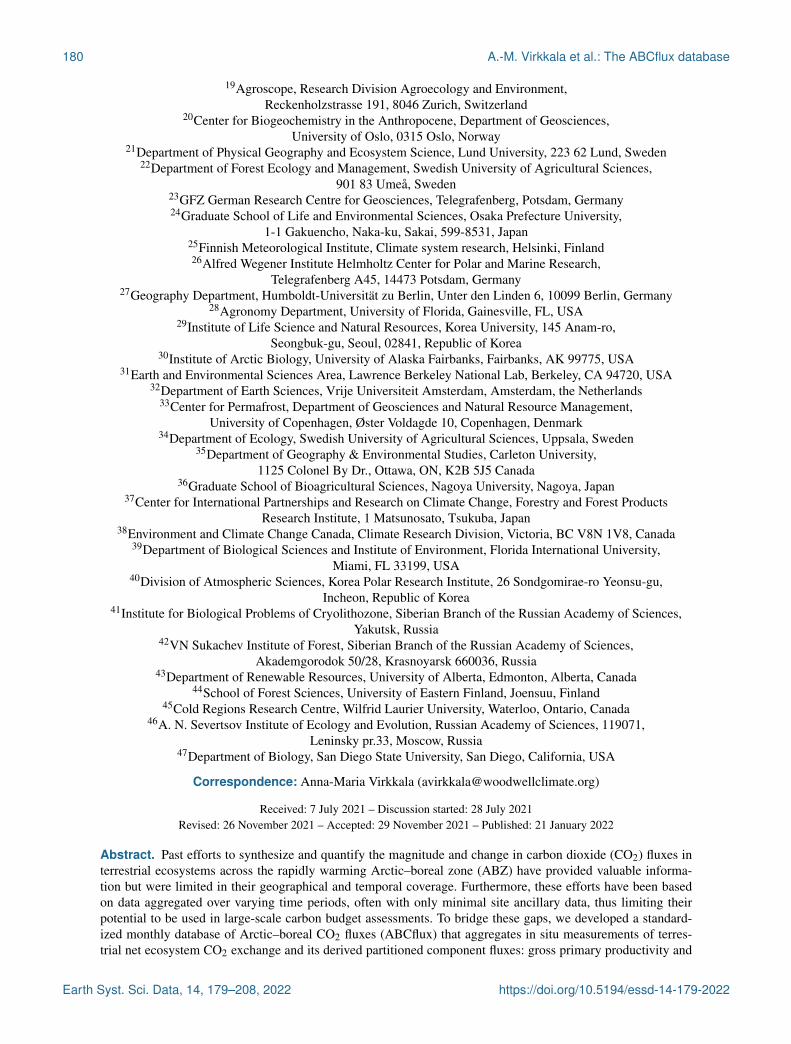
Figure 2. Map showing the distribution and measurement tech-nique at each site (a), and examples of a manual chamber (b),diffusion measurements (c), and two eddy covariance towers ina wetland–forest and tundra ecosystem (d, e). Photographs weretaken in Kilpisjärvi, Finland (July 2016), Montmorency forest,Canada (April 2021), Scotty Creek, Canada (April, 2014), andYukon–Kuskokwim Delta, Alaska (September 2019). Image cred-its for panels (b)–(e): Markus Jylhä, Alex Mavrovic, Gabriel HouldGosselin, Chris Linder, and Manuel Helbig.
fluence the estimated fluxes. If a potential data user requiresfluxes at higher temporal frequency or is interested to studythe uncertainties related to flux processing, we suggest theyutilize data from other flux repositories (see Sect. 2.1.2.) orcontact PIs.
Although the three flux measurement techniques includedin ABCflux primarily measure NEE, chamber and eddycovariance techniques can also be used to estimate GPP(the photosynthetic flux) and Reco (comprising emissions
https://doi.org/10.5194/essd-14-179-2022 Earth Syst. Sci. Data, 14, 179–208, 2022
184 A.-M. Virkkala et al.: The ABCflux database
from autotrophic and heterotrophic respiration) (Keenan andWilliams, 2018), which are also included in the database. Ateddy covariance sites, GPP and Reco are indirectly derivedfrom NEE using partitioning methods that primarily use lightand temperature data (Lasslop et al., 2010; Reichstein et al.,2005). At chamber sites, Reco can be measured directly withdark chambers, from which GPP can be calculated by sub-tracting Reco from NEE (Shaver et al., 2007). In general,these partitioned GPP and Reco fluxes have higher uncer-tainties than the NEE measurements since they are modeledbased on additional data and various assumptions (Aubinet etal., 2012). However, GPP and Reco fluxes were included inABCflux because these component fluxes may help to betterunderstand and quantify the underlying processes of land–atmosphere CO2 exchange.
In addition to CO2 fluxes, we gathered information de-scribing the general site conditions (e.g., site name, coordi-nates, vegetation type, disturbance history, a categorical soilmoisture variable, and soil organic carbon stocks), microm-eteorological and environmental measurements (e.g., air andsoil temperatures, precipitation, soil moisture, snow depth),and flux measurement technique (e.g., measurement fre-quency, instrumentation, gap-filling and partitioning method,number of spatial replicates for chamber measurements, fluxdata quality), wherever possible.
2.1 Data sources
2.1.1 Literature search
We identified potential CO2 flux studies and sites from priorsynthesis efforts (Belshe et al., 2013; McGuire et al., 2012,2018, 2021b; Natali et al., 2019a), including a search of ci-tations within and of the studies included in these prior syn-theses. We also conducted a literature search in Web of Sci-ence with the following search words: “carbon flux” or “car-bon dioxide flux” or “NEE” or “net ecosystem exchange”and “arctic” or “tundra” or “boreal”. This was done to en-sure that our database included the most recent publications.We included studies that reported at least NEE, presented atmonthly or finer temporal resolution, and had supporting en-vironmental ancillary data describing the sites. We did notinclude fluxes reported at longer time steps (e.g., seasonalaggregations), which, based on our rough estimate, resultedin a 10 %–20 % loss of data from sites and periods that wouldhave been new to ABCflux. These excluded data primarilyincluded some older, non-active eddy covariance sites andseasonal chamber measurements (e.g., Nobrega and Grogan,2008; Heliasz et al., 2011; Fox et al., 2008). However, manyof these data were located in the vicinity of existing sitescovered by ABCflux (e.g., Daring Lake, Abisko); thus ex-cluding these measurements does not dramatically influencethe geographical coverage of the sites. We extracted our vari-ables of interest (Sect. 2.3.) from these selected papers dur-ing 2018–2020. Data from line and bar plots were extracted
using Plot Digitizer (http://plotdigitizer.sourceforge.net/, lastaccess: 16 October 2019) and converted to our flux units(gCm−2 per month) if needed. Data from experimental treat-ments were excluded; however, we included flux data fromunmanipulated control plots. Monthly non-growing seasonfluxes from Natali et al. (2019a) were extracted from the re-cently published data compilation (Natali et al., 2019b). Win-ter chamber or diffusion measurements in forests from Nataliet al. (2019b) were included in the “ground_nee” field, whichrepresents forest understory (not whole-ecosystem) NEE.
2.1.2 Flux repositories
We downloaded eddy covariance and supporting environ-mental data products from AmeriFlux (Novick et al., 2018),Fluxnet2015 (Pastorello et al., 2020), EuroFlux databasecluster (ICOS, Carbon Extreme, Carbo Africa, GHG Eu-rope, Carbo Italy, INGOS) (Paris et al., 2012; Valentini,2003), and Station for Measuring Ecosystem–AtmosphereRelations (Hari et al., 2013). Data that were filtered for US-TAR (i.e., low friction velocity conditions) and gap-filledwere downloaded from repositories in 2018–2020. USTARvaried among sites due to differing site-level assumptions.We downloaded only gap-filled data that met the USTAR cri-teria for either the tower PI or given through the databaseprocessing pipeline. However, Fluxnet2015 provides severaldifferent methods for determining data quality based on dif-ferent USTAR criteria. In this case, we used the Fluxnet2015common USTAR threshold (CUT, i.e. all years at the sitefiltered with the same USTAR threshold; Pastorello et al.,2020). For observations extracted from EuroFlux, USTARthresholds for each site were derived as described in Papale etal. (2006) and Reichstein et al. (2005), using nighttime data.We extracted fluxes readily aggregated to monthly intervalsby the data processing pipeline from Fluxnet2015 and Eu-roFlux. These aggregations were not given in AmeriFlux andSMEAR. We downloaded daily gap-filled data from theserepositories and summed the data to monthly time steps. Wedid not aggregate any repository GPP, Reco, or NEE datasetsthat were not gap-filled. If fluxes were available for the samesite and period both in Natali et al. (2019b) and flux repos-itory extractions, the flux repository observations were keptin the database. Some repositories supplied eddy covariancedata version numbers, which were added to the flux database.
2.1.3 Permafrost Carbon Network data solicitation
A community call was solicited in 2018 through a CO2 fluxsynthesis workshop (Parmentier et al., 2019; Arctic DataCenter, 2021), whereby the network of ABZ flux researcherswas contacted and invited to contribute their most current un-published eddy covariance and chamber data. This resultedin an additional 39 sites and 1372 monthly observations (seecolumn extraction_source).
Earth Syst. Sci. Data, 14, 179–208, 2022 https://doi.org/10.5194/essd-14-179-2022
A.-M. Virkkala et al.: The ABCflux database 185
2.2 Partitioning approaches at eddy covariance fluxsites
ABCflux compiles eddy covariance observations that wereprimarily partitioned using nighttime Reco, which is basedon the assumption that during night, NEE measured at lowlight levels is equivalent to Reco (Reichstein et al., 2005).This nighttime partitioning approach has been the most fre-quently used approach to fill gaps in flux time series (Wut-zler et al., 2018) due to its simplicity, strong evidence oftemperature sensitivity of respiration, and direct use of Reco(i.e. nighttime NEE) flux data to estimate temperature re-sponse curves (Reichstein et al., 2005). As the nighttimeapproach was one of the first widely used partitioning ap-proaches, fluxes partitioned with the approach were the onlyones available in the flux repositories at some of the oldersites. Daytime partitioning and other approaches started todevelop more rapidly in the 2010s (Lasslop et al., 2010; Tra-montana et al., 2020). Each of the partitioning approacheshas uncertainties related to the ecological assumptions, inputdata, model parameters, and statistical approaches used to fillthe gaps.
PIs that submitted data to us directly gap-filled and parti-tioned fluxes using the approach that they determined worksbest at their site. Based on similar logic, fluxes extracted frompapers were not always partitioned using the nighttime ap-proach. In these cases, we trusted the expertise of PIs andauthors and included fluxes partitioned using other methods.Although this created some heterogeneity in the flux process-ing algorithms in the database, this approach was chosen sothat we could be more inclusive with the represented sites.
Thus, in summary, our goal was to compile fluxes that (1)can be easily compared with each other (i.e., have been gap-filled and partitioned in a systematic way), (2) are as accurateas possible given the site conditions and measurement setup(i.e., other approaches were accepted if this was suggested bythe PI), and (3) summarize information about the processingalgorithms used.
2.3 Data quality screening
We screened for poor-quality data, potential unit andsign convention issues, and inaccurate coordinates. Repos-itory eddy covariance data were processed and qual-ity checked using quality flags associated with monthlydata supplied by the repository processing pipeline.Fluxnet2015 and EuroFlux database include a data qual-ity flag for the monthly aggregated data indicating percent-age of measured (quality flag QC= 0 in FLUXNET2015)and good-quality gap-filled data (quality flag QC= 1in FLUXNET2015; average from monthly data; 0=extensive gap-filling, 1= low gap-filling); for more de-tails see the Fluxnet2015 web page (https://fluxnet.org/data/fluxnet2015-dataset/variables-quick-start-guide/last access:7 October 2020) and Pastorello et al. (2020). Note that this
quality flag field for the aggregated data differs from the onescalculated for half-hourly data derived directly from eddy co-variance tower processing programs (such as Eddypro). Weremoved monthly data with a quality flag of 0. Data withquality flags > 0 were left within the database for the user todecide on additional screening criteria. Note that the monthlydata produced by the repository processing pipeline do notinclude separate gap-filled percentages or errors of modelfit for NEE similar to those associated with the half-hourlydata. However, we included these fields to the database asPIs contributing data or scientific papers sometimes had thisinformation; however these fields were not used in data qual-ity screening. Both the monthly quality flag and gap-filledpercentage fields describe the number and quality of the gap-filled data that needed to be filled due to, for example, instru-ment malfunction, power shortage, extreme weather events,and periods with insufficient turbulence conditions.
At chamber and diffusion sites, we disregarded observa-tions including a low number of temporal replicates withina month (< 3 individual measurements in summer months)and only one measurement month to ensure the tempo-ral representativeness of the measurements. For the spring(March–May), autumn (September–November), and winter(December–February) months, one temporal replicate wasaccepted due to scarcity of measurements outside the sum-mer season (June–August); measurement frequency is in-cluded in the database. We excluded monthly summertimemeasurements with < 3 temporal replicates because withinsummer months, meteorological conditions and the pheno-logical status of the ecosystem can vary significantly (Lafleuret al., 2012; Euskirchen et al., 2012; Schneider et al., 2012;Heiskanen et al., 2021), and a single measurement is unlikelyto capture this variability. Our decision to exclude measure-ments that have only one measurement month was based onour goal to assess the temporal variability of fluxes. We justi-fied the acceptance of a lower number of temporal replicatesfor the other seasons based on the assumption that flux vari-ability is lower during the winter months, and at least duringmost of the spring and autumn months, due to the insulat-ing effects of snow (Aurela et al., 2002; Bäckstrand et al.,2010). We estimate that excluding measurements with < 3temporal replicates during the summer months resulted in a10 % loss of data. In total, 98 % of the chamber observationswere from published studies; we assume that the peer reviewprocess assessed the quality of published data.
We further screened for spatial coordinate accuracy by vi-sualizing the sites on a map. If a given site was located inwater or had imprecise coordinates, the site researchers werecontacted for more precise coordinates. We screened for po-tential duplicate sites and observations that were extractedfrom different data sources. Duplicate NEEs extracted frompapers that were also extracted from flux repositories werecompared to estimate uncertainties associated with paperextractions using Plot Digitizer as a means for extractingmonthly fluxes. A linear regression between paper (Plot Dig-
https://doi.org/10.5194/essd-14-179-2022 Earth Syst. Sci. Data, 14, 179–208, 2022

186 A.-M. Virkkala et al.: The ABCflux database
itizer) and repository extraction showed that data extractedusing Plot Digitizer were highly correlated with data fromonline databases, providing confidence in estimates extractedusing Plot Digitizer (R2
= 0.91, slope= 1.002, n= 192).Out of these duplicate observations, we only kept the data ex-tracted from the repository in the database. Finally, we askedsite PIs to verify that the resulting information was correct.
2.4 Database structure and columns
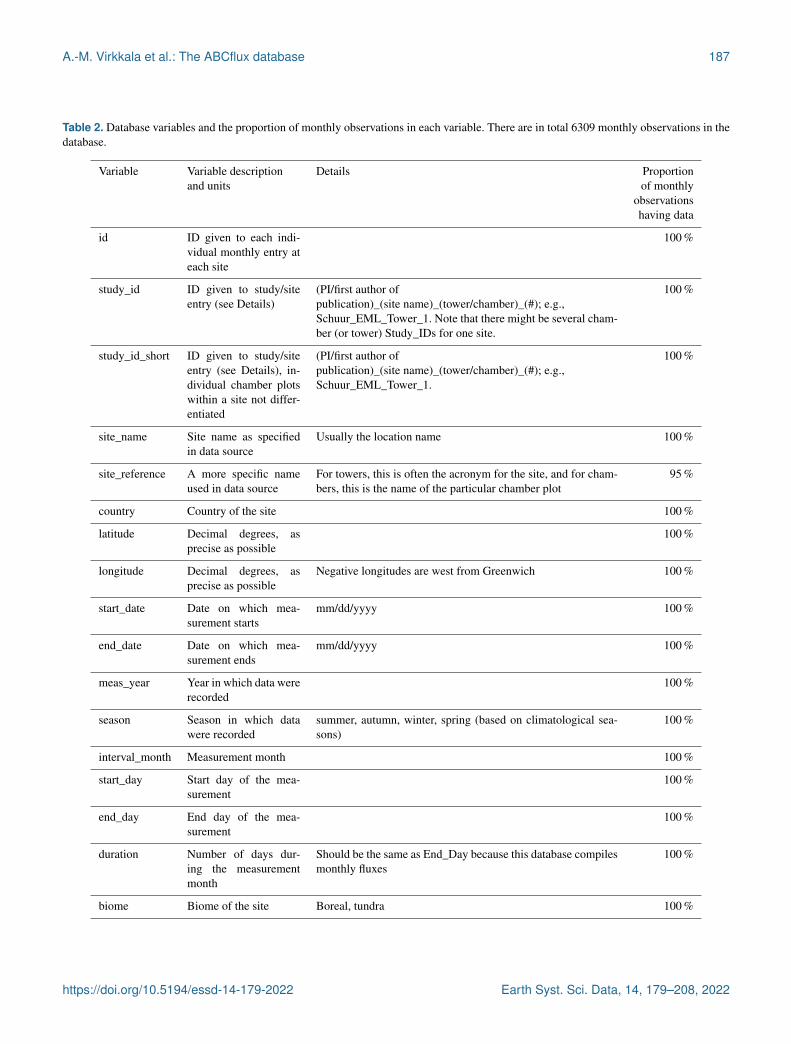
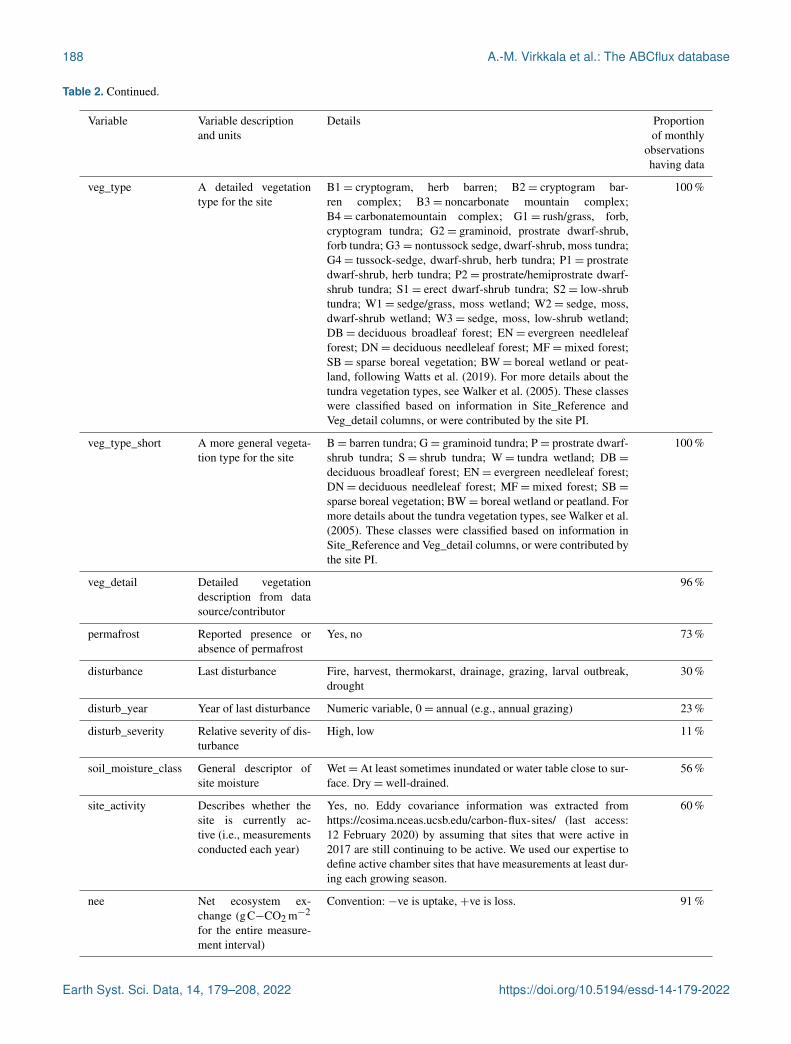
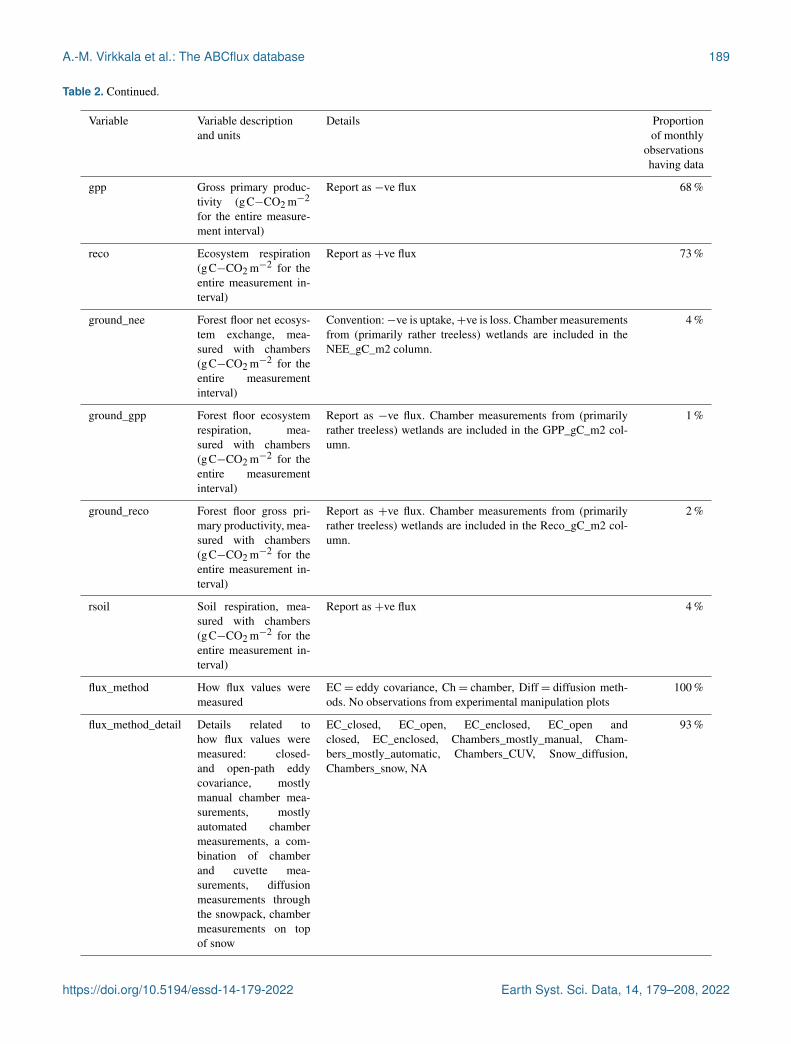
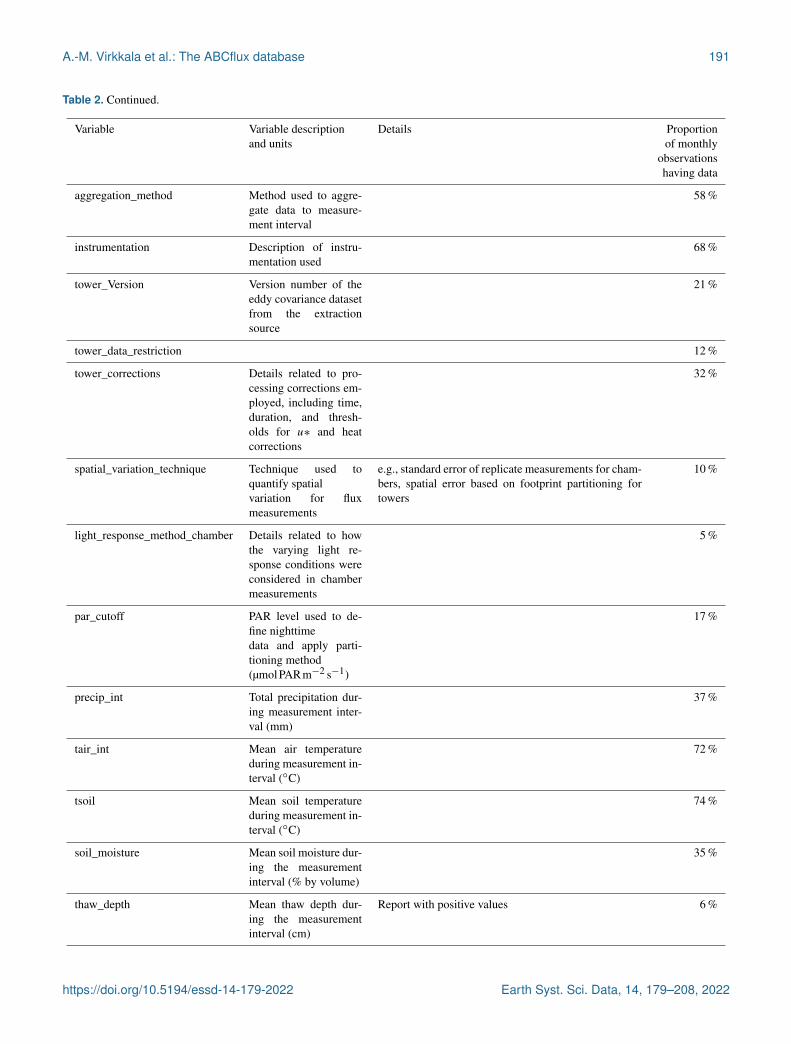
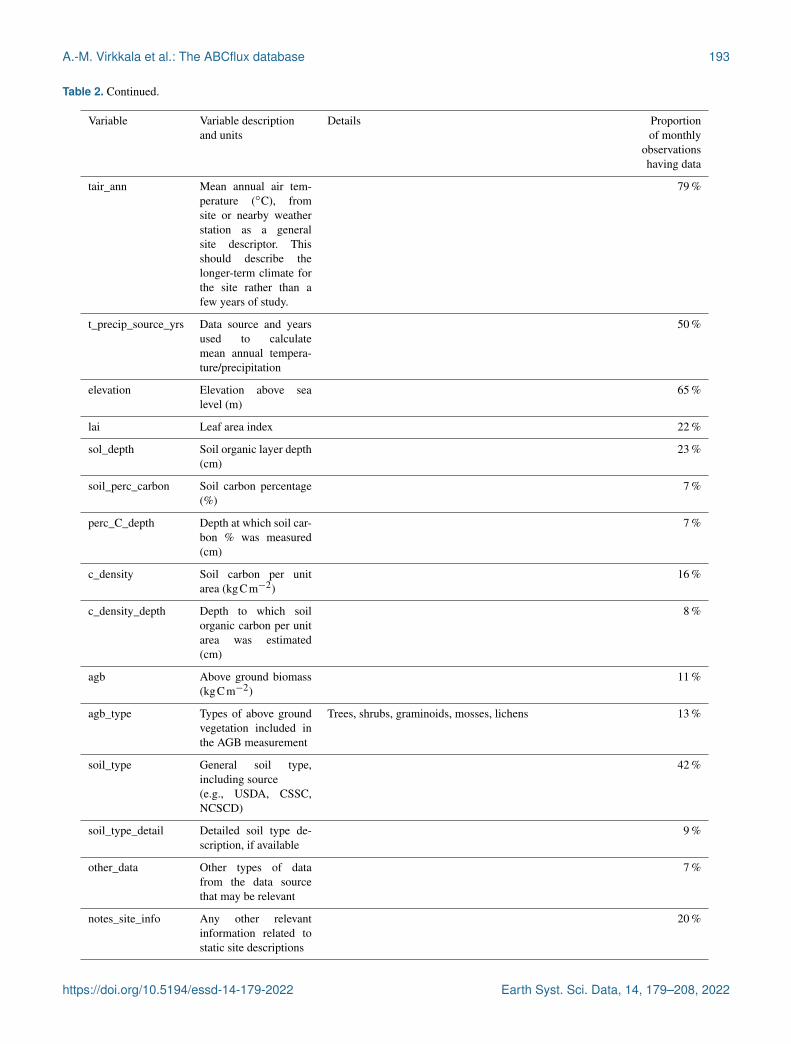
The resulting ABCflux database includes 94 variables: 16 areflux measurements and associated metadata (e.g., NEE, mea-surement date and duration), 21 describe flux measurementmethods (e.g., measurement frequency, gap-filling method),49 describe site conditions (e.g., soil moisture, air tempera-ture, vegetation type), and 8 describe the extraction source(e.g., primary author or site PI, citation, data maturity). A to-tal of 61 variables are considered static and thus do not varywith repeated measurements at a site (e.g., site name, coor-dinates, vegetation type), while 33 variables are considereddynamic and vary monthly (e.g., soil temperature). Table 2includes a description of each of the 94 variables, as well asthe proportion of monthly observations present in each col-umn. ABCflux is shared as a comma separated values (csv)file with 6309 rows; however, not all the rows have data ineach column (indicated by NA for character columns and−9999 for numeric columns).
We refer to all fields included in ABCflux as “observa-tions” although we acknowledge that, for example, GPP andReco are indirectly derived variables at eddy covariance sitesand that some flux and ancillary data can also be partly gap-filled. Further, our database does not include the actual rawobservations; rather it provides monthly aggregates. Positivevalues for NEE indicate net CO2 loss to the atmosphere (i.e.,CO2 source), and negative numbers indicate net CO2 uptakeby the ecosystem (i.e., CO2 sink). For consistency, GPP ispresented as negative (uptake) values and Reco as positive.
2.5 Database visualization
The visualizations in this paper were made with the fullABCflux database using each site month as a unique datapoint (from now on, these are referred to as monthlyobservations) and the sites listed in the “study_id_short”field. We visualized these across the vegetation types(“veg_type_short”), countries (“country”), biomes(“biome”), and measurement method (“flux_method”).
To understand the distribution and representativeness ofmonthly observations and sites across the ABCflux as wellas the entire ABZ, we used geospatial data to calculate theaerial coverages of each vegetation type and country. Veg-etation type was derived from the European Space AgencyClimate Change Initiative’s (ESA CCI) land cover productaggregated and resampled to 0.0083◦ for the boreal biome(Lamarche et al., 2013) and the raster version of the Circum-
polar Arctic Vegetation Map (CAVM) for the tundra biomeresampled to the same resolution as the ESA CCI product(Raynolds et al., 2019). ESA CCI layers were reclassifiedby grouping land cover types to the same vegetation typeclasses represented by ABCflux: boreal wetland and peatland(from now on, boreal wetland; classes 160, 170, 180 in ESACCI product), deciduous broadleaf forest (60–62), evergreenneedleleaf forest (70–72), deciduous needleleaf forest (80–82), mixed forest (90), and sparse and mosaic boreal vegeta-tion (40, 100, 100, 120, 121, 122, 130, 140, 150, 151, 152,153, 200, 201, 202). Croplands (10, 11, 12, 20, 30) and ur-ban areas (190) were removed. We used the five main phys-iognomic classes from CAVM in the tundra. Glaciers andpermanent water bodies included in either of these productswere removed. Note that in ABCflux and for the site-levelvisualizations in this paper, vegetation type for each of theflux sites was derived from site-level information, not thesegeospatial layers. These same glacier, water, and croplandmasks were applied to the country boundaries (Natural EarthData, 2021) to calculate the terrestrial area of each country.We further used TerraClimate annual and seasonal air tem-perature and precipitation layers averaged over 1989–2020to visualize the distribution of monthly observations acrossthe Arctic–boreal climate space (Abatzoglou et al., 2018).
3 Database summary
3.1 General characteristics of the database
ABCflux includes 244 sites and 6309 monthly observations,out of which 136 sites and 2217 monthly observations arelocated in the tundra (54 % of sites and 52 % of observationsfrom North America, 46 % and 48 % from Eurasia), while108 sites and 4092 monthly observations are located in theboreal biome (59 % of sites and 58 % of observations fromNorth America, 41 % and 42 % from Eurasia) (Table 3). Thelargest source of flux data is the flux repositories (48 % of themonthly observations), while flux data extracted from papersor contributed by site PIs amount to 30 % and 22 % of themonthly observations, respectively. The database primarilyincludes sites in unmanaged ecosystems, but it does containa small number (6) of sites in managed forests.
The majority of observations in ABCflux have been mea-sured with the eddy covariance technique (119 sites and4957 monthly observations), whereas chambers and diffu-sion methods were used at 125 sites and 1352 observa-tions (Table 3). About 46 % of the eddy covariance mea-surements are based on gas analyzers using closed-path tech-nology (including enclosed analyzers), 40 % are based onopen-path technology, 5 % include both and 8 % are un-known. A total of 52 % of chamber measurements wereautomated chambers (monitoring the fluxes continuouslythroughout the growing season). Only 3 % of the measure-ments were completed using diffusion methods during thewinter. Chamber and diffusion studies were primarily from
Earth Syst. Sci. Data, 14, 179–208, 2022 https://doi.org/10.5194/essd-14-179-2022
A.-M. Virkkala et al.: The ABCflux database 187
Table 2. Database variables and the proportion of monthly observations in each variable. There are in total 6309 monthly observations in thedatabase.
Variable Variable description Details Proportionand units of monthly
observationshaving data
id ID given to each indi-vidual monthly entry ateach site
100 %
study_id ID given to study/siteentry (see Details)
(PI/first author ofpublication)_(site name)_(tower/chamber)_(#); e.g.,Schuur_EML_Tower_1. Note that there might be several cham-ber (or tower) Study_IDs for one site.
100 %
study_id_short ID given to study/siteentry (see Details), in-dividual chamber plotswithin a site not differ-entiated
(PI/first author ofpublication)_(site name)_(tower/chamber)_(#); e.g.,Schuur_EML_Tower_1.
100 %
site_name Site name as specifiedin data source
Usually the location name 100 %
site_reference A more specific nameused in data source
For towers, this is often the acronym for the site, and for cham-bers, this is the name of the particular chamber plot
95 %
country Country of the site 100 %
latitude Decimal degrees, asprecise as possible
100 %
longitude Decimal degrees, asprecise as possible
Negative longitudes are west from Greenwich 100 %
start_date Date on which mea-surement starts
mm/dd/yyyy 100 %
end_date Date on which mea-surement ends
mm/dd/yyyy 100 %
meas_year Year in which data wererecorded
100 %
season Season in which datawere recorded
summer, autumn, winter, spring (based on climatological sea-sons)
100 %
interval_month Measurement month 100 %
start_day Start day of the mea-surement
100 %
end_day End day of the mea-surement
100 %
duration Number of days dur-ing the measurementmonth
Should be the same as End_Day because this database compilesmonthly fluxes
100 %
biome Biome of the site Boreal, tundra 100 %
https://doi.org/10.5194/essd-14-179-2022 Earth Syst. Sci. Data, 14, 179–208, 2022
188 A.-M. Virkkala et al.: The ABCflux database
Table 2. Continued.
Variable Variable description Details Proportionand units of monthly
observationshaving data
veg_type A detailed vegetationtype for the site
B1= cryptogram, herb barren; B2= cryptogram bar-ren complex; B3= noncarbonate mountain complex;B4= carbonatemountain complex; G1= rush/grass, forb,cryptogram tundra; G2= graminoid, prostrate dwarf-shrub,forb tundra; G3= nontussock sedge, dwarf-shrub, moss tundra;G4= tussock-sedge, dwarf-shrub, herb tundra; P1= prostratedwarf-shrub, herb tundra; P2= prostrate/hemiprostrate dwarf-shrub tundra; S1= erect dwarf-shrub tundra; S2= low-shrubtundra; W1= sedge/grass, moss wetland; W2= sedge, moss,dwarf-shrub wetland; W3= sedge, moss, low-shrub wetland;DB= deciduous broadleaf forest; EN= evergreen needleleafforest; DN= deciduous needleleaf forest; MF=mixed forest;SB= sparse boreal vegetation; BW= boreal wetland or peat-land, following Watts et al. (2019). For more details about thetundra vegetation types, see Walker et al. (2005). These classeswere classified based on information in Site_Reference andVeg_detail columns, or were contributed by the site PI.
100 %
veg_type_short A more general vegeta-tion type for the site
B= barren tundra; G= graminoid tundra; P= prostrate dwarf-shrub tundra; S= shrub tundra; W= tundra wetland; DB=deciduous broadleaf forest; EN= evergreen needleleaf forest;DN= deciduous needleleaf forest; MF=mixed forest; SB=sparse boreal vegetation; BW= boreal wetland or peatland. Formore details about the tundra vegetation types, see Walker et al.(2005). These classes were classified based on information inSite_Reference and Veg_detail columns, or were contributed bythe site PI.
100 %
veg_detail Detailed vegetationdescription from datasource/contributor
96 %
permafrost Reported presence orabsence of permafrost
Yes, no 73 %
disturbance Last disturbance Fire, harvest, thermokarst, drainage, grazing, larval outbreak,drought
30 %
disturb_year Year of last disturbance Numeric variable, 0= annual (e.g., annual grazing) 23 %
disturb_severity Relative severity of dis-turbance
High, low 11 %
soil_moisture_class General descriptor ofsite moisture
Wet= At least sometimes inundated or water table close to sur-face. Dry= well-drained.
56 %
site_activity Describes whether thesite is currently ac-tive (i.e., measurementsconducted each year)
Yes, no. Eddy covariance information was extracted fromhttps://cosima.nceas.ucsb.edu/carbon-flux-sites/ (last access:12 February 2020) by assuming that sites that were active in2017 are still continuing to be active. We used our expertise todefine active chamber sites that have measurements at least dur-ing each growing season.
60 %
nee Net ecosystem ex-change (gC−CO2 m−2
for the entire measure-ment interval)
Convention: −ve is uptake, +ve is loss. 91 %
Earth Syst. Sci. Data, 14, 179–208, 2022 https://doi.org/10.5194/essd-14-179-2022
A.-M. Virkkala et al.: The ABCflux database 189
Table 2. Continued.
Variable Variable description Details Proportionand units of monthly
observationshaving data
gpp Gross primary produc-tivity (gC−CO2 m−2
for the entire measure-ment interval)
Report as −ve flux 68 %
reco Ecosystem respiration(gC−CO2 m−2 for theentire measurement in-terval)
Report as +ve flux 73 %
ground_nee Forest floor net ecosys-tem exchange, mea-sured with chambers(gC−CO2 m−2 for theentire measurementinterval)
Convention:−ve is uptake,+ve is loss. Chamber measurementsfrom (primarily rather treeless) wetlands are included in theNEE_gC_m2 column.
4 %
ground_gpp Forest floor ecosystemrespiration, mea-sured with chambers(gC−CO2 m−2 for theentire measurementinterval)
Report as −ve flux. Chamber measurements from (primarilyrather treeless) wetlands are included in the GPP_gC_m2 col-umn.
1 %
ground_reco Forest floor gross pri-mary productivity, mea-sured with chambers(gC−CO2 m−2 for theentire measurement in-terval)
Report as +ve flux. Chamber measurements from (primarilyrather treeless) wetlands are included in the Reco_gC_m2 col-umn.
2 %
rsoil Soil respiration, mea-sured with chambers(gC−CO2 m−2 for theentire measurement in-terval)
Report as +ve flux 4 %
flux_method How flux values weremeasured
EC= eddy covariance, Ch= chamber, Diff= diffusion meth-ods. No observations from experimental manipulation plots
100 %
flux_method_detail Details related tohow flux values weremeasured: closed-and open-path eddycovariance, mostlymanual chamber mea-surements, mostlyautomated chambermeasurements, a com-bination of chamberand cuvette mea-surements, diffusionmeasurements throughthe snowpack, chambermeasurements on topof snow
EC_closed, EC_open, EC_enclosed, EC_open andclosed, EC_enclosed, Chambers_mostly_manual, Cham-bers_mostly_automatic, Chambers_CUV, Snow_diffusion,Chambers_snow, NA
93 %
https://doi.org/10.5194/essd-14-179-2022 Earth Syst. Sci. Data, 14, 179–208, 2022

190 A.-M. Virkkala et al.: The ABCflux database
Table 2. Continued.
Variable Variable description Details Proportionand units of monthly
observationshaving data
measurement_frequency Frequency of flux mea-surements
> 100 characterizes high-frequency eddy covariance (and au-tomated chamber) measurements. Manual chamber and dif-fusion techniques often have values between 1 and 30; 1=measurements done during one day of the month, 30=measurements done daily throughout the month. This is theprimary variable that characterizes the frequency and gaps inmonthly fluxes estimated with chambers and diffusion tech-niques.
100 %
diurnal_coverage Times of day coveredby flux measurements
Day, day and night 90 %
partition_method Method used to parti-tion NEE into GPP andReco
Reichstein (night time= Reco partitioning), Lasslop (bulk/day-time partitioning), Reco_measured, ANN, or GPP= Reco-NEE(for chamber sites)
16 %
spatial_reps_chamber Number of spatial repli-cates for the chamberplot
Usually, but not always, several chamber plots are measured toassure the representativeness of measurements
71 %
gap_fill Gap-filling method e.g., average, linear interpolation, lookup table, MDS (marginaldistribution sampling), light/temperature response, neural net-work, a combination of these, or a longer description related tochamber measurements
70 %
gap_perc % of NEE data that wasgap-filled in the mea-surement interval (rel-ative to standard mea-surement time step)
Reported mainly for eddy covariance data 17 %
tower_qa_qc_nee_flag Overall monthly qual-ity flag for eddy co-variance aggregated ob-servations; fraction be-tween 0–1, indicatingpercentage of measuredand good-quality gap-filled data
0= extensive gap-filling, 1= low gap-filling 44 %
tower_qa_qc_nee_source The source for the over-all quality informationfor the eddy covarianceobservations
0= Fluxnet2015, 1= Euroflux 37 %
method_error_nee RMSE or other boot-strapped error ofmodel fit for NEE(g C−CO2 m−2 for theentire measurementinterval)
23 %
method_error_technique Technique used toquantify method errorsfor flux measurements
e.g., gap-filling and partitioning errors or uncertainty in data–model fit: bootstrap, MCMC, RMSE fit, etc.
1 %
high_freq_availability Availability of high-frequency data
17 %
Earth Syst. Sci. Data, 14, 179–208, 2022 https://doi.org/10.5194/essd-14-179-2022
A.-M. Virkkala et al.: The ABCflux database 191
Table 2. Continued.
Variable Variable description Details Proportionand units of monthly
observationshaving data
aggregation_method Method used to aggre-gate data to measure-ment interval
58 %
instrumentation Description of instru-mentation used
68 %
tower_Version Version number of theeddy covariance datasetfrom the extractionsource
21 %
tower_data_restriction 12 %
tower_corrections Details related to pro-cessing corrections em-ployed, including time,duration, and thresh-olds for u∗ and heatcorrections
32 %
spatial_variation_technique Technique used toquantify spatialvariation for fluxmeasurements
e.g., standard error of replicate measurements for cham-bers, spatial error based on footprint partitioning fortowers
10 %
light_response_method_chamber Details related to howthe varying light re-sponse conditions wereconsidered in chambermeasurements
5 %
par_cutoff PAR level used to de-fine nighttimedata and apply parti-tioning method(µmolPARm−2 s−1)
17 %
precip_int Total precipitation dur-ing measurement inter-val (mm)
37 %
tair_int Mean air temperatureduring measurement in-terval (◦C)
72 %
tsoil Mean soil temperatureduring measurement in-terval (◦C)
74 %
soil_moisture Mean soil moisture dur-ing the measurementinterval (% by volume)
35 %
thaw_depth Mean thaw depth dur-ing the measurementinterval (cm)
Report with positive values 6 %
https://doi.org/10.5194/essd-14-179-2022 Earth Syst. Sci. Data, 14, 179–208, 2022

192 A.-M. Virkkala et al.: The ABCflux database
Table 2. Continued.
Variable Variable description Details Proportionand units of monthly
observationshaving data
tsoil_depth Depth of soil temper-ature measurement be-low surface (cm)
46 %
moisture_depth Depth of soil mois-ture measurement be-low surface (cm)
31 %
alt Active layer thickness(cm; maximum thawdepth), will change an-nually
Report with positive values 15 %
water_table_depth Mean water table depthduring the measure-ment interval (cm);positive is below thesurface, negative isabove (inundated)
7 %
snow_depth Mean snow depth dur-ing the measurementinterval (cm)
14 %
vapor_pressure_deficit Mean vapor pressuredeficit during the mea-surement interval (Pa)
30 %
evapotranspiration Totalevapotranspiration dur-ing the measurementinterval (mm)
4 %
par Mean photosyntheti-cally active radiationduring measurementinterval (Wm−2)
5 %
par_ppfd Mean photosyntheti-cally active radiationduring measurementinterval (measured inphotosynthetic photonflux density, PPFD;µmolm−2 s−1)
11 %
precip_ann Mean annual precip-itation (mm), fromsite or nearby weatherstation as a generalsite descriptor. Thisshould describe thelonger-term climate forthe site rather than afew years of study.
80 %
Earth Syst. Sci. Data, 14, 179–208, 2022 https://doi.org/10.5194/essd-14-179-2022
A.-M. Virkkala et al.: The ABCflux database 193
Table 2. Continued.
Variable Variable description Details Proportionand units of monthly
observationshaving data
tair_ann Mean annual air tem-perature (◦C), fromsite or nearby weatherstation as a generalsite descriptor. Thisshould describe thelonger-term climate forthe site rather than afew years of study.
79 %
t_precip_source_yrs Data source and yearsused to calculatemean annual tempera-ture/precipitation
50 %
elevation Elevation above sealevel (m)
65 %
lai Leaf area index 22 %
sol_depth Soil organic layer depth(cm)
23 %
soil_perc_carbon Soil carbon percentage(%)
7 %
perc_C_depth Depth at which soil car-bon % was measured(cm)
7 %
c_density Soil carbon per unitarea (kgCm−2)
16 %
c_density_depth Depth to which soilorganic carbon per unitarea was estimated(cm)
8 %
agb Above ground biomass(kgCm−2)
11 %
agb_type Types of above groundvegetation included inthe AGB measurement
Trees, shrubs, graminoids, mosses, lichens 13 %
soil_type General soil type,including source(e.g., USDA, CSSC,NCSCD)
42 %
soil_type_detail Detailed soil type de-scription, if available
9 %
other_data Other types of datafrom the data sourcethat may be relevant
7 %
notes_site_info Any other relevantinformation related tostatic site descriptions
20 %
https://doi.org/10.5194/essd-14-179-2022 Earth Syst. Sci. Data, 14, 179–208, 2022

194 A.-M. Virkkala et al.: The ABCflux database
Table 2. Continued.
Variable Variable description Details Proportionand units of monthly
observationshaving data
notes_time_variant Any other relevantinformation related totime-varying data
59 %
citation Journal article, datacitation, and/or othersource (online repos-itory, PI submitted,etc.)
70 %
citation_data_overlap Another citation for thesite
13 %
data_contributor_or_author Data contributor(s) orprimary author(s) asso-ciated with dataset orpublication
If you use unpublished data or data from flux reposito-ries (see Extraction_source), please contact this person
100 %
email Primary author email 93 %
orcid Personaldigital identifier: https://orcid.org/ (last access:24 November 2020)
29 %
data_availability Current availability ofdata: data available in apublished paper, in anopen online data repos-itory, in an already pub-lished synthesis, or usercontributed
Published_Paper, Published_Online,Published_Synthesis, User_Contributed
100 %
data_maturity Current maturity ofdata
Preliminary, Processed, Published, Reprocessed. Cur-rently, none of the observations belong to the Prelim-inary or Reprocessed classes, but they were kept for fu-ture versions of the database.
100 %
extraction_source Data source Paper, Virkkala or Natali syntheses, Euroflux, Fluxnet2015, PI, Ameriflux, SMEAR, ORNL DAAC, Pangaea
100 %
dataentry_person The person(s) whoadded the data to thedatabase
Primarily researchers working at Woodwell 100 %
the tundra and the sparsely treed boreal wetlands, but a fewstudies with ground surface CO2 fluxes from forests (i.e.,capturing the ground cover vegetation and not the wholeecosystem) are also included in their own fields so that theycan not be mixed up with ecosystem-scale measurements(“ground_nee”, ”ground_gpp”, “ground_reco”). Further, afew soil CO2 flux sites measuring fluxes primarily on unveg-etated surfaces during the non-growing season are includedin the database (“rsoil”). These were included in the databasebecause ground surface or soil fluxes during the non-growing
season can be of similar magnitude to the ecosystem-levelfluxes when trees remain dormant (Ryan et al., 1997; Hermleet al., 2010). Therefore, these ground or soil fluxes could po-tentially be used to represent ecosystem-level fluxes duringsome of the non-growing season months. However, we didnot make an extensive literature search for these observa-tions, rather we compiled observations if they came up in ourNEE search. Therefore, the data in these ground surface andsoil flux columns represent only a portion of such availabledata across the ABZ.
Earth Syst. Sci. Data, 14, 179–208, 2022 https://doi.org/10.5194/essd-14-179-2022
A.-M. Virkkala et al.: The ABCflux database 195
Table 3. General statistics of the database. Number of monthly CO2 flux measurements and sites derived from eddy covariance, chamber,and diffusion techniques, and the proportion of data coming from different data sources. Note that some of the data extracted from fluxrepositories and papers were further edited by the PIs; this information can be found in the database. For this table, observations that werefully contributed by the PI were considered as PI-contributed.
Flux measurement tech-nique
Number of sites Number of monthly ob-servations
Number of monthly ob-servations derived us-ing different eddy co-variance and chambertechniques
Number of monthlyobservations extractedfrom different datasources
Eddy covariance Total: 119Tundra: 47Boreal: 72
Total: 4957Tundra: 1406Boreal: 3551
Open-path: 1988Closed path: 2085Both: 245Enclosed: 240No information avail-able: 399
Flux repository: 2775Published: 810PI-contributed: 1350
Chamber Total: 104Tundra: 73Boreal: 31
Total: 1166Tundra: 708Boreal: 458
Manual: 435Automated: 696No information avail-able: 35
Flux repository: 243Published: 901PI-contributed: 22
Diffusion Total: 21Tundra: 16Boreal: 5
Total: 186Tundra: 103Boreal: 83
Flux repository: 0Published: 186PI-contributed: 0
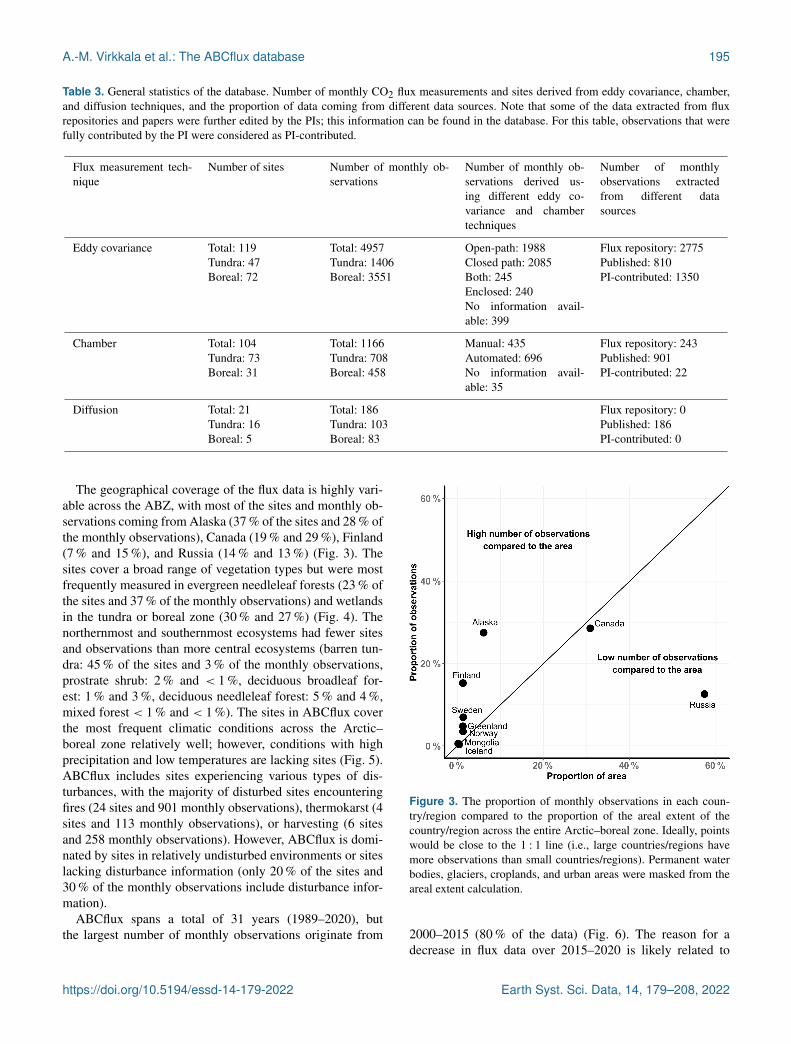
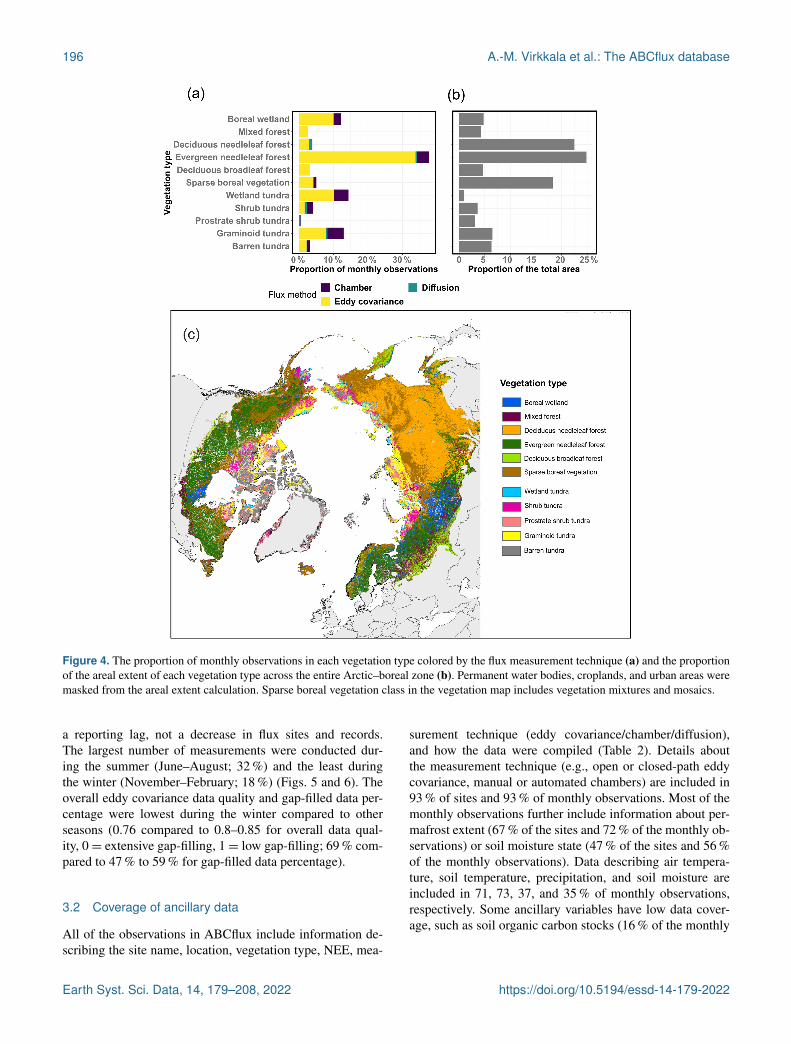
The geographical coverage of the flux data is highly vari-able across the ABZ, with most of the sites and monthly ob-servations coming from Alaska (37 % of the sites and 28 % ofthe monthly observations), Canada (19 % and 29 %), Finland(7 % and 15 %), and Russia (14 % and 13 %) (Fig. 3). Thesites cover a broad range of vegetation types but were mostfrequently measured in evergreen needleleaf forests (23 % ofthe sites and 37 % of the monthly observations) and wetlandsin the tundra or boreal zone (30 % and 27 %) (Fig. 4). Thenorthernmost and southernmost ecosystems had fewer sitesand observations than more central ecosystems (barren tun-dra: 45 % of the sites and 3 % of the monthly observations,prostrate shrub: 2 % and < 1 %, deciduous broadleaf for-est: 1 % and 3 %, deciduous needleleaf forest: 5 % and 4 %,mixed forest < 1 % and < 1 %). The sites in ABCflux coverthe most frequent climatic conditions across the Arctic–boreal zone relatively well; however, conditions with highprecipitation and low temperatures are lacking sites (Fig. 5).ABCflux includes sites experiencing various types of dis-turbances, with the majority of disturbed sites encounteringfires (24 sites and 901 monthly observations), thermokarst (4sites and 113 monthly observations), or harvesting (6 sitesand 258 monthly observations). However, ABCflux is domi-nated by sites in relatively undisturbed environments or siteslacking disturbance information (only 20 % of the sites and30 % of the monthly observations include disturbance infor-mation).
ABCflux spans a total of 31 years (1989–2020), butthe largest number of monthly observations originate from
Figure 3. The proportion of monthly observations in each coun-try/region compared to the proportion of the areal extent of thecountry/region across the entire Arctic–boreal zone. Ideally, pointswould be close to the 1 : 1 line (i.e., large countries/regions havemore observations than small countries/regions). Permanent waterbodies, glaciers, croplands, and urban areas were masked from theareal extent calculation.
2000–2015 (80 % of the data) (Fig. 6). The reason for adecrease in flux data over 2015–2020 is likely related to
https://doi.org/10.5194/essd-14-179-2022 Earth Syst. Sci. Data, 14, 179–208, 2022
196 A.-M. Virkkala et al.: The ABCflux database
Figure 4. The proportion of monthly observations in each vegetation type colored by the flux measurement technique (a) and the proportionof the areal extent of each vegetation type across the entire Arctic–boreal zone (b). Permanent water bodies, croplands, and urban areas weremasked from the areal extent calculation. Sparse boreal vegetation class in the vegetation map includes vegetation mixtures and mosaics.
a reporting lag, not a decrease in flux sites and records.The largest number of measurements were conducted dur-ing the summer (June–August; 32 %) and the least duringthe winter (November–February; 18 %) (Figs. 5 and 6). Theoverall eddy covariance data quality and gap-filled data per-centage were lowest during the winter compared to otherseasons (0.76 compared to 0.8–0.85 for overall data qual-ity, 0= extensive gap-filling, 1= low gap-filling; 69 % com-pared to 47 % to 59 % for gap-filled data percentage).
3.2 Coverage of ancillary data
All of the observations in ABCflux include information de-scribing the site name, location, vegetation type, NEE, mea-
surement technique (eddy covariance/chamber/diffusion),and how the data were compiled (Table 2). Details aboutthe measurement technique (e.g., open or closed-path eddycovariance, manual or automated chambers) are included in93 % of sites and 93 % of monthly observations. Most of themonthly observations further include information about per-mafrost extent (67 % of the sites and 72 % of the monthly ob-servations) or soil moisture state (47 % of the sites and 56 %of the monthly observations). Data describing air tempera-ture, soil temperature, precipitation, and soil moisture areincluded in 71, 73, 37, and 35 % of monthly observations,respectively. Some ancillary variables have low data cover-age, such as soil organic carbon stocks (16 % of the monthly
Earth Syst. Sci. Data, 14, 179–208, 2022 https://doi.org/10.5194/essd-14-179-2022

A.-M. Virkkala et al.: The ABCflux database 197
Figure 5. Mean annual air temperature and precipitation conditions across the Arctic–boreal zone (a), the entire ABCflux (b), and the airtemperature and precipitation conditions across the different climatological seasons included in ABCflux (c–f). Arctic–boreal climate spacewas defined based on a random sample of 20000 pixels across the domain.
Figure 6. Histograms showing the number of monthly measurements across 5-year periods (a, b) and across months (c, d) across the tundraand boreal biomes. The bar plots are colored by the flux measurement technique. Chambers in the boreal biome measured fluxes in treelessor sparsely treed areas (primarily wetlands).
https://doi.org/10.5194/essd-14-179-2022 Earth Syst. Sci. Data, 14, 179–208, 2022
198 A.-M. Virkkala et al.: The ABCflux database
observations) or active layer thickness (15 % of the monthlyobservations).
3.3 Coverage and distribution of flux data
There are 110 sites and 4290 monthly observations for GPP,121 sites and 4603 monthly observations for Reco, and 212sites and 5759 monthly observations for NEE in ABCflux.Monthly values range from −2 to −516 gCm−2 per monthfor GPP, from 0 to 550 gCm−2 per month for Reco, and from−376 to 95 gCm−2 per month for NEE (Table 4). NEE istypically negative during the summer (i.e., net CO2 sink) andmostly positive during other seasons (i.e., net CO2 source)(Fig. 7). Out of all site and year combinations, annual cumu-lative NEE (the sum of monthly NEE values for each yearand site) can be calculated for 267 site years. An average an-nual NEE calculated based on the site-level averages from1995 to 2020 is −27.9 gCm−2 yr−1 (SD 85.4) for the entireregion, −35.5 gCm−2 yr−1 (SD 93.7) for the boreal biome,and −3.3 gCm−2 yr−1 (SD 44.2) for the tundra. However,these averages do not account for the spatial or temporal dis-tribution of the observations and therefore represent coarsesummaries of the database.
4 Strengths, limitations, and opportunities
ABCflux provides several opportunities for an improved un-derstanding of the ABZ carbon cycle. It can be used to cal-culate both short- and longer-term monthly, seasonal, or an-nual flux summaries for different regions, or it can be com-bined with remote sensing and other gridded datasets to buildmonthly statistical and process-based models for CO2 fluxupscaling. ABCflux can further be utilized to study the inter-and intra-annual CO2 flux variability resulting from climateand environmental change. The site distribution in ABCfluxcan also be used to evaluate the extent of the current flux net-work and identify under-sampled regions. From a method-ological perspective, data users can compare fluxes estimatedwith the different measurement techniques which can helpunderstand the uncertainties associated with individual tech-niques. However, there are also some uncertainties that thedata user should be aware of when using ABCflux, which wedescribe below.
4.1 Comparing fluxes estimated with differenttechniques
The ABCflux database comprises aggregated observationsusing eddy covariance, chamber, and diffusion methods.These methods measure CO2 fluxes at different spatiotempo-ral resolutions and are based on different assumptions. Theeddy covariance technique is currently the primary methodto monitor long-term trends in ecosystem CO2 fluxes (Bal-docchi et al., 2018; Baldocchi, 2008), and the majorityof observations in ABCflux (79 %) have been made using
the technique. Transforming high-frequency eddy covariancemeasurements to budgets includes several processing stepsthat can, without harmonization and standardization of thesesteps (Baldocchi et al., 2001; Pastorello et al., 2020), lead tohighly different budget estimates (Soloway et al., 2017). Itis also important to acknowledge that the extent and size ofthe tower footprint differs across the sites due to differencesin the height of the tower and the direction and magnitudeof the wind (Chu et al., 2021). When fluxes are aggregatedover longer time periods to cumulative budgets, one gener-ally assumes the tower footprint remains relatively constant,capturing fluxes from a similar part of the ecosystem (i.e.,the assumption that monthly observations within one site inABCflux can be reliably compared with each other), but notethat at shorter time periods this might not be the case (Pirk etal., 2017; Chu et al., 2021).
The different gas analyzer technologies also play an im-portant role for the fluxes estimated with the eddy covariancetechnique. Sites located in the most northern and remote partsof the ABZ experience a drop in irradiation during autumnand winter which limits solar power availability for eddy co-variance measurements. Closed-path systems require morepower to run than open-path sensors, but open-path sensorsare known to have larger uncertainties. For example, open-path eddy covariance sensors have been shown to incorrectlyestimate NEE due to the self-heating effect of the analyzer,which can result in systematically higher net CO2 uptakecompared to closed-path sensors (Kittler et al., 2017a); how-ever, this pattern was not clearly observed in ABCflux whenacross-site comparisons were made. Furthermore, wintertimefluxes indicating CO2 uptake can be erroneous due to the lim-ited ability of the gas analyzer to resolve very high frequencyturbulent eddies (Jentzsch et al., 2021). Recently, some typesof open-path infrared gas analyzers have been found to beprone to biases in NEE that scale with sensible heat fluxes inall seasons rather than with self-heating (Wang et al., 2017;Helbig et al., 2016).
While using eddy covariance to estimate small-scale spa-tial variability in NEE is challenging (McGuire et al., 2012),this can be accomplished with chamber and diffusion tech-niques. Chamber measurements can be done in highly het-erogeneous environments as long as chamber closure can beguaranteed; however, most of the chamber measurements inABCflux have been conducted in relatively flat and homoge-neous graminoid- and wetland-dominated vegetation types.Most chamber sites in ABCflux include ca. 10–20 individ-ual plots in total from ca. 3–5 land cover types where fluxesare being measured (Virkkala et al., 2018). Chambers canalso provide more direct estimates of Reco and GPP rela-tive to eddy covariance-derived fluxes and are therefore use-ful for estimating the magnitude and range of those compo-nent fluxes. However, manual chamber and diffusion mea-surements are laborious and have limited temporal represen-tation, particularly during the non-growing season when theyoften have only one monthly temporal replicate in ABCflux
Earth Syst. Sci. Data, 14, 179–208, 2022 https://doi.org/10.5194/essd-14-179-2022

A.-M. Virkkala et al.: The ABCflux database 199
Table 4. Mean and standard deviation of monthly observations of net ecosystem exchange (NEE), gross primary productivity (GPP), andecosystem respiration (Reco) in gCm−2 per month. Seasons were defined based on the climatological definition (autumn: September–November; winter: December–February; spring: March–May; summer: June–August). Positive numbers for NEE indicate net CO2 loss tothe atmosphere (i.e., CO2 source), and negative numbers indicate net CO2 uptake by the ecosystem (i.e., CO2 sink). For consistency, GPPis presented as negative values and Reco as positive. Some sites compute only NEE and, consequently, NEE summaries might not entirelymatch with GPP and Reco statistics.
Biome Climatological Mean monthly Mean monthly Mean monthlyseason NEE (SD) GPP (SD) Reco (SD)
Boreal spring −5 (25) −40 (49) 34 (32)Boreal summer −35 (36) −163 (79) 124 (71)Boreal autumn 14 (18) −38 (45) 52 (46)Boreal winter 11 (8) −3 (19) 14 (20)Tundra spring 6 (9) −11 (16) 18 (14)Tundra summer −26 (38) −72 (60) 48 (30)Tundra autumn 10 (21) −14 (30) 21 (15)Tundra winter 9 (10) −2 (9) 12 (11)
(McGuire et al., 2012; Fox et al., 2008). Automated cham-ber measurements during the non-growing season are alsorare in ABCflux. Furthermore, uncertainty around gap-filledmonthly chamber fluxes is presumably larger than that ofthe eddy covariance because of the low temporal replicationof chamber measurements. Manual chamber measurementsmight, for example, be conducted during a limited periodwhich does not cover the range of meteorological and pheno-logical conditions within a month. Additional uncertaintiesin chamber measurements include, for example, accurate de-termination of chamber volume, pressure perturbations, tem-perature increase during the measurement, and collars dis-turbing the ground and causing plant root excision.
Because of these methodological differences across theeddy covariance, chamber and diffusion techniques, com-paring fluxes between the methods may result in inconsis-tencies (Fig. 7). It has been shown that chamber measure-ments can be both larger or smaller than the fluxes esti-mated with eddy covariance (Phillips et al., 2017). This dif-ference can be related to the uncertainties with the eddy co-variance or chamber technique as described above. The dif-ferences can also be due to the mismatch between the cham-ber and tower footprints (< 1 m vs. 250–3000 m radii overthe measurement equipment, respectively) and the difficultyof extrapolating local chamber measurements to landscapescales (Marushchak et al., 2013; Fox et al., 2008). How-ever, several studies have also shown good agreement acrossthe eddy covariance and chamber measurements (Laine etal., 2006; Wang et al., 2013; Eckhardt et al., 2019; Riuttaet al., 2007). Potential mismatches may also be due to abias towards daytime measurements in manual chamber mea-surements (see field “diurnal_coverage”). During daytime,plants are actively photosynthesizing whereas respiration isthe dominant flux at night (López-Blanco et al., 2017). Pre-sumably because of these day vs. nighttime differences, weobserved stronger sink strength in manual chamber measure-
ments compared to other flux measurements in ABCflux,even though eddy covariance measurements have also beenobserved to underestimate nighttime CO2 loss. This under-estimation in nighttime eddy covariance measurements isdue to suppressed turbulent exchange linked to stable atmo-spheric stratification and systematic biases due to horizon-tal advection (Aubinet et al., 2012). Despite these uncertain-ties, including fluxes estimated with all of these techniquesinto one database improves the understanding of underlyingvariability of landscape-scale flux estimates. Indeed, thereare roughly 10 sites in ABCflux that include both eddy co-variance and chamber/diffusion measurements conducted atthe same time. These observations might not have identicalsite coordinates, but they are often very close to each other(< 500 m away from each other). Including multiple methodsfrom the same site provides an opportunity to compare esti-mates from different methods over a larger number of sites.
4.2 Uncertainties in eddy covariance flux partitioning
Monthly Reco and GPP fluxes derived from eddy covari-ance were primarily estimated using nighttime partitioning(Reichstein et al., 2005). Focusing on nighttime partition-ing ensured that data from older sites using this partition-ing method could be included and that most of the fluxeswere standardized using one common partitioning method.However, particularly at sites at higher latitudes of the ABZ,low-light nighttime conditions are restricted to rather shortperiods during summer, limiting the database for assessingReco rates and therefore increasing uncertainties associatedwith the nighttime partitioning (López-Blanco et al., 2020).Recent research suggests that other methods such as day-time partitioning (Lasslop et al., 2010), and even more re-cently artificial neural networks (ANN) (Tramontana et al.,2020), might be more accurate methods for flux partition-ing by addressing the assumptions from nighttime partition-
https://doi.org/10.5194/essd-14-179-2022 Earth Syst. Sci. Data, 14, 179–208, 2022

200 A.-M. Virkkala et al.: The ABCflux database
Figure 7. The distribution of net ecosystem exchange (NEE; a, b), gross primary productivity (GPP; c, d), and ecosystem respiration (Reco;e, f) across the months and biomes, colored by the flux measurement technique. Positive numbers for NEE indicate net CO2 loss to theatmosphere (i.e., CO2 source), and negative numbers indicate net CO2 uptake by the ecosystem (i.e., CO2 sink). For consistency, GPP ispresented as negative values and Reco as positive. The boxes correspond to the 25th and 75th percentiles. The lines denote the 1.5 IQR of thelower and higher quartile, where IQR is the inter-quartile range, or distance between the first and third quartiles. There is not much chamberdata from the boreal regions as they capture NEE only at treeless wetlands.
ing methods (Pastorello et al., 2020; Papale et al., 2006; Re-ichstein et al., 2005; Keenan et al., 2019). Specifically, theassumption of a constant diel temperature sensitivity duringnight- and daytime might introduce error in eddy covariance-based Reco estimates extrapolated from nighttime measure-ments (Järveoja et al., 2020; Keenan et al., 2019). It shouldbe noted that ABCflux database used nighttime partitioning
of fluxes extracted from repositories for consistency; how-ever, fluxes contributed by some databases, PIs or extractedfrom papers may be based on other partitioning methods,as noted in the database. In a few cases, observations fromthe same site were based on different partitioning methods,which limits the usage of data at those sites for time-seriesexploration. These different gap-filling and partitioning ap-
Earth Syst. Sci. Data, 14, 179–208, 2022 https://doi.org/10.5194/essd-14-179-2022

A.-M. Virkkala et al.: The ABCflux database 201
proaches can impact the magnitude of monthly CO2 bud-gets. For example, a study comparing four gap-filling meth-ods in a boreal forest showed that the 14-year average annualNEE budget varied from 4 to 48 gCm−2 yr−1 depending onthe gap-filling approach (Soloway et al., 2017). However, acomparison of multiple gap-filling and partitioning methodsacross sites showed that variation in annual GPP and Recobetween partitioning methods was small (Desai et al., 2008),which provides confidence in estimates from partitioned GPPand Reco components from the differing methods used in thisdatabase.
Any one choice in gap-filling and partitioning introducesuncertainties, and to understand and minimize those uncer-tainties remains an important research priority. However,since this database was not designed for detailed explorationsof how the different gap-filling and partitioning approachesinfluence fluxes, we recommend users interested in thoseto access these data in flux repositories or contact site PIs.Fluxes calculated using multiple gap-filling techniques maybe considered in the next versions of ABCflux. We furthersuggest data users remain cautious when using ABCflux datato understand mechanistic relationships between meteoro-logical variables and fluxes, as the gap-filled and partitionedmonthly fluxes already include some information about, forexample, air or soil temperatures and light conditions. Tocompletely avoid circularity in these exploratory analyses,we recommend data users download the original and non-gap-filled NEE records, or download fluxes partitioned in away that is consistent and biologically relevant for the partic-ular research question from flux repositories.
4.3 Representativeness and completeness of the data
The ABCflux database site distribution covers all vegetationtypes and countries within the ABZ. However, there are re-gional and temporal biases in the database due to the differ-ences in accessibility for sampling certain regions (also doc-umented in Virkkala et al., 2019, and Pallandt et al., 2021).As a result, the number of monthly observations does not al-ways correlate with the size of the country/region or vegeta-tion type. For example, Russia and Canada cover in total ca.80 % of the ABZ but include only ca. 40 % of the monthlyobservations. While the distribution of these measurementsis rather balanced between the Russian tundra and borealbiomes, Canadian observations are primarily located in theboreal biome, largely due to the high number of measure-ments conducted as part of the NASA Boreal Ecosystem–Atmosphere Study (Sellers et al., 1997). Deciduous needle-leaf (i.e., larch) forests, the primary vegetation type in centraland eastern Siberia, has the smallest number of data com-pared to its area (< 5 % of monthly observations vs. > 20 %coverage of the ABZ). Additional data gaps are located inbarren and prostrate-shrub tundra and sparse boreal vegeta-tion, as well as in areas with high precipitation. Eddy covari-ance towers in mountainous regions are also rare (Pallandt
et al., 2021) as eddy covariance towers are most often set upover homogeneous and flat terrains to avoid advection (Bal-docchi, 2003; Etzold et al., 2010). Alaska and Finland cover< 10 % of the ABZ but include > 40 % of the monthly ob-servations.
There are differences in environmental coverage ofABCflux depending on the measured flux, measurementyear, and the measurement season. Sites with NEE observa-tions have the largest geographical coverage, with less avail-ability for partitioned GPP and Reco fluxes. Therefore, re-gional summaries of Reco and GPP do not sum up to NEE.Moreover, although the oldest records in ABCflux originatefrom 1989, observations from the 1990s are primarily locatedin a few boreal or Alaskan tundra sites. The measurementrecords from tundra sites are shorter than boreal sites overthe full time span of the database, and it is therefore moreuncertain to investigate long-term temporal changes in tundrafluxes. Finally, the lowest number of flux data in ABCflux isduring winter, which is the most challenging period for datacollection in high latitudes (Kittler et al., 2017b; Jentzschet al., 2021). Autumn and winter data included in ABCfluxfurther cover a smaller Arctic–boreal climate space, with nodata coming from extremely cold or wet conditions (Fig. 5).Fluxes are generally small during this period (Natali et al.,2019a), leading to higher relative uncertainties in flux estima-tion compared to other seasons. These regional and temporalbiases need to be considered in future analyses to assure therobustness of our understanding of carbon fluxes across theABZ.
Although ABCflux includes a comprehensive compila-tion of flux and supporting environmental and methodolog-ical information, the information is not exhaustive. We ac-knowledge that this database is missing some eddy covari-ance sites that were recently summarized in a tower sur-vey (see preliminary results in https://cosima.nceas.ucsb.edu/carbon-flux-sites/, last access: 12 February 2020), becausethese data were unavailable at the time of database compila-tion. Moreover, the overall quality or the gap-filled percent-age of the eddy covariance observations is not reported foreach eddy covariance site, limiting the potential to explorethe effects of data quality on fluxes across all the eddy covari-ance sites. Comparing soil temperature or moisture acrosssites has uncertainties due to differences in sensor depths,which are not always reported in the database. We hope toimprove and increase the flux and supporting data in the fu-ture as new data are being collected, for example, by leverag-ing the ONEflux pipeline and its different outputs (Pastorelloet al., 2020), as well as aggregating new measurements thatare not part of any networks.
5 Data use guidelines
Data are publicly available using a Creative Commons At-tribution 4.0 International copyright (CC BY 4.0). Data are
https://doi.org/10.5194/essd-14-179-2022 Earth Syst. Sci. Data, 14, 179–208, 2022
202 A.-M. Virkkala et al.: The ABCflux database
fully public but should be appropriately referenced by citingthis paper and the database (see Sect. 6). We suggest that re-searchers planning to use this database as a core dataset fortheir analysis contact and collaborate with the database de-velopers and relevant individual site contributors.
6 Data availability
The database associated with this publica-tion can be found at Virkkala et al. (2021b,https://doi.org/10.3334/ORNLDAAC/1934).
7 Conclusions
ABCflux provides the most comprehensive database of ABZterrestrial ecosystem CO2 fluxes to date. It is particularly use-ful for future modeling, remote sensing, and empirical stud-ies aiming to understand CO2 budgets and regional variabil-ity in flux magnitudes, as well as changes in fluxes throughtime. It can also be used to understand how different environ-mental conditions influence fluxes and to better understandthe current extent of the flux measurement network and itsrepresentativeness across the Arctic–boreal region.
Author contributions. The ABCflux database was conceptual-ized and developed by a team led by SMN, BMR, JDW, MM, AMV,and EAGS, with additional comments from OS. KS and SJC com-piled the data, with contributions from AMV, MM, DP, CM, andJN, and data screening by AMV and SMN. AMV drafted and co-ordinated the manuscript in close collaboration with SMN, BMR,JDW, KS, and MM. All authors contributed to the realization of theABCflux database and participated in the editing of the manuscript.PIs whose data were extracted from publications are not coauthorsin this paper, unless new data were provided, but their contact de-tails can be found in the database.
Competing interests. The contact author has declared that nei-ther they nor their co-authors have any competing interests.
Disclaimer. Publisher’s note: Copernicus Publications remainsneutral with regard to jurisdictional claims in published maps andinstitutional affiliations.
Acknowledgements. Anna-Maria Virkkala, Brendan M. Rogers,Susan M. Natali, and Jennifer D. Watts were funded by the Gor-don and Betty Moore Foundation (grant no. 8414). Brendan M.Rogers, Kathleen Savage, Sara June Connon, Christina Minions,and Julia Nojeim were also funded by the NASA Carbon Cy-cle Science and Arctic-Boreal Vulnerability Experiment programs(ABoVE grant NNX17AE13G), Susan M. Natali by NASA ABoVE(grant NNX15AT81A), and Jennifer D. Watts by NNX15AT81Aand NASA NIP grant NNH17ZDA001N. Edward A. G. Schuur
acknowledges NSF Research, Synthesis, and Knowledge Transferin a Changing Arctic: Science Support for the Study of Environ-mental Arctic Change (grant no. 1331083) and NSF PLR Arc-tic System Science Research Networking Activities (PermafrostCarbon Network: Synthesizing Flux Observations for Benchmark-ing Model Projections of Permafrost Carbon Exchange; grantno. 1931333. Edward A. G. Schuur further acknowledges US De-partment of Energy and Denali National Park. Mats B. Nilssonand Matthias Peichl acknowledge Swedish ICOS (Integrated Car-bon Observatory System) funded by VR and contributing insti-tutions; SITES (Swedish Infrastructure for Ecosystem Science)funded by VR and contributing institutions; VR (grant nos. 2018-03966 and 2019-04676), FORMAS (grant no. 2016-01289), andKempe Foundations (SMK-1211). Eugenie Euskirchen and M. Syn-donia Bret-Harte were funded by NSF Arctic Observatory Net-work and Craig A. Emmerton, Vincent L. St. Louis, and ElynHumphreys by Natural Sciences and Engineering Research Coun-cil. Ivan Mammarella, Pasi Kolari, Eeva-Stiina Tuittila, and An-nalea Lohila acknowledge ICOS-Finland and AV Russian Sci-ence Foundation, project 21-14-00209. Annalea Lohila, Mika Au-rela, Tuomas Laurila, Juha-Pekka Tuovinen, and Juha Hatakka fur-ther acknowledge the Ministry of Transport and Communication.William Quinton, Eugenie Euskirchen, and Vincent L. St. Louiswere funded by ArcticNet. Hideki Kobayashi acknowledges TheArctic Challenge for Sustainability and The Arctic Challenge forSustainability II (JPMXD1420318865), Maija E. Marushchak theAcademy of Finland project PANDA (decision no. 317054), andCarolina Voigt the Academy of Finland project MUFFIN (decisionno. 332196). Marguerite Mauritz acknowledges Arctic Data Cen-ter, National Science Foundation, US Department of Energy, De-nali National Park. Yojiro Matsuura was funded by Ministry of En-vironment, Japan, and Masahito Ueyama by the Arctic Challengefor Sustainability II (ArCS II; JPMXD1420318865) and KAK-ENHI (19H05668). Steven F. Oberbauer acknowledges US Na-tional Science Foundation, and Mikhail Mastepanov, Bo Elberling,and Torben R. Christensen the Greenland Ecosystem Monitoringprogram. Bo Elberling further acknowledge Arctic Station, Uni-versity of Copenhagen and the Danish National Research Foun-dation (CENPERM DNRF100). Efrén López-Blanco was fundedby Greenland Research Council, grant no. 80.35, financed by theDanish Program for Arctic Research and Lutz Merbold by TCOSSiberia. David Holl and Lars Kutzbach were funded by DeutscheForschungsgemeinschaft under Germany’s Excellence Strategy –EXC 177 “CliSAP – Integrated Climate System Analysis andPrediction”. Järvi Järveoja acknowledges Swedish Forest Soci-ety Foundation (2018-485-Steg 2 2017) and FORMAS (2018-00792). Donatella Zona was funded by National Science Foun-dation (NSF) (award nos. 1204263 and 1702797) NASA ABoVE(NNX15AT74A; NNX16AF94A) Program, Natural EnvironmentResearch Council (NERC) UAMS Grant (NE/P002552/1), NOAACooperative Science Center for Earth System Sciences and Re-mote Sensing Technologies (NOAA-CESSRST) under the Coop-erative agreement grant no. NA16SEC4810008, European Union’sHorizon 2020 research and innovation program under grant agree-ment no. 72789. Sang-Jong Park was funded by National ResearchFoundation of Korea Grant from the Korean Government (NRF-2021M1A5A1065425, KOPRI-PN21011). Namyi Chae acknowl-edges the National Research Foundation of Korea Grant from theKorean Government (MSIT; the Ministry of Science and ICT)
Earth Syst. Sci. Data, 14, 179–208, 2022 https://doi.org/10.5194/essd-14-179-2022

A.-M. Virkkala et al.: The ABCflux database 203
(NRF-2021M1A5A1065679 and NRF-2021R1I1A1A01053870).Sigrid Dengel was funded by Department of Energy and NGEE-Arctic. Frans-Jan W. Parmentier is funded by the Swedish ResearchCouncil (registration no. 2017-05268) and the Research Council ofNorway (grant no. 274711). Anatoly S. Prokushkin and ViacheslavI. Zyryanov were funded by a grant of the Russian Fund for Ba-sic Research no. 18-05-60203-Arktika. The authors would like toacknowledge Tiffany Windholz for her work on standardizing andcleaning up the database.
Financial support. This research has been supported bythe National Aeronautics and Space Administration (grantnos. NNX17AE13G, NNX15AT81A, NNH17ZDA001N,NNX15AT74A, and NNX16AF94A), the Gordon and BettyMoore Foundation (grant no. 8414), the National Science Foun-dation (grant nos. 1331083, 1931333, NSF Arctic ObservatoryNetwork, 1204263, and 1702797), the Vetenskapsrådet (grantnos. 2017-05268, 2018-03966, and 2019-04676), the SvenskaForskningsrådet Formas (grant nos. 2016-01289 and 2018-00792),the Kempe Foundation (grant no. SMK-1211), the Russian ScienceFoundation (grant no. 21-14-00209), the Academy of Finland (grantnos. 317054 and 332196), the Danmarks Grundforskningsfond(grant no. CENPERM DNRF100), the Deutsche Forschungsge-meinschaft (grant no. EXC 177 CliSAP), the Skogssällskapet(grant no. 2018-485-Steg 2 2017), the Natural EnvironmentResearch Council (grant no. NE/P002552/1), the National ResearchFoundation of Korea (grant nos. NRF-2021M1A5A1065425,KOPRI-PN21011, NRF-2021M1A5A1065679, and NRF-2021R1I1A1A01053870), the Norges Forskningsråd (grantno. 274711), US Department of Energy, Natural Sciences andEngineering Research Council, Russian Science Foundation (grantno. 21-14-00209), the Ministry of Transport and Communication(Finland), ArcticNet, The Arctic Challenge for Sustainabilityand The Arctic Challenge for Sustainability II (grant no. JP-MXD1420318865), KAKENHI (grant no. 19H05668), GreenlandEcosystem Monitoring Program, Danish Program for ArcticResearch (grant no. 80.35), TCOS Siberia, NOAA-CESSRST(grant no. NA16SEC4810008), European Union’s Horizon 2020(grant no. 72789), NGEE Arctic, and Russian Fund for BasicResearch (grant no. 18-05-60203-Arktika).
Review statement. This paper was edited by David Carlson andreviewed by two anonymous referees.
References
Abatzoglou, J. T., Dobrowski, S. Z., Parks, S. A., and Hegewisch,K. C.: TerraClimate, a high-resolution global dataset of monthlyclimate and climatic water balance from 1958–2015, Sci. Data,5, 170191, https://doi.org/10.1038/sdata.2017.191, 2018.
Arctic Data Center: Reconciling historical and contempo-rary trends in terrestrial carbon exchange of the northernpermafrost-zone, https://arcticdata.io/reconciling-historical-and-contemporary-trends-in-terrestrial-carbon-exchange-of-the-northern-permafrost-zone/, last access: 11 February 2021.
Aubinet, M., Vesala, T., and Papale, D.: Eddy Covariance: A Practi-cal Guide to Measurement and Data Analysis, Springer Science& Business Media, 438 pp., ISBN 9789400723504, 2012.
Aurela, M., Laurila, T., and Tuovinen, J. P.: Annual CO2 bal-ance of a subarctic fen in northern Europe: Importance ofthe wintertime efflux, J. Geophys. Res.-Atmos., 107, 4607,https://doi.org/10.1029/2002JD002055, 2002.
Bäckstrand, K., Crill, P. M., Jackowicz-Korczyñski, M., Mas-tepanov, M., Christensen, T. R., and Bastviken, D.: Annual car-bon gas budget for a subarctic peatland, Northern Sweden, Bio-geosciences, 7, 95–108, https://doi.org/10.5194/bg-7-95-2010,2010.
Baldocchi, D.: “Breathing” of the terrestrial biosphere: lessonslearned from a global network of carbon dioxide flux measure-ment systems, Aust. J. Bot., 56, 1–26, 2008.
Baldocchi, D., Falge, E., Gu, L., Olson, R., Hollinger, D., Run-ning, S., Anthoni, P., Bernhofer, C., Davis, K., Evans, R.,Fuentes, J., Goldstein, A., Katul, G., Law, B., Lee, X., Malhi,Y., Meyers, T., Munger, W., Oechel, W., Paw U, K. T., Pile-gaard, K., Schmid, H. P., Valentini, R., Verma, S., Vesala, T.,Wilson, K., and Wofsy, S.: FLUXNET: A New Tool to Studythe Temporal and Spatial Variability of Ecosystem-Scale Car-bon Dioxide, Water Vapor, and Energy Flux Densities, B. Am.Meteorol. Soc., 82, 2415–2434, https://doi.org/10.1175/1520-0477(2001)082<2415:FANTTS>2.3.CO;2, 2001.
Baldocchi, D., Chu, H., and Reichstein, M.: Inter-annual variability of net and gross ecosystem carbonfluxes: A review, Agr. Forest Meteorol., 249, 520–533,https://doi.org/10.1016/j.agrformet.2017.05.015, 2018.
Baldocchi, D. D.: Assessing the eddy covariance techniquefor evaluating carbon dioxide exchange rates of ecosystems:past, present and future, Glob. Change Biol., 9, 479–492,https://doi.org/10.1046/j.1365-2486.2003.00629.x, 2003.
Belshe, E. F., Schuur, E. A. G., and Bolker, B. M.: Tundraecosystems observed to be CO2 sources due to differentialamplification of the carbon cycle, Ecol. Lett., 16, 1307–1315,https://doi.org/10.1111/ele.12164, 2013.
Björkman, M. P., Morgner, E., Björk, R. G., Cooper, E. J.,Elberling, B., and Klemedtsson, L.: A comparison of an-nual and seasonal carbon dioxide effluxes between sub-ArcticSweden and High-Arctic Svalbard, Polar Res., 29, 75–84,https://doi.org/10.1111/j.1751-8369.2010.00150.x, 2010a.
Björkman, M. P., Morgner, E., Cooper, E. J., Elberling,B., Klemedtsson, L., and Björk, R. G.: Winter carbondioxide effluxes from Arctic ecosystems: An overviewand comparison of methodologies: Winter CO2 effluxesfrom arctic soils, Global Biogeochem. Cy., 24, GB3010,https://doi.org/10.1029/2009gb003667, 2010b.
Bond-Lamberty, B., Christianson, D. S., Malhotra, A., Penning-ton, S. C., Sihi, D., AghaKouchak, A., Anjileli, H., Altaf Arain,M., Armesto, J. J., Ashraf, S., Ataka, M., Baldocchi, D., An-drew Black, T., Buchmann, N., Carbone, M. S., Chang, S.-C.,Crill, P., Curtis, P. S., Davidson, E. A., Desai, A. R., Drake, J.E., El-Madany, T. S., Gavazzi, M., Görres, C.-M., Gough, C.M., Goulden, M., Gregg, J., Gutiérrez Del Arroyo, O., He, J.-S., Hirano, T., Hopple, A., Hughes, H., Järveoja, J., Jassal, R.,Jian, J., Kan, H., Kaye, J., Kominami, Y., Liang, N., Lipson,D., Macdonald, C. A., Maseyk, K., Mathes, K., Mauritz, M.,Mayes, M. A., McNulty, S., Miao, G., Migliavacca, M., Miller,
https://doi.org/10.5194/essd-14-179-2022 Earth Syst. Sci. Data, 14, 179–208, 2022
204 A.-M. Virkkala et al.: The ABCflux database
S., Miniat, C. F., Nietz, J. G., Nilsson, M. B., Noormets, A.,Norouzi, H., O’Connell, C. S., Osborne, B., Oyonarte, C., Pang,Z., Peichl, M., Pendall, E., Perez-Quezada, J. F., Phillips, C.L., Phillips, R. P., Raich, J. W., Renchon, A. A., Ruehr, N. K.,Sánchez-Cañete, E. P., Saunders, M., Savage, K. E., Schrumpf,M., Scott, R. L., Seibt, U., Silver, W. L., Sun, W., Szutu, D.,Takagi, K., Takagi, M., Teramoto, M., Tjoelker, M. G., Trum-bore, S., Ueyama, M., Vargas, R., Varner, R. K., Verfaillie, J.,Vogel, C., Wang, J., Winston, G., Wood, T. E., Wu, J., Wutzler,T., Zeng, J., Zha, T., Zhang, Q., and Zou, J.: COSORE: A com-munity database for continuous soil respiration and other soil-atmosphere greenhouse gas flux data, Glob. Change Biol., 26,7268–7283, https://doi.org/10.1111/gcb.15353, 2020.
Box, J. E., Colgan, W. T., Christensen, T. R., Schmidt, N. M.,Lund, M., Parmentier, F.-J. W., Brown, R., Bhatt, U. S., Eu-skirchen, E. S., Romanovsky, V. E., Walsh, J. E., Overland, J.E., Wang, M., Corell, R. W., Meier, W. N., Wouters, B., Mernild,S., Mård, J., Pawlak, J., and Olsen, M. S.: Key indicators of Arc-tic climate change: 1971–2017, Environ. Res. Lett., 14, 045010,https://doi.org/10.1088/1748-9326/aafc1b, 2019.
Cahoon, S. M. P., Sullivan, P. F., and Post, E.: Greater Abundanceof Betula nana and Early Onset of the Growing Season IncreaseEcosystem CO2 Uptake in West Greenland, Ecosystems, 19,1149–1163, https://doi.org/10.1007/s10021-016-9997-7, 2016.
Chu, H., Luo, X., Ouyang, Z., Chan, W. S., Dengel, S., Biraud,S. C., Torn, M. S., Metzger, S., Kumar, J., Arain, M. A., Arke-bauer, T. J., Baldocchi, D., Bernacchi, C., Billesbach, D., Black,T. A., Blanken, P. D., Bohrer, G., Bracho, R., Brown, S., Brun-sell, N. A., Chen, J., Chen, X., Clark, K., Desai, A. R., Du-man, T., Durden, D., Fares, S., Forbrich, I., Gamon, J. A.,Gough, C. M., Griffis, T., Helbig, M., Hollinger, D., Humphreys,E., Ikawa, H., Iwata, H., Ju, Y., Knowles, J. F., Knox, S. H.,Kobayashi, H., Kolb, T., Law, B., Lee, X., Litvak, M., Liu,H., Munger, J. W., Noormets, A., Novick, K., Oberbauer, S.F., Oechel, W., Oikawa, P., Papuga, S. A., Pendall, E., Prajap-ati, P., Prueger, J., Quinton, W. L., Richardson, A. D., Rus-sell, E. S., Scott, R. L., Starr, G., Staebler, R., Stoy, P. C.,Stuart-Haëntjens, E., Sonnentag, O., Sullivan, R. C., Suyker, A.,Ueyama, M., Vargas, R., Wood, J. D., and Zona, D.: Representa-tiveness of Eddy-Covariance flux footprints for areas surround-ing AmeriFlux sites, Agr. Forest Meteorol., 301–302, 108350,https://doi.org/10.1016/j.agrformet.2021.108350, 2021.
Desai, A. R., Richardson, A. D., Moffat, A. M., Kattge,J., Hollinger, D. Y., Barr, A., Falge, E., Noormets, A.,Papale, D., Reichstein, M., and Stauch, V. J.: Cross-site evaluation of eddy covariance GPP and RE decom-position techniques, Agr. Forest Meteorol., 148, 821–838,https://doi.org/10.1016/j.agrformet.2007.11.012, 2008.
Didan, K.: MOD13A3 MODIS/Terra Vegetation Indices MonthlyL3 Global 1 km SIN Grid V006, NASA EOSDIS Land ProcessesDAAC, https://doi.org/10.5067/MODIS/MOD13A3.006, 2015.
Dinerstein, E., Olson, D., Joshi, A., Vynne, C., Burgess, N. D.,Wikramanayake, E., Hahn, N., Palminteri, S., Hedao, P., Noss,R., Hansen, M., Locke, H., Ellis, E. C., Jones, B., Barber, C.V., Hayes, R., Kormos, C., Martin, V., Crist, E., Sechrest, W.,Price, L., Baillie, J. E. M., Weeden, D., Suckling, K., Davis,C., Sizer, N., Moore, R., Thau, D., Birch, T., Potapov, P., Tu-rubanova, S., Tyukavina, A., de Souza, N., Pintea, L., Brito, J.C., Llewellyn, O. A., Miller, A. G., Patzelt, A., Ghazanfar, S.
A., Timberlake, J., Klöser, H., Shennan-Farpón, Y., Kindt, R.,Lillesø, J.-P. B., van Breugel, P., Graudal, L., Voge, M., Al-Shammari, K. F., and Saleem, M.: An Ecoregion-Based Ap-proach to Protecting Half the Terrestrial Realm, Bioscience, 67,534–545, https://doi.org/10.1093/biosci/bix014, 2017.
Eckhardt, T., Knoblauch, C., Kutzbach, L., Holl, D., Simp-son, G., Abakumov, E., and Pfeiffer, E.-M.: Partitioning netecosystem exchange of CO2 on the pedon scale in theLena River Delta, Siberia, Biogeosciences, 16, 1543–1562,https://doi.org/10.5194/bg-16-1543-2019, 2019.
Etzold, S., Buchmann, N., and Eugster, W.: Contribution of advec-tion to the carbon budget measured by eddy covariance at a steepmountain slope forest in Switzerland, Biogeosciences, 7, 2461–2475, https://doi.org/10.5194/bg-7-2461-2010, 2010.
Euskirchen, E. S., Bret-Harte, M. S., Scott, G. J., Edgar, C., andShaver, G. R.: Seasonal patterns of carbon dioxide and wa-ter fluxes in three representative tundra ecosystems in north-ern Alaska, Ecosphere, 3, art4, https://doi.org/10.1890/es11-00202.1, 2012.
Fox, A. M., Huntley, B., Lloyd, C. R., Williams, M., andBaxter, R.: Net ecosystem exchange over heterogeneousArctic tundra: Scaling between chamber and eddy covari-ance measurements, Global Biogeochem. Cy., 22, GB2027,https://doi.org/10.1029/2007GB003027, 2008.
Gorham, E.: Northern Peatlands: Role in the Carbon Cycle andProbable Responses to Climatic Warming, Ecol. Appl., 1, 182–195, https://doi.org/10.2307/1941811, 1991.
Hari, P., Nikinmaa, E., Pohja, T., Siivola, E., Bäck, J., Vesala, T., andKulmala, M.: Station for Measuring Ecosystem–Atmosphere Re-lations: SMEAR, in: Physical and Physiological Forest Ecology,edited by: Hari, P., Heliövaara, K., and Kulmala, L., SpringerNetherlands, Dordrecht, 471–487, https://doi.org/10.1007/978-94-007-5603-8_9, 2013.
Hayes, D. J., Kicklighter, D. W., David McGuire, A., Chen, M.,Zhuang, Q., Yuan, F., Melillo, J. M., and Wullschleger, S. D.:The impacts of recent permafrost thaw on land–atmospheregreenhouse gas exchange, Environ. Res. Lett., 9, 045005,https://doi.org/10.1088/1748-9326/9/4/045005, 2014.
Heiskanen, L., Tuovinen, J.-P., Räsänen, A., Virtanen, T., Juutinen,S., Lohila, A., Penttilä, T., Linkosalmi, M., Mikola, J., Laurila,T., and Aurela, M.: Carbon dioxide and methane exchange ofa patterned subarctic fen during two contrasting growing sea-sons, Biogeosciences, 18, 873–896, https://doi.org/10.5194/bg-18-873-2021, 2021.
Helbig, M., Wischnewski, K., Gosselin, G. H., Biraud, S. C., Bo-goev, I., Chan, W. S., Euskirchen, E. S., Glenn, A. J., Marsh, P.M., Quinton, W. L., and Sonnentag, O.: Addressing a systematicbias in carbon dioxide flux measurements with the EC150 and theIRGASON open-path gas analyzers, Agr. Forest Meteorol., 228–229, 349–359, https://doi.org/10.1016/j.agrformet.2016.07.018,2016.
Heliasz, M., Johansson, T., Lindroth, A., Mölder, M., Mastepanov,M., Friborg, T., Callaghan, T. V., and Christensen, T. R.: Quan-tification of C uptake in subarctic birch forest after setback byan extreme insect outbreak, Geophys. Res. Lett., 38, L01704,https://doi.org/10.1029/2010gl044733, 2011.
Hermle, S., Lavigne, M. B., Bernier, P. Y., Bergeron, O.,and Paré, D.: Component respiration, ecosystem respira-tion and net primary production of a mature black spruce
Earth Syst. Sci. Data, 14, 179–208, 2022 https://doi.org/10.5194/essd-14-179-2022

A.-M. Virkkala et al.: The ABCflux database 205
forest in northern Quebec, Tree Physiol., 30, 527–540,https://doi.org/10.1093/treephys/tpq002, 2010.
Hugelius, G., Strauss, J., Zubrzycki, S., Harden, J. W., Schuur, E.A. G., Ping, C.-L., Schirrmeister, L., Grosse, G., Michaelson, G.J., Koven, C. D., O’Donnell, J. A., Elberling, B., Mishra, U.,Camill, P., Yu, Z., Palmtag, J., and Kuhry, P.: Estimated stocksof circumpolar permafrost carbon with quantified uncertaintyranges and identified data gaps, Biogeosciences, 11, 6573–6593,https://doi.org/10.5194/bg-11-6573-2014, 2014.
Hugelius, G., Loisel, J., Chadburn, S., Jackson, R. B., Jones, M.,MacDonald, G., Marushchak, M., Olefeldt, D., Packalen, M.,Siewert, M. B., Treat, C., Turetsky, M., Voigt, C., and Yu, Z.:Large stocks of peatland carbon and nitrogen are vulnerable topermafrost thaw, P. Natl. Acad. Sci. USA, 117, 20438–20446,https://doi.org/10.1073/pnas.1916387117, 2020.
Järveoja, J., Nilsson, M. B., Gažovic, M., Crill, P. M., and Peichl,M.: Partitioning of the net CO 2 exchange using an automatedchamber system reveals plant phenology as key control of pro-duction and respiration fluxes in a boreal peatland, Glob. ChangeBiol., 24, 3436–3451, 2018.
Järveoja, J., Nilsson, M. B., Crill, P. M., and Peichl, M.:Bimodal diel pattern in peatland ecosystem respiration re-buts uniform temperature response, Nat. Commun., 11, 4255,https://doi.org/10.1038/s41467-020-18027-1, 2020.
Jentzsch, K., Schulz, A., Pirk, N., Foken, T., Crewell, S., andBoike, J.: High levels of CO2 exchange during synoptic-scale events introduce large uncertainty into the arcticcarbon budget, Geophys. Res. Lett., 48, e2020GL092256,https://doi.org/10.1029/2020gl092256, 2021.
Jian, J., Vargas, R., Anderson-Teixeira, K., Stell, E., Herrmann, V.,Horn, M., Kholod, N., Manzon, J., Marchesi, R., Paredes, D.,and Bond-Lamberty, B.: A restructured and updated global soilrespiration database (SRDB-V5), Earth Syst. Sci. Data, 13, 255–267, https://doi.org/10.5194/essd-13-255-2021, 2021.
Keenan, T. F. and Williams, C. A.: The Terrestrial Car-bon Sink, Annu. Rev. Environ. Resour., 43, 219–243,https://doi.org/10.1146/annurev-environ-102017-030204, 2018.
Keenan, T. F., Migliavacca, M., Papale, D., Baldocchi, D., Reich-stein, M., Torn, M., and Wutzler, T.: Widespread inhibition ofdaytime ecosystem respiration, Nature Ecology & Evolution, 3,407–415, https://doi.org/10.1038/s41559-019-0809-2, 2019.
Kittler, F., Eugster, W., Foken, T., Heimann, M., Kolle, O.,and Göckede, M.: High-quality eddy-covariance CO2budgetsunder cold climate conditions: Arctic Eddy-CovarianceCO2Budgets, J. Geophys. Res.-Biogeo., 122, 2064–2084,https://doi.org/10.1002/2017jg003830, 2017a.
Kittler, F., Heimann, M., Kolle, O., Zimov, N., Zimov, S., andGöckede, M.: Long-term drainage reduces CO2 uptake andCH4 emissions in a Siberian permafrost ecosystem, Global Bio-geochem. Cy., 31, 1704–1717, 2017b.
Lafleur, P. M., Humphreys, E. R., St Louis, V. L., Myklebust, M.C., Papakyriakou, T., Poissant, L., Barker, J. D., Pilote, M., andSwystun, K. A.: Variation in peak growing season net ecosystemproduction across the Canadian Arctic, Environ. Sci. Technol.,46, 7971–7977, https://doi.org/10.1021/es300500m, 2012.
Laine, A., Sottocornola, M., Kiely, G., Byrne, K. A., Wilson, D., andTuittila, E.-S.: Estimating net ecosystem exchange in a patternedecosystem: Example from blanket bog, Agr. Forest Meteorol.,
138, 231–243, https://doi.org/10.1016/j.agrformet.2006.05.005,2006.
Lamarche, C., Bontemps, S., Verhegghen, A., Radoux, J., Vanbo-gaert, E., Kalogirou, V., Seifert, F. M., Arino, O., and Defourny,P.: Characterizing The Surface Dynamics For Land Cover Map-ping: Current Achievements Of The ESA CCI Land Cover, Proc.ESA Living Planet Symposium 2013, 9–13 September 2013, Ed-inburgh, UK, ESA SP-722, 72279, 2013.
Lasslop, G., Reichstein, M., Papale, D., Richardson, A. D., Ar-neth, A., Barr, A., Stoy, P., and Wohlfahrt, G.: Separation ofnet ecosystem exchange into assimilation and respiration usinga light response curve approach: critical issues and global evalu-ation: Separation of nee into gpp and reco, Glob. Change Biol.,16, 187–208, https://doi.org/10.1111/j.1365-2486.2009.02041.x,2010.
López-Blanco, E., Lund, M., Williams, M., Tamstorf, M. P.,Westergaard-Nielsen, A., Exbrayat, J.-F., Hansen, B. U., andChristensen, T. R.: Exchange of CO2 in Arctic tundra: im-pacts of meteorological variations and biological disturbance,Biogeosciences, 14, 4467–4483, https://doi.org/10.5194/bg-14-4467-2017, 2017.
López-Blanco, E., Jackowicz-Korczynski, M., Mastepanov, M.,Skov, K., Westergaard-Nielsen, A., Williams, M., and Chris-tensen, T. R.: Multi-year data-model evaluation reveals theimportance of nutrient availability over climate in arcticecosystem C dynamics, Environ. Res. Lett., 15, 094007,https://doi.org/10.1088/1748-9326/ab865b, 2020.
Luyssaert, S., Inglima, I., Jung, M., Richardson, A. D., Reich-stein, M., Papale, D., Piao, S. L., Schulze, E.-D., Wingate, L.,Matteucci, G., Aragao, L., Aubinet, M., Beer, C., Bernhofer,C., Black, K. G., Bonal, D., Bonnefond, J.-M., Chambers, J.,Ciais, P., Cook, B., Davis, K. J., Dolman, A. J., Gielen, B.,Goulden, M., Grace, J., Granier, A., Grelle, A., Griffis, T., Grün-wald, T., Guidolotti, G., Hanson, P. J., Harding, R., Hollinger,D. Y., Hutyra, L. R., Kolari, P., Kruijt, B., Kutsch, W., Lager-gren, F., Laurila, T., Law, B. E., Le Maire, G., Lindroth, A.,Loustau, D., Malhi, Y., Mateus, J., Migliavacca, M., Misson,L., Montagnani, L., Moncrieff, J., Moors, E., Munger, J. W.,Nikinmaa, E., Ollinger, S. V., Pita, G., Rebmann, C., Roup-sard, O., Saigusa, N., Sanz, M. J., Seufert, G., Sierra, C., Smith,M.-L., Tang, J., Valentini, R., Vesala, T., and Janssens, I. A.:CO2 balance of boreal, temperate, and tropical forests derivedfrom a global database, Glob. Change Biol., 13, 2509–2537,https://doi.org/10.1111/j.1365-2486.2007.01439.x, 2007.
Marushchak, M. E., Kiepe, I., Biasi, C., Elsakov, V., Friborg, T.,Johansson, T., Soegaard, H., Virtanen, T., and Martikainen, P. J.:Carbon dioxide balance of subarctic tundra from plot to regionalscales, Biogeosciences, 10, 437–452, https://doi.org/10.5194/bg-10-437-2013, 2013.
McGuire, A. D., Christensen, T. R., Hayes, D., Heroult, A., Eu-skirchen, E., Kimball, J. S., Koven, C., Lafleur, P., Miller, P.A., Oechel, W., Peylin, P., Williams, M., and Yi, Y.: An assess-ment of the carbon balance of Arctic tundra: comparisons amongobservations, process models, and atmospheric inversions, Bio-geosciences, 9, 3185–3204, https://doi.org/10.5194/bg-9-3185-2012, 2012.
McGuire, A. D., Koven, C., Lawrence, D. M., Clein, J. S., Xia,J., Beer, C., Burke, E., Chen, G., Chen, X., Delire, C., Jafarov,E., MacDougall, A. H., Marchenko, S., Nicolsky, D., Peng, S.,
https://doi.org/10.5194/essd-14-179-2022 Earth Syst. Sci. Data, 14, 179–208, 2022
206 A.-M. Virkkala et al.: The ABCflux database
Rinke, A., Saito, K., Zhang, W., Alkama, R., Bohn, T. J., Ciais,P., Decharme, B., Ekici, A., Gouttevin, I., Hajima, T., Hayes,D. J., Ji, D., Krinner, G., Lettenmaier, D. P., Luo, Y., Miller,P. A., Moore, J. C., Romanovsky, V., Schädel, C., Schaefer,K., Schuur, E. A. G., Smith, B., Sueyoshi, T., and Zhuang,Q.: Variability in the sensitivity among model simulations ofpermafrost and carbon dynamics in the permafrost region be-tween 1960 and 2009, Global Biogeochem. Cy., 30, 1015–1037,https://doi.org/10.1002/2016GB005405, 2016.
Merbold, L., Kutsch, W. L., Corradi, C., Kolle, O., Rebmann,C., Stoy, P. C., Zimov, S. A., and Schulze, E.-D.: Arti-ficial drainage and associated carbon fluxes (CO2/CH4) ina tundra ecosystem, Glob. Change Biol., 15, 2599–2614,https://doi.org/10.1111/j.1365-2486.2009.01962.x, 2009.
Mishra, U., Hugelius, G., Shelef, E., Yang, Y., Strauss, J., Lupachev,A., Harden, J. W., Jastrow, J. D., Ping, C.-L., Riley, W. J., Schuur,E. A. G., Matamala, R., Siewert, M., Nave, L. E., Koven, C.D., Fuchs, M., Palmtag, J., Kuhry, P., Treat, C. C., Zubrzycki,S., Hoffman, F. M., Elberling, B., Camill, P., Veremeeva, A.,and Orr, A.: Spatial heterogeneity and environmental predictorsof permafrost region soil organic carbon stocks, Sci. Adv., 7,eaaz5236, https://doi.org/10.1126/sciadv.aaz5236, 2021.
Natali, S. M., Watts, J. D., Rogers, B. M., Potter, S., Ludwig, S.M., Selbmann, A.-K., Sullivan, P. F., Abbott, B. W., Arndt, K.A., Birch, L., Björkman, M. P., Bloom, A. A., Celis, G., Chris-tensen, T. R., Christiansen, C. T., Commane, R., Cooper, E. J.,Crill, P., Czimczik, C., Davydov, S., Du, J., Egan, J. E., Elber-ling, B., Euskirchen, E. S., Friborg, T., Genet, H., Göckede, M.,Goodrich, J. P., Grogan, P., Helbig, M., Jafarov, E. E., Jastrow,J. D., Kalhori, A. A. M., Kim, Y., Kimball, J. S., Kutzbach, L.,Lara, M. J., Larsen, K. S., Lee, B.-Y., Liu, Z., Loranty, M. M.,Lund, M., Lupascu, M., Madani, N., Malhotra, A., Matamala,R., McFarland, J., McGuire, A. D., Michelsen, A., Minions, C.,Oechel, W. C., Olefeldt, D., Parmentier, F.-J. W., Pirk, N., Poul-ter, B., Quinton, W., Rezanezhad, F., Risk, D., Sachs, T., Schae-fer, K., Schmidt, N. M., Schuur, E. A. G., Semenchuk, P. R.,Shaver, G., Sonnentag, O., Starr, G., Treat, C. C., Waldrop, M.P., Wang, Y., Welker, J., Wille, C., Xu, X., Zhang, Z., Zhuang,Q., and Zona, D.: Large loss of CO2 in winter observed acrossthe northern permafrost region, Nat. Clim. Change, 9, 852–857,https://doi.org/10.1038/s41558-019-0592-8, 2019a.
Natali, S., Watts, J. D., Potter, S., Rogers, B. M., Ludwig, S.,Selbmann, A., Sullivan, P., Abbott, B., Arndt, K., Bloom, A.A., Celis, G., Christensen, T., Christiansen, C., Commane, R.,Cooper, E., Crill, P. M., Czimczik, C. I., Davydov, S., Du, J.,Egan, J., Elberling, B., Euskirchen, S. E., Friborg, T., Genet,H., Goodrich, J., Grogan, P., Helbig, M., Jafarov, E., Jastrow,J., Kalhori, A., Kim, Y., Kimball, J. S., Kutzbach, L., Lara,M., Larsen, K., Lee, B., Liu, Z., Loranty, M. M., Lund, M.,Lupascu, M., Madani, N., Malhotra, A., Matamala, R., Mcfar-land, J., Mcguire, A., Michelsen, A., Minions, C., Oechel, W.,Olefeldt, D., Parmentier, F., Pirk, N., Poulter, B., Quinton, W.,Rezanezhad, F., Risk, D., Sachs, T., Schaefer, K., Schmidt, N.,Schuur, E., Semenchuk, P., Shaver, G., Sonnentag, O., Starr, G.,Treat, C., Waldrop, M., Wang, Y., Welker, J., Wille, C., Xu,X., Zhang, Z., Zhuang, Q., and Zona, D.: Synthesis of winterin situ soil CO2 flux in pan-arctic and boreal regions, 1989–2017, ORNL DAAC, Oak Ridge, Tennessee, USA [data set],https://doi.org/10.3334/ORNLDAAC/1692, 2019b.
Natural Earth Data: Free vector and raster map data at 1 :10 m, 1 : 50 m, and 1 : 110 m scales, available at: https://www.naturalearthdata.com/, last access: 12 February 2021.
Nobrega, S. and Grogan, P.: Landscape and ecosystem-level con-trols on net carbon dioxide exchange along a natural moisturegradient in Canadian low arctic tundra, Ecosystems, 11, 377–396, https://doi.org/10.1007/s10021-008-9128-1, 2008.
Novick, K. A., Biederman, J. A., Desai, A. R., Litvak, M. E., Moore,D. J. P., Scott, R. L., and Torn, M. S.: The AmeriFlux network:A coalition of the willing, Agr. Forest Meteorol., 249, 444–456,https://doi.org/10.1016/j.agrformet.2017.10.009, 2018.
Nykänen, H., Heikkinen, J. E. P., Pirinen, L., Tiilikainen, K., andMartikainen, P. J.: Annual CO2 exchange and CH4 fluxes on asubarctic palsa mire during climatically different years, GlobalBiogeochem. Cy., 17, 2003.
Oechel, W. C., Vourlitis, G. L., Hastings, S. J., Zulueta, R. C., Hinz-man, L., and Kane, D.: Acclimation of ecosystem CO2 exchangein the Alaskan Arctic in response to decadal climate warming,Nature, 406, 978–981, https://doi.org/10.1038/35023137, 2000.
Pallandt, M., Kumar, J., Mauritz, M., Schuur, E., Virkkala, A.-M., Celis, G., Hoffman, F., and Göckede, M.: Representative-ness assessment of the pan-Arctic eddy-covariance site network,and optimized future enhancements, Biogeosciences Discuss.[preprint], https://doi.org/10.5194/bg-2021-133, in review, 2021.
Papale, D., Reichstein, M., Aubinet, M., Canfora, E., Bernhofer, C.,Kutsch, W., Longdoz, B., Rambal, S., Valentini, R., Vesala, T.,and Yakir, D.: Towards a standardized processing of Net Ecosys-tem Exchange measured with eddy covariance technique: algo-rithms and uncertainty estimation, Biogeosciences, 3, 571–583,https://doi.org/10.5194/bg-3-571-2006, 2006.
Paris, J.-D., Ciais, P., Rivier, L., Chevallier, F., Dolman, H., Flaud,J.-M., Garrec, C., Gerbig, C., Grace, J., Huertas, E., Johannessen,T., Jordan, A., Levin, I., Papale, D., Valentini, R., Watson, A.,Vesala, T., and ICOS-PP Consortium: Integrated Carbon Ob-servation System, Geophys. Res. Abstr., 14, EGU2012-12397,2012.
Parker, T. C., Subke, J.-A., and Wookey, P. A.: Rapid carbonturnover beneath shrub and tree vegetation is associated with lowsoil carbon stocks at a subarctic treeline, Glob. Change Biol., 21,2070–2081, https://doi.org/10.1111/gcb.12793, 2015.
Parmentier, F.-J., Sonnentag, O., Mauritz, M., Virkkala, A.-M., andSchuur, E.: Is the northern permafrost zone a source or a sink forcarbon?, Eos, 100, https://doi.org/10.1029/2019eo130507, 2019.
Pastorello, G., Trotta, C., Canfora, E., Chu, H., Christianson,D., Cheah, Y.-W., Poindexter, C., Chen, J., Elbashandy, A.,Humphrey, M., Isaac, P., Polidori, D., Ribeca, A., van Ingen,C., Zhang, L., Amiro, B., Ammann, C., Arain, M. A., Ardö,J., Arkebauer, T., Arndt, S. K., Arriga, N., Aubinet, M., Au-rela, M., Baldocchi, D., Barr, A., Beamesderfer, E., Marchesini,L. B., Bergeron, O., Beringer, J., Bernhofer, C., Berveiller, D.,Billesbach, D., Black, T. A., Blanken, P. D., Bohrer, G., Boike,J., Bolstad, P. V., Bonal, D., Bonnefond, J.-M., Bowling, D. R.,Bracho, R., Brodeur, J., Brümmer, C., Buchmann, N., Burban,B., Burns, S. P., Buysse, P., Cale, P., Cavagna, M., Cellier, P.,Chen, S., Chini, I., Christensen, T. R., Cleverly, J., Collalti, A.,Consalvo, C., Cook, B. D., Cook, D., Coursolle, C., Cremonese,E., Curtis, P. S., D’Andrea, E., da Rocha, H., Dai, X., Davis, K.J., De Cinti, B., de Grandcourt, A., De Ligne, A., De Oliveira,R. C., Delpierre, N., Desai, A. R., Di Bella, C. M., di Tom-
Earth Syst. Sci. Data, 14, 179–208, 2022 https://doi.org/10.5194/essd-14-179-2022

A.-M. Virkkala et al.: The ABCflux database 207
masi, P., Dolman, H., Domingo, F., Dong, G., Dore, S., Duce,P., Dufrêne, E., Dunn, A., Dušek, J., Eamus, D., Eichelmann,U., ElKhidir, H. A. M., Eugster, W., Ewenz, C. M., Ewers, B.,Famulari, D., Fares, S., Feigenwinter, I., Feitz, A., Fensholt, R.,Filippa, G., Fischer, M., Frank, J., Galvagno, M., Gharun, M.,Gianelle, D., et al.: The FLUXNET2015 dataset and the ONE-Flux processing pipeline for eddy covariance data, Sci. Data, 7,225, https://doi.org/10.1038/s41597-020-0534-3, 2020.
Pavelka, M., Acosta, M., Kiese, R., Altimir, N., Brümmer, C., Crill,P., Darenova, E., Fuß, R., Gielen, B., Graf, A., Klemedtsson, L.,Lohila, A., Longdoz, B., Lindroth, A., Nilsson, M., Marañon-Jimenez, S., Merbold, L., Montagnani, L., Peichl, M., Pihlatie,M., Pumpanen, J., Ortiz, P. S., Silvennoinen, H., Skiba, U.,Vestin, P., Weslien, P., Janouš, D., and Kutsch, W.: Standardis-ation of chamber technique for CO2, N2O and CH4 fluxes mea-surements from terrestrial ecosystems, Int. Agrophys., 32, 569–587, https://doi.org/10.1515/intag-2017-0045, 2018.
Phillips, C. L., Bond-Lamberty, B., Desai, A. R., Lavoie, M.,Risk, D., Tang, J., Todd-Brown, K., and Vargas, R.: Thevalue of soil respiration measurements for interpreting andmodeling terrestrial carbon cycling, Plant Soil, 413, 1–25,https://doi.org/10.1007/s11104-016-3084-x, 2017.
Pirk, N., Sievers, J., Mertes, J., Parmentier, F.-J. W., Mastepanov,M., and Christensen, T. R.: Spatial variability of CO2 uptakein polygonal tundra: assessing low-frequency disturbances ineddy covariance flux estimates, Biogeosciences, 14, 3157–3169,https://doi.org/10.5194/bg-14-3157-2017, 2017.
Raynolds, M. K., Walker, D. A., Balser, A., Bay, C., Campbell, M.,Cherosov, M. M., Daniëls, F. J. A., Eidesen, P. B., Ermokhina,K. A., Frost, G. V., Jedrzejek, B., Jorgenson, M. T., Kennedy, B.E., Kholod, S. S., Lavrinenko, I. A., Lavrinenko, O. V., Mag-nússon, B., Matveyeva, N. V., Metúsalemsson, S., Nilsen, L.,Olthof, I., Pospelov, I. N., Pospelova, E. B., Pouliot, D., Raz-zhivin, V., Schaepman-Strub, G., Šibík, J., Telyatnikov, M. Y.,and Troeva, E.: A raster version of the Circumpolar Arctic Veg-etation Map (CAVM), Remote Sens. Environ., 232, 111297,https://doi.org/10.1016/j.rse.2019.111297, 2019.
Reichstein, M., Falge, E., Baldocchi, D., Papale, D., Aubinet,M., Berbigier, P., Bernhofer, C., Buchmann, N., Gilmanov,T., Granier, A., Grunwald, T., Havrankova, K., Ilvesniemi, H.,Janous, D., Knohl, A., Laurila, T., Lohila, A., Loustau, D., Mat-teucci, G., Meyers, T., Miglietta, F., Ourcival, J.-M., Pumpanen,J., Rambal, S., Rotenberg, E., Sanz, M., Tenhunen, J., Seufert,G., Vaccari, F., Vesala, T., Yakir, D., and Valentini, R.: Onthe separation of net ecosystem exchange into assimilation andecosystem respiration: review and improved algorithm, Glob.Change Biol., 11, 1424–1439, https://doi.org/10.1111/j.1365-2486.2005.001002.x, 2005.
Riutta, T., Laine, J., Aurela, M., Rinne, J., Vesala, T., Laurila,T., Haapanala, S., Pihlatie, M., and Tuittila, E.-S.: Spatial vari-ation in plant community functions regulates carbon gas dy-namics in a boreal fen ecosystem, Tellus B, 59, 838–852,https://doi.org/10.1111/j.1600-0889.2007.00302.x, 2007.
Ryan, M. G., Lavigne, M. B., and Gower, S. T.: Annual carboncost of autotrophic respiration in boreal forest ecosystems in rela-tion to species and climate, J. Geophys. Res., 102, 28871–28883,https://doi.org/10.1029/97jd01236, 1997.
Schneider, J., Kutzbach, L., and Wilmking, M.: Carbon dioxide ex-change fluxes of a boreal peatland over a complete growing sea-
son, Komi Republic, NW Russia, Biogeochemistry, 111, 485–513, https://doi.org/10.1007/s10533-011-9684-x, 2012.
Schuur, E. A. G., McGuire, A. D., Schädel, C., Grosse, G., Harden,J. W., Hayes, D. J., Hugelius, G., Koven, C. D., Kuhry, P.,Lawrence, D. M., Natali, S. M., Olefeldt, D., Romanovsky, V. E.,Schaefer, K., Turetsky, M. R., Treat, C. C., and Vonk, J. E.: Cli-mate change and the permafrost carbon feedback, Nature, 520,171–179, https://doi.org/10.1038/nature14338, 2015.
Sellers, P. J., Hall, F. G., Kelly, R. D., Black, A., Baldoc-chi, D., Berry, J., Ryan, M., Ranson, K. J., Crill, P. M.,Lettenmaier, D. P., Margolis, H., Cihlar, J., Newcomer, J.,Fitzjarrald, D., Jarvis, P. G., Gower, S. T., Halliwell, D.,Williams, D., Goodison, B., Wickland, D. E., and Guertin, F.E.: BOREAS in 1997: Experiment overview, scientific results,and future directions, J. Geophys. Res., 102, 28731–28769,https://doi.org/10.1029/97jd03300, 1997.
Shaver, G. R., Street, L. E., Rastetter, E. B., Van Wijk, M. T., andWilliams, M.: Functional Convergence in Regulation of Net CO2Flux in Heterogeneous Tundra Landscapes in Alaska and Swe-den, J. Ecol., 95, 802–817, 2007.
Siewert, M. B., Hanisch, J., Weiss, N., Kuhry, P., Maxi-mov, T. C., and Hugelius, G.: Comparing carbon stor-age of Siberian tundra and taiga permafrost ecosystems atvery high spatial resolution: Ecosystem Carbon in Taigaand Tundra, J. Geophys. Res.-Biogeo., 120, 1973–1994,https://doi.org/10.1002/2015jg002999, 2015.
Soloway, A. D., Amiro, B. D., Dunn, A. L., and Wofsy, S.C.: Carbon neutral or a sink? Uncertainty caused by gap-filling long-term flux measurements for an old-growth bo-real black spruce forest, Agr. Forest Meteorol., 233, 110–121,https://doi.org/10.1016/j.agrformet.2016.11.005, 2017.
Tarnocai, C., Canadell, J. G., Schuur, E. A. G., Kuhry, P., Mazhi-tova, G., and Zimov, S.: Soil organic carbon pools in the north-ern circumpolar permafrost region, Global Biogeochem. Cy., 23,GB2023, https://doi.org/10.1029/2008GB003327, 2009.
Tramontana, G., Migliavacca, M., Jung, M., Reichstein, M.,Keenan, T. F., Camps-Valls, G., Ogee, J., Verrelst, J., and Pa-pale, D.: Partitioning net carbon dioxide fluxes into photosynthe-sis and respiration using neural networks, Glob. Change Biol.,26, 5235–5253, https://doi.org/10.1111/gcb.15203, 2020.
Valentini, R.: EUROFLUX: An Integrated Network for Studyingthe Long-Term Responses of Biospheric Exchanges of Carbon,Water, and Energy of European Forests, in: Fluxes of Carbon,Water and Energy of European Forests, edited by: Valentini, R.,Springer, Berlin, Heidelberg, 1–8, https://doi.org/10.1007/978-3-662-05171-9_1, 2003.
Virkkala, A.-M., Virtanen, T., Lehtonen, A., Rinne, J., and Lu-oto, M.: The current state of CO2 flux chamber studies inthe Arctic tundra: A review, Prog. Phys. Geog., 42, 162–184,https://doi.org/10.1177/0309133317745784, 2018.
Virkkala, A.-M., Abdi, A. M., Luoto, M., and Metcalfe, D.B.: Identifying multidisciplinary research gaps across Arc-tic terrestrial gradients, Environ. Res. Lett., 14, 124061,https://doi.org/10.1088/1748-9326/ab4291, 2019.
Virkkala, A.-M., Aalto, J., Rogers, B. M., Tagesson, T., Treat, C.C., Natali, S. M., Watts, J. D., Potter, S., Lehtonen, A., Mau-ritz, M., Schuur, E. A. G., Kochendorfer, J., Zona, D., Oechel,W., Kobayashi, H., Humphreys, E., Goeckede, M., Iwata, H.,Lafleur, P. M., Euskirchen, E. S., Bokhorst, S., Marushchak, M.,
https://doi.org/10.5194/essd-14-179-2022 Earth Syst. Sci. Data, 14, 179–208, 2022
208 A.-M. Virkkala et al.: The ABCflux database
Martikainen, P. J., Elberling, B., Voigt, C., Biasi, C., Sonnen-tag, O., Parmentier, F.-J. W., Ueyama, M., Celis, G., St Loius,V. L., Emmerton, C. A., Peichl, M., Chi, J., Järveoja, J., Nils-son, M. B., Oberbauer, S. F., Torn, M. S., Park, S.-J., Dol-man, H., Mammarella, I., Chae, N., Poyatos, R., López-Blanco,E., Røjle Christensen, T., Jung Kwon, M., Sachs, T., Holl, D.,and Luoto, M.: Statistical upscaling of ecosystem CO2 fluxesacross the terrestrial tundra and boreal domain: regional pat-terns and uncertainties, Glob. Change Biol., 27, 4040–4059,https://doi.org/10.1111/gcb.15659, 2021a.
Virkkala, A.-M., Natali, S., Rogers, B. M., Watts, J. D., Sav-age, K., Connon, S. J., Mauritz-tozer, M. E., Schuur, E. A.G., Peter, D. L., Minions, C., Nojeim, J., Commane, R., Em-merton, C. A., Goeckede, M., Helbig, M., Holl, D., Iwata, H.,Kobayashi, H., Kolari, P., Lopez-blanco, E., Marushchak, M.E., Mastepanov, M., Merbold, L., Peichl, M., Sonnentag, O.,Sachs, T., Ueyama, M., Voigt, C., Aurela, M., Boike, J., Celis, G.,Chae, N., Christensen, T., Bret-Harte, S., Dengel, S., Dolman, H.,Edgar, C., Elberling, B., Euskirchen, S. E., Grelle, A., Hatakka,J., Humphreys, E. R., Jaerveoja, J., Kotani, A., Kutzbach, L.,Laurila, T., Lohila, A., Mammarella, I., Matsuura, Y., Meyer, G.,Nilsson, M. B., Oberbauer, S. F., Park, S. J., Parmentier, F. J.W., Petrov, R., Prokushkin, A. S., Zyrianov, S., Schulze, C., St.Louis, V. L., Tuittila, E. S., Tuovinen, J. P., Quinton, W., Varla-gin, A., Zona, D., and Zyryanov, V. I.: The ABCflux Database:Arctic-Boreal CO2 Flux and Site Environmental Data, 1989–2020, ORNL DAAC, Oak Ridge, Tennessee, USA [data set],https://doi.org/10.3334/ORNLDAAC/1934, 2021b.
Voigt, C., Lamprecht, R. E., Marushchak, M. E., Lind, S. E.,Novakovskiy, A., Aurela, M., Martikainen, P. J., and Bi-asi, C.: Warming of subarctic tundra increases emissionsof all three important greenhouse gases – carbon dioxide,methane, and nitrous oxide, Glob. Change Biol., 23, 3121–3138,https://doi.org/10.1111/gcb.13563, 2017.
Walker, D. A., Raynolds, M. K., Daniels, F. J. A., Einarsson, E.,Elvebakk, A., Gould, W. A., Katenin, A. E., Kholod, S. S.,Markon, C. J., Melnikov, E. S., Moskalenko, N. G., Talbot,S. S., and Yurtsev, B. A.: The Circumpolar Arctic vegetationmap, J. Veg. Sci., 16, 267–282, https://doi.org/10.1111/j.1654-1103.2005.tb02365.x, 2005.
Wang, K., Liu, C., Zheng, X., Pihlatie, M., Li, B., Haapanala,S., Vesala, T., Liu, H., Wang, Y., Liu, G., and Hu, F.: Com-parison between eddy covariance and automatic chamber tech-niques for measuring net ecosystem exchange of carbon diox-ide in cotton and wheat fields, Biogeosciences, 10, 6865–6877,https://doi.org/10.5194/bg-10-6865-2013, 2013.
Wang, L., Lee, X., Wang, W., Wang, X., Wei, Z., Fu, C., Gao, Y.,Lu, L., Song, W., Su, P., and Lin, G.: A Meta-Analysis of Open-Path Eddy Covariance Observations of Apparent CO2 Flux inCold Conditions in FLUXNET, J. Atmos. Ocean. Technol., 34,2475–2487, https://doi.org/10.1175/JTECH-D-17-0085.1, 2017.
Watts, J. D., Natali, S., Potter, S., and Rogers, B. M.: Gridded Win-ter Soil CO2 Flux Estimates for pan-Arctic and Boreal Regions,2003–2100, ORNL DAAC, Oak Ridge, Tennessee, USA [dataset], https://doi.org/10.3334/ORNLDAAC/1683, 2019.
Wutzler, T., Lucas-Moffat, A., Migliavacca, M., Knauer, J.,Sickel, K., Šigut, L., Menzer, O., and Reichstein, M.:Basic and extensible post-processing of eddy covarianceflux data with REddyProc, Biogeosciences, 15, 5015–5030,https://doi.org/10.5194/bg-15-5015-2018, 2018.
Earth Syst. Sci. Data, 14, 179–208, 2022 https://doi.org/10.5194/essd-14-179-2022