a cellular mechanism for coral bleaching under various ...
117
UNIVERSITY OF HAWAI'I LIBRARY A CELLULAR MECHANISM FOR CORAL BLEACHING UNDER VARIOUS ENVIRONMENTAL CONDITIONS A DISSERTATION SUBMITTED TO TIlE GRADUATE DMSION OF TIlE UNIVERSITY OF HA WAI'I IN PARTIAL FULFILLMENT OF TIlE REQUIREMENTS FOR TIlE DEGREE OF DOCTOR OF PmLOSOPHY IN CELL AND MOLECULAR BIOLOGY May 2008 By Craig A. Downs Dissertation Committee: Gmy K. Ostrander, Chairperson David Haymer Tom Humphreys David Karl Robert Richmond ,)011
-
Upload
khangminh22 -
Category
Documents
-
view
0 -
download
0
Transcript of a cellular mechanism for coral bleaching under various ...

UNIVERSITY OF HAWAI'I LIBRARY
A CELLULAR MECHANISM FOR CORAL BLEACHING UNDER VARIOUS ENVIRONMENTAL CONDITIONS
A DISSERTATION SUBMITTED TO TIlE GRADUATE DMSION OF TIlE UNIVERSITY OF HA WAI'I IN PARTIAL FULFILLMENT OF TIlE
REQUIREMENTS FOR TIlE DEGREE OF
DOCTOR OF PmLOSOPHY
IN
CELL AND MOLECULAR BIOLOGY
May 2008
By Craig A. Downs
Dissertation Committee: Gmy K. Ostrander, Chairperson
David Haymer Tom Humphreys
David Karl Robert Richmond
,)011

We certify that we have read this dissertation and that, in our opinion, it is satisfactory in scope and quality as a dissertation for the degree of Doctor of Philosophy in Cell and Molecular Biology.
Dissertation Committee
Gary K. Ostrander _________ _
David Haymer
Tom Humphreys
David Karl
RobertRichmond __________ _

Abstract
Over the past thirty years, coral reefs have experienced extensive degradation worldwide. One etiology for this global degradation is a syndrome known as coral bleaching, a process whereby corals lose their algal symbionts or the symbiont's photosynthetic pigments degrade. Coral bleaching can be induced by diverse factors including high temperature, intense light or high-energy light, cold temperature, salinity changes and bacterial infection. There are very few models of coral bleaching that incorporate cellular and molecular mechanisms that have been proposed or tested. The overall objective of my dissertation is to elucidate the major cellular aspects of bleaching in coral as a result of high temperature, high light, the compound exposure of both heat stress and light stress, prolonged darkness, and hypo-salinity. The primary thesis of my dissertation is that heat stress and light stress initiate two distinct cellular mechanisms that result in coral bleaching, and that regardless of the initiating mechanisms, these two processes ultimately culminate into a single coordinated pathway whereby the coral host (animal component of the symbiosis) digests the zooxanthellae through an autophagic-related process
that I term symbiophagy. Heat stress induces symbiophagy through a non-oxidative-stress regulatory switch. Light stress, a combined heatllight stress, or any stress that imposes an oxidative stress on the coral coral host (e.g., hypo-salinity exposure), probably induces symbiophagy through an oxidation-mediated signal cascade. Bleaching from prolonged darkness is a mechanism distinct from the processes observed from a light-based stress. A second thesis of my dissertation is that there is a defined sequence of events for all the processes of bleaching. Light stress induces significant accumulation of oxidative damage products, dispersion of thylakoid membrane structure, and a collapse of integrity of the chloroplast membrane. Heat stress induces a phase separation and condensation of the thylakoid membrane through a thermodynamic process, and not an oxidative stress process. Heat and light stress are not the only environmentally-relevant stressors known to induce population-level bleaching: hypo-salinity has been associated with large bleaching events. My work demonstrates that a brief hypo-salinity exposure induces an osmotic shock and subsequent oxidative stress, to both the host and the zooxanthellae.
CralgDowns Ph.D Dissertation Abstract May 2008

Chapter I
Chapter 1
Coral Bleaching
Coral reefs constitute some of the largest and most diverse ecological communities on earth and result from the symbiotic interactions between photosynthetic dinoflagellate algae called zooxanthellae and the cnidarian coral hostl • 2. Tropical coral reefs are pan-tropical residing in the Pacific, Atlantic, and Indian Oceans, and extend as far north as 32"20N in the Atlantic Ocean, 29"311N in the Red Sea, and 32"N in the Pacific Ocean. They exist in relatively stable environments that are often oligotrophic. Large, expansive coral reefs can extend tens to hundreds of miles, such as the Great Barrier Reef of Australia, the Meso-American Reef in Central America, and the Florida Keys in North America.
Over the past thirty years, coral reefs have experienced extensive degradation worldwide2. One etiology for this global degradation is a syndrome known as coral bleaching, a process whereby corals lose their algal symbionts or the symbiont's photosynthetic pigments degrade3
•4• Coral bleaching can be induced by diverse factors
including high temperature, intense light or high-energy light, cold temperature, salinity changes and bacterial infection. In some cases, bleaching is a transient altered physiological state, the coral quickly recovers and the health of the individual is relatively un-impacted. A majority of the published observations lead to the conclusion that reproductive function and growth are significantly reduced when the colony experiences a bleaching event, while a recent observation found that when corals bleach, they soon after become infected with an infectious disease known as White Plague'. There are very few models of coral bleachin} that incorporate cellular and molecular mechanisms that have been proposed or tested2
•
Many environmental factors associated with mass bleaching events can concomitantly induce increased production of reactive oxygen species (ROS), an antioxidant response, and significant oxidative damage to symbiotic coral].6. Early studies conducted in the zooxanthellate anemone (Anthopleura elegantissima) demonstrated an increased anti-oxidant enzymatic capacity in response to hyperbaric oxygen conditions as a result of increased oxygen production from its endosymbiotic a1gae7
• Additional experiments led several workers to conclude that an increase in ROS production in A. elegantissima was mainly derived from Iight-dependent processes, such as photosynthesis8
• My recent work demonstrated that there is a significant increase in oxidative damage products in corals resulting from the interaction of high-temperature and Iighe·9, further corroborating the conclusions of several groUpSI()'12.
From the literature concerning general endosymbiosis, the dissolution of the symbiosis occurs in three general phasesl 3-16. The first phase is called the "Initiator Event", in which the physiological condition of one or both of the symbiotic partners changes, resulting in a breakdown in cellular communication that surr.:rts the symbiosis - communication that is mostly likely biochemical receptor mediated . The second phase is the host reaction to the breakdown in symbiotic communication; phagocytosis and
Downs I

Chapter I
exocytosis are examples of possible reactions. The third phase is the effect of the completion of phase IT on the cellular physiological condition of both of the symbionts; examples of this range from gross behavioral attributes, such as switching diet preferences or retraction of the tissue into the coralline skeleton to cellular and physiological responses (e.g., decreased immuno-competence, reduction in reproductive output) to acute mortality.
One proposed model concerning a possible mechanism of coral bleaching is based on the responses to oxidative stress by both components of the symbiotic relationship [7; Figure 1]. Stressors such as heat stress, hyper- and hypo salinity, high light, and ultraviolet radiation can destabilize the photosynthetic electron-transport chain resulting in increased production rates of reactive oxygen species (ROS) 6-9;27 . Production ofROS occurs in the chloroplast by several mechanisms associated with Photosystem J- and
Figure I, Downs et aI., 2000
Photosystcm II
Photosystem II-catalyzed electron transfer, the most notable being the Mehler reaction and the generation of hydrogen peroxide (H20:2) by the Oxygen-Evolving Complex 18-23 .
It is proposed that zooxanthella-generated H20 2 can diffuse from the dinoflagellate symbiont into the coral cytoplasm (Fig. I). Once inside the coral cytosol, H202 can be either 'neutralized' through enzymatic and non-enzymatic anti-oxidant pathways or it can converted into a more noxious ROS, the hydroxyl radical, either by Fenton or HaberWeiss chemistry l8. Below some ROS concentration threshold, the antioxidant defenses of the coral can compensate and ameliorate the destructive capacity of these ROS. Above
Downs 2

Chapter I
this threshold, ROS will cause oxidative damage. At some intensity of oxidative damage, corals will eliminate the dominant source of ROS production by eradicating their endosymbiotic algae. Thus, the OxidoJive Theory of Coral Bleaching proposes that bleaching may result as a coral's fina\ defense against oxidative stress (Fig.!; Ref. 7).
Figure I shows a possible scenario of the initiating phase (Phase I) of the bleaching process, though it in no way accounts for the complete process of losing the symbiotic dinoflagellate (bleaching), nor does it provide an understanding of why cellular and organismal mortality is sometimes associated with a bleaching event. Heat stress, light stress, and hypo-salinity are the most environmentally relevant stressors associated with bleaching, all of which induce oxidative stress for both coral symbionts (though cold stress, sustained darkness, chemical pollutants and infectious disease agents can also induce a bleaching pathology). During a bleaching event induced by these environmental stressors, coral cells that .harbor the dinoflagellates (gastrodermal cells) have been suggested to digest the dinoflagellate (perhaps via a classic phagocytic process), or the coral cell dies and its contents are expelled. Expulsion of the dinoflagellates (i.e., exocytosis) is the rare exception, not the norm, when bleaching results from these three stressors4
• The principle reason for our lack of understanding the process of bleaching is that the cellular process of bleaching has never been adequately described.
The Oxidative Stress Model assumes that the factor initiating the sequence of events for bleaching is associated with the dinoflagellate. Models that address Phase II were first introduced by Boschma in 1926 24, later supported by Muscatine and coworkers in the 1980;S, and further supported by Fang and coworkers in the past five years, centers around the phagocytosis of the zooxanthella or zoochlorella by the cnidarian hosr6• In this model, lysosomal fusion is inhibited by the zooxanthel1ae under normal conditions. An environmental perturbation initiates a sequence of events that somehow disrupts this symbiotic regulation, and results in the consumption of the symbiont by the host. As a component of this model, various workers have argued that the symbiotic regulation fails because the zooxanthellae's physiology is compromised (e.g., it is diseased; exhibiting a cellular pathology such as damaged nucleus, mitochondria or chloroplast), and thus fails to produce the regulatory factors that prohibit lysosomal fusion with the zooxanthellae vacuole. An alternative model posits that the symbiotic regulation fails as a result in direct changes to host cellular physiology, and is independent of any influence by the zooxanthellae. This is based on the fact that heatstress induces the process of autophagy within the host cell, and is an acclimatizing physiological response to environmental stres?'.
Unfortunately, none of the models have actually been tested in scleractinian species under different environmental conditions. Testing the models in scleractinians is obvious in its relevance to understanding the process in corals. A more intensive investigation of the different environmental conditions that result in bleaching is important because the literature is flooded with a myriad of contrasting field observations (and conflicting interpretations) describing how a specific environmental condition evokes one type of bleaching process (e.g., exocytotic) while a different environmental condition induces a different type of bleaching process (phagocytotic). Since hightemperature and high-light are the dominant factors in mass bleaching events, examining
Downs 3
Chapter I
the cellular processes of bleaching resulting from independent exposures to temperature and light, as well effects resulting from exposure to both heat and light stress, is paramount to understanding environmentally relevant bleaching.
OBJECTIVES
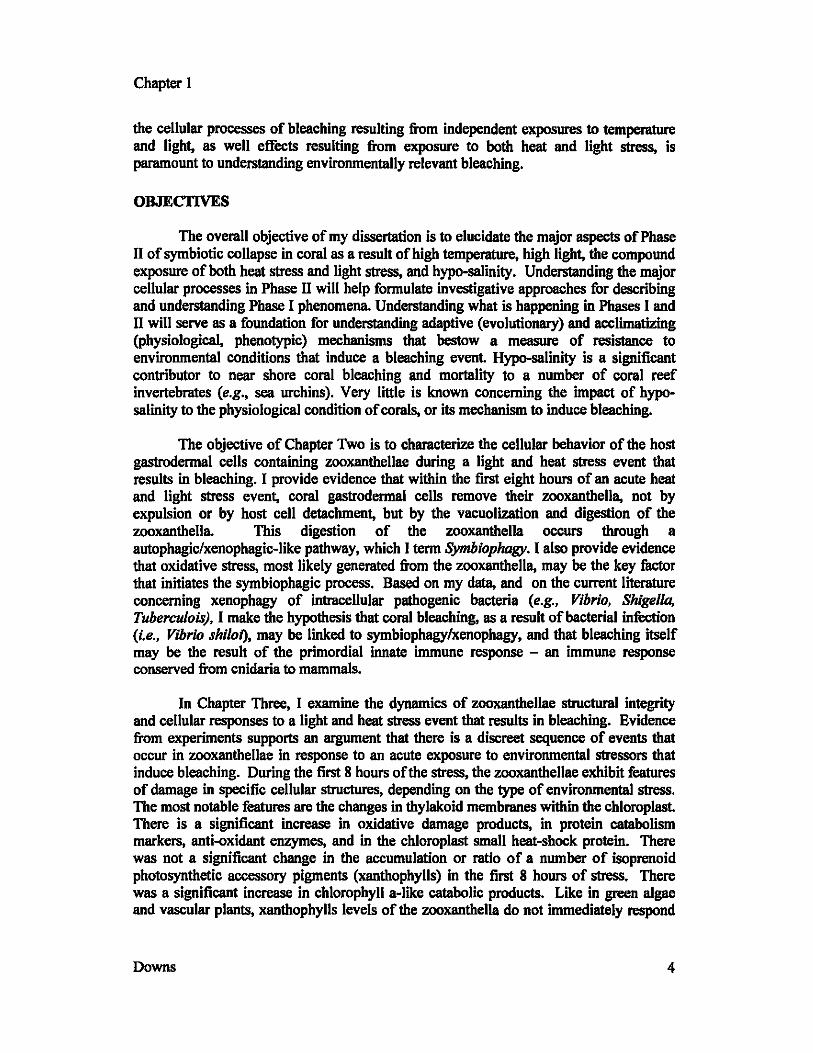
The overall objective of my dissertation is to elucidate the major aspects of Phase II of symbiotic collapse in coral as a result of high temperature, high light, the compound exposure of both heat stress and light stress, and hypo-salinity. Understanding the major cellular processes in Phase II will help formulate investigative approaches for describing and understanding Phase I phenomena. Understanding what is happening in Phases I and II will serve as a foundation for understanding adaptive (evolutionary) and acclimatizing (physiological, phenotypic) mechanisms that bestow a measure of resistance to environmental conditions that induce a bleaching event Hypo-salinity is a significant contributor to near shore coral bleaching and mortality to a number of coral reef invertebrates (e.g., sea urchins). Very little is known concerning the impact of hyposalinity to the physiological condition of corals, or its mechanism to induce bleaching.
The objective of Chapter Two is to characterize the cellular behavior of the host gastrodermal cells containing zooxanthellae during a light and heat stress event that results in bleaching. I provide evidence that within the first eight hours of an acute heat and light stress event, coral gastrodermal cells remove their zooxanthella, not by expulsion or by host cell detachment, but by the vacuolization and digestion of the zooxanthella. This digestion of the zooxanthella occurs through a autophagic/xenophagic-like pathway, which I term Symbiophagy. I also provide evidence that oxidative stress, most likely generated from the zooxanthella, may be the key factor that initiates the symbiophagic process. Based on my data, and on the current literature concerning xenophagy of intracellular pathogenic bacteria (e.g., Vibrio, Shigella, Tuberculois), I make the hypothesis that coral bleaching, as a result of bacterial infection (i.e., Vibrio shiloi), may be linked to symbiophagy/xenophagy, and that bleaching itself may be the result of the primordial innate immune response - an immune response conserved from cnidaria to mammals.
In Chapter Three, I examine the dynamics of zooxanthellae structural integrity and cellular responses to a light and heat stress event that results in bleaching. Evidence from experiments supports an argument that there is a discreet sequence of events that occur in zooxanthellae in response to an acute exposure to environmental stressors that induce bleaching. During the first 8 hours of the stress, the zooxanthellae exhibit features of damage in specific cellular structures, depending on the type of environmental stress. The most notable features are the changes in thylakoid membranes within the chloroplast There is a significant increase in oxidative damage products, in protein catabolism markers, anti-oxidant enzymes, and in the chloroplast small heat-shock protein. There was not a significant change in the accumulation or ratio of a number of isoprenoid photosynthetic accessory pigments (xanthophylls) in the first 8 hours of stress. There was a significant increase in chlorophyll a-like catabolic products. Like in green algae and vascular plants, xanthophylls levels of the zooxanthella do not immediately respond
Downs 4

Chapter I
to a stress event (i.e., within hours), but take several days to exhibit significant changes in behavior. In summary, during the initial onset of an acute stress event that results in bleaching, cellular structures are damaged, and the cell homeostatic responses includes the induction of heat-shock proteins and protein degradation machinery. After the first day, zooxanthellae that survive and are maintained in the host, induce other acclimatory responses to help maintain its survival in the stress-inducing environments.
In Chapter Four, I examine the pathology of hypo-salinity to corals. One of the obvious signs of hypo-salinity exposure to symbiotic cnidarians is bleaching. Coral reefs can experience tremendous changes in salinity, especially hypo-salinity, as a result of storms, heavy-rain seasons (e.g., monsoons), and coastal runoft'. To better understand the pathology associated with hypo-salinity stress and to lay a foundation for future investigations regarding the mechanisms of this pathology (i.e., bleaching), I examined the effects ofhypo-salinity on corals using histological and cellular diagnostic methods. Corals were exposed to five salinity regimes: 39 parts per thousand (ppt), 32 ppt, 28 ppt, 24 ppt, and 20 ppt - salinity concentrations that corals may realistically experience on a reef. Histological examination indicated that decreasing salinity induced morphological changes, including increased tissue swelling, degradation and loss of zooxanthal1ae, and tissue necrosis at the lowest two salinity concentrations. PAM chlorophyll fluorimetry kinetics demonstrated a decreasing photosynthetic efficiency with decreasing salinity conditions. The most notable finding of this study is that hypo-salinity induces an oxidative stress response in both the host and the symbiont, and that there is a linear relationship between decreasing saline conditions and increasing burdens of oxidative stress. Cytochrome P450 levels were affected by slight changes in salinity concentration, raising questions on the effects of hyposalinity on xenobiotic and toxin detoxification pathways, as well as on a number of endocrine pathways. As in heat and light stress, exposure of corals to hypo-saline conditions may have long-term ramifications on the physiology of corals, providing a mechanism for the distribution of ecotypes and species on the coral reef.
Chapter five is a summary of my dissertation, and an explanation of its importance from a historical perspective. Chapter 5 also provides information concerning the technical caveats and obstacles of using fluorescence microscopy method on coral, hindering the use of a number of important cellular and powerful techniques that could be used to better elucidate cell processes. Finally, I provide evidence for the occurrence of symbiophagy in six coral species undergoing a natural bleaching event in the field as a result of heat stress, as well as a single coral species undergoing a solar bleaching event; thereby demonstrating the occurrence of symbiophagy both in the lab and in the field.
Downs 5

Chapter 1
REFERENCES
[1] Dustan, P. Coral reefs under stress: sources ofmorta1ity in the Florida Keys. Nat. Res. Forum 23:147-155; 1999.
[2] Stone, L.; Huppert, A.; Rajagopalan, B.; Bhasin, H.; Loya, Y. Mass coral reef bleaching: a recent outcome of increased EI Nino activity? &01. Len. 2:325-330; 1999.
[3] Brown, B.E. Adaptations of reef corals to physical environmental stress. Adv. Mar. Bioi. 31:222-299; 1997.
[4] Brown, B.E. Coral bleaching: causes and consequences. Coral Reefs 16:S129-S138; 1997.
[5] Muller, E.M., Rogers, C.S., Spitzack, A.S., Van Woesik, R. Bleaching increases likelihood of disease on Acropora palmate (Lamark) in Hawknest Bay, St. John, US Virgin Islands. Coral Reefs On-line First, 2007.
[6] Downs, C.A.; Mueller, E.; Phillips,S.; Fauth, J.; Woodley, C.M. A molecular biomarker system for assessing the health of coral (Montastrea faveolata) during heat stress. Mar. Bioteehnol. 2:533-544; 2000.
[7] Downs, C.A., J.E., Fauth, J.C. Halas, P. Dustan, J. Bemiss, C.M. Woodley (2002) Oxidative stress and seasonal coral bleaching. Free Radie. Bioi. Med. 32: 533-543.
[8] Brown, B.E., C.A. Downs, R.P. Dunne, S.W. Gibb (2002) Exploring the basis of thermotolerance in the reef coral Goniastrea aspera. Mar. &01. Prog. Ser. 242: 119-129.
[9] Brown, B.E., C.A. Downs, R.P. Dunne, S.W. Gibb (2002) Tissue retraction compensates for a lack of xanthophylls cycling in irradiance-stressed corals. J. Exp. Mar. Bioi. Ecol. 277: 129-144.
[10] Dykens, J.A.; Shick, J.M.; Benoit, C.; Buettner, G.R.; Winston, G.W. Oxygen radical production in the sea anemone Anthopleura e/egantissima and its endosymbiotic algae. J. Exp. Bioi. 168:219-241; 1992.
[11] Lesser, M.P.; Stochaj, W.R.; Tapley, D.W.; Shick, J.M. Bleaching in coral reef anthozoans: effects ofirradiance, ultraviolet radiation, and temperature on the activities of protective enzymes against active oxygen. Coral Reefs 8:225-232; 1990.
[12] Lesser, M.P. Elevated temperatures and ultraviolet radiation cause oxidative stress and inhibit photosynthesis in symbiotic dinoflagellates. Llmnol. Oeearwgr.41:271-283; 1996.
[13] Moore, M.N; Allen, J.I.; Somerfield, P.J. Autophagy: role in surviving environmental stress. Mar. Environ. Res. 62:S420-A425; 2006.
[14] Dale, C; Moran, N.A. Molecular interactions between bacterial symbionts and their hosts. Cell 126:453-465; 2006.
[15] Moran, N.A. Symbiosis. Curro BioI. 16:R866-R871. [16] Douglas, A.E. Coral Bleaching - how and why? Mar. Poll. Bull. 46:385-392;2003. [17] Lesser, M.P. Oxidative stress causes coral bleaching during exposure to elevated
temperatures. Coral Reefs 16:187-192; 1997. [18] Halliwell, B.; Gutteridge, J.M.C. Free radicals in biology and medicine. New York:
Oxford University Press, Inc.; 1999.
Downs 6

Chapter 1
[19] Giardi, M.T.; Masojidek, J.; Godde, D. Effects of abiotic stresses on the turnover of the Dl reaction center II protein. Physiologia Planta. 101:635-642; 1997.
[20] Badger, M.R. Photosynthetic oxygen exchange. Ann. Rev. Plant Physiol. 36:27-53; 1985.
[21] Richter, M.; Ruhle, W.; Wild, A. Studies on the mechanism of photo system II photoinhibition: II. The involvement of toxic oxygen species. Photosyn. Res. 24:237-243;1990.
[22] Tjus, S.E.; Scheller, H.V.; Andersson, B.; Meller, B. L. Active oxygen species produced during selective excitation of photosystem I is damaging not only to photosystem I, but also to photosystem II. Plant Physiol. U5:2007-2015; 2001.
[23] Mehler, A. H. Studies on reactions ofillllminated chloroplasts. I. Mechanism of the reduction of oxygen and other Hill reagents. Arch Biachem. Biophys. 33:65-77; 1951.
[24] Boschma, H. The nature and the association between Anthazoa and zooxanthellae. Proc. Natl. Acad. Sci. USA. 11 :65-67; 1925.
[25] Hohman, T.C; McNeil, P.L.; Muscatine, L. Phagosome-lysosome fusion inhibited by algal symbionts of Hydra viridis. J. Cell BioI. 94:56-63; 1982.
[26] Chen, M. et aI., Molecular identification ofRab7 in Aiptasia pulchella and its exclusion from phagosomes harboring zooxanthellae. Biochem. Biophys. Res. Comm. 308:586-595; 2003.
[27] Moore, M.N; Allen, J.I.; Somerfield, P.J. Autophagy: role in surviving environmental stress. Mar. Environ. Res. 62:S420-A425; 2006.
[28] Dale, C; Moran, N.A. Molecular interactions between bacterial symbionts and their hosts. Cell 126:453-465; 2006.
[29] Moran, N.A. Symbiosis. Curro BioI. 16:R866-R871. [30] Douglas, A.E. Coral Bleaching - how and why? Mar. Poll. Bull. 46:385-392;2003. [31] Havaux, M., Niyogi, K.K., 1999. The violaxanthin cycle protects plants from photo-
oxidative damage by more than one mechanism. Proc. Nat!. Acad. Sci. 96, 8762-8767.
[32] Havaux, M., Tardy, F., Ravena\, J., Chanu, D., Parot, P., 1996. Thylakoid membrane stability to heat stress studied by flash spectroscopic measurements of the electrochromic shift in intact potato leaves: influence of the xanthophyll content. Plant Cell Environ. 19, 1359-1368.
[33] Havaux, M., Bonfils, J.P., Lutz, C., Niyogi, K.K., 2000. Photodamage of the photosynthetic apparatus and its dependence on the leaf developmental stage in the npq 1 Arabidopsis mutant deficient in the xanthophyll cycle enzyme violaxanthin de-epoxidase. Plant Physiol. 124, 273- 284.
[34] Suharsono, Pipe, R.K. Brown, B.E. 1993. Cellular and ultrastructura1 changes in the endoderm of the temperate sea anemone Anemonia viridis as a result of increased temperature. Mar. BioI. 116:311-318.
[35] Warner, M. E.; Fill, W. K.; Schmidt, G. W. Damage to photosystem II in symbiotic dinoflagellates: a determinant of coral bleaching. Proc. Nat!. Acad. Sci. USA 96:8007-8012; 1999.
Downs 7

Chapter 2
Chapter 2
Symbiophagy as a cellular mechanism for coral bleaching
SUMMARY
Coral bleaching is a major contributor to the global declines of coral reefs. This phenomenon is characterized by the loss of symbiotic algae, their pigments or both. Despite wide scientific interest, the mechanisms by which bleaching occurs is still poorly understood. Here I report that the removal of the symbiont during light and temperature stress is achieved using the host's cellular autophagic-associated machinery. Host cellular and sub-cellular morphologies showed increased vacuolization and appearance of autophagic membranes surrounding a variety of organelles and surrounding the symbiotic algae. Markers of autophagy (Rab 7 and LAS) corroborate these observations. Results showed that during stress the symbiont vacuolar membrane is transformed from a conduit of nutrient exchange to a digestive organelle resulting in the consumption of the symbiont, a process I term symbiophagy. I posit that during a stress event, the mechanism maintaining symbiosis is destabilized and symbiophagy is activated, ultimately resulting in the phenomenon of bleaching. Symbiophagy may have evolved from a more general primordial innate intracellular protective pathway termed xenophagy.
Downs Pagel

Chapter 2
INTRODUCTION
Bleaching in corals is marked by the loss of photosynthetic pigments or of the symbiotic dinoflagellate algae (zooxanthellae) from the coral host tissue, usually in association with environmental perturbations I. Bleaching can be induced by cold shock, bacterial infection, osmotic stress, exposure to chemical pollutants, high temperature, high-light intensity, and persistent darkness I. Coral bleaching is thought to be the principal driver in recent mass coral mortality events that are occurring globally, especially in association with an increasing occurrence ofEI Nifto events 2.
How bleaching occurs in cnidaria, and whether there are multiple mechanisms that result in bleaching, has been contentiously debated for over a century. Digestion of the symbiotic unicellular algae (zoochlorella and zooxanthellae) in cnidarians was documented as early as 1883 3, confirmed and expanded by Boschma 4, but challenged by Yonge, who argued that zooxanthellae were expelled, and not digesteds. Work from Muscatine's lab in the 1980s provided the first evidence for phagosome-mediated digestion of unicellular algae (zoochlorella) in Hydra viridii. Additional studies provided evidence that zooxanthella loss in non-scleractinian cnidarians was associated with a phagocytic-like process that resulted in their digestion7
•8
• Work on cold-induced bleaching in sea anemones and corals presented conflicting interpretations of whether the symbionts were expelled from the host through an exocytic-mediated pathway or via cellular detachment of the host cell containing the zooxanthellae9
•1O
• Several investigations have demonstrated that bleaching in corals and anemones is positively correlated with oxidative damage and that the induction of the cellular-stress response is positively correlated with resistance to bleaching11
•12
• To date, no coherent cellular mechanism of bleaching has been proposed, particularly in regards to the order in which events occur during the bleaching process.
A recent study by Fang and coworkers gave the first clue as to the role vacuolar function may have in coral bleaching by establishing the role of the Rab family of proteins in mediating symbiosis in another cnidarian, Aiptasia pu/che//aI3
•14
• They reported that the Aiptasia Rab 11 is excluded from the vacuole body containing zooxanthellae under normal conditions. However, during a stress event that results in the degradation of the zooxanthellae, ApRab 11 and especially ApRab7 were associated with endocytic phagosomes containing dead or dysfunctional zooxanthellaeI3
•14
• These findings provide key steps in developing an autophagic mechanism for cnidarian bleaching as both Rabll (a small GTPase) and Rab7 are recognized markers of autophagic activity across taxa. Xenophagy, the digestion of potential intracellular pathogens, utilizes much of the same autophagic machinery, including the Rab proteins, for the digestion of these pathogensl6
• During xenophagy, the vesicle that envelopes the intracellular bacteria is transformed from a conduit of subsistence for the pathogen to a phaglysome that degrades the bacterial6
• In a similar fashion using the same autophagic machinery, I provide evidence that the zooxanthella is removed by the coral host in a xenophagic-like process I term symbiophagy. Symbiophagy of the zooxanthellae is achieved by transforming the symbiont vacuolar membrane from a conduit of nutrient exchange to a digestive organelle resulting in the consumption of the symbiont I posit
Downs PageZ

Chapter 2
that during a stress event, the mechanism maintaining symbiosis is destabilized and symbiophagy is activated, ultimately resulting in the phenomenon of bleaching.
Downs Page 3

Chapter 2
RESULTS AND DISCUSSION
To resolve the mechanism of temperature and light dependent coral bleaching, I characterized the loss of dinoflagellates from the coral Pocillopora damicornis under different conditions, and provide evidence for a symbiophagic mechanism for this loss. I exposed corals nubbins previously acclimated to low light and 2S"C, to six environmental treatments. All experiments were begun at the same time in the morning immediately following a period of 8 hrs of darkness at 2S"C. The treatments were carried out in triplicate for a period of ten hours each: (I) a reference treatment of low light (438 lJ.ITIoles m·1
S·I PAR peak-natural irradiance using a neutral density filter) at 2S"C, (2) low light at 32"C, (3) high light (2007 lJ.ITIoles m·1 S·I PAR peak natural irradiance) at 2S"C, (4) high light at 32"C, (S) darkness at 2S"C , and (6) darkness at 32"C. At the termination of the experiment, fragments were collected for morphological and biochemical assessment. Additional fragments maintained at the same experimental conditions for 48 hours and S days were then examined for changes in gross morphology. Corals exposed to treatments 2, 3, and 4 lost over 60% of their zooxanthellae after 48 hours, while corals exposed to the dark treatments showed no bleaching at 48 hours, though after five days, significant bleaching was observed in dark exposed corals (Supplementary Fig. I). Cellular and sub-cellular morphologies of samples from each treatment were characterized using transmission electron microscopy (TEM). Comparisons were carried out on sections from the same anatomical region of each polyp (Supplementary Fig. 2). Oxidative damage and endosome/phagosome maturation were measured using ELISA (Table I). Tartrate-sensitive lysosomal acid phosphatase (LAS) and Rab7 host protein levels were used as markers of endosome/phagosome and endosomellysosome maturation, respectively. LAS accumulation reflects up-regulation of endosome/phagosome maturationl7
• Rab7 is associated with organellar membranes of Iysosomes, endosomes, phagosomes, and autophagosomes via prenylation of the Cterminal double cysteineslS and participates in the regulation of endosomellysosome maturation. The activation of Rab7 acts to block the binding of an antibody generated against the prenylation site ofRab7 in an Inhibition ELISA. The decreased ELISA signal indicates increased activation ofRab7Is
•18
•
Low-light at 25°C Effects
Fragments maintained in the reference treatment (low-light, 2SoC similar to the culture conditions these corals experienced over the previous two months) exhibited rapid regeneration of lesions from fragmenting the original colony indicating excellent tissue health2S. Transmission electron microscopy of the reference samples showed cellular anatomical features of the zooxanthellae that were readily distinguishable and exhibited coherence and integrity. The coral's double vacuolar membrane was tightly laminated to the plasma membranelthecal laminate of the zooxanthellae, and there was minuscule to no-perceptible volume of vacuolar matrix between the vacuolar membrane and dinoflagellate plasma membrane (Fig. la-c). In addition, the concentration of the oxidative damage markers and the endosomellysosome maturation markers of the samples from this treatment reflect a reference range for the naturally occurring parent colony corals altogether indicating a relatively healthy physiological condition (Table I).
Downs Page 4

Chapter 2
Low-light at 32°C Effects
Coral fragments exposed to low-light conditions at 32°C showed a marked change in cellular anatomy (Fig. I, d-e). There was no indication of exocytosis or detachment of gastrodermal cells. The gastrodermal cells showed perceptible vacuolization around the zooxanthellae, where the vacuolar matrix formed a considerable zone between the vacuolar membrane and the zooxanthellae's cellular boundary (Fig. Id). The zooxanthellae's cell membrane and thecal laminate adjoining the vacuolar matrix were undetectable, suggesting that the vacuolar matrix was degrading (Fig. Ie). A significant increase in lysosomal acid phosphatase (LAS) levels indicated an increase in phagic activity (Table I). Prenylation of Rab7 indicated an increase of phagic maturation activity (Table I). Taken together, these data indicate that zooxanthellae are at the initial stages of lysis by the host employing a symbiophagic processl6
• Based on evidence that oxidative stress can initiate and regulate autophagy via redox-sensitive proteases 19, the increased oxidative damage products resulting from the high-temperature treatment suggests that a similar mechanism may have initiated the symbiophagy (Table I).
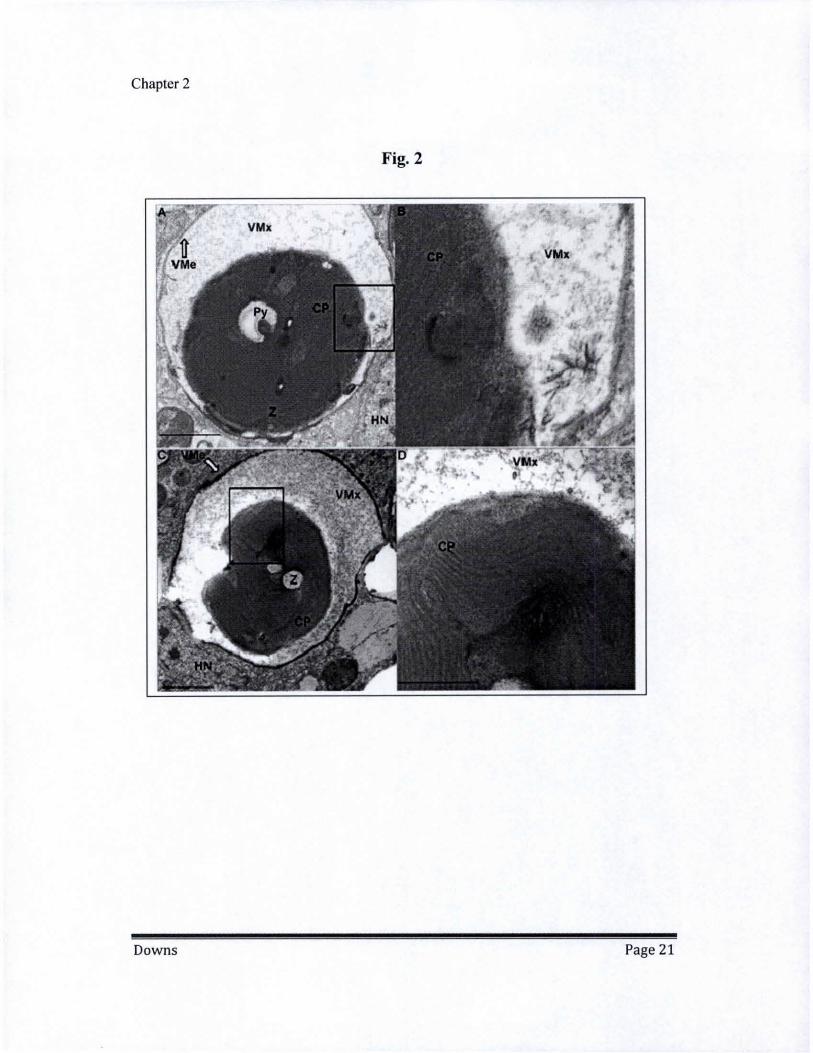
High-light at 25°C Effects
Exposure to intense irradiation is a significant factor in bleaching and can induce bleaching even in the absence of a temperature stress. Corals exposed to five times more photosynthetic active radiation at 25°C compared to the reference showed extensive signs of symbiophagy, though there were no indications of exocytosis or cell detachment Vacuolar matrix surrounding the zooxanthellae was prominent, while zooxanthellae cell membrane and thecal plates were severely degraded (Fig. 2, a-b). LAS levels significantly increased in response to the high light intensity, while Rab7 was activated -again indicating that a symbiophagic process had been initiated. LAS levels in the highlightl25°C treatment were significantly lower than the low Iightl32°C treatment, suggesting that heat stress can act independently to initiate symbiophagy, while oxidative damage under high light results in a quicker and more severe onset (Table I).
High-light at 32°C Effects
Exposing corals to combined conditions of high temperature and high light resulted in extensive degradation of the zooxanthellae in hospile. Vacuolization around the zooxanthellae was prominent with extensive degradation of the zooxanthellae's cell membrane/thecal plates and darkening and thickening of the vacuolar double membranes (Fig. 2, c-d). The zooxanthellae often exhibited sub-cellular structural deformations, including extensive thylakoid disorganization, dissolution of the nucleus, and blending of destabilized organellar structures (Fig. 2d). LAS levels were significantly elevated in comparison to the reference treatment and the high Iightl25°C treatment, but were not significantly different from the low Iightl32°C treatment (Table 1). This indicates that regulation of LAS accumulation may be influenced more by heat stress than oxidative stress. Rab7 activation was significantly higher in high Iightlhigh temperature than in any of the other treatments, reflecting the extensive vacuolization seen in the gastrodermal
Downs PageS
ehapter2
cells. Oxidative damage markers were also significantly higher in this treatment compared to any other treatment, corroborating other studies that associate oxidative stress with bleaching 11.12.
Darkness at 2Soe Effects
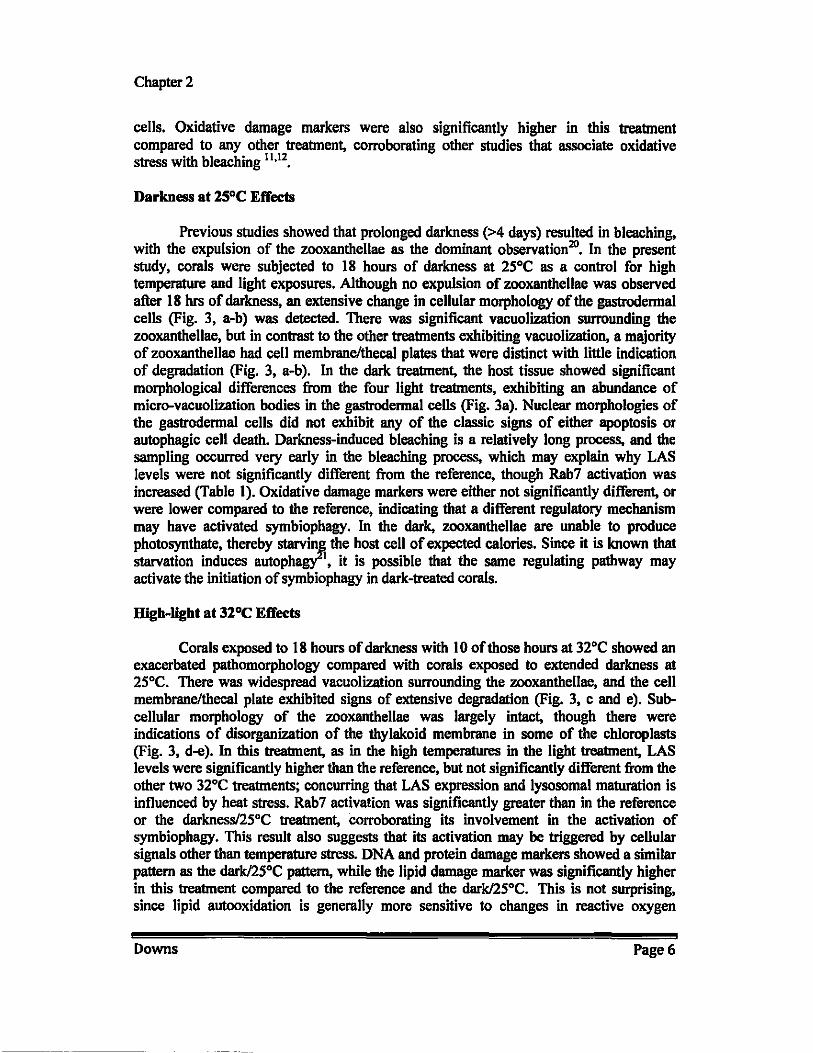
Previous studies showed that prolonged darkness (>4 days) resulted in bleaching, with the expulsion of the zooxanthellae as the dominant observation20. In the present study, corals were subjected to 18 hours of darkness at 25°e as a control for high temperature and light exposures. Although no expUlsion of zooxanthellae was observed after 18 hrs of darkness, an extensive change in cellular morphology of the gastrodermal cells (Fig. 3, a-b) was detected. There was significant vacuolization surrounding the zooxanthellae, but in contrast to the other treatments exhibiting vacuolization, a majority of zooxanthellae had cell membrane/thecal plates that were distinct with little indication of degradation (Fig. 3, a-b). In the dark treatment, the host tissue showed significant morphological differences from the four light treatments, exhibiting an abundance of micro-vacuolization bodies in the gastrodermal cells (Fig. 3a). Nuclear morphologies of the gastrodermal cells did not exhibit any of the classic signs of either apoptosis or autophagic cell death. Darkness-induced bleaching is a relatively long process, and the sampling occurred very early in the bleaching process, which may explain why LAS levels were not significantly different from the reference, though Rab7 activation was increased (Table I). Oxidative damage markers were either not significantly different, or were lower compared to the reference, indicating that a different regulatory mechanism may have activated symbiophagy. In the dark, zooxanthellae are unable to produce photosynthate, thereby starvin~ the host cell of expected calories. Since it is known that starvation induces autophagy''', it is possible that the same regulating pathway may activate the initiation of symbiophagy in dark-treated corals.
High-light at 32°e Effects
Corals exposed to 18 hours of darkness with 10 of those hours at 32°e showed an exacerbated pathomorphology compared with corals exposed to extended darkness at 25°C. There was widespread vacuolization surrounding the zooxanthellae, and the cell membrane/thecal plate exhibited signs of extensive degradation (Fig. 3, c and e). Subcellular morphology of the zooxanthellae was largely intact, though there were indications of disorganization of the thylakoid membrane in some of the chloroplasts (Fig. 3, d-e). In this treatment, as in the high temperatures in the light treatment, LAS levels were significantly higher than the reference, but not significantly different from the other two 32°C treatments; concurring that LAS expression and lysosomal maturation is influenced by heat stress. Rab7 activation was significantly greater than in the reference or the darknessl25°C treatment, corroborating its involvement in the activation of symbiophagy. This result also suggests that its activation may be triggered by cellular signals other than temperature stress. DNA and protein damage markers showed a similar pattern as the dark/25°C pattern, while the lipid damage marker was significantly higher in this treatment compared to the reference and the dark/25°C. This is not surprising, since lipid autooxidation is generally more sensitive to changes in reactive oxygen
Downs Page 6

Chapter 2
species content from its micro-environmenfl. Signs of gastrodermal tissue distress and even necrosis were prominent, indicating that the role of heat stress may be additive to the induction of phagic processes (Fig. 3, c and e; Supplementary Fig. 2). Autophagosome bodies and whorls were pronounced in gastrodermal cells not yet necrotic (Fig. 3c). Many gastrodermal cells were devoid of most organellar structures, except for vacuolated zooxanthellae, nuclei, and the littering of cystoplasmic remnants that adhered to vacuolar and plasma membranes (Fig 3e). There were no morphological signs of apoptosis, and with respect to the activation of symbiophagy and autophagy, gastrodermal nuclei also lacked many of the classic signs of autophagic programmed cell death. For example, in Fig 3e, the nucleus lacks blebbing, or vacuolization, instead the chromatin material is seen adhering to the nuclear membrane, and there is initial shearing of the nuclear membrane. Micrographs of other cnidarian species, similar to these shown here, abound in the literature, and were interpreted as celI detachment or exocytosis9
•10
•
These results indicate that dark exposure may result in a form of autophagic cell death similar to that recently reported in other organisms23-2S. Thus, similar to what occurs during Kazall silencing in Hydra endoderm, the autophagic necrosis of the gastrodermal tissue in dark exposed P. damicorms (at 25° or 32°C) may be the result of a failed process to safe guard the tight control of the tissue from extensive cellular autop~.
Symbiophagy of the zooxanthellae is a dominant coral survival response. Understanding symbiophagy in cnidaria is important for advancing our knowledge of the role of autophagic processes as a primordial intracellular protective pathway. Maintenance of symbiosis requires the suppression of phagolysomal activation and maturation of the zooxanthellae's vacuolar membrane. Other xenophagic models, such as those involving pathogens like Mycobacterium tuberculosis, Vibrios and Shigella, were shown to block phagolysomal activation and maturation, and that starvation or other stress events were found to overcome this regulation, thereby induci~ autophagy and xenophagy of intracellular bacteria as part of host innate immunity 16,27 • Corals infected with the intracellular, pathogenic Vibrio coralliilyticus often become bleached29. This suggests that the innate immune response of the coral towards the Vibrio may become non-specific and expand its xenophagic reaction towards the zooxanthellaelD
• If this is true, then many of the cytokines and stressors associated with the induction of autophagy and bacteriaVviral xenophagy may also activate symbiophagy. It is therefore imperative to explore this phenomenon in the context of primordial innate immunity as an intracellular protective pathway particularly since this pathway is likely to be a part of a more general and evolutionarily conserved defense mechanism in cnidaria and other phyla.
Downs Page 7

Chapter 2
METHODS
CoUeetion of coraL Samples were collected from the eastern side of Coconut Island at the Hawaii Institute of Marine Biology, Oahu, Hawaii, U.S.A. under the Hawaii Dept. of Land and Natural Resource pennit number SAP2005-35. Colonies were fragmented and maintained in raceways at least 45 days before the experiment. In the raceways, corals were exposed to peak planar incident irradiance of 372 f1moles of photosynthetic active radiation (PAR) photons per meter per second of shadowed sunlight. Light measurements were determined using a Li-Cor quantum radiometer and photometer (LI-250A) with a planar incident sensor (cat# Quantum)
Experimental treatments. Corals nubbins were subjected to six envimnmental treatments. Treatments were conducted in triplicate using 100gallon aquarium tanks, each containing a recirculating jet to maintain consistent water flow over the corals nubbins, as well as aquarium heaters and cooling reservoirs to maintain constant set temperature. All experiments began at the same time in the morning after a period of 8 hrs of darkness. The treatments were carried out for a period often hours each beginning at 6:00 am: (1) a reference treatment oflow light (438 f1Moles m·1 S·I PAR peak- natural irradiance using a neutral density filter) at 25"C, (2) low light at 32"C, (3) high light (2007 f1Moles m·1
S·I
PAR peak natural irradiance) at 25"C, (4) high light at 32"C, (5) darkness for 10 hours (18hr total) at 25"C, and (6) darkness for a total of 18 hours with the first 8 hours at 25"C and the next I 0 of those hours at 32"C. At the termination of the experiment, fragments were collected for morphological and biochemical assessment. Additional fragments were maintained at the same experimental conditions for 48 hours or 5 days and were then examined for gross morphology. A 75% water change of the tanks was carried out at 49 hours and 96 hours after the initiation of experimental treatments. Salinity was determined using a Vee Gee portable refractometer, (cat# A366ATC) and maintenance of constant salinity in the experimental tanks was accomplished by the addition of doubledistilled, de-ionized water. Samples used for DNA abasic site, hydroxynonenal, and protein carbonyl assays were snap-frozen in a liquid nitrogen vapor shipper, then stored at -80°C until processing. Other samples were processed for collection as described below.
Algal Density. (Supplementary Fig. 1) Coral fragments were collected, and a surgical bone cutter was used to cut a portion of the nubbin with a diameter between 3 mm to 7 mm with a sectional width of 4 mm to 7 mm. Algal density in that fragment was detennined using a modified Marsh method30
• Aluminum foil was wrapped around each coral fragment to determine the corresponding surface area of the tissue. The aluminum foil was removed and placed on a CannonScan flatbed scanner and scanned with a surface area calibrant. Surface area of the aluminum foil was detennined using IMAGE J31. The tissue was scraped from the skeleton using a stainless steel micro-chisel and placed in 5 mL of artificial seawater (salinity of 38 ppt) containing 50 milligrams of lysozyme (Sigma-Aldrich, caW L6876) and 5 milligrams of a-amylase (Roche Diagnostics, caW 10102814001) and incubated on a rocking platfonn for IS minutes. One milliliter of artificial seawater containing 25 milligrams of dispase (Gibco, Cat# 171 05-041) was added to the sample slurry, and incubated for 15 minutes. This cocktail
Downs Page 8

Chapter 2
of enzymes digests the coral mucus matrix, which can trap zooxanthellae during centrifugation causing artifact. The samples were then centrifuged in an Eppendorf swinging-bucket centrifuge at 4,000 g for 10 minutes. The supernatant was removed and the pellet resuspended in 1.5 mL of artificial seawater. Zooxanthellae were counted using a Neubauer hemocytometer (Hausser Levy Counting Chamber).
Transmission Electron Mleroseopy. A single polyp was biopsied using a 2.5 mm stainless steel leather punch. For primary fixation, the sample was submerged in modified Kranovsky's fixative (2.5% gluteraldehyde, 2% paraformaldehyde in O.lM cacodylate buffer (PH 7.2» for 30 minutes and then in 2.5% gluteraldehyde in filtered sea water. Samples were fixed in the secondary fixative overnight. For transportation, gluteraldehyde fixed samples were placed in 1% gluteraldehyde in cacodylate buffer at 4·C.
Samples were shipped from Hawaii, U.S.A. to Tel Aviv, Israel for fina1 processing and electron microscopy under the CITES export permit number 06USI I 157679.
Once in Israel, the samples underwent two washes in 0.1 M cacodylate buffer (PH 72), the samples are post fIXed in 1% osmium tetroxide (enhances membrane preservation) at 4·C for 30 minutes. Samples were then dehydrated in a graded ethanol series and then in propylene oxide followed by a gradual embedding in Araldite (502) (Electron Microscopy Sciences Fort Washington PA USA). In the final full strength araldite, the samples were subjected to mild vacuum (40Ombar) for one hour at 2S·C followed by an overnight polymerization at 60·C. The block was then trimmed and I um sections were cut, stained with toluidine blue32, sectioned (60-90 om) using an ultramicrotome and mounted on 300 mesh copper grid (Supplementary Fig. 2). The ultrathin sections were stained with lead citrate. Sections through the same approximate mid polyp body area were examined using a JEM-1230 at 80kY. Images were taken using TVIPS TemCam-F214
DNA Abash: Lesions. Tissues from the frozen coral nubbins were removed from the skeleton using a sterile micro-chiseI. The tissue was then ground to a fine, powder consistency in liquid nitrogen using a liquid nitrogen-chilled mortar and pestle. Approximately SO 111 of frozen, powdered sample was placed in a microcentrifuge tube, and DNA was isolated according to manufacturer's instructions using the Dojindo pureDNA kit-Cell,tissue (GK03-20) with one slight modification to address Maillard chemistry artifact. One hundred milligrams ofpolyvinylpolypyrrolidone (Sigma-Aldrich) was added to the tube when the sample was still frozen, and before the addition of the Kit's lysis buffer. DNA concentration was determined using an InvitrogenlMolecular Probes Quant-i'fTM DNA Assay Kit, Broad Range (cat# Q33130) using a Bio-Tek FL800 fluorescent microplate reader. DNA AP concentration was determined using the Dojindo DNA Damage Quantification Kit -AP Site Counting (cat# DK-02-10) and was conducted according to manufacturer's instructions.
Protein Carbonyl. Protein carbonyl groups were measured using a modified method of Robinson et aI., 199~3. Approximately SO 111 of frozen, powdered sample was added to a microcentrifuge tube. A solution of containing SO mM Tris-HCI (PH 7.8), 0.1 mM a-
Downs Page 9
Chapter 2
tocopherol, 0.005 mM salicylic acid, 20 mM phenylmethylsulfonyl fluoride, 20 mM benzamide, 50 f.LM a-aminocaproic acid, 1% polyvinylpolypyrrolidone (wtlvol), 0.15 mM desferoximine methylate, 0.01 mM sorbitol, I mM MgCI2, and 2 units of deoxyribonuclease I from bovine pancreas (Sigma-Aldrich, cata10g# D 4527, I microgram of protein/aliquot) was added to the sample to remove DNA, as well as to redox stabilize the sample. The sample was vortexed and incubated for 10 minutes in a 37"C waterbath, with occasional vortexing. A 100 f.LL volume of a second solution containing 10% sodium dodecyl sulfate, 50 mM Tris-HCI (PH 7.8), 80 mM disodium ethylenediamine tetraacetic acid (PH 8) and 50 mM dithiothreitol was added to the sample as both a DNAse stop solution and a general protein denaturing buffer. Samples were vortexed, and then incubated in a 55"C water bath for 6 minutes with occasional vortexing. Samples were then centrifuged for 10 minutes at 10,000 g, and the supernatant transferred to a new microcentrifuge tube. DNA concentration was determined using an InvitrogenIMolecular Probes Quant-iTTM DNA Assay Kit, Broad Range (Q33130) and a Bic-Tek FL800 fluorescent microplate reader to ensure the absence of DNA in the sample, whose presence can produce artifactual signal noise33
• Protein concentration was determined using a modified Ghosh method34
• Oxidized bovine serum albumin standards for carbonyl concentration standards were a gift from Dr. Charles Robinson.
Samples were assayed in triplicate, with a triplicate blanking of carbonyl reactivity using 20 mM sodium borohydride. Samples were applied to a Nunc 96-well maxisorp microplate. The rest of the method follows a prutocol set forth by Dr. Robinson based on Robinson et aI., 1999 using a 0.2% solution of 2,4-dinitrophenylhydrazine (DNPH) as the derivatizing reagent, except that a solution of 5% Casein (Sigma-Aldrich, C8654, w/v), 50 mM Tris-HCI (PH 7.8), I mM NaCI, 0.5 mM sorbitol, 0.15 mM desferoximine methylate, and 0.005 mM salicylic acid was used as a blocking solution instead of nonfat dry milk. DNPH was detected using a primary antibody; antidinitrophenyl mouse monoclonal Igi (gift from Dr. Charles Robinson), and a donkey anti-mouse Fab fragment conjugated with horseradish peroxidase (Jackson ImmunoResearch Laboratories) was used as a secondary antibody. NEN western lightning luminal solution «perkinElmer, Inc., Waltham MA) was used to generate a signal, and a Bic-Tek FL800 series fluorescentlluminescent microplate reader was used to read the signal.
Hydroxynonenal Adducted to Protein. Approximately 50 microliters of frozen, powdered sample was added to a microcentrifuge tube. A one milliliter solution containing 50 mM Tris-HCI (PH 7.8), 0.1 mM a-tocopherol, 0.005 mM salicylic acid, 20 mM phenylmethylsulfonyl fluoride, 20 mM benzamide, 50 f.LM a-aminocaproic acid, 1% polyvinylpolypyrrolidone (wt/vol). 0.15 mM desferoximine methylate, 0.01 mM sorbitol, 5 mM butylhydrotoluene, 2 units of deoxyribonuclease I from bovine pancreas (SigmaAldrich, cata10g# D 4527, I microgram of protein), and I microgram of ribonuclease A from bovine pancrease (Sigma-Aldrich, cataIog# R 6513) was added to the sample, and incubated for 10 minutes in a 37"C water bath with occasional vortexing. A 100 f.LL volume of a second solution containing 10% sodium dodecyl sulfate, 50 mM Tris-HCI (PH 7.8), 80 mM disodium ethylenediamine tetraacetic acid (PH 8) and 50 mM dithiothreitol was added to sample as a general protein denaturing buffer. The sample was incubated at 65"C for 6 minutes with occasional vortexing. Protein concentration was
Downs Page 10

Chapter 2
detennined using a modified Ghosh method34• The antibody against HNE adducted to
protein was obtained from Envirtue Biotechnologies, InclUS Biological and is similar to cat# H6276-10, but was raised against an antigen that was HNE adducted to bovine serum albumin and not keyhole limpet hemocyanin. Secondary antibody was a donkey anti-rabbit Fab fragment conjugated to horseradish peroxidase (Jackson ImmunoReseach). NEN westem lightning luminal solution was used to generate a signal, and a Bio-Tek FL800 series fluorescentlluminescent microplate reader was used to read the signal.
Standards of HNE-adducted to protein were created by incubating 1 mg of HNE in 10 mL of 1 mM Tris-HCI (PH 8.5) with 1 mM of the following synthesized peptide (NH2-YFNDSQRQATKDAG-CooH) for one hour. Theoretically, HNE will form stable Michael addition-type adducts with lysine and histidine residues. The adducted peptide was lyophilized, resolubilized in water and 1 % SOS, gel purified on a 20% acrylamide gel, electroeluted from the gel, and quantified using the Bicinchoninic Acid (DCA) method (Sigma-Aldrich, cat# Sigma B 9643) incubating the BCA with the sample at 60·C for 15 minutes. Absorbance was read at 562 om using an OceanOptics USB4000 spectrophotometer.
Rab7 Antigen Design and Antibody Production. Rab7 protein sequences from Acropora millepora, Aiptasia pulchella, Hydra magnipapi/lata, and Nematostella vectensis were aligned using ClustalW alignment from the Accelrys Gene Software package (Supplementary Fig. 3). The amino-acid sequence NH2-CLSGONKPQNNCSCCooH antigen was chosen based on its evolutionary proximity to P. damicornis, as well as its importance as the prenylation domain of Rab7·s• The two cysteines near the carboxyl tenninal end of the Rab7 protein playa necessary role in the activity of the Rab7 protein 35. Functional activation of Rab7 requires that one or both of these two cysteines be prenylated by Rab geranylgeranyl transferase36
• Once prenylated, the Rab7 protein is chaperoned to its target membrane/organelle by the Rab Escort Protein, and then converted to its final active form by its coupling with GW7. If an antibody is made against the unprenylated carbonxyl-terminal end of the Rab7, it should not be able to cross-react with this epitope ifit is prenylated.
The cysteine of the polypeptide was conjugated to ova albumin, and immunized in rabbits with an appropriate adjuvant. During the eighth week after immunization, sera was tested for it reactivity to the unconjugated antigen. One-dimensional SOS-PAGE and western blotting were used to optimize the separation of ~get proteins and validate the use of the Rab7 antibodies for P. dam/cornis protein extracts"".
Protein separation by SDS-polyacrylamide gel electrophoresis and Westem transfer of gel contents to a membrane for immunochemical detection was used to validate the antibody for P. damicornis (Supplementary Fig. 4). A Santa Cruz Biotechnologies, Inc. (cat# SCI 0767; antigen is the amino-acid residues 157-207 of human Rab7) polyclonal antibody was used to confirm that the Rab7-prenylation antibody reacted with a protein of the appropriate SOS-PAGE migration rate. Total soluble protein (25 J.lg) from two prepared samples were electrophoresed in a 12.5% SOS-PAGE preparative gel until the bromophenol blue dye front was near the bottom of the gel. All gels were blotted onto 0.2 J.lm polyvinylidene fluoride (PVDF) membranes (lmmobilion P, Millipore) using a wet transfer system. The membranes were blocked in
Downs Page 11

Chapter 2
5% non-fat dry milk Tris-butTered saline (TBS) solution, and assayed with primary antibody for one hour at 25° C. The blots were then washed in ms four times, and incubated in a I :30,000 dilution of alkaline phosphatase conjugated goat anti-rabbit secondary antibody solution (Jackson lmmunoResearch Laboratories, Westport, PA) for one hour at 25° C. 8lots were washed again four times in ms, and developed using a nitroblue tetrazolium/ 5-bromo-4-chloro-3-indolyl phosphate (Sigma-Aldrich, cat# 85655) and documented using a CanonScan Lidi50. To ensure a minimum of nonspecific cross-reactivity, blots were developed for at least three minutes.
As a final confirmation that the Rab7-prenylation antibody cross-reacted with the appropriate epitope, I mM ofunconjugated peptide antigen was added to I uL ofRab7-prenylation neet serum in 20 mL of ms (Supplementary Fig. 4). The solution was incubated for 30 minutes on a rocking platfonn. The blot was added to this solution after being blocked with milk for I hour (like the rest of the primary antibodies), then processed the same way as the other blots.
Validity of using the Rab7 antibody for immuno-microscopy was tested by extracting approximately 50 mg of frozen sample powder with a solution of 50 mM TrisHCl (PH 8.0), 10 mM EDTA, 20 mM phenylmethylsulfonyl fluoride, 20 mM benzamide, 50 11M a-aminocaproic acid, 1% polyvinylpolypyrrolidone (wtlvol), and 0.5% (w/v) CHAPS detergent. The sample was vortexed and incubated at 300C for 6 minutes, and then centrifuged for 10 minutes at 10,000 g. The supernatant was collected and subjected to native polyacrylamide gel electrophoresis under 10 mAmp current for four hours. Contents of the gel were transferred to PVOF membrane via a wet western transfer system. The membrane was blocked in 5% non-fat dry milk Tris-butTered saline (TBS) solution, and assayed with primary antibody for one hour at 25° C. The blots were then washed in ms four times, and incubated in a I :30,000 dilution of aIka1ine phosphatase conjugated goat anti-rabbit secondary antibody solution (Jackson ImmunoResearch Laboratories, Westport, PA) for one hour at 25° C. 8lots were washed again four times in ms, and developed using a nitroblue tetrazolium/ 5-bromo-4-chloro-3-indolyl phosphate (Sigma-Aldrich, cat# 85655) and documented using a CanonScan Lidi50. To ensure a minimum of non-specific cross-reactivity, blots were developed for at least three minutes. No bands were detected (data not shown).
Lysosomal Acid Phospbatase Antigen Design and Antibody Production. Lysosomal acid phosphatase protein sequences were retrieved from GenBank
using Accelrys Gene Software package. Protein sequences were aligned using CIusta1W alignment software, and a conserved region of the protein was detennined. The literature was scanned to ensure that this region was not susceptible to active post-translational modifications (e.g., 9, 10). The sequence NH2-NISWQPIPVHTVP-COOH was chosen as an antigen sequence (Supplementary Fig. 5). The antigen was synthesized and immunized into chickens with RIBI adjuvant Eggs were collected and the IgY fraction was separated from egg whites using an ammonium sulfate precipitation. This IgY fraction tested positive for reactivity of the unconjugated antigen using an ELISA method.
Protein separation by SDS-polyacrylamide gel electrophoresis and Western transfer of gel contents to a membrane for immunochemica1 detection was used to validate the antibody for P. damicomis (Supplementary Fig. 6). This method was
Downs Page 12
Chapter 2
identical to the one used to validate Rab7, but we were unable to obtain a commercial LAP antibody. The LAP antibody detected a protein with a nearly similar migration rate in samples from mammals (data not shown).
Rab 7 and Lysosomal Add Phosphatase ELISA. Approximately 50 microliters of frozen sample powder was placed in locking 1.8 ml microcentrifuge tubes along with 1400111 ofa denaturing buffer consisting of 2% SDS, 50 mM Tris-HCI (PH 7.8), 15 mM dithiothreitol, 10 mM EDT A, 3% polyvinylpolypyrrolidone (wt/vol), 0.005 mM salicylic acid, 0.001% (v/v) dimethyl sulfoxide, 0.01 mM AEBSF, 0.04 mM bestatin, 0.001 E-64, 2 mM phenylmethylsulfonyl fluoride, 2 mM benzamide, 5 )1M a-amino-caproic acid, and I ~ 100 uL pepstatin A"I. Samples were vortexed for 15 seconds, heated at 93°C for 6 min, with occasional vortexing, and then incubated at 25°C for 10 minutes. Samples were subject to a centrifugation (13,500 g for 8 minutes) and the middle-phase supernatant was aspirated and placed in a new tube34
• Protein concentration was determined using a modified Ghosh method34
•
Twenty-five nanograms of total soluble protein from a sample were added to a well of a Nunc Maxisorp 96-well microplate. Microplates were incubated for 12 hours in a humidified chamber at 25OC. Sample solution from each well was aspirated using a Bie-Tek EL404 Microplate Autowasher. Wells were blocked for one hour using a 5% (w/v) of non-fat dry milk in Tris-buffered saline. The blocking buffer was removed and incubated with primary antibody for one hour at 25°C. Plates were washed with Trisbuffered saline using the Microplate Autowasher, and then incubated with the appropriate secondary antibody conjugated with horseradish peroxidise (Jackson ImmunoResearch Laboratories) was used as a secondary antibody. NEN western lightning luminal solution was used to generate a signal, and a Bie-Tek FL800 series fluorescentlluminescent microplate reader was used to read the signal. All samples were assayed in triplicate; intra-specific variation of less than II % was achieved throughout the 96-wells of each microplate.
Statistics. Data were tested for normality using the Kolmogorov-Smirnov test (with Lilliefors' correction) and for equal variance using the Levene Median test. If the data were normally distributed and homogeneous, a one-way analysis of variance (ANOY A) was employed. When data did not meet the homogeneity of variances requirement for one-way ANOYA, we instead used a Kruskal-Wallis One-Way Analysis ofYariance on Ranks. When significant differences were found among treatment means, we used the Tukey-Kramer Honestly Significant Difference (HSD) method, the Dunn's post-hoc test, or the Holm-Sidak test as an exact alpha-level test to determine differences between each of the populations39
•
Downs Page 13

Chapter 2
References
I. Brown B. E. Coral bleaching: causes and consequences. Coral Reefs 16, S 129-S 138 (1997).
2. Wilkinson C. (ed), Status o/Coral Reefs o/the World: 2004. 1,67. Australian Institute of Marine Science: Townesville (2004).
3. Brandt, K. Uber die morphologische und physiologische Bedeutung des Chlorophylls bei Thieren. Min. Zool. Sta. Neapel. 4, 191-302 (1883).
4. Boschma, H. The nature of the association between Anthozoa and zooxanthellae. Proc. Nail. Acad. Sci. USA 11,65-67(1925)
5. Yonge, C. M. & Nicholls, A.G. Studies on the physiology of corals. V. The effect of starvation in light and in darkness on the relationship between corals and zooxanthellae. Scient. Rep. GI. Barrier Ree/Exped I, 177-211 (1931)
6. Hohman T.C., McNeil P.L.,& Muscatine, L.Phagosome-lysosome fusion inhibited by algal symbionts of Hydra viridis. J. Cell. Bioi. 94,56-63 (1982).
7. Suharsano, Pipe, R. K., & Brown, B.E. Cellular and ultrastructural changes in the endoderm of the temperate sea anemone Anemonia viridis as a result of increased temperature. Mar. Bioi. 116, 311-318 (1993).
8. Titlyanov, E. A., Titlyanova, T. V., Loya, Y., & Yamazato, K. Degradation and proliferation ofzooxanthellae in planulae of the hermatypic coral Stylophora pistillala Mar. Bioi. 130,471-477 (1998).
9. Steen, R.G., & Muscatine, L. Low temperature evokes rapid exocytosis of symbiotic algae by a sea anemone Bioi. Bull. 172,246-263 ( 1987)
10. Gates, R.D., Baghdasarian G., & Muscatine, L. Temperature stress causes host cell detachment in symbiotic cnidarians: implications for coral bleaching. Bioi. Bull. 182, 324-332(1992).
II. Downs, C.A., Fauth, J.E., Halas, J.C., Dustan, P., Bemiss, J.A. & C.M. Woodley. Oxidative stress and coral bleaching, Free Radical Biology and Medicine 33, 533-543 (2002).
12. Brown, B. E .. Downs, C. A. Dunne, R. P., & Gibb, S.W. Exploring the basis of thermotolerance in the reef coral Gonastrea aspera. Mar. Eco. Prog. Ser. 242, 119-129 (2002).
13. Chen, M.C., et aI. ApRabll, a cnidarain homologue of the recycling regulatory protein Rab II, is involved in the establishment and maintenance of the AiptasiaSymbiodinium endosymbiosis. Biochem. Biophys. Res. Comm. 388, 1607-1616 (2005).
14. Chen, M.C., Cheng, Y.M., Sung, PJ., Kuo, C.E., & Fang, L.S. Molecular identification ofRab7 (ApRab7) in Aiplasia pulchella and its exclusion from phagosomes harboring zooxanthellae. Biochem. Biophys. Res. Commun. 308, 585-594(2003).
15. Rak, A., Pylypenko, 0., Niculae, A., Pyatkov, K., Goody, R. S., & Alexandrov K. Structure of the Rab7:REP-1 Complex: Insights into the mechanism ofRab prenylation and choroideremia disease Cell 117, 749-760(2004).
Downs Page 14
Chapter 2
16. Levine, B. Eating oneself and uninvited guests: autophagy-related pathways in cellular defense Cell 120, 159-162 (2005).
17. Moss, D.W., Raymond, F. D., & Wile D. B. Clinical and biological aspects of acid phosphatase. Crit. Rev. Clin. Lab. Sci. 32, 431-467(1995).
18. Roberts, E. A, Chua, J., Kyei, G. B., & Deretic, V. Higher order Rab programming in phagolysosome biogenesis J. Cell Bioi. 174, 923-929 (2006).
19. Scherz-Shouval, R., Shvets, E., Fass, E., Shorer, H., Gil, L., & Zwlun E., Reactive oxygen species are essential for autophagy and specifically regulate the activity of Atg4. EMBO J. 26, 1749-1760 (2007).
20. Smith, H. G. The significance of the relationship between actinians and zooxanthellae J. Exp. Bioi. 16,334-345(1939).
21. Gozuacik, D., & Kimchi. A. Autophagy and Cell Death Curro Top. Dev. Bioi. 78, 217-245 (2007).
22. Halliwell B., & Gutteridge, J.M.C. Free radicals in biology and medicine. New York: Oxford University Press, Inc. (1999).
23. Mizushima, N. The pleiotropic role of autophagy: from protein metabolism to bactericide Cell Death Dilfer. 12, 1535-1541 (2005).
24. Samara, C., Syntichaki, P., Tavemarakis, N. Autophagy is required for necrotic cell death in Caenorhabditis elegans Cell Death Differ. 15, 105 -112(2008).
25. Tsujimoto, Y. & Shimizu, S. Another way to die: autophagic programmed cell death Cell DeathDiff.15, 1528-1534 (2005).
26. Chera, S., de Rosa R., Miljjkovich-Licina M., Dobretz K., Ghila L., Kaloulis K., & Galliot B., Silencing of the hydra serine protease inhibitor Kazall gene mimics the human SPINK I pancreatic phenotype J. Cell Science 119, 846-857(2006)
27. Ogawa, M., Yoshimori, T., Suzuki, T., Sagara, H., Mizushima,N., & Sasakawa, C. Escape ofIntracellular Shigella from Autophagy Science 307,727-731(2005).
28. Gutierrez, M.G., Saka H.A., Chinen,I., Zoppino F.C.M., Yoshimori, T., Bocco, J.L., & Colombo, M.L Protective role of autophagy against Vibrio cholerae cytolysin, a pore-forming toxin from V. cholerae Proc. Natl. Acad. Sci. USA 104, 1829 -1834 (2007).
29. Ben-Hahn, Y., Zickerman-Keren, M., & Rosenberg E., Temperature-regulated bleaching and lysis of the coral Pocillopora damicornis by the novel pathogen Vibrio coralliilyticus. Appl. Environ. Microbiol69, 4236-4242: (2003).
30. Marsh, JoA, Primary productivity of reef-building calcareous red algae. Ecology 55, 225-263 (1970).
31. Abramoft; M.D., Magelhaes, P J., & Ram, SJ. Image Processing with ImageJ. Biophotonics Inti. 11, 36-42 (2004).
32. Carson, F .L. Histotechnology: A self instroctional text. ASCP Press: Chicago. (1996). 33. Robinson, C.E. et al. Determination of Protein Carbonyl Groups by Immunoblotting.
Anal. Biochem. 266, 48-57 (1999). 34. Downs, C.A. In G. Ostrander (ed), Techniques in Aquatic Toxicology. CRC, Boca
Raton, FL, USA, pp 181 (2005). 35. Andres, D.A. et aI. cDNA cloning of component A ofRab geranylgeranyI transferase
and demonstration of its role as a Rab escort protein. Cell 73, 1091-1099 (1993). 36. Alory, C. & Balch, W.E. Molecular basis for Rab preny1atio.J. Cell. Bioi. 150, 89-
103 (2000).
Downs PagelS

Chapter 2
37. Geier, C., von Figura, K., & Pohlmann, R. Structure of the human lysosomal acid phosphatase gene. Eur. J. Biochem. 183,611-616 (1988).
38. Pohlmann, R. et a1. Human lysosomal acid phosphatase: cloning, expression and chromosomal assignment. EMBO J. 7, 2343-2349 (1989).
39. Sokal R.R. & Rohlf, FJ. Biometry. W.H. Freeman, New York, New York. Pg451-499. (1995). 40.
Acknowledgements I would like to thank Len Muscatine and Robert Richmond for helpful discussions, Rina Jeger and Vona Lichtenfeld (Ben Gurion University TEM facility) for processing of samples for electron microscopy, and Frances Ostrander and Sean Knutson for assistance with coral exposures.
Downs Page 16

Chapter 2
Table 1. Each biomarker data set was tested for normality using the KolmogorovSmirnov test (with LiIliefors' correction) and for equal variance using the Levene Median test. If the data for that biomarker were normally distributed and homogeneous, a oneway analysis of variance (ANOVA) was employed. When data for that biomarker did not meet the homogeneity of variances requirement for one-way ANOV A, a KruskalWallis One-Way Analysis of Variance on Ranks was employed. When significant differences were found among treatment means, the Tukey-Kramer Honestly Significant Difference (HSD) method, the Student-Newman-Keuls Method post-hoc test, or the Holm-Sidak test was used as an exact alpha-level test to determine differences between each of the populations. Treatment means with different superscripted letters differed significantly at a=O.05. Entries in the table give treatment means:!: I SE.
Fig. 1. Transmission electron micrographs of a zooxanthella within the endodermallayer of the host coral P. damicomis exposed to 438 llJIIoles m·1 S·I PAR peak irradiance (low light) at 25°C and 32"c. CP = chloroplast; HN = host nucleus; MT = mitochondria; P = pyrenoid body; V = vacuole; VMe = host vacuolar membrane; VMx = Vacuolar matrix; Zcm = zooxanthellae cell membrane; Ztp = zooxanthellae thecal plate; Zn = Zooxanthella nucleus. (A) Low light at 25"C (reference treatment). Magnification 1500x, Scale bar = 5000 om. (B) Magnified area from boxed area in A. Magnification 4000x, scale bar = 1000 om. (C) Low light at 25"C to illustrate the reference VMe, Zcm, and Ztp. Magnification 8000x, scale bar = 500 om. (D) Low light at 32"c. Magnification 2000x, scale bar = 2000 om. (E) Magnified area from boxed area in D. Magnification 4000x, scale bar = 1000 om.
Fig. 2. Transmission electron micrographs of a zooxanthella within the endodermal layer of the host coral P. damicomis exposed to 2007 llJIIoles m·1
S·I PAR peak irradiance (high light) at 25°C and 32"c. CP = chloroplast; HN = host nucleus; MT = mitochondria; P = pyrenoid body; VMe = host vacuolar membrane; VMx = Vacuolar matrix; Z = zooxanthellae. (A) High light at 25°C. Magnification 2000x, scale bar = 2000 om. (B) Magnified area from boxed area in A. (C) High light at 25°C. Magnification 2000x, scale bar = 2000 om. (D) Magnified area from boxed area in C. Magnification 6000x, scale bar = 1000 om.
Fig. 3. Transmission electron micrographs of a zooxanthella within the endodermal layer of the host coral P. damicomis exposed to darkness at 25°C and 32"c. CP = chloroplast; GVC = gastrovascular cavity; HN = host nucleus; MT = mitochondria; P = pyrenoid body; Pm = plasma membrane; VMe = host vacuolar membrane; VMx = Vacuolar matrix; Z = zooxanthellae; Zcm = zooxanthellae cell membrane. (A) Darkness at 25"C. Magnification 1500x, scale bar = 5000 om. (B) Magnified area from boxed area in A. Magnification 5000x, scale bar = 1500 om. (C) Darkness at 32"c. Magnification 2000x, scale bar = 2000 om. "W" indicates autophagic whorls. (D) Magnified area from boxed area in C. Magnification 10,OOOx, scale bar = 500 om. (E) Darkness at 32"c. Magnification 2000x, scale bar = 2000 om.
Downs Page 17

Chapter 2
Fig. 4. Algal Density. Coral nubbins were maintained under six environmental treatments, and sampled 48 hours and 127 hours after the initiation of the treatments. Treatments include: (I) a reference treatment oflow light (438 JIllIoles m-I S-I PAR peaknatural irradiance uSinr a neutral density filter) at 25°C, (2) low light at 32°C, (3) high light (2007 JIllIoles m- S-I PAR peak natural irradiance) at 25OC, (4) high light at 32OC, (5) darkness for a total of 10 hours (18hr total) at 25°C, and (6) darkness for a total ofl8 hours with the first 8 hours at 250C and the next 10 of those hours at 32OC. "#" indicates that the time-points within the same treatment are significantly different (a=O.050).
Fig. S. Semithin sections of polyp tissue of the coral Pocil/opora dmnicomis stained with toluidine blue, photographed at 400 magnification. H25 = High light, 25OC. L25 = Low light, 25OC. D25 = Darkness, 25OC. H32 = High light, 32C. L32 = Low light, 32°C. 032 = Darkness, 32OC. D25; note vacuolization of gastrodermal cells. For H32 and L32, note the loss of coherence and fragmentation of gastrodermal tissue. For D32, note vacuolization of gastrodermal cells and loss of gastrodermal tissue coherence.
Fig. 6. Rab7 protein sequences from four cnidarians species and Homo sapiens were aligned using ClustaIW software. The last seventy residues of the carboxyl-terminal end of the protein are presented. The last 10 residues of the protein are the cysteineprenylation domain.
Fig. 7. Pocil/opora dmnicomis samples were homogenized and subjected to SDS-PAGE (25 )I.g total soluble protein per lane), western blotting, and assayed with a polyclonal antibody. Lane A and B, blot was assayed with primary antibody against the cysteineprenylation domain of Rab7. Lane A is sample from low-light 24OC. Lane B is sample from low-light 32OC. Lane C and D, blot was assayed with primary antibody against the last fifty resides of the carboxyl-terminal end of the Human Rab7 protein from Santa Cruz Biotechnologies, Inc. Lane E is a blot assayed with primary antibody against the cysteine-prenylation domain ofRab7 that had been incubated with a saturating amount of unconjugated antigen that was used to produce this antibody.
Fig. 8. Lysosomal acid phosphatase (tartrate sensitive) protein sequences from various vertebrate and invertebrate species found in GenBank were aligned using ClustaIW software. A conserved region was identified, and the literature was consulted for evidence of post-translational modification in this region. The box indicates the sequence chosen to synthesize the antigen for LAP-antibody production.
Fig. 9. Pocillopora dmnicomis sample was homogenized and subjected to SDS-PAGE (25 )I.g total soluble protein per lane), western blotting, and assayed with a polyclonal antibody against the lysosomal acid phosphatase antigen. The apparent band in the blot has a similar migration ratelmolecular weight as the lysosomal acid phosphatase proteins from GenBank.
Downs Page 18

Chapter 2 Table 1
NoUght NoLlgbt LowUght LowLlgbt HlghUght HlghUght CeBular Parameter lS"C 31'C l5"C 31'C lS"C 31'C
DNA AP site (per I x 10· nucleotides) 22.5±S.7' 15.2±1.7' 33.2±S.4· 73.7±3.1b 165±10.4' 690±33.2d
Protein Carbonyl (pmollmg TSP) 22.3±2' 33.B±2.7' 78.2±S.lb 190.8±6.2' 207.3±11.3' 588±12d
Hydroxynonenal (nanog/mg TSP) 24.8±3.2· 81±S.cf 36.8±3.1· 2S0.3±17.5' 342±2S.s" 763.8±33.9'
Acid Phosphatase (relative units/ng TSP) 472±33' 2086±78.Sb 428.3±S4.7' 2086.3±103.6b 872.8±47.8' 2099.2S±66.3b
Rab 7 (relative units/ng TSP) 950.3±17.5' 547±12.9b 1009.3±34.2' 283.5±3.9' 661±IS' 131±15.2'
• Entries in the table give _en! means ± I SE. Treatment means with different superscripted letters differed significantly at a=O.05.
Downs Page 19

Chapter 2
Fig. I
Downs Page 20
Chapter 2
Fig. 2
Downs Page 21

Chapter 2
Fig. 3
Downs Page 22

Chapter 2
Downs
1.60
N 1.40 E u 1.20 ~ ., Co III 1.00 ., -co ~ 0.80
'" ~ 0.60 o I: i5 0.40
..... 0 .20
0.00
Fig. 4
48 aBd 127 Hours Heat and Light Treatments #
Dark 25°C
Dark 32°C
LL 25°C
LL 32°C
HL 25°C
HL 32°C
() 48 !-burs
ra 127 Hours
Page 23

Chapter 2
Fig. 5
Downs Page 24

Chapter 2
Fig. 6
QAWCBSXNDIPYFBTSAXBAINVBOAPQTIAKNAIr Consensus WH_HWH_~_H~ ___ • ___ + ___________________ + _______________ ____ + __________ _
150 160 170
------------------+-------------------.-------------------+-----------140 0 Awe H S X N DIP Y P B T S A X B A I N V BOA P Q T t A X N A L Acropora millepora 140 Q Awe H S X N N X P Y P B T S A X B A I N V B Q A P Q T I A X N A L Aiptasia pulcbella 140 Q Awe R S X N DIP Y P B T S A E B A I N V BOA F Q T I A K N A L Nematostella veetensis 141 0 Q W C H S It N B I P Y PET S A K B GIN V B B A P Q T I A It E A L Hydra magnipapillata 140 Q AWe Y S X N NIP Y PET S A E B A I N V B Q A P Q T I A Jl N A L HUman Hab7
AQETDVBLYNDPPDQIXLSGDN--KPXADNCAC---------+-------------------+-------------------+-------------------
180 190 200
--------+-------------------+-------------------+----------------.-. 175 A 0 E T B VEL Y N D P P DOl X L S G D N - X P 0 0 NNe S C 175 A 0 B T D VEL Y N D P P DOl It L S G E N - - It 0 It A D G C A C 175 AQBTDVELCNDPPDQIKLSGDT--KPXQDNCAC 1U AQBADVELYNDPPDQlltLNPDN 175 XQBTBBBLYNEPPBPIELDltNDRAltASABSCSC
Downs
Acropora mlllepora Aiptasia pulchella Nematostella vectenois Hydra magnipapl1lata JIUamn """7
Page 25

Chapter 2
ABC D E
Downs
Fig. 7
< 205 Ku
< 66Ku
< 20.1 Ku
< 6.5 Ku
Page 26

Chapter 2
121 121
"' 121 121 121 121 121 .s 123
Fig. 8
LFPPHGMQRFHPNISWQPIPVHTVPITBDRLLKPP ~~~w~ w ____________ + ___________________ + _____ • _____________ + __________ _
130 140 150 --- -_.- .-- -- --- -- -+--- -- -- --- -- -- --- --+- --- -- -- --- -- --- -- -+ --- -- -- ----LPPPDGIQRPN LPPPNGMQRPN LYPPBBQQMPN LPPPNGMQRPS LPPPNGMQH.PN LPPPNBVQBPN LPPPNGMQRPN LPPPTBVQBFN LYQPLPBMQFNE LYPPKGSQIFN
NISWQPIPVHTVPVABDRLLKFP NISWQPIPVHTVPITBORLLXFP NISWQPIPVHTVPBSGBMLLXPP NISWQPIPVBTVPITBDRLLKPP HISWQPIPVBTVPITEDRLLEPP NISWQPIPVRTVPITEDRLLXFP NISWQPIPVRTVPITEDRLLXPP NISWQPIPVRTVPITBDRLLKPP NISWQPIPVHTKPEBNDYLLRTD NITWOPIPVHTVPBSBDXLLXPP
Downs
CDDSenSllS
Boa taurus canis famil1aris Gallus gallus HoiIlo sapiens Macaca l!Dll.atta MIlS musculus Pan troglodytes Rattus norvegicus strongylocent%Otus purpuratus Xenopus tropica.lis
Page 27

Chapter 2
--<205Ku
<66Ku
<20Ku
Downs
Fig. 9
Page 28

Chapter 3
Chapter 3
Heat-stress and light-stress induce different cellular pathologies in the symbiotic zooxanthellae during coral bleaching
SUMMARY
Coral bleaching is a physiological phenomenon in which the symbiosis between the coral host and its symbiotic algal zooxanthellae is tenninated, usually by expulsion or digestion of the zooxanthellae. What initiates rejection of the zooxanthellae is unknown, though damage to photosystem n and accumulation of oxidative damage products are fuctors associated with the earliest stages of bleaching. To examine the changes in the zooxanthellae during the early onset of bleaching, I characterized the response of zooxanthellae from Pocillopora damicomis subjected to heat-stress and light-stress bleaching conditions by examining zooxanthellae cellular structoral integrity, accumulation of oxidative-damage products, heat shock-protein and antioxidant protein response, and photosynthetic pigments. My results show that in the early stages of bleaching, heat stress and light stress induce different pathomorphological changes in the chloroplast thylakoids, while a combined heat- and light-stress exposure induced both pathomorphologies - indicating that these stressors act on the zooxanthellae by different mechanisms. During a heat-stress exposure, decomposition of thylakoid-membrane structures occur before extensive oxidative damage, suggesting that it is the disorganization of the thylakoids that creates the conditions allowing for oxidative stress generation, such as photooxidative stress from the photosynthetic electron-transport-chain. However, in light stress conditions, a photo-oxidative stress is induced initially, which in turn results in structoraI damage to the chloroplast. After this initial ultrastructural damage occurs and as bleaching conditions persists, a specific program of sub-cellular stress-mitigating responses commences within the zooxanthella, regardless of the initiating stressor. This program of events is characterized by the accumulation of biochemical lesions, and changes to metabolic efficiencies by day two which is then followed by a shift in xanthophyll pool later in the program by day 4. This orchestrated cellular stress response is characteristic of early response stress-proteins being recruited to stabilize a challenge to homeostasis followed by upregulation of protective xanthophylls.
I
Downs

Chapter 3
INTRODUCTION
Coral bleaching is a physiological phenomenon in which the symbiosis between the coral host and its symbiotic dinoflagellate zooxanthellae terminates or there is a significant reduction in photosynthetic pigments within the zooxanthellal, As a result of environmental stressors, impacts from a bleaching event can result in a coral's increased susceptibility to infectious diseases, reduction in reproductive fitness, or the entire collapse of a coral reef ecosystem2.3,4, Field observations of coral bleaching were first adequately described in 1914, though it wasn't until 1925 when Boscbma provided evidence that the zooxanthellae were digested by the coralS
,6,
Vonge and Nicholls challenged this theory by providing an ~ent that zooxanthellae were expelled from the endoderm of the cnidarian, and not digested ,8, Vonge's theory of expulsion was corroborated in anemones by Smith in 1939, and went unchallenged until the work of Steele and Goreou in 1977, when they reasserted the claims of digestion of the zooxanthella9,Io, Strong evidence for in situ degradation of the zooxanthellae in the cnidarian host was demonstrated by a number of workers in the 19905, both as a function of normal physiology as well as for bleachingl,ll.14, This is not to say that expulsion as a mechanism of bleaching does not have its advocates or substantive evidencels-17, Bleaching behaviors observed other than expUlsion and digestion include host-cell detacbment, Vibrio infection, viral-induced lysis of the zooxanthella, and zooxanthellae programmed cell death20-2 I , Bleaching in cnidarians can occur through a number of processes, though the triggers for the initiation of any of the processes remains unknown,
Studies on bleaching over the past decade has predominantly focused on what happens to the zooxanthellae during a bleaching event, and whether the dissociation of the symbiosis is initiated by the zooxanthella or the hostl, In situ degradation of the zooxanthellae in corals have been shown in a half-dozen coral species as a result of high-temperature or high-light natural field events, though the authors were unable to make a distinction between self-induced zooxanthellae degradation or xenophagy by the hostll. J3
, Dunn and co-workers argue that in anemones, an algal programmed-cell-death process may be a prominent mechanism in which the zooxanthellae degrade, though their methodology could not distinguish between necrosis and programmed cell death21 , Zooxanthellae in corals can induce a number of cellular acclimatory defenses that are correlated with increased tolerance to bleaching conditions, including induction of mycosporine amino acids, heat-shock proteins, anti-oxidant enzymes and compatible solutes, and changes in photosynthetic accessory pigmen~'2S, Induction of reactive oxygen species, accumulation of oxidative damage products, and degradation of photosystem II efficiency are correlated with many environmental inducers of bleachinlf6"29, While the role each plays during the bleaching process is hypothesized, their exact roles are still unknown, as are the sequence in which each of these phenomena OCCU~,30-31.
Field observations of sudden-onset solar bleaching in the coral Goniastrea aspera indicated that within two days of the initial stress exposure (a) zooxanthellae loss resulted from algal in situ degradation, (b) there was a progressive degradation of gastrodermal cells hosting zooxanthella over the bleaching event, and (c) perplexing chlorophyll a and c concentration behaviorl3, A subsequent investigation examining the West-East bleaching behavior of tidal-flat Goniastrea aspera in Phuket, Thailand provided evidence for the importance of the host physiological processes as a factor in bleaching, though the investigators were not able to deduce
2
Downs

Chapter 3
the role the zooxanthellae played in bleaching or tolerance to bleachinf.:: further adding to the controversy concerning the zooxanthellae as a determinant of bleaching .ll,30,31. Related work in this dissertation indicate that during a bleaching event, zooxanthellae in corals are digested via an autophagy-associated pathwar2. This still leaves unanswered the question of what happens to the zooxanthellae during the initial phase of a bleaching event before digestion of the zooxanthellae commences. To begin to address this question, I sought to characterizes the response of zooxanthellae from the coral Pocillopora damicomis SUbjected to acute exposures of heat-stress and light-stress bleaching conditions by examining the zooxanthellae's cellular structural integrity, accumulation of oxidative damage products, heat shock-protein and antioxidant protein response, and photosynthetic pigments. I report that in the early stages of bleaching, heat streSS and light stress induce different pathomorphological changes in the chloroplast thylakoids, while synergism of a combined heat- and light-stress exposure induces both pathomorphologies. Though both bleaching stressors induce oxidative damage and induction of the cell-stress response, my results suggest that at least for heat stress, decomposition of thylakoid membrane structures occur before extensive oxidative damage. Zooxanthellae in corals during the later stages of a bleaching event are more tolerant to the stressful conditions, exhibiting increased homeostatic levels such as an increased xanthophylls ratio, increased anti-oxidant enzymes, and lower-levels of oxidative damage products.
3
Downs

Chapter 3
RESULTS
Initial exposure to beat stress results in the dissolution of tbe thylakoid membranes, accumulation of oxidative damage products, and induction of the stress protein response.
The reference treatment from which all other treatments are compared against is the low-light exposure at 25°C treatment. Electron microscopy of the reference samples revealed that there were no signs of vacuolizati on of the zooxanthellae by the host, as indicated by the tight association of the vacuolar membrane to the zooxanthellae (Fig. I A) . Double membranes of the zooxanthellae mitochondria were distinct and coherent, as were the trilaminate membranes of the chloroplast (F ig. I B). Thylako ids of the chloroplast fo r most of the zooxanthellae have parallel lamellar structures that are four membranes thick (F ig. I C), though zooxanthellae with di fferent condensed chromatin configurations hav ing thylakoid lamellar arrangements with three or five membranes (data not shown), further supporting Blank' s argument that different species of zooxanthellae may inhabit cnidarianslJ
.n
Zooxanthellae in corals exposed to low-light at 32°C exh ibited distinct differences from the re ference. Vacoul ization of the zooxanthell ae by the host was prominent in a majority of the electron micrographs (Fig. I D). In many of the chloroplasts within the zooxanthella, a ' disso lution' or dispersion of lamellar thylakoids was observed (Fig. I E, I F). In some cases, the plastid trilaminate envelopes were intact (F ig. I E), although breaching of the plastid membrane could often be seen as a blended zonation of both the chloroplast diffused thylakoid membranes and stroma with the cytoplasm (Fig. I F). Biochemical lesions of oxidative damage (protein carbonyl and hydroxynonenal) and DNA lesions were significantly higher in the low-light/32°C zooxanthellae as compared to reference levels (Fig. 4). Markers for protein metabolic condition (ubiqu itin and Hsp70) were sign ifican tly elevated, indicated that the zooxanthellae were experiencing extensive protein denaturation and increased protein de~radation , most likely as the resu lt of protein oxidat ion and adduction with aldehyde products 6 (Fig. 5). Levels of the ch loroplast small heat-shock protein (sHsp) were significantly higher in the low-light/32°C treatment compared to the reference, indicating a stress on Photosystem II, specifically the oxygen evolving complex37
• There was a signi ficant accumulation of glutathione peroxidase and mitochondrial manganese superoxide dismutase (MnSOD) in response to heat stress (Fig. 4). No photosynthetic pigments were signi ficant ly altered in response to the temperature stress, except for the accumulation of the chlorophyll a trans-product peak 4 (Fig.6) .
Initial exposure to light stress results in condensation of columnated thylakoid membranes, accumulation of oxidative damage products, and induction of the stress protein response.
Light stress at 25°C produced signi ficant vacuolization around the zooxanthellae by the host (F ig. 2a-b). The plastidic and mitochondrial outer envelope membranes were intact (Fig. 2B). The most prominent features resulting from the light stress was the condensation or fusion of multiple thylakoid lamellae, while no dissolution of lamellaeted thylakoids was observed (Fig. 2B). Oxidative damage markers were significantly higher in the high-light treatments compared to the heat stress and reference, indicating a photo-oxidative stress (Fig. 4) . DNA lesions were also significantly higher (F ig. 4). Hsp70 and ubiquitin levels were significantly higher than the reference values, but only ubiqu itin leve ls were signi ficantly higher than the heat stress values
4
Downs

Chapter 3
(Fig. 4). Hsp70 levels were significantly lower to both the low light 32"C treatment and the high-light 32"C treatment, suggesting that light may have a different mechanism of influence on Hsp70 accumulation than does heat stress. Glutathione peroxidase levels were significantly higher than the reference and heat-stressed samples, supporting the argument that light-stress can be a significant drive of oxidative stress. Mitochondrial MnSOO levels, though significantly higher than the reference, were almost two-fold lower than levels seen in low-light 32"C samples, suggesting that the oxidative damage and perhaps the anti-oxidant response were focused on specifically to the chloroplast (Fig. 4). No photosynthetic pigments were significantly altered in response to the heat stress, except for the accumulation of the chlorophyll a trans-product peak 4 (Fig.6).
Initial exposure to combined heat/light stress induces both thylakoid pathomorhologies, aceumulation of oxidative damage products, and induction of the stress protein response.
Zooxanthellae of coral simultaneously exposed to both heat stress and light stress exhibited extensive vacuolization around the zooxanthellae (Fig. 2C). Chloroplasts of the zooxanthllae often displayed breached plastidic membranes, similar to what was observed in Fig. IE. (Fig. 20). Mitochondria were also observed to have breached membrane integrity, possessing a zonation of mixing with the mitochondrial matrix, mitochondrial membranes, and the cytoplasm (Fig. 20). Thylakoid membranes showed pathmorphologies exhibited by both heat stress and light stress. A number of chloroplasts displayed dispersion of thylakoid membranes (Fig. 20). In some chloroplasts, condensation of thylakoid lamellae were observed, while in other chloroplasts, both condensation of lamellae and dispersion of lamellae occurred (Fig. 2E-F). Inverted biphasic thylakoid micelles could also be seen in the chloroplasts of zooxanthellae (Fig. 2E; arrow z). Oxidative damage products were higher than any other treatment, indicating that a combined heat and light stress could act synergistically to exacerbate oxidative stress (Fig. 4). ONA damage lesion were also significantly higher than in all other treatment, though lesion number was more than doubled when compared to the next highest accumulation level (Fig. 4). As in the low-lightl32°C treatment, ubiquitin and Hsp70 level were significantly higher than the reference, indicating a significant shift in protein metabolic equilibrium (Fig. 4). Chloroplast sHsps levels were almost double compared to the high-light/2S"C treatment, reflecting the increased occurrence and presence of both thylakoid pathomorphologies (Figs. 2C, 4). Glutathione peroxidase levels were significantly higher than the reference, though for this treatment, levels were lower than what were observed in the high-light/2S"C treatment. Mitochondrial MnSOO displayed the most peculiar behavior, with levels of this protein significantly lower than the reference (P= 0.007; Fig. 4). No significant changes in photosynthetic pigment levels were observed (Fig. 6).
Initial exposure to prolonged darkness at 31°C results in the dissolution of the thylakoid membrane, a shift towards protein eatabolism, and induction of anti-oxidant enzymes.
To discern the effect that light has on the zooxanthellae, corals were exposed to prolonged darkness at 2SoC and prolonged darkness at 32°C. Electron microscopy showed no pathmorphologies in zooxanthellae kept in prolonged darkness at 2S"C, except for slight vacuolization around the zooxanthellae by the host (Fig. 3A-B). Oxidative damage markers were
S
Downs

Chapter 3
significantly lower than the reference, but this was not une~38, since the oxidative stress load is predominantly driven by a photo-oxidative mechanism 9 (Fig. 4).
Prolonged darkness at 32"C resulted in vacuolization surrounding the zooxanthellae, as well as necrosis of the gastrodermal cells containing the zooxanthellae (Fig 3a; data not shown). There were no signs of breaching of either the chloroplast or mitochondrial outer membranes (Fig. 3A-B). Thylakoid lamellae showed extensive dispersion patterns, but no evidence of inverted micelles or thylakoid lamellar condensation (Fig 3D-E). Compared to the reference treatment, protein carbonyl levels were significantly lower in the darkl32"C treatment, while hydroxynonenal levels were the same as the reference, but significantly higher than the dark/2S"C treatment, indicating the heat stress causes an oxidative stress independent of an photo-oxidative mechanism. Ubiquitin levels were not significantly different from the reference, though Hsp70 levels were significantly higher than the reference, indicating no significant change in protein catabolism, but that change to the rates of either protein synthesis or protein renaturation may be occurring. Accumulation of both glutathione peroxidase and mitochondrial MnSOD indicated that the zooxanthellae were responding to an oxidative stress as a result of the heat stress. No significant changes in photosynthetic pigment levels were observed (Fig. 6).
Symbiotic zooX8nthella exhibit lower oxidative damage prodncts and increased levels of stress protein and anti-oxidants agents with prolonged exposnre to bleaching conditions.
Additional fragments for each of the six treatments were maintained at the same experimental conditions for five days. Corals exposed to treatments of low-lightl32"C, high Iightl2S"C, and high Iightl32"C lost over 60% of their zooxanthellae after 48 hours, while corals exposed to the dark treatments showed no bleaching at 48 hours32. After four days of exposure, significant bleaching was observed in dark exposed corals, while no mortality was observed at 96 hours, there was significant mortality of coral in the low Iightl32"C and high 1ight/32"C treatmentgll.
For the sampling time points at 48 hours and 96 hours, there was enough sample material from each treatment to run only two biomarker assays and the pigment analysis. At 48 hours, hydroxynonenallevels were significantly lower in the low Iightl32°C, the high Iightl2S"C and the high light 32°C treatments compared to the levels of the same treatments from the first day of exposure, though levels were especially reduced in zooxanthellae from the high light 2S0C treatment (Fig. 8, P=<O.O I; ANOY A; Holm-Sidak post hoc test). Ubiquitin levels at 48 hours were not significantly different from their respective treatments at 24 hours (Fig. 8), though all three treatments were significantly higher than reference levels at both 24 hours and 48 hours (Fig. 8, J'--<O.O I; ANOY A; Holm-Sidak post hoc test). The summed concentration of all chlorophyll a trans products were not significantly different among any of the treatments between day I and day 2 of the exposures, as were values for xanthophylls ratios and chlorophyll altotal xanthophyll ratios (Fig 9). There were no significant differences in Chlorophyll a, chlorophyll C2, and total chlorophyll a products among al\ treatment over the four days of the experiment (Fig. 10).
On Day 3 of the experiment, the ratio of Chlorophyll a trans products to total chlorophyll a in the high Iightl2S"C and low light 32°C were significantly lower than the levels they expressed on Day I (J'--<O.OOl; ANOYA; Holm-Sidak post hoc test), and were not significantly
6
Downs

Chapter 3
different from Day I and Day 3 reference values (Fig. 9). Xanthophyll ratios for the low Iightl32°C and high lightl32C treatments on Day 3 were significantly higher than all treatment ratios of Day I and Day 2, and Day 3 reference and high Iight/25°C treatments (Fig. 9). Chlorophyll altotal xanthophylls ratios for the high light 25C, low light 32OC, and high light 320C were significantly lower than all treatment values in Day I (P---<O.OOI; ANOY A, Holm-Sidak post hoc test), indicating a significant shift in the composition of the light harvesting complexes. There was not enough sample material to run ubiquitin and HNE assays.
On Day 4, HNE levels were significantly lower in the three stress treatments compared to the levels seen on Day I and Day 2 (P=<O.OOI; ANOY A, Holm-Sidak post hoc test). Ubiquitin levels were also significantly lower in the three stress treatments compared to their levels exhibited on Day 2, though still higher than the reference levels of all the other exposure days ((P---<O.OOI;, Holm-Sidak post hoc test; Fig. 9). Chlorophyll a trans products for the three stress treatments on Day 4 were not significantly different from the reference treatment on Day I, or the Day 4 reference (Fig. 9). Xanthophyll ratios of all three stress treatments were significantly higher than the Day 4 references, and all treatments of Day 1 (P---<O.OOl; ANOY A, Holm-Sidak post hoc test). Chlorophyll a trans products/total Chlorophyll a ratios for the high light 25OC, low light 32°C, and high light 320C were significantly lower than all treatment values in Day I, while high 1ight/25OC was significantly lower than the other three treatments for this day (P---<O.OOI; ANOY A, Holm-Sidak post hoc test).
7
Downs
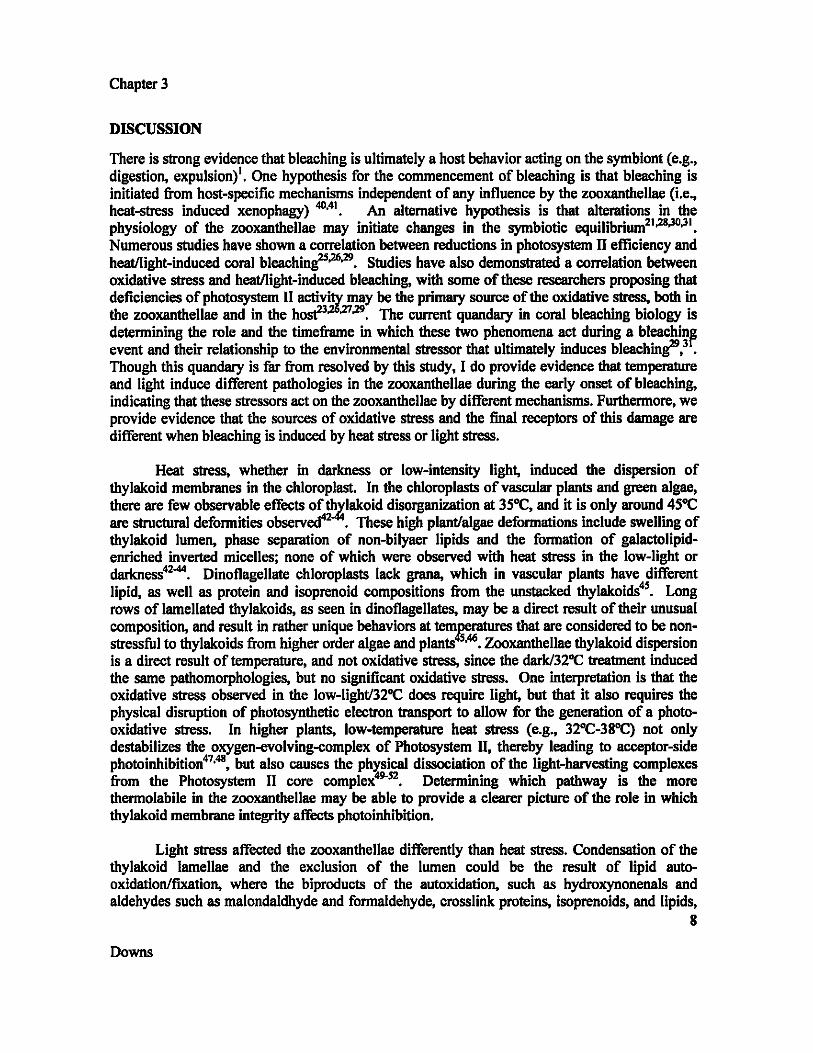
Chapter 3
DISCUSSION
There is strong evidence that bleaching is ultimately a host behavior acting on the symbiont (e.g., digestion, expulsion)l. One hypothesis for the commencement of bleaching is that bleaching is initiated from host-specific mechanisms independent of any influence by the zooxanthellae (i.e., heat-stress induced xenophagy) 40.41. An alternative hypothesis is that alterations in the physiology of the zooxanthellae may initiate changes in the symbiotic equilibrium21
,28.30;1I.
Numerous studies have shown a correlation between reductions in photosystem II efficiency and heatllight-induced coral bleachinlf,26.29. Studies have also demonstrated a correlation between oxidative stress and heatllight-induced bleaching, with some of these researchers proposing that deficiencies of photosystem II activ~ may be the primary source of the oxidative stress, both in the zooxanthellae and in the hostD ;rl.29. The current quandary in coral bleaching biology is determining the role and the timeframe in which these two phenomena act during a bleachinF event and their relationship to the environmental stressor that ultimately induces bleachin!f9,3 . Though this quandary is far from resolved by this study, I do provide evidence that temperature and light induce different pathologies in the zooxanthellae during the early onset of bleaching, indicating that these stressors act on the zooxanthellae by different mechanisms. Furthermore, we provide evidence that the sources of oxidative stress and the final receptors of this damage are different when bleaching is induced by heat stress or light stress.
Heat stress, whether in darkness or low-intensity light, induced the dispersion of thylakoid membranes in the chloroplast. In the chloroplasts of vascular plants and green algae, there are few observable effects of th .. iakoid disorganization at 35"C, and it is only around 45"C are structural deformities observ~2 . These high plantlalgae deformations include swelling of thylakoid lumen, phase separation of non-bilyaer lipids and the formation of galactolipidenriched inverted micelles; none of which were observed with heat stress in the low-light or darkness42
-44. Dinoflagellate chloroplasts lack grana, which in vascular plants have different lipid, as well as protein and isoprenoid compositions from the unstacked thylakoids4s. Long rows of lamellated thylakoids, as seen in dinoflagellates, may be a direct result of their unusual composition, and result in rather unique behaviors at tem~ratures that are considered to be nonstressful to thylakoids from higher order algae and plants 5.46. Zooxanthellae thylakoid dispersion is a direct result of temperature, and not oxidative stress, since the darkl32"C treatment induced the same pathomorphologies, but no significant oxidative stress. One interpretation is that the oxidative stress observed in the low-lightl32"C does require light, but that it also requires the physical disruption of photosynthetic electron transport to allow for the generation of a photooxidative stress. In higher plants, low-temperature heat stress (e.g., 32"C-38"C) not only destabilizes the oxygen-evolving-complex of Photosystem II, thereby leading to acceptor-side photoinhibition47.48, but also causes the physical dissociation of the light-harvesting complexes from the Photosystem II core complex49-S2. Determining which pathway is the more thermolabile in the zooxanthellae may be able to provide a clearer picture of the role in which thylakoid membrane integrity affects photoinhibition.
Light stress affected the zooxanthellae differently than heat stress. Condensation of the thylakoid lamellae and the exclusion of the lumen could be the result of lipid autooxidationlflXlltion, where the biproducts of the autoxidation, such as hydroxynonenals and aldehydes such as malondaldhyde and formaldehyde, crosslink proteins, isoprenoids, and lipids,
8
Downs
Chapter 3
resulting in the aggregate inclusions'3.S4. This in turn, would adversely affect photosynthetic electron transport, and could explain why bleaching resulting from high-light stress is correlated with decreased photosynthetic efficiency and increased damage to photosystem nS4.s'. Oxidative stress was more pronounced in the light-stress treatment compared to the heat-stress treatment, most likely a result from the photo-oxidative generation of a damaged photosynthetic electron transport chain. Significantly greater accumulation of the chloroplast sHsp in the light-stress samples compared to the low-Iightl32°C samples suggests that there is an increased stress on Photosystem n function3? Significantly lower levels of mitochondrial MnSOD in the high Iightl250C treatment compared to the low-light 320C treatment indicates that the predominant location of the oxidative stress is not in the mitochondria (Fig. 5). The greater accumulation of the mitochondria MnSOD in the low Iightl32°C and darkl32°C treatment denotes that heat stress is causing a significant oxidative stress in the mitochondria, and perhaps in the cytosol, as indicated by expression of glutathione peroxidase levels.
From the tissue level to the sub-cellular level, the sequence of events and the timescale that they occur have largely been ignored in most studies concerning the phenomenon of bleaching. The best studied time-course of bleaching (natural or laboratory induced) is the annual solar bleaching event of the Goniastrea aspera intertidal reef in Ko Phuket, Thailand, where initiation of bleaching to the recovery from bleaching occurs over a period of 15 daysl.l3. Brown and co-workers examined changes in zooxanthellae density, histology, photosynthetic efficiency, and photo~thetic pigments of coral before, during, and the recovery of bleaching event of Goniastrea13
• The onset of bleaching in our study was severely more acute than the time course associated with the environmental conditions of the solar bleaching studies in Ko Phuket, but even so, there are consistencies between the two studies. Le Tissier and Brown saw phenomena similar to that in our study, in that the zooxanthellae were ultimately digested, as well as peculiar behavior in chlorophyll a concentrationsl3. They could not discern the nature of the damage to the zooxanthellae or the source of the damage, nor could they explain the unusual behavior of chlorophyll a. We demonstrate that before signs of plasma membrane and thecal plate degradation that ensues from symbiophagy, the zooxanthellae incur tremendous internal damage as a direct result from both environmental stressors. In the high Iightl250C electron micrographs, there were cases of zooxanthellae exhibiting minor presentations of thylakoid and chloroplast membrane pathmorphologies without significant symbiophagic vacuolization (data not shown), suggesting that zooxanthellae damage may occur before the onset of symbiophagy or expulsion. Chlorophyll a levels were not significant in any of the treatments over the four days, but that the chlorophyll a trans products:total chlorophyll a ratio indicated that this large variance in total chlorophyll a levels was a result of the accumulation of the chlorophyll a trans products, and that over the bleaching event, zooxanthellae that were maintained in the host expressed lower levels of these catabolites.
Our study provides evidence for a specific sequence of events that occur during the process of bleaching, regardless of whether the initiating stressor(s) is heat, light, or both. Damage to zooxanthellae is a critical first step. This is characterized by ultra-structuraI dam~e to organelles, accumulation of biochemical lesions, and changes to metabolic efficienciesl3 . One of the first homeostatic responses to cellular injury reported here and found across all taxa of life, is the induction of stress proteinsSfi. These are known to mitigate damage by stabilizing
9
Downs

Chapter 3
metabolic pathways and cellular structures'7. As time progresses beyond the initial shock, other homeostatic defenses come on line, particularly changes in the redox capacity of the cell, i.e., anti-oxidant enzymes, solutes, and isoprenoids. Changes in membrane composition and protein isoforms also occur, enhancing the inherent stability of cellular structures and metabolic processes in the face of a persistent stressor8-60. Recognizing the sequential nature of this process and characterizing these steps allows us to recognize the crucial nodes that determine whether a coral is susceptible to the environmental conditions that are conducive to bleaching or possess sufficient homeostatic capacity to tolerate the stress event. For example, zooxanthellae clades with an inherently greater tolerance to heat stress have higher concentrations of specific unsaturated lipids, providing an increased capacity for lipid stability and fluidity61. Elucidating sub-cellular and cellular processes is necessary to differentiate between mechanisms involved in physiological acclimation and those responsible for evolutionary adaptation. Such an understanding will provide insight into the role each of these processes play in a given bleaching response, its severity and ultimate population effect, as well as the feasibility of mitigation options.
10
Downs

Chapter 3
METHODS
Collection of coraL Samples were collected from the eastern side of Coconut Island at the Hawaii Institute of Marine Biology, Oahu, Hawaii, U.S.A. Samples were collected under the Hawaii Dept of Land and Natural Resource permit number SAP2005-35. Colonies were fragmented and maintained in raceways at least 45 days before the experiment In the raceways, corals were exposed to peak planar incident irradiance of 372 pmoles of photosynthetic active radiation (PAR) photons per meter per second of shadowed sunlight Light measurements were determined using a Li-Cor quantum radiometer and photometer (LI-250A) with a planar incident sensor (caW Quantum)
Experimental treatments. Corals nubbins were subjected to six environmental treatments. Treatments were conducted in triplicate using 10-gallon aquarium tanks, each containing a recirculating jet to maintain consistent water flow over the corals nubbins, as well as aquarium heaters and cooling reservoirs to maintain constant set temperature. All experiments began at the same time in the morning after a period of 8 hrs of darkness. The treatments were carried out for a period often hours each beginning at 6:00 am: (1) a reference treatment oflow light (438 pmoles m·l
S·l PAR peak- natural irradiance using a neutral density filter) at 25"C, (2) low light at 32"C, (3) high light (2007 pmoles m·l
S·l PAR peak natural irradiance) at 25"C, (4) high light at 32"C, (5) darkness for 10 hours (18hr total) at 25°C, and (6) darkness for a total of 18 hours with the first 8 hours at 25°C and the next 10 of those hours at 32"C. At the termination of the experiment, fragments were collected for morphological and biochemical assessment Additional fragments were maintained at the same experimental conditions for five days. At 16:00 hour of each day, samples were collected from each treatment Corals exposed to treatments 2, 3, and 4 lost over 60% of their zooxanthellae after 48 hours, while corals exposed to the dark treatments showed no bleaching at 48 hours, though after five days, significant bleaching was observed in dark exposed corals (Downs et aI., in review). A 75% water change of the tanks was carried out at 49 hours and 96 hours after the initiation of experimental treatments. Salinity was determined using a Vee Gee portable refractometer, (caW A366ATC) and maintenance of constant salinity in the experimental tanks was accomplished by the addition of double-distilled, de-ionized water. Samples used for DNA abasic site, hydroXYDonenal, and protein carbonyl assays were snapfrozen in a liquid nitrogen vapor shipper, then stored at -80·C until processing. Other samples were processed for collection as described below.
Collection and purification of P. damicornis zooXllllthella. Coral tissue was removed from the skeleton using a water pick with artificial sea water as the pick media. Coral tissue and cells were disrupted using a Teflon/glass Dounce homogenizer set at a slow speed. Tissue was pelleted by subjecting the slurry to centrifugation at 10,000 g for 10 minutes using a fixed-angle centrifuge. The supernatant was checked for zooxanthella contamination, and if contamination was absent, the supernatant discarded. The pellet was resuspended by pipetting and inversion with a buffer containing 3 units/mL of lysozyme and 2 units/mL of a-amylase in artificial seawater, and incubated on a rocking platform for 15 minutes. A second solution containing 2 units/mL of dispase in artificial seawater was added to the slurry, and incubated on a rocking platform for addition 15-25 minutes. When the coral homogenate lost any observable mucous aggregation,
11
Downs

Chapter 3
the sample was centrifuged for 10 minutes at 6,000 g using a swinging-bucket centrifuge. The supernatant was discarded, the pellet washed and resuspended in artificial seawater, and subjected to centrifugation for 10 minutes at 6,000 g using a swinging-bucket centrifuge. The supernatant was discarded and the pellet was resuspended with artificial seawater, and then layered on to a Percell cushion consisting of 30% Percell (v/v), 10 mM polyethylene glycol 8000, I mM FICOLL 400,000, and seawater. The zooxanthella were collected, washed with artificial seawater to remove Percoll residue, and pelleted by centrifugation. The supernatant was removed and the pellet was frozen.
Transmission Electron Microscopy. A single polyp was biopsied using a 2.5 mm stainless steel leather punch. For primary fixation, the sample was submerged in modified Kranovsky's fIXative (2.5% gluteraIdehyde, 2% paraformaldehyde in O.1M cacodylate buffer (PH 72» for 30 minutes and then in 2.5% gluteraldehyde in filtered sea water. Samples were fixed in the secondary fixative overnight For transportation, gluteraldehyde fixed samples were placed in 1% gluteraldehyde in cacodylate buffer at 4°C.
Samples were shipped from Hawaii, U.S.A. to Tel Aviv, Israel for final processing and electron microscopy under the CITES export permit number 06USII157679.
Once in Israel, the samples underwent two washes in 0.1 M cacodylate buffer (PH 7.2), the samples are post fixed in 1% osmium tetroxide (enhances membrane preservation) at 4·C for 30 minutes. Samples were then dehydrated in a graded ethanol series and then in propylene oxide followed by a gradual embedding in Araldite (502) (Electron Microscopy Sciences Fort Washington PA USA). In the final full strength ara1dite, the samples were subjected to mild vacuum (400mbar) for one hour at 25·C followed by an ovemight polymerization at 60·C. The block was then trimmed and I um sections were cut, stained with toluidine blue63
, sectioned (60-90 om) using an ultramicrotome and mounted on 300 mesh copper grid (Fig. S2). The ultrathin sections are stained with lead citrate. Sections through the same approximate mid polyp body area were examined using a JEM-1230 at 80kV. Images were taken using TVIPS TemCamF214
DNA Abaslc LesIons. Tissues from the frozen coral nubbins were removed from the skeleton using a sterile micro-chisel. The tissue was then ground to a fine powder consistency in liquid nitrogen using a liquid nitrogen-chilled mortar and pest1e. Approximately 50 microliters of frozen, powdered sample was placed in a microcentrifuge tube, and DNA was isolated according to manufacturer's instructions using the Dojindo pureDNA kit-Cell,tissue (GK03-20) with one slight modification to address Maillard chemistry artifact One hundred milligrams of polyvinylpolypyrrolidone (Sigma-Aldrich) was added to the tube when the sample was still frozen, and before the addition of the Kit's lysis buffer. DNA concentration was determined using an InvitrogenlMolecular Probes Quant-i'fTM DNA Assay Kit, Broad Range (catJI Q33130) using a Bio-Tek FL800 fluorescent microplate reader. DNA AP concentration was determined using the Dojindo DNA Damage Quantification Kit -AP Site Counting (catJI DK-02-10) and was conducted according to manufacturer's instructions.
Protein Carbonyl. Protein carbonyl groups were measured using a modified method of Robinson63
• Approximately 50 ilL of frozen, powdered sample was added to a microcentrifuge
12
Downs

Chapter 3
tube. A solution of containing 50 mM Tris-HCI (PH 7.8), 0.1 mM a-tocopherol, 0.005 mM salicylic acid, 20 mM phenylmethylsulfonyl fluoride, 20 mM benzamide, 50 11M a-aminocaproic acid, 1% polyvinylpolypyrrolidone (wtlvol), 0.15 mM desferoximine methylate, 0.01 mM sorbitol, I mM MgCh, and 2 units of deoxyribonuclease I from bovine pancreas (Sigma-Aldrich, catalog# D 4527, I microgram of protein/aliquot) was added to the sample to remove DNA, as well as to redox stabilize the sample. The sample was vortexed and incubated for 10 minutes in a 37"C waterbath, with occasional vortexing. A 100 ILL volume of a second solution containing 10% sodium dodecyl sulfate, 50 mM Tris-HCI (PH 7.8), 80 mM disodium ethylenediamine tetraacetic acid (PH 8) and 50 mM dithiothreitol was added to the sample as both a DNAse stop solution and a general protein denaturing buffer. Samples were vortexed, and then incubated in a 55"C water bath for 6 minutes with occasional vortexing. Samples were then centrifuged for 10 minutes at 10,000 g, and the supernatant transferred to a new microcentrifuge tube. DNA concentration was determined using an InvitrogenlMolecular Probes Quant-iTfM DNA Assay Kit, Broad Range (Q33130) and a BiD-Tek FL800 fluorescent microplate reader to ensure the absence of DNA in the sample, whose presence can produce artifactuaI signal noise (3). Protein concentration was determined using a modified Ghosh method (4). Oxidized bovine serum albumin standards for carbonyl concentration standards were a gift from Dr. Charles Robinson.
Samples were assayed in triplicate, with a triplicate blanking of carbonyl reactivity using 20 mM sodium borohydride. Samples were applied to a Nunc 96-well maxisorp microplate. The rest of the method follows a protocol set forth by Dr. Robinson based on Robinson et aI., 1999 using a 0.2% solution of2,4-dinitrophenylhydrazine (DNPH) as the derlvatizing reagent, except that a solution of 5% Casein (Sigma-Aldrich, C8654, w/v), 50 mM Tris-HCl (pH 7.8), 1 mM NaCl, 0.5 mM sorbitol, 0.15 mM desferoximine methylate, and 0.005 mM salicylic acid was used as a blocking solution instead of nonfat dry milk. DNPH was detected using a primary antibody; anti-dinitrophenyl mouse monoclonal Igi (gift from Dr. Charles Robinson), and a donkey anti-mouse Fab fragment conjugated with horseradish peroxidase (Jackson ImmunoResearch Laboratories) was used as a secondary antibody. NEN western lightning luminal solution was used to generate a signal, and a BiD-Tek FL800 series fluorescentlluminescent microplate reader was used to read the signal.
Hydroxynonenal Addueted to Protein. Approximately 50 microliters of frozen, powdered sample was added to a microcentrifuge tube. A I mL solution containing 50 mM Tris-HCI (PH 7.8), 0.1 mM a-tocopherol, 0.005 mM salicylic acid, 20 mM phenylmethylsulfonyl fluoride, 20 mM benzamide, 50 11M a-aminocaproic acid, 1 % polyvinylpolypyrrolidone (wtlvol), 0.15 mM desferoximine methylate, 0.01 mM sorbitol, 5 mM butylhydrotoluene, 2 units of deoxyribonuclease I from bovine pancreas (Sigma-Aldrich, catalog# D 4527, 1 microgram of protein), and I microgram of ribonuclease A from bovine pancrease (Sigma-Aldrich, catalog# R 6513) was added to the sample, and incubated for 10 minutes in a 37"C water bath with occasional vortexing. A 100 ILL volume of a second solution containing 10% sodium dodecyl sulfate, 50 mM Tris-HCI (PH 7.8), 80 mM disodium ethylenediamine tetraacetic acid (PH 8) and 50 mM dithiothreitol was added to sample as a geneml protein denaturing buffer. The sample was incubated at 65"C for 6 minutes with occasional vortexing. Protein concentration was determined using a modified Ghosh method36
• The antibody against HNE adducted to protein was obtained from Envirtue Biotechnologies, InclUS Biological and is similar to cat# H6276-10, but was mised against an antigen that was HNE adducted to bovine serum albumin and not
13
Downs

Chapter 3
keyhole limpet hemocyanin. Secondary antibody was a donkey anti-rabbit Fab fragment conjugated to horseradish peroxidase (Jackson ImmunoReseach). NEN western lightning luminal solution was used to generate a signal, and was measured using a Bio-Tek FL800 series fluorescentlluminescent microplate reader.
Standards of HNE-adducted to protein were created by incubating 1 mg of HNE in 10 mL of I mM Tris-HCI (PH 8.5) with 1 mM of the following synthesized peptide (NH2-YFNDSQRQATKDAG-COOH) for one hour. Theoretically, HNE will form stable Michael addition-type adducts with lysine and histidine residues. The adducted peptide was lyophilized, resolubilized in water and 1 % SOS, gel purified on a 20% acrylamide gel, electroeluted from the gel, and quantified using the Bicinchoninic Acid (DCA) method (Sigma-Aldrich, cat# Sigma B 9643) incubating the BCA with the sample at 60"C for 15 minutes. Absorbance was read at 562 nm using an OceanOptics USB4000 spectrophotometer.
Sample extraction for ELISAs targeted to zooxanthella proteins. About 50 ilL of frozen zooxanthella pellet was placed in a locking 1.8 ml microcentrifuge tubes along with 1.0 mL of a denaturing buffer consisting of 2% SOS, 50 mM Tris-HCI (PH 7.8), 15 mM dithiothreitol, 10 mM EDTA, 5% polyvinylpolypyrrolidone (wt/vol), 0.05 mM sodium tetraborate, 0.005 mM salicylic acid, 0.001% (v/v) dimethyl sulfoxide, 0.01 mM AEBSF, 0.04 mM bestatin, 0.001 E-64, 2 mM phenylmethyIsulfonyl fluoride, 2 mM benzamide, 5 J.IM aamino-caproic acid, and 1 Il8 100 uL pepstatin A"I. Samples were vortexed for 15 seconds, heated at 93"C for 6 min, with occasional vortexing, and then incubated at 25"C for 10 min. Samples were subject to a centrifugation (13,500 g for 8-10 mins) and the middle-phase supernatant was aspirated and placed in a new tube36
• The sample supernatant was subjected to a protein concentration assay by the method of Ghosh36
•
Primary Antibody Validation. Antibodies to plant algae Hsp70, plant/algae glutathione peroxidase, plant/algae manganese superoxide dismutase, and the chloroplast small heat-shock protein were gifts from En Virtue Biotechnologies, Inc. Antibodies were raised against synthetic peptides that reflected conserved, yet unique, domains within these target proteins. Protein separation by SOS-polyacrylamide gel electrophoresis and Western transfer of gel contents to a membrane for immunochemical detection was used to validate the primary antibodies for zooxanthellae protein targets. Total soluble protein (25 IIg) from two prepared samples were electrophoresed in a 12.5% SOS-PAGE preparative gel until the bromophenol blue dye front was near the bottom of the gel. All gels were blotted onto 0.2 11m polyvinylidene fluoride (PVDF) membranes (ImmobiIion P, Millipore) using a wet transfer system. The membranes were blocked in 5% non-fat dry milk Tris-buffered saline (TBS) solution, and assayed with primary antibody for one hour at 25° C. The blots were then washed in TBS four times, and incubated in a 1 :30,000 dilution of alkaline phosphatase conjugated goat anti-rabbit secondary antibody solution (Jackson lmmunoResearch Laboratories, Westport, PA) for one hour at 25° C. Blots were washed again four times in TBS, and developed using a nitroblue tetrazoliuml 5-brom0-4-chloro-3-indolyl phosphate (Sigma-Aldrich, cat# B5655) and documented using a CanonScan
14
Oowns

Chapter 3
Lidi50. To ensure a minimum of non-specific cross-reactivity, blots were developed for at least three minutes.
As a final confirmation that the primary antibodies cross-reacted with the appropriate epitope, 1 mM of unconjugated peptide antigen that was used to generate the respective primary antibody was added to I ilL of primary antibody neet serum in 20 mL ofTBS. The solution was incubated for 30 minutes on a rocking platform. The blot was added to this solution after being blocked with milk for I hour (like the rest of the primary antibodies), then processed the same manner as the other blots.
ELISA. Approximately 50 microliters of frozen sample powder was placed in locking 1.8 ml microcentrifuge tubes along with 1400 ,...1 of a denaturing buffer consisting of 2% SDS, 50 mM Tris-HCI (PH 7.8), 15 mM dithiothreitol, 10 mM EDTA, 3% polyvinylpolypyrrolidone (wtlvol), 0.005 mM salicylic acid, 0.001% (v/v) dimethyl sulfoxide, om mM AEBSF, 0.04 mM bestatin, 0.001 E-64, 2 mM phenylmethylsulfonyl fluoride, 2 mM benzantide, 5 fJ.M a-amino-caproic acid, and 1 fJ.g 100 uL pepstatin A"'. Samples were vortexed for 15 seconds, heated at 93·C for 6 min, with occasional vortexing, and then incubated at 25·C for 10 minutes. Samples were subject to a centrifugation (13,500 g for 8 minutes) and the middle-phase supernatant was aspirated and placed in a new tube36
• Protein concentration was determined using a modified Ghosh method36•
Twenty-five nanograms of total soluble protein from a sample was added to a well of a Nunc Maxisorp 96-well microplate. Microplates were incubated for 12 hours in a humidified chamber at 25OC. Sample solution from each well was aspirated using a Bio-Tek EL404 Microplate Autowasher. Wells were blocked for one hour using a 5% (w/v) of non-fat dry milk in Tris-buffered saline. The block buffer was removed and incubated with primary antibody for one hour at 25OC. Plates were washed with Tris-buffered saline using the Microplate Autowasher, and then incubated with the appropriate secondary antibody conjugated with horseradish peroxidise (Jackson ImmunoResearch Laboratories) was used as a secondary antibody. NEN western lightning luminal solution was used to generate a signal, and a Bio-Tek FLSOO series fluorescentlluminescent microplate reader was used to read the signal. All samples were assayed in triplicate; intra-specific variation of less than 11 % was achieved throughout the 96-wells of each microplate.
Pigment Analysis. Algal pellets were homogenized in buffer (Tris-HCI, 10 mM) and a subsample stored for the determination of cell numbers. Pigments were extracted from the remaining homogenate using methanol with the aid of ultrasonication. Extracts were clarified using centrifugation (5 minutes at 1,800 rpm) and the supernatant drawn off for analysis by HPLC. Aliquots of the clarified extract were vortex-mixed with 1 M ammonium acetate buffer (1:1, v/v) and injected (100,...1) onto a Hypersil® MOS2 C-8 column (311m particle size, 100 x 4.6 mm) maintained at 30·C. Pigments were separated using a binary mobile phase system (min; 70/30 (v/v) methanol I 1.0 M ammonium acetate ; 100% methanol): (0; 100; 0), (2; 50; 50), (12; 30; 70), (25; 10; 90), (27; 0; 100), (29; 0; 100), (29.1; 0; 100), (35; 0; 100). Flow rate was constant
15
Downs

Chapter 3
at 0.85 ml min·l . The analyses were performed using an integrated Thermo-Separations HPLC system comprising: SCMIOOO vacuum degasser, P4000 quaternary pump, AS3000 auto-sampler (with sample tray cooling, column over and sample preparation capability) and UV6000LP diode array detector (DAD). System control, data collection and integration were performed using Chromquest software. Pigment identity was secured through co-elution with authentic pigments obtained from either Sigma Chemical Co or from om, Denmark. Confirmation of anaIyte identity was achieved through spectral comparison of DAD data to standards using the Chromquest software. Quantification of pigments was carried out at 444nm. Algal cells counts from pigment sub-samples were obtained using a Neubauer haemocytometer and by following established techniques. Pigment concentrations were then calculated as picograms per cell (pg cell·I).
Statistics. Data were tested for normality using the Kolmogorov-Smirnov test (with Lilliefors' correction) and for equal variance using the Levene Median test. If the data were normally distributed and homogeneous, a one-way analysis of variance (ANOVA) was employed64
• When data did not meet the homogeneity of variances requirement for one-way ANOVA, we instead used a Kruskal-Wallis One-Way Analysis of Variance on Ranks64
• When significant differences were found among treatment means, we used the Tukey-Kramer Honestly Significant Difference (HSD) method, the Dunn's post-hoc test, or the Holm-Sidak test as an exact alpha-level test to determine differences between each of the populations64. Pigment parameters of all six treatment over four days of exposure were analyzed using a repeated measures ANOV A with a pairwise mUltiple comparisons procedure (Holm-Sidak test)64.
16
Downs

Chapter 3
References
1. Brown B. E. Coral bleaching: causes and consequences. Coral Reefs 16, SI29-S138 (1997).
2. Muller, E.M., Rogers, C.S., Spitzacl, A.S., & van Woesik, R. Bleaching increases likelihood on Acropora palmata in Hawknest Bay, St John, US Virgin Islands. Coral Reefs 27, 191-195 (2008).
3. Szmant, A. M. &. Gassman, N.J. The effects of prolonged ''bleaching'' on the tissue biomass and reproduction of the reef coral Montastrea annuJaris. Coral Reefs 8, 217-224 (199O).
4. Ostrander, G.K., Armstrong, K.M., Knobbe, E.T .. Gerace, D., & Scully, E.P. Rapid transition in the structure of a coral reef community: the effects of coral bleaching and physical disturbance. Proc. Natl. Acad Sci. U.S.A. 97, 5297-5302 (2000).
5. Mayer, A.G. The effects of temperature on tropical marine organisms. Carnegie Inst. Wash Publ. 183,3-24 (1914).
6. Boscbma, H. The nature of the association between Anthozoa and zooxanthellae. Proc. Natl. Acad Sci. USA 11, 65-67(1925}.
7. Yonge, C. M. & Nicholls, A.G. Studies on the physiology of corals. V. The effect of starvation in light and in darkness on the relationship between corals and zooxanthellae. Scient. Rep. Gt. Barrier ReefExped I, 177-211 (1931).
8. Y onge, C.M. Studies on the physiology of corals. III. Assimilation and excretion. Scient Rep. Gt Barrier Reef Exped. 1,11-91 (1931).
9. Smith, H. G. The significance of the relationship between actinians and zooxanthellae J. Exp. Bioi. 16, 334-345(1939}.
10. Steele R.D. & Goreau, N.I. The breakdown of symbiotic zooxanthellae in the sea anemone Phyllactis osculifera (Actiniaria). J. Zool. Land. 181,421-437 (1977).
11. Brown, B.E., Dunne, R.P. Scoffin, T.P., & Le Tissier, M.D.A. Solar damage in intertidal corals. Mar. Ecol. Prog. Ser. 105,219-230 (1994).
12. Brown, B.E., Le Tissier, M.D.A., & Bythell, J.C. Mechanisms of bleaching deduced from histological studies of reef corals sampled during a natura1 bleaching event Mar. Bioi. 122, 655-663 (1995).
13. Le Tissier, M.D.A. & Brown, B.E. Dynamics of solar bleaching in the intertidal reef coral Goniastrea aspera at Ko Phuket, Thailand. Mar. Ecol. Prog. Ser. 136, 235-244 (1996).
14. Titlyanov, E. A., Titlyanova, T. V., Loya, Y., & Yamazato, K. Degradation and proliferation ofzooxanthellae in planulae of the hermatypic coral Stylophora pistillata Mar. Bioi. 130,471-477 (1998).
15. Steen, R.G .. & Muscatine, L. Low temperature evokes rapid exocytosis of symbiotic algae by a sea anemone Bioi. Bull. 172,246-263 ( 1987)
16. Fang, L-S., Wang, J-T., & Lin, K-L. The subcellular mechanism of the release of zooxanthellae during coral bleaching. Proc. Natl. Sci. Counc. ROC(B) 22, 150-158 (1998).
17. Sawyer, SJ. & Muscatine L. Cellular mechanisms underlying temperature-induced bleaching in the tropical sea anemone Aiptasia pulchella. J. Exp. Bioi. 204, 3443-3456 (2001).
Downs
17

Chapter 3
18. Gates, R.D., Baghdasarian G., & Muscatine, L. Temperature stress causes host cell detachment in symbiotic cnidarians: implications for coral bleaching. Bioi. Bull. 182, 324-332 (1992).
19. Lohr, J., Muon, C.B., & Wilson, W.H. Characterization ofa latent virus-like infection of symbiotic zooxanthellae. Appl. Environ. Microbiol. 73, 2976-2981 (2007).
20. Ben-Haim, Y., Zickerman-Keren, M., & Rosenberg E., Temperature-regulated bleaching and lysis of the coral Pocillopora damicornis by the novel pathogen Vibrio corailiilyticus. Appl. Environ. Microbiol69, 4236-4242: (2003)
21. Dunn, S.R., Thomason, J.C., Le Tissier, M.D., & Bythell J.C.Heat stress induces different forms of cell death in sea anemones and their endosymbiotic algae depending on temperature and duration.Cell Death Diff. 11, 1213 (2004).
22. Dunlap, W.C., & Shick, J.M. Ultraviolet Radiation-absorbing mycosporine-like amino acids in coral reef organisms: a biochemical and environmental perspective. J. PhycoI. 34,418-430 (1998).
23. Downs, CA., Fauth, J.E., Halas, J.e., Dustan, P., Bemiss, J.A. & C.M. Woodley. Oxidative stress and coral bleaching, Free Radical Biology and Medicine 33, 533-543 (2002).
24. Richier, S., Furia, P., Plantivaux, A., Merle, P-L., & Allemand, D. Symbiosis-induced adaptation to oxidative stress. J. Exp. Bioi. 208, 277-285 (2005).
25. Brown, B.E., Downs, C.A., Dunne, R.P., & Gibb, S.W. Preliminary evidence for tissue retraction as a mctor in photoprotection of corals incapable of xanthophyll cycling. J. Exp. Mar. BioI. EcoI. 277, 129-144 (2002).
26. Lesser, M.P. Elevated temperatures and ultraviolet radiation cause oxidative stress and inhibit photosynthesis in symbiotic dinoflagellates. LimnoI. Oceanogr. 41, 271-283 (1996).
27. Downs, C.A., Mueller, E., Phillips,S., Fauth, J., &Woodley, C.M. A molecular biomarker system for assessing the health of coral (Montastreafaveolata) during heat stress. Mar. Biotechnol. 2, 533-544 (2000).
28. Warner, M.E., Fitt, W.K., & Schmidt, G.W. Damage to photosystem II in symbiotic dinoflagellates: a determinant of coral bleaching. Proc. Natl. Acad. Sci. U.S.A. 96,8007-8012 (1999).
29. Brown, B. E., Downs, C. A. Dunne, R. P., & Gibb, S.W. Exploring the basis of thermotolerance in the reef coral Gonastrea aspera. Mar. Eco. hog. Ser. 242, 119-129 (2002).
30. Douglas, A.B. Coral bleaching - how and why? Mar. Poll. Bull. 46, 385-392 (2003). 31. Smith, DJ., Suggest, DJ., Baker, N.R. Is photoinhibition ofzooxanthellae
photosynthesis the primary cause of thermal bleaching in corals? Gto. Change BioI. II, I-II (2005).
32. Chapter 2, Downs Dissertation. 33. Blank, RJ. Unusual chloroplast structures in endosymbiotic dinoflagellates:a clue to
evolutionary differentiation in the genus Symbodinium. Pl. Sys. EvoI. 151,271-280 (1986).
34. Blank, RJ. Evolutionary differentiation in gymnodinioid zooxanthellae. Anna1 New York Acad. Sci. 503, 530-533 (1987).
18
Downs
Chapter 3
35. Blank, R.I. & Trench, R.K. Speciation and symbiotic dinoflagellates. Science 229,656-658 (1985).
36. Downs, C.A. Cellular diagnostics and its application to aquatic and marine toxicology. In: Techniques in Aquatic Toxicology V. 2. G. Ostrander (ed). CRC Press, Inc. pp 181-207(2005).
37. Downs ,C.A., Ryan, S.L., & Heckathorn, S.A. The chloroplast small heat-shock protein: evidence for a general role in protecting Photosystem II against oxidative stress and photoinhibition. J. Plant Physiol. 155,488-496 (1999).
38. Woodley, C.M, Downs, C.A., Fauth, J.E., Mueller, E~ Halas, J.C., Bemiss, J.A~ BenHairn, Y., & Rosenberg, E. A novel molecular biomarker system to assess the physiological status of corals. In M.K. Kasim Moosa, S.Soemodihardjo, A.Nong~ A.Soegiarto, K. Romimohtarto, Sukarno and Suharsono. 2002 (Editors) Proceedings of the Ninth International Coral Reef Symposium, Bali, Indonesia. Ministry of Environment, the Indonesian Institute of Sciences and the International Society for Reef Studies. 1267-1272 (2002)
39. Ort, D.R. When there is too much light. Plant Physiol. 125,29-32 (2001). 40. Moore, M.N. Autophagy as a second level protective process in conferring resistance to
environmentally-induced oxidative stress. Autophagy 4, 254-256 (2008). 41. Moore, M.N. Cytochemical demonstration of latency of lysosomal hydro lases in
digestive cells of the common mussel, Mytilus eduiis, and changes induced by thermal stress. Cell Tissue Res. 175, 279-87 (1976).
42. Gounaris, K., Brain, A.P.R., Quinn, P .1., Williams, W.P. Structural reorganisation of chloroplast thylakoid membranes in response to heat stress. Biochim. Biophys. Acta 766: 198-208, (1984).
43. Gounaris, K., Brain, A.P.R., Quinn, P .1., & Williams, W.P. Structural and functional changes associated with heat-induced phase separations of non-bilayer lipids in chloroplast thylakoid membranes. FEBS Lett. 153,47-52 (983).
44. Semenova, G.A. Structural reorganization ofthylakoid systems in response to heat treatment. Photosynthetica 42, 521-527 (2004).
45. Spector, D.L. Dinoflagellates: an introduction. In Dinoflagellates, ed. D.L. Spector. Academic Press: Orlando. PPI-15 (1984).
46. Quinn, P.J. & Williams, W.P. The structural role of lipids in photosynthetic membranes. Biochim. Biophys. Acta 737, 223-266 (1983).
47. Thompson, LK., Blaylock, ~ Sturtevant, J.M., & Brudvig, G.W. Molecular basis of the heat denaturation of photosystem II. Biochemistry 28, 6686-6695 (1989).
48. Yamane, Y., Kashino, Y., Koike, H., & Satoh, K. Effects of high temperatures on the photosynthetic systems in spinach: Oxygen-evolving activities, fluorescence characteristics and the denaturation process. Photosyntk Res. 57, 51-59 (1998).
49. Yamane, Y., Kashino, Y., Koike, H., & Satoh, K. Increases in the fluorescence Folevel and reversible inhibition of Photo system II reaction center by high-temperature treatments in higher plants. Photosyntk Res. 52, 57-64 (1997).
50. Semenova, G.A., Vasilenko, I., & Borovyagin, V. Structural changes in thylakoid membranes of chilling-resistant and sensitive plants after heating and glycerol
Downs
19

Chapter 3
dehydration as revealed by IIp NMR and electron microscopy. Biophys. Chem. 49, 59-69 (1994).
51. Aramond, P., Schreiber, U., & Bjorkman, O. Plant Physiol. 61,411-415 (1978). 52. Armond, P.A., Bj6rkman, 0., & Staehelin, L.A. Dissociation of supramolecular
complexes in chloroplast membranes. A manifestation of heat damage to the photosynthetic apparatus. Biochim. Biophys. Acta 601,433-442 (1980).
53. Warner, C.H. Formaldehyde as an oxidation product of chlorophyll extracts. Roy. Soc. Proc. B. 378-385 (1910).
54. Halliwell B., & Gutteridge, J.M.C. Free radicals in biology and medicine. New York: Oxford University Press, Inc. (1999).
55. Richter, M., Ruhle, W., & Wild, A. Studies on the mechanism of photosystem II photoinhibition II. The involvement of toxic oxygen species. Photosyn. Res. 24,237-243 (1990).
56. Schlesinger, MJ., Ashburner, M., & Tissieres, A. (eds). Heatshock: from bacteria to man. Cold Spring Harbor Laboratory, Cold Spring Harbor, NY. (1982).
57. Hartl, F.U. Molecular chaperones in cellular protein folding. Nature 381 :571-579; 1996. 58. Murata, N. & Los, D.A. Membrane fluidity and temperature perception. Plant Physiol.
115,875-879 (1997). 59. Gombos, Z., Wada, H., Hideg, E., & Murata, N. The unsaturation of membrane lipids
stabilizes photosynthesis against heat stress. Plant Physiol. 104, 563-567 (1994). 60. Clarke ,A.K., Soitamo, A., Gustafsson, P., & Oquist, G. Rapid interchange between two
distinct forms of cyanobacterial photosystem II reaction-center protein D 1 in response to photoinhibition. Proc. Natl. Acad. Sci. USA. 90, 9973-9977 (1993).
61. Tchernov, D., Gorbunov, M.Y., de Vargas, C., Yadav, S.N., Milligan, AJ., Hllggblom, & Falkowski, P. (2004) Membrane lipids of symbiotic algae are diagnostic of sensitivity to thermal bleaching in corals. Proc. Natl. Acad. Sci. USA 101, 13531-13535 (2004).
62. Carson, F.L. Histotechnology: A selfinstructional text. ASCP Press: Chicago. (1996). 63. Robinson, C.E. et a1. Determination of Protein Carbonyl Groups by Immunoblotting.
Anal. Biochem. 266, 48-57 (1999). 64. Sokal R.R. & Rohlf; FJ. Biometry. W.H. Freeman, New York, New York. Pg 451-499.
(1995).
Downs
20
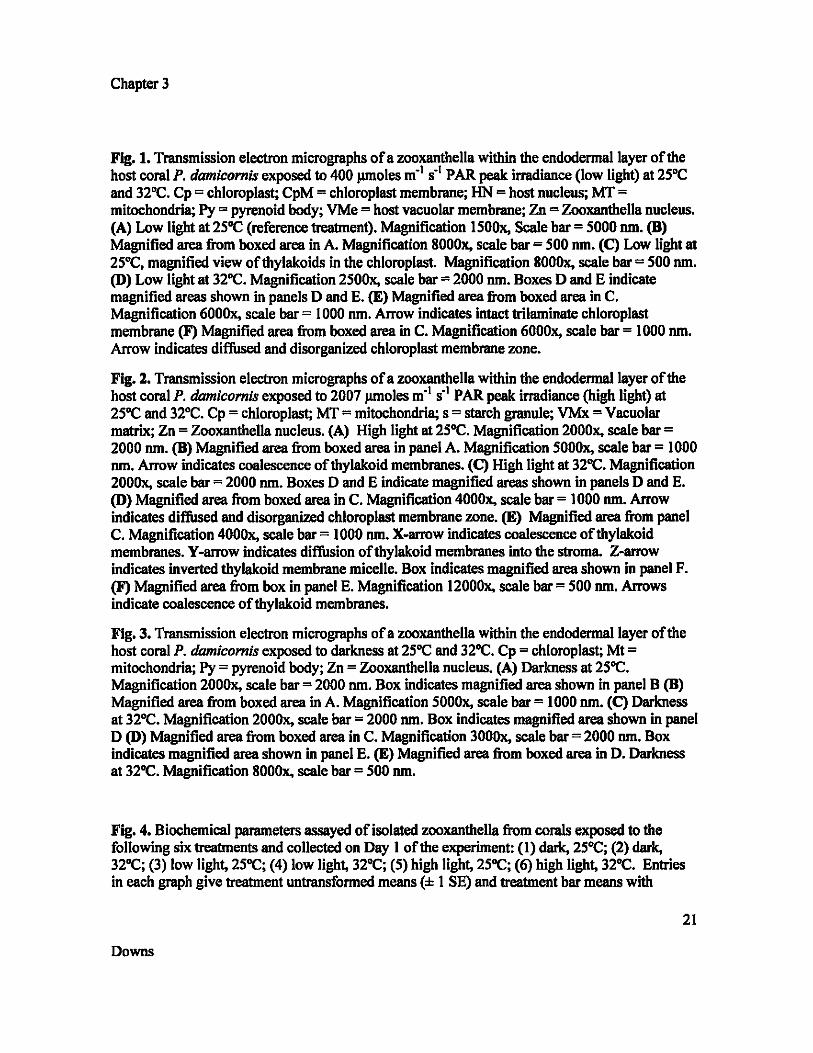
Chapter 3
Fig. I. Transmission electron micrographs ofazooxanthella within the endodennallayer of the host coral P. damicornis exposed to 400 J.U1Ioles m-I s-I PAR peak irradiance (low light) at 25DC and 32OC. Cp = chloroplast; CpM = chloroplast membrane; UN = host nucleus; MT = mitochondria; Py = pyrenoid body; VMe = host vacuolar membrane; Zn = Zooxanthella nucleus. (A) Low light at 250C (reference treatment). Magnification 1500x, Scale bar = 5000 run. (B) Magnified area from boxed area in A. Magnification 8000x, scale bar = 500 run. (C) Low light at 2SDC, magnified view of thylakoids in the chloroplast. Magnification 8000x, scale bar = 500 run. (D) Low light at 32OC. Magnification 2500x, scale bar = 2000 run. Boxes D and E indicate magnified areas shown in panels D and E. (E) Magnified area from boxed area in C. Magnification 6000x, scale bar = 1000 nm. Arrow indicates intact trilaminate chloroplast membrane (F) Magnified area from boxed area in C. Magnification 6000x, scale bar = 1000 run. Arrow indicates diffused and disorganized chloroplast membrane zone.
Fig. 2. Transmission electron micrographs ofa zooxanthella within the endodermaIlayer of the host coral P. damicornis exposed to 2007 J.U1Ioles m-I S-I PAR peak irradiance (high light) at 250C and 32OC. Cp = chloroplast; MT = mitochondria; s = starch granule; VMx = Vacuolar matrix; Zn = Zooxanthella nucleus. (A) High light at 25DC. Magnification 2000x, scale bar = 2000 run. (B) Magnified area from boxed area in panel A. Magnification 5000x, scale bar = 1000 run. Arrow indicates coalescence ofthylakoid membranes. (C) High light at 32OC. Magnification 2000x, scale bar = 2000 run. Boxes D and E indicate magnified areas shown in panels D and E. (D) Magnified area from boxed area in C. Magnification 4000x, scale bar = 1000 run. Arrow indicates diffused and disorganized chloroplast membrane zone. (E) Magnified area from panel C. Magnification 4000x, scale bar = 1000 run. X-arrow indicates coalescence of thylakoid membranes. V-arrow indicates diffusion ofthylakoid membranes into the stroma. Z-arrow indicates inverted thylakoid membrane micelle. Box indicates magnified area shown in panel F. (F) Magnified area from box in panel E. Magnification 12000x, scale bar = 500 run. Arrows indicate coalescence ofthylakoid membranes.
Fig. 3. Transmission electron micrographs of a zooxanthella within the endodennallayer of the host coral P. damicornis exposed to darkness at 25DC and 32DC. Cp = chloroplast; Mt = mitochondria; Py = pyrenoid body; Zn = Zooxanthella nucleus. (A) Darkness at 25OC. Magnification 2000x, scale bar = 2000 nm. Box indicates magnified area shown in panel B (B) Magnified area from boxed area in A. Magnification 5000x, scale bar = 1000 run. (C) Darkness at 32OC. Magnification 2000x, scale bar = 2000 run. Box indicates magnified area shown in panel D (D) Magnified area from boxed area in C. Magnification 3000x, scale bar = 2000 nm. Box indicates magnified area shown in panel E. (E) Magnified area from boxed area in D. Darkness at 32DC. Magnification 8000x, scale bar = 500 run.
Fig. 4. Biochemical parameters assayed of isolated zooxanthella from corals exposed to the following six treatments and collected on Day 1 of the experiment: (1) dark, 25OC; (2) dark, 32OC; (3) low light, 25OC; (4) low light, 32DC; (5) high light, 25OC; (6) high light, 32OC. Entries in each graph give treatment untransformed means (d: 1 SE) and treatment bar means with
21
Downs
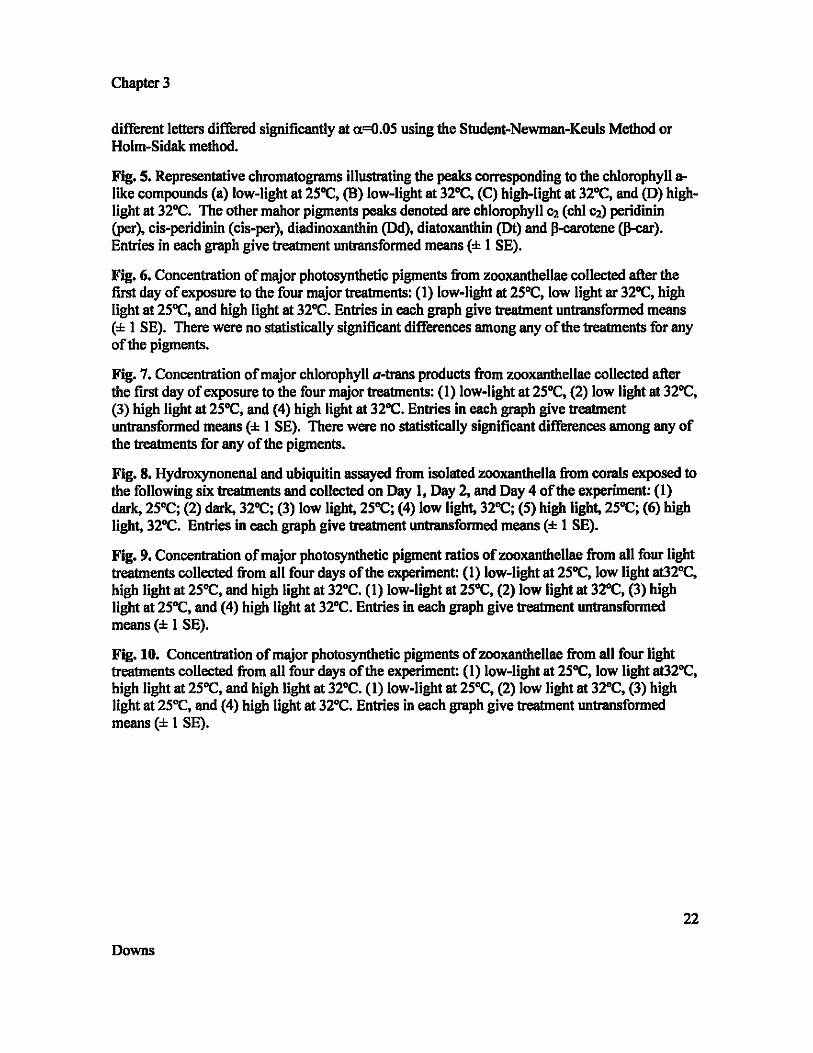
Chapter 3
different letters differed significantly at «=O.OS using the Student-Newman-Keuls Method or Holm-Sidak method.
Fig. 5. Representative chromatograms illustrating the peaks corresponding to the chlorophyll alike compounds (a) low-light at 2S"C, (B) low-light at 32"C, (C) high-light at 32°C, and (D) highlight at 32"C. The other mahor pigments peaks denoted are chlorophyll ca (chi C2) peridinin (per), cis-peridinin (cis-per), diadinoxanthin (Dd), diatoxanthin (Dt) and f3-car0tene (JH:ar). Entries in each graph give treatment untransfonned means (± 1 SE).
Fig. 6. Concentration of major photosynthetic pigments from zooxanthellae collected after the first day of exposure to the four major treatments: (1) low-light at 2SoC, low light ar 32"C, high light at 2S"C, and high light at 32"C. Entries in each graph give treatment untransformed means (± 1 SE). There were no statistically significant differences among any of the treatments for any of the pigments.
Fig. 7. Concentration of major chlorophyll a-trans products from zooxanthellae collected after the first day of exposure to the four major treatments: (1) low-light at 2SoC, (2) low light at 32"C, (3) high light at 2SoC, and (4) high light at 32°C. Entries in each graph give treatment untransfonned means (± 1 SE). There were no statistically significant differences among any of the treatments for any of the pigments.
Fig. 8. Hydroxynonenal and ubiquitin assayed from isolated zooxanthella from corals exposed to the following six treatments and collected on Day 1, Day 2, and Day 4 of the experiment: (1) dark, 2SoC; (2) dark, 32"C; (3) low light, 2S"C; (4) low light, 32"C; (S) high light, 2S"C; (6) high light, 32"C. Entries in each graph give treatment untransformed means (± 1 SE).
Fig. 9. Concentration of major photosynthetic pigment ratios of zooxanthellae from all four light treatments collected from all four days of the experiment: (I) low-light at 2SoC, low light at32°C, high light at 2S"C, and high light at 32°C. (1) low-light at 2S"C, (2) low light at 32"C, (3) high light at 2S"C, and (4) high light at 32°C. Entries in each graph give treatment untransformed means (± 1 SE).
Fig. 10. Concentration of major photosynthetic pigments ofzooxanthellae from all four light treatments collected from all four days of the experiment: (I) low-light at 2S"C, low light at32"C, high light at 2S"C, and high light at 32°C. (1) low-light at 2SoC, (2) low light at 32°C, (3) high light at 2S"C, and (4) high light at 32°C. Entries in each graph give treatment untransfonned means (± 1 SE).
22
Downs

M ~
" 0. '" ..c
U
M N


Chapter 3
Protein Carbonyl H.,dfo • .,nonlnl' IH N EJ
E " ~ .. " " ~ I J
i" • II I C , . E f-t. r rt D I' W, f- • f- f-
, A R C D- r- B B r-I n ,
o 0 f- f-
0 ~ o .. us"C O .... l2"C U2S"C ,,-xrc 14. 2S"C H.. l2"C 0 0." 1I'C 0 .. , noe LL!t'C LLlrc HLU'e In.U·C
Ubiquilin CNAAP_
• 12J)
, C I;' B,C
~ I: I J , ,. I B ~' ,. -
E A D e, - - 1: , A A - - A R C D- f-r-I I I ~ P r-I n
0 A 0 On 1I"'C ~n'C l1.u'C ~.~ ~ZI'C "UI 'C DIrt! Z$"C DIrtIl2"C LLZS'C u.= H..25'C H..l2'C
Hsp70 GIut:athIoN pwolddMe
02 " 0,'1 R 1:1 D R -'- ., 0." + r- C 5-0.1.
rt ,,,
!o." l P, -'- ~1O A A ~ 0.'
1 J r- -,.,0.08 ~ - " r- I-rtl-0.'" - -
0.04 A A , l- e- -
0.02 ffl- Hl-- -- - 0
0 DwIIIt'C _,rc ~"~ ~.~ Mlu-e ~,~
000' <II... IW ...... ~~ ~.~ u. ~,~
Chloroplnt.Hlp ......, .,
0.35 D E 10 0.' rt rt
., 0.25 ~., I 0.' D R
~o. , s -'-~ .. -!-
Y ;." E " ., 0.' - A .c ~ A A A R n- 10
0." - ,--, r-I ,...,
n 0 0 o.to 2rC o.to U"C uzrc "-"'" 1UrC ... "'" o.n: we c.rt U'c u zre u.".c ... we ...... c
26
Downs Fig. 4

Chapter 3
5l c o a. en Q)
a::
Downs
Chlc2 Per li Dd I \ /
Chla
/ Chla -2
Dt Chla -3 \ Chla +1
Wul~L __ ~~ / Car ,-_J Chla ::~ ."-. _~ 2 8 8 10 12 '4 18 18 20 22 24 26 28 30
Chlc2
\
2 • •
Chlc2
\
/per jDd
. ,. Per
Dt
Chi. -2
Chl.-3 \
Chi.
/ Chla +1
\ / Car - A __ ~~==::::2~~
12 ,. ,. ,. 26 28 30
Dd
Dt
Chi. -2
Chl.-3 \
Chla-4 \ .
Chla-5 \ \
Chi.
/ I 7a
+
1
Car I
:: ,\J 2 .. 8 8 10 12 ,. 18 18 ~ 22 ~ ~ U 30
Chlc2 Per Dd
Chla / Chi. -2
Dt Chla +1
\ Car
/ Chla -5
8 8 10 12 ,. 115 18 20 22 2. 28 28 30
Time (minutes)
Fit!. 5
Low Light, 25°C
Low Light, 32°C
High Light, 25°C
High Light, 32°C
27

Chapter 3
Oladinoxanthln Olatoxanthin
3 0.25
2.' 0.2
2 If-r--rt -~ " T ~ 0.15 -f--11f--r+-
-r- + T , - - a.'
j r-- -0.' - f-- f-- - - 0.05 I- r--- f-- r--- -
a a Ll 2S'C LL32'C Hl2S'C HL32'C LL2S'C LL3TC HL2S'C HL32'C
Total Xanthophyll Pool. D~DI+Dd)
3.' 07
o.s 3 + 2.' r --'-I 2 - .' j , l- T , - .3 - r--- r--- r--- r-J" j , r- r--- r--- - - 0.2 - f-- f-- r--- I-
0.' l- f-- f-- - - ., - r--- r--- r--- r-a a
ll2S'C LL32'C HL2S'C Hl3Z'C ll2S'C LL 32'C "'25'C H\.32"C
Peridinium Chlorophyll--c·2
12 , , 10
7 , 6 -
16 I-r l- I- I: T -
-rl--+-f---
f--lf---,- -
• l- I- 3 - - -I- - - f-- I-
2 - f-- f-- - -2 , - f-- f-- - -a a
LL2S"C lL32*C Hl2S'C Hl32'C ll2S'C ll32'C Hl2S'C Hl32'C
Chlorophyll-. Total Trans Product.
14 12
12 10
10 • ~ : r- - ~ . T rl--+r---
I-r-~r-r-r---
- • I-4 I- r--- - 1 2 r- r-- r-- r-- - 2 l- f-- - r-- I-a 0
ll2S'C Ll32'C HL2S'C HL32'C LL2S'C lL32'C HL2S'C Hl32'C
"0
Downs Fig. 6

Chapter 3
Cia-2 Oia~ 7 25
1: \ 2
~4 - ~ 1.5 --~ 3 - ~ 1 l t T r+ J-r+f-
-~~ 1 1 -
~Q5 - t-f- f-- I-- I-- r-
0 0
LJ.ZS-C LJ.32"C H..25"C H..32"C LJ.ZS-C LJ.32"C H..25"C H..32"C
Cia-4 ~
1.6 1B
~ 14 \ 16 14
2 12 12 ~ 1 1 -
I~ QB
! f-r--- -
I-- 0.6 f-- -I--
0.4 ---Pl--- f- r-- -- 02 - - -
0 0
LJ.ZS-C LJ.32'C H..25"C H..32"C LL25"C LJ.32"C H..2S'C H..32"C
29
Downs Fig. 7

Chapter 3
Hydroxynonenol (HNE)
12~-------------------------------------------,
10~------------------------------~
r 9 6 +------+-----l /l'I
R 4+------1
2 +------------1
Ll.2S· C Ll. 32·C
Ubiquitin
6 r------------------------------------------, 5+-------------------------------~~----~
r ~3 o f'l2 +-------1
o Lr:=-_ L....-...L LL 32· C
Downs
Fig. 8
DOay 1
. Oay2
.Day .
DOay1
. Oay2
.Day .
30

Chapter 3
Chl.~ik.
0.6
0.5
~4 Dlowlight2S·C
pO.3 . Hgh light 2S·C
Dlowlight 32·C
~02 DHgh ~ht 32-C
0.1
0
2 3 4
Time (day.)
31
Downs Fig. 9
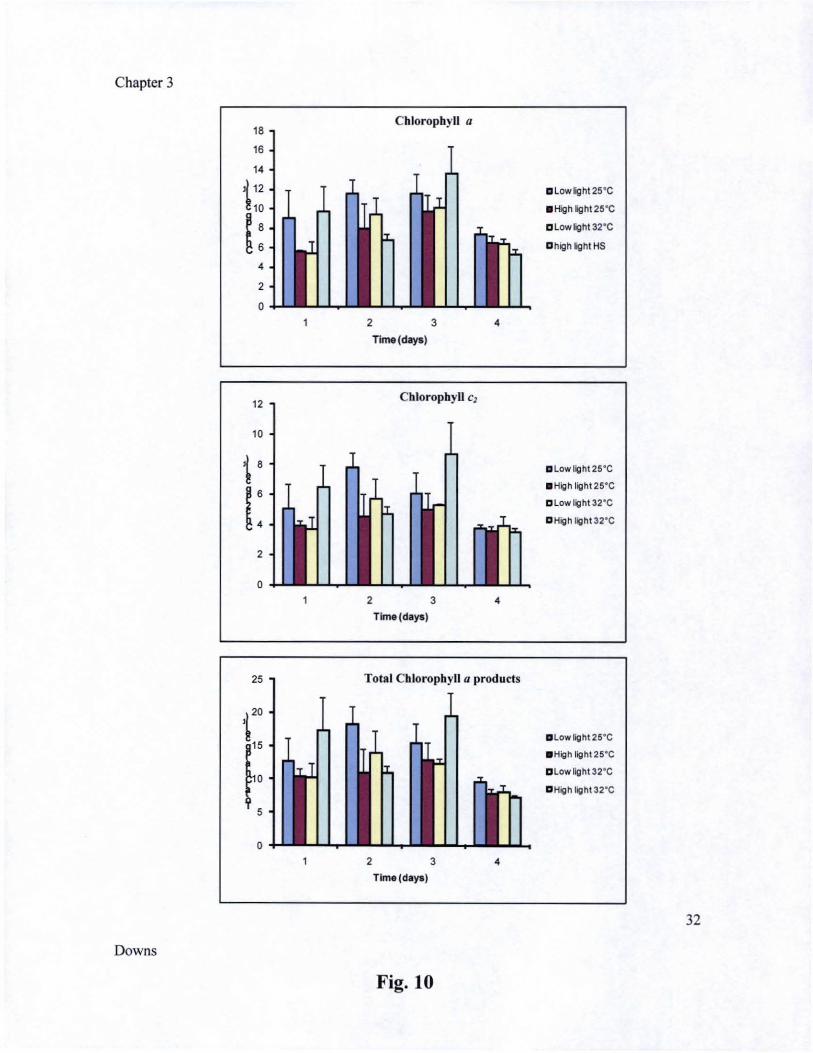
25 T I Chl oto h II orop y
T T
~ t'"
o 2 3
Time (days)
Downs
Fig. 10
d t a pro uc S
4
L.,
Dlowlight2S·C
. High light 2S'C
Glow lig ht 32"C
D High light 32"C
32

Chapter 4
Chapter 4
The cellular and histological effects of an acute, short-term
hypo-salinity exposure on the coral Stylophora pistillata
SUMMARY
Coral reefs can experience tremendous changes in salinity, especially hyposalinity, as a result of storms, heavy-rain seasons (e.g., monsoons), and coastaI runoff. Field and laboratory observations have documented extensive bleaching and mortality of hypo-saline exposed corals. To better understand the pathology associated with hyposalinity stress and to lay a foundation for future investigations regarding the mechanisms of this pathology (i.e., bleaching), we examined the effects of hypo-salinity on corals using histological and cellular diagnostic methods. Colonies of Stylophora pistillata were exposed to five salinity regimes: 43 parts per thousand (ppt), 32 ppt, 28 ppt, 24 ppt, and 20 ppt - salinity concentrations that corals may realistically experience on a reef. Histological examination indicated that decreasing salinity induced morphological changes, including increased tissue swelling, degradation and loss of zooxantIiailae, and tissue necrosis at the lowest two salinity concentrations. PAM chlorophyll fluorimetry kinetics demonstrated a decreasing photosynthetic efficiency with decreasing salinity conditions. The most notable finding of this study is that hypo-salinity induces an oxidative stress response in both the host and the symbiont, and that there is a linear relationship between decreasing saline conditions and increasing burdens of oxidative stress. Cytochrome P450 levels were affected by slight changes in salinity concentration, calling into the question the affects of xenobiotic and toxin detoxification pathways, as well as a number of endocrine pathways. As in heat and light stress, exposure of corals to hypo-saline conditions may have long-term ramifications on the physiology of corals, providing a mechanism for the distribution of ecotypes and species on the coral reef.
Downs,C.A. I

Chapter 4
INTRODUCTION
Coral reefs can experience tremendous changes in salinity. Storms, heavy-rain seasons (e.g., monsoons), hurricanes and coastal runoff can significantly alter surface and depth salinity concentrationsl4• Over the short term, haloclines of less than 14 ppt can form over in-shore reefs that are quickly dispelled within a few days after heavy rains3
•
Long-term exposure to hypo-saline conditions on coral reefs is not uncommon, decreased salinity levels (28 - 32 ppt) existed for almost a month on coral reefs located centrally on the Great Barrier Reef after heavy sto~. Studies dating back to 1928 indicate that hypo-salinity is a significant environmental factor that may impact a coral reef and influences the distribution of cnidarians species and popuIatiOnS*7. Bleaching and mortality of near-shore corals and anemones are often reported in association with hyposaline conditions resulting from heavy rainfall events","ll. In the laboratory, bleaching by hypo-salinity in corals and anemones is an establish phenomenon, inducing pathologies such as reduced photosynthetic efficiency and altered metabolism of respiratory pathwaysI2.IS. These metabolic pathologies could be associated with higher-order physiological diseases, such as reduce reproductive fitnessl6.
Corals are osmo-conformers, becoming iso-osmotic with their surroundings, gaining water when exposed to hypo-saline conditionsl7. Hypotonic conditions can cause damage within a number of different organelles and cellular fractionsl8.19
• For eukaryotes, the mitochondria are one of the most susceptible cell structures to osmotic damage20. Changes in osmolarity can disrupt mitochondrial electron transport and alter NADH redox capacity producing an increase in reactive oxygen species and altering cellular metabolism21:H. Enzymes that play key roles in amino acid metabolism that reside in the mitochondria of bivalves have also been shown to be markedly depressed in response to hypo-saline conditions23-2S. Changes in endoplasmic reticulum structure and lysosomal function have been noted in both plant and animal cells as a result of osmotic shifts26• In the chlorogJast. hypo-tonicity can inhibit photosynthetic electron transport and catalase activi~' . In hepatocytes, hypotonicity blocked induction of the Heatshock Protein Response, incurring a reduced ability of the cell to deal with stres~l. There have been less than a handful of studies that examine the physiological responses to hypo-salinity exposure. Several studies have demonstrated that hypo-salinity affects ~rotosynthesis of the coral's zooxanthellae, and general respiration of coral symbiosis32
•
To increase the understanding of the cellular and physiological effects of coral exposed to hypo-salinelhypotonic conditions and its relationship to coral bleaching, we investigated the changes in cellular structure/function and identified mechanisms of stress induced by hypo-saline conditions. In this study, we measured cellular processes of protein metabolic condition, xenobiotic response, oxidative stress and response, photosystem II efficiency in control and hypo-saline exposed corals, as well as structural changes to coral microscopic structures. We exposed colonies of Stylophora pistillata to four salinity regimes: 43 parts per thousand (ppt), 32 ppt, 28 ppt, 24 ppt, and 20 ppt -salinity concentrations that corals may realistically experience on a reef.
Downs,C.A. 2

Chapter 4
RESULTS
Antibody validation
Antibodies against cnidarian and dinoflagellate cellular biomarkers did not exhibit significant non-specific cross-reactivity (Fig I, 2, 3, and 4), hence could be validly used in an ELISA format. All blots presented in these figures are over-exposed blots; a technique to characterize the potential of non-specific cross-reactivity for the ELISA. ELISA-microplates readings are based on a 4 second exposure. The level of sensitivity between the Syngene Genegnome documentation system and the Bio-Tek FluorescentlLuminescence microplate reader are approximately equal, hence, the nonspecific, faint bands are non-detectable by the microplate reader. Because of the evolutionary conservation of ubiquitin and MXR, these antibodies detected proteins from both species in the coral homogenate (Figs. 1 and 4; ubiquitin data not shown), consequently an ELISA measurement using this antibody detects total concentration for these proteins.
ELISA Resnlts
ELISA for dinoflagellate Hsp60, dinoflagellate Hsp70, cnidarian Grp75, cnidarian Hsp60, cnidarian Hsp70, cnidarian ubiquitin ligase, total ubiquitin, chloroplast sHsp and the four major cnidarian sHsp classes were performed to address the possibility of differences in Protein Metabolic Condition between the hyposalinity treatments (Table 1). Cnidarian Hsp70 and Grp75, which are two Hsp70 homologues, and ubiquitin significantly increased in response to salinity levels 28 parts per thousand (ppt) and lower. Ubiquitin ligase and cnidarian Hsp60 were more sensitive to changes in salinity, and significantly increased at 32 ppt salinity and lower. Cnidarian small Hsps were the least sensitive to changes in salinity, and were only detectable at salinities of 24 ppt and lower. Dinoflagellate Hsp60 and the chloroplast sHsp only changed their expressions at 28 ppt and lower.
ELISA for dinoflagellate CulZnSOD, dinoflagellate GPx, cnidarian MnSOD, cnidarian CuJZnSOD, cnidarian cataIase, invertebrate MutY, DNA AP lesion, and protein carbonyl were performed to address the question of differences in Oxidative Stress and RespoTlSe among treatments (Table I). Cnidarian anti-oxidant defenses were very responsive to the slightest change in salinity, and their induction preceded detectable changes in protein oxidation. In contrast to this sensitivity, the DNA repair enzyme, MutY, only accumulated at the lowest salinity concentration. Dinoflagellate anti-oxidant enzymes responded in a similar fashion as the cnidarian anti-oxidant enzymes, except that at 20 ppt, dinoflagellate CuJZnSOD protein levels either decreased to a point where the protein levels were below the calibrant standard curve or the epitope that is recognized by the antibody had been masked (e.g., adduction with an aldehyde such 4-hydroxynonenal or oxidized). DNA damage as reflected by the accumulation of DNA abasic lesions apurinic/apyrimidinic site) on DNA more than tripled when corals were exposed to 28 ppt salinity, and increased by almost seven fold when exposed to 20 ppt salinity.
Downs,C.A. 3
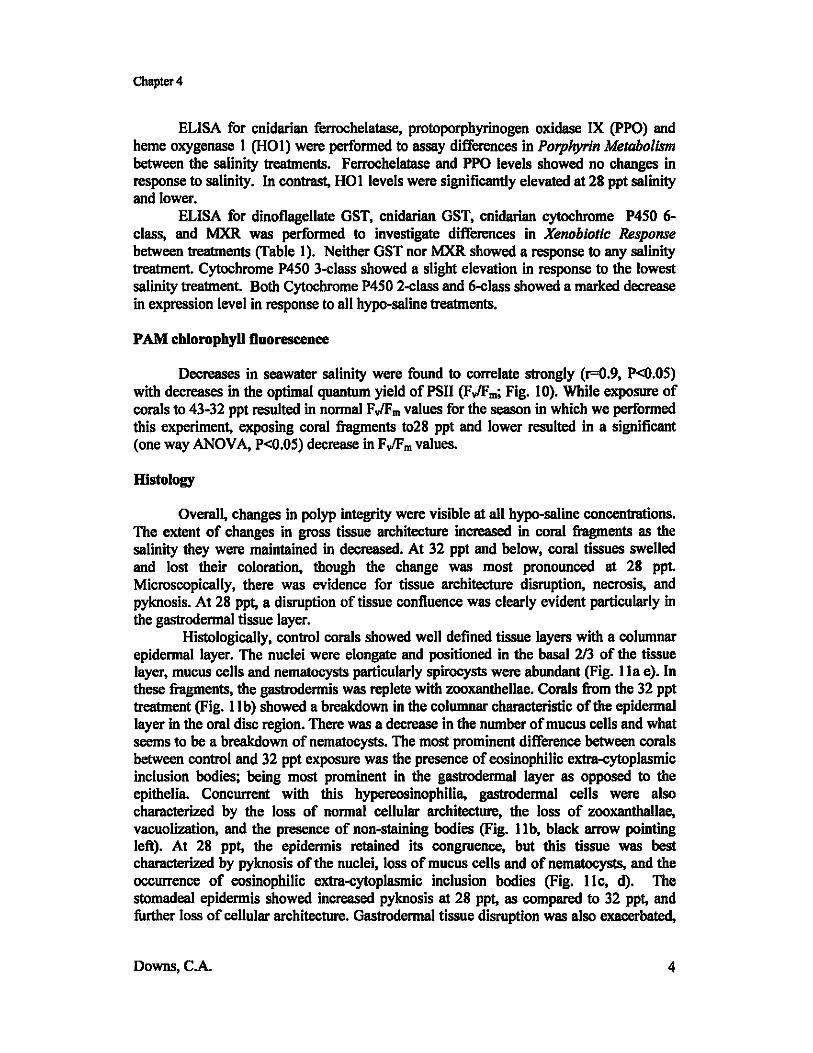
Chapter 4
ELISA for cnidarian ferrochelatase, protoporphyrinogen oxidase IX (PPO) and heme oxygenase I (HOI) were performed to assay differences in Porphyrin Metabolism between the salinity treatments. Ferrochelatase and PPO levels showed no changes in response to salinity. In contrast, HOI levels were significantly elevated at 28 ppt salinity and lower.
ELISA for dinoflagellate GST, cnidarian GST, cnidarian cytochrome P450 6-class, and MXR was performed to investigate differences in Xenobiolic Response between treatments (Table I). Neither GST nor MXR showed a response to any salinity treatment. Cytochrome P450 3-class showed a slight elevation in response to the lowest salinity treatment. Both Cytochrome P450 2-class and 6-class showed a marked decrease in expression level in response to all hypo-saline treatments.
PAM chlorophyll Duorescence
Decreases in seawater salinity were fOWld to correlate strongly (r=O.9, P<O.05) with decreases in the optimal quantum yield ofPSII (FvlFm; Fig. 10). While exposure of corals to 43-32 ppt resulted in normal FvlFm values for the season in which we performed this experiment, exposing coral fragments to28 ppt and lower resulted in a significant (one way ANOVA, P<O.05) decrease in FvlFm values.
Histology
Overall, changes in polyp integrity were visible at all hypo-saline concentrations. The extent of changes in gross tissue architecture increased in coral fragments as the salinity they were maintained in decreased. At 32 ppt and below, coral tissues swelled and lost their coloration, though the change was most pronoWlced at 28 ppt. Microscopically, there was evidence for tissue architecture disruption, necrosis, and pyknosis. At 28 ppt, a disruption of tissue confluence was clearly evident particularly in the gastrodermal tissue layer.
Histologically, control corals showed well defined tissue layers with a columnar epidermal layer. The nuclei were elongate and positioned in the basal 213 of the tissue layer, mucus cells and nematocysts particularly spirocysts were abWldant (Fig. 11a e). In these fragments, the gastrodermis was replete with zooxanthellae. Corals from the 32 ppt treatment (Fig. 11 b) showed a breakdown in the columnar characteristic of the epidermal layer in the oral disc region. There was a decrease in the number of mucus cells and what seems to be a breakdown of nematocysts. The most prominent difference between corals between control and 32 ppt exposure was the presence of eosinophilic extra-cytoplasmic inclusion bodies; being most prominent in the gastrodermal layer as opposed to the epithelia. Concurrent with this hypereosinophilia. gastroderma1 cells were also characterized by the loss of normal cellular architecture, the loss of zooxantha1lae, vacuolization, and the presence of non-staining bodies (Fig. 11 b, black arrow pointing left). At 28 ppt, the epidermis retained its congruence, but this tissue was best characterized by pyknosis of the nuclei, loss of mucus cells and of nematocysts, and the occurrence of eosinophilic extra-cytoplasmic inclusion bodies (Fig. Ilc, d). The stomadea1 epidermis showed increased pyknosis at 28 ppt, as compared to 32 ppt, and further loss of cellular architecture. Gastrodermal tissue disruption was also exacerbated,
Downs,C.A. 4

Chapter 4
as characterized by cell debris in both tissue layers, a loss of zooxanthellae, and zooxanthellae that remained were swelled in appearance (Fig. 11 f).
Gonads were evident in all fragments at all salinities (Fig. 12, 13). Planulae from fragments maintained at lower salinities showed increases in the breakdown of tissue and increased nuclear pyknosis (Fig. 12c-f). In fragments from hypo-saline treatments, oocytes appeared normal though the tissue was swelled and cell confluence was disrupted surrounding the oocytes (Fig. 13b). Although gross testes architecture was maintained, microscopic changes in tissue architecture was evident. Spermatids within the testes were swollen at the lower salinity (Fig. 13f).
DISCUSSION
Heat stress, light stress and hypo-salinity are the three most prevalent environmental stressors to induce bleachingl
,36. Determining how hypo-salinity induces coml bleaching is important in understanding commonalities and differences in bleaching mechanisms among the three stressors, as well as interest to forensics and environmental management. As a result of coastal development, the mortality and bleaching associated with corals and other coml reef organisms (i.e., sea urchins) is a recent social concern and a significant factor for environmental impact assessment and natural resource damage investigationsl ,3.4,37.
In this study we showed that Stylophora pistil/ala responds to hypo-saline conditions on a number oflevels. Gross morphological changes included increased tissue swelling, degmdation and loss of zooxanthallae with decreasing salinities, an increase in pink fluorescent coloration at the lowest salinity concentration, and tissue necrosis at the lowest two salinity concentrations. Histologically, it was possible to discern microscopic changes occurring to cellular integrity and tissue architecture and that these changes occur at differing degrees in different tissues. Changes in the symbiont's photosynthetic capacities and pathways were discernible using PAM chlorophyll fluorimetry kinetics.
One of the most important findings of this study is that hypo-salinity induces an oxidative stress response in both the host and the symbiont, and that there is a linear relationship between decreasing saline conditions and increasing burdens of oxidative stress. Heat stress and light stress both induce an oxidative stress, though the mechanism for the induction is different within these two stressors. The source of the oxidative stress by a hypo-saline stress may only be discernable by transmission electron microscopy (Downs et aI., in review).
Data from this study also indicates that hypo-salinity adversely affects more than just aerobic respirationl3-l'. Porphyrin metabolism was significantly affected, which may contribute to the overall decrease in aerobic respimtion since so much of that pathway is dependent on porphyrin products, i.e., cytochromes and hemes. Cytochrome P4S0 levels were affected by slight changes in salinity concentration, calling into the question the affects of xenobiotic and toxin detoxification pathways, as well as a number of endocrine pathways. As in heat and light stress, exposure of corals to hypo-saline conditions may have long-term mmifications on the physiology of corals, providing a mechanism for the distribution of ecotypes and species on the coral reef.
Downs, C.A. 5

Chapter 4
Protein metabolic condition
Protein metabolic condition is the cellular status of protein synthesis. protein maturation, and protein degradation. Changes in any of these processes are indicative of a significant change in cellular metabolism and homeostasis's. In this study, only six biomarkers of protein metabolic condition in cnidarians and two biomarkers in the dinoflagellate were examined, but whose changes in behavior are indicative of a wider system response. Heat-shock protein 70 (Hsp70) is a cytosolic chaperonin, while Grp75 is the mitochondrial homologue. The cytosolic Hsp70 function is a crucial element in the maturation of newly made proteins to gain their active state. GRP75 is essential in the maturation of newly imported proteins into the mitochondria. The ability to reassemble denatured proteins is often the most commonly recognized function of both Hsp70 and Grp7543
• Accumulation of these proteins can be interpreted as a shift in metabolic condition, but the direction of the shift is indeterminate by looking at Hsp70 or Grp75 alone. These markers must be examined in conjunction with other markers of protein metabolic condition to allow such resolution38
• Cnidarian heat-shock protein 60 (Hsp60) is the major mitochondrial chaperonin and functions to mature nuclear-encoded, mitochondrial-imported proteins into their active state43
• Elevation of this protein signifies that there has been a general shift in the protein metabolic condition of the mitochondria, which would implicate a possible change in the equilibria of many of the mitochondrial-associated metabolic pathways40. The dinoflagellate Hsp60 homologue is better known as the RuBisCO-binding protein and was first discovered to chaperone the RuBiSCO, the primary enzyme of the Calvin Cycle in photosynthesis41
• This protein also functions as a chaperon in for a number of stromal proteins besides RuBisC04
• Ubiquitin could be considered the 'death mark' of proteins; its cot.&ugation to broken or no-Iongerneeded proteins marks these proteins for degradation . Ubiquitin Ligase E2 is the enzyme responsible for the actual conjugation catalysis event between ubiquitin and the target protein. An increase of ubiquitin ligase indicates that protein degradation processes have been amplified44•
The cnidarian and chloroplast small heat-shock proteins (sHsps) have been grouped in the category of protein metabolic condition because they also serve as chaperonins. Small heat-shock proteins are often absent under normal conditions, but are induced only as a result of severe stress4S
• Measurement of cnidarian sHsps in this study is actually the measurement of five separate isozymes (sHsps 16, sHsp22, sHsp23, sHsp26, sHsp28), because the antibody used in the study binds to a highly conserved epitope that is found only on these five proteins. Each of these sHsps is independently regulated and localizes to different places within the cel~ and perhaps to different tissue types46-49. The chloroplast sHsp is a small heat-shock protein that is present only in the chloroplast and specifically associates with the oxygen evolving complex of photosystem Irs,so• The chlpsHsp protects photosystem II activity during heat stress, ultravioletradiation exposure, and oxidative stress, most likely via a recycling antioxidant mechanism 4S. Induction of the chloroplast sHsp is indicative of a severe stress to Photosystem II, which may have resulted from disruption of the chloroplast membranes due to intracellular turgor, as demonstrated by histological examination of severe swelling in zooxanthallae in the host exposed to hypo-saline condition.
Downs,C.A. 6

Chapter 4
Canonical correlation analysis indicates that there are definite changes in protein metabolic condition when exposed to a regime of decreasing salinity (Fig. 5). The first proteins to respond to the change in salinity were Hsp60 and ubiquitin ligase. Lack of induction of Hsp70, ubiquitin, and the sHsps at 32 ppt indicates that the organism was responding to a stressor, but was not responding to a cellular crisis (a condition defined by the presence of cellular lesions3~. For example, neither protein carbonyl, nor DNA damage, was evident at this salinity. This profile is consistent with a homeostatic response to a changing environment. This is supported by histological evidence that showed only slight changes in cellular architecture at this salinity. On the other hand, all the host biomarkers for protein metabolic condition at 28 ppt were significantly elevated in comparison to controls, indicating a marked shift in cellular condition. This condition is marked by an accumulation of cellular lesions, namely oxidized proteins and damage to DNA, most likely the result of oxidation of nucleotides. These effects were morphologically evident in the widespread changes in tissue and cellular architecture of the corals from this treatment. In particular, these changes were evident in the nuclear rounding and cell degradation found in those fragments. At 24 ppt, there is an increase in tissue degradation and the condition is further defined by the significant accumulation of the sHsps, indicating a serious alteration of metabolic structures and processes49.50. Grp75 levels were reduced at 24 ppt and 20 ppt, which may have been a result of the mitochondrial-import rate being adversely affected by the oxidative and osmotic stressSO-52. For the dinoflagellate, Hsp60 chaperonin did not significantly accumulate until exposure to 28 ppt. In sununary, decreasing salinity regimes shift protein metabolic condition from an increase in the rate of protein synthesis and protein degradation to one where there is a significant increase in the rate of protein degradation relative to protein synthesis38.
Oxidative Damage & Response
A cell is able to withstand the adverse effects of oxidative stress based on its ability to (I) suppress reactive oxygen species generation (2) neutralize reactive oxygen species once they are formed, and ~3) repair the damage caused by a reactive oxygen species lesion to a cellular structure 3. Canonical correlation analysis showed that there was significant shift in anti-oxidant defenses and an accumulation of cellular lesions associated with oxidative damage with exposure to a regime of decreasing salinity, and that the 24-20 ppt treatment was defined predominantly by accumulation of these cellular lesions (Fig. 6). The enzymes that respond to the 32 ppt salinity exposure were catalase, Cu/ZnSOD, and MnSOD, indicating that hypo-salinity induced an oxidative stress response, but no major change in tissue morphologies was visible. Induction of oxidized protein was not apparent until exposure to 28 ppt salinity when tissue breakdown was widespread and cellular debris was prevalent in both the epidermis and gastrodermal tissues (Fig. II). Induction of MutY was not apparent until 20 ppt salinity, even though DNA AP lesions significantly accumulated at higher salinities. This phenomenon may be explained by the activation of MutY repair activity without an increase in accumulation; the coneentration of MutY at 28 and 24 ppt salinity may have been sufficient to repair oxidized base pairs. The accumulation of DNA lesions at 20 ppt may have been so severe that it overwhelmed the basal capacity of MutY to repair the DNA lesions.
Downs,C.A. 7

Chapter 4
Dinoflagellate anti-oxidant enzymes exhibited a similar pattern to host antioxidant enzyme profiles, indicating that the dinoflagellate was responding to an oxidative stress insult (Fig. 6). CulZnSOD showed an unusual behavior pattern in that there was a marked decrease in the level of this dinoflagellate protein; it was detectable, but below the calibrant standard curve. Severe photo-oxidative stress can cause inactivation and degradation of CulZnSOD, as well as masking of epitopes by making the domain unrecognizable as a result of oxidative cleavage (non-protease dependent) and aldehyde adduction54-S6.
Porphyrin Metabolism
This category includes enzymes responsible for the synthesis of porphyrins, as well as enzymes responsible for the degradation of porphyrins. Porphyrins are essential ligands used by proteins in a number of physiological processes, such as oxidative phosphorylation, steroidogenesis and fatty acid synthesis, and xenobiotic responsesS7
•
Shifts in the ~rphyrin metabolic equilibrium reflect a major shift in cellular metabolism as a wholes8
• Proto~rphryinogen oxidase IX catalyzes the second to the last step of porphyrin production . Ferrochelatase is the last enzyme in porphyrin synthesis and inserts iron into the porphyrin ring to form hemin61
• Heme oxygenase I catalyzes the decomposition of heme to biliverdin, carbon monoxide, and ferrous iron62. Biliverdin is further catalyzed to bilirubin, which is a powerful lipophilic anti-oxidant63
• Porphyrin synthesis pathway by hypo-salinity exposure was unaltered as indicated by a lack of change in both ferrochelatase and protoporphryinogen oxidase IX (Fig. 7). The porphyrin degradation pathway was altered when corals were exposed to salinities of 28 ppt and lower, most likely not in response to damaged porphyrins, but from a need to increase b'I' b' 63 IU1Im.
Xenobiotic Response
Cells can regulate and expel potentially harmful xenobiotics through a three phase process. In Phase I, xenobiotics undergo an enzymatically catalyzed reaction that introduces a polar group into the xenobiotic's molecular compositio~ such as a hydroxyl (-OH), carboxyl (-COOH), thiol (-SH), or an amino (-NH2) group . It is during this phase that some xenobiotics are imJarted a toxicity, or are conferred an enhanced toxicity compared to the parent compound . Enzymes responsible for such reactions include the superfamily of cytochrome P450s, the flavin-containing monooxygenases, and a host of esterases6S
• In Phase II, these new polar metabolites are conjugated with endogenous substrates such as sulfates, acetates, glutathione, and glucuronides66
•67
• Enzymes of Phase II include the fami!?; of glutathione-s-stransferases, sulfotransferases, and UDPglucuronosyltransferases66
• 7. These new hydro-soluble products can now be managed by the cell for transport to Iysosomes for further metabolism, sequestered into lysosome-like structures for containment, or excreted from the cell through active diffusion transporters, such as the A TP-binding cassette transporters68
• In the context of cellular economics, it is important to keep in mind the energy and resource demand to up-regulate any of the components in this three phase system. Any shift in this Xenobiotic Response subcellular system will exact a demand on other sub-cellular systems, such as Protein
Downs,C.A. 8

Chapter 4
Metabolic Condition, Porphryin Synthesis, Oxidative Defense, and Cellular Redox Capacity.
Canonical correlation analysis indicated that there was a definite change in cellular condition for xenobiotic response (Fig. 8). The population exposed to normal, ambient salinity was significantly different from corals in all other treatments, while the populations exposed to 28 ppt, 24, ppt, and 20 ppt salinity were not significantly different from one another, indicating that at 28 ppt, there is a definite threshold that defines one pattern of behavior from another. Cytochrome P450 3-class showed a slight trend to increase in concentration in response to hypo-salinity, where it became a significant increase at 20 ppt salinity. This is in stark contrast to the sharp decrease in levels of both cytochrome P450 2-c1ass and 6-class in response to all hypo-saline treatments. This pattern of expression, at least for cytrochrome P450 6-c1ass, is emulated by the homologue in Porites porites when exposed to 32 ppt salinity and lower (Downs, Woodley, Capo, unpublished results).
Cytochrome P450 6-class is an invertebrate subfamily of P450s that is known to oxidize and be up-regulated by pesticides such as aldrin, dieldrin, diazinon, chlorpyrifos, deltamethrin, and a wide range of pyrethroid compounds69•70 • This class of proteins is renowned for bestowing insecticide resistance upon insects70
• Exposure to hypo-saline conditions may increase the susceptibility to toxic effect of pesticides. This has ecological implications because in most tropical regions, marine occurrences of hyposalinity are oftentimes associated with the beginning of the rainy season, which often carries the heaviest pesticide residue load is transported in runoff.
In mammals and some invertebrates, Cytochrome P450 2-class monooxygenase can be induced by ethanol, carbon tetrachloride, and PCBs congeners. This protein class also plays a significant role in steriodogenesis65
•71
• Decrease of this protein class by hypo-salinity may not only affect the coral's ability to defend against xenobiotics, but it may affect steroidogenesis, which in tum may have affects on reproductive processes.
Glutathione-S-transferase and MXR were unaffected by any hypo-salinity treatment. This was partially unexpected because MXR will not only export conjugated xenobiotics out of the cell (e.g., endosulfan, atrazine, acetametiphen), it will also actively export by-products of lipid auto-oxidation, such as malondialdehyde and hydroxylnonenal. The accumulation of reactive aldehydes should have induced an accumulation of MXR68
, unless this homologue is specific for glutathione conjugated xenobiotics, and is less sensitive to oxidative damage products.
PAM chloropbyU Ouoresceuce
The ratio ofFv/Fm is an index of that reflects the efficiency of open Photosystem II reaction centers. While the maximal FvlFm values for a wide variety of terrestrial plants range between 0.830-0.83372
, values for zooxanthellae within healthy looking corals (measured with a Diving-PAM) range between 0.565-0.65 (depending on season and depth).
Several studies have demonstrated the severe reduction in FvlFm values measured for in hospite zooxanthealle exposed to severe stress and have correlated this with expulsion of zooxanthellae, hence, coral bleaching73
•74
• During the 1998 bleaching event in the Florida Keys, FvlFm values of bleached corals ranged between 0.35-0.4775• Hence,
Downs,C.A. 9

Chapter 4
although we perfonned a relatively short-duration stress experiment, PAM measurements in our experiment indicate that zooxanthellae exposed to anything less than 28 ppt, suffered severe damage to their algal photosynthetic apparatus, leading to impairment of photosynthesis. This is in agreement with a recent study by Kerswell and Jones who showed that a significant decrease of FJFm values occurred only at salinities of26 ppt or lower (10 ppt lower than ambient )32.
Histology
Gross observations indicated no apparent distress of corals exposed to 32 ppl salinity, though histological examination showed .obvious tissue and cellular damage, which was only exacerbated with decreasing salinities. Comparison of histological plates in Fig. 11 show a change in the staining of the mesoglea, both in the central matrix and along the basal layer of the mesoglea; eosin staining becomes less pronounced in the hypo-saline samples. Cnidaria have the most primitive nervous system, whose primary axons may extend beyond the mesoglea, but location of the neural cell is found largely along the basal boundaries of the mesoglea76 (Grimmelikhuijzen et aI., 1996). Eosinstaining cells, with hematoxylin stained nuclei that run along the mesoglea boundaries, can be seen in the control plate (Fig lla), but this structure becomes more difficult to recognize in histological slides of samples from hypo-saline exposures. If these cells are neurons, it could be speculated that hypo-salinity may have an adverse effect on the nervous system of the polyp, affecting its ability to feed and conduct a competent interaction with its environment
The effect on gonadal tissue is striking (Fig. 13). Oocytes exhibited significant changes in internal architecture, including what looks to be rupturing of the nuclear membrane and displacement of the nucleolus. Follicular cells within the gonadal repository showed extensive disorganization and a reduction in eosin staining. Disruption of the gonadal tissue strongly suggests that exposure to hypo-saline conditions may have a detrimental effect on the reproductive fitness of the exposed coral. Basic reproductive studies need to be conducted to confinn this effect. If confinned, watershed management issues and activities that would impact coral reefs must be factored into risk and impact assessments 77.
Although exposure of these fragments to hypo-saline conditions was not prolonged, some cellular damage was visible at all hypo-saline conditions. Most of the effect could be attributed to "osmotic swelling" and it is likely that this resulted in some electrolyte depletion. It is possible that if this effect is relatively short-lived, the coral may recuperate quickly. The histological changes such as the hyper-eosinophilic bodies found in the tissues of colonies from the lower salinities may represent one type of effect that hypo-salinity may have on the cellular structure of coral tissues.
In light of the histological and biomarker evidence it is possible that the effect of a short-lived inundation of these corals by fresh water (that reduces salinity by not more than 9 ppt) is reversible. Similarly, Hoegh-Guldberg and Smith showed no effect on oxygen flux and biomass of zooxanthellae in S. pistillata maintained at a salinity of 5ppt lower than ambient from the Great Barrier Reer4. They did find, though, that corals exposed to 23 ppt (12ppt lower than ambient) all died following a 36 hour exposure. The
Downs, C.A. 10

Chapter 4
S. pistil/ata colonies in the present study showed similar changes in that there were no discernible macro-changes in corals that had been exposed to salinities of 7ppt (i.e., 32ppt) below ambient, though some histological and cellular biomarker changes were already discernible. Exposure of fragments to lower salinities (i.e., 28ppt and under) resulted in extreme biochemical and histological changes, as well as \ necrosis. This may indicate that the possibility for recuperation following such an osmotic shock may be relatively low and may indicate that the range of salinities in which these corals may osmo-conform is relatively narrow. Indeed, in the northern Gulf of Aqaba (Eilat), S. pistillata colonies are found in an area bordered by a relatively arid environment where the average yearly rainfall is very low (averaging about 3 cm/year). It is not surprising that these corals have minimal tolerance to drastic and prolonged changes in salinity since they are not usually exposed to low salinities. The histological changes occurring to the zooxanthellae and coral cells corroborate the results obtained by the PAM fluorescence and biomarkers of cellular metabolism. It would be of value to repeat these experiments with corals from sites that are periodically and routinely inundated by fresh water.
The integration of biochemical, morphological and cellular metabolism allow for an in-depth understanding of response of coral cells to environmental stress and their ability to withstand these stresses. Such knowledge is of particular value in light of the predicted environmental changes due to global warming, rising water levels and changes occurring in coastal land usage. Understanding the effect oflower salinities on reef corals will be useful in predicting the possible effects of increased coastal land usage, particularly when considering a hypo-saline environment compounded with contamination of crop protection products (e.g., pesticide, herbicides) or increased sea temperatures.
METHODS
Materials All chemicals for buffered solutions were obtained from EM Science. (St. Louis,
Missouri, U.S.A.). Polyvinylidene fluoride membrane was obtained from Millipore Corp. (Bedford, Massachusetts, U.S.A.). Antibodies against all the cellular biomarkers, as well as calibrant standards, were gifts from En Virtue Biotechnologies, Inc. (Winchester, Virginia, USA). Anti-rabbit conjugated horseradish peroxidase antibodies were obtained from Jackson Immunoresearch (Maine, U.S.A). DNA extraction kits and DNA AP site assay kits were obtained from Dojindo Molecular Technologies (Gaithersburg, MS, U.S.A.).
Collection and growth condition of S. pistilJata
Ten fragments, 2-3cm in length, were collected from each of eight Stylophora pistillata colonies from the reef near the H. Steinitz Marine Bilological Laboratory in Eilat, Israel. The fragments were transported to the lab in plastic bags. Each fragment was tied at its base using fishing wire and dangled from a rubber hose in outdoor running sea water aquaria maintained at ambient sea temperatures (24°C). The aquaria were
Downs,C.A. II

Chapter 4
shaded by nets that allowed 50% ambient irradiance. The fragments were allowed to acclimate for a period of two months prior to experimentation. Only fragments that looked healthy and had regenerated their tissues were used for the exposure experiments.
stress exposures
To examine the response to low salinity, S. pistil/ala fragments were exposed to reduced-salinity sea water made by diluting the ambient sea water (43 parts per thousand (ppt)) with distilled water that had the same pH as the ambient sea water. Colony genotypes were randomly distributed among the five treatments and aquaria. The five experimental exposures were 43 ppt (ambient), 32 ppt, 28 ppt, 24 ppt and 20 ppt A fragment from each colony was hung in each treatment aquarium (total of 8 fragments per treatment). Exposure was carried out for 24 hrs. At the end of the exposure, the fragments were photographed, chlorophyll fluorescence biomarkers were measured, and the samples were then immediately frozen in liquid nitrogen. All tanks were static flow and were aerated.
Biomarker Justification
The biomarkers in each cellular metabolic system were used because of the role each biomarker plays in their respective metabolic system (Table 2, ref. 38). For example, Hsp70 is a chaperonin protein that can be up-regulated and accumulate in response to both increased protein synthesis rates as well as increased protein degradation rates. Ubiquitin is up-regulated primarily by increased rates of protein degradation, as it is a necessary component of proteosome-modulated protein degradation. Both biomarkers reflect import aspects of protein metabolic condition. Biomarkers for the other cellullar systems (e.g., oxidative stress), were chosen using similar criteria. An explanation of different cellular metabolic categories and the relevant biomarkers for each system can be found in Downs (2005).38,
Sample Preparation, ELISA validation, and ELISA
Coral samples were stored at -80·C until analysis. Coral samples were ground to a powder using liquid nitrogen-chilled ceramic mortars and pestles. Samples (-10 mg) of frozen tissue were placed in 1.8ml microcentrifuge tubes along with 1,600Jl.l of a denaturing buffer consisting of 2% SDS, 50 mM Tris-HCI (PH 7.8), 25 mM dithiothreitol, 10 mM EDTA, 0.001 mM sorbitol, 3% polyvinylpolypyrroJidone (wt/vol), 0.001 mM alpha-tocopherol, 0.005 mM salicylic acid, 0.01 mM AEBSF, 0.04 mM Bestatin, 0.001 E-64, 2 mM phenylmethylsulfonyl fluoride, 0.5 mM benzamidine, 5 !1M l1-amino-caproic acid, and I flg/IOO uL pepstatin A. Samples were heated at 92°C for three minutes, vortexed for 20 seconds, incubated at 92°C for another three minutes, and then incuhated at 25°C for five minutes. Samples were centrifuged at 10,000 g for five minutes. Supernatant absent of a lipid/glycoprotein mucilage matrix was transferred to a new tube, and subjected to a protein concentration assay by the method of Ghosh 78.
Antibodies against cellular biomarkers and calibrant standards were obtained
Downs,C.A. 12

Chapter 4
from En Virtue Biotechnologies, Inc. (Winchester, VA. USA). Antibodies were raised against an 8-12 residue polypeptide conjugated to ova albumin. Antigens were designed based on extremely conserved and unique domains found within the target protein. All antibodies used in this study were immuno-purified with a Pierce Su[foLink Kit (cat.# 44895) using the original unconjugated peptide as the affinity binding agent. Anti-rabbit conjugated horseradish peroxidase antibodies were obtained from Jackson Immunoresearch (West Grove, PA, USA).
One-dimensiona[ SDS-po[yacry[amide gel electrophoresis and western blotting validated the legitimacy of an ELISA on this species of coral using a specific antibody. One-hundred and twenty micrograms of total soluble protein from three randomly prepared samples were pooled and [0 Ill! of total soluble protein per lane was loaded onto a 12.5% SDS-PAGE preparative gel (8 cm), and the gel run until the bromophenol blue front was near the bottom of the gel. A Tris(2-carboxyethy[)phosphine hydrochloride (TCEP; neutral pH) concentration of O.OOIM was added to the separating portion of the gel. Al[ gels were blotted unto po[yvinylidene fluoride (PVDF) membranes using a wettransfer system. The membrane was blocked in 7% non-fat dry milk, and assayed with the primary antibody for one hour. The blots were washed in TBS four times, and incubated in an horseradish peroxidase-conjugated secondary antibody solution for one hour. B[ots were washed four times in TBS, and developed using a NEN Western Lightning Plus [uminollhydrogen peroxide-based chemiluminescent solution and documented using a Syngene Genegnome luminescent documentation system.
Once validated, antibodies and samples were optimized for ELISA format using an 8 x 6 x 4 factorial design 79. Samp[es were subject to ELISA assay using a BeckmanCoulter Biomek 2000 using 384-well microplates. Samples were assayed using the following antibodies and En Virtue catalog numbers: algal anti-glutathione peroxidase (AB-G10 I-P), algal anti-heat shock protein 60 (AB-HIOO-P), algal anti-heat-shock protein 70 (AB-H I 0 I-P), algal anti-ch[orop[ast small heat-shock protein (AB-CHsHSP), anti-ubiquitin (AB-UlOO), cnidarian anti-heat-shock protein 70 (AB-HlOI-CDN), invertebrate Grp75 (AB-GRP75I), invertebrate anti-heat-shock protein 60 (AB-HI 00-IN), invertebrate anti-manganese superoxide dismutase (AB-S I OO-MM), cinvertebrate glutathione peroxidase (AB-GPX-IN), cnidarian g[utathion-s-transferase (pi-isoform ho[ogue; AB-GST -INV), invertebrate anti-small heat shock protein (AB-HI03), invertebrate ferroche[atase (AB-FC), invertebrate Heme Oxygenase Type I (ABHOlIN), invertebrate protoporphyrinogen oxidase IX (Ab-PPO-IN), invertebrate catalase (AB-CATI), invertebrate Cytochrome P450 2 class (AB-CY2), invertebrate Cytochrome P450 3 class (Ab-CY3), invertebrate Cytochrome P450 6 class (AB-CY6), DNPH (protein carbonyl), and anti-MXR (mu[ti-xenobiotic resistance protein, ABC family of proteins; P-g[ycoprotein 180; AB-MDR-180). Samples were assayed in triplicate with intra-specific variation of less than 12% for the whole plate. An eight-point calibrant curve using a calibrant relevant to each antibody was plated in triplicate for each plate.
DNA was isolated according to manufacturer's instructions using the Dojindo pureDNA kit-Cell, tissue (catalog # GK03-20). DNA concentrations were determined using an Invitriogen/Molecu[ar Probes Quant-iTrM DNA Assay Kit, Broad Range
Downs,C.A. 13

Chapter 4
(catalog # Q33130) using either a Shimadzu spectrofluorophotometer or a Bie-Tek fluorescent microplate reader with the appropriate excitation/emission filters. DNA AP concentration was determined using the Dojindo DNA Damage Quantification Kit -AP Site Counting (DK-02-10) and was conducted according to manufacturer's instructions with one exception. Instead of using a colormetric reporter system as the manufacturer recommended, we used NEN Western Lightning Plus luminol/hydrogen peroxide-based chemiluminescent solution as part of the detection system since the horseradish peroxide conjugate in the kit can also uses luminal as a substrate. Light detection was measured using a Bie-tek 800 fluorescentlluminescent microplate reader.
Pulse-amplitude modulated cbloropbyU fluorimetry
Optimal quantum yield of photosystem II (FvlFm; see BjOrkman and DemmigAdams, \987) was measured using a pulse amplitude modulated chlorophyll fluorometer (Diving-PAM; WaIz, Germany)80. The FvlFm ratio indicates the physiological well being of the electron transfer chain within the photosystem. Following a 24-hour exposure to the different salinities, measurements were performed on 4-7 fragments within eacb treatment after dark-adapting all corals for \ hr, using the leaf distance clip (WaIz, Germany) to allow the same angle and distance for all coral pieces.
Histology
Fragments from each exposure were fixed in 4% formalin in seawater (at the appropriate osmolarity) for 24 hours then rinsed in water and maintained in 70% EtOH. The fragments were decalcified using a one to one (v/v) solution of 50% formic acid and 20% sodium citrate. The tissue was then processed in a citadel tissue processor embedded in paraffin and sectioned (5jlm). At least five slides per treatment from at least three individuals per treatment were made. Each slide mount came from a different area and depth in the tissue. Comparisons were made between slides from the same area (in terms of tissue depth, or polyp area) for each treatment. Each slide had five to six 5 jlm in thickness consecutive sections. The sections were stained with hematoxylin leosin and observed and photographed using a Nikon microscope and digital camera
Statistical analysis
Data were tested for normality using the Kolmogorov-Smimov test (with Lilliefors' correction) and for equal variance using the Levene Median test. If the data were normally distributed and homogeneous, a one-way analysis of variance (ANOVA) was employed. When data did not meet the homogeneity of variances requirement for one-way ANOV A, we instead used Kruskal-Wallis One-Way Analysis of Variance on Ranks. When significant differences were found among treatment means, we used the Tukey-Kramer Honestly Significant Difference (HSD) method or the Holm-Sidak test as an exact alpha-level test to determine differences among each of the populations81 (Sokal and Rohlf, 1995).
We used canonical correlation analysis (CCA) as a heuristic tool to illustrate how biomarkers could be used to discriminate between populations. Canonical correlation
Downs, C.A. 14

Chapter 4
analysis is an eigen-analysis method that reveals the basic relationships between two matrices82 (Gauch, 1985), in our case those of the three populations and biomarker data. The CCA provided an objective statistical tool for (I) determining if populations are different from another using sets of cellular biomarkers that are indicative of a cellular process (e.g., protein metabolic condition, xenobiotic response), and (2) which biomarkers contributed to those differences. This analysis required combining data from all five populations into one matrix, which we did by expressing biomarker responses in a given population as a proportion of their mean levels. Two assumptions of CCA, that stressor gradients were independent and linear, were constraints of the experimental design.
Acknowledgements
This work was funded by EnVirtue Biotechnologies, Inc, the Israeli Science Foundation (ISF), and the Raynor Chair for Environmental Conservation Research. I sincerely thank Maytal Balushtein, Nachshon Siboni, and Roee Segal for their generous help in conducting the coral collection, culturing, and exposure for this experimenL We also thank Robert Richmond for editing the manuscript and Ross Jones for discussions concerning coral physiology and hypo-salinity.
Downs,C.A. 15
Chapter 4
REFERENCES
I. Coles, S.L., & Jokiel, P.L. Effects of salinity on coral reefs. In: Connell DW, Hawker DW (eds) Pollution in tropical aquatic systems. CRC Press, Boca Raton, FL, 147-166 (1992).
2. Orr, A.P. & Moorehouse, F.W. Variations in physical and chemical conditions on and near Low Isles Reef. Scientific Report of the Great Barrier Reef Expedition. British Museum (Natural History), London, voL 2, 89-98 (1933).
3. Devlin, M., Taylor, J., & Brodie, J. Flood plumes, extent, concentration and composition. GBRMPA Reef Res. 8,1-9 (1998).
4. Porter, J.W., Lewis, S.K., & Porter, K.G. The effect of multiple stressors on the Florida Keys coral reef ecosystem: A landscape hypothesis and a physiological test. Limnol. Oceanogr. 44, 941-949 (1999).
5. Berkelmans, R., & Oliver, J.K. Large-scale bleaching of corals on the Great Barrier Reef. Coral Reefs 18, 55-60 (1999).
6. Cloud, P.E. Preliminary report on geology and marine environments ofOnotoa Atoll, Gilbert Islands. Atoll Res. Bull. 12,1-73 (1952).
7. Goreau, T.F. Mass expulsion of zooxanthellae from Jamaican reef communities after hurricane Flora. Science 145,383-386 (1964).
8. Egana, A.C .. & DiSalvo, L.H. Mass expulsion of zooxanthellae by Easter Island corals. Pac. Sci. 36, 61-63 (1982).
9. Van Woesik, R., De Vantier, L.M., & Glazebrook, J.S. Effects of cyclone "Joy "on nearshore coria communities of the Great Barrier Reef. Mar. Ecol. Prog. Ser. 128, 261-270 (1995).
10. Lirman, D., Orlando, 8., Macia, S., Manzello, D., Kaufman, L., Biber, p .. et aI. Coral communities of biscayne bay, florida and adjacent offshore areas: Diversity, abundance, distribution, and environmental correlates. Aquat. Conserv. Mar. Freshwat. Ecosyst. 13, 121-35 (2008).
11. Hendy, EJ., Lough, J .M., Gagan, M.K. Historical mortality in massive porites from the central great barrier reef, australia: Evidence for past environmental stress? Coral Reefs 22, 207-15 (2003).
12. Engebretson, H., & Martin, K.L.M. Effects of decreased salinity on expUlsion of zooxanthellae in the symbiotic sea anemone Anthopleura elegantissima. Pac Sci. 48, 446--457 (1994).
13. Moberg, F., Nystrom, M., KautskY, N., Tedengren, M., & Jarayabhand, P. Effects of reduced salinity on the rates of photosynthesis and respiration in the hermatypic corals Porites lutea and Pocillopora damicomis. Mar Ecol Prog Ser 157, 53-59 (1997).
14. Hoegh-Guldberg, 0., & Smith, G. J. The effect of sudden changes in temperature, light and salinity on the population density and export of zooxanthellae from the reef coral Stylophora pistillata Esper and Seriatopora hystrix Dana. J. Exp. Mar. Bioi. Ecol. 129, 279-303 (1989).
15. Tytlianov, EA., Tsukahara, J., Tytlianov, T .L., Leletkin, V.A .. Van Woesik, R., & Yamazato, K. Zooxanthellae popUlation density and physiological state of the coral Stylophora pistillata during starvation and osmotic shock. Symbiosis 28, 303-322 (2000).
Downs,C.A. 16

Chapter 4
16. Richmond, R.H. Effects of coastal runoff on coral reproduction. In: Ginsburg RN (ed) Proc Coli Global Aspects of Coral Reefs: Health, Hazards, and History. Rosenstiel School of Marine and Atmospheric Science, Miami, pp 360-364 (1993).
17. Rankin, J.C. & Davenport, J. (1981) Animal osmoregulation. Blackie & Sons, Glasgow (1981).
18. Maeda, M., & Thompson, G.A., Jr. On the mechanism of rapid plasma membrane and chloroplast envelope expansion in Dunaliella salina exposed to hypoosmotic shock. J. Cell BioI. 102, 289-297 (1986).
19. Jahnke, L.S. &White, A.L. Long-term hypo-saline and hypersaline stresses produce distinct antioxidant responses in the marine algae DunaJiella tertiolecta. J. PlanI Physiol. 160, 1193-202 (2003).
20. Shivakumar, K. & Jayaraman, J. (1986). Salinity adaptation in fish: interaction of thyroxine with fish gill mitochondria. Archives of Biochemistry and Biophysics, 245, 356-362 (1986).
21. Ballantyne J.S. & Moon T.W. Solute effects on mitochondria from an elasmobranch (Raja erinacea) and a teleost (pseudopleuronectes americanus). J Exp Zool. 243, 319-328 (1986).
22. Martinez, F., Pardo, J.P., Flores-Herrera, O. & Espinosa-Garcia, M.T. The effect of osmolarity on human placental mitochondria function. Int . . J Biochem. Cell Bioi. 27, 795-803 (1995).
23. Ellis, L.L., Burcham, J.M., Paynter, K.T., & Bishop, S.H. Amino acid metabolism in euryhaline bivalves: regulation of glycine accumulation in ribbed mussel gills. J. Ex.p Zool. 233, 347-58 (1985).
24. Moyes, C.D., Moon, T.W., & Ballantyne, J.S. Osmotic effects on amino acid oxidation in skate liver mitochondria. J. Exp. Biol.1l5, 181-195 (1986).
25. Devin, A., Guerin, B., & Rigoulet, M. Control of oxidative phosphorylation in rat liver mitochondria: effect of ionic media. Biochim Biophys Acta. 1319,293-300 (1997).
26. Nicholson, S. Ecocytological and toxicological responses to copper in Perna veridis hemocyte lysosomal membranes. Chemosphere 45, 439-407 (2001).
27. Allen J.F. Effects of washing and osmotic shock on catalase activity of intact chloroplast preparations. FEBS Lett. 84,221-224 (1977).
28. Lockau, W. The inhibition of photosynthetic electron transport in spinach chlorop1asts by low osmolarity. EurJ Biochem. 94,365-373 (1979).
29. Burdon, R.H, O'Kane, D., Fadzillah, N., Gill, V., Boyd, P .A., & Finch, RR. Oxidative stress and responses in Arabidopsis thaliana and Oryza sativa subjected to chilling and salinity stress. Biochem Soc Trans. 4, 469-72 (1996).
30. Asada, K. The water-water cycle in chloroplasts: scavenging of active oxygen and dissipation of excess photons. Annu. Rev. Plant Physiol. Plant Mol. Bioi. SO,601-640 (1999).
31. Kurz, A.I{" Schliess, F., & Haussinger, D. Osmotic regulation of the heat shock response in primary rat hepatocytes. Hepatology28, 774-781 (1998).
32. Kershwell, A.P. & Jones. R. The effects ofhypo-osmosis on the coral Stylophora pistillata: the nature and cause of low salinity bleaching. Mar. Ecol. Prog. Ser. 253,145-154 (2004).
33. Manzello, D., & Lirman D. The photosynthetic resilience of Porites jiJrcata to
Downs,C.A. 17

Chapter 4
salinity disturbance. Coral Reefs 22,537-40 (2003). 34. Alutoin, S., Boberg, J., Nystroem, M., & Tedengren, M. Effects of the multiple
stressors copper and reduced salinity on the metabolism of the hermatypic coral Porites lutea. Mar Environ Res. 52, 289-99 (2001).
35. Muthiga, NA., & Szmant, A.M. The effects of salinity stress on the rates of aerobic respiration and photosynthesis in the hermatypic coral siderastrea siderea. BioI. Bull. 173,543-51(1987).
36. Brown, B.E. Adaptations of reef corals to physical environmental stress. Adv. Mar. BioI. 31, 222-299 (1997).
37. Dustan, P. Coral reefs under stress: sources of mortality in the Florida Keys. Nat. Res. Forum 23,147-155 (1999).
38. Downs, C.A. Cellular Diagnostics and its application to aquatic and marine toxicology. In: Techniques in Aquatic Toxicology V. 2. G. Ostrander (ed). CRC Press, Inc. pp 181-207 (2005).
39. Ellis R J. Stress proteins as molecular chaperones. In Stress proteins in medicine (ed. W. Van Eden & D. B. Young). New York: Marcel Dekker Inc (1996).
40. Papp E, Nardai G, et al. Molecular chaperones, stress proteins and redox homeostasis. Bio/actors 17,249-57 (2003).
41. Hemmingsen, S.M. The plastid chaperonin. Semin. Cell Bioi. 47-54 (1990). 42. Jackson-Constan D, Akita M, & Keegstra K. Molecular chaperones involved in
chloroplast protein import. Biochim Biophys Acta. 1541, 102-13 (2001). 43. Hershko A. & Ciechanover A. The ubiquitin system. Ann Rev Biochem 67:425-479
(1998). 44. Shang F, Gong X, et al. Activity ofubiquitin-dependent pathway in response to
oxidative stress. J. BioI. Chem. 272,23086-23093 (1997). 45. Downs, CA., Ryan, S.L., & Heckathorn, S.A. The chloroplast small heat-shock
protein: evidence for a general role in protecting photosystem n against oxidative stress and photoinhibition. J. Plant Physiol. 155,488-496 (1999).
46. Branton, M.A., MacRae, T.H., Lipschultz, F., Wells P.G. Identification ofa small heat shockla-crystallin protein in the scleractinian coral Madracis mirabilis (Duch. and Mitch.). Canadian J. Zool. 77, 675-682 (1999).
47. De Jong, W.W., Leunissen, JA., & Voorter, C.E. Evolution of the alpha-crystallin! small heat-shock protein family. Mol BioI EvolIO, 103-126 (1993).
48. Willsie, J.K. and Clegg, J.P. Small heat shock protein p26 associates with nuclear lamins and HSP70 in nuclei and nuclear matrix fractions from stressed cells. J Cell Biochem. 4, 601-614 (2002).
49. Morrow, G., Battistini, S., Zhang, P., & Tanguay, R.M. Decreased lifespan in the absence of expression of the mitochondrial small heat shock protein Hsp22 in Drosophila. J. BioI. Chem. 279, 43382-43385 (2004).
50. Heckathorn, SA., Downs, C.A, & Coleman, J.S. Small heat-shock proteins protect electron transport in chloroplasts and mitochondria during stress. Amer. Zool. 43, 865-876 (1999).
51. Omatsky, 0.1., Connor, M.K., & Hood, D.A. Expression of stress proteins and mitochondrial chaperonins in chronically stimulated skeletal muscle. Biochem. J. 311, 119-23 (1995).
52. Takahashi, M. & Hood, M.A. Protein import into subsarcolemma1 and
Downs,C.A. 18

Chapter 4
intermyofibrillar skeletal muscle mitochondria. Differential import regulation in distinct subcellular regions. J. Bioi. Chem. 271,27285-27291 (1996).
53. Halliwell, B .. & Gutteridge, J.M.C. Free Radicals in Biology and Medicine, 3rd . edition. Oxford Science Publications, Oxford, England (1999). 54. Casano, L.M., Gomez, L.D., Lascano, H.R., Gonzalez, C.A., & Trippi, V.S.
Inactivation and degradation ofCuZn-SOD by active oxygen species in wheat chloroplasts exposed to photooxidative stress. Plant Cell Physiol. 38, 433-440 (1997).
55. Kurepa, J., Herouart, D., Van Montagu, M, & Inze, D. Differential expression of CuZn- and Fe-superoxide dismutase genes of tobacco during development, oxidative stress, and hormonal treatments. Plant Cell Physlol. 38,463-470 (1997).
56. Sakaguchi, S., Fukuda, T., Takano, H., Ono, K., & Takio, S. Photosynthetic electron transport differentially regulates the expression of superoxide dismutase genes in liverwort, Marchantia paleacea var. diptera. PIanJ Cell Physiology, 45, 318-324 (2004).
57. Ajioka RS, Phillips JD, & Kushner JP. Biosynthesis of heme in mammals. Blochim. Blophys. Acta. 1763, 723-36 (2006).
58. Thunell, S. & Harper, P. Porphyrins, porphyrin metabolism, porphyries. ill Diagnosis, care and monitoring in porphyria cutQ1Wa tardo - suggestions for a handling programme. Scand J. Clin. Lab. Invest. 60, 561-580 (2000).
59. Marks, G.S., ZeIt, D.T., & Cole, S. P. Alterations in the heme biosynthesis pathway as an index of exposure to toxins. Can. J. Physlol. Pharmacol. 60, 1017-1026 (1982).
60. Dailey, H.A. Conversion of coproporphyrinogen to protoheme in higher eukaryotes and bacteria. In: Biosynthesis of Heme and Chlorophylls, Dailey HA (ed), McGrawHill, New York: 123-155 (1990).
61. Dailey, H.A., Dailey, T.A., Wu, C.K .. Medlock, A.E., Wang, F.K., Rose, J.P., Wang, B.C. 2000. Ferrochelatase at the millennium: structures, mechanisms, and [2Fe-2S] clusters. CMLS Cell. Mol. Life Sci. 57, 1909-1926 (200).
62. Schwartsburd, P.M. Self-cytoprotection against stress: feedback regulation of hemedependent metabolism. Cell Stress ChDperones. 6, 1-5 (200 I).
63. Stocker, R., & Ames B.N. Potential role of conjugated bilirubin and copper in the metabolism of lipid peroxides in bile. Proc. Natl. Acad. Sci. USA. 84, 8130-8134 (1987).
64. Jokanovic, M. Biotransformation of organophosphorus compounds. Toxicology 166, 143-160 (2001).
65. Ronis, MJJ., Lindros, K.O.,lngeJmann-Sundberg M. The CYP2E family. In Cytochrome P450: Metabolic and Toxicological Aspects. Ionnides C, Ed. Boca Raton, FL, CRC Press, p. 211-243 (1996).
66. Negishi, M., Pedersen, L.G., Petrotchenko, E., Shevtsov, S., Gorokhov, A., Kakuta, Y., & Pedersen, L.C. Structure and function of sulfotransferases. Arck Blochem. Biophys.430, 149-157 (2001).
67. Glat,t H., Boeing, H., Engelke, C.E .. Ma L Kuhlow, A., Pabel, U., Pomplun, D., & Teubner, W, Meinl W. Human cytosolic sulphotransferases: genetics, characteristics, toxicological aspects. MUlat. Res. 482,27-40 (2001).
68. Borst, P., & Elferink, R.O. Mammalian ABC transporters in health and disease. Annu Rev Biochem. 71,537-92 (2002).
69. Dunkov, B.C., Guzov, V.M., Mocelin, G .. Shotkoski, F., Brun, A .. Amichot, M ..
Downs,C.A. 19

Chapter 4
&Feyereisen, R. The Drosophila cytochrome P450 gene CYP6a2: structure, localization, heteroulous expression, and induction by phenobarbitol. DNA Cell Bioi. 16, 1345-1356 (1997).
70. Scott, J. G. and Wen, Z. Cytochrome P450 of insects: the tip of the iceberg. Pestieide Management. Science 57, 958-967 (2001).
71. Lieber C.S. Cytochrome P-450 2E 1: its physiological and pathological role. Physiol. Rev. 77, 517-544 (1997).
72. Bjllrkman O. & Demmig-Adams B. Photon yield ofCh evolution and chlorophyll characteristics at 77K among vascular plants of diverse origins. Planta 170, 489-504 (1987).
73. Bhagooli, R. & Hidaka, M. Comparison of stress susceptibility of in hospite and isolated zooxanthellae among five coral species. J. &pmtl. Mar. Bioi. Ecol. 291, 181-197 (2003).
74. Jones RJ.,& Hoegh-Guldberg, O. Effects of cyanide on coral photosynthesis: implications for identifying the cause of coral bleaching and for assessing the environmental effects of cyanide fishing. Mar. Ecol. Prog. Ser. 177, 83-91 (1999).
75. Warner, M.E., Fin, W.K., & Schmidt, G.W. Damage to photosystem II in symbiotic dinoflagellates: A detenninant of coral bleaching. Proe. Natl. Aead Sci. USA 96, 8007-8012 (1999).
76. Grimmelikhuijzen CJP, Leviev Ll, & Carstensen K. Peptides in the nervous systems of cnidarians: structure, function, and biosynthesis. Int. Rev. Cytol. 167,37-89 (1996).
77. Richmond R.H. Coral reefs: present problems and future concerns resulting from anthropogenic disturbance. American. Zoologist 33, 524-536 (1993).
78. Ghosh, S., Gepstein, S., Heikkila, JJ., & Dumbroff, B.G. Use of a scanning densitometer or an ELISA plate reader for measurement of nanogram amounts of protein in crude extracts from biological tissue. Anal. Bioehem. 169, 227-233 (1988).
79. Crowther, J. R. The ELISA Guidebook. Totowa, New Jersey: Humana Press. (2001). 80. Schreiber, U., Gademan, R., Ralph, PJ., & Larkum, A.W.D. Assessment of
photosynthetic perfonnance of Prochloron in Lissoc/onium patella in hospite by chlorophyll fluorescence measurements. Plant Cell Physiol. 38, 945-951 (1997).
81. Sokal, R.R., & Rohlf; FJ.Biometry. W.H. Freeman, New York, New York. Pp 451-499 (1995).
82. Gauch, H.G. J. Multivariate analysis in community ecology. New York: Cambridge University Press. (1985).
Downs,C.A. 20

Chapter 4
Figure 1 Protein MetaboUc Condition Biomarkers. Coral were homogenized and subjected to SOS-PAGE (5 )lI! total soluble protein per lane), western blotting, and assayed with polyclonal antibody against the following biomarkers: A = Hsp90; B = Hsp70 cnidarian; C = Hsp70 dinoflagellate; 0 = Hsp60 cnidarian; E = Hsp60 dinoflagellate.
Figure :z Oxidative Stress Biomarkers. Coral were homogenized and subjected to SOS-PAGE (5 )lI! total soluble protein per lane), western blotting, and assayed with polyclonal antibody against the following biomarkers: A = CU/ZnSOO cnidarian; B = CulZnSOO dinoflagellate; C = MnSOO cnidarian; 0 = GPx cnidarian; E = GPx dinoflagellate; F = catalase cnidarian.
Figure 3 MetaboUc Condition Biomarkers. Coral were homogenized and subjected to SOS-PAGE (5 Ill! total soluble protein per lane), western blotting, and assayed with polyclonal antibody against the following biomarkers: A = meta1lothionein I cnidarian; B = ferrochelatase cnidarian; C = aconitase cnidarian; 0 = Heme oxygenase I cnidarian.
Figure 4 Xenobiotic Response Biomarkers. Coral were homogenized and subjected to SOS-PAGE (5 Ill! total soluble protein per lane), western blotting, and assayed with polyclonal antibody against the following biomarkers: A = cytochrome P450 2-class cnidarian; B = cytochrome P450 6-class cnidarian; C = GST cnidarian; 0 = MDR, both cnidarian and dinoflagellate isoforms.
Figure 5 Canonical centroid plot of Protein MetaboUc Condition biomarkers. Original variates were biomarker levels expressed as a percentage of the control value in each treatmenL Circles show the 95% confidence intervals around the distribution centroid of each stressor. Biplot rays radiating from the grand mean show directions of original biomarker responses in canonical space. Overlapping centroids indicates that those popUlations are not significantly different from one another, while non-overlapping centroids indicate a difference. Non-overlapping centroids have a R value of less than 0.16 in this analysis. The primary question that this figure addresses: Is there a difference in protein metabolic condition between treatment?
Figure 6 Canonical centroid plot of Oxidative Stress biomarkers. Original variates were biomarker levels expressed as a percentage of the control value in each treatmenL Circles show the 95% confidence intervals around the distribution centroid of each stressor. Biplot rays radiating from the grand mean show directions of original biomarker responses in canonical space. Overlapping centroids indicates that those populations are not significantly different from one another, while non-overlapping centroids indicate a difference. Non-overlapping centroids have a R value of less than 0.09 in this analysis. The primary question that this figure addresses: Is there a difference in protein metabolic condition between treatments?
Figure 7 Canonical centroid plot of Porphyrin Metabolism biomarkers.
Downs, C.A. 21

Chapter 4
Original variates were biomarker levels expressed as a percentage of the control value in each treatment Circles show the 95% confidence intervals around the distribution centroid of each stressor. Biplot rays radiating from the grand mean show directions of original biomarker responses in canonical space. Overlapping centroids indicates that those populations are not significantly different from one another, while non-overlapping centroids indicate a difference. Non-overlapping centroids have a R value of less than 0.11 in this analysis. The primary question that this figure addresses: Is there a difference in porphyrin metabolism between treatment?
Figure 8 Canonical centroid plot of Xenobiotic Response biomarkers. Original variates were biomarker levels expressed as a percentage of the control value in each treatment. Circles show the 95% confidence intervals around the distribution centroid of each stressor. Biplot rays radiating from the grand mean show directions of original biomarker responses in canonical space. Overlapping centroids indicates that those populations are not significantly different from one another, while non-overlapping centroids indicate a difference. Non-overlapping centroids have a R value of less than 0.04 in this analysis. The primary question that this figure addresses: Is there a difference in xenobiotic response condition between treatments?
Figure 9 Canonical centroid plot of dinoOagellate biomarkers. Original variates were biomarker levels expressed as a percentage of the control value in each treatment Circles show the 95% confidence intervals around the distribution centroid of each stressor. Biplot rays radiating from the grand mean show directions of original biomarker responses in canonical space. Overlapping centroids indicates that those populations are not significantly different from one another, while non-overlapping centroids indicate a difference. Non-overlapping centroids have a R value of less than 0.02 in this analysis. The primary question that this figure addresses: Is there a difference in xenobiotic response condition between treatments?
Figure 10 Dark-adapted FvlFm. in Stylophora plstillata measured using a DIVING-PAM chlorophyll fluorometer. All measurements were performed using the leaf distance clip, following 24 hr of exposure to the different salinities, and after darkadapting all coral fragments for 1hr. n = 4-7 replicates per treatment, +1_ SE.
Figure 11 Stylophora pistillllta polyp tissue. (A) Ambient salinity (43ppt): section of stomadea1 area (X20). Arrows denote nuclei. (8) 32 ppt section of stomadea1 area blue arrows denote cell necrosis in the epidermis black arrows point to cells undergoing disintegration as denoted by hypereosonophylia (X20). (C) 28 ppt arrows denote the rounded nuclei cellular degradation is evident by increased vacuolization. (0) 28ppt section of stomadea1 area. Gastrodermal cells lost their architecture. Black arrows denote pyknosis. (X20) (E) Septal filament from control coral. Note the abundance of mucus cells and columnar integrity of the epithelium. (F) Septal filaments of coral from 28ppt note loss of cellular integrity and the rounding of the nuclei.
Figure 12 Stylophora pistUJata plannlae. Histological sections from fragments maintained at different salinities: (A) Ambient (control) salinity (XIO). (8) Close-up of
Downs,C.A. 22

Chapter 4
boxed area (X40) showing cell structure; note the well defined columnar nature of epidermal layer of the planulae, intact zooxanthellae. (C) Planula from coral in 32 ppt (XIO). (0) Close-up of boxed area showing cell structure (X40). Arrows indicates nuclei note the breakdown of tissue. (E) Planulae from coral in 28ppt (XIO) F) Close-up of boxed area (X40) showing cell structure. Arrows indicates nuclear pyknosis as well as loss of cellular integrity
Figure 13 Stylophora plstilhda gonad tissue. Histological sections from fragments maintained at different salinities: (A) Polyp form ambient (control) salinity 43ppt XIO. (B) Hypo-saline treatment 28ppt XIO. (C) Oocyte from control coral (note defined nucleus and nucleolus). (0) Oocyte from 28ppt fragment Note loss of architecture of the follicular tissue surrounding the oocyte. (E) Testes from control (43ppt) coral. (F) Testes from 28ppt treatment Note swelling of the gonad and the loss of architecture of the tissue surrounding the testes.
Downs,C.A. 23

Chapter 4
Figure 1
Ku Ku
<6 <6
A B c
Downs, C.A.
Ku
<205
<66 , <n -
I J < 11
D E
24

Chapter 4
Ku <205
_ <6
A
Downs, C.A.
Ku
B
< 14
c
Ku <205
<29
< 14
D
25

Chapter 4
Ku Ku Ku Ku '08 < 205
<66 <n <66 <51
..:....
<II
<29 II
< 14
A B c D E F
Downs, C.A. 26

Chapter 4
Ku
<66 <77
<42 <42
<6
A B
Downs, C.A.
Ku
c
Fig. 4.
Ku <205
<29
D
27

Chapter 4
Fig. 5
.,
· '0 28 ppt salinity
1 u
Activase
·15 Carbonyl
24 ppt salinity
·20
20 ppt salinity
o , 15
Canonica12
Downs, C.A. 28

Chapter 4
Fig. 6
20 ppt salinity
25
20
MnSOD
1 u 15 24 ppt salin
Heme Oxygenase
10
32 ppt salinity
5 43 ppt salinity
o 5 10 15 20
Canonlca12
Downs, C.A. 29

Chapter 4
Fig. 7
•
20 ppt sa lin Ity
• Heme OXYlll~naIS'
7
•
•
43 ppt salini
., o 3
Canonical2
Downs, C.A. 30
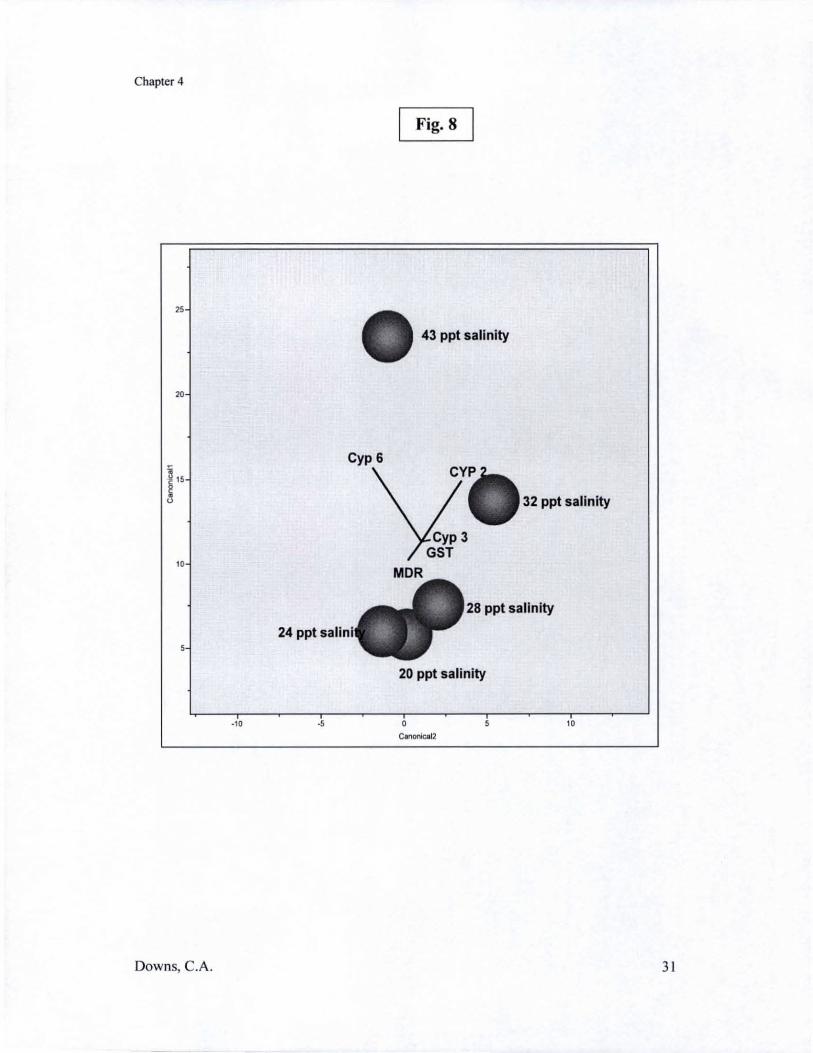
Chapter 4
25
20
Cyp 6
10
24 ppt
·10
Downs, CA.
Fig. 8
43 ppt salinity
32 ppt salinity
MDR
ppt salinity
20 ppt salinity
o C.nonIca12
10
31

Chapter 4
Fig. 9
• 20 ppt salinity
43 ppt .. 32 ppt salinity
1 dina
" GPXdino ·1.
28 ppt salinity
CuZnSOD dina ·15
24 ppt salinity
~4-----,-----__ ----,-----__ ----,-----__ ----,-----__ --~ .. • 5 10 15
CII'IOnIe&l2
Downs, CA. 32

Chapter 4
Downs, C.A.
Fig. 10
Pulse amplitude modulated chlorophyll fluorescence
0.7 ,.,....-------------, E 0.6 LL - 039 pppt > 0.5 LL
"C 0 .4 . 32 ppt
~ a. 0 28 ppt .. 0.3
024 ppt "C '1' 0.2
. 20 ppt ... .. .. 0 .1 0
0
33

Chapter 4
Downs, C.A. 34

Chapter 4
Fig. 12
Downs, C.A. 35

Chapter 4
Fig. 13
Downs, C.A. 36

Cbapter4 Table 1
Cenular BIomarker 431!1!! 32 DDt 28DSt 241!1!t 20 Illlt Protein Metabon. Condition
Hsp70 cnidarian 19S±21' 207±13' 170±26b 330±34b 424±3lb
Grp7S cnidarian 108±2' 70±4' 96±7' 45%7.4b 33±3'
Hsp60 cnidarian S±O.3' 8±O.Sb l1±lb 9%0.6" 12±O.3'
Ubiquitin 120 ±9' IS7±IS' IS8±ISb 169±13b 218±12b
Ubiquitin ligase cnidarian S89±16" 750±21" 801±38" . 894%93b,' 1110±76'
Small heat-shock proteins cnidarian 2.8±0.4' 4.3%0.2' 7.7±1.7, 27.7±4.lb 33.6%2.7 b
Hsp60 dinoflageUote 70±11' 114±14' 228±19" S23±46" 595±31'
Chloroplast small heat-shock protein 5%1' 6±14" 17±S' 72±23' 132±40'
(bIdative Damage & Response
Protein Carbonyl 3±0.6' 10±3" 33%9' 332%41 b" 527;,44>"
C.A1Alaqe cnidarian 17±S' 28±8' 4S±3b., 42±Sb.o 63±6>"
Cu/ZuSOD cnidarian 53±S' 70±3>' 77±6b I 11±8b., 185%16>"
MnSOD cnidarian 259±7" 447±8b 383±18' 672±59"-' 1179±43b.d
MutY cnidarian 81±10' 9S±S' 77±12' 89±3' 128±7'
CulZnSOD dlnoflageUote 14O±11' 215±34' 447±2S' 712±3ld BCC'
GPx-1 Dinoflagellate ·9%13" 101±12' 203%43' 341±11' 424%28'
Downs, C.A. 1

Chapter 4
Porphyrin MetaboUsm PPO CDidarian 2.7±O:t' 2.9±0.09" 2.6±O.OS' 2.7±O.02' 2.6±O.OS'
Femx:hela1ase cnidarian 14±2" 12±O.2a 13±I' 1l±0.6" 18±I'
Heme Oxygenase I cnidarian 22±2" 31±2' 30±3' 34±3b 46±S'
DNA damage
DNA AP site (per I x 10· nucleotides) 137±19" 124±2S' 428±42' S40±34'·~d 947±S8b.d
Xenfabloth: Response
CYP P4S0 2-class cnidarian 4.8±03' 4.4±O.S' 2.4±O.3' 1.3±O.ld 1.5±O.2d
CYP P4S0 3-class cnidarian 6±O.5' 12±O.S' 12±1.3' 12±O.S' lS±2b
CYP P4S0 6-class cnidarian 29±2" 7±O.4b 7±03b 11.2±O.2b 9±O.6b
GST -pi cnidarian cnidarian I03±13' 86±7' 126±4O' 12O±7' 142±19"
MXR l.l±O.2" 1.0±0.0S' 1.2±O3' 1.3±O.07' 1.I±O.2"
Table 1. Unless otherwise noted all data are presented as ftnolelng TSP. Entries In the table give treatment means ± 1 SE and treatment means with different superscripted letters differed significantly at «=O.OS using the Tukey-Kramer HSD method, Holm-Sidsk Test or Dunn's Test Bee = helow callbrant CUIVe.
Downs, C.A. 2

Chapter 5
ChapterS
Synopsis
The primary thesis of my dissertation is that heat stress and light stress initiate two distinct cellular mechanisms that result in coral bleaching, and that regardless of the initiating mechanisms, these two processes ultimately culminate into a single coordinated pathway whereby the coral host (animal component of the symbiosis) digests the zooxanthellae through an autophagic-related process that I term symbiophagy. Heat stress induces symbiophagy through a non-oxidative-stress regulatory switch. The biochemical cascade is unknown, but could either be a chaperone-mediated autophagic pathway! or a starvation-mediated autophagic pathwai. Light stress, a combined heat/light stress, or any stress that imposes an oxidative stress on the coral coral host (e.g., hYJlO":salinity exposure), probably induces symbiophagy through an oxidation-mediated signal cascade3
• Bleaching from prolonged darkness is a mechanism distinct from the processes observed from a light-based stress. Darkness induces a symbiophagic-related vacuolization around the zooxanthellae, but a second process becomes prominent and subverts symbiophagy, whereby the gastrodermal cells containing the zooxanthellae undergo cell death. There is suspicion that this cell death may be a form of non-apoptotic cell death, such as an autophagic cell death, but there was not enough information to confidently diagnose autophagic cell death4,s.
A second thesis of my dissertation is that there is a defined sequence of events for all the processes of bleaching. Oxidative-stress mediated bleaching begins with the zooxanthellae, specifically within the chloroplast of the zooxanthellae. Ultra-structural changes to the thylakoids and the severe accumulation of oxidative damage products indicates that photooxidative stress generated from the photosynthetic electron-transport-chain is the initial event of this pathway. What step along the photosynthetic electron transport pathway is responsible for the electron transfer to oxygen for creating oxygen radical is unknown, though it most likely centers on Photosystem It. It is not photoinhibition that produces the photo-oxidative stress, but that photoinhibition is a product of the photo-oxidative stresS6
•7
• Donor-side or acceptor-side electron transfer of Photosystem II to oxygen to form a radical can be determined using fluorescence kinetic analysis and electron para-resonance analysis of spintraps for oxygen radical. Early cellular responses by the zooxanthellae include induction of the chloroplast small heat-shock protein which protects the oxygen-evolving-complex of photosystem II, suggesting that "erhaps the electron that produces the oxygen radical is from the donor-side of chlorophyll a P6808
• Increased accumulation of anti-oxidant enzymes were induced early on in the oxidativestress-related bleaching process to mitigate accumulation of oxidative damage, while protein catabolism rates were shifted to account for the increase in protein damage, resulting from direct oxidation of r-side amino-acid residues or adduction of lipid peroxidation products. Several days after the initiation of the oxidative stress, xanthophylls levels shift in the surviving zooxanthellae, providing an increased redox capacity to the thylakoid membranes9 and reducing the overall oxidative 10adlO.
For heat-stress induced bleaching, there are at least two autophagic pathways within the coral host that can account for symbiophagy: protein denaturation/recycling and starvation!. It
1
Downs

Chapter 5
should be noted that even in model organisms (e.g., yeast, mammalian cell culture), these two pathways are yet to be completely defined and there is evidence of overlap. The first pathway is chaperone-mediate autophagy 1 , whereby heat stress induces a signal cascade mediated by heatshock protein-mediated chaperoninsl
. This signal cascade ultimately upregulates autophagy, such as lysosomal proliferationll
•12
• Though the data presented in my dissertation demonstrates increased symbiophagy, it should noted that evidence for this in cnidarians was first documented in 1993 by Brown and co-workersl3
•
The pathway for starvation-induced autophagy is less understood, though the association between starvation and increased autophagy is well documentedl4
• If photosynth~c-derived translocate ceases to transfer from the zooxanthellae to the coral host, either from a lack of photosynthetic activity ( e.g., darkness) or damage to the photosynthetic pathways, includin, export of photosynthate out of the chloroplast, then starvation by the coral host can resultl5
•1
,
and subsequently autophagy, as well as symbiophagy, is up-regulated (Chapter 2, Fig. 3C). A second process may subsume symbiophagy, which is autophagic cell deathI7.18• There
are a number of reports for the release of photosynthetica1ly-capable zooxanthellae from the hostI5.19-21. It is assumed by these studies that the release of zooxanthellae is via exocmsis, though they provide no evidence for this - only that they dissociated from the coral 5.19-21.
Besides expulsion via exocystosis, it is possible that the zooxanthellae dissociated from the cell through 'host-cell detachment,20 or by necrotic release. Host-cell detachment is not a characterized cellular process, and as only been put forth as a conjecture by Gates et aI.20 Close examination of the data presented in the Gates et aI., paper could easily be interpreted as zooxanthellae released from necrotic cells, and not an actual detachment from the basal extracellular matrix. The necrosis interpretation is far more likely, especially when all of the micrographs presented in the Gates et aI. paper show zooxanthellae engulfed by the host vacuolar membrane along with vacuolar matrix debris adhering to the vacuolar membrane20.
Heat and light stress are not the only environmentally-relevant stressors known to induce population-level bleaching: hypo-salinity has been associated with large bleaching events. In vascular plants and single cell organisms (e.g., yeast), osmotic shock induces oxidative stress, usually as a result of damage to electron-transport metabolic pathways22. My work demonstrates that a brief hypo-salinity exposure induces an osmotic shock and subsequent oxidative stress, to both the host and the zooxanthellae. Water temperature of run-off in the tropics can usually be of a higher-temperature than ambient sea-water temperature. Environmental risk assessments concerning run-off impacts resulting from land-use changes need to account for the possible synergistic adverse affects of both high-temperature and osmotic stress.
There were three technical factors of my dissertation that had considerable adverse influence in the power and resolution of all three investigations. The first factor was the autofluorescence associated with the coral host coral and its zooxanthellae (Fig. 1). A number of common assays for autophagy, mitochondrial damage, lysosomal activation, and other cellular diagnostics are fluorescent-based assays. Subtractive deconvolution of fluorescence images is not a valid method because the autofluorescence impacts all known emission bandwidths. Though the 'gold standard' for autophagy is still transmission electron microscopy, corroboration using fluorescence-based assays for autophagy diagnostics would have increased the confidence in the interpretations, as well as perhaps discovered the functional role of various
2
Downs
Chapter 5
organelles during the symbiophagic process, and even in the cell death of zooxanthellaecontaining gastrodermal cells. Without these fluorescence assays, other methods had to be used.
Utilization of other methods was greatly hampered by the lack of available gene and protein sequences of target proteins. 1 had to rely on evolutionary conservation of unique functional protein domains of homologous target proteins in order to design ELlSAfunmunechemical based assays. This is far from ideal. Sequencing of a coral genome is important if further work is to be conducted in the area of coral symbiophagy, innate immunity, virology, cellular homeostasis, population genetics and evolutionary biology.
The third factor was the availability of biological source material. Unlike mammalian, yeast, and plant cultore methods for popular scientific models that can be procured from readilyavailable sources, there is no established coral model that is under intense and widespread cultivation. Two species of corals are now under protection of the U.S. Endangered Species Act, and even corals within Hawaii are tightly regulated. My collaborator, Robert Richmond, had one of the few (and for awhile, only), scientific collection permits for Pocillopora damicornis in Hawaii waters. Enzymatic characterization, protein purification, pigment analysis, assay development and validation, etc, all requires large quantities of source material. Without ready access to source material, modern methods of investigation will be severely limited23,24.
REFERENCES & NOTES
1. Majeski, A.E., & Dice, I.F. Mechanisms of chaperone-mediated autophagy. Inti. J. Biochem. Cell BioI. 36, 2435-2444 (2004).
2. Mizushima, N. The pleiotropic role of autophagy: from protein metabolism to bactericide Cell Death Differ. 12, 1535-1541 (2005).
3. Scherz-Shouval, R., Shvets, E., Fass, E., Shorer, H., Gil, L., & Zwlun E., Reactive oxygen species are essential for autophagy and specifically regulate the activity of Atg4. EMBO J. 26, 1749-1760 (2007).
4. Samara, C., Syntichaki, P., & Tavernarakis, N. Autophagy is required for necrotic cell death in Caenorhabditis elegans Cell Death Differ. IS, 105 - 112(2008).
5. Tsujimoto, Y. & Shimizu, S. Another way to die: autophagic programmed cell death Cell Death Diff.15, 1528-1534 (2005).
6. Ohad, I., adir, N., Koike, H., Kyle, DJ., & Inoue, Y. Mechanism of photo inhibition in Vivo. A reversible light-induced confonnational change of reaction center II is related to an irreversible modification of the D I protein. J. BioI. Chem. 265, 1972-1979 (1980).
7. Aro, E., Virgin I., & Andersson, B. Photoinhibition of Photo system II. Inactivation, protein damage, and tornover. Biochim. Biophys. Acta 1143,113-134 (1993).
8. Heckathorn, S.A., Downs, C.A. Coleman, I.S., & Sharky, T.D. The small, methioninerich chloroplast heat-shock protein protects Photosystem II electron transport during heat stress. Plant Physiol. 116, 439-444 (1998).
9. Havaux, M., & Niyogi, K.K., The violaxanthin cycle protects plants from photo-oxidative damage by more than one mechanism. Proc. Natl. Acad. Sci. 96, 8762-8767 (1999).
10. Brown, B.E., C.A. Downs, R.P. Dunne, &S.W. Gibb Tissue retraction compensates for a lack ofxanthophylls cycling in irradiance-stressed corals. J. Exp. Mar. BioI. &01. 277, 129-144 (2002).
3
Downs

Chapter 5
11. Moore, M.N. Autophagy as a second level protective process in conferring resistance to environmentally-induced oxidative stress. Autophagy 4, 254-256 (2008).
12. Moore, M.N. Cytochemical demonstration oflatency oflysosomal hydrolases in digestive cells of the common mussel, Mytl/us eduiis, and changes induced by thermal stress. Cell Tissue Res. 175, 279-87 (1976).
13. Suharsano, Pipe, R. K., & Brown, B.E. Cellular and ultrastructural changes in the endoderm of the temperate sea anemone Anemonia viridis as a result of increased temperature. Mar. Bioi. 116, 311-318 (1993).
14. Mizushima, N. The pleiotropic role of autophagy: from protein metabolism to bactericide Cell Death Differ. 12, 1535-1541 (2005).
15. Smith, H. G. The significance of the relationship between actinians and zooxanthellae J. Exp. Bioi. 16, 334-345(1939).
16. Photosynthate is defined as any product of photosynthesis, and used here, it includes glycerol-based compounds often excreted by the zooxanthellae (translocates) and absorbed by the host. Battey, J.F., & Patton, J.S. A reevaluation of the role of glycerol in carbon translocation inzooxanthellae coelenterate symbiosis. Mar. Bioi. 79, 27-38 (1984).
17. Levine, B., & Yuan, B. Autophagy in cell death: an innocent convict? J. Clin.Invest. 115, 2679-2688 (2005).
18. Djavaheri-Mergny, M., Botti, J., & Codogno, P. Autophagy and Autophagic Cell Death. In Apoptosis, Senescence, and Cancer. Gewirtz, D.A., Holt S.E., & Grant, S. (eds). Humana Press. PP93-107 (2007)
19. Steen, R.G., & Muscatine, L. Low temperature evokes rapid exocytosis of symbiotic algae by a sea anemone Bioi. Bull. 172, 246-263 ( 1987)
20. Gates, R.D., Baghdasarian G., & Muscatine, L. Temperature stress causes host cell detachment in symbiotic cnidarians: implications for coral bleaching. BioI. Bull. 182, 324-332(1992).
21. Ralph, PJ. Gademann R. & A.W.D. Larkum. Zooxanthellae expelled from bleached corals at 33C are photosynthetically competent. Marine Ecology Progress Series. 220, 163-168 (2001).
22. Sharf stein, S.T., Shen, D., Kiehl, T.R., & Zhou, R. Molecular Response to Osmotic Shock. In: Systems Biology. Al-Rubeai. M •• & Fussenegger, M. Springer-Verlag, Amsterdam. pp 213-236 (2007).
23. Downs, C.A., C.M., Woodley, R.H. Richmond, L.L. Lanning, R. Owens. Shifting the Paradigm for Coral Reef 'Health' Assessment. Marine Pollution Bulletin.51:486-494 (2005).
24. Downs, C.A. Cellular diagnostics and its application to aquatic and marine toxicology.
Downs
In: Techniques in Aquatic Toxicology V. 2. G. Ostrander (ed)' CRC Press, Inc. pp 181-207 (2005).
4

Chapter 5
Figure Legends
Fig.I. Autofluorescence emission from different excitation bandwidths in the corals Oculina varicose, Montastrea annularis, Porites porites. Image courtesy of the Coral Autofluorescence workgroup of the U.S. Coral Disease and Health Consortium.
Fig. 2. Comparison of unbleached and bleached tissue of F aviles abdita from a natural, hightemperature bleaching event using light microscopy. Samples were collected from the field in Ko Phuket, Thailand in 1991. Besides the obvious difference in zooxanthellae (ZOOX) densities between the two physiological conditions, there is distinct vacuolization surrounding degraded zooxanthellae in the bleached figure. Gastrodermal architecture has also collapsed in the Bleached sample.
Fig. 3. Comparison of unbleached and bleached tissue of Goniastrea aspera from a natural, high-temperature bleaching event using light microscopy. Samples were collected from the field in Ko Phuket, Thailand in 1991. Besides the obvious difference in zooxanthellae (ZOOX) densities between the two physiological conditions, there is distinct vacuolization surrounding degraded zooxanthellae in the bleached figure. Gastrodermal architecture is reduced, but has not collapsed in the Bleached sample.
Fig. 4. Comparison of unbleached and bleached tissue of Goniastrea aspera from a natural, high-temperature bleaching event using transmission electron microscopy. Samples were collected from the field in Ko Phuket, Thailand in 1991. Besides the obvious difference in zooxanthellae (ZOOX) densities between the two physiological conditions, there is distinct vacuolization surrounding degraded zooxanthellae in the Bleached figure.
Downs
5

Fig.1. Chapter 5 Courtesy of the Coral Spectra Workgroup of the
Coral Disease and Health Consortium
YFP Excilation SP 500/25 Emission SP535130 Oculina varicosa MoniaMr". annufan's From Chll1etlon 20 Miles off shore From Florida Key.
_.polil •• From FIOridI Kayo
~-2i.~ ~\~.U~.~ AUTOFLUORESCENCE IN LIVING CORAL -=-::=..- IIIIU:\ 4t
Downs
6

Chapter 5 Fig. 2 Favites abdita
Uableded
• •
mesogIea •
Zoox
7
Downs

Chapter 5 Fig. 3 Goniastrea aspera
8
Downs

Chapter 5
Fig. 4. Goniastrea aspera - TEM
9
Downs