Transforming China Economic Reform and its Political Implications
Upload
khangminh22Category
view
1download
0
Masthead LogoUniversity of Pennsylvania
ScholarlyCommonsCUREJ - College Undergraduate ResearchElectronic Journal College of Arts and Sciences
4-2019
The Cost of the Cup: A Case Study on the Politicaland Economic Impacts of Hosting Mega SportingEventsGeorge J. AvdellasUniversity of Pennsylvania, [email protected]
Follow this and additional works at: https://repository.upenn.edu/curej
Part of the Political Science Commons
This paper is posted at ScholarlyCommons. https://repository.upenn.edu/curej/222For more information, please contact [email protected].
Recommended CitationAvdellas, George J., "The Cost of the Cup: A Case Study on the Political and Economic Impacts ofHosting Mega Sporting Events" 01 April 2019. CUREJ: College Undergraduate Research ElectronicJournal, University of Pennsylvania, https://repository.upenn.edu/curej/222.
The Cost of the Cup: A Case Study on the Political and Economic Impactsof Hosting Mega Sporting Events
AbstractIn the modern world, sports have become a new form of geopolitical signaling. Countries who are entrustedwith hosting mega sporting events, from the Olympic Games to the World Cup are seen as capable andcompetent nations. For developing nations, these games can bring political legitimacy, as it shows that theirrespective teams can not only compete in global events, but their governments can host safe, secure, and wellrun events.
In this thesis, I will be examining South Africa’s process in bidding, building and hosting the 2010 World Cupand the subsequent political and economic effects. South Africa was able to leverage the World Cup, as thefirst African nation to host a major international sporting event, to gain not only regional signaling—as it isstill the only African nation to host one of these events—but place itself in the international spotlight and gaingeopolitical legitimacy through its successful event.
South Africa overall held a fairly successful World Cup, leading to recognition from both domestic andinternational media outlets, while creating an environment that allowed it to emerge as a key player ininternational organizations and elevate itself on the world stage.
KeywordsWorld Cup, South Africa, Brazil, Sports, Political Economy, Showcase Effect, Political Science, SocialSciences, Rudra Sil, Sil Rudra
DisciplinesPolitical Science
This article is available at ScholarlyCommons: https://repository.upenn.edu/curej/222
The Cost of the Cup:
A Case Study on the Political and Economic Impacts of Hosting Mega Sporting Events
George J. Avdellas
Advisor: Dr. Rudra Sil
This thesis is submitted in fulfillment of
Bachelor of Arts Degree Senior Honors Thesis in Political Science
College of Arts and Sciences University of Pennsylvania
Spring 2019
ACKNOWLEDGEMENTS: This thesis would not have been possible without my father, John, who instilled in me my love of sports, my brother, Peter, who introduced me to the sport of soccer, my mother, Angelique, for always telling me to pursue my goals no matter how lofty they seem, and my two sisters, Ana and Eleni, for being my biggest supporters. Without them, I would not be who I am. Thank you to the Penn Political Science Department, specifically Dr. Rudra Sil and Dr. Eileen Doherty-Sil. Dr. Sil for believing in my thesis and supporting me through this process despite the obscure and different topic. Without his belief in my topic and countless hours spent discussing and editing this, I would not have been able to complete this. Thank you to Dr. D for guiding me through not only this process, but through the past four years at Penn and allowing me this opportunity to pursue an honors thesis.
Table of Contents Abstract Section I: Introduction, Definitions, and Literature Review Section II: World Cup Bidding Section III: Construction, Planning, and Development Section IV: The World Cup Section V: Post-World Cup Usage Section VI: Media Impact Section VII: Shadow Case with Brazil Section VIII: Conclusion Section IX: Further Works Section X: Data Set
ABSTRACT: In the modern world, sports have become a new form of geopolitical signaling. Countries
who are entrusted with hosting mega sporting events, from the Olympic Games to the World Cup
are seen as capable and competent nations. For developing nations, these games can bring
political legitimacy, as it shows that their respective teams can not only compete in global
events, but their governments can host safe, secure, and well run events.
In this thesis, I will be examining South Africa’s process in bidding, building and hosting
the 2010 World Cup and the subsequent political and economic effects. South Africa was able to
leverage the World Cup, as the first African nation to host a major international sporting event,
to gain not only regional signaling—as it is still the only African nation to host one of these
events—but place itself in the international spotlight and gain geopolitical legitimacy through its
successful event.
South Africa overall held a fairly successful World Cup, leading to recognition from both
domestic and international media outlets, while creating an environment that allowed it to
emerge as a key player in international organizations and elevate itself on the world stage.
Avdellas 1
SECTION I: INTRODUCTION, DEFINITIONS, AND LITERATURE REVIEW
Sports have been a crucial part of society since the days of Ancient Greece, and continue
to be an influential aspect on culture, politics, and the economy. Sports bring people together,
from banding together citizens of a city to uniting a nation during worldwide events, such as the
Olympics or the World Cup. These games are a source of pride, as even the smallest nations
have an opportunity to compete against larger nations on a level playing field.
In the same vein, global games can bring prestige to nations, especially developing
nations in the Global South. Hosting major sporting events gives these nations the ability to be in
the international spotlight. Nations view hosting these games as a way to be equal with larger
nations. This places them alongside other host nations that are considered global powers, like
China, Great Britain, the United States, and Russia, who have emerged as four of the largest
global players in the 20th and 21st Centuries and all have hosted some form of global sporting
competition in the past two decades.
In this thesis, I look to examine the usage of mega sporting events as political tools, with
a focus on stadium building and the subsequent economic and political effects. For this, I will be
using South Africa as an in depth case study to highlight the effects of large scale construction
projects on the international perspective of a developing nation. In terms of perspective, the
geopolitical nature of international relations lends itself in a modern world to these global games,
where these sporting events are a newfound source of soft power relations. Success, and even at
the bare minimum competence in hosting these games give not only international legitimacy to a
host nation, but can lead to a swing of confidence for the host, as the citizens can increase their
domestic self value from the event’s success. South Africa, being awarded the first African mega
sporting event, can utilize these events for political gain. This lends credibility to South Africa as
Avdellas 2
a regional power on the continent, as it has established itself as worthy by an international
organization to host this prestigious event. The primacy of this act, as they were the first African
nation, lends an even larger effect. Hosts, especially when the hosts are developing nations, are
able to use these events to showcase economic achievement or project international influence
through soft power.1 Thus we can see not only the World Cup but all mega sporting events as a
form of geopolitics and signaling for soft power relations.
These global games require large scale infrastructure developments, not only with multi-
million dollar stadiums but with roads, transportation, hotels, and other major projects needed to
host the tremendous influx of tourists. These projects are costly, but do have economic benefits
for the host nation, as many times these infrastructure developments are long overdue, but unable
to be built due to more pressing demands. In terms of political economy, the creation of large
scale sports stadiums, along with the additional infrastructure for hosting these events, puts the
state in a position to change the dynamic between the individual citizen and both their regional
and national government. When thinking about larger effects, we can use this case study to not
only examine the role of mega construction projects on domestic policy, but on international
legitimacy. With the increased focus on developing the Global South in the 21st Century, these
topics must be examined and studied, as nations use these projects to create legitimacy.
This project can be applied on a larger scale to not only major sporting events in
developing nations, but to any major construction project that would create an opportunity for
potential economic change. These economic impacts could lead to political and social changes,
from stabilizing the government to creating instability and social unrest. When thinking outside
of the world of sports, this can apply to any large scale building project that occurs in the Global
1 Cornelissen, “The Geopolitics of Global Aspiration.”
Avdellas 3
South. From development of tourist minded attractions, such as taxpayer funded public zoos, to
infrastructure (airports, railroads, bridges, etc.) to dams and other hydroelectric projects, there
are benefits and consequences from these major building projects. These programs are intended
to drive growth as new infrastructure can allow for more growth within the nation, allowing
more access to not only investment from its citizens but from foreign capital. I believe the data
found from this research can be applied in a broader sense to these projects, where publicly
funded projects can have an impact on the regional and national economic outlooks. These
projects are growing in the Global South, as the late 20th and early 21st Century has seen a
massive growth in government funded mega-construction development. Many of these projects
have faced the same level of public scrutiny as the World Cup venues, as they initially are seen
as a mismanagement of public funds, as the funds could go towards social programs like
education or public health initiatives. However, these programs in the long run may have a
beneficial effect on the nation as a whole that can exceed the investment in the mega
construction project.
In respect to mega construction projects, there has significant construction related to
these mega construction projects. Within the past few decades, we have seen projects, such as the
Kuala Lumpur International Airport in Malaysia in 1998 to the stadiums for the World Cups in
the 21st Century to more contemporary projects, including the Eurasia Tunnel in 2016 connecting
Europe and Turkey under the Bosphorus strait. Although these projects do occur in Europe and
North America, there has been significant progress within the developing world. These nations
are able to use these projects, such as Kuala Lumpar’s airport, to attract more financial
opportunities for the nation.2 These mega construction projects are built with the intent of long
2 Othman, “Challenges of Mega Construction Projects in Developing Countries.”
Avdellas 4
term use and major economic growth, as it is both a signal of modernization, but also a
legitimate way to upgrade from aging or non-existent systems to high-tech modern
infrastructures.
Mega construction projects face a slew of complex issues issues in order to be fully
completed. Aside from the financial burden, there are tremendous technological, environmental,
and cultural issues. Environmentally, these projects generally have a major impact, with a
tremendous carbon footprint due to the use of heavy machinery during construction and for
running the building once it is operational. In terms of cultural barriers, these projects generally
have international development teams, meaning that it is not only local developers planning but
outside forces that must navigate specific bureaucratic rules for the individual nations.3 In terms
of World Cups, not only do these stadiums need to be approved by the federal government who
had applied for the bids via their national sports associations, but for the specific regional and
local governments. These levels of complexity serve to make sure that the mega construction
projects follow the codes set, but cause issues for contractors who are on a fixed, shortened
timeline to build several mega construction projects in roughly a decade. For this thesis
specifically, I will not be addressing the intricate construction details, nor will I discuss the
environmental impact of these projects due to the sheer scope of the project. These factors do
have a tremendous impact on the construction process and subsequently the public opinion and
political economy of the nation, but I will focus on direct spending and the political and
economic effects from said investment.
3 He et al., “Measuring the Complexity of Mega Construction Projects in China—A Fuzzy Analytic Network Process Analysis.”
Avdellas 5
I plan on focusing on development essential to hosting a major sporting event: The World
Cup. In this, I plan on using South Africa—host of the 2010 World Cup—as the primary in-
depth case, as South Africa has a complete data set, along with having nearly a decade of
analysis on the World Cup and its effects. I plan on comparing it to the 2014 Brazilian World
Cup, as both came from postcolonial backgrounds and have had similar struggles with political
stability. However, Brazil hosted the World Cup and the Summer Olympics—the two largest
sporting events in the world—with just over two years separating the 2014 World Cup Final and
the opening ceremonies of the 2016 Rio Olympics. Due to this factor, it is extremely difficult to
parse the effects of the World Cup from the effects of the Olympics, especially with shared
infrastructure and stadiums. Within the past decade, both Brazil and South Africa have been
considered BRICS nations, an association of five major emerging regional powers and national
economies. These two nations, along with Russia, India, and China, represent over 40% of the
global population and roughly 23% of the gross world product. BRICS nations have hosted the
past three World Cups, from South Africa in 2010 to Russia in 2018, along with China hosting
the 2008 Summer Olympics and India hosting the Commonwealth Games in 2010. Both have
relatively similar Gross Domestic Product (GDP) with Brazil’s $15,600 per capita GDP and
South Africa’s $13,500 being ranked at 110th and 119th respectively.4 Both nations are currently
dealing with major political issues, as there have been marked scandals for both nations within
the past decade but their political climates are stabilizing with elections in 2018 restoring
confidence in the governments of both nations.
For stadiums specifically, there has been a tremendous amount of literature, especially in
terms of these two contemporary World Cups. Prior scholars have analyzed the political and
4 “The World Factbook.”
Avdellas 6
economic impacts of major sporting events, with these instances becoming more frequent due to
the 2018 World Cup—which brought attention back to South Africa and Brazil—and the
growing issues with the 2022 World Cup in Qatar, which will be held in the winter due to the
unplayable heat during the summer in the Arab Peninsula, and in regards to alleged human rights
violations with their construction projects, as migrant workers are dying at an alarming rate, with
estimates stating over 1,200 migrant workers have died during construction of the eight new
stadiums.5 Thus during the period between the 2018 Cup in Russia and the 2022 Cup in Qatar,
many theorists have been able to look at the 2010 and 2014 Cups with better data sets and
analyze their longer term effects.
In terms of the economic impacts of construction and the subsequent benefits from the
games being played at the stadium, there have been mixed results, with many experts stating that
the economic impacts are based on assumptions that cannot be examined. Theories, such as those
evoked by William Hunter, a former professor of economics at Marquette University, state that
the multipliers used for the calculations of economic impacts are flawed, as they give a gross
product rather than a net gain.6 Theorists also suggest the opportunity costs, as these stadiums
take up a significant geographic footprint, while other buildings can take the same space and
have potentially larger and more long lasting impacts on the community. For example, the city of
Denver was projected to return $16.5 million annually in gaining the Colorado Rockies franchise
and building Coors Field in 1995. They subsequently approved a new convention center in the
city which would generate $200 million. Thus the opportunity costs within the locales where the
stadiums are built must be considered in order to generate and accurate image of the economic
5 Wigmore, “With Four Years to Go until World Cup 2022, the Horrors in Qatar Continue – and Fifa Just Looks the Other Way.” 6 Hunter, “Economic Impact Studies: Innaccurate, Misleading, and Unneccessary.”

Avdellas 7
impact of the stadiums.7 When considering the net data, as opposed to just the gross impact of
the World Cup, the true impact of hosting the World Cup can be seen. For South Africa, we
have seen this in terms of trade-offs, as there were strategic decisions based on locations for the
stadiums, and also on the infrastructure projects.
While discussing impact, the majority of scholarship focuses on the quantifiable
economic effects, which is valid and I will examine directly throughout this thesis. However,
there are non-quantifiable political impacts that are also extremely important to consider. When
considering the economic effects of hosting as a whole, we must consider not only the direct
economic events, such as the increase of jobs during construction and the inflow of tourists
during the actual games, but the effects from sponsorships and what has been dubbed the
“showcase effect,” which puts the nation within the global spotlight and allows for messaging
and positive effects to reach the nation without these tourists directly coming to the nation for the
sporting events.8 This effect is unable to be directly observed, as we can see television data but
cannot truly know the impact of “showcasing” the nation. Sports in the late 20th and 21st
centuries have changed in terms of viewership, from the event being consumed by watching in
person, to now being primarily a spectator sport on television and now social media. Thus the
effects outlined in Hiller in 1989 can be interpreted and taken into account, but the findings have
to be modernized with the tremendous growth of television expansion and social media impacts
for the 2010 and 2014 World Cups. The modern “showcase event” may be even greater than
reported in 1989, with the increased speed of communication and spread of information between
individuals all across the globe. The advent of not only the internet, but social media, have
7 Crompton, “Economic Impact Analysis of Sports Facilities and Events.” 8 Hiller, “Impact and Image: The Convergence of Urban Factors in Preparing for the 1988 Calgary Winter Olympics.”
Avdellas 8
contributed to a more open world, which can increase the “showcase event” that benefits a nation
after hosting an event of this magnitude. For South Africa specifically, the showcase effect may
be even greater, as theorists believe that the ten stadiums built for the World Cup were meant to
“challenge pervasive negative vies and stereotypes about Africa as backward, unchanging,
‘tribal’, and hopeless continent” and to show that there is “no contradiction between being
African and being world class.9” The showcase event is another manner of soft power relations
between nations, as the cultural recognition of hosting a successful World Cup has legitimacy.
This mantra of elevating South Africa is echoed not only by the scholars, but by major political
players in South Africa as seen in earlier sections.
In terms of sports and politics, Richard Lapchick—a leading anti-apartheid activist and
current President of the National Consortium for Academics and Sports (NCAS)—has written
numerous papers on the intersection of sports and politics. He stated in the New York Times
when reflecting on President Nelson Mandela’s death in 2013 that, “You can smuggle in trade,
oil, and currency, but if you had a sporting event, you couldn’t play it in the dark… He (Nelson
Mandela) definitely believed that sports and politics are entwined.10” Lapchick sees sports as a
way to shed light on social issues, such as how HIV was considered a disease of the “other” until
Hall of Fame Lakers point guard Magic Johnson was diagnosed and suddenly drew national
attention.11 When discussing the role of sports and South Africa, he discussed watching a soccer
game with Mandela after his inauguration, where the newly inaugurated president went straight
to a South African national soccer game. Mandela spoke about the sports boycott, which
9 Alegi, “'A Nation To Be Reckoned With’: The Politics of World Cup Stadium Construction in Cape Town and Durban, South Africa.” 10 Longman, “Resistance, and Unity, in Sports.” 11 TEDx Talks, TEDxDU-Richard Lapchick-5/13/2010.
Avdellas 9
Mandela stated was one of the key reasons that he was elected and that apartheid fell. Thus, we
can see the ability of sports to create social change within a nation.
The literature focuses not only the immediate impacts, which can provide a boost to the
nation when the bids are announced and during the games themselves, but also have begun to
focus on the longer term effects. The World Cups, which are decided by FIFA’s executive
committee through bids from governments, generally promise to elevate the poorest citizens of a
nation, as the increased attention will lead to growth opportunities, especially with the
opportunity to work in construction for the stadiums and other infrastructure. However, both in
South Africa and Brazil, there was massive displacement, as the stadium construction forced
relocation of many individuals. In South Africa, the workers began to protest in 2009, due to
unfair labor conditions and wages. The government proceeded to criticize the workers and state
that their actions were “unpatriotic,” as if there was a duty to build these stadiums, despite
President Motlanthe stating that the legacy of the World Cup would be to “showcase South
African and African hospitality and humanity.12” Thus these political impacts have a great deal
of influence on the nation’s before the games, and the lack of development of these sites after the
conclusion of the event has led to long term issues in funding the continuing maintenance of
stadiums. This will be discussed in Sections IV and V on current and future usage of the ten
South African stadiums.
In addition to politics at the individual and regional level, there have been macro analyses
of the nation as a whole. Political stability, as previously defined, has been analyzed with
different definitions and guidelines, especially in terms of the World Cup. Scarlet Cornellison, a
professor at Stellenbosch University in Cape Town, has argued that mega sporting events give
12 Ngonyama, “The 2010 FIFA World Cup.”
Avdellas 10
geopolitical legitimacy to the hosts and focuses on the impact of hosting on the BRICS nations.
South Africa and Brazil have two of the largest, if not the largest economies on their continents
and have attempted to use the recognition by FIFA as a host nation to position themselves as a
regional power. The recognition gained from the international governing body of the world’s
largest sport does give them geopolitical legitimacy, especially against competing regional
powers.13As the sole African host, with Morocco losing five bids for the World Cup (1994,
1998, 2006, 2010, 2026) and no African host considered for an Olympic games, South Africa
does have a clear sign of international legitimacy as the only seemingly “trusted” African nation
to host a mega sporting event. This focus on becoming the regional power in the continent was a
primary focus of the nation, as they marketed the World Cup as the “African World Cup,” which
firmly signaled their role as a leader not only in Africa, but in the world. In terms of domestic
social cohesion and self-pride, scholars point to the 2010 World Cup as not only an opportunity
for the World Cup to change the international perspective of South Africa, but for a domestic
paradigm shift. A successful World Cup could change “how South Africans perceive themselves
and each other.14” If South Africa can succeed in these non-quantifiable factors, by increasing
their domestic stability and also their soft power, geopolitical legitimacy, then some of the goals
of the World Cup would be accomplished.
In order to present clarity within this thesis, some critical terms must be defined. These
terms will be featured throughout the thesis and thus the importance cannot be understated. I will
define “mega building” and “mega construction” as any form of large scale building project that
has a significant economic impact on the nation or region. These projects are not exclusively
13 Cornelissen, “The Geopolitics of Global Aspiration.” 14 Alegi and Bolsmann, “South Africa and the Global Game.”
Avdellas 11
stadiums, but include other projects that have been built or are in the process of being
constructed such as dams, bridges, railway systems, and airports. These mega construction
projects have been growing in the developing world, as the resources are available for
construction and these projects can return significant economic gains for these nations. However,
this case study will focus on stadiums.
Mega sporting events will be described as being large-scale cultural events, with impacts
not only on the host nation domestically, but on a global scale. These events are predictable, as
the World Cup and Olympics are run on a nearly fully fixed schedule, but the location proves to
be the variable factor, as the venues change every event. These events have a cultural and
economic impact within the country, as World Cup hosts experience a major growth in tourism
during the games, but also on the global scale, as tens of millions of people tune into the games
on their televisions, bringing the country into the global spotlight during that summer.15 Thus,
via mega sporting events, the host nation is able to use messaging to reach these millions of
individuals in a way that should politically and economically benefit the nation.
For the conversion rate, to aptly compare between Brazil and South Africa, I will be
converting both into the United States dollar when applicable. For the date, I will use the date
that is reflected in the 2010 World Cup Report from South Africa, which the media uses as their
basis. Thus the date of conversion for both projects will be November 23, 2012. This allows the
dollar to be used as a fair comparison to both and highlight the differences in cost between the
currencies and markets. The rate used 8.8695 rand per United States Dollar for South Africa and
2.089 Brazilian real per United States Dollar.
15 Horne, “The Four ‘Knowns’ of Sports Mega-Events.”
Avdellas 12
In addition, the term “developing nations” will be defined strictly for this. These would
be countries with colonial backgrounds who have begun to make significant economic progress
in the past few decades, with this thesis focusing on a case study on South Africa, with
supplemental data from Brazil. Mega construction has been growing in developing nations, from
Africa and Latin America to East Asia and the Middle East. Although the focus on this is with
stadium building, these results should be able to explain similar economic and political impacts
in other developing nations who pursue mega building projects.
Political impact, which combined with the economic impacts comprise the two dependent
variables in this thesis, will be comprised of two major factors. The first is political stability and
will be defined according to the World Bank’s Worldwide Governance Indicators. In this, the
social unrest, government stability, internal and external conflict, political and terror related
attacks, and social conflicts are all factored into the model, giving a value between -2.5
(extremely unstable) to 2.5 (extremely stable) with zero being neither stable nor unstable.16 The
second will be in regards to the election data in South Africa. South Africa has held elections
every five years for the National Assembly, and as a parliamentary system, the seat changes can
be easily identified per election. I will use three elections: one prior to the bid, one after the bid
and before the World Cup, and one after, which would be 2004, 2009, and 2014 in South Africa.
These two markers, the political stability index and the net change in seats in their respective
legislative bodies, will be used to define the political impact on the nation. I will attempt to
explain the mitigating factors, as the World Cup is not the sole reason that candidates are elected
to office, but the political impact of hosting a World Cup may affect the incumbent party, in
either a positive or negative manner.
16 Kaufmann, Kraay, and Mastruzzi, “The Worldwide Governance Indicators.”
Avdellas 13
In this thesis, I examine the construction data—with the predicted cost per stadium at
multiple points in the process, the actual cost of construction, and the regional economic changes
in the period of time, including job creation, GDP changes, and other factors. All of these actual
numbers will be compared to the predicted numbers that were submitted in the bids for the
World Cup in the original bid. In terms of regional data, I use the GDP per province and have
mapped the changed in the GDP from before the bid process to the tournament and subsequent
years after.
Outside of the data, I plan on looking at local media publications, starting with media as
the bids were announced and continuing after the World Cup was held, with any comments made
up to the present. I look at English speaking papers both domestically and internationally, which
comment on the positive and negative effects of hosting the games and can allow for insight that
show more than just the numbers given by the data. These would allow the data points to be
more materialized, as this gives a voice to the numbers by the citizens of the nation where they
are held and the international media.
In terms of methodology, I will be running a data analysis at a national and regional level.
In this, I will examine the changes in both the economic and political stability before the bids
were announced, the confirmation of the bids and of the sites chosen, to the actual games and
afterwards. One of the major areas I want to examine is the post-World Cup usage, as many of
these stadiums were developed solely for the World Cup, but were promised to be used for other
events. These stadiums involved billions of dollars of investment, yet some are currently
underutilized. Altogether, these factors will be compared to the projected economic returns and
the spending. In total, this data combined with the media reactions will be shown to either have
an effect or no effect on the political and economic state of one or both nations. Preliminarily I
Avdellas 14
expect that my initial hypothesis that mega construction in developing nations, with regards to
mega sporting events, has a negative effect on the political and economic climate. I would expect
that there is a relationship between the decline in votes for the incumbent party and the stadium
costs. This process has been studied by contemporary scholars, as not only does the spending
related to the World Cup affect the economic and political stability of a sovereign nation, but
other large scale building projects as well, such as dams, airports, and other mega building
projects.
In terms of data points, I have collected data from South Africa on several aspects of the
data. I have found regional GDP numbers per province or region, which allows the data to be
concentrated to exclusively the areas that built stadiums and had the majority of the projected
and actual revenue. In this data set, I will additionally be exploring the differences in the
projected and actual construction costs of the stadiums, and comparing major media reactions to
the differences in the cost in both nations incurred during the construction phases.
The data for the final stadium costs came from the official 2010 South Africa report on
the World Cup. This data is directly from the South African government, which was published in
a full report two and a half years after the conclusion of the tournament. The estimates in 2003
(before the bidding process was completed) and 2006 came from the 2003 Bid Book—which
included over 500 million rand for other potential stadiums—and a 2007 national treasury report.
These three points are analyzed in further sections to show the changes over time with the costs
of the stadiums.
Overall, the literature points towards the direction that there is a relationship between
hosting a mega sporting event and an impact on the political and economic stability of the host
nations. The construction costs, the tourism impact, and the subsequent political and economic
Avdellas 15
impacts will be examined in throughout the thesis, with the media’s impact being discussed in
Section VI. With these targets and data sets, we should be able to see if a relationship—whether
positive or negative—exists between both political stability and the hosting of an event and the
economic impacts of hosting.
Avdellas 16
SECTION II: WORLD CUP BIDDING PROCESS:
The World Cup is awarded to a host nation every four years, during the same year as the
Winter Olympic games. The bidding process and bids occur generally between seven and ten
years before the actual games begin, allowing nations to develop the massive building projects
necessary to host it. The Fédération Internationale de Football Association (FIFA) presides over
the sport at its highest level, managing the soccer at the World Cup and Olympic levels. The
bidding process has historically had a regional rotation, as the World Cup rotated between
regions every cycle. Until 2002, the process rotated between Europe and the Americas, with
games alternating between the regions every cycle to avoid regional bias between the two largest
soccer playing continents. However, with the 2002 World Cup hosted jointly by South Korea and
Japan, this precedent was broken and other regions became suitable hosts. FIFA then decided to
begin rotating between major regions, now including Asia, Africa, and the Middle East to
promote the game globally. Africa was chosen as the host continent in 2010, South America for
2014, and other regions, such as Australia and Qatar have submitted bids for consideration.
Thus, the committee now rotates between more areas of football for hosts and these regions only
can host the games. This process ended with the 2014 World Cup, as in 2007 FIFA has decided
that the rotational program was flawed—as only one host formally applied for the 2014 bid and
thus was automatically given the bid—while the new format allows all nations to apply for bids,
regardless of region.17 Regions who have not hosted a World Cup, if they meet the qualifications,
are now being legitimately considered—with Russia and Qatar hosting their first World Cups in
2018 and 2022, respectively. The chosen host nation does not only become the venue for the
marquee event of the World Cup, but hosts the Confederation Cup a year prior to the main event,
17 “FIFA End World Cup Rotation Policy.”
Avdellas 17
which include the host national team, the prior World Cup champion, and six winners from the
six major regional soccer groups. These six regions also comprise the majority of the teams
participating in the World Cup and represent all six populated continents. The Confederations
Cup is usually seen as a dress rehearsal by FIFA to make sure that the facilities, infrastructure,
and other parts of the host nation are up to par with the requirements.
The March 15, 2001 meeting of the FIFA Executive Committee decided that the new
rotation would begin in Africa. They allowed countries to declare interest for hosting until
December 31, 2002 and formal bids submitted by August 31, 2003. The FIFA Executive
Committee planned to decide the host in April 2004.18 Subsequently, the next region chosen was
South America, who was part of the traditional rotation process between Europe and the
Americas, but had only hosted three World Cups from 1930 to 2010—with first World Cup in
Uruguay in 1930, Brazil in 1950, and Argentina in 1978. Thus, it had been nearly four decades
since the World Cup has returned to South America. The rotation planned to include North
America, Oceania, Asia, and Europe, but was never fulfilled due to complications with finding
hosts in South America during the 2014 bidding process and subsequent FIFA corruption
scandals.
As of the present, the rules allow for any nation to bid for the World Cup, regardless of
geographic region. Regional diversity has organically occurred, as the previous five World Cups
were held in four distinct regions, with Qatar in the Middle East hosting in 2022 and the United
States, Canada, and Mexico hosting a combined 2026 World Cup in North America. With these
bids, six different regions have been or will be represented in the 21st Century, which is the most
diverse set of regions that the games have seen. The 2030 World Cup has initial bidding in
18 FIFA, “2010 FIFA World CupTM : Bidding Process Opens.”
Avdellas 18
multiple regions, as it is the centennial of the games and many interesting joint bids, such as the
“Balkan Four” of Greece, Bulgaria, Serbia, and Romania, and a unified East Asia bid in the
works with China, Japan, South Korea, and North Korea. Thus, the issues that faced these two
specific World Cups can be studied in some form of isolation, as they were the only two bound
by these geographic constraints, however the process of construction and the subsequent effects
on their respective economies and political stability can be examined and used in consideration
for other nations planning on hosting a mega sporting event. The political nature of the bid
process, as the executive voting committee of FIFA models an international governing
organization, shows the need for geopolitical legitimacy in order to gain a World Cup bid.
2010 WORLD CUP BIDDING PROCESS:
For the 2010 World Cup, five nations submitted bids: Morocco, Egypt, South Africa, and
a combined bid from Libya and Tunisia. The Executive Committee banned co-hosted games
from this tournament, meaning Libya or Tunisia would have to host the Cup. Tunisia withdrew
their bid, and Libya was unable to meet the requirements for hosting the games, and thus were
disqualified. The final three candidates were voted on and announced May 15, 2004, with South
Africa winning the vote 14-10 over Morocco, as Egypt received zero votes. Morocco has
continued to bid for World Cups, bidding (and once again losing out) for the 2026 World Cup.
With the 2026 World Cup being awarded to a three-country bid of the United States, Canada,
and Mexico, Morocco has lost out on its fifth World Cup bid.
South Africa had previously lost the bid for the 2006 World Cup to Germany in a
controversial manner, with the delegate from New Zealand abstaining from voting for South
Africa as directed by the Oceania delegation, due to “pressure from European nations,” including
Avdellas 19
alleged death threats and potential bribery.19 Thus without the New Zealand’s vote, the World
Cup was awarded to Germany by a 12-11 vote on the third ballot. Afterwards, FIFA President
Joseph “Sepp” Blatter stated that his tiebreaking vote would have awarded South Africa the
games.
Allegations of corruption did occur from the bidding process, and it was later uncovered
that $10 million in bribes were paid to the FIFA Executive Committee for South Africa to host
the World Cup and that Morocco had actually won the rights to host the games.20 Despite the
fraudulent behavior of FIFA and the South African government, this behavior does not affect the
public sentiment at the time nor the construction costs for the World Cup. These allegations were
not uncovered until well after the 2010 World Cup had taken place, and thus were not a factor in
the mega-building projects needed for hosting the games. However, we can examine this data
with the more recent trends and see if the revelation has affected the post-2015 opinion on the
2010 World Cup.
First and foremost, the initial reaction from South Africa was pure elation, as it was not
only the highest achievement of South African football—as they became the first African nation
to host the World Cup—but an achievement for the nation to show that in less than two decades,
South Africa went from a de jure segregated nation to hosting one of the largest sporting events
in the globe. As the bid was announced, the nation showed citizens celebrating, while former
President Nelson Mandela wept for joy in Zurich and stated that he felt “like a young man of
15,” as he was presented a replica of the FIFA World Cup Trophy by the governing body of the
sport, while recounting how the World Cup and FIFA had supported black South Africans during
19 Millward and Chapman, “New Zealand Is Sorry for World Cup Fiasco.” 20 Brown and Randall, “Fifa Corruption: ‘Morocco Won 2010 World Cup Vote - Not South Africa’ - as It Happened - Telegraph.”
Avdellas 20
Apartheid. The nation saw this as not only an opportunity to prove that they were a legitimate
competitor in sports, but as a legitimate world power as well. Incumbent President Thabo Mbeki
declared that “Africa’s time has come,” on national television, as he saw this event as a
geopolitical statement. He elaborated on this by stating, “We want to ensure that, one day,
historians will reflect upon the 2010 World Cup as a moment when Africa stood tall and
resolutely turned the tide on centuries of poverty and conflict21” More than this, as the first
African nation to host the World Cup, they were able to brand the event as not only their own
World Cup, but an “African World Cup” for all members of the continent.
For the 2010 World Cup, South Africa initially planned for eleven cities in ten provinces
to hold thirteen stadiums, but narrowed it down to ten stadiums in eight provinces, with three in
Gauteng, which is the most populous and wealthiest province. In the original plan, the nation
planned to renovate five stadiums and build five new stadiums, with three new stadiums in the
process of construction. The final ten stadiums included three stadiums that were not in the initial
bid report, with Nelson Mandela Bay, Moses Mabhida Stadium, and Cape Town Stadium all
being chosen to be built new instead of renovating the three existing stadiums in their respective
cities.22 However, Peter Mokaba Stadium needed extensive renovations and it was more
efficient to build a new stadium than renovate the old. The initial plans, via the 2003 World Cup
Bid Book, indicated that the nation would spend 1.061 billion Rand on the ten stadiums (with an
additional 513,750,000 to the three stadiums that were proposed, but removed from the plans
later on).
21 Runciman, “2010 World Cup.” 22 FIFA, “2010 Inspection Report for the FIFA World Cup.”
Avdellas 21
In terms of the political significance of the bid process, we must look directly to the
source of the process: the bid committee and subsequently World Cup Organizer. South Africa’s
bid was led by Danny Jordaan, the head of the South African Football Association (SAFA).
However, before this, Jordaan was a member of the South African parliament, former mayor of
Nelson Mandela Bay—the site of one of the newly constructed stadiums—and is still a member
of the African National Congress, which has been the incumbent party in South Africa since the
end of Apartheid in 1994. The bid process, while technically controlled by SAFA, has been
directly supported by the government. SAFA does not have the ability to construct stadiums,
infrastructure, or any of the necessary building projects for hosting a potential World Cup, so the
government must be directly involved. Thus, we are unable to separate the South African
government from the proceedings in the bid process, as without their approval this would not be
possible.
The current FIFA Bidding Handbook directly states that “The competitions have such a
national and international significance that the successful hosting and staging of…the
competitions cannot be effectively achieved without the full cooperation of the Government.23”
Thus FIFA itself recognizes the political aspect of their competition and directly includes this as
a factor in their bid evaluation program.
23 FIFA, “Bidding Agreement Regarding the Submission of Bids for the Right to Host and Stage the 2018 FIFA World Cup or 2022 FIFA World Cup.”
Avdellas 22
SECTION III: CONSTRUCTION IN SOUTH AFRICA:
In order for South Africa to be able to host the 2010 World Cup, the nation had to prepare
for a massive influx of tourists at one time, while building or renovating ten stadiums. Five of the
ten new stadiums needed to be completely built, while First National Bank Stadium24 had
extensive renovations to become the largest stadium on the continent of Africa at a capacity of
just under 95,000 spectators. Along with the ten stadiums, South Africa had to focus on
infrastructure, spending nearly $1.3 billion on the roads, airports, and other projects for the four-
week sporting event.
For a nationwide building project over the course of five to six years, there are numerous
issues that were unforeseen, which altered the construction costs and timeline. As a time
sensitive project, there was a need to finish all stadiums before the 2009 Confederations Cup,
which is seen as a dry run and a test for the World Cup. This event hosts the eight regional
winners and the host team who will be competing in the tournament the following year, but does
not draw the worldwide fanfare nor the full thirty-two team field that the World Cup has. Thus
this is a chance for the host nation to test their facilities in a lower pressure environment, with a
year to prepare for competition if there are any major complications. The biggest issue in South
Africa was that Nelson Mandela Bay Stadium was chosen to host the Confederation Cup, but
was not ready for the March 30, 2009 deadline. Therefore, Port Elizabeth had to withdraw their
stadium from the Confederations Cup, and press on with construction on the stadium to finish
before the actual competition. Despite the setbacks that were apparent in 2009, all ten stadiums
were completed in time for the World Cup.
24 First National Bank Stadium was renamed Soccer City, due to a FIFA rule that World Cup stadiums cannot be named after a sponsor for competition.

Avdellas 23
In terms of workers, over 240,000 workers were employed strictly in construction for the
stadiums 25. This massive influx of workers did at least contribute to a boost in the overall GDP
of the regions, as the data shows that there is a reasonable significance between GDP growth,
stadium cost, and employment from 2004 to 2012. The government, which is the source of the
employment numbers per stadium, had initially stated that the World Cup would create over
400,000 new jobs, and this nearly quarter-million employed for stadium development created an
environment where this economic growth was possible.
However, in 2009, South Africa—like many other nations—suffered a large scale
economic panic. After years of economic growth, including a peak of 7.5% growth in 2005, they
suffered a crippling recession in 2009. This panic, just months before the World Cup,
contributed to large scale effects with construction costs, as the market prices increased on the
stadiums that were not finished. This was the only year of the data range observed with negative
GDP growth (-1.54%) nationwide, as six of nine provinces also had negative growth.
In studies completed on the construction process, the largest issue that these contractors
and consultants said led to delays was material cost overruns. In addition to this, poor material
estimates and an increase in labor costs also affected the speed of construction.26 These factors
did not condemn the World Cup, as it still continued, but it did affect the prices of the World
Cup, compared to the initial figures. The value of the rand, according to its nominal effective
exchange rate27 or NEEP, plummeted in early 2009, thus spiking the costs of construction
material as the purchasing power of the rand was significantly lower.
25 “South Africa and Public Service Commission - 2010 - State of the Public Service Report 2010..Pdf.” 26 Baloyi and Bekker, “Causes of Construction Cost and Time Overruns.” 27 Nominal Exchange Rate compares the value of the rand against a basket of the five major currencies: the U.S. Dollar, Chinese yuan, the Euro, Japanese yen, and the British pound.
Avdellas 24
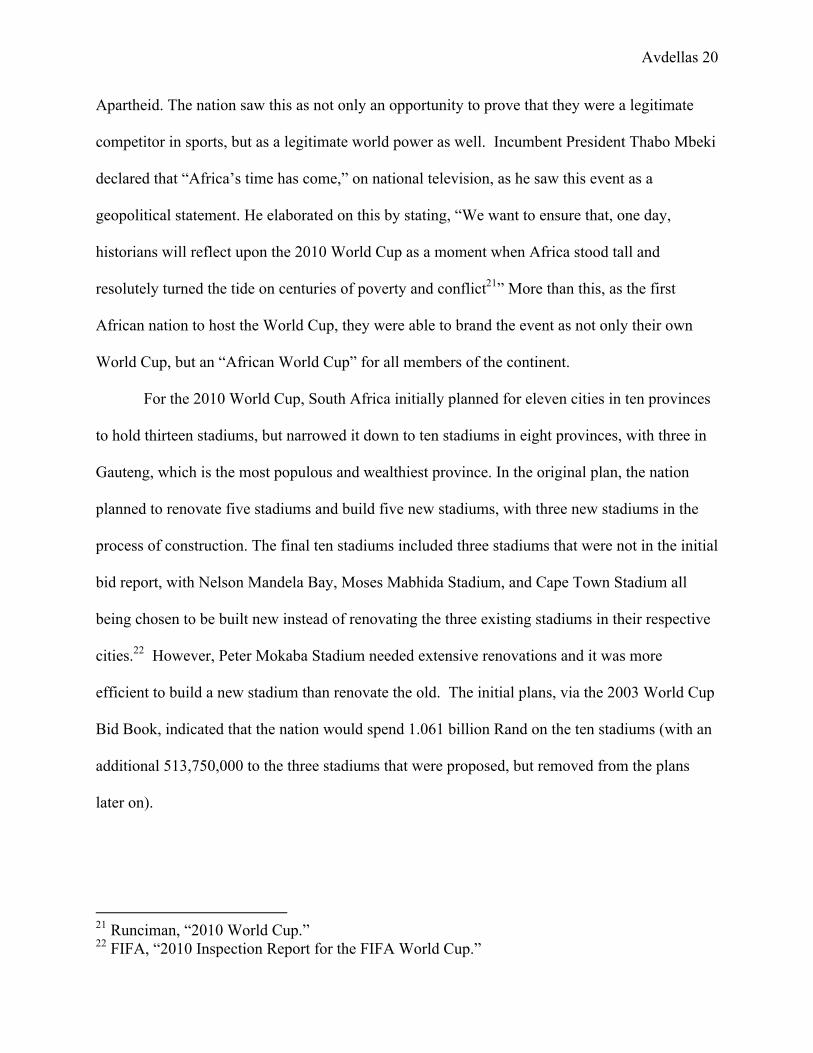
I have attached a graph below, taken from the South African Reserve Bank, that maps the
currency’s NEEP from the day that the bid was announced until the kickoff of the first World
Cup match. Notice the steep drop offs in 2006, 2007, and 2009, as all three of these factors
contributed to the increased material and labor costs.
28
As the recession was in full force, over one-quarter of the total stadium construction
workforce began to strike. The strike, consisting of over 70,000 workers, began July 8, 2009, less
than a year before the opening ceremonies of the World Cup. The National Union of
Mineworkers (NUM) represented these workers, as construction falls under their jurisdiction.
These workers—who were guaranteed weekly payment of 2,500 Rand ($310)—wanted a 13%
increase in their wages, or they would not continue. This effort legitimately threatened the
possibility of Africa’s first global sporting event, as there were six stadiums: the six not used for
the Confederation’s Cup, that needed to finish still in 2009.29 In addition to the stadiums, this
28 “Selected Historical Rates - South African Reserve Bank.” 29 “S Africa Strike Hits Stadium Work.”
Avdellas 25
strike threated the construction of a high speed rail link between the O. R. Tambo International
Airport and Johannesburg, which is essential for transporting tourists to FNB Stadium and Ellis
Park Stadium, as well as being the center of the sporting event. The strike was resolved within a
week, with workers and managers agreeing to a 12% raise, and allowing the stadium
construction to be resolved and construction to finish in time for the competition.30 This rapid
agreement, where management increased their offer from a 10% raise to a 12% raise, was due to
mounting pressure to accomplish this task, as numerous other labor disputes, especially with
large scale unions, have dragged out in South Africa in the 21st Century and beyond.
However, 2014 reports have stated that five major construction firms in South Africa
colluded on prices for their services during the World Cup, which cost the government several
million rand.31 These companies were referred to the Competition Committee and fined a total
of 1.5 billion rand, while being forced to have community service involvement, including
mentoring or financially supporting smaller, black-owned construction companies.32 These
factors, combined with the economic recession, led to an increased cost in producing these
stadiums.
This was the only major delay in construction, as overall the sites were well managed
with only two worker deaths during the entire process: one in August 2008 at Peter Mokaba
Stadium and one at Cape Town Stadium in January 2009. Outside of these deaths, there were
very few reported injuries, with FNB Stadium recording over one million accident free hours
during the building process,33 which is in stark contrast to the eight deaths in stadium
30 “2010 Construction Strike Ends | South Africa 2010 Fifa World Cup.” 31 “SA Construction Firms Accused of World Cup Collusion - BBC News.” 32 SA Commercial Prop News, “Colluding Construction Giants Reach Aggreement with Government.” 33 FIFA.com, “Tragedy Strikes 2010 Process.”
Avdellas 26
construction for the 2014 World Cup34 and seventeen for the 2018 World Cup in Russia.35
Overall, South Africa had few incidents in terms of construction for the World Cup and thus had
a fairly successful construction process, with the largest problem being the economic issues that
were encompassed all industry, not just construction for the mega sporting event.
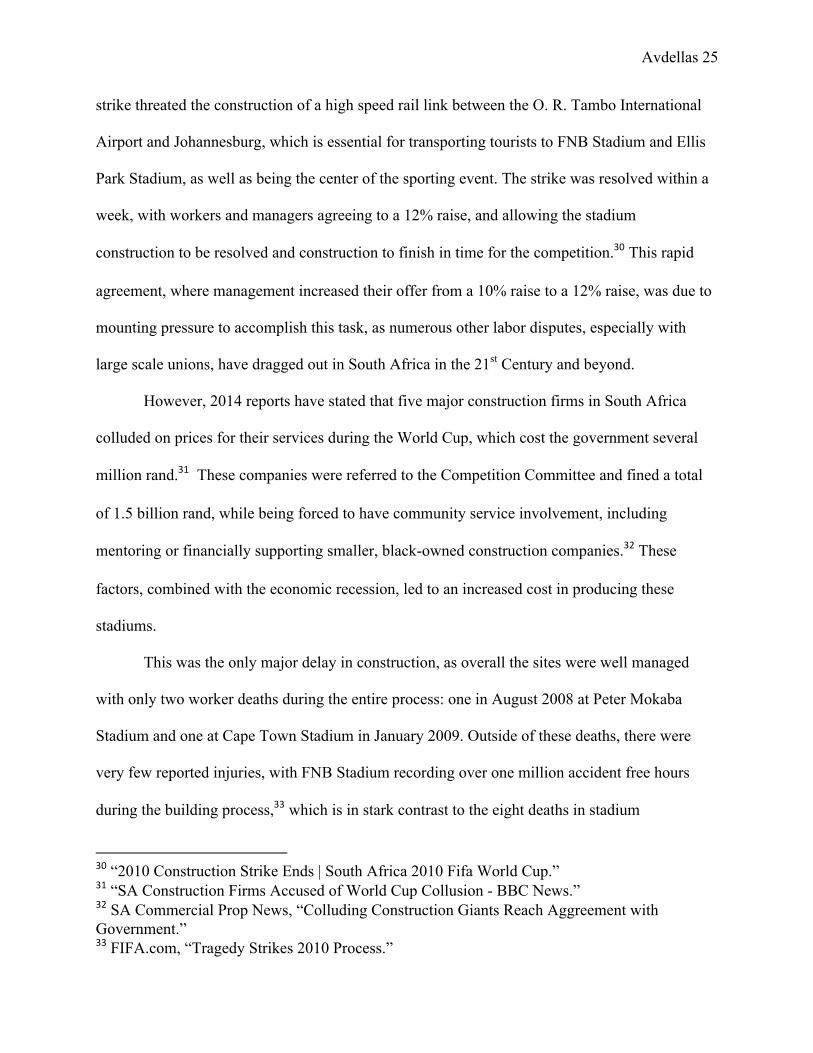
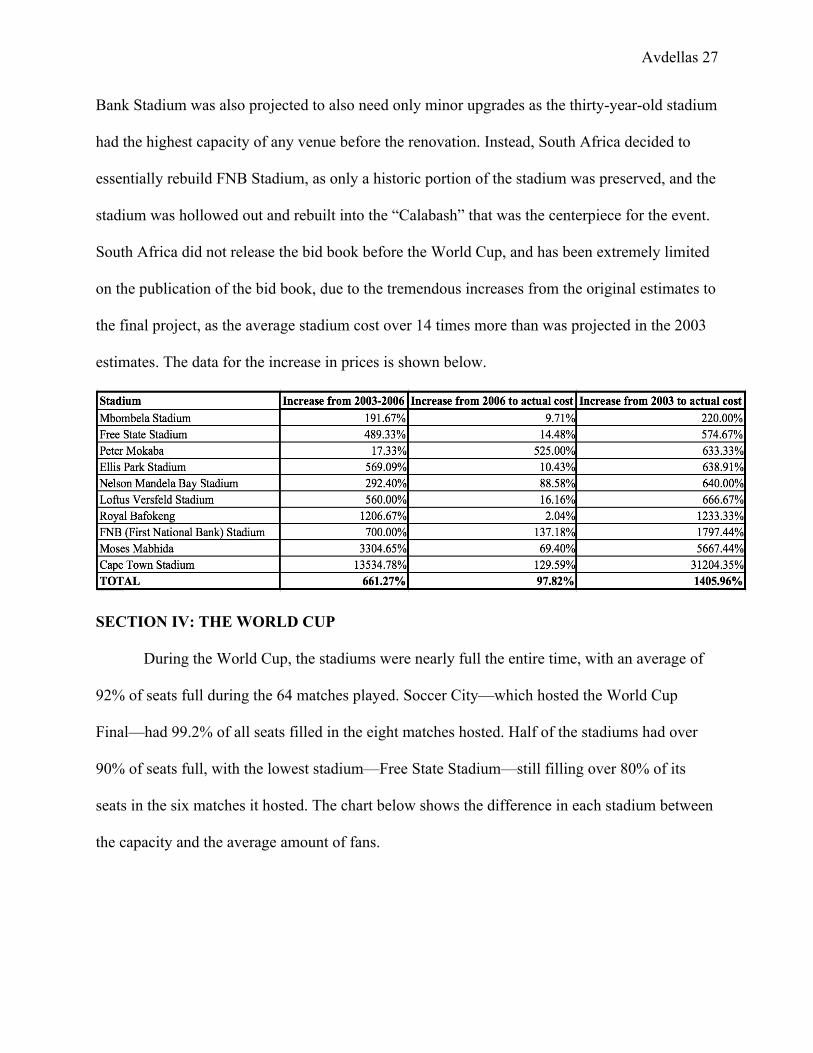
Overall, the World Cup stadiums cost significantly more than was originally expected,
with overall costs being billions of rand more than even the conservative estimates in 2007. I
have attached a graph below with the three stages of development and the major differences in
cost between the three released costs.
The vast discrepancies for Nelson Mandela Bay, Cape Town Stadium, and Moses
Mahbida Stadium are due to the original plans for FIFA to renovate three existing stadiums—
Port Elizabeth, Kings Park, and Newlands—instead of building new stadiums. First National
34 “Brazil World Cup 2014: Eighth Death at Football Stadiums - BBC News.” 35 “Report Finds 17 Deaths and Labor Abuses at Russia’s World Cup Stadiums - The New York Times.”
0 500 1000 1500 2000 2500 3000 3500 4000 4500 5000
Cape Town Stadium
Moses Mabhida
FNB (First National Bank) Stadium
Royal Bafokeng
Loftus Versfeld Stadium
Nelson Mandela Bay Stadium
Ellis Park Stadium
Peter Mokaba
Free State Stadium
Mbombela Stadium
Stadium Cost (Rand, millions)
Actual 2006 Projected Cost 2003 Projected Cost
Avdellas 27
Bank Stadium was also projected to also need only minor upgrades as the thirty-year-old stadium
had the highest capacity of any venue before the renovation. Instead, South Africa decided to
essentially rebuild FNB Stadium, as only a historic portion of the stadium was preserved, and the
stadium was hollowed out and rebuilt into the “Calabash” that was the centerpiece for the event.
South Africa did not release the bid book before the World Cup, and has been extremely limited
on the publication of the bid book, due to the tremendous increases from the original estimates to
the final project, as the average stadium cost over 14 times more than was projected in the 2003
estimates. The data for the increase in prices is shown below.
SECTION IV: THE WORLD CUP
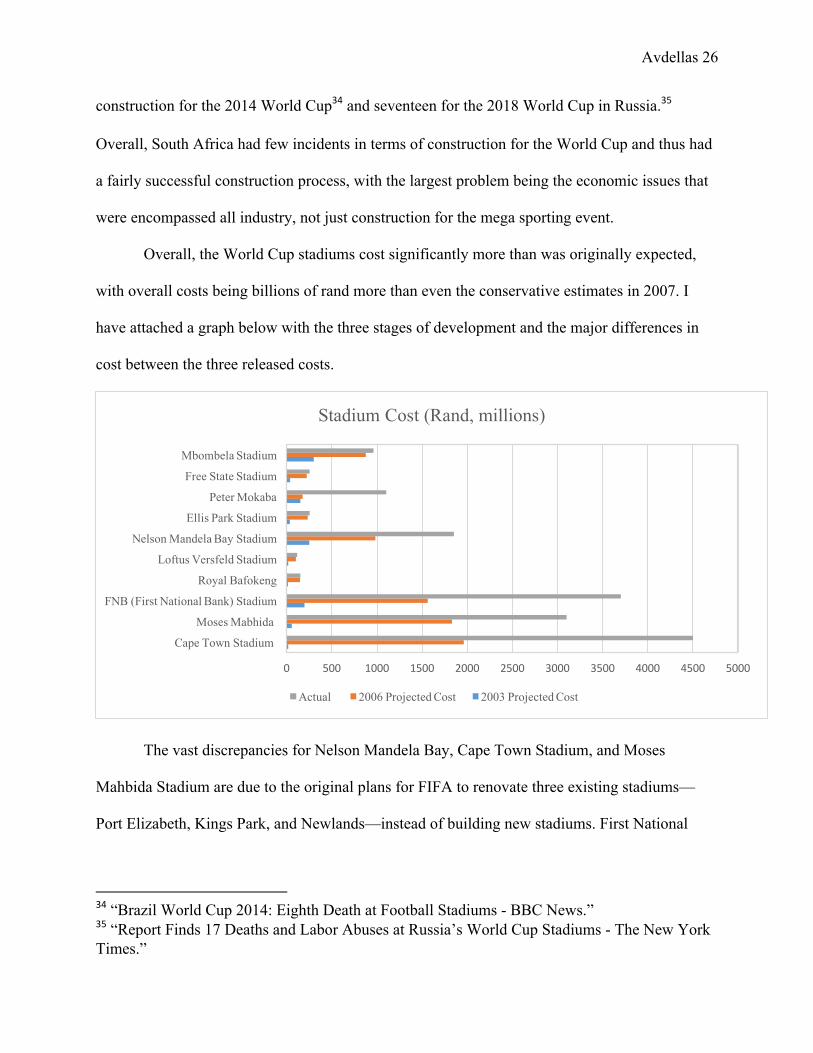
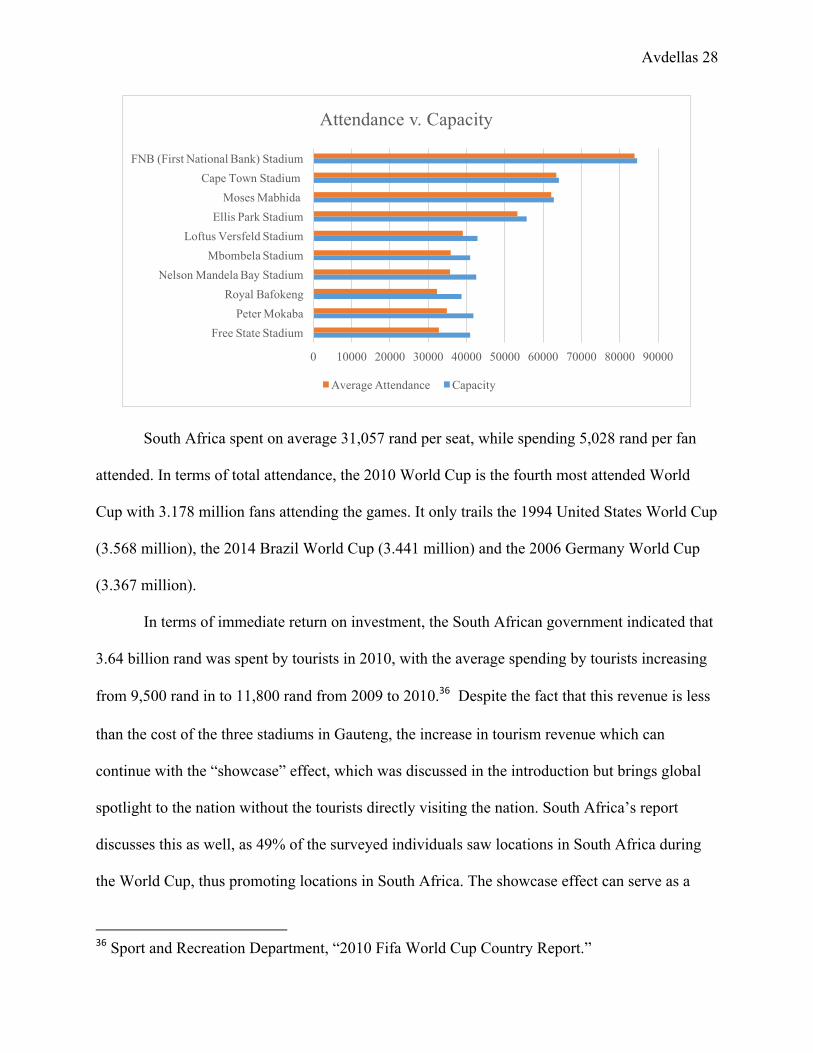
During the World Cup, the stadiums were nearly full the entire time, with an average of
92% of seats full during the 64 matches played. Soccer City—which hosted the World Cup
Final—had 99.2% of all seats filled in the eight matches hosted. Half of the stadiums had over
90% of seats full, with the lowest stadium—Free State Stadium—still filling over 80% of its
seats in the six matches it hosted. The chart below shows the difference in each stadium between
the capacity and the average amount of fans.
Avdellas 28
South Africa spent on average 31,057 rand per seat, while spending 5,028 rand per fan
attended. In terms of total attendance, the 2010 World Cup is the fourth most attended World
Cup with 3.178 million fans attending the games. It only trails the 1994 United States World Cup
(3.568 million), the 2014 Brazil World Cup (3.441 million) and the 2006 Germany World Cup
(3.367 million).
In terms of immediate return on investment, the South African government indicated that
3.64 billion rand was spent by tourists in 2010, with the average spending by tourists increasing
from 9,500 rand in to 11,800 rand from 2009 to 2010.36 Despite the fact that this revenue is less
than the cost of the three stadiums in Gauteng, the increase in tourism revenue which can
continue with the “showcase” effect, which was discussed in the introduction but brings global
spotlight to the nation without the tourists directly visiting the nation. South Africa’s report
discusses this as well, as 49% of the surveyed individuals saw locations in South Africa during
the World Cup, thus promoting locations in South Africa. The showcase effect can serve as a
36 Sport and Recreation Department, “2010 Fifa World Cup Country Report.”
0 10000 20000 30000 40000 50000 60000 70000 80000 90000
Free State StadiumPeter Mokaba
Royal BafokengNelson Mandela Bay Stadium
Mbombela StadiumLoftus Versfeld Stadium
Ellis Park StadiumMoses Mabhida
Cape Town Stadium FNB (First National Bank) Stadium
Attendance v. Capacity
Average Attendance Capacity
Avdellas 29
way for nations to continue their tourism increase after the event is over, as people who see the
positive aspects of the nation, South Africa in this case, will continue to consider it as a tourist
location. This long term impact can continue to show a return on investment for South Africa,
which can increase the political and economic influence that South Africa has on not only the
region, but on the international community.
Revised studies in the past decade have found a clear link between tourism and the FIFA
World Cup, as it is the second largest sporting tourist event. Studies place the average increase in
tourism at 8% for all major mega sporting events (the Summer and Winter Olympics, the FIFA
World Cup, the Cricket World Cup, and the Lions Rugby Tour) but there is a major discrepancy
between the Summer Olympics and FIFA World Cup versus the other events, as these marquee
events garner significantly more tourism than the others.37
SECTION V: CURRENT STADIUM USAGE:
The World Cup consists of sixty-four matches over a month long period. However, the
stadiums continue to need maintenance and staffing after the World Cup in order to stay
functional. The biggest fear of the World Cup stadium building effort is that the stadiums will be
underused after the month-long period. President Jacob Zuma stated “There are a number of
plans to make the stadiums profitable after the last whistle,” while going on to say that the nation
plans on trying to get foreign soccer stars to come play in these venues.38 which is true in some
cases, but overall most stadiums have been at least breaking even in terms of upkeep costs.
However, some of the stadiums, especially in the more remote regions, have become the dreaded
“white elephants” that the state cannot afford to maintain.
37 Fourie and Santana-Gallego, “The Impact of Mega-Events on Tourist Arrivals.” 38 O’Connor, “World Cup 2010.”

Avdellas 30
The largest stadium, FNB Stadium, has been utilized for numerous events, especially
those outside of the realm of sports. The stadium’s largest game was not a World Cup game, but
the Carning Black Lapel Cup between two of the nation’s premier soccer teams—the Kaizer
Chiefs and the Orlando Pirates—with a record of 94,807 fans in attendance. The stadium hosted
Nelson Mandela’s official memorial service in 2013. FNB Stadium is also a home venue for both
the national soccer and rugby teams. In addition to sports, FNB Stadium has hosted numerous
musical acts, including Coldplay, Justin Bieber, Beyoncé, and Jay-Z. Despite the high upkeep
costs—2.5 million rand per month—the stadium continues to be a centerpiece for events in
South Africa.39 Since its re-opening in 2009, it has gate receipts for over 8 million people
entering the stadium and holds approximately 105 events per year.40 As the largest stadium on
the continent, FNB Stadium continues to be a utilized even after the World Cup, but this seems
to be the exception, as it is the premier location in the nation for events.
Cape Town Stadium has had a reduction in capacity—removing over 13,000 seats to
accommodate luxury boxes and suites, as was projected before the stadium was built.41 The
stadium continues to be used for rugby sevens, including the World Rugby Sevens competition,
along with soccer matches and other events. The city is currently in the process of finding a
naming sponsor for the stadium, to begin to alleviate the costs on the tax payers.42 However, this
is a recent development, as the city has been managing the stadium since 2010. The city had
stated that yearly operating costs—including adjacent parks built for recreation—was
39 Mafika, “Bright Future for FNB Stadium.” 40 Ntloko, “Inside FNB Stadium.” 41 “Green Point Stadium by GMP Architekten.” 42 “City Maximises Use of Cape Town Stadium | CapeTown ETC.”
Avdellas 31
approximately 46.5 million rand per year.43 If funding from a naming sponsor is found in the
next year, this would significantly reduce the burden on tax payers. AJAX Cape Town left the
stadium for the 2014 season, due to poor conditions from hosting concerts during the season
which damaged the field.44 These concerts were necessary to maintain revenue for the stadium.
The team has since returned to the stadium since the incidents in 2014.
Moses Mabhida Stadium has faced significant issues, as it has fallen into disrepair after
the World Cup. Despite still hosting events, the city has had difficulties maintaining the stadium,
with the SkyCar—an incline system that takes tourists to the top of the stadium to view the city
of Durban from above—has been closed since October 2018 and needs a complete overhaul. The
stadium, per local reports, has panels falling from the ceiling and needs significant repairs for it
to continue working.45
Ellis Park Stadium, the second largest stadium in the country and ninth largest in the
continent, has continued to be utilized as a rugby stadium, as that was its primary purpose before
the World Cup. It serves as the home stadium for two major rugby teams, and has a greater
capacity for rugby (62,597) than it did for the World Cup (55,686. It has sold its naming rights to
Coca Cola from 2008 to 2012—excluding the World Cup—then Emirates Airlines in 2014, both
of which have alleviated some of the maintenance costs from the city of Johannesburg, who
currently owns the stadium.46 Overall, the stadium has hosted numerous major concerts, South
African teams, as well as European soccer games and is still seeing major usage after the World
Cup.
43 “‘Surprising’ Cost of Running Cape Town Stadium.” 44 Mark, “Ajax Abandon World Cup Stadium.” 45 “Moses Mabhida Stadium.” 46 Long, “Ellis Park Renamed as Emirates Lands Major Lions Deal - SportsPro Media.”
Avdellas 32
Loftus Versfeld Stadium is one of the privately owned stadiums—as it is owned by the
Blue Bulls Rugby Union. Thus the rugby club has taken care of maintenance for the stadium. In
terms of World Cup upgrades, it had the second smallest cost of all stadiums with only minor
upgrades needed in order to accommodate the competition.
Mbombela Stadium—the lowest cost new stadium built by 140 million rand—has also
had issues with upkeep, as it is managed by the Mbombela municipality. The municipality has
allocated 11.6 million rand for upkeep47, and had the Mpumalanga Black Aces use the stadium
as their home until the club dissolved in 2016. Currently the only stable tenant—outside of the
occasional national team game—is the rugby club, Pumas. Of all ten stadiums, Mbombela
Stadium has had the lowest utilization rate, as in 2014 the average attendance rate was 9.8%. The
stadium also has hosted the fewest amount of events of any of the World Cup stadiums.48
Overall, these factors could explain the decline in votes for the ANC since 2009 from
Mpumalanga.
Nelson Mandela Bay Stadium has consistently hosted local teams—as the home to both
soccer and rugby clubs—along with national team games and multiple legs of the Rugby World
Series. The municipality stated that the stadium would become profitable by 2013, and that they
have found ways to keep the stadium in good condition while reducing costs.49
The regional government in Polokwane, the home of Peter Mokaba Stadium, has seen the
additional growth in tourism and nightlife, but has not been able to break even with stadium
costs. The city, who owns the stadium, has been funding 17 million of the 23-million rand
47 Tolsi, “Stadiums Score Costly Own Goals.” 48 Humphrey and Fraser, “2010 World Cup Stadia Investment: Does the Post-Event Usage Justify the Expenditure?” 49 “‘Nelson Mandela Bay Stadium Profitable by 2013.’”
Avdellas 33
upkeep of the stadium, needing at least two matches of 15,000 fans per month to remain
solvent.50 This seems lofty, as the population of the city is just over 500,000 million inhabitants,
but possible. Peter Mokaba Stadium, as will be discussed later, has been the most frequently
criticized project from the 2010 World Cup by the press.
Royal Bafokeng Stadium has lost its sole tenant, as the Platinum Stars Football Club
dissolved in 2018, to move to Cape Town as a new franchise. Initially, the Royal Bafokeng
Nation sold the team with the intent of keeping it in the region, just under new ownership.51
However, new ownership decided to move to Cape Town. Now, there are no major professional
soccer teams in the North West Province, but the occasional African premier soccer team uses
the stadium for matches. This stadium, along with Peter Mokaba, have been the two most
criticized as they are the farthest away from population centers and do not have set teams as of
2019 that have regular matches in the stadium. However, as a privately owned stadium from the
Royal Bafokeng nation, there is not a major impact on the tax payers of Rustenberg.
Free State Stadium currently has three primary tenants: two rugby teams and one soccer
team. The stadium also has a naming deal in place with the automobile company Toyota, which
offsets some of the maintenance costs. Overall, Free State Stadium has been fairly well used
since the 2010 World Cup.
South Africa as a whole held the 2013 Africa Cup of Nations, which is biennial soccer
tournament between the top sixteen teams in Africa. The tournament was originally slated to be
held in Libya, but due to the Libyan Civil War in 2011, the committee asked South Africa to
trade bids, as South Africa was hosting the 2017 Africa Cup of Nations. South Africa was able to
50 Tolsi, “Stadiums Score Costly Own Goals.” 51Strydon,“RoyalBafokengConfirmtheSaleofEmbattledPlatinumStars.”
Avdellas 34
use five stadiums: FNB Stadium, Mose Mabhida Stadium, Nelson Mandela Bay Stadium,
Mbombela Stadium, and Royal Bafokeng Stadium. These matches had significantly less
attendance than the World Cup, but did give an opportunity for the stadiums to be used again in a
major competition after the World Cup. The total attendance and revenue was much lower, but
the ability to host a fairly successful major event with less than sixteen months’ notice was an
accomplishment for South Africa and led to further utilization of mainly empty stadiums during
that time of year.
South Africa is also exploring hosting the 2023 Women’s World Cup, as they have begun
the bid process. The South African Football Association (SAFA) sent a letter to FIFA December
8, 2018 and is waiting for a response from FIFA before sending an official bid.52 SAFA
President Danny Jordaan has used the 2010 World Cup as part of the bid for the 2023 Women’s
World Cup, and is likely to utilize many of the same venues that were used in 2010, as the
Women’s edition has a smaller field of teams. That being said, this future utilization is not
guaranteed, as several other qualified nations are also bidding for the event, including Australia,
Colombia, Japan, New Zealand, and Thailand. The nation must complete the formal bid process
by March 15, 2019. As of March 27, 2019, South Africa has confirmed their bid for the 2023
FIFA Women’s World Cup. The bid book will be submitted by October 2019 and the host
selection will be in March 2020. The host of the tournament will be chosen March 2020, giving
the host nation only three years to prepare, which indicates that only hosts with established
infrastructure and stadiums would be chosen, as new construction is impossible in that time
frame. If South Africa is chosen, it would be the first African nation to host a Women’s World
52 “SAFA President Danny Jordaan Banking on 2010 World Cup Experience - News - Kick Off.”
Avdellas 35
Cup, and just the the fifth nation to host both the men’s and women’s competition, along with the
United States, Sweden, Germany, and France. This event, which is smaller, would still bring new
life to some of the stadiums, and would once again put South Africa in the international
spotlight.
Overall, the stadiums have been utilized by local teams, despite the impacts of lower
crowds since the World Cup. When focusing on stadiums only, most of the stadiums are
sustainable in terms of operating costs. In total, five of the ten stadiums are either privately
owned or have primary naming sponsors. However, the challenges of constructing large scale
stadiums still leave a long term effect on the individual cities, leaving them responsible to fill
stadiums without the allure of the World Cup.
Avdellas 36
SECTION VI: MEDIA IMPACT
In terms of the newspaper impact, I have looked at The Sowetan, which is the largest
English language newspaper in South Africa with a readership of over two million. They were
extremely positive in the initial phases, but have voiced mixed opinions of the World Cup both
during the World Cup period (May-August 2010 with the competition occurring from June 11-
July 11) and after the World Cup (July 12, 2010-Present). In addition, I have examined
international reports from the corresponding period, using the New York Times and The
Guardian, which are two of the largest papers internationally. These pieces show a reflection of
the mainstream views of the more liberal ends of the developing world, which as shown below
are both more skeptical of the bid and reserved in their tone. These pieces from the “western
media” have the underlying assumptions about South Africa, as was discussed in the earlier
sections, but see the progress of hosting the World Cup for South African political legitimacy.
After the bids were announced, the Sowetan stated that winning the 2010 bid would be
“endorsing the South African miracle created in 1994,” as this was a public and international
way of showing that South Africa was a legitimate nation in the global scheme.53 After the vote
was confirmed and South Africa was named the winner, the Sowetan published an editorial that
declared that this was a “vote of confidence in the ability of South Africans in particular, and
Africans in general,” as the World Cup showed that in just over a decade, the nation went from
an apartheid regime to being chosen to host one of the largest international sporting events.54
Overall, the initial feedback from the World Cup was positive. Note that not many economic
details were omitted from these articles, as they focused on political legitimacy and a potential
53 “Why We Deserve the 2010 Games.” 54 “Congratulations to Ourselves.”
Avdellas 37
leadership role that was granted vis-à-vis the World Cup to South Africa. Despite the lack of
quantitative details, these show that the initial wave of support for the World Cup was a net
positive.
Internationally, the New York Times stated that the 2004 announcement that South
Africa would host “puts the ‘World’ back into the World Cup,” as after this World Cup, five of
the six populated continents have hosted the event.55 The “global pariah,” due to its past history
of apartheid, was elevated seemingly equal to the other nations in the world of sports. In relating
these articles from major global publications, we can see that although the historical chains of
apartheid will continue to fetter South Africa, that there is progress and a newfound respect that
international media outlets now posses for the nation due to their legitimacy.
In early 2010, The Guardian put out an editorial by David Runciman, a professor of
politics at the University of Cambridge, which highlights the issues with the World Cup.
Runciman does not doubt that it would be a success for South Africa to host a World Cup and
that it is in FIFA’s best interest to help South Africa achieve that goal. However, his take is that
Europe, via FIFA, will continue to corrupt the process and take from developing nations, by
taking their talent to play for clubs in Europe. He outlines that the “great hope behind holding big
sporting events in developing countries is that the glare of international publicity will drive the
process of reform,” but that it has not worked in the past, citing the 2004 Athens Olympics. He
then criticizes the funds, stating that these megaliths of stadiums were built while a third of
citizens live on less than $2 per day.56 Overall, Runciman believes that Africa can gain some
legitimacy from this, but that it is not worth the cost.
55 Vecsey, “Soccer Puts ‘World’ Back Into the World Cup - ProQuest Historical Newspapers.” 56 Runciman, “2010 World Cup.”
Avdellas 38
During the midst of the competition, the Sowetan published an article discussing the role
of the stadiums as white elephants, which was previously highlighted in the earlier section. This
fear of these stadiums turning into monoliths is very real, as the many of the stadiums did not
have sponsorships or major tenants at the time of construction. The editor of The Sowetan
directly stated that “I don’t know how there going to be maintained… You need a mathematician
to figure out how they are going to move forward and pay for them after the World Cup.”57 This
article did not focus on the larger stadiums, such as FNB Stadium, which will be utilized as the
premier stadium not only in South Africa, but in the entire continent, but especially Peter
Mokaba stadium in Polokwane. This rural city has a population of around 500,000 and was
constructed for only four World Cup games. Other stadiums who have lost their primary tenants
were also at risk at this time, per the article. However, later that year, the Sowetan declared that
“There is no way Peter Mokaba Stadium will become a white elephant,” as they had brought
some premier clubs to play in the stadiums after the World Cup.58 The 2010 article has been
dispelled and some of the fears have come true, as the stadium has current financial issues,
however, the immediate thoughts were that the stadium would at least break even.
However, one article during the World Cup was extremely negative about the World
Cup. This article, titled “Soccer has been turned into a shackle to enslave us,” highlights the
negative effects of the event and calls FIFA out for profiting off of the nation. Mngxitama
focuses on the cost trade off, as the government has allowed tax breaks for FIFA, while claiming
that budgetary constraints negatively affected the poor by cutting healthcare and other necessary
programs. Overall, this article focuses on the negative tradeoffs—which are extremely
57 O’Connor, “World Cup 2010.” 58 Moholoa, “Peter Mokaba ‘No White Elephant.’”
Avdellas 39
justifiable—as the World Cup was a tremendous investment for stadiums and infrastructure.59 As
seen in the South African budget report and in scholarly articles, there were a significant amount
of tax breaks given to corporations and FIFA as a whole for the World Cup. This promotes
industry and investment, but does have negative consequences on the host nation.
In looking at a local level, several articles have been written about the impact on locals,
but none have been more poignant than ones about the workers who have benefitted from the
additional tourism. Local vendors, such as Austin Chikovo, who was the centerpiece of a 2010
piece before the World Cup, have used the increase in tourism to benefit their families Chikovo,
a father of three, said that the increase in World Cup tourism on his flag vending business
allowed him to send his three daughters to school, pay for their uniforms and rent.60 Despite this
being just one core case of an improvement, we have to see this feature in the most prominent
English speaking newspaper as some sign of success from the less fortunate in South Africa.
During late June, the Sowetan reported the tourism data for the first half of the month.
They reported that 682,507 tourists entered the country per the Department of Home Affairs
during the first week of competition. Overall, the Minister of Home Affairs reported that 1.7
million people arrived into the nation, which was an increase of over one million from the same
period last year. Spending was also reported at 974 million rand for this period, with the United
States, United Kingdom, Australia, France, and Brazil contributing over half of the spending.61
This initial spending contributes to the 3.64 billion rand that was named in the 2010 South
African Report.
59 Mngxitama, “Soccer Has Been Turned into a Shackle to Enslave Us.” 60 Mdletshe, “2010 WORLD CUP A BOON.” 61 Monama, “Fifa World Cup Helps Boost SA Tourism.”
Avdellas 40
Reports after the World Cup cited the World Cup as a model for other African nations,
stating that “The year 2010 was a game changer and risk mitigator to which countries and cities
of Africa will point to for affirmation that it (the World Cup) can be done and they have what it
takes.” The Soweto praised the World Cup in this article as a model for the future and how a
mega sporting event should be run, while pointing to the World Cup as a model for the future of
South Africa.62 The sentiment in December 2010 was still very positive from the event. It later
concluded that it was the “best FIFA World Cup ever,” as not only was the competition exciting,
with Spain defeating the Netherlands for the trophy, but that “we (South Africa) have never seen
anything like this in the history of this country – pre-colonial, during apartheid and post-
liberation.”63 The author of this page, which was written the day of the World Cup Final, stated
that the impact on South Africa, not only with tourists, but local population as well, has led to a
successful World Cup for the nation.
The New York Times pondered the long term effects immediately after the World Cup,
by stating that the tangible benefits are uncertain, but depend on the actions taken by SAFA. If
South Africa can continue to grow its brand and national team, it can continue to elevate the
usage of these stadiums.64 President Zuma discussed the future of South African soccer, despite
the losses in the World Cup Group Stage. He told the team that, the government would use
funds that FIFA gave for development to promote the youth program, touting it as an educational
opportunity for the the less fortunate in the country to take part in the game. SAFA, per the
article, was attempting to transform the mentality of the nation and was using the World Cup to
62 Moholoa, “World Cup the Cherry on Top for 2010.” 63 Mabote, “What a Glorious 31 Days It Has Been.” 64 Marcus, “South Africans Are Left to Wonder What Lies Beyond the Cup.”
Avdellas 41
do so, as soccer is now an identity for the nation.65 If this growth can happen, then this could lead
to an increased usage of the stadiums.
The Guardian reported the initial skepticism going into the World Cup, by starting its
first article by discussing all of the potential failures from venues being incomplete to a “machete
race war” in the streets. These initial thoughts, while they certainly were exaggerated, were
common by the western media. However, the article dispels this notion and compliments the
nation in various areas, from the stadiums and infrastructure to the security. The major focus was
on the atmosphere and the legacy from the event. The article concluded by stating, “But the most
persuasive argument deployed by Jordaan and the government was that successfully delivering
the World Cup would help change perceptions of the country and the continent. That they have
surely done.66” This sentence shows the geopolitical impact of the World Cup on the
international importance of hosting these events, as the legitimacy gained goes further than the
sixty-four matches played. This legitimacy gained serves as a manner of increasing soft power,
as a successful mega sporting event lends credence to the idea that if a nation can accomplish
massive infrastructure and construction goals, while providing a fairly secure and safe
environment, it can be a responsible and impactful member of the international community.
Former President F.W. de Klerk published an article in the Sowetan discussing the World
Cup. He stated that the “Cinderella continent” of Africa had been gifted the World Cup despite
the “ugly First World stepsisters” actions in previous bidding. He continued to discuss the
skeptical mindset that others had, believing that the stadiums and infrastructure would not be
prepared. However, he echoed the successes of the World Cup, stating that this event “changed
65 Rhoden, “SPORTS OF THE TIMES: Success, or Even Lack of It, That the Hosts Can Build On.” 66 Gibson, “World Cup 2010.”
Avdellas 42
the international perceptions of our country.” This statement is much more about international
geopolitics than soccer, as the perceptions of inability to succeed—per de Klerk—were not
solely about stadium and infrastructure, but apply to the country more generally.67 De Klerk’s
message in the Sowetan show at least the perceived geopolitical impact of hosting a successful
World Cup by former South African leaders.
One year following the 2010 World Cup, the New York Times wrote to discuss the
effects of the World Cup on the first year. The article relied on survey data that said 70% of
South Africans believe that the World Cup brought economic disadvantages to the nation, but
also 78% responded that it brought “social cohesion” to the country. Despite the stadiums being
seen as monoliths by the author, she also discusses the social impact, as she senses a sense of
national pride from the event.68 The Guardian also discusses the social cohesion aspect, while
dubbing the World Cup a success. It discusses the differences between the 1995 Rugby World
Cup—the first major event after apartheid ended—and the 2010 World Cup. Richard Williams
looks at a small detail—the national anthem—and uses this to highlight social change. Rugby
was seen as an Afrikaner sport played by predominantly white nations such as New Zealand,
South Africa, Australia, and the United Kingdom, while soccer is more global. He states, “At the
early games (of the 1995 Rugby World Cup) featuring the home team in that tournament it was
noticeable that Nkosi Sikelel iAfrika (the newly created South African national anthem) was
heard in virtual silence by the almost entirely white crowd while Die Stem (the Afrikaner anthem
that was co-national anthems with Nkosi Sikelel iAfrika from 1994-1997) was belted out with
something close to defiance.” 15 years later, the tone had changed with pride in the national
67 de Klerk, “World Cup Left a Magic Legacy.” 68 Fairbanks, “OVERTIME IN SOCCER CITY: South Africans Believed the World Cup Would Bump Their Country into the First World. So Did It? -.”
Avdellas 43
team, which is mostly black, and the unified national anthem being echoed by all citizens. This
minor point shows the social cohesion, but also works towards the points discussed by leaders in
the nation like Mandela and de Klerk to put the tarnished past behind and move South Africa
away from its past and into a legitimate international power.
The Sowetan has been generally friendly to the progressive side of South African politics,
but has justifiably become critical of the World Cup due to the fears of this event as a waste of
money. In total, the Sowetan and selected international media have been fairly neutral, if not
favorable towards the South African World Cup. There have been vocal critics, both
domestically and internationally, as there are with any large scale investment project, due to the
potential ramifications of diverting these funds, but overall the writers for these selected
publications have been positive, as they have highlighted many of the major political ideas that
can bring national unity and international recognition.
Avdellas 44
SECTION VII: SHADOW CASE WITH BRAZIL
South Africa, as the first and only African nation to host a World Cup, does not have any
clear regional comparisons. However, economically and politically, it is very similar to the last
two World Cup hosts: Brazil (2014) and Russia (2018), as all three of these nations are BRICS
countries. With the close proximity of the Russian World Cup to writing this, there has not been
enough time to analyze even the short or long term effects on the state, nor has the Russian
government put out any official statistics from the competition. However, Brazil does make for a
solid comparison with South Africa. Brazil has not released any official data for the 2014 World
Cup, potentially due to the transition in government and hosting the 2016 Olympics in Brazil,
which has given additional usage and spiked tourism to Brazil.
Due to this latter factor, I am not able to do a full scale comparison of the two nations, as
Brazil has been able to utilize some of the stadiums for the Olympics. In addition, many of the
infrastructure projects that were completed were used for the subsequent sporting event, which
confounds that set. However, I have analyzed their stadiums, with data gathered from scholarly
reviews of both the stadium process. Brazil has not released employment numbers for the World
Cup either, which makes the regression that I ran using the South African data impossible to
compare to Brazil. Thus, I will be using Brazil as a more theoretical approach, with less of a
focus on data and more on the lasting effects and legacies on the nation. In terms of case study
options, I will be utilizing a “shadow” case, where two similar cases are explored in a typical
case study manner, but the latter or shadow is used in an auxiliary manner to the primary case.69
With the difference in available data, yet the clear similarities between the two nations, a shadow
69 Seawright and Gerring, “Case Selection Techniques in Case Study Research.”
Avdellas 45
case will be able to provide another example to compare the results from South Africa’s 2010
World Cup.
2014 WORLD CUP BIDDING PROCESS:
In 2003, FIFA selected South America as the next region for the rotational World Cup.70
However, only two nations had interest to host the games: Brazil and Colombia. Due to internal
complications, Colombia withdrew their bid before the FIFA Executive Committee could meet,
leaving Brazil, as the only formal bid for the 2014 World Cup.71 Thus in his made Brazil the de
facto host despite Brazilian President Luiz Inacio Lula da Silva doubting the feasibility of the
event, by stating, “We don't have any stadium which is in a condition to host World Cup games.
We’re going to have to build at least twelve new stadiums in this country.” The bid was officially
confirmed by FIFA October 20, 2007, despite the uphill battle to build twelve stadiums before
the 2013 Confederation’s Cup. This lack of infrastructure would require significant planning and
progress, which Brazil did successfully complete before the 2013 Confederations Cup and 2014
World Cup. Brazil renovated five stadiums and fully constructed seven new stadiums in twelve
cities. These cities were regionally spread out in twelve different states, where all parts of the
country had some form of access to a World Cup venue. This did allow for the World Cup in
Brazil to truly be a national game, but it led to complications with venues, as some stadiums
were constructed in thinly populated regions. However, the lack of competition for bids led to
the change in policy where the World Cup would not have regions set for each set of games.
Regarding the 2014 World Cup, we must also consider the subsequent Olympic Games
that were held in Rio de Janeiro in 2016. With holding the two largest sporting events in the
70 FIFA.com, “2014 FIFA World Cup TM to Be Held in South America - FIFA.Com.” 71 “Brazil Confirms Bid - Colombia Withdraws - FIFA.Com.”
Avdellas 46
world, there would be some overlap between the facilities used, especially the Maracanã
Stadium, which hosted the seven matches for the World Cup and four matches for the Summer
Olympics, including the championship and gold medal games for both the men’s and women’s
teams, as well as the opening ceremonies. In total, six venues overlapped between the two
competitions.
However, when construction is considered, we must factor in the bidding process. The
World Cup was awarded to Brazil in October 2007, while the Olympics were awarded to Brazil
in October 2009, leaving two years of planning completely separate from the event. In terms of
stadiums, the Olympics only utilized six of the twelve stadiums constructed for the World Cup,
while building the Estádio Olímpico72 specifically for the Olympic Games, despite the numerous
stadiums constructed for the World Cup. The focus of this will be on the building directly for the
World Cup, but there will be inherent overflow, especially with infrastructure projects that were
constructed in anticipation of both events.
BRAZIL DATA:
Brazil has not put out official numbers on the World Cup as South Africa did in late 2012
after the competition. However, FIFA initially predicted in their reports that the total stadium
construction would cost roughly 6 billion Brazilian real. The final costs were unsurprisingly
higher, as the World Cup generally costs more than the predicted values in the bid book—as seen
in South Africa, but not as dramatic as South Africa, with an average of 41% increase per
stadium. The total overrun was just over 2.5 billion real. Estadio Mineirao actually was cheaper
at the end, with a 7% decrease in costs, while Estadio Castelao was statistically even on cost.
72Estádio Olímpico is a multipurpose stadium that hosted soccer games during the Olympics. It
also hosted the all of the track and field events, except for the marathon and race walking events.
Avdellas 47
Overall, three stadiums nearly doubled in cost: Arena Pantanal (88% increase), Arena de
Baixada (95% increase), Estadio Nacional Mane Garrincha (101% increase). This increase is
significantly less than the South African data, but overall the cost of the stadiums were higher in
Brazil. Thus Brazil has more accurately budgeted the World Cup for 2014. However, Brazil
spent on average 711 million Brazillian Real per stadium (341 million USD) while South Africa
spent 1.598 billion rand per stadium (180 million USD). This nearly twofold increase is not due
to inflation, as both the Real and the Rand stayed fairly consistent in relation to the US dollar
from 2004 to 2014, with both experiencing the same devaluation in late 2008 and early 2009.
Thus the impact was that Brazil had significantly more expensive stadiums, even when adjusting
for inflation and time change than South Africa.
In terms of political stability and economic impacts, Brazil has not released employment
data from the World Cup, thus there are only estimates on the impact on construction jobs per
stadium. Due to this, I cannot do the same regressions that were done on South Africa as there is
no comparable variable to replace employment data. With this lack of available data, I have
decided to merely present the data without regression analysis, and compare the raw data to the
overall consequences and changes in South Africa.
Thus when looking at the data writ large, you can see similar changes to that occurred in
South Africa. South Africa as a whole had GDP growth of 22.63% from the World Cup bid to
the event, while Brazil experienced a 28.39% growth in their period from the bid to the World
Cup. In terms of provincial growth, the regions with stadiums had an average of 25.76% growth
in Brazil, while in South Africa, they had a 22.57% growth. The deviation between scores can be
attributed to the fact that nine of South Africa’s ten provinces were used for stadiums—with
Northern Cape, the least populated and smallest economic province—being excluded, while
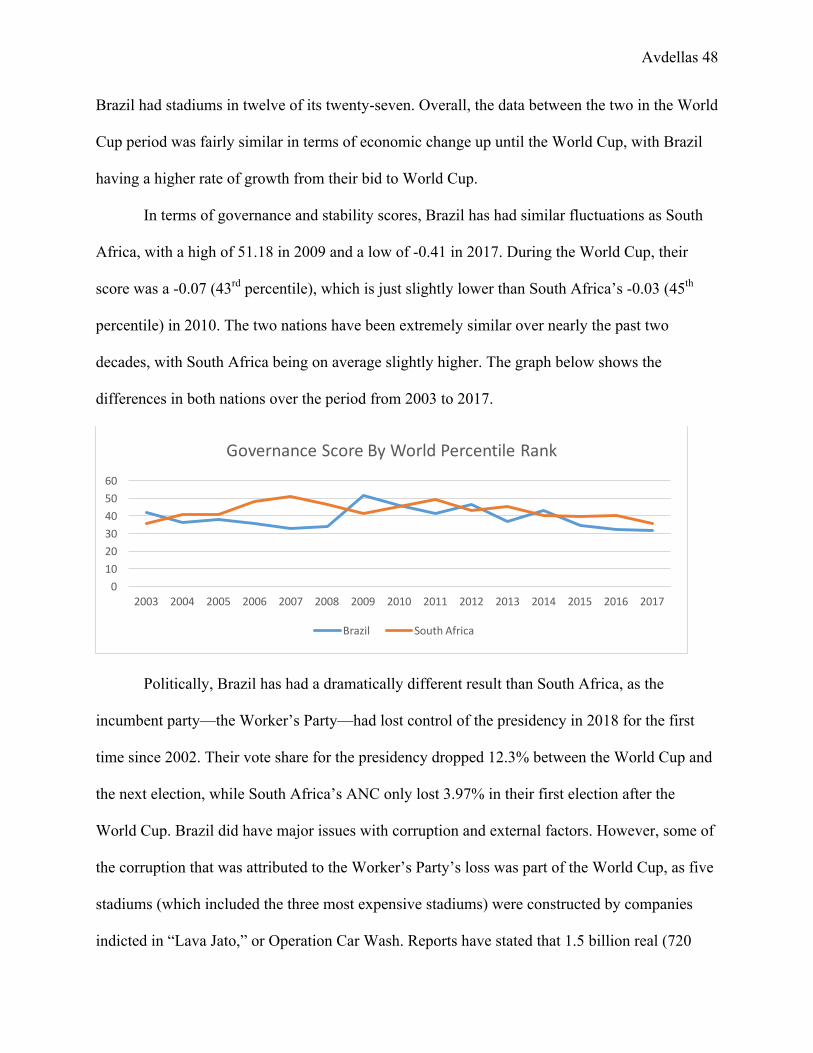
Avdellas 48
Brazil had stadiums in twelve of its twenty-seven. Overall, the data between the two in the World
Cup period was fairly similar in terms of economic change up until the World Cup, with Brazil
having a higher rate of growth from their bid to World Cup.
In terms of governance and stability scores, Brazil has had similar fluctuations as South
Africa, with a high of 51.18 in 2009 and a low of -0.41 in 2017. During the World Cup, their
score was a -0.07 (43rd percentile), which is just slightly lower than South Africa’s -0.03 (45th
percentile) in 2010. The two nations have been extremely similar over nearly the past two
decades, with South Africa being on average slightly higher. The graph below shows the
differences in both nations over the period from 2003 to 2017.
Politically, Brazil has had a dramatically different result than South Africa, as the
incumbent party—the Worker’s Party—had lost control of the presidency in 2018 for the first
time since 2002. Their vote share for the presidency dropped 12.3% between the World Cup and
the next election, while South Africa’s ANC only lost 3.97% in their first election after the
World Cup. Brazil did have major issues with corruption and external factors. However, some of
the corruption that was attributed to the Worker’s Party’s loss was part of the World Cup, as five
stadiums (which included the three most expensive stadiums) were constructed by companies
indicted in “Lava Jato,” or Operation Car Wash. Reports have stated that 1.5 billion real (720
0
10
20
30
40
50
60
2003 2004 2005 2006 2007 2008 2009 2010 2011 2012 2013 2014 2015 2016 2017
GovernanceScoreByWorldPercentileRank
Brazil SouthAfrica
Avdellas 49
million USD) derived from these five stadiums were for fraudulent payments to the companies
and government officials.73 Sergio Cabral, the former governor of Rio de Janeiro state, was
arrested and sentenced to 14 years in prison for accepting $64 million in bribes connected to
construction for the World Cup.74 This direct connection—while not the only instance of
corruption—shows how the World Cup may have influenced governance in Brazil after the
World Cup.
BRAZIL’S STADIUMS:
Brazil built seven new stadiums, while renovating five stadiums for the 2014 World Cup.
In total, the twelve stadiums—in twelve distinct regions—created a World Cup that was
regionally distributed, but incurred long distances between matches for teams. This ensured that
all of Brazil could be a part of the World Cup, but left many stadiums in low population areas.
The World Cup was well attended, with over 3.4 million total fans and over 98% of seats
filled on average for the tournament. This is higher than South Africa, who averaged just under
93% for the tournament overall. The lowest attended stadium—Arena Pernambuco—still filled
over 96% of their seats on average, compared to South Africa’s lowest stadium of just over 80%.
Brazil’s World Cup had the second most fans total, with approximately 120,000 fans fewer than
the United States World Cup in 1994. In total, the World Cup for Brazil, in terms of the actual
event, was fairly successful.
As a more soccer friendly nation, Brazil’s stadiums are for the most part still used by
major clubs, as Brazil’s Campeonato Brasileiro Série A, is one of the most competitive club
leagues in the world. Thus their stadiums, aside from Arena de Amazonia—the most criticized
73 “Arenas Da Propina.” 74 Felter and Cara Labrador, “Brazil’s Corruption Fallout.”
Avdellas 50
stadium, have at least one tenant. Seven of the eleven remaining stadiums have a Série A team as
a tenant, while Estadio Nacional Mane Garrincha hosts the Brazilian national team. Brazil’s
stadiums, much like South Africa’s, are fairly well used after the World Cup. The Arena de
Amazonia, which was built in the rainforest in a site with limited access. The expenses for the
stadium nearly triple the revenue, and this has been seen by the international media as one of the
largest “white elephants” in terms of modern construction pieces.75
Overall, South Africa’s World Cup has been seen as more positive by the international
community. Brazil’s stadiums are consistently mentioned as “white elephants,” especially with
the need to build new stadiums for the Olympics even after the construction of the World Cup
stadium, while South Africa’s have lost that terminology. This could be due to a recency bias, as
Brazil’s World Cup was the focus preceding the 2018 Russian World Cup. The dramatically
higher costs in total ($4.09 billion) compared to South Africa’s $1.8 billion also factor into the
disparity between the two games, as the fact that the event—without a change in the number of
teams competing or any major inflationary factors—had more than doubled the cost of the
previous World Cup. South Africa, just four years earlier, built essentially six new stadiums and
renovated four for less than half of the cost that Brazil built seven new stadiums and renovated
five. This number does not include infrastructure spending, which Brazil also outpaced South
Africa in. Thus with the dramatic differences in stadium spending alone, we can see stark
differences between the two similar nations.
Brazil also has hosted the World Cup before, as it was the host nation in 1950 and
currently is one of only five nations to host the World Cup twice, along with Italy, France,
Germany, and Mexico. South America has also hosted the World Cup five times, from Uruguay
75 Powell, Michael, “in the Brazillian Rain Forest, ‘a White Elephant, a Big One’”
Avdellas 51
hosting the first World Cup in 1930, along with Chile and Argentina in 1962 and 1978
respectively. Thus, Brazil would gain less prestige from hosting the World Cup than a nation
like South Africa, who has not had any of the major international mega sporting events on their
continent. This indicates that the geopolitical and soft power gains that could be achieved via a
World Cup would be less than South Africa’s. In addition, the two events in a two-year period:
with the World Cup in summer 2014 and the Olympic games in summer 2016, lead to a
lessening of the impact as well. If the goal of an international mega sporting event is to prove
legitimacy for the nation, then there is no need for a second event in that short of a time period to
prove this to the international community. Thus the effects of the World Cup were reduced by
the subsequent Olympic games.
Overall, the significantly higher costs from the World Cup in Brazil, along with the
heightened international media focus on stadiums like the Arena de Amazonia, the government
turnover and corruption, and the reduced geopolitical impact, make the South African World
Cup more successful when examined in terms of both economic and political legacies.
Avdellas 52
SECTION VIII: CONCLUSION
I have completed a regression analysis of the GDP change per region, and compared it to
the costs of the stadium and the amount of employed workers for the eight provinces that had a
stadium built, as well as the nation at large. I have left Northern Cape isolated, as they were the
lone province that did not have a stadium used for competition. I ran three different models: one
with the total GDP change from 2001 to 2013, one from the year of the bid to the year of the
competition (2004-2010) and one from the bid to two years after to see the greater impact two
years removed from the World Cup (2004-2012).
Additionally, I have looked at this data compared to the seats changed by the incumbent
party in the South African parliament. Over the past three decades, the same party—the African
National Congress (ANC) has dominated the political landscape of South Africa. The ANC has
won every national election since Apartheid fell and the voting system was integrated. However,
there has been a tremendous amount of fluctuations in the number of votes that the ANC has
received, which serves as the key indicator in the data set.
There have been other political factors outside of the World Cup that have affected voting
patterns, but the World Cup was a major economic investment for the nation at large. Total
spending by the federal government, including security, infrastructure, and the ten stadiums
constructed, cost over 30 billion rand, with the vast majority going towards stadium construction
and transportation infrastructure (9.841 billion rand and 11.728 billion rand respectively). The
South African government stated that the infrastructure investment was needed to improve the
nation, and that the World Cup merely shortened the timeframe for completing these projects.
The government states that these projects will continue to be a long term investment, as the
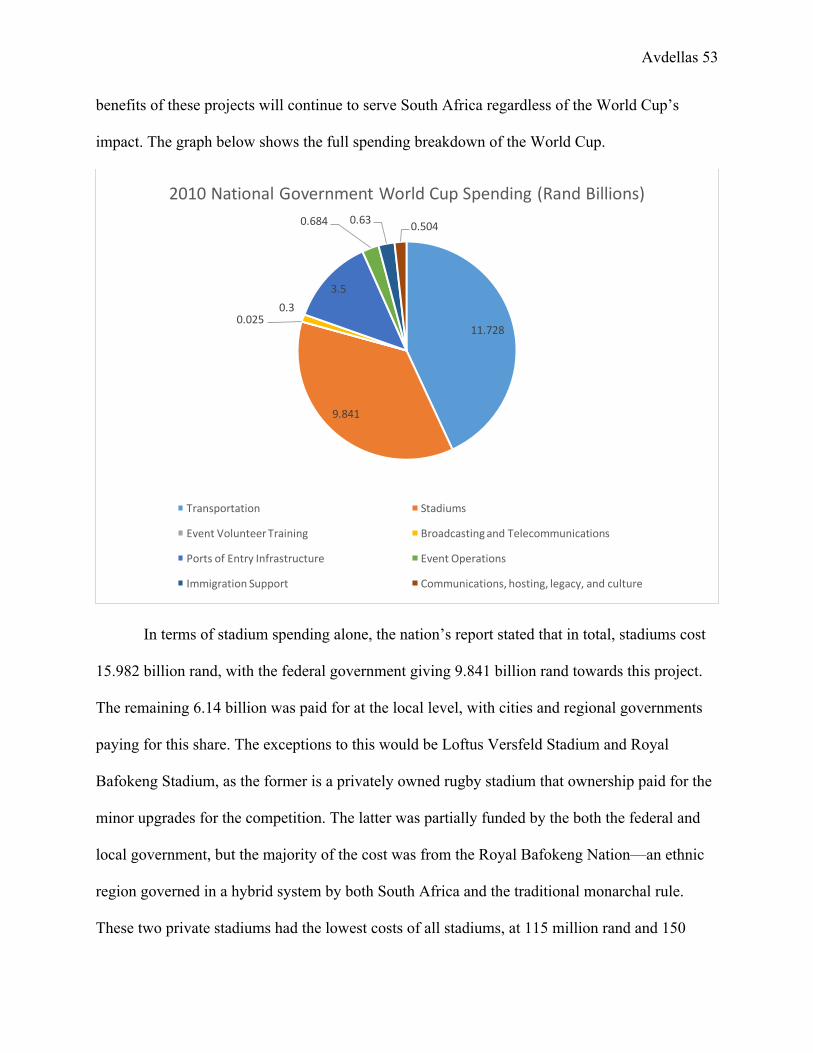
Avdellas 53
benefits of these projects will continue to serve South Africa regardless of the World Cup’s
impact. The graph below shows the full spending breakdown of the World Cup.
In terms of stadium spending alone, the nation’s report stated that in total, stadiums cost
15.982 billion rand, with the federal government giving 9.841 billion rand towards this project.
The remaining 6.14 billion was paid for at the local level, with cities and regional governments
paying for this share. The exceptions to this would be Loftus Versfeld Stadium and Royal
Bafokeng Stadium, as the former is a privately owned rugby stadium that ownership paid for the
minor upgrades for the competition. The latter was partially funded by the both the federal and
local government, but the majority of the cost was from the Royal Bafokeng Nation—an ethnic
region governed in a hybrid system by both South Africa and the traditional monarchal rule.
These two private stadiums had the lowest costs of all stadiums, at 115 million rand and 150
11.728
9.841
0.0250.3
3.5
0.684 0.630.504
2010NationalGovernmentWorldCupSpending(RandBillions)
Transportation Stadiums
EventVolunteerTraining BroadcastingandTelecommunications
PortsofEntryInfrastructure EventOperations
ImmigrationSupport Communications,hosting,legacy,andculture
Avdellas 54
million rand, respectively.76 Based upon budgeting estimates from South Africa, the total spent
on the World Cup by the federal government is equivalent to 80% of the national defense budget
and more than allocated for numerous sections, including social security, provincial welfare
services, HIV and Aids support, and environmental protection. In official government documents
describing the tax revenue and budget for 2010, they use a soccer ball as the center of the
descriptive chart with the spending breakdowns, showing that at the national level, this
tournament was the focus and pride of the nation.77 The government fully embraced the World
Cup as a means of soft power, and thus this spending was perceived to be an investment in the
future of South Africa.
Instead of utilizing the World Cup as a means of increasing tax revenue, South Africa
created numerous tax exemptions that allowed FIFA and all national associations (other than
SAFA) to operate under tax free conditions. Commercial affiliates, such licensees, broadcasters,
merchandising partners, and other FIFA-designated service providers also received some tax
exemptions for certain World Cup related goods. This legislation was passed specifically for the
World Cup, as the period of time that was covered was the 2009 Confederation’s Cup and then a
five-week period, beginning one week before the first kickoff of the 2010 World Cup and ending
the night of the championship game.78 FIFA, as a “non commercial, not for profit” organization
claims to not request tax exemptions or an easing of customs79 for the World Cup, but these
benefits are almost always granted for the event, as there is an individual section in each of the
76 Molloy and Chetty, “The Rocky Road to Legacy.” 77 “2010 South African Budget.” 78 “1512. 2010 FIFA World Cup South Africa.” 79 FIFA, “FAQ: Setting the Record Straight.”
Avdellas 55
bids within the FIFA Inspection Report that discusses the tax-free status.80 FIFA operates on a
four year budget schedule, with the year of the World Cup being the conclusion of a cycle. Thus,
FIFA put its official report out in June 2011 for the previous four years. FIFA was able to profit
nearly $631 million, with a total revenue of 4.189 billion and expenditure of 3.558 billion during
that period, with $3.48 billion in revenue coming from the broadcasting and marketing rights for
the 2010 World Cup alone.81
When looking at the South African 2010 World Cup, the conclusions must be done in
three separate aspects: the quantifiable political economy aspect, the internal social cohesion and
perception factor, and finally the soft power, international relations dynamic. These areas, when
combined, paint a clearer picture of the total effect of hosting the World Cup for South Africa.
First, we must examine the quantifiable economic data. In the five regressions that
analyzed the impacts of stadium construction costs, employment, GDP growth, and seat change,
we saw no relation between seat change and GDP change, total stadium cost, or employment
created by the stadiums. The data points are limited, as there are only nine provinces with ten
stadiums over a short period of time, however, we can assume from this that there is not a
significant relationship between political stability and the World Cup. This betrays my initial
reactions, as I would assume that the loss of votes consistently over the three elections would
have some relation to the World Cup spending, as the ANC peaked at 69.6% in 2004, just before
the World Cup bid was officially announced and then fell by 3.798% and 3.746% in the next two
elections nationwide.
80 FIFA, “2010 Inspection Report for the FIFA World Cup.” 81 FIFA, “FIFA Financial Report 2010.”
Avdellas 56
I do, however, think the most significant event is at a local level. Gauteng, the smallest
yet most populous province in South Africa, had three stadiums for the World Cup: First
National Bank Stadium, Ellis Park Stadium, and Loftus Versfeld Stadium. All three were
existing stadiums that were renovated for the World Cup, at a total cost of 4.06 billion Rand,
with 61,870 employed for construction alone. This region individually had the biggest drop in
voting for the ANC, dropping by nearly ten percent from 2009 to 2014. Johannesburg, the
nation’s capitol, is seated in Gauteng, which can attribute part of this political change as it is a
smaller, more salient region, but the large difference from both the past election (a decline of
13.812% from 2004 to 2014 versus the national average of 7.544%) to the 2014 election, which
was nearly three times as large as the decline of the average, and the largest decline of any
province. In terms of usage, these three stadiums are utilized by major clubs, with FNB Stadium
being used for the South African National Team for friendlies and as the home stadium for the
Kaizer Chiefs, and Ellis Park and Louis Versfeld Stadiums being used for the nation’s premier
rugby teams. Outside of FNB Stadium, the other two Gauteng stadiums have not received the
record number of attendees since the World Cup, which expanded the capacities of all three
stadiums.
In a similar vein, the second largest decline in ANC votes from 2009 to 2014—was in
Mpumalanga, which had a newly constructed stadium for the 2010 World Cup. This stadium was
the cheapest newly constructed stadium of any of the World Cub stadiums, at 960 million Rand,
but was paid for by taxes in the region. Mpumalanga has had the largest increase in real GDP
from 2004 to 2012, at a 54% increase over that period. Yet, the stadium’s upkeep costs continue
to place a burden on tax payers. This source of discontent for a stadium that was only used for
four games during the competition, has led to a dramatic change in voting. From 2004 to 2009,
Avdellas 57
the ANC only lost .5% in votes, yet in the aftermath of the World Cup, the 2014 election showed
over a 7% decline in votes. This dramatic difference in just five years does show that there may
be some discontent within the local population when forced to bear the brunt of a stadium cost.
In terms of political stability, the nation overall has been stable, as overall the data has
been fairly consistent. During the World Cup year, the nation had a -0.03 score, which places it
at the 45th percentile in the international community. This is slightly lower than its peak of .22
(50.72 percentile rank) in 2007, but still higher than both of its low points (2003 and 2017) at
-0.31 and -0.27 respectively. Considering the impact of security on the political stability index,
along with the mass influx of tourists, this score in 2010 does show that South Africa was fairly
stable during the World Cup. Overall, the nation has fluctuated between the 35th and 45th
percentile after the World Cup. This data is not available at a regional level, as the political
stability and governance score index does not break down at a small level, so thus it could not be
included in the data set. I have attached a graph below showing the changes in political stability
in the nation from before the World Cup to 2017. This percentage change cannot be solely
attributed to the World Cup, as discussed in the election section that there are numerous other
impacting variables, but this does show a national ranking compared to the rest of the
international community. Overall, the fluctuations in data have not been tremendously large in
either direction, with the difference in world percentile rank being just over 15 percentile points.
As a comparison, the United States, United Kingdom, and Germany, which are seen as fairly
stable developed nations, have ranged by 29.76, 17.84, and 16.8 percentage points respectively.82
82 “World Governance Indicators 2018 Interactive Data Access.”
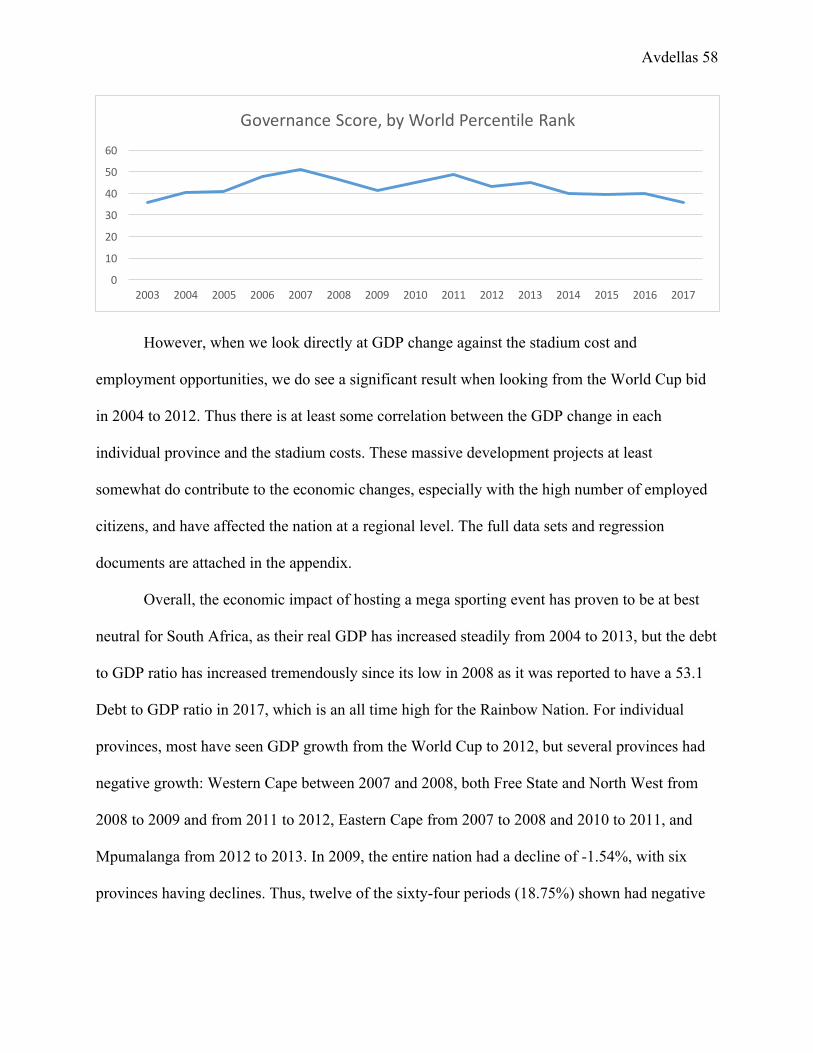
Avdellas 58
However, when we look directly at GDP change against the stadium cost and
employment opportunities, we do see a significant result when looking from the World Cup bid
in 2004 to 2012. Thus there is at least some correlation between the GDP change in each
individual province and the stadium costs. These massive development projects at least
somewhat do contribute to the economic changes, especially with the high number of employed
citizens, and have affected the nation at a regional level. The full data sets and regression
documents are attached in the appendix.
Overall, the economic impact of hosting a mega sporting event has proven to be at best
neutral for South Africa, as their real GDP has increased steadily from 2004 to 2013, but the debt
to GDP ratio has increased tremendously since its low in 2008 as it was reported to have a 53.1
Debt to GDP ratio in 2017, which is an all time high for the Rainbow Nation. For individual
provinces, most have seen GDP growth from the World Cup to 2012, but several provinces had
negative growth: Western Cape between 2007 and 2008, both Free State and North West from
2008 to 2009 and from 2011 to 2012, Eastern Cape from 2007 to 2008 and 2010 to 2011, and
Mpumalanga from 2012 to 2013. In 2009, the entire nation had a decline of -1.54%, with six
provinces having declines. Thus, twelve of the sixty-four periods (18.75%) shown had negative
0
10
20
30
40
50
60
2003 2004 2005 2006 2007 2008 2009 2010 2011 2012 2013 2014 2015 2016 2017
GovernanceScore,byWorldPercentileRank
Avdellas 59
GDP growth in the immediate impact of the World Cup. Northern Cape, the lone region without
a stadium, had a negative GDP twice in the same isolated period of eight years (25%).
The World Cup did have a tremendous impact during the four-week competition, as
South Africa reported increases in retail sales, restaurant income, credit card spending, and other
major spending areas. The issue with this effect is that tourism is a temporary increase that
inflates the statistics during the competition. Despite the short term increase, as the competition
was less than a decade ago, the negative consequences of these stadiums can be seen. However,
if South Africa would host another mega sporting event, which has been shown in their attempts
to bid for the 2023 Women’s World Cup, it could repurpose its existing stadiums for this purpose
without major infrastructure or construction costs. However, this is not a guarantee at all for the
future and South Africa needs to be able to support these massive structures internally without
the dependence on the international sporting community.
Outside of the economic effects, there are two major political effects: domestic and
international. We can see that the political leaders of South Africa had hoped to use the World
Cup to increase domestic tranquility and to increase their soft power relationship in the
international community.
In terms of domestic policy, we must look at the two factors: social cohesion and self-
image, with both stemming from the marred historic past of South Africa. Leaders used the 2010
World Cup to prove that there was not a divide in the population. The bid was announced just a
decade after the fall of apartheid so these wounds were still fresh. As seen with the media, there
were initial fears of civil unrest, with threats of violence and racial tensions, but this was
ultimately wrong, as the World Cup was fairly secure and well run. When looking at the self
image, we can look to SAFA President Danny Jordaan, who stated that, “For years, many South
Avdellas 60
Africans have been told that they are inferior, that they are not good enough. The nation has
crossed a huge psychological barrier.” Jordaan embodies the spirit of the national leaders, as this
is one of the domestic goals of the 2010 World Cup. The mere fact that South Africa was the first
African nation to host the mega sporting event gives a sense of national pride to the oft put down
nation.
In terms of soft power and international relations, I would conclude that South Africa was
fairly successful, especially with the increased pressure of being the first African nation to host a
World Cup. The expectations from the media, especially the Western powers, was that the event
would fail as South Africa could not handle it.
South Africa is a member of the United Nations, and was the one of charter members of
the international organization, signing on in 1945. However, for the first sixty years of the
international community, it was never elected to be a rotating member of the UN Security
Council, which is one of the highest levels of international recognition that a nation could get.
There is a designated rotating spot on the council for Africa, so it was not seen as a regional
power on the continent. Since it was awarded the World Cup in 2004, it has been elected to the
Security Council three times, serving from 2006-2008, from 2010-2012, and is currently serving
from 2018 until the end of 2020. It may be just coincidence, as South Africa did have issues with
apartheid tainting its image to the international community and was largely isolationist before the
turn of the 21st Century, but they were elected for their first term two years after their bid was
confirmed. This may be due to South Africa wanting to take a bigger role in the international
community and the World Cup could be part of the same pattern, but also shows the newfound
legitimacy that the international community perceives of South Africa.
Avdellas 61
When focusing on just the “showcase effect,” alone we can see the potential for
international recognition for South Africa. 52 of the 64 matches had over 50 million viewers in
the 11 major markets, including the United States, United Kingdom, Germany, and Italy, along
with an average of 70 million viewers per match internationally. The event was, at the time, the
largest period of sustained activity in Twitter’s history, with an average of 750 tweets per second
during the competition.83 The international media, with large publications in both the United
States and the United Kingdom, considered the World Cup to be a success, despite their initial
fears of not only a poorly run event, but an unsafe event. With this seal of approval by “western
media” sources, South Africa has gained a new position in the international community. These
factors, at least at the surface level, indicate that South Africa’s goal of gaining international
awareness via the World Cup was successful.
When looking at all three outcomes from the World Cup: the political economy, the
domestic social effects, and the international relations conclusions, I would say that the World
Cup for South Africa achieved its goal that was set out by its political leaders. Thus my initial
hypothesis was partially incorrect, as I expected that mega construction in developing nations
would have a negative effect on the political and economic climate. South Africa proved that it
could hold a successful mega sporting event, while breaking free of the traditional imagery that
its leaders believed shackled the nation. South Africa—despite the economic effects that
continue to linger—has emerged from the World Cup in a better role politically. In the aftermath
of the World Cup and on the international stage, President Mbeki was correct: Africa’s time has
finally come.
83 Sport and Recreation Department, “2010 Fifa World Cup Country Report.”
Avdellas 62
SECTION IX: FURTHER WORKS
Looking at South Africa in a macro context, we can examine this mega construction
project as just one of many large scale building project in the Global South. These projects have
merit, despite both their high initial construction costs and the long lasting cost of maintaining
these after construction, that can lead to increase political legitimacy, both domestically and in
the international community.
To compare this to other building projects, the South African government funded
approximately 28.5 billion rand in multiple areas, with over 6 billion rand spent by city
governments and private organizations on the stadiums alone. This total, 34.6 billion rand, is
approximately $3.9 billion USD in total investment. In terms of comparable mega construction
projects in the developing world, there are very few that compare to the total cost of a World
Cup, since it is ten stadiums and massive upgrades to infrastructure and ports. However, if seen
as individual projects, such as just the infrastructure ($1.3 billion) or individual stadiums—
ranging from $12 million to $507 million, we can compare them to other projects in the
developing world. These individual pieces, which did total a significant amount, must be looked
at in this manner, as the total cost can only be compared to other mega sporting events, such as
the 2014 World Cup or Olympic Games. When looking at the individual and regional level, the
conclusions drawn in this thesis can be expanded.
In looking at the political effects of these construction projects, it is tough to separate the
emotional effects of the sport from these stadiums, as other upgrades in the developing world,
such as dams and railways, may have more practicality but do not have the inherent national
pride that is part of a global sporting event. In this manner, I would say that sporting events are
unique. That is, these events may be less necessary, if even necessary at all, but they evoke
Avdellas 63
feelings that a dam could not. The non-quantifiable factors that were gained from not only seeing
the Bafana Bafana compete at an international level, but compete in stadiums built by South
Africans for South Africa cannot be overstated.
If further research was to be done on South Africa, I would want to examine the effects of
the infrastructure system, as this was supposed to be the necessary part for the future, while the
stadiums primary purpose was for the single event. The success and failures of the upgraded
infrastructure, which the government claimed was aged and needed repaired could be a major
point of study for future analysis. In doing this analysis with the combined parts on the
infrastructure development, it could lend further credence to the World Cup as a success, as the
World Cup was not only a success in terms of soft power relations and domestic stability, but
also a catalyst for true infrastructure upgrades within the nation.
This research can be applied to the future of developing nations hosting mega sporting
events, as numerous developing nations are bidding for future Olympics and World Cups.
Nations on both ends of the political and economic spectrum, from “Western” nations like the
United States to places such as the hinted joint bid from North and South Korea. If we can apply
not only the economic indicators, but the soft power and geopolitical effects on these nations, we
can identify whether a nation can successfully parlay hosting a mega sporting event into greater
international recognition and a more balanced geopolitical landscape.
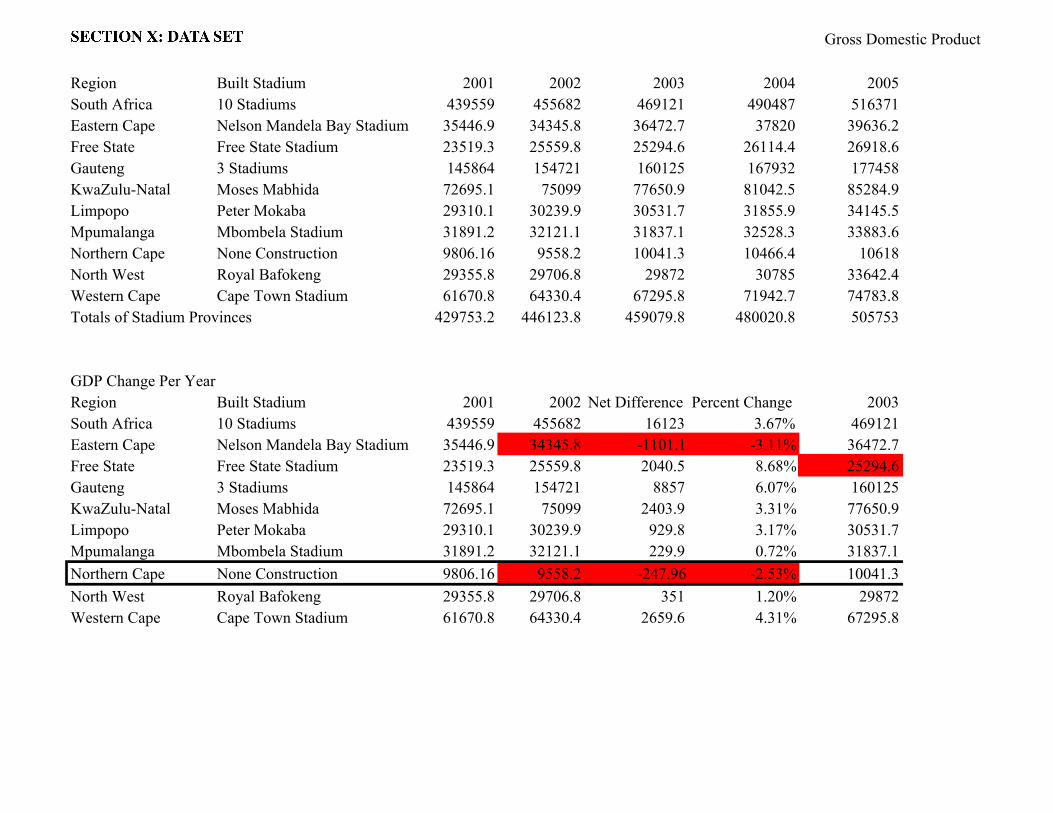
Gross Domestic Product
Region Built Stadium 2001 2002 2003 2004 2005South Africa 10 Stadiums 439559 455682 469121 490487 516371Eastern Cape Nelson Mandela Bay Stadium 35446.9 34345.8 36472.7 37820 39636.2Free State Free State Stadium 23519.3 25559.8 25294.6 26114.4 26918.6Gauteng 3 Stadiums 145864 154721 160125 167932 177458KwaZulu-Natal Moses Mabhida 72695.1 75099 77650.9 81042.5 85284.9Limpopo Peter Mokaba 29310.1 30239.9 30531.7 31855.9 34145.5Mpumalanga Mbombela Stadium 31891.2 32121.1 31837.1 32528.3 33883.6Northern Cape None Construction 9806.16 9558.2 10041.3 10466.4 10618North West Royal Bafokeng 29355.8 29706.8 29872 30785 33642.4Western Cape Cape Town Stadium 61670.8 64330.4 67295.8 71942.7 74783.8Totals of Stadium Provinces 429753.2 446123.8 459079.8 480020.8 505753
GDP Change Per YearRegion Built Stadium 2001 2002 Net Difference Percent Change 2003South Africa 10 Stadiums 439559 455682 16123 3.67% 469121Eastern Cape Nelson Mandela Bay Stadium 35446.9 34345.8 -1101.1 -3.11% 36472.7Free State Free State Stadium 23519.3 25559.8 2040.5 8.68% 25294.6Gauteng 3 Stadiums 145864 154721 8857 6.07% 160125KwaZulu-Natal Moses Mabhida 72695.1 75099 2403.9 3.31% 77650.9Limpopo Peter Mokaba 29310.1 30239.9 929.8 3.17% 30531.7Mpumalanga Mbombela Stadium 31891.2 32121.1 229.9 0.72% 31837.1Northern Cape None Construction 9806.16 9558.2 -247.96 -2.53% 10041.3North West Royal Bafokeng 29355.8 29706.8 351 1.20% 29872Western Cape Cape Town Stadium 61670.8 64330.4 2659.6 4.31% 67295.8
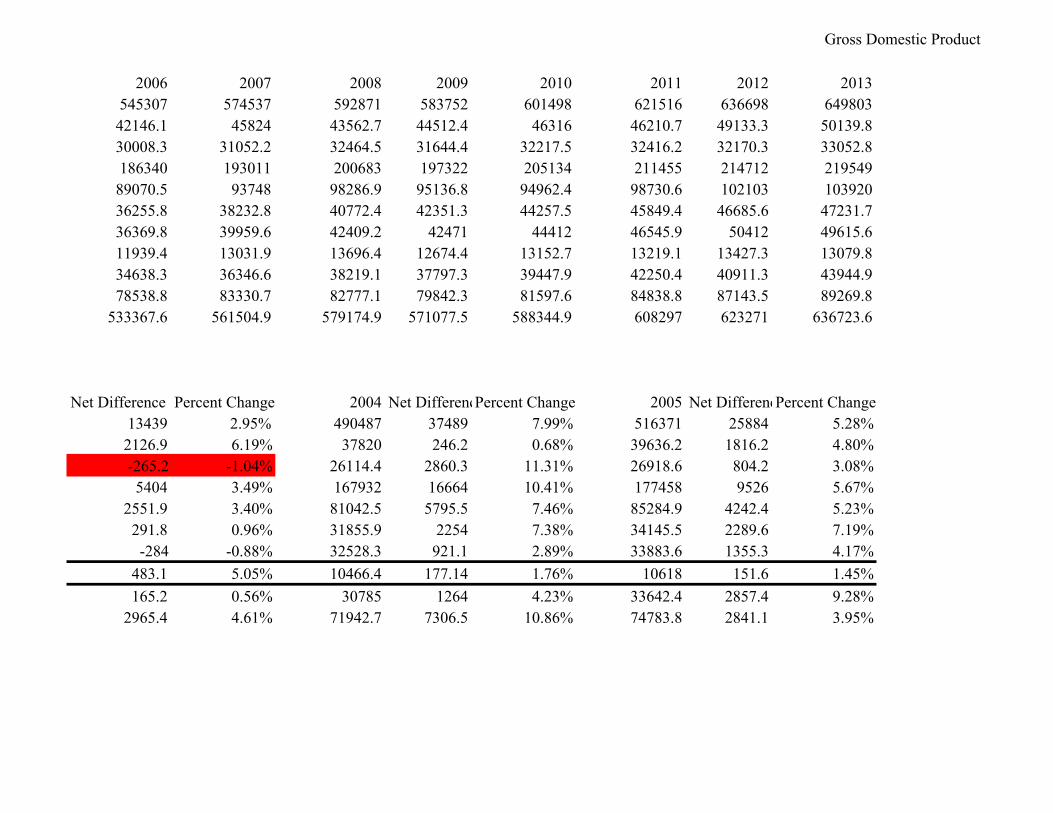
Gross Domestic Product
2006 2007 2008 2009 2010 2011 2012 2013545307 574537 592871 583752 601498 621516 636698 64980342146.1 45824 43562.7 44512.4 46316 46210.7 49133.3 50139.830008.3 31052.2 32464.5 31644.4 32217.5 32416.2 32170.3 33052.8186340 193011 200683 197322 205134 211455 214712 21954989070.5 93748 98286.9 95136.8 94962.4 98730.6 102103 10392036255.8 38232.8 40772.4 42351.3 44257.5 45849.4 46685.6 47231.736369.8 39959.6 42409.2 42471 44412 46545.9 50412 49615.611939.4 13031.9 13696.4 12674.4 13152.7 13219.1 13427.3 13079.834638.3 36346.6 38219.1 37797.3 39447.9 42250.4 40911.3 43944.978538.8 83330.7 82777.1 79842.3 81597.6 84838.8 87143.5 89269.8
533367.6 561504.9 579174.9 571077.5 588344.9 608297 623271 636723.6
Net Difference Percent Change 2004 Net DifferencePercent Change 2005 Net DifferencePercent Change13439 2.95% 490487 37489 7.99% 516371 25884 5.28%2126.9 6.19% 37820 246.2 0.68% 39636.2 1816.2 4.80%-265.2 -1.04% 26114.4 2860.3 11.31% 26918.6 804.2 3.08%5404 3.49% 167932 16664 10.41% 177458 9526 5.67%
2551.9 3.40% 81042.5 5795.5 7.46% 85284.9 4242.4 5.23%291.8 0.96% 31855.9 2254 7.38% 34145.5 2289.6 7.19%-284 -0.88% 32528.3 921.1 2.89% 33883.6 1355.3 4.17%
483.1 5.05% 10466.4 177.14 1.76% 10618 151.6 1.45%165.2 0.56% 30785 1264 4.23% 33642.4 2857.4 9.28%
2965.4 4.61% 71942.7 7306.5 10.86% 74783.8 2841.1 3.95%
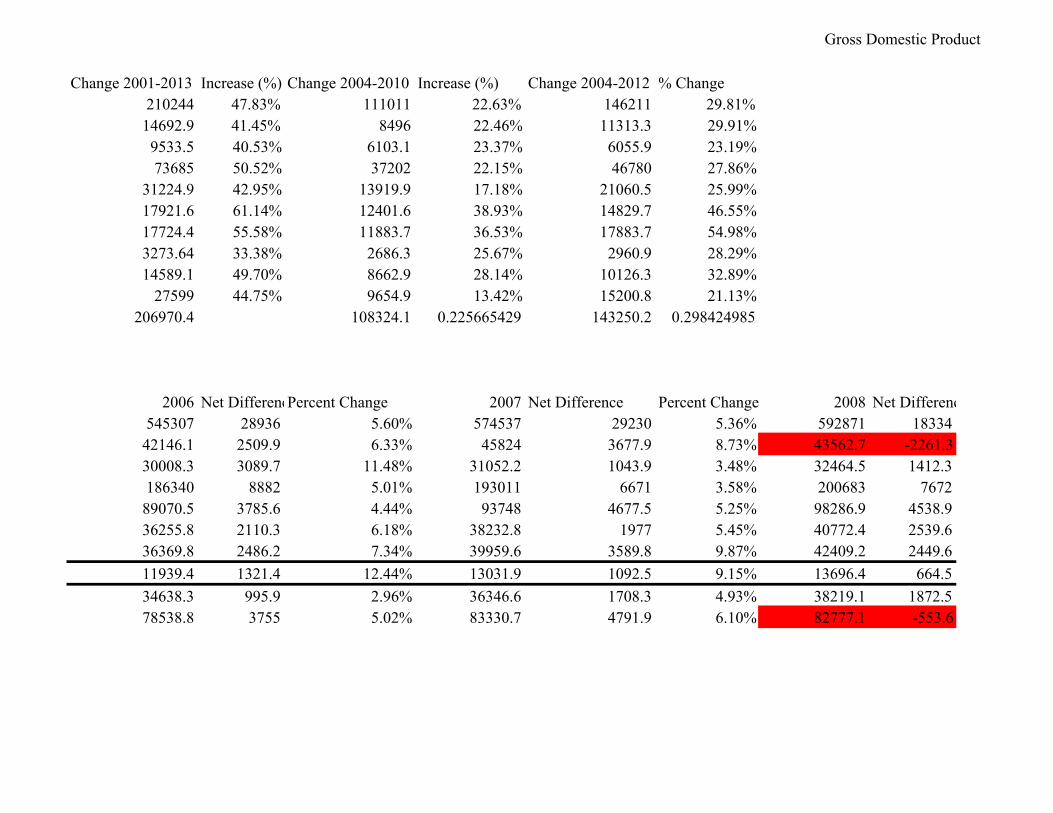
Gross Domestic Product
Change 2001-2013 Increase (%) Change 2004-2010 Increase (%) Change 2004-2012 % Change210244 47.83% 111011 22.63% 146211 29.81%14692.9 41.45% 8496 22.46% 11313.3 29.91%9533.5 40.53% 6103.1 23.37% 6055.9 23.19%73685 50.52% 37202 22.15% 46780 27.86%
31224.9 42.95% 13919.9 17.18% 21060.5 25.99%17921.6 61.14% 12401.6 38.93% 14829.7 46.55%17724.4 55.58% 11883.7 36.53% 17883.7 54.98%3273.64 33.38% 2686.3 25.67% 2960.9 28.29%14589.1 49.70% 8662.9 28.14% 10126.3 32.89%
27599 44.75% 9654.9 13.42% 15200.8 21.13%206970.4 108324.1 0.225665429 143250.2 0.298424985
2006 Net DifferencePercent Change 2007 Net Difference Percent Change 2008 Net Difference545307 28936 5.60% 574537 29230 5.36% 592871 1833442146.1 2509.9 6.33% 45824 3677.9 8.73% 43562.7 -2261.330008.3 3089.7 11.48% 31052.2 1043.9 3.48% 32464.5 1412.3186340 8882 5.01% 193011 6671 3.58% 200683 767289070.5 3785.6 4.44% 93748 4677.5 5.25% 98286.9 4538.936255.8 2110.3 6.18% 38232.8 1977 5.45% 40772.4 2539.636369.8 2486.2 7.34% 39959.6 3589.8 9.87% 42409.2 2449.611939.4 1321.4 12.44% 13031.9 1092.5 9.15% 13696.4 664.534638.3 995.9 2.96% 36346.6 1708.3 4.93% 38219.1 1872.578538.8 3755 5.02% 83330.7 4791.9 6.10% 82777.1 -553.6
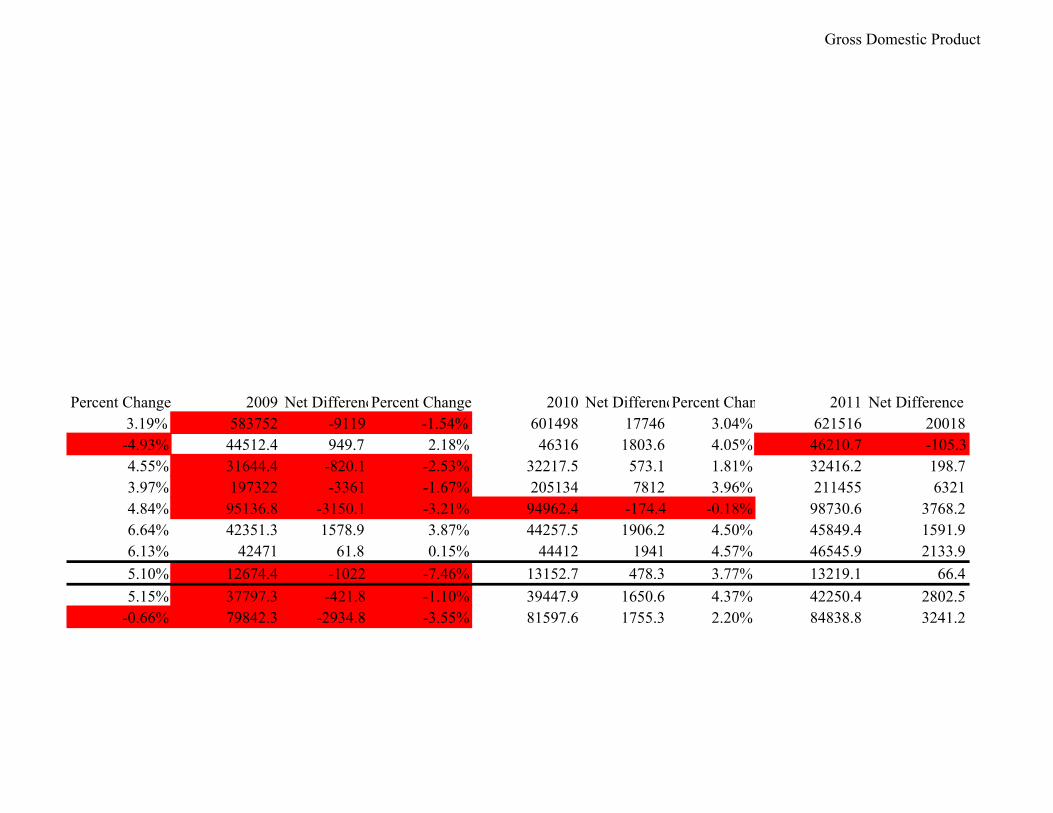
Gross Domestic Product
Percent Change 2009 Net DifferencePercent Change 2010 Net DifferencePercent Change 2011 Net Difference3.19% 583752 -9119 -1.54% 601498 17746 3.04% 621516 20018-4.93% 44512.4 949.7 2.18% 46316 1803.6 4.05% 46210.7 -105.34.55% 31644.4 -820.1 -2.53% 32217.5 573.1 1.81% 32416.2 198.73.97% 197322 -3361 -1.67% 205134 7812 3.96% 211455 63214.84% 95136.8 -3150.1 -3.21% 94962.4 -174.4 -0.18% 98730.6 3768.26.64% 42351.3 1578.9 3.87% 44257.5 1906.2 4.50% 45849.4 1591.96.13% 42471 61.8 0.15% 44412 1941 4.57% 46545.9 2133.95.10% 12674.4 -1022 -7.46% 13152.7 478.3 3.77% 13219.1 66.45.15% 37797.3 -421.8 -1.10% 39447.9 1650.6 4.37% 42250.4 2802.5
-0.66% 79842.3 -2934.8 -3.55% 81597.6 1755.3 2.20% 84838.8 3241.2
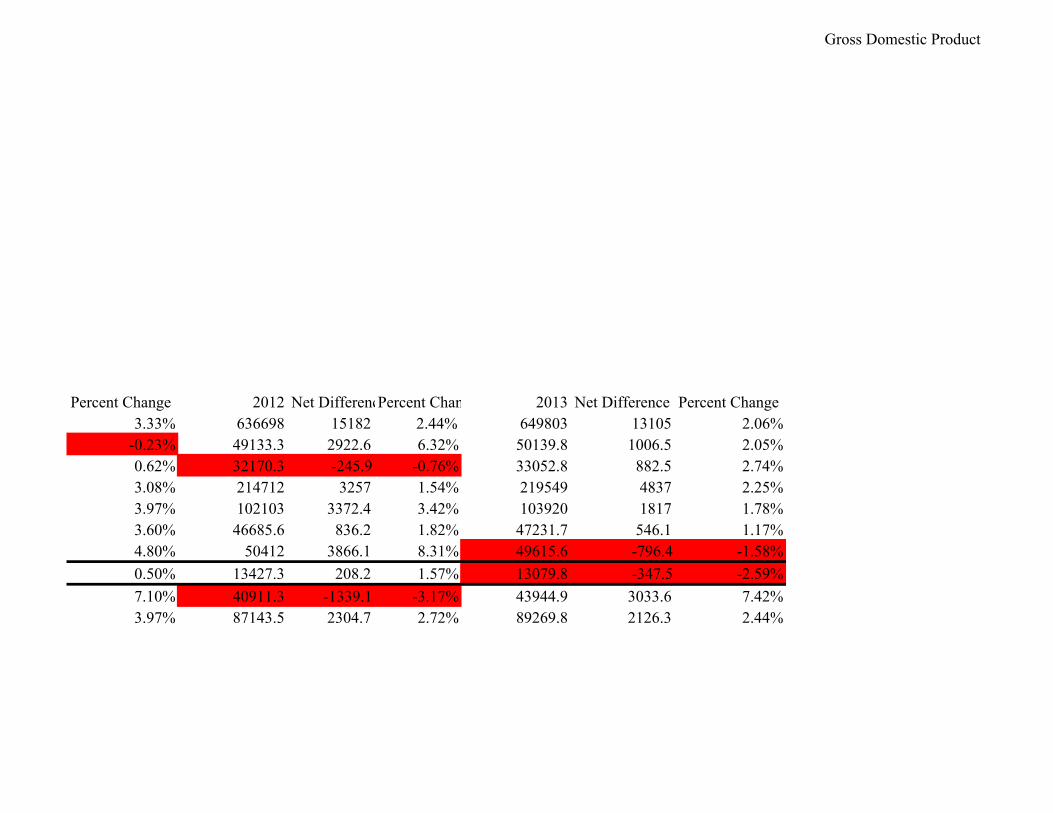
Gross Domestic Product
Percent Change 2012 Net DifferencePercent Change 2013 Net Difference Percent Change3.33% 636698 15182 2.44% 649803 13105 2.06%
-0.23% 49133.3 2922.6 6.32% 50139.8 1006.5 2.05%0.62% 32170.3 -245.9 -0.76% 33052.8 882.5 2.74%3.08% 214712 3257 1.54% 219549 4837 2.25%3.97% 102103 3372.4 3.42% 103920 1817 1.78%3.60% 46685.6 836.2 1.82% 47231.7 546.1 1.17%4.80% 50412 3866.1 8.31% 49615.6 -796.4 -1.58%0.50% 13427.3 208.2 1.57% 13079.8 -347.5 -2.59%7.10% 40911.3 -1339.1 -3.17% 43944.9 3033.6 7.42%3.97% 87143.5 2304.7 2.72% 89269.8 2126.3 2.44%
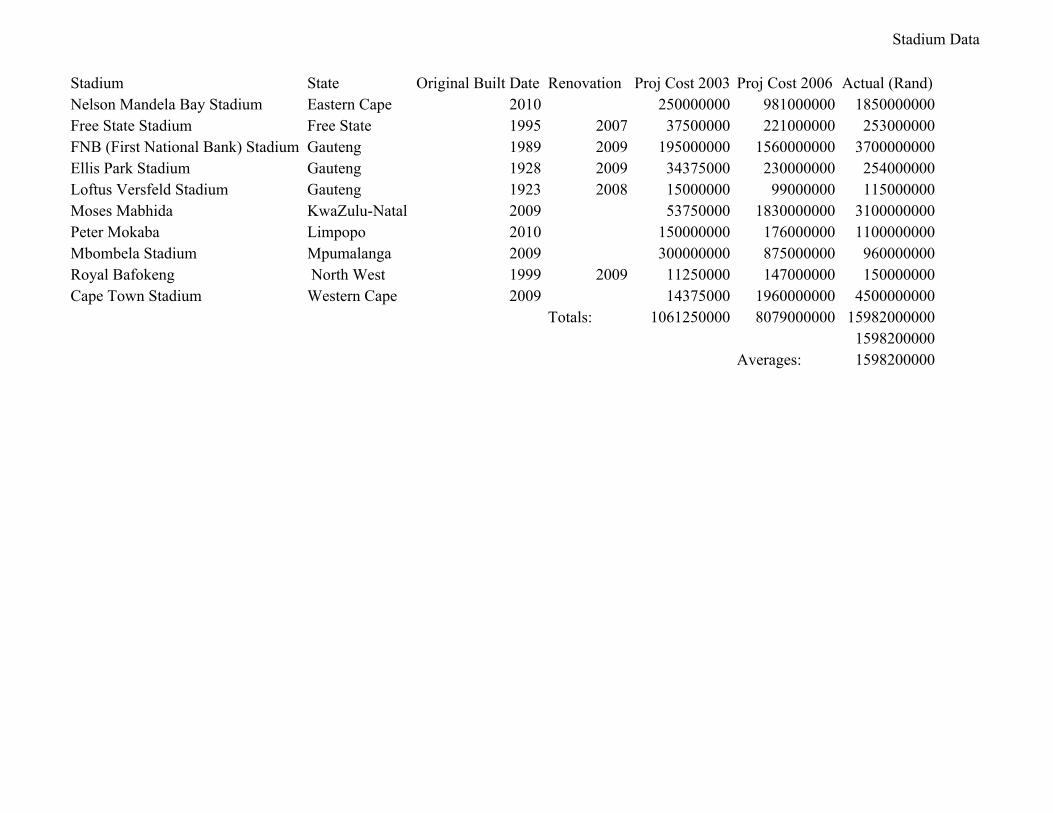
Stadium Data
Stadium State Original Built Date Renovation Proj Cost 2003 Proj Cost 2006 Actual (Rand)Nelson Mandela Bay Stadium Eastern Cape 2010 250000000 981000000 1850000000Free State Stadium Free State 1995 2007 37500000 221000000 253000000FNB (First National Bank) Stadium Gauteng 1989 2009 195000000 1560000000 3700000000Ellis Park Stadium Gauteng 1928 2009 34375000 230000000 254000000Loftus Versfeld Stadium Gauteng 1923 2008 15000000 99000000 115000000Moses Mabhida KwaZulu-Natal 2009 53750000 1830000000 3100000000Peter Mokaba Limpopo 2010 150000000 176000000 1100000000Mbombela Stadium Mpumalanga 2009 300000000 875000000 960000000Royal Bafokeng North West 1999 2009 11250000 147000000 150000000Cape Town Stadium Western Cape 2009 14375000 1960000000 4500000000
Totals: 1061250000 8079000000 159820000001598200000
Averages: 1598200000
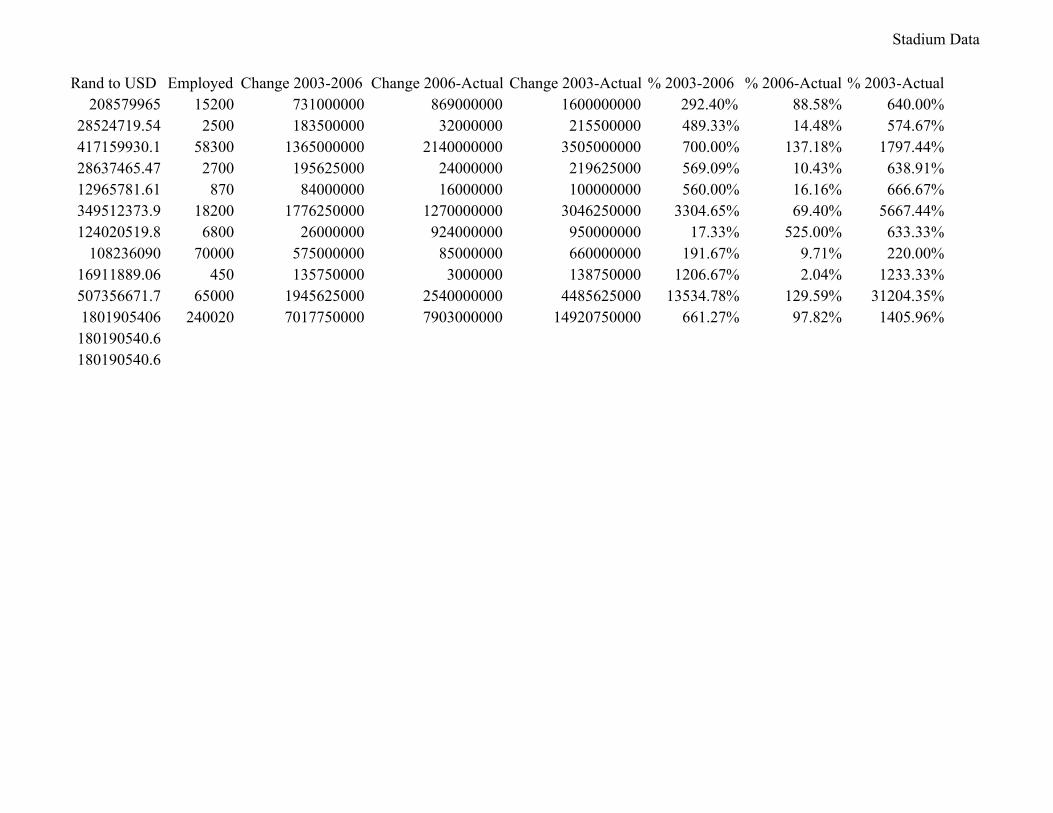
Stadium Data
Rand to USD Employed Change 2003-2006 Change 2006-Actual Change 2003-Actual % 2003-2006 % 2006-Actual % 2003-Actual208579965 15200 731000000 869000000 1600000000 292.40% 88.58% 640.00%
28524719.54 2500 183500000 32000000 215500000 489.33% 14.48% 574.67%417159930.1 58300 1365000000 2140000000 3505000000 700.00% 137.18% 1797.44%28637465.47 2700 195625000 24000000 219625000 569.09% 10.43% 638.91%12965781.61 870 84000000 16000000 100000000 560.00% 16.16% 666.67%349512373.9 18200 1776250000 1270000000 3046250000 3304.65% 69.40% 5667.44%124020519.8 6800 26000000 924000000 950000000 17.33% 525.00% 633.33%
108236090 70000 575000000 85000000 660000000 191.67% 9.71% 220.00%16911889.06 450 135750000 3000000 138750000 1206.67% 2.04% 1233.33%507356671.7 65000 1945625000 2540000000 4485625000 13534.78% 129.59% 31204.35%1801905406 240020 7017750000 7903000000 14920750000 661.27% 97.82% 1405.96%180190540.6180190540.6
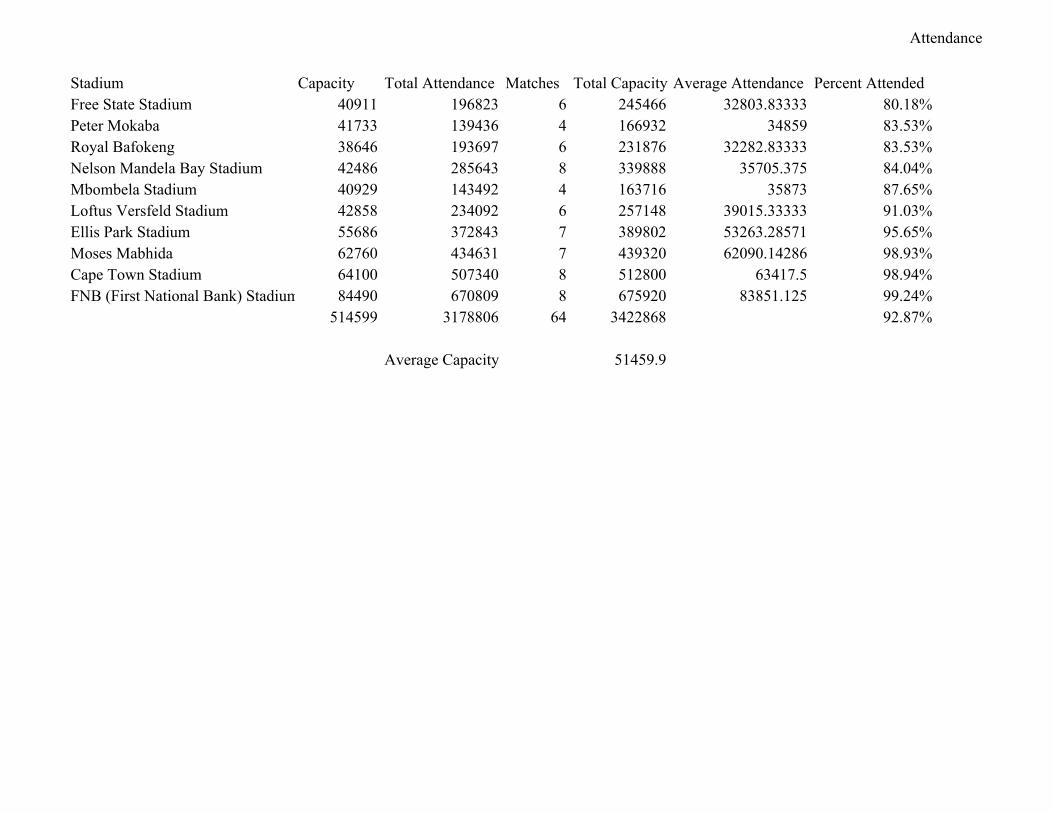
Attendance
Stadium Capacity Total Attendance Matches Total Capacity Average Attendance Percent AttendedFree State Stadium 40911 196823 6 245466 32803.83333 80.18%Peter Mokaba 41733 139436 4 166932 34859 83.53%Royal Bafokeng 38646 193697 6 231876 32282.83333 83.53%Nelson Mandela Bay Stadium 42486 285643 8 339888 35705.375 84.04%Mbombela Stadium 40929 143492 4 163716 35873 87.65%Loftus Versfeld Stadium 42858 234092 6 257148 39015.33333 91.03%Ellis Park Stadium 55686 372843 7 389802 53263.28571 95.65%Moses Mabhida 62760 434631 7 439320 62090.14286 98.93%Cape Town Stadium 64100 507340 8 512800 63417.5 98.94%FNB (First National Bank) Stadium 84490 670809 8 675920 83851.125 99.24%
514599 3178806 64 3422868 92.87%
Average Capacity 51459.9
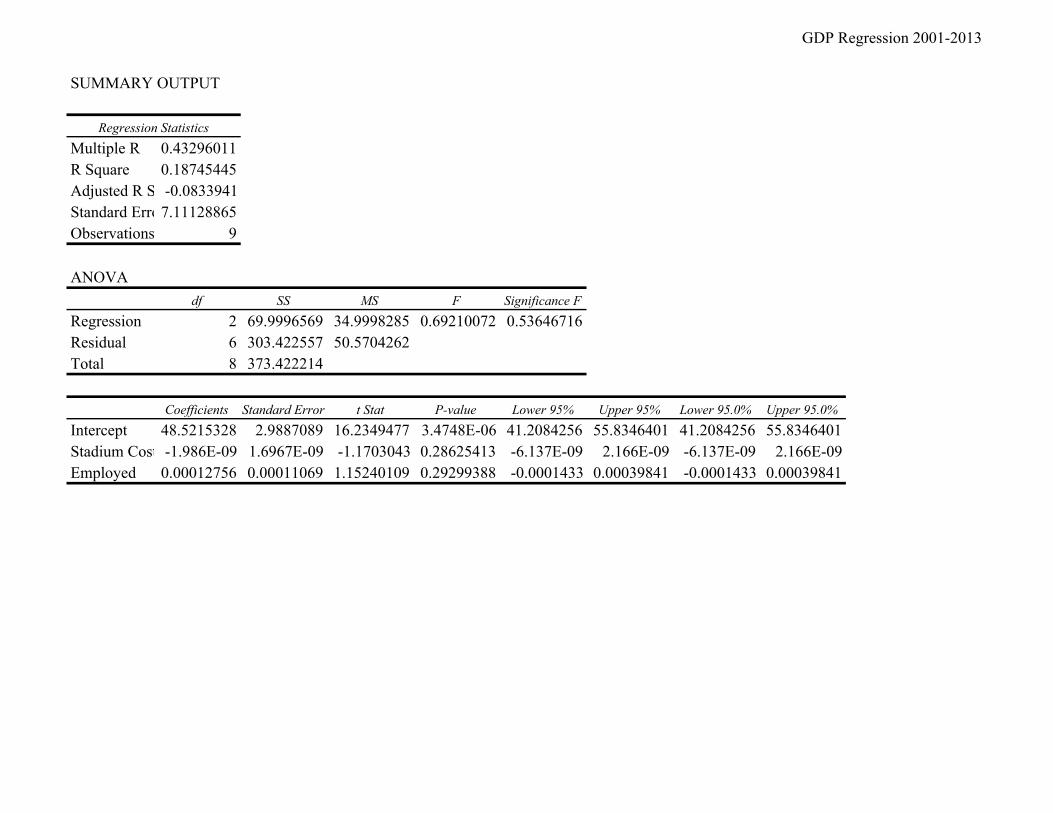
GDP Regression 2001-2013
SUMMARY OUTPUT
Regression Statistics
Multiple R 0.43296011R Square 0.18745445Adjusted R Square-0.0833941Standard Error7.11128865Observations 9
ANOVAdf SS MS F Significance F
Regression 2 69.9996569 34.9998285 0.69210072 0.53646716Residual 6 303.422557 50.5704262Total 8 373.422214
Coefficients Standard Error t Stat P-value Lower 95% Upper 95% Lower 95.0% Upper 95.0%
Intercept 48.5215328 2.9887089 16.2349477 3.4748E-06 41.2084256 55.8346401 41.2084256 55.8346401Stadium Cost -1.986E-09 1.6967E-09 -1.1703043 0.28625413 -6.137E-09 2.166E-09 -6.137E-09 2.166E-09Employed 0.00012756 0.00011069 1.15240109 0.29299388 -0.0001433 0.00039841 -0.0001433 0.00039841
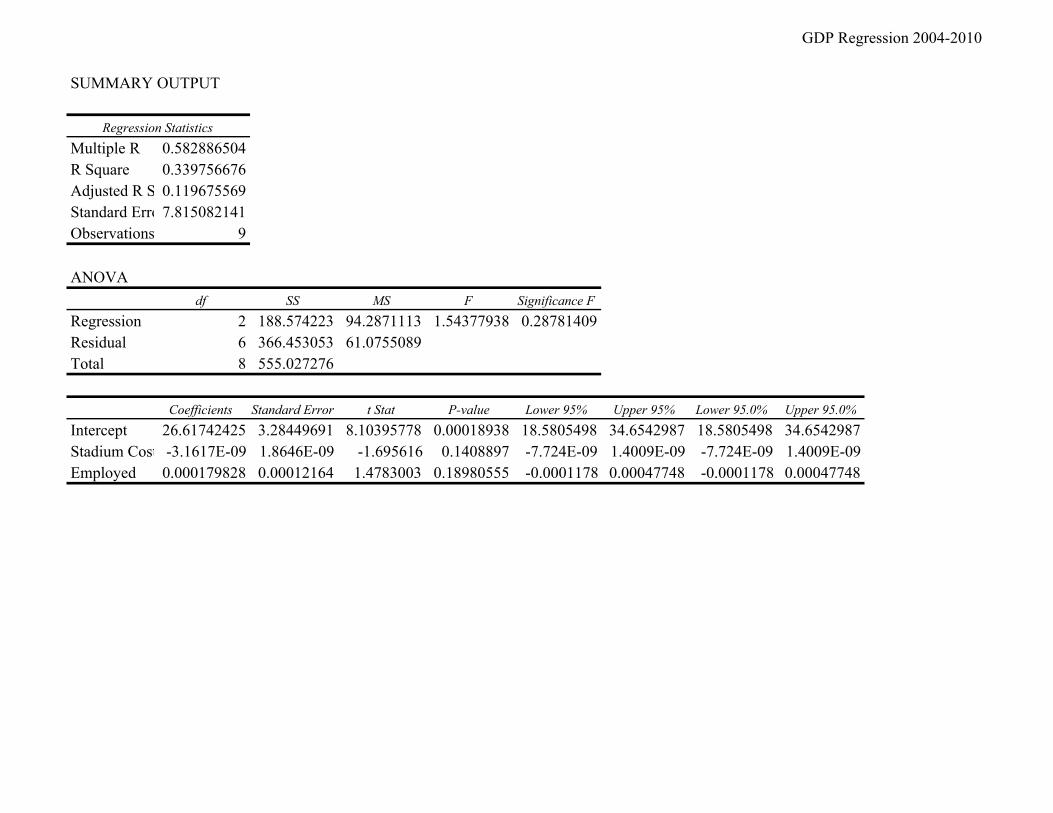
GDP Regression 2004-2010
SUMMARY OUTPUT
Regression Statistics
Multiple R 0.582886504R Square 0.339756676Adjusted R Square0.119675569Standard Error7.815082141Observations 9
ANOVAdf SS MS F Significance F
Regression 2 188.574223 94.2871113 1.54377938 0.28781409Residual 6 366.453053 61.0755089Total 8 555.027276
Coefficients Standard Error t Stat P-value Lower 95% Upper 95% Lower 95.0% Upper 95.0%
Intercept 26.61742425 3.28449691 8.10395778 0.00018938 18.5805498 34.6542987 18.5805498 34.6542987Stadium Cost -3.1617E-09 1.8646E-09 -1.695616 0.1408897 -7.724E-09 1.4009E-09 -7.724E-09 1.4009E-09Employed 0.000179828 0.00012164 1.4783003 0.18980555 -0.0001178 0.00047748 -0.0001178 0.00047748
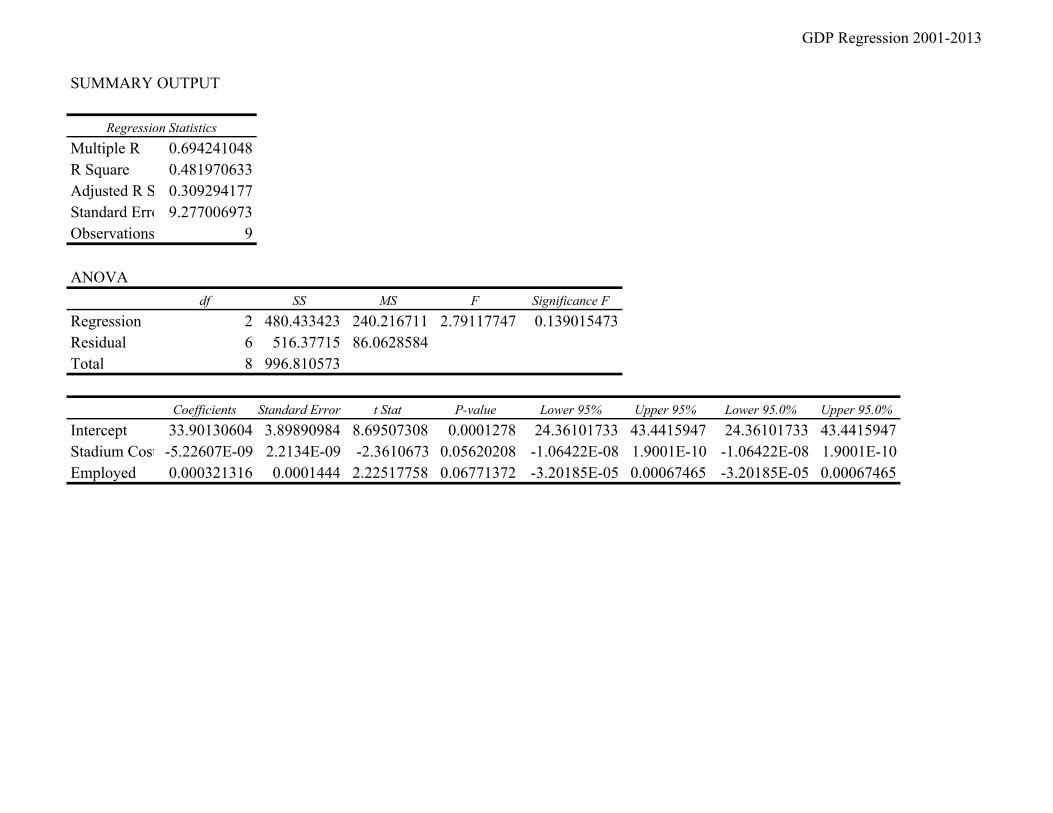
GDP Regression 2001-2013
SUMMARY OUTPUT
Regression Statistics
Multiple R 0.694241048R Square 0.481970633Adjusted R Square0.309294177Standard Error 9.277006973Observations 9
ANOVAdf SS MS F Significance F
Regression 2 480.433423 240.216711 2.79117747 0.139015473Residual 6 516.37715 86.0628584Total 8 996.810573
Coefficients Standard Error t Stat P-value Lower 95% Upper 95% Lower 95.0% Upper 95.0%
Intercept 33.90130604 3.89890984 8.69507308 0.0001278 24.36101733 43.4415947 24.36101733 43.4415947Stadium Cost -5.22607E-09 2.2134E-09 -2.3610673 0.05620208 -1.06422E-08 1.9001E-10 -1.06422E-08 1.9001E-10Employed 0.000321316 0.0001444 2.22517758 0.06771372 -3.20185E-05 0.00067465 -3.20185E-05 0.00067465
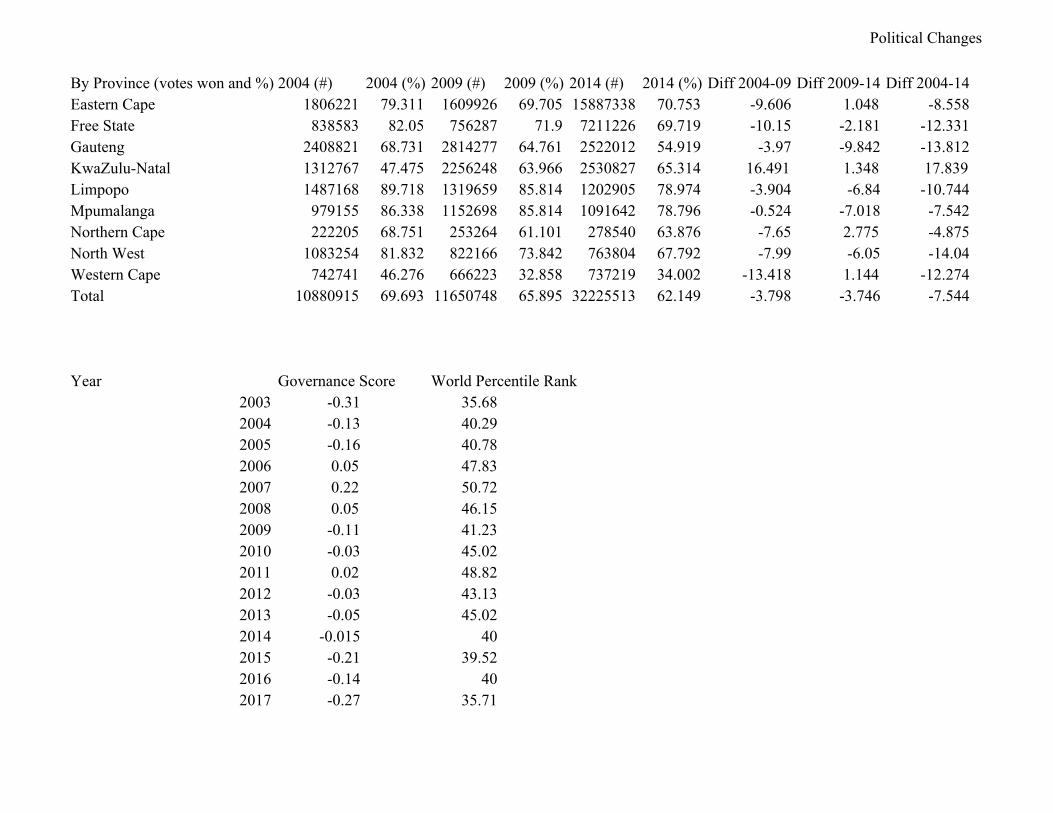
Political Changes
By Province (votes won and %) 2004 (#) 2004 (%) 2009 (#) 2009 (%) 2014 (#) 2014 (%) Diff 2004-09 Diff 2009-14 Diff 2004-14Eastern Cape 1806221 79.311 1609926 69.705 15887338 70.753 -9.606 1.048 -8.558Free State 838583 82.05 756287 71.9 7211226 69.719 -10.15 -2.181 -12.331Gauteng 2408821 68.731 2814277 64.761 2522012 54.919 -3.97 -9.842 -13.812KwaZulu-Natal 1312767 47.475 2256248 63.966 2530827 65.314 16.491 1.348 17.839Limpopo 1487168 89.718 1319659 85.814 1202905 78.974 -3.904 -6.84 -10.744Mpumalanga 979155 86.338 1152698 85.814 1091642 78.796 -0.524 -7.018 -7.542Northern Cape 222205 68.751 253264 61.101 278540 63.876 -7.65 2.775 -4.875North West 1083254 81.832 822166 73.842 763804 67.792 -7.99 -6.05 -14.04Western Cape 742741 46.276 666223 32.858 737219 34.002 -13.418 1.144 -12.274Total 10880915 69.693 11650748 65.895 32225513 62.149 -3.798 -3.746 -7.544
Year Governance Score World Percentile Rank2003 -0.31 35.682004 -0.13 40.292005 -0.16 40.782006 0.05 47.832007 0.22 50.722008 0.05 46.152009 -0.11 41.232010 -0.03 45.022011 0.02 48.822012 -0.03 43.132013 -0.05 45.022014 -0.015 402015 -0.21 39.522016 -0.14 402017 -0.27 35.71
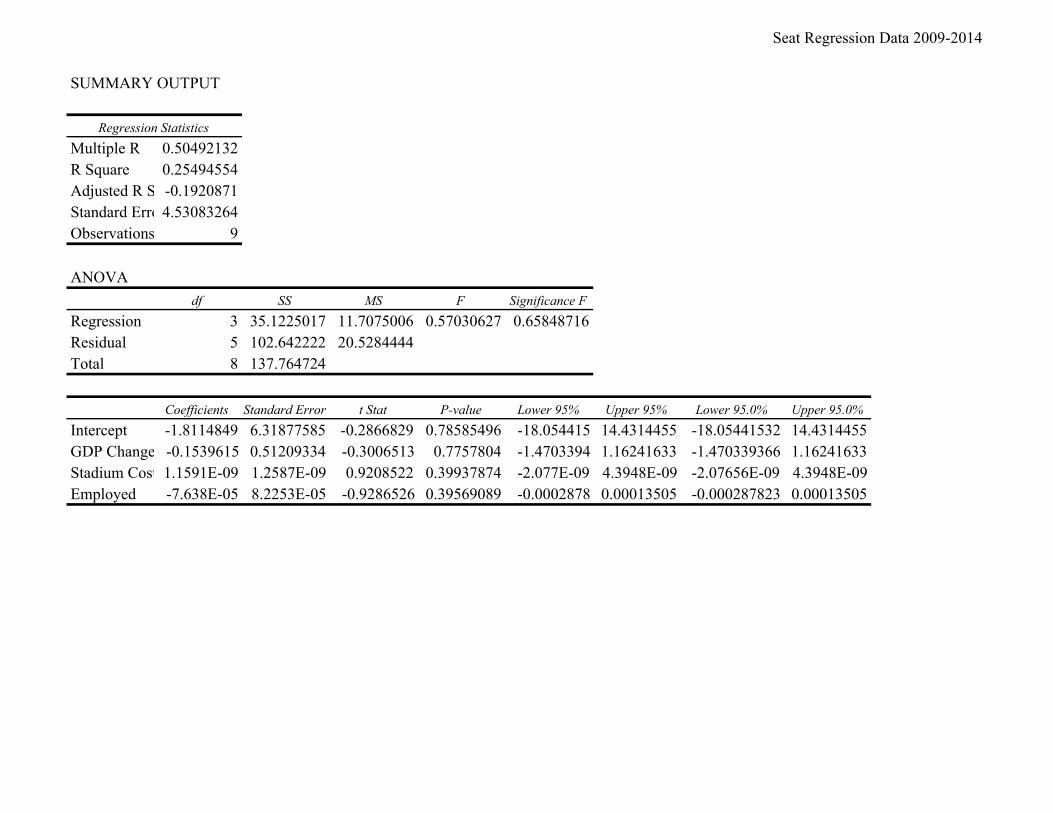
Seat Regression Data 2009-2014
SUMMARY OUTPUT
Regression Statistics
Multiple R 0.50492132R Square 0.25494554Adjusted R Square-0.1920871Standard Error4.53083264Observations 9
ANOVAdf SS MS F Significance F
Regression 3 35.1225017 11.7075006 0.57030627 0.65848716Residual 5 102.642222 20.5284444Total 8 137.764724
Coefficients Standard Error t Stat P-value Lower 95% Upper 95% Lower 95.0% Upper 95.0%
Intercept -1.8114849 6.31877585 -0.2866829 0.78585496 -18.054415 14.4314455 -18.05441532 14.4314455GDP Change from 2009-2013-0.1539615 0.51209334 -0.3006513 0.7757804 -1.4703394 1.16241633 -1.470339366 1.16241633Stadium Cost 1.1591E-09 1.2587E-09 0.9208522 0.39937874 -2.077E-09 4.3948E-09 -2.07656E-09 4.3948E-09Employed -7.638E-05 8.2253E-05 -0.9286526 0.39569089 -0.0002878 0.00013505 -0.000287823 0.00013505
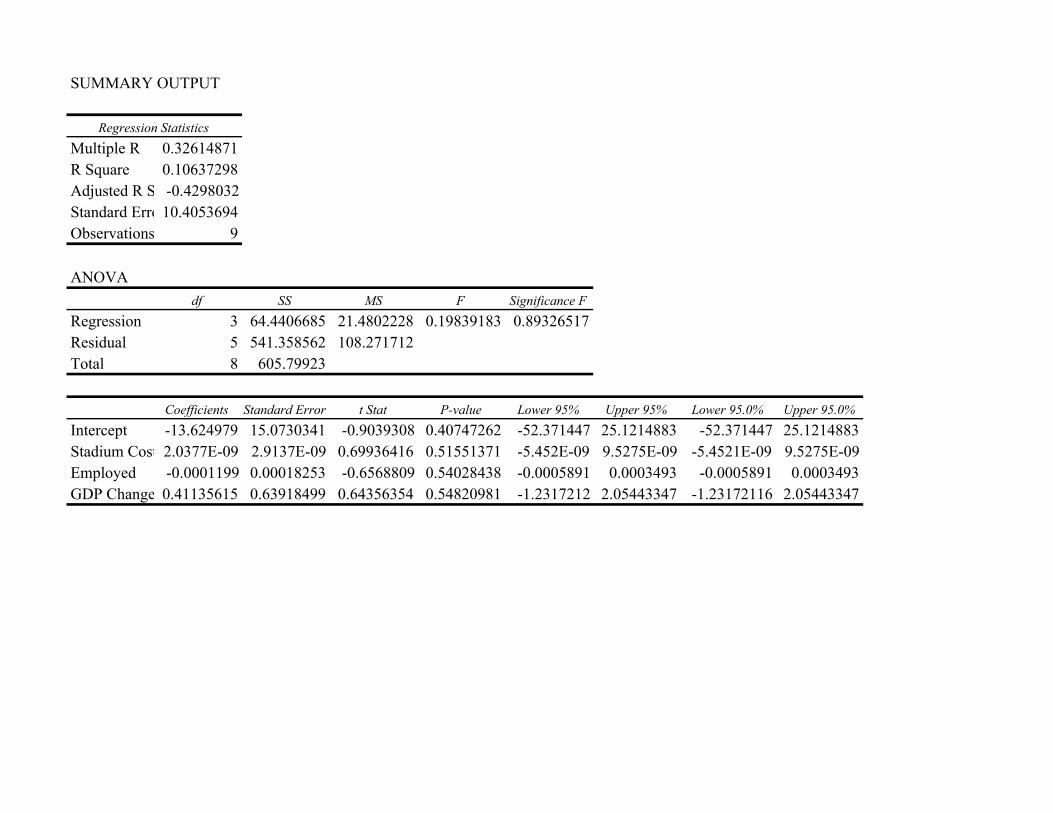
SUMMARY OUTPUT
Regression Statistics
Multiple R 0.32614871R Square 0.10637298Adjusted R Square-0.4298032Standard Error10.4053694Observations 9
ANOVAdf SS MS F Significance F
Regression 3 64.4406685 21.4802228 0.19839183 0.89326517Residual 5 541.358562 108.271712Total 8 605.79923
Coefficients Standard Error t Stat P-value Lower 95% Upper 95% Lower 95.0% Upper 95.0%
Intercept -13.624979 15.0730341 -0.9039308 0.40747262 -52.371447 25.1214883 -52.371447 25.1214883Stadium Cost 2.0377E-09 2.9137E-09 0.69936416 0.51551371 -5.452E-09 9.5275E-09 -5.4521E-09 9.5275E-09Employed -0.0001199 0.00018253 -0.6568809 0.54028438 -0.0005891 0.0003493 -0.0005891 0.0003493GDP Change from 2004-20090.41135615 0.63918499 0.64356354 0.54820981 -1.2317212 2.05443347 -1.23172116 2.05443347
Avdellas 64
“1512. 2010 FIFA World Cup South Africa.” South African Institute of Chartered Accountants,
April 2007.
https://www.saica.co.za/integritax/2007/1512_2010_FIFA_World_Cup_South_Africa.ht
m.
“2010 Construction Strike Ends | South Africa 2010 Fifa World Cup,” October 8, 2011.
https://web.archive.org/web/20111008061333/http://www.sa2010.gov.za/en/node/2429.
“2010 Inspection Report for the FIFA World Cup,” 2003.
“2010 South African Budget.” Accessed February 2, 2019.
http://www.treasury.gov.za/documents/national%20budget/2010/guides/Budget%20High
lights.pdf.
Alegi, Peter. “'A Nation To Be Reckoned With’: The Politics of World Cup Stadium
Construction in Cape Town and Durban, South Africa.” In Africa Studies, 67:397–422,
2008.
Alegi, Peter, and Chris Bolsmann. “South Africa and the Global Game: Introduction.” Soccer &
Society 11, no. 1/2 (January 2010): 1–11. https://doi.org/10.1080/14660970903331284.
“Arenas Da Propina: A Corrupção Em Cinco Estádios Da Copa.” VEJA.com. Accessed March
11, 2019. https://veja.abril.com.br/brasil/arenas-da-propina-a-corrupcao-em-cinco-
estadios-da-copa/.
Baloyi, L., and M. Bekker. “Causes of Construction Cost and Time Overruns: The 2010 FIFA
World Cup Stadia in South Africa.” Acta Structilia 18, no. 1 (January 1, 2011): 51-67–
67.
“Bidding Agreement Regarding the Submission of Bids for the Right to Host and Stage the 2018
FIFA World Cup or 2022 FIFA World Cup.,” u.d.
Avdellas 65
“Brazil Confirms Bid - Colombia Withdraws - FIFA.Com.” Accessed March 24, 2019.
https://web.archive.org/web/20130129191426/http://www.fifa.com/worldfootball/release
s/newsid%3D123706.html.
“Brazil World Cup 2014: Eighth Death at Football Stadiums - BBC News.” Accessed February
7, 2019. https://www.bbc.com/news/av/world-latin-america-27337339/brazil-world-cup-
2014-eighth-death-at-football-stadiums.
Brown, Luke, and Nicholas Randall. “Fifa Corruption: ‘Morocco Won 2010 World Cup Vote -
Not South Africa’ - as It Happened - Telegraph.” The Telegraph, June 7, 2015.
https://www.telegraph.co.uk/sport/football/fifa/11657595/Fifa-corruption-Morocco-2010-
World-Cup-vote-live.html.
“City Maximises Use of Cape Town Stadium | CapeTown ETC.” Accessed February 8, 2019.
https://www.capetownetc.com/featured/city-maximises-use-of-cape-town-stadium/.
“Congratulations to Ourselves.” The Sowetan, May 14, 2004.
Cornelissen, Scarlett. “The Geopolitics of Global Aspiration: Sport Mega-Events and Emerging
Powers.” The International Journal of the History of Sport 27, no. 16–18 (November
2010): 3008–25. https://doi.org/10.1080/09523367.2010.508306.
Crompton, John L. “Economic Impact Analysis of Sports Facilities and Events: Eleven Sources
of Misapplication.” Journal of Sport Management 9, no. 1 (January 1995): 14–35.
https://doi.org/10.1123/jsm.9.1.14.
Fairbanks, Eve. “OVERTIME IN SOCCER CITY: South Africans Believed the World Cup
Would Bump Their Country into the First World. So Did It? -.” The New York Times,
July 24, 2011.
Avdellas 66
https://proxy.library.upenn.edu:2072/hnpnewyorktimes/docview/1620491277/822C8959
FB704BCFPQ/31?accountid=14707.
Felter, Claire, and Roca Cara Labrador. “Brazil’s Corruption Fallout.” Council on Foreign
Relations. Accessed March 11, 2019. https://www.cfr.org/backgrounder/brazils-
corruption-fallout.
FIFA. “2010 FIFA World CupTM : Bidding Process Opens.” FIFA.com, October 23, 2002.
https://www.fifa.com/about-fifa/who-we-are/news/2010-fifa-world-cuptm-bidding-
process-opens-83657.
“FAQ: Setting the Record Straight,” June 10, 2014.
“FIFA Financial Report 2010.” Zurich, June 1, 2011.
“FIFA End World Cup Rotation Policy.” CNN, October 29, 2007.
http://edition.cnn.com/2007/SPORT/football/10/29/switzerland.cup/.
FIFA.com. “2014 FIFA World Cup TM to Be Held in South America - FIFA.Com.”
www.fifa.com. Accessed March 24, 2019. https://www.fifa.com/news/2014-fifa-world-
cup-held-south-america-85909.
Fourie, Johan, and Maria Santana-Gallego. “The Impact of Mega-Events on Tourist Arrivals,”
n.d., 23.
Gibson, Owen. “World Cup 2010: South Africa Leaves a World Cup Legacy to Remember |
Owen Gibson.” The Guardian, July 12, 2010, sec. Football.
https://www.theguardian.com/football/blog/2010/jul/12/south-africa-world-cup-2010.
“Green Point Stadium by GMP Architekten.” Dezeen, June 8, 2010.
https://www.dezeen.com/2010/06/08/green-point-stadium-by-gmp-architekten/.
Avdellas 67
He, Qinghua, Lao Luo, Yi Hu, and Albert P.C. Chan. “Measuring the Complexity of Mega
Construction Projects in China—A Fuzzy Analytic Network Process Analysis.”
International Journal of Project Management 33 (2015): 549–63.
Hiller, Harry H. “Impact and Image: The Convergence of Urban Factors in Preparing for the
1988 Calgary Winter Olympics.” The Planning and Evaluation of Hallmark Events,
1989, 119–31.
Horne, John. “The Four ‘Knowns’ of Sports Mega-Events.” Leisure Studies 26, no. 1 (November
1, 2005): 86–96.
Humphrey, Luke, and Gavin Fraser. “2010 World Cup Stadia Investment: Does the Post-Event
Usage Justify the Expenditure?” Rhodes University, 2014.
Hunter, William J. “Economic Impact Studies: Innaccurate, Misleading, and Unneccessary.” The
Heartland Institute 21 (July 22, 1988).
Kaufmann, Daniel, Aart Kraay, and Massimo Mastruzzi. “The Worldwide Governance
Indicators: Methodology and Analytical Issues.” SSRN Scholarly Paper. Rochester, NY:
Social Science Research Network, September 1, 2010.
https://papers.ssrn.com/abstract=1682130.
Klerk, FW de. “World Cup Left a Magic Legacy.” The Sowetan, September 10, 2010.
https://proxy.library.upenn.edu:2543/ga/default.aspx.
Long, Michael. “Ellis Park Renamed as Emirates Lands Major Lions Deal - SportsPro Media.”
http://www.sportspromedia.com, December 11, 2014.
http://www.sportspromedia.com/news/ellis_park_renamed_as_emirates_lands_major_lio
ns_deal.
Avdellas 68
Longman, Jeré. “Resistance, and Unity, in Sports.” The New York Times, December 6, 2013.
https://proxy.library.upenn.edu:2072/hnpnewyorktimes/docview/1815045703/822C8959
FB704BCFPQ/25?accountid=14707.
Mabote, Rams. “What a Glorious 31 Days It Has Been.” The Sowetan, July 9, 2010.
https://proxy.library.upenn.edu:2543/ga/default.aspx.
Mafika. “Bright Future for FNB Stadium.” Brand South Africa (blog), September 27, 2010.
https://www.brandsouthafrica.com/south-africa-fast-facts/news-facts/bright-future-for-
fnb-stadium.
Marcus, Jeffery. “South Africans Are Left to Wonder What Lies Beyond the Cup.” The New
York Times, July 13, 2010.
https://proxy.library.upenn.edu:2072/hnpnewyorktimes/docview/1458392841/822C8959
FB704BCFPQ/13?accountid=14707.
Mark, Gleeson. “Ajax Abandon World Cup Stadium.” The Sowetan, March 24, 2014.
https://proxy.library.upenn.edu:2543/ga/default.aspx.
Mdletshe, Canaan. “2010 WORLD CUP A BOON.” The Sowetan, May 21, 2010.
https://www.sowetanlive.co.za/news/2010-05-21-2010-world-cup-a-boon/.
Millward, David, and Paul Chapman. “New Zealand Is Sorry for World Cup Fiasco.” The
Telegraph, July 8, 2000.
https://www.telegraph.co.uk/news/worldnews/australiaandthepacific/niuenewzealand/134
7458/New-Zealand-is-sorry-for-World-Cup-fiasco.html.
Mngxitama, Andile. “Soccer Has Been Turned into a Shackle to Enslave Us.” The Sowetan, June
15, 2010. https://proxy.library.upenn.edu:2543/ga/default.aspx.
Avdellas 69
Moholoa, Ramatsiyi. “Peter Mokaba ‘No White Elephant.’” The Sowetan, November 23, 2010.
https://proxy.library.upenn.edu:2543/ga/default.aspx.
Molloy, Eamonn, and Trish Chetty. “The Rocky Road to Legacy: Lessons from the 2010 FIFA
World Cup South Africa Stadium Program.” Project Management Journal 46, no. 3
(June 2015): 88–107. https://doi.org/10.1002/pmj.21502.
Monama, Tebogo. “Fifa World Cup Helps Boost SA Tourism,” June 24, 2010.
https://www.sowetanlive.co.za/news/2010-06-24-fifa-world-cup-helps-boost-sa-tourism/.
“Moses Mabhida Stadium: Lack of Maintenance Could Cost Millions.” Berea Mail (blog), May
11, 2017. https://bereamail.co.za/109984/lack-of-maintenance-could-cost-millions/.
“‘Nelson Mandela Bay Stadium Profitable by 2013.’” Accessed February 8, 2019.
https://www.timeslive.co.za/news/south-africa/2011-08-19-nelson-mandela-bay-stadium-
profitable-by-2013/.
Ngonyama, Percy. “The 2010 FIFA World Cup: Critical Voices from Below.” Soccer & Society
11, no. 1–2 (January 2010): 168–80. https://doi.org/10.1080/14660970903331490.
Ntloko, Mninawa. “Inside FNB Stadium: How the 2010 World Cup Final Venue Remains
Profitable.” The Sowetan, May 12, 2017. https://www.sowetanlive.co.za/news/2017-05-
12-inside-fnb-stadium-how-the-2010-world-cup-final-venue-remains-profitable/.
O’Connor, Maura. “World Cup 2010: Are South Africa’s Stadiums White Elephants?” The
Sowetan. Accessed February 17, 2019. https://www.pri.org/stories/2010-07-06/world-
cup-2010-are-south-africas-stadiums-white-elephants.
Othman, Ayman Ahmed Ezzat. “Challenges of Mega Construction Projects in Developing
Countries.” Organization, Technology and Management in Construction: An
International Journal, May 1, 2013, 730–46.
Avdellas 70
“Report Finds 17 Deaths and Labor Abuses at Russia’s World Cup Stadiums - The New York
Times.” Accessed February 7, 2019.
https://www.nytimes.com/2017/06/14/sports/soccer/human-rights-stadiums-fifa-2018-
world-cup-russia.html.
Rhoden, William C. “SPORTS OF THE TIMES: Success, or Even Lack of It, That the Hosts
Can Build On.” The New York Times, June 23, 2010.
https://proxy.library.upenn.edu:2072/hnpnewyorktimes/docview/1461126507/822C8959
FB704BCFPQ/26?accountid=14707.
Runciman, David. “2010 World Cup: Is Africa Football’s Unheralded Star?” The Guardian, May
21, 2010, sec. Football. https://www.theguardian.com/football/2010/may/22/football-
south-africa-world-cup.
“S Africa Strike Hits Stadium Work,” July 8, 2009.
http://news.bbc.co.uk/2/hi/africa/8140433.stm.
SA Commercial Prop News. “Colluding Construction Giants Reach Aggreement with
Government.” South African Commercial Property News, February 14, 2017.
http://www.sacommercialpropnews.co.za/construction-industry/8577-colluding-
construction-giants-reach-aggreement-with-government.html.
“SA Construction Firms Accused of World Cup Collusion - BBC News,” November 13, 2014.
https://www.bbc.com/news/business-30039419.
“SAFA President Danny Jordaan Banking on 2010 World Cup Experience - News - Kick Off.”
Accessed February 8, 2019. http://www.kickoff.com/news/91402/safa-president-danny-
jordaan-banking-201.
Avdellas 71
Seawright, Jason, and John Gerring. “Case Selection Techniques in Case Study Research: A
Menu of Qualitative and Quantitative Options.” Political Research Quarterly 61, no. 2
(June 2008): 294–308. https://doi.org/10.1177/1065912907313077.
“Selected Historical Rates - South African Reserve Bank.” Accessed February 8, 2019.
https://www.resbank.co.za/Research/Rates/Pages/SelectedHistoricalExchangeAndInterest
Rates.aspx.
“South Africa and Public Service Commission - 2010 - State of the Public Service Report
2010..Pdf.” Accessed January 29, 2019. http://pmg-assets.s3-website-eu-west-
1.amazonaws.com/docs/110216state.pdf.
Sport and Recreation Department. “2010 Fifa World Cup Country Report,” 2010, 205.
Strydon, Marc. “Royal Bafokeng Confirm the Sale of Embattled Platinum Stars.” The Times,
January 31, 2018. https://www.timeslive.co.za/sport/soccer/2018-01-31-royal-bafokeng-
confirm-the-sale-of-embattled-platinum-stars/.
“‘Surprising’ Cost of Running Cape Town Stadium.” The M&G Online. Accessed February 8,
2019. https://mg.co.za/article/2010-10-07-surprising-cost-of-running-cape-town-
stadium/.
TEDx Talks. TEDxDU-Richard Lapchick-5/13/2010. University of Denver, 2010.
https://www.youtube.com/watch?v=jHIOny_C2Jk.
“The World Factbook.” Central Intelligence Agency, 2017.
https://www.cia.gov/library/publications/the-world-factbook/rankorder/2004rank.html.
Tolsi, Niren. “Stadiums Score Costly Own Goals.” The M&G Online. Accessed February 8,
2019. https://mg.co.za/article/2011-06-10-stadiums-score-costly-own-goals/.

Avdellas 72
“Tragedy Strikes 2010 Process.” www.fifa.com, August 15, 2008.
https://www.fifa.com/worldcup/news/tragedy-strikes-2010-process-851274.
Vecsey, George. “Soccer Puts ‘World’ Back Into the World Cup -.” The New York Times, May
16, 2004.
https://proxy.library.upenn.edu:2072/hnpnewyorktimes/docview/92880995/822C8959FB
704BCFPQ/7?accountid=14707.
“Why We Deserve the 2010 Games.” The Sowetan, May 14, 2010.
Wigmore, Tim. “With Four Years to Go until World Cup 2022, the Horrors in Qatar Continue –
and Fifa Just Looks the Other Way.” inews.co.uk, November 21, 2018.
https://inews.co.uk/sport/football/world-cup/qatar-2022-world-cup-fifa-sepp-blatter-
gianni-infantino-shames-football/.
“World Cup the Cherry on Top for 2010.” The Sowetan, December 31, 2010.
https://www.sowetanlive.co.za/sport/2010-12-31-world-cup-the-cherry-on-top-for-2010/.
“World Governance Indicators 2018 Interactive Data Access.” The World Bank. Accessed
February 21, 2019. http://info.worldbank.org/governance/wgi/index.aspx#reports.
Copyright © 2022 FDOKUMEN