Economic Change and Political Realignment in Antebellum ...
50
Economic Changeand Political Realignment in Antebellum Pennsylvania A MERICANS LIVING IN THE 1850s experienced a number of economic, social, and political upheavals. The disruption most studied by historians has been the realignment of the parties in the middle of the decade—the disappearance of the Whigs, the remolding of the Democrats, the unexpected entrance of the Know Nothings, and the creation and eventual dominance of the Repub- licans. At the same time the political system underwent realignment, the economy was responding to the twin forces of industrialization and market expansion. For nearly three decades manufacturing en- terprises had operated in the United States, but it seemed that in the 1850s industrial activity accelerated, and by 1860 many northerners heartily welcomed the prospect of even further advances. While the pace of industrialization increased and brought more citizens within its purview, a coincident revolution in transportation altered market structure. Most individuals had been accustomed to local markets and local exchanges; the rise of a more efficient transportation system, the railroad, suddenly opened local economies to outside producers and price competition. By the mid-1850s railroads had constructed a rudimentary national market, and this development suddenly threw numbers of Americans into a vastly more competitive situation than they had ever known. Interpretations of the political realignment of the 1850s have gen- erally not sought linkages between economic disruption and the tra- vails of the party system. The current view of the party turmoil of the 1850s holds that the demise of the second American party system was due to ethnocultural forces. Historians such as Paul Kleppner, This article is a considerably changed version of a paper, "Economic Disruption and Political Protest: Pennsylvania Nativism in the 1850s," delivered at the Social Science History Association, Toronto, Oct. 27, 1984. I would like to thank Thomas B. Alexander, William G. Shade, and William E. Gienapp for their criticism, advice, and guidance. THE PENNSYLVANIA MAGAZINE OF HISTORY & BIOGRAPHY Vol. CXIII, No. 3 (July 1989)
-
Upload
khangminh22 -
Category
Documents
-
view
3 -
download
0
Transcript of Economic Change and Political Realignment in Antebellum ...

Economic Change andPolitical Realignment inAntebellum Pennsylvania
AMERICANS LIVING IN THE 1850s experienced a number ofeconomic, social, and political upheavals. The disruption moststudied by historians has been the realignment of the parties
in the middle of the decade—the disappearance of the Whigs, theremolding of the Democrats, the unexpected entrance of the KnowNothings, and the creation and eventual dominance of the Repub-licans. At the same time the political system underwent realignment,the economy was responding to the twin forces of industrializationand market expansion. For nearly three decades manufacturing en-terprises had operated in the United States, but it seemed that in the1850s industrial activity accelerated, and by 1860 many northernersheartily welcomed the prospect of even further advances. While thepace of industrialization increased and brought more citizens withinits purview, a coincident revolution in transportation altered marketstructure. Most individuals had been accustomed to local marketsand local exchanges; the rise of a more efficient transportation system,the railroad, suddenly opened local economies to outside producersand price competition. By the mid-1850s railroads had constructed arudimentary national market, and this development suddenly threwnumbers of Americans into a vastly more competitive situation thanthey had ever known.
Interpretations of the political realignment of the 1850s have gen-erally not sought linkages between economic disruption and the tra-vails of the party system. The current view of the party turmoil ofthe 1850s holds that the demise of the second American party systemwas due to ethnocultural forces. Historians such as Paul Kleppner,
This article is a considerably changed version of a paper, "Economic Disruption and PoliticalProtest: Pennsylvania Nativism in the 1850s," delivered at the Social Science HistoryAssociation, Toronto, Oct. 27, 1984. I would like to thank Thomas B. Alexander, WilliamG. Shade, and William E. Gienapp for their criticism, advice, and guidance.
T H E PENNSYLVANIA MAGAZINE OF HISTORY & BIOGRAPHY
Vol. CXIII, No. 3 (July 1989)
348 JAMES L. HUSTON July
Ronald P. Formisano, and Joel Silbey argue that the major unsettlingfactors in American life after 1844 were immigration and Catholicism.Large numbers of Protestant Whigs and Democrats, as well as youth-ful citizens still in the process of forging political allegiances, foundinadequate the responses of the established parties to a perceivedcultural threat. These angry persons formed the Know Nothing party.But internal strains within the Know Nothing party were too great,and by 1856 it began disintegrating. Another party formed out ofthe collapse of the Whigs, the Republicans, managed to overcomecoalitional problems on the basis of antislavery and anti-southernismand finally constructed a victorious alliance of disparate northerngroups.1
The ethnocultural interpretation has not gone unchallenged. Anumber of historians continue to stress the impact of slavery-relatedissues upon the party system, while others have viewed skepticallythe claim that party loyalty was totally a product of ethnicity andreligious disposition, having little to do with economic status, wealth,or occupation.2 More recently, Michael F. Holt has argued that the
1 Paul Kleppner, The Third Electoral System, 1853-1892: Parties, Voters, and PoliticalCultures (Chapel Hill, 1979), 24, 55-73; Ronald P. Formisano, The Birth oj Mass PoliticalParties: Michigan, 1827-1861 (Princeton, 1971), 5-8, 218-54, 310-25; Joel H. Silbey, "TheSurge of Republican Power: Partisan Antipathy, American Social Conflict, and the Comingof the Civil War," in Stephen E. Maizlish and John J. Kushma, eds., Essays on AmericanAntebellum Politics, 1840-1860 (College Station, 1982), 199-229. See also Michael F. Holt,Forging a Majority: The Formation oj the Republican Party in Pittsburgh, 1848-1860 (NewHaven, 1969), 124-41, 188, 311-12; Holt, The Political Crisis oj the 1850s (New York,1978), 120-22, 139-40, 156-81; William E. Gienapp, The Origins oj the Republican Party,1852-1856 (New York, 1987), 423-39; James L. Huston, "The Demise of the PennsylvaniaAmerican Party, 1854-1858," Pennsylvania Magazine oj History and Biography (hereafter,PMHB) 109 (1985), 473-97.
2 For an example of an author who emphasizes the slavery issue in antebellum politics,see Eric Foner, "Politics, Ideology, and the Origins of the American Civil War," in GeorgeM. Fredrickson, ed., A Nation Divided: Problems and Issues oj the Civil War and Reconstruction(Minneapolis, 1975), 15-34. For examples of critics of the ethnocultural thesis, see DaleBaum, The Civil War Party System: The Case oj Massachusetts, 1848-1876 (Chapel Hill,1984), 42-43, 84-99; Stephen L. Hansen, The Making oj the Third Party System: Voters andParties in Illinois, 1850-1876 (Ann Arbor, 1980), 39-56, 59-82; and Richard L. McCormick,"Ethno-Cultural Interpretations of Nineteenth-Century American Voting Behavior," PoliticalScience Quarterly 89 (1974), 369-71. The slavery theme is introduced into realignment theoryby Jerome M. Clubb, William H. Flanigan, and Nancy H. Zingale, Partisan Realignment:Voters, Parties, and Government in American History (Beverly Hills, 1980), 19-45.
1989 ECONOMIC CHANGE AND POLITICAL REALIGNMENT 349
rise of Know Nothingism in the 1850s owed something to economicfrustration. He posited that the displacements created by a nationalmarket upset customary business patterns in the eastern states andforced individuals to seek other employments. At the same time,industrialization began undermining old craft traditions of production.Together, market transformation and industrialization destroyed manyof the usual means of acquiring a subsistence. To some extent, then,Know Nothingism was a reaction to an injurious alteration in economiclife.3
This essay explores the possible linkages between political realign-ment and economic transformation by investigating the antebellumexperience of Pennsylvania, for that state not only underwent aconsiderable upheaval in politics, it also displayed a marked industrialadvance and market reorientation. Michael F. Holt's formulation wasessentially correct; it can be demonstrated that economic change hada decided impact on the party turmoil of the 1850s. In fact, theinfluence economic transformation exercised upon antebellum partypolitics may have been more potent than Holt had originally sug-gested.
Throughout the Jacksonian period, Pennsylvania Whigs and Dem-ocrats battled ferociously for political supremacy, with the Democratsobtaining a slight advantage. During the early 1850s, the Whigsbegan disintegrating. They committed political blunders in the elec-tion of 1852, and party leaders failed to recognize growing publicconcern over immigration and Catholicism. Between 1852 and 1854secret Know Nothing lodges invaded Pennsylvania and attracted alarge following. The Know Nothings, soon to be known as the Amer-ican party, entered politics in 1854 and revealed their terrific successin recruiting the state's native citizenry. They captured 120,000 votes(33.4 percent of the total), and on a county basis they reduced thenormal percentages obtained by the Whigs by one-half and the Dem-ocrats by one-tenth. The 1854 election was the peak moment of
3 Michael F. Holt, "The Politics of Impatience: The Origins of Know Nothingism,"Journal oj American History 60 (1973), 324-30; Holt, Political Crisis oj the 1850s, 159-61.See also Ronald P. Formisano, The Transformation oj Political Culture: Massachusetts Parties,1790s-1840s (New York, 1980), 175-80, 326-43; and Baum, Civil War Party System, 73-75.
350 JAMES L. HUSTON July
Pennsylvania nativism; party splits over the selection of a U.S. Sen-ator, the growing furor over bleeding Kansas, and the failure of theorganization to capture other anti-Democratic groups led to its down-fall. In 1856 the Americans received 82,000 ballots, while the newlyformed Republicans procured almost 148,000. After 1856, the storyof Pennsylvania opposition politics is the narrative of the slow ab-sorption of the anti-Democratic forces into the Republican coalition.4
For a number of years prior to the emergence of the Know Nothingparty, Pennsylvania's economy had been undergoing a basic structuralchange. The most visible signs of the state's altered economic conditionbetween 1840 and 1860 were an upsurge in industrial activity, agrowing urban population, and a diminution in agricultural produc-tion. Perhaps the most remarkable aspect of the state's economictransformation lay in the occupations of its citizens in 1840, 1850,and 1860. Those employed in agriculture fell from 60 percent ofthe population in 1840 to between 30 and 40 percent in 1860. Boththe categories of commerce and manufacturing gained significantly.5
Historians have frequently ascribed a number of social changes inthe northern states at this time to the process of industrialization.
4 Richard P. McCormick, The Second American Party System: Party Formation in theJacksonian Era (Chapel Hill, 1966), 141-47; Holt, Forging a Majority, 123-58; Roger DeweyPetersen, "The Reaction to a Heterogeneous Society: A Behavioral and Quantitative Analysisof Northern Voting Behavior, 1845-1870, Pennsylvania a Test Case" (Ph.D. diss., Universityof Pittsburgh, 1970), 182-210, 241-47; Erwin Stanley Bradley, Simon Cameron: Lincoln'sSecretary of War: A Political Biography (Philadelphia, 1966), 90-105; John F. Coleman, TheDisruption of the Pennsylvania Democracy, 1848-1860 (Harrisburg, 1975), 63-101; WilliamGudelunas, Jr., "Nativism and the Demise of Schuylkill County Whiggery: Anti-Slaveryor Anti-Catholicism," Pennsylvania History 45 (1978), 225-36; Gienapp, Origins of theRepublican Party, 139-47, 208-13, 396-405, 420; Huston, "Demise of the PennsylvaniaAmerican Party," 482-97. Voting results based on the Tribune Almanac, 1855, 1857, andClearfield Republican, Nov. 2, 1854. Average loss of Democrats and Whigs in 1854 determinedby comparison to an average county vote for Whigs and Democrats received in the presidentialelections of 1836, 1840, 1844, and 1848.
5 Based on calculations of occupations contained in U.S. Department of State, CensusOffice, Compendium of the Enumeration of the Inhabitants and Statistics of the UnitedStates . . . in 1840 (Washington, 1841); U.S. Interior Department, Census Office, TheSeventh Census of the United States: 1850 (Washington, 1853); and Eighth Census of theUnited States (4 vols., Washington, 1864-1866). Figures taken from category titled "Oc-cupations." Farmers, according to the censuses, numbered 207,533 in 1840, 206,347 in1850, and 180,613 in 1860. The figures for manufactuing and mercantile occupationspresent some difficulty because the selection of categories in the 1850 and 1860 censusesinvolves considerable and subjective guesswork.
1989 ECONOMIC CHANGE AND POLITICAL REALIGNMENT 351
Commonly referring to various forms of the modernization thesis,such scholars have depicted the era's socioeconomic change as one inwhich agricultural laborers and craftsmen lost their world of individ-ualistic work rhythms, non-market production, and personal relation-ships; they then had to adapt to factory discipline, industrial time,machine production, and diminished craft skills.6 Yet there are reasonsfor questioning the extent of social upheaval this obvious increase inmanufacturing between 1840 and 1860 produced, for the industrial-ization that occurred largely extended older work routines rather thanreplaced them. Iron manufacturing seemed, except in some isolatedinstances, not to have altered greatly for decades. Studies of shoe-makers, hatmakers, and machine-builders, among others, have stressedthe continued craft content of working-class jobs almost into thetwentieth century. Historians have found that frequently what oc-curred in many manufacturing concerns was often not displacementof individuals by machines but rather a degradation of craft skillthrough division of labor or through outwork systems.7 Moreover, the
6 Richard D. Brown, Modernization: The Transformation oj American Life, 1600-1865(New York, 1976); Anthony F.C. Wallace, Rockdale: The Growth of an American Village inthe Early Industrial Revolution (New York, 1978), 177-83, 327-37; Susan E. Hirsch, Rootsof the American Working Class: The Industrialization of Crafts in Newark, 1800-1860 (Phila-delphia, 1978), 8-13, 21-51; Alan Dawley, Class and Community: The Industrial Revolutionin Lynn (Cambridge, 1976), 25-78; David Montgomery, "The Working Classes of the Pre-Industrial American City, 1780-1830," Labor History 9 (1968), 3-22; Bruce Laurie, WorkingPeople of Philadelphia, 1800-1850 (Philadelphia, 1980), 3-30; Paul E. Johnson, A Shopkeeper'sMillennium: Society and Revivals in Rochester, New York, 1815-1837 (New York, 1978), 15-21, 102-6.
7 David Bensman, The Practice of Solidarity: American Hat Finishers in the NineteenthCentury (Urbana, 1985), xvii-xx, 217-25; David A. Hounshell, From the American Systemto Mass Production, 1800-1932: The Development of Manufacturing Technology in the UnitedStates (Baltimore, 1984), 92-114, 164-65; Walter Licht, Working for the Railroad: TheOrganization of Work in the Nineteenth Century (Princeton, 1983), 19-25; Paul Paskoff,Industrial Evolution: Organization, Structure, and Growth of the Pennsylvania Iron Industry,1750-1860 (Baltimore, 1983), 106-35; Dawley, Class and Community, 42-50, 73-78; AlfredD. Chandler, Jr., The Visible Hand: The Managerial Revolution in American Business (Cam-bridge, 1977), 52-78; David Montgomery, "Workers' Control of Machine Production inthe Nineteenth Century," Labor History 17 (1976), 485-509; Steven J. Ross, Workers onthe Edge: Work, Leisure, and Politics in Industrializing Cincinnati, 1788-1890 (New York,1985), 68-104; Francis G. Couvares, The Remaking of Pittsburgh: Class and Culture in anIndustrializing City, 1877-1919 (Albany, 1984), 9-30; David Grimsted, "Ante-bellum Labor:Violence, Strike, and Communal Arbitration," Journal of Social History 19 (1985), 5-28.These authors generally find the mid-nineteenth century to be awkward; although importantinnovations occurred, manufacturers continued to rely upon traditional modes of production.
352 JAMES L. HUSTON July
occupations for Pennsylvania listed in the 1860 census do not promotethe view that skilled labor was being decimated by machinery. Thecensus for Pennsylvania listed some 180,000 farmers, 137,000 la-borers with no indication as to type of job performed, and 6,509factory hands. But the census listed 29,855 carpenters, 22,612 shoe-makers, 14,990 blacksmiths, 12,200 seamstresses, 11,902 apprentices,9,429 tailors, 7,218 weavers, 6,691 masons, 6,541 machinists, 5,597mantua makers, 5,206 millers, 5,126 painters, 4,240 wheelwrights,3,942 iron workers, 3,933 coopers, 3,576 milliners, 3,156 teamsters,3,104 moulders, and 3,077 printers. All other occupations whichcould be classified as manufacturing contained less than 3,000.8 Al-though there is uncertainty about job content for many of thesepositions, the above list appears weighted significantly toward skilledrather than unskilled labor. Many Pennsylvanians undoubtedly ex-perienced difficulties in adapting to manufacturing jobs, but it isquestionable as to how large that group actually was.
More profound in its effects upon the antebellum populace thanindustrialization was the railroad, for that mode of transportationincreased market size, destroyed local economies, and placed individ-uals into an intensely competitive economy. The enlarged marketcreated opportunities for many, but it also produced drastic changeand bitter disappointment for others. The railroad's impact uponPennsylvania's economy and the upheavals it generated can be doc-umented quite specifically.9
Prior to 1845, canals, turnpikes, and rivers largely determined thetrade patterns of Pennsylvania's counties. Between 1790 and 1830the state had financed the construction of several thousand miles of
8 Eighth Census: Population, 440-41. See the comments about the Pennsylvania mid-century economy by David Montgomery, Beyond Equality: Labor and the Radical Republicans,1862-1872 (New York, 1967), 4-7, 8-11.
9 A number of studies point to the unsettling social and political consequences of marketchange, that is, improved transportation: Whitney R. Cross, The Burned-Over District: TheSocial and Intellectual History of Enthusiastic Religion in Western New York, 1800-1850 (NewYork, 1950), 75-78; J. Mills Thornton, III, Politics and Power in a Slave Society: Alabama,1800-1860 (Baton Rouge, 1978), 267-91; Steven Hahn, The Roots oj Southern Populism:Yeoman Farmers and the Transformation of the Georgia Upcountry, 1850-1890 (New York,1983), 137-69; and Robert A. Gross, "Culture and Cultivation: Agriculture and Society inThoreau's Concord," Journal of American History 69 (1982), 42-61.
1989 ECONOMIC CHANGE AND POLITICAL REALIGNMENT 353
turnpikes.10 In the 1830s the state legislature committed public re-sources to canals as a means of improving transportation and, as well,of warding off incursions of Baltimore merchants seeking to tap evenmore produce of the Susquehanna River region. By 1850 the statehad a canal (the Mainline) which virtually stretched from Philadel-phia to Pittsburgh; a number of canals to the coal counties of Lehigh,Schuylkill, and Luzerne; canals on the West Branch and NorthBranch of the Susquehanna River; and canals along the ShenangoRiver in the western part of the state.11 The canal and turnpikenetwork generally complemented each other; turnpikes carried pas-sengers whereas the canals moved bulky freight. Pennsylvania's canals,however, only partially improved market conditions. The Mainlinehad too many locks and other physical imperfections to provide swifttransportation facilities.12 (See Map 1.)
A skeleton of a railroad system in Pennsylvania had emerged bythe time of the nativist explosion in 1854. Three important trunklines operated either in or on the periphery of Pennsylvania: thePennsylvania Railroad (completed 1852-1854); the New York andErie Railroad (completed 1852); and the Baltimore and Ohio Rail-road (completed to Wheeling, Virginia, 1852). By the spring of 1854western products flowed to the East Coast almost frictionlessly byuse of these lines. There were as well a number of railroads in thesoutheastern corner of the state, connecting the coal mining andagricultural regions in the Susquehanna River area to the urbanmarkets of Philadelphia, Baltimore, and New York. An important
10 Joseph Austin Durrenberger, Turnpikes: A Study of the Toll Road Movement in the MiddleAtlantic States and Maryland (Valdosta, 1931), 56-57.
11 George Rogers Taylor, The Transportation Revolution, 1815-1860 (New York, 1951),36; James Weston Livingood, The Philadelphia-Baltimore Trade Rivalry, 1780-1860 (rprt.;New York, 1970), 22-23, 74-76} Thomas C. Cochran, Pennsylvania: A Bicentennial History(New York, 1978), 87-95; Philip S. Klein and Ari Hoogenboom, A History of Pennsylvania(New York, 1973), 184-85.
12 Taylor, Transportation Revolution, 26-31, 154-56; Durrenberger, Turnpikes, 118-19;Stephenson Witcomb Fletcher, Pennsylvania Agriculture and County Life, 1840-1940 (2 vols.,Harrisburg, 1955), 2:317-18. Information for Map 1 taken from George Rogers Taylorand Irene D. Neu, The American Railroad Network, 1861-1890 (Cambridge, 1956), mapinsert; Klein and Hoogenboom, History oj Pennsylvania, 185; Cochran, Pennsylvania, 95;Wayland F. Dunaway, A History oj Pennsylvania (2nd ed., New York, 1948), 591-99; JamesTruslow Adams, Atlas of American History (New York, 1943), plates 55, 109.

354 JAMES L. HUSTON July
>
y
Is
s

1989 ECONOMIC CHANGE AND POLITICAL REALIGNMENT 355
feature of the railway system in Pennsylvania as it stood by 1854was that the eastern portion of the state (east of the SusquehannaRiver and below the town of Sunbury) had developed adequaterailroad facilities, but west of the Susquehanna River the only railroadservices in existence were those provided by the Pennsylvania Rail-road. The feeder lines in the western part of the state were yet to beconstructed.13 (See Map 1.) Certainly this system by 1860 was im-perfect, as it would take another decade before the iron-horse hadaccess to every county in the state. Nonetheless, the Pennsylvaniaantebellum railroad greatly augmented trade activities throughout thestate. Individuals may have had to use wagon or boat to get to arailroad facility, but once in place railroads lowered remaining trans-portation charges, in comparison to other modes of travel, and thespeed of delivery permitted products a greater geographical distri-bution than was possible with the canal system.
By virtue of their ability to carry freight and passengers speedilyover great distances, the railroads wrought a considerable alterationin the Keystone state's economy. The first and probably most obviouschange occurred in agriculture. Until 1840, Pennsylvania farmershad largely been self-sufficient and generally had traded in localmarkets. Transportation improvements granted access to more distantareas and especially to urban markets. Sometime between 1840 and1860, Pennsylvania farmers made the passage from self-sufficientfarming to commercial agriculture.14
The transition from self-sufficiency to commercial agriculture en-tailed a new set of economic realities governing the choice of crops.Until 1854, Pennsylvania had been one of the nation's leading grain-growing states—second in the nation in bushels of wheat produced
13 Taylor and Neu, American Ratlroad Network, 26-29; Robert B. Saylor, The Railroads ojPennsylvania (College Park, 1964), 2-91; Alfred D. Chandler, ed. and comp., The Railroads:The Nation's First Big Business: Sources and Readings (New York, 1965), 3, 8-9, 25-26, andmap pp. 4-5; Edward Hungerford, Men oj Ene: A Story oj Human Effort (New York, 1946),97-99; H.W. Schotter, The Growth and Development oj the Pennsylvania Railroad Company(Philadelphia, 1927), 27, 30, 36-37; Caroline E. MacGill, History oj Transportation in theUnited States bejore 1860 (Washington, 1917), 371, 396, 410, 412.
14 Fletcher, Pennsylvania Agriculture', 2:1, 5, 33, 41, 331-32; Jeremy Atack and FredBateman, To Their Own Soil: Agriculture in the Antebellum North (Ames, 1987), 201-4;Clarence Danhof, Change in Agriculture: The Northern United States, 1820-1870 (Cambridge,1969).

356 JAMES L. HUSTON July
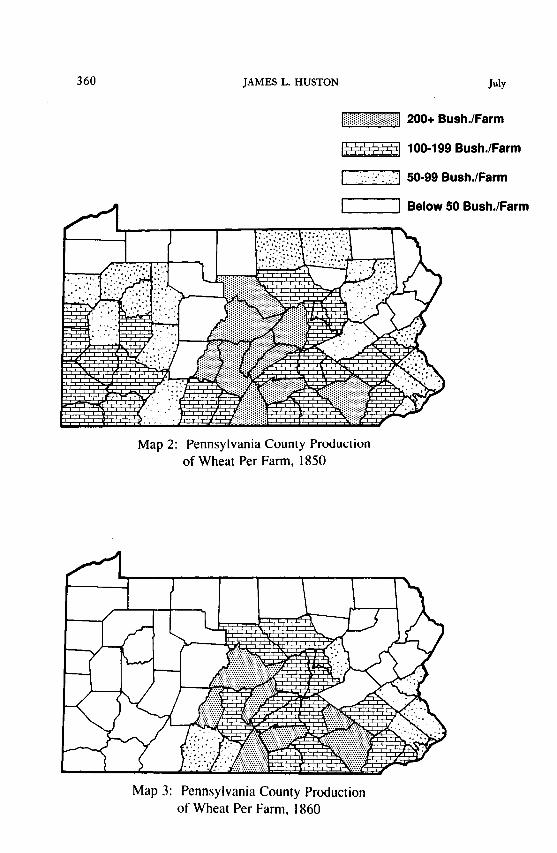
in 1840 and first in 1850. In the antebellum decades, the premiernorthern commercial crop was wheat, and Pennsylvania farmers,though reserving a considerable proportion for home consumption,sent much of their annual wheat harvest into the channels of trade.The railroad, however, enabled western grains to flood eastern mar-kets, drive down the price of cereals, and ruin the competitive positionof many Pennsylvania farmers. In terms of output per farm, therewas a marked decline in wheat (see Table 1). Yet such gross statisticsfail to indicate the tremendous internal shifting transpiring in Penn-sylvania agriculture between 1840 and I860.15 For example, ClintonCounty in the central portion of the state had in 1850 produced 299bushels of wheat per farm; in 1860 that total fell to 158 bushels.Some counties retained their agricultural competitiveness: LancasterCounty improved its wheat production over the decade from 243bushels of wheat per farm to 320 bushels. Other Pennsylvania ag-ricultural endeavors of a commercial nature that suffered from westerncompetition were swine- and sheep-raising (that is, packing and woolproduction.)16
The alterations that this enlarged national market made in Penn-sylvania's agriculture were evident by 1860. There were surges in
15 The calculations and interpretations presented here are based on county productionreported in the census years 1839-40, 1849-50, and 1859-60. However, Pennsylvania sufferedsevere damage to its wheat crop due to pests in 1859-60. How much the drop in wheatproduction was due to Pennsylvania farmers shifting to other endeavors or to destructionby insects is conjectural, although the census enumerators pointed to the midge as the chiefagent of lowered yields: Eighth Census: Agriculture, xxxiv. Yet despite insect ravages, Penn-sylvania farmers were evidently moving out of wheat for market reasons. The output ofwheat per farm for Pennsylvania counties in the ninth census reveal that 39 counties hadless wheat production per farm in 1869-70 than in 1849-50, and only 24 counties had more:Ninth Census, 5:233, 361.
16 Calculations made from Seventh Census (1850) and Eighth Census (1860). Number offarms for 1850 is provided in J.D.B. DeBow, comp., Statistical View of the United States. . . Being a Compendium oj the Seventh Census (Washington, 1854), 298. On agriculturalchange induced by railroads and western competition, see Fletcher, Pennsylvania Agriculture,2:5, 98, 139, 261-66; Paul W. Gates, The Farmer's Age: Agriculture 1815-1860 (New York,1960), 156-72, 416-17; Danhof, Change in Agriculture, 21-23, 31-45; Eighth Census: Agri-culture, xxxiii, xxxv; Percy Wells Bidwell and John I. Falconer, History oj Agriculture in theNorthern United States, 1620-1860 (Washington, 1925), 329-30. The use of output dividedby the number of farms is not to state that all farms in a county regardless of size eitherincreased or decreased production; it is merely a measure to standardize production for eachcounty so that comparisons can be made between counties.

1989 ECONOMIC CHANGE AND POLITICAL REALIGNMENT 357
output of corn, dairy products, and crops related to raising livestock(see Table 1). The rise in corn production was partly an expectedand natural one; of all the northern staples, corn had the greatestvariety of uses for farmers (as animal provender, family consumption,or local trade). It also might have been that many Pennsylvaniafarmers turned to corn when wheat no longer proved reliable as amarketable crop. Dairy products and livestock-related activities grewin output because of the influence of urban markets. Eastern citypopulations demanded fresh butter and milk as well as requiring oatsand hay to sustain city animals.17 In northern, western, and easterncounties—where access to railroad facilities existed—this transitionwas noticeable. Grain cultivation instead concentrated in south-centraland southeastern counties (such as Lancaster, Adams, Franklin, Cum-berland, and Mifflin), and even these counties turned to livestock-raising and fruit-growing to escape western competition. In somesouthwestern counties, a considerable number of individuals continuedto produce wool.
The change in Pennsylvania's agriculture can be demonstrated bythe use of maps. Maps 2 and 3 show the county production of wheatper farm (an average obtained by dividing county crop output by thetotal number of farms in the county). In 1850 wheat cultivation wasstrongest in the central portion of the state with significant productionoccurring in the western and southeastern part of the state. By 1860(Map 3), wheat farming had massively contracted to the state's centraland southeastern areas. And even these maps do not portray howmuch the central counties of Clinton, Centre, Lycoming, Mifflin,Juniata, Huntingdon, Blair, and Union lost in the process of change.18
Butter, representative of dairying, took an opposite but geographically
17 On the uses of the various crops, see Fletcher, Pennsylvania Agriculture, 2:98-99, 123,126, 128-29, 178, 262; Eighth Census: Agriculture, xlviii; Atack and Bateman, To Their OwnSoil, 114, 121, 148-49, 172. Atack and Bateman indicate that cheese production was alaborious process usually undertaken only by farmers with extensive holdings; most farmerspreferred to market surplus butter rather than to attempt to remake it into cheese (pp. 155-59).
18 The figures for the change in county wheat output per farm in bushels for the countieslisted in the text are as follows, with the 1850 figure listed first, the 1860 figure second:Clinton, 299, 158; Lycoming, 183, 109; Centre, 416, 251; Union, 221, 148; Blair, 324,211; Huntingdon, 253, 152; Mifflin, 389, 253; Juniata, 225, 121.

358 JAMES L. HUSTON July
Table 1Pennsylvania Agricultural Output, 1840,1850,1860
Category
Milch Cows (no.)(per farm)
Sheep (no.)(per farm)
Swine (no.)(per farm)
Wheat (bush.)(per farm)
Rye (bush.)(per farm)
Corn (bush.)(per farm)
Oats (bush.)(per farm)
Wool (lbs.)(per farm)
Butter (lbs.)(per farm)
Cheese (lbs.)(per farm)
1840
NANA
1,767,620NA
1,503,964NA
13,213,077NA
6,613,873NA
14,240,022NA
20,641,819NA
3,048,564NANANANANA
Census Year of:1850
530,2244.16
1,822,35714.28
1,040,3668.15
15,367,691120.46
4,805,16037.67
19,835,214155.48
21,538,156168.82
4,481,57035.13
39,878,418312.59
2,505,03419.64
1860
673,5474.32
1,631,54010.46
1,031,2666.61
13,042,16583.59
5,474,78835.09
28,196,821180.72
27,387,147175.54
4,752,52230.46
58,653,511375.93
2,508,55616.08
Sources: Sixth Census (1840); Seventh Census (1850); EightCensus (I860); J. D. B. DeBow, Statistical View ofthe United States . . . (1854)
1989 ECONOMIC CHANGE AND POLITICAL REALIGNMENT 359
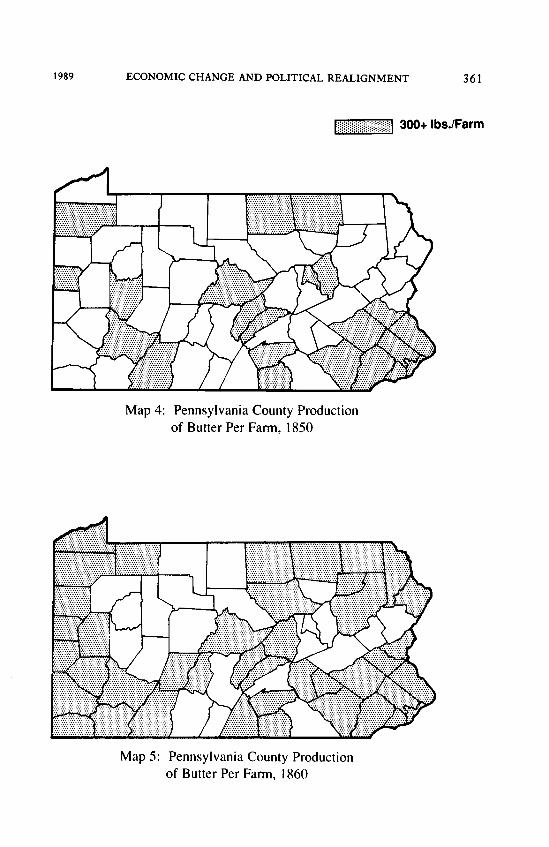
interesting course. In 1850 the output of pounds of butter per farmwas somewhat scattered over the state, but distinctly strong in thePhiladelphia region where an urban demand for dairy products existedand where farmers could easily get their products to the city (seeMap 4). By 1860, the spread of butter production was remarkable(see Map 5). But just as remarkable was the geography, for butterproduction extended around the periphery of the state and a portionof the center.19
The general tendency of the state's agriculture, then, was towarddairying and livestock-raising—that is, to alternatives to wheat farm-ing.20 But this transformation was far from complete. Although thereexisted a growing urban demand for dairy products, eastern farmersevidently failed to seize available opportunities. In the 1850s, somePennsylvania farmers began sending fluid milk to urban centers, butbutter was the state's most prominent dairy product and was animportant item in local exchanges. Making butter was the provinceof farm women and children and remained so until the 1880s, eventhough the production of butter increased dramatically over time.Dairying in the northern and eastern states actually exhibited negativeproductivity for the last four decades of the nineteenth century—farmers failed to improve either their herds or methods of extraction.Moreover, dairying and livestock-raising were not adequate incomesubstitutes for wheat production. Jeremy Atack and Fred Batemanhave demonstrated that an average eastern farmer acquired a smallbut important monetary supplement from the sale of butter, but such
19 The butter output per farm was calculated in the same manner as was wheat production:the county total of butter produced (in pounds) divided by the number of farms in thecounty. The categories constructed for output per farm in Maps 2 through 5 were somewhatarbitrarily chosen for illustrative purposes. However, Atack and Bateman indicate that theaverage Pennsylvania farm in their non-urban sample produced 40 bushels of wheat and 389pounds of butter and contained 67 acres of improved land and 46 acres of unimprovedland. They insist that most farms had surplus butter to sell on the market, so the 300pounds division used in Maps 4 and 5 may be taken to mean that the marked countiesused butter in commercial transactions (local or regional). Wheat production under 50bushels per farm was undoubtedly for home consumption, and commercial wheat farmingprobably occurred only in counties with output above 100 bushels per farm. Atack andBateman, To Their Own Soil, Table 7.2, 112-13, 159. It also should be noted that butterproduction in 1860 as displayed in Map 5 is following railroad construction.
20 This point is specifically made by Fletcher, Pennsylvania Agriculture, 2:98-99, 139.
360 JAMES L. HUSTON July
Map 2: Pennsylvania County Productionof Wheat Per Farm, 1850
Map 3: Pennsylvania County Productionof Wheat Per Farm, 1860
1989 ECONOMIC CHANGE AND POLITICAL REALIGNMENT 361
Map 4: Pennsylvania County Productionof Butter Per Farm, 1850
Map 5: Pennsylvania County Productionof Butter Per Farm, 1860

362 JAMES L. HUSTON July
activity did not replace the earnings that had earlier been obtainedfrom the sale of wheat. Pennsylvania farmers suffered in the ante-bellum decade. An indication of the troubles that Pennsylvania en-dured between 1840 and 1860 was the migration of the state's farmersto the West. As the historian of Pennsylvania agriculture, StephensonW. Fletcher, noted, the years 1840 to 1860 were a "period of painfuladjustment."21
A second distinct impact upon the Pennsylvania economy that thechange in transportation efficiency induced was the geographical dis-tribution of industrial activity. During the decades of canal andturnpike supremacy, the high cost of shipment enabled many smallentrepreneurs to establish modest manufacturing establishmentsthroughout the state in order to supply local needs. The railroadsdrastically lowered freight charges and enabled enterprises in Phila-delphia and Pittsburgh to ship their wares into the hinterland anddamage, if not destroy, the smaller businesses. Of course, improvedtransportation facilities aided some counties; it was between 1840 and1860 that the coal and iron counties of Cambria, Luzerne, andSchuylkill rose to prominence. But many firms in the interior of thestate failed, and the number of individuals employed in manufacturingas a ratio to the entire county population fell considerably—as inCentre, Cumberland, Dauphin, Franklin, Mifflin, and Perry counties.One of the results of the transportation revolution, therefore, was toconcentrate manufacturing activities in fewer locations; iron works,coal mines, and textile plants in other parts of the state withered.22
21 Ibid., 2:364, see also 2:5, 77, 96-99, 121-22, 139, 165-69, 183-95, 237-55, 261-66,274; Holt, "Politics of Impatience," 325-38. On the switch of easterners to dairying andtheir failure to develop more sophisticated techniques, see Eric Brunger, "Dairying andUrban Development in New York State, 1850-1900," Agricultural History 29 (1955), 169-74; Fred Bateman, "Improvement in American Dairy Farming, 1850-1910: A QuantitativeAnalysis," Journal oj Economic History 28 (1968), 255-73; Clarence H. Danhof, "The FarmEnterprise: The Northern United States, 1820-1860s," Research in Economic History 4 (1979),150-61; Atack and Bateman, To Their Own Soil, 146-61. Atack and Bateman estimate thatthe average yearly sale of butter surplus amounted to the equivalent of one or two months'factory wages: To Their Own Soil, 159.
22 Fletcher, Pennsylvania Agriculture, 2:33, 41-42. The percentage of manufacturing em-ployees to total county population in the counties named in the narrative are as follows,with the 1840 figure first and then that for 1860: Cambria, 04.6, 08.5; Centre, 08.2, 03.6;Cumberland, 07.0, 03.3; Dauphin, 07.5, 05.0; Franklin, 09.5, 02.6; Mifflin, 06.7, 03.4;
1989 ECONOMIC CHANGE AND POLITICAL REALIGNMENT 363
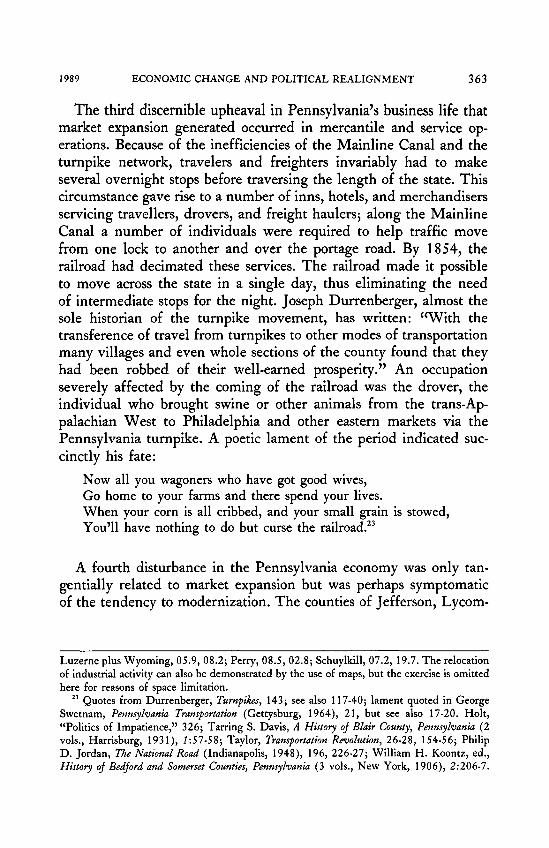
The third discernible upheaval in Pennsylvania's business life thatmarket expansion generated occurred in mercantile and service op-erations. Because of the inefficiencies of the Mainline Canal and theturnpike network, travelers and freighters invariably had to makeseveral overnight stops before traversing the length of the state. Thiscircumstance gave rise to a number of inns, hotels, and merchandisersservicing travellers, drovers, and freight haulers 5 along the MainlineCanal a number of individuals were required to help traffic movefrom one lock to another and over the portage road. By 1854, therailroad had decimated these services. The railroad made it possibleto move across the state in a single day, thus eliminating the needof intermediate stops for the night. Joseph Durrenberger, almost thesole historian of the turnpike movement, has written: "With thetransference of travel from turnpikes to other modes of transportationmany villages and even whole sections of the county found that theyhad been robbed of their well-earned prosperity." An occupationseverely affected by the coming of the railroad was the drover, theindividual who brought swine or other animals from the trans-Ap-palachian West to Philadelphia and other eastern markets via thePennsylvania turnpike. A poetic lament of the period indicated suc-cinctly his fate:
Now all you wagoners who have got good wives,Go home to your farms and there spend your lives.When your corn is all cribbed, and your small grain is stowed,You'll have nothing to do but curse the railroad.23
A fourth disturbance in the Pennsylvania economy was only tan-gentially related to market expansion but was perhaps symptomaticof the tendency to modernization. The counties of Jefferson, Lycom-
Luzerne plus Wyoming, 05.9, 08.2; Perry, 08.5, 02.8; Schuylkill, 07.2, 19.7. The relocationof industrial activity can also be demonstrated by the use of maps, but the exercise is omittedhere for reasons of space limitation.
23 Quotes from Durrenberger, Turnpikes, 143; see also 117-40; lament quoted in GeorgeSwetnam, Pennsylvania Transportation (Gettysburg, 1964), 21, but see also 17-20. Holt,"Politics of Impatience," 326; Tarring S. Davis, A History oj Blair County, Pennsylvania (2vols., Harrisburg, 1931), 7:57-58; Taylor, Transportation Revolution, 26-28, 154-56; PhilipD. Jordan, The National Road (Indianapolis, 1948), 196, 226-27; William H. Koontz, ed.,History oj Bedford and Somerset Counties, Pennsylvania (3 vols., New York, 1906), 2:206-7.
364 JAMES L. HUSTON July
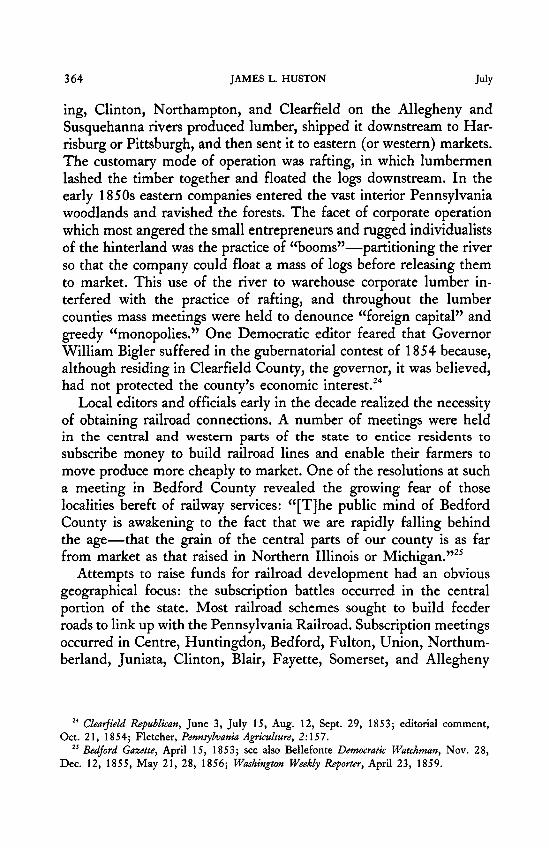
ing, Clinton, Northampton, and Clearfield on the Allegheny andSusquehanna rivers produced lumber, shipped it downstream to Har-risburg or Pittsburgh, and then sent it to eastern (or western) markets.The customary mode of operation was rafting, in which lumbermenlashed the timber together and floated the logs downstream. In theearly 1850s eastern companies entered the vast interior Pennsylvaniawoodlands and ravished the forests. The facet of corporate operationwhich most angered the small entrepreneurs and rugged individualistsof the hinterland was the practice of "booms"—partitioning the riverso that the company could float a mass of logs before releasing themto market. This use of the river to warehouse corporate lumber in-terfered with the practice of rafting, and throughout the lumbercounties mass meetings were held to denounce "foreign capital" andgreedy "monopolies." One Democratic editor feared that GovernorWilliam Bigler suffered in the gubernatorial contest of 1854 because,although residing in Clearfield County, the governor, it was believed,had not protected the county's economic interest.24
Local editors and officials early in the decade realized the necessityof obtaining railroad connections. A number of meetings were heldin the central and western parts of the state to entice residents tosubscribe money to build railroad lines and enable their farmers tomove produce more cheaply to market. One of the resolutions at sucha meeting in Bedford County revealed the growing fear of thoselocalities bereft of railway services: "[T]he public mind of BedfordCounty is awakening to the fact that we are rapidly falling behindthe age—that the grain of the central parts of our county is as farfrom market as that raised in Northern Illinois or Michigan."25
Attempts to raise funds for railroad development had an obviousgeographical focus: the subscription battles occurred in the centralportion of the state. Most railroad schemes sought to build feederroads to link up with the Pennsylvania Railroad. Subscription meetingsoccurred in Centre, Huntingdon, Bedford, Fulton, Union, Northum-berland, Juniata, Clinton, Blair, Fayette, Somerset, and Allegheny
24 Clearfield Republican, June 3, July 15, Aug. 12, Sept. 29, 1853; editorial comment,Oct. 21, 1854; Fletcher, Pennsylvania Agriculture, 2:157'.
25 Bedford Gazette, April 15, 1853; see also Bellefonte Democratic Watchman, Nov. 28,Dec. 12, 1855, May 21, 28, 1856; Washington Weekly Reporter, April 23, 1859.

1989 ECONOMIC CHANGE AND POLITICAL REALIGNMENT 365
counties. These subscription meetings often incited a violent oppo-sition, with various members of the community arguing against soul-less corporations and schemes designed to enrich New York bankers.In fact, most subscription attempts failed. But the animosity theyengendered could quite literally split a community: in 1855 the countyof Snyder was formed out of Union because a dispute arose over theroute of a proposed railroad.26
Pennsylvania's adjustment to new business conditions imposed bya broadening of market competition needs to be understood clearly.Market expansion neither plunged the state into depression nor de-stroyed its agricultural strength. To the contrary, Pennsylvania re-mained one of the most important grain-growing states in the Union,and its industrial prowess grew steadily. What occurred was not ashattering of the state's economy but an internal reshuffling of itsresources and business activities. Some individuals managed to com-pete successfully in the new market system and to continue normaleconomic routines 5 others switched into endeavors that promised betterrewards; and some were simply hurt in the change—market com-petition ruined their accustomed manner of earning a competencebut, for a variety of reasons, they experienced difficulty in finding asuitable alternative.27 Thus, whatever connections there may havebeen between market change and political affiliation is not for an-tebellum Pennsylvania a question of political reaction to depressionand a stagnant economy, but rather one of linkages between a recastingof local economic structure and political identification.
26 Lewistown Gazette, June 22, 1854, July 19, 1855; Bedford Gazette, Sept. 23, 30, 1853;John Blair Linn, History oj Centre and Clinton Counties, Pennsylvania (Philadelphia, 1883),92, 171-72; Koontz, ed., History oj Bedford and Somerset Counties, 7:220-28, 289-90; FranklinEllis, History oj that Part oj the Susquehanna and Juniata Valleys, in the Counties oj Mijjlin,Juniata, Perry, Union, and Snyder, in the Commonwealth oj Pennsylvania (2 vols., Philadelphia,1886), 7:444-47; Saylor, Railroads oj Pennsylvania, 14-16, 192, 269. These subscriptionfights set the stage for the local tax upheavals following the Panic of 1857 described inHolt, Forging a Majority, 228-58.
27 See the pertinent comments of Stanley Lebergott, The Americans: An Economic Record(New York, 1984), 100, 281-82.
366 JAMES L. HUSTON July
Bivariate and multiple correlation techniques were employed toassess whether or not the economic alterations Pennsylvania under-went exercised any influence upon the state's political system. Anumber of economic variables were constructed to see if they producedsignificant correlations with party voting in some of the major electionsin the 1850s (that is, the presidential elections of 1852, 1856, 1860,and the state supreme court judgeship election of 1854). Likewise,variables were formed to detect associations between political partiesand other attributes of the social environment—age, religion, andnativity.28 The social variables that exhibited significant associationswith a political party were placed into a multiple regression; then thebest single measure of a relationship between party and an economicfactor was added to the batch of social variables in order to determinewhether the explanatory power of the economic variable retained itspotency in the presence of those measuring social attributes.
The first set of economic variables to be discussed are ones generatedby taking the county output of a crop (rye, butter, wheat, and soforth) and dividing the figure by the county number of white adultmales (to standardize for population differences). It turns out thatthese variables are crucial in the analysis that follows and thereforedeserve some extended comment. Virtually all counties in Pennsyl-vania produced wheat, corn, oats, hay, butter, buckwheat, potatoes,and the like.29 However, the output of any one crop or product(standardized for population) varied from one county to another,indicating differences as to agricultural pursuits. When these crop
28 The dependent variables were percent votes cast by a political party in a given electionof the eligible voters. To estimate eligible voters, I followed the procedure outlined byWilliam E. Gienapp, "Nebraska, Nativism, and Rum: The Failure of Fusion in Pennsylvania,1854," PMHB 109 (1985), note to Table 2, p. 456. Voting results obtained from theTribune Almanac. Economic variables using crop outputs are created by dividing the countyoutput of the crop by the total number of white adult males in order to standardize forpopulation. Age variables are constructed by the age group divided by the number of whiteadult males; religious variables are the number of church accommodations divided by thecounty population; nativity is immigrants divided by the whole population, individuals bornin Pennsylvania divided by the county population, and American citizens born outside ofPennsylvania divided by the county population. Material taken from the published censuses.Variables are constructed from the 1850 census used in analyzing elections 1850-54; variablesare constructed from the 1860 census used in analyzing elections 1856-60.
29 A t a c k a n d B a t e m a n , To Their Own Soil, T a b l e 1 0 . 4 , p . 1 7 1 ; Eighth Census: Agriculture,122-23.

1989 ECONOMIC CHANGE AND POLITICAL REALIGNMENT 367
outputs are correlated with county voting percentages for a party, theresulting statistics reveal whether or not a consistent pattern emergesbetween voting and agricultural production.
The interpretation herein given to crop output is vital. The variablesmeasuring rye, wheat, or corn output are not to be understood asdemonstrating how rye, wheat, or corn farmers voted; the variablesas constructed preclude such a generalization. Rather, these measuresof crop output are taken to indicate the market orientation of someportion of the county's economy.30 Farmers as an occupational groupmight have voted all for one party or another, but if their farms wereenmeshed in an area of commercial development, their crop produc-tions would likely be commercial as well. The crop output, therefore,becomes a means of detecting market activity within a county andnot simply the market persuasion of a specific group of farmers.31
Thus, it would appear that a county's production of wheat wouldindicate its degree of integration into market operations during theJacksonian period. A continued production of wheat in the mid-1850scan be taken to mean that either some localities successfully respondedto western competition or that others were unable or unwilling toalter their commercial orientation to meet the new conditions imposedby the railroad. Likewise, a county's production of butter—or cropsconnected with livestock-raising—can be viewed as revealing the
30 It should be recognized that any individual Pennsylvania county contained a numberof different types of market activity, from nearly complete self-sufficiency to extremecommercialization. A crop output exhibits a tendency of some portion of the county's economyand cannot be taken as emblematic for the entire county's economy.
31 Using statistical procedures based on units of analysis that group population in orderto develop generalizations about individual behavior is an example of the problem termedthe "ecological fallacy." The associations found in correlation and regression analysis can bemisleading if one tries to presume causality between the variables. For example, the rela-tionship in antebellum Pennsylvania between industrial capital per white adult male andDemocratic party county percentage voting is positive (though weak). This should only beinterpreted as the more industrial capital a county had, the greater was its percentageDemocratic vote. It emphatically does not mean that industrial capitalists voted Democratic(though they might have). The reason for the positive association appears to be that asindustrial capital increases, the number of industrial workers increases; frequently thoselaborers were Catholic immigrants. Therefore, the positive association between industrialcapital and Democratic voting is misleading if one interjects causality and a too strict definitionof the variables without further investigation. In a similar fashion, the crop output variablesin this study are taken to illustrate market orientation of some portion of a county's economyrather than the activities of rye, wheat, or corn farmers.
368 JAMES L. HUSTON July
extent a local economy was successfully adapting to new economicconditions.32
One crop output measure requires further elaboration. The countyoutput of rye per white adult male has consistently significant cor-relations with the Democratic (positive) and Republican (negative)parties. Pennsylvania in 1860 was the nation's leading rye producer,and secondary accounts indicate that rye grew in poor soils wherecommercial crops such as wheat failed, and that rye was used fre-quently for home consumption (bread). However, rye also had anethnocultural dimension. Rye was important in brewing liquors, andpeople of German ancestry had traditional recipes calling for rye.And there are statistical connections between rye and the nay voteon a prohibition referendum in 1854 and between rye and the religiousgroups of German Reformed and Lutheran. For the purposes of thispaper, it would seem fair to conclude on the basis of secondary sourcesthat rye, although it possessed an ethnocultural dimension, was in-dicative of semi-subsistence agriculture—that is, agriculture not in-tegrated into an extensive market economy.33
The results of bivariate correlations between political parties in theelections of 1852, 1854, 1856, and 1860 with crop output variablesare presented in Table 2. The correlations reveal marked differencesbetween the parties based on county agricultural production, and
32 Atack and Bateman argue that dairying—butter production in particular—representedan extension of home manufacturing. The essence of their argument may be conceded, butthe point is that dairying entered commerce instead of being confined to home consumption;therefore, dairying in Pennsylvania became a commercial activity in response to alteredmarket conditions. Atack and Bateman, To Their Own Soil, 207.
33 On wheat and rye, see Fletcher, Pennsylvania Agriculture, 2:127; Eighth Census: Agri-culture, ix; Gates, Farmer's Age, 156-58, 173; Bidwell and Falconer, History of Agriculturein the Northern United States, 353-54; see also Sarah F. McMahon, "A Comfortable Sub-sistence: The Changing Composition of Diet in Rural New England, 1620-1840," Williamand Mary Quarterly 42 (1985), 31-33. Correlation between rye and German Reformed was.364, between rye and Lutheran, .638, between rye and nay vote for prohibition, .588. Thecontention that rye will be used in this paper as an indicator of semi-subsistence agriculturealso rests on the fact that when rye and German Reformed and rye and Lutheran are placedin multiple regressions on Democratic voting in 1852, 1854, and 1856, rye continues to bethe more important independent variable. This shows that after rye is controlled for theinfluence of these two religious denominations, it still retains explanatory potency. However,these multiple regressions have at times statistical problems because the rye and religiousvariables act as suppressors.
1989 ECONOMIC CHANGE AND POLITICAL REALIGNMENT 369
these differences in turn intimate that an essential feature of theparties was orientation to market activity.34 The Democrats appear tohave been a party that simply did not correlate at all on the countylevel with commercial crops. For all elections 1852, 1854, 1856, and1860, the correlations between county Democratic voting and variouscrop outputs were either significantly negative or simply uncorrelatedat all. This was true particularly in the case of wheat, the mostimportant commercial crop of the time. The one crop that Democraticcounty voting did significantly and positively correlate with was theproduction of rye. These findings argue that the economic base forthe Democratic party, on a county level of aggregation, was essentiallynon- or semi-commercial; Democratic county voting was attached tosomething of a localist viewpoint in economic affairs.35
Whig county percentage voting in 1852 offers an intriguing contrastto Democratic county voting. Whig county voting in 1852 registeredpositive associations with virtually all commercial crops except hay,and significantly positive with the crops of wheat and oats (see Table2). Moreover, the Whig county level voting was positively associatedwith the dollar value of farms. These correlations can be interpretedas meaning that the level of Whig voting in a county rose in accordancewith the county's extent of commercial exchange.36 The findingspresented here thereby reinforce an interpretation of the Jacksonianparty system that postulates that an essential difference between Dem-ocrats and Whigs was orientation to commercial involvement; theWhigs welcomed and sought further market expansion, whereas the
34 The unit of analysis throughout this paper is the county, and all conclusions should beunderstood in terms of the voting behavior of these aggregate units.
35 The pattern of correlations concerning Whig and Democratic voting also hold for thegubernatorial election 1851, congressional elections 1852 and 1854, and the canal com-missioner election 1853. The party competition for the elections reported in Tables 2 and4 and Table 9 is as follows: presidential election 1852, Whigs, Democrats, Free Soilers; inthe Pennsylvania Supreme Court judgeship of 1854, Whigs, Democrats, Know Nothings(Americans); in the presidential election of 1856, Democrats, Republicans, Know Nothings;in the gubernatorial election of 1860, Democrats, Republicans.
36 The farm value variable was constructed by dividing the dollar value of farms in thecounty by the number of white adult males. Table 2 only indicates the significance levelof r in cases when the significance is greater than .01 or .001. In virtually all cases in thispaper any bivariate correlation that is stronger than + / —.220 is significant at the .05 level.
370 JAMES L. HUSTON July
Democrats either feared or were ambivalent to commercialism anddesired to maintain local economies and local control.37
What occurred with the cracking of the parties in 1854 is ratherimpressive. The Democratic vote level associations with crop pro-ductions remain indicative of non-commercial agriculture, but thestrength of the associations, especially with the crops that demonstratedthe greatest growth in antebellum Pennsylvania (livestock, oats, but-ter, hay) significantly increased in a negative direction. At the sametime, the associations between crops and Whig county level voting—that is, the vote of those who continued to remain in the old Whigorganization—switched distinctly from positive relationships with thecommercial crops of the Jacksonian period (wheat, corn, andslaughter) to the crops now favored by the new, competitive marketconditions—butter, hay, oats. The association between 1854 Whigcounty voting and wheat production fell from r = .463 in 1852 to.142 in 1854, but for butter the association increased from r = .065in 1852 to .434 in 1854. Whig county voting in 1854 appears tohave maintained its strength in localities where there had been asuccessful adaptation to novel market conditions.
A positive association between production of wheat and a politicalentity seems to have attached itself to the Know Nothing movement(see Table 2). But at the same time, the Know Nothing county votein 1854 and 1856 was distinctly negatively associated with the cropsof butter, oats, and hay—the crops the alteration in the marketfavored. It appears that Know Nothingism was connected to a county'sdifficulties in adjusting to market change. The county Know Nothingvote was related to the production of the commercial crops of theJacksonian period that faced western competition in the 1850s, but
37 See, for example, Thomas B. Alexander, Peggy Duckworth Elmore, Frank M. Lowrey,and Mary Jane Pickens Skinner, "The Basis of Alabama's Ante-Bellum Two-Party Systemby Quantitative Analysis Methods," Alabama Review 19 (1966), 262-66; Donald B. Cole,Jacksonian Democracy in New Hampshire, 1800-1851 (Cambridge, 1970) , 151, 157-58, 165,169; Donald J. Ratcliffe, "Politics in Jacksonian Ohio: Reflections on the EthnoculturalInterpretation," Ohio History 88 (1979), 28-32; Harry L. Watson, Jacksonian Politics andCommunity Conflict: The Emergence oj the Second American Party System in Cumberland County,North Carolina (Baton Rouge, 1981), 206, 262-67, 299, 319-22; William G. Shade, "Societyand Politics in Antebellum Virginia's Southside," Journal oj Southern History 53 (1987),178-83. Shade, however, also indicates that religion in Prince Edward County, Virginia, wasmore important than commercial orientation: ibid., 187-90.
1989 ECONOMIC CHANGE AND POLITICAL REALIGNMENT 371
the negative relationships between Know Nothing voting and newmarket crops intimates that a successful response to changed marketconditions vitiated the strength of Know Nothing county voting. Onthe basis of county voting, Know Nothings appeared to have been aparty that harbored a commercial orientation, but the orientation wasto the past rather than to the future.
The foregoing discussion postulates that an economic influence—here, the impact of market change—affected the strength of thePennsylvania Know Nothing movement. This assertion merits furtherexploration. The literary record of Know Nothingism is not one ofeconomic grievances. It is, rather, a record of betrayed republicanism,xenophobia, and anti-Catholicism.38 The economic content of KnowNothingism in written form seems to have been limited to anger overwage competition from foreigners and increased taxes to fund poor-houses suddenly swollen with immigrant paupers. Perhaps the mostthat can be said of the tie between the Know Nothings and marketchange is that the altered economic circumstances produced a climateof frustration, apprehension, and anger. It is likely that the influx ofimmigrants between 1840 and 1857 would have produced a nativistreaction regardless of the state's economic health; certainly the statehad a history of nativist activity and hostility to Catholicism. But thefrictions generated by market transformation enhanced the appeal ofKnow Nothings and permitted the movement to obtain a strength itmight not have acquired under different conditions. Market changewas probably operating as a background condition fueling the spreadof Pennsylvania Know Nothingism.
Secondary work on the Know Nothing movement, moreover, hasprovided historians with a social profile of the party's rank and file:youthful, Protestant, middle/lower class, urban/village residency.39
Pennsylvania had two major urban centers in Pittsburgh and Phila-delphia (Allegheny and Philadelphia counties), and it may be safelyassumed that processes shaping the Know Nothing movement there
38 On the characteristics of the Know Nothings, see Holt, Political Crisis of the 1850s,154-72; Ray Allen Billington, The Protestant Crusade, 1800-1860: A Study oj the Origins ojAmerican Nativism (rev. ed., New York, 1952), 322-25, 334-36; Gienapp, "Nebraska,Nativism, and Rum," 457-58, 463-67.
39 For example, Gienapp, "Nebraska, Nativism, and Rum," 457-58, 463-67; Gienapp,Origins oj the Republican Party, 92-100, 145-46, 160-66.

372 JAMES L. HUSTON July
were different from those in the countryside. Yet the Know Nothingsscored quite highly in many non-urban counties, attracting over 40percent of the total vote in such counties as Fayette, Clinton, Ly-coming, Blair, Jefferson, Huntingdon, and Perry. The impact ofmarket change affected not only agriculture but entire local economiesas well. In non-urban counties, the difficulties associated with eco-nomic transformation could easily have been transmitted to villagemerchants and artisans.40
Analysis of Republican county voting presents interesting compli-cations. The Republican organization in Pennsylvania appeared in1855 and drew minimal support in the elections of that year. In thepresidential election of 1856 the party fared much better, becomingthe major opposition party to the Democrats.41 As Table 2 indicates,the Republican party in 1856 had two decisive features: one, Re-publican county voting was definitely not associated with the com-mercial crops of the Jacksonian period (wheat and corn); and, second,its county voting was strongly and positively associated with cropsfavored by the transformed market conditions (e.g., butter, livestock).A comparison of the correlations between Know Nothing voting andRepublican voting in 1856 in Table 2 reveals that the two partieswere arising from disparate economic bases. The Republican vote in1856 emphasizes that the party on a county level had adapted tonew market conditions and had foregone the commercial activities ofthe Jacksonian era. The Republicans on a county level appear to have
40 Correlations between parties and socioeconomic variables were found in several ways.Those reported in this article were for all counties. However, correlations were calculatedwhen Philadelphia and Allegheny counties were omitted; there was no difference in theresults. An attempt also was made to divide the state into four regions (the northern tier,eastern counties, southern counties, and interior and western counties) j in some areas Re-publicans were associated with wheat-growing (northern tier), and Know Nothings with rye(southern counties). Yet the overall patterns given in the text appear to have prevailed evenwhen the state was subdivided.
41 In 1855, in Pennsylvania, the Democrats faced a "fusion" opposition besides theRepublican party. The fusion obtained 149,745 votes, the Democrats 181,281, the Repub-licans a meager 7,223 (there were also scattered votes for Whigs and nativists). TheRepublicans only received votes in 37 counties, and only received more than 5 percent ofthe total vote in 18 counties. The most distinguishing characteristic of the Republicans atthis point—to the extent that a correlation is valid at all—is Presbyterian attendence (r =.672). In the presidential race of 1856, the Republicans received 148,000 ballots, the KnowNothings 82,000.
1989 ECONOMIC CHANGE AND POLITICAL REALIGNMENT 373
been a party that seized market opportunities; it was the party wel-coming economic change.
What then happened to the Republicans is presented in Table 3.After 1856 the Republicans and Know Nothings commenced theprocess of amalgamating into one opposition party. In the guberna-torial race of 1857, the correlations reveal a continued positive as-sociation between Republican county voting and those crops favoredby market change. In 1858 and thereafter, however, the correlationsbetween crops and Republican county voting, except for rye andbutter, seem to disappear. The evident reason is that the merger ofthe Know Nothings and Republicans into one organization practicallycancelled out the economic dimensions that had differentiated thetwo groups in 1856. The continuing impact of the slavery-extensionissue in the form of the Lecompton Constitution, a state-wide depres-sion in 1858 that elevated the tariff issue, and a shared loathing ofthe Democratic party enabled the two factions to combine (in 1858the opposition party was called the "People's party," but it soonbecame simply the Republican party).42 One can interpret this hap-penstance to mean that political concerns eventually outweighed eco-nomic differences. However, it should be noted that the distinctionbetween the Republicans and Know Nothings was not between havesand have-nots. Rather, the distinguishing feature between the twoparties was a commercial orientation toward the future versus a com-mercial orientation to the past. When the two parties combined,nonetheless, the effect statistically was to obliterate the economicessence of both: an acceptance of market behavior.
The analysis so far indicates that political realignment coincidedneatly with the change in Pennsylvania's market structure. Jacksonianpolitics involved a party system that to some extent reflected a divisionover commercial involvement, the Whigs representing those who
42 On the coalition of Republicans and Know Nothings in Pennsylvania, see William E.Gienapp, "Nativism and the Creation of a Republican Majority in the North before theCivil War," Journal oj American History 72 (1985), 555-56, Table 5 on p. 555; James L.Huston, The Panic oj 1857 and the Coming oj the Civil War (Baton Rouge, 1987), 151-66,254-60. See also the intelligent and useful remarks of Donald J. Ratcliffe, who argues thatas a party evolves the original economic impulse may be lost over time due to the growthof party loyalty and ethnocultural considerations: Ratcliffe, "Politics in Jacksonian Ohio,"9-11.
374 JAMES L HUSTON July
favored market activities, the Democrats those who favored localactivities and who either mistrusted or were ambivalent to extensiveeconomic activities. The explosion of the Jacksonian party system inthe mid-1850s coincided with the alteration in Pennsylvania's marketstructure induced by the completion of railroad lines. The Republicanparty was the party of adaptation to market conditions and respon-siveness to market signals. Democrats, in terms of their aggregatevoting performance, continued to evince hostility or nonchalance tocommercial development. And the Know Nothings appeared to bethe party of those who failed to adjust to market realities; the partydrew its county voting strength from an economic base that adheredto the commercial conditions of the Jacksonian period.43
The essential division of the parties that so far has been presentedin this paper involves three types of crops: non-commercial (rye),traditional (of the Jacksonian era), and new market. It was determinedthat for further analysis some method needed to be devised to collapsethe agricultural variables into fewer ones that retained the basic di-vision of non-commercial, traditional commercial, and new marketcommercial agriculture, in order to avoid using a number of differentvariables all of which illustrated the same phenomenon. To do this,the agricultural variables were correlated with one another to establishgroups with positive relationships. Rye generally correlated with noth-ing; wheat, corn, and possibly slaughter seemed to fit together; and
43 Note that this depiction of the economic attitudes of the Whigs, Democrats, andRepublicans is similar to the conclusions of a number of other authors Holt, Forging aMajority, 43 46, 75 77, Glyndon G Van Deusen, The Jacksoman Era, 1828 1848 (NewYork, 1959), 97, Edward Pessen, Jacksoman America Society, Personality, and Politics (Homewood, 1969), 256 66, Jean Baker, Affairs oj Party The Political Culture oj Northern Democratsin the Mid Nineteenth Century (Ithaca, 1983), 144 47, 157, Joel Silbey, A Respectable MinorityThe Democratic Party in the Civil War Era, 1860 1868 (New York, 1977), 25 27, EricFoner, Free Soil, Free Labor, Free Men The Ideology oj the Republican Party bejore the CivilWar (New York, 1970), 11 39 Besides the correlations reported in Tables 2 and 3, othercorrelations were computed that used variables constructed m somewhat different waysVoting strength also was measured as percent of total vote cast, crop output variables wereconstructed in per capita terms and even as a raw score unstandardized for population Inall cases the basic relationships between parties and agricultural output were the same andwere usually statistically significant Due to the insect problems of the 1859 census year,bivanate correlations were run with the wheat and butter production of the 1870 censusand party voting in the 1850s, and the results still conformed to the pattern given in Table2
1989 ECONOMIC CHANGE AND POLITICAL REALIGNMENT 375
butter, cheese, oats, and hay appeared to be the mix of activitiesassociated with livestock-raising and dairying. Prices for all agriculturalproducts were obtained and then an estimate was made of the valueof total county agricultural output per white adult male.44 Next, thevalue per white adult male of the crops collected into groups of non-commercial, traditional commercial, and new market commercial werecalculated; finally, a percentage was obtained that was a ratio of eachof the crop value categories to the total value of county agriculturaloutput. These figures were then correlated with the political variables.The results appear in Table 4. With the agricultural variables collapsedtogether, the bivariate relationships between parties and the categoryof commercial status stands out even more strongly. For example,Know Nothing county voting correlated with the percentage of valueof wheat to county output at r = .598; Republican county votingin 1856 correlated with percentage of new commercial crops to countyoutput at r = .626. These correlations compare favorably to thosereported by the ethnocultural school.45
Tables 2 and 3 also contain the relationship between farm size andpolitical parties. Some of these correlations are quite hefty, especiallybetween farm sizes 20-49 and 100-499 acres with Whig voting in1852, Know Nothing voting in 1854 and 1856, and Republicanvoting in 1856.46 Normally, farm size would be interpreted as a
44 Price information was taken from Anne Bezanson, Robert D. Grey, and Miriam Hussey,Wholesale Prices in Philadelphia, 1784-1861 (2 vols., Philadelphia, 1937), 2:13, 25, 31, 36,62, 78, 79, 91, 96, 97, 148, 153, 155, 159, 184, 242, 248, 265, 228-29; Gates, Farmer'sAge, 252; Bid well and Falconer, History oj Agriculture in the Northern United States, 378.An elaboration of the prices used will be given by the author upon request.
45 Ratcliffe reports his highest correlation to be -.457 for an economic variable andDemocratic voting for 1832 Ohio, which he states is as good as those published by theethnoculturists: Ratcliffe, "Politics in Jacksonian Ohio," Table 2, p. 30, and comments, p.30. Comparison with other studies is slightly more difficult because frequently other scholarshave used fewer cases and applied a rank order correlation (Spearman's rho): Paul Kleppner,The Cross oj Culture: A Social Analysis oj Midwestern Politics 1850-1900 (New York, 1970),notes 21 and 22, pp. 20-21, and 22, 42, 53, and passim; Richard Jensen, The Winning ojthe Midwest: Social and Political Conflict, 1888-1896 (Chicago, 1971), 229; Formisano, Birthoj Mass Political Parties, 292, 296-97. Michael Holt reports rather high correlations forPittsburgh, but his findings are based on 9 city wards; Holt, Forging a Majority, 328-29,336-38, 340-42, 356-60, 367-68.
46 The farm size variable was created as a percentage of the number of farms in a countyin the size category divided by the number of farms in the county. The calculation also was
376 JAMES L. HUSTON July
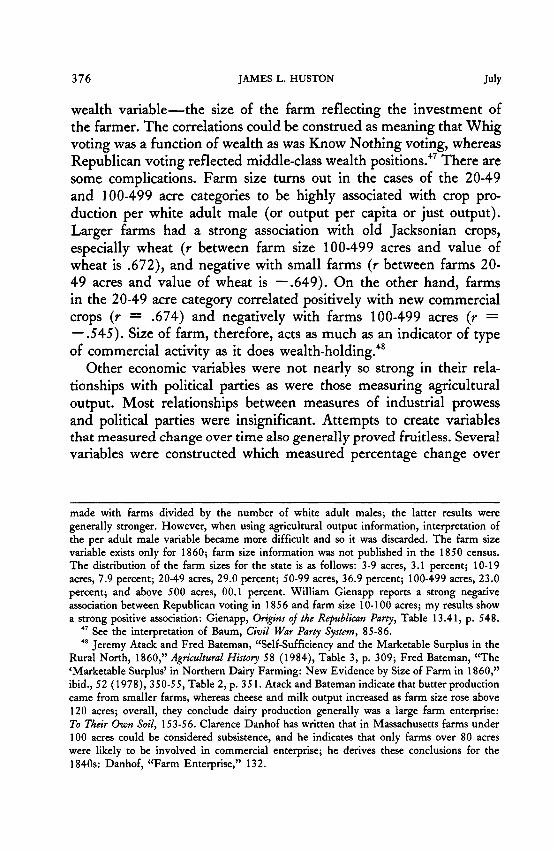
wealth variable—the size of the farm reflecting the investment ofthe farmer. The correlations could be construed as meaning that Whigvoting was a function of wealth as was Know Nothing voting, whereasRepublican voting reflected middle-class wealth positions.47 There aresome complications. Farm size turns out in the cases of the 20-49and 100-499 acre categories to be highly associated with crop pro-duction per white adult male (or output per capita or just output).Larger farms had a strong association with old Jacksonian crops,especially wheat (r between farm size 100-499 acres and value ofwheat is .6/J2), and negative with small farms (r between farms 20-49 acres and value of wheat is —.649). On the other hand, farmsin the 20-49 acre category correlated positively with new commercialcrops (r = .674) and negatively with farms 100-499 acres (r =— .545). Size of farm, therefore, acts as much as an indicator of typeof commercial activity as it does wealth-holding.48
Other economic variables were not nearly so strong in their rela-tionships with political parties as were those measuring agriculturaloutput. Most relationships between measures of industrial prowessand political parties were insignificant. Attempts to create variablesthat measured change over time also generally proved fruitless. Severalvariables were constructed which measured percentage change over
made with farms divided by the number of white adult males; the latter results weregenerally stronger. However, when using agricultural output information, interpretation ofthe per adult male variable became more difficult and so it was discarded. The farm sizevariable exists only for I860; farm size information was not published in the 1850 census.The distribution of the farm sizes for the state is as follows: 3-9 acres, 3.1 percent; 10-19acres, 7.9 percent; 20-49 acres, 29.0 percent; 50-99 acres, 36.9 percent; 100-499 acres, 23.0percent; and above 500 acres, 00.1 percent. William Gienapp reports a strong negativeassociation between Republican voting in 1856 and farm size 10-100 acres; my results showa strong positive association: Gienapp, Origins of the Republican Party, Table 13.41, p. 548.
47 See the interpretation of Baum, Civil War Party System, 85-86.48 Jeremy Atack and Fred Bateman, "Self-Sufficiency and the Marketable Surplus in the
Rural North, 1860," Agricultural History 58 (1984), Table 3, p. 309; Fred Bateman, "The'Marketable Surplus' in Northern Dairy Farming: New Evidence by Size of Farm in 1860,"ibid., 52 (1978), 350-55, Table 2, p. 351. Atack and Bateman indicate that butter productioncame from smaller farms, whereas cheese and milk output increased as farm size rose above120 acres; overall, they conclude dairy production generally was a large farm enterprise:To Their Own Soil, 153-56. Clarence Danhof has written that in Massachusetts farms under100 acres could be considered subsistence, and he indicates that only farms over 80 acreswere likely to be involved in commercial enterprise; he derives these conclusions for the1840s: Danhof, "Farm Enterprise," 132.
1989 ECONOMIC CHANGE AND POLITICAL REALIGNMENT 377
the decade (the 1860 per white adult male figure minus the 1850figure, the difference divided by the 1850 figure); they were thencorrelated with party voting. The results were less than exhilaratingand generally insignificant.49
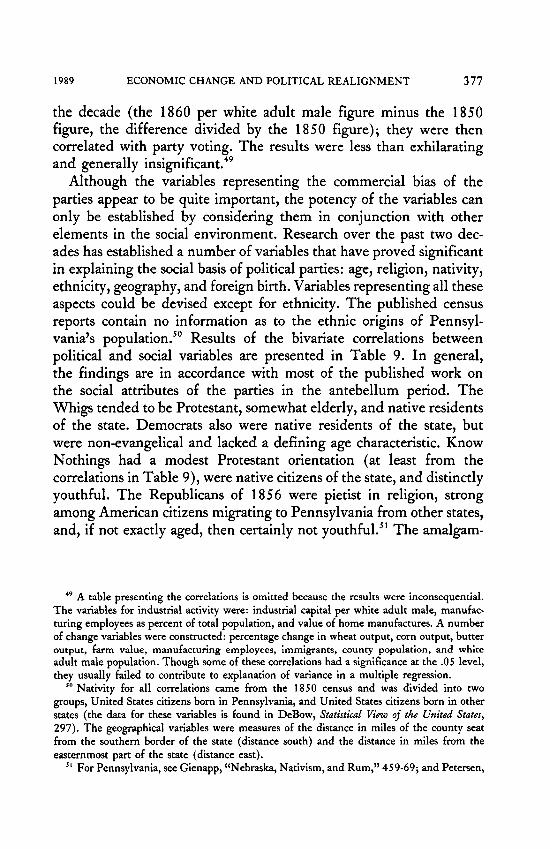
Although the variables representing the commercial bias of theparties appear to be quite important, the potency of the variables canonly be established by considering them in conjunction with otherelements in the social environment. Research over the past two dec-ades has established a number of variables that have proved significantin explaining the social basis of political parties: age, religion, nativity,ethnicity, geography, and foreign birth. Variables representing all theseaspects could be devised except for ethnicity. The published censusreports contain no information as to the ethnic origins of Pennsyl-vania's population.50 Results of the bivariate correlations betweenpolitical and social variables are presented in Table 9. In general,the findings are in accordance with most of the published work onthe social attributes of the parties in the antebellum period. TheWhigs tended to be Protestant, somewhat elderly, and native residentsof the state. Democrats also were native residents of the state, butwere non-evangelical and lacked a defining age characteristic. KnowNothings had a modest Protestant orientation (at least from thecorrelations in Table 9), were native citizens of the state, and distinctlyyouthful. The Republicans of 1856 were pietist in religion, strongamong American citizens migrating to Pennsylvania from other states,and, if not exactly aged, then certainly not youthful.51 The amalgam-
49 A table presenting the correlations is omitted because the results were inconsequential.The variables for industrial activity were: industrial capital per white adult male, manufac-turing employees as percent of total population, and value of home manufactures. A numberof change variables were constructed: percentage change in wheat output, corn output, butteroutput, farm value, manufacturing employees, immigrants, county population, and whiteadult male population. Though some of these correlations had a significance at the .05 level,they usually failed to contribute to explanation of variance in a multiple regression.
50 Nativity for all correlations came from the 1850 census and was divided into twogroups, United States citizens born in Pennsylvania, and United States citizens born in otherstates (the data for these variables is found in DeBow, Statistical View of the United States,297). The geographical variables were measures of the distance in miles of the county seatfrom the southern border of the state (distance south) and the distance in miles from theeasternmost part of the state (distance east).
51 For Pennsylvania, see Gienapp, "Nebraska, Nativism, and Rum," 459-69; and Petersen,

378 JAMES L. HUSTON July
ation of the Know Nothings and Republicans by 1860 produced anobliteration of the distinguishing characteristics of the separate groupsthat had appeared in 1856. By I860, the only attribute of the Re-publicans that is significant is the one so commonly seized upon byethnocultural historians—a pietistic religious orientation.
The correlations of the social variables with the political parties inTable 9 exhibit a few oddities worth mentioning. It proved to bequite difficult to obtain religious denomination variables that relatedto any significant degree with political parties prior to 1856 exceptfor the broadest kinds of measures (unchurched, Protestant). It isnot until the election of 1856 that correlations appear that are inter-esting, when the pietist-liturgical split becomes much more evident.52
The foreign-born measurement turned out to be void of importancein virtually every instance except Whig voting in 1852, and eventhen was very weak. Slightly more interesting were measures of totalpopulation change and foreign-born change between 1850 and 1860.The latter produced a significant positive correlation with KnowNothing voting in 1854, and the former exhibited a negative rela-tionship with Whig voting in 1852. Thus, Know Nothings wereseemingly influenced by the influx of immigrants: the greater theproportional change in the number of immigrants, the more Demo-cratic vote totals rose and so Know Nothing vote totals fell. Thenegative relationship between the Whigs and population change il-lustrates an accepted aspect of Whiggery—residential stability. Themeaning of the association is that in counties where population turn-
"Reaction to a Heterogeneous Society," 38, 102-79, 243-54, 265-67. Jean H. Baker, Am-bivalent Americans: The Know Nothing Party in Maryland (Baltimore, 1977), 129-47; Baum,Civil War Party System, 83-99; Kleppner, Third Electoral System, 55-61. For a different viewconcerning the Republican party's youthfulness, see the comment of Gienapp, Origins of theRepublican Party, 436, 43 6n.
52 Some of the correlations in Table 9 are disturbing. For example, Know Nothings in1854 appear weak in terms of religious direction. In the Know Nothing correlations for thepresidential election of 1856, both German Reformed and Lutheran denominations aresignificantly positive. It is not improbable that German Reformed members were attractedto the nativists, but normally the secondary literature posits a strong relationship betweenthe Lutherans and the Democrats. This result may be an example of a relationship betweentwo variables that is governed by an outside factor and should be read strictly in terms ofassociation rather than causation. On the other hand, Gienapp provides a well-consideredexplanation for the apparent voting preferences of Lutherans: Gienapp, "Nebraska, Nativism,and Rum," 463.

1989 ECONOMIC CHANGE AND POLITICAL REALIGNMENT 379
over was small compared to other counties, the Whig party wasstrongest. Also impressive were the variables measuring distance fromeastern and southern borders (e.g., Know Nothing voting 1856 anddistance from the southern border, r = —.5215 Republican voting1856 and distance from the southern border, r = .512). The distancevariables were something in the nature of catchall variables, seekingto capture if possible such influences as southern family connections,extensions of Yankee culture, or the effect of the frontier. In thecase of the Republicans and Know Nothings of 1856, the interpre-tation is rather clear: the farther one travelled north in Pennsylvania(and entered more the northern / Yankee culture) the stronger theRepublicans became, while in 1856 the Know Nothings had acquireda distinctly southern flavor to the party. Pennsylvania Democrats in1852 and 1854 also exhibited this southern quality; the farther norththe county, the weaker the county vote for the party.53
Perhaps the most intriguing variables in Table 9 are the onesindicative of nativity—United States citizen born in Pennsylvania orborn in other states. These correlations are generally quite substantial.Somewhat interestingly, the variables show that Whigs, Democrats,and Know Nothings related significantly with percentage of residentsborn in Pennsylvania. The Republicans, in contrast, correlated highlywith individuals who were American citizens born outside of thestate.54 Yet this association reinforces the interpretation that the Re-
53 The religious variables were constructed both as percentages of total accommodationsand percentages of total population They failed, however, to correlate significantly withpolitical variables prior to 1855 Combinations of different religious groups were tried in anattempt to formulate a variable that could produce a meaningful correlation, these attemptswere unsuccessful The change in foreign born variable (the number of foreign born in 1860minus the number in 1850, the difference divided by the 1850 number) had a negativesign This result makes sense when it is noted that the sign of this variable with the Democraticparty in 1854 and 1856 is positive, which would be expected On residency patterns, seeShade, "Society and Politics in Antebellum Virginia's Southside," 174 78, especially Table4, on cultural differences, see James M McPherson, Ordeal By Fire The Civil War andReconstruction (New York, 1982), 19 22 For the use of distance variables in regressionanalysis, see Thomas B Alexander, "The Dimensions of Voter Partisan Constancy in Presidential Elections from 1840 to 1860," in Maizlish and Kushma, eds , Essays on AmericanAntebellum Politics, 1840 1860, 70 121
54 A warning must be entered concerning the variables measuring percentage born inPennsylvania versus those born in other states The distributions of these two variables arehighly skewed, and there is a considerable clustering of points at one end of the graph andonly a few points dispersing beyond that The graphs are obviously curvilinear
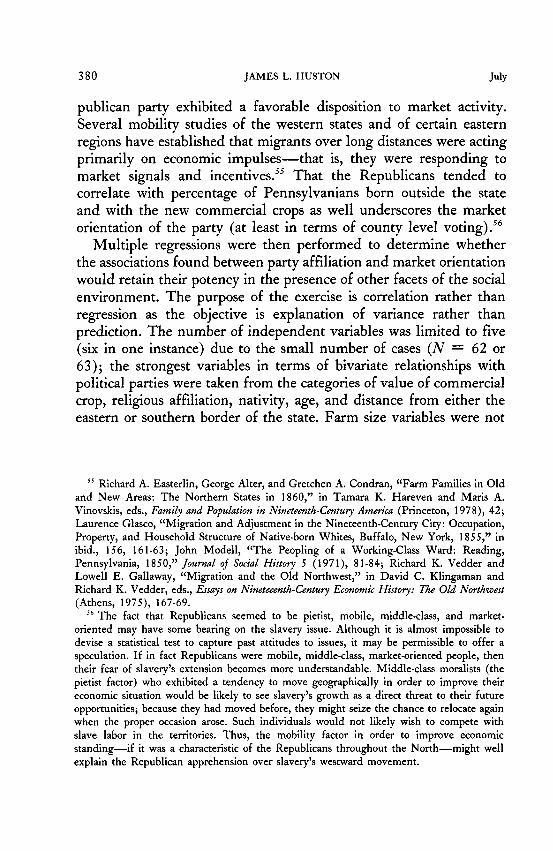
380 JAMES L. HUSTON July
publican party exhibited a favorable disposition to market activity.Several mobility studies of the western states and of certain easternregions have established that migrants over long distances were actingprimarily on economic impulses—that is, they were responding tomarket signals and incentives.55 That the Republicans tended tocorrelate with percentage of Pennsylvanians born outside the stateand with the new commercial crops as well underscores the marketorientation of the party (at least in terms of county level voting).56
Multiple regressions were then performed to determine whetherthe associations found between party affiliation and market orientationwould retain their potency in the presence of other facets of the socialenvironment. The purpose of the exercise is correlation rather thanregression as the objective is explanation of variance rather thanprediction. The number of independent variables was limited to five(six in one instance) due to the small number of cases (N = 62 or63); the strongest variables in terms of bivariate relationships withpolitical parties were taken from the categories of value of commercialcrop, religious affiliation, nativity, age, and distance from either theeastern or southern border of the state. Farm size variables were not
55 Richard A. Easterlin, George Alter, and Gretchen A. Condran, "Farm Families in Oldand New Areas: The Northern States in 1860," in Tamara K. Hareven and Maris A.Vinovskis, eds., Family and Population in Nineteenth-Century America (Princeton, 1978), 42;Laurence Glasco, "Migration and Adjustment in the Nineteenth-Century City: Occupation,Property, and Household Structure of Native-born Whites, Buffalo, New York, 1855," inibid., 156, 161-63; John Modell, "The Peopling of a Working-Class Ward: Reading,Pennsylvania, 1850," Journal oj Social History 5 (1971), 81-84; Richard K. Vedder andLowell E. Gallaway, "Migration and the Old Northwest," in David C. Klingaman andRichard K. Vedder, eds., Essays on Nineteeenth-Century Economic History: The Old Northwest(Athens, 1975), 167-69.
56 The fact that Republicans seemed to be pietist, mobile, middle-class, and market-oriented may have some bearing on the slavery issue. Although it is almost impossible todevise a statistical test to capture past attitudes to issues, it may be permissible to offer aspeculation. If in fact Republicans were mobile, middle-class, market-oriented people, thentheir fear of slavery's extension becomes more understandable. Middle-class moralists (thepietist factor) who exhibited a tendency to move geographically in order to improve theireconomic situation would be likely to see slavery's growth as a direct threat to their futureopportunities; because they had moved before, they might seize the chance to relocate againwhen the proper occasion arose. Such individuals would not likely wish to compete withslave labor in the territories. Thus, the mobility factor in order to improve economicstanding—if it was a characteristic of the Republicans throughout the North—might wellexplain the Republican apprehension over slavery's westward movement.

1989 ECONOMIC CHANGE AND POLITICAL REALIGNMENT 3 8 1
employed in this analysis, the rationale being that the strong rela-tionships between certain farm size groupings and crop productionsindicate that farm size largely reflects commercial orientation ratherthan wealth.57 Only multiple regressions of Know Nothing voting in1854, and Republican and Democratic voting in 1856, and Demo-cratic voting in 1860 are presented. In general the regressions showthat commercial orientation retained its explanatory power in thepresence of other measurements of social attributes.58
57 Independent variables that correlated at + /—.750 were eliminated to avoid multi-collinearity. The results given here were first screened for suppression among the independentvariables. Suppression is an artifact of multicollinearity. The phenomenon occurs when twoindependent variables are correlated, and the partialling process "suppresses" unimportantvariance in the independent variables and produces a greater correlation between the in-dependent variables and dependent variable than is logically warranted. Suppression can bedetected when the semi-partial correlation (sr) has a different sign than the simple correlationand when semi-partial correlations are greater in magnitude than simple correlations. Forfurther information on suppression, consult Jacob Cohen and Patricia Cohen, Applied MultipleRegression / Correlation Analysis for the Behavioral Sciences (New York, 1975), 73-102, especiallythe rule given on p. 102. See also Barbara G. Tabachinek and Linda S. Fidell, UsingMultivariate Statistics (New York, 1983), 72-145.
58 A number of trials were performed on different sets of independent variables, especiallythose representing religious categories. The regressions reported in Tables 5 through 8 aretypical of these trials. In this study, the religious variables were almost always found to beredundant in explaining variance. Tables 5 through 8 could also have been presented byonly reporting those variables which had significant ^-statistics for the regression coefficients.For most of the regressions in this study, that would have reduced the important independentvariables to two or three per regression with the exception of Republican voting in 1856.In all the regressions either a farm size or a crop variable proved to be the most significantof the independent variables. In Tables 4 through 8, several standard statistical descriptionsare employed. The mean, standard deviation, and skewness is provided for each variable inthe analysisj generally, any variable with a skewness greater than -h / — .779 is highly suspectfor use in this exercise. The correlation matrix is provided so the reader can see relationshipsbetween the variables. In the regression tables, the b-coefficient is the change that wouldoccur in the dependent variable given a unit change in the independent variable when allother variables are held constant. The standard error of the b-coefficient demonstrates whetherthe estimated b-coefficient is constrained within a wide or narrow interval. The beta coefficientis the regression coefficient standardized for units of measure so that comparisons can bemade as to the importance of the independent variables in the equation. Generally, but withsome reservations, the more important variables usually possess higher beta coefficients. Twoother means are available for assessing the contributions of variables to a regression equation.The first is the use of semi-partial correlations squared (sr2); this statistic provides the uniqueexplanation of variance this variable contributes to the equation. In Table 4, the sr2 of thevalue of wheat and corn variable indicates that 9.3 percent of the total variance explained(43.5 percent) is due to this variable. However, much of the explanation of variance is
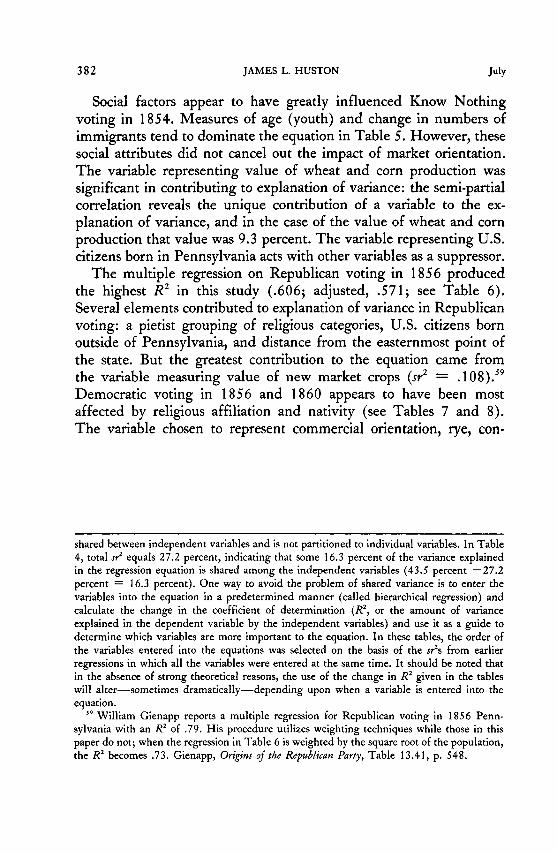
382 JAMES L. HUSTON July
Social factors appear to have greatly influenced Know Nothingvoting in 1854. Measures of age (youth) and change in numbers ofimmigrants tend to dominate the equation in Table 5. However, thesesocial attributes did not cancel out the impact of market orientation.The variable representing value of wheat and corn production wassignificant in contributing to explanation of variance: the semi-partialcorrelation reveals the unique contribution of a variable to the ex-planation of variance, and in the case of the value of wheat and cornproduction that value was 9.3 percent. The variable representing U.S.citizens born in Pennsylvania acts with other variables as a suppressor.
The multiple regression on Republican voting in 1856 producedthe highest R2 in this study (.606; adjusted, .571; see Table 6).Several elements contributed to explanation of variance in Republicanvoting: a pietist grouping of religious categories, U.S. citizens bornoutside of Pennsylvania, and distance from the easternmost point ofthe state. But the greatest contribution to the equation came fromthe variable measuring value of new market crops (sr2 = .108).59
Democratic voting in 1856 and 1860 appears to have been mostaffected by religious affiliation and nativity (see Tables 7 and 8).The variable chosen to represent commercial orientation, rye, con-
shared between independent variables and is not partitioned to individual variables. In Table4, total sr2 equals 27.2 percent, indicating that some 16.3 percent of the variance explainedin the regression equation is shared among the independent variables (43.5 percent —27.2percent = 16.3 percent). One way to avoid the problem of shared variance is to enter thevariables into the equation in a predetermined manner (called hierarchical regression) andcalculate the change in the coefficient of determination (R2, or the amount of varianceexplained in the dependent variable by the independent variables) and use it as a guide todetermine which variables are more important to the equation. In these tables, the order ofthe variables entered into the equations was selected on the basis of the sr2s from earlierregressions in which all the variables were entered at the same time. It should be noted thatin the absence of strong theoretical reasons, the use of the change in R2 given in the tableswill alter—sometimes dramatically—depending upon when a variable is entered into theequation.
59 William Gienapp reports a multiple regression for Republican voting in 1856 Penn-sylvania with an Rz of .79. His procedure utilizes weighting techniques while those in thispaper do not; when the regression in Table 6 is weighted by the square root of the population,the R2 becomes .73. Gienapp, Origins oj the Republican Party, Table 13.41, p. 548.
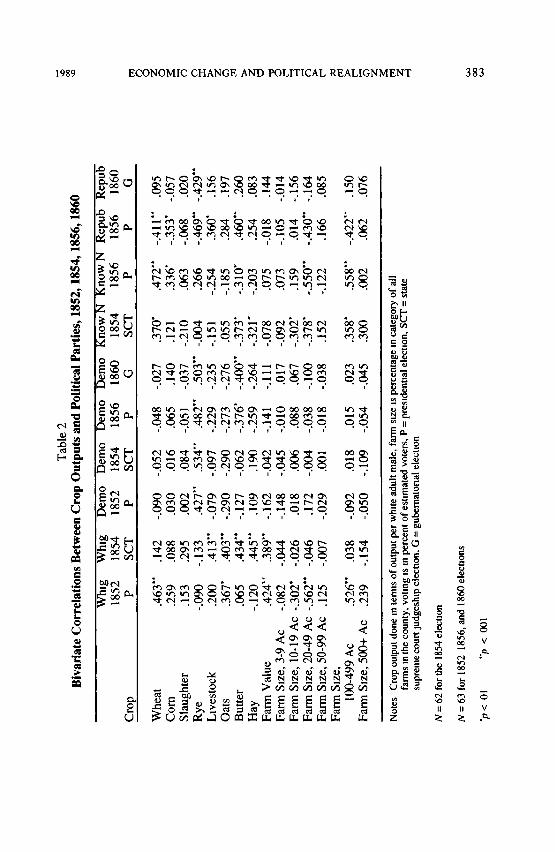
1989 ECONOMIC CHANGE AND POLITICAL REALIGNMENT 383T
able
:
v©
5
00
cf38
iliti
cal
Pa
<£"§
utpu
ts a
O
sU
een
1
tion
s 1
JS
u&
Biv
;
I R
epub
1
1856 P
> vo
.now 1854
SCT
Jl°
^ ^ i—i >»^
Is*
Whi
g18
54SC
T
W)eN
18! P
Cro
p
in
8
-.411"
*eN,4
7
oren
-.027
0 0
S
,052
-.
1
090
1
eN
en
Whe
at
r- o ON.3
53*
-.0
68.4
69**
-
i i i
336*
063
,266
^ © ^
140
037
503*
*
•
•
vo -* Vi—i oo enO O «n
030
002
,427
**
oo in moo O\ co
Os cn oin »n ON
Cor
nS
laug
hter
Rye
.360
*
mi
»ni
en
1
O N
,22
,097
-.
i
079
1
en
.41
.200
Liv
esto
ck
rON1—4
.284
in0 0
i
in
s
276
1en
,27
•• 063
i
290
*
rn
K-en
Oat
s
s
.460
**
oen
i
enreni
400*
*
i
VO
en
062
-.
1
,127
1
.43
in
s
But
ter
en "3- ^ vo TJ-
O —N O »—• H
.254
.018
.105
-
.014
-
,430
**
-.
i i i
en in en ON Oo r r m inNOOnini i
* H X (N OJ 00(NhO\Ohen O O en en
i i i i i
( N H O O ^I i i
OS '-H O 00 00in TJ- ^H oo en<N r^ O O O
,190
-.
,042
-.
,045
-.
006
.00
4 -.
i i i
,109 162
,148
018
,172
* *
in ON Tf vo vor f 00 ^- eN Tf• t en O O O
O V (S (S (SCN eN 00 O VO
o o
o en — eN3 oT <LT <LT
13 N N N
Hay
Far
mV
Far
m S
iF
arm
Si
Far
m S
i.1
66
eNeN
i
eNin
038
1
0 0
o- 100
029
*
8
ineN
O NO N
cbin
<DN
Far
m S
iF
arm
Si
oin
-.422
**
*00
,55
0 0inen
vO
s
.062
eN
8
300
en m
S3in
,01
,018
.
360
1
0 0
svOeNin
<ON
100-
49
1
,05
,109
-.
1
,050
1
in
ONeneN
o<
in
Far
m S
ize.
O to
o "
|1I *uII5/3 IIE a-
ill• i l l
111g S I S•S - 8 .2.° g>u u
s >. & | -o
• 8 8 B -8 » *
Us I ^ I3 C «> — <N J
I I I * §S S 2 53 ii ii v

384 JAMES L. HUSTON July
en
'lab
a
856-
18(
ing
1;
©
ican
>ubl
c
a
O
£U
twee
n
io+5
iSU03
iate
ivar
1860
1860
s0 0
1859
00inoo
1857
vo
185
O
cU
Ccr
§u
O
§-u
m
s .177
in r*
.166
387*
*
380
#
4i r
1
I
m
•
.195
CN•
600
353*
eoU
.080
i
020
©o
.098
106
1
167
890
1
JZ
en
429*
*
en
•
.051
OO
,276
i
#
469*
> >
.167
156
i390
i
i n
1
360*
tock
.167
,197
.057
o8
.468
**,2
84
6
m
093
O NOO
000
ON
s
0 0
460*
.138
083
ON
330
o
s
.400
*'25
4.0
43.0
4714
4.1
98
s1
.248
018
i
alu
>
i
Fai
014
i
S.0
84
i n
.01
,299
*
i
105
-9 A
.
m
on
Fai
.168
156
i
164
085
,150
i n ON ON ON
i.1
00
1
m
.01
,262
i
014
0-19
CO
vo (N r-
•
* *
oo fN men —« Tt
i i
m r** *S ^ o
i i
038
132
,132
* *
O vO CMm vo <N
i
o
<<&O\ O\ *t
22sCN i n •—
C/5 73C/3
g g g«t a a
UM tL) PU
680
076
eneno
.032
i n
i
,046
062
o<
i n
CO
i
Fai
73
e3
300II
O
|i"5
§ g
IIIIri "«<u §
3 >j2 n
Sa
II"r 2 CM
on <U <
11 iC o 22 —5 ii c 8«*- c oo o u v§=• £ .^5 g S.
m o
I I i-
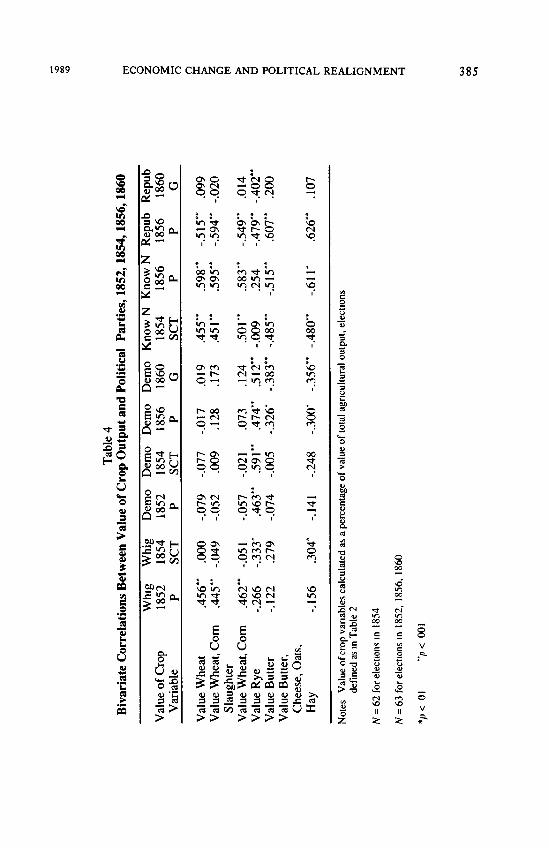
1989 ECONOMIC CHANGE AND POLITICAL REALIGNMENT 385
lab
1860
3?^
i
litic
alI P
ol
+ 4
fit*^O
ha
uoO>
CO
1
Bet
wti
ons
1o
teC
ria
5>
1 1860
vo<D 0 0
s
o
OU
I<sO
UI
Dem
oD
emc
ig
Whi
g
vOin00
i n
18;
s0 0
m0 0
1854
185
[854
m00
Cro
pal
u
>
O
Cu
SCT
O
ON
SCT
cu
<L>
abl
•j2
>
.099
-.51
0 0ON
in
**
>n
as
q
-.0
-.07
7
as
-.07
000
to
.45
r*
<D
>
.020
-.594
*
#
ON»o
»nTf
m
0 0
.009
-.05
.049
*
.44
EoU
<L>3
>
&JZW)3cd
CO
^5 ^ }"
ON ON
-.54
-.47
#
en Ttoo inin (N
in oi*
^ in
m Vq rf
-.021
.591
*-.0
5.4
6.0
51.3
33*
i i
<N SOvO VO
EoU
£<*<U <D3 3
> >
.200
s#i n
i n•*
i n0 0
r
83**
en
26*
m
-.005
r f
-.07
.279
-.12
tter
CO<u3
>
tter
,
CO
3
>
,Oal
e
.107
*VO
.62
vOi"
b00^ ;
56**
en
2i *
-.24
8-.
14.3
04*
vO
-.15
C
o
13
IIi&o<U
_3
>
O
I
I I1 i-O ^ t rT«» <u »o i n
2 S £ g v^ cS 2 2 .Ci-o «Q o o« 5 jw .«3 C (u w
5 ^ £ M _CM ro ©
O I" II Y
z ^ ^ ^

386 JAMES L. HUSTON July
Table 5Multiple Regression: Explanatory Variables for
Know Nothing Voting, State Supreme Court Judge, 1854
I. Descriptive Statistics and Variables
StandardVariable Mean Deviation Skewness
Know Nothing Vote (KN54) 22.67 10.10 .341Age 20-29 years (AGE 20-29) 35.18 2.68 1.001Value of Wheat and Corn
(VALWH&CN) 31.56 13.63 -.026Change in Immigrants 1850-60
(CH IMMIG) 56.68 69.94 1.529Distance from Eastern Border
(DISTFRE) 153.24 90.29 .143Methodist Attendance
(METH) 16.26 7.27 .000US Citizens, born in
Pennsylvania (PA BORN) 82.44 14.74 -1.098
II. Correlation Matrix
KN 54 AGE VAL WH CH DIST METH20-29 & CN IMMIG FR E
KN54AGE 20-29VALWH&
CNCH IMMIGDIST FR EMETHPA BORN
.386
.501-.321.244.232.322
.220
.056
.005
.239
.204
-.136.115.231.703
-.202-.176-.125
.182
.016 .093
III. Regression Statistics: Dependent Variable = KN 54
Statistics of the Equation
b
Explanatory VariablesAGE 20-29 1.22VALWH&CN .33CH IMMIGDIST FR EMETHPA BORN
-.04.02*
-.02*-.06*
StandardError of b
.41
.11
.02
.01
.15
.10
Beta
.32
.44-.26.14
-.01-.09
sr2
.093
.093
.064
.018
.000
.004
Changein/?2
.149
.182
.080
.020
.000
.004
Constant = - 25 6, Multiple R = 659, /?' = 435, Adjusted R" =373, Standard Error of Estimate = 8 00
*b-coefficient not significant at 05 level
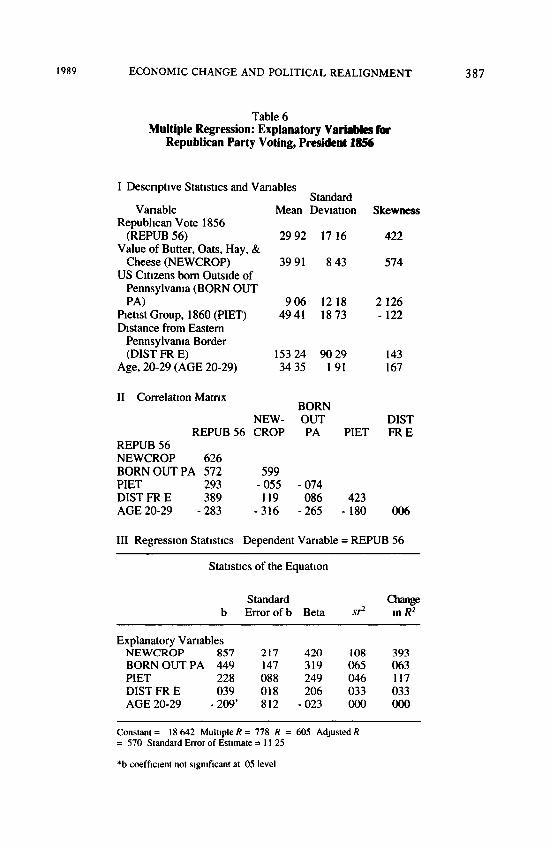
1989 ECONOMIC CHANGE AND POLITICAL REALIGNMENT 387
Table 6Multiple Regression: Explanatory Variables for
Republican Party Voting, President 1856
I Descriptive Statistics and VariablesStandard
Vanable Mean Deviation SkewnessRepublican Vote 1856
(REPUB56) 29 92 17 16 422Value of Butter, Oats, Hay, &
Cheese (NEWCROP) 39 91 8 43 574US Citizens born Outside of
Pennsylvania (BORN OUTPA) 9 06 12 18 2 126
Pietist Group, 1860 (PIET) 49 41 18 73 -122Distance from Eastern
Pennsylvania Border(DISTFRE) 153 24 90 29 143
Age, 20-29 (AGE 20-29) 34 35 191 167
II Correlation Matrix
NEW-REPUB56 CROP
REPUB 56NEWCROP 626BORN OUT PA 572PIET 293DIST FR E 389AGE 20-29 - 283
599-055119
-316
BORNOUTPA
-074086
-265
PIET
423-180
DISTFRE
006
III Regression Statistics Dependent Vanable = REPUB 56
Statistics of the Equation
b
Explanatory VariablesNEWCROP 857BORN OUT PA 449PIETDIST FR EAGE 20-29
228039
-209*
StandardError of b
217147088018812
Beta
420319249206
-023
sr2
108065046033000
Changein/?2
393063117033000
Constant = 18 642 MultipleR= 778 R = 605 Adjusted/?= 570 Standard Error of Estimate = 11 25
*b coefficient not significant at 05 level
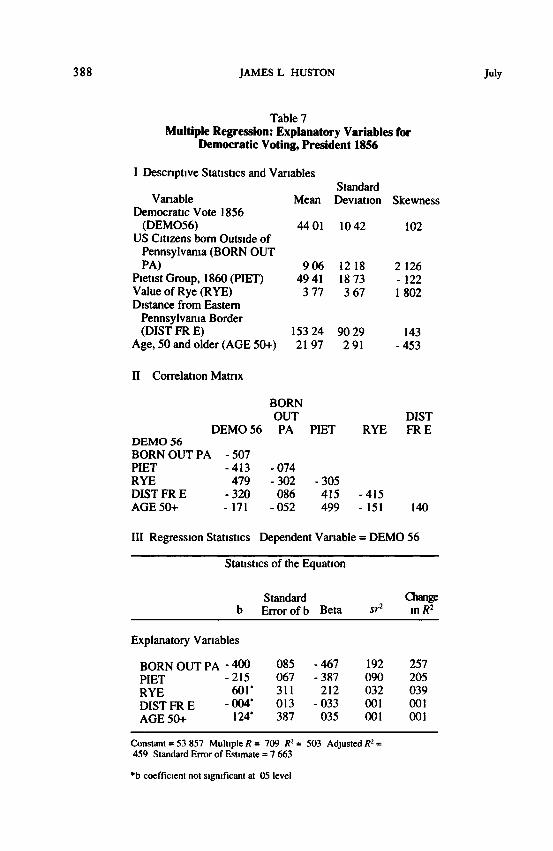
388 JAMES L HUSTON July
Table 7Multiple Regression: Explanatory Variables for
Democratic Voting, President 1856
I Descriptive Statistics and VariablesStandard
Variable Mean Deviation SkewnessDemocratic Vote 1856
(DEMO56) 44 01 10 42 102US Citizens born Outside of
Pennsylvania (BORN OUTPA) 9 06 12 18 2 126
Pietist Group, 1860 (PIET) 49 41 18 73 - 122Value of Rye (RYE) 3 77 3 67 1 802Distance from Eastern
Pennsylvania Border(DISTFRE) 153 24 90 29 143
Age, 50 and older (AGE 50+) 2197 2 91 -453
II Correlation Matrix
BORNOUT DIST
DEMO 56 PA PIET RYE FREDEMO 56BORN OUT PA - 507PIET -413 -074RYE 479 -302 -305DISTFRE -320 086 415 -415AGE 50+ -171 -052 499 -151 140
III Regression Statistics Dependent Variable = DEMO 56
Statistics of the Equation
Standard Changeb Error of b Beta sr2 mR2
Explanatory Variables
BORN OUT PAPIETRYEDIST FR EAGE 50+
-400-215
601*-004*
124*
085067311013387
-467-387
212-033
035
192090032001001
257205039001001
Constant = 53 857 Multiple R = 709 R2 = 503 Adjusted R2 =459 Standard Error of Estimate = 7 663
*b coefficient not significant at 05 level

1989 ECONOMIC CHANGE AND POLITICAL REALIGNMENT 389
Table 8Multiple Regression: Explanatory Variables for
Democratic Voting, Governor 1860
I. Descriptive Statistics and VariablesStandard
Variable Mean Deviation SkewnessDemocratic Vote 1860
(DEMO 60)Distance from Southern
Pennsylvania Border(DIST FR S)
Home Manufacturing 1860(HOME MANUF)
Pietist Group (PIET)Value of Rye (RYE)US Citizens born Outside
of Pennsylvania (BORNOUT PA)
40.10
75.02
112.4449.41
3.77
9.06
9.65
43.56
129.5818.733.67
12.18
-.487
.268
1.942-.1221.802
2.126
II. Correlation Matrix
DIST HOMEDEMO 60 FRS MANUF PIET RYE
DEMO 60DIST FR S -.280HOME MANUF -.242 -.004PIET -.360 -.130 .114RYE .510 -.043 -.176 -.305BORN OUT PA -.518 .674 .146 -.074 -.302
HI. Regression Statistics: Dependent Variable = DEMO 56
Statistics of the Equation
b
Explanatory Variables
BORN OUT PAPIETRYEHOME MANUFDIST FR S
-.345-.155.708
-.007*.003*
StandardError of b
.110
.052
.282
.007
.029
Beta
-.435-.301.269
-.094-.015
sr2
.086
.079
.055
.009
.000
Changein/?2
.268
.160
.062
.009
.000
Constant = 49 444, Multiple R = 709, R2 = 503, Adjusted IT =459, Standard Error of Estimate = 7 127
*b-coefficient not significant at 05 level
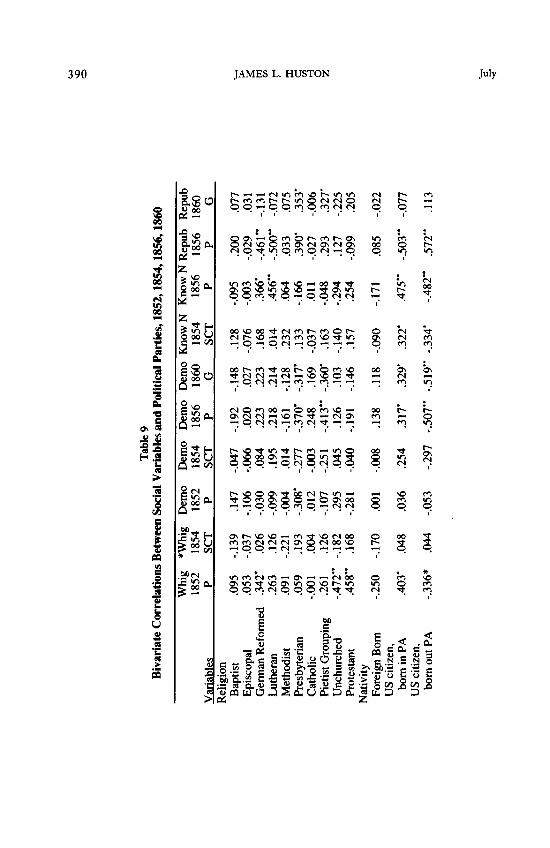
390 JAMES L. HUSTON July
o
856,
1l 9
1854
,1
83
i.5
ical
Pai
ind
Pol
it
O N <•«
#2
Tat
riab
a So
cial
|
atio
ns B
e
"5
Biv
aria
te C
on
X>&a>a:s
00
Lepu
b18
56
oc
Dem
o D
emo
KD
emo
1856
00
860
1856
1
«n00
1852
854
W)eN
x:!
00
a
a.
&CO
a
&CO
PU
&CO
a.
JX
1
,07
003
0951
00
148
..1
92
-.
1
047
i
.147
C^ COO >-i
100
31
VO
o
s
.020
j
066
i
106
i
s
§.2
'if
CO
.05
1
.461
**36
6*
-,
00VO
COCNCM
.223
.
,084
030
i
#CNTfCO
16
cs
B1
.500
**
Tt
O
214
..2
18
.,1
9509
9
1
126
CO
8
|
m
,07
033
064
CNCOCN
128
..1
61
-.
1
014
004
1
.09
1
CO
,35
390*
166
i
CO
1
.027
011
CO CO
317*
.
.370
* -.:
,277
•
308*
1
193
ON
.05
11
o
169
-..2
4800
3
1
012
81
13
r- m >n<N CN OCO CN CN
1
CO I"1- OsOS CN ON
00 "* Tt
1 1
co o r-vo rf «n
360*
.
103
-.14
6 .
CO VO ^^ CN ON
1 '
251
,045 040
i i
r*~ «n -*O ON 00»- CN CN
i i
»-» CN 00
1
oaf111o c P
CN
qi
085
171
1
oo
118
-..1
38
.00
8
1
.001
170
oCN1
i -PQ 5
>* Sb'-S*> '5 G
,07
1
.503
**
*^
CNCNCO
329*
.
.317
* .
,254
.036
iCO
ICO
D
CO~
.572
**,4
82**
,
TfCOCO
519*
* -.
.507
**
-.1
053
i
044
• *
COCO1
SS1l

1989 ECONOMIC CHANGE AND POLITICAL REALIGNMENT 391
I§
Tab
le 9
C86
018
56,1
[852
,18
rtie
s, 1
itica
ls
and
Pol
i1 V
aria
ble
.2
iSoc
Bet
wee
nel
atio
nsC
orr
aria
teBi
v
§•>& n
Rep
ub18
56 P
now
N18
54SC
T
S 00 ^
) D
emo
1854
SCT
C in r\n 22
Whi
g18
54SC
Tab
leV
an
.03
.283
i
.300
*38
6*.1
30.1
19-.0
74
r-
.01
?
.046
-.135
030
.059
.061
-.011
00
8
-.264
-.230
-.036
-.321
*
CM CO
om
ON
.03
.171
-.205
099
.045
.061
.182
?
.181
.121
q
.211
-.118
172
.155
-.17
1 -
-.062
-.15
.342
*.2
63
+o
ance
Dis
tou
ther
n
CO
.03
i n
-.521
**19
0
•*
.280
-.220
-
-.081
00
.18
-.090
I
orde
r>m
Eas
tern
ffl£
.389
*-.1
3324
4.3
27*
-.320
* -
-.315
*
*n
-.20
.130
.208
iCQ
les
Van
abng
e1
£u
atio
n,
Eg
-.12
-.030
-.059
321*
.066
.024
-
.082
8
.137
-.233
s ount
y85
0-ta
lci
r-
-.07
.085
-.144
147
.014
.084
-
.067
CN
.15
-.095
-.401
*at
ion
60op
ul85
0-
&* o 1s H I s ^I ^ fe J3 S
f 2 § 8 g
C fc c C
g 8.S I S
a til2: i i s c t3
"O c« O 3 •-
§ S "3 2 E
efl O. - <U o
Hill
I Hi I «eg § " O .c ^
l U l l i 5 §la U s 2 g vO « " u >. ir> »o$ 13 g 5 o fc £Q G o C o o C- <+X ^
fN co oD vo VO "
§ II II V
392 JAMES L. HUSTON July
tributed significantly to explanation of variance but was largely over-shadowed by the contributions of nativity and religion. Nevertheless,a persistent and important feature of Democratic county votingthroughout the 1850s was a non-commercial market orientation.60
Disposition to the market appears in this study to be one of thestrongest influences shaping the party system, but there are importantlimitations to this conclusion. Several scholars have probed Pennsyl-vania in the antebellum years by researching townships; their studieshave uniformly found that ethnocultural forces more than any othersdetermined political affiliations. They have furthermore discoveredthat at the local levels the matter of religion and ethnicity wascomplicated by unusual patterns of negative reference group rela-tionships.61 This study fails to handle the problem of ethnicity andnegative reference groups; using counties as the units of analysis hasprobably reduced the importance of ethnocultural factors in Penn-sylvania politics. Moreover, this investigation has left virtually un-touched the question of the slavery-extension issue and its role indisrupting the second party system and in producing the third partysystem. To some extent this neglect arises from the purpose of thestudy: to detect the influence of economic change upon the partiesduring the realignment period.
60 Part of the problem concerning mul t ip le regressions in the case of Democrat i c vo t ingarises from use of the variable of rye as a percentage of the value of total agricultural output.T h e variable has a smal l va lue and is not we l l distributed. W h e n rye per white adult maleis substituted, which is better distributed, the rye (non-commercia l ) variable becomes morepotent . H o w e v e r , consistency with the regressions in the other tables dictates us ing the ryevariable as a percent of total agricultural output. It is also worth not ing that all of theassociations with Democrat ic vot ing t end to be negat ive; on ly rye produced a substantialpositive correlation.
61 Petersen, "React ion to a Heterogeneous Society," 1 0 2 - 7 9 ; Gude lunas , "Nat iv i sm andthe Demise of Schuylkill County Whiggery," 225-36; William A. Gudelunas, Jr., andWilliam G. Shade, Before the Molly Maguires: The Emergence oj the Ethno-Religious Factor inthe Politics oj the Lower Anthracite Region, 1844-1872 (New York, 1976); William G. Shade,"Pennsylvania Politics in the Jacksonian Period: A Case Study, Northampton County, 1824-1844," Pennsylvania History 39 (1972), 313-33; Shade, "Political Pluralism and PartyDevelopment: The Creation of a Modern Party System, 1815-1852," in Paul Kleppner, etal., eds., The Evolution oj American Electoral Systems (Westport, 1981), 102; Gienapp, Originsojthe Republican Party, 146-47, 162-63, 420, 428-39.

1989 ECONOMIC CHANGE AND POLITICAL REALIGNMENT 393
It would appear nonetheless that economic forces had more to dowith the molding of Pennsylvania's political system than many his-torians have allowed. The probable reason for the difference is thatmany researchers have controlled for economic influences by devel-oping measures of wealth, occupation, and income. But what theyactually constructed was a variable that attempted to denote class,and within that restricted definition they found little or no relationshipworth reporting. Yet all they were entitled to claim given the natureof their efforts was that the variables they had used for regressionfailed to produce significant results, or that their measures of classdid not perform as well as did their ethnocultural measures. Economicchange may affect the political system in highly varied ways. In orderto detect such influences, it is prerequisite that pertinent variables bedeveloped. Most studies of northern states in the antebellum periodhave not found strong relationships between economic activity andparty preferences.62 Part of the reason for this failure may be due tothe design of variables which do not fully measure the impact ofeconomic activity upon politics.63
There remains the very real possibility that the long scholarlystruggle over the question of whether economic interests or socialattachments determined political partisanship might ultimately befallacious. One might readily assume that a group's cultural disposition
62 State and local studies would include Holt, Forging a Majority, Formisano, Birth ojMass Political Parties\ Hansen, Making oj the Third Party System-, Hendrik Booraem, V, TheFormation oj the Republican Party in New York: Politics and Conscience in the Antebellum North(New York, 1983); Baker, Ambivalent Americans; Mark L. Berger, The Revolution in theNew York Party Systems, 1840-1860 (Port Washington, 1973); Stephen E. Maizlish, TheTriumph oj Sectionalism: The Transformation oj Ohio Politics, 1844-1856 (Kent, Ohio, 1983).Baum, Civil War Party System, 83-89, finds economic factors more important in MassachusettsRepublicanism than ethnocultural considerations. Gienapp, Origins oj the Republican Party,438-39, generally subscribes to a cultural interpretation of partisan affiliation.
63 See the instructive comments of Michael F. Holt, "The Election of 1840, VoterMobilization, and the Emergence of the Second American Party System: A Reappraisal ofJacksonian Voting Behavior," in William J. Cooper, Jr., Michael F. Holt, and JohnMcCardell, eds., A Master's Due: Essays in Honor oj David Herbert Donald (Baton Rouge,1985), 25-27. Thomas B. Alexander, Peggy Duckworth Elmore, Frank M. Lowrey, andMary Jane Pickens Skinner some two decades ago found that they could not locate economicinfluences in party affiliation when using variables measuring income, occupation, and wealth;however, their original interpretation of a commercial / non-commercial split between Whigsand Democrats emerged when they employed variables measuring agricultural output: "Basisof Alabama's Ante-Bellum Two-Party System," 243-77.
394 JAMES L. HUSTON July
would define acceptable economic behavior. That Democrats pre-ferred a more ritualistic religion and local governmental structureslogically intimates that economically they should have preferred non-market activity. In the same vein, the Republicans' evangelistic out-look could easily have encouraged marketplace behavior.64
But in the case of Pennsylvania in the 1850s, it is highly probablethat economic forces strongly shaped the state's politics. The realign-ment of the parties in the middle of the decade followed closely analteration in market structure that the railroads created by extendingthe scope of economic competition.65 During the Jacksonian period,the Whigs, at least in terms of county voting, exhibited an acceptanceof commercial activity whereas the Democrats revealed an ambiva-lence. But commercial realities changed in the 1850s and to a con-siderable extent the parties changed with the market. Democraticcounty voting retained its non-market orientation. The Whigs seem-ingly disappeared when the old commercial basis of the Jacksonianperiod eroded in the face of western competition. In the transitionalperiod from 1854 to 1858 the Know Nothings, besides acting as thevehicle of anti-Catholicism and anti-immigration, emerged as a partywhose county vote demonstrated a difficulty in adapting to newmarket realities. Shortly after the nativist explosion in 1854, theRepublican party formed. By 1856 Republican county voting unveileda party that embraced Pennsylvania's economic transformation andthat accepted the dictates of market change. Both Republicans andKnow Nothings had a positive orientation to market forces, but forthe Republicans the disposition was to the future rather than to thepast. When the Republicans and Know Nothings merged in 1858and maintained the coalition until 1860, the two types of commercialorientation tended to cancel each other out. Yet the economic essenceof the Republican party was in fact an embrace of market activity.Thus, by 1860 the third party system had in a sense replicated the
64 See McPherson, Ordeal By Fire, 19-22, 38-45. The correlations between parties andthe geographical variables in Table 9 argue to some extent in favor of a cultural approachto Pennsylvania politics; see also Gienapp, Origins of the Republican Party, 428-31, 438-39.
65 No claim is advanced as to other states. Considerably more research would have to beundertaken before any generalization could be made about economic transformation andthe antebellum political system for the entire North.

1989 ECONOMIC CHANGE AND POLITICAL REALIGNMENT 395
second party system—one party representing commercial expansion,the other a localist, traditional economy.
Oklahoma State University JAMES L. HUSTON