A Basic Demographic Profile of Workers in Frontline Industries
75
A Basic Demographic Profile of Workers in Frontline Industries By Hye Jin Rho, Hayley Brown, and Shawn Fremstad* April 2020 Center for Economic and Policy Research 1611 Connecticut Ave. NW Suite 400 Washington, DC 20009 Tel: 202-293-5380 Fax: 202-588-1356 https://cepr.net * Hye Jin Rho is an Economist at the Center for Economic and Policy Research (CEPR). Hayley Brown is a Research Assistant at CEPR. Shawn Fremstad is a Senior Policy Fellow at CEPR.
-
Upload
khangminh22 -
Category
Documents
-
view
0 -
download
0
Transcript of A Basic Demographic Profile of Workers in Frontline Industries

A Basic Demographic Profile of Workers in Frontline Industries
By Hye Jin Rho, Hayley Brown, and Shawn Fremstad* April 2020
Center for Economic and Policy Research 1611 Connecticut Ave. NW Suite 400 Washington, DC 20009
Tel: 202-293-5380 Fax: 202-588-1356 https://cepr.net
* Hye Jin Rho is an Economist at the Center for Economic and Policy Research (CEPR). Hayley Brown is a Research Assistant at CEPR. Shawn Fremstad is a Senior Policy Fellow at CEPR.

2
A Basic Demographic Profile of Workers in Frontline Industries
Contents
Contents 2
Context 3
Methodology 5
Table 1 7
Table 2 8
Table 3 9
Acknowledgments
The authors thank Karen Conner,
Jared Gaby-Biegel Matt Sedlar,
and Sarah Rawlins.

3
A Basic Demographic Profile of Workers in Frontline Industries
Context
Before the COVID-19 pandemic, more than 30 million US workers were employed in six broad
industries that are now on the frontlines of the response. They include grocery store clerks,
nurses, cleaners, warehouse workers, and bus drivers, among others. They were essential
before the pandemic hit, yet also overworked, underpaid, under protected, and
underappreciated. The tables attached provide a basic demographic profile of workers in
these frontline industries.
Table 1 shows the number of workers in six groups of frontline industries and the
characteristics of the workforce in each of these industry groups. An accompanying
spreadsheet provides state-level versions of Table 1. Additionally, New York state data are
used in this report by the Fiscal Policy Institute.
Table 2 lists the specific industries within each of the six industry groups and shows the
percentage of women workers, workers of color, and low-income workers in each of these
industries.
Table 3 lists the top 10 occupations in each of the frontline industries and shows the
percentage of women workers, workers of color, and low-income workers in each of these
occupations.
At the national level, notable findings include:
• Workers in frontline industries are disproportionately women. About one-half of all workers are women, but nearly two-thirds (64.4 percent) of frontline workers are women. Women are particularly overrepresented in the frontline industries in Health Care (76.8 percent of workers) and Child Care and Social Services (85.2 percent). Women are also overrepresented in the following occupations within frontline industries: cashiers (71.8 percent); retail salespersons (63.5 percent); customer service representatives (63.7 percent); pharmacy technicians (81.6 percent); fast food and counter workers (67 percent); all of the top 10 occupations in the Health Care industry group (71.3 to 96.5 percent), except physicians; and, all of the top 10 occupations in the Child Care and Social Services industry group (73.1 to 97.7 percent).
• People of color are overrepresented in many occupations within frontline industries. Just over four-in-ten (41.2 percent) frontline workers are Black, Hispanic, Asian-American/Pacific Islander, or some category other than white. Hispanics are especially overrepresented in

4
A Basic Demographic Profile of Workers in Frontline Industries
Building Cleaning Services (40.2 percent of workers). Blacks are most overrepresented in Child Care and Social Services (19.3 percent of workers). Workers of color are particularly overrepresented in the following occupations: bus drivers, transit and intercity (56.7 percent); most of the top 10 occupations in Trucking, Warehouse, and Postal Service; most of the top 10 occupations in Building Cleaning Services; all of the top 10 occupations in Health Care, except registered nurses, physicians, managers, and secretaries and administrative; four of the top 10 occupations in Child Care and Social Services (childcare workers, personal care aides, social workers, and nursing assistants).
• Immigrants are overrepresented in Building Cleaning Services and in many frontline occupations in other frontline industries. About one-in-six frontline workers (17.3 percent) are immigrants. In Building Cleaning Services, 38.2 percent of workers are immigrants. Immigrant workers are also overrepresented in Grocery and Related Product Merchant Wholesalers (23.9 percent); Warehousing and Storage (22.5 percent), and Home Health Care Services (23.9 percent). Immigrants are particularly overrepresented in the following occupations: janitors and building cleaners (40.7 percent); maids and housekeeping cleaners (58.8 percent); cleaners of vehicles and equipment (34.5 percent); packers and packagers (39.1 percent); physicians (28.4 percent); and, home health aides (26.9 percent). A large share of personal care aids and nursing assistants in both the Health Care industry group and the Child Care and Social Services industry group are also immigrant workers (22.6 to 37.9 percent).
• Many workers in frontline industries are over age 50, and a substantial number live in a household with one or more older people. Just over one-in-three (33.9 percent) frontline workers are over age 50. Among all frontline workers, about one-in-six (16 percent) live with someone who is (or are themselves) over age 65.
• Many workers in frontline industries have family care obligations. More than one-third of frontline workers (35.9 percent) have a minor child at home.
• More than one-third of workers in many frontline industries live in low-income families. Roughly a third or more of low-income workers are found in six of the top 10 occupations in the Grocery, Convenience, and Drug Stores industry group; three of the top 10 occupations in the Trucking, Warehouse, and Postal Service industry group; four of the top 10 occupations in Building Cleaning Services industry group; three of the top ten occupations in the Health Care industry group; and, five of the top 10 occupations in the Child Care and Social Services industry group. Overall, almost one-quarter of frontline workers (23 percent) live in low-income families (income below 200 percent of poverty).
• The Building Cleaning Services industry has a particularly high incidence of uninsured workers. About one-in-ten frontline workers in this industry do not have health insurance. Among workers in Building Cleaning Services, nearly three-in-ten are uninsured.

5
A Basic Demographic Profile of Workers in Frontline Industries
While the COVID-19 legislation passed by Congress to date includes some important
protections for frontline workers, these workers remain under protected and under
compensated. Congress must act quickly on a variety of fronts to ensure that all frontline
workers have: 1) comprehensive health insurance that includes free coverage of COVID-19
testing and treatment; 2) paid sick leave and paid family leave; 3) free child care; 4) student
loan relief; and, 5) consumer and labor protections, including hazard pay or other additional
compensation for essential workers. Frontline workers who are immigrants should be
protected regardless of their current immigrant status. Finally, the US Occupational Safety
and Health Administration should immediately issue an Emergency Temporary Standard
requiring all employers to provide specific and necessary protections for frontline workers.
Methodology
This profile uses the most recent five-year estimates of data from the American Community
Survey (2014–2018). The demographics of the frontline workforce is unlikely to have
changed in any substantial way over the last two years, and using five-year estimates of ACS
data helps ensure that sample sizes are sufficient to produce reasonably precise estimates by
industry at the state level.
To define “frontline industries,” we use the same six industry groupings as the New York City
Comptroller did in their recent profile of frontline workers in New York City. The frontline
industry groups, each of which includes one or more specific industries (as classified using the
Census Bureau’s Industry Codes), are:
• Grocery, Convenience, and Drug Stores: Grocery and related product merchant wholesalers (4470), Supermarkets and other grocery stores (4971), Convenience Stores (4972), Pharmacies and drug stores (5070), and General merchandise stores, including warehouse clubs and supercenters (5391).
• Public Transit: Rail transportation (6080) and Bus service and urban transit (6180).
• Trucking, Warehouse, and Postal Service: Truck transportation (6170), Warehousing and storage (6390), and Postal Service (6370).
• Building Cleaning Services: Cleaning Services to Buildings and Dwellings (7690).

6
A Basic Demographic Profile of Workers in Frontline Industries
• Health Care: Offices of physicians (7970), Outpatient care centers (8090), Home health care services (8170), Other health care services (8180), General medical and surgical hospitals, and specialty hospitals (8191), Psychiatric and substance abuse hospitals (8192), Nursing care facilities (skilled nursing facilities) (8270), and Residential care facilities, except skilled nursing facilities (8290).
• Child Care and Social Services: Individual and family services (8370), Community food and housing, and emergency services (8380), and Child day care services (8470).
Our initial analysis includes all US workers in these six frontline industry categories, but no
workers in frontline occupations that are outside of these six categories. As a result, our
estimates exclude some workers in occupations (but not industries) that are clearly on the
frontlines, while also including some workers who are not in frontline occupations, even
though they are in frontline industries. For example, a police officer is a frontline occupation
in a non-frontline industry, while a school bus driver is a non-frontline occupation (at least
in areas where schools are closed) in a frontline industry (public transit). Still, the vast
majority of workers in the six frontline industries are frontline workers.

Table 1 Characteristics of Workers in Frontline Industries
All Workers
All Frontline Industries
Grocery, Convenience,
and Drug Stores
Public Transit
Trucking, Warehouse, and Postal
Service
Building Cleaning Services
Health Care
Child Care and
Social Services
All Workers (16+) 152,600,169
31,673,098
6,817,890
804,495 3,128,922
1,484,993 16,103,877
3,332,921
Female 47.4% 64.4% 50.5% 29.1% 22.7% 53.2% 76.8% 85.2% Full/Part-time
Full-time 78.6% 75.3% 63.7% 81.0% 90.5% 62.6% 79.8% 67.4% Part-time 21.4% 24.7% 36.3% 19.0% 9.5% 37.4% 20.2% 32.6% Race/Ethnicity White 63.5% 58.8% 59.5% 54.7% 56.4% 43.4% 61.1% 55.8% Black 11.9% 17.0% 14.2% 26.0% 18.2% 12.6% 17.5% 19.3% Hispanic 16.8% 16.3% 18.5% 14.0% 20.0% 40.2% 12.1% 18.0% AAPI 6.6% 6.7% 6.6% 4.1% 4.2% 2.4% 8.0% 5.3% Other 1.2% 1.2% 1.3% 1.2% 1.1% 1.3% 1.2% 1.5% Foreign Born 17.1% 17.3% 15.7% 15.2% 17.9% 38.2% 16.2% 17.0% Education Level
LTHS 9.3% 8.5% 13.0% 6.9% 12.7% 26.5% 4.3% 7.9% HS 24.5% 25.8% 36.0% 38.1% 42.6% 38.5% 17.2% 21.7% Some college 32.0% 36.3% 35.2% 39.4% 34.2% 26.0% 38.2% 34.7% College 21.6% 18.1% 11.9% 11.4% 8.7% 7.4% 22.8% 22.9% Advanced 12.6% 11.4% 4.0% 4.1% 1.8% 1.5% 17.5% 12.8% Age 50+ 33.1% 33.9% 27.4% 46.7% 40.2% 35.6% 34.6% 34.4% Home Ownership 65.3% 63.6% 59.6% 68.2% 65.5% 50.0% 66.7% 60.1% Public Transit Commute to Work 5.1% 4.8% 4.5% 9.0% 2.4% 7.8% 4.6% 6.8%
Compensation and Benefits Below poverty line 6.7% 7.2% 10.0% 4.5% 4.7% 15.9% 5.2% 10.8% <200% poverty line 20.6% 23.0% 30.1% 16.0% 19.2% 42.4% 17.8% 30.0% No health insurance 11.0% 9.9% 12.1% 5.8% 14.8% 29.1% 6.3% 10.4% Family Responsibilities Child in home 35.8% 35.9% 33.9% 32.6% 33.3% 38.8% 36.9% 36.9% Senior (age 65+) in home 14.8% 16.0% 16.8% 18.4% 14.9% 15.5% 15.3% 18.5% Source: CEPR's Analysis of American Community Survey, 2014-2018 5-Year Estimates

Table 2 Workers in Detailed Frontline Industries
Number of Workers
Share of Workers in Frontline Industries Female
Non-White
Foreign Born
<200% Poverty
Line All Frontline Industries 31,673,098 100.0% 64.4% 41.2% 17.3% 23.0% Grocery, Convenience, and Drug Stores
Grocery and Related Product Merchant Wholesalers 813,907 2.6% 26.1% 45.1% 23.9% 20.6%
Supermarkets and Other Grocery (Except Convenience) Stores 2,663,280 8.4% 47.6% 38.5% 16.1% 31.2%
Convenience Stores 338,590 1.1% 58.2% 37.5% 15.5% 33.8% Pharmacies and Drug Stores 925,336 2.9% 65.6% 37.5% 15.1% 22.7% General Merchandise Stores,
Including Warehouse Clubs and Supercenters
2,076,777 6.6% 55.9% 43.0% 12.3% 35.2%
Public Transit
Rail Transportation 255,253 0.8% 10.0% 26.2% 6.0% 6.3% Bus Service and Urban Transit 549,242 1.7% 38.0% 54.2% 19.5% 20.6%
Trucking, Warehouse, and Postal Service Truck Transportation 1,832,391 5.8% 12.3% 38.2% 18.2% 18.7% Postal Service 678,084 2.1% 43.0% 43.8% 12.8% 9.8% Warehousing and Storage 618,447 2.0% 31.4% 59.2% 22.5% 31.1%
Building Cleaning Services Services to Buildings and Dwellings
(Except Cleaning During Construction and Immediately After Construction)
1,484,993 4.7% 53.2% 56.6% 38.2% 42.4%
Health Care
Offices of Physicians 1,740,382 5.5% 77.2% 30.2% 13.8% 12.4% Outpatient Care Centers 1,633,127 5.2% 77.3% 36.8% 12.9% 15.1% Home Health Care Services 1,368,990 4.3% 87.5% 53.0% 23.9% 38.6% Other Health Care Services 1,126,466 3.6% 66.4% 40.8% 16.5% 16.1% General Medical and Surgical
Hospitals, and Specialty (Except Psychiatric and Substance Abuse) Hospitals
7,210,512 22.8% 75.0% 36.4% 15.7% 10.9%
Psychiatric and Substance Abuse Hospitals
97,814 0.3% 63.1% 40.0% 15.1% 11.6%
Nursing Care Facilities (Skilled Nursing Facilities)
1,842,045 5.8% 84.2% 44.6% 17.7% 30.7%
Residential Care Facilities, Except Skilled Nursing Facilities
1,084,541 3.4% 74.3% 42.8% 15.4% 31.2%
Child Care and Social Services Individual and Family Services 1,630,740 5.1% 78.1% 45.5% 17.5% 25.9% Community Food and Housing, and
Emergency Services 142,591 0.5% 64.2% 43.9% 11.1% 27.0%
Child Day Care Services 1,559,590 4.9% 94.6% 43.0% 17.0% 34.5% Source: CEPR's Analysis of American Community Survey, 2014-2018 5-Year Estimates

Table 3
Top 10 Occupations in Frontline Industries
(percent)
Share of Workers
in Frontline Industries Female
Non-White
Foreign Born
<200% Poverty
Line Grocery, Convenience, and Drug Stores 100.0%
Cashiers 18.3% 71.8% 44.6% 14.4% 42.7% First-Line Supervisors of Retail Sales
Workers 14.3% 49.4% 34.0% 13.4% 21.2%
Stockers and Order Fillers 11.1% 30.3% 43.9% 13.5% 35.9% Retail Salespersons 7.0% 63.5% 42.5% 15.8% 35.6% Laborers and Freight, Stock, and
Material Movers, Hand 6.5% 25.6% 42.1% 14.0% 32.4%
Customer Service Representatives 4.2% 63.7% 41.2% 12.7% 35.6% Driver/Sales Workers and Truck
Drivers 2.9% 4.4% 43.1% 19.6% 18.5%
Pharmacists 2.7% 54.7% 31.8% 22.0% 7.5% Pharmacy Technicians 2.6% 81.6% 38.3% 12.4% 27.0% Fast Food and Counter Workers 2.0% 67.0% 34.2% 11.4% 42.5%
Public Transit 100.0%
Bus Drivers, School 19.2% 48.3% 51.8% 17.5% 25.6% Bus Drivers, Transit and Intercity 18.6% 30.7% 56.7% 19.8% 22.3% Railroad Conductors and Yardmasters 5.8% 6.6% 27.8% 4.2% 5.3% Locomotive Engineers and Operators 5.3% 3.0% 23.2% 3.6% 4.0% Bus and Truck Mechanics and Diesel
Engine Specialists 3.2% 2.7% 41.8% 19.9% 8.1%
Supervisors of Transportation and Material Moving Workers 3.1% 20.1% 42.2% 12.9% 6.0%
Other Managers 2.4% 24.7% 29.8% 11.9% 6.0% Other Rail Transportation Workers 2.4% 10.2% 40.4% 12.0% 9.8% Driver/Sales Workers and Truck
Drivers 2.4% 25.2% 51.8% 18.6% 21.3%
Heavy Vehicle and Mobile Equipment Service Technicians and Mechanics
2.1% 2.6% 27.6% 8.3% 7.5%
Trucking, Warehouse, and Postal Service 100.0% Driver/Sales Workers and Truck
Drivers 42.3% 4.4% 40.9% 20.4% 18.3%
Postal Service Mail Carriers 10.4% 40.1% 37.5% 11.3% 10.3% Laborers and Freight, Stock, And
Material Movers, Hand 7.3% 14.9% 60.4% 19.4% 35.6%
Postal Service Clerks 3.6% 54.7% 52.8% 16.4% 9.1% Industrial Truck and Tractor Operators 3.0% 7.5% 63.7% 21.0% 29.9% Other Managers 2.6% 34.8% 27.4% 10.7% 9.7% Postal Service Mail Sorters,
Processors, And Processing Machine Operators
2.1% 50.0% 58.3% 16.0% 10.9%
Stockers and Order Fillers 1.8% 36.8% 55.4% 17.4% 32.7% Packers and Packagers, Hand 1.8% 55.9% 80.8% 39.1% 49.1% Bus and Truck Mechanics and Diesel
Engine Specialists 1.5% 0.8% 27.6% 13.1% 20.8%
Building Cleaning Services 100.0%
Janitors and Building Cleaners 44.7% 50.7% 62.5% 40.7% 47.3%

10
A Basic Demographic Profile of Workers in Frontline Industries
Maids and Housekeeping Cleaners 23.7% 90.7% 69.8% 58.8% 57.1% First-Line Supervisors of
Housekeeping and Janitorial Workers 8.9% 36.0% 45.0% 26.4% 25.6%
Pest Control Workers 5.2% 4.7% 30.7% 8.7% 23.4% Other Installation, Maintenance, and
Repair Workers 2.9% 6.6% 35.5% 21.4% 29.6%
Laundry and Dry-Cleaning Workers 1.7% 7.4% 43.0% 19.9% 34.9% Secretaries and Administrative, Except
Legal, Medical, and Executive 1.0% 93.5% 29.0% 10.5% 20.5%
Sales Representatives of Services, Except Advertising, Insurance, Financial Services, and Travel
0.8% 19.0% 18.8% 5.7% 13.6%
Other Managers 0.6% 33.7% 43.4% 20.9% 14.8% Cleaners of Vehicles and Equipment 0.6% 24.6% 56.6% 34.5% 39.5%
Healthcare 100.0% Registered Nurses 17.7% 88.9% 29.4% 15.8% 4.9% Nursing Assistants 8.5% 88.7% 56.7% 22.6% 41.5% Physicians 5.0% 37.5% 35.4% 28.4% 2.1% Licensed Practical and Licensed
Vocational Nurses 4.7% 87.9% 44.6% 14.3% 20.5%
Personal Care Aides 4.5% 83.9% 56.4% 23.3% 49.0% Medical and Health Services Manager 3.7% 71.3% 29.9% 12.3% 5.2% Medical Assistants 2.9% 91.7% 50.1% 15.3% 26.8% Home Health Aides 2.7% 89.9% 59.9% 26.9% 44.3% Secretaries and Administrative, Except
Legal, Medical, and Executive 2.4% 95.6% 31.8% 9.3% 14.7%
Receptionists and Information Clerks 2.3% 94.8% 39.9% 10.4% 25.5% Child Care and Social Services 100.0%
Childcare Workers 22.8% 95.0% 44.8% 21.0% 38.8% Preschool and Kindergarten Teachers 13.9% 97.7% 38.0% 11.9% 32.2% Personal Care Aides 11.6% 82.9% 56.2% 29.7% 47.2% Social Workers All Other 6.6% 82.8% 43.8% 10.9% 12.7% Social and Community Service
Managers 4.3% 73.1% 34.0% 10.0% 10.1%
Teaching Assistants 3.2% 96.8% 48.3% 17.1% 37.9% MGR-Education and Childcare
Administrat 2.6% 93.1% 37.4% 10.0% 14.5%
Receptionists and Information Clerks 2.3% 79.1% 51.3% 13.7% 25.9% Nursing Assistants 1.6% 90.2% 62.9% 37.9% 45.7% Educational, Guidance, and Career
Counselors and Advisors 1.6% 75.0% 34.8% 8.4% 15.6%
Source: CEPR's Analysis of American Community Survey, 2014-2018 5-Year Estimates

4/20/2021 Rhea Co. farm leader says all of their nearly 200 employees have virus, only 3 symptomatic | WTVC
https://newschannel9.com/news/local/rhea-co-farm-leader-says-all-of-their-nearly-200-employees-have-virus-only-3-symptomatic 1/6
ADVERTISEMENT
Rhea Co. farm leader says all of their nearly 200 employees have virus,only 3 symptomatic
by Sam LutherTuesday, May 26th 2020 AA
3
LIVE75 ° 54 ° 64 °
Search Site

4/20/2021 Rhea Co. farm leader says all of their nearly 200 employees have virus, only 3 symptomatic | WTVC
https://newschannel9.com/news/local/rhea-co-farm-leader-says-all-of-their-nearly-200-employees-have-virus-only-3-symptomatic 2/6
Southern Valley Executive O�cer John Schwalls says 100 percent of the workforce at Henderson Farm - nearly 200 employees total - has contractedCOVID-19. (Image: WTVC)
RHEA COUNTY, Tenn. — We're now learning new details about the farm that's behind a massivecoronavirus outbreak in Rhea County.
Henderson Farm in Evensville has been the center of a COVID-19 outbreak, causing thecounty's cases to jump from 13 to almost 200, but the executive o�cer of Southern Valley - apartner of the farm - tells us the infection has been contained.
Watch Sam Luther's 6pm report here.
VIEW ALL PHOTOS
LIVE75 ° 54 ° 64 °
Search Site

4/20/2021 Rhea Co. farm leader says all of their nearly 200 employees have virus, only 3 symptomatic | WTVC
https://newschannel9.com/news/local/rhea-co-farm-leader-says-all-of-their-nearly-200-employees-have-virus-only-3-symptomatic 3/6
John Schwalls has worked with Southern Valley in various roles since 1994. Today, he told usthat 100 percent of the workforce at Henderson Farm has contracted COVID-19.
Schwalls says that only three employees - less than 1% of the workforce - have shownsymptoms, in the nearly 200 employees that have the virus.
· May 26, 2020Sam Luther @SamLuther_
Replying to @SamLuther_
John Schwalls says that employees stay in an air conditioned“college dorm like room with bunk beds.” And that since the firstcase confirmed on May 11th, nobody has left the farm and gone intothe public
Sam Luther@SamLuther_
He tells me that right now everybody is asymptomatic andstill working, but the farm has offered to pay employees evenif they canʼt work. Schwalls says anybody is free to comeand go saying, “weʼre not running a concentration camp.”4�20 PM · May 26, 2020
5 Copy link to Tweet
LIVE75 ° 54 ° 64 °
Search Site

4/20/2021 Rhea Co. farm leader says all of their nearly 200 employees have virus, only 3 symptomatic | WTVC
https://newschannel9.com/news/local/rhea-co-farm-leader-says-all-of-their-nearly-200-employees-have-virus-only-3-symptomatic 4/6
This began on March 28th when workers from Mexico came to Henderson Farm to work andlive there in what Schwalls describes as “college dorm room, bunk bed like” area. Since the �rstcase of COVID-19 was con�rmed in the farm on May 11th, Schwalls says every employee wastested by the Rhea County Health Department when they came to the farm. Even thoughultimately only three people were symptomatic with a cold-like illness, every single employeetested positive for the virus.
Since this happened, Schwalls says no employee has left the Henderson Farm area, and thatsupplies have been brought to those that reside there. The company’s executive o�cer saysthat there’s been a big misconception from Rhea County residents that Hispanic people in thecommunity are contagious, when in fact none of those workers have been in local stores orrestaurants.
When we asked Schwalls if those people could freely leave the farm he says, “this isn’t aconcentration camp, people can come and go.” But he says that although they have the abilityto leave, nobody has because of their own concerns and worry.
(Image: WTVC)
Schwalls tells us that all the employees are still working, even with the virus. "I can't makeanyone not work or work," he said.
LIVE75 ° 54 ° 64 °
Search Site

4/20/2021 Rhea Co. farm leader says all of their nearly 200 employees have virus, only 3 symptomatic | WTVC
https://newschannel9.com/news/local/rhea-co-farm-leader-says-all-of-their-nearly-200-employees-have-virus-only-3-symptomatic 5/6
He says that those three people who did show symptoms were not allowed to work, however,and were isolated from the others.
We reached out to the Tennessee Department of Health, and o�cials there tell us they aremonitoring the situation, and have someone with the department speci�cally designated tomonitor symptoms and cases as they develop at the farm.
As of May 26, the state health department reports 197 cases of coronavirus in Rhea County.
On Monday, Henderson Farms released the following statement to us:
"After a worker tested positive for COVID-19 and out of an abundance of caution, we requestedthat the Rhea County Health Department test all employees at Henderson Farms in Evensville, TN.When the results came back, we learned our workers at this location tested positive for COVID-19. Atthis stage, we feel blessed that our workers are asymptomatic and the situation remains contained.Yet as a precautionary measure and in line with the latest public health guidelines, these workerscontinue to remain in isolation at the farm where they live and work. Nothing is more important tous than the health of our workers and community at large. We take this very seriously and aremonitoring the situation closely in partnership with Rhea County Health Department, taking allprecautionary measures to continue to protect our workers and our community."
This is a developing story.
MORE TO EXPLORE
Utah woman, 39, dies 4 days after 2nd dose of COVID-19 vaccine; autopsy ordered
Garth Brooks says wife Trisha Yearwood tested positive for COVID-19
Chattanooga pastor dies of COVID-19 complications, one day after wife's passing
SPONSORED CONTENT by Taboola
LIVE75 ° 54 ° 64 °
Search Site

4/20/2021 Rhea Co. farm leader says all of their nearly 200 employees have virus, only 3 symptomatic | WTVC
https://newschannel9.com/news/local/rhea-co-farm-leader-says-all-of-their-nearly-200-employees-have-virus-only-3-symptomatic 6/6
Loading ...
Beverly Hills MD | SPONSORED
Livingly | SPONSORED
Stansberry Research | SPONSORED
Surgeon Reveals How To Fill In Balding Eyebrows
Photos Of Queen Elizabeth In Her Heyday
Biggest problem in America, according to Ron Paul
ADVERTISEMENT
YOU'VE BEEN WITHUS BEFORE. WE NEED YOU AGAIN.
MAKE AN EMERGENCY GIFT
LIVE75 ° 54 ° 64 °
Search Site

/
Fact-forward journalism on demand. Subscribe now for instant access.
Advertisement
Coronavirus
Inside Green Empire Farm: Upstate NYʼs biggestcoronavirus outbreak slams migrant workersUpdated May 08, 2020; Posted May 08, 2020
The 32-acre hydroponic farm Green Empire Farms was the center of 171 confirmed coronavirus cases in Madison County. N. Scott Trimble |[email protected]
NOMMI: MOBILE HOTSPOT | SECURED 4GLTE UNLOCKED WI-FI HOTSPOT DEVICE …
(33)
$129.99
Subscribe
Please support the journalism you rely on.

/
T 6,374shares
By Marnie Eisenstadt | [email protected]
Oneida, N.Y. — Every day, more than 300 workers walked in and out of the sprawling Green Empire Farm
greenhouse on the edge of the city of Oneida.
Even when the whole world mostly shut down, the 32-acre farm under glass kept going. There were millions
of strawberries to pick after growing ripe under miles of glass. And there were half a million tomato plants
to tend.
The company, Mastronardi Produce of Canada, took measures to protect those workers from the
coronavirus, officials from Madison County and the company said.
Advertisement
But it didn’t matter. At the end of each workday, 186 workers left the giant farm in vans and on buses, to
return to hotels where they lived four to a room and slept two to a bed.
The workers’ living conditions, chosen for them by the labor company that hired them and brought them to
Oneida, were perfect for the coronavirus to dig in and take hold.
And it did.
The indoor farming complex is now the site of the biggest coronavirus cluster in Upstate New York,
according to Gov. Andrew Cuomo’s office. The only cluster outside of New York City that was bigger was in
New Rochelle.
By Thursday, 169 of the 340 workers had tested positive.
“They were living in close quarters, together, so it was ripe for spread,” said Eric Faisst, Madison County
public health director. “The conditions were perfect.”
The farmworkers living in the hotels are migrant workers who speak little English, county officials said.
Faisst said many of the workers are scared. They came here to the U.S. to work and send money to their
families. Some are from Mexico and other Spanish-speaking countries, others are from Haiti. Now they are
stuck: They can’t work, and they can’t go home.
The county had to get 12 interpreters to help with tracing the sick and exposed workers’ travels through the
area.
The outbreak was so shocking that it caught Cuomo’s attention. He mentioned it in his nationally viewed
news briefing Wednesday. He compared the cluster to outbreaks in meatpacking plants across the nation.Please support the journalism you rely on.

/
“It’s when you run a facility with a large number of workers in a dense environment,” the governor said.
But county officials say it’s not the workplace, but where the workers live that have been making them
worry since the pandemic started.
Until last April 29, it seemed like everything was under control. That’s when Faisst got the first bad news:
The night before, Oneida Health, the hospital nearest the greenhouse, saw two workers.
Both were sick with COVID-19. Both lived in those hotels, four to a room. Workers live in the Super 8 and the
Days Inn in Madison County and the La Quinta Hotel in Verona in Oneida County.
When Faisst heard of about the two positive tests among the workers, he knew he was facing a potential
cluster that showed the virus’ ability to jump from person to person at an exponential rate. All the
farmworkers, migrant and local, had to be tested.
The county called in the state for help. Two days later, an army of state and county workers set up rows
inside the greenhouse.
The farmworkers filed in, speaking to each other in Spanish and French. One by one, nurses swabbed their
noses and took down their contact information, aided by interpreters. Then the workers boarded the buses
and vans back to the hotels to wait.
By Monday, the results came back. All but 47 of the contract workers had the virus.
The county and state tested the second wave of workers, mostly local help, on Tuesday in the same way.
That turned up 31 more positives.
Part of the Flavor Army
All of the workers at the farm do the same jobs and make roughly the same pay on paper, employees said.
But they live in two different worlds and work for two different employers.
The workforce drawn from Central New York makes a little less than $13 an hour. They pick, plant, sort and
pack. They work for Green Empire Farm, which is owned by Mastronardi Produce, a 70-year-old company in
Kingsville, Ontario, that was started by an Italian immigrant who decided to grow hothouse tomatoes. The
company has at least six hothouse farms in North America.
Most of the produce is sold under the Sunset brand. The new amphitheater in the company’s hometown
bears its name: Sunset Stadium.
The company prides itself on how it treats its workers, a company spokeswoman said, and is devastated
about the outbreak at the new farm in Oneida.
Mastronardi calls its workers the “Flavor Army.”
But more than half the workers in Oneida, those in the buses and the hotels, are migrant farmworkers
employed by an Indiana company called MAC Contracting. A Mastronardi spokeswoman said MAC supplies
workers to many of the company’s greenhouses.
Faisst said the contract workers did not bring the virus into the community. The county’s first coronavirus
case was at the greenhouse, but it was a local worker.
A worker who has been at the greenhouse since it opened said the migrant workers were hired to take local
jobs that went unfilled. Both sets of workers are supposed to make the same amount: a little less than $13
an hour. The contract workers are paid by MAC, who takes money out of their checks for the hotel rooms.Please support the journalism you rely on.

/
Since the outbreak, the county has been pushing MAC to put fewer workers in the rooms and to pay them
when they’re not working, said John Becker, chairman of the Madison County Board of Supervisors.
“You’re going to comply, or we’ll take further measures,” Becker said the county told MAC.
He said he was “aghast” when he found out how many workers were living in a room, together, while public
health officials were trying to space people six feet apart.
Becker said he was concerned the workers would not be paid when they were quarantined, which made him
worry they would keep working while they were sick.
The county, he said, pushed Mastronardi to pay them while sick. Becker said the county is delivering food to
all of the workers in the hotels in Madison County while they are quarantined to keep them inside. It is
costing the county $3,000 a day.
Becker said the outbreak is peeling back the curtain on how factory farms work.
“We can’t fill the jobs with American labor, so these folks come up. They send money home. These
conditions are throughout the country,” said Becker, who ran his family’s dairy farm for decades.
ʻWe followed social distancing’
Becker said it’s unclear whether the workers have the documents to work in the U.S.
“That’s one of those questions I don’t want to ask,” he said. “That’s MAC’s deal.”
Farm labor contractors, like MAC, traditionally handle the certifying that the workers’ papers are legal for
the companies that hire them. They also handle transportation and housing.
The Oneida greenhouse had always planned to bring in some labor. There is a bunkhouse on the grounds,
but it’s not finished.
The greenhouse just opened in August. It took five years of work to get the farm to come to Madison
County, Becker said. The county was jockeying with others to get the huge operation. In the end, Madison
County had the most land and the sweetest deal: a 20-year tax break worth millions.
Company documents show that the project will be built in four phases on 600 acres of land. Each phase is a
32-acre greenhouse. The total cost is more than $100 million. It’s unclear how much of the project has been
completed.
Cris Schultz, a MAC employee in Indiana, disputed the county’s account in an interview Thursday with
syracuse.com. She said the workers never stayed more than three to a room. She said the workers pay for
some of the housing out of their paychecks, but she would not say how much.
She disputed that the workers’ living arrangements made them ill.
“Everyone is entitled to their own opinion,” Schultz said. “We followed social distancing.”
She declined to say how MAC helped the workers follow social distancing when they were on the buses or at
the hotels. County officials said that, after prodding, MAC spaced the workers out on the buses and vans
and began wiping down the vehicles several times a day.
Schultz would not say how many workers were sick with symptoms from the virus. At one point in she said
“enough” were sick; then she said none were ill. County officials said two of the workers had been
hospitalized. They have since been released and are recovering back at the hotels they were living in.Please support the journalism you rely on.

/
“I am worried about them, their health,” Schultz said. Then she hung up.
“They came here to work”
Oneida feels more like a village than a city. The population is 11,000. People mostly know each other, and
now they know the workers who have been picking and planting under the glass at the edge of the city.
The outbreak has put a spotlight on the laborers in a way that makes county and city officials worry.
“They came here to work and send money back to their country,” said Oneida Mayor Helen Acker. “They
want to work; they don’t want to be sick.”
Now they are being watched, not just by public health officials, but by people who are angry they are here.
Madison County publicly identified nine local businesses, including a laundromat and the Walmart, as
places the farmworkers frequented.
Faisst said he feels the virus is under control. The workers have been tested and quarantined. He is not
worried about them spreading the virus.
“They’re scared as hell and then on top of that, you’re starting to see this mob mentality. They’re victims of
this virus … they acquired this here,” Faisst said. “My concern is for their safety.”
None of the county officials thought the greenhouse would be closed.
All of migrant workers have been isolated in their hotels since the mass testing last Saturday.
The infected workers will be released in roughly two weeks.
Workers who have recovered and workers who tested negative will be back at work sooner.
Next week they will be picking the millions of tomatoes under acres of glass at the edge of the city.
Do you work for Green Empire Farm in Oneida or know about the handling of its workforce? ReporterMarnie Eisenstadt would like to talk to you. Contact her anytime: email | twitter| Facebook | 315-470-2246
MORE ON CORONAVIRUS
Coronavirus in NY: Cases, maps, charts and resources
Is going to school in person obsolete? Cuomo wonders why ʻold model’ persists
A struggle for PPP funds in Central NY: 6 small business owners, 1 bank and a lot of heartache
Almost half of Onondaga County’s coronavirus deaths are from nursing homes
Complete coronavirus coverage on syracuse.com
Note to readers: if you purchase something through one of our affiliate links we may earn a commission.
Around the webRegistration on or use of this site constitutes acceptance of our User Agreement, Privacy Policy and Cookie
Statement, and Your California Privacy Rights (each updated 1/1/21).
Cookies SettingsPlease support the journalism you rely on.

/
© 2021 Advance Local Media LLC. All rights reserved (About Us).
The material on this site may not be reproduced, distributed, transmitted, cached or otherwise used, except
with the prior written permission of Advance Local.
Community Rules apply to all content you upload or otherwise submit to this site.
Ad Choices
Please support the journalism you rely on.

/
Of the 5 States with the Most Farmworkers, Only 3 Are Prioritizing Vaccines —and Not All Means of Prioritizing Are Equal, per the CDC
Share:
Above, a scene from the July 2020 documentary “COVID’s Hidden Toll.” Months later, FRONTLINE found that only some states are prioritizing farmwork-ers, deemed an essential workforce, for vaccines.
On a recent Saturday morning, Karla, a farmworker from Mexico, didn’t wake up early to weed fields around
Morrow County, Oregon. Instead, she went to a regional tourism center to get her first dose of the COVID-19
vaccine.
“It took a weight off my shoulders,” she said. Karla came to the U.S. in February to find work and to save money
for her son, who just started college. “I went there because they didn’t ask for documents,” Karla said of the
tourism center. She was afraid a local clinic might ask for information that immigration authorities could use to
track her.
Karla is one of 2.4 million farmworkers in the U.S. — at least half of whom are undocumented, according to the
U.S. Department of Agriculture, and all of whom should be prioritized for COVID-19 vaccines, according to the
Centers for Disease Control and Prevention (CDC).
APRIL 16, 2021
by Paula Moura (https://www.pbs.org/wgbh/frontline/person/paula-moura/)•
MENU
(http://wosu.org/)

/
What’s more, the CDC recommends (https://www.cdc.gov/mmwr/volumes/69/wr/mm695152e2.htm) that vaccina-
tions for farmworkers be offered near their worksites or in their communities. “Minimizing barriers to access vac-
cination for frontline essential workers, such as vaccine clinics at or close to the place of work, are optimal,” the
CDC statement (https://www.cdc.gov/vaccines/hcp/acip-recs/vacc-specific/covid-19/evidence-table-phase-1b-
1c.html) said. The agency included all agricultural workers in phase 2 of its vaccine-priority recommendations,
along with police officers, to “preserve functioning of society.”
Despite the CDC’s guidance, only three of the five states with the most farmworkers, according to the U.S. Cen-
sus Bureau — California, Washington and Oregon — prioritized farmworkers for vaccinations ahead of the gener-
al population. And only two — California and Oregon — have established policies that provide vaccination clinics
for farmworkers on worksites or in their communities.
Texas and Florida did not prioritize vaccinations for farmworkers ahead of the general population. And although
officials from Washington and Texas said they were targeting or planning to target farmworkers, neither has is-
sued a state policy prioritizing vaccine events on farms or in farmworker communities.
In states lacking aggressive vaccination campaigns, farmworkers — deemed “essential” to the nation’s food sup-
ply by the Trump administration (https://www.cisa.gov/sites/default/files/publications/CISA-Guidance-on-Essen-
tial-Critical-Infrastructure-Workers-1-20-508c.pdf) and reaffirmed by President Joe Biden (https://www.white-
house.gov/briefing-room/statements-releases/2021/03/18/statement-by-president-biden-on-the-farm-work-
force-modernization-act-of-2021/) — are again at risk of COVID-19 outbreaks.
“Without true access to vaccination, I fear that we will see a dramatic increase in COVID-19 mortality … as the
harvest season ramps up, similar to 2020,” sociologist Alicia Riley told FRONTLINE. Riley coauthored a University
of California San Francisco study (https://www.medrxiv.org/content/10.1101/2021.01.21.21250266v1.full) published
in January that found the mortality rate among farmworkers increased 55% from March through September
2020, compared to the same period in previous years.
In total, some 9,100 farmworkers have died of COVID-19 in the U.S. since the beginning of the pandemic, out of
554,000 infections, according to Jayson Lusk, a professor of agricultural economics at Purdue University.
That grim death toll has repercussions beyond the workers themselves. “It’s not just the workforce. It’s their fam-
ilies, because we know that they live in overcrowded living conditions,” said Dr. Max Cuevas. Featured prominent-
ly in the July 2020 FRONTLINE documentary COVID’s Hidden Toll, Cuevas is the CEO of Clinica de Salud del Valle
de Salinas, which has been at the center of vaccine distribution in California’s Monterey County.
“Without those workers, we don’t eat,” he said.
With Targeted Clinics
Oregon — which the U.S. Census Bureau estimates has around 86,000 farmworkers — began prioritizing vaccines
for farmworkers on March 29, ahead of all adults becoming eligible May 1. At the first state-held event targeting
farm- and food-processing workers in late March, some 1,000 people in Morrow County were vaccinated.

/
“They were suggesting that folks schedule an appointment ahead of time, but they were also welcoming walk-
ins. That’s a really beneficial option,” said Zaira Sanchez, emergency relief coordinator for the farmworker-fo-
cused nonprofit UFW Foundation, which helped organize the event. “Some folks just don’t have access or skills to
navigate online registration systems.”
The next step is coordinating with the state to bring mobile vaccination clinics to farms, Sanchez said. “We are
hoping that, doing mobile clinics on worksites, we are getting to the folks who don’t have time or don’t have the
ability to travel to their appointment or to the event.”
Beyond improving access and eliminating the need to take time off work or to register online, on-site events
give clinicians the chance to thoroughly explain the importance and safety of vaccinations.
“Delivery of these services by trusted entities is important, given the mistrust, as well as misunderstanding,
around COVID and vaccines in general,” said Brenda Eskenazi, the director of the Center for Environmental Re-
search and Children’s Health at University of California Berkeley, who tracked COVID-19 infections among farm-
workers in California’s Salinas Valley.
Even so, many are wary. At an April 3 event organized by LUPE, a farmworker union, targeting agricultural work-
ers in Texas’ Rio Grande Valley, clinicians successfully delivered about 700 vaccinations, but “Half of the people
we were asking said, ‘No, thanks,’” said Daniel Diaz, LUPE’s director of organizing.
Texas — which has 143,763 farmworkers, according to the U.S. Census Bureau — now has the second highest
COVID-19 infection rate in the country, after California.
Maria, a 39-year-old farmworker in the Rio Grande Valley, said she is hesitant to get vaccinated because she has
lingering side effects from a previous bout with COVID-19: “I want to see what happens to others.”
Without Targeted Clinics
To date, vaccine rollout for the general U.S. population has bested the Biden administration’s initial timeline, but
that has not been true for people of color, including undocumented workers. Advocates worry that, as states
open up vaccines to all adults, farmworkers will be locked out. And vaccinating now is critical, many told FRONT-
LINE, because the peak agricultural season starts soon.
And yet, many farmworkers have avoided offsite vaccinations due to fear of providing information that could be
used to deport them. While a social security number or a state-issued ID is not required to receive a shot, none of
the five states with the largest numbers of farmworkers issued guidelines to vaccinators, instructing them not to
request this information.
In a statement (https://www.dhs.gov/news/2021/02/01/dhs-statement-equal-access-covid-19-vaccines-and-vac-
cine-distribution-sites), the Department of Homeland Security said it won’t perform raids on vaccination sites
and “encourages all individuals, regardless of immigration status, to receive the COVID-19 vaccine.” The CDC
(https://www.cdc.gov/coronavirus/2019-ncov/vaccines/keythingstoknow.html?
s_cid=10499:about%20covid%2019%20vaccine:sem.ga:p:RG:GM:gen:PTN:FY21) said vaccines are “free of to all
people living in the United States, regardless of their immigration or health insurance status.”

/
And yet, 14 people in Texas were denied vaccines at a University of Texas Rio Grande Valley (UTRGV) clinic, near
the border with Mexico. A LUPE report (https://lupenet.org/2021/04/12/report-inequitable-vaccine-access-for-un-
documented-people-in-the-rgv/?
tl_inbound=1&tl_groups%5b0%5d=10212&tl_form_type=1&tl_period_type=3&emci=a4d45130-659c-eb11-85aa-
0050f237abef&emdi=53429f0c-689c-eb11-85aa-0050f237abef&ceid=837127) released April 12 found that, out of
20 private providers in the state’s Cameron, Hidalgo and Starr counties, four asked for social security numbers or
a Texas ID to register for vaccinations. UTRGV ultimately issued an apology, and the 14 were vaccinated.
By contrast, Colorado (https://www.denverpost.com/2021/01/17/colorado-covid-vaccine-undocumented-nonciti-
zens/), which has around 36,733 farmworkers, issued a letter advising providers not to request IDs and threaten-
ing to cut vaccine access if they did.
In Florida — which has 96,247 farmworkers, according to the Census Bureau — many people don’t want the vac-
cine, because they don’t think it’s safe, said Maria Martinez, a coordinator with the nonprofit Farmworker Associ-
ation of Florida.
Most of the state’s farmworkers weren’t eligible for vaccines until April 5, along with the general population. In
the meantime, Martinez said, farmworkers were “harvesting potatoes and planting chili, tomatoes. They are
working. Despite bringing their mask, they are still close to each other at work.”
The Florida Department of Health didn’t respond to questions from FRONTLINE.
Challenges Remain
Even with worksite events, it’s hard to reach everyone — or to avoid line jumpers. “In the initial rollout, clearly
there were some disparities: a lot of confusion, a lack of transparency about who was receiving the vaccine and
why,” said California State Assembly member Robert Rivas (D-30), who emphasized the need for workplace safe-
ty measures in COVID’s Hidden Toll.
Together with nonprofits and mobile clinics, California has delivered more than 15,000 vaccine doses to farm-
workers and has allocated 40,000 doses for food and farmworkers. But that covers a fraction of the state’s 1 mil-
lion farmworkers, as estimated by the state’s Department of Public Health.
At the rate Monterey County is presently receiving vaccines from the state, it would take six more weeks to fully
vaccinate farmworkers — “and that’s only one of the groups that currently are eligible for the vaccine,” said
Jimenez of the county’s Health Department.
All of this is before California’s peak harvest begins in late April. As the high season moves across the U.S., it
brings an influx of new migrants, who travel through Arizona, California, Michigan and beyond.
Leticia, a 35-year-old fruit picker who lives on the outskirts of Prosser, Oregon, is concerned about more unvacci-
nated workers arriving. Getting sick would affect her ability to feed her kids.
“They say we are essential workers, but they don’t give us the same rights. If we are not protected, we will keep
working, with the virus or not,” she said. “We can’t stop and we can’t stay home.”

/
WATCH THE DOCUMENTARY
Watch COVID’s Hidden Toll (https://www.pbs.org/wgbh/frontline/film/covids-hidden-toll/) in its entirety below.
This story has been updated to include the name of Morrow County.
Paula Moura (https://www.pbs.org/wgbh/frontline/person/paula-moura/), Tow Journalism Fellow,
FRONTLINE/Newmark Journalism School Fellowship, FRONTLINE
EMAIL:[email protected] (mailto: [email protected])
TWITTER:@PaulaMoura_san (https://twitter.com/PaulaMoura_san)
Journalistic Standards (https://www.pbs.org/wgbh/frontline/about-us/editorial-standards-and-ethics)
(https://www.pbs.org/wgbh/frontline/film/covids-hidden-toll/)

/
Learn more(https://www.pbs.org/about/faqs/online-sponsorship/)
As the U.S. Crosses 500,000 Deaths from COVID-19, These 9 Documentaries Offer Context(https://www.pbs.org/wgbh/frontline/article/us-crosses-500000-deaths-covid-19-9-documentaries-offer-context/)FEBRUARY 22, 2021
Taking Office in a Time of Crisis: 16 Documentaries on Key Issues Biden Inherits(https://www.pbs.org/wgbh/frontline/article/16-documentaries-key-issues-president-biden-inherits/)JANUARY 19, 2021
Awaiting Election Results, the U.S. Set a New Daily COVID Record. These 8 Films Offer Context.(https://www.pbs.org/wgbh/frontline/article/awaiting-election-results-the-u-s-set-a-new-daily-covid-record-these-8-films-offer-context/)NOVEMBER 5, 2020
COVID's Hidden Toll(https://www.pbs.org/wgbh/frontline/film/covids-hidden-toll/)
SUPPORT PROVIDED BY
SEE WHAT FRONTLINE IS WORKING ON NOW
Your email address
Your zip code
GET OUR NEWSLETTER
RELATED ARTICLES
TOPICS
Agriculture, (https://www.pbs.org/wgbh/frontline/topic/agriculture/)
Business and Economy, (https://www.pbs.org/wgbh/frontline/topic/business-and-economy/)
COVID-19, (https://www.pbs.org/wgbh/frontline/topic/covid-19/)

/
Immigration, (https://www.pbs.org/wgbh/frontline/topic/immigration/)
Social Issues (https://www.pbs.org/wgbh/frontline/topic/social-issues/)
M O R E S TO R I E S
SHOW COMMENTS

/
N E X T O N F RO N T L I N E
Chauvin Trial Lawyers Bring Everything Together in ClosingArguments on Floyd's Death(https://www.pbs.org/wgbh/frontline/article/chauvin-trial-lawyers-bring-everything-together-in-closing-arguments-on-floyds-death/)After 45 witnesses and 14 days of testimony in the Hennepin
County District Court trial, two lawyers will make their closing
arguments, the final words the jurors hear from them before
retreating behind closed doors to deliberate.
APRIL 17, 2021
The War in Afghanistan: As Biden Sets U.S. WithdrawalDate, 13 Documentaries Explore the Conflict and ItsImpact (https://www.pbs.org/wgbh/frontline/article/war-in-afghanistan-biden-sets-us-withdrawal-13-docs/)Explore nearly two decades of reporting from FRONTLINE on
America’s longest war.
APRIL 15, 2021
After Jan. 6, Investigating the Contours of a “Broad FascistMovement” in the U.S.(https://www.pbs.org/wgbh/frontline/article/after-jan-6-investigating-the-contours-of-a-broad-fascist-movement-in-the-u-s/)In a scene from the new documentary “American Insurrection,”
correspondent A.C. Thompson talks with sociologist Pete Simi
about the state of domestic extremism in the U.S.
APRIL 14, 2021
“I Felt Hate More Than Anything”: How an Active DutyAirman Tried to Start a Civil War(https://www.pbs.org/wgbh/frontline/article/steven-carrillo-boogaloo-bois-active-duty-airman-incite-civil-war/)Steven Carrillo’s path to the Boogaloo Bois shows the hate
group is far more organized and dangerous than previously
known.
APRIL 13, 2021
(https://www.pbs.org/wgbh/frontline/article/chauvin-trial-lawyers-bring-everything-together-in-closing-arguments-on-floyds-death/)
(https://www.pbs.org/wgbh/frontline/article/war-in-afghanistan-biden-sets-us-withdrawal-13-docs/)
(https://www.pbs.org/wgbh/frontline/article/after-jan-6-investigating-the-contours-of-a-broad-fascist-movement-in-the-u-s/)
(https://www.pbs.org/wgbh/frontline/article/steven-carrillo-boogaloo-bois-active-duty-airman-incite-civil-war/)
SHOW MORE (HTTPS://WWW.PBS.ORG/WGBH/FRONTLINE/ARTICLES/)

/
G E T O U R N E W S L E T T E R
Your email address
SUBSCRIBE
F O L LOW F RO N T L I N E
The Virus That Shook The WorldAPRIL 27, 2021
>

/
(https://www.pbs.org/) (https://cpb.org/) (https://www.macfound.org/)
(https://www.fordfoundation.org/) (https://www.abramsfoundation.org/)
(http://www.parkfoundation.org/)
Funding for FRONTLINE is provided through the support of PBS viewers and by the Corporation for Public Broadcasting. Major funding for FRONTLINE isprovided by the Ford Foundation. Additional funding is provided by the Abrams Foundation; the John D. and Catherine T. MacArthur Foundation; ParkFoundation; and the FRONTLINE Journalism Fund with major support from Jon and Jo Ann Hagler on behalf of the Jon L. Hagler Foundation, andadditional support from Koo and Patricia Yuen.
Home (https://www.pbs.org/wgbh/frontline/)
Films (https://www.pbs.org/wgbh/frontline/films/)
Podcasts (https://www.pbs.org/wgbh/frontline/podcasts/dispatch/)
Investigations (https://www.pbs.org/wgbh/frontline/investigations/)
Schedule (https://www.pbs.org/wgbh/frontline/schedule/)
Contact Us (https://www.pbs.org/wgbh/frontline/about-us/contact-us/)
Our Funders (https://www.pbs.org/wgbh/frontline/about-us/our-funders/)
Privacy Policy (https://www.pbs.org/wgbh/frontline/about-us/privacy-policy/)
PBS Privacy Policy (https://www.pbs.org/about/pbs-privacy-policy/)
PBS Terms of Use (https://www.pbs.org/about/terms-use/)
Corporate Sponsorship (https://www.sgptv.org/programs/PBS-frontline/)
About Us (https://www.pbs.org/wgbh/frontline/about-us/)
History (https://www.pbs.org/wgbh/frontline/about-us/history/)
Awards (https://www.pbs.org/wgbh/frontline/about-us/awards/)
Editorial Standards and Ethics(https://www.pbs.org/wgbh/frontline/about-us/editorial-standards-and-ethics/)
Journalistic Guidelines (https://www.pbs.org/wgbh/frontline/about-us/journalistic-guidelines/)
Senior Editorial Team (https://www.pbs.org/wgbh/frontline/about-us/senior-editorial-team/)
Our Staff (https://www.pbs.org/wgbh/frontline/about-us/our-staff/)
Jobs/Internships (https://www.pbs.org/wgbh/frontline/about-us/jobs/)
Pressroom (https://www.pbs.org/wgbh/frontline/topic/announcements/)
PBS LearningMedia (https://www.pbslearningmedia.org/collection/fl/)
FRONTLINE Teacher Center(https://www.pbs.org/wgbh/pages/frontline/teach/)
Jon and Jo Ann Hagler on behalf ofthe Jon L. Hagler Foundation
Koo and Patricia Yuen
(https://www.wgbh.org/support/directed
FRONTLINE DIGITALSUPPORTERS
Lisa & Douglas Goldman Fund
ABOUT
OUR TEAM
______
______
TEACHER CENTER

/
FRONTLINE is a registered trademark of WGBH Educational Foundation. Web Site Copyright ©1995-2021 WGBH Educational Foundation. PBS is a 501(c)(3)not-for-profit organization.

Excess mortality associated with the COVID-19 pandemic among Californians 18–65 years of age, by
occupational sector and occupation: March through October 2020
Yea-Hung Chen1, Maria Glymour2, Alicia Riley2, John Balmes3, Kate Duchowny2, Robert Harrison3,
Ellicott Matthay2, Kirsten Bibbins-Domingo2,3
1Institute for Global Health Sciences, University of California, San Francisco
2Department of Epidemiology and Biostatistics, University of California, San Francisco
3Department of Medicine, University of California, San Francisco
1
All rights reserved. No reuse allowed without permission. (which was not certified by peer review) is the author/funder, who has granted medRxiv a license to display the preprint in perpetuity.
The copyright holder for this preprintthis version posted January 22, 2021. ; https://doi.org/10.1101/2021.01.21.21250266doi: medRxiv preprint
NOTE: This preprint reports new research that has not been certified by peer review and should not be used to guide clinical practice.

Abstract
Background
Though SARS-CoV-2 outbreaks have been documented in occupational settings and though there is
speculation that essential workers face heightened risks for COVID-19, occupational differences in excess
mortality have, to date, not been examined. Such information could point to opportunities for intervention,
such as workplace modifications and prioritization of vaccine distribution.
Methods and findings
Using death records from the California Department of Public Health, we estimated excess mortality among
Californians 18–65 years of age by occupational sector and occupation, with additional stratification of the
sector analysis by race/ethnicity. During the COVID-19 pandemic, working age adults experienced a 22%
increase in mortality compared to historical periods. Relative excess mortality was highest in
food/agriculture workers (39% increase), transportation/logistics workers (28% increase), facilities (27%) and
manufacturing workers (23% increase). Latino Californians experienced a 36% increase in mortality, with a
59% increase among Latino food/agriculture workers. Black Californians experienced a 28% increase in
mortality, with a 36% increase for Black retail workers. Asian Californians experienced an 18% increase, with
a 40% increase among Asian healthcare workers. Excess mortality among White working-age Californians
increased by 6%, with a 16% increase among White food/agriculture workers.
Conclusions
Certain occupational sectors have been associated with high excess mortality during the pandemic,
particularly among racial and ethnic groups also disproportionately affected by COVID-19. In-person
essential work is a likely venue of transmission of coronavirus infection and must be addressed through strict
enforcement of health orders in workplace settings and protection of in-person workers. Vaccine distribution
prioritizing in-person essential workers will be important for reducing excess COVID mortality.
Introduction
More deaths are occurring during the COVID-19 pandemic than predicted by historical trends [1-4]. In
California, per-capita excess mortality is relatively high among Blacks, Latinos, and individuals with low
educational attainment [4]. An explanation for these findings is that these populations face unique
occupational risks because they may disproportionately make up the state’s essential workforce and because
2
All rights reserved. No reuse allowed without permission. (which was not certified by peer review) is the author/funder, who has granted medRxiv a license to display the preprint in perpetuity.
The copyright holder for this preprintthis version posted January 22, 2021. ; https://doi.org/10.1101/2021.01.21.21250266doi: medRxiv preprint

essential workers often cannot work from home [4-6]. Additionally, due to historical structural inequities,
low-wage essential workers may be more likely to live in crowded housing [5-7], resulting in household
transmission.
Despite the inherent risks that essential workers face, no study to date has examined differences in excess
mortality across occupation. Such information could point to opportunities for intervention, such as
workplace modifications and prioritization of vaccine distribution. Using time-series models to forecast
deaths from March through October 2020, we compare excess deaths among California residents 18–65 years
of age across occupational sectors and occupations, with additional stratification of the sector analysis by
race/ethnicity.
Methods
We obtained data from the California Department of Public Health on all deaths occurring on or after
January 1, 2016.
To focus on individuals whose deaths were most plausibly linked to work, we restricted our analysis to
decedents 18–65 years of age. Death certificates include an open text field for “Decedent’s usual occupation,”
described as “type of work done during most of working life.” Retirement is not separately recorded. We
processed the occupation information listed on the death certificates using an automated system developed
by the National Institute for Occupational Safety and Health, which converts free-text occupational data to
2010 US Census codes. A team of 3 researchers manually categorized the resulting 529 unique codes into
occupational sectors, with a focus on the 13 sectors identified by Cailfornia officials as comprising the state’s
essential workforce[8] and retail workers; we anticipated that these sectors would be most at risk. To ease
presentation, we combined or eliminated some sectors, placing the defense, communications/IT, and financial
sectors in the not-essential category (under the logic that it was particularly difficult to ascertain which
workers in these sectors fully met the state’s definitions for essential work) and placing chemical, energy, and
water sectors in the facilities category. This resulted in the following 9 groups: facilities, food/agriculture,
government/community, health/emergency, manufacturing, retail, transportation/logistics, not essential, and
unemployed/missing. We defined 4 racial/ethnic groups: Asian, Black, Latino, and White, with the
definition of Latino overwriting any racial designation in the death records. Our definition of Asian, Black,
and White excludes individuals identified on the death certificate as multiracial.
We defined pandemic time as beginning on March 1, 2020. In some time-stratified analysis, we compared the
months of March through May to the months of June and July. We chose the cutoff of June 1 because it is
3
All rights reserved. No reuse allowed without permission. (which was not certified by peer review) is the author/funder, who has granted medRxiv a license to display the preprint in perpetuity.
The copyright holder for this preprintthis version posted January 22, 2021. ; https://doi.org/10.1101/2021.01.21.21250266doi: medRxiv preprint

roughly 3 weeks after the state’s post-shutdown reopening in early May, and because we anticipate lags
between policy, infection, and death. Similarly, the ending date of July 31 is roughly 3 weeks after the state
ordered restaurants and indoor businesses to close in early July.
We conducted time-series analysis for each occupational sector, with additional stratification by
race/ethnicity. For each group of interest (for example, each occupational sector of interest), we repeated the
following procedure. We aggregated the data to months or weeks, using the weekly analysis for visualizations
and the monthly analysis to derive summary measures. Following our previous work [4], we fit dynamic
harmonic regression models with autoregressive integrated moving average (ARIMA) errors for the number
of monthly/weekly all-cause deaths, using deaths occurring among the group prior to March 1, 2020. For
each iteration, we used a model-fitting procedure described by Hyndman and Khandakar [9]. Using the final
model, we forecast the number of deaths for each unit of time, along with corresponding 95% prediction
intervals (PI). To obtain the total number of excess deaths for the entire time window, we subtracted the
total number of expected (forecast) deaths from the total number of observed deaths. We obtained a 95% PI
for the total by simulating the model 10,000 times, selecting the 97.5% and 2.5% quantiles, and subtracting
the total number of observed deaths. We report in our tables the observed number of deaths divided by the
expected number of deaths, as predicted by our models. We interpret these ratios as risk ratios for mortality,
comparing pandemic time to non-pandemic time. We also estimated excess mortality for all specific
occupations; for individual occupations, we defined excess mortality and risk ratios by comparing 2020
deaths to the arithmetic mean of 2018 and 2019 deaths.
We conducted all analyses in R, version 4.04.
Results
We estimate that from March 2020 through October 2020, there were 10,047 (95% PI: 9,229–10,879) excess
deaths among Californians 18–65 years of age (Table 1). Relatively large numbers of excess deaths were
recorded among workers in the facilities sector (1,681; 95% PI: 1,447–1,919) and the transportation/logistics
sector (1,542; 95% PI: 1,350–1,738). Relative to pre-pandemic time, mortality increased during the pandemic
by 39% among food/agriculture workers (risk ratio RR=1.39; 95% PI: 1.32–1.48), 28% among
transportation/logistics workers (RR=1.28; 95% PI: 1.24–1.33), 27% among facilities workers (RR=1.27; 95%
PI: 1.22–1.32), and 23% (RR=1.23; 95% PI: 1.18–1.28) among manufacturing workers.
4
All rights reserved. No reuse allowed without permission. (which was not certified by peer review) is the author/funder, who has granted medRxiv a license to display the preprint in perpetuity.
The copyright holder for this preprintthis version posted January 22, 2021. ; https://doi.org/10.1101/2021.01.21.21250266doi: medRxiv preprint

Table 1. Excess mortality among Californians 18–65 years of age, by occupational sector:March through October 2020.
Excess deaths Risk ratioa
Entire state 10,047 (9,229–10,879) 1.22 (1.20–1.24)Facilities 1,681 (1,447–1,919) 1.27 (1.22–1.32)Food or agriculture 1,050 (897–1,204) 1.39 (1.32–1.48)Government or community 422 (324–520) 1.14 (1.11–1.18)Health or emergency 585 (523–647) 1.19 (1.17–1.22)Manufacturing 638 (530–749) 1.23 (1.18–1.28)Retail 646 (517–778) 1.18 (1.14–1.23)Transportation or logistics 1,542 (1,350–1,738) 1.28 (1.24–1.33)Not essential 1,167 (910–1,428) 1.11 (1.08–1.14)Unemployed or missing 1,969 (1,718–2,225) 1.23 (1.19–1.27)a Risk ratios are defined as the observed number of deaths divided by theexpected number of deaths. They are interpretable as the risk ratio formortality, comparing pandemic time to non-pandemic time.
Relative increases in mortality varied over time (Fig 1) and by occupational sector (Fig 2). In March through
May, there was a 14% increase in mortality among all working-age Californians (RR=1.14; 95% PI:
1.09–1.20) compared to a 31% increase among workers in the food/agriculture (RR=1.31; 95% PI: 1.17–1.49).
In the months of June and July, the RR were particularly high in the food/agriculture (RR=1.61; 95% PI:
1.44–1.83), transportation/logistics (RR=1.52; 95% PI: 1.38–1.69), manufacturing (RR=1.52; 95% PI:
1.37–1.72), and facilities sectors (RR=1.44; 95% PI: 1.31–1.61).
Figure 1. Risk ratios for death, comparing pandemic time to non-pandemic time, amongCalifornians 18–65 years of age, March through October 2020.
1.0
1.2
1.4
1.6
Mar 7 Apr 4 May 2 Jun 6 Jul 4 Aug 1 Sep 5 Oct 3
Ris
k ra
tio
The dashed vertical lines mark boundaries between phases of California’s major pandemic policies, laggedto acknowledge time from policy decisions to infection to death. The first phase corresponds to a period ofsheltering in place, while the second phase corresponds to a period of reopening.
5
All rights reserved. No reuse allowed without permission. (which was not certified by peer review) is the author/funder, who has granted medRxiv a license to display the preprint in perpetuity.
The copyright holder for this preprintthis version posted January 22, 2021. ; https://doi.org/10.1101/2021.01.21.21250266doi: medRxiv preprint

Figure 2. Risk ratios for death, comparing pandemic time to non-pandemic time, amongCalifornians 18–65 years of age, by occupational sector, March through October 2020.
Manufacturing Transportation or logistics Not essential Unemployed or missing
Facilities Food or agriculture Government or community Health or emergency
Apr 4 Jun 6 Aug 1 Oct 3 Apr 4 Jun 6 Aug 1 Oct 3 Apr 4 Jun 6 Aug 1 Oct 3 Apr 4 Jun 6 Aug 1 Oct 3
1.0
1.5
2.0
1.0
1.5
2.0
Ris
k ra
tio
The dashed vertical lines mark boundaries between phases of California’s major pandemic policies, laggedto acknowledge time from policy decisions to infection to death. The first phase corresponds to a period ofsheltering in place, while the second phase corresponds to a period of reopening.
RR also varied by race/ethnicity (Table 2). Latino Californians experienced a 36% increase in mortality
during the pandemic (RR=1.36; 95% PI: 1.29–1.44), with a 59% increase among Latino food/agriculture
workers (RR=1.59; 95% PI: 1.47–1.75). Black Californians experienced a 28% increase in mortality
(RR=1.28; 95% PI: 1.24–1.33), with a 36% increase for Black retail workers (RR=1.36; 95% PI: 1.21–1.55).
Asian Californians experienced an 18% increase (RR=1.18; 95% PI: 1.14–1.23), with a 40% increase among
Asian healthcare workers (RR=1.40; 95% PI: 1.33–1.49). Mortality among White working-age Californians
increased by 6% (RR=1.06; 95% PI: 1.02–1.12) with a 16% increase among White food/agriculture workers
(RR=1.16; 95% PI: 1.09–1.24).
6
All rights reserved. No reuse allowed without permission. (which was not certified by peer review) is the author/funder, who has granted medRxiv a license to display the preprint in perpetuity.
The copyright holder for this preprintthis version posted January 22, 2021. ; https://doi.org/10.1101/2021.01.21.21250266doi: medRxiv preprint

Table 2. Risk ratios for mortality, comparing pandemic time to non-pandemic time, amongCalifornia residents 18–65 years of age, by occupational sector and race/ethnicity, Marchthrough October 2020.
All races Asian Black Latino White
All sectors 1.22 (1.20–1.24) 1.18 (1.14–1.23) 1.28 (1.24–1.33) 1.36 (1.29–1.44) 1.06 (1.02–1.12)
Food or agriculture 1.39 (1.32–1.48) 1.18 (1.05–1.33) 1.34 (1.19–1.54) 1.59 (1.47–1.75) 1.16 (1.09–1.24)Transportation or logistics 1.28 (1.24–1.33) 1.26 (1.12–1.44) 1.35 (1.26–1.46) 1.40 (1.31–1.52) 1.10 (1.02–1.20)Facilities 1.27 (1.22–1.32) 1.24 (1.08–1.46) 1.25 (1.17–1.34) 1.38 (1.27–1.51) 1.11 (1.04–1.20)Unemployed or missing 1.23 (1.19–1.27) 1.08 (1.04–1.14) 1.31 (1.22–1.40) 1.31 (1.22–1.41) 1.09 (1.01–1.20)Manufacturing 1.23 (1.18–1.28) 1.18 (1.06–1.33) 1.13 (1.01–1.30) 1.44 (1.34–1.57) 1.00 (0.92–1.10)Health or emergency 1.19 (1.17–1.22) 1.40 (1.33–1.49) 1.27 (1.17–1.40) 1.32 (1.18–1.51) 1.02 (0.96–1.10)Retail 1.18 (1.14–1.23) 1.10 (1.00–1.22) 1.36 (1.21–1.55) 1.40 (1.28–1.55) 1.08 (1.04–1.13)Government or community 1.14 (1.11–1.18) 1.22 (1.07–1.41) 1.20 (1.09–1.33) 1.42 (1.32–1.53) 0.96 (0.89–1.04)Not essential 1.11 (1.08–1.14) 1.14 (1.06–1.23) 1.23 (1.15–1.33) 1.29 (1.20–1.41) 1.00 (0.95–1.07)
Per occupation (Table 3), risk ratios for mortality comparing pandemic time to non-pandemic time were
highest among cooks (RR=1.60), packaging and filling machine operators and tenders (RR=1.59),
miscellaneous agricultural workers (RR=1.55), bakers (RR=1.50), and construction laborers (RR=1.49).
Table 3. Risk ratios for mortality, comparing pandemic time to non-pandemic time, amongCalifornia residents 18–65 years of age, by occupation, March through October 2020.
Code Description Deathsa Risk ratio4020 Cooks 828 1.608800 Packaging and filling machine operators and tenders 172 1.596050 Miscellaneous agricultural workers 617 1.557800 Bakers 104 1.506260 Construction laborers 1,587 1.498965 Production workers, all other 452 1.468320 Sewing machine operators 127 1.445610 Shipping, receiving, and traffic clerks 146 1.444250 Grounds maintenance workers 712 1.405240 Customer service representatives 562 1.374000 Chefs and head cooks 532 1.351107 Computer occupations, all other 136 1.359600 Industrial truck and tractor operators 364 1.343500 Licensed practical and licensed vocational nurses 109 1.340410 Property, real estate, and community association managers 157 1.334230 Maids and housekeeping cleaners 378 1.333930 Security guards and gaming surveillance officers 707 1.329130 Driver/sales workers and truck drivers 1,962 1.329830 Military, rank not specified 111 1.329620 Laborers and freight, stock, and material movers, hand 2,550 1.315940 Office and administrative support workers, all other 123 1.307750 Miscellaneous assemblers and fabricators 354 1.292010 Social workers 217 1.284040 Bartenders 148 1.282540 Teacher assistants 183 1.28a Number of deaths in pandemic time. The table is restricted to occupations with 100or more pandemic-time deaths.
7
All rights reserved. No reuse allowed without permission. (which was not certified by peer review) is the author/funder, who has granted medRxiv a license to display the preprint in perpetuity.
The copyright holder for this preprintthis version posted January 22, 2021. ; https://doi.org/10.1101/2021.01.21.21250266doi: medRxiv preprint

Discussion
Our analysis of deaths among Californians between the ages of 18 and 65 shows that the pandemic’s effects
on mortality have been greatest among essential workers, particularly those in the food/agriculture,
transportation/logistics, facilities, and manufacturing sectors. Such workers experienced an increased risk of
mortality of greater than 20% during the pandemic, with an increased risk of greater than 40% during the
first two full months of the state’s reopening. Excess mortality in high-risk occupational sectors was evident
in analyses stratified by race/ethnicity, especially for Latino, Black, and Asian workers.
Our findings are consistent with a small but growing body of literature demonstrating occupational risks for
SARS-CoV-2 infection. For example, a study of the UK Biobank cohort found that essential workers,
particularly healthcare workers, had high risks for COVID-19 [10]. Similarly, numerous studies have
documented SARS-CoV-2 infection among healthcare workers [11]. Our study, however, is unique in
examining excess mortality and multiple occupational sectors. Though our work is in agreement with prior
studies in finding pandemic-related risks among healthcare workers [11], it suggests that the risks are even
higher in other sectors, such as food/agriculture and transportation/logistics.
This study is also among the first to examine deaths by both occupation and race/ethnicity. Occupational
exposures have been postulated as an important contributor for disparities in excess mortality by race
ethnicity, particularly because certain occupations require in-person work [4]. Though we tended to find the
largest relative increases in mortality in each racial/ethnic group in the food/agriculture and
transportation/logistics sectors, there was variation across race/ethnicity. For example, among Asians, the
largest RR was in the health/emergency sector, even though the relative risk increases in that sector were
relatively low among other racial/ethnic groups. Such differences may reflect cross-sector differences in
demographics. There are, for example, a large number of Latinos who work in meat-processing facilities [12],
consistent with data that show that Latinos make up a large proportion of COVID-19 cases in such settings
[13]. Similarly, the large RR among Asians in the health/emergency sector could be due to the relatively
large number of Filipino Americans in nursing professions [14]. During the pandemic in particular, such
disproportionate representation may easily lead to cross-race variability in risk. A recent study found, for
example, that Black workers are more likely to be employed in occupations that frequently require close
proximity to others [15]. Inequalities in risk may be exacerbated by underlying structural inequities, such as
immigration status or poverty [16].
Though non-occupational risk factors may be relevant, it is clear that eliminating COVID-19 will require
addressing occupational risks. In-person essential workers are unique in that they are not protected by
8
All rights reserved. No reuse allowed without permission. (which was not certified by peer review) is the author/funder, who has granted medRxiv a license to display the preprint in perpetuity.
The copyright holder for this preprintthis version posted January 22, 2021. ; https://doi.org/10.1101/2021.01.21.21250266doi: medRxiv preprint

shelter-in-place policies. Indeed, our study shows that excess mortality rose sharply in the food/agriculture
sector during the state’s first shelter-in-place period, from late March through May; these increases were not
seen among those working in non-essential sectors. Complementary policies are necessary to protect those
who cannot work from home. These can and should include: free personal protective equipment, clearly
defined and strongly enforced safety protocols, easily accessible testing, generous sick policies, and
appropriate responses to workplace safety violations. As jurisdictions struggle with difficult decisions
regarding vaccine distribution, our findings offer a clear point of clarity: vaccination programs prioritizing
workers in sectors such as food/agriculture are likely to have disproportionately large benefits for reducing
COVID-19 mortality.
We acknowledge limitations to the study, including misclassification of occupation in death certificates due to
coarse categories or inaccurate reports. The decedent’s primary occupation is typically reported by the next
of kin who may not be able to precisely describe the work. The primary occupation, which is reported on the
death certificate, may not match the most recent occupation, which is more likely to drive occupational risk.
These limitations would in general attenuate apparent differences across occupational sectors but are unlikely
to account for our primary results.
Our study places a powerful lens on the unjust impact of the COVID-19 pandemic on mortality of working
age adults in different occupations. Our analysis is among the first to identify non-healthcare in-person
essential work, such as food and agriculture, as a predictor of pandemic-related mortality. Essential
workers—especially those in the food/agriculture, transportation/logistics, facilities, and manufacturing
sectors—face increased risks for pandemic-related mortality. Shutdown policies by definition do not protect
essential workers and must be complemented with workplace modifications and prioritized vaccine
distribution. If indeed these workers are essential, we must be swift and decisive in enacting measures that
will treat their lives as such.
References
1. Weinberger DM, Chen J, Cohen T, et al. Estimation of excess deaths associated with the COVID-19
pandemic in the United States, March to May 2020. JAMA Intern Med. 2020;180(10):1336-1344. doi:
10.1001/jamainternmed.2020.3391
2. Woolf SH, Chapman DA, Sabo RT, Weinberger DM, Hill L, Taylor DDH. Excess deaths from
COVID-19 and other causes, March-July 2020. JAMA. 2020;324(15):1562-1564.
doi:10.1001/jama.2020.19545
9
All rights reserved. No reuse allowed without permission. (which was not certified by peer review) is the author/funder, who has granted medRxiv a license to display the preprint in perpetuity.
The copyright holder for this preprintthis version posted January 22, 2021. ; https://doi.org/10.1101/2021.01.21.21250266doi: medRxiv preprint

3. Rossen LM, Branum AM, Ahmad FB, Sutton P, Anderson RN. Excess deaths associated with
COVID-19, by age and race and ethnicity — United States, January 26–October 3, 2020. MMWR
Morb Mortal Wkly Rep. 2020;69:1522–1527. doi:10.15585/mmwr.mm6942e2
4. Chen Y-H, Glymour MM, Catalano R, Fernandez A, Nguyen T, Kushel M, Bibbins-Domingo K. Excess
mortality in California during the COVID-19 pandemic, March-August, 2020. JAMA Intern Med.
2020;e207578. doi: 10.1001/jamainternmed.2020.7578
5. Bibbins-Domingo. K. This time bust be different: disparities during the COVID-19 pandemic. Ann
Intern Med. 2020;173(3):233-234. doi: 10.7326/M20-2247
6. Rodriguez-Diaz CE, Guilamo-Ramos V, Mena L, et al. Risk for COVID-19 infection and death among
Latinos in the United States: examining heterogeneity in transmission dynamics. Ann Epidemiol.
2020;S1047-2797(20)30267-2. doi: 10.1016/j.annepidem.2020.07.007
7. Yancy CW. COVID-19 and African Americans. JAMA. 2020;323(19):1891. doi:
10.1001/jama.2020.6548
8. State of California. Essential Workforce. https://covid19.ca.gov/essential-workforce/. Accessed
October 1, 2020.
9. Hyndman RJ, Athanasopoulos G. Forecasting: Principles and Practice. 2nd ed. Melbourne, Australia:
OTexts; 2018.
10. Mutambudzi M, Niedwiedz C, Macdonald EB, et al. Occupation and risk of severe COVID-19:
prospective cohort study of 120 075 UK Biobank participants. Occup Environ Med. Published online
December 9, 2020:oemed-2020-106731. doi: 10.1136/oemed-2020-106731
11. Gholami M, Fawad I, Shadan S, et al. COVID-19 and healthcare workers: a systematic review and
metaanalysis. Int J Infect Dis. Published online January 2021. doi: 10.1016/j.ijid.2021.01.013
12. Kandel W, Parrado EA. Restructuring of the US meat processing industry and new Hispanic migrant
destinations. Popul Dev Rev. 2005;31(3):447-471. doi: 10.1111/j.1728-4457.2005.00079.x
13. Waltenburg MA, Victoroff T, Rose CE, et al. Update: COVID-19 among workers in meat and poultry
processing facilities — United States, April–May 2020. MMWR Morb Mortal Wkly
Rep. 2020;69:887-892. doi: 10.15585/mmwr.mm6927e2
14. Wong T. Little noticed, Filipino Americans are dying of COVID-19 at an alarming rate. The Los
Angeles Times. July 21, 2020.
15. Hawkins D. Differential occupational risk for COVID-19 and other infection exposure according to race
and ethnicity. Am J Ind Med. 2020;63(9):817-820. doi: 10.1002/ajim.23145
16. Riley AR, Chen Y-H, Matthay EC, et al. Excess deaths among Latino people in California during the
COVID-19 pandemic. medRxiv. 2020;12.18.20248434. doi: 10.1101/2020.12.18.20248434
10
All rights reserved. No reuse allowed without permission. (which was not certified by peer review) is the author/funder, who has granted medRxiv a license to display the preprint in perpetuity.
The copyright holder for this preprintthis version posted January 22, 2021. ; https://doi.org/10.1101/2021.01.21.21250266doi: medRxiv preprint

Livestock plants and COVID-19 transmissionCharles A. Taylora , Christopher Boulosb , and Douglas Almonda,c,1
aSchool of International and Public Affairs, Columbia University, New York, NY 10027; bBooth School of Business, The University of Chicago, Chicago, IL60637; and cDepartment of Economics, Columbia University, New York, NY 10027
Edited by Geoffrey M. Heal, Columbia University, New York, NY, and approved October 16, 2020 (received for review May 19, 2020)
Policy responses to the COVID-19 outbreak must strike a bal-ance between maintaining essential supply chains and limitingthe spread of the virus. Our results indicate a strong positiverelationship between livestock-processing plants and local com-munity transmission of COVID-19, suggesting that these plantsmay act as transmission vectors into the surrounding popula-tion and accelerate the spread of the virus beyond what wouldbe predicted solely by population risk characteristics. We esti-mate the total excess COVID-19 cases and deaths associatedwith proximity to livestock plants to be 236,000 to 310,000 (6to 8% of all US cases) and 4,300 to 5,200 (3 to 4% of all USdeaths), respectively, as of July 21, 2020, with the vast major-ity likely related to community spread outside these plants. Theassociation is found primarily among large processing facilitiesand large meatpacking companies. In addition, we find evidencethat plant closures attenuated county-wide cases and that plantsthat received permission from the US Department of Agricultureto increase their production-line speeds saw more county-widecases. Ensuring both public health and robust essential supplychains may require an increase in meatpacking oversight andpotentially a shift toward more decentralized, smaller-scale meatproduction.
COVID-19 | supply chains | livestock | agriculture | public health
Among the many challenges posed by the COVID-19 out-break, maintaining essential supply chains while mitigating
community spread of the virus is vital to society. Using county-level data as of July 21, 2020, we test the relationship betweenone such type of essential activity, livestock processing, and thelocal incidence of COVID-19 cases. We find that the presence ofa slaughtering plant in a county is associated with four to six addi-tional COVID-19 cases per thousand, or a 51 to 75% increasefrom the baseline rate. We also find an increase in the death rateby 0.07 to 0.1 deaths per thousand people, or 37 to 50% overthe baseline rate. Our estimates imply that excess COVID-19infections and deaths related to livestock plants are 236,000 to310,000 (6 to 8% of all US cases) and 4,300 to 5,200 (3 to 4%of all US deaths), respectively, with the vast majority occurringamong people not working at livestock plants.
We further find the temporary closure of high-risk plants to befollowed by lower rates of COVID-19 case growth. We also findthat smaller, decentralized facilities do not appear to contributeto transmission and that plants that received permission fromthe US Department of Agriculture (USDA) to increase theirproduction-line speeds saw more county-wide cases. Our associ-ations hold after controlling for population risk factors and otherpotential confounders, such as testing rates. Although lacking anatural experiment to cement causality, we employ a combina-tion of empirical tools—including an event study, instrumentalvariables (IVs), and matching—to support our findings.
The centrality of livestock processing to local economies andnational food supplies implies that mitigating disease spreadthrough this channel may take an economic toll. Understandingthe public health risk posed by livestock processing is essen-tial for assessing potential impacts of policy action. However,generating case data attributable to livestock plants is chal-lenging: Contact tracing in the United States is decentralizedand sporadic, and there may be incentives for companies and
government bodies to obscure case reporting (1–5). Our studyrepresents an attempt to address this gap in knowledge.
Heterogeneity in COVID-19 PatternsThe disease burden of COVID-19 is not uniformly distributedacross the global population. Certain conditions appear to influ-ence the degree to which people spread the virus. Some contextsand social behaviors are believed to lead to superspreadingevents that disproportionately affect local populations (6, 7).Previous studies have explored links between the incidence ofCOVID-19 cases and a range of demographic and environmentalfactors, such as age, occupation, income, race, intergenerationalmixing, temperature, and humidity (8–13). Social, commercial,and industrial activities are also believed to affect transmis-sion, for which reason countries worldwide have implementeda range of economic and social-distancing measures (8, 14–20). In the United States, some industries are exempted fromshelter-in-place orders and have remained operational due totheir necessity to satisfy basic societal needs (21). We investi-gate the relationship between transmission and one such activity,livestock processing.
COVID-19 and Livestock PlantsThe livestock- and poultry-processing industry is an essentialcomponent of the global food supply chain. In the United States,it is a large industry, employing 500,000 people. It is also highlyconcentrated: The largest four companies in beef, pork, andpoultry processing capture 55 to 85% of their respective mar-kets (22–27). This degree of concentration stands in contrast tothe European Union (EU), for example, where the top 15 meatcompanies represent 28% of EU meat production (28).
Significance
The COVID-19 pandemic is a public health and economic cri-sis in which policymakers face tradeoffs between maintainingessential economic activities and mitigating disease spread.Our study suggests that, among essential industries, livestockprocessing poses a particular public health risk extending farbeyond meatpacking companies and their employees. We esti-mate livestock plants to be associated with 236,000 to 310,000COVID-19 cases (6 to 8% of total) and 4,300 to 5,200 deaths(3 to 4% of total) as of July 21. We also illustrate potentialcontributions of plant size, industrial concentration, plant shut-downs, and policy actions to this phenomenon. These resultsmotivate investigation into supply chains, operating proce-dures, and labor relations within the meatpacking industry.
Author contributions: C.A.T., C.B., and D.A. designed research, performed research,analyzed data, and wrote the paper.y
Competing interest statement: C.A.T., D.A., and editor Geoffrey M. Heal are affiliatedwith Columbia University.y
This article is a PNAS Direct Submission.y
Published under the PNAS license.y
See online for related content such as Commentaries.y1 To whom correspondence may be addressed. Email: [email protected]
This article contains supporting information online at https://www.pnas.org/lookup/suppl/doi:10.1073/pnas.2010115117/-/DCSupplemental.y
First published November 19, 2020.
31706–31715 | PNAS | December 15, 2020 | vol. 117 | no. 50 www.pnas.org/cgi/doi/10.1073/pnas.2010115117
Dow
nloa
ded
by g
uest
on
Apr
il 20
, 202
1

ECO
NO
MIC
SCIE
NCE
S
Over the decades, the livestock- and poultry-processing indus-try in the United States has consolidated its operations intofewer, larger plants, in which meat production per plant hasincreased threefold since 1976 (29, 30). Today, 12 plants pro-duce over 50% of the country’s beef, and 12 others, similarly,produce over 50% of the country’s pork (30, 31). Early inthe COVID-19 pandemic, livestock-processing plants worldwideexperienced spikes in infections, facing shutdowns that disruptedmeat and dairy supplies (32–35). In the United States, reportsof COVID-19 spreading within the livestock-processing indus-try led to increased attention and updated safety guidance by theCenters for Disease Control and Prevention (CDC) (22). Severalplants were forced to shut down until, among other factors, a fed-eral executive order invoked the status of livestock processing as“critical infrastructure” for national security and mandated thatthese plants remain open (36, 37).
Work routines in livestock processing have several character-istics that make plants susceptible to local outbreaks of respira-tory viruses. The CDC includes the following among potentialrisk factors: long work shifts in close proximity to coworkers,difficulty in maintaining proper face covering due to physicaldemands, and shared transportation among workers (22). Pre-vious research has proposed occupational exposure to livestockanimals as a driver of viral spread, although an experimentalstudy did not find pigs or chickens to be susceptible to the SARS-CoV-2 virus associated with COVID-19 (38–41). Increases inproduction-line speeds due to technological enhancements aswell as policy changes have also been hypothesized to exacer-bate COVID-19 transmission (5, 42). Among those we investi-gate are USDA waivers on poultry-production line-speed limitsfor plants with strong commercial production practices andmicrobial control (43).∗
The indoor climate of livestock facilities may increase trans-mission risk. To preserve meat after slaughter, processing areasare maintained at 0 to 12 ◦C (44), and such low temperatureshave been linked to increased COVID-19 risk (45, 46). Thoughthese rooms are kept at 90 to 95% relative humidity to preventmeat from drying and losing weight, the low absolute humidityat near-freezing temperatures may encourage the transmissionof airborne viruses such as influenza (47–49). Moreover, stud-ies have suggested that industrial climate control systems usedto cool and ventilate meat processing facilities may furtherthe spread of pathogenic bioaerosols, a proposed COVID-19transmission route (46, 50–53).
Workers’ socioeconomic status and labor practices may alsocontribute to infection and transmission. Among front-line meat-processing workers in the United States, 45% are categorizedas low income, 80% are people of color, and 52% are immi-grants, many of whom are undocumented and lack ready accessto healthcare and other worker protections that could facili-tate COVID-19 prevention and treatment (54–56). In addition,employees at these facilities may face incentives to continueworking even while sick through company policies on med-ical leave and attendance bonuses (5, 22, 57). In addition,through consolidation over the decades, the meatpacking indus-try has potentially increased its monopsonistic power over labormarkets, which has been linked to greater work hazards (58–60).
ResultsWe find a strong relationship between proximity of livestockplants and the incidence of COVID-19 over time. Fig. 1 plotsaverage COVID-19 case and death rates over time by whether
*The CEOs of Wayne Farms and Tyson Foods—both granted waivers in April 2020—are,respectively, chairman of the National Chicken Council (the body that initially lobbiedfor the line speed waivers) and a public advocate for the poultry industry, buying full-page newspaper ads in April stating that the food supply chain was “broken.”
there is a large livestock facility in a given county relative to ratesin counties at varying distances from a plant. In both cases, wesee an increasing divergence in outcomes beginning in early Aprilbased on livestock-plant proximity.
Fig. 1 does not account for county-level differences in termsof density and demographics. In Table 1, we estimate the rela-tionship between livestock plants and COVID-19 incidence asof July 21, 2020, using regression models that control for poten-tial confounding variables, including county-level measures ofincome; population density and its square; the timing of the firstcase; the proportions of elderly people, uninsured people, front-line workers, and people using public transportation; racial andethnic characteristics; average household size; local freight traf-fic; and populations of nursing homes and prisons. We find thatlivestock plants are associated with an increase in COVID-19cases by approximately four per thousand people, representinga 51% increase over the July 21 baseline rate of eight per thou-sand. Likewise, death rates increase by 0.07 per thousand, or 37%over the county baseline of 0.2 deaths per thousand. The resultsare robust both nationally and when only considering variationwithin states after including state fixed effects. We also use analternate specification with a binary measure of whether a countyhas one or more livestock plants. Such counties are associatedwith six additional cases per thousand, or a 75% increase overthe baseline, as well as 0.1 additional deaths per thousand, or50% over the baseline county death rate.† In addition, COVID-19 appears to arrive earlier in counties with livestock plants (SIAppendix, Table S2).
Heterogeneity by Facility Type, Size, Operations, and Company.We now present potential characteristics of livestock facilitiesthat might contribute to these observed relationships with theCOVID-19 case and death rate.Facility type. We first looked at the relationship betweenreported cases and the type of animal slaughtered or processed.We found that beef, pork, and poultry plants each show a sig-nificant relationship with COVID-19 cases and deaths, withpork plants showing the greatest measured magnitude of thethree in cases and beef plants showing the greatest magni-tude in deaths (SI Appendix, Table S3). As seen in the mapin Fig. 2, pork and beef plants are well distributed throughoutthe United States, and, although, poultry plants are relativelyconcentrated in the southeastern United States, they are foundacross 10 states. Overall, the wide geographic distribution offacilities by type mitigates concerns of this being a regionalphenomenon.Facility size. We next investigated whether there are differen-tial relationships with COVID-19 transmission based on the sizeof processing facilities. Livestock facility data were gatheredfrom the USDA’s Food Safety and Inspection Service (FSIS). SIAppendix, Table S4 categorizes beef, pork, and poultry plants byorder of magnitude based on the pounds per month processed:large (category 5; over 10 million), medium (category 4; over 1million), and small (category 3; over 100,000 and under 1 mil-lion). Each size category was sufficiently represented, with 349small plants, 126 medium plants, and 225 large plants. Very smallplants (categories 1 and 2), which are often niche providers, wereexcluded.‡
† In line with the literature, we find COVID-19 incidence to be strongly associatedwith population density, average household size, the timing of the first confirmedcase, and the proportion of a county’s population who are public-transit commuters,elderly, Black, Hispanic, in a nursing home, uninsured, or institutionalized (SI Appendix,Table S1).
‡ In our main analyses, we included category 4 and 5 pork and beef facilities and cate-gory 5 poultry facilities (which comprise 57% of total poultry plants); see Materials andMethods for a full discussion.
Taylor et al. PNAS | December 15, 2020 | vol. 117 | no. 50 | 31707
Dow
nloa
ded
by g
uest
on
Apr
il 20
, 202
1

Fig. 1. Mean county-level COVID-19 cases per thousand (A) and deaths per thousand (B) over time based on proximity to a livestock facility. The band“0–50 km” excludes the county itself. Counties are categorized into nonoverlapping, single categories based on the nearest facility (e.g., if a county containsa livestock facility and is within 50 km of another facility outside the county, the county is coded “In county” and not “0–50 km”). A visualization map isincluded in SI Appendix, Fig. S1.
We found the relationship between livestock plants andCOVID-19 transmission to be most pronounced among thelargest plants, whose presence in a county is associated witha 35% higher COVID-19 case rate relative to the averagecoefficient for livestock plants shown in Table 1. Small andmedium-sized plants were generally not found to have signifi-cant relationships with local COVID-19 transmission, suggestingthat the scale of production is an important variable for industryleaders and policymakers to consider.Production line speeds. We next examined whether there is arelationship between local COVID-19 transmission and plant-operating procedures. We collected data on whether a poultryplant had been granted a waiver from the USDA permittingproduction-line processing speeds of 175 birds per minute, upfrom the statutory limit of 140. Waivers were first issued to20 poultry plants in 2012 as part of a pilot study to test self-monitoring of safety. It was then expanded in September 2018 toallow all poultry plants the opportunity to apply for these waivers.A faster production line can result in both workers locating ingreater proximity to one another and increased difficulty in main-taining personal protective equipment and thus could contributeto conditions that increase the likelihood of viral transmission.
Of the 120 poultry plants in our sample, 48 plants currentlyhave waivers, 16 of which were issued in 2020.§ An analy-sis of the relationship between line speed waivers and localCOVID-19 incidence suggests, though with less precise esti-mates, that waivers predict increases in county-level case ratesdouble those in counties with nonwaiver poultry plants (SIAppendix, Table S5). Among plants issued a waiver in 2020,the relationship is even greater in magnitude. This finding sug-gests a potential pathway between a livestock plant’s operatingprocedures and COVID-19 transmission.Facility operator. We next looked at differential relationshipswith COVID-19 by company. The relationship between localCOVID-19 incidence and medium and large plants (FSIS cat-egories 4 or 5) owned or operated by some of the largest USprocessors (National Beef, JBS, Tyson, Cargill, and Smithfield)and their subsidiaries is presented in SI Appendix, Table S6.These magnitudes can be visualized in Fig. 3: The strongest
§Among counties with poultry plants, those with and without waivers appear similarin their average characteristics, reducing waiver-selection concerns. The exception isthat waiver counties have lower proportions of Black residents and prison populations,factors associated with increased COVID-19 risk.
relationship is found with National Beef, whose indicated rela-tionship with COVID-19 case rates is approximately five timesgreater in magnitude than that of other livestock facilities. How-ever, all of the large companies appear to have larger coefficientsthan the baseline. Aside from Smithfield, the relationship withdeaths is positive, albeit less significant, which may be due tosmall sample size.¶
Behavioral change. If livestock facilities are driving higherCOVID-19 incidence, and if livestock processing is an essen-tial industry, we would expect people in livestock-plant coun-ties to work more compared to those in nonlivestock countiesin response to COVID-related lockdowns. To this end, weemployed county-level mobility data made available by Googlefor COVID-19 researchers. We constructed a baseline measureof average time-use change before and after March 13, 2020, thedate the United States declared a national disaster in relationto COVID-19 and shortly after the World Health Organizationdeclared COVID-19 a pandemic.
We then examined how the presence of livestock plants variedwith time spent working and engaging in shopping and recre-ation. We controlled for the same demographic and location-based covariates as in other models. We found that the presenceof livestock plants is strongly associated with more time spentat work (SI Appendix, Table S7). This association is relative tothe baseline behavior change across all other counties, indicat-ing that people in livestock-plant counties are working more (orcutting back on work less) than people in other counties. Mean-while, there is a lesser and imprecise relationship with retail andrecreation activities, which may contribute to viral spread. Thissupports the notion that livestock plants, rather than unrelatedchanges in behavior in these same counties, are the more likelyvehicle of COVID-19 transmission.‖
Plant shutdowns. Many livestock plants were temporarily shutdown to halt the spread of COVID-19. In such cases, we wouldexpect the dynamics of caseloads and deaths over time to varynegatively with the timing of shutdown, after a lag. Were con-founders instead driving our results, they would have to follow
¶In our collected sample, the number of facilities per company varies: National Beefhas only seven plants in seven counties, whereas Tyson Foods has 80 plants across 69counties. The other companies fall somewhere in between.‖It is possible that additional time spent working, and thus out of the house, may explain
some of the additional time spent on retail activities (e.g., gas stations or workdaymeals).
31708 | www.pnas.org/cgi/doi/10.1073/pnas.2010115117 Taylor et al.
Dow
nloa
ded
by g
uest
on
Apr
il 20
, 202
1
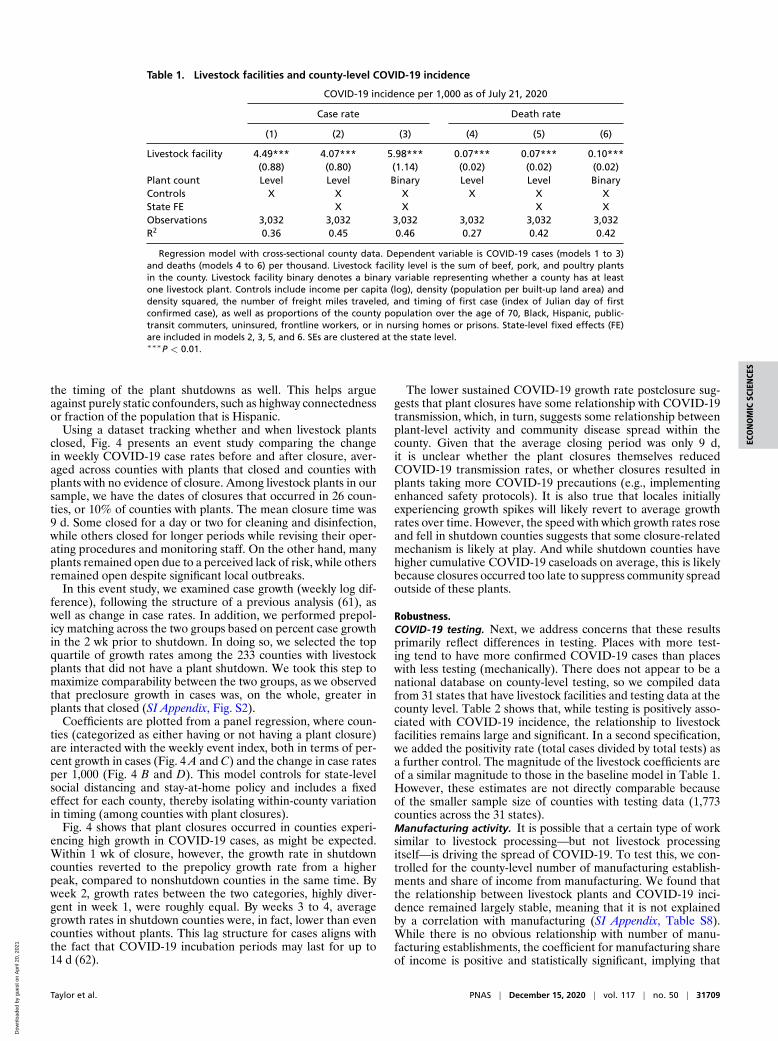
ECO
NO
MIC
SCIE
NCE
S
Table 1. Livestock facilities and county-level COVID-19 incidence
COVID-19 incidence per 1,000 as of July 21, 2020
Case rate Death rate
(1) (2) (3) (4) (5) (6)
Livestock facility 4.49*** 4.07*** 5.98*** 0.07*** 0.07*** 0.10***(0.88) (0.80) (1.14) (0.02) (0.02) (0.02)
Plant count Level Level Binary Level Level BinaryControls X X X X X XState FE X X X XObservations 3,032 3,032 3,032 3,032 3,032 3,032R2 0.36 0.45 0.46 0.27 0.42 0.42
Regression model with cross-sectional county data. Dependent variable is COVID-19 cases (models 1 to 3)and deaths (models 4 to 6) per thousand. Livestock facility level is the sum of beef, pork, and poultry plantsin the county. Livestock facility binary denotes a binary variable representing whether a county has at leastone livestock plant. Controls include income per capita (log), density (population per built-up land area) anddensity squared, the number of freight miles traveled, and timing of first case (index of Julian day of firstconfirmed case), as well as proportions of the county population over the age of 70, Black, Hispanic, public-transit commuters, uninsured, frontline workers, or in nursing homes or prisons. State-level fixed effects (FE)are included in models 2, 3, 5, and 6. SEs are clustered at the state level.∗∗∗P < 0.01.
the timing of the plant shutdowns as well. This helps argueagainst purely static confounders, such as highway connectednessor fraction of the population that is Hispanic.
Using a dataset tracking whether and when livestock plantsclosed, Fig. 4 presents an event study comparing the changein weekly COVID-19 case rates before and after closure, aver-aged across counties with plants that closed and counties withplants with no evidence of closure. Among livestock plants in oursample, we have the dates of closures that occurred in 26 coun-ties, or 10% of counties with plants. The mean closure time was9 d. Some closed for a day or two for cleaning and disinfection,while others closed for longer periods while revising their oper-ating procedures and monitoring staff. On the other hand, manyplants remained open due to a perceived lack of risk, while othersremained open despite significant local outbreaks.
In this event study, we examined case growth (weekly log dif-ference), following the structure of a previous analysis (61), aswell as change in case rates. In addition, we performed prepol-icy matching across the two groups based on percent case growthin the 2 wk prior to shutdown. In doing so, we selected the topquartile of growth rates among the 233 counties with livestockplants that did not have a plant shutdown. We took this step tomaximize comparability between the two groups, as we observedthat preclosure growth in cases was, on the whole, greater inplants that closed (SI Appendix, Fig. S2).
Coefficients are plotted from a panel regression, where coun-ties (categorized as either having or not having a plant closure)are interacted with the weekly event index, both in terms of per-cent growth in cases (Fig. 4 A and C) and the change in case ratesper 1,000 (Fig. 4 B and D). This model controls for state-levelsocial distancing and stay-at-home policy and includes a fixedeffect for each county, thereby isolating within-county variationin timing (among counties with plant closures).
Fig. 4 shows that plant closures occurred in counties experi-encing high growth in COVID-19 cases, as might be expected.Within 1 wk of closure, however, the growth rate in shutdowncounties reverted to the prepolicy growth rate from a higherpeak, compared to nonshutdown counties in the same time. Byweek 2, growth rates between the two categories, highly diver-gent in week 1, were roughly equal. By weeks 3 to 4, averagegrowth rates in shutdown counties were, in fact, lower than evencounties without plants. This lag structure for cases aligns withthe fact that COVID-19 incubation periods may last for up to14 d (62).
The lower sustained COVID-19 growth rate postclosure sug-gests that plant closures have some relationship with COVID-19transmission, which, in turn, suggests some relationship betweenplant-level activity and community disease spread within thecounty. Given that the average closing period was only 9 d,it is unclear whether the plant closures themselves reducedCOVID-19 transmission rates, or whether closures resulted inplants taking more COVID-19 precautions (e.g., implementingenhanced safety protocols). It is also true that locales initiallyexperiencing growth spikes will likely revert to average growthrates over time. However, the speed with which growth rates roseand fell in shutdown counties suggests that some closure-relatedmechanism is likely at play. And while shutdown counties havehigher cumulative COVID-19 caseloads on average, this is likelybecause closures occurred too late to suppress community spreadoutside of these plants.
Robustness.COVID-19 testing. Next, we address concerns that these resultsprimarily reflect differences in testing. Places with more test-ing tend to have more confirmed COVID-19 cases than placeswith less testing (mechanically). There does not appear to be anational database on county-level testing, so we compiled datafrom 31 states that have livestock facilities and testing data at thecounty level. Table 2 shows that, while testing is positively asso-ciated with COVID-19 incidence, the relationship to livestockfacilities remains large and significant. In a second specification,we added the positivity rate (total cases divided by total tests) asa further control. The magnitude of the livestock coefficients areof a similar magnitude to those in the baseline model in Table 1.However, these estimates are not directly comparable becauseof the smaller sample size of counties with testing data (1,773counties across the 31 states).Manufacturing activity. It is possible that a certain type of worksimilar to livestock processing—but not livestock processingitself—is driving the spread of COVID-19. To test this, we con-trolled for the county-level number of manufacturing establish-ments and share of income from manufacturing. We found thatthe relationship between livestock plants and COVID-19 inci-dence remained largely stable, meaning that it is not explainedby a correlation with manufacturing (SI Appendix, Table S8).While there is no obvious relationship with number of manu-facturing establishments, the coefficient for manufacturing shareof income is positive and statistically significant, implying that
Taylor et al. PNAS | December 15, 2020 | vol. 117 | no. 50 | 31709
Dow
nloa
ded
by g
uest
on
Apr
il 20
, 202
1

Fig. 2. Shaded counties contain at least one beef or pork facility categorized by USDA FSIS as processing more than 1 million pounds per month (categories4 and 5) or at least one poultry facility categorized as processing more than 10 million pounds per month (category 5).
manufacturing may be associated with higher COVID-19 inci-dence. Such a relationship is plausible given that, like livestockprocessing, employees in the manufacturing sector may workin close proximity and that many manufacturing activities areconsidered essential to supply chains.Dropping counties distant from livestock plants. Another poten-tial concern is that counties very far from livestock plants havelower population densities and different demographic makeupsthan counties nearer these plants. Correspondingly, there is arisk that incorporating these counties into our analysis may intro-duce bias into our livestock-plant estimates. An analysis omittingcounties more than 100 km from a county with a livestock plantshowed a relationship with livestock facilities greater in mag-nitude than the base specification, indicating that our findingsare robust to this risk and, perhaps, somewhat conservative (SIAppendix, Table S9).Dependent-variable transformations. To address concerns abouta skewed outcome variable, we employed the natural logand inverse hyperbolic sine of the dependent variable andfound a consistently positive, but smaller-magnitude, relation-ship between livestock plants and increased COVID-19 case anddeath rates (SI Appendix, Table S10).
Alternative Statistical Approaches to Confounding. Above, we haveshown the robustness of multivariate regression results to variousconfounders—demographic, geographic, and behavioral—andsample-selection criteria. Additionally, we have shown that thedynamics over time of COVID-19 cases and deaths vary with thetiming of livestock-plant shutdowns.
Here, we present results of additional statistical methods usedto explore the relationship between livestock plants and COVID-19 cases and deaths in the cross-section. The methods we usedto help address potential bias and endogeneity concerns areIV analysis, propensity-score matching, and nearest-neighbormatching. We note that the 259 counties in our sample with live-stock plants differ in important ways from those without plants.We constructed a balance table comparing counties with andwithout livestock plants (SI Appendix, Table S11). Counties with
plants have higher population density, a lower proportion ofelderly people, higher proportions of Black and Hispanic people,and larger household sizes. Income levels, by contrast, are simi-lar. Each particular statistical method adjusts for these baselinedifferences in different ways. To preview, we find the observedrelationship with COVID-19 incidence to be robust to all threeapproaches.Instrumental variables. First, we employed an IV approach usinghistorical livestock agricultural production data. The selectionof this instrument was motivated by meat processors’ need tominimize costs of transporting livestock supply when selectingthe location of plants. In the first stage, we regressed the cur-rent number of livestock plants in each county on the county’slivestock-production value in 1959 in terms of animals sold, asderived from the USDA census. Note that this only includesagricultural operations, and not livestock processing. We believethat this is a strong instrument, given that most of the interstatehighway system was constructed during the 1960s, most currentlyoperating livestock processing plants were built in the 1970sor later, and livestock agricultural operations in 1959 appearunlikely to affect current public health outcomes.
In the second stage, we regressed COVID-19 incidence on thispredicted value of livestock plants as well as the other covariatesin the primary specification. The first stage in the IV analysis,presented in SI Appendix, Table S12, shows that the instru-ment is highly relevant with the F -statistic far above Stock andYogo’s (63) 10% maximal bias threshold. The overall IV resultsin Table 3 show the relationship between livestock facilities andCOVID-19 case and death rates to be even stronger for eachoutcome, except the within-state death rate, which is of compa-rable magnitude but less precisely estimated. We note that theIV approach restricts identifying variation to that attributableto livestock agriculture proximity, thereby reducing statisticalpower.Propensity-score and nearest-neighbor matching. For bothpropensity-score matching and nearest-neighbor matching, weconstructed comparable subsamples of our dataset with andwithout livestock facilities to estimate an effect of having these
31710 | www.pnas.org/cgi/doi/10.1073/pnas.2010115117 Taylor et al.
Dow
nloa
ded
by g
uest
on
Apr
il 20
, 202
1

ECO
NO
MIC
SCIE
NCE
S
Fig. 3. Relationship between COVID-19 cases and livestock plants ownedor operated by large meatpacking companies. Coefficients are firm fixed-effect coefficients plotted from SI Appendix, Table S6. Error bars represent95% CIs.
livestock facilities among otherwise similar counties on COVID-19 cases and deaths.
For propensity-score matching, we first predicted the probabil-ity that a county has at least one livestock facility (binary value)using a binomial regression that includes all of the covariatesfrom our primary model specification in Table 1, as well as theirquadratic terms to increase model flexibility. We then confirmedthat observations were relatively balanced across covariateswithin each propensity-score quartile (SI Appendix, Table S13.This suggests that the propensity score is, indeed, balancing themultidimensional covariates. In a second step, we used this pre-dicted probability (i.e., the propensity score) as a control in aregression of COVID-19 incidence on livestock plants. The ideais that the propensity score helps account for bias in the locationof livestock plants.
For nearest-neighbor matching, we used the MatchIt pack-age in R to restrict the sample to similar treated and controlgroups. The matching occurred by using a nearest-neighbor algo-rithm based on predicting the livestock binary variable with thecovariates in our primary specification. To ensure an adequatesample size, we allowed the algorithm to match two nonplantcounties to every one county with a livestock plant. We found theresulting 774 county subsample to be well balanced (SI Appendix,Table S14).∗∗ SI Appendix, Table S15 consolidates the resultsand includes outputs from Table 1 for reference. In this analy-sis, coefficients for both case and death rates remain of a similarmagnitude and level of significance.Community spread beyond livestock plants. COVID-19 trans-mission likely extends beyond the county containing the livestockplant. SI Appendix, Fig. S3 expands our main analysis to includeneighboring counties grouped by distance band, as charted inFig. 1 and visualized in the map in SI Appendix, Fig. S1. Wefound evidence of a relationship between livestock plants andincreased COVID-19 case rates up to 150 km away from a plant,
**A balance table for the entire sample is shown in SI Appendix, Table S11.
further supporting the notion of community spread beyond theimmediate work context.††
To validate and contextualize our findings, we first estimatedthe total excess cases and deaths related to livestock plantsimplied by our results. For one set of estimates, we multipliedthe plant-level coefficient for excess cases and deaths relatedto livestock plants by the total number of plants and the aver-age population per plant to arrive at a national total. A secondapproach used a binary measure for whether a county has oneor more livestock plants and multiplied this coefficient by thecounty-level mean population and number of counties with live-stock plants. The estimates resulting from this exercise were,respectively, 236,000 to 310,000 cases and 4,300 to 5,200 deaths.A summary of this calculation is shown in SI Appendix, Table S19.
Next, we estimated the share of cases among livestock employ-ees relative to total excess cases in an attempt to determine theshare of excess cases that may be occurring outside the livestockplants. We used the CDC’s state-level aggregate count of live-stock workers testing positive for COVID-19 as of May 31 across26 states (64). Comparing this to state-level case data as of May31, we found that livestock workers represented 2.7% of casesin these states. Using this ratio to estimate the total numberof infected livestock workers among all of the cases observedin these states on July 21, we arrived at an estimate of 35,635infected workers, ∼7% of the industry’s entire employee base.Using our calculation of 236,000 to 310,000 cases nationwide dueto livestock plants, we estimated that livestock workers repre-sent 12 to 15% of these excess total cases. In other words, forevery worker infected at a livestock plant, between seven andeight local nonworkers were ultimately infected by the end of thesample period, underscoring the high potential for communityspread.
DiscussionAngrist and Krueger (65) noted that “one should always bewary of drawing causal inferences from observational data.” Weknow of no random-assignment design that could address ourresearch question and thereby yield the most reliable path tocausal inference. The best we can do here is provide an unusu-ally broad array of observational evidence. This includes (butis not limited to) ruling out the most obvious confounders,a cross-sectional IV, and the event-study analysis leveragingshutdown timing. A still more compelling natural experimentwould leverage explicit and exogenous variation that driveslivestock-plant shutdowns, i.e., an IV for the shutdowns or theirtiming. Unfortunately, we know of no such identifying variation.
Readers may disagree on whether our array of analyses hasisolated a causal effect. Given this, and in order to be conserva-tive, we avoided causal language throughout our text so as notto overstate the “hardness” of our method (66). This avoidanceand caution stands in contrast to other recent, impactful work onCOVID-19.
Still, we believe that our array of analyses constitutes the bestfeasible approach to shed light on the role of livestock-processingplants in the US COVID-19 pandemic. For a question of thisimportance, we believe there is no “harder” method available(66). As policymakers and industry leaders seek to preserve vitalfood-supply chains while mitigating the pandemic’s spread, evi-dence on the potential scope of the issue is particularly valuable,as well as assessment of the relationship between temporaryplant shutdowns and subsequent COVID-19 growth dynamics.
††We present summary statistics by distance band in SI Appendix, Tables S16–S18. Theaverage number of counties in each band increases with distance. There is a clearpositive relationship between COVID-19 cases and deaths in relation to livestock facil-ities, and the county-level mean case rate varies directly with a county’s proximity to aneighboring county with a livestock facility.
Taylor et al. PNAS | December 15, 2020 | vol. 117 | no. 50 | 31711
Dow
nloa
ded
by g
uest
on
Apr
il 20
, 202
1

Fig. 4. Graphs match COVID-19 pretrends of control group (green lines) to counties with plant shutdowns (red lines) based on percent growth in cases(weekly log difference) in the 2 wk prior to shutdown. Selected counties are in the top quartile of growth rates among the 233 counties with livestockplants that did not have a plant shutdown. For nonshutdown counties, week 0 is assigned to the mean shutdown date, April 22, 2020. A and B plotcoefficients from a panel regression, where counties are interacted with the weekly event index in terms of percent growth in cases (A) and changein case rates per 1,000 (B). Estimates are relative to the baseline trend across all counties. One week prior (week −1) is omitted as the reference level.Models control for stay-at-home orders at the state level and include a fixed effect for each county. Error bars reflect a 95% CI. C and D are dailyline charts of the mean values of each group in terms of percent case growth and change in case rate, respectively. Gray shaded bars reflect the esti-mated period when the effect of closing a plant would have been reflected in cases (1 to 3 wk after), given that incubation periods may last up to14 d) (62).
Although our estimate that 6 to 8% of COVID-19 cases areassociated with livestock plants may appear high, it is importantto recall that high levels of geographic heterogeneity in COVID-19 incidence can be explained by some combination of individualbehavior, government policy, social-distancing compliance, andeconomic activity: The United States, for example, has 4% of theworld’s population, but approximately a quarter of all cases anddeaths as of July 2020. When narrowing the geographic focus,we can imagine the distribution of COVID-19 incidence to besimilarly clustered, if not even lumpier.
Kansas provides a telling example of the outsized role of live-stock facilities: As of July 20, a total of 3,200 of 23,300 state cases(14%) were directly linked to meatpacking (67). For context,there are 17,200 employees in the animal-slaughtering industryin Kansas (68), or 0.6% of the state’s population, suggesting thatlivestock plants had a relationship of a magnitude closer in scaleto our own estimates (Kansas’ estimate is 23× their labor foot-print). Although the figure we are estimating in our study (6 to8% of all US cases out of a national livestock workforce of 0.15%,
or a multiplier of 40 to 53×) is larger, we believe that this findingis plausible, considering follow-on community spread; Kansas’official tally, though evidently aided by some degree of contracttracing, was reportedly hampered by lags in hiring staff and leg-islative actions that have inhibited tracing efforts (69). That is,the figure we have calculated could, in fact, be more completethan the Kansas figure in capturing the spread resulting fromlivestock plants.
Our analysis of individual meatpacking companies maypresent an opportunity to explore how differences in corpo-rate structure and operating practices may account for theirdifferential public health outcomes. In particular, the evi-dence that shutting down plants temporarily may be relatedto decreases in COVID-19 case growth presents a potentiallypowerful transmission mitigant. In addition, the positive rela-tionship between COVID-19 transmission and production-linespeed waivers issued to poultry plants, particularly those dur-ing the 2020 pandemic, is notable, given that these waivers areintended for plants with safe commercial production practices
31712 | www.pnas.org/cgi/doi/10.1073/pnas.2010115117 Taylor et al.
Dow
nloa
ded
by g
uest
on
Apr
il 20
, 202
1

ECO
NO
MIC
SCIE
NCE
S
Table 2. COVID-19 testing, livestock facilities, and COVID-19 incidence
Dependent variable
Case rate Death rate
(1) (2) (3) (4) (5) (6) (7) (8)
Livestock facility 4.07*** 4.30*** 4.19*** 4.19*** 0.07*** 0.06** 0.06** 0.06**(0.80) (1.23) (1.21) (1.20) (0.02) (0.03) (0.03) (0.03)
Testing per 1,000 0.01* 0.01* 0.0001** 0.0001**(0.003) (0.003) (0.0000) (0.0000)
Positivity rate 0.86** 0.02**(0.38) (0.01)
Controls X X X X X X X XState FE X X X X X X X XObservations 3,032 1,773 1,773 1,773 3,032 1,773 1,773 1,773R2 0.45 0.44 0.45 0.45 0.42 0.44 0.44 0.44
Regression model with cross-sectional county-level data from 31 states with livestock facilities and availabledata on county-level testing gathered from 31 state health departments. Dependent variables are COVID-19cases (models 1 to 4) and deaths (models 5 to 8) per thousand. Livestock facility is the sum of beef, pork, andpoultry plants in the county. Testing per thousand represents the number of tests taken per thousand peoplein these states as of July 14, 2020. Positivity rate is total cases divided by total tests. Controls include incomeper capita (log), density (population per built-up land area) and density squared, the number of freight milestraveled, and timing of first case (index of Julian day of first confirmed case), as well as proportions of thecounty population over the age of 70, Black, Hispanic, public-transit commuters, uninsured, frontline workers,or in nursing homes or prisons. State-level fixed effects (FE) are included in all models. SEs are clustered atstate level.∗P < 0.1; ∗∗P < 0.05; ∗∗∗P < 0.01.
and microbial control.‡‡ This finding suggests a need foradditional examination of this program.
An implication of this study is that some aspects of large meat-processing plants render them especially susceptible to spreadingrespiratory viruses. One potential explanation is that large plantssimply entail more activity and employ more people. Becausethese plants provide a central location for moving products, itis plausible that a linear increase in the potential infected withinthe plant would entail a nonlinear response, owing to the com-plex and exponential nature of disease-transmission dynamics(70). Another driver may be the large physical spaces where pro-cessing occurs. Larger rooms tend to be louder and, thus, requiremore shouting (53), and they may require stronger climate con-trol, which we note in our introduction may aggravate COVID-19spread. A larger space that employees must navigate in reachingtheir workstations may also increase the number of workplaceinteractions.
More broadly, the finding that meatpacking plants may con-tribute to high levels of community spread underscores thepotential negative public health externalities generated by theindustry, which may be attributable to industrial concentration,operating practices, and labor conditions. Complicating this mat-ter from an economic standpoint is the supply-chain choke pointcreated by large plants disrupted by COVID-19, causing foodshortages, driving up prices, and incurring substantial upstreamand downstream economic losses. Cataloging and addressing theunderlying factors that produced this systemic risk in the firstplace could not only strengthen the US food system in the faceof COVID-19 and future disruptions, but also help illuminateanalogous weak points in other industries and supply chains.
Materials and MethodsOur analysis used a county-level dataset of COVID-19 cases and deaths fromthe New York Times, based on reports from state and local health agencies(71). Included in counts are both confirmed and probable deaths, as cate-
‡‡In contrast, some plants receiving waivers had recent Occupational Safety and HealthAdministration violations (42).
gorized by states. The five county boroughs of New York City are groupedinto one unit. We limited the analysis to the continental United States. Ourbaseline model specification takes the following form:
outcomei = β*livestocki + θ*controlsi +αs + εi , [1]
where outcomei is the COVID-19 case or death rate in county i, β is thecoefficient of interest, controlsi is a vector of county-level covariates, αs is adummy for fixed effects in state s, and εi is the error term.
Covariate data include county-level race, ethnicity, and age structure datafrom the US Census and mean county-level income data from the US Bureauof Economic Analysis (72, 73). Data on nursing-home populations, incar-cerated populations, uninsured populations, average household size, andwork-commuting methods come from the 2014–2018 American Commu-nity Survey (74–77). Data on manufacturing establishments come from the
Table 3. Livestock facilities and county-level COVID-19incidence, IV
Dependent variable
Case rate Death rate
(1) (2) (3) (4)
Livestock facility 9.00*** 6.12*** 0.13* 0.06(2.80) (1.43) (0.07) (0.06)
Controls X X X XState FE X XObservations 3,032 3,032 3,032 3,032R2 0.33 0.45 0.27 0.42
Regression model with an instrument for the presence of a livestock plantin a county using the county’s livestock production value in 1959 in terms ofanimals sold. Livestock facility is the sum of beef, pork, and poultry plants inthe county. Controls include income per capita (log), density (population perbuilt-up land area) and density squared, the number of freight miles trav-eled, and timing of first case (index of Julian day of first confirmed case), aswell as proportions of the county population over the age of 70, Black, His-panic, public-transit commuters, uninsured, frontline workers, or in nursinghomes or prisons. State-level fixed effects (FE) are included in models 2 and4. SEs are clustered at the state level.∗P < 0.1; ∗∗∗P < 0.01.
Taylor et al. PNAS | December 15, 2020 | vol. 117 | no. 50 | 31713
Dow
nloa
ded
by g
uest
on
Apr
il 20
, 202
1

American Economic Survey (68). Number of frontline workers were derivedfrom Center for Economic Policy Research data (54), transforming from Pub-lic Use Microdata Area-level to the county level, assuming even allocation.The freight index is from the Federal Highway Administration’s Freight Anal-ysis Framework (78) using the variable AADTT12, the annual average dailytruck traffic in 2012, which we sum across all listed highways in a givencounty. Data on state-level social-distancing policy come from a datasetsynthesizing news articles tracking these policy measures (79–81).
Locations and characteristics of livestock processing facilities come fromthe USDA FSIS (82). Beef and pork livestock plants were filtered to includeplants with volume of all processed products greater than 1 million poundsper month (categories 4 and 5), which account for the vast majority ofUS production. Poultry livestock were filtered to include plants with vol-umes greater than 10 million pounds per month (category 5) because that
category alone accounts for the majority of US production. County-levelmobility data were made accessible to COVID-19 researchers by Google (83).County-level COVID-19 testing data came from a dataset gathered from 31state health agencies (84). Data on line-speed waivers came from the USDAFSIS (85). Data on plant closures and opening dates came from a datasetassembled from various local news reports, building on a dataset from theMidwest Center for Investigative Reporting (86, 87). Historical livestock-production data are from the 1959 USDA census of agriculture, accessedvia the Inter-University Consortium for Political and Social Research (88).
Data Availability. Detailed CSV datasets concerning plant and county-leveldata relevant to COVID-19 employed in this study are available in Zenodoat https://doi.org/10.5281/zenodo.4069616. Further information is availablein Github at https://github.com/cboulos/livestock-covid.
1. V. Subbian et al., Ethics and informatics in the age of COVID-19: Challenges andrecommendations for public health organization and public policy. J. Am. Med. Inf.Assoc., 10.1093/jamia/ocaa188 (2020).
2. R. J. Foley, Outbreak at Iowa pork plant was larger than state reported. AP News, July22, 2020. https://apnews.com/article/85a02d9296053980ea47eba97f920707. Accessed11 August 2020.
3. L. Douglas, “As more meatpacking workers fall ill from Covid-19, meat compa-nies decline to disclose data.” Fern’s AG Insider (2020). https://thefern.org/aginsider/as-more-meatpacking-workers-fall-ill-from-covid-19-meat-companies-decline-to-disclose-data/. Accessed 30 May 2020.
4. C. Collins, S. Novack, COVID-19 cases now tied to meat plants in rural Texascounties wracked with coronavirus. Texas Observer, April 22, 2020. https://www.texasobserver.org/east-texas-coronavirus-chicken/. Accessed 20 May 2020.
5. J. Mayer, How Trump is helping tycoons exploit the pandemic. New Yorker, July20, 2020. https://www.newyorker.com/magazine/2020/07/20/how-trump-is-helping-tycoons-exploit-the-pandemic. Accessed 27 July 2020.
6. L. Hamner, High SARS-CoV-2 attack rate following exposure at a choir practice—Skagit County, Washington, March 2020. Morb. Mortal. Wkly. Rep. 69, 606–610(2020).
7. R. Bouffanais, S. S. Lim, Cities—try to predict superspreading hotspots for COVID-19.Nature 583, 352–355 (2020).
8. J. B. Dowd et al., Demographic science aids in understanding the spread and fatalityrates of COVID-19. Proc. Natl. Acad. Sci. U.S.A. 117, 9696–9698 (2020).
9. T. Barbieri, G. Basso, S. Scicchitano, Italian workers at risk during the COVID-19epidemic. https://doi.org/10.2139/ssrn.3572065 (10 April 2020).
10. G. J. Borjas, Demographic determinants of testing incidence and COVID-19 infec-tions in New York City neighborhoods. https://www.iza.org/publications/dp/13115/demographic-determinants-of-testing-incidence-and-covid-19-infections-in-new-york-city-neighborhoods. Accessed 16 May 2020.
11. M. M. Sajadi et al., Temperature and latitude analysis to predict potential spread andseasonality for COVID-19. https://doi.org/10.2139/ssrn.3550308 (9 March 2020).
12. K. M. O’Reilly et al., Effective transmission across the globe: The role of climate inCOVID-19 mitigation strategies. Lancet. Planet. Health 4, e172 (2020).
13. National Academies of Sciences, Engineering, and Medicine, “Rapid expert consulta-tion on SARS-CoV-2 survival in relation to temperature and humidity and potentialfor seasonality for the COVID-19 pandemic (April 7, 2020)” (Tech. Rep., The NationalAcademies Press, Washington, DC, 2020).
14. R. M. Anderson, H. Heesterbeek, D. Klinkenberg, T. D. Hollingsworth, How willcountry-based mitigation measures influence the course of the COVID-19 epidemic?Lancet 395, 931–934 (2020).
15. S. H. Ebrahim, Q. A. Ahmed, E. Gozzer, P. Schlagenhauf, Z. A. Memish, Covid-19 andcommunity mitigation strategies in a pandemic. BMJ 368, m1066 (2020).
16. J. A. Lewnard, N. C. Lo, Scientific and ethical basis for social-distancing interventionsagainst COVID-19. Lancet Infect. Dis. 20, 631–633 (2020).
17. S. M. Moghadas et al., Projecting hospital utilization during the COVID-19 outbreaksin the United States. Proc. Natl. Acad. Sci. U.S.A. 117, 9122–9126 (2020).
18. M. U. G. Kraemer et al., The effect of human mobility and control measures on theCOVID-19 epidemic in China. Science 368, 493–497 (2020).
19. C. R. Wells et al., Impact of international travel and border control measures on theglobal spread of the novel 2019 coronavirus outbreak. Proc. Natl. Acad. Sci. U.S.A.117, 7504–7509 (2020).
20. M. Roser, H. Ritchie, E. Ortiz-Ospina, J. Hasell, Coronavirus pandemic (COVID-19).Our World in Data (2020). https://ourworldindata.org/coronavirus. Accessed 21 July2020.
21. US Department of Homeland Security, “Advisory memorandum on identification ofessential critical infrastructure workers during COVID-19 response” (Tech. Rep., USDepartment of Homeland Security, Washington, DC, 2020).
22. J. W. Dyal, COVID-19 among workers in meat and poultry processing facilities—19states, April 2020. MMWR Morb. Mortal. Wkly. Rep. 69, 557–561 (2020).
23. J. M. MacDonald, W. D. McBride, “The transformation of US livestock agriculturescale, efficiency, and risks” (Economic Information Bulletin 43, US Department ofAgriculture, Washington, DC, 2009).
24. M. Hendrickson, P. H. Howard, D. Constance, Power, food and agriculture: Implica-tions for farmers, consumers and communities. https://doi.org/10.2139/ssrn.3066005(1 November 2017).
25. Tyson Foods Inc., Tyson Foods Facts. https://ir.tyson.com/about-tyson/facts/default.aspx. Accessed 11 August 2020.
26. M. K. Wohlgenant, Competition in the US meatpacking industry. Annu. Rev. Resour.Econ. 5, 1–12 (2013).
27. C. E. Ward, A review of causes for and consequences of economic concentra-tion in the U.S. meatpacking industry. CAFRI: Curr. Agric. Food Resour. Issues,10.22004/ag.econ.45696 (2002).
28. European Federation of Food Agriculture and Tourism Trade Unions, “Putting meaton the bones: A report on the structure and dynamics of the European meat indus-try” (Tech. Rep., European Federation of Food Agriculture and Tourism Trade Unions,Brussels, Belgium, 2011).
29. M. K. Hendrickson, Resilience in a concentrated and consolidated food system. J.Environ. Soc. Sci. 5, 418–431 (2015).
30. J. Skerritt, D. Shanker, M. Hirtzer, Meat shortages reopen costly path to smaller U.S.plants. Bloomberg, 26 June 2020. https://www.bloomberg.com/news/articles/2020-06-26/meat-shortages-reopen-costly-path-to-small-u-s-slaughterhouses. Accessed 2 July2020.
31. National Pork Board, “Estimated daily US slaughter, capacity by plant (head per day)”(Tech. Rep., National Pork Board, Des Moines, IA, 2019).
32. A. Mano, Nine meat plants in southern Brazil face COVID-19 outbreaks. Reuters,30 April 2020. https://fr.reuters.com/article/us-health-coronavirus-brazil-meatpackers-idUSKBN22C2J8. Accessed 27 May 2020.
33. D. Busvine, Coronavirus spread accelerates again in Germany, Reuters, 9 May 2020.https://www.reuters.com/article/us-health-coronavirus-germany-cases/coronavirus-spread-accelerates-again-in-germany-idUSKBN22M019. Accessed 14 May 2020.
34. J. Scott, A. Chandler, An Australian meatworks is at the center of a virus outbreak.Bloomberg, 3 May 2020. https://www.bloomberg.com/news/articles/2020-05-04/virus-outbreak-in-australian-meatworks-echoes-problems-in-u-s. Accessed 15 May 2020.
35. M. Hirtzer, T. Freitas, U.S. could be weeks from meat shortages with shutdownsspreading. Bloomberg, 24 April 2020. https://www.bloomberg.com/news/articles/2020-04-24/meat-threats-grow-with-first-brazil-shutdown-u-s-turkey-halt. Accessed15 May 2020.
36. J. Mason, T. Polansek, Trump orders U.S. meat-processing plants to stay open despitecoronavirus fears. Reuters, 28 April 2020. https://www.reuters.com/article/us-health-coronavirus-trump-liability/trump-orders-u-s-meat-processing-plants-to-stay-open-despite-coronavirus-fears-idUSKCN22A2OB. Accessed 15 May 2020.
37. White House, “Executive order on delegating authority under the DPA with respectto food supply chain resources during the national emergency caused by the outbreakof COVID-19” (Executive Order, White House, Washington, DC, 28 April 2020).
38. K. VanderWaal, J. Deen, Global trends in infectious diseases of swine. Proc. Natl. Acad.Sci. U.S.A. 115, 11495–11500 (2018).
39. K. P. Myers et al., Are swine workers in the United States at increased risk of infectionwith zoonotic influenza virus? Clin. Infect. Dis. 42, 14–20 (2006).
40. K. Schlottau et al., Experimental transmission studies of SARS-COV-2 in fruit bats,ferrets, pigs and chickens. Lancet Microbe 1, E218–E225 (2020).
41. Q. Yang et al., Assessing the role of live poultry trade in community-structured trans-mission of avian influenza in China. Proc. Natl. Acad. Sci. U.S.A. 117, 5949–5954(2020).
42. S. Thompson, D. Berkowitz, “USDA allows poultry plants to raise line speeds, exac-erbating risk of COVID-19 outbreaks and injury” (Policy & Data Brief, NationalEmployment Law Project, New York, NY, 2020).
43. USDA Food Safety and Inspection Service, “Petition to permit waivers of maximumline speeds for young chicken establishments operating under the new poultryinspection system; criteria for consideration of waiver requests for young chickenestablishments to operate at line speeds of up to 175 birds per minute” (Notice, FoodSafety and Inspection Service, Washington, DC, 2018).
44. G. Cano-Munoz, G. C. Munoz, “Manual on meat cold store operation and man-agement” (FAO Animal Production and Health Paper 92, Food and AgricultureOrganization., Rome, Italy, 1991).
45. T. Carleton, K. C. Meng, Causal empirical estimates suggest covid-19 transmissionrates are highly seasonal. medRxiv, https://doi.org/10.1101/2020.03.26.20044420 (30March 2020).
46. S. Zuber, H. Brussow, COVID 19: Challenges for virologists in the food industry.Microb. Biotechnol. 13, 1689–1701 (2020).
47. J. Shaman, M. Kohn, Absolute humidity modulates influenza survival, transmission,and seasonality. Proc. Natl. Acad. Sci. U.S.A. 106, 3243–3248 (2009).
48. T. H. Koep et al., Predictors of indoor absolute humidity and estimatedeffects on influenza virus survival in grade schools. BMC Infect. Dis. 13, 71(2013).
31714 | www.pnas.org/cgi/doi/10.1073/pnas.2010115117 Taylor et al.
Dow
nloa
ded
by g
uest
on
Apr
il 20
, 202
1

ECO
NO
MIC
SCIE
NCE
S
49. E. R. Deyle, M. C. Maher, R. D. Hernandez, S. Basu, G. Sugihara, Global environmentaldrivers of influenza. Proc. Natl. Acad. Sci. U.S.A. 113, 13081–13086 (2016).
50. S. H. Beck et al., Monitoring of pathogenic bioaerosols in beef slaughter facili-ties based on air sampling and airflow modeling. Appl. Eng. Agric. 35, 1015–1036(2019).
51. S. Asadi, N. Bouvier, A. S. Wexler, W. D. Ristenpart, The coronavirus pandemic andaerosols: Does COVID-19 transmit via expiratory particles? Aerosol Sci Technol. 54,635–638 (2020).
52. R. Mittal, R. Ni, J. H. Seo, The flow physics of COVID-19. J. Fluid Mech. 894, F2 (2020).53. J. Borak, Airborne transmission of COVID-19. Occup. Med. 70, 297–299 (2020).54. S. Fremstad, H. J. Rho, H. Brown, “Meatpacking workers are a diverse group who
need better protections” (Tech. Rep., Center for Economic and Policy Research,Washington, DC, 2020).
55. L. A. Compa, “Blood, sweat, and fear: Workers’ rights in US meat and poultry plants”(Tech. Rep., Human Rights Watch, New York, NY, 2004).
56. W. Kandel, E. A. Parrado, Restructuring of the US meat processing industry and newHispanic migrant destinations. Popul. Dev. Rev. 31, 447–471 (2005).
57. M. Grabell, What happens if workers cutting up the nation’s meat get sick? Prop-ublica, 28 March 2020. https://www.propublica.org/article/what-happens-if-workers-cutting-up-the-nations-meat-get-sick. Accessed 14 May 2020.
58. D. H. Constance, F. Martinez-Gomez, G. Aboites-Manrique, A. Bonanno, “The prob-lems with poultry production and processing” in The Ethics and Economics ofAgrifood Competition, H. S. James. Ed. (International Library of Environmental, Agri-cultural, and Food Ethics, Springer Netherlands, Dordrecht, Netherlands, 2013), pp.155–175.
59. J. M. MacDonald, M. Ollinger, K. E. Nelson, C. R. Handy, “Consolidation in U.S. meat-packing” (Agricultural Economic Report AER-785, Economic Research Service, USDepartment of Agriculture, Washington, DC, 2000).
60. W. K. Viscusi, Union, labor market structure, and the welfare implications of thequality of work. J. Labor Res. 1, 175–192 (1980).
61. S. Hsiang et al., The effect of large-scale anti-contagion policies on the COVID-19pandemic. Nature 584, 262–267 (2020).
62. D. Baud et al., Real estimates of mortality following COVID-19 infection. Lancet Infect.Dis. 20, P773 (2020).
63. J. H. Stock, M. Yogo, “Testing for weak instruments in linear IV regression” in Iden-tification and Inference for Econometric Models, D. W. K. Andrews, Ed. (CambridgeUniversity Press, 2005), pp. 80–108.
64. M. A. Waltenburg et al., Update: COVID-19 among workers in meat and poultryprocessing facilities—United States, April–May 2020. Morb. Mortal. Wkly. Rep. 69887–892 (2020).
65. J. D. Angrist, A. B. Krueger, “Empirical strategies in labor economics” in Handbook ofLabor Economics, O. C. Ashenfelter, D. Card, Eds. (Elsevier, Amsterdam, Netherlands,1999), vol. 3, part A, pp. 1277–1366.
66. G. A. Akerlof, Sins of omission and the practice of economics. J. Econ. Lit. 58, 405–418(2020).
67. Kansas Department of Health and Environment, “COVID-19 (2019 novel coronavirus)summary” (Tech. Rep., Kansas Department of Health and Environment, Topeka, KS,2020).
68. US Census Bureau, “All sectors: County business patterns by legal form of organiza-tion and employment size class for U.S., states, and selected geographics: 2018” (Tech.Rep., US Census Bureau, Suitland, MD, 2019).
69. C. Mitchell, Kansas’ top health official sounds the alarm on COVID-19, predicts currenttrend line will ’steepen.’ Lawrence Journal-World, 1 July 2020. https://www2.ljworld.
com/news/state-region/2020/jul/01/kansas-top-health-official-sounds-the-alarm-on-covid-19-predicts-current-trend-line-will-steepen/. Accessed 15 July 2020.
70. N. C. Grassly, C. Fraser, Mathematical models of infectious disease transmission. Nat.Rev. Microbiol. 6, 477–487 (2008).
71. The New York Times, Data from “Coronavirus (Covid-19) data in the United States.”GitHub. https://github.com/nytimes/covid-19-data. Accessed 22 July 2020.
72. SEER Program, National Cancer Institute, NIH, Data from “US population data (under-lying data provided by National Center for Health Statistics).” National CancerInstitute Surveillance, Epidemiology, and End Results Program. https://seer.cancer.gov/popdata/download.html. Accessed May 15, 2020.
73. US Bureau of Economic Analysis, Data from “Table SAINC5: Personal income by majorcomponent and industry.” Bureau of Economic Analysis Interactive Data Application.https://apps.bea.gov/iTable/iTable.cfm?reqid=70step=1reqid=70step=1. Accessed May15, 2020.
74. US Census Bureau, “Group quarters population by group quarters type, 2004-2018 American community survey 5-year estimates” (Tech Rep., US Census Bureau,Suitland, MD, 2019).
75. US Census Bureau, “Selected characteristics of health care coverage in the UnitedStates, 2004-2018 American community survey 5-year estimates” (Tech Rep., USCensus Bureau, Suitland, MD, 2019).
76. US Census Bureau, “Commuting characteristics by sex, 2004-2018 American com-munity survey 5-year estimates” (Tech Rep., US Census Bureau, Suitland, MD,2019).
77. US Census Bureau, “Households and families, 2004-2018 American community survey5-year estimates” (Tech Rep., US Census Bureau, Suitland, MD, 2019).
78. US Department of Transportation, “FAF4 network database and flow assignment:2012 and 2045” (Tech. Rep., US Department of Transportation, Washington, DC,2020).
79. National Academy for State Health Policy, “Each state’s COVID-19 reopening andreclosing plans and mask requirements” (Tech. Rep., National Academy for StateHealth Policy, Washington, DC, 2020).
80. J. Gershman, A guide to state coronavirus reopenings and lockdowns. WallStreet Journal, 20 May 2020. https://www.wsj.com/articles/a-state-by-state-guide-to-coronavirus-lockdowns-11584749351. Accessed 15 July 2020.
81. J. C. Lee, S. Mervosh, Y. Avila, B. Harvey, A. L. Matthews, See how all 50 states arereopening (and closing again). NY Times, 27 October 2020. https://www.nytimes.com/interactive/2020/us/states-reopen-map-coronavirus.html. Accessed 1 August 2020.
82. USDA Food Safety and Inspection Service, “Meat, poultry and egg product inspectiondirectory” (Tech. Rep., USDA Food Safety and Inspection Service, Washington, DC,2020).
83. Google LLC, Google COVID-19 community mobility reports. https://www.google.com/covid19/mobility/. Accessed 22 July 2020.
84. C. A. Taylor, C. Boulos, D. Almond, County-level COVID-19 testing data. Zenodo.https://doi.org/10.5281/zenodo.4069616. Deposited 6 October 2020.
85. USDA Food Safety and Inspection Service, “Salmonella initiative program participantstable” (Tech. Rep., USDA Food Safety and Inspection Service, Washington, DC, 2020).
86. S. Chadde, “Tracking covid-19’s impact on meatpacking workers and industry” (Tech.Rep., Midwest Center for Investigative Reporting, Champaign, IL, 2020).
87. C. A. Taylor, C. Boulos, D. Almond, State closures. Zenodo. https://doi.org/10.5281/zenodo.4069616. Deposited 6 October 2020.
88. M. Haines, P. Fishback, P. Rhode, Data from “United States agriculture data, 1840–2012.” Inter-University Consortium for Political and Social Research. Accessed 1August 2020.
Taylor et al. PNAS | December 15, 2020 | vol. 117 | no. 50 | 31715
Dow
nloa
ded
by g
uest
on
Apr
il 20
, 202
1

4/20/2021 Meatpacking plants have been deadly COVID-19 hot spots – but policies that encourage workers to show up sick are legal
https://theconversation.com/meatpacking-plants-have-been-deadly-covid-19-hot-spots-but-policies-that-encourage-workers-to-show-up-sick-are-legal-152572 1/5
Author
Ruqaiijah YearbyProfessor of Law, Saint Louis University
Close
Academic rigor, journalistic flair
Working in meatpacking plants has always been dangerous. A recent study shows that it
became deadlier in the era of COVID-19, even as company profits soared.
This analysis, published in December 2020, estimates that 6%-8% of all COVID-19 cases
and 3%-4% of all COVID-19 deaths in the U.S. through July 21, 2020 were tied to meat
and poultry plants. Workers in these facilities stand close together on processing lines,
which makes social distancing difficult.
At the same time, companies like Tyson, which produces chicken, beef and pork, and JBS,
which produces beef and pork, are reporting high earnings despite COVID-related challenges such as
plant closures.
I am a law professor and have written about links between lax state and federal enforcement of health
and safety laws and increased rates of COVID-19 infections and deaths. Thanks to punitive attendance
rules and Trump administration policies, meat- and poultry-processing workers have been
unnecessarily exposed to COVID-19. In my view, the best way to protect them is to reform laws that
prioritize production over workers’ health.
Nearly 1,000 workers at this Smithfield Foods pork-processing plant in South Dakota contracted COVID-19 between mid-March and mid-April 2020.Kerem Yucel / AFP via Getty Images
Meatpacking plants have been deadly COVID-19 hot spots – butpolicies that encourage workers to show up sick are legalFebruary 26, 2021 8.24am EST •Updated February 26, 2021 4.41pm EST
k l k l k fk l k l k f

4/20/2021 Meatpacking plants have been deadly COVID-19 hot spots – but policies that encourage workers to show up sick are legal
https://theconversation.com/meatpacking-plants-have-been-deadly-covid-19-hot-spots-but-policies-that-encourage-workers-to-show-up-sick-are-legal-152572 2/5
Sick on the job
Meat- and poultry-processing companies’ standard attendance policies were punitive even before the
pandemic. Companies issued points for employees who missed work and fired those who accumulated
too many points. These policies are still in place.
Workers at Tyson and JBS plants are required to go to work even if they are experiencing symptoms
of COVID-19 or awaiting test results. The companies excuse absences for COVID-19 only if a worker
has tested positive for the virus, or in Tyson’s case, has “documented clinical symptoms.” Tyson and
JBS workers have told reporters that costs and wait times make it hard for them to access testing, so
they go to work sick.
That said, both companies have taken steps to control the spread of COVID-19 at their plants. Tyson
hired medical professionals, cleans its plants daily and monitors social distancing. JBS now offers
unlimited personal protective equipment and tests symptomatic workers and close contacts.
However, even with safety protocols, the virus can spread in the workplace if infected employees come
to work.
ProPublica@propublica
“They will keep going until all of their employees have thisvirus. They would rather risk their employeesʼ health andkeep their production going,” a county official wrote last Aprilabout a National Beef plant where 250+ had already testedpositive.
Meat and poultry workers began calling for better protection early in the COVID-19 pandemic.
Are meatpacking plants keeping essential workers safe?Are meatpacking plants keeping essential workers safe?

4/20/2021 Meatpacking plants have been deadly COVID-19 hot spots – but policies that encourage workers to show up sick are legal
https://theconversation.com/meatpacking-plants-have-been-deadly-covid-19-hot-spots-but-policies-that-encourage-workers-to-show-up-sick-are-legal-152572 3/5
Meat and poultry plants as ‘critical infrastructure’
As COVID-19 spread in the spring of 2020, then-President Donald Trump signed an executive order
that included language provided by meat trade associations designating meat and poultry plants as
critical infrastructure under the Defense Production Act. The order directed the U.S. Department of
Agriculture to ensure that meat and poultry processing facilities stayed open or that they reopened as
soon as possible during the pandemic to prevent meat shortages.
In May 2020, COVID-19 infections among meat- and poultry-processing workers more than tripled,
and the number of deaths quadrupled. Still, with the USDA’s help, companies invoked the executive
order to maintain operations. For example, in Cold Spring, Minnesota, a Pilgrim’s Pride plant that
processes chicken stayed open because of Trump’s order even though worker infections spiked from
83 on May 8 to 194 on May 11.
Emails Reveal Chaos as Meatpacking Companies Fought Health Agenc…Thousands of pages of documents obtained by ProPublica show howquickly public health agencies were overwhelmed by meatpacking …propublica.org
12�51 PM · Feb 21, 2021
145 See the latest COVID-19 information on Twitter

4/20/2021 Meatpacking plants have been deadly COVID-19 hot spots – but policies that encourage workers to show up sick are legal
https://theconversation.com/meatpacking-plants-have-been-deadly-covid-19-hot-spots-but-policies-that-encourage-workers-to-show-up-sick-are-legal-152572 4/5
Profits and lawsuits
On Nov. 17, 2020, Tyson announced net income of US$692 million for the fourth quarter of 2020, up
from $369 million for the same period in 2019. Tyson stock traded at $1.81 per share, up 49.5% from
the same period in 2019. This was a result of increased production. To date, over 12,500 Tyson
workers have been infected with COVID-19.
Tyson currently faces a lawsuit for a COVID-19 outbreak at a plant in Waterloo, Iowa that has
sickened at least 1,000 workers and killed five. The wrongful death lawsuit filed by the families of
three deceased employees charges that the company required workers – including some who were
transferred from facilities with COVID-19 outbreaks – to work long hours in cramped conditions.
For its part, JBS reported $581.2 million in net profits in the third quarter of 2020, beating analysts’
forecasts. On Sept. 12, 2020, the U.S. Occupational Safety and Health Administration fined the
company $15,615 due to six deaths and 290 COVID-19 infections in its Greeley, Colorado plant.
Commenting on the fine, two former federal regulators noted that the Trump administration could
have punished JBS much more severely if it had penalized the company for violations at multiple
plants and designated them as willful violations. In November 2020, 32 new infections were
confirmed at the Greeley plant.
Legal reforms
Critics argue that the Occupational Safety and Health Administration has not adequately enforced
workplace health and safety laws during the pandemic. Trump’s executive order limited OSHA’s
authority to enforce the laws and authorized the Department of Agriculture to keep meat and poultry
Chart: The Conversation, CC BY-ND • Source: Center for Economic and Policy Research • Get the data
Frontline meatpacking workers are disproportionatelypeople of color and immigrantsWorkers who handle processing jobs in meat and poultry plants have less formal education thanaverage U.S. workers and are more likely to be Black or Hispanic, born outside the country, andliving in a home where English is not the primary language.
20
40
60
80%64%64%
WhiteWhite
19%19%12%12%
BlackBlack
25%25%17%17%
HispanicHispanic
44%44%
7%7%
AsianAsianAmerican/Paci�cAmerican/Paci�c
IslandsIslands
10%10%17%17%
Foreign bornForeign born
52%52%
4%4%
LimitedLimitedEnglish-English-
speakingspeakinghouseholdhousehold
25%25%34%34%
High schoolHigh schooleducation oreducation or
lessless
82%82%
Frontline meatpacking workers are de�ned as people working in the “Animal Slaughtering and Processing Industry”in one of three classi�cations: Butchers and Other Meat, Poultry, and Fish Processing Workers; Packaging andFilling Machine Operators and Tenders; and Food Processing Workers, All other. Together these groups compriseapproximately 194,000 people – over 40% of all workers in the industry.
All US workersAll US workers Front-line meatpacking workersFront-line meatpacking workers

4/20/2021 Meatpacking plants have been deadly COVID-19 hot spots – but policies that encourage workers to show up sick are legal
https://theconversation.com/meatpacking-plants-have-been-deadly-covid-19-hot-spots-but-policies-that-encourage-workers-to-show-up-sick-are-legal-152572 5/5
Inequality Unions Meat workplace safety Minorities Immigrants Employment law Poultry workplace law
Trump administration Occupational safety Occupational Safety and Health Administration COVID-19 Essential workers
plants open despite outbreaks. Even with stronger enforcement,
however, punitive attendance policies still could increase infection rates
by requiring workers to go to work sick.
President Joe Biden issued an executive order on Jan. 21, 2021, directing
the Department of Labor to issue stronger guidance on workplace safety
during the pandemic. But employers do not have to comply with this
guidance, and it does not address punitive attendance policies.
I believe three reforms are needed to fill the gap. First, federal and state
agencies could use their legal authority to prohibit punitive attendance
policies. Section 5 of the Occupational Safety and Health Act of 1970
includes a “general duty standard” that requires employers to provide
employees with a place of employment free from recognized hazards that are causing or likely to cause
death or serious harm.
Although this would be a new use of the “general duty” standard, it would address a recognized
hazard that is likely to cause death or serious harm. This is a mandatory requirement that employers
already have to comply with and does not require an in-person inspection to enforce.
Second, Biden could withdraw Trump’s executive order classifying meat and poultry plants as critical
infrastructure. And the Biden administration could require plants to close down if new outbreaks
occur among their workers.
Finally, meat and poultry companies could be required to provide workers with hazard pay, which
should increase if the companies’ net profits rise. As a precedent, Seattle, Long Beach, California and
Oakland, California all recently adopted hazard pay mandates for grocery workers during the
pandemic.
Grocery store chains are challenging the laws, arguing that their profit margins cannot support these
payments. But it would be hard for meat and poultry companies to make that argument in light of
their recent earnings.
Meatpacking plants emerged as hot spots of infection early in the COVID-19 pandemic. As of Feb. 24,
2021, more than 57,454 meat- and poultry-processing workers had tested positive for COVID-19 and
284 had died. In my view, it is time for legal action to protect meat and poultry workers and
compensate them fairly for working in hazardous conditions during this pandemic.
This article has been updated to note that the estimates cited for COVID-19 illnesses and deaths at
meat and poultry plants as a fraction of all U.S. COVID-19 illnesses and deaths covered the period
up through July 21, 2020.
If confirmed as U.S. secretary of labor, Boston Mayor MartyWalsh would be the first union member to hold the post innearly 50 years. Graeme Jennings/Pool via AP

4/20/2021 Meatpacking Workers are a Diverse Group Who Need Better Protections - Center for Economic and Policy Research
https://cepr.net/meatpacking-workers-are-a-diverse-group-who-need-better-protections/ 1/10
APRIL 29, 2020
.
Yesterday, on Workers Memorial Day, President
Trump issued an executive order that requires beef,
pork, and poultry producers to continue operating.
The executive order also directs the Secretary of
Agriculture to issue any additional orders and
• ARTICLE Coronavirus US
Workers
MeatpackingWorkers are aDiverseGroup WhoNeed BetterProtections
ESMenu

4/20/2021 Meatpacking Workers are a Diverse Group Who Need Better Protections - Center for Economic and Policy Research
https://cepr.net/meatpacking-workers-are-a-diverse-group-who-need-better-protections/ 2/10
regulations necessary to keep producers operating.
On the same day, the United Food and Commercial
Workers reported that there had been at least 20
worker deaths in meatpacking and food processing
due to the virus. UFCW also reported that at least
6,500 meatpacking and food processing workers
have been directly impacted by the virus — meaning
they tested positive for COVID-19 or are awaiting
test results, missed work due to self-quarantine,
have been hospitalized, and/or are symptomatic —
and 22 meatpacking plants have been closed at some
point due to the virus so far.
The executive order impacts 194,000 frontline
meatpacking workers in the Animal Slaughtering and
Processing Industry (see Methodology section below
for the three occupations classi�ed as frontline
meatpacking occupations). This industry also
employs an additional 280,000 workers, most of
whom are also directly a�ected by the order. As this
brief shows, frontline meatpacking workers are a
diverse group in which people of color and
immigrants are overrepresented compared to the US
workforce overall. They do dangerous work, even in
the best of times, and are poorly compensated for it.
The federal government needs to change course and
act immediately to provide better protections for
these and other essential workers. This includes
making many of the optional recommendations
issued by the CDC in April mandatory and
enforceable, to ensure the safety of both workers and
their surrounding communities.
ESMenu

4/20/2021 Meatpacking Workers are a Diverse Group Who Need Better Protections - Center for Economic and Policy Research
https://cepr.net/meatpacking-workers-are-a-diverse-group-who-need-better-protections/ 3/10
A Basic Demographic Pro�le ofMeatpacking Workers
People of color, immigrants, and people in relatively
low-income families are disproportionately
employed in meatpacking plants. Almost one-half
(44.4 percent) of meatpacking workers are Hispanic,
and one-quarter (25.2 percent) are Black.
Across all the occupations of people working in the
Animal Slaughtering and Processing Industry, more
than half of all workers are people of color (34.9
percent are Hispanic, and 22.5 percent are Black). In
some occupations within the industry, more than
two-thirds of workers are people of color, including:
Hand Packers and Packagers (75.3 percent); Laborers
and Freight, Stock, and Material Movers, Hand (68.6
percent); and Industrial Truck and Tractor Operators
(67.3 percent).
Immigrants are particularly overrepresented in
frontline meatpacking occupations. About 17 percent
of workers in the US workforce today are immigrants.
But more than one-half (51.5 percent) of frontline
meatpacking workers are immigrants. About one-
quarter (25.1 percent) of these workers live in
households in which all of the members (age 14 or
older) have limited pro�ciency in English, over six
times the rate for US workers overall. Other
occupations within the Animal Slaughtering and
Processing Industry also have a high share of
ESMenu

4/20/2021 Meatpacking Workers are a Diverse Group Who Need Better Protections - Center for Economic and Policy Research
https://cepr.net/meatpacking-workers-are-a-diverse-group-who-need-better-protections/ 4/10
immigrants: Hand Packers and Packagers (52.9
percent); Industrial Truck and Tractor Operators
(38.8 percent); and Laborers and Freight, Stock, and
Material Movers, Hand (38.2 percent).
Nearly half of frontline meatpacking workers (45.1
percent) live in low-income families (below 200
percent of the federal poverty line, or less than
$52,400 for a family of four in 2020) and about one-
in-eight (12.4 percent) have income below the
poverty line. This compares to 20.6 percent of all
workers from low-income families and 6.7 percent of
all workers with income below the poverty level.
Meatpacking workers also disproportionately lack
health insurance (15.5 percent), have one or more
children to care for (44.3 percent), and are less
educated (2.5 percent have a college degree or
more).
Characteristics of Frontline Meatpacking Workers
Animal Slaughtering
and Processing
Industry
All Workers All
Workers
Frontline
Meatpacking
Workers
All Workers (16+) 152,600,169 473,467 193,996
(%) (%) (%)
Female 47.4 36.2 42.0
Full/Part-time
Full-time 78.6 94.8 94.0
Part-time 21.4 5.2 6.0
Race/Ethnicity
White 63.5 34.5 19.1
ESMenu

4/20/2021 Meatpacking Workers are a Diverse Group Who Need Better Protections - Center for Economic and Policy Research
https://cepr.net/meatpacking-workers-are-a-diverse-group-who-need-better-protections/ 5/10
Black 11.9 22.5 25.2
Hispanic 16.8 34.9 44.4
AAPI 6.6 7.0 10.0
Other 1.2 1.1 1.2
Foreign Born 17.1 37.5 51.5
Limited English
Speaking Household
4.0 16.8 25.1
Education Level
LTHS 9.3 32.6 44.1
HS 24.5 38.3 38.0
Some college 32.0 20.6 15.4
College 21.6 6.7 2.0
Advanced 12.6 1.8 0.5
Child in home 35.8 41.6 44.3
Compensation and
Bene�ts
Below poverty line 6.7 8.8 12.4
<200% poverty line 20.6 34.9 45.1
No health insurance 11.0 11.8 15.5
Top 10 States, Frontline
Meatpacking Workers
Texas 8.5 7.7 8.3
Georgia 3.1 6.9 7.5
Arkansas 0.9 7.8 7.5
North Carolina 3.1 6.7 7.0
Iowa 1.1 6.1 6.7
Nebraska 0.7 4.7 6.1
California 12.0 4.3 4.1
Missouri 1.9 3.5 3.9
Illinois 4.1 3.9 3.7
Alabama 1.4 3.7 3.4
Source and Notes: CEPR’s Analysis of American Community
Survey, 2014-2018 5-Year Estimates.
ESMenu

4/20/2021 Meatpacking Workers are a Diverse Group Who Need Better Protections - Center for Economic and Policy Research
https://cepr.net/meatpacking-workers-are-a-diverse-group-who-need-better-protections/ 6/10
The Federal Government Needsto Do More to ProtectMeatpacking Workers
Meatpacking workers exemplify today’s diverse,
multicultural working class. Even before the
pandemic, they did hazardous work on a daily basis
with injury and illness rates about two times higher
than workers on average. Instead of increasing
protections for these workers during the pandemic,
the current administration has increased the risks
they face. In addition to yesterday’s executive order,
the United States Department of Agriculture (USDA)
has waived federal regulations on maximum line
speed in at least 15 poultry plants this month. As
ESMenu

4/20/2021 Meatpacking Workers are a Diverse Group Who Need Better Protections - Center for Economic and Policy Research
https://cepr.net/meatpacking-workers-are-a-diverse-group-who-need-better-protections/ 7/10
documented in recent reporting by USA Today and
the Midwest Center on Investigative Reporting, USDA
granted more “waivers in one week in April than in
any previous month over the past eight years ….”
The federal government needs to change course and
act immediately to provide better protections for
these and other essential workers. For meatpacking
workers, these protections must include:
�. guaranteed, free testing on a priority basis;
�. suspending all USDA waivers that allow plants to operate
at faster speeds than allowed by federal regulations;
�. ensuring that processing plants enforce physical
distancing between workers, even if it means slowing the
speed of production;
�. ensuring that all meatpacking workers have necessary
personal protective equipment;
�. workers who have or may have COVID-19 stay home;
�. ensuring that all workers who need to stay home due to
COVID-19 receive sick pay; and
�. ensuring that meatpacking workers have a voice in their
workplaces, including, as recommended in a recent
report by Sharon Block and other labor law experts, a
“meaningful role in designing and implementing the
safety and health protocols that govern their lives on the
job.”
Methodology
ESMenu

4/20/2021 Meatpacking Workers are a Diverse Group Who Need Better Protections - Center for Economic and Policy Research
https://cepr.net/meatpacking-workers-are-a-diverse-group-who-need-better-protections/ 8/10
This pro�le of meatpacking workers uses the most
recent �ve-year estimates of data from the
American Community Survey (2014–2018) Public
Use Microdata Sample. The demographics of
meatpacking workers are unlikely to have changed in
any substantial way over the last two years, and using
�ve-year estimates of ACS data helps ensure that
sample sizes are su�cient to produce reasonably
precise estimates by industry and occupation.
Frontline Meatpacking Workers: “Frontline
meatpacking workers” are de�ned as people working
in the “Animal Slaughtering and Processing Industry”
in one of these three occupations (as classi�ed using
the Census Bureau’s Standard Occupational
Classi�cation system):
Butchers and Other Meat, Poultry, and Fish Processing
Workers (51-3020)
Packaging and Filling Machine Operators and Tenders
(51-9111)
Food Processing Workers, All other (51-3099)
Workers in these three occupations make up more
than 40 percent of all workers in the Animal
Slaughtering and Processing industry.
Immigrants: Immigrants are de�ned as foreign-
born persons and include naturalized citizens.
Limited English Pro�ciency: A household has
limited pro�ciency in English if none of the members
(age 14 or older) have “good” or “very good”
ESMenu

4/20/2021 Meatpacking Workers are a Diverse Group Who Need Better Protections - Center for Economic and Policy Research
https://cepr.net/meatpacking-workers-are-a-diverse-group-who-need-better-protections/ 9/10
pro�ciency in English.
Poverty: Poverty is de�ned using the very dated
o�cial poverty de�nition, and does not take account
of taxes, work expenses (like child care and
commuting costs), various near-cash bene�ts, and
changes in typical living standards (beyond in�ation)
since the 1960s.
Coronavirus
US
Workers
RELATED ARTICLES
Putting the Debt in ContextDEAN BAKER / APRIL 14, 2021
Big Jump In Energy Prices Pushes Overall CPIUp 0.6 Percent in March as Depressed PricesBounce BackDEAN BAKER / APRIL 13, 2021
KEEP UP WITH OUR LATEST NEWS
[email protected] SIGN UP
ESMenu

4/20/2021 Meatpacking Workers are a Diverse Group Who Need Better Protections - Center for Economic and Policy Research
https://cepr.net/meatpacking-workers-are-a-diverse-group-who-need-better-protections/ 10/10
PREVIEW: What to Look for in the MarchConsumer Price IndexDEAN BAKER / APRIL 12, 2021
Patents and the Pandemic: Can We LearnAnything?DEAN BAKER / APRIL 12, 2021
.
CONTACT US
ABOUT
US
PUBLICATIONS
OUR
FUNDERS
NEWSROOM
SUBSCRIBE
This website is licensed under a Creative Commons Attribution 4.0 International License and governed by our Privacy Policy.
ESMenu

Annals of Epidemiology 58 (2021) 69–75
Contents lists available at ScienceDirect
Annals of Epidemiology
journal homepage: www.annalsofepidemiology.org
Original article
COVID-19 mortality in California based on death certificates:
disproportionate impacts across racial/ethnic groups and nativity
Erika Garcia, PhD
a , ∗, Sandrah P. Eckel, PhD
a , Zhanghua Chen, PhD
a , Kenan Li, PhD
b , Frank D. Gilliland, MD
a
a Department of Preventive Medicine, University of Southern California, Los Angeles, CA b Spatial Sciences Institute, University of Southern California, Los Angeles, CA
a r t i c l e i n f o
Article history:
Received 29 October 2020
Revised 10 March 2021
Accepted 10 March 2021
Available online 18 March 2021
Keywords:
COVID-19
Mortality
Disparities
Race
Ethnicity
Nativity
a b s t r a c t
Purpose: To examine characteristics of coronavirus disease 2019 (COVID-19) decedents in California (CA)
and evaluate for disproportionate mortality across race/ethnicity and ethnicity/nativity.
Methods: COVID-19 deaths were identified from death certificates. Age-adjusted mortality rate ratios
(MRR) were compared across race/ethnicity. Proportionate mortality rates (PMR) were compared across
race/ethnicity and by ethnicity/nativity.
Results: We identified 10,200 COVID-19 deaths in CA occurring February 1 through July 31, 2020. The
most frequently observed characteristics among decedents were age 65 years or above, male, Hispanic,
foreign-born, and educational attainment of High School or below. MRR indicated elevated COVID-19
morality rates among Asian/Pacific Islander, Black, and Hispanic groups compared with the White group,
with Black and Hispanic groups having the highest MRR at 2.75 (95%CI: 2.54–2.97) and 4.18 (95%CI: 3.99–
4.37), respectively. Disparities were larger at younger ages. Similar results were observed with PMR, and
patterns of age-racial/ethnic disparities remained in analyses stratified by education. Elevated PMR were
observed in all ethnicity/nativity groups, especially foreign-born Hispanic individuals, relative to U.S.-born
non-Hispanic individuals. These were generally larger at younger ages and persisted after stratifying by
education.
Conclusions: Differential COVID-19 mortality was observed in California across racial/ethnic groups and
by ethnicity/nativity groups with evidence of greater disparities among younger age groups. Identifying
COVID-19 disparities is an initial step toward mitigating disease impacts in vulnerable communities.
© 2021 Elsevier Inc. All rights reserved.
l
n
I
m
p
C
S
L
o
o
t
9
h
1
Abbreviations: AI/AN, American Indian/Alaskan Native; A/PI, Asian/Pacific Is-
ander; CA, California; CCDF, California Comprehensive Death Files; CCMDF, Califor-
ia Comprehensive Master Death File; COVID-19, Coronavirus disease 2019; ICD-10,
nternational Statistical Classification of Diseases and Related Health Problems; MR,
ortality rates; MRR, mortality rate ratios; PM, proportionate mortality; PMR, pro-
ortionate mortality rates; U.S., United States.
Disclosures: Dr. Garcia reports grants from Keck School of Medicine of USC
OVID-19 Research Fund, grants from National Institute of Environmental Health
ciences, during the conduct of the study. Dr. Gilliland has nothing to disclose. Dr.
i has nothing to disclose. Dr. Eckel reports grants from Keck School of Medicine
f USC COVID-19 Research Fund, during the conduct of the study; grants from NIH,
utside the submitted work. Dr. Chen has nothing to disclose. ∗ Corresponding author. Keck School of Medicine of USC, Department of Preven-
ive Medicine, 2001 N. Soto Street, SSB1 Rm 225F MC 9237, Los Angeles, CA 90089-
237. Tel.: + 1-323-442-1092.
E-mail address: [email protected] (E. Garcia).
I
p
m
e
m
s
t
a
s
(
c
h
w
ttps://doi.org/10.1016/j.annepidem.2021.03.006
047-2797/© 2021 Elsevier Inc. All rights reserved.
ntroduction
There is a growing body of literature on the differential im-
acts of the coronavirus disease 2019 (COVID-19) in historically
arginalized groups in the United States (U.S.), including dis-
ase incidence [1-3] , hospitalization [4-8] , severity [ 5 , 9 , 10 ], and
ortality [ 3-5 , 11-13 ]. Identifying COVID-19 disparities is an initial
tep toward mitigating disease impacts in vulnerable communi-
ies. Much of the current evidence, however, has relied on ecologic
nalyses using aggregate data for both the characteristic under
tudy (e.g., percentage Black in a county) and COVID-19 outcome
e.g., county-level mortality) [ 1 , 3 , 11 , 13-15 ]. Studies that have been
onducted with individual-level data are primarily derived from
ospital/healthcare networks or insurance companies [ 2 , 4 , 6 , 7 , 9 , 16 ],
hich may not be representative of COVID-19 impacts in the gen-

E. Garcia, S.P. Eckel, Z. Chen et al. Annals of Epidemiology 58 (2021) 69–75
e
a
d
c
f
s
t
f
p
w
a
o
n
a
e
m
t
a
c
i
a
S
a
t
d
g
t
a
c
M
S
a
t
C
C
t
a
a
b
n
i
p
c
n
o
U
H
w
j
C
S
1
d
C
w
d
a
t
d
(
d
9
C
S
p
t
s
m
p
2
a
a
N
t
u
r
d
g
r
t
e
a
g
w
d
M
2
fi
a
M
o
r
a
r
a
w
f
b
t
d
a
b
f
c
m
P
i
r
m
s
b
c
o
R
F
ral population given barriers to healthcare access and insurance
mong historically marginalized groups. Use of death certificate
ata allows for investigation into individual-level characteristics,
aptures all individuals in the catchment area, and does not suf-
er from substantial under-reporting of key characteristics as was
een for race/ethnicity information for COVID-19 decedents early in
he pandemic. It is important to note that any disparities observed
or COVID-19 morality are an accumulation of disproportionate im-
acts along the entire continuum of COVID-19 disease, beginning
ith exposure to the virus and culminating in death. The mech-
nisms and magnitudes of disparities likely differ for each step
f the disease pathway [17] . Appropriate estimates of disease are
eeded, not only by single factors, such as racial/ethnic group, but
lso by intersections with other factors, such as with age, sex, and
ducational attainment, which considers that groups are not ho-
ogenous and indeed reflect diverse experiences and impacts of
he pandemic [18-20] . Intersectional analysis allows for a more nu-
nced understanding of disparate burden of COVID-19, which is
rucially needed to design and implement effective public health
nterventions to mitigate disease impacts.
The objective of this study was to examine demographic char-
cteristics of COVID-19 decedents in California (CA)—which as of
eptember 2020 is among the hardest hit states in terms of cases
nd deaths [21] —and evaluate for disproportionate mortality across
hese characteristics. In addition to descriptive information on
ecedents, COVID-19 mortality was compared across racial/ethnic
roups considering age, sex, and education using mortality rate ra-
ios (MRR) and proportionate mortality ratios (PMR). We also ex-
mined COVID-19 mortality by ethnicity and nativity combined,
onsidering age and education, with PMR.
ethods
tudy setting and population
Data on causes of death, race/ethnicity, sex, age, educational
ttainment, country of birth, and county of residence were ob-
ained using the California Comprehensive Death Files (CCDF) and
alifornia Comprehensive Master Death File (CCMDF) from the
alifornia Department of Public Health, Center for Health Statis-
ics and Informatics for 2016 to 2020 (CCMDF for 2016–2018
nd CCDF for 2019–2020). Data for 2020 were updated weekly
nd last date of data export used in this analysis was Septem-
er 9, 2020. Race/ethnicity were grouped into non-Hispanic White,
on-Hispanic Black, Asian/Pacific Islander (regardless of Hispanic-
ty; Asian/PI), American Indian/Alaskan Native (regardless of His-
anicity; AI/AN), Hispanic (excludes A/PI, AI/AN), and Multira-
ial/Other/Unknown. County of birth was used to define decedents’
ativity status, categorized as U.S.-born or foreign-born. Categories
f ethnicity and nativity combined were U.S.-born non-Hispanic,
.S.-born Hispanic, Foreign-born non-Hispanic, and Foreign-born
ispanic, using Hispanicity as defined for race/ethnicity. This study
as approved by the Committee for the Protection of Human Sub-
ects of the state of CA.
OVID-19-related deaths
Mortality data included the 10th revision of the International
tatistical Classification of Diseases and Related Health Problems (ICD-
0) codes for underlying cause of death and up to 20 relevant con-
itions. Effective April 1, 2020, there was a new ICD-10 code for
OVID-19, U07.1; however, because we used the dynamic CCDF file
ith weekly updates for recent mortality, final coded data on un-
erlying cause of death and relevant conditions were not avail-
ble for all 2020 deaths. Thus, we developed an algorithm using
he code U07.1 and a keyword search to identify COVID-19-related
70
eaths and applied it to all deaths occurring after February 1, 2020
e Fig. 1 ). Among deaths with coded data on underlying cause of
eath and relevant conditions, our algorithm correctly identified
9.95% of deaths coded with U07.1. Analyses were restricted to
OVID-19-related deaths occurring February 1-July 31, 2020.
tatistical analysis
Temporal trends in COVID-19 mortality in CA during the study
eriod are presented. Descriptive statistics among decedents iden-
ified as having COVID-19 mortality were presented for the entire
tudy period as well as for subperiods with distinct patterns in
ortality (i.e., distinct “epidemic periods”).
COVID-19 age-adjusted mortality rates (MR) per 10 0,0 0 0
erson-years were calculated using direct standardization to the
019 CA population using 5-year age intervals and were compared
cross racial/ethnic groups using mortality rate ratios (MRR) by sex
nd epidemic period, accounting for variation in observation time.
on-Hispanic White was used as the referent group. Population es-
imates were obtained from the CDC WONDER Online Database
sing the Bridged-Race Population Estimates for CA [22] and
acial/ethnic groups were combined to align with the categories
escribed above (does not include “Multiracial/Other/Unknown”
roup). Age-adjusted MR were also calculated and compared across
acial/ethnic groups using MRR for selected counties with greater
han 500 COVID-19 deaths using 2019 county-specific population
stimates for both population and direct standardization. COVID-19
ge-specific MR were calculated and compared across racial/ethnic
roups using MRR by age groups (excluding 0–19 years category,
hich had only 5 deaths) and sex.
Analyses using proportionate mortality (PM) were restricted to
eaths among decedents aged 20 years and older and occurring
arch 1-July 31 (only 2 COVID-19 deaths occurred before March 1,
020). PM was defined as number of COVID-19 deaths in a speci-
ed subpopulation (e.g., a certain racial/ethnic group) divided by
verage all-cause mortality in the same subpopulation occurring
arch 1-July 31 in 2016–2019 among decedents aged 20 years and
lder (multiplied by 100 to be akin to a percentage). The PM met-
ic allows for COVID-19 mortality to be interpreted as a percent-
ge of “typical” mortality in a group. Mortality for past years was
estricted to match the time frame for 2020 COVID-19 deaths to
ccount for annual trends in mortality. All-cause mortality in 2020
as not used as the reference, which would have been common
or PM. This is because evidence suggests all-cause mortality has
een affected by the pandemic not only through COVID-19 mor-
ality [23] . PM ratios (PMR) were used to compare across dece-
ent characteristics, including racial/ethnic group, sex, educational
ttainment, and ethnicity and nativity combined, as well as com-
inations of these. Educational attainment may serve as a proxy
or socioeconomic status which is linked with healthcare access,
o-morbidities, and other factors such as employment type that
ay impact COVID-19 infection and mortality [24-27] . Because the
MR metric relies on all-cause mortality, we additionally exam-
ned differences in all-cause mortality rates for 2019 by age among
acial/ethnic groups using 2019 death data and population esti-
ates.
All analyses were performed using SAS statistical software ver-
ion 9.4 (SAS Institute Inc., Cary, NC) and statistical tests were
ased on 2-sided tests with α = 0.05. Standard errors and 95%
onfidence intervals (95%CI) were computed using standard meth-
ds (see eMethods) [28] .
esults
We identified 10,200 COVID-19 deaths occurring in CA between
ebruary 1 and July 31, 2020. Distinct temporal patterns in weekly

E. Garcia, S.P. Eckel, Z. Chen et al. Annals of Epidemiology 58 (2021) 69–75
Fig. 1. Age-standardized COVID-19 mortality rates for all ages and select ages by race/ethnicity. Mortality rates are per 10 0,0 0 0 person-years. Bars represent 95% confidence
intervals.
m
(
t
d
s
d
p
D
l
p
i
M
u
(
a
p
a
e
(
t
B
s
t
4
r
a
3
w
8
t
d
t
A
8
(
P
c
d
i
s
t
a
a
l
h
b
i
t
f
h
m
i
l
P
i
v
b
(
A
ortality identified three periods in the COVID-19 epidemic in CA
e Fig. 2 ): the first period, through April 19, had an upward trend;
he second period, April 20–June 16, demonstrated a steady slight
ecline; the third period, June 17-July 31, had an upward trend
imilar to the first period. Distribution of characteristics among
ecedents with COVID-19 mortality are shown for the entire study
eriod ( Table 1 ) and by the three epidemic periods (e Table 1 ).
ecedents were consistently older, more likely to be male, had
ower educational attainment, and most were foreign-born. His-
anic was the predominant race/ethnicity among decedents, which
ncreased proportionately during the epidemic.
ortality rate ratios
Morality rates were considerably higher among older individ-
als, but with differences observed across racial/ethnic groups
Fig. 1 ). Compared with the White group, MRR were elevated
mong Asian/PI, Black, and Hispanic groups, with Black and His-
anic groups having the highest MRR at 2.75 (95%CI: 2.54–2.97)
nd 4.18 (95%CI: 3.99–4.37), respectively ( Fig. 2 and e Fig. 3 ;
Table 2 ). This pattern persisted within each epidemic period
e Fig. 3 ). Analyses by county of residence for counties with greater
han 500 COVID-19 deaths (Los Angeles, Orange, Riverside, San
ernardino, and San Diego Counties) showed that while there were
ome differences in specific MRRs estimated by racial/ethnic group,
he overall pattern of COVID-19 mortality disparity persisted (eFig.
).
Age-specific MRR revealed greater differences among
acial/ethnic groups, with greater disproportionate mortality
mong younger Black and Hispanic individuals ( Fig. 2 ; eTable
). Compared with White individuals aged 20–54 years, the MR
as 4.7-fold (95%CI: 3.5–6.3) higher among Black individuals and
.5-fold (95%CI: 6.9–10.4) higher among Hispanic individuals of
he same age. When examined by sex, disparities observed among
71
ecedents aged less than 84 years were higher among females in
he Black group and among males in the Hispanic group. In the
sian/PI group, mortality disparity was greatest among those aged
5 year or more, with the largest MRR observed for females, 1.70
95%CI: 1.50–1.93).
roportionate mortality
Univariate analyses using PMR found elevated PM in males
ompared with females, in all non-White racial/ethnic groups, in
ecedents with lower educational attainment, and in all ethnic-
ty/nativity groups relative to U.S.-born non-Hispanic (eTable 4).
Analyses comparing across racial/ethnic groups by age demon-
trated greater disparities among younger decedents, similar to
hose observed with MRR (eTable 5). Elevated PMR persisted in
nalyses stratified by education ( Fig. 3 ; eTable 6). For example,
mong decedents aged 20–64 years with high school education or
ess, the PM in the Hispanic group was 8.5-fold (95%CI: 7.4–9.9)
igher compared with the White group. For the same age group,
ut among those with some college or more, the PMR for Hispan-
cs remained highly elevated at 7.0 (95%CI: 5.8–8.6). All-cause mor-
ality rates for 2019 were lower compared with the White group
or all racial/ethnic group, except the Black group which were
igher. This may lead PMR to over or underestimate true COVID-19
ortality disparities which should be considered when interpret-
ng these results These differences, however, were not sufficiently
arge to explain away all disparities observed (eFig. 5). Adjusting
MR for differences in all-cause mortality produces estimates sim-
lar to MRR reported above (eTable 7).
When examining ethnicity and nativity combined by age, ele-
ated PMR were observed for all groups, especially for the foreign-
orn Hispanic group, relative to the U.S.-born non-Hispanic group
eTable 8). PMR were generally larger among younger age groups.
fter accounting for educational attainment by stratification, el-

E. Garcia, S.P. Eckel, Z. Chen et al. Annals of Epidemiology 58 (2021) 69–75
Fig. 2. Age-standardized COVID-19 mortality rate ratios for all ages and select ages by race/ethnicity. Bars represent 95% confidence intervals. Referent group is non-Hispanic
Whites.
Fig. 3. Proportionate mortality ratios for COVID-19 by race/ethnicity, age, and educational attainment. Proportionate mortality ratios are based on COVID-19 deaths occurring
between March 1-July 31, 2020 among decedents aged 20 years and older. Subpopulation proportionate mortalities were calculated using all-cause mortality in the same
subpopulation occurring March 1–July 31 in 2016–2019 among decedents aged 20 years and older. Bars represent 95% confidence intervals. Referent group for PMR is
non-Hispanic White.
72

E. Garcia, S.P. Eckel, Z. Chen et al. Annals of Epidemiology 58 (2021) 69–75
Table 1
Distribution of selected characteristics among dece-
dents identified as having COVID-19 mortality, Cali-
fornia, February 1–July 31, 2020
N (%)
Deaths 10,200
Age
0–19 5 (0.1)
20–44 421 (4.1)
45–54 710 (7.0)
55–64 1467 (14.4)
65–74 2222 (21.8)
75–84 2450 (24.0)
85 or older 2925 (28.7)
Sex
Male 5914 (58.0)
Female 4286 (42.0)
Race/ethnicity
Hispanic (excludes A/PI, AI/AN) 4914 (48.2)
Mexican 3333 (67.8)
Other Hispanic 1581 (32.2)
NH White 3025 (29.7)
Asian/Pacific Islander 1290 (12.7)
Filipino 441 (34.2)
Chinese 251 (19.5)
Korean 207 (16.1)
Vietnamese 97 (7.5)
Japanese 82 (6.4)
Other Asian 212 (16.4)
Black 804 (7.9)
Multiracial/other/unknown 124 (1.2)
American Indian/Alaskan Native 43 (0.4)
Educational Attainment
Less than high school 3637 (35.7)
High school 3027 (29.7)
Some college 1040 (10.2)
Associate degree 478 (4.7)
Bachelor’s degree 966 (9.5)
Graduate degree 499 (4.9)
Unknown 553 (5.4)
Country of birth
United States 4413 (43.3)
Mexico 2942 (28.8)
Philippines 442 (4.3)
El Salvador 364 (3.6)
Guatemala 219 (2.2)
South Korea 195 (1.9)
Other country 1302 (12.8)
Unknown 323 (3.2)
e
y
n
w
c
D
w
c
r
t
C
B
i
c
c
f
t
l
s
y
l
o
t
t
m
p
m
c
y
t
u
v
r
s
p
v
p
w
g
r
Table 2
Proportionate mortality (PM) and proportionate mortality ratio (PMR) by ethnicity and
decedents aged 20 years and older, California, March 1–July 31, 2020
High school or less
Ethnicity and nativity combined Age COVID-19 Deaths PM (95% CI) a
U.S.-born non-Hispanic 20 to 64 295 3.6 (3.2–4.0)
65 to 74 309 5.7 (5.1–6.3)
75 to 84 441 6.1 (5.6–6.7)
85 < = 602 4.9 (4.6–5.3)
U.S.-born Hispanic 20 to 64 272 10.1 (9.0–11.4)
65 to 74 170 18.1 (15.6–21.1)
75 to 84 166 14.0 (12.0–16.3)
85 < = 236 12.1 (10.7–13.8)
Foreign-born non-Hispanic 20 to 64 84 6.7 (5.4–8.4)
65 to 74 109 9.3 (7.7–11.2)
75 to 84 224 10.0 (8.8–11.4)
85 < = 506 12.1 (11.1–13.2)
Foreign-born Hispanic 20 to 64 1177 38.7 (36.6–41.0)
65 to 74 792 45.2 (42.1–48.4)
75 to 84 691 32.4 (30.1–35.0)
85 < = 547 23.7 (21.8–25.8)
a Subpopulation PM were calculated using all-cause mortality in the same subpopulat
older.
73
vated PMR remained ( Table 2 ). Among decedents aged 20–64
ears, PMR for foreign-born Hispanic compared with U.S.-born
on-Hispanic among those with a high school education or less
as PMR = 10.7 (95%CI: 9.5–12.1), while among those with some
ollege or more was PMR = 8.4 (95%CI: 6.9–10.1).
iscussion
This study used death certificate data to identify decedents
ith COVID-19 mortality in CA and to investigate demographic
haracteristics associated with mortality using two different met-
ics of association, MRR and PMR. Disproportionate COVID-19 mor-
ality was observed among Black, Hispanic, and Asian/PI groups in
A. Larger relative disparities were observed at younger ages for
lack and Hispanic individuals. Disparities persisted after account-
ng for educational attainment, serving here as a proxy for socioe-
onomic status. Disproportionate mortality was also observed by
ombinations of ethnicity and nativity, with all groups (especially
oreign-born Hispanic individuals) having greater COVID-19 mor-
ality compared with U.S.-born non-Hispanic individuals, particu-
arly at younger ages. Disparities by nativity remained in analy-
es controlling for educational attainment. The larger disparities in
ounger age groups are particularly important given younger popu-
ations may be overlooked in public health campaigns due to their
verall lower risk of severe disease. Here, however, we observed
he mortality rate for Black individuals aged 55–64 to be higher
han mortality rate for White individuals 10 years older, and the
ortality rate for Hispanic individuals aged 55–64 years to be ap-
roaching mortality rate for White individuals 20 years older. The
uch larger disparities observed in MRR for Hispanic individuals
ompared with Black individuals, for all ages but particularly for
ounger ages, are likely driven in part by the high COVID-19 mor-
ality observed for foreign-born Hispanic individuals. Younger pop-
lations should be included among targets in public health inter-
entions. Disparities in COVID-19 mortality may be driven by a va-
iety of factors, including complex interaction between social and
tructural determinates of health, barriers to accessing care, higher
revalence of underlying co-morbidities associated with more se-
ere COVID-19 disease and adverse outcomes, and differential ex-
osure to virus due to working and living conditions [ 24 , 29-34 ]—
hich maybe different and interact differently among the different
roups (race/ethnicity and ethnicity/nativity) and subgroups (age-
ace/ethnicity and age-ethnicity/nativity groups) examined here.
nativity combined, age, and educational attainment for COVID-19 deaths among
Some college or more
PMR (95% CI) COVID-19 Deaths PM (95% CI) a PMR (95% CI)
Referent 223 3.1 (2.7–3.5) Referent
Referent 315 4.3 (3.8–4.8) Referent
Referent 468 5.4 (4.9–5.9) Referent
Referent 532 4.4 (4.0–4.8) Referent
2.81 (2.40–3.29) 130 10.4 (8.8–12.4) 3.40 (2.76–4.18)
3.20 (2.69–3.80) 67 13.0 (10.2–16.5) 3.06 (2.39–3.92)
2.29 (1.94–2.71) 40 9.2 (6.8–12.6) 1.71 (1.26–2.33)
2.46 (2.13–2.84) 33 8.6 (6.1–12.1) 1.96 (1.40–2.74)
1.87 (1.48–2.37) 138 7.9 (6.7–9.3) 2.57 (2.09–3.16)
1.63 (1.32–2.01) 180 11.5 (10.0–13.4) 2.71 (2.27–3.23)
1.63 (1.40–1.90) 207 9.5 (8.3–10.9) 1.77 (1.51–2.07)
2.46 (2.20–2.75) 265 10.1 (8.9–11.4) 2.30 (1.99–2.64)
10.73 (9.51–12.11) 161 25.6 (21.9–29.9) 8.35 (6.93–10.05)
7.96 (7.06–8.98) 94 31.5 (25.7–38.5) 7.39 (6.06–9.02)
5.31 (4.76–5.92) 59 19.2 (14.9–24.7) 3.55 (2.78–4.54)
4.80 (4.31–5.34) 50 15.2 (11.5–20.0) 3.46 (2.64–4.52)
ion occurring March 1–July 31 in 2016–2019 among decedents aged 20 years and

E. Garcia, S.P. Eckel, Z. Chen et al. Annals of Epidemiology 58 (2021) 69–75
t
t
d
B
w
a
[
o
1
u
o
f
f
h
a
s
I
C
f
l
c
s
p
s
a
c
p
c
A
p
w
i
r
i
d
t
B
r
w
B
i
i
t
e
l
i
i
A
j
a
b
s
a
B
t
a
t
a
t
e
d
t
c
c
i
c
a
b
t
a
H
g
i
p
d
t
H
p
s
i
w
H
w
[
e
h
[
e
m
t
c
n
c
a
o
d
v
e
c
m
t
i
H
a
i
a
d
i
P
b
i
p
i
m
1
w
d
F
w
i
f
d
s
e
i
h
j
d
Differences in COVID-19 mortality can develop anywhere along
he disease continuum from exposure, to incidence, severity, and
hen ultimately death. The mechanisms and magnitude of these
ifference are likely different for different groups (e.g., younger
lack group, older Asian/PI, etc.) at different points along the path-
ay. Several studies have reported differential COVID-19 impacts
cross racial/ethnic groups including for incidence [ 1 , 35 ], severity
4-6 , 8-10 ], death [ 12 , 13 , 27 ], however few studies have examined
utcomes by nativity [36] . Ecologic studies have reported COVID-
9 incidence rates to be positively associated with higher pop-
lation percentage Black [ 14 , 26 , 37 ], Hispanic/Latino [ 15 , 26 , 34 , 37 ],
r foreign-born [ 26 , 37 ]. In a Massachusetts study the association
or Latino population percentage was attenuated after accounting
or percent foreign-born noncitizens living in a community, mean
ousehold size, and share of food service workers (all which were
lso positively associated with incidence) [37] . In contrast, the as-
ociation for Black population percentage was not attenuated [37] .
n a study across 22 states, a disproportionate number of incident
OVID-19 cases relative to population demographics was reported
or Hispanic, Black, AI/AN, Asian, and Native Hawaiian/Pacific Is-
ander individuals in counties considered hotspots for COVID-19 in-
idence [1] . Healthcare system-based studies have reported greater
evere acute respiratory syndrome coronavirus 2 testing and test
ositivity rate for non-English speakers compared with English-
peakers [36] and higher odds of infection for non-Hispanic Black
nd Hispanic individuals adjusting for demographic and socioe-
onomic characteristics [35] . Higher hospitalization has been re-
orted for Black and Hispanic patients, even after adjusting for
o-morbidities and demographic and socioeconomic factors [ 4 , 6 , 8 ].
mong patients hospitalized with COVID-19 infection, non-White
atients were more likely to present with higher disease severity,
hich was associated with worse outcomes [10] .
These disproportionate effects in disease incidence and sever-
ty contribute to COVID-19 mortality disparities, which have been
eported based on aggregate data or healthcare system-based stud-
es for Black and Hispanic individuals. A study using aggregate
ata on COVID-19 from regions across the U.S. report dispropor-
ionately higher COVID-19 mortality relative to population size for
lack individuals and higher estimated case-fatality [12] . Among
ural counties, average daily increase in COVID-19 mortality rates
ere significantly higher in counties with the largest shares of
lack and Hispanic residents [13] . A study using electronic med-
cal record data from 24 healthcare organization reported Black
ndividuals having a greater odds of COVID-19 mortality, even af-
er controlling for age, sex, and several co-morbidities [27] . Differ-
nces between Black and White individuals were larger in those
ess than 50 years of age, similar to larger MRR and PMR observed
n younger age groups in the present study. Not all studies examin-
ng race/ethnicity have observed difference in COVID-19 mortality.
large study using data from 92 U.S. hospitals found that after ad-
usting for a variety of factors including comorbidities, insurance,
nd neighborhood deprivation there was no difference in mortality
etween Black and White patients with COVID-19 [7] . Similarly, a
tudy in Louisiana found that after adjusting for sociodemographic
nd clinical factors, in-hospital mortality was not different between
lack and White patients [4] . It may be that once COVID-19 pa-
ients are ill to the point of hospitalization, differences in mortality
re less appreciable. Overall, this evidence taken together supports
he notion that mortality differences across racial/ethnic groups
nd by ethnicity/nativity reported in the present study are likely
he cumulative effects across the entire pathway of disease.
Quantification of COVID-19 mortality disparities is needed so
ffective public health interventions can be developed to mitigate
isproportionate burden of the pandemic on vulnerable popula-
ions [38] . Factors that may contribute to mortality disparities and
ould be targets for interventions include barriers to healthcare ac-
74
ess including medical mistrust and insurance, living and work-
ng conditions, being essential/frontline workers, underlying health
onditions including suboptimal disease management, and social
nd structural determinants of health [ 24 , 29-33 , 39 ]. Interactions
etween structural, social, and individual factors that contribute
o differential COVID-19 mortality are complex and vary not only
cross these different historically marginalized groups (e.g., Black,
ispanic, Asian/PI, foreign-born Hispanic), but also within these
roups (e.g., younger and older Hispanic individuals). Public health
nterventions and policies should consider the differing and com-
lex risk structure across and within these groups. For example,
ifferential workplace exposure may contribute to increased mor-
ality among younger Black and Hispanic, including foreign-born
ispanic, individuals. People of color are more likely to be em-
loyed in essential industries and in occupations with more expo-
ure to infections and close proximity to others [30] . Black workers
n particular face an elevated risk for these factors [30] . A study of
orkplace COVID-19 outbreaks in Utah found 73% of cases were in
ispanic or non-White workers, whereas Hispanic and non-White
orkers represent only 24% of the workforce in affected industries
33] . Immigrant families faced additional complicating factors (e.g.,
mployment in jobs with higher potential exposure, no/inadequate
ealth insurance and paid leave, multigenerational housing, etc.
40 , 41 ]) which must be considered for public health planning. For
xample public charge regulations may have disincentivized im-
igrant families from accessing healthcare if they become symp-
omatic [ 40 , 41 ]. This delays testing and treatment and may in-
rease disease transmission risk within their home and commu-
ities [ 40 , 41 ].
This study has limitations. First, while use of death certifi-
ate data has many advantages, there were a limited number of
vailable demographic and socioeconomic variables. Augmentation
f these data with neighborhood characteristics based on dece-
ent residential address is an area of future work. Second, the
ariable related to socioeconomic position used in this analysis—
ducational attainment—is only one dimension of person’s socioe-
onomic status and does not fully capture this complex deter-
inant of health. Further, there may be misreporting of educa-
ional attainment on death certificates, with prior studies find-
ng higher underreporting of educational attainment for Black and
ispanic decedents compared with White decedents [42] . This is
lso likely for foreign-born individuals. Any differential misreport-
ng, however, would be expected to lead to less misclassification
mong Black and Hispanic (and possibly also foreign-born) dece-
ents categorized as “Some college or more” yet large mortal-
ty disparities persisted in stratified analyses. Third, PM, and thus
MR, uses as a comparison all-cause mortality, which if different
etween groups may over or underestimate differences in mortal-
ty between groups. When all-cause mortality rates are lower com-
ared with the referent group, PMR will overestimate differences
n COVID-19 mortality, but as discussed differences in all-cause
ortality rates were not sufficient to explain all observed COVID-
9 disparities. When all-cause mortality rates are higher, such as
as observed for Black individuals, the PMR will underestimate
ifferences COVID-19 mortality. This study has several strengths.
irst, to identify COVID-19 mortality we used death certificate data
hich captures all mortality in the state and does not restrict to
ndividuals in a healthcare/insurance network. Second, we had in-
ormation on individual-level demographic characteristics on dece-
ents, which was advantageous in two regards: (i) there was sub-
tantial under-reporting of race/ethnicity for COVID-19 decedents
arly in the pandemic and there is still a lack of reporting by nativ-
ty, which precludes analyses by these factors, and (ii) we did not
ave to rely on aggregate demographic data which could be sub-
ect to the ecologic fallacy. Third, because of this individual-level
ata we were able to examine mortality by several demographic

E. Garcia, S.P. Eckel, Z. Chen et al. Annals of Epidemiology 58 (2021) 69–75
f
o
C
a
w
P
t
m
i
p
t
A
r
t
s
d
R
[
[
[
[
[
[
[
[
[
[
[
[
[
[
[
[
[
[
[
[
[
[
[
[
actors in combination to better understand intersectional impacts
f COVID-19.
onclusions
Differential COVID-19 mortality was observed in California
cross racial/ethnic groups and by ethnicity and nativity combined,
ith evidence of greater disparities among younger age groups.
atterns of disparities persisted after accounting for educational at-
ainment. Drivers of these disparate COVID-19 impacts are likely
ultifactorial and involve the interplay of structural, social, and
ndividual factors that must be considered in the design and im-
lementation for public health interventions to effectively mitigate
he impacts of this disease.
cknowledgments
This research was supported by the National Institute of Envi-
onmental Health Sciences ( P30ES007048 ), the Hastings Founda-
ion, and by the Keck School of Medicine of USC COVID-19 Re-
earch Fund through a generous gift from the W. M. Keck Foun-
ation.
eferences
[1] Moore JT , Ricaldi JN , Rose CE , Fuld J , Parise M , Kang GJ , et al. Disparities in in-
cidence of COVID-19 among underrepresented racial/ethnic groups in counties
identified as hotspots during June 5-18, 2020 - 22 States, February-June 2020. MMWR Morb Mortal Wkly Rep 2020;69(33):1122–6 .
[2] Rozenfeld Y , Beam J , Maier H , Haggerson W , Boudreau K , Carlson J , et al. Amodel of disparities: risk factors associated with COVID-19 infection. Int J Eq-
uity Health 2020;19(1):126 . [3] Adhikari S , Pantaleo NP , Feldman JM , Ogedegbe O , Thorpe L , Troxel AB . Assess-
ment of community-level disparities in coronavirus disease 2019 (COVID-19)
infections and deaths in large US metropolitan areas. JAMA Network Open 2020;3(7):e2016938 .
[4] Price-Haywood EG , Burton J , Fort D , Seoane L . Hospitalization and mortal-ity among Black patients and White patients with Covid-19. N Engl J Med
2020;382(26):2534–43 . [5] Poulson M , Geary A , Annesi C , Allee L , Kenzik K , Sanchez S , et al. National
disparities in COVID-19 outcomes between Black and White Americans. J Natl
Med Assoc 2020 . [6] Azar KMJ , Shen Z , Romanelli RJ , Lockhart SH , Smits K , Robinson S , et al. Dis-
parities in outcomes among COVID-19 patients in a large health care system
in California. Health Aff (Millwood) 2020;39(7):1253–62 .
[7] Yehia BR , Winegar A , Fogel R , Fakih M , Ottenbacher A , Jesser C , et al. As-sociation of race with mortality among patients hospitalized with coron-
avirus disease 2019 (COVID-19) at 92 US hospitals. JAMA Network Open
2020;3(8):e2018039 . [8] Karaca-Mandic P , Georgiou A , Sen S . Assessment of COVID-19 hospitalizations
by race/ethnicity in 12 states. JAMA Intern Med 2021;181(1):131–4 . [9] Ebinger JE , Achamallah N , Ji H , Claggett BL , Sun N , Botting P , et al. Pre-ex-
isting traits associated with Covid-19 illness severity. PLoS ONE 2020;15(7):e0236240 .
[10] Joseph NP , Reid NJ , Som A , Li MD , Hyle EP , Dugdale CM , et al. Racial and eth-
nic disparities in disease severity on admission chest radiographs among pa- tients admitted with confirmed coronavirus disease 2019: a retrospective co-
hort study. Radiology 2020;297(3):E303–12 . [11] Mahajan UV , Larkins-Pettigrew M . Racial demographics and COVID-19 con-
firmed cases and deaths: a correlational analysis of 2886 US counties. J Public Health (Oxford, England) 2020;42(3):445–7 .
12] Holmes L Jr , Enwere M , Williams J , Ogundele B , Chavan P , Piccoli T , et al. Black-
White risk differentials in COVID-19 (SARS-COV2) transmission, mortality and case fatality in the United States: translational epidemiologic perspective and
challenges. Int J Environ Res Public Health 2020;17(12):4322 . [13] Cheng KJG , Sun Y , Monnat SM . COVID-19 death rates are higher in rural coun-
ties with larger shares of Blacks and Hispanics. J Rural Health: official journal of the American Rural Health Association and the National Rural Health Care
Association 2020;36(4):602–8 . [14] Millett GA , Jones AT , Benkeser D , Baral S , Mercer L , Beyrer C , et al. Assess-
ing differential im pacts of COVID-19 on black communities. Ann Epidemiol
2020;47:37–44 . [15] Rodriguez-Diaz CE , Guilamo-Ramos V , Mena L , Hall E , Honermann B , Crow-
ley JS , et al. Risk for COVID-19 infection and death among Latinos in theUnited States: examining heterogeneity in transmission dynamics. Ann Epi-
demiol 2020;52:46-53 e42 .
75
[16] Alobuia WM , Dalva-Baird NP , Forrester JD , Bendavid E , Bhattacharya J , Ke-bebew E . Racial disparities in knowledge, attitudes and practices related to
COVID-19 in the USA. J Public Health (Oxford, England) 2020;42(3):470–8 . [17] Holtgrave DR , Barranco MA , Tesoriero JM , Blog DS , Rosenberg ES . Assessing
racial and ethnic disparities using a COVID-19 outcomes continuum for New
York State. Ann Epidemiol 2020;48:9–14 .
[18] Hankivsky O , Kapilashrami A . Beyond sex and gender analysis: an intersec- tional view of the COVID-19 pandemic outbreak and response. London, UK:
Global Policy Institute, Queen Mary University of London; 2020 .
[19] Crenshaw K . Mapping the margins: Intersectionality, identity politics, and vio- lence against women of color. Stan L Rev 1990;43:1241 .
20] Collins PH . Intersectionality’s definitional dilemmas. Annu Rev Sociol 2015;41:1–20 .
21] Dong E , Du H , Gardner L . An interactive web-based dashboard to trackCOVID-19 in real time. Lancet Infect Dis 2020;20(5):533–4 .
22] United States Department of Health and Human Services (US DHHS), Centers
for Disease Control and Prevention (CDC), National Center for Health Statis- tics (NCHS), Bridged-Race Population Estimates, United States July 1st res-
ident population by state, county, age, sex, bridged-race, and Hispanic ori- gin. Compiled from 1990-1999 bridged-race intercensal population estimates
(released by NCHS on 7/26/2004); revised bridged-race 20 0 0-20 09 inter- censal population estimates (released by NCHS on 10/26/2012); and bridged-
race Vintage 2019 (2010-2019) postcensal population estimates (released by
NCHS on 7/9/2020). CDC WONDER Online Database. http://wonder.cdc.gov/ bridged- race- v2019.html . Accessed Sep 2, 2020.
23] Weinberger DM , Chen J , Cohen T , Crawford FW , Mostashari F , Olson D ,et al. Estimation of excess deaths associated with the COVID-19 pan-
demic in the United States, March to May 2020. JAMA Intern Med 2020;180(10):1336–44 .
24] Dorn AV , Cooney RE , Sabin ML . COVID-19 exacerbating inequalities in the US.
Lancet 2020;395(10232):1243–4 . 25] Abedi V , Olulana O , Avula V , Chaudhary D , Khan A , Shahjouei S , et al. Racial,
economic, and health inequality and COVID-19 infection in the United States. J Racial Ethn Health Disparities 2020:1–11 .
26] Maroko AR , Nash D , Pavilonis BT . COVID-19 and inequity: a comparative spatialanalysis of New York city and chicago hot spots. J Urban Health: Bull New York
Acad Med 2020;97(4):461–70 .
27] Harrison SL , Fazio-Eynullayeva E , Lane DA , Underhill P , Lip GYH . Comor-bidities associated with mortality in 31,461 adults with COVID-19 in the
United States: A federated electronic medical record analysis. PLoS Med 2020;17(9):e1003321 .
28] Greenland S , Rothman KJ . Ch. 14: Introduction to Categorical Statistics. In: Rothman KJ, Greenland S, Lash TL, editors. Modern Epidemiology. 3rd ed.
Philadelphia, PA: Lippincott Williams & Wilkins (LWW); 2008. p. 238–57 .
29] Chamie G , Marquez C , Crawford E , Peng J , Petersen M , Schwab D , et al. SARS–CoV-2 community transmission disproportionately affects Latinx population
during Shelter-in-Place in San Francisco. Clin Infect Dis 2020 Epub ahead of print .
30] Hawkins D . Differential occupational risk for COVID-19 and other infection ex- posure according to race and ethnicity. Am J Ind Med 2020;63(9):817–20 .
31] Tai DBG , Shah A , Doubeni CA , Sia IG , Wieland ML . The Disproportionate Impactof COVID-19 on Racial and Ethnic Minorities in the United States. Clin Infect
Dis 2021;72(4):703–6 .
32] Evans MK . Covid’s Color Line - Infectious Disease, Inequity, and Racial Justice. N Engl J Med 2020;383(5):408–10 .
33] Bui DP , McCaffrey K , Friedrichs M , LaCross N , Lewis NM , Sage K , et al. Racialand Ethnic Disparities Among COVID-19 Cases in Workplace Outbreaks by In-
dustry Sector - Utah, March 6-June 5, 2020. MMWR Morb Mortal Wkly Rep 2020;69(33):1133–8 .
34] Vijayan T , Shin M , Adamson PC , Harris C , Seeman T , Norris KC , et al. Beyond
the 405 and the 5: geographic variations and factors associated with SARS–CoV-2 positivity rates in Los Angeles County. Clin Infect Dis 2020 Epub ahead
of print . 35] Vahidy FS , Nicolas JC , Meeks JR , Khan O , Pan A , Jones SL , et al. Racial
and ethnic disparities in SARS-CoV-2 pandemic: analysis of a COVID-19 ob- servational registry for a diverse US metropolitan population. BMJ Open
2020;10(8):e039849 .
36] Kim HN , Lan KF , Nkyekyer E , Neme S , Pierre-Louis M , Chew L , et al. Assess-ment of disparities in COVID-19 testing and infection across language groups
in seattle, Washington. JAMA Network Open 2020;3(9):e2021213 . 37] Figueroa JF , Wadhera RK , Lee D , Yeh RW , Sommers BD . Community-level fac-
tors associated with racial and ethnic disparities in COVID-19 rates in Mas- sachusetts. Health Aff (Millwood) 2020;39(11):1984–92 .
38] Webb Hooper M , Napoles AM , Perez-Stable EJ . COVID-19 and racial/ethnic dis-
parities. JAMA 2020;323(24):2466–7 . 39] Kopel J , Perisetti A , Roghani A , Aziz M , Gajendran M , Goyal H . Racial and gen-
der-based differences in COVID-19. Front Public Health 2020;8:418 . 40] Cholera R , Falusi OO , Linton JM . Sheltering in place in a xenopho-
bic climate: COVID-19 and children in immigrant families. Pediatrics 2020;146(1):e20201094 .
41] Wilson FA , Stimpson JP . US policies increase vulnerability of immigrant com-
munities to the COVID-19 pandemic. Ann Glob Health 2020;86(1):57 . 42] Rostron BL , Boies JL , Arias E . Education reporting and classification on death
certificates in the United States. Vital and health statistics Series 2. Data Eval Methods Res 2010(151):1–21 .