Enhancing Pulse Production through Cluster Frontline Demonstration on ...
54
Enhancing Pulse Production through Cluster Frontline Demonstration on Pulses in Assam, Arunachal Pradesh and Sikkim (2017-18) Edited and Compiled by: A.K. Tripathi R. M. Bordoloi Divyashree Saikia Musliha Nasrin Paragjyoti Bordoloi Utpal Bhagawati N Uttam Singh Aniruddha Roy Bagish Kumar P K Sinha ÷Ê.∑§Î.•ŸÈ.¬.- ∑§ÎÁ· ¬˝ılÙÁª∑§Ë ©¬ÙÿÙª •ŸÈ‚¥œÊŸ ‚¥SÕÊŸ, •¥ø‹– VI ªÈflÊ„Ê≈UË, •‚◊-|}vÆÆ{ ICAR-Agricultural Technology Application Research Institute Zone-VI, Guwahati, Assam-781006
-
Upload
khangminh22 -
Category
Documents
-
view
2 -
download
0
Transcript of Enhancing Pulse Production through Cluster Frontline Demonstration on ...

Enhancing Pulse Production through Cluster Frontline
Demonstration on Pulses in Assam, Arunachal Pradesh and Sikkim
(2017-18)
Edited and Compiled by: A.K. Tripathi
R. M. Bordoloi Divyashree Saikia
Musliha Nasrin Paragjyoti Bordoloi
Utpal BhagawatiN Uttam SinghAniruddha RoyBagish Kumar
P K Sinha
÷Ê.∑§Î.•ŸÈ.¬.- ∑§ÎÁ· ¬˝ılÙÁª∑§Ë ©¬ÙÿÙª •ŸÈ‚¥œÊŸ ‚¥SÕÊŸ, •¥ø‹– VIªÈflÊ„Ê≈UË, •‚◊-|}vÆÆ{
ICAR-Agricultural Technology Application Research InstituteZone-VI, Guwahati, Assam-781006

Citation: Tripathi, A.K., Bordoloi, R.M., Saikia, D., Nasrin, M., Bordoloi, P., Bhagawati, U., N Uttam Singh., Aniruddha Roy., Bagish Kumar., P. K. Sinha., (2018) “Enhancing Pulse Production through Cluster Frontline Demonstration on Pulses in Assam, Arunachal Pradesh and Sikkim”, ICAR-ATARI, Guwahati
Published by:Director, ICAR-ATARI, Guwahati, Zone-VI, Pin no. 781006, India Telephone no: 0361-2234304e-mail:[email protected], icaratariguwahati.yahoo.comWebsite: www.atariguwahati.inAll rights reserved © ICAR-Agricultural Technology Application Research Institute, Guwahati, 2018All may use for any reasonable non-commercial purpose, subject to proper attribution of authorship, citation and ownership of the rights.
Edited and Compiled by: Dr. A.K. TripathiDr. R. M. BordoloiMs. Divyashree SaikiaMs. Musliha NasrinMr. Paragjyoti BordoloiMr. Utpal BhagawatiDr. N Uttam SinghDr. Aniruddha RoyDr. Bagish KumarDr. P K Sinha
Year of Publication : 2018
Contributors:All the KVKs of Assam
Cover design :Mr. Prabhat Kumar NayakShri Utpal BhagawatiShri Dipak Kumar Mandal
Printed at :Rumi Jumi Enterprise, G.S.Road, Six mile, Guwahati # 09127055734, 09864075734
This technical bulletin is an output of the project “Cluster Frontline Demonstration on Pulses (CFLD)” under National Food Security Mission (NFSM)

III
Performance of Cluster Frontline Demonstration on Pulses in Assam, Arunachal Pradesh & Sikkim
PREFACE India is the largest producer, consumer and importer of pulses in the world. Pulses account for considerable percentage of the area under food grains and contribute significantly to the total food grains production in the country. In view of the acute need to augment pulse production to meet the ever increasing demand of a burgeoning population, several initiatives have been pioneered in the form of several flagship programmes to bridge the gap between production and consumption and make the country self-sufficient. Presently, pulse development programmes are being implemented through the Centrally Sponsored Schemes of NFSM-Pulses. ICAR-ATARI, Guwahati, in collaboration with a vast network of 30 KVKs under its jurisdiction, has taken various initiatives to increase the production of pulses 3in the North-eastern region. The major constraints that have posed significant challenge in achieving the desired target are being identified and appropriate measures are taken up to enhance production and prevent crop loss. Newer technologies have penetrated various districts of the north eastern region and are being widely embraced by the farming community, resulting in several fold increase in the production of pulses in the states of Assam, Arunachal Pradesh and Sikkim. Some of the new age techniques viz. integrated nutrient management (INM), integrated pest management (IPM), use of high yielding varieties and pest control have been integrated into various farming practices, which helped to increase the production and improve the quality of various pulses viz. black gram, green gram, lentil, field pea, lathyrus etc. The need for more such science based technologies, which help to increase production and reduce the cost involved, have been acknowledged and efforts in this direction are already underway to lay the groundwork for cutting edge research fortified by appropriate and timely percolation of the scientific knowledge and technical knowhow to the farming community. The Krishi Vigyan Kendras (KVKs) under Zone VI have been constantly striving to develop scientific methods to overcome some of the common problems associated with cultivation of pulses and assuage the concerns of the farmers involved by imparting them with adequate knowledge and right set of skills to deal with various kinds of adversities.
The author sincerely extends his heartfelt gratitude to Dr. V. P. Chahal, A.D.G. (Agricultural Extension), ICAR, New Delhi, for his generous support in implementing the CFLD (Pulses) programme in NE Region of India. Dr. Bidyut C. Deka, Director, ICAR-ATARI, Umiam, Dr. A.K. Singha, Principal Scientist, Dr. P.C. Jat, Senior Scientist for their support in efficient implementation of cluster frontline demonstration on pulses under NFSM. The author is also thankful to Mr. Daegal A Massar and the staff of KVKs under ICAR-ATARI, Guwahati, including the SRFs for their contribution towards preparation of the bulletin. It is expected that this publication will be helpful for concerned stakeholders to implement pulse production programmes in respective areas.


V
Performance of Cluster Frontline Demonstration on Pulses in Assam, Arunachal Pradesh & Sikkim
CONTENT
Sl No.
ParticularsPage No.
1. Introduction 1
2. Growth and its Decomposition Analysis: 8
3. Technology demonstrated during CFLDs 14
4. CFLD on pulses implemented during Kharif 2017-18 18
5 CFLD on pulse implemented during Rabi 2017-18 18
6 Performance of Pulses conducted in Kharif 2017-18 19
7 Performance of pulses conducted during Rabi 2017-18 24
8 Training and Monitoring 34
9 Success Story of ASSAM 35
10 Success Story of ARUNACHAL PRADESH 43
11 Success Story of SIKKIM 44


1
Performance of Cluster Frontline Demonstration on Pulses in Assam, Arunachal Pradesh & Sikkim
1. INTRODUCTION
Pulses are an important commodity group of crops that provide high quality protein complementing cereal proteins for pre-dominantly substantial vegetarian population of the country. Although, being the largest pulse crop cultivating country in the World, pulses share a total food grains of only 6-7% in the country. The cultivation of pulses builds up a mechanism to fix atmospheric nitrogen in their root nodules and thus meet their nitrogen requirements to a great extent. In India, pulses can be produced with a minimum use of resources and hence, it becomes less costly even than animal protein. In comparison to other vegetables, pulses are rich in protein which are less expensive and can be cultivated as an inter-crop and also as mixed crop. Pulses are mostly cultivated under Rain-fed conditions and do not require intensive irrigation facility and this is the reason why pulses are grown in areas left after satisfying the demand for cereals/cash crops. Even in such conditions, pulses give better returns. Apart from this, pulses possess several other qualities such as they are rich in protein, improve soil fertility and physical structure, fit in mixed/inter-cropping system, crop rotations and dry farming and provide green pods for vegetable and nutritious fodder for cattle as well. India is the world’s largest producer and consumer of a wide variety of pulses which is dominated by tropical and sub-tropical crops such as chickpea, black gram, red gram (pigeon pea), green gram (mungbean), lentil and so on, high in protein, fiber, vitamins, and also suppliers of high quality carbohydrates, minerals and vitamins. The carbohydrates provided by pulses are released slowly as compared to cereals and so have a high value for maintaining optimal blood sugar levels and restoring energy over a long period of time after the meals.
Table 1.1. Contribution of pulses to total food grains in India
Year Pulses Food grains% contribution to
food grains
A P Y A P Y A P A
2010-11 26.40 18.24 691 126.67 244.49 1930 20.84 7.46 35.802011-12 24.46 17.09 699 124.76 259.32 2079 19.61 6.59 33.612012-13 23.25 18.34 789 120.77 257.12 2129 19.25 7.13 37.062013-14 25.21 19.25 764 125.04 265.04 2120 20.16 7.26 36.032014-15 23.10 17.16 743 122.07 252.67 2069 18.92 6.791 35.91
*{A- Million ha, P- Million Tonnes, Y- kg/ha}
Source: Agricultural Statistics at a glance, 2013. Directorate of Economics and Statistics, Ministry of Agriculture, Govt. of India (websitehttp://www.dacnet.nic.in/eands)

2
Performance of Cluster Frontline Demonstration on Pulses in Assam, Arunachal Pradesh & Sikkim
India has achieved 19.25 million tonnes (Table 1.1) of pulse production from an area of about 25.2 million hectare during the year 2013-14 (DAC, MOA & FW, GoI). However, the per capita availability of protein is 28 g/day which is much lower than the FAO recommended level of 80 g/day (Nagy et al. 2013; Prasad et al. 2013; Saroj et al. 2013). Per capita consumption of pulses over the years has come down to 30 g/day in 2008 from 61 g/day in 1951 (Reddy, 2009). The same trend is also followed in the North Eastern part of our country.
Considering the importance of pulses in achieving nutritional security, the 68th
UN General Assembly declared 2016 as International Year of Pulses (IYP). Pulses are mainly grown in the uplands in the North Eastern Hill Region of India. The major pulses grown in NE India are green gram (Vigna radiata), black gram (Vigna mungo), pigeon pea (Cajanus cajan), cowpea (Vigna unguiculata), french bean (Phaseolus vulgaris), chickpea (Cicer arietinum), lentil (Lens culinaris) and field pea (Pisum sativum). In 2013-14, NE India produced 209.3 thousand tonnes of pulses from an area of 252.8 thousand hectare with an average productivity of 828 kg/ ha. Pulse production has been given more emphasis under the National Food Security Mission (NFSM).
Per capita availability of pulses in India
The per capita availability of pulses has decreased considerably owing to the stagnant pulse production and continuous increase in population. The per capita per day availability of pulses in 1951 was 60 g that goes down to 35.4 g in the year 2010. The per capita per year availability shows the decreasing trend from 22.1 kg in 1951 to 12.9 kg in the same period. However, since 2011 an increasing trend is being observed in per capita per day availability of pulse. In the year 2015, provisional per capita/year availability is 16.0 kg which is 43.8 g per capita per day (Table 1.2).
Table 1.2. Per capita availability of pulses in India
YearPulses availability
(g per capita per day) (kg per capita per year)
1951 60.7 22.11961 69.0 25.21971 51.2 18.71981 37.5 13.71991 41.6 15.21992 34.3 12.51993 36.2 13.21994 37.2 13.61995 37.8 13.8

3
Performance of Cluster Frontline Demonstration on Pulses in Assam, Arunachal Pradesh & Sikkim
1996 32.7 12.01997 37.1 13.51998 32.8 12.01999 36.5 13.32000 31.8 11.62001 30.0 10.92002 35.4 12.92003 29.1 10.62004 35.8 13.12005 31.5 11.52006 32.5 11.82007 35.5 12.92008 41.8 15.32009 37.0 13.52010 35.4 12.92011 43.0 15.72012 41.6 15.22013 43.3 15.82014 46.4 16.92015 43.8 16.02016 43.0 15.7
2017 * (P) 52.9 19.3
*P= Provisional
Source: Per capita Net Availability of food grains
IMPORT/EXPORT AND AVAILABILITY OF PULSES
Table 1.3. Status of pulse production, import and export
Year Production Import Export Total availability
2011-12 170.89 33.65 1.74 206.282012-13 183.43 38.39 2.02 223.842013-14 192.53 36.44 3.46 232.422014-15 172.85 45.85 2.22 220.922015-16 164.70 57.98 2.56 225.242016-17 224.01 66.09 1.37 288.70
Source: DGCI &S, Ministry of Commerce, Kolkata (Quantity – Lakh Tonnes)

4
Performance of Cluster Frontline Demonstration on Pulses in Assam, Arunachal Pradesh & Sikkim
Table 1.4. Major pulse importing and exporting countries (2016-17)
Pulse Top 5 Export Destinations Top 5 Import Sources
Pea (Pisum sativum) Shri Lanka DSR (96.3%), Myanmar (1.6%), Bhutan (1.4%), Nepal (0.5%), U Arab EMTS (0.09%).
Canada (54.5%), Russia (10.3%), Luthuania (9.0%), France (6.8%), USA (6.4%)
Chickpeas (Garbanzos) Pakistan (21.6%), U Arab EMTS (10.6%), Algeria (11.6%), Saudi Arab (9.5%), Sri Lanka (7.3%)
Australia (85.1%), Russia (4.7%), Tanzania (3.8%), USA (1.4%), Canada (0.91%),
Moong/Urd USA (39.96%), Sri Lanka (13.05%), UK (9.86%), Australia (7.77%), Malaysia (7.63%)
Myanmar (70.37%), Kenya (7.43%), Australia (6.32%), Tanzania (3.15%), Uzbekistan (2.60%)
Lentils (Masur) Sri Lanka DSR (43.39%), Bangladesh (18.11%), U Arab EMTS (8.35%), Egypt A RP (3.98%), USA (3.67%)
Canada (89.58%), USA (7.47%), Australia (2.88%), Turkey (0.03%), Mozambique (0.03%).
Pigeon pea (Tur) USA (40.79%), U Arab EMTS (18.28%), Canada (11.28%), UK (10.75%), Singapore (5.11%),
Myanmar (46.35%), Tanzania (18.71%), Mozambique (15.36%), Malawi (12.56%), Sudan (3.36%)
(%) figures in parenthesis indicates percentage share of global import/exportable
Source: Annual Report DPD 2016 -17
Table 1.5. State wise productions of pulses in India during 2016 -17
State/ UTTur Gram Urad Moong
Other Pulses
Total Pulses
(Thousand tonnes)
Andhra Pradesh+ Telangana 183 461 300 167 45 1156Assam 5 - 47 12 48 112Bihar 33 61 14 107 205 420Chhattisgarh 34 290 31 4 296 655Gujarat 258 192 46 59 26 581
5
Performance of Cluster Frontline Demonstration on Pulses in Assam, Arunachal Pradesh & Sikkim
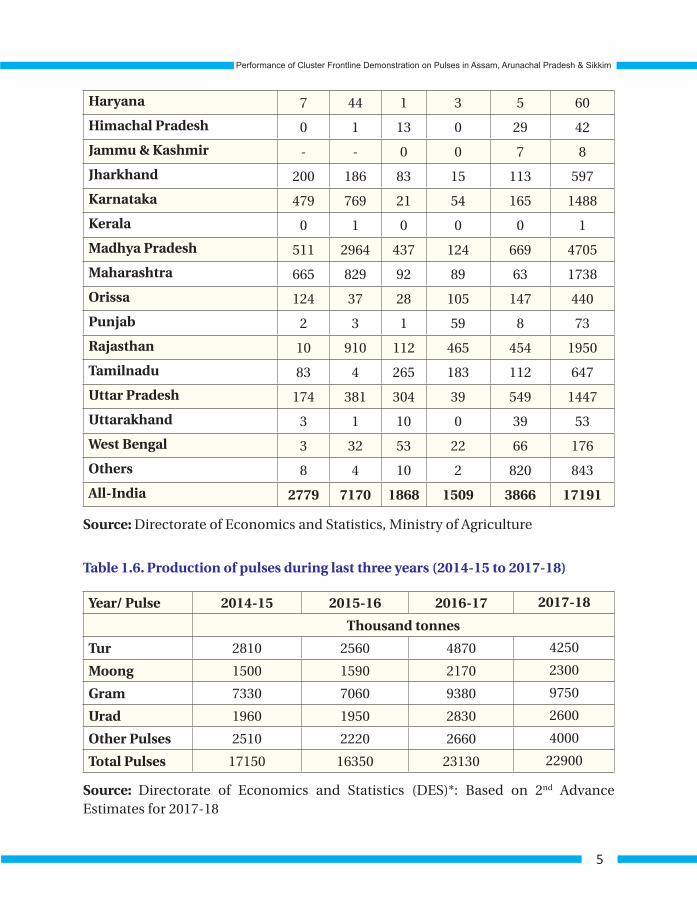
Haryana 7 44 1 3 5 60Himachal Pradesh 0 1 13 0 29 42Jammu & Kashmir - - 0 0 7 8Jharkhand 200 186 83 15 113 597Karnataka 479 769 21 54 165 1488Kerala 0 1 0 0 0 1Madhya Pradesh 511 2964 437 124 669 4705Maharashtra 665 829 92 89 63 1738Orissa 124 37 28 105 147 440Punjab 2 3 1 59 8 73Rajasthan 10 910 112 465 454 1950Tamilnadu 83 4 265 183 112 647Uttar Pradesh 174 381 304 39 549 1447Uttarakhand 3 1 10 0 39 53West Bengal 3 32 53 22 66 176Others 8 4 10 2 820 843All-India 2779 7170 1868 1509 3866 17191
Source: Directorate of Economics and Statistics, Ministry of Agriculture
Table 1.6. Production of pulses during last three years (2014-15 to 2017-18)
Year/ Pulse 2014-15 2015-16 2016-17 2017-18
Thousand tonnes
Tur 2810 2560 4870 4250
Moong 1500 1590 2170 2300
Gram 7330 7060 9380 9750
Urad 1960 1950 2830 2600
Other Pulses 2510 2220 2660 4000
Total Pulses 17150 16350 23130 22900
Source: Directorate of Economics and Statistics (DES)*: Based on 2nd Advance Estimates for 2017-18

6
Performance of Cluster Frontline Demonstration on Pulses in Assam, Arunachal Pradesh & Sikkim
Tab
le 1
.7. A
rea,
pro
du
ctio
n a
nd
ave
rage
yie
ld o
f maj
or
pu
lse
in A
ssam
du
rin
g 20
11-1
2 to
201
5-16
Cro
pA
rea
(ha)
Pro
du
ctio
n (t
on
nes
)A
vera
ge y
ield
(kg/
ha)
2011
-12
2012
-13
2013
-14
2014
-15
2015
-16
2011
-12
2012
-13
2013
-14
2014
-15
2015
-16
2011
-12
2012
-13
2013
-14
2014
-15
2015
-16
Gre
engr
am11
512
1005
212
184
1128
510
798
6347
5953
7807
7757
7310
552
592
641
687
677
Bla
ckgr
am53
669
4852
754
001
5283
051
579
2983
226
735
3131
934
237
3394
155
655
158
064
865
8
Len
til
2254
428
923
2999
329
051
2718
011
798
1673
122
364
2252
419
645
523
578
746
775
723
Pea
2115
130
952
3124
629
952
2833
413
602
1982
126
509
2767
625
441
643
640
848
924
898
Oth
ers
1540
615
090
1446
216
964
1572
093
3490
6592
3911
074
1409
060
660
163
965
389
6
Sou
rce:
Sta
tus P
aper
on
Puls
es

7
Performance of Cluster Frontline Demonstration on Pulses in Assam, Arunachal Pradesh & Sikkim
Table 1.8 Area, production and average yield of major pulse in Assam during 2015-16
Crop ZoneArea (ha)
Production(t)
Average yield (kg/ha)
Blackgram Barak Valley Zone 1480 975 659
Central Brahmaputra Valley Zone 3340 2428 729
Hill Zone 1668 1097 658
Lower Brahmaputra Valley Zone 24218 16752 692
North Bank Plain Zone 11412 8003 701
Upper Brahmaputra Valley Zone 9461 4636 495
Greengram Barak Valley Zone 284 140 492
Central Brahmaputra Valley Zone 1301 955 734
Hill Zone 1220 927 759
Lower Brahmaputra Valley Zone 2574 1575 622
North Bank Plain Zone 3457 2550 735
Upper Brahmaputra Valley Zone 1798 1163 350
Lentil Barak Valley Zone 31 21 677
Central Brahmaputra Valley Zone 1414 1017 720
Hill Zone 261 157 601
Lower Brahmaputra Valley Zone 19484 13933 715
North Bank Plain Zone 5411 4110 759
Upper Brahmaputra Valley Zone 579 407 705
Pea Barak Valley Zone 524 394 751
Central Brahmaputra Valley Zone 2911 2787 957
Hill Zone 116 704 630

8
Performance of Cluster Frontline Demonstration on Pulses in Assam, Arunachal Pradesh & Sikkim
Lower Brahmaputra Valley Zone 10189 9112 895
North Bank Plain Zone 7206 7202 999
Upper Brahmaputra Valley Zone 6388 5242 820
Others Barak Valley Zone 5621 6255 1115
Central Brahmaputra Valley Zone 1137 658 580
Hill Zone 74 38 515
Lower Brahmaputra Valley Zone 6416 5577 8692
North Bank Plain Zone 1644 1078 6557
Upper Brahmaputra Valley Zone 828 484 585
Source: https://des.assam.gov.in/information-services/agriculture
2. Growth and its Decomposition Analysis:
Temporal variations of growth rate in area, production and yield of pulses, decomposition of source of output growth and variability among the states over the study years in a state wise comparative mode has been investigated in the chapter. Before proceeding to the analytical part lets have an overview of area, production and yield of rice in terms of Triennium Ending (TE) in five periods viz. TE 1974-75, TE 1984-85, TE 1994-95, TE 2004-05 and TE 2014-15 (Table 1.9). Considering the triennium figures, on an average, Assam registered the highest area and production under pulses followed by Nagaland, Manipur and Tripura while Mizoram and Meghalaya have shown the least area and production under pulses. When yield is considered, on an average Mizoram ranked first followed by Meghalaya and Arunachal Pradesh while lowest yield was observed in Assam as per the studied triennium figures. Though fluctuations were shown by few states in the studied triennium endings, overall increment in area, production and yield were observed in NER.

9
Performance of Cluster Frontline Demonstration on Pulses in Assam, Arunachal Pradesh & Sikkim
Table 1.9: Triennium ending area, production and yield of pulses in the states of NER for TE 1974-75, TE 1984-85, TE 1994-95, TE 2004-05 and TE 2014-15
STATE AR AS MN ML MZ NL SK TR NER India
Area in 000’ ha
TE 1974-75 88.1 7.0 1.3 0.1 3.4 2.5 99.9 12332.4TE 1984-85 0.0 131.7 0.0 3.0 0.9 1.8 8.4 5.9 151.8 23119.2TE 1994-95 6.1 197.4 0.0 3.3 4.9 10.2 10.9 16.8 249.6 33710.5TE 2004-05 6.9 111.2 5.8 4.7 4.5 31.7 7.0 8.7 180.5 22239.1TE 2014-15 10.2 146.5 30.2 4.8 3.7 38.2 6.3 10.8 250.7 24009.1Production in 000’ tons
TE 1974-75 38.9 2.8 0.7 0.1 1.7 0.9 44.0 4035.4TE 1984-85 0.0 54.3 0.0 2.3 0.0 1.5 7.3 2.7 68.1 12297.9TE 1994-95 5.4 100.0 0.0 2.4 9.2 8.5 10.3 9.0 144.8 18654.4TE 2004-05 7.3 61.8 2.9 3.5 4.8 28.9 6.7 5.4 121.2 13053.2TE 2014-15 12.1 99.9 28.3 6.1 5.0 42.9 5.8 7.7 207.7 18249.9Yield in kg/ha
TE 1974-75 441 579 498 350 442 326TE 1984-85 412 754 0 932 857.9 454 448 532TE 1994-95 884 507 737 1898 829 948 533 580 553TE 2004-05 1063 556 502 743 1083 910 948 621 671 585TE 2014-15 1180 681 939 1184 1315 1122 922 714 827 760
Growth rates of area, production and productivity
To estimate the growth performance of area, production and yield of pulses in state wise comparative mode during the period 1966-67 to 2014-15, time series data on area, production and productivity of pulses were analysed. The whole period was divided into five decades to understand the decadal performance. The periods 1966-67 to 1974-75, 1975-76 to 1984-85, 1985-86 to 1994-95, 1995-96 to 2004-05 and 2005-06 to 2014-15 have been referred to as period 1, period 2, period 3, period 4 and period 5 respectively from here onwards. When Table 2.0 is looked period-wise across the states the following discussions can be drawn.
Among the states Manipur registered the highest significant growth in area (16%), production (22%) and yield (5%) followed by Nagaland. All the states registered positive and almost significant figures in area and production except Sikkim. Yield growth rate were found positive and almost significant in all the states except Mizoram. NER has showed significantly positive growth rate in area, production and yield during the overall study period.

10
Performance of Cluster Frontline Demonstration on Pulses in Assam, Arunachal Pradesh & Sikkim
Table 2.0: Compound growth rate of area, production and yield of pulses in the states of NER during the decades 1966-67 to 1974-75, 1975-76 to 1984-85, 1985-86 to 1994-95, 1995-96 to 2004-05 and 2005-06 to 2014-15 and overall period 1966-67 to 2014-15.
ST AR AS MN ML MZ NL SK TR NER
Period 1: 1966-67 to 1974-75
A 1.06 -13.01*** 1.84 24.9 -1.39 2.64P 2.28 -6.19 1.55 29.1 -3.68 3.97Y 1.21 7.84 -0.28 3.36** -2.32 1.3
Period 2: 1975-76 to 1984-85
A 5.35*** 11.01*** -13.62 21.04 2.85 5.49***P 6.63*** 13.22** -8.25 33.14*** 4.48 7.61***Y 1.22 1.99 6.21 9.99 1.58 2.01*
Period 3: 185-86 to 1994-95
A 4.89 5.56 1.5 11.23 8.76 -1.99 9.89 5.94P 7.67* 7.42 -0.02 -9.43 13.69 -0.05 12.11 8.53**Y 2.65 1.77 -1.5 -2.47 4.53 1.98 2.02 2.44
Period 4: 1995-96 to 2004-05
A 0.79 -3.67 -0.52 4.4 -1.45 13.60** -2.35 -2.33 -0.82P 2.06 -3.35 -0.97 4.18 -6.44 13.03* -0.97 -0.62 0.11Y 1.26 0.34 -0.45 -0.21 -5.06 -0.5 1.41 1.74 0.94
Period 5: 2005-06 to 2014-15
A 4.03** 4.52*** 17.60** 1.09 -4.94 1.35 -3.93 4.7 4.39***P 5.43** 7.67** 28.81** 7.2 -0.39 0.05 -3.8 5.87 6.18**Y 1.35 3.02 9.54* 6.04** 4.79 -1.29 0.14 1.12 1.71
Entire Period: 1966-67 to 2014-15
A 2.56*** 0.90* 16.01*** 3.22*** 8.56*** 9.03*** -1.32 2.82** 2.17***P 3.98*** 2.09*** 22.39*** 4.20*** 3.45 11.29*** -0.79 4.43*** 4.00***Y 1.38*** 1.18*** 5.50** 0.95** -2.17 2.08*** 0.54 1.57*** 1.79***
***, ** and * refer to significant at 1%, 5% and 10% respectively.
Wherein ST=State, A= Area, P= Production and Y= Yield
From table 2.0 it is observed that area effect is more contributory than yield effect in all the states in overall study periods. Hence production in the region has increased as a result of area increase than yield improvements. Period 1, though data were not available for all the states, but it was found that area effect is more contributory than

11
Performance of Cluster Frontline Demonstration on Pulses in Assam, Arunachal Pradesh & Sikkim
yield effect. Period 2, it was found that area effect is more than yield effect. Period 3, it was observed that in all the North-eastern States, area effect was higher in production increase than yield effect except Nagaland where it was found that yield effect was higher than area effect. Period 4, it was observed that in all the North-eastern States, contribution of area effect was more in production increase than yield effect except Arunachal Pradesh where it was found that yield effect was higher than area effect. Period 5, all the North-eastern States, showed that contribution of area was more in production increase than yield effect except Meghalaya where it was found that yield effect was higher than area effect. In the entire period, NER showed contribution of interaction effect (43) was higher than area effect (37) and yield effect (20).
Table 2.1: Percentage contribution of area, yield and their interaction in the change of pulses production during the decades 1966-67 to 1974-75, 1975-76 to 1984-85, 1985-86 to 1994-95, 1995-96 to 2004-05 and 2005-06 to 2014-15 and overall period 1966-67 to 2014-15.
STATE AR AS MN ML MZ NL SK TR NER In-dia
Period 1: 1966-67 to 1974-75
∆P 100 100 0 100 100 100 100A0∆Y -70 -136 0 10 52 -11 50Y0∆A 178 203 0 84 56 113 47∆A∆Y -9 33 0 6 -8 -3 4
Period 2: 1975-76 to 2014-15
∆P 100 100 100 100 100 100 100 100A0∆Y 17 15 100 100 22 32 24 29Y0∆A 71 62 -125 0 60 53 60 50∆A∆Y 12 23 125 0 18 16 16 20
Period 3: 1985-86 to 1994-95
∆P 100 100 100 100 100 100 100 100 100A0∆Y 24 25 -336 21 53 22 10 26 8Y0∆A 71 66 511 0 37 76 76 62 89∆A∆Y 6 10 -75 79 10 2 15 12 3
Period 4: 1995-96 to 2004-05
∆P 100 100 100 100 100 100 100 100 100 100A0∆Y 62 -21 22 3 53 -23 -68 -96 -59 -55Y0∆A 34 112 79 96 57 167 142 167 142 138∆A∆Y 4 9 -1 1 -9 -44 27 29 16 17

12
Performance of Cluster Frontline Demonstration on Pulses in Assam, Arunachal Pradesh & Sikkim
Period 5: 2005-06 to 2014-15
∆P 100 100 100 100 100 100 100 100 100 100A0∆Y 23 37 15 41 -67 -155 -63 28 26 78Y0∆A 66 45 47 32 143 285 158 63 62 18∆A∆Y 11 18 38 28 24 -30 5 9 12 4
Overall Period: 1975-76 to 2014-15
∆P 100 100 100 100 100 100 100 100 100 100A0∆Y 27 34 17 9 10 4 33 12 20 36Y0∆A 44 36 29 38 32 40 57 56 37 27∆A∆Y 29 30 53 53 58 56 9 33 43 37
∆P: Change in Production. A0∆Y: Yield Effect. Y0∆A: Area Effect. ∆A∆Y: Interaction Effect. NA: Not applicable
Overall study period instability index of area, production and yield was found highest in Mizoram State followed by Nagaland. In NER instability index of production (12.64) was found highest followed by area (9.95) and yield (8.57).
Table 2.2: Instability index of area, production and yield of pulses during the decades 1966-67 to 1974-75, 1975-76 to 1984-85, 1985-86 to 1994-95, 1995-96 to 2004-05 and 2005-06 to 2014-15 and overall period 1966-67 to 2014-15.
STATE AR AS MN ML MZ NL SK TR NER India
Period 1: 1966-67 to 1974-75
AREA 6.40 1.37 20.94 23.46 19.81 5.94 5.38PRDN 19.99 34.82 18.62 25.18 25.26 18.76 16.32YIELD 16.41 33.45 3.84 2.06 12.43 15.17 12.06
Period 2: 1975-76 to 1984-85
AREA 4.18 12.81 40.57 87.04 20.01 13.30 4.20 17.27PRDN 8.35 20.78 75.65 9.26 24.58 8.11 29.13YIELD 6.76 22.66 39.98 14.86 19.49 6.47 14.91
Period 3: 1985-86 to 1994-95
AREA 9.72 21.52 6.16 111.83 43.94 28.79 19.40 13.64 12.52PRDN 6.37 23.71 7.27 50.17 56.86 20.60 14.36 12.16YIELD 9.43 8.06 4.65 24.57 39.87 4.33 9.33 9.56
Period 4: 1995-96 to 2004-05
AREA 17.11 15.84 17.11 35.83 18.58 17.29 15.94 14.02 14.21PRDN 17.76 13.79 16.90 31.34 24.17 16.12 15.23 12.01 17.45YIELD 6.49 4.11 2.28 18.97 21.65 6.29 5.19 5.34 12.83

13
Performance of Cluster Frontline Demonstration on Pulses in Assam, Arunachal Pradesh & Sikkim
Period 5: 2005-06 to 2014-15
AREA 6.73 6.41 25.4 38.79 16.26 11.31 33.06 16.72 6.12 7.41PRDN 9.7 8.22 40.99 44.18 45.52 11.19 33.98 15.48 6.46 9.43YIELD 3.62 5.1 19.9 7.85 42.89 5.9 3.57 2.45 3.73 5.96
Entire Period: 1966-67 to 2014-15
AREA 12.16 13.18 23.31 20.71 64.07 47.26 25.9 16.81 9.95 12.3PRDN 12.83 16.38 35.36 24.07 55.27 44.88 36.88 20.2 12.64 18.05YIELD 6.13 8.8 16.16 11.62 33.93 24.49 22.22 10.63 8.57 11.16

14
Performance of Cluster Frontline Demonstration on Pulses in Assam, Arunachal Pradesh & Sikkim
Cro
pP
lan
tin
g M
eth
od
Vari
etie
sSe
ed T
reat
men
tW
eed
man
agem
ent
Fert
iliz
er m
anag
emen
tIn
sect
pes
t an
d d
isea
se
Blac
kgra
mLi
ne
Sow
ing
and
boar
dcas
ting
PU-3
1R
hiz
obiu
m a
nd P
SB
inoc
ulat
ion
With
150
g/
3-4
kg se
ed a
long
w
ith 5
0% R
D o
f N &
P
and
full
dose
of K
(RD
=
10:3
5:10
N;P
2O5:
K2
O)
One
wee
ding
at 2
0-25
day
s afte
r sow
ing
is to
be
done
Pend
imet
halin
@
1.0
kg/h
a as
pre
-em
erge
nce
FYM
/Com
post
1 t/
ha,
22
kg/
ha U
rea,
220
kg/
ha S
SP, 2
5 kg
/ha
MO
P,Ve
rmic
ompo
st
Org
anic
man
ure,
TAT
A Bh
usud
ha (O
rgan
ic)
Cop
per O
xych
lori
de @
0.
3% a
t 7-1
0 da
ys in
terv
al,
Car
bend
azim
@ 0
.05%
N
eem
bas
ed fo
rmul
atio
n (1
500
ppm
)
Gre
engr
amLi
ne S
owin
g,IP
M-0
2-3,
Pr
atap
, SG
C-2
0,
SGC
-16,
Sa
mra
t
Seed
trea
tmen
t with
PS
B/R
hiz
obiu
m @
50
g/kg
of s
eed
Tric
hod
erm
a sp
p. @
5
g/kg
of s
eed.
One
wee
ding
at 2
0-25
day
s afte
r sow
ing
is to
be
done
Pend
imet
halin
@
1.0
kg/h
a as
pre
-em
erge
nce
Inte
grat
ed N
utri
ent
Man
agem
ent
Verm
icom
post
@ 1
q/bi
gha.
Pra
ctic
es U
rea
22kg
/ha,
SSP
220
kg/h
a,
MO
P 25
kg/h
a &
FYM
(3
-4 t/
ha),
Lim
e 65
.5 k
g/ha
as s
oil a
men
dmen
t ac
cord
ingl
y to
bri
ng th
e pH
of s
oil t
o ar
ound
6
Cop
per O
xych
lori
de @
0.
3% a
t 7-1
0 da
ys in
terv
alC
arbe
ndaz
im @
0.0
5%
Rajm
ahLi
ne S
owin
gTr
ipur
a Se
l-1,
Ar
ka
Kom
al,
HU
R-30
1,
Jwal
a
Seed
trea
tmen
t with
C
apta
n @
3 g
/kg,
INM
&
impr
oved
var
ietie
s,
also
seed
trea
tmen
t w
ith b
iofe
rtili
zers
and
do
lom
ite. O
rgan
ic
nutr
ient
man
agem
ent
Wee
ding
at 2
0-25
D
AE a
nd su
bseq
uent
w
eedi
ng w
hen
ne
cess
ary
Pend
imet
halin
@
1.0
kg/h
a as
pre
-em
erge
nce
FYM
/com
post
@ 1
0 t/
haU
rea
87 k
g/ha
, SSP
220
kg
/ha,
MO
P 25
kg/
ha,
CaC
O3 in
the
form
of
dolo
miti
c lim
e @
65.
5 kg
/big
ha a
pplie
d 15
da
ys b
efor
e se
edin
g
Spra
ying
of M
alat
hion
50
EC @
1.5
lit/
ha w
as u
sed.
3.
Tech
no
logy
dem
on
stra
ted
du
rin
g C
FL
Ds
3.1
Tec
hn
olo
gy d
emo
nst
rate
d d
uri
ng
CF
LD
s o
n p
uls
es 2
017-
18 (A
ssam
)
Th
e te
chno
logi
es o
f Bla
ck g
ram
, Gre
en g
ram
, Raj
mas
h, F
ield
pea
, len
til a
nd L
athy
rus w
ere
dem
onst
rate
d in
Ass
am
duri
ng 2
017-
18 is
giv
en in
the
Tabl
e 2.
3.
Tab
le 2
.3 T
ech
no
logy
dem
on
stra
ted
du
rin
g C
FL
Ds
on
pu
lses
201
7-18
(Ass
am)

15
Performance of Cluster Frontline Demonstration on Pulses in Assam, Arunachal Pradesh & Sikkim
Fiel
d Pe
aLi
ne so
win
gPr
akas
h,
PS-1
0,
Arke
l
Seed
coa
ting
with
R
hiz
obiu
m a
nd P
SB
@ 1
.6 k
g/ h
a al
ong
with
Tr
eat t
he se
eds w
ith
Car
bend
azim
(or)
Th
iram
@ 2
g/k
g of
se
ed 2
4 hr
s bef
ore
sow
ing
(or)
with
ta
lc fo
rmul
atio
n of
Tri
chod
erm
a vi
rid
e @
4 g
/kg
seed
(o
r) P
seu
dom
onas
fl
uor
esce
ns @
10
g/kg
se
ed.
Fluc
hlor
alin
45%
EC
@ 1
.5 k
g a.
i./ha
as
pre
-em
erge
nce
spra
y on
e da
y be
fore
sow
ing
be
inco
rpor
ated
in th
e so
il w
ith li
ght h
oein
g
50%
RD
of N
P an
d fu
ll K
(RD
= 1
0:46
:10
N:
P 2O5: K
2O) a
nd B
orax
@
10.
0 kg
/ha,
INM
and
im
prov
ed v
arie
ties
1. C
oria
nder
cro
p w
ill b
e gr
own
arou
nd th
e fie
ld to
at
trac
t nat
ural
ene
mie
s.
2. E
rect
ion
of 2
0 bi
rd
perc
hes/
ha w
hich
are
re
mov
ed ri
ght a
fter
mat
urity
. 3.
Phe
rom
one
trap
s fo
r tw
o in
sect
s’ v
iz.
Hel
icov
erp
a ar
mig
era
and
Spod
opte
ra li
tura
@ 5
/ha
will
be
inst
alle
d. S
pray
ing
of A
zadi
rach
tin 0
.03%
(3
00 p
pm) @
3 m
l/lit
from
pr
eflo
wer
ing
stag
e to
m
atur
ity st
age
at 1
5 da
ys
inte
rval
.
Lent
ilLi
ne so
win
gM
oitr
ee,
KLS
-218
, W
BL-7
7,
HU
L-57
Seed
trea
tmen
t with
R
hiz
obiu
m @
50
g/kg
of
seed
and
INM
with
im
prov
ed v
arie
ty
Two
wee
ding
s at 2
0 an
d 30
DAS
.Ap
ply
Oxy
fluor
ofen
@
150
g a
.i. /
ha a
s pr
e-em
erge
nce
follo
wed
by
1 ha
nd
wee
ding
at 2
0 D
AS.
Use
of v
erm
icom
post
@
1.0
t/ha
seed
trea
tmen
t with
C
arbe
ndaz
im @
2 g
/kg
Org
anic
man
ure
(Tat
a Bh
usud
ha)
Inco
rpor
atio
n of
Tr
ich
oder
ma
viri
dae
@
5 kg
/ha
mul
tiplie
d on
de
com
pose
d FY
M @
100
kg
/ha
seed
trea
tmen
t with
C
arbe
ndaz
im @
2g/
kg
Lath
yrus
Lath
yrus
so
wn
as re
lay
Rata
nSe
ed tr
eatm
ent
with
bio
fert
ilize
rs
(Azo
toba
cter
and
PS
B) @
50g
per
kg
of
seed
s
Hoe
ing
in in
ter-
row
spac
es a
nd
wee
ding
at 2
0-25
da
ys a
fter s
owin
g
10.0
kg
N a
nd 2
6.0
kg P
2O5 1
5 kg
K2O
/ha
appl
ied.
Inte
grat
ed
Nut
rien
t Man
agem
ent
Verm
icom
post
@ 1
q/bi
gha.
Dim
etho
ate
0.0
6 %
for
aphi
ds a
nd p
od b
orer
s

16
Performance of Cluster Frontline Demonstration on Pulses in Assam, Arunachal Pradesh & Sikkim
3.2
Tec
hn
olo
gy d
emo
nst
rate
d d
uri
ng
CF
LD
s o
n p
uls
es 2
017-
18 (A
run
ach
al P
rad
esh
)
Th
e te
chno
logi
es o
f Bla
ck g
ram
, Fie
ld p
ea a
nd L
entil
wer
e de
mon
stra
ted
in A
runa
chal
Pra
desh
dur
ing
2017
-18
is
give
n in
the
Tabl
e 2.
4.
Tab
le 2
.4 T
ech
no
logy
dem
on
stra
ted
du
rin
g C
FL
Ds
on
Pu
lses
201
7-18
(Aru
nac
hal
Pra
des
h)
Cro
pP
lan
tin
g m
eth
od
Vari
etie
sSe
ed tr
eatm
ent
Wee
d
man
agem
ent
Fert
iliz
er
man
agem
ent
Inse
ct p
est a
nd
d
isea
se
Blac
k gr
amLi
ne
Sow
ing
PU-3
1Se
ed tr
eatm
ent w
ith
Rh
izob
ium
cul
ture
an
d Tr
icho
derm
a vi
ride
@ 1
0.0g
/kg
seed
. See
d tr
eatm
ent
with
Rhi
zobi
um @
50
g/kg
seed
One
wee
ding
at
20-2
5 da
ys a
fter
sow
ing
is to
be
done
Rh
izob
ium
Verm
icom
post
Anna
purn
a an
d Ve
rmic
ompo
st 2
q/
ha. F
YM @
8-1
0 to
nnes
/ha
Fie
ld
Pea
Line
So
win
gPr
akas
h,
Arke
lSe
ed tr
eatm
ent w
ith
Rh
izob
ium
cul
ture
an
d Tr
ich
oder
ma
@
5.0
g/kg
seed
Bavi
stin
@ 2
.0 g
/kg
seed
Fluc
hlor
alin
45
% E
C @
1.5
kg
a.i.
/ha
as
pre-
emer
genc
e sp
ray
one
day
befo
re so
win
g be
in
corp
orat
ed in
th
e so
il w
ith li
ght
hoei
ng
Ure
aSS
P R
hiz
obiu
mPh
osph
obac
teri
aD
AP
Inco
rpor
atio
n of
Tri
chod
erm
a vi
rid
ae @
5 k
g/ha
Lent
ilLi
ne
Sow
ing
HU
L-57
Rh
izob
ium
cul
ture
@
50 g
/ kg
of s
eeds
and
PS
B @
50
g/kg
seed
. IN
M &
hig
h yi
eldi
ng
vari
ety
Two
wee
ding
s at
20 a
nd 3
0 D
ASVe
rmic
ompo
st@
1/
haN
=10
kg/h
aP 2O
5 =
20 k
g/ha
K 2O =
15
kg/h
a
Mon
ocro
toph
os
@ 2
- 2.
5 m
l/lit

17
Performance of Cluster Frontline Demonstration on Pulses in Assam, Arunachal Pradesh & Sikkim
3.3
Tec
hn
olo
gy d
emo
nst
rate
d d
uri
ng
CF
LD
s o
n p
uls
es 2
017-
18 (S
ikki
m)
Th
e te
chno
logi
es o
f bla
ck g
ram
, raj
mah
and
gre
en g
ram
dem
onst
rate
d in
Sik
kim
dur
ing
2017
-18
is g
iven
in th
e Ta
ble
2.5
Tab
le 2
.5 T
ech
no
logy
dem
on
stra
ted
du
rin
g C
FL
Ds
on
pu
lses
201
7-18
(Sik
kim
)
Cro
pP
lan
tin
g m
eth
od
Vari
etie
sSe
ed tr
eatm
ent
Wee
d
man
agem
ent
Fert
iliz
er
man
agem
ent
Inse
ct p
est a
nd
d
isea
se
Blac
kgra
mLi
ne
sow
ing
SKPD
-3R
hiz
obiu
m a
nd
PSB
inoc
ulat
ion
With
150
g/3
-4 k
g se
ed
One
wee
ding
at
20-2
5 da
ys a
fter
sow
ing
Aplic
atio
n of
N @
20
kg/h
a fr
om o
rgan
ic
inpu
ts v
iz. F
YM,
mix
ed c
ompo
st,
verm
icom
post
an
d bi
ofer
tiliz
ers
(Nal
pak)
, Org
anic
cu
ltiva
tion
Spra
ying
of
neem
bas
ed
form
ulat
ion
(150
0 pp
m)
@ 3
-5 m
l/l o
f w
ater
at 1
0 da
ys in
terv
al,
Org
anic
m
anag
emen
t of
pest
& d
isea
seRa
jmas
hLi
ne
sow
ing
Jwal
aSe
ed T
reat
men
t w
ith B
io-f
ertil
izer
s @
50
g/kg
of s
eed,
ap
plic
atio
n of
N
eem
bici
dine
@
3ml/
lit a
gain
st
suck
ing
pest
s
20-2
5 da
ys a
fter
emer
genc
e,
and
subs
eque
nt
wee
ding
as a
nd
whe
n ne
cess
ary
Biof
ertil
izer
s R
hiz
obiu
m a
nd P
SBse
ed tr
eatm
ent w
ith
Bio-
fert
ilize
rs @
50
g/kg
of s
eed
Nee
mbi
cidi
ne
@ 3
ml/
lit
agai
nst s
ucki
ng
pest
s
Gre
engr
amLi
ne
sow
ing
Sam
rat
Seed
trea
tmen
t w
ith R
hiz
obiu
m
@ 5
0 g/
kg S
eed
and
appl
icat
ion
of N
eem
bici
dine
@
3 m
l/lit
aga
inst
su
ckin
g pe
sts
FYM
@ 2
t/ac
re
was
app
lied
as
the
farm
er’s
co
ntri
butio
ns
FYM
Ver
mic
ompo
st
@ 1
q/bi
gha
Pse
ud
omon
as
flu
ores
cen
s 1%
Nee
mbi
cidi
ne

18
Performance of Cluster Frontline Demonstration on Pulses in Assam, Arunachal Pradesh & Sikkim
4. CFLD on pulses implemented during Kharif 2017-18
During 2017-18, a total of 1630 numbers of CFLDs on Kharif pulses were conducted in 580 ha area. Out of it, a total of 1252 numbers of CFLDs were conducted in 430 ha of Assam, 453 numbers of CFLDs were conducted in 180 ha in Arunachal Pradesh and 120 numbers of CFLDs were conducted in 40 ha in Sikkim.
Table 2.6 CFLD pulse implemented during Kharif 2017-18
Sl.No State Crop
Target of FLD approved
Achievement of FLDs
Demo Area(ha)
Demo Area(ha)
1 AssamBlack gram 725 290 803 290
Green gram 350 140 449 140
Sub-Total 1075 430 1252 430
2Arunachal
Pradesh
Black gram 228 90 228 90
Field Pea 150 60 150 60
Lentil 75 30 75 30
Sub-Total 453 180 453 180
3Sikkim
Black gram 25 10 35 10
Green gram 50 20 50 20
Rajmah 25 10 35 10
Sub-Total 100 40 120 40
Grand Total 1453 580 1630 580
5. CFLD on pulse implemented during Rabi 2017-18
A total area of 895 ha was allotted to conduct 2310 numbers of Cluster Frontline Demonstration in pulses for the year 2017-18. Out of it, a total 1985 nos. of Cluster Frontline Demonstration were conducted in 765 ha of Assam, 225 number of demonstrations in 90 ha of Arunachal Pradesh and 100 number of demonstrations in 40 ha of Sikkim during Rabi season

19
Performance of Cluster Frontline Demonstration on Pulses in Assam, Arunachal Pradesh & Sikkim
Table 2.7 CFLD pulse implemented during Rabi 2017-18
Sl. No State Crop
Target of FLD approved
Achievement of FLDs
DemoArea (ha)
DemoArea (ha)
1 Assam
Lentil 950 380 975 380
Field Pea 487 195 520 195
Rajmah 277 110 277 110
Lathyrus 200 80 213 80
Sub-Total 1914 765 1985 765
2Arunachal Pradesh
Field Pea 75 30 75 30
Lentil 150 60 150 60
Sub-Total 225 90 225 90
3 Sikkim Rajmah 100 40 100 40
Sub-Total 100 40 100 40
Total 2239 895 2310 895
6. Performance of Pulses conducted in Kharif 2017-18
6.1. Performance of Black gram demonstration conducted during Kharif 2017-18 in Assam
During Kharif 2017-18, 803 numbers of CFLDs were demonstrated by KVK Jorhat, Sibsagar, Tinsukia, Golaghat, Nagaon, Morigaon, Karbianglong, Bongaigaon, Baksa, Dhubri, Udalguri, Darrang, Kamrup and Kokrajhar in an area of 290 ha. The highest performance was recorded in Upper Brahmaputra Valley Zone by KVK Tinsukia with a productivity of 9.88 q/ha from “PU 31” variety.

20
Performance of Cluster Frontline Demonstration on Pulses in Assam, Arunachal Pradesh & Sikkim
Agro
Clim
atic
Zo
ne/C
limat
eK
VKs
Vari
ety
dem
onst
rate
d
Dis
t. av
g.
(q/h
a)
Area
(in
ha
)
No.
of
dem
o
Yiel
d (q
/ha)
%In
crea
se
Net
retu
rn (R
s/ha
)B:
C ra
tio
Che
ckD
emo
Che
ckD
emo
Che
ckD
emo
Upp
er
Brah
map
utra
Va
lley Z
one
Jorh
atPU
316
3075
5.17
7.97
54.1
670
0017
635
1.26
1.67
Sibs
agar
PU 31
6.58
1025
55.
240
.066
4080
401.
231.
28
Tins
ukia
PU 31
6.48
2061
7.36
9.88
34.2
327
970
4338
02.
192.
68
Gola
ghat
PU 31
610
255.
58.
664
.58
2140
020
302
2.03
2.44
Cent
ral
Brah
map
utra
Va
lley Z
one
Naga
onPU
315.
3520
603.
125.
957
.92
2900
020
600
5.60
1.85
Mor
igao
nPU
316.
3120
505
7.5
50.0
012
900
4460
1.52
1.21
Hill
y Te
mpe
rate
Zo
ne
Karb
i An
glon
gPU
315.
8620
564.
87.
147
.92
2358
613
800
2.24
1.92
Lowe
r Br
ahm
aput
ra
Valle
y Zon
e
Bong
aiga
onPU
-31
10.7
1039
5.9
7.8
39.5
812
400
1870
02.
102.
49
Baks
aPU
-31
5.39
1025
6.1
831
.15
7853
1553
51.
441.
86
Dhub
riPU
-31
7.2
2020
6.5
940
.98
1665
220
758
2.14
2.36
Uda
lgur
iPU
-31
4.57
2050
4.5
5.63
25.1
113
660
2465
51.
872.
22
Darra
ngPU
-31
710
105.
87.
732
.75
1390
221
612
2.09
2.28
Kam
rup
PU-3
15.
2230
525.
35.
88.
020
,250
22,2
502.
802.
83
Kokr
ajha
rPU
-31
5.17
2050
5.4
6.7
24.0
20,6
0040
,200
1.74
1.52
Tab
le 2
.8 P
erfo
rman
ce o
f Bla
ck g
ram
dem
on
stra
tio
n c
on
du
cted
du
rin
g K
ha
rif 2
017-
18 in
Ass
am

21
Performance of Cluster Frontline Demonstration on Pulses in Assam, Arunachal Pradesh & Sikkim
Blackgram variety PU-31 cultivated in KVK Karbianglong
Blackgram variety PU-31 cultivated in KVK Dhemaji
6.2. Performance of Black gram demonstration conducted during Kharif 2017-18 in Arunachal
During Kharif 2017-18, 228 numbers of CFLDs were demonstrated by KVK Changlang, East Siang, Tawang, Tirap in an area of 90 ha. The highest performance was recorded KVK Changlang in “PU 31” variety with a productivity of 11.25 q/ha.Table 2.9 Performance of Black gram demonstration conducted during Kharif 2017-18 in Arunachal
KVKsVariety
demonstrated
Dist. avg. (q/ha)
Area (in ha)
No. of demo
Yield (q/ha) %
Increase
Net return (Rs/ha)
B:C ratio
Check Demo Check Demo Check Demo
Changlang PU -31 7 50 125 6.58 11.25 70.97 12960 34277 1.65 2.46
East Siang PU-31 4.5 10 25 4.6 5.8 26.1 26680 34200 2.5 2.9
Tawang PU-31 5.25 20 53 5.25 8 52.38 31750 52000 2.5 3.1
Tirap PU 31 4.78 10 25 4.8 6.58 37.08 10546 23086 1.59 2.26
Black gram variety PU-31 cultivated in KVK East Siang
Black gram variety PU-31 cultivated in KVK Tirap

22
Performance of Cluster Frontline Demonstration on Pulses in Assam, Arunachal Pradesh & Sikkim
6.3. Performance of Black gram demonstration conducted during Kharif 2017-18 in Sikkim
During Kharif 2017-18, 50 numbers of CFLDs were demonstrated by KVK East Sikkim in an area of 20 ha. The productivity of 11.25 q/ha was recorded by KVK East Sikkim with “PU 31” variety.
Table 3.0 Performance of black gram demonstration conducted during Kharif 2017-18 in Sikkim
KVKsVariety
demonstrated
Dist. avg.
(q/ha)
Area (in ha)
No. of demo
Yield (q/ha) %
Increase
Net return (Rs/ha)
B:C ratio
Check Demo Check Demo Check Demo
East Sikkim SKPD3 9.65 20 50 6.4 10.4 62.5 14840 30290 1.73 2.17
Training on Black gram var. SKPD3, East Sikkim
Cultivation of Black gram var. SKPD3, East Sikkim
6.4. Performance of Green gram demonstration conducted during Kharif 2017-18 in Assam
During Kharif 2017-18, 449 numbers of CFLDs were demonstrated by KVK Jorhat, Sibsagar, Tinsukia, Golaghat, Nagaon, Morigaon, Udalguri and Sonitpur in an area of 140 ha. The highest performance was recorded in Central Brahmaputra Valley Zone by KVK Morigaon with “IPM 2-3” variety having productivity of 12.96 q/ha.

23
Performance of Cluster Frontline Demonstration on Pulses in Assam, Arunachal Pradesh & Sikkim
Tab
le 3
.1 P
erfo
rman
ce o
f Gre
en g
ram
dem
on
stra
tio
n c
on
du
cted
du
rin
g K
ha
rif 2
017-
18 in
Ass
am
Agro
Clim
atic
Zo
ne/C
limat
eK
VKs
Vari
ety
dem
onst
rate
d
Dis
t. av
g.
(q/h
a)
Area
(in
ha
)
No.
of
dem
o
Yiel
d (q
/ha)
%In
crea
se
Net
retu
rn (R
s/ha
)B:
C ra
tio
Che
ckD
emo
Che
ckD
emo
Che
ckD
emo
Upp
er
Brah
map
utra
Va
lley Z
one
Jorh
atIP
M 2-
36
2013
05.
128.
9274
.22
2130
045
160
1.81
2.72
Sibs
agar
SGC-
205.
1310
26Ni
l7.
5Ni
lNi
l24
140
Nil
1.85
Tins
ukia
SGC-
167.
310
396.
68.
833
.33
1815
042
475
1.72
2.54
Gola
ghat
SGC-
166
1025
6.75
8.2
21.5
2590
025
900
2.23
2.3
Cent
ral
Brah
map
utra
Va
lley Z
one
Naga
onIP
M 2-
35.
8830
793.
796.
366
.23
9600
2670
02.
031.
37
Mor
igao
nIP
M 2-
33.
720
507.
9112
.96
63.8
417
050
4876
01.
942.
68
Lowe
r Br
ahm
aput
ra
Valle
y Zon
eU
dalg
uri
PU-3
1NA
1025
4.2
6.5
54.7
620
260
3185
52.
292.
58
North
Ban
k Pl
ain
Zone
Soni
tpur
SGC
- 16
7.3
3075
3.2
4.1
28.1
311
800
1720
01.
862.
1

24
Performance of Cluster Frontline Demonstration on Pulses in Assam, Arunachal Pradesh & Sikkim
Green gram variety SGC – 16 cultivated in KVK Tinsukia
Green gram var. IPM 2-3 cultivated in KVK Jorhat
6.5. Performance of Green gram demonstration conducted during Kharif 2017-18 in Sikkim
Green gram production was done in an area of 40 ha in Sikkim. The highest performance was recorded by KVK North Sikkim in “Samrat” variety with a productivity of 7.8 q/ha.
Table 3.2 Performance of Green gram demonstration conducted during Kharif 2017-18 in Sikkim
KVKsVariety
demonstrated
Dist. avg.
(q/ha)
Area (in ha)
No. of demo
Yield (q/ha) %
Increase
Net return (Rs/ha)
B:C ratio
Check Demo Check Demo Check Demo
North Sikkim Samrat 6.05 20 50 6.6 7.8 18.18 81000 98000 3 3.2
West Sikkim Samrat 7.25 20 50 5.2 7.4 42.31 52900 64200 1.76 1.86
7. Performance of pulses conducted during Rabi 2017-18
7.1 Performance of field pea demonstration conducted during Rabi 2017-18 in Assam
A total 520 numbers of CFLDs on Rabi field pea were demonstrated in all the six zones of Assam covering an area of 185 ha. KVK Chirang under Lower Brahmaputra Valley Zone recorded the highest yield of Rabi field pea variety PS-10 with 16 q/ha in the year 2017-18.

25
Performance of Cluster Frontline Demonstration on Pulses in Assam, Arunachal Pradesh & Sikkim
Tabl
e 3.
3 P
erfo
rman
ce o
f fie
ld P
ea d
emon
stra
tion
con
duct
ed d
uri
ng
Rab
i 201
7-18
(ASS
AM
)
Agr
o C
lim
atic
Zo
ne/
K
VK
sVa
riet
y de
mon
stra
ted
Dis
t.
avg.
(q
/h
a)
Are
a (i
n
ha)
No.
of
dem
o
Yie
ld
%N
et r
etu
rn (R
s/h
a)B
:C r
atio
(q/h
a)In
crea
se
Ch
eck
Dem
o
Ch
eck
Dem
oC
hec
kD
emo
1.U
pp
er
Bra
hm
apu
tra
Vall
ey Z
one
Jorh
atPr
akas
h5.
210
365.
217.
136
.311
110
3453
01.
552.
55
Dib
ruga
rhPr
akas
h3.
595
20N
il9.
55N
il
1870
0.00
0.
64
2.Lo
wer
B
rah
map
utr
a Va
lley
Zon
e
Baks
aPr
akas
h8.
1220
468.
511
29.4
210
218
1612
41.
391.
58
Barp
eta
Prak
ash
8.52
1031
11.2
14.8
32.1
426
400
5200
01.
882.
73
Bong
aiga
onPr
akas
h 10
.710
39N
il12
.8N
ilN
il23
300
Nil
2.08
Uda
lgur
iPr
akas
h5.
620
55N
il12
.2N
ilN
il26
000
Nil
2.14
Chira
ngPS
-10
7.48
1039
10.5
1652
.474
800
1265
003.
484.
78
3.N
orth
ban
k P
lain
Zon
e
Dhe
maj
iPr
akas
h6.
3820
307.
813
.54
73.5
812
225
3626
61.
643.
02
Soni
tpur
Prak
ash
5.8
2059
4.3
7.2
67.4
412
650
2770
01.
832.
45
4.C
entr
al
Bra
hm
apu
tra
Vall
ey Z
one
Nag
aon
Prak
ash
5.69
2052
4.72
8.36
77.1
221
345
5429
41.
93.
1
5.B
arak
Val
ley
Zon
eH
aila
kand
iPr
akas
h9.
210
346.
827.
9616
.71
1149
016
620
1.74
1.87
6. H
ill
Tem
per
ate
Zon
e
Karb
i An
glon
gPr
akas
h7.
2430
794.
58.
282
.22
9180
4000
1.74
1.28

26
Performance of Cluster Frontline Demonstration on Pulses in Assam, Arunachal Pradesh & Sikkim
Field pea var. Prakash cultivated in KVK Dhemaji
CFLD Field pea var. Prakash in KVK Karbianglong
Field pea var. Prakash cultivated in KVK Dibrugarh
CFLD Field pea var. Prakash in KVK Udalguri
7.2 Performance of field pea demonstration conducted during Rabi 2017-18 in Arunachal Pradesh
A total 150 numbers of CFLDs on Rabi field pea were demonstrated in the state of Arunachal Pradesh covering an area of 60 ha. KVK Tawang with the Prakash variety recorded the highest yield of 17 q/ha.

27
Performance of Cluster Frontline Demonstration on Pulses in Assam, Arunachal Pradesh & Sikkim
Tab
le 3
.4 P
erfo
rman
ce o
f fie
ld P
ea d
emo
nst
rati
on
co
nd
uct
ed d
uri
ng
Ra
bi
2017
-18
(Aru
nac
hal
Pra
des
h)
Stat
eK
VKs
Vari
ety
dem
onst
rate
dD
ist.
avg.
(q
/ha)
Area
(i
n ha
)N
o. o
f de
mo
Yiel
d %
Net
retu
rn (R
s/ha
)B
:C r
atio
(q/h
a)In
crea
se
Che
ckD
emo
C
heck
Dem
oC
heck
Dem
o
Arun
acha
l Pr
ades
h
Wes
t Ka
men
gAr
kel
NA
1039
1216
.235
1601
2.5
62,0
001.
592.
63
East
Sia
ngPr
akas
h5
1025
6.65
7.55
16.5
421
500
2750
01.
471.
51Lo
wer
Su
bans
iriPr
akas
h4.
520
314.
235.
6734
.04
2876
043
040
1.3
1.72
Taw
ang
Prak
ash
6620
5510
1770
3350
068
500
2.2
3
Pod
Form
atio
n in
var
. Pra
kash
, KVK
Eas
t Sia
ng

28
Performance of Cluster Frontline Demonstration on Pulses in Assam, Arunachal Pradesh & Sikkim
7.3
Per
form
ance
of l
enti
l dem
on
stra
tio
n c
on
du
cted
du
rin
g R
ab
i 201
7-18
in A
ssam
A to
tal 9
75 n
umbe
rs o
f CFL
Ds
on R
abi L
entil
wer
e de
mon
stra
ted
in a
ll th
e si
x zo
nes
of A
ssam
cov
erin
g an
are
a of
38
0 h
a. K
VK
Sib
saga
r un
der U
pp
er B
rah
map
utr
a Va
lley
Zo
ne
reco
rded
the
high
est y
ield
of R
abi L
entil
with
10.
45 q
/ha
in th
e ye
ar 2
017-
18.
Tab
le 3
.5 P
erfo
rman
ce o
f len
til d
emo
nst
rati
on
co
nd
uct
ed d
uri
ng
Ra
bi 2
017-
18
(ASS
AM
)
Agro
Clim
atic
Zo
neK
VKs
Vari
ety
dem
onst
rate
dD
ist.
avg.
(q
/ha)
Area
(in
ha
)
No.
of
dem
oYi
eld
%N
et re
turn
(Rs/
ha)
B:C
rati
o
(q/h
a)In
crea
se
Che
ckD
emo
C
heck
Dem
oC
heck
Dem
o
1.U
pper
Br
ahm
aput
ra
Valle
y Zo
ne
Gola
ghat
KLS-
218
6.75
5012
56.
158.
6340
.33
1872
5.00
1868
4.67
464.
291.
00Si
bsag
ar K
LS-2
187.
6510
30Ni
l10
.45
Nil
Nil
2235
0Ni
l1.
74Jo
rhat
KLS 2
185.
210
565.
217.
136
.311
110
3453
01.
552.
55
2.Lo
wer
Br
ahm
aput
ra
Valle
y Zo
ne
Baks
aKL
S 218
5.85
3075
6.1
8.3
36.0
695
9415
252
1.41
1.62
Barp
eta
HU
L-57
4.96
4018
35.
857.
3525
.64
1470
021
800
1.83
2.22
Bong
aiga
onKL
S-21
86.
4420
866.
27.
216
.13
2295
027
825
2.61
2.8
Darra
ngKL
S 218
7.5
2040
5.88
7.54
28.2
315
780
2374
01.
812.
1Dh
ubri
KLS-
218
5.3
2050
7.5
9.5
26.6
620
250
3045
01.
962.
4
Kam
rup
KLS-
218
5.1
2050
5.85
7.8
33.3
399
0514
950
1.65
1.92
Chira
ngM
oitre
e4.
8550
145
5.24
7.18
37.0
225
400
5550
02.
263.
47Ko
kraj
har
WBL
-77
4.88
2055
6.3
7.8
23.8
122
000
2780
01.
571.
733.
Nor
th b
ank
Plai
n Zo
neDh
emaj
iKL
S 218
3.78
2050
5.4
8.2
51.8
515
688
2990
51.
942.
55
Soni
tpur
KLS2
188.
420
504.
98.
2568
.420
000
4165
02.
43.
59

29
Performance of Cluster Frontline Demonstration on Pulses in Assam, Arunachal Pradesh & Sikkim
4.Ce
ntra
l Br
ahm
aput
ra
Valle
y Zo
ne
Naga
onKL
S-21
86.
1430
784.
646.
8647
.84
2032
658
485
1.5
2.5
Mor
igao
n K
LS-2
1810
.09
1027
4.9
8.1
65.3
132
5093
751.
171.
34
6. H
ill T
em-
pera
te Z
one
Karb
i An
glon
gLe
ntil
Not
culti
-va
ted
1013
4.9
8.25
68.4
Lent
il va
r. KL
S –
218
culti
vate
d in
KV
K D
hubr
iLe
ntil
var.
HU
L - 5
7 cu
ltiva
ted
in
KVK
Barp
eta
Lent
il in
Ric
e U
tera
cro
ppin
g un
der
CFL
D, K
VK Jo
rhat

30
Performance of Cluster Frontline Demonstration on Pulses in Assam, Arunachal Pradesh & Sikkim
7.4
Per
form
ance
of l
enti
l dem
on
stra
tio
n c
on
du
cted
du
rin
g R
ab
i 20
17-1
8 in
Aru
nac
hal
Pra
des
h
A to
tal 7
5 nu
mbe
rs o
f CFL
Ds o
n R
abi L
entil
wer
e de
mon
stra
ted
in th
e st
ate
of A
runa
chal
Pra
desh
cov
erin
g an
are
a of
30
ha.
KV
K T
irap
with
the
vari
ety
of H
UL
– 5
7, re
cord
ed th
e yi
eld
with
5.5
q/h
a in
the
year
201
7-18
.
Tab
le 3
.6 P
erfo
rman
ce o
f len
til d
emo
nst
rati
on
co
nd
uct
ed d
uri
ng
Ra
bi
2017
-18
(AR
UN
AC
HA
L P
RA
DE
SH)
Stat
eK
VKs
Vari
ety
dem
onst
rate
d
Dis
t. av
g.
(q/
ha)
Area
(i
n ha
)
No.
of
dem
o
Yiel
d %
Net
retu
rn (R
s/ha
)B
:C r
atio
(q/h
a)In
crea
se
Che
ckD
emo
C
heck
Dem
oC
heck
Dem
o
Arun
acha
l Pr
ades
hTi
rap
HU
L-57
4.16
3075
4.45
5.5
23.6
5457
3660
1.44
1.19
7.5
Per
form
ance
of l
ath
yru
s d
emo
nst
rati
on
co
nd
uct
ed d
uri
ng
Ra
bi 2
017-
18 in
Ass
am
A to
tal 2
13 n
umbe
rs o
f CFL
Ds o
n R
abi L
athy
rus w
ere
dem
onst
rate
d in
all
the
six
zone
s of A
ssam
cov
erin
g an
are
a of
80
ha.
KV
K D
arra
ng
unde
r Low
er B
rah
map
utr
a Va
lley
Zo
ne
reco
rded
the
high
est y
ield
of R
abi f
ield
pea
with
8.6
3 q/
ha in
the
year
201
7-18
.
Tab
le 3
.7 P
erfo
rman
ce o
f lat
hyr
us
dem
on
stra
tio
n c
on
du
cted
du
rin
g R
ab
i 201
7-18
.
(ASS
AM
)
Agro
Clim
atic
Zo
neK
VKs
Vari
ety
dem
onst
rate
dD
ist.
avg.
(q/h
a)Ar
ea
(in
ha)
No.
of
dem
o
Yiel
d %
Net
retu
rn (R
s/ha
)B:
C ra
tio
(q/h
a)In
crea
se
Che
ckD
emo
C
heck
Dem
oC
heck
Dem
o
2.Lo
wer
Br
ahm
aput
ra
Valle
y Zo
ne
Baks
aRa
tan
5.6
1025
5.5
6.8
23.6
352
8073
531.
331.
43
Darra
ngRa
tan
Not a
vaila
ble
1030
7.25
8.63
19.0
325
200
3318
02.
382.
78
Kokr
ajha
rRa
tan
Faile
d du
e to
poor
ge
rmin
atio
n 10
25Ni
lNi
lNi
l

31
Performance of Cluster Frontline Demonstration on Pulses in Assam, Arunachal Pradesh & Sikkim
3.N
orth
ban
k Pl
ain
Zone
Soni
tpur
Rata
n4.
510
253.
24.
128
.13
8200
1455
01.
521.
9
4.Ce
ntra
l Br
ahm
aput
ra
Valle
y Zo
neNa
gaon
Rata
nNA
2054
5.42
7.24
33.5
719
587
4649
01.
82.
8
5.Ba
rak
Valle
y Zo
neKa
rimga
njRa
tan
410
254
5.2
3011
500
1600
02.
352.
6
6. H
ill T
empe
rate
Zo
neKa
rbi
Angl
ong
Rata
nNA
1029
Nil
6.8
Nil
Nil
7200
Nil
1.43
Lath
yrus
var
. Rat
an
culti
vate
d in
KVK
Ka
rbia
nglo
ng
Lath
yrus
var
. Rat
an
culti
vate
d in
KVK
Bak
sa
CFL
D L
athy
rus v
ar. R
atan
in
KVK
Nag
aon
CFL
D L
athy
rus v
ar. R
atan
in
KVK
Dar
rang

32
Performance of Cluster Frontline Demonstration on Pulses in Assam, Arunachal Pradesh & Sikkim
7.6
Per
form
ance
of R
ajm
ah d
emo
nst
rati
on
co
nd
uct
ed d
uri
ng
Ra
bi
2017
-18
in A
ssam
A to
tal 2
77 n
umbe
rs o
f CFL
Ds o
n R
abi R
ajm
ah w
ere
dem
onst
rate
d in
all
the
six
zone
s of A
ssam
cov
erin
g an
are
a of
11
0 h
a. K
VK
Hai
laka
nd
i und
er B
arak
Val
ley
Zo
ne
reco
rded
the
high
est y
ield
of R
abi R
ajm
ah w
ith 1
7.5
q/h
a in
the
year
20
17-1
8.
Tab
le 3
.8 P
erfo
rman
ce o
f Raj
mah
dem
on
stra
tio
n c
on
du
cted
du
rin
g R
ab
i 20
17-1
8.
(ASS
AM
)
Agro
C
limat
ic
Zone
KVK
sVa
riet
y de
mon
stra
ted
Dis
t. av
g.
(q/h
a)Ar
ea
(in
ha)
No.
of
dem
oYi
eld
%N
et re
turn
(Rs/
ha)
B:C
rat
io
(q/h
a)In
crea
se
Che
ckD
emo
C
heck
Dem
oC
heck
Dem
o
2.B
arak
Va
lley
Zone
Hai
laka
ndi
Trip
ura
Sele
ctio
n12
.530
7714
.217
.523
.27
3670
053
200
2.2
2.6
Karim
ganj
Arka
Kom
al10
4010
08.
214
.678
.05
1510
01.
547
600
2.46
Cach
arH
UR-
301
1240
100
1214
.722
.520
500
1.5
3060
01.
7
Line
Sow
ing
of R
ajm
ah v
ar. H
UR
– 30
1 in
KVK
Cac
har
CFL
D R
ajm
ah v
ar. A
rka
Kom
al in
KVK
Ka
rim
ganj
CFL
D R
ajm
ah v
ar. T
ripu
ra S
elec
tion
in
KVK
Hai
laka
ndi

33
Performance of Cluster Frontline Demonstration on Pulses in Assam, Arunachal Pradesh & Sikkim
7.7
Per
form
ance
of R
ajm
ah d
emo
nst
rati
on
co
nd
uct
ed d
uri
ng
Ra
bi 2
017-
18 in
Sik
kim
A to
tal 1
00 n
umbe
rs o
f CFL
Ds o
n R
abi R
ajm
ah w
ere
dem
onst
rate
d in
Sik
kim
cov
erin
g an
are
a of
40
ha.
KV
K N
ort
h
Sikk
im re
cord
ed th
e hi
ghes
t yie
ld o
f Rab
i Raj
mah
with
16.
6 q
/ha
in th
e ye
ar 2
017-
18.
Tab
le 3
.9 P
erfo
rman
ce o
f Raj
mah
dem
on
stra
tio
n c
on
du
cted
du
rin
g R
ab
i 201
7-18
.
(SIK
KIM
)
Stat
e K
VKs
Vari
ety
dem
onst
rate
d
Dis
t. av
g.
(q/
ha)
Area
(i
n ha
)
No.
of
dem
o
Yiel
d %
Net
retu
rn (R
s/ha
)B
:C r
atio
(q/h
a)In
crea
se
Che
ckD
emo
C
heck
Dem
oC
heck
Dem
o
SIK
KIM
Nor
th S
ikki
mJw
ala
9.48
2050
9.5
16.6
75.5
63,5
201,
69,0
002.
272.
95W
est S
ikki
mJw
ala
13.3
520
509.
616
.473
.54
1113
3014
3275
2.28
2.47
Jwal
a Va
riet
y of
Raj
mah
dem
onst
rate
d by
KVK
W
est S
ikki
mJw
ala
Vari
ety
of R
ajm
ah d
emon
stra
ted
by K
VK
Nor
th S
ikki
m

34
Performance of Cluster Frontline Demonstration on Pulses in Assam, Arunachal Pradesh & Sikkim
8. Training and Monitoring
ICAR-Agricultural Technology Application Research Institute, Zone - VI organised one day, and two-days training programme for Nodal Officers of Krishi Vigyan Kendras under NFSM Pulse during 2018-19. The main objective of the training programme was to increase the production and productivity of pulses through various packages of practices. The details of training programme organised are in Table 1.33.Table 4.0 Training and monitoring organized by ICAR-ATARI-III (Old Zone)
Sl. No Training Programme Participants
1 26-27, February, 2018 442 30, August, 2018 543 15-16, March, 2019 88
8.1 Monitoring of CFLDs on pulses during 2017-18
For any extension programme monitoring is very important. At programme level, monitoring is to track implementation and output systematically, and measure the effectiveness of the programmes. A number of officials visited in the field, where CFLD pulses were demonstrated for monitoring and evaluating purpose.
Sl. No.
No. of field visit by officials of ICAR / DAC
& FWWho participated in the visit
1. 39
Dr. K. Manoharan, Director, Directorate of Jute Development, Ministry of Agriculture & Farmers Welfare, Govt. of IndiaMr. Shamsher Singh, National Consultant, NFSMDr. H.C. Bhattacharyya, DEE, AAU, JorhatScientist from AAU, JorhatDr. D.K. Sharma, Director, ICAR-NRC on Pig, RaniJoint Director, ICAR RC for NEH Region, Nagaland CentreDr. S.P. Das, Principal Scientist, ICAR RC for NEH Region, Tripura Centre, Scientist from RARSOfficer from State department, Senior Scientist & Head of KVKs and SMSs

35
Performance of Cluster Frontline Demonstration on Pulses in Assam, Arunachal Pradesh & Sikkim
9. Success Story of ASSAM
9.1. Name of KVK : - KVK Barpeta
2. Crop and Variety : - Field pea (Variety: Prakash)
3. Name of farmer & Address-
Mr. Prabhat Das, Village: Meda, Barpeta
4. Background information about farmer field
Local variety of Field pea was grown every year after harvesting of winter paddy by Mr. Das. But his production and productivity was very low due to lack of good quality seeds.
5. Details of technology demonstrated
Improved variety of Prakash was demonstrated in his filed along with scientific production practices.
6. Institutional Involvement - KVK, Barpeta.
7. Success Point - He was satisfied by adopting the technology.
8. Outcome Yield (q/ha)
Demonstration Potential yield of variety/technology District average (Previous year)State average (Previous year)
14.56 q/ha12.0 q/ha8.52 q/ha11.47q/ha
9. Performance of technology vis-à-vis Local check (Increase in productivity and returns)
Specific Technology
Yield (q/ha) Gross cost (Rs/ha)
Gross income (Rs/ha)
Net income(Rs/ha
B:C ratio
Farmer practices 8.33 18,480.00 47,200.00 28,720.00 2.55
Demonstration 14.56 20,540.00 58,500.00 37,960.00 2.84
% Increase % increase over check is 75%.

36
Performance of Cluster Frontline Demonstration on Pulses in Assam, Arunachal Pradesh & Sikkim
9.2 Name of KVK : KVK Chirang
2. Crop and Variety : Blackgram (Var. PU-31)
3. Name of farmer & Address : Subhan Ali
Father’s Name: Shom Miya
Village: Majrabari, P.O:
District: Chirang (BTAD), Assam
Ph: 8011151993
4. Background information about farmer field-
Md. Subhan Ali a small farmer of Chirang district has a land holding of 2.5 ha. He used to grow rice, blackgram and jute according to land situation during kharif season. After harvesting the Kharif crops, he used some areas for cultivation of rabi crops viz-rapeseed, lentil and vegetables. The soil condition is mostly sandy loam and rainfed. Md. Subhan Ali cultivates blackgram in the kharif season in his upland fields under rainfed condition with no scientific production technology.
5. Details of technology demonstrated-
The technology demonstrated was the scientific method of cultivation that included the use of high yielding variety (PU-31), application of recommended dose of fertilizer (N:P2O5:K2O@10:35 kg/ ha), treatment of seed with rizhobium.
6. Institutional Involvement-
The demonstration was conducted with active involvement of KVK Chirang. The critical inputs viz- seed, bio fertilizer, fertilizer, pesticides etc were provided by KVK. Also Training, method demonstration for treatment of seeds with rizhobium culture, diagnostic field visit etc were carried out by KVK.
7. Success Point-
Earlier the farmer, Mr. Subhan Ali used to grow blackgram in traditional method. He used local varieties which are generally low performer. No recommended dose of fertilizer and/ or bio fertilizer was applied. As a result yield was very low. But, due to intervention of KVK, Chirang in respect of HYV, scientific method of production, INM, IPM, training, diagnostic service the yield of the crop increased significantly.
8. Farmer Feedback-
The farmer, Mr. Subhan Ali was very happy and satisfied for the achievement of technology demonstrated by KVK, Chirang. He found the technology very useful and easy to apply in the field situation.
Mr. Subhan Ali showed his field to other farmers of nearby villages and motivated most of them to accept the technology.

37
Performance of Cluster Frontline Demonstration on Pulses in Assam, Arunachal Pradesh & Sikkim
9. Outcome Yield (q/ha)
Demonstration = 8.7
Potential yield of variety/technology = 12.0
District average (Previous year) = 5.3
State average (Previous year) = 5.1
10. Performance of technology vis-à-vis Local check (Increase in productivity and returns)
Specific Technology
Yield (q/ha)
Gross cost (Rs/ha)
Gross income (Rs/ha)
Net income(Rs/ha
B:C ratio
Farmer practices
6.2 22500.00 49,600.00 28,100.00 2.2
Demonstration 8.7 26000.00 69,600.00 48,100.00 2.67
% Increase 40.23% 40.23%
(Price of blackgram @ Rs. 8000.00 q/ ha)
9.3 Name of KVK: - KVK Darrang
2. Crop and Variety: - Blackgram, Variety: PU 31
3. Name of farmer & Address
Monuranjan Deka, Baralakhaity, Darrang
4. Background information about farmer field
The field mostly remains vacant after the cultivation of Sali rice. However, only in few area the farmer are involved in blackgram cultivation.
5. Details of technology demonstrated
IPM with yellow sticky trap and Chloropyrifos 20EC and popularization of HYV
6. Institutional Involvement
KVK, Darrang did extensive and adequate field survey in selected suitable areas and encouraged farmers to cultivate Black gram under Cluster Front Line Demonstration Programme during Kharif 2018-19
7. Success Point-
Barren areas after Sali rice converted to blackgram grown area.

38
Performance of Cluster Frontline Demonstration on Pulses in Assam, Arunachal Pradesh & Sikkim
8. Farmer Feedback-
Feedback were encouraging and appreciated the work done by KVK Darrang and insisted such kind of variety and technology in the near future. According to the farmer, technology of IPM can be easily made available.
9. Outcome Yield (q/ha)
Demonstration Potential yield of variety/technology District average (Previous year)State average (Previous year)
8.0710.005.505.94
10. Performance of technology vis-à-vis Local check (Increase in productivity and returns)
Specific Technology
Yield (q/ha)
Gross cost (Rs/ha)
Gross income (Rs/ha)
Net income(Rs/ha
B:C ratio
Farmer practices 5.10 22,000 40000 18000 1.82
Demonstration 8.07 24,000 68000 44000 2.83
% Increase 36.80
11. Quality Photographs:

39
Performance of Cluster Frontline Demonstration on Pulses in Assam, Arunachal Pradesh & Sikkim
9.4 Name of KVK: - KVK Jorhat
2. Crop and Variety : - Black gram, variety: PU-31
3. Name of farmer & Address : Mr. Gajen Dutta
S/O of Thogi Dutta
Birinabari, Majuli
4. Background information about farmer field
The farmer’s field is near to river Brahmaputra and is flood affected area.
5. Details of technology demonstrated
Blackgram variety PU-31 is having the duration of 75 days, bold seeded with an potential yield of 12.5 q/ha. The variety is also tolerant to YMV.
6. Institutional Involvement
KVK scientists demonstrated high yielding Blackgram variety PU-31 in 5 bigha (0.66ha) area under cluster frontline demonstration.
7. Success Point
After the success Mr.Dutta despite bad weather condition and heavy rainfall upto last week of Sept 2018, is keen on cultivating Blackgram. Variety PU-31 and also motivated other fellow farmers for cultivating greengram for next season.
8. Farmer Feedback
Satisfied with the Blackgram variety.
9. Outcome Yield (q/ha)
Demonstration : 6.4 q/ha Potential yield of variety/technology : 12.5 q/ha State average (Previous year) : 5.73 q/ha District average (Previous year) : 6 q/ha
10. Performance of technology vis-à-vis Local check (Increase in productivity and returns)
Specific Technology
Yield (q/ha)
Gross cost (Rs/ha)
Gross income (Rs/ha)
Net income(Rs/ha
B:C ratio
Farmer practices 4.2 23000 23100 100 1.0Demonstration 6.4 26200 35200 9000 1.34% Increase 152.38

40
Performance of Cluster Frontline Demonstration on Pulses in Assam, Arunachal Pradesh & Sikkim
11. Quality Photographs:
9.5 Name of KVK: - KVK Karimganj
2. Crop and Variety : - Black Gram (Var. PU-31)
3. Name of farmer & Address: - Abu Bakkar, Nayagram, Karimganj
4. Background information about farmer field
The field remains vacant mostly after the cultivation of Sali rice. However, only in few area the farmers are cultivate blackgram.
5. Details of technology demonstrated
Cultivation of improved variety of blackgram through organic means.
6. Institutional Involvement
KVK, Karimganj did extensive and adequate field survey and selected suitable areas and farmer’s to cultivate Black gram under Cluster Front Line Demonstration Programme during Kharif 2018-19
7. Success Point
Barren areas after Sali rice converted to Black gram grown area.
8. Farmer Feedback
Feedback were tremendously encouraging and applauded the work done by KVK Karimganj and insisted such kind of variety and technology in the near future.
9. Outcome Yield (q/ha)
Demonstration Potential yield of variety/technology District average (Previous year)State average (Previous year)
7.5012.005.50

41
Performance of Cluster Frontline Demonstration on Pulses in Assam, Arunachal Pradesh & Sikkim
10. Performance of technology vis-à-vis Local check (Increase in productivity and returns)
Specific Technology
Yield (q/ha)
Gross cost (Rs/ha)
Gross income (Rs/ha)
Net income(Rs/ha
B:C ratio
Farmer practices 4.20 34,500 42,000 7500 1.21
Demonstration 7.50 41,500 75,000 33,500 1.80
% Increase 78.57
11. Quality Photographs:
9.6 Name of KVK: - KVK Tinsukia
2. Crop & variety: - Green gram (Var. Rupohi)
3. Farmers Name & Address: - Mr. Hiteswar Gogoi, Ratanpur Village 4, Sadiya, Tinsukia
4. Background Information-
In Assam, Green gram is cultivated in 11285 ha with a production and productivity of 7757 MT and 687 q/ha, respectively which is lower than the national average. Tinsukia district of Assam has a sizeable area under green gram cultivation with area and production 213 ha and 111 MT, respectively. However, with the available improved technologies, it is possible to bridge the yield gap and increase the productivity up to the potential level (14.0 q/ha).The reasons for low productivity are poor knowledge about newly released crop variety and protection technologies and their management practices in the farmer’s field.
5. Technology Demonstrated
Green gram variety Rupohi is having the duration of 65-70 days with an average yield of 12-13 q/ha and protein content of 24.5%. The variety is also resistant to CLS and YMV.

42
Performance of Cluster Frontline Demonstration on Pulses in Assam, Arunachal Pradesh & Sikkim
6. Institutional Involvement
KVK scientists demonstrated high yielding Greengram variety Rupohi in 2 bigha (0.26ha) area under cluster frontline demonstration.
7. Success Point
After the success Mr. Gogoi is keen on cultivating greengram variety Rupohi and also motivated other fellow farmers for cultivating greengram for next season.
8. Outcome
The farmer got an average yield of 12.01 q/ha with 93.7% increase in yield over local variety
Outcome Yield (q/ha)Demonstration Potential yield of variety/technology District average (Previous year)State average (Previous year)
5.4 q/ha12-15 q/ha4.4 q/ha4.9 q/ha
9. Performance of technology vis-à-vis Local check (Increase in productivity and returns)
Practice usedYield
(q/ha)
Total cost of
cultivation (Rs.)
Gross income
(Rs.)
Net income
(Rs.)
Cost benefit
ratio
% increase
Package Demonstration
12.01 27595.00 84070.00 56475.00 3.05 211.1
Farmer’s Practice
6.2 25250.00 43400.00 18150.00 1.17 -
10. Quality Photographs:

43
Performance of Cluster Frontline Demonstration on Pulses in Assam, Arunachal Pradesh & Sikkim
10. Success Story of ARUNACHAL PRADESH
10.1 Name of KVK : KVK East Siang, CHF, CAU, Pasighat, A.P.2. Crop and Variety Black gram, Variety PU-31.3. Name of farmer & Address : Mr. Tate Saroh, Village Jampani, Ruksin block, East Siang, Arunachal Pradesh.4. Background information about farmer field
Farmers cultivated Potato in Rabi season followed by Maize and Summer Vegetables.5. Details of technology demonstrated
Improved Variety PU-31, seed treatment with Rhizobium culture and Trichoderma viride @ 10.0 g/kg seed; FYM @ 8-10 tonnes/ha (Based on availability).6. Institutional Involvement KVK East Siang, CHF, CAU, Pasighat, A.P. provided training, improved Variety PU-31, Rhizobium culture and Trichoderma viride for seed treatment @ 10.0 g/kg seed.7. Success Point Higher yield upto the tune of 6.0 q/ha was obtained during Kharif 2018 cropping season, less insect pest (Leaf webber 7%) and disease (Powdery mildew 8%) incidence was recorded.8. Farmer Feedback The technology is suitable for East Siang district, A.P., has got bold seeds and less susceptible to insect pest and diseases.
Outcome Yield (q/ha)Demonstration Potential yield of variety/technology District average (Previous year)State average (Previous year)
8.07q/ha12q/ha
9. Performance of technology vis-à-vis Local check (Increase in productivity and returns
Specific Technology
Yield (q/ha)
Gross cost (Rs/ha)
Gross income (Rs/ha)
Net income(Rs/ha
B:C ratio
Farmer practices 4.6 18000 54000 36000 3.00Demonstration 5.4 18000 46000 28000 2.5% Increase 17.39

44
Performance of Cluster Frontline Demonstration on Pulses in Assam, Arunachal Pradesh & Sikkim
10. Good Quality Photographs:
11. Success Story of SIKKIM
11.1 Name of KVK : - KVK East Sikkim
2. Crop and Variety : - Black gram (SKPD-3).
3. Name of farmer & Address :- Mohan Prasad Dhakal.
Village: Ralap
Block: Sang
District: East Sikkim
4. Background information about farmer field
Farmers of the Sikkim generally growing Pahenlo dal (black gram) during Kharif season after maize crop. During winter season no major pulses are grown by the farmers in the state. Hence, the cropping intensity and productivity is very low (118%) in the state. The main reason of low productivity of crops is use of traditional crop cultivars and farming practices. This is mainly non-timely supply of quality seed. Apart from this, high soil acidity and light texture of soil promotes the leaching of nutrients under high rainfall conditions. To enhance the production and productivity of the pulses in Sikkim, there is urgent need of scientific package and practices of pulse crop.
5. Details of technology demonstrated
Organic cultivation opractices of improved black gram (SKPD-3) was demonstration in the 0.5 ha land of Sh. Mohan Prasad Dhakal field under the CFLD on Pulse programme. Seed was sown in first week of August, 2018 with the application of FYM or MC @ 5 t/ha and biofertilizer @ 5 kg/ha. Two hand weeding was done at the interval of 20 and 45 DAS. One spray of Neem based formulation (1500 ppm) @ 5% was done at the flowering stage.

45
Performance of Cluster Frontline Demonstration on Pulses in Assam, Arunachal Pradesh & Sikkim
6. Institutional Involvement
KVK-East Sikkim was involved in providing two numbers of training on organic cultivation of black gram and its pest and disease management. Several diagnostic visit was conducted by the KVK personel for pest and disease during the cropping period.
7. Success Point
Yield of the demonstration crop has been enhanced by 61.9% over the farmers’ practices and net income has also doubled (BC ratio: 2.13).
8. Farmer Feedback
Farmers were highly impressed and motivated to adopt the demonstrated technology higher yield and income and its cost effectiveness.
Outcome Yield (q/ha)Demonstration Potential yield of variety/technology District average (Previous year)State average (Previous year)
10.210.8
9.65
9.02
9. Performance of technology vis-a-vis Local Check (Increase in productivity and returns)
Specific Technology
Yield (q/ha)
Gross cost (Rs/ha)
Gross income (Rs/ha)
Net income(Rs/ha
B:C ratio
Farmer practices 6.3 20870 35280 14410 1.69
Demonstration 10.2 26765 57120 30355 2.13
% Increase 61.90 28.2 61.90 110.6
10. Good Quality Photographs:

46
Performance of Cluster Frontline Demonstration on Pulses in Assam, Arunachal Pradesh & Sikkim
11.2 Name of KVK : - KVK North Sikkim
2. Crop and Variety : - Green gram, Samrat.
3. Name of farmer & Address : Phurzom lepcha, Lum.
4. Background information about farmer field
Land was used for cultivation of vegetables.
5. Details of technology demonstrated
Variety/Technology demonstrated: Samrat.
SEED RATE: 8 kg.
FERTILIZER:
FYM @ 5t/ha.
Vermicompost @2 t /ha.
Neem Cake @ 1t/ha (15 days prior to sowing).
Seed Treatment
Rhizobium@200gm/10kg seed.
PSB@200gm/10kg seed.
6. Institutional Involvement - Nil
7. Farmer Feedback
Farmers liked the variety since the productivity was high as compared to the local variety
9. Performance of technology vis-a-vis Local Check (Increase in productivity and returns)
Specific Technology
Yield (q/ha)
Gross cost (Rs/ha)
Gross income (Rs/ha)
Net income(Rs/ha
B:C ratio
Farmer practices 7.25 43,000 1,45,000 1,05,000 3.37
Demonstration 8.07 45,000 1,61,400 1,16,400 3.6
% Increase 11.31

47
Performance of Cluster Frontline Demonstration on Pulses in Assam, Arunachal Pradesh & Sikkim
List of Contributors:Assam
1. Krishi Vigyan Kendra Baksa, Dhepargaon, Baksa, 7813542. Krishi Vigyan Kendra Barpeta, Howly, Assam, 781316 3. Krishi Vigyan Kendra Bongaigaon, Abhayapuri, Bongaigaon, 7833844. Krishi Vigyan Kendra Cachar, P.O. Arunachal, State: Assam, 7880255. Krishi Vigyan Kendra Chirang, P.O. Kajalgaon, Dist.: Chirang, BTAD, 7833856. Krishi Vigyan Kendra Darrang, Mangaldai, 784125, Assam 7. Krishi Vigyan Kendra Dhemaji, Silapathar, Assam, 787059 8. Krishi Vigyan Kendra Dhubri, P.O. Box No 1, Bilasipara, Dhubri, Assam, 7833489. Krishi Vigyan Kendra Golaghat, Khumtai, Golaghat, 78561910. Krishi Vigyan Kendra Hailakandi, ICAR Research Complex for NEH Region, Lakshmisahar,
788152, 11. Krishi Vigyan Kendra Jorhat, Kaliapani, Jorhat, Assam-78511212. Krishi Vigyan Kendra Kamrup, Kahikuchi Campus, Guwahati-1713. Krishi Vigyan Kendra Karbi Anglong, Diphu, Karbi Anglong, P.O.- Diphu, 782 460 14. Krishi Vigyan Kendra Karimganj, Settelement Rd., Karimganj, 78871215. Krishi Vigyan Kendra Kokrajhar, Telipara, Gossaigaon, Kokrajhar, Assam, 783360 16. Krishi Vigyan Kendra Morigaon, Jagiroad, Morigaon, Assam, 782410 17. Krishi Vigyan Kendra Nagaon, Shillongani, Nagaon, Assam, 78200218. Krishi Vigyan Kendra Tinsukia, Citrus Research Station, Gellapukhuri, Tinsukia, 78612519. Krishi Vigyan Kendra Sibsagar, PO: Rahdoipukhuri via Santak, 78568720. Krishi Vigyan Kendra Sonitpur, Napam, Assam.21. Krishi Vigyan Kendra Udalguri, NH – 15, Lalpool, BTAD, Udalguri, Assam, 78451422. Krishi Vigyan Kendra Dibrugarh, Romai, Kordoibam, P.O. Lahoal, P.O. Box No 24, 786010Arunachal Pradesh
1. Krishi Vigyan Kendra Changlang, P.O. Jairampur, Arunachal Pradesh -792121 2. Krishi Vigyan Kendra East Siang, College of Horticulture and Forestry, CAU, P.O. –
Pasighat, East Siang District, Arunachal Pradesh, -7911023. Krishi Vigyan Kendra Lower Subansiri, Distt.[Yachuli (Ziro-II)] Hapoli-791120, Arunachal
Pradesh 4. Krishi Vigyan Kendra Tawang, mahatma gandhi road,District-tawang, 5. Krishi Vigyan Kendra Tirap, P.O. Deomali, Arunachal Pradesh, 792129
6. Krishi Vigyan Kendra West Kameng, Dirang, Arunachal Pradesh, 790 101Sikkim
1. Krishi Vigyan Kendra East Sikkim, ICAR Research Complex for NEH Region, Sikkim Centre, Ranipool-737 135,
2. Krishi Vigyan Kendra North Sikkim Pentok, Mangan, North Sikkim, 737116
3. Krishi Vigyan Kendra West Sikkim, Gyaba, Gyalshing, West Sikkim, 737111

48
Performance of Cluster Frontline Demonstration on Pulses in Assam, Arunachal Pradesh & Sikkim
References
1) Agricultural Statistics at a Glance, 2013 Directorate of Economics and Statistics, Ministry of Agriculture, Government of India (websitehttp://www.dacnet.nic.in/eands)
2) Annual Report DPD 2016-17
3) A. Roy, N.U. Singh, A.K. Tripathi, A. Yumnam, P.K. Sinha, B. Kumar and S.K. Das (2017), Dynamics of Pulse Production in North-East Region of India- A State-wise Analysis : Economic Affairs, Vol. 62, No. 4, pp. 1-8, December.
4) DGCI & S, Ministry of Commerce, Kolkata
5) Directorate of Economics and Statistics (DES)*: Based on 2nd Advance Estimates for 2017-18
6) Directorate of Economics and Statistics, Ministry of Agriculture & Farmers Welfare, Government of India
7) Per Capita Net Availability of Food grains
8) Pulses in India: Retrospect and Prospects (2016), Ministry of Agriculture & Farmers Welfare Department of Agriculture, Cooperation and Farmers, Directorate of Pulses Development, Vindhyachal Bhavan Bhopal (M.P)
9) Status Paper on Pulses
10) https://des.assam.gov.in/information services/agriculture