9 ISSUE: 2 JULY-DECEMBER - 2018 - Healthline Journal
84
HEALTHLINE A National Journal of Indian Association of Preventive and Social Medicine For more details visit : www.healthlinejounral.org VOLUME : 9 ISSUE: 2 JULY-DECEMBER - 2018 pISSN 2229-337X / eISSN 2320-1525
-
Upload
khangminh22 -
Category
Documents
-
view
1 -
download
0
Transcript of 9 ISSUE: 2 JULY-DECEMBER - 2018 - Healthline Journal

HEALTHLINE
A National Journal of Indian Association of Preventive and Social Medicine
For more details visit : www.healthlinejounral.org
VOLUME : 9 ISSUE: 2 JULY-DECEMBER - 2018
pISSN 2229-337X / eISSN 2320-1525

HEALTHLINE JOURNAL
A National Journal of
Indian Association of Preventive and Social Medicine managed by IAPSM-GC
Volume 9 Issue 2 (July-December 2018)
Editorial Board Editor in Chief, Managing Editor and Publisher :
Executive Editor :
Joint Editor :
Dr. K. N. Sonaliya
Dr. Viral R. Dave
Dr. Bhavik M. Rana
Editorial Board Members
Overseas MembersDr. Samir Shah, Oman Dr. Kush Sachdeva, USA
Advisory Board Members (Ex officio)
Correspondence
Disclaimer
Editor in Chief, Healthline Journal, Community Medicine Department, GCS Medical College, Hospital and Research Center, Opp. DRM Office, Nr. Chamunda Bridge, Naroda Road, Ahmedabad-380025, Gujarat. Telephone: 07966048000 Ext. No. 8351, Email: [email protected].
Views expressed by the authors do not reflect those of the Indian Association of Preventive and Social Medicine-Gujarat Chapter. All the opinions and statements given in the articles are those of the authors and not of the editor (s) or publishers. The editor (s) and publishers disclaim any responsibility for such expressions. The editor (s) and publishers also do not warrant, endorse or guarantee any service advertised in the journal.
Healthline journal is indexed with
Index Copernicus, DOAJ, OPENJGATE, CABI, Index Medicus-SEAR
Dr. A. Bhagyalaxmi,
Dr. A. M. Kadri,
Dr. Abhiruchi Galhotra,
Dr. Amit Kumar Singh,
Dr. Amita Kashyap,
Dr. Anurag Srivastava,
Dr. Atul Trivedi,
Dr. B. M. Vashisht,
Dr. Bhavesh Modi,
Dr. C. M. Singh,
Dr. D. S. Martolia,
Ahmedabad
Rajkot
Raipur
Srinagar
Jaipur
Moradabad
Bhavnagar
Rohtak
Gandhinagar
Patna
Kannauj
Dr. Damodar Bachani,
Dr. Dilip Kumar Das,
Dr. Dinesh Kumar Pal,
Dr. Dipesh Parmar,
Dr. Harivansh Chopra,
Dr. Jitendra Bhawalkar,
Dr. K. C. Premarajan,
Dr. Meenu Kalia,
Dr. Paresh Dave,
Dr. Prakash Patel,
Dr. Prakash Vaghela,
NewDelhi
Kolkata
Bhopal
Jamnagar
Meerut
Pune
Puducherry
Chandigarh
Gandhinagar
Surat
Gandhinagar
Dr. Rakesh Kakkar,
Dr. Rashmi Sharma,
Dr. Renu Agarwal,
Dr. S. K. Bhasin,
Dr. Shalabh Sharma,
Dr. Shalini Nooyi,
Dr. Sheetal Vyas,
Dr. Sonal Parikh,
Dr. Sunil Nayak,
Dr. V. S. Mazumdar,
Dehradun
Ahmedabad
Agra
New Delhi
Udaipur
Banglore
Ahmedabad
Ahmedabad
Valsad
Baroda
Dr. J. K. Kosambiya, President, IAPSM-GC Dr. Shailesh Sutariya, Secretary, IAPSM-GC

:: 01 ::
HEALTHLINE JOURNALA National Journal of
Indian Association of Preventive and Social Medicine managed by IAPSM-GC
Volume 9 Issue 2 (July-December 2018)
INDEXPage No.
Editorial
Original Articles
Frailty and Aging
Naresh Makwana........................................................................................................................................................................................................03
...............................................................................................................................................................................07
............................................................................................................11
............................................................................................................................................16
..........................................................................................21
....................................................................................................................................................27
...........................................................................................................................................34
CME
Severe Acute Malnutrition in Children: Management in Community
Assessment of Infrastructure and Logistics at Various Facilities Providing Sterilization Services in
Rajkot District
A Cross-Sectional Study to Measure Children's Morbidity Experience and Assess Dietary Intake
after One Year Post-discharge from Nutritional Rehabilitation Center of Bhavnagar District of
Gujarat
Assessment of Satisfaction among Outpatient Department (OPD) Patients Visiting District
Hospital of West Gujarat
A Study on Knowledge and Practices Regarding Hand Hygiene and Factors Affecting its Adherence
among Healthcare Providers of a Tertiary Care Hospital of South Gujarat
Impact of IEC Regarding Awareness of Human Immuno-deficiency Virus (HIV)/ Acquired Immuno-
Deficiency Syndrome (AIDS) in Secondary School Students of Ahmedabad City, Gujarat
Sunil Nayak, Vaibhav Gharat
Nirav K. Nimavat, Dhara N. Jahangirporia, Umed V. Patel
Subhash Dhaka, K. D. Bhalani, Antara Banik
Mittal Rathod, Naresh Makwana, Sudha Khambhati, Mehul Kaliya
Baria Hinal, Patel Ravikant, Nayak Sunil
Ravi Patel, Milan Chaudhary, Utkarsh Khare

INDEX
:: 02 ::
Content Page No.
Factors Affecting Exclusive Breastfeeding and Complementary Feeding Practices among the Mothers
of Children between Age Group of 12 to 23 Months in Udaipur, Rajasthan
Clinico-Epidemiological Study of Patients Suffering from Sickle Cell Anaemia In a District Level
Private Hospital of a Tribal District in South Gujarat
Innovative Methods to Overcome Barriers and Improve Immunization Coverage: A Comparative Study
in Two Wards of Ahmedabad City
Impact of Communication Skills Training Programme on Interns in a Medical College of India
Profile of Patients of Ocular Trauma Visiting Municipal Eye Hospital Ahmedabad in the Months of
August and September 2016
Patient Satisfaction Survey: To Improve Quality of Care at Tertiary Care Center, South Gujarat
Mohnish N. Tundia, Dhara V. Thakrar, Bhawarlal L. Vyas
Shashwat Nagar, Hiren Patel
Shraddha Patel, Sheetal Vyas
Rashmi Katyal, Medhavi Agarwal, Deepak Upadhyay, Arun Singh, Himalaya Singh, Himanshu Tanwar.
Bhavesh Prajapati, Aparajita Shukla
Naresh Chauhan, Hiteshree Patel, Harsad Patel, J. K. Kosanbiya
.......................................................................................................................38
....................................................................................................................................................................................45
...................................................................................................................................................................................52
............59
...................................................................................................................................................................63
......................................................................................................69
HEALTHLINE JOURNALA National Journal of
Indian Association of Preventive and Social Medicine managed by IAPSM-GC
Volume 9 Issue 2 (July-December 2018)

:: 03 ::
Editorial Healthline Journal Volume 9 Issue 2 (July-December 2018)
Frailty and Aging
Naresh Makwana
Professor, Community Medicine Department, Shree M.P.Shah Government Medical College, Jamnagar, Gujarat, India
Dr. Naresh Makwana, E mail: [email protected] :
Introduction:
With the advancement in the health technologies,
life expectancy at birth is improving throughout the
developed and even, in the developing world. Along
with that, aged population is also growing rapidly
worldwide. Globally, the number of older persons
(aged 60 years or over) is expected to more than
double, from 841 million people in 2013 to more than
2 billion in 2050. Currently, near around 65-70% of
the world's older adults live in developing countries.
Further, UN report expects that, by 2050, nearly 8 in
10 of the world's older population will live in the less
developed regions. This has profound implications
for the planning and delivery of health and social care.
The most problematic expression of population
ageing is the clinical condition of frailty. Frailty results
from age-related decline in the efficiency of
physiological systems, which makes the person
vulnerable to sudden health status changes triggered
by minor stressor events. Frailty is a state of
increased vulnerability to adverse outcomes, such as
falls, functional decline, hospitalization and death. As
the clinical importance of the concept of frailty is
increasingly recognized, it is of major importance to
identify frail older adults. The present research topic
represents a timely addition to the burgeoning body
of evidence which aims to provide fresh perspectives
in our understanding of the frailty phenomena
occurring with aging.
Wh ile pol ic ymakers , pract i t ioners and
researchers in many countries have acknowledged
that frailty is a major public health problem, there is
substantial disagreement about definitions of frailty
and the extent and scope of public and private
responsibility in the prevention and management of
frailty. Conceptual models for understanding frailty
both implicitly and explicitly suggest that it is a state of
[1]
[2]
[3]
[4]
What is Frailty?
reduced physiological reserves associated with
ageing that affects an individual's capacity for
functional independence. Fried (1994) refers to
frailty as a wasting syndrome of advanced old age,
while Rockwood et al. (1994) base their model of
frailty on a model of breakdown among older
people.
Frailty is an indicator of health status in old age.
It is a clinical state of increased vulnerability
resulting from age-associated decline in reserve and
function across multiple physiologic systems such
that the ability to cope with every day or acute
stressors is compromised. This cumulative decline
erodes homeostatic reserve until relatively minor
stressor events trigger disproportionate changes in
health status, typically a fall or delirium. An overt
state of frailty is believed to be preceded by
behavioural adaptation made in response to
declining physiologic reserve and capacity with
which to meet environmental challenges. The causes
of this loss of physiologic reserve are likely to be
multi-factorial, including both environmental
challenges (e.g., area deprivation) and intra-
individual challenges (e.g., age-related physiologic
changes).
Lacking gold standard, one most widely used
operational definition of frailty given by Fried et al
viewed frailty as a clinical syndrome in which three
or more of the following criteria were present:
unintentional weight loss, self-reported exhaustion,
weakness, slow walking speed, and low physical
activity. Older people are most vulnerable to
adverse outcome results from frailty. Longitudinal
cohort study of 754 community dwelling older
persons which lasted for 10 years exhibited that, in
last years of life the most common condition leading
to death was frailty (27.9%), followed by organ
failure (21.4%), cancer (19.3%), other causes
[5]
[6]
[7]
[8]
[7]
[7, 8-10]

:: 04 ::
Makwana Naresh Fragility and Aging
(14.9%), advanced dementia (13.8%), and sudden
death (2.6%).
The Operational definitions for frailty and
inclusion and exclusion criteria varied between
studies, which largely explained considerable
variations in reported frailty prevalence rates of 4.0-
59.1%. In case of phenotype model, the weighted
average prevalence of pre-frailty was 44.2% and
frailty was 9.9%. Frailty was statistically more
prevalent in females (9.6%) than in males (5.2%).
Frailty increases steadily with age.
Systematic review of frailty prevalence worldwide
concluded that 10.7% of community-dwelling adults
aged 65 years were frail and 41.6% pre-frail. In
the United Kingdom, with the rising population of
older adults (>64 years of age), frailty syndrome has
increased from 12% in January 2005 to 14% in March
2013. Data from Survey of Health, Aging and
Retirement in Europe (SHARE) in 2004 covering
more than 10 European countries, showed
prevalence of frailty and pre-frailty in 65+ age group
as 17.0% (15.3 – 18.7) were frail and 42.3% (40.5 –
44.1) prefrail. If we look at the low and middle
income countries, the prevalence of frailty was much
higher than that for developed countries.
Frailty is linked with many chronic debilitating
diseases of old age and its prevalence differs with
different diseases. Several studies have marked
significant association of frailty with most non-
communicable/chronic diseases. Inter-relationship
between frailty, co-morbidity and disability was
investigated in the Cardiovascular Health Study (CHS)
population. Frailty and co-morbidity (defined as two
or more of the following nine diseases: myocardial
infarction; angina; congestive heart failure;
c lau dic at i o n; arth r it i s ; canc er; d i ab etes ;
hypertension; chronic obstructive pulmonary
disease) was present in 46.2% of the population,
frailty and disability (defined as the presence of
restriction in at least one activity of daily living) was
present in 5.7%, and the combination of frailty,
disability and co-morbidity was present in 21.5% of
[11]
[8, 12]
[13]
[14]
[15]
[16]
Burden of Frailty
Frailty and Co-morbidity
≥
the study group. Importantly, frailty was present
without co-morbidity or disability in 26.6% of the
study group. This finding provides support for frailty
as an independent concept, distinct from co-
morbidity and disability.
There are numerous tools available to measure
each component of frailty in older persons. Most
commonly used tool to examine leg strength is
repeated chair stand test, timed up and go test to
check mobility, balance test to look for static balance,
walk test examining gait speed and so on. These tools
help the investigator to identify the person having
pre-frail or frail criteria. Presence of any two out of
five criteria keeps the person in pre-frail category,
whereas presence of three or more criteria will
categorize the person as frail as per Fried's
phenotypical model of frailty. Another frailty
measurement tool, Frailty Index (FI), was developed
based on cumulative deficit model underpinning the
Canadian Study of Health and Aging (CSHA) Frailty
Index. The FI was a simple calculation of the
presence or absence of each variable as a proportion
of the total (e.g. 20 deficits present out of a possible
92 gives a FI of 20/92 = 0.22). Thus frailty is defined
as the cumulative effect of individual deficits - 'the
more individuals have wrong with them, the more
likely they are to be frail. The British Frailty Index
has also recently been developed. It was argued
that compared to Fried's Frailty phenotype, Frailty
Index (FI) is a more sensitive predictor of adverse
health outcomes due to its finer graded risk scale and
its robustness in clinical inferences with regard to
numbers and actual composition of items in FI.
The Frail Elderly Functional Questionnaire (19
items) was identified as a potential outcome
measure for frailty intervention studies as it is
suitable for use by telephone or proxy, valid and
reliable , and is sensitive to change . The
Groningen Frailty Indicator and the Tilburg Frailty
Indicator are simple and similar questionnaire
based approaches to detecting people with frailty.
The Edmonton Frail Scale is a multi-dimensional
assessment instruments and a test for cognitive
[8]
[7]
[8]
[7, 17]
[18]
[19]
[20] [21]
[22]
[23]
Frailty Tools

:: 05 ::
Healthline Journal Volume 9 Issue 2 (July-December 2018)
impairment. Comprehensive Geriatric Assessment
(CGA) has become the internationally established
method to assess older people in clinical practice. It is
a multidisciplinary diagnostic process to determine
an older person's medical, psychological and
functional capability to develop a plan for treatment
and follow up.
Few pharmacological agents have been
investigated in frailty. Angiotensin Converting
Enzyme (ACE) inhibitors have been demonstrated to
improve the structure and biochemical function of
skeletal muscle and there is evidence that ACE
inhibitors may halt or slow the decline in muscle
strength in older age and improve exercise capacity
and quality of life. Testosterone improves muscle
strength but also increases adverse cardiovascular
and respiratory outcomes. Low vitamin D levels
have been associated with frailty and vitamin D has
been demonstrated to improve neuromuscular
function. Although vitamin D prescription for older
people who are deficient may reduce falls and use of
calcium/vitamin D supplements for older people in
long-term care can reduce fractures, the general use
of vitamin D as treatment for frailty remains
controversial.
Frailty can be diagnosed at the earliest to avert its
consequences. It is frequently observed that after
crossing their sixty, most of people want relaxation
when their children are ready to take their roles.
However, this relaxation for prolonged period makes
them sedentary and they may become pre-frail. Cells
in our body are continuously regenerated and this
process requires proper nutrition, regular physical
activity and healthy life-style. As the age advances,
individual compromises in his daily physical activity
that affects normal body function, metabolism and
endocrine activity ultimately leading to frailty. To
mitigate frailty, one has to remain active physically,
mentally and socially.
Reducing the prevalence or severity of frailty is
likely to have large benefits for the individual, their
families and for society. Several approaches have
[24]
[17, 25]
[26]
[27]
[28]
[8]
[8]
Role of Pharmacological agents in Frailty
Prevention of frailty
been investigated in clinical trials. Nutritional
interventions may have potential to address the
impaired nutrition and weight loss of frailty.
However, there is a paucity of evidence. Exercise has
physiological effects on the brain, endocrine system,
immune system and skeletal muscle. Three
systematic reviews of home-based and group-based
exercise interventions for frail older people
concluded that exercise can improve outcomes of
mobility and functional ability.
Researchers are expected to explore various
aspects of frailty and mechanism of its development.
Frailty is an emerging geriatric syndrome and new
collaborative and interdisciplinary research projects
are needed to detect and severity grade the frailty, so
that it forms the part of routine clinical practice. The
use of pharmacological agents for the prevention and
treatment of frailty is one of the important areas for
future research.
Frailty is a vital issue in geriatric health care and is
also a crucial factor in the hospitalization of geriatric
population. Identifying and assessing frailty at the
earliest can reduce risk of frequent hospitalization
among aged people and help them to live happy and
independent healthy life.
[8]
[29-31]
Scope and Research
Conclusion
References :
1. United Nations, Department of Economic and Social Affairs,
Population Division (2013). World Population Ageing 2013.
ST/ESA/SER.A/348.
2. Andrew Clegg, John Young, Steve Iliff e, Marcel OldeRikkert,
Kenneth Rockwood. Frailty in elderly people. Lancet 2013; 381:
752–62.
3. Emiel O. Hoogendijk, Olga Theou, Kenneth Rockwood,Bregje D.
Onwuteaka-Philipsen, Dorly J. H. DeegMartijn Huisman.
Development and validation of a frailty index in the Longitudinal
Aging Study Amsterdam. Aging ClinExp Res (2017) 29:927–933.
4. Lim W-S, Canevelli M and Cesari M (2018) Editorial: Dementia,
Frailty and Aging. Front. Med. 5:168.
5. Maureen Markle-Reid and Gina Browne. Conceptualizations of
frailty in relation to older adults. Blackwell Publishing Ltd,
Journal of Advanced Nursing, 44(1), 58–68.
6. Brigitte Santos-Eggimann, Patrick Cuénoud, Jacques Spagnoli,
and Julien Junod. Prevalence of Frailty in Middle-Aged and
OlderCommunity-Dwelling Europeans Living in 10 Countries. J
Gerontol A BiolSci Med Sci.2009. Vol. 64A, No. 6, 675–681.

:: 06 ::
7. Qian-Li Xue. The Frailty Syndrome: Definition and Natural
History.ClinGeriatr Med. 2011 February; 27(1): 1–15.
8. Frailty in older people. Lancet. 2013 March 2; 381(9868):
752–762.
9. Fried LP, Tangen CM, Walston J, Newman AB, Hirsch C,
Gottdiener J, et al. Frailty in Older Adults: Evidence for a
Phenotype. Journal of Gerontology: Medical Sciences 2001,
56A:3, M146–M156.
10. Marc D. Rothman, Linda Leo-Summers, Thomas M. Gill.
Prognostic Significance of Potential Frailty Criteria. Journal of
American Geriatric Society. 56:2211–2216, 2008.
11. Gill TM, Gahbauer EA, Han L, Allore HG. Trajectories of disability
in the last year of life. N Engl J Med 2010; 362(13): 1173–80.doi:
10.1056/NEJMoa0909087.
12. Siriwardhana DD,Hardoon S, Rait G, et al. Prevalence of frailty
and prefrailty among community-dwelling older adults in low-
income and middleincome countries: a systematic review and
m e t a - a n a l y s i s . B M J O p e n 2 0 1 8 ; 8 : e 0 1 8 1 9 5 .
doi:10.1136/bmjopen-2017-018195.
13. Collard RM, Boter H, Schoevers RA, etal.Prevalence of frailty in
community-dwelling older persons: a systematic review. J Am
GeriatrSoc 2012;60(8): 1487-92.
14. Soong J, Poots AJ, Scott S, et al. Quantifying the prevalence of
frailty in English hospitals. BMJ Open 2015; 5:e008456.
doi:10.1136/bmjopen-2015-008456.
15. Santos-Eggimann b, Cuénoud P, Spagnoli J, Junod J. Prevalence of
Frailty in Middle-Aged and OlderCommunity-Dwelling
Europeans Living in 10 Countries. J Gerontol A BiolSci Med
Sci2009;64A(6):675–681doi:10.1093/gerona/glp012.
16. Nguyen TN, Cumming RG, Hilmer SN. A Review of Frailty in
Developing Countries. J Nutr Health Aging 2015;19(9):941-6.
17. Gray WK, Richardson J, McGuire J, Dewhurst F, Elder V, Weeks J,
Walker RW, Dotchin CL.Frailty Screening in Low- and Middle-
Income Countries: A Systematic Review. Journal of American
Geriatric Society. 64:806–823, 2016.
18. .Kamaruzzaman S, Ploubidis GB, Fletcher A et al. A reliable
measure of frailty for a community dwelling older population.
Health Qual Life Outcomes 2010;8:123.
19. Rockwood K, Andrew M, Mitnitski A. A comparison of two
approaches to measuring frailty inelderly people. Journals of
Gerontology Series A-Biological Sciences and Medical Sciences.
2007; 62:738–743.
20. Gloth FM 3rd, Walston J, Meyer J, Pearson J. Reliability and
validity of the Frail ElderlyFunctional Assessment
questionnaire. Am J Phys Med Rehabil. 1995; 74(1):45–53.
[PubMed:7873113].
21. Gloth FM 3rd, Scheve AA, Shah S, Ashton R, McKinney R. The Frail
El de r ly Fu nc t i o n al As se s s m en t q u es t i o n na i re: i t s
responsiveness and validity in alternative settings. Arch Phys
MedRehabil. 1999; 80(12):1572–6. [PubMed: 10597808].
22. Schuurmans H, Steverink N, Lindenberg S, Frieswijk N, Slaets JP.
Old or frail: what tells usmore? J Gerontol A BiolSci Med Sci.
2004; 59(9):M962–5. [PubMed: 15472162].
23. Gobbens RJ, van Assen MA, Luijkx KG, Schols JM. The Predictive
Validity of the Tilburg. Frailty Indicator: Disability, Health Care
Utilization, and Quality of Life in a Population at
Risk.Gerontologist. 2012.
24. Rolfson DB, Majumdar SR, Tsuyuki RT, Tahir A, Rockwood K.
Validity and reliability of theEdmonton Frail Scale. Age Ageing.
2006; 35(5):526–9. [PubMed: 16757522].
25. .Rubenstein LZ, Stuck AE, Siu AL, Wieland D. Impacts of geriatric
evaluation and managementprograms on defined outcomes:
overview of the evidence. J Am Geriatr Soc. 1991; 39(9 Pt 2):
26. Schaufelberger M, Andersson G, Eriksson BO, Grimby G, Held P,
Swedberg K. Skeletal musclechanges in patients with chronic
heart failure before and after treatment withenalapril. Eur
Heart J. 1996; 17(11):1678–85. [PubMed: 8922916].
27. Onder G, Penninx BW, Balkrishnan R, Fried LP, Chaves PH,
Williamson J, Carter C, Di Bari M,Guralnik JM, Pahor M. Relation
between use of angiotensin-converting enzyme inhibitors
andmuscle strength and physical function in older women: an
observational study. Lancet. 2002;359(9310):926–30.
[PubMed: 11918911].
28. Sumukadas D, Witham MD, Struthers AD, McMurdo ME. Effect
of perindopril on physicalfunction in elderly people with
functional impairment: a randomized controlled trial.
CMAJ.2007; 177(8):867–74. [PubMed: 17923654].
29. De Vries NM, van Ravensberg CD, Hobbelen JS, OldeRikkert MG,
Staal JB, Nijhuis-van derSanden MW. Effects of physical exercise
therapy on mobility, physical functioning, physicalactivity and
quality of life in community-dwelling older adults with
impaired mobility, physicaldisability and/or multi-morbidity: a
meta-analysis. Ageing Res Rev. 2012; 11(1):136–49.[PubMed:
22101330].
30. Theou O, Stathokostas L, Roland KP, Jakobi JM, Patterson C,
Vandervoort AA, Jones GR. Theeffectiveness of exercise
interventions for the management of frailty: a systematic
review. JAging Res. 2011; 2011:569194. [PubMed: 21584244].
31. Clegg A, Barber S, Young J, Forster A, Iliffe S. Do home-based
exercise interventions improveoutcomes for frail older people?
F in d in g s from a syst em at i c rev ie w. Rev i ew s i n
clinicalgerontology. 2012; 22(1):68–78.
Makwana Naresh Fragility and Aging

:: 07 ::
Healthline Journal Volume 9 Issue 2 (July-December 2018)
Severe Acute Malnutrition in Children: Management in Community
Sunil Nayak , Vaibhav Gharat1 2
1 2Pofessor & Head, Assistant Professor, Department of Community Medicine, GMERS Medical College,
Valsad, Gujarat, India
Dr. Sunil Nayak, E mail: [email protected] :
CME
Introduction:
Malnutrition is a general term of under nutrition
resulting from inadequate consumption, poor
absorption or excessive loss of nutrients, but the term
can also encompasses over nutrition, resulting from
excessive intake of specific nutrients. Undernutrition
is one of the most concerning health and
development issues in India as in other parts of the
world. Undernutrition encompasses stunting
(chronic malnutrition), wasting (acute malnutrition)
and deficiencies of micronutrients (essential
vitamins and minerals). The high mortality and
disease burden resulting from under nutrition call for
urgent implementation of interventions to reduce
their occurrence and this would include determined
action on the social determinants of under
nutrition.
National Family Health Survey- 4 (NFHS-4) shows
that the proportion of children who are stunted or
underweight increases rapidly with the child's age
from birth to age 20-23 months; peaking at age 20
months. Even during the first six months of life, when
most infants are breastfed, 20-30 percent of children
are underweight. It is notable that by age 6-23
months, when many children are being weaned from
breast milk, 38.4 percent of children are stunted and
7.5% are severely underweight.
Wasting in individual children and population
group can change rapidly and shows marked seasonal
patterns associated with changes in food availability
or disease prevalence to which it very sensitive. A
wasted child has a weight for height Z score that at
least two standard deviation (-2SD) below the
median for the WHO Child Growth Standards. As per
WHO fact sheet of September 2014, malnourished
children, particularly those with Severe Acute
Malnutrition have a higher risk of death from
common childhood illness such as diarrhoea,
pneumonia and malaria. Nutrition related factors
contribute to about 45% of deaths in children under
[1]
[2]
five years of age. Acute malnutrition is classified into
severe acute malnutrition (SAM) and moderate acute
malnutrition (MAM) according to severity of
malnutrition.
Severe Acute Malnutrition (SAM) is both a
medical and social disorder. The medical problem is
due to the social problems at home. Incorrect
breast feeding practices, late introduction of
complementary feeds, inappropriate foods and
feeding practices, feeding diluted feeds containing
less amount of nutrients, repeated cases of
diarrhoea, acute respiratory infections, malaria and
measles. SAM increases significantly the risk of death
in children under five years of age. It can be direct
cause of child death by increasing the case fatality
rate in children suffering from common illnesses
such as diarrhoea and pneumonia. Children who are
severely wasted are 9 times more likely to die than
well-nourished children. SAM children are at greater
risk of mortality due to severe depletion of fat and
muscles of body with compromised immunity leads
to recurrent morbidity. To prevent morbidity and
mortality various means of management and
interventions for SAM children are essential.
Acute malnutrition is a condition resulting from a
nutritional deficit over a relatively short duration
of time, and Severe Acute Malnutrition is an
exacerbation of symptoms. Severe Acute
Malnutrition (SAM) is defined as a weight-for-height
measurement of < -3SD or more below the mean
National Centre for Health Statistics reference
values, which is called “wasted”; the presence of
bilateral pitting edema of nutritional origin,
which is called “edematous malnutrition”, or a
mid-upper-arm circumference of less than 115 mm
in children age 6 months–5 years.
Malnutrition in all forms is a serious public
health problem in both developing and developed
[1]
[1]
[3]
Severe Acute Malnutrition

:: 08 ::
Nayak & Garat Severe Acute Malnutrition in Children...
countries worldwide, and is an underlying factor in
10-11 million deaths of children under 5 years old
who die from preventable causes. The most
concentrated prevalence of acute malnutrition in
children under 5 years old throughout the world can
be found in Sub-Saharan Africa and South Asia with
9% and 15% of children population respectively.
There are classically two forms of protein energy
malnutrition: Kwashiorkor and Marasmus. Both
forms are deficient in protein; however, their
etiologies and clinical presentations are different.
Marasmus, stemming from the Greek terminology
meaning “withering” is classified as severe wasting.
In contrast to Marasmus, which is previously
described as a chronic malnutrition of total calorie
deprivation where the body is able to adapt the under
nutrition for a prolonged period of time,
Kwashiorkor is specifically a deprivation of protein in
the child's diet and clinically presents in a much
different way. This type of malnutrition is often an
acute process as a result of rapidly decreasing
nutrients. Children have severe diffuse edema, dry
skin lesions as well as lethargy and liver malfunction.
Commonly, children globally will have a mixture of
both forms of protein energy malnutrition and will
present with Marasmus Kwashiorkor. This
presentation is a combination of abdominal edema
and extremity wasting. Severe acute malnutrition is a
major area of importance globally causing millions of
preventable deaths. In order to address this
epidemic, identifying the risk factors that lead to the
development of this illness provide a foundation to
remedy the issue. Many studies have evaluated
numerous risk factors associated with SAM.
The burden of under-nutrition among under-five
children has not changed much even though various
intervention programs are in operation in India.
Current changing dietary patterns are also affecting
the nutrition status of under-five children resulting
in increased prevalence of adult non-communicable
diseases such as obesity, diabetes, hypertension and
coronary heart disease.
Substantial global progress has been made in
reducing child deaths since 1990. The total number
of under-5 deaths worldwide has declined from 12.6
[4]
[3]
Malnutrition in children under the age of 5 years
million in 1990 to 5.6 million in 2016 – 15000 every
day compared with 35 000 in 1990. Since 1990, the
global under-5 mortality rate has dropped 56%, from
93 deaths per 1000 live births in 1990 to
41 in 2016.
Although the world as a whole has been
accelerating progress in reducing the under-5
mortality rate, disparities exist in under-5 mortality
across regions and countries. Sub-Saharan Africa
remains the region with the highest under-5
mortality rate in the world, with 1 child in 13 dying
before his or her fifth birthday. Inequity also persists
within countries geographically or by social-
economic status. The latest mortality estimates by
wealth quintile show that in 99 low and middle
income countries, under-5 mortality among children
born in the poorest households is on average twice
that of children born in the wealthiest households.
Eliminating this gap between mortality in the
poorest and wealthiest households would have
saved 2 million lives in 2016.
[5]
[5]
Figure 1: Interactions between malnutrition and
disease
More than half of under-5 child deaths are due to
diseases that are preventable and treatable through
simple, affordable interventions. Strengthening
health systems to provide such interventions to all
children will save many young lives.
Malnourished children, particularly those with
severe acute malnutrition, have a higher risk of death
from common childhood illness such as diarrhoea,
pneumonia, and malaria. Nutrition-related factors
contribute to about 45% of deaths in children under
5 years of age.
[5]
[5]

:: 09 ::
Healthline Journal Volume 9 Issue 2 (July-December 2018)
In 2013, an estimated 2.9 million children
underfive were admitted globally for treatment of
severe acute malnutrition (SAM). This figure
represents significant progress when compared with
just over 1 million reported during 2009 (UNICEF
Nutrition Section 2013) yet is clearly insufficient
when compared to the global burden of 17 million
children affected by SAM (UNICEF, WHO, World Bank
2014). Children with SAM are nine times more
likely to die than well-nourished children. In light of
the growing understanding of the links between
episodes of acute malnutrition and stunting, it is clear
that prevention and treatment of acute malnutrition
is critical to child survival and development.
SAM c hi ld ren c o u ld be wi th med ic a l
complications and without complications, and this
would form the basis of their management.
1. SAM children with complications require
treatment at the facility level and needs hospital
based care and management for stabilization and
rehabilitation. Facility based management
includes setting up and managing within the
health facility premises, a functional space
basically Nutrition Rehabilitation Center (NRC)
and Child Malnutrition Treatment Center
(CMTC) where these children are cared for.
2. SAM Children without complications could be
treated at community level under the
[6]
Management
Figure 2: Life course and intergenerational effects of malnutrition
supervision of health functionaries, using
standard feeding and treatment protocols.
The Government of Gujarat has established
NRCs/CMTCs at the District and sub-district levels
for the management of children with SAM. The GoG
has initiated community based management of SAM,
using a standard therapeutic food and treatment
protocols.
Children with SAM need more energy and
protein so that in addition to their normal energy
and protein requirement, lost body mass is rebuilt.
The most effective therapy is based on the use of
Ready-to-Use Therapeutic Foods (RUTF) enriched
with essential vitamins and minerals that is
designed to treat severe acute malnutrition in the
Community-based Management of Acute
Malnutrition (CMAM) programme. This energy-
dense, RUTF can be given as take home ration and
fed to the child as instructed by the Auxiliary Nurse
Midwife (ANM)/ Accredited Social Health Activist
(ASHA)/ Anganwadi Worker (AWW). RUTF is a
medicinal food for children with SAM only. It should
NOT be shared with any other child.
Mother/Caretaker should wash her/his and
child's hands with soap before preparing the feed
and feeding the child respectively. Then, the child
should be given RUTF 6-8 times a day in small
amounts. It should be given after breastfeeding the
[7]
Nutrition Treatment

:: 10 ::
child and before any other food. Plenty of clean
drinking water should be offered along with RUTF.
Sick children often do not like to eat. In such cases we
should give small regular feeds of RUTF and
encourage the child to eat often (if possible eight
feeds a day). If the child is breastfed, breastfeed the
child before giving RUTF and it should be continued
for up to 2 years and beyond. If the child finishes the
recommended amount of RUTF being given and is
still hungry, s/he can be given any other foods
(supplementary food, local homemade food). Always
offer child plenty of clean water to drink while he/she
is eating the RUTF. Keep food clean and covered.
When a child has diarrhoea, do not stop feeding.
Continue to feed RUTF and (if applicable) breast milk.
If the child is able to eat on his/her own, then
encourage him/her to do so.
During nutritional treatment along with RUTF
child should also offered homemade food if s/he is
hungry and demands for more food. RUTF will be
given to child according to his/her age on daily basis
for 8 weeks of treatment and after finishing the daily
dose of RUTF child can be given the home made food
like khichdi, suji kheer, rice and dal, chapatti, dal,
vegetables and mashed fruits and vegetables also.
Priority should be given to RUTF and then other food
shou2ld be offered. Child should be provided plenty
of water for drinking. Home food offered should be
age appropriate in terms of consistency, texture, and
safe.
Vitamin A Deficiency (VAD) is the leading cause of
preventable blindness in children and increases the
risk of disease and death from severe infections.
Children with SAM usually have deficiency of Vitamin
A. Vitamin A deficiency also makes them prone to
infections. RUTF given to children with SAM in the
CMAM programme has Vitamin A. Still we need to
give Vitamin A dose as per the protocol. If the child is
not able to open his/her eyes or has night blindness,
send him/her to NRC for further checkup. Vitamin A
should not be given in oedema cases. If the child
vomits within 15 minutes of administration of
Vitamin A, don't give it again to child. Vitamin A
should be given as per age of the child. Use marked
spoon (1 ml, 2 ml) which is given with vitamin A
Vitamin A
bottle. Vitamin A solution should be ONLY
administered with the spoon that accompanies the
bottle.
The body defense system (immune function)
does not work properly in children with SAM. The
usual signs of infection such as fever are often absent
and infections remain hidden. The important
principle of community based management of SAM is
that all children should be given oral amoxicillin.
Amoxicillin is also effective in reducing overgrowth
of bacteria in the Gastrointestinal (GI) tract which is
c om mo nly as so ci ated w ith severe ac ute
malnutrition.
A l b e n d a z o l e i s b e s t a b s o r b e d a f t e r
reconditioning of the GI tract with broad spectrum
antibiotic. Albendazole is actively absorbed from the
intestine and is more effective when the GI tract is
free of other infections. It is therefore given on the
second week (on 7 Day). Albendazole is
metabolized efficiently by children over twelve
months; routine treatment should therefore be given
only to children over twelve months of age. Children
who have been transferred from the NRC should not
receive routine medications that have already been
administered in inpatient care.
Antibiotics (Amoxicillin)
Albendazole
t h
References :
1. Causes of under-five child mortality, WHO fact sheet N.178 of
September 2014.
2. International Institute for for Population Sciences, India
National Family Health Survey (NFHS-4), 20015-16.
International Institute for Population Sciences, 2016.
3. Collins S, Dent N, Binns P, Bahwere P, Sadler K, Hallam A.
Management of severe acute malnutrition in children. The
Lancet. 2006;368(9551):1992-2000.
4. Manary MJ, Broadhead RL, Yarasheski KE. Whole-body protein
kinetics in marasmus and kwashiorkor during acute infection.
Am J Clin Nutr. 1998;67(6):1205-9.
5. Children: Reducing mortality. http://www.who.int/news-
room/fact-sheets/detail/childrenreducing- mortality accessed
on 15/6/2018.
6. WHO, 'WHA Global Nutrition Targets 2025: Stunting Policy
Brief ' http://www.who.int/nutrition/topics/globaltargets
stunting_ policybrief.pdf.
7. Grellety, E., Shepherd, S., Roederer, T., Manzo, M., Doyon, S.,
Ategbo, E. and Grais, R. (2012). Effect of Mass Supplementation
with Ready-to-Use Supplementary Food during an Anticipated
Nutritional Emergency. PLoS ONE, 7(9), p.e44549.
Nayak & Garat Severe Acute Malnutrition in Children...
:: 11 ::
Healthline Journal Volume 9 Issue 2 (July-December 2018)Original Article
Assessment of Infrastructure and Logistics at Various Facilities Providing
Sterilization Services in Rajkot District
Nirav K. Nimavat , Dhara N. Jahangirporia , Umed V. Patel1 2 3
1
2
3
Assistant Professor, PSM Department, C.U. Shah Medical College, Surendranagar, Gujarat, India
Tutor, PSM Department, Government Medical College, Surat, Gujarat, India
Associate Professor, PSM Department, P.D.U. Government Medical College, Rajkot,Gujarat, India
Dr. Dhara N. Jahangirporia, E mail: [email protected] :
Abstract :
Introduction :
Objective:
Method:
Results:
Conclusion:
Key words :
The National Population Policy 2000 and the Reproductive and Child Health (RCH)
Programme Phase II emphasize the importance of achieving population stabilization and attaining the goal
of replacement-level fertility. Sterilization services are largely being provided through a network of public
and private sector facilities. To assess the infrastructure and logistics at various health facilities of
Rajkot District where Sterilization services provided A cross-sectional study was conducted by
Community Medicine department, PDU Government Medical College, Rajkot, during February-March 2015.
All health facilities of Rajkot district where Laparoscopic Tubal Ligation (Lap TL) camps were organized
including 4 Community Health Centers (CHCs), 5 Sub-District Hospital (SDHs) 1 district hospital, and 1
medical college and hospital were selected for the study. A standard checklist was used for infrastructure and
logistics available at various facilities. The data entry was done in Microsoft Office Excel 2007 and analysis
was done using the same software. Majority of places; infrastructure and facilities are available as
well as clean.Storage facility for contraceptives was adequate at all the 11 facilities. All the 11(100.0%)
facilities have vehicle/ambulance in running condition. At 3(27.27%) facilities there were no boards
displaying service timings. Availability of staff as per sanctioned posts was at 3(27.27%) places and various
categories of staff for the activities were present at 6(54.55%) facilities. Improvement is
required in displaying of IEC materials and sitting arrangement for beneficiaries.
Infrastructure, Logistics, Sterilization Camp
Introduction:
The National Population Policy 2000 and the
Reproductive and Child Health Programme Phase II
emphasize the importance of achieving population
stabilization and attaining the goal of replacement-
level fertility by 2010. Sterilization services are
largely being provided through a network of public
and private sector facilities. In most states, camps are
a major source of sterilization services. Hence, the
camp approach is still being followed in several
states.
The Reproductive and Child Health Programme
provides a basket of choices of contraceptive
methods, including terminal and spacing methods.
Despite the general acceptance of sterilization, it is
observed that the services being provided currently
in the country are not meeting the needs of the people
due to various factors, such as the absence of skilled
[1]
[1]
service providers and insufficient availability of
service centers. As per the National Family Health
Survey III (2005-2006) estimates, the unmet need
for spacing method was 6.2% and the unmet need
for terminal method was 6.6% with wide interstate
variations.
In the year 1952, India was one of the first
countries in the world to formulate a family planning
program at national level. In the 1980s, the program
entered the era of laparoscopic technique of female
sterilization, which is simpler and less traumatic
than the more common method of Tubal
Ligation(TL) and today almost a two-third of all
tubectomies are laparoscopic cases.
The term 'infrastructure' is used in manifold
ways to describe the structural elements of systems.
In the context of a health care system and in
[1]
[1]

:: 12 ::
Nimavat at al Assessment of Infrastructure and Logistics...
reference to health care facilities, we defined “facility
infrastructure” as the total of all physical, technical
and organizational components or assets that are
prerequisites for the delivery of health care services.
It can be seen as a major component of the structural
quality of a health care system. Same applies to
health care facilities, i.e., functionality, quality and
extent of such components and assets determine the
accessibility, availability, quality and acceptability of
health care services as well as the working conditions
of facility staff.
Present study was conducted with the objectives
of assessing the infrastructure and logistics at various
health facilities of Rajkot District where Sterilization
services are provided.
A cross-sectional study was conducted by
Community Medicine Department, PDU Government
Medical College, Rajkot, during February to March
2015. Total 11 health facilities of Rajkot district
including 4 CHCs, 5 SDHs, 1 district hospital, and 1
medical college and hospital were included in this
study. Sample size was proportion to size sample and
random method of sampling was used.
The schedule of visit of all facilities was sent in
advance to all Taluka Health Officers (THO) of Rajkot
[2]
[3-8]
Method:
district, all the above-mentioned health facilities and
to all empanelled surgeons, who are doing these Lap
TL operations. THOs of the concerned health
facilities were intimated 1 day in advance about the
visit of a team. Assessment team consisted of two
Resident doctors, one Health Educator and one
Faculty member of Community Medicine,
Department, PDU Govt. Medical College, Rajkot.
A standard checklist recommended by Research
Studies & Standards Division, Ministry of Health and
Family Welfare, Government of India, October 2006,
quality assurance manual for sterilization services,
was used for infrastructure and available logistics
assessment.
Our team assessed health facilities for
infrastructure facility, Operation Theater (OT)
facility and logistics availability by using standard
checklist for facility audit. Data were collected for
infrastructure and logistics from all 11 facilities. The
data entry was done in Microsoft Office Excel 2007
and analysis was done using the same software.
It was a survey by Health and Family Welfare
Department, Government of Gujarat and conducted
by PSM department, so no issue of ethical clearance
was required.
Study Tool :
[1]
Table 1: Infrastructure facilities at various health care facilities
The building is in good condition 11 (100.0) 00 (00.00)
The facility is clean 10 (90.91) 01 (09.09)
Running water is available at the service points 11 (100.0) 00 (00.00)
Clean & functional toilet facility is available for staff & clients 10 (90.91) 01 (09.09)
Electricity is available 11 (100.0) 00 (00.00)
Functional generator available 11 (100.0) 00 (00.00)
Petrol, Oil & Lubricants (POL) available for generator 11 (100.0) 00 (00.00)
Available Space earmarked for examination & counseling to assure privacy 07 (63.64) 04 (36.36)
Waiting area with adequate seating facility available 10 (90.91) 01 (09.09)
Infrastructure facilitiesNo. of Heath Centers (N=11)
Yes N (%)
No N (%)

:: 13 ::
Healthline Journal Volume 9 Issue 2 (July-December 2018)
Table 2 : Contraceptive stock position at various facilities
Contraceptive Stock PositionNo. of Heath Centers (N=11)
Yes N (%)
Yes N (%)
Yes N (%)
No N (%)
No N (%)
No N (%)
Buffer stock available for one month
1.Oral Pills 08 (72.73) 03 (27.27)
2.Condoms 04 (36.36) 07 (63.64)
3.Copper T 10 (90.91) 01 (09.09)
4.Emergency Contraceptive Pills (EC Pills) 06 (54.55) 05 (45.45)
Facility have adequate storage facility for contraceptives 11 (100.0) 00 (00.00)
Stock-out occur anytime 07 (63.64) 04 (36.36)
If yes, then stock-out occur for which contraceptives (n=7)
1.Oral Pills 02 (28.57) -
2.Condoms 05 (71.43) -
3.Copper T 00 (00.00) -
4.Emergency Contraceptive Pills 00 (00.00) -
11 (100.0) 00 (00.00)
Supplies available in good condition (not expired, not damaged) 11 (100.0) 00 (00.00)
Availability of effective logistic system that easily track stock level
Table 3 : Availability of vehicle at various health care facilities
Availability of VehicleNo. of Heath Centers (N=11)
Facility have a vehicle/ ambulance in running condition 11 (100.0) 00 (00.00)
Availability of POL for vehicle 11 (100.0) 00 (00.00)
Table 4 : IEC materials at various facilities
IEC materialsNo. of Heath Centers (N=11)
Availability of Clients rights displayed at a prominent place 06 (54.55) 05 (45.45)
Board displaying service timings available 08 (72.73) 03 (27.27)
Availability of free & paid services displayed on wall painting 06 (54.54) 05 (45.45)
Availability of Signboard indicating the direction for each
service point displayed 08 (72.73) 03 (27.27)
Flip charts, models, specimens & samples of contraceptives
available in counseling room 04 (36.36) 07 (63.64)
Posters, banners & handbills available at the site & displayed 06 (54.55) 05 (45.45)
Suggestion & complaint system for clients
(Complaint box and/or a book) available 06 (54.55) 05 (45.45)

:: 14 ::
Results:
Out of 11 facilities, all have building in good
condition, running water, electricity and functional
generator. Almost 90% facilities have clean and toilet
for staff and waiting area with seating facility. Only at
7(63.64%) facilities, adequate space was earmarked
for examinations. [Table 1]
It was observed that storage facility for
contraceptives was adequate at all the 11 facilities.
But stock-out was reported for condoms at
5(71.43%) and for oral pills at 2(28.57%) places.
[Table 2]
All the 11(100.0%) facilities have vehicle/
ambulance in running condition as well as POL for
vehicle. [Table 3]
At 3(27.27%) facilities, there were no boards
displaying service timings; at 5(45.45%) facilities, no
free/paid services displayed and IEC material such as
posters, banners and handbills were also not
available/displayed at 5(45.45%) facilities. [Table 4]
In the present study, majority of facilities were
clean; running water and electricity was available.
Generator and Petrol, Oil & Lubricants (POL) for
generator were available at all 11 facilities for
electricity back up. Similar findings were also
observed by Mishra at el that majority facilities
(95.8%) had continuous water supply and with
alternate source of water supply during any
disruptions. All facilities visited had the provision
of electricity and alternate backup arrangement for
electricity with generator or inverters during power
disruptions.
In this study only at 7(63.64%) facilities,
adequate space was earmarked for examinations. In
a study by Mishra et al observed that 75% facilities do
not have adequate space was earmarked for
examinations and counseling.
Buffer stock of copper-T for one month was
adequate at 11 facilities but condoms, oral pills and
emergency pills were not adequate. So stock-out was
reported for condoms at 5(71.43%) and for oral pills
Discussion:
[9]
at 2(28.57%) facilities. A study from Ghana by Adjei
et al also reported that 75% public facilities had oral
contraceptives available.
In present study 8(72.73%) facilities having
Signboard displaying service timings available and
indicating the direction for each service point
displayed.At 5(45.45%) facilities, no free/paid
services displayed and IEC material such as posters,
b a n n e r s a n d h a n d b i l l s w e r e a l s o n o t
available/displayed at 5(45.45%) facilities.
All facilities had vehicles for transportation. In a
study by Mavalankar et al reported availability of
vehicles in most of the facilities but vehicles were
over crowded.
A standard checklist recommended by Research
Studies & Standards Division, Ministry of Health and
Family Welfare, Government of India, October 2006,
quality assurance manual for sterilization services,
was used for infrastructure and logistics which is the
strength of the study. Whereas, perception regarding
infrastructure space and cleanliness of facilities was
a subjective matter is the limitation of this study.
In present study, all facilities were clean and
having electricity, running water, clean and
functional toilet and vehicle. Improvement is
required in available space for examination and
counselling, one month buffer stock of oral
contraceptives, displaying of IEC materials.
IEC materials related to contraception-
sterilization along with board of service timings &
scheme benefits should be displayed at prominent
and suitable place. Sitting arrangement for
beneficiaries-relatives should be increased as per
need.
Funding: Nil
Conflict of Interest: Nil
[10]
[11]
Strength and Limitations of the Study:
Conclusion:
Recommendations:
Declaration:
Nimavat at al Assessment of Infrastructure and Logistics...

:: 15 ::
Healthline Journal Volume 9 Issue 2 (July-December 2018)
References :
1. Division S, Welfare F. Quality Assurance Manual for Sterilization
Services. October 2006
2. Donabedian A. Quality Assessment and Monitoring. Eval Health
P r o f 1 9 8 3 ; 6 ( 3 ) : 3 6 3 – 7 5 . A v a i l a b l e f r o m :
http://journals.sagepub.com/doi/abs/10.1177/01632787830
0600309
3. Rawlins BJ, Kim Y-M, Rozario AM, Bazant E, Rashidi T, Bandazi
SN, et al. Reproductive health services in Malawi: An evaluation
of a quality improvement intervention. Midwifery
2013;29(1):53–9.Available from: http://linkinghub.
elsevier.com/retrieve/pii/S0266613811001689
4. Choo S, Perry H, Hesse AAJ, Abantanga F, Sory E, Osen H, et al.
Assessment of capacity for surgery, obstetrics and anaesthesia in
17 Ghanaian hospitals using a WHO assessment tool. Trop Med
I n t H e a l t h 2 0 1 0 ; 1 5 ( 9 ) : n o - n o . A v a i l a b l e f r o m :
http://www.ncbi.nlm.nih.gov/pubmed/20636302
5. Fotso JC, Mukiira C. Perceived quality of and access to care among
poor urban women in Kenya and their utilization of delivery
care: harnessing the potential of private clinics? Health Policy
Plan 2012;27(6):505–15. Available from: https://academic.
oup.com/heapol/article- lookup/doi/10.1093/heapol/czr074
6. Le Bacq F, Rietsema A. High maternal mortality levels and
additional risk from poor accessibility in two districts of
n o r t h e r n p ro v i n c e , Z a m b i a . I n t J E p i d e m i o l o g y
1997;26(2):357–63. Available from: https://academic.
oup.com/ije/article-lookup/doi/10.1093/ije/26.2.357
7. Haynes AB, Weiser TG, Berry WR, Lipsitz SR, Breizat A-HS,
Dellinger EP, et al. A Surgical Safety Checklist to Reduce
Morbidity and Mortality in a Global Population. N Engl J Med
2009;360(5):491–9. Available from: http://www.nejm.org/
doi/abs/10.1056/NEJMsa0810119
8. Urassa DP, Carlstedt A, Nystrom L, Massawe SN, Lindmark G.
Quality assessment of the antenatal program for anaemia in
rural Tanzania. Int J Qual Health Care 2002; 14(6):441–8.
Available from: https://academic.oup.com/intqhc/article-
lookup/doi/10.1093/intqhc/14.6.441
9. Mishra S, Panda BB, Mishra T, Sahu T. Assessment of
infrastructure at government healthcare facilities for providing
family welfare services in Odisha. J Prev Med Holist Health 2015
;2(1):4–7. Available from: http://www.indianjournals.com
/ijor.aspx?target=ijor:jpmhh&volume=2&issue=1&article=02
10. Adjei KK, Laar AK, Narh CT, Abdulai MA, Newton S, Owusu-Agyei
S, et al. A comparative study on the availability of modern
contraceptives in public and private health facilities in a peri-
urban community in Ghana. Reprod Health 2015;12:68.
Av a i l a b l e f r o m : h t t p : / / w w w. n c b i . n l m . n i h . g o v
/pubmed/26253112
11. Mavalankar D. Mavalankar, Dileep; Sharma, Bharti.: The Qualtiy
of Care in Sterilization Camps: Evidence from Gujarat.: In
Improving Quality of Care in India's Family Welfare Programme
edited by Michael A. Koenig and ME Khan. Population Council.
1999. p. 293-313. ISBN 0-87834-099-8.

:: 16 ::
Healthline Journal Volume 9 Issue 2 (July-December 2018)
A Cross-Sectional Study to Measure Children's Morbidity Experience and Assess Dietary Intake during One Year Post-discharge from Nutritional Rehabilitation Center of Bhavnagar District of Gujarat Subhash Dhaka , K. D. Bhalani , Antara Banik
1 2 1
1 2Resident Doctor, Associate Professor, Dept. of Community medicine, Government Medical College,
Bhavnagar, Gujarat, India
Dr. K. D. Bhalani, E mail: [email protected] :
Introduction :
Globally, it is estimated that there are nearly 20
million children who are severely acutely
malnourished and most of them live in south Asia
and in sub-Saharan Africa. According to NFHS-4
survey, 7.5% children under five years of age are
suffering from SAM in India. According to WHO,
children suffering from severe acute malnutrition
are at 5–20 times higher risk of death compared to
well-nourished children. Current estimates suggest
that about 1 million children die every year from
severe acute malnutrition.
[1]
[2]
[1]
Original Article
Abstract :
Key words:
Introduction:
Objectives:
Method:
Results:
Conclusion:
Malnutrition is responsible for the high incidence of morbidity in children and vice a
versa. This study has been conducted to assess the progress of the children after their discharge from
Nutritional Rehabilitation Centre (NRC) by measuring the episodes of the common morbidities, they
experienced during last one year and also to assess their current routine dietary intake. To
evaluate morbidity experience and assess dietary intake of the children after one year of their discharge
from NRC, Bhavnagar It was a community-based cross-sectional study carried out on all children
who were discharged from NRC Bhavnagar between 1 April-2015 and 31 March-2016, conducted during
the period between July 2016 and August 2017. The parents/guardians were interviewed by using the pre-
tested, semi-structured questionnaire to collect the information regarding dietary practices and prevalence
of childhood morbidities during last one year. Total 1071 episodes of illnesses were experienced
during last one year by 152 children, who were discharged from NRC, Bhavnagar during the period under
study. The most common morbidities found among the children were cough, cold and fever. Average number
of episodes of morbidities among the normal children was 7.5 episodes/child/year, among malnourished
children, it was 5.9 episodes/child/year among moderately malnourished children, it was
6.7 episodes/child/year. Average protein and calories intake of SAM and normal children across all age-
groups were found almost equal to or more than the requirement according to their age.
Average number of episodes of morbidities experienced by the normal children, were higher than the
number of episodes experienced by the malnourished children in the year following their discharge from
NRC, Bhavnagar.
st st
Morbidity, Nutritional Rehabilitation Centre, Severe Acute Malnutrition (SAM)
Severe acute malnutrition puts the children at a
greater risk of dying from common infections,
increases the frequency and severity of such
infections and contributes to delayed recovery. In
addition, the interaction between severe acute
malnutrition and infections can create a potentially
lethal cycle of worsening illness and deteriorating
nutritional status.
Nutrition Rehabilitation Centers (NRC) were
started by Government of Gujarat at each district
headquarters under Mission Balam Sukham in 2013
in order to get back the SAM children on track of

:: 17 ::
Dhaka et al A Cross-Sectional Study to Measure...
recovery. There was no data available regarding the
status of these children once they were discharged
from the NRC. This study was conducted among the
children after one year of their discharge from NRC,
Bhavnagar to evaluate their morbidity experience
and assess their routine dietaryintake.
It was a community-based cross-sectional study,
which was carried out between July 2016 to August
2017. Study subjects consisted of all the children who
were discharged from NRC, Bhavnagar between
1 April-2015 and 31 March-2016. After receipt of
permission from in-charge of NRC, Bhavnagar for
conducting the study, a list of the children, who were
discharged from NRC, Bhavnagar between April 1,
2015, and March 31, 2016 was obtained.
A semi-structured questionnaire was designed in
English and vernacular language. A pilot study was
conducted and the questionnaire was corrected
accordingly. Ethical clearance was obtained from
Institutional Review Board of Government Medical
College, Bhavnagar.
All the parents/guardians of the participants
were contacted telephonically and were requested to
participate in the study. They were visited at their
convenient time and place. The participants were to
be considered non-respondent, if they could not be
interviewed after 2 such attempts.
Method:
st st
After obtaining informed consent from each of
the respondents (i.e. mothers/caregivers of the
children), an interview was conducted and data were
collected with a pre-tested and semi-structured
questionnaire. The respondents were asked about
the various common morbidities; the child had
experienced during last one year.
They were also asked about the food intake of the
child by using 24 hour recall method. The
information thus obtained was then converted into
the amount of protein and calories consumed, by
using nutritive value tables from the book, Nutritive
Values of Indian Foods, published by NIN, ICMR.
Data entry and statistical analysis was done by
using EPI Info 7.0 software.
Ethical approval: The study were approved by the
Institutional Review Board of Government Medical
College, Bhavnagar
There were 161 children discharged from NRC,
Bhavnagar between 1 April-2015and 31 March-
2016. Nine of them could not be interviewed after 2
scheduled attempts. So they were excluded from the
study and final analysis was carried out from the data
collected from total 152 (94.4%) respondents.
[3]
st st
Results:
Table 1: Sex wise average number of episodes of different morbidities in the children during Last One Year.
Type of MorbidityAverage No. of Episodes/ Child/Year
Total N=152
BoysN=77
GirlsN=75
Cough and cold
Pneumonia
Breathlessness
Earache
Fever
Diarrhea
Measles
Other illnesses
Total
2.5 2.4 2.5
0.1 0.1 0.1
0.1 0.0 0.1
0.5 0.5 0.5
2.0 2.0 2.0
1.8 1.8 1.7
0.1 0.1 0.1
0.1 0.1 0.1
7.0 7.0 7.1

Type of MorbidityAvergae No. of Episodes/ Child/Year
Total N=152
SAMN=15
MAMN=52
NormalN=85
Cough and cold 2.5 2.1 2.4 2.5
Pneumonia 0.1 0.2 0.1 0.1
Breathlessness 0.1 0.0 0.1 0.0
Earache 0.5 0.2 0.2 0.7
Fever 2.0 1.8 2.0 2.0
Diarrhea 1.8 1.5 1.6 1.9
Measles 0.1 0.1 0.0 0.1
Other illnesses 0.1 0.1 0.1 0.1
Total 7.0 5.9 6.7 7.5
:: 18 ::
Healthline Journal Volume 9 Issue 2 (July-December 2018)
Type of MorbidityAverage No. of Episodes/ Child/Year
<24 month
N=3
24-35 monthN=39
36-47monthN=46
48-59monthN=33
>60monthN=31
Cough and cold 2.7 2.4 2.6 2.5 2.4
Pneumonia 0.0 0.1 0.1 0.2 0.1
Breathlessness 0.0 0.0 0.1 0.0 0.0
Earache 0.3 0.5 0.6 0.5 0.5
Fever 2.0 2.2 1.9 2.1 2.0
Diarrhea 1.7 1.9 1.7 1.7 1.8
Measles 0.0 0.1 0.1 0.1 0.1
Other illnesses 0.0 0.1 0.1 0.2 0.1
Total 6.7 7.2 7.0 7.2 6.8
Table 2: Age-group wise average number of episodes of different morbidities in the children during last one year
Table 3: Average number of episodes of morbidities during last one year in the children according to
their malnutrition status.
It was found that during last one year on an
average, a male child suffered from 7 episodes of
common morbidities whereas a female child suffered
from 7.1 episodes of common morbidities per year.
For any of the morbidity in the table-1, difference in
the average number of episodes between boys and
girls was not found statistically significant. (t- test, p >
0.05, df =150).
It was found that on an average each child (of any
age group) suffered from around 7 (Range- 6.7 to 7.2)
episodes of common morbidities during last year. For
any of the morbidity in table-2, difference in the
average number of episodes between the children of
<36 months and >36 months of age (groups in the
table 2 were merged accordingly for the calculation of
the t test) was not found statistically significant
(t test, p > 0.05, df=150).
:: 19 ::
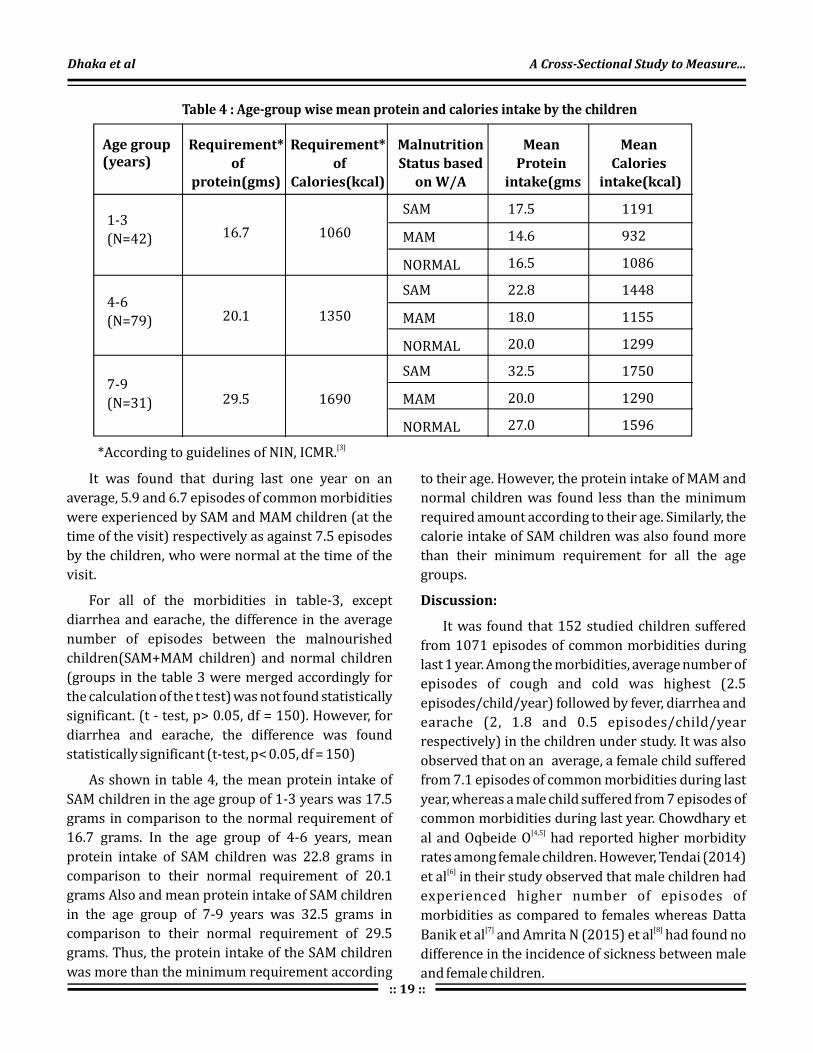
Table 4 : Age-group wise mean protein and calories intake by the children
Age group(years)
1-3
(N=42)
4-6
(N=79)
7-9
(N=31)
Requirement*
of
protein(gms)
Requirement*
of
Calories(kcal)
Malnutrition
Status based
on W/A
Mean
Protein
intake(gms
Mean
Calories
intake(kcal)
16.7 1060
20.1 1350
29.5 1690
SAM
MAM
NORMAL
17.5
14.6
16.5
22.8
18.0
20.0
32.5
20.0
27.0
1191
932
1086
1448
1155
1299
1750
1290
1596
SAM
MAM
NORMAL
SAM
MAM
NORMAL
It was found that during last one year on an
average, 5.9 and 6.7 episodes of common morbidities
were experienced by SAM and MAM children (at the
time of the visit) respectively as against 7.5 episodes
by the children, who were normal at the time of the
visit.
For all of the morbidities in table-3, except
diarrhea and earache, the difference in the average
number of episodes between the malnourished
children(SAM+MAM children) and normal children
(groups in the table 3 were merged accordingly for
the calculation of the t test) was not found statistically
significant. (t - test, p> 0.05, df = 150). However, for
diarrhea and earache, the difference was found
statistically significant (t-test, p< 0.05, df = 150)
As shown in table 4, the mean protein intake of
SAM children in the age group of 1-3 years was 17.5
grams in comparison to the normal requirement of
16.7 grams. In the age group of 4-6 years, mean
protein intake of SAM children was 22.8 grams in
comparison to their normal requirement of 20.1
grams Also and mean protein intake of SAM children
in the age group of 7-9 years was 32.5 grams in
comparison to their normal requirement of 29.5
grams. Thus, the protein intake of the SAM children
was more than the minimum requirement according
*According to guidelines of NIN, ICMR.[3]
to their age. However, the protein intake of MAM and
normal children was found less than the minimum
required amount according to their age. Similarly, the
calorie intake of SAM children was also found more
than their minimum requirement for all the age
groups.
It was found that 152 studied children suffered
from 1071 episodes of common morbidities during
last 1 year. Among the morbidities, average number of
episodes of cough and cold was highest (2.5
episodes/child/year) followed by fever, diarrhea and
earache (2, 1.8 and 0.5 episodes/child/year
respectively) in the children under study. It was also
observed that on an average, a female child suffered
from 7.1 episodes of common morbidities during last
year, whereas a male child suffered from 7 episodes of
common morbidities during last year. Chowdhary et
al and Oqbeide O had reported higher morbidity
rates among female children. However, Tendai (2014)
et al in their study observed that male children had
experienced higher number of episodes of
morbidities as compared to females whereas Datta
Banik et al and Amrita N (2015) et al had found no
difference in the incidence of sickness between male
and female children.
Discussion:
[4,5]
[6]
[7] [8]
Dhaka et al A Cross-Sectional Study to Measure...

:: 20 ::
Healthline Journal Volume 9 Issue 2 (July-December 2018)
It was observed that more or less the children of
all age-groups have experienced similar number of
episodes of common illnesses i.e. around 7
episodes/child/year (Range – 6 .7 to 7.2
episodes/child/year). Mean number of episodes of
cough and cold experienced by the children across all
age groups were around 2.5 episodes followed by
around 2 episodes of fever. No clear age-trend could
be observed regarding the experience of common
morbidities in these children.
It was found that during last one year, average
numbers of episodes of common morbidities
experienced by the SAM, MAM and normal children
were 5.9, 6.7 and 7.5 respectively. Except for diarrhea
and earache, the difference in the morbidity rates
between underweight (SAM and MAM) and normal
children was not found statistically significant.
Arun. A, et al (2014) in their hospital based
prospective observational study in Kanpur, found
that 36.5% of the malnourished children
sufferedfrom acute gastroenteritis and 26.5%
suffered from acute respiratory infections.
Tuberculosis was also present in 21.5% cases.
It can be observed from the study that the average
energy and protein intake by SAM children were
comparatively higher than MAM and normal children.
This may be due to either increased requirement of
energy and protein in SAM children or probably
because SAM children were being cared more. This
result can also be because of the effect of other
confounding factors like age, sex, etc.
Result of the study showed that protein and
calories intake of MAM children in all age-groups
were less than their normal requirement according to
their age. Being a MAM child, he/she should have had
more intake than normal child. So these children
were (even after more than a year of their discharge
from NRC) still not on track of good nutrition.
Male and female children who were discharged
from NRC, Bhavnagar experienced similar number of
episodes of common morbidities on an average. It
was also concluded that there was no statistically
significant difference found between the children of
<36 months and 36 or >36 months of children for the
[9]
Conclusion:
experience of the number of episodes. Normal
children had experienced more number of episodes
of common morbidities as compare to malnourished
children. However, the difference was not found
statistically significant for any of the morbidities
except diarrhea and earache. Average energy and
protein intake of MAM children was comparatively
lower than the SAM and normal children and also
lower than the recommended required intake for
their age.
Funding: Nil
Conflict of Interest: Nil
Declaration:
References :
1. WHO. Community Based Management of Severe Acute
Malnutrition. WHO. 2007. May: p-7.
2. MOFHW, GOI. India fact sheet.NFHS-4.Mumbai.2015-2016.
3. Gopalan C, Rama Sastri BV. Balasubramanian SC. Nutritive value
of Indian foods.National Institute of Nutrition. ICMR, Hyderabad:
1993
4. Chowdhary A. and Chowdhary KC. Morbidity pattern seen in the
urban paediatric centre pondicherry.Ind J Paediatrics.1973;
40(11);396–402
5. Ogbeide O, Osuhor PC. Morbidity and mortality patterns among
malnourished children in Benin City, Nigeria.Pubmed.1984
Oct;14(4):178-80.
6. Tendai Munthali, Choolwe Jacobs, Lungowe Sitali,Rosalia Dambe,
Charles Michelo. Mortality and morbidity patterns in under-five
children with severe acute malnutrition (SAM) in Zambia: a five-
year retrospective review of hospital-based records
(2009–2013) Arch Public Health. 2015; 73(1): 23.
7. Datta Banik ND, Krishan R, Mane SIS, Lila R. Longitudinal study on
morbidity and mortality patterns of children in Delhi during the
first two years of life. A review of 1000 children. Indian J Med Res.
1967; 55(5):504-510.
8. Amrita N. A Cross- sectional study on morbidity profile of
children below 6 years in rural field practice area of KIMS. Indian
Journal of Basic and Applied Medical Research. 2015; 4(3):577-
583.
9. A. Arya, P. Lal, P. Kumar. Co-morbidities in Children with Severe
Acute Malnutrition.International Journal of Contemporary
Medical Research. 2015; 4(5):77-83.

:: 21 ::
Assessment of Satisfaction among Outpatient Department (OPD) Patients Visiting District Hospital of West Gujarat
Mittal Rathod , Naresh Makwana , Sudha Khambhati , Mehul Kaliya1 2 3 4
1 2 3
4
Tutor, Professor, Lady Medical Officer, Community Medicine Department, Shree M. P. Shah Government Medical
College, Jamnagar, Gujarat, India
Assistant Professor, Medicine Department, Shree M.P.Shah Government Medical College, Jamnagar, Gujarat, India
Dr. Mittal Rathod, E mail: [email protected] :
Original Article Healthline Journal Volume 9 Issue 2 (July-December 2018)
A
Quality care, Patient satisfaction, Public health
bstract:
Key Words :
Introduction:
Objective:
Method
Results:
Selection of an appropriate health care and measurement of its quality is very complex
and elusive, yet the tools of its measurement have been improving. It is easier to evaluate the patient's
satisfaction towards the service than to evaluate the quality of medical services that they receive. Therefore,
a research on patient satisfaction can be an important tool to measure of health system performance and
improve the quality of services. Satisfaction manifests itself in the distribution, access and utilization of
health services. The main objective of this study is to measure the satisfaction of OPD (Outpatient
Department) patients in district hospital, Jamnagar, Gujarat. : Data were collected from a pre-tested,
pre-structured questionnaire from 322 patients, who gave the verbal consent at the end of their O.P.D visit at
the health facility, Guru Govind Singh Government Hospital, Jamnagar. The items in the questionnaire
referred to particulars of the patients such as age, gender, education, occupation, income, family type etc.;
perception of patients towards doctor , paramedical staff, basic amenities and quality of care. The responses
were expressed in proportions. The data was tabulated on Microsoft Excel sheet and analyzed using EPI info.
Although majority of patients were satisfied with the availability of medicines; availability of
information on illness, treatment and prevention; doctor's patience, compassion and dedication but most of
the patients were not satisfied with the behavior of hospital personnel ;delay in reception of investigation
reports ;unhygienic toilets and improper cleanliness of hospital; and lack of availability of drinking water .
Introduction:
Quality care is the most important dimension of
public health and it has emerged as an internationally
important aspect in the health care services provision.
This quality of care can be measured in terms of
structure, process and outcome. Structure refers to
the basic infrastructure and facility, process refers to
the way the care is delivered and outcome refers to the
end result.
While measuring health outcome and quality of
patient care services, patient's satisfaction is
considered to be important component. the
outcome of any disease is influenced not only by the
appropriate diagnostic and treatment services but
also the receipt of satisfactory care from service
providers. A satisfied patient is more likely to develop
[1, 2]
[3, 4]
a deeper and longer lasting relationship with their
medical provider, leading to improve compliance,
continuity of care and ultimately better health
outcome. But it is difficult to measure the satisfaction
and gauze responsiveness of health systems as not
only the clinical but also the non-clinical outcomes of
care do influence the patients' satisfaction , such as:
Quality of clinical services provided, availability of
medicine, behavior of doctors and other health staff,
cost of services, hospital infrastructure, physical
comfort, emotional support, and respect for patient
preferences. Mismatch between patient expectation
and the service received is related to decreased
satisfaction. Therefore, assessing patient
perspectives gives them a voice, which can make
public health services more responsive to people's
[5]
[6]
[ 7 ]

:: 22 ::
Rathod et al Assessment of Satisfaction...
needs and expectations. In the recent past, studies
on patient satisfaction gained popularity and
usefulness as it provides the chance to health care
providers and mangers to improve the services in the
public health facilities. Patients' feedback is necessary
to identify problems that need to be resolved in
improving the health services. Even if they still do not
use this information systematically to improve care
delivery and services, this type of feedback triggers a
real interest that can lead to a change in their culture
and in their perception of patients. OPD is the
window to any health system and OPD care indicates
the quality care of hospital reflected by patient's
perception in terms of satisfaction to the services they
are provided. This study was therefore undertaken
at OPDs of tertiary level health facility in Jamnagar to
measure patient satisfaction. The main objective of
this paper is to know the desired level of services as
perceived by the patients about various components
of out-door patient department (OPD) services. In this
study, the OPD is defined as the hospital's department
where patients received diagnoses and/or treatment
but did not stay overnight.
Study design: Institution based cross-sectional study.
Study population: The present study was conducted
among the patients attending the outpatient
department (OPD) of Guru Govind Singh government
hospital, Jamnagar.
Period of study: 4 months from August 2017 to
November 2017. The period of survey was for 1 month
(September 2017).
Sampling frame: The sampling frame consisted of the
outpatient department (OPD) of Guru Govind Singh
government hospital, Jamnagar. .
Sample size: Anticipated p value of fifty percent was
taken thus according to WHO practical manual on
sample size determination in health studies by
Lwanga and Lemeshow N = ZαPQ/l Where, Zα =1.96
at 5% significance level, N= required sample size,
P=proportion or prevalence of interest, Q=100-p,
L=allowable error. Thus it came to 384 subjects. 384
OPD patients were interviewed one to one during the
September 2017.
[8, 9]
[10]
[11]
2
Method:
Sampling technique: Proportionate probability
sampling, the sampling population was interviewed
from the most frequented OPDs (Medicine, General
surgery, Obstetrics and Gynecology, Pediatrics,
Orthopedics, Otorhinolaryngology, Ophthalmology,
Skin, Tuberculosis and Chest diseases) according to
probability proportion to size based on the past
years OPD attendance For 6 days in a week for a
month.
Inclusion criteria: A new or referred patient
attending the OPD of the respective health care
facility, who gave verbal consent.
Exclusion criteria: Patients working in the health
care facility and patients admitted (indoor patients)
and follow-up patients attending the OPD of the
respective health care facility, who didn't gave verbal
consent or gave incomplete information, were
excluded from the study.
Selection of patient: The patients attending the OPD
of the respective health care facility were selected for
the interview by purposive sampling. Depending
upon the previous attendance of the particular
department and the time taken to complete the
interview, a random number was chosen and every
5 patient was selected for the interview. This
process was continued till the required sample size
was completed.
Tools of data collection: Permission to conduct
the study was taken from the superintendents of the
concerned health care facility. All the patients were
interviewed after they had consulted the doctor.
Informed verbal consent was taken from all the
participating patients before the start of the
interview after telling them about the objective of the
study and the approximate time that will be involved
in the completion of the interview. The prescribing
doctor was largely kept unaware of the procedure,
except in unavoidable circumstances, to avoid the
bias in their behavior with the patient. A pre-tested
pre-structured questionnaire was used to record
information taking the key elements of socio-
demographic characteristics and perception of the
patients regarding quality of services available at the
outpatient health care facility. Analysis Data was
tabulated on Microsoft Excel sheet and analyzed
using the software Epi Info version 6.
th

:: 23 ::
Healthline Journal Volume 9 Issue 2 (July-December 2018)
Results:
Table 1: Distribution of participants according to
their socio-demographic profile:
Among all the subjects interviewed during the
data collection, 322 were included in the statistical
analysis and the remaining was not included,
because of incomplete information. A majority
(56.21%) of the responders were male. About 40% of
the responders were illiterate. About half (56%)
belonged to a joint family. Nearly half of the study
subjects belonged to the lower socioeconomic status
category as per the Kuppuswamy classification.
The results regarding each question are shown in
Table 2. Most of the respondents were satisfied with
arrangements registration counter, the availability of
medicines; also they were able to get the medicines
easily. Most of the respondents agreed that complete
information was provided to them on the illness,
treatment, and the methods to avoid illness. Almost
half (48%) of the patients were not satisfied with the
politeness of the hospital personnel. More than half
(61%) of the patients stated that hospital personnel
were not helpful. 59 % patients said that the doctor
did not give them adequate time while 60% of the
patients said that the doctor has given enough time to
listen completely to their complains. 57% of the
patients were satisfied that the doctor has checked
carefully and was readily answering their questions.
Almost 50% of the patients were told that the doctor
gave them adequate time and didn't rush. 42%
patients couldn't easily locate the place of
investigation. 55% of the patients didn't receive their
reports in time. 57% of the patients were not
satisfied with the cleanliness of the hospital. 69% of
the patients were not satisfied with the toilet
conditions. 59% of the patients stated that drinking
water wasn't available in the hospital. Majority of
patients found that there was problem of
overcrowding & improper sitting arrangements.
Overall 66.45% respondents termed the hospital
services as satisfactory, 62.11% were satisfied with
the treatment given, but 52.48% stated that the
services provided were not worth the money spent,
and 40.99% replied that they would like to visit the
facility again in future. [Table 3]
Sociodemographic
Characteristics (Percentage)
Age Group (in years completed)
Gender
Education
Occupation
Family type
Family members
Income
No.
<20 50 (15.53% )
20-29 95 (29.50 %)
30-39 50 (15.53 %)
40-49 45 (13.98%)
50-59 36 ( 11.18% )
>60 46 (14.29 %)
Female 141 (43.79% )
Male 181 (56.21 %)
Illiterate 129 (40.06%)
Primary 75 (23.29%)
Secondary 63 ( 19.57% )
Higher secondary 37 (11.49%)
Graduate 18 ( 5.59% )
Business 38 ( 11.80% )
Farmer 23 (7.14% )
Housewife 139 (43.16% )
Laborer 26 ( 8.07% )
Service 49 (15.21% )
Student 5 ( 1.55% )
Others 41 (12.73% )
None 1 (0.31% )
Joint 182 (56.52%)
Nuclear 118 (36.65%)
Three generation 22 (6.83%)
4 66 (20.50%)
5-10 248 (77.02%)
>10 8 (2.48%)
< 10,000 Rs 88 (27.33%)
10,000-14,000 Rs 157 (48.76%)
15,000-19,000 Rs 52 (16.15 %)
>20,000 Rs 25 (7.76%)
<

:: 24 ::
Table 3 : Distribution of participants according to patients' perception on Quality of care
Table 2: Distribution of patients' perception of the quality of services available (n =322)
Sr.
No
Question YesN (%)
NoN (%)
Don't knowN (%)
1. Is Registration counter appropriate? 310(96.27) 12(3.73) 0
2. Do you find problem of overcrowding? 318(98.76) 4(1.24) 0
3. Are sitting arrangements proper? 23(7.14) 299(92.86) 0
4. Does hospital has all essential medicines? 315(98.83) 7(2.17) 0
5. Are you able to get medicines easily? 302(93.78) 20(6.2) 0
6. Has doctor advised you on methods to avoid illness? 306(95.03) 15(4.66) 1(0.31)
7. Whether complete information on illness given? 295(91.62) 26(8.07) 1(0.31)
8. Whether complete information on treatment given? 270(83.85) 52(16.15) 0
9. Has hospital personnel talk politely? 165(51.24) 156(48.45) 1(0.31)
10. Were hospital personnel helpful? 120(37.27) 199(61.80) 3(0.93)
11. Did doctor give enough time to explain? 129(40.06) 189(58.70) 4(1.24)
12. Has doctor listened carefully? 193(59.94) 128(39.75) 1(0.31)
13. Has doctor checked carefully? 184(57.14) 136(42.24) 2(0.62)
14. Was doctor ready to answer questions? 184(57.14) 138(42.86) 0
15. Did doctor give adequate time? 163(50.62) 155(48.14) 4(1.24)
16. Was Place for giving samples easily located? 182(56.52) 138(42.86) 2(0.62)
17. Were reports of investigations received in time? 144(44.72) 178(55.28) 0
18. Do you find hospital cleanliness adequate? 137(42.55) 184(57.14) 1(0.31)
19. Do you find condition of toilets satisfactory? 96(29.81) 223(69.25) 3(0.93)
20. Is drinking water available in hospital? 131(40.68) 190(59) 1(0.31)
Sr.
No
Variable GoodN (%)
PoorN (%)
1. Hospital service 214(66.45%) 108(33.55%)
2. Treatment aspects 200(62.11%) 122(37.89%)
3. Value for money spent 153(47.52%) 169(52.48%)
4. Future preference for services 190(59.01%) 132(40.99%)
Rathod et al Assessment of Satisfaction...
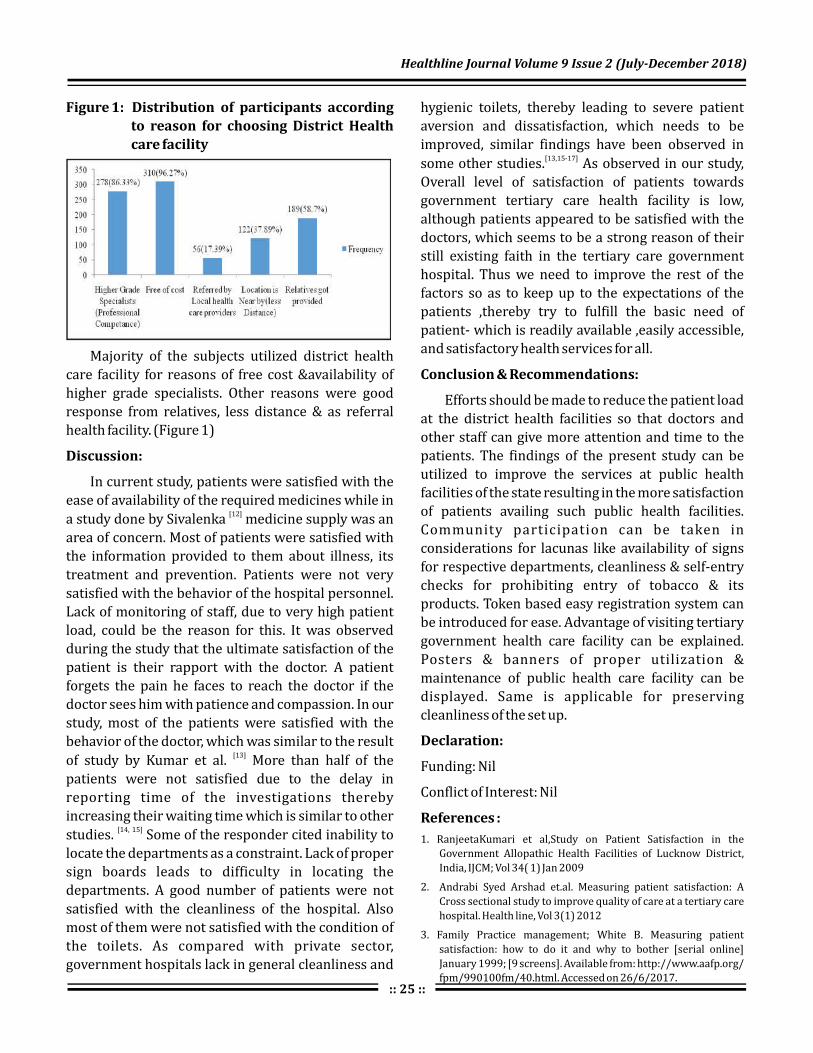
Healthline Journal Volume 9 Issue 2 (July-December 2018)
:: 25 ::
Figure 1: Distribution of participants according
to reason for choosing District Health
care facility
Majority of the subjects utilized district health
care facility for reasons of free cost &availability of
higher grade specialists. Other reasons were good
response from relatives, less distance & as referral
health facility. (Figure 1)
In current study, patients were satisfied with the
ease of availability of the required medicines while in
a study done by Sivalenka medicine supply was an
area of concern. Most of patients were satisfied with
the information provided to them about illness, its
treatment and prevention. Patients were not very
satisfied with the behavior of the hospital personnel.
Lack of monitoring of staff, due to very high patient
load, could be the reason for this. It was observed
during the study that the ultimate satisfaction of the
patient is their rapport with the doctor. A patient
forgets the pain he faces to reach the doctor if the
doctor sees him with patience and compassion. In our
study, most of the patients were satisfied with the
behavior of the doctor, which was similar to the result
of study by Kumar et al. More than half of the
patients were not satisfied due to the delay in
reporting time of the investigations thereby
increasing their waiting time which is similar to other
studies. Some of the responder cited inability to
locate the departments as a constraint. Lack of proper
sign boards leads to difficulty in locating the
departments. A good number of patients were not
satisfied with the cleanliness of the hospital. Also
most of them were not satisfied with the condition of
the toilets. As compared with private sector,
government hospitals lack in general cleanliness and
Discussion:
[12]
[13]
[14, 15]
hygienic toilets, thereby leading to severe patient
aversion and dissatisfaction, which needs to be
improved, similar findings have been observed in
some other studies. As observed in our study,
Overall level of satisfaction of patients towards
government tertiary care health facility is low,
although patients appeared to be satisfied with the
doctors, which seems to be a strong reason of their
still existing faith in the tertiary care government
hospital. Thus we need to improve the rest of the
factors so as to keep up to the expectations of the
patients ,thereby try to fulfill the basic need of
patient- which is readily available ,easily accessible,
and satisfactory health services for all.
Efforts should be made to reduce the patient load
at the district health facilities so that doctors and
other staff can give more attention and time to the
patients. The findings of the present study can be
utilized to improve the services at public health
facilities of the state resulting in the more satisfaction
of patients availing such public health facilities.
Community participation can be taken in
considerations for lacunas like availability of signs
for respective departments, cleanliness & self-entry
checks for prohibiting entry of tobacco & its
products. Token based easy registration system can
be introduced for ease. Advantage of visiting tertiary
government health care facility can be explained.
Posters & banners of proper utilization &
maintenance of public health care facility can be
displayed. Same is applicable for preserving
cleanliness of the set up.
Funding: Nil
Conflict of Interest: Nil
[13,15-17]
Conclusion & Recommendations:
Declaration:
References :
1. RanjeetaKumari et al,Study on Patient Satisfaction in the
Government Allopathic Health Facilities of Lucknow District,
India, IJCM; Vol 34( 1) Jan 2009
2. Andrabi Syed Arshad et.al. Measuring patient satisfaction: A
Cross sectional study to improve quality of care at a tertiary care
hospital. Health line, Vol 3(1) 2012
3. Family Practice management; White B. Measuring patient
satisfaction: how to do it and why to bother [serial online]
January 1999; [9 screens]. Available from: http://www.aafp.org/
fpm/990100fm/40.html. Accessed on 26/6/2017.

:: 26 ::
4. Family Practice Management; How satisfied are your patients?
April 1998; [2 screens]. Available from: http://www.aafp.org/
fpm/980400fm/fpstats.html. Accessed on 26/6/2017.
5. Agrawal D. Health sector reforms: Relevance in India. IJCM; 2006;
31:220-2.
6. Jenkinson C et al. Patients' experiences and satisfaction with
health care: Results of a questionnaire study of specific aspects of
care. QualSaf Health Care 2002; 11:335-9.
7. McKinley RK et al. Patient satisfaction with out of hour's primary
medical care. Qual Health Care 2001; 10:23-8.
8. The World Health Report 2000-Health Systems: Improving
Performance. World Health Organization. Geneva: WHO, 2000.
9. Rao KD et al. Towards patient-centered health services in India- a
scale to measure patient perceptions of quality. Int J Qual Health
Care 2006; 18:414-21.
10. Boyer L et al. Perception and use of the results of patient
satisfaction surveys by care providers in a French teaching
hospital. Int J Qual Health Care 2006; 18:359-64.
11. Haldar et al. Assessment of Client's Perception in Terms of
Satisfaction and Service Utilization in the Central Government
Health Scheme Dispensary at Kolkata., IJCM, Vol. 33(2), April
2008
12. Sivalenka S. Patient satisfaction surveys in public hospitals in
India. Available from: http://www.rand.org. (Last accessed on
2011 Feb 16)
13. Kumari R Et al, Study on patient satisfaction in the government
allopathic health facilities of Lucknow district, India. IJCM 2009;
34:35-42
14. Prahlad Rai Sudani et.al.Measuring patient satisfaction a case
study to improve quality of care at public health facilities, IJCM
Vol 35(1) Jan 2010, 52-56.
15. R K McKinley et al. Patient satisfaction with out of hour's primary
medical care. Quality in health care, 2001; 10:23-28
16. Peerasak L et al. Patient satisfaction on health service at the
family medicine learning centers. Chiang Mai Med Bull 2004;
43:67-76.
17. Bhattacharya a et al. Study of patient satisfaction hospital in a
tertiary referral hospital. JAHA 2003; 15:29-31
Rathod et al Assessment of Satisfaction...

:: 27 ::
Healthline Journal Volume 9 Issue 2 (July-December 2018)Original Article
A Study on Knowledge and Practices Regarding Hand Hygiene and Factors Affecting its Adherence among Healthcare Providers of a Tertiary Care Hospital of South GujaratHinal Baria , Ravikant Patel , Sunil Nayak
1 2 3
1 2 3Assistant professor, Associate Professor, Professor and Head, Department of Community Medicine,
GMERS Medical College, Valsad, Gujarat, India
Dr. Ravikant Patel, E mail: [email protected] :
Abstract :
Introduction:
.
Aims and objectives:
Method:
Results
Conclusion
Keywords:
About 1.4 million people around the world become seriously ill from Health Care
Associated Infections at any given time The risk of infection in developing countries is 2 to 20 times higher
than in developed countries and its incidence in India ranges from 5-30%. To study
knowledge and practices regarding hand hygiene among Health Care Providers and to study the factors
affecting the hand hygiene adherence. Cross sectional study conducted in tertiary care of hospital
of Valsad. Prior oral informed consent was taken from the participants before the start of the study. An
anonymous questionnaire formed as per WHO guidelines on hand hygiene was used as data collection tool.
: 64% medical and 72% paramedical staff has taken training in hand hygiene in last three years.
19.37% medical and 26.02% paramedical staff reported less time and more work load as barriers in
implementing routine hand hygiene practices respectively. 20.93% medical and 6.97% paramedical staff
reported training as an important factor for improved hand hygiene practices in the hospital. 66% staff of
both groups correctly knows about required time needed for hand washing practice as per WHO guidelines
whereas 26% medical and 44% paramedical staff doesn't have correct knowledge of hand hygiene
practices when hands are visibly soiled. : Lack of correct knowledge regarding hand hygiene
practices among health care providers.
Adherence, Hand Hygiene, Hand washing, Health Care Providers
Introduction:
More than 1.4 million people around the world
become seriously ill from Hospital Acquired Infection
(HAI) at any given time.
The burden of HAI in India is poorly documented.
The Hospital Infection Society of India estimates that
the incidence of HAI in India ranges from 5-30%. It
has been shown that most infections are transmitted
by the hands of Health Care Workers (HCW).
Hand washing causes a significant reduction in
the carriage of potential pathogens on the hands of
HCWs and risk of cross transmission of infection in
health care facilities. Hand hygiene is now regarded
as one of the most important element of infection
control activities. In the wake of the growing burden
[1]
[2]
[3]
[4]
of health care associated infections (HCAIs), the
increasing severity of illness and complexity of
treatment, superimposed by Multi-Drug Resistant
(MDR) pathogen infections, Health Care Practitioners
(HCPs) are reversing back to the basics of infection
preventions by simple measures like hand hygiene.
This is because enough scientific evidence supports
the observation that if properly implemented; hand
hygiene alone can significantly help prevent
transmission of infections.
There is now undisputed evidence that strict
adherence to hand hygiene reduces the risk of cross-
transmission of infections. With “Clean Care is Safer
Care” as a prime agenda of the global initiative of
WHO on patient safety programmes, it is time for
developing countries to formulate the much-needed
[5-9]

Table 1: Correct knowledge regarding hand hygiene and its practices.
Sr.
No
Question MedicalN=50 (%)
Paramedical N=50 (%)
P value
a. Formal training in hand hygiene in the last three years 32 (64%) 36 (72%) p>0.05
b. Did you routinely using alcohol base handrub? 46 (92%) 45 (90%) p>0.05
c. Did you aware of standard operating procedure regarding
hand hygiene? 38 (76%) 42 (84%) p>0.05
d. Which is the main route of cross-transmission of potentially
harmful germs between patients in a health-care facility 29 (58%) 27 (54%) p>0.05
e. Most frequent source of germs responsible for health
care-associated infections 25 (50%) 10 (20%) P<0.05
Baria et al A Study on Knowledge and Practices...
:: 28 ::
policies for implementation of basic infection
prevention practices in health care setups. This study
focuses on one of the simplest, low cost but least
accepted from infection prevention that is hand
hygiene. So the study was conducted with the
objectives to study the knowledge and practices
regarding handhygiene among health care providers
and to study the factors affecting the adherence and
to study any differences in practices among different
categories of health care providers.
Study was started after the written
permission from the institutional ethics committee
of the institution.
The study was undertaken at two stages:
A cross sectional study was conducted in a Tertiary
Care Hospital of South Gujarat from period 16 July
2017- 15 August 2017. Stratified random sampling
method is used and participants are divided into two
strata's; Medical and Paramedical staff and as per the
convenience sampling method we had randomly
selected 50 medical and 50 paramedical from various
study units of hospital (Outpatient departments
(OPD), Inpatient departments (IPD), Intensive Care
Method:
Stage 1: To assess the knowledge and practices of
Health care providers regarding the hand
hygiene practices.
Unit (ICU) ,Labour Room (LR). An anonymous
pretested and preformed questionnaire formed as
per the WHO guidelines on hand hygiene was
administered to the participants as a tool for data
collection to know their knowledge and practices.
Prior to data collection a verbal informed consent
was taken from each participant and those who had
not given consent are excluded from the study.
An infrastructure survey of the hospital (wards, OPDs
ICUs Operation Theatre, Labour room) was
undertaken to determine whether it is appropriate
and adequate for the effective implementation of
hand hygiene practices.
Data was collected and analyzed in Microsoft Office
excel.
Present study was conducted with the objective to
study the knowledge and practices regarding hand
hygiene among the health care providers (medical
and paramedical staff). The study revealed that
overall there is lack of correct knowledge among the
health care providers. The difference in knowledge
and practices among the groups was also found
highly significant (p<0.005) in the study.
[6]
Stage 2: Infrastructure survey
Results:
(Table 1)

Healthline Journal Volume 9 Issue 2 (July-December 2018)
:: 29 ::
Sr.
No
Question MedicalN=50 (%)
Paramedical N=50 (%)
P value
f. What is the minimal time needed for alcohol-based hand
rub to kill most germs on your hands? 29 (58%) 16(32%) P<0.05
g. Pathogens that readily survive in the environment of the
patient for days to weeks. 30 (38.96%) 28 (32.55%) p>0.05
h. Time needed for hand washing practice. 33 (66%) 25 (50%) p>0.05
i. which hand hygiene actions that prevents transmission of germs to the patient
1 Before touching a patient 47(94%) 45(90%) p>0.05
2 Immediately after a risk of body fluid exposure 15 (30%) 12(24%) p>0.05
3 After exposure to the immediate surroundings of a patient 35(70%) 34(68%) p>0.05
4 Immediately before a clean/aseptic procedure 33(66%) 32(64%) p>0.05
j. which Hand hygiene actions that prevents transmission of germs to the health-care worker
1 After touching a patient 47(94%) 43(86%) p>0.05
2 Immediately after a risk of body fluid exposure 41(82%) 38(76%) p>0.05
3 Immediately before a clean/aseptic procedure 16(32%) 10(20%) p>0.05
4 After exposure to the immediate surroundings of a patient 37(76%) 31(62%) p>0.05
k. identify the Statements on alcohol-based handrub and handwashing with soap and
water are true
1 Handrubbing is more rapid for hand cleansing than
handwashing 39(78%) 40(80%) p>0.05
2 Handrubbing causes skin dryness than handwashing 29(58%) 31(62%) p>0.05
3 Handrubbing is more effective against germs than
handwashing 27(54%) 26(52%) p>0.05
4 Handwashing and handrubbing are recommended to be
performed in sequence 26(52%) 20(40%) p>0.05
5 It is sufficient to wash hands only once before attending to
many patients in the ward. 34(68%) 38(76%) p>0.05
6 Visibly soiled hands can be cleansed using an alcohol based
hand rub 37(74%) 18(36%) P<0.0005
7 Soap and alcohol based hand rub can be used concomitantly 20(40%) 18(36%) p>0.05
8 Gloves should be changed or removed if moving from a
contaminated body site to either another body site
within the same patient or the environment. 40(80%) 41(82%) p>0.05

:: 30 ::
More than 50% of health Care Providers are of the opinion that training in hand hygiene can prove effective in
increasing hand hygiene practices in the hospital (Table 2)
Table 2: Attitude of health care workers towards the effectiveness of actions to improve the compliance of
hand hygiene practice
Opinion regarding the
effectiveness of actions
Medical n=50 (%) Paramedical n=50 (%)
Effective EffectiveVery
Effective
Very
Effective
Not
Effective
Not
Effective
The health care facility makes
alcohol based hand rub available
at the point of care
Hand hygiene posters are
diaplayed at point of care
Each health care workers should
be trained in hand hygiene
Clear and simple instructions for
hand hygiene are made visible
for every health care worker
Administration of the hospital
should support and promote
hand hygiene practices
How do you consider the effort
required by you to perform good
hand hygiene when caring for
patients
30
(60%)
28
(56%)
19
(38%)
34
(68%)
22
(44%)
25
(50%)
36
(72%)
23
(46%)
20
(40%)
26
(52%)
28
(56%)
33
(66%)
20
(40%)
20
(40%)
31
(62%)
16
(32%)
27
(54%)
24
(48%)
13
(26%)
24
(48%)
29
(58%)
22
(44%)
21
(42%)
17
(34%)
0
2
(4%)
0
0
1
(2%)
1
(2%)
1
(2%)
3
(6%)
1
(2%)
2
(4%)
1
(2%)
0
(0%)
Baria et al A Study on Knowledge and Practices...
l. what is the required hand hygiene method in following situations?
1 Before palpation of the abdomen 46(92%) 44(88%) p>0.05
2 Before giving an injection 45(90%) 24(48%) p<0.00005
3 After emptying a bedpan 45(90%) 45(90%) p>0.05
4 After removing examination gloves 40(80%) 33(66%) p>0.05
5 After making a patient’s bed 33(66%) 21(66%) p<0.05
6 After visible exposure to blood 45(90%) 41(82%) p>0.05
m. Things that should be avoided, as associated with increased likelihood of colonization
of hands with harmful germs?
1 Wearing jewellery 34(68%) 31(62%) p>0.05
2 Damaged skin 44(88%) 43(86%) p>0.05
3 Artificial fingernails 44(88%) 39(78%) p>0.05
4 Regular use of a hand cream 37(76%) 32(64%) p>0.05

More work load (26%) and less time (19.37%) are the barriers reported by the Health care providers in
implementing routine hand hygiene practices (Table 3)
Majority of staff suggested frequent training and motivation from hospital administrations for improving the
hand hygiene practices (Table 4).
Table 4: Suggestions to improve hand hygiene practices
Healthline Journal Volume 9 Issue 2 (July-December 2018)
:: 31 ::
Table 3: Barriers in implementing routine hand hygiene practice
Barriers Medical Paramedical
More work load 7(5.42%) 38(26.02%)
Less time 25(19.37%) 24(16.43%)
Water not available/out of reach 20(15.50%) 13(8.90%)
Sink not available/ out of reach 11(8.52%) 8(5.47%)
Laziness 13(10.07%) 7(4.79%)
No administrative motivation 14(10.85%) 9(6.16%)
Allergy to soap and alcohol based hand rub 4(3.10%) 9(6.16%)
No time in emergency situations 22(17.05%) 21(14.38%)
Lack of knowledge of hand hygiene practices 13(10.07%) 17(11.64%)
Suggestions Medical Paramedical
Training at frequent intervals 9(20.93%) 3(6.97%)
Awareness and Educational programmes 7(14%) 6(12%)
Motivation from hospital administration 4(9.30%) 15(2.32%)
Availability of soap and water 4(8%) 1(2.32%)
Others 5(11.62%) 3(6.97%)
Discussion:
Training and education is the corner stone before
to make implementation on any practices. Our study
was conducted to know the knowledge and practices
regarding hand hygiene among health care providers.
In the present study more than 30% of health care
providers had not taken formal training in hand
hygiene in the last three years which is an important
factor for the sensitization of the staff for correct
implementation of hand hygiene practices in routine
patient care, on the contrary in a study by Lt V. Anargh
et al it was reported that majority of health staff
(91%) had received the formal training on hand
hygiene at the time of employment in the hospital
Majority of the staff in the present study knows the
correct routine use of alcohol based handrub as it is a
routine practice of using alcohol based hand rub by
the doctors and the paramedical staff during patient
care and also similar findings observed in other
studies. Difference in the knowledge and practices
of hand hygiene among the medical and paramedical
staff is noted in the study and the difference was
found statistically highly significant (p<0.005), this
may be due to lack of proper trainings and
sensitization on routine hand hygiene practices.
Similar findings were also reported in a study by
[10]
[11]

:: 32 ::
Majority of staff suggested frequent training and motivation from hospital administrations for improving the
hand hygiene practices (Table 4).
infrastructure required for OPD IPDs ICU LR NICU
hand hygiene (n=10) (n=7) (n=2) (n=1) (n=1)
Availability of sink 9 7 2 1 1
Accessibility of sinks 9 7 2 1 1
Physical condition of sink 9 7 2 1 1
Availability of water 8 7 2 1 1
Type of tap (ELBOW OPERATED) 8 5 1 1 1
Working status of tap 9 7 2 1 1
Availability of soap stand 7 6 2 1 1
Availability of cleansing agent 9 7 2 1 1
Is Alcohol based hand rub available? 10 7 2 1 1
Availability of towel stand 4 3 2 1 0
Availability of towel 10 7 2 1 0
Physical condition of towel 9 6 2 1 0
Condition of sink drain 9 7 2 1 1
Table 5: Availability of required infrastructure for implementation of hand hygiene practices
different studies on health care providers.
Majority of the health care providers in current study
reported more work load and less time are the
factors for hindering their hand hygiene practices.
The infrastructure required to perform effective
hand hygiene practices was found adequate in
infrastructure survey and it was not the factor
responsible for non-adherence to hand hygiene. The
contrast findings was observed by in a study by
Raman Sharma et that the reasons for non-
adherence are unavailability of soap at the washing
area (82.4%) and work load pressure (94.2%). in
our study majority of the Health Care providers were
of the opinion that frequent trainings and workshops
help their compliance in handhygiene practices and
similar recommendations were also made in similar
studies that Multifaceted interventions like
education, regular feedback, reinforcement training
needs to be undertaken to improve the compliance of
care providers to hand hygiene practices.
Not feasible to measure
the hand hygiene practices by observation method.
[12, 13]
[14]
[15]
Limitations of the study:
Conclusion & Recommendations:
The study reveals that there is lack of knowledge
regarding hand hygiene and its practices between
different Health care Providers and more work load
and less staff are the factors affecting their
adherence to effective implementation of hand
hygiene practices. The following are the
recommendations:
1. Training and education of health care workers is
necessary at frequent intervals to improve their
hand hygiene knowledge and practices.
2. Motivation and support from the hospital
administration.
3. Supervision of adherence to hand hygiene
practices at frequent intervals.
4. Barriers to hand hand hygiene adherence should
taken into consideration by the higher
authorities and should to seek as early as
possible.
Baria et al A Study on Knowledge and Practices...
Healthline Journal Volume 9 Issue 2 (July-December 2018)
:: 33 ::
5. Pre-employment sensitization training should be
a key component for newer staff.
Funding: Nil
Conflict of Interest: Nil
Declaration:
References :
1. Weinstein, R. (1998). Nosocomial Infection Update. Emerging
Infectious Diseases, 4(3), 416-420
2. Report of WHO regional Patient Safety workshop on Clean Care is
Safer Care. [Internet]. Bangkok: WHO; 2007 p. 1-34. Available
from: http://apps.searo.who.int.
3. Bauer, T., Ofner, E., Just, H., Just, H. and Daschner, F. (1990). An
epidemiological study assessing the relative importance of
airborne and direct contact transmission of microorganisms in a
medical intensive care unit. Journal of Hospital Infection, 15(4),
pp.301-309.
4. Steere A, Mallison GF (1975). Handwashing Practices for the
Prevention of Nosocomial Infections. Annals of Internal Medicine,
83(5), p.683.
5. Guide to implementation of the WHO multimodal hand hygiene
improvement strategy. [Internet]. www.who.int. 2018 [cited 9
August 2017]. Available from: http://www.who.int/gpsc/en/
6. WHO Guidelines on Hand Hygiene in Health Care. First Global
Patient Safety Challenge. Clean Care is Safer Care. [Internet].
www.who.int. 2009 [cited 9 August 2017]. Available from:
http://www.who.int/gpsc/en/
7. Boyce, J., & Pittet, D. (2002). Guideline for Hand Hygiene in Health-
Care Settings: Recommendations of the Healthcare Infection
C o n t r o l P r a c t i c e s A d v i s o r y C o m m i t t e e a n d t h e
HICPAC/SHEA/APIC/IDSA Hand Hygiene Task Force. Infection
Control & Hospital Epidemiology, 23(S12), S3-S40. doi:
10.1086/503164
8. Kampf, G., & Kramer, A. (2004). Epidemiologic Background of
Hand Hygiene and Evaluation of the Most Important Agents for
Scrubs and Rubs. Clinical Microbiology Reviews, 17(4), 863-893.
doi: 10.1128/cmr.17.4.863-893.2004
9. Daniels IR, Rees BI. (1999).Handwashing: simple, but effective.
Ann R Coll Surg Engl , 81: 117-8.
10. Anargh, V., Singh, H., Kulkarni, A., Kotwal, A., & Mahen, A. (2013).
Hand hygiene practices among health care workers (HCWs) in a
tertiary care facility in Pune. Medical Journal Armed Forces India,
69(1), 54-56. doi: 10.1016/j.mjafi.2012.08.011
11. S.J.S (2011). A Study To Assess The Hand Hygiene Practices
Among Health Care Workers In Csicu, Sctimst (phd). Sree Chitra
Tirunal Institute For Medical Science And Technology
Trivandrum.
12. Songa J, Van Roekel K, Mwangi J, Noel L.(2015). A study on Hand
Washing Practices among Health Care Workers in Embu Referral
Hospital, Embu Country. Pinnacle Medicine & Medical sciences,
2(6):78-784.
13. Nair, S. S., Hanumantappa, R., Hiremath, S. G., Siraj, M. A., &
Raghunath, P. (2014). Knowledge, Attitude, and Practice of Hand
Hygiene among Medical and Nursing Students at a Tertiary Health
Care Centre in Raichur, India. ISRN Preventive Medicine, 2014,
608927. http://doi.org/10.1155/2014/608927.
14. Sharma R, Sharma M, Koushal V.(2012). Hand washing
compliance among healthcare staff in Intensive Care Unit (ICU) of
a Multispecialty Hospital of North India. Journal of Hospital
Administration, 1(2):27-33.
15. Mandal L, Kaur s, Marwah R, Das A.(2008). Hand hygiene
practices among care providers of leukemia children. Nursing
and Midwifery Research Journal, 4(2):51-58.

:: 34 ::
Healthline Journal Volume 9 Issue 2 (July-December 2018)
Impact of Information, Education and Communication (IEC) Regarding Awareness of Human Immuno-deficiency Virus (HIV)/ Acquired Immuno-deficiency Syndrome (AIDS) in Secondary School Students of Ahmedabad City, Gujarat Ravi Patel , Milan Chaudhary , Utkarsh Khare1 1 1
1Resident,Department of Community Medicine, B.J. Medical College, Ahmedabad, Gujarat, India
Dr. Milan Chaudhary, E mail: [email protected] :
Original Article
Abstract :
Keywords :
Introduction:
Method:
Results:
Conclusion:
There is no cure for HIV/AIDS and no effective vaccine available till date. So, only
prevention of transmission of HIV would be effective in significantly slowing the spread of AIDS. With this
view the following study was undertaken to assess the level of awareness regarding HIV/AIDS among
secondary school students and to evaluate impact of IEC among them. An interventional study was
conducted in randomly selected 3 schools with all the class 9 and 10 students. First, students were pre-
tested for their awareness by semi-structured questionnaire then IEC was given which include poster and
intra group open discussion. Post test evaluation was conducted after 24 hours to evaluate impact of IEC.
Analysis was done in Ms Excel 2007. Out of 298 students, 87.58% had heard about HIV/AIDS. Only
34% knew about full form of HIV/AIDS which increased to 71% after IEC intervention. There were many
myths for HIV/AIDS transmission i.e. it is transmitted by Mosquito bite 58%, Sneezing and coughing of HIV
positive person 58.72% which decreased to 13%, 15% respectively. Only 34% were aware HIV/AIDS is not
curable which increased to 74.83 %. These all differences were found statistically significant. (Z test of
proportion was applied) Educational programmes are recommended to facilitate students
with correct scientific knowledge regarding HIV/AIDS.
th th
Awareness, IEC, HIV/AIDS
Introduction :
The Acquired Immune Deficiency Syndrome
(AIDS) is a fatal illness caused by retrovirus known as
the Human Immunodeficiency Virus (HIV) which
breaks down the body's immune system, leaving the
victim vulnerable to a host of life – threatening
opportunistic infections, neurological disorders, or
unusual malignancies. Among the special features of
HIV infection are that once infected, it is probable that
a person will be infected for life. Strictly speaking, the
term AIDS refers only to the last stage of the HIV
infection. AIDS can be called our modern pandemic,
affecting both industrialized and developing
countries. An estimated 36.7 million people were
living with HIV worldwide in 2016.
Young people, especially young women and young
key populations, continue to be disproportionately
affected by HIV—In 2014, there were 3.9 million
young people aged between 15 and 24 years living
[1]
[2]
with HIV and 620 000 young people became newly
infected with the virus. AIDS is now the second
leading cause of death among young people world-
wide. In India, people in the age group of 15-29
years account for 31 percent of AIDS burden.
Adolescents are at high risk of contracting HIV
du e to lac k s u f f i c i ent i n fo rm ati o n an d
understanding of HIV/AIDS. So, UNAIDS
recommends the adoption of a 'life-cycle approach'
to HIV prevention.
Programme managers and policy makers have
often recommended that schools can act at the
centre point for disseminating information and
education on HIV/AIDS. Hence school education has
been described as a 'social vaccine' and it can serve
as a powerful preventive tool. With the above views
in mind the following study was undertaken to find
out the existing knowledge and change in
knowledge about HIV/AIDS after education
intervention and to find out the association.
[3]
[4]
[ 5 ]
[6]
[7]

Patel et al Impact of IEC on Knowledge of HIV/AIDS...
:: 35 ::
Method:
An interventional was conducted during March to
May 2018.The study was carried out at three
randomly selected schools which were located in
different areas of Ahmedabad. All students from
classes 9 and 10 present on the day of the study
were included. A total, 298 students were present.
First, baseline data about HIV/AIDS awareness was
collected by using semi-structured questionnaire.
The questionnaire included questions for assessing
knowledge (Full form of HIV/AIDS, Modes of
transmission of HIV/AIDS, Prevention from
HIV/AIDS). It was followed by educational session
which included posters and intra group open
discussion for duration of 1 hour. Post test was
conducted after 24 hours. The Performa for pretest
and posttest was same.
The results were expressed in percentages
represented by tables and Analysis was done by Ms
Excel 2007.
Ethical considerations were carefully and
systemically adhered to throughout the study.
Permission to carry out the research was obtained
from school authorities. School students were
enrolled after obtaining informed consent and
participation was purely voluntary and they were also
assured that the study will not have any detrimental
effect on the participant. The students were assured
that any information, thus obtained will be treated
with utmost confidence.
th th
Results:
Table 1
Out of 298 participants, 87.58 % had heard
about HIV/AIDS. Only 33.55% of students had
knowledge regarding full form of HIV/AIDS but
after giving health education, this was increased up
to 71.14% (Z -value= 9.18, p<0.05)
Before intervention, 76.17 % of students were
aware that HIV/AIDS can be transmitted through
unsafe sexual relationships which increased to
84.22% after intervention. Awareness for other
modes of transmission were 75.16% for
contaminated blood transfusion, 81.87% for
sharing needle and syringes, 77.51% for HIV/AIDS
positive mother to baby. These observations
increased up to 85.23%, 94.29%, 91.94 %
respectively. These differences were found
statistically significant (Z test of proportion was
applied, p<0.05) ( )
There were many misconceptions about
transmission of HIV/AIDS which are shown in Table
2. 58.38% of students said that it is transmitted by
mosquito bite, 58.72% said that it is transmitted
due to sneezing and coughing of HIV/AIDS
positive person, 33.89% said that it is transmitted
by touching to HIV/AIDS positive person. After
intervention, these misconceptions reduced to
13.42%, 15.10% and 10.73% respectively which
were statically significant. (Z test of proportion was
applied, p<0.05)
Table 1 : Awareness for various modes of transmission of HIV/AIDS
Modes of transmission Awareness
Pre-test Post-test Z-value p-value
Unsafe sexual relationship 227
(76.17%) (84.22%)
Contaminated blood transfusion 224
(75.16%) (85.23%)
Sharing needle and syringes 244
(81.87%) (94.29%)
From HIV/AIDS positive mother to baby 231
(77.51%) (91.94%)
251 2.4671 < 0.05
254 3.0838 < 0.05
281 4.6786 <0.05
274 4.8969 <0.05

Healthline Journal Volume 9 Issue 2 (July-December 2018)
:: 36 ::
Table 2 : Prevalence of misconceptions about HIV/AIDS transmission (N=298)
Table 3 : Awareness regarding prevention for HIV/AIDS (N=298)
Misconceptions
Preventive modes
Prevalence
Awareness
Pre-test
Pre-test
Post-test
Post-test
Z-value
Z-value
p-value
p-value
Transmitted by mosquito bite 174
(58.38%) (13.42%)
Transmitted by sneezing and coughing of
HIV/AIDS positive person (58.72%) (15.10%)
Transmitted by touching to
HIV/AIDS positive person (33.89%) (10.73%)
40 11.44 <0.05
175 45 11.03 <0.05
101 32 6.78 <0.05
Safe sexual relationship (e.g. Use condom) 221
(74.16%) (80.53%) 1.83 >0.05
Checked blood for blood transfusion 251
(84.22%) (89.26%) 1.81 >0.05
Disposable needle and syringes 215
(72.14%) (76.51%) 1.21 >0.05
HIV/AIDS is not curable disease 102
(34.22%) (74.83%) 9.95 <0.05
240
266
228
223
Table 3 shows awareness regarding prevention
from HIV/AIDS. 74.16% of students were aware that
use of condom during sexual relationship, 84.22%
aware that use of checked blood for blood transfusion
and 72.14% aware that disposable needle and
syringes are various measures for prevention from
HIV/AIDS. After intervention, there were
improvement in these percentages but it was not
statically significant (Z test of two proportion was
applied, p>0.05)
There was only 34.22% of students were aware
that HIV/AIDS is not curable disease but there was
significant improvement up to 74.83% (Z value=9.95,
p<0.05) (Table 3.)
Awareness is the key to prevention of HIV/AIDS.
This study assessed impact of health education on
awareness of HIV/AIDS in secondary school students.
Discussion :
In this study, 87.58% participants heard about
HIV/AIDS. A study done by Shinde M et al showed
similar finding (86.72%) whereas study conducted in
Delhi and done by Lal et al, showed higher number of
percentage (100%).
In this study, considerable percentages of student
were aware about various modes of transmission of
HIV/AIDS and various methods of prevention. Another
study done by Gupta et al also showed that good
number of percentage of study participants were
aware for various modes of transmission of
HIV/AIDS. But we found that there were many
misconceptions regarding transmission of HIV/AIDS
which were significantly reduced after intervention.
58.38% study participants said, it is transmitted by
mosquito bite. Another study done by Shinde M et al
also showed that 55.69 % study participants had
misconception that HIV/AIDS is transmitted by
mosquito bite.
[8,9]
[10]
[8]

:: 37 ::
This study showed that after intervention, there was
significant increase in percentage of students who
were aware that HIV/AIDS is not curable. Before
intervention, only 34.22% were aware that HIV/AIDS
is not curable. Another study done by Gupta et al also
showed that only 39.1% of participants were aware
that HIV/AIDS is not curable.
To conclude, this study suggests that there are
misconceptions regarding HIV/AIDS in secondary
school students. Educational programs are needful
and effective to facilitate the students with various
domains of HIV/AIDS. So, there is need to strengthen
school adolescent education programmes
Relevant curricula should be developed every
year in secondary school students.
Strengthen school adolescent education
programmes. Incorporation of group discussion,
posters, drama during health education programmes
is advisable. Relevant curricula should be developed
every year in secondary school students.
Funding: Nil
Conflict of Interest: Nil
[10]
Conclusion :
Recommendations
Declaration:
References :
1. K.PARK. Epidemiology of Communicable Diseases, In: Park's
Textbook Of Preventive And Social Medicine, 24TH edition.
Jabalpur, India; M/S Banarsidas Bhanot; 2017. p.361.
2. UNICEF. The AIDS epidemic continues to take a staggering toll,
but progress is possible. Updated: Jan2018. Available from:
https://data.unicef.org/topic/hivaids/global-regional-trends
[Accessed 12th July 2018].
3. UNAIDS. Active involvement of young people is key to ending the
AIDS epidemic by 2030. Updated: 12 August 2015. Available
from: http://www.unaids.org/en/resources/presscentre
/featurestories/2015/august/20150812PACT [Accessed 12th
July 2018].
4. NACO. Youth and HIV/AIDS. Available from: http://naco.gov.in/
youth [Accessed 12th July 2018]
5. PRB. Youth and the HIV/AIDS Crisis. Available from:
https://www.prb.org [Accessed 14th July 2018]
6. UNAIDS. 'Get on the Fast Track: The Life-Cycle Approach to HIV'
Available from: http://www.unaids.org/sites/default/
files/media_asset/Get-on-the-Fast-Track_en.pdf [Accessed 14th
July 2018]
7. Boler T, Jellema A. Deadly inertia: a cross-country study of
educational responses to HIV/AIDS. Brussels, Belgium: The
Global Campaign For Education, 5 Bld Du Roi Albert II. 1210,
2005
8. Shinde M, Trivedi A, Shinde A, Mishra SK. A study of awareness
regardin HIV/AIDS among secondary school students.
International Journal Of Community Medicine And Public
Health. 2017 Jan 5;3(6):1461-5.
9. Lal P, Nath A, Badhan S, Ingle GK. A study of awareness about
HIV/AIDS among senior secondary school children of Delhi.
Indian journal of community medicine: official publication of
Indian Association of Preventive & Social Medicine. 2008 Jul;
33(3):190.
10. Gupta P, Anjum F, Bhardwaj P, Srivastav JP, Zaidi ZH. Knowledge
about HIV/AIDS among secondary school students. North
American journal of medical sciences. 2013 Feb;5(2):119.
Patel et al Impact of IEC on Knowledge of HIV/AIDS...

Factors Affecting Exclusive Breastfeeding and Complementary Feeding Practices among the Mothers of Children between Age Group of 12 to 23 Months in Udaipur, Rajasthan Mohnish N. Tundia , Dhara V. Thakrar , Bhawarlal L. Vyas1 1 2
1
2
Assistant Professor, Community Medicine Department, American International Institute of Medical sciences, Udaipur, Rajasthan, India
Professor, Community Medicine Department, American International Institute of Medical sciences, Udaipur, Rajasthan, India
Dr. Dhara V. Thakrar, E mail: [email protected] :
Original Article Healthline Journal Volume 9 Issue 2 (July-December 2018)
:: 38 ::
Abstract:
Introduction
Objective:
Method
Results
Conclusion:
Keywords
: Poor feeding practices are a major threat to social and economic development. Not
breastfeeding significantly increases risk for a large number of acute and chronic diseases including lower
respiratory infection, ear infections, bacteraemia, bacterial meningitis, urinary tract infection, and
necrotizing enterocolitis. This study will provide evidence about factors affecting exclusive breastfeeding
and complementary feeding practices and
To find out various factors affecting Exclusive Breast Feeding (EBF) & complementary feeding
practices among the mothers of Udaipur city. : A total of 210 mothers were interviewed who were
randomly selected from the outpatient department over a period of 6 months in this cross sectional study.
An oral consent was taken from the participating mothers. : Out of total, 69.05% mothers gave
prelacteal feeds to their babies. 54.76% of mothers had initiated breast feeding within 1-4 hour of birth. Only
33.81% babies were given exclusive breast feeding for six months. 17.14%, 13.81% and 22.38% mothers
were counselled about breastfeeding by local health worker, doctor and relatives respectively, while 46.67%
were not counselled at all. Prelacteal feeds was given in nearly two third of babies. Only one
third mothers gave colostrum to their babies.Exclusive breastfeeding was received by only one third babies.
Less than 10% of babies were breastfed for 2 years. The association was statistically significant between
exclusive breastfeeding and factors like place of delivery, numbers of Antenatal visits, education and
occupation of mother
: Exclusive Breastfeeding, Mother, Prelacteal Feed
will highlight level of problem in community. Aim and
Introduction:
Good nutrition is vital to ensure that the infant
develops both physically and mentally to the fullest
potential. Poor feeding practices are a major threat to
social and economic development. Scientific
research, such as the studies summarized in a 2007
review for the U.S Agency for Healthcare Research
and Quality (AHRQ) and a 2007 review for the WHO
(World Health Organization), have found numerous
benefits of breastfeeding for the infant. According to
the American Academy of Paediatrics, research
shows that breast feeding provides advantages with
regard to general health, growth, and development.
Not breastfeeding significantly increases risk for a
large number of acute and chronic diseases including
lower respiratory infection, ear infections,
bacteraemia, bacterial meningitis, urinary tract
infection, and necrotizing enterocolitis. Previous
studies have demonstrated that, there is a possible
protective effect of breast milk feeding against sudden
infant death syndrome, insulin-dependent diabetes
mellitus, Cohn's disease, ulcerative colitis, lymphoma,
allergic diseases, digestive diseases, and a possible
enhancement of cognitive development. Poor infant
feeding practices and their consequences are one of
the world's major problems and a serious obstacle to
social and economic development. It is not only a
problem of the developing world, it occurs in many
parts of the developed world as well.
Today, malnutrition is a major public health
problem in India. Malnutrition is not only influenced
by factors, such as poverty, lack of health care,
[1]
[2]
[3]

Tundia et al Factors Affecting Exclusive Breastfeeding...
:: 39 ::
unsanitary conditions, lack of food, but also by social,
& cultural factors including poor caring practices &
behavior of mother regarding breastfeeding &
complementary feeding practices. The link between
malnutrition and infant feeding has been well
established. In spite of implementation of national
guidelines of Infant & Young Child Feeding (IYCF)
practices in India, rate of exclusive breastfeeding and
complementary feeding are still poor. According to
NFHS 4, only 55% children were exclusively breast fed
& only 43% children were started complimentary
feeding between 6-9 months at national level. The
Government of India for the first time had included
specific goals to improve infant feeding practices for
reducing the Infant Mortality Rate (IMR),
malnutrition and promoting integrated early child
development in the 10 th Five-Year Plan. It also aimed
to increase the rate of initiation of breastfeeding
within 1 h to 50% from the current level of 15.8%, and
to increase the exclusive breastfeeding rate to 80%
[4]
[5]
during the first six months from the current level of
around 41%.
This study will provide evidence about
factors affecting exclusive breastfeeding and
complementary feeding practices and
To find out various factors affecting exclusive
breastfeeding & complementary feeding practices
among the mothers of Udaipur city.
1. To study the pattern of breastfeeding &
complementary feeding practices among
lactating mothers of Udaipur city.
[6]
Aim:
Objectives:
will highlight
level of problem in community and thus will help
health planner and policy makers to channelize
resources to address this problem at community
level.
Table 1 : Factors affecting Breastfeeding Practices
Affecting factors Frequency(No.) Percentage (%)
Time of initiating breast feeding
Prelacteal feeds
Type
Colostrum given
Within 1 hr. of birth 78 37.11
Between 1-4 hr. of birth 115 54.76
Between 1-3 days 17 08.09
First breast completely emptied before putting baby on
other breast 84 40.00
Yes 145 69.05
No 65 30.95
Sugar water 66 45.52
Honey 53 36.55
Castor oil 07 04.83
Cow/buffalo milk 19 13.10
Yes 74 35.24
No 136 64.76

Healthline Journal Volume 9 Issue 2 (July-December 2018)
:: 40 ::
Table 2: Distribution of mothers according to their feeding practices
Feeding practices Frequency(No.) Percentage (%)
Exclusive breast feeding for 6 months
Duration of Breast feeding
Initiation of complementary feeding
Feeding during illness
Counselor whose advices were followed by beneficiary
Yes 71 33.81
No 139 66.19
6 months 23 10.95
12 months 108 51.43
18 months 63 43.45
24 months 16 07.62
6 months 128 60.95
12 months 72 34.29
18 months 10 04.76
Continued 127 60.48
Discontinued 83 39.52
Local health worker 36 17.14
Doctor 29 13.81
Relatives 47 22.38
Not counseled 98 46.67
2. To identify various factors affecting breastfeeding
& complementary feeding practices.
A cross-sectional study was conducted on mothers
of children between age group of 12 to 24 months,
attending an Urban Health Training Centre running
under American International Institute of Medical
Sciences, Udaipur, Rajasthan. Ethical committee
approval was taken to carry out study. An oral consent
was taken from the participating mothers. A total of
210 mothers were interviewed who were randomly
selected from the outpatient department over a
period of 6 months. A structured, pretested and
Method:
predesigned questionnaire was used to collect
information on the socio-demographic profile (age,
parent's education, occupation etc.), details on the
initiation and duration of breastfeeding and weaning
practices. Illiterate mothers were asked to answer the
questions orally and were filled in by volunteers.
Table 1 shows that out of all mothers, 37.11%,
54.76% and 08.09% had initiated breast feeding
within 1 hour, between 1-4 hour of birth and between
1-3 days of birth of baby, respectively. About 40%
mothers emptied first breast completely before
putting baby on other breast. Out of total, 69.05%
Results:

:: 41 ::
mothers gave Prelacteal feeds to their babies. In
Prelacteal feeds, 45.52%, 36.55%,4.83% and 13.10%
mothers gave sugar water, honey, castor oil and
cow/buffalo milk to their babies respectively. 35.24%
mothers gave colostrum to their babies.
Table-2 shows that 33.81% babies were given
exclusive breast feeding for six months. 7.62%,
10.95%, 43.45% and 51.43% babies were breast fed
for 24, 6, 18 and 12 months respectively.
Complementary feeding was initiated at 6 months in
60.95% babies while it was initiated at 18 months in
04.76% babies. 60.48% mothers continued feeding
during illness of babies. In our study, 17.14%, 13.81%
and 22.38% mothers followedthe advises of local
health worker, doctor and relatives respectively about
breastfeeding, while 46.67% were not counselled at
all.
Table 3 shows that Exclusive breastfeeding was
more in hospital delivery (68.05%), than home
delivery (15.94%), and the difference was highly
significant (p<0.00001). Out of total hospital delivery,
38(53%) were normal and 34(47%) were done by
cesarean section. EBF had more in those mothers who
had >4 ANC check up (70.31%) as compared to<4 ANC
check ups and the difference is also highly significant
(p<0.00001). Proportion of EBF babies was different
in different religion but difference was not statistically
significant. In primi mothers, proportion of EBF
(37.88%) were more as compared to multipara but the
difference was not significant. Those who highly
educated had given EBF (46.15%) up to 6 months ain
comparison with lower education and difference was
statistically significant (p=0.007). Almost similar
proportion of EBF (32.35%, 33.33%, 35.48%) were
seen in different age of mother (<19, 20-29, >30
respectively). EBF were seen more in socio economic
class 1 & 2 (39.58%) as compared to other class but the
difference was not significant. Housewives had more
EBF (53.41%) as compared to working women and the
difference was highly significant (p<0.00001).
Discussion:
This study was conducted on mothers of children
between age group of 12 to 24 months, attending an
Urban Health Training Centre running under
American International Institute of Medical
Sciences, Udaipur, Rajasthan. In our study, 37% of
infants were feed within 1 hour of birth and while 17
% were fed within 1 day. A study done by Patricia et
al. revealed that 11.6% infants in urban area and
9.4% infants in rural area were put to breast within
the first hour; 33.3% infants in urban area and 25.6%
infants in rural area were breastfed within the first
day. More than half of the infants in our study
initiated breastfeeding within 1-4 hours and one
third were fed with colostrum, while study from the
Nepal showed that most of the infants initiated
breastfeeding within 24 hours and were fed with
colostrum. Only 35% of the mothers gave
colostrum in patil et al. study from Karnataka.
In our study, almost two third of infants had given
prelacteal feed and sugar water was the most
common Prelacteal feed given to the infant. Around
91% mothers gave pre lacteal feeds to their children
in study from Karnataka and commonest prelacteal
feed given was sugar water followed by sugar water
plus honey. Prelacteal feed is a popular custom in
the society of giving honey, sugar water and water to
the newborn. Study from the Eastern India
reported that 24% of infants given Prelacteal feed.
Study by Sriram et al showed prelacteal feeds were
given to 34.67% of infant. This custom increases
the chances of infection to the infant.
One third of mothers had given exclusive breast
feeding upto 6 months to their baby in our study.
Only 5 % of mothers given EBF upto 6 months to their
babies in Patil et al. study. In study from eastern
India, 60% of infants received exclusive breast
feeding upto 6 months. A meta-analysis by Arun
Gupta and Y. P. Gupta showed that more than half the
children (54%) in the age group of 0-3 months were
exclusively breastfed whereas this percentage was
much lower (26%) for children in the age group of 4-
6 months. Medhi GK et al in their study among the
tea garden workers in Assam also found that 69%
mothers EBF their infants till six months of age.
Majority of mothers (78%) practiced breast
feeding upto 12 months of age while only 2% breast
fed upto 24 months and 76% of mothers initiated
[7]
[8]
[9]
[9]
[10]
[11]
[12]
[9]
[11]
[13]
[14]
Tundia et al Factors Affecting Exclusive Breastfeeding...

:: 42 ::
Table 3 : Association of exclusive breastfeeding with different factors
VariableEBF (%)
(n=71)
Non-exclusive
breast feeding
(%) (n=139)
Chi-square P value*
Place of delivery
Ante Natal Care
Religion
Parity
Education
Age of the mother
Socio Economic Status
Occupation
Hospital** 49 (68.05%) 23(31.95%)57.41 <0.00001
Home Delivery 22 (15.94%) 116 (84.06%)
>4 ANC check up 45 (70.31%) 19 (29.69%)54.81 <0.00001
<4 ANC check ups 26 (17.81%) 120 (82.19%)
Hindu 57 (36.77%) 98(63.23%)
2.9946 0.2237Muslim 11(28.95%) 27 (71.05%)
Other 03 (17.65%) 14(82.35%)
Primi 25 (37.88%) 41 (62.12%)
1.3081 0.51991 to 3 37 (33.63%) 73(66.36%)
>3 09 (26.47%) 25 (73.53%)
Illiterate 07 (17.07%) 34 (82.93%)
11.8492 0.0079Primary/Middle 22 (28.57%) 55 (71.43%)
High school 24 (45.28%) 29 (54.72%)
College & Above 18 (46.15%) 21 (53.85%)
<19 years 11 (32.35%) 23 (67.65%)
0.1215 0.941020-29 years 38 (33.33%) 76 (66.67%)
>30 years 22 (35.48%) 40 (64.52%)
I & II 19 (39.58%) 29 (60.42%)
0.9283 0.628674III 29 (32.22%) 61 (67.78%)
IV &V 23 (31.94%) 49 (68.06%)
House wife 47 (53.41%) 41 (46.59%)
40.7071 <0.00001Labourer 01 (1.85%) 53 (98.15%)
Service 12 (29.27%) 29 (70.73%)
Business 11 (40.74%) 16 (59.26%)
*p<0.05 statistically significant, **Normal Delivery: 38, Cesarean Section: 34
Healthline Journal Volume 9 Issue 2 (July-December 2018)

:: 43 ::
complementary feeding by 6 months of age in Das et
al. study. In present study more than half of the
women continued breast feeding upto 12 months
and after that most of them continued upto 18
months and 60 % of mothers started complementary
feeding at 6 months of age. A study from Ahmedabad
showed 74.67% mothers initiated complementary
feeding by 6 months but only 29.33% had the right
attributes. Majority of mothers (49.2%)
introduced complementary feeding after completion
of six months in study from Assam. Similar to our
study observations Basnet S et al found that 50% of
the mothers started complementary feeds at 6
months of age. In a study by Rao S et al 77.5%
mothers were found to have started complementary
feeding at the recommended time. But a study by
Kavitha S et al found that 62% of infants were weaned
prematurely. 88% of mothers had continued
feeding during illness and Local health worker was
the most frequent counselor regarding feeding
followed by Doctor in study from South India,
while in our study 60% of mothers continued
breastfeeding during in illness . Almost half of the
mothers in present study were not counseled about
feeding. The most frequent counselor regarding
feeding was doctor in the study from Gujarat. It is
essential to educate the mother regarding exclusive
breast feeding, timely and appropriate initiation of
complementary feeding for adequate growth of the
infant.
On bivariate analysis of certain maternal and
socio-demographic factors influencing Exclusive
Breast Feeding (EBF), it was seen that exclusive
breast feeding was significantly associated with 4 or
more numbers of ANC visits, place of delivery,
educational status and occupation of mother in
current study. Katila D et al in their study also
observed similar results for ANC visits and education
of mother. Bharati SR in a study conducted in South
India identified the factors that significantly
influence the duration of breast-feeding was income,
education and employment. Swetha R et al also
observed in their study that employment was
significantly associated with duration of EBF.
[11]
[ 1 5 ]
[16]
[17]
[18]
[19]
[11]
[15]
[16]
[20]
[21]
Conclusion:
Declaration:
In this study we can see that most of mothers had
initiated breastfeeding between 1 to 4 hours of birth
of baby. Prelacteal feeds was given in nearly two third
of babies. Sugar water was mostly preferred as
Prelacteal feed by mothers. Only one third mothers
gave colostrum to their babies. Exclusive
breastfeeding was received by only one third babies.
Less than 10% of babies were breastfed for 2 years.
Nearly two third of mothers continued to give
breastfeeding during illness of babies. Almost half
mothers were not counselled at all.The association
was statistically significant between exclusive
breastfeeding and factors like place of delivery,
numbers of Antenatal visits, education and
occupation of mother. While difference was not
significant in case of factors like religion, parity, age of
mother and socio-economic status.
Funding: Nil
Conflict of Interest: Nil
References :
1. Lucas A, Cole TJ. "Breast milk and neonatal necrotising
enterocolitis".Lancet.1990; 336(8730): 1519-23.
2. Gartner LM, Morton J, Lawrence RA, et al."Breastfeeding and the
use of human milk". Pediatrics. 2005; 115 (2): 496–506.
3. Akri J. Infant feeding: The physiological basis. Bull World Health
Organ 1989;67 (1 Suppl):8-9
4. Infant feeding styles: barriers and opportunities for good
nutrition in India. Engle PL. UNICEF Country Office, New Delhi,
India. Nutr Rev. 2002 May; 60(5 Pt 2):S109-14.
5. National Family Health Survey (NFHS-4). 2015-16. Volume I.
International Institute for Population Sciences. Deonar, Mumbai.
6. National guidelines on infant and young child feeding. Ministry of
Human Resource Development. Department of Women and Child
development (Food and Nutrition Board). Government of India.
http://wcd.nic.in/nationalguidelines.pdf; 2004. p. 2-3.
7. Haggerty, Patricia A, Rutstein SO. Breastfeeding and
complementary infant feeding, and the postpartum effects of
breastfeeding. Demographic and Health Surveys comparative
studies17 th edn. Calverton, Md. Macro International, 1999. 145-
53.
8. Manjeswori Ulak, Ram K Chandyo, Lotta Mellander, Prakash S
Shrestha and Tor A Strand. Infant feeding practices in Bhaktapur,
Nepal: across-sectional, health facility based survey.
International breastfeeding journal. 2012. 7:1.
9. Yadavannavar M. C. and Patil S. S. Socio cultural factors affecting
breast feeding practices and Decisions in rural women. IJPAES.
Vo-1, Issue-2 June-Aug :2011:46-50.
Tundia et al Factors Affecting Exclusive Breastfeeding...

Healthline Journal Volume 9 Issue 2 (July-December 2018)
:: 44 ::
10. Kathleen M. McKenna, MPH, SNM, Rani T. Shankar, CNM, MS, MPH.
The Practice of Prelacteal Feeding to Newborns Among Hindu and
Muslim Families. Journal of Midwifery and Women's Health.
2009; 54(1):78-81.
11. Das R, Mukherjee A. Knowledge, attitude and practices of infant
feeding practices among rural women in Eastern India. Journal of
Evolution of Medical and Dental Sciences 2014; Vol. 3, Issue 02,
Jan 13; 506-512.
12. Sriram S, Soni P, Thanvi R, Prajapati N, Mehariya KM. Knowledge,
attitude and practices of mothers regarding infant feeding
practices. Natl J Med Res. 2013; 3(2): 147-50
13. Gupta A, Gupta YP. Status of infant and young child feeding in 49
districts (98 blocks) of India. A National Report of the
Quantitative Study. Breastfeeding Promotion Network of India
(BPNI). 2003; 14-8.
14. Medhi GK, Mahanta J. Breastfeeding, Weaning Practices and
Nutritional Status of Infants of Tea Garden Workers of Assam.
Indian Pediatrics. 2004;41:1277-9.
15. Sriram S, Soni P, Thanvi R, Prajapati N, Mehariya KM. Knowledge,
attitude and practices of mothers regarding infant feeding
practices. Natl J Med Res. 2013; 3(2): 147-50
16. Kalita D and Borah M. Current practices on infant feeding in rural
areas of Assam, India: a community based cross sectional study.
Int J Community Med Public Health. 2016 Jun;3(6):1454-1460.
17. Basnet S, Sathian B, Malla K, Koirala DP. Reasons for Early or Late
Initiation of Complementary Feeding: A Study in Pokhara.
American Journal of Public Health Research. 2015;3(4):69-75
18. Rao S, Swathi PM, Unnikrishnan B, Hegde A. Study of
Complementary Feeding Practices among Mothers of Children
Aged Six Months to Two Years – A Study from Coastal South India.
AMJ. 2011;4(5):252-7.
19. Kavitha S, Nadhiya C, Parimalavalli R. Study of Complementary
feeding practices among mothers of infants aged six months to
one year. Healthline. 2014;5( 2):29-35.
20. Bharati SR. Socio-economic dimensions of breastfeeding - a
study in Hyderabad. Health and Population - Perspectives and
Issues. 2000;23(3):144-59.
21. Swetha R, Ravikumar J, Nageswara Rao R. Study of breastfeeding
practices in coastal region of South India: a cross sectional study.
International Journal of Contemporary Pediatrics. 2014;1(2):74-
8.

Clinico-Epidemiological Study of Patients Suffering from Sickle Cell Anaemia In a District Level Private Hospital of a Tribal District in South GujaratShashwat Nagar , Hiren Patel1
2
1 2Associate Professor, Assistant Professor, Department of Community Medicine, Parul Institute of Medical Sciences and Research,
Vadodara, Gujarat, IndiaDr. Hiren B. Patel, E mail: [email protected] :
Original Article Healthline Journal Volume 9 Issue 2 (July-December 2018)
:: 45 ::
Abstract:
Introduction
Objectives:
Method:
Results:
Conclusion:
Keywords
: Sickle cell disorder is an autosomal recessive condition, in which inheritance of an
affected gene from both parents results in a disorder. According to hospital based epidemiological survey,
the prevalence of sickle cell gene is observed among tribal population, which accounts for 15 % of the total
population of Gujarat and are distributed in various districts. To study clinical profile,
epidemiological characteristics and socio-demographic features of persons having sickle cell disease and
sickle cell trait and establish relationships if any of the epidemiological profile with the clinical and socio-
demographic features of the study subject. The study was carried out in Janak Smarak hospital in
Vyara Town, Tapi District. It was a descriptive cross-sectional study for a period of one year and minimum of
75 persons with sickle cell disease and 150 persons with sickle cell trait was taken for the study.
Proportion of females affected were more than that of the male. Majority of the participants
belonged to Gamit caste and most of them were Hindus. Majority of the participants were married and it was
significantly associated with Sickle cell status of the individuals. Majority of sickle cell disease patients had
clinical manifestations of sickle cell crisis like pain in both upper and lower limbs; weakness, fever and body
ache and sign of pallor. Nearly half of the sickle cell disease patients had a history of blood
transfusion. Family history and predisposition happens to remain one of the most important
predictors of the Sickle cell status among the population. Nearly more than half of the Sickle Cell Disease
patients needed regular transfusion with Blood or any of its components. This points out the necessity of
establishing these units in higher numbers in tribal areas.
: Blood transfusion, Sickle Cell Crisis, Sickle Cell Disease, Sickle Cell trait, Tribal Community
Introduction:
Sickle Cell Disease (SCD) is genetic blood disorder
that affects the Haemoglobin in Red Blood Cell. Sickle
cell disorder is an autosomal recessive condition, in
which inheritance of an affected gene from both
parents results in a disorder while inheritance of one
abnormal gene results in a healthy carrier. It is
characterized by vaso-occlusive pain crises, risk for
pneumococcal infections, acute chest syndrome, and
stroke and organ failure and is associated with
substantial morbidity and premature mortality. The
main reasons for mortality among sickle cell disease
patients are infection, acute splenic sequestration,
severe anaemia and haemolytic crisis.
According to hospital based epidemiological
survey, the prevalence of sickle cell gene is observed
[1]
[2]
[1]
to be 0-18 percent in northern- eastern India, 0 to 33
percent in western India, 22.5 to 44.4 percent in
central part of India and 1 to 40 percent in southern
India and the gene frequency of Hb-S varies between
0.031- 0.41. Another survey done by the Indian Red
Cross Society in Gujarat, where nearly 1, 68,498 tribal
individuals from 22 districts were screened, the
overall prevalence of sickle cell carriers was found to
be 11.37 per cent. Some studies have also
documented high prevalence of sickle gene in various
tribal communities of Gujarat that include Bhils and
Dhodias of Panchmahal, Dublas, Naikas, Koli, Dhanka,
Gamit, Vasava, Bariya, Varli, Vaghari, Kukna, Halpati, &
Chaudhari. Tribal population accounts for 15 % of the
total population of Gujarat and are distributed in
various districts of the state such as Sabarkantha,
Banaskantha, Panchmahal, Vadodara, Narmada,
[3]
[4, 5]

Nagar & Patel Clinico-Epidemiological Study of Patients ...
:: 46 ::
Bharuch, Surat, Valsad, Dang and the surrounding
UTs like Div-Daman. In Tapi District of Gujarat,
Sickle Cell Disease is more prevalent among the socio-
economically disadvantaged and medically
underserved communities.
The study was carried out in Janak Smarak
Hospital, a trust managed hospital located in Vyara
where all diagnostic and treatment facilities for this
condition are available to know the epidemiological
and clinical pattern of patients reported with this
inherited disorder.
1. To study clinical profile of persons having sickle
cell disease and sickle cell trait.
2. To study the epidemiological characteristics and
Socio-demographic features of persons having
sickle cell disease and sickle cell trait
3. E s t a b l i s h re l a t i o n s h i p s i f a ny o f t h e
epidemiological profile with the clinical and
socio-demographic features of the study subjects
The study was carried out in Janak Smarak
hospital in Vyara Town, Tapi District, Gujarat. It was a
descriptive cross-sectional study between March
2014 to February 2015 i.e. for a period of one year.
After getting permission from the institutional ethics
committee of Sumandeep Vidhyapeeth, Piparia,
persons having sickle cell disease or sickle cell trait
(diagnosed at Janak Smarak Hospital, Vyara) were
contacted to explain the purpose of the study and
nature of his / her participation and to collect the
basic personal and epidemiological information,
clinical information like symptomatology, History of
blood transfusion, Family history of Sickle cell
Disease & Sickle cell Trait, after getting their written
consent for participation in the study. Only those who
consented for the study were included as subjects to
collect the data further. Prior permission from the
hospital authorities was also sought to carry out the
study.
For estimation of sample size, a small pilot study
was carried out between 1 April 2013 to 30
September 2013. During this period of 6 months, a
total of 38 patients were diagnosed with Sickle cell
[6]
st th
Objectives of the study:
Method:
Anemia and 164 individuals were diagnosed having
sickle cell trait. This data was then compared with the
past records of 3 years of the hospital and it was
observed that the no. of sickle cell patients and traits
who had reported to the hospital were almost similar
in number, hence it was assumed that for a
forthcoming period of one year a minimum of 75
persons with sickle cell disease and 150 persons with
sickle cell trait would be available for study at the
hospital. This was hence taken as the sample size for
the study.
The study was carried out using a pre-designed
and pre-tested questionnaire and the data was
collected by directly interviewing the subjects and
examining them.
The data collected was analyzed using MS Excel
2007 and suitable statistical tests were applied at 5%
level of significance.
Table 1 suggests that proportion of females
affected were more than that of their male
counterparts. Majority of the participants belonged to
Gamit caste and most of them were Hindus. Majority
of the participants were married. Majority of subjects
among both males and females were educated up to
secondary with more proportion of illiterate among
females was more than males. Most of the patients
were from Social Class 1 and 2.
Table 2 shows that the prevalence of the SCD and
Sickle Cell Trait (SCT) was higher in age groups above
18 yrs of age. However, the prevalence of both SCD &
SCT was almost 30% in those aged <17 yrs. It was also
noteworthy that the females were affected more than
the males in both the groups. To assess the impact of
Social Demographic variable with SCD & SCT, all of the
socio demographic variables were analysed &
association was sought using chi squared test which
showed that out of all the variables, only marital
status was significantly associated with Sickle cell
status of the individuals. (X value= 17.68; p<0.001)
Table 3 shows that Majority of sickle cell Disease
patients had clinical manifestations of sickle cell
crisis like pain in both upper & lower limbs (58%);
weakness (53%), fever (48%) and body ache
(44.3%). Where as in sickle cell trait patients, it was
Results:
2

:: 47 ::
Healthline Journal Volume 9 Issue 2 (July-December 2018)
* “Others” include Valvi and Kokani castes. ** NA suggest children less than 18 years of age (out of school)
*** Social class as per Modified B.G. Prasad`s Classification of 2015 (AICPI= Rs. 816/-)
Variable Female (n=132) Male (n=93) Total (n=225)
Table 1: Socio demographic profile of the subjects
Age (Years) Number Number NumberPercentage (%) Percentage (%) Percentage (%)
1 – 5 4 3.03 2 2.15 6 2.66
6-17 33 25 34 36.55 67 29.78
18-45 81 61.37 48 51.61 129 57.34
46- 100 14 10.60 9 9.67 23 10.22
Gamit 99 75 66 70.96 156 69.33
Chaudhari 39 29.54 23 24.73 62 27.55
Others* 3 2.27 4 4.30 7 3.11
Married 72 54.54 34 36.55 106 47.74
Unmarried 21 15.90 25 26.88 46 20.72
Widow/widower 4 3.03 0 0 4 1.77
NA(1-17 years of age) 35 26.51 34 36.55 69 30.66
Hindu 123 93.18 86 92.47 209 92.88
Christian 9 6.81 7 7.52 16 7.11
Illiterate 25 18.93 7 7.52 32 14.22
Primary
(1-7 standard) 32 24.24 33 35.48 65 28.88
Secondary
(8-10 standard) 40 30.30 23 24.73 63 28
Higher Secondary
(11-12 standard) 18 13.63 10 10.57 28 12.44
Diploma/ ITI / PTC 1 0.75 1 1.07 2 0.88
Graduate 12 9.09 15 16.12 27 12
PG/Diploma 2 1.51 2 2.15 4 1.77
NA 2 1.51 2 2.15 4 1.77
Student 53 40.15 50 53.76 103 45.77
Housewife 67 50.75 0 0 67 29.77
Farmer 6 4.54 24 25.80 30 13.33
Job 0 0 5 5.37 5 2.22
Teacher 5 3.78 5 5.37 10 4.44
ANM 1 0.75 0 0 1 0.44
Shopkeeper 1 0.75 0 0 1 0.44
Driver 0 0 1 1.07 1 0.44
NA** 2 1.51 2 2.15 2 0.88
CLASS -I 42 31.8 31 33.3 73 32.4
CLASS - II 77 58.3 50 53.8 127 56.4
CLASS - III 12 9.1 9 9.7 21 9.3
CLASS - IV 0 0 2 2.2 2 0.9
CLASS - V 1 0.8 1 1.1 2 0.9
Caste
Marital Status
Religion
Education
Occupation
Social Class***

:: 48 ::
Variable SCD (n=75) SCT (n=150) Chi –Square
Table 2: Association of various Socio-Demographic Variables with SCD & SCT status of the subjects
Age (Years) Number NumberPercentage (%) Percentage (%)
* “Others” include Valvi and Kokani castes.
** NA includes (1-17 years of age).
χ2 value=0.418, df=2,
p=0.8112
χ2 value=6.738, DF=5,
p=0.2408
χ2 value=9.38, DF=3,
p=0.0245
1 – 5 3 4 4 36-17 21 28 46 31
18-45 51 68 78 5246- 100 0 0 22 14
Gamit 53 71 103 69Chaudhari 22 29 42 28
Others* 0 0 5 3
Married 27 36 79 53Unmarried 29 39 17 11
Widow/widower 0 0 4 3NA** (1-17 years of age) 19 25 50 33
Hindu 68 91 141 94Christian 7 9 9 6
Illiterate 9 12 23 15Primary
(1-7 standard) 24 32 41 27Secondary
(8-10 standard) 17 23 46 31Higher Secondary(11-12 standard) 11 15 17 11
Diploma/ ITI / PTC 0 0 2 1Graduate 12 16 15 10
PG/Diploma 1 1 3 2NA 1 1 3 2
Student 43 57 60 40Housewife 18 24 49 33
Farmer 7 9 23 15Job 3 4 5 3
Teacher 2 3 8 5ANM 1 1 0 0
Shopkeeper 0 0 1 1Driver 0 0 1 1
NA 1 1 3 2
CLASS -I 20 27 53 35CLASS - II 43 57 84 56CLASS - III 8 11 13 9CLASS - IV 2 3 0 0CLASS - V 2 3 0 0
SexFemale 41 55 91 61
Male 34 45 59 39Caste
Marital Status
Religion
Education
Occupation
Social Class***
χ2 value=2.894, df =4,
p=0.5757
χ2 value=0.036, df =1,
p=0.8499
χ2 value=17.682, df =2,
p=0.000145
χ2 value=0.094, df =1,
p=0.7591
χ2 value=0.515, df =1,
p=0.4728
Nagar & Patel Clinico-Epidemiological Study of Patients ...

Healthline Journal Volume 9 Issue 2 (July-December 2018)
:: 49 ::
SymptomsSCD
(n=75)SCT
(n=150)Total
(n=225)
Table 3 : Clinical Manifestation at the time admission of sickle cell disease & sickle cell trait patient
Number Number NumberPercentage (%) Percentage (%) Percentage (%)
Weakness 40 53 31 21 71 32
Fever 36 48 47 31 83 37
Body ache/ Joint pain/
Back pain 33 44.3 110 74 156 69
Pain in both upper &
lower limb 43 58 48 32 91 40.1
Breathlessness/ Chest
pain/ Coughing 17 23 26 17 43 18
Giddiness/ Headache
/ Uneasiness 7 9.3 18 12 25 11
Abdominal pain/Vomiting 16 21 1 0.6 17 7.4
Pallor 44 59 109 73 153 68
Icterus 10 13 20 13 30 13
Splenomegaly/
Hepatomegaly 19 26 1 1 20 9
Oedema 2 3 20 13 22 10
Signs
*Many patients had multiple symptoms & Signs
seen that most of the patients had clinical
manifestation of Body ache/Joint pain/ Back Pain 74
% followed by pain in both upper & lower limb 32%;
fever 31% and weakness 21%.
Table also shows that, majority of both the Sickle
Cell Disease and Sickle cell trait patients showed sign
of pallor; followed by Splenomegaly/hepatomegaly
in Sickle cell Disease patients & Icterus and Edema in
the Sickle cell trait patients.
Figure 1: Family history of sickle cell disease &
sickle cell trait among the patients
Figure 1 shows that nearly 30% of Sickle cell trait
individuals and 25% of sickle cell disease patients
had no family history of any sickle cell status, which
implies that majority of them did have either a one
parent or two parent history of sickle cell
disease/trait. Nearly 20% had a two parent history
and the remaining had only one parent history of
SCD/trait . This clearly shows the family
preponderance in the transmission of the sickle cell
status.
Figure 2: History of Blood transfusion of sickle
cell disease & sickle cell trait patients

:: 50 ::
It can be seen from Figure 2 that nearly half of the
sickle cell disease patients and a very small
proportion of sickle cell trait individuals had a history
of blood transfusion. This clearly shows the
importance of having blood storage centres and
blood banks in more numbers in tribal districts as it
can be a life-saving tool among the affected
individuals. The requirement of blood transfusion
among sickle cell disease patients was significantly
higher as compared to the sickle cell trait patients and
the same was statically significant using the chi
squared test. ( 2 Test value=71.3, DF=1, p<0.01)
The present study was carried out during in Janak
Smarak hospital of Vyara. A total of 225 participants,
75 of which were patients of Sickle Cell Disease & the
remaining 150 had Sickle Cell Trait were included in
the study. It was observed that proportion of females
affected was more than that of their male
counterparts which could have been because a higher
sex ratio of Tapi district (1004 females per thousand
males as per census 2011) . A study conducted by
Shrestha A et al and Jain B et al found that males
were more affected than females.
Majority of participants belong to Gamit caste,
followed by Chaudhari caste because of a higher
population of these communities residing in the
district (Data of Census 2011) The present study
revealed that marital status was significantly
associated with occurrence of SCD & SCT status. This
can lead to higher chances of future transmission of
sickle cell in the progeny due to higher prevalence of
consanguineous marriages in the tribal communities.
A study by M Kamble et al also describes about
history of consanguinity marriage; out of which
(8.2%) had sickle cell disease and (5.2%) had sickle
cell trait. It is hence extremely necessary to carry out
genetic counselling after knowing sickle cell status
among potential couples before marriage to avoid the
further transmission in the successive generations.
Present study showed that over all literacy rate
was 84% while 14% patients were illiterate, which
was almost similar to the census data for the state and
the district. A study by Gustafson SL et al described
that the a higher the level of knowledge of Sickle Cell
χ
Discussion:
[7]
[8] [9]
[7]
[10]
[11]
Disease, there is better acceptance of genetic
counselling and testing as was primarily found
among the high school graduates. The more
educated people are the better is the access to health
services and more is the acceptance of IEC related to
the disease.
Current study showed that the clinical
manifestations of fever & pain in both upper & lower
limb (hand foot syndrome) was among the most
common symptoms in the study population A study
by K Swarnkar also showed similar results.
Therefore, it is prudent that the affected individuals
must be made aware of these alarming symptoms
requiring admission and immediate treatment so
that their lives can be saved. Our study revealed that
pallor was the commonest sign in both SCD and SCT. A
study by Patra Pradeep et al and a study by K
Swarnkar also show that pallor was common sign
in both SCD & SCT trait patients.
Current study also observed that about 29% of the
Sickle Cell Disease patients & 36 % of the Sickle Cell
Trait patients had a positive maternal history of
SCD/SCT.A Study by Warade J et al also showed a
positive family history for either sickle cell disease or
sickle cell trait and thus how showed the impact of
family history over the occurrence of disease. The
present study revealed that majority of sickle cell
disease & 6% of sickle cell trait patients had history of
blood transfusion. The requirement of blood
transfusion is extremely critical and must be planned
at tribal areas in secondary and tertiary care
hospitals to ensure higher quality of life and better
treatment facilities for the affected.
It can be concluded from the study that younger
generation of the community especially females were
more affected with both sickle cell disease and trait.
Most common clinical manifestations among the
subjects include Fever & Pain in both upper & lower
limb (hand foot syndrome) and also the joints. Family
history and predisposition happens to remain one of
the most important predictors of the Sickle cell status
among the population thereby reiterating the need of
regular Genetic Counseling at hospitals (Both Govt
and Private) in Tribal Areas of the state. Nearly more
[11]
[12]
[11]
[13]
Conclusion:
Nagar & Patel Clinico-Epidemiological Study of Patients ...

Healthline Journal Volume 9 Issue 2 (July-December 2018)
:: 51 ::
than half of the Sickle Cell Disease patients needed
regular transfusion with Blood or any of its
components. This points out the necessity of
establishing these units in higher numbers in tribal
areas.
It is a well-known fact that sickle cell disease is an
incurable genetic disease and hence prevention of the
disorder stays as the mainstay of its control in the
community settings. It is necessary to educate the
tribal communities about the disease & its
prevention. Endogamy marriages among the sickle
cell trait patients increase the chances of the
occurrence of the disease as the subsequent
generation has a higher chance of contracting sickle
cell disease and thus emphasizes the need of regular
genetic counselling sessions in hospitals and in the
community to ensure that more and more people can
be protected from the disease and its dangerous
repercussions.
Studies of similar types especially in tribal areas
can help in generating and strengthening evidence
for availability of special services to the affected
including Genetic counselling, screening and
treatment services including availability of blood
units on a priority basis.
Funding: Nil
Conflict of Interest: Nil
Recommendations:
Declaration:
References :
1. Hanmante R. D, Chopade S. W, Dhumure K. S, Shere S, Bindu R. S.
Neonatal Screening for Sickle Cell Disorders. International
Journal of Recent Trends in Science and Technology 2011;
1(3):104-09.
2. Balgir R. Epidemiology, Population Health Genetics and
Phenotypic Diversity of Sickle Cell Disease in India. The Internet
Journal of Biological Anthropology 2007; 1(2):1-12.
3. M. Kaur., CBS Dangi, M Singh, H Singh, S.Kapoor, Burden of Sickle
Cell Diseases among Tribes of India- A Burning Problem.
International Research Journal of Pharmaceutical and Applied
Sciences (IRJPAS) 2013; 3(1): 60-80.
4. Roshan Colah, Malay Mukherjee, Snehal Martin, Kanjaksha
Ghosh. Sickle cell disease in tribal populations in India. Indian J
Med Res 2015; 141: 509-515.
5. Patel AP, Naik MR, Shah NM, Sharma N, Parmar P. Prevalence of
common hemoglobinopathies in Gujarat: An analysis of a large
population screening program. Natl J Community Med 2012; 3:
112-6.
6. Vasava B, Chudasama RK, Godara NR, Srivastava RK. Sickle cell
disease status among school adolescents and their tribal
community in South Gujarat. Online J Health Allied Scs 2009;
8(2):4.
7. Tapi District Population Census 2011 [Internet]. Office of the
Registrar General & Census Commissioner, India, Ministry of
Home Affairs, Government of India 2011 [cited 2018 Aug 14].
Available from : http://www.census2011.co.in/ census/district
/207-tapi.html
8. Shrestha A, Karki S. Analysis of sickle hemoglobin. Journal of
Pathology of Nepal 2013; 3:437 – 440.
9. Bhavan B Jain, Sulekha Ghosh;Spectrum Of Sickle Cell Disorders
In A Rural Hospital Of West Bengal. Indian J. Prev.Med 2012;
43(2); 208-11.
10. K Swarnkar, A Kale, B Lakhkar. Clinico-Epidemiological and
Hematological Profile of Sickle Cell Anemia with Special
Reference to Penicillin Prophylaxis in A Rural Hospital Of Central
India. The Internet Journal of Epidemiology [Online] 2010
Volume 9 Number 2. Available from: http://ispub.com
/IJE/9/2/3368.
11. Gustafson SL (2006) (Knowledge and health beliefs of sickle cell
disease and sickle cell trait: the influence on acceptance of
genetic screening for sickle cell trait. A thesis presented at
University of Pittsburgh 3-4.
12. Patra Pradeep K, Chauhan Virander S,Khodidar Prafulla K, Dalla
Abdul R, Sejeant Graham R. Screening for the sickle cell gene in
Chhattisgarh state, India: an approach to a major public health
problem, J Community Genet 2011;2(1):147–151.
13. Warade J, Pandey A. Distribution of Sickle Cell Disease in
Different Communities of Patient Visiting Out Patient
Department. J Pharm Biomed Sci 2014; 04(08):728-732.

Innovative Methods to Overcome Barriers and Improve Immunization Coverage:
A Comparative Study in Two Wards of Ahmedabad City
Shraddha Patel , Sheetal Vyas 1 2
1 2 Resident, Professor and Head, Department of community Medicine, AMC MET Medical College,
Ahmedabad, Gujarat, India Dr Sheetal Vyas, E mail: [email protected] :
Original Article Healthline Journal Volume 9 Issue 2 (July-December 2018)
:: 52 ::
Abstract:
Introduction:
Objectives
Method
Results
Conclusion
Key words
Immunization is one of the most cost effective public health interventions since it
provides direct and effective protection against preventable morbidity and mortality. : To
identify the challenges and barriers associated with immunization coverage. Also to implement innovative
strategies to overcome these challenges before session of Intensified Mission Indradhanush (IMI) and
compare the coverage levels in areas with versus without use of innovative methods. : Two slum
areas were selected from the South zone of Ahmedabad Municipal Corporation (AMC) and out of those one
was from UHTC of AMC MET Medical College which was the intervention area in this study. Families with
incomplete immunization of children <2 years were included in the study. In intervention area, personal
visit by investigator, one to one health education, mobile reminders and support of local influencers was
taken to increase the coverage. Data of both the areas were collected in a pre-designed and pre-tested
proforma and analysed. Qualitative analysis of reasons for not accepting immunization services was also
carried out. : Coverage of BCG, fIPV 1, OPV1 and Pentavalent-1 was 100% in both the areas. Coverage
of OPV2 and Pentavalent-2 was 100% and 57% in intervention and non-intervention areas respectively.
Overall coverage of all other vaccines was more in the UHC Isanpur which was the intervention area. Further
even in the non-intervention area, more experience of ASHA was significantly associated with better
coverage. Qualitative analysis revealed not informed about IMI round, fears and religious beliefs etc. as
reasons for not accepting immunization services. : Personal visits, Involvement of community
leader, Motivation and mobile reminders about the round of IMI was highly effective in improving coverage
of IMI from due list.
: Intensified Mission Indradhanush, Immunization coverage, Motivation, Reminders, Vaccines.
Introduction:
The benefits of immunization are not restricted to
improvements in health and life expectancy but also
have the social and economic impact at both
community and national levels. Global vaccination
coverage – the proportion of the world's children who
receive recommended vaccines – has remained the
same over the past few years. During 2017, about
85% of infants worldwide (116.2 million infants)
received 3 doses of diphtheria-tetanus-pertussis
(DTP3) vaccine, protecting them against infectious
diseases that can cause serious illness and disability
or be fatal. By 2017, 123 countries had reached at
least 90% coverage of DTP3 vaccine. [1]
The 2018
Global Vaccine Action Plan report highlights that
without sustained attention, hard-fought gains can
easily be lost. Where children are unvaccinated,
outbreaks occur and diseases that were eliminated
become endemic once again. To strengthen and re-
energize the programme and achieve full
immunization coverage for all children and pregnant
women at a rapid pace, the Government of India
launched “Mission Indradhanush in December
2014. The ultimate goal of Mission Indradhanush is
to ensure full immunization with all available
vaccines for children up to two years of age and
pregnant women. The Government has identified
201 high focus districts across 28 states in the
[2]
”

Patel & Vyas Innovative Methods to Overcome Barriers...
:: 53 ::
country that have the highest number of partially
immunized and unimmunized children. To further
intensify the immunization programme, Intensified
Mission Indradhanush (IMI) was launched on October
8, 2017. Through this programme, Government of
India aims to reach each and every child up to two
years of age and all those pregnant women who have
been left uncovered under the routine immunization
programme/UIP. The special drive will focus on
improving immunization coverage in select districts
and cities to ensure full immunization to more than
90% by December 2018. Through UIP, Government of
India is providing vaccination free of cost against
vaccine preventable diseases include diphtheria,
pertussis, tetanus, polio, measles, severe form of
childhood tuberculosis, hepatitis B, meningitis and
pneumonia (Hemophilus influenza type B infections),
Japanese encephalitis (JE) in JE endemic districts with
introduction of newer vaccines such as rotavirus
vaccine, IPV, adult JE vaccine, Pneumococcal
Conjugate Vaccine (PCV) and Measles-Rubella (MR)
vaccine in UIP/National Immunization Programme.
[3]
To improve immunization coverage, most
interventions that are part of the national
immunization program in India address supply-side
challenges. But, there is growing evidence that
addressing demand-side factors can potentially
contribute to improvement in childhood vaccination
coverage in low- and middle-income countries.
Participatory engagement of communities can
address demand-side barriers while also mobilizing
the community to advocate for better service
delivery. Evidence shows that unvaccinated and
partially vaccinated children are most susceptible to
childhood diseases and disability, and run a three to
six times higher risk of death as compared with fully
immunized children. There are wide variations in the
proportion of unvaccinated and partially vaccinated
children within states and districts. The latest NHM
data shows that 86.9% children are fully immunized
in Gujarat. There is a long list of other challenges to
India's immunization program. These include a
shortage of trained personnel to manage the program
at both the national and state levels; the need to
undertake innovations in vaccines, disease
surveillance, vaccine procurement, and effective
[4]
[5]
vaccine management; the absence of good data on
disease burden to inform vaccination priorities; the
lack of baseline surveillance data for monitoring the
effects of vaccination; and the absence of a system of
routine reporting and surveillance. Challenges to
improving coverage also lay on the demand
side—that is, the degree to which individuals do their
part to be vaccinated. Poor education levels, which
are consistently correlated with the likelihood that
individuals will not complete vaccination schedules,
pose a major barrier to expanding vaccination rates in
rural areas. Adverse events following immunization,
even when these are shown to be unrelated to a
vaccine, have been widely reported in the Indian
news media and have contributed to a culture hostile
to vaccination in certain Indian communities. Better
communication about the benefits of vaccines and the
potential but typically harmless side effects, such as
sore arms and low-grade fevers, could greatly boost
confidence in vaccines and the immunization
program
In view of all this, the present study was carried
out to identify the reasons for non and/or poor
immunization, motivating the beneficiaries for
acceptance of the immunization services by clearing
their myths, sending them mobile reminders for the
IMI session and increasing the participation by the
involving community influencers for improving the
coverage. Also the role of focused micro-planning was
explored for improvement in the coverage levels.
A mixed methods interventional comparative
study with qualitative component was carried out
amongst children below 2 years of age who were in
due list of immunization for IMI session atAMC's
Urban Health Centers (UHC) Isanpur (UHTC of our
institute) and Behrampura UHC (which was
randomly selected out of all UHCs of South Zone of
AMC) during the IMI round of November 2017. All
the children in the due list of visited UHCs were
included except mobile booth children. Study was
carried out from 1 November to 15 November 2017.
One week before IMI round due list of children was
obtained from urban ASHA workers. Additionally, in
our interventional area which was Isanpur UHC
.[6]
st th
Method:

Healthline Journal Volume 9 Issue 2 (July-December 2018)
:: 54 ::
following interventions were carried out:
Personal visit was done by investigator to each of
these families and an attempt was made to
understand the reasons for refusal of
immunization for their children. Families were
cleared about their myths and fears related to
vaccination and were on the spot educated about
benefits of vaccination.
Mobile number of a person from each family was
noted down and they were reminded about
vac c i nat i o n, exa ct p lac e and t i m e o f
immunization session. This was done one day
prior to IMI round.
During house to house visit in intervention area,
we came across four unimmunized children
whose name was not in due list prepared by the
health worker. So we asked ASHA to add them too
in due list and motivated them to attend IMI
session.
Four community leaders were identified and they
were requested to motivate families about
benefits of vaccination. Community leaders
•
•
•
•
personally visited all the houses of children
whose families refused to vaccinate their children
to remind them about visit in IMI session one day
prior to IMI round.
We tried to build positive rapport and trust
between vaccine provider, community leaders
and parents.
Predesigned and pretested proforma was used for
data collection at both UHCs.
Additionally a semi-structured questionnaire for
the personal interview of mother/ father/
grandmother/grandfather of the child in the family
was also prepared for the purpose of qualitative
analysis. During the interview responses given by all
of them were noted down as common attitude of the
whole family towards immunization of children of the
family. At the end of IMI session data was compiled,
analysed & compared. Qualitative analysis of the
reasons for non-immunization which came forward
during the process of intervention was also done.
•
Results:
Name of vaccineSr.No
UHC Isanpur UHC Behrampura
Number of children Number of children
In due list
In due list
Covered during IMI
Covered during IMI
% %
Table 1: Coverage of different vaccines at Isanpur and Behrampura UHCs
1 BCG 10 10 100 5 5 100
2 OPV1 10 10 100 5 5 100
3 Pentavalent1 10 10 100 5 5 100
4 fIPV-1 10 10 100 5 5 100
5 OPV-2 8 8 100 7 4 57
6 Pentavalent2 8 8 100 7 4 57
7 OPV-3 7 9 128 12 8 66
8 Pentavalent3 7 9 128 12 8 66
9 fIPV-2 7 9 128 12 8 66
10 Measels-1 9 11 122 7 4 57
11 DPT-B 1 1 100 16 6 37.5
12 Measels-2 1 1 100 16 6 37.5
13 OPV-B 1 1 100 16 6 37.5
Total 35 39 111 47 27 57

:: 55::
At Isanpur UHC which was our intervention area,
vaccine coverage of BCG, OPV 1, Pentavalent-1and
fIPV-1 was 100% as all 10 children from the due list
were covered during IMI session. At Behrampura UHC
(non- intervention area) vaccine coverage of BCG,
OPV 1, Pentavalent-1 and fIPV-1 was 100% as all 5
children of the due list were covered during session.
At Isanpur UHC vaccine coverage of OPV-2 and
Pentavalent-2 was 100%as all 8 children of due list
were covered during session. At Behrampura UHC,
vaccine coverage of OPV-2 and Pentavalent-2 was 57
% as only 4 children were vaccinated from due list of 7
children.
At Isanpur UHC, vaccine coverage of OPV-3,
Pentavalent-3 and fIPV-2 was 128% as due list had
only 7 children but as mentioned earlier, more eligible
children were enrolled by the investigator during the
survey for the purpose of this study and hence 9 were
covered during session . At Behrampura UHC, vaccine
coverage of OPV-3, Pentavalent-3, fIPV-2 was 66 % as
only 8 children were vaccinated from due list of 12
children. At Isanpur UHC, vaccine coverage of
Measels-1 was 122% as 11 children were covered
against the due list of 9 during session. The reason for
the same is as explained earlier. At Behrampura UHC,
Variable Isanpur UHC Behrampura UHC
Table 2: Age and Experience of ASHA Workers in Isanpur & Behrampura UHCs
Age (Years)
30-34
35-39
40-44
44-49
Experience (in years)
0-2
2-4
4-6
6-8
8-10
No.
0
1
4
1
1
1
2
1
1
No.
3
2
1
0
2
2
2
0
0
Mean Age Mean Age
Mean Experience Mean Experience
42 3.2 years+ 34 4.96 years+
5 2.9 years+ 3 0.89 years+
vaccine coverage of Measels-1 was 57%as from due
list of 7 children only 4 were covered during session.
At Isanpur UHC vaccine coverage of Measels-2, DPT-
B, OPV-B was 100% as there was one child in the due
list and the same was vaccinated during session. At
Behrampura UHC vaccine coverage of Measels-2,
DPT-B, OPV-B was 37.5% as only 6 children were
vaccinated from due list of 16 during session. At
Isanpur UHC total vaccine coverage was 111% as 39
children were vaccinated from due list of 35 children.
More than 100 % of vaccination coverage was
because of interventional methods and additional
registration of eligible children by the investigator
during study. At Behrampura UHC total vaccine
coverage was only 57% as only 27 children were
vaccinated from due list of total 47 children. (Table 1)
There were 6 ASHA workers at each UHC which
was included in the study. Mean age of ASHA in
Isanpur was 42+ 3.2 year and mean age of ASHA in
Behrampura was 34 4.96 years. This difference in
age was statistically highly significant ( t=3.320,
p=0.0077) indicating that ASHA at Behrampura UHC
were younger as compared to Isanpur.
Mean work experience of ASHA in Isanpur was
5 2.9 years whereas it was 3 0.89 years at
+
+ +
Patel & Vyas Innovative Methods to Overcome Barriers...

Healthline Journal Volume 9 Issue 2 (July-December 2018)
:: 56 ::
Behrampura. This difference in experience of ASHA
was statistically not significant (t=1.61, p=0.1374).
(Table 2)
When the coverage as per the experience of ASHA
worker was analyzed for Behrampura UHC, there was
statistically significant difference (p 0.008) with ASHA
having more than 4 years of experience had more
coverage as compared to ASHA having experience of
less than 4 years. At Isanpur UHC, both categories had
coverage more than 100%. (Table 3)
In the intervention area i.e. Isanpur UHC,
during the visit by the investigator qualitative
analysis revealed following reasons for non-
receipt of the vaccines for their children by the
families:
Four families revealed that they were not
contacted by the health worker regarding this
IMI round hence they were not aware about
the same.
In one family the mother and grandmother of
the child were having fear of fever after
vaccination.
In one family fear of occurrence of swelling at
the site of vaccination was the reason for non-
acceptance of vaccine for the child.
In two families belief that child will get scared
or get sick post vaccination was the reason.
In five families mothers were illiterate and had
no knowledge about the vaccination
In two families there was perceived
unaffordability and unawareness about free
•
•
•
•
•
•
Experience of
ASHA (years)
Isanpur UHC
No. of children
As per
due list
<4
4 >
9
26
19
28
11(122%)
28(108%)
8(42%)
19(68%)
As per
due list
Covered Covered
No. of children Z value P value
Behrampura UHC
Table 3 : ASHA's work experience Versus Vaccination coverage
1.7 0.008
vaccination at government health facilities
· In one family there were cultural and
religious beliefs due to which they were
against vaccination of the children
· Three families said that there were rumors
about vaccine contamination with chemical
due to which they were not accepting the
vaccines.
· Some families were ready for acceptance of
oral vaccine but denied for injectable
vaccines.
· In four families they were not getting female
children vaccinated.
· One family refused to vaccinate child who
was born after many miscarriages as that
family believed that vaccination could
negatively affect their child's health.
· Other reasons were lack of vaccine related
education and misplaced immunization
records (Mamta card/ private records). In
majority of the families response was
provided by mother, grandmother and
grandfather. So they become influencers for
the decision making regarding vaccination of
the child in the family. However, all these
issues were addressed during intervention
by the investigators prior to IMI round.
The present Interventional comparative
study with qualitative component was carried
Discussion:

:: 57 ::
out among Children below 2 years of age who
were in due list of immunization for IMI session at
AMC's UHC Isanpur (UHTC of our institute) and
Behrampura UHC.PresentStudy used innovative
methods like personal interaction, one to one
health education, mobile reminders and
reminders by the community influencers of the
areas to overcome barriers in order to improve
immunization coverage in a ward of Ahmedabad
city. In another study by Debjani Berman et al
District Level Household and Facility Survey-3
(DLHS-3) 2007-2008 data was used in exploring
the quality of immunization in terms of month-
specific vaccine coverage and barriers to access in
West Bengal, India. In a study by Ersin Uskun et al
study of effectiveness of an intervention to
increase knowledge of primary healthcare
workers and coverage was done. In
present study one of the intervention method
implemented was mobile reminder to parents of
children. In another two studies, one by Peter G.
Szilagyi et al
ersonal visit done by
investigator to each of these families and
motivation by respective community group
leader and an attempt was made to understand
the reasons for refusal of immunization. In study
by Mira Johri et al personal
Lack of adequate information
from vaccine providers regarding the
status of each child to whom they should
administer the recommended vaccines can
significantly influence vaccination coverage. In
present study above barrier was found as one of
the reason for non-immunization. In another
three studies same reason was found to be a
barrier in low immunization coverage.
[7]
[8]
[12-14]
vaccination
Jasim Uddin
vaccination
et al and another by
effect of Patient Reminder/Recall
Interventions on Immunization Rates was
studied. In present study another intervention
method used was p
home visits
by volunteers and community mobilization
were performed to promote acceptance of
immunization.
[9,10]
[11]
Low immunization rates in India are due to
reasons such as lack of awareness among
parents about the benefits of vaccination, fear of
Adverse Events Following Immunization (AEFI),
cultural diversity (with various religions,
languages, traditions, beliefs and customs)
mothers literacy, gender equity etc. In present
study all these factors like Cultural and Religious
beliefs, gender equity, false rumors about
vaccine contamination with chemical, lack of
vaccine related education, was found as reasons
for refusal of vaccination. In study done by
Devasenapathy N et al all the above factors were
found for low immunization coverage in urban
poor settlements of Delhi.
Experience and well trained health worker
plays important role to deliver immunization
services efficiently. In our present study
experience of workers played a significant role
in immunization coverage. In study done by
Ersin Uskun et all intervention to increase
knowledge about immunization in primary
health workers played a significant role to
increase immunization coverage. In the
present study the local community influencers
were sensitized to give reminders to the families
about IMI round. Similarly in a study by J.P.
Montgomery et al it was concluded that
community leaders can be tremendously useful
to health care providers, especially when it
comes to improving vaccination coverage.
Multicomponent interventions strategies that
use a combination of techniques to improve
immunisation uptake are helpful to increase
immunization coverage. In present study in our
intervention area vaccination coverage was
found to be more than 100% because of multiple
interventions applied. In study by et
al Health education programme including mass
me d i a c a mp a i g n a n d di s t r i b u t i on o f
immunization guidelines and updates ,
reminder cards plus educational posters in
[12]
[8]
[15]
Nia Williams
Patel & Vyas Innovative Methods to Overcome Barriers...

Healthline Journal Volume 9 Issue 2 (July-December 2018)
:: 58 ::
examination rooms reported a statistically
significant difference in immunization rate.
On the demand side of immunization services,
personal visit by health care workers, specific
health educational interventions aimed at
improving vaccination by removing fears and
myths related to vaccination amongst parents
proved to be beneficial. Motivation by community
leader played a crucial role in convincing the
people about the need of immunization for their
children. Reminder by mobile played very
important role to increase the immunization
coverage. Since many complex factors contribute
to low immunisation rates, area specific
combination of interventions will be required to
improve immunisation coverage.
Immunization service delivery is a complex
process that can encounter barriers at many
stages. Further, vaccine preventable diseases are
still endemic or epidemic in India. Underlying
issues need to be identified and addressed in
order to improve vaccination coverage of India's
children. Adoption of specific interventions for
resistant areas has to be done often by involving
local community influencers.
Funding: Nil
Conflict of Interest: Nil
[14]
Conclusion:
Recommendations:
Declaration:
References :
1. Immunization coverage; available at: http://www.who.int/
en/news-room/fact-sheets/detail/immunization-coverage.Last
accessed on: 03/12/2018
2. 2018 Assessment Report of the Global Vaccine Action Plan;
available at: http://www.who.int/immunization/en/ . Last
accessed on: 04/12/2018
3. Mission Indradhanush; available at: https://www.nhp.gov.in/
mission-indradhanush1_pg. Last accessed on: 05/12/2018
4. Pramanik S, Ghosh A, Nanda RB, de Rouw M, Forth P, Albert S.
Impact evaluation of a community engagement intervention in
improving childhood immunization coverage: a cluster
randomized controlled trial in Assam, India. BMC public health.
2018 Dec;18(1):534.
5. Annual report for immunization; available at: http://nhm.gov.in
/ n r h m - c o m p o n e n t s / r m n c h - a / i m m u n i z a t i o n /
immunization.html. Last accessed on: 05/12/2018
6. Laxminarayan R, Ganguly NK. India's vaccine deficit: why more
than half of Indian children are not fully immunized, and what
can—and should—be done. Health Affairs. 2011 Jun
1;30(6):1096-103.
7. Barman D, Dutta A. Access and barriers to immunization in West
Bengal, India: quality matters. Journal of health, population, and
nutrition. 2013 Dec;31(4):510.
8. Uskun E, Uskun SB, Uysalgenc M, Yag z M. Effectiveness of a
training intervention on immunization to increase knowledge of
primary healthcare workers and vaccination coverage rates.
Public Health. 2008 Sep 1;122(9):949-58.
9. Szilagyi PG, Bordley C, Vann JC, Chelminski A, Kraus RM, Margolis
PA, Rodewald LE. Effect of patient reminder/recall interventions
on immunization rates: a review. Jama. 2000 Oct
11;284(14):1820-7.
10. Uddin MJ, Shamsuzzaman M, Horng L, Labrique A, Vasudevan L,
Zeller K, Chowdhury M, Larson CP, Bishai D, Alam N. Use of mobile
phones for improving vaccination coverage among children
living in rural hard-to-reach areas and urban streets of
Bangladesh. Vaccine. 2016 Jan 4;34(2):276-83.
11. Johri M, Chandra D, Koné GK, Dudeja S, Sylvestre MP, Sharma JK,
Pahwa S. Interventions to increase immunisation coverage
among children 12–23 months of age in India through
participatory learning and community engagement: pilot study
for a cluster randomised trial. BMJ open. 2015 Sep
1;5(9):e007972.
12. Devasenapathy N, Jerath SG, Sharma S, Allen E, Shankar AH,
Zodpey S. Determinants of childhood immunisation coverage in
urban poor settlements of Delhi, India: a cross-sectional study.
BMJ open. 2016 Aug 1;6(8):e013015.
13. Esposito S, Principi N, Cornaglia G, ESCMID Vaccine Study Group
(EVASG). Barriers to the vaccination of children and adolescents
and possible solutions.Clinical Microbiology and Infection. 2014
May;20:25-31.
14. Williams N, Woodward H, Majeed A, Saxena S. Primary care
strategies to improve childhood immunisation uptake in
developed countries: systematic review. JRSM short reports.
2011 Oct;2(10):1-21.
15. Montgomery JP, Ganguly P, Carlson BF, Shrivastwa N, Boulton ML.
An evaluation of immunization services, using the reaching every
district criteria, in two districts of Gujarat, India. Global health
research and policy. 2018 Dec;3(1):5.
ı
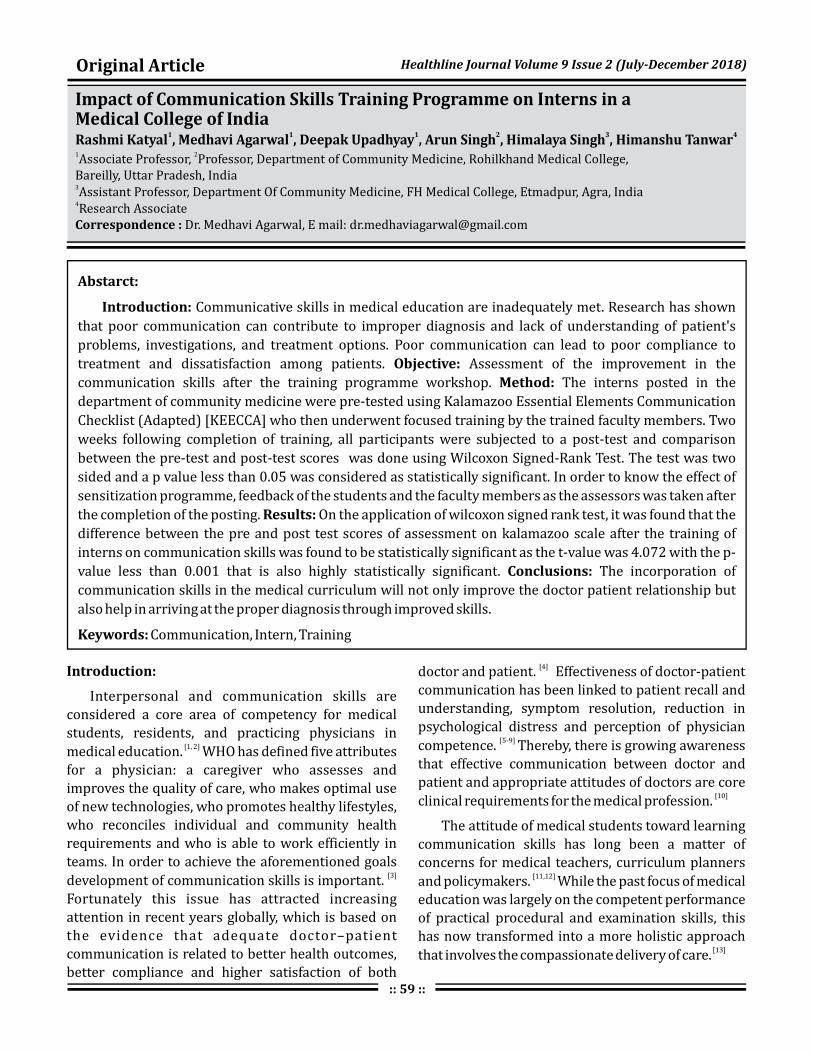
Impact of Communication Skills Training Programme on Interns in a Medical College of IndiaRashmi Katyal , Medhavi Agarwal , Deepak Upadhyay , Arun Singh , Himalaya Singh , Himanshu Tanwar
1 1 1 2 3 4
1 2
3
4
Associate Professor, Professor, Department of Community Medicine, Rohilkhand Medical College, Bareilly, Uttar Pradesh, India
Assistant Professor, Department Of Community Medicine, FH Medical College, Etmadpur, Agra, India
Research Associate Dr. Medhavi Agarwal, E mail: [email protected] :
Original Article Healthline Journal Volume 9 Issue 2 (July-December 2018)
:: 59 ::
Abstarct:
Introduction:
Objective:
Method:
Results:
Conclusions:
Keywords:
Communicative skills in medical education are inadequately met. Research has shown
that poor communication can contribute to improper diagnosis and lack of understanding of patient's
problems, investigations, and treatment options. Poor communication can lead to poor compliance to
treatment and dissatisfaction among patients. Assessment of the improvement in the
communication skills after the training programme workshop. The interns posted in the
department of community medicine were pre-tested using Kalamazoo Essential Elements Communication
Checklist (Adapted) [KEECCA] who then underwent focused training by the trained faculty members. Two
weeks following completion of training, all participants were subjected to a post-test and comparison
between the pre-test and post-test scores was done using Wilcoxon Signed-Rank Test. The test was two
sided and a p value less than 0.05 was considered as statistically significant. In order to know the effect of
sensitization programme, feedback of the students and the faculty members as the assessors was taken after
the completion of the posting. On the application of wilcoxon signed rank test, it was found that the
difference between the pre and post test scores of assessment on kalamazoo scale after the training of
interns on communication skills was found to be statistically significant as the t-value was 4.072 with the p-
value less than 0.001 that is also highly statistically significant. The incorporation of
communication skills in the medical curriculum will not only improve the doctor patient relationship but
also help in arriving at the proper diagnosis through improved skills.
Communication, Intern, Training
Introduction:
Interpersonal and communication skills are considered a core area of competency for medical
students, residents, and practicing physicians in
medical education. WHO has defined five attributes for a physician: a caregiver who assesses and improves the quality of care, who makes optimal use
of new technologies, who promotes healthy lifestyles, who reconciles individual and community health requirements and who is able to work efficiently in teams. In order to achieve the aforementioned goals
development of communication skills is important.
Fortunately this issue has attracted increasing attention in recent years globally, which is based on the evidence that adequate doctor–patient communication is related to better health outcomes,
better compliance and higher satisfaction of both
[1, 2]
[3]
doctor and patient. Effectiveness of doctor-patient communication has been linked to patient recall and
understanding, symptom resolution, reduction in psychological distress and perception of physician
competence. Thereby, there is growing awareness that effective communication between doctor and patient and appropriate attitudes of doctors are core
clinical requirements for the medical profession.
The attitude of medical students toward learning
communication skills has long been a matter of concerns for medical teachers, curriculum planners
and policymakers. While the past focus of medical education was largely on the competent performance
of practical procedural and examination skills, this has now transformed into a more holistic approach
that involves the compassionate delivery of care.
[4]
[5-9]
[10]
[11,12]
[13]

Katyal et al Impact of Communication Skills Training Programme...
:: 60 ::
Objective:
Method:
Assess the improvement in interpersonal skills and skills pertaining to (history taking, listening, explaining the illness, explain dosage and duration of treatment, advice on prevention of similar illnesses in future) after the communication skills training programme.
The permission of the institutional ethical committee was taken before conducting the study. Written permission through e-mail was taken for the use of Kalamazoo Essential Elements Communication Checklist (Adapted) ;[The KCS-Adapted instrument was minimally modified at Harvard Medical School by Rider and colleagues2 using global ratings on a Likert scale (1 = poor to 5 = excellent) for the 7 KCS competencies.] The informed consent of interns [
,who participated in the study was also obtained. The study duration was for one year including data collection for 3 months. The study subjects were the interns posted in the department of community medicine in Rohilkhand Medical College and Hospital [Bareilly, Uttar Pradesh] in this duration of data collection.
Faculty members who underwent basic training in communication skills as a part of basic course workshop and ATCOM [Attitude and Communication (AT-COM)] sensitization in medical education technologies were sensitized and oriented for the workshop for training the interns using the validated MCI module on ATCOM sensitization. The same faculty members being a part of the medical education unit who participated in the training of the interns assessed individually all interns on patients and their average was taken to avoid bias.
T h e K a l a m a z o o E s s e n t i a l E l e m e n t s Communication Checklist (Adapted) was used to identify the 10 skills for assessment.
First of all, the pilot testing was done to know the feasibility of the study. After the pre-test, all interns underwent focused training by the trained faculty members comprising of multiple sessions in a day. Two weeks following completion of training, all
Medical intern is a term used in some countries to describe a physician in training who has completed medical school and has a medical degree, but does not yet have a full license to practice medicine unsupervised ]
participants were subjected to a post-test to avoid bias introduced due to immediate post-test.
On application of wilcoxon signed rank test, it was found that the difference between the pre and post test scores of kalamazoo scale after the training of the interns on communication skills through the workshop was found to be statistically significant as the t-value was 4.072 with the p-value less than 0.001 which is highly statistically significant.
On comparing individually the questions asked in the kalamazoo scale as a pre and post test, it was found that building the relationship (t-value-3.691), opening the discussion (t-value-3.510), gathering the information (t-value-2.952), understanding the patient's perspective (t-value-3.450), sharing information (t-value-4.155), reaching agreement (t-value-3.400) and providing closure (t-value-4.114) were all found to be statistically significant (P-value
<0.05) (Table 1and Figure 1)
In the indexed study, it was evident that there was a significant improvement in the scores of post test after the training of interns on communication skills through the workshop as compared to the pre-test scores. It was found that the difference between the pre and post test scores of kalamazoo scale was found to be statistically significant on application of wilcoxon signed rank test [ t-value 4.072 ; p-value less than 0.001; highly statistically significant.
Similarly, Barbara L. Joyce found significant improvement in their study when rated by the faculty, self rating and that done by the simulated patients where it was found that Residents' cumulative self ratings on the KEECCA [Kalamazoo Essential Elements Communication Checklist (Adapted) ] ranged from 14 to 35 with a mean (SD) of 26.87 (5.01) where most (79.8%) residents rated their communication skills as “good” or better; Faculty ratings ranged from 13 to 35 with a mean of 25.25 (5.08) where a majority of faculty (79.9%) rated residents' skills as “good” or higher, and 27.9% of faculty provided “very good” or “excellent” ratings while cumulative ratings ranged from 13 to 35 with a mean of 21.72 (4.53); a smaller proportion of (54.1%) rated residents as “good” or better, and only 15.6% provided ratings of “very good” or “excellent.”
Results:
Discussion:
[1,2].
[1]
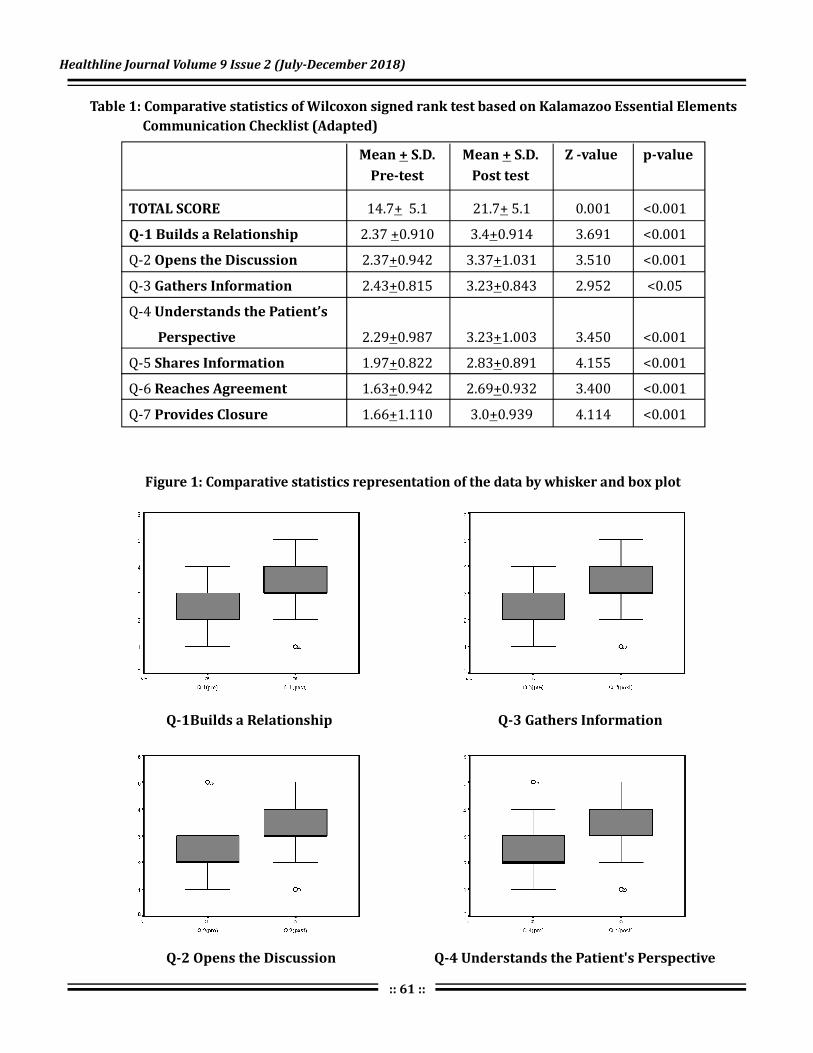
Healthline Journal Volume 9 Issue 2 (July-December 2018)
:: 61 ::
Figure 1: Comparative statistics representation of the data by whisker and box plot
Table 1: Comparative statistics of Wilcoxon signed rank test based on Kalamazoo Essential Elements
Communication Checklist (Adapted)
Mean S.D.
Pre-test
+ Mean S.D.
Post test
+ Z -value p-value
TOTAL SCORE
Q-1 Builds a Relationship
Opens the Discussion
Gathers Information
Understands the Patient’s
Perspective
Shares Information
Reaches Agreement
Provides Closure
14.7 5.1 21.7 5.1 0.001 <0.001
2.37 0.910 3.4 0.914 3.691 <0.001
Q-2 2.37 0.942 3.37 1.031 3.510 <0.001
Q-3 2.43 0.815 3.23 0.843 2.952 <0.05
Q-4
2.29 0.987 3.23 1.003 3.450 <0.001
Q-5 1.97 0.822 2.83 0.891 4.155 <0.001
Q-6 1.63 0.942 2.69 0.932 3.400 <0.001
Q-7 1.66 1.110 3.0 0.939 4.114 <0.001
+ +
+ +
+ +
+ +
+ +
+ +
+ +
+ +
Q-1Builds a Relationship Q-3 Gathers Information
Q-2 Opens the Discussion Q-4 Understands the Patient's Perspective

:: 62 ::
Q-5 Shares Information
Q-6 Reaches Agreement
Q-6 Reaches Agreement
Similar results were found in the study conducted by
Nayyar Iqbal where ninety-six per cent of participants (50 out of 52) showed improvement in their performance after the focused training though the assessment done using Calgary cambridge scale [Communication skills assessment scale]. The mean marks of the pre-test and post-test were 10.77± 3 and 18.04±2, respectively, out of a maximum mark of 20 ( <0.05).
The research work enlightens the medical educators that introduction of communication skills programme of the interns showed improvement in their communication skills leading to a step towards
[2]
p
Conclusions:
the accomplishment of the goal of a competent Indian Medical Graduates. Therefore, it is strongly recommended that this kind of training progranmme should be incorporated in the curriculum, not only as a part of the internship training programme but also as a part of the undergraduate training in medical institutions.
I owe my research work to the almighty that motivated this impossible to do innovative intervention extended to not only the interns but also the medical undergraduates as well as postgraduates with the immense co-operation of our Dean, the FAIMER faculty, FAIMER fellows and my colleagues.
Funding: Nil
Conflict of Interest: Nil
Acknowledgement:
Declaration:
References :1. Horowitz SD. Evaluation of clinical competencies: basic
certification, subspecialty certification, and recertification. Am J Phys Med Rehabil 2000;79(5):478-80.
2. Makoul G. MSJAMA. Communication skills education in medical school and beyond. JAMA 2003;289(1):93.
3. Deveugele M, Derese A, De Maesschalck S, Willems S, Van Driel M, De Maeseneer J. Teaching communication skills to medical students, a challenge in the curriculum? Patient Educ Couns 2005;58(3):265-70.
4. Stewart M, Brown JB, Boon H, Galajda J, Meredith L, Sangster M.
Evidence on patient-doctor communication. Cancer Prev Control 1999;3(1):25-30.
5. Kaplan SH, Greenfield S, Ware JE. Impact of the doctorpatient relationship on the outcomes of chronic disease. In: Stewart M, Roter D, editor. Communicating with Medical Patients.Newbury Park, CA . 2005 Oct 1; 55(519): 793–801.
6. RuizMoral R, Pérez Rodríguez E, Pérula de Torres LA, de la Torre J. Physicianpatient communication: a study on the observed behaviours of specialty physicians and the ways their patients perceive them. Patient Educ Couns. 2006;64:242–248.
7. Ward MM, Sundaramurthy S, Lotstein D, Bush TM, Neuwelt CM, Street RL., Jr Participatory patient physician communication and morbidity in patients with systemic lupus erythematosus. Arthritis Rheum. 2003;49:810–818.
8. Windish DM, Price EG, Clever SL, Magaziner JL, Thomas PA. Teaching medical students the important connection between communication and clinical reasoning. J Gen Intern Med. 2005;20:1108–1113.
9. Stewart MA. Effective physician-patient communication and health outcomes: a review. CMAJ 1995;152(9):1423- 33.
10. Laine C, Davidoff F. Patient-centered medicine. A professional evolution. JAMA 1996;275(2):152-6.
11. Meryn S. Improving doctor-patient communication. Not an option, but a necessity. BMJ 1998;316(7149):1922.
12. Jones R, Higgs R, de Angelis C, Prideaux D. Changing face of medical
curricula. Lancet 2001;357(9257):699-703.13. Epstein RM, Hundert EM. Defining and assessing professional
competence. JAMA. 2002;287(2):226-35.
Br J Gen Pract
Katyal et al Impact of Communication Skills Training Programme...

Profile of Patients of Ocular Trauma Visiting Municipal Eye Hospital Ahmedabad in the Months of August and September 2016Bhavesh Prajapati , Aparajita Shukla1 2
1 2Resident, Professor and Head, Community Medicine Department, Smt. NHL Municipal Medical College,
Ahmedabad, Gujarat, India
Dr. Bhavesh Prajapati, E mail: [email protected] :
Original Article Healthline Journal Volume 9 Issue 2 (July-December 2018)
:: 63 ::
Abstarct:
Introduction:
Objectives:
Method:
Results:
Conclusion:
Key words:
Globally, more than 55 million eye injuries occur per year, while there are approximately
1.6 million people with blindness from ocular trauma. The prevalence of ocular trauma in India was reported
as 2.4%. Measures to create awareness about ocular trauma and preventive measures would result in a great
decrease in ocular morbidity and mortality due to trauma. To assess the proportion of different
types of ocular injuries among the patients. To correlate the different causative factors and conditions
leading to Ocular Trauma. To make recommendations for public health and clinical strategies for the
prevention, management, and research of ocular trauma in the future. The study design was cross-
sectional, done in Municipal Eye Hospital Ahmedabad with help of semi-structured pilot tested
questionnaire from August 2016 to September 2016. The type of sampling is non-random with sample size
of 141. Out of 141 cases, maximum injuries were observed in male patients and in the 15-29 years
age group (34%). Extra ocular foreign body injury (max. in 15-29 age groups) was seen maximum followed
by blunt trauma (max. in children). Patients with extra ocular foreign body injuries reported the earliest.
Only 15% of patient reported with complication (max. in Open Globe injuries). Vision was affected in 9.9%
patients with maximum in wooden stick injuries and 19% eyes required surgical intervention.
Eye should be protected while driving to prevent exposure of foreign body. Patients who reported within 24
hours had the least complications. So, Awareness should be created by the authorities through mass media
regarding ocular trauma and benefits of early reporting.
Blunt Trauma,Extra ocular foreign body, Open Globe injuries
Introduction:
Ocular trauma is one of the leading causes of
preventable blindness in world today, 90% of all eye
injuries are preventable. Globally, more than 55
million eye injuries occur per year, while there are
approximately 1.6 million people with blindness from
ocular trauma, 2.3 million people who are bilaterally
visually impaired, and 19 million people with
unilateral blindness or visual loss. The incidence of
ocular trauma may be higher in developing countries.
The prevalence of ocular trauma in India was reported
as 2.4%. Ocular trauma is a major cause of
preventable monocular blindness and visual
impairment in the world. Decrease or loss of vision,
either monocular or binocular, may result in
significant economic burdens to families and
countries due to time lost from work, or school, and
[1,2]
[3]
[4]
[5]
family care giving, expensive hospitalization, special
visit and treatment, prolonged follow-up, and visual
rehabilitation. Prevention is always better than cure:
measures to create awareness about ocular trauma
and preventive measures would result in a great
decrease in ocular morbidity and mortality due to
trauma. Early detection and management hold the
key to trauma management and prevention of
further complications. In this study we have profiled
ocular trauma that were reported to Municipal
Corporation run tertiary care Eye Hospital, its
clinical presentation, cause and nature of trauma, the
extent of damage and the loss of vision associated
with it, along with other parameters.
1. To assess the proportion of different types of
ocular injuries among the patients
Objectives:

Prajapati & Shukla Profile of Patients of Ocular Trauma...
:: 64 ::
2. To correlate the different causative factors and
conditions leading to Ocular Trauma
3. To make recommendations for public health and
cl inical strategies for the prevention,
management, and research of ocular trauma in
the future.
It was a cross-sectional study carried out in
Municipal Eye Hospital of Ahmedabad with help of
Self-structured Pilot tested Questionnaire. The time
period of the study was from 1 August 2016 to 30
September 2016. A total of 141 patients were selected
for the purpose of study.
Inclusion criteria: All cases of ocular trauma reported
during the study period were included in the study.
Exclusion criteria: Those who did not give consent
were excluded from the study.
Ethical considerations: Permission was obtained
from the head of institution, heads of ophthalmology
and community medicine and the Superintendent of
Municipal eye hospital. Verbal consent of study
population was obtained and they were ensured of
confidentiality and were explained about the purpose
of study.
Data collection and analysis: Demographic data
and a detailed history of each subject were taken. The
clinical data of affected eye, ophthalmologic status
post injury, causes and types of ocular trauma, time
interval from injury to presentation, duration of
hospitalization, and follow-up were collected from the
clinical records. It was analyzed using appropriate
statistical parameter. Associations between variables
were checked by Chi-Square test and significance was
considered when p<0.05. The patient's records were
kept confidential. Operational definitions were
according to World Health Organization (WHO) and
Birmingham Eye Trauma Terminology System
(BETTS).
Mean age was 28.96 ± 16.4 years.The largest age
group was 15–29 years followed by 30–44 years,
presenting two peaks of the age distribution and
accounting for 34% and 27%, respectively.(Graph 1)
Method:
Results:
st th
[6]
Graph 1: Age Distribution of patients [n = 141]
Graph 2: Type of injuries [n = 141]
Males had a higher rate than females (74.5%
versus 25.5%), with a male-to-female ratio of 3:1.
Extra ocular foreign body Injury (40.4%) was seen
maximum followed by Blunt Trauma (39.7%).
(Graph 2)
Extra ocular foreign body injuries were
significantly higher in 15-29 year age groups
andBlunt trauma was significantly higher in 0-14 year
age group. (P value = 0.01).(Table 1)
O n ly 1 5% o f p a t i en t s re p o r t ed w i t h
complications and it was significantly higher in Open
Globe injuries.(P value = 0.001). (Table 2)
There was a wide variety of injury causes that
resulted in ocular trauma. Most of the injuries were
caused by foreign body (36, 25.5%). (Table 3)
Foreign body was the main cause in all age groups
except for patients aged 0 to 14 years old, for whom
the main causes were injury by wooden stick.
(Table 4)
Of the patients, 82.6% presented within 24 hours
after eye injuries. A further 13.9% presented between

Healthline Journal Volume 9 Issue 2 (July-December 2018)
:: 65 ::
Table 1: Age v/s type of injury [n=141]
Type of Injury
Extra ocular
FB
No. % No. % No. %
0-14 3 5.3 19 33.9 4 25 1 20 1 14.3
15-29 24 42.1 13 23.2 4 25 1 20 6 85.7
30-44 17 29.8 13 23.2 5 31.3 3 60 0 0
45-59 12 21.0 5 8.9 2 12.5 0 0 0 0
60 1 1.8 6 10.8 1 6.2 0 0 0 0
Total 57 100 56 100 16 100 5 100 7 100
No. % No. %
>
Age
Blunt
Trauma
Open Globe Thermal Chemical
Table 2: Complication v/s type of injury [n=141]
Table 3: Cause of injury [n=141]
Complication
Frequency PercentType of Injury
Extra ocular FB 0 0
Blunt Trauma 6 28.57
Open Globe 14 66.67
Thermal 1 4.76
Chemical 0 0
Total 21 100
Frequency PercentCause of injury
Extra ocular FB 0 0
Blunt Trauma 6 28.57
Open Globe 14 66.67
Thermal 1 4.76
Chemical 0 0
Total 21 100
(in Completed Yrs)

:: 66 ::
Table 4: Age v/s Cause of Injury [n=141]
Cause of Injury
Ball Dust FB Finger Iron Wooden Stick Other
0-14 2 20 1 16.7 1 2.8 3 33.3 1 5.3 7 50 13 27.6
15-29 4 40 3 33.4 19 47.2 2 22.3 7 26.3 2 14.3 17 34
30-44 2 20 1 33.4 10 30.6 2 11.1 8 47.4 3 21.4 9 21.4
45-59 2 10 1 16.7 6 19.4 1 22.2 3 21 0 0 6 8.5
60 0 10 0 0 0 0 1 11.1 0 0 2 14.3 2 8.5
Total 10 100 6 100 36 100 9 100 19 100 14 100 47 100
>
Age
No. No. No. No. No. No. No.% % % % % % %
Table 5: Time elapsed since injury [n=141]
Time elapsed since injury
< 24 hours
No. % No. % No. % No. %
Extra ocular FB 42 44.2 12 75 1 25 55 47.8
Blunt Trauma 41 43.1 3 18.8 2 50 46 40.0
Open Globe 2 2.1 0 0 1 25 3 2.6
Thermal 3 3.2 1 6.2 0 0 4 3.5
Chemical 7 7.4 0 0 0 0 7 6.1
Total 95 100 16 100 4 100 115 100
Type of injury24 - 48 hours >48 hours
Total
one and two days from the occurrence of the injury.
Only 3.5% presented more than 2 days after sustaining
the eye injuries. Out of all the cases, patients with extra
ocular foreign body injuries reported the earliest. (P
value = 0.001) (Table 5)
Out of all the cases, 57 (40.4%) patients had
injuries in their left eyes whereas 79 (56.1 %) had
injuries in their right eyes. Both eyes were involved in 5
(3.5%) patients. In terms of management, 71% eyes
were medically treated, and the rest 19% eyes
required surgical intervention. Out of those surgically
treated patients, maximumsurgeries were required in
open globe injury. All the cases of extra ocular foreign
body are treated medicallyfollowed by blunt
trauma.Ocular wall repair (13 %), lensectomy, or
phacoemulsification (34.8 %) was the most common
surgical procedures and Posterior vitrectomy was
required for 21.7 % eyes. Removal of foreign body
was performed in 14 (9.9 %) eyes and saline wash
was given to 16 (11.34 %) eyes. Out of the 141 cases,
60 (42.6%) cases had visual outcome of 6/6 – 6/9,
but 14 (9.9%) patients were documented to have a
blinding outcome i.e., visual acuity of <6/60.
In our study, males had a higher rate than
females. Other studies also reported a higher rate in
males. This might be due to different
occupational exposure between different genders.
Most females are housewives and engaged in
occupations with low risk; however, males are prone
Discussion :
[7–11]
Prajapati & Shukla Profile of Patients of Ocular Trauma...
(in Completed Yrs)

Healthline Journal Volume 9 Issue 2 (July-December 2018)
:: 67 ::
to do rough work and more likely to take part in
dangerous sports and activities.
Mean age was 28.96 ± 16.4 years (1-74 years). Most
of the eye injuries were found in young-aged groups
(15–29 years) followed by middle-aged groups (30–44
years) which is coincident with other studies. This
may be explained by the fact that the working
population is of high risk and accounts for the largest
portion of ocular trauma. People between the age of 30
to 44 years old and 15 to 29 years old are exactly the
major labors and play major roles in supporting
families, resulting in a significantly larger portion than
others.
After injuries, over four-fifths of patients (82.6%)
presented on the same day as sustaining their injuries,
and 3.5% patients still had a delay of 3 days before
clinical review. In the JUDO study 31.6 % patients
presented within 48 hours whereas 28.6% arrived one
week or later. Cao et al. thought that delayed
presentation was a matter of concern about final VAs.
This suggests that the public's awareness of seeking
medical care in timely manners should be improved.
Our study showed a significant association between
duration of presentation and presence of complication
at presentation which may affect the final visual
outcome.
In our study, Extra ocular foreign body injuries
(40.4%) were the most common type of ocular trauma,
and metallic objects, widely used in workplaces,
remained the leading (25.5%) agents that cause eye
injuries, which were consistent with other studies.
The main contributing factor for the higher proportion
of work-related injury is the local work tasks, which
commonly involve high-powered tools that generate
metal fragments at high velocities. However, another
important factor is disregarding the safety of workers.
Of the documented ones, in the JUDO study, wood is
the commonest material accounting 40.9% followed
by metal 18.1% and stone 13.3%. Regarding the
material of injury the commonest material accounting
for trauma was metal in 13.5 % patients, followed by
wood, in our study.
With regard to surgical procedures, of the 141
[12,13]
[14] [15]
[15,16]
[14]
injured eyes, 13 % had ocular wall repairs, 34.8 %
had lensectomy or phacoemulsification, and 11.34%
had anterior chamber washouts, which suggest that
injury is preferred in the anterior segment of the
globes than the posterior segment, highlighting the
significance of the anterior segment. This suggests
that wearing eye-protection devices should be
introduced, because such anterior segment injuries
would have been easily blocked by eye-protection
devices.
Out of the 141 cases, 60(42.6%) cases had visual
outcome of 6/6 – 6/9, but 14(9.9%) patients were
documented to have a blinding outcome i.e., visual
acuity of <6/60. Study of JUDO showed 21.1% of the
ocular injuries were documented to have a blinding
outcome i.e., visual acuity < 6/60.
There were some limitations in our study,
comprehensive information about medical records
was not sufficient enough to display and information
provided by the patients may not be completely
accurate.However, with these limitations, our data
still provided useful information concerning the
clinical characteristics of ocular trauma.
In conclusion, susceptible population of eye
injuries were middle and young-aged groups, and
the proportion of males was higher.Delay in
presentation, has a significant association with
presence of complications which may have a
detrimental visual outcome.
Thus it is recommended preventive measures
advocated by health workers to emphasize the
importance of early health seeking behaviour and
follow up of patients with ocular trauma. Efforts
should be invested in education for eye protection in
order to prevent ocular trauma in the young and
middle-aged working groups. Simple safety
procedures like wearing goggles in driving,
protective goggles in welding, supervising children
while playing, etc. should be advocated using mass
media. A standardized reporting system, as exists in
other countries, is recommended and would help to
[17]
[14]
Conclusion :
Recommendations :

:: 68 ::
evaluate changes in the epidemiology of eye injuries
over time and provide population-based longitudinal
data for preventive strategies.
Funding: Nil
Conflict of Interest: Nil
Declaration:
References :
1. Pizzarello LD. Ocular trauma: time for action. Ophthalmic
Epidemiol.1998; 5:115-116.
2. Keeney A.H. − Prevention of Eye Injuries. In: Freeman H.M., Ocular
Trauma. Appleton-Century-Crofts, New York, 1979; 377-383
3. A. D. Negrel and B. Thylefors, “The global impact of eye injuries,”
Ophthalmic Epidemiology, vol. 5, no. 3, pp. 143–169, 1998.
4. Katz J, Tielsch JM. Lifetime prevalence of ocular injuries from the
Baltimore eye survey.ArchOphthalmol 1993;111:1564-8.
5. Schein OD, Hibberd P, Shingleton BJ, Kunzweiler T, Frambach DA,
Seddon JM, et al. The spectrum and burden of ocular injury.
Ophthalmology 1988;95:300–5. [PubMed: 3173996]
6. F. Kuhn, V. Mester, A. Berta, and R. Morris, “Epidemiology of severe
eye injuries. United States Eye Injury Registry (USEIR) and
Hungarian Eye Injury Registry (HEIR),” Der Ophthalmologe,
7. C. A. McCarty, C. L. H. Fu, and H. R. Taylor, “Epidemiology of ocular
trauma in Australia,” Ophthalmology, vol. 106, no. 9, pp.
1847–1852, 1999.
8. S. Cillino, A. Casuccio, F. Di Pace, F. Pillitteri, and G. Cillino, “A five-
year retrospective study of the epidemiological characteristics and
visual outcomes of patients hospitalized for ocular trauma in a
Mediterranean area,” BMC Ophthalmology, vol. 8, no. 1, 6 pages,
2008.
9. M. M. Soliman and T. A. Macky, “Pattern of ocular trauma in Egypt,”
Graefe's Archive for Clinical and Experimental Ophthalmology, vol.
246, no. 2, pp. 205–212, 2008.
10. A. Korra, K. el-Kashlan, and A. Kassem, “The pattern of hospitalized
ocular injuries in Alexandria University Hospital,” Bulletin of the
Ophthalmological Society of Egypt, vol. 65, no. 69, pp. 269–281,
1972.
11. D. S. Morris, S. Willis, D. Minassian, B. Foot, P. Desai, and C. J.
MacEwen, “The incidence of serious eye injury in Scotland: a
prospective study,” Eye (London, England), vol. 28, no. 1, pp. 34–40,
2014.
12. P. Desai, C. J. MacEwen, P. Baines, and D. C. Minassian,
“Epidemiology and implications of ocular trauma admitted to
hospital in Scotland,” Journal of Epidemiology and Community
Health, vol. 50, no. 4, pp. 436–441, 1996.
13. R. J. Glynn, J. M. Seddon, and B. M. Berlin, “The incidence of eye
injuries in New England adults,” Archives of Ophthalmology, vol.
106, no. 6, pp. 785–789, 1988.
14. Asaminew T, Gelaw Y, Alemseged F. A 2-year review of ocular
trauma in JIMMA University Specialized Hospital Ethiop J Health
Sciences 2009; 19:67-76
15. H. Cao, L. Li, and M. Zhang, “Epidemiology of patients
hospitalized for ocular trauma in the Chaoshan region of China,
2001-2010,” PloS One, vol. 7, no. 10, article e48377, 2012
16. M. Soylu, S. Sizmaz, and S. Cayli, “Eye injury (ocular trauma) in
southern Turkey: epidemiology, ocular survival, and visual
outcome,” International Ophthalmology, vol. 30, no. 2, pp.
143–148, 2010.
17. L. P. Fong and Y. Taouk, “The role of eye protection in work related
eye injuries,” Australian and New Zealand Journal of
Ophthalmology, vol. 23, no. 2, pp. 101–106, 1995.
Prajapati & Shukla Profile of Patients of Ocular Trauma...

Patient Satisfaction Survey: To Improve Quality of Care at Tertiary Care Center, South GujaratNaresh Chauhan , Hiteshree Patel , Harsad Patel , J. K. Kosambiya1 2 3 4
1 2 3 4Assistant Professor, Tutor, Associate Professor, Professor and Head, PSM Department,
Government Medical College, Surat, Gujarat, India
Dr. Hiteshree Patel, E mail: [email protected] :
Original Article Healthline Journal Volume 9 Issue 2 (July-December 2018)
:: 69 ::
Abstarct:
Introduction:
Aims and Objectives
Method:
Results:
Conclusion
Keywords:
Mismatch between patient expectation and the service received is related to decreased
satisfaction. : To measure level of satisfaction and identify the obstacles in availing
services among the patient at Tertiary Care Center, South Gujarat. It was a cross sectional study,
included 800 respondents, 400 each from indoor and outdoor facilities. Respondents from all the
department have been taken by proportion to their OPD and IPD load (PPS) after informing and taking their
consent. Data has been collected by using android smart phones. General perception of the clients
for the OPD services were 60% believed that the time to get services is appropriate, 98% respondents
satisfied with staff behavior, 60% satisfied with the cleanliness OPD at the same time few dissatisfied with
public utilities (16%), 70% patient satisfied with available water and other amenities in, around the hospital
and 77% felt that the space in OPDs was crowded. All the patient whom examination required reported that
the privacy has been maintain. As many as 92% wish to return every time for the treatment from our hospital.
General perception regarding the IPD services shows that more than 95% patients were satisfied with
various services like quality of medical care, nursing care, diagnostic and referral service, admission process,
discharge process and physician services. As far as the staying is concerned at people ranked lowest to the
availability of drinking water and cleanliness of toilet and bathroom. : The findings of the present
study can be utilized to improve the services.
Patient satisfaction, Public health facilities, Quality of care
Introduction:
Satisfaction can defined as the extent of an
individual's experience compared with his or
herexpectations. Patients' satisfaction is related to the
extent to which general health care needs
andcondition specific needs are met. Evaluating to
what extent patients are satisfied with healthservices
is clinically relevant, as satisfied patients are more
likely to comply with treatment, takean active role in
their own care, to continue using medical care
services and stay within a healthprovider and
maintain with a specific system. In addition, health
professionals may benefit fromsatisfaction surveys
that identify potential areas for serviceimprovement
and health expenditure may be optimised through
patient-guided planning andevaluation. Mismatch
between patient expectation and the service received
is related todecreased satisfaction. Therefore,
[1]
assessing patient perspectives gives them a voice,
which canmake public health services more
responsive to people's needs and expectations. .
PublicHospitals need more Patient Satisfaction
Surveys at regular intervals, as the PSS subjective
data supported with other objective data like hospital
indicators would further help in improving quality of
services in Public hospitals. Patient satisfaction
depends up on many factors such as: Quality of
clinical services provided, availability of medicine,
behaviour of doctors and other health staff, cost of
services, hospital infrastructure, physical comfort,
emotional support, and respect for patient
preferences.
This institute is one of the well-known
multispecialty tertiary care Hospitals in South
Gujarat since 1964. Backed with a vision to offer the
best in pat ient care and equipped with
[2]
[3]
[4]

Chauhan et al Patient Satisfaction Survey...
:: 70 ::
technologically advanced healthcare facilities, it is one
of the upcoming names in the healthcare industry. A
team of well-trained medical staff, non-medical staff
and experienced clinical technicians work round-the-
clock to offer various services that include X-ray
,Sonography , Blood Bank , Eye Bank , Ambulance
Service , Fax Facility . A team of doctors on board,
including specialists are equipped with the knowledge
and expertise for handling various types of medical
cases. Every day around 2500 OPD and 1200 IPD
weekly patients receive medical care from the hospital.
This study attempts to highlight patient satisfaction
after their interaction with the system in different
phase of services such as approach to the hospital,
doctor, examination by doctor, information given about
disease & medications, availability of services, waiting
time, accommodation facilities and cost provided for
services. The purpose of present study was to carry out
evaluation of hospital services by getting feedback from
outdoor and indoor patients attending New Civil
Hospital, Surat.
1. To measure level of satisfaction among the patient
attending Tertiary Care Center, South Gujarat.
2. To identify the obstacles in availing services.
: Tertiary Care Center, South Gujarat.
: Cross- sectional observational study
: Total 402 OPD patients and 397 Indoor
patients were included in this study. (Considering 50%
patients dissatisfy with the services). To calculate
sample size from different department, OPD and IDP
data of March 2017 has been selected from Medical
Record Section. Sampling population were selected
from different department like Medicine, Surgery, OBS
and gynaecology, Opthalmology, Orthopedics, ENT,
Paediatrics, Pychiatry, Dentisty, TB chest and Skin VD.
: Respondents from all the department
have taken by proportion to their OPD load. (Sampling
method- Population Proportion to size). Survey has
been conducted for the period of 1 week (6 working
Aims and Objectives:
Method:
Study setting
Study design
Sample size
Inclusion criteria:
OPD patients
days) from 24 April to 1 May 2017. Total 67
respondents per day have been selected randomly
from all the Departments. Every 20 patient has been
selected till the desired number of sample size per
day was achieved. In case of first visit in institute,
interview conducted at the time of exit from hospital.
In case of follow up visit, interview has been
conducted in OPD waiting area.
: Total 397 IPD patient got selected.
All the participants admitted in different ward with
minimum hospital stay more than 24 hrs have been
taken till the desired number of sample size was
achieved. On the day of discharge, after taking
written consent the participants have been
interviewed.
Written consent has been taken from all the selected
respondents after explaining them regarding study.
: Respondents who has not given
written consent.
: Ranking was given based on descending
order of mean score of each facilities. This score was
used for accommodation facilities.
:
Data have been collected by 17 intern doctors posted
in PSM Department. They were given formal training
on date 17 April 2017 and piloting in the same week.
Patient satisfaction survey questioner has been
designed for both indoor patients and outdoor
patients. Data have been collected on ODK collect
v1.5.1 version using android smart phones and
analysis done by SPSS.17.
: Written informed consent has
obtained from selected respondents. No harm to
study participants. All details have been maintained
by the investigator in strict confidentiality and
analysis would be anonymous. Report shall be
submitted to medical superintendent and concerned
authority.
: One and half Month (17 April to
May 2017)
th st
th
th
[5]
th
Indoor patients
Exclusion criteria
Ranking
Data collection
Ethical issue
Study Period

Perception of the participants N (%)
Too long
Sr.No Variables (N)
Appropriate Medium Too short
Healthline Journal Volume 9 Issue 2 (July-December 2018)
:: 71 ::
Table 1: General perception of the clients for the OPD services available at Tertiary Care Center
1.
at case window 67 (17) 241 (60) 80 (20) 14 (3) -
2. Nurse (347) 209 (60) 114 (33) 20 (6) 3 (1) 1
3. Technical Staff (306) 164 (54) 114 (37) 23 (8) 5 (2) -
4. Pharmacist (369) 181 (49) 142 (38) 38 (10) 8 (2) -
5. Dispensary (391) 231 (59) 147 (38) 13 (3) - -
6. Laboratory (294) 155 (53) 118 (40) 20 (7) 1 (0)
7. Injection Room (178) 90 (51) 78 (43) 10 (6) - -
8. Dressing Room (161) 98 (61) 54 (34) 8 (5) 1 (1) -
9. Public utility (320) 78 (24) 138 (43) 53 (17) 39 (12) 12 (4)
10 Drinking-water
facility (290) 105 (36) 133 (46) 33 (11) 19 (7)
11 other Amenities 164 (44) 160 (42) 36 (10) 11 (3) 2 (1)
43 (11) 264 (66) 56 (14) 37 (37) 2 (0)
Waiting time
Behaviour of staff
Completely Somewhat Neutral Somewhat Completely
satisfied satisfied dissatisfied dissatisfied
Cleanliness
Extent of crowding (402)
Over
crowded crowded space
1 Overall
(402)
(373)
Somewhat Neutral Adequate Spacious
Figure 1:Study area
Results:
Total 799 patients were included in the study (402
OPD and 397 IPD patients). Out of them, 47%
participants were males, rest 53% were females
and 39% participants were males, rest 61% were
females for OPD and IPD respectively. The mean age
of the participants was 38 and 34 years for OPD and
IPD respectively. The education level of the OPD
participants was poor as most of them were either
illiterate (19%) or primary passed (44%). Similarly,
IPD participants also very poor in education as 57%
and 21% were illiterate and primary education
respectively. Majority of the patient were Gujarati
Hindu followed by Hindi from UP, most of them
doing household duties. Median income reported
for OPD respondents was 9000 and for IPD 5000.
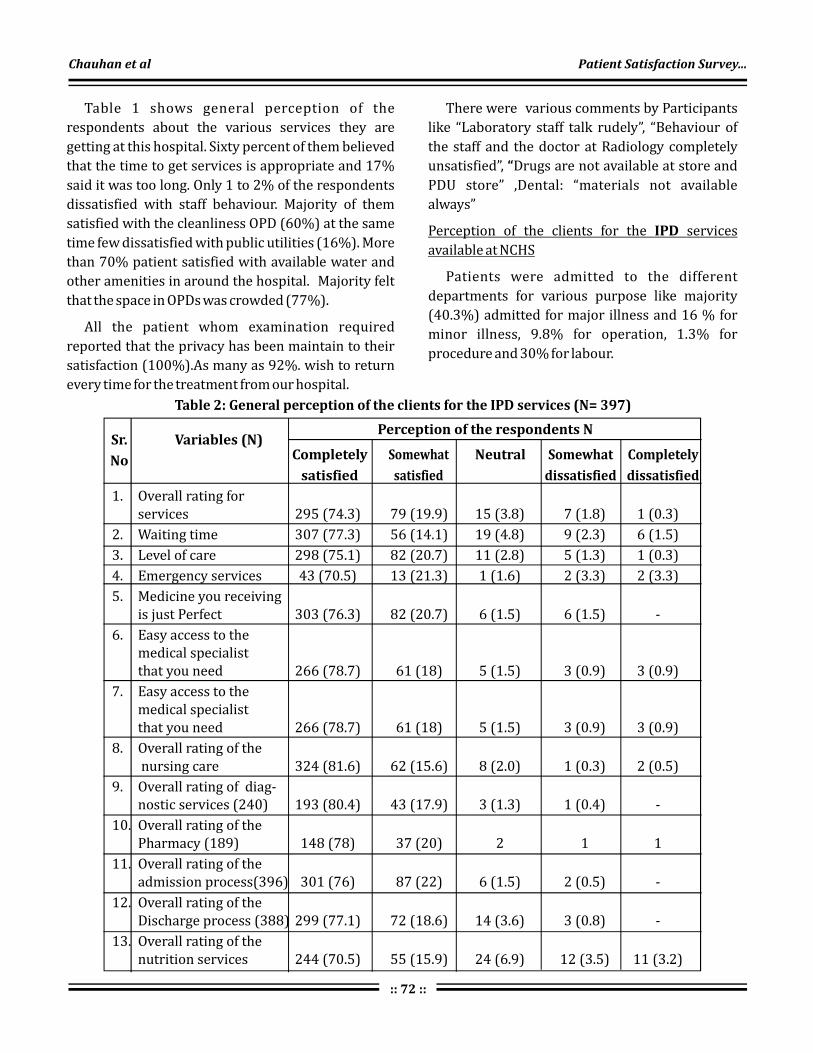
Perception of the respondents N
Completely
satisfied
Sr.
No
Variables (N)Somewhat
satisfied
Neutral Somewhat
dissatisfied
Completely
dissatisfied
:: 72 ::
Table 2: General perception of the clients for the IPD services (N= 397)
1. Overall rating for services 295 (74.3) 79 (19.9) 15 (3.8) 7 (1.8) 1 (0.3)
2. Waiting time 307 (77.3) 56 (14.1) 19 (4.8) 9 (2.3) 6 (1.5)
3. Level of care 298 (75.1) 82 (20.7) 11 (2.8) 5 (1.3) 1 (0.3)
4. Emergency services 43 (70.5) 13 (21.3) 1 (1.6) 2 (3.3) 2 (3.3)
5. Medicine you receiving is just Perfect 303 (76.3) 82 (20.7) 6 (1.5) 6 (1.5) -
6. Easy access to the medical specialist that you need 266 (78.7) 61 (18) 5 (1.5) 3 (0.9) 3 (0.9)
7. Easy access to themedical specialist that you need 266 (78.7) 61 (18) 5 (1.5) 3 (0.9) 3 (0.9)
8. Overall rating of the nursing care 324 (81.6) 62 (15.6) 8 (2.0) 1 (0.3) 2 (0.5)
9. Overall rating of nostic services (240) 193 (80.4) 43 (17.9) 3 (1.3) 1 (0.4) -
10. Overall rating of the Pharmacy (189) 148 (78) 37 (20) 2 1 1
11. Overall rating of the admission process(396) 301 (76) 87 (22) 6 (1.5) 2 (0.5) -
12. Overall rating of theDischarge process (388) 299 (77.1) 72 (18.6) 14 (3.6) 3 (0.8) -
13. Overall rating of the nutrition services 244 (70.5) 55 (15.9) 24 (6.9) 12 (3.5) 11 (3.2)
diag-
Table 1 shows general perception of the
respondents about the various services they are
getting at this hospital. Sixty percent of them believed
that the time to get services is appropriate and 17%
said it was too long. Only 1 to 2% of the respondents
dissatisfied with staff behaviour. Majority of them
satisfied with the cleanliness OPD (60%) at the same
time few dissatisfied with public utilities (16%). More
than 70% patient satisfied with available water and
other amenities in around the hospital. Majority felt
that the space in OPDs was crowded (77%).
All the patient whom examination required
reported that the privacy has been maintain to their
satisfaction (100%).As many as 92%. wish to return
every time for the treatment from our hospital.
There were various comments by Participants
like “Laboratory staff talk rudely”, “Behaviour of
the staff and the doctor at Radiology completely
unsatisfied”, Drugs are not available at store and
PDU store” ,Dental: “materials not available
always”
Patients were admitted to the different
departments for various purpose like majority
(40.3%) admitted for major illness and 16 % for
minor illness, 9.8% for operation, 1.3% for
procedure and 30% for labour.
“
Perception of the clients for the services
available at NCHS
IPD
Chauhan et al Patient Satisfaction Survey...

Completely
satisfied
Sr.
No
Variable Somewhat
satisfied
Neutral Somewhat
dissatisfied
Completely
dissatisfied
Table 3: Perception of the clients for the physician services available at Tertiary Care Center
1. Overall rating 319 (80.4) 67 (16.9) 5 (1.3) 5 (1.3) 1 (0.3)
2. Courtesy, respect,
friendliness and
kindness 313 (79) 53 (13.4) 22 (5.6) 6 (1.5) 2 (0.5)
3. Thoroughness of
examinations 326 (82.3) 54 (13.6) 11 (2.8) 1 (0.3) 4 (1)
4. Doctor act business
like and impersonal
towards me 326 (83) 55 (14) 9 (2.3) 1 (0.3) 2 (0.5)
5. Those who provide you
medical care hurry too
much when they treat
you 332 (84.5) 43 (10.9) 15 (3.8) 3 (0.8) 0 (0)
6. Physician responsive-
to Questions 306 (77.1) 64 (16.1) 18 (4.5) 7 (1.8) 2 (0.5)
7. Explanation of tests
procedures and
treatments 287 (72.3) 52 (13.1) 45 (11.3) 11 (2.8) 2 (0.5)
8. Sometimes doctors use
medical term without
explaining (391) 274 (70.1) 55 (14.1) 51 (13) 8 (2) 3 (0.8)
9. Aftercare instructions 284 (73.2) 77 (19.8) 14 (3.6) 10 (2.6) 3 (0.8)
ness
Healthline Journal Volume 9 Issue 2 (July-December 2018)
:: 73 ::
Table 2 General perception regarding the availed
services at NCHS shows that more than 90% patients
were satisfied with overall service, very few 2% of the
participants not satisfied with the services and they
mainly score negative. As far as the emergency
services at NCHS are concerned around 7% people
gave negative feedback. As far as the quality care is
concerned more than 95% respondents were satisfied
with the current standards. However, 6% of them
believed it was not up to the mark. They also
commented about the availability of the specialist
lacking in some department (2%). More than 95%
respondents satisfied with the nursing care and only
as few as 5% to as high as 25% were not satisfied with
the subdomains which includes responsiveness to
needs (25% in psychiatry), waiting time when
called (25% in psychiatry) etc. Regarding food
provided to patient, 10% of the respondents did not
like the quality of food they received at NCHS.
Satisfaction with the referral and diagnostic
services were good (>95%) except radiology dept.
Drug availability which needs to be taken care of.
Overall more than 95 percent respondents satisfied
with the admission process. Majority satisfied with
the discharge process (98%) and some have
commented that they were not properly given
aftercare instruction.

Table 4: Ranking of the overall staying as per score given by client
:: 74 ::
Rank Variable N Mean
Accommodations facility overall rating 397 4.78
Ranking of different facilities
1.
2.
3.
4.
5.
6.
7.
8.
9.
10.
11.
12.
Ease of access to the facility 397 4.76
Equipments 393 4.74
Safety 397 4.71
Comfort 397 4.64
Privacy 396 4.58
Cleanliness 397 4.56
Quietness 397 4.54
Attractiveness 397 4.53
Temperature 397 4.52
Toilet 397 4.42
Bathroom 397 4.40
Drinking water 391 4.35
Figure 2: Day of the week and the perception
regarding getting the services
From , we can see that majority of patient
believe that time for getting the service is appropriate.
In initial day of week, more number of patients
believes that time for getting the service is too long
compare to other days.
More than 97% clients satisfied with physician
services like examinations, behaviour, commun-
ication with the patient(Table 3).
figure 2
As far as the staying is concerned at NCHS, people
ranked lowest to the availability of drinking water
and cleanliness of toilet and bathroom
Doctor in hurry, Patient
was not explained properly and was not admitted on
time.
Hurry too much & early
discharge, Less attention to aftercare.
Should attend patient when call sister.
Had to send relative 3 times to get x ray
plate, Long waiting in radiology dept, MRI should be
available free of cost in hospital, Sonography takes
time even if referral is urgent, Too much waiting time
at USG.
Too often pricking for blood sample
collection
Drugs are not available,
Waiting time too long
Bathrooms are not properly
clean, Dirty bathroom & toilet sometime, Drinking
water facility should be there on each floor, Drinking
(Table 4).
Comments from Respondents:
Emergency Department:
Physician service:
Nursing:
Radiology:
Laboratory:
.
Pharmacy/Drug store:
Accommodations:
Chauhan et al Patient Satisfaction Survey...

Healthline Journal Volume 9 Issue 2 (July-December 2018)
:: 75 ::
water source quite far, Have to go to ground floor to
take drinking water, Running water is not available in
washrooms, valuables were stolen from the ward,
drinking water should be available on the floor
Difficulty in accessing some
facilities due to lack of education in parents of patient,
Drinking water should be provided to every floor,
Number of lifts should be increased.
Patient satisfaction is considered one of the
important quality indicators at the health care
institutes. Satisfaction is achieved when the patients'
perception of the quality of care and services that they
receive in healthcare setting has been positive,
satisfying, and meets their expectations.
In present study, 60% clients believe that waiting
time at case window is appropriate whereas in
Patavegar et al study and Kumari et al study less
than 50% clients give similar opinion. Difference
within patients perception is depend on various
factors like location of institute, timing of services,
facilities at services, infrastructure of institutes. In
present study almost all patients (98%) were satisfied
with behavior of staff compare to Arsad et al study
(90%) and Kumari et al study (73%).
In studyof Arsad et al and Kumari et al more
than 60% patients were satisfied with cleanliness of
OPD. In present study 70% patients were satisfied
with basic amenities which is more compare to other
study. We have to focus that remaining 30 to 40%
patients were not satisfied with cleanliness and basic
amenities. During planning strategy, we have to
focused regarding this. In study of Arsad et al ,
Kumari et al and present study found that majority
of people believe that OPD is overcrowding and large
factor behind that is lack of human recourses.
Schoenfelder et al
General Comments:
Discussion:
[6] [7]
[8]
[7]
[8] [7]
[8]
[7]
revealed 10 determinants of
global patient satisfaction for indoor patients. The
most influential determinants were outcome of
treatment (OR 3.70) and kindness of the hospital's
nurses (OR 2.78) and physicians (OR 1.96). Regarding
the performance of service component, poor
accommodation and quality of food resulted in
decreasing global patient satisfaction. Both
organization of admission and discharge were
associated with global patient satisfaction .
Satisfaction level of patients is a subjective. It
depend on many factors. In present study, Majority
of patients (>90%) were satisfied with OPD services,
I P D s e r v i c e s , P h y s i c i a n s e r v i c e s a n d
accommodation facilities. Some patients were give
comments regarding various facilities. From that
comments we can identified
[9]
obstacles in availing
services like lack of human resource, patients
overload, not availability of drinking water,
uninterrupted supply of drugs and dental materials,
more waiting time for USG, issue regarding
behaviour of staff with patients ect.
General perception of the clients for the OPD
services were 98% respondents satisfied with staff
behavior, 70% patient satisfied with available water
and other amenities in, around the hospital, 60%
believed that the time to get services is appropriate, ,
60% satisfied with the cleanliness OPD at the same
time few dissatisfied with public utilities (16%), and
77% felt that the space in OPDs was crowded.All the
patient whom examination required reported that
the privacy has been maintain. As many as 92% wish
to return every time for the treatment from our
hospital.General perception regarding the IPD
services shows that more than 95% patients were
satisfied with various services like quality of medical
care, nursing care, diagnostic and referral service,
admission process, discharge process and physician
services. As far as the staying is concerned at people
ranked lowest to the availability of drinking water
and cleanliness of toilet and bathroom.Obstacles in
availing services are lack of human resource,
patients overload, not availability of basic amenities,
lake of materials, more waiting time for radiology
facilities and issue regarding behaviour of staff. The
findings of the present study can be utilized to
improve the services.
The study findings suggest that following
measures may be taken by the policy makers and
hospital administrators to increase the patient
satisfaction.
Conclusions :
Recommendations:

:: 76 ::
•
•
•
•
•
•
•
Efforts should be made to reduce the waiting time
and patient load so that doctors and other staff
can give more attention and time to the
respondents;
Efforts are also needed to strengthen
i n f r a s t r u c t u re a n d h u m a n r e s o u r c e s
(uninterrupted supply of the drugs and dental
materials, availibity of the drinking water at each
wards and cleaning and maintenance of the public
utility).
Certain improvements are also needed in the
waiting area by making it informative and
comfortable and improvement of the skills of
doctor-patient communication.
The findings of the present study can be utilized to
improve the services at Tertiary Care Center,
resulting in the more satisfaction of respondents
availing such public health facilities.
Patient satisfaction is considered by some to be of
dubious benefit in facilitating the process of
clinical care, as respondents have no specific
clinical expertise and are -perhaps- readily
influenced by non- medical factors.
High levels of ceiling effect with high levels of
satisfaction due to respondents "fear of giving
negative evaluations".
Perceptions about need have an impact on
satisfaction – the more you need the less satisfied
you are. However, in the present study no need
assessment has been done.
Funding: Nil
Conflict of Interest: Nil
Limitations:
Declaration :
References :
1. Asadi-Lari M, Tamburini M, Gray D. Patients’ needs, satisfaction,
and health related quality of life: towards a comprehensive model.
Health Qual Life Outcomes [Internet]. 2004;2(1):32. Available
from: http://www.hqlo.com/content/2/1/32
2. Report F, Chapters RBY. World health report systems/ : improving
performance. 2019;4–7.
3. Sivalenka S. Patient Satisfaction Surveys in Public Hospitals in
India. 2000;
4. Sodani PR, Kumar RK, Srivastava J, Sharma L. Measuring patient
satisfaction: a case study to improve quality of care at public
health facilities. Indian J Community Med. 2010;35(1):52–6.
5. Powell L. Linda Powell, MS Mountain States Group, Inc.
6. Patavegar B, Shelke S. a Cross-Sectional Study of Patient’S
Satisfaction Towards Services Received At Tertiary Care Hospital
on Opd Basis. Natl J … [Internet]. 2012;3(2):232–7. Available
from: http://search.ebscohost.com/ login.aspx?direct=
t r u e & p r o f i l e = e h o s t & s c o p e = s i t e & a u t h t y p e
=crawler&jrnl=09763325&AN=83333142&h=ThkFEy4iFtFYrrg
m/XnqJaPUz1J4vqoGrq4dy3/lqA1xVFobqdrMppQ4ECFckcFItxC
Ev9G4/rnSwkTRJz3YJQ==&crl=c
7. Kumari R, Idris M, Bhushan V, Khanna A, Agarwal M, Singh S. Study
on patient satisfaction in the government allopathic health
facilities of lucknow district, India. [Internet]. Vol. 34, Indian
journal of community medicine/ : official publication of Indian
Association of Preventive & Social Medicine. 2009. p. 35–42.
Available from: http://www.ncbi.nlm.nih.gov/pubmed/
19876453
8. S. A, H. A, Hamid, Shamila. Measuring patients satisfaction: a cross
sectional study to improve quality of care at a tertiary care
hospital [Internet]. Vol. 9, East African journal of public health.
2012. p. 26–8. Available from: http://ovidsp.ovid.com
/ovidweb.cgi?T=JS&PAGE=reference&D=emed14&NEWS=N&A
N=366014008
9. Schoenfelder T, Klewer J, Kugler J. Determinants of patient
satisfaction: A study among 39 hospitals in an in-patient setting in
Germany. Int J Qual Heal Care. 2011;23(5):503–9.
Chauhan et al Patient Satisfaction Survey...

:: 77 ::
Healthline Journal Volume 9 Issue 2 (July-December 2018)
INSTRUCTIONS FOR AUTHORS
“Healthline” is a biannual national journal of Indian
Association of Preventive and Social Medicine.
“Healthline” aims to promote quality research in the field
of Community Medicine and Public health. The editorial
board of the journal is committed to an unbiased,
independent, anonymous and confidential review of
submitted articles. Manuscripts submitted to this
Journal, should not have been published or under
consideration for publication in any substantial form in
any other publication, professional or lay. All the
manuscripts once submitted to and published in the
Healthline will become the property of the journal.
Authors are requested to strictly follow the guidelines
provided herewith, while preparing the manuscripts for
submission to the “Healthline” journal.
The “Heathline” journal follows double blind peer
review process. Following receipt of a manuscript from
the authors, the manuscript undergoes an editorial
review (by editor in chief/executive editor/joint editor).
If the manuscript is found appropriate for the further
process following the editorial review, the blind
manuscript is sent to two anonymous peer reviewers
and one statistical reviewer. It is ensured that the
reviewers are having qualifications of post-graduation
or higher in the concerned subjects and not from the
same institute where the authors belong. Upon
completion of peer review, the changes suggested by the
reviewers are forwarded to the authors and
modifications are sought with explanations (if required).
The revised manuscript is again forwarded to the
concerned reviewers. If the reviewers are satisfied with
the revisions from the authors, the manuscript is
accepted and formative changes are done for the
publication. At any stage of review, if editorial board
members or reviewers find the manuscript unsuitable
for the publication, the manuscript is rejected.
The manuscript can be submittedthrough email to
[email protected]. The email should contain
soft copies of authorship and copyright form (duly
signed by all the authors), title page and original
manuscript in separate documents.Authors are
requested to prepare the article typed in “Times New
Process for submission:
Peer Review Process:
General Instructions:
Roman” fonts with size of “12”.Double spacing
(including references), should be followed with wide
margins. There is no need to send a hard copy.
For any query, kindly reach editorial office through e
mail at [email protected].
Following are the word limits to be followed while
submitting an article.
Editorial (by invitation only) 1500
Continuing Medical Education
/Review article 4500
Original article * 3000
Short article 1500
Letter to Editor 750
Book review (should not be
sponsored by any
company/organization) 500
Preparation of Manuscript
Type of Article Maximum
Word Limit
*Excluding abstract, references, tablesand images
Manuscript should be prepared using American
English language.Articles exceeding the word limit for a
particular category of manuscript would not be
processed further.Uniform Requirements for
Manuscripts (URM) submitted to Biomedical
Journals should be consulted before submission
ofmanuscript ( http://www.icmje.org ).
All articles should mention how human and
a n i m a l e t h i c a l a s p e c t o f t h e s t u d y w a s
addressed.Whether informed consent was taken or
not. Identifying details should be omitted if they are
not essential. When reporting experiment on
human subjects, authors should indicate whether
the procedures followed were in accordance with the
Helsinki Declaration of 1975, as revised in 2000.
(http://www.wma.net).
Each of the following sections should begin on
a separate page. Number all pages in sequence.
Ethical Issues:

:: 78 ::
Healthline Journal Volume 9 Issue 2 (July-December 2018)
Title page:
Abstract:
Manuscript:
Conflict of interest and financial support:
This should contain the title of the manuscript, name and designation of all the authors, a short title (not more than 40 letters) to be used as the running title, source of support in the form of grants, equipments, drugs etc., acknowledgement, the institution where the work has been carried out and the address with contact number and email ID of the corresponding author. There should also be mention of life membership number of first or second author with IAPSM-GC. Articles not containing life membership number of first or second author in the title page will be charged publication fees according to criteria for non member authors. Briefly mention contribution of each author in multi author article.
Abstract should be a structured condensation of the work not exceeding 250 words for original research articles and 150 words for short articles. It should be structured under thefollowing headings: background, objectives, methods, results, conclusions, and 3- 5 keywords to index the subject matter of the article. Please do not make any other heading.
It must be concise and should include title, introduction, material and methods, result, discussion, conclusion, recommendations and references. The manuscript should not contain names or any other information related to authors. The matter must be written in a manner, which is easy to understand, and should be restricted to the topic being presented. Each Table and Figure should be on separate page and should be given at the end of the manuscript. Please do not insert tables etc. within the text.These should be placed as the last element of the text before references. Written permissions of persons/agency acknowledged should be provided, if applicable.
The situations where conflict of interest arises are when an author (or the author's institution), reviewer, or editor has financial or personal relationships that inappropriately influence (bias) his or her actions (such relationships are also known as dual commitments, competing interests, or competing loyalties). The potential of influences can vary from the insignificant ones to the significant ones where the results of the reviews or publication process. The conflict of interest can also occur if an individual believes that the relationship affects his or her scientific judgment.
Financial relationships (such as employment, consultancies, stock ownership, honoraria, paid expert testimony) are also one of the identifiable conflicts of interest and the most likely to undermine the credibility of the journal, the authors, and of science itself. The other potential conflicts can occur for other reasons, such as academic rivalry, personal relationships and intellectual desire.(Source: International Committee of Medical Journal Editors (“Uniform Requirements for Manuscripts Submitted to Biomedical Journals”), February 2006)A brief statement on source of funding and conflict of interest should be included in the manuscript.
The involvement of study participants should be voluntary and following informed consent. Any details disclosing identification of the patients (names, record numbers, contact details, photographs and pedigree) must not be included in the published article. In case, such information is necessary for scientific reasons, an informed consent must be obtained from the study participants or parents/guardian (in case of children less than 18 years of age). Informed consent for this purpose requires that a patient who is identifiable be shown the manuscript to be published. Authors should identify individuals who provide writing assistance and disclose the funding source for this assistance. Identifying details should be omitted if they are not essential. Complete anonymity is difficult to achieve, however, and informed consent should be obtained if there is any doubt. If identifying characteristics are altered to protect anonymity, authors should provide assurance that alterations do not distort scientific meaning and editors should so note. When informed consent has been obtained it should be indicated in the published article. (Source: International Committee of Medical Journal Editors ("Uniform Requirements for Manuscripts Submitted to Biomedical Journals"), February 2006)
In citing other work, only reference consulted in original should be included. If it is against citation by others, this should be so stated. Signed permission is required for use of data from persons cited in personal communication. ANSI standard style adapted by the National Library of Medicine (NLM) should be fo l lowed. Con sul t ht tp:/ /ww w.nl m.n ih. gov /bsd/uniform_ requirements.html. References should be numbered and listed consecutively in the order in
Published Statement of Informed Consent:
References:

:: 79 ::
which they are first cited in the text and should be identified in the text, tables and legends by Arabic numerals as
. The full list of reference at the end of the paper should include; names and initials of all authors up to six (if more than 6, only the first 6 are given followed by et al.); the title of the paper, the journal title abbreviation according to the style of Index Medicus (http://www.ncbi.nlm.nih.gov /entrez/query.fcgi? db=journals), year of publication; volume number; first and last page numbers. Reference of books should give the names and initials of the authors, book title, place of publication, publisher and year; those with multiple authors should also include the chapter title, first and last page numbers and names and initials of editors. For citing website references, give the complete URL of the website, followed by date of accession of the website. Quote such references as - author name, title of the article, the website address, and date of accession.
Several research studies have revealed gap between facts and beliefs of adolescent girls and showed that there is low level of awareness about menstruation
among girls when they first experience it.
Mehta MN, Mehta NJ. Serum lipids and ABO Blood group in cord blood of neonates. Indian J Pediatr.1984; 51:39-43.
Smith GDL. Chronic ear disease. Edinburgh: Churchill Livingstone; 1980.
Malhotra KC. Medicogenetics. problems of Indian tribes. In: Verma IC, editor. Medical genetics in India.vol. 2. Pondicherry: AuromaEntrprises; 1978. p. 51-55.
Papers accepted but not yet published should be included in the references followed by 'in press”. Those in preparation, personal communications and unpublished observations should be referred to as such in the text only.
These should be of the highest quality, preferably black and white and editable. Graphs should be drawn by the artist or prepared using standard computer software. Number all illustrations with Arabic numerals (1, 2, 3….).
A descriptive legend must accompany each illustration and must define all abbreviations used therein.
superscripts in square brackets (as example shown below)
Illustrations (Maximum 4):
Legends:
Citation:
Journals:
Book:
Chapter in the Book:
[4]
Tables (Maximum 4):
Abbreviation:
Manuscript Processing Charges:
Criteria Applicable
charges/ article
These must be self–explanatory and must not duplicate information in the text. Each table must have a title and should be numbered with Arabic numerals. Each table should be typed in double space, on a separate sheet of paper. No internal horizontal or vertical lines should be used. All tables should be cited in the text.
As there are no universally accepted abbreviations, authors should use familiar ones and should define them when used first in the text.
As per the 22 General Body Meeting of IAPSM-GC, manuscript processing charges will be applicable to the publications in “Healthline” journal, as mentioned
below, with effect from 1 issue of volume 6 of Healthline Journal.
First or Second Author
with IAPSM-GC membership Rs. 1000
First or Second Author
without IAPSM-GC membership Rs. 1500
nd
st
Healthline Journal Volume 9 Issue 2 (July-December 2018)
The manuscript processing charges as mentioned
above can be paid by cheque / online transfer in favour
of below mentioned account.
Name of Account :
Account Number :
IFSC Code :
Address :
MICR Code:
Following online payment of manuscript
processing charges, the receipt of fund transfer
should be emailed to .
Dr. K. N. Sonaliya, Editor in chief, Community
Medicine Department, GCS Medical College, Opp.
DRM Office, Nr. Chamunda Bridge, Naroda Road,
Ahmedabad-380025, Gujarat, India.
HEALTHLINE IAPSMGC
34898725422
SBIN0003043
State Bank of India, Civil Hospital Precincts Branch, Opp. B. J. Medical College, PO Bag No. 1, Ahmedabad-380016
380002011
If paid by cheque, duly prepared cheques should be sent
to

:: 80 ::
COPYRIGHT FORM
Undertaking by Authors
We, the undersigned, give an undertaking to the following effect with regard to our article
entitled
ubmitted for publication in Healthline journal :
1. The article mentioned above has not been published or submitted to or accepted for publication in
any form, in any other journal.
2. We also vouchsafe that the authorship of this article will not be contested by anyone whose
name(s) is/are not listed by us here.
3. I/We declare that I/We contributed significantly towards the research study i.e., (a)
conception, design and/or analysis and interpretation of data and to (b) drafting the article or
revising it critically for important intellectual content and on (c) final approval of the version to be
published.
4. I/We hereby acknowledge the “Healthline” journal - conflict of interest policy requirement to
carefully avoid direct and indirect conflicts of interest and, accordingly, hereby agree to promptly
inform the editor or editor's designee of any business, commercial, or other proprietary
support, relationships, or interests that I/We may have which relate directly or indirectly to the
subject of the work.
5. I/We also agree to the authorship of the article in the following sequence:-
“________________________________________________________________________________________________________
_________________________________________________” s
Name of author Signature with Date
1._______________________________ ________________________________
2._______________________________ ________________________________
3._______________________________ ________________________________
4._______________________________ ________________________________
5._______________________________ ________________________________
6._______________________________ ________________________________
Scanned copy of completed and duly signed declaration form should be emailed to the Editor/Publisher at
Healthline Journal Volume 9 Issue 2 (July-December 2018)

Healthline Journal Volume 9 Issue 2 (July-December 2018)
The editorial board is highly obliged to the following reviewers for their kind
co-operation in review of the manuscripts published in Volume 9 Issues 1 &
2 of “Healthline” Journal.
A. Bhagyalaxmi
Abhiruchi Galhotra
Anil N. S.
Arpit Prajapati
Bansata
Bhavna Puwar
D. V. Bala
Deepak Sharma
Devang Raval
Dhiren Amin
Harshad Patel
Hitesh Shah
Ilesh Kotecha
Irfan Momin
J. P. Mehta
Kedar Mehta
Kishor Sochaliya
Mihir Rupani
Parag Chavda
Pradeep Pithadia
Prakash Patel
Rajshree Bhatt
Rashmi Sharma
Samir Shah
Sangita Patel
Sheetal Vyas
Shobha Misra
Sonal Shah
Sumit Unadkat
Udai Shankar Singh
Vaibhav Ramanuj
Venu Shah
Editor in ChiefHealthline Journal


![[Volume 23], July - December 1925 - FRASER - St. Louis Fed](https://static.fdokumen.com/doc/165x107/63389ed1283e1abca203decf/volume-23-july-december-1925-fraser-st-louis-fed.jpg)