75 As NQR signature of the isoelectronic nature of ruthenium for iron substitution in...
6
Phys. Status Solidi B 251, No. 5, 974–979 (2014) / DOI 10.1002/pssb.201350237 p s s basic solid state physics b status solidi www.pss-b.com physica 75 As NQR signature of the isoelectronic nature of ruthenium for iron substitution in LaFe 1-x Ru x AsO Marcello Mazzani *,1 , Pietro Bonf ` a 1 , Giuseppe Allodi 1 , Samuele Sanna 2 , Alberto Martinelli 3 , Andrea Palenzona 3,4 , Pietro Manfrinetti 3,4 , Marina Putti 3 , and Roberto De Renzi 1 1 Department of Physics and Earth Sciences, University of Parma, Parma, Italy 2 Department of Physics, University of Pavia, Pavia, Italy 3 CNR-SPIN, Genova, Italy 4 Department of Chemistry and Industrial Chemistry, University of Genova, Genova, Italy Received 27 September 2013, revised 6 December 2013, accepted 7 January 2014 Published online 13 February 2014 Keywords DFT calculations, iron-based superconductors, nuclear quadrupole resonance, superconductivity, strongly correlated electron systems ∗ Corresponding author: e-mail marcello.mazzani@fis.unipr.it, Phone: +39 0521 905245, Fax: +39 0521 905223 We have investigated the effects of the isovalent ruthenium sub- stitution in LaFe 1−x Ru x AsO, by extensive 75 As NQR (nuclear quadrupole resonance) measurements, supported by DFT (den- sity functional theory) calculations, in order to characterize both the lattice and electronic structure details. The evidence for five different local configurations around the arsenic site emerges upon increasing ruthenium for iron substitution. DFT calcu- lations confirm the attribution of the measured electric field gradients (EFGs) to ruthenium atom occupancies (0, 1, 2, 3, and 4) on the nearest-neighbour sites of arsenic. It is found that the low-frequency (Ru-free) NQR peak remains almost unaffected upon ruthenium substitution, providing an experimental confir- mation that ruthenium does not introduce delocalized carriers in the iron plane. © 2014 WILEY-VCH Verlag GmbH & Co. KGaA, Weinheim 1 Introduction One of the issues recently arising in the field of iron-based superconductors is the effective role of charge doping in promoting the superconducting ground state. It is generally assumed that superconductivity (SC) in these systems is obtained by injection of extra charges. Inter- layer doping, indeed, was recently confirmed to introduce a significant concentration of extra carriers directly to the iron 3d states, as expected [1]. On the other hand, SC also emerges in compounds where doping comes from transition metal (TM) substitution: here it was recently argued from theoretical calculations that the extra charge from the TM is screened on such a short length scale that the total electron density becomes isovalent to iron [2–4]. Therefore, TM sub- stitution does not seem to dope the system with electrons at all, even if inducing SC. These findings have been partially confirmed by experiments even if there is still no general agreement among different techniques [5]. In view of these considerations, the appearance of SC in the ‘122’ family even upon the isovalent Ru:Fe sub- stitution [6–9] becomes less surprising. Nonetheless, the introduction of ruthenium in the ‘1111’ compounds [10] does not favour superconductivity and even leads to its suppression in optimally electron doped samples [11–13]. As a first step towards a deeper understanding of the key parameters responsible for SC by TM substitution, one has to identify how isovalent substitutions affect the electronic states of the iron plane. To this aim, here we explore the struc- tural and electronic orders of the parent magnetic compound LaFe 1−x Ru x AsO, as a function of ruthenium concentration x, by means of nuclear quadrupolar resonance (NQR). This technique has been already extensively applied to the char- acterization of iron-based superconductors. Indeed, the 75 As nucleus (I = 3/2) allows us to probe the iron-plane elec- tronic environment, providing access to both the normal and superconducting states’ properties. In particular, NQR measurements have been used in the ‘1111’ compounds to investigate the charge distribution and electronic ordering upon F doping [14], while NQR relaxation times have helped to identify the superconducting gap structure [15] and the role of spin fluctuations [16]. © 2014 WILEY-VCH Verlag GmbH & Co. KGaA, Weinheim
Transcript of 75 As NQR signature of the isoelectronic nature of ruthenium for iron substitution in...
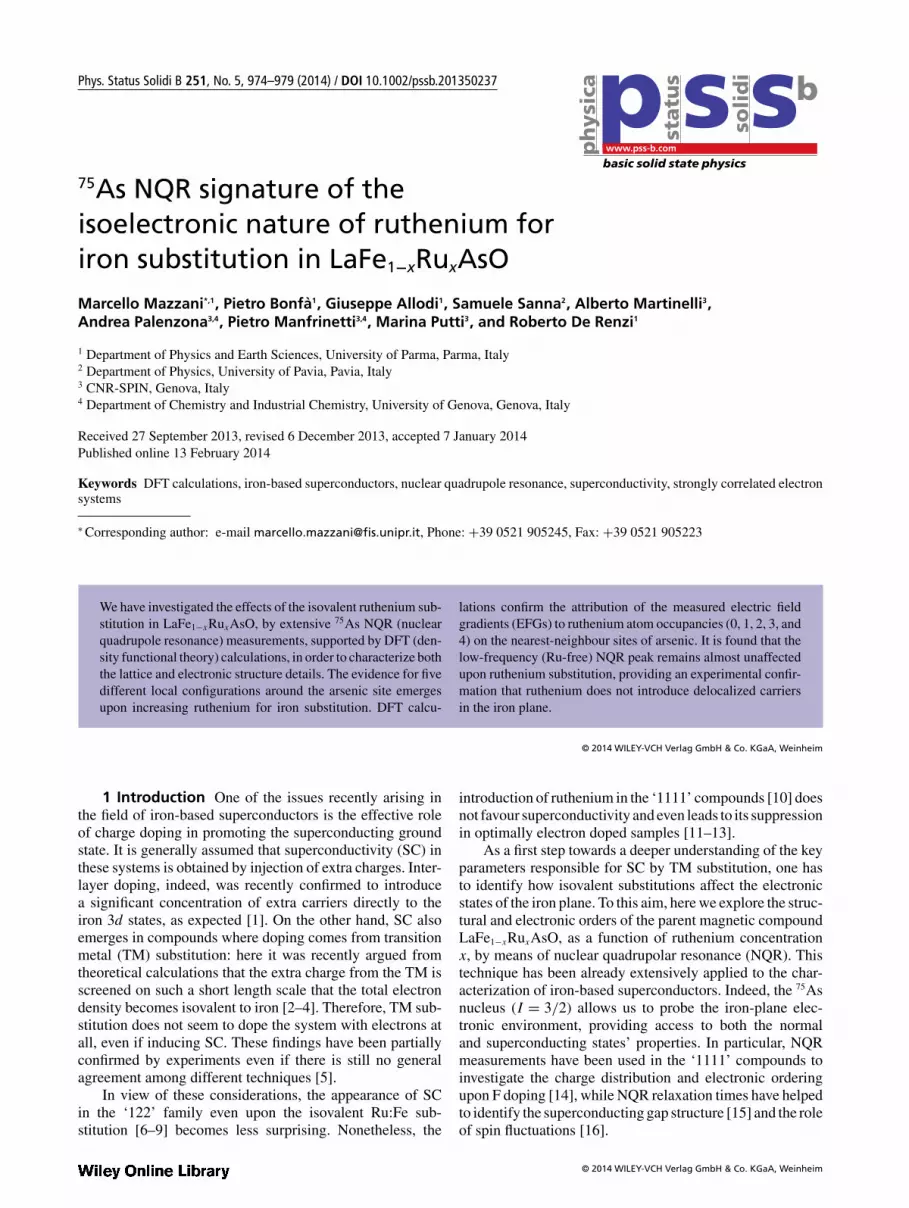
Phys. Status Solidi B 251, No. 5, 974–979 (2014) / DOI 10.1002/pssb.201350237 p s sbasic solid state physics
b
sta
tus
so
lid
i
www.pss-b.comph
ysic
a
75As NQR signature of the
isoelectronic nature of ruthenium for
iron substitution in LaFe1−xRu
xAsO
Marcello Mazzani*,1, Pietro Bonfa1, Giuseppe Allodi1, Samuele Sanna2, Alberto Martinelli3,Andrea Palenzona3,4, Pietro Manfrinetti3,4, Marina Putti3, and Roberto De Renzi1
1 Department of Physics and Earth Sciences, University of Parma, Parma, Italy2 Department of Physics, University of Pavia, Pavia, Italy3 CNR-SPIN, Genova, Italy4 Department of Chemistry and Industrial Chemistry, University of Genova, Genova, Italy
Received 27 September 2013, revised 6 December 2013, accepted 7 January 2014
Published online 13 February 2014
Keywords DFT calculations, iron-based superconductors, nuclear quadrupole resonance, superconductivity, strongly correlated electronsystems
∗ Corresponding author: e-mail [email protected], Phone: +39 0521 905245, Fax: +39 0521 905223
We have investigated the effects of the isovalent ruthenium sub-
stitution in LaFe1−xRuxAsO, by extensive 75As NQR (nuclear
quadrupole resonance) measurements, supported by DFT (den-
sity functional theory) calculations, in order to characterize both
the lattice and electronic structure details. The evidence for five
different local configurations around the arsenic site emerges
upon increasing ruthenium for iron substitution. DFT calcu-
lations confirm the attribution of the measured electric field
gradients (EFGs) to ruthenium atom occupancies (0, 1, 2, 3, and
4) on the nearest-neighbour sites of arsenic. It is found that the
low-frequency (Ru-free) NQR peak remains almost unaffected
upon ruthenium substitution, providing an experimental confir-
mation that ruthenium does not introduce delocalized carriers
in the iron plane.
© 2014 WILEY-VCH Verlag GmbH & Co. KGaA, Weinheim
1 Introduction One of the issues recently arising inthe field of iron-based superconductors is the effective roleof charge doping in promoting the superconducting groundstate. It is generally assumed that superconductivity (SC) inthese systems is obtained by injection of extra charges. Inter-layer doping, indeed, was recently confirmed to introducea significant concentration of extra carriers directly to theiron 3d states, as expected [1]. On the other hand, SC alsoemerges in compounds where doping comes from transitionmetal (TM) substitution: here it was recently argued fromtheoretical calculations that the extra charge from the TM isscreened on such a short length scale that the total electrondensity becomes isovalent to iron [2–4]. Therefore, TM sub-stitution does not seem to dope the system with electrons atall, even if inducing SC. These findings have been partiallyconfirmed by experiments even if there is still no generalagreement among different techniques [5].
In view of these considerations, the appearance of SCin the ‘122’ family even upon the isovalent Ru:Fe sub-stitution [6–9] becomes less surprising. Nonetheless, the
introduction of ruthenium in the ‘1111’ compounds [10] doesnot favour superconductivity and even leads to its suppressionin optimally electron doped samples [11–13].
As a first step towards a deeper understanding of the keyparameters responsible for SC by TM substitution, one hasto identify how isovalent substitutions affect the electronicstates of the iron plane. To this aim, here we explore the struc-tural and electronic orders of the parent magnetic compoundLaFe1−xRuxAsO, as a function of ruthenium concentrationx, by means of nuclear quadrupolar resonance (NQR). Thistechnique has been already extensively applied to the char-acterization of iron-based superconductors. Indeed, the 75Asnucleus (I = 3/2) allows us to probe the iron-plane elec-tronic environment, providing access to both the normaland superconducting states’ properties. In particular, NQRmeasurements have been used in the ‘1111’ compounds toinvestigate the charge distribution and electronic orderingupon F doping [14], while NQR relaxation times have helpedto identify the superconducting gap structure [15] and the roleof spin fluctuations [16].
© 2014 WILEY-VCH Verlag GmbH & Co. KGaA, Weinheim
Original
Paper
Phys. Status Solidi B 251, No. 5 (2014) 975
We anticipate that the introduction of ruthenium leads toevident NQR signatures, corresponding to the local configu-rations of ruthenium atoms on the nearest neighbours of thearsenic site.
2 Experimental details A series of polycrystallinesamples of LaFe1−xRuxAsO (0.00 ≤ x ≤ 0.80) were pre-pared by high-temperature solid-state reaction betweenpre-synthesized LaAs and high-purity Fe2O3, RuO2, Fe,and Ru. The synthesis procedure is described in detail inRef. [10]. Here, x indicates the nominal ruthenium com-position of the starting material. These same compoundshave been characterized in detail both by neutron (NPD) andsynchrotron (XRD) powder diffraction [17] and by energydispersive X-ray spectroscopy (EDS). Their magnetic andelectronic properties have been studied by magneto-transportmeasurements [18], neutron diffraction [17], μSR, and solid-state NMR [19].
A systematic 75As NQR investigation was performed onthe samples with ruthenium concentrations 0, 0.10, 0.20,0.30, 0.40, 0.50, 0.65, and 0.80, at room temperature. ForNQR measurements, the pellets were crushed into powdersand spectra were taken by changing the resonant frequencyω point by point, in the range 8.75–25 MHz. The broadbandHyReSpect spectrometer [20] was employed. Repetitiontimes of 10 ms, well above longitudinal relaxation times,were used and data acquisition lasted more than 3 weeks foreach complete spectrum.
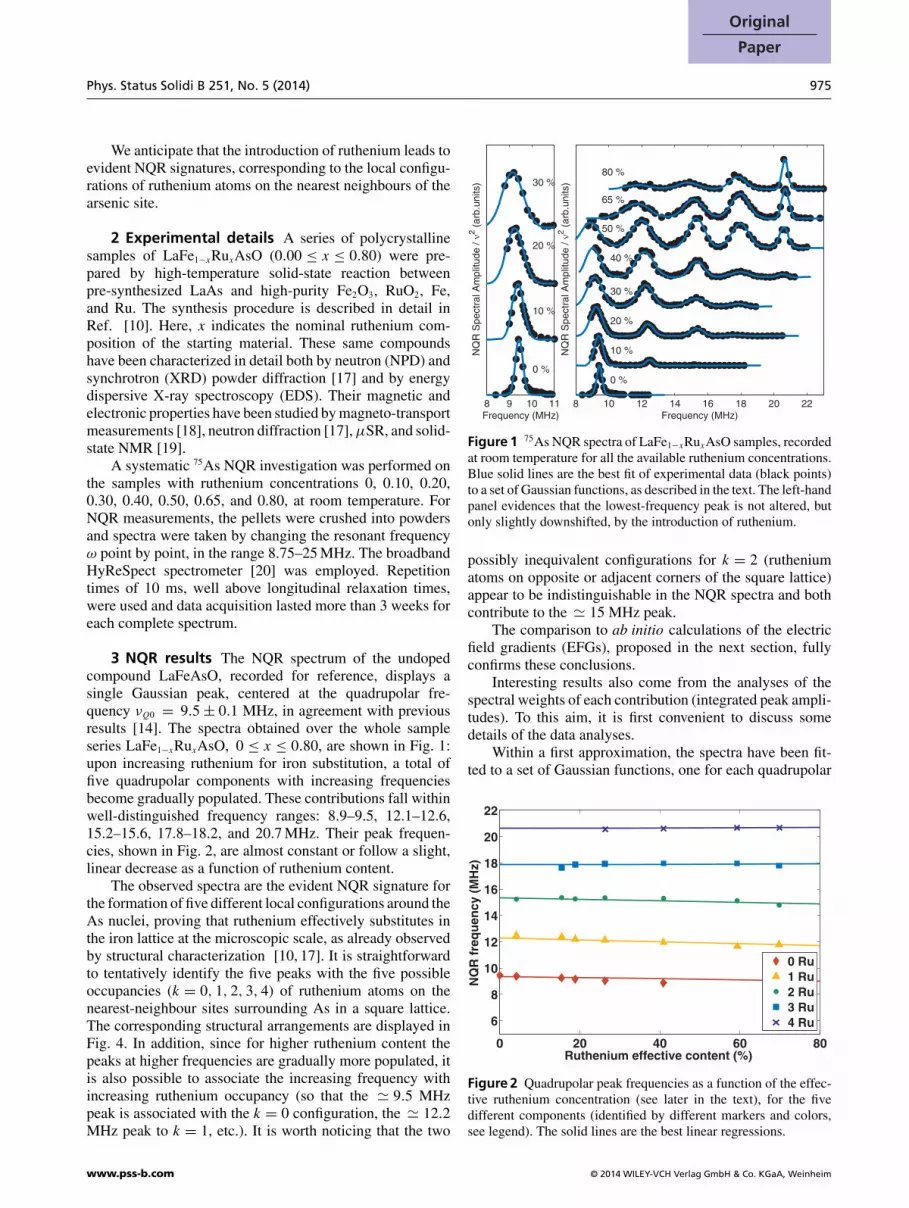
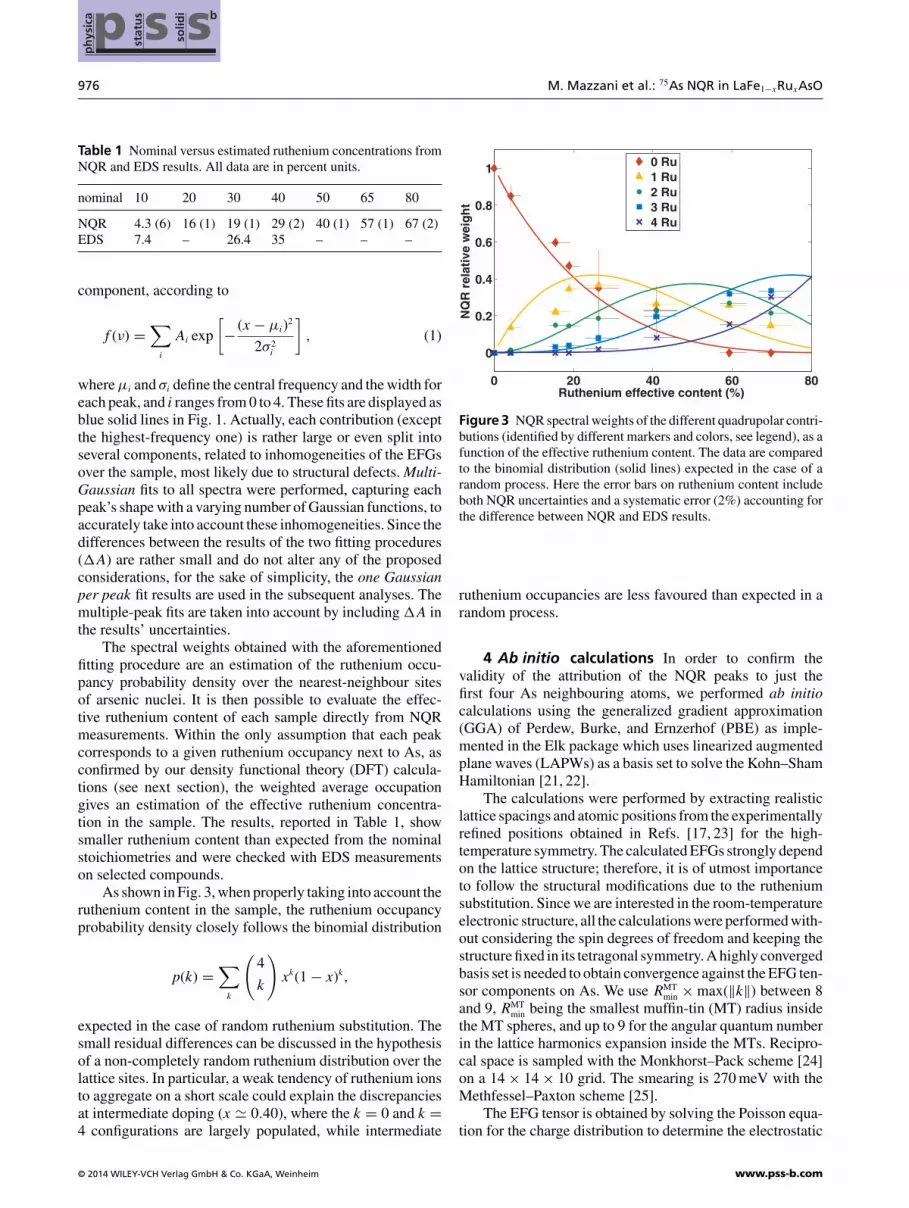
3 NQR results The NQR spectrum of the undopedcompound LaFeAsO, recorded for reference, displays asingle Gaussian peak, centered at the quadrupolar fre-quency νQ0 = 9.5 ± 0.1 MHz, in agreement with previousresults [14]. The spectra obtained over the whole sampleseries LaFe1−xRuxAsO, 0 ≤ x ≤ 0.80, are shown in Fig. 1:upon increasing ruthenium for iron substitution, a total offive quadrupolar components with increasing frequenciesbecome gradually populated. These contributions fall withinwell-distinguished frequency ranges: 8.9–9.5, 12.1–12.6,15.2–15.6, 17.8–18.2, and 20.7 MHz. Their peak frequen-cies, shown in Fig. 2, are almost constant or follow a slight,linear decrease as a function of ruthenium content.
The observed spectra are the evident NQR signature forthe formation of five different local configurations around theAs nuclei, proving that ruthenium effectively substitutes inthe iron lattice at the microscopic scale, as already observedby structural characterization [10, 17]. It is straightforwardto tentatively identify the five peaks with the five possibleoccupancies (k = 0, 1, 2, 3, 4) of ruthenium atoms on thenearest-neighbour sites surrounding As in a square lattice.The corresponding structural arrangements are displayed inFig. 4. In addition, since for higher ruthenium content thepeaks at higher frequencies are gradually more populated, itis also possible to associate the increasing frequency withincreasing ruthenium occupancy (so that the ≃ 9.5 MHzpeak is associated with the k = 0 configuration, the ≃ 12.2MHz peak to k = 1, etc.). It is worth noticing that the two
8 10 12 14 16 18 20 22
Frequency (MHz)
NQ
R S
pe
ctr
al A
mp
litu
de
/ ν
2 (
arb
.un
its)
8 9 10 11
Frequency (MHz)
NQ
R S
pe
ctr
al A
mp
litu
de
/ ν
2 (
arb
.un
its)
0 %
10 %
20 %
30 %
40 %
50 %
30 %
20 %
10 %
0 %
80 %
65 %
Figure 1 75As NQR spectra of LaFe1−xRuxAsO samples, recorded
at room temperature for all the available ruthenium concentrations.
Blue solid lines are the best fit of experimental data (black points)
to a set of Gaussian functions, as described in the text. The left-hand
panel evidences that the lowest-frequency peak is not altered, but
only slightly downshifted, by the introduction of ruthenium.
possibly inequivalent configurations for k = 2 (rutheniumatoms on opposite or adjacent corners of the square lattice)appear to be indistinguishable in the NQR spectra and bothcontribute to the ≃ 15 MHz peak.
The comparison to ab initio calculations of the electricfield gradients (EFGs), proposed in the next section, fullyconfirms these conclusions.
Interesting results also come from the analyses of thespectral weights of each contribution (integrated peak ampli-tudes). To this aim, it is first convenient to discuss somedetails of the data analyses.
Within a first approximation, the spectra have been fit-ted to a set of Gaussian functions, one for each quadrupolar
0 20 40 60 80
6
8
10
12
14
16
18
20
22
Ruthenium effective content (%)
NQ
R f
req
uen
cy (
MH
z)
0 Ru
1 Ru
2 Ru
3 Ru
4 Ru
Figure 2 Quadrupolar peak frequencies as a function of the effec-
tive ruthenium concentration (see later in the text), for the five
different components (identified by different markers and colors,
see legend). The solid lines are the best linear regressions.
www.pss-b.com © 2014 WILEY-VCH Verlag GmbH & Co. KGaA, Weinheim
ph
ysic
a ssp
sta
tus
so
lid
i b
976 M. Mazzani et al.: 75As NQR in LaFe1−xRuxAsO
Table 1 Nominal versus estimated ruthenium concentrations from
NQR and EDS results. All data are in percent units.
nominal 10 20 30 40 50 65 80
NQR 4.3 (6) 16 (1) 19 (1) 29 (2) 40 (1) 57 (1) 67 (2)
EDS 7.4 – 26.4 35 – – –
component, according to
f (ν) =∑
i
Ai exp
[
−(x − μi)
2
2σ2i
]
, (1)
where μi and σi define the central frequency and the width foreach peak, and i ranges from 0 to 4. These fits are displayed asblue solid lines in Fig. 1. Actually, each contribution (exceptthe highest-frequency one) is rather large or even split intoseveral components, related to inhomogeneities of the EFGsover the sample, most likely due to structural defects. Multi-
Gaussian fits to all spectra were performed, capturing eachpeak’s shape with a varying number of Gaussian functions, toaccurately take into account these inhomogeneities. Since thedifferences between the results of the two fitting procedures(�A) are rather small and do not alter any of the proposedconsiderations, for the sake of simplicity, the one Gaussian
per peak fit results are used in the subsequent analyses. Themultiple-peak fits are taken into account by including �A inthe results’ uncertainties.
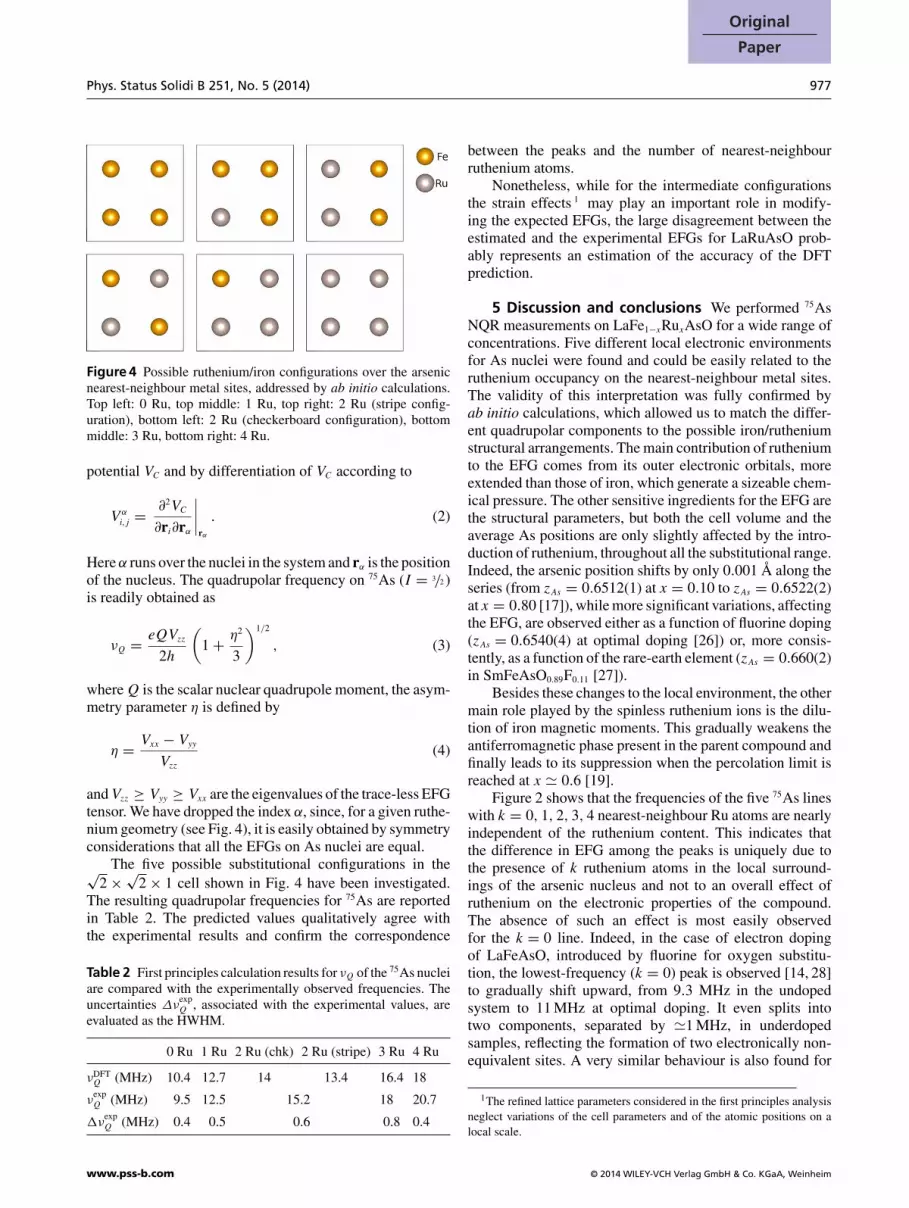
The spectral weights obtained with the aforementionedfitting procedure are an estimation of the ruthenium occu-pancy probability density over the nearest-neighbour sitesof arsenic nuclei. It is then possible to evaluate the effec-tive ruthenium content of each sample directly from NQRmeasurements. Within the only assumption that each peakcorresponds to a given ruthenium occupancy next to As, asconfirmed by our density functional theory (DFT) calcula-tions (see next section), the weighted average occupationgives an estimation of the effective ruthenium concentra-tion in the sample. The results, reported in Table 1, showsmaller ruthenium content than expected from the nominalstoichiometries and were checked with EDS measurementson selected compounds.
As shown in Fig. 3, when properly taking into account theruthenium content in the sample, the ruthenium occupancyprobability density closely follows the binomial distribution
p(k) =∑
k
(
4
k
)
xk(1 − x)k,
expected in the case of random ruthenium substitution. Thesmall residual differences can be discussed in the hypothesisof a non-completely random ruthenium distribution over thelattice sites. In particular, a weak tendency of ruthenium ionsto aggregate on a short scale could explain the discrepanciesat intermediate doping (x ≃ 0.40), where the k = 0 and k =4 configurations are largely populated, while intermediate
0 20 40 60 80
0
0.2
0.4
0.6
0.8
1
Ruthenium effective content (%)
NQ
R r
ela
tiv
e w
eig
ht
0 Ru
1 Ru
2 Ru
3 Ru
4 Ru
Figure 3 NQR spectral weights of the different quadrupolar contri-
butions (identified by different markers and colors, see legend), as a
function of the effective ruthenium content. The data are compared
to the binomial distribution (solid lines) expected in the case of a
random process. Here the error bars on ruthenium content include
both NQR uncertainties and a systematic error (2%) accounting for
the difference between NQR and EDS results.
ruthenium occupancies are less favoured than expected in arandom process.
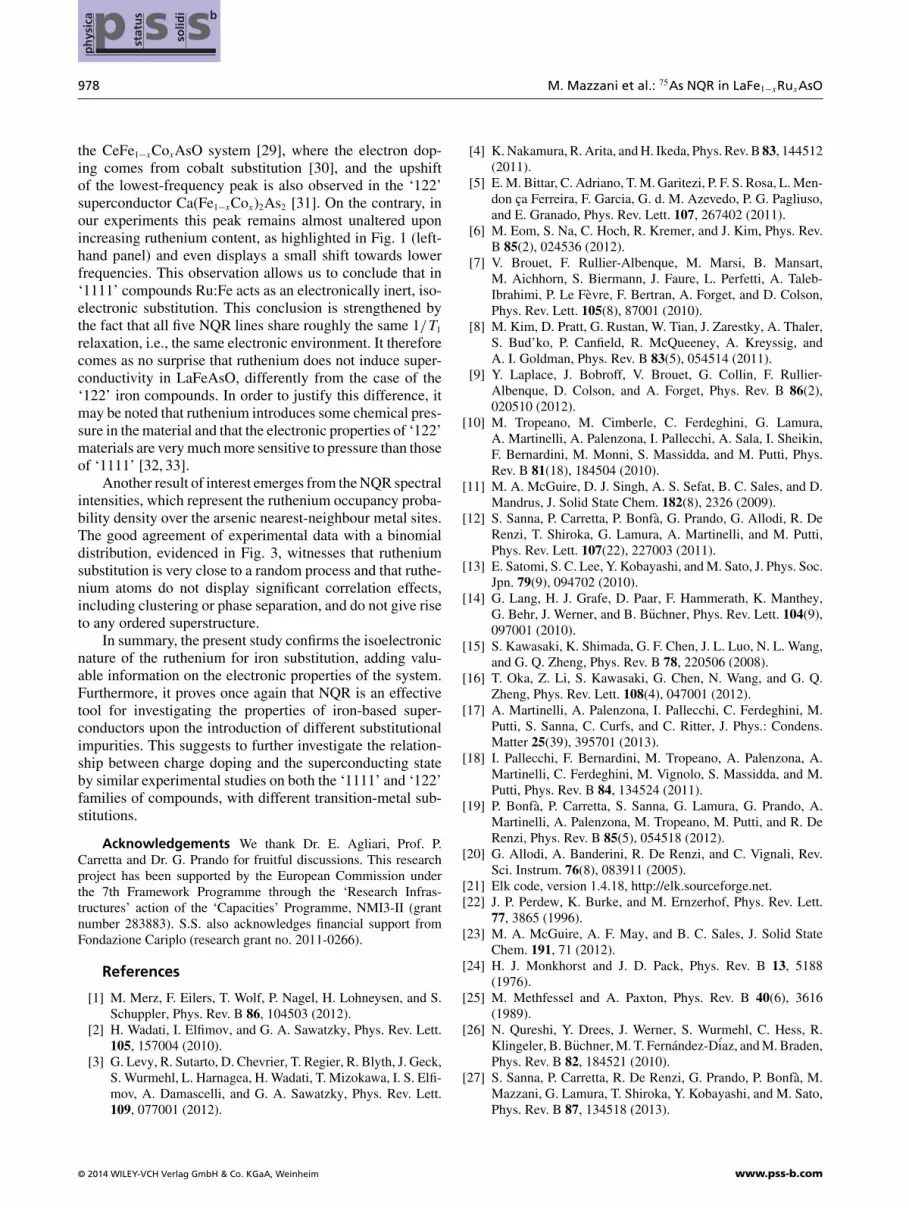
4 Ab initio calculations In order to confirm thevalidity of the attribution of the NQR peaks to just thefirst four As neighbouring atoms, we performed ab initio
calculations using the generalized gradient approximation(GGA) of Perdew, Burke, and Ernzerhof (PBE) as imple-mented in the Elk package which uses linearized augmentedplane waves (LAPWs) as a basis set to solve the Kohn–ShamHamiltonian [21, 22].
The calculations were performed by extracting realisticlattice spacings and atomic positions from the experimentallyrefined positions obtained in Refs. [17, 23] for the high-temperature symmetry. The calculated EFGs strongly dependon the lattice structure; therefore, it is of utmost importanceto follow the structural modifications due to the rutheniumsubstitution. Since we are interested in the room-temperatureelectronic structure, all the calculations were performed with-out considering the spin degrees of freedom and keeping thestructure fixed in its tetragonal symmetry. A highly convergedbasis set is needed to obtain convergence against the EFG ten-sor components on As. We use RMT
min × max(‖k‖) between 8and 9, RMT
min being the smallest muffin-tin (MT) radius insidethe MT spheres, and up to 9 for the angular quantum numberin the lattice harmonics expansion inside the MTs. Recipro-cal space is sampled with the Monkhorst–Pack scheme [24]on a 14 × 14 × 10 grid. The smearing is 270 meV with theMethfessel–Paxton scheme [25].
The EFG tensor is obtained by solving the Poisson equa-tion for the charge distribution to determine the electrostatic
© 2014 WILEY-VCH Verlag GmbH & Co. KGaA, Weinheim www.pss-b.com
Original
Paper
Phys. Status Solidi B 251, No. 5 (2014) 977
Figure 4 Possible ruthenium/iron configurations over the arsenic
nearest-neighbour metal sites, addressed by ab initio calculations.
Top left: 0 Ru, top middle: 1 Ru, top right: 2 Ru (stripe config-
uration), bottom left: 2 Ru (checkerboard configuration), bottom
middle: 3 Ru, bottom right: 4 Ru.
potential VC and by differentiation of VC according to
V α
i,j=
∂2VC
∂ri∂rα
∣
∣
∣
∣
rα
. (2)
Here α runs over the nuclei in the system and rα is the positionof the nucleus. The quadrupolar frequency on 75As (I = 3/2 )is readily obtained as
νQ =eQVzz
2h
(
1 +η2
3
)1/2
, (3)
where Q is the scalar nuclear quadrupole moment, the asym-metry parameter η is defined by
η =Vxx − Vyy
Vzz
(4)
and Vzz ≥ Vyy ≥ Vxx are the eigenvalues of the trace-less EFGtensor. We have dropped the index α, since, for a given ruthe-nium geometry (see Fig. 4), it is easily obtained by symmetryconsiderations that all the EFGs on As nuclei are equal.
The five possible substitutional configurations in the√2 ×
√2 × 1 cell shown in Fig. 4 have been investigated.
The resulting quadrupolar frequencies for 75As are reportedin Table 2. The predicted values qualitatively agree withthe experimental results and confirm the correspondence
Table 2 First principles calculation results for νQ of the 75As nuclei
are compared with the experimentally observed frequencies. The
uncertainties ΔνexpQ , associated with the experimental values, are
evaluated as the HWHM.
0 Ru 1 Ru 2 Ru (chk) 2 Ru (stripe) 3 Ru 4 Ru
νDFTQ (MHz) 10.4 12.7 14 13.4 16.4 18
νexpQ (MHz) 9.5 12.5 15.2 18 20.7
�νexpQ (MHz) 0.4 0.5 0.6 0.8 0.4
between the peaks and the number of nearest-neighbourruthenium atoms.
Nonetheless, while for the intermediate configurationsthe strain effects 1 may play an important role in modify-ing the expected EFGs, the large disagreement between theestimated and the experimental EFGs for LaRuAsO prob-ably represents an estimation of the accuracy of the DFTprediction.
5 Discussion and conclusions We performed 75AsNQR measurements on LaFe1−xRuxAsO for a wide range ofconcentrations. Five different local electronic environmentsfor As nuclei were found and could be easily related to theruthenium occupancy on the nearest-neighbour metal sites.The validity of this interpretation was fully confirmed byab initio calculations, which allowed us to match the differ-ent quadrupolar components to the possible iron/rutheniumstructural arrangements. The main contribution of rutheniumto the EFG comes from its outer electronic orbitals, moreextended than those of iron, which generate a sizeable chem-ical pressure. The other sensitive ingredients for the EFG arethe structural parameters, but both the cell volume and theaverage As positions are only slightly affected by the intro-duction of ruthenium, throughout all the substitutional range.Indeed, the arsenic position shifts by only 0.001 A along theseries (from zAs = 0.6512(1) at x = 0.10 to zAs = 0.6522(2)at x = 0.80 [17]), while more significant variations, affectingthe EFG, are observed either as a function of fluorine doping(zAs = 0.6540(4) at optimal doping [26]) or, more consis-tently, as a function of the rare-earth element (zAs = 0.660(2)in SmFeAsO0.89F0.11 [27]).
Besides these changes to the local environment, the othermain role played by the spinless ruthenium ions is the dilu-tion of iron magnetic moments. This gradually weakens theantiferromagnetic phase present in the parent compound andfinally leads to its suppression when the percolation limit isreached at x ≃ 0.6 [19].
Figure 2 shows that the frequencies of the five 75As lineswith k = 0, 1, 2, 3, 4 nearest-neighbour Ru atoms are nearlyindependent of the ruthenium content. This indicates thatthe difference in EFG among the peaks is uniquely due tothe presence of k ruthenium atoms in the local surround-ings of the arsenic nucleus and not to an overall effect ofruthenium on the electronic properties of the compound.The absence of such an effect is most easily observedfor the k = 0 line. Indeed, in the case of electron dopingof LaFeAsO, introduced by fluorine for oxygen substitu-tion, the lowest-frequency (k = 0) peak is observed [14, 28]to gradually shift upward, from 9.3 MHz in the undopedsystem to 11 MHz at optimal doping. It even splits intotwo components, separated by ≃1 MHz, in underdopedsamples, reflecting the formation of two electronically non-equivalent sites. A very similar behaviour is also found for
1The refined lattice parameters considered in the first principles analysis
neglect variations of the cell parameters and of the atomic positions on a
local scale.
www.pss-b.com © 2014 WILEY-VCH Verlag GmbH & Co. KGaA, Weinheim
ph
ysic
a ssp
sta
tus
so
lid
i b
978 M. Mazzani et al.: 75As NQR in LaFe1−xRuxAsO
the CeFe1−xCoxAsO system [29], where the electron dop-ing comes from cobalt substitution [30], and the upshiftof the lowest-frequency peak is also observed in the ‘122’superconductor Ca(Fe1−xCox)2As2 [31]. On the contrary, inour experiments this peak remains almost unaltered uponincreasing ruthenium content, as highlighted in Fig. 1 (left-hand panel) and even displays a small shift towards lowerfrequencies. This observation allows us to conclude that in‘1111’ compounds Ru:Fe acts as an electronically inert, iso-electronic substitution. This conclusion is strengthened bythe fact that all five NQR lines share roughly the same 1/T1
relaxation, i.e., the same electronic environment. It thereforecomes as no surprise that ruthenium does not induce super-conductivity in LaFeAsO, differently from the case of the‘122’ iron compounds. In order to justify this difference, itmay be noted that ruthenium introduces some chemical pres-sure in the material and that the electronic properties of ‘122’materials are very much more sensitive to pressure than thoseof ‘1111’ [32, 33].
Another result of interest emerges from the NQR spectralintensities, which represent the ruthenium occupancy proba-bility density over the arsenic nearest-neighbour metal sites.The good agreement of experimental data with a binomialdistribution, evidenced in Fig. 3, witnesses that rutheniumsubstitution is very close to a random process and that ruthe-nium atoms do not display significant correlation effects,including clustering or phase separation, and do not give riseto any ordered superstructure.
In summary, the present study confirms the isoelectronicnature of the ruthenium for iron substitution, adding valu-able information on the electronic properties of the system.Furthermore, it proves once again that NQR is an effectivetool for investigating the properties of iron-based super-conductors upon the introduction of different substitutionalimpurities. This suggests to further investigate the relation-ship between charge doping and the superconducting stateby similar experimental studies on both the ‘1111’ and ‘122’families of compounds, with different transition-metal sub-stitutions.
Acknowledgements We thank Dr. E. Agliari, Prof. P.
Carretta and Dr. G. Prando for fruitful discussions. This research
project has been supported by the European Commission under
the 7th Framework Programme through the ‘Research Infras-
tructures’ action of the ‘Capacities’ Programme, NMI3-II (grant
number 283883). S.S. also acknowledges financial support from
Fondazione Cariplo (research grant no. 2011-0266).
References
[1] M. Merz, F. Eilers, T. Wolf, P. Nagel, H. Lohneysen, and S.
Schuppler, Phys. Rev. B 86, 104503 (2012).
[2] H. Wadati, I. Elfimov, and G. A. Sawatzky, Phys. Rev. Lett.
105, 157004 (2010).
[3] G. Levy, R. Sutarto, D. Chevrier, T. Regier, R. Blyth, J. Geck,
S. Wurmehl, L. Harnagea, H. Wadati, T. Mizokawa, I. S. Elfi-
mov, A. Damascelli, and G. A. Sawatzky, Phys. Rev. Lett.
109, 077001 (2012).
[4] K. Nakamura, R. Arita, and H. Ikeda, Phys. Rev. B 83, 144512
(2011).
[5] E. M. Bittar, C. Adriano, T. M. Garitezi, P. F. S. Rosa, L. Men-
don ca Ferreira, F. Garcia, G. d. M. Azevedo, P. G. Pagliuso,
and E. Granado, Phys. Rev. Lett. 107, 267402 (2011).
[6] M. Eom, S. Na, C. Hoch, R. Kremer, and J. Kim, Phys. Rev.
B 85(2), 024536 (2012).
[7] V. Brouet, F. Rullier-Albenque, M. Marsi, B. Mansart,
M. Aichhorn, S. Biermann, J. Faure, L. Perfetti, A. Taleb-
Ibrahimi, P. Le Fevre, F. Bertran, A. Forget, and D. Colson,
Phys. Rev. Lett. 105(8), 87001 (2010).
[8] M. Kim, D. Pratt, G. Rustan, W. Tian, J. Zarestky, A. Thaler,
S. Bud’ko, P. Canfield, R. McQueeney, A. Kreyssig, and
A. I. Goldman, Phys. Rev. B 83(5), 054514 (2011).
[9] Y. Laplace, J. Bobroff, V. Brouet, G. Collin, F. Rullier-
Albenque, D. Colson, and A. Forget, Phys. Rev. B 86(2),
020510 (2012).
[10] M. Tropeano, M. Cimberle, C. Ferdeghini, G. Lamura,
A. Martinelli, A. Palenzona, I. Pallecchi, A. Sala, I. Sheikin,
F. Bernardini, M. Monni, S. Massidda, and M. Putti, Phys.
Rev. B 81(18), 184504 (2010).
[11] M. A. McGuire, D. J. Singh, A. S. Sefat, B. C. Sales, and D.
Mandrus, J. Solid State Chem. 182(8), 2326 (2009).
[12] S. Sanna, P. Carretta, P. Bonfa, G. Prando, G. Allodi, R. De
Renzi, T. Shiroka, G. Lamura, A. Martinelli, and M. Putti,
Phys. Rev. Lett. 107(22), 227003 (2011).
[13] E. Satomi, S. C. Lee, Y. Kobayashi, and M. Sato, J. Phys. Soc.
Jpn. 79(9), 094702 (2010).
[14] G. Lang, H. J. Grafe, D. Paar, F. Hammerath, K. Manthey,
G. Behr, J. Werner, and B. Buchner, Phys. Rev. Lett. 104(9),
097001 (2010).
[15] S. Kawasaki, K. Shimada, G. F. Chen, J. L. Luo, N. L. Wang,
and G. Q. Zheng, Phys. Rev. B 78, 220506 (2008).
[16] T. Oka, Z. Li, S. Kawasaki, G. Chen, N. Wang, and G. Q.
Zheng, Phys. Rev. Lett. 108(4), 047001 (2012).
[17] A. Martinelli, A. Palenzona, I. Pallecchi, C. Ferdeghini, M.
Putti, S. Sanna, C. Curfs, and C. Ritter, J. Phys.: Condens.
Matter 25(39), 395701 (2013).
[18] I. Pallecchi, F. Bernardini, M. Tropeano, A. Palenzona, A.
Martinelli, C. Ferdeghini, M. Vignolo, S. Massidda, and M.
Putti, Phys. Rev. B 84, 134524 (2011).
[19] P. Bonfa, P. Carretta, S. Sanna, G. Lamura, G. Prando, A.
Martinelli, A. Palenzona, M. Tropeano, M. Putti, and R. De
Renzi, Phys. Rev. B 85(5), 054518 (2012).
[20] G. Allodi, A. Banderini, R. De Renzi, and C. Vignali, Rev.
Sci. Instrum. 76(8), 083911 (2005).
[21] Elk code, version 1.4.18, http://elk.sourceforge.net.
[22] J. P. Perdew, K. Burke, and M. Ernzerhof, Phys. Rev. Lett.
77, 3865 (1996).
[23] M. A. McGuire, A. F. May, and B. C. Sales, J. Solid State
Chem. 191, 71 (2012).
[24] H. J. Monkhorst and J. D. Pack, Phys. Rev. B 13, 5188
(1976).
[25] M. Methfessel and A. Paxton, Phys. Rev. B 40(6), 3616
(1989).
[26] N. Qureshi, Y. Drees, J. Werner, S. Wurmehl, C. Hess, R.
Klingeler, B. Buchner, M. T. Fernandez-Diaz, and M. Braden,
Phys. Rev. B 82, 184521 (2010).
[27] S. Sanna, P. Carretta, R. De Renzi, G. Prando, P. Bonfa, M.
Mazzani, G. Lamura, T. Shiroka, Y. Kobayashi, and M. Sato,
Phys. Rev. B 87, 134518 (2013).
© 2014 WILEY-VCH Verlag GmbH & Co. KGaA, Weinheim www.pss-b.com
Original
Paper
Phys. Status Solidi B 251, No. 5 (2014) 979
[28] H. Grafe, G. Lang, F. Hammerath, D. Paar, K. Manthey, K.
Koch, H. Rosner, N. J. Curro, G. Behr, J. Werner, N. Leps, R.
Klingeler, H. H. Klauss, F. J. Litterst, and B. Buchner, New
J. Phys. 11(3), 035002 (2009).
[29] G. Lang, H. Grafe, and B. Buchner, private communication.
[30] G. Prando, O. Vakaliuk, S. Sanna, G. Lamura, T. Shiroka,
P. Bonfa, P. Carretta, R. De Renzi, H. H. Klauss, C. G. F.
Blum, S. Wurmehl, C. Hess, and B. Buchner, Phys. Rev. B
87, 174519 (2013).
[31] S. H. Baek, H. J. Grafe, L. Harnagea, S. Singh, S. Wurmehl,
and B. Buchner, Phys. Rev. B 84, 094510 (2011).
[32] E. Gati, S. Kohler, D. Guterding, B. Wolf, S. Knoner, S. Ran,
S. Budko, P. C. Canfield, and M. Lang, Phys. Rev. B 86,
220511 (2012).
[33] R. D. Renzi, P. Bonfa, M. Mazzani, S. Sanna, G. Prando, P.
Carretta, R. Khasanov, A. Amato, H. Luetkens, M. Bendele,
F. Bernardini, S. Massidda, A. Palenzona, M. Tropeano, and
M. Vignolo, Supercond. Sci. Technol. 25(8), 084009 (2012).
www.pss-b.com © 2014 WILEY-VCH Verlag GmbH & Co. KGaA, Weinheim