4.1 Stock description and management units 4.2 Ling (Molva ...
97
ICES WGDEEP REPORT 2018 | 21 4 Ling ( Molva molva ) in the Northeast Atlantic 4.1 Stock description and management units 4.2 Ling ( Molva Molva ) in Division 5.b 4.2.1 The fishery The longline fisheries in Faroese waters were mainly on the slope on the Faroe Plateau and a small amount of it was on the bank areas and Wyville-Thomson Ridge (Figure 4.2.1). Ling was also caught as bycatch by trawlers fishing saithe on the Faroe Plateau (Figure 4.2.2). In the latest years, foreign catches was mainly by the Norwegian long- liners. Figure 4.2.1. Ling in 5.b. Spatial distribution of the longline fishery 1985 to present, where ling was >30% of the total catches in the sets. These are the data behind the longliners cpue series of ling. Figure 4.2.2. Ling in 5.b. Spatial distribution of pair trawler fishery 1994 to present, where ling was in the catch and saithe >60% of the total catch per haul. These are the data behind the pair trawler bycatch cpue series of ling. 4.2.2 Landings trends Landings data for this stock are available from 1904 onwards (Figure 4.2.3). Landing statistics for ling by nation for the period 1988–2017 are given in Tables 4.2.1–4.2.3 and total landings data from 1904 onwards are shown in Figure 4.2.3. Total landings in Division 5.b have in general been very stable since the 1970s varying between around 4000 and 7000 tonnes. In the period from 1990–2005 around 20% of the catch was fished
-
Upload
khangminh22 -
Category
Documents
-
view
0 -
download
0
Transcript of 4.1 Stock description and management units 4.2 Ling (Molva ...

ICES WGDEEP REPORT 2018 | 21
4 Ling (Molva molva) in the Northeast Atlantic
4.1 Stock description and management units
4.2 Ling (Molva Molva) in Division 5.b
4.2.1 The fishery
The longline fisheries in Faroese waters were mainly on the slope on the Faroe Plateau
and a small amount of it was on the bank areas and Wyville-Thomson Ridge (Figure
4.2.1). Ling was also caught as bycatch by trawlers fishing saithe on the Faroe Plateau
(Figure 4.2.2). In the latest years, foreign catches was mainly by the Norwegian long-
liners.
Figure 4.2.1. Ling in 5.b. Spatial distribution of the longline fishery 1985 to present, where ling was
>30% of the total catches in the sets. These are the data behind the longliners cpue series of ling.
Figure 4.2.2. Ling in 5.b. Spatial distribution of pair trawler fishery 1994 to present, where ling was
in the catch and saithe >60% of the total catch per haul. These are the data behind the pair trawler
bycatch cpue series of ling.
4.2.2 Landings trends
Landings data for this stock are available from 1904 onwards (Figure 4.2.3). Landing
statistics for ling by nation for the period 1988–2017 are given in Tables 4.2.1–4.2.3 and
total landings data from 1904 onwards are shown in Figure 4.2.3. Total landings in
Division 5.b have in general been very stable since the 1970s varying between around
4000 and 7000 tonnes. In the period from 1990–2005 around 20% of the catch was fished
22 | ICES WGDEEP REPORT 2018
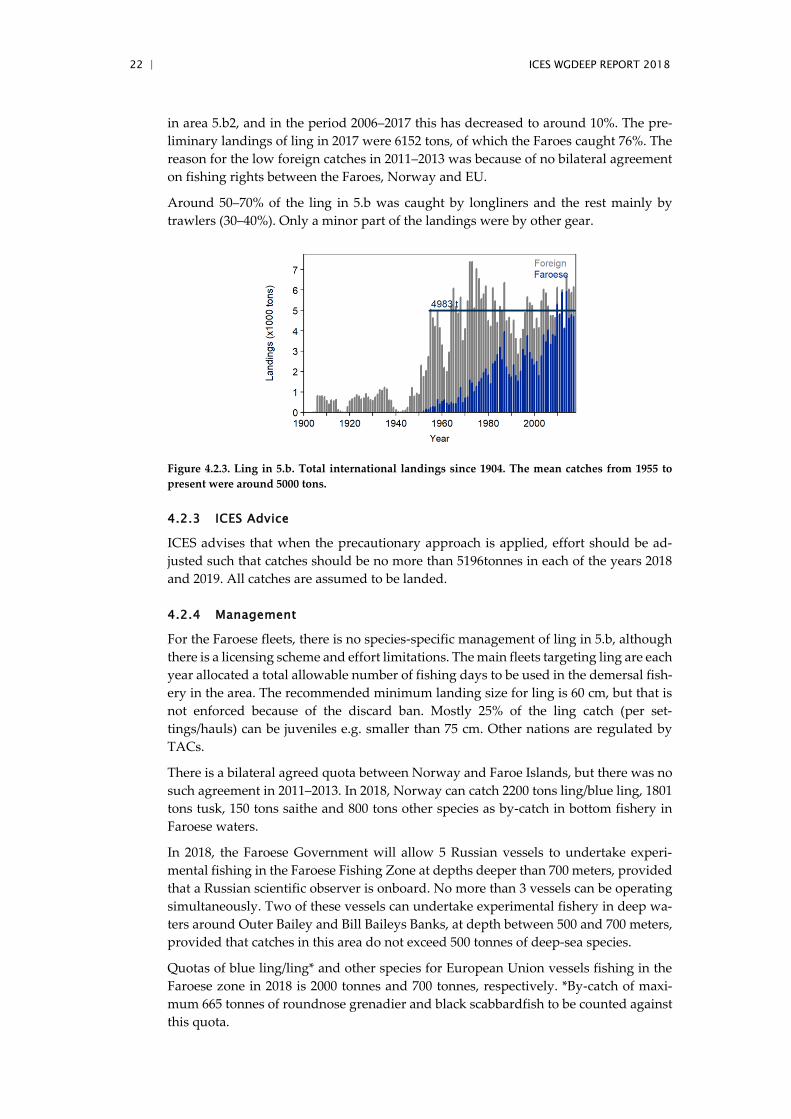
in area 5.b2, and in the period 2006–2017 this has decreased to around 10%. The pre-
liminary landings of ling in 2017 were 6152 tons, of which the Faroes caught 76%. The
reason for the low foreign catches in 2011–2013 was because of no bilateral agreement
on fishing rights between the Faroes, Norway and EU.
Around 50–70% of the ling in 5.b was caught by longliners and the rest mainly by
trawlers (30–40%). Only a minor part of the landings were by other gear.
Figure 4.2.3. Ling in 5.b. Total international landings since 1904. The mean catches from 1955 to
present were around 5000 tons.
4.2.3 ICES Advice
ICES advises that when the precautionary approach is applied, effort should be ad-
justed such that catches should be no more than 5196tonnes in each of the years 2018
and 2019. All catches are assumed to be landed.
4.2.4 Management
For the Faroese fleets, there is no species-specific management of ling in 5.b, although
there is a licensing scheme and effort limitations. The main fleets targeting ling are each
year allocated a total allowable number of fishing days to be used in the demersal fish-
ery in the area. The recommended minimum landing size for ling is 60 cm, but that is
not enforced because of the discard ban. Mostly 25% of the ling catch (per set-
tings/hauls) can be juveniles e.g. smaller than 75 cm. Other nations are regulated by
TACs.
There is a bilateral agreed quota between Norway and Faroe Islands, but there was no
such agreement in 2011–2013. In 2018, Norway can catch 2200 tons ling/blue ling, 1801
tons tusk, 150 tons saithe and 800 tons other species as by-catch in bottom fishery in
Faroese waters.
In 2018, the Faroese Government will allow 5 Russian vessels to undertake experi-
mental fishing in the Faroese Fishing Zone at depths deeper than 700 meters, provided
that a Russian scientific observer is onboard. No more than 3 vessels can be operating
simultaneously. Two of these vessels can undertake experimental fishery in deep wa-
ters around Outer Bailey and Bill Baileys Banks, at depth between 500 and 700 meters,
provided that catches in this area do not exceed 500 tonnes of deep-sea species.
Quotas of blue ling/ling* and other species for European Union vessels fishing in the
Faroese zone in 2018 is 2000 tonnes and 700 tonnes, respectively. *By-catch of maxi-
mum 665 tonnes of roundnose grenadier and black scabbardfish to be counted against
this quota.

ICES WGDEEP REPORT 2018 | 23
4.2.5 Data available
Data on length, gutted weight and age are available for ling from the Faroese landings
and Table 4.2.4 gives an overview of the levels of sampling since 1996.
There are also catch and effort data from logbooks for the Faroese longliners and trawl-
ers.
From the two annual Faroese groundfish surveys on the Faroe Plateau, especially de-
signed for cod, haddock and saithe, biological data (mainly length and round weight,
Table 4.2.4) as well as catch and effort data are available. Data of ling larvae from the
annual 0-group survey on the Faroe Plateau was also used.
In addition, there are also data available on catch, effort and mean length from Norwe-
gian longliners fishing in Faroese waters.
4.2.5.1 Landings and discards
Landings were available for all relevant fleets. No estimates of discards of ling are
available. But since the Faroese fleets are not regulated by TACs and in addition there
is a ban on discarding in Faroese EEZ, incentives for illegal discarding are believed to
be low. The landings statistics are therefore regarded as being adequate for assessment
purposes.
4.2.5.2 Length compositions
Length composition data are available from the Faroese commercial longliners, the
trawler fleet that captures ling as bycatch and two groundfish surveys (Figures 4.2.4–
4.2.7).
Figure 4.2.4. Ling in 5.b. Length distribution in the landings of ling from Faroese longliners
(>110 GRT). ML-mean length and N-number of length measures.

24 | ICES WGDEEP REPORT 2018
Figure 4.2.5. Ling in 5.b. Length distribution in the landings of ling from Faroese trawlers
(>1000 HP). ML-mean length and N-number of length measures.
Figure 4.2.6. Ling in 5.b. Length distribution from the spring groundfish survey. ML- mean length,
N–number of calculated length measures. The small ling are often sampled from a subsample of
the total catch, so the values are multiplied to total catch.

ICES WGDEEP REPORT 2018 | 25
Figure 4.2.7. Ling in 5.b. Length distribution from the summer groundfish survey. ML- mean length,
N–number of calculated length measures. The small ling are often sampled from a subsample of
the total catch, so the values are multiplied to total catch.
4.2.5.3 Catch-at-age
Catch-at-age data were provided for Faroese landings in 5.b for the period 1996 to pre-
sent. Due to few age data in the recent period were all ages from 1996 to present com-
bined (the same age–length key for all these years in the exploratory assessment).
Thereafter were the age–length data distributed on the lengths for the distinct years
and fleets (longliners and trawlers) (Figure 4.2.8). The common ages in the landings are
from five to nine years and the mean age is around 7–8 years.
Figure 4.2.8. Ling 5.b. Catch-at-age composition used in the exploratory assessment. MA- mean age.

26 | ICES WGDEEP REPORT 2018
4.2.5.4 Weight-at-age
Mean weight-at-age data from the landings in 5.b were modelled by using all the age
samples from landings (1996 to present) combined before they were distributed on the
length distribution for the distinct year and fleet (longliners and trawlers). There is no
particular decreasing trend in the mean weights over the period (Figure 4.2.9).
Figure 4.2.9. Ling in 5.b. Mean weight-at-age in the catches.
4.2.5.5 Maturity and natural mortality
Maturity ogives of ling are presented in Table below. The results fit well with the state-
ment that ling become mature at ages 5–7 (60–75 cm lengths) in most areas, with males
maturing at a slightly lower age than females (Magnusson et al., 1997).
Maturity parameters:
AREA SEX A50 N L50 N RW50 N GW50 N
Faroese waters Combined 5.89 1677 68.86 1737 2069.5 1308 1435.2 295
Faroese waters Female 6.21 846 71.81 871
Faroese waters Male 5.60 831 66.54 865
The same calculated maturity-at-age of all data was used for all years in the assessment
for sexes combined.
No information is available on natural mortality of ling in 5.b. Natural mortality of 0.15
was assumed for all ages in the exploratory assessment.
4.2.5.6 Catch, effort and research vessel data
Commercial cpue series
There are catch per unit of effort (cpue) data available from three commercial series,
the Faroese longliners, the Faroese pair trawlers (bycatch) and Norwegian longliners
fishing in Division 5.b. The Faroese cpue data are from five longliners (GRT>110) and
6–10 pair trawlers (HP>1000). The effort obtained from the logbooks was estimated as
1000 hooks from the longliners, number of fishing (trawling) hours from the trawlers
and the catch as kg stated in the logbooks. The selection of data and standardization
are described in the stock annex for ling in 5.b. The data selected in the longliner series
was only from sets where ling was more than 30% of the total catch to be able to com-
pare with the Norwegian longliner series.

ICES WGDEEP REPORT 2018 | 27
The standardized cpue data from Norwegian longliners fishing in Division 5.b are de-
scribed in the stock annex for ling in 2.a (Section ling in 1 and 2). The sets where ling
>30% of the total catch were used. The Norwegian and Faroese longliners are compa-
rable and both have ling (and tusk) as target species.
Fisheries-independent cpue series
Cpue estimates (kg/hour) for ling are available from two annual groundfish trawl sur-
veys on the Faroe Plateau designed for cod, haddock and saithe. The annual survey on
the Faroe Plateau covers the main fishing areas and mainly the larger part of the spatial
distribution area. Information on the surveys and standardization of the data are de-
scribed in the stock annex.
A potential recruitment index was calculated from ling less than 40 cm from the survey.
In addition, an index was calculated from the annual 0-group survey on the Faroe Plat-
eau.
4.2.6 Data analyses
Mean length in the length distribution from commercial catches from Faroese long-
liners and trawlers showed an increase in mean length from 74–79 cm in 2007 to mainly
around 83–86 cm since 2010 (Figure 4.2.4–4.2.5). The mean length in length distribu-
tions for the Norwegian longliners fishing in Faroese waters, in the period 2003–2009
were around 87 cm. The Faroese trawlers have a slightly higher mean length in the
catches as the Faroese longliners.
Length distributions from the two groundfish surveys on the Faroe Plateau showed
high interannual variation in mean length, from 65 to 85 cm, which may partly be ex-
plained by occasional high abundance of individuals smaller than 60 cm (Figures 4.2.6–
4.2.7).
Fluctuations in abundance
Information on abundance trends can be derived from the cpue data from the Faroese
longliners (Figure 4.2.10), Norwegian longliners fishing in 5.b (Figure 4.2.11), bycatch
from the Faroese pair trawlers fishing saithe (Figure 4.2.10) and from the Faroese
groundfish surveys (Figure 4.2.12). Data from these series are presented in Table 4.2.5–
4.2.6.
The Faroese longline cpue series and the Faroese trawl bycatch cpue series show an
increasing trend since around 2001 (Figure 4.2.10). The Norwegian longline series show
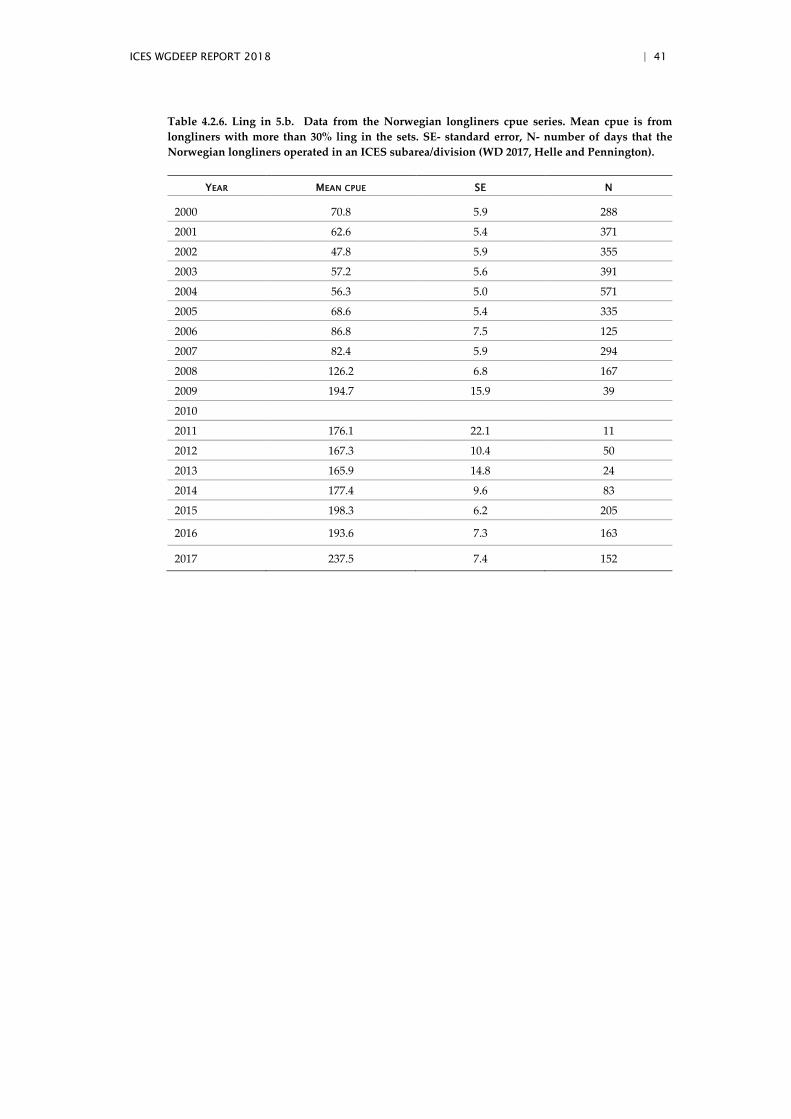
an increase since 2004 (Figure 4.2.11). It has to be noted that there are less than 100
fishing days from Norwegian longliners in Faroese waters in 2009–2014 (Table 4.2.6).
The two survey cpue series indicate a stable situation since the late 1990s and an in-
crease in recent years (Figure 4.2.12). There were a small decrease in latest years, but
the values were still well above the mean value.
A potential recruitment index was calculated from the two surveys as the number of
ling smaller than 40 cm (Figure 4.2.13). This shows indications of increasing recruit-
ment in recent years. In addition, a potential recruitment index was calculated of ling
(2–3 cm in length) from the annual 0-group survey on the Faroe Plateau 1983 to present,
which also showed indications of high recruitment (Figure 4.2.14). These recruitment
indices support an indication of increasing recruitment in recent years.

28 | ICES WGDEEP REPORT 2018
Figure 4.2.10. Ling in 5.b. Standardized cpue from Faroese longliners (turquoise line) and pair
trawlers (bycatch, dark blue line) fishing in Faroese waters. Data from longliners (>110 GRT) are
from sets where ling >30% of the total catch. Data from trawlers are from hauls where ling was
caught and saithe >60% of the total catch. The error bars are SE.
Figure 4.2.11. Ling in 5.b. Standardized cpue (kg/ 1000 hooks) of ling from Norwegian longliners
fishing in 5.b. The bars denote the 95% confidence intervals. Note that there are very few data since
2006.
Figure 4.2.12. Ling in 5.b. Standardized cpue (kg/h) from the two annual Faroese groundfish surveys
on the Faroe Plateau. The error bars are SE. The data for 1983–1993 were not standardized.

ICES WGDEEP REPORT 2018 | 29
Figure 4.2.13. Ling in 5.b. Index (number/hour) of ling smaller than 40 cm from the spring- and
summer survey on the Faroe Plateau.
Figure 4.2.14. Ling in 5.b. Index (number/hour) and occurrence (%) of ling (2–3 cm in length) caught
in the annual 0-group survey on the Faroe Plateau.
Analytical assessment
An exploratory assessment of ling in Division 5.b was done by using an age-based
model SAM. The summer survey series was used as tuning series. Ages from 2137 oto-
liths were used in the combined age–length key, and then distributed out on length
distribution of each distinct year (1996 to present). The summer surveys on the Faroe
Plateau cover most of the spatial distribution area and the fishery areas. In addition,
the surveys also had the same trend as the commercial series.
The SAM model fitted the cpue-data well, but the log q residuals showed some sea-
sonal problems in following the cohorts.
The results from the SAM model supported that ling in Faroese waters is at a high level
as both the recruitment and SSB were above long-term mean in the latest five years
(Figure 4.2.15). The retrospective pattern showed that fishing mortality tended to be
underestimated, whereas the recruitment and SSB tended to be overestimated.

30 | ICES WGDEEP REPORT 2018
Figure 4.2.15. Ling in 5.b. Output from the age based assessment using SAM.
4.2.6.1 Reference points
No reference points have been proposed for this stock. However, as adult abundance
as measured by surveys is above the average of the time-series, expert judgement con-
sidered it likely that SSB is above any candidate values for MSY Btrigger.
Yield per recruit analysis in SAM from the exploratory assessment gave FMAX = 0.21,
F0.1 =0.12 and F0.35SPR = 0.15.
4.2.7 Comments on assessment
All signs from commercial catches and surveys indicate that ling in Division 5.b is at
present in a good state. This is confirmed in the exploratory assessment using the sum-
mer survey as tuning series.
There is a clear seasonal pattern in log q residuals and there need to be a closer look at
the diagnostic to find the best settings. It is a need to look closer at the ALK for the
whole period to try to solve the strong log q residual patterns. Still, the assessment
shows that there is an increase in recruitment, stock biomass and spawning–stock bio-
mass during the last year’s period.
Ling in 5.b is a category 3 stock according to the ICES DLS approach proposed by the
ADG in 2012. There are possibilities to increase ling in 5.b to a category 1 stock with
the excising data.
In the advice a 3.2 rule was used on the summer survey.
4.2.8 Management consideration
Stability in landings and trends in abundance indices suggest that ling in Division 5.b
has been stable since the middle of the 1980s, with an increasing trend in the last seven
years. The available data series does not cover the entire period of the fishery (back to
the early 1900s; see Figure 4.2.3) and no information is available on stock levels prior
to 1986. There is evidence of increased recruitment in the last seven years compared to
earlier levels.
The only species-specific management for Faroese fisheries of ling in Division 5.b is the
recommended minimum landing size (60 cm), but this does not appear to be enforced
because of the discard ban. Mostly 25% of the ling catch (per settings/hauls) can be
juveniles e.g. smaller than 75 cm.
The exploitation of ling is influenced by regulations aimed at other groundfish species,
e.g. cod, haddock, and saithe such as closed areas. The fisheries by other nations are
regulated by TACs.

ICES WGDEEP REPORT 2018 | 31
4.2.9 Application of MSY proxy reference points
Conclusions from WKProxy review 2017 on lin.27.5b:
The RG believes that an acceptable proxy method (LBI) was used and concurs with the
EG that the stock is not overfished and is not experiencing overfishing. Based on the
analysis provided by the EG, the trends from SAM results and LBI indicators, the RG
determined that the stock is in good health. The RG concluded that the stock was not
experiencing overfishing due to the F trends, F2015 compared to Fmax, and LBI values.
These proxy values indicated that the stock was in good health.
Length-based indicator method (LBI)
The input parameters and the catch length composition for the period 1995–2017 are
presented in the table below and in Figure 4.2.16. The length data used in the LBI model
are data from the Faroese longliner and trawler fleets. The length data are not raised to
total catch.

32 | ICES WGDEEP REPORT 2018
Input parameters for LBI.
DATA TYPE YEARS/VALUE SOURCE NOTES
length–frequency
distribution
1995–2017 Faroese long-liners and
trawlers
Length–weight relation 0.0033* length 3.1311
Faroese survey data combined
sex
LMAT 69 cm Faroese survey data
Linf 198 cm Faroese survey data
Figure 4.2.16. Ling in Faroese waters (5.b). Catch length distributions for the period 2001–2016 with
2 cm length bins (sex combined).
Output from the screening of length indicator ratios for combined sexes was conducted
under three scenarios: (a) Conservation; (b) Optimal yield, and (c) maximum sustaina-
ble yield (Figure 4.2.17).

ICES WGDEEP REPORT 2018 | 33
Figure 4.2.17. Ling in Faroese waters (5.b). Screening of length indicators ratios for sex combined
under three scenarios: (a) Conservation, (b) Optimal yield, and (c) maximum sustainable yield.
Analysing the results showed that the conservation of immature ling indicator, Lc/Lmat,
was usually less than one, while L25%/Lmat was usually around 1 (Figure 4.2.17). In 2014-
2017, L25%/Lmat , has been greater than 0.96 (Table below).
The conservation of large ling indicator, Lmax5%/Linf , was around 0.6 for the entire period
(Figure 4.2.17), and between 0.60 and 0.62 in 2014-2017 (Table below). The indicator
was less than 0.8, which suggests that there were few mega-spawners in the catch.
Since the VBF produced an unusually high Linf, the value used in the model was Lmax.
This could be the reason that the indicator ratio was less than 0.8. If we would have
used a lower Linf value, the indicator ratio would have been higher! The catch was
lower than the length of optimal yield.
The MSY indicator (Lmean/LF=M) was greater than 1 for almost the whole period (Figure
4.2.17), which indicates that ling in Faroese waters are fished sustainably.
Conclusion: The overall perception of the stock during the period 2014–2017 is that ling
in Faroese waters seems to be fished sustainably (Table below). However, the results
are very sensitive to the assumed values of Lmat and Linf.
The final results from the LBI method.
Optimizing Yield MSY
Ling 5.b Lc/Lmat L25%/Lmat Lmax5%/Linf Pmega Lmean/Lopt Lmean/LF=M
Ref >1 >1 >0.8 >30% ~1 (>0.9) ≥1
2014 0.65 1.10 0.61 0% 0.66 1.03
2015 0.65 1.08 0.62 0% 0.67 1.05
2016 0.54 0.96 0.60 0% 0.62 1.04
2017 0.71 1.07 0.61 0% 0.62 0.99
Conservation

34 | ICES WGDEEP REPORT 2018
SPiCT
The input data for catch was a time-series of landings for area 27.5.b from 1988–2017.
The abundance index was from the Faroese annual trawl summer survey (1996–2017).
The model did not give any reliable results. A default run gave the warning message:
“Model did not obtain proper convergence! Estimates and uncertainties are most likely
invalid and cannot be trusted”. Several different settings were tried (as suggested in
the WKProxy review, WGDEEP report 2017). With setting of α=1, β=1 and n=2 the
model did converge, but the confidence limits are very wide and the FMSY value is high.
Example of the output tables and figures is showed below.
The conclusion was that this model cannot be used for lin-27.5b assessment unit. Still,
the results showed that the biomass has been above the biomass reference point (Btrig-
ger=BMSY/2) and the fishing mortality has been below the FMSY proxy.
Stochastic reference points (Srp)
estimate cilow ciupp log.est rel.diff.Drp
Bmsys 1026.005573 92.2407374 11412.39180 6.933428 0.002880195
Fmsys 5.583232 0.5107966 61.02719 1.719768 -0.001788981
MSYs 5728.456462 5318.7423499 6169.73173 8.653201 0.001101515
Predictions w 95% CI (inp$msytype: s)
prediction cilow ciupp log.est
B_2018.00 1035.8050777 97.8923587 10959.917339 6.9429343
F_2018.00 5.5339937 0.5428487 56.415513 1.7109097
B_2018.00/Bmsy 1.0095511 0.5290437 1.926482 0.0095058
F_2018.00/Fmsy 0.9911811 0.5081669 1.933302 -0.0088580
Catch_2018.00 5693.3685323 4956.6937312 6539.529574 8.6470574
E(B_inf) 1028.0171624 NA NA 6.9353871

ICES WGDEEP REPORT 2018 | 35
1990 1995 2000 2005 2010 2015
05000
10000
15000
Time
Bt
1990 1995 2000 2005 2010 2015
010
20
30
40
50
Time
Ft
1990 1995 2000 2005 2010 2015
0.5
1.0
1.5
2.0
Time
Bt
BM
SY
1990 1995 2000 2005 2010 2015
0.5
1.5
2.5
3.5
Time
Ft
FM
SY
spict_v1.2.3@fa5b2fae48d0c88c609cf384634389b55eb2eaae
1990 1995 2000 2005 2010 2015
8.0
8.4
8.8
Catch
Time
log c
atc
h d
ata
2000 2005 2010 2015
1.5
2.5
3.5
Index 1
Time
log in
dex 1
data
1990 1995 2000 2005 2010 2015
-20
12
Bias p-val: 0.9564
Time
Catc
h O
SA
resid
uals
JanAprJulOct
2000 2005 2010 2015
-10
12
Bias p-val: 0.5216
Time
Index 1
OS
A r
esid
uals
0 1 2 3 4
-0.4
0.2
0.8
Lag
Catc
h A
CF
LBox p-val: 0.6751
0 1 2 3 4
-0.4
0.2
0.8
Lag
Index 1
AC
F
LBox p-val: 0.7636
-2 -1 0 1 2
-20
12
Shapiro p-val: 0.2747
Theoretical Quantiles
Sam
ple
Quantil
es
-2 -1 0 1 2
-10
12
Shapiro p-val: 0.0399
Theoretical Quantiles
Sam
ple
Quantil
es
spict_v1.2.3@fa5b2fae48d0c88c609cf384634389b55eb2eaae

36 | ICES WGDEEP REPORT 2018
4.2.10 Tables
Table 4.2.1. Ling in 5.b1. Nominal landings (1988–present).
YEAR DENMARK
(2)
FAROE
S
FRANC
E
GERMAN
Y
NORWA
Y
E&W
(1)
SCOTLAND
(1)
RUSSI
A
TOTA
L
1988 42 1383 53 4 884 1 5
2372
1989
1498 44 2 1415
3
2962
1990
1575 36 1 1441
9
3062
1991
1828 37 2 1594
4
3465
1992
1218 3
1153 15 11
2400
1993
1242 5 1 921 62 11
2242
1994
1541 6 13 1047 30 20
2657
1995
2789 4 13 446 2 32
3286
1996
2672
1284 12 28
3996
1997
3224 7
1428 34 40
4733
1998
2422 6
1452 4 145
4029
1999
2446 17 3 2034 0 71
4571
2000
2103 7 1 1305 2 61
3479
2001
2069 14 3 1496 5 99
3686
2002
1638 6 2 1640 3 239
3528
2003
2139 12 2 1526 3 215
3897
2004
2733 15 1 1799 3 178 2 4731
2005
2886 3
1553 3 175
4620
2006 3 3563 6
850
136
4558
2007 2 3004 9
1071
6
4092
2008
3354 4
740 32 25 11 4166
2009 13 3471 2
419
270
4174
2010 28 4906 2
442
121
5500
2011 49 4270 2
0
0
4321
2012 117 5452 7
0
0
5576
2013 3 3734 7
0
0
3744
2014
5653 10
308
7 13 5990
2015
4375 15
993 1 3 6 5392
2016
4214 4
855 0 114
5187
2017
*
4422 4
864
54
5345
*Preliminary.
(1) Includes 5.b2.
(2) Greenland 2006–2013.

ICES WGDEEP REPORT 2018 | 37
Table 4.2.2. Ling in 5.b2. Nominal landings (1988–present).
YEAR FAROES FRANCE NORWAY TOTAL
1988 832
1284 2116
1989 362
1328 1690
1990 162
633 795
1991 492
555 1047
1992 577
637 1214
1993 282
332 614
1994 479
486 965
1995 281
503 784
1996 102
798 900
1997 526
398 924
1998 511
819 1330
1999 164 4 498 666
2000 229 1 399 629
2001 420 6 497 923
2002 150 4 457 611
2003 624 4 927 1555
2004 1058 3 247 1308
2005 575 7 647 1229
2006 472 6 177 655
2007 327 4 309 640
2008 458 3 120 580
2009 270 1 198 469
2010 393 1 236 630
2011 522 0 0 522
2012 434 1 0 435
2013 387 1 0 388
2014 276
389 665
2015 244 1 337 582
2016 569 4 126 699
2017* 266
542 808
*Preliminary.

38 | ICES WGDEEP REPORT 2018
Table 4.2.3. Ling in 5.b. Nominal landings (1988–present).
YEAR 5.B1 5.B2 5.B
1988 2372 2116 4488
1989 2962 1690 4652
1990 3062 795 3857
1991 3465 1047 4512
1992 2400 1214 3614
1993 2242 614 2856
1994 2657 965 3622
1995 3286 784 4070
1996 3996 900 4896
1997 4733 924 5657
1998 4029 1330 5359
1999 4571 666 5238
2000 3479 629 4109
2001 3686 923 4609
2002 3528 611 4139
2003 3897 1555 5453
2004 4731 1308 6039
2005 4620 1229 5849
2006 4558 655 5213
2007 4092 640 4731
2008 4166 580 4747
2009 4174 469 4643
2010 5500 630 6129
2011 4321 522 4843
2012 5576 435 6011
2013 3744 388 4132
2014 5990 665 6655
2015 5392 582 5974
2016 5187 699 5886
2017* 5345 808 6153
*Preliminary.

ICES WGDEEP REPORT 2018 | 39
Table 4.2.4. Ling in 5.b. Overview of the sampling from commercial landings and different surveys
since 1996.
COMMERCIAL SAMPLING SURVEY SAMPLING
Year Length Gutted Weight Age Length Round weight Age
1996 6399 410 1084 1748 366 11
1997 7900 541 1526 1478 326 0
1998 5912 538 1081 1580 820 0
1999 4536 360 480 805 665 0
2000 3512 360 360 1237 684 14
2001 3805 420 420 1573 889 0
2002 4299 180 300 1492 817 0
2003 6585 360 661 1608 887 0
2004 6827 1169 659 1968 1131 0
2005 7167 3217 540 1511 1050 0
2006 6503 4038 276 1338 937 0
2007 4031 1713 120 1166 969 0
2008 2521 1945 60 1454 1052 10
2009 4373 4348 232 1499 1039 0
2010 4345 4279 180 2392 1395 0
2011 3405 2828 0 2562 1949 0
2012 2810 2447 50 1855 1771 0
2013 2477 2076 0 1873 1652 274
2014 2985 2274 20 2923 2268 556
2015 2544 2171 210 3453 2502 418
2016 2761 2360 360 2490 2227 435
2017 2977 2426 480 1890 1469 437

40 | ICES WGDEEP REPORT 2018
Table 4.2.5. Ling in 5.b. Data on the cpue series from Faroese commercial fleets and groundfish
surveys. Only the spring survey data from 1983–1993 was not standardized. N- number of sets/hauls
behind the commercial cpues.
LONGLINE TRAWL (BYCATCH) SPRING SURVEY SUMMER SURVEY
Year Mean se N Mean se N Mean se Mean se
1983 7.7
1984 8.3
1985 5.5
1986 44.6 0.6 47 8.6
1987 57.2 0.8 91 10.9
1988 46.4 1.1 26 6.9
1989 48.0 1.2 28 6.6
1990 47.6 1.1 39 6.2
1991 48.9 0.6 110 8.0
1992 36.3 0.4 139 4.0
1993 39.2 0.5 130 6.1
1994 46.6 0.4 182 14.8 0.2 69 4.3 2.1
1995 42.6 0.4 150 15.3 0.1 244 7.3 3.6
1996 46.7 1.3 22 15.3 0.1 216 17.5 11.2 15.3 5.1
1997 69.7 1.0 91 18.4 0.1 586 16.9 7.9 9.4 3.2
1998 49.7 0.7 77 15.4 0.1 597 23.9 15.8 9.9 4.1
1999 45.1 0.6 80 13.4 0.0 926 13.6 8.0 5.8 2.2
2000 29.6 0.5 68 13.3 0.0 851 9.4 5.4 6.8 2.3
2001 47.1 1.2 31 13.4 0.0 905 13.8 8.0 8.1 2.7
2002 39.2 1.8 9 12.5 0.0 792 10.4 4.2 7.9 2.2
2003 50.5 1.0 26 15.3 0.1 701 16.1 6.9 4.0 1.1
2004 52.6 0.7 73 18.9 0.3 591 12.5 6.1 17.9 6.5
2005 49.3 0.4 120 21.8 0.4 783 11.0 4.8 11.4 3.1
2006 54.8 0.5 135 22.6 0.5 666 11.1 4.3 8.4 2.4
2007 48.9 0.5 72 21.6 0.4 692 8.4 4.2 9.9 3.4
2008 55.6 0.4 175 25.1 0.5 612 10.8 5.6 14.0 5.5
2009 50.8 0.4 181 23.1 0.4 759 14.4 6.2 11.7 3.4
2010 74.3 0.4 823 29.7 0.4 968 15.2 5.4 22.1 8.8
2011 78.6 0.5 796 35.2 0.6 714 17.4 7.5 23.3 7.9
2012 77.5 0.5 679 41.7 0.6 1118 17.1 7.6 19.8 7.0
2013 96.1 0.8 368 36.3 0.5 928 17.8 9.9 21.4 6.7
2014 118.6 1.0 649 52.3 0.6 1275 18.5 9.2 33.4 14.9
2015 88.8 0.7 447 55.7 0.6 1614 26.0 12.3 25.7 10.5
2016 98.4 1.1 341 54.2 0.6 1257 17.9 7.6 22.3 7.3
2017 115.2 0.7 265 56.7 0.4 990 23.1 7.5 21.2 7.6
ICES WGDEEP REPORT 2018 | 41
Table 4.2.6. Ling in 5.b. Data from the Norwegian longliners cpue series. Mean cpue is from
longliners with more than 30% ling in the sets. SE- standard error, N- number of days that the
Norwegian longliners operated in an ICES subarea/division (WD 2017, Helle and Pennington).
YEAR MEAN CPUE SE N
2000 70.8 5.9 288
2001 62.6 5.4 371
2002 47.8 5.9 355
2003 57.2 5.6 391
2004 56.3 5.0 571
2005 68.6 5.4 335
2006 86.8 7.5 125
2007 82.4 5.9 294
2008 126.2 6.8 167
2009 194.7 15.9 39
2010
2011 176.1 22.1 11
2012 167.3 10.4 50
2013 165.9 14.8 24
2014 177.4 9.6 83
2015 198.3 6.2 205
2016 193.6 7.3 163
2017 237.5 7.4 152
42 | ICES WGDEEP REPORT 2018
4.3 Ling (Molva Molva) in Subareas 1 and 2
4.3.1 The fishery
Ling has been fished in Subareas 1 and 2 for centuries, and the historical development
is described in Bergstad and Hareide (1996). In particular, the post-World War II in-
crease in catch caused by a series of technical advances, is well documented. Currently
the major fisheries in Subareas 1 and 2 are the Norwegian longline and gillnet fisheries,
but bycatches of ling are taken by other gears, such as trawls and handlines. Around
50% of the Norwegian landings are taken by longlines and 45% by gillnets, partly in
the directed ling fisheries and in part as bycatch in fisheries for other ground fish. Other
nations catch ling as bycatch in their trawl fisheries. Figure 4.3.1 shows the spatial dis-
tributions of the total catches for the Norwegian longline fishery in 2013 to 2017.
The Norwegian longline fleet (vessels larger than 21 m) increased from 36 in 1977 to a
peak of 72 in 2000, and afterwards the number stabilized at 25 in 2015 to 2017. The
number of vessels declined mainly because of changes in the law concerning the quotas
for cod. The average number of days that the longliners operated in ICES Subareas 1
and 2 has declined since its peak in 2011. During the period 2000 to 2014 the main
technological change in Subareas 1 and 2 was that the average number of hooks per
day increased from 31 000 hooks to 35 000 hooks. During the period 1974 to 2014 the
total number of hooks per year has varied considerably, but with a downward trend
since 2002 (for more information see Helle and Pennington, WD 2018).
Since the total number of hooks per year takes into account; the number of vessels, the
number of hooks per day, and the number of days each vessel participated in the fish-
ery, it follows that it may be a suitable measure of changes in applied effort. Based on
this gauge, it appears that the average effort for the years 2011–2017 is 43% less than
the average effort during the years 2000–2003. . It should be noted that the annual fish-
ery covers the entire distribution of tusk in Subareas 1 and 2 (see Figure 4.3.1), so that
the catch produced by the applied effort is likely proportional to the actual population.

ICES WGDEEP REPORT 2018 | 43
Figure 4.3.1. Distribution of the total catch of ling in Subareas 1 and 2 taken by the Norwegian
longline fishery in 2013–2017.

44 | ICES WGDEEP REPORT 2018
4.3.2 Landings trends
Landing statistics by nation in the period 1988–2017 are in Tables 4.3.1a–d. During
2000–2005, the landings varied between 5000 and 7000 t, which was slightly lower than
the landings in the preceding decade. In 2007, 2008 and 2010 the landings increased to
over 10 000 t. The preliminary landings for 2017 is 7971 t. Total international landings
in Areas 1 and 2 are given in Figure 4.3.2.
Figure 4.3.2. Total international landings of ling in Subareas 1 and 2.
4.3.3 ICES Advice
Advice for 2018 and 2019: ICES advises that when the precautionary approach is ap-
plied, catches should be no more than 13 103 tonnes for each year, 2018 and 2019. All
catches are assumed to be landed.
Management
There is no quota for the Norwegian fishery for ling, but the vessels participating in
the directed fishery for ling and tusk in Subareas 1 and 2 are required to have a specific
licence. There is no minimum landing size for the Norwegian EEZ.
The quota for ling in EU and international waters was set at 36 t for 2017.
4.3.4 Data available
4.3.4.1 Landings and discards
Amounts landed were available for all relevant fleets. No estimate of the amount of
ling discards is available. But since the Norwegian fleets are not regulated by TACs,
and there is a ban on discarding, the incentive for illegal discarding is believed to be
low. The landings statistics are therefore regarded as being adequate for assessment
purposes.
4.3.4.2 Length compositions
Length composition data are available for the longliners and gillnetters from the Nor-
wegian Reference fleet. Figures 4.3.3 and 4.3.4 show the length distribution of ling in
Areas 1 and 2 for the period 2001 to 2017. The mean length in Area 1 has varied slightly,
0
2
4
6
8
10
12
1988 1991 1994 1997 2000 2003 2006 2009 2012 2015
Lan
din
gs (
10
00
to
ns)
Year
2b
2a
1

ICES WGDEEP REPORT 2018 | 45
while the mean length in Area 2a has been very stable. The weight–length graphs are
in Figure 4.3.5.
Figure 4.3.3. Box and whiskers plots for the length of ling in Areas 1, 2a and 2b for the period 2001
to 2017.
Figure 4.3.4. Plots of the length distributions of ling in Subareas 1 and 2 combined for the period
2001 to 2016.

46 | ICES WGDEEP REPORT 2018
Figure 4.3.5. Weight–length relationship for the period 2008–2016, and only for 2016 (upper panel)
and for females and for males, separately (lower panel). Data were collected by the Norwegian
Reference Fleet.
4.3.4.3 Age compositions
The Catch-at-age composition for each year is in figure 4.3.6, and box and whiskers
plots for the estimated age distribution of the catch for: the total catch; and separately
for the longline fishery and for the gillnet fishery for 2010–2016 (Figure 4.3.7).
We
igh
t, k
g
Length, cm
Subareas 1 and 2 (all data)
Kg = exp(-1.78469 + 0.0354878*Lengde)
0 10 20 30 40 50 60 70 80 90 100 110 120 130
0
5
10
15
20
We
igh
t, k
g
Length, cm
Subareas 1 and 2 (2016)
Kg = exp(-1.65006 + 0.0344346*Lengde)
0 10 20 30 40 50 60 70 80 90 100 110 120 130
0
5
10
15
20
We
igh
t, k
g
Length, cm
Subareas 1 and 2 (females)
Kg = exp(-1.98181 + 0.0373454*Lengde)
0 10 20 30 40 50 60 70 80 90 100 110 120 130
0
5
10
15
20
We
igh
t, k
g
Length, cm
Subareas 1 and 2 (males)
Kg = exp(-2.13315 + 0.0392273*Lengde)
0 10 20 30 40 50 60 70 80 90 100 110 120 130
0
5
10
15
20

ICES WGDEEP REPORT 2018 | 47
Figure 4.3.6. Ling in Areas 1 and 2, Catch-at-age composition. MA denotes mean age.
Figure 4.3.7. Age composition of the fish caught by longliners and gillnetters during the period
2002–2016.

48 | ICES WGDEEP REPORT 2018
4.3.4.4 Length and weight-at-age
Figure 4.3.8 shows the average mean length and mean weight-at-age for the years
2009–2017.
Figure. 4.3.8. Average mean length and mean weight versus age for the period 2010–2017.
4.3.4.5 Maturity and natural mortality
Maturity ogives for ling are in Figure 4.3.9 and in the following table. The results fit
well with previous observations that ling reach maturity between ages 5–7 (60–75 cm)
in most areas, while males reach maturity at a slightly younger age than females (Mag-
nusson et al., 1997).
Maturity parameters:
STOCK L50 N A50 N SOURCE
Lin-arct 73.0 1540 7.0 769 Norwegian long liners (Reference fleet) and survey data
Figure 4.3.9. Maturity ogives for ling in Areas 1 and 2: males and females (upper panel) and for
males and females combined (lower panel).
4.3.4.6 Catch and effort data
Two standardized cpue series for 2000–2017 for Norwegian longliners are in Figure
4.3.10. One series was based on all the catch data, and the other cpue series used only
Lengde = 51,0561 + 5,82454*Alder
0 4 8 12 16 20
Alder
0
20
40
60
80
100
120
140
160
180
Len
gd
e
Vekt kg = -2,34044 + 1,03134*Alder
0 4 8 12 16 20
Alder
0
5
10
15
20
Vekt
kg
ICES WGDEEP REPORT 2018 | 49
catches that made up more than 30% of the total catch by weight, that is it is assumed
that these were targeted catches. No research vessel data are available.
4.3.5 Data analyses
Length distribution
In Figures 4.3.3 and 4.3.5 are plots of the length distributions in Areas 2 and 3 for 2001
to 2016. It appears that the mean length in Area 1 has varied slightly, while the mean
length in Area 2a and 2b has been very stable. The average length is slightly higher in
the gillnet fishery than in the longline fishery.
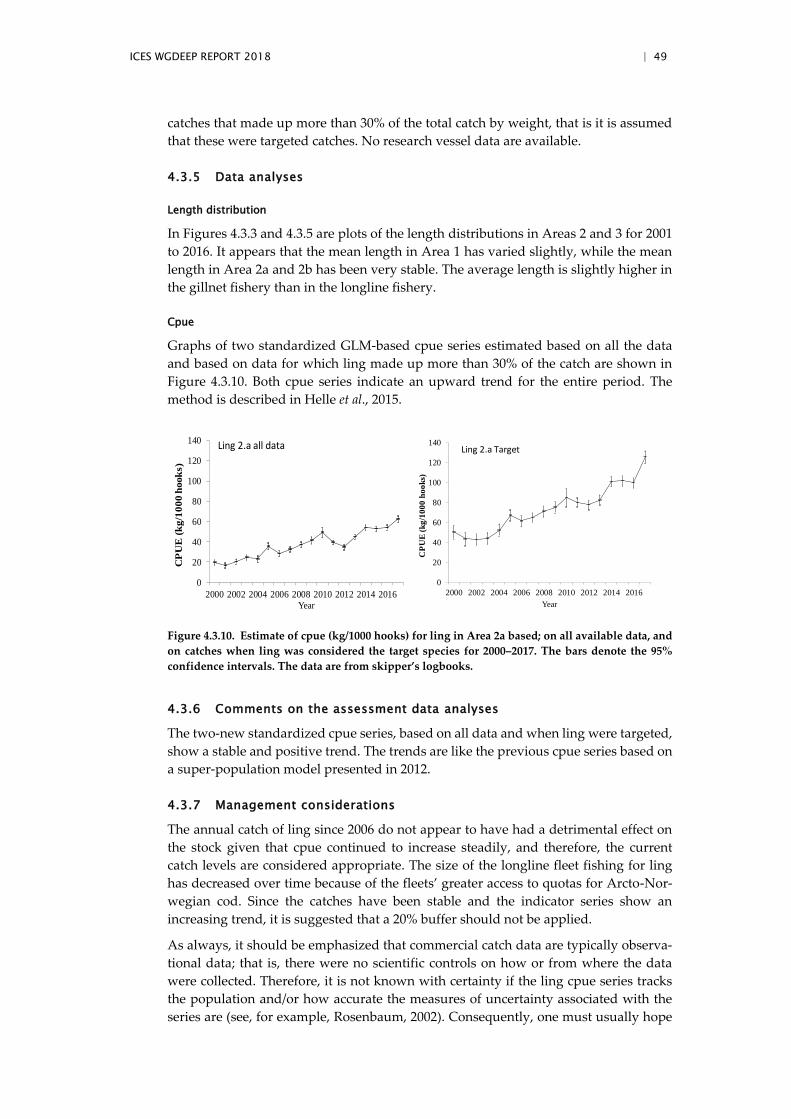
Cpue
Graphs of two standardized GLM-based cpue series estimated based on all the data
and based on data for which ling made up more than 30% of the catch are shown in
Figure 4.3.10. Both cpue series indicate an upward trend for the entire period. The
method is described in Helle et al., 2015.
Figure 4.3.10. Estimate of cpue (kg/1000 hooks) for ling in Area 2a based; on all available data, and
on catches when ling was considered the target species for 2000–2017. The bars denote the 95%
confidence intervals. The data are from skipper’s logbooks.
4.3.6 Comments on the assessment data analyses
The two-new standardized cpue series, based on all data and when ling were targeted,
show a stable and positive trend. The trends are like the previous cpue series based on
a super-population model presented in 2012.
4.3.7 Management considerations
The annual catch of ling since 2006 do not appear to have had a detrimental effect on
the stock given that cpue continued to increase steadily, and therefore, the current
catch levels are considered appropriate. The size of the longline fleet fishing for ling
has decreased over time because of the fleets’ greater access to quotas for Arcto-Nor-
wegian cod. Since the catches have been stable and the indicator series show an
increasing trend, it is suggested that a 20% buffer should not be applied.
As always, it should be emphasized that commercial catch data are typically observa-
tional data; that is, there were no scientific controls on how or from where the data
were collected. Therefore, it is not known with certainty if the ling cpue series tracks
the population and/or how accurate the measures of uncertainty associated with the
series are (see, for example, Rosenbaum, 2002). Consequently, one must usually hope
0
20
40
60
80
100
120
140
2000 2002 2004 2006 2008 2010 2012 2014 2016
CP
UE
(k
g/1
00
0 h
ook
s)
Year
Ling 2.a all data
0
20
40
60
80
100
120
140
2000 2002 2004 2006 2008 2010 2012 2014 2016
CP
UE
(k
g/1
00
0 h
oo
ks)
Year
Ling 2.a Target

50 | ICES WGDEEP REPORT 2018
and pray that a cpue series, which is based only on commercial catch data, truly tracks
abundance.
An infamous example of a misleading cpue series based on commercial data was a
cpue series for Newfoundland cod that incorrectly indicated that the abundance of the
cod stock was increasing greatly. Advice based on this cpue series ultimately caused
the collapse of the stock (see, e.g., Pennington and Strømme, 1998).
In general, any assessment method based only on commercial catch data needs to be
applied with caution. The reason that assessments using only commercial data are
problematic is because the relation between the commercial catch and the actual pop-
ulation is normally unknown and probably varies from year to year.
4.3.8 Application of MSY proxy reference points
Two different methods were tested for ling in areas 1 and 2: The Length-based indicator
method (LBI) and SPiCT.
Length-based indicator method (LBI)
The input parameters and the length distributions of the catches for the period 2001–
2017 are in Table 4.3.2 and Figure 4.3.11. The length data used in the LBI model are
from the Norwegian longliner fleet.
Table 4.3.2. Ling in arctic waters (1, 2.a, 2.b). Input parameters for LBI.
DATA TYPE YEARS/VALUE SOURCE NOTES
Length–frequency
distribution
2001–2016 Norwegian long-liners (Reference fleet)
fishing in divisions 1,2a,2b
Length–weight
relation
0.0055* length 3.0175
Norwegian Reference fleet and survey data
LMAT 73 cm Norwegian Reference fleet and survey data Sexes
combined Linf 172 cm (Lmax) Norwegian Reference fleet and survey data
Figure 4.3.11. Ling in arctic waters (1, 2.a, 2.b). Catch length distributions, 2 cm length classes, for
the period 2001–2017 (sex combined).

ICES WGDEEP REPORT 2018 | 51
Outputs from the screening of length indicator ratios for combined sexes under three
scenarios: (a) Conservation; (b) Optimal yield; and (c) maximum sustainable yield, are
in Figure4.3.12.
Figure 4.3.12. Ling in arctic waters (1, 2.a, 2.b). Screening of the length indicator ratios for sex com-
bined under three scenarios: (a) Conservation; (b) Optimal yield; and (c) maximum sustainable
yield.
Analysis of results
The model for the conservation of immature ling shows that Lc/Lmat is usually less than
one, but L25%/Lmat is usually greater than 1 (Figure 4.3.12). In 2014–2017, L25%/Lmat was
also greater than 1 (Table 4.3.3), therefore there is no indication that immature ling are
being overfished.
For the status for large ling, the model shows that the indicator ratio of Lmax5%/Linf is
around 0.7 for the whole period (Figure 4.3.12) and between 0.68 and 0.74 in 2014–2017
(Table 4.3.3), which is less than the limit of 0.8 suggesting that there is a lack of mega-
spawners in the catch, which indicates that there is a truncation point in the length
distribution. The mean length of ling in the catch is lower than the mean length for
optimizing yield.
The MSY indicator (Lmean/LF=M) is greater than 1 for almost the whole period (Figure
4.3.12), which indicates that ling in arctic waters are fished sustainably. Regarding
model sensitivity, the MSY value was always greater than 0.90.
Conclusion: The overall perception of the stock during the period 2014–2017 is that ling
in arctic waters seems to be fished sustainably (Table 4.3.3). However, the results are
very sensitive to the assumed values of Lmat and Linf.

52 | ICES WGDEEP REPORT 2018
Table 4.3.3. Ling in arctic waters (1, 2.a, 2.b). The final results from the LBI method.
Conservation Optimizing Yield MSY
Lc/Lmat L25%/Lmat Lmax5%/Linf Pmega Lmean/Lopt Lmean/LF=M
Ref >1 >1 >0.8 >30% ~1 (>0.9) ≥1
2014 0.64 1.12 0.70 1% 0.77 1.17
2015 0.73 1.12 0.70 0% 0.79 1.10
2016 0.70 1.14 0.72 2% 0.80 1.12
2017 0.73 1.11 0.74 2% 0.81 1.12
Results for the SPiCT model:
The input data were landings in 2000–2017, and the cpue index for the targeted fishery
from 2000–2017 (Figure 4.3.13).
The model converges and both the deterministic and stochastic reference points are
very similar, but the confidence intervals are very large.
Outputs from the model: Bmsy=28126, Fmsy= 0.399, MSY=11215, K=42675.
(Advice for 2018-2019 is 13103 tons and the total landings in 2017 was 7971 tons).
The results show wide confidence intervals for the absolute biomass and fishing mor-
tality. The traffic light figure shows that the stock started in the red zone and are now
in the green zone (Figure 4.3.14.) This corresponds to the present perception of the de-
velopment of the stock. The diagnostics do not show any patterns in the residuals and
no significance for bias, auto correlation or normality (Figure 4.3.15).
The retrospective analysis shows that the model is not robust enough for ling in sub-
areas 1 and 2 (Figure 4.3.16).
Figure. 4.3.13. Input data.

ICES WGDEEP REPORT 2018 | 53
Figure. 4.3.14. Plots of the results.
Figure 4.3.15. Diagnostic from SPiCT
Figure 4.3.16. Retrospective analysis.

54 | ICES WGDEEP REPORT 2018
4.3.9 Tables
Table 4.3.1a. Ling 1.a and b. WG estimates of landings.
YEAR NORWAY ICELAND SCOTLAND FAROES FRANCE TOTAL
1996 136 136
1997 31 31
1998 123 123
1999 64 64
2000 68 1 69
2001 65 1 66
2002 182 24 206
2003 89 89
2004 323 22 345
2005 107 107
2006 58 58
2007 96 96
2008 55 55
2009 236 236
2010 57 57
2011 129 129
2012 158 158
2013 126 126
2014 122 1 123
2015 93 93
2016 65 65
2017 43 43
*Preliminary.

ICES WGDEEP REPORT 2018 | 55
Table 4.3.1b. Ling 2a. WG estimates of landings.
YEAR FAROES FRANCE GERMANY NORWAY E & W SCOTLAND RUSSIA IRELAND ICELAND SPAIN GREENLAND POLAND TOTAL
1988 3 29 10 6070 4 3 6119
1989 2 19 11 7326 10 - 7368
1990 14 20 17 7549 25 3 7628
1991 17 12 5 7755 4 + 7793
1992 3 9 6 6495 8 + 6521
1993 - 9 13 7032 39 - 7093
1994 101 n/a 9 6169 30 - 6309
1995 14 6 8 5921 3 2 5954
1996 0 2 17 6059 2 3 6083
1997 0 15 7 5343 6 2 5373
1998 13 6 9049 3 1 9072
1999 12 7 7557 2 4 7581
2000 9 39 5836 5 2 5891
2001 6 9 34 4805 1 3 4858
2002 1 4 21 6886 1 4 6917
2003 7 3 43 6001 8 6062
2004 15 0 3 6114 1 5 6138
2005 6 5 6 6085 2 2 6106
2006 9 8 6 8685 6 1 11 8726
2007 18 6 7 9970 1 0 55 1 10 058
2008 22 4 7 11 040 1 1 29 0 11 104
2009 1 2 7 8189 0 19 17 8244

56 | ICES WGDEEP REPORT 2018
YEAR FAROES FRANCE GERMANY NORWAY E & W SCOTLAND RUSSIA IRELAND ICELAND SPAIN GREENLAND POLAND TOTAL
2010 10 0 18 10 318 0 2 47 10 395
2011 4 6 6 9763 19 9798
2012 21 6 9 8334 7 45 3 8425
2013 7 9 7 8677 1 114 4 8819
2014 3 13 3 9245 73 9337
2015 10 5 4 8220 3 115 5 8362
2016 18 6 11 8523 2 3 112 8 2 9 6 8700
2017* 17 13 8 7684 3 150 15 4 6 7900
*Preliminary.
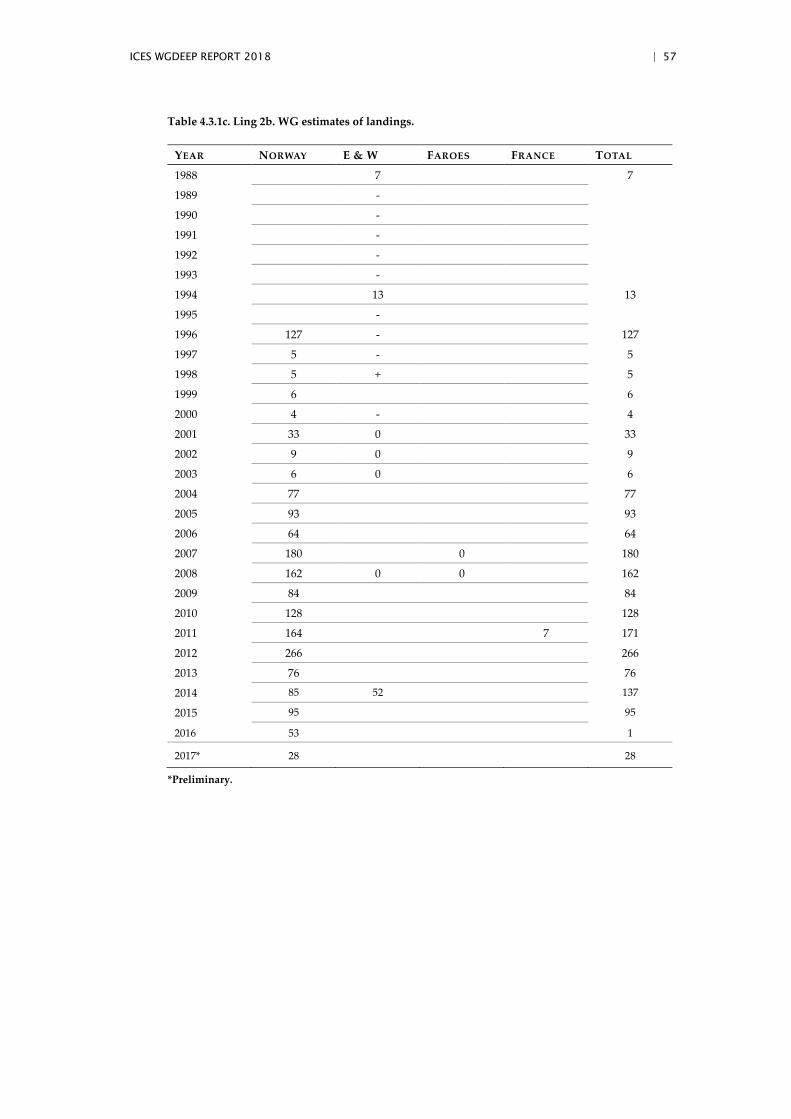
ICES WGDEEP REPORT 2018 | 57
Table 4.3.1c. Ling 2b. WG estimates of landings.
YEAR NORWAY E & W FAROES FRANCE TOTAL
1988 7 7
1989 -
1990 -
1991 -
1992 -
1993 -
1994 13 13
1995 -
1996 127 - 127
1997 5 - 5
1998 5 + 5
1999 6 6
2000 4 - 4
2001 33 0 33
2002 9 0 9
2003 6 0 6
2004 77 77
2005 93 93
2006 64 64
2007 180 0 180
2008 162 0 0 162
2009 84 84
2010 128 128
2011 164 7 171
2012 266 266
2013 76 76
2014 85 52 137
2015 95 95
2016 53 1
2017* 28 28
*Preliminary.

58 | ICES WGDEEP REPORT 2018
Table 4.3.1d. Ling 1 and 2. Total landings by subarea or division.
YEAR 1 2.A 2.B ALL AREAS
1988 6119 7 6126
1989 7368 7368
1990 7628 7628
1991 7793 7793
1992 6521 6521
1993 7093 7093
1994 6309 13 6322
1995 5954 5954
1996 136 6083 127 6346
1997 31 5373 5 5409
1998 123 9072 5 9200
1999 64 7581 6 7651
2000 69 5891 4 5964
2001 66 4858 33 4957
2002 206 6917 9 7132
2003 89 6062 6 6157
2004 345 6138 77 6560
2005 107 6106 93 6306
2006 58 8726 64 8848
2007 96 10 058 180 10 334
2008 80 11 104 161 11 346
2009 236 8244 84 8564
2010 57 10395 128 10580
2011 129 9798 171 10098
2012 158 8425 266 8849
2013 126 8819 76 9021
2014 123 9337 137 9606
2015 93 8362 95 8550
2016 65 8700 54 8819
2017* 43 7900 28 7971
*Preliminary.

ICES WGDEEP REPORT 2018 | 59
4.4 Ling (Molva Molva) in Division 5.a
4.4.1 The fishery
The fishery for ling in 5.a has not changed substantially in recent years. Around 150
longliners annually report catches of ling, around 50 gillnetters, around 60 trawlers and
ten Nephrops boats. Most of ling in 5.a is caught on longlines and the proportion caught
by that gear has increased since 2000 to around 65% in 2009–2017. At the same time the
proportion caught by gillnets has decreased from 20–30% in 2000–2007 to around 6%
in 2017. Catches in trawls have varied less and have been at around 20% of Icelandic
catches of ling in 5.a (Table 4.4.1).
Table 4.4.1. Ling in 5.a. Number of Icelandic boats and catches by fleet segment participating in
the ling fishery in 5.a.
YEAR NUMBER OF BOATS
CATCHES IN
TONNES SUM
Longliners Gillnetters Trawlers Longline Gillnet Trawl Others
2000 165 88 68 1537 703 729 236 3526
2001 146 114 57 1086 1056 492 223 3174
2002 128 92 56 1277 649 661 248 3111
2003 137 73 54 2207 453 580 336 3840
2004 144 67 68 2011 548 656 506 4000
2005 152 60 72 1948 517 1081 766 4596
2006 167 51 81 3733 634 1242 669 6577
2007 155 59 76 4044 667 1396 492 6889
2008 138 43 78 5002 509 1509 714 7993
2009 141 46 67 6230 747 1540 1096 9867
2010 156 50 68 6531 390 1537 1411 10 143
2011 151 58 59 5595 241 1677 1279 9060
2012 156 48 58 7477 264 1398 1551 10 952
2013 163 45 57 6781 354 2805 254 10 194
2014 128 30 60 10 342 673 2722 228 13 965
2015 159 44 58 7765 655 1913 1218 11 551
2016 137 46 60 5242 689 1833 820.6 8581
2017 132 40 61 4901 560 1541 700.4 7703
Most of the ling caught in 5.a by Icelandic longliners is caught at depths less than 300m
and by trawlers, less than 500 m (Figure 4.4.1). The main fishing grounds for ling in 5.a
as observed from logbooks are in the south, southwestern and western part of the Ice-
landic shelf (Figure 4.4.2). The main trend in the spatial distribution of ling catches in
5.a according to logbook entries is the decreased proportion of catches caught in the
southeast and increased catches on the western part of the shelf. Around 40% of ling
catches are caught on the southwestern part of the shelf (Figure 4.4.3). In recent years
the main fishing pressure has shifted towards shallower waters (Figure 4.4.1).

60 | ICES WGDEEP REPORT 2018
Figure 4.4.1. Ling in 5.a. Depth distribution of ling catches from longlines, trawls and gillnets from
Icelandic logbooks.
Figure 4.4.2. Ling in 5.a. Geographical distribution (tonnes/square mile) of the Icelandic longline
ling fishery since 1998 as reported in logbooks by the Icelandic fleet.

ICES WGDEEP REPORT 2018 | 61
Figure 4.4.3. Ling in 5.a. Changes in spatial distribution of ling catches as recorded in Icelandic
logbooks.
4.4.2 Landings trends
In 1950–1971 landings of ling in 5.a ranged between 7 kt to 15 kt. Landings decreased
between 1972 and 2005 to between 3 kt to 7 kt as a result of foreign vessels being ex-
cluded from the Icelandic EEZ. In 2001 to 2010 catches increased substantially year on
year and reached 11 kt in 2010 and remained at that level until 2014, apart from 2011
catches of 9.6 kt, when the catches increased to 16 kt. This catch level has not been
reached since the early seventies. (Table 4.4.6 and Figure 4.4.4).
4.4.3 ICES Advice
The ICES advice for 2017 states: ICES advises on the basis of an MSY approach that
catches should be no more than 9 343 t. All catches are assumed to be landed.
Figure 4.4.4. Ling in 5.a. Nominal landings.
4.4.4 Management
The Icelandic Ministry of Industries and Innovation (MII) is responsible for manage-
ment of the Icelandic fisheries and implementation of legislation. The Ministry issues

62 | ICES WGDEEP REPORT 2018
regulations for commercial fishing for each fishing year (1 September–31 August), in-
cluding an allocation of the TAC for each stock subject to such limitations. Ling in 5.a
has been managed by TAC since the 2001/2002 fishing year.
Landings have exceeded both the advice given by MRI and the set TAC from 2002/2003
to 2012/2013 but amounted to less than two thirds in 2015/2016 (Table 4.4.2). Overshoot
in landings in relation to advice/TAC has been decreasing steadily since the 2009/2010
fishing year, with an overshoot of 53% to 35% in 20102011, 24% in 2011/2012 and 4% in
2012/2013. The reasons for the implementation errors are transfers of quota share be-
tween fishing years, conversion of TAC from one species to another and catches by
Norway and the Faroe Islands by bilateral agreement. The level of those catches is
known in advance but has until recently not been taken into consideration by the Min-
istry when allocating TAC to Icelandic vessels. There is no minimum landing size for
ling in 5.a.
There are agreements between Iceland, Norway and the Faroe Islands relating to a
fishery of vessels in restricted areas within the Icelandic EEZ. Faroese vessels are al-
lowed to fish 5600 t of demersal fish species in Icelandic waters which includes maxi-
mum 1200 tonnes of cod and 40 t of Atlantic halibut. The rest of the Faroese demersal
fishery in Icelandic waters is mainly directed at tusk, ling and blue ling. Further de-
scription of the Icelandic management system can be found in the stock annex.
Table 4.4.2. Advice given by MRI, set national TAC by the Ministry of Fisheries and Agriculture
and landings by fishing year (1st of September–31st of August).
FISHING YEAR MRI-ADVICE NATIONAL-TAC LANDINGS
1999/2000 3961
2000/2001 3451
2001/2002 3000 3000 2968
2002/2003 3000 3000 3715
2003/2004 3000 3000 4608
2004/2005 4000 4000 5238
2005/2006 4500 5000 6961
2006/2007 5000 5000 7617
2007/2008 6000 7000 8560
2008/2009 6000 7000 10 489
2009/2010 6000 7000 10 713
2010/2011 7500 7500 10 095
2011/2012 8800 9000 11 133
2012/2013 12 000 11 500 12 445
2013/2014 14 000 13 500 14 983
2014/2015 14 300 13 800 13 166
2015/2016 16 200 15 000 9769
2016/2017 9343 8143 8336
2017/2018 8598 8598

ICES WGDEEP REPORT 2018 | 63
4.4.5 Data available
In general sampling is considered good from commercial catches from the main gears
(longlines and trawls). The sampling does seem to cover the spatial distribution of
catches for longlines and trawls but less so for gillnets. Similarly, sampling does seem
to follow the temporal distribution of catches (see WGDEEP 2012).
4.4.5.1 Landings and discards
Landings by Icelandic vessels are given by the Icelandic Directorate of Fisheries. Land-
ings of Norwegian and Faroese vessels are given by the Icelandic Coast Guard. Dis-
carding is banned by law in the Icelandic demersal fishery. Based on limited data,
discard rates in the Icelandic longline fishery for ling are estimated very low (<1% in
either numbers or weight) (WGDEEP, 2011:WD02). Measures in the management sys-
tem such as converting quota share from one species to another are used by the fleet to
a large extent and this is thought to discourage discarding in mixed fisheries. A de-
scription of the management system is given in the area overview.
4.4.5.2 Length compositions
An overview of available length measurements is given in Table 4.4.4. Most of the
measurements are from longlines. The number of available length measurements has
been increasing in recent years in line with increased landings. Length distributions
from the Icelandic longline and trawling fleet are presented in Figure 4.4.5.
Table 4.4.4. Ling in 5.a. Number of available length measurements from Icelandic commercial
catches.
Year Longlines Gillnets D. Seine Trawls Sum
2000 1624 566 0 383 2573
2001 1661 493 0 37 2191
2002 1504 366 0 221 2091
2003 2404 300 0 280 2984
2004 2640 348 46 141 3175
2005 2323 31 101 499 2954
2006 3354 645 0 1558 5557
2007 3661 0 76 400 4137
2008 5847 357 15 969 7188
2009 9014 410 0 966 10 390
2010 7322 57 0 2345 9724
2011 7248 0 150 1995 9393
2012 12 770 85 150 2748 15 753
2013 10 771 267 122 2337 13 497
2014 6448 1286 120 5053 13 610
2015 3315 1563 0 5667 10 545
2016 2483 2039 0 3673 8195
2017 1636 485 0 3189 5310

64 | ICES WGDEEP REPORT 2018
Figure 4.4.5. Ling in 5.a. Length distributions from the Icelandic longline fleet (blue area) and trawls
(red lines).
4.4.5.3 Age compositions
A limited number of otoliths collected in 2010 were aged and a considerable difference
in growth rates was observed between the older data and the 2010 data (WGDEEP,
2011:WD07). Substantial progress has been made since 2010. Now aged otoliths are
available from the 2000 onwards (Table 4.4.5). Most of the ling caught in the Icelandic
spring survey is between age 5 and 8 but from longlines the age is between 6 and 9.
Table. 4.4.5. Ling in 5.a. Number of available aged otoliths from the commercial catches.
YEAR LONGLINES GILLNETS D. SEINE TRAWLS TOTAL
2000 650 200 0 150 1000
2001 550 193 0 37 780
2002 519 166 0 150 835
2003 900 100 0 150 1150
2004 750 100 46 100 996
2005 750 0 0 231 981
2006 1137 288 0 550 1975
2007 1300 0 50 100 1450
2008 1950 150 0 365 2465
2009 2550 150 0 400 3100
2010 2498 50 0 850 3398
2011 2546 0 50 700 3296
2012 4031 50 50 941 5072
2013 2863 100 50 800 3813
2014 743 225 20 913 1901
2015 595 300 0 1003 1898
2016 440 345 0 680 1465
2017 310 85 0 595 990
ICES WGDEEP REPORT 2018 | 65
4.4.5.4 Weight-at-age
No data available.
4.4.5.5 Maturity and natural mortality
No new data available (See stock annex for current estimates).
No information is available on natural mortality of ling in 5.a, set to 0.15 in the analyt-
ical assessment.
4.4.5.6 Catch, effort and research vessel data
Catch per unit of effort and effort data from the commercial fleets
The cpue estimates of ling in 5.a have not been considered representative of stock abun-
dance.
Icelandic survey data
Indices: The Icelandic spring groundfish survey, which has been conducted annually
in March since 1985, covers the most important distribution area of the ling fishery. In
addition, the autumn survey was commenced in 1996 and expanded in 2000 however
a full autumn survey was not conducted in 2011 and therefore the results for 2011 are
not presented. A detailed description of the Icelandic spring and autumn groundfish
surveys is given in the stock annex.
Figure 4.4.5 shows both a recruitment index and the trends in biomass from both sur-
veys. Length distributions from the spring survey are shown in Figure 4.4.6 (abun-
dance) and changes in spatial distribution the spring survey are presented in Figure
4.4.7.

66 | ICES WGDEEP REPORT 2018
Figure 4.4.5. Ling in 5.a. Shown are a) Total biomass indices, b) biomass indices larger than 40 cm,
c) biomass indices larger than 80 cm and d) abundance indices smaller than 40 cm. The lines with
shades show the spring survey index from 1985 and the points with the vertical lines show the
autumn survey from 1997. The shades and vertical lines indicate +/- standard error.
Figure 4.4.6. Ling in 5.a. Abundance indices by length (3 cm grouping) from the spring survey since
1985.

ICES WGDEEP REPORT 2018 | 67
Figure 4.4.7. Ling in 5.a. Estimated survey biomass in the spring survey by year from different parts
of the continental shelf (upper figure) and as proportions of the total (lower figure).

68 | ICES WGDEEP REPORT 2018
4.4.6 Data analyses
There have been no marked changes in the number of boats participating in the ling
fishery in 5.a. Most of ling catches are taken at depths less than 250 meters (Figure
4.4.1). Spatial distribution of catches has been similar since 2000 with around 80% of
catches caught on the western and southwestern part of the shelf (Figures 4.4.2 and
4.4.3).
Sampling from commercial catches of ling is considered good; both in terms of spatial
and temporal distribution of samples in relation to landings (WGDEEP 2012). Mean
length as observed in length samples from longliners decreased from 2000 to 2008 from
around 91 cm to 80 cm (Figure 4.4.5). This may be the result of increased recruitment
in recent years rather than increased fishing effort. Mean length has varied in the pe-
riod 2009 to 2016 between 82–92 cm with no clear trend. It is premature to draw con-
clusions from the limited age-structured data. It can only be stated that most of the
ling caught in the Icelandic spring survey is between age 5 and 9; but from longlines
the age is between the ages of 6 to 10.
Ling in both in the spring and autumn surveys are mainly found in the deeper waters
south and west off Iceland. Both the total biomass index and the index of the fishable
biomass (>40 cm) in the March survey gradually decreased until 1995 (Figure 4.4.5). In
the years 1995 to 2003 these indices were half of the mean from 1985–1989. In 2003 to
2007, the indices increased and have been for the last five years the highest in the time-
series. The index of the large ling (80 cm and larger) shows similar trend as the total
biomass index (Figure 4.4.5). The recruitment index of ling, defined here as ling smaller
than 40 cm, also showed a similar increase in 2003–2007 and but then decreased by
around 25% and remained at that level until 2010. Then the juvenile index fell to a very
low level in 2014 but has since then started showing signs of an upward trend (Figure
4.4.5). However, the increase in the juvenile index is very uncertain as it is simply some
variation in the length distribution of the survey but not a distinct peak (Figure 4.4.6).
The shorter autumn survey shows that biomass indices were low from 1996 to 2000 but
have increased since then (Figures 4.4.5). There is a consistency between the two survey
series; the autumn survey biomass indices are however derived from substantially
fewer ling caught. Also, there is an inconsistency in the recruitment indices (<40 cm),
where the autumn survey shows much lower recruitment, in absolute terms compared
with the spring survey (Figure 4.4.5). This discrepancy is likely a result of much lower
catchability of small ling (due to different gears) in the autumn survey, where ling less
than 40 cm has rarely been caught.
Changes in spatial distribution as observed in surveys: According to the spring survey
most of the increase in recent years in ling abundance is in the western area, but an
increase can be seen in most areas. However most of the index in terms of biomass
comes from the southwestern area or around 40% compared to around 30% between
2003 and 2011. A similar pattern is observed in the autumn survey.
Analytical assessment on Ling using Gadget
In 2014 a model of Ling in 5.a developed in the Gadget framework (see
http://www.hafro.is/gadget for further details) was benchmarked for the use in assess-
ment. As part of a Harvest Control Evaluation requested by Iceland this stock was
benchmarked in 2017 (WKICEMSE 2017). Several changes were made to the model
setup and settings which are described in the Stock Annex.

ICES WGDEEP REPORT 2018 | 69
Data used and model settings
Data used for tuning are given in the stock annex.
Model settings used in the Gadget model for ling in 5.a are described in more detail in
the stock annex.
Diagnostics
Observed and predicted proportions by fleet
Overall fit to the predicted proportional length and age–length distributions is close to
the observed distributions. (Figures 4.4.7 to 4.4.12). In the initial years of the spring the
observed length proportions appear have greater noise in, however as the number of
samples caught the noise level decreases. Similarly for gears where only a small portion
of the ling catch is caught, such as the gillnet, the overall noise is greater than for those
gears with greater number of samples.
Figure 4.4.7. Ling in 5.a. Fitted proportions-at-length from the Gadget model (black lines) compared
to observed proportions in the spring survey (green lines and points).
Figure 4.4.8. Ling in 5.a. Fitted proportions-at-age from the Gadget model (black lines) compared to
observed proportions in the spring survey catches (green lines and points).

70 | ICES WGDEEP REPORT 2018
Figure 4.4.9. Ling in 5.a. Fitted proportions-at-age from the Gadget model (black lines) compared to
observed proportions in longlines catches (blue lines and points).
Figure 4.4.10. Ling in 5.a. Fitted proportions-at-length from the Gadget model (black lines) com-
pared to observed proportions from longline catches (green lines and dots).
Model fit
Figure 4.4.13 shows the overall fit to the survey indices described in the stock annex.
In general, the model appears to follow the stock trends historically. Furthermore, the
terminal estimate is not seen to deviate substantially from the observed value for most
length groups, with model overestimating the abundance in the two largest length
groups. Looking at the first three length groups (20–50, 50–60, 60–70) the model ap-
pears to discount the recruitment peak observed between 2005 and 2010 as the increase
is not observed in the bigger length classes to the same degree. Summed up over survey
biomass the model overestimates the biomass in the terminal years.

ICES WGDEEP REPORT 2018 | 71
Figure 4.4.13. Fitted spring survey index by length group from the Gadget model (black line) and
the observed number of ling caught in the survey (dotted line). The green line indicates the differ-
ence between the terminal fit and the observations.
Results
The results are presented in Table 4.4.7 and Figures 4.4.14 and 4.4.16. Recruitment
peaked in 2009 to 2010 but has decreased and is estimated in 2013 to 2015 to be at low
level. Spawning–stock biomass has increased since 2000 and is now estimated the
highest SSB estimate in the time-series. Similarly, harvestable biomass is estimated at
its highest level in the time-series. Fishing mortality for fully selected ling (age 14–19)
has decreased from 0.66 in 2009 to 0.25 in 2015.
This year’s assessment shows a downward revision of SSB and an upward revision of
fishing mortality compared to the 2014 and 2015 assessments (Figure 4.4.15). The rea-
son for this revision is the ‘one-way trip’ in the data and as the model is now getting
closer to the terminal total survey index there is a downward revision of biomass.
Therefore, when running an analytical retrospective analysis, a very similar pattern is
observed (Figure 4.4.16). Nevertheless, some slight inconsistencies were found in input
data and catches used in the model. The catches in the model have been updated with
official ICES catches as presented in Table 4.4.6.
Figure 4.4.14. Ling in 5.a. Estimated biomass, fishing mortality, recruitment and total catches.

72 | ICES WGDEEP REPORT 2018
Reference points
At the WKDEEP-2014 benchmark meeting for ling in 5.a the following reference points
were adopted.
REFERENCE POINT VALUE TECHNICAL BASIS
MSY Btrigger 9.5 Based on Bpa
FMSY 0.24 Based on stochastic simulations
Blim 8.6 Median of the lowest SSB
Bpa 9.5 Based on the 97.5% quantile of the lowest SSB
As part of the WKICEMSE 2017 HCR evaluations the following reference points were
defined for the stock.
The management plan proposed by Iceland is:
The spawning–stock biomass trigger (MGT Btrigger) is defined as 9.93 kt, the ref-
erence biomass is defined as the biomass of ling 70+ cm and the target harvest
rate (HRMGT) is set to 0.18. In the assessment year (Y) the TAC for the next fishing
year (September 1 of year Y to August 31 of year Y+1) is calculated as follows:
When SSBY is equal or above MGT Btrigger:
TACY/y+1 = HRMGT*BRef,y
When SSBY is below MGT Btrigger:
TACY/y+1 = HRMGT* (SSBy/MGT Btrigger) * Bref,y
WKICEMSE 2017 concluded that the HCR was precautionary and in conformity with
the ICES MSY approach.

ICES WGDEEP REPORT 2018 | 73
4.4.7 Comments on the assessment
At WKICEMSE 2017 the assessment was benchmarked. Various settings were changed
from the previous assessment. Therefore, the assessment in 2017 is not directly com-
parable to previous assessments of this stock.
4.4.7.1 Management considerations
All the signs from commercial catch data and surveys indicate that ling in 5.a is at pre-
sent in a good state. This is confirmed in the Gadget assessment. However, the drop
in recruitment since 2010 will result in decrease in sustainable catches in the near fu-
ture.
Currently the longline and trawl fishery represent 95% of the total fishery, while the
remainder is assigned to gillnets. Should those proportions change dramatically, so
will the total catches as the selectivity of the gillnet fleet is substantially different from
other fleets.

74 | ICES WGDEEP REPORT 2018
4.4.8 Tables
Table 4.4.6. Ling in 5.a. Catches by country (Source STATLANT).
YEAR BELGIUM FAROE GERMANY ICELAND NORWAY UK TOTAL
1980 445 607 0 3149 423 0 4624
1981 196 489 0 3348 415 0 4448
1982 116 524 0 3733 612 0 4985
1983 128 644 0 4256 115 0 5143
1984 103 450 0 3304 21 0 3878
1985 59 384 0 2980 17 0 3440
1986 88 556 0 2946 4 0 3594
1987 157 657 0 4161 6 0 4981
1988 134 619 0 5098 10 0 5861
1989 95 614 0 4896 5 0 5610
1990 42 399 0 5153 0 0 5594
1991 69 530 0 5206 0 0 5805
1992 34 526 0 4556 0 0 5116
1993 20 501 0 4333 0 0 4854
1994 3 548 0 4049 0 0 4600
1995 0 463 0 3729 0 0 4192
1996 0 358 0 3670 20 0 4048
1997 0 299 0 3634 0 0 3933
1998 0 699 0 3603 0 0 4302
1999 0 500 0 3973 120 1 4594
2000 0 0 0 3196 67 3 3266
2001 0 362 2 2852 116 1 3333
2002 0 1629 0 2779 45 0 4453
2003 0 565 2 3855 108 5 4535
2004 0 739 1 3721 139 0 4600
2005 0 682 1 4311 180 20 5194
2006 0 960 1 6283 158 0 7402
2007 0 807 0 6592 185 0 7584
2008 0 1366 0 7736 176 0 9278
2009 0 1157 0 9610 172 0 10939
2010 0 1095 0 9867 168 0 11130
2011 0 588 0 8743 249 0 9580
2012 0 875 0 10706 248 0 11829
2013 0 1030 0 10212 294 0 11445
2014 0 1738 0 12450 158 0 13930
2015 0 1233 0 11553 250 0 12862
2016 0 1072 0 8582 230 0 9884
2017* 0 829 0 7703 243 0 8774
*Preliminary.

ICES WGDEEP REPORT 2018 | 75
Table 4.4.7. Ling in 5.a. Results from the Gadget assessment.
YEAR BIOMASS B75 SSB REC3 CATCH HR F
1982 20,49 16,78 17,43 6,48 4,99 0,31 0,33
1983 19,52 13,26 14,63 0,87 5,12 0,40 0,42
1984 17,75 10,91 11,19 2,72 3,88 0,36 0,40
1985 17,97 11,09 11,17 4,05 3,45 0,31 0,36
1986 19,53 12,27 11,72 1,61 3,60 0,30 0,39
1987 20,57 13,52 12,50 2,13 4,97 0,38 0,51
1988 20,23 13,26 12,91 2,62 5,85 0,45 0,67
1989 18,95 12,74 12,06 4,62 5,55 0,45 0,74
1990 18,71 11,30 11,32 3,91 5,56 0,50 0,73
1991 18,71 10,12 10,11 1,20 5,79 0,58 0,79
1992 17,72 9,64 9,63 3,16 5,09 0,53 0,78
1993 17,72 10,30 10,24 1,82 4,71 0,47 0,79
1994 17,60 11,21 10,41 2,32 4,11 0,37 0,61
1995 18,01 11,96 11,21 3,01 3,97 0,33 0,47
1996 18,73 12,41 11,82 2,18 4,07 0,33 0,44
1997 19,11 12,94 12,25 2,11 3,91 0,30 0,38
1998 19,55 13,38 12,93 1,97 4,35 0,33 0,42
1999 19,34 12,93 12,92 2,91 4,62 0,36 0,45
2000 19,06 13,05 12,65 2,84 3,28 0,25 0,33
2001 20,28 13,85 13,28 4,23 3,36 0,24 0,33
2002 22,23 14,72 14,18 3,31 4,53 0,31 0,38
2003 23,22 15,02 14,41 4,42 4,28 0,28 0,33
2004 25,17 15,80 15,50 5,27 4,63 0,29 0,34
2005 27,62 17,13 16,60 6,84 5,20 0,30 0,36
2006 30,81 18,01 17,80 6,19 7,43 0,42 0,50
2007 32,49 18,16 17,93 9,72 7,62 0,42 0,50
2008 36,07 19,17 19,04 9,13 9,28 0,49 0,57
2009 39,25 19,37 19,67 10,83 10,95 0,57 0,69
2010 42,46 20,31 20,51 11,40 11,15 0,54 0,62
2011 47,02 22,92 22,56 7,55 9,65 0,41 0,46
2012 52,91 28,19 27,42 5,07 11,83 0,42 0,47
2013 55,55 32,78 32,15 2,80 11,54 0,35 0,40
2014 56,41 37,28 36,59 3,06 14,25 0,38 0,46
2015 52,68 38,03 37,14 2,55 13,04 0,35 0,42
2016 48,19 37,30 35,85 3,20 9,88 0,27 0,32
2017 45,69 36,76 35,29 3,85 8,77 0,24 0,28
2018 43,80 34,75 34,20 5,44

76 | ICES WGDEEP REPORT 2018
4.5 Ling (Molva Molva) in Areas (3.a, 4, 6, 7, 8, 9, 10, 12, 14)
4.5.1 The fishery
Significant fisheries for ling have been conducted in Subareas 3 and 4 at least since the
1870s, pioneered by Swedish longliners. Since the mid-1900s the major targeted ling
fishery in 4.a is by Norwegian longliners conducted around Shetland and in the
Norwegian Deep. There is little activity in 3.a. Of the total Norwegian 2016 landings in
Subareas 3 and 4, 83% were taken by longlines, 9% by gillnets, and the remainder by
trawls. The bulk of the landings from other countries were taken by trawls as
bycatches, and the landings from the UK (Scotland) are the most substantial. The
comparatively low landings from the central and southern North Sea (4.b,c) are
bycatches from various other fisheries.
The major directed ling fishery in Area 6 is the Norwegian longline fishery. Catches of
ling by trawl fisheries from the UK (Scotland) and from France are primarily bycatches.
When Areas 3–4 and 6–14 are pooled over 1988–2017, 42% of the total landings were
in Area 4, 30% in Area 6.a, and 24% in Area 6.b.
In Subarea 7, the Divisions b, c, and g–k provide most of the landings of ling.
Norwegian landings, and some Irish and Spanish landings are from targeted longline
fisheries, whereas other landings are primarily bycatches in trawl fisheries. Data split
by gear type were not available for all countries, but the bulk of the total landings (at
least 60–70%) were taken by trawls in these areas.
In Subareas 8 and 9, 12 and 14 all landings are bycatches from various fisheries.
The Norwegian fishery
The Norwegian longline fleet increased from 36 in 1977 to a peak of 72 in 2000, and
afterwards the number of vessels decreased and then stabilized at 25 in 2015 to 2017.
The number of vessels declined mainly because of changes in the law concerning the
quotas for cod. The average number of days that each Norwegian longliner operated
in an ICES division was highly variable for 4.a, stable for 6.b and declining for 6.a. The
average number of hooks has remained relatively stable in 4.a and 6.a. During the pe-
riod 1974 to 2017 the total number of hooks per year has varied considerably, but with
a downward trend since 2002 (For more information see Helle and Pennington, WD
2018).
Since the total number of hooks per year takes into account; the number of vessels, the
number of hooks per day, and the number of days each vessel participated in the fish-
ery, it follows that it may be a suitable measure of changes in applied effort. Based on
this gauge, it appears that the average effort for the years 2011–2017 is 43% less than
the average effort during the years 2000–2003.
The French fishery
French fleets operating in 6, 7.bck are mainly otter trawlers, gillnetters and longliners,
which accounts for around 850 t of ling in 2017, mainly from otter trawlers (450t). Gill-
netters landed 10 t and longliners around 390 t.
The number of otter trawlers operating in the region has decreased from around 70 in
the beginning of the 2000s to 32 in 2017. Gillnetters have had a relatively stable number
of boats involved, between 12 and 20 during the period 2000 to 2017. The number of
longliners has increased from one in 2000 to 17 in 2017 (Table 4.5.3).

ICES WGDEEP REPORT 2018 | 77
Since 2000, otter trawlers have exhibited a nearly continuous decrease in effort by a
factor of 2, but with a slight increase in 2017. Gillnetters had a peak effort in mid 2000
followed by a steep decrease by a factor of 5 since 2010 with an increase in 2017. The
recorded fishing efforts by longliners has been imprecise due to lack of information in
the first part of the 2000s. The activity seems to have peaked in 2007 followed by a
sharp decrease to 2009. Since 2009, the effort has been steadily increasing.
Landings of ling by otter trawlers have been increasing since 2004. For gillnetters and
longliners, landings are closely related to changes in efforts. Since 2011 landings have
been stable for gillnetters and increasing for longliners.
The Spanish fishery
The Spanish fleet fishes for ling in ICES Subarea 7, for the most part in Divisions b, c
and g–k, and the catch is mainly taken by longliners. However, there are also important
bycatches of ling by trawlers operating in the Subarea 7. Porcupine Bank is an im-
portant fishing area for the trawlers, therefore the data from the Porcupine Bank Span-
ish ground fish survey could be useful as an indicator of the abundance and status of
ling in the area.
4.5.2 Landings trends
Landing statistics by nation in the period 1988–2017 are in Tables 4.5.1 and 4.5.2 and
Figures 4.5.1 and 4.5.2.
There was a decline in landings from 1988 to 2003, since then the amount landed has
been stable and slightly increasing. When Areas 3–14 are pooled, the total landings
averaged around 32 000 t in the period 1988–1998 and afterwards the average catch
varied between 16 000 and 17 000 tons per year. The preliminary landings for 2017 is
20 276 t.
Figure 4.5.1. International landings. Ling in other areas.
0
5000
10000
15000
20000
25000
30000
35000
40000
45000
1988
1990
1992
1994
1996
1998
2000
2002
2004
2006
2008
2010
2012
2014
2016
Lan
din
gs in
to
ns
Year
14
12
9
8
7
6
4
3
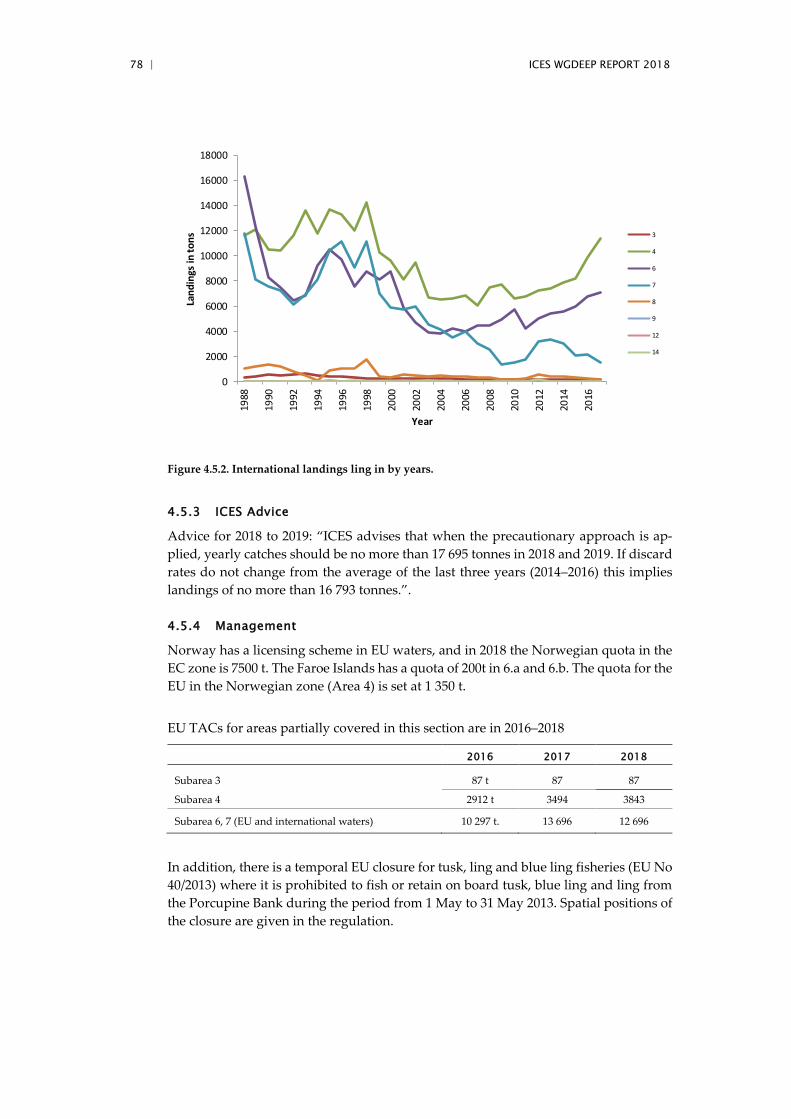
78 | ICES WGDEEP REPORT 2018
Figure 4.5.2. International landings ling in by years.
4.5.3 ICES Advice
Advice for 2018 to 2019: “ICES advises that when the precautionary approach is ap-
plied, yearly catches should be no more than 17 695 tonnes in 2018 and 2019. If discard
rates do not change from the average of the last three years (2014–2016) this implies
landings of no more than 16 793 tonnes.”.
4.5.4 Management
Norway has a licensing scheme in EU waters, and in 2018 the Norwegian quota in the
EC zone is 7500 t. The Faroe Islands has a quota of 200t in 6.a and 6.b. The quota for the
EU in the Norwegian zone (Area 4) is set at 1 350 t.
EU TACs for areas partially covered in this section are in 2016–2018
2016 2017 2018
Subarea 3 87 t 87 87
Subarea 4 2912 t 3494 3843
Subarea 6, 7 (EU and international waters) 10 297 t. 13 696 12 696
In addition, there is a temporal EU closure for tusk, ling and blue ling fisheries (EU No
40/2013) where it is prohibited to fish or retain on board tusk, blue ling and ling from
the Porcupine Bank during the period from 1 May to 31 May 2013. Spatial positions of
the closure are given in the regulation.
0
2000
4000
6000
8000
10000
12000
14000
16000
18000
1988
1990
1992
1994
1996
1998
2000
2002
2004
2006
2008
2010
2012
2014
2016
Lan
din
gs in
to
ns
Year
3
4
6
7
8
9
12
14
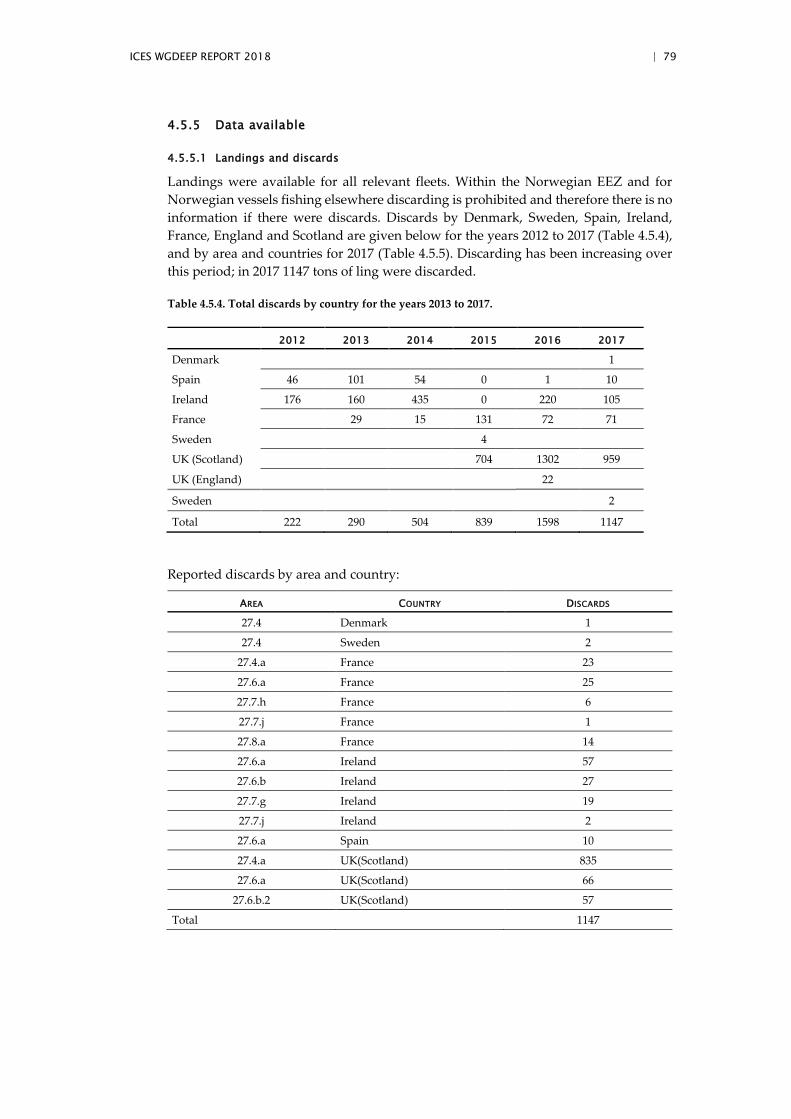
ICES WGDEEP REPORT 2018 | 79
4.5.5 Data available
4.5.5.1 Landings and discards
Landings were available for all relevant fleets. Within the Norwegian EEZ and for
Norwegian vessels fishing elsewhere discarding is prohibited and therefore there is no
information if there were discards. Discards by Denmark, Sweden, Spain, Ireland,
France, England and Scotland are given below for the years 2012 to 2017 (Table 4.5.4),
and by area and countries for 2017 (Table 4.5.5). Discarding has been increasing over
this period; in 2017 1147 tons of ling were discarded.
Table 4.5.4. Total discards by country for the years 2013 to 2017.
2012 2013 2014 2015 2016 2017
Denmark 1
Spain 46 101 54 0 1 10
Ireland 176 160 435 0 220 105
France 29 15 131 72 71
Sweden 4
UK (Scotland) 704 1302 959
UK (England) 22
Sweden 2
Total 222 290 504 839 1598 1147
Reported discards by area and country:
AREA COUNTRY DISCARDS
27.4 Denmark 1
27.4 Sweden 2
27.4.a France 23
27.6.a France 25
27.7.h France 6
27.7.j France 1
27.8.a France 14
27.6.a Ireland 57
27.6.b Ireland 27
27.7.g Ireland 19
27.7.j Ireland 2
27.6.a Spain 10
27.4.a UK(Scotland) 835
27.6.a UK(Scotland) 66
27.6.b.2 UK(Scotland) 57
Total 1147

80 | ICES WGDEEP REPORT 2018
4.5.5.2 Length composition
Data from the Norwegian reference fleet
Average fish length, weight–length relationships and the length distribution for the
Norwegian longline and gillnet fishery in Areas 4a, 6a, 6b are shown in Figures 4.5.3–
4–5.7, respectively. Data are from the Norwegian longline reference fleet. Weight as a
function of length for ling in Areas 6 and 7 are based on Spanish data (Figure 4.5.8).
Figure 4.5.3. Box and whisker plots of the annual length distributions for the Norwegian longline
reference fleet in 4.a, 4.b, 6.a and 6.b.

ICES WGDEEP REPORT 2018 | 81
Figure 5.4.4. . Length distributions of ling in Areas 4.a, 6.a and 6.b for the Norwegian reference fleet.

82 | ICES WGDEEP REPORT 2018
Figure 4.5.5. Weight as afunction of length for ling based on all available Norwegian data.
Figure 4.5.9. Weight as a function of length for ling in Areas 6 and 7 based on Spanish data from
2014 to 2017.
Estimated Length distributions based on the Spanish Porcupine Bank (NE Atlantic) surveys
In Figure 4.5.10 are the estimated length distributions of ling for the years 2001–2017.
(For more information see Fernández-Zapico et al., WD 2018).
All data
Vekt kg = exp(-1,81005 + 0,0355234*Lengde)
0 10 20 30 40 50 60 70 80 90 100 110 120 130
Lengde
0
5
10
15
20V
ekt
kg
2017
Vekt kg = exp(-1,97462 + 0,0369584*Lengde)
0 10 20 30 40 50 60 70 80 90 100 110 120 130
Lengde
0
5
10
15
20
Ve
kt
kg
Females
Vekt kg = exp(-1,99445 + 0,0375929*Lengde)
0 10 20 30 40 50 60 70 80 90 100 110 120 130
Lengde
0
5
10
15
20
Ve
kt
kg
Males
Vekt kg = exp(-1,88643 + 0,0364704*Lengde)
0 10 20 30 40 50 60 70 80 90 100 110 120 130
Lengde
0
5
10
15
20
Ve
kt
kg
All data
weight_g = exp(4,50403 + 0,0412233*length_cm)
0 30 60 90 120 150
length_cm
0
4
8
12
16(X 1000,0)
we
igh
t_g
Females
weight_g = exp(4,90047 + 0,0362886*length_cm)
0 30 60 90 120 150
length_cm
0
3
6
9
12
15(X 1000,0)
we
igh
t_g
Males
weight_g = exp(4,62766 + 0,0401469*length_cm)
0 30 60 90 120 150
length_cm
0
4
8
12
16(X 1000,0)
we
igh
t_g

ICES WGDEEP REPORT 2018 | 83
Figure 4.5.10. Estimated length distributions of ling (M. molva) based on the Porcupine Bank Span-
ish survey in the period 2001–2017.
4.5.5.3 Age compositions
Estimated age distributions for the years 2009–2016 based on data from the Norwegian
Reference fleet for all areas combined (Figures 4.5.12) and box and whisker plots for
the age composition of the fish taken by longliners and gillnetters in Area 4.a (Figure
4.5.13).
Molva molva
Length (cm)
Ind
haul
1
0.05
0.10
0.15
0.20
0.252009
0.05
0.10
0.15
0.20
0.252010
0.05
0.10
0.15
0.20
0.252011
0.05
0.10
0.15
0.20
0.252012
0.05
0.10
0.15
0.20
0.252013
0.05
0.10
0.15
0.20
0.252014
0.05
0.10
0.15
0.20
0.252015
0.05
0.10
0.15
0.20
0.252016
0.05
0.10
0.15
0.20
0.25
20 40 60 80 100 120 140
2017
Molva macrophthalma
Length (cm)
Ind
haul
1
1
2
3
42009
1
2
3
42010
1
2
3
42011
1
2
3
42012
1
2
3
42013
1
2
3
42014
1
2
3
42015
1
2
3
42016
1
2
3
4
20 40 60 80 100 120 140
2017

84 | ICES WGDEEP REPORT 2018
Figure 4.5.12. Age distributions for ling areas combined for all catches taken by longliners and by
gill netters.

ICES WGDEEP REPORT 2018 | 85
Figure 4.5.13. Age composition of the fish in area 4a taken by longliners and gillnetters.
4.5.5.4 Weight-at-age
Average weight- and length-at-age for 2009 to 2016 for Areas 4.a and 6.a based on data
from the longliners in the Norwegian reference fleet Figure 4.5.13. and the average
length-at-age and average weight-at-age for the Spanish ling fishery (2014–2017) on
Porcupine Bank (Figures 4.5.14 and 4.5.15).
Figure 4.5.13. Average weight- and length-at-age for 2009 to 2017 for Areas 4.a and 6.a.
Figure 4.5.14. Average length-at-age based on Spanish data for areas 6 and 7 from 2014 to 2017.
Vekt kg = -1,70853 + 0,884844*Alder
0 4 8 12 16 20
Alder
0
5
10
15
20
Vekt
kg
Lengde = 50,6762 + 5,61694*Alder
0 4 8 12 16 20
Alder
0
20
40
60
80
100
120
140
160
180
Len
gd
e
All data
length_cm = exp(3,62235 + 0,107357*Age)
0 3 6 9 12 15
Age
0
30
60
90
120
150
len
gth
_cm
Females
length_cm = exp(3,6572 + 0,103065*Age)
0 3 6 9 12 15
Age
0
30
60
90
120
150
len
gth
_cm
Males
length_cm = exp(3,66189 + 0,101057*Age)
0 3 6 9 12 15
Age
0
30
60
90
120
150
len
gth
_cm

86 | ICES WGDEEP REPORT 2018
Figure 4.5.15. Average weight-at-age based on Spanish data for Areas 6 and 7 from 2014 to 2017.
4.5.5.5 Maturity and natural mortality
Maturity ogives for ling are in Figure 4.5.16 and in the Table below. The results fit well
with the statement that ling becomes mature at-ages 5–7 (60–75 cm lengths) in most
areas, with males maturing at a slightly lower age than females (Magnusson et al.,
1997).
Maturity parameters:
STOCK L50 N A50 N SOURCE
Lin-lin.27.3.a4.a6-91214 63.6 1472 4.8 336 Norwegian long liners (Reference fleet) and survey data
Figure 4.5.16. Ling lin.27.3a4a6-91214, Maturity ogives for age and length for males and females (top
panel) and sexes combined (lower panel).
All
weight_g = exp(5,51836 + 0,340821*Age)
0 3 6 9 12 15
Age
0
4
8
12
16(X 1000,0)
weig
ht_g
Females
weight_g = exp(5,79071 + 0,303579*Age)
0 3 6 9 12 15
Age
0
3
6
9
12
15(X 1000,0)
we
igh
t_g
Males
weight_g = exp(5,69392 + 0,31263*Age)
0 3 6 9 12 15
Age
0
4
8
12
16(X 1000,0)
we
igh
t_g

ICES WGDEEP REPORT 2018 | 87
4.5.5.6 Catch, effort and research vessel data
Spanish Porcupine Bank survey
The Spanish bottom trawl survey on the Porcupine Bank (ICES divisions 7.c and 7.k)
has been carried out annually since 2001 to study the distribution, relative abundance
and biological parameters of commercial fish in these areas (ICES, 2010a; 2010b). The
survey provides estimates of biomass and abundance indices. Area covered by the sur-
vey is shown in Figure 4.5.17.
Figure 4.5.17. Left: Stratification design used in the Porcupine surveys starting in 2003: Previous
years were re-stratified. Depth strata are: E) shallower than 300 m, F) 301 – 450 m and G) 451 – 800
m. Grey area in the middle of Porcupine bank denotes a large non-trawlable area. Right: distribu-
tion of hauls in 2017
French IBTS survey
The survey was cancelled in 2017 due to technical difficulties with the survey vessel
and therefore no new data are available.
Commercial cpues
French lpue
Landing effort, measured in hours at sea, and landings per unit of effort (lpue) are
provided by the French otter trawl, longline and gillnet fishery for areas 6 and 7.bck
for the years 2000–2017.
Norwegian longline cpue
Norway started in 2003 to collect and enter data from official logbooks into an elec-
tronic database and data are now available for the period 2000–2017. Vessels were se-
lected that had a total landed catch of ling, tusk and blue ling exceeding 8 t in a given
year. The logbooks contain records of the daily catch, date, position, and number of
hooks used per day. The quality of the Norwegian logbook data is poor in 2010 due to
changes from paper to electronic logbooks. Since 2011 data quality has improved con-
siderably and data from the entire fleet were available.
Galway
IRELAND
Sector 1: E, F & G
Sector 2: F & G
15º 14º 13º 12º 11º 10º 9º
51º
52º
53º
54º
15º 14º 13º 12º 11º 10º 9º
51º
52º
53º
54º
Galway
IRELAND
15º 14º 13º 12º 11º 10º 9º
51º
52º
53º
54º
15º 14º 13º 12º 11º 10º 9º
51º
52º
53º
54º
Valid towsExtra tows
88 | ICES WGDEEP REPORT 2018
For the standardised Norwegian cpue series, data were available from official logbooks
from 2000 onwards. All catch data, and a subset where ling appeared to have been
targeted (>30 percent of total catch), were used to estimate a standardized cpue series.
A standardised commercial cpue series using data from the Norwegian longline
reference fleet was based on methods described in Helle et al., 2015.
4.5.6 Data analyses
Length data analysis
Mean length of the commercial catches by the Norwegian longlining reference fleet
fluctuate and is approximately 90 cm for Areas 4 and 6.b and around 80 cm for Area
6.a. The series does not indicate any apparent time trends.
On Porcupine Bank the estimated length distributions appear to be quite stable with a
length range of approximately 30–130 cm. The mode of the distributions tends to be
around 70 cm, and there are no clear recruitment signals, which implies that Porcupine
Bank is not a recruitment area for young ling (Figure 4.5.17). For more information, see
Fernández-Zapico et al., WD 2018.
French lpue
The landings of ling by otter trawlers increased from 2004–2014. During the last three
years there has been a decrease in landings. For gillnetters and longliners, changes in
landings are closely related to changes in effort (Figure 4.5.8).
Overall, while total fishing effort has decreased in the areas fished by the three major
French fleets, there is a clear increasing trend in lpue for otter trawlers and a decrease
since 2014 for the gillnetters. The lpue seems to be low but stable for longliners.

ICES WGDEEP REPORT 2018 | 89
Figure 4.5.18. Lpue series for the main French fleet operating in 6, 7.b, c and k.
Spanish ling 2016 Porcupine Bank (NE Atlantic) survey
Estimated biomass and abundance indices based on data from the Porcupine Survey
for the years 2001–2017 are in Figure 4.5.19. The abundance indices for ling based on
the survey have been quite stable from 2001–2012. Taking into account the 80% confi-
dence limits, except for the peak in 2013, the abundance indices for ling have been quite
stable, for the years 2001–2016, however there is a downward trend after the peak in
2013.
0
10000
20000
30000
40000
50000
60000
70000
80000
90000
100000
0
100
200
300
400
500
600
700
800
900
2000 2005 2010 2015
Effo
rt (
tim
e a
t se
a -
ho
urs
)
Lan
din
gs (
ton
s)
French otter trawlers in VI, VIIbck
0
5
10
15
20
25
30
2000 2005 2010 2015
LPU
E (k
g/h
ou
rs)
French otter trawlers in VI, VIIbck
0
5
10
15
20
25
30
2000 2005 2010 2015
LPU
E (k
g/h
ou
rs)
French gillneters in VI, VIIbck
0
5000
10000
15000
20000
25000
30000
35000
0
50
100
150
200
250
300
350
2000 2005 2010 2015
Effo
rt (
tim
e a
t se
a -
ho
urs
)
Lan
din
gs (
ton
s)
French gillneters in VI, VIIbck
0
100
200
300
400
500
600
700
800
2000 2005 2010 2015
LPU
E (k
g/h
ou
rs)
French longliners in VI, VIIbck
0
5000
10000
15000
20000
25000
0
50
100
150
200
250
300
350
400
450
2000 2005 2010 2015
Effo
rt (
tim
e a
t se
a -
ho
urs
)
Lan
din
gs (
ton
s)
French longliners in VI, VIIbck

90 | ICES WGDEEP REPORT 2018
Figure 4.5.19. Estimated biomass and abundance indices based on the Porcupine Survey for the
years 2001–2017. Boxes mark the parametric, based standard error of the stratified abundance index.
Lines mark bootstrap confidence intervals (α = 0.80, bootstrap iterations = 1000).
Cpue series based on the Norwegian longline fleet
For ling, cpue has generally increased for all areas until 2017 when there was a decrease
in all areas. A large part of Rockall (Area 6.b) was closed for fishing in the beginning
of 2007. After 2007, the cpue for ling increased steadily until 2015, after this there have
been a declining trend.
When all data for “ling other areas” are combined, the cpue series indicates a steady
increase since 2003 to 2017 and the decline in 2017 is not apparent when all data are
combined.
Year
kg
haul
1
Molva molva
0
2
4
6
8
10
2001
2002
2003
2004
2005
2006
2007
2008
2009
2010
2011
2012
2013
2014
2015
2016
2017
10 %
90 %
Biomass
Year
Ind
haul
1
0
1
2
3
4
2001
2002
2003
2004
2005
2006
2007
2008
2009
2010
2011
2012
2013
2014
2015
2016
2017
10 %
90 %
Number
Year
kg
haul
1
Molva macrophtalma
0
10
20
30
2001
2002
2003
2004
2005
2006
2007
2008
2009
2010
2011
2012
2013
2014
2015
2016
2017
10 %
90 %
Biomass
Year
Ind
haul
1
0
20
40
60
80
2001
2002
2003
2004
2005
2006
2007
2008
2009
2010
2011
2012
2013
2014
2015
2016
2017
10 %90 %
Number

ICES WGDEEP REPORT 2018 | 91
Figure 4.5.20. Cpue series for ling for the period 2000–2017 based on all available data and when
ling appeared to have been targeted. The bars denote the 95% confidence intervals.
The ling stocks in Areas (3.a, 4, 6, 7, 8, 9, 10, 12, 14) were best covered by the Norwegian
longline fleet. It was therefore decided in plenary that a combined cpue series should
be made in order to give advice for the entire area, and that the data from the targeted
fishery should be used. The combined series is shown in Figure 4.5.21.
0
20
40
60
80
100
120
140
160
2000 2002 2004 2006 2008 2010 2012 2014 2016
CP
UE
(k
g/1
00
0 h
ook
s)
Year
Ling 4.a all data
0
20
40
60
80
100
120
140
160
2000 2002 2004 2006 2008 2010 2012 2014 2016
CP
UE
(k
g/1
00
0 h
ook
s)
Year
Ling 4.a Target
0
30
60
90
120
150
180
210
240
270
300
330
2000 2002 2004 2006 2008 2010 2012 2014 2016
CP
UE
(k
g/1
00
0 h
ook
s)
Year
Ling 6.a all data
0
30
60
90
120
150
180
210
240
270
300
330
2000 2002 2004 2006 2008 2010 2012 2014 2016C
PU
E (
kg
/10
00
hook
s)
Year
Ling 6.a Target
0
20
40
60
80
100
120
140
160
180
200
220
2000 2002 2004 2006 2008 2010 2012 2014 2016
CP
UE
(k
g/1
00
0 h
oo
ks)
Year
Ling 6.b all data
0
20
40
60
80
100
120
140
160
180
200
220
2000 2002 2004 2006 2008 2010 2012 2014 2016
CP
UE
(k
g/1
00
0 h
ook
s)
Year
Ling 6.b Target

92 | ICES WGDEEP REPORT 2018
Figure 4.5.21. Cpue series for ling, areas combined, for the period 2000–2017 based on data when
ling appeared to have been targeted. The bars denote the 95% confidence intervals.
Biological reference points
See Section 4.5.9.
4.5.7 Comments on the assessment
The standardised cpue time-series for the Norwegian longliners shows similar trends
as the superpopulation model presented in 2012 and the the unstandardised time-
series presented in 2011. The trend is either stable (4.a and 6.a) or increasing (6.b)
during the last decade (Figure 4.5.21).
All data in Areas 4.a, 6.a and 6.b were combined to make one index for the entire area.
These series show the same positive trend as for each area separately. This positive
trend is also reflected in the French lpue series based on the otter trawlers but not in
the Spanish biomass and abundance indices.
4.5.8 Management considerations
The cpues series based on commercial data either indicate a stable or an increasing
trend, since the catches have been stable and the indicator series shows an increasing
trend. There has been an increase in discarding of ling, in 2016 there was a peak when
around 8% was discarded, in 2017 5% of the catches were discarded.
As always, it should be emphasized that commercial catch data are typically observa-
tional data; that is, there were no scientific controls on how or from where the data
were collected. Therefore, it is not known with certainty if the ling cpue series tracks
the population and/or how accurate the measures of uncertainty associated with the
series are (see, for example, Rosenbaum, 2002). Consequently, one must usually hope
and pray that a cpue series, which is based only on commercial catch data, truly tracks
abundance.
An infamous example of a misleading cpue series based on commercial data was a
cpue series for Newfoundland cod that incorrectly indicated that the abundance of the
cod stock was increasing greatly. Advice based on this cpue series ultimately caused
the collapse of the stock (see, e.g. Pennington and Strømme, 1998).
0
30
60
90
120
150
180
2000 2002 2004 2006 2008 2010 2012 2014 2016
CP
UE
(k
g/1
00
0 h
ook
s)
Year
Ling other areas combined

ICES WGDEEP REPORT 2018 | 93
In general, any assessment method based only on commercial catch data needs to be
applied with caution. The reason that assessments using only commercial data are
problematic is because the relation between the commercial catch and the actual pop-
ulation is normally unknown and probably varies from year to year.
4.5.9 Application of MSY proxy reference points
Two different methods were tested for Ling, the Length based indicator method (LBI)
and SPiCT.
Length-based indicator method (LBI)
The input parameters and the catch length composition for the period 2002–2017 are in
the following tables and figures. The length data used in the LBI model are data from
the Norwegian longline fleet. The length data are not weighted and therefore do not
represent the length distribution of the entire catch.
Input parameters for LBI.
DATA TYPE SOURCE YEARS/VALUE NOTES
Length–frequency
distribution
Norwegian longliners (Reference
fleet)
2002–2017
Length–weight relation Norwegian Reference fleet and
survey data
0.0055* length 3.0120
LMAT Norwegian Reference fleet and
survey data
64 cm Combined
sexes
Linf Norwegian Reference fleet and
survey data
183 cm
Figure 4.5.22. Ling in other areas (3.a, 4.a, 4.b, 6.a, 6.b, 7). Catch length composition for the period
2001–2016 at 2 cm length classes (sex combined).

94 | ICES WGDEEP REPORT 2018
Outputs
The screening of length indicator ratios for combined sexes was conducted under three
scenarios: (a) Conservation. (b) Optimal yield, and (c) maximum sustainable yield. The
results are presented in the following figures.
Figure 4.5.23. Ling in other areas (3.a, 4.a, 4.b, 6.a, 6.b, 7). Screening of length indicator ratios for sex
combined under three scenarios: (a) Conservation, (b) Optimal yield, and (c) maximum sustainable
yield.
Analysis of results
For the conservation of immature ling the model shows that Lc/Lmat is usually less than
one, but L25%/Lmat is usually greater than 1 (Figure 4.5.23). In 2014–2017, L25%/Lmat has
been greater than 1. The sensitivity measure, Lmat, suggests that there is no overfishing
of immature ling.
The conservation measure for large ling shows that the indicator ratio of Lmax5%/Linf is
around 0.6 for the whole period (Figure 4.5.23) and between 0.58 and 0.64 in 2014–2017
(table under). Therefore, since the conservation indicator is less than 0.8, this implies
that there are few of mega-spawners in the catch which indicates that there is a trunca-
tion point in the length distribution of the catch, i.e. the present catch levels are not
optimal.
The MSY indicator (Lmean/LF=M) is greater than 1 for almost the whole period which indi-
cates that ling in other areas were fished sustainably. The sensitivity measure, Linf, in-
dicates that MSY is always higher than 0.94.

ICES WGDEEP REPORT 2018 | 95
Conclusions
The overall perception of the stock during the period 2014–2017 is that ling in other
areas seems to be fished sustainably. However, the results are very sensitive to the as-
sumed values of Lmat and Linf.
Traffic light indicators
CONSERVATION OPTIMIZING YIELD MSY
Lc/Lmat L25%/Lmat Lmax5%/Linf Pmega Lmean/Lopt Lmean/LF=M
Ref >1 >1 >0.8 >30% ~1 (>0.9) ≥1
2014 0.78 1.13 0.62 0% 0.65 0.97
2015 0.56 1.06 0.61 0% 0.64 1.09
2016 0.52 1.17 0.64 0% 0.68 1.19
2017 0,52 1.16 0.58 0% 0.67 1.14
Plots for the SPiCT model:
The input data were landings 1988–2017, and the cpue index for the targeted fishery
from 2000–2017 (Figure 4.5.24).
The model converges and both the deterministic and stochastic reference points are
very similar, but the confidence intervals are very large.
Outputs from the model: Bmsy=162920, Fmsy= 0.155, MSY=25062, K= 667567
(Advice for 2018-2018 is 17695 tons and the total landings in 2017 was 20 276 tons).
The plots of the results show wide confidence intervals for the absolute biomass and
fishing mortality. The traffic light figure shows that the stock started in the red zone
and is now in the green zone. (Figure 4.5.25). The diagnostics do not show any patterns
in the residuals and no signs of bias, auto correlation or normality. This corresponds to
the present perception of the development of the stock (Figure 4.5.26).
The retrospective analysis shows that the model is not robust enough for ling in “other
areas” (Figure 4.5.27).
Figure 4.5.24. Input data

96 | ICES WGDEEP REPORT 2018
Figure 4.5.25. Plots of the results.
Figure 4.5.26. Diagnostics from SPiCT.

ICES WGDEEP REPORT 2018 | 97
Figure 4.5.27. Retrospective analysis.

98 | ICES WGDEEP REPORT 2018
4.5.10 Tables
Table 4.5.1. Ling 3a, 4a, 6, 7, 8, 9, 12 and 14. WG estimates of landings.
Ling 3
YEAR BELGIUM DENMARK GERMANY NORWAY SWEDEN E & W TOTAL
1988 2 165 - 135 29 - 331
1989 1 246 - 140 35 - 422
1990 4 375 3 131 30 - 543
1991 1 278 - 161 44 - 484
1992 4 325 - 120 100 - 549
1993 3 343 - 150 131 15 642
1994 2 239 + 116 112 - 469
1995 4 212 - 113 83 - 412
1996 212 1 124 65 - 402
1997 159 + 105 47 - 311
1998 103 - 111 - - 214
1999 101 - 115 - - 216
2000 101 + 96 31 228
2001 125 + 102 35 262
2002 157 1 68 37 263
2003 156 73 32 261
2004 130 1 70 31 232
2005 106 1 72 31 210
2006 95 2 62 29 188
2007 82 3 68 21 174
2008 59 1 88 20 168
2009 65 1 62 21 149
2010 58 64 20 142
2011 65 57 18 140
2012 66 <1 61 17 144
2013 56 1 62 11 130
2014 51 1 54 14 120
2015 58 1 50 16 125
2016 77 1 57 17 152
2017* 58 1 57 22 138
*Preliminary.

ICES WGDEEP REPORT 2018 | 99
Table 4.5.1. (continued).
Ling 4.a
*Preliminary.
(1) Includes 4b 1988–1993.
YEAR BELGIUM DENMARK FAROES FRANCE GERMANY NETH. NORWAY SWEDEN1) E&W N.I. SCOT. TOTAL
1988 3 408 13 1143 262 4 6473 5 55 1 2856 11 223
1989 1 578 3 751 217 16 7239 29 136 14 2693 11 677
1990 1 610 9 655 241 - 6290 13 213 - 1995 10 027
1991 4 609 6 847 223 - 5799 24 197 + 2260 9969
1992 9 623 2 414 200 - 5945 28 330 4 3208 10 763
1993 9 630 14 395 726 - 6522 13 363 - 4138 12 810
1994 20 530 25 n/a 770 - 5355 3 148 + 4645 11 496
1995 17 407 51 290 425 - 6148 5 181 5517 13 041
1996 8 514 25 241 448 6622 4 193 4650 12 705
1997 3 643 6 206 320 4715 5 242 5175 11 315
1998 8 558 19 175 176 7069 - 125 5501 13 631
1999 16 596 n.a. 293 141 5077 240 3447 9810
2000 20 538 2 147 103 4780 7 74 3576 9246
2001 702 128 54 3613 6 61 3290 7854
2002 6 578 24 117 4509 59 3779 9072
2003 4 779 6 121 62 3122 5 23 2311 6433
2004 575 11 64 34 3753 2 15 1852 6306
2005 698 18 47 55 4078 4 12 1537 6449
2006 637 2 73 51 4443 3 55 1455 6719
2007 412 - 100 60 4109 3 31 1143 5858
2008 446 1 182 52 4726 12 20 1820 7259
2009 427 7 90 27 4613 7 19 2218 7408
2010 433 62 40 3914 28 1921 6398
2011 541 90 62 3790 8 18 1999 6508
2012 419 105 47 4591 6 28 1822 7018
2013 548 104 83 4273 5 15 2169 7197
2014 404 182 53 5038 3 23 2046 7749
2015 424 127 53 5369 6 90 2018 8069
2016 797 304 71 6021 5 65 2477 9740
2017* 1036 300 111 6925 11 78 2761 11222

100 | ICES WGDEEP REPORT 2018
Table 4.5.1. (continued).
Ling 4.bc.
YEAR BELG
IUM
DENM
ARK
FRA
NCE
SWE
DEN
NOR
WAY
E &
W
SCOTL
AND
GERM
ANY
NETHERL
ANDS
TOTAL
1988 100 173 106 - 379
1989 43 236 108 - 387
1990 59 268 128 - 455
1991 51 274 165 - 490
1992 261 56 392 133 - 842
1993 263 26 412 96 - 797
1994 177 42 40 64 - 323
1995 161 39 301 135 23 659
1996 131 100 187 106 45 569
1997 33 166 1 9 57 215 170 48 699
1998 47 164 5 129 128 136 18 627
1999 35 138 - 51 106 106 10 446
2000 59 101 0 8 45 77 90 4 384
2001 46 81 1 3 23 62 60 6 2 284
2002 38 91 4 61 58 43 12 2 309
2003 28 0 3 83 40 65 14 1 234
2004 48 71 1 54 23 24 19 1 241
2005 28 56 5 20 17 10 13 149
2006 26 53 8 16 20 8 13 144
2007 28 42 1 5 48 20 5 10 159
2008 15 40 2 5 87 25 15 11 200
2009 19 38 2 13 58 29 137 17 1 314
2010 23 55 1 13 56 26 10 17 201
2011 15 59 0 85 24 11 17 211
2012 12 45 1 10 84 25 7 8 192
2013 15 47 1 5 71 0 21 12 4 176
2014 16 46 0 6 34 7 14 15 3 141
2015 11 36 6 54 10 16 14 147
2016 14 42 6 50 7 9 21 1 150
2017* 9 36 9 74 4 9 2 143
*Preliminary.

ICES WGDEEP REPORT 2018 | 101
Table 4.5.1. (continued).
Ling 6.a update for Spain.
YEAR BELGIUM DENMARK FAROES FRANCE (1) GERMANY IRELAND NORWAY SPAIN(2) E&W IOM N.I. SCOT. TOTAL
1988 4 + - 5381 6 196 3392 3575 1075 - 53 874 14 556
1989 6 1 6 3417 11 138 3858 307 + 6 881 8631
1990 - + 8 2568 1 41 3263 111 - 2 736 6730
1991 3 + 3 1777 2 57 2029 260 - 10 654 4795
1992 - 1 - 1297 2 38 2305 259 + 6 680 4588
1993 + + - 1513 92 171 1937 442 - 13 1133 5301
1994 1 1 1713 134 133 2034 1027 551 - 10 1126 6730
1995 - 2 0 1970 130 108 3156 927 560 n/a 1994 8847
1996 0 1762 370 106 2809 1064 269 2197 8577
1997 0 1631 135 113 2229 37 151 2450 6746
1998 1531 9 72 2910 292 154 2394 7362
1999 941 4 73 2997 468 152 2264 6899
2000 + + 737 3 75 2956 708 143 2287 6909
2001 774 3 70 1869 142 106 2179 5143
2002 402 1 44 973 190 65 2452 4127
2003 315 1 88 1477 0 108 1257 3246
2004 252 1 96 791 2 8 1619 2769
2005 18 423 89 1389 0 1 1108 3028
2006 5 499 2 121 998 0 137 811 2573
2007 88 626 2 45 1544 0 33 782 3120
2008 21 1004 2 49 1265 0 1 608 2950

102 | ICES WGDEEP REPORT 2018
YEAR BELGIUM DENMARK FAROES FRANCE (1) GERMANY IRELAND NORWAY SPAIN(2) E&W IOM N.I. SCOT. TOTAL
2009 30 418 85 828 116 1 846 2324
2010 23 475 164 989 3 0 1377 3031
2011 102 428 95 683 8 1683 2999
2012 30 585 47 542 862 1589 3655
2013 50 718 54 1429 899 10 1500 4660
2014 0 937 39 1006 1005 6 1768 4761
2015 891 65 1214 961 4 1629 4764
2016 92 1005 156 1313 1109 9 1975 5659
2017* 5 868 156 1530 1500 3 2244 6306
*Preliminary. (1) Includes 6.b until 1996 (2) Includes minor landings from 6.b.

ICES WGDEEP REPORT 2018 | 103
Table 4.5.1. (continued).
Ling 6.b.
YEAR FAR
OES
FRANC
E (2)
GERM
ANY
IRELA
ND
NOR
WAY
SPAI
N (3)
E &
W
N.
I.
SCOTL
AND
RUS
SIA
TOTAL
1988 196 - - 1253 93 - 223 1765
1989 17 - - 3616 26 - 84 3743
1990 3 - 26 1315 10 + 151 1505
1991 - - 31 2489 29 2 111 2662
1992 35 + 23 1713 28 2 90 1891
1993 4 + 60 1179 43 4 232 1522
1994 104 - 44 2116 52 4 220 2540
1995 66 + 57 1308 84 123 1638
1996 0 124 70 679 150 101 1124
1997 0 46 29 504 103 132 814
1998 1 10 44 944 71 324 1394
1999 26 25 41 498 86 499 1175
2000 + 18 31 19 1172 157 475 7 1879
2001 + 16 3 18 328 116 307 788
2002 2 2 2 289 65 173 533
2003 2 3 25 485 34 111 660
2004 + 9 3 6 717 6 141 182 1064
2005 31 4 17 628 9 97 356 1142
2006 30 4 3 48 1171 19 130 6 1411
2007 4 10 35 54 971 7 183 50 1314
2008* 69 6 20 47 1021 1 135 214 1513
2009 249 5 6 39 1859 3 439 35 2635
2010 215 2 34 2042 0 394 2687
2011 12 5 16 957 1 268 1259
2012 60 7 13 1089 3 218 1390
2013 19 8 532 6 229 1 795
2014 60 7 10 435 2 258 2 774
2015 5 10 1 16 952 11 6 211 3 1215
2016 56 35 821 2 4 170 1088
2017* 5 2 59 498 7 2 219 1 793
*Preliminary. (1) Includes XII. (2) Until 1966 included in 6.a. (3) Included in Ling 6.a.
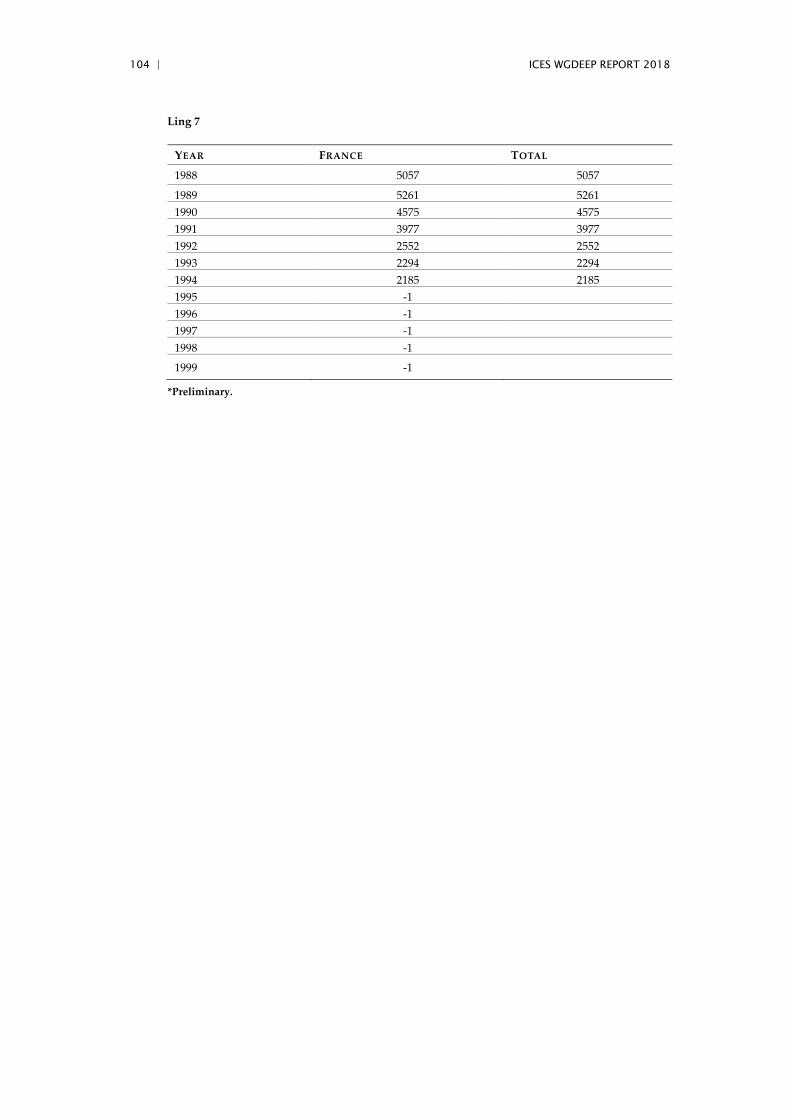
104 | ICES WGDEEP REPORT 2018
Ling 7
YEAR FRANCE TOTAL
1988 5057 5057
1989 5261 5261
1990 4575 4575
1991 3977 3977
1992 2552 2552
1993 2294 2294
1994 2185 2185
1995 -1
1996 -1
1997 -1
1998 -1
1999 -1
*Preliminary.

ICES WGDEEP REPORT 2018 | 105
Table 4.5.1. (continued).
Ling 7.a.
YEAR BELGIUM FRANCE IRELAND E & W IOM N.I. SCOTLAND TOTAL
1988 14 -1 100 49 - 38 10 211
1989 10 -1 138 112 1 43 7 311
1990 11 -1 8 63 1 59 27 169
1991 4 -1 10 31 2 60 18 125
1992 4 -1 7 43 1 40 10 105
1993 10 -1 51 81 2 60 15 219
1994 8 -1 136 46 2 76 16 284
1995 12 9 143 106 1 -2 34 305
1996 11 6 147 29 - -2 17 210
1997 8 6 179 59 2 -2 10 264
1998 7 7 89 69 1 -2 25 198
1999 7 3 32 29 -2 13 84
2000 3 2 18 25 25 73
2001 6 3 33 20 31 87
2002 7 6 91 15 7 119
2003 4 4 75 18 11 112
2004 3 2 47 11 34 97
2005 4 2 28 12 15 61
2006 2 1 50 8 27 88
2007 2 0 32 1 8 43
2008 1 0 13 1 0 15
2009 1 36 9 2 0 48
2010 28 15 1 0 44
2011 1 2 23 1 1 28
2012 2 11 1 0 14
2013 1 6 23 30
2014 2 0 11 16 29
2015 1 8 10 19
2016 1 10 13 24
2017* 9 15 24
Preliminary. (1) French catches in 7 not split into divisions, see Ling 7. (2) Included with UK (EW).

106 | ICES WGDEEP REPORT 2018
Table 4.5.1. (continued).
Ling 7.b, c.
YEAR FRANCE (1) GERMANY IRELAND NORWAY SPAIN (3) E & W N.I. SCOTLAND TOTAL
1988 -1 - 50 57 750 - 8 865
1989 -1 + 43 368 161 - 5 577
1990 -1 - 51 463 133 - 31 678
1991 -1 - 62 326 294 8 59 749
1992 -1 - 44 610 485 4 143 1286
1993 -1 97 224 145 550 9 409 1434
1994 -1 98 225 306 530 2 434 1595
1995 78 161 465 295 630 -2 315 1944
1996 57 234 283 168 1117 -2 342 2201
1997 65 252 184 418 635 -2 226 1780
1998 32 1 190 89 393 329 1034
1999 51 4 377 288 488 159 1366
2000 123 21 401 170 327 140 1182
2001 80 2 413 515 94 122 1226
2002 132 0 315 207 151 159 964
2003 128 0 270 74 52 524
2004 133 12 255 163 27 50 640
2005 145 11 208 17 48 429
2006 173 1 311 147 13 23 668
2007 173 5 62 27 71 20 358
2008 122 16 44 0 14 63 259
2009 42 71 0 17 1 131
2010 34 82 0 6 131 253
2011 29 58 28 93 208
2012 126 1 39 230 370 1 246 1013
2013 267 2 46 379 136 180 1010
2014 118 57 279 19 59 532
2015 101 53 184 144 78 560
2016 93 46 6 172 46 207 570
2017* 90 32 133 34 26 315
*Preliminary. (1) See Ling 7. (2) Included with UK (EW). (3) Included with 7.g–k until 2011.

ICES WGDEEP REPORT 2018 | 107
Table 4.5.1. (continued).
Ling 7.d, e.
YEAR BELGIUM DENMAR
K
FRANCE
(1)
IRELAN
D
E &
W
SCOTLA
ND
CH.
ISLANDS
NETHERLAN
DS
SPAI
N
TOTAL
1988 36 + -1 - 743 - 779
1989 52 - -1 - 644 4 700
1990 31 - -1 22 743 3 799
1991 7 - -1 25 647 1 680
1992 10 + -1 16 493 + 519
1993 15 - -1 - 421 + 436
1994 14 + -1 - 437 0 451
1995 10 - 885 2 492 0 1389
1996 15 960 499 3 1477
1997 12 1049 1 372 1 37 1472
1998 10 953 510 1 26 1500
1999 7 545 - 507 1 1060
2000 5 454 1 372 14 846
2001 6 402 399 807
2002 7 498 386 0 891
2003 5 531 1 250 0 787
2004 13 573 1 214 801
2005 11 539 236 786
2006 9 470 208 687
2007 15 428 0 267 710
2008* 5 348 214 2 569
2009 6 186 170 1 363
2010 4 144 138 8 294
2011 5 238 176 6 425
2012 7 255 1 164 2 7 436
2013 5 259 218 482
2014 4 338 1 262 605
2015 5 204 137 1 347
2016 3 141 149 293
2017* 4 105 94 203
*Preliminary.

108 | ICES WGDEEP REPORT 2018
Table 4.5.1. (continued).
Ling 7.f.
YEAR BELGIUM FRANCE (1) IRELAND E & W SCOTLAND TOTAL
1988 77 -1 - 367 - 444
1989 42 -1 - 265 3 310
1990 23 -1 3 207 - 233
1991 34 -1 5 259 4 302
1992 9 -1 1 127 - 137
1993 8 -1 - 215 + 223
1994 21 -1 - 379 - 400
1995 36 110 - 456 0 602
1996 40 121 - 238 0 399
1997 30 204 - 313 547
1998 29 204 - 328 561
1999 16 108 - 188 312
2000 15 91 1 111 218
2001 14 114 - 92 220
2002 16 139 3 295 453
2003 15 79 1 81 176
2004 18 73 5 65 161
2005 36 59 7 82 184
2006 10 42 14 64 130
2007 16 52 2 55 125
2008 32 88 4 63 187
2009 10 69 1 26 106
2010 10 42 0 17 0 69
2011 20 39 2 94 155
2012 28 80 <1 59 <1 167
2013 22 68 1 93 40 224
2014 61 182 0 91 334
2015 15 54 2 17 88
2016 25 51 1 34 3 114
2017* 7 21 1 19 48
*Preliminary. (1) See Ling 7.

ICES WGDEEP REPORT 2018 | 109
Table 4.5.1. (continued).
Ling 7.g–k.
YEAR BELGIUM DENMARK FRANCE GERMANY IRELAND NORWAY SPAIN (2) E&W IOM N.I. SCOT. TOTAL
1988 35 1 -1 - 286 - 2652 1439 - - 2 4415
1989 23 - -1 - 301 163 518 - + 7 1012
1990 20 + -1 - 356 260 434 + - 7 1077
1991 10 + -1 - 454 - 830 - - 100 1394
1992 10 - -1 - 323 - 1130 - + 130 1593
1993 9 + -1 35 374 1551 - 1 364 2334
1994 19 - -1 10 620 184 2143 - 1 277 3254
1995 33 - 1597 40 766 - 195 3046 -3 454 6131
1996 45 - 1626 169 771 583 3209 447 6850
1997 37 - 1574 156 674 33 2112 459 5045
1998 18 - 1362 88 877 1669 3465 335 7814
1999 - - 1220 49 554 455 1619 292 4189
2000 17 1062 12 624 639 921 303 3578
2001 16 1154 4 727 24 559 591 285 3360
2002 16 1025 2 951 568 862 102 3526
2003 12 1240 5 808 455 382 38 2940
2004 14 982 686 405 335 5 2427
2005 15 771 12 539 399 313 4 2053
2006 10 676 935 504 264 18 2407
2007 11 661 1 430 423 217 6 1749
2008 11 622 8 352 391 130 27 1541
2009 7 183 6 270 51 142 14 673
2010 10 108 1 279 301 135 14 848
2011 15 260 465 16 157 23 936
2012 23 584 2 516 201 138 56 1520
2013 24 622 495 190 74 203 1608
2014 13 535 445 177 185 202 1557
2015 11 391 366 153 131 13 1065
2016 10 383 549 107 114 9 1172
2017* 10 291 392 85 91 12 881
*Preliminary. (1) See Ling 7. (2) Includes 7.b, c until 2011. (3) Included in UK (EW).

110 | ICES WGDEEP REPORT 2018
Table 4.5.1. (continued).
Ling 8.
YEAR BELGIUM FRANCE GERMANY SPAIN E & W SCOT. TOTAL
1988 1018 10 1028
1989 1214 7 1221
1990 1371 1 1372
1991 1127 12 1139
1992 801 1 802
1993 508 2 510
1994 n/a 77 8 85
1995 693 106 46 845
1996 825 23 170 23 1041
1997 1 705 + 290 38 1034
1998 5 1220 - 543 29 1797
1999 22 234 - 188 8 452
2000 1 227 106 5 339
2001 245 341 6 2 594
2002 316 141 10 0 467
2003 333 67 36 436
2004 385 54 53 492
2005 339 92 19 450
2006 324 29 45 398
2007 282 20 10 312
2008 294 36 15 3 345
2009 150 29 7 186
2010 92 31 11 134
2011 148 47 6 201
2012 349 201 2 552
2013 281 139 35 4 459
2014 280 110 4 1 395
2015* 269 63 5 337
2016 207 77 3 287
2017* 154 43 2 199

ICES WGDEEP REPORT 2018 | 111
Ling 9.
YEAR SPAIN TOTAL
1997 0 0
1998 2 2
1999 1 1
2000 1 1
2001 0 0
2002 0 0
2003 0 0
2004
2005
2006
2007 1 1

112 | ICES WGDEEP REPORT 2018
Table 4.5.1. (continued).
Ling 12.
YEAR FAROES FRANCE NORWAY E & W SCOTLAND GERMANY IRELAND TOTAL
1988 - 0
1989 - 0
1990 3 3
1991 10 10
1992 - 0
1993 - 0
1994 5 5
1995 5 45 50
1996 - 2 2
1997 - + 9 9
1998 - 1 - 1 2
1999 - 0 - - + 2 2
2000 1 - 6 7
2001 0 29 2 24 4 59
2002 0 4 4 0 8
2003 17 2 0 19
2004
2005 1 1
2006 1 1
2007 0
2008 0
2009 0 1 1
2010 0
2011 1 1
2012 3 1 4
2013 0
2014 0
2015 0
2016 0
2017* 0

ICES WGDEEP REPORT 2018 | 113
Table 4.5.1. (continued).
Ling 14.
YEAR FAROES GERMANY ICELAND NORWAY E & W SCOTLAND RUSSIA TOTAL
1988 3 - - - - 3
1989 1 - - - - 1
1990 1 - 2 6 - 9
1991 + - + 1 - 1
1992 9 - 7 1 - 17
1993 - + 1 8 - 9
1994 + - 4 1 1 6
1995 - - 14 3 0 17
1996 - 0 0
1997 1 60 61
1998 - 6 6
1999 - 1 1
2000 26 - 26
2001 1 35 36
2002 3 20 23
2003 83 83
2004 10 10
2005 0
2006 0
2007 5 5
2008 1 1 2
2009 + 3 3
2010 3 3
2011 2 1 3
2012 1 105 106
2013 0
2014 1 1 6 1 1 9
2015 0
2016 9 1 10 1 21
2017* 1 1 2 4
*Preliminary.

114 | ICES WGDEEP REPORT 2018
Table 4.5.2 Ling. Total landings by subarea or division.
Year 3 4.a 4.bc 6.a 6.b 7 7.a 7.bc 7.de 7.f 7.g–k 8 9 12 14 All areas
1988 331 11 223 379 14 556 1765 5057 211 865 779 444 4415 1028 0 3 41 056
1989 422 11 677 387 8631 3743 5261 311 577 700 310 1012 1221 0 1 34 253
1990 543 10 027 455 6730 1505 4575 169 678 799 233 1077 1372 3 9 28 175
1991 484 9969 490 4795 2662 3977 125 749 680 302 1394 1139 10 1 26 777
1992 549 10 763 842 4588 1891 2552 105 1286 519 137 1593 802 0 17 25 644
1993 642 12 810 797 5301 1522 2294 219 1434 436 223 2334 510 0 9 28 531
1994 469 11 496 323 6730 2540 2185 284 1595 451 400 3254 85 5 6 29 823
1995 412 13 041 659 8847 1638 305 1944 1389 602 6131 845 50 17 35 880
1996 402 12 705 569 8577 1124 210 2201 1477 399 6850 1041 2 0 35 557
1997 311 11 315 699 6746 814 264 1780 1472 547 5045 1034 0 9 61 30 097
1998 214 13 631 627 7362 1394 198 1034 1500 561 7814 1797 2 2 6 36 142
1999 216 9810 446 6899 1175 84 1366 1060 312 4189 452 1 2 1 26 013
2000 228 9246 384 6909 1879 73 1182 846 218 3578 339 1 7 26 24 916
2001 262 7854 284 5143 788 87 1226 807 220 3360 594 0 59 36 20 720
2002 263 9072 309 4127 533 119 964 891 453 3526 467 0 8 23 20 756
2003 261 6433 234 3246 660 112 524 787 176 2940 436 19 83 15 912
2004 232 6306 241 2769 1064 97 640 801 161 2427 492 0 10 15 240
2005 210 6449 149 3028 1142 61 429 786 184 2053 450 1 0 14 942
2006 188 6719 144 2573 1411 88 668 687 130 2407 398 1 0 15 414
2007 174 5858 159 3119 1314 43 358 710 125 1749 312 0 5 13 927
2008 168 7259 200 2950 1551 15 259 569 187 1541 345 0 1 15 045
2009 149 7408 314 2324 2635 48 131 363 106 673 186 1 3 14 341

ICES WGDEEP REPORT 2018 | 115
Year 3 4.a 4.bc 6.a 6.b 7 7.a 7.bc 7.de 7.f 7.g–k 8 9 12 14 All areas
2010 142 6398 201 3031 2687 44 253 294 69 848 134 0 3 14 104
2011 140 6508 211 2999 1259 28 208 425 155 936 201 0 3 13 073
2012 145 7018 192 3655 1390 14 1013 436 167 1520 552 0 106 16 208
2013 130 7197 176 4660 795 30 1010 482 224 1608 459 0 0 16 771
2014 120 7749 141 4761 774 29 532 605 334 1557 395 0 9 17 075
2015 125 8069 147 4764 1215 19 560 347 88 1065 337 0 0 16 736
2016 152 9739 150 5659 1088 24 570 293 114 1172 287 21 19269
2017 138 11222 143 6306 793 24 315 203 48 881 199 0 4 20276
*Preliminary.


ICES WGDEEP REPORT 2018 | 117
Table 4.5.3. Number of French fishing vessels (otter trawlers, gillnetters and longliners) during the
period 2000–2016.
NUMBERS OF SHIPS OTTER TRAWLERS GILLNETTERS LONGLINERS
2000 65 12 1
2001 77 13 2
2002 66 15 3
2003 61 19 2
2004 52 22 0
2005 46 24 1
2006 44 20 6
2007 42 20 7
2008 37 20 7
2009 38 20 6
2010 29 21 2
2011 32 18 3
2012 36 15 4
2013 33 14 8
2014 33 13 9
2015 31 9 11
2016 26 5 12
2017 28 11 17