3D Technologies for the Digital Documentation of an Ancient Wooden Structure
15
3D Technologies for the Digital Documentation of an Ancient Wooden Structure by Caterina Balletti, Matteo Berto, Caterina Gottardi and Francesco Guerra Reprinted from International Journal of Heritage in the Digital Era volume 3 number 1 2014
Transcript of 3D Technologies for the Digital Documentation of an Ancient Wooden Structure
3D Technologies for the DigitalDocumentation of an AncientWooden StructurebyCaterina Balletti, Matteo Berto, Caterina Gottardi and Francesco Guerra
Reprinted from
International Journal ofHeritage in the Digital Eravolume 3 number 1 2014
19
3D Technologies for theDigital Documentationof an Ancient WoodenStructureCaterina Ballettia, Matteo Bertob, Caterina Gottardia
and Francesco Guerraa
Laboratorio di Fotogrammetria, Sistema dei Laboratori, Università IUAVdi Venezia, Santa Croce 191, 30135, Venice, Italya(balletti; cgottardi; guerra2)@[email protected]
volume 3 number 1 2014International Journal of Heritage in the Digital Era
20
3D Technologies for the DigitalDocumentation of an AncientWooden StructureCaterina Balletti, Matteo Berto, Caterina Gottardi and Francesco Guerra
Abstract:
In this paper we would like to present an operational procedure for
surveys of complex structures, such as the wooden dome of
SS. Giovanni e Paolo in Venice. The aim of this work was to analyse
the shape and the geometry of this very articulated constructive
technique: because of its complexity, a laser scanning survey,
with the support of more traditional methods, such as direct and
topographic survey, seemed to be the best way to analyse this
structure: from the data elaboration it was possible to create a 3D
model of each element as in reality, without any simplification. In line
with the growing demand of digital documentation in the field of
Cultural Heritage, the 3D technology applied to this research allowed
an immediate reading of the whole architectural system. This paper
analyses the difficulties encountered during the survey and illustrates
the solutions chosen to overcome them.
1. Introduction
The aim of this research was to define a methodology for creating accurate digitalrepresentations, starting from a high-resolution laser scanning survey, in order to analyse theshape and the spatial complexity of an intricate structure. At the end of this work weobtained an operational procedure for future surveys of similar structures.
This work arose from the will to study and analyse one of the most fascinating andparticular architectural techniques in Venice: the wooden domes. The dome of SS. Giovannie Paolo was the perfect case study: it had not been entirely studied yet and it was possible toaccess it safely to carry out the survey and the necessary geometrical analysis.
The result, obtained after the editing of point-clouds, is a 3D model of each one of thedome’s elements, regardless if it is a wooden, wall, or metallic element. Different phases wereneeded to achieve the final result: on-site inspections in the Basilica and in the dome, on-site
data acquisition, which was carried out in two days and finally dataelaboration and creation of the 3D model. It was also necessary toscan the interior of the Basilica, in order to study the curvature of thewall intrados of the dome. The survey has been carried out togetherwith an historical research with the aim of acquiring as muchinformation and drawings as possible on the architectural evolution: thegraphic and bibliographic documentation of the wooden dome wasindeed scarce. The survey allowed us to obtain a deeper knowledge ofthe structure and therefore to read the XIX-century drawings andhistorical representations in a more critical way than when we firststarted. The model shows the formal differences of the structure incomparison with the historical representations. Not only the woodenelements are represented in a different position, but they are alsorepresented with a more regular and simplified geometry than in reality.
Data acquisition through the laser scanner and the further 3Dmodelling is a very well known method in architecture and in the fieldof Cultural Heritage [1]. Thanks to the laser scanning technique it ispossible to analyse and study the object in a 3D environment, evenfrom the georeferencing of the point-clouds obtained from thescans [2]. In addition, with this model it is possible to understand thegeometry of the wooden beams and it also works as a support forfurther analysis, for example in the conservation field. Therepresentation of the three dimensions allows the reading of thecondition of elements, and the model can be used as a database ofthe architectural parts [3].
A wooden system, as complex as the one of the Venetian domes,can only be represented with a 3D model. This is the only way to clearlyread the whole structure in its complexity. At first, large architecturalstructures can be very difficult to read and to separate into theirdifferent parts; this happens because more elements were addedduring later restoration works that can alter the original shape, whichbecomes often more complex. However, with the model it is possible toread the single parts and understand the hierarchical structure. The laserscanning technique was the best procedure to create a 3D model ofsuch a geometrical complex structure such as the dome of SS. Giovannie Paolo. The model not only had to be accurate, but also easilyunderstandable in each of its different elements and this was possibleonly thanks to the applied survey method. Moreover, the model was notonly thought to be an end in itself, but also to be measured andanalysed in the future, adding new information, if necessary [4].
In the following paragraphs a brief historical introduction of thedome of SS. Giovanni e Paolo will be made (Sec. 2, 2.1), followed by adescription of the methods used to carry out the survey of the woodenand wall structure. Data acquisition (Sec. 3) and elaboration processes
213D Technologies for the Digital Documentation of an Ancient WoodenStructure
(Sec. 4) are described together with the creation of the 3D digitalrepresentations (Sec. 5). To conclude, final considerations on theresearch and the aims achieved are presented (Sec. 6,7).
2. The Dome of SS. Giovanni e Paolo Basilica
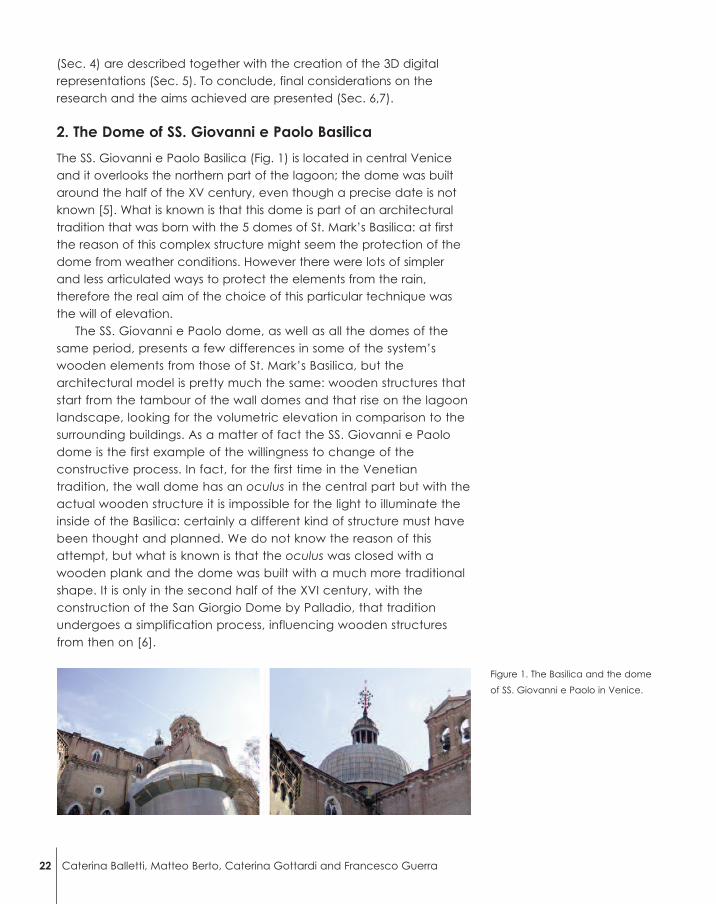
The SS. Giovanni e Paolo Basilica (Fig. 1) is located in central Veniceand it overlooks the northern part of the lagoon; the dome was builtaround the half of the XV century, even though a precise date is notknown [5]. What is known is that this dome is part of an architecturaltradition that was born with the 5 domes of St. Mark’s Basilica: at firstthe reason of this complex structure might seem the protection of thedome from weather conditions. However there were lots of simplerand less articulated ways to protect the elements from the rain,therefore the real aim of the choice of this particular technique wasthe will of elevation.
The SS. Giovanni e Paolo dome, as well as all the domes of thesame period, presents a few differences in some of the system’swooden elements from those of St. Mark’s Basilica, but thearchitectural model is pretty much the same: wooden structures thatstart from the tambour of the wall domes and that rise on the lagoonlandscape, looking for the volumetric elevation in comparison to thesurrounding buildings. As a matter of fact the SS. Giovanni e Paolodome is the first example of the willingness to change of theconstructive process. In fact, for the first time in the Venetiantradition, the wall dome has an oculus in the central part but with theactual wooden structure it is impossible for the light to illuminate theinside of the Basilica: certainly a different kind of structure must havebeen thought and planned. We do not know the reason of thisattempt, but what is known is that the oculus was closed with awooden plank and the dome was built with a much more traditionalshape. It is only in the second half of the XVI century, with theconstruction of the San Giorgio Dome by Palladio, that traditionundergoes a simplification process, influencing wooden structuresfrom then on [6].
22 Caterina Balletti, Matteo Berto, Caterina Gottardi and Francesco Guerra
Figure 1. The Basilica and the dome
of SS. Giovanni e Paolo in Venice.
2.1. The historical evolution of the wooden dome
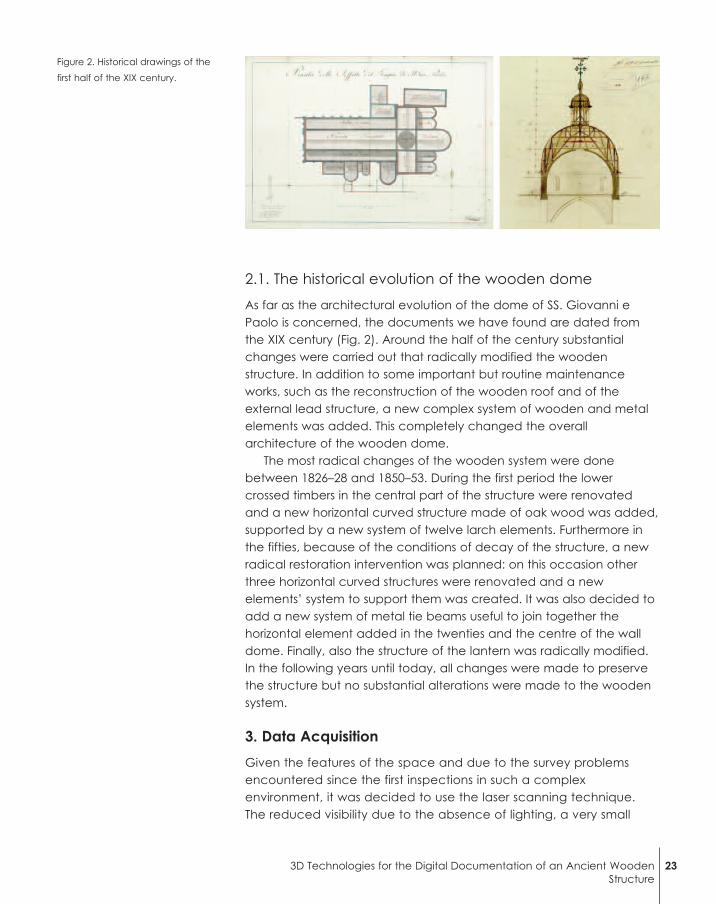
As far as the architectural evolution of the dome of SS. Giovanni ePaolo is concerned, the documents we have found are dated fromthe XIX century (Fig. 2). Around the half of the century substantialchanges were carried out that radically modified the woodenstructure. In addition to some important but routine maintenanceworks, such as the reconstruction of the wooden roof and of theexternal lead structure, a new complex system of wooden and metalelements was added. This completely changed the overallarchitecture of the wooden dome.
The most radical changes of the wooden system were donebetween 1826–28 and 1850–53. During the first period the lowercrossed timbers in the central part of the structure were renovatedand a new horizontal curved structure made of oak wood was added,supported by a new system of twelve larch elements. Furthermore inthe fifties, because of the conditions of decay of the structure, a newradical restoration intervention was planned: on this occasion otherthree horizontal curved structures were renovated and a newelements’ system to support them was created. It was also decided toadd a new system of metal tie beams useful to join together thehorizontal element added in the twenties and the centre of the walldome. Finally, also the structure of the lantern was radically modified.In the following years until today, all changes were made to preservethe structure but no substantial alterations were made to the woodensystem.
3. Data Acquisition
Given the features of the space and due to the survey problemsencountered since the first inspections in such a complexenvironment, it was decided to use the laser scanning technique.The reduced visibility due to the absence of lighting, a very small
233D Technologies for the Digital Documentation of an Ancient WoodenStructure
Figure 2. Historical drawings of the
first half of the XIX century.
planking level and a high number of wooden elements with irregularshapes make this structure fascinating and extremely complex to besurveyed at the same time. The base has a width of approximately14.5 metres, the height from the planking level to the roof isapproximately 10 metres and these become 23 metres with thelantern and the cross on the top. The planking level, where thewooden elements of the structure are based, has a width of 60cm.Moreover, inside this environment, there was not any artificialillumination and the natural light was all coming from the upper partwhere a little trapdoor allowed people to go outside. The difficulty ofusing traditional survey methods such as direct or photogrammetricsurvey became clear, and therefore it was decided to use the laserscanning technique for the metric survey [7]. With this technique itwas possible to overcome all the problems described above:contrary to the passive sensors (topography and photogrammetry),while making the measure the laser scanner uses an encoded light(active sensor) that is almost indifferent to the environment’s lightconditions in which we operate [8]. For this reason, thanks to theindifference of the laser scanner to lighting it was possible to solvethe problem of reduced visibility, its ability to acquire a huge amountof points allowed us to accurately identify the geometry of thestructure and thanks to the short scanning time it was possible toreduce the on site survey time. Moreover, the reduced dimensionsand weight of the laser scanner we used - definitely more handythan those used a few years ago - allowed us to take it up to thedome with no problems.
The structure has an octagonal scheme but with the changesmade in the XIX century, the observer will perceive a different division,highlighted by the 12 systems of wooden elements. This is the reasonwhy we decided to put the laser scanner in each of the twelve spans.The other scans were carried out from the intermediate and toplanding of the staircase that takes you to the top part of the dome,and from the stairs that go outside: in this way it was possible to scan agreat part of the lantern.
For all the scans, we used the laser scanner phase shift FARO Focus3D. This laser scanner has a range from 0.6 m to 120 m, with anaccuracy of ±2mm for distances included in a range from 10 to25 meters. It has a vertical visual field of 305° and a horizontal one of360°. Moreover, it has a measurement speed up to 976.000 points/sec.A digital camera with a 70 megapixel resolution is integrated in thelaser scanner. The acquisition resolution selected for this work was setup to have one point every 6 mm at a distance of 10 meters; howeverthe high number of scans and their very close distance to theanalysed object have permitted to obtain very dense point clouds, for
24 Caterina Balletti, Matteo Berto, Caterina Gottardi and Francesco Guerra
a total of 800 millions points. The main problem of such a hugequantity of data acquisition is the very difficult management in thenext phase of data processing.
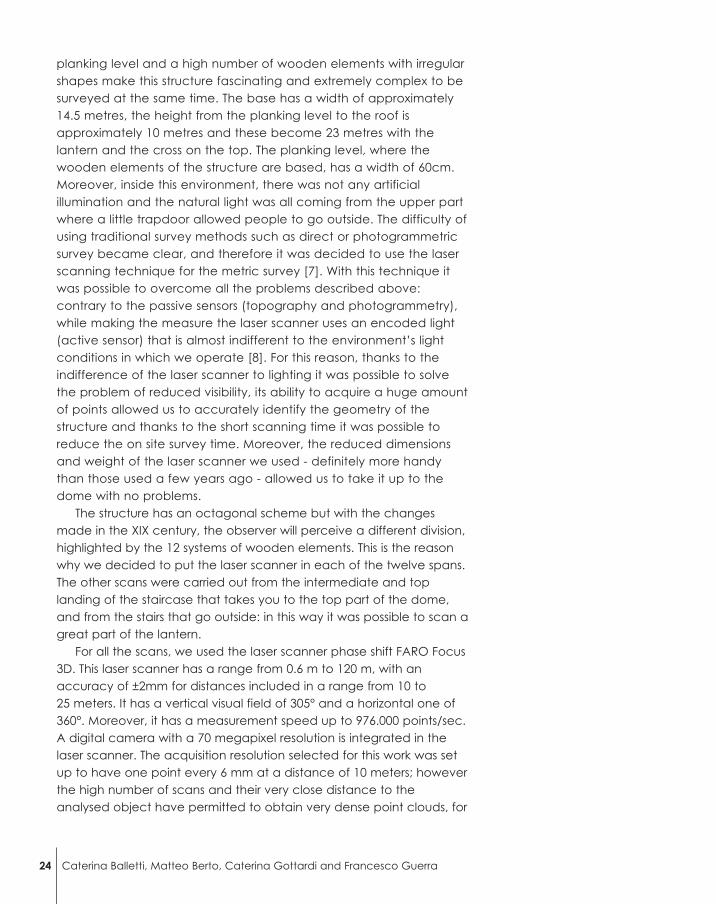
In the processing phase the scans’ elaboration software easilyrecognizes some signalization systems. For this reason high-contrast andspherical targets (with a diameter of 12 cm) were positioned (Fig. 3).The acquisition of the scans with the laser scanner was carried outtogether with a topographic support for a better control in thealignment and registration phases and especially due to the complexityof the structure of the space: for the acquisition of the points we usedthe total station Leica TCR 1103. In this case, for the collimation of thecontrol points, local lighting systems were used to identify the targets.Finally, the wooden material’s response to the laser scanner did notcause any particular problems in terms of the intensity value.
Data acquisition was carried out in two days. During the first daywe created the topographic support with the total station, we carriedout the scans from the intermediate landing, the top landing andthree scans of the planking level. During the second day we finished allthe spans at the basement. A total of 20 scans and 860 million pointswere acquired inside the wooden dome. During the modelling phase,to analyse the curvature of the intrados, it was necessary to do othertwo scans from inside the Basilica. In this case the targets werepositioned in the apsidal part and in the last two columns of the aislebefore the transept.
4. Data Processing
After the acquisition of the data, the first step was the alignment of thetwenty scans through the semi-automatic recognition of the targetspositioned on the timber elements in the acquisition phase; theaverage precision obtained in the scans alignment was 4 mm. Sometargets were collimated with the total station to guarantee theverticality of the local reference system and to georeference thepoint-clouds in the same reference system, after their alignment.
253D Technologies for the Digital Documentation of an Ancient WoodenStructure
Figure 3. The wooden structure of the
dome and the targets that we used
for the survey.
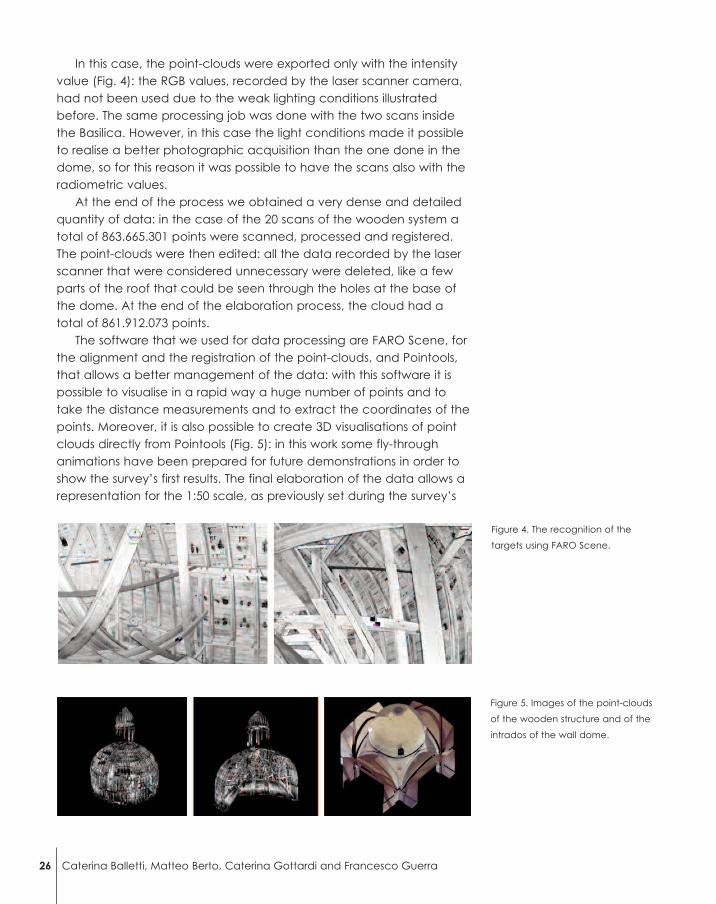
In this case, the point-clouds were exported only with the intensityvalue (Fig. 4): the RGB values, recorded by the laser scanner camera,had not been used due to the weak lighting conditions illustratedbefore. The same processing job was done with the two scans insidethe Basilica. However, in this case the light conditions made it possibleto realise a better photographic acquisition than the one done in thedome, so for this reason it was possible to have the scans also with theradiometric values.
At the end of the process we obtained a very dense and detailedquantity of data: in the case of the 20 scans of the wooden system atotal of 863.665.301 points were scanned, processed and registered.The point-clouds were then edited: all the data recorded by the laserscanner that were considered unnecessary were deleted, like a fewparts of the roof that could be seen through the holes at the base ofthe dome. At the end of the elaboration process, the cloud had atotal of 861.912.073 points.
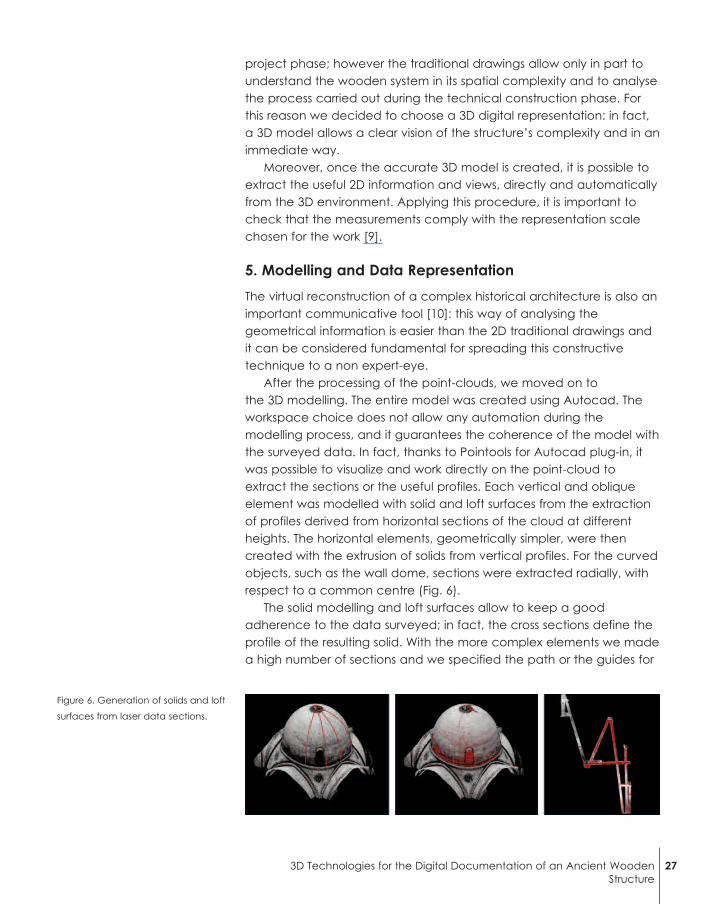
The software that we used for data processing are FARO Scene, forthe alignment and the registration of the point-clouds, and Pointools,that allows a better management of the data: with this software it ispossible to visualise in a rapid way a huge number of points and totake the distance measurements and to extract the coordinates of thepoints. Moreover, it is also possible to create 3D visualisations of pointclouds directly from Pointools (Fig. 5): in this work some fly-throughanimations have been prepared for future demonstrations in order toshow the survey’s first results. The final elaboration of the data allows arepresentation for the 1:50 scale, as previously set during the survey’s
26 Caterina Balletti, Matteo Berto, Caterina Gottardi and Francesco Guerra
Figure 4. The recognition of the
targets using FARO Scene.
Figure 5. Images of the point-clouds
of the wooden structure and of the
intrados of the wall dome.
project phase; however the traditional drawings allow only in part tounderstand the wooden system in its spatial complexity and to analysethe process carried out during the technical construction phase. Forthis reason we decided to choose a 3D digital representation: in fact,a 3D model allows a clear vision of the structure’s complexity and in animmediate way.
Moreover, once the accurate 3D model is created, it is possible toextract the useful 2D information and views, directly and automaticallyfrom the 3D environment. Applying this procedure, it is important tocheck that the measurements comply with the representation scalechosen for the work [9].
5. Modelling and Data Representation
The virtual reconstruction of a complex historical architecture is also animportant communicative tool [10]: this way of analysing thegeometrical information is easier than the 2D traditional drawings andit can be considered fundamental for spreading this constructivetechnique to a non expert-eye.
After the processing of the point-clouds, we moved on tothe 3D modelling. The entire model was created using Autocad. Theworkspace choice does not allow any automation during themodelling process, and it guarantees the coherence of the model withthe surveyed data. In fact, thanks to Pointools for Autocad plug-in, itwas possible to visualize and work directly on the point-cloud toextract the sections or the useful profiles. Each vertical and obliqueelement was modelled with solid and loft surfaces from the extractionof profiles derived from horizontal sections of the cloud at differentheights. The horizontal elements, geometrically simpler, were thencreated with the extrusion of solids from vertical profiles. For the curvedobjects, such as the wall dome, sections were extracted radially, withrespect to a common centre (Fig. 6).
The solid modelling and loft surfaces allow to keep a goodadherence to the data surveyed; in fact, the cross sections define theprofile of the resulting solid. With the more complex elements we madea high number of sections and we specified the path or the guides for
273D Technologies for the Digital Documentation of an Ancient WoodenStructure
Figure 6. Generation of solids and loft
surfaces from laser data sections.
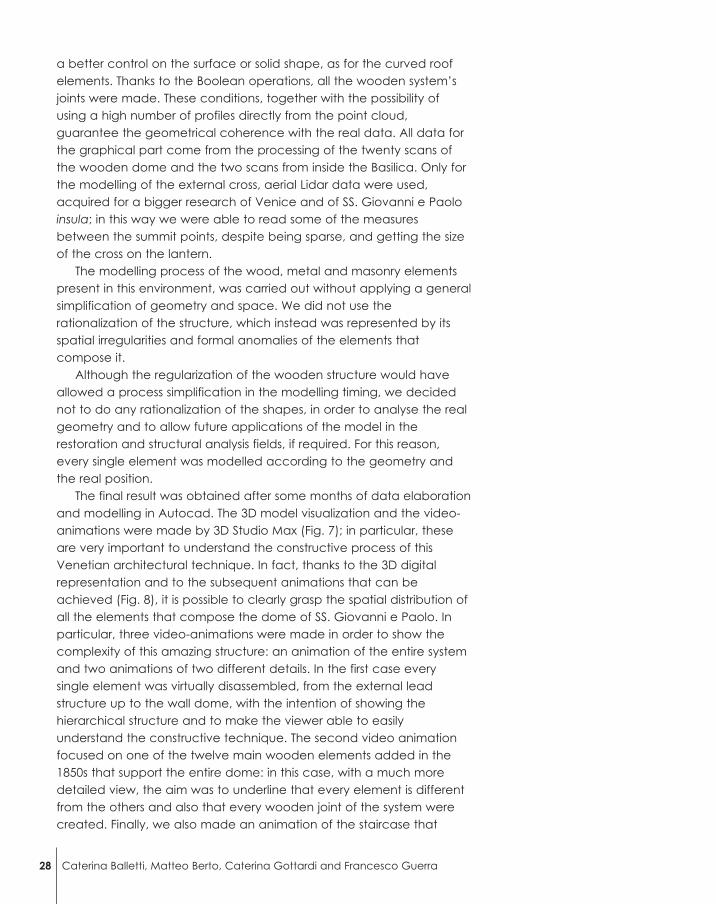
a better control on the surface or solid shape, as for the curved roofelements. Thanks to the Boolean operations, all the wooden system’sjoints were made. These conditions, together with the possibility ofusing a high number of profiles directly from the point cloud,guarantee the geometrical coherence with the real data. All data forthe graphical part come from the processing of the twenty scans ofthe wooden dome and the two scans from inside the Basilica. Only forthe modelling of the external cross, aerial Lidar data were used,acquired for a bigger research of Venice and of SS. Giovanni e Paoloinsula; in this way we were able to read some of the measuresbetween the summit points, despite being sparse, and getting the sizeof the cross on the lantern.
The modelling process of the wood, metal and masonry elementspresent in this environment, was carried out without applying a generalsimplification of geometry and space. We did not use therationalization of the structure, which instead was represented by itsspatial irregularities and formal anomalies of the elements thatcompose it.
Although the regularization of the wooden structure would haveallowed a process simplification in the modelling timing, we decidednot to do any rationalization of the shapes, in order to analyse the realgeometry and to allow future applications of the model in therestoration and structural analysis fields, if required. For this reason,every single element was modelled according to the geometry andthe real position.
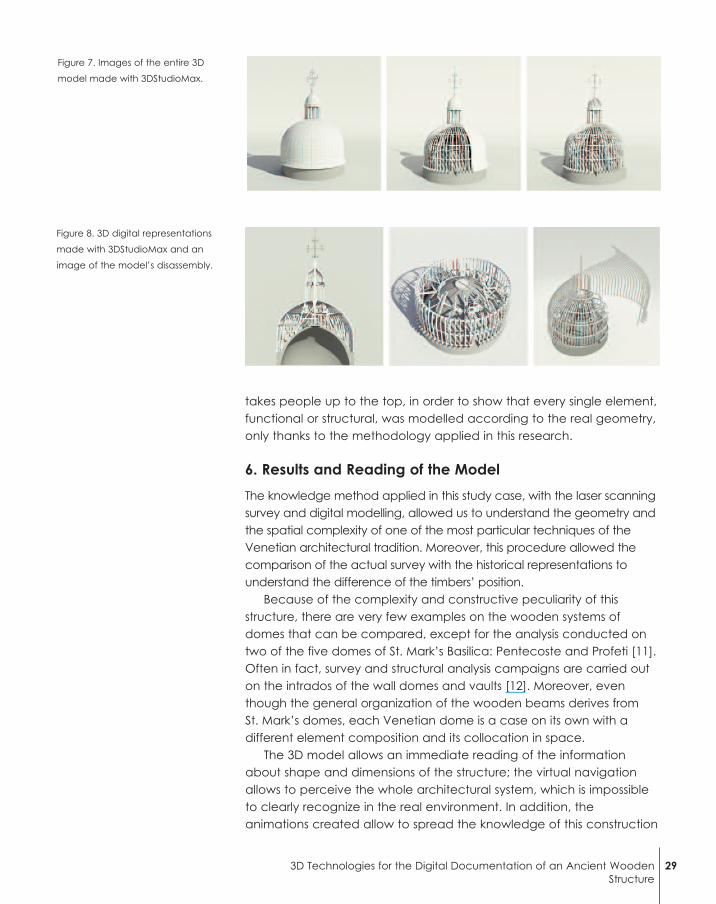
The final result was obtained after some months of data elaborationand modelling in Autocad. The 3D model visualization and the video-animations were made by 3D Studio Max (Fig. 7); in particular, theseare very important to understand the constructive process of thisVenetian architectural technique. In fact, thanks to the 3D digitalrepresentation and to the subsequent animations that can beachieved (Fig. 8), it is possible to clearly grasp the spatial distribution ofall the elements that compose the dome of SS. Giovanni e Paolo. Inparticular, three video-animations were made in order to show thecomplexity of this amazing structure: an animation of the entire systemand two animations of two different details. In the first case everysingle element was virtually disassembled, from the external leadstructure up to the wall dome, with the intention of showing thehierarchical structure and to make the viewer able to easilyunderstand the constructive technique. The second video animationfocused on one of the twelve main wooden elements added in the1850s that support the entire dome: in this case, with a much moredetailed view, the aim was to underline that every element is differentfrom the others and also that every wooden joint of the system werecreated. Finally, we also made an animation of the staircase that
28 Caterina Balletti, Matteo Berto, Caterina Gottardi and Francesco Guerra
takes people up to the top, in order to show that every single element,functional or structural, was modelled according to the real geometry,only thanks to the methodology applied in this research.
6. Results and Reading of the Model
The knowledge method applied in this study case, with the laser scanningsurvey and digital modelling, allowed us to understand the geometry andthe spatial complexity of one of the most particular techniques of theVenetian architectural tradition. Moreover, this procedure allowed thecomparison of the actual survey with the historical representations tounderstand the difference of the timbers’ position.
Because of the complexity and constructive peculiarity of thisstructure, there are very few examples on the wooden systems ofdomes that can be compared, except for the analysis conducted ontwo of the five domes of St. Mark’s Basilica: Pentecoste and Profeti [11].Often in fact, survey and structural analysis campaigns are carried outon the intrados of the wall domes and vaults [12]. Moreover, eventhough the general organization of the wooden beams derives fromSt. Mark’s domes, each Venetian dome is a case on its own with adifferent element composition and its collocation in space.
The 3D model allows an immediate reading of the informationabout shape and dimensions of the structure; the virtual navigationallows to perceive the whole architectural system, which is impossibleto clearly recognize in the real environment. In addition, theanimations created allow to spread the knowledge of this construction
293D Technologies for the Digital Documentation of an Ancient WoodenStructure
Figure 7. Images of the entire 3D
model made with 3DStudioMax.
Figure 8. 3D digital representations
made with 3DStudioMax and an
image of the model’s disassembly.
technique to people who are not specialized in this sector. The analysisof the shapes of this structure is fundamental not only for theknowledge of the complicated wooden system and of the rankingcomposition of the elements that create it, but also for other analysisand considerations, for example about the state of condition anddecay [13] or its historical architectural evolution.
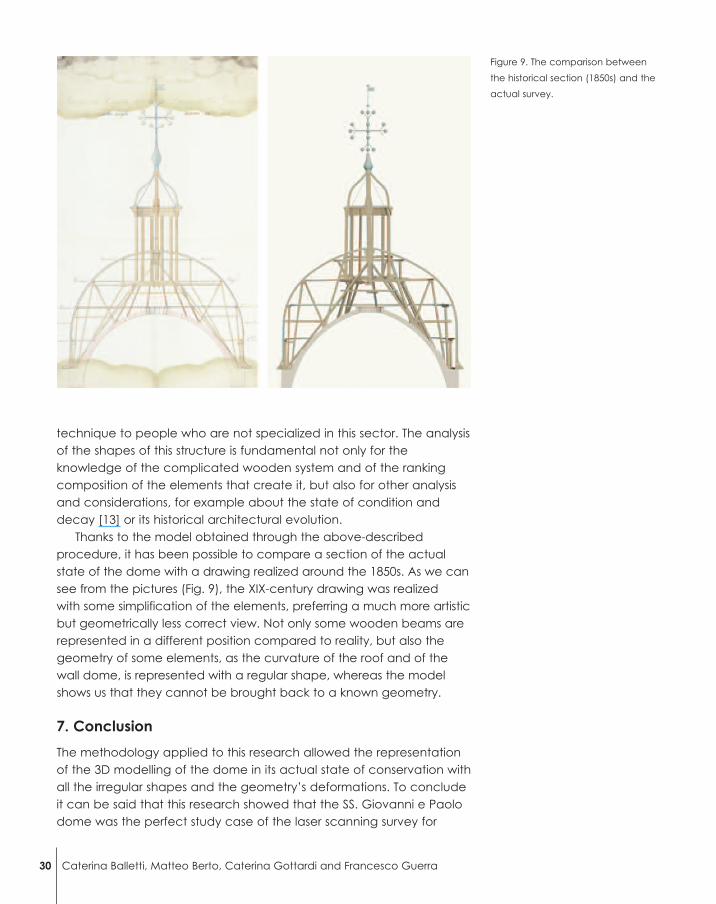
Thanks to the model obtained through the above-describedprocedure, it has been possible to compare a section of the actualstate of the dome with a drawing realized around the 1850s. As we cansee from the pictures (Fig. 9), the XIX-century drawing was realizedwith some simplification of the elements, preferring a much more artisticbut geometrically less correct view. Not only some wooden beams arerepresented in a different position compared to reality, but also thegeometry of some elements, as the curvature of the roof and of thewall dome, is represented with a regular shape, whereas the modelshows us that they cannot be brought back to a known geometry.
7. Conclusion
The methodology applied to this research allowed the representationof the 3D modelling of the dome in its actual state of conservation withall the irregular shapes and the geometry’s deformations. To concludeit can be said that this research showed that the SS. Giovanni e Paolodome was the perfect study case of the laser scanning survey for
30 Caterina Balletti, Matteo Berto, Caterina Gottardi and Francesco Guerra
Figure 9. The comparison between
the historical section (1850s) and the
actual survey.
complex structure analysis. In fact, thanks to the accuracy and thelarge amount of laser scanner data acquisition in a relatively shorttime, it was possible to study in a very detailed way an architecturewith such a geometrical and spatial complexity [14].
The 3D model allows to clearly and quickly understand a structurethat is otherwise hard to comprehend. Moreover, the model wascreated not only as an instrument for the geometrical and spatialknowledge of the dome, but also in order to be useful for furtherresearches: the survey is firstly an analysis of the shapes and then itcan be used as a support for other investigations in the architecturalfield. For example, its application in the conservative field becomesobvious as a spatial support for every worthwhile analysis [15]: themodel becomes an important documentation of the state of conditionof the wooden beams and it also might be used as an archive ofeach one of the objects that contributes to compose such aninteresting structure with such an important architectonic value.
The survey and the subsequent 3D modelling, allow an easycomprehension of the wooden elements of this complex constructivesystem and they are the basis for the creation of a database where itis possible to georeference the information about the woodenstructure. Every single element can be catalogued, for example,according to its structural function, type of wood, conservation statusand maintenance and renovation interventions carried out in the past.The results allow many future applications, especially in theconservative and diagnostic field.
At the end of this work, we would like to present this methodologyas an operational workflow for the survey of Venetian historicalwooden roofs and, in particular, for wooden domes.
8. References[1] Remondino, F., Rizzi, A., Reality-based 3D documentation of natural and
cultural heritage sites – Techniques, problems and examples, AppliedGeomatics, 2010, vol. 2 (3), pp. 85–100.
[2] Barber, D., Mills, J., 3D Laser Scanning for Heritage. Advice and guidanceto users on laser scanning in archaeology and architecture, EnglishHeritage, Swindon, 2011.
[3] Fregonese, L., Scaioni, M., Taffurelli, L., Generation of a spatial informationsystem for architecture with laser scanning data, The InternationalArchives of Photogrammetry, Remote Sensing, and Spatial informationSciences, 2009, vol. XXXVIII, Part 3/W8, pp. 87–92.
[4] Fassi, F., Achille, C., Gaudio, F., Fregonese, L., Integrated Strategies for themodeling of very large, complex architecture, The International Archivesof the Photogrammetry, Remote Sensing and Spatial InformationSciences, 2011, vol. XXXVIII, Part 5/W16, pp. 105–112.
[5] Merotto Ghedini, M., Santi Giovanni e Paolo, in: Valcanover, F. andWolters, W., eds., L’architettura gotica veneziana, Istituto Veneto diScienze, Lettere ed Arti, Venice, 2000, pp. 115–122.
313D Technologies for the Digital Documentation of an Ancient WoodenStructure
[6] Piana, M., San Giorgio e le cupole lignee lagunari. Annali di Architettura,2009, vol. 21, pp. 79–90.
[7] Balletti, C., Guerra, F., Gerbaudi, F., The survey of the wooden structure ofthe roof of Palazzo Ducale in Venice, The International Archives ofPhotogrammetry, Remote Sensing, and Spatial information Sciences,2003, vol. XXXIV, Part 5/W12, pp. 49–53.
[8] Guidi, G., Russo, M., Beraldin, J.A., Acquisizione 3D e modellazionepoligonale, McGraw-Hill Companies, Milano, 2010.
[9] Fassi, F., Achille, C., Fregonese, L., Surveying and modelling the main spireof Milan cathedral using multiple data sources, The PhotogrammetricRecord, 2011, vol. 26 (issue 136), pp. 462–487.
[10] Guidi, G., Russo, M., Diachronic 3D reconstruction for lost CulturalHeritage, The International Archives of Photogrammetry, Remote Sensing,and Spatial information Sciences, 2011, vol. XXXVIII, Part 5/W16,pp. 371–76.
[11] Fregonese, L., Taffurelli, L., 3D model for the documentation of culturalheritage: the wooden domes of St. Mark’s Basilica in Venice, TheInternational Archives of the Photogrammetry, Remote Sensing andSpatial Information Sciences, 2009, vol. XXXVIII, Part 5/W1, pp. 1–6.
[12] Tucci, G., Nobile, A., Riemma, M., The Basilica della Madonna dell’Umiltàin Pistoia: survey, analysis and documentation, in: Proceedings of XXIIIInternational CIPA Symposium, Prague, 2011, pp. 1–8.
[13] Bertolini Cestari, C., Chiabrando, F., Invernizzi, S., Marzi, T., Spanò, A.,Terrestrial laser scanning and settled techniques: a support to detectpathologies and safety conditions of timber structures, AdvancedMaterials Research, 2013, vol. 778, pp. 350–357.
[14] Vacca, G., Deidda, M., Dessi, A., Marras, M., Laser scanner survey tocultural heritage conservation and restoration, The International Archivesof the Photogrammetry, Remote Sensing and Spatial InformationSciences, 2012, vol. XXXIX, Part B5, pp. 589–594.
[15] Brunetaud, X., De Luca, L., Janvier-Badosa, S., Beck, K., Al-Mukhtar, M.,Application of digital techniques in monument preservation, EuropeanJournal of Environmental and Civil Engineering, 2012, vol. 16 (5),pp. 543–556.
32 Caterina Balletti, Matteo Berto, Caterina Gottardi and Francesco Guerra