3D simulation of hydrogen production by ammonia decomposition in a catalytic membrane reactor
10
3D simulation of hydrogen production by ammonia decomposition in a catalytic membrane reactor Andrea Di Carlo a , Alessandro Dell’Era b , Zaccaria Del Prete c, * a Department of Chemistry, Chemical Engineering and Materials, University of L’Aquila, 67100 Campo di Pile (AQ), Italy b Department of Mechanics and Energetics, University "Guglielmo Marconi”, 00193 Rome, Italy c Department of Mechanical and Aerospace Engineering, SAPIENZA University of Rome, via Eudossiana 18, 00184 Rome, Italy article info Article history: Received 14 January 2011 Received in revised form 3 June 2011 Accepted 6 June 2011 Available online 16 July 2011 Keywords: Hydrogen storage Ammonia cracking Membrane reactor CFD model abstract Ammonia decomposition in an integrated Catalytic Membrane Reactor for hydrogen production was studied by numerical simulation. The process is based on anhydrous NH 3 thermal dissociation inside a small size reactor (30 cm 3 ), filled by a Ni/Al 2 O 3 catalyst. The reaction is promoted by the presence of seven Pd coated tubular membranes about 203 mm long, with an outer diameter of 1.98 mm, which shift the NH 3 decomposition towards the products by removing hydrogen from the reaction area. The system fluid-dynamics was implemented into a 2D and 3D geometrical model. Ammonia cracking reaction over the Ni/ Al 2 O 3 catalyst was simulated using the TemkinePyzhev equation. Introductory 2D simulations were first carried out for a hypothetic system without membranes. Because of reactor axial symmetry, different operative pressures, tempera- tures and input flows were evaluated. These introductory results showed an excellent ammonia conversion at 550 C and 0.2 MPa for an input flow of 1.1 mg/s, with a residual NH 3 of only a few ppm. 3D simulations were then carried out for the system with membranes. Hydrogen adsorption throughout the membranes has been modeled using the Sievert’s law for the dissociative hydrogen flux. Several runs have been carried out at 1 MPa changing the temperature between 500 C and 600 C to point out the conditions for which the permeated hydrogen flux is the highest. With temperatures higher than 550 C we obtained an almost complete ammonia conversion already before the membrane area. The working temperature of 550 C resulted to be the most suitable for the reactor geometry. A good matching between membrane permeation and ammonia decomposition was obtained for an NH 3 input flow rate of 2.8 mg/s. Ammonia reaction shift due to the pres- ence of H 2 permeable membranes in the reactor significantly fostered the dissociation: for the 550 C case we obtained a conversion rate improvement of almost 18%. Copyright ª 2011, Hydrogen Energy Publications, LLC. Published by Elsevier Ltd. All rights reserved. 1. Introduction Hydrogen production and storage are still the main challenges for the realization of a sustainable hydrogen economy. The difficulties in reaching a satisfactory fuel gravimetric density, together with high safety levels, have to be overcome in order to achieve extensive hydrogen utilization. H 2 gas-phase storage presents well-known problems related to the unavoidable need of high pressure vessel and yet results in low volumetric density (30 kg/m 3 at 70 MPa), whereas solid * Corresponding author. Tel.: þ39 06 44585559; fax: þ39 06 4881759. E-mail address: [email protected] (Z. Del Prete). Available at www.sciencedirect.com journal homepage: www.elsevier.com/locate/he international journal of hydrogen energy 36 (2011) 11815 e11824 0360-3199/$ e see front matter Copyright ª 2011, Hydrogen Energy Publications, LLC. Published by Elsevier Ltd. All rights reserved. doi:10.1016/j.ijhydene.2011.06.029
-
Upload
independent -
Category
Documents
-
view
1 -
download
0
Transcript of 3D simulation of hydrogen production by ammonia decomposition in a catalytic membrane reactor
i n t e r n a t i o n a l j o u r n a l o f h y d r o g e n en e r g y 3 6 ( 2 0 1 1 ) 1 1 8 1 5e1 1 8 2 4
Avai lab le a t www.sc iencedi rec t .com
journa l homepage : www.e lsev ier . com/ loca te /he
3D simulation of hydrogen production by ammoniadecomposition in a catalytic membrane reactor
Andrea Di Carlo a, Alessandro Dell’Era b, Zaccaria Del Prete c,*aDepartment of Chemistry, Chemical Engineering and Materials, University of L’Aquila, 67100 Campo di Pile (AQ), ItalybDepartment of Mechanics and Energetics, University "Guglielmo Marconi”, 00193 Rome, ItalycDepartment of Mechanical and Aerospace Engineering, SAPIENZA University of Rome, via Eudossiana 18, 00184 Rome, Italy
a r t i c l e i n f o
Article history:
Received 14 January 2011
Received in revised form
3 June 2011
Accepted 6 June 2011
Available online 16 July 2011
Keywords:
Hydrogen storage
Ammonia cracking
Membrane reactor
CFD model
* Corresponding author. Tel.: þ39 06 4458555E-mail address: zaccaria.delprete@unirom
0360-3199/$ e see front matter Copyright ªdoi:10.1016/j.ijhydene.2011.06.029
a b s t r a c t
Ammonia decomposition in an integrated Catalytic Membrane Reactor for hydrogen
production was studied by numerical simulation. The process is based on anhydrous NH3
thermal dissociation inside a small size reactor (30 cm3), filled by a Ni/Al2O3 catalyst. The
reaction is promoted by the presence of seven Pd coated tubular membranes about 203 mm
long, with an outer diameter of 1.98 mm, which shift the NH3 decomposition towards the
products by removing hydrogen from the reaction area. The system fluid-dynamics was
implemented into a 2D and 3D geometrical model. Ammonia cracking reaction over the Ni/
Al2O3 catalyst was simulated using the TemkinePyzhev equation.
Introductory 2D simulations were first carried out for a hypothetic system without
membranes. Because of reactor axial symmetry, different operative pressures, tempera-
tures and input flows were evaluated. These introductory results showed an excellent
ammonia conversion at 550 �C and 0.2 MPa for an input flow of 1.1 mg/s, with a residual
NH3 of only a few ppm. 3D simulations were then carried out for the system with
membranes. Hydrogen adsorption throughout the membranes has been modeled using the
Sievert’s law for the dissociative hydrogen flux. Several runs have been carried out at 1 MPa
changing the temperature between 500 �C and 600 �C to point out the conditions for which
the permeated hydrogen flux is the highest. With temperatures higher than 550 �C we
obtained an almost complete ammonia conversion already before the membrane area. The
working temperature of 550 �C resulted to be the most suitable for the reactor geometry.
A good matching between membrane permeation and ammonia decomposition was
obtained for an NH3 input flow rate of 2.8 mg/s. Ammonia reaction shift due to the pres-
ence of H2 permeable membranes in the reactor significantly fostered the dissociation: for
the 550 �C case we obtained a conversion rate improvement of almost 18%.
Copyright ª 2011, Hydrogen Energy Publications, LLC. Published by Elsevier Ltd. All rights
reserved.
1. Introduction together with high safety levels, have to be overcome in order
Hydrogen production and storage are still themain challenges
for the realization of a sustainable hydrogen economy. The
difficulties in reaching a satisfactory fuel gravimetric density,
9; fax: þ39 06 4881759.a1.it (Z. Del Prete).2011, Hydrogen Energy P
to achieve extensive hydrogen utilization. H2 gas-phase
storage presents well-known problems related to the
unavoidable need of high pressure vessel and yet results in
low volumetric density (30 kg/m3 at 70 MPa), whereas solid
ublications, LLC. Published by Elsevier Ltd. All rights reserved.
i n t e rn a t i o n a l j o u r n a l o f h y d r o g e n en e r g y 3 6 ( 2 0 1 1 ) 1 1 8 1 5e1 1 8 2 411816
storage inside metal and nanofabricated hydrides still suffers
the lack of a material matching all suitable requirements of
energetic density, temperature/pressure work condition and
adsorption/desorption kinetic. Liquid cryogenic H2 has
a better volumetric density (70 kg/m3 at - 253 �C) however,
around 30% of its heating value is required for liquefaction
and, to minimize hydrogen boil-off, it needs heavily insulated
and expensive tanks [1].
A different storagemethod, which is recently gainingmore
and more interest, is the storage in non-cryogenic hydrogen-
rich liquids, which involves the production on-demand of
hydrogen by thermal cracking or chemical decomposition.
One of the first liquid which seemed suitable for hydrogen
storing purposes has been methanol; having a good lower
heating value (19.9 MJ/kg) and a hydrogen volumetric content
of 87 kg/m3 (12.5% on a mass basis). But it has also several
drawbacks, as the need to conduct the reaction with water
(reducing the effective energy density carried by methanol)
and the presence of carbon-oxides in the final products [2].
Taking into consideration features as reforming temperature
and efficiency, ammonia appears today a more interesting
hydrogen carrying fuel than methanol for many applications
[3]. In the last century, it has been widely used as fertilizer,
cleaning agent, and explosive. With the growing need of
a densehydrogencarrying fuel, anhydrousammonia (NH3) has
received more and more attention as a candidate source for
atomic hydrogen storage, offering for that purpose optimal
physical properties. In fact, liquid anhydrous NH3 has
a hydrogen volumetric content of 120 kg/m3 (17.6% on a mass
basis) i.e. 1.7 times the amount of cryogenic liquidhydrogenon
a volume basis and an energy density of 17.8 MJ/kg. It does not
contain carbon atoms that cause the presence of pollutant
carbon-oxides between the decomposition products, and it
does not need additional water to keep the decomposition
reaction going. On the bad side, ammonia is a toxic compound
and, even if it can be detected by the human nose at very low
concentration (10e20 ppm), it can be lethal if inhaled at high
concentration (higher than 2000 ppm). Nonetheless, it is
produced and distributed world-wide in millions of tons per
year, so procedures for safe handling have beendeveloped and
are well established in every country. No significant ammonia
supply problems are known with regard to geographic distri-
bution, nor with regard to storage and transport, which can be
done in liquid phase at ambient temperature and low pressure
(<2 MPa) or at atmospheric pressure and moderate low
temperature (�30 �C) [4] [5]. Despite ammonia synthesis is an
energy demanding process, its production cost is yet lower
than 1 $/kg, while hydrogen production cost varies from 3.5 to
5.5 $/kg (depending on delivery phase: gaseous or liquid).
Ammonia decomposition process has been studied a long
time for many reasons, e.g. for removal of toxic ammonia
traces from coal gasification streams, or as reaction associated
with the process of metal nitriding [6e8]. Ammonia decom-
position can be regarded as the reverse process of the
synthesis reaction, occurring in industry at approximately
500 �C and 250 atm (DH ¼ �92.4 kJ/mol). Thermal cracking of
ammonia into hydrogen and nitrogen proceeds according to
the simple endothermic reaction:
2NH353H2 þN2 (1)
(DH¼ 66.5 kJ/mol) [9]. Ammonia cracking can be operated at
temperatures between 700 and 900 �C and unlike ammonia
synthesis, low pressure is preferred [5]. Usually, the use of an
appropriate catalyst can significantly reduce reaction
temperatures and can improve conversion rates. Theoretical
studies observed that for ammonia, the optimal synthesis
catalyst is not necessarily the optimal decomposition catalyst
[10]; nonetheless, synthesis catalysts are often used for the
decomposition process. Typical catalysts used both for
ammonia synthesis and cracking include iron oxide, molyb-
denum, ruthenium, and nickel [5]. Ru catalysts perform better
than Fe catalysts, particularly at low temperature and close to
the thermodynamic equilibrium, but are considerably more
expensive than Fe ones and have a shorter catalytic lifetime
[11]. More common and less expensive materials, that employ
for example Ni-alumina compounds in the catalysts, are
suggested bymany authors [12e14], claiming good conversion
results in a wide temperature and pressure range (e.g.
9e36 atm and 400e600 �C) [15]. Several studies about
ammonia decomposition over Ni-alumina catalyst were
carried out in the last decade, also because a significant
development in membrane science stimulated increasing
research efforts on catalytic membrane reactors [15e17].
Numerical studies that simulate the process in a catalytic
reactor over Ni-Al2O3, reported results as good as the
complete decomposition of ammonia already at a tempera-
ture of 400 �C and a pressure of 5 atm [17]. It has to be high-
lighted though, that many of the results quoted here
originated from purification processes in gasification plants
and not from studies aiming at hydrogen storage and
production with ammonia.
There are interesting examples in the literature which
focused on miniaturized reactors for portable devices with
a volume of only a few mm3 [18,19], or military applications
with a power range up to 50e60 Watt [4]; no catalytic
membrane reactors (CMR) was yet employed in these studies.
As the matter of fact, the utilization of membranes has the
double advantage of enhancing the ammonia decomposition
by immediately removing hydrogen from the reaction area,
shifting therefore the decomposition reaction towards the
products, and (especially with palladium membranes)
providing hydrogen with high purity, which is ideal when
feeding PEM fuel cells; e.g. to ensure a long durability, PEM fuel
cells require residual ammonia to be reduced below ppm
levels, since exposure of the acidic PEM electrolyte to
ammonia causes severe and irreversible loss of the fuel cell
performances [5]. Nowadays few companies can provide
commercial CMR. The REB Research� reactor simulated in our
study uses palladium-coated metal sandwich membranes,
which should insure the hydrogen permeating through the
membranes is pure at 99.9999%, regardless of any hydrogen
back-pressure change caused by a variable fuel cell load
demand [20]. This type of reactor has been realized to generate
high quality hydrogen by means of the simultaneous steam
reforming of a liquid fuel and the purification of the reformed
gas, obtained by permeating only hydrogen through the
selective membranes.
The work of Chein et al. [17] is the first example where a 2D
computational fluid dynamic (CFD) modeling was applied to
the catalytic decomposition of NH3 based on a simple
i n t e r n a t i o n a l j o u r n a l o f h y d r o g e n en e r g y 3 6 ( 2 0 1 1 ) 1 1 8 1 5e1 1 8 2 4 11817
chemical reaction model. A cylindrical reactor packed with
NiePt/Al2O3 catalyst particles was used as the physical
domain. This catalyst was chosen because the well-
established reaction model could be based on experimental
data. The NH3 decompositionwas predicted both theoretically
and numerically. Their results showed how adopting
a chemical reaction model similar to that used for methanol
reforming with a CuO/ZnO/Al2O3 catalyst, the numerical
model predicts quite satisfactory the experimental results.
Nonetheless, no examples employing CMR to reform
ammonia have been found in the literature. Therefore, the
aim of this work is to evaluate the behaviour of a micro CMR
for ammonia decomposition by using a CFD model. Kinetic
and mass transfer effects of the cracking reaction were
considered in the model. A 2D model was first employed to
evaluate the conversion efficiency of the micro-reactor
working without membranes. Then, a 3D simulation was
carried out to evaluate the gain in conversion efficiency
brought by the Pd/Ag membranes. Using a 3D simulation for
the CMR was necessary because of the internal asymmetry
introduced by the presence of the membranes inside the
reactor.
2. Reactor configuration
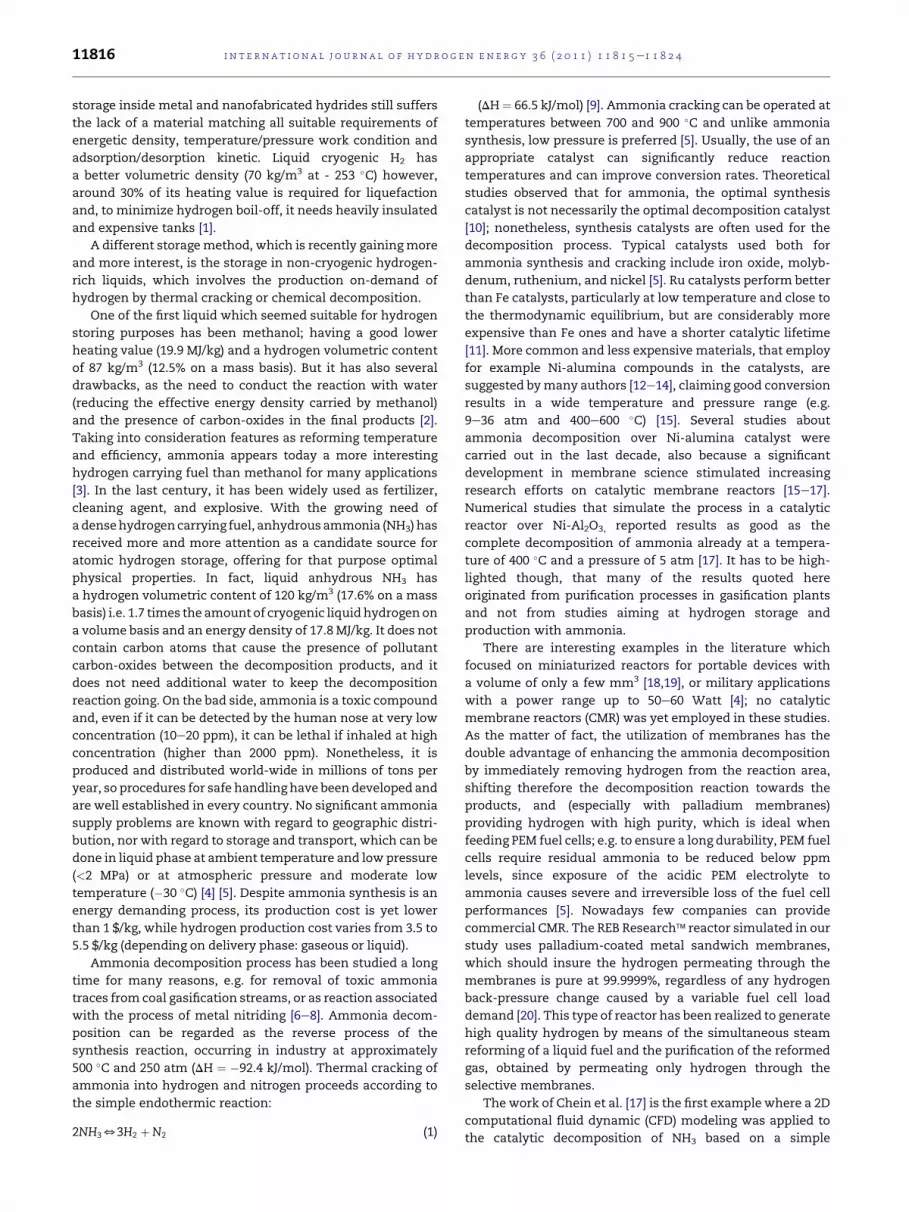
A schematic illustration of the membrane micro-reactor,
simulated with mesh points is shown in Fig. 1.
The reactor is basically a 25 cm long inconel tube with an
innerdiameterof12mmandathicknessof2mm.Seven tubular
membranesmade of palladium coating high permeability alloy
are placed at the bottom side of the reactor; each candle has
a total length of 15 cm and an outer diameter of 2 mm. There-
fore, the first 10 cm at the top of the reactor are not engaged by
the membranes. The catalyst particles are packed inside the
whole reactor. Preheated gaseous NH3 is fed into the reactor at
Fig. 1 e Schematic representa
a volumetric flow rate Q through the top inlet (see Fig. 1). This
reactor configuration has been designed to let the NH3 strongly
dissociate already along the first 10 cm, before running into the
Pd-membranes. Hydrogen is then selectively permeated
through the membranes due to the H2 pressure difference
among the outer and inner side of the Pd-membranes and sent
to thehydrogencircuit,while the retentategas, composedofN2,
un-permeated H2 and residual unconverted NH3, outgoes the
reactor from a different bottom outlet (see Fig. 1). The Ni/Al2O3
catalyst we considered is a commercial nickel-based catalyst,
ground to a mean particle diameter of 500 mm.
3. Model
The model we adopted is based on the fundamental concept
of interpenetrating continua for multiphase mixtures.
According to this theory, different phases can be present at
the same time in the same computational volume. Such an
idea is made possible by the introduction of a new dependent
variable, the void fraction 3i of each phase i. In this study the
phases we considered were the gas phase and the solid phase
(catalyst). The fundamental equations of mass, momentum,
chemical species and energy conservation are then solved for
the gas phase, while the solid phase is seen as a packed bed.
3.1. Dissociation model
To compute the kinetic expression of the catalyzed reactions,
several processes that act against the reactions, and are
therefore a resistance for it, have to be considered. For a single
porous particle they are:
C Gas film layer resistance: reagents and products diffuse
respectively from the gas towards the external surface
or from external surface towards the gas of the catalytic
particle.
tion of the micro-reactor.
i n t e rn a t i o n a l j o u r n a l o f h y d r o g e n en e r g y 3 6 ( 2 0 1 1 ) 1 1 8 1 5e1 1 8 2 411818
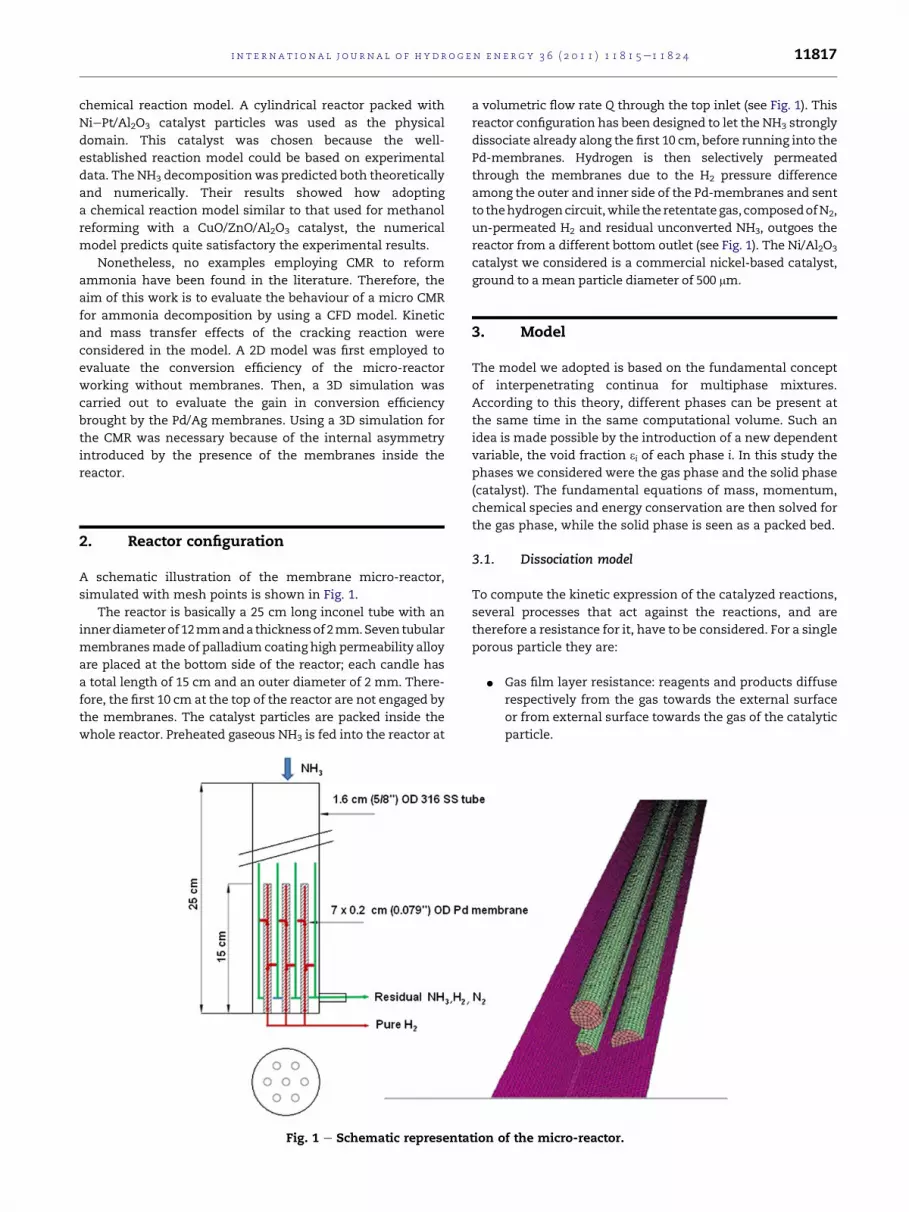
C Pores diffusion resistance: the inside of the particle
contains most of the catalytic surface, therefore the
reactions occur prevalently inside the particle. So the
reagents have to diffuse inside the particle, while the
products have to diffuse from the inside to the outer
surface of the catalyst.
C Superficial phenomena resistance: the reagents moving
inside the catalyst are adsorbed by the solid surfaces,
then they react following their kinetic mechanism and
the products are desorbed to the gas phase.
These three distinct phenomena are schematized in Fig. 2.
As shown in the figure, the gas film layer resistance could be
considered in serieswith the parallel resistance resulting from
pore diffusion resistance and superficial phenomena
resistance.
To take into account the different resistance mechanisms,
the chemical species evolving in the reaction have to be
considered in the gas phase (g) and in the solid-catalyst phase
(c). The following chemical species balance could be set:
DDt
�3grgymðgÞ
�¼ V$
�3gDmðgÞVymðgÞ
�þ rghmðgÞSc
�ymðcÞ � ymðgÞ
�(2)
where m ¼ NH3, H2, N2.
The terms yg and yc are referred to the mass fraction of
species m in the gas phase ( g) and in the solid-catalyst phase
(c) respectively, Dm( g) is the effective diffusion coefficient of
the species in bulk, calculated using the Wilke equation [21]:
DmðgÞ ¼ 1Pnsm
ynðgÞDmnðgÞ
(3)
The binary diffusion coefficient Dmn( g) has been calculated
using the Chapman-Enskog [22] equation:
DmnðgÞ ¼ 0:0018583
ffiffiffiffiffiffiffiffiffiffiffiffiffiffiffiffiffiffiffiffiffiffiffiffiffiffiffiffiffiffiffiffiffiffiffiffiffiffiffiffiT3
�1
MmðgÞþ 1MnðgÞ
�s1
ps2mnUmn
(4)
where the expressions to calculate the required parameters
can be found in Bird [22]. Sc is the catalyst surface per unit
volume:
Sc ¼ 6dc
(5)
Fig. 2 e Section of a catalytic particle containing an ideal
pore.
The presence of the membrane will be discussed later.
Finally hm( g) is the mass transfer coefficient deduced using
RanzeMarshall correlation:
hmðgÞdcDmðgÞ
¼ 2þ 0:6ðScÞ1=3�Rep
�1=2(6)
A simpler model to consider the parallel effect brought by
the pore diffusion resistance and the superficial phenomena
resistance is based on the calculation of a so-called “effec-
tiveness factor”. To define the problem, the kinetic mecha-
nism for ammonia cracking reaction (eq. (1)) has to be set. For
this scope the formulation proposed by Dittmeyer et al. [16]
was used:
R ¼ k
"�p2NH3
p3H2
�b
�pN2
K2eq
�p3H2
p2NH3
�1�b#
(7)
where
k ¼ k0e�E=RT (8)
The necessary coefficient to define the kinetic Arrhenius k,
the equilibrium constant Keq can be find in [15]. The reaction
rate of the species in the solid phase rm(c) is defined using the
reactions stoichiometry:
rNH3ðcÞ ¼ �2hR
rH2ðcÞ ¼ 3hR
rN2ðcÞ ¼ hR
(9)
To close the reaction it was imposed that the amount of the
consumed/produced species in the solid phase were equal to
the species transferred from the gas phases to the solid phases
and vice versa:
rghgSc
�ymðcÞ � ymðgÞ
�¼ 3crcrmðcÞMM (10)
The momentum balance for the gas phase is given by the
NaviereStokes equation, modified to include an interphase
momentum transfer term:
v�rg3gng
�vt
þ V$�rg3gngng
�¼ V$
�sg�þ rg3gg� 3gVp� bgcng (11)
where g is referred to the gas phase, c to the catalyst solid
phases, p is the thermodynamic pressure, b the interface
momentum transfer coefficient, and sg the gas phase viscous
stress tensor. In particular b is deduced by Ergun equation:
bgc ¼ 15032cmg
3cd2c
þ 1:753crg
ngdc
(12)
The conservation of energy for the three phases is for gas-g,
catalyst-c:
vðri3iHiÞvt
þ V$ðri3iHiniÞ ¼ �3ivpvt
þ si : V$ni
þVkiVTi þXisj
hhij
�Tj � Ti
�� bij
�nj � ni
�2i
þXk
rkðcÞDHk (13)
where H is the specific enthalpy of the different phases, k the
thermal conductivity, h the convection coefficient between
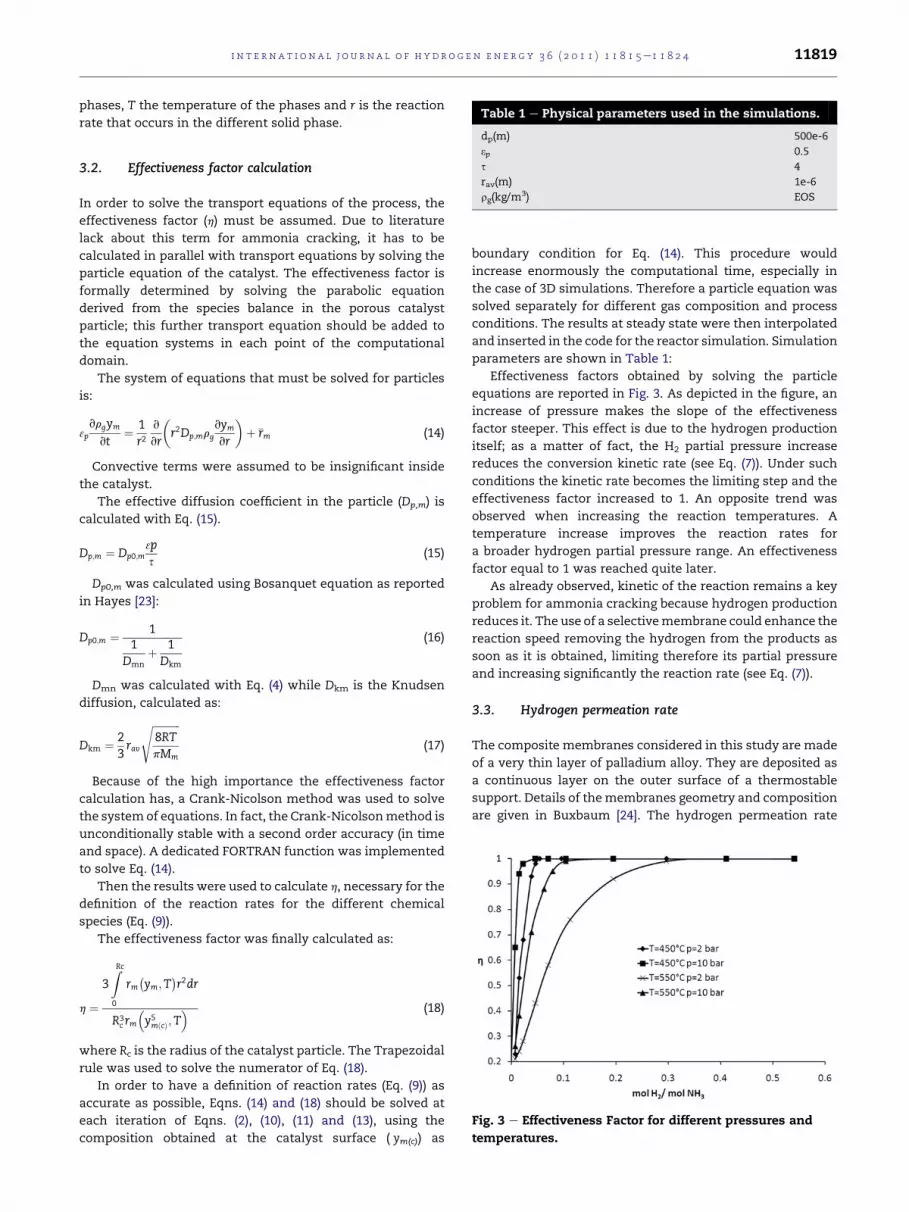
Table 1 e Physical parameters used in the simulations.
i n t e r n a t i o n a l j o u r n a l o f h y d r o g e n en e r g y 3 6 ( 2 0 1 1 ) 1 1 8 1 5e1 1 8 2 4 11819
phases, T the temperature of the phases and r is the reaction
rate that occurs in the different solid phase.
dp(m) 500e-63p 0.5
s 4
rav(m) 1e-6
rg(kg/m3) EOS
Fig. 3 e Effectiveness Factor for different pressures and
temperatures.
3.2. Effectiveness factor calculation
In order to solve the transport equations of the process, the
effectiveness factor (h) must be assumed. Due to literature
lack about this term for ammonia cracking, it has to be
calculated in parallel with transport equations by solving the
particle equation of the catalyst. The effectiveness factor is
formally determined by solving the parabolic equation
derived from the species balance in the porous catalyst
particle; this further transport equation should be added to
the equation systems in each point of the computational
domain.
The system of equations that must be solved for particles
is:
3pvrgym
vt¼ 1
r2v
vr
�r2Dp;mrg
vym
vr
�þ rm (14)
Convective terms were assumed to be insignificant inside
the catalyst.
The effective diffusion coefficient in the particle (Dp,m) is
calculated with Eq. (15).
Dp;m ¼ Dp0;m3ps
(15)
Dp0,m was calculated using Bosanquet equation as reported
in Hayes [23]:
Dp0;m ¼ 11
Dmnþ 1Dkm
(16)
Dmn was calculated with Eq. (4) while Dkm is the Knudsen
diffusion, calculated as:
Dkm ¼ 23rav
ffiffiffiffiffiffiffiffiffiffiffi8RTpMm
s(17)
Because of the high importance the effectiveness factor
calculation has, a Crank-Nicolson method was used to solve
the systemof equations. In fact, the Crank-Nicolsonmethod is
unconditionally stable with a second order accuracy (in time
and space). A dedicated FORTRAN function was implemented
to solve Eq. (14).
Then the results were used to calculate h, necessary for the
definition of the reaction rates for the different chemical
species (Eq. (9)).
The effectiveness factor was finally calculated as:
h ¼3ZRc0
rm�ym;T
�r2dr
R3c rm
�y5mðcÞ;T
� (18)
where Rc is the radius of the catalyst particle. The Trapezoidal
rule was used to solve the numerator of Eq. (18).
In order to have a definition of reaction rates (Eq. (9)) as
accurate as possible, Eqns. (14) and (18) should be solved at
each iteration of Eqns. (2), (10), (11) and (13), using the
composition obtained at the catalyst surface ( ym(c)) as
boundary condition for Eq. (14). This procedure would
increase enormously the computational time, especially in
the case of 3D simulations. Therefore a particle equation was
solved separately for different gas composition and process
conditions. The results at steady state were then interpolated
and inserted in the code for the reactor simulation. Simulation
parameters are shown in Table 1:
Effectiveness factors obtained by solving the particle
equations are reported in Fig. 3. As depicted in the figure, an
increase of pressure makes the slope of the effectiveness
factor steeper. This effect is due to the hydrogen production
itself; as a matter of fact, the H2 partial pressure increase
reduces the conversion kinetic rate (see Eq. (7)). Under such
conditions the kinetic rate becomes the limiting step and the
effectiveness factor increased to 1. An opposite trend was
observed when increasing the reaction temperatures. A
temperature increase improves the reaction rates for
a broader hydrogen partial pressure range. An effectiveness
factor equal to 1 was reached quite later.
As already observed, kinetic of the reaction remains a key
problem for ammonia cracking because hydrogen production
reduces it. The use of a selectivemembrane could enhance the
reaction speed removing the hydrogen from the products as
soon as it is obtained, limiting therefore its partial pressure
and increasing significantly the reaction rate (see Eq. (7)).
3.3. Hydrogen permeation rate
The composite membranes considered in this study are made
of a very thin layer of palladium alloy. They are deposited as
a continuous layer on the outer surface of a thermostable
support. Details of themembranes geometry and composition
are given in Buxbaum [24]. The hydrogen permeation rate
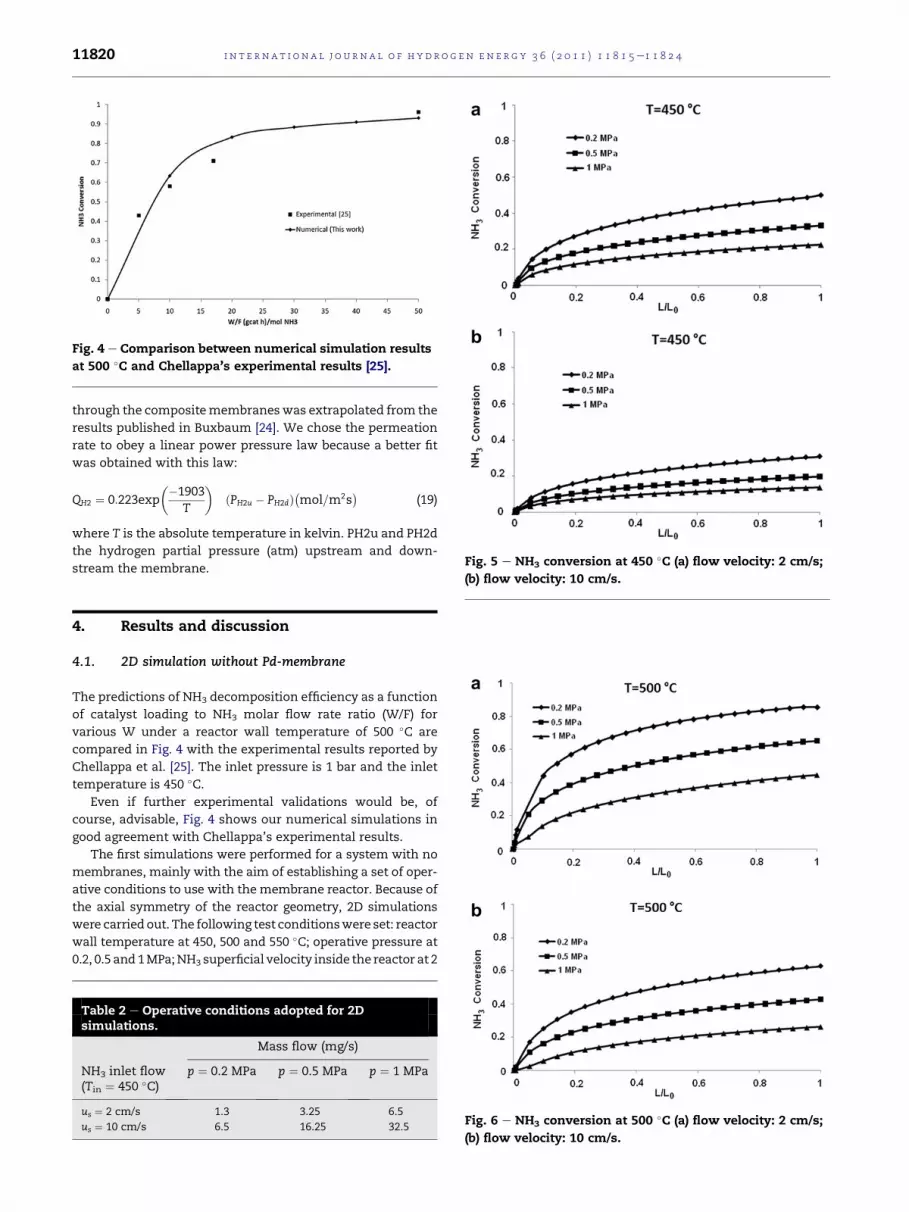
Fig. 4 e Comparison between numerical simulation results
at 500 �C and Chellappa’s experimental results [25].
Fig. 5 e NH3 conversion at 450 �C (a) flow velocity: 2 cm/s;
i n t e rn a t i o n a l j o u r n a l o f h y d r o g e n en e r g y 3 6 ( 2 0 1 1 ) 1 1 8 1 5e1 1 8 2 411820
through the compositemembraneswas extrapolated from the
results published in Buxbaum [24]. We chose the permeation
rate to obey a linear power pressure law because a better fit
was obtained with this law:
QH2 ¼ 0:223exp
��1903T
�ðPH2u � PH2dÞ
�mol=m2s
�(19)
where T is the absolute temperature in kelvin. PH2u and PH2d
the hydrogen partial pressure (atm) upstream and down-
stream the membrane.
(b) flow velocity: 10 cm/s.4. Results and discussion
4.1. 2D simulation without Pd-membrane
The predictions of NH3 decomposition efficiency as a function
of catalyst loading to NH3 molar flow rate ratio (W/F) for
various W under a reactor wall temperature of 500 �C are
compared in Fig. 4 with the experimental results reported by
Chellappa et al. [25]. The inlet pressure is 1 bar and the inlet
temperature is 450 �C.Even if further experimental validations would be, of
course, advisable, Fig. 4 shows our numerical simulations in
good agreement with Chellappa’s experimental results.
The first simulations were performed for a system with no
membranes, mainly with the aim of establishing a set of oper-
ative conditions to use with themembrane reactor. Because of
the axial symmetry of the reactor geometry, 2D simulations
were carried out. The following test conditionswere set: reactor
wall temperature at 450, 500 and 550 �C; operative pressure at
0.2, 0.5 and 1MPa;NH3 superficial velocity inside the reactor at 2
Table 2 e Operative conditions adopted for 2Dsimulations.
Mass flow (mg/s)
NH3 inlet flow(Tin ¼ 450 �C)
p ¼ 0.2 MPa p ¼ 0.5 MPa p ¼ 1 MPa
us ¼ 2 cm/s 1.3 3.25 6.5
us ¼ 10 cm/s 6.5 16.25 32.5 Fig. 6 e NH3 conversion at 500 �C (a) flow velocity: 2 cm/s;
(b) flow velocity: 10 cm/s.
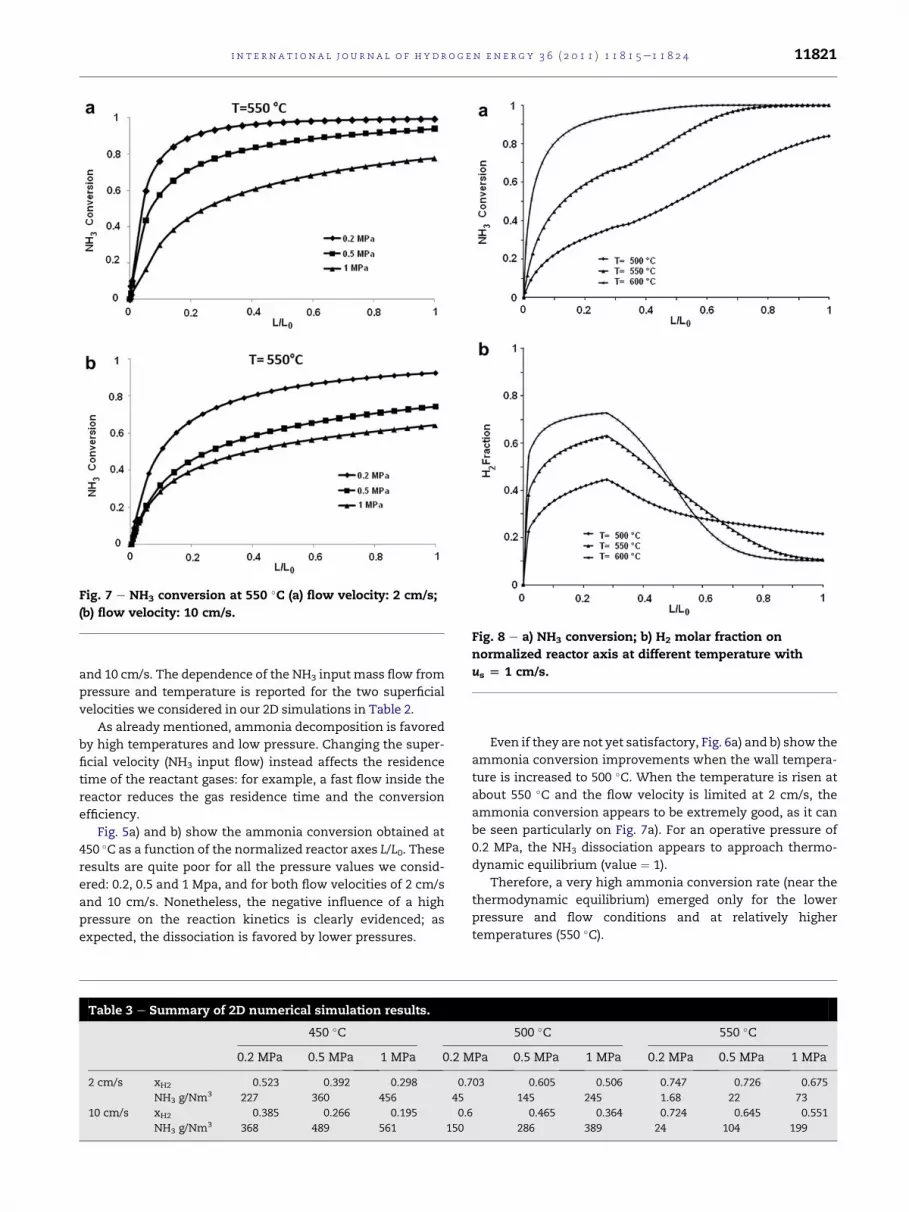
Fig. 7 e NH3 conversion at 550 �C (a) flow velocity: 2 cm/s;
(b) flow velocity: 10 cm/s.
Fig. 8 e a) NH3 conversion; b) H2 molar fraction on
normalized reactor axis at different temperature with
us [ 1 cm/s.
i n t e r n a t i o n a l j o u r n a l o f h y d r o g e n en e r g y 3 6 ( 2 0 1 1 ) 1 1 8 1 5e1 1 8 2 4 11821
and 10 cm/s. The dependence of the NH3 input mass flow from
pressure and temperature is reported for the two superficial
velocities we considered in our 2D simulations in Table 2.
As already mentioned, ammonia decomposition is favored
by high temperatures and low pressure. Changing the super-
ficial velocity (NH3 input flow) instead affects the residence
time of the reactant gases: for example, a fast flow inside the
reactor reduces the gas residence time and the conversion
efficiency.
Fig. 5a) and b) show the ammonia conversion obtained at
450 �C as a function of the normalized reactor axes L/L0. These
results are quite poor for all the pressure values we consid-
ered: 0.2, 0.5 and 1 Mpa, and for both flow velocities of 2 cm/s
and 10 cm/s. Nonetheless, the negative influence of a high
pressure on the reaction kinetics is clearly evidenced; as
expected, the dissociation is favored by lower pressures.
Table 3 e Summary of 2D numerical simulation results.
450 �C
0.2 MPa 0.5 MPa 1 MPa 0.2 M
2 cm/s xH2 0.523 0.392 0.298 0.7
NH3 g/Nm3 227 360 456 45
10 cm/s xH2 0.385 0.266 0.195 0.6
NH3 g/Nm3 368 489 561 150
Even if they are not yet satisfactory, Fig. 6a) and b) show the
ammonia conversion improvements when the wall tempera-
ture is increased to 500 �C. When the temperature is risen at
about 550 �C and the flow velocity is limited at 2 cm/s, the
ammonia conversion appears to be extremely good, as it can
be seen particularly on Fig. 7a). For an operative pressure of
0.2 MPa, the NH3 dissociation appears to approach thermo-
dynamic equilibrium (value ¼ 1).
Therefore, a very high ammonia conversion rate (near the
thermodynamic equilibrium) emerged only for the lower
pressure and flow conditions and at relatively higher
temperatures (550 �C).
500 �C 550 �C
Pa 0.5 MPa 1 MPa 0.2 MPa 0.5 MPa 1 MPa
03 0.605 0.506 0.747 0.726 0.675
145 245 1.68 22 73
0.465 0.364 0.724 0.645 0.551
286 389 24 104 199
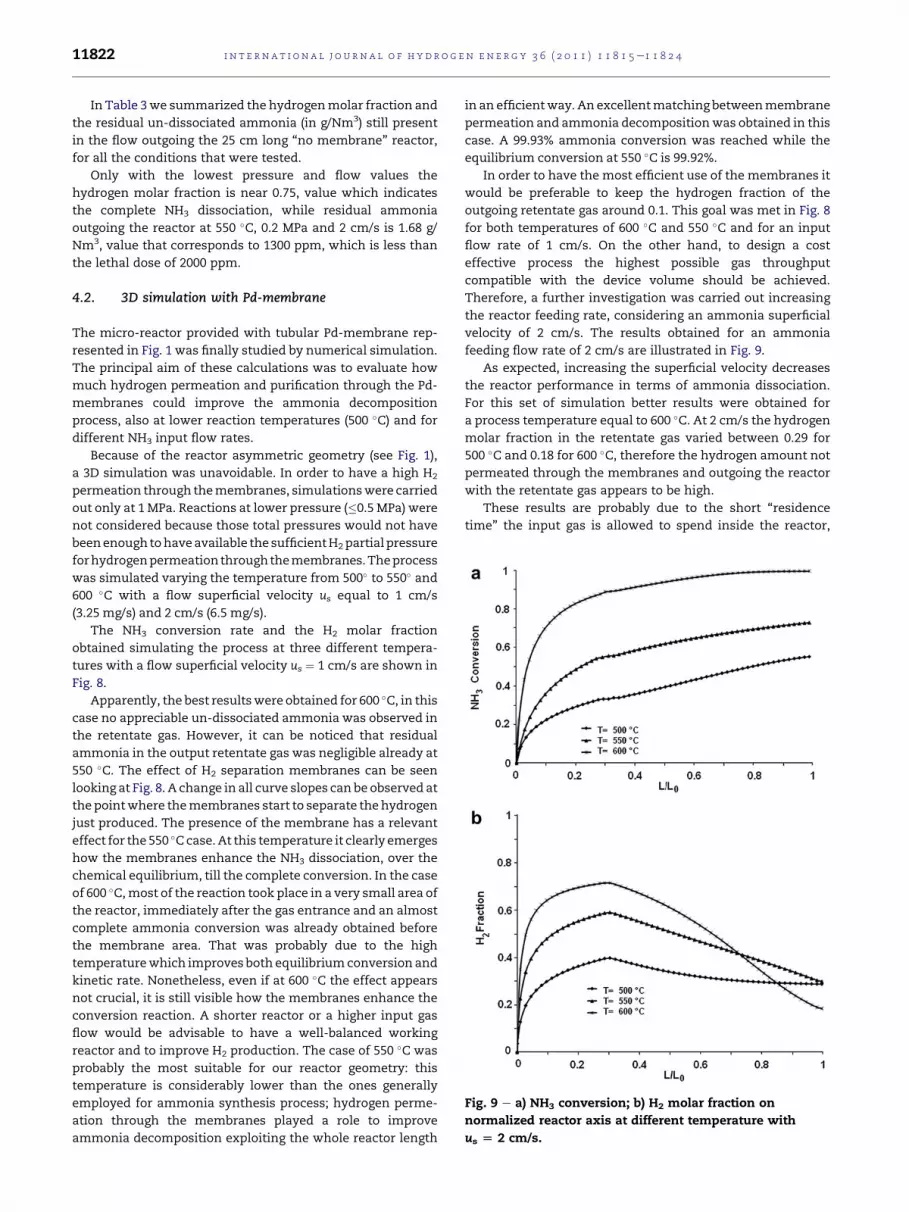
Fig. 9 e a) NH3 conversion; b) H2 molar fraction on
normalized reactor axis at different temperature with
us [ 2 cm/s.
i n t e rn a t i o n a l j o u r n a l o f h y d r o g e n en e r g y 3 6 ( 2 0 1 1 ) 1 1 8 1 5e1 1 8 2 411822
In Table 3we summarized the hydrogenmolar fraction and
the residual un-dissociated ammonia (in g/Nm3) still present
in the flow outgoing the 25 cm long “no membrane” reactor,
for all the conditions that were tested.
Only with the lowest pressure and flow values the
hydrogen molar fraction is near 0.75, value which indicates
the complete NH3 dissociation, while residual ammonia
outgoing the reactor at 550 �C, 0.2 MPa and 2 cm/s is 1.68 g/
Nm3, value that corresponds to 1300 ppm, which is less than
the lethal dose of 2000 ppm.
4.2. 3D simulation with Pd-membrane
The micro-reactor provided with tubular Pd-membrane rep-
resented in Fig. 1 was finally studied by numerical simulation.
The principal aim of these calculations was to evaluate how
much hydrogen permeation and purification through the Pd-
membranes could improve the ammonia decomposition
process, also at lower reaction temperatures (500 �C) and for
different NH3 input flow rates.
Because of the reactor asymmetric geometry (see Fig. 1),
a 3D simulation was unavoidable. In order to have a high H2
permeation through themembranes, simulationswere carried
out only at 1 MPa. Reactions at lower pressure (�0.5 MPa) were
not considered because those total pressures would not have
beenenough tohaveavailable the sufficientH2partial pressure
forhydrogenpermeationthroughthemembranes.Theprocess
was simulated varying the temperature from 500� to 550� and600 �C with a flow superficial velocity us equal to 1 cm/s
(3.25 mg/s) and 2 cm/s (6.5 mg/s).
The NH3 conversion rate and the H2 molar fraction
obtained simulating the process at three different tempera-
tures with a flow superficial velocity us ¼ 1 cm/s are shown in
Fig. 8.
Apparently, the best resultswere obtained for 600 �C, in this
case no appreciable un-dissociated ammonia was observed in
the retentate gas. However, it can be noticed that residual
ammonia in the output retentate gas was negligible already at
550 �C. The effect of H2 separation membranes can be seen
looking at Fig. 8. A change in all curve slopes can be observed at
thepointwhere themembranes start to separate thehydrogen
just produced. The presence of the membrane has a relevant
effect for the 550 �Ccase.At this temperature it clearly emerges
how the membranes enhance the NH3 dissociation, over the
chemical equilibrium, till the complete conversion. In the case
of 600 �C,most of the reaction took place in a very small area of
the reactor, immediately after the gas entrance and an almost
complete ammonia conversion was already obtained before
the membrane area. That was probably due to the high
temperaturewhich improves both equilibriumconversion and
kinetic rate. Nonetheless, even if at 600 �C the effect appears
not crucial, it is still visible how the membranes enhance the
conversion reaction. A shorter reactor or a higher input gas
flow would be advisable to have a well-balanced working
reactor and to improve H2 production. The case of 550 �C was
probably the most suitable for our reactor geometry: this
temperature is considerably lower than the ones generally
employed for ammonia synthesis process; hydrogen perme-
ation through the membranes played a role to improve
ammonia decomposition exploiting the whole reactor length
in an efficientway. An excellentmatching betweenmembrane
permeation and ammonia decompositionwas obtained in this
case. A 99.93% ammonia conversion was reached while the
equilibrium conversion at 550 �C is 99.92%.
In order to have the most efficient use of the membranes it
would be preferable to keep the hydrogen fraction of the
outgoing retentate gas around 0.1. This goal was met in Fig. 8
for both temperatures of 600 �C and 550 �C and for an input
flow rate of 1 cm/s. On the other hand, to design a cost
effective process the highest possible gas throughput
compatible with the device volume should be achieved.
Therefore, a further investigation was carried out increasing
the reactor feeding rate, considering an ammonia superficial
velocity of 2 cm/s. The results obtained for an ammonia
feeding flow rate of 2 cm/s are illustrated in Fig. 9.
As expected, increasing the superficial velocity decreases
the reactor performance in terms of ammonia dissociation.
For this set of simulation better results were obtained for
a process temperature equal to 600 �C. At 2 cm/s the hydrogen
molar fraction in the retentate gas varied between 0.29 for
500 �C and 0.18 for 600 �C, therefore the hydrogen amount not
permeated through the membranes and outgoing the reactor
with the retentate gas appears to be high.
These results are probably due to the short “residence
time” the input gas is allowed to spend inside the reactor,
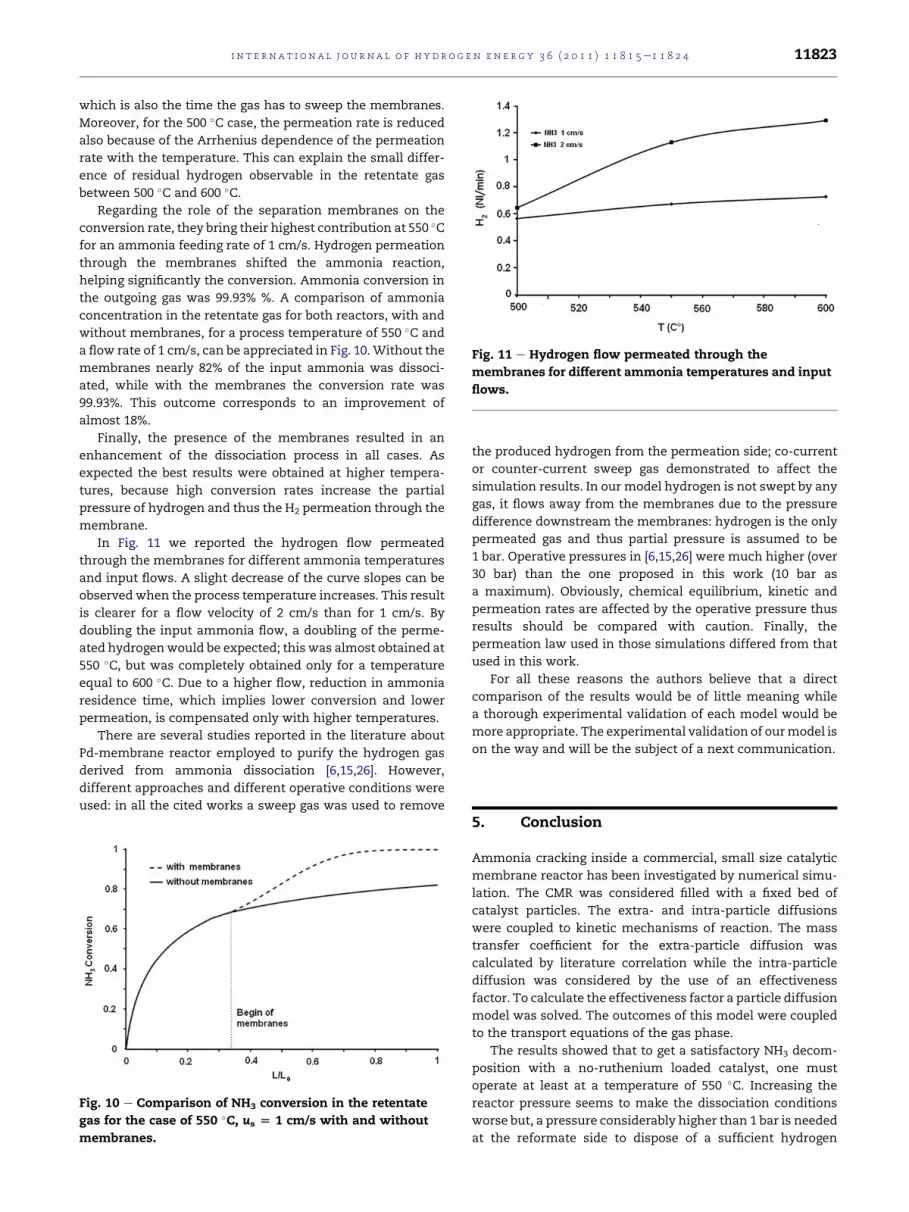
Fig. 11 e Hydrogen flow permeated through the
membranes for different ammonia temperatures and input
flows.
i n t e r n a t i o n a l j o u r n a l o f h y d r o g e n en e r g y 3 6 ( 2 0 1 1 ) 1 1 8 1 5e1 1 8 2 4 11823
which is also the time the gas has to sweep the membranes.
Moreover, for the 500 �C case, the permeation rate is reduced
also because of the Arrhenius dependence of the permeation
rate with the temperature. This can explain the small differ-
ence of residual hydrogen observable in the retentate gas
between 500 �C and 600 �C.Regarding the role of the separation membranes on the
conversion rate, they bring their highest contribution at 550 �Cfor an ammonia feeding rate of 1 cm/s. Hydrogen permeation
through the membranes shifted the ammonia reaction,
helping significantly the conversion. Ammonia conversion in
the outgoing gas was 99.93% %. A comparison of ammonia
concentration in the retentate gas for both reactors, with and
without membranes, for a process temperature of 550 �C and
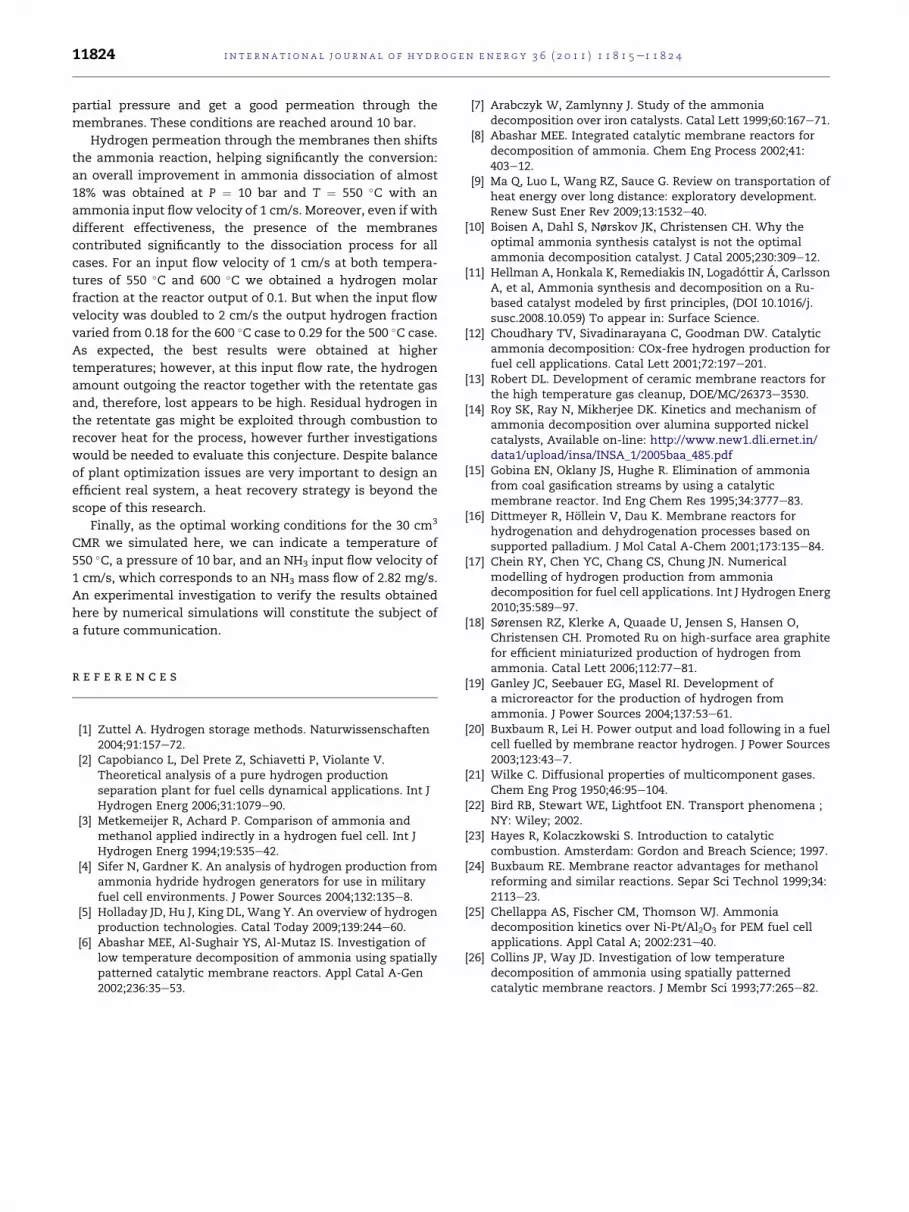
a flow rate of 1 cm/s, can be appreciated in Fig. 10.Without the
membranes nearly 82% of the input ammonia was dissoci-
ated, while with the membranes the conversion rate was
99.93%. This outcome corresponds to an improvement of
almost 18%.
Finally, the presence of the membranes resulted in an
enhancement of the dissociation process in all cases. As
expected the best results were obtained at higher tempera-
tures, because high conversion rates increase the partial
pressure of hydrogen and thus the H2 permeation through the
membrane.
In Fig. 11 we reported the hydrogen flow permeated
through the membranes for different ammonia temperatures
and input flows. A slight decrease of the curve slopes can be
observedwhen the process temperature increases. This result
is clearer for a flow velocity of 2 cm/s than for 1 cm/s. By
doubling the input ammonia flow, a doubling of the perme-
ated hydrogenwould be expected; this was almost obtained at
550 �C, but was completely obtained only for a temperature
equal to 600 �C. Due to a higher flow, reduction in ammonia
residence time, which implies lower conversion and lower
permeation, is compensated only with higher temperatures.
There are several studies reported in the literature about
Pd-membrane reactor employed to purify the hydrogen gas
derived from ammonia dissociation [6,15,26]. However,
different approaches and different operative conditions were
used: in all the cited works a sweep gas was used to remove
Fig. 10 e Comparison of NH3 conversion in the retentate
gas for the case of 550 �C, us [ 1 cm/s with and without
membranes.
the produced hydrogen from the permeation side; co-current
or counter-current sweep gas demonstrated to affect the
simulation results. In our model hydrogen is not swept by any
gas, it flows away from the membranes due to the pressure
difference downstream the membranes: hydrogen is the only
permeated gas and thus partial pressure is assumed to be
1 bar. Operative pressures in [6,15,26] were much higher (over
30 bar) than the one proposed in this work (10 bar as
a maximum). Obviously, chemical equilibrium, kinetic and
permeation rates are affected by the operative pressure thus
results should be compared with caution. Finally, the
permeation law used in those simulations differed from that
used in this work.
For all these reasons the authors believe that a direct
comparison of the results would be of little meaning while
a thorough experimental validation of each model would be
more appropriate. The experimental validation of ourmodel is
on the way and will be the subject of a next communication.
5. Conclusion
Ammonia cracking inside a commercial, small size catalytic
membrane reactor has been investigated by numerical simu-
lation. The CMR was considered filled with a fixed bed of
catalyst particles. The extra- and intra-particle diffusions
were coupled to kinetic mechanisms of reaction. The mass
transfer coefficient for the extra-particle diffusion was
calculated by literature correlation while the intra-particle
diffusion was considered by the use of an effectiveness
factor. To calculate the effectiveness factor a particle diffusion
model was solved. The outcomes of this model were coupled
to the transport equations of the gas phase.
The results showed that to get a satisfactory NH3 decom-
position with a no-ruthenium loaded catalyst, one must
operate at least at a temperature of 550 �C. Increasing the
reactor pressure seems to make the dissociation conditions
worse but, a pressure considerably higher than 1 bar is needed
at the reformate side to dispose of a sufficient hydrogen
i n t e rn a t i o n a l j o u r n a l o f h y d r o g e n en e r g y 3 6 ( 2 0 1 1 ) 1 1 8 1 5e1 1 8 2 411824
partial pressure and get a good permeation through the
membranes. These conditions are reached around 10 bar.
Hydrogen permeation through the membranes then shifts
the ammonia reaction, helping significantly the conversion:
an overall improvement in ammonia dissociation of almost
18% was obtained at P ¼ 10 bar and T ¼ 550 �C with an
ammonia input flow velocity of 1 cm/s. Moreover, even if with
different effectiveness, the presence of the membranes
contributed significantly to the dissociation process for all
cases. For an input flow velocity of 1 cm/s at both tempera-
tures of 550 �C and 600 �C we obtained a hydrogen molar
fraction at the reactor output of 0.1. But when the input flow
velocity was doubled to 2 cm/s the output hydrogen fraction
varied from 0.18 for the 600 �C case to 0.29 for the 500 �C case.
As expected, the best results were obtained at higher
temperatures; however, at this input flow rate, the hydrogen
amount outgoing the reactor together with the retentate gas
and, therefore, lost appears to be high. Residual hydrogen in
the retentate gas might be exploited through combustion to
recover heat for the process, however further investigations
would be needed to evaluate this conjecture. Despite balance
of plant optimization issues are very important to design an
efficient real system, a heat recovery strategy is beyond the
scope of this research.
Finally, as the optimal working conditions for the 30 cm3
CMR we simulated here, we can indicate a temperature of
550 �C, a pressure of 10 bar, and an NH3 input flow velocity of
1 cm/s, which corresponds to an NH3 mass flow of 2.82 mg/s.
An experimental investigation to verify the results obtained
here by numerical simulations will constitute the subject of
a future communication.
r e f e r e n c e s
[1] Zuttel A. Hydrogen storage methods. Naturwissenschaften2004;91:157e72.
[2] Capobianco L, Del Prete Z, Schiavetti P, Violante V.Theoretical analysis of a pure hydrogen productionseparation plant for fuel cells dynamical applications. Int JHydrogen Energ 2006;31:1079e90.
[3] Metkemeijer R, Achard P. Comparison of ammonia andmethanol applied indirectly in a hydrogen fuel cell. Int JHydrogen Energ 1994;19:535e42.
[4] Sifer N, Gardner K. An analysis of hydrogen production fromammonia hydride hydrogen generators for use in militaryfuel cell environments. J Power Sources 2004;132:135e8.
[5] Holladay JD, Hu J, King DL, Wang Y. An overview of hydrogenproduction technologies. Catal Today 2009;139:244e60.
[6] Abashar MEE, Al-Sughair YS, Al-Mutaz IS. Investigation oflow temperature decomposition of ammonia using spatiallypatterned catalytic membrane reactors. Appl Catal A-Gen2002;236:35e53.
[7] Arabczyk W, Zamlynny J. Study of the ammoniadecomposition over iron catalysts. Catal Lett 1999;60:167e71.
[8] Abashar MEE. Integrated catalytic membrane reactors fordecomposition of ammonia. Chem Eng Process 2002;41:403e12.
[9] Ma Q, Luo L, Wang RZ, Sauce G. Review on transportation ofheat energy over long distance: exploratory development.Renew Sust Ener Rev 2009;13:1532e40.
[10] Boisen A, Dahl S, Nørskov JK, Christensen CH. Why theoptimal ammonia synthesis catalyst is not the optimalammonia decomposition catalyst. J Catal 2005;230:309e12.
[11] Hellman A, Honkala K, Remediakis IN, Logadottir A, CarlssonA, et al, Ammonia synthesis and decomposition on a Ru-based catalyst modeled by first principles, (DOI 10.1016/j.susc.2008.10.059) To appear in: Surface Science.
[12] Choudhary TV, Sivadinarayana C, Goodman DW. Catalyticammonia decomposition: COx-free hydrogen production forfuel cell applications. Catal Lett 2001;72:197e201.
[13] Robert DL. Development of ceramic membrane reactors forthe high temperature gas cleanup, DOE/MC/26373e3530.
[14] Roy SK, Ray N, Mikherjee DK. Kinetics and mechanism ofammonia decomposition over alumina supported nickelcatalysts, Available on-line: http://www.new1.dli.ernet.in/data1/upload/insa/INSA_1/2005baa_485.pdf
[15] Gobina EN, Oklany JS, Hughe R. Elimination of ammoniafrom coal gasification streams by using a catalyticmembrane reactor. Ind Eng Chem Res 1995;34:3777e83.
[16] Dittmeyer R, Hollein V, Dau K. Membrane reactors forhydrogenation and dehydrogenation processes based onsupported palladium. J Mol Catal A-Chem 2001;173:135e84.
[17] Chein RY, Chen YC, Chang CS, Chung JN. Numericalmodelling of hydrogen production from ammoniadecomposition for fuel cell applications. Int J Hydrogen Energ2010;35:589e97.
[18] Sørensen RZ, Klerke A, Quaade U, Jensen S, Hansen O,Christensen CH. Promoted Ru on high-surface area graphitefor efficient miniaturized production of hydrogen fromammonia. Catal Lett 2006;112:77e81.
[19] Ganley JC, Seebauer EG, Masel RI. Development ofa microreactor for the production of hydrogen fromammonia. J Power Sources 2004;137:53e61.
[20] Buxbaum R, Lei H. Power output and load following in a fuelcell fuelled by membrane reactor hydrogen. J Power Sources2003;123:43e7.
[21] Wilke C. Diffusional properties of multicomponent gases.Chem Eng Prog 1950;46:95e104.
[22] Bird RB, Stewart WE, Lightfoot EN. Transport phenomena ;NY: Wiley; 2002.
[23] Hayes R, Kolaczkowski S. Introduction to catalyticcombustion. Amsterdam: Gordon and Breach Science; 1997.
[24] Buxbaum RE. Membrane reactor advantages for methanolreforming and similar reactions. Separ Sci Technol 1999;34:2113e23.
[25] Chellappa AS, Fischer CM, Thomson WJ. Ammoniadecomposition kinetics over Ni-Pt/Al2O3 for PEM fuel cellapplications. Appl Catal A; 2002:231e40.
[26] Collins JP, Way JD. Investigation of low temperaturedecomposition of ammonia using spatially patternedcatalytic membrane reactors. J Membr Sci 1993;77:265e82.