3D Delineation: A modernisation of drawing methodology for field archaeology (Master's Thesis)
75
3D DELINEATION A modernisation of drawing methodology for field archaeology Justin J.L. Kimball Master’s Thesis in Archaeology Spring 2014 Supervisor: Nicolo Dell’Unto Department of Archaeology & Ancient History Lund University
-
Upload
universitetetioslo -
Category
Documents
-
view
4 -
download
0
Transcript of 3D Delineation: A modernisation of drawing methodology for field archaeology (Master's Thesis)
3D DELINEATION A modernisation of drawing methodology for field archaeology
Justin J.L. Kimball Master’s Thesis in Archaeology
Spring 2014 Supervisor: Nicolo Dell’Unto
Department of Archaeology & Ancient History Lund University

i
ABSTRACT A recent trend concerning archaeological research has focused on producing a real-time
methodology for 3D digital models as archaeological documentation within the excavation setting.
While such methodologies have now firmly been established, what remains is to explore how 3D
models can be integrated more fully alongside other forms of archaeological documentation. This
thesis explored one avenue by developing a method that combines the interpretative power of
traditional archaeological drawings and the realistic visualisation capacity of 3D digital models. An
experiment was developed during archaeological excavations at Uppåkra, Sweden where
photographic data was captured to produce 3D digital models through Photoscan. These models
were geospatially located within ESRI’s 3D GIS ArcScene where shapefile editing tools were used
to draw overtop of their surfaces in three-dimensions. All drawings followed closely the single
context method of drawing, were allotted context numbers, and given descriptive geodatabase
attributes. This methodology resulted in the further integration of 3D models alongside other
forms of archaeological documentation. The drawings increased the communicative powers of
archaeological interpretation by enabling the information to be disseminated in a 3D environment
alongside other formats of data that would have otherwise been disconnected in 2D space. Finally,
the database attributes permitted the drawings complete integration within the geodatabase,
thereby making them available for query and other analytical procedures. Archaeological
information is three-dimensional, therefore archaeologists must begin to approach documentation
bearing this in mind. This technique has demonstrated that 3D models are a fluidic form of
documentation allowing for accurate preservation of archaeology while enabling new forms of
data to be derived all within a limited amount of time. Archaeologists must begin to affect change
towards embracing 3D models and their associated applications as a standard tool within the
excavator’s toolbox.
Keywords: 3D modelling; multi-view stereo reconstruction; MSR; archaeological drawing; 3D
drawing; field archaeology; excavation methodology; excavation documentation; archaeological
photography; transparency; reconstruction; 3D/4D GIS.
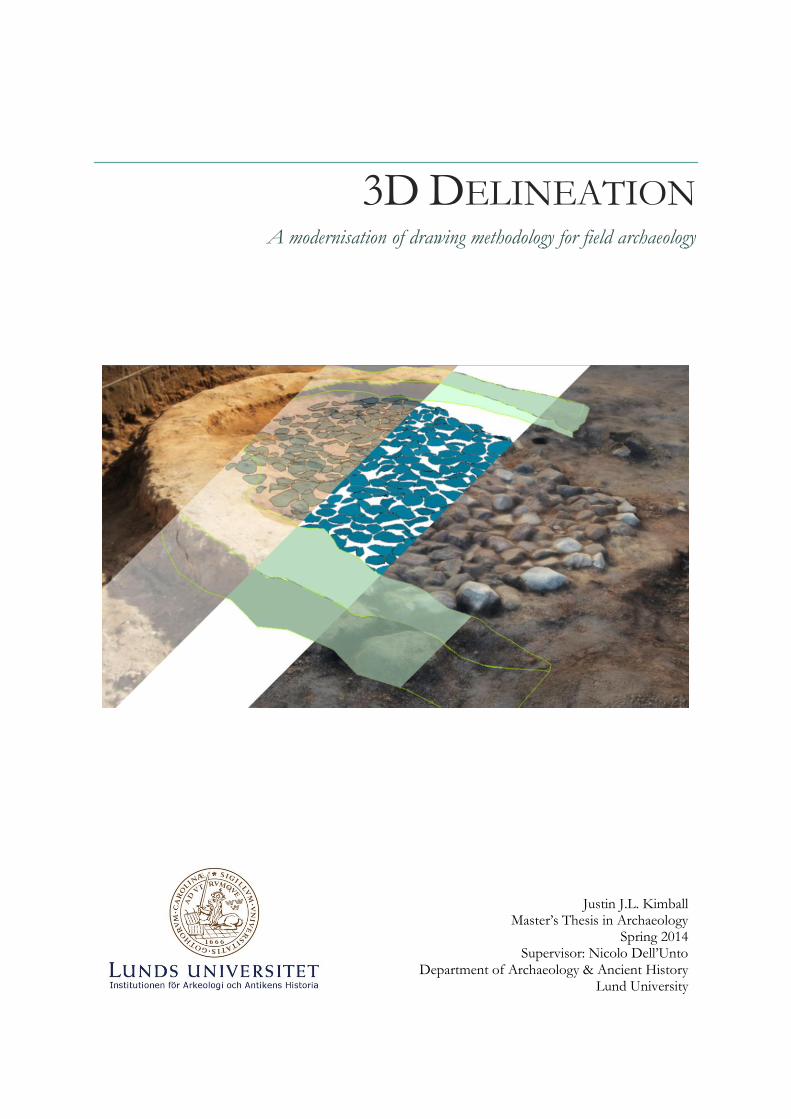
Cover Image: (A still image of 3D models and 3D drawings) Presented here is a composite image
showing multiple 3D models and 3D drawings from the same perspective in a 3D GIS
environment. From upper left corner to lower right corner: 1) 3D model of an earlier phase of
excavation of an oven feature in Trench 5, Uppåkra; 2) the same 3D model as before, reduced in
transparency to reveal the 3D delineation of archaeological features that were ‘at-the-time’ hidden
beneath the clay layer (an example of chronological—4D—layering; 3) another example showing
chronological layering, this time solely with 3D drawings of the clay horseshoe-shape and the
underlying stone-packing layer; 4) an image retaining the 3D polygon drawing of the horseshoe-
shaped clay layer superimposed over top of the last phase of excavation (stone-packing layer); and
5) a final example of chronological layering where only the 3D polyline is visible over the 3D
model representing the last phase of excavations. (Image by J.J.L. Kimball 2014; 3D Drawings by
J.J.L. Kimball 2014; Base 3D model by J.J.L. Kimball 2014; Overlay 3D model by N. Dell’Unto)
ii
TABLE OF CONTENTS Abstract ..........................................................................................................................................................i
1 – Introduction .......................................................................................................................................... 1
2 – State of the Art ..................................................................................................................................... 2
3 – Theory .................................................................................................................................................. 11
4 – Methodology ....................................................................................................................................... 14
4.1 – Review of Established Methodologies and Associated Technologies ................................ 14
4.2 – Introduction to Utilised Technologies .................................................................................... 17
4.2.1 –Camera Systems .................................................................................................................... 18
4.2.2 – Adobe Photoshop Lightroom 5.4 .................................................................................... 20
4.2.3 – Agisoft’s Photoscan 1.0.4 .................................................................................................. 20
4.2.4 – EDM Total Station ............................................................................................................. 24
4.2.5 – ArcGIS 10.2.1 ...................................................................................................................... 24
4.3 – Limitations ................................................................................................................................... 24
5 – Experiment: 3D Delineation ............................................................................................................ 25
5.1 – General Background of Uppåkra ............................................................................................. 25
5.2 – Documentation Methodology at Uppåkra since 2011 .......................................................... 27
5.3 – State of the Art: 3D Modelling at Uppåkra ............................................................................ 27
5.4 – Experiment Overview ................................................................................................................ 29
5.5 – Experiment Methodology ......................................................................................................... 29
5.6 – Results Concerning 3D Archaeological Drawings ................................................................ 33
6 – Discussion ........................................................................................................................................... 46
6.1 – Statement of Perceived Impact ................................................................................................ 51
6.1.1 – Guidelines and Symbologies for 3D Archaeological Drawing ..................................... 52
6.2 – Cautions and Limitations........................................................................................................... 54
6.3 – Concerns Regarding the Photographic Process ..................................................................... 59
7 – Conclusion ........................................................................................................................................... 63
8 – Acknowledgments .............................................................................................................................. 65
9 – References ........................................................................................................................................... 66
9.1 – Literary Sources .......................................................................................................................... 66
9.2 – Online Sources ............................................................................................................................ 70
9.3 – Multimedia Sources .................................................................................................................... 72
1
1 – INTRODUCTION Field archaeology has always been a discipline that depends greatly upon technology and the way
those technologies are used in order to achieve knowledge of archaeological material (Jensen 2012,
pp. 12-13). Such a fact has become reaffirmed in the last two and a half decades as digital
technologies have increasingly made their presence evident throughout archaeology. This
particular influx has been of tremendous benefit in that digital technologies have opened new
possibilities, through which new paths have been pioneered. Following such opportunities,
archaeologists have now acquired the ability to look upon the excavation with a new light: the
application of digital technology not only enables new forms of data for analyses, it also facilitates
all stages of acquisition, management, and post-processing—including not just digital data, but
traditional forms of data as well. Research into digital technologies thus represents an exciting and
promising avenue in which to explore archaeological resources. While an increased dependence
upon digital technologies does not mark a replacement of traditional archaeological tools, it is
important to recognise that digital technologies are able to play an important supplementary role—
one where, through our potential to acquire and interpret both traditional and newer forms of
data, the conclusions of an archaeological investigation are made more accurately, expeditious, and
fruitful.
It must be recognised however that digital technologies are in a continuous state of
development and thus these technologies, whether indirectly or directly, are also developing as
viable components towards the production of archaeological knowledge. In turn, this signifies that
there are yet many aspects to be explored regarding the theoretical and methodological aspects of
digital technology itself and its role in concert alongside of their more traditional counterparts in
archaeology. Therefore, the pronounced youth of digital technologies sets forth a profound
challenge for archaeologists. Only through an all-encompassing, deliberate, and objectified
amelioration of digital methodologies will these technologies be able to find their place within
archaeology—a deployment where their strengths are used efficiently, and more importantly in an
archaeologically relevant manner, towards the development of standards aimed at achieving
comprehension over targeted archaeological material and the ability to disseminate the resulting
knowledge (Campana 2014, pp. 7-8).
One of these more recent trends in the use of digital technologies in archaeology has been
the introduction of and the increasing interest placed upon 3D digital data technologies. Such
interest has occurred through advances in computer technologies that have just begun to allow
archaeologists access to hardware and software that are inexpensive and user-friendly. This has
presented archaeologists with a typology of data that is so ‘new’ that its role has not yet been
cemented within archaeology. Thus, both a heightened awareness and a desire to solidify a place
for 3D digital data technologies have created an interest to pursue these technologies more
thoroughly. In field archaeology for example, a continual stream of research papers have been
published over the past decade where 3D models have been used to capture and generate
archaeological knowledge. Some of these experiments are significant as they have attempted to do
2
so in the timeframe of the excavation itself. These mark important milestones as they have shed
light upon the value that 3D models present for archaeology1.
Thus, the methodology described and developed in this thesis has sought to contribute
towards the exploration of innovative applications for 3D data in field archaeology. It has
specifically addressed the question: in what other manners can 3D models be used in the
comprehension, interpretation, and visualisation of archaeological materials? In other words,
beyond simply creating and visualising 3D models, how can these models aid field archaeologists
in making explicit what has been identified as archaeologically-relevant? Utilising some of the
methodologies and techniques produced in previous studies, this thesis has demonstrated a
different approach in using 3D surface models that builds upon the strengths offered through this
technology. Furthermore, this application for 3D models has been shown to fit seamlessly
alongside of other traditional excavation tools—a combination that facilitates the production and
communication of archaeological knowledge. These methodologies have the potential to provide
researchers with unique and powerful perspectives and therefore must be considered as
prosperous ventures for future research and deployment within field archaeology.
2 – STATE OF THE ART Central to numerous state of the art sections is the exploration of technology and its impacts within
the area of study. ‘Technology’ is a key concept throughout this thesis and thus it is relevant to
establish a clear understanding of what is actually meant it. A good general perspective comes from
the Oxford Dictionary of English which defines technology as “the application of scientific knowledge
[in the form of machinery and/or devices] for practical purposes” (Stevenson 2010). If one were
to narrow the perspective into pursuing a more archaeologically-relevant definition for technology,
the Concise Oxford Dictionary of Archaeology states that technology is “the application of knowledge
to facilitate the obtaining and transformation of natural materials” and that “technology involves the
creation of material instruments . . . used in human interactions with nature” [emphasis mine] (Darvill
2009). This definition is decidedly more accurate regarding the role of technology within
archaeology.
As human beings, we explore and experience our world through our highly sophisticated
sensory organs. However, while we may assume an all-encompassing comprehension of the world
around us through these senses, we are actually quite confined by the limitations of those organs.
Technology however presents a means through which we are able to augment our bodies and senses
to realise what would otherwise be difficult or even impossible to perceive. Such a concept is easy
to illustrate through how archaeologists use technology to enhance certain aspects of the real-
world. Take for example, the archaeological use of remote sensing. From a very general
perspective, remote sensing may be understood as “the acquisition and measurement of
information about certain properties of phenomena, objects, or materials by a recording device
not in physical contact with the features under surveillance” (Khorram et al. 2012, p. 2; cf. also
1 By design, the 2D medium that this thesis has been written on frustrates the ability to visually demonstrate certain aspects about the 3D objects discussed. This has been somewhat circumvented through a webpage that the reader may visit for additional 3D visual information (eg. images, videos, and 3D PDFs). Wherever applicable, a link, such as the one below, will be provided in a footnote to direct the reader to the website containing additional visual media. https://sites.google.com/site/justinjlkimball/masters-data
3
Schowengerdt 2007, p. 2; Wiseman & El-Baz 2007, p. 1). To maintain the distance from the
subject, these recording instruments are commonly affixed to mobile platforms such as airplanes
and satellites (Khorram et al. 2012, p. 2) although other types of platforms, especially within
archaeological settings, may also be utilised such as kites, balloons, and unmanned aerial vehicles
(UAVs) (cf. Eisenbeiss 2009). The instruments used are specially attuned to receive specific
propagated signals within a typology such as those within the electromagnetic spectrum (Khorram
et al 2012, p. 2; Parcak 2009, pp. 42-44; Schowengerdt 2007, p. 2). These sensors therefore permit
the operator to ‘see’ certain signals (eg. gamma, x-ray, ultraviolet, near and middle infrared, thermal
infrared, microwave, and radio) that would otherwise be invisible to the naked eye.
Bearing this example and the previous definitions in mind, I propose that a more accurate
definition of technology—where technology is more explicitly understood as a tool within
archaeology—might be described as the development and application of scientific knowledge as
implements intended to facilitate, augment, and/or transcend biological limitations with an
overarching goal to enable interaction with a variety of archaeologically-relevant materials. With
the definition of technology now thoroughly explored and established, the evolution of technology
within archaeology ending in the current state of the art may now be summarised.
The primary goal of archaeology is of course chiefly concerned with understanding our
human past. In order to achieve this goal, archaeologists must have access to data and the primary
mode of acquiring such data is through the process of excavation: where archaeological material—
obtainable through no other means—is literally unearthed from its encasement within the ground
(Barker 1993, p. 13). In its earliest form, archaeology was aimed towards recovering only artefacts.
Thus shovels and mattocks were utilised to clear away earth in order to gain access to those objects.
This changed in the 19th century when archaeologists began focus more on the archaeological site
and the information that was contained within. Naturally, this led to the development of the
written and drawn records, both of which complement one another and are standards of
excavation to this day (Drewitt 2011; Roskams 2001; Barker 1993). Drawn records focus
specifically on the production of drawings derived from the measurement of surface features and
can be broken down into horizontal (plan) and vertical (section) types. The emphasis upon
recording features within the site rather than simply collecting artefacts ultimately impacted the act
of excavation. More specifically, in order to accommodate the written and drawn records,
excavation had to be conducted in a meticulous and clean manner (Barker 1993, p. 25). As a result,
tools capable of finesse were employed for excavation purposes—the most iconic of course being
the trowel. It is important to recognise however that the trowel did not completely supplant the
shovel. On the contrary, the trowel was adopted in response to the need to take more care during
the excavation process—an aspect that arose with the adoption of newer techniques that in turn
inspired new methodologies and resulted in the realisation of new forms of archaeological data.
The increased attention to detail influenced other aspects of the site to be scrutinised. One
of particular relevance was the study of the stratigraphic sequence which allowed archaeologists a
better understanding of site creation and past activities (Museum of London Archaeological
Service 1994). The inspiration for the archaeological study of stratigraphy was borrowed from
geology with particular attention paid to the Geological Law of Superposition. In 1973, Edward
Harris would amend this law to make it more suitable for archaeology. Thus Harris’
(Archaeological) Law of Superposition holds that:

4
“In a series of layers and interfacial features, as originally created, the upper units of stratification
are younger and the lower are older, for each must have been deposited on, or created by the
removal of, a pre-existing mass of archaeological stratification”
E. C. Harris (1997, p. 30).
Superposition is an important concept because it seeks to understand the relationship between the
features and deposits within a site (Harris 1997, p. 30). More importantly was that this work lead
to the development of an excavation methodology named the single context system. Intended for
use at sites with complex stratifications, this method functions under the knowledge that
archaeological sites are formed through actions that either deposit or remove layers. The results
of such actions are referred to as ‘contexts’ and are always either ‘sealed’ or ‘cut’ by the context(s)
above (Museum of London Archaeological Service 1994). Thus each individual context is
considered important, resulting in the production of large numbers of documents (eg. drawings—
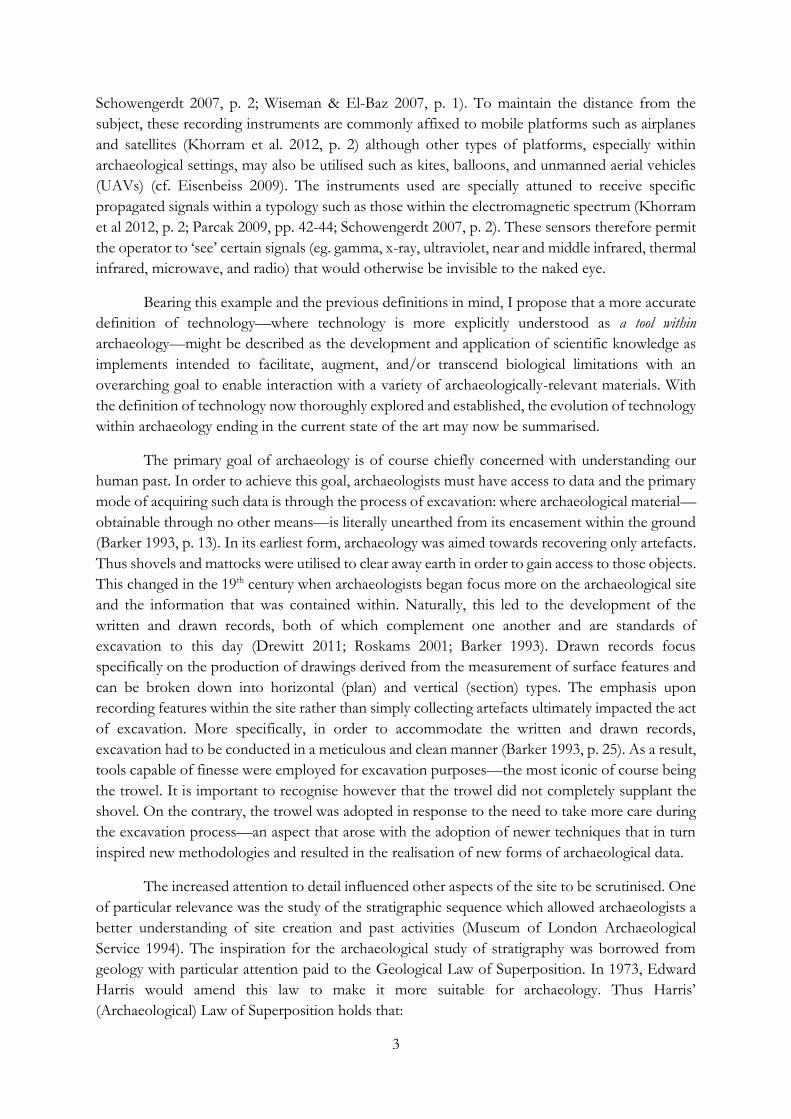
a format central to this thesis). The methodology for such drawings were standardised in order to
ensure they were scientifically valuable. Thus, the act of drawing follows a specific set of guidelines
that help to produce 2D geometric representations of the object recorded. In order to facilitate
the production of these archaeological drawings, a standardised symbology, called the single
context planning method, was established where specific line symbologies were used to translate
3D archaeological features into a 2D medium. These unique and descriptive lines help to convey
important information that would otherwise be difficult to explain in writing (cf. Figure 1) and are
an industry standard in archaeological practice today.
Another important technology leading towards the current state of the art was the
introduction and development of photography within archaeology. Photographic technology
presented a powerful tool to archaeologists that, when executed by someone with experience with
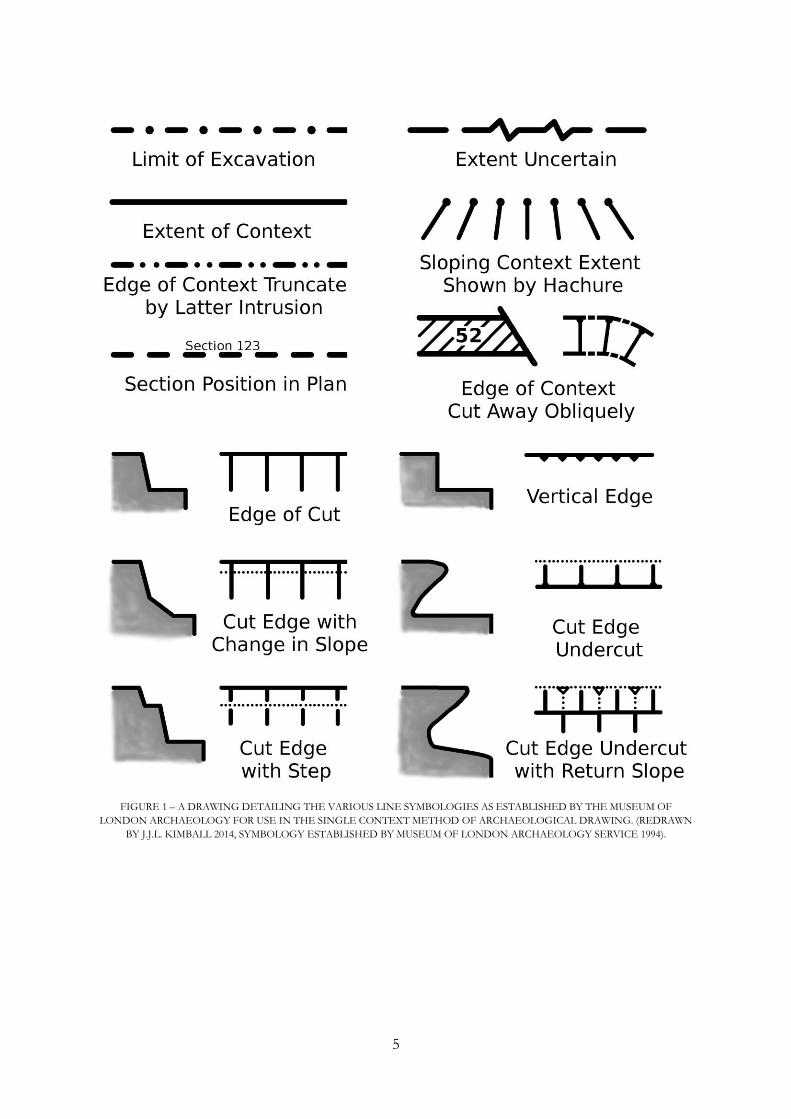
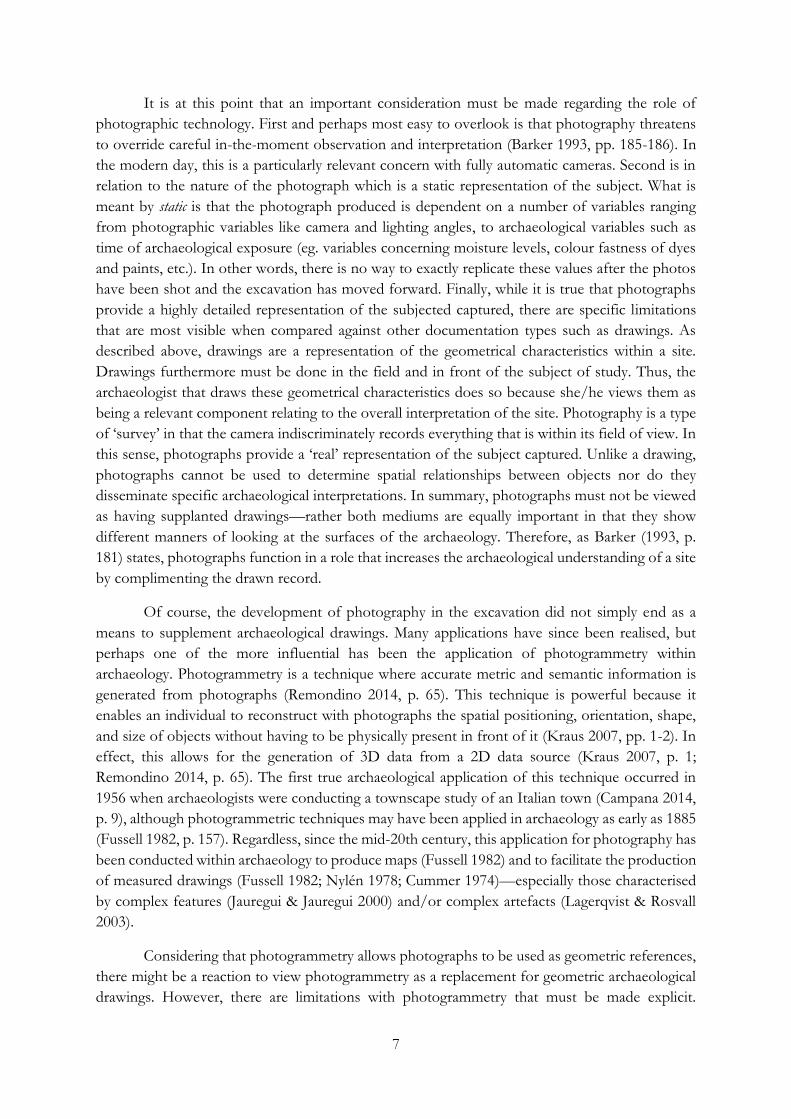
the technology, was able to quickly record a highly-detailed representation of the site. Although
photography started out as a way to document the apex of archaeological discovery (cf. Figure 2
& Figure 3), archaeologists eventually began to record the phases of excavation as the
archaeological investigation progressed forward (Drewitt 2011, p. 131). Later in the 20th century,
as photography equipment became more compact and mobile, the photographic record would
become an incredibly critical component within archaeological investigations. The increased
flexibility of this technology influenced the creation of its own methodology, where archaeological
features and surfaces were first prepared in order to visually define as much detail as possible for
photographic recording (Drewitt 2011, p. 131). Such record photographs can be broken down into
two groups describing the perspective from which they are captured: vertical and oblique (Barker
1993, p. 181). Vertical photography refers to the suspension of the camera directly above the
subject for recording (Barker 1993, pp. 181-182). This form of photography produces an image
that has a similar perspective to the archaeological plan drawing. Oblique photography helps to
define the features of the site by using various lighting and camera angles to record the contrasts
between highlights and shadows. This teases out details that may otherwise be difficult to see
(Barker 1993, pp. 182-183), such as the subtleties between individual rocks in a stone-packing or
highlighting the edges of postholes.
5
FIGURE 1 – A DRAWING DETAILING THE VARIOUS LINE SYMBOLOGIES AS ESTABLISHED BY THE MUSEUM OF
LONDON ARCHAEOLOGY FOR USE IN THE SINGLE CONTEXT METHOD OF ARCHAEOLOGICAL DRAWING. (REDRAWN
BY J.J.L. KIMBALL 2014, SYMBOLOGY ESTABLISHED BY MUSEUM OF LONDON ARCHAEOLOGY SERVICE 1994).

6
FIGURE 2 – AN EXAMPLE OF EARLY ARCHAEOLOGICAL PHOTOGRAPHY; PICTURED IS THE APEX OF THE EXCAVATION
OF THE OSEBERG SHIP, NORWAY. (PHOTOGRAPH © KULTURHISTORISK MUSEUM, UIO 2014).
FIGURE 3 – ANOTHER EXAMPLE OF EARLY ARCHAEOLOGICAL PHOTOGRAPHY; PICTURED ARE THE EXCAVATORS
AND ARCHAEOLOGISTS, IN THE BACKGROUND THE OSEBERG SHIP, NORWAY. (PHOTOGRAPH © KULTURHISTORISK
MUSEUM, UIO 2014).
7
It is at this point that an important consideration must be made regarding the role of
photographic technology. First and perhaps most easy to overlook is that photography threatens
to override careful in-the-moment observation and interpretation (Barker 1993, pp. 185-186). In
the modern day, this is a particularly relevant concern with fully automatic cameras. Second is in
relation to the nature of the photograph which is a static representation of the subject. What is
meant by static is that the photograph produced is dependent on a number of variables ranging
from photographic variables like camera and lighting angles, to archaeological variables such as
time of archaeological exposure (eg. variables concerning moisture levels, colour fastness of dyes
and paints, etc.). In other words, there is no way to exactly replicate these values after the photos
have been shot and the excavation has moved forward. Finally, while it is true that photographs
provide a highly detailed representation of the subjected captured, there are specific limitations
that are most visible when compared against other documentation types such as drawings. As
described above, drawings are a representation of the geometrical characteristics within a site.
Drawings furthermore must be done in the field and in front of the subject of study. Thus, the
archaeologist that draws these geometrical characteristics does so because she/he views them as
being a relevant component relating to the overall interpretation of the site. Photography is a type
of ‘survey’ in that the camera indiscriminately records everything that is within its field of view. In
this sense, photographs provide a ‘real’ representation of the subject captured. Unlike a drawing,
photographs cannot be used to determine spatial relationships between objects nor do they
disseminate specific archaeological interpretations. In summary, photographs must not be viewed
as having supplanted drawings—rather both mediums are equally important in that they show
different manners of looking at the surfaces of the archaeology. Therefore, as Barker (1993, p.
181) states, photographs function in a role that increases the archaeological understanding of a site
by complimenting the drawn record.
Of course, the development of photography in the excavation did not simply end as a
means to supplement archaeological drawings. Many applications have since been realised, but
perhaps one of the more influential has been the application of photogrammetry within
archaeology. Photogrammetry is a technique where accurate metric and semantic information is
generated from photographs (Remondino 2014, p. 65). This technique is powerful because it
enables an individual to reconstruct with photographs the spatial positioning, orientation, shape,
and size of objects without having to be physically present in front of it (Kraus 2007, pp. 1-2). In
effect, this allows for the generation of 3D data from a 2D data source (Kraus 2007, p. 1;
Remondino 2014, p. 65). The first true archaeological application of this technique occurred in
1956 when archaeologists were conducting a townscape study of an Italian town (Campana 2014,
p. 9), although photogrammetric techniques may have been applied in archaeology as early as 1885
(Fussell 1982, p. 157). Regardless, since the mid-20th century, this application for photography has
been conducted within archaeology to produce maps (Fussell 1982) and to facilitate the production
of measured drawings (Fussell 1982; Nylén 1978; Cummer 1974)—especially those characterised
by complex features (Jauregui & Jauregui 2000) and/or complex artefacts (Lagerqvist & Rosvall
2003).
Considering that photogrammetry allows photographs to be used as geometric references,
there might be a reaction to view photogrammetry as a replacement for geometric archaeological
drawings. However, there are limitations with photogrammetry that must be made explicit.

8
Photogrammetry of course relies upon photographs, and as discussed previously photographs
function as an indiscriminate survey of the site—as such, photogrammetry naturally shares many
of the same limitations that photography does. Thus, even though photogrammetry offers
archaeologists the opportunity to conduct spatial analysis, this technique does not replace but
instead complements other forms of archaeological documentation.
The next significant technological leap within archaeology came with the increased
computerisation of technologies within archaeology. The development of computer systems in
turn lead to some traditional technologies getting an overhaul. For example, in the 1980s, the
theodolite was used as the foundation for the development of the electronic distance measurement
(EDM) total station (Drewitt 2011, p. 64). Designed as a device for surveying and producing
topographical maps, total stations measure distances, angles, and elevations by describing these
values as spatial coordinates relative to the total station itself (Nikon Corporation 2008). While
archaeologists have utilised this technology in this very role, they have also applied it as a means
to measure the elevation of archaeological units, to document the spatial location of artefacts, and
to even ‘trace’ the limits of trenches and archaeological features. The major limitation of this
technology is that it requires a computer to visualise the data that it produces. In fact, when one
considers all of the technologies and their associated data discussed up to this point, it becomes
quite apparent that they are all disjointed in relation to one another. Each represents different
manners of focusing on the same material. Yet as relevant as these different perspectives are, by
design they must also be presented as individual typologies apart from one another. What was
needed was a way to tie these data—both spatial and non-spatial—together within one platform.
The solution would be found in the geographic information system (GIS).
GIS has been a revolutionary technology for archaeology. A GIS refers to a suite of
software where the chief application is as a database allowing for the storage and management of
spatial information (Chapman 2009, p. 14). Thus, archaeologists have moved away from paper
databases and embraced the efficiency offered by computerised (GIS) databases (Wescott 2005, p.
1). Secondarily, and dependent on the efficiency of the first, GISs are capable to transcend the
storage and management of data to include the ability to manipulate, analyse, and visualise data as
well (Chapman 2009, p. 15). Such properties intrinsic to GIS allow the user a new manner with
which to interact and ultimately understand spatial information (Conolly & Lake 2006, p. 11).
Upon their first development, GISs were limited only to one of two typologies of digital data—
raster or vector (Chapman 2009, p. 15). Today however, most GISs are capable of working with
both types of data. What is evident regarding GIS is that, when used correctly, it represents an
incredibly powerful and diverse tool—capable of the absolutely crucial process of managing
multiple typologies of data in logical and consistent manners, to more complex and technical
operations involved with the analysis of those data (Conolly & Lake 2006, p. 10). There is little
doubt that GIS has affected the whole of archaeology (Chapman 2009, p. 9; Lucas 2001, p. 128;
for a list of broad applications within archaeology cf. Wescott & Brandon 2005).
More importantly for this thesis however is the impact that GIS has had within field
archaeology—and it can be stated confidently that the implications have been profound. Field
archaeology has traditionally been divided into tasks to be accomplished during the excavation and
also after the excavation (aka post-excavation) (Conolly & Lake 2006, p. 36; cf. also chapter
divisions in Drewitt 2011). The large datasets pulled from excavation activities necessitated a

9
specific and undivided attention to detail that was not feasible during field investigations—thus
there was a natural division between the two. Furthermore, the introduction of computers and the
subsequent digitistation of technologies resulted both in an enlargement of data within datasets
and also a generation of entirely new typologies of data altogether. Of course, computer storage
and processing technology progressed forward with the result being the development of more
compact and mobile computers. Such leaps in technology saw the movement of the computer
from the office and/or lab into the field itself—thereby causing the dividing lines between
excavation and post-excavation duties to become blurred. The combined field operation of a total
station alongside of a GIS platform illustrates the closing of this gap: spatial data gathered by the
total station can be immediately input into the excavation GIS. This allows for the spatial data to
become processed, stored, and linked with other archaeological data within the same GIS at the
time of acquisition (Conolly & Lake 2006, pp. 36-37). This is only one example of a typology of
data that can be managed by GIS in the field. More recently, there has been a trend to take 3D
models and place these beside other typologies of data within a GIS. This effectively results in a
3D GIS—the development of which absolutely lends credibility to the prediction that GIS may
be “destined to have as profound an effect on the field of archaeology as did the introduction of
carbon dating in the 1950s” (Wescott 2005, p. 1).
In order to understand why a 3D GIS is so impacting for field archaeology, it must first
be defined what 3D models actually are. The concept of 3D models refers to a type of data by
which the ‘real’ world and its three-dimensional properties (eg. shapes) are translated into
computerised representations via mathematics that simulate those three-dimensional properties
(Szeliski 2011, p. 3). While 3D models are most recognised for their entertainment value, these
models also hold many benefits for scientific endeavours. However, for a 3D model to be
recognised as scientifically valuable, it must have a well-defined purpose oriented towards
answering specific questions or providing specific data (Hermon & Nikodem 2008, pp. 1-2). Thus,
bearing this in mind, 3D models have to help archaeologists document in manners unachievable
before. Traditionally, the only way to document archaeological objects was to translate their real-
world 3D properties into 2D representations (eg. through graphical mediums like drawings and
photographs). With the introduction of 3D models however, archaeologists were given the
opportunity to document archaeological objects as they are found in situ—as three-dimensional
entities (Campana 2014, p. 7). The development of 3D models can be accomplished through
different technologies. For field archaeology, two technologies stand out as the most common:
laser scanners and multi-view stereo reconstruction techniques (MSR).
Laser scanners refer to a group of technologies that produce dense point clouds or polygon
meshes by measuring the real-world through lasers, lights, or x-rays (3D Systems 2014) and come
in two primary types, laser triangulation and time-of-flight scanners. Both utilise different methods
of laser measurement and thus have different applications. Laser triangulation scanners are
designed for short-range applications and function by systematically moving a laser beam, focused
into either a point or line, across the surface of an object. The distance and angles between the
laser source and receiving sensor are precisely known, thus the sensor determines the distance of
the object’s surface through trigonometric triangulation by measuring the angle that the light is
reflected back towards the scanner (Guidi 2014, pp. 39-42; 3D Systems 2014). The other typology
of scanners, time-of-flight laser scanners, excel in mid- to long-range applications and function by

10
measuring the amount of time it takes the laser to fire, reflect off the object, and return to the
scanner. The laser emitter and receiving sensor are afforded a 360o degree view around itself by
either moving these components directly or aiming the beams via a mirror (Guidi 2014, pp. 42-44;
3D Systems 2014; Al-kheder et al. 2009, p. 540). In field archaeology, laser scanners offer
archaeologists with the ability to describe the entirety of their site as very high-quality 3D dense
point clouds. Such applications for laser scanners have been hailed as providing a means for
preserving (representations of) archaeological material (Al-kheder et al. 2009; Balzani et al. 2004);
disseminating archaeological data as representations amongst specialists (Guidi 2014; Al-kheder et
al. 2009; Balzani et al. 2004); production of orthophotos (Bennett 2011, pp. 21-22; Davies 2011,
pp. 37-38); production of detailed sections and plans of highly complex features (Clarke 2011, pp.
25-26); and recording the stratigraphy exposed over the course of an excavation (Doneus &
Neubauer 2005).
The second technology involved with the development of 3D models within the field
setting is MSR. This technique relies upon a dataset made up of overlapping photographs. These
photographs are input within a software which searches for shared points between photographs,
aligns those points, and through mathematical algorithms, uses those points to develop a 3D
representational model of the subject(s) captured (Szeliski 2011, p. 3). Since MSR depends on
photographic datasets to create the models, the least-complicated choice for data collection is
therefore digital JPG images—a format of image that allows for the ability to quickly capture and
produce ready-to-view images that can be uploaded directly from the camera to the computer
without the need for photographic development processes. For field archaeology, there is an
important distinction that must be made regarding MSR and other 3D documentation techniques.
Unlike laser scanners and photogrammetry, which can be costly and time-consuming endeavours
(Forte et al. 2012), MSR is considerably low-cost and time-saving in comparison—a fact that is
attestable through experiments proving MSR to be capable of functioning within the time-span of
the excavation where it can be used to produce daily 3D models of entire excavation sites and
trenches (Dellepiane et al. 2013; also Forte et al. 2012). Furthermore, MSR techniques are
inherently easier to transport compared to laser scanners in that they rely upon the humble digital
camera which can easily be carried in a hip bag. The laser scanner itself is considerably more heavy
and bulky in comparison and requires a heavy tripod to stabilise it in order to effectively capture
the subject.
MSR is still relatively new to archaeology, thus some researchers have concerned
themselves with the development of methodologies for general field documentation (Muzzupappa
et al. 2013) and for specific use within the excavation process (De Reu et al. 2014; Dellepiane et
al. 2013; Callieri et al. 2011). Others have focused more on specific applications for MSR including
3D modelling as supplemental to traditional documentation technologies (Koutsoudis et al. 2014);
as a means to encourage dissemination of excavation data (Opitz et al. 2013); as a solution to
facilitate the speed through which representations can be produced for presentation purposes
(Ducke et al. 2011); a method of ‘realistic’ documentation for the preservation of endangered
archaeological evidence (Fux et al. 2009); and production of orthophotos and maps (Verhoeven
et al. 2012). More recent trends have seen the utilisation of MSR with the aim to create new systems
for acquiring and visualising the excavation process and site itself. Some specific examples of these
are explored in greater detail in the case study section later in this work.
11
As with all of the other technologies explored through this state of the art, it must be
stressed that 3D models are not a replacement for traditional technologies. 3D models represent
a unique perspective of archaeological information that, when combined alongside other
documentation formats (especially together within a GIS), serve to aid our comprehension and
interpretation of the material uncovered through archaeological investigation.
3 – THEORY
“Archaeology is concerned with telling the story of the past and telling stories about the past”
E. B. W. Zubrow (2006, p. 8).
The development of such archaeological narratives rests within the realm of theory in that it
provides a means for archaeologists to comment on evidence of (pre)historic events captured in
the archaeological record (Darvill 2009). In other words, theory functions as the lens through
which we develop a pipeline for investigation. This begins with the development of specific
questions, leading into the application of methodologies designed to uncover evidence, and ending
towards answering those questions through the organisation and interpretation of that data (and,
frequently, the production of new questions). This process should ideally result in the production
of an archaeological report, scientific articles, and potentially also a popular science description.
Thus, through these stages, a logical conclusion is developed resulting from a discourse focused
upon the archaeological material and experiences, and presented to interested parties as a form of
narrative—or more simply put, an archaeological story.
Technology is therefore inescapably bound in partnership to theoretical perspectives. This
can be evident in a plethora of examples. For example, the telescope had huge impacts upon how
astronomers viewed the stars and our own position within the universe; or take the microscope
which captured the attention of other scientists, such as biologists, who were then able to view a
world that is simply too small for the naked eye to see. Telescopes—technology—have opened
new data for us to analyse and interpret new ways of explaining things. Archaeologists are familiar
with this progression as well. The trowel, as described above, has forced archaeologists to excavate
slowly, methodically, and thoughtfully. Through the trowel we are capable of sensing—and
furthermore interpreting—so much more detail. Thus it can be firmly stated that technology is
capable of affecting theory as well as being an implement of it. It both enables more specific and
technically demanding questions and surveys (Zubrow 2006, pp. 13-14 cf. especially Table 1.1 on
p. 14) but at the same time (if the technology itself is limited or even if it does not yet exist) may
function to hinder and/or reduce some manners of thinking to mere foresights and dreams
(Zubrow 2006, p. 13). The prominent question then becomes what precise role does technology play
within archaeology?
This particular debate is perhaps most widely recognisable regarding the role of GIS in
geography (cf. Wright et al. 1997). However, the debate is also mirrored within archaeology, again
most notably regarding the archaeological role of GIS (cf. Conolly & Lake 2006), but also in
relation to digital technologies in general (cf. Zubrow 2006). Two distinct and conflicting camps

12
have risen from these discussions: one that sees digital technologies as 'science'; and the other that
views digital technologies relegated as simple 'tools' (Conolly & Lake 2006, p. 3; Zubrow 2006, p.
9; Wright et al. 1997, pp. 346-347).
As a science, 3D digital documentation technologies are understood as active,
consequential, influential, and provoking. They command an ability to affect not only how we
interpret data, but how we approach problems and ask questions—in a certain sense, digital
technologies may be summarised as a lens through which we can view archaeology and pose
questions about it. Advocates of this camp would therefore argue that these technologies are theory-
active within general archaeological theory. They may also have so much power that they can
influence their own unique theoretical perspectives (Zubrow 2006, p. 9). As such, digital
technologies as a science bring with them their own unique set of problems that may cooperate or
clash with other theoretical paradigms used in archaeology. In this role, GIS transcends disciplines
such as geography and archaeology and becomes a discipline in its own right. As a science, GIS
would necessitate the creation and mastery of a complete set of theories in order to locate its
position as an academic discipline itself, rather than as a small component utilised by individual
disciplines (Wright et al. 1997, p. 347).
On the other hand, digital technologies as a ‘tool’ are viewed as inactive—neutral elements
relegated to the role of implements to be deployed and conducted by theory. They are tools, much
like the trowel and camera, in that they are utilised in the production, management, and
presentation of data (data that can is to be analysed and interpreted by archaeological theory). In
this role, they require not necessarily the development of mastery but rather the development of
technical competence (Wright et al. 1997, p. 347). As tools, digital technologies function as hands-on
devices and are therefore viewed as theory-inactive. It is within the latter of these two camps that
most research tied to technology within archaeology is focused. However, it has been emphasised
that digital technologies are absolutely capable of functioning in both capacities—they command
enough power to affect theory while at the same time enabling the performance of methodology
(Zubrow 2006, pp. 16; 22). What is perhaps more important to highlight regarding digital
technologies and field archaeology is that “digital archaeologists create problems that require digital
solutions” (Zubrow 2006, p. 12). In other words, digital technologies are capable of producing
new forms of data—data that will at the very least demand some degree of alteration in current, if
not altogether entirely new, theoretical frameworks for understanding these data.
Of particular mention then are 3D digital documentation technologies. Archaeology is naturally
involved with three dimensional space. However, until recently archaeologists have had to record
and visualise (apart from a few exceptions (cf. Nordbladh 2012 for an example of physical 3D
models and miniatures pp. 245-249, especially Fig. 2 p. 248; and p. 250 for an example of a 3D
model from 1817 detailing the 3D aspects of a burial mound with novel uses of 2D materials)) in
manners that are inherently restricted to two dimensions because of the limitations in
technology—eg. paper. Thus, plan/section drawings, artefact/monument drawings, maps, and
photographs are all representations of 3D archaeological entities described upon a 2D surface
(with 3D being described through having volume and/or having x, y, & z coordinates and 2D
being limited to being described through only two coordinates x & y) (Campana 2014, p. 7). With
the introduction of computers, the digitisation of older technologies, and the introduction of
newer digital technologies, archaeologists now have access to hardware and software that not only
13
enable the recording of three dimensional data in high-resolution representations of the
excavation, but the manipulation, analysis, interpretation, annotation, and visualisation of three
dimensional archaeological representations as well. Thus Zubrow’s call for digital solutions for
digital problems is irrefutably applicable in our modern world and may be further honed by stating
that 3D problems require 3D solutions.
Another important theoretical perspective that is relevant to this discussion is that of
reflexivity towards methodology. While most archaeologists would agree that archaeological data
and archaeological ‘facts’ are inherently loaded with theoretical perspectives, fewer are willing to
discuss the degree to which archaeological practice itself is laden with theory (Hodder 1999, p. 80).
The practice of archaeology, Hodder argues, is intimately bound together with archaeological
theory because it chiefly involves interpretation (1999, pp. 81-82). This particular point is well
summarised by Hodder through his statement that the act of archaeological interpretation begins
immediately along the trowel’s edge (Hodder 1999, pp. 83). In other words, archaeologists are
engaging in interpretation the moment that hand and trowel begin to explore the subtle and not-
so-subtle variations present in the excavation surface—eg. interpretations are made when the
archaeologist decides which variations in texture or colour should be ignored or followed (Hodder
1999, p. 92). However, some aspects of archaeology require a fixed system of defining objects and
contexts. Hodder points out that after a soil layer has been excavated, the opportunity to interpret
it further in situ has been lost—the resulting interpretation cannot be changed because that layer
cannot be re-measured or re-analysed as with an artefact (Hodder 1999, p. 93). Furthermore,
archaeology needs fixed definitions so that there is something to compare and contrast
archaeological entities against (Hodder 1999, p. 93). What is therefore required, Hodder states, is
a methodology that is capable of fluidity between objects, contexts, and interpretations—especially
within the process of excavation. In this manner, interpretation can be used to settle upon
excavation and acquisition strategies. All of this is applicable to digital technologies in that the
archaeologist must make decisions, based on the knowledge of the site and what needs to be done,
in order to select the appropriate tools and methodologies for the job.
Finally, a reflexive perspective on methodology enables multivocality—an important
aspect that advocates for as many ‘voices’ to be heard and recognised in order to increase the
shared understanding of something such as the archaeology uncovered through excavations.
Hodder notes that this has been accomplished on a larger scale by the adoption of the single
context method developed by the Museum of London Archaeological Service (1999, p. 93). This
is a significant development for Hodder because it took the right of interpretation away from the
site director and placed it within the hands of the excavators themselves. In other words, because
the single context method required each individual to record her/his own interpretation of the
site, the excavators were thus encouraged to participate in the narration of the archaeology
discovered (Hodder 1999, pp. 93-96). Whereas such a process has been usually undertaken through
traditional methodologies, newer digital technologies promise these individuals even more
opportunities to document and share their interpretations regarding the archaeology that they have
experienced.
Therefore, theory today, especially in regards to the relationship between the current state
of the art of technology and archaeological excavation, can be boiled down to a simple yet
important role: theory defines what technologies are selected and how those technologies are used.
14
Not only is each site itself different, but there will always also be variations in the amount of
resources available (eg. especially time and money) as well as variations with what technologies
(and also individuals with the training and skill to use those technologies) are available. Theory can
then be utilised as guidance towards the selection of the best technology that will enable the
collection of the most accurate and useful information with the amount of available resources.
4 – METHODOLOGY To demonstrate how the current state of the art and theory are applied in practice, a few examples
have been described in the pages following. These examples have been selected because they stand
as testament to how digital technologies have been applied within archaeology and are thus central
to the theme that has been explored in this thesis.
4.1 – REVIEW OF ESTABLISHED METHODOLOGIES AND ASSOCIATED
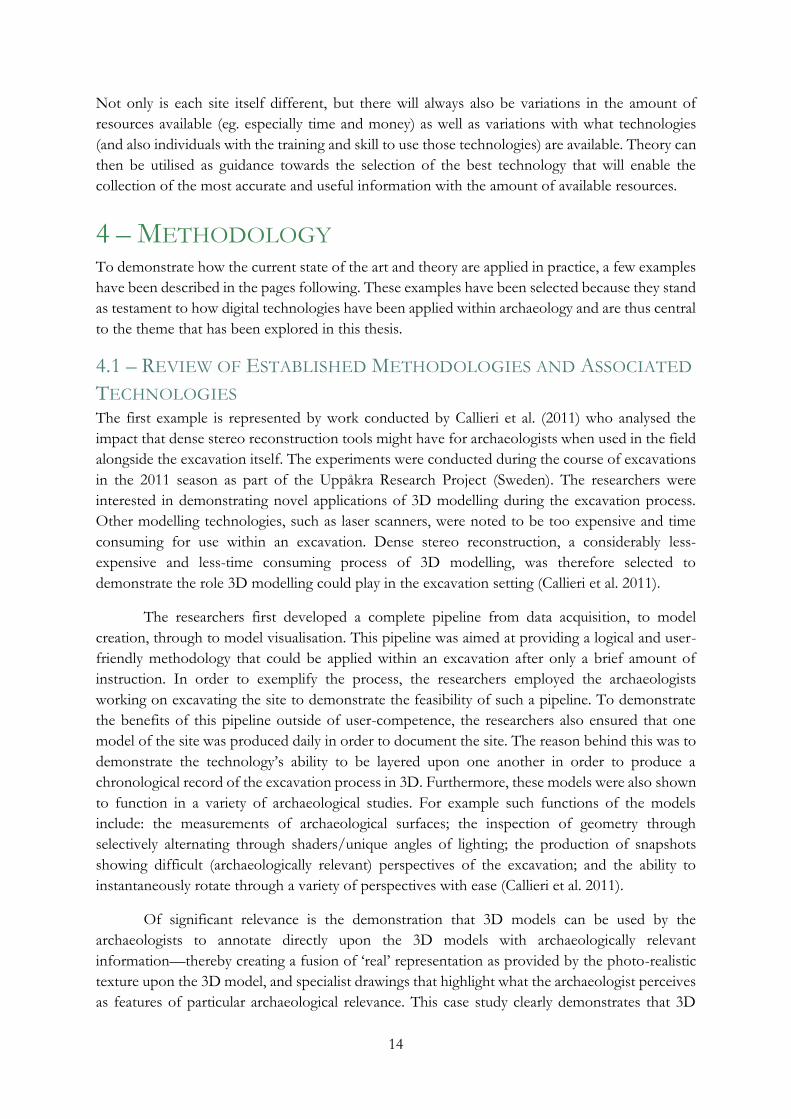
TECHNOLOGIES The first example is represented by work conducted by Callieri et al. (2011) who analysed the
impact that dense stereo reconstruction tools might have for archaeologists when used in the field
alongside the excavation itself. The experiments were conducted during the course of excavations
in the 2011 season as part of the Uppåkra Research Project (Sweden). The researchers were
interested in demonstrating novel applications of 3D modelling during the excavation process.
Other modelling technologies, such as laser scanners, were noted to be too expensive and time
consuming for use within an excavation. Dense stereo reconstruction, a considerably less-
expensive and less-time consuming process of 3D modelling, was therefore selected to
demonstrate the role 3D modelling could play in the excavation setting (Callieri et al. 2011).
The researchers first developed a complete pipeline from data acquisition, to model
creation, through to model visualisation. This pipeline was aimed at providing a logical and user-
friendly methodology that could be applied within an excavation after only a brief amount of
instruction. In order to exemplify the process, the researchers employed the archaeologists
working on excavating the site to demonstrate the feasibility of such a pipeline. To demonstrate
the benefits of this pipeline outside of user-competence, the researchers also ensured that one
model of the site was produced daily in order to document the site. The reason behind this was to
demonstrate the technology’s ability to be layered upon one another in order to produce a
chronological record of the excavation process in 3D. Furthermore, these models were also shown
to function in a variety of archaeological studies. For example such functions of the models
include: the measurements of archaeological surfaces; the inspection of geometry through
selectively alternating through shaders/unique angles of lighting; the production of snapshots
showing difficult (archaeologically relevant) perspectives of the excavation; and the ability to
instantaneously rotate through a variety of perspectives with ease (Callieri et al. 2011).
Of significant relevance is the demonstration that 3D models can be used by the
archaeologists to annotate directly upon the 3D models with archaeologically relevant
information—thereby creating a fusion of ‘real’ representation as provided by the photo-realistic
texture upon the 3D model, and specialist drawings that highlight what the archaeologist perceives
as features of particular archaeological relevance. This case study clearly demonstrates that 3D
15
models can be used alongside other traditional methodologies. It is also able to demonstrate that
3D models have novel applications that set them apart from those that have been utilised
traditionally by archaeologists.
A second example of the importance of 3D digital models can be seen through the Gabii
Goes Digital project (cf. Opitz et al. 2013). The project was realised in order to address a growing
need to publish and share vast quantities of non-traditional (digital) data. Through their work, the
Gabii Goes Digital team is able to present how 3D digital models are important for establishing a
transparency of methodologies and interpretations, while also functioning as an important tool for
the dissemination of archaeological knowledge to a wide audience of archaeological and non-
archaeological spectators. The central documentation technology for their work at Gabii has been
3D models produced through MSR. Opitz et al. (2013) note that these models allow for a wide
array of archaeological knowledge to be disseminated amongst specialists and the public alike. The
problem they have identified is that, despite the number of projects experimenting with techniques
like MSR, there has been little effort spent in establishing how these models can be efficiently
shared, integrated into publications, visualised, and archived (Opitz et al. 2013). Their answer to
these issues is to bring 3D digital models out from the appendix and into the core of archaeological
work. In this manner they argue that it forces these models to become more visible and—most
importantly—scrutinised in the peer-review process.
The Gabii Goes Digital team produces and disseminates their digital documentation data
through a specific pipeline that includes five steps: 1) the collection of photographic and geospatial
points; 2) the production of 3D models through Photoscan and the development of a database; 3)
the construction of scenes using the 3D digital models—this environment also allows for the
visualisation of the models and for the testing of theories; 4) encouragement of interactivity by
linking the models together with other sources of information; and 5) the development of
stratigraphic sequences. These data are all contained within a web-based database and are viewable
(in limited format) to anyone with access to the internet. Using this workflow in conjunction with
the visualisation medium, Opitz et al. are able to interrogate 3D digital archaeological data in a
manner that encourages it to be peer-reviewed. Their process makes clear the decisions made
during the excavation itself and during the interpretation using the 3D models—thus transparency
is achieved which in turns allows for these 3D digital data to come under analysis by other
researchers. Finally, the medium itself is a useful way to engage public interest and share specialised
archaeological knowledge.
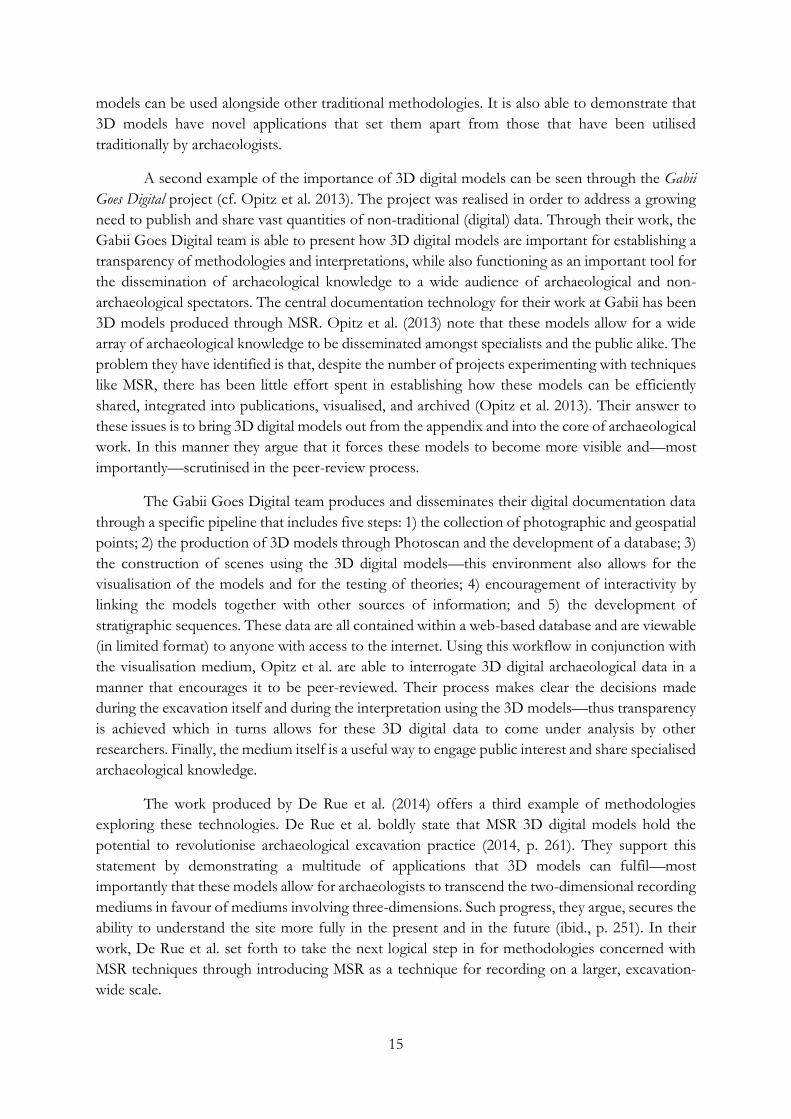
The work produced by De Rue et al. (2014) offers a third example of methodologies
exploring these technologies. De Rue et al. boldly state that MSR 3D digital models hold the
potential to revolutionise archaeological excavation practice (2014, p. 261). They support this
statement by demonstrating a multitude of applications that 3D models can fulfil—most
importantly that these models allow for archaeologists to transcend the two-dimensional recording
mediums in favour of mediums involving three-dimensions. Such progress, they argue, secures the
ability to understand the site more fully in the present and in the future (ibid., p. 251). In their
work, De Rue et al. set forth to take the next logical step in for methodologies concerned with
MSR techniques through introducing MSR as a technique for recording on a larger, excavation-
wide scale.
16
To accomplish their goal, De Rue et al. utilised MSR in place of traditional methodologies
that would have been used to record excavation surfaces, stratigraphy, sections, profiles, and
samples (ibid., p. 252). The models were made using Photoscan and were produced immediately
after recording. In place of plans, orthophotos were derived from the models and to provide the
concept of height, DSM (Digital Surface Models) were used as an accompaniment (ibid., p. 254).
All models were located within both a 2D and 3D GIS to allow for their integration into the
archaeological excavation database. Shapefiles were linked to the aforementioned orthophotos and
contained information such as context numbers, descriptions, and interpretations (ibid., p. 254).
Vertically oriented orthphotos were used to capture stratigraphic data (ibid., pp. 256-259). In some
instances, these section views were used to produce digital section drawings and, when combined
with the orthophotos and DSMs, used for archaeological plan drawings—thus the full range of
archaeological documentation was achieved (ibid., p. 259).
What De Rue et al. concluded was that 3D digital models, produced through MSR,
promoted a significant increase in the overall quality of recording in comparison to traditional
methods (ibid., p. 260). Furthermore, they state that the 3D models facilitated the further
understanding of the archaeological data as it was recorded as it existed—in three-dimensions. The
last important result stated was that 3D models, when combined with other forms of
archaeological documentation data, almost allow for an archaeologist to virtually revisit certain
phases of the excavation. In summary, they conclude that the scientific quality presented by the
use of 3D digital models surpasses anything that can be produced through traditional
methodologies (ibid., p. 262).
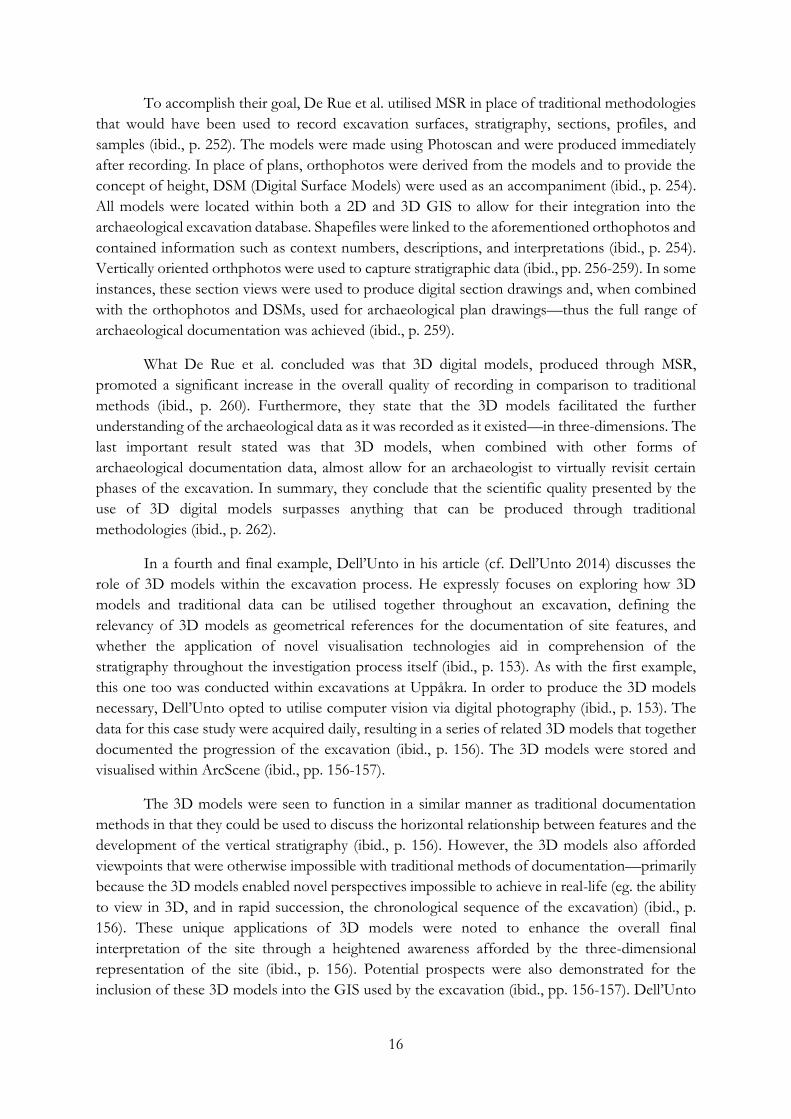
In a fourth and final example, Dell’Unto in his article (cf. Dell’Unto 2014) discusses the
role of 3D models within the excavation process. He expressly focuses on exploring how 3D
models and traditional data can be utilised together throughout an excavation, defining the
relevancy of 3D models as geometrical references for the documentation of site features, and
whether the application of novel visualisation technologies aid in comprehension of the
stratigraphy throughout the investigation process itself (ibid., p. 153). As with the first example,
this one too was conducted within excavations at Uppåkra. In order to produce the 3D models
necessary, Dell’Unto opted to utilise computer vision via digital photography (ibid., p. 153). The
data for this case study were acquired daily, resulting in a series of related 3D models that together
documented the progression of the excavation (ibid., p. 156). The 3D models were stored and
visualised within ArcScene (ibid., pp. 156-157).
The 3D models were seen to function in a similar manner as traditional documentation
methods in that they could be used to discuss the horizontal relationship between features and the
development of the vertical stratigraphy (ibid., p. 156). However, the 3D models also afforded
viewpoints that were otherwise impossible with traditional methods of documentation—primarily
because the 3D models enabled novel perspectives impossible to achieve in real-life (eg. the ability
to view in 3D, and in rapid succession, the chronological sequence of the excavation) (ibid., p.
156). These unique applications of 3D models were noted to enhance the overall final
interpretation of the site through a heightened awareness afforded by the three-dimensional
representation of the site (ibid., p. 156). Potential prospects were also demonstrated for the
inclusion of these 3D models into the GIS used by the excavation (ibid., pp. 156-157). Dell’Unto

17
also provides a description of how to accomplish such a 3D GIS—of special note is that ArcScene
limits the number of polygons and textures for each 3D model imported (2014, p. 157).
In summary, Dell’Unto was able to demonstrate that 3D models have a definite place
within the excavation process—one that does not replace traditional methodologies and
technologies, but instead functions neatly within current excavation methodologies and
complements documentation provided by traditional technologies. 3D models are thus
demonstrated as representing a viable and impacting tool for use in the collection and visualisation
of data in the excavation process.
4.2 – INTRODUCTION TO UTILISED TECHNOLOGIES The methodology discussed in this work aimed to explore beyond the aspects presented above in
order to analyse some of the limits and potentials that are offered by these technologies. In order
to begin, it was necessary to harness the methodologies as described by Callieri et al. (2011), Opitz
(2013), De Rue et al. (2014), and Dell'Unto (2014), to acquire the digital photography data for the
experiment contained in this thesis. These data were used as source material for multi-view stereo
reconstruction software in order to produce 3D models with photorealistic textures. The inclusion
of geospatial reference points along the borders of the subject of acquisition have enabled the
models to be georeferenced through use of a total station. The subsequent georeferenced models
have then been input into a GIS, as described by Dell'Unto (2014), in order to establish a
chronological sequence documenting the process of excavation surrounding one specific trench.
Beyond these previously established methodologies however, this thesis has endeavoured
to demonstrate how a more specific use of 3D polylines and polygons to characterise the features
detected during the archaeological investigation campaign, and the further customisation of the
attribute tables intrinsic to GIS databases, may result in a more complete integration of the 3D
models into the documentation system applied in the field. In order to maintain a continuity with
traditional methodologies, all drawings have been accomplished in 3D upon the digital medium
presented by GIS while grounding, as closely as possible, the 3D symbologies to the original line
symbologies as set by the Museum of London Archaeological Service’s single-context method of
archaeological drawing (1994). Furthermore, both standard formats of archaeological drawing
have been realised—eg. plan and section drawings. In regards to the database component, every
delineated archaeological feature has been allotted a unique context number. This identification
number serves as a reference number for all relevant attributes—including those attributes typical
of archaeological material as well as those that would normally be incorporated alongside of
archaeological drawings—which have been input into the GIS database to allow for the potential
to query for specific details. In short, the experiment developed aims to present that 3D models—
in the framework of the archaeological excavation—can be utilised as geometrical references to (i)
‘annotate’ the information retrieved in the field and to (ii) use those information as a tool of
discussion in the post-excavation phase.
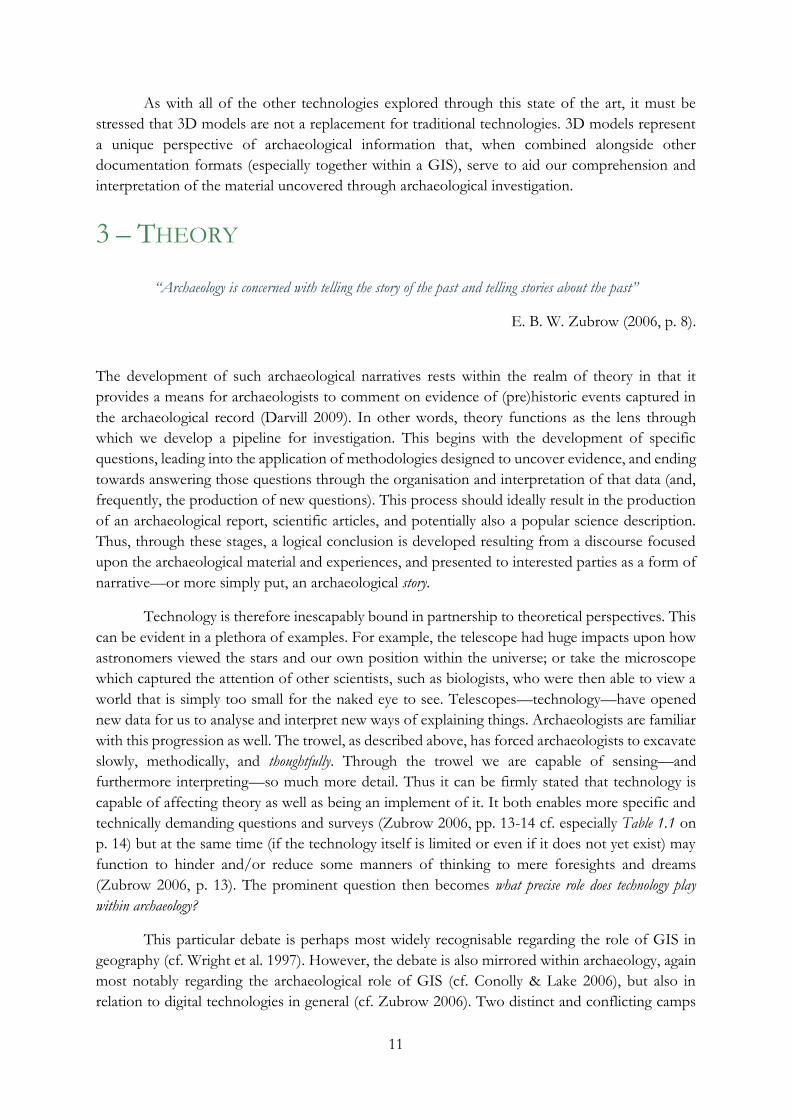
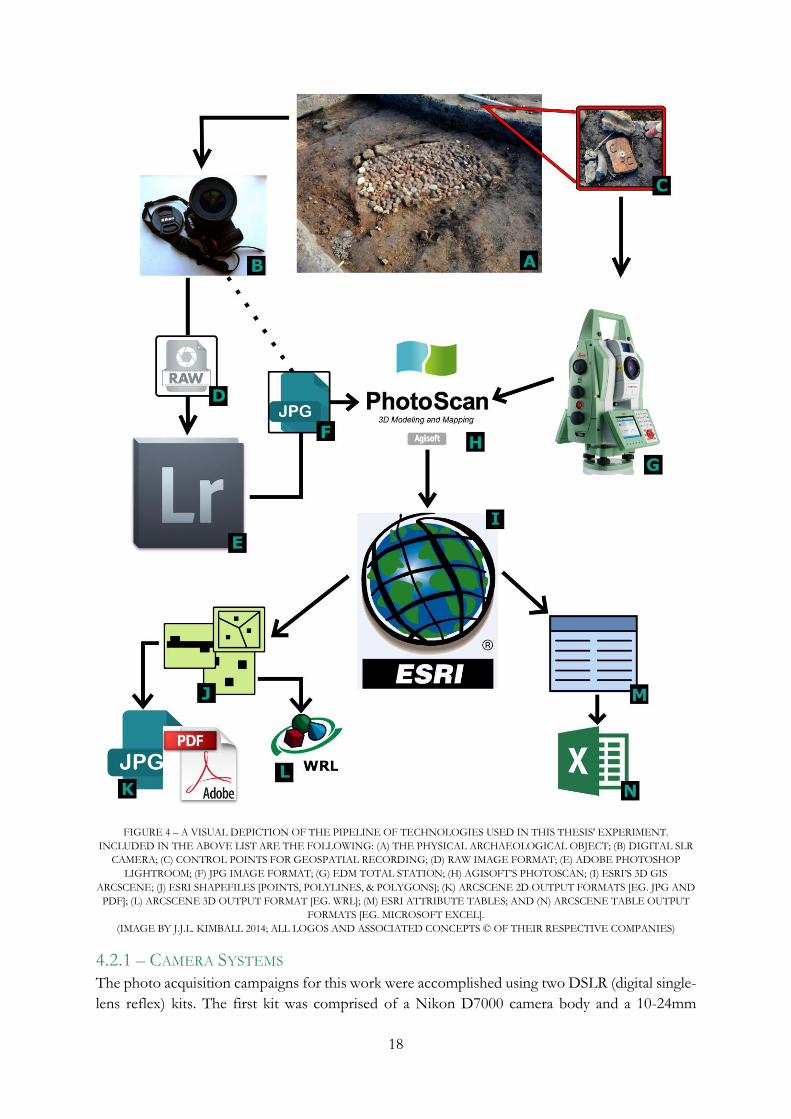
A list of technologies, their descriptions, and how they have been applied within this work
are provided immediately after the graphical depiction (Figure 4) below:
18
FIGURE 4 – A VISUAL DEPICTION OF THE PIPELINE OF TECHNOLOGIES USED IN THIS THESIS' EXPERIMENT.
INCLUDED IN THE ABOVE LIST ARE THE FOLLOWING: (A) THE PHYSICAL ARCHAEOLOGICAL OBJECT; (B) DIGITAL SLR
CAMERA; (C) CONTROL POINTS FOR GEOSPATIAL RECORDING; (D) RAW IMAGE FORMAT; (E) ADOBE PHOTOSHOP
LIGHTROOM; (F) JPG IMAGE FORMAT; (G) EDM TOTAL STATION; (H) AGISOFT’S PHOTOSCAN; (I) ESRI’S 3D GIS
ARCSCENE; (J) ESRI SHAPEFILES [POINTS, POLYLINES, & POLYGONS]; (K) ARCSCENE 2D OUTPUT FORMATS [EG. JPG AND
PDF]; (L) ARCSCENE 3D OUTPUT FORMAT [EG. WRL]; (M) ESRI ATTRIBUTE TABLES; AND (N) ARCSCENE TABLE OUTPUT
FORMATS [EG. MICROSOFT EXCEL].
(IMAGE BY J.J.L. KIMBALL 2014; ALL LOGOS AND ASSOCIATED CONCEPTS © OF THEIR RESPECTIVE COMPANIES)
4.2.1 – CAMERA SYSTEMS
The photo acquisition campaigns for this work were accomplished using two DSLR (digital single-
lens reflex) kits. The first kit was comprised of a Nikon D7000 camera body and a 10-24mm
19
NIKKOR ultra-wide angle lens. The Nikon D7000 camera body is characterised by its high-quality
DX CMOS APS-C 16.2 megapixel sensor that is capable of producing low-noise images in an ISO
range between 100-6400. The letter combination ‘DX’ is used to denote a specific format of Nikon
image sensors that conform to the Advanced Photo Systems standard of APS-C. APS-C (or APS-
Classic) describes the ratio size of the sensor which in this case is 3:2 (the traditional format of the
average film camera). CMOS simply describes the type of integrated circuit used to build these
sensors. It is useful to mention that the DX sensors have a crop factor of 1.5x—thus the focal
lengths of all lenses are effectively ‘elongated’ by 1.5x—in other words, a 10mm lens paired with
a DX crop sensor will produce a photograph that would appear to be shot with a 15mm lens. It is
beyond the scope of this thesis to go into a list of pros and cons regarding crop factors. However,
it is pertinent to acknowledge that if one wants to utilise the full capabilities of a wide angle lens,
it is most effective to employ a camera with an FX (full 35mm equivalent frame) sensor, where a
10mm lens will produce photographs characteristic of having been shot with a 10mm lens. A
concise way of understanding crop factor is that it causes some of what the lens can ‘see’
(specifically the edges) to be omitted from the resulting image. Of course, this does not adversely
affect the production of models, but instead may or may not make the acquisition campaign more
difficult.
Another two notable features of this camera is that it is both rugged and weather-sealed—
two characteristics that enable it to take a certain amount of punishment via the occupational
hazards of dust, mud, and rain that are ever-present on an archaeological site (although such
hazards should always be avoided if and whenever possible). One final important characteristic for
this thesis is that the D7000 can simultaneously capture photographs in both JPG and RAW
formats—the benefits of which allow the collection of high-quality, unadulterated raw
photographic data for storage/superior-quality model production purposes while also facilitating
the in-field production of models through the simultaneous creation of an identical JPG image
(which are an ideal format for usage with MSR techniques). For a more detailed list of
specifications concerning the Nikon D7000 DSLR cf. Nikon Corporation (2014).
The lens utilised alongside of the Nikon D7000 in the first kit was a high-quality AF-S
zoom 10-24mm f/3.5 - 4.5G ED NIKKOR ultra-wide angle lens that was specifically designed
for use with DX format cameras (Nikon Corporation 2014a). This lens houses glass of a very good
quality and is capable of producing incredibly sharp photographs. Owing to its ultra-wide focal
length, however, there is a considerable amount of distortion that increases closer to the edges and
corners of the photograph.
The second kit consisted of a Canon EOS 550D camera body and a fixed focal length
15mm wide angle lens. Like its Nikon counterpart, the Canon EOS 550D also contains an APS-C
CMOS sensor—however at 18 megapixels, the Canon sensor is slightly larger than the Nikon
D7000 sensor. This sensor is also capable of producing low-noise images with a sensitivity range
between 100 to 6400 ISO. The crop factor on the Canon 550D is slightly tighter than the Nikon
at 1.6x (Canon Incorporated 2014). Thus the 15mm lens used on this camera functions as if it
were a 24mm wide angle lens. This camera was operated by my supervisor, Nicolo Dell’Unto
whom was also acquiring 3D models of the excavations. Although I did not use this camera myself,
it was important to recognise that some of the models used within this work were made with a

20
camera system apart from my own. For a more detailed overview of the Canon EOS 550D cf.
Canon Incorporated (2014).
It is of course necessary to stress that there are many other camera systems that are equal
or better than the Nikon D7000 (as exemplified above), however I have selected to use this specific
camera in my thesis primarily because it was my own personal camera—a camera that I have
selected as an upgrade in my personal kit to facilitate the production of high-quality photographs
for my own professional photography business. There are other obvious rationales to such systems
however. The Nikon D7000, like its primary competitor the Canon EOS 60D, is a high-end
consumer/semi-professional grade camera (also referred to as ‘prosumer’). When paired with a
selection of lenses covering a range between wide-angle, human-eye focal length equivalent
(~50mm), and macro, these camera systems are likely to be one of the most standard pieces of
equipment in the field archaeologists’ tool box. As such, this thesis discusses the applications of
this type of camera for the production of multi-view stereo reconstruction 3D models simply
because of their availability, their capability of producing crisp, clean, detailed photographs, and
the ability to have complete control over the necessary settings.
4.2.2 – ADOBE PHOTOSHOP LIGHTROOM 5.4
Adobe’s Photoshop Lightroom is a photo editing and photo management software bundled into
one package. As such, it has all of the necessary features required to process, or ‘develop’, any
photographs captured. Of greatest importance is that it allows for the opening of RAW format
files (like Nikon’s NEF) that would otherwise require special software apart from what is locally
installed on most computers. Lightroom also allows for batch editing (a term referring to the photo
editing of an entire group—a ‘batch’—of images rather than one image at a time) which expedites
the process of editing, converting (when recorded in RAW format), and exporting image files for
use with multi-view stereo reconstruction 3D modelling software. Significantly, any modifications
made to the images through the Lightroom’s editing software do not alter the original file. Instead, all
changes made to the photographs are saved within Lightroom’s catalogue (the photo database
system) as a sort of metadata tag that describes what modifications and information belong to
which RAW photograph. This is a particularly important characteristic to have at one’s disposal as
it allows for the raw data to be utilised on the spot when needed—but also allows for that same
data to be stored in its original format for use when new developments in the technology come to
pass in the future. At the rate that technology is evolving, it is very likely that new developments
will improve the quality of the end product derived through techniques such as MSR. Thus it is
critical to maintain a best-quality standard of data in order to ensure that such future possibilities
can exploit the data of today (which remains as the only record of excavated features). For a more
detailed explanation of Lightroom’s features, cf. Adobe Systems Incorporated (2014).
In summary, this software was selected primarily because it enables the storage and full
control over the raw, unadulterated photographic data—thereby allowing for the archaeologist to
export the necessary quality and resolution of the photograph for whatever application is required.
4.2.3 – AGISOFT’S PHOTOSCAN 1.0.4
Agisoft’s Photoscan is a standalone (does not require an internet connection) multi-view stereo
reconstruction software. This software ranges in price from $180 for the standard edition to $3500
for the professional edition. While both produce the same quality of 3D models, the professional
21
version allows for the model to be georeferenced in the software itself. The most difficult part of
utilising this software is the production of usable photographs through a systematic process—
everything else about the software is relatively straightforward. Photoscan, while benefitting from
being used on more powerful desktop computers (eg. Agisoft (2014) recommends that it be run
on a desktop with an Intel Sandy Bridge 3930K processor, a motherboard with 8 DDR3 slots and
1 PCI Express x16 slot, 64 GB of RAM (8 sticks of 8 GB DDR3 RAM), and an NVidia GeForce
GTX 580 video card), can be run on laptop computers that have limited resources—for example,
the laptop utilised for the production of models in this thesis (Intel Core i5 2.50 GHz processor,
8 GB of RAM, and an Intel Graphics video card with 1250 MB dedicated video memory (5300
MB with shared system memory)) has only a fraction of Agisoft’s recommended computer
specifications, yet it is still capable of producing high-quality 3D models. It must be emphasised
that a less-powerful computer does not result in a lower quality model, but instead results in a
longer processing time with a greater chance of failure (through the software freezing and/or
crashing due to the limitations in computing power).
While there are many other software capable of producing multi-view stereo
reconstruction 3D models, only Photoscan stands apart as an all-in-one inclusive program.
Verhoeven (2011) offers a detailed explanation of how Photoscan works to construct 3D models.
Simplistically, the process begins by the user feeding uncalibrated, overlapping images into the
software. Through mathematical algorithms, the software detects and then tracks how points move
throughout the series of images. During this initial step, the lens distortion from the photographs
are also removed by separate algorithms using information about the lens contained within the
metadata of the photographs. It is worth mentioning that after this step, the original data—the
digital photographs—have effectively been utilised to create three new data sets: (i) an interrelated
set of points common to multiple photographs; (ii) the establishment of the spatial location for
the camera, in relation to the object of acquisition, for each aligned image; and (iii) the internal
parameters of the camera relating to focal length and its distortion effects (Verhoeven 2011, p.
68). After this initial data creation, the next step is the development of a dense point cloud based
on the matched points established in the first step. This is then followed by the construction of a
triangulated mesh and finally by the texturisation of the model (Verhoeven 2011, pp. 68-70). An
example of the various steps in the process can be seen in Figure 5 & Figure 6. Furthermore, the
reader may find 3D examples of MSR models via the link in the footnote below2.
These attributes, intrinsic to Photoscan, offer several benefits to archaeologists. Most
important is that, as an all-inclusive and stand-alone software, archaeologists do not have to jump
between other software programs to accomplish a fully-developed 3D model. Furthermore, this
software does not require an internet connection. These two facts alone make Photoscan an ideal
candidate for application within the field. Another benefit is that the developers have made the
process itself incredibly flexible.
2 For an example of a 3D model produced through MSR, cf. various media under the title “MSR Runestone” in the following webpage: https://sites.google.com/site/justinjlkimball/masters-data

22
FIGURE 5 – (STILL IMAGES OF A 3D MODEL) STEPS IN MSR PRODUCTION WITH PHOTOSCAN; (TOP) ESTIMATION OF
INTERNAL CAMERA PARAMETERS AND CAMERA PROJECTIONS; (LEFT) DENSE-POINT CLOUD; (RIGHT) MESH. (IMAGE
BY J.J.L. KIMBALL 2014; 3D MODEL BY J.J.L. KIMBALL 2014).
For example, in between stages of model creation, the user can enable and disable certain
photographs in order to achieve the best representation of the object possible. This is especially
important for archaeologists as the ‘organised chaos’ present at a site undergoing excavations may
present challenges—especially regarding the end-result of the texturisation process. Beyond simply
creating a model, Photoscan also allows for the user to perform cleaning tasks on the resulting
model, decimate it, and export it in a variety of formats such as OBJ, DAE, and PDF. Exportation
into PDF is extremely important as it is by far the simplest and most far-reaching format allowing
for the dissemination of 3D models. In the case of OBJ and DAE, this allows for the user to
import the model into different software programs, such as 3DS Max or Blender for the
development of an ‘explorable’ virtual scene of the excavation. Furthermore, if the professional
version of Photoscan is used, one can also select points upon the model to mark with
georeferenced data (eg. points obtained via a total station or GPS). Once georeferenced, these
models can then be imported into the GIS which allows for the integration of the models directly
alongside other archaeological datasets. It is because of these features that Photoscan has been
selected as the software of choice for producing multi-view stereo reconstruction 3D models in
this thesis.
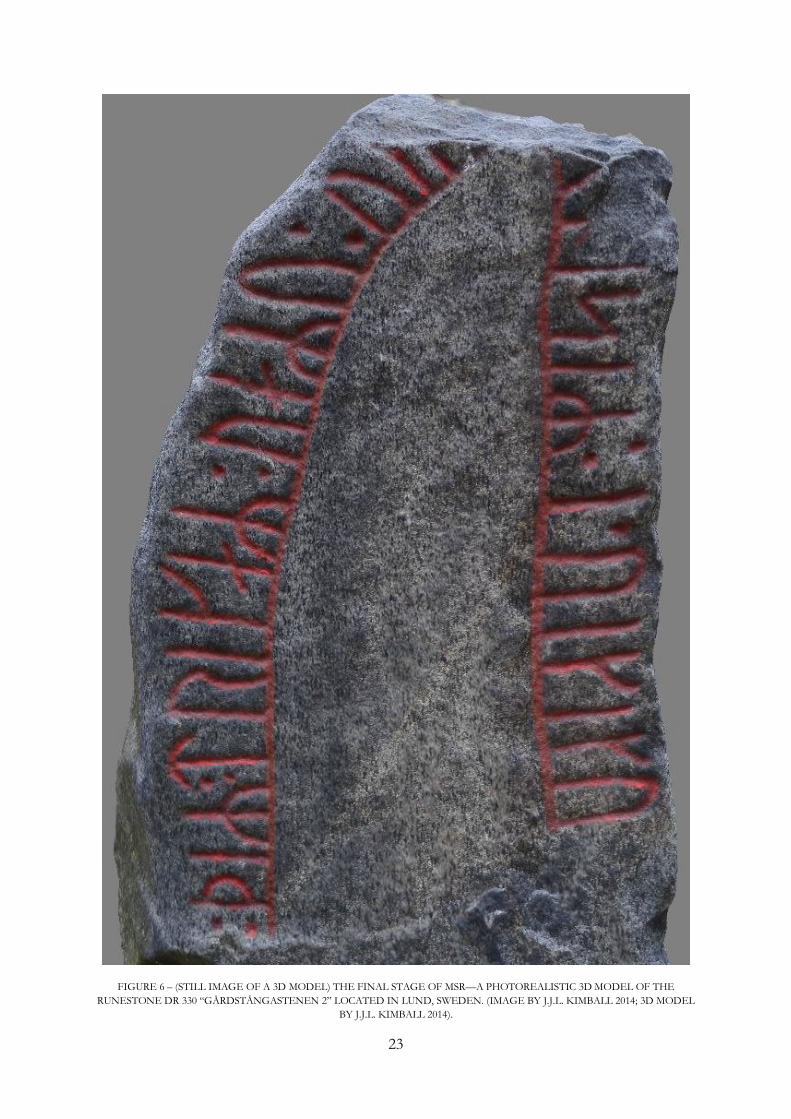
23
FIGURE 6 – (STILL IMAGE OF A 3D MODEL) THE FINAL STAGE OF MSR—A PHOTOREALISTIC 3D MODEL OF THE
RUNESTONE DR 330 “GÅRDSTÅNGASTENEN 2” LOCATED IN LUND, SWEDEN. (IMAGE BY J.J.L. KIMBALL 2014; 3D MODEL
BY J.J.L. KIMBALL 2014).
24
4.2.4 – EDM TOTAL STATION
A Leica EDM total station and accompanying prism were necessary tools for this thesis’
experiment. This instrument was utilised to record the spatial locations of anchor points that were
positioned around the perimeter of Trench 5. It was also important that these points were located
close to the edge in order to ensure that they would be recorded in the photographs during the
photo acquisition campaign. In turn, this meant that those points would also be present on the 3D
models which thereby would allow for them to be georeferenced directly in Photoscan and,
ultimately, would facilitate their accurate placement alongside of other spatial information within
the GIS platform. Whereas a survey-grade GPS system could have also been used to gather these
points, the excavation leaders favoured the use of an EDM total station for practically all spatial
recording; as such it was logical to also utilise this system because of its availability on site, and
because of its use for the documentation of all other spatial data.
4.2.5 – ARCGIS 10.2.1
The suite of software offered through ESRI’s ArcGIS—particularly ArcMap—has been an
industry standard in archaeological practice for quite some time. A basic definition of GIS would
be that it allows for the storage, manipulation, analysis, query, and visualisation of spatial data
(ESRI 2014; Chapman 2009, p. 15). It is important to recognise however that, while ArcMap does
store three-dimensional data, the software is limited in that it must visualise the depth value of
spatial data in graphical form on top of a two-dimensional plane. Such graphical representations
have commonly been accomplished through the use of contour lines and spot heights (Chapman
2009, pp. 43-44). However, through ArcScene, 3D spatial data can be visualised in a 3D digital
environment. Furthermore and importantly, ArcScene allows for the visualisation of 3D spatial
data in both raster and vector formats. As 3D models are constructed from both vector and raster
data, this means that they can be visualised within ArcScene. It must be stressed that, at least at
the time of writing this, ESRI’s ArcScene is the only software capable of performing these
operations.
For archaeologists this is an extremely important development. At the most basic level this
software allows for 3D models to be included alongside of other spatial data. More importantly
however, is that the database functions intrinsic to ArcGIS can therefore be applied directly to
these models. Furthermore, the user can use the editing capabilities of ArcScene to create new
data, such as shapefiles, that are based specifically upon the 3D features of these models. These
shapefiles can then be assigned specific attributes that are then also included within the database—
thereby increasing the level to which these 3D models are integrated. In the end, this results in an
increase in the relevancy that these models have towards both disseminating and generating
archaeological knowledge.
4.3 – LIMITATIONS There are some limitations regarding the methodology and selection of technologies discussed
above that must be made explicit. First of all, the scope of focus—a single trench in a single (and
considerably brief) excavation—was necessarily limited. This limitation was imposed not just
because of the short amount of time the excavation was conducted, but rather because of the
limited amount of time given for the authoring of this thesis. By focusing specifically upon one
sole trench, a high-quality, well-planned, and well-executed pipeline was created in the allotted time
25
constraints. It was deemed to be more logical and effective to pursue the results in this manner so
that an effective pipeline could be presented to future researchers for further testing such as
determining its limitations when utilised on a project characterised by significantly greater
complexity and size.
Another issue that should be highlighted is in reference to the selection of technologies.
The pipeline developed is not meant to be restricted to using only these systems described above.
A large factor in the selection of these technologies has resulted in what has been immediately and
affordably available. Other researchers may have access to more or less of these technologies—
but that still is not the point that should be understood as important. What instead must be
recognised is that this pipeline should be viewed as a framework to which components can be
added, removed, or replaced with others in order to facilitate both the technologies available to a
field excavator and the scope of the research question being asked. For example, one could just as
easily use a completely different camera system instead of the one used in this work; or perhaps
instead of using ArcGIS, one might try using another like GIS platform when another is inevitably
developed as a competitive response to ESRI’s ArcScene. Yet, despite that this work was limited
to available technologies, and others may indeed function as suitable replacements or additions, it
must also be acknowledged that those tools listed previous work well together in the established
pipeline and are therefore highly recommended. Perhaps an interesting future endeavour for
research would be to explore other combinations of technologies in order to see what sorts of
results might be produced.
5 – EXPERIMENT: 3D DELINEATION The experiment described below demonstrates how 3D models may be further integrated into a
GIS, thereby increasing not only its relevance as archaeological source material, but also leading to
the creation of new types of data with their own value for archaeological research. The data for
the experiment was acquired during the 2013 field excavations at Uppåkra, Sweden, while the
process of 3D digital delineation was performed throughout the 2014 semester.
5.1 – GENERAL BACKGROUND OF UPPÅKRA Managed today by Lund University, Uppåkra is a rich archaeological site located 5km south of the
city of Lund in the province of Skåne, Sweden. First discovered in 1934, this site has been the
focus of intensive archaeological investigation since the inception of the Uppåkra Research Project
in 1996. A series of excavations in conjunction with field surveys and metal-detector surveys has
revealed that Uppåkra was an extensive settlement site covering over 40 hectares of land. This size
gives Uppåkra the distinction of being the largest known settlement site in southern Sweden
(Larsson 2007, p. 12). Metal-detector surveys turned up nearly 20 000 finds that helped to date the
site as ranging from the pre-Roman Iron Age through to the Viking Age. The majority of the
metallic items were concentrated within an area located on top of the highest point of elevation
within the settlement area (Larsson 2007, p. 12). Excavations in this area began in 1999 and during
excavations between 2001 and 2005 a building of unusual construction—compared to others
within the excavation area—was uncovered (Larsson 2007, p. 14). This building was found to
contain an impressive number of gold-foil figures, a highly ornate silver and bronze beaker, and a
glass bowl made with two layers of glass (Larsson 2007, p. 16). These factors have led researchers
26
to consider this building to be of particular relevance, although there has been some disagreement
on its function (eg. whether it was a house, hall, or temple and whether the activities conducted
there were of cult or ceremonial function) (Larsson 2007 p. 21).
Excavations since those focusing on the aforementioned building have explored other
buildings located within the settlement site in order to understand the phases of those buildings
and their relationship to the site as a whole. These investigations began in 2008, when the focus
of excavations were turned towards exploring the archaeology of a series of large long houses.
(Söderberg & Piltz Williams 2012, p. 7). In the summer of 2010, a geophysical survey conducted
in partnership with the Ludwig Botzman Institute for Archaeological Prospection and Virtual
Archaeology revealed an interesting circular anomaly to the west of the Uppåkra churchyard
(Söderberg & Piltz Williams 2012, p. 7; Trinks et al. 2013, p. 34; Dell’Unto 2014, pp. 153-154). In
2011, two distinct excavations were pursued: the first, named Stora Uppåkra 8:3, focused at
continuing the exploration of the longhouses that was started in 2008 (Söderberg & Piltz Williams
2012, pp. 10-11) while the second, named Stora Uppåkra 8:4, was directed towards exploring the
circular anomaly discovered by the geophysical survey (Söderberg & Piltz Williams p. 12).
The excavations at Stora Uppåkra 8:3 revealed that there was a connection between the
longhouses visible in the modern excavations and those found in the 1934 excavations. Of the
houses examined, house number 22, a longhouse from the Viking age, was noted to have two
phases: a younger and an older. The older phase was delineated entirely, while the younger phase
was found to continue eastward beyond the limits of the excavation (Söderberg & Piltz Williams
2012, p. 7). The second excavation at Stora Uppåkra 8:4 was aimed at investigating whether there
was a relationship between the anomaly and Iron Age graves. While the anomaly was a grave, it
was revealed to be from the middle to late Neolithic rather than the Iron Age. While this did not
answer any questions about Iron Age graves related to the Iron Age settlement at Uppåkra, it was
exceptional nonetheless considering that graves of this style have not been documented before in
Skåne (Söderberg & Piltz Williams 2012, p. 7).
The most recent excavations at Uppåkra, in 2013, were conducted in the field to the west
of the modern church (Figure 7) and were aimed at: (i) following up the results of the geophysical
survey conducted in 2010; (ii) defining the purpose of the area: and (iii) determining whether that
purpose was related to the craft industry at Uppåkra (Apel & Piltz Williams 2014, in press). The
actual process of excavation was conducted by undergraduate and graduate students. In order to
explore these goals, five trenches were made—each focusing on a different anomaly revealed by
the geophysical survey. The archaeological investigation revealed the remains of buildings and
paved surfaces, a historical road, cooking pits, and an oven (Apel & Piltz Williams 2014, in press).
The archaeological stratigraphy at Uppåkra is characterised by many complex layers—a factor that
attracts many researchers that become involved in experimenting with new techniques and
methodologies. The excavations also present an ideal learning environment for students.
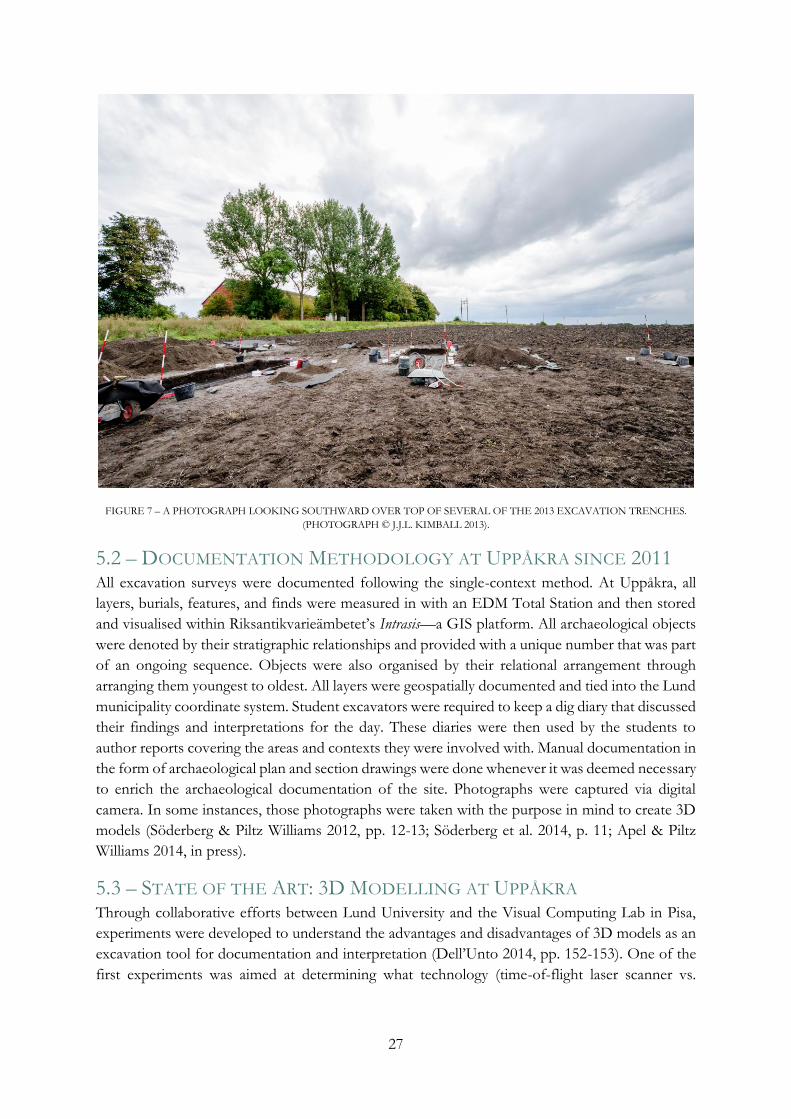
27
FIGURE 7 – A PHOTOGRAPH LOOKING SOUTHWARD OVER TOP OF SEVERAL OF THE 2013 EXCAVATION TRENCHES.
(PHOTOGRAPH © J.J.L. KIMBALL 2013).
5.2 – DOCUMENTATION METHODOLOGY AT UPPÅKRA SINCE 2011 All excavation surveys were documented following the single-context method. At Uppåkra, all
layers, burials, features, and finds were measured in with an EDM Total Station and then stored
and visualised within Riksantikvarieämbetet’s Intrasis—a GIS platform. All archaeological objects
were denoted by their stratigraphic relationships and provided with a unique number that was part
of an ongoing sequence. Objects were also organised by their relational arrangement through
arranging them youngest to oldest. All layers were geospatially documented and tied into the Lund
municipality coordinate system. Student excavators were required to keep a dig diary that discussed
their findings and interpretations for the day. These diaries were then used by the students to
author reports covering the areas and contexts they were involved with. Manual documentation in
the form of archaeological plan and section drawings were done whenever it was deemed necessary
to enrich the archaeological documentation of the site. Photographs were captured via digital
camera. In some instances, those photographs were taken with the purpose in mind to create 3D
models (Söderberg & Piltz Williams 2012, pp. 12-13; Söderberg et al. 2014, p. 11; Apel & Piltz
Williams 2014, in press).
5.3 – STATE OF THE ART: 3D MODELLING AT UPPÅKRA Through collaborative efforts between Lund University and the Visual Computing Lab in Pisa,
experiments were developed to understand the advantages and disadvantages of 3D models as an
excavation tool for documentation and interpretation (Dell’Unto 2014, pp. 152-153). One of the
first experiments was aimed at determining what technology (time-of-flight laser scanner vs.
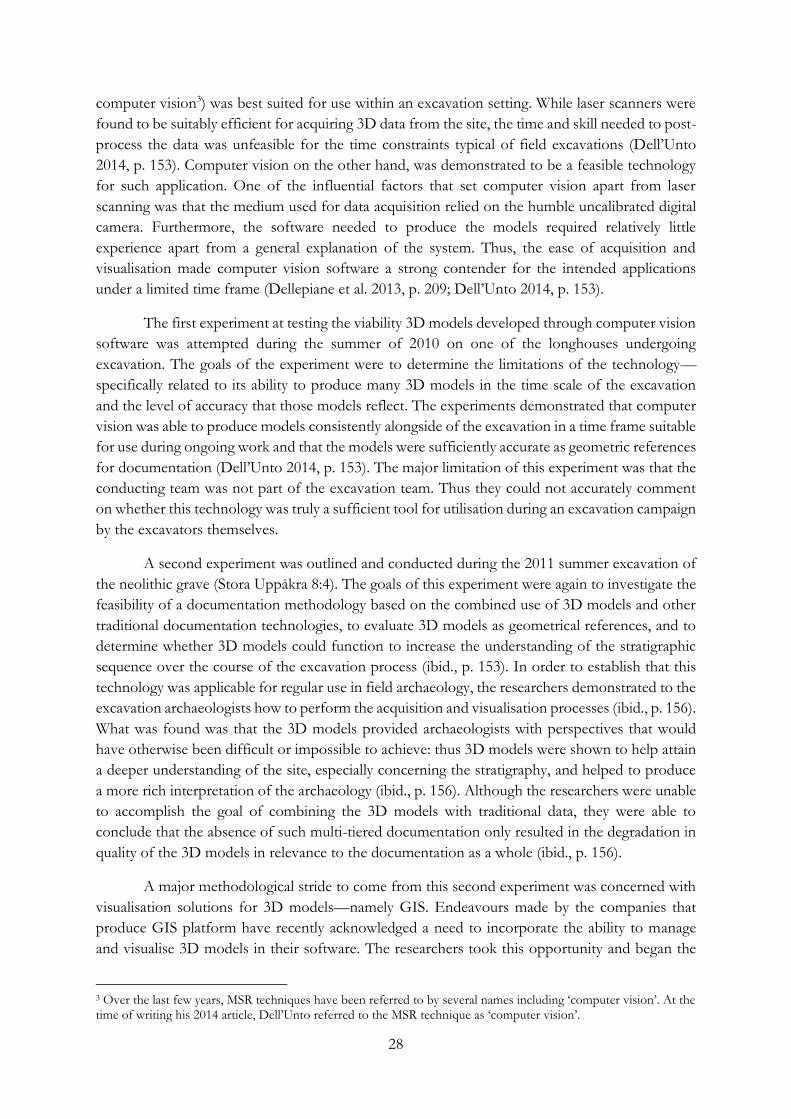
28
computer vision3) was best suited for use within an excavation setting. While laser scanners were
found to be suitably efficient for acquiring 3D data from the site, the time and skill needed to post-
process the data was unfeasible for the time constraints typical of field excavations (Dell’Unto
2014, p. 153). Computer vision on the other hand, was demonstrated to be a feasible technology
for such application. One of the influential factors that set computer vision apart from laser
scanning was that the medium used for data acquisition relied on the humble uncalibrated digital
camera. Furthermore, the software needed to produce the models required relatively little
experience apart from a general explanation of the system. Thus, the ease of acquisition and
visualisation made computer vision software a strong contender for the intended applications
under a limited time frame (Dellepiane et al. 2013, p. 209; Dell’Unto 2014, p. 153).
The first experiment at testing the viability 3D models developed through computer vision
software was attempted during the summer of 2010 on one of the longhouses undergoing
excavation. The goals of the experiment were to determine the limitations of the technology—
specifically related to its ability to produce many 3D models in the time scale of the excavation
and the level of accuracy that those models reflect. The experiments demonstrated that computer
vision was able to produce models consistently alongside of the excavation in a time frame suitable
for use during ongoing work and that the models were sufficiently accurate as geometric references
for documentation (Dell’Unto 2014, p. 153). The major limitation of this experiment was that the
conducting team was not part of the excavation team. Thus they could not accurately comment
on whether this technology was truly a sufficient tool for utilisation during an excavation campaign
by the excavators themselves.
A second experiment was outlined and conducted during the 2011 summer excavation of
the neolithic grave (Stora Uppåkra 8:4). The goals of this experiment were again to investigate the
feasibility of a documentation methodology based on the combined use of 3D models and other
traditional documentation technologies, to evaluate 3D models as geometrical references, and to
determine whether 3D models could function to increase the understanding of the stratigraphic
sequence over the course of the excavation process (ibid., p. 153). In order to establish that this
technology was applicable for regular use in field archaeology, the researchers demonstrated to the
excavation archaeologists how to perform the acquisition and visualisation processes (ibid., p. 156).
What was found was that the 3D models provided archaeologists with perspectives that would
have otherwise been difficult or impossible to achieve: thus 3D models were shown to help attain
a deeper understanding of the site, especially concerning the stratigraphy, and helped to produce
a more rich interpretation of the archaeology (ibid., p. 156). Although the researchers were unable
to accomplish the goal of combining the 3D models with traditional data, they were able to
conclude that the absence of such multi-tiered documentation only resulted in the degradation in
quality of the 3D models in relevance to the documentation as a whole (ibid., p. 156).
A major methodological stride to come from this second experiment was concerned with
visualisation solutions for 3D models—namely GIS. Endeavours made by the companies that
produce GIS platform have recently acknowledged a need to incorporate the ability to manage
and visualise 3D models in their software. The researchers took this opportunity and began the
3 Over the last few years, MSR techniques have been referred to by several names including ‘computer vision’. At the time of writing his 2014 article, Dell’Unto referred to the MSR technique as ‘computer vision’.
29
process of importing their 3D models into ESRI’s ArcGIS. They relied upon Agisoft’s Photoscan
because of its ability to produce georeferenced models—allowing them to be positioned
geographically within the GIS itself (ibid., pp. 156-157). The inclusion of these 3D models into the
excavation GIS thus allows for the models to be incorporated alongside of other documentation
types. Therefore, models are not only managed and visualised alongside other relevant
information, but they can also be given attributes and, through those attributes, included within
query results (ibid., p. 157).
5.4 – EXPERIMENT OVERVIEW Uppåkra is a complex site—a particular characteristic that becomes especially apparent when
looking at the many minute layers of stratigraphy. Other complexities also include a consideration
to the number of individuals working at the site and the variety of research projects ongoing at
any given time. Further compounding these issues is that excavations generally only last a few
weeks at most, making the entire archaeological experience very short and truncated. It is bearing
these factors in mind that the overarching goal of this experiment hopes to address with the
established methodology. The general methodology used has been based on those that have either
been long established (eg. archaeological drawing) or recently brought to light (eg. the works by
Callieri et al 2011; Dellepiane et al. 2013; & Dell’Unto 2014).
While the documentation methods at Uppåkra are tried and true, they are not without their
problems. Of most concern is that they can be time consuming, tedious, prone to operator-error,
and are simply fixed in one perspective. This experiment therefore proposes a novel use for the
employment of a GIS platform to not only visualise 3D models, but demonstrate that a 3D/4D
GIS (3D referring of course to 3D data within a 3D GIS environment and 4D referring to the
chronological sequencing or ‘layering’ of such data within the 3D GIS) can perform certain
documentation tasks that have been considered the roles of traditional methodologies in
archaeological documentation. As has been driven home many times before, these techniques are
not to be viewed as replacements for traditional documentation techniques. Instead, this
experiment shows that these applications function to compliment traditional documentation
methodologies when used alongside them and, furthermore, may offer a viable solution when
traditional methodologies are not feasible because of constraining factors.
I have made an attempt to present this experiment in a manner that is conducive for all
field applications, but I also recognise that my solutions may be heavily coloured by my own
experiences at Uppåkra—a site that has its own unique problems that may or may not be relevant
to other sites. However, I stand by my convictions that this experiment has demonstrated an
important new documentation technique provided through the use of a 3D GIS.
5.5 – EXPERIMENT METHODOLOGY The experiment developed for this thesis can be broken down into five distinct steps: 1) the
creation of the 3D models through MSR; 2) the introduction of those 3D models into the
excavation GIS to establish a 3D/4D GIS; 3) the actual drawing in 3D overtop of those models
within the GIS itself; 4) the linking of those drawings into the GIS database; and finally followed
by 5) the visualisation and output of those models and drawings in various 2D and 3D formats.
The first step out of necessity included the photographic acquisition campaign and was achieved
30
during the 2013 autumn excavations at Uppåkra. Prior to any photographic documentation, a
series of points were placed and recorded via total station around the trenches (Figure 8). The
points collected were then stored within the excavation GIS. These points would be used later to
georeference the models produced. Enough photographic data was captured to create six unique
3D models, however, despite there being multiple trenches, only four trenches were documented
with 3D models during the campaign. While it is useful to acknowledge this, it did not affect the
experiment as only the 3D models of Trench 5 have been utilised in this work. For my own
acquisition campaign, my camera was set to capture RAW images to be later developed into high-
quality JPGs. The methodology of the acquisition was done in the manner established by Callieri
et al. (2011) for field archaeological applications where the operator must move around the target
while taking a series of overlapping photographs. The photographs were uploaded from the
camera’s memory card to Adobe Photoshop’s Lightroom software. It was also within this software
that the images were organised into specific folders representing individual and distinct datasets.
In order to render the data into 3D format, the datasets were input into Agisoft’s Photoscan. When
creating the models, the parameters were set to high-quality settings in order to produce incredibly
detailed models. The texturisation process was also set to the highest quality in order to ensure the
creation of high resolution, photorealistic textures. These models were stored in their own folders
within their respective datasets.

31
FIGURE 8 – A PHOTOGRAPH FROM ONE OF THE ACQUISITION CAMPAIGNS AROUND TRENCH 5; NOTE THE MARKERS
ALONG THE EDGES OF THE TRENCH. (PHOTOGRAPH © J.J.L. KIMBALL 2013).
The second step involved the importation of the 3D models into ESRI’s ArcGIS. This
was accomplished by following the methodology set forth by Dell’Unto (2014, pp. 156-157) which
results in the establishment of a 3D/4D GIS. The first step involved the application of the
georeferenced points acquired by the total station to the respective points visible on the 3D model
itself. This task is accomplished directly within the professional version of Photoscan. The 3D
models were then decimated in Photoscan to ensure that they would not exceed the maximum
amount of polygons defined by ArcGIS. After, the decimated models were exported into a 3D file
format readable by the ESRI’s ArcGIS. When imported into ArcGIS, the software was able to
recognise the geographical coordinates stored within the models. This made it possible for ArcGIS
to automatically position each model within its appropriate geographical position in relation to the
other data contained in the database (Figure 9).
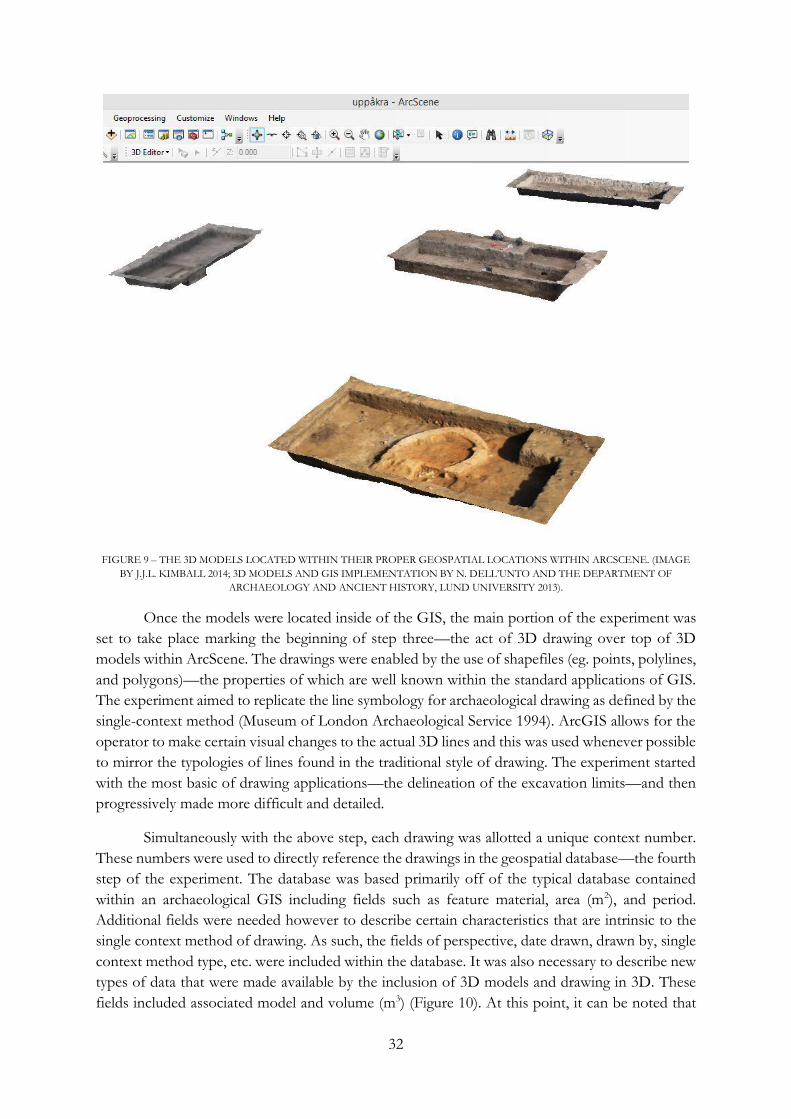
32
FIGURE 9 – THE 3D MODELS LOCATED WITHIN THEIR PROPER GEOSPATIAL LOCATIONS WITHIN ARCSCENE. (IMAGE
BY J.J.L. KIMBALL 2014; 3D MODELS AND GIS IMPLEMENTATION BY N. DELL’UNTO AND THE DEPARTMENT OF
ARCHAEOLOGY AND ANCIENT HISTORY, LUND UNIVERSITY 2013).
Once the models were located inside of the GIS, the main portion of the experiment was
set to take place marking the beginning of step three—the act of 3D drawing over top of 3D
models within ArcScene. The drawings were enabled by the use of shapefiles (eg. points, polylines,
and polygons)—the properties of which are well known within the standard applications of GIS.
The experiment aimed to replicate the line symbology for archaeological drawing as defined by the
single-context method (Museum of London Archaeological Service 1994). ArcGIS allows for the
operator to make certain visual changes to the actual 3D lines and this was used whenever possible
to mirror the typologies of lines found in the traditional style of drawing. The experiment started
with the most basic of drawing applications—the delineation of the excavation limits—and then
progressively made more difficult and detailed.
Simultaneously with the above step, each drawing was allotted a unique context number.
These numbers were used to directly reference the drawings in the geospatial database—the fourth
step of the experiment. The database was based primarily off of the typical database contained
within an archaeological GIS including fields such as feature material, area (m2), and period.
Additional fields were needed however to describe certain characteristics that are intrinsic to the
single context method of drawing. As such, the fields of perspective, date drawn, drawn by, single
context method type, etc. were included within the database. It was also necessary to describe new
types of data that were made available by the inclusion of 3D models and drawing in 3D. These
fields included associated model and volume (m3) (Figure 10). At this point, it can be noted that
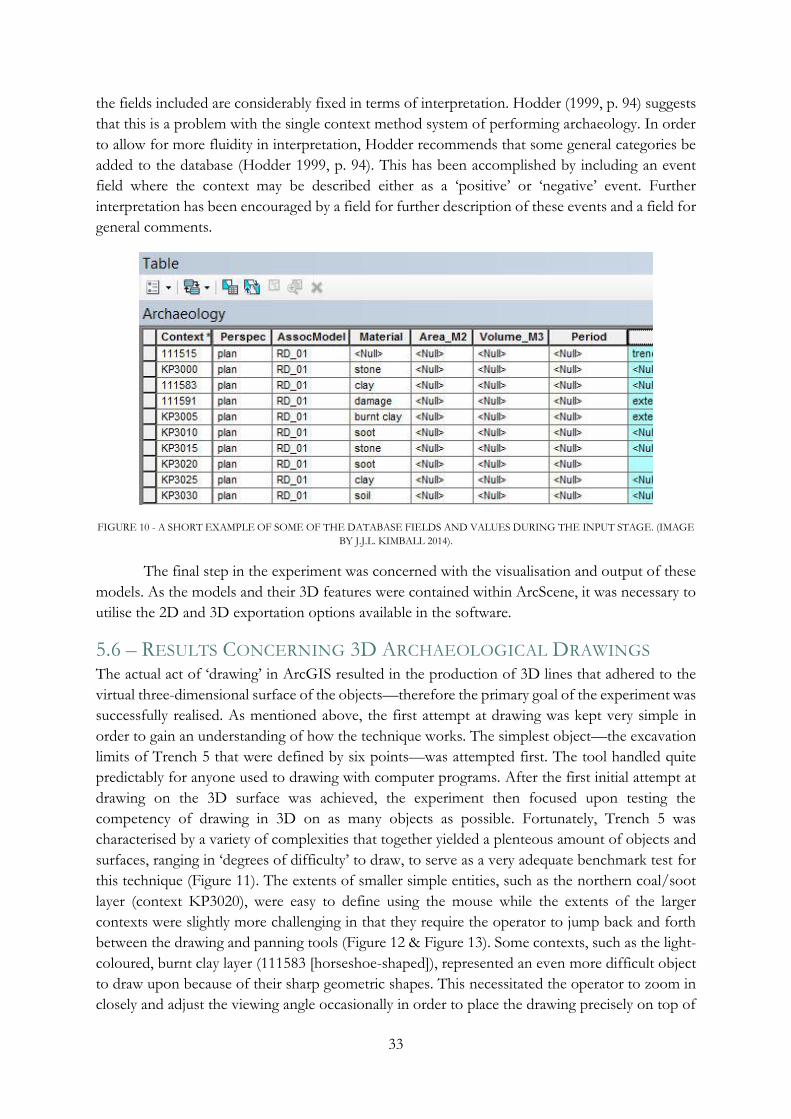
33
the fields included are considerably fixed in terms of interpretation. Hodder (1999, p. 94) suggests
that this is a problem with the single context method system of performing archaeology. In order
to allow for more fluidity in interpretation, Hodder recommends that some general categories be
added to the database (Hodder 1999, p. 94). This has been accomplished by including an event
field where the context may be described either as a ‘positive’ or ‘negative’ event. Further
interpretation has been encouraged by a field for further description of these events and a field for
general comments.
FIGURE 10 - A SHORT EXAMPLE OF SOME OF THE DATABASE FIELDS AND VALUES DURING THE INPUT STAGE. (IMAGE
BY J.J.L. KIMBALL 2014).
The final step in the experiment was concerned with the visualisation and output of these
models. As the models and their 3D features were contained within ArcScene, it was necessary to
utilise the 2D and 3D exportation options available in the software.
5.6 – RESULTS CONCERNING 3D ARCHAEOLOGICAL DRAWINGS The actual act of ‘drawing’ in ArcGIS resulted in the production of 3D lines that adhered to the
virtual three-dimensional surface of the objects—therefore the primary goal of the experiment was
successfully realised. As mentioned above, the first attempt at drawing was kept very simple in
order to gain an understanding of how the technique works. The simplest object—the excavation
limits of Trench 5 that were defined by six points—was attempted first. The tool handled quite
predictably for anyone used to drawing with computer programs. After the first initial attempt at
drawing on the 3D surface was achieved, the experiment then focused upon testing the
competency of drawing in 3D on as many objects as possible. Fortunately, Trench 5 was
characterised by a variety of complexities that together yielded a plenteous amount of objects and
surfaces, ranging in ‘degrees of difficulty’ to draw, to serve as a very adequate benchmark test for
this technique (Figure 11). The extents of smaller simple entities, such as the northern coal/soot
layer (context KP3020), were easy to define using the mouse while the extents of the larger
contexts were slightly more challenging in that they require the operator to jump back and forth
between the drawing and panning tools (Figure 12 & Figure 13). Some contexts, such as the light-
coloured, burnt clay layer (111583 [horseshoe-shaped]), represented an even more difficult object
to draw upon because of their sharp geometric shapes. This necessitated the operator to zoom in
closely and adjust the viewing angle occasionally in order to place the drawing precisely on top of

34
the surface of the model. The most challenging application that this technique was tested with was
to draw the packed-stone layer of the oven—a context that is characterised by a series of tightly-
spaced stones. All stones were drawn using the 3D drawing tool and although it took a
considerable amount of time (about ~50-60 minutes for the approximate ~350 visible stones) to
draw compared to other contexts, it was still considerably easy to accomplish (Figure 14 & Figure
15). In comparison to the traditional hand-drawn plan, the results of digital drawing look
promising. There are notable visual differences between the two drawings, however in theory, the
delineation accomplished by 3D drawing should be technically more ‘accurate’ compared to the
plan drawn by hand (Figure 16; compare also the location of lines in relation to stones in Figure
14 & Figure 15).
FIGURE 11 – (PHOTOGRAPH) A PHOTOGRAPH DISPLAYING SOME OF THE COMPLEXITIES FACED IN TRENCH 5.
(PHOTOGRAPH © J.J.L. KIMBALL 2013).
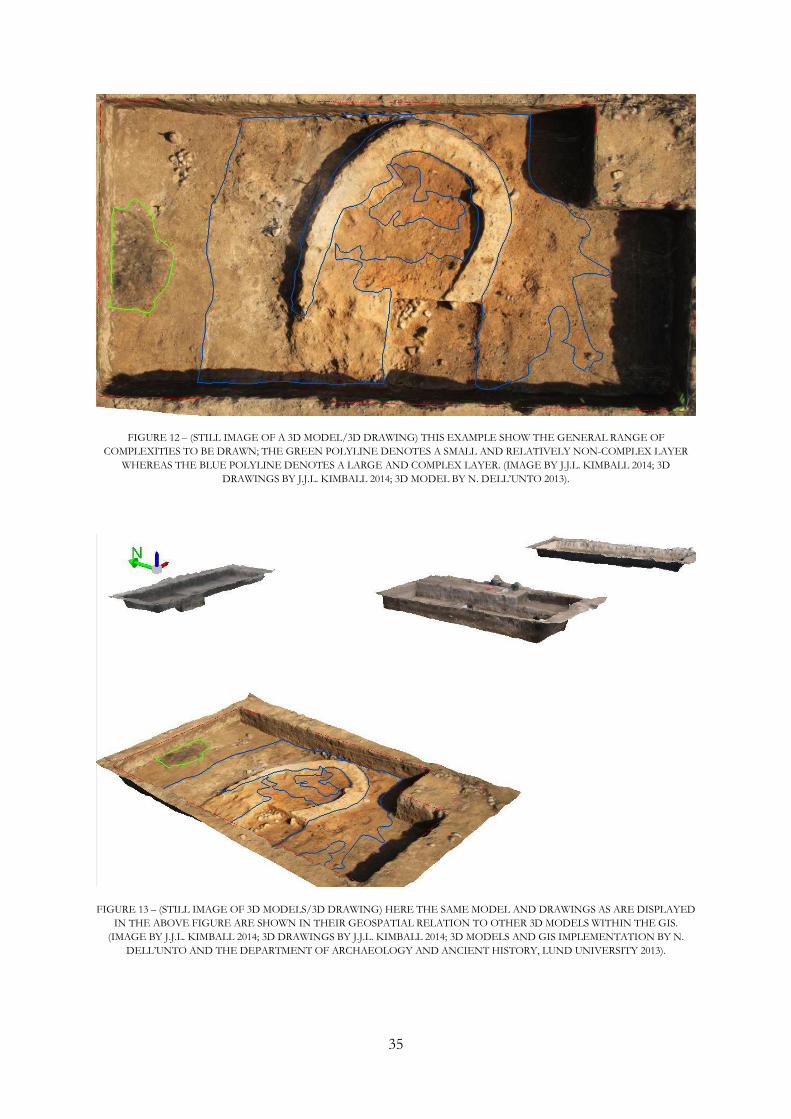
35
FIGURE 12 – (STILL IMAGE OF A 3D MODEL/3D DRAWING) THIS EXAMPLE SHOW THE GENERAL RANGE OF
COMPLEXITIES TO BE DRAWN; THE GREEN POLYLINE DENOTES A SMALL AND RELATIVELY NON-COMPLEX LAYER
WHEREAS THE BLUE POLYLINE DENOTES A LARGE AND COMPLEX LAYER. (IMAGE BY J.J.L. KIMBALL 2014; 3D
DRAWINGS BY J.J.L. KIMBALL 2014; 3D MODEL BY N. DELL’UNTO 2013).
FIGURE 13 – (STILL IMAGE OF 3D MODELS/3D DRAWING) HERE THE SAME MODEL AND DRAWINGS AS ARE DISPLAYED
IN THE ABOVE FIGURE ARE SHOWN IN THEIR GEOSPATIAL RELATION TO OTHER 3D MODELS WITHIN THE GIS.
(IMAGE BY J.J.L. KIMBALL 2014; 3D DRAWINGS BY J.J.L. KIMBALL 2014; 3D MODELS AND GIS IMPLEMENTATION BY N.
DELL’UNTO AND THE DEPARTMENT OF ARCHAEOLOGY AND ANCIENT HISTORY, LUND UNIVERSITY 2013).
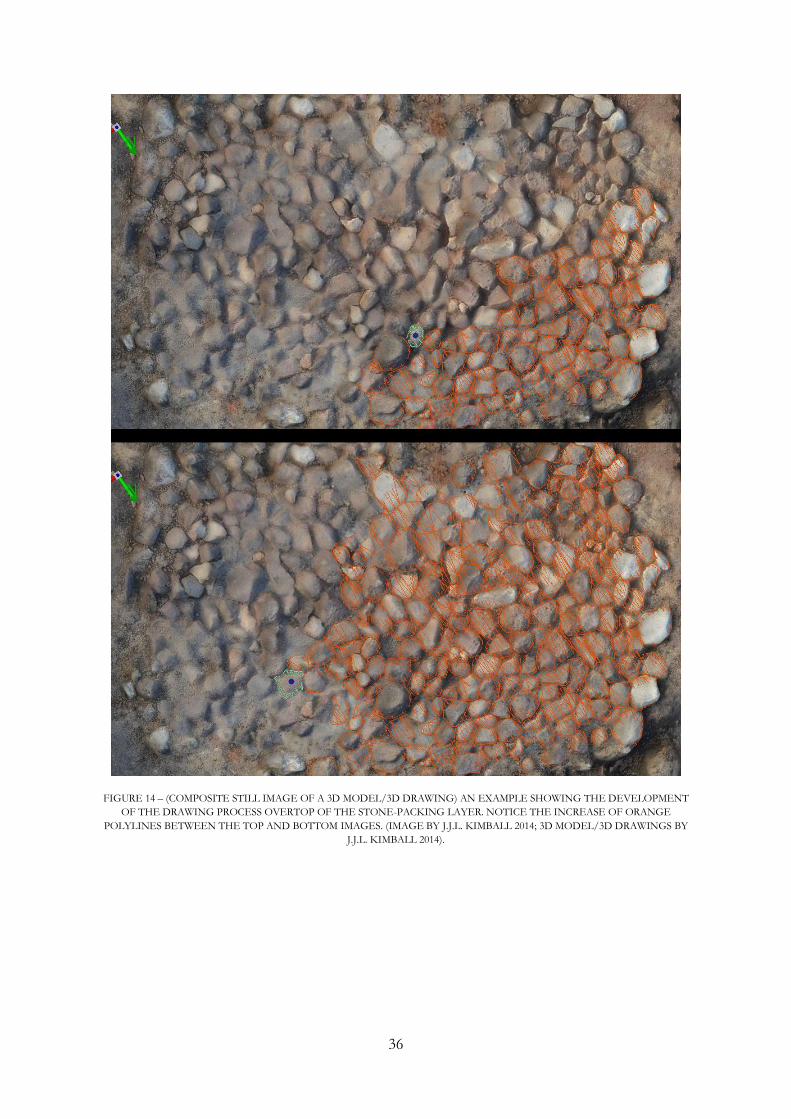
36
FIGURE 14 – (COMPOSITE STILL IMAGE OF A 3D MODEL/3D DRAWING) AN EXAMPLE SHOWING THE DEVELOPMENT
OF THE DRAWING PROCESS OVERTOP OF THE STONE-PACKING LAYER. NOTICE THE INCREASE OF ORANGE
POLYLINES BETWEEN THE TOP AND BOTTOM IMAGES. (IMAGE BY J.J.L. KIMBALL 2014; 3D MODEL/3D DRAWINGS BY
J.J.L. KIMBALL 2014).
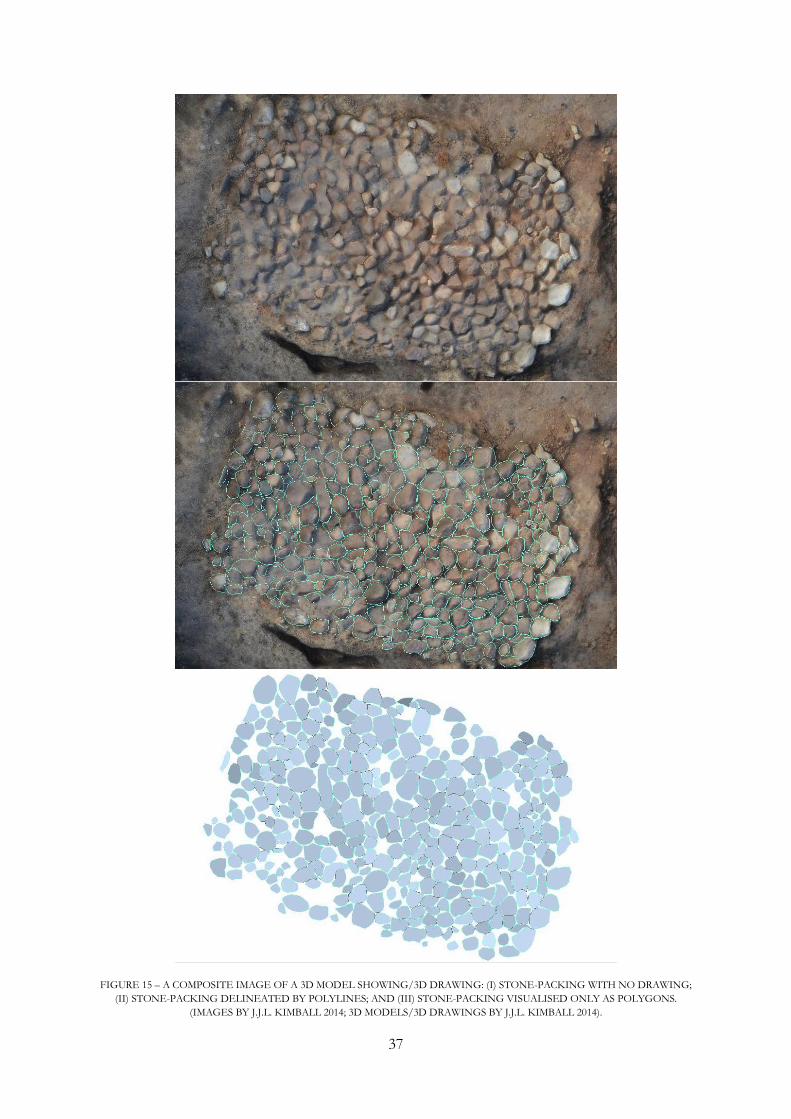
37
FIGURE 15 – A COMPOSITE IMAGE OF A 3D MODEL SHOWING/3D DRAWING: (I) STONE-PACKING WITH NO DRAWING;
(II) STONE-PACKING DELINEATED BY POLYLINES; AND (III) STONE-PACKING VISUALISED ONLY AS POLYGONS.
(IMAGES BY J.J.L. KIMBALL 2014; 3D MODELS/3D DRAWINGS BY J.J.L. KIMBALL 2014).
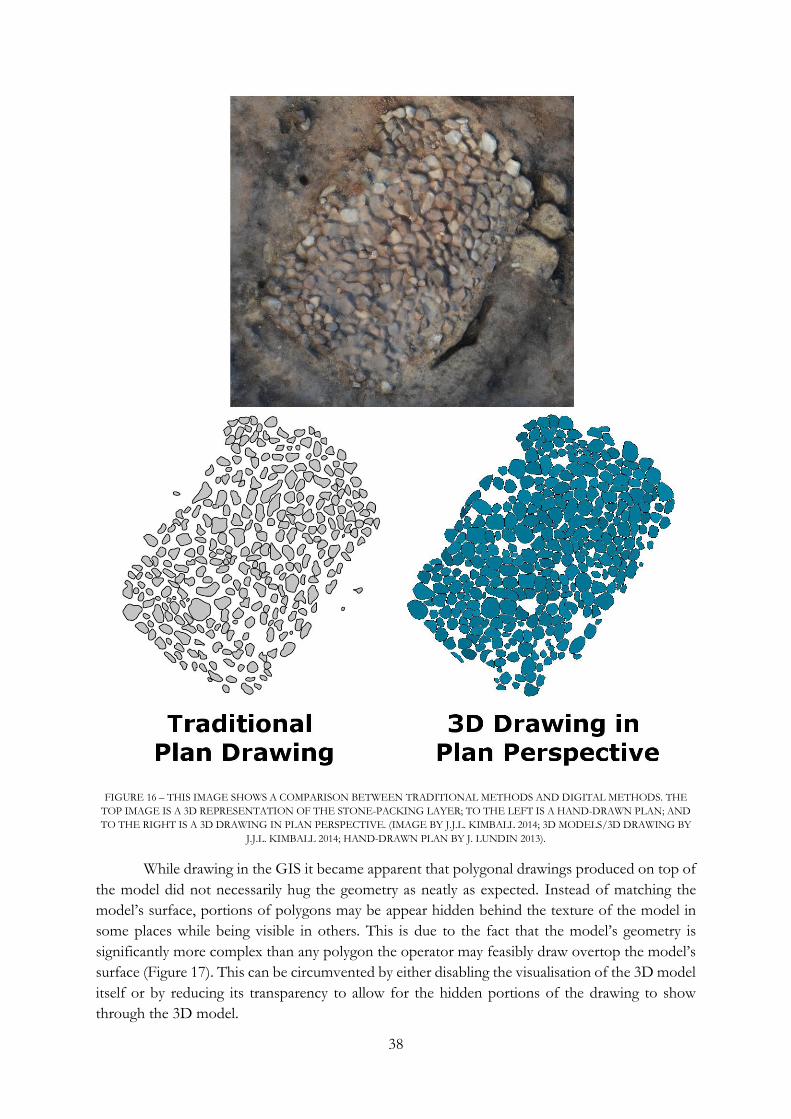
38
FIGURE 16 – THIS IMAGE SHOWS A COMPARISON BETWEEN TRADITIONAL METHODS AND DIGITAL METHODS. THE
TOP IMAGE IS A 3D REPRESENTATION OF THE STONE-PACKING LAYER; TO THE LEFT IS A HAND-DRAWN PLAN; AND
TO THE RIGHT IS A 3D DRAWING IN PLAN PERSPECTIVE. (IMAGE BY J.J.L. KIMBALL 2014; 3D MODELS/3D DRAWING BY
J.J.L. KIMBALL 2014; HAND-DRAWN PLAN BY J. LUNDIN 2013).
While drawing in the GIS it became apparent that polygonal drawings produced on top of
the model did not necessarily hug the geometry as neatly as expected. Instead of matching the
model’s surface, portions of polygons may be appear hidden behind the texture of the model in
some places while being visible in others. This is due to the fact that the model’s geometry is
significantly more complex than any polygon the operator may feasibly draw overtop the model’s
surface (Figure 17). This can be circumvented by either disabling the visualisation of the 3D model
itself or by reducing its transparency to allow for the hidden portions of the drawing to show
through the 3D model.
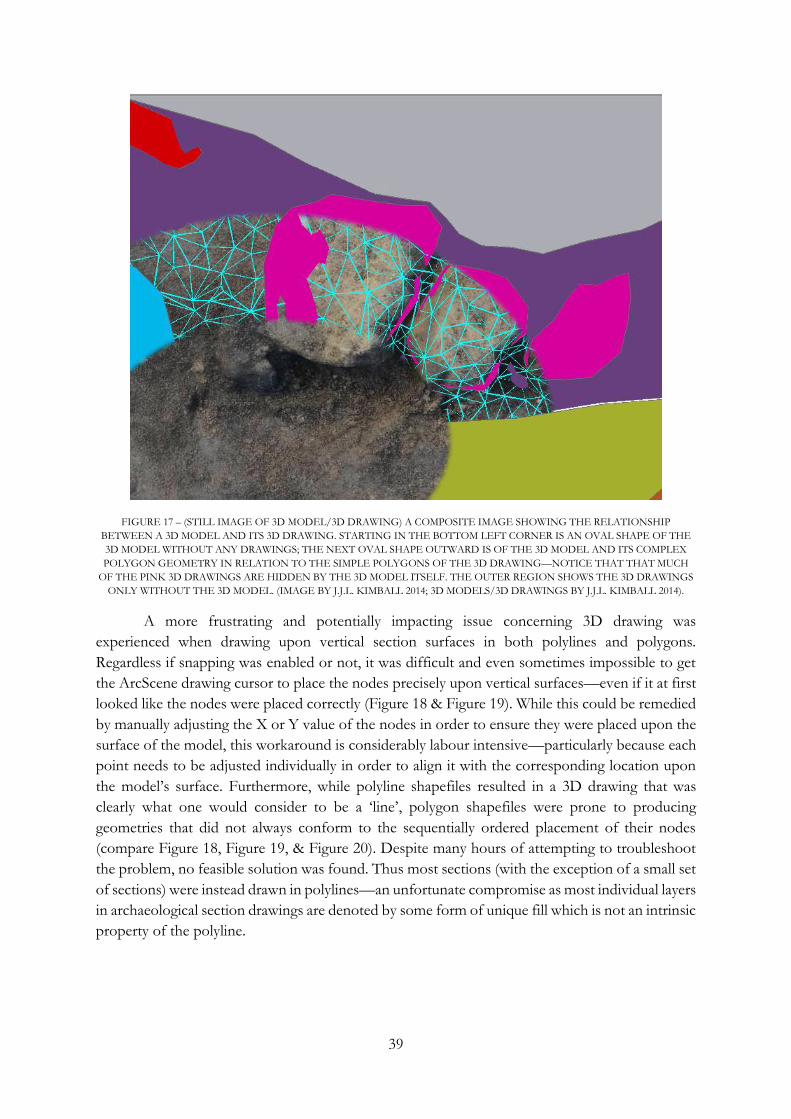
39
FIGURE 17 – (STILL IMAGE OF 3D MODEL/3D DRAWING) A COMPOSITE IMAGE SHOWING THE RELATIONSHIP
BETWEEN A 3D MODEL AND ITS 3D DRAWING. STARTING IN THE BOTTOM LEFT CORNER IS AN OVAL SHAPE OF THE
3D MODEL WITHOUT ANY DRAWINGS; THE NEXT OVAL SHAPE OUTWARD IS OF THE 3D MODEL AND ITS COMPLEX
POLYGON GEOMETRY IN RELATION TO THE SIMPLE POLYGONS OF THE 3D DRAWING—NOTICE THAT THAT MUCH
OF THE PINK 3D DRAWINGS ARE HIDDEN BY THE 3D MODEL ITSELF. THE OUTER REGION SHOWS THE 3D DRAWINGS
ONLY WITHOUT THE 3D MODEL. (IMAGE BY J.J.L. KIMBALL 2014; 3D MODELS/3D DRAWINGS BY J.J.L. KIMBALL 2014).
A more frustrating and potentially impacting issue concerning 3D drawing was
experienced when drawing upon vertical section surfaces in both polylines and polygons.
Regardless if snapping was enabled or not, it was difficult and even sometimes impossible to get
the ArcScene drawing cursor to place the nodes precisely upon vertical surfaces—even if it at first
looked like the nodes were placed correctly (Figure 18 & Figure 19). While this could be remedied
by manually adjusting the X or Y value of the nodes in order to ensure they were placed upon the
surface of the model, this workaround is considerably labour intensive—particularly because each
point needs to be adjusted individually in order to align it with the corresponding location upon
the model’s surface. Furthermore, while polyline shapefiles resulted in a 3D drawing that was
clearly what one would consider to be a ‘line’, polygon shapefiles were prone to producing
geometries that did not always conform to the sequentially ordered placement of their nodes
(compare Figure 18, Figure 19, & Figure 20). Despite many hours of attempting to troubleshoot
the problem, no feasible solution was found. Thus most sections (with the exception of a small set
of sections) were instead drawn in polylines—an unfortunate compromise as most individual layers
in archaeological section drawings are denoted by some form of unique fill which is not an intrinsic
property of the polyline.
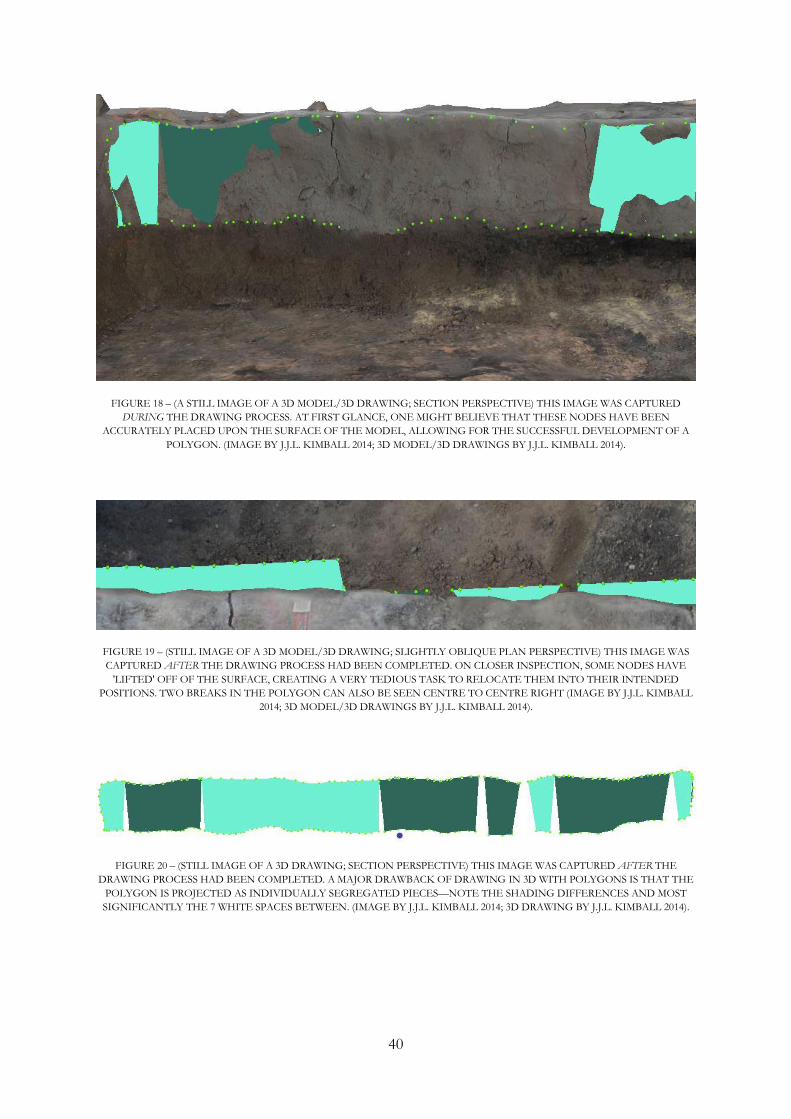
40
FIGURE 18 – (A STILL IMAGE OF A 3D MODEL/3D DRAWING; SECTION PERSPECTIVE) THIS IMAGE WAS CAPTURED
DURING THE DRAWING PROCESS. AT FIRST GLANCE, ONE MIGHT BELIEVE THAT THESE NODES HAVE BEEN
ACCURATELY PLACED UPON THE SURFACE OF THE MODEL, ALLOWING FOR THE SUCCESSFUL DEVELOPMENT OF A
POLYGON. (IMAGE BY J.J.L. KIMBALL 2014; 3D MODEL/3D DRAWINGS BY J.J.L. KIMBALL 2014).
FIGURE 19 – (STILL IMAGE OF A 3D MODEL/3D DRAWING; SLIGHTLY OBLIQUE PLAN PERSPECTIVE) THIS IMAGE WAS
CAPTURED AFTER THE DRAWING PROCESS HAD BEEN COMPLETED. ON CLOSER INSPECTION, SOME NODES HAVE
'LIFTED' OFF OF THE SURFACE, CREATING A VERY TEDIOUS TASK TO RELOCATE THEM INTO THEIR INTENDED
POSITIONS. TWO BREAKS IN THE POLYGON CAN ALSO BE SEEN CENTRE TO CENTRE RIGHT (IMAGE BY J.J.L. KIMBALL
2014; 3D MODEL/3D DRAWINGS BY J.J.L. KIMBALL 2014).
FIGURE 20 – (STILL IMAGE OF A 3D DRAWING; SECTION PERSPECTIVE) THIS IMAGE WAS CAPTURED AFTER THE
DRAWING PROCESS HAD BEEN COMPLETED. A MAJOR DRAWBACK OF DRAWING IN 3D WITH POLYGONS IS THAT THE
POLYGON IS PROJECTED AS INDIVIDUALLY SEGREGATED PIECES—NOTE THE SHADING DIFFERENCES AND MOST
SIGNIFICANTLY THE 7 WHITE SPACES BETWEEN. (IMAGE BY J.J.L. KIMBALL 2014; 3D DRAWING BY J.J.L. KIMBALL 2014).
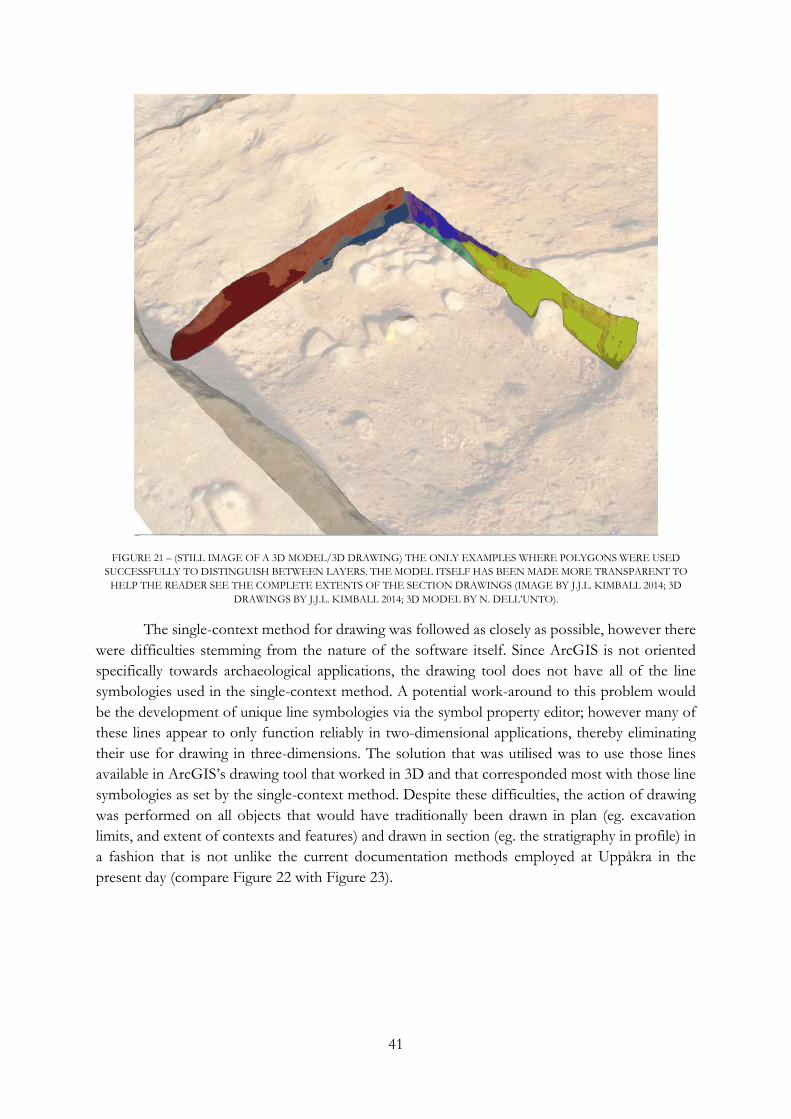
41
FIGURE 21 – (STILL IMAGE OF A 3D MODEL/3D DRAWING) THE ONLY EXAMPLES WHERE POLYGONS WERE USED
SUCCESSFULLY TO DISTINGUISH BETWEEN LAYERS. THE MODEL ITSELF HAS BEEN MADE MORE TRANSPARENT TO
HELP THE READER SEE THE COMPLETE EXTENTS OF THE SECTION DRAWINGS (IMAGE BY J.J.L. KIMBALL 2014; 3D
DRAWINGS BY J.J.L. KIMBALL 2014; 3D MODEL BY N. DELL’UNTO).
The single-context method for drawing was followed as closely as possible, however there
were difficulties stemming from the nature of the software itself. Since ArcGIS is not oriented
specifically towards archaeological applications, the drawing tool does not have all of the line
symbologies used in the single-context method. A potential work-around to this problem would
be the development of unique line symbologies via the symbol property editor; however many of
these lines appear to only function reliably in two-dimensional applications, thereby eliminating
their use for drawing in three-dimensions. The solution that was utilised was to use those lines
available in ArcGIS’s drawing tool that worked in 3D and that corresponded most with those line
symbologies as set by the single-context method. Despite these difficulties, the action of drawing
was performed on all objects that would have traditionally been drawn in plan (eg. excavation
limits, and extent of contexts and features) and drawn in section (eg. the stratigraphy in profile) in
a fashion that is not unlike the current documentation methods employed at Uppåkra in the
present day (compare Figure 22 with Figure 23).
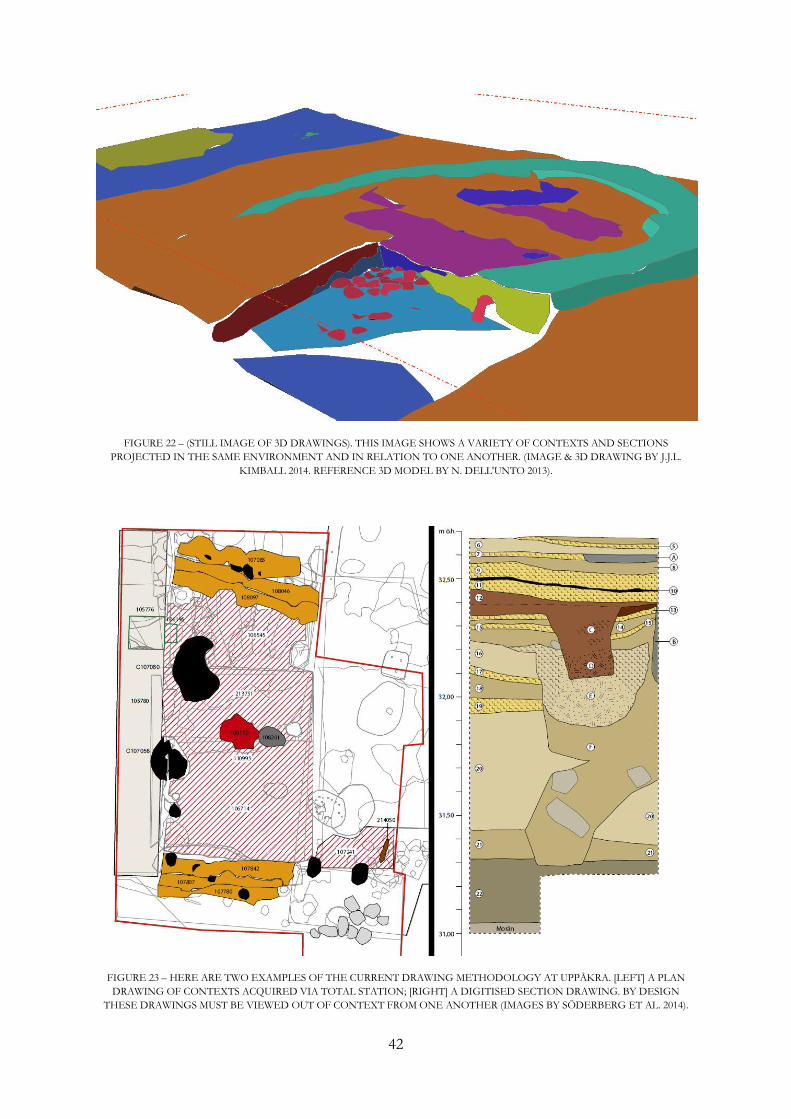
42
FIGURE 22 – (STILL IMAGE OF 3D DRAWINGS). THIS IMAGE SHOWS A VARIETY OF CONTEXTS AND SECTIONS
PROJECTED IN THE SAME ENVIRONMENT AND IN RELATION TO ONE ANOTHER. (IMAGE & 3D DRAWING BY J.J.L.
KIMBALL 2014. REFERENCE 3D MODEL BY N. DELL'UNTO 2013).
FIGURE 23 – HERE ARE TWO EXAMPLES OF THE CURRENT DRAWING METHODOLOGY AT UPPÅKRA. [LEFT] A PLAN
DRAWING OF CONTEXTS ACQUIRED VIA TOTAL STATION; [RIGHT] A DIGITISED SECTION DRAWING. BY DESIGN
THESE DRAWINGS MUST BE VIEWED OUT OF CONTEXT FROM ONE ANOTHER (IMAGES BY SÖDERBERG ET AL. 2014).
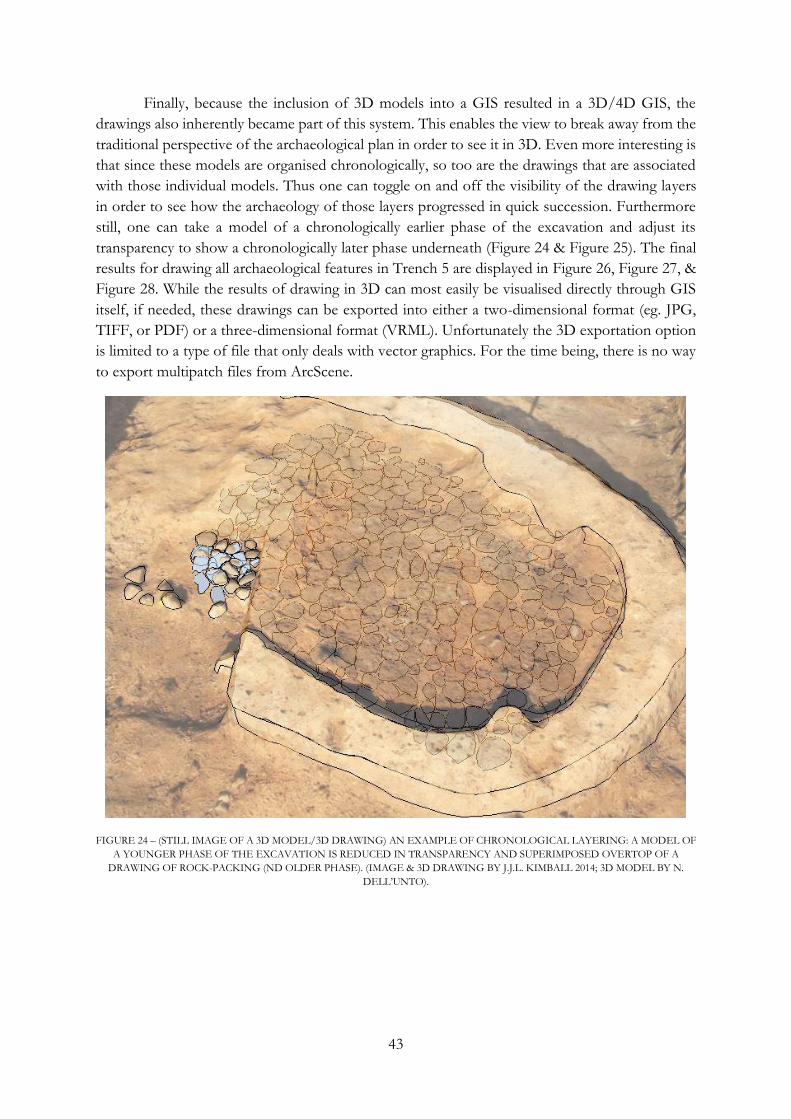
43
Finally, because the inclusion of 3D models into a GIS resulted in a 3D/4D GIS, the
drawings also inherently became part of this system. This enables the view to break away from the
traditional perspective of the archaeological plan in order to see it in 3D. Even more interesting is
that since these models are organised chronologically, so too are the drawings that are associated
with those individual models. Thus one can toggle on and off the visibility of the drawing layers
in order to see how the archaeology of those layers progressed in quick succession. Furthermore
still, one can take a model of a chronologically earlier phase of the excavation and adjust its
transparency to show a chronologically later phase underneath (Figure 24 & Figure 25). The final
results for drawing all archaeological features in Trench 5 are displayed in Figure 26, Figure 27, &
Figure 28. While the results of drawing in 3D can most easily be visualised directly through GIS
itself, if needed, these drawings can be exported into either a two-dimensional format (eg. JPG,
TIFF, or PDF) or a three-dimensional format (VRML). Unfortunately the 3D exportation option
is limited to a type of file that only deals with vector graphics. For the time being, there is no way
to export multipatch files from ArcScene.
FIGURE 24 – (STILL IMAGE OF A 3D MODEL/3D DRAWING) AN EXAMPLE OF CHRONOLOGICAL LAYERING: A MODEL OF
A YOUNGER PHASE OF THE EXCAVATION IS REDUCED IN TRANSPARENCY AND SUPERIMPOSED OVERTOP OF A
DRAWING OF ROCK-PACKING (ND OLDER PHASE). (IMAGE & 3D DRAWING BY J.J.L. KIMBALL 2014; 3D MODEL BY N.
DELL’UNTO).
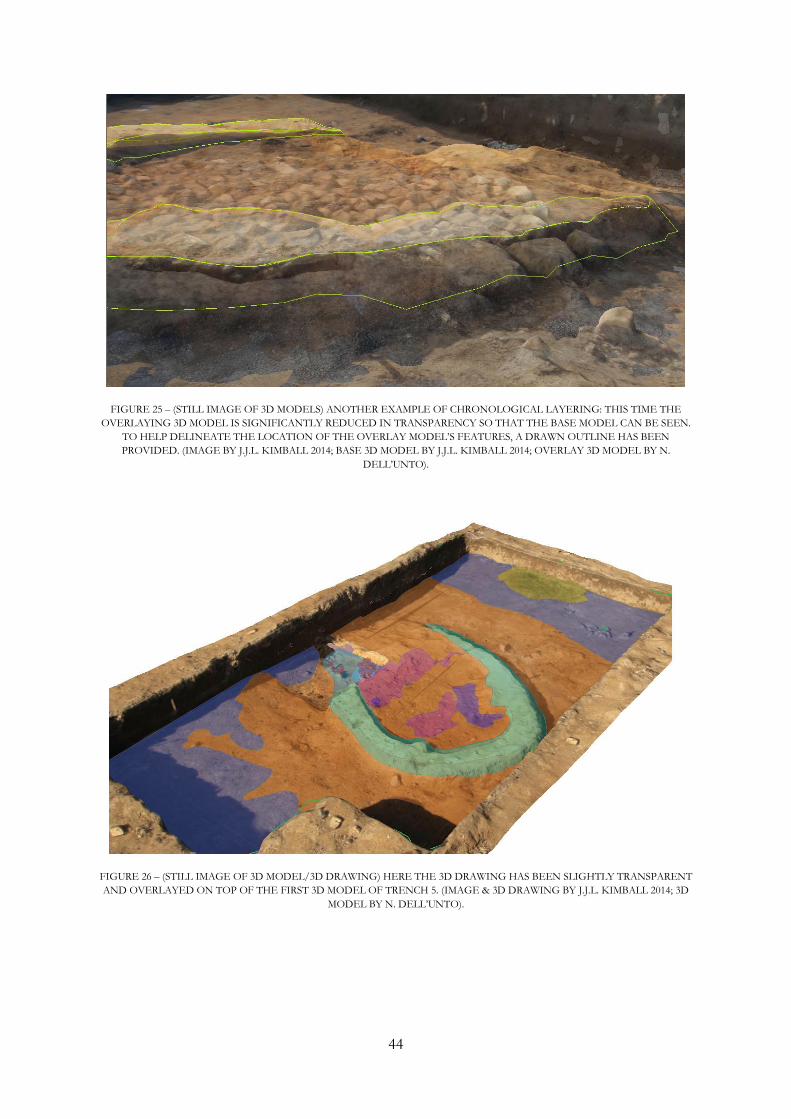
44
FIGURE 25 – (STILL IMAGE OF 3D MODELS) ANOTHER EXAMPLE OF CHRONOLOGICAL LAYERING: THIS TIME THE
OVERLAYING 3D MODEL IS SIGNIFICANTLY REDUCED IN TRANSPARENCY SO THAT THE BASE MODEL CAN BE SEEN.
TO HELP DELINEATE THE LOCATION OF THE OVERLAY MODEL’S FEATURES, A DRAWN OUTLINE HAS BEEN
PROVIDED. (IMAGE BY J.J.L. KIMBALL 2014; BASE 3D MODEL BY J.J.L. KIMBALL 2014; OVERLAY 3D MODEL BY N.
DELL’UNTO).
FIGURE 26 – (STILL IMAGE OF 3D MODEL/3D DRAWING) HERE THE 3D DRAWING HAS BEEN SLIGHTLY TRANSPARENT
AND OVERLAYED ON TOP OF THE FIRST 3D MODEL OF TRENCH 5. (IMAGE & 3D DRAWING BY J.J.L. KIMBALL 2014; 3D
MODEL BY N. DELL’UNTO).
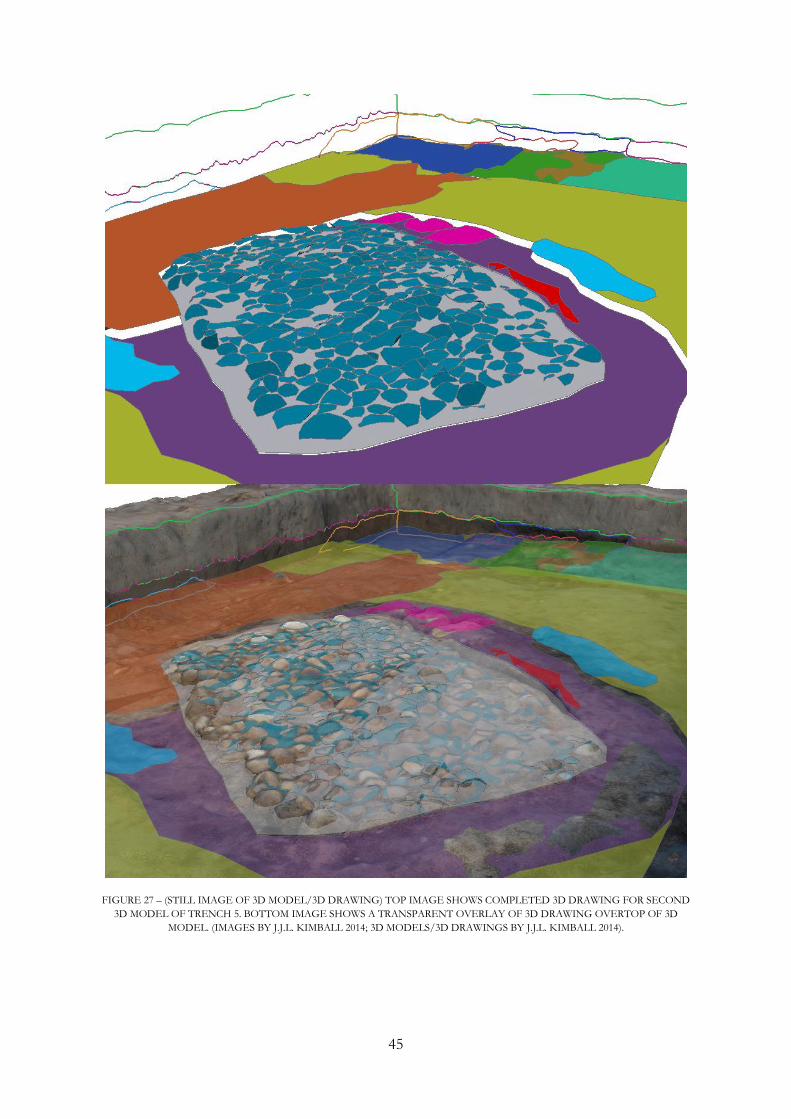
45
FIGURE 27 – (STILL IMAGE OF 3D MODEL/3D DRAWING) TOP IMAGE SHOWS COMPLETED 3D DRAWING FOR SECOND
3D MODEL OF TRENCH 5. BOTTOM IMAGE SHOWS A TRANSPARENT OVERLAY OF 3D DRAWING OVERTOP OF 3D
MODEL. (IMAGES BY J.J.L. KIMBALL 2014; 3D MODELS/3D DRAWINGS BY J.J.L. KIMBALL 2014).
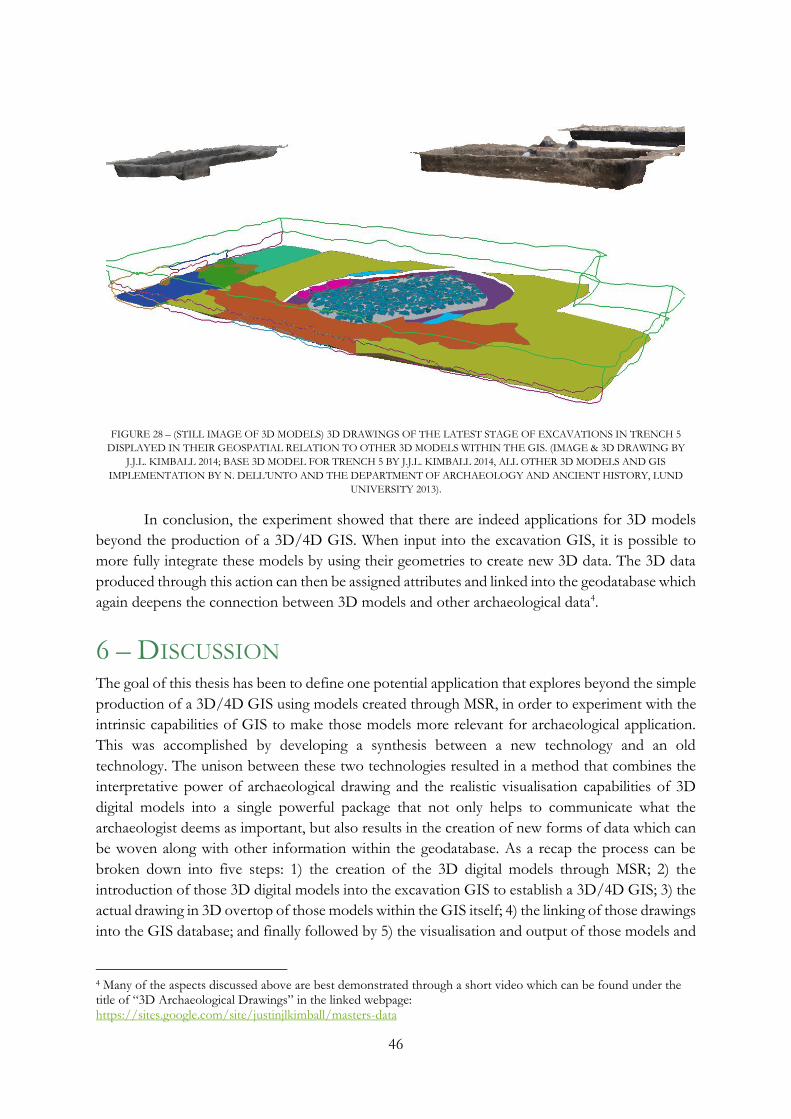
46
FIGURE 28 – (STILL IMAGE OF 3D MODELS) 3D DRAWINGS OF THE LATEST STAGE OF EXCAVATIONS IN TRENCH 5
DISPLAYED IN THEIR GEOSPATIAL RELATION TO OTHER 3D MODELS WITHIN THE GIS. (IMAGE & 3D DRAWING BY
J.J.L. KIMBALL 2014; BASE 3D MODEL FOR TRENCH 5 BY J.J.L. KIMBALL 2014, ALL OTHER 3D MODELS AND GIS
IMPLEMENTATION BY N. DELL’UNTO AND THE DEPARTMENT OF ARCHAEOLOGY AND ANCIENT HISTORY, LUND
UNIVERSITY 2013).
In conclusion, the experiment showed that there are indeed applications for 3D models
beyond the production of a 3D/4D GIS. When input into the excavation GIS, it is possible to
more fully integrate these models by using their geometries to create new 3D data. The 3D data
produced through this action can then be assigned attributes and linked into the geodatabase which
again deepens the connection between 3D models and other archaeological data4.
6 – DISCUSSION The goal of this thesis has been to define one potential application that explores beyond the simple
production of a 3D/4D GIS using models created through MSR, in order to experiment with the
intrinsic capabilities of GIS to make those models more relevant for archaeological application.
This was accomplished by developing a synthesis between a new technology and an old
technology. The unison between these two technologies resulted in a method that combines the
interpretative power of archaeological drawing and the realistic visualisation capabilities of 3D
digital models into a single powerful package that not only helps to communicate what the
archaeologist deems as important, but also results in the creation of new forms of data which can
be woven along with other information within the geodatabase. As a recap the process can be
broken down into five steps: 1) the creation of the 3D digital models through MSR; 2) the
introduction of those 3D digital models into the excavation GIS to establish a 3D/4D GIS; 3) the
actual drawing in 3D overtop of those models within the GIS itself; 4) the linking of those drawings
into the GIS database; and finally followed by 5) the visualisation and output of those models and
4 Many of the aspects discussed above are best demonstrated through a short video which can be found under the title of “3D Archaeological Drawings” in the linked webpage: https://sites.google.com/site/justinjlkimball/masters-data
47
drawings in various 2D and 3D formats. These steps together represent a methodology for an
archaeologically-relevant application of 3D digital models in a manner that enables archaeologists
to comprehend, interpret, visualise, and disseminate archaeological information within a timeframe
congruent with the constraints endemic to field archaeology.
More specifically, there are many significant findings that have been made apparent
through this methodology. One such finding is in reference to the actual act of drawing, in that
drawing in 3D upon a 3D digital model forces the archaeologist to think in the terms of the natural
three-dimensional world. In other words, this technique is a direct response to the call for 3D
solutions for 3D problems. Unlike the traditional method of plan drawing, where one uses a plumb
bob and measuring stick to determine the two-dimensional location of features within a grid, three-
dimensional drawing requires the user to think and perform the act of drawing in 3D. To ensure
that one achieves the desired results of drawing, their perspective of the object must be
occasionally manipulated—they must move, bob, and weave their way in the act of drawing. In
this way, they are able to traverse the object and get some sense of its geometry while ensuring
that their line falls where they want it to. In this regard, the nature of the model forces the
archaeologist to re-experience it. Furthermore, the 3D digital model itself affords the archaeologist
with unique vantage points that may otherwise be difficult, impossible, or even risky/dangerous
(to either the archaeologist or the archaeology itself). This technique may therefore allow some
features to be documented in detail that may have otherwise not been documented at all.
Another consideration is that this technique can be applied in the performance of both
archaeological and plan section drawings. While there is a limited capability to reproduce certain
typologies of lines that are defined by the single-context method (cf. Museum of London
Archaeological Service 1994 and Figure 1 on page 6 of this work) in the drawing tool of ArcGIS,
I believe that the actual nature of documenting and drawing in 3D upon a 3D representation is
beginning to abrogate the need for such symbolically-laden line typologies—after all, those
symbolically-laden lines were targeted toward conveying 3D characteristics upon a 2D medium
(eg. paper). Instead of relying upon such symbolic line types, an archaeologist equipped with a 3D
model adorned with archaeologically-relevant 3D drawings only has to change her/his own
perspective in order to understand and appreciate visually the 3D characteristics of the object. Of
course, it is still important for the interpretation that such information be included apart from the
model itself. This can be directly accomplished by adding a section to the attributes table where
the archaeologist may include keywords describing in text the type of context extent or cuts.
Furthermore, this enables the archaeologist to query for archaeological objects with certain context
or cut types as defined by their keyword characteristics.
In addition to the above consideration, another finding of interest relates to the two 2D
typologies of archaeological drawing: plans and sections. Since 3D digital models occupy a three-
dimensional space, both types of archaeological drawings can be visualised immediately within the
same space and in relation to each other. Before, such visualisations could only be linked together
via text or certain symbologies (eg. in the single-context planning method, a section would be
recorded on the plan with a dashed line denoted by the section identity number above the line).
With this methodology, it is again as simple as changing the perspective in order to achieve a fully-
visualised superimposition of the drawing in situ overtop of the feature.
48
The act of drawing directly into a computer also has its own benefits. Most evident perhaps
is that computer software offers the opportunity for a ‘cleaner’ end result (eg. no eraser marks,
dirt, mud, or (accidental) coffee stains, etc.). Furthermore, because the medium is digital in nature,
there is no need to digitise the drawing via a document scanner. Another benefit is that drawing
in 3D has been accomplished in vector graphics. While the raster representation of the model itself
might not benefit from this process, the vector-based drawings permit the archaeologist to zoom
in or out without the fear of sacrificing the quality of the drawing because of pixilation (the
mathematical algorithms intrinsic within vector graphics technically allow for infinite zoom
without loss in detail). Scanned versions of archaeological drawings do not allow for this because
scanners are raster-based devices. Another benefit relating to digital drawing, especially in a
geometrically referenced space, relates to the ability to perform measurements. In ArcScene, a
handy feature called ‘Measure’ allows for one to perform a variety of measurements on both their
3D models and their 3D drawings. For example, the measure tool allows for one to measure: a
direct line between two points; the height of objects; the area of an object; and the distance around
a feature (Figure 29). While this tool could be useful at any given moment, its particular worth can
be appreciated when one recognises that it can allow for the measurement of 3D modelled features
long after they have been destroyed by the process of archaeology.
Not so surprisingly, yet still profound nonetheless, was that drawing in 3D was found to
expedite the act of archaeological drawing. Another benefit was that the drawings seemed to have
a high congruency between what was actually visible on the model itself and what was drawn in
the software. Thus, drawing in 3D on a digital medium is both efficient and accurate. Others have
already explored the benefits of drawing in digital mediums (cf. Prins & Adams 2012; Cianciarulo
& Guerra 2007), however these researchers have restricted their drawings to two-dimensions only.
The methodology demonstrated in the experiment must not be confused with these attempts as it
has accomplished digital drawings in three-dimensions. Regardless, there are definitely similarities
between 2D and 3D digital drawing—such as not having to jostle around the subject and fumble
with cumbersome measuring instruments to produce the archaeological drawing. This of course
increases the accuracy and quality, while reducing the time it takes to develop the drawings. Unique
to drawing in 3D however, is that the archaeologist can move the camera as needed—the mobility
of which affords the archaeologist a complete 3D perspective of the archaeological object that is
being recorded. Even those archaeologists who are less-artistically competent should feel
comfortable with this technique as it involves simply tracing out what is visible. Yet it is still
important to stress the speed in which it takes to complete these drawings. The traditional
methodology concerned with producing archaeological drawings is known to take a considerable
amount of time when done correctly, thereby it is usually reserved for those features and contexts
perceived as having significant value. With the same amount of care, but minus the time one needs
to take to fiddle with bulky measuring instruments, one can achieve similar results but housed
within a 3D environment—all within the timeframe of the excavation.

49
FIGURE 29 – (STILL IMAGE OF A 3D DRAWING) ONE OF THE MEASURE TOOL FEATURES IN ARCSCENE: HERE THE TOOL
HAS BEEN USED TO MEASURE DIAGONALLY ACROSS THE STONE-PACKING LAYER WHICH FOR A RESULT OF 1.959
METERS ACROSS. (IMAGE BY J.J.L. KIMBALL 2014; REFERENCE 3D MODEL/3D DRAWING BY J.J.L. KIMBALL 2014).
A supplementary note to the above paragraph is that there some concerns may arise along
the lines of the caution presented by Barker’s view on photography in that drawing in a digital
space may remove the archaeologist away from the actual archaeology before them. This issue is
indeed valid, however it is somewhat more valid for 2D digital drawing than it is for 3D digital
drawing. Drawing in 2D restricts the archaeologist by constricting their perspective to one plane.
3D on the other hand allows for the archaeologist to explore the scene—to change their
perspective whether that be the angle of view and/or the amount of magnification. Regardless, it
is important for the archaeologist to perform these tasks in front of the object being documented
if at all possible. This allows for the archaeologist to check the model to ensure it is an acceptable
representation of the archaeology while at the same time offering a valuable source of reference
to compare their drawing against.
For archaeologists concerned with rescue and development-led archaeology, the
truncation in time it takes to document cannot be overemphasised. When time and money are a
serious issue, this methodology can be applied in order to conduct the art of archaeological drawing
outside of the excavation itself. The value of the ability to accomplish such a task after the
50
excavation phase or even the entire excavation itself has passed, becomes an especially pronounced
when one imagines a situation where the archaeology itself is threatened. Such instances are not
unheard of—take for example the discovery of the Scar boat burial, located in Orkney, in 1985.
The site however, being discovered by a non-archaeologist, was left undisturbed for over six years
until its significance was realised. By this time, coastal erosion had destroyed portions of the site
and what was left was threatened by a shrinking amount of time to recover and document (Towrie
2014; Owen & Dalland 1999, pp. 1-2). The archaeologists were fortunate to have such mild late
autumn/early winter weather on the site, and although there was a real sense of urgency to
complete the excavation before the conditions soured, they were able to complete drawings of the
archaeology (Owen & Dalland 1999, pp. 25 & 30). In circumstances such as this, where the
archaeological documentation process itself is either rushed or unable to be conducted properly,
the application of the established methodology holds much promise.
Another example of the above situation has been noted at Çatalhöyük. The nature of the
construction material that make of the buildings uncovered at Çatalhöyük is considerably unstable.
This makes conservation difficult and thus one response has been to make an effort to document
these buildings (Forte et al. 2012, pp. 374-374). Yet another useful application that is of chief
benefit to those concerned with rescue and development-led archaeology, is that 3D digital models
and 3D archaeological drawing allows for a detailed and powerful way of documenting layers of
an excavation that, because of time or financial limitations, must be destroyed in order to reach
layers deemed more significant. Thus in both of these examples, the documentation of the
threatened archaeology in 3D may be the only chance that archaeologists have to perform the
important task of creating archaeological drawings.
A final consideration is in reference towards who should be exercising the technique of
3D archaeological drawing. My response to this falls in line with Hodder’s reflexive methodology
of excavation practice: it should be the individual excavators themselves that deploy this technique.
It is they that excavate the archaeology and experience the site through that process. Therefore it
is a tool that must applied first and foremost by those individuals as they have the knowledge to
describe most accurately exposed during the process of excavation—particularly those contexts
that are visually invisible but tactually evident. Therefore 3D archaeological drawing is a tool that
must be completed whenever possible in the field and by those individuals performing the action
of excavating. In addition to these factors, giving the excavators control over this technology
functions to further bring the voice of the humble field archaeologist from behind the scenes and
into a more forefront position. As noted by Hodder (1999, p. 94), putting techniques such as this
in the hands of the field archaeologist increases mutlivocality and thereby adds to the fullness of
the resulting interpretation. Ensuring that the excavating archaeologist has command over this
technique presents another important factor: it places this technique in the frontlines of
archaeology where interpretation happens as trowel meets earth (Hodder 1999, p. 94).
The ability to conduct archaeological drawings in 3D is a technique that must not be
understated. With many benefits—such as enabling the archaeologist to approach the three-
dimensional nature of the site with a three-dimensional documentation method; allowing for the
visualisation of previously disjointed objects (eg. plan and section drawings, also photographs) in
relation to one another in the same space, providing expedited and more accurate drawings, and
increasing multivocality by giving the individual excavator a greater voice—it is irrefutable that 3D
51
digital models are a useful typology of data that must be considered more closely as being relevant
for archaeological knowledge. This statement is unequivocal when supported by the experiment
above—an experiment that has demonstrated that drawing upon 3D models allows for a more
powerful and communicative form of archaeological documentation in a three-dimensional
medium that is closer to reality for the subject of study.
6.1 – STATEMENT OF PERCEIVED IMPACT
“It is wisdom to recognize necessity, when all other courses have been weighed . . .”
Spoken by Gandalf the Grey in “The Fellowship of the Ring”
(J. R. R. Tolkien 2008, p. 201).
Throughout this thesis, especially within the state of art section, I have maintained a stance where
digital technologies must not be seen as supplanting traditional technologies. Adherence to this
statement is vital for archaeology because the history of our practice defines what we endeavour
to achieve today. However another underlying theme has been present the entire time—that which
acknowledges technological evolution. Archaeology has not been a stranger to these processes:
cameras have moved from film to memory cards; technology has long existed to create digital
copies of paper documentation; and furthermore paper databases have also become digitised
allowing for a variety of new processes—the list goes on. Yet despite the digitisation of such
technologies, they have fundamentally remained the same: digital cameras still involve the capture
of photons upon a light-sensitive surface in order to produce representations of the scene before
them; digital documents still need to be authored or created through great forethought and a
synthesis of data and ideas; and databases like GIS still depend on the input of vast amounts of
data. While the technologies have changed, and to some extent their methodologies have changed,
their involvement in our endeavours are more present than ever. They have not been supplanted—
rather if anything, we have come to depend upon them more than ever. The continual digitisation
of our technology is, at least in the near future, unstoppable. Thus it is the wisest course of action
to continually keep an open mind towards understanding how newer technologies work as well as
a willingness to embrace those technologies for application within archaeological practice.
Through such actions, a more reflexive archaeology can be achieved than would be possible if one
were to rely purely on traditional forms of technology.
Thus archaeologists must begin looking towards ways to update and modernise the
discipline of archaeology. One manner in which this can be realised is for archaeologists to begin
to more earnestly embrace 3D documentation technologies. Already paper, pencils, and erasers
have begun to disappear from our modern world in favour of smart phones, tablets, and laptops.
However, I do not mean that archaeologists should cast traditional technologies completely aside.
After all, there certainly is relevance in teaching children how to write with a pencil, just as there
will certainly be a relevance and richness provided through the continual instruction of students
in the ‘basic’ two-dimensional techniques of archaeology (Campana 2014, p. 7). Undoubtedly there
will be a time in every archaeologist’s career where such ‘mundane’ technologies become the
saviours for documentation in field excavation—particular stories such as mobile phones being
inhumed in trenches, digital cameras falling into buckets of water, or a total station’s (unintentional
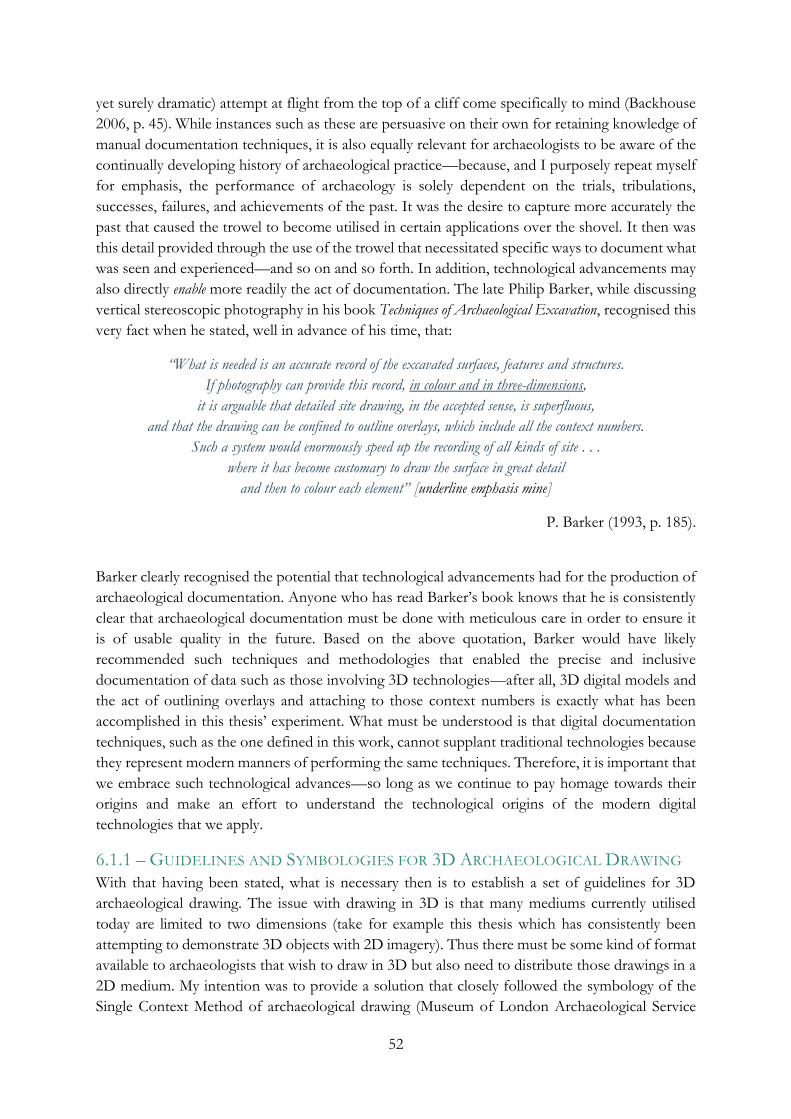
52
yet surely dramatic) attempt at flight from the top of a cliff come specifically to mind (Backhouse
2006, p. 45). While instances such as these are persuasive on their own for retaining knowledge of
manual documentation techniques, it is also equally relevant for archaeologists to be aware of the
continually developing history of archaeological practice—because, and I purposely repeat myself
for emphasis, the performance of archaeology is solely dependent on the trials, tribulations,
successes, failures, and achievements of the past. It was the desire to capture more accurately the
past that caused the trowel to become utilised in certain applications over the shovel. It then was
this detail provided through the use of the trowel that necessitated specific ways to document what
was seen and experienced—and so on and so forth. In addition, technological advancements may
also directly enable more readily the act of documentation. The late Philip Barker, while discussing
vertical stereoscopic photography in his book Techniques of Archaeological Excavation, recognised this
very fact when he stated, well in advance of his time, that:
“What is needed is an accurate record of the excavated surfaces, features and structures.
If photography can provide this record, in colour and in three-dimensions,
it is arguable that detailed site drawing, in the accepted sense, is superfluous,
and that the drawing can be confined to outline overlays, which include all the context numbers.
Such a system would enormously speed up the recording of all kinds of site . . .
where it has become customary to draw the surface in great detail
and then to colour each element” [underline emphasis mine]
P. Barker (1993, p. 185).
Barker clearly recognised the potential that technological advancements had for the production of
archaeological documentation. Anyone who has read Barker’s book knows that he is consistently
clear that archaeological documentation must be done with meticulous care in order to ensure it
is of usable quality in the future. Based on the above quotation, Barker would have likely
recommended such techniques and methodologies that enabled the precise and inclusive
documentation of data such as those involving 3D technologies—after all, 3D digital models and
the act of outlining overlays and attaching to those context numbers is exactly what has been
accomplished in this thesis’ experiment. What must be understood is that digital documentation
techniques, such as the one defined in this work, cannot supplant traditional technologies because
they represent modern manners of performing the same techniques. Therefore, it is important that
we embrace such technological advances—so long as we continue to pay homage towards their
origins and make an effort to understand the technological origins of the modern digital
technologies that we apply.
6.1.1 – GUIDELINES AND SYMBOLOGIES FOR 3D ARCHAEOLOGICAL DRAWING
With that having been stated, what is necessary then is to establish a set of guidelines for 3D
archaeological drawing. The issue with drawing in 3D is that many mediums currently utilised
today are limited to two dimensions (take for example this thesis which has consistently been
attempting to demonstrate 3D objects with 2D imagery). Thus there must be some kind of format
available to archaeologists that wish to draw in 3D but also need to distribute those drawings in a
2D medium. My intention was to provide a solution that closely followed the symbology of the
Single Context Method of archaeological drawing (Museum of London Archaeological Service
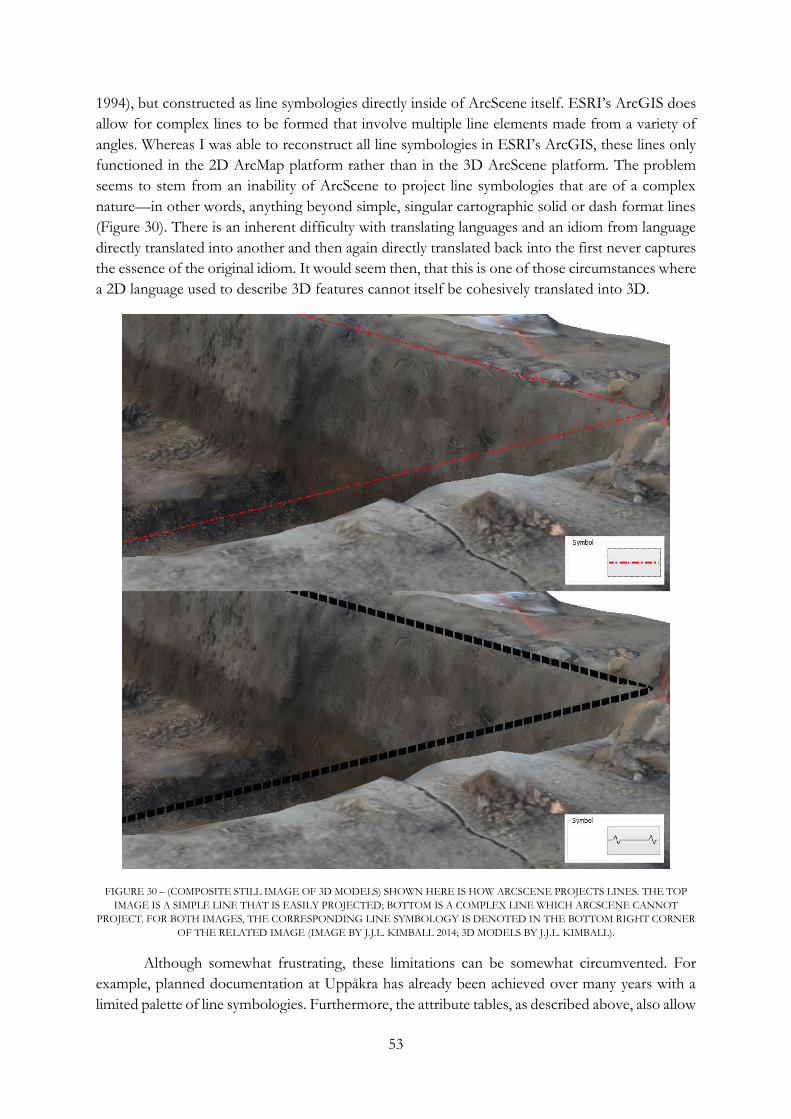
53
1994), but constructed as line symbologies directly inside of ArcScene itself. ESRI’s ArcGIS does
allow for complex lines to be formed that involve multiple line elements made from a variety of
angles. Whereas I was able to reconstruct all line symbologies in ESRI’s ArcGIS, these lines only
functioned in the 2D ArcMap platform rather than in the 3D ArcScene platform. The problem
seems to stem from an inability of ArcScene to project line symbologies that are of a complex
nature—in other words, anything beyond simple, singular cartographic solid or dash format lines
(Figure 30). There is an inherent difficulty with translating languages and an idiom from language
directly translated into another and then again directly translated back into the first never captures
the essence of the original idiom. It would seem then, that this is one of those circumstances where
a 2D language used to describe 3D features cannot itself be cohesively translated into 3D.
FIGURE 30 – (COMPOSITE STILL IMAGE OF 3D MODELS) SHOWN HERE IS HOW ARCSCENE PROJECTS LINES. THE TOP
IMAGE IS A SIMPLE LINE THAT IS EASILY PROJECTED; BOTTOM IS A COMPLEX LINE WHICH ARCSCENE CANNOT
PROJECT. FOR BOTH IMAGES, THE CORRESPONDING LINE SYMBOLOGY IS DENOTED IN THE BOTTOM RIGHT CORNER
OF THE RELATED IMAGE (IMAGE BY J.J.L. KIMBALL 2014; 3D MODELS BY J.J.L. KIMBALL).
Although somewhat frustrating, these limitations can be somewhat circumvented. For
example, planned documentation at Uppåkra has already been achieved over many years with a
limited palette of line symbologies. Furthermore, the attribute tables, as described above, also allow
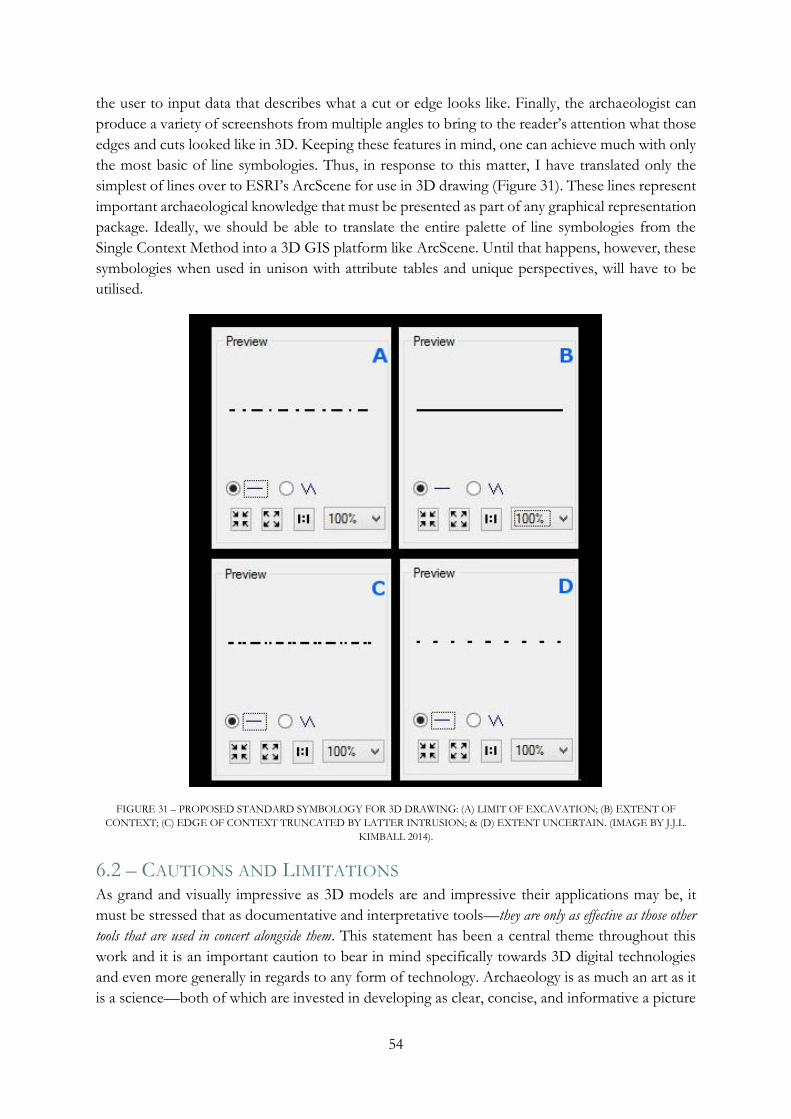
54
the user to input data that describes what a cut or edge looks like. Finally, the archaeologist can
produce a variety of screenshots from multiple angles to bring to the reader’s attention what those
edges and cuts looked like in 3D. Keeping these features in mind, one can achieve much with only
the most basic of line symbologies. Thus, in response to this matter, I have translated only the
simplest of lines over to ESRI’s ArcScene for use in 3D drawing (Figure 31). These lines represent
important archaeological knowledge that must be presented as part of any graphical representation
package. Ideally, we should be able to translate the entire palette of line symbologies from the
Single Context Method into a 3D GIS platform like ArcScene. Until that happens, however, these
symbologies when used in unison with attribute tables and unique perspectives, will have to be
utilised.
FIGURE 31 – PROPOSED STANDARD SYMBOLOGY FOR 3D DRAWING: (A) LIMIT OF EXCAVATION; (B) EXTENT OF
CONTEXT; (C) EDGE OF CONTEXT TRUNCATED BY LATTER INTRUSION; & (D) EXTENT UNCERTAIN. (IMAGE BY J.J.L.
KIMBALL 2014).
6.2 – CAUTIONS AND LIMITATIONS As grand and visually impressive as 3D models are and impressive their applications may be, it
must be stressed that as documentative and interpretative tools—they are only as effective as those other
tools that are used in concert alongside them. This statement has been a central theme throughout this
work and it is an important caution to bear in mind specifically towards 3D digital technologies
and even more generally in regards to any form of technology. Archaeology is as much an art as it
is a science—both of which are invested in developing as clear, concise, and informative a picture
55
as possible—and archaeologists accomplish this by using a variety of tools to gather a number of
perspectives that together help to enrich our understanding of the past. In this sense, archaeology
may considered to be more akin to a craft skill (Edgeworth 2006, p. 77). This concept can be
illustrated with the experiences garnered throughout the writing process of this thesis.
At the beginning, before I had access to the formal archaeological site report or the
excavation GIS5, I was restricted to the photographs and the 3D models derived through MSR
from those photographs. When I started to experiment with my drawings techniques in ArcGIS,
I quickly realised that I could identify archaeological contexts and features—but had absolutely no
idea, at least beyond speculation based on experience, what they may be and how they could have
been related. Furthermore, I had no way of knowing whether there were any ‘invisible’ contexts—
those that are not so apparent with the eye, but are very much so ‘felt’ with the trowel (since 3D
models are visual representations, drawing a context where the quality of the soil was ‘felt’ to be
dramatically different than the surrounding soil is impossible without documentation or personally
experiencing the excavation).
Fortunately, I was granted access to all the information I needed, however this experience
has influenced me to share this caution about 3D—or for that matter, any other—documentative
technology. Such technologies, however powerful they may be, are only useful when operated in
concert with other documentation formats. 3D models and the ability to draw in 3D upon those
models represents only one manner in which to study the archaeological excavation—it enriches
other perspectives but is also itself enriched by other perspectives. Another point to stress is one
discussed in the subsection immediately above: these techniques are also constricted by the
knowledge of the user. Therefore such documentation methodologies must absolutely be applied
whenever possible by those who are actually in the field performing the excavations. The
archaeologist who digs a specific trench has an intimate knowledge that is accessible only by
her/him. While a GIS technician can undoubtedly make such 3D drawings and connect them into
the database, the archaeologist that possess that intimate knowledge might be able to do so more
exactly or more descriptively because of that knowledge.
There many also be some concern regarding the nature behind the act of drawing in 3D
over top of 3D models—that this process is itself purely interpretative rather than observational.
The issue therefore is that, as an interpretative medium, 3D drawing cannot be a form of objective
documentation. There is of course a level of truth to the above apprehension. What must be kept
in mind however, is that archaeologists are constantly and actively interpreting things that diverge
from a perceived norm. This exemplifies exactly what Hodder has argued: that the act of
excavation is itself the act of interpretation (1999, pp. 83). Each excavation is unique (e.g. the
archaeology itself is different, what resources are available, the level of urgency to excavate, etc.).
Archaeologists therefore must pose appropriate questions and goals for each excavation and
determine what methodologies will produce the best results. This is reflected in documentation
methodology where archaeologists actively choose—or interpret—the moment when to engage in
5 I would like to stress that I intend absolutely no disrespect to the excavation leaders, my supervisor, or anyone else with access to the archaeological documentation from Uppåkra. These individuals were accommodating and extremely generous in providing me access to any and all of the materials I required or, at the very least, guided me to an individual who had access. My intentions with this paragraph have been to demonstrate a potential, but very serious, limitation to the technologies I have used and techniques I have developed for this thesis.
56
record-making and through what technology that record is accomplished. This problem resonates with
the problem that Hodder notes, that archaeologists too readily refuse to acknowledge that the
practice of archaeology—including the act of documentation—is theoretical and therefore,
through design and perspective, it is also interpretative (1999, pp. 81-82).
The above paragraph highlights an important discussion in archaeology today where
archaeological data is coming under scrutiny to determine whether it is objective or constructive.
Unfortunately, this is an issue that far surpasses what the scope this thesis is capable of achieving.
However it is important to take a stance on the matter. Perhaps it is most useful to seek a solution
by understanding the definition of a document, which is defined by the Oxford Dictionary of English
as “a piece of written, printed, or electronic matter that provides information or evidence or that serves as
an official record” [emphasis mine] (Stevenson 2010). Archaeologists, over the course of the
excavation, are constantly producing such documentation that can be argued as being more or less
affected by interpretation. Photo-realistic 3D models are a ‘real’ representation of the archaeology
uncovered while a 3D drawing is more of a representation of what the archaeologist has deemed
as important. While there may be a clear distinction between the two formats here, what is most
important to recognise is that both formats are capturing, containing, and displaying data that has
been deemed as important. It is therefore arguable that 3D drawings can and should be considered
as a valid form of documentation that can enrich the understanding of an archaeological site during
and after the excavation process.
Moving on, there is a particularly rather inconvenient limitation of using ESRI’s ArcGIS
for this methodology that became apparent during the experiment—there is no easy way to view
the 3D archaeological drawings in 3D outside of ArcGIS. It is possible to export specific
perspectives in popular 2D file formats (such as PDF, JPG, and TIFF), but the only way to export
the 3D drawings as 3D representations is through a vector format called WRL. This is problematic
for two reasons: first is that specialist software is needed to visualise this file format and even when
specialist software is downloaded, the visualisation of the data through the WRL file is difficult to
‘explore’ on-screen; and second is that as a vector file format, WRL does not allow for the
visualisation of the raster components of the 3D model. Thus, WRL is an inefficient file format
for the exportation of these 3D models and their associated data. Whether this issue is being
addressed by ESRI is unknown to the author, as is whether other GISs with 3D visualisation
capabilities are able to perform the exportation of 3D documents. Considering that the PDF file
format has the capability to visualise 3D data, it is my hope that ESRI will in the future include an
export option to do so. In the meantime, future endeavours to uncover a manner of visualising
these data are an absolute requirement for the dissemination value of this methodology. Until then,
the only feasible manner of disseminating this information is through ArcGIS itself which carries
with it obvious negative factors (eg. especially price of the software itself and the weight (in GB)
of the 3D document).
An even more frustrating issue with ESRI’s ArcScene was the difficulties that were
experienced by the operator when attempting to draw upon a vertically oriented surface. As noted
in Section 5.6 of this work, at best there was some discrepancy with how shapefile nodes were
placed upon a vertical surface. At worst however, was concerning how polygons were projected
where a single polygon (intended to be one polygon) was broken apart into sometimes incoherent
structures barely reminiscent of the pattern of nodes laid down (Figure 32; cf. also Figure 18,
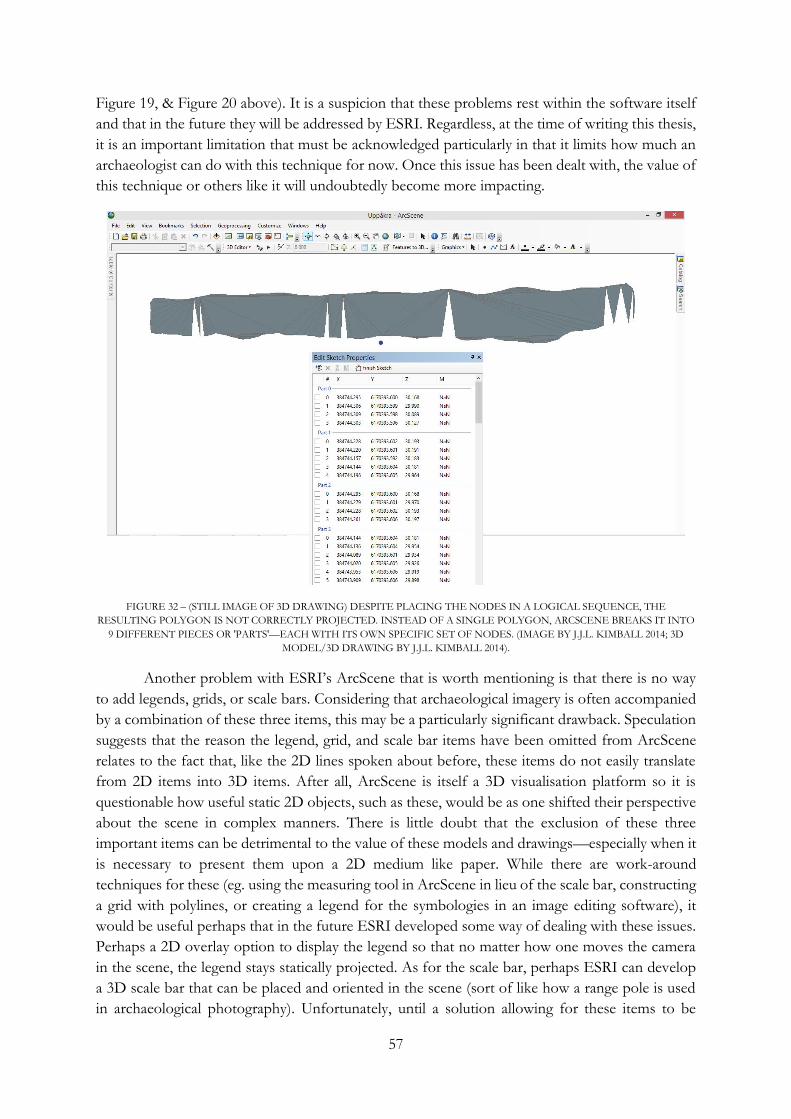
57
Figure 19, & Figure 20 above). It is a suspicion that these problems rest within the software itself
and that in the future they will be addressed by ESRI. Regardless, at the time of writing this thesis,
it is an important limitation that must be acknowledged particularly in that it limits how much an
archaeologist can do with this technique for now. Once this issue has been dealt with, the value of
this technique or others like it will undoubtedly become more impacting.
FIGURE 32 – (STILL IMAGE OF 3D DRAWING) DESPITE PLACING THE NODES IN A LOGICAL SEQUENCE, THE
RESULTING POLYGON IS NOT CORRECTLY PROJECTED. INSTEAD OF A SINGLE POLYGON, ARCSCENE BREAKS IT INTO
9 DIFFERENT PIECES OR 'PARTS'—EACH WITH ITS OWN SPECIFIC SET OF NODES. (IMAGE BY J.J.L. KIMBALL 2014; 3D
MODEL/3D DRAWING BY J.J.L. KIMBALL 2014).
Another problem with ESRI’s ArcScene that is worth mentioning is that there is no way
to add legends, grids, or scale bars. Considering that archaeological imagery is often accompanied
by a combination of these three items, this may be a particularly significant drawback. Speculation
suggests that the reason the legend, grid, and scale bar items have been omitted from ArcScene
relates to the fact that, like the 2D lines spoken about before, these items do not easily translate
from 2D items into 3D items. After all, ArcScene is itself a 3D visualisation platform so it is
questionable how useful static 2D objects, such as these, would be as one shifted their perspective
about the scene in complex manners. There is little doubt that the exclusion of these three
important items can be detrimental to the value of these models and drawings—especially when it
is necessary to present them upon a 2D medium like paper. While there are work-around
techniques for these (eg. using the measuring tool in ArcScene in lieu of the scale bar, constructing
a grid with polylines, or creating a legend for the symbologies in an image editing software), it
would be useful perhaps that in the future ESRI developed some way of dealing with these issues.
Perhaps a 2D overlay option to display the legend so that no matter how one moves the camera
in the scene, the legend stays statically projected. As for the scale bar, perhaps ESRI can develop
a 3D scale bar that can be placed and oriented in the scene (sort of like how a range pole is used
in archaeological photography). Unfortunately, until a solution allowing for these items to be

58
projected within ArcScene is found, archaeologists will either have to make do without or
construct their own solutions.
It is my sincerest wish that the methodology developed for this thesis is considered by
many of the archaeological sub-disciplines. However, I must strongly advise that for some
archaeological applications—in particular for example, buildings archaeology—where MSR might
not be a feasible solution for the production of 3D models. Unfortunately, as my own experiences
have shown, the quality of MSR drops significantly the further away that the subject of acquisition
is. Thus buildings, or more specifically the upper limits of walls and ceilings may be very difficult
to capture accurately via MSR techniques. It is best that laser scanners be utilised to accomplish
the development of a dense point cloud to allow for the construction of 3D models. However,
laser scanners have their own inherent problems. Most problematic is that, while laser scanners do
have a digital camera to assist in the production of photo-realistic textures for the model, these
digital cameras pale in comparison to DSLRs. The difference in quality is most pronounced when
the subject is poorly lit (for example, a poorly-lit interior of a building such as a cathedral). The
work around for this is to conduct two campaigns in unison: one aiming at producing MSR data
and the other at producing laser scanner data. One can then combine the two typologies of data
in order to produce a 3D model with extremely high-quality geometry and photo-realistic textures.
These 3D models can then be input into GIS and used to perform 3D archaeological drawings in
the manner suggested by this work.
I would now like to bring to the reader’s attention to two final points for contemplation.
First is that archaeologists must strive to remember that these 3D technologies produce very
persuasive representations of the world around us. A famous quote, coined by Alfred Korzybski
and analysed by Gregory Bateson, is of particular relevance: the map is not the territory mapped, and the
name is not the thing named (Bateson 1979, p. 30). Consequentially, this can be further expanded to
state that the photograph is not the subject photographed and the 3D model is not the thing modelled.
It is therefore a serious oversight to believe that these ways of representing our perceived world
are anything more than representations. After all, it is us ourselves that decide (interpret) when,
why, what of, and how we capture such representations. They must therefore be treated
accordingly. Second is that our institutions of higher learning that are responsible for educating
the next generation of archaeologists must be active in teaching students not only these
technologies but the foundations upon which they are built. In this manner, it is possible today to
ensure a higher quality of archaeological documentation in the future.
If anything is to be taken away from these cautions and limitations it is that: 1) 3D digital
documentation technologies cannot be used as the sole documentary method—they must be used
in unison with other formats to ensure a rich, detailed, and (most importantly) archaeologically-
relevant dataset can be achieved from the excavation; and 2) whenever possible, the act of drawing
upon the 3D models, must be undertaken by the archaeologist that was involved with the process
of excavation—as only they, through their direct and developed interpretations, can realise the
most accurate interpretation of the archaeology represented on in those drawings. If these two
considerations are met, then it is possible to ensure that these techniques and technologies are
utilised in the most appropriate manner for archaeological investigation.
59
6.3 – CONCERNS REGARDING THE PHOTOGRAPHIC PROCESS Before the close of this thesis it is important to discuss some concerns regarding the current
photographic process within archaeological practice—specifically for application within the MSR
technique. In response to the digitisation of camera technologies, archaeologists should consider
re-evaluating the process and guidelines for archaeological photography. While discussing the
entire matter is well beyond the scope of this thesis, an attempt has been made to briefly address
the photographic process as it is conducted in the MSR technique. Other researchers have already
discussed the need for careful photography when utilising MSR and MSR-like approaches for the
creation of 3D models. While I respect much of what has been emphasised by these researchers,
I want to suggest some amendments to the current photographic method as I believe there is room
for improvement. It has been rightly cautioned that the quality of model output from the MSR
technique is dependent upon the quality of data input: in other words, impressive visual 3D
representations require high-quality, high-resolution, and very sharp (in-focus) photographs.
Chapman (2009, p. 54) points out that GIS databases are only as good as the data input—the same
holds true for 3D digital models produced through MSR. The following paragraphs have addressed
some of the issues that must be considered regarding the photographic process in archaeology.
Prior to any photographs being captured of the site, archaeologists must first pay close
attention to the preparation of both the site itself and the archaeological surfaces within. By design,
photographs record all visible entities that are in their field of view—this often leads to clutter and
a weakening of the message that the photographer is trying to convey through her/his photograph.
Thus, it is commonly stated that photography is the art of exclusion. The same holds for archaeological
photography in that care must be taken to remove items that are non-essential to the photographic
record of the site (eg. buckets, shovels, trowels, measuring sticks, kneepads, etc.) (Fisher 2009, p.
13). However in respect to photography aimed at the development of 3D models, it is just as
important to (temporarily) remove other items such as strings that delineate boundaries, small
finds markers that protrude from the surface being photographed, and even trench markers. All
of these items lead towards cluttering the resulting digital model and can even negatively impact
the end product (Figure 33 & Figure 34), therefore it is important to remove them whenever
possible. Another task that must be accomplished is that the archaeological surfaces must be
properly prepared for documentation. This involves trowelling away a very thin layer off the
surface. Such a procedure can be termed a ‘photo-clean’ of the surface and while there are
variations in method depending on the material encountered, all methods are aimed at clearing
away anything that obstructs (eg. loose spoil, boot prints, etc.) the underlying archaeology (Figure
35). A proper cleaning of the surface also has the effect of ‘freshening’ the site, making some
context extents appear crisper and producing a more vivid distinction between colours (Barker
1993, pp. 108-109; Roskams 2001, pp. 126-128; Fisher 2009, p. 13). It is crucial that the site be
properly prepared for documentation in these manners. Not only does it contribute to the
production of very crisp archaeological photographs, but these photographs in turn will result in
excellent textures for 3D models. While these two benefits should be persuasive enough, it is also
pertinent to mention that models with crisp textures facilitates the process of developing 3D
archaeological drawings—the more clearly the archaeologist can see the features, the more accurate
and efficient she/he will be at producing the drawing.
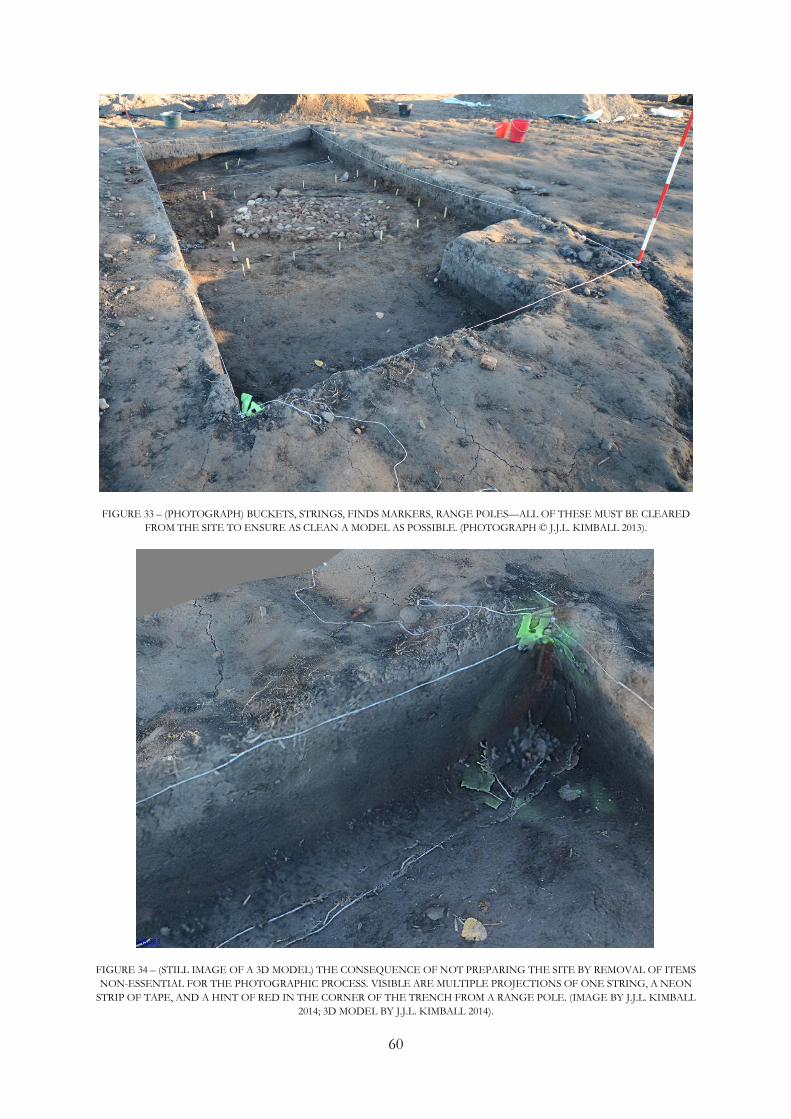
60
FIGURE 33 – (PHOTOGRAPH) BUCKETS, STRINGS, FINDS MARKERS, RANGE POLES—ALL OF THESE MUST BE CLEARED
FROM THE SITE TO ENSURE AS CLEAN A MODEL AS POSSIBLE. (PHOTOGRAPH © J.J.L. KIMBALL 2013).
FIGURE 34 – (STILL IMAGE OF A 3D MODEL) THE CONSEQUENCE OF NOT PREPARING THE SITE BY REMOVAL OF ITEMS
NON-ESSENTIAL FOR THE PHOTOGRAPHIC PROCESS. VISIBLE ARE MULTIPLE PROJECTIONS OF ONE STRING, A NEON
STRIP OF TAPE, AND A HINT OF RED IN THE CORNER OF THE TRENCH FROM A RANGE POLE. (IMAGE BY J.J.L. KIMBALL
2014; 3D MODEL BY J.J.L. KIMBALL 2014).

61
Another consideration towards site photography is concerning photographic platforms.
Any photographer will teach that the most sure-fire way to ensure the capture of sharp images is
by stabilising the camera on a sturdy base, such as a tripod. The methodology suggested by many
of the research papers
however, omits any mention
of a stabilisation platform for
the camera—instead opting
for the archaeologist to hand-
hold the camera and move
around the subject.
Understandably, in some
circumstances, this may be the
only option; especially when
the lack of time is a particular
factor of concern. There are
two advantages offered by
using a tripod apart from
stabilisation. First is that, as a
stabilisation tool, the tripod
allows the photographer to
utilise slower shutter speeds
and narrower apertures.
While a wide-open aperture
lets more light into the camera sensor, thereby allowing for faster shutter speeds (and possibly
justifying the methodology to handhold the camera), the downside is that wide-open apertures
result in photographs with shallow depths of field. With a shallow depth of field, the plane of focus
becomes apparent much more quickly in that objects to the fore and backgrounds appear out of
focus closer to the plane of focus. This may compound the model construction process, especially
in items that are captured in close proximity to the camera, by requiring more photos to be
captured with a greater percentage of overlap.
Second is that the tripod itself slows down the photographer—the act of moving the tripod
about forces the photographer to experience the scene—think about the subject—and thus plan
the best course of action. Handholding the camera might be quicker, but there is a sense of
hurriedness that by wielding the camera in this manner that may result in the experienced
photographer from getting jittery and moving ever so slightly during the photo captures. Such
movement can prove later to be disastrous for the development of the 3D model, particularly if
the opportunity for acquisition has passed. Further weight for the use of a tripod to help the
archaeologist slow down and think about the site, need not be sought any further than the
cautionary words stating that photography takes the archaeologist fundamentally away from the
archaeology—it can represent a method that ensures and rewards one through rapid capture of
the site without paying attention to what is being captured and why. The tripod may help, with the
even more rapid-fire state of technology today, to help realise this caution in practice.
FIGURE 35 – (STILL IMAGE OF A 3D MODEL) THE BLUE CIRCLE HIGHLIGHTS A
PARTIAL BOOT PRINT THAT IS FOREVER IMMORTALISED IN THIS 3D DIGITAL
MODEL. (IMAGE BY J.J.L. KIMBALL 2014; 3D MODEL BY N. DELL’UNTO).

62
Apart from using a tripod there must also be an awareness towards how the digital camera
works. To frequent do we depend solely on our technology working and producing what we expect
it to. As preached about above, we must understand how we can achieve the results we want—we
must pay homage to the traditional technologies and the methods used to achieve the desired
results. One of the fundamental tenets of the MSR technique is that, like the aim of drawing
features or photographing them, it represents our interpretation that this state of the site is worth
documenting. In other words, we chose to document the archaeology at this particular moment
because of something perceived as being archaeologically-relevant. Thereby it is best to capture
the site as we actively see it, meaning we must capture it in the photographic conditions that are
present at that very moment (eg. lightning, moisture level of the soil, etc.). It is advocated that the
photographs must not be edited as doing so may misrepresent how the site was actually seen.
There is an issue with this logic. Experience with photographic image formats suggests
that, if these files were to be utilised in the time frame of the excavation, compressed image formats
like JPG have likely been utilised over non-compressed, unadulterated RAW forms. The issue with
the JPG format is that many cameras, including DSLRs, are programmed to edit the JPGs image
when they are captured. In this manner, the camera—not the photographer—is altering certain
photographic properties such as the values of contrast and colour saturation. Photography, no
matter the goal, is a type of archaeological documentation and it must therefore be conducted in
such a manner. Allowing the camera to oversaturate and/or increase the contrast beyond what
was actually seen only does a disservice to the documentation process. Archaeologists must return
to the care that was exercised when photography was limited by film. It is now too easy and
common practice to assume the camera will do all of the work.
The best method is therefore for the photographer to edit her/his own photographs. Since
JPG both edits and compresses the image, a different format must be utilised: RAW. The RAW
format for images functions closest to how film operated in that it is the most unaltered version
of the photograph. Like film, the RAW photograph must be developed by a software like
Photoshop or GIMP. The archaeologist has complete control over the editing process and
therefore can ensure that only the closest approximation in colour saturation and contrast is
applied to the photograph. By utilising a software like Adobe Photoshop Lightroom these edits
are easy to achieve and, as is the nature of MSR photography, groups of photographs needing the
same modifications can be done all at once. This expedites the process dramatically. All of these
software furthermore allow for the RAW files to be exported controllably into a more storage-
friendly format such as JPG. One final comment should be made regarding the RAW and JPG
formats: in some circumstances, especially in the methodologies above that advocate for the
application of MSR techniques within the timeframe of the excavation, processing the RAW files
might not be feasible. A solution however, is that most DSLR cameras allow for the simultaneous
capture of RAW and JPG formats at the same time. While this does take up more memory card
space, it does offer the opportunity for the archaeologist to develop a 3D model for immediate
application when needed with the ability of developing something closer to reality later (for
publication of museum display for example).
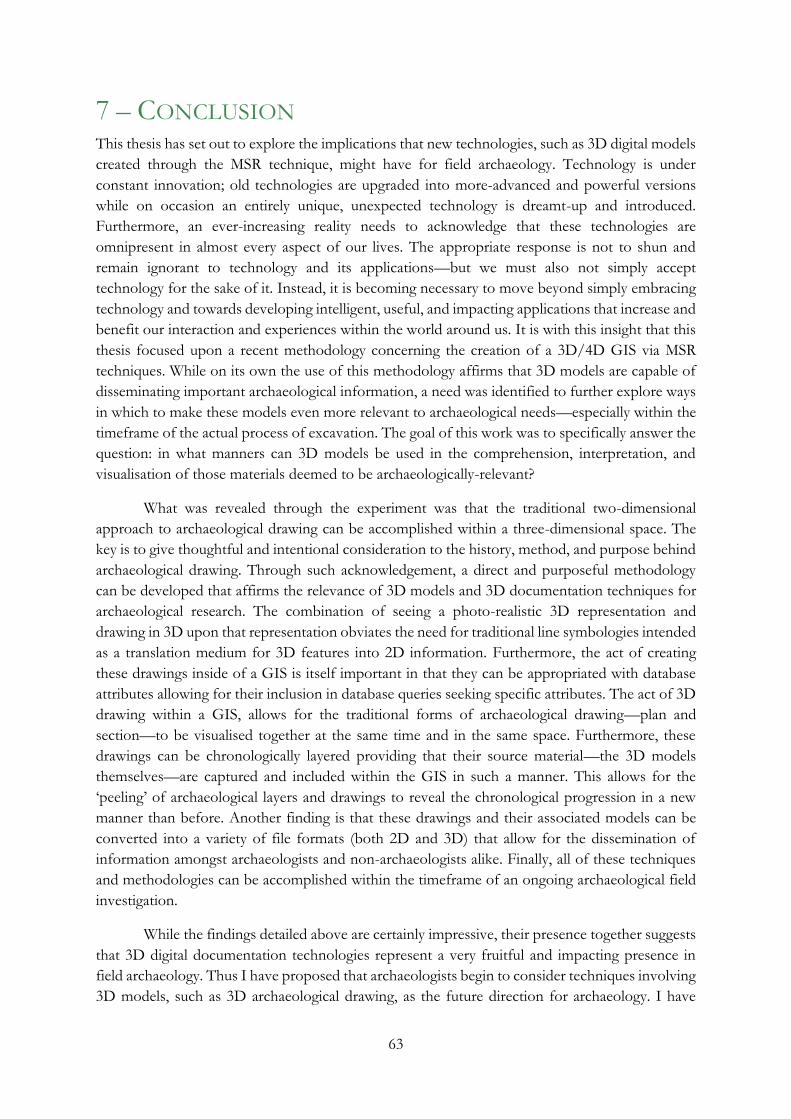
63
7 – CONCLUSION This thesis has set out to explore the implications that new technologies, such as 3D digital models
created through the MSR technique, might have for field archaeology. Technology is under
constant innovation; old technologies are upgraded into more-advanced and powerful versions
while on occasion an entirely unique, unexpected technology is dreamt-up and introduced.
Furthermore, an ever-increasing reality needs to acknowledge that these technologies are
omnipresent in almost every aspect of our lives. The appropriate response is not to shun and
remain ignorant to technology and its applications—but we must also not simply accept
technology for the sake of it. Instead, it is becoming necessary to move beyond simply embracing
technology and towards developing intelligent, useful, and impacting applications that increase and
benefit our interaction and experiences within the world around us. It is with this insight that this
thesis focused upon a recent methodology concerning the creation of a 3D/4D GIS via MSR
techniques. While on its own the use of this methodology affirms that 3D models are capable of
disseminating important archaeological information, a need was identified to further explore ways
in which to make these models even more relevant to archaeological needs—especially within the
timeframe of the actual process of excavation. The goal of this work was to specifically answer the
question: in what manners can 3D models be used in the comprehension, interpretation, and
visualisation of those materials deemed to be archaeologically-relevant?
What was revealed through the experiment was that the traditional two-dimensional
approach to archaeological drawing can be accomplished within a three-dimensional space. The
key is to give thoughtful and intentional consideration to the history, method, and purpose behind
archaeological drawing. Through such acknowledgement, a direct and purposeful methodology
can be developed that affirms the relevance of 3D models and 3D documentation techniques for
archaeological research. The combination of seeing a photo-realistic 3D representation and
drawing in 3D upon that representation obviates the need for traditional line symbologies intended
as a translation medium for 3D features into 2D information. Furthermore, the act of creating
these drawings inside of a GIS is itself important in that they can be appropriated with database
attributes allowing for their inclusion in database queries seeking specific attributes. The act of 3D
drawing within a GIS, allows for the traditional forms of archaeological drawing—plan and
section—to be visualised together at the same time and in the same space. Furthermore, these
drawings can be chronologically layered providing that their source material—the 3D models
themselves—are captured and included within the GIS in such a manner. This allows for the
‘peeling’ of archaeological layers and drawings to reveal the chronological progression in a new
manner than before. Another finding is that these drawings and their associated models can be
converted into a variety of file formats (both 2D and 3D) that allow for the dissemination of
information amongst archaeologists and non-archaeologists alike. Finally, all of these techniques
and methodologies can be accomplished within the timeframe of an ongoing archaeological field
investigation.
While the findings detailed above are certainly impressive, their presence together suggests
that 3D digital documentation technologies represent a very fruitful and impacting presence in
field archaeology. Thus I have proposed that archaeologists begin to consider techniques involving
3D models, such as 3D archaeological drawing, as the future direction for archaeology. I have

64
suggested in 6.1 - Statement of Perceived Impact that those typologies of approaches should be a step
towards updating the archaeological method of drawing. By this, I do not advocate that 3D
drawing should supplant the traditional methodology, but instead that this technique should be
acknowledged as the technological evolution of the archaeological drawing. By conducting such
techniques already in the 3D digital medium, we are not only engaging more deeply with the
omnipresence of technology but we are documenting directly in the format that we actively
experience archaeology in the real world: we are engaging 3D problems with 3D solutions. Archaeologists,
as capable of advocating change for present and future archaeological endeavours, must begin to
concern themselves with the modernisation of the archaeological discipline—the embracement
and continual development of 3D models and their associated techniques is an example of one
potential direction that may contain many fruitful prospects for such an undertaking.
Yet there are limitations that must be kept ever-present in the mind. 3D models and 3D
drawing cannot be used as the only form of documentation. It is necessary to remember that these
documentation formats are part of an interconnected and interdependent web of many
documentation types that as a whole strengthen each other and create a more vivid picture of the
past. As such, it must be ensured that this technology is used by the most qualified individual—
the archaeologist that actually performed the excavation. Only she/he holds the story of how the
excavation process progressed. If they are not allowed to document their interpretations of the
archaeology through the methodologies defined above, then the documentation itself suffers in
quality. Finally, it is important to remember that the 3D models themselves are not the subject
modelled—in other words, models are not ‘truths’. 3D models are extremely powerful; powerful
to the point that they are persuasive and enchanting. It must always be remembered that they are
interpretations and relegated within the role of helping to understand archaeological knowledge as
opposed to dictating it.
When utilised properly however, 3D replicas of the site offer a plethora of uses. While I
have strove to produce as full and thoughtful of a methodology as possible, there will always be
room for improvement. Future research can definitely be aimed towards refining the technique
above or discovering alternates methods altogether. Another direction of interested would be to
explore further other applications that 3D models may have for archaeological researcher. It is,
after all, worthwhile to define what 3D models are and are not capable of. Only through such
scrutiny can their true value be realised and their proper place defined within archaeological
research.
What is important to take away from this work is that the technologies and methodologies
as described above are all capable of impacting archaeological research within the timeframe of the
process of excavation in profound manners. Archaeologists do a disservice to the discipline by clinging
stubbornly to technologies of the past. Yet the same can be stated for those archaeologists who
embrace modern technology for the sake of embracing it. Instead, what archaeologists must strive
for is a way to acknowledge the history of archaeological practice as a means to justify and cement
the adoption of new technology and the upgrading or modernising of traditional technologies.
Through such actions, we ensure that the act of archaeological investigation is maintained and kept
efficient, but it also enables us to upgrade the archaeological toolkit with more sophisticated tools
that not only allow for us to develop a larger and more clear picture of the past but, more
65
importantly, permit us to arrive at new and exciting questions that ensure the continuation and
future evolution of archaeological endeavour.
8 – ACKNOWLEDGMENTS I would like to take a brief moment to extend my appreciation towards my supervisor, Nicolo
Dell’Unto, for the support, guidance, and patience throughout the past two years, and for granting
me access to the models and data he collected himself from the Uppåkra excavations. To Jan Apel,
thank you first and foremost for allowing me use to the excavation’s drawings and records, but
also for the feedback and suggested future considerations regarding this work. To Carolina Larsson
and Stefan Lindgren, I would like to express my thanks for your support in all technological
matters—your assistance throughout the year with various quirks and problems relating to 3D
models has been extremely helpful. Thank you also to Birgitta Piltz Williams for taking the time
to accommodate both my photo and geospatial acquisition campaigns during a very busy dig
season in 2013.
To all of the professors and instructors whom I have had the opportunity of learning from
over these past two years, you have my sincerest gratitude—there is no doubt in my mind that my
colleagues and I have benefitted immensely from your willingness to share with us your collective
knowledge and experiences.
Last but certainly not least, to all my fellow colleagues, friends, mentors, and family
members: you are most definitely not forgotten nor unappreciated. On the contrary, the largest
and most resounding thanks must go to you, for if not for you collective support, patience, advice,
wisdom, and laughter, this work would not have been possible.
—— Tack så mycket, kiitos paljon, thank you! ——

66
9 – REFERENCES
9.1 – LITERARY SOURCES Apel, J. & Piltz Williams, B. (2014). Uppåkra 2013. Institutionen för Arkeologi och Antikens
Historia: Sweden.
Backhouse, P. (2006). Drowning in data? Digital data in a British contracting unit. In T. L. Evans
& P. Daly (eds.) Digital Archaeology: bridging method and theory. Routledge: United Kingdom.
pp. 43-49.
Balzani, M., Santopuoli, N., Grieco, A., & Zaltron, N. (2004). Laser Scanner 3D Survey in
Archaeological Field: the Forum of Pompeii. International Conference on Remote Sensing
Archaeology, pp. 169-175.
Barker, P. (1993). Techniques of Archaeological Excavation. Routledge: United Kingdom.
Callieri, M., Dell’Unto, N., Dellepiane, M., Scopigno, R., Soderberg, B., & Larsson, L. (2011).
Documentation and Interpretation of an Archaeological Excavation: an experience with
Dense Stereo Reconstruction tools. The 12th International Symposium on Virtual Reality,
Archaeology and Cultural Heritage VAST.
Campana, S. (2014). 3D Recording and Modelling in Archaeology and Cultural Heritage: Theory
and best practices. In F. Remondino & S. Campana (eds.) 3D Recording and Modelling in
Archaeology and Cultural Heritage: Theory and best practices. BAR International Series 2598. pp.
7-12.
Cianciarulo, D. & Guerra, F. (2007). Digital Recording in Archaeological Excavation Using
Tablet PC. XXI International CIPA Symposium, 01-06 October, Athens, Greece.
Conolly, J. & Lake, M. (2006). Geographical Information Systems in Archaeology. Cambridge University
Press: United Kingdom.
Cummer, W. W. (1974). Photogrammetry at Ayia Irini on Keos. Journal of Field Archaeology, 1
(3/4), pp. 385-387.
De Reu, J., De Smedt, P., Herremans, D., Van Meirvenne, M., Laloo, P., & De Clercq, W.
(2014). On introducing an image-based 3D reconstruction method in archaeological
excavation practice. Journal of Archaeological Science, 41, pp. 251-262.
Dellepiane, M., Dell’Unto, N., Callieri, M., Lindgren, S., & Scopigno, R. (2013). Archeological
excavation monitoring using dense stereo matching techniques. Journal of Cultural Heritage,
14 (3), pp. 201-210.
Dell’Unto, N. (2014). The Use of 3D Models for Intra-Site Investigation in Archaeology. In F.
Remondino & S. Campana (eds.) 3D Recording and Modelling in Archaeology and Cultural
Heritage: Theory and best practices. BAR International Series 2598. pp. 151-158.
Doneus, M. & Neubauer, W. (2005). 3D Laser Scanners on Archaeological Excavations. CIPA
2005 XX International Symposium.

67
Drewitt, P. L. (2011). Field Archaeology: An Introduction. 2nd Edition. Routledge: United Kingdom.
Ducke, B., Score, D., & Reeves, J. (2011). Multiview 3D reconstruction of the archaeological site
at Weymouth from image series. Computers & Graphics, 35, pp. 375-382.
Edgeworth, M. (2006). Acts of Discovery: An Ethnography of Archaeological Practice. Doctoral Thesis.
University of Durham: United Kindom.
Eisenbeiss, H. (2009). A Model Helicopter Over Pinchango Alto - Comparison of Terrestrial
Laser Scanning and Aerial Photogrammetry. In M. Reindel & G. A. Wagner (eds.) New
Technologies for Archaeology: Multidisciplinary Investigations in Palpa and Nasca, Peru. Springer:
United Kingdom.
Fisher, L. J. (2009). Photography for Archaeologists Part I : Site specific record. BAJR Practical
Guide Series, Guide 25. British Archaeological Jobs and Resources: United Kingdom.
Fitzjohn, M. (2011). Viewing places: GIS applications for examining the perception of space in
the mountains of Sicily. World Archaeology, 39 (1), pp. 36-50.
Forte, M. (2014). Virtual Reality, Cyberarchaeology, Teleimmersive Archaeology. In F.
Remondino & S. Campana (eds.) 3D Recording and Modelling in Archaeology and Cultural
Heritage: Theory and best practices. BAR International Series 2598. pp. 115-129.
Forte, M., Dell’Unto, N., Issavia, J., Onsureza, L., & Lercaria, N. (2012). 3D Archaeology at
Çatalhöyük. International Journal of Heritage in the Digital Era, 1 (3), pp. 351-378.
Fussell, A. (1982). Terrestrial photogrammetry in archaeology. World Archaeology, 14 (2), pp. 157-
172.
Fux, P., Sauerbier, M., Kersten, T., Linstaedt, M., & Eisenbeiss, H. (2009). Perspectives and
Constrasts: Documentation and Interpretation of the Petroglyphs of Chichictara, Using
Terrestrial Laser Scanning and Image-Based 3D Modeling. In M. Reindel & G. A. Wagner
(eds.) New Technologies for Archaeology: Multidisciplinary Investigations in Palpa and Nasca, Peru.
Springer: United Kingdom. pp. 359-377.
Guidi, G. (2014). Terrestrial Optical Active Sensors—Theory and Applications. In F.
Remondino & S. Campana (eds.) 3D Recording and Modelling in Archaeology and Cultural
Heritage: Theory and best practices. BAR International Series 2598. pp. 39-62.
Harris, E. C. (1997). Principles of archaeological stratigraphy. 2nd Edition. Academic Press: United
Kingdom.
Hermon, S. & Nikodem, J. (2008). 3D Modelling as a Scientific Research Tool in Archaeology.
In A. Posluschny, K. Lambers, & I. Herzog (eds.) Layers of Perception. Proceedings of the 35th
International Conference on Computer Applications and Quantitative Methods in Archaeology (CAA),
Berlin, Germany, April 2-6 2007 (Kolloquien zur Vor- und Frühgeschichte, Vol 10). pp. 1-6.
Hodder, I. (1999). The Archaeological Process: An Introduction. Blackwell: United Kingdom.

68
Hodder, I. (ed.) (2000). Towards a reflexive method in archaeology: the example at Çatalhöyük. McDonald
Institute for Archaeological Research: United Kingdom.
Jauregui, L. M. & Jauregui, M. (2000). Terrestrial Photogrammetry Applied to Architectural
Restoration and Archaeological Surveys. International Archives of Photogrammetry and Remote
Sensing, XXXIII (B5), pp. 401-405.
Khorram, S., Nelson, S. A. C., Kock, F. H., van der Wiele, C. F. (2012). Remote Sensing. Springer:
United Kingdom.
Koutsoudis, A., Vidmar, B., Ioannakis, G., Arnaoutoglou, F., Pavlidis, G., & Chamzas, C. (2014).
Multi-image 3D reconstruction data evaluation. Journal of Cultural Heritage, 15, pp. 73-79.
Kraus, K. (2007). Photogrammetry: Geometry from Images and Laser Scans. I. Harley & S. Kyle (trans.)
2nd Edition. Walter de Gruyter GmbH & Co.: Germany.
Lagerqvist, B. & Rosvall, J. (2003). A system approach to the management of photographs and
other information sources within the conservation field. Photogrammetric Record, 18 (102),
pp. 105-130.
Larsson, L. (2007). The Iron Age ritual building at Uppåkra, southern Sweden. Antiquity, 81, pp.
11-25.
Madry, S., Cole, M., Gould, S., Resnick, B., Seibel, S., & Wilkerson, M. (2005). In M. W. Mehrer
& K. L. Wescott (eds.) GIS and Archaeological Site Location Modeling, Taylor and Francis:
United Kingdom. pp. 292-309.
Mccoy, M. D., Mills, P. R., Lundblah, S., Rieth, T., Kahn, J. G., & Gard, R. (2011). A cost
surface model of volcanic glass quarrying and exchange in Hawai'i. Journal of Archaeological
Science, 38 (10), pp. 2547-2560.
Museum of London Archaeological Service. (1994). Archaeological Site Manual. 3rd Edition. RAS
Printers Ltd.: United Kingdom.
Muzzupappa, M., Gallo, A., Spadafora, F., Manfredi, F., Bruno, F., & Lamarca, A. (2013). 3D
reconstruction of an outdoor archaeological site through a multi-view stereo technique.
Digital Heritage International Congress, 1, pp. 169-176.
Nordbladh, J. (2012). The Shape of History: To give physical form to archaeological knowledge.
In O. W. Jensen (ed.) Histories of Archaeological Practices: Reflections on Methods, Strategies and
Social Organisation in Past Fieldwork. NRS tryckeri: Sweden.
Nylén, E. (1978). The recording of unexcavated finds: X‐ray photography and photogrammetry.
World Archaeology, 10 (1), pp. 88-93.
Owen, O. & Dalland, M. (1999). Scar: a Viking boat burial on Sanday, Orkney. Tuckwell: United
Kingdom.
Parcak, S. H. (2009). Satellite Remote Sensing for Archaeology. Routledge: United Kingdom.
69
Remondino, F. (2014). Photogrammetry: Theory. In F. Remondino & S. Campana (eds.) 3D
Recording and Modelling in Archaeology and Cultural Heritage: Theory and best practices. BAR
International Series 2598. pp. 65-73.
Roskams, S. (2001). Excavation. Cambridge University Press: United Kingdom.
Schowengerdt, R. A. (2007). Remote Sensing: Models and Methods for Image Processing. 3rd Edition.
Academic Press: United States of America.
Szeliski, R. (2011). Computer Visions: Algorithms and Applications. Springer: United Kingdom.
Söderberg, B., & Piltz Williams, B. (2012). Uppåkra 2011. Institutionen för Arkeologi och
Antikens Historia: Sweden.
Söderberg, B., Piltz Williams, B., & Bolander, A. (2014). Uppåkra 2012. Institutionen för
Arkeologi och Antikens Historia: Sweden.
Stevenson, A. (ed.) (2010). Oxford Dictionary of English. 3rd Edition. Oxford University Press:
United Kingdom.
Tolkien, J. R. R. (2008). The Fellowship of the Ring. Digital Reset Edition. Harper Collins: United
Kingdom
Trinks, I., Larsson, L., Gabler, M., Nau, E., Neubauer, W., Klimcyk, A., Söderberg, B., &
Thorén, H. (2013). Large-Scale Archaeological Prospection of the Iron Age Settlement Site
Uppåkra - Sweden. In W. Neubauer, I. Trinks, R. B. Salisbury, & C. Einwögerer (eds.)
Proceedings of the 10th International Conference on Archaeological Prospection Vienna, May 29th - June
2nd 2013. Austrian Academy of Sciences Press: Austria. pp. 31-34.
Veljanovski, T. & Stančič, Z. (2005). Predictive Modeling in Archaeological Location Analysis
and Archaeological Resource Management: Principles and Applications. In M. W. Mehrer
& K. L. Wescott (eds.) GIS and Archaeological Site Location Modeling. Taylor and Francis:
United Kingdom. pp. 363-379.
Verhoeven, G. (2011). Software Review: Taking Computer Vision Aloft – Archaeological Three-
dimensional Reconstructions from Aerial Photographs with Photoscan. Archaeological
Prospection. 18, pp. 67-73.
Verhoeven, G., Taelman, D., & Vermeulen, F. (2012). Computer Vision-Based Orthophoto
Mapping of Complex Archaeological Sites: The Ancient Quarry of Pitaranha (Portugal-
Spain). Archaeometry, 54 (6), pp. 1114-1129.
Wescott, K. L. (2005). Introduction. In K. L. Wescott & R. J. Brandon (eds.) Practical Applications
of GIS for Archaeologists: A Predictive Modeling Toolkit. Taylor & Francis e-Library Edition.
Taylor & Francis: United Kingdom. pp. 1-5.
Wescott, K. L. & Brandon, R. J. (eds.) (2005). Practical Applications of GIS for Archaeologists: A
Predictive Modeling Toolkit. Taylor & Francis e-Library Edition. Taylor & Francis: United
Kingdom.

70
Whitley, T. G. (2005). Predictive Modeling in a Homogeneous Environment: An Example from
the Charleston Naval Weapons Station, South Carolina. In M. W. Mehrer & K. L. Wescott
(eds.) GIS and Archaeological Site Location Modeling. Taylor and Francis: United Kingdom. pp.
326-361.
Wiseman, J. R. & El-Baz, F. (2007). Introduction. In J. R. Wiseman & F. El-Baz (eds.) Remote
Sensing in Archaeology. Springer: United States of America. pp. 1-8.
Wright, D. J., Goodchild, M. F., & Proctor, J. D. (1997). GIS: Tool or Science? Demystifying the
Persistent Ambiguity of GIS as “Tool” versus “Science”. Annals of the Association of
American Geographers, 87 (2), pp. 346-362.
Zubrow, E. B. W. (2006). Digital Archaeology: A historical context. In T. L. Evans & P. Daly
(eds.) Digital Archaeology: bridging method and theory. Routledge: United Kingdom. pp. 8-26.
9.2 – ONLINE SOURCES Adobe Systems Incorporated (2014). Photoshop Lightroom 5: Features. Adobe.
[Online] Available from: http://www.adobe.com/products/photoshop-
lightroom/features.html [Accessed: 20 Mar 2014].
Agisoft (2014). Frequently Asked Questions, Agisoft Photoscan: What is the recommended
hardware configuration for Photoscan users?. Agisoft.
[Online] Available from: http://www.agisoft.ru/support [Accessed: 20 Mar 2014].
Bateson, G. (1979). Mind and Nature: A Necessary Unity. E. P. Dutton: United States of America.
[Online] Available from: http://nas.cml-
agc.com/public/documents/bateson/mind%20and%20nature%20-
%20a%20necessary%20unity.pdf [Accessed: 30 April 2014].
Bennett, B. (2011). Case Study 2. In D. M. Jones (ed.) 3D Laser Scanning for Heritage: Advice and
guidance to users on laser scanning in archaeology and architecture. 2nd Edition.
[Online] Available from: http://www.english-heritage.org.uk/publications/3d-laser-
scanning-heritage2/3D_Laser_Scanning_final_low-res.pdf [Accessed: 5 April 2014].
Canon Incorporated. (2014). Canon EOS E550D Product Specification. Canon.
[Online] Available from:
http://www.canon.co.uk/For_Home/Product_Finder/Cameras/Digital_SLR/EOS_550
D/ [Accessed 24 May 2014].
Clarke, J. (2011). Case Study 5. In D. M. Jones (ed.) 3D Laser Scanning for Heritage: Advice and
guidance to users on laser scanning in archaeology and architecture. 2nd Edition.
[Online] Available from: http://www.english-heritage.org.uk/publications/3d-laser-
scanning-heritage2/3D_Laser_Scanning_final_low-res.pdf [Accessed: 5 April 2014].
Darvill, T. (2009). The Concise Oxford Dictionary of Archaeology. 2nd Edition. Oxford Reference
[Online] Availble from:
http://www.oxfordreference.com.ludwig.lub.lu.se/view/10.1093/acref/9780199534043.0
01.0001/acref-9780199534043-e-231?rskey=vFyzVG&result=2 [Accessed: 11 April 2014].

71
Davies, T. (2011). Case Study 14. In D. M. Jones (ed.) 3D Laser Scanning for Heritage: Advice and
guidance to users on laser scanning in archaeology and architecture. 2nd Edition.
[Online] Available from: http://www.english-heritage.org.uk/publications/3d-laser-
scanning-heritage2/3D_Laser_Scanning_final_low-res.pdf [Accessed: 5 April 2014].
ESRI. (2014). ArcGIS Features. ESRI.
[Online] Available from: http://www.esri.com/software/arcgis/features [Accessed: 20
Mar 2014].
Forte, M. (2012). 3D Archaeology at Çatalhöyük. Archaeology of the Mediterranean World.
[Online] Available from: http://mediterraneanworld.wordpress.com/2013/12/05/3d-
archaeology-at-catalhoyuk/ [Accessed: 26 April 2014].
Ludwig Botzman Institute for Archaeological Prospection and Virtual Archaeology. (2014).
Ludwig Botzman Institute for Archaeological Prospection and Virtual Archaeology.
[Online] Available from: http://archpro.lbg.ac.at/ [Accessed: 9 May 2014].
Nikon Corporation (2008). Total Station: Measuring Distances, Heights, and Angles to Provide
Accurate Position Data. Nikon.
[Online] Available from:
http://www.nikon.com/about/technology/life/others/surveying/index.htm [Accessed:
22 April 2014].
Nikon Corporation (2014). Nikon Digital SLR Camera D7000 Specifications. Nikon.
[Online] Available from: http://imaging.nikon.com/lineup/dslr/d7000/spec.htm
[Accessed: 20 March 2014].
Nikon Corporation (2014a). AF-S DX NIKKOR 10-24mm f/3.5-4.5G ED. Nikon.
[Online] Available from: http://imaging.nikon.com/lineup/lens/zoom/widezoom/af-
s_dx_10-24mmf_35-45g_ed/index.htm [Accessed: 20 March 2014].
Opitz, R., Terrenato, N., & Limp, F. (2013). Gabii Goes Digital. Gabii Goes Digital.
[Online] Available from:
http://gabiiserver.adsroot.itcs.umich.edu/gabiigoesdigital/index.html [Accessed: 9 May
2014].
Prins, A. & Adams, M. J. (2012). Practical Uses for Photogrammetry on Archaeological
Excavations. In JVRP White Papers in Archaeological Technology.
[Online] Available from: http://www.jezreelvalleyregionalproject.com/practical-uses-for-
photogrammetry-on-archaeological-excavations.html [Accessed: 9 May 2014].
Rick, J. W. (1996). Total Stations in Archaeology. Society for American Archaeology Bulletin, 14 (4).
[Online] Available from:
http://www.saa.org/Portals/0/SAA/publications/SAAbulletin/14-4/SAA16.html
[Accessed: 5 April 2014].

72
Towrie, S. (2014). The Scar Viking Boat Burial. Orkneyjar: the heritage of the Orkney Islands.
[Online] Available from: http://www.orkneyjar.com/history/scarboat/ [Accessed: 29
April 2014].
van Maren, G. (2011). 2D to 3D. ArcGIS Resources.
[Online] Available from: http://blogs.esri.com/esri/arcgis/2011/09/29/2d-to-3d/
[Accessed: 8 May 2014].
3D Systems. (2014). 3D Scanners: A guide to 3D scanner technology. 3D Systems: Geomagic.
[Online] Available from: http://www.rapidform.com/3d-scanners/ [Accessed 26 April
2014].
9.3 – MULTIMEDIA SOURCES Kimball, J. J. L. (2014). Master’s Thesis Data.
[Online] Available from: https://sites.google.com/site/justinjlkimball/masters-data
[Accessed 28 May 2014].
Kulturhistorisk museum, UiO. (2014). CfO0166. Universitetsmuseenes fotoportal.
[Online] Available from:
http://www.unimus.no/foto/imageviewer.html#/?id=12756821&type=jpeg [Accessed 6
May 2014].
Kulturhistorisk museum, UiO. (2014). CfO0177. Universitetsmuseenes fotoportal.
[Online] Available from:
http://www.unimus.no/foto/imageviewer.html#/?id=1779938&type=jpeg [Accessed 6
May 2014].