
3-D numerical groundwater flow simulation for geological discontinuities in the Unkheltseg Basin,...
17
1 23 Environmental Earth Sciences ISSN 1866-6280 Environ Earth Sci DOI 10.1007/s12665-014-3697-4 3-D numerical groundwater flow simulation for geological discontinuities in the Unkheltseg Basin, Mongolia Yohannes Yihdego, Cara Danis & Andrew Paffard
Transcript of 3-D numerical groundwater flow simulation for geological discontinuities in the Unkheltseg Basin,...

1 23
Environmental Earth Sciences ISSN 1866-6280 Environ Earth SciDOI 10.1007/s12665-014-3697-4
3-D numerical groundwater flowsimulation for geological discontinuities inthe Unkheltseg Basin, Mongolia
Yohannes Yihdego, Cara Danis &Andrew Paffard

1 23
Your article is protected by copyright and
all rights are held exclusively by Springer-
Verlag Berlin Heidelberg. This e-offprint is
for personal use only and shall not be self-
archived in electronic repositories. If you wish
to self-archive your article, please use the
accepted manuscript version for posting on
your own website. You may further deposit
the accepted manuscript version in any
repository, provided it is only made publicly
available 12 months after official publication
or later and provided acknowledgement is
given to the original source of publication
and a link is inserted to the published article
on Springer's website. The link must be
accompanied by the following text: "The final
publication is available at link.springer.com”.

ORIGINAL ARTICLE
3-D numerical groundwater flow simulation for geologicaldiscontinuities in the Unkheltseg Basin, Mongolia
Yohannes Yihdego • Cara Danis • Andrew Paffard
Received: 8 August 2013 / Accepted: 9 September 2014
� Springer-Verlag Berlin Heidelberg 2014
Abstract Groundwater models which realistically repre-
sent the hydrogeology of a complex system, like the
Unkheltseg Basin, are critically important to Mongolia.
They have flow on benefits to research, governments,
management strategies and commercial development
within the country. Limited case studies of calibrated 3-D
numerical transient simulations in fault-controlled con-
nection between basins, similar to the Unkheltseg Basin,
are available in the public domain and the model presented
here aims to address this problem. This basin is uniquely
geologically controlled and a key water supply resource for
future economic development in the Taikh Valley. Com-
mercial exploration projects have produced the high-qual-
ity geological and hydrogeological data gathered,
necessary for successful model simulation at a basin-wide
scale. Using the ‘‘DRAIN Package’’ and ‘‘Fracture-Well
Package FW4’’ in MODFLOW-SURFACT, the spatial
discretization necessary to fully represent horizontal and
vertical flow direction was achieved to effectively con-
strain recharge and discharge across the fault barrier. This
model is an important tool for establishing a long-term
monitoring programme in a fault-controlled basin, which
predicts regional impacts, both short and long term.
Keywords Groundwater � 3-D numerical modelling �Geological discontinuity � Mongolia
Introduction
Groundwater resources play a vital role in Mongolia’s econ-
omy and the industrial and domestic water demand is mainly
met from groundwater sources; about 80 % of the total con-
sumption is from groundwater (Hasiniaina et al. 2010).
Modelling of groundwater resources in Mongolia, which is
also common elsewhere, is challenging, due to limited infor-
mation, both published and government data, historical reli-
ance on simple analytical assessments and complex
geological systems that present limitations to various model-
ling techniques. For effective groundwater management
resource comprehensive and realistic modelling is essential.
Over the past few years, many international companies,
working on projects requiring groundwater supply (Oyu
Tolgi, Energy Resources UHG Coal Mine, Burun Narran Coal
Project), have begun presenting 3-D numerical simulations for
resource estimation and using these simulations to calculate
resource lifespan and extraction limits, something not possible
with the current analytical methods used in Mongolia.
Over the last few years, a number of discussion papers
have addressed the issue of how models can best serve the
process of decision support. Previous studies (e.g. Gupta
et al. 2012; Kresic and Mikszweski 2014; Nordstrom 2012;
Simmons and Hunt 2012; Voss 2011) have addressed the
extent to which the model’s parameters should be adjusted
to allow it to replicate past system behaviour as a precursor
to its being used in management of future system behaviour
and how complex (or otherwise) it needs to be when used
in this capacity. In this context, a model’s purpose is to
predict the behaviour of a system under a management
regime. Selection of an appropriate level of model com-
plexity is most difficult where predictions required of a
model are only partially constrained by historical data
(Doherty and Simmons 2013).
Y. Yihdego (&) � C. Danis � A. Paffard
Snowy Mountains Engineering Corporation (SMEC),
Sydney, NSW 2060, Australia
e-mail: [email protected]
123
Environ Earth Sci
DOI 10.1007/s12665-014-3697-4
Author's personal copy
Faulted aquifers constitute one of the most complex
geological environments for analysis and interpretation of
hydraulic test data because of the inherent ability of faults
to act not only as high transmissive zones but also as
hydraulic barriers (Bense et al. 2013; Bredehoeft 1997;
Cello et al. 2000; Evans et al. 1997; Folch and Mas-Pla
2008; Shan et al. 1995). Whilst our interpretation of the
faulted aquifer remains linear in nature, parameter esti-
mation by numerical simulation highlighted the presence of
hydraulic barriers associated with the faults. These barriers
are readily apparent in the constant discharge test data.
Fracture zones and faults have long been identified as
having significant influence on groundwater flow and
transport because of their contribution to altering the
effective permeability of the aquifer. For this reason, there
have been numerous investigations aimed at describing a
wide range of phenomena, over a range of scales, that are
associated with fractures and faulting (Allen and Michel
1999; Nordqvist et al. 1992; Yihdego and Becht 2013). The
role of groundwater transfers in geological complex terrain
is challenging (e.g. Nelson and Mayo 2014; Yihdego and
Webb 2014). In faulted aquifers, additional complexities
may exist because faults are often observed to act both as
conduits (Huntoon and Lundy 1979; Pimentel and Hamza
2014) and as barriers (Ran et al. 2014; Rojstaczer 1987) to
flow. Thus, broad generalisations regarding the influence of
faults are difficult to make.
The groundwater resource estimation for the basin
region was initially based on yields from pumping tests
(Battumur 2009), interpreted analytically by the Cooper–
Jacob simplification of the this approach (e.g. Freeze and
Cherry 1979; Fetter 1994). This estimation indicated that
there could be sufficient groundwater to supply mining
activities nearby but numerical modelling was required to
confirm and assess the impacts. Snowy Mountains Engi-
neering Corporation (SMEC) was commissioned in 2011 to
undertake a pre-feasibility level study and in 2012 feasi-
bility level groundwater resource assessment, focusing on
the Unkheltseg Basin as a mine water supply source for
Bayan Airag Exploration.
The Unkheltseg Basin
The Unkheltseg Basin is located approximately 930 km
west of the Mongolian capital Ulaanbaatar, 250 km south
of the border with Russia, in Zavkhan province, Erdene-
khairkhan Soum in a region characterised by steep moun-
tainous terrains and wide valleys. The region is dominated
by reverse faults, striking parallel to the mountain ranges,
which have significant vertical displacement, up to 100 m
in some areas. This faulted geometry often disconnects
groundwater aquifers in alluvial systems and there is often
limited or no hydraulic connectivity across the faults. The
basin system appears to be fault block dominated, creating
a basin with steep sides and a relatively flat base which
conceptually looks much like a bath tub (tank reservoir).
The discharge from the basin system into the southern Tost
Basin is controlled by the permeability and hydraulic
conditions of the barrier as groundwater discharge occurs
across a geological discontinuity, which is presumed here
to be a fault uplifted basement. Therefore, there is no direct
hydraulic connection between the basin and the southern
Tost Basin and this groundwater storage–discharge rela-
tionship cannot be easily handled by simple analytical
equations or 1-D or 2-D numerical simulation programmes.
The challenge with 3-D numerical simulations is to pro-
duce a model which realistically simulates natural condi-
tions. Using the ‘‘DRAIN Package’’ and ‘‘Fracture-Well
Package FW4’’ in MODFLOW-SURFACT, the work pre-
sented here shows a successful simulation that correlates
well with the hydrogeological conditions observed.
The model scenario problem
In watershed models, the subsurface-saturated domain is
often represented by a linear, or non-linear, storage–dis-
charge function (e.g. Fiorillo 2011; Kampf and Burges 2007;
Rupp et al. 2009; Singh and Woolhiser 2002; Wenping et al.
2011). In some cases, the derivation of the function begins
with a physics-based description of saturated flow, but
assumptions made thereafter (e.g. constant head gradient or
successive steady states) lead to a single-valued storage–
discharge function (e.g. TOPMODEL; Beven and Kirkby
1979).These storage–discharge functions are advantageous
in that they are computationally very simple but this repre-
sentation means at the scale of the model element (e.g. sub-
catchment) there is no explicit distribution information in
any spatial dimension (x, y or z) and the model is considered
as zero or one dimensional (e.g. Kampf and Burges 2007).
Models which discretise the groundwater domain in two or
three dimensions and numerically solve the governing partial
equation for saturated flow (e.g. Palma and Bentley 2007;
Singh and Woolhiser 2002; Vandenbohede et al. 2011) do
have the advantage of being spatially explicit. Using a
transient saturated flow model gives analytical solutions to
linear partial differential equations subjected to time-varying
stress, such as recharge or pumping (e.g. Bidwell et al. 2008;
Pulido-Velazquez et al. 2005; Wenping et al. 2011). How-
ever, these solutions can be limited to a homogenous 1-D
representation of an aquifer, which may entail a severe
simplification of the system (Rupp et al. 2009).
A model is a scale-down simplified representation of a
natural system. Therefore, the developments of a model
presuppose the knowledge of the system. The solution to
the problem of how to model the ‘‘tank–reservoir’’ Unk-
heltseg Basin was to utilise 3-D transient and steady-state
Environ Earth Sci
123
Author's personal copy
models in MODFLOW-SURFACT, which overcome the
drawbacks of the 1-D or 2-D analytical equations, because
spatial information (i.e. hydraulic head) is retained in the
primary and secondary flow directions and the restrictive
assumption that discharge has a one-to-one relationship to
aquifer storage is not made (Sloan 2000).
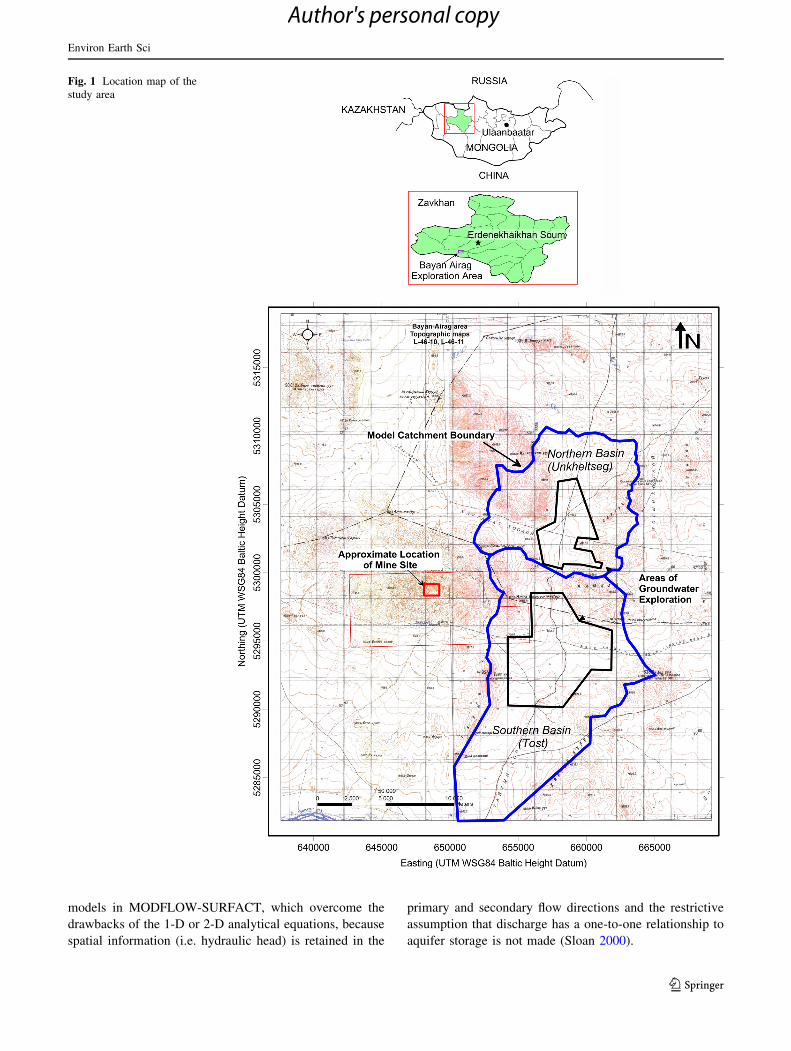
Fig. 1 Location map of the
study area
Environ Earth Sci
123
Author's personal copy

The purpose of this work is to select an appropriate level
of model structure and parameterization for the peculiar/
unique Unkheltseg basin and to provide a successful
example of 3-D groundwater resource modelling at a basin
scale to academics, relevant industries and government
agencies in Mongolia. A detailed and accurate modelling is
critically important to Mongolia, because this basin system
is unusual in that recharge is limited, the system is geo-
logically controlled and the system potentially has a
maximum groundwater level which when reached allows
discharge to the down gradient Tost Basin. Recharge in the
Tost Basin is primarily from discharge of the Unkheltseg
Basin, an interesting link that poses resource management
challenges for the area. The Unkheltseg Basin aquifer
system located in the Taikh Valley in northern Mongolia
(Fig. 1) was assessed via computer 3-D numerical steady
state and transient flow simulations, using MODFLOW-
SURFACT, for the groundwater resource potential to
supply water for a nearby mine and the potential impacts of
extraction.
This paper describes the conceptual model and the
numerical approach, and demonstrates the importance of
using transient simulations for model calibration. The
objective is to demonstrate the effectiveness of transient
numerical modelling as an important tool and interpretation
of data from complex aquifer regimes, particularly those
that are derived from faulted aquifers on the basin scale.
Background and data sources
The purpose of this work is not to reproduce the SMEC
report but to summarise relevant information and present
the groundwater simulations and results. Most of the
information presented in this paper and associated
assumptions and interpretations have been sourced from
the following consultant’s reports: EcoTrade (2007),
Battumur (2009), SMEC (2011, 2012) which are confi-
dential at present. Bayan Airag Exploration has provided
permission for the work undertaken by SMEC (2012) and
associated interpretations to be published in this paper.
This work provides one of a few published hydrogeological
numerical assessments in Mongolia, benefiting the Mon-
golian scientific community and providing a reference tool
for consultants and academics working on similar basin
systems.
SMEC’s (2012) study focused on a quantitative assess-
ment of the potential of the aquifer as a water supply source
to meet the mining demands using steady and transient
numerical groundwater flow models. The average mine
water demand is expected to be 9 L/s with a peak of 17 L/s
and minimum or 4.2 L/s with a proposed mine life of
7 years (excluding construction). Therefore, the project
required water supply of up to (2.82 9 105 m3/year) 9 L/s
for a period of 7 years. In addition, the study assessed the
effects of the groundwater development from simulated
long-term extraction.
Climate and topology
The climate in the region of the basin is characterised by
warm summers and cold winters with temperatures ranging
between -38 and 30 �C. Precipitation has been recorded at
Dorvuljin Soum some 30 km south of the basin. The
average for the past 10 years is 90 mm, of which around
90 % falls during the summer months of June–August.
Anecdotal evidence suggests that rainfall on the mountain
range west of the basin (comprised of limestone) may be
higher due to orographic effects. The area is mountainous
with elevations ranging between 1,670 and 2,160 m above
sea level with the floor of the basin ranging in elevation
from 1,720 to 1,800 m above sea level, with its lowest
point in the south. It is surrounded by a limestone mountain
to the west and hills to the east. The basin drains south
towards the Zavkhan River, approximately 30 km away.
The basin has no permanent surface water bodies (i.e.
springs, lakes, permanent rivers). Surface flows only occur
after intense rainfall events which exceed infiltration rates.
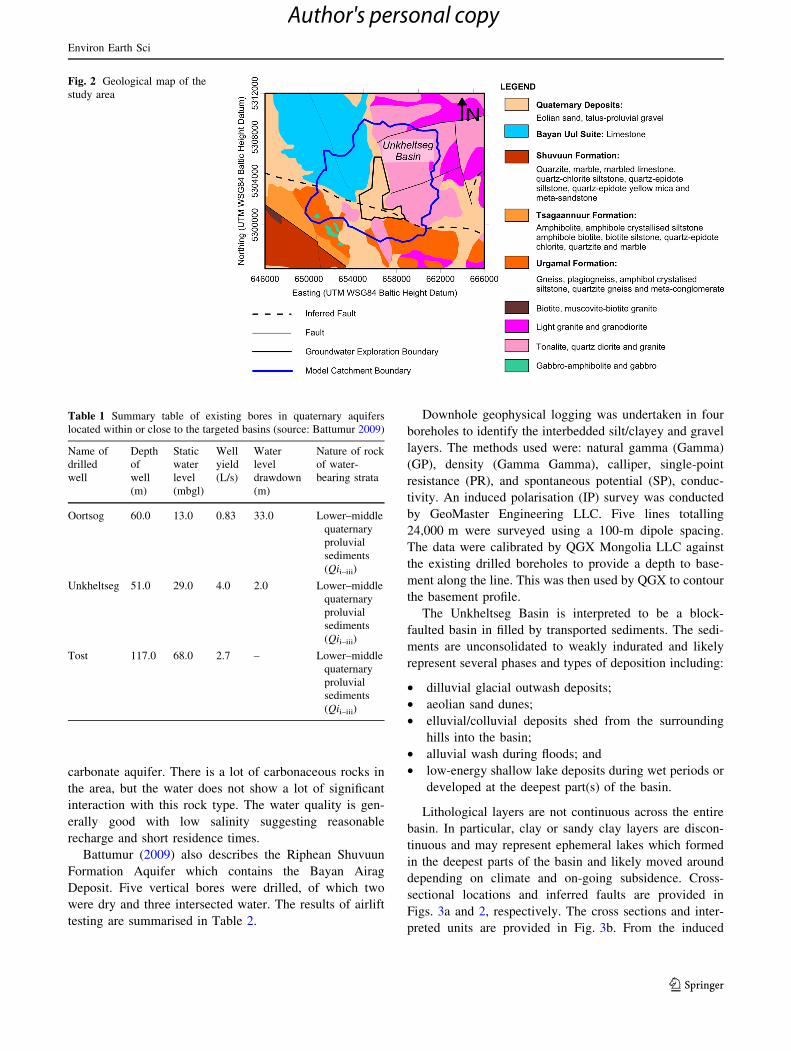
Geology and hydrogeology
The basin is infilled with quaternary unconsolidated sedi-
ments overlying a Riphean aged bedrock basement com-
prising limestone (west and north west), tonalite, quartz,
diorite and granite (east and south) (Fig. 2). Two main
aquifer types were identified: the unconfined to semi-con-
fined dilluvial/colluvial unconsolidated sediments and
confined bedrock Riphean Shuvuun Formation (Ecotrade
2007). The unconsolidated aquifers are distributed near the
slopes of mountains and through the ravines and dry river
beds and consist of gravel and pebbles, small clay lenses
and small boulders. Pre-feasibility reports and hydrogeo-
logical assessments have characterised an upper and lower
aquifer separated by a leakey, low permeability, aquitard
(SMEC 2011). The Shuvuun Formation is a low yielding
bedrock aquifer with limited interconnection and extent
(Battumur 2009).
Table 1 summarises the results of testing of bores in the
Unkheltseg Basin (Unkheltseg Bore) and south of the basin
(Tost and Oortsog Bores). The information suggests that
the Unkheltseg Bore was pumped for 72 h with 2 m
drawdown and reached full recovery after 2 h. Ground-
water quality is dominated by sodium and magnesium
cations and chloride, sulphite and carbonate anions.
Salinity varies between 800 and 1,800 mg/L. None of the
samples have a ‘typical’ signature expected from a
Environ Earth Sci
123
Author's personal copy
carbonate aquifer. There is a lot of carbonaceous rocks in
the area, but the water does not show a lot of significant
interaction with this rock type. The water quality is gen-
erally good with low salinity suggesting reasonable
recharge and short residence times.
Battumur (2009) also describes the Riphean Shuvuun
Formation Aquifer which contains the Bayan Airag
Deposit. Five vertical bores were drilled, of which two
were dry and three intersected water. The results of airlift
testing are summarised in Table 2.
Downhole geophysical logging was undertaken in four
boreholes to identify the interbedded silt/clayey and gravel
layers. The methods used were: natural gamma (Gamma)
(GP), density (Gamma Gamma), calliper, single-point
resistance (PR), and spontaneous potential (SP), conduc-
tivity. An induced polarisation (IP) survey was conducted
by GeoMaster Engineering LLC. Five lines totalling
24,000 m were surveyed using a 100-m dipole spacing.
The data were calibrated by QGX Mongolia LLC against
the existing drilled boreholes to provide a depth to base-
ment along the line. This was then used by QGX to contour
the basement profile.
The Unkheltseg Basin is interpreted to be a block-
faulted basin in filled by transported sediments. The sedi-
ments are unconsolidated to weakly indurated and likely
represent several phases and types of deposition including:
• dilluvial glacial outwash deposits;
• aeolian sand dunes;
• elluvial/colluvial deposits shed from the surrounding
hills into the basin;
• alluvial wash during floods; and
• low-energy shallow lake deposits during wet periods or
developed at the deepest part(s) of the basin.
Lithological layers are not continuous across the entire
basin. In particular, clay or sandy clay layers are discon-
tinuous and may represent ephemeral lakes which formed
in the deepest parts of the basin and likely moved around
depending on climate and on-going subsidence. Cross-
sectional locations and inferred faults are provided in
Figs. 3a and 2, respectively. The cross sections and inter-
preted units are provided in Fig. 3b. From the induced
Fig. 2 Geological map of the
study area
Table 1 Summary table of existing bores in quaternary aquifers
located within or close to the targeted basins (source: Battumur 2009)
Name of
drilled
well
Depth
of
well
(m)
Static
water
level
(mbgl)
Well
yield
(L/s)
Water
level
drawdown
(m)
Nature of rock
of water-
bearing strata
Oortsog 60.0 13.0 0.83 33.0 Lower–middle
quaternary
proluvial
sediments
(Qii–iii)
Unkheltseg 51.0 29.0 4.0 2.0 Lower–middle
quaternary
proluvial
sediments
(Qii–iii)
Tost 117.0 68.0 2.7 – Lower–middle
quaternary
proluvial
sediments
(Qii–iii)
Environ Earth Sci
123
Author's personal copy
polarisation survey, drilling results and cross sections, it is
clear the Unkheltseg Basin is enclosed and can be thought
of as a ‘tub full of water and sediment’. The Unkheltseg
basin is interpreted to be an infilled block-faulted basin and
as such the lithological layers are not continuous across the
entire basin. The groundwater gradient, at 0.0015, is very
flat and only increases slightly in the northern part to
around 0.008 and is likely a response to the basin archi-
tecture and recharge and discharge zones. The architecture
of the basin is not that dissimilar to a tub in that the basin
has steep sides with a flat gently dipping base determined
through a drilling exploration programme and geophysical
surveying (SMEC 2012). The very flat groundwater gra-
dient indicates either high permeability, at least within the
upper aquifer, or low recharge.
Water level drawdown responses were observed in the
monitored bores and show that:
• the drawdown in the pumping bore is much greater than
the nearby monitoring bores suggesting poor bore
development;
• the impacts of pumping are transmitted quickly through
the upper aquifer and more slowly through the lower
aquifer;
• the water level in the upper aquifer declines quickly
then continues to decline as a rate much slower than the
pumping bore and lower aquifer; and
• the water level in the lower aquifer has a delayed
response to pumping and the water level mimics the
response in the pumping bore. This indicates reasonable
development of the lower aquifer screens.
Water level monitoring indicates that there is no pres-
sure difference between the upper water table aquifer and
lower aquifer. This indicates the two are interconnected.
The upper aquifer is considered to be semi-confined and
the lower aquifer leaky confined. Recovery and pumping
test data indicate that the upper aquifer is several times
more permeable (on average) than the lower aquifer.
Monitoring of water levels conducted since 2010 indicates
very little change in the water level over time suggesting
either limited recharge during this period or the basin has a
spill point which controls the maximum groundwater ele-
vation. The increase in groundwater elevation to the north
reflects the decreasing permeability and likely recharge.
Groundwater recharge within the basin predominately
results from precipitation via direct infiltration and moun-
tain slope runoff from the surrounding hills and mountains.
This occurs mainly through surface runoff which flows
from the higher elevated mountains to the basin margins
where it infiltrates. Recharge may also occur via lateral and
vertical movement from bedrock exposed at surface and
this then recharges the basin sediments via fractures/
structures from the bedrock below the surface of the sed-
iments. Moreover, recharge may occur from direct infil-
tration of precipitation which falls on the colluvial basin
sediments or from overland flow; this is thought to only
occur during very heavy rainfall events. Due to orographic
effects, precipitation is considered higher in the mountains
surrounding the basins. This suggests that most recharge
occurs via mountain front infiltration and bedrock transfer.
The low salinity of the groundwater suggests a short resi-
dence time and moderate turn over. Recharge is therefore
thought to occur directly via mountain front or direct
infiltration with low evaporation losses and the ground-
water travel distance is short.
The depth to the water table is 36 m at the southern
end and over 100 m at the northern end of the basin,
too deep for evapotranspiration losses via capillary for-
ces or transpiration via plants. Groundwater discharge
from the basin sediments is assumed to occur via base
flow through the fault barrier between the basin and the
Southern Tost Basin, due to the significant groundwater
level changes. No permanent or ephemeral surface water
bodies (such as springs, lakes and rivers) are located
within the basin. Given the stable groundwater eleva-
tions and gradient, based on 18 months monitoring,
discharge to the southern basin is assumed to occur
when the groundwater level in the basin sediments is at
the level indicated by monitoring. Discharge from the
Tost Basin eventually reaches the Zavkhan River, which
is located 30 km south, which is considered the main
groundwater recipient. Minor discharge occurs via
abstraction of groundwater for stock and domestic use
by the local population.
Water level monitoring (SMEC 2012) indicated that
there is no difference between the upper and lower aquifer
groundwater levels and suggests that the two aquifers are
interconnected. Recovery and pumping test data (SMEC
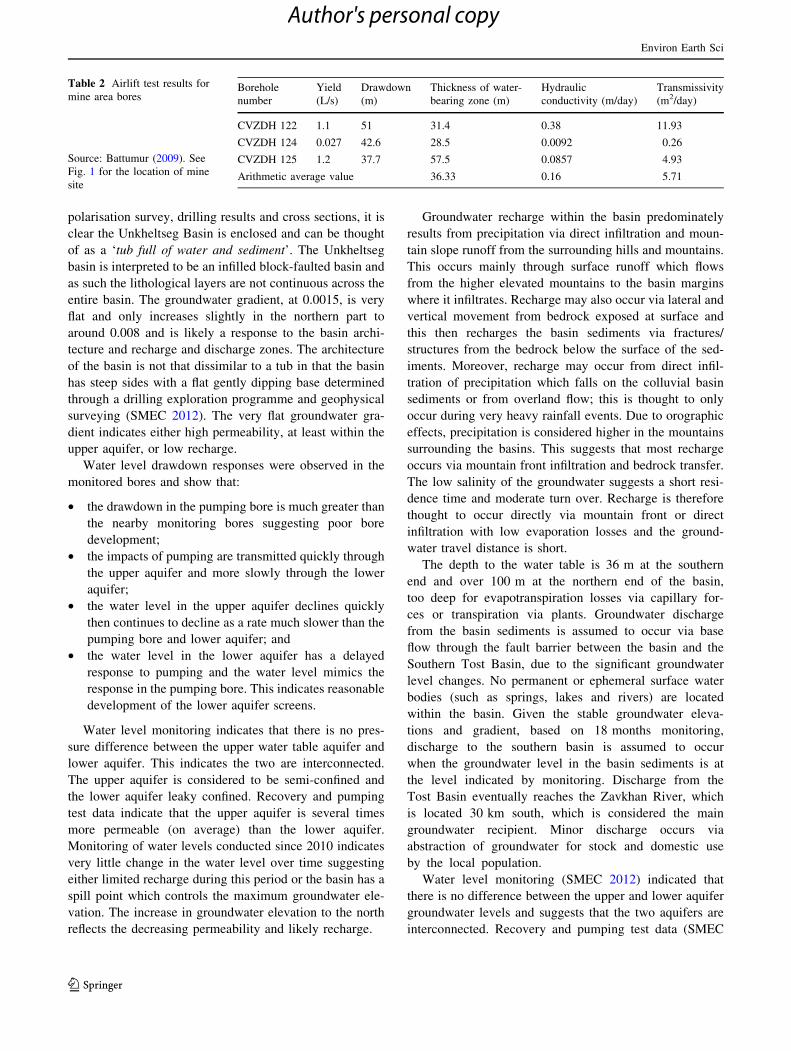
Table 2 Airlift test results for
mine area bores
Source: Battumur (2009). See
Fig. 1 for the location of mine
site
Borehole
number
Yield
(L/s)
Drawdown
(m)
Thickness of water-
bearing zone (m)
Hydraulic
conductivity (m/day)
Transmissivity
(m2/day)
CVZDH 122 1.1 51 31.4 0.38 11.93
CVZDH 124 0.027 42.6 28.5 0.0092 0.26
CVZDH 125 1.2 37.7 57.5 0.0857 4.93
Arithmetic average value 36.33 0.16 5.71
Environ Earth Sci
123
Author's personal copy

Fig. 3 Location map of the cross section lines (a), cross sections (b) and 3-D geology of the study area (c)
Environ Earth Sci
123
Author's personal copy
2012) indicated that the upper aquifer is several times more
permeable (on average) than the lower aquifer. During the
period of the SMEC investigation (2010–2011), the
groundwater levels showed very little change suggesting
either limited recharge during this period or the control of
groundwater level by a spill point through the fault barrier.
This spill point controls the maximum groundwater ele-
vation not unlike a dam. Higher groundwater levels in the
north of the basin reflect decreasing permeability and likely
recharge.
Conceptual model
Models are first and foremost an integration and synthesis
of knowledge about a groundwater system allowing one
to gain insight into how subsurface flow systems function
(e.g. Bredehoeft 2005; Vandenbohede et al. 2011). The
conceptual model for the Unkheltseg basin system
evolved, as illustrated in Fig. 3, from a basic under-
standing visualised as a bath tub full of sediment and
water that was developed into a conceptual 2-D geolog-
ical model which became a 3-D geological framework for
the numerical simulation. The challenge with the basin
model was the limited structural and geological infor-
mation available. Exploration drill-hole data were com-
bined with interpreted depth to basement from
geophysical-induced polarisation surveys, mapped geol-
ogy and topography to determine the thickness of sedi-
ments. Drill-hole data and borehole gamma logs were
utilised to interpret the key geological layers and define
the upper and lower aquifers.
The approach to creating the geological surfaces used a
similar methodology to Danis (2012) in that the layers are
created from the interpolation of drill-hole data, geo-
physical data and mapped surface geology. In complex
lithology, such as where there are numerous discontinuous
sedimentary layers, to create a 3-D representation that
best resembles geological reality requires a degree of
simplification to maintain computational ability. There-
fore, the basin model was simplified to geological units
comprising the key aquifers and aquitard and the base-
ment. Each layer is referenced to the UTM WGS 84
Baltic Height Datum and created using the Kriging
algorithm in SurferTM version 9 (Golden Software Inc)
with a spacing of 50 m over the model domain. The
surfaces were exported out of Surfer into Hydro Geo-
Builder (Schlumberger Water Services 2009) where the
surface was created using Kriging interpolation from the
irregularly spaced data and then imported into MOD-
FLOW-SURFACT. The model consists of four layers as
outlined in Table 3.
Numerical model
Modelling was undertaken using MODFLOW-SURFACT
code (HydroGeoLogic Inc 2002), an advanced MOD-
FLOW (McDonald and Harbaugh 1988; Harbaugh et al.
2000), based code developed by HydroGeoLogic Inc. that
handles complete desaturation and resaturation of grid
cells), within the framework of Visual MODFLOW Ver-
sion 4.6 (Schlumberger Water Services 2010). MOD-
FLOW-SURFACT solves enhanced equations for
performing unconfined simulations to rigorously model
desaturation/resaturation of aquifers and overcome
numerical difficulties encountered with the previous ver-
sions of MODFLOW. In addition, MODFLOW-SURFACT
provides a rigorous bore withdrawal package ‘‘Fracture-
Well Package FLW4’’ that emulates flow through multi-
layer bore. The fracture tube representation allows con-
nection of aquifer cells. Volumetric fluxes from each
individual node associated with the fracture are automati-
cally computed by the code, to sum the total drawdown
from the bore. In addition, the total withdrawal rate pre-
scribed for the bore is rigorously incorporated. Another
feature of FLW4 is that for an overpumped unconfined
system, the total bore withdrawal is automatically adjusted
when the water level in the well has reached the bottom of
the bore.
The model domain for the investigation is a sub-regional
area which encompasses the basin (Fig. 1). The actual area
modelled was determined during the desktop phase of the
model development and comprises a rectangular area of
approximately 6 km by 7 km, totalling approximately
43 km2. The model was designed for steady state and
transient state simulation of groundwater flow. A steady-
state model was developed first to assess regional flow
patterns in the basin aquifers and to calibrate the recharge
and transmissivity. Calibration was accomplished, via the
trial and error method, by applying a set of hydraulic
parameters; boundary conditions and stresses that produce
computer-generated pressure heads (or water level draw-
downs) that correlate with actual field measurement. A
transient model was then developed, using the steady-state
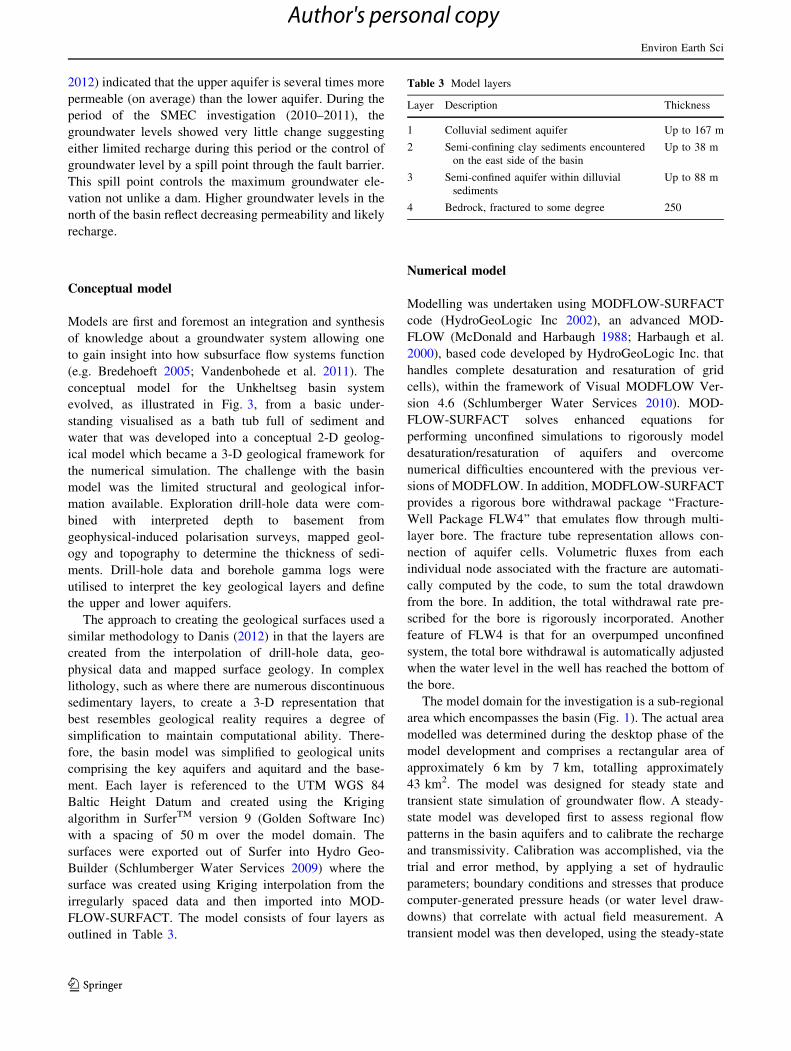
Table 3 Model layers
Layer Description Thickness
1 Colluvial sediment aquifer Up to 167 m
2 Semi-confining clay sediments encountered
on the east side of the basin
Up to 38 m
3 Semi-confined aquifer within dilluvial
sediments
Up to 88 m
4 Bedrock, fractured to some degree 250
Environ Earth Sci
123
Author's personal copy
model hydraulic head output as the initial head to assess
potential impacts of extraction/pumping on the ground-
water flow pattern based on the measured pumping test
data, observation data and 12 months of monitoring data.
Domain and discretisation
The extent of the model domain was based on the appro-
priate site-specific geological and hydrogeological bound-
aries. The model domain was designed to reflect the extent
of the aquifers that is expected to significantly control the
major groundwater flow. The model contains 119 rows by
144 columns giving 68,544 cells. An approximate
70 9 70 m grid was applied across the model area, with
refinement of the grid to 5 9 5 m around the proposed
pumping bores to allow for the steeper hydraulic gradient
near the pumping bores. In the vertical direction, deformed
model layers were used to represent the hydrogeological
framework in the model (Fig. 3c). Vertical discretisation
using deformed model layers allows horizontal continuity
to be maintained with fewer cells (Reilly and Harbaugh
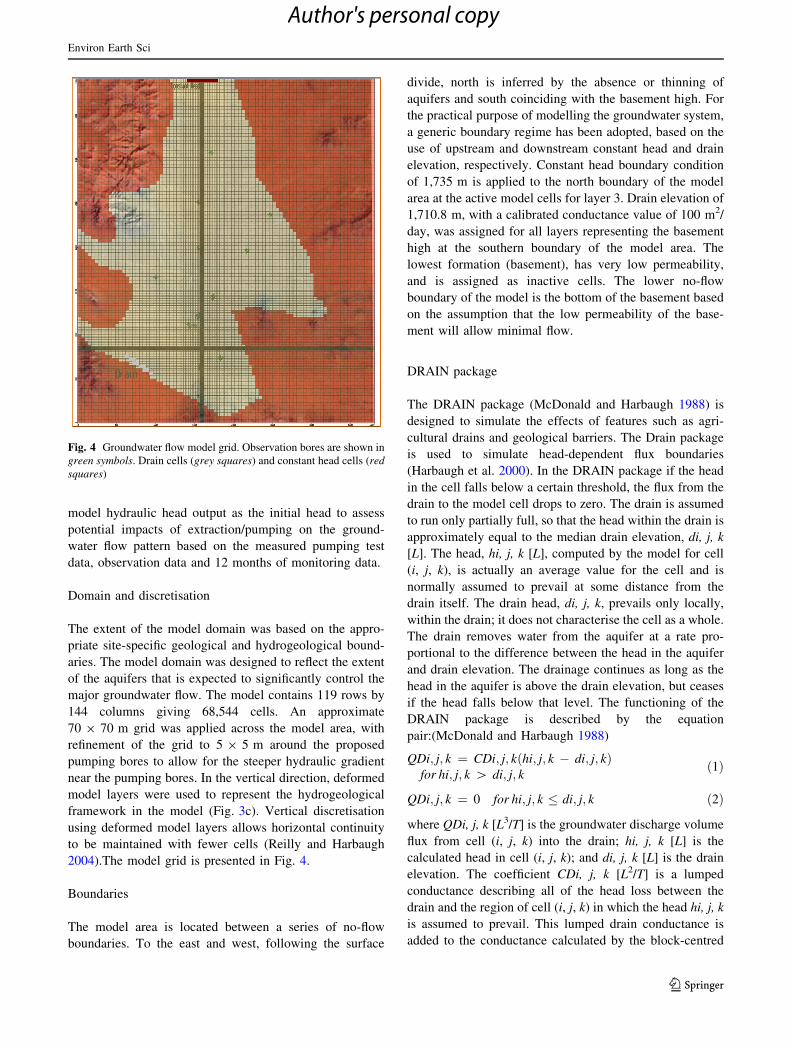
2004).The model grid is presented in Fig. 4.
Boundaries
The model area is located between a series of no-flow
boundaries. To the east and west, following the surface
divide, north is inferred by the absence or thinning of
aquifers and south coinciding with the basement high. For
the practical purpose of modelling the groundwater system,
a generic boundary regime has been adopted, based on the
use of upstream and downstream constant head and drain
elevation, respectively. Constant head boundary condition
of 1,735 m is applied to the north boundary of the model
area at the active model cells for layer 3. Drain elevation of
1,710.8 m, with a calibrated conductance value of 100 m2/
day, was assigned for all layers representing the basement
high at the southern boundary of the model area. The
lowest formation (basement), has very low permeability,
and is assigned as inactive cells. The lower no-flow
boundary of the model is the bottom of the basement based
on the assumption that the low permeability of the base-
ment will allow minimal flow.
DRAIN package
The DRAIN package (McDonald and Harbaugh 1988) is
designed to simulate the effects of features such as agri-
cultural drains and geological barriers. The Drain package
is used to simulate head-dependent flux boundaries
(Harbaugh et al. 2000). In the DRAIN package if the head
in the cell falls below a certain threshold, the flux from the
drain to the model cell drops to zero. The drain is assumed
to run only partially full, so that the head within the drain is
approximately equal to the median drain elevation, di, j, k
[L]. The head, hi, j, k [L], computed by the model for cell
(i, j, k), is actually an average value for the cell and is
normally assumed to prevail at some distance from the
drain itself. The drain head, di, j, k, prevails only locally,
within the drain; it does not characterise the cell as a whole.
The drain removes water from the aquifer at a rate pro-
portional to the difference between the head in the aquifer
and drain elevation. The drainage continues as long as the
head in the aquifer is above the drain elevation, but ceases
if the head falls below that level. The functioning of the
DRAIN package is described by the equation
pair:(McDonald and Harbaugh 1988)
QDi; j; k ¼ CDi; j; k hi; j; k � di; j; kð Þfor hi; j; k [ di; j; k
ð1Þ
QDi; j; k ¼ 0 for hi; j; k � di; j; k ð2Þ
where QDi, j, k [L3/T] is the groundwater discharge volume
flux from cell (i, j, k) into the drain; hi, j, k [L] is the
calculated head in cell (i, j, k); and di, j, k [L] is the drain
elevation. The coefficient CDi, j, k [L2/T] is a lumped
conductance describing all of the head loss between the
drain and the region of cell (i, j, k) in which the head hi, j, k
is assumed to prevail. This lumped drain conductance is
added to the conductance calculated by the block-centred
Fig. 4 Groundwater flow model grid. Observation bores are shown in
green symbols. Drain cells (grey squares) and constant head cells (red
squares)
Environ Earth Sci
123
Author's personal copy

flow (BCF) package, which is derived from the horizontal
and vertical resistance between the node centre of the drain
cell and the centres of the adjacent nodes. The summed
DRAIN and BCF conductance therefore defines the total
resistance to flow of the MODFLOW drain cell. The head
losses between the drain and its adjacent cells are caused
by convergent flow towards the drain, flow through the
backfill material of the drain, and flow through the wall of
the drain (McDonald and Harbaugh 1988).
Hydraulic properties
The aquifer properties adopted are either based on the
results of the hydrogeological investigation (pumping tests)
and data contained in Wenping et al. (2011). Where no data
were available, industry accepted values and best estimates
were used. Adopted aquifer properties including hydraulic
conductivity, storage coefficients and porosity are sum-
marised in Table 4. The aquifer parameters have been
estimated using the Cooper–Jacob straight line and dis-
tance drawdown methods for non-equilibrium conditions.
They provide an assessment of the transmissivity and
storage coefficient for the individual bores and regionally
perspective. The results are summarised in Table 2. As the
discharge rate from each aquifer is unknown it has been
assumed that the discharge is either 4 L/s from each or 1 L/s
from the lower and 7 L/s from the upper aquifer based on
the 2010 pumping test results (SMEC 2011). Assessment
using the Aqtsolv Pro 4.0 software indicates the discharge
from each aquifer is closer to 1 and 7 L/s based on curve
matching (i.e. using these flow rates the curve match is
better than using 4 L/s from each aquifer) from the lower
and upper aquifers, respectively. Table 2 provides the
results of multiple assessment assuming confined and leaky
confined aquifers.
For all sediments, the vertical hydraulic conductivity is
set at 1/10th horizontal hydraulic conductivity, to reflect
the effects of vertical anisotropy caused by layering in
sedimentary deposition, as well as layered heterogeneity
(Freeze and Cherry 1979; Kazemi 2012). Anisotropy
implies that there must be some sort of preferred orienta-
tion to either the fractures or the brecciated material within
the fault zone that leads to excellent conductivity along the
faults. In a direction perpendicular to the fault plane, the
conductivity is much lower. Geologically, it is possible that
a fault breccia with gouge will behave anisotropically, as
clay like within the fault (Lopez and Smith 1996). For the
basement, the groundwater flow in the vertical direction is
considered higher than in the horizontal direction; there-
fore, the vertical hydraulic conductivity is set at 10 times of
the horizontal hydraulic conductivity. Generic storage
terms have been used for all confining and semi-confining
layers. In the case of the colluvial and dilluvial aquifers,
the storage terms were obtained from either the SMEC
(2011, 2012) pumping test results or published literature
values of a comparable lithology. To simulate basement
aquifer recharge the limestone outcrop west of the basin
sector of the model domain was assigned a relatively high
permeability, 0.06 m/day.
Recharge, discharge and evapotranspiration
The net recharge to the upper groundwater table at the
model area is assumed to be 0.9 mm per annum, 1 % of
precipitation based on the characteristic of surface geology
and depth of groundwater. The rainfall was used for a
transient run, using the monthly time-varying recharge rate
from 2010 to 2012 (1 % of monthly precipitation was
assumed). Evapotranspiration, given the depth of ground-
water, is[15 m below ground level, is not considered to be
active.
Steady-state calibration
The model was calibrated by matching observed ground-
water heads against predicted heads in 20 bores within the
model domain (Fig. 5). To improve calibration, the
hydraulic conductivity and recharge zones were adjusted
until the modelled head elevations were able to match
observed head elevations to an acceptable level of accuracy.
The results of the calibrated head versus the observed
head of layer 1 and 3, which have a correlation coefficient
of 0.98, a root mean squared error of 0.45 m and residual
mean error of 0.11 m, are considered to be very good. The
baseline gradient and flow are in a southerly and south
westerly direction through the aquifer. Based on these
results, it is considered that the model realistically simu-
lates the groundwater elevation and flow direction across
the model domain.
Table 4 Calibrated aquifer properties
Layer Description Horizontal
hydraulic
conductivity
(m/day)
Specific
yield
Specific
storage
(1/m)
1 Colluvial
sediments
0.26 0.02 2E-7
2 Clay aquitard 0.001 0.002 2E-7
3 Dilluvial
sediments
0.1 0.004 1E-8
4 Basement—
partially
fractured
0.0001 0.004 1E-7
4 Basement—
limestone
0.06 0.14 1E-7
Environ Earth Sci
123
Author's personal copy

The volume of water entering the basin aquifers is
mainly through rainfall recharge with some through bed-
rock flow. The simulation shows that the flow system
conserves mass (Table 5) i.e. the volume of water entering
the model through recharge and through flow equals the
volume that leaves the model through drainage represent-
ing the basement high. The groundwater level at the fault
barrier is at an elevation of 1,710.8 m, with a calibrated
conductance value of 100 m2/day.
Overall, model calibration is considered acceptable on
the basis of the correlation coefficient (0.98), mass balance
discrepancy (0.02 %) and spatially random residual error
(Barnett et al. 2012).
Transient state calibration and simulation
Calibration: observed head
The transient state calibration aims to achieve a difference
of ±0.5 m between the modelled and observed head
drawdown. Fluctuation of the drawdown is mainly caused
by the fluctuation of recharge, drainage at the fault barrier
and applied constant head condition.
Calibration: pumping test data
Pumping tests were conducted by SMEC (2012) to evaluate
the aquifer hydraulic conductivity and storage coefficient
for transient model calibration. Field pumping tests were
run for 10 days with one production bore discharging 8 L/
s, on average, and 10 observational piezometers. Here the
model simulates the water level drawdown over a period of
26 days, with 10 time steps and a time step multiplier of
1.2. Aquifer parameters were adjusted in the model man-
ually to match the observed drawdown for a short transient
event. Results of the modelled drawdown versus observed
drawdown show that there is a good match after about
10 days but initially the match is not as good which is
likely a result of the storage properties. According to
Middlemis (2004) regional model should not be expected
to exactly reproduce local-scale changes in head response
to pumping.
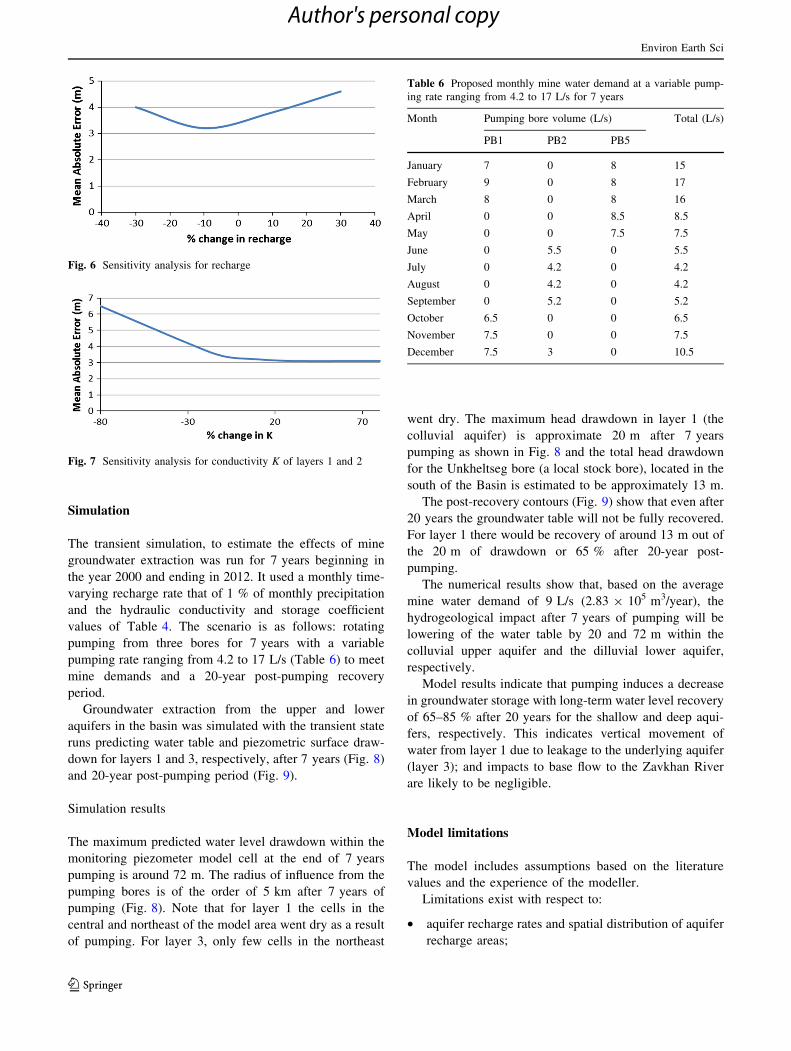
The value in any model comes from analysing the
sensitivity of parameters to change to see what effect such
changes may have on the model results. The sensitivity of
recharge and permeability was assessed and the results,
Figures. 6 and 7 were plotted against mean absolute error
in metres. Most sensitive to change was the hydraulic
conductivity of layers 1 and 2 and, as anticipated, recharge.
Drain conductance, specific yield and specific storage were
sensitive to a lesser degree.
Fig. 5 Potentiometric
surface—steady state (arrow
flow direction) and observation
piezometer (green) layer 1—
colluvial sediments and layer
3—dilluvial sediments
respectively
Table 5 Modelled mass water balance summary for steady state
Component Inflow (m3/day) Outflow (m3/day)
Recharge 3.5 0
Drain 9.5
Through flow (constant head) 6 0
In–out: 0.0 m3/day
Discrepancy: 0 %
Environ Earth Sci
123
Author's personal copy
Simulation
The transient simulation, to estimate the effects of mine
groundwater extraction was run for 7 years beginning in
the year 2000 and ending in 2012. It used a monthly time-
varying recharge rate that of 1 % of monthly precipitation
and the hydraulic conductivity and storage coefficient
values of Table 4. The scenario is as follows: rotating
pumping from three bores for 7 years with a variable
pumping rate ranging from 4.2 to 17 L/s (Table 6) to meet
mine demands and a 20-year post-pumping recovery
period.
Groundwater extraction from the upper and lower
aquifers in the basin was simulated with the transient state
runs predicting water table and piezometric surface draw-
down for layers 1 and 3, respectively, after 7 years (Fig. 8)
and 20-year post-pumping period (Fig. 9).
Simulation results
The maximum predicted water level drawdown within the
monitoring piezometer model cell at the end of 7 years
pumping is around 72 m. The radius of influence from the
pumping bores is of the order of 5 km after 7 years of
pumping (Fig. 8). Note that for layer 1 the cells in the
central and northeast of the model area went dry as a result
of pumping. For layer 3, only few cells in the northeast
went dry. The maximum head drawdown in layer 1 (the
colluvial aquifer) is approximate 20 m after 7 years
pumping as shown in Fig. 8 and the total head drawdown
for the Unkheltseg bore (a local stock bore), located in the
south of the Basin is estimated to be approximately 13 m.
The post-recovery contours (Fig. 9) show that even after
20 years the groundwater table will not be fully recovered.
For layer 1 there would be recovery of around 13 m out of
the 20 m of drawdown or 65 % after 20-year post-
pumping.
The numerical results show that, based on the average
mine water demand of 9 L/s (2.83 9 105 m3/year), the
hydrogeological impact after 7 years of pumping will be
lowering of the water table by 20 and 72 m within the
colluvial upper aquifer and the dilluvial lower aquifer,
respectively.
Model results indicate that pumping induces a decrease
in groundwater storage with long-term water level recovery
of 65–85 % after 20 years for the shallow and deep aqui-
fers, respectively. This indicates vertical movement of
water from layer 1 due to leakage to the underlying aquifer
(layer 3); and impacts to base flow to the Zavkhan River
are likely to be negligible.
Model limitations
The model includes assumptions based on the literature
values and the experience of the modeller.
Limitations exist with respect to:
• aquifer recharge rates and spatial distribution of aquifer
recharge areas;
Fig. 6 Sensitivity analysis for recharge
Fig. 7 Sensitivity analysis for conductivity K of layers 1 and 2
Table 6 Proposed monthly mine water demand at a variable pump-
ing rate ranging from 4.2 to 17 L/s for 7 years
Month Pumping bore volume (L/s) Total (L/s)
PB1 PB2 PB5
January 7 0 8 15
February 9 0 8 17
March 8 0 8 16
April 0 0 8.5 8.5
May 0 0 7.5 7.5
June 0 5.5 0 5.5
July 0 4.2 0 4.2
August 0 4.2 0 4.2
September 0 5.2 0 5.2
October 6.5 0 0 6.5
November 7.5 0 0 7.5
December 7.5 3 0 10.5
Environ Earth Sci
123
Author's personal copy

• hydrogeological properties of limestone and basement
rock units; and
• structural influence on groundwater flow (faults, frac-
tures and joints).
The current model assumes limited rainfall recharge of 1 %
of precipitation, discharge controlled by geology with a set
invert point and limited influence from the underlying and
surrounding bedrock. The large limestone located on the
northwestern side of the basin may provide a significant
amount of water. However, only long-term pumping and
monitoring will allow assessment of the influence of these
factors and the level of conservativeness of the adopted model
parameters. Groundwater recharge is rarely well defined (Voss
2011). Initial head data are related to the time span of obser-
vations used for calibrating the transient state model. Data
from two hydrological years have been used, as no longer term
data were available; and this may be a source of uncertainty
since long-term fluctuations may not have been observed.
Fig. 8 Drawdown (m) map of
the model area, after 7 year—
(end of pumping). Layer 1 and
layer 3
Fig. 9 Drawdown (m) map of
the model area, after 20-year
post-pumping—layer 1 and
layer 3. Note that the reduction
in drawdown (due to recovery
for 20-year post-pumping)
comparing with the Fig. 8 (end
of the pumping time)
Environ Earth Sci
123
Author's personal copy
The geological data and measurements used in creating
this model are spatially limited within the Unkheltseg
Basin and this should be taken into account when assessing
the results.
Conclusions
In large arid or semi-arid inland basins in Mongolia and China,
reverse faults, parallel to the mountain strike in general and
having significant vertical displacement, make the ground-
water level in the Quaternary aquifer systems differ by 100 m
or more on the two sides of the fault. There is no direct
hydraulic connection between the two sides and a ground-
water fall occurs across the fault. The downstream aquifer
system has enough capacity to accept the lateral discharge
from the upstream side, and this means that the recharge to the
downstream aquifer system is equal to the discharge of the
upstream aquifer system. The discharge or recharge amount is
decided only by the permeability and hydraulic conditions of
the upstream aquifer system. Simulation of the upstream
aquifer system (and hence a groundwater fall formed by
faults) has become an interesting challenge in regional
groundwater modelling. The Unkheltseg Basin is an example
of an unusual geologically constrained groundwater resource
located in the Taikh Valley in northern Mongolia. This
resource is critical for economic development in the region but
previous assessments had been limited to the analytical
interpretation of pumping test data. With no direct hydraulic
connection between the two parts of the basin system,
groundwater recharge from Unkheltseg Basin to the Tost
Basin is controlled geologically across the fault and may only
occur when the groundwater table in the Unkheltseg Basin is
at a specific level.
For effective groundwater management on a regional
scale, a calibrated 3-D numerical simulation was required
to assess both the ability of the resource to supply mine
demand and assess the potential impacts of such extraction
activities. Producing a calibrated and validated ground-
water model increases confidence in the conceptual model
of the main physical processes and forces that are con-
trolling hydraulic heads and fluxes. Model sensitivity
analysis is a useful tool for identifying the most critical
parameters of the hydrogeologic system to ensure appro-
priate field monitoring. The approach in this case identified
the need for explicit spatial discretization and full repre-
sentation of horizontal and vertical flow directions at the
south end of the Unkheltseg Basin as the key factors nec-
essary to constrain the recharge area and assess and
quantify the groundwater dynamics. Changing stresses,
such as increasing recharge, only slightly affect the simu-
lated water table as the controlling factor is the threshold
discharge level across the fault barrier.
Accurate regional groundwater models that predict
regional impacts are an important management tool in
countries like Mongolia who have a high dependence on
groundwater. Groundwater models are important tools for
demonstrating a qualitative and quantitative understanding
of a hydrogeological system that is consistent with the
current available data. This model showed that short-term
high-intensity extraction would affect a large area over a
very long period of time. Whilst the Bayan Airag mine is
currently the only mine planning to extract water from this
basin system, there are already stock and domestic users of
the groundwater resource. The model demonstrates how
existing users will be impacted and where future potential
users may also be impacted highlighting the importance of
proper long-term aquifer management strategies.
Acknowledgments The authors would like to thank Bill Colvin and
the staff of Bayan Airag Exploration LLC for providing permission to
publish this work and in the undertaking of the fieldwork for the Pre
and Feasibility level assessments. Valuable comments and sugges-
tions by the Editor (James W. LaMoreaux) and two anonymous ref-
erees are greatly appreciated.
References
Allen DM, Michel FA (1999) Characterizing a faulted aquifer by field
testing and numerical simulation. Groundwater 37(5):718–728
Barnett B, Townley LR, Post V, Evans RE, Hunt RJ, Peeters L,
Richardson S, Werner AD, Knapton A, Boronkay A (2012)
Australian groundwater modelling guidelines, Waterlines report.
National Water Commission, Canberra
Battumur (2009) Assessment of water supply options for proposed
Bayan Airag gold–copper mine
Bense VF, Gleeson T, Loveless SE, Bour O, Scibek J (2013) Fault
zone hydrogeology. Earth Sci Rev 127:171–192
Beven KJ, Kirkby MJ (1979) A physically based variable contributing
area model of basin hydrology. Hydrol Sci Bull 24:43–69
Bidwell VJ, Stenger R, Barkle GF (2008) Dynamic analysis of
groundwater discharge and partial-area contribution to Puke-
manga Stream, New Zealand. Hydrol Earth Syst Sci 12:975–987
Bredehoeft JD (1997) Fault permeability near Yucca Mountain.
Water Resour Res 33(11):2459–2463
Bredehoeft JD (2005) The conceptualization model problem-surprise.
Hydrogeol J 13:37–46
Cello G, Gambini R, Mazzoli S, Read A, Tondi E, Zucconi V (2000)
Fault zone characteristics and scaling properties of the Val
d’Agri fault system (Southern Apennines, Italy). J Geodyn
29(3–5):293–307
Danis C (2012) Sydney–Gunnedah–Bowen Basin deep 3-D structure.
Explor Geophys 43:26–35. doi:10.1071/EG11043
Doherty J, Simmons TC (2013) Conceptual modelling in decision
support; reflections on a unified conceptual framework. Hydro-
geol J 21:1531–1537
EcoTrade (2007) Bayan Airag Environmental and Social Baseline
Report, Zavha Aimag, Southern Mongolia
Evans JP, Forster CB, Goddard JV (1997) Permeability of fault-
related rocks, and implications for hydraulic structure of fault
zones. J Struct Geol 19:1393–1404
Fetter CW (1994) Applied hydrogeology, 3rd edn. Prentice Hall,
Upper Saddle River
Environ Earth Sci
123
Author's personal copy

Fiorillo F (2011) Tank–reservoir drainage as a simulation of the
recession limb of karst spring hydrographs. Hydrogeol J
19:1009–1019
Folch A, Mas-Pla J (2008) Hydrogeological interactions between
fault zones and alluvial aquifers in regional flow systems. Hydrol
Process 22:3476–3487
Freeze RA, Cherry JA (1979) Groundwater. Prentice Hall Inc, Upper
Saddle River
Gupta HV, Clark MP, Vrugt JA, Abramowitz G, Ye M (2012)
Towards a comprehensive assessment of model structural
adequacy. Water Resour Res. doi:10.1029/2011WR011044
Harbaugh AW, Banta ER, Hill MC, McDonald MG (2000) MOD-
FLOW-2000, the US Geological Survey modular ground-water
model—user guide to modularization concepts and the ground-
water flow process, Open File Report. OFR00-92, US Geological
Survey, Denver, Colorado, pp 121
Hasiniaina F, Zhou J, Guoyi L (2010) Regional assessment of
groundwater vulnerability in Tamtsag Basin, Mongolia using
drastic model. J Am Sci 6(11):65–78
Huntoon PW, Lundy DA (1979) Fracture-controlled ground-water
circulation and well siting in the vicinity of Laramie, Wyoming.
Groundwater 17(5):463–469. doi:10.1111/j.1745-6584.1979.
tb03342.x
HydroGeoLogic Inc. (2002) MODFLOW-SURFACT: a compre-
hensive MODFLOW-based hydrologic modelling system: code
documentation and user’s manual. HydroGeoLogic Inc., USA
Kampf SK, Burges SJ (2007) A framework for classifying and
comparing distributed hillslope and catchment hydrologic mod-
els. Water Resour Res 43:W05423. doi:10.1029/2006WR005370
Kazemi GA (2012) Hydrogeology—a global perspective. InTech
publishing company, Rijeka. ISBN: 978-953-51-0048-5
Kresic N, Mikszweski A (2014) Hydrogeological conceptual site
models data analysis and visualization. Environ Earth Sci
72:623. doi:10.1007/s12665-014-3268-8
Lopez DL, Smith L (1996) Fluid flow in fault zones: influence of
hydraulic anisotropy and heterogeneity on the fluid flow and heat
transfer regime. Water Resour Res 32:3227–3235
McDonald MG, Harbaugh AW (1988) A modular threedimensional
finite-difference ground-water flow model. USGS Techniques of
Water-Resources Investigations Book 6, Chapter A1
Middlemis H (2004). Benchmarking best practice for groundwater
flow modelling. The Winston Churchill Memorial Trust of
Australia
Nelson ST, Mayo AL (2014) The role of interbasin groundwater
transfers in geologically complex terranes, demonstrated by the
Great Basin in the western United States. Hydrogeol J
22:807–828
Nordqvist AW, Tsang YM, Tsang CF, Dverstorp B, Andersson J
(1992) A variable aperture fracture network model for flow and
transport in fractured rocks. Water Resour Res 28(6):1703–1713
Nordstrom DK (2012) Models, validation and applied geochemistry:
issues in science, communication, and philosophy. Appl Geo-
chem 27:1899–1919
Palma HC, Bentley LR (2007) A regional scale groundwater flow for
the Leon-Chinandega aquifer, Nicaragua
Pimentel ET, Hamza VM (2014) Use of geothermal methods in
outlining deep groundwater flow systems in paleozoic interior of
Brazil. Hydrologeol J 22:107–128
Pulido-velazquez MA, Sahquillo-Herraiz A, Camilo OJ, Pulido-
velazquez D (2005) Modelling of stream–aquifer interaction: the
embedded multi reservoir model. J Hydrol 313:166–181
Ran G, Eyal S, Yoseph Y, Amir S, Noam W (2014) The permeability
of fault zones: a case study of the Dead Sea rift (Middle East).
Hydrogeol J 22:425–440. doi:10.1007/s10040-013-1055-3
Reilly TE, Harbaugh AW (2004) Guidelines for evaluating ground-
water flow models. US Geological Survey Scientific Investiga-
tions Report 2004-5038, 30 p
Rojstaczer S (1987) The local effects of groundwater pumpage within
a fault-influenced groundwater basin, Ash Meadows, Nye
County, Nevada, USA. J Hydrol 91:319–337
Rupp DE, Schmidt J, Woods RA, Bidwell VJ (2009) Analytical
assessment and parameter estimation of a low-dimensional
groundwater model. J Hydrol 377:143–154
Schlumberger Water Services (2009) Hydro geobuilder. A flexible,
simulator-independent, hydrogeological modelling environment.
User’s manual. Waterloo, Ontario, Canada
Schlumberger Water Services (2010) Visual modflow. Dynamic
groundwater flow and contaminant transport modelling software.
User’s manual. Waterloo, Ontario, Canada
Shan S, Javandel I, Witherspoon PA (1995) Characterisation of leaky
faults: study of water flow in aquifer-fault-aquifer systems.
Water Resour Res 31(12):2897–2904
Simmons CT, Hunt RJ (2012) Updating the debate on model complexity.
GSA Today 22(8):28–29. doi:10.1130/GSATG150GW.1
Singh VP, Woolhiser DA (2002) Mathematical modelling of
watershed hydrology. J Hydrol Eng 7:270–292
Sloan WT (2000) A physics-based function for modelling transient
groundwater discharge at the watershed scale. Water Resour Res
36:225–242
SMEC (2011) Bayan Airag Gold Project pre-feasibility level mine
water supply assessment. Bayan Airag Exploration LLC
SMEC (2012) Bayan Airag Gold Project feasibility level mine water
supply assessment. Bayan Airag Exploration LLC
Vandenbohede A, Hinsby K, Courtens C, Lebbe L (2011) Flow and
transport model of a polder area in the Belgian coastal plain:
example of data integration. Hydrogeol J 19:1599–1615
Voss CI (2011) Groundwater modelling fantasies—part 1, adrift in
the details. Hydrogeol J 19:1281–1284
Wenping L, Zhenying L, Haipeng G, Ning L, Weidong K (2011)
Simulation of groundwater fall caused by geological disconti-
nuities. Hydrogeol J 19:1121–1133
Yihdego Y, Becht R (2013) Simulation of lake–aquifer interaction at
Lake Naivasha, Kenya using a three-dimensional flow model
with the high conductivity technique and a DEM with bathym-
etry. J Hydrol 503:111–122
Yihdego Y, Webb AJ (2014) Use of a conceptual hydrogeological
model and a time variant water budget analysis to determine
controls on salinity in Lake Burrumbeet in southeast Australia.
Environ Earth Sci. http://link.springer.com/article/10.1007/
s12665-014-3509-x
Environ Earth Sci
123
Author's personal copy