29211_1981_VAD.pdf - Linguistic Survey Of India
359
CENSUS OF INDIA 1981 SERIES 5 GUJARAT SURVEY REPORT ON SELECTED TOWN VADNAGAR J.K. PATEL Dy. Director .of Census Operations, Gujarat
-
Upload
khangminh22 -
Category
Documents
-
view
0 -
download
0
Transcript of 29211_1981_VAD.pdf - Linguistic Survey Of India
CENSUS OF INDIA 1981
SERIES 5
GUJARAT
SURVEY REPORT
ON SELECTED
TOWN
VADNAGAR
J.K. PATEL Dy. Director .of Census
Operations, Gujarat


IJJ · I/) · .. :l ~
0 .: ii I · 0 .. . ~ I/) ·
DI~OOI
".J _'" LHS ~ Z 'i' ~ t l "" to , , \.... IO
l,) It> (
I I ,.., A- l,," )
'011 ;, ,
c IJJ • .. III c 0 ~O lC ~J • O( 0 JID 6 (z II ~~ .. Z a :lJ .. ID( .. ..
III ~ lI: Z "" IL « 0 z 00
f)
, (' r,,) v'
III III
< ..I
~ i Z .. -N e < lC ., II) N
UJ " ~ .. I
N
r- < 0 4 ~ N
a: l ~ < i II N
J r- ~
~ U ., - .. a: .. r-II) 0 0 -0 .,
of
z
o 'oil
r;
'" III
0: ( ,.j
~ 0:
i Z
:lli! ( U)
---- LU ... - ~
11 o o :
J ~
· 0 " ~ (, . ., ~
J' \/\
"
.t
f ' • , • ....
~ • .. • 0 · ~ t .. c 0 II:
• Q
~ II
.. 0
.. .. .. III ~ ... II. 0 z
I a: II .,U o
, ,
III ' III ' :> ' o : I
l- . III . III ' a: J ~O ~J O( J0 (Z 0~ Z ::lJ III ( llZ « 00
: : J : • ' I •• '. I ., ( ,
, ' I ' , " •. 1 Z , . U ' , , , " III 0 ' ,_ ,
. , , ' , ': ,- ,Ill Z , ""Z, Cl-,UI'
'0 ,Qz( ,;;,u,

(. ill
~ 0: <1' ( 0
0 ~ ~iII .-7 >:~ %
«:> I_ v U~ \I- Z::J
~U 0:0 (ill
~~ Z(
~ I
ZZ ( E ~I Oz 'or Z e t-O Z::J Z 11. ,
;( « or Z Z Z Z
( 0 ill Z 0: (
« ( ..J
I
• :> • ,; cO _ z " • < <
I 0 u Z
:> 0 " • " ~ <
0
~ z :>
I 0 U • Z < Z • ~
" 0
( I-
~ < Z
ill « ( ill II: ill ill ..J ( ( ill 0: I/) III
( ill « 0: ( ::J ( 0: UJ « 0: « ill ill « 0: I/) c( IIJ 0: U c( ill ::J 0: c(
:> ..J > 0 ..... « ..J c(
~ ill 0: c( ..J Z ill ..J I4J Z c( 0 Z U
III c( I/) Q ~ 0: c( ~ ~ ~ ~ l-I/) Z I/) .J I/) ~
ill I- U ~ UJ ill Z ..J I
~ I/) e ill Z u ::J ..J U 0: ~ U z
III 0 III ::J I/) U III ill ~ ::J ~
::J 0 UJ ill 0 ~
a. III a. ill 0: 0: c( Q ~
< ~
IIMII~:::~D ~ z ~ < ~ ~ Z 0 ~ >
r' ~ '\ , I i
.I
\\ '
!l.'l ) I I ) , '
\ L.J I i I
( ( z j z .I
/ i l i i
r.i
, ~ x x , x x x x///
l x x x x x x x x x x
, x x x x x x
/
I o (
~ ( I/)
.',' :.


List of Statement
List of Appendix
List of Illustration
Foreword
Preface
Acknowledgement
Town at a Glance
Chapter I: Introduction
CONTENTS
Chapter II: History of growth of the town
Chapter III: Amenities and Services-History of growth and the present position
Chapter IV Economic life of the town
Chapter V: .Ethnic and selected Socia Demographic Characteristics of the Population
Chapter VI: Migration and settlement of families
Chapter VII: Neighbourhood Pattern
Chapter VIII: Family life in the Town
Chapter IX: Housing and material culture
Chapter X: Slums, Blighted and other areas with Sub-standard living conditions
Chapter XI: Organisation of Power and Prestige
Chapter XII: Leisure and Recreation, social participation, Social Awareness, Religion and Crime
Page
(v)
(xv)
(xvii)
(xix)
(xxi)
(xxiii)
(xxv)
1
16
24
53
83
124
161
189
211
219
228
Chapter XIII: Linkages and Continua
Chapter XIV: Conclusion
APPENDICES
(iv)
Page
252
270
275

Statement No.
1
1.1
1.2
II .1
111.1
111.2
111.3
111.4
111.5
111.6
111.7
111.8
111.9
111.10
111.11
111.12
List of Statement in the Report Vadnagar Town
Title Page
2 3
CHAPTER-I
Rainfall in Vadnagar 4
Religious composition of the population by Sex in Vadnagar 1981 Census 14
CHAPTER-II
Area, number of houses, household and population in 1951-1981 Census 20
CHAPTER-III
Important public institution (other than Banks, Educational and 28 Medical institution) in Vadnagar
No. of electric connection under different categories and 32 volume of consumption in Vadnagar during 1986-87
The information regarding the money collected under different heads 33 of electric connection and number of pending applications
Information regarding Vadnagar control point State Transport, 35 buses, Gujarat State
Trunk call rates 38
Income of Nagar Panchayat Vadnagar 40
Expenditure of Nagar Panchayat Vadnagar 42
Total income and expenditure of Nagar Panchayat during 1985-86 42 to 1988
No. of educational institution and teachers in Vadnagar 46
Incidence of diseases treated in Medical institution in Vadnagar 49
The Statement regarding Family Planning in the town 50
Disease for which animals were vaccinated 52
1
IV.1
IV.2
IV.3
IV.4
IV.5
IV.6
IV.7
IV.8
IV.9
IV.10
IV.11
IV.12
IV.13
IV.14
IV.15
IV.16
IV.17
IV.18
IV.19
(vi)
2
CHAPTER-IV
Classification of workers '1961, 1971 and 1981 Vadnagar town
Scheduled caste and Scheduled tribe workers in the town
Population, Main workers, Marginal workers and Non-workers in Scheduled caste and Scheduled tribe
Distribution of workers and non-workers by Sex and locality
Distribution of workers and non-workers by age and sex
Participation rate by sex and locality
Distribution of households by employment depth 1988 e.g number of workers in the households
Distribution of households by Un-employment depth (number of un-employment in the household)
Percentage distribution of non-workers by sex and type of activity
Distribution of households by number of members and occupational diversity
Distribution of population by sex, broad age-group occupation
Distribution of workers and non-workers by mother tongue
Distribution of workers by employment status and locality
Workers by caste/community
Occupation and Employment status of workers
The details regarding the distance from place of work (Kms.)
Mode of transport to place of work
Persons seeking employment classified by age and sex
Persons seeking employment by duration of stay
3
54
55
56
57
57
58
60
61
62
63
64
65
65
66
68
69
70
71
71
(vii)
1 2 3
IV.20 Persons seeking employment for the first time by education 72
IV.21 Details regarding previous employment 73
IV.22 The details regarding the households in position of agricultural 74 or horticultural land
IV.23 Manpower engaged in agricultural operations 75
IV.24 Small scale industry 76
IV.25 Number of establishments 78
IV.26 The details regarding lodges and restaurants in the town 79
IV.27 Number of depositors, type of accounts and amount 79 deposited (in lakhs)
IV.28 Transport of commodities by rail/other public transport 80 during last one year
CHAPTER-V
V.1 Distribution of population by religion 1981 Census 83
V.2 The details of Scheduled Castes 84
V.3 The details of other castes 85
VA Mother tongue, subsidiary languages of members as related to 86 duration of stay in present residence
V.5 Mother tongue and subsidiary language in Vadnagar 88
V.6 (a) Mother tongue and subsidiary languages related to age 90 and (b) and sex
V.7 Distribution of population by age and sex 91
V.8 Distribution of population by age, sex and marital status 93
V.9 Age at marriage by sex 94
V.10 Caste/Community wise details of age at marriage 95
(viii)
1 2 3
V.11 Age at marriage by religion 95
V.12 Age at marriage as related to educational level 97
V.13 The details relating to average age at marriage of Scheduled 100 castes and other communities
V.14 The details regarding average age at marriage as related to 101 education level and time of marriage
V.15 Age at first marriage as related to age at marriage and time of narriage 102
V.16 The details relating to widow/widower re-marriage by age of 103 becoming widow/widower
V.17 The details regarding the Divorced/Separated and re-marriage 104
V.18 Growth of literacy in Vadnagar since 1951 106
V.19 The distribution of population according to age, sex and educational level 106
V.20 Distribution of population by caste/community, age, sex and 107 educational level
V.21 Distribution of students by Age-Sex and Religion 109
V.22 Distribution of student by Age, Sex and caste/community 111
V.23 The Statement giving the code of different educational level 113
V.24 The Statement showing distribution of population by the average 113 per head educational score by locality
V.25 Distribution of population by caste/community and average 114 educational score
V.26 Distribution of households by type of households and average 116 educational score
V.27 Households default consistency in enrolling school going children 118 by caste/community
V.28 Households default inconsistency in enrolling school going 118 children by caste/community
V.29 Households default inconsistency (unstructured) in enrolling 119 children in school by caste/community

(ix)
1 2 3
V.30 Household default consistency in enrolling children in school by 120 type of occupation, caste/religion of head of household
V.31 Household default in-consistency in enrolling children in school 120 by type of occupation, caste and religion of head of household
V.32 Households default inconsistency (unstructured) in enrolling children 120 in school by type of occupation, caste anc;i religion of head of household
V.33 The Statement regarding never attendance and discontinuation after 121 ever attendance by age, sex and reason
V.34 Discontinuation of education by age, sex, caste/community and 122 class upto which level
V.35 Discontinuation of education by occupation of head of household 122
CHAPTER-VI
VI. 1 Persons born outside the town 125
VI.2 Place of last residence of members of the household as 126 related to the place of birth
VI.3 Distribution of households by migration status as per the 127 place of birth of heads of households
VIA Distribution of migrants by place of last residence and duration 128 of stay in the present residence
VI.5 Distribution of migrants by age, sex and place of last residence 130
VI.6 Distribution of workers and non-workers by migration status 132 with reference to place of last residence
VI.7 Distribution of migrant workers and non-workers by duration 134 of stay in present residence
VI.8 Work participation rate among migrants and non-migrants 135
VI.9 Employment status of workers by migration status with reference 136 to place of last residence
VI.10 Distribution of households by size and migration status by place of 136 birth of head of households
1
VI.11
VI.12
VI.13
VI.14
VI.15
VI.16
VI.17
VI.18
VI.19
VI.20
VI.21
VI.22
VI1.1
VII.2
VI1.3
VilA
VI1.5
(x)
2
Distribution of households by number of members and place of last residence
Distribution of households by number of members migration status and duration of stay in the present residence
Distribution of households by migration status and place of birth of head of household and composition by sex of members
Migration stages of households hailing from outside
Broad category of 'place from where the household hails and reasons of migration
Property at the place from where migrated by the description of place and distance
Unit of migration as related to the place of last residence
Visit of close relatives during three years by duration of stay in present residence and frequency of visit
Visit by close relations during three years by duration of stay in present residence and frequency of visit
Distribution of migrant households which migrated after 1955 by distance of origin of migration
Characteristics (at the time of migration) of the place of origin of migration Age, Sex and study in educational institutions by migration status as determined by place of birth
CHAPTER-VII
Statement showing distribution of population of the interviewed households by locality
Distribution of members of interviewees by age
Religion-wise break-up of population
Distribution of households by caste/community
Distribution of interviewees according to different religion/caste/ community
3
137
138
139
140
141
141
143
144
145
146
146
148
150
150
151
152
154

1
VIII. 1
VII 1.2
VII 1.3
VIII.4
VII 1.5
VII 1.6
(xi)
2
CHAPTER-VIII
Distribution of households by number of members and age of head of households
Distribution of households by nature of relation of members to head of household and migration status of head of household
Distribution of households by type and educational level of head of household
Distribution of households by type of households and by Castel Tribe/Community of head of household
Distribution of households by type of households and type of occupation of head of household
Distribution of heads of households whose family members are staying out of the town by Caste/Community and occupational category
3
161
162
164
166
170
173
VII 1.7 The details regarding households whose family members are staying outside 174 ,by Caste/Community and distance of place of last residence of head of household
VII 1.8
VII 1.9
VIII.10
VIII.11
VIII.12
VII1.13
VIII.14
VIII.15
Distribution of family members staying outside the town by occupational division of the head of the household and relation to head of household
Distribution of members staying outside by age, sex and relation to head of the household
Distribution of family members staying outside by educ,ltionallevel and nature of relation to head of households
Distribution of non-workers staying outside by nature of activity
Distribution of family members staying outside by nature of occupation and relationship with head of household
Distribution of members staying outside the town by reason of stay
Distribution of person staying out by relationship to head of household and duration of stay outside the town
Remittances sent by absentee family members
176
178
179
180
181
182
184
(Xiv)
1 2 3
CHAPTER-XIII
XII1.1 Growth of population in the town of Mahesana district 254
XII 1.2 Travel Index of persons, males and females by locality 265
XII 1.3 Frequency of visits to rural areas by members of households 266
XII 1.4 Purpose of visit of the members of households 267
XII 1.5 Visit to rural places by migration status 268

List of Appendices in the Report Vadnagar Town
Appendix No.
Title
1
1
2
3
4
5
6
7
8
2
Distribution of workers and non-workers with reference to particip[ation rate of community/caste sample population of Vadnagar
The details about Crops, production, consumption by locality
Practice of animal husbandary by religion, caste, community
Default households enrolling schooling children by scheduled castes and other communities of head of household
Main characteristics of neighbourhood as described by persons belonging to different religions, caste/tribe, etc.
Different occupational category
Main characteristics of neighbourhood as described with reference to any particular aspect or land scape
The details of cultural, religions and social activities of neighbourhood as reported by persons belonging to different religion/caste/community
Page
3
277
279
280
282
284
285
287
288
9 The details of cultural religious and social activities of neighbourhood as reported 289 by persons belonging to different occupation and educational level
1() The details of cultural, religious and social activities of neighbourhood as reported 291 by persons belonging to different age-group
11
12.
13
14
15
Purchase of commodities in the town
Purchase of commodities in and outside neighbourhood by occupation of interviewees
Educational facility and its enjoyment in and outside neighbourhood by level of education
The medical facility and its enjoyment in and outside neighbourhood
The occupation followed by the head of the household
292
293
294
295
296
(xvi)
Appendix No.
Title
1
16
17
18
19
20
21
22
23
24
25
26
27
28
29
30
31
2
Households classified by number of married couples without other members/with other members and number of rooms occupied by them
Particulars of five most respected persons in the neighbourhood of locality
Particulars of most influential persons in the neighbourhood of locality locality
Leisure time activity related to occupation
Number of villages in each taluka of Mahesana district according to the population size 1981 Census
Rural population of district and taluka according to population range (1981)
Area, Census houses and hOl,lseholds population as per 1981 Census of the selected villages
Proportion of workers, marginal workers and non-workers and its detail 1981
Proportion of literates during 1971 and 1981 Census in the selected villages
Availability of basic amenities in the selected villages
The details of the land use pattern in 25 selected villages
Travel Index of persons by caste and community
Persons by occupational category who travelled the distance of 500 kms. and above
Travel Index of persons by occupation who travelled the distance of 100 kms. and less
Type of household
List of abbrivation
Page
3
299
302
304
306
308
309
310
312
315
317
320
322
324
325
327
328
LIST OF ILLUSTRATION
SI. No. Title
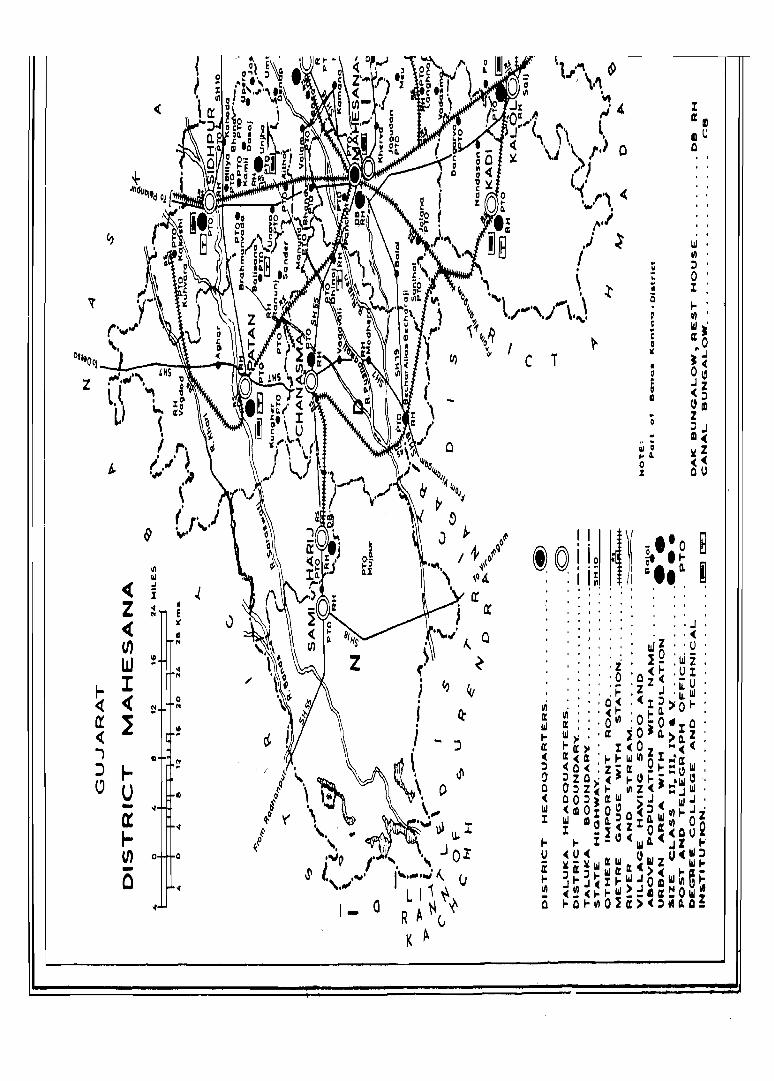
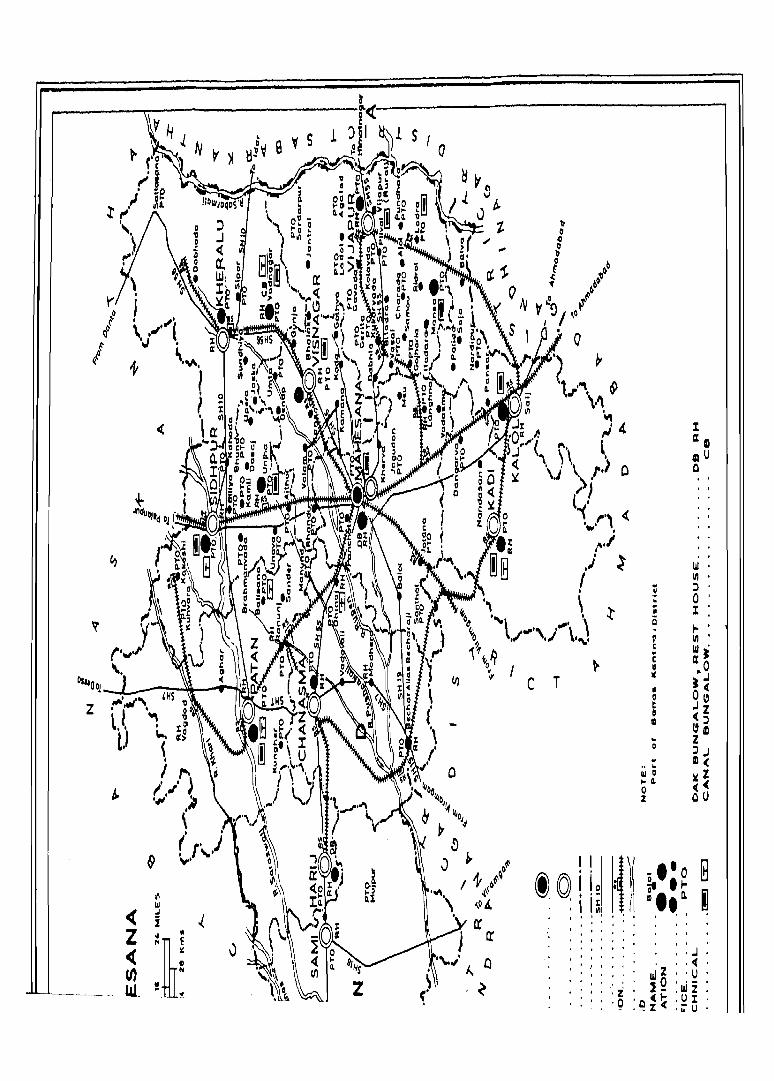
1. District Map of Mahesana
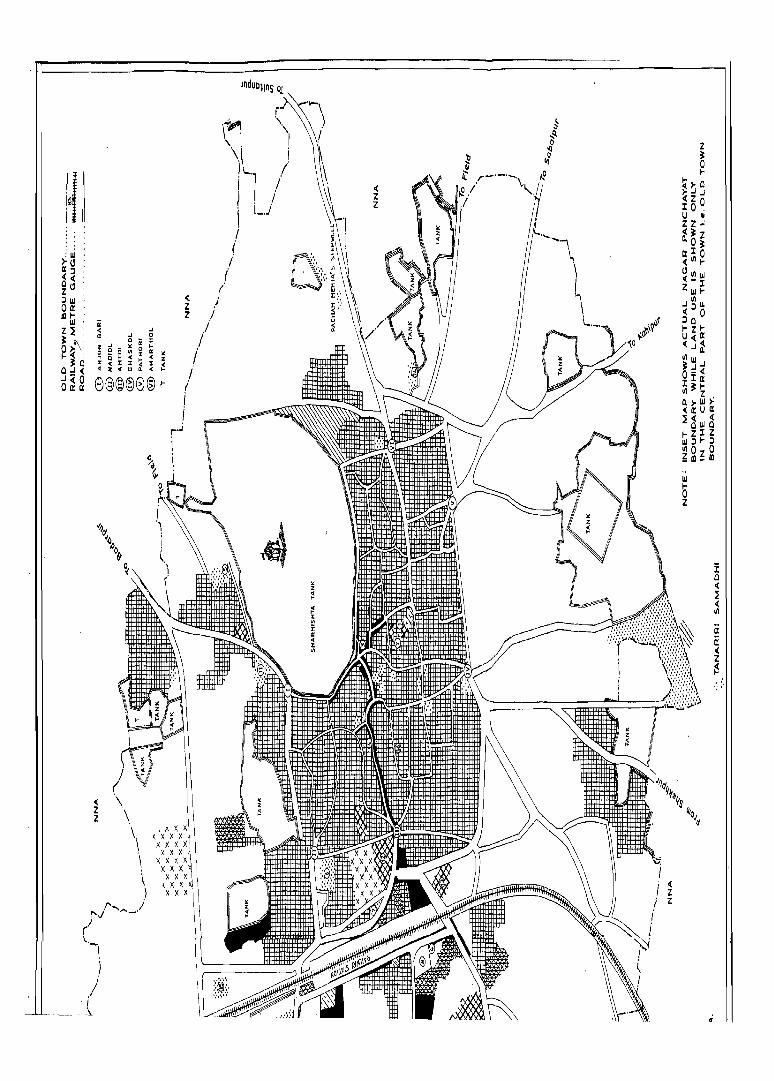
2. Town Map of Vadnagar
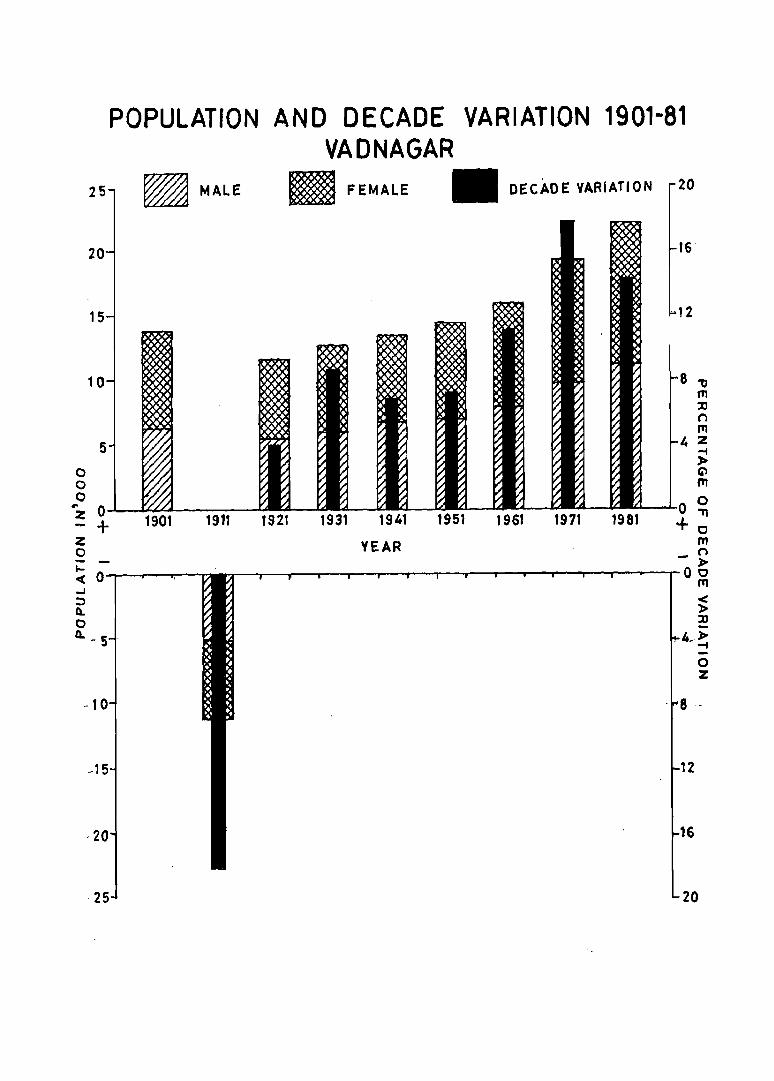
3. Population and decade variation 1901-1981 Vadnagar
4. Street Scene
5. View of Sarmishtha Talao and Deri in the Centre of Sarmishtha Talao
6. Arjun Bari
7. Nadiol Gate and Ghaskol Gate
8. Toran
9. Tana Deri and Riri Deri
10 Mehta Step-well and Pachham Mehta Step-Well
11. Nagar Panchayat Office and Deputy Director of Census Operations discussing with Members of Nagar Panchayat
12. Water Tank
13. Vadnagar Railway Station and Bus Station
14. Primary School Building and High School Building
15. Vadnagar College and Poly Technic
16. Nagrik Hospital and Vadnagar Nagarik General Hospital
17. Health Centre-1885 and Veterinary Hospital
18. Workers by Caste/Community
19. Distribution of Population by Age and Sex
20. Growth of Literacy-1951-1981
Page
Frontispiece
Facing Frontispiece
2
6
7
8
9
11
12
13
25
31
34
44
45
47
48
67
92
105

(xviii)
SI. No. Title Page
21. Houses by Predominant Materials of Roof, Ceiling and walls 192 and Walls
22. Classification of Households according to number of 195 members and number 01 occupied Rooms
23. Slum Area 212
24. Library Tower 229
25. Cinema House 230
26. Hatkeshwar Mahadev Temple and Carving at Hatkeshwar 235 Temple Bhim Shaking tree
27. Carving of Samudra manthan-Hatkeshwar Temple and 236 Carving at Hatkeshwar Temple
28. Carving at Hatkeshwar Temple 237
29. Mahakaleshwar Temple 238
30. Jain Temples 239
31. Village and Town falling within radius of 5 km, 10 km, 259 and 15 km. from Vadnagar Town as Centre
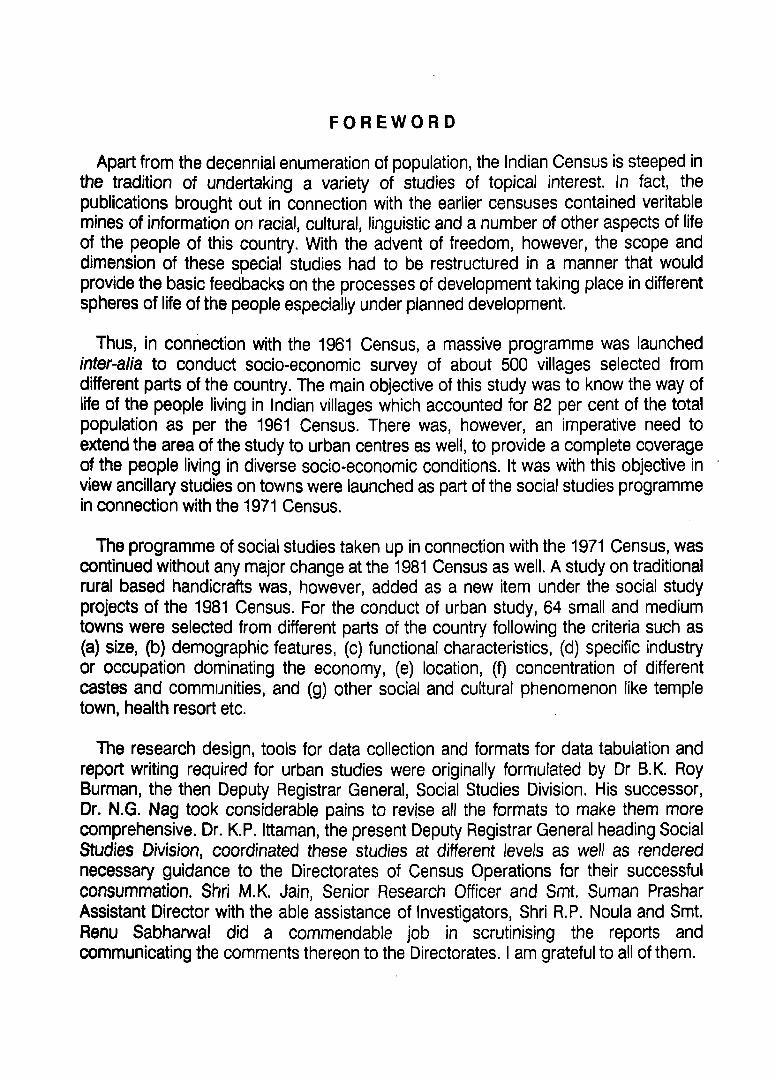
FOREWORD
Apart from the decennial enumeration of population, the Indian Census is steeped in the tradition of undertaking a variety of studies of topical interest. In fact, the publications brought out in connection with the earlier censuses contained veritable mines of information on racial, cultural, linguistic and a number of other aspects of life of the people of this country. With the advent of freedom, however, the scope and dimension of these special studies had to be restructured in a manner that would provide the basic feedbacks on the processes of development taking place in different spheres of life of the people especially under planned development.
Thus, in connection with the 1961 Census, a massive programme was launched inter-alia to conduct socia-economic survey of about 500 villages selected from different parts of the country. The main objective of this study was to know the way of life of the people living in Indian villages which accounted for 82 per cent of the total population as per the 1961 Census. There was, however, an imperative need to extend the area of the study to urban centres as well, to provide a complete coverage of the people living in diverse socio-economic conditions. It was with this objective in view ancillary studies on towns were launched as part of the social studies programme in connection with the 1971 Census.
The programme of social studies taken up in connection with the 1971 Census, was continued without any major change at the 1981 Census as well. A study on traditional rural based handicrafts was, however, added as a new item under the social study projects of the 1981 Census. For the conduct of urban study, 64 small and medium towns were selected from different parts of the country following the criteria such as (a) size, (b) demographic features, (c) functional characteristics, (d) specific industry or occupation dominating the economy, (e) location, (f) concentration of different castes and communities, and (g) other social and cultural phenomenon like temple town, health resort etc.
The research design, tools for data collection and formats for data tabulation and report writing required for urban studies were originally formulated by Dr B.K. Roy Burman, the then Deputy Registrar General, Social Studies Division. His successor, Dr. N.G. Nag took considerable pains to revise al/ the formats to make them more comprehensive. Dr. K.P. Ittaman, the present Deputy Registrar General heading Social Studies Division, coordinated these studies at different levels as well as rendered necessary guidance to the Directorates of Census Operations for their successful consummation. Shri M.K. Jain, Senior Research Officer and Smt. Suman Prashar Assistant Director with the able assistance of Investigators, Shri R.P. Noula and Smt. Renu Sabharwal did a commendable job in scrutinising the reports and communicating the comments thereon to the Directorates. I am grateful to all of them.

(xx)
The present report is the out~come of a study on Vadnagar town undertaken by the Directorate of Census Operations, Gujarat. I am indebted to Shri J.K. Patel, Deputy Director and his colleagues in the Census Directorate for their painstaking efforts in bringing out this report.
New Delhi, the 1 st of June, 1988
V.S. VERMA Registrar General, INDIA

PREFACE
As an ancillary to 1971 Census a special project of the study of selected town was undertaken to have a probe into the process of urbanisation in a developing country like India. This project was continued without any major change at the 1981 Census also. In his forward the Registrar General, India has explained the philosophy, methodology and the scope of such urban studies. All over India, 64 small and medium towns were selected for the study to understand the intensity and direction of the socia-economic forces generated by urbanisation as also affecting the process of urbanisation and its impact on the rural neighbourhood. In Gujarat 3 towns were selected under this project and the report on Vadnagar is the second.
Vadnagar a medium size town is situated on the bank of 'Sarmistha' tank in one corner of the district Mahesana of Gujarat which is built on an elevation of about 70 feet from the surrounding land mass. The entire town has slopy narrow lanes which may hardly provide sufficient space for the internal roads. The town is the original home of the Vadnagra Nagar Brahmins, however, at present very few families of these Brahmins are found in the town. Vadnagar has been recorded as Municipal town since 1901 Census which after introduction of Panchayat Raj has a Nagar Panchayat as its civic status. In Vadnagar people professing different religious faith and belonging to different caste, creed and community live together in perfect peace and harmony.
In this report an attempt has been made to depict the socia-cultural and demographic profile of the dwellers of the town since the days of its glorious past. The analysis of the data both regard to even a few such selected small towns would pinpoint the factors of which we should take care to avoid trady growth and help us to take steps to ensure a balanced development in which amenities of every kind would be available which would also fulfil the normal expectations of the people living in that area.
The report is based on data collected through a socio-economic survey conducted in sampled households of the various localities as also by contacting various educational, medical, religious and other institutions, trade and commercial establishments, Government and Semi-Government offices as well as by meeting a few eminent persons in the town. We have also made use of 1981 Census data. The sQcio-economic structure of the town has more or less retained its traditional frame and the shift from the traditional to the modern has been quite slow. The economic resources of the town have not developed beyond the age old frame. However, a marketing complex has been constructed recently on the left side of the bus stand and in front of Railway Station but the town is having no big industrial unit. In short the town is changing very slowly and its impact on the surrounding rural areas is very limited. The results included in this report generally refer to the period from June~July 1986. Additional data were also collected whenever necessary after this survey.

(XXii)
I must express my sincere thanks to Shri J.K. Parikh, Ex. Deputy Director who has supervised the field operation. The first draft of 3 chapters was prepared by Shri N.S. Bhatnagar, Ex. Assistant Director who had to leave this office on account of transfer. He was also assisted by Shri S.V. Shah, Statistical Assistant in his drafting work. Initial draft of other 2 chapters each was prepared by Sarvashri K.D. Vaisnav, Investigator and A.T. Singaporewala, Statistical Assistant and one by Smt. P.A. Shah, Investigator. I am grateful to all of them for their painstaking efforts in preparation of this ·report.
The undersigned has not only finalised the entire report but also drafted six chapters straightway. I also visited the town twice for on-the-spot study and general look before finalising the report. The field work carried out by the Statistical Assistants was supervised by Sarvashri H.D. Solanki and R.A. Trivedi, Investigators, who also collected some general information besides canvassing of town schedule during their supervision. The names of other members of staff of this Directorate who were closely associated with this work are given separately. I am thankful to all of them for their valuable contribution in preparation of this report.
I must record my deepest sense of gratitude to Shri V.S. Verma, lAS, Registrar General, India, for his valuable guidance, encouragement and constant inspiration in bringing out this report in time. I am also grateful to Dr. K.P. Ittaman, Deputy Registrar General (Social Studies), Shri M.K. Jain, Senior Research Officer and Smt. Suman Prashar, Assistant Director(T) for clearing the report in time limit and making suggestions to prove its utility. I am also thankful to Dr. B.K. Roy, Deputy Registrar General (Map) for timely clearing the maps included in this report. I am thankful to Shri B.P. Jain, Deputy Director (Printing) for his timely help in printing this report.
I also take this opportunity in expressing my sincere thanks to Professor R.S, Bhavsar and Shri Gordhanbhai Patel, residing in the town, for extending wholehearted cooperation and also for providing valuable information during our visit to Vadnagar.
Ahmadabad, 6-5-1989
J.K. PATEL Deputy Director Of Census Operations,
Gujarat, Ahmadabad
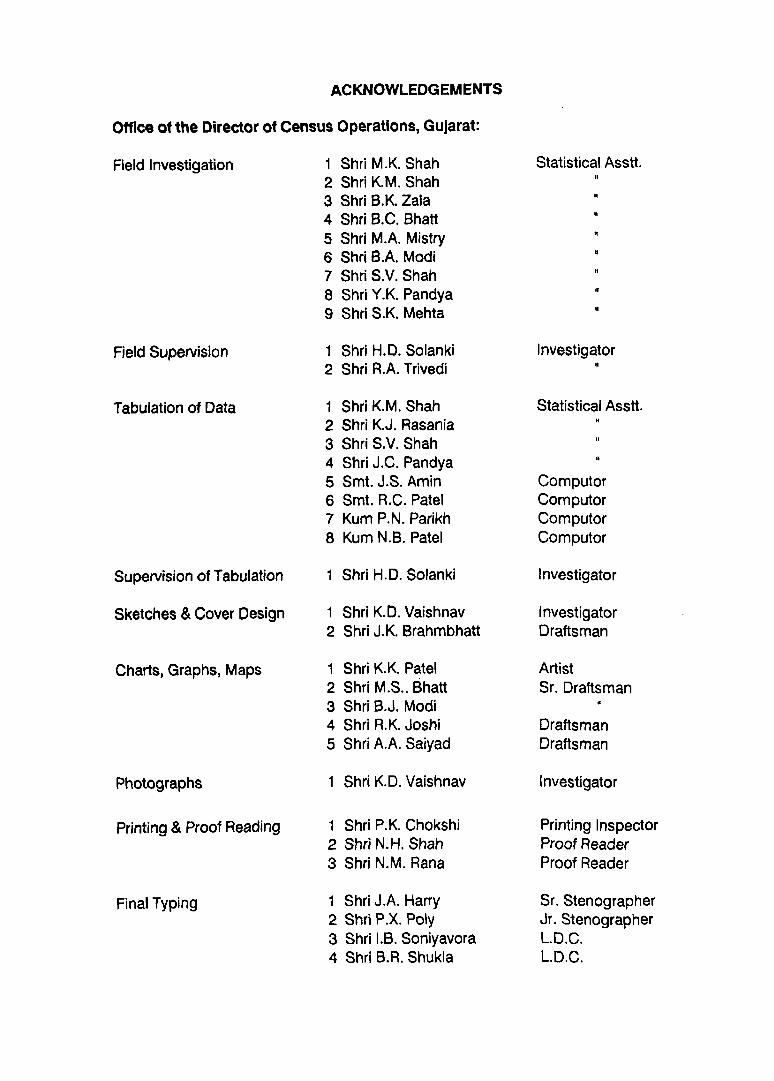
ACKNOWLEDGEMENTS
Office of the Director of Census Operations, Gujarat:
Field Investigation
Field Supervision
Tabulation of Data
Supervision of Tabulation
Sketches & Cover Design
Charts, Graphs, Maps
Photographs
Printing & Proof Reading
Final Typing
1 Shri M.K. Shah 2 Shri K. M. Shah 3 Shri B.K. Zala 4 Shri B.C. Bhatt 5 Shri M.A. Mistry 6 Shri B.A. Modi 7 Shri S.V. Shah 8 Shri Y.K. Pandya 9 Shri S.K. Mehta
1 Shri H.D. Solanki 2 Shri A.A. Trivedi
1 Shri K M. Shah 2 Shri KJ. Rasania 3 Shri S.V. Shah 4 Shri J.C. Pandya 5 Smt. J.S. Amin 6 Smt. R.C. Patel 7 Kum P.N. Parikh 8 Kum N.B. Patel
1 Shri H.D. Solanki
1 Shri KD. Vaishnav 2 Shri J.K. Brahmbhatt
1 Shri KK Patel 2 Shri M.S .. Bhatt 3 Shri B.J. Modi 4 Shri A. K Joshi 5 Shri A.A. Saiyad
1 Shri KD. Vaishnav
1 Shri P.K Chokshi 2 Shri N.H. Shah 3 Shri N.M. Rana
1 Shri J.A. Harry 2 Shri P .X. Poly 3 Shri LB. Soniyavora 4 Shri B.A. Shukla
Statistical Asstt.
»
»
Investigator
Statistical Asstt.
Computor Computor Computor Computor
Investigator
Investigator Draftsman
Artist Sr. Draftsman
Draftsman Draftsman
Investigator
Printing Inspector Proof Reader Proof Reader
Sr. Stenographer Jr. Stenographer L.D.C. L.D.C.

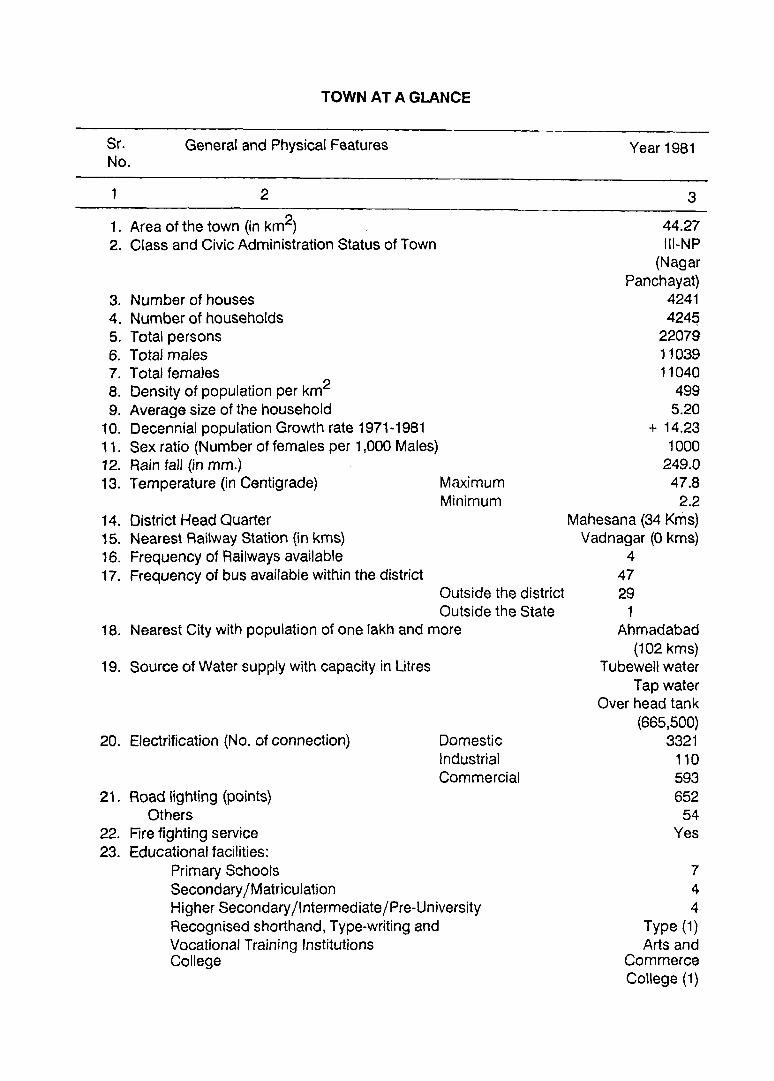
TOWN AT A GLANCE
Sr. No.
General and Physical Features
1 2
1. Area of the town (in km2) 2. Class and Civic Administration Status of Town
3. Number of houses 4. Number of households 5. Total persons 6. Total males 7. Total females 8. Density of population per km2
9. Average size of the household 10. Decennial population Growth rate 1971-1981 11. Sex ratio (Number of females per 1,000 Males) 12. Rain tall (in mm.) 13. Temperature (in Centigrade) Maximum
Minimum 14. District Head Quarter 15. Nearest Railway Station (in kms) 16. Frequency of Railways available 17. Frequency of bus available within the district
Outside the district Outside the State
18. Nearest City with population of one lakh and more
19. Source of Water supply with capacity in Litres
20. Electrification (No. of connection)
21. Road lighting (points) Others
22. Rre fighting service 23. Educational facilities:
Primary Schools Secondary/Matriculation
Domestic Industrial Commercial
Higher Secondary /Intermediate/Pre-University Recognised shorthand, Type-writing and Vocational Training Institutions College
Year 1981
3
44.27 Ill-NP
(Nagar Panchayat)
4241 424q
22079 11039 11040
499 5.20
+ 14.23 1000
249.0 47.8
2.2 Mahesana (34 Kms)
Vadnagar (0 kms) 4
47 29
1 Ahmadabad
(102 kms) Tubewell water
Tap water Over head tank
(665,500) 3321
110 593 652
54 Yes
7 4 4
Type (1) Arts and
Commerce College (1)
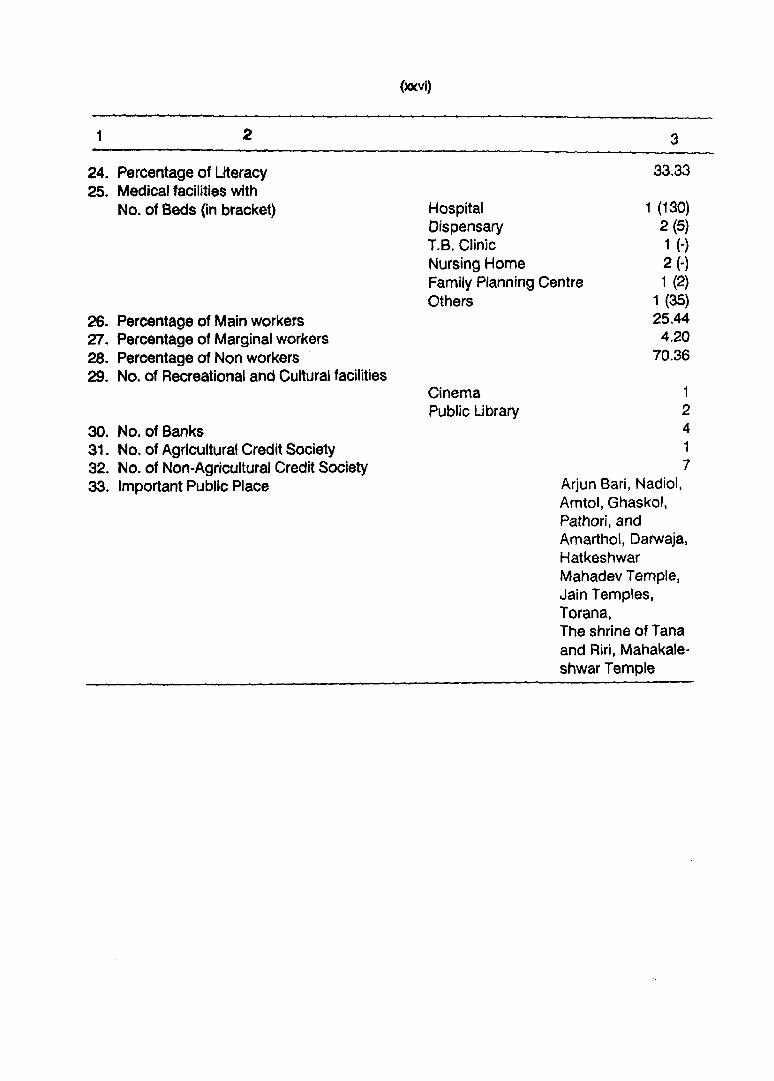
1 2
24. Percentage of Ute racy 25. Medical facilities with
No. of Beds (in bracket)
26. Percentage of Main workers 27. Percentage of Marginal workers 28. Percentage of Non workers ' 29. No. of Recreational and Cultural facilities
30. No. of Banks 31. No. of Agricultural Credit Society 32. No. of Non-Agricultural Credit Society 33. Important Public Place
Hospital Oispensary T.B. Clinic Nursing Home
3
33.33
1 (130)
Family Planning Centre Others
2 (5) 1 (-) 2 (-) 1 (2)
1 (35) 25.44
4.20 70.36
Cinema Public Library
1 2 4 1 7
Arjun Bari, Nadiol, Amtol, Ghaskol, Pathori, and Amarthol, Darwaja, Hatkeshwar Mahadev Temple, Jain Temples, Torana, The shrine of Tana and Airi, Mahakaleshwar Temple

CHAPTER-I
INTRODUCTION
Location: Vadnagar is situated in the north eastern corner of the district Mahesana of Gujarat. It is situated on an elevation of about 70 feet from the surrounding land mass. The town has a railway station and inadequate road links. The metre-gauge railway line on one hand goes towards Ahmadabad and on the other to Taranga Hills.
The taluka head-quarters of this town is at Kheralu at a distance of 14 Kms. The district head-quarters is at Mahesana having population of less than one lakh at a distance of about 34 Kms. The nearest air port and radio station are at Ahmadabad city, situated at a distance of 102 kms. The town is connected by a number of State Transport buses with important places within and outside the district.
Important Characteristics
Vadnagar town is situated on the bank of a big tank named 'Sarmistha tank'. The town of the earlier days got expanded opposite to the tank. If viewed from a height the town appears to have developed in the form of 'Semi-circle' around this tank which has an island. This island is the homeland of crocodiles and other reptiles. A number of small temples, old and new are also noticed around this tank. The town has the slope land and consequently the roads inside the town are in the 'Zig-zag' style. They are narrow and made of cement. The houses in the town are mostly very old and a large number of them are being altered. The town has a number of places of historical importance specially the six ancient doors/gates namely Arjun Bari, Nadiol, Amtol, Ghaskol, Pathori and Amarthol, and the way en-circling the town, temples like 'Hatkeshwar Mahadev' and shrines of great Jain musicians
and Tana-Airi etc. In the Arjun Bari gate on a stone slab on the north-west side of the Sarmistha tank is an inscription in 46 lines showing the building of the walls of the town, by Kumarpal Solanki in Vikram Samvat 1208 (Feb. 1152 AD). The stone slabs of deep red colour have been very frequently used in the above six doors and walls and on roads at many places. The town has been stated to be a centre of attraction for invaders and the repeated attacks which were made on this town further support the belief that the ancient Vadnagar or a part of the town might have been buried under the present one.
The ancient Vadnagar as described in all the sources was a town of rich and prosperous people. The town is the original home of the Vadnagar Nagar Brahmins though at present there are only few families left of them. At present it is mainly inhabitated by Kadva Patidars, Thakardas/Thakors and Bhavsar etc. The town as a whole gives a poor appearance except a few isolated localities. The people are worth admiration in matters of their democratic behaviour, socialbrotherhood and high sense of co-operation. In the old town .t~e market and the residential areas are mixed-up while the outer and new growth of the town has a separate Marketing offices and residential areas. The town has educational facilities from primary to graduation standard. The 'Nagar-Panct'layat' manages the local affairs like drinking water, cleanliness and other amenities in the town.
The town has small scale industries of agricultural tools and implements manufacturing, it has also rice mills, oil mills
0 0 0 .. 0 z - + z 0 - -I-«
- 1
-15
POPULATION AND DECADE VARIATION 1901-81 VADNAGAR
~ MALE III FEMALE DECADE VARIATION
8 "lJ 111 :0 n 111
4 2 -t » G'I m 0
1901 1911 " +0 m
_n l>
00 ITI
< » ::0 -l> -1 -0 z
and printing presses etc., The town is also the centre of the Kolhapuri 'gur' trade. No big industrial unit was found in the town. A separate Market yard has also been constructed.
3
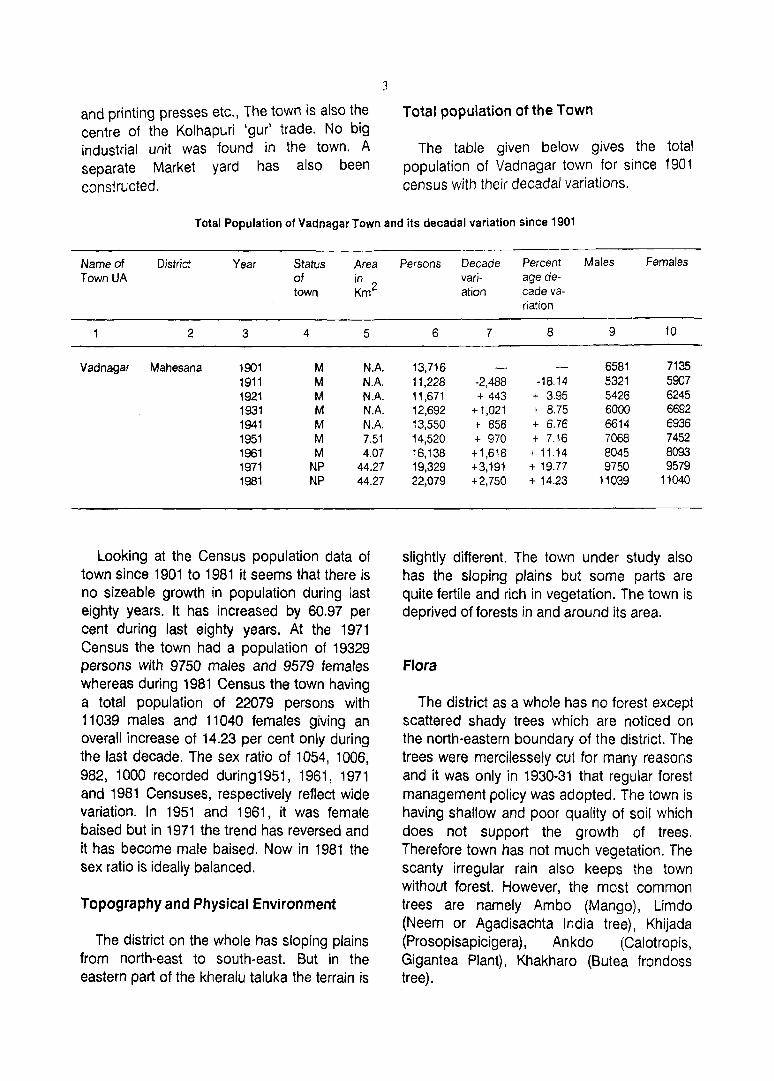
Total population of the Town
The table given below gives the total population of Vadnagar town for since 1901 census with their decadal variations.
Total Population of Vadnagar Town and its decadal variation since 1901
Nameot District Year Status Area TownUA ot in 2
town Km
2 3 4 5
Vadnagar Mahesana 1901 M N.A. 1911 M N.A. 1921 M NA 1931 M N.A. 1941 M N.A. 1951 M 7.51 1961 M 4.07 1971 NP 44.27 1981 NP 44.27
Looking at the Census population data of town since 1901 to 1981 it seems that there is no sizeable growth in population during last eighty years. It has increased by 60.97 per cent during last eighty years. At the 1971 Census the town had a population of 19329 persons with 9750 males and 9579 females whereas during 1981 Census the town having a total population of 22079 persons with 11039 males and 11040 females giving an overall increase of 14.23 per cent only during the last decade. The sex ratio of 1054, 1006, 982, 1000 recorded during1951, 1961, 1971 and 1981 Censuses, respectively reflect wide variation. In 1951 and 1961, it was female baised but in 1971 the trend has reversed and it has become male baised. Now in 1981 the sex ratio is ideally balanced.
Topography and Physical Environment
The district on the whole has sloping plains from north-east to south-east. But in the eastern part of the kheralu taluka the terrain is
Persons Decade Percent Males Females var;- age de-ation cade va-
riation
6 7 8 9 10
13,716 6581 7135 11,228 -2,488 -18.14 5321 5907 11,671 + 443 + 3.95 5426 6245 12,692 + 1,021 + 8.75 6000 6692 13,550 + 858 + 6.76 6614 6936 14,520 + 970 + 7.16 7068 7452 16,138 +1,618 + 11.14 8045 8093 19,329 +3,191 + 19.77 9750 9579 22,079 +2,750 + 14.23 11039 11040
slightly different. The town under study also has the sloping plains but some parts are quite fertile and rich in vegetation. The town is deprived of forests in and around its area.
Flora
The district as a whole has no forest except scattered shady trees which are noticed on the north-eastern boundary of the district. The trees were mercilessely cut for many reasons and it was only in 1930-31 that regular forest management policy was adopted. The town is having shallow and poor quality of soil which does not support the growth of trees. Therefore town has not much vegetation. The scanty irregular rain also keeps the town without forest. However, the most common trees are namely Ambo (Mango), Limdo (Neem or Agadisachta India tree), Khijada (Prosopisapicigera), Ankdo (Calotropis, Gigantea Plant), Khakharo (Butea frondoss tree).
In September 1988 Gujarat like other parts of the country experienced sufficient rain and thus when the author alongwith other members of the team visited the town during this period found the entire surrounding belt consisting of small and big green trees and bushes everywhere.
Fauna
The town is not having any local breed of animals deserving special mention here. Because of lack of forest the town has no wild animals. The animals commonly found in the town one domestic
Buffaloes and cows are quite good in number being 2248 and 1378 respectively. Oxen numbered 931 are primarily used in ploughing and carrying load from one place to another. The other animals in the town which are being used for carrying load from one place to another, may be short or long distance, are Ghoda (Horses, 3), Gadheda (bonkeys 113) and Unt (Camels 86). Besides other animals like Bakra (Goats, 169), Gheta (Sheep, 488), Kutra (Dogs, 495) and MurgaBatka (Poultry, 266) were also found to be there.
4
The above information relates to the year 1982-83 which was collected from the local Revenue office. Besides there may be some more animals which have not been registered with the Revenue Department.
Climate
Vadnagar experiences oppressive heat during the months of March to June and cold during November to February each year.
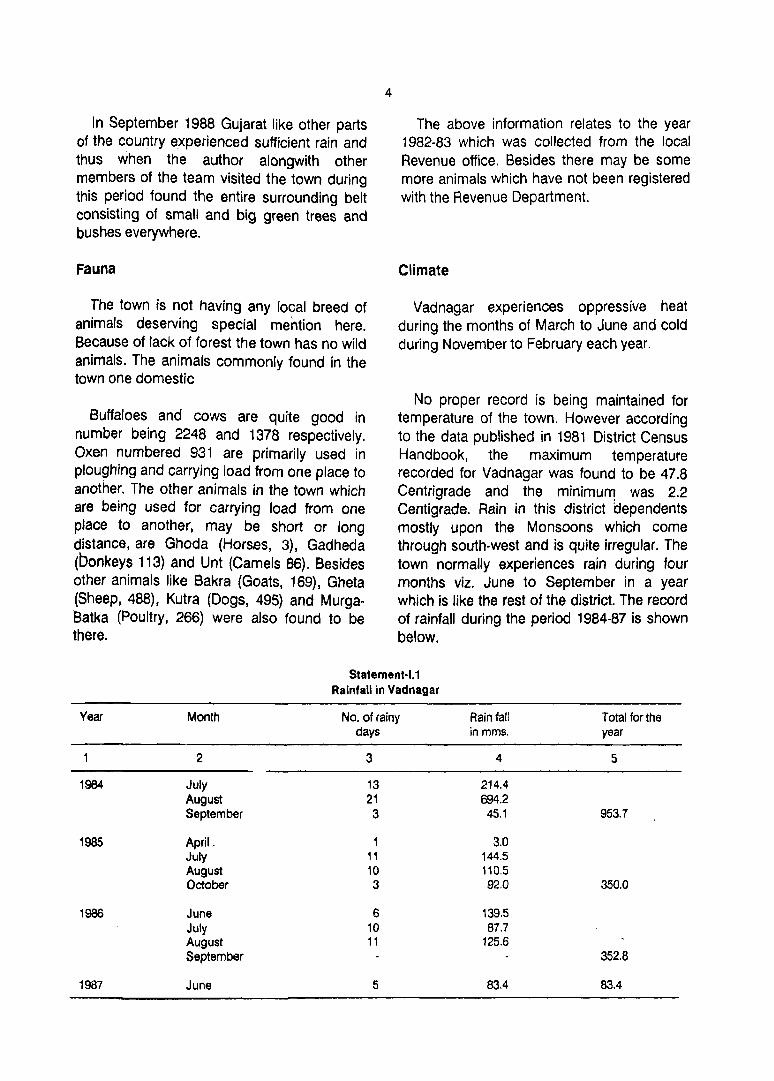
No proper record is being maintained for temperature of the town. However according to the data published in 1981 District Census Handbook, the maximum temperature recorded for Vadnagar was found to be 47.8 Centrigrade and the minimum was 2.2 Centigrade. Rain in this district dependents mostly upon the Monsoons which come through south-west and is quite irregular. The town normally experiences rain during four months viz. June to September in a year which is like the rest of the district. The record of rainfall during the period 1984-87 is shown below.
Statement-1.1 Rainfall in Vadnagar
Year Month No. of rainy Rain fall Total for the days inmms. year
2 3 4 5
1984 July 13 214.4 August 21 694.2 September 3 45.1 953.7
1985 April, 1 3.0 July 11 144.5 August 10 110.5 October 3 92.0 350.0
1986 June 6 139.5 July 10 87.7 August 11 125.6 September 352.8
1987 June 5 83.4 83.4

It would be seen that the minimum rainfall was in the year 1987, when it rained only for 5 days in the month of June, recording only 83.4 mms. The year 1984 recorded the maximum in 37 days providing 953.7 mm. of rainfall. In the remaining two years viz. 1985 and 1986 the rainfall was recorded for 25 and 27 days with 350 and 353 mms. of rain respectively. Data thus indicates that the town does not get sufficient rainfall.
Morphology including Streets
The earlier town appears to have been lost in antiquity. The entire town has slopy narrow lanes which are unplanned and zig-zag. The lanes and bylanes are congested and cannot afford passage vehicular traffic. Less attention seems to have been paid to provide comfortable spacious roads. The houses of the town do not reflect any architectural skill. Each house appears to have been built according to certain requirements of the household and further modifications are made from time to time as per the need. The streets are not named. The co-operative housing societies are yet to start in the town.
Some new buildings have been constructed on the right hand side of the town State Transport bus stand. Here the staff quarters of police department, irrigation department and agriculture department have been built. A marketing complex has also been constructed on the left side of the bus stand. The complex is just in the front of the railway station. Small temporary shops in wooden structures have also been built which are in a line behind the rail line.
Functional Areas
Functionally the town can be categorised as agricultural. The town having an area of 44.27 sq. kms. mainly consists of residential areas, except the middle part of the town which is a residential cum-commercial. The area of Railway Station and State Transport Bus
5
Depot lying on the western side of tne town is throbbing with transport activities where large number of passengers are going outside and coming inside the town. The town is having no big industrial units. The shops are mostly run on the ground floor whereas the upper 1Ioor(s) of the buildings are used for residential purposes.
In the following paras an attempt has been made to discuss different functional areas of the town.
The entire town can be treated as commercial area since 748 shops mainly of cloth, textiles. ready made garments, grocery, cutlery, gur, chemists, books and stationary, black-smithy, shoe-making etc. are scattered in the entire town. There would be hardly any lane in the town without any shop. It is because of the reason that the town has admixture of commercial establishments (shops) and residences even in the area which is called the main market place. The exclusive categorisation of any functional, area may not be possible in this town.
The five small scale manufacturing units in the town are also not working in a separate complex. They have got mixed with the residential houses. There are about 50 hawkers selling vegetable and tea, they all do their business at fixed places in the town except on the day of Shitla Satam fair, which falls on the 7th day of dark lunar fortnight in the month of Srawan each year. On this day they prefer to move in the town for better sale.
Important Public Places:
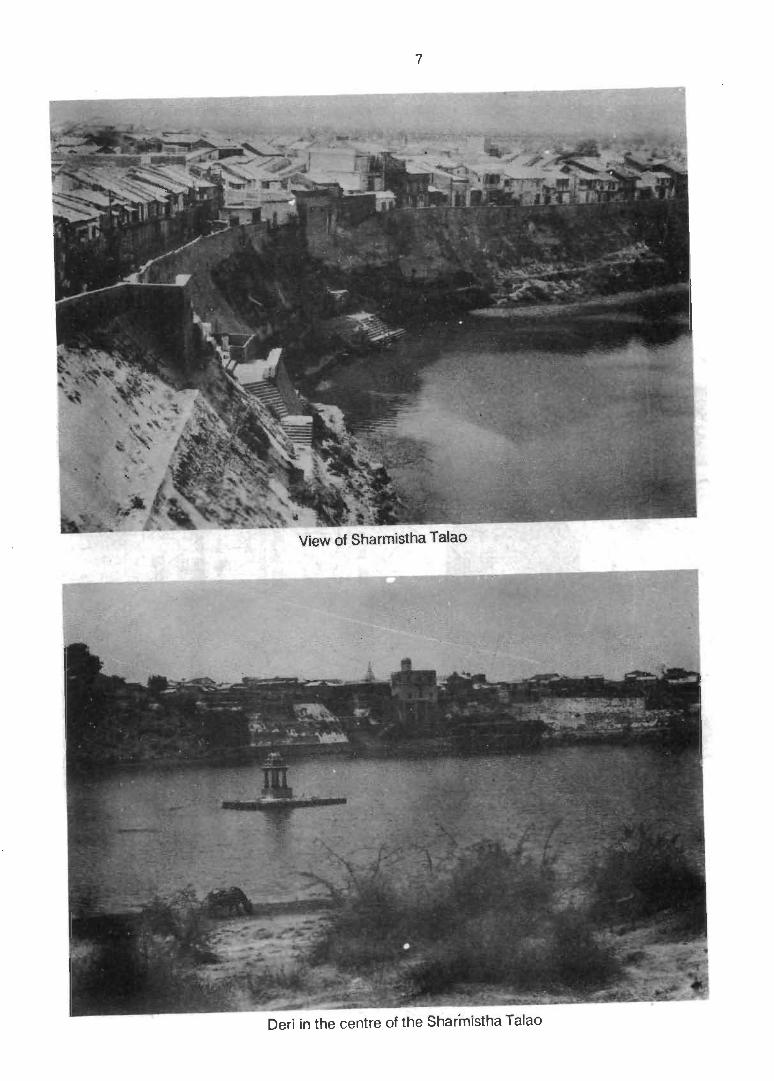
'To the north-east of the town there is large circular Sarmistha Tank. An island in the midst of the water seems to be the home of large number of alligators'. The tank is of special attraction to the visitors, the town people and to those who go t,or picnic. The tank has stone walls and steps. It is surrounded by shady trees. Here and there small ~emples have also

6
Street Scene
7
,
View of Sharmistha Talao
Oeri in the centre of the Sharmistha Talao
8
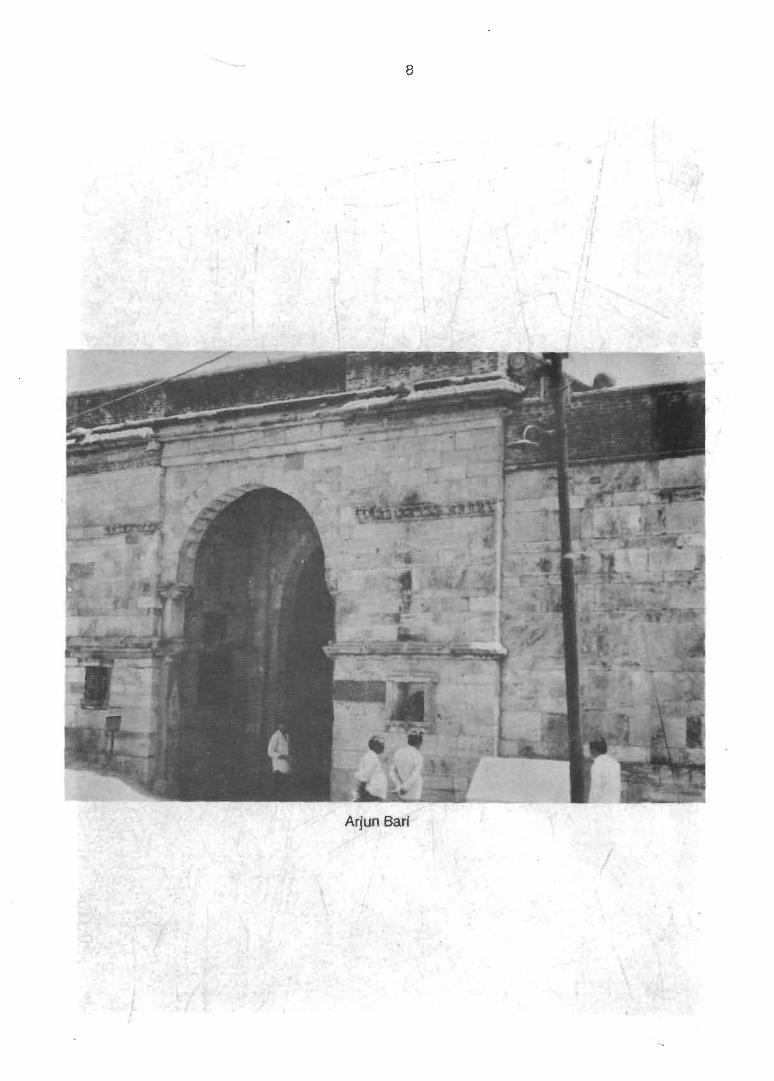
Arjun Sari

9
Ghaskot Gate
been erected. The tank may be categorised as the most important public place for Vadnagar specially when there is no good garden or park in the town. 1 The tombs of a Brahmin girl and her Pathan lover killed while elopeming is also seen here.
Next comes the six historical gates of the town. The Arjun Bari gate is on the northwestern side of the Sarmistha tank. Near the town an inscription made in Vikram Samvat 1208 (Sept. 1152 AD) by the poet Sri pal can still be seen. The inscription describes the history of Solanki Dynasty and the glamour and prosperity of the town in the following words.
'There the Brahmins descendants from the Nagar race, protect the King and the dealm and guard them by sacrifice that word of evil and cause prosperity. Nevertheless list this Brahmin town, though this given up to difficult austerities, should suffer, harm, the king, full of devotion ordered a rampart to be built for its protection. The crest-gemel of the Chalukyaadorned this whole town with a rampart desiring to benefit the Brahmins etc.'
All the gates except the 'Torent-gate' are of the same design, height and the same material has been used in their construction. The enterance of the gates none on one side the idol of Ganapati and other figure on the other. The idols were made as a part of the gate walls and appear to have not been fixed with the wall. Around the Shrine a frame also been made.
The chief temple of the Hatkeshwar Mahadev to the west of the town picturesquely place below the walls with a high and massive 'Sikhara'. It is believed to have been built during the Solanki period. The Shiv-Ling in the temple is believed to be 'Swayambhue' (Selfemerged). As per a reference to the
10
Hatkeshwar Mahadev in the Nagar Khand of the Skandh Puran, Hatkeshwar Mahadev is the family deity of the Nagar Brahmins. The main temple comprises of Garbhagriha, Kori, Mandapa, Porches and compound and a high massive Sikhara walls. The whole temple is elaborately carved and has some subsidiary temples a round it. The smaller temple called Kasi Visvasvar, standing in the compound is said to be older than the main shrine. Several sculptures are also seen on the outer walls ot the main temple.
It is also said that during olden days the Hatkeshwar Mahadev temple and the Sarmistha lake were in the midst of the Vadnagar town. The fact that both of them are now situated a little away from the town shows that the original Vadnagar had much larger area. The temples of Somnath Mahadev, Ambaji Mata, Kaleshwar Mahadev, Ashapuri Mata, Jaleshwar Mahadev, Ajpal Mahadev, and Dhuneshwar Mahadev are also found in the town.
Of the older remains of Vadnagar the chief are two magnificent Kirti stambhs or triamphal arches that once must have been connected with a great temple of which not a vestige now remains. They stand outside the walls to the north of the town and are identical in size and design. The more easternly of the two is in a better state of preservation, other stands parallel to it but to the north-west. Both of them face the east and now occupy the intermediate space between the arches. They are build of red and yellow sandstone without mortar or other cementing material. The famous TORAN or arch is decorative springing from the bracket capitals of the pillars. Their construction is purely free, the two pillars supporting a deep architrave and pediment. It is considered one of the best specimens of Indian sculpture. Their mouldings and decorative motives resemble each other much
1. Shri Sayaji Balgnan Mala Book 149-Vadnagar Bv- Kanaiyalal Bhaishankar Dave Publication, the year 1937 Page No. 113.
2. Gazette. of India of Gujarat State, Mahesana District p.841.

11
Toran


13

and are almost identical with the remains of a Toran at Modhera.
The town Vadnagar was also well known as a centre of Music-The famous twin sisters Tana and Riri who sang 'Malhar' to Cool the burning sensation which T ansen experienced by singing Dipak Raag also belonged to this town. The shrines of TANA and RIRI are said to exist near the Mahakaleshwar Mahadev temple and the cremation ground which are situated in the south of the town.
The town is old and holy and has its temples and fairs also, it is no wonder that it can boast of an uncommon concourse of the 'Targala caste' of Singers.
Religious Composition of Population
There are 20,364 persons returned as Hindus followed by 1534 persons recorded as Muslim with 751 males and 783 females. Jains are only 174 persons whereas Christian population is negligible having only 7 persons
14
residing in 1 household. Next in order comes scheduled caste with total number of 1770 persons of which 926 are males and 844 females.
In the field survey only two religions namely Hindu and Muslim have been covered. The data concerning 1373 persons residing in 257 households was collected in the field survey. Out of total 1373 persons 1285 belong to Hindu including scheduled caste and 88 to Muslim community. Of these 1285 Hindus, 118 persons belong to scheduled caste community of which Chamar, Garoda, Vankar, Bhangi, Mochi, etc. are important communities residing in the town. Among Hindus, Thakor (332), Patel (258), Brahmin (86), Prajapati (74), Ghanchi (50), Vaghari (44), Modh Vania (40), Rabari (38), Shoi (28), Sathwara (25), Luhar (25), Bhavsar (24), Soni (20), Oabgar (15), Suthar (10), Valand (10) are the important communities residing in the town. The details regarding religious composition of the town per 1981 Census as well as that of field survey are shown in the statement given below.
Statement-I.2
Religious Composition of the Population by Sex in Vadnagar-1981 Census
Name of Population 1981 Census SafY'lple Population Religion ._ ....... -.. _ .... _ ...... _-.. _ ...... _ ..... __ .. _--_ ... _---_ ... -_ .. - ..... - ...... ----_ .. -_ .. --... ----_ .. -_ .. -_ ...... _-..... - ..... -.. _ .... _ ..... _------_ ..... _ .. -_ ......... -_ .. -.... -_ ... --.. ---
P M F P M F
2 3 4 5 6 7
Hindu including 20364 10187 10177 1285 644 641 SC Population
Jain 174 97 77
Muslim 1534 751 763 88 40 48
Christian 7 4 3
Total 22079 11039 11040 1373 684 689
Scheduled Caste 1770 926 844 118 62- 56
The above composition shows that the Hindus constitute about 92.23 per cent, Muslim 6.95 per cent and Jain only 0.79 per cent. The percentage of scheduled castes population to total population of town comes to about 8.02 per cent.
Residential Pattern with reference to the ethnic group
If we look at the distribution of households in the town we find that in almost all localities except 5th one generally all communities of different ethnic groups including SC caste population reside together. Sut in the 5th locality all communities except SC caste population live together. In the first locality one household each of Bawa Oedh and Vankar scheduled caste communities and other households of Barot, Brahmin, Oarji, Ganchi, Kadia, Luhar, Modh Vania, Muslim, Ode, Patel, Prajapati, Rabari, Raval, Salat, Sathwara, Soni, Thakor and Vaghri communities reside together. Similarly in the second, third and forth localities, communities of both non-scheduled and scheduled caste reside.
15
Slum Area
There is no notified or registered slum areas in the town. However, the areas of substandard living conditions are found mostly in outskirts of the town and also on the bank of Sharmista tank. Here huts are made of thatch, tin sheets and mud. The main entrance of most of the house here is covered with a cloth or gunny bag. It also appears that the people living in such huts have not paid any attention to cleanliness. They are stated to be living there from a long time. Their earnings are too small to have a good house. Most of the huts have only one room without ventilator to live in. The couple and children are found to live in the same room. These slum dwellers seem to be ignored in the matter education and health services. The food habits and way of dressing differs considerably from the middle class people since they can hardly afford to have nutritious food and good clothing. The main concentration of people belonging to scheduled caste and also poor and backward non-scheduled caste people like Shoi, Rabari, Raval, Sathwara, Thakor, Vagharis, Ode etc. are also found in such huts.
CHAPTER-II
HISTORY OF GROWTH OF THE TOWN
Myth, Legend or History connected with the growth of the town
Vadnagar is a small but one of the oldest towns of Gujarat State. The earliest references may be found in one of the Chapters of 'SKANDHPURANA' under 'Nagarkhand' 1. The information given therein appears to be exaggerated. The inscriptions wri~en on copper belonging to Vallabhi Maitrak period also describe about this town. The famous book entitled 'Jain Kalpa Sutra' written by a jain saint 'Bhadrabahu Swamy' also contains the story of the establishment of this town2. Nonetheless, the well known Chinese traveller to India, during seventh century has also described this town in his writings. People say that the golden period of this town was during the time when Gujarat was ruled by Chalukya (Solanki) dynasty. The last ruler of this royal family King Kumarpal has also built up a fortwall surrounding the town3. Such conclusions are drawn from the inscriptions written and affixed on the fort-walls. The ancient historical books like 'Aa-In-E-Akbari' and 'Mirate-eSikandari,4 also contain description about the town. Another valuable book of the past 'Nirnaydeep 5 written by 'Achal' has discussed the towns it progress and prosperity in the past. According to Muhnot Nensi of Rajputana the town was known as 'Singarpura in the 17th century'. 6
The Indian history of XX century is mainly of English rule. Burgess has· appropriately quoted the words of colonel Tod which read as under:
"Kanaksen, a prince of the race of sun, abandoned his native country of Koshal, the kingdom of which Ayodhya was the capital in A.D. 144-145. He wrested dominions from a prince of tl1e Parmar race and founded
d ,,7
Va nagar.
Another story which establishes the proof about the town being there and of its being very old is related to 'Narsinh Mehta', a Poet of repute and devotee of Lord Krishna. It is stated that about 500 years ago Mehta was the first Vadnagar Brahman to enter this town. In fact Narsinh found refugee in this ;town on account of the fact that he adopted worship of Lord Krishna leaving Mahadev.
Period of Establishment of the town
The above references speak about the existence of the town in the ancient historical, religious and political writings. The present name of the town Vadnagar was known by different names in different periods. However, the exact date and the person who assigned this name to the town is not known. In the
1. Shri Sayaji Balgnan Mala Book-149-Vadnagar by Kanaiyalal Bhaishankar Dave Publication, the year- 1937, Page No.3
2. Ibid, Page No.9
3. Ibid, Page No.3
4. Shri Sayaji B::.lgnan Mala Book-149 Vadnagar by Kanaiyalal Bhaishankar Dave Publication, the year 1937, Page No.4
5. Ibid, Page No.4
6. Ibid, Page No.4
7. Ibid, Page No.4

ancient as well as medieval period of the Indian history the town was known as Anandpur, Nagar, Chamatkarpur1, Skandpur, etc.
About the identity of the town as Anandpur there exists a great difference of opinion. Dr. Fleet has written that the present town Anand, 25 miles away from south-east of Kaira was the ancient Anandpura. According to Dr. Durgees the ancient Anandpura was in Kathiawad. However, Stevenson. Vivan de Sain-Martin, Dr. Buhler and Dr. Bhandarkar the modern Vadnagar is the ancient Anandpura and situated in the northern part of the Gujarat State. It is also gathered that the town was called Chamatkarpur in 'Kirta Yuga', Amartpura in 'Treta Yuga', and 'Anandpura' in 'Dvapura Yuga' and sometime as Vrdhanagara. The references· of this town in the writtings of the famous chinese traveller 'Hu-en-Tsiang' help us in reaching to a definite conclusion regarding its identification2. He says 'From this (Vallabhi) going north-west 700 or so, we come to 'o-nan-to-pu-Io' (Anandpura). This country is about 2;000 Ii in circuit, the capital about 20: The population is dense, the establishment rich. There is no chief ruler but it is an appanage of Malwa'.
The statement leads to conclude that Anandpura was at a distance of 140 miles from Vallabhi-Precisely it is the same distance of Vadnagar from Walia-whereas Anandpura of Kathiawad is at a distance of 50 miles from Walia. The only mistake appears in mentioning the direction since Vallabhi is 140 miles or 1000 Ii to the south and not to the north of Kutch.
The other -inscriptional references load to conclude that the present Vadriagar was Anandpura which was neither in Kathiawad nor Anand in Kaira. As far as the other names
17
of this town like Chamatkarpur. Ananddham and Manpur are concerned they point towards the fact that the place was the adode of highly learned Brahmin community who also spreaa their knowledge about the religion and citigation in other parts of the Gujarat. 3
Reverting back to the question of first establishment of the town and its name may be said that the detail historical description is available is Skandh purana under the chapter Nagar Khand. The other book containing the legendary references about the town has been written by Col. Tad. Chapters 10 to 13 of Nagarkhand in Skandhpurana describe about the town as under
There used .to be a dense grove where the present town Vadnagar is established. Lord Brahma, the creator of universe, went underworld and when came out brought from there Hatkeshwar Mahadev and established a temple of Lord Shiva in this grove. This area afterwards became famous as 'Hatkeshwar Region'. Once. the king of Anartdesh named Chamatkar 4 came to this place. He was suffering from 'Leacoderma' during those days. None of the treatment proved effective and his condition deteriorated, continuously. The Brahmins of the Hatkeshwar region advised him to take bath in 'Shankh Tirth tank' specially when there is full moon in the sky in Chaitra and pray Lord Shiva in the temple. By doing this the king was fully cured. The king was much pleased and he built a town at that place and gifted it to Brahmins. The town was then known as 'Chamatkarpur'. (The Chapter I of the book Ras.)
Mala, describes about king Chamatkar that he was suffering from leprosy and when advised by the Brahmins to take bath in the "Shankh Tirth" on 14th day of Chaitra he did the same. The king was cured and the
1. Shri Sayaji Balgnan Mala Book-149 Vadnagar by Kanaiyalal Bhaishankar Dave Publication, the year- 1937, Page No.9.
2. Shri. SaY~!i Balgnan Mala Book 149- Vadnagar By Kanaiyalal Bhaish~nkar Dave Publication, the year 1937 Page 2 3. Sh~1 Saya!~ Balgnan Mala Book 149-Vadnagar By Kanaiyalal t3haishankar Dave Publication, the year 1937. Page 29. 4. Shn SaYBJI Balgnan Mala Book-149 Vadnagar tsy Kanaiyalal Bhaishankar Dave t'ublication, the year 1937 Page No. 23

Brahmins named this town as Chamatkarpur. Achakshwar temple was also built by the king in this town.
Historical facts do not support the above story since no king named as Chamatkar or town Chamatkarpur is found in the history of Gujarat. Though in olden days north Gujarat was called Anartdesh. The existence of Anartdesh in Gujarat is also found in the inscriptions of the Sudarshan lake which is situated near Girnar Mountain. Poetic descriptions are also available where the northern part of the Gujarat in the period I to IX century was called as Anartdesh.
The town known as Anandpur, Nagar, Anartpur are also found in Vallabhi's copper plate 1 inscriptions which also describe that such a town was in existence before 5th century A.D. Nonetheless, Skandhpurana appearing in the list of Naradpurana is believed to have been written earlier or in 4th century A.D. Thus, it may be concluded that the story of earlier Vadnagar may be under some Olhi, name, regarding the war between different kings, the glory of knowledge of Pandits and the prosperity of the town is a true description.
According to some eminent writers and on the basis of certain historical references the town Vadnagar might have been established for the first time during second century A.D. According to one opinion the town might have been established during 70 B.C. to 398 A.D. Le. a period in the history when Kshtrap dynasty ruled over Gujarat. The historical facts do not support that any Kshtrap king has ever given any town in gift to Brahmins except ~he son-in-law of the first king of this royai family who gifted many towns and cows and built many pilgrim places. This fact has also been mentioned in the inscriptions of Nasik Sunnar and Karla. Thus, the possibility of establishing this town by Ushardat who ruled Gujarat during 2nd century may not be ruled
18
out. Vadnagar is the seventh name of this town.
Different Names Vadnagar has attracted considerably the
poets and consequently found its na~e i.n poetic inscription. The poet Vallabh In hiS book 'NAGAROTTAPATTI' meaning 'Origin of Nagar Brahmins' describes that the town was known as 'Chamatkarpur, Manpur, Anandpur and Vadnagar'. The other poetic inscriptions of Vallabhi talk about Nagar, Anandpur and AnartpLir as names of the present Vadnagar. According to one inscription on stone nearby Arjun Bari gate the town was known. as 'Anandpur' during that period. A royal pnest as well as poet named Sarneshwar Dev has described Vadnagar as Nagar in his poem 'Surthotsar'. The book 'Nirnay Deepak' by Achal Dwivedi Vriddhanagar.2
In the absence of any systematic historical evidences it would be difficult to prove how many names were in vogue for this town priqr to Vadnagar. However, Achal Dwivedi's views about Vadnagar as Vriddhanagar appear to be quite appealing. It mainly centres around the residents of this town of that time who were known as 'Vridhas'. The place where Vridhas lived was known as Vadnagar. A Jain priest of 1441 A.D. has also described that the Vadnagar was a pilgrim centre for jains.
It may be concluded on the basis of the above discussions that Vadnagar as well as Vriddhnagar were in vogue in 14th and 15th century A.D.
Ancient glory of Vadnagar
It has been accepted that Vadnagar is an ancient town of Gujarat. It has been a centre of learned -people, poets priests and Musicians. The people of this place were prosperous.
The prosperity of the town was well known because of its trade and commerce. It is said
1. Shri Sayaji Balgnan Mala Book 149 Vadnagar By Kanaiyalal Bhaishankar Dave Publication, the year 1937 Page No. 11
2. Shri SayaJi Balgnan Mala Book 149 Vadnagar, by Kanaiyalal Bhaishankar Dave Publication, 1937, Page 28
that the famous book on Jain religion named 'Kalpasutra' was written in Vadnagar by Bhadrabahu in 5th century A.D. 1. According to Khafikhan, the Persian poet in the time of Aurangzeb, the town Vadnagar was most prosperous, developed in business, trade and commerce. The business of that time being mainly in the hands of Nagar Brahmins. A reference to that ;s found in "Mirate-esikandari'. In addition it is also written these that Rana Sanga of Chitod2 once got attracted towards the wealth, and prosperity of the town and planned to attack on it. The intellectual Nagar community persuaded the king from not doing so. It leads to conclude that till 16th century A.D. the town continued to be very prosperous. The ancient monuments also speak about its prosperity.
The Nagar community which was residing in the neighbourhood attacked upon the town in VA 404 or 348 A.D. but they were defeated. According to the book 'Nagarottapatti' (origin of Nagar) the town was looted second time by 588 A.D. May be because of this reason.some of the Nagar famili.es fled away from this place to Kathiawad and Rajputana. When Arabs invaded Vallabhipur in 8th century the town was again looted third time. At that time some of the Nagar families took shelter in Idar and are still there to be known as 'Idawa Nagars'. Kutubuddin the emperor of Delhi when invaded Gujarat and destroyed the area from Abu to Patan the town Vadnagar was also looted. In 1725 A.D. the Vadnagar people gave Rs. 4/- lakhs to a Maratha commander as ransom with a request not to loot them. Again in 1726 A.D. the town was captured by another Maratha commander named Kantaji Kadam. The historic wall of the town was destroyed and the wealth was plundered. The destruction made by this Maratha commander was so severe that since then the town has not attained its earlier prosperity.3
19
Size and Boundary
Before coming to the present description of the size and boundary of the town it would be appropriate to note such detail of past Vadnagar. According to 'Hu-en-Teiang' the town Anandpur (present Vadnagar) was spread in 3 ' /2 miles in length and breadth. It was a populous place having domination of Brahmins. The European scholar Mr. Wells in his book 'Buddhist Record of Western India' has written that the circumstance of the Anandpur-taluka was 210 miles and that of Anandpur town 21 miles. The figures may appear to be exaggerated but the fact of Vadnagar's being a big town is established. Till the medieval period the town continued to be great, both in size and population.
The present Vadnagar hardly depicts of the glamourous out-look. The town Vadnagar (Nagar Panchayat) has 44.27 sq. kms. area with a total population of 22079 persons. Population and growth are inter linked. Thus, in order to assess the growth of the town, it would be quite appropriate to have a look at population growth of Vadnagar.
The Census records of the last eighty years (1901-1981) speak that there is no sizeable growth of population of the town. The town was having a population of 13,716 persons in 1901 whereas it has added only 8,363 persons upto 1981. It means about 105 persons a year. Similar is the condition of economic development of the town.
On one hand the boundary of the town is close to Visnagar which is comparatively a developed town and taluka place. On the opposite side of the town are village Undhai, Karbatiya, Umta and Sundhiya. These villages are in the range of five to seven kms. from
1. Shri Sayaji Balgnan Mala Book 149-Vadnagar by Kanaiyalal Bhaishankar Dave 1937 Page No. 60 2. Shri Sayaji Balgnan Mala Book-149 Vadnag,ar by Kanaiyalal Bhaishankar Dave publication-the year 1937
Page No. 65 3. Shri Sayaji Balgnan Mala Book-f49 Vadnagar by. Kanaiyalal Bhaishankar Dave Publication, the year1937
Page No. 69.

20
Vadnagar. On the right hand side of the town is Kheralu another taluka to which it is -linked by road as well as by train. Inspite of many such factors which have not only adversely affected the economic growth of the town but have taken away the major economic activities from this place to Visnagar the area of the town has considerably increased since 1951. It may be said that on one side its boundary is close to Visnagar and Kheralu and four or five villages on other side.
Growth of the Town
Economic growth and population increase
of a place are interlinked. Despite their best efforts the town was not linked to the nearby villages by roads 'rJy 1960 consequently the people started migrating to the places where they could carry their trade and business more conveniently. Even at present the town does not show much progress in the matters of population and economic growth.
The following statement presents the number of houses, households and population in Vadnagar in the last four decades:
Statement 11.1
Area, number of houses, households and population in 1951-1981 Censuses
Year Area of Number of population the t02'n ---------.. ----_ .. ----------_ ... _------- --------------------- .. _------------------------.. _-----.. ---_ in km Houses
2 3
1951 7.51 3504
1961 4.07 3588
1971 44.27 3862
1981 44.27 4241
Source: D.C.H. Books.
The area of the municipal town during 1951 Census was 7.51 sq. km. which was reduced to 4.07 sq. km. in 1961 census. However after its conversion to Nagar Panchayat the area has been increased to 44.27 in 1971 which remained constant till 1981 census. Thus area of the town has been increased more than 10 times from 1961 to 1971 period.
In 1951 there were 3509 households residing in 3504 census houses which were shared by total 14520 persons of Vadnagar town. The number of households has increased to 4245 during the period of last 30 years. Simultaneously the number of occupied
House- Persons Males Females holds
4 5 6 7
3509 14520 7068 7452
3627 16138 8045 8093
3862 19329 9750 9579
4245 22079 11039 11040
residential houses has also increased from 3504 to 4241 which are shared by total 22079 persons. It indicates that the proportion of increase in both number of households and residential houses is almost the same. It also shows that the increase in census houses during the period from 1951 to 1981 in respect of selected town (Vadnagar) was only 21 per cent as against about 66 per cent increase recorded for Visnagar town.
The population of town was 14520 persons in 1951 which has increased to 2207~ in the 1981 census. This shows that 7559 persons were added during last 30 years or in

otherworlds only 34.24 per cent Increase at the average yearly increase of about 1 per cent has been observed during the period of 30 years. It is interesting to note here that the increase in total number of Census houses was 737 only in last 30 years giving an average yearly increase of 0.7 per cent and overall percentage increase of 21 per cent in 30 years. This further reveals the fact that both growth in population and increase in houses Vadnagar seems to be quite standstill.
Lastly the number of female~ per thousand males was more in 1951. In .961 also the females out numbered males whereas in 1971 reverse trend is observed where number of males are more. In 1981 census the number of males and females is almost equal. It is also evident from this fact that more males might be going out of town in search of the livelihood.
11.5 Land Utilisation
Land utilisation particl;Jlars of agricultural land in Vadnagar are available. Out of total agricultural land of 3718 hectares, 2508 hectares land is under non-irrigation and rest of 1210 hectares is under irrigation. The irrigation is being done by wells, tube-wells, and canals. The area irrigated by wells is 60 hectares, by tube-well 420 hectares and by canal.730 hectares. The chief crops grown under irrigated areas are wheat (N.O. Graminacae), raido (Mustard), isabgul (Spogel seed; Psyllium), jeeras (cumin) and the crops grown without irrigation facilities are bajari (millet), jowar (coarse millet), tur (cajanusindicus), muth (name of a kind of pulse, name of leguminulue) and gawar (a kind of bean) etc.
The land utilisation statistics further reveal that about 574 hectares of land seems to have been allotted as grazing land for cattle which is known as 'Gauchar' in local language. No special rules have been framed for the use of land in Vadnagar. However, the Nagar Panchayat has recently made a plan to
21
promote the establishment of industries in the town. It was proposed to form Vadnagar Industrial Development Corporation (VIDC) for further development of the small scale industries. The plan to purchase 14 hectares land has been prepared of which 2.83 hectares land has already been purchased at cheaper rate. However, buyers shall have no right of re-sale of land. The proposed plan is being executed.
The Nagar Panchayat has earmarked the land of the town for different purposes. The details are as under:
Land use pattern in the town
Sr. Category of No. land use
2
1. Residential
2. Administrative purpose
3. Educational Institutions
4. (a) Commercial (b) Industrial (c) Road (d) Park (e) Govt. quarters (f) Vacant (g) Agricultural
purpose
Total
Hectares of land allotted --------------Hectare
3
648
21
19
2 2
3732
4424
DA
4
44
33
30
3 65 70
49
Mts.
5
96
72
99
34 54 94
49
The above use of land and its allocation for different purposes hardly make any provision for constructing a separate commercial complex, industrial area and also parks. None the less the provision of roads has also escaped the list. The reservation of land for agricultural purposes appears to be quite sufficient. Thus town planners seem to have tried to categories the land according to its utility for residents of Vadnagar.
Prices of Land
The land on an average is being sold at price of Rs. 10,000/- per Bigha. Due to the Location of the Railway station and the state Transport Bus stand are towards the west. So the town has also developed more in this direction. Near these two places the rate of land is comparatively higher than the rest of the town.
History of settlement of different category of Population '
As reQards the settlement of Hindus in the town it is said that saints like Markande used to live in this town in Ashram to preach and practice the religion and spritualism to the people. Jains being the business community appear to have come in the town for trade. It is also believed that Jain saint named 'Bhadrabahu' (5th century A.D) wrote his famous book 'Kalpasutra' in this town. At present there are two old and famous Jain temple in the town. As regards the settlement of Muslim population of the town no coded facts are available but due to their lengthy rule over the country as well as some period over Gujarat and assults on town some families might have chosen to live here.
The town in the ancient period or in the beginning was a centre of Nagar-Brahmins. The story is related to the establishment of Hatkeshwar Mahadev temple. Once in a year the Nagars invariably come to this town to worship Lord-Shiva in this temple at the occasion of 'Maha-8hiva Ratri'. At present the Nagars in Vadnagar are not in good numbers but they still worship 'Hatkeshwar Mahadev'. A reason for split-up amongst the NagarBrahmins of Vadnagar is that when Visaldev founded Visnagar he summoned many Brahmin's to a yagna, but most of the lie-hand Vadnagar Brahmins refused to receive dakshina from his hands and treated those
22
who did so as out-castes. The split-up the Vadnagar Nagar-Brahmins*.
According to Abul Fazal as described in Aine-I, Akbari (1590 A.D) this ancient town was having 3000 places of worship (pagodas) near each of which was a tank. Chiefly Brahmins were the inhabitants. Even if the smallest shrines of today is taken into account, this number is far in excess. At present the town has big and small 360 piaces of worship belonging to Hindus, the Jains and the Muslims.
History of In-migration and Out-migration
If we analyse the figures of population gro~'1h of the town we notice that Vadnagar has only the natural growth of population. It is mainly because of the non-availability of business and employment opportunities in the town. The out-migration seems to Qe more and in-migration almost insignificant. Because of this reason the people for business prefer to go out side the town. The town having no big industry is unable to attract people for employment. The number of government and private offices is also very small, thereby the town does not provide sufficient employment opportunities which normally attracts immigration.Consequently, the town people are to depend upon other places for their establishing business and employment. This assumption may be supported by the fact that about 12,000 persons are the daily pass holders of railways. These people go in the nearby areas for earning their livelihood. The extend of out-migration may only be checked by creating proper business, industrial and service opportunities.
Other Factors and Growth of the Town
The situation and environmental conditions is a typical one in the town. The town is built on an elevation of about 70 feet from the
* Gazette of India, Gujarat 8tate-1975 Mahesana District-Chapter-XIC, page 841
surrounding land mass. It is surrounded by several tanks. The town has no raw material to feed any industry. Limited number of trains running on meter-gauge rail line pass through the town. Linkage with pucca roads is also inadequate. The setting up of industries in the town may not be an easy task. For example a factory of cement pipes was set-up in the town with appreciable investment but ultimately it was closed down because of many such problems which had no immediate solutions.
Impact of Topography and other factors on growth pattern and growth history
The climate of Vadnagar is more or less like the other parts of the district. The town received irregular and scanty rainfall especially during last 3 years consequently there is no forest as such the land in surrounding villages of the town is however fortile for vegetation where irrigation facility has been made available to the farmers.
In the past the town was a place of attraction so far as trade and commerce of agricultural commodities are concerned. During the investigation it was also informed that the town was the main centre for agricultural produces till the metal roads from adjoining villages upto Visnagar were not constructed and that the sale and purchase of
23
the rice, jowar and jeera in lakhs of rupees per day. A very big empty godown near railway station witnesses this fact. Obviously, the people of nearby villages prefer to take their goods to Visnagar which got linked with pucca roads to all such villages. This single factor has brought Vadnagar town from a big trade centre to a small local market meeting the daily requirements of town people. The big businessmen have gradually shifted their trade to Visnagar town which has also become a good industrial town of the district.
This town seems to have taken away most of the trade and business from Vadnagar. The progress of the selected town appears to be stand-still in matters of population and economic growth.
Thus the main factors which hamper the economic development of the town seems to be inadequate road facility, migration of businessmen to the nearby places for setting up their trade and commerce etc. the inadequate industrial development. The pucca roads also play very important role in the development of any place. Thus the town seems to be deprived of such road facility. Since Vadnagar is not a taluka head-quarters the important administrative offices like Mamlatdar's office, Taluka Development Office are not located in the town.

CHAPTER-III
AMENITIES AND SERVICES-HISTORY OF GROWTH AND THE PRESENT POSITION
Urbanisation and the development of various amenities and services which are made available to the people go hand in hand. It is generally observed that developing or under developed places are mostly devoid of such facilities which are found in developed urban units. As a matter of fact the analysis of such amenities and services available to the people of Vadnagar will enable us to see whether the smaller urban units like the selected town have any impact of the urban life.
Administrative Offices
The role of administrative offices in the history of the growth of any town may be assigned second to none. Such offices help the place to develop in the different fields. Vadnagar does not happen to be a Taluka headmaster and hence most of the administrative offices are functioning in Kheralu the taluka head-quarters at a distance of about 11 kms. from the selected town. May be because of this reason the growth of the town in matters of economy and population seem to be less as compared to the other urban units of the district. However, at present following two main offices.
(1) The Revenue (Talati) office (2) Police sub-Inspector office
may be called as the administrative offices in the town.
1 The Revenue Office
This office was set up before the attainment of independence of the country Le. 1947. The office has a strength of only 3 persons out of
which one is group 'D' or Class IV employee. The office's main function is revenue collection.
2 Police Sub-Inspector's Office
The role of Police Sub-Inspector's office is maintaining law and order in the town, providing safety and security to the people and property of the town's people. The police station was established in 1947 and has present strength of 86 persons.
3 Other offices
Post and Telegraph office
The post and Telegraph office of the town is believed to have been established about 100 years ago. The Post office of the town is· rendering services to the town as well as to the surrounding villages. The total strength of the Post office is of 20 persons out of which 3 are Class IV employe~s and 1 casual labour and the rest are group Class III employees.
4. Railway station
The exact date, month and year in which the first train touched or passed through Vadnagar is not available. However, people say that the Railway station was established long ago. The Railway station of the town has a total strength of 15 persons including the station master.
5. Telephone Office
Anotller important office is of Telephone Inspector's office which was established in the
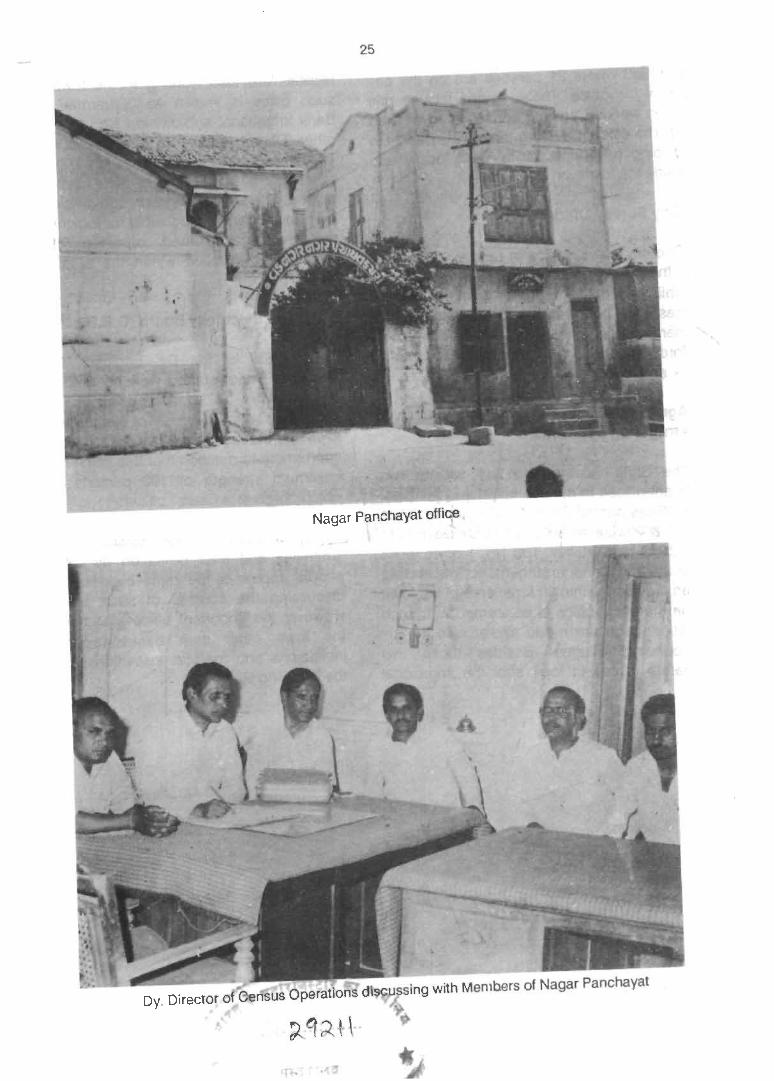
25
Nagar Panchayat offic;e
Dy. Director of eensus Operations dl~ussing with Members of Nagar Panchayat ).
year 1958 where 21 persons are on the pay rolls of the office. These figures include one person working against consolidated or fixed pay. The office is serving the town's people in providing telephone facility both locally and outside the town.
6. City Survey Office
The city survey office is rendering services to the town people in the matters of establishing right of property, maps of the offices, their boundaries and the name of the owner etc. This office was started in the town before 1947 and is being run with the help of a clerk and a peon.
7. Agriculture Examiner Office and offices of the Irrigation Department
The State Government has set up two different offices to provide irrigational facilities. The offices named Agriculture Examiner office No. 1 & 2 were established in the year 1981 and 1973 respectively. The No.1 office looks after the irrigational arrangements which have been provided within 30 kms. area of the town while the other office is concerned with such facilities which are made available to the six surrounding villages. Besides these two separate offices to look after the irrigational
26
facilities are also working in the town. One such office is known as 'Sabarmati' Right Bank irrigational sub-division No.1' and the other 'Dharoi Irrigational sub-division NO.6'. The later office was established in 1977 and at present 2 Class II officers have also been posted. The Dharoi Irrigation sub-division No. 6 office is mainly responsible for looking after the maintenance and repairing of the machinaries installed within the area of 13 kms.
8. Gujarat Electricity Board (G.E.B.) Office
The office of the Oy. Engineer, Gujarat Electricity Board started working in the town on 1 st May 1975. This office is mainly concerned with the supply of electricity in the town and the adjoining 38 villages. It would be appropriate to mention that this office has the maximum strength of 100 persons out of which only one is Class I officer.
The analysis of the available; various amenities and their utilisation by the town people appear to be quite essential before discussing the sources of such amenities. However the important offices functioning in the town other than banks, educational institutions and medical institutions given in the following statement.
STATEMENT 111-1 Important Public Institutions (other than Banks,
Educational and Medical Institutions) in Vadnagar

SI. Name of the No. Government office
2
1, Sub Treasury Office, Vadnagar
2. Talati-Cum-Mantri Office, Vadn~gar
3. Police Sub-Inspentor, Vadnagar
4. Nagar Panchayat Office, Vadnagar
5. Post and Telegraph, Office, Vadnagar
6. Rly. Station, Vadnagar
7. Phone Inspector
8. City Survey Office
9. Agriculture Examiner Office, No.2
10. Agriculture Examiner Office, No.1, Vadnagar
11. Sabarmati Right Bank Irrigation Sub-Division No.1, Vadnagar
12. Dharai Irrigation Sub-Division No.6, Vadnagar
13. Dy. Engineer, Gujarat Electricity Board, Vadnagar
Source :-'Respective officer of Vadnagar Town.
28
STATEMENT
Important Public Institutions (Other than Banks, Educational
Location
3
Vadnagar
Vadnagar
Vadnagar
Vadnagar
Vadnagar
Vadnagar
Vadnagar
Vadnagar
Vadnagar
Vadnagar
Vadnagar
Vadnagar
Vadnagar
When established
4
30-10-1979
Before 1947
1947
1952
1888
Very Old
26-1-58
Before 1947
1973
March 1981
1970
26-10-77
1-5-1975
Nature of functions
5
To collect and distribute Govt. money
Revenue recovery etc.
To maintain Law and order
Post and telegraph services
To transport passengers and goods by Rly.
Telephone service
City Survey
Irrigation work
Irrigation
Irrigation
Repairs and maintenance of -canal
Power supply and maintenance

29
111.1
and Medical Institutions) in Vadnagar
Jurisdiction Number of Employees
Class Class Class Class Fixed Daily Total I II III IV Pay Wages
6 7 8 9 10 11 12 13
Vadnagar and surrounding 3 4 villages
Vadnagar 2 3
Vadnagar and surrounding villages 86 86
Vadnagar 21 57 2 2 82
Vadnagar and surrounding 12 villages 16 3 20
Vadnagar 4 11 15
Vadnagar 20 21
Vadnagar 2
Surrounding 6 villages of Vadnagar 7 8
Surrounding 30 kms. area of 7 8 Vadnagar
Surrounding 13 kms. area of 12 3 16 Vadnagar
Surrounding 13 kms. area of 2 12 4 18 Vadnagar
Vadnagar and surrounding 30 18 50 100 38 villages
Amenities
(a) Water Supply
The Nagar Panchayat has built two water tanks to meet the water requirement of the town's people. One tank is under-ground whose capacity 1,00,000 gallons while the other has 20,000 gallons capacity. The town has a total of 2567 connections in residential houses. The offices of the town have been provided 30 connections whose break-up for each office is given as under:
Name of the office
1. Dharoi colony having Govt. offices
2. Post Office
3. Gujarat Electricity Board
4. Railways
No. of connection
26
2
The commercial plants are provided 52 connections while public places have been provided 64 taps. So far the Panchayat authorities stated to have covered 80% of the population and the town's area in supplying water. At present the meters have not been used for charging the water-taxes, however a system has been found to be in use that the water-taxes are being fixed according to the diameter of the pipe used in connection.
For residential houses there are three types of pip'es being used viz. firstly the pipe of 0.50" diameter for which the annual charges per connection are Rs. 46/- secondly the connections were 0.75" diameter pipe is used the charges are Rs. 69/- per annum and thirdly, the pipes of 11 diameter is used are to pay yearly charges of Rs. 92/- per connection. The pipe of identical diameter in use in the
30
commercial complex and their annual charges per annum have been shown as under:
Diameter of Annual water the pipe charges
(Rs) Ps.
1. 0.50" 120-00
2. 0.73" 155-00
3. 1.00" 190-00
As far as charges from the railways are concerned it has been found that for consuming 1000 Gallons of water the charge'5 shall be Rs. 1050/-.
It has also been observed that all the residential houses in the town have been provided the water connections. However, a common difficulty has been brought to white that because of uneven level of land of somewhere the pipe line is to be netted at a lower level while at other places it is taken to a higher level. The connections which provided at a higher level generally have no water because the pressure of the water flowing in the pipe is quite less.
The other sources of water supply are tube wells numbered 4 out of which only 2 are found in the working condition. As far as water tank is concerned the 'Sarmistha tank' is always remaining full of water.
(b) Conservancy
The cleanliness in the town is unsatisfactory. The internal roads in the town are dirty and broken. Places for public conveniences are very small in number and are totally neglected. The town has no sewerage system. There is 20 kms. long open drainage line which is cleaned twice a week by the staff employed by the Nagar Panchayat. The public latrines/urinals have been provided
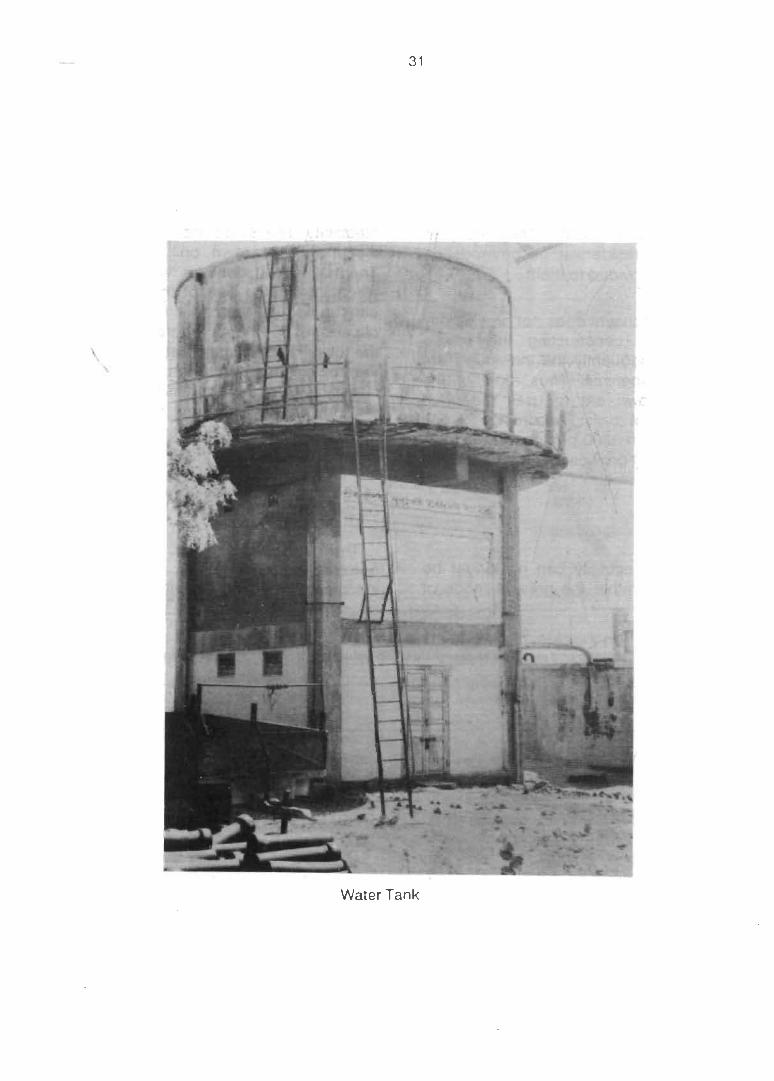
31
Water Tank
in the town area at ten different places. Only 400 latrines have been found in the entire town. The cleanliness is maintained by the Nagar Panchayat and a deep dug outside the town has been made to dump the waste. The Nagar Panchayat has employed 49 persons (out of which 20 are females) to clean the latrines and carry the waste. They are paid monthly but no residential accommodation has so far been provided to them.
The Nagar Panchayat does not provide any financial help in constructing the \ private latrines and consequently the individuals are to bear such expenses. Thus most of the people in the town are to uses the open places for natural calls. According to one estimate more than 3000 persons of the town are sharing latrines provided by the Panchayat in 10 different lacalities.
(c) Power
Availability of electricity can no longer be treated as luxury rather the present mode of
32
life appears to be incomplete without the different uses of such facility. Considering the utility of electricity in industrial, agricultural and other fields. An attempt has been made throughout the country to provide the same even in small villages. In Vadnagar Gujarat Electricity Board is responsible for providing electricity. The Board took over the charge of electrifying the town on 1 st May, 1975. A Thermal sub-station for generation of the electricity for the use of the town has been constructed in Vadnagar itself with a total capacity of 66 K. V. As regards the coverage at the town in electrification about 98 per cent of the town area has been covered. Further classification of this figure is that 95 per cent of the people of town are being served the electricity while the 90 per cent of the total buildings have been electrified. In one year (April'86 to March '87) the total consumption of the electricity in the town was recorded to be 2408291 units.
The statement given below indicates number of connections and volume of electricity consumed in 1986-87.
Statement 111.2
No. of electric connections under different categories and volume of consumption in Vadnagar during 1986-87
Sr. Type of No. connection
2
1. Domestic
(a) Lighting
(b) Power
2. Industrial
3. Irrigational
4. Commercial
5. Road
6. Others (Water works)
Total
Total No.of connections
3
3729
3729
110
56
636
5
4537
No.of units consumed
4
727868
727868
340625
630669
278824
113155
317150
2408291

The information regarging the money which was collected under different heads of electric connections, the amount to the realised and
33
the fresh applications pending for providing new connections for the town is shown below:
Statement - 111.3
The information regarding the money collected under different heads of electric connections and number of pending applications
Sr. Type of connection Total money in Rs. No.of
No. in 1986-87 applications Pending
Realised Due
2 3
1. Domestic 649-00
a) Lighting 649-00
b) Power
2. Industry 414-00
3. Irrigation 222-00
4. Commercial 337-00
5. Road lightings 72-00
6. Others including water works 251-00
According to above information which was collected from the Board's office of Vadnagar for the year 1986-87 provides two faces of the situation. Firstly, the amount which is yet t() be realised from the people for the units of electricity they have already consumed amounts to more than As.2,16400, while the payments received during the year totalled Rs. 1,94500. The position of supplying new connections is not so unsatisfactory since only 200 fresh applications are pending·. The services of the Board in matters of supplying the electricity and other services may be taken to be excellent since the town people reported that they had no complaint against it.
The Gujarat Electricity Board has also been making constant efforts to provide proper road lighting in the town. At present the Bulb as well as Tube light are provided. According to one information the town was having
4 5
629-00 200
629-00
423-00 2
422-00 10
333-00 10
88-00
269-00 3
minimum 345 Tube light paints while the figure for Bulb points was 395. The total consumption for road lighting during a month was about 10,000 units costing about Rs. 1,15,000/- per annum.
(d) Fire Fighting
The Panchayat established a separate wing in their office in the year 1955 for extinguishing the fire. Vadnagar being a small town, there is only one fire fighting engine and only 3 persons are employed including the driver. No such case of fire was however recorded during the last 11/2 years.
(e) Transport and Communication
Vadnagar railway station was ~stablished
prior to 1947. Trains starting from Ahm?dabad and going upto Taranga pass through this

34
Vadnagar Railway Station
Bus Station
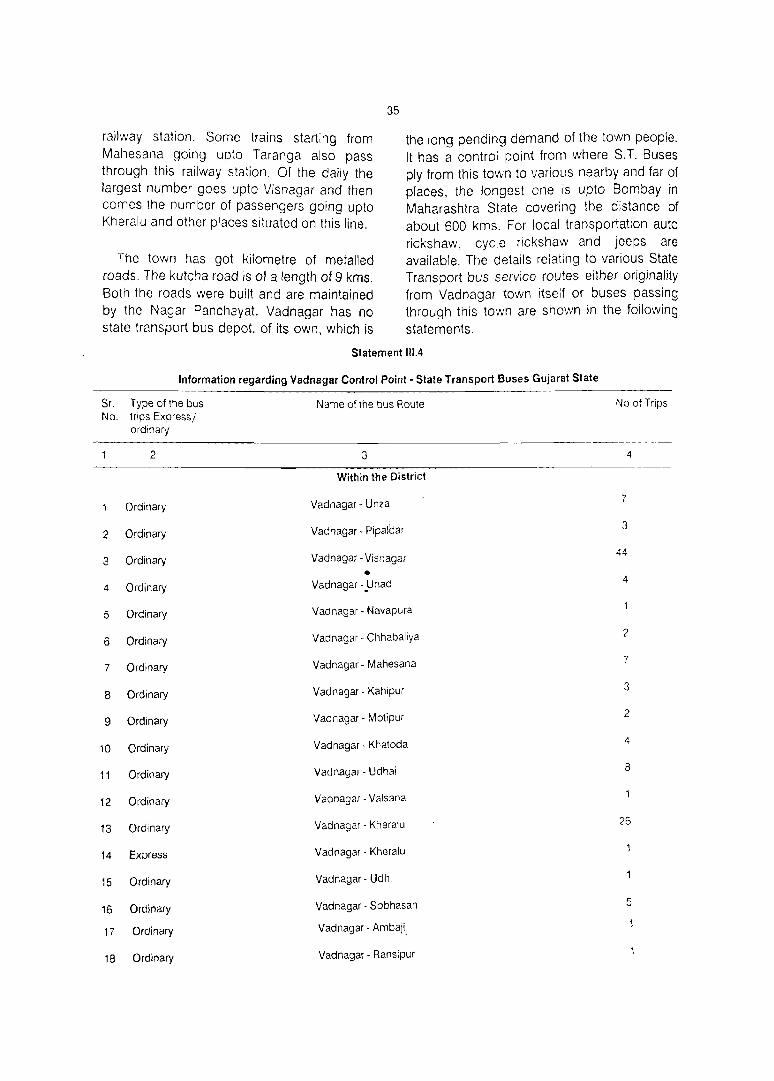
35
railway station. Some trains starting from Mahesana going upto Taranga also pass through this railway station. Of the daily the largest number goes upto Visnagar and then comes the number of passengers going upto Kheralu and other places situated on this line.
the long pending demand of the town people. It has a control point from where S.T. Buses ply from this town to various nearby and far of places, the longest one is upto Bombay in Maharashtra State covering the distance of about 600 kms. For local transportation auto rickshaw, cycle rickshaw and jeeps are available. The details relating to various State Transport bus service routes either originality from Vadnagar town itself or buses passing through this town are shown in the foilowing
statements.
The town has got kilometre of metalled roads. The kutcha road is of a length of 9 kms. Both the roads were built and are maintained by the Nagar Panchayat. Vadnagar has no state transport bus depot. of its own, which is
Statement 111.4
Information regarding Vadnagar Control Point - State Transport Buses Gujarat State
Sr. Type of the bus Name of the bus Route No. trips Express/
ordinary
2 3
Within the District
Ordinary Vadnagar - Unza
2 Ordinary Vadnagar - Pipaldar
3 Ordinary Vadnagar - Visnagar
• 4 Ordinary Vadnagar -_Unad
5 Ordinary Vadnagar - Navapura
6 Ordinary Vadnagar - Chhabaliya
7 Ordinary Vadnagar - Mahesana
8 Ordinary Vadnagar - Kahipur
9 Ordinary Vadnagar - Motipur
10 Ordinary Vadnagar - Khatoda
11 Ordinary Vadnagar - Udhai
12 Ordinary Vadnagar - Valsana
13 Ordinary Vadnagar - Kheralu
14 Express Vadnagar - Kheralu
15 Ordinary Vadnagar - Udhi
16 Ordinary Vadnagar - Sobhasan
17 Ordinary Vadnagar - Ambaji_
18 Ordinary Vadnagar - Ransipur
No.ofTrips
4
7
3
44
4
2
7
3
2
4
8
26
5

36
2 3 4
19 Ordinary Vadnagar - Sultan pur 3
20 Ordinary Vadnagar - Sidhpur 2
21 Ordinary Vadnagar - Idar 2
22 Ordinary Vadnagar - Red Laxmipura 2
23 Ordinary Vadnagar - Bamanva 2
24 Ordinary Vadnagar-Shekpur 2
25 Ordinary Vadnagar - Patan 2
26 Ordinary Vadnagar - Ganeshpura
27 Ordinary Vadnagar - Kamalpur 2
28 Ordinary Vadnagar - Vagadi
29 Ordinary Vadnagar - Galvada
30 Ordinary Vadnagar - Vijapur 3
31 Ordinary Vadnagar - Rajpur
32 Ordinary Vadnagar - Gorisana 2
33 Ordinary Vadnagar - Mansa 3
34 Ordinary Vijapur - Taranga
35 Ordinary Sankeshvar - Taranga
36 Ordinary Taranga - Mahesana
37 Ordinary Kheralu - Mahesana
38 Ordinary Vadnagar - Amuraji
39 Ordinary Vadnagar - Madhusan
40 Ordinary Vadnagar - Gundrasan
41 Ordinary Kheralu - Bacharaji
42 Ordinary Vijapur - Jantral
43 Ordinary Mahesana - Taranga
44 Ordinary Taranga - Vijapur
45 Ordinary Mahesana - Bijalasan
46 Ordinary Vadnagar - Harij
47 Ordinary Vadnagar - Jantral
TOTAL 164

37
2 3 4
Outside the District
Express Ahmedabad - Kheralu 3
2 Ordinary Vadnagar -Idar 2
3 Express Vadnagar - Surat
4 Express Ahmadabad - Vijapur
5 Express Vadnagar - Ahmadabad 4
6 Ordinary Vadnagar - Himatnagar
7 Express Vadnagar - Gandhinagar
8 Ordinary Taranga - Ahmadabad
9 Express Taranga - Ahmadabad
10 Express Vadnagar - Somnath
11 Express Kheralu - Baroda
12 Ordinary Mahesana - Ambaji 3
13 Ordinary Ambaji - Khambhat
14 Express Ahmadabad - Dharoi
15 Ordinary Ambaji - Mahesana 3
16 Express Porbandar - Palanpur
17 Ordinary Gandhinagar - Ambaji
18 Express Ahmadabad - Taranga 2
19 Express Ambaji - Gadhda 2
20 Express Kheralu - Ahmadabad 3
21 Express Pal an pur - Porbandar
22 Ordinary Ambaji - Vijapur
23 Ordinary Ambaji - Gandhinagar
24 Express Ukai - Ambaji
25 Express Dharoi - Ahmadabad
26 Ordinary Khambhat - Ambaji
27 Express Somnath - Ambaji
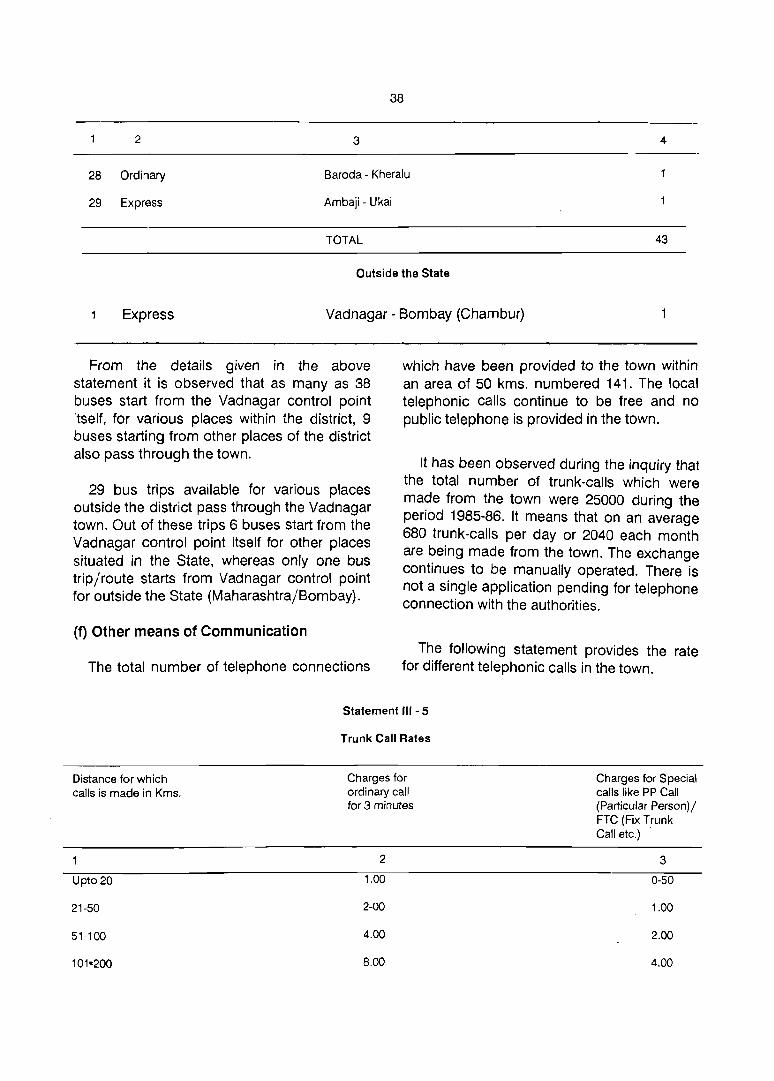
38
2 3 4
28 Ordinary Baroda - Kheralu
29 Express Ambaji - Ukai
TOTAL 43
Outside the State
Express Vadnagar - Bombay (Chambur)
From the details given in the above statement it is observed that as many as 38 buses start from the Vadnagar control point itself, for various places within the district, 9 buses starting from other places of the district also pass through the town.
29 bus trips available for various places outside the district pass through the Vadnagar town. Out of these trips 6 buses start from the Vadnagar control point itself for other places situated in the State, whereas only one bus trip/route starts from Vadnagar control point for outside the State (Maharashtra/Bombay).
(1) Other means of Communication
The total number of telephone connections
which have been provided to the town within an area of 50 kms. numbered 141. The local telephonic calls continue to be free and no public telephone is provided in the town.
It has been observed during the inquiry that the total number of trunk-calls which were made from the town were 25000 during the period 1985-86. It means that on an average 680 trunk-calls per day or 2040 each month are being made from the town. The exchange continues to be manually operated. There is not a single application pending for telephone connection with the authorities.
The following statement provides the rate for different telephonic calls in the town.
Statement'" - 5
Distance for which calls is made in Kms.
Upto20
21-50
51-100
Trunk Call Rates
Charges for ordinary call for 3 minutes
2
1.00
2-00
4.00
8.00
Charges for Special calls like PP Call (Particular Person) I FTC (Fix Trunk Call etc.) .
3
0-50
1.00
2.00
4.00
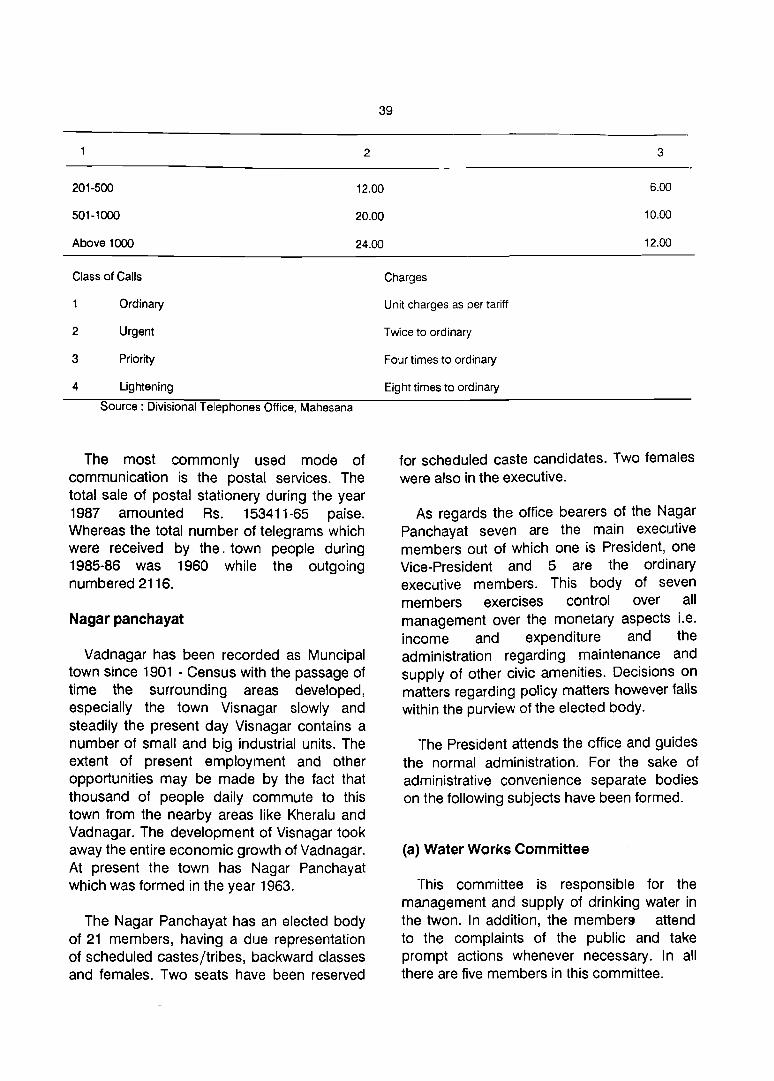
39
2
201-500 12.00
501-1000 20.00
Above 1000 24.00
Class of Calls
Ordinary
2 Urgent
3 Priority
4 Lightening
Source: Divisional Telephones Office, Mahesana
The most commonly used mode of communication is the postal services. The total sale of postal stationery during the year 1987 amounted Rs. 153411-65 paise. Whereas the total number of telegrams which were received by the. town people during 1985-86 was 1960 while the outgoing numbered 2116.
Nagar panchayat
Vadnagar has been recorded as Muncipal town since 1901 - Census with the passage of time the surrounding areas developed, especially the town Vis nagar slowly and steadily the present day Vis nagar contains a number of small and big industrial units. The extent of present employment and other opportunities may be made by the fact that thousand of people daily commute to this town from the nearby areas like Kheralu and Vadnagar. The development of Visnagar took away the entire economic growth of Vadnagar. At present the town has Nagar Panchayat which was formed in the year 1963.
The Nagar Panchayat has an elected body of 21 members, having a due representation of scheduled castes/tribes, backward classes and females. Two seats have been reserved
3
6.00
10.00
12.00
Charges
Unit charges as per tariff
Twice to ordinary
Four times to ordinary
Eight times to ordinary
for scheduled caste candidates. Two females were also in the executive.
As regards the office bearers of the Nagar Panchayat seven are the main executive members out of which one is President, one Vice-President and 5 are the ordinary executive members. This body of seven members exercises control over all management over the monetary aspects i.e. income and expenditure and the administration regarding maintenance and supply of other civic amenities. Decisions on matters regarding policy matters however falls within the purview of the elected body.
The President attends the office and guides the normal administration. For the sake of administrative convenience separate bodies on the following subjects have been formed.
(a) Water Works Committee
This committee is responsible for the management and supply of drinking water in the twon. In addition, the member9 attend to the complaints of the public and take prompt actions whenever necessary. In all there are five members in this committee.

(b) Evaluation committee
A five members committee to assess the value of a house for matters of house-tax has also been formed. It has also been gathered that the committee members look after the problems of the tax payers.
(c) Health Committee
In this committee also five me01bers are nominated. The committee maintains laison with different medical and health agencies of the town and puts forth expectations and requirements of the people before the concerned authorities. The reponsibility of the committee increases considerably at the time when diseases spread or at the time of flood or famine. The members help the successful implementation of govenment programmes by motivating the public. The members have fixed visiting hours for the public.
(d) Committee for Social Justice
The Nagar Panchayat has very appropriately taken the step to check the atrocities on scheduled and backward classes. Exploitation of the people on the basis of caste, class community or religions, etc. are to be stopped. Because of past social practice the members of the scheduled castes/tribes can easily become the victim of
40
social injustice at a small place like Vadnagar. A seven members committee has been formed by the Nagar Panchayat who has been empowered to attend the cases of social injustice. All the members are of scheduled caste community.
(e) Education Committee
This committee of 5 members has to look after the education department of the Panchayat. The schools which are run by the Nagar Panchayat directly fall under their jurisdiction. Appointments of teachers in such schools, distribution of salary to teachers and to persons working therein, maintenance of buildings, supply of materials to the schools, distribution of mid-day meals, help to students who come from poor families and economically backward students, incentives to brilliant students etc. are th~ area of operation of the committee.
Nagar Panchayat Budget
The financial resources occupy the top most place in the effective functioning of any organisation like Nagar Panchayat. The statement given below indicates the details of income and expenditure of Nagar Panchayat, Vadnagar for 3 years viz. 1985-86, 1986-87, 1987-88.
Statement 111.6
Income of Nagar Panchayat • Vadnagar
SI. Source of Income Year
No. 1985-86 1986-87 1987-88
2 3 4 5
Taxes 771,311 902,560 1,442,300
2 Fees 26,708 28,200 34,700
3 Grants 196,166 477,525 388,897
4 Police 2,937 2,550 4,000
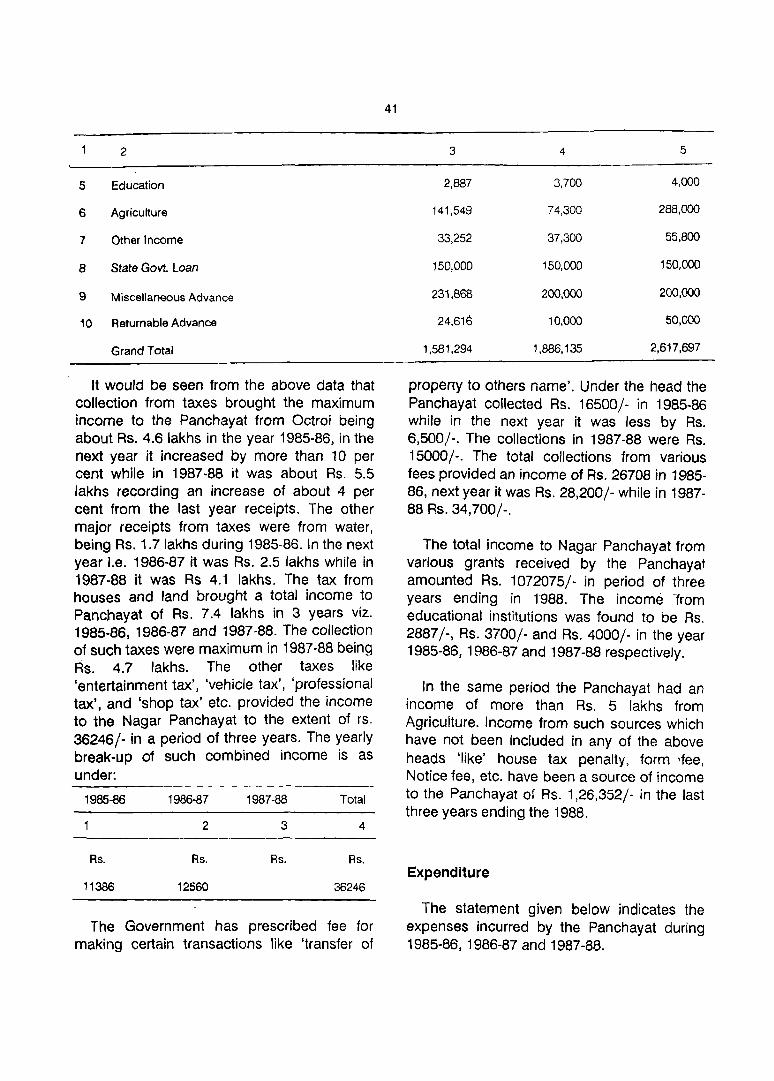
2
5 Education
6 Agriculture
7 Other Income
8 State Govt. Loan
9 Miscellaneous Advance
10 Returnable Advance
Grand Total
It would be seen from the above data that collection from taxes brought the maximum income to the Panchayat from Octroi being about Rs. 4.6 lakhs in the year 1985-86, in the next year it increased by more than 10 per cent while in 1987-88 it was about Rs. 5.5 lakhs recording an increase of about 4 per cent from the last year receipts. The other major receipts from taxes were from water, being Rs. 1.7lakhs during 1985-86. In the next year Le. 1986-87 it was Rs. 2.5 lakhs while in 1987-88 it was Rs 4.1 lakhs. The tax from houses and land brought a total income to Panchayat of Rs. 7.4 lakhs in 3 years viz. 1985-86, 1986-87 and 1987-88. The collection of such taxes were maximum in 1987-88 being Rs. 4.7 lakhs. The other taxes like 'entertainment tax', 'vehicle tax', 'professional tax', and 'shop tax' etc. provided the income to the Nagar Panchayat to the extent of rs. 36246/- in a period of three years. The yearly break-up of such combined income is as under:
1985-86 1986-87 1987-88 Total
2 3 4
Rs. Rs. Rs. Rs.
11386 12560 36246
The Government has prescribed fee for making certain transactions like 'transfer of
41
3 4 5
2,887 3,700 4,000
141,549 74,300 288,000
33,252 37,300 55,800
150,000 150,000 150,000
231,868 200,000 200.000
24,616 10,000 50,000
1,581,294 1,886,135 2,617,697
property to others name'. Under the head the Panchayat coilected Rs. 16500/- in 1985-86 while in the next year it was less by Rs. 6,500/-. The collections in 1987-88 were Rs. 15000/-. The total collections from various fees provided an income of Rs. 26708 in 1985-86, next year it was Rs. 28,200/- while in 1987-88 Rs. 34,700/-.
The total income to Nagar Panchayat from various grants received by the Panchayat amounted Rs. 1072075/- in period of three years ending in 1988. The income -from educational institutions was found to be Rs. 2887/-, Rs. 3700/- and Rs. 4000/- in the year 1985-86, 1986-87 and 1987 -88 respectively.
In the same period the Panchayat had an income of more than Rs. 5 lakhs from Agriculture. Income from such sources which have not been included in any of the above heads 'like' house tax penalty, form 'fee. Notice fee, etc. have been a source of income to the Panchayat ot Rs. 1.26,352/- in the last three years ending the 1988.
Expenditure
The statement given below indicates the expenses incurred by the Panchayat during 1985-86, 1986-87 and 1987-88.

42
Statement 111.7
Expenditure of Nagar Panchayat - Vadnagar
SI. Item of Expenditure No.
2
i) Establishment including Administration
ii) Health and Sanitation including Family Welfare
ii) Road repairing Water and other Public amenities
Total
The above statement points out that the Panchayat has to spend a good amount on matters relating to establishment and Administration since a little less than Rs.S lakhs were spent in the year 1986-87 while the expenditure made on this item in the next year amounted to Rs. 828066/-. The maximum expenses were made under Health and Sanitation being Rs. 9.9 lakhs in 1986·87 and Rs. 12.1 lakhs in the next year. The expenses
Year
1985·86 1986-87 1987-88
3 4 5
480,433 662,232 828,066
819,113 993,240 1,214,408
65,082 64,000 357,500
1,364,628 1,719,472 2,399,974
made in providing public conveniences including road repairing and water works were found to be of the extent of Rs. 64 thousands in 1986-87 and Rs.35.8 thousands in the next year.
A comparative statement of the total income and expenditure of Nagar Panchayat is given below:
Statement 111-8
Total income and expenditure of Nagar Panchayat during 1985-86 to 1988
Total Income in Rs.
1985-86 1986-87 1987-88
2 3
15,81,294 1886135 2617697
It is commendable that the Nagar Panchayat is managing its working very economically and because of this fact they are in position to have savings out of their incomes. This could be possible because of the fact that the Panchayat has a devoted team of workers who are very careful in discharging their duties in the best possible
Expenditure in Rs.
1985-86 1986-87 1987-88
4 5 6
1364628 1719472 2399974
manner. According to a member they do not hesitate to raise donations in case they feel that huge expenditure is involved in some programme and its implementation.
Educational Institutions
The town has got one 'Arts and Commerce

college' which was as having the total strength of 197 students in Arts faculty and 108 in commerce out of which 65 and 25 were female students Arts and commerce respectively. As regards the teaching staff the college is having 9 male teachers in Arts, 6 in commerce and 1 female teacher each in Arts and commerce departments.
The Vadnagar education society is running two Higher Secondary schools in the town while one such school is under patronage of Nagrik Society. The Sarva Vidyalaya society is running such a school in the town. All the higher secondary schools in the town are receiving hundred per cent grant from the government. The total number of students enrolled in all the higher secondary schools was 1943 out of which 656 were female students. It amounts to that females attending such institutions were about a little more than 50 per cent to the total male students.
The total strenght of the teachers who were teaching in all the Higher Secondary institutions was 76 out of which only 11 were female teachers.
The town has six primary institutions including one Islamic Madrasa in which a total of 2572 children were on rolls. The extent of female students attending the primary school was of 75% to the total male students. It reads to conclude that gradually the drop outs amongst the female students comes to about 25%, upto the stage of attending Higher Secondary classes. In all the above six schools 71 teachers are engaged with 42 female teachers. It coincides with the trend
43
that in imparting primary education females are preferred. All the institutions function under the supervision of District Education Committee.
Industrial Training Institution (!.T.I.)
The town has the facility of imparting joboriented technical education which is under the patronage of Jyoti Trust Vadnagar. The State Govt. has financed the institute upto 90 per cent in matters of salary of the' persons working therein and upto 50 per cent in providing equipments and other tools. The institute imparts Diploma courses of draftsman mainly in civil, mechanical, Electrical and StJrveyer. The Institution was having 142 male students and 9 male teachers. The examination is being organised by the Technical Board, Gandhinagar.
Others
The classes of recognised courses of stitching and embroidery are also being conducted for females by the Managing Committee of Bhogilal Chakulal Library, Vadnagar. The classes are run 'in two shifts. '[nall 80 female students were under training being taught by 4 female teachers.
A private typing and stenography institute was also found in the town having 145 males and 90 females. All the students were divided into 3 classes. The total strength of teaching staff was only 3 out of which 1 was female. The following statement shows the details of educational institutions.

44
Primary School I:::lWIQmg
High School
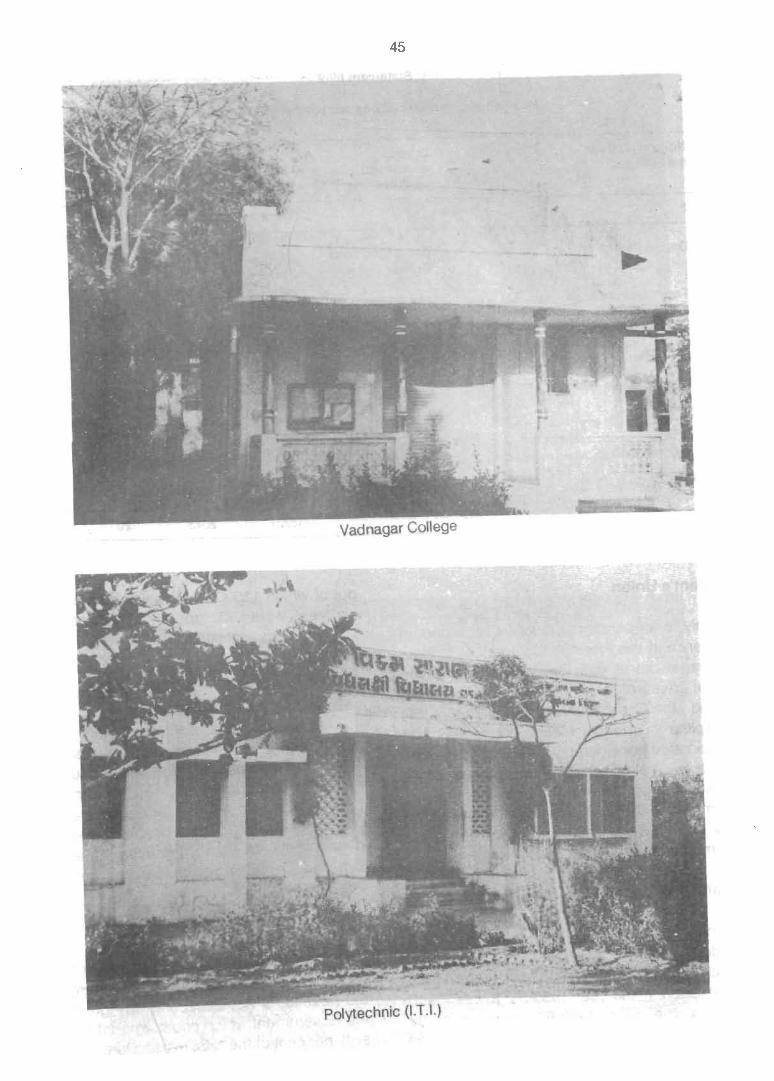
45
"
polytechnic (I.T.I.)
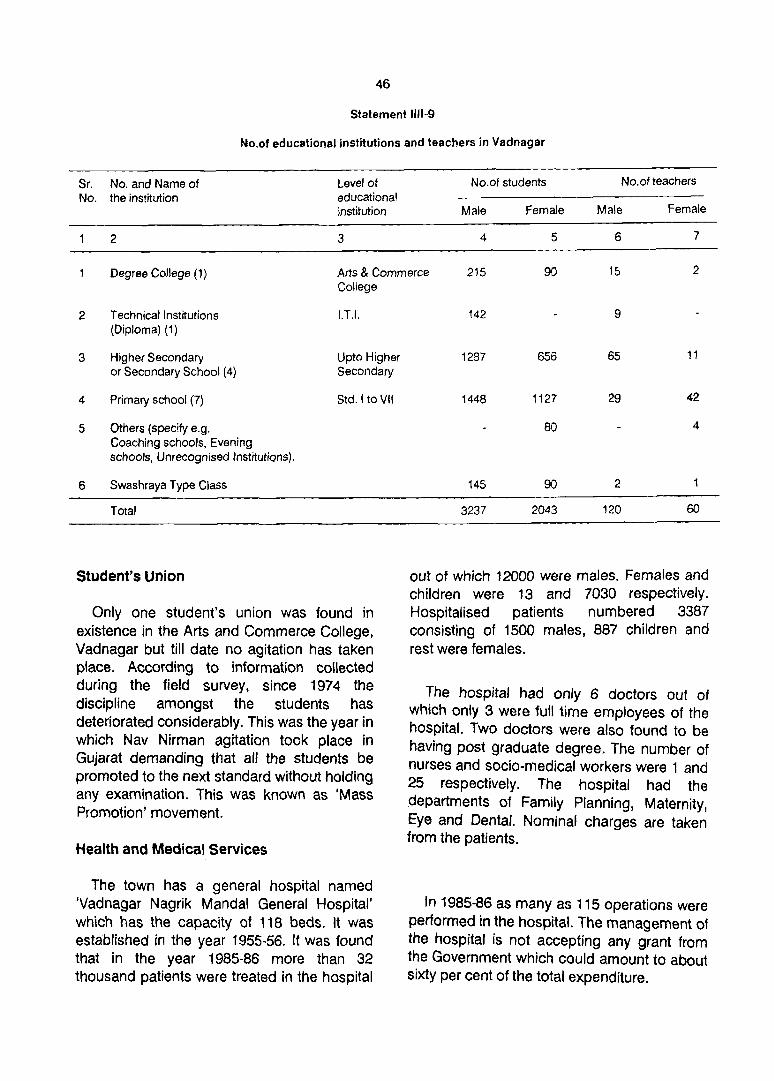
46
Statement 1111-9
No.of educational institutions and teachers in Vadnagar
Sr. No. and Name of Level of No.of students No.of teachers
No. the institution educational institution Male Female Male Female
2 3 4 5 6 7
Degree College (1) Arts & Commerce 215 90 15 2 College
2 T echnicallnstitutions I.T.I. (Diploma) (1)
3 Higher Secondary Upto Higher or Secondary School (4) Secondary
4 Primary school (7) Std. f to VII
5 Others (specify e.g. Coaching schools, Evening schools, Unrecognised Institutions).
6 Swashraya Type Class
Total
Student's Union
Only one student's union was found in existence in the Arts and Commerce College, Vadnagar but till date no agitation has taken place. According to information collected during the field sUNey, since 1974 the discipline amongst the students has deteriorated considerably. This was the year in which Nav Nirman agitation took place in Gujarat demanding that all the students be promoted to the next standard without holding any examination. This was known as 'Mass Promotion; movement.
Health and Medical Services
The town has a general hospital named 'Vadnagar Nagrik Mandai General Hospital' which has the capacity of 118 beds. It was established in the year 1955-56. It was found that in the year 1985-86 more than 32 thousand patients were treated in the hospital
142 9
1287 656 65 11
1448 1127 29 42
80 4
145 90 2
3237 2043 120 60
out of which 12000 were males. Females and children were 13 and 7030 respectively. Hospitalised patients numbered 3387 consisting of 1500 males, 887 children and rest were females.
The hospital had only 6 doctors out of which only 3 were full time employees of the hospital. Two doctors were also found to be having post graduate degree. The number of nurses and socia-medical workers were 1 and 25 respectively. The hospital had the departments of Family Planning, Maternity, Eye and Dental. Nominal charges are taken from the patients.
In 1985-86 as many as 115 operations were performed in the hospital. The management of the hospital is not accepting any grant from the Government which could amount to about sixty per cent of the total expenditure.

Vadnagar Nagrik General Hospital
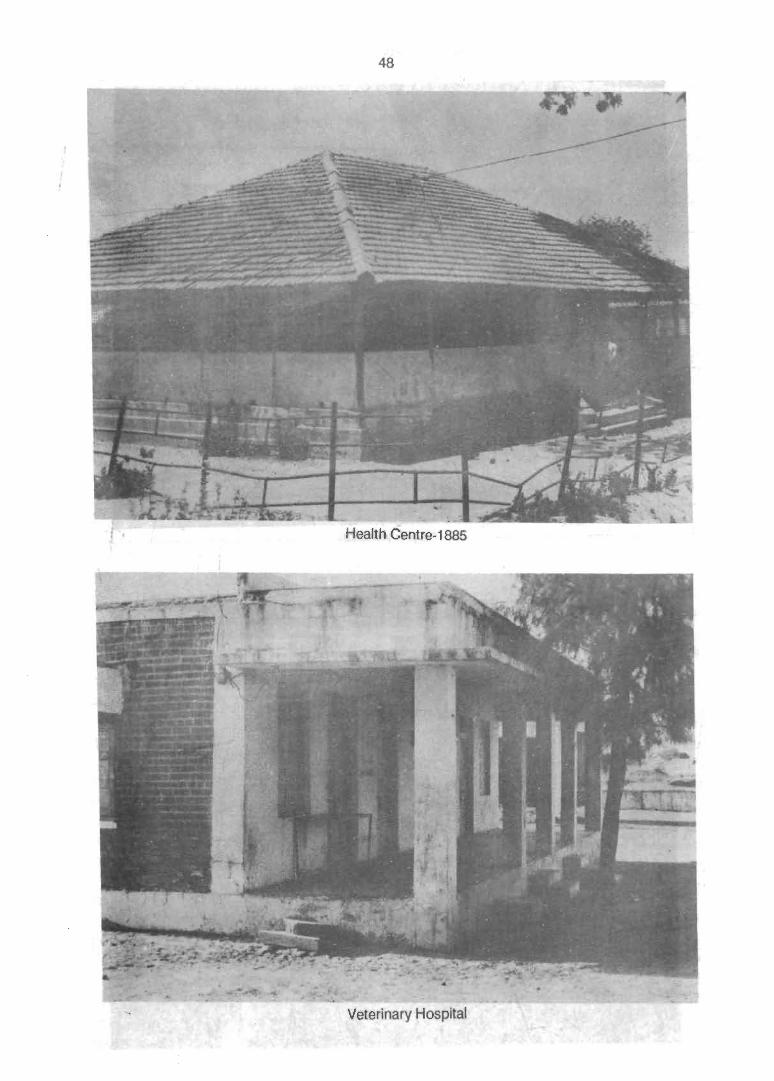
48
Health Centre-1885
Veterinary Hospital
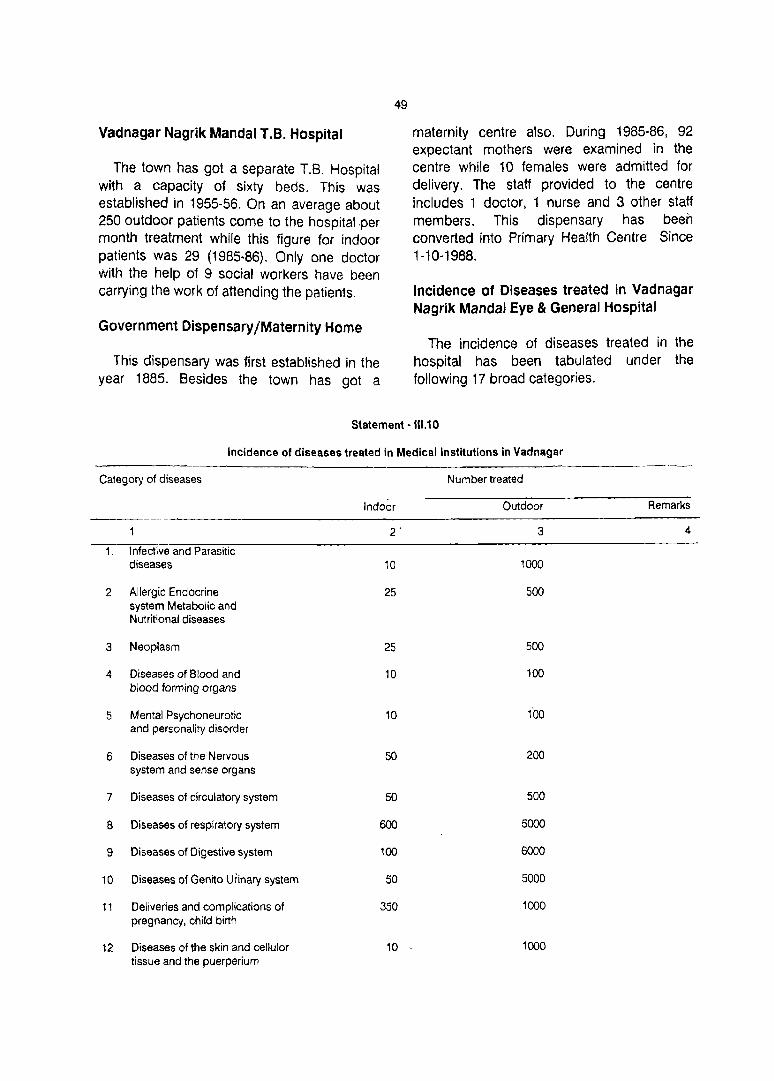
Vadnagar Nagrik Mandai T.B. Hospital
The town has got a separate T.B. Hospital with a capacity of sixty beds. This was established in 1955-56. On an average about 250 outdoor patients come to the hospital per month treatment while this figure for indoor patients was 29 (1985-86). Only one doctor with the help of 9 social workers have been carrying the work of attending the patients.
Government Dispensary/Maternity Home
This dispensary was first established in the year 1885. Besides the town has got a
49
maternity centre also. During 1985-86, 92 expectant mothers were examined in the centre while 10 females were admitted for delivery. The staff provided to the centre includes 1 doctor, 1 nurse and 3 other staff members. This dispensary has beeh converted into Primary Health Centre Since 1-10-1988.
Incidence of Diseases treated in Vadnagar Nagrik MandaI Eye & General Hospital
The incidence of diseases treated in the hospital has been tabulated under the following 17 broad categories.
Statement -111.10
Incidence of diseases treated in Medical Institutions in Vadnagar
Category of diseases Number treated
Indoor Outdoor Remarks
2' 3 4
1. Infective and Parasitic diseases 10 1000
2 Allergic Endocrine 25 500 system Metabolic and Nutritional diseases
3 Neoplasm 25 500
4 Diseases of Blood and 10 100 blood forming organs
5 Mental Psychoneurotic 10 100 and personality disorder
6 Diseases of the Nervous 50 200 system and sense organs
7 Diseases of circulatory system 50 500
8 Diseases of respiratory system 600 5000
9 Diseases of Digestive system 100 6000
10 Diseases of Genito Urinary system 50 5000
11 Deliveries and complications of 350 1000 pregnancy, child birth
12 Diseases of the skin and cellulor 10 1000 tissue and the puerperium

2
13 Disease of the Bones and organ of movements
14 Congenital Malformations
15 Certain diseases of early infancy
16 Symptoms sensility and Illdefined condition
17 Accidents, Poisoning and violence
The above classification recorded the highest number of patients in 'Diseases of Respiratory System' having 600 indoor patients and 5000 outdoor patients. It was followed by 'Diseases of Digestive systems and Diseases of Genito-Urinary-Systems' recording a total of 6100 and 5000 indoor and outdoor patients respectively. The cases of delivery complications during the year were recorded 1350. The incidence of skin diseases and that of Parasitic diseases recorded equal number of indoor and outdoor patients being 1010. The diseases of circulatory system was found having 50 indoor patients and 500 outdoor patients.
Two diseases of neoplasm and of Allergic Endorcrine system Metabolic and Nutritional system, recorded equal number of indoor (25 each) and outdoor (500 each) patients.
50
3
10
5
5
10
30
4
100
30
25
50
150
Persons suffering from diseases of 'Nervous system' totalled 250 out of which 50 were indoor patients. The incidence of Accidents, violence and poisoning was found amongst 180 persons out of which 150 were outdoor patients while the rest were to be admitted for treatment in the hospital.
Three incidence viz. diseases of Blood and blood forming organs. Mental Psychoneurotic and Persenality disorder and lastly of Bones and Movement organs recorded each 10 indoor patients and 100 outdoor patients.
As regards the popularity and success of Family Planning Programmes in the town the data for the different years and medical centres has been collected and given in the following statement.
Statement 111.11
The statement regarding Family Planning in the town
Sr. Year Name of Type of No.of persons No. Institution medical who availed
services services recorded
2 3 4 5
1985-86 Vadnagar Nagrik Tubectomy 115 Mandai General Hospital Operations
2 1986-87 Govt. Dispensary Only obstetric treatment 3D·
8 including 18 Vasectomy and rest Leproscopy operations

Veterinary Dispensary
The town has one Veterinary Dispensary. where a qualified Doctor has been posted to attend sick animals of the town and of surrounding villagers. The Doctor periodioally visits the villages of his area. The data in this regard was re~dily available from 1981 to
Sr. Year No.
2
1981-82
2 1982-83
3 1983-84
4 1984-85
5 1985-86
51
1985-86. The indoor patients were maximum during 1984-85 (60), followed by 1985·86 (56). In the year 1983·84 the member was only 34. The corresponding number in 1981·82 and 1982-83 was 10 and 8 respectively.
Following statement gives the number of out an in patients during 1981-86
No.of indoor No.of outdoor animal patients animal patients
3 4
10 1016
8 868
34 124
60 1482
56 1541
The details regarding number of Sick animals attended by Doctor during his tour are shown below:·
Sr. Year No.
2
1981-82
2 1982-83
3 1983-84
4 1984-85
5 1985-86
The total number of castrations performed in the period of 1981·82 to 1985·86 comes to 220 Le. on an average 42 per year, the highest number 64 and 57 are found to be recorded during 1984-85, and 1985-86. The information
No.of animals Medicine treated on tour supplied to
3 4
41 304
15 317
780 427
370 765
1142 930
regarding the diseases amongst the animals which are to be cured by vaccination is given as under. Data regarding the vaccination against different diseases is·presented below

52
Statement 111.12
Disease for which animals were vaccinated
Sr. Year Hacmarchagie Diseases No Septicemly
Diseases Rincler Foot & Antirabit Others Pest Mouth' Pest
2 3 4 5 6 7
1981-82 1557 350
2 1982-83 2932 200
3 1983-84 6204 1535 50
4 1984-85 4712 490 120
5 1985-86 7389 100 80 15
and health services for the people as well as to the
It may be concluded the town has sufficient medical animals.
CHAPTER IV
ECONOMIC LIFE OF THE TOWN
The data relating to economic activities of the people is of immense value for economic analysis as well as for studying their social conditions. The occupational structure of the people reflects their social, cultural and educational levels. The higher participation rate may reveal larger opportunities of work in those areas or it may show the backwardness of the region which compels more people to work. It can be seen that in the areas where population depends on agriculture, the participation rate is higher thereby having less proportion of non-workers. It is generally seen that in urban areas, the number of persons engaged in agricultural activities is comparatively low. However, Vadnagar town is still in the process of development of nonagricultural activities like industry, commerce and others therefore a sizeable number is engaged in the agricultural activities. This is evident from the fact that about 32 per cent of the main workers are engaged as cultivators and agricultural labourers as per the 1981 Census. Thus, it can be said that the town Vadnagar has mixed economy where manpower is the main resource, having as subsidiary resources of land and livestock. The town Vadnagar was having primary activities as its main functional categories both in 1961 and 1971 Censuses and the same functional category continued in 1981 Census. It was the important marketing centre for the agricultural produce in the past and lot of it was exported by railways. But now the town has lost its glory which is evident from the fact that the same big godown near the railway station is lying empty.
Dividing the population of 1981 census into
two broad groups of workers and non-workers it was found that 5,618 persons are workers (Main-workers) and as many as 15,534 are non-workers. In terms of percentage workers come to 25.44 per cent or about one fourth of the total population. Whereas non-workers constituted 70.36 per cent of the total population of the town. The rest are marginal workers which was only 4.20 per cent. It was also observed that out of total 5,618 mainworkers as many as 5,212 or 92.77 per cent were males and 406 or 7.23 per cent were female workers. This establishes the fact that the female partiCipation in the economic activities is quite less as compared to their male counterparts. The classification of workers according to different industrial categories serves as yardstick to measure the economic progress of the town. The data on economic activity for the previous two censuses is not actually comparable with 1981 Census 'owing to conceptual differences and this conceptual change has evidently affected the proportion of ttle workers especially in primary sector. The concept adopted in 1981 Census was that a person engaged in a particular work for more than 6 months or 183 days was treated as 'Main Worker' and those who worked for less than 6 months or 183 days were treated as 'Marginal Workers' while non-workers are the persons who are not gainfully employed or working anywhere.
Classification of workers, 1961, 1971 and 1981 Censuses
The following statement furnishes the details regarding the working population during the period 1961 to 1981.

54
Statement - IV.1
Classification of Workers, 1961,1971 and 1981 - Vadnagar Town
Industrial 1961 1971 ' 1981 (Main workers) Category
Persons Males Females Persons Males Females Persons Males Females
2 3 4 5 6 7 8 9 10
Cultivators 2,686 1,315 1,371 1,422 1,326 96 1,435 1,333 102 (44.63) (36.79) (56.10) (31.10) (31.50) (26.45) (25.54) (25.58) (25.12)
Agricultural 131 7~ 59 372 307 65 359 279 80 Labourers (2.18) (2.01) (2.41) (8.13) (7.29) (17.91) (6.39) (5.35) (19.70)
Household 953 423 530 360 330 30 369 336 33 Industry (15.84) (11.84) (21.69) (7.87) (7.84) (8.26) (6.57) (6.45) (8.13)
Other workers 2,248 1,764 484 2,419 2,247 172 3,455 3,264 191 (37.35) (49.36) (19.80) (52.90) (53.37) (47.38) (61.50) (62.62) (47.05)
Total Workers 6,018 3,574 2,444 4,573 4,210 363 5,618 5,212 406 (JOO.OO} (100.00) (100.00) (100.00) (100.00) (100.00) (100.00) (100.00) (100.00)
Source: District Census Handbook, Mahesana district-1961,1971 & 1981.
The vide variation in proportion of workers classified under industrial categories recorded in respective censuses is mainly due to different concepts adopted at the time of Census. The proportion of Agriculturists was as high as 44.63 per cent in 1961 which was reduced to 31.10 per cent in 1971 and further decreased to 25.54 percent during 1981 Census. The vast reduction of the workers in this category during 1981 Census was attributed mainly to the fact that only those who were engaged as cultivators for more thfm amonths or 183 days of the reference period of 1 year were treated as main workers whereas those who worked for less period were treated as marginal workers which can be evidently seen from the above data that proportion of female workers was 56.10 per cent in 1961 has reduced drastically to 25.12 per cent in 1981 Census.
As regards the category of agricultural labourers it is also observed that the percentages recorded in 1961 Census are quite less in comparison to those found in
1971 and 1981 Censuses in respect of both sexes especially in case of female workers. The proportion was only 2.41 per cent in 1961 which increased to 19.70 per cent in 1981. While it was 17.91 per cent in 1971 Census.
On the other hand the proportion of persons engaged in Household Industry was quite high in 1961 Census as compared to the proportions recorded in 1971 and 1981 Censuses. The proportion in respect of female participation was as high as 21.69 per cent in comparison to 8.13 per cent observed in 1981 Census. It is also seen that the proportions of workers engaged in Household Industry are quite comparable in 1971 and 1981·Censuses due to conceptnal similarity. So far as the category of other workers is concerned the proportions recorded in 1971 and 1981 Censuses are more or less comparable whereas the persons recorded in 1961 Census were found to be small in number. In respect of proportion of workers engaged in agriculture sector it is observed that no significant difference in proportion of female
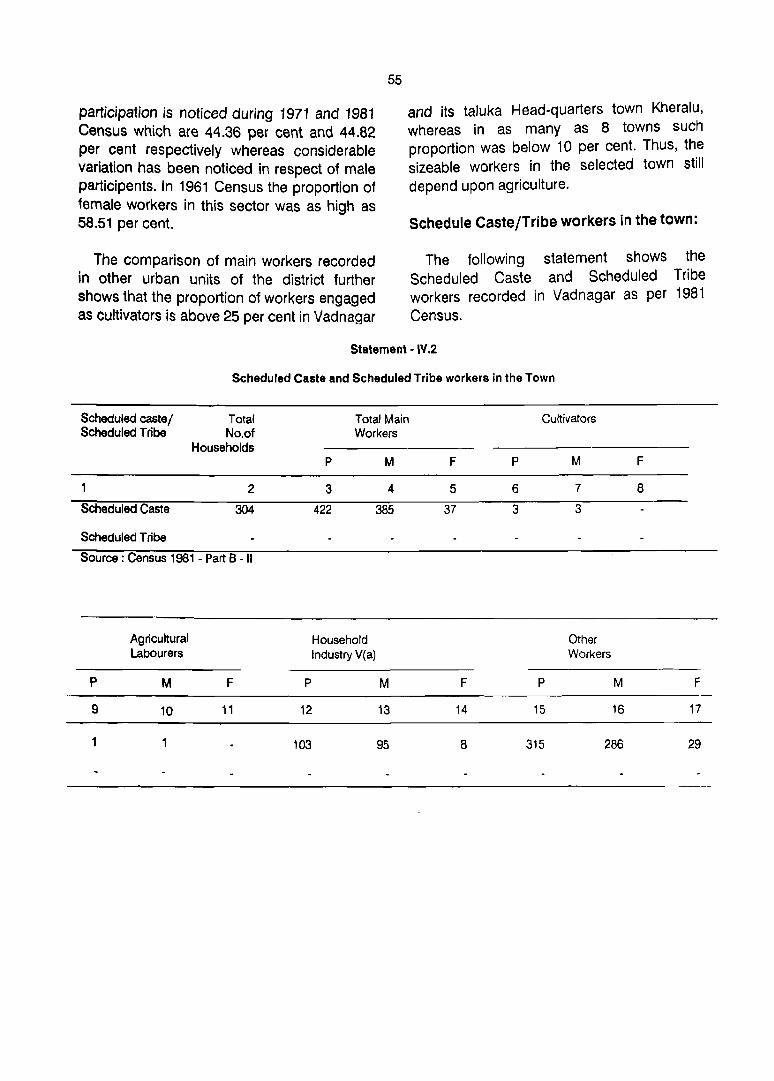
participation is noticed during 1971 and 1981 Census which are 44.36 per cent and 44.82 per cent respectively whereas considerable variation has been noticed in respect of male participents. In 1961 Census the proportion of female workers in this sector was as high as 58.51 per cent.
The comparison of main workers recorded in other urban units of the district further shows that the proportion of workers engaged as cultivators is above 25 per cent in Vadnagar
55
and its taluka Head-quarters town Kheralu, whereas in as many as 8 towns such proportion was below 10 per cent. Thus, the sizeable workers in the selected town still depend upon agriculture.
Schedule Caste/Tribe workers in the town:
The following statement shows the Scheduled Caste and Scheduled Tribe workers recorded in Vadnagar as per 1981 Census.
Statement· IV.2
Scheduled Caste and Scheduled Tribe workers in the Town
Scheduled castel Total Total Main Cultivators Scheduled Tribe No.of Workers
Households P M F P M F
2 3 4 5 6 7 8
Scheduled Caste 304 422 385 37 3 3
Scheduled Tribe
Source: Census 1981 - Part B -"
Agricultural Household Other Labourers Industry V(a) Workers
p M F P M F P M F
9 10 11 12 13 14 15 16 17
1 1 103 95 8 315 286 29
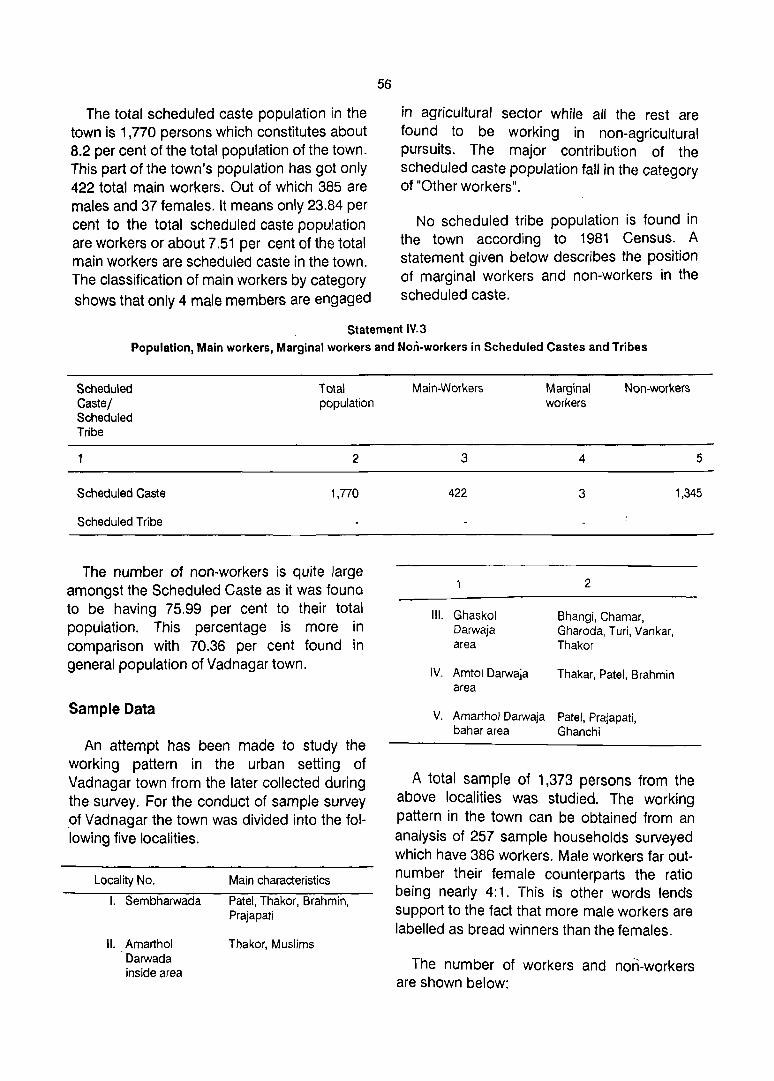
The total scheduled caste population in the town is 1,770 persons which constitutes about 8.2 per cent of the total population of the town. This part of the town's population has got only 422 total main workers. Out of which 385 are males and 37 females. It means only 23.84 per cent to the total scheduled caste population are workers or about 7.51 per cent of the total main workers are scheduled caste in the town. The classification of main workers by category shows that only 4 male members are engaged
56
in agricultural sector while all the rest are found to be working in non-agricultural pursuits. The major contribution of the scheduled caste population fall in the category of "Other workers".
No scheduled tribe population is found in the town according to 1981 Census. A statement given below describes the position of marginal workers and non-workers in the scheduled caste.
Statement IV.3
Population, Main workers, Marginal workers and Non-workers in Scheduled Castes and Tribes
Scheduled Total Castel population Scheduled Tribe
2
Scheduled Caste 1,770
Scheduled Tribe
The number of non-workers is quite large amongst the Scheduled Caste as it was fauna to be having 75.99 per cent to their total population. This percentage is more in comparison with 70.36 per cent found in general population of Vadnagar town.
Sample Data
An attempt has been made to study the working pattern in the urban setting of Vadnagar town from the later collected during the survey. For the conduct of sample survey of Vadnagar the town was divided into the following five localities.
Locality No.
I. Sembharwada
II. Amarthol -Oarwada inside area
Main characteristics
Patel, Thakor, Brahmin, Prajapati
Thakor, Muslims
Main-Workers Marginal Non-workers workers
3 4 5
422 3 1,345
2
III. Ghaskol Bhangi, Chamar, Darwaja Gharoda, Turi, Vankar, area Thakor
IV. Amtol Darwaja Thakar, Patel, Brahmin area
V. Amarthol Darwaja Patel, Prajapati, bahar area Ghanchi
A total sample of 1,373 persons from the above localities was studied. The working pattern in the town can be obtained from an analysis of 257 sample households surveyed which have 386 workers. Male workers far outnumber their female counterparts the ratio being nearly 4: 1. This is other words lends support to the fact that more male workers are labelled as bread winners than the females.
The number of workers and non-workers are shown below:

57
Statement IV. 4
Distribution of population into workers and non-workers, by sex and locality
Workers Non-Workers Locality
Total Male Female Total Male Female
2 3 4 5 6 7
I. Sembharwada 104 84 20 283 101 182
II. Amarthol Darwaja inside area 79 63 16 154 54 100
III. Ghaskol Darwaja area 67 58 9 187 68 119
IV. Amtol Darwaja area 77 72 5 209 74 135
V. Amarthol Darwaja bahar area 59 53 6 154 57 97
Total 386 330 56 987 354 633
Out of 386 total workers the highest number was found in locality I with 104 or 26.94 per cent. The number of workers are more or less evenly distributed in locality II and ·IV whereas the lowest percentage of workers with 59 or 15.28 per cent was found in the locality V. The male workers outnumbered females in all the five localities. The female workers are below 10 in number in last three localities unlike the working force in rural, where the sweat of labour is shared among both sexes. While in Vadnagar, a lopsided working pattern with a
greater lean on male side is noted. This is mainly due to the absence of sufficient avenues of employment for women in the town. The lower proportion of female workers reflects in higher proportion of smaple nonworkers, which is as high as 64.14 per cent. It is also seen that the female non-workers outnumbered male non-workers in all the five selected loealities.
Classification by Age and Sex
Statement IV.5
Distribution of workers and non-workers by Age and Sex
Age groups Workers Non·workers
Total Male Female Total Male Female ,
2 3 4 5 6 7
0-14 473 255 218
15-24 81 72 9 209 62 147
25-34 96 79 17 80 8 72
35-49 127 112 15 92 2 90
50-59 48 41 7 61 7 54
60+ 34 26 8 72 20 52
Total 386 330 56 987 354 633

In a broad classification of the working force into child, adult and ripe age group, child labour has a nil return. The rest of workers are distributed as 177 young aged 15-34, 175 middle aged 35-59 years and 34 ripe above 60 years. Thus the young aged and middle aged workers are evenly distributed. The available labour force among the working age (15-59) account for 794 or 57.83 per cent. However, the actual working force among them account for 352 leaving the rest unexploited. Thus the participation rate actually comes to 44.33 per
58
cent. The participation rate in respect of males accounts for as high as 79.37 per cent. On the other hand such rate for females comes to 11.68 per cent only. The socio-corelate of the disparity between male and female participation rate can. be analysed with reference to various factors, namely, community, religion, etc. Before discussing details by community and religion it would be appropriate to have an idea about participation rate by sex in each locality the details are as under:
Statement IV.S
Participation rate by Sex and Locality
Adults-aged 15-59
Locality Persons Male
2 3
I. Sembharwada 211 101
II. Amartho! Darwaja 149 69 inside area
III. Ghasko! Oarwaja area 129 60
IV. Amtol Darwaja area 176 89
V. Amartho! Darwaja 129 64 bahar area
Total 794 383
The highest participation rate of 48.32 per cent is found in Locality II followed by Locality III with 46.51 per cent and by Locality V with 44.19 per cent whereas rate in Locality I and IV is more or less same. The participation rate among males varies from 74.26 per cent in Locality I to 88.33 per cent in Locality III. It is also as high as 81.16 per cent in Locality II. So far as participation rate among females is concerned it is exactly 20 per cent in Locality II which is followed by Locality I with 12.73 per cent whereas in last 2 Localities the rate is below 10 per cent. Thus, the participation rate of females in the economic activities is far
Actual worker aged Participation rate 15-59
Female Persons Male Female Persons Male Female
4 5 6 7 8 9 10
110 89 75 14 42.18 74.26 12.73
80 72 56 16 48.32 81.16 20.00
69 60 53 7 46.51 88.33 10.14
87 74 69 5 42.05 77.53 5.75
65 57 51 6 44.19 79.69 9.23
411 352 304 48 44.33 79.37 11.68
below the male participation rate in all the five Localities. Thus, it is evident from the above data that the even adult females may not be getting sufficient opportunities in the economic activity except perhaps the work of agricultural labour and other miscellaneous casual labour type work which is being done mo:...tly by the lower income group people.
The distribution of workers and non-workers with reference to th\~ participation rate by caste/community and 'Sex, etc., are shown in Appendix NO.1 given atJhe end of the report.
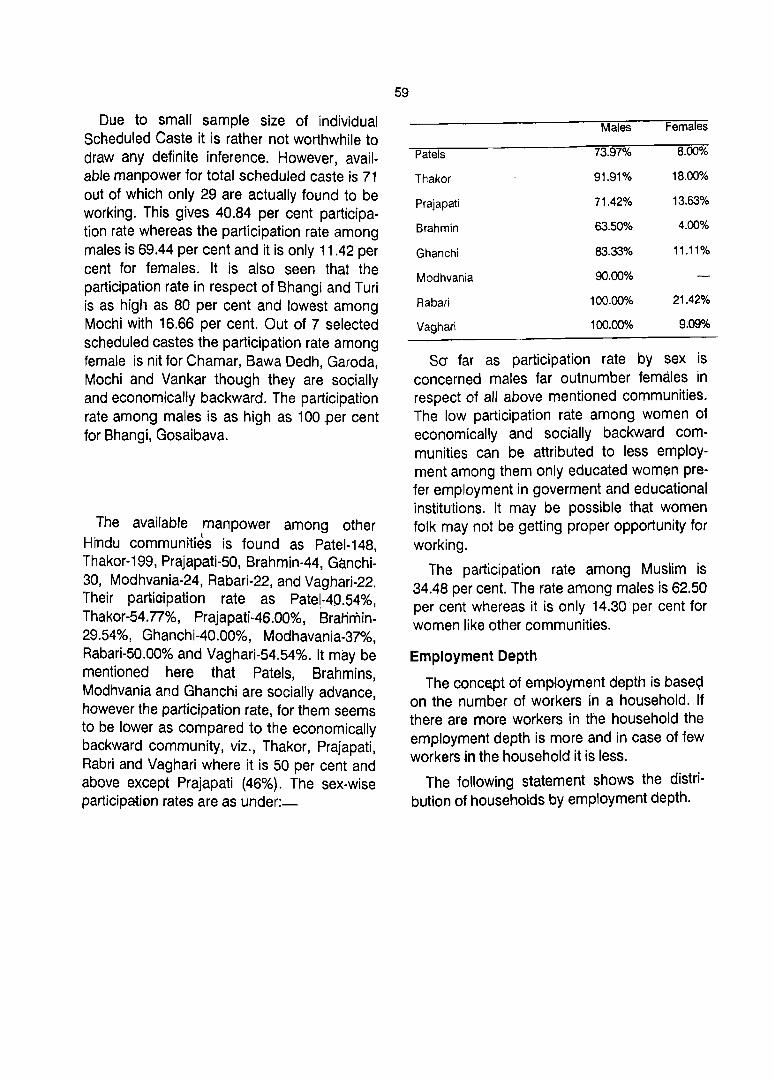
Due to small sample size of individual Scheduled Caste it is rather not worthwhile to draw any definite inference. However, available manpower for total scheduled caste is 71 out of which only 29 are actually found to be working. This gives 40.84 per cent participation rate whereas the participation rate among males is 69.44 per cent and it is only 11.42 per cent for females. It is also seen that the participation rate in respect of Bhangi and Turi is as higl1 as 80 per cent and lowest among Mochi with 16.66 per cent. Out of 7 selected scheduled castes the participation rate among female is nit for Chamar, Bawa Dedh, Garoda, Mochi and Vankar though they are socially and economically backward. The participation rate among males is as high as 100 .per cent for Bhangi, Gosaibava.
The available manpower among other Hindu communities is found as Patel-148 , Thakor-199, Prajapati-50, Brahmin-44, Ganchi-30, Modhvania-24, Rabari-22, and Vaghari-22. Their partiaipation rate as Patel-40.54%, Thakor-54.77%, Prajapati-46.00%, Bralimin-29.54%, Ghanchi-40.00%, Modhavania-37%, Rabari-50.00% and Vaghari-54.54%. It may be mentioned here that Patels, Brahmins, Modhvania and Ghanchi are socially advance, however the partiCipation rate, for them seems to be lower as compared to the economically backward community, viz., Thaker, Prajapati, Rabri and Vaghari where it is 50 per cent and above except Prajapati (46%). The sex-wise participati"n rates are as under:-
59
Males Females
Patels 73.97% 8.00010
Thakor 91.91% 18.00%
Prajapati 71.42% 13.63%
Brahmin 63.50% 4.00%
Ghanchi 83.33% 11.11%
Modhvania 90.00%
Rabari 100.00% 21.42%
Vaghari 100.00% 9.09%
Sa far as participation rate by sex is concerned males far outnumber females in respect of all above mentioned communities. The low participation rate among women of economically and socially backward communities can be attributed to less employment among them only educated women prefer employment in goverment and educational institutions. It may be possible that women folk may not be getting proper opportunity for working.
The participation rate among Muslim is 34.48 per cent. The rate among males is 62.50 per cent whereas it is only 14.30 per cent for women like other communities.
Employment Depth
The concept of employment depth is base<;1 on the number of workers fn a household. If there are more workers in the household the employment depth is more and in case of few workers in the household it is less.
The following statement shows the distribution of households by employment depth.

60
Statement IV.7
Distribution of households by employment depth 1988 e.g. number of workers in the households
No. of workers in household
No, of households by number of adults having workers noted in Col. 1
All 1·3 Adults 4·6 Adults 7·10 Adults 11 & above Total workers households adults
2 3 4 5 6 7
Nil 21 (42) 21 (42)
135(377) 103(225) 31 (145) 1 (7) 135
2 54(199) 22(50) 30(135) 2(14) 108
3 20(103) 1(3) 16(77) 3(23) 60
4 6(40) 3(16) 3(24) 24
5 5(33) 2(11 ) 3(22) 25
Total- 241(794) 147(320) 82(384) 12(90) 352
N.B. Excluding 16 households having no adults (15·59) in the household.
The above data reveals that out of total 257 surveyed households there are in all 16 households having no adult members in the age-group 15-59 years and 21 households were having no workers. While as many as 135 or 56.02 per cent households have only one worker. The remaining 85 households have between them 217 workers ranging from two to five workers per household. There are 5 households with 5 workers.
Out of 794 adults residing in 241 households, 352 are workers which gives an employment depth 01 44.33 per cent. Further study of distribution of households by number of workers in each of them reveals that as many as 54 households having 2 workers in eaCh. of them have recorded the employment depth 01 54.27 per cent. The highest employment depth of 75.76 per cent is noticed in last households having out of 33 adults 25 are workers. The employment depth is 60.00 per cent among households having 4 workers
per household which is followed by the households having 3 workers per household with 58.25 per cent.
Further the highest employment depth among the households by different class of population size is observed among 12 households in the population size of 7-10 members being 45.56 per cent which is followed by 147 households in the size class of 1-3 members with 46.86 per cent. In the size class of population 4-6 there are 82 households where the extent of employment depth works out to 41.93 per cent.
Unemployment Depth
The concept of unemployment and under employment depth is based on the number 01 non-workers including seeking work in the household. The details are given in the following statement. •

61
Statement IV.S
Distribution of households by unemployment depth (number of unemployment in the household)
No.of unemployed No.of households by size and number of Adults having number of non-workers noted in Col. 1 including who are
'1 & above Total non-seeking work All house- 1-3 4-6 7-10 holds Adults Adults Adults Adults workers
2 3 4 5 6 7
Nil 19(39) 17(34) 2(5)
99(211 ) 86(167) 13(44) 99
2 60(210) 37(98) 21(98) 2(14) 120
3 38(182) 7(21) 29(146) 2(15) 114
4 17(95) 14(73) 3(22) 68
5 7(50) 3(18) 4(32) 35
6 1 (7) 1(7) 6
7
Total 241 (794) 147(320) 82(384) 12(90) 442
N.B.: Excluding 16 households having no adults (15-59) in the households.
The above data reveals that 442 persons out of total 794 adults residing in 241 households were recorded as non-workers and unemployed including seeking work. This shows that there is 55.67 per cent unemployment depth in the sample. In fact there were 19 households where the depth of unemployment is nil or wherein no adult has been reported unemployed (including seeking work) or in other words all the adult members of these households are reported as workers. The unemployment depth is 46.70 per cent in respect of 99 households, 57.14 per cent in respect of 60 households and it is 62.64 per cent among 38 households. Whereas the unemployment depth is 70.10 per cent in case of 17 households. It is 70.00 per cent for 7 households and as high as 85.71 per cent for the last 1 household. Further the study of unemployment depth among the households grouped under the different size class of population reveals a percentage of
unemployment depth with 55.67 per cent among the households of the size class of population 1-3 and 56.56 per cent in size class of population 4-6 members where as in the bigger size class of population 7-10 members the unemployment depth is found to be recorded 53.33 per cent. It is seen that under size class of population of 1-3 members in respect of 7 households all 21 adults were recorded as non-workers giving 100 per cent unemployment depth.
Out of 442 non-workers only 36 were found . to be seeking work. This shows unemployment depth of 8.09 per cent only as compared to the unemployment depth of 55.67 per cent worked out on the basis of total non-~orkers.
The following statement shows the percentage distribution of non-workers by sex and type of activity.

62
Statement-IV.9
Percentage distribution of non-workers by sex and type of activity
Type of activity Total no. of non-workers Percentage of non-workers
P M
2 3
Full time student 398 203
Household duty 313 3
Dependent 226 111
Infant 11 6
Disabled
Retired 24 18
Rentiers having no independent means'
Beggar
Vagrant
Inmates of Institution
Others 14 13
Total 987 354
It will be seen that the ratio of male nonworkers to female non-workers is nearly 3 to 5. Females predominantly fall in the category of household duties which are as many as 310 out of total 313 persons. In terms of percentage it is as high as about 49 percent. The number of male and female non-workers in the category of 'dependents' is almost evenly distributed. The percentage of male full-time students to total male non-workers comes to 57.34 per cent. While similar percentage for the female works out to 30.80 per cent. The percentage of retired to total non-workers is found to be 5.08 and. 0.95 respectively for males and females, while such
F P M F
4 5 6 7
195 40.32 57.34 30.80
310 31.71 0.85 48.97
115 22.90 31.36 18.17
5 1.12 1.70 0.79
6 2.43 5.08 0.95
0.10 0.16
1.42 3.67 0.16
633 100.00 100.00 100.00
percentages in respect of infants are 1.70 per cent and 0.79 per cent.
In short full-time students, household workers and dependents constitute the bulk of non-working force, viz., 94.93 per cent of the total non-workers. Individual categorywise, 40.32 per cent are full time students, 31.71 per cent household workers and 22.90 per cent dependents.
Households by Occupational Diversity
The details regarding the distribution of households by number of members and occupational diversity are given below.

63
Statement IV.10
Distribution of households by number of members and occupational diversity
Distribution of occupational diversity
1. Husband and Wife (Occup. 1- Occup .. II)
2. Father and Sons (s) (Occup. III - Occup. IV)
3. Brother and Brother(s} (Occup. V - Occup. VI)
4. Mother and Daughter(s) (Occup. VII - Occup. VIII)
5. Sister and Brother (Occup. IX - Occup. X)
6. Wife and Second Wife (Occup. XI - Occup. XII)
7. Single Workers
8. Husband, Wife, Son, Brother, Mother and any other members of the household
9. Not classified
Total
More than half of the total households were having single worker. The maximum households numbering 48 with 126 members have occupational diversity between Father and Son{s) whereas the different occupation between Husband and Wife was found in 16 households with 32 members. The different occupation among brothers was noticed in 13 households having 28 total members. While in one household each different occupation between Mother and Daughter(s), Sister and Brother and Wife and Second wife was also found. It is also observed that in as many as 14 households having 52 members different occupation among Husband, Wife, Son, Brother, Mother and other members was found. In 22 households the occupational diversity was not classified.
No.of households
2
16
48
13
141
14
22
257
No.of members
3
32
126
28
3
2
2
141
52
386
In short the above data indicates that occupations followed by different members in the household are in diverse and heterogeneous order. Each member in the household seems to have an individual pattern of avocation and a mode of life governed by individual set of factors.
Distribution of population by sex, broad age-group occupation
The details regarding distribution of population by sex, broad age-group occupation are shown in the following statement.
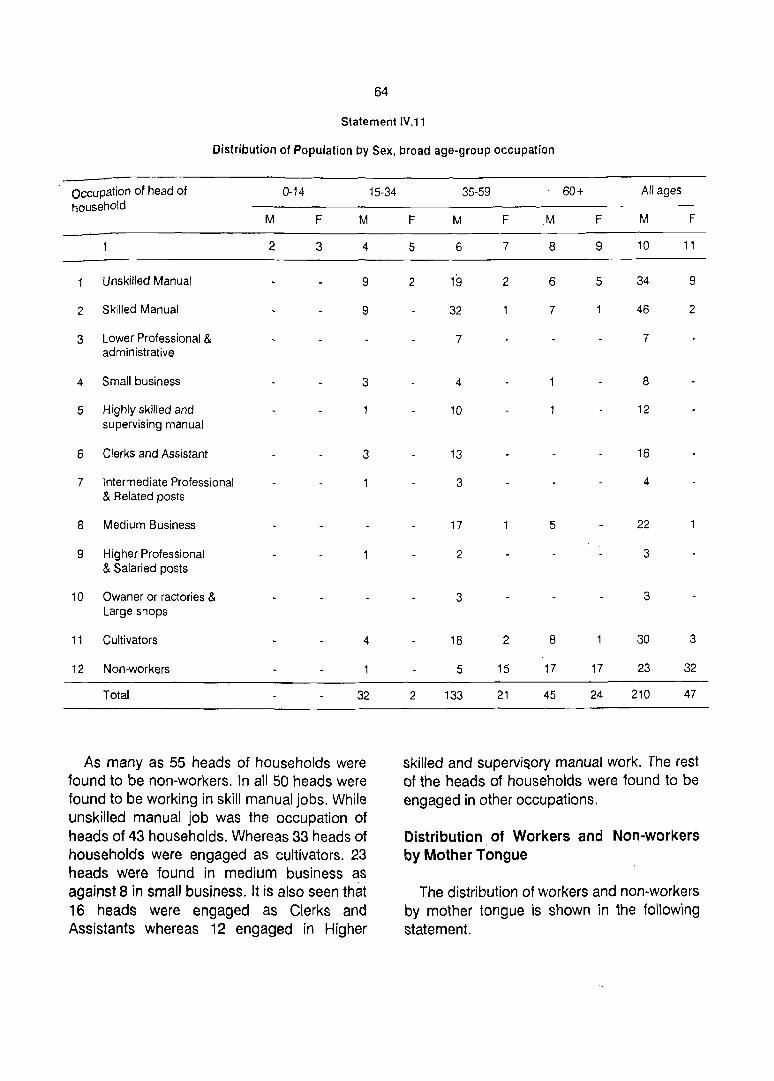
64
Statement IV.11
Distribution of Population by Sex, broad age-group occupation
occupation of head of 0-14 household
M F M
2 3 4
Unskilled Manual 9
2 Skilled Manual 9
3 Lower Professional & administrative
4 Small business 3
5 Highly skilled and supervising manual
6 Clerks and Assistant 3
7 Intermediate Professional & Related posts
8 Medium Business
9 Higher Professional & Salaried posts
10 Owaner or ractories & Large shops
11 Cultivators 4
12 Non-workers
Total 32
As many as 55 heads of households were found to be non-workers. In all 50 heads were found to be working in skill manual jobs. While unskilled manual job was the occupation of heads of 43 households. Whereas 33 heads of households were engaged as cultivators. 23 heads were found in medium business as against 8 in small business. It is also seen that 16 heads were engaged as Clerks and Assistants whereas 12 engaged in Higher
15-34 35-59 60+ All ages
F M F M F M F
5 6 7 8 9 10 11
2 19 2 6 5 34 9
32 7 46 2
7 7
4 8
10 12
13 16
3 4
17 5 22
2 3
3 3
18 2 8 30 3
5 15 17 17 23 32
2 133 21 45 24 210 47
skilled and supervi~ory manual work. The rest of the heads of households were found to be engaged in other occupations.
Distribution of Workers and Non-workers by Mother Tongue
The distribution of workers and non-workers by mother tongue is shown in the following statement.
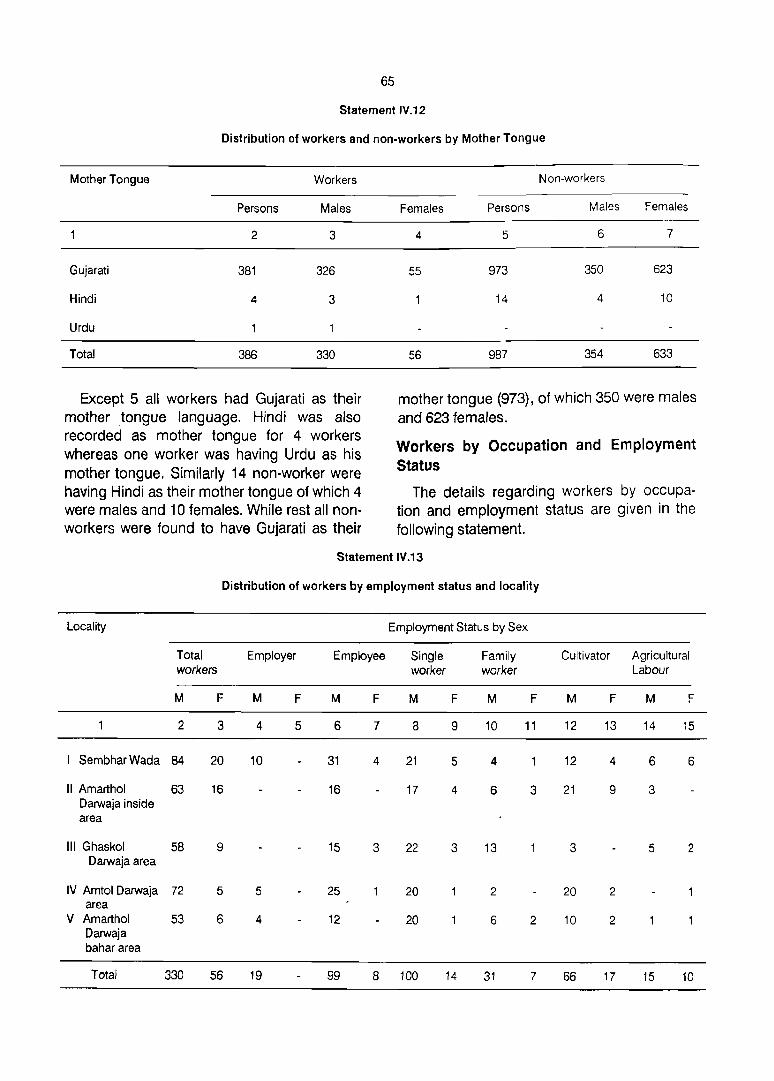
65
Statement IY.12
Distribution of workers and non-workers by Mother Tongue
Mother Tongue Workers
Persons Males
2 3
Gujarati 381 326
Hindi 4 3
Urdu
Total 386 330
Except 5 all workers had Gujarati as their mother tongue language. Hindi was also recorded as mother tongue for 4 workers whereas one worker was having Urdu as his mother tongue. Similarly 14 non-worker were having Hindi as their mother tongue of which 4 were males and 10 females. While rest all nonworkers were found to have Gujarati as their
Non-workers
Females Persons Males Females
4 5 6 7
55 973 350 623
14 4 10
56 987 354 633
mother tongue (973), of which 350 were males and 623 females.
Workers by Occupation and Employment Status
The details regarding workers by occupation and employment status are given in the following statement.
Statement IV.13
Distribution of workers by employment status and locality
Locality
Total workers
M
2
Sembhar Wad a 84
11 Amarthol Darwaja inside area
111 Ghaskol Darwaja area
63
58
IV Amtol Darwaja 72 area
V Amarthol 53 Darwaja bahar area
Total 330
F
3
20
16
9
5
6
56
Employer
M F
4 5
10
5
4
19
Employment Status by Sex
Employee
M F
6 7
31 4
16
15 3
25
12
Single worker
M
8
21
17
22
20
20
99 8 100
F
9
5
4
3
14
Family worker
M
10
4
6
13
2
6
31
F
11
3
2
7
Cultivator Agricultural Labour
M F M F
12 13 14 15
12 4 6 6
21 9 3
3 5 2
20 2
10 2
66 17 15 10

Out of 330 male workers, only 19 had their employment status as employer, whereas 99 are employees. Of the rest 100 were single workers, 31 family workers, 66 cultivators and 15 agricultural labourers. Not a single female worker was recorded as employer. They were, however, distributed as 8 employees, 14 single workers, 7 family workers, 17 cultivators and 10 agricultural labourers.
The maximum number of workers was found in locality I with 104, which is followed by locality II with 79 and locality IV with 77. The workers with status employer were found in locality I (10), III (5), and Locality V (4).
66
Whereas the male workers whose employment status, was employee, single worker, family worker, cultivator and agricultural labour were found in all localities except locality IV wherein not a single agricultural labourer was recorded. It is also seen that out of 56 female workers as many as 45 are found in first three localities.
Workers by Caste/Community and Employment Status
The following statement shows the workers by caste/community.
Statement IV.14
Workers by Caste/Community
Employment status Hindu Muslim Total
Scheduled Other Caste Community
M F M F M F M F
2 3 4 5 6 7 8 9
Employer 18 19
2 Employee 8 2 85
3 Single worker 14 81
4 Family worker 27
5 Cultivator 66
6 Agricultural labour 3 2 12
Total 25 4 289
As regards the workers belonging to Scheduled Caste it will be seen that of the 25 male workers as many as 14 were single workers were 8 employees and 3 were agricultural labourers. Whiie 4 female workers were distributed as employees and agricultural labourers respectively. Regarding the workers belonging to other Hindu c6mmunites it is observed that out of total 289 male workers the employment status of 85
4 6 2 99 8
10 5 4 100 14
7 4 31 7
17 66 17
8 15 10
46 16 6 330 56
was employee. Whereas 81 were found single workers and 66 cultivators. In all 18 workers were also recorded as employers and 27 as family workers. Out of 56 female workers 17 were recorded as cultivators and 10 as single workers. The workers belonging to Muslim religion were distributed as employees (6), Single workers (5), Family workers (4) and one member was employer while- females were employees and single workers only.
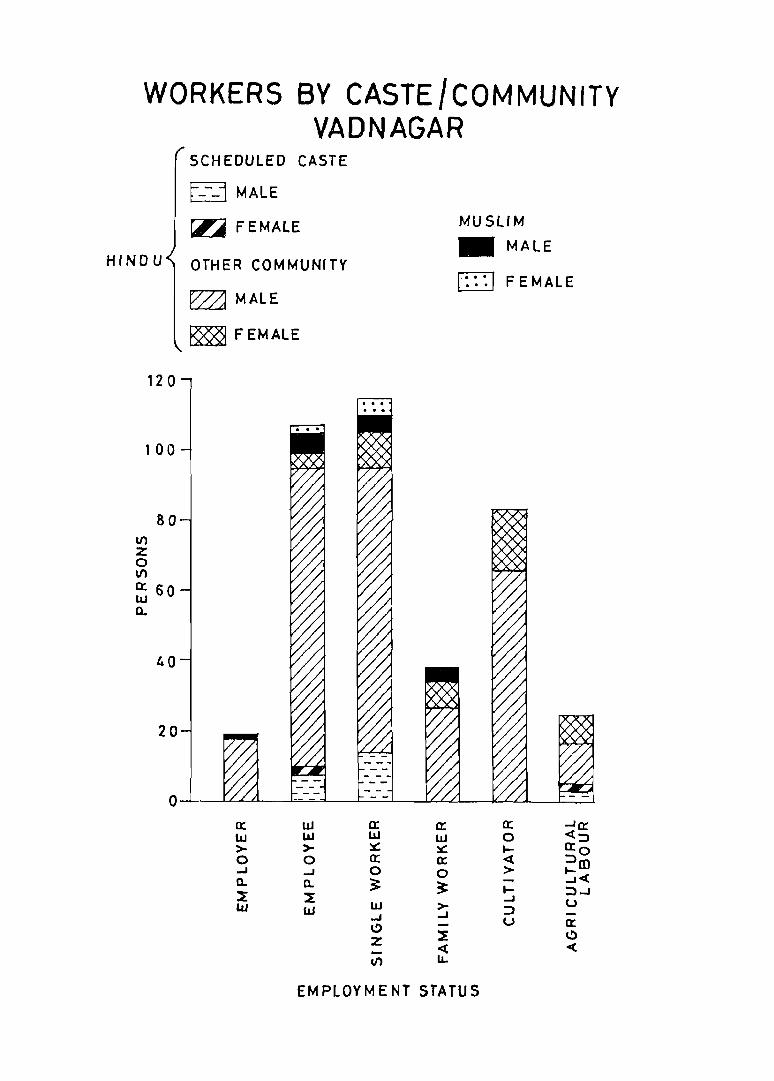
WORKERS BY CASTE /COMMUNITY VADNAGAR
SCHEDULED CASTE
E---j MALE
~ FEMALE
HI NO U OTHER COM MUNrTY
120
100
VI Z o I/)
80
a: 60 LIJ Q.
40
20
0
~MAlE
~ FEMALE
a: LU >-0 ...J a.. ~ ILl
UJ UJ >-0 ...J a. ~ W
a: UJ :::c: a: 0 3: LIJ ...J \!)
Z -I/)
MUSLIM
_ MALE
1:::1 FEMALE
a:: a:: ...In: UJ 0 <:::J :::c: I-- 0: 0 cr: « :::Jm 0 > !::icc ~ -I-- :::J....I
...J U >- :::J ....I -U 0: -::E C)
<t c( LL
EMPLOYMENT STATUS

68
Statement IV.15
Occupation and Employment Status of workers
Name of occupation Total Employment Status worker __________ -::-:-----:-__ -::-----::-__ ---::::-:-:_-:--:--:-
Single Family Culti- Agricul-Employer Employee
1. Unskilled Manual
2. Skilled Manual
3. I_ower Professional & Administrative
4. Small Business
5. Highly skilled Supervisory Manual
6. Clerks & Assistants
7. Intermediate Professional & related posts, Secondary Teachers
8. Medium business
9. Highly Professional & Salaried posts
10. Owner of Factories, and large shops
11. CLiltivators
Total
2 3
90
87 9
7
11
37 2
22
6
33 5
3
6 3
84
386 19
The above distribution of workers by employment status shows that out of 386 workers as many as 114 were having employment status or single worker. While 107 were recorded as employees, 83 were cultivators and 25 agricultural labourers. 19 workers were also recorded as employer.
The distribution of workers by type of occupation further indicates that 90 were engaged in unskilled manual job, of which 25 were employees and 3'7' single workers and rest 3 were family workers. Similarly out of 87
worker worker vators tural labour
4 5 6 7 8
25 37 3 25
27 33 18
7
9 2
24 11
16 5
4 2
16 11
3
2
83
107 114 38 83 25
workers whose occupation was skilled manual job, 9 were employer, 37 employees, 33 single workers and 18 family workers. Whereas out of 84 workers whose occupation was cultivations all except one were having cultivators as the employment status, of the 33 workers engaged in the medium business 5 were employer, 1 employee, 16 single worker and 11 family workers. In all 22 workers were employed as Clerks and Assistants of which as many as 16 have employment status as employee, 5 single workers and only 1 family workers.

69
Statement IV.16
The details regarding the distance from place of work (Kms.)
Type of Occupation
II
2 3
1. Unskilled Manual 1.16 0.75
2. Skilled Manual
3. Lowest Professional & Administrative
4. Small Business
5. Highly skilled & Supervisory Manual
6. Clerks and Assistants
7. Intermediate professional & related post Secondary Teachers
8. Medium business
9 Higher professional & Salaried posts
10. Owners of Factories & Large Shops
11. Cultivators
Distance from place of work
4.25 2.63
2.50 1.00
3.33 0.50
B.OO 0.50
1.00
0.33 0.50
5.33
0.B7 1.22
The classification of average distance from the place of work by occupation reveals that the workers in occupational category Higher professional and salaried posts residing in locality V had to travel maximum distance among all occupational categories. The average distance from the place of work in their cases comes out to a little more than 22 kms. This is very closely followed by the workers in occupational category 'Clerks and Assistants' residing in the locality III with the average distance from the place of work 20 kms. where as those workers belonging to locality had to travel 8 kms. to reach their place of work. The workers in occupational category highly skilled supervisory manual,
Average distance from place of work (Kms.)
Locality
III IV V
4 5 6
3.00 2.60 1.00
0.33 6.00 2.85 I
1.00 2.85
0.25 12.00
20.00 1.40 0040
0.50
0.16
10.00 22.50
2.00 2.45 1.75
residing in locality V had also to travel the average distance of 12 kms. from the place of work.
The workers categorised as highly professional and salaried posts residing in
. locality III had to travel the average distance of 10 kms.
In short workers engaged in various occupations residing in locality I had to travel minimum distance of 0.33 kms. whereas workers engaged as Clerks and Assistants have to travel distance of 8 kms. from the place of their work. It is also seen that the workers of locality II are required to travel less
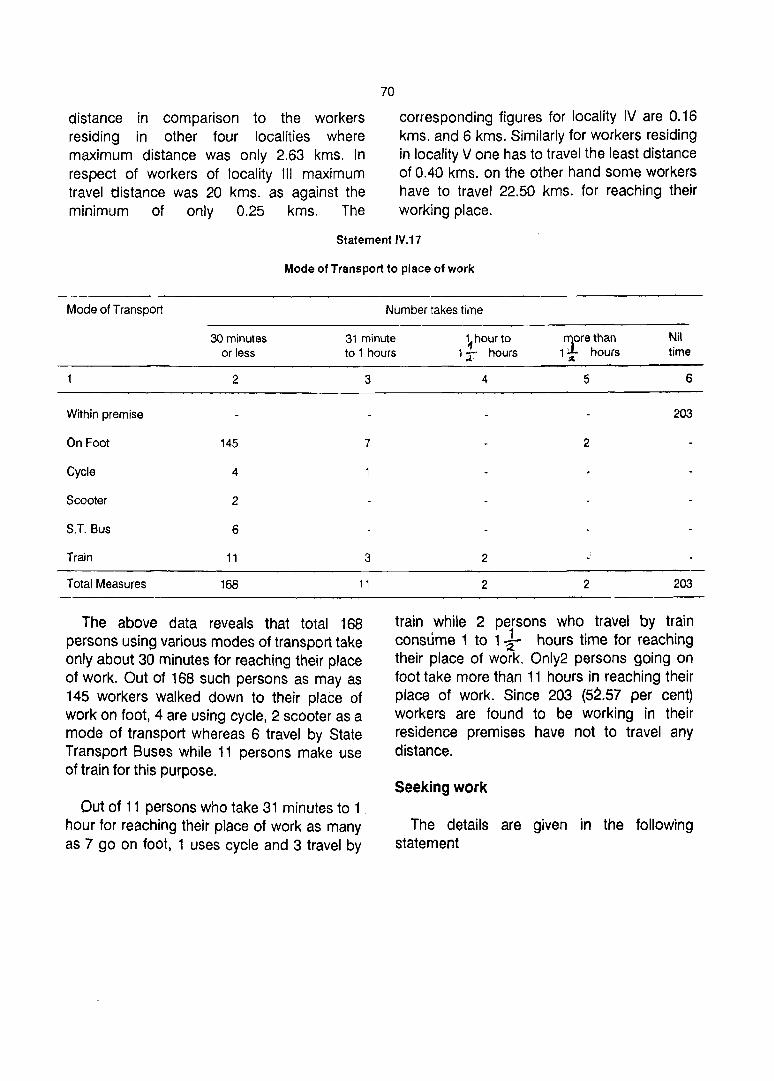
distance in comparison to the workers residing in other four localities where maximum distance was only 2.63 kms. In respect of workers of locality III maximum travel distance was 20 kms. as against the minimum of only 0.25 kms. The
70
corresponding figures for locality IV are 0.16 kms. and 6 kms. Similarly for workers residing in locality Vane has to travel the least distance of 0040 kms. on the other hand some workers have to travel 22.50 kms. for reaching their working place.
Statement IV.17
Mode of Transport to place of work
Mode of Transport Number takes time
30 minutes or less
31 minute to 1 hours
~hour to 1 r hours
rrrethan Nil 1 ~ hours time
2 3
Within premise
On Foot 145 7
Cycle 4
Scooter 2
S.T. Bus 6
Train 11 3
Total Measures 168 11
The above data reveals that total 168 persons using various modes of transport take only about 30 minutes for reaching their place of work. Out of 168 such persons as may as 145 workers walked down to their place of work on foot, 4 are using cycle, 2 scooter as a mode of transport whereas 6 travel by State Transport Buses while 11 persons make use of train for this purpose.
Out of 11 persons who take 31 minutes to 1 . hour for reaching their place of work as many as 7 go on foot, 1 uses cycle and 3 travel by
4 5 6
203
2
2
2 2 203
train while 2 persons who travel by train consume 1 to 1 -} hours time for reaching their place of work. Only2 persons going on foot take more than 11 hours in reaching their place of work. Since 203 (52.57 per cent) workers are found to be working in their residence premises have not to travel any distance.
Seeking work
The details are given in the following statement

71
Statement -IV.18
Persons seeking employment Classified by Age & Sex
Locality No.of Persons seeking employed by age-group No.of House holds
Population House- ----------------------------------------
holds with atleast one emp-
15-24 25-34 35-49 50-59 60+ Total
M F loyed M F M F M F M F M F M F
2 3 4 5 6 7 8 9 10 11 12 13 14 15 16 17
Sembhar 76 185 Wada
" Amarthol 44 117 Darwaja inside area
III Ghaskol 43 126 Darwada area
IV Amtol 53 146 Darwaja area
V Amarthol 41 110 Darwaja bahar area
202
116
128
140
103
5 3 3 2
8 7 4 11
6 3 2 2 5 3
5 4 2 6
4 2 2 3 2
Total 257 684 689 28 18 5 10 2 28 8
Out of 257 households in 28 households there is atleast one unemployed person. It is also obseNed that out of total 684 males 28 or 4.09 per cent are seeking employment while of 689 females only 8 are seeking employment. The persons seeking employment all except one belong to agegroup 15-24 and 25-34 years. In all the five localities one or more males are seeking
employment who belong to age-group 15-24 years. In all 36 persons out of 1,373 are found to be seeking employment.
The following statement shows the distribution of persons seeking employment by last residence and duration of stay in the town.
Statement IV.19
Last residence of the place
Vadvali-Mahesana
Ahmadabad
Persons seeking employment by duration of stay
4-5 years
2
6-9 years
3
10-19 years
4
20+ years
5
Total
6
2

2
Himatnagar (Sabar Kantha)
Kalal (Mahesana)
Chanasma (Mahesana)
Shekhpur (Mahesana)
Vadnagar (Mahesana)
Total
Out of 36 persons seeking employment there are 29 persons whose place of last residence was Vadnagar town itse11. In case of 4 persons the place of last residence was either a village or some other town of Mahesana district, whereas Ahmadabad was the place of last residence in respect of 2
72
3 4 5 6
5 23 29
7 27 36
persons. Himatnagar town Of Sabar Kantha district was the place of last residence for 1 person seeking employment. It is also seen that out of 36 persons seeking employment as many as 27 were staying since more than 20 years in the town and 7 were staying for 10-19 years.
Statement IV-20
Person seeking employment for the first time by education
Educational level Number seeking employment for the first time by age
15-19 20-24 25-29 30-34 35+ Total Regis- Not tered regis-with tered emplo- with yment emple-exch- yment ange exch-
ange
2 3 4 5 6 7 8 9
Illiterate
Primary 3 2 7 4 3
Matriculation/Secondary 3 4 8 4 4
Higher Secondary 3 5 9 5 4
Not Tech. Diploma
Tech. Diploma 2 2 2
Graduate degree 5 2 2 9 6 3
Post Graduate
Total 5 18 10 2 36 22 14

Not a single illiterate person was found to be seeking employment. On the other hand 9 persons who were graduates also seeking employment for the first time. There was only one person with post graduate degree who was seeking employment for the first time. The persons seeking employment for the first time were distributed according to educational level as 7 primary, 8 Matriculation/Secondary, 9 Higher Secondary and 2 Technical Diploma.
It will also be noticed from the above data that out of 36 persons seeking employment
73
for the first time 22 have registered their names with the employment exchange whereas rest 14 have not done so which inclucfes 3 graduates, 4 having higher secondary level, 4 with matriculation and 3 having primary education.
It was also noticed that only 2 persons who were previously employed as Clerks in State Transport and Gujarat Electricity Board for 1 year, had later become unemployed due to abolition their respective posts.
Statement IV.21
Description of occupation sought
Labour
Draftsman
Clerk
8ank Job
Peon-cum-Waterman
Carpenter
Rikshaw job
Clerk or Teacher
Peon-cum-Sweeper
Clerk-cum-Typist
Peon
Truck Driver
Cloth Stitches
Wireman
Total
Details regarding previous employment
M
2
2
2
Number where employment sought is in consonance with previous employment
F
3
M
4
10
3
3
2
2
26
Number where employment is not consonance with previous employment
F
5
2
3
8
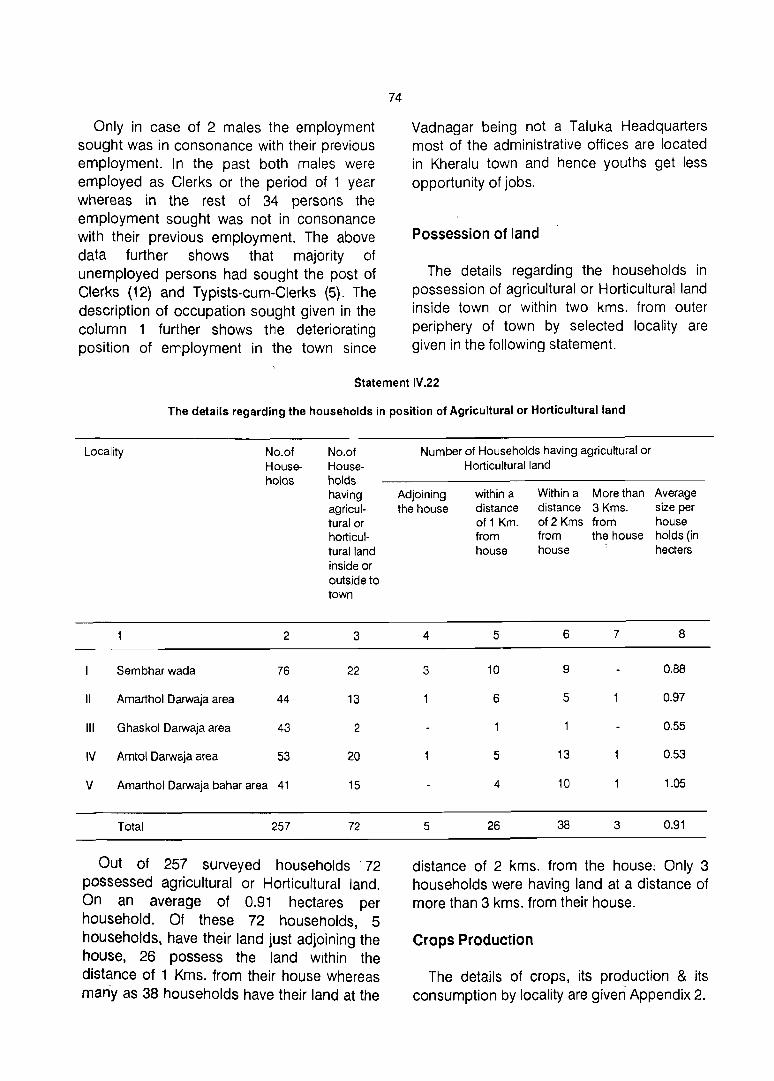
Only in case of 2 males the employment sought was in consonance with their previous employment. In the past both males were employed as Clerks or the period of 1 year whereas in the rest of 34 persons the employment sought was not in consonance with their previous employment. The above data further shows that majority of unemployed persons had sought the post of Clerks (12) and Typists-cum-Clerks (5). The description of occupation sought given in the column 1 further shows the deteriorating position of employment in the town since
74
Vadnagar being not a Taluka Headquarters most of the administrative offices are located in Kheralu town and hence youths get less opportunity of jobs.
Possession of land
The details regarding the households in possession of agricultural or Horticultural land inside town or within two kms. from outer periphery of town by selected locality are given in the following statement.
Statement IV.22
The details regarding the households in position of Agricultural or Horticultural land
Locality
Sembhar wada
II Amarthol Darwaja area
III Ghaskol Darwaja area
IV Amtol Darwaja area
No.of Households
2
76
44
43
53
V Amarthol Darwaja bahar area 41
Total 257
No.of Households having agricultural or horticulturalland inside or outside to town
3
22
13
2
20
15
72
Out of 257 surveyed households 72 possessed agricultural or Horticultural land. On an average of 0.91 hectares per household. Of these 72 households, 5 households, have their land just adjoining the house, 26 possess the land within the distance of 1 Kms. from their house whereas many as 38 households have their land at the
Number of Households having agricultural or Horticultural land
Adjoining within a Within a More than the house distance distance 3 Kms.
of 1 Km. of 2 Kms from from from the house house house
,
4 5 6 7
3 10 9
6 5
5 13
4 10
5 26 38 3
Average size per house holds (in hecters
8
0.88
0.97
0.55
0.53
1.05
0.91
distance of 2 kms. from the house; Only 3 households were having land at a distance of more than 3 kms. from their house.
Crops Production
The details of crops, its pro9uction & its consumption by locality are given Appendix 2.
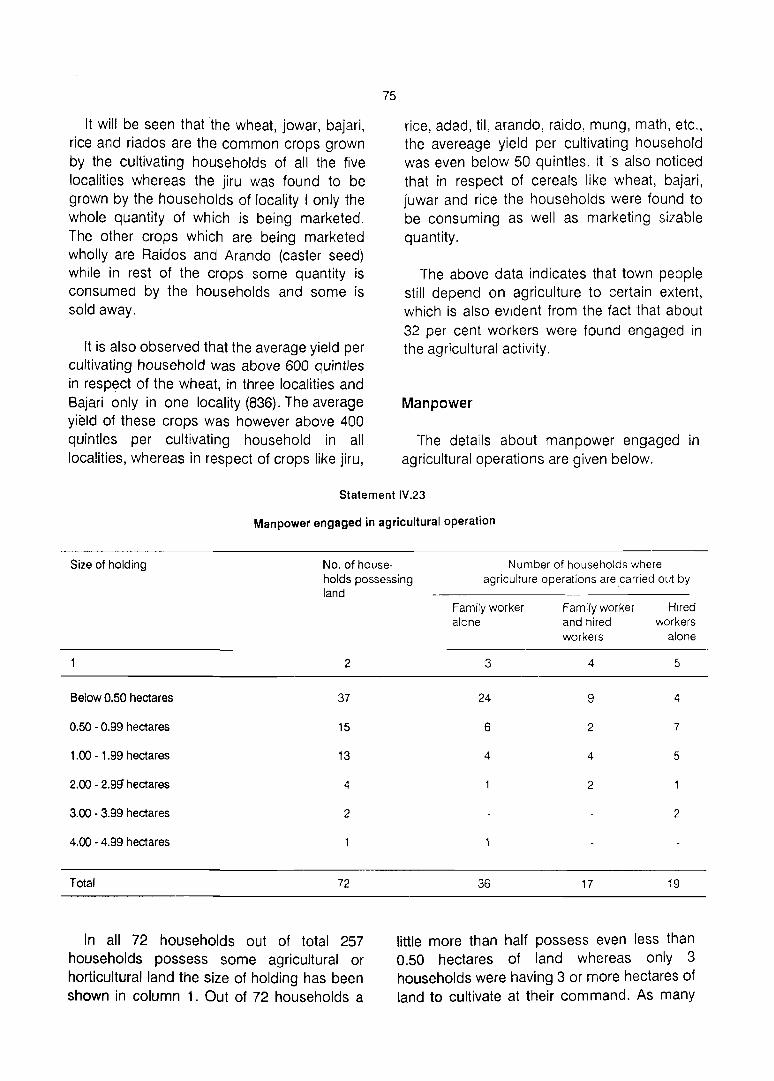
It will be seen that the wheat, jowar, bajari, rice and riados are the common crops grown by the cultivating households of all the five localities whereas the jiru was found to be grown by the households of locality I only the whole quantity of which is being marketed. The other crops which are being marketed wholly are Raidos and Arando (caster seed) while in rest of the crops some quantity is consumed by the households and some is sold away.
It is also observed that the average yield per cultivating household was above 600 quintles in respect of the wheat, in three localities and Bajari only in one locality (836). The average yield of these crops was however above 400 quintles per cultivating household in all loca!ities, whereas in respect of crops like jiru,
75
rice, adad, til, arando, raido, mung, math, etc., the avereage yield per cultivating household was even below 50 quintles. It is also noticed that in respect of cereals like wheat, bajari, juwar and rice the households were found to be consuming as well as marketing sizable quantity.
The above data indicates that town people still depend on agriculture to certain extent, which is also evident from the fact that about 32 per cent workers were found engaged in the agricultural activity.
Manpower
The details about manpower engaged in agricultural operations are given below.
Statement IV.23
Manpower engaged in agricultural operation
Size of holding No. of house- Number of households where holds possessing agriculture operations are carried out by land
2
Below 0.50 hectares 37
0.50 - 0.99 hectares 15
1.00 - 1.99 hectares 13
2.00 - 2.9g hectares 4
3.00 - 3.99 hectares 2
4.00 - 4.99 hectares
Total 72
In all 72 households out of total 257 households possess some agricultural or horticultural land the size of holding has been shown in column 1. Out of 72 households a
Family worker Family worker Hired alone and hired workers
workers alone
3 4 5
24 9 4
6 2 7
4 4 5
2
2
36 17 19
little more than half possess even less than 0.50 hectares of land whereas only 3 households were having 3 or more hectares of land to cultivate at their command. As many

as 15 households possess less than one hectare and land whereas 13 households also possess more than one but less than 2 hectares of land.
As regards the manpower engaged in agricultural operations it will be seen that exactly half of the cultivating households carried out such operations .with the help of family workers alone whereas 17 households engaged hired workers in addition to family workers and as many as 19 households engaged only hired workers for carrying out different agricultural operations.
Animal Husbandry
The details regarding practice of animal husbandry by type at religion, caste, community are given in Appendix 3.
Out of total 257 surveyed households, 98 households keep different types of livestock and poultry which are 179 in number. It is also
76
observed that out of total 179 livestock/poultry as many as 112 were buffaloes possessed by 62 households, 29 cows by 11 households, 26 bullocks by 19 households, 4 goats by 3 households and 4 donkeys by 1 household. So far as the possession of livestock by scheduled caste is concerned it is seen that only one Chamar household keeps one buffalo and one Bhangi household keeps 2 goats. One Muslim family keeps 1 goat. As regards the other Hindu communities it is observed that Thakor and Patel numbering 57 households keep maximum number of livestock, viz., 106 buffaloes, 24 bullocks, 10 cows, etc., whereas the 5 households of Rabari keep as many as 18 cows and 3 buffaloes.
Small Scale Industry
The details about household and small scale industry by type ,and location of household are given in the following statement.
Statement IV.24
Types of products
Agricultural Instrument
2 Gold & Silver ornament
3 Manufacture of chappals
4 Manufacture of Doors, Chairs, Tables from wood
5 Manufacture of Bidi
6 Manufacture of Iron parts
7 Tailoring (cloths)
8 Printing work
No.of house-holds engaged in household & small scale industry
2
2
Small scale industry
Number of households engaged in manufacture which are situated in
Locality I
3
Locality II
4
Locality Locality Locality III IV V
5 6 7

2
9 Manufacture of Earthern pots
10 Spinning of cotton
Total 11
In all 11 different types of households and small scale industries existing in the town were studied in the sample area. It is also seen that each selected locality has atleast one such industry whereas locality II has 4 industries, locality IV has 3 and locality III has 2 such industries while only one industry is existing each in locality I & V.
It was also observed during the survey that out of 11 industries as many as 8 were located in the same house or adjoining house and 1 industry was located within 1 Km. from the house/household whereas 2 such industries were found 1-2 Kms. away from the household.
As regards the households belonging to religion/caste/community engaged in such industries it was observed that only Scheduled Caste belonging to Machi caste was engaged in manufacturing of chappals/shoes. The other communities like Vaghari was engaged in production of agricultural instruments, soni in Gold and Silver Ornaments Dabgar in manufacture of bidis, Luhar in manufacture of iron parts, Sathwara in spinning of cotton, Darji in tailoring. One Machi was also engaged in printing work while 2 Muslim households one each in preparation of wooden chairs and tables and manufacturing of bidis.
As regards the use of fuel or power in such household industries it was found that in most of the household industries manpower is being used. Coal is being used in the household industry like manufacture of Gold and Silver ornaments and, manufacture of iron
77
3 4 5 6 7
4 2 3
parts, in Industry like manufacture of wooden doors, chairs and tables and industry of printing work the Electricity was used as fuel or power.
Professional and Private Practitioners
In the field of medical and health services the town Vadnagar has 13 doctors practising in the Allopathic branch of medicines of which 2 doctors are having post-graduate qualifications, Ayurvedic and Homeopathic practioners are six and one respectively. It was also observed that the town has no 'Hakim', viz., Unani Medical Practioners. All one qualified and registered Medical Practitioners. One Dentist was also found to be practising in the town.
There also exists Veternary Centre where a qualified Veternist was posted to attend the diseased cattle. Six Pharmacists and two Astrologers were also found settled in this town. Four Lawyers were also practising in the Civil Court.
Market
Establishment
No big industrial unit was found in the town. However, various types of small industries like rice mill, oil mill, printing press, preparation of T. V, Cabinets, manufacturing and repairing of Transformers, diamond cutting, motor rewinding, saw mill, etc., are existing in'the town. The details relaitng to the type of industry and number of workers engaged, etc., are shown in the following statement.

78
Statement IV.25
Number of Establishments
Sr. No.
2
Name
AIMAC Industry - T.v. Cabinet manufacturing
2 T.M.C. - Manufacture of Transformer and repairing
3 Diamond cutting
4 Saw Mill - Wood Cutting
5 Dyeing works - Dyeing of textiles
6 Rice Mill
7 Bidi Making
8 Oil Mill
9 Engineering works - welding and lathe works
10 Printing Press
11 Pinal Industry - Manufacturing of iron windows
12 Ice factory
13 Everest Engineering works - Moulding work
14 Motor rewinding works
15 Dhanani Dal (Corriander split) Manufacturing
It was also observed such manufacturing units are not functioning in a separate complex but they are got established in the residential houses. All the above industries excluding Dyeing and Bidi making are run by electriCity.
It is seen from the above data that AIMAC, T.M.C. and Diamond Cutting industries are the developed ones to a certain extent since they engage more than 30 workers. Some industrial units like rice mill, oil mill, ice factory etc., are go in to production.
No. of units No. of workers
3 4
60
50
35
5 11
8 18
5
7
3 16
2 7
5 10
3 7
6
3 3
7
Eating Houses
In this town no good lodges or restaurants are found. Three restaurants serving the items of light refreshments are found which are located near the railway station and state Transport Bus Depot. Similarly two lodges without boarding facilities are also found in the interior of the town. The following statement gives the details of restaurants and lodges in the town and the average nU[l1ber of customers served by them everyday.

79
Statement IV.26
The details regarding lodges and restaurants in the towns
Type & Name Location Average Specialities Remarks customers of the esta-per day blishment
if any
2 3 4 5
1. Shivam Near ST 500 Tea, cold drinks, Mostly bus restaurant bus stand light refreshment passengers
take benefit
2. Satkar In Bajar near 400 Only tea and coffee Mostly railway restaurant railway station passengers take
benefit
3. Sahyog In Bajar near 400 Only tea and coffee -do· restaurant railway station
4. Sarasvati Interior in 20 Full meal including People fro surround-Lodge town bajar chapatis, rice, dal etc. ing villages and
outsiders
5. Sagar Lodge Interior in 35 Full meal, including -do· town bajar roti / chapatis,
curd, dal, etc.
Banking facility
Each of the following bank has one branch in the town. (i) Bank of Baroda, (ii) Dena Bank (iii) Vadnagar Nagrik sahakari Bank, (iv)
Mehsana District Central Co-operative Bank. Besides these banks the Savings bank of Post Office also provides the limited banking facilities to the town people. The details are shown in the following Statement.
Statement IV.27
Number of Depositors, Type of accounts and amounts deposited (in lakhs)
Type of Account No.of Amount deposited Depositor (in lakhs)
Fixed Deposit 10394 337.31
Saving Accounts 22910 169.22
Current Accounts 730 37.09
Others 81 4.69
34115 548.31

A total of 34115 persons were operating one or other type of Bank account includs in the town. This number of persons from the adjoining rural areas also. The amount deposited under different schemes was about 548 lakhs. Fixed Deposit with 337.31 lakhs, followed by saving accounts with 169.22 lakhs where in highest number of persons was also found to be recorded with 22910 persons. The amount of about 5 lakhs was deposited under others. It seems that the saving capacity of Vadnagar people is quite good.
The banks in Vadnagar also provide loans to the people for different purposes. The total loans of 292.23 lakhs was advanced in the year 1986-87.
Wholesale Food Grain Market
In the old town there is no demarkation between the residential and marketing area i.e., houses are being used for shops as well as residence. However at present for wholesale trade a separate market yard,
80
namely, "Agriculture Produce Market Committee Vadnagar Keralu' has' been constructed. There are approximately 52 ~rain and oil seeds whole sale shops who stock Bajari, Wheat, Rice, Mung, Gram, Raido, Isabgul, Groundnut, etc. Their main customers are retail shopkeepers who have the capacity to purchase and store at a time when the cost of the particular commodity is cheap and the prices are likely to increase in the subsequent months. There are about 300 persons who work in these shops. The market. had a business turn over of Rs. 317 lakhs. Patels, Banias and Modis Mainly are associated with such trade. No facility of warehouse or cold storage is found in the town. There are no commission agents involved between traders and producers. Direct purchase and sale transactions are found in the town. Therefore, the people who run such shops maintain very good relations with the cultivators of the surrounding villages. Important commodities sent from th~ town and brought to the town from outside during last year is given in the following statement.
Statement IV.2B
Transport of commodities by rail/other public transport during last One year
Five important Total tannage of Five important Total tannage imported/ commodities exported/ export/sent from commodities imported/ brought to town during sent from town the town during brought to town last one year
last one year during last one year
Name of Place of Public In Name of Places from Public In quintal commodity dispatch Transport quintal Commo- were brought Transport
dity to town
2 3 4 5 6 7 8
Raido Mahesana Truck 8,000 Wheat Visnagar Tractor, Truck 3,000 Ahmadabad Unjha Vadodara
Aranda Mahesana Truck 40,000 Rice Bavla Truck 3,000 (Caster Ahmadabad Khambhat Seeds) Vadodara
Unjha
Isabgul Sidhpur -do- 5,500 Mug Visnagar Carnal Cart, 500 Tractor. Truck
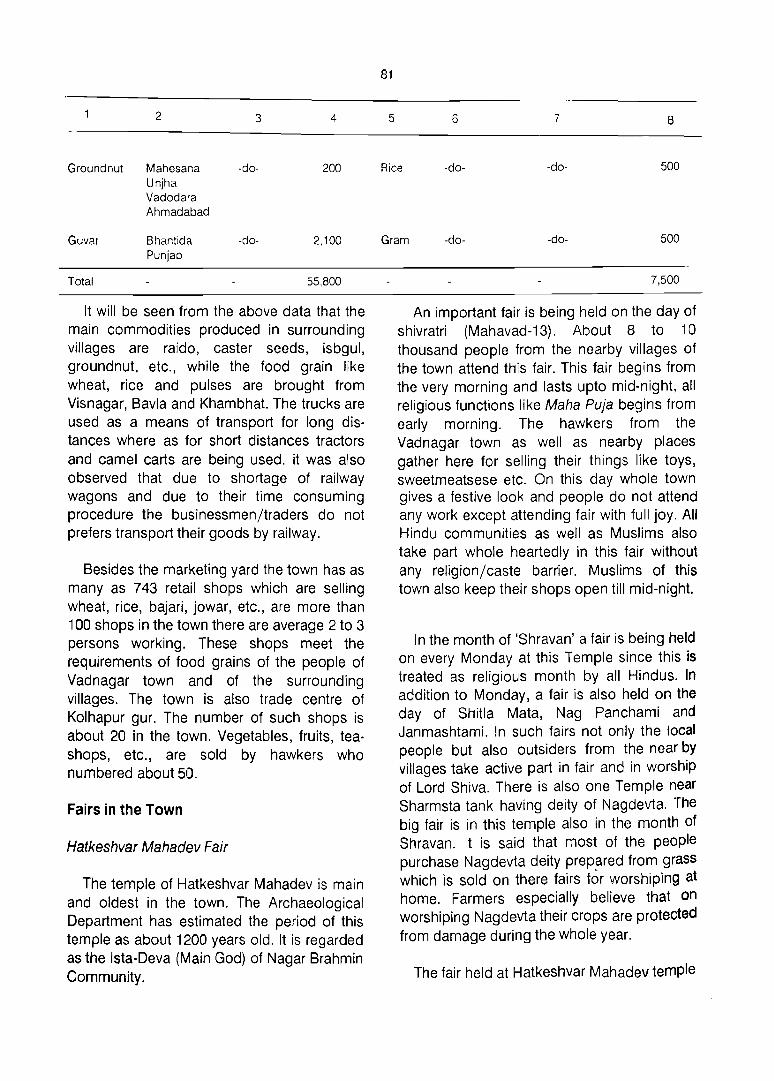
2
Groundnut Mahesana Unjha Vadodara Ahmadabad
Guvar Bhantida Punjab
Total
3 4
-do- 200
-do- 2,100
55,800
It will be seen from the above data that the main commodities produced in surrounding villages are raido, caster seeds, isbgul, groundnut, etc., while the food grain like wheat, rice and pulses are brought from Visnagar, Bavla and Khambhat. The trucks are used as a means of transport for long distances where as for short distances tractors and camel carts are being used. it was also observed that due to shortage of railway wagons and due to their time consuming procedure the businessmen/traders do not prefers transport their goods by railway.
Besides the marketing yard the town has as many as 743 retail shops which are selling wheat, rice, bajari, jowar, etc., are more than 100 shops in the town there are average 2 to 3 persons working. These shops meet the requirements of food grains of the people of Vadnagar town and of the surrounding villages. The town is also trade centre of Kolhapur gur. The number of such shops is about 20 in the town. Vegetables, fruits, teashops, etc., are sold by hawkers who numbered about 50.
Fairs in the Town
Hatkeshvar Mahadev Fair
The temple of Hatkeshvar Mahadev is main and oldest in the town. The Archaeological Department has estimated the period of this temple as about 1200 years old. It is regarded as the Ista-Deva (Main God) of Nagar Brahmin Community.
81
5 6 7 8
Rice -do- -do- 500
Gram -do- -do- 500
7,500
An important fair is being held on the day of shivratri (Mahavad-13). About 8 to 10 thousand people from the nearby villages of the town attend this fair. This fair begins from the very morning and lasts upto mid-night, all religious functions like Maha Puja begins from early morning. The hawkers from the Vadnagar town as well as nearby places gather here for selling their things like toys, sweetmeatsese etc. On this day whole town gives a festive look and people do not attend any work except attending fair with full joy. All Hindu communities as well as Muslims also take part whole heartedly in this fair without any religion/caste barrier. Muslims of this town also keep their shops open till mid-night.
In the month of 'Shravan' a fair is being held on every Monday at this Temple since this is treated as religious month by all Hindus. In addition to Monday, a fair is also held on the day of Shitla Mata, Nag Panchami and Janmashtami. !n such fairs not only the local people but also outsiders from the near by villages take active part in fair and in worship of Lord Shiva. There is also one Temple near Sharmsta tank having deity of Nagdevta. The big fair is in this temple also in the month of Shravan. It is said that most of the people purchase Nagdevta deity prepared from grass which is sold on there fairs for worshiping at home. Farmers especially believe that on worshiping Nagdevta their crops are protected from damage during the whole year.
The fair held at Hatkeshvar Mahadev temple
Qn the day of Janmashtmi is very important for the local as well as people of the nearby villages. They start coming early in the morning for attending this fair and worship the
82
Shiv god in this temple. The people of Nagar Community come to attend this fair even from far off places, since the Hatkeshvar Mahadev is the family deity of Nagar brahmins.

CHAPTERV
ETHNIC AND SELECTED SOCIODEMOGRAPHIC CHARACTERISTICS OF
THE POPULATION
Urbanisation leads to many sociological changes in human life. For example a planned and small family is seen more in urban areas than in the rural. The mortality rates are more controlled and comparatively less in urban places as compared to the rural areas. It is a matter of importance to study whether such conspicuous changes are visible in the composition of population of Vadnagar and whether such compositions pOint towards the progress of urbanisation in the town. The study will also provide the basis for viewing the heterogenity and density of population and the degree of interaction between the groups and individuals. Such analYSis would be revealing and would answer the peculiari· ties in the economic, technological and social system prevailing in the town. In order to make any such assessment, the study of physical structure of the population in the
context of its sociological aspects like ethniC composition, etc., appear quite necessary.
Nationality Except one person there is no other foreign
national in the town, he is a Pakistani who migrated to India after partition of the country in 1947. On further inquiry it was found that this person is a 44 year old Sindhi who first settled in Sidhpur town from where he migrated to Vadnagar. Later he got Indian national and is engaged in small business.
Population by Religion
Vadnagar mainly Hindu dominated and to certain extent Jain and Muslim religions are found. Christians are very few whereas Sikhs and Buddhists are not returned in the town. The population by reliQion is shown hfllnw·.
Statement V.1
Religion
Hindus
Muslims
Jains
Christians
Sikhs
Buddhists
Total
No.of House-holds
2
3925 (92.46)
283 (6.67)
36 (0.85)
1 (0.02)
4245 (100.00)
Distribution of Population by Religion -1981 Census
Population Percentage to total population
Persons Males Females Persons Males Females
3 4 5 6 7 8
20364 10187 10177 92.23 92.28 92.18
1534 751 783 6.95 6.80 7.09
174 97 77 0.79 0.88 0.70
7 4 3 0.03 0.04 0.03
22079 11039 11040 100.00 100.00 100.00

The above data indicates that Hindus constitute the bulk of the total population with 92.23 per cent followed by Muslims with 6.95 per cent. The share of Jains being even less than one per cent, whereas the proportion of Christian is rather negligible.
In all 37 different castes/communities including scheduled castes have been covered in the sample. Besides the seven different scheduled castes there are 30 other
84
communities namely Patels, Thakors, Brahmins, Vagharis, Raval, Ghanchi, suthars, Shavsar, Shoi, Darji, Kadia, Mali, Modh Vanias, Luhar, Ode, Prajapati, Rajput, Salat, Soni, Sindhi, Sathwara, etc. which were covered in the sample.
For 90nvenience the whole town was divided into five localities for the purpose of sample survey. The population of schedLiled castes so recorded is shown below:
Statement-V.2
The details of scheduled castes
Name of scheduled castes in Vadnagar covered in sample
1. Chamar
2. Garoda
3. Vankar
4. Bhangi
5. Bawa Dedh
6. Turi
7. Mochi
Total
No.of households
2
5
4
4
3
2
2
21
According to 1981 Census the percentage of scheduled castes population to total population of Vadnagar comes to about B.O percent.
Population
Person Male rl!Jmale
3 4 5
31 14 17
24 13 11
19 9 10
19 13 6
7 3 4
12 8 4
6 2 4
118 62 56
Other Communities
The other castes found in the town aJongwith their populations have been enumerated below.
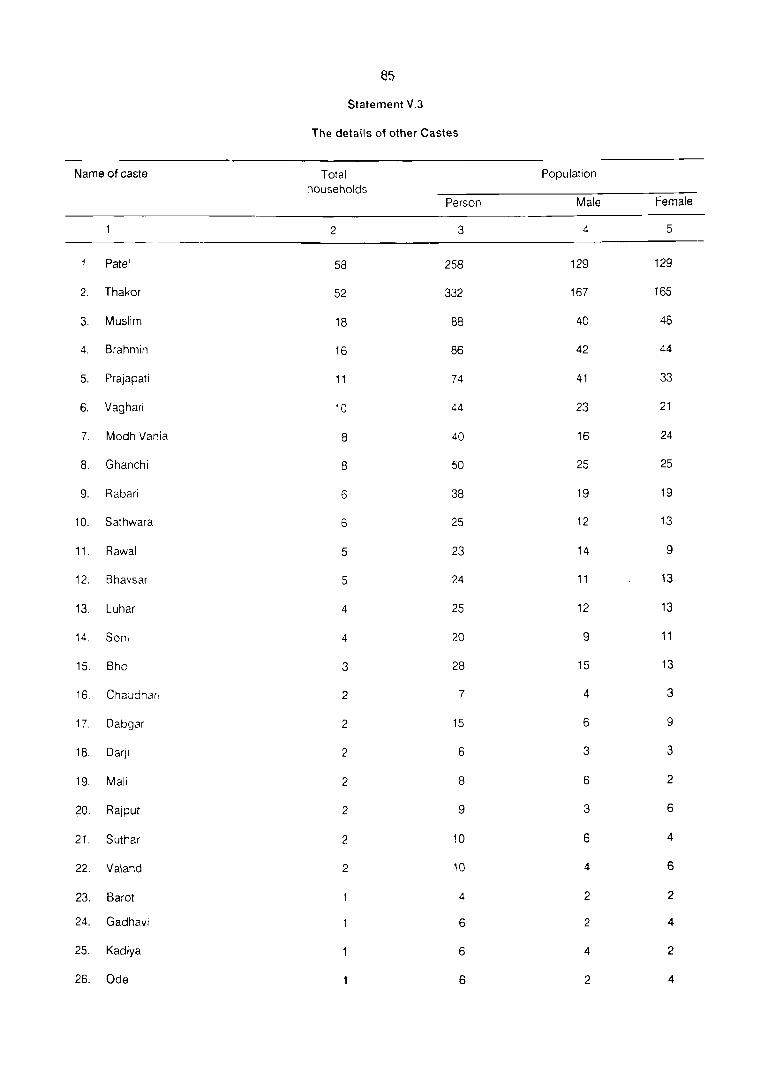
as,
Statement V.3
The details of other Castes
Name of caste Total Population households
Person Male Female
2 3 4 5
Patel 58 258 129 129
2. Thakor 52 332 167 165
3. Muslim 18 88 40 48
4. Brahmin 16 86 42 44
5. Prajapati 11 74 41 33
6. Vaghari 10 44 23 21
7. Modh Vania 8 40 16 24
8. Ghanchi 8 50 25 25
9. Rabari 6 38 19 19
10. Sathwara 6 25 12 13
11. Rawal 5 23 14 9
12. Bhavsar 5 24 11 13
13. Luhar 4 25 12 13
14. Sonl 4 ~O 9 11
15. Bhol 3 28 15 13
16. Chaudhan 2 7 4 3
17. Oabgar 2 15 6 9
18. Oarji 2 6 3 3
19. Mali 2 8 6 2
20. Rajput 2 9 3 6
21. Suthar 2 10 6 4
22. Valand 2 10 4 6
23. Baret 4 2 2
24. Gadhavi 6 2 4
25. Kadiya 6 4 2
26. Ode 6 2 4

2
27. Salat
28. Sindhi
29. Thakkar
30. Naik
Total 236
Most of the caste mImes are associated with the type of occupation these castes pursue. For example Dabgar is a community which is primarily engaged in manufacturing and repairing of the Drums and Drum like musical instruments. Darji are the tailors who cut and stich the cloths. Ghanchis are the persons who extract oii from the till seeds, whereas Luhars are engaged in iron work and Suthars in carpentary and other wood work. Malis are the gardeners by profession. Patels are the agriculturists and economically better class of the society. Whereas, Muslims are the lower middle class group in the town engaged in the miscellaneous works. The Thakors are also basically agriculturist and belong to poor class few of them are engaged as agricultural labourers.
86
3 4 5
7 3 4
4 2 2
1255 622 633
The above nomenclature also indicates towards the names of the profession attached with a particular caste or community.
Mother Tongue and subsidiary languages
Gujarati is the Mother tongue of majority of the people of the town. They communicate in this language. Females of the town more commonly speak and write only in this language. According to the survey data Hindi, Urdu, Marathi, Sanskrit and English enjoy the status of subsidiary languages. The figures given below indicate the classification of sample data by mother tongue.
Statement-V.4
Mother tongue, subsidiary languages of members as related to duration of stay in present residence
Mother DCJration Number speaking subsidiary languages with reference to duration of stay
tongue of stay in years Hindi English Guja- Arabi Sans- Marathi Urdu Sindhi Rajas-
rati krit thani
2 3 4 5 6 7 8 9 10 11
Gujarati 0-9 48 21 1 10 + 307 139 2 2 8 14
Hindi 0-9 3 7 10 +
Urdu 0-9 10 +
Total 356 163 8 3 2 8 14

It will be seen that the 355 persons whose mother tongue is Gujarati have also knowledge of Hindi as a subsidiary language, 48 of them are here since 9 years and as many as 307 are for more than 10 years in the town. In all 163 members got recorded English as their subsidiary language while 14 as Urdu and 8 Marathi their subsidiary language. Out of 163 members whose subsidiary language is English 139 are staying since more than 10 years in the town and whose subsidiary language is either Urdu or Marathi are also staying since more than 10
87
years.
Those whose mother tongue is Hindi 7 persons got recorded their subsidiary language Gujarati and 3 English. The members of Urdu mother tongue one each recorded Hindi and Gujarati as their subsidiary language. In sample population 356 members ~ot recorded Hindi, 163 English, 14 Urdu, 8 each Gujarati and Marathi as their subsidiary language and 3 recorded Arabian, 2 Sanskrit, 1 each Sind hi and Rajasthani as their subsidiary language.

88
Statement
Mother tongue and subsidiary
Mother Total Speakers of subsidiary language , tongue speakers
(Mother Hindi English Sanskrit Marathi tongue) No. Score No. Score No. Score No. Score
2 3 4 5 6 7 8 9 10
Gujarati* 1212 355 0.83 160 0.44 2 8 0.01
Hindi 17 3 0.64
Urdu 3.00
Total 1230 356 163 2 8

89
V.5
language in Vadnagar
Urdu Sindhi Rajasthani Gujaratt Arabian No. Score No. Score No. Score No. Score No. Score
11 12 13 14 15 16 17 18 19 20
14 0.02 3
7 0.94
3.00
14 8 3
* The total speakers excludes the persons aged 0-4 years.
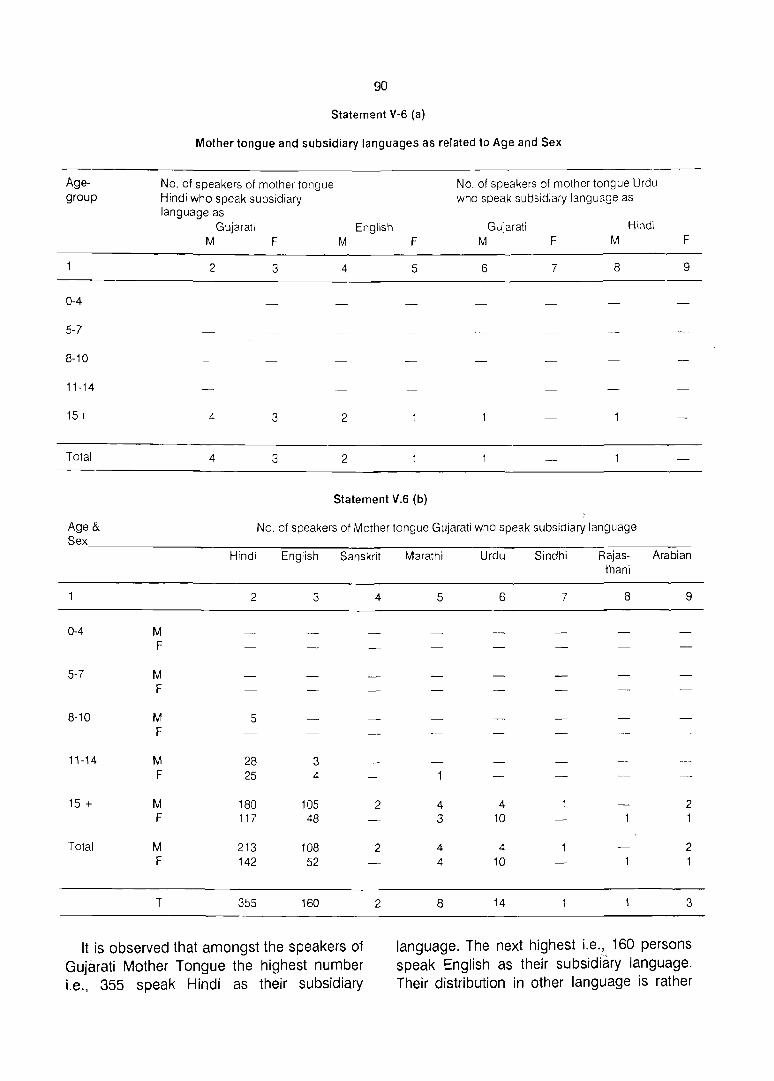
Agegroup
0-4
5-7
8-10
11-14
15+
Total
90
Statement V-6 (a)
Mother tongue and subsidiary languages as related to Age and Sex
No. of speakers of mother tongue Hindi who speak subsidiary language as
Gujarati English M F M F
2 3 4 5
4 3 2
4 3 2
Statement V.6 (b)
No. of speakers of mother tongue Urdu who speak subsidiary language as
Gujarati M
6
F
7
Hindi M
8
F
9
Age & No. of speakers of Mother tongue Gujarati who speak subsidiary language
Sex ________________ ~~~~~~--~--------------~------~------~---------Hindi English Sanskrit Marathi Urdu Sindhi Rajas- Arabian
2 3 4
0-4 M F
5-7 M F
8-10 M 5 F
11-14 M 28 3 F 25 4
15 + M 180 105 F 117 48
Total M 213 108 F 142 52
T 355 160
It is observed that amongst the speakers of Gujarati Mother Tongue the highest number i.e., 355 speak Hindi as their subsidiary
2
2
2
5
4 3
4 4
8
6
4 10
4 10
14
7
thani
8 9
2 1
2 1
3
language. The next highest Le., 160 persons speak English as their subsidiary language. Their distribution in other language is rather

small. Males' dominate amongst the speaker of Hindi and English as their subsidiary languages.
Institutional Population
4 households with 27 members were recorded as institutional population in Vadnagar town. Thus the selected town has recorded only 0.75 pers cent of total institutional population of the district as there are in all 138 households having 3092 such persons in the town.
Houseless Population
During 1981 Census there was no return of houseless population in the town.
91
Disabled Population
Apart from listing of Census houses some important data on the physically handicaped person was also recorded during the houselisting operations of 1980.
There were in all 36 disabled persons recorded in Vadnagar town of which 12 were totally blind, 16 totally crippled and 8 totally dumb persons. Thus Vadnagar town ranked 9th in recording disabled persons in the district. The lowest with 11 disabled persons was found in Kheralu town.
Population by Age and Sex
The details of the population covered in sample survey are given in the following statement.
Statement V.7
Distribution of Population by Age and Sex
Age Group
0-14
15-19
20-24
25-29
30-49
50-59
60 +
Total
Person
2
473
164
126
108
287
109
106
1373
Population
Male
3
255
72
62
51
150
48
46
684
It 'Nill be noticed that the age·group 0-14 has the largest bulk of population in the town being 34.45 per cent to the total population in the sample. The male population claims about 37.3 per cent of total male sample population
Percentage to total Population
Female Person Male Female
4 5 6 7
218 34.45 37.28 31.64
92 11.94 10.53 13.35
64 9.18 9.06 9.29
57 7.87 7.46 8.27
137 20.90 21.93 19.89
61 7.94 7.02 8.85
60 7.72 6.72 8.71
689 100.00 100.00 100.00
under this age-group and females acco~nt for 31.6 per cent of the total female population. In short the people in the dependent age-groups of 0-14 and 60 years and above are found to have 42.17 per cent of the persons whereas
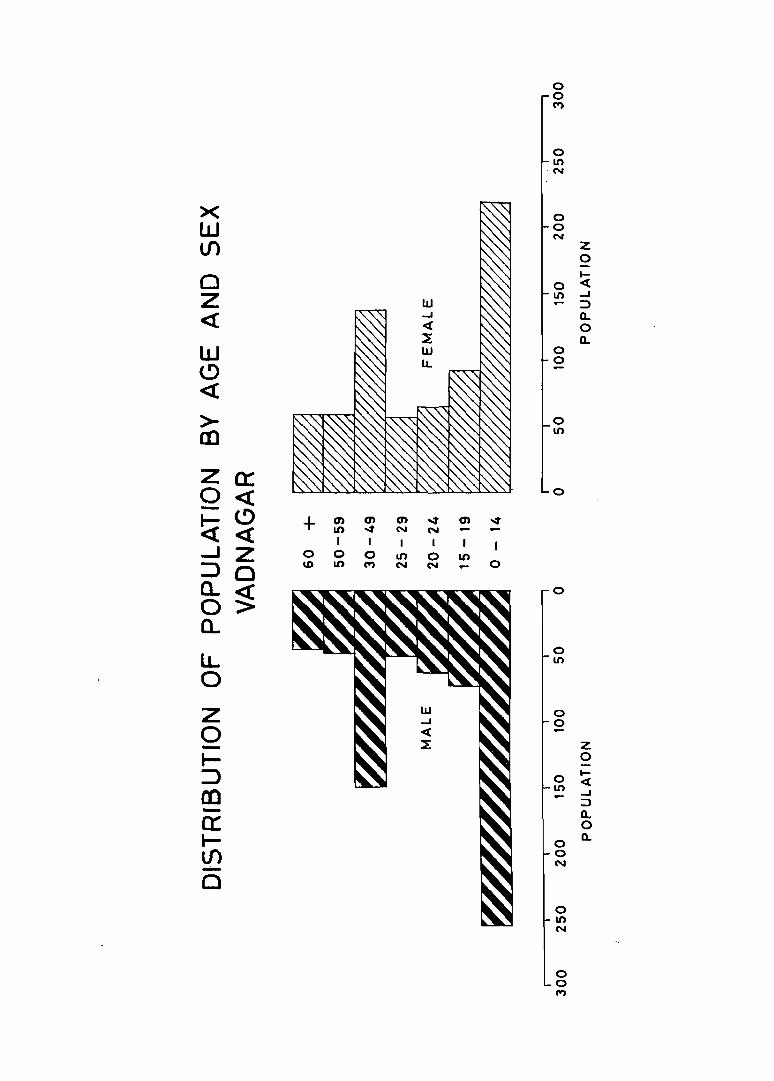
0 0 (")
0 In N
>< 0 W 0
N
If) Z 0
Cl I-
0 <t Z In ...J
:J
<{ Q.. 0 Q.
W 0
<!) 0
« > 0
m to
Z a: 0 « 0
~ (!) + en en en -4' en ~ « to -4 N N
I I I I ...J Z 0 0 0 I.{) 0 Ul
::> Cl U) LO ('P) N N 0
c... ~ 0
0 c... lJ...
0 In
0
Z 0
0 0
- z I- 0
::> 0 I-«
CO to ...J
::> - Q. a:: 0
I- 0 Q.
If) 0 - N
0 0 to N
0 0 (")

the working age-groups 15-24 and 25-59 years constitute 57.83% of the population. The respective percentages tor males and temales are 55.99% and 59.64%. The smaller percentages of 7.7, 6.7 and 8.7 of total persons, males and females respectively in the age-group 60 years and above indicates that the longevity of the people seems to be
93
not much or very small number of persons only survive for more than 60 years.
Age, Sex and Marital Status
During the sample survey the marital status ot 1373 persons of Vadnagar town was also recorded. The details are shown in the statement below.
Statement V.B
Distribution of population by Age, Sex and Marital Status
Never married Married Widowed Divorced Separated Total Age-Group
M F M F M
2 3 4 5 6
0-14 255 218
15-19 67 71 5 21
20-24 31 15 31 46
25-29 7 5 44 51
30-49 4 140 124 5
50-59 46 47 2
60 + 35 17 10
Total 365 310 301 306 17
From the above data it will be seen that not a single male or female marries before the age of 15 years. It may also be seen that 5 boys and 21 girls out of total 72 boys and 92 girls in the age-group 15-19 years were married. Their percentages being 6.9 and 22.3 of total males and females in this age-group.
The above data further reveals that out of total of 121 females in age-group 20-29 years as many as 97 or 80 per cent are married. This figure 10r males is 75 or 66.4 per cent out of total 113. In the next age-group of 30-49 years out of total 150 males as many as 140 are married and 124 out of 137 females are also married.
F M F M F M F
7 8 9 10 11 12 13
255 218
72 92
2 62 64
51 57
11 150 137
14 48 61
43 46 60
68 4 684 689
The longevity of females seems to be more as compared to the life span of males since number of widows (68) is higher in comparison to widowers (17). Very few cases of divorces are recorded in the sample population whereas a case of separation pertaining to a female is observed.
Age at Marriage
A significant factor for determining the various economic aspects. of society is to know the average age at marriage of males and females. It is generally observed that in the developed urban areas the males as well as females are comparatively better educated
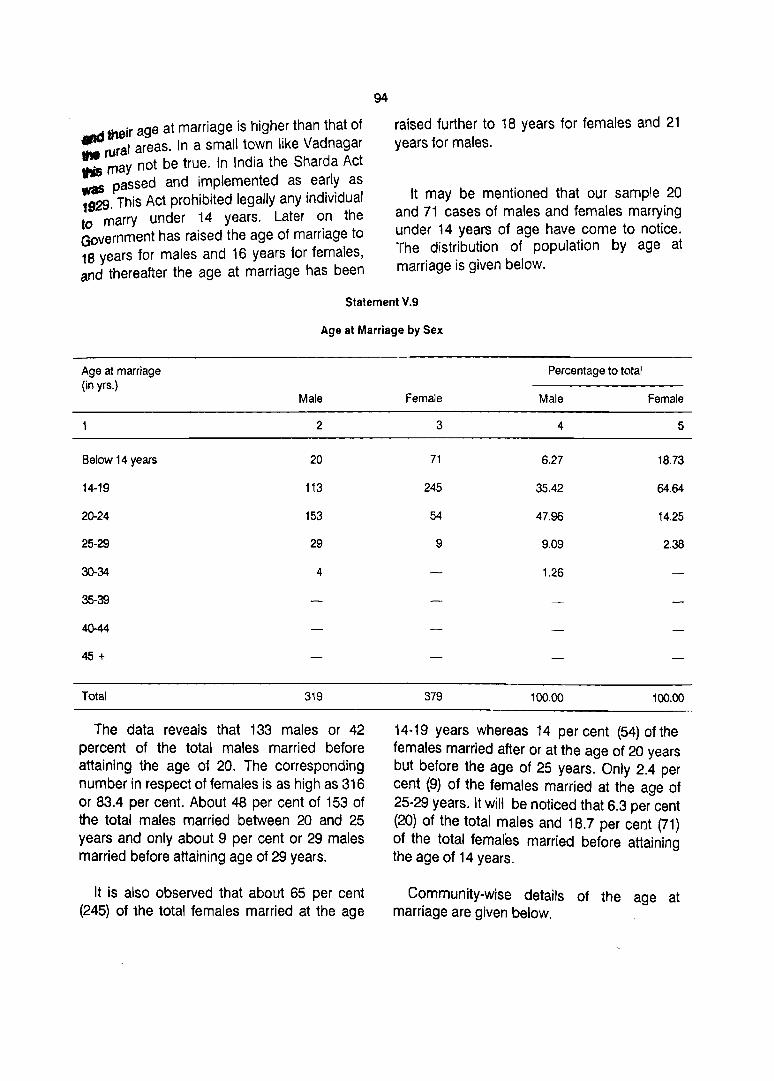
· their age at marriage is higher than that of tf'drural areas. In a small town like Vadnagar ~ may not be true. In India the Sharda Act : passed and implemented as. ea.rl¥ as 1929. This Act prohibited legally any Individual t marry under 14 years. Later on the ~vernment has raised the age of marriage to 18 years for males and 16 years for females, and thereafter the age at marriage has been
94
raised further to 18 years for females and 21 years for males.
It may be mentioned that our sample 20 and 71 cases of males and females marrying under 14 years of age have come to notice. The distribution of population by age at marriage is given below.
Statement V.9
Age at Marriage by Sex
Age at marriage (in yrs.)
Below 14 years
14-19
20-24
25-29
30-34
35-39
40-44
45 +
Total
Male
2
20
113
153
29
4
319
The data reveals that 133 males or 42 percent of the total males married before attaining the age 01 20. The corresponding number in respect of females is as high as 316 or 83.4 per cent. About 48 per cent of 153 of the total males married between 20 and 25 years and only about 9 per cent or 29 males married before attaining age of 29 years.
It is also observed that about 65 per cent (245) of the total females married at the age
Percentage to total
Female Male Female
3 4 5
71 6.27 18.73
245 35.42 64.64
54 47.96 14.25
9 9.09 2.38
1.26
379 100.00 100.00
14-19 years whereas 14 per cent (54) of the females married after or at the age of 20 years but before the age of 25 years. Only 2.4 per cent (9) of the females married at the age of 25-29 years. It will be noticed that 6.3 per cent (20) of the total males and 18.7 per cent (71) of the total females married before attaining the age of 14 years.
Community-wise details of the age at marriage are given below.
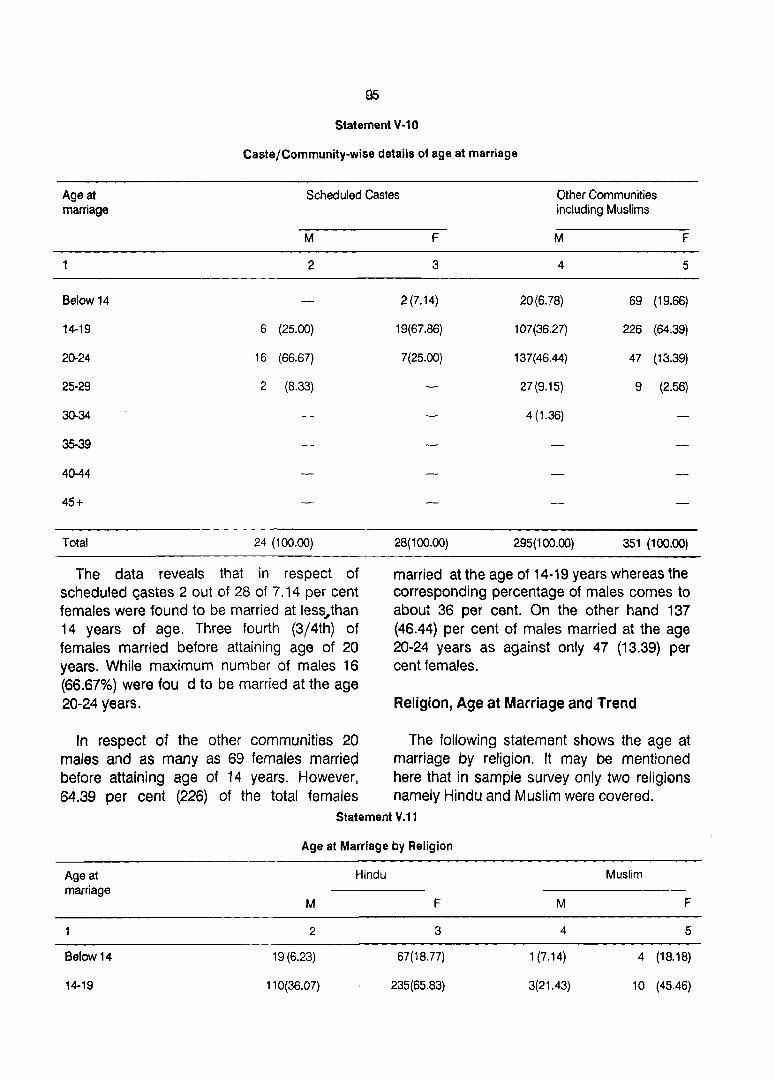
Statement V-10
Caste/Community-wise details of age at marriage
Age at marriage
Scheduled Castes Other Communities including Muslims
Below 14
14-19
20-24
25·29
30-34
35-39
40-44
45+
Total
M
2
6 (25.00)
16 (66.67)
2 (8.33)
24 (100.00)
The data reveals that in respect of scheduled qastes 2 out of 28 of 7.14 per cent females were found to be married at less,than 14 years of age. Three fourth (3/4th) of females married before attaining age of 20 years. While maximum number of males 16 (66.67%) were fou d to be married at the age 20-24 years.
In respect of the other communities 20 males and as many as 69 females married before attaining age of 14 years. However, 64.39 per cent (226) of the total females
F
3
2 (7.14)
19(67.86)
7(25.00)
28(100.00}
M
4
20(6.78)
107(36.27)
137(46.44)
27 (9.15)
4 (1.36)
295(100.00}
F
5
69 (19.66)
226 (64.39)
47 (13.39)
9 (2.56)
351 (100.00)
married at the age of 14-19 years whereas the corresponding percentage of males comes to about 36 per cent. On the other hand 137 (46.44) per cent of males married at the age 20-24 years as against only 47 (13.39) per cent females.
Religion, Age at Marriage and Trend
The following statement shows the age at marriage by religion. It may be mentioned here that in sample survey only two religi"ns namely Hindu and Muslim were covered.
Statement V.11
Age at marriage
Below 14
14-19
Age at Marriage by Religion
M
2
19 (6.23)
110(36.07)
Hindu
F
3
67(18.77)
235(65.83)
M
4.
1 (7.14)
3(21.43)
Muslim
F
5
4 (18.18)
10 (45.46)

20-24
25-29
30-34
35-39
40-44
45 +
Total
2
145(47.54)
27 (8.85)
4(1.31)
305(100.00)
The above data does not establish any definite trend between age at marriage and religion may be due to small sample size especially of Muslim population. It will be noticed that both Hindu and Muslim females at the age below 14 years were found to be married almost in equal proportion viz. a little more than 18 per cent of the total females married before reaching age of 14 years. Whereas the corresponding percentage in respect of males is 6 to 7 per cent.
Analysis further shows that in case of both Hindu and Muslim religions maximum males
96
3
46(12.88)
9 (2.52)
357(100.00)
4
8(57.14)
2(14.29)
14(100.00)
5
8 (36.36)
22 (100.00)
were found to be married at 20-24 years of age. The respective percentages were 47.54 per cent for Hindus and 57.14 per cent for Muslims, whereas the maximum number of females belonging to these religions were found to be married at age of 14·19 years. The percentages are 65.83 per cent for Hindus and 45.46 per cent for Muslims.
Education and Age at Marriage
The following statement gives the distribution of population by educational level and age at marriage.

STATEMENT V-12 Age at Marriage as related to Educational level

98
Statement
Age at Marriage as related
Educational Age at level
Below 14 14-19 20-24 M F M F M F
2 3 4 5 6 7
Illiterate 3 52 29 147 48 31
2 Literate
3 Primary Edu. Stand. 11 17 56 72 36 14 I to VII passed
4 Matriculation/Secondary 3 14 14 26 3 edu. VIII-X passed
5. Higher Secondary /Inter- 3 14 11 30 5 mediate Std. XI-XII passed
6. Technical Dip. or Carti. not equal to Degree
7 Graduate degree other 7 than technical degree
8 Post-graduate degree 4 other than technical degree
9 Engineering and Technology
Total 20 71 113 245 153 54

V.12
to educational level
marriage
M
8
7
11
5
3
2
29
25-29 F
9
4
5
9
99
30-34 35-39 M F M
10 11 12
3
4
40 + Total F M F M F
13 14 15 16 17
88 234
117 108
48 17
50 17
9 2
5
319 379

It will be see(l that about 19 per cent of the total females got married before 14 years and 64.6 per cent married between 14 to 19 years. This means that a little more than 83 per cent of the females married before reaching age of 20 years. Whereas such percentage in respect of males is only 41.71. The correlation between age at marriage and educational level further shows that the age at marriage increases with the increase in their education, which is evident from the fact that 22.2 per cent of the total illiterate females are married below 14 years of age. This percentage is reduced to 15.94 per cent in respect of females having primary education viz. the such percentage is nil in respect of females having education upto matriculation and secondary. It is also observed that 3.41 per cent of the illiterate males were married before the age of 14 years and 9.40 per cent of the males got married between 14-19 years.
100
The data further reveal that in respect of educational level illiterate, percentages of males and females married below the age of 20 years are 36.36% and 85.04 per cent respectively whereas in respect of educational standard 'Matriculation and Secondary' such percentages are reduced to 34 per cent and 70.6 per cent respectively. In the same category out of total 50 males as many as 30 males got married between 20-24 years which comes to 60 per cent of the total males. In short the above data indicates that the education has some impact on the age at marriage.
Average age at marriage
The details relating to average age at marriage as related to caste/other communities/religions and time of marriage etc. are shown in the following statement.
Statement V.13
The details relating to average age at marriage of Scheduled Castes and Other Communities
Scheduled Castesj Communities/ Religions
No. of ever married
Average age at married of ever married males who married
Average age at marriage of ever married females who married M
2
All Scheduled castes 24
All other communities 295
Hindus 305
Muslims 14
Total 319
F
3
28
351
357
22
379
Earlier than 30
years
4
19.40
17.19
17.31
17.25
17.30
The data indicates, that an average age at marriage far ever married males and females was faund ta be 17.30 years and 13.91 years respectively for those wha married earlier than
15-29 Within Earlier 15-29 Within years 15 years than 30 years 15 years
years
5 6 7 8 9
20.77 20.90 15.57 17.00 17.36
19.64 21.75 13.77 16.73 20.24
19.76 21.68 13.87 16.76 19.96
21.80 21.80 14.40 19.00 19.00
19.87 21.69 13.91 16.87 19.90
30 years. Whereas those married within the period of 15 years the average age at marriage far the ever married males was recorded 21.69 years. It was 19.90 years for ever married females.

101
The data further show that the average age at marriage recorded for scheduled castes for three different duration was higher in comparison to other communities residing in the town except the 'period of within 15 years' for males where it was slightly less. It is
surprising to note here that the average age at marriage recorded for Hindus was quite lower as compared to the Muslim population. In reason for such findings could be attributed to the small sample size.
Statement-V.14
The details regarding average age at marriage as related to educational level and time of marriage.
Educational level Number of ever married
M F Earlier
2
1. Illiterate 88
2. Literate (without Ed. level)
3. Primary education 117 from Std. I to VII passed
5. Matriculation/Secondary 48 education from Std. VIII to X passed
6. Higher Secondary/50 Intermediate/Pre-University Std. XI to XII passed
8. Technical diploma or certificate not equal to degree
9. Graduate degree other than technical degree
.10. Post-graduate degree other than technical degree
11. Engineering and Technology
Total
9
5
319
3
234
108
17
17
2
379
than 30 years
4
18.58
16.69
16.40
16.00
16.00
17.25
Average Age at Marriage and Educatioh The data do not show any correlation
between the average age at marriage and the
Average age at marriage of ever married males who married
15-19 years
5
20.00
19.75
18.87
19.32
24.00
22.25
17.00
19.73
With in 15
years
6
22.10
21.26
21.14
18.48
18.00
23.33
22.00
21.06
Average age at marriage of ever married females who married
Earlier than 30 years
7
14.11
14.85
14.33
15-19 years
8
16.63
3.00
17.61
16.71
17.33
18.00
16.89
With in 15 years
9
17.27
18.77
17.80
15.60
23.00
17.60
educational level of the residents of Vadnagar town. This is evident from the fact that the
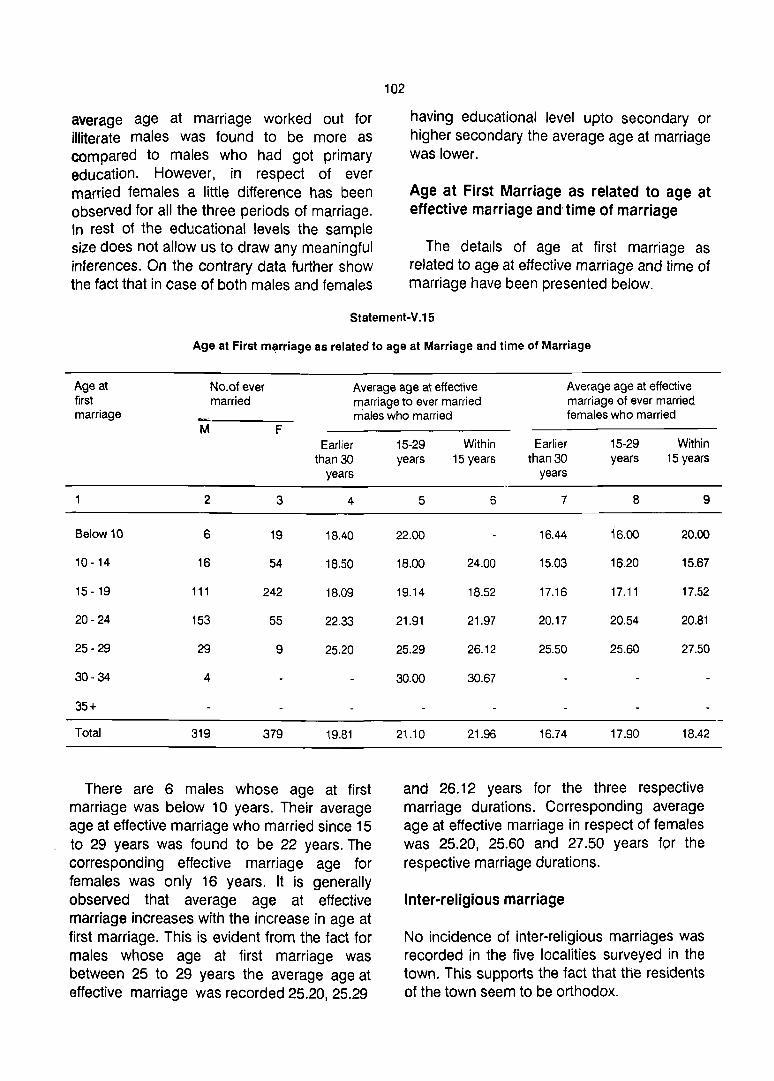
average age at marriage worked out for illiterate males was found to be more as compared to males who had got primary education. However, in respect of ever married females a little difference has been observed for all the three periods of marriage. In rest of the educational levels the sample size does not allow us to draw any meaningful inferences. On the contrary data further show the fact that in case of both males and females
102
having educational level upto secondary or higher secondary the average age at marriage was lower.
Age at First Marriage as related to age at effective marriage and time of marriage
The details of age at first marriage as related to age at effective marriage and time of marriage have been presented below.
Statement-V.15
Age at First m~rriage as related to age at Marriage and time of Marriage
Age at NO.ofever Average age at effective Average age at effective first married marriage to ever married marriage of ever married marriage males who married females who married
M F Earlier
than 30 years
2 3 4
Below 10 6 19 18.40
10 - 14 16 54 18.50
15 - 19 111 242 18.09
20 - 24 153 55 22.33
25 - 29 29 9 25.20
30- 34 4
35+
Total 319 379 19.81
There are 6 males whose age at first marriage was below 10 years. Their average age at effective marriage who married since 15 to 29 years was found to be 22 years. The corresponding effective marriage age for females was only 16 years. It is generally observed that average age at effective marriage increases with the increase in age at first marriage. This is evident from the fact for males whose age at first marriage was between 25 to 29 years the average age at effective marriage was recorded 25.20, 25.29
15-29 Within Earlier 15-29 Within years 15 years than 30 years 15 years
years
5 6 7 8 9
22.00 16.44 16.00 20.00
18.00 24.00 15.03 16.20 15.67
19.14 18.52 17.16 17.11 17.52
21.91 21.97 20.17 20.54 20.81
25.29 26.12 25.50 25.60 27.50
30.00 30.67
21.10 21.96 16.74 17.90 18.42
and 26.12 years for the three respective marriage durations. Corresponding average age at effective marriage in respect of females was 25.20, 25.60 and 27.50 years for the respective marriage durations.
Inter-religious marriage
No incidence of inter-religious marriages was recorded in the five localities surveyed in the town. This supports the fact that ttte residents of the town seem to be orthodox.
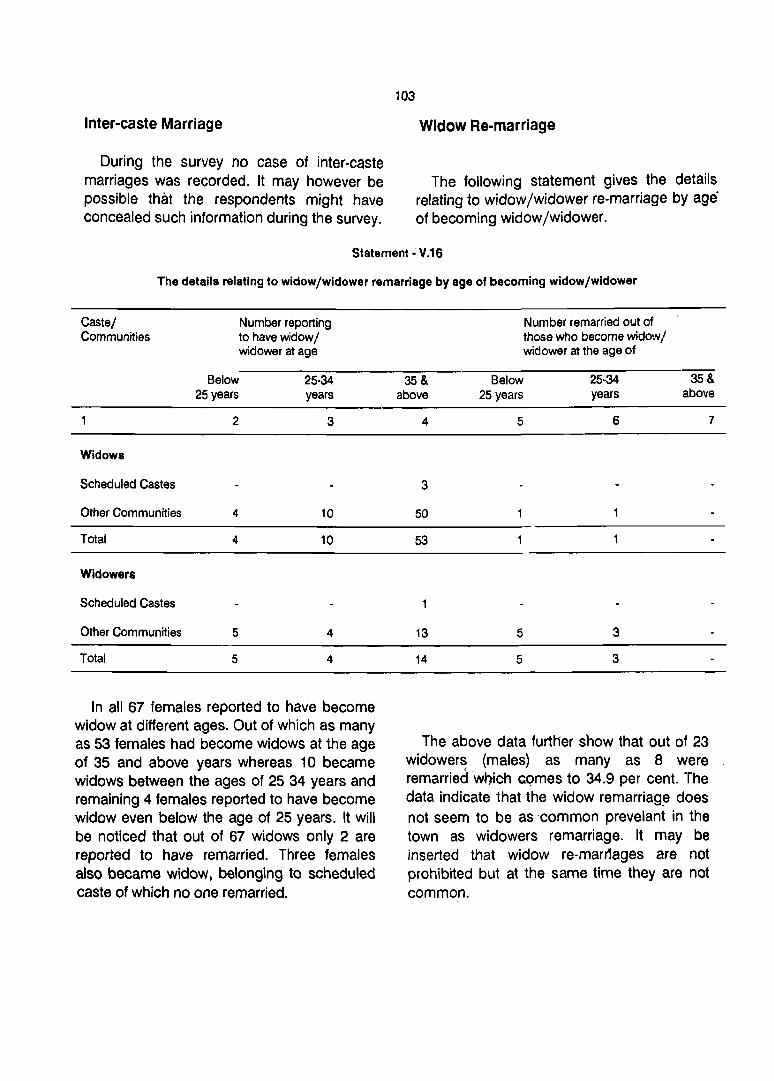
Inter-caste Marriage
During the survey no case of inter-caste marriages was recorded. It may however be possible that the respondents might have concealed such information during the survey.
103
Widow Re-marriage
The following statement gives the details relating to widow/widower re-marriage by age' of becoming widow/widower.
Statement ~ V.16
The details relating to widow/widower remarriage by age of becoming widow/widower
Castel Communities
Widows
Scheduled Castes
Other Communities
Total
Widowers
Scheduled Castes
Other Communities
Total
Number reporting to have widow / widower at age
Below 25 years
25-34 years
2 3
4 10
4 10
5 4
5 4
In all 67 females reported to have become widow at different ages. Out of which as many as 53 females had become widows at the age of 35 and above years whereas 10 became widows between the ages of 25 34 years and remaining 4 females reported to have become widow even below the age of 25 years. It will be noticed that out of 67 widows only 2 are reported to have remarried. Three females also became widow, belonging to scheduled caste of which no one remarried.
35& above
4
3
50
53
13
14
Number remarried out of those who become widow / widower at the age of
Below 25 years
25-34 years
5 6
5 3
5 3
35& above
7
The above data further show that out of 23 widower~ (males) as many as 8 were remarried wt)jch comes to 34.9 per cent. The data indicate that the widow remarriag~ does not seem to be as common prevelant in the town as widowers remarriage. It may be inserted that widow re-marr1ages are not prohibited but at the same time they are not common.

Caste/Tribe/ Community
104
Divorced/Separated - Remarriage
Statement V.17
The details regarding the Divorced/Separated and Remarriage
Number reporting to have Number remarried of those who become divorced/separated become divorced separated at the age at the age of
Below ~ 25-34 35+ Below 25-34 35+ 25 years years
l' 2 3
MALES
Scheduled Castes 2
Other Communities 2 4
Total 4
FEMALES
Scheduled Castes 2
Other Communities 3
Total 5
Out of divorced or separated males in the age group below 25 years all remarried whereas those who were separated or divorced (4) between 25 to 34 years half (2) of them remarried. Most of the divorced or separated males belonging to scheduled castes reported to have remarried.
Out of 6 females all except reported to have become divorced or separated at the age below 25 years out of these only 3 remarried. Thus j~ can be said that the married life of the town people is quite smooth and happy. Though Divorced/separation cases are not many, but remarriage is permitted.
, . Literacy
Li~era~y , is, treated, to be an important cqmppnent of the .Ro~ulation characteristics. After_ the fre.eddfti ~t tH~ countrY the, _r;latl8R~1 Government R~§ ffi~&e planned ~R8
years 25 years years years
4 5 6
2
2 2
4 2
2
3
systematic efforts to educate the people. 1 he five year plans made special allocations for spreading the literacy in the country. Though the growth of population of Vadnagar has not been of great significance the spreading of literacy in the town seems to be satisfactory. In 1951 the total literacy rate was recorded to be a little more than 34.00 per cent with 48 per cent and 21 per cent for males and females, respectively. In next two decades the total literacy rate increased to 41.00 per cent and 46.00 per cent respectively. During this period the female literacy rate also increased considerably. In the last Census (1981) the total literacy rate for the town was about 52.00 per cent while for males it was a little more than 62.00 per cent.
The growth of literacy in comparison to the rest of the urban units of the district further indicate,~ t,ha~ the cr~de Iiter~cy ral~ rec8~8$g during 1m~1 cgH§d~ IH ~~g~$Bt 8f lAs ssls8ls8
7

G~OWrH 01= LITERACY VADNAGAR 1951-1981
~ MALE ~ FEMALE
12
-_J
j!j§1 1~61 19t1 1!j81 YEAR

town is lowest (51.75%) among all towns at the district except Harij (45.72%). Thus the Vadnagar remains a little behind so far as general literacy in the urban units of the district is concerned.
It is also surprising that the general literacy rate was lower in Vadnagar town than all towns during all periods except Harij, Kheralu and Mansa in 1961. The selected town is also
106
lagging behind in literacy of males and females both as compared to other towns of the district. Thus, above data relating to the number of literates recorded at different Censuses broadly indicate that the general literacy does not seem to have come up to the desired level in Vadnagar as compared to the other urban units of the district. Therefore Vadnagar requires more efforts to be made in regard to educational field.
Statement-V.18
Growth of Literacy in Vadnagar since 1951
Year Total literates Percentage of literates
Persons Males Females Persons Males Females
2 3 4 5 6 7
1951 4932 3396 1536 33.97 48.05 20.61
1961 6634 4410 2224 41.10 54.82 27.48
1971 8953 5639 3314 46.32 57.84 34.60
1981 11387 6913 4474 51,57 62.62 : 40.53
Source: District Census Hand Book.
Age, Sex and Educational Level distribution of populatibn according to age, sex and educational level. The details are
The survey findings also show the given in the statement below.
Statement-V.19
The distribution of Population according to Age, Sex and Educational level
EducationallAvel ;~
Age and Sex ---_ ... ----.. _ .. ------_ .. -_ ..... ------... -----_ .............. --_ .. ---_ .. -_ ... ----------.-------5-14 15-24 25-34 35-49 50 + Total
---_ ...... _----_ .. _----_ ...... ------_ .. -----_ .. --------------_ .. ---------------_ ... ------M F M F M F M F M F M F
2 3 4 5 6 7 8 9 10 11 12 13
1. Illiterate 35 43 28 58 23 48 20 53 33 89 139 291
2. Literate (without edu- 2 3 cational level)
3. Primary education from 122 102 28 26 22 25 37 36 53 33 262 222 standard-I to VII passed
5. Matriculation/Secondary 18 12 53 44 20 6 21 7 2 - 114 69 -education from Standard VIII to X passed
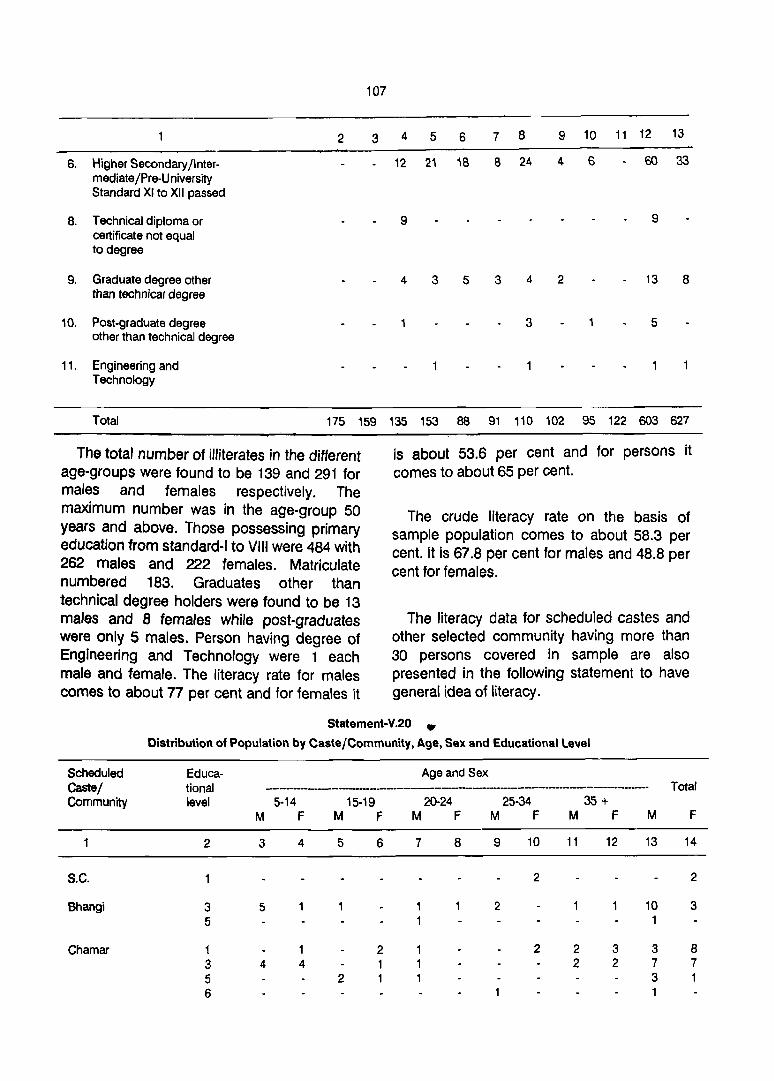
107
2 345 6 7 8 9 10 11 12 13
6. Higher Secondary/Inter- 12 21 18 8 24 4 6 60 33 mediate /Pre-U niversity Standard XI to XII passed
8. Technical diploma or 9 9 certificate not equal to degree
9. Graduate degree other 4 3 5 3 4 2 13 8 than technical degree
10. Post-graduate degree 3 1 5 other than technical degree
11. Engineering and Technology
Total 175 159 135 153 88 91 110 102 95 122 603 627
The total number of illiterates in the different age-groups were found to be 139 and 291 for males and females respectively. The maximum number was in the age-group 50 years and above. Those possessing primary education from standard-I to VIII were 484 with 262 males and 222 females. Matriculate numbered 183. Graduates other than technical degree holders were found to be 13 males and B females while post-graduates were only 5 males. Person having degree of Engineering and Technology were 1 each male and female. The literacy rate for males comes to about 77 per cent and for females it
is about 53.6 per cent and for persons it comes to about 65 per cent.
The crude literacy rate on the basis of sample population comes to about 58.3 per cent. It is 67.8 per cent for males and 48.8 per cent for females.
The literacy data for scheduled castes and other selected community having more than 30 persons covered in sample are also presented in the following statement to have general idea of literacy.
Statement-V.20 _
Distribution of Population by Caste/Community, Age, Sex and Educational Level
Scheduled Educa- Age and Sex Caste/ tional -------_ ...... _---------------_ .. -----------_ .. --..... _---_ .. _--... -----... _--- Total Community level 5-14 15-19 20-24 25-34 35+
M F M F M F M F M F M F
2 3 4 5 6 7 8 9 10 11 12 13 14
S.C. 2 2
Bhangi 3 5 1 2 10 3 5 1
Chamar 1 1 2 2 2 3 3 8 3 4 4 1 2 2 7 7 5 2 1 3 1
6 1

108
2 3 4 5 6 7 8 9 10 11 12 13 14
Bawa-Dedh 1 2 2
3 1
6 2 2
Garoda 1 1 1 3 1 4
3 4 3 1 1 2 6 5
5 2 1 4
Machi 3 1
5 1
6 2
Turi 1 2 2 2 3
3 2 , 5 1
Vankar 1 2 3
3 2 2 1 3 3
5 2 2 3 s 1 2 1
8 9
Brahmin 1 2 2 1 4
3 11 7 1 2 7 10 18 20
5 3 2 2 5 1 2 1 ~ 7 10
6 2 1 2 2 1 7 3
9 1 2 3 2 1 5 4
10 1 1
Ghanchi 1 3 3
3 8 4 3 .6 11 10
5 3 6 4 7
6 2 2 5 8 3
8 1
ModhVania 1 2 2
3 5 6 2- 2 7 9
5 3 2 1 2 5
6 2 2 2 5 8 1
10 2 11 1
Patel 1 3 3 3 2 2.4 5 30 3 26 27 1 3 12 22 20 52 59 5 7 4 13 11 3 3 8 .4 10 3 41 25 6 3 1 4 4 8 13 7 8 3 3 9 1 3
Prajapati 1 2 3 3 6 9 9 16 2 1 1 3- 6 1 2 1 2 ,4 2 3 15 8 5 3 2 1 2 8 6 1 2 1 4

109
2 3 4 5 6 7 8 9 10 11 12 13 14
Rabari 1 1 2 3 3 1 7 6 13
3 3 2 3 6 3 5 1 1 1 1
6 9
Thakor 1 15 25 5 22 15 21 15 17 27 47 77 132
2 1 1 3 25 10 9 3 5 13 55 12
5 1 2 2 3 3 11 6 1 2 1 4
Muslim 1 3 1 1 2 3 3 11 7 17
3 3 8 2 5 2 4 4 4 2 15 19
5 3 3 1 1 3 1 8 5
6 1
9 1
10
Other Communities 1 11 9 2 4 5 11 9 27 28 52
2 1 1 3 19 25 2 1 3 7 3 8 27 20 54 61
5 3 2 5 6 6 1 4 3 2 21 11
6 2 5 1 2 5 3 6 14 11
8 1 2 3 9 2 2 3 2
10 1
All Scheduled 1 2 2 1 8 5 10 6 22
Castes (a\\ SCs) 3 16 12 2 2 3 6 7 29 21 5 6 4 3 2 11 5
6 2 2 3 6 3
8 1
9 2
The serial number in col. 2 corre.spond with the serial numbers of educational standards given 'in statement V-19.
Education and Caste distribution of students according to age, sex The statement given below gives the and religion.
Statement-V.21
Distribution of students by age-sex and religion
Religion Age Total Number Number not studying studying
--------------------------------------------------------------------------------- .. _--------------------------------------------- .. _----_ M F M F M F
2 3 4 5 6 7 8
Hindu 5-9 69 63 53 46 16 17 10-14 99 84 90 57 9 27 15-19 66 84 40 42 26 42 20-24 59 57 12 4 47 53 25+ 277 297 1 2 276 295
Total 570 585 196 151 374 434 (34.39) (25.81) (65.61) (74.19)

110
2 3 4
Muslim 5-9 5 4 10-14 1 5 15-19 6 8 20-24 3 7
25+ 18 18
Total 33 42
Grand Total 603 627
The town has predominant Hindu population which comes to more than 90 per cent of the total population. In the sample survey Hindu and Muslim religions have been covered. The town has 51.59 per cent literacy rate as per 1981 Census, whereas proportion of literates as per the survey was 58.4 percent.
It will be seen that out of total 603 males, 205 (34.00%) are studying. The Corresponding number in respect of females is 160 (25.52%).
This means that 66 per cent males and a little more than 74 per cent females are not studying. The above data further indicate that only 34.39 per cent of males and 25.81 per cent of females belonging to Hindu religion are studying. The figures in respect of Muslim religion are still less which are 27.27% males and 21.43% for females.
The analysis of above data further disclose that the position in the different age-groups of 5-9 and 10-14 contribute fairly satisfactory for those studying in educational institutions. The proportion in respect of males in age-group 5-14 was as high as 85.12 per cent which has reduced to 60.61 per cent in the higher agegroup of 15-19 years. The proportion further dropped down to only 20.33 per cent in agegroup 20-24. The proportion of females
5 6 7 8
5 3 1 5 3 1 3 7
3 7 18 18
9 9 24 33 (27.27) (21.43) (72.73) (78.57)
205 160 398 467 (34.0u) (25.52) (66.00) (74.48)
attending educational institutions in age-group 5-14 was 70.7 per cent which reduced to 50 per cent in next higher age-group of 15-19 years.
The corresponding figures in the age-group 20-24 has decreased to only 7.02 per cent. The different percentages of different agegroups pOint to the fact that majority of youngsters left their study after age of 19 years. As the sample is quite small so the inferences for Muslims can not be drawn. The data show that not a single male or female under age-group 20-24 attends any educational institution, whereas in case of Hindus the corresponding number was 7.02 percent.
Scheduled Caste Children in Educational Institutions
The scheduled castes constitute the economically weaker section of the society. Since the attainment of independence the Government has always planned for the promotion of education amongst the persons who constitute the weaker section of the SOCiety.
The following statement provides the distribution of students by caste/tribe/ community and age and sex.
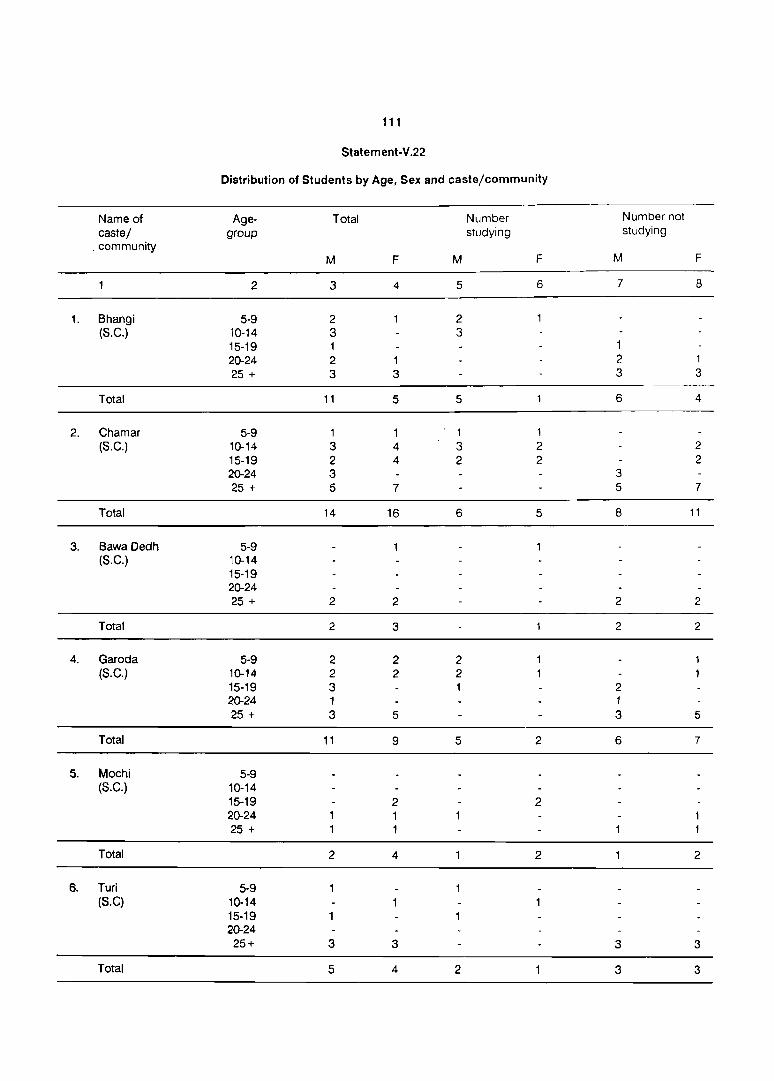
111
Statement-V.22
Distribution of Students by Age, Sex and caste/community
Name of Age- Total Number Number not
castel group studying studying _ community
M F M F M F
2 3 4 5 6 7 B
1. Bhangi 5-9 2 2 (S.C.) 10-14 3 3
15-19 1 1 20-24 2 1 2 1 25 + 3 3 3 3
Total 11 5 5 6 4
2. Chamar 5-9 1 1 1 (S.C.) 10-14 3 4 3 2 2
15-19 2 4 2 2 2 20-24 3 3 25 + 5 7 5 7
Total 14 16 6 5 8 11
3. Bawa Dedh 5-9 (S.C.) 10-14
15-19 20-24 25 + 2 2 2 2
Total 2 3 2 2
4. Garoda 5-9 2 2 2 (S.C.) 10-14 2 2 2
15-19 3 1 2 20-24 1 1 25 + 3 5 3 5
Total 11 9 5 2 6 7
5. Mochi 5-9 (S.C.) 10-14
15-19 2 2 20-24 1 25 + 1
Total 2 4 2 2
6. Turi 5-9 (S.C) 10-14
15-19 20-24 25+ 3 3 3 3
Total 5 4 2 3 3
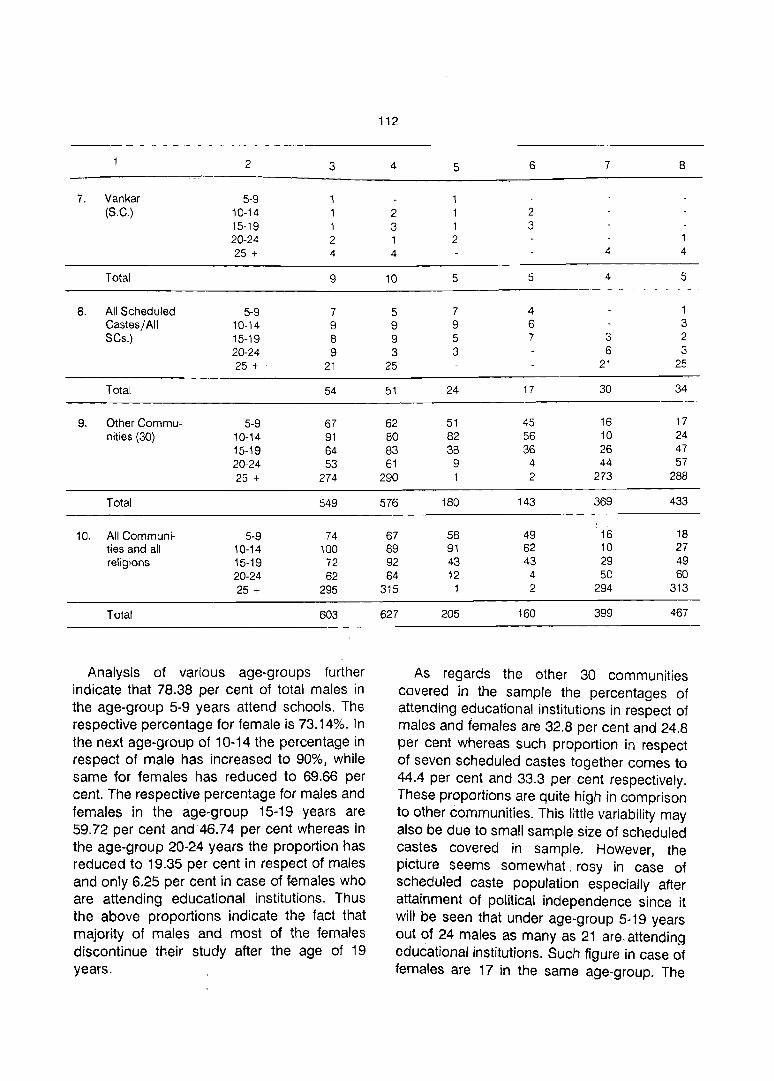
2 3
7. Vankar 5-9 1 (S.C.) 10-14 1
15-19 1 20-24 2 25 + 4
Total 9
8. All Scheduled 5-9 7 Castes/All 10-14 9 SCs.) 15-19 8
20-24 9 25 + ' 21
Total 54
9. Other Commu- 5-9 67 nities (30) 10-14 91
15-19 64 20-24 53 25 + 274
Total 549
10. All Communi- 5-9 74 ties and all 10-14 100 religions 15-19 72
20-24 62 25 + 295
Total 603
Analysis of various age-groups further indicate that 78.38 per cent of total males in the age-group 5-9 years attend schools. The respective percentage for female is 73.14%. In the next age-group of 10-14 the percentage in respect of male has increased to 90%, while same for females has reduced to 69.66 per cent. The respective percentage for males and females in the age-group 15-19 years are 59.72 per cent and' 46.74 per cent whereas in the age-group 20-24 years the proportion has reduced to 19.35 per cent in respect of males and only 6.25 per cent in case of females who are attending educational institutions. Thus the above proportions indicate the fact that majority of males and most of the females discontinue their study after the age of 19 years.
112
4 5 6 7 8
2 2 3 1 3 .
1 2 4 4 4
10 5 5 4 5
5 7 4 1
9 9 6 3
9 5 7 3 2
3 3 6 3
25 21 25
51 24 17 30 34
62 51 45 16 17
80 82 56 10 24
83 38 36 26 47 61 9 4 44 57
290 2 273 288
576 180 143 369 433
67 58 49 16 18 89 91 62 10 27 92 43 43 29 49 64 12 4 5C 60
315 2 294 313
627 205 160 399 467
As regards the other 30 communities covered in the sample the percentages of attending educational institutions in respect of males and females are 32.8 per cent and 24.8 per cent whereas such proportion in respect of seven scheduled castes together comes to 44.4 per cent and 33.3 per cent respectively. These proportions are quite high in comprison to other communities. This little variability may also be due to small sample size of scheduled castes covered in sample. However, the picture seems somewhat. rosy in case of scheduled caste population especially after attainment of political independence since it will be seen that under age-group 5-19 years out of 24 males as many as 21 are.attending educational institutions. Such figure in case of females are 17 in the same age-group. The

proportion in respect of irldividual schedulea caste in tile ..10c-pr C'LJ~1 5-10 YC3rs is also quite encouraging It is ,1Is(1 l"1bscrvcd ttlat like other communities the proportron of attending school/educational institution after tile age of 19 years is has a steep fall in respect of individual scheduled caste.
Statement-V.23
The Statement giving the code of different Educational level
level of education
Illiterate
literate without educational level
Primary (education from Std. I to VII Passed)
Matriculation ISecondary I Intermediate/Pre-University (from VIII to XII passed)
No of points allotted to each individual with reference to educational level
2
o
2
3
113
Technical Diploma not equal to degree
Post-graduation/graduate degree other than technical degree or
Technical degree or diploma equal to degree or post-graduate degree
and Engineering and Technology
2
4
5
6
In order to obtain the average per head score the total score of all individuals, male and female h~s been divided by the total number of individuals.
(i) Educational Score
The statement given below shows localitywise distribution of population by average educational score per head.
Statement-V.24
The statement showing distributioll of population by the average per head educational score by Locality.
locality
Locality-' Sembharwada
locality-II Amarthol Darwaja inside area
Locality-III Ghaskol Darwaja area
Locality-IV Amtol Darwaja area
locality-V Amarthol Darwaja bahar area
Total
•
Population ---------------------.. _--------------------... ----.. ----
P M F
2 3 4
345 162 183
212 106 106
223 107 116
257 132 125
193 96 97
1230 603 627
Score Education ---------------------... _-------------------------... --
P M F
5 6 7
1.77, 2.06 1.51
1.23 1.61 0.84
1.36 1.60 1.13
1.57 2.00 1.12
2.08 2.47 1.69
1.61 1.95 1.27
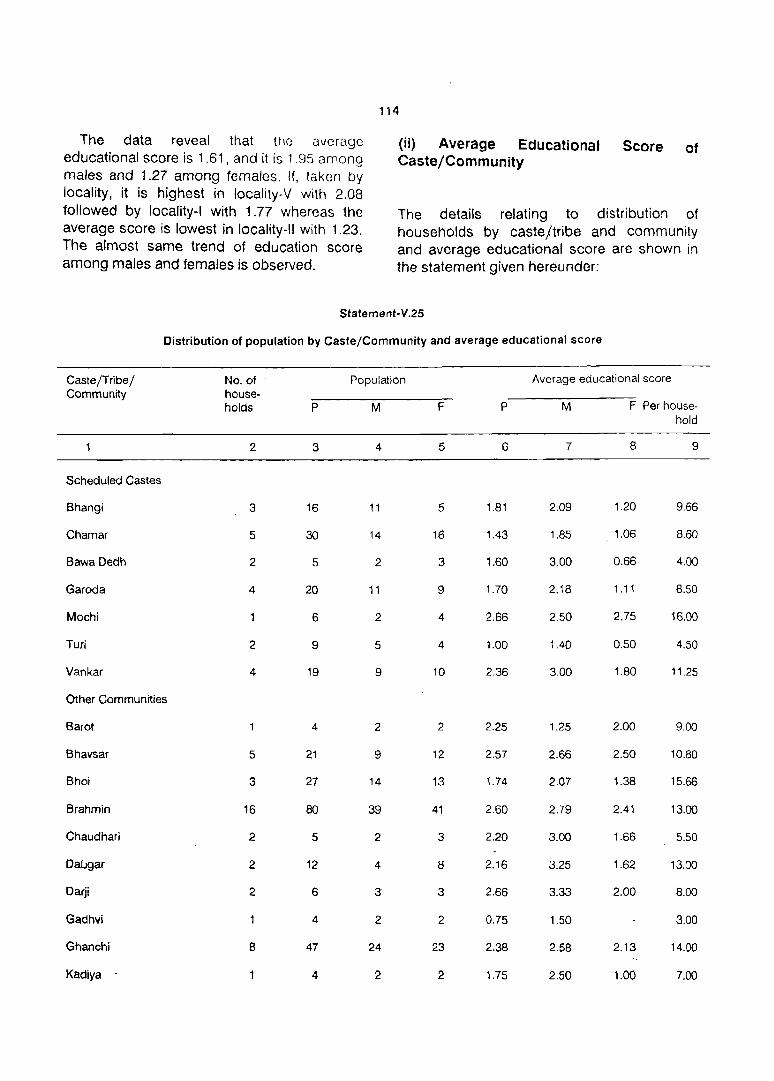
The data reveal that the average educational score is 1.61, and it is 1.95 among males and 1.27 among females. If, taken by locality, it is highest in locality-V with 2.08 followed by locality-I with 1.77 whereas the average score is lowest in locality-II with 1.23. The almost same trend of education score among males and females is observed.
114
(ii) Average Educational Score of Caste/Community
The details relating to distribution of households by caste/tribe and community and average educational score are shown in the statement given hereunder:
Statement-V.25
Distribution of population by Caste/Community and average educational score
Caste/Tribe/ Community
Scheduled Castes
Bhangi
Chamar
Sawa Dedh
Garoda
Mochi
Turi
Vankar
Other Communities
Barat
Bhavsar
Bhoi
Brahmin
Chaudhari
DaGgar
Darji
Gadhvi
Ghanchi
Kadiya
No. of households
2
3
5
2
4
2
4
5
3
16
2
2
2
8
Population
p M
3 4
16 11
30 14
5 2
20 11
6 2
9 5
19 9
4 2
21 9
27 14
80 39
5 2
12 4
6 3
4 2
47 24
4 2
F p
5 6
5 1.81
16 1.43
3 1.60
9 1.70
4 2.66
4 1.00
10 2.36
2 2.25
12 2.57
13 1.74
41 2.60
3 2.20
8 2.16
3 2.66
2 0.75
23 2.38
2 1.75
Average educational score
M F Per house-
7
2.09
1.85
3.00
2.18
2.50
1.40
3.00
1.25
2.66
2.07
2.79
3.00
3.25
3.33
1.50
2.58
2.50
8
1.20
; 1.06
0.66
1.11
2.75
0.50
1.80
2.00
2.50
1.38
2.41
1.66
1.62
2.00
2.13
1.00
hold
9
9.66
8.60
4.00
8.50
16.00
4.50
11.25
9.00
10.80
15.66
13.00
5.50
13.00
8.00
3.00
14.00
7.00

115
2 3 4 5 6 7 8 9
Luhar 4 23 11 12 1.00 1.00 1.00 5.75
Mali 2 8 6 2 2.37 2.50 2.00 9.50
ModhVania 8 37 15 22 2.70 3.06 2.45 12.50
Muslim 18 75 33 42 1.66 2.03 1.38 7.35
Naik (Tar9ala) 10 4 6 3.00 3.25 2.83 15.00
Ode 4 3 1.50 2.00 1.33 6.00
Patel 58 238 117 121 2.14 2.51 1.78 8.79
Prajapati 11 62 36 26 1.40 1.86 0.76 7.70
Rabari 6 32 14 18 1.00 1.28 1.00 5.33
Rajput 2 6 2 4 1.50 2.50 1.00 4.50
Raval 5 20 11 9 1.10 1.63 0.44 4.40
Salat 2.00 2.00 2.00
Sathwara 6 25 12 13 1.84 2.25 1.46 7.66
Sindhi 7 3 4 2.00 2.00 2.00 14.00
Soni 4 20 9 11 2.30 2.33 2.27 11.50
Suthar 2 10 6 4 2.40 2.66 2.00 12.00
Thakkar
Thakor 52 292 147 145 0.61 1.04 0.17 3.46
Yaghari 10 36 18 18 0.30 0.50 0.11 1.10
Valand 2 8 3 5 2.37 2.33 2.40 9.50
Grand Total 257 1230 603 627 1.61 1.95 1.27 7.71
, '

116
Statement-V.26
Distribution of households by type of households and average educational Score
Type of households
No. of households
Population Average educational score
1. Nuclear
2. Supplemented Nuclear
2
22
13
p M
3 4
22 6
26 13
3. Sub-nuclear 94 445 236
4. Single person (self)
5. Supplemented sub-nuclear
6. Collateral joint
7. Supplemented Collateral joint
8. Lineal jOint
9. Supplemented Lineal joint
10. Lineal collateral joint
11. Supplemented lineal collateral joint
12. Others
9
33
22
9
51
4
34 10
178 76
105 55
34 14
361 181
25 12
Total 257 1230 603
It will be seen that among seven scheduled castes the average educational score is highest for Mochi with 2.66 which is closely followed by Vankar with 2.36 whereas it is lowest for Turi with 1.00. Among males the average educational score is highest with 3.00 for Bawa Dedh and Vankar castes. So far as feffi!l.e§ are corieerHS8 It is hl~Hest wilh 1 :s~ tar \tsA~sF ~Aa ISwe§t witA §:§§ fSF rUFi: rAe
F Per head _________ Per house-
P M F hold
5 6 7 8 9
16 0.77 1.16 0.62 0.77
13 1.50 2.00 1.00 3.00
209 1.96 2.17 1.73 9.31
24 2.00 2.50 1.79 7.55
102 1.66 2.06 1.36 8.00
50 1.61 2.18 1.00 7.72
20 1.58 2.00 1.30 6.00
180 1.26 1.65 0.87 8.98
13 0.16 0.33 1.00
627 1.61 1.95 1.27 7.71
average educational score per household was found to be recorded highest with 16.00 for Mochi followed by Vankar with 11.25. For the remaining scheduled castes it is below 10.
Among other than scheduled caste communities it will be observed that the ~verage edueati9A~1 §E8f@ Is Hig~Eist with 3.80 IA Fe§~@et sf N~I~: WA@r@a§ fef tA@ f@§t sf tR@

communities it is below 3, the highest being 2.70 for Modh Vania very closely followed by Darj; with 2.66 and Brahmin with 2.60. The identical trend is also observed in respect of males and females.
So far as the average educational score per household is concerned it will be seen that the Bhoi community has recorded the highest score with 15.66 very closely followed by Nalk with 15.00. It is seen that the average educational score is fou:1d to be above lOin respect of Bhavsar (10.80), Brahmin (13.00), Oabgar (13.00), Ghanchi (14.00), Modh Vania (12.50), Sindhi(14.00), Soni (11.50), and Suthar (12.00). The general average educational score per household is found to be recorded 7.71.
117
As regards the distribution of households by type and educational score in Vadnagar the single persons (seln family have highest score with 2.00 very closely followed by sub-nuclear families with 1.96 and supplemented subnuclear families with 1.66. The lowest educational score with only 0.16 was found in supplemented lineal jOint families. The nuclear . households have recorded the educational score as low as 0.77.
As regards the average educational score per household it will be seen that the subnuclear families have highest score with 9.31 closely followed by lineal joint with 8.98 and supplemented sub-nuclear with 8.96. The lowest score with 0.77 is found in nuclear families followed by supplemented lineal joint with 1.00.
Non-enrolment in school
The details regarding the default in enrolling children in school by scheduled castes and other communities.
The details regarding default in enrolling children in school by scheduled castes and 8lRs~ B8,tl1mciHIH~s of head of household are ~1~sA IA '~SSsA81*:f
Out of total 257 households surveyed in the sample 98 households had no child of school going age (5-14 years). Whereas rest of the 159 households were having school going age children of which 52 had only male children and 39 have only female children. While 68 households had both male and female children of school going age. It has been also found that 7 were such households amongst the scheduled castes who had no child of school going age.
It is further observed that out of 52 households having only male children 4 failed to send all children to school and 2 households failed to send some of the children. Whereas out of 39 households having only female children of school going age 8 failed to send all children to school. It is also noticed that out of 68 households having both male and female school going age children only 4 households failed to send both to the school and 2 households seen to have failed to send male children only to school while 6 households also failed to send only female children to school. It is further observed . from the above data that 4 households failed to send some male and female children to school. However, overall picture seems to be quite rosy since very few households have failed to send their male and female children to school. The trend observed in case of total number of househOlds is also more or less same in respect of other communities covered in the sample. In short the position regarding enrollment of school going age children belonging to different communities covered in the sample is fairly satisfactory .
The details relating to the household default consistency by sex in enrolling children as related to educational level, caste or community of head of household, etc. are shown below:

118
Default consistency children are not enrolled.
It means both male and female children of school going age are not enrolled in the school.
Default Inconsistency
It means all male children of school going age enrolled in school but such female
Default Inconsistency (un-structured)
Its meaning is that· some male and some female children are enrolled and others are
not.
The details are shown in the following
statements.
Statement V.27
Households default consistency in enrolling school going children by caste/community
Caste/Community No. of households with both No of households having default male and female children of consistency by education level of school going age and having head of household default consistency ... ---_ .. __ ... _-_ ................. _--.. --_ ............................................ _ ........ _---
Illiterate Primary education (I to VII Std. passed)
2 3 4
luhar
Thakor 3 2
Total 4 2 2
Statement V.28
Households default inconsistency in enrolling school going children by caste/community
Caste/Community No. of households with both No of households having default male and female children of inconsistency by education level of school going age and having head of household default inconsistency
Illiterate Matriculation/ Secondary education (VII toX passed)
2 3 4
Raval
Thakor 5 4
Total 6 5

119
Statement V.29
Households default inconsistency (unstructured) in enrolling children in school by caste/community
Caste/Community
Bhoi
Thakor
Vaghari
Total
No. of households with both male and female children of school going age and having default inconsistency ( unstructured)
2
2
4
The data presented in above three statements reveals that out of 4 households having both male and female school going age children 2 households were having default consistency whose head of households was illiterate whereas for such rest of 2 households head of the household was having primary education. It is also seen that 3 households belonged to Thakor community of Hindu religion and one to Luhar community.
From the data given in the next statement it will be noticed that there were 6 households having default inconsistency in enrolling school going age children out of which in 5 the head of household was illiterate respectively belonged to Thakor and Raval community of Hindu religion whereas in case of remaining one household the head of household was having education level matriculation or secondary.
No of households having default inconsistency (unstructured) by education of head of household
Illiterate
3
2
2
Primary education (I to VII Std. passed)
4
2
The third statement indicates the households having default inconsistency (unstructured) in enrolling children in the school. There were 4 such households belonging to Shoi, Thakor and Vaghari community of Hindu religion. Out of 4 such households in case of 2 households the head was illiterate and remaining 2 households were having head of household with primary education. It is also observed that above type of households to not seem to have found in Muslim religion may be because of small sample size.
Household Default in enrolling children in school as related to religion and occupation of head of households. The following statements show the details regarding default in enrolling children in school by type of Occupation religion/caste of head of household.

120
Statement V.30
Households default consistency in enrolling children in school by type of occupation caste/religion of head of household
Occupation of head of household
1
Skilled Manual (2)
Non-workers (15)
Total.
No. of households with both male and female children of school going age and having default consistency
2
3
4
Statement V.31
No of households showing default consistency where head of household is Other Hindu
Luhar Thakor
3 4
2
3
Households default inconsistency in enrolling children in school by type of occupation, caste and religion of head of household
Type of occupation
Unskilled workers (1)
Cultivators (11)
Non-workers (15)
Total
No. of households with both male and female children of school going age and having default inconsistency
2
3
2
6
Statement V.32
No of households showing default inconsistency where head of household is Other Hindu
Raval Thakor
3 4
3
5
Households default inconsistency (unstructured) in enrolling children in school by type of occupation, caste and religion of head of household
Type of occupation
Skilled manual (2)
Small Business (4)
Cultivators (11)
Total
No. of households with both male and female children of school going age and having inconsistency (unstructured)
2
2
4
No of househOlds showing default inconsistency (unstructured where head of household is Other Hindu
Bhoi Thakor Vaghari
3 4 5
2
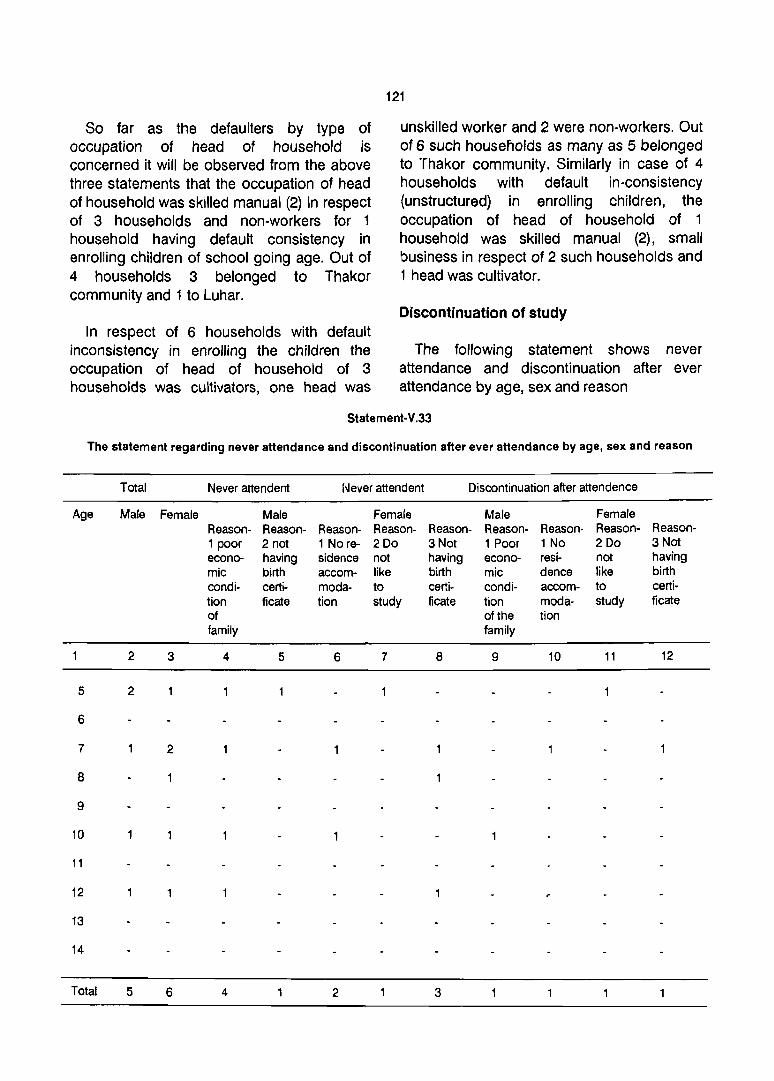
So far as the defaulters by type of occupation of head of household is concerned it will be observed from the above three statements that the occupation of head of household was skilled manual (2) in respect of 3 households and non-workers for 1 household having default consistency in enrolling children of school going age. Out of 4 households 3 belonged to Thakor community and 1 to Luhar.
In respect of 6 households with default inconsistency in enrolling the children the occupation of head of household of 3 households was cultivators, one head was
121
unskilled worker and 2 were non-workers. Out of 6 such households as many as 5 belonged to Thakor community. Similarly in case of 4 households with default in-consistency (unstructured) in enrolling children, the occupation of head of household of 1 household was skilled manual (2), small business in respect of 2 such households and 1 head was cultivator.
Discontinuation of study
The following statement shows never attendance and discontinuation after ever attendance by age, sex and reason
Statement-V.33
The statement regarding never attendance and discontinuation after ever attendance by age, sex and reason
Total Never attendent I~ever attendent Discontinuation after attendence
Age Male Female Male Female Male Female Reason- Reason- Reason- Reason- Reason- Reason- Reason- Reason- Reason-1 poor 2 not 1 No re- 2Do 3 Not 1 Poor 1 No 2 Do 3 Not econo- having sidence not having econo- resi- not having mic birth accom- like birth mic dence like birth condi- certi- moda- to certi- condi- accom- to certi-tion ficate tion study ficate tion moda- study ficate of of the tion family family
2 3 4 5 6 7 8 9 10 11 12
5 2
6
7 2
8
9
10
11
12
13
14
Total 5 6 4 2 3
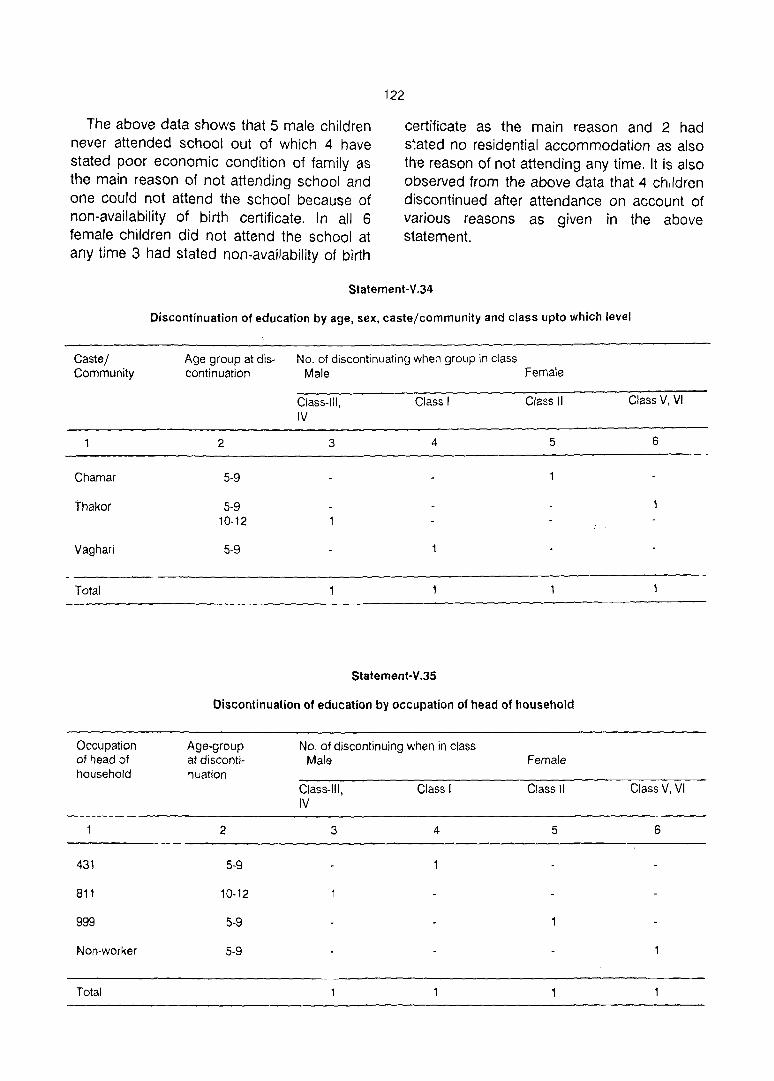
The above data shows that 5 male children never attended school out of which 4 have stated poor economic condition of family as the main reason of not attending school and one could not attend the school because of non-availability of birth certificate. In all 6 female children did not attend the school at any time 3 had stated non-availability of birth
122
certificate as the main reason and 2 had stated no residential accommodation as also the reason of not attending any time. It is also observed from the above data that 4 children discontinued after attendance on account of various reasons as given in the above statement.
Statement-V.34
Castel Community
Chamar
Thakor
Vaghari
Total
Occupation of head of household
431
811
999
Non-worker
Total
Discontinuation of education by age, sex, caste/community and class upto which level
Age group at dis- No. of discontinuating when group in class continuation Male Female
2
5-9
5-9 10-12
5-9
Class-III, IV
3
Class I Class II
4 5
Statement-V.35
Discontinuation of education by occupation of head of household
Age-group at discontinuation
2
5-9
10-12
5-9
5-9
No. of discontinuing when in class Male
Class-III, IV
3
Class I
4
Female
Class II
5
Class V, VI
6
Class V, VI
6

The study of cases of discontinuation may be quite interesting to have a view of age and the class after which the studies were dropped.
Discontinuation of education by different age groups and educational level etc. further indicates that only one male child belonging to age-group 10-12 years left the study when he
123
was in class-Ill-IV, whereas out of 3 female children one belonging to age-group 5-9 years also discontinued when she was in class-I and another child of the same age-group left when she was in class-II. One child also discontinued the study from class Vth. However, in a small sample size the occupation of head of household does not seem to play an important role in discontinuation of the study of the children.

CHAPTER-VI
MIGRATION AND SETTLEMENT OF FAMILIES
Urban centres always attract people from outside since they possess better employment and business opportunities. Per chance the town Vadnagar being development has no such attraction. May be because of this fact the extent of outmigration is more than in inmigration. In such situation the growth of the population may be mainly due to natural growth.
Migration is an important factor in influencing the population of an area. Outmigration registers a fall and in-migration registers a rise.While impact on population in the natural course is caused by the fertility and mortality rates of the area concerned the contribution of migration is rather artificial. There are various forms of migration such as birth migration, marriage migration, seasonal and temporary migration of labour,periodic migration and so on. Till 40's,the imgration from India abroad and vice versa has remained much restricted.Even inter-state movement within the country was also of low magnitude.
To have a deeper insight particulars were collected regarding history of migration and settlement of families in the town by canvassing household schedules. It would have been better to examine the phenomena of .migration in the town on the basis of 1981 census data, but unfortunately such data are not available at town level and in these circumstances we have to rely on surveyed data only.
Before taking anything into account,it would
be appropriate to have a view of the people wno were born outside the town.
Migration
Urbanisation relates to rise in population which is due to either natural increase in population or due to migration of the people from different places. Economic, social and other factors play important role in assessing the migration. The flow of migration to Vadnagar when compared to that of State,district and to the nearest town Visnagar is very small.The growth of population between 1901-1981 in state, district and Vis nagar town has been 422.06 per cent,191.09 per cent and 170.04 per cent respectively while that of V~dnagar town was having only 60.97 per cent.Between 1971-81 in the same respect is the corresponding figures were 27.27%, 21.81% and 33.75 per cent respectively while that of Vadnagar town was only 14.24 per cent.
Out of 257 households surveyed with a population of 1373' persons only 60 households with a population of 354 were found to have migrated to Vadnagar town prior to 1966 A.D .. After more than 20 years viz.the average growth per decade was considerably less being 13.58 per cent. These figure are less than the corresponding figures for 1971-81 Le.(14.24%}.lt can thus be said that the increase in population in Vadnagar town is mainly due to natural incr~ase rather than due to any other factor like migration etc.
Before taking anything into account it would be appropriate to have an idea of the people who were born outside the to~n.The following statement gives the distribution of persons born outside the town.
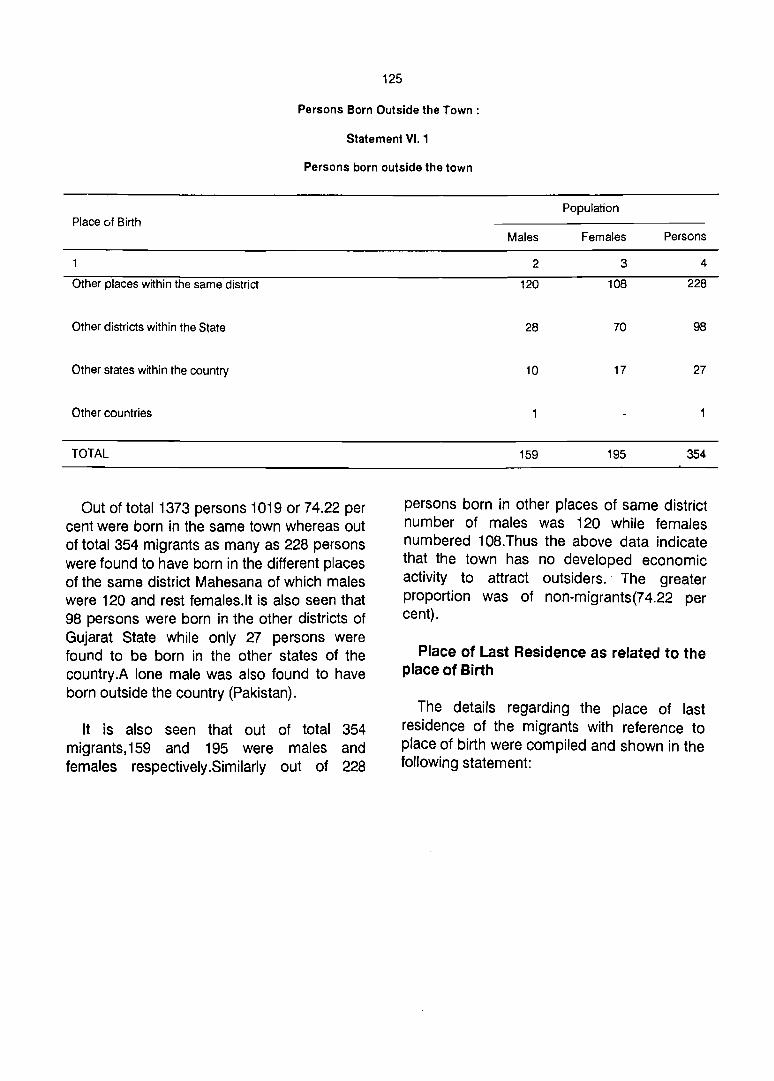
125
Persons Born Outside the Town:
Statement VI. 1
Persons born outside the town
Place Cif Birth
Other places within the same district
Other districts within the State
Other states within the country
Other countries
TOTAL
Out of total 1373 persons 1019 or 74.22 per cent were born in the same town whereas out of total 354 migrants as many as 228 persons were found to have born in the different places of the same district Mahesana of which males were 120 and rest females. It is also seen that 98 persons were born in the other districts of Gujarat State while only 27 persons were found to be born in the other states of the country.A lone male was also found to have born outside the country (Pakistan).
It is also seen that out of total 354 migrants,159 and 195 were males and females respectively.Similarly out of 228
Population
Males Females Persons
2 3 4
120 108 228
28 70 98
10 17 27
159 195 354
persons born in other places of same district number of males was 120 while females numbered 108.Thus the above data indicate that the town has no developed economic activity to attract outsiders. The greater proportion was of non-migrants(74.22 per cent).
Place of Last Residence as related to the place of Birth
The details regarding the place of last residence of the migrants with reference to place of birth were compiled and shown in the following statement:

126
Statement VI.2
Place of last residence of members of the households as related to the place of birth
Place of last residence Place of birth
Same as place Different from of birth place of birth
M F P M F P
2 3 4 5 6 7
A Same place (Born in the town) 518 484 1002 7 10 17 B Total migrants Rural 72 64 136 18 45 63
Urban 32 32 64 37 54 91 Born in the other Rural 70 56 126 15 19 34 places of the same district Urban 24 9 33 11 24 35
2 Born in the other Rural 2 5 7 2 24 26 districts but within Gujrat State Urban 6 20 26 18 21 39
Ahmadabad Rural 2 3 1 1 Urban 5 14 19 18 20 38
Banas Kantha Rural 7 7 Urban
Gandhinagar Rural 2 2 Urban
Junagadh Rural Urban
Kheda Rural Urban
Panch Mahals Rural 2 2 4 Urban
Sabar Kantha Rural 2 2 9 9 Urban 3 4
Vadodara Rural Urban
Valsad Rural 2 2 Urban 1 1
3 Other states within Rural 3 3 1 2 3 the country Urban 2 3 5 7 9 16
Daman Rural Urban 3 3 ,6
Maharashtra Rural 3 3 Urban 2 2 4 3 3
Rajasthan Rural Urban

Uttar Pradesh Rural Urban
West Bengal Rural Urban
Other country Rural Urban
The above data reveal that out of total lOi9 non-migrants born in the town as many as 1002 persons has the same town as their place of last residence. This means that 17 persons were also born in the same town but have different place of last residence,similarly out of 228 members born in the different places of the district as many as 159 members had the same place of last residence as well as the place of birth whereas the last residence was different from the place of birth for 69 members. It was also seen that the place of last residence as well as the place of birth was the same for 33 persons who were born in the different districts of the Gujarat.On the other hand the place of last residence was different from the place of birth in respect of 65 persons.Simiiarly out of total 27 persons were born in the other states and Union territories of the country as many as 19 persons had their place of last residence different from the place of their birth, while the remaining 8 had same place of birth as well as last residence.
In short the above data indicates that out of total 354 migrants the place of birth and last residence was the same in respect of as many as 200 persons which means that such members had migrated to this town directly from their place of birth where as the 154 members having their place of last residence different from the place of birth seem to have come to this town after staying elsewhere. The data also reveals the maximum migrants were from within the same district (228). As regards the migrants who hailed from the other districts of Gujarat it is observed that as many as 61 members migrated from Ahmadabad
127
2 3 4 5 6 7
2 3
3 3 6
district out of which 22 migrated from the place of their birth while 39 members from the different place of their birth.As many as 22 persons also migrated from the other two neighbouring districts viz. Sabarkantha (15), Banas Kantha (7). Thus out of total 98 migrants from the other districts of the state the share of migrants from these three neighbouring districts was 83 and rest of 15 were from other 6 districts.
Other states from where the migrants hailed were Maharashtra (10), West Bengal (6), Uttar Pradesh (4), Rajasthan, and Union Territory of Daman(6).Only one person was born in foreign country of Pakistan who migrated to this town after staying elsewhere.
The following statement shows the details relating to the place of last residence as related to place of birth of the head of household
STATEMENT VI.3
Distribution of households by migration status as per
the place of birth of heads of households
Migration status according to place of birth
Within the town (non-migrant)
Other places within the District
Other districts within the state
Other States within the country
Other countries
TOTAL ........
Place of Birth
2
197
44
11
4
257
Criteria
Place of last residence
3
182
46
20
9
257

There seems close correlation between both the criteria for migration. As many as 197 heads of household were non-migrant under the migration criterion 'Place of Birth' as against 182 under the place of last residence. This means that 15 heads of household were born in Vadnagar town having different places of last residence before they enumerated in the town during the survey.
On examining the details it was observed that the place of last residence of 3 heads of households was other places of the same district whereas the place of last residence was other districts of the state for as many as 9 heads of the households. In respect of the remaining 3 heads of households it was other states of the country.ln short the data reveal that among 197 heads of the households born in Vadnagar town as many as 182 had both place of birth and the place of last residence was the Vadnagar town itself.
128
As regards the migrants it was seen that as many as 20 heads had migrated from the other districts of the state in comparison to 12 heads migrated from their place of birth in other districts within the state. The data further reveal that 9 heads might have migrated from the places other than their place of birth. Similarly 1 head of household was also born in the other country namely Pakistan whose place of last residence was other district within the state showing that he settled in Vadnagar town after staying elsewhere
Duration of staying in the present residence
The details regarding the migrants classified by place of last residence and duration of stay in the town are given in the following statement.
STATEMENT VI.4
Distribution of Migrants by place of last residence and duration of stay in the present residence.
Migration status Duration of stay in the present residence with reference to Less 1-4 5-9 10-19 20+ ALL place of last than Years Years Years Years duration residence 1 Year
M F M F M F M F M F M F
2 3 4 5 6 7 8 9 10 11 12 13
A Non-migrants 7 6 54 59 58 59 127 146 279 224 525 494 (born in the town)
B Total Migrants R 2 30 27 19 21 17 27 23 31 90 108 U 4 3 14 19 17 16 26 33 8 16 69 87
1 Outside the R 1 2 29 25 17 20 14 22 23 24 84 93 town within the district U 6 8 4 6 10 12 5 4 25 30
2 Outside the R 2 2 4 4 6 district but within the state U 4 3 7 9 10 6 13 13 2 9 36 40
Ahmadabad R 1 2 1
U 2 3 3 5 2 2 4 2 10 15
Banas Kantha R U 2 2
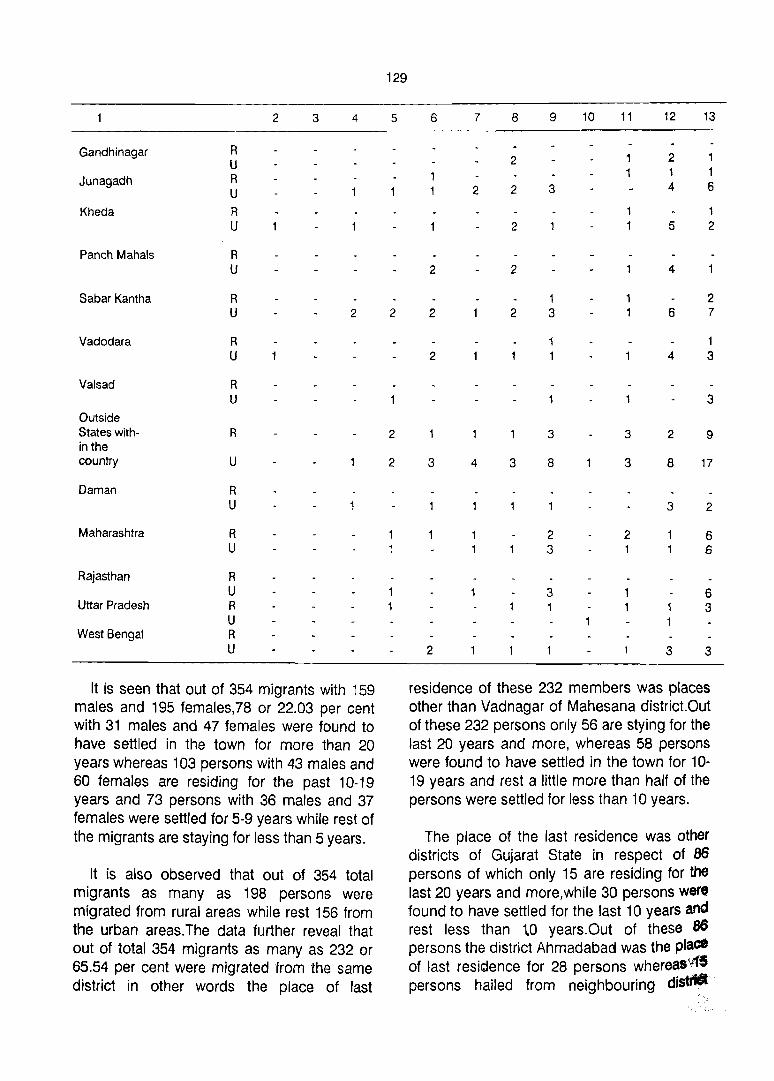
129
2 3 4 5 6 7 8 9 10 11 12 13 -----------------~~~----~ -_
Gandhinagar
Junagadh
Kheda
Panch Mahals
Sabar Kantha
Vadodara
Valsad
Outside States within the country
Daman
Maharashtra
Rajasthan
Uttar Pradesh
West Bengal
R U R U
R U
R U
R U
R U
R U
R
u
R U
R U
R U R U R U
2
It is seen that out of 354 migrants with 159 males and 195 females,78 or 22.03 per cent with 31 males and 47 females were found to have settled in the town for more than 20 years whereas 103 persons with 43 males and 60 females are residing for the past 10-19 years and 73 persons with 36 males and 37 females were settled for 5-9 years while rest of the migrants are staying for less than 5 years.
It is also observed that out of 354 total migrants as many as 198 persons were migrated from rural areas while rest 156 from the urban areas. The data further reveal that out of total 354 migrants as many as 232 or 65.54 per cent were migrated from the same district in other words the place of last
2
2
2
2
2 2
2
2 2
2 2
2
3 4 3
2
3
1 3
3
8
2 3
3
1 1
3
3
2 1
2 1 4
5
4
6
4
2
8
3
3
1 1 6
1 2
2 7
1 3
3
9
17
2
6 6
6 3
3
residence of these 232 members was places other than Vadnagar of Mahesana district.Out of these 232 persons only 56 are stying for the last 20 years and more, whereas 58 persons were found to have settled in the town for 10-19 years and rest a little more than half of the persons were settled for less than 10 years.
The place of the last residence was other districts of Gujarat State in respect of as persons of which only 15 are residing for the last 20 years and more,while 30 persons were found to have settled for the last 10 years and rest less than to years. Out of these 86 persons the district Ahmadabad was the plaCf) of last residence for 28 persons whereas<1f5 persons hailed from neighbouring distttl·
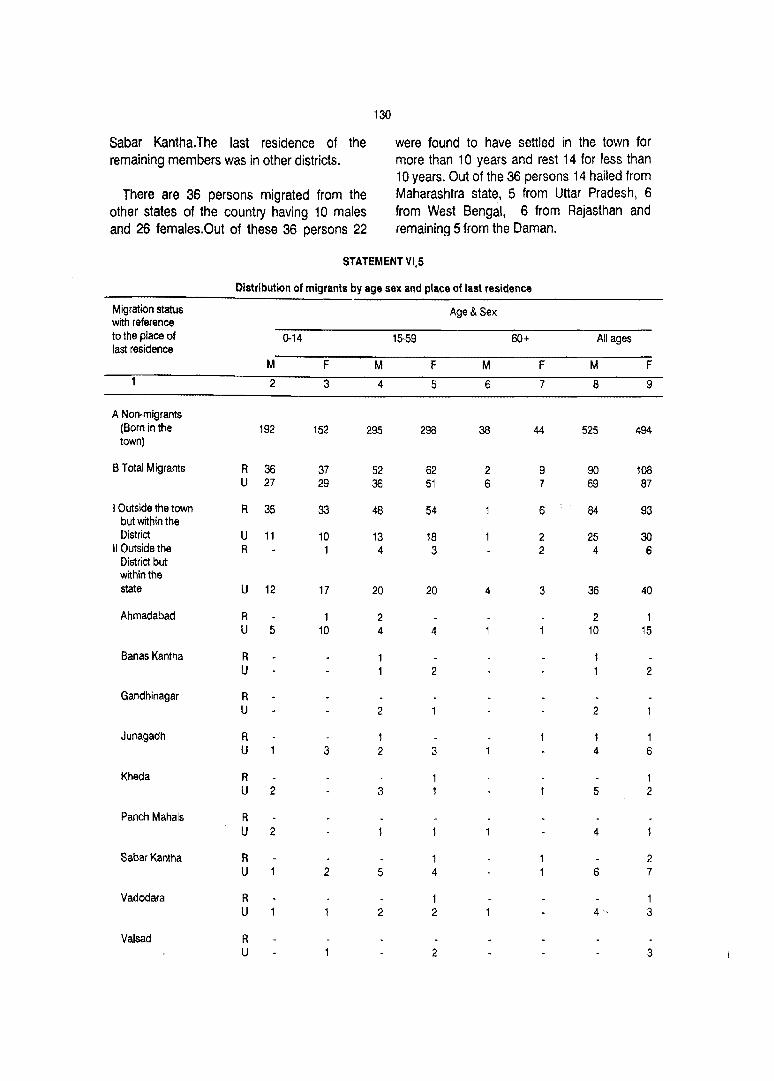
130
Sabar Kantha.The last residence of the were found to have settled in the town for remaining members was in other districts. more than 10 years and rest 14 for less than
10 years. Out of the 36 persons 14 hailed from There are 36 persons migrated from the Maharashtra state, 5 from Uttar Pradesh, 6
other states of the country having 10 males from West Bengal, 6 from Rajasthan and and 26 females.Out of these 36 persons 22 remaining 5 from the Daman.
STATEMENT VI,S
Distribution of migrants by age sex and place of last residence
Migration status Age & Sex with reference to the place of 0-14 last residence
15-59 60+ All ages
M F M F M F M F
2 3 4 5 6 7 8 9
A Non-migrants (Born in the 192 152 295 298 38 44 525 494 town)
B Total Migrants R 36 37 52 62 2 9 90 108 U 27 29 36 51 6 7 69 87
I Outside the town R 35 33 48 54 6 84 93 but within the District U 11 10 13 18 2 25 30
II Outside the R 1 4 3 2 4 6 District but w~hinthe
state U 12 17 20 20 4 3 36 40
Ahmadabad R 1 2 2 1 U 5 10 4 4 10 15
Banas Kanlha R U 2 2
Gandhinagar R U 2 2
Junagadh R 1 1 1 U 3 2 3 4 6
Kheda R 1 U 2 3 5 2
Panch Mahals R U 2 4
Sabar Kantha R 2 U 2 5 4 6 7
Vadodara R 1 1 U 2 2 4·· 3
Valsad R U 2 3

2 3
Outside states R 3 but within the country U 4 2
Daman R U 2
Maharashtra R 2 U
Rajasthan R U
Uttar Pradesh R U
West Bengal R U 2 2
The above statement reveals that out of 354 migrants with 159 males and 195 females as many as 201 persons with 88 males and 113 females belonged to working age group 15-59 years.Which gives the proportion of 56.78 per cent of the total migrants while children under age-group 0-14 years are 129 in number of which 63 are males and rest females.The number of migrants belonging to ripe age of 60 and above years are numbered 24 only with 8 males and 16 females. The above data thus show that the number of female migrants(195} is more in comparison to males(159).
Out of 232 persons migrated from the other places of the same district Mahesana as many as 133 or 57.33 per cent belonged to the working age-group 15-59 years while 89 migrants belonged to age-group 0-14 years and only 10 to ripe age of 60 and above years.
Similarly those migrated from the other districts of Gujarat are numbered 86 or which as many as 47 with more or less equal number of males and females were in the adult age-group 15-59 years while only 9 persons were in the ripe age of 60 and above years.The persons whose place of last residence was other states of India are 36 in
131
4
3
5 6 7 8 9
5 2 9
13 2 8 17
2 3 2
3 6 5 6
5 6
2 3
3 3
number out of which more than half belonged to age-group 15-59 years while 10 belonged to age group 0-14 years and rest 5 were in the ripe age-group 60 + years.
The above age wise analysis reveal the fact that majority of migrants were from the working age 15-59 years which means that adult male members seem to have migrated for livelihood purpose while females might be due to social reason like marriage etc.
Workers and Non-workers by migration status
Out of total 354 migrants only 89 or 25.14 per cent were workers and rest 265 or 74.86 per cent non-workers.Out of 89 workers as many as 67 were males and only 22 females while out of 265 non-workers the number of females was as high as 173 or 65.28 per cent as compared to their counterparts which was 92 in number.Thus it is observed from the data that workers have more males as compared to females and non-workers have more females in comparison to males.
The data also reveal that out of 89 total migrant workers as many as 80 or 89.89 per cent belong to the. age-group 15-59 years
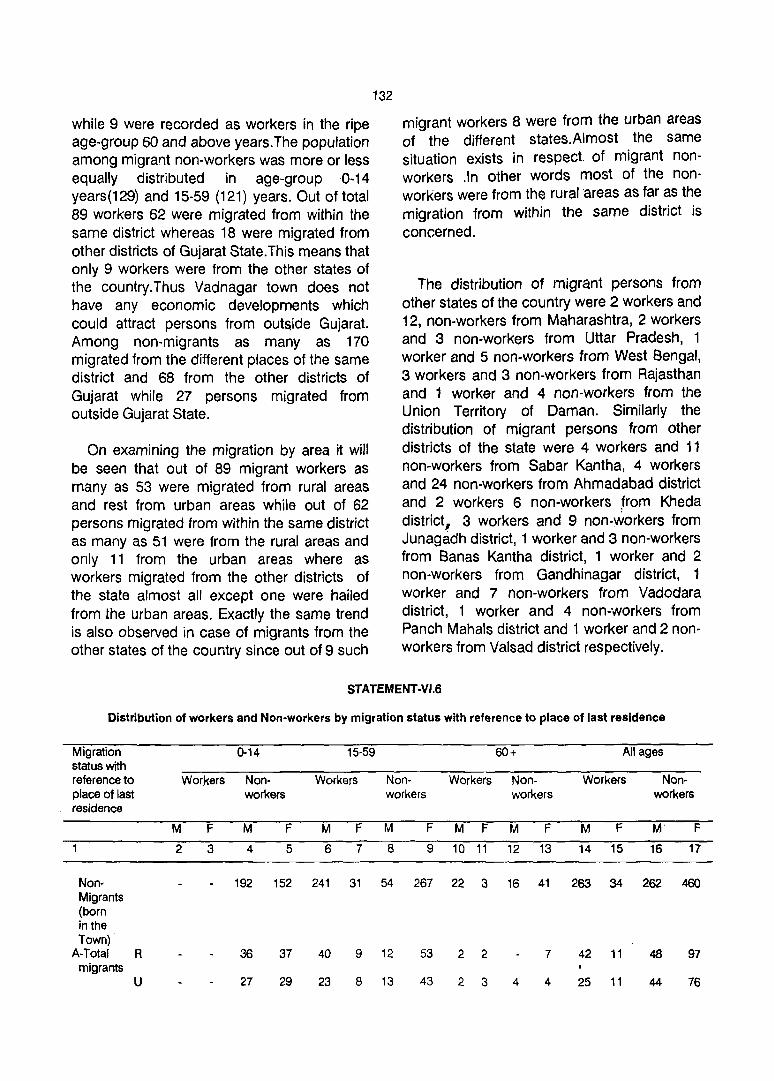
while 9 were recorded as workers in the ripe age-group 60 and above years. The population among migrant non-workers was more or less equally distributed in age-group 0-14 years(129) and 15-59 (121) years. Out of total 89 workers 62 were migrated from within the same district whereas 18 were migrated from other districts of Gujarat State.This means that only 9 workers were from the other states of the country.Thus Vadnagar town does not have any economic developments which could attract persons from outside Gujarat. Among non-migrants as many as 170 migrated from the different places of the same district and 68 from the other districts of Gujarat while 27 persons migrated from outside Gujarat State.
On examining the migration by area it will be seen that out of 89 migrant workers as many as 53 were migrated from rural areas and rest from urban areas while out of 62 persons migrated from within the same district as many as 51 were from the rural areas and only 11 from the urban areas where as workers migrated from the other districts of the state almost all except one were hailed from the urban areas. Exactly the same trend is also observed in case of migrants from the other states of the country since out of 9 such
132
migrant workers 8 were from the urban areas of the different states.Almost the same situation exists in respect of migrant nonworkers .In other words most of the nonworkers were from the rural areas as far as the migration from within the same district is concerned.
The distribution of migrant persons from other states of the country were 2 workers and 12, non-workers from Maharashtra, 2 workers and 3 non-workers from Uttar Pradesh, 1 worker and 5 non-workers from West Bengal, 3 workers and 3 non-workers from Rajasthan and 1 worker and 4 non-workers from the Union Territory of Daman. Similarly the distribution of migrant persons from other districts of the state were 4 workers and 11 non-workers from Sabar Kantha, 4 workers and 24 non-workers from Ahmadabad district and 2 workers 6 non-workers from Kheda district, 3 workers and 9 non-workers from Junagadh district, 1 worker and 3 non-workers from Banas Kantha district, 1 worker and 2 non-workers from Gandhinagar district, 1 worker and 7 non-workers from Vadodara district, 1 worker and 4 non-workers from Panch Mahals district and 1 worker and 2 nonworkers from Valsad district respectively.
STATEMENT-VI.6
Distribution of workers and Non-workers by migration status with reference to place of last residence
Migration status with reference to place of last residence
NonMigrants (born in the Town) .
A-Total R migrants
u
Wor.kers
M F
2 3
0-14 15·59 60+ All ages
Non- Workers Non- Workers Non- Workers Non-workers workers workers workers
M F M F M F M F M F M F M· F
4 5 6 7 8 9 10 11 12 13 14 15 16 17
192 152 241 31 54 267 22 3 16 41 263 34 262 460
36 37 40 9 12 53 2 2 7 42 11 48 97
27 29 23 8 13 432344 25 11 44 76

133
2 3 4 5 6 7 8 9 fO 11 12 13 14 15 16 i1
1 Outside R 35 33 39 9 9 45 1 2 4 40 11 44 82
the U 11 10 9 4 18 1 1 1 10 1 15 29 town but within the district
2 Outside R 1 1 3 3 2 3 6 the dis- U 12 17 11 5 9 15 4 2 '1 6 25 34 trict within the state
1 Ahmada- R 1 2 2 1
bad U 5 10 3 1 3 3 7 14
2 Banas R Kantha U 2 2
3 Gandhi- R nagar U
4 Juna- R 1 1 1
gadh U 3 1 2 1 , 3 5
5 Kheda R U 2 2 4
6 Panch R Mahals U 2 3
7 Sabar R 1 2 Kantha U 2 2 3 3 2 2 4 5
8 Vado- R 1
dara U 2 3 3
9Valsad R U l' 2
Outside R 1 3 5 1 1 1 9 states U 4 2 3 3 10 1 1 4 4 4 13 within country
1 Daman R U 2 2 2 2
2 Maha- R 2 3 6 rashtra U 4 1 5
3 Rajas- R than U 2 3 3 3
4 Uttar R 2 3 Pradesh U
SWest R Bengal U 2 2 2 3
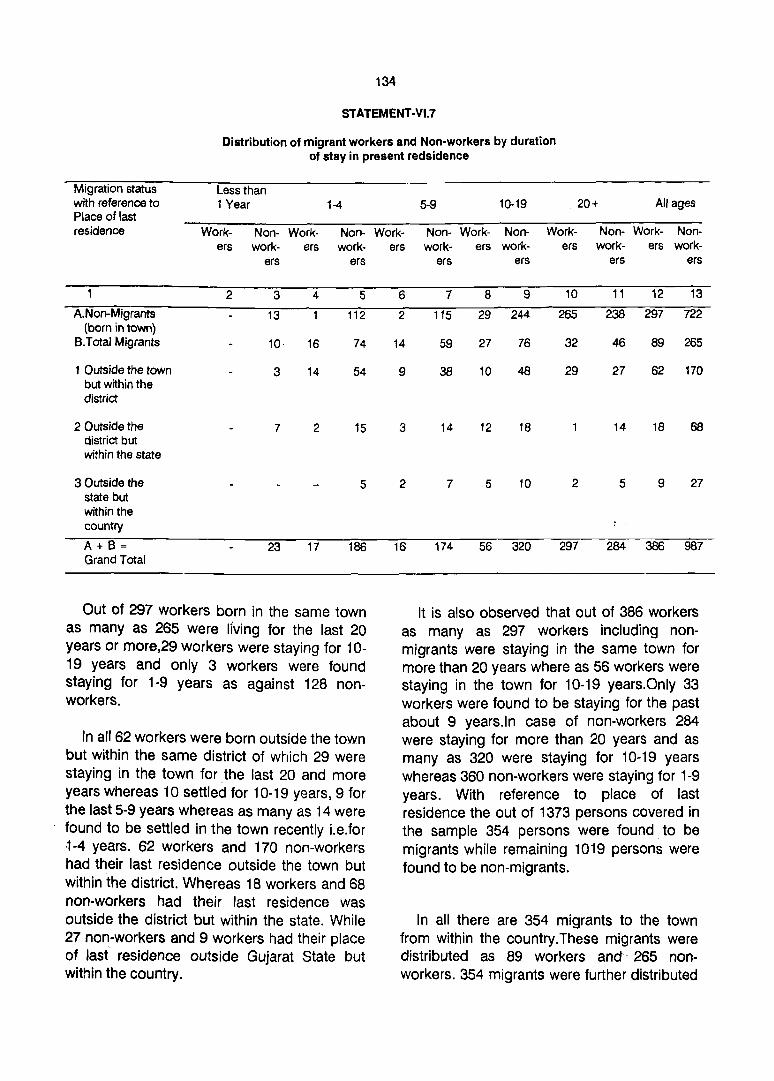
134
STATEMENT-VI.7
Distribution of rnigrant workers and Non-workers by duration of stay in present redsidence
Migration status Less than with reference to 1 Year 1-4 Place of last residence Work- Non- Work- Non-
ers work- ers work-ers ers
2 3 4 5
A.Non-Migrants 13 112 (born in town)
B.Total Migrants 10· 16 74
1 Outside the town 3 14 54 but within the district
2 Outside the 7 2 15 district but within the state
3 Outside the 5 state but within the country
A+B= 23 17 186 Grand Total
Out of 297 workers born in the same town as many as 265 were living for the last 20 years or more,29 workers were staying for 10-19 years and only 3 workers were found staying for 1-9 years as against 128 nonworkers.
In all 62 workers were born outside the town but within the same district of which 29 were staying in the town for. the last 20 and more years whereas 10 settled for 10-19 years, 9 for the last 5-9 years whereas as many as 14 were found to be settled in the town recently Le.for 1-4 years. 62 workers and 170 non-workers had their last residence outside the town but within the district. Whereas 18 workers and 68 non-workers had their last residence was outside the district but within the state. While 27 non-workers and 9 workers had their place of last residence outside Gujarat State but within the country.
5-9 10-19 20+ All ages
Work- Non- Work- Non- Work- Non- Work- Non-ers work- ers work- ers work- ers work-
ers ers ers ers
6 7 8 9 10 11 12 13
2 115 29 244 265 238 297 722
14 59 27 76 32 46 89 265
9 38 10 48 29 27 62 170
3 14 12 18 14 18 68
2 7 5 10 2 5 9 27
16 174 56 320 297 284 386 987
It is also observed that out of 386 workers as many as 297 workers including nonmigrants were staying in the same town for more than 20 years where as 56 workers were staying in the town for 10-19 years. Only 33 workers were found to be staying for the past about 9 years.ln case of non-workers 284 were staying for more than 20 years and as many as 320 were staying for 10-19 years whereas 360 non-workers were staying for 1-9 years. With reference to place of last residence the out of 1373 persons covered in the sample 354 persons were found. to be migrants while remaining 1019 persons were found to be non-migrants.
In all there are 354 migrants to the town from within the country.These migrants were distributed as 89 workers anct' 265 nonworkers. 354 migrants were further distributed
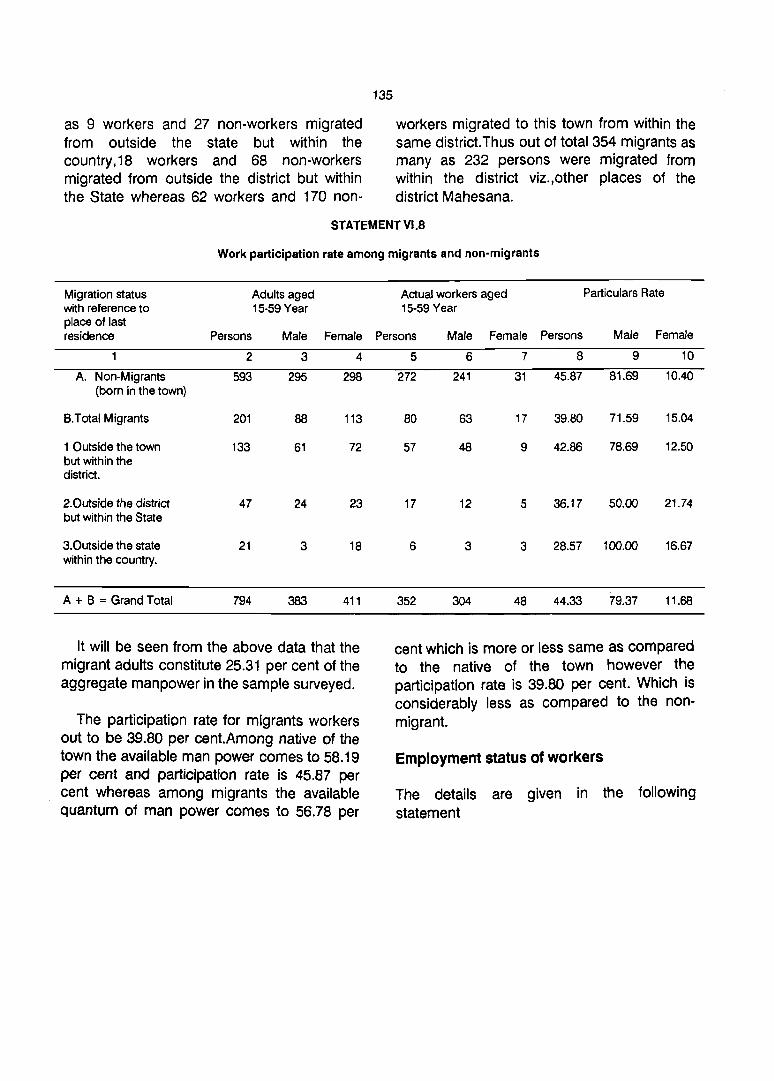
as 9 workers and 27 non-workers migrated from outside the state but within the country,18 workers and 68 non-workers migrated from outside the district but within the State whereas 62 workers and 170 non-
135
workers migrated to this town from within the same district.Thus out of total 354 migrants as many as 232 persons were migrated from within the district viz.,other places of the district Mahesana.
STATEMENT Vl.8
Work participation rate among migrants and non-migrants
Migration status with reference to place of last residence
A. Non-Migrants (born in the town)
B.Total Migrants
1 Outside the town but within the district.
2.0utside the district but within the State
3.0utside the state within the country.
A + B = Grand Total
Adults aged 15-59 Year
Persons Male
2 3
593 295
201 88
133 61
47 24
21 3
794 383
Female
4
298
113
72
23
18
411
It will be seen from the above data that the migrant adults constitute 25.31 per cent of the aggregate manpower in the sample surveyed.
The participation rate for migrants workers out to be 39.80 per cent.Among native of the town the available man power comes to 58.19 per cent and participation rate is 45.87 per cent whereas among migrants the available quantum of man power comes to 56.78 per
Actual workers aged 15-59 Year
Particulars Rate
Persons Male Female Persons Male Female
5 6 7 8 9 10
272 241 31 45.87 81.69 10.40
80 63 17 39.80 71.59 15.04
57 48 9 42.86 78.69 12.50
17 12 5 36.17 50.00 21.74
6 3 3 28.57 100.00 16.67
352 304 48 44.33 79.37 11.68
cent which is more or less same as compared to the native of the town however the participation rate is 39.80 per cent. Which is considerably less as compared to the nonmigrant.
Employment status of workers
The details are given in the following statement

136
STATEMENT VI.9
Employment status of workers by migration status with reference to place of last residence
Migration status with reference to the place of last residence
A. Non-Migrants (born in town)
B. Total Migrants
1. Outside the town but within the district
2. Outside the district but within the state
3. Outside the state but within the country
Total Worker
R U'
R
U
R U
R
M
2
263
42 25
40
10
1 11
Emplo-yer
F M
3 4
34 10
11 5 11 4
11 5
2
6
u 4 4
Out of 89 total migrant workers,the employment status for 9 workers was Employer,whereas 30 workers were found to be engaged as employee, 32 as single workers 10 as family worker, 5 as a agricultural labour .
Similarly out of total 62 workers migrated from within the same district majority of them
Employment Status
Emplo- Single Family Culti- Agri. yee worker worker vator labour
F M F M F M F M F M F
5 6 7 8 9 10 11 12 13 14 15
70
18 11
17
4
1 6
7 81
9 4 10 9
9 4
4
4 4
2 4
27 62 16 13 9
4 6 4 2
4 6 3 2
were emloyees and single workers while 10 were engaged as family workers. Almost same trend in regard to employment status was observed in respect of the workers who migrated from the other districts of the state as well as other states of the country
Households by size and Migration status:
(1) By Place of birth
STATEMENTVI.10
Distribution of households by size and migration status by place of birth of head of households
Migration status No.of households having no.of members place of birth of head of house- Single 2-3 4-5 6-7 8-9 10-12 13+ Total hold. member
1 2 3 4 5 6 7 8 9 Non-migrants 11 27 65 54 25 12 3 197 (born in town)
Total-migrants 11 10 25 8 3 3 60

137
2 3 4 5 6 7 8 9
Other places 6 9 18 6 2 3 44 within the district
2. Other districts 4 4 11 within the state
3. Other states 3 4 within the country
4. Other country
TOTAL 22 37 90 62 28 15 3 257
(2) Place of Last residence :
STATEMENTVl.11
Distribution of households by no. of members and place of last residence
Migration status No.of households having no.of members with reference to place of last Single 2-3 4-5 6-7 8-9 10-12 13+ Total residence of head member of household
2 3 4 5 6 7 8 9
A. Non-migrants 10 25 60 49 24 11 3 182 (born in the town)
B. Migrants (Total) 12 12 30 13 4 4 75
1. Other places within 4 9 22 5 3 3 46 the district
2. Other districts 5 3 5 5 20 within the state
3. Other states within 3 3 3 9 the country
4. Other country
TOTAL 22 37 90 62 28 15 3 257
It is seen from the above statement that out of 257 households 60 or 23.94 per cent were heads of households in respect of 11 migrant households, of which as many as 44 households was in other districts of Gujarat heads of the households were found to have and it was other states of India in respect of 4 been born in other places of the same district households. A lone head of household was Mahesana.Whereas the place of birth of the born in the foreign country namely Pakistan.

As regards the size of households it is seen that among 197 local households there were 11 single member households whereas majority of the households were having 4-5 members (65) and 6-7 members (54) whereas 12 households have 10-12 members and 3 have as many as 13 and more members. It is also observed that there are 11 single member households amongst 60 migrant households within the country.The most common size of households ranges between 4 - 5 members (25). The next most common size of the
138
household has 2-3 members (10) whereas 3 migrant households also have as many as 10-12 members.A lone household migrated from the other country has 6-7 members.
Duration of stay in present residence:
The following statement shows the details relating to non-migrant and migrant households by duration of stay in the present residence in the town according to the number of members in the household.
Statement VI.12
Distribution of households by number of members, migration status and duration of stay in the present residence
Number of No.of non- NO.of migrant households members migrant
households By duration of residence by place of birth Less than 1-5
1 Year years
2 3 4
Single 11
2 13
3
4 28 3
5 37 5
6-7 54
8-9 25
10-12 12
13 + 3
TOTAL 197 11
The above data indicates that out of 60 migrated households as many as 33 heads of the households were found to be settled for more than 20 years in the town while 11 heads were reported to be staying for 6-10 years and equal number of households (11) were also found to have settled for 1-5 years.Only 5
6-10 11-20 20+ All yeaes years years duration
5 6 7 8
10 11
2 2 6
2 4
2 3 9
4 6 16
6 8
2 3
2 3
11 5 33 60
heads of households were settled in this town for more than 10 years on the other hand none of the migrated househ()lds were found to have settled recently. Thus the head of household of 33 households had the longest stay in the town and 11 had the-shortest stay.
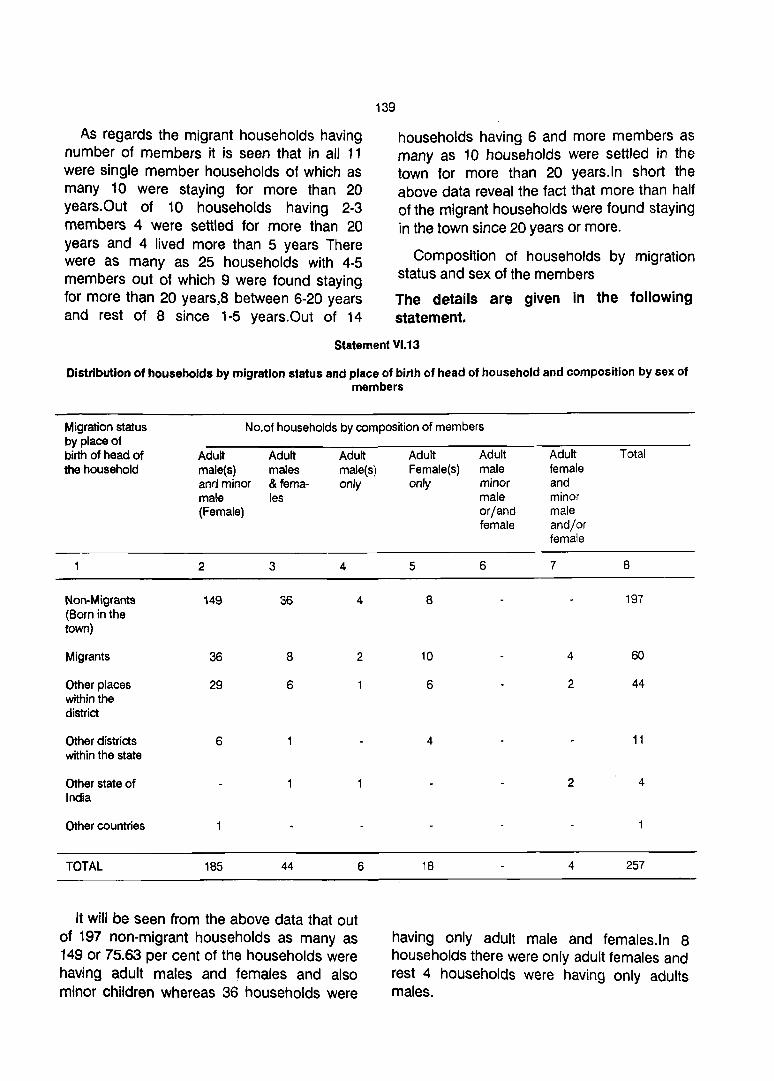
139
As regards the migrant households having number of members it is seen that in all 11 were single member households of which as many 10 were staying for more than 20 years.Out of 10 households having 2-3 members 4 were settled for more than 20 years and 4 lived more than 5 years There were as many as 25 households with 4-5 members out of which 9 were found staying for more than 20 years,8 between 6-20 years and rest of 8 since 1-5 years. Out of 14
households having 6 and more members as many as 10 households were settled in the town for more than 20 years.ln short the above data reveal the fact that more than half of the migrant households were found staying in the town since 20 years or more.
Composition of households by migration status and sex of the members
The details are given in the following statement.
Statement Vl.13
Distribution of households by migration status and place of birth of head of household and composition by sex of members
Migration status by place of
No.of households by composition of members
birth of head of the household
Non-Migrants (Born in the town)
Migrants
Other places within the district
Other districts within the state
Other state of India
Other countries
TOTAL
Adult male(s) ann minor male (Female)
2
149
36
29
6
185
Adult Adult males male(s) & fema- only les
3 4
36 4
8 2
6
44 6
It will be seen from the above data that out of 197 non-migrant households as many as 149 or 75.63 per cent of the households were having adult males and females and also minor children whereas 36 households were
Adult Adult Adult Total Female(s) male fema.le only minor and
male minor or/and male female and/or
female
5 6 7 8
8 197
10 4 60
6 2 44
4 11
2 4
18 4 257
having only adult male and females. In 8 households there were only adult females and rest 4 households were having only adults males.

Similarly out of 60 migrant households as many as 36 households were having adult males and females with also minor children while in 8 households both adult males and females were staying on the other hand in 10 households only adult females were found
140
staying and 4 households were having adult females wi-\h minor children whereas in rest 2 were having only adult males in the household.
Migration Stages:
STATEMENT Vl.14
Migration stages of households hailing from outside
Broad category of Total NO.of house-place from where No.of holds migra-t)'le households hail house- ted prior to
hold~ 1966
2 3
Other towns of 8 the district
2 Other rural places 17 of the district
3 Other districts of 9 the State
4 Other States of 6 2 the Country
5 Other Countries
TOTAL 40 3
In all 40 households were the migrants to Vadnagar town of which 3 households were migrated prior to 1966. 8 households were from the other towns of the same district of which 1 household was migrated before 1966 and 7 from 1966 to 1976 and later.
It is also seen that out of these 7 households 6 had migrated directly from the places of their origin whereas the remaining 1 has migrated in two stages.ln all 17 households were migrated from the rural areas of the same district. Out of these 17 households 13 were migrated from the place of their birth while 2 each have come in two stages and four or more stages. Whereas
No.of housenolds migrated from 1966 to 1976 and later
Directly In two Three Four or from the stages stages more stages place of origin
4 5 6 7
6
13 2 2
9
3
31 4 2
those migrated from the other districts of the State all the 9 households were migrated from the place of origin. The 6 households were also migrated from the other States of the country of which 2 have come to this town prior to 1966. 3 migrated from the place of birth and alone has migrated in two stages.
In short out of total 40 migrant households 3 have migrated to this town prior to 1966 whereas as many as 31 households were migrated directly from the place of their origin and 4 were migrated in two--stages.While 2 were migrated in four or more stages.
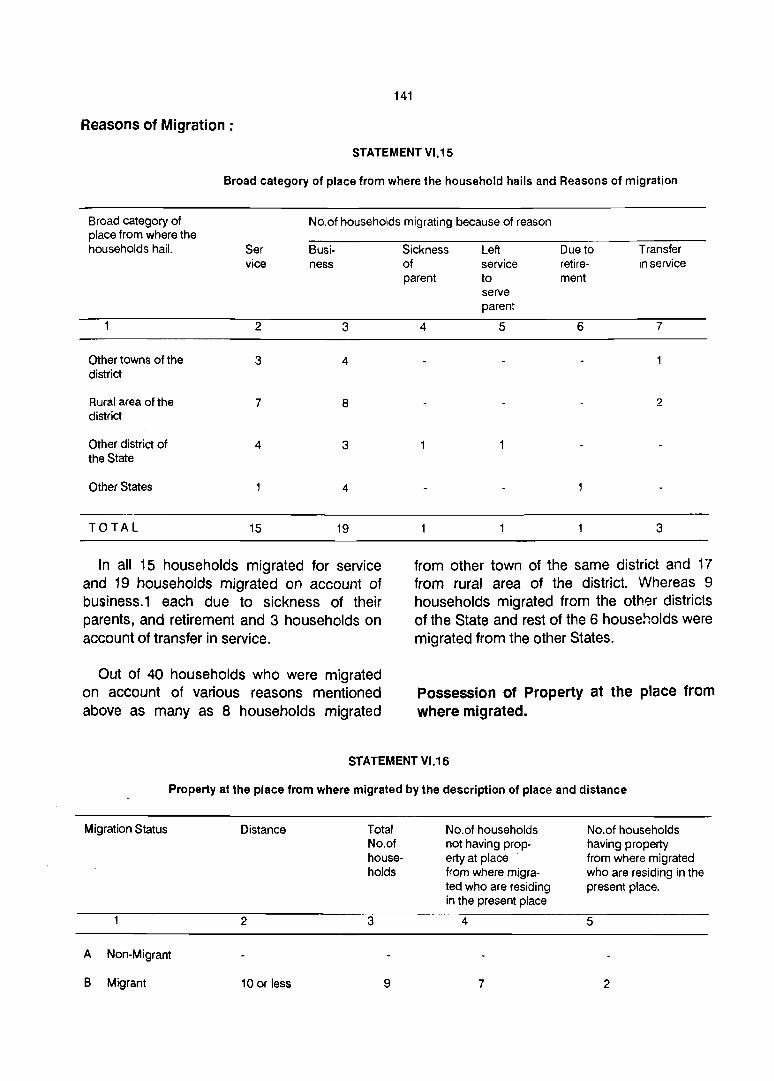
141
Reasons of Migration:
STATEMENT VI.1S
Broad category of place from where the household hails and Reasons of migration
Broad category of place from where the households hail.
No.of households migrating because of reason
Ser vice
Business
Sickness Left Due to Transfer in service
Other towns of the district
Rural area of the district
Other district of the State
Other States
TOTAL
2 3
3 4
7 8
4 3
4
15 19
In all 15 households migrated for service and 19 households migrated on account of business.1 each due to sickness of their parents, and retirement and 3 households on account of transfer in service.
Out of 40 households who were migrated on account of various reasons mentioned above as many as 8 households migrated
of service retire-parent to ment
serve parent
4 5 6 7
2
3
from other town of the same district and 17 from rural area of the district. Whereas 9 households migrated from the other districts of the State and rest of the 6 households were migrated from the other States.
Possession of Property at the place from where migrated.
STATEMENT VI.16
Property at the place from where migrated by the description of place and distance
Migration Status
A Non-Migrant
B Migrant
Distance
2
10 or less
Total No.of households
3
9
No.of households not having property at place from where migrated who are residing in the present place
4
7
No.of households having property from where migrated who are residing in the present place.
5
2
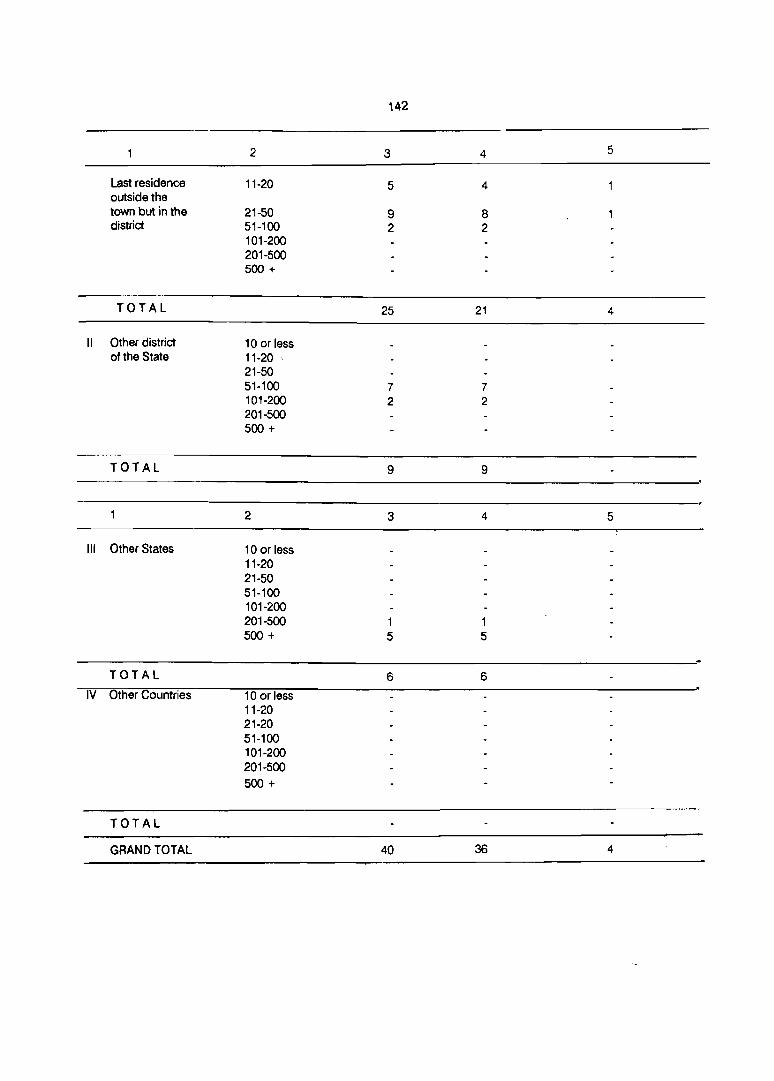
142
2 3 4 5
Last residence 11-20 5 4 outside the town but in the 21-50 9 8 district 51-100 2 2
101-200 201-500 500 +
TOTAL 25 21 4
II Other district 10 or less of the State 11-20 '
21-50 51-100 7 7 101-200 2 2 201-500 500 +
TOTAL 9 9
2 3 4 5
III Other States 10 or less 11-20 21-50 51-100 101-200 201-500 1 1 500 + 5 5
TOTAL 6 6
IV Other Countries 10 or less 11-20 21-20 51-100 101-200 201-500
500 +
TOTAL
GRAND TOTAL 40 36 4

143
Unit of Migration
Statement VI.17
Unit of migration as related to the place of last residence
No. of households whose place of last residence
Last residence outside the town but within the district (a) Male working members only (b) All at a time (c) Male working m"lmbers first other followers (d) Others
II Last residence outside the district but within the State (a) Male working members only (b) All at a time (c) Male working members first other followers (d) Others
III Last residence in other states and Union Territories but within the Country (a) Male working members only (b) All at a time (c) Male working members first other followers (d) Others
TOTAL MIGRANTS: (a) Male working members only (b) All at a time (cl Male working members first other followers (d) Others
It is observed that out of total 40 migranted households as many as 25 migrated to this town all at a time from the place of their last residence. Whereas in respect of 7 households only male working members were migrated. While in case of other 7 households male working members were migrated in the first instant followed by other members lateron. It was also reported that in case of alone household wife migrated first and the husband followed lateron.
The above data also indicates that out of total 40 migrant households as many as 25 households were having their place of last re3idence in the same district only. Out of these 25 households 19 were migrated all at a time, male members first and other followed them in respect of 3 households. While in
No. of households
2
25 2
19 3 1
9 4 3 2
6
1 3 2
40 7
25 7 1
respect of 2 households only male working members were migrated.
In 9 households reported to have migrated to this town from the other districts of the State. Out of these 9 households only male working members were migrated in respect of 4 households. While all family members reported to have migrated at a time in case of 3 households. For the rest of 2 households male working members migrated first followed by other members of the family.
Out of 6 households whose place of last residence was other States 3 households migrated with all members at a time and 1 household migrated with male working members only. While in remammg 2 households male working members reported to have migrated first and other household members followed them subsequently.

144
Visit to close relations
Statement VI.1B
Visit of close relatives during three years by duration of stay in present residence and frequency of visit
Close relations
No. of No. of households having close relations of head of households described in col. 1 and at house- least one member of which visited the close relations during last 3 years which are staying
at place from where migrated
Father
Mother
Son
Unmarried Daughter
Unmarried Sister
Wife
TOTAL
holds having relations at col. 1 as at place from where migrated
2
13
10
7
3
2
5
40
in the town upto.
Upto 5-9 4 years years
Not 1-3 4-6 Not once times times once
3 4 5 6
2
3
4 9 2
Of the total migrant households 40 had one or the other close relations left at the places from where migrated. In 13 cases Father, in 10 cases Mother, in 7 cases Son, unmarried daughter in case of 3 households, and unmarried sister in case of 2 households were left behind. Whereas wife was left behind in case of 5 households. The frequency of visits by the migrant households to their close relations having a stay of 20 + years in the town was also examined. In all 7 households were reported to have visited their close relations 4-6 times. 8 households staying in the town fifth part 10-19 years also visited their close relations during the period of last 3 years of which 3 visited 1-3 times and rest 5 households 4-6 times. 10 out of the 12
10-19 20 + years years
1-3 4-6 Not 1-3 4-6 Not 1-3 4-6 times times once times times once times times
7
2
3
2
2
10
8 9 10 11 12 13 14
2 3 3
2 2
2
3 5 7
households who were reported to have beer staying in the town for the past 5-9 years have visited their close relations 1-3 times during the last 3 years. Whereas 2 have not visited even once.
Similarly out of 13 households staying in the town for the past about 4 years as many as 9 have paid visits to their close relation 1 c3 times and 4 had not paid any visit during the last 3 years. In short out of 40 migrated households at least one member of 34 households has paid visit to their close relations at the place from where they had migrated. On the other hand members of the 6 households had not paid visit even once during last 3 years of stay in the town.

145
Visit by Close Relatives:
Statement VI.19
Visit by close relations during three years by duration of stay in present residence and frequency of visit
Close Noot No. of households having close relations of head of households described in col. 1 relations house- in the place from where the households halls who visited the household during at place of holds the last 3 years. 'from where having migrated relation Upto 5-9 10-19 20 + years
at col. 1 4 years years years as at place Not 1-3 4-6 Not 1-3 4-6 Not 1-3 4-6 Not 1-3 4-6 from once times times once times times once times times once times times where migrated
2 3 4 5 6
Father 13 2 2
Mother 10 2
Son 7
Unmarried 3 Daughter
Unmarried 2 Sister
Wif61 5 3
TOTAL 40 7 9 4
The data furnishes the details regarding frequency of visits paid by relatives. It is seen that 9 migrant households staying in the town for the last four years are reported to be visited by the close relatives 1-3 times and 7 households were not visited at all. Similarly the 7 households staying for the last 5-9 years were visited 1-3 times while in case of 4 households no close relatives visited them. In all 8 households were reported to have been staying in the town sincQ 10-19 years of which 5 households were visited 1-3 times, and the 3 households were visited 4-6 times of the 5
7 8 9 10 11 12 13 14
2 3 2
3 2
2
7 5 3 4
households staying in the town for the last 20 years or more, 4 households were visited 4-6 times and 1 household was visited 1-3 times. Thus out of 40 migrant households the close relatives of as many as 29 households have paid visits to them. In 22 households their close relatives visited 1-3 times and in the remaining households their close relatives visited 4-6 times. Whereas in 11 households no relatives have paid visits at all in the last 3 years.
Distance from plaee of Origin of migration

146
Statement Vl.20
Distribution of migrant households which migrated a-fter 1955 by distance of origin of migration
No. of households migrated after 1955 from the places Distance in Km.
10 and less
11-20
21-50
51-100
101-200
201-500
500 +
TOTAL
Other towns of the district
2
6
8 17
As regards the distance of place of birth it will be seen that the place of birth for as many as 23 households was within the distance of 50 kms. All these households migrated from within the same district. The birth place of 9 households was at a distance between 51 and 100 kms. Out of which 7 migrated from the other districts of the State and rest 2 were from the same district. While the place of
8
Other States of the country
Rural Urban
6 7
4
4
Union Territories of the state
Rural Urban
8 9
origin was at a distance between 101 and 200 kms. For 2 households migrated from other districts of the State. Whereas place of origin was at a distance of 500 and more in respect of 5 households all such households were migrated from the other States of the country.
Characteristics of Place of Origin Statement VI.21
Characteristics (at the time of migration) of the place of origin of Migration
The place from Total Characteristics of place of origin
where the house- No. of hold migrated house- Households migrated Households migrated
hold prior to 1966 from after 1966
Village Small Medium City Village Small Medium City town size town size
town town
2 3 4 5 6 7 8 9 10
Other towns 8 6
of the district
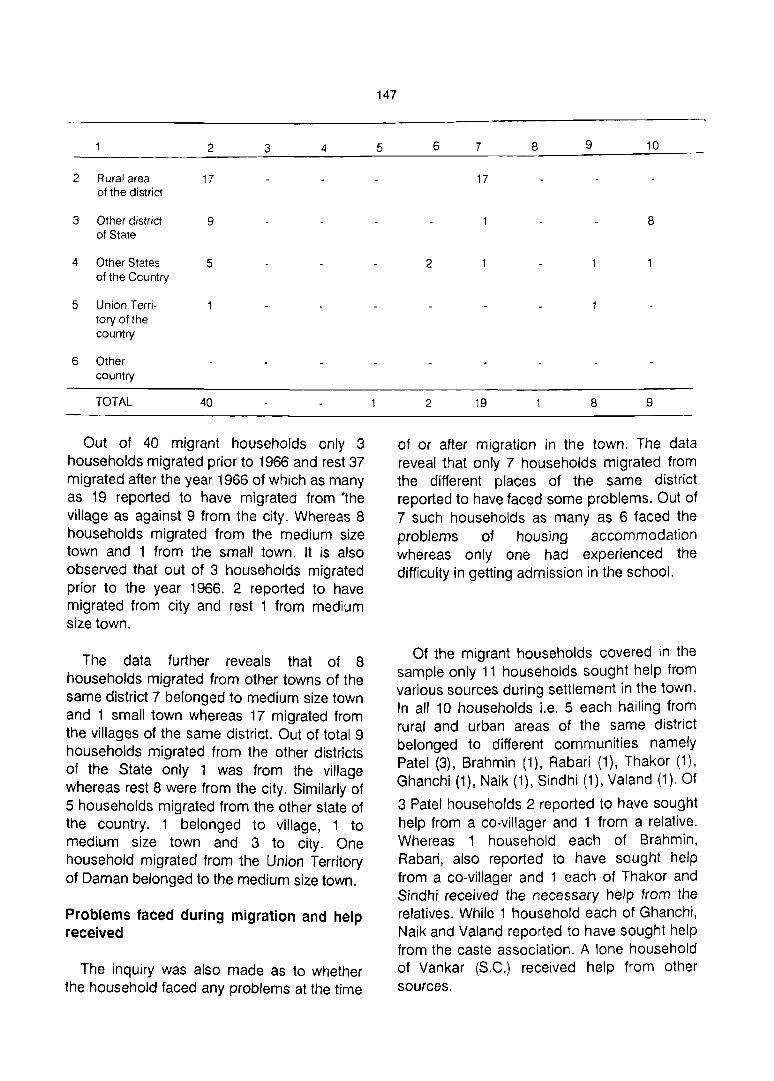
2 Rural area of the district
3 Other district of State
4 Other States of the Country
5 Union T erritory of the country
6 Other country
TOTAL
2 3 4
17
9
5
40
Out of 40 migrant households only 3 households migrated prior to 1966 and rest 37 migrated after the year 1966 of which as many as 19 reported to have migrated from 'the village as against 9 from the city_Whereas 8 households migrated from the medium size town and 1 from the small town. It is also observed that out of 3 households migrated prior to the year 1966. 2 reported to have migrated from city and rest 1 from medium size town.
The data further reveals that of 8 households migrated from other towns of the same district 7 belonged to medium size town and 1 small town whereas 17 migrated from the villages of the same district. Out of total 9 households migrated from the other districts of the State only 1 was from the village whereas rest 8 were from the city. Similarly of 5 households migrated from the other state of the country. 1 belonged to village, 1 to medium size town and 3 to city. One household migrated from the Union Territory of Daman belonged to the medium size town.
Problems faced during migration and help received
The inquiry was also made as to whether the household faced any problems at the time
147
5 6 7 8 9 10
17
8
2
2 19 8 9
of or after migration in the town. The data reveal that only 7 households migrated from the different places of the same district reported to have faced some problems. Out of 7 such households as many as 6 faced the problems of housing accommodation whereas only one had experienced the difficulty in getting admission in the school.
Of the migrant households covered in the sample only 11 households sought help from various sources during settlement in the town. In all 10 households i.e. 5 each hailing from rural and urban areas of the same district belonged to different communities namely Patel (3), Brahmin (1), Rabari (1), Thakor (1), Ghanchi (1), Naik (1), Sindhi (1), Valand (1). Of
3 Patel households 2 reported to have sought help from a co-villager and 1 from a relative. Whereas 1 household each of Brahmin, Rabari, also reported to have sought help from a co-villager and 1 each of Thakor and Sindhi received the necessary help from the relatives. While 1 household each of Ghanchi, Naik and Valand reported to have sought help from the caste association. A lone household of Vankar (S.C.) received help from other sources.

148
Age-Sex and Study by Migration Status institutions according to migration status, age' and sex were also examined. The details are.
The data about the School going age shown in the following statement. children and studying in educational
Statement VI.22
Age-Sex and study in educational institutions by migration status as determined by place of birth
Age- Total Migration status group
M
2 3
A Non-Migrant 5-9 65 (Born in town) 10-14 77
15-19 57 20-24 51 25+ 247
TOTAL 497
B Migrants 5-9 7 (Born outside 10-14 20 the town but 15-19 9 within the 20-24 8 district 25 + 39
TOTAL 83
2 Born in other 5-9 1 districts but 10-14 1 within the state 15-19 6
20-24 3 25 + 6
TOTAL 17
3 Born in the other 5-9 State but within 10-14 the country 15-19
20-24 25 + 2
TOTAL 3
Out of 497 non-migrant males 165 or 33.20 per cent are studying in the educational institution. The percentage for females comes to about 23.7 per cent. So far as migrant population is concerned it will be seen that out of total 103 males 38 or 36.89 per cent attend school or educational institutions whereas such percentage for females comes 30.66 per
Number Number not studying studying
F M F M F
4 5 6 7 8
51 53 37 12 14 69 70 49 7 20 65 33 24 24 41 53 8 3 43 50
248 1 2 246 246 486 165 115 332 371
13 3 9 4 4 14 18 8 2 6 20 5 14 :4 6
4 3 5 4 50 39 50
101 29 31 54 70
1 4 1 3 2 5 2 1 3 1 2 3
11 6 11 20 8 5 9 15
1 1 1 5 3 2 4 3 5 2 5
16 6 2 10
cent. These percentages are little more than those recorded for non-migrant population. Among different types of migrants the percentage varies from 32.60 per cent for those who were born outside -the town but within the district to 36.84 per cent in respect of persons migrated from other states.

CHAPTER-VII
NEIGHBOURHOOD PATTERN
The survey of the town was designed so as to supply the necessary information on neighbourhood and community life. The systematic sampling method was adopted and proportionate representation was given to all areas inhabited by economically, well to-do people, middle income and low income group and also different ethnic groups, commercial area etc. The discussions which were held with the people of the town of different castes, class, community and religion agreed unanimously that there is no well defined neighbourhood in the town. The town has grown without any planning, the town has also low density of population. The population growth is equally low. Majority of persons are living in their own houses which appear to have been built long ago. It is an ancient town situated at a height of 70 ft. of the earth level.
The town has Serpentile narrow lanes. In fact they may not be called roads but lanes. The town was an important trade and commerce centre in the past. At present there is nothing like the past. The people of the town were found complaining against the town planners that Vadnagar was never linked properly with the neighbouring villages. The neighbouring town Visnagar provides an easy access and consequently all the economic prosperity, development of trade and commerce seem to have been snatched away by Visnagar. Un-employment among the town people is high and therefore the town needs systematic and planned industrialisation.
Neighbourhood in the strict sense is difficult to define. In physical sense it represents the group of persons who live in close physical proximity. However, the word neighbourhood is defined in different ways i.e. somewhere in terms of physical identity a particular place or region, a locality or group of neighbours of
social and moral entity or combination of the two viz. physical and moral entity. This chapter is aimed at to discuss about the persons of Vadnagar, who live in close relationship within the bonds of phYSical, social and moral links. Thus the word neighbourhood in the context of the aim of the present chapter, may be called, places which are near to each other and where the persons are living together sharing their joys and sorrrows.
The town is small both in terms of size and population and therefore people maintain and continue the physical link very easily. For example a person living in one extreme end and another other end may contact/meet each other very easily. Distance does not appear to have been a barri~r for the maintenance of harmonious relations/ neigbourhoods in the town.
The town is broadly divided into wards and further division of wards into convenient blocks. It looks very clear that the arrangements so devised mainly serve the needs of local administrative convenience. Such classification also serve the purpose of Census count. There are 6 Census wards and 49 blocks as per 1981 Census. The town has a total population of 22079 persons with an area of 44.27 sq. kms. It is always easier, for the people to meet frequently going on foot sometimes using the cheaper transportation if necessary. Thus for the people of Vadnagar the most significant aspect appears to be the study of mode and extent of participation of the people in each others social and cultural activities irrespective of their caste, class community of religion. On occasions like festivals or social and cultural gatherings the town people behave like one unit. According to Prof. Bhavsar an eminent education list of

150
the town 'the earlier social values are under the process of social-change but the speed with which such changes are taking place is quite insignificant, for example we do not have any problems of youth indiscipline in schools and colleges. However, it cannot be denied that there is considerable deterioration in the levels of respect given to their teachers now and earlier.
Selection of localities and neighbourhood
In order to get some meaningful information regarding the pattern of neIghbourhood in
Vadnagar in all 50 household schedules were canvassed.
An attempt was made while selecting the households that the selected families may represent each community living in the town. The selected localities are known by some specific name and thus they have been assigned numbers from I to V. also.
The statement given below indicates the number of persons interviewed in each locality.
Statement VII.1
Statement showing distribution of population of the interviewed households by locality
Locality No. of neighbour- No. of person in households hood scheduled canvassed Person Male Female
2 3 4 5
Sembharwada 10 52 23 29
II Amarthol Darwaja inside area 12 82 42 40
III Ghaskol Darwaja area 10 62 32 30
IV Amtol Darwaja area 8 52 27 25
V Amarthol Darwaja bahar area 10 54 30 24
TOTAL 50 302 154 148
Other Characteristics As regards the age-structure of the persons
recorded in the sample schedule it is given below in the form of a statement.
Statement VII.2
Distribution of members of Interviewers houeholds by age
Locality
I Sembharwada
II Amarthol Darwaja inside area
Households Below schedules 20 yrs
2 3
10 24
12 36
20-34 35-59·
4 5
10 11
21 21
60 + Total
6 7
7 52
4 82
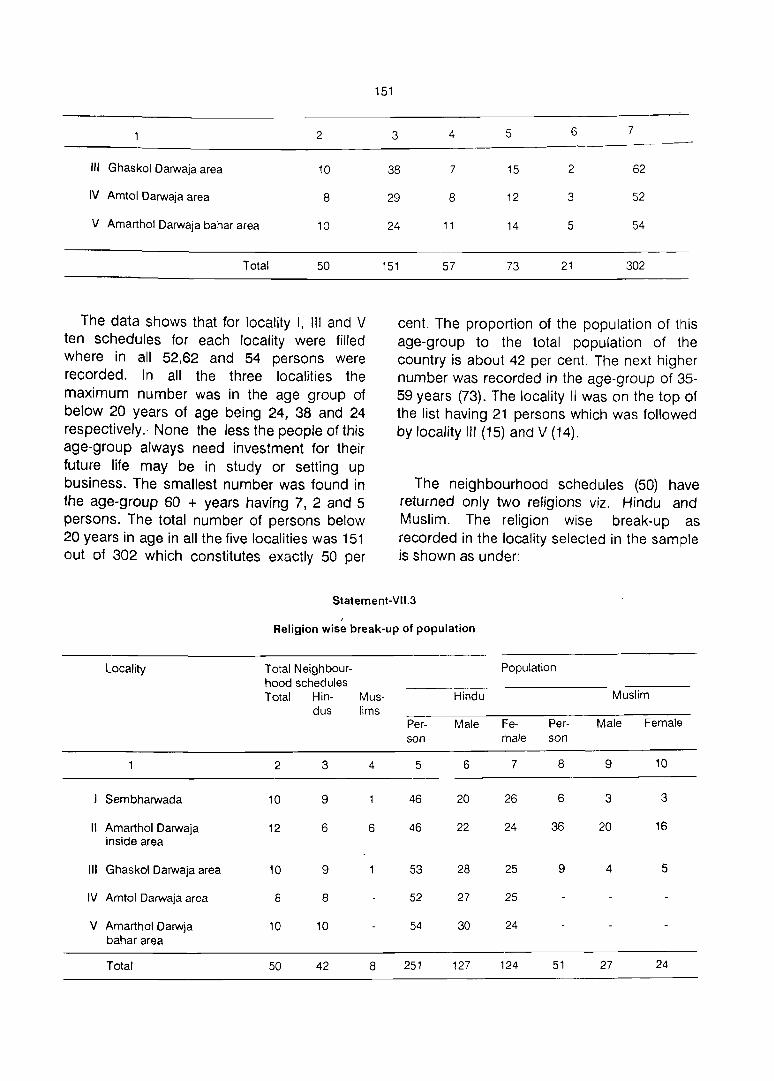
2
"' Ghaskol Oarwaja area 10
'V Amtal Oarwaja area 8
V Amarthal Oarwaja bahar area 10
Total 50
The data shows that for locality I, III and V ten schedules for each locality were filled where in all 52,62 and 54 persons were recorded. In all the three localities the maximum number was in the age group of below 20 years of age being 24, 38 and 24 respectively. None the less the people of this age-group always need investment for their future life may be in study or setting up business. The smallest number was found in the age-group 60 + years having 7, 2 and 5 persons. The total number of persons below 20 years in age in all the five localities was 151 out of 302 which constitutes exactly 50 per
151
3 4 5 6 7
38 7 15 2 62
29 8 12 3 52
24 11 14 5 54
151 57 73 21 302
cent. The proportion of the population of this age-group to the total population of the country is about 42 per cent. The next higher number was recorded in the age-group of 35-59 years (73). The locality II was on the top of the list having 21 persons which was followed by locality III (15) and V (14).
The neighbourhood schedules (50) have returned only two religions viz. Hindu and Muslim. The religion wise break-up as recorded in the locality selected in the sample is shown as under:
Statement-Vl1.3 ,
Religion wise break-up of population

152
It is seen that out of 50 neighbourhood schedules canvassed 8 or 16 per cent pertains to Muslim religion and rest 42 or 84 per cent belong to Hindu religion. The 12 schedules which were allotted to locality II half belonged to Muslim. The locality IV and V do not cover Muslim households. Similarly out of total 302 persons covered in the sample 51 persons or 16.88 per cent also belong to Muslim religion of which 27 are males and 24 females. In all 251 persons belong to Hindu religion of which persons recorded in localities III, IV and Vare above 50 persons and 46 persons each in I and II locality.
Scheduled Castes -and Tribes
Only in one locality viz. III was found having the total scheduled castes.
Name of the caste No. of households
1. Chamar 2
2. Garoda 3
3. Bhangi 2
4. Vankar 1
The town has no scheduled tribe.
Statement VII.4
Distribution of households by caste/community
HINDU
Locality Vag- Modh Pat- Ghan- Brah- Tha- Gadh- Naik Soni Bhav- Mus-hari Vania el chi min kor avi sar lim
I Sembharwada
II Amarthol Darwaja inside area
III Ghaskol Darwaja area
IV Amtol Darwaja area
V Amarthol Darwaja bahar area
TOTAL
2 3 4 5
6
8
14
As regards the position of other communities in each of the sampled locality it is found that out of 10 schedules canvassed for locality I only one nousehold each of Vaghari, ModhVania, Brahmin and Muslim and six households of Patels were recorded. Out of 12 households canvassed in locality II,
6
3
4
7 8 9 10 11 12
6 6
3
9 8
6 households equally distributed between Muslim and Thakor families. In locality III one family each of Muslims and Gadhavi was found. The households of above mentioned. scheduled castes were also found to be recorded in this locality. The locality IV returned 3 families each of Brahmin and

Thakor besides one each of Naik and Soni family. Three castes namely Patel, Ghanchi and Bhavsar appeared in the sample locality V. Where 8 faflJilies were of Patels and 1 each of Ghanchi and Bhavsar. In short out of 42 households belonging to other communities the maximum households belong to Patel with 14 followed by Thakor with 9 and Muslim with 8 households. The 4 households of Brahmin were also canvassed for this purpose for the rest of the communities only 1 household was covered.
Identification of Neighbourhood
locality-I
~hiS locality contains three neighbourhoods namely Patel Vas, Vaghari Vas and Muslim Vas. Patel Vas ·area is mainly inhabited byPatel community whereas V"ghari Vas neighbourhood is mainly inhabited by Vaghari community and that of Muslim Vas is inhabited by Muslim.
The whole area containing 3 neighbourhoods is also known as Nadio, Darwaja Area. Regarding the occupation of the residents of this area it was observed that about 20% are engaged in business, 40% in cultivation and 40% are engaged in different services. In addition to Patels, Vagharis and Muslims, some houses of Modhvania and Brahmin are also located in these neighbourhoods.
Locality-II
This locality contains two neighbourhoods namely Sembhar Vada (Amarthol Darwaja) and Thakor Vas. Sembharvada named after the Sembhar village from where Muslim community migrated, whereas Thakorvas neighbourhood is mainly inhabited by Thakor community.
The whole area containing two neighbourhood is also known as area of Amarthol Darwaja which is situated in the east
153
side of Vadnagar. In regard to occupation of the residents of these two neighbourhood, it was found that 80% were engaged in various services and 20% in business mostly in bidi work and cultivation.
Locality-III
This locality contains two neighbourhoods namely Bhangivas and Chamarvas. Both Bhangivas and Chamarvas are chiefly inhabited by Bhangi and Chamar communities respectively which are being treated as the Scheduled Caste in Gujarat.
The whole area having two neighbourhoods is also known as a plain area of Ghaskal of Darwaja. Mainly middle and poor class people are residing here. With regard to occupation of the residents of these two neighbourhoods, it was seen that 30% are engaged in leather work, 30% work as agricultural labourers and remaining 40% are engaged in miscellaneous labour work.
Locality-IV
This locality contains two neighbourhoods namely Kansaravas and Thakorvas (Amtol Oarwaja). Kansara Vas area is mainly inhabited by Kansara community whereas Thakorvas (Amtol Darwaja) area is named after the Amtol Mataji temple and gate.
The whole area containing two neighbourhoods is' known as Amtol Darwaja area and top level place of Vadnagar town. With regard to occupation of the residents of these two neighbourhoods it was observed that mainly they are working as cultivators, retail businessman and also labourers.
locality-V
This locality contains three neighbourhoods namely Patelvas, Dabgar vas and Chhipa vas. Patel vas area is mainly inhabited by Patel
community where as Dabgar vas is mainly inhabited by Dabgar community and that of Chhipa vas is inhabited by Chhipa comlT!unity. The whole area containing three neighbourhoods is also known as a Amarthol Darwaja area. Regarding occupation of the residents of these three neighbourhoods, it was observed that 20% are businessman and remaining 80% are engaged in cultivation, retail business and various services.
Names and History of Neighbourhood
Interviewers were asked -such questions which directly related to the establishment of association of neighbourhood. Such questions were asked from the persons of each locality. One distinct feature for establishing the history of neighbourhood is that the people generally refer to a building which is nearest to their surroundings.
It will be seen that each locality has ~uch residence who belong to different castes but maintain neighbourly relationship with each other. It is also observed that most of the neighbourhoods seem to have been on the basis of community mainly residing in the area. First locality contains both Hindus and Muslims and was having three different
154
neighbourhoods namely Patelvas, Vagharivas and Muslimvas named on the basis of main community residing in the locality. The locality II has two neighbourhoods viz. Thakorvas or Amarthol Darwaja and Sembharwada which is not strictly attached with the name of particular caste/community. However, local~ty III has recorded different communities including scheduled castes belonging to Hindu religion and they have selected three neighbourhoods viz. Bhangivas and Chamarvas attached with the name of scheduled caste Bhangi and Chamar, whereas the third one Amarthol Darwaja is named on historical fact. Similarly for locality IV and V the majority of neighbourhoods stated by the different community are attached with the name of particular community viz. Patelvas, Dabgarvas, Chhipavas and Kansara (Bhavsar) Vas, etc. In brief it seems that the primary group of neighbour is caste/community or religion. However, it was informed by the interviwers th?t inspite of such diversity based on caste,' community or religion the dimension of their neighbourhood to the respective areas do not have any restriction.
Locality and Neighbourhood
Statement-VIl.5
Name of Loc~iity
Locality·' Sembharwada
Locality·1I Amarthol Darwaja inside area
Distribution of interviewees according to different religion/caste/community
Neighbourhood Number of interviewees described by ..... _- .. _---------------_ .. --.. _--------- .. _-------- .. _------.. _-------------------------persons inter- Religion-1 Religion-2 viewed in the (Hindu) (Muslim) locality Castel Caste/Community
Community
2 3 4
1 Patefvas Vaghari 1 Muslim 2 Vagharivas Modh Vania 1 3 Muslimvas Patel 6
Brahmin 1
Sembharwada Thakor 6 Muslim 6 (Amarthol Darwaja)
2 Thakorvas
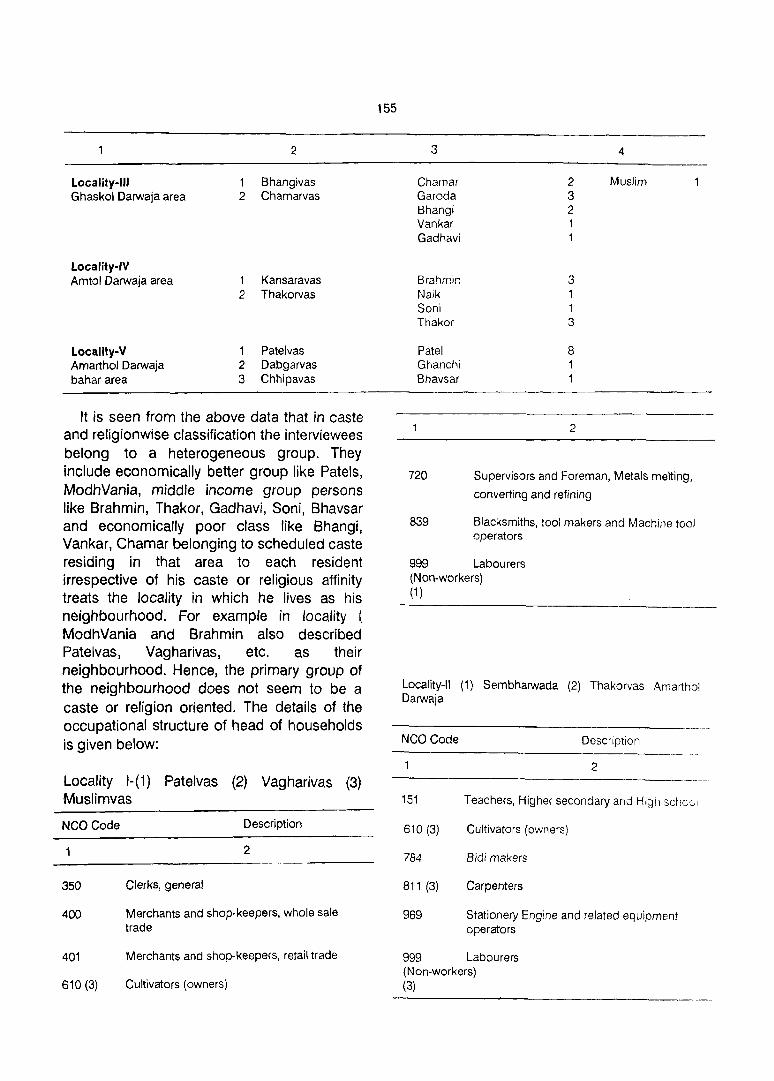
Locality-III Ghaskol Darwaja area
Locality-IV Amtol Darwaja area
Locality-V Amarthol Darwaja bahar area
2
1 Bhangivas 2 Chamarvas
1 Kansaravas 2 Thakorvas
1 Patelvas 2 Dabgarvas 3 Chhipavas
It is seen from the above data that in caste and religionwise classification the interviewees belong to a heterogeneous group. They include economically better group like Patels, ModhVania, middle income group persons like Brahmin, Thakor, Gadhavi, Soni, Bhavsar and economically poor class like Bhangi, Vankar, Chamar belonging to scheduled caste residing in that area to each resident irrespective of his caste or religious affinity treats the locality in which he lives as his neighbourhood. For example in locality t ModhVania and Brahmin also described Patelvas, Vagharivas, etc. as their neighbourhood. Hence, the primary group of the neighbourhood does not seem to be a caste or religion oriented. The details of the occupational structure of head of households is given below:
Locality 1-(1) Patelvas (2) Vagharivas (3) Muslimvas
NCO Code
350
400
401
610 (3)
Description
2
Clerks, general
Merchants and shop-keepers, whole sale trade
Merchants and shop-keepers, retail trade
Cultivators (owners)
155
3
Chamar Garoda Bhangi Vankar Gadhavi
Brahmin Naik Soni Thakor
Patel Ghanchi Bhavsar
2 -3
2 1
3 1 1 3
8 1 1
2
4
Muslim
720 Supervisors and Foreman, Metals melting,
converting and refining
839 Blacksmiths, tool makers and Machine tool operators
999 Labourers (Non-workers) (1 )
Locality-II (1) Sembharwada (2) Thakorvas Amarthol Darwaja
NCO Code
151
610 (3)
784
811 (3)
969
Description
2
Teachers, Higher secondary and High schcci
Cultivators (owners)
Bidi makers
Carpenters
Stationery Engine and related equipment operators
999 Labourers (Non-workers) (3)

Locality-III Ghaskol Darwaja area (1) Bhangivas (2) Chamarvas
2
199 Professional workers
380 Postman
430 Salesman, Shop assistants and Demonstrators
431 Street vendors, Canvassers and News vendors
541 Sweepers, cleaners and related workers
809 Leather cutters, Lasters and Sewers and related workers
959 Well Diggers and construction workers
999 Labourers (Non-workers) (2)
Locality-IV (1) Kansaravas (2) Thakorvas
151
401 (2)
610 (2)
881
2
Teachers, Higher secondary and secondal)l schools
Merchants and Shop-keepers, Retail trade
Cultivators (owners)
Jewellers, Goldsmiths and Silversmiths
903 Tyre makers and Vulcanizers (Non-workers) (1 )
Locality-V Amarthol Darwaja bahar area
(1) Patelvas (2) Dabgarvas (3) Chhipavas
2
320 Stenographers and Steno-typists
401 (5)
600
Merchants and Shop-keepers, Retail trade
Farm managers and Supervisors, Crop Productions
819 Carpenters, Cabinet makers and related Non-workers workers (2)
156
In the absence of sufficient number of Government offices in the town it has been assumed that the teachers, highly educated persons and businessmen constitute the section of such persons who can talk about the levels of neighbourhood in the town.
The locality recorded Patelvas, Vagharivas and Muslimvas as the neighbourhoods. The persons appearing in this locality are clerks, whole sale and retail merchants and shop-keepers, cultivators, blacksmiths, supervisors and foreman in metal meltin~ and labourers. The locality II includes mainly Sembharwada and Thakorvas or Amarthol Oarwaja as the neighbourhoods. The teachers of higher secondary and secondary schools, cultivators, businessmen, carpenters, the workers in stationary establishments and non-workers are the residents of this locality. They all live peacefully maintaining friendly relations with each other.
In locality III people mentioned Bhangivas and Chamarvas as their neighbourhood both Bhangis and Chamars belonging to scheduled caste community and economically poor section of the society. In this locality some professional workers, postmen, shop-keepers, street vendors, sweepers, cleaners, leather workers, hut builders, labourers and nonworkers live who were contacted in connection with the neighbourhood pattern. In locality IV the interviewee have mentioned the 'Kansaravas' and Thakorvas as their neighbourhoods. Here also the teachers of secondary and higher secondary schools, merchants, shop-keepers, cultivators, jewellers, goldsmiths, silversmiths, tyre makers and vulcar1':ters and non-workers are the residents of the locality aod they maintain friendly relation with each other. Lastly in locality V the persons whose occupation is stenography, trade and commerce, farm management and supervision of crop production, carpenters and non-workers etc. are the residents of this locality which includes 'Patelvas', Dabgarvas
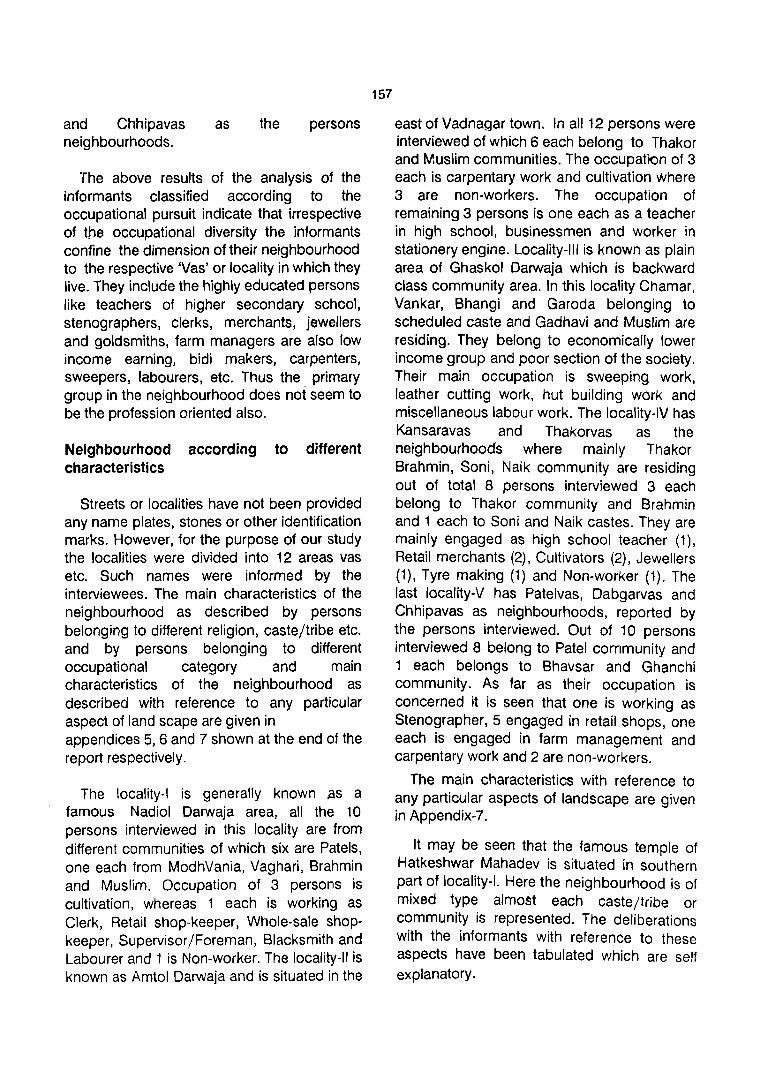
and Chhipavas as the persons neighbourhoods.
The above results of the analysis of the informants classified according to the occupational pursuit indicate that irrespective of the occupational diversity the informants confine the dimension of their neighbourhood to the respective 'Vas' or locality in which they live. They include the highly educated persons like teachers of higher secondary school, stenographers, clerks, merchants, jewellers and goldsmiths, farm managers are also low income earning, bidi makers, carpenters, sweepers, labourers, etc. Thus the primary group in the neighbourhood does not seem to be the profession oriented also.
Neighbourhood according to different characteristics
Streets or localities have not been provided any name plates, stones or other identification marks. However, for the purpose of our study the localities were divided into 12 areas vas etc. Such names were informed by the interviewees. The main characteristics of the neighbourhood as described by persons belonging to different religion, caste/tribe etc. and by persons belonging to different occupational category and main characteristics of the neighbourhood as described with reference to any particular aspect of land scape are given in appendices 5, 6 and? shown at the end of the report respectively.
The locality-I is generally known as a famous Nadiol Oarwaja area, all the 10 persons interviewed in this locality are from different communities of which six are Patels, one each from ModhVania, Vaghari, Brahmin and Muslim. Occupation of 3 persons is cultivation, whereas 1 each is working as Clerk, Retail shop-keeper, Whole-sale shopkeeper, Supervisor/Foreman, Blacksmith and Labourer and 1 is Non-worker. The locality-II is known as Amtol Oarwaja and is situated in the
157
east of Vadnagar town. In all 12 persons were interviewed of which 6 each belong to Thakor and Muslim communities. The occupation of 3 each is carpentary work and cultivation where 3 are non-workers. The occupation of remaining 3 persons is one each as a teacher in high school, businessmen and worker in stationery engine. Locality-III is known as plain area of Ghaskol Oarwaja which is backward class community area. In this locality Chamar, Vankar, Bhangi and Garoda belonging to scheduled caste and Gadhavi and Muslim are residing. They belong to economically lower income group and poor section of the society. Their main occupation is sweeping work, leather cutting work, hut building work and miscellaneous labour work. The locality-IV has Kansaravas and Thakorvas as the neighbourhoods where mainly Thakor Brahmin, Soni, Naik community are residing out of total 8 persons interviewed 3 each belong to Thakor community and Brahmin and 1 each to Soni and Naik castes. They are mainly engaged as high school teacher (1), Retail merchants (2), Cultivators (2), Jewellers (1), Tyre making (1) and Non-worker (1). The last locality-V has Patelvas, Dabgarvas and Chhipavas as neighbourhoods, reported by the persons interviewed. Out of 10 persons interviewed 8 belong to Patel community and 1 each belongs to Bhavsar and Ghanchi community. As far as their occupation is concerned it is seen that one is working as Stenographer, 5 engaged in retail shops, one each is engaged in farm management and carpentary work and 2 are non-workers.
The main characteristics with reference to any particular aspects of landscape are given in Appendix-?
It may be seen that the famous temple of Hatkeshwar Mahadev is situated in southern part of locality-I. Here the neighbourhood is of mixed type almost each caste/tribe or community is represented. The deliberations with the informants with reference to these aspects have been tabulated which are self explanatory.
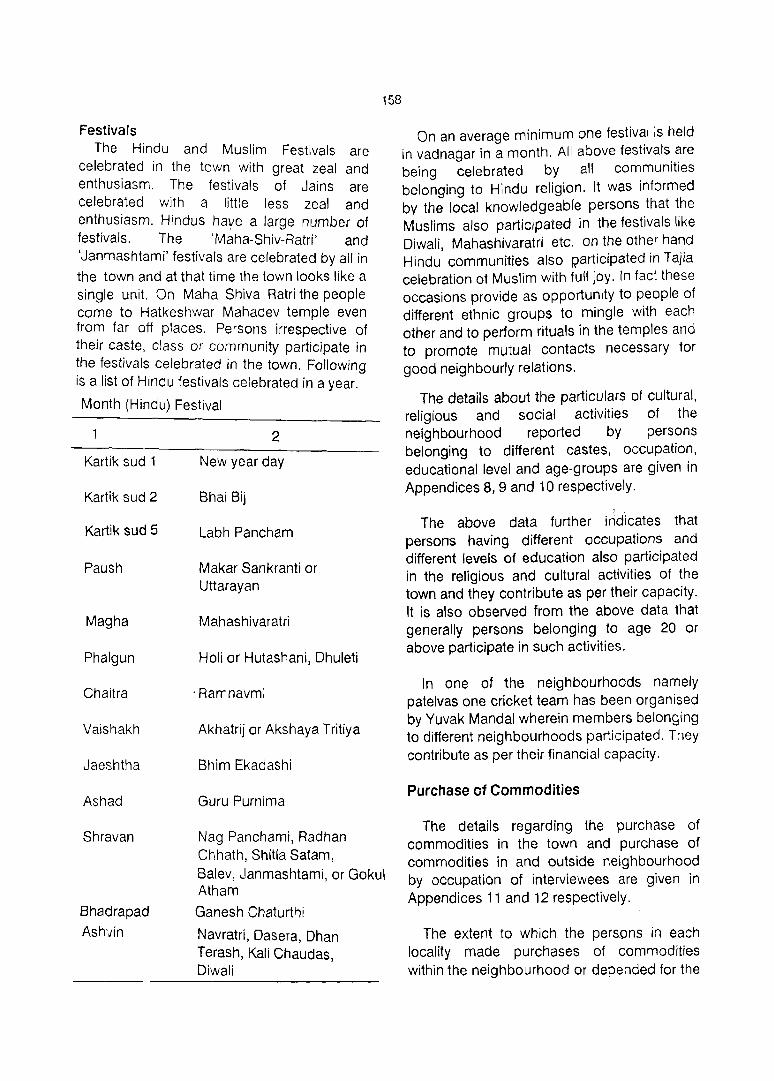
Festivals The Hindu and Muslim Festivals are
celebrated in the town with great zeal and enthusiasm. The festivals of Jains are celebrated with a Iitt:e less zeal and enthusiasm. Hindus have a large number of festivals. The 'Maha-Shiv-Ratri' and 'Janmashtami' festivals are celebrated by all in the town and at that time the town looks like a single unit. On Maha Shiva Ratri the people come to Hatkeshwar Mahadev temple even from far off places. Persons irrespective of their caste, class or community participate in the festivals celebrated in the town. Following is a list of Hindu festivals celebrated in a year.
Month (Hindu) Festival
Kartik sud 1
Kartik sud 2
Kartik sud 5
Paush
Magha
Phalgun
Chaitra
Vaishakh
Jaeshtha
Ashad
Shravan
2
New year day
Bhai Bij
Labh Panch am
Makar Sankranti or Uttarayan
Mahashivaratri
Holi or Hutashani, Dhuleti
. Ramnavmi
Akhatrij or Akshaya Tritiya
Bhim Ekadashi
Guru Purnima
Nag Panchami, Radhan Chhath, Shitla Satam,
158
Balev, Janmashtami, or Gokul Atham
Bhadrapad
Ash\/fn Ganesh Chaturthi
Navratri, Dasera, Dhan Terash, Kali Chaudas, Diwali
On an average minimum one festival is held in vadnagar in a month. All above festivals. are being celebrated by all con:munltles belonging to Hindu religion. It was Informed by the local knowledgeabre persons that the Muslims also participated in the festivals like Diwali Mahashivaratri etc. on the other hand HindU' communities also r;>articipated in Tajia celebration of Muslim with full joy. In fact these occasions provide as opportunity to people of different ethnic groups to mingle with each other and to perform rituals in the temples and to promote m\.ltual contacts necessary for good neighbourly relations.
The details about the particulars of cultural, religious and social activities of the neighbourhood reported by pers?ns belonging to different castes, occupation, educational level and age-groups are given in Appendices 8, 9 and 10 respectively.
The above data further indicates that persons having different occupations and different levels of education also participated in the religious and cultural activities of the town and they contribute as per their capacity. It is also observed from the above data that generally persons belonging to age 20 or above participate in such activities.
In one of the neighbourhoods namely patelvas one cricket team has been organised by Yuvak Mandai wherein members belonging to different neighbourhoods participated. They contribute as per their financial capacity.
Purchase of Commodities
The details regarding the purchase of commodities in the town and purchase of commodities in and outside neighbourhood by occupation of interviewees are given in Appendices 11 and 12 respectively.
The extent to which the persons in each locality made purchases of commodities within the neighbourhood or depended for the

same outside neighbourhood was also attempted in the survey.
Thakors and Kansaras, Chhipas in locality-V. The further classification of this information according to occupation reveals that irrespective of the occupation viz. may be teacher, stenographer, street vendors, carpenters, black-smiths or a jeweller all depend outside the neighbourhood for making the purchase of the commodities.
Educational Facilities
For Patelvas, Vagharivas and Muslimvas in the locality-I no institution of higher standard was found and all the residents were availing the facility of primary school. The locality-II was having one Balmandir and one primary school. People expressed the requirement of a high school which was not in their area. However, only 10 households were found availing of the facility of primary school in locality-I and six households were availing the facility of Balmandir and primary school in locality-II. Similar condition of availability of educational institutions was found in the remaining locality where only school of primary standard was in existence and requirement for a high school was expressed by the interviewees.
Medical Facilities
As far as the medical and health facilities are concerned there is one clinic available in all the five selected localities. As far as the number of neighbourhoods in each locality is concerned it will be observed that one clinic is available in each of Patelvas in locality-I, Sembharwada in Locality II, Bhangivas in locality III and Oabgarvas in Locality V. No such medical facility in any of two neighbourhoods of locality-IV is existing. It is obvious that households of the neighbourhoods where such facility is not available have expressed desire for clinic facility in their areas. The persons who were
159
interviewed opined that the private hospital doctors were costly and because of this reason they need to go outside the neighbourhood but within the town for such purposes. The details showing the educational facility and its enjoyment in and outside the neighbourhood by level of education as well as the medical facility and its enjoyment in and outside the neighbourhood are given in the Appendices 13 and 14.
Recreational Facility in the Neighbourhood
Except in Patelvas no other loocality was havinq the recreational facility as recorded during the survey. However, in the name of recreation, the town has only one theatre where Gujarati and Hindi movies are shown. The cinema is very close to locality-I. Since there is no good park/garden or any other recreational facility people mostly depend upon cinema as the main source of recreation.
General Observations
Vadnagar presents all such characteristics of neighbourhood which are necessarily present in small town or a little developed village.
People know each other. They frequently meet and discuss social and other related matters. Elderly persons of a locality are given the same regard which may be expected from the children, youth and other younger agegroup. Brotherly behaviour amongst the persons is always noticed. Marriage is an occasion when neighbourhood is tested in Vadnagar specially in the marriage of the girls everybody helps according to his capacity. The entire area appears as one family since it becomes difficult to distinguish amongst the relatives and friends. Marriages are mostly inter caste, Divorce or separation seldom take place. Married life is peaceful and in the event of isolated cases of disputes the elderly ladies of the family as well as of the neighbourhood exercise their influence to settle the matter.

The youth do not smoke freely in the locality. Teachers are highly respected by the students as well as by their parents.
The birth of a child is traditionally celebrated by organising the 'ladies sanget' {female
160
music) in the house of the newly born child. When people fail sick there are many to come to them or look after. At the time of death breded family is provided food and break-fast by the neighbourhood for a couple of days. Thus it may be concluded that Vadnagar has ideal standard of neighbourhood.
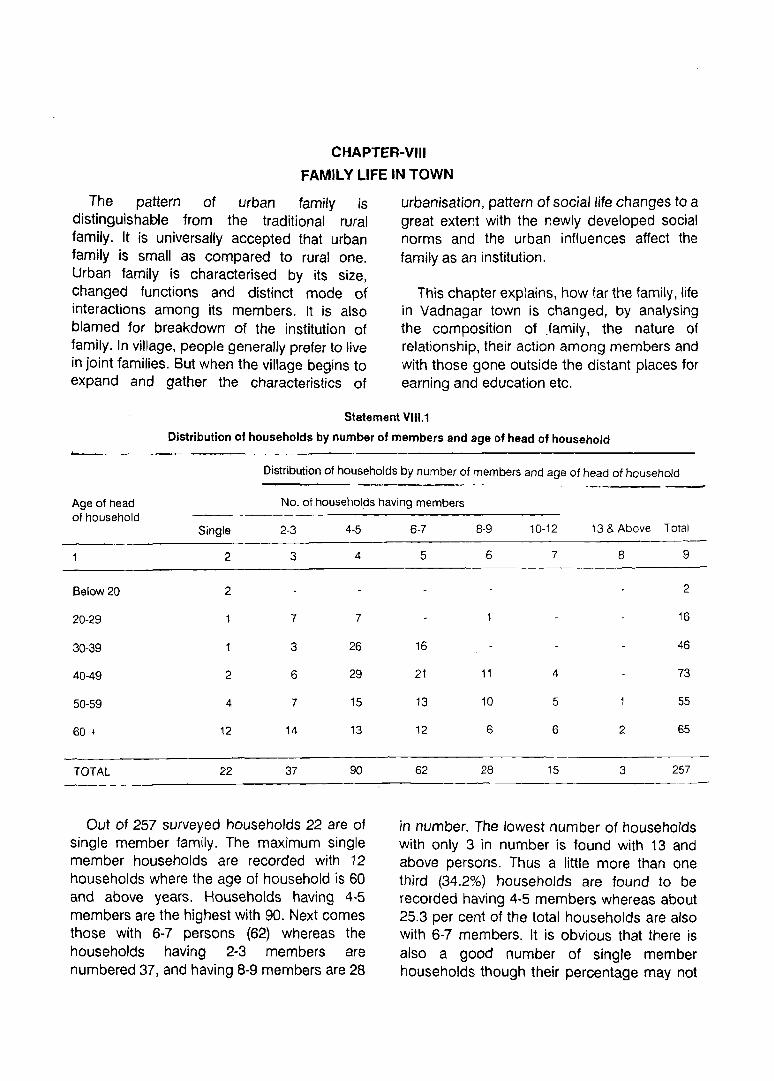
CHAPTER-VIII
FAMILY LIFE IN TOWN
The pattern of urban family is distinguishable from the traditional rural family. It is universally accepted that urban family is small as compared to rural one. Urban family is characterised by its size, changed functions and distinct mode of interactions among its members. It is also blamed for breakdown of the institution of family. In village, people generally prefer to live in jOint families. But when the village begins to expand and gather the characteristics of
urbanisation, pattern of social life changes to a great extent with the newly developed social norms and the urban influences affect the family as an institution.
This chapter explains, how far the family, life in Vadnagar town is changed, by analysing the composition of .family, the nature of relationship, their action among members and with those gone outside the distant places for earning and education etc.
Statement VIII.1
Distribution of households by number of members and age of head of household ..___ ... - -~.- ~-- ------._------------------
Distribution of households by number of members and age of head of household
Age of head of household
No. of households having members
Single 2-3 4·5
2 3 4
Below 20 2
20·29 7 7
30-39 3 26
40-49 2 6 29
50-59 4 7 15
60 + 12 14 13
TOTAL 22 37 90
Out of 257 surveyed households 22 are of single member family. The maximum single member househOlds are recorded with 12 households where the age of household is 60 and above years. Households having 4·5 members are the highest with 90. Next comes those with 6-7 persons (62) whereas the households having 2-3 members are numbered 37, and having 8·9 members are 28
6·7 8-9 10·12 13 & Above Total
5 6 7 8 9
2
16
16 46
21 11 4 73
13 10 5 55
12 6 6 2 65
62 28 15 3 257
in number. The lowest number of households with only 3 in number is found with 13 and above persons. Thus a little more than one third (34.2%) households are found to be recorded having 4·5 members whereas about 25.3 per cent of the total households are also with 6·7 members. It is obvious that there is also a good number of Single member households though their percentage may not
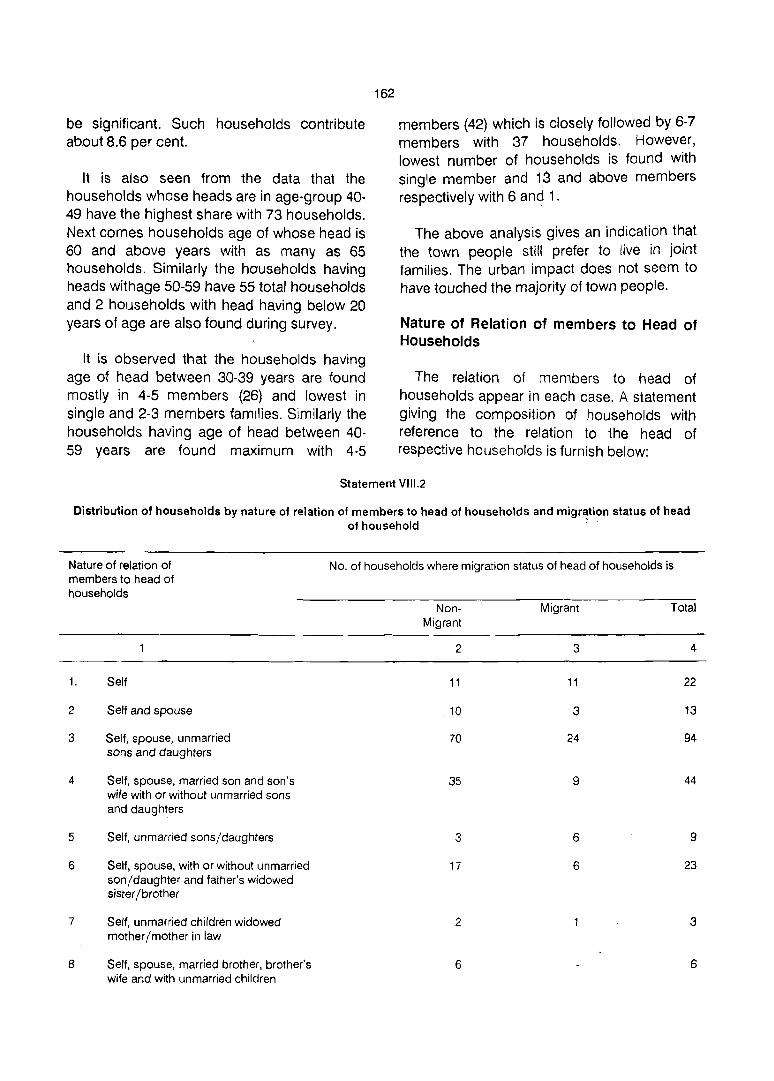
be significant. Such households contribute about 8.6 per cent.
It is also seen from the data that the households whose heads are in age-group 40-49 have the highest share with 73 households. Next comes households age of whose head is 60 and above years with as many as 65 households. Similarly the households having heads with age 50-59 have 55 total households and 2 households with head having below 20 years of age are also found during survey.
It is observed that the households having age of head between 30-39 years are found mostly in 4-5 members (26) and lowest in single and 2-3 members families. Similarly the households having age of head between 40-59 years are found maximum with 4-5
162
members (42) which is closely followed by 6-7 members with 37 households. However, lowest number of households is found with single member and 13 and above members respectively with 6 and 1.
The above analysis gives an indication that the town people still prefer to live in jOint families. The urban impact does not seem to have touched the majority of town people.
Nature of Relation of members to Head of Households
The relation of members to head of households appear in each case. A statement giving the composition of households with reference to the relation to the head of respective households is furnish below:
Statement VII1.2
Distribution of households by nature of relation of members to head of households and migration status of head of household :
Nature of relation of members to head of households
1. Self
2 Self and spouse
3 Self, spouse, unmarried sons and daughters
4 Self, spouse, married son and son's wife with or without unmarried sons and daughters
5
6
7
8
Self, unmarried sons/daughters
Self, spouse, with or without unmarried son/daughter and father's widowed sister/brother
Self, unmarried children widowed mother /mother in law
Self, spouse, married brother, brother's wife and with unmarried children
No. of households where migration status of head of households is
Non- Migrant Total Migrant
2 3 4
11 11 22
10 3 13
70 24 94
35 9 44
3 6 9
17 6 23
2 3
6 6

9 Self, spouse, married brother with spouse, unmarried children and widowed mother/widowed father
10 Self, spouse married sons and spouse and father widowed brother.
11
12
Self, spouse, married sons with their spouse with unmarried children
Others
The data presented in the ~bove statement indicates that there are 34 households which are incomplete having no married couple. Out of these 34 households as many as 22 are single members households. The half of these single member households belong to other places where as the rest of the half households are the permanent residents of Vadnagar town having single member households live without any relatives with them. The other broken households are those with self (male or female) with- unmarried son/daughter and widowed mother/mother in law are 12 in number viz., only in 1 household the head is widower with unmarried children and in as many as 8 households heads are widows looking after their unmarried children.
Families having couple(s) account for 190. The most common type of households is the one where the head lives with his/her spouse, unmarried sons and daughters which is 94 in number whereas there are 13 households wherein only self and his/her spouse are living. Thus 107 households fall under the category of 'Nuclear families'. There are 44 lineal joint families in which the heads live with
163
2 3 4
3 3
6 6
33 33
their respective wives, married sons and daughters. There are 6 households belong to collateral joint family in which the head lives with his wife, married brother, brother's wife and unmarried sons and daughters. In 6 households categorised as lineal collateral joint family in which three or more couples are linked lineally and collaterally consisting of the head of households his spouse, married sons with their spouse and also unmarried children of the couples. There are 9 households categorised as Sub-Nuclear households consisting of self (Male or Female) with unmarried children. In addition to this there are 33 households.
The most common combination obviously is self, spouse and their unmarried sons and daughters. It is perhaps due to the nature and place of employment and decaying old tradition of joint family system especially in urban areas. The definitions of type of households are shown in Appendix-13.
Households by type of education of head of households
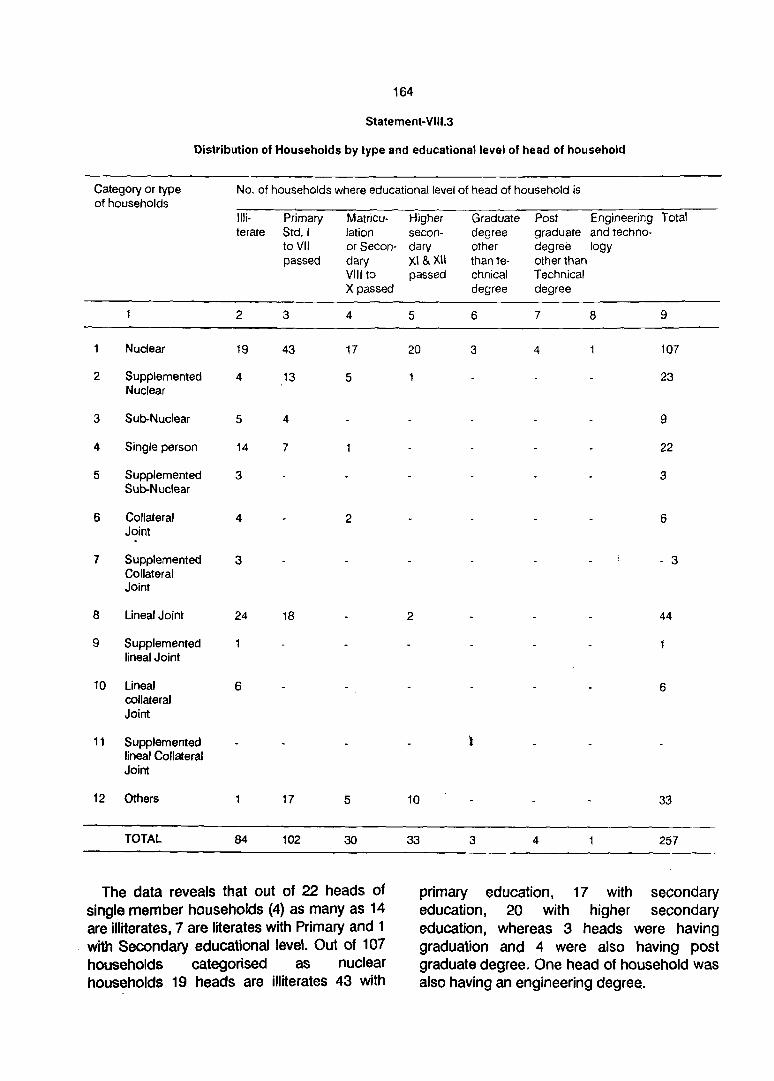
164
Statement-VIII.3
Distribution of Households by type and educational level of head of household
Category or type of households
No. of households where educational level of head of household is
2
3
4
5
6
7
8
Nuclear
Supplemented Nuclear
Sub-Nuclear
Single person
Supplemented Sub-Nuclear
Collateral Joint
Supplemented Collateral JOint
Lineal Joint
9 Supplemented lineal Joint
10 Lineal collateral Joint
11 Supplemented lineal Collateral Joint
12 Others
TOTAL
Illiterate
2
19
4
5
14
3
4
3
24
6
84
Primary Std. I to VII passed
3
43
13
4
7
18
17
102
Matriculation or Secondary VIII to X passed
4
17
5
2
5
30
The data reveals that out of 22 heads of single member households (4) as many as 14 are illiterates, 7 are literates with Primary and 1 with Secondary educational level. Out of 107 households categorised as nuclear households 19 heads are illiterates 43 with
Higher secondary XI & XII passed
5
20
2
10
33
Graduate degree other than technical degree
6
3
l
3
Post Engineering Total graduate and techno-degree logy other than Technical degree
7
4
4
8 9
107
23
9
22
3
6
- 3
44
6
33
257
primary education, 17 with secondary education, 20 with higher secondary education, whereas 3 heads were having graduation and 4 were also having post graduate degree. One head of household was also having an engineering degree.

Next common type of households is lineal joint. Such households are 44 in number of which as many as 24 heads are illiterates, 18 are having primary education whereas head of 2 households are having higher secondary level education. In all 9 households are categorised as sub-nuclear, of which 5 heads are illiterates and rest 4 are having primary education. Out of 6 collateral joint households heads of 4 households are illiterates.
It is also observed that out of total 257 households head of 84 are 'lI!lterates·. The
165
head of households having education upto primary standard top the list with 102 or 39.7 per cent. The secondary and higher secondary standard to gather accounted for 63 or 24.5 per cent whereas graduates and post graduates were 7 or 2.73 per cent.
Distribution of households by Caste
The following statement shows the distribution of households by caste/tribe/community of head of household and type of household.

166
Statement
Distribution of households by type 6f household and by
Type of Households No.of Households by where
Scheduled Caste Other communities
Van- Bhan- Cha- Gosia Garo- Mochi Turi .. Patel Tha- Brah- Praja-kar gi mar Bava da kor min pati
2 3 4 5 6 7 8 9 10 11 12
Nuclear 2 2 2 29 15 7 3
2 Supplemented 5 4 Nuclear
3 Sub-Nuclear 4
4 Single person 6 2 3
5 Supplemented Sub-nuclear
6 Collateral Joint 5
7 Supplemented Collateral Joint
8 Lineal Joint 2 2 8 10 2 2
9 Supplemented Lineal Joint
10 Lineal 6 Collateral Joint
11 Supplemented lineal Collateral Joint
12 Others 4 9 3 5
Total 4 3 5 2 4 2 58 52 16 11
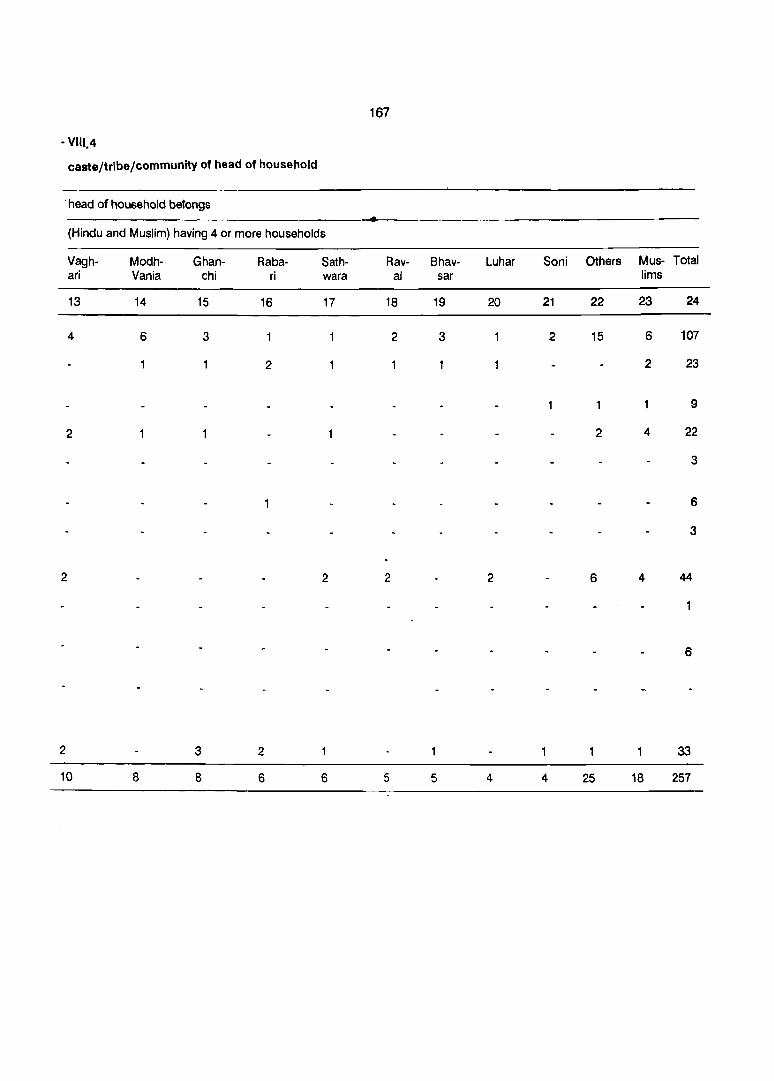
167
- VillA
caste/tribe/community of head of household
, head of hOU6Elhold betongs
(Hindu and Muslim) having 4 or more households
Vagh- Modh- Ghan- Raba- Sath- Rav- Bhav- Luhar Soni Others Mus- Total ari Vania chi ri wara al sar lims
13 14 15 16 17 18 19 20 21 22 23 24
4 6 3 2 3 2 15 6 107
2 2 23
9
2 2 4 22
3
6
3
2 2 2 2 6 4 44
6
2 3 2 33
10 8 8 6 6 5 5 4 4 25 18 257
Coming to the religion wise distribution, out of 107 nuclear households 101 belong to Hindu of which 9 belong to Scheduled caste and 92 to other Hindu communities whereas 6 belong to Muslim religion. The distribution of 44 lineal joint households further shows that 40 belong to Hindu and 4 to Muslim.
Out of 22 single member households maximum belong to Patel Community with 6 households followed by Muslim with 4 and Brahmin with 3. Similarly out of total 107 nuclear households having head and spouse with or without unmarried children as many as 29 belong to Patel, 15 households to Thakor community, 7 to Brahmin 6 each to Modh Vania and Muslim. In rest of the communities the number of households is below 5.
Out of total 44 households under category lineal joint having 'self and spouse with or without unmarried children and also with married son and his wife'. The main share is contributed by Patel and Thakor communities with 18 households whereas the other communities contribute 6. The contribution of Muslim households is 4 and that of the rest of the castes is 2 each. Almost similar trend is also observed in rest of the types of
168
households. Wherein maximum households with 33 are recorded under category others (12).
The statement further indicates that out of total 58 heads of households belonging to Patel exactly half of the households are categorised as Nuclear whereas 8 are found to be lineal jOint. Whereas this number in respect of Thakor community is 15 and 10 respectively. Similarly out of total 21 households of Scheduled caste as many as 9 are categorised as 'nuclear' households, 4 as lineal joint, 3 each as sub-nuclear and 'Supplemented sub-nuclear' whereas 2 households are supplemented collateral joint. Of the total 18 households of Muslim 6 are nuclear,4 each single person households and lineal joint whereas 2 are categorised as supplimented nuclear.
Distribution by Occupation
Data collected in the household schedules regarding occupation of the heads of households was tabulated according to the above broad occupational categories cross classified by the type of households as shown below:
STATEMENT VII-5 Distribution of households by type of househol and
type of occupation of head of household
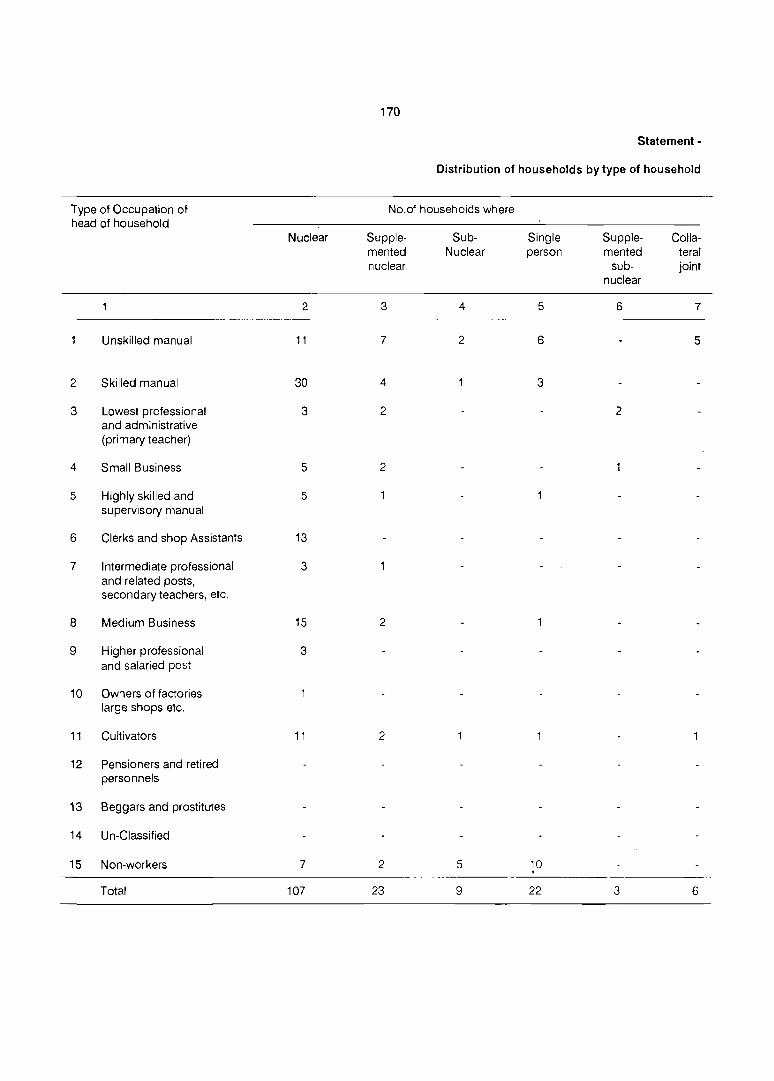
170
Statement -
Distribution of households by type of household
Type of Occupation of No.of households where head of household
Nuclear Supple- Sub- Single Supple- Colla-mented Nuclear person mented teral nuclear sub- joint
nuclear
2 3 4 5 6 7
Unskilled manual 11 7 2 6 5
2 Skilled manual 30 4 3
3 Lowest professional 3 2 2 and administrative (primary teacher)
4 Small Business 5 2
5 Highly skilled and 5 supervisory manual
6 Clerks and shop Assistants 13
7 Intermediate professional 3 and related posts, secondary teachers, etc.
S Medium Business 15 2
9 Higher professional 3 and salaried post
10 Owners of factories large shops etc.
11 Cultivators 11 2
12 Pensioners and retired personnels
13 Beggars and prostitutes
14 Un-Classified
15 Non-workers 7 2 5 10
Total 107 23 9 22 3 6

171
Viti ,5
and type of occupation of head of household
type of households is
Supple- Lineal Supple- Lineal Supple- Others Total Type of Occupation of mented jOint mented colla- mented head of household colla- lineal teral linea! teral joint joint colla-jOint teral
joint
8 9 10 11 12 13 14
6 6 43 Unskilled manual
5 2 4 50 Skilled manual
7 Lowest professional and administrative (Primary teacher)
8 Small Business
3 2 12 Highly skilled and supervisory manual
3 16 Clerks and shop Assistants
4 I ntermed iate professional and
related posts, Secondary teachers, etc,
2 2 23 Medium Business
3 Higher professional and
salari post
2 3 Owners of factories large
shops etc.
16 33 Cultivators
Pensioners and retired
personnels
Beggars and prostitutes
Un-Classified
13 18 55 Non-workers
3 44 6 33 257 Total
The above data reveals that out of total 257 heads of the households 43 or '16.73 per cent are engaged in unskilled manual jobs. A little less than one fifth of the total heads (50) of households are found to be engaged in ski.lled manual jobs. The proportion of heads of households engaged in cultivation is 33 or 12.84 per cent of the total heads of households: Whereas 23 heads are engaged in Medium business on the ,other hand only 8 heads are found to be engaged in a small business job. Out of total heads of the households Primary teachers are 7 in number and secondary teachers are only 4. As many as 16 heads are engaged in the job of clerks and shop assistants. The cro's~ classification of heads of households by occupations vis-avis the type of households hardly reveals any correlation between the two. It appears that unskilled manual job, skilled manual jobs, cultivation, medium business, job of clerks and shop assistants are the important occupations.
It is also observed that out of total 130 nuclear and supplemented nuclear households 34 heads are engaged in skilled manual job. 18 in unskilled manual job, 24 in small and medium business job and 13 in the cultivation. While 'lineal joint' families stand
172
next to nuclear as they are 44 in number. Among these as many as 16 heads of households are engaged in cultivation, 11 heads are engaged in skilled and unskilled manual job and 4 i[1 small and medium business. It also appears from the above data that out of 22 single member households 10 heads are reported to' be non-workers and 9 are engaged in unSkilled. and skilled manual job.
Sub-nuclear households are 9 in number of which a little more than half of the heads are found to be non-workers. Of 6 collateral joint 5 are engaged as unskilled workers anp 1 as Cultivator, while of 6 lineal collateral joint, 2 skilled manual workers, 3 clerks and· shop assistants and 1 medium businessman 'are noticed. In short the number of, he~ds engaged in all other occupations is, of {he small order the highest being 12 in highly skilled and supervisory manual job.
Members of Households Staying Outsi!;le t '
The distribution of heads of the households whose family members are staying out of the town by caste/community and occupational division of the head of household is given in the following statement.

173
Statement VIII.6
Distribution of heads of households whose family members are staying out of the town ,by caste/community and occupational category
Castel No.of 0-1 0-2 0-3 0-4 0-5 0-6 7-8-9 X Community house
holds Profe- Administ- Clerical Sales Service Farmers, Produ- Non-ssional, rative, and workers workers Fisher ction workers
technical executive related men, and and related ' and workers Hunters, related
workers manageri- Loggers, workers, al workers and related Transport
workers equipment operators
and labourers
2 3 4 5 6 7 8 9 10
Scheduled Caste
Bhangi
Chamar
BawaDedh
Garoda 2 2
Mochi
Turi
Vankar 2 2
TotalSC 9 2 6
Other Castes
Bhavnagar 5 3
Brahmin 6 3 2
Chaudhari 2
Darji
Ghanchi 3
Luhar
Vania 2
Naik
Patel 25 2 6 3 7 6
Prajapati 6 4

2 3 4
Rabari 3
Raval 2
Sathwara 2
Soni 3
Thakor 11
Vaghari 6
Total 79 7 \ 2
Muslim 8 2
Grand Total 96 9 2
The occupational divisions 7-8-9 i.e production and related workers transport equipment etc. having 23 or 8.95 per cent heads who had their close relatives staying outside the town. This is followed by occupation division 6· Farmers, Fishermen etc., having 18 or 7.00 per cent who had their close relatives staying outside. The occupation division of the sales workers constituting about 6.61 per cent (17) of the total heads of households which haej atleast
I
orie member living outside. The number of heads in the remaining other divisions i.e. '1, 2, 3 & 5 had some of their relations staying
174
5
3
6 7 8 9 10
3
2
10
2 2
17 18 17 14
4 2
\ 17 2 18 23 22
> \ \
outside. There are as many as 22 non-work~rs whose relatives are also staying outside the town.
It appears from the data that among the relatives of households belonging to castes like Patel, Thakor, Brahmin, Prajapati and Vaghari it is more common to stay outside. Even among Musl:ms as many as 8 households out of total 18 households having their relatives staying outside town.
Distance of Place of last residence
Statement - VII1.7
The details regarding households whose family members are staying outside by caste/community and distance
of place of last residence of head of household
Religion/Caste Community
Hindu
Scheduled Caste
Bhan-gi
Chamar
No.of households
2
No.of households whose family members are .. staying outside and where distance of place of last residence of head of household
Same, town
50 or less
51-100 101-200 201-500. 500+ Total
3 4 5 6 7 8 9

2 3
Bawa Dedh
Garoda 2
Mochi
Turi
Vankar 2 2
Total 9 7
Other Communities
Bhavsar 5 4
Brahmin 6 4
Chaudhari 2
Ghanchi 3 2
Darji
Luhar
Vania 2
Naik
Patel 25 21
Prajapati 6 5
Rabari 3 2
Raval 2 2
Sathwara 2 2
Soni 3 2
Thakor 11 11
Vaghari 6 3
Total 79 59
Muslim 8 5
Gr. Total 96 71
Out of 96 households whose family members are staying outside, the place of last residence of 71 heads of households is the same town whereas the distance of the place
175
4
2
2
2
2
12
3
17
5 6 7 8 9
2
2
9
5
6
2
3
2
25
6
3
2
2
3
11
6
4 4 79
8
4 4 96
of last residence is less than 50 kms. in respect of 17 heads of households. In respect of 4 heads of households such distance is between 51 and 100 kms. whereas the
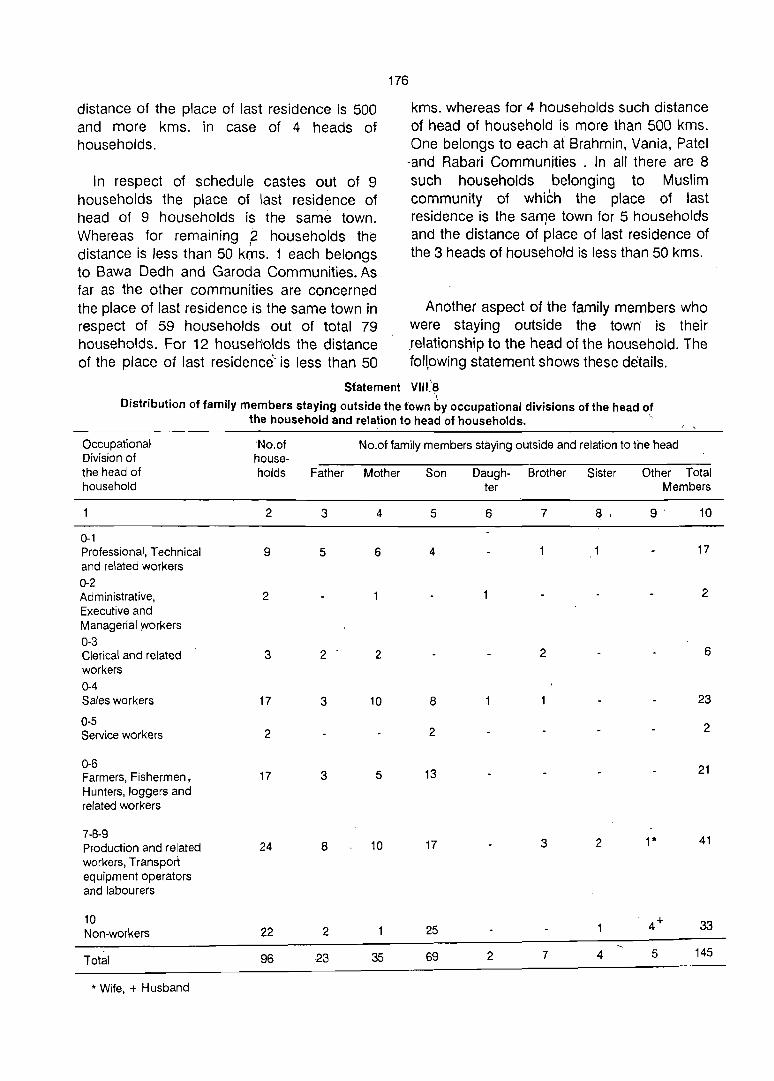
distance of the place of last residence is 500 and more kms. in case of 4 heads of households.
In respect of schedule castes out of 9 households the place of last residence of head of 9 households is the same town. Whereas for remaining 2 households the , distance is less than 50 kms. 1 each belongs to Bawa Dedh and Garoda Communities. As far as the other communities are concerned the place of last residence is the same town in respect of 59 households out of total 79 households. For 12 househ'olds the distance of the place of last residence'is less than 50
176
kms. whereas for 4 households such distance of head of household is more than 500 kms. One belongs to each at Brahmin, Vania, Patel -and Rabari Communities . In all there are 8 such households belonging to Muslim community of which the place of last residence is the sall)e town for 5 households and the distance of place of last residence of the 3 heads of household is less than 50 kms.
Another aspect of the family members who were staying outside the town is their relationship to the head of the household. The following statement shows these details.
statement VIII~'8 Distribution of family members staying outside the town 6y occupational divisions of the head of
the household and relation to head of households.
Occupational Division of the head of household
0-1 Professional, Technical and related workers
0-2 Administrative, Executive and Managerial workers
0-3 Clerical and related workers
0-4 Sales workers
0-5 Service workers
0-6 Farmers, Fishermen, Hunters, loggers and related workers
7-8-9 Production and related workers, Transport equipment operators and labourers
10 Non-workers
Total
* Wife, + Husband
No.of households
2
9
2
3
17
2
17
24
22
96
Father
3
5
2
3
3
8
2
23
No.of family members staying outside and relation to the head
Mother Son
4 5
6 4
2
10 8
2
5 13
10 17
25
35 69
Daugh- Brother Sister ter
6 7 & '
2
3 2
2 7 4
Other Total Members
9' 10
17
2
6
23
2
21
1* 41
33
5 145
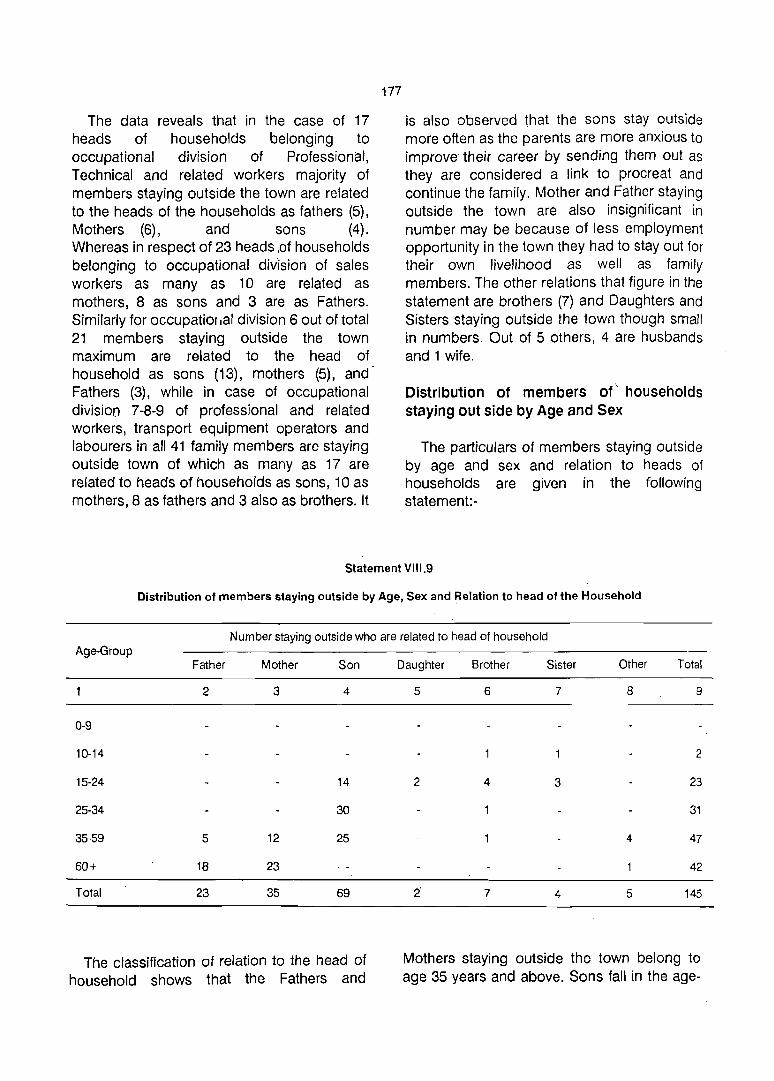
The data reveals that in the case of 17 heads of households belonging to occupational division of Professional, Technical and related workers majority of members staying outside the town are related to the heads of the households as fathers (5), Mothers (6), and sons (4). Whereas in respect of 23 heads ,of households belonging to occupational division of sales workers as many as 10 are related as mothers, 8 as sons and 3 are as Fathers. Similarly for occupatiol,al division 6 out of total 21 members staying outside the town maximum are related to the head of household as sons (13), mothers (5), and· Fathers (3), while in case of occupational division 7-8-9 of professional and related workers, transport equipment operators and labourers in all 41 family members are staying outside town of which as many as 17 are related to heads of households as sons, 10 as mothers, 8 as fathers and 3 also as brothers. It
177
is also observed that the sons stay outside more often as the parents are more anxious to improve their career by sending them out as they are considered a link to procreat and continue the family. Mother and Father staying outside the town are also insignificant in number may be because of less employment opportunity in the town they had to stay out for their own livelihood as well as family members. The other relations that figure in the statement are brothers (7) and Daughters and Sisters staying outside the town though small in numbers. Out of 5 others, 4 are husbands and 1 wife.
Distribution of members of \ households staying out side by Age and Sex
The particulars of members staying outside by age and sex and relation to heads of households are given in the farrowing statement-
Statement VIII,9
Distribution of members staying outside by Age, Sex and Relation to head of the Household
Number staying outside who are related to head of household Age-Group
Father Mother Son
2 3 4
0-9
10-14
15-24 14
25-34 30
35-59 5 12 25
60+ 18 23
Total 23 35 69
The classification of relation to the head of household shows that the Fathers and
Daughter Brother Sister Other Total
5 6 7 8 9
2
2 4 3 23
31
4 47
42
2' 7 4 5 145
Mothers staying outside the town belong to age 35 years and above. Sons fall in the age-

group 15-59 years, whereas daughters in the age-group 15-24 years. Brothers who are also staying outside mostly belong to working agegroups 15-59 years and 4 sisters fall in the age-group 10-24 years. In case of others 4 husbands and 1 wife belong to age-group 35-59 years and 60 + years respectively.
178
Distribution of the members staying outside by literacy level
The educational lE)vel of the family members who are staying outside the town by the nature of relation to' head of the household is given in the following statement-
Statement VIII.1 0
Distribution of Family members staying outside by educational level and nature of relation to head of household.
No.of persons staying outside who are related to head of household , Educational level
2
Illiterates
Primary Std. I-VIII passed
3 Matriculation/ Secondary VII I-X passed
4 Higher Secondary XI-XII passed
5 Non-technical Diploma or Certificate not equal to degree
6 Technical Diploma or certificate not equal to degree
7 Graduate degree other than technical degree
8 Engineering and Technology
9 Agriculture and Dairying
Total
Father Mother
2 3
9 23
11 11
2
23 35
There are in all 107 literate persons among the total of 145 persons who are staying outside town. The literacy rate in Vadnagar as per 1981 Census was 51 .57 per cent and according to the sample population it is 58.27
Son I Daughter Brother Sister Oth_e(s Total
4
5
19
24
8
4
4
4
69
5 6 7 8 9
, 1 38
2 3 147
3 33
.3 12
4
5
4
2 7 4 5 145
per cent. The percentage of literacy among the persons staying outside town comes to 73.8 per cent. This indicates that education is an important factor in affecting'the stay out. It is also seen that Primary and Secondary

educational levels occupy the highest position with 47 and 33 persons respectively followed by Higher secondary. Among others 5 are graduates and 4 are with the engineering and technical education. One person has a degree in Agriculture and dairying.
From the above data various. educational levels can be seen among sons, who are staying outside the town.
Further more there are 19 sons out of total 69 who are educated below Matriculation or Secondary level. Whereas 5 sons are ~Iso Illiterate, 24 are matriculate, 8 higher secondary, while 4 possess technical diploma not equal to degree and equal number of sons
179
(4) were having degree in Engineering and Technology. Only one has a degree in Agriculture and dairying so far as education of daughter staying ouside is concerned one each is matriculate and Higher Secondary. It is also seen that Mothers staying outside are invariably Illiterate. As far the other relations the educational level attached is normally below matriculation except brothers.
Non-workers who are staying outside
Particulars of non-worker family members who are staying outside by nature of activity and relationship to head of household are shown in the following statement:
Statement VIII.11
Distribution of Non-Workers staying out side by nature of activity
Nature of activity of non-worker family members staying outside
Number who are related to head of households
Father Mother
2 3
Fulitime students
2 Household duty 14
3 Dependents 5 17
4 Retired 7 3
Total 13 34
Out of 145 absentee close relatives there are 61 non-workers wherein 13 are fathers, 34 mothers, 5 sons, 2 daughters, 2 brothers, 4 sisters and 1 is wife. As regards their activities
Son
4
4
5
Daughter Brother Sister Others Total
5 6 7 8 9
2 2 3 11
16
23
11
2 2 4 61
it will be seen from the above that 11 are full time students, as many as 16 are engaged in household work, 23 are found to be dependants and rest 11 are retired persons.

180
Workers who are staying outside
Statement VIII.12
Distribution of family members staying outside by nature of occupation and relationship with head of household.
No.of family members staying activities who are rel'lted to head of household as
Occupation
Father M9ther
2 3
Division 0-1 ~
0-2
0-3 1
0-4 3
0-5
0-6 3
7-8-9 3
Total 10
The above data provides an information about the occupation of absentee members with reference to relation to the head of household. It can be seen that out of tot~1 145 absentee members 84 are engag~d. in economic activity. This means that the remaining as many as 61 members are not engaged in any economic activity. It is further noticed that production and related workers, transport equipment operators and labourers attract a larger proportion of workers (33), to places outside the town. The next comes the occupational division of sales workers with 15 members followed by clerical and related workers with 13 and Professional, Technical and Jelated workers with 1 i persons. In all. 5
Son Daughter Brother Sister Others . Total
4
10-
2
10
11
4
2
25
64
5 6 7 8 9
11
2
2 13 \
\15 j\
5
5
4 33
5 I 4 84
persons are also engaged in occupational divisions 5 and 6 of service workers and Farmers, Fishermen, Hunters, Loggers and related workers.
As regards the nature of relation of absentee members .with the head of household it will be seen that out of 84 workers, 64 are sons engaged in different types of occupations. While father are in number '10 who also engaged in various occupations. Out of 5 brothers, 4 are engaged in the work of occupational division 7-8-9 and 1 in of division 0-1.
Purpose of staying outside
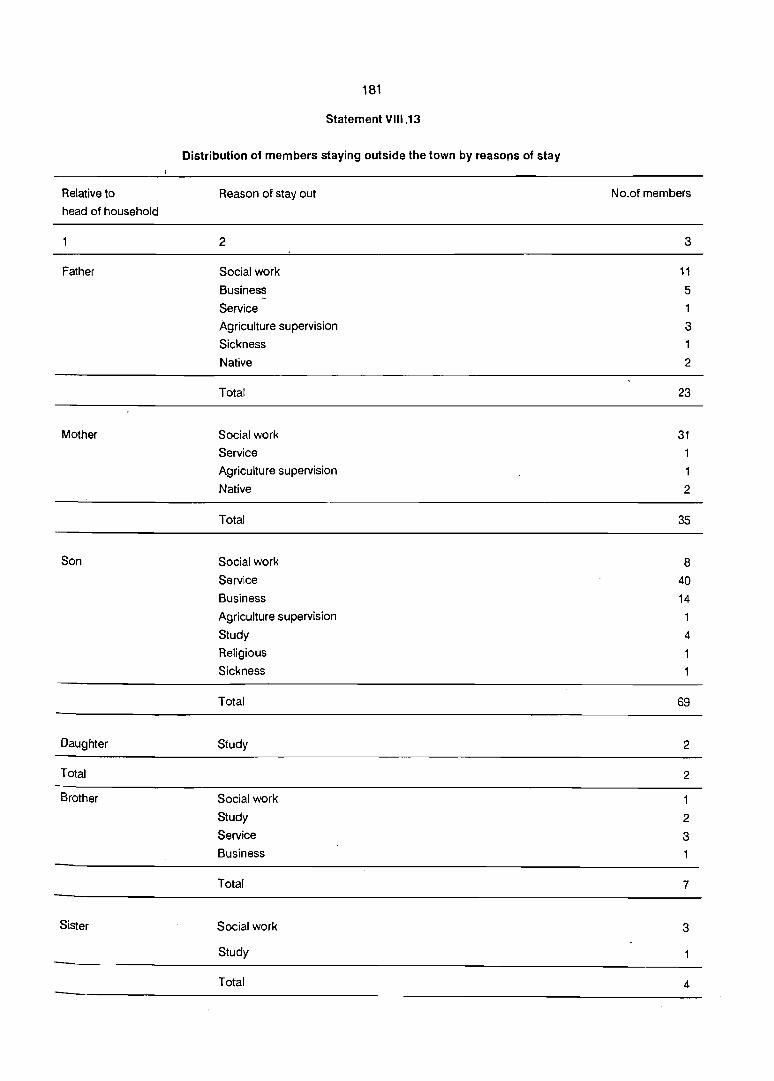
Relative to
head of household
Father
Mother
Son
Daughter
Total
Brother
Sister
181
Statement VIII.13
Distribution of members staying outside the town by reasons of stay
Reason of stay out
2
Social work
Business
Service
Agriculture supervision
Sickness
Native
Total
Social work
Service
Agriculture supervision
Native
Total
Social work
Service
Business
Agriculture supervision
Study
Religious
Sickness
Total
Study
Social work
Study
Service
Business
Total
Social work
Study
Total
No.of members
3
~1
5
3
2
23
31
2
35
8
40 14
1
4
69
2
2
2
3
7
3
4
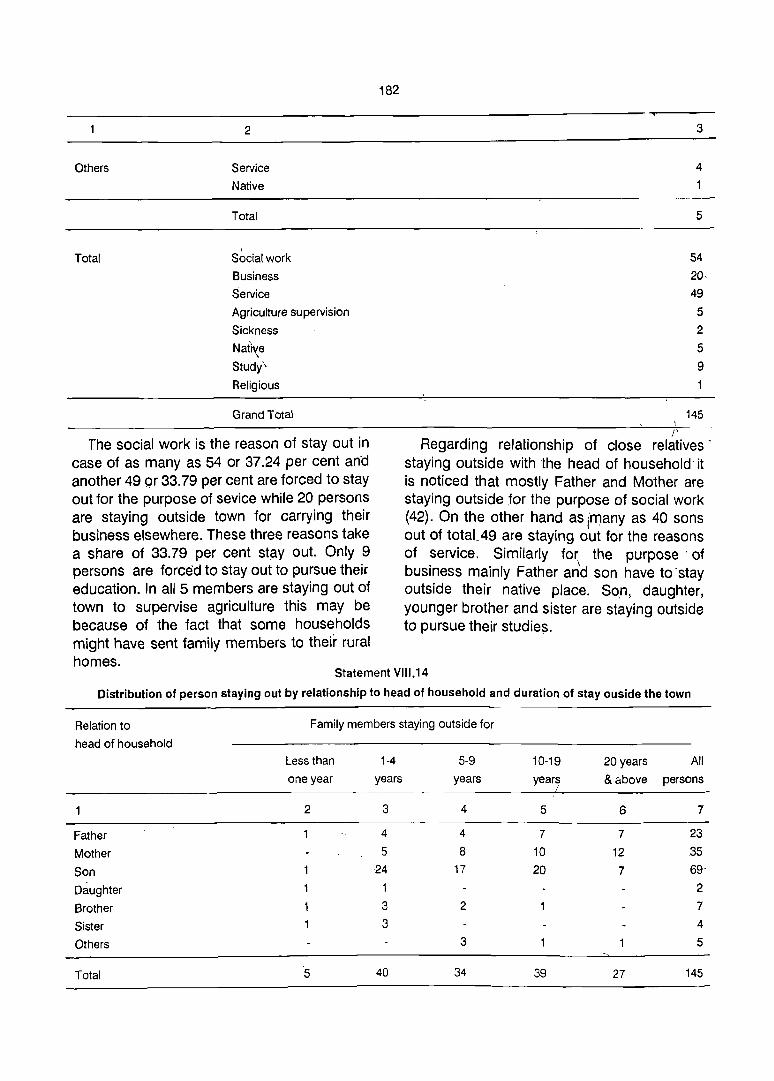
2
Others Service
Native
Total
Total Sbcialwork
Business
Service
Agriculture supervision
Sickness
Native , Study"
Religious
Grand Total
The social work is the reason of stay out in case of as many as 54 or 37.24 per cent and another 49 or 33.79 per cent are forced to stay out for the purpose of sevice while 20 persons are staying outside town for carrying their business elsewhere. These three reasons take a share of 33.79 per cent stay out. Only 9 persons are forced to stay out to pursue their education. In all 5 members are staying out of town to supervise agriculture this may be because of the fact that some households might have sent family members to their rural homes.
182
3
4 1
5
54 20,
49 5
2
5
9
145
J' Regarding relationship of close relatives'
staying outside with the head of household'it is noticed that mostly Father and Mother are staying outside for the purpose of social work (42). On the other hand as irT)any as 40 sons out of totaL 49 are staying out for the reasons of service. Similarly for the purpose' of business mainly Father an\d son have to 'stay outside their native place. Son, daughter, younger brother and sister are staying outside to pursue their studies.
Statement VIII.14
Distribution of person staying out by relationship to head of household and duration of stay ouside the town
Relation to Family members staying outside for
head of household
Less than 1-4 5-9
one year years years
2 3 4
Father 4 4
Mother 5 8
Son 24 17
Daughter 1
Brother 3 2
Sister 3
Others 3
Total 5 40 34
10-19 20 years All
years & above persons I
5 6 7
7 7 23
10 12 ,35
20 7 69
39 27
2
7
4
5
145

The above data indicates thaf out of 145 absentee members 66 or 45.52 per cent staying outside town are doing 50 for the last over 10 years. As many as 27 absentee members are staying out for the last over twenty years. Whereas only 5 members are dOing so for the last 4 years. A little more than half the absentee persons are staying outside for less than ten years.
Analysis of absentee members with reference to their relation with the head of the household further states that more than 50 per cent of the fathers are doing so for the last
183
over 10 years. Out of total 35 mothers staYing outside the town as many as 22 are doing so over last 10 years whereas 25 sons are doing so far less than 5 years and 27 sons are staying outside town since 10 years and more.
Remittances
Regarding remittances some members received money from their respective heads of households and at the same time other members sent the amount to their kins. The. details are shown in the following statement.

184
Statem~nt -
Remittances SEr .lY
State to No.of No.of Same District
which head house- absentee
of household hold members NO.of No.of Averag
belongs I households households amoun
to which receiving remittaTc,e
absentee remittance per hol)se-
jmembers from hold
: belongs members
2 3 4 5 r 6 -
Gujarat 95 144 57 12 587 Maharashtra
Total 96 145 57 12 587

VIII.15
Absentee family members
Other District
No.of No.of
households households
to which receiving
absentee remittance
members from
belongs members
7 8
38 22
38 22
Average
amount
remittance
per
household
9
930
930
185
Other States
No.of No.of Average
households households amount
to which receiving of remi-
absentee remittance ttance per
members from household
belongs members (Rs.)
10 11 12
700
700

186
Statement VIII.16
The details regarding remittance sent by absentee family mamebrs
Relation ship NO.of AVE;lrage amount remritted by absentee family mer:nbers whose
to head of absentee present address is
household family
members I Same Other Rural Other district Other Total
town town area of the state state
but of the of the
separate district district Rural Urban
house-
hold
\
2 3 4 5 6 7 8 9
Father 23 3600 2700 6;300 Mother 35 600 600 Son 69 1453 3600 600 3200 1967 108~0 Daughter 2
Brother 7 Sister 4 Others 5 3600 5283 8883
Total 145 5053 7200 3300 3800 7250 26603
Statement VIII.17
The details regarding amount .sent by each household to absentee members
Relationship No.of Average amount sent by each households absentee members whose present
with head of absentee address is
household family
members Same town Other town Rural area Other district Other states
but separate of the of the of the state
household district district
Rural Urban
2 3 4 5 6 / 7 8
Father 23 200 500
Mother 35 600
Son 69 3600 1616
Daughter 2 1700
Brother 7
Sister 4 Others' 5
Total 145 800 500 3600 3316
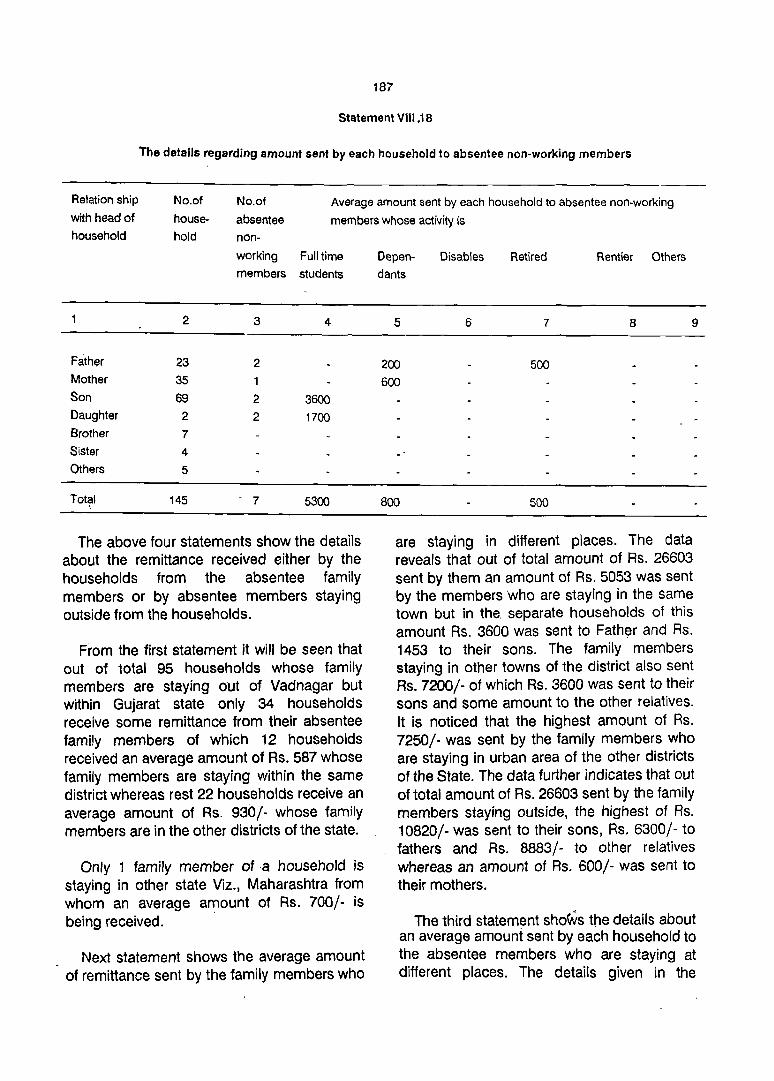
187
Statement VIII.1B
The details regarding amount sent by each household to absentee non-working members
Relation ship
with head of
household
No.of
house
hold
No.of
absentee
non
working
Average amount sent by each household to absentee non-working
members whose activity is
Full time Depen- Disables Retired Rentier Others
members students dants
Father
Mother
Son
Daughter
Brother
Sister
Others
Total \
2
23 35 69 2
7
4
5
145
3
2
1
2
4
3600 2 1700
7 5300
The above four statements show the details about the remittance received either by the households from the absentee family members or by absentee members staying outside from the households.
From the first statement it will be seen that out of total 95 households whose family members are staying out of Vadnagar but within Gujarat state only 34 households receive some remittance from their absentee family members of which 12 households received an average amount of Rs. 587 whose family members are staying within the same district whereas rest 22 households receive an average amount of Rs. 930/- whose family members are in the other districts of the state.
Only 1 family member of a household is staying in other state Viz., Maharashtra from whom an average amount of Rs. 700/- is being received. .
Next statement shows the average amount of remittance sent by the family members who
5
200 600
800
6 7 8 9
500
500
are staying in different places. The data reveals that out of total amount of Rs. 26603 sent by them an amount of Rs. 5053 was sent by the members who are staying in the same town but in the. separate households of this amount Rs. 3600 was sent to Father and Rs. 1453 to their sons. The family members staying in other towns of the district also sent Rs. 7200/- of which Rs. 3600 was sent to their sons and some amount to the other relatives. It is noticed that the highest amount of Rs. 7250/- was sent by the family members who are staying in urban area of the other districts of the State. The data further indicates that out of total amount of Rs. 26603 sent by the family members staying outside, the highest of Rs. 10820/- was sent to their sons, Rs. 6300/- to fathers and Rs. 8883/- to other relatives whereas an amount of Rs. 600/- was sent to their mothers.
The third statement shotVs the details about an average amount sent by each household to the absentee members who are staying at different places. The details given in the

statement further disclose that an amount of Rs. 800/- was sent to absentee family members who are staying within the town but in the separate households of which Rs. 200/was sent to Father and Rs. 600/- to Mothers. An amount of Rs.3600/- was also sent to absentee family members (sons) who are staying in rural area of other district of the State and Rs. 3316/- was sent to by the households to the absentee family members staying in urban part of the other district of the State of which Rs. 1616/- was sent to their
188
sons and Rs. 1700 to their daughters. The fourth statement shows the details of
amount sent by the households to the absentee non-working members staying outside. It will be observed that the highest amount of Rs. 5300/- 'was sent to absentee sons and daughters who are the full time students, Rs. 800/- to the absentee Fathers (Rs. 200) and Mothers (Rs. 600) who are the dependants. It is also seen that an amount of Rs. 500/- is being sent by the household to the absentee retired father.
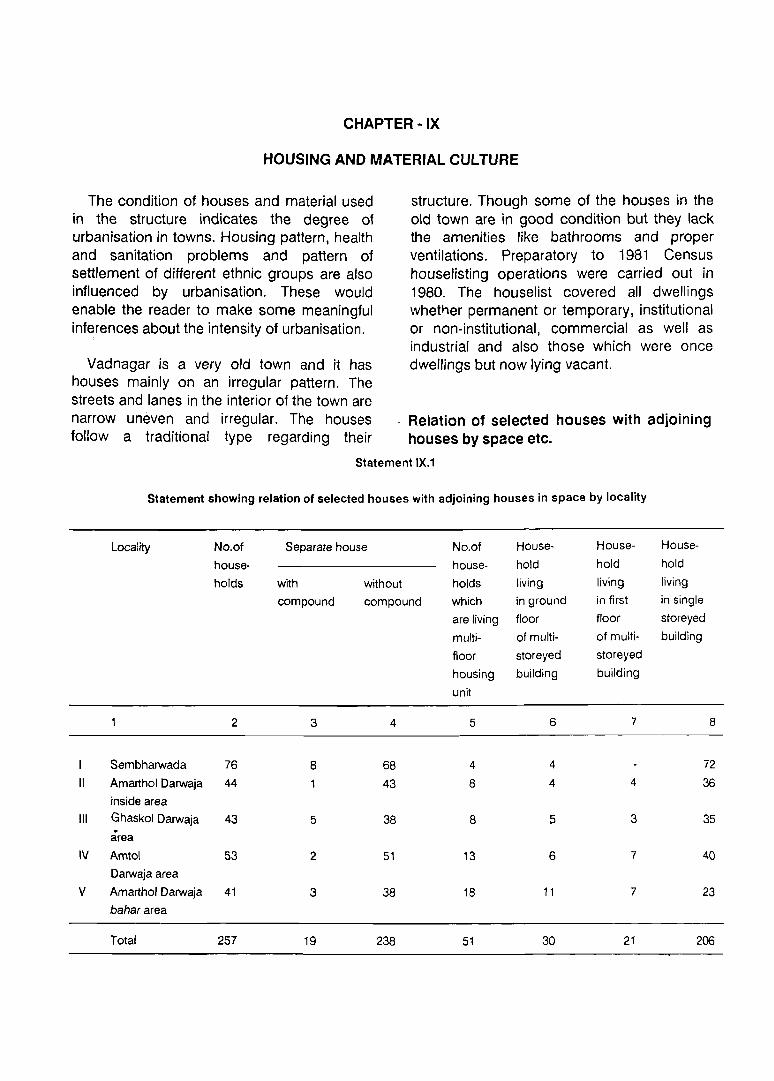
CHAPTER -IX
HOUSING AND MATERIAL CULTURE
The condition of houses and material used in the structure indicates the degree of urbanisation in towns. Housing pattern, health and sanitation problems and pattern of settlement of different ethnic groups are also influenced by urbanisation. These would enable the reader to make some meaningful inferences about the intensity of urbanisation.
Vadnagar is a very old town and it has houses mainly on an irregular pattern. The streets and lanes in the interior of the town are narrow uneven and irregular. The houses follow a traditional type regarding their
structure. Though some of the houses in the old town are in good condition but they lack the amenities like bathrooms and proper ventilations. Preparatory to 1981 Census houselisting operations were carried out in 1980. The houselist covered all dwellings whether permanent or temporary, institutional or non-institutional, commercial as well as industrial and also those which were once dwellings but now lying vacant.
- Relation of selected houses with adjoining houses by space etc.
Statement IX.1
Statement showing relation of selected houses with adjoining houses in space by locality
Locality No.of Separate house No.of House- House- House-
house- house- hold hold hold
holds with without holds living living living
compound compound which in ground in first in single
are living floor floor storeyed
multi- of multi- of multi- building
floor storeyed storeyed
housing building building
unit
2 3 4 5 6 7 8
Sembharwada 76 8 68 4 4 72
II Amarthol Oarwaja 44 43 8 4 4 36 inside area
III Ghaskol Oarwaja 43 5 38 8 5 3 35 area
IV Amtol 53 2 51 13 6 7 40 Oarwaja area
V Amarthol Oarwaja 41 3 38 18 11 7 23 bahar area
Total 257 19 238 51 30 21 206
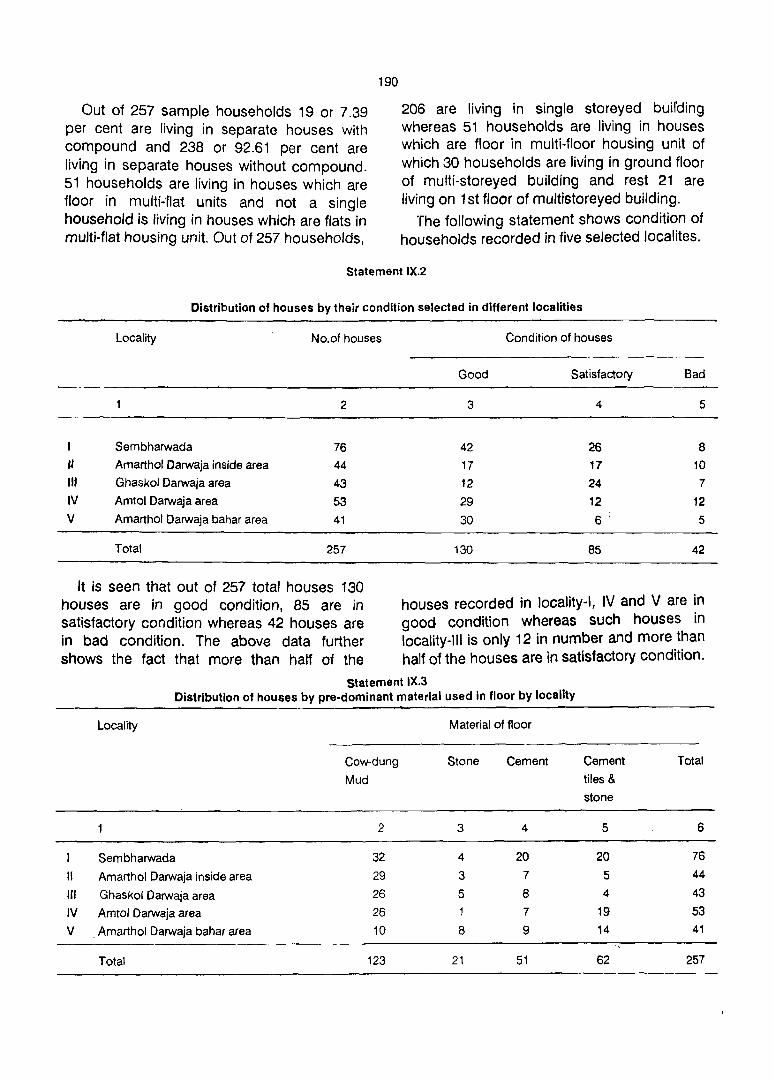
Out of 257 sample households 19 or 7.39 per cent are living in separate houses with compound and 238 or 92.61 per cent are living in separate houses without compound. 51 households are living in houses which are floor in multi-flat units and not a single household is living in houses which are flats in multi-flat housing unit. Out of 257 households,
190
206 are living in single storeyed buirding whereas 51 households are living in houses which are floor in multi-floor housing unit of which 30 households are living in ground floor of multi-storeyed building and rest 21 are living on 1 st floor of multistoreyed building.
The following statement shows condition of households recorded in five selected Jocalites.
Statement IX.2
Distribution of houses by their condition selected in different localities
Locality No.of houses
2
I Sembharwada 76 U Amarthol Oarwaja inside area 44 III Ghaskol Darwaja area 43 IV Amtol Darwaja area 53 V Amarthol Darwaja bahar area 41
Total 257
It is seen that out of 257 total houses 130 houses are in good condition, 85 are in satisfactory condition whereas 42 houses are in bad condition. The above data further shows the fact that more than half of the
Condition of houses
Good Satisfactory Bad
3 4 5
42 26 8 17 17 10 12 24 7
29 12 12
30 6' 5
130 85 42
houses recorded in locality-I, IV and V are in good condition whereas such houses in locality-III is only 12 in number and more than half of the houses are in satisfactory condition.
Statement IX.3
II
III IV V
Distribution of houses by pre-dominant material used in floor by locality
Locality
Cow-dung
Mud
2
Sembharwada 32
Amarthol Darwaja inside area 29
Ghaskol Darwaja area 26
Amtol Oarwaja area 26
_ Amarthol Oarwaja bahar area 10
Total 123
Material of floor
Stone
3
4
3
5
1
8
21
Cement
4
20 7
8
7
9
51
Cement
tiles & stone
5
20
S
4
19
14
62
Total
6
76
44 43 S3 41
257
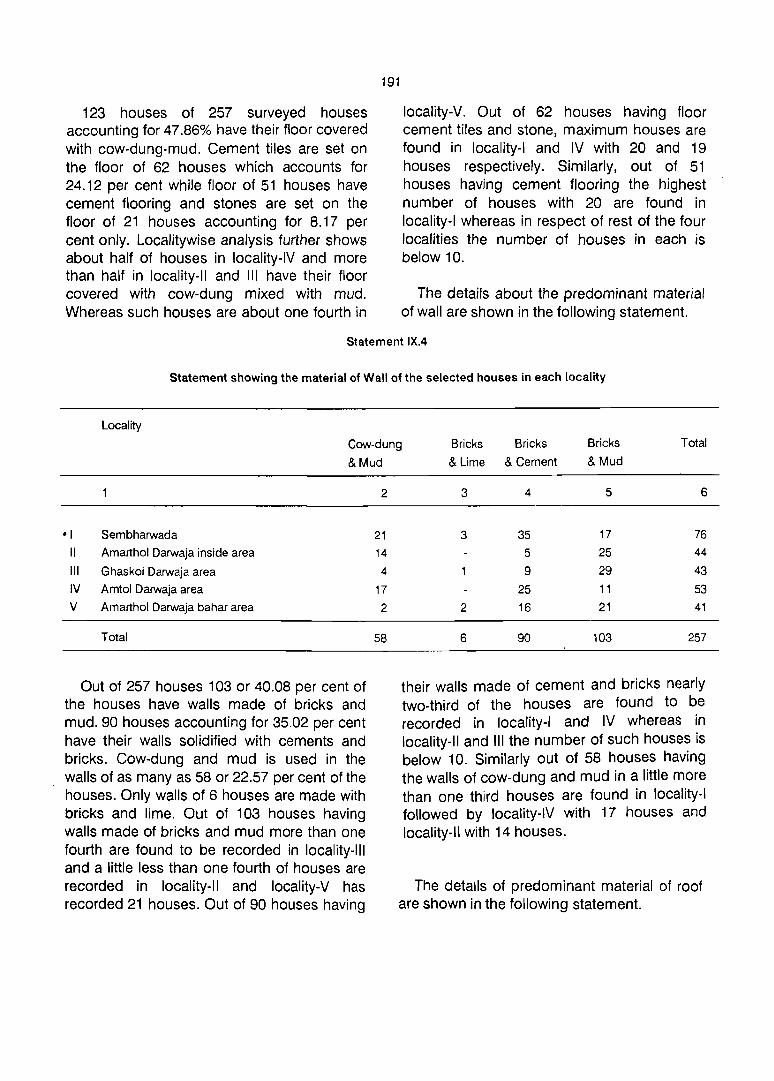
191
123 houses of 257 surveyed houses accounting for 47.86% have their floor covered with cow-dung-mud. Cement tiles are set on the floor of 62 houses which accounts for 24.12 per cent while floor of 51 houses have cement flooring and stones are set on the floor of 21 houses accounting for 8.17 per cent only. Localitywise analysis further shows about half of houses in locality-IV and more than half in locality-II and III have their floor covered with cow-dung mixed with mud. Whereas such houses are about one fourth in
locality-V. Out of 62 houses having floor cement tiles and stone, maximum houses are found in locality-I and IV with 20 and 19 houses respectively. Similarly, out of 51 houses having cement flooring the highest number of houses with 20 are found in locality-I whereas in respect of rest of the four localities the number of houses in each is below 10.
The details about the predominant material of wall are shown in the following statement.
Statement IXA
Statement showing the material of Wall of the selected houses in each locality
Locality
Cow-dung Bricks Bricks Bricks Total
&Mud
• I Sembharwada
II Amarthol Darwaja inside area
III Ghaskol Darwaja area
IV Amtol Darwaja area
V Amarthol Darwaja bahar area
Total
Out of 257 houses 103 or 40.08 per cent of the houses have walls made of bricks and mud. 90 houses accounting for 35.02 per cent have their walls solidified with cements and bricks. COW-dung and mud is used in the walls of as many as 58 or 22.57 per cent of the houses. Only walls of 6 houses are made with bricks and lime. Out of 103 houses having walls made of bricks and mud more than one fourth are found to be recorded in locality-III and a little less than one fourth of houses are recorded in locality-II and locality-V has recorded 21 houses. Out of 90 houses having
2
21 14 4
17 2
58
& Lime & Cement &Mud
3 4 5 6
3 35 17 76
5 25 44
9 29 43
25 11 53 2 16 21 41
6 90 103 257
their walls made of cement and bricks nearly two-third of the houses are found to be recorded in locality-I and IV whereas in locality-II and III the number of such houses is below 10. Similarly out of 58 houses having the walls of cow-dung and mud in a little more than one third houses are found in locality-I followed by locality-IV with 17 houses and locality-II with 14 houses.
The details of predominant material of roof are shown in the following statement.
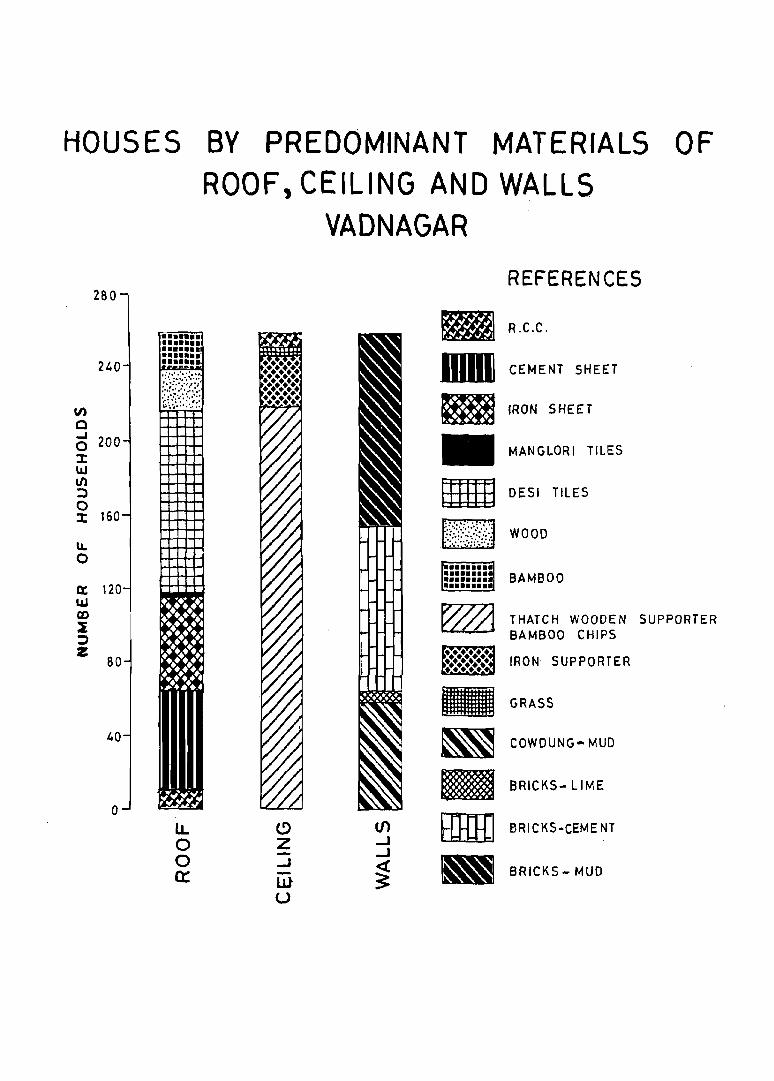
HOUSES BY PREDOMINANT MATERIALS OF ROOF, CEILING AND WALLS
VADNAGAR
V)
c 5 200 ::x: UJ V'l :::l o J: J60
lI.. o
0: 120 L&J (%)
~ :> Z 80
40
o
........ ••••••• ••••••• •••••••• •••• ! ••
La.. o o a::
-• &I
m .~
~
-~ 1111
c.!) en mmJ Z _J _J
_J
~ W U
REFERENCES
R.C.C .
CEMENT SHEET
IRON SHEET
MANGLORI TILES
DESI TILES
WOOD
BAMBOO
THATCH WOODEN SUPPORTER BAMBOO CHIPS
IRON SUPPORTER
GRASS
COWDUNG- MUD
BRICKS- LIME
BRICKS-CEME NT
BRICKS - MUD

193
Statement IX.5
Statement showing material of Roof of the selected houses in each Locality
Locality Material of Roof
RCC Cement Iron Mang- Deshi Wood Bamboo Total
sheet sheet lory tiles and
2 3
Sembharwada 7 2 II Amdrthol Darwaja inside area 2 III Ghaskol Darwaja area 12 IV Amtol Darwaja area 21 V Amarthol Darwaja bahar area 19
Total 10 55
It is seen that majority of houses (96) have roofs covered with Deshi tiles which comes to about 37.35 per cent. This is followed by 55 houses which have their roofs covered with cement sheets, 50 houses have their roofs covered with iron sheets accounting for 19.5 per cent while 25 houses accounting for 9.7 per cent have their roofs covered with wood and thatches. Only 10 houses have R.C.C. terrace while manglori tiles are used to cover the roofs of 2 houses only. The 96 houses having roofs covered with Deshi tiles are more or less evenly distributed among five localities, the highest being 24 in lacality-IV. Out 01 55 houses having roof covered with cement
tiles thatches
4 5 6 7 8 9
36 16 2 12 76 12 21 4 4 44
20 8 1 43 24 5 2 53 15 6 41
50 2 96 25 19 257
sheets the highest number of houses are recorded in 10cality"IV with 21 houses closely followed by localty-V with 19 houses, whereas in locality-I and " such houses are very less in number with 2 and 1 respectively. Of the total 50 houses having roofs covered with Iron sheets as many as 36 or 14.0 per cent are found to be recorded in locality- I and 12 such houses are found in locality-II. 70 per cent of the houses having roofs covered with R.C.C. are found in locality-I. Similarly, maximum number of houses having their roofs covered with Bamboo are also found in locality-I with 12 houses out of total 19. Predominant material used in celilings is shown below.
Statement IX.iS
Statement showing material of ceilings of the selected houses in each locality
Locality
Sembharwada
II Amarthol Darwaja inside area
Thatch Iron
wooden suppo-
suppo- rters
rters
bamboo
chips
2
61 39
3
8
4
Grass
4
R.C.C.
5
6
Total
6
76 44

194
2
III Ghaskol Darwaja area 35 IV Amtol Darwaja area 47 V Amarthol Darwaja bahar area 37
Total 219
All houses are of old conventional style and so are their ceilings. Out of 257 houses as many as 219 or 85.21 per cent are found to have ceiling made of' bamboo chips supported on wooden frame. This is followed by 28 or 10.90 per cent houses are with ceiling supported on iron frame, 6 houses have R.C.C. ceiling accounting for 2.33 per cent only and the ceiling of grass is found in 4 houses. Locality-wise analysis shows that out of 76 houses studied in locality-I as many as 61 have ceiling made of bamboo chips. It is also noticed that out of total 6 houses having R.C.C. ceiling all are found to be recorded in this locality. About one-fourth of total houses having ceifing made of iron supporter are found in locality-I and III respectively.
3
7
5 4
28
4
1
1
4
5 6
43
53
41
6 257
As regards material used in doors and windows it was obseNed from the data that out of 257 houses as many as 245 houses have doors made of wood. Only 9 houses have doors of iron sheet. Similarly, 201 houses have windows made of wood where as 39 houses have iron sheet windows.
Number of rooms and number of members
The study of availability 91 space to each member of the family in a house is quite significant. The relevant details of sampled households are shown in the following statement.
Statement IX.7
Classification of households according to number of members and number of occupied rooms.
Number of
occupied rooms
One Room
Two rooms
Three rooms
Four rooms
Five rooms
Six rooms
Seven rooms
Eight rooms
Nine rooms
Thirteen rooms
Fifteen rooms
Total
Number of
households
2
69
102
35
24
11
10
1
2
257
Number of
members
3
367
529
197
121
55
62
6
11
5
5
15
1373
Percentage Percentage
to total to total
households members
4 5
26.84 26.73
39.69 38.53
13.62 14.35
9.34 8.81
4.28 4.01
3.89 4.52
0.39 0.44
0.78 0.80
0.39 0.36
0.39 0.36
0.39 1.09
100.00 100.00

NUMBER OF HOUSEHOLDS 0
0 0 0 0 0 0 a:: .- co W .., N
W CO ~111
V') ~OO~ N33!.:II.:I c
:::>~ ~
0
zO :J: WOO~ N33H:lnO. UJ liN
0 0 .C/) ::::>
1-0:: 0 :J: ~OO~ N33l~IHJ
<.!)C ZW
WOO~ 3A13MJ. - liN -0.. Cl:::J a:: U lIN WOO~ N3A313 °u ~O lIN WOO~ N3! «LL If)OO::
WOO~ 3NIN « Ca:<.!) ...JW<c °mz WOO~ lH~J3
Gj~C tf):J« WOO~ N3A3S :::::>z> 0 0 ::C z
WOO~ XIS
lJ..« WOO~ 3A 1.:1 Ot/)
c/)
Za:: a: WOO~ ~no.:l UJ
OW m ~ -(I] UJ
~~ ~ WOO~ 33~Hl
UW
~ li:~ WOOij OMl -1I11J... 1110 WOO~ 3NO « _J
u 0
00,. HI Sij39W3W
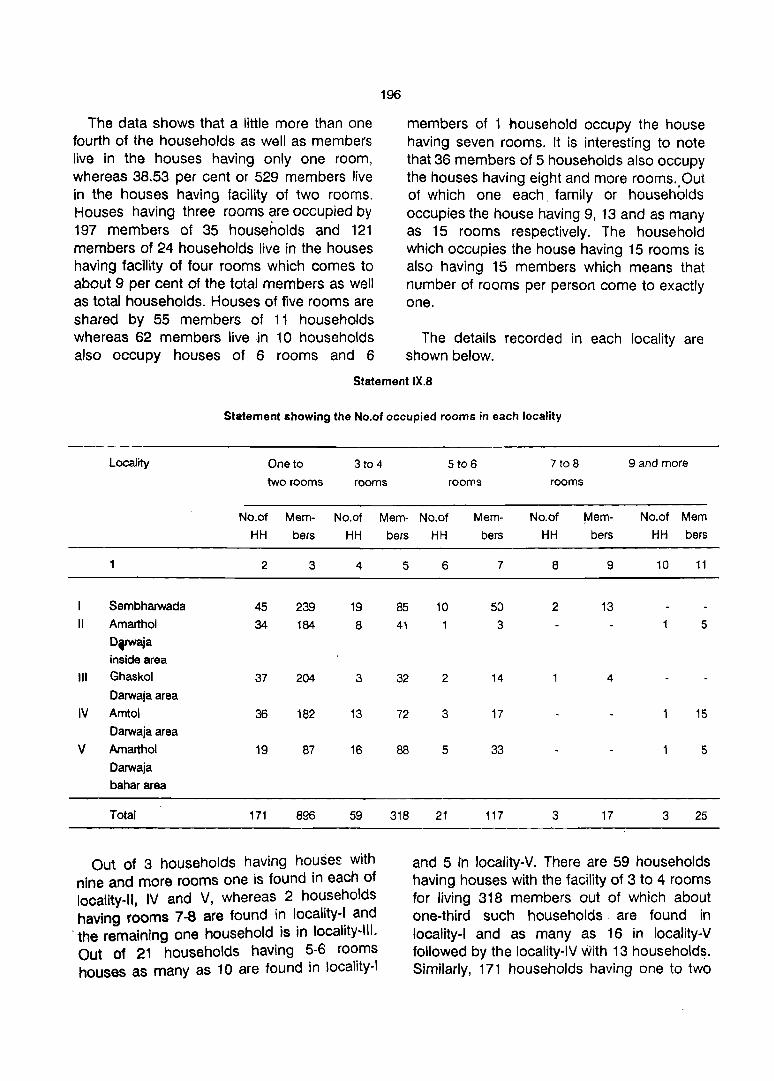
196
The data shows that a little more than one fourth of the households as well as members live in the houses having only one room, whereas 38.53 per cent or 529 members live in the houses having facility of two rooms. Houses having three rooms are occupied by 197 members of 35 households and 121 members of 24 households live in the houses having facility of four rooms which comes to about 9 per cent of the total members as well as total households. Houses of five rooms are shared by 55 members of 11 households whereas 62 members live ,in 10 households also occupy houses of 6 rooms and 6
members of 1 household occupy the house having seven rooms. It is interesting to note that 36 members of 5 households also occupy the houses having eight and more rooms. Out of which one each family or households occupies the house having 9, 13 and as many as 15 rooms respectively. The household which occupies the house having 15 rooms is also having 15 members which means that number of rooms per person come to exactly one.
The details recorded in each locality are shown below.
Statement IX.S
Statement showing the No.of occupied rooms in each locality
Locality One to
two rooms
3to 4
rooms
StoB 7 to 8 9 and more
rooms rooms
NO.of Mem- NO.of Mem- No.of Mem
bers
No.of
HH
tJlem
bers
No.of Mem
HH bers HH bers HH HH bers
1
Sembharwada
" Amarthof
Dt'Waja
inside area
'" Ghaskol
Darwaja area
IV Amtol
Darwaja area
V Amarthol
Darwaja
bahar area
Total
2
45 34
37
36
19
171
3
239
184
204
182
87
896
4
19
8
3
13
16
59
Out of 3 households having house~ with nine and more rooms one is found in each of locality-II, IV and V, whereas 2 households having rooms 7-8 are found i~ I?cality-~ and
-the remaining one household IS In locality-III. Out of 21 households having 5-6 rooms houses as many as 10 are found in loeality-I
5
85 41
32
72
88
318
6
10
2
3
5
21
7
50 3
14
17
33
117
8
2
3
9 10 11
13
5
4
15
5
17 3 25
and 5 In locality-V. There are 59 households having houses with the facility of 3 to 4 rooms for living 318 members out of which about one-third such households are found in locality-I and as many as 16 in locality-V followed by the locality-IV with 13 households. Similarly, 171 households having one to two
room houses are mainly shared by first four localities.
The data is further studied with reference to the details regarding the number of rooms occupied by number of couples with or without other members of their families is presented in Appendix 16.
The study with reference to number of rooms occupied by number of couples with other members of their families reveals the fact that one married cQuple of 165 families have to accommodate 847 members with them while two married couples of 40 families have to accommodate 296 members and three married couples of 14 families have to accommodate 152 other members with them. The rest of 38 families or households were having 78 members.
The data given in the above statement further reveal that in comparison to households having more couples, Single married couples have to accommodate more members with them. This is highest with 36 households having one married couple each and have to accommodate more members, with them. This highest with 36 households having one couple per household accommodating approximately 5 other persons in their two room houses. Highest conjection is in the households that do not fall in tre above categories having one room and have to accommodate their other members:
These are 23 households with one married couple and have to accommodate 127 other members viz. approximately 5 to 6 members per household,? households with two married couples accommodating 55 other members on an average of 8 members per househqld
197
and 4 households having three married couples accommodating total 42 members giving about 10 members per household.
It is also seen that there is one household with three married couples having 11 other members aged 5 and above staying within the household with only one room facility whereas one household having three married couples but without any other members aged 5 and above with·them enjoys two rooms facility.
As regards the households having two married couples it is observed that one household having only one room facility accommodating 7 members aged 5 and above whereas 9 households having two rooms facility accommodating 65 other members aged 5 and above and one household each with facility of three and four rooms was having 5 and 6 members aged 5 and above respectively. It is also seen that 3 households with two rooms facility do not have any other members aged 5 and above accommodating 15 members with them.These households have also 2 married couples.
Lastly there are in all 13 househQlds having only one married couple enjoying the facility of five and more rooms also having other members aged 5 and above accomodating 81 total members.
Per Capita Floor Space
An assessment regarding the availability of floor space to each member in a sample house was also attempted in the survey since it is an important indicator to study the pattern of housing condition.The details are given in the following statement.

198
STATEMENT IX.9
Households classified by locality and per capita floor space
Locality Total Total
House- memb-
holds ers 1 or less 2-3
Per capita flopr space
4-5 6-9 10-15 16+
sq.mtr. sq.mtr. sq.mtr. sq.mtr. sq.mtr. sq.mtr.
HH Mem- HH Mem- HH Mem- HH Mem- HH Mem HHMem-
ber ber ber ber ber ber
2 3 4 5 6 7
Sembharwada 76 387 11 73 6 34
II Amarthol
Oarwaja
inside area
III Ghaskol
Oarwaja
area
IV Amtol
Oarwaja
area
44 233 4
43 254 5
53 286 4
32 13 81
38 11 68
38 9 53
V Amarthol 41 213 2 14 5 27
Oarwaja
bahar area
Total 257 1373 26 195 44 263
It can be seen that 195 members of 26 households with an average of little more than 7 members per household get a floor space of only one square meter or less per person.This is little better than 263 members of 44 households with an average of 6 members per household who enjoy two to three sqaure meters of floor space per person in their houses.The 72 households having 389 members with an average of more than 5 but less than 6 members per household who enjoy 4 to 9 sq. meters of floor space per person.The households each having about 5 members on an average are 43 in number with 224 members.The per capita floor space tor these members comes to 10-15 sq. meters. The members numbering 302 in 72 households with an average of about 4
8 9 10 11 12 13 14 15
11 59 12 60 9 51 27 110
5 23 3 9 9 56 10 32
9 58 8 53 7 33 3 4
8 40 7 50 14 66 39
5 4 20 4 18 21 117
38 197 34 192 43 224 72 302
persons enjoy a floor space of 16 square meters or more per person.
The localitywise analysis indicates· that households in 10cality-llI,enjoy per capita floor space of 16 sq.mtr.and more,3 households in locality-I having average of 1 person only enjoy this facility,whe:reas as many as 27 households having average of about 4 persons enjoy the per capita facility of 16 sq. meters and more.This is followed by locality-V with 21 households and 117 memberS.lt is also observed that in localities II and IV for the households enjoying per capita floor space of 1 or less sq. meter the average number of members per household comes to 8 or more. Similarly, in case of households which enjoy per capita floor space of 10-15 sq. meters an

average households size comes to a little more than 6 persons in locality-II and less than 5 persons in locality-III.
199
Amenities The sample data throws light on the different amenities available in the houses surveyed.The details are shown as under.
Statement IX.10
Amenities
1. Kitchen
2. Bathroom
3. Lavatory
4. Source of
drinking water
5. Water for
washing
6. Electricity
current
Availability of Amenities in the houses
Availability
2
Not having
Having separately
Shares with others
Total
Not having
Having separately
Shareswith others
Total
Not having
Having separately
Shares with others
Total
Not having
Having separately
Shares with others
Total
Not having
Having separately
Shares with others
Total
Not having
Having separately
Shares with others
Total
No. of
househols
3
72
185
257
147
i10
257
173
82 2
257
142
110
5
257
158
97
2
257
70 184
3
257

200
Statement IX.11 Availability of amenities by locality
Locality Locality Locality Locality Locality
Amenities I II III IV V
households households households households households
2 3 4 5 6
1. Kitchen
Not having 9 19 19 17 8 Separate having 67 25 24 36 33 Shares with others
Total 76 44 43 53 41
2. Bathroom
Not having 35 34 33 33 12 Separate having 41 10 10 20 29 Shares with others
Total 76 44 43 53 41
3. Lavatory
Not having 45 36 34 37 21 Separate having 31 8 8 16 19 Shares with others
Total 76 44 43 53 41
4. Source of drinking water
Not having 41 31 32 32 6 Separate having 34 11 9 21 35 Shares with others 2 2
Total 76 44 43 53 41
5. Water for washing
Not having 46 34 32 37 9
separate having 30 10 9 16 32
Shares with others 2
Total 76 44 43 53 41
6. Electricity current
Not having 22 13 16 17 2
Separate having 54 30 26 35 39
Shares with others
Total 76 44 43 53 41
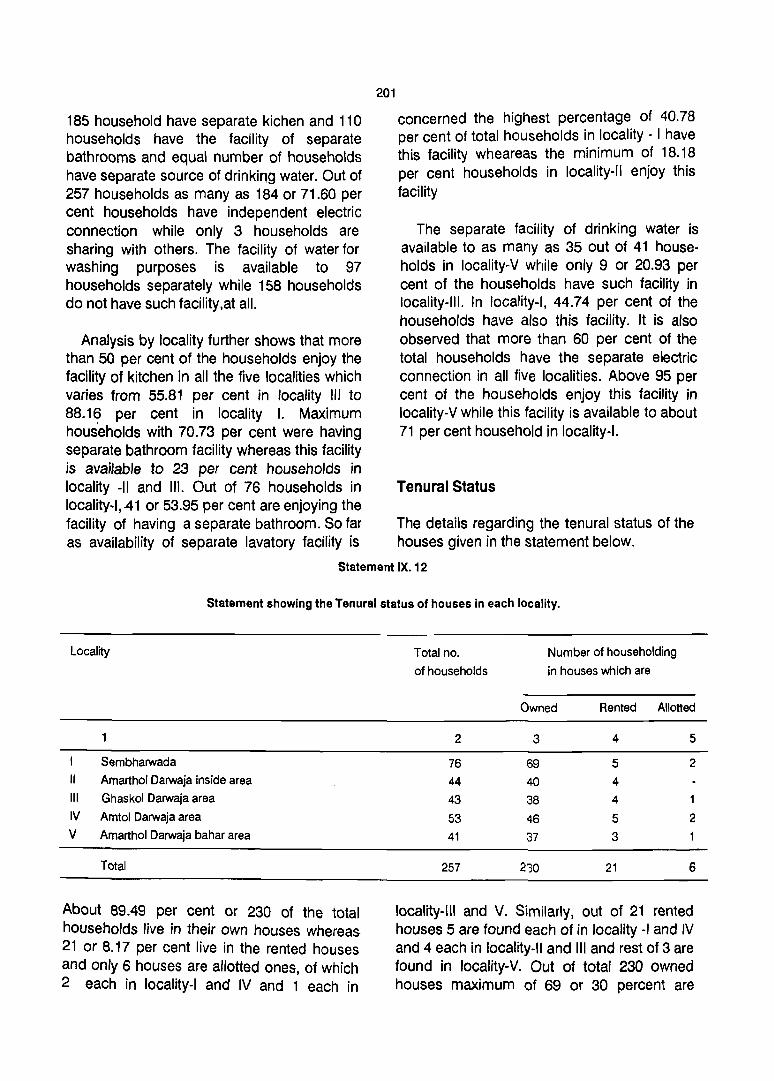
185 household have separate kichen and 110 households have the facility of separate bathrooms and equal number of households have separate source of drinking water. Out of 257 households as many as 184 or 71.60 per cent households have independent electric connection while only 3 households are sharing with others. The facility of water for washing purposes is available to 97 households separately while 158 households do not have such facility,at all.
Analysis by locality further shows that more than 50 per cent of the households enjoy the facility of kitchen in all the five localities which varies from 55.81 per cent in locality '" to 88.16 per cent in locality I. Maximum households with 70.73 per cent were having separate bathroom facility whereas this facility is available to 23 per cent households in locality -II and III. Out of 76 households in locality-I,41 or 53.95 per cent are enjoying the facility of having a separate bathroom. So far as availability of separate lavatory facility is
201
concerned the highest percentage of 40.78 per cent of total households in locality - I have this facility wheareas the minimum of 18.18 per cent households in locality-II enjoy this facility
The separate facility of drinking water is available to as many as 35 out of 41 households in locality-V while only 9 or 20.93 per cent of the households have such facility in locality-III. In locality-I, 44.74 per cent of the households have also this facility. It is also observed that more than 60 per cent of the total households have the separate electric connection in all five localities. Above 95 per cent of the households enjoy this facility in locality-V while this facility is available to about 71 per cent household in locality-I.
Tenural Status
The details regarding the tenural status of the houses given in the statement below.
Statement IX. 12
Statement showing the Tenural status of houses in each locality.
Locality
Sembharwada
II Amarthol Darwaja inside area
III Ghaskol Darwaja area
IV Amtol Darwaja area
V Amarthol Darwaja bahar area
Total
About 89.49 per cent or 230 of the total households live in their own houses whereas 21 or 8.17 per cent live in the rented houses and only 6 houses are allotted ones, of which 2 each in locality-I and IV and 1 each in
Total no.
of households
2
76 44
43
53 41
257
Number of householding
in houses which are
Owned Rented Allotted
3 4 5
69 5 2
40 4
38 4
46 5 2
37 3
2'30 21 6
locality-III and V. Similarly, out of 21 rented houses 5 are found each of in locality -I and IV and 4 each in locality-II and III and rest of 3 are found in locality-V. Out of total 230 owned houses maximum of 69 or 30 percent are
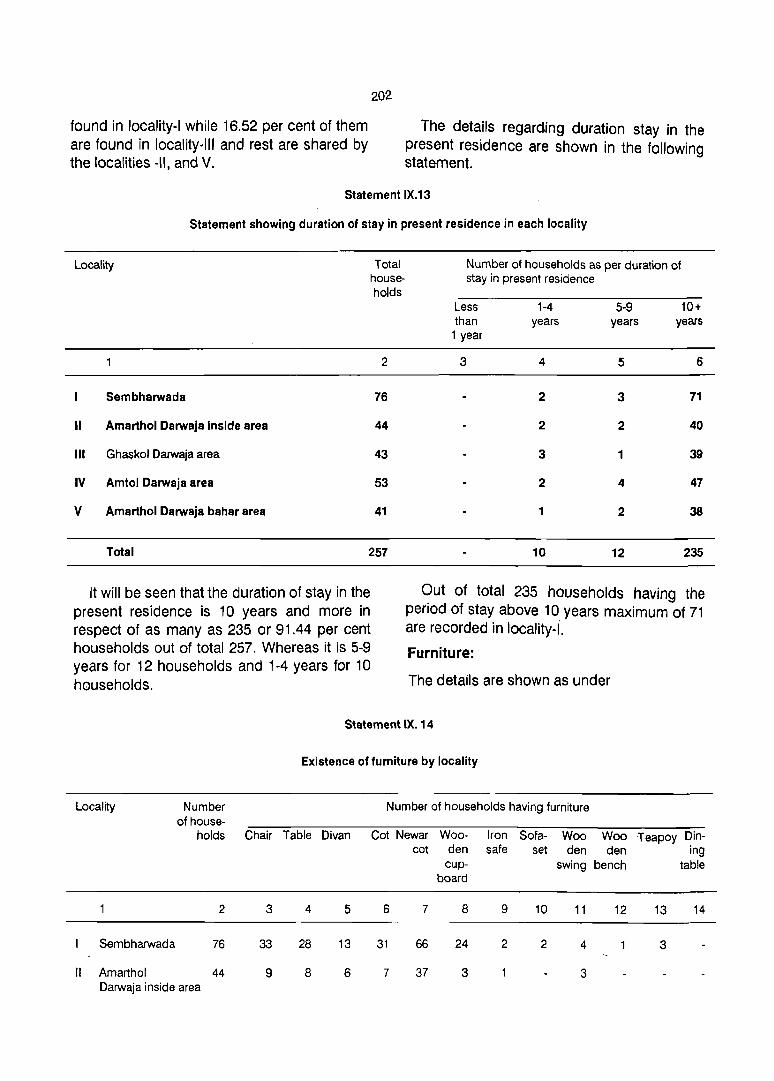
found in locality-I while 16.52 per cent of them are found in locality-III and rest are shared by the localities -II, and V.
202
The details regarding duration stay in the present residence are shown in the following statement.
Statement IX.13
Statement showing duration of stay in present residence in each locality
Locality Total households
2
Sembharwada 76
II Amarthol Darwaja inside area 44
III Ghaskol Darwaja area 43
IV Amtol Darwaja area 53
V Amarthol Darwaja bahar area 41
Total 257
It will be seen that the duration of stay in the present residence is 10 years and more in respect of as many as 235 or 91.44 per cent households out of total 257. Whereas it is 5-9 years for 12 households and 1-4 years for 10 households.
Number of households as per duration of stay in present residence
Less 1-4 5-9 10+ than years years years
1.year
3 4 5 6
2 3 71
2 2 40
3 1 39
2 4 47
1 2 38
10 12 235
Out of total 235 households having the period of stay above 10 years maximum of 71 are recorded in locality-I.
Furniture:
The details are shown as under
Statement IX. 14
Existence of furniture by locality
Locality Number Number of households having furniture of house-
holds Chair Table Divan Cot Newar Woo- Iron Sofa- Woo Woo Teapoy Din-cot den safe set den den ing
cup- swing bench table board
2 3 4 5 6 7 8 9 10 11 12 13 14
Sembharwada 76 33 28 13 31 66 24 2 2 4 3
II Amarthol 44 9 8 6 7 37 3 3 Darwaja inside area
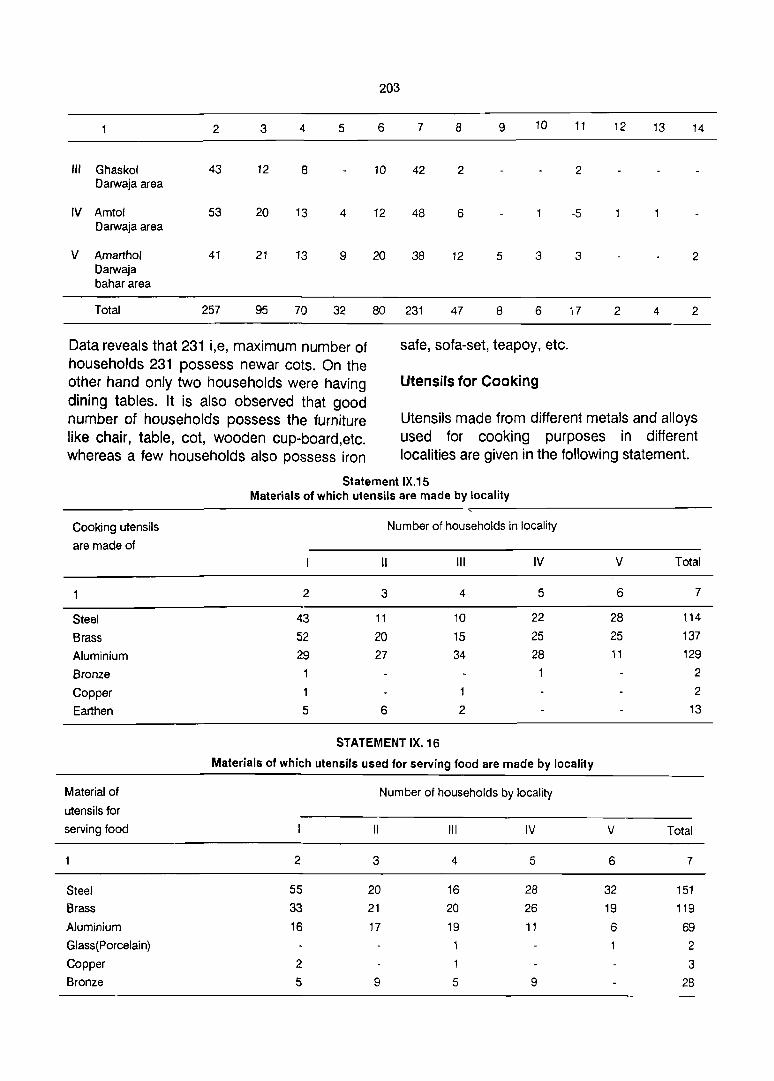
203
2 3 4 5 6 7 8 9 10 11 12 13 14
III Ghaskol 43 12 8 10 42 2 2 Darwaja area
IV Amtol 53 20 13 4 12 48 6 -5 Darwaja area
V Amarthol 41 21 13 9 20 38 12 5 3 3 2 Darwaja bahar area
Total 257 95 70 32 80 231 47 8 6 17 2 4 2
safe, sofa-set, teapoy, etc.
Utensils for Cooking
Data reveals that 231 i,e, maximum number of households 231 possess newar cots. On the other hand only two households were having dining tables. It is also observed that good number of households possess the furniture like chair, table, cot, wooden cup-board,etc. whereas a few households also possess iron
Utensils made from different metals and alloys used for cooking purposes in different localities are given in the following statement.
Cooking utensils
are made of
Steel
Brass
Aluminium
Bronze
Copper
Earthen
Material of
utensils for
serving food
Steel
Brass
Aluminium
Glass(Porcelain)
Copper
Bronze
Stat~ment IX.15 Materials of which utensils are made by locality
Number of households in locality
II III IV
2 3 4 5
43 11 10 22
52 20 15 25
29 27 34 28
1
1 1
5 6 2
STATEMENT IX. 16
Materials of which utensils used for serving food are made by locality
2
55
33
16
2 5
Number of households by locality
II
3
20 21
17
9
III
4
16
20
19 1
1
5
IV
5
28 26
11
9
V Total
6 7
28 114
25 137 11 129
2 2
13
V Total
6 7
32 151 19 119
6 69
2
3 28
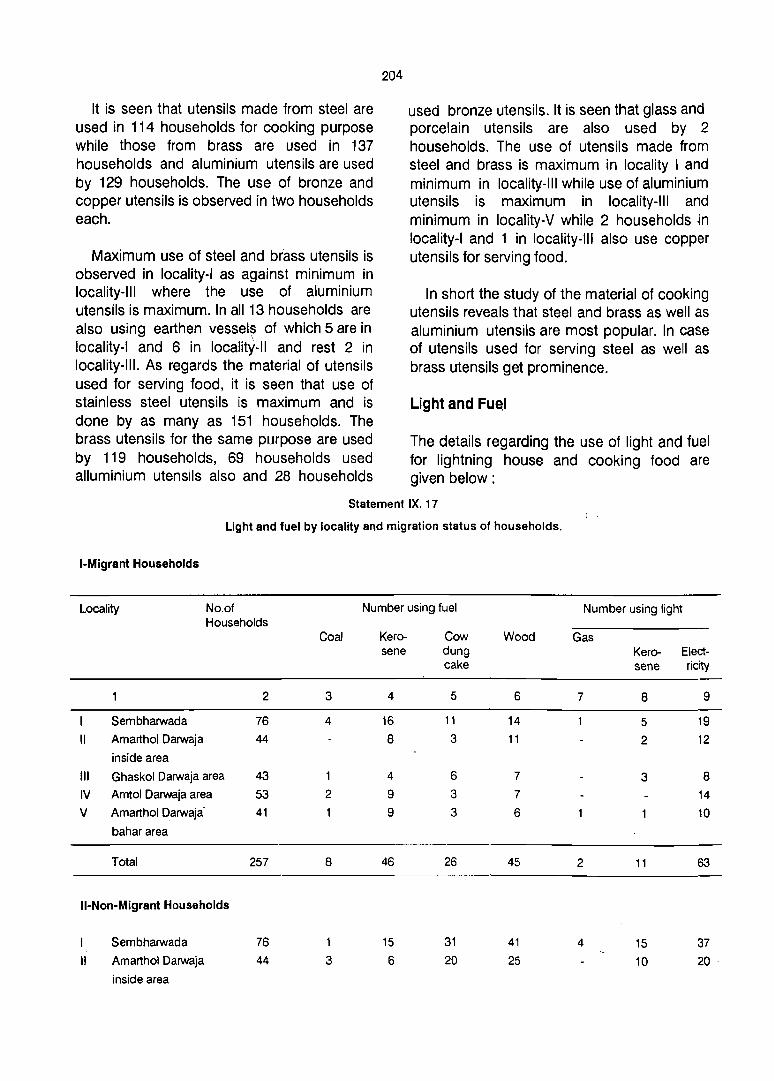
It is seen that utensils made from steel are used in 114 households for cooking purpose while those from brass are used in 137 households and aluminium utensils are used by 129 households. The use of bronze and copper utensils is observed in two households each.
Maximum use of steel and brass utensils is observed in locality-I as against minimum in locality-III where the use of aluminium utensils is maximum. In all 13 households are also using earthen vessel~ of which 5 are in locality-I and 6 in locality-II and rest 2 in locality-III. As regards the material of utensils used for serving food, it is seen that use of stainless steel utensils is maximum and is done by as many as 151 households. The brass utensils for the same purpose are used by 119 households, 69 households used alluminium utensils also and 28 households
204
used bronze utensils. It is seen that glass and porcelain utensils are also used by 2 households. The use of utensils made from steel and brass is maximum in locality I and minimum in locality-III while use of aluminium utensils is maximum in locality-III and minimum in locality-V while 2 households ·in locality-I and 1 in locality-III also use copper utensils for serving food.
In short the study of the material of cooking utensils reveals that steel and brass as well as aluminium utensils are most popular. In case of utensils used for serving steel as well as brass utensils get prominence.
Light and Fu~1
The details regarding the use of light and fuel for lightning house and cooking food are given below:
Statement IX. 17
Light and fuel by locality and migration status of households.
I-Migrant Households
Locality No.of Number using fuel Number using light Households
Coal Kero- Cow Wood Gas sene dung Kero- Elect-
cake sene ricity
2 3 4 5 6 7 8 9
Sembharwada 76 4 16 11 14 5 19 II Amarthol Oarwaja 44 8 3 11 2 12
inside area
III Ghaskol Darwaja area 43 1 4 6 7 3 8 IV Amtol Darwaja area 53 2 9 3 7 14 V Amarthol Darwaja' 41 9 3 6 10
bahar area
Total 257 8 46 26 45 2 11 63
II-Non-Migrant Households
Sembharwada 76 15 31 41 4 15 37 II Amarthol Oarwaja 44 3 6 20 25 10 20
inside area

2 3 '
III Ghaskol Darwaja area 43 3 IV Amtol Darwaja area 53 1 V Amarthol Darwaja 41 6
bahar area
Total 257 14
Kerosene, wood, cow-dung cake, coal and gas is generally used for cooking while kerosene and electricity is used for lighting houses.
The above data reveals that most of the migrant households use kerosene, cow-dung eake and wood for cooking purpose. Only 2 households use gas while 8 households use coal. The distribution of households using gas by locality shows one household each in locality-I and V whereas out of 8 households using coal half are found in locality-I. As regards other fuels maximum number of households are recorded in locality-I. It is also seen that as many as 63 households use el~ctricity -for lightning tne house whereas 11 households use kerosene for this purpose.
In respect of non-migrant households the data reveals the fact that as many as 148 households use wood for the purpose of cooking while 119 households use cow-dung
205
4
7 10 12
50
5 6 7 8 9
24 26 16 16
30 36 16 23
14 20 2 28
119 148 4 59 124
cake for the same purpose. Kerosene and coal are being used by 50 and 14 households respectively. Whereas 4 households in locality-I use gas for cooking purpose. As regards the lighting houses it will be seen that majority of households (124) use electricity for this purpose while kerosene for the same purpose is being used by 59 households. Out of 124 households USing electricity 37 are recorded in loeality-I and 28 in locality-V which comes to a little more than half of the total households, using electricity.
, It ;s also seen that out of total 148 households using wood for cooking purposes a little more than 50 per cent are found in locality-I and IV. Similarly, about half the households using cow-dung cake for cooking are recorded in locality-I and IV.
Luxury and Costly Goods
The details are show'n in the statement below.
STATEMENT IX.18
Locality
I Sembharwada
II Amarthol Darwaja inside area
III Ghaskol Darwaja area
IV Amtol Darwaja area I
V Amarthol Darwaja bahar area
Total
Presence of luxury and costly goods by locality
Total Households
2
76 44 43 53 41
257
No.of house-holds having no lux-ury and costly goods
3
23 18 20 17 9
87
Number of households possessing
Wrist Table Radio watch clock
4 5 6
42 38 41 20 12 12 18 14 13 31 22 19 28 21 25
139 107 110
Tele-vision
7
4 1
2
5
13
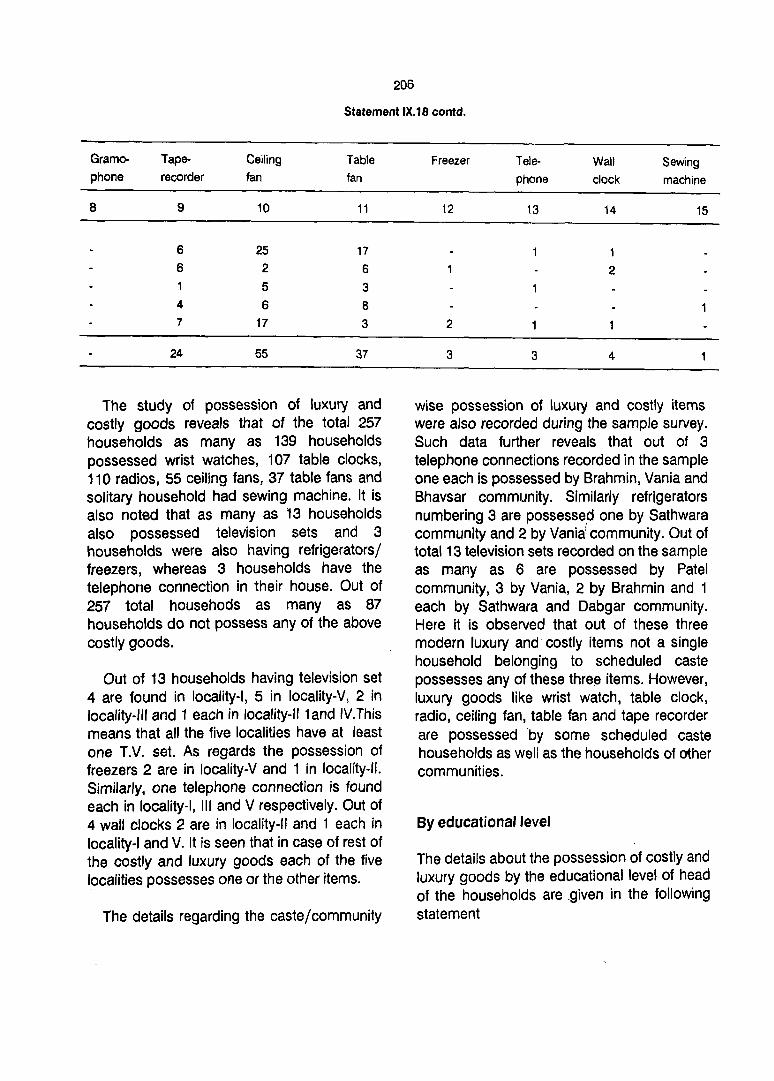
206
Statement IX.18 contd.
Gramo- Tape- Ceiling Table phone recorder fan fan
B 9 10 11
6 25 17 6 2 6
5 3 4 6 8 7 17 3
24 55 37
The study of possession of luxury and costly goods reveals that of the total 257 households as many as 139 households possessed wrist watches, 107 table clocks, 110 radios, 55 ceiling fans, 37 table fans and solitary household had sewing machine. It is also noted that as many as 13 households also possessed television sets and 3 households were also having refrigerators/ freezers, whereas 3 households have the telephone connection in their house. Out of 257 total househods as many as 87 households do not possess any of the above costly goods.
Out of 13 households having television set 4 are found in locality-I, 5 in locality-V, 2 in locality-III and 1 each in locality-II 1and IV.This means that all the five localities have at least one T.V. set. As regards the possession of freezers 2 are in locality-V and 1 in locality-II. Similarly, one telephone connection is found each in locality-I, III and V respectively. Out of 4 wall clocks 2 are in locality-II and 1 each in locality-I and V. It is seen that in case of rest of the costly and luxury goods each of the five localities possesses one or the other items.
The details regarding the caste/community
Freezer Tele- Wall Sewing phone clock machine
12 13 14 15
1
2
2
3 3 4
wise possession of lUxury and costly items were also recorded during the sample survey. Such data further reveals that out of 3 telephone connections recorded in the sample one each is possessed by Brahmin, Vania and Bhavsar community. Similarly refrigerators numbering 3 are possessed one by Sathwara community and 2 by Vania~ community. Out of total 13 television sets recorded on the sample as many as 6 are possessed by Patel community, 3 by Vania, 2 by Brahmin and 1 each by Sathwara and Dabgar community. Here it is observed that out of these three modern lUxury and costly items not a single household belonging to scheduled caste possesses any of these three items. However, luxury goods like wrist watch, table clock, radio, ceiling fan, table fan and tape recorder are possessed by some scheduled caste households as well as the households of other communities.
By educational level
The details about the possession of costly and luxury goods by the educational level of head of the households are given in the following statement
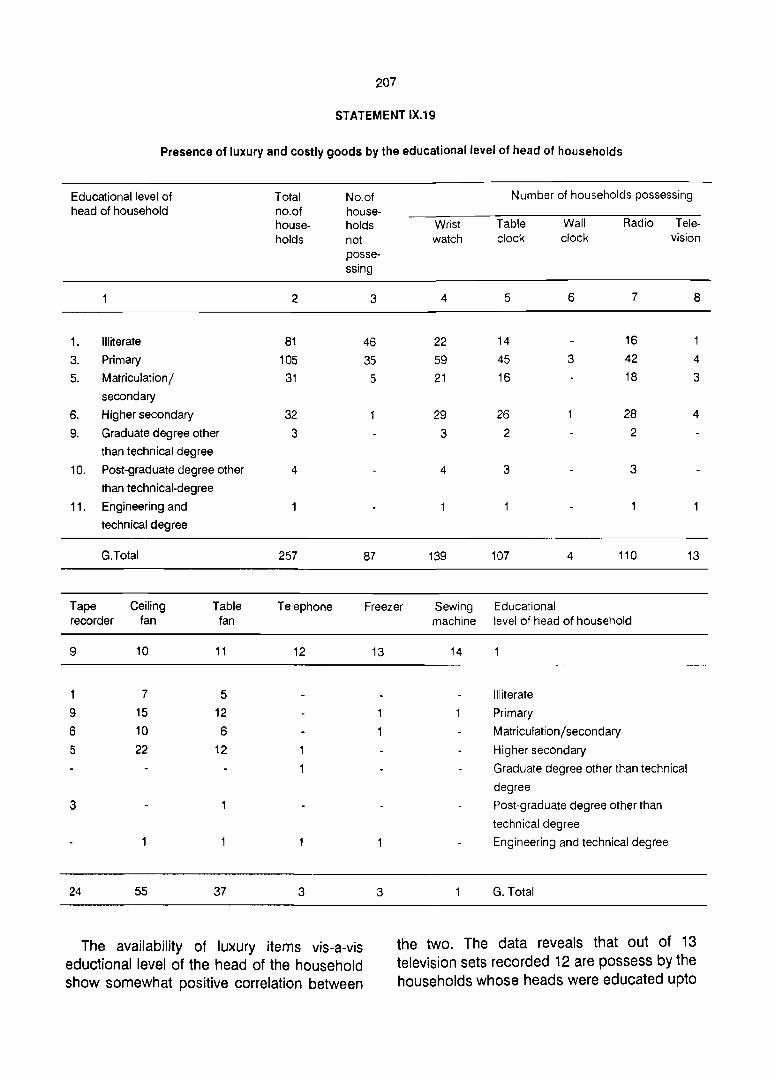
207
STATEMENT IX.19
Presence of luxury and costly goods by the educational level of head of households
Educational level of Total No.of Number of households possessing head of household no.of house-
house- holds Wrist Table Wall Radio Tele-holds not watch clock clock vision
posse-ssing
2 3 4 5 6 7 8
1. Illiterate 81 46 22 14 16
3. Primary 105 35 59 45 3 42 4
5. Matriculation/ 31 5 21 16 18 3
secondary
6. Higher secondary 32 29 26 28 4
9. Graduate degree other 3 3 2 2
than technical degree
10. Post-graduate degree other 4 4 3 3 than technical-degree
11. Engineering and
technical degree
G.Total 257 87 139 107 4 110 13
Tape Ceiling Table Telephone Freezer Sewing Educational recorder fan fan
9 10 11 12
7 5 9 15 12
6 10 6 5 22 12 1
1
3
24 55 37 3
The availability of luxury items vis-a-vis eductional level of the head of the household show somewhat positive correlation between
13
3
machine level of head of household
14
Illiterate
Primary
Matriculation/secondary
Higher secondary
Graduate degree other than technical
degree
Post-graduate degree other than
technical degree
Engineering and technical degree
G. Total
the two. The data reveals that out of 13 television sets recorded 12 are possess by the households whose heads were educated upto
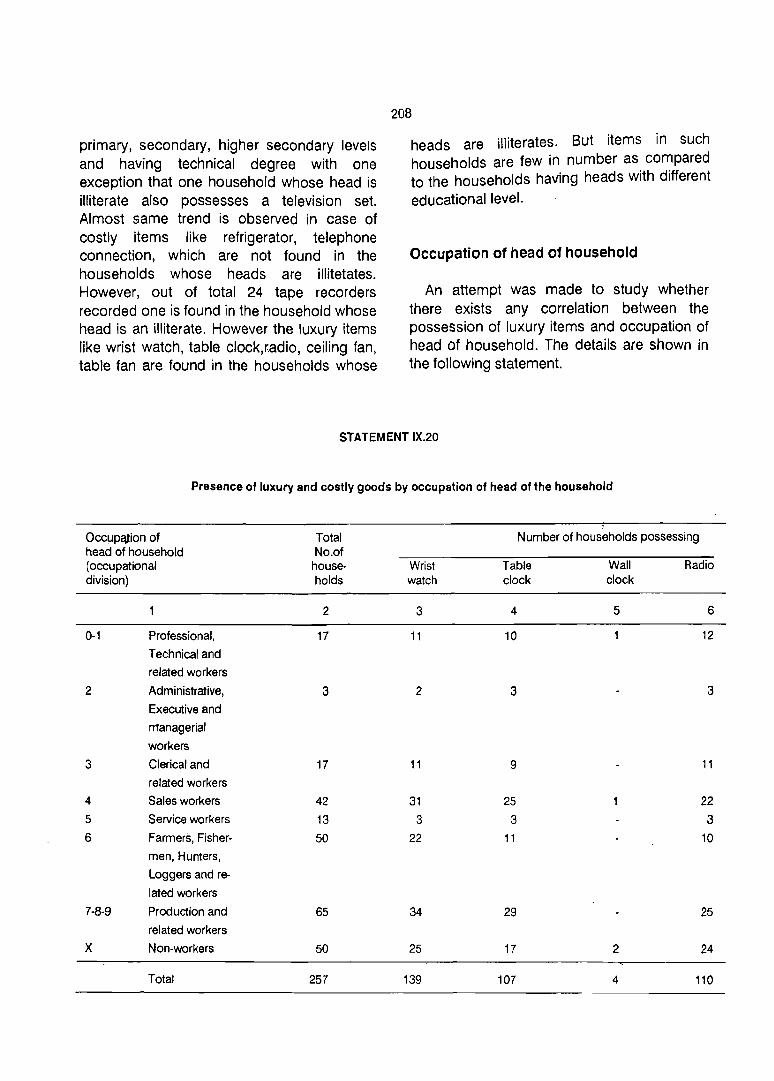
primary, secondary, higher secondary levels and having technical degree with one exception that one household whose head is illiterate also possesses a television set. Almost same trend is observed in case of costly items like refrigerator, telephone connection, which are not found in the households whose heads are illitetates. However, out of total 24 tape recorders recorded one is found in the household whose head is an illiterate. However the luxury items like wrist watch, table clock,radio, ceiling fan, table fan are found in the households whose
208
heads are illiterates. But items in such households are few in number as compared to the households having heads with different educational level.
Occupation of head of household
An attempt was made to study whether there exists any correlation between the possession of luxury items and occupation of head of household. The details are shown in the following statement.
STATEMENT IX.20
Presence of luxury and costly goods by occupation of head of the household
Occupqtion of Total Number of households possessing head of household No.of (occupational house- Wrist Table Wall Radio division) holds watch clock clock
2 3 4 5 6
0-1 Professional, 17 11 10 12
Technical and
related workers
2 Administrative, 3 2 3 3 Executive and
managerial
workers
3 Clerical and 17 11 9 11 related workers
4 Sales workers 42 31 25 22 5 Service workers 13 3 3 3
6 Farmers, Fisher- 50 22 11 10 men, Hunters,
Loggers and re-
lated workers
7-8-9 Production and 65 34 29 25 related workers
X Non-workers 50 25 17 2 24
Total 257 139 107 4 110

209
Statement IX.20 (contd.)
Tape Television Ceiling Table recorder tan tan
7 8 9 10
2 6 6 3 1
1 6 8 5 5 14 5
1 1-
2 1 5 5
8 3 12 8
5 2 8 3
24 13 55 37
There does not seem exact positive correlation between the possession of luxury and costly items and occupation of head of household. This may be seen from the fact that the costly and luxury items like television set, refrigerator, telephone connection are found in the households whose heads are engaged as administrative, executive and managerial workers, sales workers. However, television set is also found in the households whose heads are working as Farmers, Fishermen, Loggers and related workers, Production and related workers. The same item is also observed in the house of nonworkers. Similarly refrigerator is also found in the house of non-worker.
Whereas the luxury and costly goods like wrist watch, table clock, radio, tape recorder, ceiling fan, table fan, etc. are recorded in the households whose heads of household are engaged as workers nearly in all types of occupational divisions as well as house in which the heads are recorded as non-workers.
Dress
In the past, dress was symbol of identification and recognisation of a particular caste as each caste was wearing a typical traditional
Telephone Freeze Sewing machine
11 12 13
2
3 3
dress with specific colour combinations. Nowa-days this practice has been vanished in most of the castes.
The dress can be classified as those worn by elders, adults and those put on by minors viz. children. This classification is applicable to both males as well as females. Moreover, the dress is also peculiar according to different occupation status.
Adult male members commonly use Dhoti, Paheran, Kafni and phenta/Paghadi or topi. Dhoti is used to cover the lower part of the body while Paheran/Kafni is put on to cover the upper part of the body. Phenta, Paghadi or Topi is used as head garment. The white captopi is gradually replacing the Phenta, Paghadi. Most of the cultivators use Dhoti, Kafni, Paheran and Topi. The modern dress viz. pant, shirt or lengha is now gradually gaining ground in the young group of all castes. Most of the servicemen put on pant and shirt. It is also noticed that the new generation of cultivators and rural artisans and some young agricultural labourers have also adopted modern dress e.g. pant and shirt.
Similarly, dress for females can be classified according to adult or married

females and female children. In case of adult or married females there is no diversity of trait in dress as they consist of the dress e.g. kabja, choli, blouse to cover the upper part of the body. The chaniya or Ghaghara or pettiooat is put on to cover from waist to feet a sari is also put on to cover both the upper and lower parts of the body, Sari measures 5 yards in length and 45 to 54 inches in width. The girls wear Ghaghara, Ghaghari, Kabja, Blouse, Odhani. The."Use of frock has also increased.
The girls of certain castes namely Brahmin, Luhar, Oarji and Raval wear Frock, Sl<irt,' Top and Chaddi. Generally coarse cloth is used for these clothes. However, on festival occasions they put on silk or fine court saries. The extra clothes are preserved in the wooden or steel cup-boards or steel trunks. A small group of men was found wearing checkered shirts and pants. The ladies belonging to community Vanias, Brahmins, Businessmen were also found wearing silk saries.
CHAPTER X
SLUMS, BLIGHTED AND OTHER AREAS WITH SUB-STANDARD LIVING CONDITIONS
Slum are commonly in all big towns and cities, which have attracted the rural poor who cannot afford convetional housing to live in or for whom no housing has been planned. No exact definition of slum commonly used by all has been framed. Various agencies have adopted defferent definitions. Spontaneity and disorganised growth of inhabitation are basic characteristics of slums. The United Nations Organisation defines slum as "a building, group of building or area charactrised by overcrowding, deterioration, insanitary conditions or absence of facilities or amenities which because of these conditions or any of them endanger health, safety or morals of its inhabitants or the community".* Slums are thus charactorised by appearance, economic status, over-crowding, nature of population, health and sanitary conditions, morals and way of life etc. Thus the slum and blighted areas both represent sub-standard living conditions. The life of the slum dwellers runs counter to the democratic way of life. The responsibility for amelioration of the slums lies on both slum and non-slum dwellers. The improvement of the slum areas is indeed a challenging task for the planners and administrators.
In a small town like Vadnagar such localities being sub-standard conditions and absence of sanitary facilities are found outside the town. Here also huts made of grass,tin sheets, walls of mud and the entrance covered with a cloth or gunny bag are found, by the side of each gate. It appears that the people living in such huts have not paid any attention towards cleanliness. The people living in such huts are stated to be living there from a long time. Most of them have forcibly occupied the land for
which no rent seems to be paid by them. It can be safely presumed that they might have been compelled to occupy the land because they have come to the town from the neighbouring areas in search of some work and might have grabbed the space of two sq. meters to accomadate their family. Their earnings are too meagre to occupy a good house.
Such households are closely packed with one another and are made with mud walls and earthen foundation and basement. The roof is mostly of deshi tiles, bamboo or of leaves, such. huts are constructed by themselves without utilising the services of masons or carpenters. Most of the huts have one room, without ventilation or varandah or kitchen. One side of the wall is used as kitchen. Windows are yet to be introduced. In some cases the walls are plastered but the complete puccahuts are very rare. The floors are levelled and smeared with COW-dung.
The most pitiable condition leading to several social evils is that wife, marriedl unmarried children all live together mostly in one room. The space utilised by such families is absolutely insufficient to meet the minimum requirement. Obviously privacy is quite impossible and the unmarried children,are the worst affected members of the family. Clothes, money, utensils, etc. are kept in the available one room. Sanitary conditions are totally unsatisfactory. They have no latrines and bathrooms. The inhabitants go to the nearby open places to ease themselves Not a Single hut is electrified. The only source of water for drinking and washing is the public taps.
* Chapter-I, Introduction: " Survey of Slums of seven cities of Gujarat" prepareQ by Core Consultants Pvt. Ltd.,
'Ahmadabad. Published by Gujarat Slum Clearance Board, Vol. I Main Report.

212
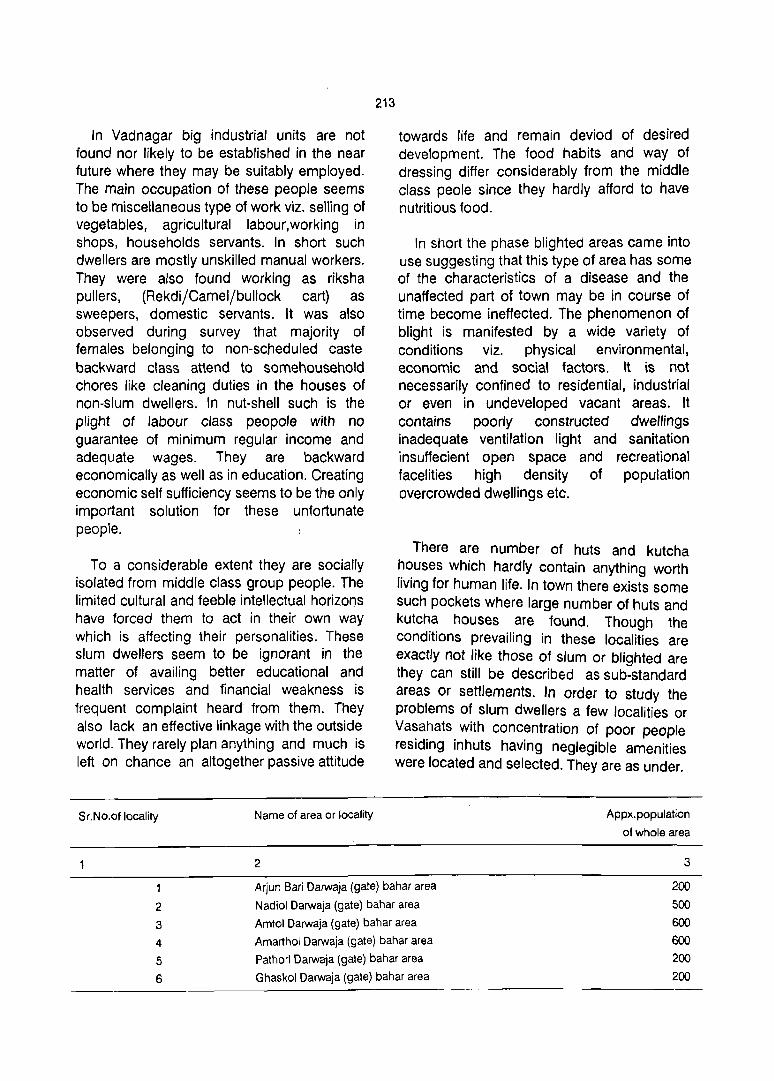
In Vadnagar big industrial units are not found nor likely to be established in the near future where they may be suitably employed. The main occupation of these people seems to be miscellaneous type of work viz. selling of vegetables, agricultural labour,working in shops, households servants. In short such dwellers are mostly unskilled manual workers. They were also found working as riksha pullers, (Rekdi/Cameljbullock cart) as sweepers, domestic servants. It was also observed during survey that majority of females belonging to non-scheduled caste backward class attend to somehousehold chores like cleaning duties in the houses of non-slum dwellers. In nut-shell such is the plight of labour class peopole with no guarantee of minimum regular income and adequate wages. They are backward economically as well as in education. Creating economic self sufficiency seems to be the only important solution for these unfortunate people.
To a considerable extent they are socially isolated from middle class group people. The limited cultural and feeble intellectual horizons have forced them to act in their own way which is affecting their personalities. These slum dwellers seem to be ignorant in the matter of availing better educational and health services and financial weakness is frequent complaint heard from them. They also lack an effective linkage with the outside world. They rarely plan anything and much is left on chance an altogether passive attitude
Sr.No.of locality Name of area or locality
1 2
213
towards life and remain deviod of desired development. The food habits and way of dressing differ considerably from the middle class peale since they hardly afford to have nutritious food.
In short the phase blighted areas came into use suggesting that this type of area has some of the characteristics of a disease and the unaffected part of town may be in course of time become ineffected. The phenomenon of blight is manifested by a wide variety of conditions viz. physical environmental, economic and social factors. It is not necessarily confined to residential, industrial or even in undeveloped vacant areas. It contains poorly constructed dwellings inadequate ventilation light and sanitation insuffecient open space and recreational facelities high density of population overcrowded dwellings etc.
There are number of huts and kutcha houses which hardly contain anything worth living for human life. In town there exists some such pockets where large number of huts and kutcha houses are found. Though the conditions prevailing in these localities are exactly not like those of slum or blighted are they can still be described as sub-standard areas or settlements. In order to study the problems of slum dwellers a few localities or Vasahats with concentration of poor people residing inhuts having neglegible amenities were located and selected. They are as under.
Appx.population
of whole area
3
Arjun Bari Darwaja (gate) bahar area 200
2 Nadiol Darwaja (gate) bahar area 500
3 Amtol Darwaja (gate) bahar area 600
4 Amarthol Darwaja (gate) bahar area 600
5 Pathorl Darwaja (gate) bahar area 200
6 Ghaskol Darwaja (gate) bahar area 200

In order to record some extra information 27 households were selected on purposive sample basis from the above mentioned areas. The main concentration of people belonging to Scheduled caste namely Bhangi,
214
Chamar, Vankar, Bawa-dedh and also poor backward non-scheduled caste people like ~hoi, Rabari, Raval, sathwara, Thakor,Vaghari, Ode and Muslim is found in such pockets. The details are given in the following statement.
Statement X.1
Distribution of household selected from sub-standared living area with population by caste/community and type
of house
Caste jCommunity No.of
households
2
Bhangi (SC) 1
Chamar (SC) 2 Bawa-Dedh (SC) 1
Garoda (SC) 2
Mochi (SC)
Turi (SC) 1
Vankar (SC) 2 Bhoi 1
Muslim 2 Ode
Rabari 2 Rawal 2
Sathawara 1
Thakor 5 Vaghari 3
Total 27
134 members of 25 households were of Hindu religion out of which 54 members of 10
households belong to scheduled caste. In all 10 members of 2 households are of Muslim religion. Out of 27 houses as many as 22 houses are Kutcha and only 5 are semi-pucca houses.
The availability of space can be assessed by the number of rooms and their size was shared by 144 members of these areas. The details are as under.
p
3
5 10
5
12
6
6
10
11
10
6
12
5
7
25 14
144
Population Type of house
M F Pucca Kutcha
4 5 6 7
2 3 5 5 2
2 3
5 7 2
2 4
4 2 1
5 5 2
7 4
4 6 2 4
8 4 2 3 2 1
3 4 1
18 7 5 6 8 3
76 68 5 22
No. of No. of rooms Size in feet.
households
2 3
15 12'x1S'
9 2 10'x12'
3 3 10'x10'
It will very well be seen that out of 27 households as many as 15 share- only one room of size 12'x15' whereas 9 households live in 2 rooms of size 1 O'x 12' and rest 3 are
having 3 rooms of facility. This indicates how these households accomodate themselves in a small space.
Amenities
The above mentioned settlements are very old in the town and people belonging to low economic strata reside in these areas in old and mostly Kutcha houses. These localities are connected with each other by narrow streets in which light poles are fixed at a distance of 20 feet. During the inquiry it was noticed that electricity has not reached in their houses. So far as tOilet facility is concerned it was observed that in some localities Nagar Panchayat authority has built some public latrines only for females. Whereas males have to use open place for this purpose. Their own houses do not have the facility of latrines. Similarly for drinking water facility the Nagar Panchayat has provided some public hydrants. However sewerage for disposal of waste water is not available which goes in the open space and thereby it breeds mosquitoes. There is much congestion in these localities.
Education
The education level of head of the household is shown below:-
Education level of Head
of Household
Illiterate
Upto 2nd Standard
Upto 3rd Standard
Upto 4th Standard
No. of household
2
15 2
1
5
215
Upto 7th Standard
Upto Sthe Standard Upto S.S.C. (Secondary)
Total
2
1
2
27
Out of total 27 households selected heads of 15 households are found to be illiterate which comes to more than half of the total households. It is also observed that only 1 head of household is having S.S.C. certificate. 2 have studied upto 9th standard. 1 upto 7th standard and 5 upto 4th standard. The above data indicate the poor education level of head of there households.
As regards the number of school going children belonging to these 27 selected households, it was observed that out of 19 male school going children 8 are not attending school whereas out of 15 such female children 6 are not attending schools. It is also observed that out of total non-school going children about half of the children never attended school and rest had left after attending. Main reason reported for not attending schools or leaving the school after attending seem to be the poor economic condition, unaware of the present value of literacy especially in case of females. These dropouts are usually engaged in same gainful work even at their teens.
Composition of population of selected households.
The following statement shows the composition of population by ioealities.
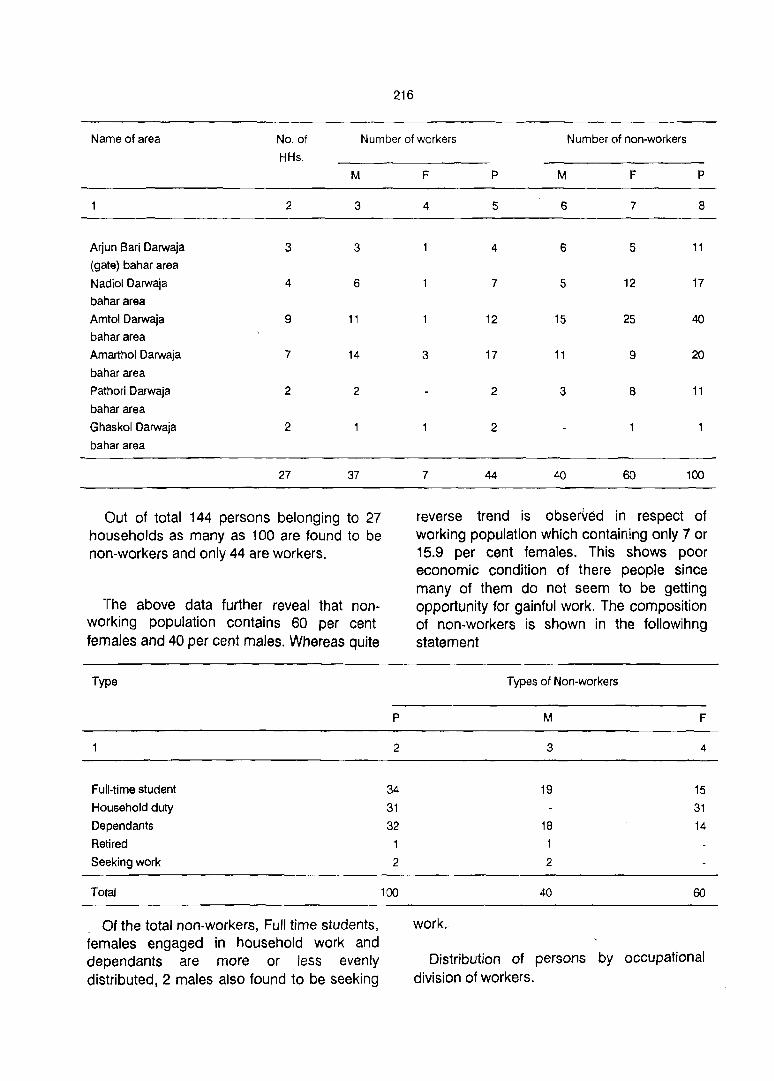
216
Name of area No. of Number of workers Number of non-workers
Arjun Sari Oarwaja
(gate) bahar area
Nadiol Darwaja
bahar area
Amtol Darwaja
bahar area
Amarthol Darwaja
bahar area
Pathori Oarwaja
bahar area
Ghaskol Darwaja
bahar area
HHs.
2
3
4
9
7
2
2
27
M
3
3
6
11
14
2
37
Out of total 144 persons belonging to 27 households as many as 1 00 are found to be non-workers and only 44 are workers.
The above data further reveal that nonworking population contains 60 per cent females and 40 per cent males. Whereas quite
Type
FUll-time student
Household duty
Dependants
Retired
Seeking work
Total
Of the total non-workers, Full time students, females engaged in household work and dependants are more or less evenly distributed, 2 males also found to be seeking
p
2
34
31
32
1
2
100
F P M F P
4 5 6 7 8
4 6 5 11
7 5 12 17
12 15 25 40
3 17 11 9 20
2 3 8 11
2
7 44 40 60 100
reverse trend is obserVed in respect of working population which containing only 7 or 15.9 per cent females. This shows poor economic condition of there people since many of them do not seem to be getting opportunity for gainful work. The composition of non-workers is shown in the followihng statement
Types of Non-workers
M
3
19
18
2
40
work.
F
4
15
31
14
60
Distribution of persons by occupational division of workers.
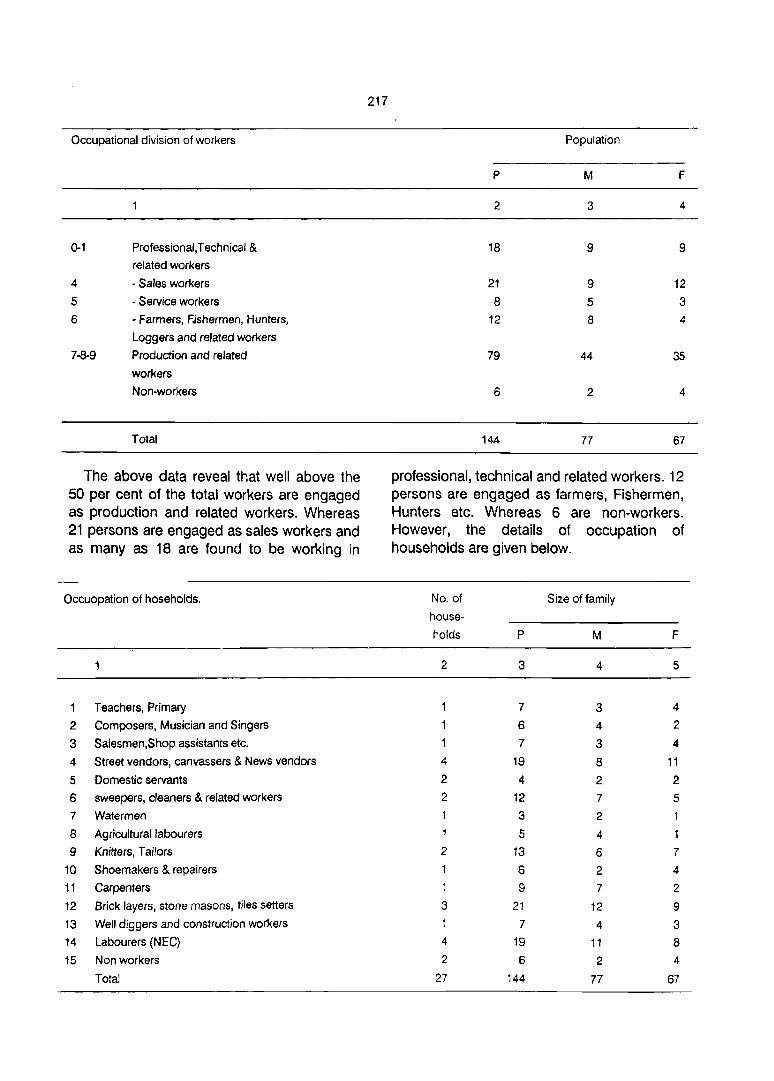
Occupational division of workers
0-1 Professional,Technical & related workers
4 - Sales workers
5 - Service workers
6 - Farmers, Fjshermen, Hunters,
Loggers and related workers
7-8-9 Production and related
workers
Non-workers
Total
The above data reveal that well above the 50 per cent of the total workers are engaged as production and related workers. Whereas 21 persons are engaged as sales workers and as many as 18 are found to be working in
Occuopation of hoseholds.
Teachers, Primary
2 Composers, Musician and Singers
3 Salesmen,Shop assistants etc.
4 Street vendors, canvassers & News vendors
5 Domestic servants
6 sweepers, cleaners & related workers
7 Waterman
8 Agricultural labourers
9 Knitters, T ai/ors
10 Shoemakers & repairers
11 Carpenters
12 Brick layers, stone masons, tiles setters
13 Well diggers and construction wol'kers
14 Labourers (NEG)
15 Non workers
Total
217
Population
p M F
2 3 4
18 9 9
21 9 12
8 5 3
12 8 4
79 44 35
6 2 4
14.4 77 67
professional, technical and related workers. 12 persons are engaged as farmers, Fishermen, Hunters etc. Whereas 6 are non-workers. However, the details of occupation of households are given below.
No. of
house
holds
2
4
2 2
2
1
3
4
2
27
P
3
7
6 7
19
4
12
3
5 13
6
9
21
7
19
6
144
Size offamily
M
4
3 4
3
8
2
7
2
4
6
2
7
12
4
11
2
77
F
5
4
2
4
11
2
5
7
4
2
9
3
8 4
67
In 4 households, all 19 workers were engaged as labourers & street vendors there by giving an average of 5 workers per households. The maximum of 21 workers in 3 households are found to be engaged as Brick layers, stone masons and tiles setters whereas 13 workers in 2 households are engaged as Knitters, Tailors and 12 persons of 2 households are engaged as sweepers, cleaners and related workers. It is seen that 5 workers of 1 household are working as agricultural labourers whereas 9 workers of 1 household are working as ~arpenters and 7 worker of 1 household are well diggers and construction workers, 4 workers of 2 households are found to be working as Domestic workers. 6 workers in 1 household are also working as shoemakers and shoe repairers. Thus in short it is seen that the members of the selected households are engaged in the work which mostly does not guarantee for regular income to the family
218
except 1 household with 7 members engaged as Primary teachers
These settlements have houses belonging to some other communities who are mostly back-ward and poor people. The unskilled labourers migrating from nearby rural areas also prefer to reside in these areas thus adding to its congestion. As the housing is one of the major economic problems in the urban areas so these places being comparetively cheap attracted the low income group of people. Here it was observed that people from many nearby villages migrated to Vadnagar in search of their livelihood and settled permanently there. It was also informed that the Nagar Panchayat has given some waste land free of cost for their housing. The authority seems quite eager to make necessary improvement in their living conditions and to provide possible amenities like drinking water and fight etc.
CHEPTER -XI
ORGANISATION OF POWER AND PRESTIGE
Vadnagar has no signs of urban society. Actually the town is in a transitional stage where conditions of semi-urban areas are in existence. In such small places a group of persons always enjoy the supreme respect they are known and respected. In matters of common welfare their views are always heard and implemented. Many a times the family disputes are also by them settled and saved them from going to court.
In a small town popularity of a person in the field of serving the human beings spreads very fast. A few of them command a great respect from the town people, while others are in high esteem of the people. On the basis of schedules, the information about five most respected and socially known persons of the town was collected.
The maintenance of peace law and order in the town and security of life and property of the town people is the prime responsibility of the police sub-inspector of Vadnagar. The other officers who are also responsible for civic administration in the town are the executive committee of the Nag~r Panchayat and the Mamlatdar whp periodically visits this town for the revenue matters.
Respected persons of the town
In order to collect the information regarding respected persons of Vadnagar the town was divided into 10 different localities or neighbourhoods. In all 50 persons were interviewed regarding the five most respected and influential persons in their neighbourhood and in the town as a whole. This approach obviously throws light upon the influence
exercised by the persons as also the corresponding esteem derived from the set of respondents. It is also seen that the smallness of a town often makes a person popular in a locality or sub-locality which has a transcending fame throughout the town. The five most respected persons as indicated by the interviewees is given in the Appendix no. 17. These persons belong to different castes drawn from all walks of life.
The Appendix-17 indicates the particulars of five most respected persons in the 10 neighbourhoods of the town. The columns 2 to 8 show the name, sex, caste, education, occupation and religion of the respected persons in each neighbourhood.
It will be seen from the above that in all 49 persons 5 each in 9 localities and 4 in one locality were recorded as most respected persons of 10 neighbourhoods. Out of 49 persons, 4 persons namely S/Shri Sukhlal Bechar, Laxmikant and Jayantibhai are reported to be respectable in first 3 localities and Shri Gunvantlal reported as respected in forth, ninth and tenth localities while as many as 7 persons are reported to be respected in two neighbourhoods and rest are recorded as respected persons in their respective neighbourhoods only. Out of 7 such respected persons two are found to be recorded in first and second neighbourhoods, three in fourth and ninth neighbourhoods and the remaining two persons are found to be respected in fifth and tenth and in fifth and eighth neighbourhoods. As regards their sex it is observed that all are males. Only one lady who is the Panchayat member was reported as respected person in 10th neighbourhood. Regarding the education level of the most

respected persons, it is observed that out of 49 persons as many as 10 are having education upto Primary level, viz. Std. I to VII. passed, 26 are having secondary level education (VIII-X passed) and 12 persons have also obtained the graduation degree in Arts, Law and Science. One person is also having a post-graduate d.egree. This means that education of person is also one of the factors in selection of respected person in the town. Regarding the occupation of the selected respected persons in the town, it is observed that out of total 49 persons as many as 21 are engaged in various types of business whereas 8 persons are engaged in servIce of transport, Panchayat and Government and an equal number of persons are retired ones including advocates and P .S.1. Six persons were engaged in cultivation and 1 each was social worker, member of panchayat, advocate and chairman of cooperative society and the remaining one was dOing the ritual services (Yajman).
It is evident from the above fact that though education is an important consideration, however, persons with even a low educational level are held in high esteem. Similarly one's occupational pursuit also does not seem to be an attribute for such an esteem, as data reveal that persons of diverse occupations are held in esteem.
It is seen that one Shri Laxmikant (B.A.) and Shri Gunvantbhai (L.L.B.) are reported to be respected in three localities, whereas SjShri Sukhlal Bechar, Jayantibhai having only education upto 8th Std. and Secondary level respectively are also respected in three localities. Similarly persons having B.A. and L.L.B. education level are respected in two localities, on the other hand persons who were having education level upto 5th to 8th standard are equally respected in two localities.
Only one lady Smt. Madhukantaben, member of Panchayat was reported to be the
220
respected lady member in locality 10. She was having the education back ground upto X standard. It was gathered from the people that she was promptly solving problems brought to her notice specially by the women folk of the town.
Out of 49 respected persons 43 were Hindus and rest 6 were Muslim. Regarding castes of respectable persons it is observed that among Hindus 8 persons belonged to Patel community, 9 were Brahmins, 4 were Baniya, 5 Thakors, 3 Naik, 2 Sathwara, 1 each belonged -to Suthar, Rabari, Ghanchi and Bhavsar and as many as 8 persons belonged to Scheduled castes of which 3 were Parmars, 2 Chamars, 1 each Shrimali, Garoda and Harijan.
Regarding the occupation of persons who were interviewed for naming the respected persons in their localities it is seen that out of 50 interviewees as many as 14 were businessmen, 10 were engsged in different services. 9 cultivators, 9 were non-workers whereas rest were engaged in various occupations.
Similarly the educational level of persons interviewed for naming the respected persons in their respective neighbourhoods was also recorded. From the details it is observed that out of 50 interviewees as many as 12 were illiterate and 22, 9, 5 were educated upto primary, matriculation and higher secondary levels respectively. The rest of one each is a graduate and a post-graduate with extra degree of bachelor of education.
Most Influential persons in the localities
The interviewees were also asked to identify people whom they think influential in their neighbourhood.
As regards the information about the influential persons in the differeN localities of the town it was found that a group of people
commanded respect and influence in the social circle. Such persons were found attending marriages, funerals etc. 01 the locality. They consoled the breaved family. Advised the people in matters which were brought to their notice. Their influence in solving the family disputes was also found helpful. They also watched the activities of the children and youth of their locality. In fact they acted as the sOcially respected and influential persons. The information was collected for the same localities as that for respectable persons as shown in the ApP6ndix no. 18. The particulars of most influencial persons in the neighbourhood of locality is given in Appendix 18.
In Appendix 17 out of 49 persons reported to be influential persons in 10 neighbourhoods of 5 localities SjShri Vadibhai and Amitbhai are reported to be influential persons in 3 neighbourhoods whereas 7 other persons are reported to be influential persons in two neighbourhoods of which 1 in first and second neighbourhood 2 in first and third neighbourhood 4 in fourth and ninth neighbourhood. The 29 persons are reported to be influential in their respected localities or neighbourhood. Shri Vadibhai who is educated only upto 8th standard and engaged as cultivator is reported to be the most influential person in first three neighbourhoods. Whereas Shri Amitbhai soni having education level of 7th standard and engaged in selling of gold and silver ornaments is also equally influential in these three neighbourhoods. Out of 49 influential persons 48 are males and only one is female. Except five all these influential persons are Hindus.
As regards the education of influential persons is concerned, it is observed that at least one person having educational level upto graduation was found to be reported in 6 neighbourhoods. The influential persons with less educational qualification were found in Chamarvas neighbourhood where all the five
221
members have attained education upto 5th standard. They all belong to scheduled caste. It is interesting to note that even for Bhangivas locality people reported 3 non-scheduled caste members as their most influential persons 1 each is Patel, Muslim and Suthar having education upto S.S.C., S.S.C. and 6th standard respectively.
Regarding the educational level of individuals it is seen that out of 49 persons as many as 32 are having education upto secondary level and 9 membners are with Primary level education whereas 6 members are graduates. The two extreme cases in educational level are also noticed wherein one is an illiterate and the other one is having a post-graduate degree. Here also it is noted that education is one of the important considerations in selection of influential persons in the various neighbourhoods.
So far as the occupation of most influential persons is concerned it will be seen that out of total 49 persons 10 persons are engaged in different business, 6 as cultivators. Whereas equal number of persons are working as contractors. 7 are engaged in service of various organisations. Five are retired persons, 5 are sonies who are doing silver and goldsmith work, 2 persons are engaged as Photographers' 2 are doing the tailoring work, 3 are social workers and rest are engaged in miscellanious worK. Thus diversity in occupation is found and same is not the yardstick for selection of the most influential persons. Similarly education is also not the sole criterion for determining the influential-persons which is evident from the fact that a person having post-graduate degree in Commerce (M.Com.) is the most influential person in Kansaravas neighbourhood whereas on the other hand another one illiterate. Thakor is equally influential person reported by the people for Thakorvas neighbourhood.
It is also observed from the above
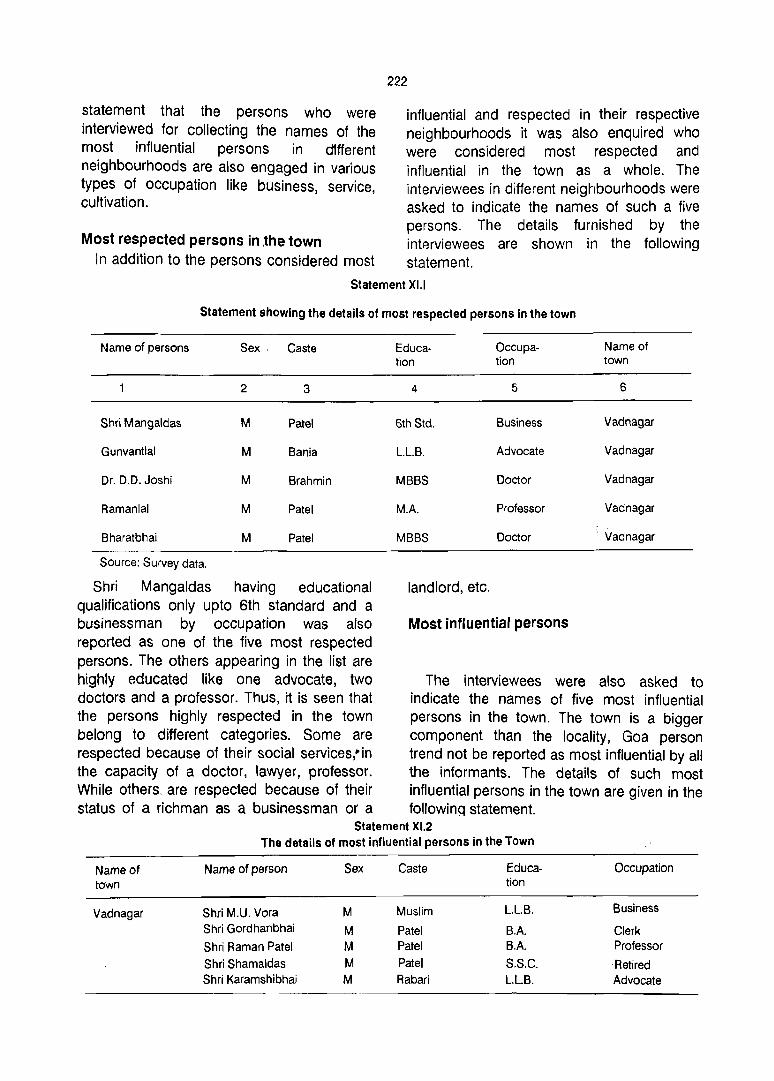
statement that the persons who were interviewed for collecting the names of the most influential persons in cJ1fferent neighbourhoods are also engaged in various types of occupation like business, service, cultivation.
Most respected persons in .the town In addition to the persons considered most
222
influential and respected in their respective neighbourhoods it was also enquired who were considered most respected and influential in the town as a whole. The interviewees in different neighbourhoods were asked to indicate the, names of such a five persons. The details furnished by the interviewees are shown in the following statement.
Statement XU
Statement showing the details of most respected persons in the town
Name of persons Sex, Caste
2 3
Shri Mangaldas M Patel
Gunvantlal M Bania
Dr. D.O. Joshi M Brahmin
Ramanlal M Patel
Bharatbhai M Patel
Source: Survey data.
Shri Mangaldas having educational qualifications only upto 6th standard and a businessman by occupation was also reported as one of the five most respected persons. The others appearing in the list are highly educated like one advocate, two doctors and a professor. Thus, it is seen that the persons highly respected in the town belong to different categories. Some are respected because of their social services," in the capacity of a doctor, lawyer, professor. While others. are respected because of their status of a richman as a businessman or a
Educa- Occupa- Name of tion tion town
4 5 6
6th Std. Business Vadnagar
L.L.B. Advocate Vadnagar
MBBS Doctor Vadnagar
M.A. Professor Vadnagar
MBBS Doctor Vadnagar
landlord, etc.
Most influential persons
The interviewees were also asked to indicate the names of five most influential persons in the town. The town is a bigger component than the locality, Goa person trend not be reported as most influential by all the informants. The details of such most influential persons in the town are given in the followinq statement.
Statement XI.2 The details of most influential persons in the Town
Nameot Name of person Sex Caste Educa- Occupation town tion
Vadnagar Shri M.U. Vora M Muslim L.L.B. Business
Shri Gordhanbhai M Patel BA Clerk Shri Raman Patel M Patel BA Professor
Shri Shamaldas M Patel S.S.C. Retired Shri Karamshibhai M Rabari L.l.B. Advocate

From the statement it is seen that the persons treated as highly influential in the t~wn belong to different categories and having different occupations. Out of this list 2 were L.L.B. one was a businessman and the other was an Advocate. Only one Muslim, who was a law graduate and was having business was reported to be most influential in the town. The two other members of Patel caste were graduates. One was clerk and the other was a Professor. The remaining person was educated upto S.S.C. who was Patel by caste was leading a retired life. It is evident from the above list that bUSinessmen, advocates doctors, professors are claimed to be as most influential persons in the town. Among others, clerks and even retired people are also considered as influential persons.
The town is predominantly inhabited by Hindus and about 6 per cent of the total population only are muslims. This dominance of Hindus however has not deprived the minorities of their rights and privileges, provided in the constitution. Any untoward projection in the form of rift and factions among different religious groups has not been reported during our enquiry. The harmonious living among various religious groups within the well settled conventional and die hard principles of social hierarchy is the humdrum of the town's life. This is well evident from the fact that the post of President of Nagar Panchayat is held by a Muslim. It is equally worth while to note that various committees formed by the Nagar Panchayat are represented by the persons of different communities belonging to Hindu and Muslim religious and Scheduled caste communities. It is also seen that even Chairmen for the various Committees were elected from Muslims, and Scheduled caste communities. However, common acceptance of certain groups as most influential in their neighbourhood and dominance of certain castes in certain localities by virtue of their numerical predominance do exists.
223
Occupation-wise, the agriculturists and businessmen are the important lobby in almost all localities of the town. Similarly, social workers, service people, advocates, etc. are equally important persons for residents of the various localities of the town.
Political Parties
Vadnagar being a small town does not enjoy and special significance in national or state politics. However, it seems quite necessary to study the functioning of various political parties due to influence which the national or state politics exert in the life of this town indirectly. In all three political parties (Congress (I), Janta Party and Bharatiya Janata Party were active in the town as observed during the field survey. Besides the above three political parties, youth congress party also seems active in the town. The details are given as under
(1) All India Congress (I)
The branch office of Congress (I) is functioning in Vadnagar since 1969. Among the three political in the town the Congress claims to have the largest number of members with total 2500 members. Out of which 100 are active members. Members of this party belong to castes/communities with different occupations. According to party sources the aims and objectives of the party are to serve the public. It was also informed that the party is working as per the instruction received from the State head-quarters under 20 point national programme of the party. Vadnagar town is included . in Patan lok-sabha constituency and Unjha Vidhan sabha constituency. The Lok-sabha seat was won by the party whereas Vidhan Sabha seat was won by the oppqsition party (Janta Party) during the last general elections.
(2) Janta Party
This pOlitical party is also functioning since

1969 having total of 425 members. Out of which only 17 are active members. This party also whole members from all castes/ communities and religions. According to party people their aims and objectives are to serve public and particularly the poor. As main opposition group in the Vidhan Sabha the party workers organise various functions according to the need of the town people. In the last Vidhan-Sabha elections the party canc1.Jate won the seat of this constituency.
(3) Bharatiya Janta Party
This party is functioning since the year 1952 having 400 members of which 50 are active members. According to them the party enrole people from all walks of life, caste of communities or religion. It is also informed that their main objective is to serve people. However, during last general elections party neither won the Lok-sabha nor Vidhan-sabha seats. They generally follow the instructions
Sr. No. Total Total of Consti- voters voting tuency
2 3
665 547
2 624 404
3 661 453
4 714 501
5 648 636
6 612 559
7 529 360
8 673 551
9 600 364
10 653 441
11 926 544
12 741 491
224
received from State and district head-quarter offices.
ln addition to above All India political parties. Youth Congress Party is also functioning in the town. Youth Congress party is having as many as 1200 members of which 50 are active workers. The party with people from all castes and communities religions. The aim is to serve the people especially the Youths. This party also works for 20 point programme as per instructions of congress high command.
Nagar Panchayat Election
In the election of Nagar Panchayat no Party candidates seem to have contested. The last election of Panchayat was held in Vadnagar during the year 1985. The result was declared on 29-5-1985. The following are the details of election held in 1985. In all total 21 persons were to be elected.
Valid Invalid Remarks votes votes
5 6 6
535 12 Reserved for SC
395 9
445 8
486 15
622 14
553 6
355 5 Reserved for female
533 18
357 7 Reserved for female
434 7
545 9
471 20

2 3
13 644 574
14 673 528
15 606 466
16 555 396
17 544 424
18 534 433
19 580 455
20 588 493
21 589 468
Total 13359 10098
In the last Nagar Panchayat elections the whole town was divided into 21 election wards each returning a candidate. There were 13359 voters. The average number of voters per ward was 636 approximately. Two of the constituencies were reserved for Scheduled caste candidates and 2 were reserved for female candidates. The dominant religious groups in 18 of the wards was Hindu while in the rest three it was Muslim. The total number of votes polled were 10098 which comes to 75.6 per cent. However, there were 194 invalid votes polled which comes out to 1.45 per cent of the total. The voting percentage of valid votes comes to about 74.13 per cent. The high
Ward Name of Candidate Sex No.
2 3
Shri Kamleshkumar M R. Makwana
2 Shri Manuprasad M C. Patel
3 Shri Vishnuprasad M K. Barot
225
4 5 6
563 11
518 10
461 5
388 8
419 5
427 6
450 5
484 9 Reserved for SC
463 5
9904 194
percentage of valid votes polled shows that the town people are very much conscious of franchise and the role of Nagar Panchayat administration in the affairs of the town. The highest percentage of valid votes was polled in Ward No.5 with 95.99% followed by Ward No.6 with 90.36 per cent. In ward No.1, 13 and 20 the percentage of such voting was more than 80 per cent. It is also seen that in 11 wards the polling was above the general average and in rest of 10 wards it was below the average. Out of 21 candidates 18 were Hindus and 3 were Muslims. The details regarding the name, age and education of the elected candidates are shown below.
Age Education Remarks
4 5 6
28 Graduate Reserved for SC
43 Matric
49 Non-metric

226
2 3 4 5 6
4 Shri Mangaldas M. M 58 6th Std. Patel
5 Shri Ishvarii V. M 40 Matric Thakor
6 Shri Laxmikant N. M 50 Graduate Upadhyay
7 Smt. Madhuben C. F 55 6th Std Reserved for female Pandya
8 Shri Ganeshji J. M 35 Matric Thakor
9 Shri Madhukantaben F 56 5th Std. Reserved for female I. Joshi
10 Shri Mohmadarif U. M 47 Matric Vora
11 Shri Samtaji K. M 52 9th Std. Thakor
12 Shri Sartanji G. M 45 7th Std. Thakor
13 Shri Gulabkhan M. M 48 10th Std. Malek
14 Shri Nazirbhai M. M 44 Matric Mansuri
15 Shri Santibai S. M 52 Matric Patel
16 Shri Jayantilal M. M 45 Matric Patel
17 Shri Narendrakumar M 36 Graduate D. Patel
18 Shri Pravinkumar M 30 Graduate K. Patel
19 Shri Vasantlal M M 37 Matric Patel
20 Shri Natv!\rlal R. M 34 Graduate Reserved for SC Parmar
21 Shri Ratilal S. M 47 Post-graduate Bhavsar
The average age of the elected candidates which one is below 30 years of age, 4 are comes to about 44 years. In all there are 7 between 41 and 46 years, 5 between 46 and candidates whose age is 40 and below of 50 years and rest 5 candidates are above 50

years of age. Regarding their educational level, it is seen that as many as 8 candidates were having S.S.C or Matric certificate whereas 5 candidates also have graduate degree and alone candidate has also postgraduate degree and rest 7 candidates possessed only primary education.
Voluntary Organisation
There is one union in the town for the welfare of the traders of the town. It is known as 'Vadnagar Gunjbajar Trader Association'. Its main aim is to look after genuine needs of businessmen. It is mainly related to the wholesale trade of grain, 'gur' and oil seeds etc. Only traders of market are associated. It was established in the year 1968. Which was not affiliated to any All India or Regional political organisation and was also not under the influence of any political party. It is also seen that only businessmen are being elected as office bearers and members of executive
227
committee. There are 35 members in this association wherein Patels, Baniyas, Ghanchis, etc. are mainly the members who are eng'aged in various types of business in the town. The annual fee is Rs. 25j-with Rs. 5-as registration fee which has to be paid by each member. Their organisation directly derives its power from businessmen or public through elections which is held at specific intervals.
Student's union
A union was reported to exist in Vadnagar Arts and Commerce College. It was informed by the authority that till now no students agitation has been noticed. Only in the year 1974 during the Navnirman agitation which was spread over the whole state this union also demanded the mass promotion in the next higher class without holding the examinations.
CHAPTER XII
LEISURE AND RECREATION, SOCIAL PARTICIPATION, SOCIAL AWARENESS, RELIGION AND CRIME
Vadnagar a good example of once a flourshing cultural religious and commercial town in the past which has gradually reached a moribund state at present. It has reached a stagnant point. This is mainly due to lack of proper communication with other (space) area. There is only one cinema house, library and a JCC Club which provides whatever little recreation to the people of the town.
Before independence Vadnagar was under Baroda state and it came to light that preindependence (i.e. before 1947) Baroda State had certain basic public amenities such as parks, play grounds, library, school etc., to the towns under its control. However, parks and playgrounds are not found here, it is possible that there areas might have been utilised for other public purposes.
Now before discussing the leisure and recreational activities of the people, the infrastructural facilities available in the town be considered.
Library
For providing reading facilities and to increase the aptitude for reading and knowledge a good library-Sheth Bhogilal Chakulal Vidyavardhak Pustakalaya was established in 1905. The foundation stone of the library was laid by Shri Pilajirao Vithalrao Gaekwad the then Subha of Mahesana Prant. The new buflding was constructed in 1935. The library was organised by Shri Gajanan B. Pathak. It is situated near the southern side of Sharmistha Talao (tank).
At present the library has about 50,000 books on various subjects and languages
schedule in English, Gujarati, Hindi, Urdu, Sanskrit, Marathi. The Dailies, Weeklies, Fortnightly, Monthly magazines numbering about 75 are also subscribed for its members. The basic membership is Rs. 51/- and a donation of Rs. 25/- onwards is accepted. The photograph of the donor who donates Rs. 500/- is displayed in the library. There are about 800 members. The library staff consists of one Librarian and 3 Peons. Over and above providing the reading facility the library also organised Mahila Shivan classes (ladies tailoring class). These classes are run with the help of 3 lady tutors. There are 14 Sewing machines. The tailoring classes are conducted in morning and evening for 3 years tailoring course. A fee of Rs. 20/- p.m. each is charged for tailoring and embroidery classes and Rs. 25/- for combined class. Moreover, weaker sections are provided all possible help by the library. The expenditure is met from the amount collected towards memberShip, donation, etc.
The Library also has preserved a stuffed body of crocodile of 6' in length which was found outside Arjun bari gate before 30 years. Government has given sanction for a museum but still it has not come into existence.
Jaces Club
The club was started in 1980 having 40 members. The basic membership is Rs. 100/ -. Any educated person ca(l become member. The main aim or object at the club is to serve the people of the town and surrounding villages. Members meet on every Friday to chalk out programme. The activities carried out are free medical aid to needy persons, it also organises medical camps,
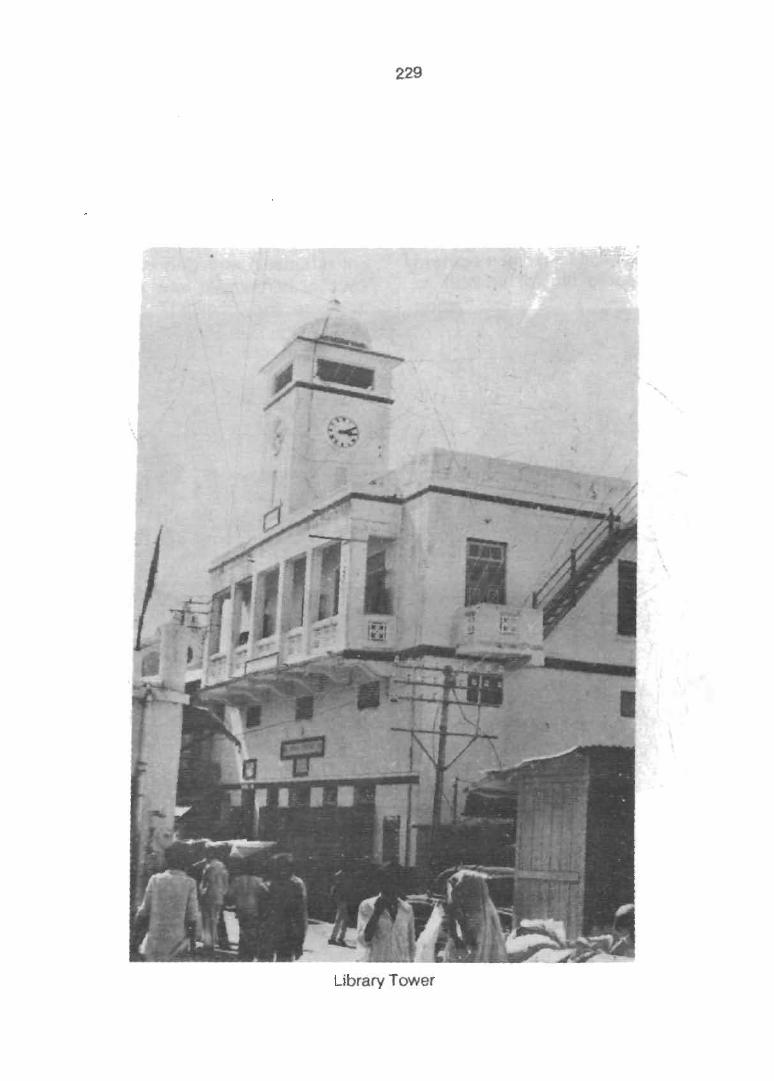
229
Library Tower
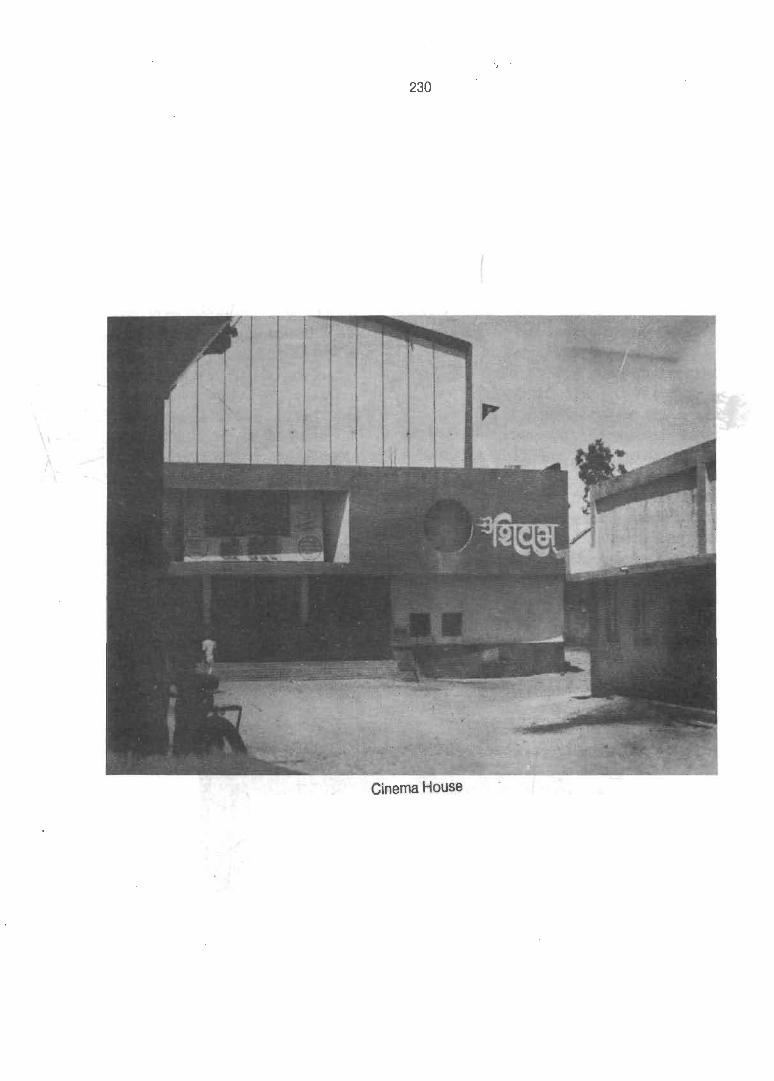
",
230
entertainment and cultural programmes, cattle camps, etc. This has helped in motitating social awareness. The main source of finance is membership plus donations received from members and other sources.
Cinema
Shivam theatre is only one cinema in the town. This cinema was established in 1983 and is near State Transport bus stand. It
231
Class No. of tickets sold
Rate
2
Balcony 15,000
2 Upper class 13,000
3 lower class 10,000
Note: Hindi and Gujarati films are exhibited in this cinema.
Others
Other recreational and cultural activities are mainly carried out by the college authority. They are college tournaments, college debates, competition and talent, Mayur Sangit Trophy, where students of Arts and Commerce college participate in such activities. The Anand Sanskar an another organisation and Adhyapan Mandai also organise such programmes. It was also informed that an Art exhibition was held in 1985-86 in which historical photographs of Vadnagar were displayed. Students, teachers, professors and other people also took part in
3
5
4
2
occupies an area of about 225 sq. feet. The building is constructed with cement and
having R.C.C. work. Total number of seats are 749 of which 267 are of balcony class, 371 of upper class and III lower class. Th? rates of tickets are Rs. 5, 4 and 2 respectively. The films are exhibited in 4 shows daily. First show starts at 12.30 and last at 21.30 hours. The average number of tickets sold during month of 1985-86 (month preceding survey) is as under:
Average total Average total monthly income annual income in Rs. in Rs.
4 5
75,000 9,00,000
52,000 6,24,000
20,000 2,40,000
this exhibition. A Komi Akta Sammelan (Community harmony) was held on Vas ant Rajab day which is being observed on 1 st July of every year. People of all walks of life participate in this function. In 1985-86 Tanariri Sangit Mahotsava was held in which Radio and Television artists were also invited along with amateur artists. The expenditure on such activities was done from college and other welfare funds.
News-papers-Journals, Periodical by type
No-newspapers, journals, etc., is published from Vadnagar.
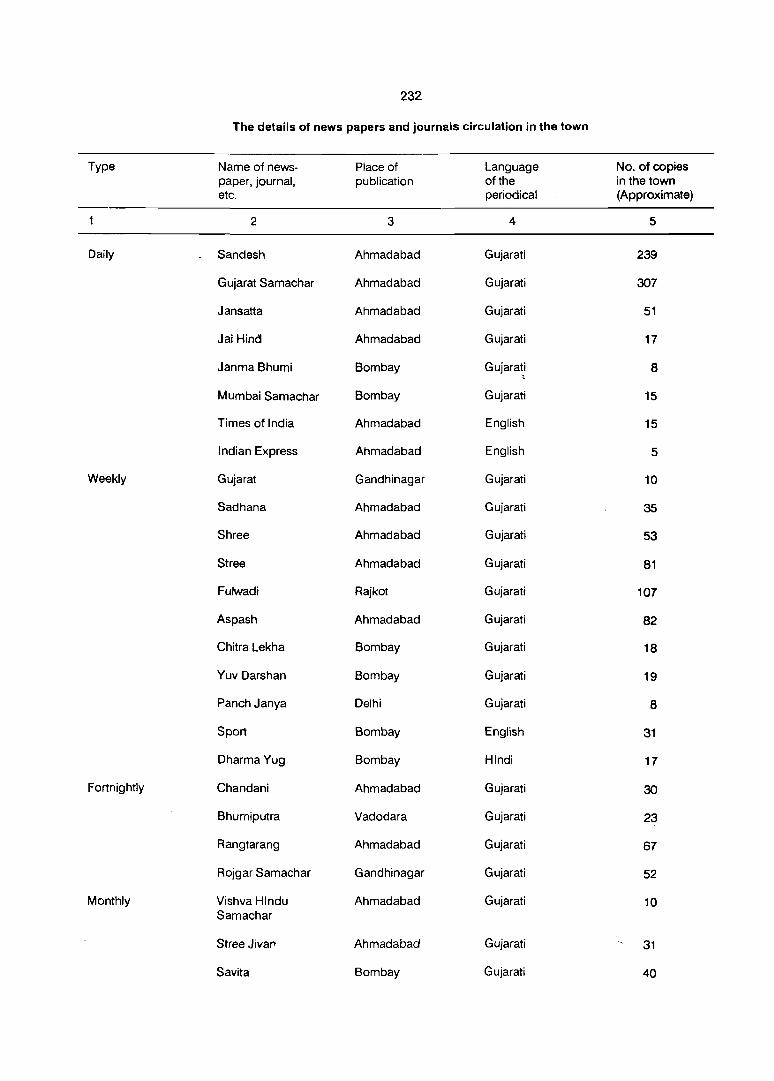
232
The details of news papers and journals circulation in the town
Type Name of news- Place of Language No. of copies paper, journal, publication of the in the town etc. periodical (Approximate)
2 3 4 5
Daily Sandesh Ahmadabad Gujarati 239
Gujarat Samachar Ahmadabad Gujarati 307
Jansatta Ahmadabad Gujarati 51
Jai Hind Ahmadabad Gujarati 17
Janma Bhumi Bombay Gujarati 8 ~
Mumbai Samachar Bombay Gujarati 15
Times of India Ahmadabad English 15
Indian Express Ahmadabad English 5
Weekly Gujarat Gandhinagar Gujarati 10
Sadhana Ahmadabad Gujarati 35
Shree Ahmadabad Gujarati 53
Stree Ahmadabad Gujarati 81
Fulwadi Rajkot Gujarati 107
Aspash Ahmadabad Gujarati 82
Chitra Lekha Bombay Gujarati 18
Yuv Darshan Bombay Gujarati 19
Panch Janya Delhi Gujarati 8
Sport Bombay English 31
Dharma Yug Bombay Hindi 17
Fortnightly Chandani Ahmadabad Gujarati 30
Bhumiputra Vadodara Gujarati 23
Rangtarang Ahmadabad Gujarati 67
Rojgar Samachar Gandhinagar Gujarati 52
Monthly Vishva Hindu Ahmadabad Gujarati 10 Samachar
Stree Jivar Ahmadabad Gujarati 31
Savita Bombay Gujarati 40

233
2 3 4 5
Soviet Desh Delhi Gujarati 19
Akhand Anand Ahmadabad Gujarati 42
Jankalyan Ahmadabad Gujarati 57
Leisure time activities
Commonly leisure is considered as the spare time enjoyed or used for recreational purposes activity at one's own will, or free time not used for work excluding the time consumed for eating sleeping and day to day
SI Type of leisure time activity No.
2
1. Bhajan Kirtan
2. Visit club, library
3. Roaming in Bazar, Market and chitchating
4. News paper reading
5. Listening Radio, Tape & Television
6. Agriculture and Farm Supervision
7. Social activities
8. Misc. work
9. Honorary service
10. Religious activities
11. Tution
12. Tin repairing
13. Tea hawker
14. Spinning
15. Rest
16. No activity
Total
duties performed for maintenance or care of body.
The survey has brought out some features about leisure time activities of people of Vadnagar.
The details of these activities as under:
Male
3
31
35
38
32
17
18
19
15
8
11
9
7
2
2
26
84
354
Persons above age 15 and above
Female
4
39
5
12
57
The above data indicates that out of 354 males as many are 84 have reported no leisure time activity, whereas in 'Bhajan-kirtan', visiting club library, roaming in Bazar, Market and Chit-chating and News Paper reading were the leisure time activities reported by more than 30 members (males). Out of 57 females as many as 39 reported Bhajan-Kirtan as their leisure time activity. Listening of Radio, Tape 'and Television were the leisure time activities reported by 17 males and only 1 female. The social activity was the leisure time activity of 19 male members while 26 males and 5 -females reported ~imply 'rest' as their leisure time activity. The religious work is being carried out by 11 males during their leisure time.
On the basis the data in Appendix-19 it is seen that the leisure time activities cover the performance of domestic work, radio and tape listening, reading visiting clubs, library, walking, social work, Bhajan-kirtan, religion work, gossipping, etc.
It is evident from the above data that out of 386 total workers 80 belonging to un-skilled manual job who pass their leisure time in gossipping, agricultural activity, in religious activity, in reading, roaming, in market, rest and in miscellaneous work.
Among the skilled manual workers numbered 87, tin repairing, rest, library reading, bhajan and agricultural supervision, etc. are the main leisure time activities. The workers engaged in small business are 11 only who too are fond of gossiping in leisure time. The rest and other miscellaneous work seem to be the other leisure time activity.
In respect of persons engaged in professional and administration honorary service, tution, listening radio and watching television are the leisure time activities. In fact it is also seen that most of the persons in higher age-groups are fond of gossiping,
234
Among highly skilled and supervisory people rest, radio listening, reading, spinning, supervision of agriculture, indoor games, etc., were found to be leisure time activities. Whereas the clerks and assistants have reading, rest, typing and stenography, listening radio, etc., the leisure time activities.
There are 6 persons engaged in intermediate professional and medium business. They were having listening of audio tapes, reading, moving i11 garden, social work, rest as their leisure time activities. While highly professional and salaried persons who are 3 in number are reported to be engaged in religious activity during their leisure time.
The maximum persons were found in agricultural activity who are 84 in number. Their main leisure time activities are BhajanKirtan, Roaming in Bazar, Reading, Rest and Household work. It is also observed from the above data that the age-group of persons does not show any significant inferences, however, data by sex indicates that more number of males have reported their leisure time activities. In 1act they participate in more than one leisure time activity.
Religious Institution and religious activity
There are about 360 temples in the town of which Hatkeshwar Mahadev temple in one· of the most important temples.
Hatkeshwar Mahadev
This is the main and oldest temple in the town. The Archeological Department has estimated the period of the temple as 1200 years old. The Shiva linga is supposed to be Swayambhu (self emerges). It is regarded as Ista-Deva (main god) of Nagar community. The temple is managed by a trust. Description of the temple is found in the Nagar Khand of Skandha Purana. Lord Shiva .has narrated his main eight abode on earth Naimisharanya, Kedar, Puskar, Kurangangalya, Kashi, _

235
_'
Hatkeshwar Mahadev Temple
Carving at Hatkeshwar Temple--Bhim shaking tree
, ' • • · . \\ , . . ' \.
I '
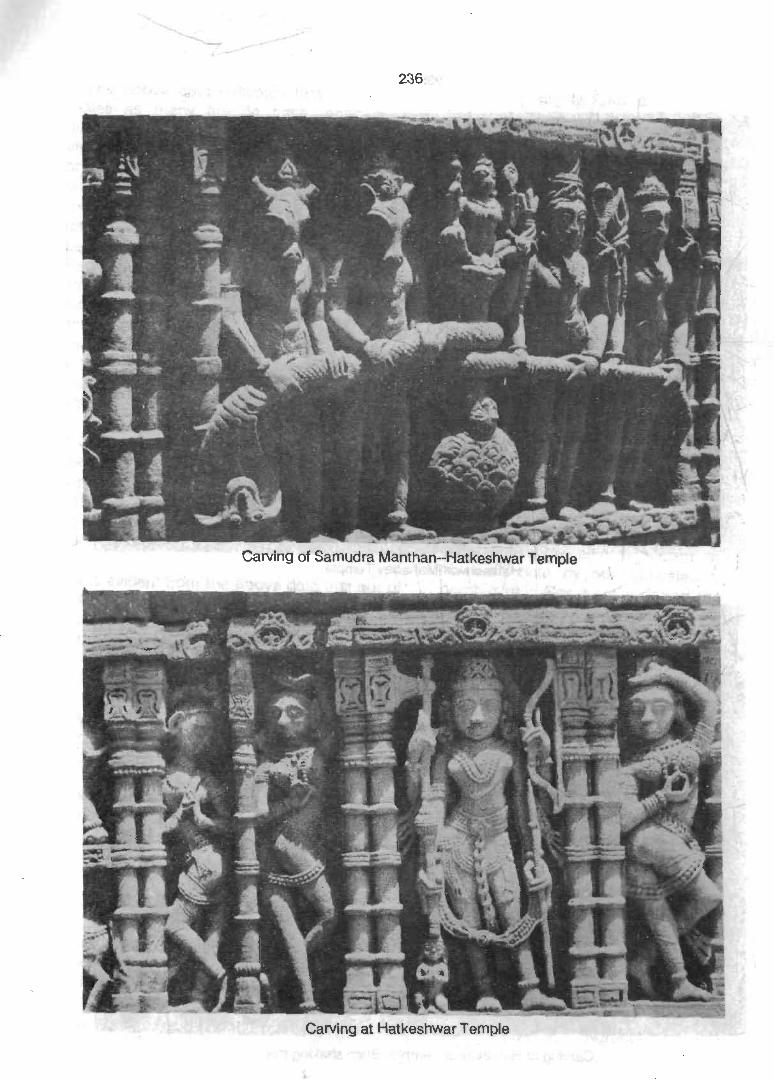
236
Carving of Samudra Manthan- Hatkeshwar Temple
Carving at Hatkeshwar Temple

237
Carving at HatkeshwarTemple

238
Mahakaleshwar Temple

239
,
"
Jain Temple
Jain Temple ·

Kuruskhetra, Prabhas and Hatkeshwar when Parvati-consort of Shiva asked that if a person is unable to take bath in these eight places then which is the place where he can have bath and attain moksha (salvation). On this Shiva replied that Hatkeshwar is the most sacred place where all the eight sketras are aboding so those who desire moksha (salvation) ca,) attain it at Hatkeshwar.
Fairs are held on Diwali and New Year Day, Le., 1 Sud Ashwin. In the month of Shrawana (July-August) fair is neld em every Monday. About 8 to 1\:J thousand lJeople attend this fair. On Shiva Ratri day about 20,OJO pecple visit the fair. The annual income of temple is about one lakh. There is a dharmashala having 13 rooms attained to the temple. The visitors are charged Rs. 11/- per day as depreciation charges.
Other main temples are
1. Amthor mata
2. Mahakaleshwar Mahadev
3. Shitala Mata
4. Lareshwar-Kusheswa.' Mahadev
Jain Temple
1. Chauta wala Derasar
2. Hathi wala
3. Atala wala
4. Chaumukhi wala II
5. Bhojak ni
Mosques
1. Karba Mosque
2. Juma
240
3. Bardli Mosque
4. Khajuri wali
5. Abarwada ni
6. Vorwad
All the temples, Derasars, Mosques are pucca built with stone and mortar. Festivals are organised at each temple, Derasar, Mosque,
Festivals
The festivals have a great social importance since they bring feeling of community brotherhood amongst all, irrespective of their being rich or poor. The rich persons not only participate in the austerities but also donate liberally which enables the organisers to spend this money for a be~er cause like the two square meals to the starving persons, clothes, educating the poor children, providing mE-dicines to those who cannot afford and shel~r to homeiess, etc.
Hindu Festivals
Navratri the fe:rlivals of nine nights is celebrated in whole GUjarat including the selected town with full pleasure and enthusiasm. It }ails in Ashvin Sud 1 to 9 which is most impC'ftant for all communities. This festival is celeorated at home as well as in the temples also collective worship of mother and public celebrations are the socio-cultural aspects of this festival. The worship of goddess as mother is believed to ,be one of the oldest form of worship. According to the Hindu religion three greatest powers are in the hands of three goddesses. The goddess Saraswati is worshipped for attainment of knowledge. Laxmi for wealth and Durga for ShaktL Some of the important forms of mother cult or Shakti puja as destroyer of evil are Amba, Jagdamba, Uma, Gauri, Bhagvati,
Bhavani, !:..ahta, Durga, Kali, Tara, Tripura Sundari, etc. The devotees believe that each of the goddesses has the power to punish the wrong doers, destroying their evils like mother. Amthor mata, Shitala mata, Amba mata, Chamunda mata, Khodiyar mata, etc., are the mother temples in the town. The oldest temple of Amthor mata is of great significance to the town people. The Shitla mata temple is also equally important for town people. The regular fair is being held every year wherein thousands of people not only from town but also from nearby villages visit this fair/festival.
Shitala Satam is also being celebrated in the town especially by women for their betterment.
Diwali
DiwaH marks the close of the year and beginning of the cycie of festivals for the next year. It is called the festival of hopes and aspirations. It is universally celebrated with great joy and happiness. The festival in fact brings cluster of holidays. In Vadnagar like other parts of the State. Diwali is the name given to Ashvin ama\lasya. The town provides a spectacular look on this occasion. The actual preparation for Diwali, Vagh Baras and Labh Pancham start from Navratri and Dassera.
The earlier preparations for this cluster of festivals in the town include cleaning the floors, repairing the walls, decorating the house with flowers and pictures, etc. At this time each household is full of activities. This festival is celebrated on the last day of the Hindu year. The Jain community treats this day as the day of Nirvan and celebrate this festival as the holy anniversary of 24th Tirthankar Mahavir Swami.
New Year Day
On K~rtik Sud 1 the people of Vadnagar and all parts of Gujarat celebrate New Year
241
Day. This festival may be called festival of all in the town since everybody participates in the celebration irrespective of caste, community or religion. In the morning the people get-up before the sunrise and take bath. The first thing after bath is to purchase salt which is called sub-ras. The word sub-ras means all tastes. People visit nearby temples as early as possible which enables them to receive their friends. Friends and relatives visit each others house and extent the greetings to each other by saying 'Salmubarak' or 'Happy New Year'. This day is not being celebrated as new year in other parts of the Country.
In Gujarat Kartik Sud 5 is being celebrated as Labh Pancham which is the most , auspicious day for Hindu and Jains in the town. They believe that any work, business, etc., started on this day brings success.
Muslim Festivals
Vadnagar is preodminantly inhabited by Hindus, however, Muslims festivals like Muharrum, Id-e-Milad, etc., are being celebrated with full joy and town people believe thC\t Muhrrum is a festival of prayer for acquiring blessings of God. On 10th day of the first month of Hijire calendar God created heavens and other beauties of nature like sea, mountain, river, etc. The first man (Adam) and other prophets like Ibrahim and Isa a Jesus were also created. On this day the main significance is of remembering the tregic story of 'KARBALA' which is the place of the pilgrimage for them where they were killed. The mourning is done in the form of collective participation by taking out a procession of Tazias through the main streets of the town and are immersed in tank.
Id-e-Milad and Sara Wafat
As a mark of respect of prophet Mohamad the birth anniversary on Id-e-Milad and death anniversary on Bara Wafat is celebrated each year. His father's name was Abdulla and of
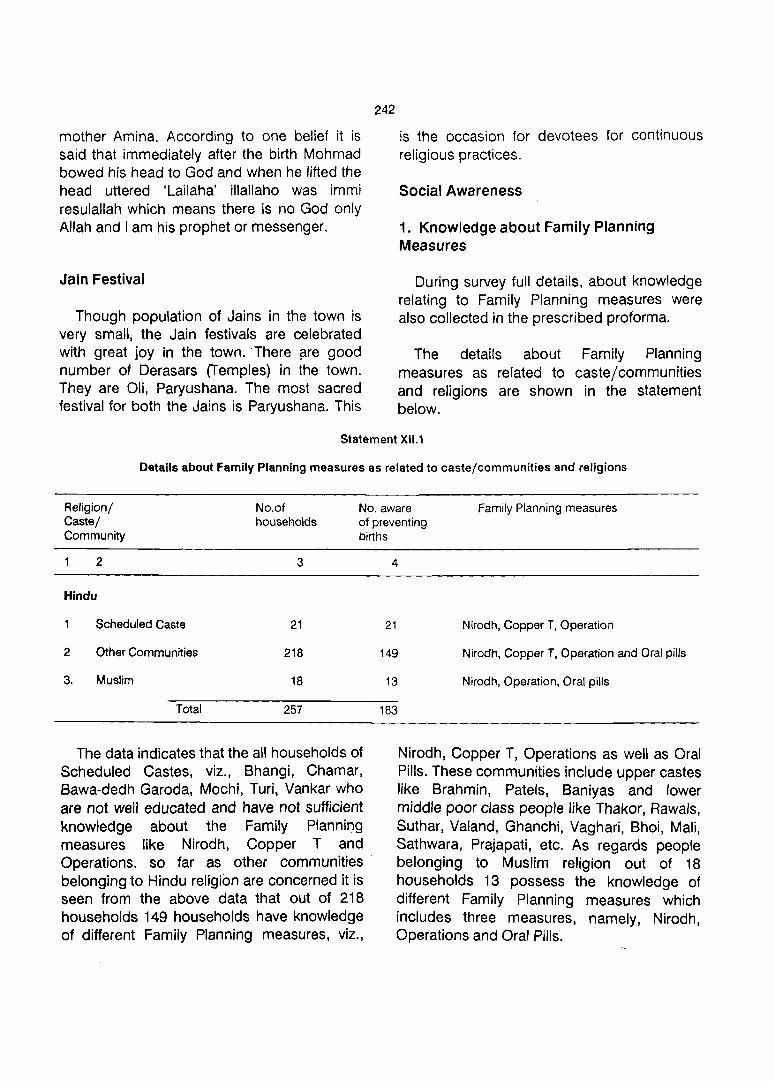
mother Amina. According to one belief it is said that immediately after the birth Mohmad bowed his head to God and when he lifted the head uttered 'Lailaha' illallaho was immi resulallah which means there is no God only Allah and I am his prophet or messenger.
Jain Festival
Though population of Jains in the town is very small, the Jain festivals are celebrated with great joy in the town. 'There $lre good number of Derasars (Temples) in the town. They are ali, Paryushana. The most sacred festival for both the Jains is Paryushana. This
242
is the occasion for devotees for continuous religious practices.
Social Awareness
1. Knowledge about Family Planning Measures
During survey full details, about knowledge relating to Family Planning measures were also collected in the prescribed proforma.
The details about Family Planning measures as related to caste/communities and religions are shown in the statement below.
Statement XII.1
Details about Family Planning measures as related to caste/communities and religions
Religionl Castel Community
No.of households
No. aware Family Planning meas!Jres of preventing births
2 3
Hindu
Scheduled Caste 21
2 Other Communities 218
3. Muslim 18
Total 257
The data indicates that the all households of Scheduled Castes, viz., Bhangi, Chamar, Bawa-dedh Garoda, Mochi, Turi, Vankar who are not well educated and have not sufficient knowledge about the Family Planning measures like Nirodh, Copper T and Operations. so far as other communities belonging to Hindu religion are concerned it is seen from the above data that out of 218 households 149 households have knowledge of different Family Planning measures, viz.,
4
21 Nirodh, Copper T, Operation
149 Nirodh, Copper T, Operation and Oral pills
13 Nirodh, Operation, Oral pills
183
Nirodh, Copper T, Operations as well as Oral Pills. These communities include upper castes like Brahmin, Patels, Baniyas and lower middle poor class people like Thakor, Rawa/s, Suthar, Valand, Ghanchi, Vaghari, Bhoi, Mali, Sathwara, Prajapati, etc. As regards people belonging to Muslim religion out of 18 households 13 possess the knowledge of different Family Planning measures which includes three measures, namely, Nirodh, Operations and Oral Pills.

243
2. Knowledge about Practice of Family Planning
Statement XII.2
Knowledge about Practice of Family Planning
Religion/ No.of No. any of his Number whose non-kin Castel house- kins practising known persons practising Community
Hindu
Scheduled Caste
Other Communities
Muslim
Total
holds
2
21
218
18
257
measure-1
3
Operation (2)
Operation (23)
Operation (25)
The above data confirms the poor state. of affairs regarding .knowledge of the practising of Family Planning measures, since it is seen that out of total 257 households, only 25 or 9.73 per cent having knowledge of practising Family Planning measure, namely, Operation and 2 have about use of Nirodh who are their kins. Regarding non-kin known persons only 3 households are having knowledge of operations. Similarly out of 218 households belonging to other Hindu communities, only 23 seem to have knowledge of practising the measures, namely operation, whereas 1 household knows about use of Nirodh from their kins. Whereas only 3 non-kin known persons are also having knowledge of operations. As regard the Scheduled caste persons out of 21 households only 2 are
measure-2
4
Nirodh ('I)
Nirodh (1)
Nirodh (2)
measure··1 measure-2
5 6
Operation (3)
Operation (3)
practising Family Planning measures. The above data indicate that operation is only measure known by most of the kins and nonkins known persons. While in Muslims out of 18 households, only one has reported to have knowledge about the use of Nirodh. Both Scheduled Caste people and Muslims possess full knowledge about the Family Planning measures but very few of them have knowledge about practising such measures by their kin and non-kin persons.
Adoption of Family Planning Measures by Age and Sex
The details are given in the following statement.
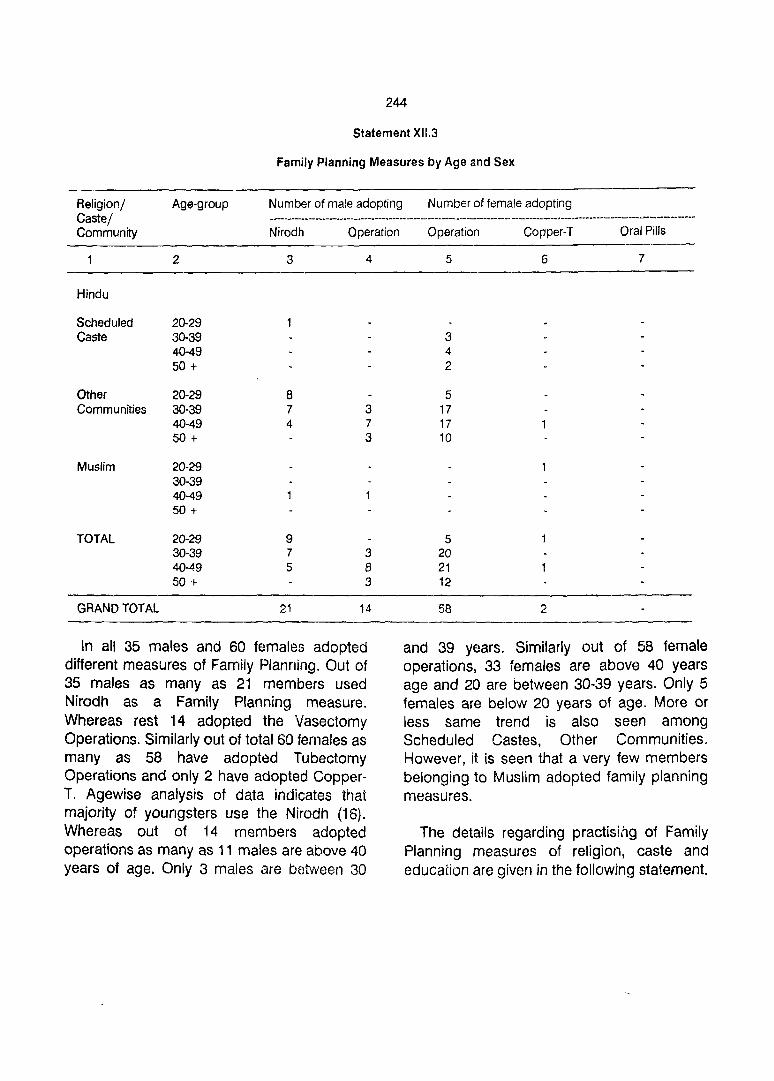
244
Statement XII.3
Family Planning Measures by Age and Sex
Religion/ Castel Community
Age-group Number of male adopting Number of female adopting -... ---.,-.. --_ ... _----... ---..... -... -.. ---..... --........ -------------_-------------..... -- .. _---.... ...--_ .. ---..... -----_ .. -... ---------,..-...... ---_ .. --_ ..
Hindu
Scheduled Caste
2
20-29 30-39 40-49 50 -t
Other 20-29 Communities 30-39
40-49 50 +
Muslim 20-29
TOTAL
GRAND TOTAL
30-39 40-49 50 +
20-29 30-39 40-49 50 +
Nirodh
3
8 7 4
9 7 5
21
Operation
4
3 7 3
3 8 3
In all 35 males and 60 females adopted different measures of Family Planning. Out of 35 males as many as 21 members used Nirodh as a Family Planning measure. Whereas rest 14 adopted the Vasectomy Operations. Similarly out of total 60 females as many as 58 have adopted Tubectomy Operations and only 2 have adopted CopperT. Agewise analysis of data indicates that majority of youngsters use the Nirodh (16). Whereas out of 14 members adopted operations as many as 11 males are above 40 years of age. Only 3 males are between 30
Operation
5
3 4 2
5 17 17 10
5 20 21 12
58
Copper-T Oral Pills
6 7
2
and 39 years. Similarly out of 58 female operations, 33 females are above 40 years age and 20 are between 30-39 years. Only 5 females are below 20 years of age. More or less same trend is also seen among Scheduled Castes, Other Communities. However, it is seen that a very few members belonging to Muslim adopted family planning measures.
The details regarding practising of Family Planning measures of religion, caste and education are given in the following statement.
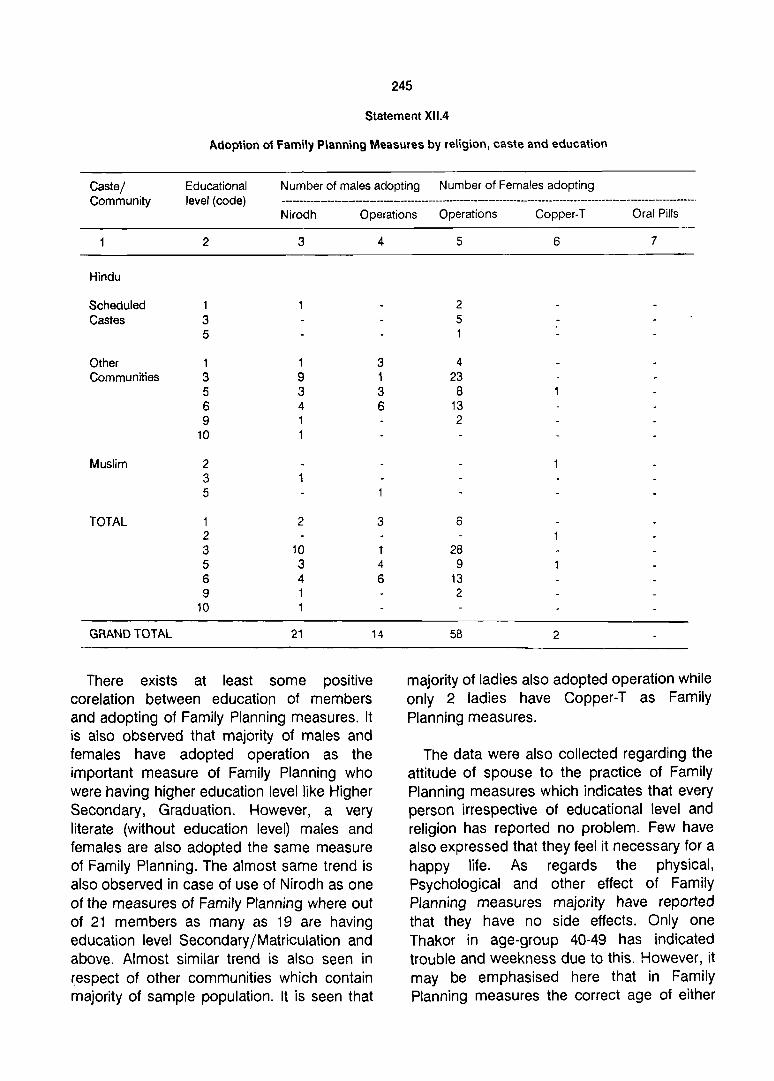
245
Statement XI1.4
Adoption of Family Planning Measures by religion, caste and education
Castel Community
Educational level (code)
Number of males adopting Number of Females adopting
Nirodh Operations Operations Copper-T Oral Pills
Hindu
Scheduled Castes
Other Communities
Muslim
TOTAL
2
1 3 5
1 3 5 6 9
10
2 3 5
1 2 3 5 6 9
10
3
1 9 3 4 1 1
2
10 3 4 1 1
4
3 1 3 6
3
1 4 6
GRAND TOTAL 21 14
There exists at least some positive corelation between education of members and adopting of Family Planning measures. It is also observed that majority of males and females have adopted operation as the important measure of Family Planning who were having higher education level like Higher Secondary, Graduation. However, a very literate (without education level) males and females are also adopted the same measure of Family Planning. The almost same trend is also observed in case of use of Nirodh as one of the measures of Family Planning where out of 21 members as many as 19 are having education level Secondary/Matriculation and above. Almost similar trend is also seen in ~espect of other communities which contain majority of sample population. It is seen that
5
2 5
4 23 8
13 2
6
28 9
13 2
5B
6 7
2
majority of ladies also adopted operation while only 2 ladies have Copper-T as Family Planning measures.
The data were also collected regarding the attitude of spouse to the practice of Family Planning measures which indicates that every person irrespective of educational level and religion has reported no problem. Few have also expressed that they feel it necessary for a happy life. As regards the physical, Psychological and other effect of Family Planning measures majority have reported that they have no side effects. Only one Thakor in age-group 40-49 has indicated trouble and weekness due to this. However, it may be emphasised here that in Family Planning measures the correct age of either

sex and number of children are most important factors which will have to be taken into account while analysing any type of surveyed data.
During our enquiry the details regarding desirable number of sons and daughters as reported by married persons were also collected. The data indicate that irrespective of caste/community nobody had desired only one daughter. Similarly desire of one son was reported by 1 family only. While majority have desired 2 sons and 1 daughter. Next comes the desire of one son and qne daughter and a very few have also shown their desire for 2 daughters rather than to increase their family size.
The respondents were also asked to furnish the reason of small family size or desire of one son and one daughter, etc. From the
246
response received from the people it is observed that the high living cost is the main reported reason of a few which does not allow them for more children. However, majority have reported that small size lead them to a happy family life.
They were also asked to furnish reply regarding the aspiration about number of son and daughter in case of persons with spouse alive. It is observed from the response that most of people seem to have aspiration for male child and it was also seen that irrespective of sector, caste, religion and economical or social status persons seem to desire more male children.
Knowledge about Indian Legislation
The details are shown in Statement X11.5.
Statement XII.5
Knowledge about Indian Social Legislation as related to Religion/Caste/Community
Religion/ Total Literate (1) Primary (2) Matriculation/ Graduate and above (4) Castel No. of Secondary (3) Commu- informants -------.. ----------------------~-------------------- ... -------------------------nity Aware Not Aware
aware
2 3 4 5
HINDU
Scheduled 21 6 2 Caste
Other 218 42 23 Commu-nity
Muslim 18 3 3
TOTAL 257 51 28
Data indicate that of th~ 257 informants as many as 218 have some knowledge about social legislation while 39 informants do not know about such legislation. Persons having
Not Aware Not Aware Not aware aware aware
6 7 8 9 10
8 5
81 7 62 3
5 6
94 8 73 3
knowledge about the social legislation of which 51 are illiterates plus literate without level, 94 studied upto matriculation and as many as 73 informants were having higher

247
secondary and graduation, whereas 3 also possess technical degree. While among 39 who are ignorant about social legislation, 28 were illiterates, 8 have primary education, 2 were matriculates and one has higher secondary education. So far as persons belonging to Scheduled Caste are concerned it is noted that out of 21 informants as many as 19 have the knowledge about Indian Social Legislation. Similarly out of 18 informants belonging to Muslim religion 14 have the knowledge of this subject.
Social Legislation
The social legislations were framed to safeguard the interest and to remove the exploitation of innocent, helpless and weaker section of the society.
Reporting of Indian Social Legislation
The details about the reporting and knowledge about legislation are shown in the following statement.
Statement XI1.6
Details about the reporting and knowledge about legislation
Religion/ Total Number of having knowledge of Castel infor· .. __ ......... -............. _ .......... _.. .... _-_ ... _-_ .......... _------------_ ............ -_ ...... _-----... _ ........... _-_ .. _ .. _-----------------------... ----------... _---------_ .. Community mants Untoucha- Child Dowry
bility marriage Prohibi-Act restra- tion
int Act Act
2 3 4 5
HINDU
Scheduled 19 19 16 10 Caste
Other 189 159 157 100 Communi· ties
Muslim 14 10 10 2
Total 222 188 183 112 Informants
The above data indicates that majority informants have knowledge about the untouchability Act, child marriage restraint act, and Dowry Prohibition Act, the respective number of informants are 188,183 and 112 out of total 222 informants who were asked to furnish this information. Similarly out of 222 informants as many as 104 have also knowledge about the Hindu Succession Act whereas very few of them know about Hindu Marriage Act, Prohibition Act and Abolition of Child Labour Act. It is surprised to note here
Hindu Hindu Prohibi- Abolition of marriage succes- tion Act Child Act sion Act Labour
Act
6 7 8 9
5
12 90 4 3
9
13 104 4 4
tMat only 4 persons reported to have knowledge about Prohibition Act which is being enforced only in Gujarat State.
It is further observed from the data that all informants belonging to Scheduled Caste were well aware of the untouchability Act. Whereas 16 and 10 informants have also knowledge about Child marriage restraint Act and Dowry Prohibition Act respectively and 5 informants know about Hindu Succession Act. It is also seen that only 1 person has reported

to have knowledge about Hindu Marriage Act and Abolition of Child Labour Act. While none has reported about prohibition Act. More or less similar trend is also observed in respect of other communities of Hindu religion. So far as Muslims are concerned majority have knowledge about untouchability Act, Child Marriage Restraint" Act and Hindu Succession Act.
As regards the assessment of legal action and suggestions to overcome shortcomings it is observed that majority among Scheduled Castes as well as other communities have reported about adequacy for legal actions taken so far under this Act. Only 1 Modh Vaniya person has desired the strict action with proper punishment. Similarly, one Muslim member has also reported that dowry should be abolished at all cost and action should be taken against defaulters. One Ghanchi caste member also reported to our investigator team that slackness in observation of these acts is noticed and hence the legal provisions under the various Acts should be observed very strictly.
Regarding the attitude of the informants with reference to the Indian Social Legisla!ions the details were also collected during the field survey. The details are narrated as under.
Among the illiterate and educated Scheduled Caste persons have expressed their attitude as under:
1. Untouchability Act
Opportunity is provided for upliftment of lower caste people.
II Equal rights are proviped for all.
III Untouchability is more or less removed.
2. Child Marriage Restraint Act
I It controls the growth of population.
248
" It helps in stopping child marriage.
III It also helps in stopping the life of the child from getting spoiled.
IV The number of child marriage can be reduced to great extent under this act.
3. Dowry Prohibition Act
Poor Families get relief.
II It has provided more protection to ladies.
III It reduces dowry,
4. Hindu Marriage Act
I Ladies get their rights.
5. Hindu Succession Act
Equal share to ladies is given in hereditary property.
II Equal distribution in hereditary property is given.
6. Prohibition Act
It is observed that nobody has any knowledge or have any attitude in respect of this act.
Though the act was for the first time introduced in the former Bombay State and has been continued after the formation of Gujarat State in 1960 and is still inforce. Gujarat is the only State in Union of India enforcing this act.
Abolition of Child Labour Act
Only few people have knowledge about it.

As regards other communities of Hindu religion the report is as under:
I Untouchability Act:
It provides equal rights to all.
II Social inequality is removed.
III It reduces untouchability.
IV Integrity of nation is preserved.
V Harijan will get justice.
2. Child Marriage Restraint Act:
It controls the growth of population.
II It helps in stopping ci"lild marriage.
3. DOwry Prohibition Act:
I It provides relief to poor people.
II Law has provided more protection to ladies.
III It reduces unnecessary debt.
IV It reduces the accident of burning of ladies.
249
4. Hindu Marriage Act:
I It provides ladies their rights.
5. Hindu Succession Act:
Equal distribution in hereditary property.
6. Prohibition Act:
Nobody has reported any comments on this act.'
7. Abolition of Child Labour Act:
I This has abolished child labour.
However, in practice it is observed that it has very negligible effect and exploitation of children in shops, factories, restaurants, etc., is obviously noticed.
Reporting about Implementation of Acts:
The details regarding the implementation of acts in the area classified by religion, caste/community of the informants are given below:
Statement XII. 7
Implementation of acts in the area classified by Religion/Caste/Community
Religion/ Total No of informants reporting Act implements adequately in the area Number Castel No. of reported Community infor- Untou- Child Dowry Hindu Hindu Prohibi- Aboli- about
mants chabi- marri- prohi- marri- Succes- tion tion of non-imple-lity age bition age sion Act Child mentation Act Act Act Act Act Labour of Act
Act
2 3 4 5 6 7 8 9 10
HINDU:
Scheduled Caste 19 17 14 9 5

2.50
Other Communities
Muslims
Total
2
189
14
222
3
159
10
186
4 5
152 100
5
171 110
The above data indicate that majority have reported about the adequate implementation of Untouchability Act, Child Marriage Restraint Act, Dowry Prohibition Act, and Hindu Succession Act. Whereas a few have reported about the implementation of Hindu Marriage Act, Prohibition Act and Abolition of Child Labour Act. On the other hand as many as 12 informants have reported that these Acts have not been properly implemented, however, they have not stated any reasons thereof. These informants are 1 Bhangi (SC), 1 Bhoi, :t Brahmin, 2 Patel, 1 Rabari, 4 Thakor and 2 Vaghari (all other castes).
Crime Statistic and Institutions Dealing with Criminal and Deviation in Behaviour
The people of Vadnagar seem to be peace loving. This can be seen from the fact that in
6 7 8 9 10
6 88 4 11
11
6 104 5 12
Vadnagar town no communal riots are ever reported. Similarly, people remained passive during Navnirman Andolan (agitation) ana Anamat andolan (agitation) I which were seen in most of the towns. The police station was established in the year 1949. Though under former Baroda State different police control system was in existence in each vil!age ar.d town. At present Vadnagar Police Station is under the control of Sub-Inspector and covers 69 surrounding villages. There is one town police chowky and 3 out-posts. This Police Station has a strength of 86 employees. The jurisdiction of this pOlice chowky covers an area of 36 Kms.
There is a total prohibition in the State and so selling and drinking of liquor is totally banned and t,eated as an offence. The position of the cases registered in the last 7 years is given below:
Statement xlI.a
Details of crime and execution
year Number of cases registered under Prohibition Act
Group l toV Group VI No. of No. of No. of (Theft, Robbery, Breach (Accident, Damaging the cases cases cases of Trust, Injury) standing crop, Ban on regis- field executed
carrying weapon, tared in miscellaneous crime) court
No. of No. of No. of No. of No. of No. of cases cases cases cases cases cases regist- field in execu- regis- field in executed ered court ted tered court
2 3 4 5 6 7 8 9 10
1981 244 123 4 119 95 49 117 117 49
1982 207 124 5 169 157 89 203 202 134

251
2 3 4 5 6 7 8 9 10
1983 208 146 6 204 195 58 113 113 61
1984 217 156 19 224 218 97 173 173 92
1985 243 196 27 203 199 74 183 183 86
1986 212 168 11 236 228 49 161 159 34
1987 119 43 95 65 71 22 (Upto 30-6-87)
Total 1450 956 72 1250 1157 416 1021 969 457
The data reveal that in the year 1985, the period were 1250 of which 93% were field in crimp registered and field in the court in the the court while 37% were executed. group I to V were highest. The total ca~es registered during 1981 to 1987 under. these Under prohibition crime highest of 203 were groups were is 1450. Out of these, 83% were registered in the year 1982. The total crime field in the court of which 31% were executed. registered are 1021 out of which 95% were
field in the court of which 58% were executed.
As regards crime in group VI the highest of Thus it is observed that the people are 236 were registered in the year 1986. The total peace loving and so the overall picture of the crimes tegistered in this group for the same crime is normal.

CHAPTER-XIII
LINKAGE AND CONTINUA
The impact of urbanisation on the surrounding rural areas of a town is an universally accepted fact. The factors associated with the process of urbanisation are economic, industrial development, development in communications and transport and road network, availability of educational and recreational facilities. In this process it is necessary to know such things as the area of greatest influence, the economic activities of hinterland, the pattern and use of transport system etc. Unlike Western countries where the hinterland enjoys all the facilities of an urban centre, in Indian cities the hinterland is smaller in extent and with lesser amenities. With this intent, some villages within a radial ranges of twenty kms. with a sectorisation of these radial distance into five, ten, fifteen and twenty have been made to study the impact of urbanisation overlaying on this sectors.
To study the impact of the urbanisation of the selected town over the region it seems necessary to study the region itself. The district of Mahesana in which Vadnagar is located has in all 14 towns of which 4 are of class-II, 5 class-III, 4 class-IV and 1 class-V town. The Vadnagar is of class-III town. Kheralu taluka has two villages industry Vadnagar.
The urban population in Mahesana district is less which accounts for 20.10 per cent as per 1981 Census whereas the urban population of the State as a whole comes to 31.10 per cent. Out of total urban population of Gujarat, the district shares only 4.62 per cent. Similarly out of total urban population of the district-share of Vadnagar town is also only 4.31 per cent. In Kheralu taluka in which Vadnagar town is located the percentage of urban population comes to 16.20 per cent.
This shows that the urbanisation in Kheralu taluka is in slow speed in comparison to the district (20.10%) as well as State (31.10%). Only 14 towns among total 255 towns are located in the district.
Thus the district has got predominence of rural population. The selected town Vadnagar is surrounded by Kheralu taluka in north, Visnagar and Vijapur talukas in south, Sidhpur taluka in west side and Banaskantha in east side. Whereas the towns in surrounding area of Vadnagar town are Kheralu and Sidhpur in north, Visnagar, Vijapur and Mahesana in south, Patan and Chanasma in west (far from vadnagar), The other towns of the district viz. Kalol, Mahesana, Patan, Kadi, Mansa, Chansama, Harij, etc. are beyond 25 kms.
The density of Ropulation of the State is 174 persons per km2. Whereas same for the Mahesana district is 282 persons per km2, pretty high. in comparison to the State. On the other hand the density of population of Vadnagar town works out to 499 persons per km2. The proportion of rural population of the district is 79.90 per cent (1981) against the corresponding proportion of 68.90 per cent of the State. The number of inhabited villages per town works out to 77, for the district as a whole. The number of villages per town comes to 179, 60, 41 and 53 for Kheralu, Visnagar, Sidhpur and Vijapur talukas nearby the town. The percentage of urban population in these talukas is 16.15%, 23.45, 31.39% and 10.85% respectively.
The total area of the district is 9027 km2
and t~e district has 1 089 vill~es so that area per Village comes 8.29 km . The area per villages in the talukas of Kheralu, Visnagar, Sidhpur 2and Vijapur is 6.04 km2, 8.21 km2, 8,26 km and 8.81 km2 respectively.
The distribution of inhabited villages in each taluka and in the district as well as the rural population of each taluka and the district according to population range as per 1981 is given in Appendix 20 and 21.
The data in Appendices 20 and 21 indicates that in the surrounding talukas of the selected town the proportion of villages is highest with 60.3 per cent in the population range of 1000-4999 persons whereas the proportion of villages is highest with 60.6 per cent in the population range of 500-4999 persons in respect of talukas away from the Vadnagar town. However, the Model size of village in the district lies in the population size 1000-4999 persons having the proportion of villages with 58.7 per cent. In Kheralu taluka where the selected town is located the model size lies in the population size 500-4999 persons with about 55 per cent villages.
The next statement indicates the proportion of rural population in each population range for the taluka and the district. It will be seen that the proportion of rural population in respect of nearby talukas comes to 66.4 per cent in population size 2000-4999 persons whereas the proportion comes to 71.7 per cent under population range 1000-4999 persons in respect of talukas away from the town. The model size is 1000-4999 with proportion of population of 66.7 per cent. The mode~ size for Kheralu taluka is also 1000-4999 persons with proportion of 65.6 per cent. The average population of 38 hinterland villages comes to 2784 persons which fits in the model size of Kheralu taluka.
The functional category of Vadnagar town as per 1971 Census was primary activities. At
253
the time of 1961 Census also the functional category of the town was primary activities. The town seems to continue with the same functional category at present. Thus Vadnagar town is not an industrial town in the true sense. The primary activity are considerably found in this town included in the activity under the agriculture sector. Since about 32 per cent of the t6tal main workers were engaged under agricultural sector. The main food grains produced are Bajri, Wheat and Rice in addition to the cash crops like Raido Jiru and Caster-oil seeds. Whereas neighbouring town Visnagar had primary activities-cum-industry-cum-service in 1961 and Commerce-cum-industry-service in 1971.
To have a deeper insight into the impact of the town on neighbouring hinterland and vice versa the data from a few villages was collected. The demographic and economic characteristics proposed to be discussed are population density, proportion of literates, rate of participation in non-agricultural operation or ratio of workers in secondary and tertiary sector and ratio of households to houses etc. The dispersion of urban influence into rural surroundings was studied upto a distance of 20 kms. round Vadnagar town.
population growth of town
Before discussing the above details it would be appropriate to have an idea of about the growth of population of the selected town with reference to other towns of the district. The details relating to the growth of various towns of the district are shown in the following statement.

254
Statement XIII.1
Growth of Population in the towns of Mahesana district
Name and Class of town 1951-61
Vadnagar III
Patan II
Mahesana II
Kalol II,
Sidhpur II
Vis nagar III
Unjha III
Kadi III
Mansa III
Vijapur IV
Kheralu IV
Chansma IV
Harij IV
The data reveal that the Vadnagar town under study shows very slow progress in a low profile like growth of population. Whereas its neighbouring town Visnagar has shown very high growth rate especially in last two decades mainly due to industrialisation and better road linkage with other towns and the district headquarters. Similarly Kheralu which is the taluka head-quarters town has also shown comparatively higher population growth during last two decades also due to good linkage road facility. It is alSo observed that the Vadnagar tr,wn has shown (lowest growth rate (14.23%) among all towns) during last decade of 1971·81 except Chansma (11.49%). Whereas Mahesana tops the list in growth may be due to district head-quarters as well as deve·lopment of industries.
2
(%)
11.14
20.70
42.86
42.39
33.22
23.18
32.49
16.14
15,38
17.99
13.71
9.71
28.75
1961-71 1971-81
3 4
(%) (%)
19.77 14.23
24.19 22.75
58.74 41.21
57.55 39.00
22.11 27.51
34.18 33.95
33.42 38.80
19.74 24.58
31.12 27.53
29.03 19.34
33.24 27.71
18.93 11.49
23.51 34.49
From the data relating to density of each village in the distance range, ratio of household to house, proportion of total workers to total population and proportion of primary sector to total workers etc. are shown in the Appendix 22. The various hypotheses concerning the linkages between the urban and rural life and also concerning the continuation of urban life to the rural surroundings are proposed to be tested from the census data. The important hypotheses seeming plausible are that nearer the village to the town the larger is the proportion of workers in th~ secondary and tertiary sector, larger proportion of households to census house'S, hrgher the rate of literacy existence of permanent markets, better availability of land use pattern also tend to be urbanised, greater

extent of non-agricultural land, possession of more objects of conspicuous consumption, food habit may also be urbanised near the villages to the town the higher the density of population etc. These hypotheses in view we may take one by one condition in the following paragraphs. The selected hinterland villages are not only belonging to Kheralu taluka in which the selected town is located but also belonging to Visnagar, Vijapur and Sidhpur talukas.
I. Density of Population (peA)
The average population per sample village is 2784 persons. The density of population 38 sample villages approximates 303 persons per km2 which is not only higher than the Kheralu taluka rural (257) but is also high in comparison to Mahesana district rural (233) and Gujarat state rural (123).
255
So far as the density of population in the four distance ranges is concerned it will be . seen that the density is as high as 460 persons per km2 in the distance range of 'within 5 kms.' from the town. Whereas the density works out in the ascending order of distance to 301,278 and 271 persons per km2. Thus the population density in the sample villages in different concentric slabs represents a uniform pattern with the decreasing trend. The above logic considerably confirms that the villages nearer to an urban centre have a greater density of population or the hypothesis that the near a village is to an urban centre the higher the density of population is in these cases true to great extent as far as the total population of villages in a different distance slabs is concerned.
The examination of individual village in the different ranges further reveals that in the distance range of 16.20 kms. the density varies from 170 per km2 in Nagvasan village to 1354 in the sakari village. The abnormal
high density in this village seems mainly due to very small area ot the village (0.71 km2). The density in Bhunav and Ranchhodpura villaqes works out to 552 a~d 471 persons per kmZ which is also much higher as compared to the average of 271 persons. Since these villages come under the more influence of others towns than the selected towns. The village Ranchhodpura is only 3 kms. away from the Unjha town and 4 kms. from Vijapur town. Whereas the village Bhunav is within 10 kms. from Sidhpur town and is well connected by road from Kheralu to Sidhpur.
In the distance range of 11-15 kms. the density of population is found above the average density of 278 persons in two villages out of total 11 villages in this slab, which is 534 persons in Kansa village and 1061 persons in Denap village. The village Kansa is only 5 kms. from the Visnagar town and is also on the road from Visnagar to Unjha town having educational facility upto high school is available. The village has also post office and phone facility while village denap is also 8 kms. away from Visnagar town and is on the road from Visnagar to Sidhpur town having educational facility upto higher secondary school as well as post office and phone facility is available. Thus both these villages are away from Vadnagar town they are equally influenced by Visnagar town. Similarly, in distance range of 5-10 kms. from the selected town higher density in comparison to the average density of 303 persons is found in Sipor with 388 persons per km2 and Sundhiya village with 394 persons. The village Sundhya is any 6 kms. from Kheralu town and on the road from Vadnagar to Kheralu. In this village also the educational facility upto Higher Secondary level as well as facility of Post office and Telephone is available whereas the village Sipor is not only 6 kms. from the selected town but also about 7 kms. from Kheralu town, thus is influenced by both these towns. The facility like telephone office, phone and Higher Secondary education is available in the village.

II Ratio of Households to Houses (peA)
The number 'of occupied residential houses and households is shown in the column 3 and 4 of the above statement.
The hypotheSiS, the villages nearer an urban centre tend to have higher ratio of households to houses does not give encouraging evidence since data shows almost same ratio in all the four distance slabs. No significant variation in the ratio of households to houses is noticed Vice-Versa the distance from the town. This may perhaps be due to fact that in rural area normally there is an independent household with every house. Growth rate in Hinterland villages on the basis of peA data.
At the first instant it is to be examined whether proximity to an urban centre has any impact on the growh of population.
It is seen that seven villages combined together in the first distance range of 'within' 5 kms.' have shown the growth rate of 29.71 Per cent. In rest of three distance ranges the growth of population is 15.64 per cent, 19.06' per cent, and 15.31 per cent respectively in order of distance. This more or less confirms the fact that the villages nearer to urban centre have higher growth of population in other words it can be seen that proximity to an centre in these cases has had an impact on the growth of population.
An average growth of population for 38 selected villages is 18.35 per cent during 1971-81 decade. On Examining the individual village for growth of population it is seen that the distance range of 16-20 kms. the growth rate is highest with 52.14 per cent in Rajpur (gadh) village. This may be due to small population of the village and same is on the road from Kheralu to Ambaji the famous temple in Gujarat. The village is also 5 kms. from the developed village Sattasan having area of 2733.95 hectors and 4599 population.
256
The growth rate is above 25 per cent In Kesarpur village with 29.34 per cent, Sakari village with 29.30 per cent and Kajialiyasana village 25.77 per cent. The higher growth rate in Kesarpur village seems to be due to small sizse. The village Sakari is on the road from Kheralu town to Palanpur town and is only 5 kms. from Kheralu town. Thus it is influence by Kheralu town. While Kajaliyasana village is also 8 kms. from Visnagar town and on road tram VisnaQar to Sidhpur town. Thus, it comes under the influence of Visnagar town.
In the distance range 10-15 kms. four villages were having growth rate well above the average growth rate of 19.03 per cent. The respective villages are Salad village with 29.73 per cent, Valagana with 24.68 per cent, Kansa with 33.61 per cent and Gajipur with 34.67 per cent. The last village Gajipur is a small size village with only 303 persons as per 1981 Census. The village Kansa ,is about 4 kms. from Visnagar town and also 'on the road from Visnagar to Unjha town thus it is influenced by Visnagar town. Whereas the village Valgana is having more than two thousand population and has also primary health sub-centre; High School and Post office. On the other hand village Salad is 8 kms. from Kheralu town having also High school, Post office and Telephone facility. Thus it comes under the influence of Kheralu town.
In the distance range of 5-10 kms. four villages namely Gunja, Sadikpur, Sajpur, and Chhogala were having 25 per cent growth rate as compared to average growth rate of 15.64 per cent. Out of these villages Sadikpur and Sajpur are small size villages being 5 kms. from Kheralu and Vadnagar towns. rhus, both villages are influenced by these two towns, Chhogala is medium size village. All these three villages have recorded very high growth rate viz. 42.35, 34.65 and 47.52 per cent respectively. The village Chhogala is only 5 kms. from Visnagar, the industrial town, thus influenced by Visnagar town. Only village Gunja was having more than six thousand

population with about 25 per cent growth rate. This village is only 5 kms. from Visnagar and connected by road and railway. Thus some villages though far from the selected town are influenced by other nearby urban centres and hence have recorded higher growth of population.
Workers and Non-workers (PCA)
The proportion of workers, marginal
workers and non-workers in the selected village is shown in Appendix-23.
Industrial Classification of Workers (PCA)
The 38 total sample villages constitute about 31 per cent workers out of the total population as per 1981 Census. Kheralu taluka rural and Mahesana district rural correspondingly constitute 31.64 and 29.79 per cent workers respectively. These percentages are more or less comparable with . the proportion worked out for the hinterland zone. Thus the proportion of total main workers in the nearest hinterland zone of the urban centre does not exceed the corresponding percentages in rest of the three distance slabs as well as the percentage of workers in taluka rural and district rural. Thus, the hypothesis that villages influenced by an urban centre tend to have a larger proportion of workers, does not seem to hold good. Since the percentage of total workers in the nearest zone is less in comparison to such percentages in rest of the three distance ranges. The percentages in the four different distance ranges workout to 28.60%, 30.60%, 31.16% and 31.77 per cent respectively. Such inconsistancy seems due to the fact that the further off villages are influenced by other towns of the district namely Sidhpur, Vijapur and to some extent and Vis nagar in particular which is evident from the fact that the village Sakari situated in the distance range of 16-20 kms. from Vadnagar has recorded about 58 per cent of workers of total population. Similarly in the distance range of 11-55 kms.
257
Gorisana village has also recorded well above 50 per cent of main workers of total population of 1599. This is due to the influence of other nearby towns.
The other hypothesis that the village situated at closer to an urban centre usually show a larger proportion of workers engaged in the secondary and tertiary sectors of economy as compared to the villages situated far from the urban centre. It may be mentioned that for 1981 Census workers classified by nine industrial categories are not available and hence workers engaged in Primary sector and the workers engaged in Secondary and Tertiary sectors combined have been attempted to analyse here. The Primary sector is related to exploitation of natural resources such as agricultural and allied activities while industrial categories like household and nonhousehold, industries, communication, trade and commerce, transport and storage, construction and other services etc. constitute the secondary and tertiary sectors.
The proportion of workers engaged in Primary and in Secondary IT ertiary sectors combined for 38 sample villages is 70.37 per cent and 29.63 per cent respectively. Whereas such proportion for Kheralu taluka rural is 79.98 per cent and 20.02 per cent and for Mahesana district rural works out to 75.26 per cent and 24.74 per cent respectively. The percentage for Gujarat State rural is 79.96 per cent and 20.04 per cent. It emerges that the proportion of workers in secondary and tertiary combined in the sample v;lIages is higher as compared to the proportion worked out for rural area of taluka, district and the State as a whole whereas proportion of workers engaged in Primary sector in the sample village is comparatively less.
The distribution of workers in two sectors in the first distance range (within 5 kms.) is 84.06 per cent and 15.94 per cent. In the second distance range of 5-10 kms. 66.65% and 34.35 per cent. The proportion of workers in the third
distance range of 11-15 kms. is 65.99% and 34.01 per cent respectively while in the last distance range of 16-20 kms. it is 78.41 per cent and 21.59 per cent respectively. It can be also seen that the proportion of workers engaged in Primary and Secondary/Tertiary sectors in the villages situated within 10 kms. from the town is 70.71% and·29.29 per cent.
It may seen that the proportion of workers in Secondary IT ertiarv sectors combined in the last distance range is qUite less in comparison to third and second distance ranges wlilch were having 34.0 per cent and 34.35 per cent respectively. While this proportion is higher than the proportion recorded for the first distance range (15.74%). Thus, the aforesaid hypothesis does not seem to support in this case also. This data also shows that the hypothesis that nearer a village is to an urban centre, the higher the percentage of workers would be in the secondary and tertiary sector is not found true in this case. This may perhaps be due to the fact that villages situated at the more distance from the selected town seem to have been influenced by the other nearby urban centres namely Visnagar, Vijapur, Sidhpur and Kheralu towns.
It also seems necessary to see the extent of persons engaged in the marginal workers category. It is seen from the above data that about 7.46 per cent of the total population of 38 sample villages are engaged as the marginal workers as against 30.70 per cent as the main workers. This means that 61.84 per cent of the total population are non-workers. The proportion of marginal workers in four distance ranges in the order of the distance is 7.36,7.47,6,74 and 9.08 per cent respectively. Similarly, the proportion of non-workers iii the same ranges is 63.98, 61.93, 62.10 and 59.15 per cent respectively. Thus, the proportion of main workers varies from 28.66 per cent in the first distance range to 31.77 Per cent in the fourth distance range. Thus, the figures of the hinterland selected units hint towards the extent of unemployment situation in the hinterland zone.
258
Literacy (peA)
The details relating to rate of literacy in the selected villages as per 1971 and 1981 (PCA data) are shown in Appendix 24.
The literacy rate in the 38 sample villages approximates to 50.83 per cent as per 1981 Census. The literacy rate of 50.83 per cent is
higher by about 12.22 per cent than that of Kheralu taluka rural (38.61 per cent). The literacy rate in Mahesana district rural is 43.66 per cent in 1981 Census. Thus, the rate in sample villages is fairly high as compared to that of Gujarat State (36.20%) as well as Mahesana district rural (43.66%).
However vide variation in literacy rate among the villages situated in different distance slabs is seen. The rate in the first distance range of within' 5 kms is 43.86 per cent. The rate in the second distance range of '5-10 kms' is 53.81 per cent which is much higher than the rate recorded in the first slab. The literacy rate in third slab of 11-15 kms. is 53.91 per cent which is still a little higher than the ~econd slab. Whereas the last distance range of '16-20 kms.' has shown the literacy rate of 45.01 per cent which is also a little higher than the rate recorded in the first slab but comparatively lower than the rate recorded in the second and third distance ranges. Thus, there is significant difference in the literacy rate in the selected group of villages in so far as these distance from urban factor is concerned espeCially in first three distance ranges. Thus, above logic does not confirm the fact that the villages nearer to an selected urban centre have a higher rate of literacy and it also does not show as an indicator of the urban centre on these villages. The data further shows that the sample villages are not influenced by the Vadnagar town alone but are simultaneously under the influence of other towns also viz. visnagar, Vijapur, Sidhpur and Kheralu towns.
The literacy rate recorded for individual
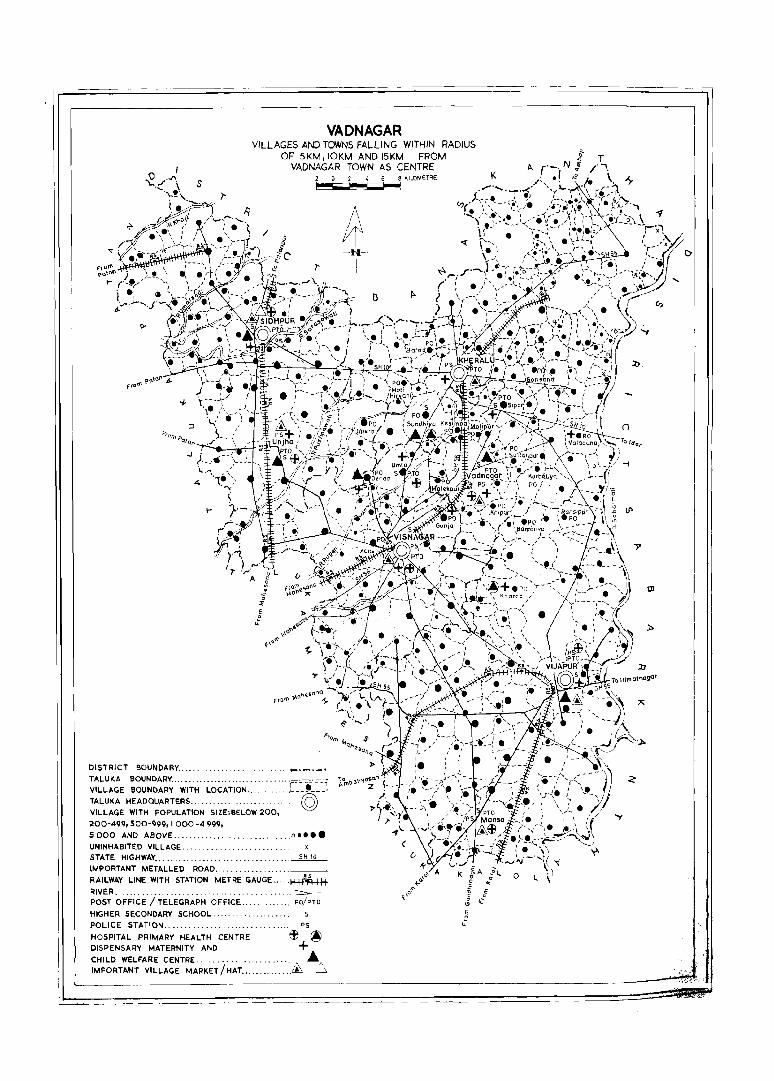
VADNAGAR VILLAGES AND TOWNS FALLING WITHIN RADIUS
OF SKM, IOKM AND ISKM FROM VADNAGAR TOWN AS CENTRE
s 2 0 2 4 6 8 KILOMETRE
~
DISTRICT BOUNDARY .... . TALUKA BOUNDARY ...... , VILLAGE BOUNDARY WITH LOCATION .. TALUKA HEADQUARTERS.
I
VILLAGE WITH POPULATION SIZE;BELOW 200, 200-499,500-999, I 000 -4 999,
5000 AND ABOVE... .. ......... .. UNINHABITED VILLAGE. x STATE HIGHWAY.. .. ........... ~ IMPORTANT METALLED ROAD ................... __ _
RAILWAY LINE WITH STATION METRE GAUGE .... H+F;4.+I+ RIVER.............................. ....... ..~-POST OFFICE I TELEGRAPH OFFICE.. PO/PTO
HIGHER SECONDARY SCHOOL ..... POLICE STATION .........
HOSPITAL PRIMARY HEALTH CENTRE
Ir -H-
I
K

village in different distance ranges further indicates that in the distance range of 16-20 kms. the literacy rate works out to as high as 60.71 per cent in respect of Biliya village. The rate is also above 50 per cent in Bhunav village within 51.72 per cent and Kajialiyasan village with 51 .37 per cent which are well above the average rate of 45.01 per cent. In these three villages education facility upto
high school level is available. Similarly, in distance range of 11-15 kms. it is seen that Kansa village having population of 8623 persons as per 1981 Census has shown the literacy rate of 66.87 per cent. The village Oenap which is having a population of 6717 persons has shown very high literacy rate of 62.94 per cent. The literacy rate is well above the average literacy rate of 53.91 per cent recorded for this slab. Similarly in the distance range of '5-10 kms.' the literacy rate is a little more than 60 per cent in bigger size villages namely Umta village with 60.53 per cent and Gunja village with 61.33 per cent respectively, :t is also seen that out of 9 villages selected in this distance range' as many as in 6 villages the literacy rate is above the average rate of 53.33 per cent. In all these villages the educational facility of primary school, high school and in some villages higher secondary school are available. Thus, the higher literacy rate in distant villages may be not only due to the influence of selected town but also due to the influence of other towns of the district.
BaSic Amenities: (Village Directory)
Out of 38 sample villages the availability of certain services and basic amenities for 25 selected villages in different distance ranges is shown in the Appendix 25. The 1981 Census collected information about the availability of basic amenities like education, medical, power supply, drinking water, post and communication. ~tc. for each village.
Education
All 25 selected villages have the facility of
261
education. It is observed from the above statement that all the 25 villages have the Primary school whereas 14 villages have also the facility of High School. In four villages namely Sipor, Sundhiya, Umta in the distance range of 5-10 kms. and Oenap in the distance range of 11-15 kms. have also the education facility upto Higher secondary level for or preuniversity college.
Medical
As regards the availability of medical facility in the selected villages it is seen that out of 25 selected villages this facility is not available only in three villages namely Navapur, Chhogala and Kat which are however available within the distance of 5 kms. The child welfare Health Centre (CHW) is found to exist in as many as 20 villages. The Primary Health Sub-Centre (PHS) is existing in 11 villages, t in-distance range 'within 5 kms.', 3 in 5-10 kms. , 5-in 11-15 kms. and 2 in 16-20 kms. Similarly Family Planning Centre (FPC) is available in 12 villages 1 in the first range, 4 in second range, 5 in third range and 2 in the last range.
The Sipor and Umta in distance slab of '5-10 kms. and Denap in the distance range 11-15 kms. have also a dispensary (0). The subsidised Medical Practitioners are working in the 3 villages. The village Sundhiya in distance range of 5-10 kms. has also the facility of Maternity and Child Welfare Centre (MCW) , Child Welfare Centre (CWC) , Primary Health Centre (PHC) and Maternity Home (MH) whereas village Umta in the same distance range has also Hospital (H).
Communication and approach to village
It is seen that out of 25 selected villages the State Transport Bus Stop (BS) is available in as many as 22 villages. Whereas, the villages Kesimpa in the distance range within 5 kms. and VarEltha and Pudgam in the distance range '16-20 kms' have both bus stop (BS)
and railway station (RS). However, the village Navapur in the first distance range, Sadikpur in second distance range have neither the facility of bus stop (BS) nor the railway station (RS) which is available within the distance of 5 kms.
As regar~ds the approach to selected villages it is observed from the above data that out of 25 village 15 have pucca roads and rest 10 have kuchha roads for approaching· the selected villages.
Drinking Water, Post & Telegraphs, Power Supply
The facility drinking water of Taps (T) is available is as many as 17 villages. In addition as many as 22 villages are also using drinking water from wells (yV). Whereas 11 villages use Tubewell (TW) water for drinking purpose and 4 villages also use Tank water (TK) for this purpose. Only 2 villages use river water (R) for drinking purpose. It may be mentioned here that most of the villages are having two to three source for drinking water purpose, like Tap, Tank, Tubewell, Tap, Well, River of which the majority combination of three sources is Tap, Well and Tube well (T,W,TW). It is observed that Karbatiya is the only village where all households use Tap water (T). On the other hand Sadikpur in the second distance range, Gorisana in the third distance range, Kesarpur, Varetha and Sakari in the fourth distance range villages use only well (yV) for drinking water. The Post Office and Phone (PO), Phone) facilities are available in as many as 13 of the sample villages. Whereas Post & Telegraph office and phone facilities (PTa, Phone) are available in 3 of the villages viz. Sipor, Umta and Bhunav villages. Whereas in three villages namely Karbaliya, Molipur and Varetha only Post Office (PO) facilities are available while this facilities are not available while this facilities are not available in the 6 villages viz. Navapur, Sadikpur, Chhogala, Gajipur, Keserpur and Sakari which are however available within the distance of about 5 kms.
262
The introduction of electric connections fOI lighting has certainly been an urban feature till recently. However, it· will be seen from the above data that out of 25 villages in as many as 16 villages, the electricity has supplied for all purpose (EA). Whereas in 3 villages the same has been supplied for both Agricultural and Domestic purpose (EAG,ED). However, in rest of the 6 villages the electric connecti(;ms are given only for the purpose of agriculture (EAG). It is seen from the data that Bajari, Wheat and· Jowar are the staple food in all selected villages.
The details of land use pattern in 25 selected villages are shown in Appendix 26. The proportion of total cultivable area for 25 villages is about 92 per cent. The proportion of irrigated area to the total cultivable area comes to 49.76 per cent> Whereas sLJch proportion to the total area of 25 villages comes to 45.75 per cent.
In the Mahesana district as a whole 30.99 per cent of the area was irrigated whereas 48.98 per cent area was un-irrigated. The remaining 20.03 per cent area was distributed as 10.41 per cent cultivable waste, 8.82 not available for cultivation and 0.80 per cent forests. While Kheralu taluka the proportion of area under irrigation was 28.41 per cent. Whereas 45.94 per cent was un-irrigated. The proportion of area not available for cultivation is 13.18 per cent. The remaining 12.97 per cent areas was distributed as 6.28 per cent cultivable waste and 5.69 per cent forests.
In comparison to 25 sample villa'ges 45.74 per cent areas was irrigated whereas 40.13 per cent was un-irrigated. The proportion of area not available for cultivation is 8.09 per cent and 6.06 per cent of the total area was cultivable waste. This comparision of land use pattern confirms our hypothesis that the rural areas nearer an urban centres have a better land use pattern. When compared with rural

areas distant apart from urban influence. It may be mentioned here that the villages situated further off from the selected towns are· Simultaneously influenced by other nearby towns.
The area under irrigation in four distance
ranges in the ascending order of distance was 44.25, 48.86, 43.49 and 45.05 per cent whereas the proportion of un-irrigated area was 44.05 38.50, 40.49 and 40.69 per cent respectively. Similarly, the proportion in respect of cultivable waste in four distance slabs was 3.91, 5.11, 7.02 and 7.83 per cent. Whereas such proportion for the area not available for cultivation was 8.79, 7.53, 9.00 and 6.43 per cent.
Thus, the hypothesis that the area under cultivation tends to decrease with the increase in distance from the urban centre seems to be true in this case to a certain extent. The proportion comes to 87.30 per cent in respect of the group of villages selected in first distance range of 'within 5 kms.'. The proportion in rest of three distance slabs in order of ascending distance was 87.36 per cent 83.91 per cent and 85.74 per cent. However, no significant difference is observed in four di~tance slabs may be due to the influence of other nearby towns to some extent.
General Observations
It is surprising to note here that not a single village of the whole district has a market or marketing centre as such. Therefore the question of existing the market in the selected villages does not arise at all. The marketing centre in respect of the selected villages is either Vadnagar Visnagar, Sidhpur, Unjha or Kheralu town depending upon their convenience. However, in most of the bigger size villages grocery shops predominate and the variety of goods sold or services made available are limited, viz. only grocery and other essential items of day to day use are
263
being sold in such shops. The villagers have to purchase the commodities like cloth, jaggery, ground nut oil tins, ready made cloths, ornaments etc. from the nearby urban centres.
The shopping habits of the villagers in the selected villages would naturally indicate considerable intercourse between the villages and the urban centres. In Mahesana district common bus services, are supplemented by private modes of transport like tractors, scooters, rickshaws,· motor or jeeps etc. Interestingly, camel carts, bullock carts are still in use in the villages for transport purpose.
The use of luxury items such as radio, gramophone, transistorised radio, televison, cameras, were seen in the urban households and their use as such was an urban phenomenon in the past. However, luxury items as mentioned above tend to be 10und also in hinterland villages influenced by the urban centres. Radio, Transistor, Tape recorder and even television to some extent are the familier articles of use in the villages now-a-days. Similarly, under the urban impact adoption of innovations such as tractors, thrashers, seed drills have also become popular in cultivation and due to use of such mechanised means the most of the agricultural land was found to be under double cropping pattern in the majority of the sample villages.
Transport and Communication
The town Vadnagar is well connected by different bus route services. These buses are the mode of communications with other places. The Vadnagar is also railway station and daily 4 trains come to the town and equal number pass through for other places. The town is also a turminal pOint for State Transport bus services. About 203 buses are plying through the town. The longest bus route is the Vadnagar-Bombay. the details regarding bus services are given in the Chapter-III.

It is mentioned in the earlier paras that 22 hinterland villages out of 25 are having State Transport Bus Stand and 3 villages have also Railway Stations. Thus, hinterland villages are well connected by bus service routes. In addition to bus and rail facilities three wheelers, rickshaws facilities are also available from the towns namely Vadnagar, Visnagar, Vijapur and Kheralu to nearby villages, within the reasonable' fair some time only equal to a bus fair. ThuS, the system of transport and communication seems to be quite satisfactory in hinterland villages from the urban centres. Similarly, for transporting essential agricultural goods and other commodities like milk, vegetables, etc. camel carts, tempos, tractors etc. are available in plenty from villages to urban centres and vice-versa.
Trade and Commerce
The agricultural produce of the district is sufficient to meet the demand of food grain. The food gains whole sale markets are located in Mahesana Unjha and Vis nagar towns. Main staple food in majority of hinterland villages is bajari, jower, wheat, whereas rice and maize are found in some villages as food grain. The retailers in the town and hinterland purchase'it from Kheralu, Visanagar towns. The agricultural implements are manufactured in the town. The food grains are also exported to nearby villages and other towns. However, the other consumable items like cloths, utensils, medicines, electrical goods, furnitures, crockery etc. are brought from Mahesana, Unjha and Ahmedabad.
264
Recreational Facility
Though there are no picture halls in the villages of hinterland. However, the villages falling under different distance ranges .have an easy approach to picture houses situated in the three towns namely Kheralu, Vadnagar, and Visnagar.
Bhawai seems to be the other traditional mode of .entertainment for villagers. It is a folk
drama performed particularly at night on some religious and social occassions. Since it is being performed at night time and it being their leisure time. It is very popular with the villages. Mahesana' district was' the main centre for Bhawai fold drama in the past which is similar to Yakhayayan of Andhra' Pradesh. Tamasha of Maharashtra, Lalit gondal of Bengal and Bihar, Ras, Jhumar of Rajasthan, Jatra of Hariyana, Swan of Punjab, Terrukutti of Tamil Nadu and Ras, Nautanki Swons or Bhand of Uttar Pradesh etc.
The Bhavai is performed by male members of Targala, Naik, Vyas and Bhojak. Now-adays though fold drama has lost its glory due to changes in modern life and introduction of other means of entertainment, however it still remains as a good means of entertainment especially in rural areas. It is a cheaply available source of entertainment at their doorsteps.
Social Aspects
Ast~ere are towns·within the distance slabs the urban' im'pact is very well noticed in the hinterlanq villages. Moreover, every selected village has a primary school and some have high school facilities also. There are three political parties namely All India Congress, Janta Party and Bharatiya Janta Party. There are reliylous places in the hinterland villages and in Vadnagar town several fairs and festivals are being held in these areas throughout the year which also provide recreation to village people.
Travel Index
The economic prosperity of any community would naturally depend upon the mobility of the constituent population. A community may be treated to be progressive if its members on average are found to have travelled longer distance and retrogressive if they have moved less. The travel index here stands for the

arithmetic average of maximum distance travelled by all persons aged 5 and above during their lifetime.
265
The following statement shows the Travel Index of persons of the town by lo~ality and sex.
Statement XIII.2
Travel Index of persons, males and females by locality
Name of Locality
Sembharwada
II Amarthol Oarwaja inside area
III Ghaskol Oarwaja area
IV Amtol Oarwaja area
V Amarthol Oarwaja bahar area
Total for town
The above data reveals that males covers more distance as compared to females in all selected localities except the locality-V. The travel index for males is 309 kms. in comparison to 260 kms. for· the males. The longest distance travelled by males comes to 377 km. in first locality, which is almost nearer to 372 kms. travelled by the females in the locality-V. It is also seen that the females of localities II, IV & V seem to cover shorter distance. 147 being least whereas for males it is recorded for the last three localities the smallest being 225 km.
The details relating to travel index of persons, males and females by caste, tribe and community are shown in the Appendix 27. The data of Appendix 27 further indicates that the persons belonging to scheduled caste seem to cover small distance as compared to the persons of other communities.
Among them the travel index for BawaOedh found to be the highest i.e. 401 kms. This was followed by Vankars with 320 kms. While it is least with 21 kms. for Turi. Same
Travel Index
Persons Males Females
2 3 4
363 379 350
272 344 200
212 229 200
190 231 147
358 334 372
283 309 260
trend of travel index is also seen among males . and females.
Among other communities the travel index for Bhavsar was found to be the highest with 942 kms. This was followed by Malis with 852 kms. and Modhvanias with 657 kms. and Brahmin with 615 kms. The said indix was least among Bhois with 25 kms. only. Very closely followed by Odes with 29 kms. The travel index among Muslims was found to be 546 kms. whereas it is 588 kms. for Ghanchi communities.
As regards the travel index among male members it was found to be 1104 kms. for Bhavsars followed ·by Oabgars with 812 kms. Naik (Targala) with· 797 kms. and Muslims by 771 kms. The least travel index was found among Odes with 34 kms. followed by Bhois with 42 kms. Regarding travel index among female members it is seen that it is highest with 1370 kms. for Malis followed by Bhavsars with 802 kms. and Modhvanias with .770 kms. It was least with 8 kms. only for Bhois followed by Odes with 27 kms.

The travel index for persons of the remaining communities varies from 56 kms. for Thakor to 588 for Ghanchis. Whereas for males the travel index varies from 57 kms. for Sind his to 702 kms. for Brahmins and among females it varies from 47 kms. for Thakor to 533 kms. for Brahmins.
Travel Index by Occupational Category
The details regarding the travel index of persons by occupational category who travelled the distance of 500 kms. and above are given in the Appendix 28.
The information was collected for 1260 persons who were engaged in various occupations of which 603 are males and 627 females. The average distance covered was about 283 kms. of which 307 was by males while 260 kms. by females. Maximum distance of 50QO kms. covered by the persons engaged in Hand Printing job which was followed by the persons engaged as woeking propritors,
. directors, with Travel Indix 1677 kms. The travel index for the persons engaged as clerical supervisors was found to be 1550 kms. The travel index was above 1000· kms. in respect of persons engaged as supervisors, formen and stenographers. The travel index was least for the persons engaged as Accounts and Auditors with 506 kms ..
266
During the survey, it was observed that within Gujarat State, Ahmedabad, Mahesana, Visnagar, Ambaji are frequently visited by the people of Vadnagar. As regared ouside linkage the places visited were Delhi, Nasik, hardwar, Clacutta, Badrikedar, Jaganathpuri, Kolhapur, Solapur, Kanya Kumari, Ayodhya, Tirupati, Patna, Etc. While places visited outside country were Sri Lanka and Maccamadina.
The data relating to the travel index below 100 kms. in respect of persons engaged in the various occupations is given in Appendix 29. The travel index is highest with 95 kms. for persons engaged as sweepers, cleaners and related workers which was followed by the cooks, waiters, bartenders, grain millers, tyre makers etc.
The travel index was below 10 kms. for the persons engaged as the Postmen (9) , Tea, Coffee and Cocoa Preparters (6) and as Merchants and Shop-keepers, Whole-sale and retailers (2).
Frequency of Visits
The details regarding the frequency of visits to rural areas by members of households.
Statement XIII ,3
Total
No. of
house
holds
257
Distance
of place
visited
2
Upto 10 kms.
10 - 20 kms.
21 - 50 kms.
Frequency of visits to rural areas by members of households.
No. of
house
holds
whose
members
visited
rural
areas
3
48 22
24
Once
4
18
12
15
No. fo household members visited
Twice
5
6
6
3
Thrice
6
6 1
3
Four
times
7
4
Five
times & more
8
14
2
2
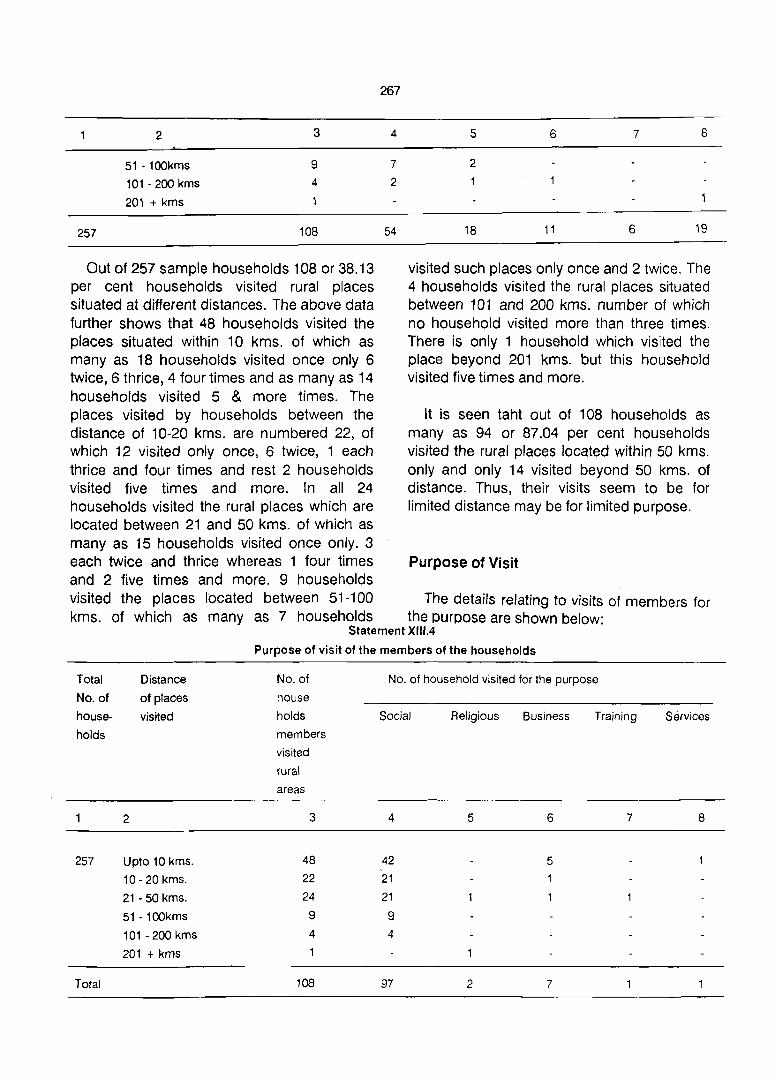
2 3
51 - 100kms 9
101 - 200 kms 4
201 + kms 1
257 108
Out of 257 sample households 108 or 38.13 per cent households visited rural places situated at different distances. The above data further shows that 48 households visited the places situated within 10 kms. of which as many as 18 households visited once only 6 twice, 6 thrice, 4 four times and as many as 14 households visited 5 & more times. The places visited by households between the distance of 10-20 kms. are numbered 22, of which 12 visited only once, 6 twice, 1 each thrice and four times and rest 2 households visited five times and more. In all 24 households visited the rural places which are located between 21 and 50 kms. of which as many as 15 households visited once only. 3 each twice and thrice whereas 1 four times and 2 five times and more. 9 households
267
4
7
2
54
5 6 7 8
2
18 11 6 19
visited such places only once and 2 twice. The 4 households visited the rural places situated between 101 and 200 kms. number of which no household visited more than three times. There is only 1 household which visited the place beyond 201 kms. but this household visited five times and more.
It is seen taht out of 108 households as many as 94 or 87.04 per cent households visited the rural places located within 50 kms. only and only 14 visited beyond 50 kms. of distance. Thus, their visits seem to be for limited distance may be for limited purpose.
Purpose of Visit
visited the places located between 51-100 The details relating to visits of members for kms. of which as many as 7 households the purpose are shown below:
Total
No. of
house
holds
257
Total
2
Distance
of places
visited
Upto 10 kms.
10 - 20 kms.
21 - 50 kms.
51 - 100kms
101 - 200 kms
201 + kms
Statement XIII.4
Purpose of visit of the members of the households
No. of
house
holds
members
visited
rural
areas
3
48 22 24
9
4
1
108
No. of household visited for the purpose
Social Religious Business Training
4
42 21
21
9 4
97
5
2
6 7
5
7
Services
8
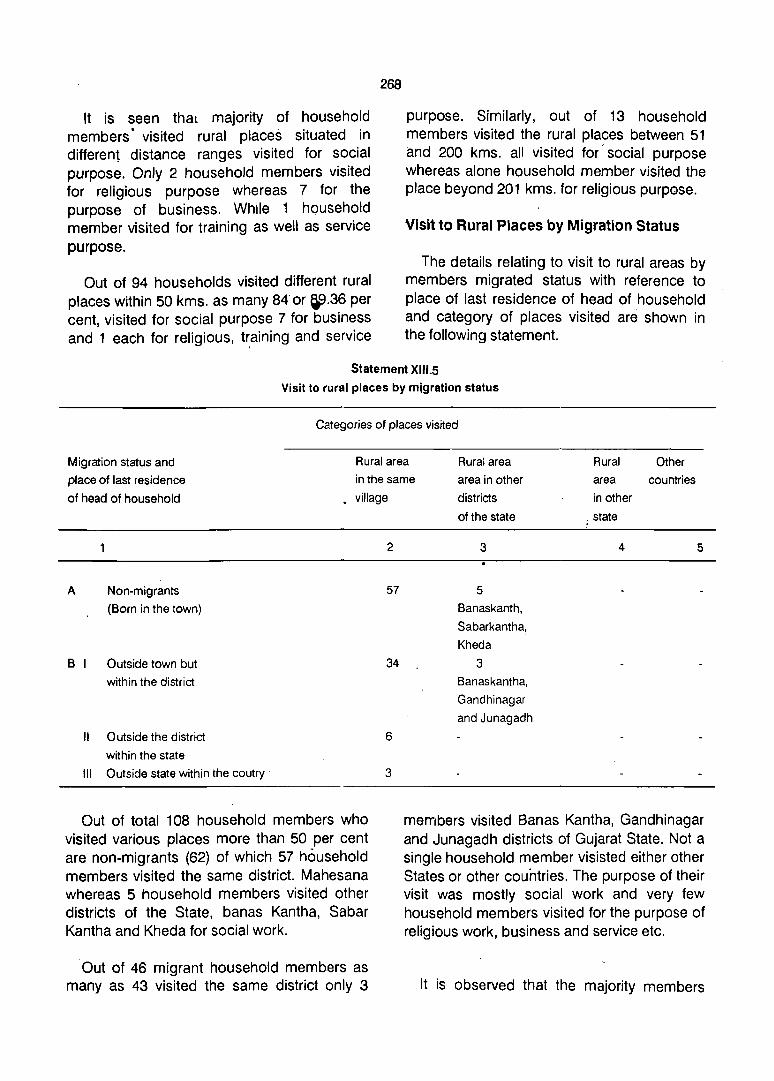
It is seen that majority of household members' visited rural places situated in different distance ranges visited for social purpose. Only 2 household members visited for religious purpose whereas 7 for the purpose of business. While 1 household member visited for training as well as service purpose.
Out of 94 households visited different rural places within 50 kms. as many 84 or ~.36 per cent, visited for social purpose 7 for business and 1 each for religious, t~aining and service
268
purpose. Similarly, out of 13 household members visited the rural places between 51 and 200 kms. all visited for' social purpose whereas alone household member visited the place beyond 201 kms. for religious purpose.
Visit to Rural Places by Migration Status
The details relating to visit to rural areas by members migrated status with reference to place of last residence of head of household and category of places visited are shown in the following statement.
Statement XIII.5
Visit to rural places by migration status
Categories of places visited
Migration status and
place of last residence
of head of household
Rural area
in the same
village
Rural area
area in other
districts
Rural Other
area countries
in other
A Non-migrants
(Born in the town)
B I Outside town but
within the district
II Outside the district
within the state
III Outside state within the coutry .
Out of total 108 household members who visited various places more than 50 per cent are non-migrants (62) of which 57 household members visited the same district. Mahesana whereas 5 household members visited other districts of the State, banas Kantha, Sabar Kantha and Kheda for social work.
Out of 46 migrant household members as many as 43 visited the same district only 3
2
57
34
6
3
of the state
3
5
Banaskanth,
Sabarkantha!
Kheda
3 Banaskantha,
Gandhinagar
and Junagadh
. state
4 5
members visited Banas Kantha, Gandhinagar and Junagadh districts of Gujarat State. Not a single household member visisted either other States or other countries. The purpose of their visit was mostly social work and very few household members visited for the purpose of religious work, business and service etc,
It is observed that the majority members
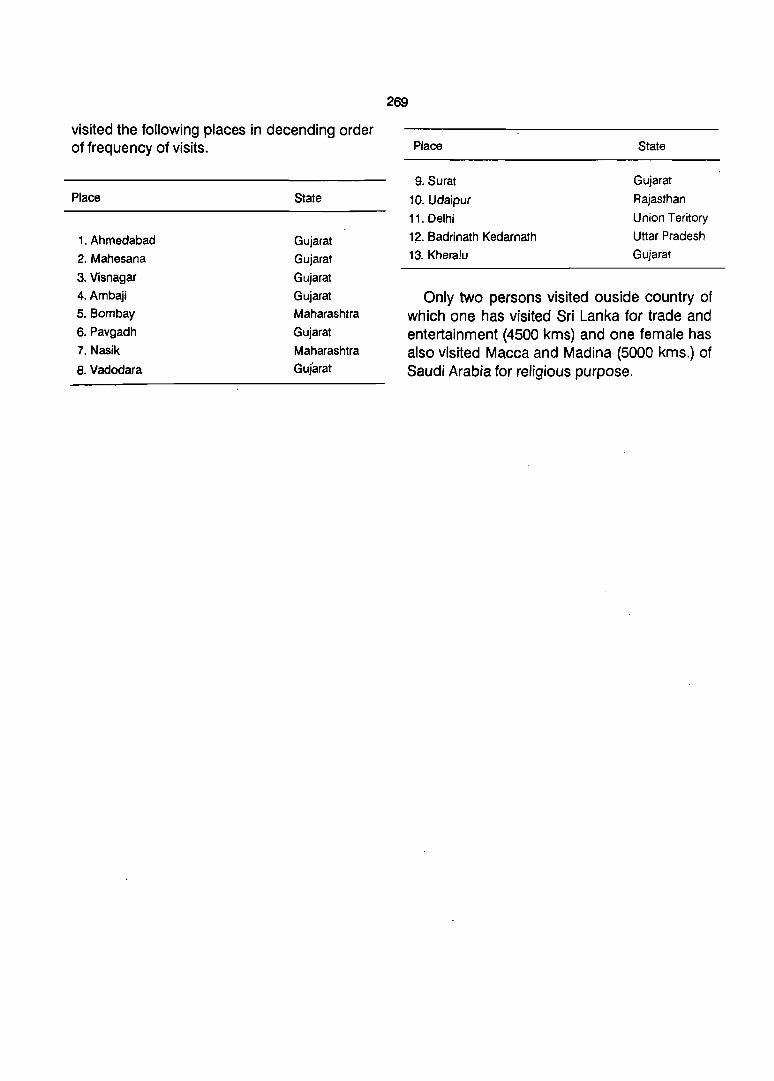
visited the following places in decending order of frequency of visits.
Place State
1. Ahmedabad Gujarat 2. Mahesana Gujarat
3. Visnagar Gujarat 4. Ambaji Gujarat 5. Bombay Maharashtra
6.Pavgadh Gujarat
7. Nasik Maharashtra
8. Vadodara Gujarat
269
Place
9. Surat
10. Udaipur
11. Delhi
1~. Badrinath Kedarnath
13. Kheralu
State
Gujarat
Rajasthan
Union Teritory
Uttar Pradesh
Gujarat
Only two persons visited ouside country of which one has visited Sri Lanka for trade and entertainment (4500 kms) and one female has also visited Macca and Madina (5000 kms.) of Saudi Arabia for religious purpose.

CHAPTER XIV
CONCLUSION
14.1 Vadnagar has a population of 22079 as per 1981 Census. The town appears to have spread in the form of "Semi-circle" around the 'Sharmista' tank. Being situated about 46 kms. away from the district head-quarters town Mahesana of the population range 50,000-99,999, the impact of this town was however not observed. Since its neighbouring town Visnagar is developing fast.
It is to be admitted that the growth of the town is almost stagnant leading to no significant functional changes. In both 1961 and 1971 censuses the town was having primary activities as its functional category and same seems to continue at present also. The status of town was assigned to Vadnagar in 1901. However, the population growth rate during last decade was only 14.23 per cent being lowest among 13 other towns of the district. The town does not have good internal roads as well as pucca linkage roads to attract nearby villagers to bring their agricultural produce for selling in the town. In fact, Vadnagar is passing through a transitional stage looking forward to achieve its past glory of trade and commerce through good linkage road facility. Broadly speaking, majority of town people are served by pipe water supply, a few are dependent on hand pumps and public taps.
14.2 Social structure of the town is heterogeneous with some changes. But the primary society of individual caste that plays important role in rural society is no where found in an urban society like Vadnagar. The caste, community or religion play no important role in diSintegrating the people. Inter-caste living in residential area is prevalent except for the fact that scheduled castes had segregated dwellings. The town has 'no scheduled tribe population. But like rural set up where,
scheduled castes and scheduled tribes live away from the main quarters, in an urban setting like Vadnagar the distance factor does not have any impact. They have also their homes mixed amidst other settlements separated just by small distance. people of all religions, castes and communities maintain harmonious relations and worth mentioning is the inter-caste or inter religion partiCipation in each other's social and religious gatherings. The restricted social mobility is not observed in the small town like Vadnagar. it also helps participation in voluntary groups and associations by the members of these hetrogeneous castes. Similarly no segregation is found except in the case of scheduled castes. The heterogenity helps functional inter-dependence also. There is an increased tolerance on social differences as such is contributed by indirect means: like pressure from other groups like various committees and elected members. it is also generally said that the growth of urban areas has also contributed change in social structure. The chances for inter-caste marriages in such an urban setting is therefore more. However, in small town like Vadnagar the cate-integration by marrying within the castes is still maintained. No incidence of inter-caste or inter-religious marriage was reported in the sample population. The cases of divorce are also negligible. Besides secondary group of integration like caste association or community association are found in the town. The changes are there in the outlook of intercommunity living. The degree of tolerance in inter-dining and inter-living is not shown in social integration by means of inter-caste marriages. Inter-caste and inter-community marriages in the urban society of Vadnagar are resisted with equal force as found in rural society.

14.3 The size of the town is one of the reasons for the efficient Nagar Panchayat which is having elected body. The Nagar Panchayat is responsible for overall management and is very effectively handling and managing civic amenities like drainage, conservancy, water supply, public lighting. However, the finance available for the Nagar Panchayat does not seem enough to provide better internal roads and to certain extent other sanitary conveniences to the town dwellers.
14.4 As a matter of fact the size of Vadnagar town does not provide much toP bring out all facilities that are 'normally available in a big town or city. Internal roads are dirty, quite narrow and thus have not won the favour of Vadnagar town d~ellers and transporters as well. It also cannot boast of any internal transportation. However, internal transport system is not exten~ive to make an easy access to the place of town. It is easy to contact anybody in the town area even at the end of town. This has naturally necessitated the workers either to go by walk or by cycles within town and its periphery. Only a few persons like college teachers, bank employees and some businessmen have automobile two wheelers like scooter or motorbike. The car owners are hardly seen in the town. The officials of police, Electricity and Health departments use car or jeep which are also accountable.
14.5 The medical and health facilities are also moderately available. The town has General Hospital, T.B. Hospital, Government Maternity Centre besides veterinary Dispensary. Thus the town seems to have sufficient agencies to provide the medical and health services to the people as well as to the animals. The availability of Veterinary medicines and doctors is also meeting such requirements of the nearby villages 'Of the taluka. The town is small in extent and the land available has been put into maximum use. The non-industrial character to a great extent helps non-pollution of its environment. One finds cultivators, agricultural labourers
271
and other dependents who earn their livelihood from cultivation which. is seen from the fact that about 32 per cent of the totaJ'main workers were found to depend upon agricultural sector. The trade and commerce in the town is also mainly agriculture based.
14.6 Educational facilities available in the town do not seem disproportionate to the growth of the town. It has got one Arts and Commerce college, 2 higher secondary and 2 high schools besides 6 primary schools" In addition, facility of imparting job orien"fed technical 'education is also found in the town, the classe.s for stiching and empbroidary are conducted for females. However, establishment of college does not seem corelated to the size structural development of the town as such. The present Vadnagar hardly depicts the glamourous outlook, which was well known for its trade and commerce in the past. The housing activity and population growth in the town is almost stagnant in comparison with its neighbouring town Visanagar. A little development that has taken place was in the west direction towards railway station and S.T. Bus stand. The town does not have a Bus Depot. The town people emphatically demand the provision of Bus Depot and adequate linkage roads. The nonavailability of both these facilities has adversely affected the proper growth of the town economy since big businessmen have gradully shifted their trade to the neighbouring industrial town Visanagar which has. good linkage roads.
14.7 The analytical study made in the earlier chapters calls for a test of certain theoretical orientation and hypotheses. The town can be considered as an ecological complex with reference to mutual adaptation to environment, population, social organisation and technology. This orientation requires the test of certain hypothes with reference to the size of the town, functional category, its growth history etc., since testing of hypothesis absolutely depends upon such factors.
The testing of hypothesis led to some salient results as follows:-
1. The hypot~esis that the villages nearer to an urban centre the higher the density of population was found true as far as the villages in a different distance slabs is concerned.
2. The hypothesis that villages closer to an urban centre tend to have higher ratio of households to houses is not supported in respect of this study.
3. The hypothesis that the villages nearer to urban centre have higher growth of population or proximity to an urban centre in these cases has had an impact on the growth of population was found true to certain extent.
4. The hypothesis that the villages influenced by an urban centre tend to have a larger proportion of workers does not hold good in this study.
5. The hypothesis that nearer a vHlage is to an urban ~entre ,the high,er the percentage of workers would be in the secondary and Territory sector is also not found true in this case.
6. The hypothesis that the villages closer to an urban centre tend to have higher extent of literacy does not found true in this study (since further off villages seem to have been influenced by other towns of the district)
7. In hinterland villages it is seen that the area under cultivation tends to decrease with increase in distance from the urban centre viz. area nearer to urban centre have better land use pattern as compared to far off areas from the town. The hypothesis was found true in this study to a certain extent (since some villages have also been influenced by other towns).
272
14.8 There is hardly any sense of using the environments with sorce aesthetic taste. The town is having no linking for beautiful garden of picnic spot. It is small. in extent and its nonindustrial character helps non-pollution of its environment. The growth of Vadnagar town does, not display truly urban and ocmplex characteristics of a town'. The hypothesis that a rise in urban population means more than a simple growth in number has not much relevance in case of a small town like Vadnagar. Burges test of urban growth in terms of zonal development has not even a limited application in small town Vadnagar. However, the core traits are noticed in its growth, the land value is comparatively high in business and market areas. But the testing of uses of different lands working outward from this central business district is not for a delineation of such segregated units due to small size of town. Similarly, the theory of "Hoste" of radical growth in terms of wedge shaped sectors can also not be tested in context of Vadnagar town at present since the town has not shown sufficient expansion at the margins with narrow and compressed growth at the centre. However, it seems that in future this theory can be applied since the town has started growing at the margin. A test of Channey Harvis is concept of development growth into series of cells which in extending outwards each from its nucleous joined up with other in a living organism with a most powerful nuclear drawing the rest to come and giving them a certain integration if not orientation, is not traceable in small town like Vadnagar. Thus, this theory also meets the same fate as the other theories for a underdeveloped town like Vadnagar. However, there is still scope for improvement in the services which are provided by the Nagar Panchayat.
14.9 In viewing the growth, of urban population certain factors are to be taken ihto cOllsideration since the growth of urban population is not a more increase in number, It

means certain changes In the Intra-structure of the society in its economic status and to certain extent in its political and administrative set up also. In any urban increase it is generally said that the lower classes increase at a greater rate than the upper classes. However, this is not observed in Vadnagar town. Similarly, the higher speed growth of the urban is in fact causeq by the influence from the outside rather than due to . natural increase. The influence is provided by migrants within the .district bounds, since chances of migration from inter-state' or intercountry migration are very less. The dominant trend of intra and inter-district migrants was also observed in the sample study.
14.10 The density of population does not seem to be playing any vital role in indicating some characteristics of urbanisaiton like increasing complexity, division of labour participation in the voluntary groups, personal anonymity in inter-personal content and' toleration of social differences. Similarly, the influence of Vadnagar town in adjoining rural areas is also not evently felt in all directions. Since some villages are influenced by other urban centres. No such phenomenan as an increase of lower classes at a greater rate than the upper classes, encroachment upon the establishment of old families by newly richer sections among the upper income groups, speedy growth of the city caused by continuous flow of population from outside moving of upper classes from more centrally located ~reas to the outskirts, geographical distance being considered a class distinction, old middle class resideents being converted into multiple dwellings and the resultant deterioration in the standard of houses cannot be studied with any element of general derivations. Thus, it is rather difficult to draw any meaningful inferences on the basi~; of such hupothesis.
273
To sum up, this old historical town is in the process of transition. Its economy depends on agricultural sector to certain extent. The migrants of the town are mostly drawn from nearby villages' within district barring a few exceptional inter-state and inter-district migrants. Its linkage with hinter-land has not brought even some transformation over the region, because of the fact that the town itself has not gained much from the impact of urbanisation.
Suggestions
14.1 Since town is not having even a taluka head-quarters, a few persons got the employment opportunity in the Government or Semi Government offices and further less number is in the Nagar Panchayat office. it is also observed that due to non-existence of big industries, the local youths do not find any proper opportunity to get employment in the town and they are pushed out for the same.
. Most of the youths are commuting Visanagar . town for working in various industries. It is suggested that local authority should make all . possible efforts to develop the diamond cutting industries in the town itself which will provide ample scope for employment. Similarly adequate of road linkage facility is the long pending demand of the town people which may be met by the authority concerned which may enable to achieve the past glory in trade and commerce. The demand of town people for establishing Bus Depot may also be met by the authority. The proposed plan of forming Vadnagar Industrial DevelOpment Corporation (VIDC) may also be encouraged by the authority which will enable the town authority to take necessary steps for development of small scale industries in the town.

APPENDICES


277
Appendix -1
Distribution of workers and non-workers with reference to participation rate of community/caste sample population of Vadnagar
Religion/ Adults aged 15-59 Actual worker aged 15-59 Participation rate Castel Community Person Male Female Person Male -Female Persons Male Female
2 3 4 5 6 7 8 9 10
HINDU
Scheduled Caste
Bhangi 10 6 4 8 6 2 80.00 100.00 50.00
Chamar 20 10 10 7 7 35.00 70.00 0.00
Bawa Dedh 4 2 2 2 2 50.00 100.00 0.00
Garoda 12 7 5 4 4 33.33 57.14 0.00
Mochi 6 2 4 16.67 50.00 0.00
Turi 5 3 2 4 2 2 80.00 66.67 100.00
Vankar 14 6 8 3 3 21.43 50.00 0.00
Total 71 36 35 29 25 4 40.85 69.44 11.43
Other Selected Community
Patel 148 73 75 60 54 6 40.54 73.97 8.00
Thakor 199 99 100 109 91 18 54.77 91.92 18.00
Prajapati 50 28 22 23 20 3 46.00 71.43 13.64
Ghanchi 30 12 18 12 10 2 40.00 83.33 11.11
Brahmin 44 19 25 13 12 29.55 63.16 4.00
Rabari 22 8 14 11 8 3 50.00 100.00 21.43
Vaghari 22 11 11 12 11 54.55 100.00 9.09
Modhvania 24 10 14 9 9 37.50 90.00 0.00
Bhoi 17 11 6 8 8 47.06 72.73 0.00
Luhar 10 5 5 7 5 2 70.00 100.00 40.00
Bhavsar 12 4 8 2 2 16.67 50.00 0.00
Raval 10 5 5 5 5 50.00 100.00 0.00
Sathwara 16 7 9 7 7 43.75 100.00 0.00

278
2 3 4 5 6 7 8 9 10
Soni 11 5 6 2 2 18.18 40.00 0.00
Suthar 8 5 3 2 2 25.00 40.00 0.00
Valand 7 3 4 2 2 28.57 66.67 0.00
Oabgar 7 3 4 3 3 42.86 100.00 0.00
Others 28 15 13 16 13 3 57.14 86.67 23.08
Total 665 323 342 303 264 39 45.56 81.73 11.40
Muslim 58 24 ' 34. 20 15 5 34.48 62.50 14.71
Grand Total 794 383 411 352 304 48 44.33 79.37 11.68

279
Appendix - 2
The details about crops, Production, consumption by locality
Locality Total House- Crops No. of Yield Con sum- Marketing House- holds Culti- House- per ption per hblds having vated holds cultiva- per cultiva-
land ting cultiva- ting house- ting house-hold house- hold
hold
2 3 4 5 6 7 8
Sembhar wada 70 22 1 Wheat 22 602.72 325.45 277.27 2 Juwar 283.63 220.00 63.63 3 Jiru 0.90 0.90 4 Bajari 586.36 304.54 281.82 5 Rice 13.63 2.72 10.91 6 Tuar 78.18 40.00 38.18 7 Mung 47.27 32.73 14.54 8Adad 18.18 4.54 13.64 9 Math 18.18 4.54 13.64
10 Til 22.72 2.72 20.00 11 Arando 13.63 13.63 12 Raido 22.72 22.72
II Amarthol Darwaja 44 13 1 Wheat 13 646.15 376.92 269.23 inside area 2 Juwar 153.84 115.38 38.46
3 Bajari 518.40 318.40 200.00 4 Rice 23.07 23.07 5 Raido 38.40 1.54 36.92 6 Chora 69.23 46.15 23.08
III Ghaskol Darwaja area 43 2 1 Juwar 2 450.00 350.00 100.00 2 Bajari 400.00 300.00 100.00 3 Tuar 50.00 10.00 40.00
IV Amtol Darwaja area 53 20 1 Wheat 20 572.00 397.00 175.00 2 Juwar 160.00 60.00 100.00 3 Bajari 565.00 435.00 130.00 4 Raido 30.00 00.00 130.00 5 Rice 30.00 30.00
V Amarthol Darwaja 41 15 1 Wheat 15 613.33 380.00 233.33 bahar area 2 Juwar 196.00 69.33 126.67
3 Bajari 835.40 329.33 506.07 4 Rice 73.33 10.67 62.66 5 Tuar 16.00 8.00 8.00 6 Mung 80.00 13.33 66.67 7 Aranda 66.60 66.60 8 Raido 230.00 230.00 9 Choli 62.66 1.33 61.33 10 Guvar 53.33 53.33

280
Appendix
Practice of animal husbandary
Types of livesstock
Religion/ Cow Buffalo Bullock Goat Castel Community No.of Number No.of Number No.of Number No.of
House- recorded House- recorded House- recorded house-hold hold hold hold
2 3 4 5 6 7 8
HINDU
Scheduled Caste
Chamar
Bhangi
Other Community
Patel 2 23 39 6 8
Thakor 4 8 34 67 12 16
Rabari 5 18 2 3
Kadia 2
Ode
Prajapati
Luhar
Kumbhar
Tota! 11 29 61 111 19 26 1
Muslim 1
Grand Total 11 29 62 112 19 26 3
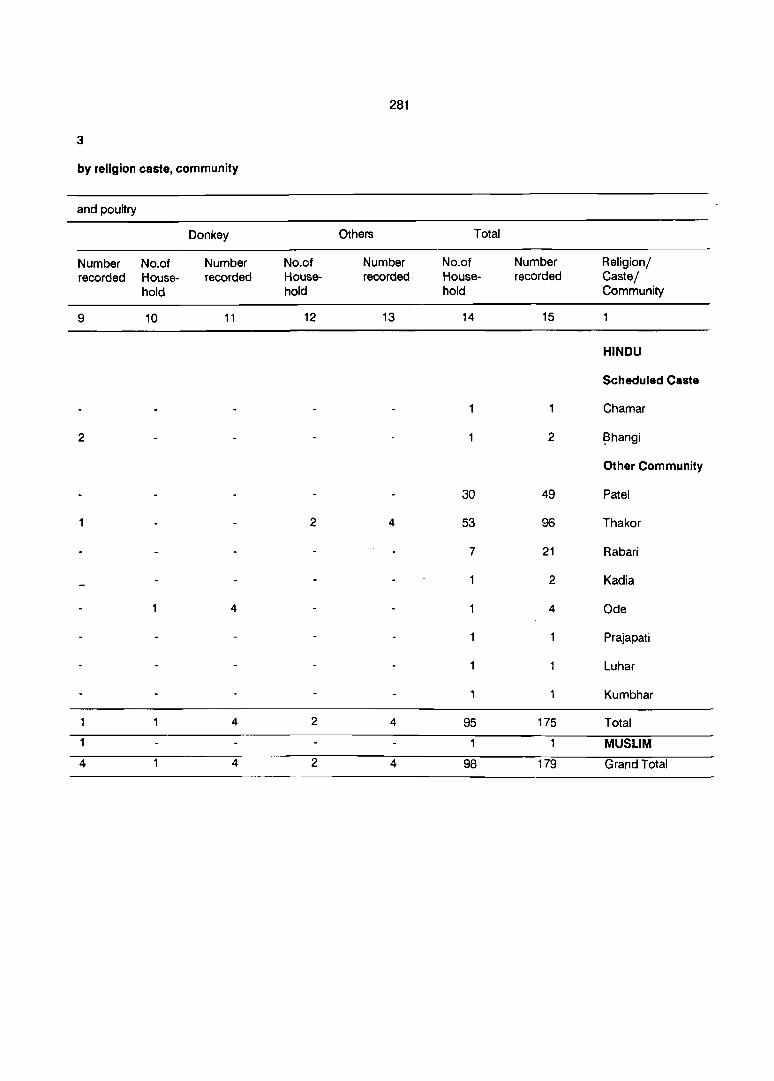
281
3
by religion caste, community
and poultry
Donkey Others Total
Number No.of Number No.of Number No.of Number Religion/ recorded House- recorded House- recorded House- recorded Castel
hold hold hold Community
9 10 11 12 13 14 15
HINDU
Scheduled Caste
Chamar
2 2 ~hangi
Other Community
30 49 Patel
2 4 53 96 Thakor
7 21 Rabari
2 Kadia
4 4 Ode
Prajapati
Luhar
Kumbhar
4 2 4 95 175 Total
1 MUSLIM
4 4 2 4 98 179 Grand Total
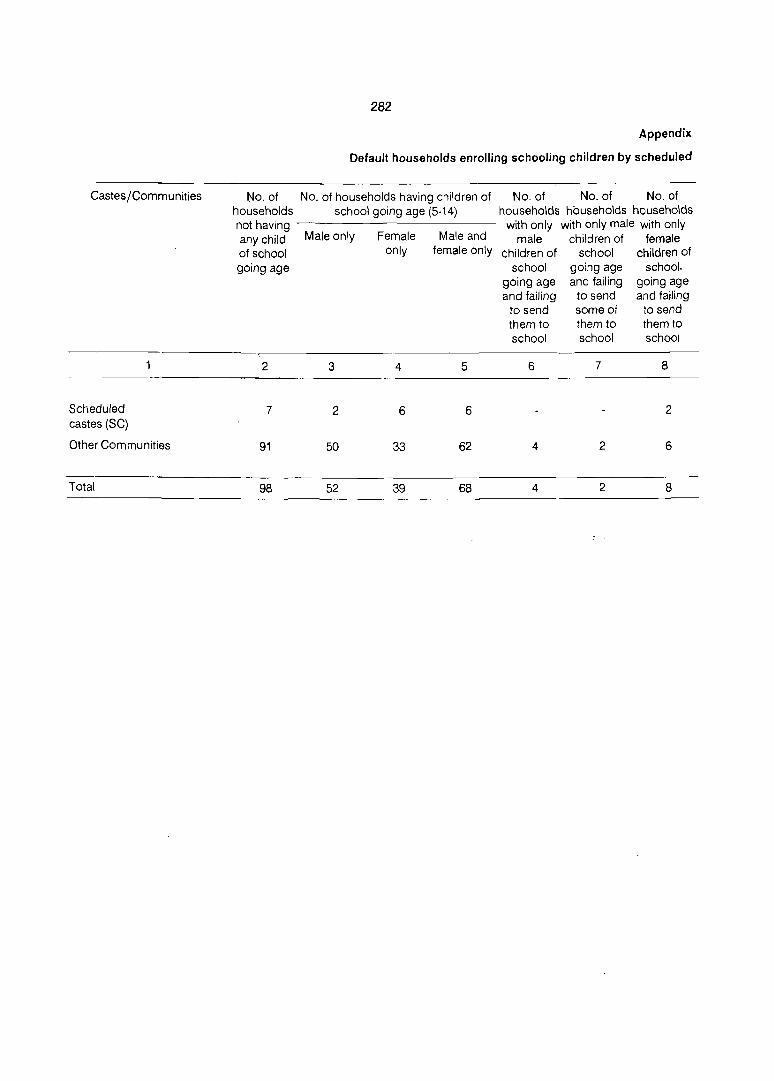
282
Appendix
Default households enrolling schooling children by scheduled
Castes/Communities No. of No. of households having children of No. of No. of No. of households school going age (5-14) households households households not having
Male only Female Male and with only with only male with only
any child male children of female of school only female only children of school children of going age school going age school.
going age and failing going age and failing to send and failing
to send someo! to send them to them to them to school school school
2 3 4 5 6 7 8
Scheduled 7 2 6 6 2 castes (SC)
Other Communities 91 50 33 62 4 2 6
Total 98 52 39 68 4 2 8

283
·4
castes and other communities of head of household
No. of No. of No. of No. of households households households households
with only having both with both male with both male female children male and and female and·female of school going female children children of children of age and failing of school going school going school going to send some age and tailing age and failing age and lailing
otthem to to send both to to send male to send only school school children only some male
to school children to school
9 10 11 12
4 2
4 2
No. of No. of No. of households households households
with both male with both male with both male and female and female and female children of children of children of
school going school going school going age and failing age and failing age and failing
to senf only to send only some to send some female female children male and some
children to to school female children school to school
13 14 15
6 4
6 4
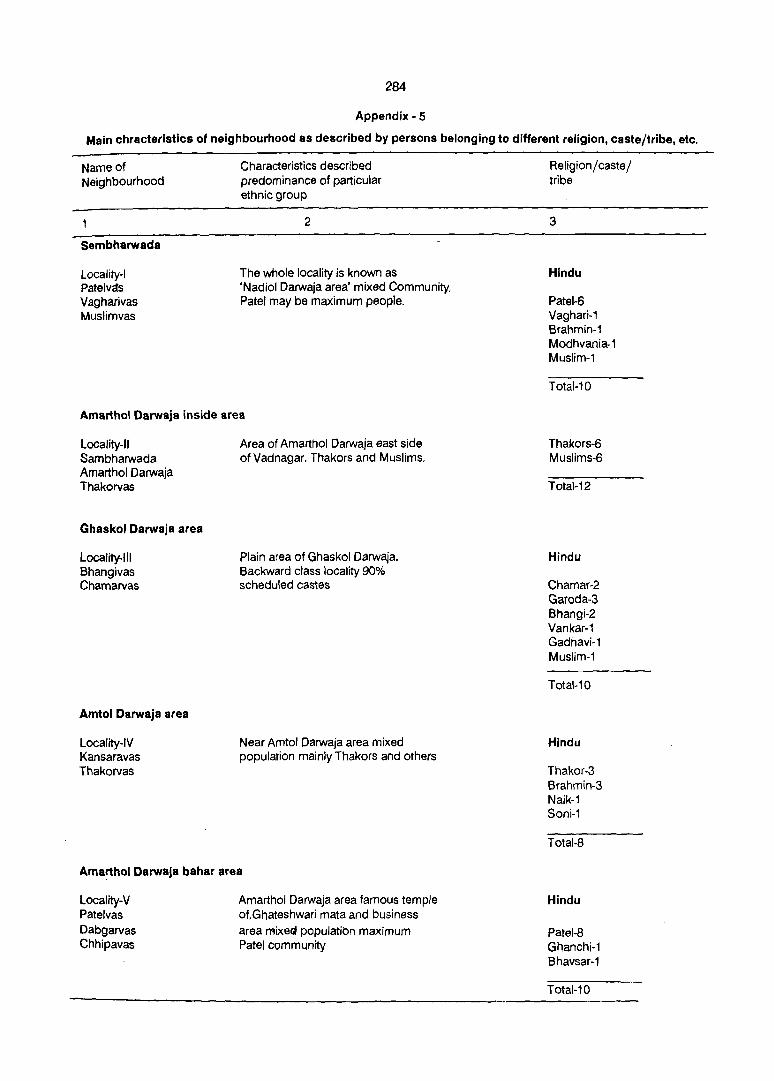
284
Appendix - 5
Main chracteristics of neighbourhood as described by persons belonging to different religion, caste/tribe, etc.
Name of Neighbourhood
Sembharwada
Locality-I Patelvcfs Vagharivas Muslimvas
Characteristics described predominance of particular ethnic group
2
The whole locality is known as 'Nadiol Darwaja area' mixed Community. Patel may be maximum people.
Amarthol Darwaja inside area
locality-II Sambharwada Amarthol Darwaja Thakorvas
Ghaskol Darwaja area
Locality-III Bhangivas Chamarvas
Amtol Darwaja area
Locality-IV Kansaravas Thakorvas
Area of Amarthol Darwaja east side of Vadnagar. Thakors and Muslims.
Plain area of Ghaskol Darwaja. Backward class locality 90% scheduled castes
Near Amtol Darwaja area mixed population mainly Thakors and others
Amarthol Darwaja bahar area
locality-V Patelvas Dabgarvas Chhipavas
Amarthol Darwaja area famous temple of,Ghateshwari mata and business
area mixe~ populatibn maximum Patel community
Religion!caste! tribe
3
Hindu
Patel-6 Vaghari-1 Brahmin-1 Modhvania-1 Muslim-,
Total-10
Thakors-6 Muslims-6
Total-12
Hindu
Chamar-2 Garoda-3 Bhangi-2 Vankar-1 Gadhavi-1 Muslim-1
Total-10
Hindu
Thakor-3 Brahmin-3 Naik-1 Soni-1
Total-8
Hindu
Patel-8 Ghanchi-1 Bhavsar-1
Total-10
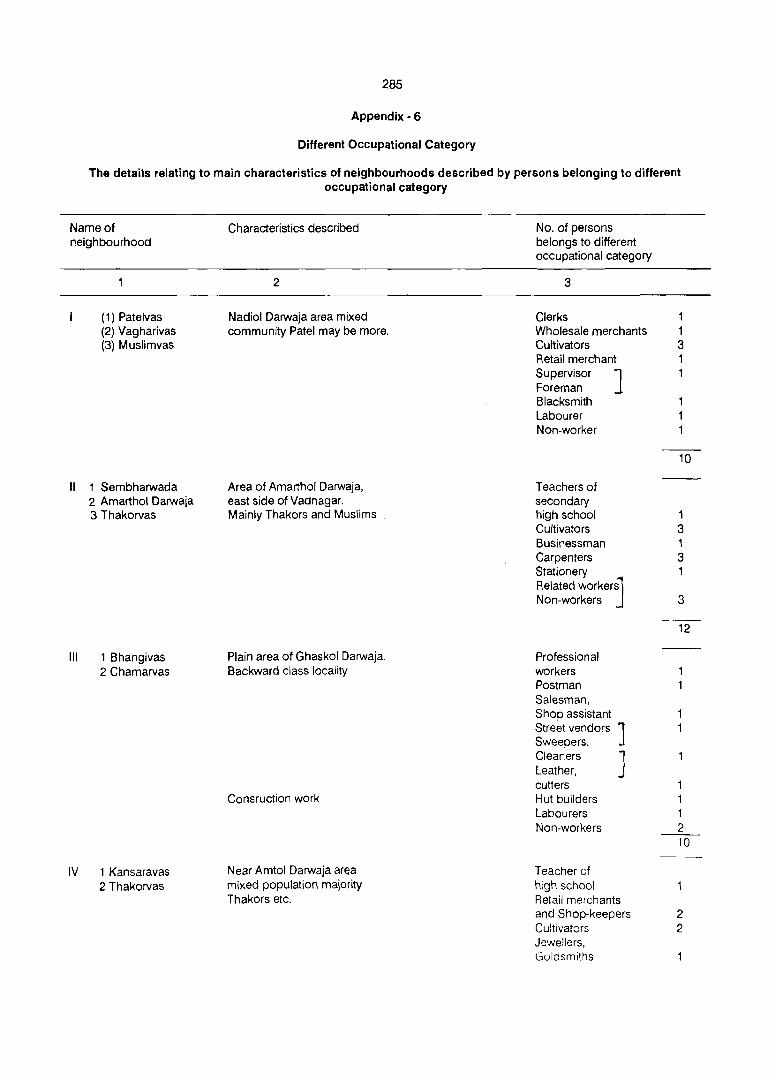
285
Appendix· 6
Different Occupational Category
The details relating to main characteristics of neighbourhoods described by persons belonging to different occupational category
Name of neighbourhood
(1) Patelvas (2) Vagharivas (3) Muslimvas
II 1 Sembharwada 2 Amarthol Darwaja 3 Thakorvas
III 1 Bhangivas 2 Chamarvas
IV 1 Kansaravas 2 Thakorvas
Characteristics described
2
Nadiol Oarwaja area mixed community Patel may be more.
Area of Amarthol Darwaja, east side of Vadnagar. Mainly Thakors and Muslims
Plain area of Ghaskol Darwaja. Backward class locality
Cons ruction work
Near Amtol Darwaja area mixed population majority Thakors etc.
No. of persons belongs to different occupational category
3
Clerks 1 Wholesale merchants 1 Cultivators 3 Retail merchant 1 Supervisor ] 1 Foreman Blacksmith Labourer Non-worker
10
Teachers of secondary high school 1 Cultivators 3 Businessman 1 Carpenters 3 Stationery 1 Related worker~ Non-workers 3
12
Professional workers Postman Salesman, Shop assistant Street vendors ] Sweepers, Cleaners J Leather, cutters 1 Hut builders 1 Labourers 1 Non-workers 2
10
Teacher of high school Retail merchants and Shop-keepers 2 Cultivators 2 Jewellers, Guldsmiths

v 1 Patelvas 20abgarvas 3Chhipavas
286
2
Amarthol Oarwaja area famous temple of Ghateshwari mata ana business area mixed population
3
lyre makers Non-workers
Stenographer Retail merchant Farm managers Carpenters, etc. Non-workers
8
1 5 1 1 2
10

287
Appendix-7
Main characteristics of neighbourhood as described with reference to any particular aspect of land scape.
Name of neighbourhood
Patelvas Vagharivas Muslimvas
" Sembharwada Amarthol Oarwaja Thakorvas
III Bhangivas Chamarvas
IV Kansaravas Thakorvas
V Patelvas Dabgarvas Chhipavas
Characteristics described with reference to any particular aspects of landscape
2
Balaji temple, Kanayalal's temple, Gopalji temple, Hatkeshwar Mahadev temple, Swaminarayan temple, Laxminarayan Mandir, Samales Talav (Tank)
Masjid and Sadnasa Pir Oargah, Samthor Mataji temple, Ramkund Gorikund and Oai Talav (Tank)
Bhagwat mataji telllple, Sihori matas temple, Khodiyar Mata's temple, Shakti mata Kuldevi
Top level place of Vadnagar town.
Lureshvar mandir, Shitala mata, Durga mata, Bhuveshvar mata, Limbaji mandir, Masjid Sadnasa Pir Dargah
No. of persons described
3
10
12
10
8

288
Appendix - 8
The details of cultural, Religions and Social activities of neighbourhood as reported by persons belonging to different religion/caste/community
Name of Cultural, Religious or Number of housholds belonging to neighbour- social activity hood
Hindu Muslims
Name Deseri- Performer Partici- Financial Partici- Finencial ption pated contri- pated contri-
bution bution
2 3 4 5 6 7 8
Patel and Religious Navratri Hindu 2 (H.H) Donation Vagharivas all members Rs.10/-
2 (H.H) one Rs.5/-member
Muslims and Religious Tajia Muslim 4 (H.H) As per Sembharwada all members capacity Thakorvas Religious Navratri Hindu 4 (H.H) one As per
and two capacity members Rs.10/-or
Rs.2/-
4 (H.H) all Rs.5/-members
Bhangivas Religious Navratri Hindu 2 (H.H) one As per Bhajan member capRcity
Rs.5/-
2 (H.H) all members
Chamarvas Religious Navratri Hindu 2 (H.H) Rs.5/-Bhajan one member and
2 (H.H) all Rs. 10/-members
Kansaravas Religious Navratri Hindu 1 (H.H) Rs.11/-all member
Dabgarvas Religious Navratri Hindu 1 (H.H) Rs.51-one member
Chhipavas Religious Navratri Hindu 1 (H.H) Rs.5/-all members

289
Appendix·9
The details of cultural religious and social activities of neighbourhood as reported by persons belonging to different occupation and educational level.
Neigh- Cultural, Aeligious bour- or social activities Occupation Participation Financial hood contribution
Name Aeli- Performer gious
2 3 4 5 6 7
Merchants, Machine 2 (H.H) all As. 10/-tools operators, members cultivators 2 (H.H) one As. 5/-
member
2 Merchants, Metal 4 (H.H) all As per processors, labourers, members capacity Bidi makers
3 Teachers, Carpenters, 4 (H.H) one As. 10/-Jewellers, cultivators, or two members Rs.5/-stationery engine
4 (H.H) all As. 2/-members
4 Shop assistants 2 (H.H) one As per Postman, Sweepers, member capacity labourers 2 (H.H) all . As. 5/-
members
5 Construction workers, 2 (H.H) all Rs. 5/- and Professional workers, members leather workers 2(H.H) one As. 10/-
member
6 Cultivators 1 (H.H) all As. 11/-members
7 Stenographers 1 (H.H) one Rs.5/-and others member
8 Merchants 1 (H.H) all As. 5/-members

290
Educational level Participation Financial (Code) contribution
1 (H.H) 3 2 (H.H) all Rs.10/-members
1 (H.H) 5 2 (H.H) one Rs.5/-member
2 (H.H) 6
2 1 (H.H) 1 4 (H.H) all As per members Capacity
3 (H.H) 6
3 4 (H.H) 1 4 (H.H) one Rs. 10/-or two members
3 (H.H) 3 4 (H.H) all Rs.5/-members
1 (H.H) 10 Rs.2/-
4 3 (H.H) 3 2 (H.H) one As per member capacity
1 (H.H) 5 2 (H.H) all members Rs.5/-
5 2 (H.H) 1 2 (H.H) one Rs. 5/- and member
1 (H.H) 3 2 (H.H) all Rs. 10/-members
1 (H.H) 5
6 1 (H.H) 3 1 (H.H) all Rs.11/-members
7 1 (H.H) 6 1 (H.H) one Rs.5/-member
8 1 (H.H) 6 1 (H.H) all Rs.5/-members
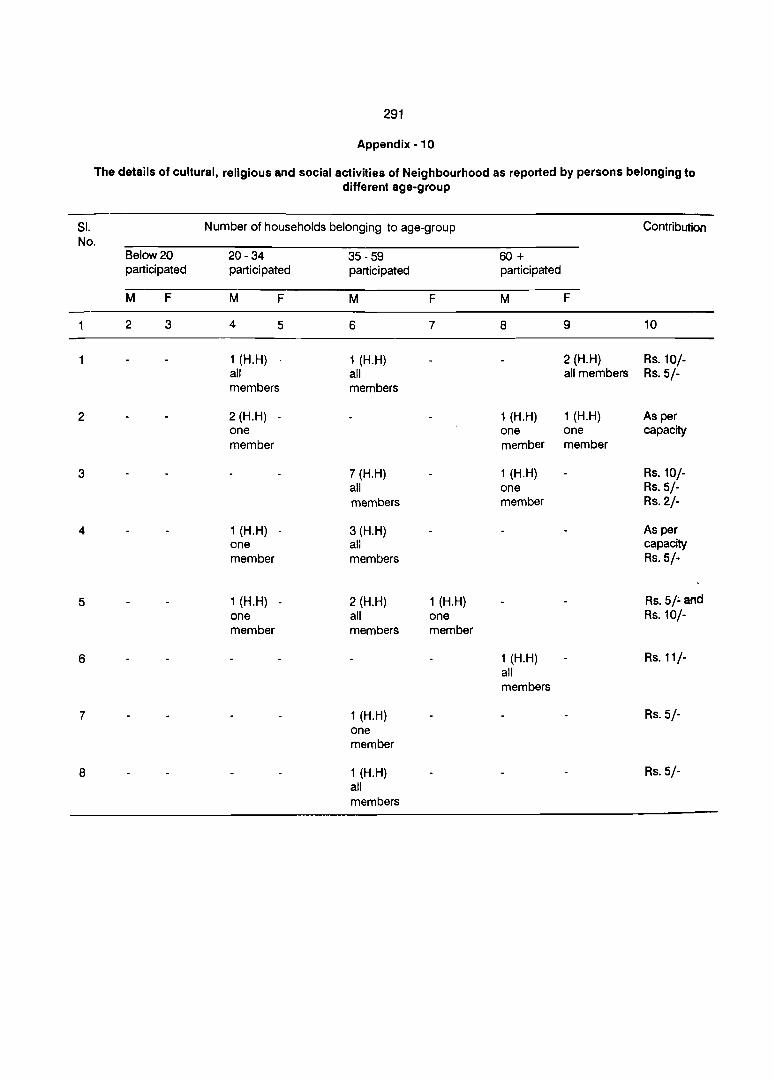
SI.
291
Appendix - 10
The details of cultural, religious and social activities of Neighbourhood as reported by persons belonging to different age-group
Number of households belonging to age-group Contribution No.
Below 20 20-34 35 - 59 60+ participated participated participated participated
M F M F M F M F
2 3 4 5 6 7 8 9 10
1 (H.H) 1 (H.H) 2 (H.H) Rs.10/-all all all members Rs.5/-members members
2 2 (H.H) - 1 (H.H) 1 (H.H) As per one one one capacity member member member
3 7 (H.H) 1 (H.H) Rs.10/-all one Rs.5/-members member Rs.2/-
4 1 (H.H) - 3 (H.H) As per one all capacity member members Rs.5/-
5 1 (H.H) - 2 (H.H) 1 (H.H) Rs. 5/:' and one all one Rs.10/-member members member
6 1 (H.H) Rs.11/-all members
7 1 (H.H) Rs.5/-one member
8 1 (H.H) Rs.5/-all members

Locality
Locality-I Sembharwada
Locality-II Amarthol Oarwajain side area
Locality-III Ghaskol Oarwaja area
Locality-IV Amtol Darwaja area
Locality-V Amarthol Oarwaja b~har area
292
Appendix ~ 11
Purchase of Commodities in the Town.
locality neighourhood
2
Patelvas, Vagharivas Muslimvas
Sambharwada Thakorvas
Bhangivas, Chamarvas
Kansaravas, Thakorvas
Dabagarvas, Chhipavas
Total No. of interviewers
3
10
12
10
8
10
No. of purchasing commodities
Outside neighbourhood
4
10
12
10
8
10
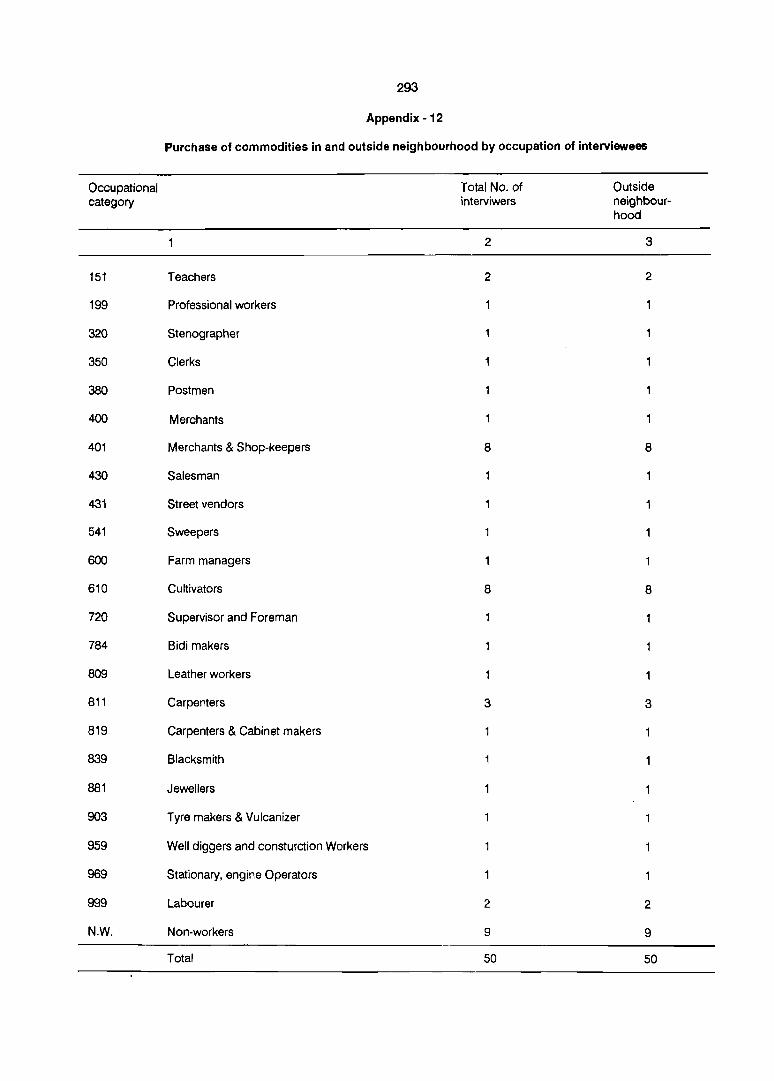
293
Appendix - 12
Purchase of commodities in and outside neighbourhood by occupation of interviewees
Occupational Total No. of Outside category interviwers neighbour-
hood
2 3
151 Teachers 2 2
199 Professional workers
320 Stenographer
350 Clerks
380 Postmen
400 Merchants
401 Merchants & Shop-keepers 8 8
430 Salesman
431 Street vendors
541 Sweepers
600 Farm managers
610 Cultivators 8 8
720 Supervisor and Foreman
784 Bidi makers
809 Leather workers
811 Carpenters 3 3
819 Carpenters & Cabinet makers
839 Blacksmith
881 Jewellers
903 Tyre makers & Vulcanizer
959 Well diggers and consturction Workers
969 Stationary, engine Operators
999 Labourer 2 2
N.W. Non-workers 9 9
Total 50 50

294
Appendix - 13
Educational Facility and its enjoyment in and outside neighbourhood by level of education
Institution for education
Territorial Neighbour- No.of neigh- No.of house- No.of house-' No.of households unit under hoods/other bourhoods/ holds requir- holds availing availing of the
consideration units other units ing the insti- of the facility of
(Locality) where institution tutional facility in other wise
facility
2 3 4 5 6
Locality -I Patelvas, One Primary High School T en Households High school Sembharwada Vagharivas, school availing of facility is not
Muslimvas primary school available in area
Locality -II Sembharwada One BaigJandir . Primary & Six households Primary and high Amarthol Thakorvas One Primary- High school there is only school are not Oarwaja school High school one Balmandir. available in the inside area For 6 households area
only one primary s-::hool
Locality-III Chamarvas Primary Four households Ghaskol High school educational Oarwaja area facility is not
there. High school is not in area
Bhangivas Primary school High school Six households availing facility of primary school
Locality-IV Kansaravas Primary Education facility Arntol Thakorvas High school is not there Oarwaja area
Locality-V Patelvas Primary school High school Eight house- High school is not Amarthol Dabgarvas Balmandir Primary High holds availing there primary and Oarwaja Chhipavas Primary school facility of hig1 school is not bahar area High school primary school. there. High
The(e is only school is not one Balmandir there and Primary school
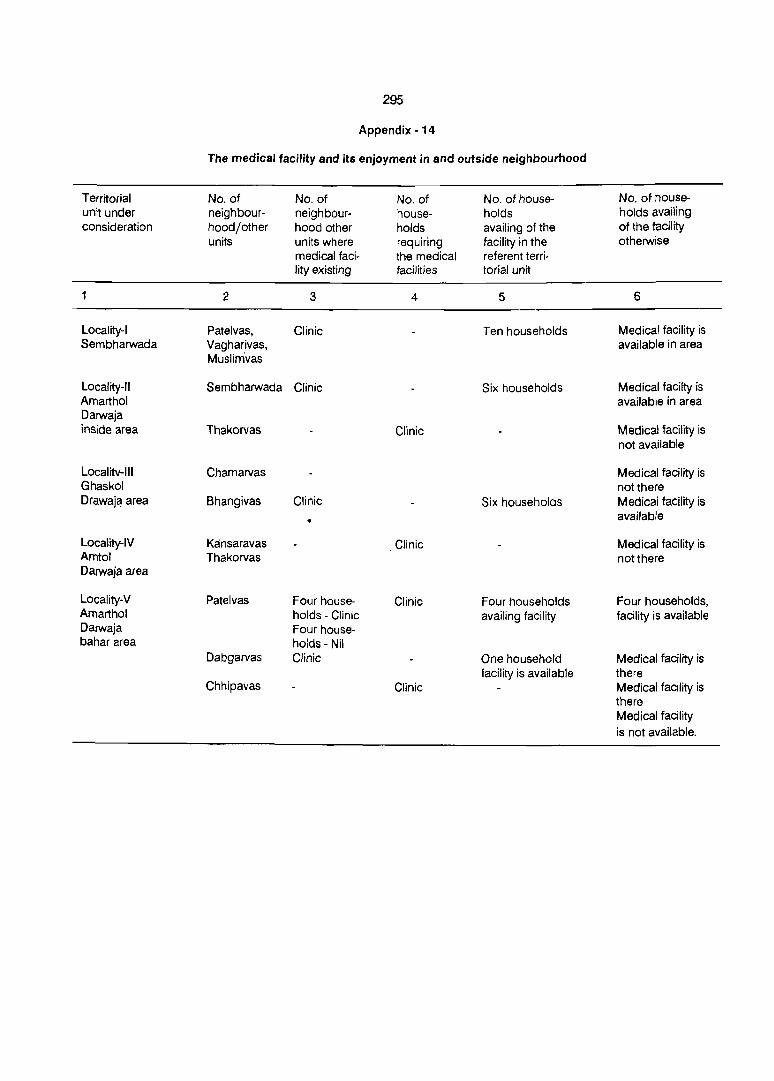
295
Appendix - 14
The medical facility and its enjoyment in and outside neighbourhood
Territorial No. of No. of No. of No. of house- No. of house-unit under neighbour- neighbour- house- holds holds availing consideration hood/other hood other holds availing of the of the facility
units units where requiring facility in the otherwise medical faci- the medical referent terri· lity existing facilities torial unit
1 2 3 4 5 6
Locality-I Patelvas, Clinic T en households Medical facility is Sembharwada Vagharivas, available in area
Muslimvas
Locality-II Sembharwada Clinic Six households Medical facilty is Amarthol available in area Darwaja inside area Thakorvas Clinic Medical facility is
not available
Localitv-III Chamarvas Medical facility is Ghaskol not there Drawaja area Bhangivas Clinic Six householas Medical facility is
available
Locality-IV Kansaravas Clinic Medical facility is Amtol Thakorvas not there Darwaja area
Locality-V Patelvas Four house· Clinic Four households Four households, Amarthol holds - Clinic availing facility facility is available Darwaja Four house· bahar area holds - Nil
Dabgarvas Clinic One household Medical facility is facility is available there
Chhipavas Clinic Medical facility is there Medical facility is not available.
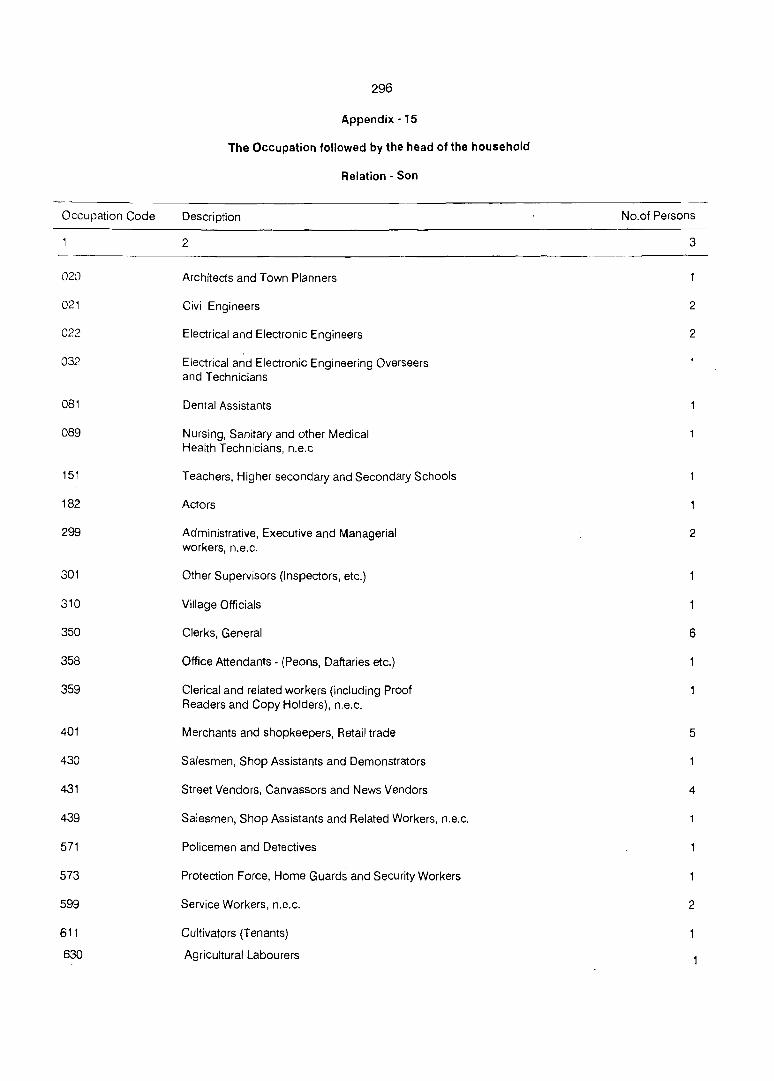
Occupation Code
020
021
022
032
081
089
151
182
299
301
310
350
358
359
401
430
431
439
571
573
599
611
630
296
Appendix· 15
The Occupation followed by the head of the household
Relation· Son
Description
2
Architects and Town Planners
Civil Engineers
Electrical and Electronic Engineers
Electrical and Electronic Engineering Overseers and Technicians
Dental Assistants
Nursing, Sanitary and other Medical Health Technicians, n.e.c
Teachers, Higher secondary and Secondary Schools
Actors
Administrative, Executive and Managerial workers, n.e.c.
Other Supervisors (Inspectors, etc.)
Village Officials
Clerks, General
Office Attendants· (Peons, Daftaries etc.)
Clerical and related workers (including Proof Readers and Copy Holders), n.e.c.
Merchants and shopkeepers, Retail trade
Salesmen, Shop Assistants and Demonstrators
Street Vendors, Canvassors and News Vendors
Salesmen, Shop Assistants and Related Workers, n.e.c.
Policemen and Detectives
Protection Force, Home Guards and Security Workers
Service Workers, n.s.c.
Cultivators (Tenants)
Agricultural Labourers
No.of Persons
3
2
2
2
6
5
4
2

297
2 3
750 Supervisors and Foremen, Spinning, Weaving, Knitting, Dyeing and Related Processes
755 Weavers and Related Workers
830 Supervisors and Foremen, Blacksmithy, Tool making 3 and Machine Tool Operations
831 Blacksmiths, Hammersmiths and Forging Press Operators
855 Electrical wiremen
889 Jewellers and Precious Metal Workers, n.e.c.
920 Supervisors and Foremen, Printing and 4 related workers
921 Compositors
951 Bricklayers, Stone masons and Tiles Setters 2
980 Supervisors and Foremen, Transport equipment 2 Operations
986 Tram,- Car and Motor Vehicle Drivers
999 Labourers, n.e.c. 7
Total 64
Relation· Father
310 Village Officials
401 Merchants and Shopkeepers, Retail trade 3
610 . Cultivators (Owners) 3
892 Potters and Related Clay and Abrasive Formers
986 Tram, car and Motor Vehicle Drivers
999 Labourers, n.e.c.
Total 10
Relation - Brothers
153 Teachers, Primary
729 Metal Processors, n.e.c. 2
752 Spinners and Winders
830 Supervisors and foremen, Blacksmithy, Tool making and Machine Tool operations.
Total. -_ --_.
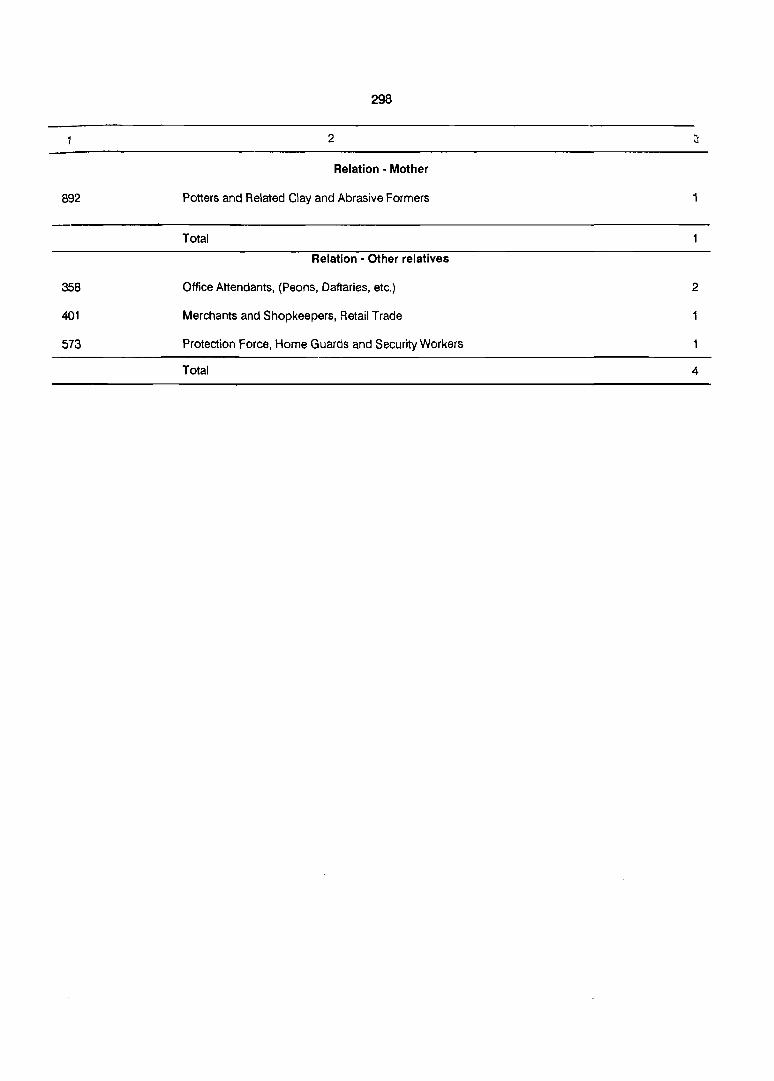
892
358
401
573
298
2
Relation - Mother
Potters and Related Clay and Abrasive Formers
Total
Relation - Other relatives
Office Attendants, (Peons, Daftaries, etc.)
Merchants and Shopkeepers, Retail Trade
Protection Force, Home Guards and Security Workers
Total
2
4
APPENDIX 16 Households classified by number of married couples
without other members/with other members and number of rooms occupied by them

300
Appendix
Households classified by number of married couples without other membersl
Classification of Total Total Households occupying Households occupying Households number number one room two rooms
of· of House- members No.of No.of No.of No.of No.of holds House- mem- House- members House
holds bers holds holds
2 3 4 5 6 7 8
One married couple
Without other members 22 64 3 8 14 39 2 aged 5 and above
With other members 93 497 19 93 36 188 16 aged 5 and above
Two married couples
Without other members 4 21 6 3 15 aged 5 and above
With other members 12 83 7 9 65 aged 5 and above
Three married couples
Without other members 6 6 aged 5 and above
With other members 11 11 aged 5 and above
Four married couples
Without other members aged 5 and above
With other members aged 5 and above
Others with couples
One married couple 50 286 23 127 16 97 7
Two married couples 24 192 7 55 7 54 3
Three married couples 12 135 4 42 3 31 2
Other without couples 38 78 22 22 10 30 6
Total 257 1373 81 371 99 525 37

301
16
with other members and number of rooms occupied by them
Households Households oocupying Hooseholds occupying Unspecified occupying four rooms three rooms more rooms five rooms
No.of No.of No.of No.of No.of No.of No.of Remarks members House- members House- members House- members
holds holds holds
9 10 11 12 13 14 15 16
9 3 8
90 9 45 13 81
5 6
39 4 23
25 3 25 4 33
23 2 24 15
26
217 18 108 22 152
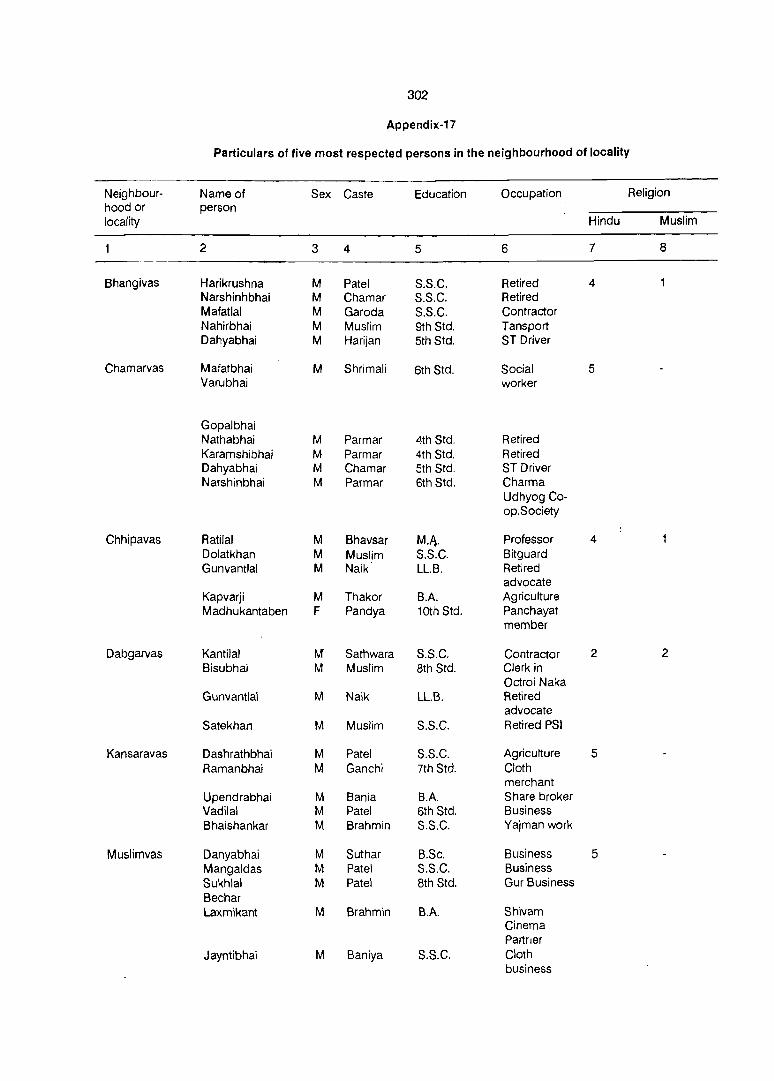
302
Appendix-17
Particulars of five most respected persons in the neighbourhood of locality
Neighbour- Name of Sex Caste Education Occupation Religion hood or person locality Hindu Muslim
2 3 4 5 6 7 8
Bhangivas Harikrushna M Patel S.S.C. Retired 4 Narshinhbhai M Chamar S.S.C. Retired Mafatlal M Garoda S.S.C. Contractor Nahirbhai M Muslim 9th Std. Tansport Dahyabhai M Harijan 5th Std. ST Driver
Chamarvas Mafatbhai M Shrimali 6th Std. Social 5 Varubhai worker
Gopalbhai Nathabhai M Parmar 4th Std. Retired Karamshibhai M Parmar 4th Std. Retired Dahyabhai M Chamar 5th Std. ST Driver Narshinbhai M Parmar 6th Std. Charma
Udhyog Co-op.Society
Chhipavas Ratilal M Bhavsar MA. Professor 4 Dolatkhan M Muslim S.S.C. Bitguard Gunvantlal M Naik LL.B. Retired
advocate Kapvarji M Thakor BA Agriculture Madhukantaben F Pandya 10th Std. Panchayat
member
Dabgarvas Kantilal M Sathwara S.S.C. Contractor 2 2 Bisubhai M Muslim 8th Std. Clerk in
Octroi Naka Gunvantlal M Naik LL.B. Retired
advocate Satekhan M Muslim S.S.C. Retired PSI
Kansaravas Dashrathbhai M Patel S.S.C. Agriculture 5 Ramanbhai M Ganchi 7th Std. Cloth
merchant Upendrabhai M Bania B.A. Share broker Vadilal M Patel 6th Std. Business Bhaishankar M Brahmin S.S.C. Yajman work
Muslimvas Dahyabhai M Suthar B.Sc. Business 5 Mangaldas M Patel S.S.C. Business Sukhlal M Patel 8th Std. Gur Business Bechar Laxmikant M Brahmin B.A. Shivam
Cinema Partrler
Jayntibhai M Baniya S.S.C. Cloth business
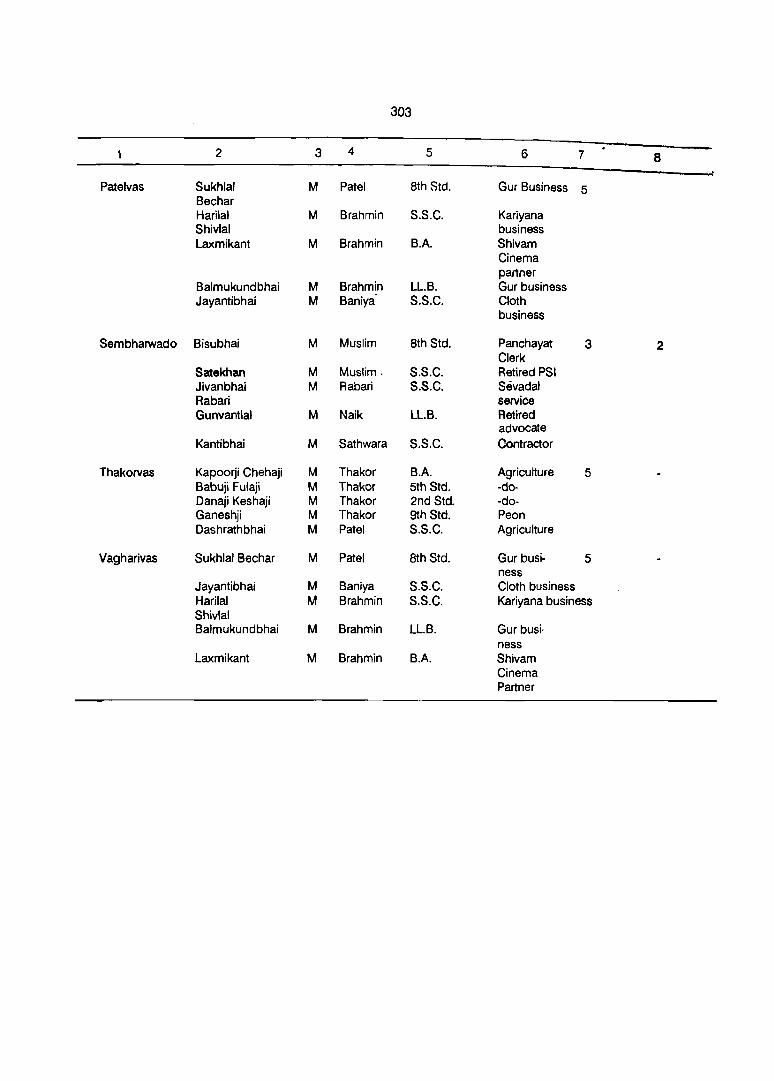
303
2 3 4 5 6 7 8
Patelvas Sukhlal M Patel 8th Std. Gur Business 5 Bechar Harilal M Brahmin S.S.C. Kariyana Shivlal business Laxmikant M Brahmin BA Shivam
Cinema partner
Balmukundbhai M Brahmin LL.B. Gur business Jayantibhai M Baniya' S.S.C. Cloth
business
Sembharwado Bisubhai M Muslim 8th Std. Panchayat 3 2 Clerk
Satekhan M Muslim. S.S.C. Retired PSI Jivanbhai M Rabari S.S.C. Sevadal Rabari service Gunvantlal M Naik LL.B. Retired
advocate Kantibhai M Sathwara S.S.C. Contractor
Thakorvas Kapoorji Chehaji M Thakor BA Agriculture 5 Babuji Fulaji M Thakor 5th Std. -do-Danaji Keshaji M Thakor 2nd Std. -do-Ganeshji M Thakor 9th Std. Peon Dashrathbhai M Patel S.S.C. Agriculture
Vagharivas Sukhlal Bechar M Patel 8th Std. Gur busi- 5 ness
Jayantibhai M Baniya S.S.C. Cloth business Harilal M Brahmin S.S.C. Kariyana business Shivlal Balmukundbhai M Brahmin LL.B. Gur busi·
ness Laxmikant M Brahmin BA Shivam
Cinema Partner

304
Appendix-iS
Particulars of most influential persons in the neighbourhood of locality.
Neighbour- Name of Sex Caste Educa- Occupation Religion
hood of person tion locality Hindu Muslim
2 3 4 5 6 7 8
Bhangivas Ram, .. Ii M Suthar 6th Std. Contractor 4
Bakorbhai M Muslim S.S.C. Oil Merchant Raslkbhal M Patel S.S.C. Talati Mafatlal M Garoda S.S.C. Contractor Babaldas M Harijan 8th Std. Postman
Chamarvas Premjibhai M Parmar 5th Std. Social worker 5 Kalabhai M Parmar 4th Std. Retired Mohanbhai M Parmar 3rdStd. Retired Karamshibhai M Parmar 5th Std. Retired Mafatlal M Shrimali 5th Std. Social worker
Chhipavas Jivanji M Rabari LL.B. Advocate 4 Shamaldas M Patel S.S.C. . T aluka Presid-
ent Retired Maharaja M Brahmin S.S.C. Retired Manubhai M Bania 10th Std. Contrcator
Dabgarvas Mulchanddas M Darji S.S.C. Oarji 4 Ratilal M Sathwara S.S.C. Contractor Ramanlal M Patel 10th Std. Gold business Dolatkhan M Muslim S.s.C. Bitguard Indulal M Brahmin S.S.C. Photographer
Kansaravas Jyotiram M Patel 10th Std. Gur business 5 Kanubhai M Sathwara S.S.C. Contractor Harikrishna M Brahmin S.S.C. Retual Service Vasantibhai M Patel M.Com. Service Vidhyutbhai M Brahmin BA Service
Muslimvas Mangaldas M Patel S.S.C. Business 5 Manubhai M Patel 8th Std. Cultivators Gajendrabhai M Patel BA Business Vadibhai M Patel 8th Std. Cultivators Amitbhai M Soni 7th Std. Soni
Patelvas Daudbhc.i M Muslim 10th Std. Hardware business 4 Vadibhai M Patel 8th Std. Cultivators Manubhai M Patel 8th Std. Cultivators Amitbhai M Soni 7th Std. Soni Gajendrabhai M Patel BA Business
Sembharwado Dolatkhan M Muslim S.S.C. Bitguard 4 Mulchanddas M Oarji S.S.C. Oarji Rambhai M Sathwara S.S.C. Contractor Indubhai M Brahmin S.S.C. Photographer Ramanlal M Patel 10th Std. Choksi work
• Thakorvas Kapoorji Chehaji M Thakor BA Cultivators 5
Sardar M Thakor 9th Std. Milk Dairy Ganesh M Thakor 9th Std. Peon
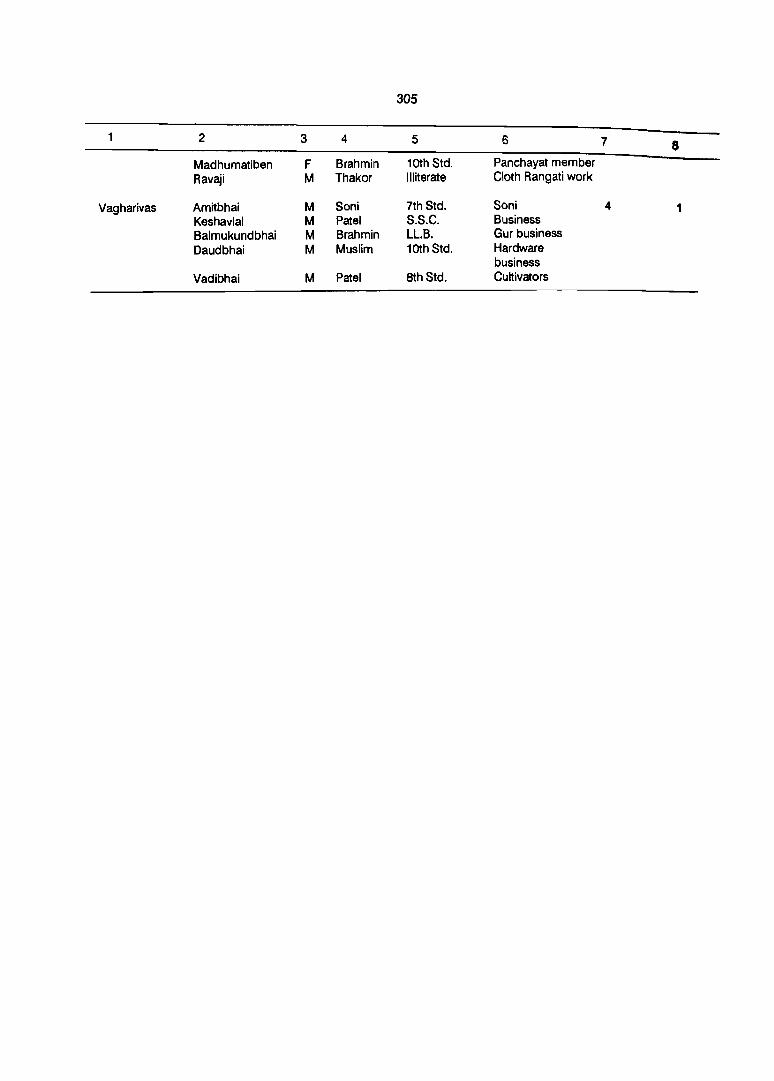
305
2 3 4 5 6 7 8 Madhumatiben F Brahmin 10th Std. Panchayat member Ravaji M Thakor Illiterate Cloth Rangati work
Vagharivas Amitbhai M Soni 7th Std. Soni 4 1 Keshavlal M Patel S.S.C. Business Balmukundbhai M Brahmin LL.B. Gur business Daudbhai M Muslim 10th Std. Hardware
business Vadibhai M Patel 8th Std. Cultivators

Description of leisure time Activity
Reading, Roaming in Bazar and Gossiping
Bhajan-Kirtan Reading,Roaming in Bazar, Supe-rvision in agriculture
Honorary Service, tuition listening radio etc.
Rest and misce-llaneous work
Rest, Roaming in bazar, Radio listening, Reading, Spinning, Agriculture, Supervision
Reading Rest, Radio Listening Typing and Stenography Work, Agriculture Supervision
Listening Tar.3, Radio, Reading and Rest
306
Appendix-19
leisure time activity related to occupation
Age-Sex
15-19 20-24 25-34 35-44
M F M F M F M F
2 3 4 5 6 7 8 9
I Occupation-Unskilled Manual
10 11 3 14 10 15 6
II Skilled Manual
7 13 20 18
III Lowest Professional & Administrative
2
IV Small Business
2 4
V Highly skilled and S'lpervisory Manual
7 15 10
VI Clerks and Assistants
2 3 8
VII Intermediate, Professional and Related post-Secondary Teacher
3
45-59 60 +
M F M F
10 11 12 13
8 4 3 6
17 2 6
5
2
4
7
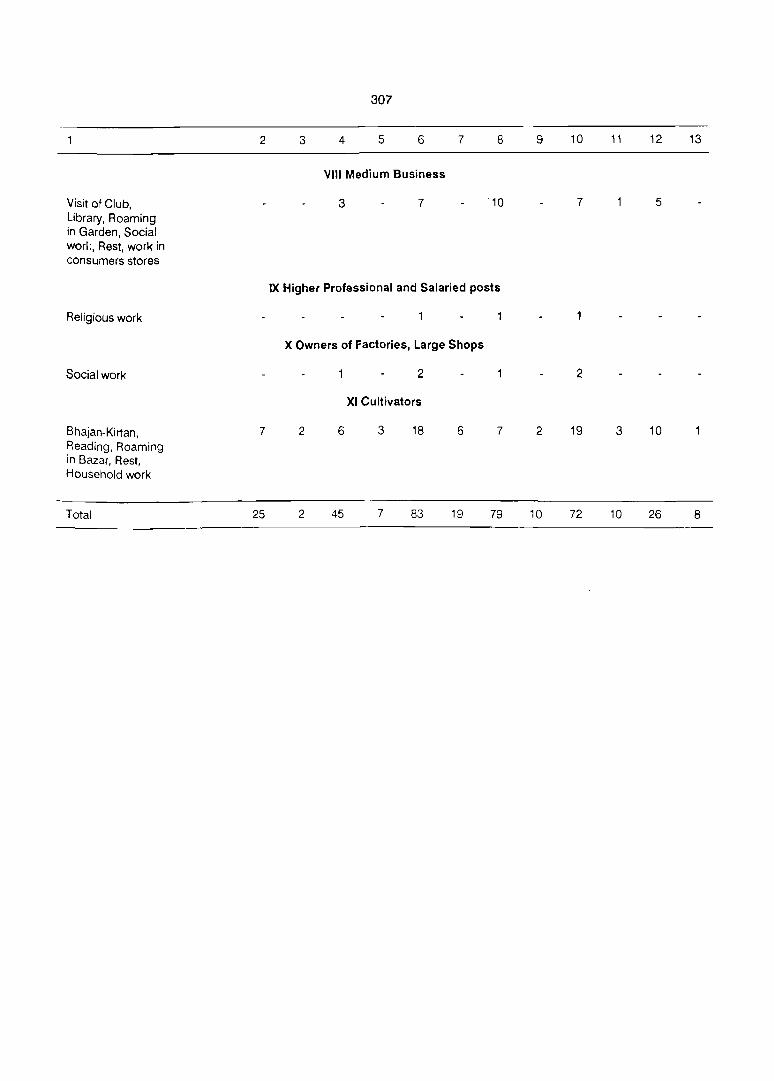
307
2 3 4 5 6 7 8 9 10 11 12 13
VIII Medium Business
Visit of Club, 3 7 '10 7 5 Library, Roaming in Garden, Social worl:, Rest, work in consumers stores
IX Higher Professional and Salaried posts
Religious work
X Owners of Factories, Large Shops
Social work 2 2
XI Cultivators
Bhajan-Kirtan, 7 2 6 3 18 6 7 2 19 3 10 Reading, Roaming in Bazar, Rest, Household work
Total 25 2 45 7 83 19 79 10 72 10 26 8
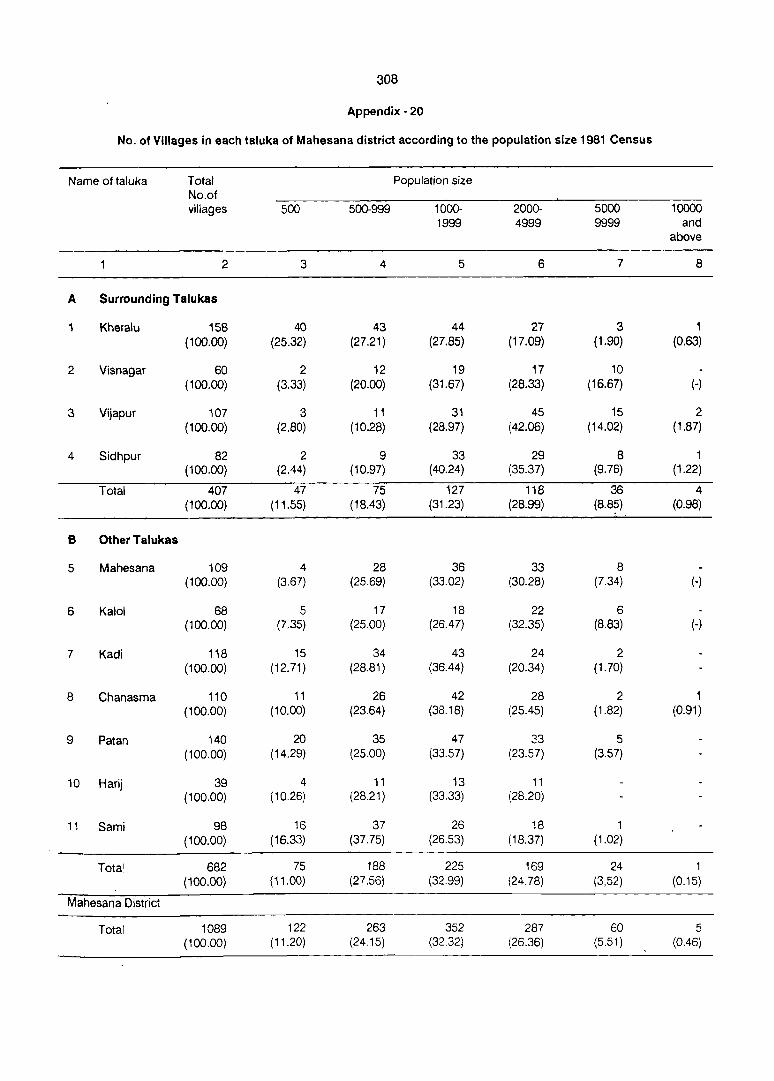
308
Appendix· 20
No. of Villages in each taluka of Mahesana district according to the population size 1981 Census
Name of taluka Total Population size No.of villages 500 500-999 1000- 2000- 5000 10000
1999 4999 9999 and above
2 3 4 5 6 7 8
A Surrounding Talukas
1 Kheralu 158 40 43 44 27 3 1 (100.00) (25.32) (27.21) (27.85) (17.09) (1.90) (0.63)
2 Visnagar 60 2 12 19 17 10 (100.00) (3.33) (20.00) (31.67) (28.33) (16.67) (-)
3 Vijapur 107 3 11 31 45 15 2 (100.00) (2.80) (10.28) (28.97) (42.06) (14.02) (1.87)
4 Sidhpur 82 2 9 33 29 8 1 (100.00) (2.44) (10.97) (40.24) (35.37) (9.76) (1.22)
Total 407 47 75 127 118 36 4 (100.00) (11.55) (18.43) (31.23) (28.99) (8.85) (0.98)
B Other Talukas
5 Mahesana 109 4 28 36 33 8 (100.00) (3.67) (25.69) (33.02) (30.28) (7.34) (-)
6 Kalol 68 5 17 18 22 6 (100.00) (7.35) (25.00) (26.47) (32.35) (8.83) (-)
7 Kadi 118 15 34 43 24 2 (100.00) (12.71) (28.81) (36.44) (20.34) (1.70)
8 Chanasma 110 11 26 42 28 2 1 (100.00) (10.00) (23.64) (38.18) (25.45) (1.82) (0.91)
9 Patan 140 20 35 47 23 5 (100.00) (14.29) (25.00) (33.57) (23.57) (3.57)
10 Harij 39 4 . 11 13 11 (100.00) (10.26) (28.21) (33.33) (28.20)
11 Sami 98 16 37 26 18 1 (100.00) (16.33) (37.75) (26.53) (18.37) (1.02)
Total 682 75 188 225 169 24 1 (100.00) (11.00) (27.56) (32.99) (24.78) (3,52) (0.15)
Mahesana District
Total 1089 122 263 352 287 60 5 (100.00) (11.20) (24.15) (32.32) (26.36) (5.51) (0.46)
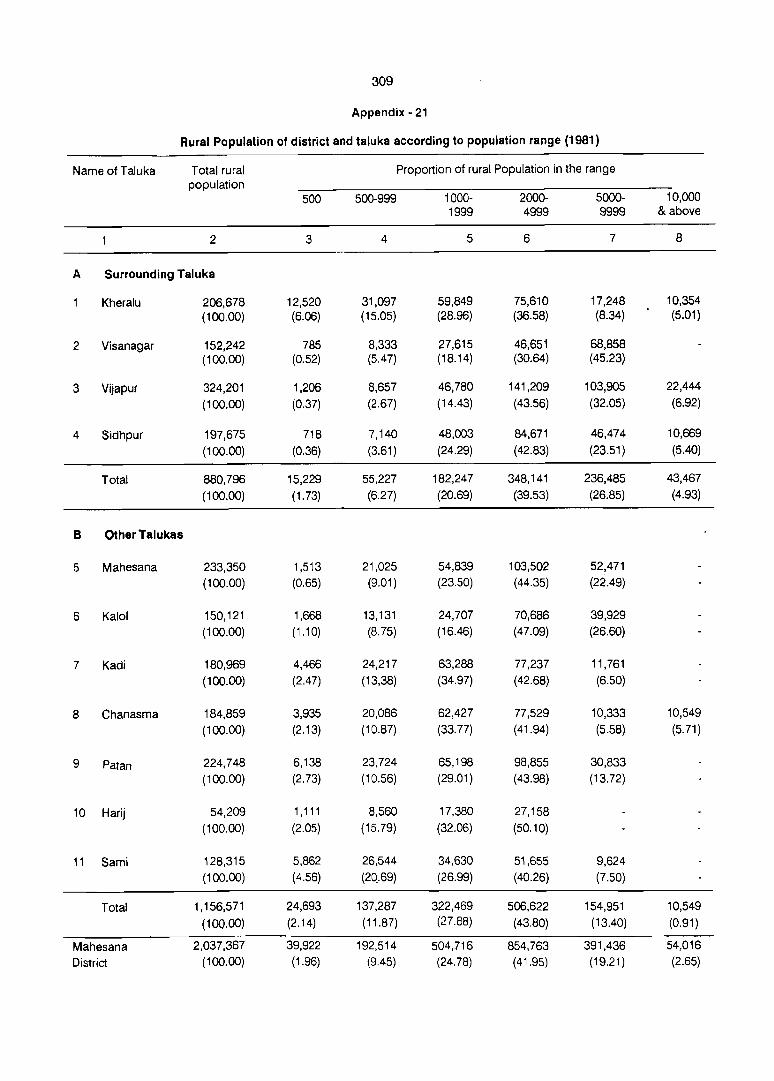
309
Appendix· 21
Rural Population of district and taluka according to population range (1981)
Name of Taluka Total rural Proportion of rural Population in the range population
500 500-999 1000- 2000- 5000- 10,000 1999 4999 9999 & above
2 3 4 5 6 7 8
A Surrounding Taluka
Kheralu 206,678 12,520 31,097 59,849 75,610 17,248 10,354
(100.00) (6.06) (15.05) (28.96) (36.58) (8.34) (5.01)
2 Visanagar 152,242 785 8,333 27,615 46,651 68,858 (100.00) (0.52) (5.47) (18.14) (30.64) (45.23)
3 Vijapur 324,201 1,206 8,657 46,780 141,209 103,905 22,444
(100.00) (0.37) (2.67) (14.43) (43.56) (32.05) (6.92)
4 Sidhpur 197,675 718 7,140 48,003 84,671 46,474 10,669
(100.00) (0.36) (3.61) (24.29) (42.83) (23.51 ) (5.40)
Total 880,796 15,229 55,227 182,247 348,141 236,485 43,467
(100.00) (1.73) (6.27) (20.69) (39.53) (26.85) (4.93)
B Other Talukas
5 Mahesana 233,350 1,513 21,025 54,839 103,502 52,471
(100.00) (0.65) (9.01) (23.50) (44.35) (22.49)
6 Kalal 150,121 1,668 13,131 24,707 70,686 39,929
(100.00) (1.10) (8.75) (16.46) (47.09) (26.60)
7 Kadi 180,969 4,466 24,217 63,288 77,237 11,761
(100.00) (2.47) (13,38) (34.97) (42.68) (6.50)
8 Chanasma 184,859 3,935 20,086 62,427 77,529 10,333 10,549
(100.00) (2.13) (10.87) (33.77) (41.94) (5.58) (5.71)
9 Patan 224,748 6,138 23,724 65,198 98,855 30,833
(100.00) (2.73) (10.56) (29.01) (43.98) (13.72)
10 Harij 54,209 1,111 8,560 17,380 27,158
(100.00) (2.05) (15.79) (32.06) (50.10)
11 Sami 128,315 5,862 26,544 34,630 51,655 9,624
(100.00) (4.56) (2Q.69) (26.99) (40.26) (7.50)
Total 1,156,571 24,693 137,287 322,469 506,622 154,951 10,549
(100.00) (2.14) (11.87) (27.88) (43.80) (13.40) (0.91)
Mahesana 2,037,367 39,922 192,514 504,716 854,763 391,436 54,016
District (100.00) (1.96) (9.45) (24.78) (41.95) (19.21) (2.65)
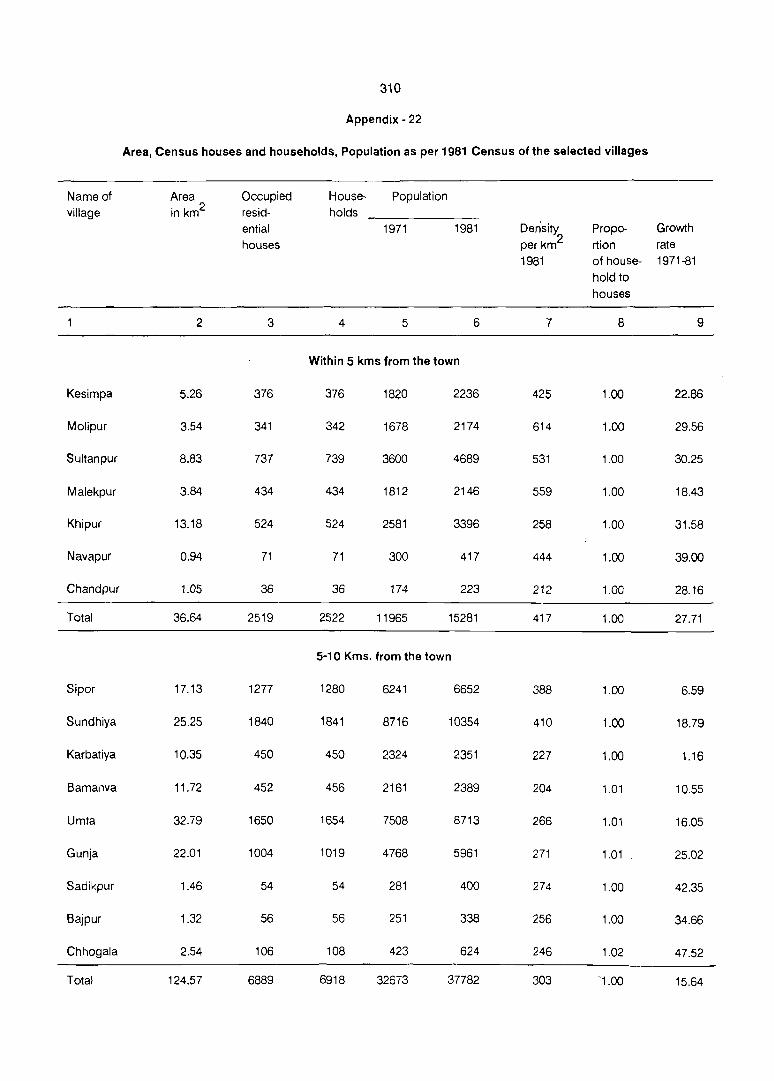
310
Appendix - 22
Area, Census houses and households, Population as per 1981 Census of the selected villages
Name of Area Occupied House- Population village in krn2 resid- holds
ential 1971 1981 Density Propo- Growth
houses per km2 rtion rate
1981 of house- 1971-81
hold to houses
2 3 4 5 6 7 8 9
Within 5 kms from the town
Kesimpa 5.26 376 376 1820 2236 425 1.00 22.86
Molipur 3.54 341 342 1678 2174 614 1.00 29.56
Sultanpur 8.83 737 739 3600 4689 531 1.00 30.25
Malekpur 3.84 434 434 1812 2146 559 1.00 18.43
Khipur 13.18 524 524 2581 3396 258 1.00 31.58
Navapur 0.94 71 71 300 417 444 1.00 39.00
Chandpur 1.05 36 36 174 223 212 1.00 28.16
Total 36.64 2519 2522 11965 15281 417 1.00 27.71
5-10 Kms. from the town
Sipor 17.13 1277 1280 6241 6652 388 1.00 6.59
Sundhiya 25.25 1840 1841 8716 10354 410 1.00 18.79
Karbatiya 10.35 450 450 2324 2351 227 1.00 1.16
Bamanva 11.72 452 456 2161 2389 204 1.01 10.55
Umta 32.79 1650 1654 7508 8713 266 1.01 16.05
Gunja 22.01 1004 1019 4768 5961 271 1.01 25.02
Sadikpur 1.46 54 54 281 400 274 1.00 42.35
Bajpur 1.32 56 56 251 338 256 1.00 34.66
Chhogala 2.54 106 108 423 624 246 1.02 47.52
Total 124.57 6889 6918 32673 37782 303 -1.00 15.64

311
2 3 4 5 6 7 8 9
11 • 15 Kms. from the town
Balad 12.19 534 535 2146 2784 228 1.00 29.73
Gorisana 8.05 310 311 1402 1599 199 1.00 14.05
Moti Hirvanl 8.68 208 210 975 1056 122 1.01 8.31
Valagana 16.50 454 454 1779 2218 134 Lon 24.68
Ransipur 16.09 390 390 1883 2116 132 1.00 12.37
Kharod 18.51 944 945 4188 4854 262 1.00 15.90
Denap 6.33 1105 1106 6296 6717 1061 1.00 6.69
Kansa 16.14 1412 1420 6454 8623 534 1.01 33.61
Upera 22.69 951 952 4514 5300 234 1.00 17.41
Suvaria 0.88 19 19 102 104 118 1.00 1.90
Gajipur 2.43 52 52 225 303 125 1.00 34.67
Total 128.49 6379 6394 29964 35674 278 1.00 19.06
16 • 20 Kms. from the town
Rajpur (Gadh) 1.82 109 109 351 534 293 1.00 52.14
Kesarpur 2.27 85 85 351 454 200 1.00 29.34
Varetha 6.28 246 246 1228 1326 211 1.00 7.98
Sakari 0.71 145 150 744 962 1354 1.03 29.30
Nagvasan 8.73 270 270 1278 1486 170 1.00 16.27
Bhunav 6.30 633 635 3206 3480 552 1.00 8.55
Ranchhodpura 5.53 445 445 2294 2606 471 1.00 13.60
Kajialiyasna 3.40 115 115 551 693 203 1.00 25.77
Pudgam 13.86 458 459 2098 2576 186 1.00 22.78
Kot 7.63 249 249 1271 1319 172 1.00 3.78
Biliya 6.35 296 297 1423 1624 256 1.00 14.13
Total 62.88 3051 3060 14795 17060 271 1.00 15.31
Gr. Total 349.74 18332 18894 89397 105797 303 1.00 18.35

312
Appendix - 23
Proportion of workers, marginal workers and non-workers and its detail 1981.
Name of Population Main Marginal Non- Proportion of village worker worker worker
Main Marginal Workers Workers workers workers primary secon-to popu- to POpu- sector daryand lation lation to total tertiary
main workers workers to main
workers
2 3 4 5 6 7 8 9
Within 5 kms from the town
Kesimpa 2236 571 16 164!l. 25.54 0.71 73.38 26.62
Molipur 2174 649 19 1506 29.85 0.87 87.37 12.83
Sultanpur 4689 1266 343 3080 27.00 7.31 92.73 7.27
Malekpur 2146 612 287 1247 28.52 13.37 68.p3 31.37
Khipur 3396 961 448 1987 28.30 13.19 82.83 17.63
Navapur 417 258 159 61.87 00.00 98.45 1.55
Chand pur 223 63 11 149 28.25 4.93 82.54 17.46
Total 15281 4380 1124 9777 28.66 7.36 84.06 15.94
5 - 10 kms. from the town
2 3 4 5 6 7 8 9
Sipor 6652 1888 143 4621 28.38 2.15 59.00 41.00
Sundhiya 10354 3170 395 6789 30.62 3.81 78.23 21.77
Karbatiya 2351 534 587 1230 22.71 24.97 67.98 32.02
Bamanva 2389 604 601 1184 25.28 25.16 85.10 14.90
Umta 8713 2889 682 5142 33.16 7.83 55.69 44.31
Gunja 5961 2121 285 3555 35.58 4.78 58.37 41.63
Sadikpur 400 112 288 28.00 0.00 85.71 14.29
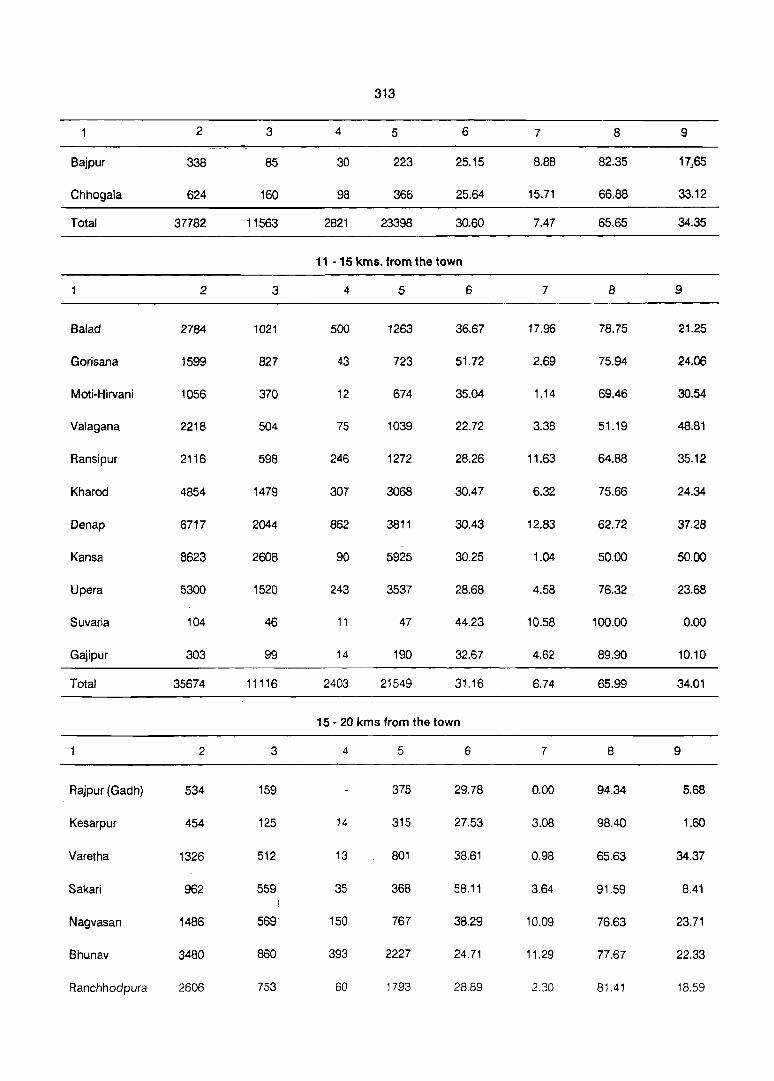
313
2 3 4 5 6 7 8 9
Bajpur 338 85 30 223 25.15 8.88 82.35 17:65
Chhogala 624 160 98 366 25.64 15.71 66.88 33.12
Total 37782 11563 2821 23398 30.60 7.47 65.65 34.35
11 - 15 kms. from the town
2 3 4 5 6 7 8 9
Salad 2784 1021 500 1263 36.67 17.96 78.75 21.25
Gorisana 1599 827 43 723 51.72 2.69 75.94 24.06
Moti-Hirvani 1056 370 12 674 35.04 1.14 69.46 30.54
Valagana 2218 504 75 1039 22.72 3.38 51.19 48.81
Ransipur 2116 598 246 1272 28.26 11.63 64.88 35.12
Kharod 4854 1479 307 3068 30.47 6.32 75.66 24.34
Denap 6717 2044 862 3811 30.43 12.83 62.72 37.28
Kansa 8623 2608 90 5925 30.25 1.04 50.00 50.00
Upera 5300 1520 243 3537 28.68 4.58 76.32 23.68
Suvaria 104 46 11 47 44.23 10.58 100.00 0.00
Gajipur 303 99 14 190 32.67 4.62 89.90 10.10
Total 35674 11116 2403 21549 31.16 6.74 65.99 34.01
15 - 20 kms from the town
2 3 4 5 6 7 8 9
Rajpur (Gadh) 534 159 375 29.78 0.00 94.34 5.68
Kesarpur 454 125 14 315 27.53 3.08 98.40 1.60
Varetha 1326 512 13 801 38.61 0.98 65.63 34.37
Sakari 962 559' 35 368 58.11 3.64 91.59 8.41
Nagvasan 1486 569; 150 767 38.29 10.09 76.63 23.71
Bhunav 3480 860 393 2227 24.71 11.29 77.67 22.33
Ranchhodpura 2606 753 60 1793 28.89 2.30 81.41 18.59

314
2 3 4 5 6 7 8 9
Kajialiyasna 693 226 242 225 32.61 34.92 86.11 13.89
Pudgam 2576 733 6 1837 28.4q 0.23 81.31 18.69
Kat 1319 439 309 571 33.28 23.43 56.49 43.51
Biliya 1624 485 327 812 29.86 20.14 77.11 22.89
Total 17060 5420 1549 10091 31.77 9.08 78.41 21.59
Gr.Total 105797 32479 7897 65421 30.70 7.46 70.37 .29.63

315
Appendix - 24
Proportion of literates during 1971 and 1981 Census in the selected villages
---Name of village Population Literates Proportion of literates
1971 1981 1971 1981 1971 1981
2 3 " 5 6 7
Within 5 Kin •. from the town
Kesimpa 1820 2236 570 957 31.32 42:80
Moltipur 1678 2174 622 1237 37.07 56.90
Sultanpur 3600 4689 638 1596 17.72 34.04
Malekpur 1812 2146 1117 1124 61.64 52.38
Khipur 2581 3396 1046 1647 40.53 48.50
Navapur 300 417 44 75 14.67 17.99
Chandpur 174 223 67 67 38.51 30.04
Total 11965 15281 4104 6703 34.30 43.86
5 -10 kms. from the town
2 3 4 5 6 7
Sipor 6241 6652 2759 3655 44.21 54.95
Sundhiya 8716 10354 2652 4460 30.43 43.08
Karbatiya 2324 2351 1044 1267 44.92 53.89
Bamanva 2161 2389 1313 1310 60.76 54.83
Umta 7508 8713 3765 5274 50.15 60.53'
Gunja 4768 5961 2463 3656 51.66 61.33
Sadikpur 281 400 78 239 27.76 59.75
Bajpur 251 338 68 97 27.09 28.70
Chhogala 423 624 137 216 32.39 34.62
Total 32673 37782 14279 20174 43.70 53.38
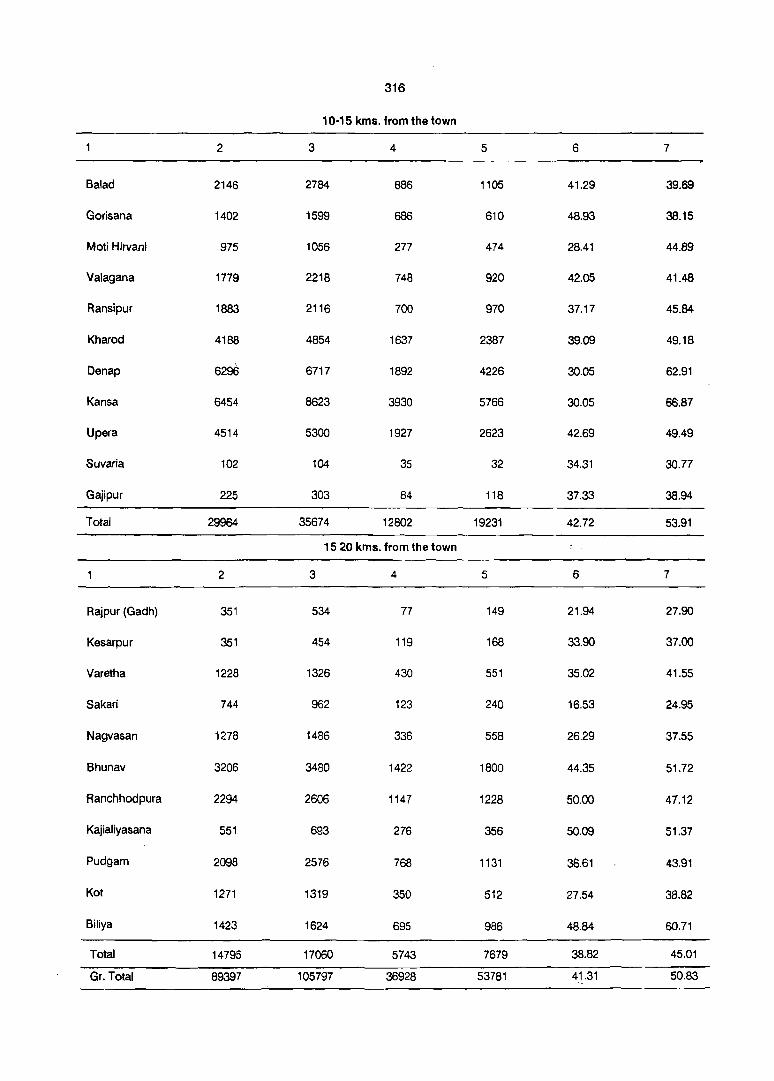
316
10·15 kms. from the town
2 3 4 5 6 7
Balad 2146 2784 886 1105 41.29 39.69
Gorisana 1402 1599 686 610 48.93 38.15
Moti Hirvani 975 1056 277 474 28.41 44.89
Valagana 1779 2218 748 920 42.05 41.48
Ransipur 1883 2116 700 970 37.17 45.84
Kharod 4188 4854 1637 2387 39.09 49.18
De nap 6296 6717 1892 4226 30.05 62.91
Kansa 6454 8623 3930 5766 30.05 66.87
Upera 4514 5300 1927 2623 42.69 49.49
Suvaria 102 104 35 32 34.31 30.77
Gajipur 225 303 84 118 37.33 38.94
Total 29964 35674 12802 19231 42.72 53.91
15 20 kms. from the town
2 3 4 5 6 7
Rajpur (Gad h) 351 534 77 149 21.94 27.90
Kesarpur 351 454 119 168 33.90 37.00
Varetha 1228 1326 430 551 35.02 41.55
Sakari 744 962 123 240 16.53 24.95
Nagvasan 1278 1486 336 558 26.29 37.55
Bhunav 3206 3480 1422 1800 44.35 51.72
Ranchhodpura 2294 2606 1147 1228 50.00 47.12
Kajialiyasana 551 693 276 356 50.09 51.37
Pudgam 2098 2576 768 1131 36.61 43.91
Kot 1271 1319 350 512 27.54 38.82
Biliya 1423 1624 695 986 48.84 60.71
Total 14795 17060 5743 7679 38.82 45.01
Gr. Total 89397 105797 36928 53781 41.31 50.83 -
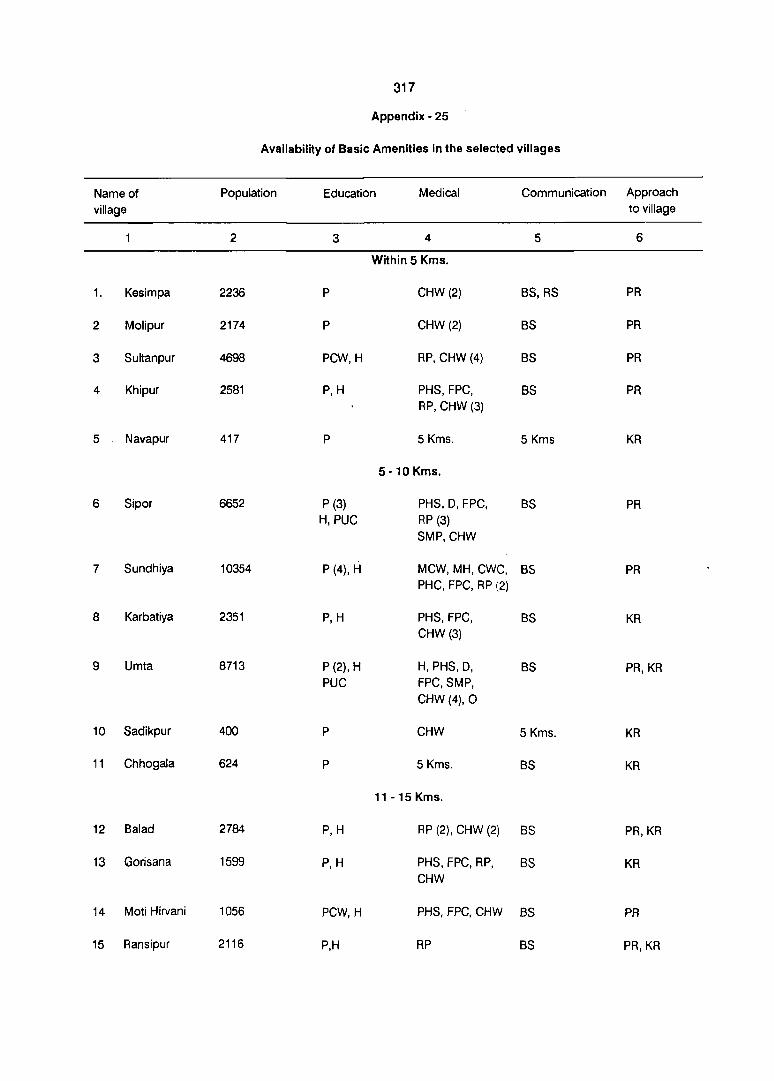
317
Appendix - 25
Availability of Basic Amenities in the selected villages
Name of Population Education Medical Communication Approach
village to village
2 3 4 5 6
Within 5 Kms.
1. Kesimpa 2236 P CHW (2) BS,RS PR
2 Molipur 2174 P CHW(2) BS PR
3 Sultanpur 4698 PCW,H RP, CHW (4) BS PR
4 Khipur 2581 P,H PHS, FPC, BS PR RP, CHW (3)
5 Navapur 417 P 5 Kms. 5Kms KR
5 -10 Kms.
6 Sipor 6652 P (3) PHS, D, FPC, BS PR H, PUC RP (3)
SMP, CHW
7 Sundhiya 10354 P (4), H MCW, MH, CWC, BS PR PHC, FPC, RP (2)
8 Karbatiya 2351 P,H PHS, FPC, BS KR CHW(3)
9 Umta 8713 P (2), H H, PHS, D, BS PR,KR PUC FPC, SMP,
CHW (4),0
10 Sadikpur 400 P CHW 5 Kms. KR
11 Chhogala 624 P 5 Kms. BS KR
11 -15 Kms.
12 Balad 2784 P,H RP (2), CHW (2) BS PR,KR
13 Gorisana 1599 P,H PHS, fPC, RP, BS KR CHW
14 Moti Hirvani 1056 PCW,H PHS, FPC, CHW BS PR
15 Ransipur 2116 P,H RP BS PR,KR

318
2 3 4 5 6
16 Denap 6717 P(2), H, CWC, PHS, D BS KR PUC FPC, RP (2),
SMP, CHW (4)
17 Kansa 8623 P(2), H PHS, FPC, BS PR,KR RP (2), CHW
18 Upera 5300 P (2), H PHS,FPC,RP BS PR CHW(4) CHW
19 Gajipur 303 P CHW 5 Kms. KR
16 - 20 Kms.
20 Kesarpur 454 P CHW BS KR
21 Varetha 1326 P PHS, FPC BS,RS PR
22 Sakari 962 P CHW BS PR
23 Bhunav 3480 P,H PHS, FPC BS KR RP, CHW
24 Pundgam 2596 P (2) CHW BS,RS KR
25 Kot 1317 P 5 Kms. BS PR,KR
Drinking Post & Power Staple food
Water Telegraph supply
Potable
2 7 8 9 10
Within 5 Kms.
1. Kesimpa 2236 T, W, TW PO, Phone EA Bajri,Jowar, Wheat
2 Molipur 2174 W,TK PO EAG, EO Bajri, Wheat
3 Sultanpur 4698 T,TW,W PO, Phone EA Bajri,Jowar, Wheat
4 Khipur 2561 !,W PO, Phone EA Bajr-i, Wheat
5 Navapur 417 T, TK 5 Kms. EAG Bajri,Jowar, Wheat
5 -10 Kms.
6 Sipor 6652 T, W, TK, TW PTO, Phone EA Bajri,Jowar,
Wheat
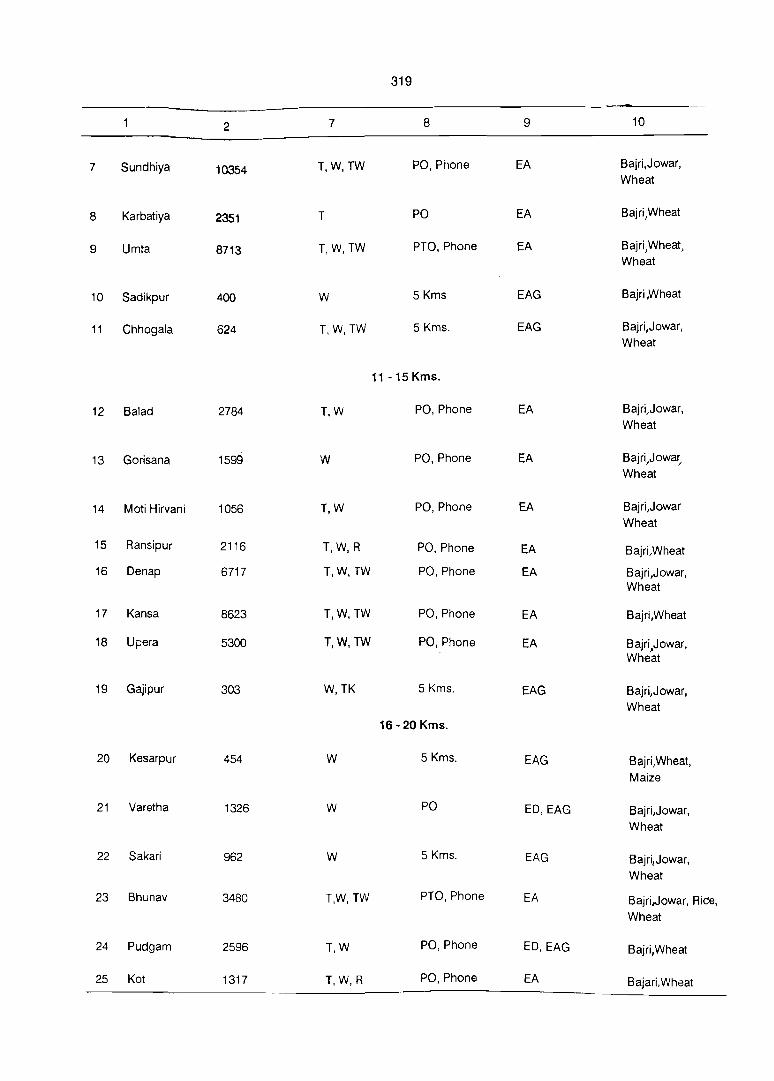
319
2 7 8 9 10
7 Sundhiya 10354 T, W, TW PO, Phone EA Bajri,Jowar, Wheat
8 Karbatiya 2351 T PO EA Bajri,Wheat
9 Umta 8713 T,W,TW PTO, Phone EA Bajri,Wheat, Wheat
10 Sadikpur 400 W 5 Kms EAG Bajri ,Wheat
11 Chhogala 624 T,W,TW 5 Kms. EAG Bajri/Jowar,
Wheat
11-15Kms.
12 Balad 2784 T,W PO, Phone EA Bajri,Jowar,
Wheat
13 Gorisana 1599 W PO, Phone EA Bajri,Jowa~
Wheat
14 Moti Hirvani 1056 T,W PO, Phone EA Bajri,Jowar
Wheat
15 Ransipur 2116 T,W,R PO, Phone EA Bajri/Wheat
16 Denap 6717 T,W, TW PO, Phone EA Bajri,Jowar, Wheat
17 Kansa 8623 T,W,TW PO, Phone EA Bajri,Wheat
18 Upera 5300 T,W,TW PO, Phone EA Bajri .• Jowar, Wheat
19 Gajipur 303 W,TK 5 Kms. EAG Bajri,Jowar,
Wheat
16·20 Kms.
20 Kesarpur 454 W 5 Kms. EAG Bajri,Wheat,
Maize
21 Varetha 1326 W PO ED, EAG Bajri,Jowar, Wheat
22 Sakari 962 W 5 Kms. EAG Bajri,Jowar,
Wheat
23 Bhunav 3480 T,W,TW PTO, Phone EA Bajri,Jowar, Rice,
Wheat
24 Pudgam 2596 T,W PO, Phone ED, EAG Bajri,Wheat
25 Kot 1317 T, W,R PO, Phone EA BajarL Wheat

320
Appendix - 26
The details of the land use pattern in 25 selected villages
Name of Total area Land use (under different types of land use in hectare) village in hectare
Irrigated Un-irrigated Cultivable Area not
area waste available
for cultivation
2 3 4 5 6
Within 5 Kms.
1. Kesimpa 526.11 114.00 281.00 44.00 87.11
(100.00) (21.67) (53.41 ) (8.36) (16.56)
2 Molipur 353.73 119.00 186.00 13.00 35.73 (100.00) (33.64) (52.58) (3.68) (10.10)
3 Sultanpur 883.11 214.00 573.11 96.00 (100.00) (24.23) (64.90) (10.87)
4 Khipur 1318.02 923.00 285.00 63.00 47.02 (100.00) (70.03) (21.62) (4.78) (3.57)
5 Navapur 94.40 35.00 42.00 4.00 13.40
(100.00) (37.08) (44.49) (4.24) (14.19)
Total 3175.37 1405.00 1367.11 124.00 279.26
(100.00) (44.25) (43.05) (3.91) (8.79)
5 -10 Kms.
6 Sipor 1713.46 473.00 1052.46 83.00 105.00 (27.60) (61.43) (4.84) (6.13)
7 Sundhiya 2624.73 1172.00 1165.00 131.73 156.00
(44.65) (44.39) (5.02) (5.94)
8 Karbatiya 1034.86 341.00 600.86 50.00 43.00
(32.95) (58.06) (4.83) (4.16)
9 Umta 3279.14 2257.00 512.00 167.00 343.14
(68.83) (15.62) (5.09) (10.46)
10 Sadikpur 145.81 65.00 51.00 13.00 16.81 (44.58) (34.98) (8.92) (11.52)
11 Chhogala 254.08 115.00 104.00 18.00 17.08
(45.26) (40.93) (7.08) (6.73)
Total 9052.08 4423.00 3485.32 462.73 681.03
(48.86) (38.50) (5.H) (7.53)

321
2 3 4 5 6
11 -15 Kms.
12 Balad 1219.44 210.00 842.00 106.44 61.00
(17.22) (69.05) (8.73) (5.00)
13 Gorisana 805.19 397.00 282.00 92.00 34.19
(49.31) (35.02) (11.43) (4.24)
14 Moti Hirvani 867.58 300.00 459.00 56.58 52.00
(34.58) (52.91) (6.52) (5.99)
15 Ransipur 1609.33 800.00 649.00 106.00 54.33
(49.71) (40.32) (6.59) (3.38)
16 Denap 633.15 445.00 92.00 37.15 59.00
(70.28) (14.53) (5.87) (9.32)
17 Kansa 1613.77 950.00 468.77 80.00 115.00
(58.87) (29.05) (4.96) (7.12)
18 Upera 2269.18 855.00 832.00 161.18 421.00
(37.68) (36.67) (7.10) (18.55)
19 Gajipur 242.58 70.0() 125.00 10.58 37.00 (28.86) (51.53) (4.36) (15.25)
Total 9260.22 4027.00 3749.77 649.93 833.52
(43.49) (40.49) (7.02) (9.00)
16 - 20 Kms.
20 Kesarpur 226.89 58.00 144.89 17.00 7.00 (25.56) (63.86) (7.49) (3.09)
21 Varetha 628.41 200.00 359.00 34.00 35.41
(31.83) (57.13) (5.41 ) (5.63)
22 Sakari 70.80 25.00 8.80 32.00 5.00 (35.31) (12.43) (45.20) (7.06)
23 Bhunav 630.24 306.00 242.00 32.24 50.00 (48.55) (38.40) (5.12) (7.93)
24 Pundgam 1385.85 750.00 447.00 79.85 109.00 (54.12) (32.25) (5.76) (7.87)
25 Kot 763.02 330.00 306.00 95.00 32.02
(43.25) (40.10) (12.45) (4.20)
Total 3705.21 1669.00 1507.69 290.09 238.43 (45.05) (40.69) (7.83) (6.43)
Gr. Total 25192.88 11524.00 10109.89 1526.75 2032.24
(45.74) (40.13) (6.06) (8.07)
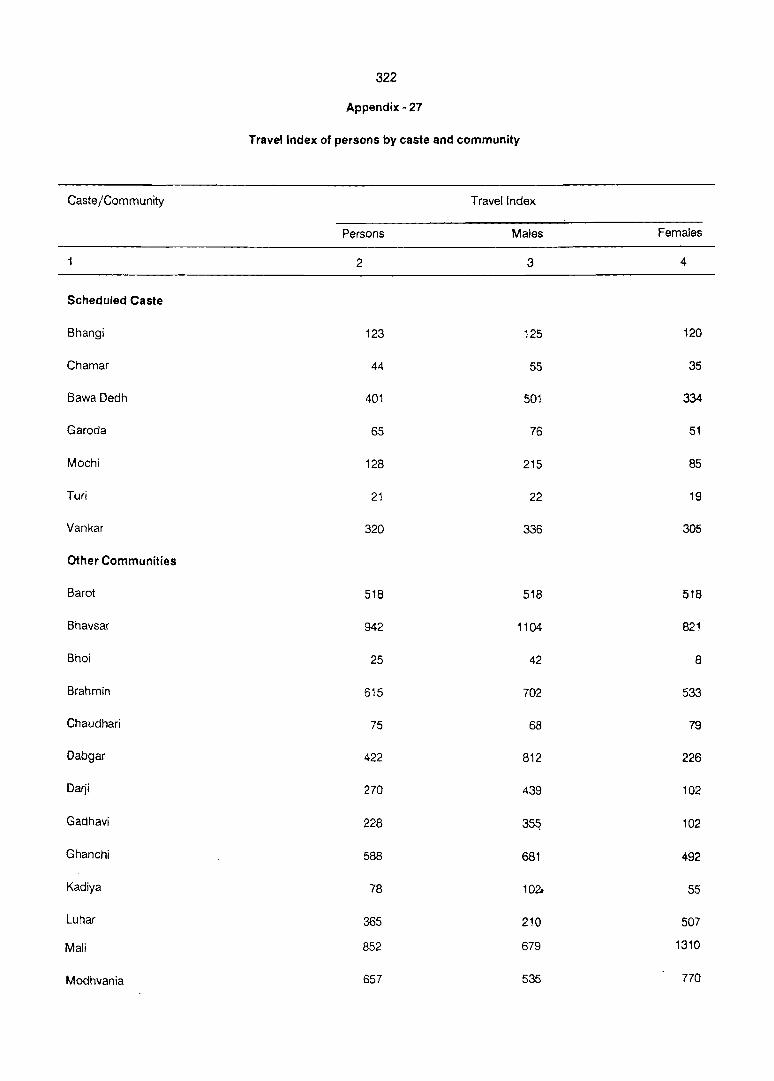
Caste jCommunity
Scheduled Caste
Bhangi
Chamar
Bawa Oedh
Garoda
Mochi
Turi
Vankar
Other Communities
Barot
Bhavsar
Bhoi
Brahmin
Chaudhari
Oabgar
Darji
Gadhavi
Ghanchi
Kadiya
Luhar
Mali
Modhvania
322
Appendix - 27
Travel Index of persons by caste and community
Travel Index
Persons Males
2 3
123 125
44 55
401 501
65 76
128 215
21 22
320 336
518 518
942 1104
25 42
615 702
75 68
422 812
270 439
228 35q
588 681
78 1020
365 210
852 679
657 535
Females
4
120
35
334
51
85
19
305
518
821
8
533
79
226
102
102
492
55
507
1310
770
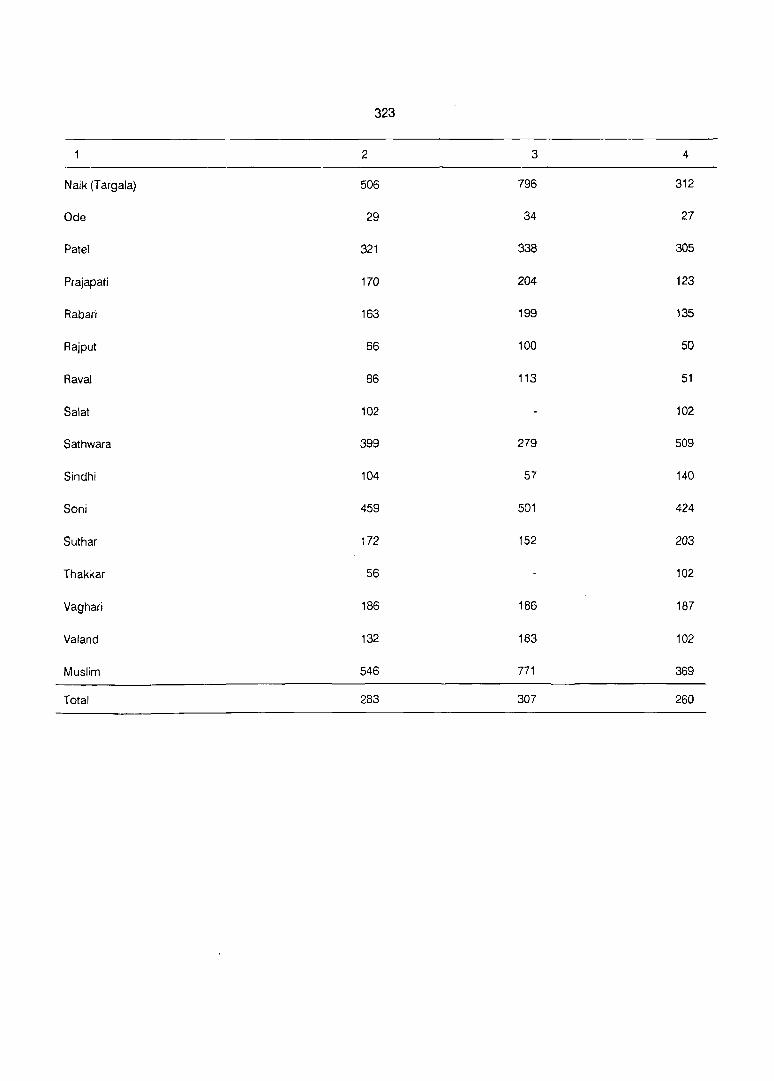
323
2 3 4
Naik (Targala) 506 796 312
Ode 29 34 27
Patel 321 338 305
Prajapati 170 204 123
Rabari 163 199 135
Rajput 66 100 50
Raval 86 113 51
Salat 102 102
Sathwara 399 279 509
Sindhi 104 57 140
Soni 459 501 424
Suthar 172 152 203
Thakkar 56 102
Vaghari 186 186 187
Valand 132 183 102
Muslim 546 771 369
Total 283 307 260

324
Appendix. 28
Persons by occupational category who travelled the distance of 500 Kms. and above
Occupation Description of Travel Index
Code OCCI 'pation . (500 Kms. & above)
Persons Males Females
2 3 4 5
1. 758 Hand Printing 5000 5000
2. 259 Working propritors Directors 1677 1903 1621
3. 300 Clerical Supervisors 1550 1393 1655
4. 720 Supervisors and Foreman 1261 1315 1207
5. 320 Stenographers 1100 1100 1100
6. 811 Carpenters 1150 1150
7. 330 Book·keepers I Accounts Clerks 1560 1506
8. 400 Merchants & Shopkeepers 769 756 783
9. 442 Agents and Brokers 676 583 713
10. 190 Merchants & Shopkeepers 614 659 513
11. 301 Other Supervisors (Inspectors etc.) 567 682 1656
12. 358 Office Attendents (Peons, Dafiaries) 692 692
13. 120 Accounts & Auditors 607 607
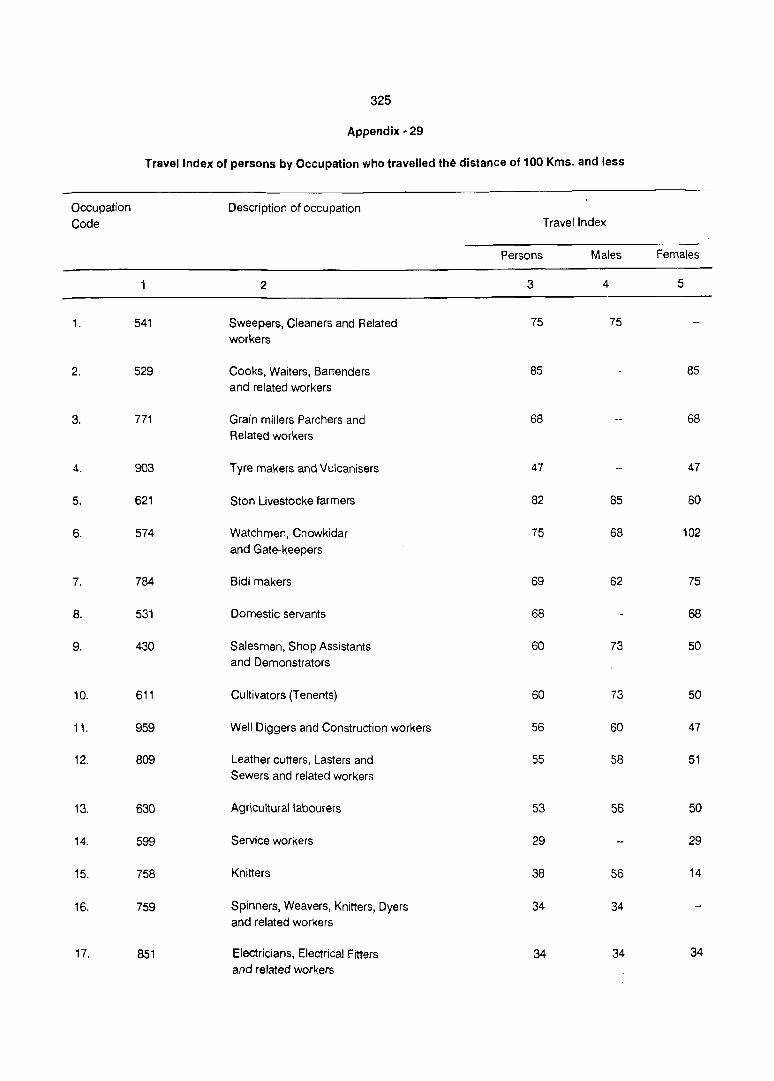
325
Appendix· 29
Travel Index of persons by Occupation who travelled the distance of 100 Kms. and less
Occupation Description of occupation Code Travel Index
Persons Males Females
2 3 4 5
1. 541 Sweepers, Cleaners and Related 75 75 workers
2. 529 Cooks, Waiters, Bartenders 85 85 and related workers
3. 771 Grain millers Parchers and 68 68 Related workers
4. 903 Tyre makers and Vulcanisers 47 47
5. 621 Ston Livestocke farmers 82 85 80
6. 574 Watchmen, Chowkidar 75 68 102 and Gate-keepers
7. 784 Bidi makers 69 62 75
8. 531 Domestic servants 68 68
9. 430 Salesmen, Shop Assistants 60 73 50 and Demonstrators
10. 611 Cultivators (Tenents) 60 73 50
11. 959 Well Diggers and Construction workers 56 60 47
12. 809 Leather cutters, Lasters and 55 58 51 Sewers and related workers
13. 630 Agricultural labourers 53 56 50
14. 599 Service workers 29 29
15. 758 Knitters 38 56 14
16. 759 Spinners, Weavers, Knitters, Dyers 34 34 and related workers
17. 851 ElectriCians, Electrical Fitters 34 34 34 and related workers

326
2 3 4 5
18. 831 Blacksmiths, Hammersmiths and 31 36 34 Forging Press operators
19. 500 Hotel and Restaurants keepers 27 29 23
20. 339 Book keepers, Cashiers 34 34 and related workers
21. 180 Composers, Musicians and Singers 18 21 14
22. 969 Stationery Engine and related 13 23 9 equipment operators
23. 380 Postmen 34 34
24. 778. Tea, Coffee and Cocoa preparors 6 6 6
25. 409 Merchants and Shop-keepers 2 4 whole sale and retailer
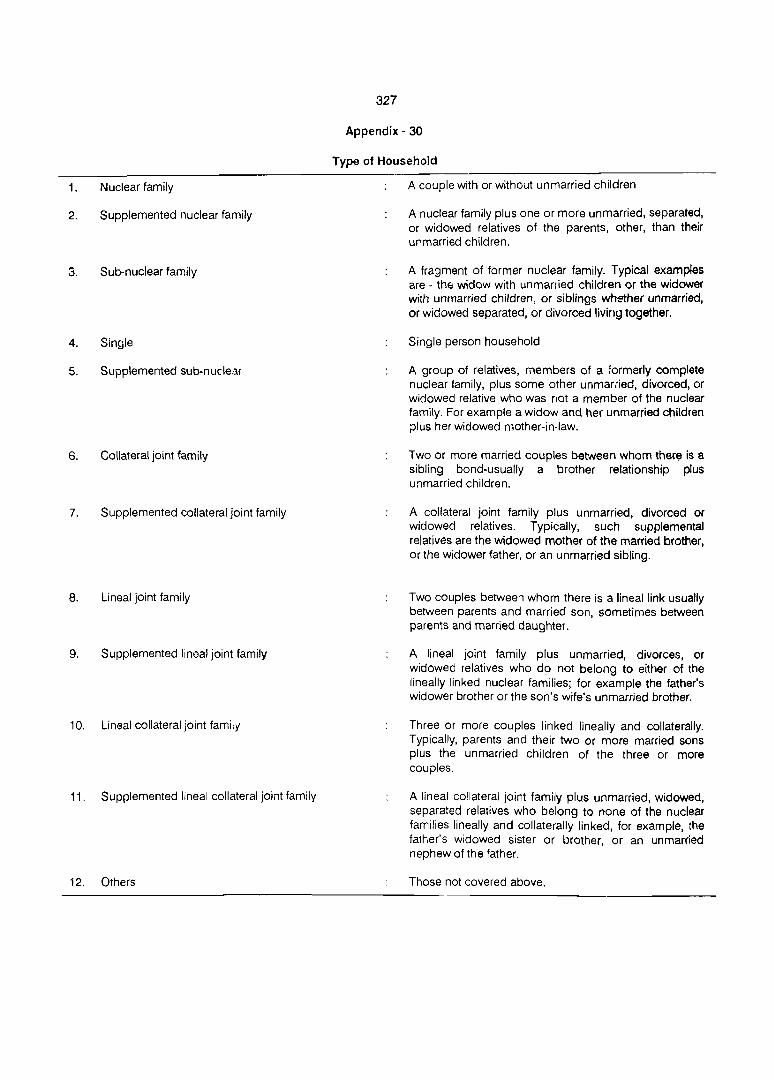
1. Nuclear family
2. Supplemented nuclear family
3. Sub-nuclear family
4. Single
5. Supplemented sub-nuclem
6. Collateral jOint family
7. Supplemented collateral joint family
8. Lineal joint family
9. Supplemented lineal joint family
10. Lineal collateral joint family
11. Supplemented lineal collateral joint family
12. Others
327
Appendix - 30
Type of Household
A couple with or without unmarried children
A nuclear family plus one or more unmarried, separated, or widowed relatives of the parents, other, than their unmarried children.
A fragment of former nuclear family. Typical examples are - the widow with unmarried children or the widower with unmarried children, or siblings whether unmarried, or widowed separated, or divorced living together.
Single person household
A group of relatives, members of a formerly complete nuclear family, plus some other unmariied, divorced, or widowed relative who was not a member of the nuclear family. For example a widow and her unmarried children jJlus her widowed mother-in-law.
Two or more married couples between whom there is a sibling bond-usually a brother relationship plus unmarried children.
A collateral joint family plus unmarried, divorced or widowed relatives. Typically, such supplemental relatives are the widowed mother of the married brother, or the widower father, or an unmarried sibling.
Two couples between whom there is a lineal link usually between parents and married son, sometimes between parents and married daughter.
A lineal joint family plus unmarried, divorces, or widowed relatives who do not belong to either of the lineally linked nuclear families; for example the father's widower brother or the son's wife's unmarried brother.
Three or more couples linked lineally and collaterally. Typically, parents and their two or more married sons plus the unmarried children of the three or more couples.
A lineal collateral joint family plus unmarried, widowed, separated relatives who belong to none of the nuclear families lineally and collaterally linked, for example, the father's widowed sister or brother, or an unmarried nephew of the father.
Those not covered above.
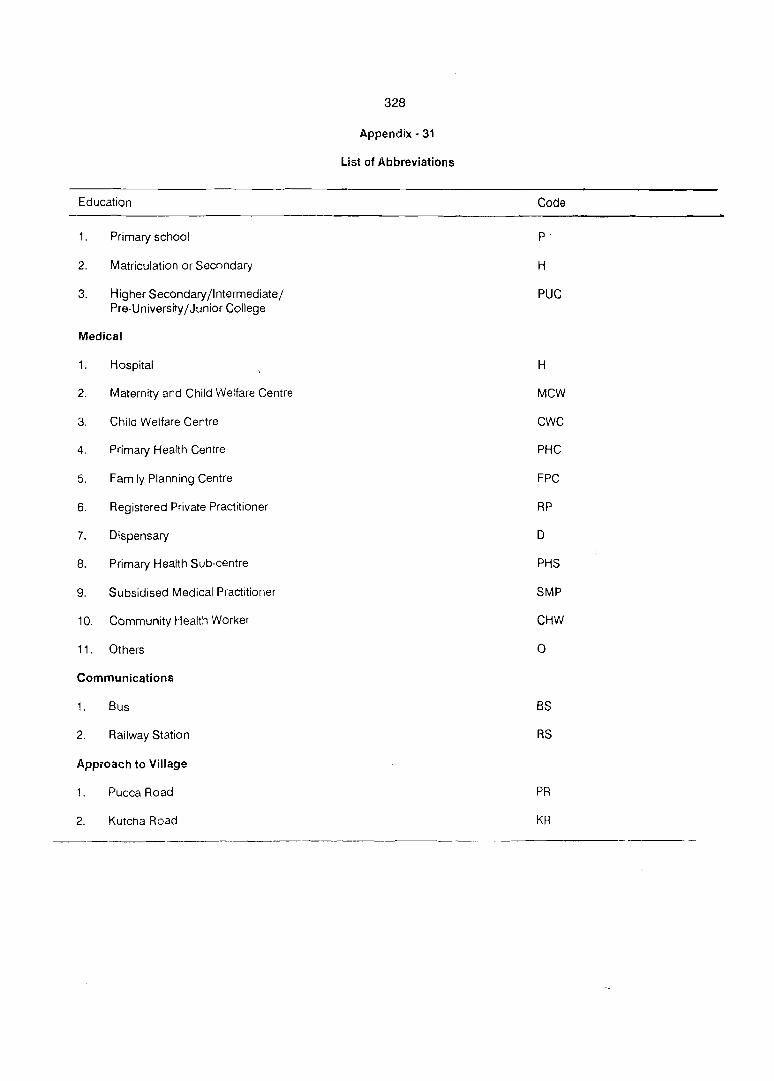
Education
1.
2.
3.
Primary school
Matriculation or Secondary
Higher Secondary/lntermediate/ Pre-University/Junior College
Medical
1. Hospital
2. Maternity and Child Welfare Centre
3. Child Weifare Centre
4. Primary Health Centre
5. Family Planning Centre
6. Registered Private Practitioner
7. Dispensary
8. Primary Health Sub-centre
9. Subsidised Medical Practitioner
10. Community Health Worker
11. Others
Communications
1. Bus
2. Railway Station
Approach to Village
1. Pucca Road
2. Kutcha Road
328
Appendix· 31
list of Abbreviations
Code
P
H
puc
H
MCW
CWC
PHC
FPC
RP
D
PHS
SMP
CHW
o
BS
RS
PR
KR
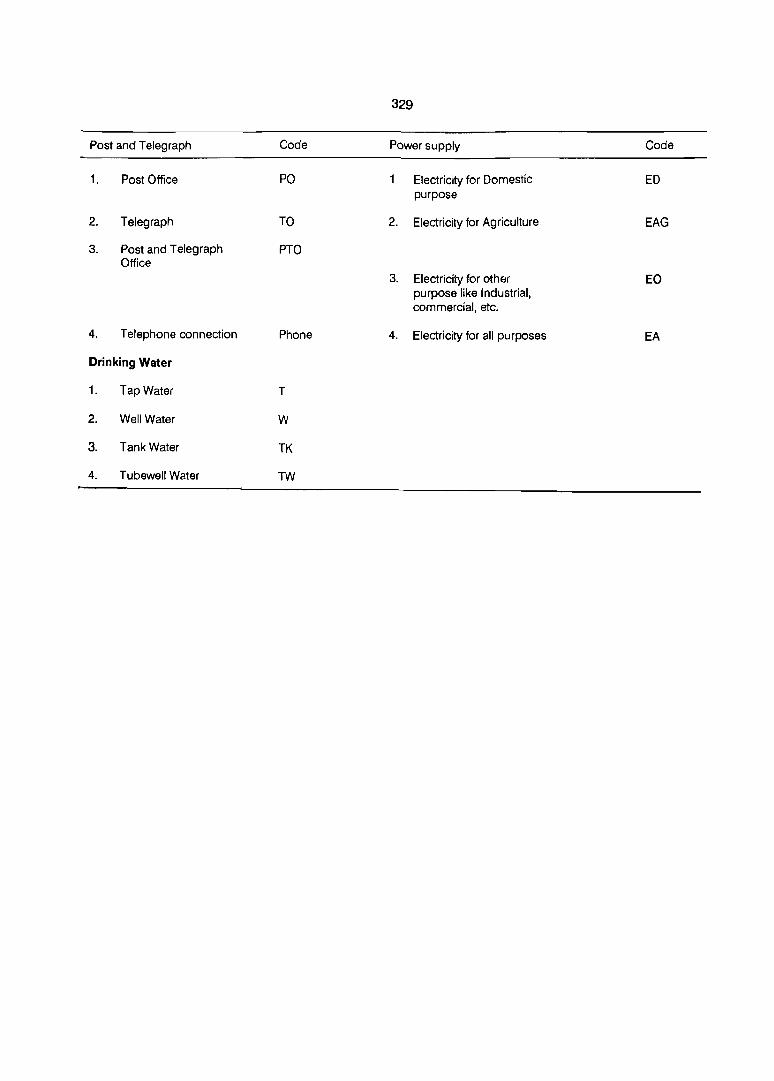
329
Post and Telegraph Code Power supply Code
1. Post Office PO Electricity for Domestic ED purpose
2. Telegraph TO 2. Electricity for Agriculture EAG
3. Post and Telegraph PTO Office
3. Electricity for other EO purpose like Industrial, commercial, etc.
4. Telephone connection Phone 4. Electricity for all purposes EA
Drinking Water
1. Tap Water T
2. Well Water W
3. Tank Water TK
4. Tubewell Water TW