2021 SAN FRANCISCO HOUSING INVENTORY
94
2021 SAN FRANCISCO HOUSING INVENTORY
-
Upload
khangminh22 -
Category
Documents
-
view
2 -
download
0
Transcript of 2021 SAN FRANCISCO HOUSING INVENTORY

2021SAN FRANCISCO HOUSING INVENTORY

Front Cover: 1950 Mission Street, 60 Affordable Housing Units;
Photo Source: https://www.dbarchitect.com/ Photo Credit: Bruce Damonte
© 2022 San Francisco Planning Department
49 South Van Ness Avenue, Suite 1400 San Francisco, CA 94103-3114 www.sfplanning.org

San Francisco Planning Department
April 2022
2021SAN FRANCISCO HOUSING INVENTORY


i
TABLE OF CONTENTS
Introduction iv
Highlights 4
Findings 16
Housing Stock 17
Housing Production Trends 18
New Housing Construction 18
Projects Approved and Under Review by Planning 20
Units Authorized for Construction 21
Demolitions 21
Alterations and Conversions 21
Accessory Dwelling Units 24
Additional Units Proposed Through Density Bonus Programs 25
New Housing Unit Trends 27
Types of Buildings 27
New Housing Units Added by Zoning District 27
Condominiums 29
New Condominium Construction 29
Condominium Conversions 30
Residential Hotels 31
Affordable Housing 32
Standards and Definitions of Affordability 32
New Affordable Housing Production 35
Inclusionary Housing 37
Affordability of Market Rate Housing 38
Affordable Housing Acquisition and Rehabilitation 39
Changes in Housing Stock by Planning District 40
Housing Stock by Planning District 42
Housing Construction in the Bay Area 45
Appendices 40
Appendix A: Project Lists 48
Appendix B: Community Plan Area Annual Monitoring 48
Appendix C: San Francisco Zoning Districts 48
Appendix D: In-Lieu Housing Fees Collected 48
Appendix E: Glossary 85

S A N F R A N C I S C O P L A N N I N G D E P A R T M E N Tii
Tables
Table 1. San Francisco Housing Stock by Building Type, 2010-2021 17
Table 2. San Francisco Housing Trends, 2002-2021 19
Table 3. Projects and Units Filed at Planning Department for Review, 2017-2021 20
Table 4. Units and Projects Authorized for Construction by DBI by Building Type, 2017-2021 20
Table 5. Units Demolished by Building Type, 2017-2021 22
Table 6. Units Demolished by Zoning District, 2021 22
Table 7. Units Added or Lost Through Alteration Permits, 2017-2021 23
Table 8. Units Lost Through Alterations and Demolitions, 2017-2021 23
Table 9. Accessory Dwelling Units Added, 2017-2021 24
Table 9A. Accessory Dwelling Units Legalized, 2017-2021 24
Table 10. ADUs Added and Legalized Through Ordinance by Building Type, 2017-2021 24
Table 11. Density Bonus Projects in the Pipeline by Total Units, 2021 26
Table 12. Density Bonus Projects in the Pipeline by Status of Application, 2021 26
Table 13. New Housing Units Added by Building Type, 2017-2021 26
Table 14. New Housing Units Added by Generalized Zoning, 2021 27
Table 15. New Housing Units Added by Zoning District, 2021 28
Table 16. New Condominiums Recorded by DPW, 2012-2021 29
Table 17. New Condominiums Recorded by DPW by Building Type, 2017-2021 29
Table 18. Condominium Conversions Recorded by DPW, 2012-2021 30
Table 19. Condominium Conversions Recorded by DPW by Building Type, 2017-2021 30
Table 20. Changes in Residential Hotel Stock, 2017-2021 31
Table 21. 2021 Rental Affordable Housing Guidelines 33
Table 22. 2021 Homeownership Affordable Housing Guidelines 34
Table 23. New Affordable Units by Income Level, 2017-2021 36
Table 24. [Blank: Depricated] 36
Table 25. New Affordable Housing Production by Source, 2017-2021 37
Table 26. Housing Price Trends, San Francisco Bay Area, 2017-2021 38
Table 27. Units Acquired or Rehabilitated, 2017-2021 39
Table 27A. Details of Units Acquired or Rehabilitated, 2021 39
Table 27B. Rental Assistance Demonstration Program, 2016-2021 39
Table 28. Housing Units Completed and Demolished by Planning District, 2021 41
Table 29. Net Change in Housing Stock by Planning District, 2010-2021 43
Table 30. New Units Authorized in San Francisco and the Bay Area Counties, 2021 46
Table A-1. Major Market Rate Housing Projects Completed, 2021 49
Table A-2. Major Affordable Housing Projects Completed, 2021 50
Table A-3. Major Housing Projects Reviewed and Entitled by Planning Department, 2021 51
Table A-4. Major Housing Projects with Applications Accepted at the Planning Department, 2021 59
Table A-5. Major Projects Authorized for Construction by DBI, 2021 64
Table A-6. Density Bonus Projects in the Pipeline by Program, 2021 65
Table A-7. Major Affordable Projects in the Pipeline as of December 31, 2021 70
Table A-8. Housing Trends by Neighborhood, 2021 74
Table B-1. Housing Trends by Planning Area, 2021 76
Table B-2. Units Entitled by Planning Area, 2021 77

iii
Table B-3. Net Housing Units Completed by Building Type and Planning Area, 2021 78
Table B-4. Units Demolished by Building Type and Planning Area, 2021 79
Table B-5. Units Lost Through Alterations and Demolitions by Planning Area, 2021 79
Table B-6. New Affordable Housing Constructed in Planning Areas, 2021 80
Table C. San Francisco Zoning Districts, as of 2021 81
Table D. In-Lieu Housing Fees Collected, Fiscal Years 2012-2021 83
FiguresFigure 1. Housing Production Process 2
Figure 2. Net Housing Units Added in 2021 by Building Type 17
Figure 3. Units Completed from New Construction & Units Demolished by Planning District, 2021 41
Figure 4. Housing Stock by Building Type by Planning District, 2021 42
Figure 5. Bay Area Housing Construction Trends, 2012-2021 46
Maps
Map 1. San Francisco Planning Districts 40

S A N F R A N C I S C O P L A N N I N G D E P A R T M E N Tiv
INTRODUCTION: ABOUT THE 2021 HOUSING INVENTORY

1
S a n F r a n c i s c o H o u s i n g I n v e n t o r y | 2020
This report was prepared from information received from a number of different sources including the Department of Building Inspection, the Department of Public Works, and Planning Department records. The Mayor’s Office of Hous-ing and the Office of Community Investment and Infrastructure (Successor Agency to the San Fran-cisco Redevelopment Agency) provided informa-tion on affordable housing projects. The California Homebuilding Foundation/Construction Industry Research Board provided building permit data for the Bay Area region. The California Association of Realtors provided housing rental and ownership costs. Project sponsors also contributed data. The City is undergoing systems and process improve-ments to improve overall data quality related to permit data collection and tracking across all permitting agencies. The data presented in this report is the best available data as of the date of publication.
Copies of this report can be downloaded from the Publications & Reports link at the Planning Department’s web site at http://www.sfplanning.org.
A limited number of copies are available for pur-chase from the Planning Department, 49 South Van Ness Avenue, Suite 1400, San Francisco, CA 94103. Copies may also be reviewed at the Government Information Center on the fifth floor of the San Francisco Main Library.
Department Staff Contact for this report is:
Reza AmindarbariActing Data and Analytics [email protected]
The Housing Inventory is the Planning Depart-ment’s annual survey of housing production trends in San Francisco. The report details changes in the City’s housing stock, including housing construction, demolition, and alterations, and has been published regularly since 1967. This report presents housing production activity completed or authorized during the year 2021.
By monitoring changes in San Francisco’s housing stock, the Housing Inventory provides a basis for evaluating the housing production goals and poli-cies of the Housing Element of the San Francisco General Plan. Housing policy implications that may arise from data in this report, however, are not discussed here.
The Housing Inventory reports housing production, which begins when a building permit application for a project is filed with the City. The application is first reviewed by the Planning Department for compliance with the Planning Code, zoning, and other applicable policies. If the Planning Depart-ment approves the project, the Department of Building Inspection (DBI) reviews the application for compliance with the Building Code. If DBI approves the application, it issues a permit autho-rizing construction. The next step is for the project sponsor to begin construction on the project. Once construction has been completed and passed all required inspections, DBI issues a Certificate of Final Completion (CFC) for the project.
The Housing Inventory also reports the annual net gain in housing units citywide by general Zoning Districts and by Planning Districts. Net gain is the number of newly constructed units with CFCs issued, adjusted for alterations – which can add or subtract units – and demolitions. Affordable housing, condominiums, and changes in the residential hotel stock are other areas of interest covered by the Housing Inventory. In addition, the report provides a regional perspective by examin-ing housing construction activity and home prices for the nine-county Bay Area region. Finally, major projects completed, authorized, under review, or in the pipeline are listed in Appendix A. The Hous-ing Inventory also summarizes housing production trends in the recently adopted planning areas in Appendix B. These plan areas have separate five-year monitoring reports that detail housing production trends.

S A N F R A N C I S C O P L A N N I N G D E P A R T M E N T2
Housing Production Process
The Housing Inventory describes net changes in the housing stock and details units that have been certified complete, units that were authorized for construction, and units that are under review by the Planning Department.
The housing production process begins with a project review by the Planning Department and ends with the issuance of a Certificate of Final Completion (CFC) by the Department of Building Inspection (DBI). Figure 1 outlines the main stages of the housing production process.
Units Reviewed by Planning Department and DBI
For most major projects, review by the Planning Department is the first step in the process. Propos-als are reviewed by the Planning Department for compliance with the Planning Code, the General Plan, environmental requirements, and other regu-lations and policies. Generally, only major projects require special Planning Department approvals, such as a conditional use permit or variance. The number and type of projects undergoing Planning Department review are indicators of current build-ing interest and production expectation within the next two to five years. Following Planning Depart-ment approval and entitlements, DBI reviews the project for compliance with the Building Code.
Units Authorized for Construction
If DBI approves the project following its own review, it issues building permits authorizing construction. Projects with approved building permits generally start construction within 90 days from the date the permit is issued. Start of
construction, however, may be delayed for up to a year. If the permit is not picked up or acted on within 90 days, the permit expires. The number of units authorized for construction is a key indicator of future housing construction.
Units Certified Complete
Projects are inspected by DBI at various stages throughout the construction process. However, inspectors only issue Certificates of Final Comple-tions (CFCs) for projects that are deemed 100% complete. Units certified complete are an indicator of changes to the City’s housing supply and include units gained or lost from new construction, alterations, and demolitions.
For the purposes of this report, however, units that have received Temporary Certificates of Occupancy (TCOs) from DBI are also considered and counted as completed units.
Housing UnitsUnder Planning/
DBI Review
Housing UnitsUNDER PLANNIng/
DBI REVIEW
Housing UnitsAuthorized for
Construction
Housing UnitsUnder
Construction
Housing UnitsCertifiedComplete
FIGURE 1.The Housing Production Process
Note: Most housing projects require Planning Department review. For some projects, including major multi-phased projects, State and/or other City agencies may serve as the lead entitling agency.

3Casa Adelante (2060 Folsom Street); 100% Affordable Units Photo Source: https://medasf.org/

Power BI Desktop
SUMMARY OF HIGHLIGHTS
124,051 (30%)
81,238 (20%)37,511 (9%)
38,403 (9%)
125,817 (31%)Single Family
2 to 4 Units5 to 9 Units
10 to 19 Units
20 + Units
The construction of new housing in 2021 totaled 4,649 gross units compared to 4,402 units in 2020, which represents a 6 % increase from 2020. This production includes 4,081 units in new construction compared to 3,957 units in 2020, and 568 new units added through conversion of non-residential uses or expansion of existing structures compared to 444 in 2020. Sixteen ( 16 ) units were lost compared to 358 units lost in 2020, including demolitions (12; a 97% decrease from 352 demolitions in 2020), and unit mergers (3; a 40% decrease from 5 mergers in 2020). The city experienced a 28% increase in units added through alterations ( 568 in 2021 compared to 444 in 2020) and a 33% decrease in units lost through alterations since 2020 (4 in 2021 compared with 6 in 2020).
There was a net addition of 4,633 units to the City’s housing stock in 2021 compared to 4,043 units in 2020, which is a 15% increase from the 2020 net addition. The net addition in 2021 is also about 33% higher than the 10-year average net addition of 3,478, and is approximately 16% above the 5-year average net addition of 4,000 units. By the end of 2021, there were approximately 407,020 dwelling units in the city, compared to approximately 402,387 units in 2020, representing a 1% increase in total housing stock.
In 2021, affordable housing production totaled 1,495 units compared to 818 units in 2020, which is an 83% increase in completed affordable housing units. This is also about 25% above the five-year average of 1,196 affordable units. These new affordable units made up 32% of new units added to the City’s housing stock. This count includes approximately 355 inclusionary units, 855 100% affordable units, and 285 accessory dwelling units in 2021, compared to 480 inclusionary units, 208 100% affordable units, and 177 accessory dwelling units in 2020. About 74% of the new affordable units are affordable to low-income households.
In 2021, DBI authorized the construction of 2,093 net units compared to 3,165 units authorized in 2020, representing a 34% decrease from 2020. Eighty-four percent (84%) of new housing units authorized for construction over the last 5 years has been for buildings with 20 or more units. The Planning Department approved and fully entitled 54 projects in 2021. These projects propose a total of 2,010 new units.
HOUSING STOCKHOUSING STOCK BY BUILDING TYPE
407,020 AS OF 2021
1.2%CHANGE FROM 2020 {402,387}
S A N F R A N C I S C O P L A N N I N G D E P A R T M E N T4
HIGHLIGHTS: 2021 SNAPSHOT

Power BI Desktop
SUMMARY OF HIGHLIGHTS
124,051 (30%)
81,238 (20%)37,511 (9%)
38,403 (9%)
125,817 (31%)Single Family
2 to 4 Units5 to 9 Units
10 to 19 Units
20 + Units
The construction of new housing in 2021 totaled 4,649 gross units compared to 4,402 units in 2020, which represents a 6 % increase from 2020. This production includes 4,081 units in new construction compared to 3,957 units in 2020, and 568 new units added through conversion of non-residential uses or expansion of existing structures compared to 444 in 2020. Sixteen ( 16 ) units were lost compared to 358 units lost in 2020, including demolitions (12; a 97% decrease from 352 demolitions in 2020), and unit mergers (3; a 40% decrease from 5 mergers in 2020). The city experienced a 28% increase in units added through alterations ( 568 in 2021 compared to 444 in 2020) and a 33% decrease in units lost through alterations since 2020 (4 in 2021 compared with 6 in 2020).
There was a net addition of 4,633 units to the City’s housing stock in 2021 compared to 4,043 units in 2020, which is a 15% increase from the 2020 net addition. The net addition in 2021 is also about 33% higher than the 10-year average net addition of 3,478, and is approximately 16% above the 5-year average net addition of 4,000 units. By the end of 2021, there were approximately 407,020 dwelling units in the city, compared to approximately 402,387 units in 2020, representing a 1% increase in total housing stock.
In 2021, affordable housing production totaled 1,495 units compared to 818 units in 2020, which is an 83% increase in completed affordable housing units. This is also about 25% above the five-year average of 1,196 affordable units. These new affordable units made up 32% of new units added to the City’s housing stock. This count includes approximately 355 inclusionary units, 855 100% affordable units, and 285 accessory dwelling units in 2021, compared to 480 inclusionary units, 208 100% affordable units, and 177 accessory dwelling units in 2020. About 74% of the new affordable units are affordable to low-income households.
In 2021, DBI authorized the construction of 2,093 net units compared to 3,165 units authorized in 2020, representing a 34% decrease from 2020. Eighty-four percent (84%) of new housing units authorized for construction over the last 5 years has been for buildings with 20 or more units. The Planning Department approved and fully entitled 54 projects in 2021. These projects propose a total of 2,010 new units.
HOUSING STOCKHOUSING STOCK BY BUILDING TYPE
407,020 AS OF 2021
1.2%CHANGE FROM 2020 {402,387}
S a n F r a n c i s c o H o u s i n g I n v e n t o r y | 2021
5

Power BI Desktop
NEW CONSTRUCTION TRENDS
4,081 2021
NEW CONSTRUCTION, 2002-2021
4,633 2021
3 % MORE THAN 2020 {∆ 124 }
0
2,000
4,000
6,000
NU
MBE
R O
F U
NIT
S
2005 2010 2015 2020
4,081
4,895
348
3,366
2,309
3,454
2,435
4,402
1,675
2,730
1,619 1,780
3,019
2,3302,260
1,082
3,954
2,197
794
4,633
2,572
1,487
2,913
4,636
2,496 2,567
1,9601,914
1,317
Units Completed from New Construction Net Units Added to City Housing Stock
15 % MORE THAN 2020 {∆ 590 }
33.2 % ABOVE 10 YR AVG { 3,478 }
25.1 % ABOVE 10 YR AVG { 3,261 }
Note: Net unit change and new construction figures for 2015 to 2020 have been updated since the previous Housing Inventory Report (2020) due to data cleanup.
Power BI Desktop
UNIT DEMOLITION TRENDS
12 2021
UNITS DEMOLISHED, 2002-2021
97 % LESS THAN 2020 {∆ -340 }
0
2,000
4,000
6,000
NU
MBE
R O
F U
NIT
S
2005 2010 2015 2020
12429 352355
84 25 184173 17081 3029 139286 174 127 9529 53
4,633
5,077
3,454
2,572
3,514
1,487
2,913
4,636
2,496
4,043
1,779
2,567
1,9601,914
1,230
4,118
1,317
UnitsDemolished Net Units Added To City Housing Stock
90.6 % BELOW 10 YR AVG { 128 }
Note: Net unit change figures for 2015 to 2020 have been updated since the previous Housing Inventory Report (2020) due to data cleanup.
S A N F R A N C I S C O P L A N N I N G D E P A R T M E N T6

Power BI Desktop
NEW CONSTRUCTION TRENDS
4,081 2021
NEW CONSTRUCTION, 2002-2021
4,633 2021
3 % MORE THAN 2020 {∆ 124 }
0
2,000
4,000
6,000
NU
MBE
R O
F U
NIT
S
2005 2010 2015 2020
4,081
4,895
348
3,366
2,309
3,454
2,435
4,402
1,675
2,730
1,619 1,780
3,019
2,3302,260
1,082
3,954
2,197
794
4,633
2,572
1,487
2,913
4,636
2,496 2,567
1,9601,914
1,317
Units Completed from New Construction Net Units Added to City Housing Stock
15 % MORE THAN 2020 {∆ 590 }
33.2 % ABOVE 10 YR AVG { 3,478 }
25.1 % ABOVE 10 YR AVG { 3,261 }
Note: Net unit change and new construction figures for 2015 to 2020 have been updated since the previous Housing Inventory Report (2020) due to data cleanup.
Power BI Desktop
UNIT DEMOLITION TRENDS
12 2021
UNITS DEMOLISHED, 2002-2021
97 % LESS THAN 2020 {∆ -340 }
0
2,000
4,000
6,000
NU
MBE
R O
F U
NIT
S
2005 2010 2015 2020
12429 352355
84 25 184173 17081 3029 139286 174 127 9529 53
4,633
5,077
3,454
2,572
3,514
1,487
2,913
4,636
2,496
4,043
1,779
2,567
1,9601,914
1,230
4,118
1,317
UnitsDemolished Net Units Added To City Housing Stock
90.6 % BELOW 10 YR AVG { 128 }
Note: Net unit change figures for 2015 to 2020 have been updated since the previous Housing Inventory Report (2020) due to data cleanup.
S a n F r a n c i s c o H o u s i n g I n v e n t o r y | 2021
7

Power BI Desktop
UNIT CHANGING AUTHORIZATION TRENDS
2,093 2021
NET UNITS AUTHORIZED FOR CONSTRUCTION, DEMOLITION, AND UNIT ADDING/REMOVING ALTERATIONS, 2015-2021
34 % LESS THAN 2020 {∆ -1,072 }
0
2,000
4,000
6,000
NU
MBE
R O
F U
NIT
S
2015 2016 2017 2018 2019 2020 2021
2,093
4,629
2,642
4,083
4,5494,587
3,165
4,633
5,077
2,5722,913
4,0434,118
Net Units Authorized Net Units Added to City Housing Stock
42.9 % BELOW 10 YR AVG { 3,664 }
Note: Figures for units authorized between 2015 and 2020 have been updated since the previous Housing Inventory Report (2020) due to improvement in methodology. See the glossary for Authorized definition. Net unit change figures for 2015 to 2020 have also been updated since the previous Housing Inventory Report (2020) due to data cleanup
Power BI Desktop
UNITS FILED AND ENTITLED TRENDS
2,010 2021
UNITS FILED AND ENTITLED, 2015-2021
7,817 2021
30 % LESS THAN 2020 {∆ -869 }
0
5,000
10,000
15,000
20,000
NU
MB
ER O
F U
NIT
S
2015 2016 2017 2018 2019 2020 2021
2,010
6,345
2,115
2,8793,474
2,2053,894
7,8179,702
2,621
4,560
5,421
3,462
5,034
Net Units Entitled Net Units Filed
198 % MORE THAN 2020 {∆ 5,196 }
36.3 % BELOW 10 YR AVG { 3,154 }
62.8 % ABOVE 10 YR AVG { 4,803 }
Note: Figures for units entitled between 2015 and 2020 have been updated since the previous Housing Inventory Report (2020) to address inconsistencies in the methodology. The figures include SB35 projects as well. Figures for units filed between 2015 and 2020 have also been updated since the previous Housing Inventory Report (2020) due to methodology improvements.
S A N F R A N C I S C O P L A N N I N G D E P A R T M E N T8

Power BI Desktop
UNIT CHANGING AUTHORIZATION TRENDS
2,093 2021
NET UNITS AUTHORIZED FOR CONSTRUCTION, DEMOLITION, AND UNIT ADDING/REMOVING ALTERATIONS, 2015-2021
34 % LESS THAN 2020 {∆ -1,072 }
0
2,000
4,000
6,000
NU
MBE
R O
F U
NIT
S
2015 2016 2017 2018 2019 2020 2021
2,093
4,629
2,642
4,083
4,5494,587
3,165
4,633
5,077
2,5722,913
4,0434,118
Net Units Authorized Net Units Added to City Housing Stock
42.9 % BELOW 10 YR AVG { 3,664 }
Note: Figures for units authorized between 2015 and 2020 have been updated since the previous Housing Inventory Report (2020) due to improvement in methodology. See the glossary for Authorized definition. Net unit change figures for 2015 to 2020 have also been updated since the previous Housing Inventory Report (2020) due to data cleanup
Power BI Desktop
UNITS FILED AND ENTITLED TRENDS
2,010 2021
UNITS FILED AND ENTITLED, 2015-2021
7,817 2021
30 % LESS THAN 2020 {∆ -869 }
0
5,000
10,000
15,000
20,000
NU
MB
ER O
F U
NIT
S
2015 2016 2017 2018 2019 2020 2021
2,010
6,345
2,115
2,8793,474
2,2053,894
7,8179,702
2,621
4,560
5,421
3,462
5,034
Net Units Entitled Net Units Filed
198 % MORE THAN 2020 {∆ 5,196 }
36.3 % BELOW 10 YR AVG { 3,154 }
62.8 % ABOVE 10 YR AVG { 4,803 }
Note: Figures for units entitled between 2015 and 2020 have been updated since the previous Housing Inventory Report (2020) to address inconsistencies in the methodology. The figures include SB35 projects as well. Figures for units filed between 2015 and 2020 have also been updated since the previous Housing Inventory Report (2020) due to methodology improvements.
S a n F r a n c i s c o H o u s i n g I n v e n t o r y | 2021
9

Power BI Desktop
2021 HOUSING UNIT TRENDSUNITS ADDED BY BUILDING TYPE, 2021
UNITS LOST THROUGH ALTERATIONS AND DEMOLITIONS BY TYPE OF LOSS, 2021
UNITS DEMOLITIONS BY BUILDING TYPE, 2021
0
1,000
2,000
3,000
4,000
Single Family 2 to 4 Units 5 to 9 Units 10 to 19Units
20 + Units
27 221 113 105
4,183
0
5
10
Single Family 2 to 4 Units 5 to 9 Units 10 to 19 Units 20 + Units
6 6
0 0 0
0
5
10
UnitsDemolished
TotalAlterations
Illegal UnitsRemoved
UnitsMerged
Into LargerUnits
CorrectionTo OfficialRecords
UnitsConverted
12
4
0
3
01
4,649TOTAL NEWUNITS ADDED,2021
16TOTAL UNITSLOST, 2021
12TOTAL UNITS DEMOLISHED,2021
6%CHANGE FROM 2020 {4,402}
96%CHANGE FROM 2020 {358}
97%CHANGE FROM 2020 {352}
Power BI Desktop
CONDOMINIUMS IN 2021NEW CONDOMINIUMS RECORDED BY BUILDING TYPE, 2021
CONDOMINIUM CONVERSIONS BY BUILDING TYPE, 2021
0
500
1,000
1,500
2,000
2 Units 3 to 4 Units 5 to 9 Units 10 to 19Units
20+ Units
6 19 36 34
2,130
0
10
20
30
40
50
2 Units 3 Units 4 Units 5 to 6 Units
34
0
12
0
2,225TOTAL NEWCONDOMINIUMSRECORDED BYBUILDING TYPE,2021
68%CHANGE FROM 2020 {6,987}
46TOTALCONDOMINIUMCONVERSIONS BY BUILDING TYPE, 2021
77%CHANGE FROM 2020 {201}
S A N F R A N C I S C O P L A N N I N G D E P A R T M E N T10

Power BI Desktop
2021 HOUSING UNIT TRENDSUNITS ADDED BY BUILDING TYPE, 2021
UNITS LOST THROUGH ALTERATIONS AND DEMOLITIONS BY TYPE OF LOSS, 2021
UNITS DEMOLITIONS BY BUILDING TYPE, 2021
0
1,000
2,000
3,000
4,000
Single Family 2 to 4 Units 5 to 9 Units 10 to 19Units
20 + Units
27 221 113 105
4,183
0
5
10
Single Family 2 to 4 Units 5 to 9 Units 10 to 19 Units 20 + Units
6 6
0 0 0
0
5
10
UnitsDemolished
TotalAlterations
Illegal UnitsRemoved
UnitsMerged
Into LargerUnits
CorrectionTo OfficialRecords
UnitsConverted
12
4
0
3
01
4,649TOTAL NEWUNITS ADDED,2021
16TOTAL UNITSLOST, 2021
12TOTAL UNITS DEMOLISHED,2021
6%CHANGE FROM 2020 {4,402}
96%CHANGE FROM 2020 {358}
97%CHANGE FROM 2020 {352}
Power BI Desktop
CONDOMINIUMS IN 2021NEW CONDOMINIUMS RECORDED BY BUILDING TYPE, 2021
CONDOMINIUM CONVERSIONS BY BUILDING TYPE, 2021
0
500
1,000
1,500
2,000
2 Units 3 to 4 Units 5 to 9 Units 10 to 19Units
20+ Units
6 19 36 34
2,130
0
10
20
30
40
50
2 Units 3 Units 4 Units 5 to 6 Units
34
0
12
0
2,225TOTAL NEWCONDOMINIUMSRECORDED BYBUILDING TYPE,2021
68%CHANGE FROM 2020 {6,987}
46TOTALCONDOMINIUMCONVERSIONS BY BUILDING TYPE, 2021
77%CHANGE FROM 2020 {201}
S a n F r a n c i s c o H o u s i n g I n v e n t o r y | 2021
11

Power BI Desktop
AFFORDABLE HOUSING IN 2021NEW AFFORDABLE AND MARKET RATE UNITS, 2021
NEW AFFORDABLE HOUSING BY INCOME LEVEL, 2021
0
1,000
2,000
3,000
Affordable Units Market Rate
1,495
3,154
0
200
400
600
ExtremelyLow [<30%]
Very Low[30-50%]
Lower[51-60%]
Low[61-80%]
Moderate[81-120%]
13
567
0
528
387
1,495TOTAL NEWAFFORDABLE UNITS, 2021
109%CHANGE FROM 2020 {715}
3,154TOTAL MARKET RATE,2021
14%CHANGE FROM 2020 {3,686}
Power BI Desktop
HOUSING TRENDS BY GEOGRAPHYNew Units Authorized in San Francisco and the Bay Area Counties, 2021
County Single-Family Units Multi-Family Units Total Units
Percent of Bay Area Total
AlamedaSanta ClaraContra CostaSonomaSan FranciscoSan MateoSolanoNapaMarin
1,5891,7662,2281,255
43682900322233
4,4943,1791,6951,2672,178
6413478621
6,0834,9453,9232,5222,2211,3231,247
408254
27%22%17%11%10%6%5%2%1%
Total 9,018 13,908 22,926 100%
27%
22% 6%
17%
5%
2% 11%
1%
10%
Source: Construction Industry Research Board (CIRB)
S A N F R A N C I S C O P L A N N I N G D E P A R T M E N T12

Power BI Desktop
AFFORDABLE HOUSING IN 2021NEW AFFORDABLE AND MARKET RATE UNITS, 2021
NEW AFFORDABLE HOUSING BY INCOME LEVEL, 2021
0
1,000
2,000
3,000
Affordable Units Market Rate
1,495
3,154
0
200
400
600
ExtremelyLow [<30%]
Very Low[30-50%]
Lower[51-60%]
Low[61-80%]
Moderate[81-120%]
13
567
0
528
387
1,495TOTAL NEWAFFORDABLE UNITS, 2021
109%CHANGE FROM 2020 {715}
3,154TOTAL MARKET RATE,2021
14%CHANGE FROM 2020 {3,686}
Power BI Desktop
HOUSING TRENDS BY GEOGRAPHYNew Units Authorized in San Francisco and the Bay Area Counties, 2021
County Single-Family Units Multi-Family Units Total Units
Percent of Bay Area Total
AlamedaSanta ClaraContra CostaSonomaSan FranciscoSan MateoSolanoNapaMarin
1,5891,7662,2281,255
43682900322233
4,4943,1791,6951,2672,178
6413478621
6,0834,9453,9232,5222,2211,3231,247
408254
27%22%17%11%10%6%5%2%1%
Total 9,018 13,908 22,926 100%
27%
22% 6%
17%
5%
2% 11%
1%
10%
Source: Construction Industry Research Board (CIRB)
S a n F r a n c i s c o H o u s i n g I n v e n t o r y | 2021
13

Power BI Desktop
2,221 2021
NEW UNITS AUTHORIZED IN THE BAY AREA REGION, 2017-2021
20,705 2021
19%LESS THAN 2020 {∆ -546}
0
10,000
20,000
30,000
NU
MBE
R O
F U
NIT
S
2017 2018 2019 2020 2021
20,705
26,595
14,929
24,623
19,792
2,221
4,9183,195
4,717 4,906
Units Authorized In Rest Of Bay Area Units Authorized In San Francisco
39%MORE THAN 2020 {∆ 5,776}
38%ABOVE 10 YR AVG {3,802}
14%BELOW 10 YR AVG {2,342}
HOUSING TRENDS BY GEOGRAPHY
16% 16% 20% 18% 10%
% SF Units Percentage of Total Bay Area
Power BI Desktop
70%
11%
9%
10%
Above Moderate (> 120% AMI)
Moderate Income (80–120% AMI)
Low Income (50-80% AMI)
Very Low Income (< 50% AMI)
REGIONAL HOUSING NEED ALLOCATION, PLANNING PERIOD 2015-2022
Household Affordability Housing Goals AuthorizedUnits
Deficit % Progress* Completed Units
Above Moderate (> 120% AMI)
Moderate Income (80–120% AMI)
Low Income (50-80% AMI)
Very Low Income (< 50% AMI)
TOTALS
12,536
5,460
4,639
6,234
28,869
18,826
2,847
2,500
2,688
26,861
0
2,613
2,139
3,546
8,298
150%
52%
54%
43%
71%
22,220
1,817
2,317
2,657
29,011
UNITS AUTHORIZED, 2015 - 2021
*In accordance with HCD instructions, progress is measured based on authorized unit additions (i.e., authorized demolitions and alterations that result in unit loss are excluded). In calculating the total progress, above moderate units in the excess of the RHNA target are not counted.
The State Department of Housing and Community Development, along with the Association of Bay Area Governments set the regional housing needs allocation or RHNA targets for housing production in every county in the Bay Area. Over 28,000 new housing units have been allocated to San Francisco for the years 2015-2022. The number of units authorized as of 2021 are shown in the pie chart.
S A N F R A N C I S C O P L A N N I N G D E P A R T M E N T14

Power BI Desktop
2,221 2021
NEW UNITS AUTHORIZED IN THE BAY AREA REGION, 2017-2021
20,705 2021
19%LESS THAN 2020 {∆ -546}
0
10,000
20,000
30,000
NU
MBE
R O
F U
NIT
S
2017 2018 2019 2020 2021
20,705
26,595
14,929
24,623
19,792
2,221
4,9183,195
4,717 4,906
Units Authorized In Rest Of Bay Area Units Authorized In San Francisco
39%MORE THAN 2020 {∆ 5,776}
38%ABOVE 10 YR AVG {3,802}
14%BELOW 10 YR AVG {2,342}
HOUSING TRENDS BY GEOGRAPHY
16% 16% 20% 18% 10%
% SF Units Percentage of Total Bay Area
Power BI Desktop
70%
11%
9%
10%
Above Moderate (> 120% AMI)
Moderate Income (80–120% AMI)
Low Income (50-80% AMI)
Very Low Income (< 50% AMI)
REGIONAL HOUSING NEED ALLOCATION, PLANNING PERIOD 2015-2022
Household Affordability Housing Goals AuthorizedUnits
Deficit % Progress* Completed Units
Above Moderate (> 120% AMI)
Moderate Income (80–120% AMI)
Low Income (50-80% AMI)
Very Low Income (< 50% AMI)
TOTALS
12,536
5,460
4,639
6,234
28,869
18,826
2,847
2,500
2,688
26,861
0
2,613
2,139
3,546
8,298
150%
52%
54%
43%
71%
22,220
1,817
2,317
2,657
29,011
UNITS AUTHORIZED, 2015 - 2021
*In accordance with HCD instructions, progress is measured based on authorized unit additions (i.e., authorized demolitions and alterations that result in unit loss are excluded). In calculating the total progress, above moderate units in the excess of the RHNA target are not counted.
The State Department of Housing and Community Development, along with the Association of Bay Area Governments set the regional housing needs allocation or RHNA targets for housing production in every county in the Bay Area. Over 28,000 new housing units have been allocated to San Francisco for the years 2015-2022. The number of units authorized as of 2021 are shown in the pie chart.
S a n F r a n c i s c o H o u s i n g I n v e n t o r y | 2021
15
S A N F R A N C I S C O P L A N N I N G D E P A R T M E N T16
FINDINGS:HOUSING IN SAN FRANCISCO

Power BI Desktop
The number of units in San Francisco’s housing stock is derived by taking the total units from the 2010 Five Year American Community Survey (2010 ACS5) count as baseline, then adding net unit change (the sum of units completed from new construction and alterations minus units lost from demolition and alterations) each subsequent year.
Based on the 2010 ACS5 and net unit changes between 2010 and 2021, there are about 407,967 housing units in San Francisco, distributed between single family units (30%), moderate density buildings (two to nine units – 29%), and higher density structures (10 or more units – 40%). This distribution is similar over the last nine years as presented in Table 11.
Housing Stock
In 2021, there was a net gain of 4,633 units in the City’s housing stock. As of December 2021, units in buildings with 20 or more units comprised 30% of the City’s total housing. Of all units added since the 2010 ACS5, about 93% have been in buildings with 20 units or more.
Table 1 provides a profile of San Francisco’s housing stock by building type. Figure 2 illustrates San Francisco’s net housing stock by building type for 2021.
TABLE 1.San Francisco Housing Stock by Building Type, 2010–2021
FIGURE 2Net Housing Units Added in 2021 by Building Type
Building Type (groups) Single Family 2 to 4 Units 5 to 9 Units 10 to 19 Units 20 + Units TOTAL
2010 ACS5Net Added 2011-2020Net Added 2021
123,9518020
79,7741,248
216
37,088304119
37,656611136
93,49628,1794,142
371,96530,4224,633
Total 124,051 81,238 37,511 38,403 125,817 407,020
0
1,000
2,000
3,000
4,000
Single Family 2 to 4 Units 5 to 9 Units 10 to 19 Units 20 + Units
20216 119 136
4,142
Housing Stock
The number of units in San Francisco’s housing stock is derived by taking the total units from the 2010 Five Year American Community Survey (2010 ACS5) count as baseline, then adding net unit change (the sum of units completed from new construction and alterations minus units lost from demolition and alterations) each subsequent year.
Based on the 2010 ACS5 and net unit changes between 2010 and 2021, there are about 407,967 housing units in San Francisco, distrib-uted between single family units (30%), moderate density buildings (two to nine units – 29%), and higher density structures (10 or more units –
40%). This distribution is similar over the last nine years as presented in Table 11. In 2021, there was a net gain of 4,633 units in the City’s housing stock. As of December 2021, units in buildings with 20 or more units comprised 30% of the City’s total housing. Of all units added since the 2010 ACS5, about 93% have been in buildings with 20 units or more.
Table 1 provides a profile of San Francisco’s hous-ing stock by building type. Figure 2 illustrates San Francisco’s net housing stock by building type for 2021.
17
S a n F r a n c i s c o H o u s i n g I n v e n t o r y | 2020

S A N F R A N C I S C O P L A N N I N G D E P A R T M E N T18
Housing Production Trends
New Housing Construction
» In 2021, new construction units total 4,081 units compared to 3,957 units in 2020, a increase of 3% from 2020. New construction in 2021 is 25% above the 10-year average of 3,261 new construction units.
» Alterations resulted in 568 units added through conversion or expansion of existing structures and addition or legalization of accessory dwell-ing units, compared to 444 in 2020, resulting in a 28% increase from 2020. Four (4) units were lost due to conversions and mergers. This means a net total of 564 units were added to the housing stock through “alterations” of existing units or buildings. This is a 29% increase from the 438 net units added in 2020 as a result of alterations.
» Only 12 units were demolished in 2021.
» The net addition to the City’s housing stock in 2021 is 4,633 units compared to 4,043 units in 2020, which represents a 15% increase from 2020 and is 33% above the 10-year average of 3,478 net new units.
» In 2021, 1,495 affordable housing units were completed compared to 715 units in 2020, which is a 110% increase from the previous year. Affordable units completed in 2021 make up 32% of the total new units built in 2021.
» In 2021, DBI authorized 2,221 units for construction. This represents a 30% decrease from the number of units authorized in 2020 (3,195).
Table 2 and the figure on page 6 show housing production trends over the past 20 years. The table and figure account for net new units gained – which is the number of units newly constructed and adjusted for alterations, which can add or subtract units, and demolitions.
Three projects with the largest number of units completed in 2021 include: 1169 Market St (502 units), 30 Otis St (395 units) and 1140 Harrison St (371 units).
1950 Mission St (157 units) , 691 China Basin St (152 units) and 1990 Folsom St (143 units) are three major 100% affordable projects com-pleted in 2021.
A list of all market rate projects with ten units or more completed in 2021 is included in Appendix A-1. Appendix A-2 includes all major affordable housing projects with 20 or more units completed in 2021.

Power BI Desktop
TABLE 2.San Francisco Housing Trends, 2002–2021
Year
Net UnitsAuthorized
Units Completedfrom New
Construction
Units Demolished Net Units Gainedor Lost fromAlterations
Net Change In Number ofUnits
2002
2003
2004
2005
2006
2007
2008
2009
2010
2011
2012
2013
2014
2015
2016
2017
2018
2019
2020
2021
1,478
1,845
2,318
5,571
2,332
3,281
2,346
752
1,209
2,033
3,888
3,168
3,834
4,083
2,642
4,629
4,587
4,549
3,165
2,093
2,260
2,730
1,780
1,872
1,675
2,197
3,019
3,366
1,082
348
794
2,330
3,454
2,435
4,895
3,954
2,309
4,402
3,957
4,081
73
286
355
174
41
81
29
29
170
84
127
429
95
25
30
18
53
139
352
12
221
52
62
157
280
451
273
117
318
5
650
59
155
503
212
182
316
373
438
564
2,408
2,496
1,487
1,855
1,914
2,567
3,263
3,454
1,230
269
1,317
1,960
3,514
2,913
5,077
4,118
2,572
4,636
4,043
4,633
TOTAL 59,803 52,940 2,602 5,388 55,726
19
S a n F r a n c i s c o H o u s i n g I n v e n t o r y | 2020

Power BI Desktop
Depending on the type of project, there are various approvals by the Planning Department that a project needs to be fully entitled. Full entitlement of a project means that the project sponsor can proceed with the next step in the development process: securing approval and issuance of a building permit.
> In 2021, 420 projects with 7,817 total gross units were filed with the Planning Department, compared to 483 projects with 2,621 units filed in 2020. This is a 198% increase from the number of projects filed in 2020 and is about 36% below the ten-year average of 3,154 units.
> The Planning Department approved and fully entitled 54 projects in 2021. These projects propose a total of 2,010 units. Two of the larger projects filed in 2021 include 3251 20th Ave (2930 units) and 50 Main St (808 units).
Projects Approved and Under Review by Planning
TABLE 3.
TABLE 4.
Table 3 shows the number of housing projects filed with the Planning Department over the last five years. Units filed at the Planning Department is defined as the number of units associated with applications that have been fully completed and accepted for review. It is important to note that Planning may not approve all projects under review or may not approve projects at the unit levels requested. Project sponsors may also change or withdraw the project proposals. Some projects listed in Table 3 as undergoing Planning Department review may have reached their approval stage, been authorized for construction, or may have been completed. Lastly, many of the housing projects under development by the Office of Community Investment and Infrastructure (OCII) or other agencies with their own entitlement process do not show up in Table 3 because those agencies are responsible for the review of those projects.
Appendix A-3 records major projects (10 units or more) that received Planning entitlements in 2021. Appendix A-4 contains a list of the major projects filed at the Planning Department for review during 2021.
Projects and Units Filed at Planning Department for Review, 2017–2021
Units and Projects Authorized for Construction by DBI by Building Type, 2017–2021
Year Projects Filed
Units Filed Projects Entitled Units Entitled
20172018201920202021
612576535483420
5,4215,0343,4622,6217,817
4143442754
3,4742,1152,2052,8792,010
TOTAL 2,626 24,355 209 12,683
Year
Single Family 2 Units 3 to 4 Units 5 to 19 Units 20 + Units Total Units Total Projects
20172018201920202021
11142362543
152193257139186
11798
17281
104
204323398217226
4,1334,2624,0432,7331,662
4,7174,9184,9063,1952,221
470478641335417
TOTAL 257 927 572 1,368 16,833 19,957 2,341
S A N F R A N C I S C O P L A N N I N G D E P A R T M E N T20
Projects Approved and Under Review by Planning
Depending on the type of project, there are vari-ous approvals by the Planning Department that a project needs to be fully entitled. Full entitlement of a project means that the project sponsor can proceed with the next step in the development process: securing approval and issuance of a building permit.
» In 2021, 420 projects with 7,817 total gross units were filed with the Planning Department, compared to 483 projects with 2,621 units filed in 2020. This is a 198% increase from the number of units filed in 2020 and is about 63% above the ten-year average of 4,803 units.
» The Planning Department approved and fully entitled 54 projects in 2021. These projects propose a total of 2,010 units. Two of the larger projects filed in 2021 include 3251 20th Ave (2930 units) and 50 Main St (808 units).
Table 3 shows the number of housing projects filed with the Planning Department over the last five years. Units filed at the Planning Department is defined as the number of units associated with applications that have been fully completed and accepted for review. It is important to note that Planning may not approve all projects under review or may not approve projects at the unit lev-els requested. Project sponsors may also change or withdraw the project proposals. Some projects listed in Table 3 as undergoing Planning Depart-ment review may have reached their approval stage, been authorized for construction, or may have been completed. Lastly, many of the housing projects under development by the Office of Com-munity Investment and Infrastructure (OCII) or other agencies with their own entitlement process do not show up in Table 3 because those agencies are responsible for the review of those projects.
Appendix A-3 records major projects (10 units or more) that received Planning entitlements in 2021. Appendix A-4 contains a list of the major projects filed at the Planning Department for review during 2021.

21
S a n F r a n c i s c o H o u s i n g I n v e n t o r y | 2020
Units Authorized for Construction
» In 2021, DBI authorized the addition of 2,221 units (through new construction and alteration) compared to 3,195 units in 2020, which is 30% less than in 2020.
» There were more projects but fewer units in 2021: 417 compared to 335 projects in 2020. In 2021, the average number of units per project citywide was 5.3 units, which is below the average number of units per project over the last five-year period between 2017 and 2021 (8.5).
Table 4 summarizes the number of projects and units by building type authorized for construction by the DBI.
» The majority of units authorized for construc-tion in 2021 (75%) involve projects with 20 units or more.
» Major projects authorized for construction dur-ing the reporting year include: 1068 Mission St (254 units), 921 Howard St (203 units), and 65 Ocean Ave (193 units).
Appendix A-5 lists all projects with 10 or more units authorized for construction in 2020.
Demolitions
» A total of 12 units were demolished in 2021.
» The demolition of the 12 units in 2021 is 91% below the five-year demolition average of 128 units.
Table 5 shows the units demolished between 2017 and 2021 by building type and Table 6 shows the demolitions in 2021 by Zoning District.
It should be noted that city policies require a minimum of one-to-one replacement of demol-ished housing.
Alterations and Conversions
The alteration permits are for improvements within existing buildings or dwelling units. Some alterations expand the building envelope without increasing the number of units in the building. The Housing Inventory is primarily concerned with alterations that result in a net loss or gain in the total number of units in the housing stock.
Dwelling units are gained by additions to existing housing structures, conversions to residential use, and legalization of illegal units. Dwelling units are lost by merging separate units into larger units, by conversion to commercial use, or by the removal of illegal units.
The net gain of 564 units from alterations in 2021 is comprised of 568 units added and 4 units eliminated.
» Units gained through alterations increased 29% from the previous year – 564 units in 2021 compared to 438 units in 2020.
» 318 units of alterations in 2021 are new accessory dwelling units or legalized secondary units.
» Of the 4 units lost through alteration in 2021, four (4) units were lost due to mergers and one (1) was a unit conversion. This represents a 33% decrease in units lost through alterations from 2020.
Table 7 shows the number of units added or eliminated through alteration permits from 2017 to 2021. Table 8 profiles the type of alterations and demolitions that caused the loss of units dur-ing the same period.

Power BI Desktop
TABLE 6.Units Demolished by Zoning District, 2021
TABLE 5.
Zoning District Buildings Single Family Multi-Family Total Percent of Total
PDR-1-GRH-1RH-2RH-3RM-1RM-2
124020
023010
202020
225030
17%17%42%0%
25%0%
TOTAL 9 6 6 12 100%
Year Buildings Single 2 Units 3 to 4 Units 5 + Units Total
20172018201920202021
142527509
1122986
44026
30
1200
027
118342
0
1853
13935212
TOTAL 125 56 16 15 487 574
Units Demolished By Building Type, 2017–2021
S A N F R A N C I S C O P L A N N I N G D E P A R T M E N T22

Power BI Desktop
TABLE 8.Units Lost Through Alterations and Demolitions, 2017-2021
TABLE 7.
Year Illegal UnitsRemoved
Units Merged intoLarger Units
Correction toOfficial Records
UnitsConverted
TotalAlterations
UnitsDemolished
Total Units Lost
20172018201920202021
41301800
35353
121000
21011
47572164
1853
13935212
6511016035816
TOTAL 89 19 22 5 135 574 709
Year Units Added Units Eliminated Net Change
20172018201920202021
229373394444568
47572164
182316373438564
TOTAL 2,008 135 1,873
Units Added or Lost Through Alteration Permits, 2017–2021
23
S a n F r a n c i s c o H o u s i n g I n v e n t o r y | 2020

Power BI Desktop
Accessory Dwelling Units (ADUs), also known as secondary units, in-law units, or cottages, are independent dwelling units added to existing residential buildings. ADUs are subordinate to the primary residential unit(s), generally due to the location or size of the ADU. These units can either be developed within the existing building, as an extension to the existing building, or as an entirely separate structure.
As part of an effort to address growing housing demands, the ADU program offers homeowners and contractors a way to add a unit to an existing residential building. By legally adding a unit, a homeowner potentially subsidizes their mortgage by creating a rental apartment, or enables the creation of a multi-generational household.
A property owner or landlord can also turn underutilized spaces within an existing apartment building into additional dwelling units, and as a result, increase housing options for residents.
Accessory Dwelling Units
TABLE 9.
TABLE 10.
In 2021, 248 ADUs were completed. 97 ADUs were added in buildings with two to four units, and 50 ADUs were added in building with five or more units.
The legalization program also allows legalizations of existing ADUs without any prior evidence. This voluntary program allows property owners to formally register and rent their unwarranted units in San Francisco, and to ensure that each unit meets safety conditions.
In 2021, 70 illegal secondary units were legalized through the legalization program.
Table 9 shows the number of ADUs added and Table 9A shows the number of ADUs legalized in 2021. Table 10 shows the number of ADUs added and legalized by building type in 2021.
Accessory Dwelling Units Added, 2017–2021
Accessory Dwelling Units Added and Legalized Through Ordinance by Building Type, 2017–2021
Year ADUs Completed
20172018201920202021
2687
182133248
TOTAL 676
Year
Buildings Detached Unit 2 to 4 Units 5 to 9 Units 10+ Units Total
20172018201920202021
79113198154209
7
5060
10886
113
1717473554
1869
11469
136
85146269190310
TOTAL 753 7 417 170 406 1000
TABLE 9A.Accessory Dwelling Units Legalized, 2017–2021
Year Legalizations Legalizations throughOrdinance 43-14
20172018201920202021
201719108
5959875762
TOTAL 74 324
S A N F R A N C I S C O P L A N N I N G D E P A R T M E N T24
Accessory Dwelling Units
Accessory Dwelling Units (ADUs), also known as secondary units, in-law units, or cottages, are independent dwelling units added to existing residential buildings. ADUs are subordinate to the primary residential unit(s), generally due to the location or size of the ADU. These units can either be developed within the existing building, as an extension to the existing building, or as an entirely separate structure.
As part of an effort to address growing housing demands, the ADU program offers homeowners and contractors a way to add a unit to an exist-ing residential building. By legally adding a unit, a homeowner potentially subsidizes their mortgage by creating a rental apartment, or enables the creation of a multi-generational household.
A property owner or landlord can also turn under-utilized spaces within an existing apartment building into additional dwelling units, and as a result, increase housing options for residents.
» In 2021, 248 ADUs were completed. 97 ADUs were added in buildings with two to four units, and 50 ADUs were added in building with five or more units.
The legalization program also allows legalizations of existing ADUs without any prior evidence. This voluntary program allows property owners to for-mally register and rent their unwarranted units in San Francisco, and to ensure that each unit meets safety conditions.
» In 2021, 70 illegal secondary units were legal-ized through the legalization program
Table 9 shows the number of ADUs added and Table 9A shows the number of ADUs legalized in 2021. Table 10 shows the number of ADUs added and legalized by building type in 2021.

25
S a n F r a n c i s c o H o u s i n g I n v e n t o r y | 2020
Additional Units Proposed Through Density Bonus Programs
The California State Density Bonus Law offers development incentives to projects that provide on-site affordable housing. In 2017, the City established the Individually Requested State Density Bonus Program, which incorporates additional requirements and standards for local implementation of the State Program. The housing project utilizing this program must comply with the Inclusionary Affordable Housing Requirement, but the project may only seek a bonus at a single income level. The State Program offers projects the right to receive up to three incentives or concessions that are required to provide for afford-able housing costs. A concession or incentive can be a reduction in site development standards, or a modification of zoning code requirements, approval of mixed-use zoning, or other regulatory conessions or incentivies.
HOME-SF is an optional local density bonus program that may be used by applicants in lieu of the State Program to construct mixed-income projects with a higher percentage of inclusionary units in certain areas of San Francisco. Under this program, 20 to 30 percent of the units in a new housing project must be affordable to low, middle, and moderate-income families. To provide more family friendly housing, 40 percent of the total units in the building must be two bedrooms or larger. In return, density bonuses and zoning modifications are provided, thus allowing project sponsors to accommodate additional affordable units.
Of all the density bonus projects filed, only one project has been completed as of December 2021: 333 12th Street, with its 200 units, was completed in 2021.
» As of December 2021, 91 projects were in the pipeline for the State Density Bonus Program. These projects propose adding 11,595 units to the housing stock.
» As of December 2021, 22 projects were in the pipeline for the HOME-SF Density Bonus Program. These projects propose adding 1,355 units to the housing stock.
Table 11 on the following page shows the number of units associated with density bonus projects in the pipeline. Table 12 on the following page shows the number of projects in different stages of application as of December 2021. Table A-6 in Appendix A lists the density bonus projects in the pipeline and any associated waivers or incentives and concessions

Power BI Desktop
TABLE 13.New Housing Units Added by Building Type, 2017–2021
TABLE 11.
Year Single Family 2 Units 3 to 9 Units 10 to 19 Units 20 + Units TOTAL
20172018201920202021TOTAL
4946993427
255
12998
163143129662
20994
195149205852
6510986
126105491
3,7312,3354,2523,9494,183
18,450
4,1832,6824,7954,4014,649
20,710
Program Projects Total UnitsBefore Bonus
Total Unitswith Bonus
AffordableUnits
Percent of TotalUnits with Bonus
HOME-SF Density Bonus ProgramState Density Bonus Program
2291
135511595
3544274
10.46%89.54%
TOTAL 113 12950 4628 100.00%
Density Bonus Projects in the Pipeline by Total Units as of December 2021
TABLE 12.Density Bonus Projects in the Pipeline by Status of Application as of December 2021
Program Projects PPA Filed Under Review Entitled Building Permit Issued
HOME-SF Density Bonus ProgramState Density Bonus Program
2291
010
1248
924
19
TOTAL 113 10 60 33 10
S A N F R A N C I S C O P L A N N I N G D E P A R T M E N T26

Power BI Desktop
TABLE 14.
New Housing Units Added by Generalized Zoning, 2021
Generalized Zoning Districts Net UnitsAdded
Percent of Total Rank
Commercial (C-2, C-3-G, C-3-O(SD))Industrial (SALI, PDR-1-G)Mixed Use (CMUO, CRNC, NC, NCT, RC, etc.)Residential, House and Mixed (RED, RH, RM, RTO)
1,711146
1,809983
37%3%
39%21%
2413
TOTAL 4,649 100% 10
New Housing Unit Trends
New construction and residential conversions are the primary engine behind changes to the housing stock. This section examines units added to the housing stock over the past five years by looking at the types of buildings and the Zoning Districts where they occurred. For 2021, this section examines all units added to the housing stock including ADUs, not just those added through new construction.
> The share of units added in high-density buildings (20 or more units) matches the five-year average of 90%.
Table 13 on the opposite page shows new construction from 2017 through 2021 by building type.
> Ninety percent (90%) of new housing units added over the last 5 years involve buildings with 20 or more units.
> Thirty-four (34) single-family units were added in 2021 compared to 93 units in 2020, which is a 63% decrease from the previous year. Single-family building construction made up a very small proportion of new construction in the past five years (1.3%).
> Fewer units were added in the “Single Family” category in 2021 than in the previous four years (amounts ranging from 37 to 93 units were added each year between 2016 and 2019).
Types of BuildingsNew Housing Units Added by Zoning District
Approximately 55% of units added in 2021 were in Mixed Use zoning districts. Commercial zoning districts made up 27% of the total units added, Residential, House and Mixed zoning districts contributed 11%, and Public zoning districts followed with 6% of total units added.
Table 14 summarizes new units added in 2021 by generalized Zoning Districts. Table 15 lists the number of units constructed in various Zoning Districts in the City. A complete list of San Francisco’s Zoning Districts is included in Appendix C.
27
S a n F r a n c i s c o H o u s i n g I n v e n t o r y | 2020
New Housing Unit Trends
New construction and residential conversions are the primary engine behind changes to the housing stock. This section examines units added to the housing stock over the past five years by looking at the types of buildings and the Zoning Districts where they occurred. For 2021, this section examines all units added to the housing stock including ADUs, not just those added through new construction
Types of Buildings
» Ninety percent (90%) of new housing units added over the last 5 years involve buildings with 20 or more units.
» Twenty-seven (27) single-family units were added in 2021 compared to 34 units in 2020, which is a 21% decrease from the previous year. Single-family building construction made up a very small proportion of new construction in the past five years (1.2%).
» The share of units added in high-density build-ings (20 or more units) matches the five-year average of 90%.
Table 13 shows new units added construction from 2017 through 2021 by building type.
New Housing Units Added by Zoning District
Approximately 39% of units added in 2021 were in Mixed Use zoning districts. Commercial zoning districts made up 37% of the total units added, Residential, House and Mixed zoning districts con-tributed 21%, and Public zoning districts followed with 3% of total units added.
Table 14 summarizes new units added in 2021 by generalized Zoning Districts. Table 15 lists the number of units added in various Zoning Districts in the City. A complete list of San Francisco’s Zon-ing Districts is included in Appendix C.

Power BI Desktop
TABLE 15.New Housing Units Added by Zoning District, 2021
Zoning Districts
Units Percent of Total Ranking
C-2
C-3-G
C-3-O(SD)
C-3-R
C-3-S
CCB
MB-RA
MUG
MUR
NC-1
NC-2
NC-3
NCD
NCT
RC-3
RC-4
RED
RH-1
RH-1(D)
RH-1(S)
RH-2
RH-3
RM-1
RM-2
RM-3
RM-4
RTO
RTO-M
SALI
TB DTR
UMU
WMUG
125
1,139
120
24
302
1
152
2
1
13
5
12
97
98
1
199
7
79
6
1
3%
25%
3%
1%
7%
0%
3%
0%
0%
0%
0%
0%
2%
2%
0%
4%
0%
2%
0%
0%
11
1
12
18
4
29
9
28
30
22
27
23
14
13
31
8
25
15
26
32
253
61
224
232
10
37
23
31
146
19
548
681
5%
1%
5%
5%
0%
0%
0%
1%
3%
0%
12%
15%
5
16
7
6
24
21
19
17
10
20
3
2
TOTAL 4,649 100% 528
S A N F R A N C I S C O P L A N N I N G D E P A R T M E N T28

Power BI Desktop
All condominium developments, whether new construction or conversions, are recorded with the Department of Public Works’s (DPW) Bureau of Street-Use and Mapping (BSM). Annual condominium totals recorded by DPW do not directly correlate with annual units completed and counted as part of the Housing Inventory because DPW’s records may be for projects not yet completed or from projects completed in a previous year. Large multi-unit developments also file for condominium subdivision when they are first built even though the units may initially be offered for rent. Condominium construction, like all real estate, is subject to market forces and varies from year to year.
TABLE 17.
Table 16 shows construction of new condominiums recorded by DPW over the past ten years and Table 17 shows new condominium construction by building type over the past five years.
New Condominiums Recorded by the DPW by Building Type, 2017–2021
Year
2 Units 3 to 4 Units 5 to 9 Units 10 to 19 Units 20+ Units TOTAL
20172018201920202021
222040206
1242473819
3825535936
2856481634
3,1162,9804,1396,8542,130
3,2163,1234,3276,9872,225
TOTAL 108 158 211 182 19,219 19,878
TABLE 16.New Condominiums Recorded by DPW, 2012–2021
Year Units % Change fromPrevious Year
2012201320142015201620172018201920202021
9762,5861,9772,0992,0193,2163,1234,3276,9872,225
-40%165%-24%
6%-4%59%55%39%61%
-68%TOTAL 29,535 25%
Condominiums
New Condominiums Recorded
> New condominiums recorded in 2021 comprised of 6,987 units compared to 4,327 units in 2020, a 61% increase from the previous year.
> Approximately 98% of the condominiums recorded were in buildings with 20 or more units (6,854 units which represented a 58% increase from 2020).
29
S a n F r a n c i s c o H o u s i n g I n v e n t o r y | 2020
Condominiums
All condominium developments, whether new construction or conversions, are recorded with the Department of Public Works’s (DPW) Bureau of Street-Use and Mapping (BSM). Annual condo-minium totals recorded by DPW do not directly correlate with annual units completed and counted as part of the Housing Inventory because DPW’s records may be for projects not yet completed or from projects completed in a previous year. Large multi-unit developments also file for condominium subdivision when they are first built even though the units may initially be offered for rent. Condo-minium construction, like all real estate, is subject to market forces and varies from year to year.
New Condominiums Recorded
» New condominiums recorded in 2021 com-prised of 2,225 units compared to 6,987 units in 2019, a 68% decrease from the previous year.
» Approximately 96% of the condominiums recorded were in buildings with 20 or more units.
Table 16 shows construction of new condomini-ums recorded by DPW over the past ten years and Table 17 shows new condominium construction by building type over the past five years.

Power BI Desktop
The San Francisco Subdivision Code regulates condominium conversions. Since 1983, conversions of units from rental to condominium have been limited to 200 units per year and to buildings with six or fewer units. More than 200 units may be recorded in a given year because units approved in a previous year may be recorded in a subsequent year. The 200-unit cap on conversions can also be bypassed for two-unit buildings with owners occupying both units.
> Condominium conversions decreased by 48% in 2021 (201 from 387 conversions in 2020). This number is 52% lower than the 10-year average of 421 units.
> About 52% of units converted in 2021 occurred in two-unit buildings, followed by 23% occurring in 5 to 6-unit buildings.
> Sixty-five percent (65%) of the condominium conversions in 2021 (131) were in buildings with two or three units, consistent with past trend of 60-80% from 2014 through 2019.
Table 18 shows the number of conversions recorded by DPW from 2012-2021. Table 19 shows condominium conversions by building type over the past five years.
TABLE 19.Condominium Conversions Recorded by the DPW by Building Type, 2017–2021
Year
2 Units 3 Units 4 Units 5 to 6 Units TOTAL
20172018201920202021
11886
23810434
724869270
4812402412
584540460
29619138720146
TOTAL 580 216 136 189 1,121
TABLE 18.
Condominium Conversions Recorded by DPW, 2012–2021
Year Units % Change fromPrevious Year
2012201320142015201620172018201920202021
48836973066141729619138720146
3%-24%98%-9%
-37%-29%-35%103%-48%-77%
TOTAL 3786 -6%
Condominium Conversions
S A N F R A N C I S C O P L A N N I N G D E P A R T M E N T30
Condominium Conversions
The San Francisco Subdivision Code regulates condominium conversions. Since 1983, conver-sions of units from rental to condominium have been limited to 200 units per year and to build-ings with six or fewer units. More than 200 units may be recorded in a given year because units approved in a previous year may be recorded in a subsequent year. The 200-unit cap on conver-sions can also be bypassed for two-unit buildings with owners occupying both units.
» Condominium conversions decreased by 77% in 2021 (46 from 201 conversions in 2020). This number is 88% lower than the 10-year average of 379 units.
» About 74% of units converted in 2021 occurred in two-unit buildings, followed by 26% occurring in 4-unit buildings.
» 100% of the condominium conversions in 2021 were in buildings with two to four units.
Table 18 shows the number of conversions recorded by DPW from 2012-2021. Table 19 shows condominium conversions by building type over the past five years.

31
S a n F r a n c i s c o H o u s i n g I n v e n t o r y | 2020
Residential Hotels
Residential hotels in San Francisco are regulated by Administrative Code Chapter 41 – the Residen-tial Hotel Conversion and Demolition Ordinance (HCO), enacted in 1981. DBI Housing Inspection Services Division administers the HCO. This ordinance preserves the stock of residential hotels and regulates the conversion and demolition of residential hotel units.
Table 20 reports the number of residential hotel buildings and units for both for-profit and nonprofit residential hotels from 2017 through 2021.
» As of 2021, 19,000 residential hotel rooms are registered in San Francisco; 65% are residential rooms in for-profit residential hotels and 35% are residential in non-profit hotels.
Power BI Desktop
Residential hotels in San Francisco are regulated by Administrative Code Chapter 41 – the Residential Hotel Conversion and Demolition Ordinance (HCO), enacted in 1981. DBI Housing Inspection Services Division administers the HCO. This ordinance preserves the stock of residential hotels and regulates the conversion and demolition of residential hotel units.
Table 20 reports the number of residential hotel buildings and units for both for-profit and nonprofit residential hotels from 2017 through 2021.
> As of 2021, 19,000 residential hotel rooms are registered in San Francisco; 65% are residential rooms in for-profit residential hotels and 35% are residential in non-profit hotels.
TABLE 20.Changes in Residential Hotel Stock, 2017–2021
Year
For-ProfitResidentialHotelBuildings
For-ProfitResidentialHotelResidentialRooms
For-ProfitResidentialHotel TouristRooms
Non-ProfitResidentialHotelBuildings
Non-ProfitResidentialHotelResidentialRooms
TotalBuildings
TotalResidentialRooms
20172018201920202021
392397394389387
12,49812,71012,49012,42412,274
2,5262,6742,5552,5092,398
109106110114114
6,5416,4896,7096,6456,726
501503504503501
19,03919,19919,19919,06919,000
TOTAL 1,959 62,396 12,662 553 33,110 2,512 95,506
Residential Hotels

S A N F R A N C I S C O P L A N N I N G D E P A R T M E N T32
Affordable Housing
Standards and Definitions of AffordabilityAffordable housing by definition is housing that is either rented or owned at prices affordable to households with low to moderate incomes. The United States Department of Housing and Urban Development (HUD) determines the thresholds by household size for these incomes for the San Francisco HUD Metro Fair Market Rent Area (HMFA). MOHCD’s 2021 Maximum Income by Household Size Table is derived from HUD’s 2021 Median Family Income for a 4-person Household for San Francisco (‘HMFA’), unadjusted for high housing costs, and rounded to the nearest $50, and further derived via application of MOHCD AMI Hold Harmless Policy, effective 05/03/2019. The HMFA includes San Francisco, Marin, and San Mateo counties. The standard definitions for hous-ing affordability by income level are as follows:
Extremely low income: Units affordable to house-holds with incomes at or below 30% of the HUD median income for the San Francisco HFMA;
Very low income: Units affordable to households with incomes at or below 50% of the HUD median income for the San Francisco HFMA;
Lower income: Units affordable to households with incomes at or below 60% of the HUD median income for the San Francisco HFMA;
Low income: Units affordable to households with incomes at or below 80% of the HUD median income for the San Francisco HFMA,
Moderate income: Units affordable to households with incomes at or below 120% of the HUD median income for the San Francisco HFMA; and
Market rate: Units at prevailing prices without any affordability requirements. Market rate units generally exceed rental or ownership affordability levels, although some small market rate units may be priced at levels that are affordable to moderate income households.
Housing affordability for units is calculated as follows:
Affordable rental unit: A unit for which rent equals 30% of the income of a household with an income at or below 120% of the HUD median income for the San Francisco HFMA, utilities included.
Affordable ownership unit: A unit for which the mortgage payments, PMI (principal mortgage insurance), property taxes, homeowners dues, and insurance equal 33% of the gross monthly income of a household earning between 80% and 120% of the San Francisco HFMA median income.
Inclusionary Affordable Housing Program/OCII’s Limited Equity Program —Ownership Units: These are units priced for which the mortgage payments, PITI (principal, interest, taxes and insurance), and homeowners association dues equal less than 33% of the gross monthly income of a household earning between 80% and 130% of MOHCD AMI (assuming a 5% down payment and a 30-year fixed mortgage at the current market interest rate). [Note: This characterization relates to pricing rather than qualifying; households can qualify from 80% to 150% MOHCD AMI for inclusionary ownership units.]
Inclusionary Affordable Housing Program — Rental Units: These units are rental units for which rent equals 30% of income for households earning between 55% and 110% AMI MOHCD AMI. [Qualifying range is 25% to 130% of MOHCD AMI.]
OCII/Development Agreement units’ pricing ranges from 45% to 150% of MOHCD AMI.
Tables 21 and 22 show the incomes and prices for affordable rental and ownership units based on 2021 HUD income limits.

33
S a n F r a n c i s c o H o u s i n g I n v e n t o r y | 2020Power BI Desktop
TABLE 21.2021 Rental Affordable Housing Guidelines
Income Levels HouseholdSize Average Unit Size MaximumAnnualIncome
MonthlyRent
Extremely Low Income (30% of HUD Median Income) 1 Studio
2 1 Bedroom
3 2 Bedroom
4 3 Bedroom
5 4 Bedroom
6 5 Bedroom
Very Low Income (50% of HUD Median Income) 1 Studio
2 1 Bedroom
3 2 Bedroom
4 3 Bedroom
5 4 Bedroom
6 5 Bedroom
Lower Income (60% of HUD Median Income) 1 Studio
2 1 Bedroom
3 2 Bedroom
4 3 Bedroom
5 4 Bedroom
6 5 Bedroom
Low Income (80% of HUD Median Income) 1 Studio
2 1 Bedroom
3 2 Bedroom
4 3 Bedroom
5 4 Bedroom
6 5 Bedroom
$28,000
$31,950
$35,950
$39,950
$43,150
$46,350
$46,650
$53,300
$59,950
$66,600
$71,950
$77,250
$55,950
$63,950
$71,950
$79,900
$86,300
$92,700
$74,600
$85,250
$627
$713
$783
$852
$899
$947
$1,093
$1,247
$1,383
$1,518
$1,619
$1,719
$1,326
$1,513
$1,683
$1,851
$1,978
$2,106
$1,792
$2,045
$95,900
$106,550
$115,100
$123,600
$2,282
$2,517
$2,698
$2,878

S A N F R A N C I S C O P L A N N I N G D E P A R T M E N T34
Power BI Desktop
TABLE 22.2021 Homeownership Affordable Housing Guidelines
Income Levels Household Size MaximumAnnual Income
MonthlyHousingExpense
MaximumPurchase Price
Low Income (70% of HUD Median Income) 1
2
3
4
5
Median Income (90% of HUD Median Income) 1
2
3
4
5
Moderate Income (110% of HUD Median Income) 1
2
3
4
5
$65,300
$74,600
$83,950
$93,250
$100,700
$83,950
$95,900
$107,900
$119,900
$129,450
$102,600
$117,200
$131,900
$146,500
$158,250
$1,796
$2,052
$2,309
$2,564
$2,769
$2,309
$2,637
$2,967
$3,297
$3,560
$2,822
$3,223
$3,627
$4,029
$4,352
$248,984
$277,026
$305,333
$333,376
$351,630
$359,527
$401,590
$443,919
$486,247
$515,612
$446,340
$502,425
$559,039
$615,124
$656,130

35
S a n F r a n c i s c o H o u s i n g I n v e n t o r y | 2020
New Affordable Housing Production
Table 23 shows the production of affordable housing by levels of affordability. These numbers do not include affordable units that result from acquiring and rehabilitating residential buildings by nonprofit housing organizations. Those units are covered later in the report.
» In 2021, 1,495 affordable housing units were completed compared to 715 units in 2020, which is a 110% increase from the previous year. Of these, 480 are new inclusionary units.
» The number of affordable units built in 2021 (1,495) is 42% higher than the five year aver-age of affordable units built (1,051 units).
» Low, very low, and extremely low-income units represented 74% of the new affordable units that were constructed in 2021; moderate income units made up the remaining 26%.
» A total of 318 Accessory Dwelling Units (ADUs) were added or legalized in 2021. Typically, these are smaller units and are sometimes referred to as secondary units. These are also usually affordable to households with moderate incomes, however, these units are not income-restricted. Informed by a regional analysis on affordability of ADUs by MTC, in 2021, 285 of the 318 ADUs added or legalized, qualified as affordable units.
Major (20 or more units) new affordable hous-ing projects completed in 2021 are detailed in Appendix A-2. On-site affordable inclusionary units are listed under major market rate projects in Appendix A-1. Affordable housing projects under construction, or in pre-construction or preliminary planning with either the Mayor’s Office of Housing and Community Development or the Office of Community Investment and Infrastructure are presented in Appendix A-7.
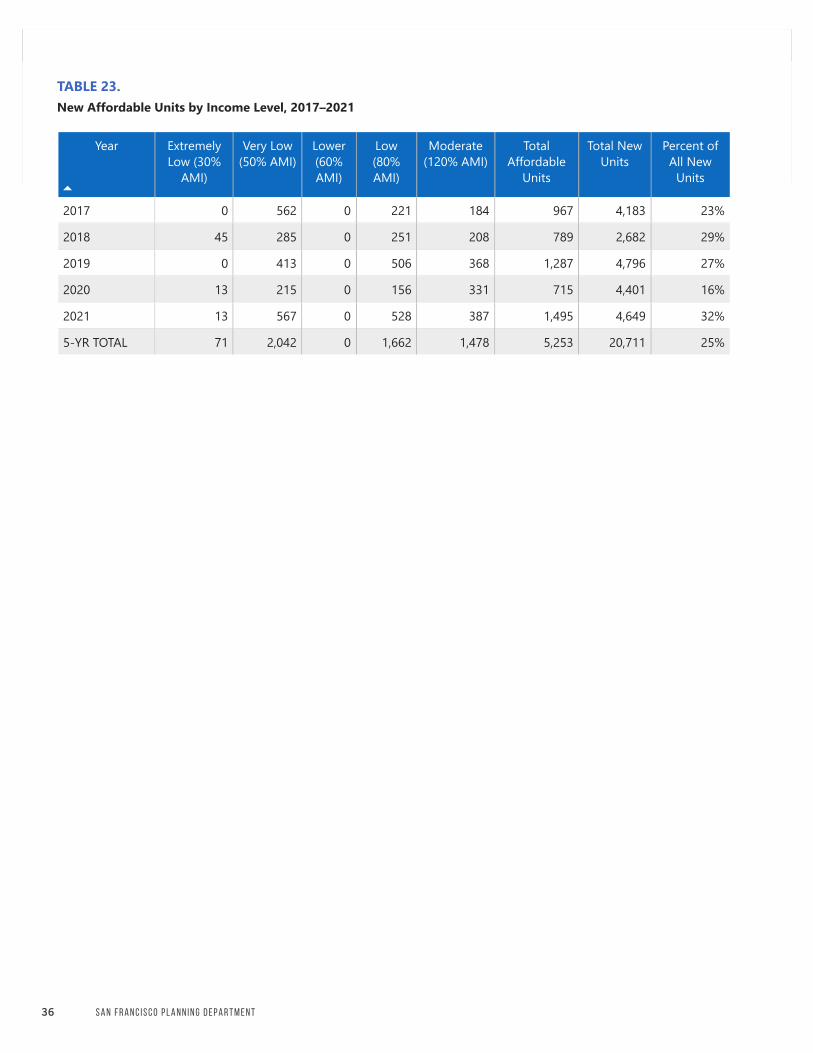
S A N F R A N C I S C O P L A N N I N G D E P A R T M E N T36
Power BI Desktop
TABLE 23.
TABLE 24.[NOT USED]
New Affordable Units by Income Level, 2017–2021
Year
ExtremelyLow (30%
AMI)
Very Low(50% AMI)
Lower(60%AMI)
Low(80%AMI)
Moderate(120% AMI)
TotalAffordable
Units
Total NewUnits
Percent ofAll New
Units
2017
2018
2019
2020
2021
5-YR TOTAL
0
45
0
13
13
71
562
285
413
215
567
2,042
0
0
0
0
0
0
221
251
506
156
528
1,662
184
208
368
331
387
1,478
967
789
1,287
715
1,495
5,253
4,183
2,682
4,796
4,401
4,649
20,711
23%
29%
27%
16%
32%
25%

Power BI Desktop
In 1992, the Planning Commission adopted guidelines for applying the City’s Inclusionary Affordable Housing Policy. This policy required housing projects with 10 or more units that seek a conditional use (CU) permit or planned unit development (PUD) to set aside a minimum of 10% of their units as affordable units. In 2002, the Board of Supervisors legislated these guidelines into law and expanded the requirement to all projects with 10 or more units. In condominium developments, the inclusionary affordable ownership units would be available to households earning up to 100% of the AMI; below market inclusionary rental units are affordable to households earning 60% or less of the area median income (AMI). If a housing project required a conditional use permit, then 12% of the units would need to be made available at the same levels of affordability.
In 2006, the inclusionary requirements were increased to 15% if units were constructed on-site, and to 20% if constructed off-site and is applicable to projects of five units or more. In 2013, the inclusionary requirements were changed back to projects with 10 or more units and the on-site requirement went back down to 12%. In August 2017, the inclusionary requirements were changed to 12% of on-site units for projects with 10 to 24 units, and 18% on-site for rental projects with 25 units or more and 20% on-site for ownership projects with 25 units or more. For projects within the Mission Planning Area,
Inclusionary Housing
North of Market Residential SUD (Tenderloin), and SoMa NCT (6th Street), the inclusionary requirements are as follows: 25% on-site for rental, 27% on-site for ownership in projects with 25 or more units.These increases apply to new projects without an environmental evaluation initial study on or after January 12th, 2016. Table 25 shows inclusionary units completed from 2017 to 2021.
> 480 inclusionary units were completed in 2020.
> In 2020, the number of inclusionary units built (480) represented a 19% increase from that provided in 2019 (405). The number of inclusionary housing units built in 2020 is also 25% above than the five-year annual average of 384 units.
Appendix A-1 provides a complete list of projects with ten or more units constructed in 2020 and details of inclusionary units for those projects that have them.
In Fiscal Year 2020, a total of $15 million was collected as partial payments of in-lieu fees for projects. Appendix D is a summary of in-lieu fees collected since 2012.
TABLE 25.New Affordable Housing Production by Source, 2017-2021
Year Inclusionary Units Units in 100%Affordable Projects
Affordable ADU's orLegalized Units
Total Affordable Units
20172018201920202021
346397464486355
53925557252
855
82137251177285
967789
1,287715
1,495TOTAL 2,048 2,273 932 5,253
37
S a n F r a n c i s c o H o u s i n g I n v e n t o r y | 2020
Inclusionary Housing
In 1992, the Planning Commission adopted guidelines for applying the City’s Inclusionary Affordable Housing Policy. This policy required housing projects with 10 or more units that seek a conditional use (CU) permit or planned unit devel-opment (PUD) to set aside a minimum of 10% of their units as affordable units. In 2002, the Board of Supervisors legislated these guidelines into law and expanded the requirement to all projects with 10 or more units. In condominium developments, the inclusionary affordable ownership units would be available to households earning up to 100% of the AMI; below market inclusionary rental units are affordable to households earning 60% or less of the area median income (AMI). If a housing project required a conditional use permit, then 12% of the units would need to be made available at the same levels of affordability.
In 2006, the inclusionary requirements were increased to 15% if units were constructed on-site, and to 20% if constructed off-site and is applicable to projects of five units or more. In 2013, the inclusionary requirements were changed back to projects with 10 or more units and the on-site requirement went back down to 12%. In August 2017, the inclusionary require-ments were changed to 12% of on-site units for projects with 10 to 24 units, and 18% on-site for rental projects with 25 units or more and 20% on-site for ownership projects with 25 units or more. For projects within the Mission Planning Area,
North of Market Residential SUD (Tenderloin), and SoMa NCT (6th Street), the inclusionary require-ments are as follows: 25% on-site for rental, 27% on-site for ownership in projects with 25 or more units.These increases apply to new projects without an environmental evaluation initial study on or after January 12th, 2016. Table 25 shows inclusionary units completed from 2017 to 2021.
» 355 inclusionary units were completed in 2021.
» In 2021, the number of inclusionary units built (355) represented a 26% decrease from that provided in 2020 (480). The number of inclusionary housing units built in 2021 is also 3% less than the five-year annual average of 365 units.
Appendix A-1 provides a complete list of projects with ten or more units constructed in 2020 and details of inclusionary units for those projects that have them.
In Fiscal Year 2021, a total of $4,379,076 was collected as partial payments of in-lieu fees for projects. Appendix D is a summary of in-lieu fees collected since 2012.

Power BI Desktop
TABLE 26.Housing Price Trends, San Francisco Bay Area, 2017–2021
Year
RENTAL- 2 BRApartment: SanFrancisco
RENTAL- 2 BRApartment: Bay Area
FOR SALE- 2 BR House:San Francisco
FOR SALE- 2 BR House:Bay Area
20172018201920202021
$4,500$4,650$4,500$3,570$3,970
$2,846$2,963$3,166$2,110$2,963
$1,469,000$1,573,000$1,450,000$1,581,000$1,690,000
$910,350$939,216$908,750
$1,058,000$1,200,000
TOTAL $21,190 $14,048 $7,763,000 $5,016,316
The San Francisco Bay Area remains one of the nation’s most expensive housing markets, despite median rents dropping by about 20% in 2020.
> In 2020, the median rental price for a two-bedroom apartment in San Francisco was $3,570 compared to $4,500 in 2019, a 21% decrease from the previous year. This significant drop in rent has been attributed in part to the outward migration of people from the city during the COVID-19 pandemic.
> The 2020 median rental price for a two-bedroom apartment in San Francisco is 69% higher than the median rental price for the entire Bay Area.
> In 2020, the median price for a two-bedroom home in San Francisco increased to $1,581,000. This price is 9% higher than the 2019 median home price ($1,450,000).
Affordability of Market Rate Housing
> A three-person household with a combined household income at 80% of the median income could pay a maximum rent of $2,215 (according to Table 21) or only about 62% of the median rent ($3,570).
Table 26 gives rental and sales prices for 2017 through 2021.
S A N F R A N C I S C O P L A N N I N G D E P A R T M E N T38
Affordability of Market Rate Housing
» In 2021, the median rental price for a two-bedroom apartment in San Francisco was $3,970 compared to $3,570 in 2020, an 11% increase from the previous year.
» The 2020 median rental price for a two-bedroom apartment in San Francisco is 34% higher than the median rental price for the entire Bay Area.
» In 2021, the median price for a two-bedroom home in San Francisco increased to $1,690,000. This price is 7% higher than the 2020 median home price ($1,581,000).
» A three-person household with a combined household income at 80% of the median income could pay a maximum rent of $2,282 (according to Table 21) or only about 57% of the median rent ($3,970).
Table 26 shows median rental and sales prices for 2017 through 2021.

Power BI Desktop
Acquisition and rehabilitation involves non-profit housing organizations purchasing existing residential buildings in order to rehabilitate units for low- and very low-income persons. Table 27 shows units that have been rehabilitatedthrough funding by the Mayor’s Office of Housing and Community Development (MOHCD) and the Office of Community Investment and Infrastructure (OCII). Often it is more economical to purchase and rehabilitate existing units than to build new units. While many of these units are residential hotel (single room occupancy or SRO) units, acquisition and rehabilitation also includes homes for residential care providers, apartments for families, and conversions of commercial or industrial buildings for homeless persons and families. The Housing Inventory reports units in such projects as adding to the housing stock only when new units are created as a result of the rehabilitation.
> In 2021, the Mayor’s Office of Housing and Community Development and the Office of Community Investment and Infrastructure rehabilitated 758 units.
TABLE 27A.Details of Units Acquired or Rehabilitated, 2021
Address Total Units Units Acquired /Rehabilitated
1382 30th Ave 4 4TOTAL 4 4
Affordable Housing Acquisition and Rehabilitation
TABLE 27.Units Acquired or Rehabilitated, 2017–2021
Year Units Acquired /Rehabilitated
20172018201920202021
11949
181405
4TOTAL 758
TABLE 27B.Rental Assistance Demonstration Program, 2016–2021
Year Very Low IncomeUnits Turned Over
/Rehabilitated
Low Income UnitsTurned Over
/Rehabilitated
201620172018201920202021
21580
934000
1180
233000
TOTAL 3092 351
The City has also strengthened eviction and tenant protections, and preserved the affordability of 563 units across 53 properties through its Small Sites acquisition and rehabilitation program since 2014.
The Mayor’s Office of Housing and Community Development implemented the first phase of the Rental Assistance Demonstration (RAD) program in 2015. RAD is a voluntary, permanent conversion of public housing to the Section 8 housing program. Since 2016, 3,443 units of public housing properties were transferred to owner/developer teams to rehabilitate.
39
S a n F r a n c i s c o H o u s i n g I n v e n t o r y | 2020
Affordable Housing Acquisition
and Rehabilitation
Acquisition and rehabilitation involves non-profit housing organizations purchasing existing residential buildings in order to rehabilitate units for low- and very low-income persons. Table 27 shows units that have been rehabilitated through funding by the Mayor’s Office of Housing and Community Development (MOHCD) and the Office of Community Investment and Infrastructure (OCII). Often it is more economical to purchase and rehabilitate existing units than to build new units. While many of these units are residential hotel (single room occupancy or SRO) units, acquisition and rehabilitation also includes homes for residential care providers, apartments for fami-lies, and conversions of commercial or industrial buildings for homeless persons and families. The Housing Inventory reports units in such projects as adding to the housing stock only when new units are created as a result of the rehabilitation..
» In 2021, the Mayor’s Office of Housing and Community Development and the Office of Community Investment and Infrastructure rehabilitated 4 units.
The City has also strengthened eviction and tenant protections, and preserved the affordability of 563 units across 53 properties through its Small Sites acquisition and rehabilitation program since 2014.
The Mayor’s Office of Housing and Community Development implemented the first phase of the Rental Assistance Demonstration (RAD) program in 2015. RAD is a voluntary, permanent conver-sion of public housing to the Section 8 housing program. Since 2016, 3,443 units of public hous-ing properties were transferred to owner/developer teams to rehabilitate.

S A N F R A N C I S C O P L A N N I N G D E P A R T M E N T40
13. Ingleside
1. Richmond
7. Central
12. South Central
10. South Bayshore
15. Outer Sunset
Presidio
8. Mission
2. Marina
14. Inner Sunset
9. South of Market
3. Northeast
4. Downtown
5. Western Addition
Golden Gate Park 6. Buena Vista
11. Bernal Heights
Changes in Housing Stock by Geography
This section discusses the City’s housing stock by geography. Map 1 shows San Francisco‘s 15 Planning Districts.
Table 28 summarizes newly constructed units completed, altered units, and units demolished in each Planning District. The table also ranks each Planning District by its position for each of the ratings categories.
» The South of Market Planning District had the most new construction in 2021 with 1,080 units built or 36% of the total new construction. It lost 0 units through demolition and gained an additional 4 net units added through conversion or alteration, making it the district with the third-highest net gain of 1,137 net new units or 25% of net new addition Citywide.
» The Mission had the greatest amount of net new housing units with 1,305 net new units. Downtown Planning District followed with 1,186 net new housing units added Citywide.
» The Central Planning District had the highest number of units demolished, with 5 units lost or about 42% of the total 12 units that were demolished in 2021.
» The Ingleside Planning District gained the least number of units in 2021, adding 0 new units through completions , losing 0 units through demolition, and gaining only 10 units through alterations resulting in a net gain of 10 units to the housing stock.
Figure 3 on the following page shows total new housing constructed and demolished by San Francisco Planning Districts in 2021.
MAP 1. San Francisco Planning Districts

Power BI Desktop
TABLE 28.Housing Units Completed and Demolished by Planning District, 2021
No.
District Name UnitsCompletedfrom NewConstructi
on
New UnitsCompleted
Rank
UnitsDemolished
UnitsDemolished
Rank
UnitsGained/
LostThrough
Alterations
UnitsAlteredRank
NetGain
HousingUnits
Net GainHousing
Rank
1
2
3
4
5
6
7
8
9
10
11
12
13
14
15
Richmond
Marina
Northeast
Downtown
Western Addition
Buena Vista
Central
Mission
South of Market
South Bayshore
Bernal Heights
South Central
Ingleside
Inner Sunset
Outer Sunset
2
2
144
1,155
307
9
1,182
1,080
6
2
168
2
22
10
11
6
2
4
14
8
1
3
9
12
5
15
13
7
1
1
5
2
2
1
3
3
1
2
2
3
34
29
26
31
48
35
35
125
57
15
11
42
10
44
22
8
10
11
9
3
7
6
1
2
13
14
5
15
4
12
35
31
169
1,186
355
35
39
1,305
1,137
21
13
208
10
45
44
11
12
6
2
4
10
9
1
3
13
14
5
15
7
8
Total 4,081 12 564 4,633
FIGURE 3.Units Completed from New Construction & Units Demolished by Planning District, 2021
0
500
1,000
1,500
Richmond
Marina
Northeast
Downtown
Western Additio
n
Buena VistaCentra
l
Mission
South of Market
South Bayshore
Bernal Heights
South Central
Ingleside
Inner Sunset
Outer Sunset
2 2
144
1,155
307
9
1,1821,080
6 2
168
2 221 1 5 2 2 1
New Units Completed Units Demolished
41
S a n F r a n c i s c o H o u s i n g I n v e n t o r y | 2020

Power BI Desktop
FIGURE 4.Housing Stock by Building Type by Planning District, 2021
0 10,000 20,000 30,000 40,000
01 - Richmond
02 - Marina
03 - Northeast
04 - Downtown
05 - Western Addition
06 - Buena Vista
07 - Central
08 - Mission
09 - South of Market
10 - South Bayshore
11 - Bernal Heights
12 - South Central
13 - Ingleside
14 - Inner Sunset
15 - Outer Sunset
Presidio, Treasure Island
Single Family 2 to 4 Units 5 to 9 Units 10 to 19 Units 20 + Units
Figure 4 shows the total overall housing stock by building type for the 15 San Francisco Planning Districts. Table 29 contains San Francisco housing stock totals by Planning District and shows the net gain since the 2010 Census.
> The Northeast and Richmond Planning Districts continue to have the highest number of overall units, having 41,344 units and 37,760 units respectively. The Northeast District accounts for about 10% of the City’s housing stock, while the Richmond Planning District accounts for about 9%.
> The South Central, Outer Sunset, and Ingleside Planning Districts remain the areas with the highest number of single-family homes in San Francisco. Together these areas account for approximately 46% of all single-family homes.
> The Richmond, Central, Northeast, and Mission Planning Districts are the areas with the highest numbers of buildings with 2 to 4 units, representing 19%, 11%, 10%, and 9% of those units respectively.
Housing Stock by Planning District
> In the “5 to 9 Units” category, the Northeast, Richmond, Western Addition, and Mission Planning Districts have the highest numbers of those units with 17%, 14%, 11%, and 10% respectively.
> The Marina, Northeast, Western Addition, and Richmond Planning Districts continue to have the highest share of buildings with 10 to 19 units. Fifty-eight percent (58%) of the City’s multi-family buildings with 10 to 19 units are in these districts.
> The Downtown Planning District has the largest stock of the city’s high-density housing – about 29,834 units. The South of Market District closely follows with about 29,394 units. Eighty-seven percent (87%) of all housing in the Downtown Planning District is in buildings with 20 or more units. This district accounts for 24% of all the high-density housing citywide. The South of Market District, with 78% of its units in buildings with 20 units or more, also claims 24% of the City’s high-density housing.
S A N F R A N C I S C O P L A N N I N G D E P A R T M E N T42
Housing Stock by Planning District
Figure 4 shows the total overall housing stock by building type for the 15 San Francisco Planning Districts. Table 29 contains San Francisco housing stock totals by Planning District and shows the net gain since the 2010 Census.
» The Northeast and Richmond Planning Districts continue to have the highest number of overall units, having 41,344 units and 37,760 units respectively. The Northeast District accounts for about 10% of the City’s housing stock, while the Richmond Planning District accounts for about 9%.
» The South Central, Outer Sunset, and Ingleside Planning Districts remain the areas with the highest number of single-family homes in San Francisco. Together these areas account for approximately 46% of all single-family homes.
» The Richmond, Central, Northeast, and Mis-sion Planning Districts are the areas with the highest numbers of buildings with 2 to 4 units, representing 19%, 11%, 10%, and 9% of those units respectively.
» In the “5 to 9 Units” category, the Northeast, Richmond, Western Addition, and Mission Planning Districts have the highest numbers of those units with 17%, 14%, 11%, and 10% respectively.
» The Marina, Northeast, Western Addition, and Richmond Planning Districts continue to have the highest share of buildings with 10 to 19 units. Fifty-eight percent (58%) of the City’s multi-family buildings with 10 to 19 units are in these districts.
» The Downtown Planning District has the largest stock of the city’s high-density housing – about 29,834 units. The South of Market District closely follows with about 29,394 units. Eighty-seven percent (87%) of all housing in the Downtown Planning District is in buildings with 20 or more units. This district accounts for 24% of all the high-density housing citywide. The South of Market District, with 78% of its units in buildings with 20 units or more, also claims 24% of the City’s high-density housing.

Power BI Desktop
TABLE 29.Net Change in Housing Stock by Planning District, 2010–2021
Planning District YEAR (groups) Single Family 2 to 4 Units 5 to 9 Units 10 to 19 Units 20+ Units District Total*
1 - Richmond 2010 ACS5
2011-2020
2021
Percent of Total
TOTAL
2 - Marina 2010 ACS5
2011-2020
2021
Percent of Total
TOTAL
3 - Northeast 2010 ACS5
2011-2020
2021
Percent of Total
TOTAL
4 - Downtown 2010 ACS5
2011-2020
2021
Percent of Total
TOTAL
5 - Western Addition 2010 ACS5
2011-2020
2021
Percent of Total
TOTAL
6 - Buena Vista 2010 ACS5
2011-2020
2021
Percent of Total
TOTAL
11,388
-18
0
0
11,370
3,469
-8
1
0
3,462
2,080
0
0
0
2,080
547
3
0
0
550
15,525
177
21
0
15,723
5,636
46
8
0
5,690
7,621
61
8
0
7,690
719
10
0
0
729
5,126
68
9
0
5,203
3,824
12
8
0
3,844
6,147
62
11
0
6,220
494
16
0
0
510
3,845
30
4
0
3,879
7,404
27
14
0
7,445
6,585
41
11
0
6,637
2,460
82
2
0
2,544
1,467
115
1
0
1,583
5,817
333
0
0
6,150
17,965
721
139
0
18,825
24,967
4,892
1,184
0
31,043
37,351
372
35
0
37,758
26,150
410
31
0
26,591
40,398
885
169
0
41,452
29,187
5,003
1,186
0
35,376
2,535
1
0
0
2,536
2,777
0
1
0
2,778
6,065
72
16
0
6,153
6,633
75
1
0
6,709
4,055
39
18
0
4,112
3,339
35
14
0
3,388
4,381
69
16
0
4,466
2,099
21
16
0
2,136
12,283
1,540
305
0
14,128
2,062
1,065
3
0
3,130
29,319
1,721
355
0
31,395
16,910
1,196
35
0
18,141
43
S a n F r a n c i s c o H o u s i n g I n v e n t o r y | 2020
CONTINUED >
9.2% 19.4% 13.9% 10.1% 1.3% 9.3%
2.8% 7.0% 10.2% 19.4% 4.9% 6.5%
0.4% 0.9% 1.4% 6.6% 24.7% 8.7%
2.2% 8.3% 9.0% 5.6% 2.5% 4.5%
1.7% 9.5% 16.6% 17.3% 15.0% 10.2%
2.0% 7.6% 11.0% 11.6% 11.2% 7.7%

Power BI Desktop
Planning District YEAR (groups) Single Family 2 to 4 Units 5 to 9 Units 10 to 19 Units 20+ Units District Total*
7 - Central 2010 ACS5
2011-2020
2021
Percent of Total
TOTAL
8 - Mission 2010 ACS5
2011-2020
2021
Percent of Total
TOTAL
9 - South of Market 2010 ACS5
2011-2020
2021
Percent of Total
TOTAL
10 - South Bayshore 2010 ACS5
2011-2020
2021
Percent of Total
TOTAL
11 - Bernal Heights 2010 ACS5
2011-2020
2021
Percent of Total
TOTAL
12 - South Central 2010 ACS5
2011-2020
2021
Percent of Total
TOTAL
13 - Ingleside 2010 ACS5
2011-2020
2021
Percent of Total
TOTAL
10,219
6
3
0
10,228
6,295
8
4
0
6,307
2,379
7
1
0
2,387
7,614
57
2
0
7,673
8,671
117
22
0
8,810
7,026
133
26
0
7,185
2,933
62
7
0
3,002
1,614
-24
19
0
1,609
2,935
32
7
0
2,974
3,797
68
28
0
3,893
1,207
39
12
0
1,258
700
-18
0
0
682
2,398
24
7
0
2,429
3,221
175
3
0
3,399
1,428
81
0
0
1,509
514
23
0
0
537
2,167
176
0
0
2,343
4,205
2,069
1,244
0
7,518
14,070
14,953
1,117
0
30,140
890
1,671
0
0
2,561
26,390
355
39
0
26,784
24,544
2,453
1,305
0
28,302
22,017
15,142
1,137
0
38,296
11,332
1,709
21
0
13,062
5,926
19
3
0
5,948
21,602
-56
3
0
21,549
16,497
85
1
0
16,583
2,796
43
10
0
2,849
3,005
103
35
0
3,143
1,565
190
9
0
1,764
537
0
0
0
537
858
-64
0
0
794
606
0
0
0
606
130
0
0
0
130
589
-6
3
0
586
900
20
0
0
920
199
0
0
0
199
800
315
167
0
1,282
4,832
274
0
0
5,106
9,588
62
13
0
9,663
26,854
292
208
0
27,354
24,400
569
10
0
24,979
S A N F R A N C I S C O P L A N N I N G D E P A R T M E N T44
CONTINUED >
8.2% 10.8% 7.9% 6.3% 1.9% 6.6%
1.9% 3.7% 3.4% 3.9% 23.9% 9.4%
4.8% 3.5% 1.4% 0.3% 0.2% 2.4%
13.4% 2.2% 1.6% 2.4% 4.1% 6.1%
5.1% 8.8% 10.4% 8.9% 6.0% 7.0%
6.2% 2.0% 1.8% 1.4% 2.0% 3.2%
17.4% 3.9% 2.1% 1.5% 1.0% 6.7%

Power BI Desktop
This section provides a regional context to the City’s housing production trends. San Francisco is one of nine counties that make up the Bay Area.
> In 2020, Bay Area counties authorized 17,696 units for construction, 22% less than the 2019 authorizations of 22,736 units.
> Alameda (21%), Santa Clara (20%) and San Francisco (16%) counties accounted for 57% of the total units authorized in 2020.
> In San Francisco, 99% of new housing is in multi-family buildings. Alamada (69%), Santa Clara (63%), Contra Costa (45%), and San Mateo (44%),
Housing Construction in the Bay Area
also have a high percentage of authorized units in multi-family structures. Single-family housing units predominatein Napa (100%), Marin (97%),and Solano (58%).
The map on page 12 shows the nine counties that make up the Greater San Francisco Bay Area. Table 30 shows the total number of units authorized for construction for San Francisco and the rest of the Bay Area for 2021. Figure 5 shows trends in housing construction by building type from 2012 to 2020.
Planning District YEAR (groups) Single Family 2 to 4 Units 5 to 9 Units 10 to 19 Units 20+ Units District Total*
14 - Inner Sunset 2010 ACS5
2011-2020
2021
Percent of Total
TOTAL
15 - Outer Sunset 2010 ACS5
2011-2020
2021
Percent of Total
TOTAL
Presidio, TreasureIsland and Golden
Gate Park
2010 ACS5
2011-2020
2021
Percent of Total
TOTAL
Citywide 2010 ACS5
2011-2020
2021
Percent of Total
TOTAL
10,450
3
1
0
10,454
19,321
-27
0
0
19,294
852
0
0
0
852
123,951
80
20
0
124,051
4,528
86
14
0
4,628
4,750
97
17
0
4,864
687
0
0
0
687
79,774
1,248
213
0
81,235
1,555
5
1
0
1,561
1,385
1
5
0
1,391
523
9
0
0
532
37,088
304
113
0
37,505
1,226
18
7
0
1,251
442
6
22
0
470
34
0
0
0
34
37,656
611
105
0
38,372
1,188
7
22
0
1,217
495
48
0
0
543
89
0
0
0
89
93,496
28,179
4,182
0
125,857
18,947
119
45
0
19,111
26,393
125
44
0
26,562
2,185
9
0
0
2,194
371,965
30,422
4,633
1
407,020
45
S a n F r a n c i s c o H o u s i n g I n v e n t o r y | 2020
Housing Construction in the Bay Area
This section provides a regional context to the City’s housing production trends. San Francisco is one of nine counties that make up the Bay Area.
» In 2021, Bay Area counties authorized 22,960 units for construction, 27% more than the 2020 authorizations of 18,124 units.
» Alameda (27%), Santa Clara (22%) and San Francisco (17%) counties accounted for 66% of the total units authorized in 2021.
» In San Francisco, 99% of new housing is in multi-family buildings. Alameda (74%), Santa Clara (64%), Contra Costa (43%), and San
Mateo (48%), also have a high percentage of authorized units in multi-family structures. Authorized single-family housing units pre-dominate in Napa (78%), Marin (92%),and Solano (72%).
The map on page 12 shows the nine counties that make up the Greater San Francisco Bay Area. Table 30 shows the total number of units authorized for construction for San Francisco and the rest of the Bay Area for 2020. Figure 5 shows trends in housing construction by building type from 2012 to 2021.
8.4% 5.7% 4.2% 3.3% 1.0% 4.7%
15.6% 6.0% 3.7% 1.2% 0.4% 6.5%
0.7% 0.8% 1.4% 0.1% 0.1% 0.5%
30.0% 20.0% 9.0% 9.0% 31.0% 100.0%

Power BI Desktop
County Single-Family Units Multi-Family Units Total Units Percent of Total
AlamedaContra CostaMarinNapaSan FranciscoSan MateoSanta ClaraSolanoSonoma
1,5892,228
23332243
6821,766
9001,255
4,4941,695
2186
2,178641
3,179347
1,267
6,0833,923
254408
2,2211,3234,9451,2472,522
27%17%1%2%
10%6%
22%5%
11%Total 9,018 13,908 22,926 100%
TABLE 30.New Units Authorized in San Francisco and the Bay Area Counties, 2021
5,000
10,000
15,000
20,000
NU
MB
ER O
F U
NIT
S
2012 2014 2016 2018 2020
9,018
10,313
5,598
6,9225,980
8,002
4,974
8,962
7,263
8,635
13,908
21,200
15,492
12,01411,202
13,571 13,295
20,705
15,736
11,686
Single-FamilyUnits Multi-Family Units
FIGURE 5.Bay Area Housing Construction Trends, 2012–2021
S A N F R A N C I S C O P L A N N I N G D E P A R T M E N T46

47
S a n F r a n c i s c o H o u s i n g I n v e n t o r y | 2020
APPENDICES:A CLOSER LOOK AT HOUSING IN SAN FRANCISCO

S A N F R A N C I S C O P L A N N I N G D E P A R T M E N T48
Appendix A: Project Lists
This Appendix details major projects in various stages of the planning or construction process: projects under Planning Department review, projects that have been authorized for construc-tion by the DBI, and projects that have been completed. A project’s status changes over time. During a reporting period, a project may move from approved to under construction or from under construction to completed. Similarly, a project may change from rental to condominiums, or vice versa, before a project is completed or occupied.
Table A-1 details major market-rate housing proj-ects with ten or more units that were completed in 2021. This list also includes the number of inclusionary units in the project.
Table A-2 is comprised of major affordable hous-ing projects with twenty or more units that were completed in 2021.
Table A-3 provides information for all projects with twenty or more units that were fully entitled by the Planning Department in 2021. These projects typically require either a conditional use permit, environmental review, or some other type of review by the Planning Commission or Zoning Administrator, or the Environmental Review Officer.
Table A-4 provides information for all projects with ten or more units that were filed with the Planning Department in 2021. These projects require a conditional use permit, environmental review, or other types of review by the Planning Commission, Zoning Administrator, or the Environ-mental Review Officer. This list does not include projects submitted for informal Planning project review and for which no applications have been filed, and only includes fully complete applications accepted for review by the Planning Department.
Table A-5 contains residential projects with ten or more units authorized for construction by DBI in 2021.
Table A-6 contains residential projects proposing to utilize a density bonus program.
Table A-7 is an accounting of affordable housing projects in the “pipeline”— projects that are under construction, or in pre-construction or preliminary planning with either the Mayor’s Office of Hous-ing or the Office of Community Investment and Infrastructure.
Table A-8 details 2021 housing production in Analysis Neighborhoods as defined by San Fran-cisco Indicator Project (DPH).
Appendix B: Planning Area Annual Monitoring
Tables in Appendix B have been added to the Housing Inventory to comply in part with the requirements of Planning Code §341.2 and Administrative Code 10E.2 to track housing devel-opment trends in the recently-adopted community area plans. These plan areas also have separate monitoring reports that discusses housing produc-tion trends in these areas in greater detail.
Table B-1 details 2021 housing trends in recently adopted planning areas.
Table B-2 summarizes the units entitled by the Planning Department in 2021 by planning areas.
Table B-3 summarizes units gained from new construction in 2021 by planning areas.
Table B-4 summarizes units demolished in 2021 by planning areas.
Table B-5 summarizes units lost through altera-tions and demolitions in 2021 by planning areas.
Table B-6 summarizes affordable housing projects for 2021 in planning areas.
Appendix C: San Francisco Zoning Districts
Appendix D: In-Lieu Housing Fees Collected
Appendix E: Glossary

Power BI Desktop
TABLE A-1.Major Market Rate Housing Projects Completed, 2021
Street Address / ProjectName
TotalProjectUnits
UnitsCompleted
Before2021
UnitsCompleted
in 2021
AffordableUnits
Unit Mix TenureType Initial Sales Price orRental Price
1169 Market St
30 Otis St
1140 Harrison St
434 Minna St
950 Market St
1001 South Van Ness Av
333 12th St
975 Bryant St
706 Mission St
830 Eddy St
1532 Harrison St
88 Broadway
75 Howard St
2500 Turk Bl
2698 Turk Bl 0
555 Golden Gate Av
1145 Polk St
770 Powell St
1174 Folsom St
230 07th St
502
395
371
302
242
208
200
185
169
137
136
125
120
84
71
55
54
44
42
40
0
0
0
0
0
0
104
0
146
0
0
0
0
0
0
0
0
32
0
0
502
395
371
302
242
208
96
185
23
137
136
125
120
84
71
55
54
12
42
40
74
0
0
36
27
30
0
20
22
52
0
0
0
7
8
0
0
5
NA
NA
NA
NA
NA
NA
NA
NA
NA
NA
NA
NA
NA
NA
NA
NA
NA
NA
NA
NA
Ownership
Rental
Rental
Rental
Ownership
NA
Rental
Rental
Ownership
Rental
Rental
NA
Ownership
NA
NA
Ownership
Ownership
NA
NA
Ownership
NA
From $3,031 To$7,560
From $2,494 To$6,509
Form $2,625 To$5,755
NA
NA
NA
From $2,653 To$4,357
NA
From $2,128 To$7,780
From $2,846 To$5,503
NA
From $1,495,000 To$7,250,000
NA
NA
$649,000 +
NA
NA
NA
From $1,198,000 To$1,728,000
349 8th St
3701 Noriega St
2410 33rd Av
38
12
10
0
0
0
38
12
10
6
NA
NA
NA
Ownership
Rental
Rental
$575,000 +
NA
From $3,200 To$4,450
49
S a n F r a n c i s c o H o u s i n g I n v e n t o r y | 2020

Power BI Desktop
TABLE A-2.Major Affordable Housing Projects Completed, 2021
Address TotalUnits
AffordableUnits
Unit Mix TenureType
Price (Rentalor Selling) AMI %Targets
TypeofHousing
1301 16th St
1950 Mission St
691 China Basin St
1990 Folsom St
2060 Folsom St
490 South Van NessAve
3001 24th St
172
157
152
143
127
81
45
29
155
151
142
126
80
44
Studios: 4 One bedroom: 13 Two bedroom: 11 Three bedroom: 1
Studios: 32 One bedroom: 36 Two bedroom: 73 Three bedroom: 14
Studios: 10 One bedroom: 34 Two bedroom: 76 Three bedroom: 29 Four bedroom: 1 Five bedroom: 1
Studios: 23 One bedroom: 48 Two bedroom: 60 Three bedroom: 11
Studios: 22 One bedroom: 15 Two bedroom: 48 Three bedroom: 42
Studios: 2 One bedroom: 44 Two bedroom: 30 Three bedroom: 4
Studios: 44
Rental
Rental
Rental
Rental
Rental
Rental
Rental
Studio: $1,182/month One BR: $1,339/month Two BR: $1,494/month Three BR:$1,649/month
Studio:$936-$1,272/month One BR:$1,052-$1,436/month Two BR:$1,167-$1,599/month Three BR:$1,280-$1,760/month
Studio:$823-$1,383/month One BR:$876-$1,948/month Two BR:$1,022-$2,175/month Three BR:$1,120-$2,402/month Four BR: $1,527/month Five BR: $1,625/month
Studio:$823-$1,586/month One BR:$923-$1,794/month Two BR:$1,022-$2,002/month Three BR:$1,120-$2,209/month
Studio: 30% of income One BR: $1,444/month Two BR:$1,317-$1,606/month Three BR:$1,610-$1,770/month
Studio: $1,272/month One BR:$923-$1,436/month Two BR:$1,022-$1,599/month Three BR:$1,120-$1,760/month
Studio: 30% of income
0.55
45%-60%
40%-80%
40%-74%
50%-60%
40%-60%
30%-50%
Family
Family
Family
Family
Family/Transition-Age Youth
Family
Senior
S A N F R A N C I S C O P L A N N I N G D E P A R T M E N T50

Power BI Desktop
TABLE A-3.Major Housing Projects Reviewed and Entitled by Planning Department, 2021
PlanningCase No.
First Address /Project Name
Case Description Units ApprovalDate
Action
2014.1058
2015-005983PRJ
2015-009955PRJ
2015-012577PRJ
2017-004557PRJ
6424 3rd Street /1088 Key Avenue
850 Bush Street
1525 PINE ST
1200 Van NessAvenue
550 OFARRELL ST
The Project includes demolition of the existing one-story building on theproject site, and new construction of a four-story, 40-ft tall, mixed-usebuilding (approximately 28,73 gross square feet) with 17 dwelling-units,approximately 2,671 square feet of retail sales and service use, 17 off-street parking spaces (via stackers), 17 Class 1 bicycle parking spaces, and4 Class 2 bicycle parking spaces. The Project includes a dwelling unit mixconsisting of 2 three-bedroom units, 10 two-bedroom units, and 5 one-bedroom units. The Project includes 2,303 square feet of common openspace via ground floor courtyard and fourth floor roof deck, and 366additional square feet of private open space via second-floor terraces.
The project sponsor proposes a five-story vertical and horizontal additionto the existing 18-foot-tall, two-story, 3,080-gross-square-foot commercialbuilding. The project would add 21 residential units (7 one-bedroom unitsand 14 two-bedroom units) and approximately 1,850 square feet of retailspace (1,550 square feet at the ground floor and 300 square feet at thesecond floor). With implementation of the project, the proposed mixed-use building would be 65 feet tall (81 feet tall with elevator penthouse),seven stories, and approximately 16,425 gross square feet in size. Theproject would provide 21 class 1 bicycle spaces at the ground-floor leveland zero off-street vehicular parking spaces. The project would require48.7 cubic yards of soil disturbance; no underground levels are proposed.
The Project would demolish the existing 1,661 square foot one-storycommercial restaurant (dba “Grubstake”) and construct a new 83-foot talleight-story mixed-use building with a 2,856 square foot restaurant and 21dwelling units. The Project relies on State Density Bonus Provisions for anadditional six units over the base density of 15 units, for a total of 21 units. Conditional Use required for Development on a Large Lot, Dwelling UnitMix, Non-Residential Use Size, and Restaurant Operating Hours.
The proposed project will be the construction of 130' high, 13-story,259,621 gsf mixed use (retail/commercial/residential) building with aparking garage for 368 cars in five below grade levels. The proposedproject will have retail which may include a grocery store, medical officesand clinics on Level 2 through Level 5 and an eight-story residential towerwith 95 dwelling units (71 one bedrooms and 24 two bedrooms).
Demolish all but the façade of the existing two-story parking garage andconstruct a 13-story over-basement residential tower (approximately112,810 square feet) that would utilize Section 207(c)(1) to achieve 111dwelling units (22 on-site affordable units). Project requires Conditional Use Authorization for structure height and tomodify bulk limits, and a Variance from the rear yard and dwelling unitexposure requirements. Preferred Project retains the façade of the existing garage as a “retainedelement.” A Project Variant is also being analyzed as part of the EIR.
17
21
21
107
111
13-May-21
16-Dec-21
22-Jul-21
23-Sep-21
14-Jan-21
Approved
Approved
Approved
Approved
Approved
51
S a n F r a n c i s c o H o u s i n g I n v e n t o r y | 2020
CONTINUED >NOTE: The case descriptions were pulled from the system as-is.
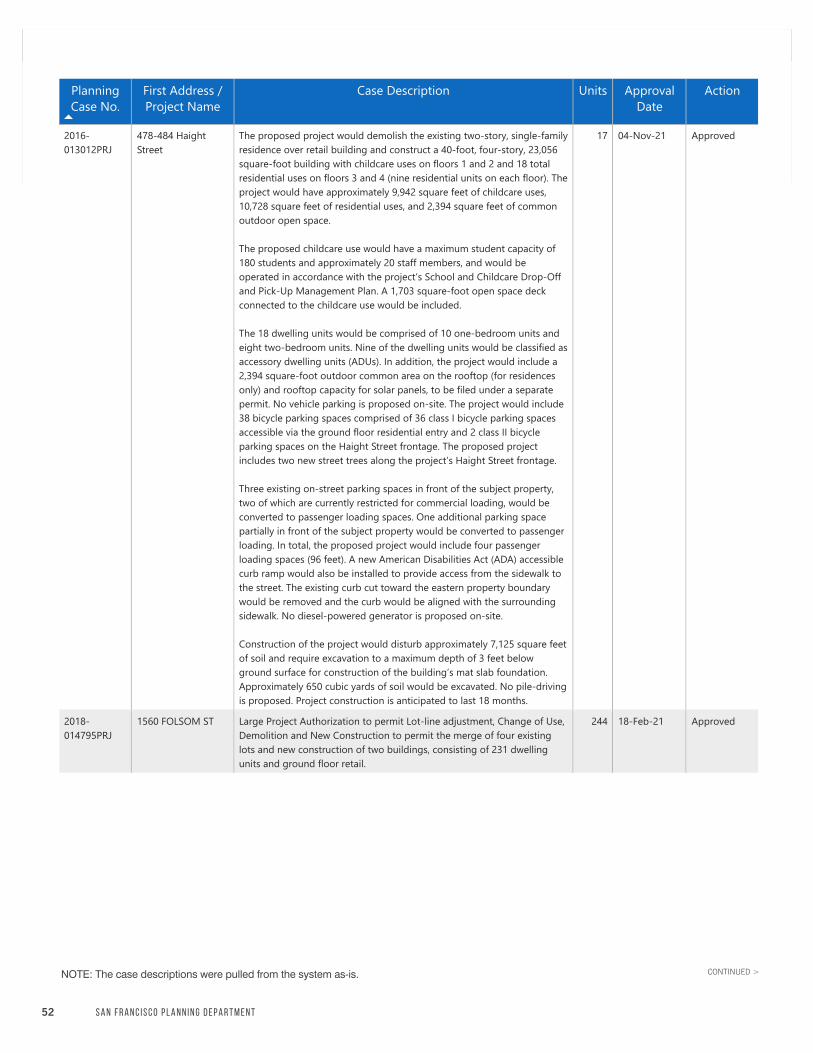
Power BI Desktop
PlanningCase No.
First Address /Project Name
Case Description Units ApprovalDate
Action
2016-013012PRJ
2018-014795PRJ
478-484 HaightStreet
1560 FOLSOM ST
The proposed project would demolish the existing two-story, single-familyresidence over retail building and construct a 40-foot, four-story, 23,056square-foot building with childcare uses on floors 1 and 2 and 18 totalresidential uses on floors 3 and 4 (nine residential units on each floor). Theproject would have approximately 9,942 square feet of childcare uses,10,728 square feet of residential uses, and 2,394 square feet of commonoutdoor open space. The proposed childcare use would have a maximum student capacity of180 students and approximately 20 staff members, and would beoperated in accordance with the project’s School and Childcare Drop-Offand Pick-Up Management Plan. A 1,703 square-foot open space deckconnected to the childcare use would be included. The 18 dwelling units would be comprised of 10 one-bedroom units andeight two-bedroom units. Nine of the dwelling units would be classified asaccessory dwelling units (ADUs). In addition, the project would include a2,394 square-foot outdoor common area on the rooftop (for residencesonly) and rooftop capacity for solar panels, to be filed under a separatepermit. No vehicle parking is proposed on-site. The project would include38 bicycle parking spaces comprised of 36 class I bicycle parking spacesaccessible via the ground floor residential entry and 2 class II bicycleparking spaces on the Haight Street frontage. The proposed projectincludes two new street trees along the project’s Haight Street frontage. Three existing on-street parking spaces in front of the subject property,two of which are currently restricted for commercial loading, would beconverted to passenger loading spaces. One additional parking spacepartially in front of the subject property would be converted to passengerloading. In total, the proposed project would include four passengerloading spaces (96 feet). A new American Disabilities Act (ADA) accessiblecurb ramp would also be installed to provide access from the sidewalk tothe street. The existing curb cut toward the eastern property boundarywould be removed and the curb would be aligned with the surroundingsidewalk. No diesel-powered generator is proposed on-site. Construction of the project would disturb approximately 7,125 square feetof soil and require excavation to a maximum depth of 3 feet belowground surface for construction of the building’s mat slab foundation.Approximately 650 cubic yards of soil would be excavated. No pile-drivingis proposed. Project construction is anticipated to last 18 months.
Large Project Authorization to permit Lot-line adjustment, Change of Use,Demolition and New Construction to permit the merge of four existinglots and new construction of two buildings, consisting of 231 dwellingunits and ground floor retail.
17
244
04-Nov-21
18-Feb-21
Approved
Approved
S A N F R A N C I S C O P L A N N I N G D E P A R T M E N T52
CONTINUED >NOTE: The case descriptions were pulled from the system as-is.

Power BI Desktop
PlanningCase No.
First Address /Project Name
Case Description Units ApprovalDate
Action
2017-012086PRJ
2018-007380PRJ
2018-016808PRJ
770 WOOLSEY ST
1320 WASHINGTONST
321 FLORIDA ST
The Project (“Project”) includes demolition of the existing abandonedgreenhouse structures and new construction of 31 three-story residentialduplex buildings with a height of approximately 35 feet and a total GrossFloor Area of approximately 118,600 square feet with ground floor garageand storage spaces. The Project would construct a total of 62 dwellingunits. The Project includes 62 off-street vehicle parking spaces, 93 Class 1and 12 Class 2 bicycle parking spaces. The Project will also provideapproximately 43,300 square feet of open space. Of that total amount,approximately 14,900 square feet will be private rear yards, approximately11,200 square feet will be common shared spaces for the residential units,and approximately 17,200 square feet will be provided as a publiclyaccessible open space at the corner of Woolsey and Hamilton Streets. Aspart of demolition, the Project Sponsor would salvage materials from theoriginal boiler house and greenhouses as feasible. The Project would also add a new 11-foot wide sidewalk along WaylandStreet and fill an existing trench to create a new 10-foot wide sidewalkalong Bowdoin Street. The existing sidewalks on Hamilton and Woolseystreets would be replaced with 10-foot wide sidewalks and would addfour new sidewalk bulbouts (one at each corner of the site). The Projectwould include 31 new curb cuts and provide approximately 28 on-streetparking spaces surrounding the Project site. Two on-street car sharespaces will be located on Hamilton Street near the proposed publiclyaccessible open space. A total of approximately 33 street trees would beprovided along the perimeter of the block. (11-8-21 kjd)
The 9,453-square-foot project site is located on the block bound byWashington, Jackson, Leavenworth and Jones streets in the Nob Hillneighborhood of San Francisco. A 28-foot-tall, two-story, 18,906-square-foot public parking garage with 48 vehicle parking spaces, built in 1920,currently occupies the site. The proposed project would demolish theexisting building and construct an approximately 65-foot-tall, six-story-over-basement, 47,329-square-foot residential building with 25 dwellingunits (12 one-bedroom units, 9 two-bedroom units, and four three-bedroom units). The project would also include 25 unbundled vehicleparking spaces and 25 bicycle parking spaces in a basement garage. Anew 10-foot-wide curb cut on Washington Street would provide access tothe new garage, replacing the existing 64-foot-wide curb cut. A mainentrance along Washington Street would provide pedestrian access to thebuilding lobby. Two bicycle parking spaces and four new street treeswould be installed in the public right of way along the Washington Streetfrontage. The project would include 6,078 square feet of open space forbuilding residents in a combination of private roof terraces and rear yards,and a common roof deck. The new building would be supported by a mator spread footing foundation. Construction would last approximately 18months and include excavation of the entire site to depths of 13.5 to 20.5feet below ground surface (from front to back of site) resulting in theremoval of approximately 5,100 cubic yards of soil.
The proposed project is a mixed-use residential development, located inthe Urban Mixed-Use (UMU) District, which would be built on an existingsurface parking lot. The project as proposed applies the State DensityBonus Program, which allows for a 35% increase in density. The baseproject is a 6 story building, containing 95,385 square feet of residentialuse, and the density bonus project is a 10 story building, contianing128,770 square feet of residential use, with 169 units, 54 parking spacesand 128 bicycle parking spaces. Thirty-one affordable units will beprovided on site. The project proposes approximately 1,591 square feet ofground floor retail space.
62
25
168
18-Nov-21
04-Nov-21
25-Feb-21
Approved
Approved
Approved
53
S a n F r a n c i s c o H o u s i n g I n v e n t o r y | 2020
CONTINUED >NOTE: The case descriptions were pulled from the system as-is.

Power BI Desktop
PlanningCase No.
First Address /Project Name
Case Description Units ApprovalDate
Action
2017-015678PRJ
425 BROADWAY The project site is currently developed with a 144-space, 21,725 square-foot commercial parking structure that is accessed via Broadway andMontgomery Street. On Broadway, there is also a Muni bus stop servicedby the 12-Folsom Muni bus route adjacent to the site, and a commercial loadingzone along the property frontage. The proposed project would demolish the existing parking structure andconstruct two new mixed-use buildings on the L-shaped project site. TheBroadway building would be five stories (56 feet) tall with two basementlevels and contain approximately 6,700 square feet of design professionaloffice space in the two basement levels, approximately 3,450 square feetof retail on ground level, approximately 1,850 square feet of designprofessional office and two residential units on floor 2, and 12 residentialunits on floors 3 to 5 (i.e., four residences per floor). The Broadwaybuilding would also include 2,640 square feet of common open space onthe rooftop. Select dwelling units would also have a private terrace. The Montgomery building would be seven stories (64 feet) tall with onebasement level and would contain a 17-space basement parking garage in the basement level, approximately2,150 square feet of design professional office space and 1,150 squarefeet of retail space on floor 1 (street level), approximately 2,100 squarefeet of design professional office and three residential units on floor 2,and 25 residential units on floors 3 to 7 (i.e., five residences per floor). TheMontgomery building rooftop would be solar-ready to accommodatesolar panels. The two proposed buildings would be separated by VerdiAlley, which is a public right-of-way that extends west from MontgomeryStreet for approximately 58 feet and a private alley following the westernterminus of the public right-of-way; the private segment of the alley is burdened with a below-grade sewer easement held by the San Francisco Public UtilitiesCommission. The private segment of Verdi Alley would provide projectopen space, and the public segment would provide pedestrian access tothe residential and office lobbies in the Montgomery building andvehicular access for emergency services, deliveries, trash pick-ups, andmaintenance of the below-grade sewer. In total, the proposed project includes approximately 52,365 gross squarefeet of residential use, 4,940 gross square feet of retail use, and 17,995gross square feet of design professional office use. The dwelling unit mixwould comprise of 16 one-bedroom units, 21 two-bedroom units, and fivethree-bedroom units. Of the 42 total residential units, six of the unitswould be affordable units. The proposed project would include 17vehicular residential parking spaces, 47 secure class 1 bicycle parkingspaces and 7 class 2 parking spaces along the project’s frontage onBroadway and Montgomery Street. Neither building would include back-up diesel generators. The existing commercial loading zone on Broadwaywould be retained. The proposed project would be supported by a mat foundation.Construction of the project would disturb approximately 13,641 squarefeet of soil and require excavation to a depth of 15 feet below groundsurface, except at the location of vehicle stackers and elevator pits, whichwould have a maximum depth of 21 feet. The project would excavateapproximately 6,997 cubic yards of soil. Project construction is anticipatedto last 26 months.
34 16-Dec-21 Approved
S A N F R A N C I S C O P L A N N I N G D E P A R T M E N T54
CONTINUED >NOTE: The case descriptions were pulled from the system as-is.

Power BI Desktop
PlanningCase No.
First Address /Project Name
Case Description Units ApprovalDate
Action
2018-015815PRJ
2018-016721PRJ
2019-012676PRJ
2019-012820PRJ
1055 TEXAS ST(formerly 999 TEXASST)
0 GUTTENBERG ST
159 FELL ST
4742 MISSION ST
The Project includes the construction of a five-story-over-two basements,49-foot-tall residential building with 25 dwelling units on two vacant lots.The building would contain approximately 20,329 gross square feet andprovide approximately 3,015 square feet of usable common open space,and 374 square feet of private open space for the residents in the rearyard and on roof decks above the fourth and fifth floors. A total of 25Class 1 bicycle parking spaces would be provided in a basement-levelbicycle room and four Class 2 spaces on the sidewalk adjacent to theproject site. The Project would also include a lot merger of Lots 032 and033 on Block 4224. In order for the Project to proceed, the Commission must grant a HOME-SF Project Authorization, pursuant to Planning Code Sections 206.3 and328. Using the HOME-SF Program, the Project is receiving developmentbonuses to allow form-based density and the addition of one additionalstory of height in exchange for providing 25% on-site affordable dwellingunits. The Project is also receiving Zoning Modifications from the rearyard, open space, and dwelling unit exposure requirements of PlanningCode Sections 134, 135, and 140, respectively.
The 36,406-square-foot project site is a vacant, irregularly shaped lot inthe interior of the block bounded by Guttenberg, Morse, Brunswick andLowell streets. The proposed project would construct three new two- tothree-story (21- to 26-foot-tall) residential buildings totaling 32,214square feet. The new buildings would include a total of 19 dwelling unitswith eleven three-bedroom units and eight two-bedroom units. Thedwelling units would be accessed from Guttenberg Street by a new 30-foot-wide curb cut leading to a new approximately 267-foot-long, 20-foot-wide private driveway with approximately 5-foot-wide sidewalks oneither side. A total of 29 unbundled vehicle parking spots and 19 bicycleparking spaces would be provided in ground-level parking garages ineach building. Approximately 8,000 square feet of private open spacewould also be provided in the form of rear yards. Solar photovoltaicsystems would be installed on the roofs of each building. Site gradingwould involve excavation to depths of three to 6.5 feet below groundsurface. Trenching for utilities would involve excavation to a maximumdepth of eight feet below ground surface. The proposed project wouldinclude approximately 370 cubic yards of soil export and import toconstruct the project. The project would require planning commissionapproval of a conditional use authorization for a planned unitdevelopment pursuant to planning code sections 303 and 304.
Demolition of an existing 2-story building. Construction of a new 7-storybuilding with ground-floor retail and 20 residential units.
The Project includes the demolition of an existing 7,065 gross square foot,single-story, vacant commercial building and new construction of a 45,235gross square foot, eight-story-over-basement, 74-foot 6-inch-tall, 46dwelling unit mixed-use building with approximately 2,456 square feet ofcommercial space on the ground floor and mezzanine level. The Projectincludes a dwelling unit mix consisting of 2 three-bedroom units, 16 two-bedroom units, 12 one-bedroom units, and 16 studio units. The Projectwould include approximately 4,608 square feet of usable open space on acommon roof deck and 611 square feet of private open space via threeprivate decks, 7 off-street vehicle parking spaces and 46 Class 1 bicycleparking spaces located at the basement level, and 4 Class 2 bicycleparking spaces. The proposed project is a Home-SF development.
25
19
24
46
14-Jan-21
11-Mar-21
29-Jul-21
04-Mar-21
Approved
Approved
Approved
Approved
55
S a n F r a n c i s c o H o u s i n g I n v e n t o r y | 2020
CONTINUED >NOTE: The case descriptions were pulled from the system as-is.

Power BI Desktop
PlanningCase No.
First Address /Project Name
Case Description Units ApprovalDate
Action
2019-013276PRJ
2019-019698PRJ
2019-020740PRJ
2019-020818PRJ
2020-001610PRJ
560 BRANNAN ST
4512 23RD ST
468 TURK ST
5012 03RD ST
3832 18TH ST
The proposed Project includes demolition of a two-story, 15,672 square-foot PDR building and the new construction of a nine-story (96-feet tall),mixed-use building with approximately 80,520 square feet of residentialuse for a total of 120 dwelling units and 5,745 square feet of ground floorPDR use. The Project would provide 107 Class 1 and 8 Class 2 bicycleparking spaces. No off-street parking spaces will be proposed.
The Project includes new construction of a 11,661 square foot, five-story-over-basement, 45-foot 9-inch-tall, 13 dwelling unit building on a vacantlot. The Project would include approximately 1,782 square feet of usable open space via two commonroof decks, one private patio and rear yard, and 13 Class 1 bicycle parkingspaces located at the basement level. The project is utilizing the Home-SFprogram for zoning modifications to the rear yard, dwelling unit exposureand open space and development bonuses for a one floor increase inheight to the zoning height and bulk district zoning requirements.
The proposed project would demolish the existing 2-story 8,730 squarefeet (sf) commercial building and construct a 35,090 sf residentialbuilding. The project site is located at 468 Turk, on a single 4,695 sf parcel(Block 0336 Lot 006.), in the RC-4 “High Density Residential- Commercial”Zoning District, 80-T Height/Bulk District, “North of Market Special UseDistrict-Subarea 1” and “Uptown Tenderloin Historic District”. Theproposed structure would be nine stories high over basement with aheight of 86 feet and would include 101 group home units.
The project proposes to construct a new six story, 69-foot tall mixed-useresidential and commercial building on a vacant lot. The proposed 25,430square-foot building would contain 616 square feet of commercial spaceon the ground floor and 21,780 square feet of residential uses on floors 1through 6 consisting of 29 dwelling units comprised of eight studios,eight one-bedroom units, 10 two-bedroom units, and three three-bedroom units. The proposed project is a Home-SF project and nine ofthe dwelling units would be on-site affordable units. The project wouldinclude 2,525 total square feet of common outdoor space comprised of a735 square-foot patio on the ground floor and a 1,790 square-footrooftop open space. In addition, the proposed project includes 32 class-I secure bicycleparking spaces and four class-II bicycle parking spaces on the 3rd Streetproject frontage, consistent with the city’s bicycle parking requirements.No on-site vehicular parking is proposed. The existing street trees andvehicle parking spaces on the street frontage would remain unchanged.No back-up diesel generator is proposed. Construction of the project would occur over the course of approximately18 months. The project would be supported by a mat slab foundation andwould excavate approximately 315 cubic yards of soil to a depth of 2 feetbelow grade for foundation construction. No pile driving or nighttimeconstruction is proposed.
The project sponsor proposes the demolition of the approximately 25-foot-tall, two-story, single-family residence and construction of a 60-foot-tall (68-foot-tall with elevator penthouse), six-story, residential buildingcontaining 19 group housing units. The proposed building would beapproximately 11,147 gross square feet in size and would provide 890square feet of common open space at the ground floor and 314 squarefeet of private open space at the 6th floor. The project would not provideoff-street vehicular parking. The project proposes to use the state densitybonus program.
120
13
101
29
18
18-Nov-21
21-Oct-21
06-May-21
29-Jul-21
14-Oct-21
Approved
Approved
Approved
Approved
Approved
S A N F R A N C I S C O P L A N N I N G D E P A R T M E N T56
CONTINUED >NOTE: The case descriptions were pulled from the system as-is.

Power BI Desktop
PlanningCase No.
First Address /Project Name
Case Description Units ApprovalDate
Action
2019-023105PRJ
2020-006779PRJ
2020-010648PRJ
2021-005007PRJ
2800 GEARY BLVD
375 06TH AVE
240 VAN NESS AVE
300 DE HARO ST
The proposed site is located on the northwest corner of Geary Boulevardand Wood Street, on the block bound by Geary Boulevard to the south,Collins Street to the west, Euclid Avenue to the north, and LaurelStreet/Lupine Avenue/Wood Street to the east, in the Presidio Heightsneighborhood. The proposed project would demolish the existing one-story building on the 11,680-square-foot project site (previously aFirestone Tire retail and service center) and would construct a new mixed-use residential and commercial building. The proposed building would include a total of 42 dwelling units,consisting of 24 one-bedroom, 13 two-bedroom, and five three-bedroom.The proposed building would be 6 stories tall and 65 feet in height to theroof (79 feet to the top of the elevator penthouse) and would containapproximately 55,360 gross square feet. The building would contain 850square feet of ground-level commercial space, a community room, patio,rear yard, roof deck, and solar panels. The project would utilize theHOME-SF program to increase the allowable number of units and buildingheight from 40 feet to 65 feet tall. The proposed project would remove the existing curb cut on GearyBoulevard and would add a new ten-foot-wide curb cut along WoodStreet for entrance to a ramp for a basement parking garage. The garagewould contain a total of 23 parking spaces, 20 of which would utilize a carstacker, and 43 Class I bicycle parking spaces. The proposed project would excavate over an approximately 8,000 squarefoot area to an average depth of 11 feet for a total excavation amount ofapproximately 3,260 cubic yards of soil. The proposed project would addtwo additional street trees (for a total of four trees) along the GearyBoulevard frontage, and six additional street trees along the Wood Streetfrontage. The building would be supported by a reinforced concrete matfoundation.
Priority Project per ED 13-01 Demolition of an existing mortuary and construction of a new 98 unit100% affordable senior housing building with a ground floorneighborhood commercial space. No parking provided
The project would demolish the existing structures and construct an 8-story building with 112 dwelling units. Two units will be reserved for on-site staff and 110 will be 100% affordable, with 25% of the units servingindividuals with intellectual and developmental disabilities. Ground floorwould include Cultural, Institutional, and Educational space. No carparking is proposed. The project is being reviewed under SB-35 and seeks two concessions andeight waivers under the State Density Bonus.
300 De Haro is a 12 story group housing project, situated at the corner ofDe Haro and 16th Streets. It will have 450 co-living units, ample and welldesigned indoor and outdoor common spaces, lively ground floor retailand amenity spaces, and parking for both bikes and cars. The project will use both SB-35 and the State Density Bonus to increasedensity and on-site affordabilty. Fifty three percent (53%) of the units willbe affordable, for a total of 239 affordable units. Affordable units will beoffered at various tiers: 40 units at 50-55% AMI, 185 at 80% AMI, and 14at 110% AMI.
42
98
112
450
17-Jun-21
02-Feb-21
05-Apr-21
15-Dec-21
Approved
Approved
Approved
Approved
57
S a n F r a n c i s c o H o u s i n g I n v e n t o r y | 2020
CONTINUED >NOTE: The case descriptions were pulled from the system as-is.

Power BI Desktop
PlanningCase No.
First Address /Project Name
Case Description Units ApprovalDate
Action
2020-005897PRJ
233 GEARY ST The proposed project site is located at the northeast corner of Geary andStockton streets on a block bounded by Geary Street to the north,Stockton Street to the east, and O’Farrell and Powell streets to the southand west, respectively. The project site comprises two contiguous parcelstotaling 18,906 square feet at the former Macys location on Union Square.The site includes assessor’s block 0314/lots 018-020. The existing buildingon the site consists of 148,105 square feet of retail (basement 1 + floors1-7), 31,552 square feet of office uses (floors 8-11), and 24,140 square feetof common space at the basement 2 level, level 11, and at the roof andmechanical penthouse levels. The building height would remainunchanged at approximately 153 feet to the roof level (179 feet in heightinclusive of mechanical penthouse). The project proposes a change in usefor the conversion of the existing office and retail department store(former Macys) building into a mixed-use building with approximately63,240 square feet of retail (floors 1-3 + basement floors), 81,470 squarefeet of office (floors 4-7 and 11), and 49,700 square feet of residential usewith 21 dwelling units (floors 8 – 10). The project would relocate the sixthfloor powder room to the third floor. The roof level would include anapproximately 5,300-square-foot roof terrace with a 10-foot trellis. Thetrellis would not increase the building height. The project would include36 Class I, and 4 Class II bicycle parking spaces[1]. Entry access to theresidential units and office space would be from Stockton Street; retailaccess would be from Geary Street. Freight loading would take place at the two loading spaces at the sub-basement level, accessed from O’Farrell Street, and a 23’- 2” yellow curbfor active freight loading and unloading for commercial vehicles at thenortheast corner of Geary and Stockton streets. The project would require18,215 cubic feet of temporary excavation for the footings, elevator pit,showers, and utilities and 16,392 cubic feet excavation for permanentfoundation support totaling of 1,334 cubic yards of debris and material.Project construction duration is estimated at 18 months and anticipatedto begin in late 2021.
21 22-Jul-21 Approved
S A N F R A N C I S C O P L A N N I N G D E P A R T M E N T58
NOTE: The case descriptions were pulled from the system as-is.
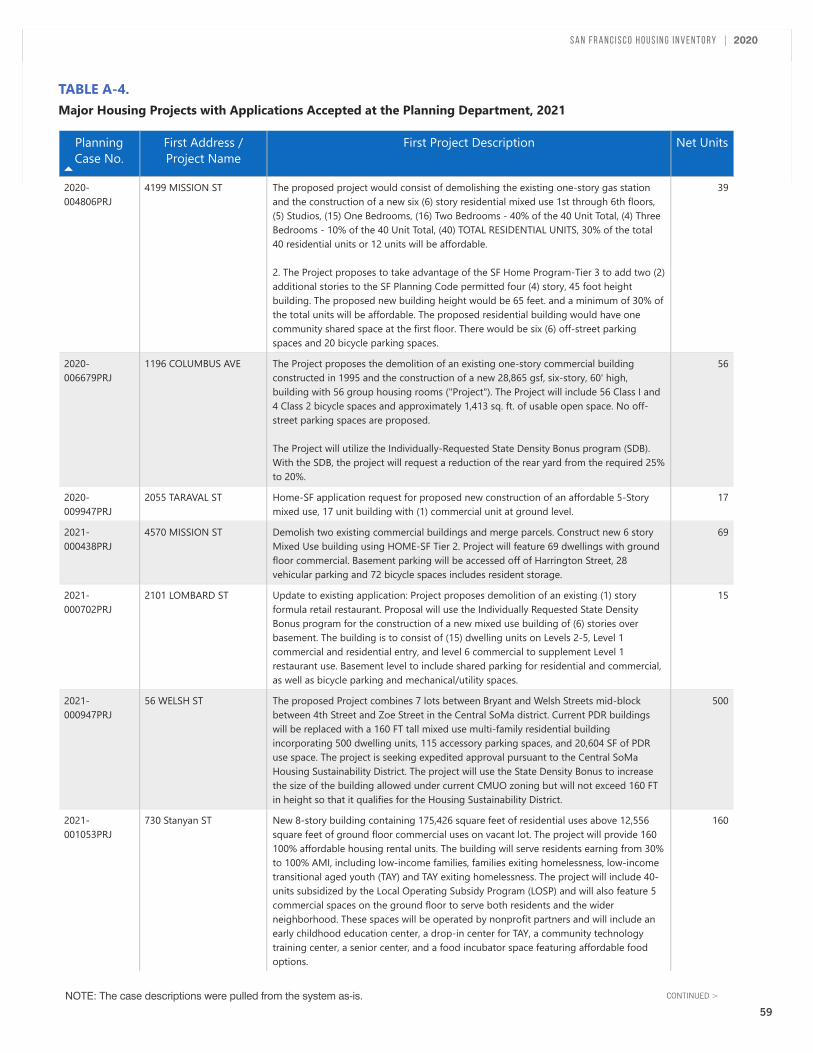
Power BI Desktop
TABLE A-4.Major Housing Projects with Applications Accepted at the Planning Department, 2021
PlanningCase No.
First Address /Project Name
First Project Description Net Units
2020-004806PRJ
2020-006679PRJ
2020-009947PRJ
2021-000438PRJ
2021-000702PRJ
2021-000947PRJ
2021-001053PRJ
4199 MISSION ST
1196 COLUMBUS AVE
2055 TARAVAL ST
4570 MISSION ST
2101 LOMBARD ST
56 WELSH ST
730 Stanyan ST
The proposed project would consist of demolishing the existing one-story gas stationand the construction of a new six (6) story residential mixed use 1st through 6th floors,(5) Studios, (15) One Bedrooms, (16) Two Bedrooms - 40% of the 40 Unit Total, (4) ThreeBedrooms - 10% of the 40 Unit Total, (40) TOTAL RESIDENTIAL UNITS, 30% of the total40 residential units or 12 units will be affordable. 2. The Project proposes to take advantage of the SF Home Program-Tier 3 to add two (2)additional stories to the SF Planning Code permitted four (4) story, 45 foot heightbuilding. The proposed new building height would be 65 feet. and a minimum of 30% ofthe total units will be affordable. The proposed residential building would have onecommunity shared space at the first floor. There would be six (6) off-street parkingspaces and 20 bicycle parking spaces.
The Project proposes the demolition of an existing one-story commercial buildingconstructed in 1995 and the construction of a new 28,865 gsf, six-story, 60' high,building with 56 group housing rooms ("Project"). The Project will include 56 Class I and4 Class 2 bicycle spaces and approximately 1,413 sq. ft. of usable open space. No off-street parking spaces are proposed. The Project will utilize the Individually-Requested State Density Bonus program (SDB).With the SDB, the project will request a reduction of the rear yard from the required 25%to 20%.
Home-SF application request for proposed new construction of an affordable 5-Storymixed use, 17 unit building with (1) commercial unit at ground level.
Demolish two existing commercial buildings and merge parcels. Construct new 6 storyMixed Use building using HOME-SF Tier 2. Project will feature 69 dwellings with groundfloor commercial. Basement parking will be accessed off of Harrington Street, 28vehicular parking and 72 bicycle spaces includes resident storage.
Update to existing application: Project proposes demolition of an existing (1) storyformula retail restaurant. Proposal will use the Individually Requested State DensityBonus program for the construction of a new mixed use building of (6) stories overbasement. The building is to consist of (15) dwelling units on Levels 2-5, Level 1commercial and residential entry, and level 6 commercial to supplement Level 1restaurant use. Basement level to include shared parking for residential and commercial,as well as bicycle parking and mechanical/utility spaces.
The proposed Project combines 7 lots between Bryant and Welsh Streets mid-blockbetween 4th Street and Zoe Street in the Central SoMa district. Current PDR buildingswill be replaced with a 160 FT tall mixed use multi-family residential buildingincorporating 500 dwelling units, 115 accessory parking spaces, and 20,604 SF of PDRuse space. The project is seeking expedited approval pursuant to the Central SoMaHousing Sustainability District. The project will use the State Density Bonus to increasethe size of the building allowed under current CMUO zoning but will not exceed 160 FTin height so that it qualifies for the Housing Sustainability District.
New 8-story building containing 175,426 square feet of residential uses above 12,556square feet of ground floor commercial uses on vacant lot. The project will provide 160100% affordable housing rental units. The building will serve residents earning from 30%to 100% AMI, including low-income families, families exiting homelessness, low-incometransitional aged youth (TAY) and TAY exiting homelessness. The project will include 40-units subsidized by the Local Operating Subsidy Program (LOSP) and will also feature 5commercial spaces on the ground floor to serve both residents and the widerneighborhood. These spaces will be operated by nonprofit partners and will include anearly childhood education center, a drop-in center for TAY, a community technologytraining center, a senior center, and a food incubator space featuring affordable foodoptions.
39
56
17
69
15
500
160
59
S a n F r a n c i s c o H o u s i n g I n v e n t o r y | 2020
NOTE: The case descriptions were pulled from the system as-is. CONTINUED >

Power BI Desktop
PlanningCase No.
First Address /Project Name
First Project Description Net Units
2021-001542PRJ
2021-005007PRJ
2021-005342PRJ
2021-005588PRJ
2021-005814PRJ
2021-007014PRJ
400 PAGE ST
300 DE HARO ST
925 BRYANT ST
25 MASON ST
659 UNION ST
1369 HYDE ST
Adding six (6) units on ground level per ordinance 162-16. Convert existing garage intonew dwelling units within (e) envelope. Eight new bedrooms, one new den, eight newbathrooms, six new dishwashers, seven new washer/dryers. New windows facing thestreet.
300 De Haro is a 12 story group housing project, situated at the corner of De Haro and16th Streets. It will have 450 co-living units, ample and well designed indoor andoutdoor common spaces, lively ground floor retail and amenity spaces, and parking forboth bikes and cars. The project will use both SB-35 and the State Density Bonus to increase density and on-site affordabilty. Fifty three percent (53%) of the units will be affordable, for a total of239 affordable units. Affordable units will be offered at various tiers: 40 units at 50-55%AMI, 185 at 80% AMI, and 14 at 110% AMI.
The Project proposes the demolition of the existing 13,000 square foot retail/warehousebuilding and 7,000 square feet of surface parking and the construction of a new 7-storyresidential building by seeking an individually requested state density bonus. Theproposed project’s base density could be maximumly developed as a four-story, 48-footgroup housing residential building with a residential gross floor area of 67,652 sq. ft. anda total gross floor area of 83,999 sq. ft. The Project would seek a 50% density bonusunder the individually requested state density bonus program to construct a 127,467 sq.ft. seven-story-over-basement residential building with ground floor retail. In order toachieve that bonus, 15% of base project units must be subject to 50% AMI, which coversthe project’s on-site inclusionary requirement at the very-low-income level. The projectwill also provide 4.5% of base project units at low income and 4.5% of base project unitsat moderate income.
Proposed development at the site is for a 100,000 square feet 155 unit residentialcomplex. The estimated construction costs would be $95 million at parcel number 0340002. The building would consist of 12 stories, one basement. Type 1-A.
The Project is proposed as a State Density Bonus (“SDB”; Gov. Code § 65915) ministerialreviewed mixed use housing development adhering to all zoning requirements wherepossible, and otherwise seeking waivers and incentives as needed to accommodate thescope of the development proposal. The Project seeks to develop 23 residential unitsconsisting of twenty (20) base units, designating two (2) very low-income units, andaccepting three (3) of the seven (7) bonus, market-rate units available under the SDBalong with two (2) incentives and an unlimited number of waivers. Working with the neighborhood, the applicant has agreed to preserve the VerdiBuilding’s three street-facing walls (such that no new shadow is cast on WashingtonPark), rebuild the floor plates, and the rear wall. The Project will also add anapproximately 30’ 6” extension along Powell Street, east of the Verdi Building in what isnow a vacant space adjacent to the structure, for a lobby, elevators, stairs, and oneadditional unit per floor. The Project proposes to add a partially enclosed fourth floor setto the rear of Verdi Building, with open space area for the balance of the roof of thestructure. The Project proposes an incentive under the SDB to permit for Restaurant Uses on theground floor and rooftop (i.e., within the partial fourth floor and open space in the rearof the roof area described immediately above) and SDB waivers for Height (Section 250),Dwelling Unit Exposure (Section 140), Open Space (Section 135), Rear Yard (Section 134)and Use Size (Section 121.1).
Addition of 17 ADUs to existing 82-unit multi-family building per ord. 162-16. Addwindows at front elevations for proposed ADUs.
11
450
218
155
23
17
S A N F R A N C I S C O P L A N N I N G D E P A R T M E N T60
CONTINUED >NOTE: The case descriptions were pulled from the system as-is.

Power BI Desktop
PlanningCase No.
First Address /Project Name
First Project Description Net Units
2021-007313PRJ
2021-008648PRJ
2021-009951PRJ
2021-010017PRJ
2021-011813PRJ
2021-011858PRJ
80 JULIAN AVE
1338 MISSION ST
2530 18TH ST
5222 03RD ST
67 BELCHER ST
395 3rd St
The Village will be 79 feet in height (plus up to 16’ of mechanical space) and 6 storiesplus a full basement consisting of 41,600 gsf of new space.The Village will providecommunity-based services like housing navigation, benefits counseling, workforcedevelopment and education related services. Dedicate space for a citywide program forAmerican Indian youth and teens (Second Floor and Basement), house a dental clinic(Third Floor) and medical clinic (Fourth Floor) operated by the Native American HealthCenter(“NAHC”), create 12 group housing units with bathrooms of transitional housing,house the Women’s Lodge in 9 bedrooms accommodating women with young childrenages 0 to 5 (Sixth Floor).
Mission Street Management LLC (the "Project Sponsor") proposes to demolish theexisting buildings and construct a 30-story, approximately 327'4" tall residential buildingwith 287 dwelling units and 1,514 square feet of ground floor retail (the "Project"). TheProject will provide a total of 14,038 square feet of common residential open spacethroughout the building including a garden, amenity terraces, and shared residentterraces at alternating levels. The Project's unit mix is 77 studios (26.8%), 138 1-bedrooms (48.1%), 43 2-bedrooms (15%), and 29 3-bedrooms (10.1%). Off-streetparking and loading will be accessible from a 22' driveway along Mission Street with twoloading spaces and 21 parking spaces located on level 1 of the basement and 28 parkingspaces on level 2 of the basement, for a total of 49 off-street parking spaces. (Please seeattached PRJ for further details.)
The project is a new, 8-story building of concrete construction that will provide muchneeded supportive housing for low-income families and those transitioning out ofhomelessness. The housing component of the project is 100% affordable, up to the 80%AMI level. The project will consist of 60-75 units in a mix of sizes up to three-bedroomunits. The building's lowest two floors will also include dedicated office space for theHomeless Prenatal Program (HPP), allowing them to expand their existing office,program, and training spaces currently housed next door at 2500 18th Street. Theproject is seeking SB-35 approval and will be using the State Density Bonus for approvalof a height beyond that currently zoned. The existing unoccupied warehouse on the sitewill be demolished.
New construction of a seven level residential building utilizing the Home-SF program toprovide 100 dwelling units. The project will follow the Home-SF tier 3 guidelines andshall provide greater than the required 30% affordable number of units. The Additionalaffordable units will be targeted toward middle-income tenants such as teachers.
The proposed project is a density bonus residential project. Demolition of the existingtwo-story single-family dwelling and new construction of a five-story (56 feet tall)building with up to 31 residential units with one, two, and three bedrooms. The newbuilding floor area would be 54,500 square feet, including 15 off-street parking spaces.The project would seek density bonus waivers of the height limit, exposure, and the rearyard height controls. The project will require a Conditional Use Authorization for thedemolition of a dwelling unit and large lot development, and an Individually-RequestedState Density Bonus Application.
The Project will replace an existing surface parking lot with a 336 foot tall residentialProject with 4,459sf of Retail space facing 3rd Street and Harrison Street, whichincorporates approximately 524 dwelling units and accessory below grade parking. TheProject will use the State Density Bonus law waivers to exceed minimum floor plate size,building height, and open space requirements. The Project will comply with both therequired 21.0% affordable housing requirement by providing 12% at 50% AMI; 4.5% at80% AMI; 4.5% at 110% AMI as well on-site affordable requirements of the densitybonus.
21
287
73
100
30
524
61
S a n F r a n c i s c o H o u s i n g I n v e n t o r y | 2020
CONTINUED >NOTE: The case descriptions were pulled from the system as-is.

Power BI Desktop
PlanningCase No.
First Address /Project Name
First Project Description Net Units
2021-012028PRJ
2021-012100PRJ
3251 20TH AVE
2550 IRVING ST
The Stonestown Development is a proposed mixed-use, multi-phased master-planneddevelopment located on the west side of San Francisco. The 40.9 acre privately-ownedsite is comprised of an 11 acre shopping center (Stonestown Galleria), 3 acres of streets,and 26.9 acres of surface parking lots. An adjacent site of approximately 3 acres may beincorporated into the Project. The existing Stonestown Galleria will remain a part of thefuture development with minor modifications and upgrades, and the 26.9 acres ofsurface parking lots and potentially the adjacent 3 acre lot will be transformed into apredominantly residential neighborhood with additional uses including parks and plazas,retail, community amenity space, office, commercial, and structured parking. Collectively,the existing shopping center and new uses will make up a new neighborhood or “TownCenter”. The Town Center will be a place for the community to live and gather, withshops, entertainment, restaurants, parks, and plazas all in one neighborhood. The proposed Project includes approximately 4,700,000 gross square feet (GSF) of newbuilding area allocated among the following uses: approximately 2,930 residentialdwelling units, up to 3,700 parking spaces, approximately 200,000 GSF of retail andcommunity amenity space, up to 200,000 GSF of office, and up to 200 hotel rooms. Anadditional 150 units may be added on the adjacent property. In addition, the Projectproposes to make improvements to the street network, circulation, and utilities. Lastly,the Project includes approximately 6 acres of publicly accessible parks, plazas, and openspace. Brookfield Properties (Project Sponsor) proposes to enter into a DevelopmentAgreement (DA) accompanied by a site specific rezoning of the property to a Special UseDistrict (SUD) and related design guidelines.
2550 IRVING STREET IS A 100% AFFORDABLE FAMILY HOUSING RENTAL DEVELOPMENT,OF 90 UNITS IN SEVEN STORIES, EXCLUDING PARAPETS, MECHANICAL, STAIR ANDELEVATOR PENTHOUSES, WITH GROUND FLOOR RESIDENTIAL AMENITIES (COMMONLAUNDRY, COMMUNITY ROOM AND KITCHEN, RESIDENT LOUNGE, RESTROOMS) ANDSUPPORT SERVICE PROGRAM OFFICES, PROPERTY MANAGEMENT OFFICES, MEPSPACES, TRASH TERMINATION ROOM, BICYCLE PARKING, AND RESIDENT PARKINGUTILIZING A PUZZLE LIFT AND PIT STACKER SYSTEM. THE PROPOSED UNIT MIX INCLUDES STUDIOS, ONE-BEDROOM, TWO-BEDROOM, ANDTHREE-BEDROOM UNITS. AT LEAST 50% OF THE UNITS WILL BE TWO- AND THREE-BEDROOM UNITS. OPEN SPACE IS PROVIDED WITH AN AT-GRADE COURTYARD IN THEREAR YARD, AND A ROOF DECK AND URBAN AGRICULTURE SPACE. STREETSCAPEIMPROVEMENTS WILL INCLUDE NEW SIDEWALK LANDSCAPING, STREET TREES, ANDVEHICLE CURB CUTS FOR GARAGE ENTRY AND RESIDENTIAL TRASH. EXISTINGPEDESTRIAN CURB CUTS AT CROSSWALKS TO REMAIN. The project will pursue SB35 and state density bonus law AB 1763 for zoningmodifications and priority processing. Under state density bonus law AB 1763, theproject seeks exceptions, concessions and waivers for the following: - Rear Yard - Above Grade Parking Setback - Usable Open Space - Active Ground Floor Uses - Freight Loading The existing 2-story structure and site elements (the San Francisco Police Credit Union,surface parking and landscaping) will be demolished for the new construction.
2930
90
S A N F R A N C I S C O P L A N N I N G D E P A R T M E N T62
CONTINUED >NOTE: The case descriptions were pulled from the system as-is.

Power BI Desktop
PlanningCase No.
First Address /Project Name
First Project Description Net Units
2021-012305PRJ
2021-012382PRJ
2021-012554PRJ
2021-012562PRJ
2021-012583PRJ
2021-012714PRJ
2021-012927PRJ
2021-013057PRJ
333 RANDOLPH ST
2700 SLOAT BLVD
2045 SUTTER ST
50 MAIN ST
841 POLK ST
955 SANSOME ST
244 09TH ST
842 CALIFORNIA ST
Existing 2-Story building mixed-use residential/commercial building, to comply withcomplaints 201961761, 201798122, 20197221, 2019015851ENF to qualify unwarrantedunits. This is an existing, Two- Story over Basement, mixed-use, building. Originally, there werefour residential units and offices on the first floor and second floor. We are requesting amerging of the two UDUs 13 and 14 per Planning Dept. Request to qualify the exitrequirements, light, ventilation, egress, fire separation, and other code-compliantrequirements for life safety.
Home-SF application request for new construction of a 400 condominium, 12-Storymixed-use building. The Project will contain (128 studios; 96 one-bedrooms;131 two-bedrooms; and 45 three-bedrooms), ranging in size from approximately 350 to 1,080 square feet.
100% affordable housing project. Addition of 5th story to existing 4 story building; 2045Sutter street (building a) construction of new elevator for 5 floors (16 new units).Application 202110140447 and 202109098099 plans shared. Two applications on set ofplans.
The Project proposes demolition of the existing 2-story, 50,683-sf parking garage at 50Main; new construction of a residential tower at 50 Main with 808 units in an 85-storytall building; alteration of the existing 473'6" tall, 1,000,180-gsf office building at 77Beale and an addition of 49,999 gsf of new office use; renovation and alteration of theexisting historic 569,622-gsf office buildings with ground floor retail at 215 and 245Market Street with primary changes occurring in the interior courtyard annex buildingswithout any additional office square footage; and creation of a new publicly accessiblepark at the project site's ground floor.
New construction of a 13 story over basement group housing residential building. Thepurpose of the project is to provide the maximum number of high quality individualgroup housing bedrooms to contribute to San Francisco's housing stock.
The proposed project would demolish the existing 3-story, 52,180 sf parking garage andconstruct a new ten-story mixed-use structure that contains ground floor retail space(approximately 2,536 square feet) and 57 dwelling units. The additional (tenth) story isrequested through HOME-SF legislation, Tier 2 option. Thirty-seven unbundled parkingspaces and two car-share spaces are proposed in a garage accessed from SansomeStreet.
Large Project Authorization request for demolition of the existing building and constructan 8-story, 80-foot-tall mixed-use building with 27 dwelling units and 1,396 square feetof ground floor commercial space (the "Project"). The Project will also provide 536square feet of common residential open space at the rear yard on the second floor and a725 square feet roof deck. The Project's unit mix is 13 studios, 13 2-bedrooms, and 1 3-bedroom. The Project does not propose parking and will provide 27 Class I bicycleparking spaces and 4 Class II bicycle parking spaces. The Project will provide on-site BMR units and seeks a density bonus under theindividually requested State Density Bonus Program. The Project requires waivers fromthe following physical development standards in the San Francisco Planning Code("Planning Code") in order to construct the Project with allowable density bonus units:rear yard (Section 134), usable open space (Section 135, 823(c)(2)(B)), height (Section260(a)), and dwelling unit exposure (Section 140).
Conditional Use Authorization request for demolition and removal of four existingstructures, including two single family homes, one three-unit residential apartmentbuilding, and one commercial building. One unit was owner occupied by the seller; theremainder have been vacant for many years. Proposed construction consists of a single7-story building (plus basement), with 22 market-rate condominiums and 2 market-ratereplacement rental units, and on-site parking in basement level.
11
400
28
808
40
57
27
20
63
S a n F r a n c i s c o H o u s i n g I n v e n t o r y | 2020
NOTE: The case descriptions were pulled from the system as-is.

Power BI Desktop
TABLE A-5.Major Projects Authorized for Construction by DBI, 2021
Address
Units Construction Type Earliest Authorization Data
1 AVENUE OF THE PALMS *
1 EARL ST
1068 MISSION ST
1125 STEVENSON ST
1335 LARKIN ST
1535 JACKSON ST
1570 PACIFIC AV
1900 MISSION ST
198 VALENCIA ST
2340 SAN JOSE AV
2525 VAN NESS AV
2750 19TH ST
343 08TH ST
388 BEALE ST
4840 MISSION ST
65 OCEAN AV
690 MARKET ST
706 MISSION ST
869 LA SALLE AV
879 LA SALLE AV
138
34
254
64
23
11
53
11
28
131
28
63
38
13
137
193
24
23
40
40
New Construction
New Construction
New Construction
New Construction
New Construction
Alternation
New Construction
Alternation
New Construction
New Construction
New Construction
New Construction
New Construction
Alternation
New Construction
New Construction
Alternation
Alternation
New Construction
New Construction
17-Nov-21
28-May-21
30-Jul-21
11-Jan-21
12-Feb-21
29-Jan-21
22-Dec-21
30-Aug-21
29-Mar-21
08-Jul-21
21-May-21
21-Jul-21
30-Jul-21
24-Feb-21
14-Jun-21
21-Jan-21
27-Oct-21
03-Sep-21
30-Jun-21
30-Mar-21
889 LA SALLE AV
898 LA SALLE AV
899 LA SALLE AV
921 HOWARD ST
986 SOUTH VAN NESS AV
40
16
44
203
11
New Construction
New Construction
New Construction
New Construction
New Construction
25-Jun-21
16-Jun-21
15-Jun-21
24-May-21
11-Jun-21
S A N F R A N C I S C O P L A N N I N G D E P A R T M E N T64

Power BI Desktop
Address
Total Unitswith Bonus
AffordableUnits
Waivers Incentives and Concessions
620 Folsom Street
395 3rd st
555-585 Bryant Street
469 Stevenson
300 De Haro
95 Hawthorne
3832 18th Street
1338-1370 Mission Street
457-475 Minna
1068 Mission
650 Harrison Street
346 9th Street
1560 Folsom St.
1458 San Bruno Ave
1101 Sutter Street
600 7th Street
925 Bryant Street
925 Bryant Street
623
559
500
495
449
392
290
287
270
258
245
245
244
231
221
221
218
218
102
115
78
73
181
55
45
44
143
256
35
35
34
30
44
220
35
35
Setbacks and streetwall, rearyard, exposure
setback, lot coverage, buildingheight, bulk controls fortowers
Setback/Streetwall, PermittedObstructions, Exposure,Ground Floor Ceiling Height,Open Space, Loading, LotCoverage,Wind, Height,Narrow Streets, MassReduction, Mid-block alleys
FAR, Rear Yard, Open Space,Exposure, Wind, Bulk
Ground Floor Ceiling Height,Rear Yard, Loading, Height,Horizontal Mass Reduction,Unit Size
Streetwall, Rear Yard, OpenSpace, Wind, Height
Height, Rear Yard, Exposire
Height, Bulk, Rear Yard, Wind
Bicycle Parking
Height, Open Space, Off-street loading
Height, Rear Yard, Exposure,Horizonal Mass Break
Height, Rear yard, OpenSpace, Off-street loading
Exposure, Height, Bulk, Heighton Narrow Streets
Rear Yard, Exposure, Off-streetLoading Dimensions,Horizontal Mass Reduction
Rear Yard, Exposure, Height,Narrow Alley, Loading,Ground Floor Ceiling Height
Rear yard, useable openspace, dwelling unit exposure,ground floor ceiling, off-streetloading dimensions, heightlimit, narrow alley setback,horizontal mass reduction,dwelling unit size (no waiver -is this from tcac)
height
streetwall requirements,open space, curbcut
Living Roof, Curb Cut, Parking and LoadingRntrances
height
None
None
None
Active Ground Floor
Rear Yard
None
Open Space
None
Parking and Loading Entrance Width
Residential Open Space, Ground FloorCeiling Height
Open Space, ground floor frontage
useable open space could be incentive
TABLE A-6.Density Bonus Program Projects in the Pipeline by Program, 2021
State Density Bonus, 2021
65
S a n F r a n c i s c o H o u s i n g I n v e n t o r y | 2020
CONTINUED >NOTE: The case descriptions were pulled from the system as-is.

Power BI Desktop
Address
Total Unitswith Bonus
AffordableUnits
Waivers Incentives and Concessions
921 Howard
600 McAllister
1500 15th Street
2588 Mission Street
321 Florida
730 Stanyan
401 South Van Ness
1200 Larkin Street
333 12th Street
833 Bryant
819 Ellis Street
4840 Mission
1351 42nd Avenue
2340 San Jose
681 Florida
300 5th Street
560 Brannan Street
984 Folsom Street
155 Grove Street
468 Turk Street
203
196
190
181
168
160
153
153
148
146
138
137
135
131
130
130
120
111
109
101
201
26
30
17
23
160
153
31
27
145
0
135
134
130
129
20
18
0
107
17
Upper Level Setback, RearYard, Open Space, Height, LotCoverage, Exposure
Height, Alley Setback, OpenSpace, Rear Yard, Exposure,Active Uses
Height and Rear Yard
Height, Bulk, RearYard,Exposure, Loading,Ground Floor Ceiling Height
Height, Ground Floor CeilingHeight
Height, Rear Yard, OpenSpace, Exposure
Rear Yard, Height, GroundFloor Ceiling Height, OpenSpace
Height, Bulk
Rear Yard, Height, OpenSpace, Exposure, Loading
Rear Yard, Active GroundFloor, Height
Height, Open Space
Use Size, Rear Yard, OpenSpace, Exposure
Rear Yard, Front Setback,Exposure, Open Space, Height,Off-street loading
Height, Bulk, Rear Yard,Exposure, Ground FloorCeiling Height
Height, Exposure, Rear Yard
Height limit, Exposure, LotCoverage, Upper LevelSetbacks, Off-street Loading
Height, Sun Access Plane, LotCoverage, Exposure, PDRReplacement, PDR, Permittedobstructions, Setabck andStreetwall, Wind, NarrowStreets and alleys, AMR, OpenSpace
Height, Rear Yard
Setabck and Streetwall, Rearyard, Open Space, Exposure,Active Ground Floor, Height,Transparency
Height, Upper Story Setback,Rear Yard
None
Loading, Flex Spaces
None
Open Space
Open Space
None
None
Use Size
None
Permitted Obstructions, Bicycle Parking,Open Space
None
None
Open Space
Open Space, Ground Floor Ceiling height
Open Space
Living Roof, Ceiling Height
None
Wind
None
S A N F R A N C I S C O P L A N N I N G D E P A R T M E N T66
CONTINUED >NOTE: The case descriptions were pulled from the system as-is.

Power BI Desktop
Address
Total Unitswith Bonus
AffordableUnits
Waivers Incentives and Concessions
1567 California
530 Turk
4200 Geary Street
1965 Market
750 Florida
1585 Folsom Street
2918 Mission
793 South Van Ness
2530 18th Street
2140 Market Street
266 4th Street
180 Jones
220 9th Street
1355 Fulton
2205 Mission
78 Haight St. aka Parcel U
344 14th Street
755 Brannan Street
1196 Columbus Avenure
598 Bryant
100
100
98
96
94
94
75
75
73
70
70
70
64
64
63
63
62
57
56
54
11
24
97
14
19
15
7
11
73
6
70
69
12
13
31
63
9
8
12
353
Rear Yard, Open Space,Exposure, Bulk
Rear Yard, Open Space,Exposure
None
Height, Rear yard, Exposure
Height, SunPlane, Exposure,Rear Yard
Height, Bulk, Rear Yard,Exposure
Height
Height, Rear yard, Exposure
Open Space, Exposure
None
Height
Height, Bulk, Rear Yard,Exposure
Height, Rear Yard, OpenSpace, Exposure, Bulk
None
Rear Yard, Open Sapce, Height
Rear Yard, Height, OpenSpace,Permitted Obstructions,Narrow Streets
Ground Floor Ceiling Height
unit mix
None
height
Reduction of ground floor non-residentialfloor-to-floor height
None
None
Rear Yard, Parking
None
Active Ground Floor, Bicycle Parking, LotCoverage
Rear Yard, Open Space, Exposure, GroundFloor Ceiling Height
None
Open Space
Ground Floor Ceiling Height, Use Size
Use Size, Ground Floor Ceiling Height,Permitted Obstructions, Bicycle Parking
None
None
2030 Polk Street
1721 15th Street
875 Sansome
351 12th Street
53
50
48
48
9
11
0
48
Bulk, Rear Yard
Height, Open Space, Exposure
Rear Yard and Open Space
Rear Yard, Exposure, Height
None
Rear Yard
None
Open Space
67
S a n F r a n c i s c o H o u s i n g I n v e n t o r y | 2020
CONTINUED >NOTE: The case descriptions were pulled from the system as-is.

Power BI Desktop
Address
Total Unitswith Bonus
AffordableUnits
Waivers Incentives and Concessions
98 Pennsylvania Avenue
618 Octavia Street
618 Octavia Street
3001 24th Street
141 Leland Street
5400 Geary Boulevard - AlexandriaTheater
3330 Geary
535 Green Street
3260 26th St
67-69 Belcher Street
350 Ocean Street
425 Broadway
2135 Market Street
1535 Jackson
67 Belcher St
2051 Market
2300 Harrison
1021 Valencia Street
4716-4722 Mission Street
1233 Folsom
48
46
46
45
45
43
41
39
37
36
35
34
30
30
30
29
24
24
24
22
7
10
10
44
45
0
12
5
6
3
6
0
3
30
3
3
3
2
3
2
Height, rear yard, ground floorheight
exposure, height, rear yard
Height, Rear Yard, Open Space
Exposure, Bike Parking
Open Space
Rear Yard, Exposure, Height
Height, rear yard, transformermaybe
Height, Rear Yard, Open Space
height, exposure, rear yard,open space
Rear Yard, Bulk, Exposure
Height, Rear Yard, Exposure,Open Space, Horizonal MassBreak, Height Limits forNarrow Streets
Rear Yard, Open Space
Height, Rear yard, Exposure
Height, Narrow Streets
Rear Yard, Open Space,Exposure, Height
Open space - because theyare building it but it doesn'tcount, exposure, rear yard,folsom street frontage
N/A
parking?
None
Rear Yard
Rear Yard
curb cut
None
Permmitted Obstructions
None
None
None
None
Rear Yard, Ground Floor Ceiling Height,Active Uses
None
height
1233 Folsom 24 2 Height, Folsom Setback, RearYard, Exposure, Open Space
Hotel Rooms
S A N F R A N C I S C O P L A N N I N G D E P A R T M E N T68
CONTINUED >NOTE: The case descriptions were pulled from the system as-is.

Power BI Desktop
Address Total Units with Bonus Affordable Units Waivers Incentives and Concessions
2601 Van Ness
2700 Sloat Blvd
2800 Geary
285 Ocean Avenue
3055 Clement Street
3330 Geary
3333 San Bruno
3565 Geary Blvd.
3601 Lawton Street
3945 Judah
4110 Geary Blvd.
4512 23rd Street
4712-4720 3rd Street
4742 Mission
5012 3rd Street
5425 Mission Street
65 Ocean
841 Polk Street
921 O'Farrell Street
955 Sansome
60
400
42
21
7
41
69
73
82
20
16
13
21
46
29
40
193
60
40
57
18
120
13
6
2
12
17
18
20
5
4
3
4
11
9
12
48
0
12
14
N/A
N/A
N/A
N/A
N/A
N/A
N/A
N/A
N/A
N/A
N/A
N/A
N/A
N/A
N/A
N/A
N/A
N/A
N/A
N/A
N/A
N/A
N/A
N/A
N/A
N/A
N/A
N/A
N/A
N/A
N/A
N/A
N/A
N/A
N/A
N/A
N/A
N/A
N/A
N/A
999 Texas 25 6 N/A N/A
HOME-SF Density Bonus Program 2021
Address
Total Unitswith Bonus
AffordableUnits
Waivers Incentives and Concessions
1324 Powell Street
240-250 Church Street
2395 sacramento 2340 websterppa
222 Dore
580 Minna Street
1525 Pine Street
280 7th Street
2955 Mission Street
5272-5280 3rd Street
2255 Taraval Street
24
24
24
22
22
21
20
18
11
7
2
3
3
2
2
2
2
5
4
0
Additional height bonus
rear yard, du exposure, height
Height, Rear Yard, Exposure,
rear yard, exposure, bulk
Rear Yard, Open Space,Ground Floor Ceiling Height,Exposure, Transparency,Setbacks on Narrow Streets,Bulk
Rear Yard, Exposure
exposure, height, rear yard
Height
Rear Yard, Usable Open Space,Exposure
Open space, rear yard
None
Open Space
open space - b/c fee is an alterate
Permitted Obstructions, DU Mix
Open Space
Height for Elevator Penthouse
N
None
69
S a n F r a n c i s c o H o u s i n g I n v e n t o r y | 2020
NOTE: The case descriptions were pulled from the system as-is.

Power BI Desktop
TABLE A-7.Major Affordable Projects in the Pipeline as of December 31, 2021
PipelineStatus
Address /Project Name
DevelopmentType
Very LowIncome
Homelessor Single
Very LowIncomeSeniors
Very LowIncomeFamilies
Very LowIncome
Disabled
LowerIncome
Low toModerateIncome
HomeownerModerateIncome
TotalAffordable
Units
TotalUnits
Complete 1950 MissionSt / Le Fenix
NewConstruction
1990 Folsom /Casa Adelante
NewConstruction
2060 Folsom /Casa Adelante
NewConstruction
3001 24thStreet / Casade la Mission
NewConstruction
490 South VanNess Ave
NewConstruction
691 ChinaBasin St /
Mission BaySouth Block 6
West
NewConstruction
735 Davis /Seawall Lot
322-1 Senior
NewConstruction
SUBTOTALS
CurrentlyUnder
Construction
1068 MissionSt
NewConstruction
2340 San JoseAve / BalboaPark Upper
Yard
NewConstruction
242 Hahn St /Sunnydale
Block 6
NewConstruction
3138 KamilleCt / BernalDwellingsHOPE VI
Rehabilitation
401 Avenue ofthe Palms /Maceo May
Apts
NewConstruction
401 Rose St /Hayes ValleySouth HOPE
VI
Rehabilitation
32
29
44
27
15
147
153
0
103
87
68
23
178
89
126
0
124
28
97
62
46
6
363
5
159
109
27
37
8
72
36
41
104
0
156
142
126
44
89
151
52
760
256
130
167
159
104
109
157
143
127
45
89
152
53
766
258
131
168
160
105
110
S A N F R A N C I S C O P L A N N I N G D E P A R T M E N T70
CONTINUED >

Power BI Desktop
PipelineStatus
Address /Project Name
DevelopmentType
Very LowIncome
Homelessor Single
Very LowIncomeSeniors
Very LowIncomeFamilies
Very LowIncome
Disabled
LowerIncome
Low toModerateIncome
HomeownerModerateIncome
TotalAffordable
Units
TotalUnits
CurrentlyUnder
Construction
410 ChinaBasin St /
Mission BaySouth Block 9
NewConstruction
4840 MissionSt
NewConstruction
555 Larkin St NewConstruction
681 Florida St NewConstruction
833 Bryant St NewConstruction
88 Broadway /Seawall Lot
322-1 Family
NewConstruction
921 HowardSt
NewConstruction
In Pre-Construction
Phase
1 Avenue ofthe Palms /
TreasureIsland Parcel
C3.1
NewConstruction
1151 FairfaxAve / HuntersView Phase III
HOPE SF
NewConstruction
1360 43rd Ave/ ShirleyChisholm
Village
NewConstruction
1801 25th St /Potrero Block
B
NewConstruction
240 Van NessAve / KelseyCivic Center
NewConstruction
266 4th St NewConstruction
299 FremontSt / TransbayBlock 2 West
NewConstruction
4200 GearyBlvd
NewConstruction
600 7th St NewConstruction
140
39
145
71
35
30
20
120
74
74
75
40
49
97
33
107
80
10
20
27
21
10
54
16
15
33
34
34
67
38
61
11
40
16
150
27
20
62
16
14
29
5
51
23
24
140
135
107
129
145
124
201
137
117
134
156
107
69
152
97
207
141
137
108
130
146
125
203
138
118
135
157
109
70
153
98
208
71
S a n F r a n c i s c o H o u s i n g I n v e n t o r y | 2020
CONTINUED >

Power BI Desktop
PipelineStatus
Address /Project Name
DevelopmentType
Very LowIncome
Homelessor Single
Very LowIncomeSeniors
Very LowIncomeFamilies
Very LowIncome
Disabled
LowerIncome
Low toModerateIncome
HomeownerModerateIncome
TotalAffordable
Units
TotalUnits
In Pre-Construction
Phase
180 Jones NewConstruction
667 Linden St/ Hayes ValleyNorth HOPE
VI
Rehabilitation
730 StanyanSt
NewConstruction
78 Haight St /Central Fwy
Parcel U
NewConstruction
Hunters PointShipyard
Blocks 52 &54
NewConstruction
SunnydaleBlock 3
NewConstruction
TransbayBlock 2 East
NewConstruction
InPreliminaryPlanning
1095Connecticut
St / 751Missouri St
PotreroTerrace &
Potrero AnnexHOPE SF
NewConstruction
11 Innes Ct /Hunters PtShipyard,Block 56
NewConstruction
160 Freelon St NewConstruction
1654Sunnydale
Ave /SunnydaleHOPE SF
NewConstruction
1939 MarketSt
NewConstruction
207 CameronWy / Alice
Griffith Ph 5HOPE SF
NewConstruction
207 CameronWy / Alice
Griffith Ph 6HOPE SF
NewConstruction
2550 Irving St NewConstruction
69
40
32
20
59
130
51
79
111
126
10
619
72
775
30
61
32
41
50
181
89
196
5
10
31
20
18
69
83
119
63
111
167
100
800
72
89
971
59
35
130
89
70
84
120
63
112
168
101
1,600
73
90
1,700
60
36
131
90
S A N F R A N C I S C O P L A N N I N G D E P A R T M E N T72
CONTINUED >

Power BI Desktop
PipelineStatus
Address /Project Name
DevelopmentType
Very LowIncome
Homelessor Single
Very LowIncomeSeniors
Very LowIncomeFamilies
Very LowIncome
Disabled
LowerIncome
Low toModerateIncome
HomeownerModerateIncome
TotalAffordable
Units
TotalUnits
InPreliminaryPlanning
375 LagunaHonda Blvd /
LagunaHonda
HospitalContinuum of
Care
NewConstruction
BalboaReservoirBuilding E
NewConstruction
HPSY II-CandlestickPoint 10a
NewConstruction
HPSY II-CandlestickPoint 11a
NewConstruction
Mission BayBlock 9A
NewConstruction
SUBTOTALS
SunnydaleBlock 7
NewConstruction
SunnydaleBlock 9
NewConstruction
PipelineTotals
TOTALS
40
40
38
118
1,032
158
347
524
26
1,709
51
75
2,886
0
27
115
137
733
1,451
97
148
304
17
24
982
0
103
198
123
155
175
148
3,211
68
99
7,005
200
124
156
176
148
4,753
69
100
8,579
73
S a n F r a n c i s c o H o u s i n g I n v e n t o r y | 2020

Power BI Desktop
TABLE A-8.Housing Trends by Neighborhood, 2021
Analysis Neighborhood Units Completedfrom New
Construction
UnitsDemolished
Units Gained orLost from
Alterations
Net Change InNumber of
Units
Rank
Bayview Hunters PointBernal Heights
Castro/Upper MarketChinatown
Crocker AmazonDiamond Heights
Downtown/Civic CenterExcelsior
Financial District/South BeachGlen Park
Haight AshburyHayes Valley
Inner RichmondInner SunsetJapantownLakeshore
Lone MountainMarinaMission
Mission BayNob Hill
Noe ValleyNorth Beach
Oceanview/Merced/InglesideOuter Mission
Outer RichmondOuter Sunset
Pacific HeightsParksidePortola
Potrero HillPresidio Heights
6217 1
2643 2 92
829152
12 2
1411162
17233
14401438-1
16722
270
2013179000
18287
614401338-10
17624
1,097152
14211726343434155
282011221235347
1328
665 2 6 2
4 2
1116269
16 9 6
113
7717269
180
1504
133
91833292716341934312332
S A N F R A N C I S C O P L A N N I N G D E P A R T M E N T74
CONTINUED >

Power BI Desktop
Analysis Neighborhood Units Completedfrom New
Construction
UnitsDemolished
Units Gained orLost from
Alterations
Net Change InNumber of
Units
Rank
Russian HillSeacliff
South of MarketSunset/Parkside
TenderloinTreasure Island
Twin PeaksVisitacion Valley
West of Twin PeaksWestern Addition
San Francisco
1,0892255
167
3453,037
1
12
12
54723
249 6
111011
1,608
110
1,63645
30406
17810
3564,633
24341
104
34306
253
75
S a n F r a n c i s c o H o u s i n g I n v e n t o r y | 2020

Power BI Desktop
TABLE B-1.Housing Trends by Planning Area, 2021
Planning Area Net UnitsAuthorized
UnitsCompletedfrom New
Construction
UnitsDemolished
Net UnitsGained orLost fromAlteration
Net Change InNumber of Units
Balboa ParkBayview Hunters Point
Central SoMaCentral Waterfont
ChinatownDowntownEast SoMa
Fisherment's WharfHunters Point ShipyardIndia Basin Shoreline
JapantownMarket and Octavia
Mission (EN)Mission Bay
Northeast WaterfrontParkmercedRincon Hill
Showplace Square/ Potrero HillTransbay
Transit Center DistrictTreasure Island
Van Ness CorridorWestern ShorelineWestern SoMa (EN)
Yerba BuenaRest of City
13128
2052
279
2143
111133
1320
6
302 1 6
395546152125
18719
120
2
1411
74521
24128
11
020
30311
74521006
419672152125
00
19819
120138284
3923
722
192
698
288
10
22
17823
476
0194
287623
754San Francisco 2,093 3,037 12 1,608 4,633
S A N F R A N C I S C O P L A N N I N G D E P A R T M E N T76

Power BI Desktop
TABLE B-2.Units Entitled by Planning Area, 2021
Planning Area Projects Units Entitled
Bayview Hunters PointCentral SoMa
ChinatownCivic CenterDowntown
Market and OctaviaMission (EN)
Showplace Square/Potrero Hill (EN)Van Ness Corridor
Western SoMa (EN)Rest of the City
3111123521
34
54120
11122130
177479109244663
San Francisco 54 2,010
77
S a n F r a n c i s c o H o u s i n g I n v e n t o r y | 2020

Power BI Desktop
TABLE B-3.Net Housing Units Completed by Building Type and Planning Area, 2021
Planning Area
Single Family 2 Units 3 to 9 Units 10 to 19 Units 20 + Units TOTAL
Balboa ParkBayview Hunter's Point
Central SoMaCentral Waterfont
ChinatownDowntownEast SoMa
Fisherman's WharfHunter's Point Shipyard
JapantownMarket and Octavia
Mission (EN)Mission Bay
Northeast WaterfrontRincon Hill
Showplace Square/ Potrero HillTransbay
Transit Center DistrictVan Ness CorridorWestern ShorelineWestern SoMa (EN)
Yerba BuenaRest of City
0210100 00110000 00
1401002 00 30005 00
4 76
55 6 22
83
19
0
302
745 1
-1404610152125
187
120192
416
30311
7452106
419672152125
019819
120194
2 8
0
106
7
121
106
86923
413
87623
754TOTAL 14 131 210 136 4,142 4,633
S A N F R A N C I S C O P L A N N I N G D E P A R T M E N T78
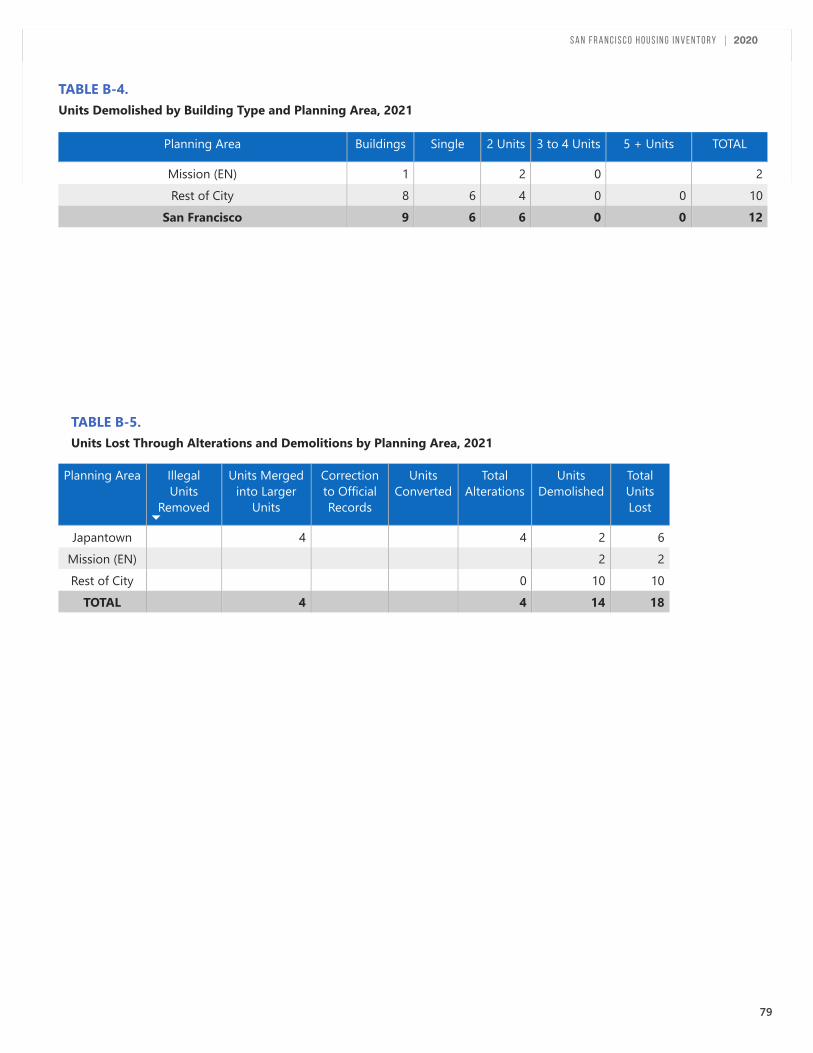
Power BI Desktop
TABLE B-4.Units Demolished by Building Type and Planning Area, 2021
TABLE B-5.Units Lost Through Alterations and Demolitions by Planning Area, 2021
Planning Area Buildings Single 2 Units 3 to 4 Units 5 + Units TOTAL
Mission (EN)Rest of City
18
6
24
00
0
210
San Francisco 9 6 6 0 0 12
Planning Area IllegalUnits
Removed
Units Mergedinto Larger
Units
Correctionto OfficialRecords
UnitsConverted
TotalAlterations
UnitsDemolished
TotalUnitsLost
JapantownMission (EN)Rest of City
4
4 0
22
10
62
10TOTAL 4 4 14 18
79
S a n F r a n c i s c o H o u s i n g I n v e n t o r y | 2020

Power BI Desktop
TABLE B-6.New Affordable Housing Constructed in Planning Areas, 2021
Planning Area
Project AffordableUnits
TotalCompleted
in 2021
TotalUnits
FirstAMI
Target
FirstTenure
First FundingSource
Central SoMa 434 Minna St
Downtown 1169 Market St
950 Market St
Mission 1001 South Van Ness Av
2070 Folsom St
3001 24th St
490 South Van Ness Av
NORTHEAST WATERFRONT 88 Broadway
Showplace Square/PotreroHill
975 Bryant St
Transbay 500 Folsom St
Van Ness Corridor 555 Golden Gate Av
830 Eddy St
Western SoMa (EN) 1532 Harrison St
230 07th St
349 8th St
833 Bryant St
Rest of City 1145 Polk St
1501 Sunnydale Av
2410 33rd Av
3701 Noriega St
36
67
33
28
126
44
80
52
30
4
7
20
22
5
6
145
8
23
3
3
302
502
242
208
127
45
81
125
185
19
55
137
136
40
38
146
54
167
10
12
302
502
242
208
127
45
81
125
185
19
55
137
136
40
38
146
54
167
10
12
MOD
LOW
LOW
LOW
LOW
VERYLOW
LOW
VERYLOW
LOW
LOW
MOD
LOW
MOD
LOW
MOD
VERYLOW
LOW
LOW
VERYLOW/LOW/MOD
VERYLOW/LOW/MOD
Rental
Ownership
Ownership
NA
Rental
Rental
Rental
NA
Rental
Rental
Ownership
Rental
Rental
Ownership
Ownership
Rental
Ownership
Rental
Rental
Rental
Inclusionary
Inclusionary
Inclusionary
Inclusionary
AHSC,CDLAC andLIHTC
LIHTC
CDLAC andLIHTC
Inclusionary
Inclusionary
Inclusionary
Inclusionary
Inclusionary
Inclusionary
Inclusionary
Inclusionary
Inclusionary
Inclusionary
Inclusionary
Inclusionary
S A N F R A N C I S C O P L A N N I N G D E P A R T M E N T80

Power BI Desktop
TABLE C.San Francisco Zoning Districts, as of 2021
Zoning Type
Zoning Label First General Descriptions
Residential, House and MixedDistricts
RH-1
RH-1(D)
RH-1(S)
RH-2
RH-3
RM-1
RM-2
RM-3
RM-4
Residential Transit-Oriented Districts RTO
RTO-M
Residential-Commercial Districts RC-3
RC-4
Downtown Residential Districts DTR-RH
DTR-SB
DTR-TB
Neighborhood Commercial Districts NC-1
NC-2
NC-3
NCD-24th-Noe
NCD-Broadway
NCD-Castro
NCD-Haight
NCD-InnerClement
NCD-Inner Sunset
NCD-North Beach
NCD-OuterClement
NCD-Pacific
NCD-Polk
NCD-Sacramento
NCD-Union
Residential, House - One Family
Residential, House - One Family (Detached Dwellings)
Residential, House - One Family with Minor Second Unit
Residential, House - Two Family
Residential, House - Three Family
Residential, House - Low Density
Residential, House - Moderate Density
Residential, House - Medium Density
Residential, House - High Density
Residential Transit-Oriented
Residential Transit-Oriented, Mission
Medium Density
High Density
Downtown Residential - Rincon Hill District
Downtown Residential - South Beach District
Downtown Residential - Transbay District
Neighborhood Commercial Cluster District
Small Scale Neighborhood Commercial District
Moderate Scale Neighborhood Commercial District
24th - Noe Valley Neighborhood Commercial District
Broadway Neighborhood Commercial District
Castro Neighborhood Commercial District
Haight Neighborhood Commercial District
Inner Clement Neighborhood District
Inner Sunset Neighborhood District
North Beach Neighborhood Commercial District
Outer Clement Neighborhood District
Pacific Neighborhood Commercial District
Polk Neighborhood Commercial District
Sacramento Neighborhood Commercial District
Union Neighborhood Commercial District
81
S a n F r a n c i s c o H o u s i n g I n v e n t o r y | 2020
CONTINUED >

Power BI Desktop
Zoning Type
Zoning Label First General Descriptions
Neighborhood Commercial Districts NCD-UpperFillmore
NCD-UpperMarket
NCD-West Portal
NC-S
Neighborhood Commercial TransitDistricts
NCT-1
NCT-2
NCT-24th-Mission
NCT-3
NCT-Hayes-Gough
NCT-Mission
NCT-Ocean
NCT-SoMa
NCT-Upper Market
NCT-Valencia
Chinatown Mixed Use Districts CCB
CRNC
CVR
South of Market Mixed Use Districts RED
RSD
SLI
SLR
SSO
Eastern Neighborhoods Mixed UseDistricts
MUG
MUO
MUR
SPD
UMU
Commercial Districts C-2
Upper Fillmore Neighborhood Commercial District
Upper Market Neighborhood Commercial District
West Portal Neighborhood Commercial District
Neighborhood Commercial Shopping Center District
Neighborhood Commercial Transit Cluster District
Small-Scale Neighborhood Commercial Transit District
24th - Mission Neighborhood Commercial Transit District
Moderate-Scale Neighborhood Commercial Transit District
Hayes - Gough Neighborhood Commercial Transit District
Mission Neighborhood Commercial Transit District
Ocean Neighborhood Commercial Transit District
South of Market Neighborhood Commercial Transit District
Upper Market Neighborhood Commercial Transit District
Valencia Neighborhood Commercial Transit District
Chinatown Community Business District
Chinatown Residential Neighborhood Commercial District
Chinatown Visitor Retail District
South of Market Residential Enclave District
South of Market Residential Services District
South of Market Service-Light Industrial District
South of Market Light Industrial-Residential District
South of Market Services / Secondary Office District
Mixed Use - General District
Mixed Use - Office District
Mixed Use - Residential District
South Park Mixed Use District
Urban Mixed Use District
Community Business District
S A N F R A N C I S C O P L A N N I N G D E P A R T M E N T82 CONTINUED >

Power BI Desktop
TABLE D.In-Lieu Housing Fees Collected, 2012–2021
Year Amount Collected
2012201320142015201620172018201920202021
$1,536,683$9,130,671
$29,911,959$73,576,017$91,178,296
$107,299,676$51,133,873$30,922,187$14,826,324$4,379,076
TOTAL $413,894,762
Zoning Type
Zoning Label First General Descriptions
Downtown Commercial Districts C-3-G
C-3-O
C-3-O (SD)
C-3-R
C-3-S
Industrial Districts C-M
M-1
M-2
PDR-1-B
PDR-1-D
PDR-1-G
PDR-2
Redevelopment Agency Districts HP-RA
MB-RA
Downtown Commercial - General District
Downtown Commercial - Office District
Downtown Commercial - Office (Special Development) District
Downtown Commercial - Retail District
Downtown Commercial - Service District
Heavy Commercial District
Light Industrial District
Heavy Industrial District
Production Distribution and Repair Light Industrial BufferDistrict
Production Distribution and Repair Design District
Production Distribution and Repair General District
Core Production Distribution and Repair District
Bayview Hunters Point Redevelopment Area Plan District
Mission Bay Redevelopment Area Plan District
83
S a n F r a n c i s c o H o u s i n g I n v e n t o r y | 2020

S A N F R A N C I S C O P L A N N I N G D E P A R T M E N T84

85
S a n F r a n c i s c o H o u s i n g I n v e n t o r y | 2020
Appendix E: Glossary
Affordable Housing Unit: A housing unit – owned or rented – at a price affordable to low- and middle-income households. An affordable rental unit is one for which rent equals 30% of the income of a household with an income at or below 80% of the HUD median income for the San Francisco PMSA, utilities included. An affordable ownership unit is one for which the mortgage payments, PMI, property taxes, homeowners dues, and insurance equal 33% of the gross monthly income of a household earning between 80% and 120% of the San Francisco PMSA median income, assuming a 10% down pay-ment and a 30-year, 8% fixed-rate loan.
Alterations: Improvements and enhancements to an existing building. At DBI, building permit applications for alterations use Forms 3 and 8. If you are not demolishing an existing building (Form 6) or newly constructing a new building (Forms 1 and 2), you are “altering” the building.
Authorized:
Certificate of Final Completion (CFC): A document issued by DBI that attests that a building is safe and sound for human occupancy.
Conditional Use Permit: A permit that is only granted with the consent of the Planning Commis-sion, and not as of right.
Condominium: A building or complex in which units of property, such as apartments, are owned by individuals and common parts of the property, such as the grounds and building structure, are owned jointly by all of the unit owners.
Current dollars: The dollar amount for a given period or year not adjusted for inflation. In the case of income, it is the income amount in the year in which a person or household receives it. For example, the income someone received in 1989 unadjusted for inflation is in current dollars.
General Plan: Collection of Objectives, Policies, and Guidelines to direct guide the orderly and prudent use of land.
HMFA: HUD Metro FMR (Fair Market Rent) Area an urbanized county or set of counties with strong social and economic ties to neighboring communities. PMSAs are identified within areas of one million-plus populations.Housing Unit: A dwelling unit that can be a single family home, a unit in a multi-unit building or complex, or a unit in a residential hotel.
Inclusionary Housing Units: Housing units made affordable to lower- and moderate-income house-holds as a result of legislation or policy requiring market rate developers to include or set aside a percentage (usually 10% to 20%) of the total hous-ing development to be sold or rented at below market rates (BMR). In San Francisco, this is usually 15%, and it applies to most newly constructed housing developments containing five or more dwelling units.
Median Income: The median divides the household income distribution into two equal parts: one-half of the households falling below the median household income and one-half above the median.
Pipeline: All pending development projects – filed, approved or under construction. Units associ-ated with a projects are considered to be “in the pipeline” from the day they are submitted for review with the Planning Department, the Redevelopment Agency (SFRA), or DBI, until the day the project or subset of units is issued a Certificate of Final Completion or Temporary Certificate of Occupancy by DBI.
Planning Code: A local law prescribing how and for what purpose each parcel of land in a community may be used.
Primary Metropolitan Statistical Area (PMSA): A PMSA is an urbanized county or set of counties with strong social and economic ties to neighboring com-munities. PMSAs are identified within areas of one million-plus populations.
Single Room Occupancy (SRO) Units: Residential hotel rooms, typically occupied by one person, lack-ing bathroom and/or kitchen facilities.
Temporary Certificate of Occupancy (TCO): Like a CFC, a TCO allows occupancy of a building pending final inspection.

Mayor
London Breed
Board of Supervisors
Connie Chan Matt Haney Rafael Mandelman Gordon Mar Myrna Melgar Aaron Peskin Dean Preston Hillary Ronen Ahsha Safaí Catherine Stefani Shamann Walton, President
Planning Department
Rich Hillis, Director of Planning Tom DiSanto, Director of Administration Reza Amindarbari, Acting Manager, Data & Analytics Group John Boldrick, Analyst, Data & Analytics Group Oscar Hernandez-Gomez, Planner, Analyst, Data & Analytics Group Ken Qi, Planner, Analyst, Data & Analytics Group
Department of Building Inspection
Mayor’s Office of Housing and Community Development
Office of Community Investment and Infrastructure
Department of Public Works
Office of Economic and Workforce Development
Rent Board
Office of Civic Invesment & Infrastructure
Published April 2022
ACKNOWLEDGMENTS
Planning Commission
Sue Diamond Frank S. Fung Theresa Imperial Joel Koppel Kathrin Moore, Vice-President Gabriella Ruiz Rachael Tanner, President