2014 BUDGET DOCUMENT - Peel Region
547
Charting our Course 2014 BUDGET DOCUMENT
-
Upload
khangminh22 -
Category
Documents
-
view
10 -
download
0
Transcript of 2014 BUDGET DOCUMENT - Peel Region

Charting our Course
2014 BUDGET DOCUMENT

THIS PAGE INTENTIONALLY LEFT BLANK

TABLE OF CONTENTS Strategic Plan 2011-2014 Term of Council Priorities 2014 Budget Document Guidelines 2014 Budget Report to Council – (to come with Agenda) 2014 Budget Executive Summary 2014 Consolidated Budget Tax Supported Programs REGION CONTROLLED PROGRAMS PUBLIC WORKS – TAX SUPPORTED PROGRAMS
Public Works Tax Supported Budget Overview Program Summaries
− Transportation − Waste Management − Development Services − Operations Support – Tax
HEALTH SERVICES
Departmental Budget Overview Program Summaries
− Public Health − Long Term Care − Paramedic Services − Health Services Program Support
HUMAN SERVICES
Departmental Budget Overview Program Summaries
− Social Assistance/Employment − Housing − Early Learning/Child care − Community Investment
INTERNAL SERVICES & PAMA/NON-PROGRAM
− Internal Services & PAMA − Non Program
REGION FINANCED EXTERNAL ORGANIZATIONS − Peel Regional Police (P.R.P.) − Ontario Provincial Police (O.P.P.) − Conservation Authorities − Assessment Services
Utility Rate Supported Programs PUBLIC WORKS – UTILITY RATE SUPPORTED PROGRAMS
Public Works Utility Rate Supported Budget Overview Program Summaries
− Water − Wastewater − Operations Support-Utility

THIS PAGE INTENTIONALLY LEFT BLANK

Charting our Course
STRATEGIC PLAN2011–2014
Charting our course
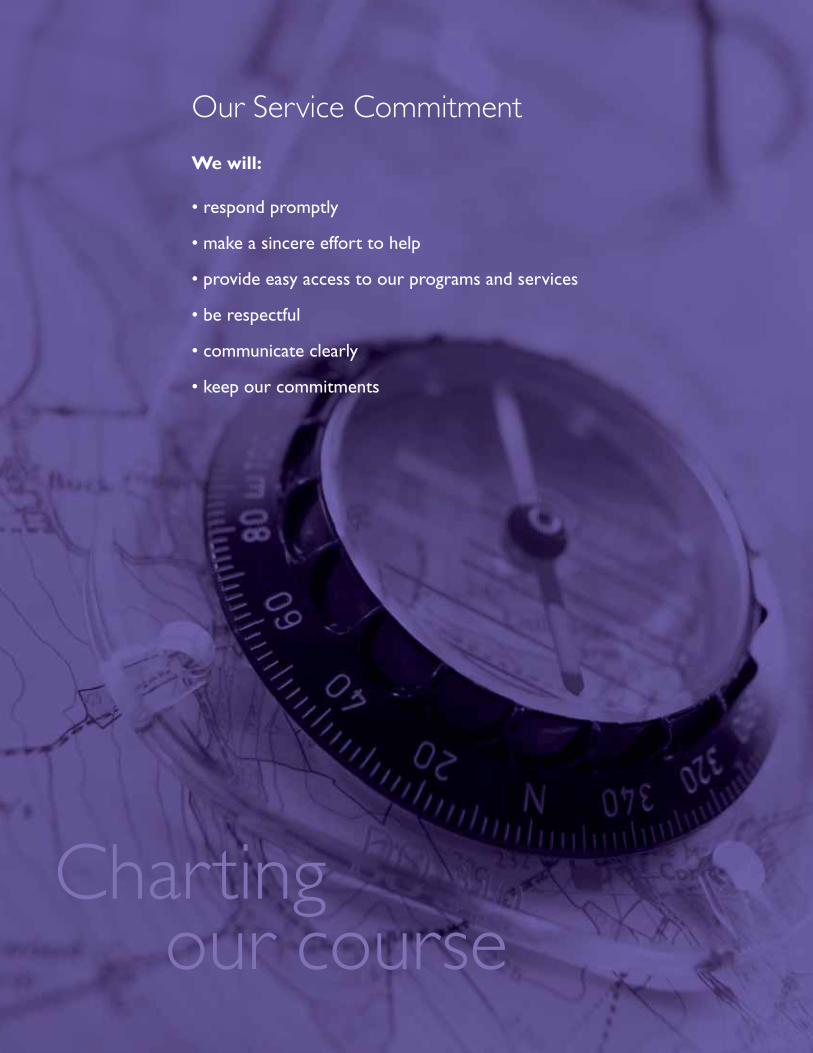
Our Service Commitment
We will:
• respond promptly
• make a sincere effort to help
• provide easy access to our programs and services
• be respectful
• communicate clearly
• keep our commitments

Charting our Course
Region of Peel Strategic Plan
The Region of Peel’s Strategic Plan charts the long-term vision for the communities in Peel, and the Region’s role in achieving that vision. Reviewed and updated at the beginning of each term of Regional Council, the Strategic Plan guides the work ofCouncil and staff. The Strategic Plan contains a vision for the community, a mission for achieving the vision, and goals that respond to Peel’s changing and diverse needs.
The Strategic Plan goals have been aligned to seven key themes that encompassthe programs and services delivered to the Peel community.
EnvironmentProtect, enhance and restore the environment
Social DevelopmentBuild a community that is stable, responsive and adaptable
Community HealthMaintain and improve the health of Peel’s community
TransportationSupport and influence sustainable transportation systems
Cultural DevelopmentBuild a cohesive Peel community
Public SafetyEnsure a safe Peel community
Service ExcellenceStrive for continued excellence as a municipal government
Responsible and effective planning is critical to the success of the Region of Peel. The Strategic Plan provides a foundation for establishing Term of Council Priorities, theannual Budget as well as program and operational plans. It keeps the organization focused on delivering the right services in the right way to the Peel community.
The Strategic Plan works together with the Term of Council Priorities, Performance Reporting and Budget as a compass, charting our course. These components guide both the strategic and operational decisions made at the Region of Peel over the current term of Council.
The Region of Peel’s Strategic Plan identifies a clear vision, and the work required to reach it.
1

Message from the Regional Chair
I am pleased to present on behalf of Regional Council our revised Strategic Plan. This Strategic Plan is a testament to Council’s leadership and commitment to servingthe changing and diverse needs of our residents and businesses in Peel.
We are committed to working collaboratively with other levels of government, our community partners, residents and business owners to ensure that we are enablingthe delivery of the right services to the right people at the right time.
To ensure the Strategic Plan provides a clear direction for Peel, Council actively participated in a number of workshops to develop a Plan that considers the needs of their constituents and all residents and businesses in Peel.
Council continues to present solutions and recognize opportunities in our large community, the second-largest municipality in the Greater Toronto Area with a population of more than 1.3 million.
As our community grows, so does the demand for services. Council’s focus remains on keeping Peel strong—and this Strategic Plan is our dedication to your quality of life.
Emil KolbRegional Chair
2

Message from theChief Administrative Officer
This Strategic Plan is the foundation of our planning as an organization. It is part of astrong and integrated planning process, ensuring we are focused on delivering thepublic services as mandated by Regional Council.
Because our planning is integrated, our Strategic Plan informs the Term of Council Priorities, directs measurement of services, and deliberately sets appropriate budgettargets. Together, they chart our course. They set the direction for staff and Councilto realize our vision and achieve our goals. This improved alignment enables us todemonstrate the results of our work to meet the needs of the community whilemaintaining strong fiscal and administrative accountability.
Region of Peel employees are focused on providing excellent public service. We arecommitted to communicating clearly; doing what we say we will; following service delivery standards; and providing easy access to our services. Our promise to deliverclient-centred service is upheld by our Regional Values.
Achieving our vision is dependant on staff working collaboratively with Council, other levels of government, community partners, residents and businesses in Peel.By doing this well, we are better able to serve the communities in Peel. We strive to be a government that earns public trust and confidence.
David SzwarcChief Administrative Officer
3

Vision Peel is a safe, healthy, prosperous, sustainable and inclusive community that protects its quality of life.
MissionThe Region of Peel serves our community through progressive leadership, education, advocacy, collaboration and public service excellence.
Goals and Strategic Actions
Goal 1: Protect, enhance and restore the environment
1.1 Demonstrate leadership in responsible environmental management practices and energy use.
1.2 Minimize the impact of waste.
1.3 Improve air quality, mitigate and adapt to climate change.
1.4 Protect and restore water resources, significant natural heritage and environmentally sensitive areas.
1.5 Support the viability of Peel’s agricultural resources.
1.6 Promote low impact development and urban restoration.
1.7 Collaborate with other levels of government and agencies on environmental issues.
Environment
4

Goal 2: Build a community that is stable, responsive and adaptable
2.1 Provide innovative and adaptable housing options.
2.2 Strengthen partnerships and services to respond to the needs of people during vulnerable times in their lives.
2.3 Implement prevention strategies that result in measurable outcomes and social change.
2.4 Strengthen neighbourhoods to enable people to participate in the community and economy.
Goal 3: Maintain and improve the health of Peel’s community
3.1 Influence healthy living through community design.
3.2 Increase investment in prevention strategies to strengthen the effectiveness and sustainability of the entire health system in Peel.
3.3 Deliver services that anticipate and respond to the evolving health needs of the community.
3.4 Ensure a clean, safe and adequate water supply.
Goal 4: Support and influence sustainable transportation systems
4.1 Support adequate Regional roads infrastructure and protect the traffic movement functionality of existing and future arterial roads to support evolvingtransportation needs.
4.2 Collaborate with other levels of government and agencies to influence solutions.
4.3 Support improved and integrated active transportation, transit and land use systems to effectively move people and goods throughout Peel.
4.4 Collaborate with other levels of government and agencies to encourage barrier-free transportation within the Greater Golden Horseshoe.
4.5 Adapt, protect and accommodate integrated goods movement in the Regional transportation system while minimizing conflicts with adjacent land uses.
Social Development
Community Health
Transportation
5

Goal 5: Build a cohesive Peel community
5.1 Strengthen connections among the communities of Peel through partnerships with other levels of government and agencies.
5.2 Support the strengthening of neighbourhood cohesion through celebrating thecultural diversity, heritage and history of the communities of Peel.
5.3 Contribute to creating a receptive, accessible community that ensures full participation for all.
Goal 6: Ensure a safe Peel community
6.1 Strengthen Regional emergency management.
6.2 Manage Regional infrastructure to ensure a safe living and working environment.
6.3 Collaborate with other governments, organizations and emergency services todevelop initiatives to build a safe community.
Goal 7: Strive for continued excellence as a municipal government
7.1 Ensure the financial sustainability of Regional services.
7.2 Advocate to senior levels of government for adequate funding to address community needs in Peel.
7.3 Educate residents and businesses about the programs and services provided by the Region of Peel.
7.4 Communicate with citizens directly to educate about the community needs thatexist in Peel.
7.5 Strengthen coordination between area municipalities and the Region, as well as other levels of government and community partners to deliver services andachieve strategic goals.
7.6 Demonstrate accountability by making evidence-informed decisions, measuring performance and reporting outcomes.
7.7 Attract and invest in a skilled, engaged and diverse municipal workforce.
7.8 Manage growth through long-term integrated planning.
Cultural Development
Public Safety
Service Excellence
6

Strategic Planning at the Region of Peel The Region of Peel’s strategic planning process is focused on identifying and respondingto the needs in Peel’s communities. The Region plans with a clear purpose, striving tobuild trust and confidence in the Region of Peel as a high-performing government.
The Region is aligning planning efforts and resources with Regional Council priorities.By measuring outputs and outcomes, the Region is better able to demonstrate theservices it provides are the right ones, and that they contribute to the quality of life inall of Peel’s communities.
The Strategic Plan is the keystone for the Region’s strategic planning process. To create this long-term plan, Council and staff reviewed existing program plans fromacross the organization, as well as plans of other related organizations—includingthose of Caledon, Brampton and Mississauga. This information, along with currentand future projections of demographic, social, health, environmental and economicdata was used to create the Strategic Plan.
In 2011, the development of Term of Council Priorities was introduced as a second step in the planning process. These are the areas of focus approved by Council thatwill advance the Strategic Plan during its term. The annual Budget provides resources necessary to execute the Region’s priorities, and achieve the desired outcomes for Peel’s communities. The Region will measure and report to Council and the community on its progress against the plan throughout this term of Council.
This process creates a better, stronger link between the Strategic Plan, Term of CouncilPriorities, program planning and operations, measurement, and annual Budget—it is integrated planning. As a result, the new Strategic Plan gives Peel’s communities a clear understanding of the Region of Peel’s priorities.
7

• Defence• Criminal law• Employment insurance• Postal service
• Census• Copyrights• Trade regulation• External relations
• Money and banking• Transportation• Citizenship• Indian affairs
• Property and civil rights• Administration of
justice
• Natural resources• Environment• Education
• Health• Welfare
• Regional roads• Public health• Non-profit housing• Heritage
• Police• Long term care centres• Water and wastewater• Social services
• Children’s services• Paramedics• Garbage and recycling
The Roles of GovernmentCanada’s levels of government share powers and responsibilities for public service andgovernance. This chart provides an overview of the role of each order of government.
Federal
One government that has responsibility for governance of services that relate to the whole country.
Provincial
Each province has its own government that has responsibility for governanceof services that relate to that province.
Regional
The Region of Peel is a municipal government that provides services over a large geographic area (i.e. Caledon, Brampton, Mississauga).
Municipal
Cities, towns and villages all over Canada have their own municipal governments to provide local services.
• Local roads• Parks and recreation• Planning and zoning• Taxation• By-law enforcement• Economic development• Fire• Libraries• Licensing
8

Charting our course
Regional Values
Supportive and Respectful Environment
We work in an environment that is positive, healthy, caring and free from discrimination. We respect diversity and treat one another in ways that are fair, courteous and compassionate, recognizing everyone's contributions.
Teamwork
We practise teamwork, co-operation and collaboration and reinforce these with a strong vision and positive leadership.
Effective Communication
We practise open, two-way communication in a clear and honest manner.
Integrity
We are ethical, professional and trustworthy in our work.
Quality Service
We provide services that are accountable, accessible, responsive, efficient and effective. We seek new and innovative ideas for improvement in policies, practices and services.

The Regional Municipality of Peel10 Peel Centre Dr.,Brampton, ON L6T 4B9905-791-7800
peelregion.ca
This report was printed on Rolland Enviro100. Rolland Enviro100contains 100 per cent recycled post-consumer fibre, is certified EcoLogo, Processed Chlorine Free and made using Biogas Energy.
SIP-0079 11/05

Update On Term Of Council Priorities

THIS PAGE INTENTIONALLY LEFT BLANK

Charting our Course
TERM OF COUNCIL PRIORITIES2011–2014
Year 1

Charting our course
Our Service Commitment
We will:
• respond promptly
• make a sincere effort to help
• provide easy access to our programs and services
• be respectful
• communicate clearly
• keep our commitments

Charting our Course
Region of PeelTerm of Council PrioritiesThe Region of Peel’s Strategic Plan charts the long-term vision for the communities inPeel, and the Region’s role in achieving that vision. The Strategic Plan is the keystoneof the strategic planning process.
In 2011, the Term of Council Priorities were introduced as a second step to help the Region confidently chart its course. These are the areas of focus developed by Council to advance the Strategic Plan. The annual Budget provides resources necessary to execute the Term of Council Priorities and achieve the desired outcomesfor Peel’s community. To ensure focus on the right things, the Term of Council Priorities will be reviewed and updated on an annual basis. As part of the Region’s ongoing monitoring and reporting, it will measure and report on its progressthroughout the current Term of Council.
The Term of Council Priorities are aligned to the Strategic Plan goals and actions. Thesegoals correspond with seven key themes that encompass the programs and servicesdelivered to the Peel community.
Protect, enhance and restore the environment
With an impressive mix of urban and rural landscapes, Peel’s area municipalities haveall contributed to building complete, liveable and vibrant communities that respectPeel’s natural heritage. Growth pressures and environmental changes challenge theRegion to ensure services are in place to protect the water we drink, the air webreathe, and the places we work and play.
Build a community that is stable, responsive and adaptable
The Region of Peel, through leadership, system management, directly delivered services, funding, partnerships with other governments and community agenciesworks to ease economic and social disparities, and strengthen the self-sustaining abilities of individuals, families and communities.
Environment
Social Development
1

Maintain and improve the health of Peel’s community
The health of Peel’s population is of primary importance. It affects people’s quality of life and the economic and social sustainability of our communities. Working in partnership with volunteers, school boards, not-for-profits, businesses, governmentsand other health care agencies, the Region of Peel plays important roles in improvingand maintaining health, reducing disparities, and enhancing the sustainability of thehealth care system.
Support and influence sustainable transportation systems
Sustained economic prosperity and growth is fostered by adequate, safe and efficienttransportation infrastructure. Moving people and goods throughout Peel supportseconomic development while contributing to the overall quality of life for people wholive, work or travel in Peel.
Build a cohesive Peel community
Peel’s communities have a strong, vibrant and diverse cultural heritage. The Region ofPeel’s directly delivered programs and activities help to foster connections amongcommunities as Peel’s heritage evolves. Celebrating these connections contributes toa welcoming, accessible community that ensures full participation for everyone.
Ensure a safe Peel community
The Region of Peel collaborates with governments, organizations and emergency services to provide residents with both a coordinated emergency management plan forthe community, and with the knowledge to help themselves should emergencies arise.
Strive for continued excellence as a municipal government
The Region of Peel is recognized for its history of service excellence and strong fiscalmanagement. The Region continues to focus on measured results and feedback fromservice recipients and residents in order to continue to build and maintain publictrust and confidence.
Community Health
Transportation
Cultural Development
Public Safety
Service Excellence
2

Priority Outcome Actions (2011) Actions (2012–2014) Strategic Plan Themes
Reduce greenhousegas emissions
Protect the communityby managing the negative impacts associated with climatechange
Develop and adopt Climate Change Strategy—Confirm short and long term targets for reductions in greenhouse gas emissions
Implement ClimateChange Strategy—Develop greenhouse gas monitoring programfollowing implementa-tion of strategy to trackprogress on achievingtargeted emission reductions
Environment
Increase waste diversion
Reduce the negative impact of waste on theenvironment
Update long term WasteManagement Strategy—Ensure compliance withWaste Diversion Act—Establish new short andlong term targets forWaste Diversion
Implement long termWaste ManagementStrategy—Achieve short term diversion targets
EnvironmentService Excellence
Reduce per capitawater consumption
Optimize use of existing infrastructureand minimize negative impact to natural environment
Review Water EfficiencyPlan—Realign existing WaterSmart Peel to meet requirements of WaterOpportunities Act
Implement Water Efficiency Plan
EnvironmentService Excellence
Improve stormwater management
Reduce the citizen risksassociated with floodingand address broader environmental impacts
Develop storm watermanagement frameworkwith area municipalitiesand conservation authorities—Establish targets
Support implementationof framework recommendationsadopted by Council
EnvironmentPublic SafetyService Excellence
Assess water andwastewater capacity
Ensure water andwastewater capacitymeets anticipated community needsthrough 2031
Update Water andWastewater Plans—Consultant award forlake system (Q1)—Consultant award forgroundwater systems (Q2)
Implement endorsedplans
EnvironmentCommunity Health Service Excellence
Enhance integrityof wastewater collection system
Optimize the cost oftreatment—Reduce the risk of bypass events and theresulting impact on theenvironment—Reduce the extent towhich homes are exposedto surcharging events
Develop framework forInflow and InfiltrationStrategy—Continue to pilot tacticsin support of CooksvilleCreek Task Force—Enhance inspection program
Undertake risk-basedcondition assessment toidentify critical areas—Develop a Region-wideprogram
EnvironmentCommunity Health Service Excellence
Term of Council Priorities
3

Priority Outcome Actions (2011) Actions (2012–2014) Strategic Plan Themes
Increase supply of appropriatehousing options
Increase access to appropriate housing andprevent homelessness
Invest in housing andhomelessness prevention—Increase rent-geared-toincome and rent supplements—Provide home ownershipassistance and rental andutility arrears supports—Present policy options to Council to addresshousing wait list over the long term
Implement Council endorsed plan for infrastructure (new development, redevelopment, and infill), rent-geared-to income subsidies andrent supplements, andstate of good repair
Social DevelopmentService Excellence
Review the coreservices deliveredby Human Services
Determine the appropriate mix of Regional services andservice delivery modelto respond tocommunity needs
Review core services inresponse to shifting roles across municipal,provincial and federalgovernments—Assess the impacts of affordable housing andsocial assistance reform,technology moderniza-tion and employmentstrategy—Present policy options to Council that assessthe impact of full daylearning
Implement endorsedrecommendations
Social Development
Increase activetransportation
Reduce the proportionof trips generated bycars, thereby reducinggreenhouse gas emissions and improvingcitizen health
Develop Peel’s ActiveTransportation Plan
Implement endorsedplan
Community Health TransportationService Excellence
Optimize earlychild developmentin Peel
Ensure expectant mothers are healthy before and during pregnancy, birth outcomes are positive, and the attachment relationship betweenparent and child hasbeen firmly establishedduring the first year of life
Conduct research anddevelop and/or confirminterventions that support optimal childwell-being—Release Perinatal andChild Health Status Reports—Continue to work with hospitals on breastfeeding
Provide programs andpolicies to educate and support mothersand infants from pre-conception through the first year of life—Work with Child andYouth Initiative
Community Health
4

Priority Outcome Actions (2011) Actions (2012–2014) Strategic Plan Themes
Assess the impacts of the agingpopulation onhealth and humanservices delivered
Determine the appropriate mix andservice level of Regionalservices to respond tocommunity needs
Develop a Seniors Planto understand the impacts of the aging population on existingservices—Provide policy options toCouncil to guide futureservice planning
Implement endorsedplan
Community Health
Explore the feasibility of community paramedicine partnerships andstrategies
Reduce nonessentialtransports to area hospitals
Assess the feasibility ofcommunity paramedicinepartnerships and strategies, including consideration of required changes to regulations, medical oversight, training, anddispatch model
Present policy optionsto Council—Implement endorsed actions
Community Health
Complete arterialroads review
Ensure the respectiveresponsibilities of theRegion and area municipalities related to Peel's road networkare clear, transparent, efficient and effective
Finalize Arterial RoadReview—Present findings to Arterial Road Reviewsub-committee
Implement endorsedchanges resulting fromreview
TransportationService Excellence
Update Long TermTransportation Planto meet currentand future needs
Ensure that Peel’s transportation needsare planned for throughto 2031
Update Long Term Transportation Plan
Implement endorsedplan
TransportationService Excellence
Improve efficiencyof goods movement in Peelin collaborationwith Peel GoodsMovement TaskForce
Support the competitiveness of businesses, and the availability of high quality jobs in Peel
Develop Goods Movement Task ForceAction Plan
Implement endorsedplan
TransportationService Excellence
Increase capacity(trips) availablethrough accessibletransportationservices
Address the transitneeds of Peel's residentswith all types of mobility impairments in compliance with theAccessibility for Ontarianswith Disabilities Act
Update Accessible Transportation ProgramMaster Plan
Develop flexible modelfor service deliveryusing appropriate portfolio of modes—Increase and improvecross border transportation forclients —Increase customer satisfactionratings—Implement endorsedplan
TransportationCultural DevelopmentService Excellence
5

Priority Outcome Actions (2011) Actions (2012–2014) Strategic Plan Themes
Develop Long TermFinancial Plan
Ensure the long term financial outlook for theRegion is sustainable
Develop and engageCouncil in Long Term Financial Plan—Develop Strategic Use of Debt Policy—Report to Council onthe impact of incorporating privateside infrastructure (noisewalls, private side connections, and drive-way rehabilitation costs)into State of Good Repair program—Update DevelopmentCharges and Administrative By-laws—Propose a framework to Council for a utilityrate structure which reinforces water conservation practices,while better matchingrevenues to costs
Implement the plan—Update financial policies and report on compliance—Implement debt policy and report oncompliance—Implement private sideinfrastructure policy andreport on compliance—Maintain DevelopmentCharge By-law—Implement new utilityrate structure
Service Excellence
Promote a supportive environment forhealthy weights
Reduce overweight/obesity, diabetes andcardiovascular diseasethrough increased physical activity and increased consumptionof fruits and vegetables
Conduct literature review to identify keypriority areas for action—Complete policy workrelated to built environment (i.e. identifying opportunities to influence urban and regional planning) andSchool Food and Beverage Policy—Produce discussion document on policy interventions
Ensure all Peel schools(385 schools) complywith the provincial nutrition standards by 2012—Two external organizations will adopthealthier food policiesfor their programs—Increase the walkabilityof Peel as a result oftwo new policy changesadopted into urban andregional planningprocesses
EnvironmentCommunity Health
6

Priority Outcome Actions (2011) Actions (2012–2014) Strategic Plan Themes
Build communitycapacity
Build a viable Peel community throughcontributing to the sustainability and effectiveness of the notfor profit sector
Maintain service levelsfor community agenciesand present policy options to Council toset priorities and direction—Invest in research to inform decision-making—Support funding for twocommunity hubs—Invest in communitypartners through neighbourhood development with focuson youth—Implement Regional Diversity Strategy to influence the delivery of inclusive and equitableservices to the community—Work with Child andYouth Initiative andother community partners to preventyouth violence and maximize services forages 0–24—Advocate to province tocomplete Mental Healthand Addictions Strategyand to increase fundingfor services in Peel
Implement three-yearCouncil approved planand annual grants andcommunity programs asinformed by RBA trendsand learnings
Social DevelopmentCultural DevelopmentPublic SafetyService Excellence
Support tobaccofree living
Reduce the prevalenceof smoking and exposure to second-hand smoke to reduce smoking related diseases
Conduct review of tobacco strategy frameworks—Implement new strategiesfor the prevention andcessation of smoking andfor the protection ofothers from the effectsof second-hand smoke—Initiate Ottawa-modelcessation program withTrillium hospital
Expand hospital basedcessation programs—Launch cessation program in primary care—Others to be determined
Community Health
7
Priority Outcome Actions (2011) Actions (2012–2014) Strategic Plan Themes
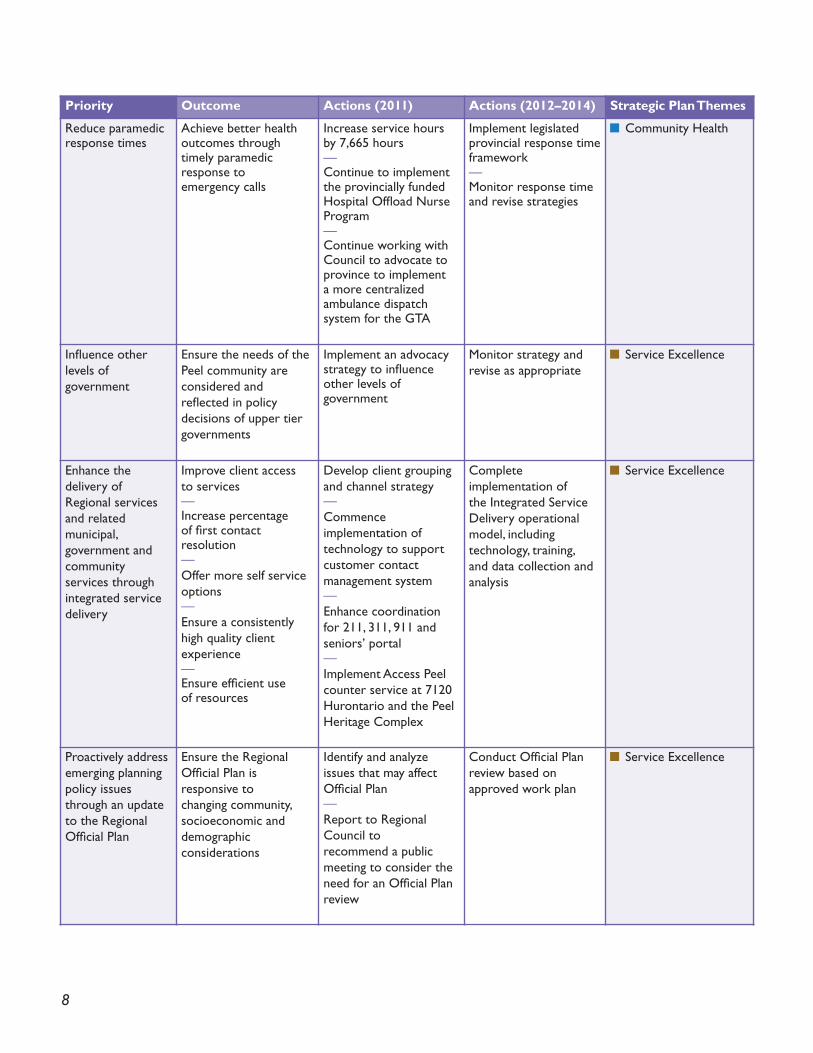
Reduce paramedicresponse times
Achieve better healthoutcomes throughtimely paramedic response to emergency calls
Increase service hoursby 7,665 hours—Continue to implementthe provincially fundedHospital Offload NurseProgram—Continue working withCouncil to advocate toprovince to implement a more centralized ambulance dispatch system for the GTA
Implement legislatedprovincial response timeframework—Monitor response timeand revise strategies
Community Health
Influence other levels of government
Ensure the needs of thePeel community areconsidered and reflected in policy decisions of upper tiergovernments
Implement an advocacystrategy to influenceother levels of government
Monitor strategy andrevise as appropriate
Service Excellence
Enhance the delivery of Regional servicesand related municipal, government andcommunity services throughintegrated servicedelivery
Improve client access to services—Increase percentage of first contact resolution—Offer more self serviceoptions—Ensure a consistentlyhigh quality client experience—Ensure efficient use of resources
Develop client groupingand channel strategy—Commence implementation of technology to supportcustomer contact management system—Enhance coordinationfor 211, 311, 911 andseniors’ portal—Implement Access Peelcounter service at 7120Hurontario and the PeelHeritage Complex
Complete implementation of the Integrated ServiceDelivery operationalmodel, including technology, training, and data collection andanalysis
Service Excellence
Proactively addressemerging planningpolicy issuesthrough an updateto the Regional Official Plan
Ensure the Regional Official Plan is responsive to changing community, socioeconomic and demographic considerations
Identify and analyze issues that may affect Official Plan—Report to RegionalCouncil to recommend a publicmeeting to consider theneed for an Official Planreview
Conduct Official Planreview based on approved work plan
Service Excellence
8

Charting our course
Regional Values
Supportive and Respectful Environment
We work in an environment that is positive, healthy, caring and free from discrimination. We respect diversity and treat one another in ways that are fair, courteous and compassionate, recognizing everyone's contributions.
Teamwork
We practise teamwork, co-operation and collaboration and reinforce these with a strong vision and positive leadership.
Effective Communication
We practise open, two-way communication in a clear and honest manner.
Integrity
We are ethical, professional and trustworthy in our work.
Quality Service
We provide services that are accountable, accessible, responsive, efficient and effective. We seek new and innovative ideas for improvement in policies, practices and services.

The Regional Municipality of Peel10 Peel Centre Dr.,Brampton, ON L6T 4B9905-791-7800
peelregion.ca
This report was printed on Rolland Enviro100. Rolland Enviro100contains 100 per cent recycled post-consumer fibre, is certified EcoLogo, Processed Chlorine Free and made using Biogas Energy.
SIP-0086 11/05

2014 Budget Document Guidelines

THIS PAGE INTENTIONALLY LEFT BLANK

2014 Budget Document Guidelines
2014 Budget Document Guidelines Budget documentation continues to evolve to be more focused on decision making. For 2014, the document dialogue is at the Departmental level supported by program detail presented as Program Summaries. The department document contains the integrated Operating and Capital Budget story which highlights the additional cost required to provide 2013 level of service in 2014 due to inflation, cost of living and annualization of previous Council decisions. Included in the document is the cost of new pressures in 2014 related to service demand and growth and requests for new services. The reporting on capital projects provides an update on existing capital works as well as discussion on the new capital being recommended. The document provides a high level discussion on output and outcome measures that the department will track in 2014 to measure performance and effectiveness of the department’s deliverables with a more extensive list of these output and outcome measures in each of the Program summaries. The document provides a high level financial projection of the department’s needs over the next four years with a more comprehensive projection provided in each of the program summaries. The final appendix of the departmental overview details the 2014 Operating Budget request. Following the departmental document, and separated by a program title page are the program summaries which include the details on the following topics:
• Summary I. 2014 Operating Pressures: • Summary II. Operating Four Year Program Forecast: • Summary III. 2014 New Capital • Summary IV. Ten-Year Capital Plan • Summary V. Outputs/Outcomes Measures
Section I. Existing Services and Service Levels Budget development starts with the review of Operating resources and deliverables. This section of the document outlines the responsibilities and existing services that the Department provides. Included is a brief description of some of the key initiatives undertaken in 2013. Section II. Issues and Trends All departments face continuing challenges in meeting staffing requirements, funding shortfalls, mitigating commodity cost increases and serving the needs of a growing community. Presented in this section are some of the challenges and emerging trends that are affecting the departmental responsibilities and service delivery. Section III. Business Focus This section highlights the areas of focus for the 2014 business plan. Included is a list of Departmental and Term of Council Priorities that will be the focus for the 2014 budget. Section IV. 2014 Operating Budget To continue supporting Regional programs at current service levels, the budgets for the delivery of these services require increases in 2014. A more detailed explanation of the changes affecting the 2014 budget appear in Appendix I at the departmental level and in Summary I in each of the Program Summaries.
1

2014 Budget Document Guidelines
1. 2014 Departmental Operating Budget Overview Presented under this topic is a departmental summary displayed by program denoting the previous years’ budget, the projection to year end and the budget request for 2014 and the year over year variance. Also included is a graphic representation of the 2014 requirements on expenditure type and revenue source. 2. 2014 Proposed Budget This section provides a detailed explanation of the major drivers of the 2014 proposed budget changes. It highlights the drivers of the change to maintain existing service levels, to support change in existing service levels or introduce new services to meet service demand and community needs. These changes fall under three different categories; Base Budget, Service Demand and Budget for New Services.
a) Base Budget Changes To continue supporting Regional programs at current service levels, the budgets for delivery of these services will require increases in 2014. These figures appear in Appendix I of the departmental document and in Summary I of each of the program summaries. Under this heading the following factors are discussed. • Annualization: These are the costs related to previously approved Council decisions • Inflation: Costs in this category are primarily related to inflationary pressures in the area of
Salary and Benefits which are due to cost of living and normal staff progression through the salary ranges and inflationary increases in the market place in acquiring services and supplies
• Economic Factors: The costs in this category are directly related to economic conditions. Costs that generally rise in poor economic conditions are those related to Social programs. Other areas that could be affected due to poor market conditions are revenue shortfalls.
• Base Subsidy/Recoveries – Subsidies and external recoveries account for some of the revenue that supports regional services. This section provides the detail on the changes to these subsidies or external recoveries that will impact the 2014 budget.
• Cost Mitigation – This category provides details on cost increases that are lessened through efficiencies implemented within the department. Presented under this topic are those costs that can be quantified as well as those savings that are of an intangible nature such as volunteer hours
• Other –Pressures that do not fall into the categories highlighted above (i.e. change in assumptions, change in contract indices)
b) Service Demand The 2014 Program pressures to deliver the Operating Budget are discussed under the following headings in Appendix I of the Department document and in Summary I in each of the Program sections. This section provides a snapshot of the needs of the department as a result of some of the following factors: • Growth - Increased demand (i.e. due to population growth) required to provide the same
service level as 2013. • Service Demand - Service level enhancements or new services required to support program
delivery based on Council/Community needs. • Subsidy Changes - Some program budgets are largely funded by subsidies received from
various levels of government. The changes in and expected levels of these subsidies for the 2014 fiscal year are captured under this topic.
2

2014 Budget Document Guidelines
• Other Pressures - Programs face many challenges in maintaining service levels. Other areas of pressure that affect service delivery such as increased reserve contributions to support the Capital plan are presented here.
Some additional information under the following topics may be included: • Staffing - Acquiring and sustaining staff complement is an integral part of program delivery
and budget development. Presented under this topic is the current staffing complement and changes in staffing requirements to meet 2014 budget needs.
• User Fees - Wherever practical, user fees are charged for services provided. User fees are based on the true cost of the delivery of that service.
c) Budget for New Services As part of the Operating Budget development staff identify additional resources that the programs require to continue to meet community needs and comply with legislative standards. This section provides the detail on the addition of new services or new resources that have been included in the 2014 Operating Budget request.
Section V. 2014 Capital Budget As part of budget development each department identifies its capital requirements. This section of the document provides the go forward numbers on existing projects and identifies new capital initiatives for the 2014 budget cycle.
1. 2014 Departmental Capital Plan Overview Presented under this topic is a departmental summary displaying the Capital Works in Process (CWIP), the 2014 Capital Budget Request and the total departmental capital budget for 2014. The chart breaks down the capital budget by funding source: DC Growth, External and Non-DC Internal. The graphic presentation displays the 2014 Capital Budget requirements broken down by Program and funding source.
2. Existing Capital Projects Provided under this topic is a brief description of major works in progress for each of the programs within the department. 3. 2014 Capital Budget and Operating Impact
a) 2014 Capital Budget This section provides a discussion on the 2014 major capital works. Operating Impact of 2014 Capital Budget This section provides a brief discussion on the operating impact of the 2014 Capital Budget on future years’ operating budgets. Included is a chart that displays the staff and non staff costs as well as the year of the expected operating impact.
4. 2014 – 2022 10-Year Capital Plan This section provides detail presented by program on some of the major works that will be undertaken by the department over the next ten years. It also includes a graphic representation of the 10 year capital Budget by Program and by Funding Source.
3

2014 Budget Document Guidelines
Section VI. Output/Outcome Measures As part of the yearly budget development each department identifies key outputs and outcomes that are tracked in order to measure performance and service effectiveness. This section provides a brief discussion on some of the key measures that the department will track during 2014. Section VII. Staffing Presented in this section is a chart displaying staff requirements. It includes the approved positions at the start of the budget year, the proposed changes for 2014 and the per cent variance between the two. It also provides a brief discussion on the proposed changes. Section VIII. Future Outlook This section provides the four year Operating Budget forecast for the department. The chart presents the requirements by program displaying the 2014 Budget forecast in 2013, the 2014 Budget Request, and the forecast for years 2015-2017. More comprehensive detail on the information presented here is provided in Summary II of the program summaries. Section IX. Disclosure of 2014 Budget Risks and Key Program Assumptions In preparing budgets, assumptions are made based on the best available information at the time. This section of the document discloses the various risks that have been incorporated in the departmental budget. Section X. Useful Links Provided in this section are some useful links for the reader to access more information on the individual programs within the department using the Region’s Internet Site. Appendix I. 2014 Operating Budget Pressures – Departmental Summary This appendix summarizes the changes to the 2013 base budget and the new pressures that have been included in the 2014 Departmental Operating Budget request.
Program Summaries Summary I 2014 Operating Budget Pressures: This summary itemizes the changes to the 2013 base budget and the new pressures for 2014 that have been included in the 2014 budget.
• The development of the 2014 base budget starts with the adjustment of the 2013 budget to maintain 2013 service levels which are presented under the topic Base Pressures
• The second component in developing the 2014 budget is to address the needs of the program to meet current pressures the program is facing as well as any new services that are being requested. All these factors are totalled to arrive at the 2014 Recommended Cost of Service.
• Total Expenditure is calculated by taking the program’s Gross cost, adding internal charges and deducting internal recoveries
4

2014 Budget Document Guidelines
• Net Cost is calculated by taking the program’s Total Expenditure, deducting all external recoveries. (i.e. Grants & Subsidies, Fees & Charges, Supplementary Taxes, Reserve Contributions) to arrive at the property tax levy
Summary II Operating Budget Four Year Program Forecast: This summary charts the Operating Budget forecast for the budget year and the next three years. It also provides a discussion on the various assumptions that have been included to arrive at the numbers. Summary III 2014 New Capital: This appendix provides the detail of the 2014 Capital Budget. Included in the detail is the Project Number, the Project Description, Ward, Total Expense, and the Source of Funds: External (funded by an external body), Internal (Reserves), or DC (Development Charges). Projects where status identified with an “A” will proceed to Council for approval and those identified with “P” will require further review and a subsequent Council Report before proceeding. Summary IV Ten-Year Capital Plan: This appendix provides the detail of the program’s Ten Year Capital Plan. Funding requirements are displayed in detail for the first five years and years 6 -10 are aggregated. Summary V Output/Outcome Measures: As part of the yearly budget development each program identifies key outputs and outcomes that are tracked in order to measure performance and service effectiveness. These outputs and outcomes are specific, measurable and result-oriented. A chart of program measures with the expected results for 2013 and the measures that will be tracked in 2014 is provided in Section VI.
5

THIS PAGE INTENTIONALLY LEFT BLANK

2014 Budget Executive Summary

THIS PAGE INTENTIONALLY LEFT BLANK

Executive Summary Of Region of Peel Proposed 2014 Budget
The Region of Peel proposed 2014 budget results in a property tax increase of 0.6 per cent (or net tax levy increase of 1.5 per cent) and a utility rate increase of seven per cent. The chart below provides a high level summary of the proposed 2014 Tax and Utility Rate Budgets.
2014 Property Tax Supported Budget
2014 Property Tax Supported Operating Budget
The proposed 2014 Property Tax Supported Operating Budget results in a property tax increase of 0.6 per cent (or net tax levy increase of 1.5 per cent which is below Council’s 2014 Budget target of 1.8%). Regionally Controlled programs and External Agencies met Council’s direction and can be broken down as below.
Net Expenditure
2014 vs. 2013* Net Levy Change
Property Tax
Impact** Regionally Controlled Programs - Operating 2.37% 0.5% 0.2%Increase related to ARRASC – Coleraine Drive 0.03%Sub-total Regionally Controlled Programs 2.4% 0.5% 0.2%External Agencies Police (Peel Regional Police and O.P.P.) 3.3% 0.8% 0.3% Conservation Authorities 8.3% 0.2% 0.1% Municipal Property Assessment Corporation 2.2% - -Total Proposed 2014 Tax Supported Budget 2.9% 1.5% 0.6%
* Year over year increase in net expenditure before tax assessment growth**Assumes the weighted average municipal portion of tax bill is 42%
1

2
a. Regionally Controlled Tax Supported Programs - Operating
The proposed 2014 Budget for Regionally Controlled programs results in a propertytax increase of 0.2 per cent net of the Provincial Upload and assessment growth. Theproposed budget includes:
• A 1.0 per cent infrastructure levy to maintain Peel’s capital assets• Efficiencies used to fund an additional 360 Rent Supplement subsidies, and
128 families through Peel Renovates• An additional 40,000 Accessible Transportation trips• One additional ambulance on the road to address increase in 911 calls• Elimination of the Childcare waitlist including 535 additional special needs
children being supported• 6,000 additional immunization records assessed
By identifying operational efficiencies and being more innovative in service delivery, the proposed budget also manages pressures including lower revenue from recyclable materials. The Budget reflects an appropriate balance of risk and meeting service needs.
b. Regionally Financed External Agencies
The proposed 2014 Budget for Regionally Financed External Agencies results in a 0.4per cent property tax increase net of the Provincial Upload and assessment growth.
The Police Services 2014 Proposed Budget (including Peel Regional Police andOntario Provincial Police) results in a 0.3 per cent property tax increase net of CourtSecurity / Prisoner Transport Upload. The increase is largely driven by cost of livingand additional resources to service the needs of Peel’s growing population which arecompletely funded by assessment growth.
The Conservation Authorities 2014 Proposed Budget (including Credit ValleyConservation Authority , Toronto and Region Conservation Authority and ConservationHalton) results in a 0.1 per cent property tax impact that is largely driven by economicadjustments for labour in the three Conservation Authorities in addition to a reductionof planning fees from greenfield development specifically impacting the Credit ValleyConservation Authority. The full increase will be absorbed by the property tax base.
2014 Property Tax Supported Capital Budget
The proposed 2014 Tax Supported Capital Budget totals $808 million. The Capital Budget supports maintaining a State of Good Repair, supporting Peel’s growth plan and other Council priorities. The budget includes capital investment in the following major areas:
• Peel Energy Recovery Centre project to process and dispose of garbage withenergy from waste
• Waste Collection Carts project (Phase One) for bi-weekly curbside collectionstarting in 2016 for most Peel residents.
• Construction of new roads and maintenance of existing roads• Peel Regional Police capital requirements in information technology development
or upgrades, facilities revitalization and expansion, ongoing replacement ofvehicles and communications equipment to meet service demands
• Construction of new ambulance facilities to improve service delivery and meetgrowth
• Lakeview Waterfront Connection Project

3
Future Outlook 2014 – 2017
As in the table below, the three year forecast for Tax Supported programs has an average net tax levy increase of 2.7 per cent (or an average property tax impact of 1.1 per cent) based on current Council directed service levels. The forecast includes a one per cent infrastructure levy consistent with past Council policy, and the continuation of the Social Assistance and Court Security upload (to 2018).
2014 Forecast
Forecast* Budget 2015 2016 2017 Regionally Controlled Programs 2.0% 1.3% 2.1% 2.0% 2.0%External Agencies 2.2% 1.5% 2.2% 2.0% 1.8%Tax Assessment Growth (1.5%) (1.3%) (1.4%) (1.3%) (1.2%)Total Tax Levy Impact 2.8% 1.5% 2.9% 2.7% 2.6%Total Property Tax Impact** 1.2% 0.6% 1.2% 1.1% 1.1%
* As forecast in the 2013 Budget** Assumes the weighted average municipal portion of tax bill is 42%
2014 Utility Rate Supported Budget
2014 Utility Rate Supported Operating Budget
The proposed 2014 Utility Rate Supported Budget results in an average utility rate increase of seven per cent. This is predominantly driven by a seven per cent increase to reserve contributions for the state of good repair of water and wastewater infrastructure. The increase is less than the overall eight per cent increase as forecast in the 2013 budget and is largely due to savings related to outsourcing wastewater lab operation.
2014 Utility Rate Supported Capital Budget
The proposed 2014 Utility Rate Supported Capital Budget totals $479 million. The proposed capital investment is to upgrade and expand water and wastewater facilities, install water distribution systems, and develop, improve and upgrade the transmission system, and the primary and local trunk collection systems.
Future Outlook – 2014 to 2017
2014 Forecast
Forecast* Budget 2015 2016 2017Operations 2% 0% 1% 1% 1%Capital Infrastructure 6% 7% 6% 3% 3%Total Utility Rate Impact 8% 7% 7% 4% 4%
*As forecast in the 2013 Budget
The three year forecast for Utility Rate Supported program has an average increase of five per cent and includes an increase to improve the sustainability of the capital plan (2015 – 6%, 2016 – 3% and 2017 – 3%) and assumes that total water consumption will increase by one per cent each year.

THIS PAGE INTENTIONALLY LEFT BLANK

2014 Consolidated Operating&
Capital Budget

THIS PAGE INTENTIONALLY LEFT BLANK

2014 Consolidated Operating and Capital Budget
Table of Contents
INTRODUCTION ................................................................................................................................... 1
2014 BUDGET TAX & UTILITY RATE IMPACT .......................................................................................... 1 STRATEGIC DIRECTION ........................................................................................................................ 2 WHAT PEEL IS FACING ......................................................................................................................... 3 HOW THE 2014 BUDGET SUPPORTS PEEL’S FINANCIAL CONDITION ........................................................ 4 BUDGET DEVELOPMENT APPROACH ..................................................................................................... 6 2014 BUSINESS PLANNING PROCESS ................................................................................................... 7
2014 REGIONAL BUDGET OVERVIEW...................... ......................................................................... 8
2014 REGIONAL BUDGET SUMMARY ..................................................................................................... 8 2014 SERVICE LEVELS......................................................................................................................... 9
2014 OPERATING BUDGET – TAX SUPPORTED PROGRAMS..... .................................................. 11
OVERVIEW ........................................................................................................................................ 11 REGIONALLY CONTROLLED PROGRAMS .............................................................................................. 14 REGIONALLY FINANCED EXTERNAL ORGANIZATIONS ............................................................................ 20 FOUR YEAR OPERATING BUDGET OUTLOOK – TAX SUPPORTED PROGRAMS ......................................... 22
2014 CAPITAL BUDGET – TAX SUPPORTED PROGRAMS....... ...................................................... 23
2014 CAPITAL BUDGET ...................................................................................................................... 23 2014-2023 TEN YEAR CAPITAL PLAN ................................................................................................. 26
2014 OPERATING BUDGET - UTILITY RATE SUPPORTED..... ........................................................ 30
OVERVIEW ........................................................................................................................................ 30 OPERATING BUDGET PRESSURE......................................................................................................... 31 OPERATING BUDGET FINANCING......................................................................................................... 32 FOUR YEAR OPERATING BUDGET OUTLOOK – UTILITY RATE SUPPORTED PROGRAMS ........................... 33
2014 CAPITAL BUDGET – UTILITY RATE SUPPORTED PROGRA MS............................................ 34
2014 CAPITAL BUDGET ...................................................................................................................... 34 2014-2023 TEN YEAR CAPITAL PLAN ................................................................................................. 35
DISCLOSURE OF 2014 BUDGET KEY ASSUMPTIONS & RISKS .. .................................................. 39
CONCLUSION..................................................................................................................................... 41
SUMMARIES: Summary I: 2014 Operating Budget Summary by Program…………………………………..……….....43 Summary II: Summary of Budget Costs Mitigated In 2014 Operating Budget………………….…….....44 Summary III: 2015-2017 Operating Budget Forecast………………………………………………...……..45 Summary IV: 2014 Capital Budget – Sources of Financing by Program……………………………….....46 Summary V: 2014 to 2023 Capital Plan………………………………………...……………………….......47 Summary VI (a): Summary of Staffing Information………………………………………………………….......48 Summary VI (b): 2014 Detailed Staffing Request FTEs Only………………………………….…………..…..49 Summary VII: 2014 User Fees……………………………………………………………………………........50 Summary VIII: 2014 User Fees…………………………………………………………………………….…...62

THIS PAGE INTENTIONALLY LEFT BLANK

2014 Consolidated Operating and Capital Budget
1
Introduction The Region of Peel provides community and infrastructure services to approximately 1.3 million people and 88,000 businesses in Brampton, Caledon and Mississauga. The 2014 Budget supports the Region’s commitment to deliver value for money and quality services to its residents that remain affordable to the tax and utility rate payers. The 2014 Budget is focused on people and positive outcomes - the positive outcomes we achieve in the lifetime of a resident, or 1.3 million lifetimes, every day. The Region of Peel is part of a two tier municipal structure providing a range of municipal services to residents and businesses. The Region is made up of three diverse area municipalities and many more cultural, economic, and social communities. Peel works closely with area municipalities and other levels of government to ensure services are delivered effectively. Region of Peel services fall within six themes:
• Environment - Protect, enhance and restore the environment • Social Development - Build a community that is stable, responsive and adaptable • Community Health - Maintain and improve the health of Peel’s community • Transportation - Support and influence sustainable transportation systems • Cultural Development - Build a cohesive Peel community • Public Safety - Ensure a safe community
Delivering value for money to tax and utility rate payers is at the heart of Peel’s goal in achieving service delivery excellence. This excellence is measured in a number of ways including maintaining Peel’s Triple A (AAA) credit rating, a high level of customer satisfaction and trust and confidence from citizens, an engaged, dedicated and outcome oriented work force, and a continuous quest for alternative service delivery methods to improve cost effectiveness and the quality of services. The 2014 Budget provides resources necessary to support the Region’s investment in region-wide infrastructure such as the Regional road network, essential services such as water and wastewater systems as well as services related to the health and well being of our citizens and community including accessible transportation, childcare, affordable housing, long-term care, Peel Art Gallery, Museum and Archives (PAMA), paramedic services, policing, public health, social assistance, and waste management services. 2014 Budget Tax & Utility Rate Impact The primary objective of the 2014 Budget for the Region of Peel is to achieve an appropriate balance between meeting community needs and maintaining financial sustainability while minimizing the impact of tax and utility rate increases on Peel’s residents and businesses. Our focus is on supporting the people and businesses in Peel to thrive, so that residents enjoy a healthy and safe life. The 2014 Budget for Region Tax Supported Programs is a net tax levy increase of 1.5 per cent or a 0.6 per cent property tax increase. The 2014 Water and Wastewater Rate Supported budget results is an average Utility Rate increase of 7 per cent.

2014 Consolidated Operating and Capital Budget
2
Table 1
2014 Budget – Tax and Utility Rate Impact
Average
Residential Average Small
Business Property Tax Impact of 0.6% 1 $27 $45 Utility Rate Impact of 7% 2 $39 $94
1 Based on average home value at $409,500 and average small business value at $500,000 2 Based on average household consumption at 310m3 and average small business consumption at 730m3
The property tax bill has three components: cost of regional services, cost of area municipal services, and cost of education. For 2014, Peel’s approach continues to focus on how the Regional budget changes impact the overall property tax bill in Peel. As Peel’s budget represents on average 42 per cent of the total tax bill it is important to recognize the area municipalities’ budget increases and the education portion of the tax bill to fully understand the impact of the Region’s 2014 Budget. Table 2 displays the breakdown of the three components affecting Peel’s taxpayer. Of note, the education portion of the combined tax bill has not increased for 15 years. Table 2 Strategic Direction In 2011, Council endorsed a renewed Strategic Plan, Charting our Course Strategic Plan 2011 – 2014, to support the work of the organization over its term. Executing a strategic plan is critical to the success of any organization. The Strategic Plan charts the long-term vision for the communities in Peel and the Region’s role in achieving that vision. To better align resources to advance Peel’s strategic outcomes identified in the Strategic Plan, Council approved 24 Term of Council Priorities (ToCP) to set the course of action for the 2011 – 2014 term. These priorities are aimed at addressing both current and long term challenges in Peel. The 2014 Budget includes resources to support the advancement of these priorities. To further support these priorities, each program has identified a number of output and outcome measures to ensure the right set of services is being provided in the right way. Identifying output and outcome measures ensures that resources are aligned to meet Council’s priorities. Tracking
2014 Budget Average Residential Tax Impact
Lower Tier Municipalities
37%
Peel Region 42%
Education 21%

2014 Consolidated Operating and Capital Budget
3
these measures will better inform Council on the effectiveness and performance of Peel’s services within the community. Annually, staff report on progress toward achieving Council’s strategic outcomes prior to the budget discussion. What Peel is Facing Peel is facing a changing and dynamic environment. Significant trends are resulting in increased program pressures and more complex community issues: the economy, population growth, changing demographics, changing land use, the environment and increasing regulations and legislation. The following provides further discussion on the trends Peel is facing and the possible solutions. Economy The Region, like the rest of the world, has continued to face economic challenges since the recession of 2008. The global and Canadian economies drive the local economy in Peel. The slow economic growth impacts Peel in several ways: lower assessment growth, higher social assistance caseload, increased demand for affordable housing, lower and less predictable revenues for recyclable materials, volatility in energy prices and lower interest rates. Population Growth Peel’s population is projected to grow by an average of 23,650 people per year until 2041 according to the new amended estimates in the Places to Grow Act. The largest component of that new population will be arriving from outside of Canada. This growth will continue to put pressure on the Region and Council to increase service volumes. In 2014, Council will consider an update to the Regional Official Plan to 2041 based on these latest estimates. Changing Demographics and Land Use Peel’s demographics are changing over time. An aging population in Peel increases demand for a range of Regional services including paramedic, public health, affordable housing, long term care and accessible transportation. Emerging population health trends such as rising rates of obesity are placing greater demands on the broader health system. Similarly, changes in land use such as intensification impact Peel’s infrastructure requirements and some service delivery such as the impact of growing traffic congestion on Paramedic response times and Accessible Transportation scheduling. Investing in Improving the Environment Since the 1990’s there has been growing awareness and desire to better manage the impact of society on the environment. As a municipality, Peel is faced with doing its part to be a good steward of the environment, often at an increased cost to tax and utility rate payers. Developing effective and sustainable environmental practices needs to be supported with a positive environmental and financial return on investment. Increased Regulations and Legislation In the past decade there has seen significant regulatory changes as the Province addresses risks and responds to public concerns such as Walkerton, Severe Acute Respiratory Syndrome (SARS), and Hemagglutinin Type 1 and Neuraminidase Type 1 (H1N1). Recent legislation imposing more stringent requirements on Peel programs include: Long Term Care Homes Act, new Ontario Public Health standards, Safe Drinking Water Act, Ontario Disabilities Act, Municipal Freedom of Information Act and the Personal Health Information Protection Act. The new ON1 Call Act - infrastructure notification system, requires the Region to provide service locates within 5 business days.

2014 Consolidated Operating and Capital Budget
4
In addition to the above major trends, there are a number of other factors that drive budget considerations. The Region’s aging infrastructure is putting pressure on the sustainability of the capital program. Provincial and Federal funding formulas e.g. Public Health and Affordable Housing, haven’t kept pace with Peel’s growth and need, and as these levels of governments deal with fiscal restraints and added pressures, the funding shortfall potentially will continue to grow. Solutions Peel’s ability to respond to the growing complexity of these issues in its community is also challenged by changing public expectations of service levels and changing public perception. Solutions will require integrated planning, increased partnerships, and new ways of doing business. Council will continue to make decisions that balance these competing pressures; staff will continue to provide evidence to inform and measure success. These and other emerging trends emphasize the complexities around budget planning. The Region’s responsibility is to its citizens, ensuring the community’s needs are met while minimizing tax increases. Decisions made today must be affordable in the future. The financial resource requirements to support 2014 program priorities were established by examining key budget drivers including changing population, aging infrastructure, environmental issues, citizen safety, legislative compliance, provincial subsidies, inflationary and economic impacts, while ensuring value for money to Peel’s rate payers. How the 2014 Budget Supports Peel’s Financial Condi tion The Long Term Financial Planning Strategy applies a disciplined and integrated financial planning approach that identifies and manages risks to the Region of Peel’s long-term financial sustainability and credit rating. The Strategy also prioritizes the resources needed to achieve strategic objectives and supports the cost efficient delivery of Regional services. Long-term sustainability is achieved when the pillars of financial sustainability, financial vulnerability and financial flexibility are balanced. The following demonstrates how the 2014 Budget impacts Council’s nine financial principles: Respect for the tax and utility rate payer As directed by Regional Council on April 11, 2013 the 2014 Budget was developed to achieve a 1.8 per cent net tax levy increase to be in line with inflation. The forecast net tax levy increases for 2015 to 2017 were also reviewed and adjusted to be in line with inflation. Utility rates remain the lowest in the GTA. Ensure the Capital Plan is sustainable The Capital Plan valued at $5.8 billion was developed in the context of affordability and while ensuring the operating impact is sustainable and affordable. Capital expenditures are consistent with Peel’s enterprise asset management strategy and Council policy directions ie: Long Term Waste Management Strategy, Active Transportation Strategy, and Paramedic 10 Year Facility program. As reported to Council on November 28, 2013, the proposed Capital Plan is underfunded. The 2014 Budget proposes a Tax supported infrastructure levy of one per cent to continue to address the capital financing shortfall of $213 million over the 10 year plan. Additionally, the Utility Rate supported budget proposes an infrastructure levy of 7 per cent to address the capital financing shortfall of $205 million over the 10 year plan.

2014 Consolidated Operating and Capital Budget
5
Maintain assets The Capital Plan proposes capital investments of $1.5 billion to maintain Peel’s existing infrastructure to approved asset levels of service. As reported to Council on November 14, 2013, Peel’s infrastructure is overall rated good. Included in the capital plan are asset end of life capital projects e.g. Peel Manor study and the redevelopment of the Mavis Yard. Deferred maintenance on Child Care centres being leased out to child care operators will be completed prior to the transfer to new operators. Deliver value for money The Region of Peel continuously seeks out efficiencies and quality improvements in the way it manages and delivers services. The 2014 Budget and Forecast include the impact of Council directions on Child Care service delivery which has allowed $6 million to be invested in child care services, eliminating the child care wait list as well as annual savings of $1.8 million associated with the outsourcing of laboratory services. The 2016 Forecast includes $5 million annual savings achieved through Council’s direction for bi-weekly garbage collection. Staff are proposing these savings be utilized to partially offset cost related to the development of the Peel Energy Recovery Centre anticipated to be operational in 2020. Users pay where appropriate Less than 46 percent of the 2014 Budget is funded through property taxes. A total of 30 per cent is recovered through user fees including the utility rate supported program which is fully recoverable through user fees. The User Fee By-law proposes amendments to user fees to ensure full cost recovery where appropriate. As reported to Council on November 28, 2013, Peel’s current DC rates are understated by 12.0 to 15.5 per cent dependent on the category. While not yet meeting the DC adequacy requirement of 20 per cent, with the new population growth and planning period to 2041, staff will likely propose the DC By-law be updated in 2015. Work with area municipalities to support the econom ic viability of the community The 2014 Budget reflects an integrated approach to working collaboratively with Area Municipalities to support the economic viability of the community. The 2014 Budget includes investing in Lakeview Water Connection which will support the transformation of Peel’s lake shore. Peel is collaborating with Area Municipalities and Conservation Authorities to prioritize climate change funding in response to increasing flood incidents. Similarly, Peel is collaborating with Area Municipalities through the development of the Long Term Affordable Housing strategy, the Employment Trends Study as well as in the area of co-locating paramedic stations with area fire services and other regionally operated programs where possible. Overall, Peel’s net tax levy increase of 1.5 per cent keeps in mind the impact on a single tax payer. Make prudent investments The 2014 Budget assumptions incorporate Peel’s investment policy direction with respect to investment income on available reserves and sinking funds. Sufficient cash is on hand to protect liquidity required to fund Peel’s 2014 debt charges. Mitigate significant fluctuations in tax and utilit y rates As reported to Council on November 28, 2013 in the report “Status of Reserves and Outlook”, Peel’s tax rate stabilization reserves of $84 million (as at September 30, 2013, inclusive of Peel Regional Police and Ontario Provincial Police and net of Go Transit Liability) are sufficient to manage the risks associated with tax supported programs in the budget year e.g. weather, economy, levels of funding etc. Similarly the utility rate stabilization reserves of $ 31 million are sufficient to mitigate risks in this program such as consumption demand due to weather and volatility of electricity prices. The 2014 Budget proposes contingent tax supported rate stabilization reserve draws of $12.6 million to fund one time pressures and smooth out the tax

2014 Consolidated Operating and Capital Budget
6
impact associated with elevated social assistance case load and recognize the final year costs to operate Peel’s Childcare Centres. Borrow only for substantial long-term assets at aff ordable levels The 2014 Budget assumes the issuance of debt in accordance with Peel’s debt plan and policy. Debt will be issued to cash flow the net cost of Peel’s utility rate supported development charges, estimated at $190 million. The 2014 Capital Budget includes tax supported debt for the development of the Peel Energy Recovery Centre. The project is included in 2014 to support the issuance of a Request for Proposal with debt financing required near the end of the capital project, currently estimated for 2019 to 2020. As reported to Council on November 14, 2013 Peel has sustained its Triple A credit rating throughout the challenging economic times associated with the recession in 2008 and 2009. The 2014 Budget supports maintaining Peel’s overall financial condition. Budget Development Approach In developing the 2014 Budget, key principles were followed including:
• protecting long term financial sustainability • identifying efficiencies to help offset inflationary pressures • assessment growth to fund service demands • addressing the most urgent needs in the community as identified through the strategic
planning process • aligning resources to increase the effectiveness of desired outcomes • commitment to measure the success of the plan
The 2014 Budget demonstrates an emphasis on providing the right services in the most cost effective way, thereby ensuring value for money to Peel’s tax and utility rate payers. It reflects Peel’s commitment to being citizen focused, maintaining and improving existing services, while being fiscally responsible and financially stable. To better understand whether Peel is meeting these expectations, Peel conducts a number of surveys to solicit public input across a broad spectrum of its services. The Focus GTA Spring 2013 survey shows that 79 per cent of Peel residents are satisfied with the services and programs offered by the Region and that 75 per cent feel they receive good value for their tax dollars. The results of this study also confirm that the Region’s priorities align to the issues raised by the communities in Peel.
2014 Consolidated Operating and Capital Budget
7
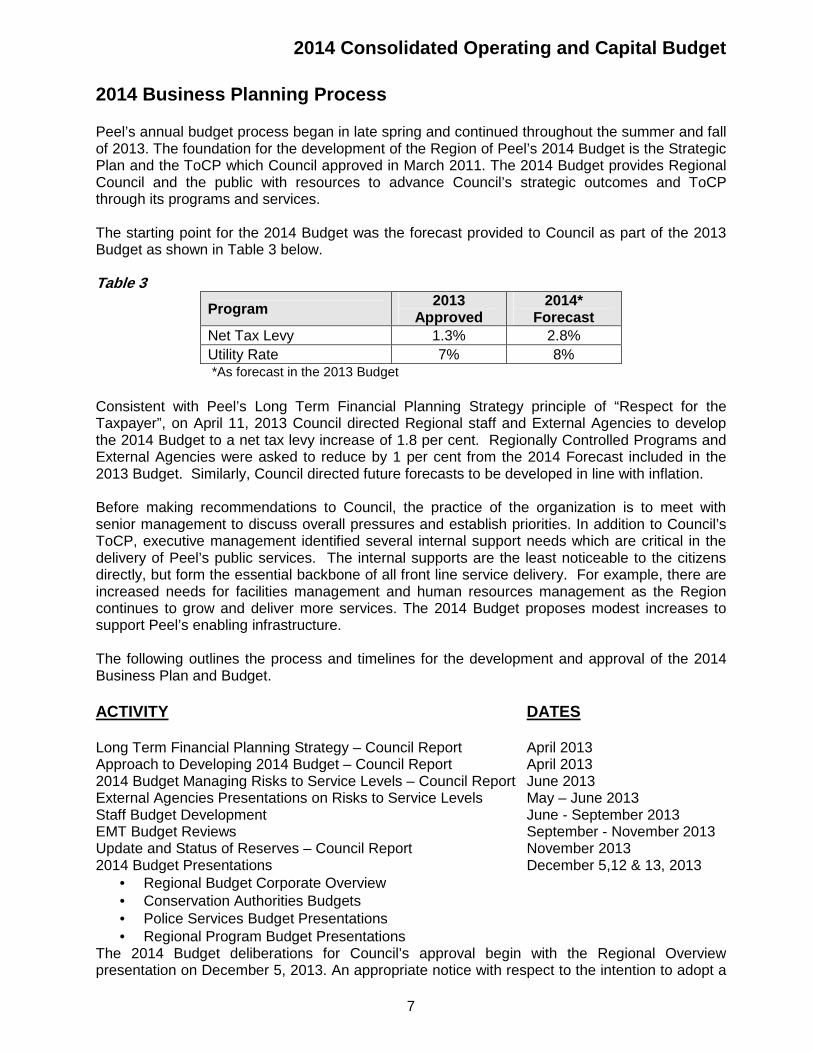
2014 Business Planning Process Peel’s annual budget process began in late spring and continued throughout the summer and fall of 2013. The foundation for the development of the Region of Peel’s 2014 Budget is the Strategic Plan and the ToCP which Council approved in March 2011. The 2014 Budget provides Regional Council and the public with resources to advance Council’s strategic outcomes and ToCP through its programs and services. The starting point for the 2014 Budget was the forecast provided to Council as part of the 2013 Budget as shown in Table 3 below. Table 3
Program 2013 Approved
2014* Forecast
Net Tax Levy 1.3% 2.8% Utility Rate 7% 8%
*As forecast in the 2013 Budget
Consistent with Peel’s Long Term Financial Planning Strategy principle of “Respect for the Taxpayer”, on April 11, 2013 Council directed Regional staff and External Agencies to develop the 2014 Budget to a net tax levy increase of 1.8 per cent. Regionally Controlled Programs and External Agencies were asked to reduce by 1 per cent from the 2014 Forecast included in the 2013 Budget. Similarly, Council directed future forecasts to be developed in line with inflation. Before making recommendations to Council, the practice of the organization is to meet with senior management to discuss overall pressures and establish priorities. In addition to Council’s ToCP, executive management identified several internal support needs which are critical in the delivery of Peel’s public services. The internal supports are the least noticeable to the citizens directly, but form the essential backbone of all front line service delivery. For example, there are increased needs for facilities management and human resources management as the Region continues to grow and deliver more services. The 2014 Budget proposes modest increases to support Peel’s enabling infrastructure. The following outlines the process and timelines for the development and approval of the 2014 Business Plan and Budget. ACTIVITY DATES Long Term Financial Planning Strategy – Council Report April 2013 Approach to Developing 2014 Budget – Council Report April 2013 2014 Budget Managing Risks to Service Levels – Council Report June 2013 External Agencies Presentations on Risks to Service Levels May – June 2013 Staff Budget Development June - September 2013 EMT Budget Reviews September - November 2013 Update and Status of Reserves – Council Report November 2013 2014 Budget Presentations December 5,12 & 13, 2013
• Regional Budget Corporate Overview • Conservation Authorities Budgets • Police Services Budget Presentations • Regional Program Budget Presentations
The 2014 Budget deliberations for Council’s approval begin with the Regional Overview presentation on December 5, 2013. An appropriate notice with respect to the intention to adopt a

2014 Consolidated Operating and Capital Budget
8
budget was prepared and published in four local newspapers a minimum of 10 days before the final adoption of the budget and on the Region’s web site, meeting the notice requirements as outlined in the Municipal Act amendments in force January 1, 2008, “Requirements for Compliance".
2014 Regional Budget Overview 2014 Regional Budget Summary The budget has two distinct components, the Tax Supported Budget and the Utility Rate Supported Budget. These two components are further broken down into Operating Budget and Capital Budget. The Tax Supported Budget supports both Regionally Controlled Programs and Regionally Financed External Organizations. The 2014 Region of Peel Operating Budget totals $2.0 billion, and the 2014 Region of Peel Capital Budget totals $1.3 billion, inclusive of the Tax and Utility Rate Budgets. The chart below displays the 2014 Operating and Capital Budget allocation for Regionally Controlled and External Agencies, inclusive of tax and utility rate budgets. It also displays the average annual increase to the tax and utility rates for Peel’s average household and small business. Table 4
2014 Regional Budget Overview - $3.3 BOperating Budget - $2.0 B & Capital Budget – $1.3 B
10-Year Capital Plan - $5.8 B
Property Tax Supported Programs
* Property Tax Increase 0.6% (includes 1% for infrastructure)
** Impact: Average home value at $409,500 $27 Average Small Business at $500,000 $45 Commercial $134 Industrial $150
Region’s Portion of Annual Average Residential Municipal Tax Bill $1,783
Operating Budget $1,546M Capital Budget $808M 10-Year Capital Plan $3,168M
Utility Rate Supported Programs
Operating Budget $416M Capital Budget $479M 10-Year Capital Plan $2,674M
Average Utility Rate Increase 7% (includes 7% for infrastructure)
Impact: Average household (310m3) $39 Average Small Business (730m3) $94
Annual Average Residential Water Bill $540
* Assumed weighted average municipal portion of tax bill is 42%
** Weighted average of 3 area municipalities.

2014 Consolidated Operating and Capital Budget
9
2014 Service Levels The 2014 Budget includes resources to deliver current levels of service and service level increases to a growing and aging population. The 2014 budget provides funding to support the following services to the taxpayers and ratepayers in Peel. Environment
• Over 500,000 tonnes of waste managed per year • Management of six community recycling centres including the new Heartlake community
recycling centre being developed, an Integrated Material Recovery Facility (MRF), a compost facility, landfill gas extraction system and 21 closed landfill sites
• 34,250 hectares of area regulated, through conservation authorities, to protect life and property of Peel residents from hazards due to flooding, erosion and slope failure and approximately 170,000 trees, shrubs and seedlings planted annually
• 642 million litres per day of wastewater collected and treated for approximately 303,980 customer accounts
• 608 million litres/day of municipal water treated, transmitted, and distributed to over 311,510 retail and wholesale customer accounts
Social Development • 17,000 Ontario Works (OW) cases per month • 19,005 social housing units/beds/homes • 7,400 subsidized child care spaces with 1,335 spaces for children with special needs
Community Health • 703 beds available or 256,595 resident days of care in five long term care homes • 50,000 children provided with dental screening, 11,000 in need of urgent treatment • 248,806 immunization records reviewed • 50 ambulances on the road at peak times to respond to 95,000 projected 911 calls
annually • 9,610 health inspections at 5,580 food premises
Transportation • 540,000 Accessible Transportation Trips • 1,621 lane kilometres of roads, 169 structures (including bridges and major culverts) and
436 signalized intersections Cultural Development
• Through Peel Art Gallery, Museum and Archives (PAMA): continuing stewardship of Peel’s cultural heritage with an education program for 6,000 individuals annually, a seniors outreach to 6,700 individuals annually and 4,900 annual research inquiries
Public Safety
• Effective and visible policing services responding to over 226,000 calls for service in Mississauga and Brampton by Peel Regional Police and 17,500 by Ontario Provincial Police in Caledon annually

2014 Consolidated Operating and Capital Budget
10
Service Excellence
• Maintain Peel’s Triple A (AAA) credit rating • Customer Satisfaction, Trust and Confidence scores show that Peel’s residents are
satisfied with Peel’s services and programs and feel they receive good value for their tax dollars
• Maintain engaged, dedicated and outcome oriented work force • Continue to seek alternative service delivery methods to improve cost effectiveness and
the quality of Peel services The service level increases supported by the proposed 2014 budget include the following:
• 40,000 more trips for Accessible Transportation services • 535 more special need children being supported • Additional 360 rent supplement subsidies • One additional ambulance on the road and additional 5,110 Paramedic Service hours to
address increase in 911 calls • Pilot for Extended Community Recycling Centre (CRC) hours • 6,000 additional immunization records assessed • Upload of Coleraine Drive from Town of Caledon to the Region

2014 Consolidated Operating and Capital Budget
11
2014 Operating Budget – Tax Supported Programs Overview The Tax portion of the Operating Budget supports both Region Controlled Program services and Region Financed External Organization services. Table 5 below indicates the programs/services included in each group.
Table 5
Property Tax Supported Services
Region Controlled Programs Region Financed External Organizations • Accessible Transportation • Policing and 911 • Roads and Traffic - Peel Regional Police • Waste Management - Ontario Provincial Police - Caledon • Development Services • Conservation Authorities • Early Learning and Childcare • Property Assessment Services • Housing and Homelessness • Social Assistance and Employment • Community Investment • Long Term Care • Paramedic Services • Public Health • Heritage, Arts and Culture
Tax Rate Impact As mentioned earlier, budget preparation includes consideration of the overall tax bill facing residents of Peel including the portions for area municipalities and education. Peel strives for minimal impact on taxpayers while maintaining essential and expected service delivery in keeping with the Regions financial principles. The following tax rate impacts are all below the targets established by Council as part of the 2014 budget process. The 2014 Budget results in a 1.5 per cent tax levy increase over 2013. The total net budget increased by $25.2 million:
• 46 per cent or $11.7 million of the increase is funded by growth in the property assessment base of 1.33 per cent.
• 54 per cent or $13.5 million of the increase is funded by a 1.5 per cent increase of property tax levy
The property tax increase translates into:
• a $27 annual property tax increase to $1,783 for an average single family home assessed at $409,500;
• And a $45 annual property tax increase for the average small business assessed at $500,000.
The 1.5 per cent of tax levy increase is comprised of 0.5 per cent increase for Regionally Controlled Programs and 1.0 per cent increase for Regionally Financed External Organizations. Table 6 below provides the breakdown of the 1.5 per cent tax levy increase.

2014 Consolidated Operating and Capital Budget
12
Table 6
2014 Net Tax Levy Impact 2013
Net Levy $M
2014 Net Levy
$M
Net Budget
Increase $M
Net Expenditure
Increase %
Net Tax Levy Impact After Assessment
Growth %
Regional Services 491.1 502.7 11.6 2.4 0.5 Police Services 350.0 361.7 11.7 3.3 0.8 Conservation Authorities 18.3 19.8 1.5 8.3 0.2 MPAC 17.2 17.6 0.4 2.2 -
Total Net Levy 876.6 901.8 25.2 2.9 1.5 * Note: Schedule may not add due to rounding.
Total Expenditures and Revenue The 2014 Property Tax Supported Operating Budget totals $1.5 billion for both Regionally Controlled Programs and Regionally Financed External Organizations.
• Forty-two per cent or $643.9 million of the total gross budget is funded by non property tax revenue sources
• Fifty-eight per cent or $901.8 million is funded by property tax. Table 7 below displays the 2014 gross operating budget expenditure allocation and related funding sources for Tax Supported Programs Table 7
2014 Tax Supported Operating Budget
Total Expenditures - $1.5 Billion(In Millions)
Police Services,
$403.6, 26%
Regionally Controlled Programs, $1,104.8,
72%
MPAC, $17.6, 1%
Conservation Authorities* $19.8, 1%
Total Revenue - $1.5 Billion (In Millions)
Grants & Subsidies, 454.3, 29%
Property Tax, 901.8, 59%
User Fees, 19.4, 1%
Reserves, 47.3, 3%
PILTS/Supps16.6, 1%
Other Revenue, 106.3, 7%
* Exclude $16M in CA expenditures funded by utility rates

2014 Consolidated Operating and Capital Budget
13
Where Your 2014 Tax Dollars Will Be Spent The 2014 Net Property Tax Supported Budget totals $901.8 million. After tax assessment growth of $11.7 million (1.33 per cent), this results in a $13.5 million or 1.5 per cent net levy increase.
• Regionally controlled programs account for a $4.8 million increase • Regionally External Financed Organizations account for an $8.7 million increase.
Table 8 below outlines where the 2014 tax dollars will be spent based on a residential assessment of $100 thousand.
Table 8 Where Your 2014 Tax Dollars Will Be Spent
(Based on $100,000 of Residential Assessment)
$15
$15
$20
$21
$36
$49
$56
$9
$10
$175
$4
$4
$13
$10
$0 $40 $80 $120 $160
Other *
Capital Investment Plan
Early Learning &Childcare
Public Health
Internal Services
Long Term Care
Paramedic Services
Social Assistance
Transportation
Waste Management
Housing
MPAC
Conservation Authorities
Police
-$4
$--
$--
$--
$1
($2)
($1)
$2
$--
$1
$4
($2)
$--
$--
Average home of $409,500 will see increase of $27; 2014 Tax $1,783
Regionally Financed External Organizations Regionally Controlled Programs
* Other: includes Community Investment, Development Services, Public Works Operations Support, and Health Services Program Support Note: Number may not add due to rounding. $- denotes no change.
Per $100,000 assessment value: • Property tax increase: $6.5 • 2014 property tax: $435

2014 Consolidated Operating and Capital Budget
14
Regionally Controlled Programs - 0.5 Per Cent Net T ax Levy Increase Operating Budget Pressures The increase in the 2014 Region Controlled Programs Operating Budget is a result of meeting the demand of a number of significant pressures offset by operational efficiencies and the provincial upload. The pressures are categorized as Base Pressures, Service Demands which includes New Services and Capital Infrastructure. Base Pressures Base pressures are the additional costs required to provide 2013 level of service in 2014. These pressures include a wide range of factors including the price of gasoline and the overall economic climate. Broadly speaking base pressures include adjustments due to inflation, economic factors, annualization of previous Council decisions and prior year tax management decisions. The major pressures are summarized as follows:
Labour Costs Labour costs increased by $6 million, a 1.4 per cent increase over 2013 budget. Included in the labour cost increase are economic adjustments for bargaining (as per bargained contracts) and non bargaining employees, but not the impact of staff level reductions in ELCC. Other Pressures
Other pressures of approximately $4 million include additional costs on goods and services driven by an estimated inflation of 1.8 per cent. Service contracts impacted by inflation include: operating contracts for Transportation and Waste Management, supplies and equipment in Paramedic and Long Term Care, and agency payments in Housing and Community Investment.
Costs Mitigated through Efficiencies A total of $3.1 million in budgeted costs have been mitigated through various initiatives and are presented in Summary II of this document. Included in these efficiencies are savings for items such as the review of the facility maintenance contract for 7120 Hurontario, reduced costs for paint disposal and the outsourcing of large vehicle repairs. In addition to these efficiencies Councils decision to exit the direct delivery of child care will allow an additional $8.9 million reinvestment to support 21 child care system enhancements in 2014. Details of the reinvestment plan are provided in the October 31st, 2013 Task Force report “Proposed 2014 Early Learning and Child Care Funding Allocation Approach”.
Service Demands Service demand relates to the cost to provide service level enhancements, and new service level requirements. These additions respond to increased community needs and support the Region’s strategic objectives and Term of Council Priorities. Operating costs for service demands are often a result of past Council decisions related to capital investments.
Capital Induced Service Demand The 2014 Operating Budget includes the operational impact of previously approved capital works totalling $0.6 million

2014 Consolidated Operating and Capital Budget
15
Table 9
Net Cost (In $’000)
Capital Induced Service Demands 2014
Budget 2015
Impact
Paramedic Services • Operational cost of new stations and related operational expenditures to
address population growth and service demand based on the projected increase in call volume
• Provision of Make Ready process related to the opening of the
Fernforest reporting station with service starting December 2014.
• Facility staff costs to support effective operations of new reporting and satellite stations. The FTE’s are being requested in the 2014 Internal Services budget.
$150
$65
$247
$0
$729
$0
Transportation • Traffic Engineering costs with additional 5 traffic signals • Roads Operations and Maintenance with additional 19 lane kilometers and
increases in signs and catch basins • Accessible Transportation - buses
$21
$104
$56
$0 $0
$0
Total Capital Induced Service Demands $643 $729
Operating Service Demand The 2014 Operating Budget also includes program service demands totalling $6.8 million.
Arterial Roads Review Ad Hoc Steering Committee (ARRASC) Impact
The transfer of financial responsibility for Coleraine Drive is anticipated to occur in 2014. This will have an impact of $258 thousand in 2014. This amount was considered to be outside of the Region’s net expenditure target established by Council for 2014 since a corresponding decrease should occur in the area municipal budget. The annualization impact for this in 2015 is estimated as a further $198 thousand.
Other Program Service Demands Table 10 below provides the details of other 2014 program service demands of approximately $6.5 million for tax supported programs.

2014 Consolidated Operating and Capital Budget
16
Table 10
Net Cost (In $’000)
Program Service Demands 2014
Budget 2015
Impact
Public Health • New Flu Immunization initiative to reach the underserviced high risk
populations, using redeployed savings identified through Flu clinic savings.
$20
$0
Paramedic Services • To address call volume growth: Add 5,110 service hours with 9.5
paramedics, starting June 2014. • Summer students required due to increasing service demands to ensure
administrative demands are met • $181 thousand (gross cost) for the Public Access Defibrillation and CPR
program; including 1.0 FTE.
$1,051
$25
$111
$155
$0
$0
Long Term Care • Increase in hours and programs in Community Support Services for
seniors in the community, fully funded by the MOHLTC and Client Fees $0 $0
Housing Rent Supplement Supports $3 million increase in rent supplement supports to address the housing wait list and provide an additional 360 rent supplements. Funded from net budget reductions in other Human Services program areas. Peel Renovates $2 million increase in Peel Renovates program to support 128 families. Funded from budget reductions in Homelessness program as a result of policy changes in the Homelessness Prevention Fund. Our Place Peel Increase funding for Our Place Peel to stabilize support at Wilkinson and Cawthra Road shelters specifically for youth housed in adult shelters.
$3,000
$0
$179
$0
$0
$0
Community Investment Community Investment Program $1 million increase in the Region's investment in not for profit sector from $4.5 to $5.5 million to support organization’s overall sustainability and operational health.
$1,000
$0
Corporate Support • Investment in business intelligence to inform decision-making and
information
$ 205
$ 0

2014 Consolidated Operating and Capital Budget
17
Net Cost (In $’000)
Program Service Demands 2014
Budget 2015
Impact
Transportation • Accessible Transportation – 40,000 additional trips
$425
$0
Waste Management • MRF – Addition of 1-7 Plastics to the Blue Box program • Bi-weekly Cart-based Collection Implementation phased in over 3 years
using draws from Rate Stabilization Reserve, drawing $0.780 million in 2014, $3.146 million in 2015 and $1.158 in 2016 resulting in a zero budget increase
$530 $0
$0 $0
Total Program Service Demands $6,546 $155
Capital Infrastructure Funding – Through the Proper ty Tax
Based on the Tax Supported Programs’ 2014-2023 capital plan, there is a projected shortfall of $213 million in available funding as illustrated in Table 11 below. The shortfall of $213 million excludes the expenditures and reserve contributions required for the new Peel Energy Recovery Center, which will be financed through debt issuance as directed by Council. The 2014 Tax Supported budget includes a one per cent levy increase to support the long term financial investment in the state of good repair of regional tax supported assets. This represents $8.8 million of the tax levy increase.

2014 Consolidated Operating and Capital Budget
18
Table 11
*Regionally Controlled Programs Operating Budget Financing The 2014 Budget is supported by a number of revenue sources. These can be categorized as Assessment Growth, Grants and Subsidies, User Fees, and Working Fund Draws. In addition to these sources of revenue, the property taxpayer is benefitting from the Province taking back some of the previously downloaded program costs.
Assessment Growth The growth in revenue from increased property assessment in Peel for 2014 is estimated at 1.33 per cent, which has been incorporated in the 2014 Budget. The 2014 Budget as forecast in the 2013 Budget assumed a 1.5 per cent growth in assessment. Grants and Subsidies Provincial funding assumptions are reviewed annually. The 2014 Tax Supported budget includes $442 million in grants and subsidies, a $17 million or 4 per cent increase over 2013 budget. Approximately 50 per cent of the increase is a result of the increased Social Assistance funding. 2013 Budget was revised to reflect in-year ELCC funding of $26.0 million. Commodity Revenue for Recycled Materials in Waste M anagement and WDO Funding
Commodity prices for recycled materials, predominantly fibre, are expected to continue to be sluggish into 2014. The 2014 Budget reflects a reduction in commodity revenue of $1.8 million, offset by $2.1 million increase in Waste Diversion Ontario (WDO) funding.
2014-2023 Tax Supported
Reserve Requirement*
$1,444 M
Total Available Funding in Reserves
$1,231 M
1% annual levy increase in 2014 and maintained
Unfunded gap of $213 M reduced to $110 M

2014 Consolidated Operating and Capital Budget
19
User Fees Due to the nature of Regional services a small percentage of Peel’s Operating Tax Supported Budget revenue is generated by user fee collection. The 2014 Tax Supported Budget includes $15.3 million in User Fees (excludes Police) representing 1.4 per cent of total revenue. This is in keeping with Regions financial principle of “users pay where appropriate”. The total user fees have decreased since 2013 due to the fact that child care user fees will no longer be collected once the Region exits the direct delivery of that service. Rate Stabilization Fund Draws The 2014 Tax Supported Budget includes $8.2 million in rate stabilization fund draws to support various initiatives. A major request, in the amount of $3.0 million is to support Council direction to phase in service re-investments as the Region transitions out of the business of directly operated child care centres. Uploading Provincial Costs The 2014 Budget includes the impact of the ongoing upload of OW benefits costs which will continue until 2018. The total benefit of the OW benefits upload for 2014 is $4.6 million.
Staffing Complement A net reduction of 29 full-time equivalent (FTE) positions is proposed in 2014 for Regionally Controlled Tax Supported programs. This is a combination of the reduction of 54.5 FTEs in 2014 due to the exit of direct delivery of child care and the 25.5 proposed new staffing requests included in this budget. Table 12
2013 Revised
FTEs
2014 Change
2014 Budget
Change from 2013 Revised %
Tax Supported Programs
4,011.25 (29) 3,982.25 (0.7)
Regular and temporary positions are approved and managed in accordance with the Workforce Level and Control Policy HR04-01. The overall 2014 Tax Supported budget includes wage gapping in the amount of $5.5 million (58 positions), which recognizes the financial impact of the natural staff turnover patterns.

2014 Consolidated Operating and Capital Budget
20
Regionally Financed External Organizations – 1.0 Pe r Cent Net Levy Increase Overview The 2014 Region’s tax levy includes financing to non-Regionally controlled external organizations for a total cost of $399.0 million. The total 2014 Budget increase after assessment is $8.7 million for these organizations which translates to a 1.0 per cent net levy increase. The external organizations consist of: Peel Regional Police (PRP), Ontario Provincial Police (OPP) for services in the Town of Caledon, three conservation authorities (CAs) namely, Credit Valley Conservation Authority (CVCA), Toronto and Region Conservation Authority (TRCA), Conservation Halton (CH), and Municipal Property Assessment Corporation (MPAC) for Assessment Services. The requirement to fund these external organizations is based on Provincial legislation. For the 2014 budget process Council provided the external organizations with direction to bring in their 2014 budget requests at a level 1.0 per cent below the 2014 forecast provided as part of the 2013 budget process. The final submissions from the external agencies to Regional Council for 2014 funding complied with this direction. The following outlines the method of apportionment that applies to each externally funded organization: • Peel Regional Police budgeted costs are apportioned to the cities of Mississauga and
Brampton tax levies • Ontario Provincial Police (Caledon Detachment) budgeted costs are apportioned to the Town
of Caledon tax levies • Conservation Authorities’ budgeted costs are partially funded by municipalities within the
watersheds they manage. Peel’s portion is funded by tax levies with a share on the utility bill. The utility portion of Peel’s Conservation Authority budget has been capped at $16 million since 2008. Therefore, conservation budget increases have been financed through the property tax rate only. Staff is monitoring the allocation and it is forecast that the impact to tax only will continue in the next few years however the gap is closing.
• Municipal Property Assessment Corporation is funded by municipalities according to a formula based on assessment value and the number of properties in each municipality as a per cent of the provincial totals. The budgeted cost is apportioned to all property tax payers.
Operating Budget Pressures The following outlines the program drivers behind the year-over-year changes to the net operating budget for the Region Financed External Organizations for 2014.
Peel Regional Police PRP’s 2014 net budget of $349.6 million represents an increase of $11.2 million over the 2013 level of spending or 3.3 percent mainly due to: • Base budget increases totalling $7.6 million (primarily related to annualization and cost of
living increases, offset by the inclusion of $1.4 million in increased revenue resulting from the phase-in of the Court Security and Prisoner Transport Upload by the Provincial Government).
• Service demand increases totalling $3.6 million for 22 additional front-line officers

2014 Consolidated Operating and Capital Budget
21
Ontario Provincial Police (Town of Caledon) The OPP’s net budget of $12.1 million represents an increase of $0.5 million or 4.6 per cent mainly due to:
• Base budget increases representing costs for the OPP contract and OPP Property Services offset by cost mitigations such as the elimination of Civilian Data Entry operations costs and increased revenue from the phase-in of the Court Security and Prisoner Transport Upload by the Provincial Government.
Conservation Authorities The CA’s total levy request of $35.8 million represents an increase of $1.5 million or 4.4 per cent. Of the total, $16.0 million will be funded from the utility rate (zero per cent increase) and $19.8 million from the tax rate (8.3 per cent increase). The increase is largely driven by economic adjustments for labour in the three conservation authorities in addition to a reduction of planning fees from greenfield development specifically impacting the CVCA.
The details of the increases are presented by Conservation Authority in Table 13 below. Table 13
Conservation Authorities (CAs)
General Levy Increases
$'000
Special Levy Increases/
(Decreases) $'000
Total Levy Increases/
(Decreases) $'000
CVCA $611 $954 $1,565
TRCA $63 ($123) ($60)
CH $11 ($3) $8 Total CA Levy Increase $685 $828 $1,513
Municipal Property Assessment Corporation MPAC’s net budget of $17.6 million represents an increase of $0.4 million or 2.2 per cent over 2013 budget. As communicated by MPAC in 2012 their net budget increase from 2013 to 2016 will be limited on average to 0.95%. Peel’s higher increase is a direct result of assessment growth in Peel being greater than the provincial average.

2014 Consolidated Operating and Capital Budget
22
Four Year Operating Budget Outlook – Tax Supported Programs The four year financial outlook is based on maintaining existing service levels to a growing and changing population in the most cost effective manner, general assumptions for inflation, and the operational impact of capital works. In April, 2013 Council directed that budget forecasts be reviewed to bring about a sustainable budget forecast. Changing legislation, provincial subsidy and the fluctuating economy will continue to influence budget increases over the next four years. Future budgets will no longer be able to use tax room made available by the GTA Pooling upload, which was fully uploaded in 2013. However, OW Benefit costs will be incrementally uploaded until 2018 at which time the province will fund 100 per cent of the mandatory benefit costs. Peel’s tax rate will benefit from the upload of some of the cost of Prisoner Transport and Court Security in Police Services in 2014 continuing to 2018. Staff have projected that Peel’s taxpayers can expect to see an average net levy increases of 2.7 per cent over the next three years based on current Council directed service levels. Included in these forecasts is the impact of the capital plan on the Operating budget i.e. increased lane kilometres, new paramedic stations and the investment in sustaining Peel’s infrastructure. These forecasted increases may change as Council determines priorities throughout the next four years. Provided in Summary III of this document are the details on the net budget increases for 2015-2017. Table 14
Forecasted Net Budget 2014 - 2017
Budget Forecast
2014 2015 2016 2017
Region Controlled Programs 1.3% 2.1% 2.0% 2.0% External Agencies 1.5% 2.2% 2.0% 1.8% Tax Assessment Growth (1.3%) (1.4%) (1.3%) (1.2%)
Total Tax Levy Impact 1.5% 2.9% 2.7% 2.6%
Total Property Tax Impact* 0.6% 1.2% 1.1% 1.1% * Based on weighted average municipal portion of tax bill is 42%

2014 Consolidated Operating and Capital Budget
23
2014 Capital Budget – Tax Supported Programs The 2014 Tax Supported Capital budget totals $808.0 million. Regionally Controlled programs represent approximately 95 per cent of the total tax supported capital plan with Police Services accounting for the balance. Thirty-seven per cent is funded by capital reserves, 7 per cent is funded by Development Charge (DC) Reserve funds, 55 per cent is funded by debt and the remaining 1 per cent is financed by external sources. The Regions capital budget supports the financial principles of “ensure the capital plan is sustainable”, “borrow only for substantial long term assets at affordable levels” and “maintain assets”. 2014 Capital Budget - $808.0 million 2014 Capital Budget The two largest components of the 2014 Tax Supported Capital Budget are Waste Management at $576.2 million or 72 per cent and Transportation at $106.7 million or 13 per cent. The major capital work in the 2014 capital budget includes the following:
Waste Management: $576.2 million for the Waste Management Program to fund $514.2 million for projects dealing with processing of recyclables, organics and waste (including the Peel Energy Recovery Center of $509 million), and $0.7 million for maintenance at recycling centres and transfer stations Transportation: $106.7 million for the Transportation Program, including $ 42.4 million for road construction, $19.1 million for new and improvements to existing intersections and $15.0 million for road resurfacing and crack sealing Peel Police: $37.2 million for Peel Regional Police, including $11.5 million for the expansion and maintenance of facilities, $15.5 million for IT infrastructure and $8.3 million for vehicles and communication equipment Paramedic Services: $36.1 million to service the ambulance fleet and to address facility development and growth demands Internal Services: $24.7 million mainly for office facility maintenance and information technology upgrade and enhancement Housing: $11.6 million, including funding for capital repairs for housing providers and shelter repair and replacement Lakeview Waterfront Connection of $5.5 million to advance project and complete detailed design. Costs will be updated in a Council report after detailed design has been completed
2014 Capital Budget Financing The 2014 Tax Supported Capital Budget is financed by four sources: Capital Reserves, DC Reserve Funds, Debt and External which includes funding from other municipal partners.
Capital Reserves: $299.2 million or 37 per cent of the 2014 Capital Budget is financed by Capital Reserves,

2014 Consolidated Operating and Capital Budget
24
DC Reserve Funds: $60.3 million or seven per cent is financed through DC Reserve Funds, Debt: $ 445.2 million or 55 per cent is financed through the issuance of debt for the Peel Energy Recovery Centre. The issuance of debt is not anticipated until 2019 to 2020. External Funding: the remaining $3.3 million or 1 per cent is financed through external funding sources largely comprised of funding from Federal and Provincial governments, local municipalities and Greater Toronto Airport Authority (GTAA).
Table 15 below provides the components of the 2014 Capital Budget by program and the funding source. Table 15
2014 Tax Supported Capital Budget 2014 Capital Cash Flow The table below shows Peel’s projected capital cash flow for 2014. Table 16
Capital Projects Carry-forward from 2013 ($M)
(A)
2014 Capital Budget
($M) (B)
Total Capital in 2014
($M) (A+B)
2014 Projected Cash Flow
($M)
$615.4 $808.0 $1,423.4 $365.6
Total Expenditures - $808 Million (In $ Millions)
Operations Support, $5.1, 1%
Internal Services, $24.7, 3%
Health Services, $40.8, 5%
Human Services, $11.8, 1%
Police Services, $37.2, 5%
Transportation$106.7, 13%
CA Managed, $5.5, 1%
Waste Management, $576.2, 71%
Total Funding Source - $808 Million(In $ Millions)
Debt, $445.20, 55%
Capital Reserves,
$299.2, 37%
Development Charges, $60.3, 7%
External, $3.30, 1%

2014 Consolidated Operating and Capital Budget
25
Projected capital expenditures relate primarily to work in process from previously approved capital budgets. Typically projects of significant size take multiple years to complete and therefore remain a work in progress for several years. Adequate financing is in place to fund the 2014 projected cash flow of $365.6 million. Operating Impact of 2014 Capital Budget The 2014 Capital Budget includes new infrastructure which will enhance Peel’s service levels to meet the demands of a growing community. The Capital Budget includes growth related services such as additional lane kilometres and new paramedic stations. When these capital works become operational there will be a direct impact on the operating budget requiring additional resources to service the public. The future expected operational impact of the 2014 Capital Budget is estimated at $3.7 million, phased in over several years as the work is completed. These expected operating costs associated with capital have been included in the future years’ operating budget forecast. Table 17
(In $ Millions) 2014 2015 2016 2017 onward Total
Transportation $0.2 $0.2 $0.3 $0.3 $1.0
Internal Services $0.0 $0.6 $0.0 $0.1 $0.7
Health Services $0.5 $0.0 $0.0 $0.0 $0.5
Peel Regional Police $0.1 $0.9 $0.4 $0.1 $1.5
Total Operating Impact $0.8 $1.7 $0.7 $0.5 $3.7
• Transportation: The operating impact relates to constructing new lane kilometres, traffic signals, structures, catch basins, and installation of new signs.
• Internal Services: The cost of operating a new data center and ongoing software
maintenance, and the annual maintenance fees for new planning and budgeting software. • Peel Regional Police: In 2014 the ongoing operating impact of capital projects is $0.1
million. Projects such as the replacement of the Digital Recording System, Portfolio Management Software, Community Complaints Tracker, Recording of Prisoner Vans, Network Analysis Tools and eToken replacement require software maintenance.

2014 Consolidated Operating and Capital Budget
26
2014-2023 Ten Year Capital Plan - $3.2 billion 2014-2023 Capital Plan In addition to the one year Capital Budget the Region prepares a nine year forecast, which is approved by Council in principle. Planning beyond the horizon of the single budget year allows the Region to assess the sustainability of future plans. As the Region’s assets start to reach the end of useful life, the Region must ensure that there is a plan to repair, replace or decommission these assets to support residents’ needs over the long term and to meet Peel’s growth requirements. The Ten Year Capital Budget for Tax Supported programs totals $3.2 billion. Highlights of the 2014-2023 Tax Supported Capital Plan include the following:
Transportation: total of $1,309.2 million includes $868.2 million for road construction, $68.4 million for new and improvements to existing intersections and $150.0 million for road resurfacing and crack sealing Waste Management: total of $830.4 million includes $661.4million for processing of recyclables, organics and waste (including the PERC facility) and $31.2 million for maintenance of community recycling centers and transfer stations Peel Regional Police: total of $262.4 million includes $105.6 million for the improvement and replacement of automated systems, $124.3 million for facilities and vehicles Housing: total of $263.1 million includes $159.6 million for the construction of additional affordable housing units (700 units), with approximately 40 per cent allocated to Rent Geared to Income (RGI) units and $97.2 million in loans and or grants to Peel’s social housing providers for state of good repair maintenance on capital assets Paramedic Services : total of $114.0million includes $69.6 million for site relocations and growth satellite stations and $33.7 million for ambulance fleet requirements Internal Services: total of $186.3 million includes $69.9 million in Information Technology (IT) for client technology and infrastructure replacement and enhancement, and $80.9 million to support the state of good repair of Regional buildings and a new parking structure Long-Term Care: total of $102.0 million includes $48.0 million major maintenance on existing facilities and $45.5 million for a building or facility for development of new LTC services
2014-2023 Capital Plan by Classification – Regional ly Controlled Tax Programs The 2014- 2023 Tax Supported Capital Plan can be separated into three general categories: State of Good Repair (SOGR), DC Funded Growth, and Non-DC Funded Growth & Council Priorities as displayed in the table below. Throughout the budget process the capital plan is vetted thoroughly to ensure value for money. Table 18 below refers to the total Tax Supported Capital Plan by category.

2014 Consolidated Operating and Capital Budget
27
SOGR capital work is estimated at $659.1 million which represents the capital investment in existing Peel-owned capital assets to maintain asset condition and current service levels using Peel’s Corporate Asset Management (CAM) Strategy. The CAM strategy uses a risk based approach to give a strategic perspective on the state of Peel’s infrastructure highlighted where reinvestments in capital assets are most needed to maintain state of good repair and service levels to the public. The strategy provides a framework that guides the programs in planning the most appropriate capital work to address infrastructure needs. The majority of the SOGR capital work in the ten year capital plan relates to Transportation, Internal Services and Waste Management. DC Funded Growth capital work estimated at $902.8 billion represents the capital investment to service the growth in Peel’s population, financed from DC Reserve Funds. The majority of the Growth capital work in the ten year capital plan relates to Transportation and Housing.
Non-DC Growth and Council Priorities capital work of $1,343.9 million represents other capital asset acquisitions and improvements which are largely related to service enhancements, and non-DC funded growth that are funded from capital reserves and external recoveries. The majority of the capital work in the ten year capital plan is for the new PERC facility in the Waste Management Program, additional paramedic stations in Paramedic Services and road construction and resurfacing in Transportation. As per recent Council direction the Lakeview Waterfront Connection project has been included although more detailed cost estimates will be brought to Council when detailed design has been completed.
Table 18
Tax Supported Programs (Excludes External Agencies)
2014-2023 Capital Plan ($ M)
State of Good Repair $ 659.1
DC Supported Growth $ 902.8
Non-DC Growth and Council Priorities $1,343.9*
Total $2,905.8
*Note: PERC, although included in this category, 160,000 tonnes of capacity replace
energy from waste previously provided under contract.

2014 Consolidated Operating and Capital Budget
28
2014-2023 Capital Plan Financing The 2014-2023 Tax Supported Capital Plan of $3.2 billion is funded by four sources. Fifty-four per cent is funded by capital reserves, 29 per cent is funded by DC reserve funds, 14 per cent is funded by debt and the remaining 3 per cent of the total plan is funded by external sources. Table 19 below provides the components of the 2014 capital budget by program and funding source. Table 19
2014-2023 Ten Year Tax Supported Capital Plan Sustainability – Adequacy of Reserves/Liquidity Capital Reserves are used to fund the state of good repair of existing assets and other capital work not eligible for DC funding. The types of capital projects supported by these reserves include replacement of Region vehicles and equipment, resurfacing of regional roads, major building equipment repairs and building maintenance, replacement of regional buildings and waste management infrastructure development. Capital Reserves provide the resources to advance the Region’s capital plan. They provide financial flexibility to meet long term financing requirements and help achieve the long term financial sustainability of infrastructure. In 2007, Council adopted the strategy to increase the tax supported reserves by a one per cent tax rate each year to support the non-DC capital plan. The increase in the capital reserves are also an important factor in Peel’s overall liquidity and financial condition which supports Peel’s Triple A (AAA) credit rating.
Total Expenditures - $3.2 Billion (In $ Millions)
Health Services,
$223.6, 7%
Internal Services,
$186.3, 6%
Police Services,
$262.6, 8%
Human Services,
$265.1, 8%
CA Managed, 30.5, 1%
Waste Management, $830.4, 26%
Transportation$1,309.2, 42%
Operations Support
$60.6, 2%
Total Funding Source - $3.2 Billion(In $ Millions)
Debt, $445.2, 14%
Development Charges
$930.3, 29%
External, $108.1, 3%
Capital Reserves, $1,684.9,
54%

2014 Consolidated Operating and Capital Budget
29
Current reserve levels and contributions are not sufficient to address the Region's Tax Supported capital plan. The current projected shortfall to 2023 is estimated at $213 million in tax supported reserves. The 2014 Budget proposes a one per cent infrastructure levy to support funding Peel’s long term infrastructure requirements. Regional Council directed staff to complete an annual assessment of the adequacy of the existing DC Reserve and that staff should commence a new Background Study if the assessment indicated a shortfall of 20 per cent. This was completed and the assessment concluded that a 15.5 per cent increase to DC rates would be needed to ensure the sustainability of the DC program to the year 2031, the current planning horizon. As the current DC rates are within the 20 per cent threshold no new Background Study is triggered at this time.

2014 Consolidated Operating and Capital Budget
30
2014 Operating Budget - Utility Rate Supported Overview - 7.0 Per Cent Utility Rate Increase The Utility Rate Supported Operating Budget totals $416.0 million. Besides providing water and wastewater services to Peel Region's citizens and businesses, Peel also provides services to the western part of York Region. Costs for these services are fully recovered from York Region. The Utility Rate program also provides $16 million in financial support to the three conservation authorities which serve the Region. Water and Wastewater program increases are based on identified cost pressures and forecasted billable flows. Included in the Utility Rate expenditures are the debt costs to finance Peel’s growing population and related infrastructure requirements. These debt costs totalling $93.0 million currently have no impact on the Utility Rate as they are completely funded from development charge revenues. The Utility Rate Supported Operating Budget is financed mostly through revenue from consumers. Other financing sources include external sources (i.e. York Region), grants, and sewer surcharge revenue. The 2014 Water and Wastewater Budget results in a blended utility rate increase of seven per cent. This seven per cent increase in the Utility rate translates into a $39 annual increase to $540 in an average residential annual water bill based on household consumption of 310m3, and a $94 annual increase on the average small business water bill based on consumption of 730m3. Table 20
2014 Utility Rate Supported Operating Budget
Total Revenue - $416.0 million(In Millions)
DC Revenue, $93.0, 22%
Other, $5.8, 1%
External Recovery, $28.7, 7%
Regional Rate,
$288.4, 70%
Total Expenditures - $416.0 million(In Millions)
Debt Cost, 93.0, 22%
Water, $177.7, 43%
Wastewater, $113.9, 27%
Conservation Authorities, $16.0, 4%
Non-Program, $12.1, 3%
Operation Support
Services, $3.3, 1%

2014 Consolidated Operating and Capital Budget
31
Operating Budget Pressure The proposed budget increase in the 2014 Utility Supported Operating Budget is a result of meeting the demand of a number of significant pressures offset by operational efficiencies. The pressures are categorized as Base Pressures, Service Demands and Capital Infrastructure Funding. Base Pressures Base pressures include adjustments for annualization, inflation, economic factors and prior year management decisions. Budget adjustment due to base pressures in the 2014 Utility Rate budget totals $3.7 million. Main base pressures include increases in the Ontario Clean Water Agency (OCWA) contract of $2.7 million, hydro increase of $2.6 million, and inflationary cost adjustments including labour increases of $1.2 million. These increases are offset by operational efficiencies of $2.7 million which are related to savings as a result of outsourcing wastewater lab operation ($1.8 million) and reduction in chemicals and gas due to continued process improvements at the treatment facilities ($0.9 million). The budget also reflects stabilization in Peel water demand at 165,200 mega litres, the same level as the 2013 Budget estimates. Service Demand The proposed 2014 Utility Rate Budget includes budget increase driven by service demand. As suggested by legislated requirements of the ON1call - infrastructure notification system, the Region is required to provide the service locates within 5 business days, which poses huge challenges on the current operations as well as significant financial pressures. While seeking further guidance from the regulatory body, the program includes $0.8 million in the 2014 budget considering a service level of 10 business days. If 5 business days is mandated, the operating cost will have to be increased significantly. The 2014 Utility Rate Budget assumes an additional 4,750 new accounts will be added to the billing base addressed though current resources. Capital Infrastructure Funding – Through the Utilit y Rate The commitment to maintain quality water and wastewater services and comply with regulations includes a continued focus on asset management work. Based on the 2014-2023 capital plan there is a projected shortfall of $205 million in available funding. Included in the 2014 Budget is a seven per cent rate increase or $18.3 million to close the unfunded gap based on the current ten year capital plan as illustrated in Table 21 below.
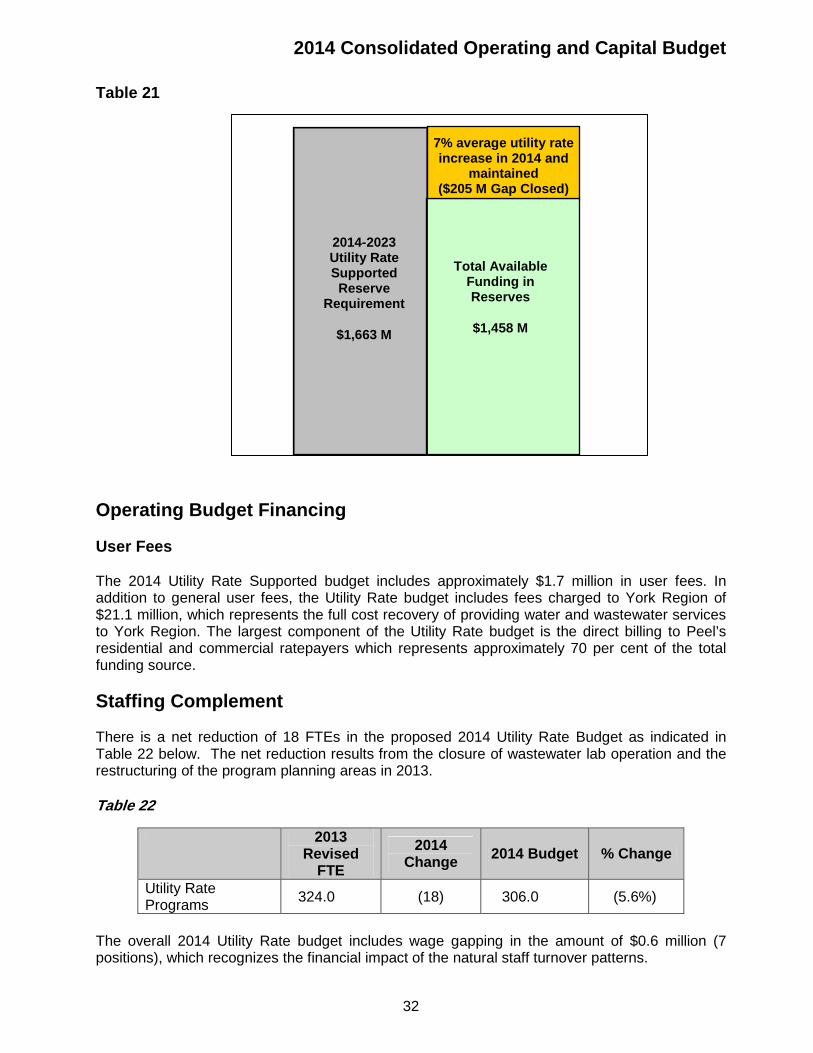
2014 Consolidated Operating and Capital Budget
32
Table 21
Operating Budget Financing User Fees The 2014 Utility Rate Supported budget includes approximately $1.7 million in user fees. In addition to general user fees, the Utility Rate budget includes fees charged to York Region of $21.1 million, which represents the full cost recovery of providing water and wastewater services to York Region. The largest component of the Utility Rate budget is the direct billing to Peel’s residential and commercial ratepayers which represents approximately 70 per cent of the total funding source. Staffing Complement There is a net reduction of 18 FTEs in the proposed 2014 Utility Rate Budget as indicated in Table 22 below. The net reduction results from the closure of wastewater lab operation and the restructuring of the program planning areas in 2013. Table 22
2013 Revised
FTE
2014 Change 2014 Budget % Change
Utility Rate Programs 324.0 (18) 306.0 (5.6%)
The overall 2014 Utility Rate budget includes wage gapping in the amount of $0.6 million (7 positions), which recognizes the financial impact of the natural staff turnover patterns.
2014-2023 Utility Rate Supported Reserve
Requirement
$1,663 M
Total Available Funding in Reserves
$1,458 M
7% average utility rate increase in 2014 and
maintained ($205 M Gap Closed)

2014 Consolidated Operating and Capital Budget
33
Four Year Operating Budget Outlook – Utility Rate S upported Programs The 2014 Utility Rate Supported Budget increase provides the balance to maintain capital infrastructure in a state of good repair, address service level requirements while minimizing the impact to Peel’s ratepayer. Assumptions for demand reflect the trends over the past five years and take into account new growth. For the period 2015-2017, Peel Utility Rate programs are looking at an average combined annual rate increase of five per cent. A number of key assumptions such as the water and wastewater capital stabilization reserve contributions, energy prices, Peel water consumption, and operating costs in water and wastewater programs will continue to influence the rates in future budgets. Included in these future rates is the six per cent increase for 2015 and three per cent per year for 2016 to 2017 to support state of good repair of existing and new regional infrastructure. Peel’s current Utility Rates are the lowest in comparison to similar municipalities in Ontario. With the forecasted increases to 2017 Peel’s Utility Rates are expected to remain the lowest in comparison to similar municipalities. Displayed in Table 23 below are the projected utility rate increases for the next four years. Of note, all utility rate increases are effective on April 1 of the budget year. Provided in Summary III of this document are the details on the net budget increases for 2015-2017. Table 23
Forecasted Utility Rate Impact 2014 – 2017
Budget Forecast
2014 2015 2016 2017 Operating Operations 0.0% 1.0% 1.0% 1.0% Capital Infrastructure 7.0% 6.0% 3.0% 3.0%
Total Utility Rate Impact * 7.0% 7.0% 4.0% 4.0% Household Bill With annual consumption of 310m3 $540 $576 $598 $618
Small Business With annual consumption of 730m3 $1,354 $1,446 $1,501 $1,550
Note: The 3 year forecast impact is an average of 5% from 2015-2017.

2014 Consolidated Operating and Capital Budget
34
2014 Capital Budget – Utility Rate Supported Progra ms
2014 Capital Budget - $478.9 million The 2014 Utility Rate Supported Capital budget totals $478.9 million. The Water program accounts for $295.3 million or 62 per cent, the Wastewater program totals $172.3 million or 36 per cent and Public Works Operations Support is $11.3 million of the total. Table 24 below provides the breakdown of these three programs that make up the total of the 2014 Utility Rate Supported Capital Plan. Financing for the 2014 Utility Rate Supported Capital Budget is provided from the following sources: Capital Reserves, DC Reserves, and Other which includes funding from other municipal partners The breakdown of these financing sources are as follows: Capital Reserves, $200.9 million or 42 per cent, DC Reserves, $271.9 million or 57 per cent, and Other, $6.1 million or 1 per cent which is largely comprised of funding from other municipalities, with York Region as the largest contributor. The total funding in this capital plan is presented in Table 24 below.
Table 24 2014 Utility Rate Supported Capital Budget
Major components of the 2014 Utility Rate Capital Budget include:
• $279.3 million for plant facilities and distribution systems • $123.2 million for the development, improvement and upgrade of primary and local trunk
collection system
Total Expenditures - $478.9 Million (In $Millions)
Wastewater, $172.3, 36%
Water$295.3, 62%
Operations Support
$11.3, 2%
Total Funding Source - 478.9 Million(In $ Millions)
Capital Reserves,
$200.9, 42%
Other $6.1, 1%
DC$271.9, 57%

2014 Consolidated Operating and Capital Budget
35
2014 Capital Cash Flow The table below shows Utility Rate Supported programs’ projected capital cash flow for 2014. Table 25 Projected capital expenditures relate primarily to work in process from previously approved capital budgets. Typically projects of significant size take longer to complete and therefore remain on the active books for several years. Current debt financing plan anticipates a $190 million debt issuance to cash flow 2014 DC capital financing requirements. Adequate financing plans are in place to fund the non DC portion of the 2014 projected cash flow. Operating Impact of Capital The operating impact of the 2014 Capital Budget is mainly attributable to the OCWA base fee, which was set during the new contract negotiation to support the anticipated capital expansions. The actual base fee is being adjusted in the annual operating budget development to address the changes in the capital schedule. The operating impact has been included in future years’ operating budget forecasts. Table 26
Incremental (In $ Millions) 2014 2015 2016 2017 onward Total
Net Operating Impact $4.2 $0.4 $0.4 $0.4 $5.4
2014-2023 Ten Year Capital Plan - $2.7 billion 2014-2023 Capital Plan As in the Tax supported programs, the Utility Rate program also prepares a nine year forecast, which is presented to Council to approve in principle. The Ten Year Capital Budget for Utility Rate Supported programs totals $2.7 billion. Highlights of the 2014-2023 Capital Plan include the following:
• $1.6 billion for the Water program, including $1.3 billion for treatment plant facilities and distribution systems, $336.4 million for the development and upgrade of the transmission system,
• $1.0 billion for the Wastewater program, including $303.5 million for wastewater treatment plants, $632.6 million for the primary and local collection system
• $27.5 million for the replacement of water meters and $7.6 million to support water efficiency strategy
Capital Projects Carry-forward from 2013 ($M)
(A)
2014 Capital Budget
($M) (B)
Total Capital in 2014
($M) (A+B)
2014 Projected Cash Flow
($M)
$1,637.0 $478.9 $2,115.9 $450.0

2014 Consolidated Operating and Capital Budget
36
2014-2023 Capital Plan by Classification The 2014- 2023 Utility Rate Supported Capital Plan can be separated into four general categories: State of Good Repair, DC Funded Growth, External and Council Priorities.
State of Good Repair (SOGR) capital work estimated at $1.0 billion represents the capital improvements on existing Peel-owned capital assets to maintain asset condition and current levels of service including meeting current regulatory requirements. Approximately 36 per cent of the total Utility Rate Supported capital work is for State of Good Repair. The Regions investment in SOGR is guided by the principles of the Corporate Asset Management Policy.
DC Funded Growth capital work estimated at $1.2 billion represents investment in new capital investment to service Peel’s population growth financed from DC and non DC funding sources. Approximately 47 per cent of the total Utility Rate Supported capital work is to address the pressure from growth. Non-DC Growth and Council Priorities capital work of $424.1 million represents capital asset acquisitions and improvements which are largely required for anticipated service enhancements and are funded from internal reserves. This category also includes capital work of $34.4 million which represents capital work done by Peel through shared funding contributions whereby there are mutual benefits to both Peel and Non Peel parties. This work relates to future water treatment facilities and transmission mains.
Table 27
Utility Supported Programs
2014-2023 Capital Plan ($ M)
State of Good Repair $ 1,008.2
DC Supported Growth $1,241.6
Other $ 424.1
Total $2,673.9

2014 Consolidated Operating and Capital Budget
37
2014-2023 Capital Plan Financing The 2014-2023 Utility Rate Supported Capital Plan of $2.7 billion is funded by three sources: 53 per cent is funded by capital reserves, 46 per cent is funded by DC reserve, and the remaining 1 per cent of the total plan is funded by external sources. Table 28 below provides the components of the 2014 capital budget by program and the funding source Table 28
2014-2023 Utility Rate Supported Capital Plan
Sustainability – Adequacy of Reserves Capital Reserves are used to fund the state of good repair of existing assets and other capital work not eligible for DC funding. The types of capital projects supported by these reserves include replacement of vehicles, replacement of linear assets, pipes, feedermains and facilities. Capital Reserves provide the resources to advance the Region’s capital plan. They provide financial flexibility to meet long term financing requirements and help achieve the long term financial sustainability of its infrastructure. In 2009, Council adopted the strategy to increase the utility rate supported reserves by a three per cent utility rate each year to support the non DC capital plan. In an effort to close the Utility Rate supported capital financing gap more quickly, in 2012 & 2013 Council approved 6 per cent utility rate increase. The increase in the capital reserves are also an important factor in Peel’s overall liquidity and financial condition which supports Peel’s Triple A (AAA) credit rating. Current reserve levels and contributions are not sufficient to address the Region's Utility Rate Supported capital plan. The current projected shortfall to 2023 is estimated at $205 million in utility rate supported reserves. The 2014 Budget proposes a 7 per cent infrastructure levy to support funding Peel’s long term infrastructure requirements.
Total Expenditures - $2.7 Billion(In $ Millions)
Wastewater, $979.6, 37%
Water, $1,650.7,
61%Other,
$43.6, 2%
Total Funding Source - $2.7 Billion(In $ Millions)
Capital Reserves, $1,397.8,
53%
Other, $34.4, 1%
DC, $1,241.6,
46%

2014 Consolidated Operating and Capital Budget
38
Based on current Corporate Asset Management modelling significant state of good repair requirements have been identified for the period between 2024 and 2033. The increased state of good repair costs will require additional increases to capital reserve contributions in future years.

2014 Consolidated Operating and Capital Budget
39
Disclosure of 2014 Budget Key Assumptions & Risks Budget preparation requires assumptions to be made based on best available information and updated annually based on historical trends. The budget reflects an appropriate level of risk but there are certain items which should be highlighted: Labour Costs
• Contract Settlements: The 2014 Budget makes assumptions for outstanding labour settlements for bargaining unit staff. The assumptions are consistent with Council direction for negotiating purposes. Outstanding bargaining unit contracts are in Long Term Care.
• Pay Equity: The Region regularly assesses compliance with pay equity legislation. The Region is in the process of finalizing the settlement of an outstanding pay equity matter with Long Term Care bargaining unit(s). When the matter is completely settled, future budgets will be amended accordingly.
Economic and Market Volatility
• Revenue for Recycled Materials : World economic changes may cause wide swings with commodity prices. In the 2014 budget the projection of blue box material to market is 83,300 tonnes which is based on operating trends in 2013. Changes in the economy affect the ability to sell material.
• Energy Costs: The Region of Peel is the largest consumer of energy in Peel. Energy costs are a significant component of the operating costs of Peel’s Utility Rate Supported programs. For 2014, the budget for electricity was increased by approximately 7 per cent over 2013 budget levels. Given the potential volatility in energy costs, the actual expenditures may vary from the budget amount.
• OW Caseload: OW caseload is directly tied to the performance of Peel’s economy. The Region applies regression modelling to forecast changes in caseload. The Province is phasing in by 2018 the upload of social assistance benefit costs. Until full upload, increases in the municipal cost of benefits is being supported by working fund reserves to avoid any property tax impact.
• Sinking Fund Rate of Return: The Region contributes amounts to sinking funds to be used to retire long term debt in the future. The amount required to be contributed annually is dependent upon the rate of return on the sinking fund investments. Lower than expected returns would eventually cause increases in annual contributions.
• Supplemental Assessment & Tax Rebates: Changes in the economy contribute to spikes in assessment growth and in tax rebates for items such as vacant commercial properties. In the year following Current Value Assessments, property assessment appeals tend to increase. Rate Stabilization Reserves are adequate to protect against the negative impacts related to Tax Rebates.
Weather
• Utility Rate Supported Programs and Transportation: Operations of three Regional programs are influenced by seasonal weather patterns, Water, Wastewater and Transportation. Weather impacts water consumption demand primarily during the summer and the roads maintenance program in the winter. These budgets are developed by using a five year trend analysis in an effort to mitigate the annual volatility

2014 Consolidated Operating and Capital Budget
40
in weather. Managing financial risks associated with weather volatility in these programs is supported by Working Fund and Stabilization Reserves.
Regulations and Legislation
• Changes to Regulations and Legislation: The 2014 Budget was developed with an understanding of the cost to comply with relevant regulations and legislation. As changes in regulations and legislation come into place staff will assess the cost of compliance and report to Council appropriately. For example, the need to adhere to the required legislation Ontarians with Disabilities Act (AODA), ON1Call Act and Canadian Environmental Protection Act (CEPA) may pose future challenges.
• Ontario Public Health Standards: The 2014 Public Health budget does not include the cost to fully implement current Ontario Public Health Standards which replaced the previous Mandatory Health Programs and Services Guidelines in 2009. The Region of Peel continues to advocate to the Province for adequate funding to support compliance with the Standards.
Grants & Subsidies
• Provincial Funding: Provincial funding is a primary source of revenue to offset the municipal cost to deliver Health and Human Services programs. The 2014 Budget assumptions for provincial funding recognize that in some programs the level of funding falls short of prescribed formulas and/or does not recognize the needs of a growing population. Each program models increases in provincial funding of up to two per cent.
• Other Funding: The 2014 Budget includes known funding. Flexibility has also been built in to allow for the potential new financing available through the Building Canada Fund. The exact impact of this potential new funding and the Regions ability to successfully access it is not known with certainty since the details of the program have not been released yet.
Rate Stabilization Reserves
• Contingent Draws : Rate Stabilization Reserves are used to minimize annual fluctuations in property tax and utility rates as they provide funding for one-time costs, allows significant pressures to be phased in and are also used to address program pressures where there is some degree of uncertainty. These are especially important given that historical analysis shows that there can be noticeable swings in revenues from year to year. The 2014 Budget includes $12.6 million in contingent Rate Stabilization Reserve draws, $8.2 million for Regionally Controlled Programs and $4.4 million for Externally Financed organizations. Utilization of the Rate Stabilization Reserves is contingent on Peel’s actual 2014 financial performance.
Debt Financing
• Tax Supported Debt : As of August 31, 2013 Tax supported debt totals $85 million. $33 million of this amount was issued in 2013 for affordable housing. Debt financing costs of $5.1 million are included in the 2014 tax supported operating budget. The 2014 Budget anticipates the PERC project will require the issuance of debt later in the 10 year capital plan.
• Development Charge Supported Debt: As of August 31, 2013 $1,273 million debt will
be outstanding for growth related water and wastewater infrastructure funded entirely

2014 Consolidated Operating and Capital Budget
41
through future development charge revenue. Based on the 2012 development charge background study it is anticipated debt will continue to be issued to a maximum of $2.6 billion. Based on 2014 development charge related expenditures and revenues, $190 million of debt issuance is planned for 2014.
• Development Charge Adequacy – The adequacy of the current DC rate was assessed
in conjunction with the 2014 Budget process. The assessment indicates the current DC rates are within the 20 per cent threshold and a new Background Study is not required at this time. When the new Background Study does occur it will have to take into consideration the new growth projections included in the amendment to the Places to Grow Act including the necessary infrastructure to support the growth.
Uncertain Liabilities
• Go Transit : The 2014 Budget does not include Peel’s outstanding liability to GO Transit
of $114.9 million, which includes the October 2013 year to date amount for the 2007 through 2013 fiscal years. This represents an unfinanced liability due to Peel Regional Council’s decision to limit funding for GO Transit to the growth capital plan funded through development charges. As the GO Transit liability grows, existing Rate Stabilization Reserves – Tax may be insufficient to cover the full amount.
• Social Housing Providers : Under legislation the Region of Peel is required to provide
financial support to social housing providers in Peel with respect to capital maintenance of the social housing stock, including Peel Living. The financial support may be in the form of a loan or grant. Peel maintains Reserve R1919 – Contingency Liability Reserve for these purposes. The Region is working with service providers to determine adequacy of asset management programs and financing requirements. In 2014, the CFO will assess the adequacy of the reserve.
Conclusion The services provided by the Region of Peel touch the lives of the citizens of the three area municipalities in essential ways and contribute to the ability of their citizens, businesses and communities to survive and thrive. Peel’s services are focused on positive outcomes for 1.3 million residents and 88,000 businesses The 2014 Operating Budget represents an appropriate approach and balance between minimizing the impact on Region of Peel tax and rate payers and:
• Delivering essential and other critical services • Meeting the demands of a growing and aging population • Responding to economic realities • Maintaining important fiscal strengths of the organization
The 2014 Capital Budget and 2014-2023 Ten Year Capital Forecast represent the long term commitment by the Region to serve Peel residents and tax and rate payers through prudent asset management and responsible and necessary maintenance of Regional infrastructure, which assists in delivering the services our citizens need and expect.

2014 Consolidated Operating and Capital Budget
42
THIS PAGE LEFT INTENTIONALLY BLANK

Summary I
2013 BudgetTotal Net Net
Expenditure Grants* Other Expenditure Expenditure $ %PROPERTY TAX SUPPORTED
Transportation 78,886 692 3,869 74,325 73,489 835 1.1 Waste Management 130,601 11,906 17,740 100,956 101,114 (158) (0.2) Development Services 2,783 - 1,882 901 902 (1) (0.1) Public Works Operations Support Services ** 1,404 - 1,404 592 (592) (100.0) Early Learning and Child Care 111,819 85,410 5,616 20,792 23,792 (3,000) (12.6) Housing 173,602 42,066 15,023 116,513 111,986 4,527 4.0 Social Assistance and Employment 215,294 170,290 1,561 43,444 47,232 (3,788) (8.0) Community Investment 7,595 1,001 - 6,594 5,599 995 17.8 Long Term Care 83,965 37,906 15,068 30,992 30,183 809 2.7 Health Services Program Support 729 - - 729 709 20 2.8 Public Health 84,524 56,412 1,384 26,728 25,782 946 3.7 Paramedic Services 78,622 36,074 712 41,836 39,712 2,124 5.3 Non Program/Internal Services*** 134,934 13,687 82,335 38,912 29,985 8,926 29.8 Region Programs 1,104,759 455,444 146,594 502,722 491,079 11,643 2.4
Police ServicesOntario Provincial Police 13,802 - 1,678 12,124 11,592 532 4.6 Peel Regional Police 389,750 12,506 27,669 349,575 338,407 11,167 3.3 Subtotal Police Services 403,553 12,506 29,347 361,699 349,999 11,700 3.3
Conservation Authorities 19,775 - - 19,775 18,262 **** 1,512 8.3 ****Municipal Property Assessment Corporation 17,602 17,602 17,222 380 2.2 Region Financed External Organizations 440,930 12,506 29,347 399,076 385,483 13,593 3.5
Total Property Tax Supported 1,545,689 467,950 175,941 901,798 876,562 25,236 2.9
UTILITY RATE SUPPORTED
Water 232,243 - 55,953 176,290 158,113 18,177 10.6 Non Program 6,452 - - 6,452 6,119 332 - Conservation- Allocation 8,014 - - 8,014 8,014 **** - - Total Water 246,709 - 55,953 190,756 172,246 18,510 -
Wastewater 152,340 - 39,606 112,735 107,900 4,835 4.0 Non Program 5,604 - - 5,604 5,308 296 - Conservation- Allocation 8,014 - - 8,014 8,014 **** - - Total Wastewater 165,958 - 39,606 126,352 121,222 5,131 -
Operation Support Services - Utility Rate ** 3,275 - 3,275 - - - - Total Utility Rate Supported 415,942 - 98,834 317,108 293,468 23,641 8.1
TOTAL REGION 1,961,631 467,950 274,774 1,218,907 1,170,030 48,877 4.2
Note: Schedule may not add due to rounding
* Includes revenue received from Payments in Lieu of Taxes (PILTs)
***The increase is largely due to the $8.8 million investment in the Capital Plan
****The overall increase to the 2014 Conservation Authorities' Budget is 4.4% after incorporating the $ 16.0 million funded through the Utility Rate Budget.
2014 Operating Budget Summary By Program ($'000)
RevenueChange from 20132014 Proposed Budget
** Total Expenditures for Operations Support are net of allocations to Public Work programs and are split 30/70 between tax and utility rate supported programs respectively.
43

SUMMARY II
Program Budget Costs MitigatedTotal
Expenditures ($'000)
Total Revenue ($'000)
Net Costs ($'000)
Transportation Adjustment of number of winter events to reflect trend of milder winters (778) (778)
Waste Management Cost of Paint disposal reduced by $0.8M reflecting the Stewardship Ontario (SO) incentive program. Reduction in the cost of haulage and disposal of $0.3M.
(1,145) (1,145)
Operations Support
New Survey Technology resulting in proficiency, Improvements in the delivery of activities , ambulance maintenance provided in-house and outsourcing large vehicle repairs
(169) (169)
Vector-Borne Diseases Larval and Lab Contract Renewals (69) (51) (18)
Reduction in Influenza Clinics due to Additional Community Providers (40) (20) (20)
Efficiencies from On-call Scheduling changes (17) - (17)
Paramedic Services Decreased Advanced Care Paramedic class size from 12 to 6 (121) (121)
Early Learning & Child Care
Cost reductions in goods and services as a result of identified savings, $208K redeployed to fund two Performance Measurement specialist positions in Strategic Plan, Policy and Partnerships
(335) (335)
Internal Services Expired office space lease for Standish facility and 7120 maintenance contract cost reduction (903) (429) (474)
(3,577) (500) (3,077)
Peel Regional Police In-depth line by line review of program spending (1,138) 113 (1,251)
OPP Elimination of Civilian Data Entry operations from Contract Costs (200) (200)
(4,915) (387) (4,528)
Operation reduction due to lab closure (1,800) - (1,800)
Reduction in chemical and gas budgets due to continued process improvements at the treatment facilities (933) - (933)
(2,733) - (2,733)
(7,648) (387) (7,261)
SUMMARY OF BUDGET COSTS MITIGATED IN 2014 OPERATING BUDGET
Total Budget Costs Mitigated
Subtotal Utility Rate Supported Programs
Subtotal Tax Supported Programs
Subtotal Regionally Controlled Tax Supported Programs
Public Health
Wastewater
44

SUMMARY III
2015-2017 Operating Budget Forecast (Net Expenditure $'000)
PROPERTY TAX SUPPORTED$ % Change $ % Change $ % Change
Regionally Controlled Programs 521,305 3.7% 540,469 3.7% 559,896 3.6%
Region Financed External Organizations Police Services 378,845 4.7% 394,566 4.1% 410,335 4.0% Conservation Authorities 22,611 14.3% 25,135 11.2% 26,893 7.0% Municipal Property Assessment Corporation 17,815 1.2% 18,029 1.2% 18,246 1.2%
Subtotal 419,271 5.1% 437,730 4.4% 455,474 4.1%
Total Property Tax Supported 940,576$ 4.3% 978,199$ 4.0% 1,015,370$ 3.8%
Net Levy Increase After Assessment Growth 2.9% 2.7% 2.6%
Property Tax Impact* 1.2% 1.1% 1.1%
*Assumes Regional share of the property tax bill is 42 per cent
UTILITY RATE SUPPORTED(Peel Required Billings) $ % Change $ % Change $ % Change
Water 188,768 8.1% 197,105 4.4% 205,228 4.1% Wastewater 121,943 7.1% 127,696 4.7% 133,564 4.6%
Total Utility Rate Supported 310,711$ 324,801$ 338,792$ Utility Rate Increase (blended) 7% 4% 4%
*Assumes annual consumption increase of one per cent
2017
20172015 2016
2015 2016
45

SUMMARY IV
($'000)
Program Development Charges Reserves Debt External
Sources Total
Financing
Tax Supported Programs
Regionally Controlled Tax
Public Works
Transportation 57,877 46,919 1,905 106,701
Waste Management * 0 131,012 445,187 0 576,199
PW Ops Support 0 5,094 0 5,094
Subtotal Public Works Services 57,877 183,025 445,187 1,905 687,994
Conservation Authorities Managed** 0 5,500 0 0 5,500
Human ServicesChildren's Services 0 200 0 200
Housing 0 11,623 0 11,623
Subtotal Human Services 0 11,823 0 0 11,823
Health Services
Long Term Care 0 3,349 0 3,349
Paramedic Services 1,095 35,023 0 36,118
Public Health 600 410 275 1,285
Subtotal Health Services 1,695 38,782 0 275 40,752
Internal Services
Corporate Services 283 3,523 0 3,806
Employee & Business Services 0 20,853 0 20,853
Subtotal Internal Services 283 24,376 0 0 24,659
Total Region Controlled Tax 59,855 263,506 445,187 2,180 770,728
External AgenciesPeel Regional Police 431 35,688 1,117 37,236
Subtotal External 431 35,688 0 1,117 37,236
Total Tax Supported Programs 60,286 299,194 445,187 3,297 807,964
Utility Supported Programs Water 160,471 132,856 1,984 295,311
Wastewater 111,435 56,756 4,098 172,289
Operation Support 0 11,335 0 11,335
Total Utility Programs 271,906 200,947 0 6,082 478,935
Total Region 332,192 500,141 445,187 9,379 1,286,899
% Total Funding 26% 39% 35% 1% 100%
Note:* Debt for Waste Management relates to Peel Energy Recovery Centre (PERC) project.** Conservation managed project relates to Lakeview Waterfront Connection Project.
2014 Capital BudgetSources of Financing By Program
46

SUMMARY V
("$000)
Program Development Charges Reserves Debt External
Sources Total
Financing
Tax Supported Programs
Regionally Controlled Tax
Public Works
Transportation 834,599 413,053 61,581 1,309,233
Waste Management * 0 385,250 445,187 0 830,437
PW Ops Support 0 60,592 0 60,592
Subtotal Public Works Services 834,599 858,895 445,187 61,581 2,200,262
Conservation Authorities Managed** 0 30,500 0 0 30,500
Human Services
Children's Services 0 2,000 0 2,000
Housing 42,697 190,446 30,000 263,143
Subtotal Human Services 42,697 192,446 0 30,000 265,143
Health Services
Long Term Care 14,340 87,631 0 101,971
Paramedic Services 6,111 107,905 0 114,016
Public Health 2,880 4,440 275 7,595
Subtotal Health Services 23,331 199,976 0 275 223,582
Internal Services
Corporate Services 2,206 18,751 0 20,957
Employee & Business Services 0 165,357 0 165,357
Subtotal Internal Services 2,206 184,108 0 0 186,314
Total Region Controlled Tax 902,833 1,465,925 445,187 91,856 2,905,801
External AgenciesOntario Provincial Police 250 0 0 250
Peel Regional Police 27,185 218,942 16,242 262,369
Subtotal External 27,435 218,942 0 16,242 262,619
Total Tax Supported Programs 930,268 1,684,867 445,187 108,098 3,168,420
Utility Supported Programs
Water 729,130 912,582 8,942 1,650,654
Wastewater 512,459 441,678 25,498 979,635
Operation Support 0 43,577 0 43,577
Total Utility Programs 1,241,589 1,397,837 0 34,440 2,673,866
Total Region 2,171,857 3,082,704 445,187 142,538 5,842,286
% Total Funding 37% 53% 8% 2% 100%
Note:* Debt for Waste Management relates to Peel Energy Recovery Centre (PERC) project.** Conservation managed project relates to Lakeview Waterfront Connection Project.
2014-2023 10-Year Capital PlanSources of Financing By Program
47

SUMMARY VI(a)
Summary of Staffing Information
2013 Revised % Change
TAX SUPPORTED PROGRAMS FTEsAdditions/
(Reduction) FTEs %
Public WorksPW Operations Support 234.25 1.00 235.25Transportation Services 227.50 5.00 232.50Waste Management 164.50 2.00 166.50Development Services 25.00 0.00 25.00
651.25 8.00 659.25
Health ServicesHealth Services Program Support 49.00 0.00 49.00Public Health 637.80 0.00 637.80Long Term Care 676.64 0.00 676.64Paramedic Services 468.50 10.50 479.00
1,831.94 10.50 1,842.44
Human ServicesSocial Assisstance and Employment 399.50 0.00 399.50Early Learning and Childcare 248.50 (54.50) 194.00Housing 157.50 0.00 157.50Community Investment 7.00 0.00 7.00
812.50 (54.50) 758.00
Internal ServicesCorporate Services 220.80 3.00 223.80Employee & Business Services 480.76 4.00 484.76Council & Chair 1.50 0.00 1.50
12.50 0.00 12.50715.56 7.00 722.56
4,011.25 (29.00) 3,982.25 -0.7%
Peel Regional Police 2,805.00 33.00 2,838.00 1.2%
TOTAL REGION OF PEEL - Tax Supported 6,816.25 4.00 6,820.25 0.1%
2013 Revised % Change
FTEsAdditions/
(Reduction)* FTEs %
Public WorksUtility 37.00 0.00 37.00Water 171.00 0.00 171.00Wastewater 116.00 (18.00) 98.00
324.00 (18.00) 306.00 -5.5%
TOTAL REGION OF PEEL 7,140.25 (14.00) 7,126.25 -0.2%
* Note: The net reduction of 18 FTEs relates to the lab closure in 2013.
Total Region Controlled Programs - Utility
CAO's Office
Total Region Controlled Programs - Tax
UTILITY SUPPORTED PROGRAMS
2014 Proposed
2014 Proposed
48

SUMMARY VI(b)
2014 Detail Staffing Request FTEs Only
ProgramFTE
CountPosition Requested Position Type
Public WorksTransportation 2.0 Transhelp Operator Full-Time Union
3.0 Truck Driver I Full-Time UnionOperation Support 1.0 CVC Mechanic Full-Time UnionWaste Managemant 1.0 Technical Analyst Full-Time Non Union
1.0 Project Manager Full-Time Non UnionTotal Public Works 8.0
Health ServicesParamedic Services 1.0 Specialist Full-Time Non Union
8.0 Primary Care Paramedic Full-Time Union1.5 Paramedic Part Time Part-Time Union
Total Health Services 10.5
Internal ServicesCorporate Services 2.0 Data Analyst - Information Management Full-Time Non Union
1.0 Specialist -Law Clerks Full-Time Non Union
Employee & Business Services 1.0 Analyst - Purchasing Full-Time Non Union2.0 Building Operators - Paramedic Facility Full-Time Non Union1.0 Specialist - Building Automation Full-Time Non Union
Total Internal Support 7.0
Total Region Controlled Programs FTE's 25.50 *
Note:
* Net reduction of 47 FTEs after factoring in the reduction of 54.5 FTEs in Early Learning and Child Care and the reduction of 18 FTEs due to lab closure in 2013.
49

SUMMARY VII
SUMMARY OF 2014 USER FEES
TABLE A: 2014 User Fee Summary of Changes
IIIIIIVVVIVIIVIIIIXXXIXIIXIIIXIV
TABLE B: Number of Fee Changes by ProgramTYPE OF CHANGE
I II III IV V VI VII VIII IX X XI XII XIII XIV
1 1
1 1
TOTAL 10 8 2 101 8 33 1 17 4 1 14 2 4 2 207
Name and Title Changes Only:* Name of division changed from "Planning, Policy & Research division" to "Integrated Planning"
Other Changes: User Fee Name/Footnote Changes:**PART 2: Employee and Business Services Pg 51-53 ***PART 4: Health Services- Public Health Pg 59****PART 6: Peel Regional Police - Pg 60-61
Increased 8 fee(s) to align with current market
Added two new fees as it already exists but is charged outside the Fees -Bylaw
13
Increased 33 fee(s) which are moving towards full recoveryIncreased one fee(s) due to rounding
PART 3: Public Works - Water
Deleted 14 fee(s) as service is no longer offered
Decreased 17 fee(s) as a result of process efficienciesDecreased four fee(s) to align with current marketDeleted one fee(s) to align with current market
Two fee name change ONLY and no change in fee amount
Deleted two fees as it is already exists in the by-law under the same ProgramFour fees had service changes ONLY and no Change in Fee Amount
TYPE OF CHANGEI Added 10 new fee (s) for a new product/service being provided.
- 8 Fees added to EBS- Peel Art Gallery Museum and Archives (PAMA) -One Fee added to EBS -Facility Construction and Real Estate - Lease of regional facilities formerly used for direct early child education -One Fee added to Public Health - To provide HPV vaccine to clients who are not eligible for free Provincially funded vaccine.
Added eight new fees to recover costs due to higher volumes
1
TOTAL
1
PART 1:Corporate Services*
DEPARTMENTS/PROGRAMS
1
1
PART 2: Employee and Business Services ** 9 5 9
1
1
37
73
20
4
55
1 5
PART 3: Public Works- Waste Management
2 10
9PART 3:Public Works - Wastewater
32
PART 3: Public Works -Development Services
PART 3: Public Works -Transportation 1 217
3
31
3
PART 4: Health Services- Public Health*** 1
3PART 4: Health Services - Long Term Care 1 2
PART 4: Health Services - Paramedic Services
PART 6: Peel Regional Police**** 1 15 3313 1
8
3
13
Increased 101 fee(s) due to inflation and/or materials/services/labour cost increases
1
4
Each year, as part of the Business Planning and Budget process, all fees and charges in the current User Fees and Charges By-laws are reviewed and updated to form part of the Region's annual financial plan. The revised fees or changes are presented to Regional Council for approval. With Council's approval the "Schedule A" attached to the Region's general fees and charges by-law is amended and attached to the newly enacted UserFees and Charges By-law.
The proposed 2014 User Fees include 207 changes: 20 new fees have been introduced, 17 fees discontinued, 143 fees increased, 21 fees have decreased and six fees have name change and/or service level change with no change in fee amount.
In 2014 there will be 509 user fees in total; Table A and Table B below provide a summary of the proposed changes by type and by program.
50

SUMMARY VII
Description of Service/Activity for which the Fee or Charge is being imposed Service Unit 2013 Current Fees 2014 Proposed Fees HST
2014 Proposed Fees inclusive of applicable taxes
Variance 2014 vs
2013KEY
PART 1: CORPORATE SERVICES
Development Financing
Compliance Letters (inquiries on compliance with Regional conditions for sale/purchase of property) letter $70.00 $100.00 n/a $100.00 30.00 V
PART 2: EMPLOYEE AND BUSINESS SERVICES
Peel Art Gallery Museum and Archives Archives Fees*
SCANS to Disc item $8.85 $0.00 + $0.00 -8.85 XI
Copy of existing scan to disk item $0.00 $15.00 + $16.95 15.00 I
New scan at basic resolution and size item $0.00 $20.00 + $22.60 20.00 I
Custom scan at high resolution and/or large size item $0.00 cost based on formula + cost based on
formula N/A I
Non-Research Uses item $30.97 $0.00 + $0.00 -30.97 XI
Non-Research Uses - Deposit item $30.97 $0.00 + $0.00 -30.97 XI
Genealogy Course person $57.52 $0.00 + $0.00 -57.52 XI
Adult Education / Interest Course person/session $0.00 $25.00 + $28.25 25.00 I
Art for Grown-ups (6 week of 1 evening per week) adult $154.87 $0.00 + $0.00 -154.87 XI
Art for Teens (Drama and Dance) person $128.32 $0.00 + $0.00 -128.32 XI
Art in the Afternoon child $5.31 - $7.97 $0.00 + $0.00 -5.31/-7.97 XI
Adult Programs adult $0.00 $30.00 - $90.00 + $33.90-$101.70 30.00-90.00 I
PAMA Kids child $0.00 $30.00 - $70.00 + $33.90-$79.10 30.00-70.00 I
School Visit Tours of Art Gallery & Museum student $3.98 - $10.62 $5.31 - $10.62 + $6.00-$12.00 1.33 VI
Guide/Scout Tours group $66.37 $0.00 + $0.00 -66.37 XI
Private Tours group $0.00 $66.37 + $75.00 66.37 I
Membership Fees
Corporate Membership Fees
Facility Rental Business Hours
Facility Rental during business hours 1/2 day $150.00 $200.00 + $226.00 50.00 IV
Facility Rental during non business hours 1/2 day $0.00 $350.00 + $395.50 350.00 I
NOTE - For cash transactions (only), when pennies are not available (following the Royal Canadian Mint’s elimination of the penny from circulation), the total cash payment for the final fee (inclusive of taxes where applicable) will be rounded (up or down) to the nearest five-cent increment in accordance with Regional accounting procedures.
2013 Budget- * Friends of the Peel Heritage Complex receive a 10% discount on all Archive Fees.
2014 Proposed Budget - * Friends of the Peel Art Gallery, Museum & Archives receive a 10% discount on all Archive Fees.
2014 Proposed Budget -"Fees include a family membership fee of $60 and the remainder is a tax deductable donation" - (Amount adjusted to reflect the increased family membership fee of $60 in 2013)
2013 Budget - "Fees include a family membership fee of $45 and the remainder is a tax deductable donation"
2014 Proposed Budget - "$60 goes towards the general fund for membership and the remainder is considered a donation" ( Amount adjusted to reflect the increased fees in 2013)
2013 Budget - "$45 goes towards the general fund for membership and the remainder is considered a donation"
51

SUMMARY VII
Description of Service/Activity for which the Fee or Charge is being imposed Service Unit 2013 Current Fees 2014 Proposed Fees HST
2014 Proposed Fees inclusive of applicable taxes
Variance 2014 vs
2013KEY
Facility Rental during business hours, Member or Not for Profit 1/2 day $120.00 $200.00 + $226.00 80.00 IV
Facility Rental, business hours, full day day $250.00 $400.00 + $452.00 150.00 IV
Facility Rental, business hours, full day, Member or Not for Profit day $200.00 $340.00 + $384.20 140.00 IV
Facility Rental, Thurs evenings, 3 hours* 6pm-9pm*** $200.00 $200.00 + $226.00 0.00 XIII
Facility Rental, Thurs evenings, 3 hours, Members or Not for Profit** 6pm-9pm*** $160.00 $160.00 + $180.80 0.00 XIII
***2013 Budget - "1/2 eve"***2014 Proposed Budget - " 6pm-9pm"
Friday - Saturday and Sunday Rates
Facility Rental, half day, noon - 4pm* 1/2 day $350.00 $350.00 + $395.50 0.00 XIII
Facility Rental, Saturday, 3 hours 1/2 day $0.00 $500.00 + $565.00 500.00 II
Facility Rental, Saturday, 3 hours, Members or Not for Profit 1/2 day $0.00 $450.00 + $508.50 450.00 II
Facility Rental, half day, member, noon - 4pm ** 1/2 day $280.00 $280.00 + $316.40 0.00 XIII
Social Booking, half day,1 - 4 pm, member 1/2 day $0.00 $340.00 + $384.20 340.00 II
Social Booking, half day, 1 - 4 pm 1/2 day $0.00 $400.00 + $452.00 400.00 II
Social Booking, half day, 6 - 11 pm 1/2 day $0.00 $700.00 + $791.00 700.00 II
Courtroom Use Fees- Weekdays (Occupancy 150 people)*
Wedding Package (rehearsal, prep, photos, ceremony, reception) package $1,500.00 $2,200.00 + $2,486.00 700.00 IV
Wedding Package (rehearsal, prep, photos, ceremony, reception) member package $1,250.00 $1,870.00 + $2,113.10 620.00 IV
Wedding or Event photos only package** $100.00 $200.00 + $226.00 100.00 IV
Courtroom ceremony package** $250.00 $300.00 + $339.00 50.00 IV
Courtroom ceremony, members package** $200.00 $255.00 + $288.15 55.00 IV
**2013 Budget - Service Unit - "Hour"**2014 Proposed Budget -Service Unit- "Package"
*2014 Proposed Budget - Footnote Change "Members of the Peel Art Gallery, Museum & Archives receive a 15% discount" (discount reduced in order to recover staffing cost to
*2014 Proposed Budget- "Facility Rental, Thurs evenings, 3 hours"
**2013 Budget- "Facility Rental, M - Thurs evenings, 3 hours, Members or Not for Profit"
*2013 Budget - "Facility Rental, M - Thurs evenings, 3 hours"
**2014 Proposed Budget - "Facility Rental, half day, member, noon - 4pm"
*2013 Budget - Footnote change - " Members of the Peel Heritage Complex receive a 20% discount"
**2014 Proposed Budget - "Facility Rental, Thurs evenings, 3 hours, Members or Not for Profit"
*2013 Budget - "Facility Rental, half day, noon - 4pm or 6 - 10pm"*2014 Proposed Budget - "Facility Rental, half day, noon - 4pm"
**2013 Budget - "Facility Rental, half day, member, noon - 4pm or 6 - 10pm"
52
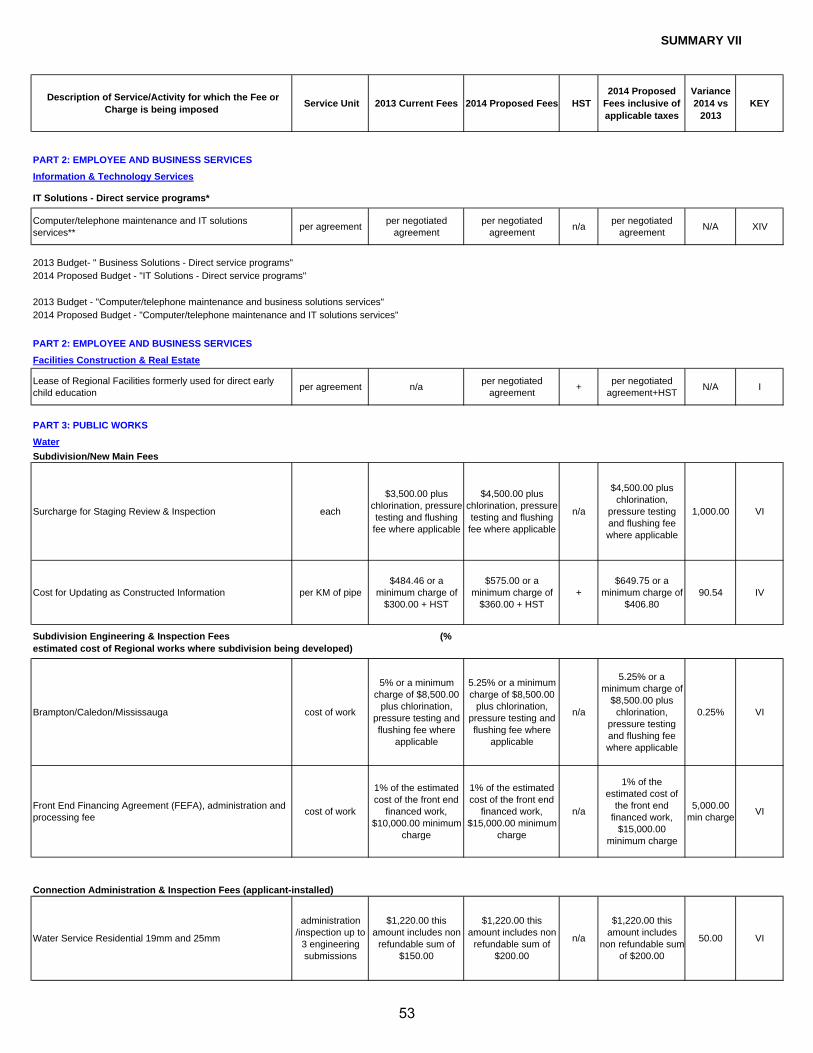
SUMMARY VII
Description of Service/Activity for which the Fee or Charge is being imposed Service Unit 2013 Current Fees 2014 Proposed Fees HST
2014 Proposed Fees inclusive of applicable taxes
Variance 2014 vs
2013KEY
PART 2: EMPLOYEE AND BUSINESS SERVICES
Information & Technology Services
IT Solutions - Direct service programs*
Computer/telephone maintenance and IT solutions services** per agreement per negotiated
agreementper negotiated
agreement n/a per negotiated agreement N/A XIV
PART 2: EMPLOYEE AND BUSINESS SERVICES
Facilities Construction & Real Estate
Lease of Regional Facilities formerly used for direct early child education per agreement n/a per negotiated
agreement + per negotiated agreement+HST N/A I
PART 3: PUBLIC WORKS
WaterSubdivision/New Main Fees
Surcharge for Staging Review & Inspection each
$3,500.00 plus chlorination, pressure testing and flushing fee where applicable
$4,500.00 plus chlorination, pressure testing and flushing fee where applicable
n/a
$4,500.00 plus chlorination,
pressure testing and flushing fee where applicable
1,000.00 VI
Cost for Updating as Constructed Information per KM of pipe$484.46 or a
minimum charge of $300.00 + HST
$575.00 or a minimum charge of
$360.00 + HST+
$649.75 or a minimum charge of
$406.80 90.54 IV
Brampton/Caledon/Mississauga cost of work
5% or a minimum charge of $8,500.00
plus chlorination, pressure testing and flushing fee where
applicable
5.25% or a minimum charge of $8,500.00
plus chlorination, pressure testing and flushing fee where
applicable
n/a
5.25% or a minimum charge of
$8,500.00 plus chlorination,
pressure testing and flushing fee where applicable
0.25% VI
Front End Financing Agreement (FEFA), administration and processing fee cost of work
1% of the estimated cost of the front end
financed work, $10,000.00 minimum
charge
1% of the estimated cost of the front end
financed work, $15,000.00 minimum
charge
n/a
1% of the estimated cost of
the front end financed work,
$15,000.00 minimum charge
5,000.00 min charge VI
Water Service Residential 19mm and 25mm
administration /inspection up to
3 engineering submissions
$1,220.00 this amount includes non
refundable sum of $150.00
$1,220.00 this amount includes non
refundable sum of $200.00
n/a
$1,220.00 this amount includes
non refundable sum of $200.00
50.00 VI
Subdivision Engineering & Inspection Fees (% estimated cost of Regional works where subdivision being developed)
Connection Administration & Inspection Fees (applicant-installed)
2013 Budget - "Computer/telephone maintenance and business solutions services"2014 Proposed Budget - "Computer/telephone maintenance and IT solutions services"
2013 Budget- " Business Solutions - Direct service programs"2014 Proposed Budget - "IT Solutions - Direct service programs"
53

SUMMARY VII
Description of Service/Activity for which the Fee or Charge is being imposed Service Unit 2013 Current Fees 2014 Proposed Fees HST
2014 Proposed Fees inclusive of applicable taxes
Variance 2014 vs
2013KEY
First submission application fee administration $150.00 non-refundable
$200.00 non-refundable n/a $200.00 non-
refundable 50.00 VI
Water Service Residential 19mm and 25mm, installed under Capital Project administration $150.00 $200.00 n/a $200.00 50.00 VI
Water Service - ICI and services 37 mm & up
administration /inspection up to
3 engineering submissions
$1,960.00 this amount includes non
refundable sum of $450.00
$2,176.00 this amount includes non
refundable sum of $500.00
n/a
$2,176.00 this amount includes
non refundable sum of $500.00
216.00 VI
Water Service - ICI and services 37 mm & up installed under Capital Project administration $450.00 $500.00 n/a $500.00 50.00 VI
Water Service - hydrant & valve
administration /inspection up to
3 engineering submissions
$1,960.00 this amount includes non
refundable sum of $450.00
$2,176.00 this amount includes non
refundable sum of $500.00
n/a
$2,176.00 this amount includes
non refundable sum of $500.00
216.00 VI
Processing requests/revisions to existing water services
administration /inspection up to
3 engineering submissions
$450.00 $500.00 n/a $500.00 50.00 VI
Processing requests/revisions to existing non-residential and multi-residential sewer/water services
administration/ inspection up to 3 engineering submissions
$0.00 $900.00 n/a $900.00 900.00 II
Confirmation of Capacity Statement each $560 non refundable $620 non refundable n/a $620 non refundable 60.00 VI
Watermain Tapping Fees ( 0 mm to 300 mm)
After Regular Hours & Saturdays tap $820.00 $775.00 n/a $775.00 -45.00 VIII
Work beyond four hours hour $205.00 $195.00 n/a $195.00 -10.00 VIII
Sundays & Holidays tap $1,070.00 $1,000.00 n/a $1,000.00 -70.00 VIII
Work beyond four hours hour $265.00 $250.00 n/a $250.00 -15.00 VIII
Hydrant PermitsAdministration Charge (+ charge for water used based on current rates) permit $150.00 $250.00 + $282.50 100.00 VI
Meter Rental Fee (no charge for first day) day $1.50 $3.00 + $3.39 1.50 VI
PART 3: PUBLIC WORKS
Water - Operations Support
METERING AND INSTALLATIONReplacement Charges - Damaged Equipment
Standard Residential Service Size equipment 71.66 + materials 72.27 + materials n/a 72.27 + materials 0.61 IV
Standard Residential Service Size (regular hours) removal 71.66 + materials 72.27 + materials n/a 72.27 + materials 0.61 IV
Standard Residential Service Size (after hours) removal $107.50 $108.41 n/a $108.41 0.91 IV
Meter Size, 16mm x 19mm meter $382.00 $397.00 n/a $397.00 15.00 IVMeter Installation Charges Sub-Divisions and Flat Rate
Customer-Requested Meter Removal/Re-Installation (including required turn-on/off, regular hours - Monday-Friday, 8:30 am - 4:30 pm)
54

SUMMARY VII
Description of Service/Activity for which the Fee or Charge is being imposed Service Unit 2013 Current Fees 2014 Proposed Fees HST
2014 Proposed Fees inclusive of applicable taxes
Variance 2014 vs
2013KEY
Meter Size, 19mm meter $424.00 $440.00 n/a $440.00 16.00 IV
Meter Size, 25mm meter $467.00 $483.00 n/a $483.00 16.00 IV
(38mm and greater are applicant installed)Meter Size, 16mm x 19mm meter $431.00 $433.00 n/a $433.00 2.00 IV
Meter Size, 19mm meter $479.00 $481.00 n/a $481.00 2.00 IV
Meter Size, 25mm meter $556.00 $564.00 n/a $564.00 8.00 IV
Meter Size, 38mm meter $1,016.00 $1,049.00 n/a $1,049.00 33.00 IV
Meter Size, 50mm meter $1,140.00 $1,170.00 n/a $1,170.00 30.00 IV
Meter Size, 75mm Tru-Flo meter $3,940.00 $3,993.00 n/a $3,993.00 53.00 IV
Meter Size, 100mm Tru-Flo meter $5,085.00 $5,186.00 n/a $5,186.00 101.00 IV
Meter Size, 150mm Tru-Flo meter $9,913.00 $10,080.00 n/a $10,080.00 167.00 IV
Meter Size, 100mm Protectus Fireline and Domestic use meter $6,310.00 $6,340.00 n/a $6,340.00 30.00 IV
Meter Size, 150mm Protectus Fireline and Domestic use meter $9,880.00 $10,030.00 n/a $10,030.00 150.00 IV
Meter Size, 200mm Protectus Fireline and Domestic use meter $12,849.00 $13,034.00 n/a $13,034.00 185.00 IV
Meter Size, 250mm Protectus Fireline and Domestic use meter $17,367.00 $17,610.00 n/a $17,610.00 243.00 IVMeter Size, 250X300mm Protectus Fireline and Domestic use meter $17,899.00 $18,149.00 n/a $18,149.00 250.00 IV
Frozen & Damaged Meters
Meter Size, 16 mm & 16mm X 19mm meter $147.67 down to $7.77
$148.83 down to $7.83 + $168.18 down to
$8.85 $1.16 to
.06 IV
Meter Size, 19mm meter $185.19 down to $9.75
$187.36 down to $9.86 + $211.72 down to
$11.14$2.17 to
.11 IV
Meter Size, 25mm meter $216.80 down to $11.41
$219.40 down to $11.55 + $247.92 down to
$13.05$2.60 to
.14 IV
Meter Size, 38mm meter $537.49 down to $28.29
$544.07 down to $28.64 + $614.80 down to
$32.36$6.58 to
$.35 IV
Meter Size, 50mm meter $650.01 down to $34.21
$658.09 down to $34.64 + $743.64 down to
$39.14$8.08 to
$.43 IV
Meter Size, 75mm Tru-Flo meter $2,719.49 down to $143.13
$2752.48 down to $144.87 + $3110.30 down to
$163.70$32.99 to
$1.74 IV
Meter Size, 100mm Tru-Flo meter $3,592.34 down to $189.07
$3,640.27 down to $191.59 + $4,113.51 down to
$216.50$47.93 to
$2.52 IV
Meter Size, 150mm Tru-Flo meter $6,956.90 down to $366.15
$7,048.54 down to $370.98 + $7,964.85 down to
$419.21$91.64 to
$4.83 IV
Meter Size, 150mm Protectus meter $11,237.46 down to $591.45
$11,352.49 down to $597.50 + $12,828.31 down to
$675.18$115.03 to
$6.05 IV
Meter Size, 200mm Protectus meter $14,535.52 down to $765.03
$14,687.77 down to $773.04 + $16,597.18 down to
$873.54$152.25 to$8.01 IV
Meter Size, 250mm Protectus meter $18,730.66 down to $985.82
$18,939.61 down to $996.82 + $21,401.76 down to
$1,126.41$208.95 to
$11 IV
Upgrading and DowngradingMeter Size, 16mm X 19mm meter $241.44 $243.28 + $274.91 1.84 IV
Meter Size, 19mm meter $280.91 $282.26 + $318.95 1.35 IV
Meter Size, 25mm meter $325.37 $332.84 + $376.11 7.47 IV
Meter Size, 38mm meter $742.12 $750.35 + $847.90 8.23 IV
Meter Size, 50mm meter $865.90 $875.80 + $989.65 9.90 IV
Meter Size, 75mm Tru-Flo meter $3,612.88 $3,658.85 + $4,134.50 45.97 IV
Meter Size, 100mm Tru-Flo meter $4,751.59 $4,812.26 + $5,437.85 60.67 IV
Meter Installation Charges Industrial, Commercial, Institutional
All charges are pro-rated charges based on the remaining life of the meter
55

SUMMARY VII
Description of Service/Activity for which the Fee or Charge is being imposed Service Unit 2013 Current Fees 2014 Proposed Fees HST
2014 Proposed Fees inclusive of applicable taxes
Variance 2014 vs
2013KEY
Meter Size, 150mm Tru-Flo meter $9,447.52 $9,570.65 + $10,814.83 123.13 IV
Meter Size, 150mm Protectus Fireline and Domestic use meter $9,206.07 $9,328.29 + $10,540.97 122.22 IV
Meter Size, 200mm Protectus Fireline and Domestic use meter $12,047.38 $12,207.11 + $13,794.03 159.73 IV
Meter Size, 250mm Protectus Fireline and Domestic use meter $16,377.02 $16,595.27 + $18,752.66 218.25 IV
Meter Test Request
Meter Size, 16mm X 19mm meter $242.38 $246.46 n/a $246.46 4.08 IV
Meter Size, 19mm meter $242.38 $246.46 n/a $246.46 4.08 IV
Meter Size, 25mm meter $242.38 $246.46 n/a $246.46 4.08 IV
Meter Size, 38mm meter $350.27 $357.68 n/a $357.68 7.41 IV
Meter Size, 50mm meter $357.27 $357.68 n/a $357.68 0.41 IV
Meter Test RequestThird Party Field TestMeter Size 75 mm to 150 mm meter $522.58 $527.36 n/a $527.36 4.78 IV
Meter Size 100 mm to 250 mm Protectus meter $522.58 $527.36 n/a $527.36 4.78 IV
Meter Size, 16mm x 19mm meter $184.00 $186.00 n/a $186.00 2.00 IV
Meter Size, 19mm meter $184.00 $186.00 n/a $186.00 2.00 IV
Meter Size, 25mm meter $184.00 $186.00 n/a $186.00 2.00 IV
Meter Size, 38mm meter $224.00 $227.00 n/a $227.00 3.00 IV
Meter Size, 50mm meter $224.00 $227.00 n/a $227.00 3.00 IV
Administrative Fee invoicing $92.00 $93.00 + $105.09 1.00 IV
Wastewater
Water Pollution Analyses
Biochemical Oxygen Demand analysis $34.19 $27.00 n/a $27.00 -7.19 IX
Suspended Solids analysis $14.38 $13.00 n/a $13.00 -1.38 IX
Oil & Grease analysis $35.00 $65.00 n/a $65.00 30.00 V
Total Phosphorus analyses $25.25 $22.00 n/a $22.00 -3.25 IX
Animal/Vegetable/Oil & Grease analysis $35.00 $0.00 n/a $0.00 -35.00 X
Contract Plans & Documents
Volume 1 (prequalified) - hard copy* document $40.00 $45.00 + $50.85 5.00 V
Volume 1 - hard copy* document $15.00 $20.00 + $22.60 5.00 V
Volume 2 - hard copy document $25.00 $30.00 + $33.90 5.00 V
Contract Plans (1-20 sheets)* set $15.00 $20.00 + $22.60 5.00 V
Brampton/Caledon/Mississauga cost of work
5% or a minimum charge of $8,500.00
plus chlorination, pressure testing and flushing fee where
applicable
5.25% or a minimum charge of $8,500.00
plus chlorination, pressure testing and flushing fee where
applicable
n/a
5.25% or a minimum charge of
$8,500.00 plus chlorination,
pressure testing and flushing fee where applicable
0.25% VI
Meter is removed and sent to third party for testing for Volumetric and Odometer Tests
Subdivision Engineering & Inspection Fees (% estimated cost of Regional works where subdivision being developed)
*For contracts greater than 40 sheets the price will be based on actual document costs.
Third Party volumetric tests only at Atlantic Liquid Meters
Administrative Fee to recover Connection Fees not paid prior to installation
56

SUMMARY VII
Description of Service/Activity for which the Fee or Charge is being imposed Service Unit 2013 Current Fees 2014 Proposed Fees HST
2014 Proposed Fees inclusive of applicable taxes
Variance 2014 vs
2013KEY
Front End Financing Agreement (FEFA), administration and processing fee cost of work
1% of the estimated cost of the front end
financed work, $10,000.00 minimum
charge
1% of the estimated cost of the front end
financed work, $15,000.00 minimum
charge
n/a
1% of the estimated cost of
the front end financed work,
$15,000.00 minimum charge
5,000 minimum charge
VI
Road Cut Permit Fees
Cost for Updating as Constructed Information per KM of pipe and/or lane km
$484.46 or a minimum charge of
$300.00
$575.00 or a minimum charge of
$360.00+
$649.75.00 or a minimum charge of
$406.8090.54 IV
Sewer Service Residential
administration/ inspection up to 3 engineering submissions
$1,220.00 this amount includes non
refundable sum of $150.00
$1,220.00 this amount includes non
refundable sum of $200.00
n/a
$1,220.00 this amount includes
non refundable sum of $200.00
50.00 VI
First submission application fee administration $150.00 non-refundable
$200.00 non-refundable n/a $200.00 non-
refundable 50.00 VI
Sewer Service Residential, installed under Capital Project administration $150.00 $200.00 n/a $200.00 50.00 VI
Sewer Service ICI
administration/ inspection up to 3 engineering submissions
$1,960.00 this amount includes non
refundable sum of $450.00
$2,176.00 this amount includes non
refundable sum of $500.00
n/a
$2,176.00 this amount includes
non refundable sum of $500.00
216.00 VI
Sewer Service ICI, installed under Capital Project administration $450.00 $500.00 n/a $500.00 50.00 VI
Processing requests/revisions to existing residential sewer/water services
administration/ inspection up to 3 engineering submissions
$450.00 $500.00 n/a $500.00 50.00 VI
Processing requests/revisions to existing non-residential and multi-residential sewer/water services
administration/ inspection up to 3 engineering submissions
$0.00 $900.00 n/a $900.00 900.00 II
Confirmation of Capacity Statement each $560 non refundable $620 non refundable n/a $620 non refundable 60.00 VI
PART 3: PUBLIC WORKS
Transportation - Roads
Signal Timing Fees per intersection $47.49 $48.90 n/a $48.90 1.41 IV
Legal Letter letter $411.11 $423.40 n/a $423.40 12.29 IV
Maintenance Recovery Administration Cost recovery $173.47 $178.70 n/a $178.70 5.23 IV
Access/servicing Compliance letters letter $255.09 $262.70 n/a $262.70 7.61 IV
Temporary Access Fee permit $276.34 $284.60 n/a $284.60 8.26 IV
Connection Administration & Inspection Fees (applicant-installed)
Traffic Information/Administration Fees (Traffic Signals and Systems)
Traffic Development/Administration Fees (Traffic Development)
57

SUMMARY VII
Description of Service/Activity for which the Fee or Charge is being imposed Service Unit 2013 Current Fees 2014 Proposed Fees HST
2014 Proposed Fees inclusive of applicable taxes
Variance 2014 vs
2013KEY
Roads FeesExcess Load Permits (1 - 10 Vehicles) permit $103.00 $150.00 n/a $150.00 47.00 VI
Excess Load Permits annual (11 vehicles and greater) permit $305.00 $350.00 n/a $350.00 45.00 VI
Excess Load Permits (single/multiple) permit $103.00 $150.00 n/a $150.00 47.00 VI
Road Occupancy permit $400.00 $450.00 n/a $450.00 50.00 VI
Filming/Advertising Permits permit $187.46 $200.00 n/a $200.00 12.54 VI
Special Event - Road Closure Permits* permit $533.54 $550.00 n/a $550.00 16.46 VI
Special Event - no Road Closure* permit $266.77 $275.00 n/a $275.00 8.23 VI
Roads Fees
Tourism Signs on Regional Roads year $153.00 $157.60 n/a $157.60 4.60 IV
Low Speed Signs year $65.00 $67.00 n/a $67.00 2.00 IV
High Speed Signs year $153.00 $157.60 n/a $157.60 4.60 IV
Signs with custom Logo if client qualifies one time $100.00 $103.00 n/a $103.00 3.00 IV
ATR Count per location per year $23.92 $24.60 n/a $24.60 0.68 IV
24-Hour Volume Map per map per year $23.92 $24.60 n/a $24.60 0.68 IV
8-Hour Manual Count count per year $23.92 $24.60 n/a $24.60 0.68 IV
Providing Collision Information per location per year $23.92 $24.60 n/a $24.60 0.68 IV
Site Servicing on Regional Roads - Residential
administration /inspection up to
3 engineering submissions
$1,760.00 this amount includes non
refundable sum of $150.00
$1,850.00 this amount includes non
refundable sum of $200.00
n/a
$1,850.00 this amount includes
non refundable sum of $200.00
90.00 VI
Site Servicing on Regional Roads - ICI
administration /inspection up to
3 engineering submissions
$2,580.00 this amount includes non
refundable sum of $450.00
$2,890.00 this amount includes non
refundable sum of $500.00
n/a
$2,890.00 this amount includes
non refundable sum of $500.00
310.00 VI
Processing requests/revisions to existing sewer services
administration /inspection up to
3 engineering submissions
$450.00 $500.00 n/a $500.00 50.00 VI
Contract Plans & Documents
Volume 1 (prequalified) - hard copy* document $39.82 $41.00 + $46.33 1.18 IV
Volume 1 - hard copy* document $15.04 $15.50 + $17.52 0.46 IV
Volume 2 - hard copy document $24.78 $25.50 + $28.82 0.72 IV
Contract Plans (1-20 sheets)* set $15.04 $15.50 + $17.52 0.46 IV
PART 3: PUBLIC WORKS
Transportation - Transhelp & Accessible Transportation
Transhelp Adult Fares 10 trips (one way) $32.50 $0.00 n/a $0.00 -32.50 XII
Transhelp Adult Fares - Same Day Service Fare 1 trip (one way) $3.25 $0.00 n/a $0.00 -3.25 XII
Development Services Administration & Inspection Fees
Traffic Information/Administration Fees (Traffic Operations)
*For contracts greater than 40 sheets the price will be based on actual document costs.
*Any Manager within Operations Support Services is authorized to exempt, in whole or in part, any person from the Special EventRoads Fees, where he or she is of the opinion that the payment of such fees may cause undue financial hardship to the personrequiring the service in question.
58

SUMMARY VII
Description of Service/Activity for which the Fee or Charge is being imposed Service Unit 2013 Current Fees 2014 Proposed Fees HST
2014 Proposed Fees inclusive of applicable taxes
Variance 2014 vs
2013KEY
Accessible Transportation Adult Fares 1 trip (one way) $3.25 $3.50 n/a $3.50 0.25 V
Transhelp Monthly Pass monthly $108.00 $112.00 n/a $112.00 4.00 V
Taxi Scrip Book booklet $0.00 $25.00 n/a $25.00 25.00 III
PART 3: PUBLIC WORKS
Development ServicesPlanning PublicationsWaste Collection, Design Standards Manual for New Developments copy $2.65 $3.00 + $3.00 0.35 IV
PART 3: PUBLIC WORKS
Waste Management
Compost (Bulk) Delivery - within Region of Peel only 2-4 tonnes truck load $40.00 $0.00 + $0.00 -40.00 XI
Compost (Bulk) Delivery - within Region of Peel over 5+ tonnes truck load $75.00 $0.00 + $0.00 -75.00 XI
Compost (Bulk) Delivery - outside of the Region of Peel truck load $100.00 $0.00 + $0.00 -100.00 XI
PART 4: HEALTH SERVICES
Public HealthEnvironmental HealthReplacement Food Handler Training & Certification Wallet Card client $9.29 $8.85 + $10.00 -0.44 IX
Communicable DiseasesHealthy Sexuality Clinic Fees*Thermometers client $30.97 $31.00 + $35.03 0.03 VII
HPV Vaccine (series of 3 doses) client $0.00 $141.75 + $160.18 141.75 I
PART 4: HEALTH SERVICES
Long Term Care
Seniors Day Program Fees - Minimum Fee per Day day $0.00 $10.00 n/a $10.00 10.00 III
Guest Meals Fees meal $7.00 $7.15 + $8.08 0.15 IV
Changes from 2013 to 2014 - ( Changed "projects" to "products", Added "and/or other suppliers")
* Any manager, supervisor, physician, registered nurse or public health nurse employed by or on behalf of the Regional Corporation’s Healthy SexualityProgram is authorized to exempt, in whole or in part, any client from the Healthy Sexuality Clinic Fees, where he or she is of the opinion that the paymentof such fees may cause undue economic hardship to the person requiring the service in question;
* Healthy Sexuality Program Staff (managers, supervisors, physicians, registered nurses and/or public health nurses employed by the Regional Corporation) are authorized to adjust Healthy Sexuality Clinic Fees as a result of changes to the cost of existing products and/or changes in products as directed by the Ministry of Health and Long-Term Care and/or other suppliers".
Changes from 2013 to 2014 - ( Changed "person" to "client")
59

SUMMARY VII
Description of Service/Activity for which the Fee or Charge is being imposed Service Unit 2013 Current Fees 2014 Proposed Fees HST
2014 Proposed Fees inclusive of applicable taxes
Variance 2014 vs
2013KEY
Meals on Wheels meal $7.00 $7.15 n/a $7.15 0.15 IV
PART 4: HEALTH SERVICES
Paramedic Services
Ambulance Paid Duty with Administration Fee per hour $180.00 $190.00 n/a $190.00 10.00 IV
PART 6 : PEEL REGIONAL POLICE
Human Resources
Personnel File Copy copy $168.00 $165.00 n/a $165.00 -3.00 VIII
Communications Centre
Audio CD Dictaphone System - 1st CD compact disc $57.15 $0.00 n/a $0.00 -57.15 XI
Audio CD NICE System - 1st CD compact disc $36.03 $37.25 n/a $37.25 1.22 IV
Audio CD NICE * compact disc $3.73 $3.60 n/a $3.60 -0.13 VIII
False Alarm Attendance per occurrence $0.00 $160.00 n/a $160.00 160.00 II
*Name Change
*2014 Proposed Budget - " Audio CD NICE"
Records Search UnitRecords Suspensions * request $80.00 $80.00 n/a $80.00 0.00 XIV
*Name Change
*2014 Proposed Budget - " Records Suspensions"
Customer Services UnitM.V.A. Witness Statement request $118.00 $133.00 n/a $133.00 15.00 IV
M.V.C. Search/Report request $48.00 $40.00 n/a $40.00 -8.00 VIII
Letter - Occurrence Enquiry report $74.00 $29.00 n/a $29.00 -45.00 VIII
Insurance Information Report report $50.00 $32.00 n/a $32.00 -18.00 VIII
Lost/Stolen Passport request $55.00 $42.00 n/a $42.00 -13.00 VIII
Forensic IdentificationVisa Prints (price per person) prints $24.00 $25.00 n/a $25.00 1.00 IV
Additional Visa Prints prints $9.00 $4.00 n/a $4.00 -5.00 VIII
Blood Stain Pattern AnalysisVehicle Fee per KM $0.57 $0.73 n/a $0.73 0.16 IV
PhotographsPhotograph Enlargement per photo $56.00 $60.00 n/a $60.00 4.00 IV
Additional Photograph Enlargement per photo $12.00 $10.00 n/a $10.00 -2.00 VIII
Contact Sheet (Photograph Proofs) sheet $83.00 $86.00 n/a $86.00 3.00 IV
Major Collision Bureau
Survey Data Report * per diagram and efile $147.00 $131.00 + $148.03 -16.00 VIII
Final Technical Collision Report per report $184.00 $185.00 + $209.05 1.00 IV
Collision Investigator Notes (with field sketch) all officer's notes per collision $195.00 $327.00 + $369.51 132.00 IV
*2013 Budget - "Pardon Applicant Checks"
*2013 Budget - "Audio CD Dictaphone or NICE System - Additional CD"
60

SUMMARY VII
Description of Service/Activity for which the Fee or Charge is being imposed Service Unit 2013 Current Fees 2014 Proposed Fees HST
2014 Proposed Fees inclusive of applicable taxes
Variance 2014 vs
2013KEY
Collision Scene Video video $254.00 $0.00 + $0.00 -254.00 XI
M.V.A. Witness - Major Collision per request $177.00 $180.00 + $203.40 3.00 IV
Event Data Recorder per recording $160.00 $132.00 + $149.16 -28.00 VIII
Wincrash Crush Analysis for Speed per analysis $194.00 $0.00 + $0.00 -194.00 XI
Visual Statement Drawing per analysis $1,112.00 $141.00 + $159.33 -971.00 VIII
*Name Change
*2014 Proposed Budget - "Survey Data Report "
Division OperationsDVD Recording - Crown's Disclosure Copy dvd $3.45 $3.70 n/a $3.70 0.25 IV
DVD Recording - Additional Crown's Disclosure Copy dvd $11.60 $13.50 n/a $13.50 1.90 IV
DVD Recording - Additional Copy Defence dvd $24.70 $37.10 n/a $37.10 12.40 IV
Digital Recording Cells - Crown copy dvd $6.56 $9.30 n/a $9.30 2.74 IV
Digital Recording Cells - additional copy dvd $9.38 $14.80 n/a $14.80 5.42 IV
Digital Recording Cells - additional copy defence dvd $22.19 $38.40 n/a $38.40 16.21 IV
Underwater Search and RecoveryUnderwater Search and Recovery Vessel per hour $134.17 $133.15 n/a $133.15 -1.02 VIII
Division 15 - Use of ForceRange per hour $42.16 $33.00 + $37.29 -9.16 VIII
*2013 Budget - "Computer Assisted Diagram (report size) / Geodometer EFILE"
61

SUMMARY VIII
SCHEDULE A
Sewer Surcharge Rate and Sewer Waste Disposal Charge
1. Qualitative Sanitary Sewer Surcharge Rate: $328.00 per 1,000 cubic meters.
2. Sewer Waste Disposal Charge: $13.00 per 1,000 gallons.
The rates set out below are effective for all accounts rendered on or after the day this by-lawcomes into effect.
NOTE: For cash transactions (only), when pennies are not available (following the Royal Canadian Mint’s elimination of the penny from circulation), the total cash payment for the final fee (inclusive of taxes where applicable) will be rounded (up or down) to the nearest five-cent increment in accordance with Regional accounting procedures.
62

SUMMARY VIII
SCHEDULE A
Wastewater System Fees and Charges (Sewer Charge Rates)
SECTION 1
1. Unmetered Consumption
A flat rate of $8.94 per month for property owners whose water supply is unmetered.
2. Consumption Rates
Each metered service shall be billed separately. The metered rates shall be as follows:
(a) $7.9047 per ten cubic metres (10m3) metered or(b) $3.59 per thousand Imperial gallons metered.
SECTION 2
1. Unmetered Consumption
A flat rate of $9.30 per month for property owners whose water supply is unmetered.
2. Consumption Rates
Each metered service shall be billed separately. The metered rates shall be as follows:
(a) $8.2209 per ten cubic metres (10m3) metered or(b) $3.74 per thousand Imperial gallons metered.
The rates set out in Section 1 below are effective for all accounts rendered from the date thisby-law is passed up to and including accounts rendered on March 31, 2014. The rates set outin Section 2 below are effective for all accounts rendered on or after April 1, 2014.
NOTE: For cash transactions (only), when pennies are not available (following the Royal Canadian Mint’s elimination of the penny from circulation), the total cash payment for the final fee (inclusive of taxes where applicable) will be rounded (up or down) to the nearest five-cent increment in accordance with Regional accounting procedures.
63

SUMMARY VIII
SCHEDULE A
Water Consumption Fees and Charges
SECTION 1
1. Unmetered Consumption
A flat rate of $12.22 per month for property owners whose water supply is unmetered.
2. Consumption Rates
Each metered service shall be billed separately. The metered rates shall be as follows:
(a) $9.6724 per ten cubic metres (10m3) metered or(b) $4.40 per thousand Imperial gallons metered
SECTION 2
1. Unmetered Consumption
A flat rate of $13.54 per month for property owners whose water supply is unmetered.
2. Consumption Rates
Each metered service shall be billed separately. The metered rates shall be as follows:
(a) $10.7170 per ten cubic metres (10m3) metered or(b) $4.87 per thousand Imperial gallons metered
NOTE: For cash transactions (only), when pennies are not available (following the Royal Canadian Mint’s elimination of the penny from circulation), the total cash payment for the final fee (inclusive of taxes where applicable) will be rounded (up or down) to the nearest five-cent increment in accordance with Regional accounting procedures.
The rates set out in section 1 below are effective for all accounts rendered from the date this by-law is passed up to and including accounts rendered on March 31, 2014. The rates set out inSection 2 below are effective for all accounts rendered on or after April 1, 2014.
64

SUMMARY VIII
SCHEDULE A
Waste Management System Fees
Description
1 Community Recycling Centre Minimum Drop-off (50 kg or less) $5.00 per drop off2 Community Recycling Centre Drop-off (over 50 kg) $0.10 per kilogram
(kg)3 Community Recycling Centre Drop-Off Fee (scales non-
operational) - Car/Minivan$5.00 per drop off
4 Community Recycling Centre Drop-Off Fee (scales non-operational) - Pick-ups and Larger Vehicles
$10.00 per drop off
5 Community Recycling Centre Drop-Off Fee (scales non-operational) - Trailers
$5.00 + appropriate vehicle fees per
drop off6 Dedicated loads of Yard Waste (Caledon and Bolton CRCs only) No Charge if deemed
acceptable7 Community Recycling Centre Drop-off Fee: No charge if deemed
acceptable-Household Hazardous Waste-Reusable Goods-Dedicated Loads of Blue Items*-Dedicated Loads of Passenger Car or Light Truck Tires-Dedicated Loads of any size Tires (effective at Caledon CRC only)-Dedicated Loads of Waste Electrical and Electronic Equipment
* Deleted - " and Grey Box Items"
Small Quantity Generator Disposal Fees were deleted as these charges are not charged to businesses because of the Extended Producer Responsibility (EPR) funding programs.
Effective date: All rates set out below are effective for all accounts rendered on or after the day this by-law comes into effect.
Proposed Rates
NOTE: For cash transactions (only), when pennies are not available (following the Royal Canadian Mint’s elimination of the penny from circulation), the total cash payment for the final fee (inclusive of taxes where applicable) will be rounded (up or down) to the nearest five-cent increment in accordance with Regional accounting procedures.
Changes from 2013 to 2014
"Tipping Fees (Caledon Land Fill exclusive of yard waste) " was deleted as the landfill is now closed and is at 98% capacity. The fee is similar to "Community Recycling Centre Drop-off (over 50 kg)" and would be charge at $0.10 cents per kilogram when used in the case of emergency
65

THIS PAGE INTENTIONALLY LEFT BLANK

Tax Supported Programs
• Region Controlled Programs - Public Works - Health Services - Human Services - Internal Services, PAMA & Non-
Program

THIS PAGE INTENTIONALLY LEFT BLANK

Public Works

THIS PAGE INTENTIONALLY LEFT BLANK

PUBLIC WORKS
Tax Supported Programs
2014 Budget Document

THIS PAGE INTENTIONALLY LEFT BLANK
1

Public Works Tax Rate Supported Programs 2014 Budget Document
Table of Contents
Section I. Existing Services and Service Levels ................................................................1
1. Who we are............................................................................................................................1
2. Existing Services and Service Levels ....................................................................................1
3. Key Initiatives in 2013 ............................................................................................................3
Section II. Issues and Trends .................................................................................................4
Section III. 2014 Business Focus ...........................................................................................9
Section IV. 2014 Operating Budget ......................................................................................10
1. 2014 Departmental Operating Budget Overview .................................................................10
2. 2014 Proposed Budget ........................................................................................................11
Section V. 2014 Capital Budget ............................................................................................16
1. 2014 Departmental Capital Plan Overview ..........................................................................16
2. Existing Capital Projects ......................................................................................................16
3. 2014 Capital Budget and Operating Impact.........................................................................18
4. 2014 – 2023 10 - Year Capital Plan.....................................................................................20
Section VI. Output/Outcome Measures................................................................................21
Section VII. Staffing ................................................................................................................22
Section VIII. Future Outlook...................................................................................................23
Section IX. Disclosure of 2014 Budget Risks and Key Program Assumptions ...............24
Appendix 1: 2014 Operating Budget Pressures – Departmental Summary ......................25

THIS PAGE INTENTIONALLY LEFT BLANK

Public Works Tax Supported Programs
Section I. Existing Services and Service Levels 1. Who we are The areas of focus in Public Works remain on providing quality services to the residents and businesses of Peel, and have the overall responsibility to deliver tax and utility supported programs. This document refers specifically to the tax supported programs; Transportation, Waste Management Development Services and tax portion of Operations Support. The Water and Wastewater programs can be found in the Public Works Utility Rate Supported Budget Document. The following chart represents the Public Works divisional structure which the Regional Council governs.
Public Works
Water
Wastewater
OperationsSupport
2. Existing Services and Service Levels Transportation
a) Description of Services: The Transportation division is responsible for planning future long range transportation needs and delivering capital program to meet those needs. The division operates and maintains Region of Peel’s (Region) road network while ensuring safe and efficient movement of pedestrian and vehicular traffic; in addition to providing accessible transportation services for the residents of Peel.
b) Key Facts
• Operate and maintain 1,602 lane km of roads • 169 structures (including bridges and major culverts) • 436 signalized intersections • 565 meters of new guiderails installed • 325 dead trees removed from roadsides • 294,760 km logged under Winter Patrol program • 67,000 km logged under Summer Patrol program • 74,000 meters of snow fence installed and removed • 560 edge kilometers of roadway swept each spring • 3,885 customer service requests from both internal and external clients received and
addressed • 1,612 traffic studies completed • 6,674 collision records analyzed for historical data collection in 2011 • 500,000 accessible transportation trips provided for 12,960 registered clients
Waste Management
Development Services
Utility Rate Supported Tax Supported
Transportation
1

Public Works Tax Supported Programs
• Approximately 22 million km of single-occupant vehicle trips and 4.8 million kilograms of greenhouse gas have been reduced in the past twelve months.
• Commuters utilizing sustainable modes of transportation, such as carpooling, collectively saved about $14 million in commuting cost in the past 12 months.
• 33,000 metres of Active Transportation facilities constructed including sidewalks, multi-use trails, and paved shoulders.
Waste Management
a) Description of Services: The Waste Management division provides waste management services to residents and small businesses in the Region. These services include the collection, processing and disposal of garbage, blue box material, green bin organic material, leaf and yard waste and white goods. Through its network of Community Recycling Centres (CRC), the Region also provides residents and small businesses with a convenient method to drop off garbage, recyclable material, household hazardous waste, reusable goods and special waste items such as renovation waste, scrap metal, rubble and more.
b) Key Facts
• Weekly collection of curbside Blue Box, Green Bin and garbage • Seasonal weekly / bi-weekly collection of curbside leaf and yard trimmings • Call in service of collection of curbside White Goods (fees applied) • Twice weekly collection of Multi Residential garbage • Weekly collection of Multi Residential Blue Box • Twice weekly collection of Business Improvement Area (BIA) garbage • Weekly collection of BIA and school Blue Box • Seven days per week, eight hour per day operation of five Community Recycling Centres
(CRCs); sixth CRC facility (Heart Lake) will open in Brampton in the fall of 2014 • Monitoring and remediation of closed municipal landfill sites
Development Services
a) Description of Services: The Development Services division provides a “one-window” approach to all Regional land development related matters. Development Services division responds to development applications, monitors information and resolves problems pertaining to development proposals as well as reviews and approves engineering drawings for provision of regional services in subdivisions, connection approvals to existing water and wastewater facilities and provides planning consulting services to other departments within the Region.
b) Key Facts • 1,270 Development Applications processed • 450 Engineering Submissions received and processed • 3,650 Connection Applications processed • 98 per cent of all applications processed without any Dispute Resolution
Operations Support
a) Description of Services: The services provided by the Operations Support division benefit other divisions within the Public Works department, other Regional programs such as Paramedics and Police Services, as well as the general public. The services are funded by a combination of tax and utility rate supported programs. Within Operations Support, there are two sections fully funded by the utility rates; Meter Operations and Billing. These will be discussed in the Utility Rate Supported Budget Document.
2

Public Works Tax Supported Programs
b) Key Facts • Fleet procurement, maintenance, and repair provided year-round, 24/7 emergency service • Facility Services – maintenance and repairs of Public Works locations • Supply Management – product inventory management, storage and distribution • Fleet Training and Licensing – training, license renewal, legislation compliance • Survey and Inspection Services - survey services (design and construction) and
construction quality control & assurance on all new development projects, ICI connections and Regional Road accesses/permitting
• Computer Aided Design (CAD) – services for Public Works capital projects and other departments in the Region
• Geographic Information Systems • Asset Information Management/Business Analysis and Project Management • Public Works Customer Service Centre – 24/7/365 contact for residents to report
emergency water/wastewater/roads emergency situations • Education and outreach services related to Waste Management and Transportation
community programs 3. Key Initiatives in 2013
• Endorsement of Peel’s Road Characterization Study (RCS) by Regional Council and implementation of a new Controlled Access By-Law
• Endorsement of Peel’s Strategic Goods Movement Network Study by Regional Council. • RWIS (Road Weather Information System) forecasting enhancements through the
installation of three RWIS weather stations in various climate zones in Peel to provide Peel specific weather forecasting data.
• Commenced development of an Accessible Transportation Master Plan study • Continued work on the Arterial Roads Review • Council approved a three zone competitive tendering process for 2016 curbside collection
contract • Positive green bin and blue box diversion results from the year long pilot; Council
approved Region wide Bi-weekly Cart Collection to be implemented in 2016 • Pilot to examine the impact of extending of CRC operating hours at Battleford, Bolton and
Brampton CRCs to inform on reduced wait times and provide more drop-off time options to residents; this pilot will be extending into 2014 for full seasonal results.
• In June 2013, Council approved the Business plan for the Peel Energy Recovery Centre (PERC) and directed staff to commence the competitive procurement process; by which the Request for Prequalification (RFQ) document was issued in August 2013.
• Council approved the addition of Mixed Rigid Plastics (1-7) to the Blue Box recycling program.
• Continued work with school boards to develop and implement the Waste Education Framework.
• Undertaking a service level investigation on the Connections Applications Process • Completed major redevelopment at Copper Yard and site planning and design for the
redevelopment of both the Wolfedale Yard and Mavis Road facility • Upgraded VCOM user gear to function within the new VCOM infrastructure • The Issued for Construction (IFC) work to mitigate backlog of electronic storage of asset
information due to the amount of growth • Initiated the Information Technology Strategy for Public Works
3
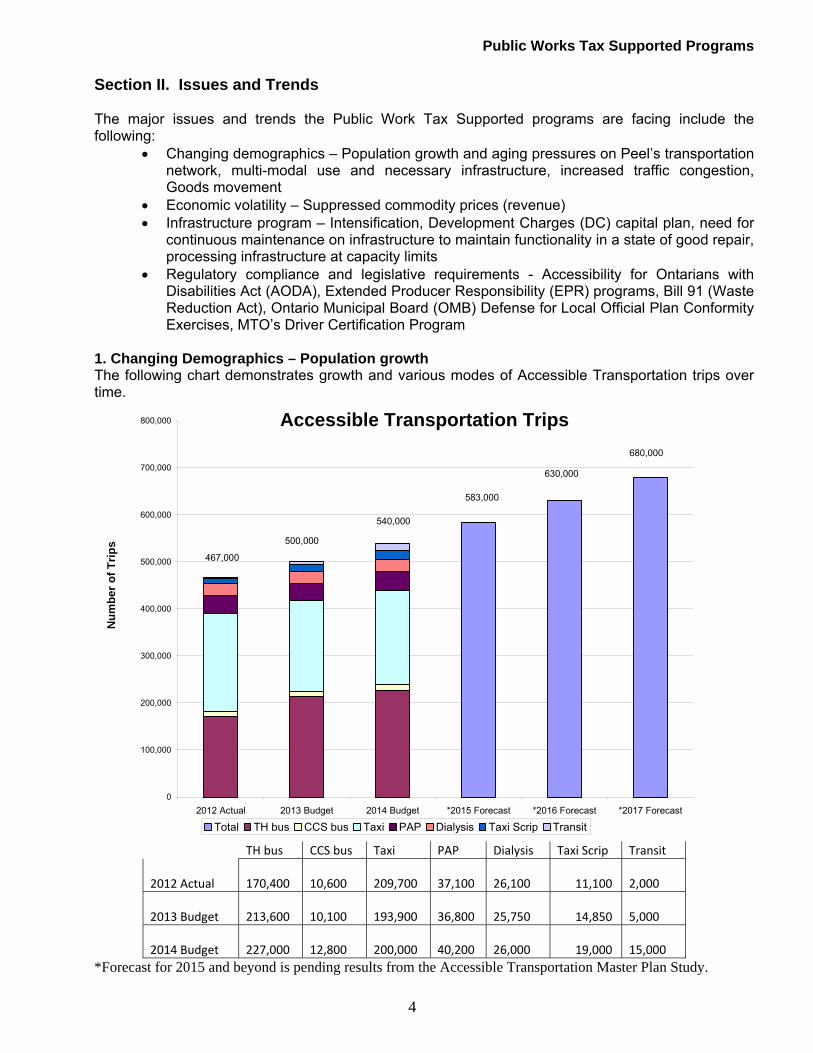
Public Works Tax Supported Programs
Section II. Issues and Trends The major issues and trends the Public Work Tax Supported programs are facing include the following:
• Changing demographics – Population growth and aging pressures on Peel’s transportation network, multi-modal use and necessary infrastructure, increased traffic congestion, Goods movement
• Economic volatility – Suppressed commodity prices (revenue) • Infrastructure program – Intensification, Development Charges (DC) capital plan, need for
continuous maintenance on infrastructure to maintain functionality in a state of good repair, processing infrastructure at capacity limits
• Regulatory compliance and legislative requirements - Accessibility for Ontarians with Disabilities Act (AODA), Extended Producer Responsibility (EPR) programs, Bill 91 (Waste Reduction Act), Ontario Municipal Board (OMB) Defense for Local Official Plan Conformity Exercises, MTO’s Driver Certification Program
1. Changing Demographics – Population growth The following chart demonstrates growth and various modes of Accessible Transportation trips over time.
Accessible Transportation Trips
0
100,000
200,000
300,000
400,000
500,000
600,000
700,000
800,000
2012 Actual 2013 Budget 2014 Budget *2015 Forecast *2016 Forecast *2017 Forecast
Num
ber o
f Trip
s
Total TH bus CCS bus Taxi PAP Dialysis Taxi Scrip Transit
467,000
500,000
540,000
583,000
630,000
680,000
TH bus CCS bus Taxi PAP Dialysis Taxi Scrip Transit
170,400
10,600
209,700
37,100
26,100 11,100
2,000 2012 Actual
213,600
10,100
193,900
36,800
25,750 14,850
5,000 2013 Budget
227,000
12,800
200,000
40,200
26,000 19,000
15,000 2014 Budget
*Forecast for 2015 and beyond is pending results from the Accessible Transportation Master Plan Study.
4

Public Works Tax Supported Programs
Expanding facilities and fleet in Public Works to meet growing needs. The following graph reflects growth of vehicles.
Fleet ServicesFleet Growth
402450 476 485 488 518 525 535
73
7989
104 107111 122 128
33
0
100
200
300
400
500
600
700
800
2007 2008 2009 2010 2011 2012 2013 2014Projection
Year
# of
veh
icle
s
CVC
Ambulance
Regular Fleet
`
2. Economic Volatility – Suppressed Commodity Prices The following graph demonstrates volatility of commodity prices and its impact on Waste Management revenue stream. History of Commodity Revenue
$0$200,000$400,000$600,000$800,000
$1,000,000$1,200,000$1,400,000$1,600,000
Jan-0
8
Apr-08Ju
l-08
Oct-08Ja
n-09
Apr-09Ju
l-09
Oct-09Ja
n-10
Apr-10Ju
l-10
Oct-10Ja
n-11
Apr-11Ju
l-11
Oct-11Ja
n-12
Apr-12Ju
l-12
Oct-12Ja
n-13
Apr-13Ju
l-13
Oct-13Ja
n-14
Apr-14Ju
l-14
Oct-14
Mon
thly
Rev
enue
Fibres Containers (excl. glass) Basket
Budget - Fibres Budget - Containers Budget
5

Public Works Tax Supported Programs
3. Infrastructure Program - Intensification Intensification projects are more complex than Greenfield applications due to the greater number of stakeholders, infrastructure information not being easily accessible or available and often upgrades to the existing infrastructure are required to accommodate the proposal. As a result, more formal coordinating meetings are required between Regional staff and the staff of local municipalities to improve alignment between development approvals and infrastructure planning in key intensification areas.
a) Infrastructure Program – DC Capital The road network is planned, designed, constructed and maintained so that regional customers can travel within Peel with ease. The map below illustrates major growth related projects being undertaken during the period of 2014 to 2018.
Transportation Major Growth Related Projects from years 2014 – 2018 by 2014 Capital Plan
6

Public Works Tax Supported Programs
b) Infrastructure Program – Maintenance The following examples of services are carried out yearly to ensure the Transportation infrastructure remains in a state of good repair:
• 5,000 catch basins cleaned • 314 tonnes of cold mix asphalt to repair potholes used • 2.1 million meters of yellow and white lines, arrows, stop bars and cross walks retraced • Up to 25, 000 meters of ditching completed • 910 edge kilometers of grass cut (8 times per year in urban areas and 2 times per year in
rural) • 60 kilometers of gravel shouldering resurfaced • 45 Culverts replaced • 131 Catch Basins and Man Holes repaired/reset • 544 kilometers of shoulders – re-graded twice per year • 2.5 centerline kilometers of gravel road graded once per week • 18,000 square meters of asphalt patched per year • Over 18,000 traffic signs inspected for reflectivity once per year • 200,000 meters of pavement cracks sealed per year
c) Infrastructure Program – Processing Capacity Limits Key Waste Management processing infrastructure is at capacity or is nearing the end of its useful life; it will need to be expanded or replaced within the next few years. Peel’s waste programs and 2012 diversion rate (latest full year of data) are summarized in the following table.
Tonnage Percentage Programs At Home Diversion (Back yard composting, grass cycling, LCBO bottle returns) 19,667 4.0%Re-Useable Goods (collected at CRCs) 600 0.1%Blue Box Recyclables 102,584 21.1%Green Bin Organics and Yard Trimmings 83,420 17.2%White Goods 76 0.0%Municipal Hazardous & Special Waste (MHSW) 2,191 0.5%Waste Electrical & Electronic Equipment (WEEE) 1,374 0.3%Used Tires 233 0.0%Other Recyclables (Metal, Shingles, Drywall and Wood) 10,914 2.3%Energy-from-Waste (Scrap metal) 3,946 0.8%Energy-from-Waste (beneficial use of Ash) 21,993 4.5%
246,998 50.8%* Sub-Total 3R's Diversion EFW – Waste Converted to Energy ** 104,358 21.5%Total Diversion from Landfill 351,356 72.3%Landfill in Ontario 134,546 27.7%Total Waste Managed 485,902 100.0%
* 2013 Diversion rate, without Energy-from-Waste (EFW), projected to be just under 50%
** EFW Contract ended in October 2012
7

Public Works Tax Supported Programs
The following diagram illustrates Waste Management’s current waste generation, collection and transfer, processing and disposal system:
GENERATION
325,000 Curbside Households • 89,000 tonnes of blue box
materials • 31,000 tonnes of organics • 36,000 tonnes of yard waste • 10,000 tonnes of leaf • 182,000 tonnes of garbage
91,000 Multi-Residential Households
• 12,000 tonnes of blue box materials
• 55,000 tonnes of garbage
5 Community Recycling Centres • 2,000 tonnes of blue box materials • 18,000 tonnes of non-blue box
recyclable material • 5,000 tonnes of yard waste • 23,000 tonnes of garbage and
rubble
Blue Box Materials Recovery Facility – operated by Canada Fibers Limited
Peel Integrated Waste Management Facility (PIWMF)
COLLECTION TRANSFER, PROCESSING AND DISPOSAL
• Curbside collection contract with Waste Management of Canada Corporation for Brampton/Mississauga
• Curbside collection contract with Green for Life (GFL) for Caledon
• Front-end container collection contract with Miller Waste System
• Cart-based collection contract with Green for Life (GFL)
Region forces
Peel Compost Curing Facility
Landfill
Recycling Markets
Caledon Composting Facility
3rd Party Compost Processor
REGION OF PEEL WASTE MANAGEMENT SYSTEM (2012)
25 year landfill contract with WMCC
PIWMF – Composting Facility
BLUE BOX RECYCLABLES
ORGANICS
GARBAGE
PIWMF – Waste Transfer Station
PIWMF – Waste Transfer Station
3rd Party Transfer Station
4. Regulatory Compliance and Legislative Requirements
• Regulatory requirement changes in the Accessibility for Ontarians with Disabilities Act (AODA) impact on ability to meet clients’ demand for accessible transportation
• Potential changes to Extended Producer Responsibility (EPR) programs and Bill 91 (Waste Reduction Act) will significantly change the Waste Management program
• Stricter vehicle emissions control legislation resulting in increased capital costs, while supporting Council priority to reduce greenhouse gas emissions
• Increased volume of training for Regional drivers and operators to meet legislated requirements
• Stricter standards for membership in MTO’s Driver Certification Program • Ontario Municipal Board (OMB) Defense for Local Official Plan Conformity Exercises – Norval
Quarry – The Region has interests in the outcome of the application by Brampton Brick for a shale quarry on Winston Churchill and is an equal participant with the City of Brampton on peer reviewing documents prepared by the applicant’s consultants. It is expected that the hearing will occur in 2014.
• More rigorous environmental and legislative regulations in the construction industry requiring an overall increase in accountability, professionalism and stewardship during construction projects
8

Public Works Tax Supported Programs
Section III. 2014 Business Focus In 2014, Public Works tax supported programs will continue to focus on the following areas: 1. Term of Council Priorities (ToCP’s)
• ToCP #2 – Increase Waste Diversion – Reduce the negative impact of waste on the environment
• ToCP #4 – Improve Storm Water Management – Reduce the citizen risks associated with flooding and address the broader environmental impacts
• ToCP #9 – Increase Active Transportation – Reduce the proportion of trips generated by cars, thereby reducing green house gas emissions and improving citizen health
• ToCP #13 - Complete Arterial Roads Review – Ensure that the respective responsibilities of the Region and area municipalities related to Peel’s road network are clear, transparent, efficient and effective
• ToCP #14 – Update long-term transportation plan to meet current and future needs – Ensure that Peel’s transportation needs are planned for through 2031
• ToCP #15 – Improve efficiency of goods movement in Peel in collaboration with Peel Goods Movement Task Force – Support the competitiveness of businesses and the availability of high quality jobs in Peel Region of Peel
• ToCP #16 – Increase capacity (trips) available through accessible transportation services – address the transit needs of Peel’s residents with all types of mobility impairments in compliance with the Accessibility for Ontarians with Disabilities Act (AODA)
2. Other Business Focus
• Complete the Accessible Transportation Master Plan • Update Transportation Demand Management Master Plan • Finalize Long Term Waste Management Plan for Council • Commence operation of Heart Lake CRC • Finalize evaluation of RFQ submissions and issue Request for Proposal (RFP) for Peel
Energy Recovery Centre (PERC) • Continue work with Minister of Energy to obtain a Power Purchase Agreement (PPA) for
PERC • Issue a Request for Tender for (RFT) for the 2016 Curbside Collection Contracts (three zones) • Issue RFT for approximately one million curbside collection carts (2014 Phase One) • Finalize review of major processing infrastructure and present recommended infrastructure
plan including future land acquisition • Development Services to reduce reliance on tax supported programs from 30 per cent in 2012
to 24 per cent in 2014, through process and user fee reviews • Implement recommended improvements to site servicing commenting process • Planned redevelopment of the Wolfedale Yard and Mavis facility to increase capacity to
accommodate growth • Support the implementation of both CSI and MiDesk along with the replacement/procurement
of the Corporate Maintenance Management System • Lead the Enterprise Asset Management Solution Project with the focus to acquire an Asset
Management Solution in order to streamline current business practices
9

Public Works Tax Supported Programs
Section IV. 2014 Operating Budget 1. 2014 Departmental Operating Budget Overview The Tax Supported Net Operating Budget for Public Works totals $176,181 million net expenditures, an overall zero change from the 2013 Budget level.
The following division specific factors and funding decisions have been reflected in the 2014 Budget:
• 40,000 additional Accessible Transportation trips – $0.4 million • Operating cost of capital – $0.2 million • Operating impact of Coleraine Dr. upload (ARRASC – Phase II), including debt servicing
charges – $0.3 million • Increased collection costs due to households growth • Pilot for extended CRC hour - $0.5 million • MRF 1-7 Plastics - $0.53 million • Cart Implementation - $0.8 million for Phase One (2015 Phase Two and Three - $3.146
million, 2016 Phase Four - $1.158 million), funded from working fund reserves • Reduction of $0.8 million in HHW disposal costs due to EPR and $0.345 million reduction in
compost residue disposal • Extended Producer Responsibility (EPR) funding for Blue Box program increase - $2.1 million • Reduction in Blue Box fibre revenues resulting from ongoing adverse economic conditions -
$1.8 million • Full allocation of the Advance Blvd. facility purchase from the Operations Support division to
client facing programs - $0.6 million to utility supported programs
2014 Budget – Net Expenditures
(In $’000) 2013 Budget
2013 Projection (As at Aug. 31, 2013)
2014 Budget
Budget Change %
2014 vs. 2013Transportation Program $73,489 $73,844 $74,325 1.1%Waste Management $101,114 $94,114 $100,956 -0.2%Development Services $902 $710 $901 -0.1%Operations Support $592 $592 $0 -100.0%Total Public Works Tax Supported Services $176,097 $169,260 $176,181 0.0%
:
10

Public Works Tax Supported Programs
The following graphs illustrate the net expenditures by type and funding sources: Note: The above pie charts reflect Operations Support Budget which is funded by both, Tax and Utility Rate Supported programs. * Included in the “Reserves” number is the provincial gas tax received, which flows in and out through Peel’s reserves account, in accordance with the provincial agreement guidelines to account for this source of funding. 2. 2014 Proposed Budget Transportation The 2014 Budget is reflective of 2013 actuals and includes an increase of $0.355 million. The following major factors contribute to 2014 Transportation budget increase:
• Additional 40,000 trips (broken down in the table below) are to be delivered by Accessible Transportation (in accordance with the Term of Council Priority #16)
Trip Delivery 2013 Budget 2014 Budget Variance
Taxi Trips 193,900 200,000 6,100
Bus Trips TH Bus 213,600 227,000 13,400
CCS Bus 10,100 12,800 2,700
Other RC Dialysis 25,750 26,000 250
RC PAP 32,650 36,000 3,350
CCS PAP 4,150 4,200 50
Taxi Scrip 14,850 19,000 4,150
Conventional Transit 5,000 15,000 10,000
Total 500,000 540,000 40,000
Total Expenditures By Type Tax Supported Programs (In $'000)
Goods & Services, $125,025,
51%
Labor Costs,
$65,827, 27%
Contributo Reser*, $52,7
22%
Funding tOther
Agencies$602, 0
tion ves 67,
o
, %
Total Funding Source By Type Tax Supported Programs (In $000)
Reserves *, $842, 0%
User Fees, $25,778,
11%
Regional Tax ,
$176,182, 73%
Capital Recoveries,
$18,604, 8%
Grants & Subsidies, $12,597,
5%
Charges to Rate
supported programs, $7,441, 3%
11

Public Works Tax Supported Programs
• Increased operating cost of capital due to asset base growth is outlined in the following table:
Asset Count 2013 Budget 2014 Budget VarianceLane KM 1,602 1,621 19Signalized Intersections 432 436 4Catch Basins 9,138 9,168 30Signs 18,031 18,316 285‐
• Decrease of direct cost for winter maintenance due to forecasted lower number of winter events budgeted (33 vs. 28) based on the last five year trend
• An additional third winter maintenance shift at Copper Yard is required to ensure compliance with the Hours of Service Regulation 555/06. Staff resources required to fulfill the third shift will not only provide benefits to the winter maintenance program but will also address operational needs of two summer activities (grass cutting and line painting).
• As per ARRASC recommendation for implementation of Option 4A of jurisdictional review, Coleraine Drive between Mayfield Road and King Street is expected to be fully transferred from the Town of Caledon to the Region in 2014. This transfer results in operating maintenance and debt service costs of $0.3 million.
• CPI increase applied to labour costs and various contracts Waste Management The 2014 Budget is reflective of 2013 actuals and includes an increase of $0.363 million. The following major factors contribute to 2014 Waste Management budget increase: a) Reduction in the budget for the following operational efficiencies:
• $0.8 million reduction in the Household Hazardous Waste program (HHW) disposal due to the Stewardship Ontario (SO) incentive program;
• $0.345 million reduction in Compost processing for the cost of haulage and disposal. • Reduced Commodity Revenue of $1.8 million is offset by increased Extended Producer
Responsibility (EPR) program of $2.1 million for a positive impact of $0.3 million. • $0.25 million increase in CRC tip fee revenue as a result of increased Tip Fees implemented
in 2012 budget. b) Increases in the budget for the following factors:
• Two additional FTEs and contract staff are required to assist with Infrastructure Development; • One additional contract is required for oversight of the Heart Lake and other CRCs to ensure
effective operations as well as the development and maintenance of Key Performance Indicators (KPI)
c) Tax Management
• 2016 Bi-weekly Cart-based Collection Implementation of one million carts phased in over 3 years using draws from Waste Rate Stabilization Reserve, R0015, drawing $0.780 million in 2014, $3.146 million in 2015 and $1.158 in 2016 resulting in a zero budget increase.
• Council’s request to extend CRC hours – pilot project with full year impact of $0.5 million using draws from the Waste Rate Stabilization Reserve, R0015
• 2014 Budget incorporates an additional contribution to reserve of $8.4 million for the PERC for a total reserve balance of $18.4 million as of December 2014
.
12

Public Works Tax Supported Programs
2014 Budget – Net Expenditures
2014 Budget Changes (In $’000)
2013 Budget
a. Base
Changes
b. Service Demand
c. New
Services
2014 Budget
$73,489 -$29 $606 $258 $74,324Transportation $101,114 -$873 $185 $530 $100,956Waste Management
$902 -$1 $0 $0 $901Development Services $592 -$592 $0 $0 $0Operations Support
$176,098 -$1,493 $791 $788 $176,181Total Tax Supported Public
Works Services Note: Please refer to Appendix 1 for departmental details. Details of each program’s budget changes are included in the respective program summary. a) Base Budget Changes
Inflation Transportation and Waste Management divisions are greatly affected by Consumer Price Index (CPI) increase as majority of their services are contracted out. The following Inflationary impacts are reflected in the divisional budgets:
• Transportation: $0.262 million • Waste Management: $0.850 million
Economic Factors The Waste Management Division relies on commodity prices as its source of revenue. Over the past few years these prices have been negatively impacted by adverse economic conditions and have been extremely volatile. The 2014 Budget reflects a reduction in commodity revenue of $1.8 million as this trend is believed to be long term. Base Subsidy/Recoveries
• Provincial subsidy of Dedicated Gas Tax reflected in the Transportation division fluctuates from year to year as the allocation formula depends on previous years spending and delivery of trips. For 2013/2014 the Region’s portion of the allocation increased by $21.5 thousand.
• WDO subsidy of the Blue Box EPR program in the Waste Management division increased by $2.1 million
Other Pressures The Waste Management 2014 Budget includes one time cost associated with extended CRC hours pilot project (full year) and initial staffing costs of Bi-weekly program roll out. As these costs are considered “one time”, they are being funded through working fund reserves.
13

Public Works Tax Supported Programs
Cost Mitigation through Efficiencies & Recoveries Transportation The Transportation division utilized its existing staff complement through redeployments and reorganization in order to deliver an efficient level of service.
• Budget for direct cost of winter maintenance was further reduced, based on five year analysis, to account for the latest trend of milder winters. The budgeted winter events were lowered from 33 to 28 which resulted in a budget reduction of $778 thousand.
• The eight per cent increase in trip demand is being accommodated by using a combination of additional taxis, increased efficiencies on TransHelp buses and diversion of approximately 10,000 trips onto conventional transit. Improvements in the labour contract allow for use of additional part-time resources which decreases over-time costs and allows for full-time replacements when necessary. Continued use of technology, including software and map upgrades, results in improved routing allowing for more shared rides and fuel savings. Continued promotion of accessible conventional transit diverts some trips where possible.
• The Road Operations and Maintenance section is proposing a couple of options to mitigate the issue of the winter maintenance non compliance with Hours of Service (HOS) O. Reg 555/06. In order to remedy this, other activities were also reviewed including the Line Painting Retrace contract, and the Urban Grass Cutting program. The following options were analysed and considered:
o Status Quo (Do Nothing) - this option will not resolve the issue of non compliance with HOS and will result in cost increase of the line painting contract by $492.0 thousand
o Option 1 - create a winter maintenance third shift by upgrading two existing staff, add two contractor combination units, and increase the line painting retrace contract for a total cost of $656.0 thousand. This option allows for compliance to HOS through the creation of the third shift but does not address the service quality issues of the line painting retrace program. This option also results in a highest net cost to the program.
o Option 2 (Hybrid) – Recommended Option – is a combination of reallocating internal resources and contracting out services. Three additional FTEs (truck drivers) are required to balance the needs of all three operational activities (winter maintenance, line painting retrace program, and urban grass cutting). The overall cost of this option is $501.0 thousand. This option ensure compliance with HOS through the creation of the third shift and balanced approach to summer maintenance ensuring better quality of service and improved response time for line painting program, and most effective delivery of the urban grass cutting. The overall cost of this option is $501.0 thousand.
Waste Management • Budget for the cost of paint disposal was reduced by $0.8 million reflecting the Stewardship
Ontario (SO) incentive program. • Efficiencies in compost processing resulted in lower tonnes of compost overs to landfill; the
Division has been able to reduce the cost of haulage and disposal by $0.345 million. Operations Support • New survey technology has resulted in proficiency, allowing for the redeployment of one staff
to another area within the division • Efficiencies from the CVC Fleet partnership, are included in the budget and one FTE for the
additional mechanic required which is fully recovered through charges to the CVC • Improvements in the delivery of activities at the Peel Children’s Water Festival will result in
overall operational efficiencies and cost savings for future water festivals
14

Public Works Tax Supported Programs
• Since 2005, ambulance maintenance has been provided in-house, which has simplified the process by removing the need for multiple specialized vendors, thereby reducing the amount of ambulance downtime, resulting in a cumulative savings of over $2.5 million
• Efficiencies are being achieved by outsourcing large vehicle repairs, such as transmission services, due to the complex and time-consuming nature of the work
b) Service Demand
Net Cost ($’000)
Program Service Demands 2014 Budget
2015 Impact
Transportation Traffic Engineering – operating impact of new capital $21 $0Roads Operations and Maintenance – operating impact of new capital $104 $0Accessible Transportation – 40,000 additional trips and operating impact of new capital $481 $0
Waste Management Growth $185 $0
$791 $0Total Service Demands c) Budget for New Services
Net Cost (In ‘000) Program New Services 2014
Budget 2015
Impact Transportation
Operating Impact of Coleraine Drive Upload $258 $198 Waste Management
MRF – Addition of 1-7 Plastics to the Blue Box program $530 $0Bi-weekly Cart-based Collection Implementation phased in over 3 years using draws from Waste Rate Stabilization Reserve, R0015, drawing $0.780 million in 2014, $3.146 million in 2015 and $1.158 in 2016 resulting in a zero budget increase $0 $0
$788 $198Total New Services New services included in 2014 Budget in both Transportation and Waste Management Divisions have been previously approved by Council.
15

Public Works Tax Supported Programs
Section V. 2014 Capital Budget 1. 2014 Departmental Capital Plan Overview The following table/graphs summarize the Tax Rate Supported 2014 capital budget.
Classification of Capital Plan
Carry – Forward from Prior Years
(In $’000)
2014 Capital Budget
(In $’000)
Total Capital In 2014
(In $’000) DC Growth $244,018 $57,877 $301,895Externally Funded $35,679 $447,092 $482,771Non-DC Internal $182,873 $183,025 $365,898
$462,570 $687,994 $1,150,564Total Expenditures
$104,000 $67,000 $171,0002014 Cash Flow
348 67 415# of Projects * Note: The table above and pie charts below reflect the tax supported and tax-utility supported capital budget for Operations Support. The purely utility rate supported capital budget is reflected in the Utility Rate Supported document. The following graphs illustrate the Tax Supported 2014 Capital Budget by Classification and Division 2014 Tax Supported Capital Budget
By Funding Source (In $'000)
External, $1,905, 0%
Non-DC Internal, $183,025, 27%Debt Funding,
$445,187, 65%
DC Growth, $57,877, 8%
2014 Tax Supported Capital BudgetBy Division (In $'000)
Operations Support, $5,094, 1%
Transportation, $106,701, 15%
Waste Management, $576,199, 84%
2. Existing Capital Projects As of August 31, 2013, there were 361 active capital projects in Tax Supported Public Works programs with a gross remaining budget of $555.6 million and uncommitted remaining balance of $256.6 million. The following outlines major capital work in progress as well as key deliverables in 2014:
16

Public Works Tax Supported Programs
Transportation Status of major capital work in progress:
• Completed detailed design of the Bolton Arterial Roadway. Construction commenced in July 2013. Completion anticipated by fall of 2014.
• Completed detailed design and utility relocation for the road widening of Queen Street from Mississauga Road to Chinguacousy. Construction to commence spring 2014.
• Construction of intersection improvements and ‘ZUM’ transit infrastructure along Steeles Avenue substantially completed.
• Annual resurfacing/rehabilitation program for 2013 is complete. Approximately (41 lane km) of road rehabilitated in 2013 to maintain a state of good repair. Pre-Engineering is underway to develop 2014 program.
Key deliverables in 2014:
• Four lane widening of Mississauga Road from Financial Drive to Embleton Drive and Williams Parkway to Bovaird
• Construction and substantial completion of the Bolton Arterial Roadway (BAR) • Completion of five lane widening of Mayfield Road from Dixie Road to Bramalea Road • Tender for and commence construction for the six lane widening of Mavis Road from 407 to
Steeles Avenue • Commence six lane widening of Dixie Road from north of Steeles Avenue to Clark Boulevard
(Steeles intersection, noise wall and railway bridge already complete); Completion in 2015. • Environmental Assessment – Steeles Avenue Widening to six lanes from Chinguacousy to
Winston Churchill Boulevard • Environmental Assessment for reconstruction of Mississauga Road, Olde Base Line, Winston
Churchill Boulevard and Bush Street • Environmental Assessment to widen Airport Road from Mayfield to King Street to five lanes • Ongoing Road Resurfacing Program to maintain the roads in state of good repair
Waste Management Status of major capital work in progress:
• Construction of Heart Lake CRC is progressing and is expected to be completed in the fall of 2014.
• Peel Energy Recovery Centre (PERC) – approved by Council in June 2013; currently in procurement phase with RFQ evaluation and RFP issuance in 2014.
• Blue Box Material Recycling Facility (MRF) improvements to process Mixed Rigid Plastics (MRP), approved by Council in June to be completed in 2014.
• Radio Frequency Identification Device (RFID) for multi-residential waste containers, approved by Council in June 2013; being implemented at 20 buildings in 2014. Region-wide implementation is expected in 2015.
Key deliverables in 2014:
• Opening of the Heart Lake CRC in the fall of 2014 • Complete MRF capital improvements for MRP by June 2014. • Tender for Peel Curing Facility road realignment and pad expansion to be completed in winter
2014. • PERC RFQ to be evaluated in early 2014 and PERC RFP to be issued by end of 2014.
17

Public Works Tax Supported Programs
Operations Support – Tax supported
• Focus on the development and enhancement of business tools and applications which will allow for improved service delivery (Information Systems)
• Fleet Services anticipates approximately $9.0 million to be spent on vehicle and equipment replacement. Complex vehicle and equipment specifications increased the procurement cycle time to 18-24 months.
• $1.3 million will be spent on user gear which will interface with the new VCOM Infrastructure.
3. 2014 Capital Budget and Operating Impact a) 2014 Capital Budget The 2014 Capital Budget for Tax Supported Programs is $720.3 million; a $571.3 million dollar increase over 2014 projected Budget approved in principal through 2013 Budget submission. A full list of 2014 capital budget projects can be found in respective program summary.
• The review of Transportation capital program resulted in an increase of $4.2 million. The following are highlights of the main drivers behind the increase:
o Deferral of projects ($17.7 million reduction) offset by project advancement ($7.7 million increase)
o Scope change ($2.0 million increase) o Revision of property costs ($2.9 million increase) o Construction Price Index ($0.1 million decrease) o New Projects added to the Budget ($9.4 million increase)
• Waste Management Division increased its 2014 capital budget by $534.4 million. This increase was primarily due to:
o PERC (11-6605): project in the amount of $509 million has been brought forward from 2015 Budget to coincide with procurement timelines stipulated by 2014 RFP issuance. In addition, the project cost increased by $118 million as its size was revised from a 200,000 Tonne per year (TPY) facility to 300,000 TPY facility as presented to Council in June 2013.
o Collection Carts (13-6430): project was originally set up through 2013 Budget in year 2015. The Project has now been brought forward to 2014 Budget with expanded scope with additional cost of $13 million.
o PIWMF-MRF Equipment and Upgrades (12-6620): • $4.0 million 2014 Mixed rigid plastics • MRF Upgrades deferred to 2015/2016 ($12.2 million)
• 2014 Operations Support Capital budget reflects increase of $2.4 million for Vehicle and Equipment Replacement to adjust for continued growth in the size of the fleet for both Public Works and Ambulance
Transportation - new projects
Mavis Road Facility Redevelopment
Demand for Accessible Transportation is growing due to aging population, changing demographics and regulatory landscape. A new head office and joint use facility opened in Brampton in the fall of 2013. However, to achieve further efficiency it is recommended that Accessible Transportation operations deliver service via multiple site locations strategically placed in the Region. As such a second site operating in Mississauga is required. The originally planned site at Wolfdale is not feasible; therefore it is imperative that another Mississauga site
18

Public Works Tax Supported Programs
commences construction as soon as possible. A complete re-structuring of Mavis Road facility as a joint use facility with Peel Paramedics is recommended. The works will be funded by Federal Gas Tax, $5 million transferred from the existing Wolfdale redevelopment project and $5 million from the 2014 budget. Under Maintenance Envelope
The Under Maintenance Envelope will provide budget to fund any contingencies arising for the road capital projects during the under maintenance period. This approach is fully enabled through Financial Management By-law enacted in 2014. It allows for a faster project close out and return of unused funds to reserve giving the assurance of availability of funds if needed; and at the same time providing for greater liquidity in accordance with the Region’s long-term financial strategy. The under maintenance envelope pilot for Transportation has yearly fund availability of $1 million. The value of the envelope will be reevaluated based on the actual need for 2015. CNR Structure over Dixie Road
Heavy rainfall from the July 8th event damaged the embankment slopes, retaining wall, sidewalk, railings and pavement at the CNR underpass. SPL Consultants Limited was retained to undertake a geotechnical review of the structure and recommends restoration of embankment gutter, replacement of a section of the sidewalk and railings, drilling of 75 mm drainage holes at 1.5-2m spacing through the concrete retaining wall or installation of perimeter drain behind the wall to relieve water seepage; and evaluation of the integrity of the retaining wall.
Badlands Parking Lot
The Cheltenham Badlands are located on Olde Base Line Road in the Town of Caledon. They are one of the best examples of “badlands topography” development in southern Ontario. As such, the site has been designated an Earth Science Area of Natural and Scientific Interest (ANSI) by the MNR, and they are a popular tourist destination. Due to the site’s relative proximity to major urban centers, it is anticipated that the already large number of visitors to the site will increase.
The Region conducted a traffic study and the study confirmed that immediate traffic calming measures should be taken in the short term and in the long term, designated parking should be provided at the site. The Region is heading up a team consisting of members of Ontario Heritage Trust, Bruce Trail Conservancy, Niagara Escarpment Commission and Credit Valley Conservation, among others, and is currently in the process of reviewing parking lot options that can be supported and built in 2014/15. $1.5 million tax dollars are earmarked in the 2014 budget pending identification of the final parking lot solution, estimate to construct, and further consultation with potential funding partners
b. Operating Impact of 2014 Capital Budget
Transportation
• Listed above new Transportation capital projects will not have any staffing or operating impact in the future as the new facility, new under maintenance envelope and refurbished structure will be maintained by the existing workforce.
• There will be operating impact of building new lane kilometres, traffic signals, structures, catch basins, and installation of new signs; and in 2014 this impact is estimated at $181.0 thousand.
19
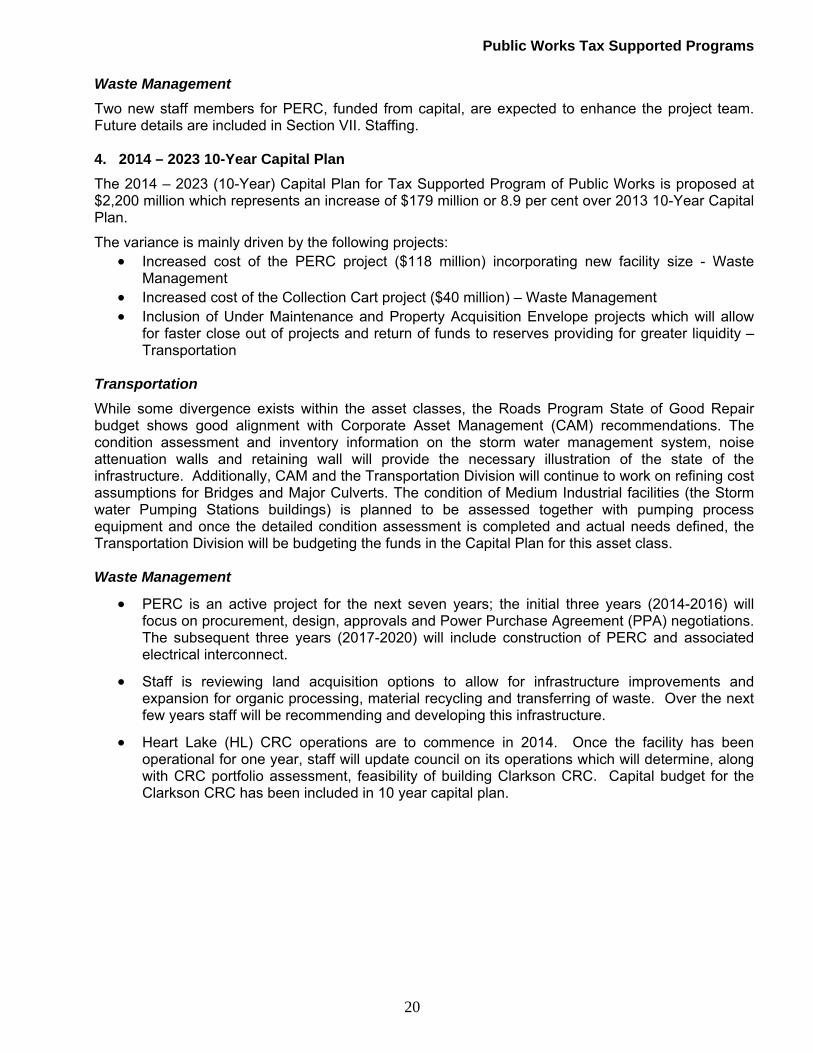
Public Works Tax Supported Programs
Waste Management Two new staff members for PERC, funded from capital, are expected to enhance the project team. Future details are included in Section VII. Staffing. 4. 2014 – 2023 10-Year Capital Plan The 2014 – 2023 (10-Year) Capital Plan for Tax Supported Program of Public Works is proposed at $2,200 million which represents an increase of $179 million or 8.9 per cent over 2013 10-Year Capital Plan.
The variance is mainly driven by the following projects: • Increased cost of the PERC project ($118 million) incorporating new facility size - Waste
Management • Increased cost of the Collection Cart project ($40 million) – Waste Management • Inclusion of Under Maintenance and Property Acquisition Envelope projects which will allow
for faster close out of projects and return of funds to reserves providing for greater liquidity – Transportation
Transportation While some divergence exists within the asset classes, the Roads Program State of Good Repair budget shows good alignment with Corporate Asset Management (CAM) recommendations. The condition assessment and inventory information on the storm water management system, noise attenuation walls and retaining wall will provide the necessary illustration of the state of the infrastructure. Additionally, CAM and the Transportation Division will continue to work on refining cost assumptions for Bridges and Major Culverts. The condition of Medium Industrial facilities (the Storm water Pumping Stations buildings) is planned to be assessed together with pumping process equipment and once the detailed condition assessment is completed and actual needs defined, the Transportation Division will be budgeting the funds in the Capital Plan for this asset class. Waste Management
• PERC is an active project for the next seven years; the initial three years (2014-2016) will focus on procurement, design, approvals and Power Purchase Agreement (PPA) negotiations. The subsequent three years (2017-2020) will include construction of PERC and associated electrical interconnect.
• Staff is reviewing land acquisition options to allow for infrastructure improvements and expansion for organic processing, material recycling and transferring of waste. Over the next few years staff will be recommending and developing this infrastructure.
• Heart Lake (HL) CRC operations are to commence in 2014. Once the facility has been operational for one year, staff will update council on its operations which will determine, along with CRC portfolio assessment, feasibility of building Clarkson CRC. Capital budget for the Clarkson CRC has been included in 10 year capital plan.
20

Public Works Tax Supported Programs
10 Year Tax Supported Capital BudgetBy Division (In $'000)
Transportation, $1,309,233, 59%
Waste Management, $830,437, 38%
Operations Support, $60,592, 3%
10 Year Tax Supported Capital BudgetBy Funding Source (In $'000)
DC Growth, $834,599, 38%
Debt Funded, $445,187, 20%
Non-DC Internal, $858,895, 39%
External, $61,581, 3%
* Note: The above pie charts reflect the entire capital budget for Operations Support, which is funded by both, Tax and Utility Rate Supported programs. A full list of 10-year capital plan by program can be found in the respective program summary. Section VI. Output/Outcome Measures Transportation The following measures have been introduced in 2013 budget and will continue to guide Transportation Division’s performance measure through year 2014:
• Winter maintenance response time to a winter event • Winter maintenance achievement of bare pavement • Roadway deficiency customer service request handling • Level of Service achievement for road maintenance routine activities • Corridor study to monitor and measure travel time, average speed, traffic delays, fuel
consumption and emission levels • Per cent of accessible transportation trips delivered on time • Incidence of customer issues per 1,000 trips • Incidence of lane closures in construction sites during rush hour (excluding emergency) • Network Pavement Ride Condition Index (RCI)
Waste Management The following performance measures continue to guide Waste Management Division through year 2014:
• Residential Waste Diverted • Waste Collection Complaints per 2,000 households served per day • Net Cost of Waste Management per Household • Net Cost of CRCs per Vehicle Trip
Development Services 2011 is the first full year when data for a file classification metric were collected. Of 1,152 development applications processed, 1,127 or 97.4 per cent were considered to be Class 1 (routine),
21

Public Works Tax Supported Programs
18 or 1.5 per cent were considered Class 2 (requiring in depth review) and seven (0.6 per cent) fell in Class 3 requiring some dispute resolution tactics. The Divisional goal is for all applications to fall under the routine (Class 1) category providing tools and a better dispute resolution system are available. Operations Support Operations Support is currently undergoing a division-wide Business Performance Management Review pilot project to ensure that we are managing performance in a concise manner, at a strategic and operational level. This pilot will examine how our performance measures align with our Output/Outcome measures. Detailed outcome/output measures for each program can be found in respective program summary. Section VII. Staffing 2014 Staffing budget includes the following changes: Transportation
• Addition of two drivers for Accessible Transportation and one staff person in Road Operations and Maintenance along with the conversion of six students to two full-time equivalent employees.
Waste Management
• Two FTEs will assist the Peel Energy Recovery Centre (PERC) project team, focusing on environmental approvals, specifically the Environmental Screening, and providing support during the stakeholder engagement and public consultation process of the project. Cost of these positions will be recovered from capital.
• Two contract staff for the Infrastructure Development Plan have been identified to assist with planning and implementation of new strategic assets. One to oversee and deliver long term organics processing system. One to assist with coordination of the various, long term infrastructure projects.
• One contract has been requested for Waste Operations, focusing on the oversight of the Heart Lake and other CRCs for effective operations and Key Performance Indicators (KPI).
Operations Support The 2014 Budget includes one mechanic to support maintenance of CVC fleet. The staffing changes in the 2014 budget are summarized as follows:
2013
Revised FTEs
Changes in 2014 2014
Budget Total
Change % 2014 vs.
2013 Transportation 227.5 5 232.5 2.20%Waste Management 164.5 2 166.5 1.22%Development Services 25.0 0 25 0%Operations Support (tax & utility rate supported) 234.25
1 235.25 0.43%
Total 651.25 8 659.25 1.23%
22

Public Works Tax Supported Programs
Section VIII. Future Outlook Summary table of the Tax Supported Public Works Programs Operating Budget 4 Year Forecast is shown below. Net Expenditures (In $’000)
2014 Budget Forecasted in 2013 Budget
2014
Budget
2015
Forecast
2016
Forecast
2017
Forecast Transportation $74,246 $74,324 $75,996 $77,678 $79,552Waste Management $104,171 $100,956 $103,726 $107,062 $109,859Development Services $900 $901 $925 $926 $927Operations Support $1,208 $0 $0 $0 $0Total Tax Supported Public Works Programs $180,525 $176,181 $180,647 $185,666 $190,338# of FTEs* 649.25 659.25 679.25 688.25 691.25 Notes: Details of each program’s forecast can be found in the respective program summary. * Includes all Operations Support staff (tax & utility rate supported) Transportation The 2014 Budget forecast is lower than forecast projected through 2013 Budget. The major variance is due to change of trip mix delivered by Accessible Transportation (including diversion of approximately 10,000 trips onto conventional transit), increase of fare per trip by $0.25, decrease of direct cost of the winter maintenance due to drop in budgeted winter events from 33 to 28 events and introduction of the third shift at Copper Yard that will provide for better management, will improve level of service, and create efficiencies. The forecast only incorporates operating impact of Coleraine upload (ARRASC phase II).
Waste Management The Waste Management program will continue providing high level of customer service to the residents of Peel in spite of ever changing business landscape. The forecast incorporates Region-wide implementation of Bi-weekly Cart Collection approved by Council. Adoption of this program will result in annual savings in waste collection contract in 2016. These savings will be reflected in the Capital LTWMS – EFW Savings Reserve R1140. The program implementation will cost approximately $5.2 million over the next three years. Since this cost is will only be incurred in the short term, it will be funded through working funds reserves. Waste Management staff is in a process of developing a Long-Term Waste Management Plan. The plan aims to provide guidance to the Region throughout expansion and continuous improvement of its waste services. The plan will emphasize Peel’s intention to conserve resources, recover materials and energy while staying within practical constraints such as cost increases, limited tax-base and technological capabilities. The plan will impact all phases of Waste Management including collection, processing, energy recovery and residue disposal. The plan will also provide continuous monitoring of system efficiency and quality through the development of key performance indicators for all phases of the waste system.
23

Public Works Tax Supported Programs
Operations Support The Operations Support division will continue supporting changing service level demands to accommodate fleet growth, addresses demands relating to facility growth, increased level of complexity in construction inspection, support environmental education. Information Services will restructure and re-prioritize work plans to increase its capacity to meet IT initiatives required by Public Works programs. Section IX. Disclosure of 2014 Budget Risks and Key Program Assumptions Transportation
• Budget for winter maintenance is based on a “typical” winter season. Budget could be exceeded if the number of winter events is unusually high.
• Balancing Peel forces and external services to achieve optimal cost effectiveness for Accessible Transportation.
• Competing priority demands could result in project delays. Waste Management
• Current global economic environment makes it difficult to reasonably forecast CPI and fuel prices, even a year in advance. The budget submission reflects the industry’s best forecast.
• The Division continues to face uncertainty related to economic impact and its reflection on commodity prices. The 2014 Budget reflects a reduction of $1.8 million predominantly related to suppressed fibre prices; the true impact cannot be determined with certainty.
• Implementation of Producer funding of EPR programs in Ontario remains undefined. • The 2014 budget has not taken into account any additional funding for future storm clean up.
Any such costs would be funded from working funds reserves. • Heart Lake CRC budget is based on operations completed by a contractor. If services are not
contracted out, an additional 15 FTE will be required to operate the Heart Lake CRC. • The development of the PERC is proceeding on the expectation that the Province, through
OPA, will purchase the electricity provided by the facility as it has for other EFW projects in the Province.
Development Services The Division is expecting 2014 level of development be consistent with the average for the previous five years. If development falls below the five year average, revenues will be affected.
24

Public Works Tax Supported Programs
APPENDIX 1 Tax Supported Programs
2014 Operating Budget Pressures ($’000)
Total Expenditures
Total Revenue Net Cost
2013 Revised Cost of Service 256,687 80,589 176,098
2014 Budget Changes a. Base Budget Changes
Annualization Inflation 2,964 423 2,541Economic Factors (1,811) 1,811
Base Subsidy/Recoveries (759) 3,470 (4,229)Cost Mitigation (2,092) (169) (1,923)Other Pressures 1,001 0 1,001
Subtotal – Base Budget Changes 1,114 1,913 (799)
b. Service Demand Growth 1,002 211 791Service Demand 576 502 74Subsidy/Recovery Change 282 1052 (770)Other Pressures 750 750 0
Subtotal – Service Demand 2,610 2,515 95 c. New Service(s)
MRF 1-7 Plastics – Waste 530 530Car Implementation – Waste – funded though working funds reserves 800 800Coleraine Dr. Upload – Transp. 144 (144) 258
CVC Mechanic – Fleet Partnership 89 89 0 Subtotal – New Services(s) 1,563 775 788 Total 2014 Budget Changes 5,287 5,203 84 2014 Budget
(2014 Cost of Service) 261,973 85,792 176,181
25

Public Works Tax Supported Programs
THIS PAGE INTENTIONALLY LEFT BLANK

TRANSPORTATION
PROGRAM BUDGET SUMMARY
Summary I: 2014 Operating Budget Pressures
Summary II: Operating Budget Four-Year Program Forecast
Summary III: 2014 New Capital
Summary IV: Ten Year Capital Plan
Summary V: Output and Outcome Measures

THIS PAGE INTENTIONALLY LEFT BLANK

SUMMARY ITRANSPORTATION
2014 CURRENT PRESSURES ($'000)
Total Expenditures
Total Revenue
Net Cost
2013 Revised Budget (2013 Cost of Service) 77,933 4,444 73,489
Base Budget Changes
240 (22) 262
Base Subsidy/Recoveries 21 42 (21)
Economic Factors -
Other Pressures 508 508
Cost Mitigation (778) (778)
(9) 20 (29)
2014 Service Demand
817 211 606
Other Pressures
Total 2014 Service Demand 817 211 606
2014 New Services
Coleraine Drive Upload 144 (114) 258
144 (114) 258
2014 Probudget (2014 Recommended Cost of Service) 78,885 4,561 74,324
PROGRAM NAME
Annualization
Cost of Living/ Inflation
Total 2014 New Services
Total 2014 Base Budget Changes
Growth
Service Demand
Subsidy/Recovery Change
1

SUMMARY IITRANSPORTATION
OPERATING BUDGET FOUR-YEAR PROGRAM FORECAST
In $'0002014 Budget
Forecasted in 2013 Budget
2014 Budget 2015 Forecast 2016 Forecast 2017 Forecast
Total Expenditures 78,779 78,885 80,680 82,495 84,512 Total Revenue 4,533 4,561 4,684 4,817 4,960 Net Expenditures 74,246 74,324 75,996 77,678 79,552
# of FTEs 227.50 232.50 240.50 245.50 248.50
Key forecast assumptions:8% increase in Accessible Transportation trips delivered per yearIncrease in asset base (lane km, traffic signals, bridges, catch basins)Upload of Coleraine Drive from the Town of Caledon in 2014
Program Assumptions
2

2014 NEW CAPITAL DETAIL
TRANSPORTATION
SUMMARY III
2014 Financing Sources and Funding Status ($'000)
Project #Expense
FundingTotal
Project Name
Approved or Pending
External Internal DCA
2014 Funding Status:
2014(A/P)
Ward
GeneralA 09-4002 REGIONAL ROAD STORM SEWER DATA BASE
AND MAPPING 0 150 0 150
A 09-4120 SALT MANAGEMENT PROGRAM 0 400 0 400
A 14-4000 UNALLOCATED FUNDING PEEL 0 1,000 0 1,000
A 14-4003 ACTIVE TRANSPORTATION INFRASTRUCTURE IMPROVEMENTS
0 1,900 0 1,900
P 14-4007 BADLANDS PARKING LOT 0 1,500 0 1,500
A 14-4105 EMERALD ASH BORER TREATMENT AND TREE REMOVAL PROGRAM
0 102 0 102
Road ConstructionA 09-4050 WINSTON CHURCHILL BOULEVARD - 560M
NORTH OF TERRA COTTA CONSERVATION ENTRANCE TO OLDE BASE LINE ROAD
C2 329 409 0 738
A 11-4080 HIGHWAY 50 - CASTLEMORE ROAD TO MAYFIELD ROAD AND MAYFIELD ROAD FROM COLERAINE DRIVE TO HWY 50
418 0 418 836
A 11-4090 OLD CHURCH ROAD - EAST LEG OF MARILYN STREET TO INNIS LAKE ROAD
177 0 1,658 1,835
A 12-4040 BOVAIRD DRIVE - LAKE LOUISE DRIVE/WORTHINGTON AVENUE TO MISSISSAUGA ROAD
0 0 1,500 1,500
3

2014 NEW CAPITAL DETAIL
TRANSPORTATION
SUMMARY III
2014 Financing Sources and Funding Status ($'000)
Project #Expense
FundingTotal
Project Name
Approved or Pending
External Internal DCA
2014 Funding Status:
2014(A/P)
Ward
A 12-4085 THE GORE ROAD - PATTERSON SIDE ROAD TO HIGHWAY 9
0 2,055 0 2,055
A 14-4009 AIRPORT ROAD URBANIZATION - COUNTRYSIDE DRIVE TO MAYFIELD ROAD
0 313 0 313
A 14-4020 DIXIE ROAD - BOVAIRD DRIVE TO COUNTRYSIDE DRIVE
B10 0 0 2,899 2,899
A 14-4030 AIRPORT ROAD - 1000 M NORTH OF MAYFIELD ROAD TO KING STREET
0 0 3,817 3,817
A 14-4035 STEELES AVENUE - CHINGUACOUSY ROAD TO MISSISSAUGA ROAD
B6 0 0 2,814 2,814
A 14-4045 WINSTON CHURCHILL BOULEVARD AND OLDE BASE LINE ROAD FROM BUSH STREET TO MISSISSAUGA ROAD
C1 342 1,016 0 1,358
A 14-4065 BUSH STREET AND MISSISSAUGA ROAD FROM WINSTON CHURCHILL BOULEVARD TO OLDE BASE LINE ROAD
C1 0 1,647 0 1,647
A 14-4100E PROPERTY ACQUISITION ENVELOPE B6,B3,7,8,9,B10 0 0 21,544 21,544
A 14-4103E UNDER MAINTENANCE ENVELOPE 0 300 700 1,000
IntersectionsA 07-4260 DERRY ROAD/GOREWAY DRIVE 0 85 1,190 1,275
A 10-4265 DERRY ROAD/MCLAUGHLIN ROAD 0 0 600 600
4
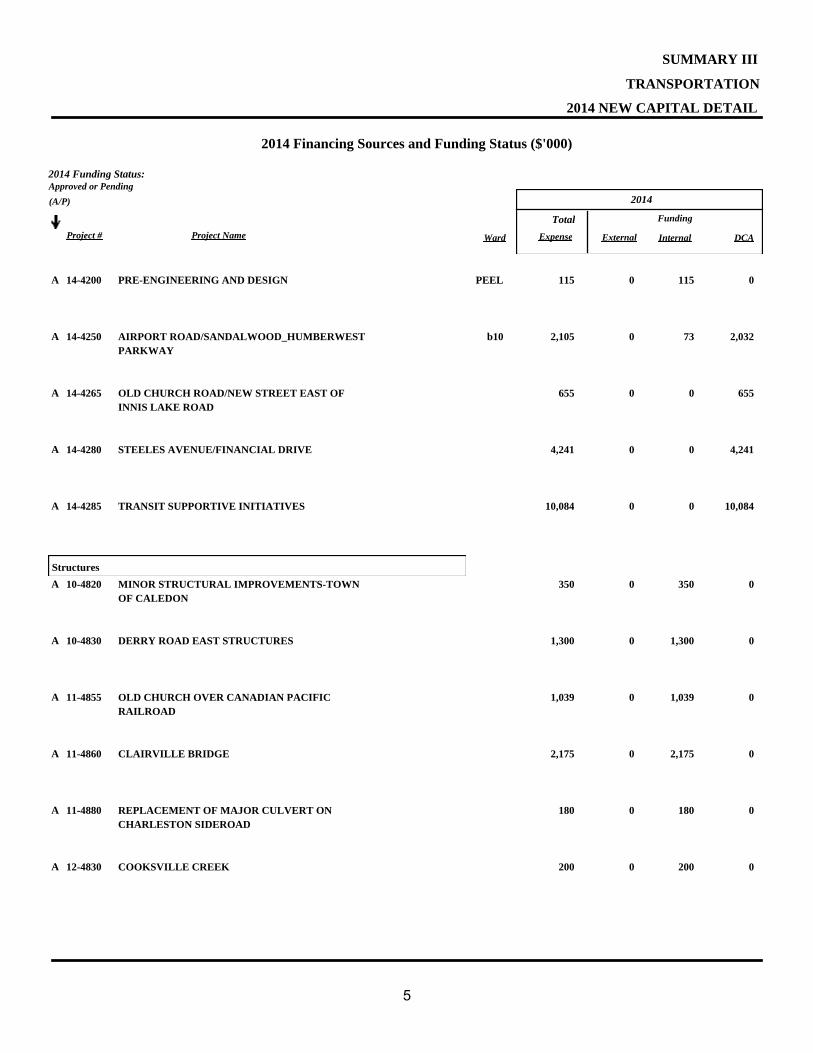
2014 NEW CAPITAL DETAIL
TRANSPORTATION
SUMMARY III
2014 Financing Sources and Funding Status ($'000)
Project #Expense
FundingTotal
Project Name
Approved or Pending
External Internal DCA
2014 Funding Status:
2014(A/P)
Ward
A 14-4200 PRE-ENGINEERING AND DESIGN PEEL 0 115 0 115
A 14-4250 AIRPORT ROAD/SANDALWOOD_HUMBERWEST PARKWAY
b10 0 73 2,032 2,105
A 14-4265 OLD CHURCH ROAD/NEW STREET EAST OF INNIS LAKE ROAD
0 0 655 655
A 14-4280 STEELES AVENUE/FINANCIAL DRIVE 0 0 4,241 4,241
A 14-4285 TRANSIT SUPPORTIVE INITIATIVES 0 0 10,084 10,084
StructuresA 10-4820 MINOR STRUCTURAL IMPROVEMENTS-TOWN
OF CALEDON 0 350 0 350
A 10-4830 DERRY ROAD EAST STRUCTURES 0 1,300 0 1,300
A 11-4855 OLD CHURCH OVER CANADIAN PACIFIC RAILROAD
0 1,039 0 1,039
A 11-4860 CLAIRVILLE BRIDGE 0 2,175 0 2,175
A 11-4880 REPLACEMENT OF MAJOR CULVERT ON CHARLESTON SIDEROAD
0 180 0 180
A 12-4830 COOKSVILLE CREEK 0 200 0 200
5

2014 NEW CAPITAL DETAIL
TRANSPORTATION
SUMMARY III
2014 Financing Sources and Funding Status ($'000)
Project #Expense
FundingTotal
Project Name
Approved or Pending
External Internal DCA
2014 Funding Status:
2014(A/P)
Ward
A 13-4860 STEELES CANADIAN NATIONAL RAILWAY UNDERPASS
0 656 0 656
A 14-4800 CULVERTS PEEL 0 250 0 250
A 14-4810 DETAILED BRIDGE CONDITION SURVEYS PEEL 0 100 0 100
A 14-4815 BRIDGE AND CULVERT MANAGEMENT SYSTEM Peel 0 200 0 200
A 14-4820 4TH LINE WEST CALEDON OVER CREDIT RIVER 0 211 0 211
A 14-4830 QUEEN STREET WEST BRIDGE 0 274 0 274
A 14-4850 CANADIAN NATIONAL RAILWAY OVER DIXIE ROAD
0 1,050 0 1,050
A 14-4860 ERIN MILLS PARKWAY WALKWAY UNDERPASS SOUTH
0 197 0 197
A 14-4870 ERIN MILLS PARKWAY WALKWAY UNDERPASS NORTH
0 164 0 164
Pavement ManagementA 14-4600 PAVEMENT MANAGEMENT 0 15,000 0 15,000
Roadway Safety and Mitigation
6

2014 NEW CAPITAL DETAIL
TRANSPORTATION
SUMMARY III
2014 Financing Sources and Funding Status ($'000)
Project #Expense
FundingTotal
Project Name
Approved or Pending
External Internal DCA
2014 Funding Status:
2014(A/P)
Ward
A 13-4915 STREETSCAPING REHABILITATION IN CALEDON EAST
0 313 0 313
A 14-4400 TRAFFIC SIGNALS AND STREET LIGHTING PEEL 0 550 0 550
A 14-4405 VARIOUS SIGNAL PHASING UPDATES PEEL 0 100 100 200
A 14-4410 CENTRALIZED TRAFFIC CONTROL SYSTEM UPGRADES AND INTELLIGENT TRANSPORTATION SYSTEMS INITIATIVES
Peel 0 960 0 960
A 14-4420 TRANSIT SUPPORTIVE INITIATIVES - BOVAIRD DRIVE
0 0 641 641
A 14-4430 TRAFFIC SIGNAL COMPONENT REPLACEMENT 0 100 0 100
A 14-4435 TRAFFIC DATA COLLECTION AND ANALYSIS PEEL 0 13 238 251
A 14-4440 PEDESTRIAN COUNTDOWN SIGNALS 0 200 0 200
A 14-4510 NOISE ATTENUATION WALLS Peel 0 500 0 500
A 14-4515 NOISE ATTENUATION WALL INSPECTION AND ASSET MANAGEMENT
PEEL 0 100 0 100
A 14-4700 ROADSIDE SAFETY BARRIERS Peel 0 100 0 100
7

2014 NEW CAPITAL DETAIL
TRANSPORTATION
SUMMARY III
2014 Financing Sources and Funding Status ($'000)
Project #Expense
FundingTotal
Project Name
Approved or Pending
External Internal DCA
2014 Funding Status:
2014(A/P)
Ward
A 14-4710 NEW PAVEMENT MARKINGS AND SIGNS 0 200 0 200
A 14-4750 TRAFFIC SAFETY INITIATIVES 0 150 0 150
A 14-4900 LANDSCAPING PEEL 0 200 0 200
A 14-4904 STREETSCAPING IMPROVEMENTS IN THE VILLAGE OF ALTON
0 250 0 250
Roads StudiesA 14-4300 TRAFFIC ENGINEERING STUDIES PEEL 0 0 1,380 1,380
A 14-4310 ROAD PROGRAM PLANNING AND STUDIES PEEL 0 175 175 350
A 14-4380 WINSTON CHURCHILL BOULEVARD CLASS E.A. - HIGHWAY 401 TO EMBLETON ROAD
639 0 639 1,278
Accessible TransportationA 14-0245 TRANSHELP VEHICLE REPLACEMENT PEEL 0 591 0 591
A 14-0247 MAVIS YARD REDEVELOPMENT 0 5,000 0 5,000
A 14-0260 ACCESSIBLE TRANPORTATION STUDIES/SURVEY
0 150 0 150
Operating Capital - Other
8

2014 NEW CAPITAL DETAIL
TRANSPORTATION
SUMMARY III
2014 Financing Sources and Funding Status ($'000)
Project #Expense
FundingTotal
Project Name
Approved or Pending
External Internal DCA
2014 Funding Status:
2014(A/P)
Ward
A 14-4005 RESTORATION WORKS PEEL 0 100 0 100
A 14-4015 STORM SEWER REMEDIATION 0 350 0 350
A 14-4415 RED LIGHT CAMERA Peel 0 1,500 0 1,500
A 14-4450 IMPLEMENTATION OF THE ARTERIAL ROADS RATIONALIZATION REVIEW
0 300 0 300
Operating Capital - Transportation PlanningA 14-7711 TRANSPORTATION PLANNING STUDIES PEEL 0 198 144 342
A 14-7720 GOODS MOVEMENT PROGRAM Peel 0 408 408 816
2014Totals for Budget Year: 1,905 46,919 57,877 106,701
9

GrossDescriptionSub Type
Ten Year Combined Capital Program ($'000)
Yrs 6-1020182017201620152014
TRANSPORTATION
SUMMARY IV
TEN YEAR CAPITAL PLAN
GeneralMiscellaneous roads project.
150 0 0 0 0 0 150REGIONAL ROAD STORM SEWER DATA BASE AND MAPPING
09-4002
CREATION OF A DATA BASE OF ALLREGION ROAD STORM SEWER FOR THEPURPOSE OF PROACTIVE MAINTENANCEAND MANAGEMENT.
1,250 0 0 0 600 250 400SALT MANAGEMENT PROGRAM09-4120IMPLEMENTATION OF SALT MANAGEMENTINITIATIVES.
500 0 0 0 0 500 0SNOW STORAGE FACILITY13-4007DEVELOPMENT OF A FACILITY TOSTORE AND TREAT SNOW REMOVED FROMREGIONAL ROADS.
10,000 5,000 1,000 1,000 1,000 1,000 1,000UNALLOCATED FUNDING14-4000UNFORESEEN AND EMERGENCY WORKS.
19,000 9,500 1,900 1,900 1,900 1,900 1,900ACTIVE TRANSPORTATION INFRASTRUCTURE IMPROVEMENTS
14-4003
IMPLEMENTATION OF ACTIVETRANSPORTATION INFRASTRUCTURE ASOUTLINED IN THE ACTIVETRANSPORTATION PLAN.
1,500 0 0 0 0 0 1,500BADLANDS PARKING LOT14-4007CONSTRUCTION OF A VISITOR PARKINGLOT AT THE CALEDON CHELTENHAMBADLANDS.
969 195 93 189 159 231 102EMERALD ASH BORER TREATMENT AND TREE REMOVAL PROGRAM
14-4105
REMOVAL AND TREATMENT OF SPECIFICASH TREES WITHIN THE REGIONALRIGHT-OF WAY INFECTED BY EMERALDASH BORER INSECTS.
10

GrossDescriptionSub Type
Ten Year Combined Capital Program ($'000)
Yrs 6-1020182017201620152014
TRANSPORTATION
SUMMARY IV
TEN YEAR CAPITAL PLAN
7,092 3,939 2,525 0 628 0 0TRANSPORTATION INITIATIVES16-4001CONSTRUCTION OF THREE COMMUTERPARKING LOTS IN PEEL.
10 YearTotals For: RR General 5,052 3,881 4,287 3,089 5,518 18,634 40,461
Road ConstructionProperty acquistion, design, utility relocations, structures, roadwidenings and reconstructions.
15,398 0 0 0 0 15,398 0WINSTON CHURCHILL BOULEVARD - EMBLETON ROAD TO MAYFIELD ROAD
06-4015
TWO (2) LANE RECONSTRUCTION FROMEMBLETON ROAD TO MAYFIELD ROAD.
4,290 0 0 0 3,358 194 738WINSTON CHURCHILL BOULEVARD - 560M NORTH OF TERRA COTTA CONSERVATION ENTRANCE TO OLDE BASE LINE ROAD
09-4050
TWO (2), LANE RECONSTRUCTION FROM560 METRES NORTH OF THE TERRACOTTA CONSERVATION ENTRANCE TOOLDE BASE LINE ROAD.
27,639 0 0 0 26,713 926 0DIXIE ROAD - QUEEN STREET TO BOVAIRD DRIVE
10-4020
FOUR (4) TO SIX (6) LANE WIDENINGFROM QUEEN STREET EAST TO BOVAIRDDRIVE.
41,178 0 0 38,590 2,588 0 0MISSISSAUGA ROAD - BOVAIRD DRIVE TO MAYFIELD ROAD
10-4040
TWO (2) TO FOUR (4) LANE WIDENINGFROM BOVAIRD DRIVE TO MAYFIELDROAD.
7,510 0 0 0 7,510 0 0THE GORE ROAD - HIGHWAY 50 TO QUEEN STREET EAST
10-4070
TWO (2) TO (4) LANE WIDENING FROMHIGHWAY 50 TO QUEEN STREET EAST.
11

GrossDescriptionSub Type
Ten Year Combined Capital Program ($'000)
Yrs 6-1020182017201620152014
TRANSPORTATION
SUMMARY IV
TEN YEAR CAPITAL PLAN
17,714 0 0 0 15,728 1,986 0DIXIE ROAD - COUNTRYSIDE DRIVE TO 2 KM NORTH OF MAYFIELD ROAD
11-4020
TWO (2) TO FOUR (4) LANE WIDENINGFROM COUNTRYSIDE DRIVE TOMAYFIELD ROAD. AND TWO (2) TOFIVE (5) LANE WIDENING FROMMAYIELD ROAD TO 2 KM NORTHERLY.
37,129 0 30,977 0 0 6,152 0MAYFIELD ROAD - AIRPORT ROAD TO THE GORE ROAD AND THE GORE ROAD - BEAMISH COURT TO MAYFIELD ROAD
11-4075
TWO (2) TO FOUR (4) LANE WIDENINGON MAYFIELD ROAD FROM AIRPORTROAD TO THE GORE ROAD AND TWO (2)TO FOUR (4) WIDENING FROM BEAMISHCOURT TO MAYFIELD ROAD ANDRECONSTRUCTION OF THE GORE ROADFROM MAYFIELD ROAD TO 1 KM NORTHOF MAYFIELD ROAD.
52,265 39,860 0 0 4,970 6,599 836HIGHWAY 50 - CASTLEMORE ROAD TO MAYFIELD ROAD AND MAYFIELD ROAD FROM COLERAINE DRIVE TO HWY 50
11-4080
FIVE (5) TO SEVEN (7) LANEWIDENING FROM CASTLEMORE ROAD TOMAYFIELD ROAD AND TWO (2) TO FOURLANE WIDENING ON MAYFIELD ROADFROM COLERAINE DRIVE TO HWY 50.
1,835 0 0 0 0 0 1,835OLD CHURCH ROAD - EAST LEG OF MARILYN STREET TO INNIS LAKE ROAD
11-4090
TWO (2) LANE TO FOUR (4) LANEWIDENING OF OLD CHURCH ROAD FROMTHE EAST LEG OF MARILYN STEET TOINNIS LAKE ROAD.
16,390 0 0 0 0 14,890 1,500BOVAIRD DRIVE - LAKE LOUISE DRIVE/WORTHINGTON AVENUE TO MISSISSAUGA ROAD
12-4040
TWO (2) TO FOUR (4) LANE WIDENINGFROM LAKE LOUISEDRIVE/WORTHINGTON AVENUE TOMISSISSAUGA ROAD.
12

GrossDescriptionSub Type
Ten Year Combined Capital Program ($'000)
Yrs 6-1020182017201620152014
TRANSPORTATION
SUMMARY IV
TEN YEAR CAPITAL PLAN
11,877 0 0 0 9,822 0 2,055THE GORE ROAD - PATTERSON SIDE ROAD TO HIGHWAY 9
12-4085
TWO (2) LANE RECONSTRUCTION AND/OR PAVEMENT REHABILITATION OFTHE GORE ROAD FROM PATTERSON SIDEROAD TO HIGHWAY 9.
22,170 0 14,795 1,617 5,758 0 0MAYFIELD ROAD - HURONTARIO STREET TO CHINGUACOUSY ROAD
13-4055
TWO (2) TO FOUR (4) LANE WIDENINGFROM HURONTARIO STREET TOCHINGUACOUSY ROAD.
29,246 19,146 0 2,101 0 7,999 0MAYFIELD ROAD - THE GORE ROAD TO COLERAINE DRIVE
13-4065
TWO (2) TO FOUR (4) LANE WIDENINGFROM THE GORE ROAD TO COLERAINEDRIVE.
2,397 0 0 0 2,084 0 313AIRPORT ROAD URBANIZATION - COUNTRYSIDE DRIVE TO MAYFIELD ROAD
14-4009
URBANIZATION OF AIRPORT ROAD FROMCOUNTRYSIDE DRIVE TO MAYFIELDROAD. DESIGN IN 2014.
23,961 0 0 18,748 2,314 0 2,899DIXIE ROAD - BOVAIRD DRIVE TO COUNTRYSIDE DRIVE
14-4020
FOUR (4) TO SIX (6) LANE WIDENINGFROM BOVAIRD DRIVE TO COUNTRYSIDEDRIVE. DESIGN IN 2014.
25,406 18,520 3,069 0 0 0 3,817AIRPORT ROAD - 1000 M NORTH OF MAYFIELD ROAD TO KING STREET
14-4030
TWO (2) TO FIVE (5) LANE WIDENINGFROM 1.0 KM NORTH OF MAYFIELDROAD TO KING STREET. DESIGN ANDPROPERTY ACQUISITION IN 2014.
21,423 0 16,508 2,101 0 0 2,814STEELES AVENUE - CHINGUACOUSY ROAD TO MISSISSAUGA ROAD
14-4035
FOUR (4) TO SIX (6) LANE WIDENINGFROM CHINGUACOUSY ROAD TOMISSISSAUGA ROAD. DESIGN IN 2014.
13

GrossDescriptionSub Type
Ten Year Combined Capital Program ($'000)
Yrs 6-1020182017201620152014
TRANSPORTATION
SUMMARY IV
TEN YEAR CAPITAL PLAN
13,940 0 0 10,956 1,626 0 1,358WINSTON CHURCHILL BOULEVARD AND OLDE BASE LINE ROAD FROM BUSH STREET TO MISSISSAUGA ROAD
14-4045
TWO (2) LANE RECONSTRUCTION AND/OR PAVEMENT REHABILITATION OFWINSTON CHURCHILL BOULEVARD ANDOLDE BASE LINE ROAD FROM BUSHSTREET TO MISSISSAUGA ROAD.DESIGN IN 2014.
12,648 9,599 0 744 658 0 1,647BUSH STREET AND MISSISSAUGA ROAD FROM WINSTON CHURCHILL BOULEVARD TO OLDE BASE LINE ROAD
14-4065
TWO (2) LANE RECONSTRUCTION AND/OR PAVEMENT REHABILITATION OFBUSH STREET AND MISSISSAUGA ROADFROM WINSTON CHURCHILL BOULEVARDTO OLDE BASE LINE ROAD. DESIGN IN2014.
21,544 0 0 0 0 0 21,544PROPERTY ACQUISITION ENVELOPE14-4100EFUNDING FOR THE PURPOSE OFACQUIRING PROPERTY FORDEVELOPMENT CHARGES FUNDEDPROJECTS.
10,000 5,000 1,000 1,000 1,000 1,000 1,000UNDER MAINTENANCE ENVELOPE14-4103EFUNDS FOR THE PURPOSE OF FUNDINGOUTSTANDING DEFICIENCIES IN AROADS CAPITAL PROJECT DURING THEWARRANTY PERIOD.
19,076 14,534 1,500 427 0 2,615 0CAWTHRA ROAD - QUEEN ELIZABETH WAY TO DUNDAS STREET
15-4030
FOUR (4) TO SIX (6) LANE WIDENINGFROM QUEEN ELIZABETH WAY TODUNDAS STREET. DEPENDENT UPONRESULTS OF FEASIBILTY STUDY.
14

GrossDescriptionSub Type
Ten Year Combined Capital Program ($'000)
Yrs 6-1020182017201620152014
TRANSPORTATION
SUMMARY IV
TEN YEAR CAPITAL PLAN
22,056 18,182 0 1,536 0 2,338 0WINSTON CHURCHILL BOULEVARD - 2.0 KM SOUTH OF EMBLETON ROAD TO POTENTIAL BY-PASS
15-4040
TWO (2) TO FOUR (4) LANE WIDENINGFROM 2.0 KM SOUTH OF EMBLETONROAD TO POTENTIAL BY-PASS.
6,351 5,503 0 0 0 848 0WINSTON CHURCHILL BOULEVARD - HIGHWAY 401 TO STEELES AVENUE
15-4060
FOUR (4) TO SIX (6) LANE WIDENINGFROM HIGHWAY 401 TO STEELESAVENUE.
30,758 18,127 2,101 7,835 0 2,695 0MAYFIELD ROAD - CHINGUACOUSY ROAD TO MISSISSAUGA ROAD
15-4070
TWO (2) TO FOUR (4) LANE WIDENINGFROM CHINGUACOUSY ROAD TOMISSISSAUGA ROAD.
30,762 23,008 0 4,363 0 3,391 0THE GORE ROAD - QUEEN STREET EAST TO COTTRELLE BOULEVARD
15-4080
FOUR (4) TO SIX (6) LANE WIDENINGFROM QUEEN STREET EAST TOCOTTRELLE BOULEVARD.
18,357 15,909 0 0 2,448 0 0STEELES AVENUE - MISSISSAUGA ROAD TO WINSTON CHURCHILL BOULEVARD
16-4020
FOUR (4) TO SIX (6) LANE WIDENINGFROM MISSISSAUGA ROAD TO WINSTONCHURCHILL BOULEVARD.
14,154 12,396 0 0 1,758 0 0THE GORE ROAD - COTTRELLE BOULEVARD TO CASTLEMORE ROAD
16-4030
FOUR (4) TO SIX (6) LANE WIDENINGFROM COTTRELLE BOULEVARD TOCASTLEMORE ROAD.
20,152 17,487 0 0 2,665 0 0MISSISSAUGA ROAD - FINANCIAL DRIVE TO QUEEN STREET
16-4060
FOUR (4) TO SIX (6) LANE WIDENINGFROM FINANCIAL DRIVE TO QUEENSTREET. DEPENDENT UPON RESULTS OFFEASIBILITY STUDIES.
15

GrossDescriptionSub Type
Ten Year Combined Capital Program ($'000)
Yrs 6-1020182017201620152014
TRANSPORTATION
SUMMARY IV
TEN YEAR CAPITAL PLAN
16,227 14,979 0 1,248 0 0 0MAYFIELD ROAD - DIXIE ROAD TO BRAMALEA ROAD
17-4020
FOUR (4) TO SIX (6) LANE WIDENINGFROM DIXIE ROAD TO BRAMALEA ROAD.
29,966 18,251 9,319 2,396 0 0 0MAYFIELD ROAD - MISSISSAUGA ROAD TO WINSTON CHURCHILL BOULEVARD
17-4030
TWO (2) TO FOUR (4) LANE WIDENINGFROM MISSISSAUGA ROAD TO WINSTONCHURCHILL BOULEVARD.
21,134 18,325 0 2,809 0 0 0AIRPORT ROAD - KING STREET TO OLDE BASE LINE ROAD
17-4060
TWO (2) TO FIVE (5) LANE WIDENINGFROM KING STREET TO OLDE BASELINE ROAD.
19,058 16,579 2,479 0 0 0 0MISSISSAUGA ROAD - QUEEN STREET TO BOVAIRD DRIVE
18-4020
FOUR (4) TO SIX (6) LANE WIDENINGFROM QUEEN STREET TO BOVAIRDDRIVE.
22,727 20,127 2,600 0 0 0 0MAYFIELD ROAD - HEARTLAKE ROAD TO HURONTARIO STREET
18-4030
FOUR (4) TO SIX (6) LANE WIDENINGFROM HEARTLAKE ROAD TO HURONTARIOSTREET.
29,135 25,851 3,284 0 0 0 0BOVAIRD DRIVE - MISSISSAUGA ROAD TO 1.5 KM WEST OF HERITAGE ROAD
18-4040
TWO (2) TO FOUR (4) LANE WIDENINGFROM MISSISSUAGA ROAD TO 1.5 KMWEST OF HERITAGE ROAD.
24,263 21,945 2,318 0 0 0 0MAYFIELD ROAD - BRAMALEA ROAD TO AIRPORT ROAD
18-4050
FOUR (4) TO SIX (6) LANE WIDENINGFROM BRAMALEA ROAD TO AIRPORTROAD.
16

GrossDescriptionSub Type
Ten Year Combined Capital Program ($'000)
Yrs 6-1020182017201620152014
TRANSPORTATION
SUMMARY IV
TEN YEAR CAPITAL PLAN
128,109 128,109 0 0 0 0 0FUTURE CONSTRUCTION PROJECTS19-4010ALLOCATION FOR FUTURE PROJECTS
10 YearTotals For: RR Construction 42,356 67,031 91,000 96,471 89,950 481,437 868,245
IntersectionsNew intersections and improvements to existing intersections.
1,275 0 0 0 0 0 1,275DERRY ROAD/GOREWAY DRIVE07-4260NORTHBOUND AND SOUTHBOUND DUALLEFT TURN LANES AND EASTBOUNDRIGHT TURN LANE. ADDITIONALFUNDING.
600 0 0 0 0 0 600DERRY ROAD/MCLAUGHLIN ROAD10-4265SOUTH BOUND DUAL LEFT TURN LANES.ADDITIONAL FUNDS FOR PROPERTYACQUISITION.
1,545 0 0 1,545 0 0 0ERIN MILLS PARKWAY/BURNHAMTHORPE ROAD
11-4250
SOUTH BOUND DUAL LEFT TURN LANES.
3,539 0 3,539 0 0 0 0DERRY ROAD/ARGENTIA ROAD11-4295SOUTH BOUND RIGHT, NORTH BOUND ,SOUTH BOUND AND WEST BOUND DUALLEFT TURN LANES.
1,150 575 115 115 115 115 115PRE-ENGINEERING AND DESIGN14-4200FUNDING FOR PRE-ENGINEERING ANDDESIGN OF REQUIRED WORKSSCHEDULED FOR THE FOLLOWING YEAR.
2,105 0 0 0 0 0 2,105AIRPORT ROAD/SANDALWOOD_HUMBERWEST PARKWAY
14-4250
ROAD RELATED WORKS ON AIRPORTROAD IN CONJUNCTION WITH THE CITYOF BRAMPTON'S WIDENING OFSANDALWOOD PARKWAY. REGIONALCONTRIBUTION.
17
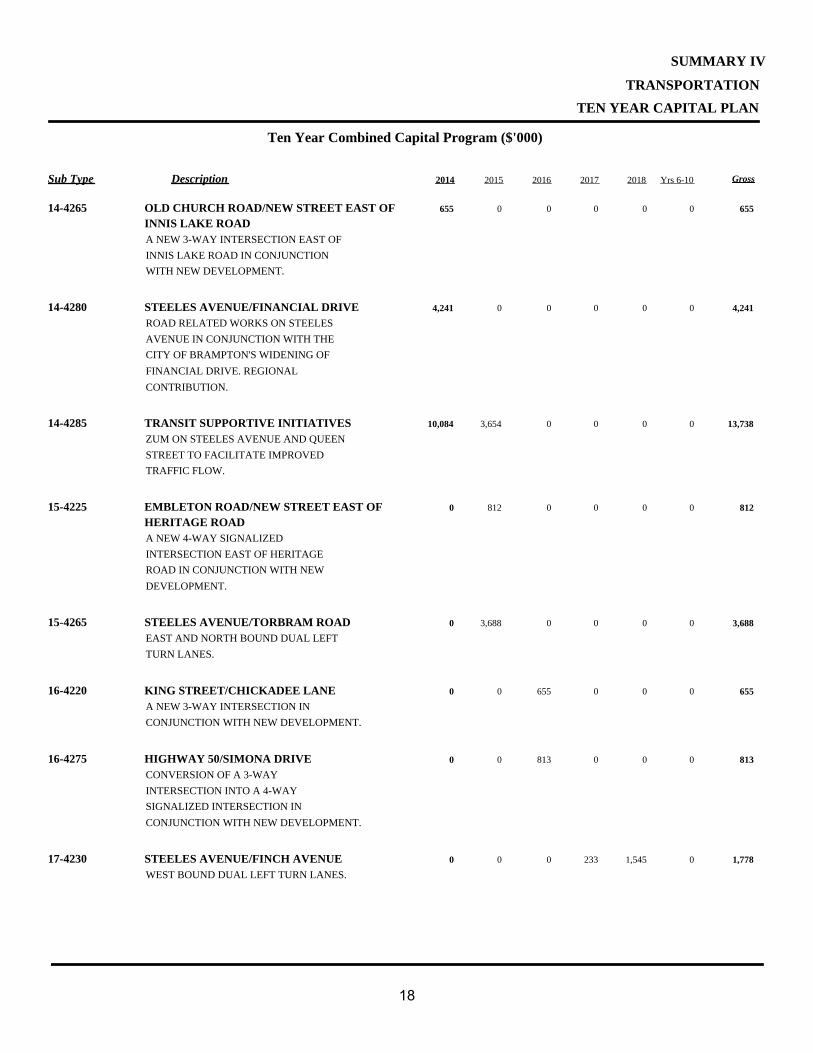
GrossDescriptionSub Type
Ten Year Combined Capital Program ($'000)
Yrs 6-1020182017201620152014
TRANSPORTATION
SUMMARY IV
TEN YEAR CAPITAL PLAN
655 0 0 0 0 0 655OLD CHURCH ROAD/NEW STREET EAST OF INNIS LAKE ROAD
14-4265
A NEW 3-WAY INTERSECTION EAST OFINNIS LAKE ROAD IN CONJUNCTIONWITH NEW DEVELOPMENT.
4,241 0 0 0 0 0 4,241STEELES AVENUE/FINANCIAL DRIVE14-4280ROAD RELATED WORKS ON STEELESAVENUE IN CONJUNCTION WITH THECITY OF BRAMPTON'S WIDENING OFFINANCIAL DRIVE. REGIONALCONTRIBUTION.
13,738 0 0 0 0 3,654 10,084TRANSIT SUPPORTIVE INITIATIVES14-4285ZUM ON STEELES AVENUE AND QUEENSTREET TO FACILITATE IMPROVEDTRAFFIC FLOW.
812 0 0 0 0 812 0EMBLETON ROAD/NEW STREET EAST OF HERITAGE ROAD
15-4225
A NEW 4-WAY SIGNALIZEDINTERSECTION EAST OF HERITAGEROAD IN CONJUNCTION WITH NEWDEVELOPMENT.
3,688 0 0 0 0 3,688 0STEELES AVENUE/TORBRAM ROAD15-4265EAST AND NORTH BOUND DUAL LEFTTURN LANES.
655 0 0 0 655 0 0KING STREET/CHICKADEE LANE16-4220A NEW 3-WAY INTERSECTION INCONJUNCTION WITH NEW DEVELOPMENT.
813 0 0 0 813 0 0HIGHWAY 50/SIMONA DRIVE16-4275CONVERSION OF A 3-WAYINTERSECTION INTO A 4-WAYSIGNALIZED INTERSECTION INCONJUNCTION WITH NEW DEVELOPMENT.
1,778 0 1,545 233 0 0 0STEELES AVENUE/FINCH AVENUE17-4230WEST BOUND DUAL LEFT TURN LANES.
18

GrossDescriptionSub Type
Ten Year Combined Capital Program ($'000)
Yrs 6-1020182017201620152014
TRANSPORTATION
SUMMARY IV
TEN YEAR CAPITAL PLAN
1,459 0 0 1,459 0 0 0MISSISSAUGA ROAD/NEW STREETS17-4240SOUTH BOUND RIGHT TURN LANES,(4), NORTH OF STEELES AVENUE INCONJUNCTION WITH NEW DEVELOPMENT.
655 0 0 655 0 0 0WINSTON CHURCHILL BOULEVARD/NEW COLLECTOR ROAD
17-4250
A NEW 3-WAY SIGNALIZEDINTERSECTION NORTH OF EMBLETONROAD IN CONJUNCTION WITH NEWDEVELOPMENT.
855 0 0 855 0 0 0AIRPORT ROAD/INTERMODAL DRIVE17-4255ROAD RELATED WORKS ON AIRPORTROAD IN CONJUNCTION WITH THE CITYOF BRAMPTON'S WIDENING OFINTERMODAL DRIVE. REGIONALCONTRIBUTION.
817 0 0 817 0 0 0AIRPORT ROAD SOUTH OF MAYFIELD ROAD
17-4260
CONSTRUCTION OF A NEW 3-WAYINTERSECTION PLUS SIGNALIZATION.
2,351 1,545 806 0 0 0 0MISSISSAUGA ROAD/ARGENTIA ROAD18-4220EAST BOUND DUAL LEFT TURN LANES.
759 0 759 0 0 0 0EMBLETON ROAD/COLLECTOR ROAD18-4225A NEW SIGNALIZED INTERSECTION INBRAMWEST IN CONJUNCTION WITH NEWDEVELOPMENT.
1,777 1,544 233 0 0 0 0HIGHWAY 50/CASTLEMORE ROAD18-4230SOUTH BOUND DUAL LEFT TURN LANES.
654 0 654 0 0 0 0HIGHWAY 50/COLLECTOR ROAD18-4235A NEW 3-WAY SIGNALIZEDINTERSECTION BETWEEN COUNTRYSIDEROAD AND MAYFIELD ROAD INCONJUNCTION WITH NEW DEVELOPMENT.
19

GrossDescriptionSub Type
Ten Year Combined Capital Program ($'000)
Yrs 6-1020182017201620152014
TRANSPORTATION
SUMMARY IV
TEN YEAR CAPITAL PLAN
655 0 655 0 0 0 0WINSTON CHURCHILL BLVD/COLLECTOR ROAD
18-4245
A NEW 3-WAY SIGNALIZEDINTERSECTION BETWEEN EMBLETONROAD AND HALTON 10 SIDE ROAD INCONJUNCTION WITH NEW DEVELOPMENT.
833 546 287 0 0 0 0STEELES AVENUE/TOMKEN ROAD18-4250NORTH BOUND RIGHT TURN LANE.
687 0 687 0 0 0 0WINSTON CHURCHILL BLVD/NEW COLLECTOR ROAD
18-4255
A NEW 3-WAY SIGNALIZEDINTERSECTION BETWEEN LAKESHOREBLVD AND ROYAL WINDSOR DRIVE INCONJUNCTION WITH NEW DEVELOPMENT.
1,425 0 1,425 0 0 0 0QUEEN STREET/TORBRAM ROAD18-4260ROAD RELATED WORKS ON QUEENSTREET IN CONJUNCTION WITH THECITY OF BRAMPTON'S WIDENING OFTORBRAM ROAD. REGIONALCONTRIBUTION.
2,279 0 2,279 0 0 0 0KENNEDY ROAD/WILLIAMS PARKWAY18-4265ROAD RELATED WORKS ON KENNEDYROAD IN CONJUNCTION WITH THE CITYOF BRAMPTON'S WIDENING OFWILLIAMS PARKWAY. REGIONALCONTRIBUTION.
16,621 16,621 0 0 0 0 0FUTURE INTERSECTION IMPROVEMENTS19-4205ALLOCATIONS FOR FUTURE PROJECTS.
10 YearTotals For: RR Intersection Imp. 19,075 8,269 1,583 5,679 12,984 20,831 68,421
StructuresBridge and culvert repairs and replacements.
20

GrossDescriptionSub Type
Ten Year Combined Capital Program ($'000)
Yrs 6-1020182017201620152014
TRANSPORTATION
SUMMARY IV
TEN YEAR CAPITAL PLAN
350 0 0 0 0 0 350MINOR STRUCTURAL IMPROVEMENTS-TOWN OF CALEDON
10-4820
MINOR STRUCTURAL UPGRADES TOPRE-EMPT MAJOR STRUCTURALREPAIRS. QUEEN STREET OVER CREDITRIVER - ALTON # 1360490,CHARLESTON SIDE ROAD ATWILLOUGHBY ROAD # 240940,CENTREVILLE CREEK ON OLD CHURCHROAD EAST OF AIRPORT ROAD #220510, AND HIGHWAY 50 OVERHUMBER - PALGRAVE # 502870.ADDITIONAL FUNDING.
1,300 0 0 0 0 0 1,300DERRY ROAD EAST STRUCTURES10-4830LOCATED ON DERRY ROAD BETWEENGOREWAY DRIVE AND PROFESSIONALCOURT/LEGION ROAD.REHABILITATION OF STRUCTURE #050140, LOCATED 0.35KM WEST OFGOREWAY DRIVE AND STRUCTURE #050120, LOCATED 0.2KM WEST OFGOREWAY DRIVE. ADDITIONAL FUNDING.
1,039 0 0 0 0 0 1,039OLD CHURCH OVER CANADIAN PACIFIC RAILROAD
11-4855
LOCATED ON OLD CHURCH ROAD, 0.5KMWEST OF REGIONAL ROAD 50.REHABILITATION OF STRUCTURE #220050.
2,175 0 0 0 0 0 2,175CLAIRVILLE BRIDGE11-4860LOCATED ON STEELES AVENUE EAST0.4 KM WEST OF HIGHWAY 50.REHABILITATION OF STRUCTURES #150040 N/S.
180 0 0 0 0 0 180REPLACEMENT OF MAJOR CULVERT ON CHARLESTON SIDEROAD
11-4880
REPLACEMENT OF MAJOR CULVERT ONCHARLESTON SIDEROAD, EAST OFSAINT ANDREW'S ROAD. ADDITIONALFUNDING.
21

GrossDescriptionSub Type
Ten Year Combined Capital Program ($'000)
Yrs 6-1020182017201620152014
TRANSPORTATION
SUMMARY IV
TEN YEAR CAPITAL PLAN
200 0 0 0 0 0 200COOKSVILLE CREEK12-4830LOCATED ON THE QUEENSWAY AVENUE,0.31 KM EAST OF HURONTARIOSTREET. REHABILITATION OFSTRUCTURE # 200490.
656 0 0 0 0 0 656STEELES CANADIAN NATIONAL RAILWAY UNDERPASS
13-4860
LOCATED ON STEELES AVENUE, EASTOF AIRPORT ROAD. REHABILITATIONOF STRUCTURE #150300.
2,495 0 0 0 0 2,495 0CEDAR MILLS SOUTH ARCH13-4870LOCATED ON HIGHWAY 50, 0.1 KMSOUTH OF OLD CHURCH ROAD.REHABILITATION OF STRUCTURE #502371.
2,079 0 0 0 0 2,079 0CEDAR MILLS NORTH ARCH13-4880LOCATED ON HIGHWAY 50, 0.01 KMSOUTH OF OLD CHURCH ROAD.REHABILITATION OF STRUCTURE #502380.
2,500 1,250 250 250 250 250 250CULVERTS14-4800REPAIRS AND REPLACEMENTS.
1,000 500 100 100 100 100 100DETAILED BRIDGE CONDITION SURVEYS14-4810DETAILED CONDITION SURVEYS ANDDESIGN OF BRIDGES SCHEDULED FORTHE FOLLOWING YEAR.
1,000 400 200 0 200 0 200BRIDGE AND CULVERT MANAGEMENT SYSTEM
14-4815
INSPECTIONS OF STRUCTURES ANDUPDATES TO THE BRIDGE MANAGEMENTSYSTEM.
22

GrossDescriptionSub Type
Ten Year Combined Capital Program ($'000)
Yrs 6-1020182017201620152014
TRANSPORTATION
SUMMARY IV
TEN YEAR CAPITAL PLAN
1,267 0 0 0 1,056 0 2114TH LINE WEST CALEDON OVER CREDIT RIVER
14-4820
LOCATED ON MISSISSAUGA ROAD, 0.55KM NORTH OF KING STREET.REHABILITATION OF STRUCTURE #013320.
1,642 0 0 0 1,368 0 274QUEEN STREET WEST BRIDGE14-4830LOCATED ON QUEEN STREET WEST,0.13 KM EAST OF MCLAUGHLIN ROAD.REHABILITATION OF STRUCTURE#060060.
1,050 0 0 0 0 0 1,050CANADIAN NATIONAL RAILWAY OVER DIXIE ROAD
14-4850
LOCATED ON DIXIE ROAD, 0.40 KMNORTH OF LAKESHORE BLVD.REHABILITATION OF STRUCTURE #040040.
1,182 0 0 0 985 0 197ERIN MILLS PARKWAY WALKWAY UNDERPASS SOUTH
14-4860
LOCATED ON ERIN MILLS PARKWAY,0.46 KM NORTH OF DUNDAS STREET.REHABILITATION OF STRUCTURE#010220.
985 0 0 0 821 0 164ERIN MILLS PARKWAY WALKWAY UNDERPASS NORTH
14-4870
LOCATED ON ERIN MILLS PARKWAY,0.1 KM NORTH OF BURNHAMTHORPEROAD WEST. REHABILITATION OFSTRUCTURE #010370.
2,673 0 0 2,136 0 537 0KING STREET OVER THE HUMBER RIVER15-4830LOCATED ON KING STREET EAST, 0.55KM EAST OF HWY 50.REHABILITATION OF STRUCTURE#090140.
23

GrossDescriptionSub Type
Ten Year Combined Capital Program ($'000)
Yrs 6-1020182017201620152014
TRANSPORTATION
SUMMARY IV
TEN YEAR CAPITAL PLAN
886 0 0 709 0 177 0KING STREET EAST OF UNION STREET15-4840LOCATED ON KING STREET, 0.5 KMEAST OF UNION STREET.REHABILITATION OF STRUCTURE #090120.
3,667 0 0 3,334 0 333 0CANADIAN PACIFIC RAILWAY OVER DIXIE ROAD
15-4880
LOCATED ON DIXIE ROAD, 0.5KMSOUTH OF DUNDAS STREET.REHABILITATION OF STRUCTURE#040360.
2,084 0 0 0 0 2,084 0BOVAIRD DRIVE CULVERT15-4890LOCATED ON BOVAIRD DRIVE, 1 KMWEST OF HERITAGE ROAD.REHABILITATION OF CULVERT.
3,453 0 2,765 0 688 0 0QUEEN STREET EAST OVER HUMBER RIVER TRIBUTARY
16-4830
LOCATED ON QUEEN STREET EAST,0.35 KM WEST OF HWY 50.REHABILITATION OF STRUCTURE #1070020.
1,376 0 1,100 0 276 0 0AIRPORT ROAD OVER CANADIAN NATIONAL RAILWAY
16-4840
LOCATED ON AIRPORT ROAD, 0.45 KMNORTH OF THAMESGATE DRIVE.REHABILITATION OF STRUCTURE #070610.
729 625 0 104 0 0 0CHARLESTON SIDEROAD OVER CREDIT RIVER BRIDGE
17-4850
LOCATED ON CHARLESTON SIDEROAD,0.45 KM WEST OF MCLAREN ROAD.REHABILITATION OF STRUCTURE #241120.
24

GrossDescriptionSub Type
Ten Year Combined Capital Program ($'000)
Yrs 6-1020182017201620152014
TRANSPORTATION
SUMMARY IV
TEN YEAR CAPITAL PLAN
2,319 0 2,319 0 0 0 0AIRPORT ROAD OVER MIMICO CREEK TRIBUTARY
18-4810
LOCATED ON AIRPORT ROAD 0.7 KMNORTH OF STEELES AVENUE EAST.REHABILITATION OF STRUCTURE #070770.
24,372 24,372 0 0 0 0 0FUTURE STRUCTURAL REHABILITATION PROJECTS
19-4800
ALLOCATIONS FOR FUTURE STRUCTUREREHABILITATION PROJECTS.
10 YearTotals For: RR Structures 8,346 8,055 5,744 6,633 6,734 27,147 62,659
Pavement ManagementRoad resurfacing and crack sealing.
150,000 75,000 15,000 15,000 15,000 15,000 15,000PAVEMENT MANAGEMENT14-4600FUNDING FOR THE PURPOSE OFMAINTAINING THE REGIONAL ROADSYSTEM IN "GOOD STATE OF REPAIR".
10 YearTotals For: RR Pavement Mgmt. 15,000 15,000 15,000 15,000 15,000 75,000 150,000
Roadway Safety and MitigationTraffic signals, street lighting, roadside safety devices, noiseattenuation walls and landscaping improvements.
313 0 0 0 0 0 313STREETSCAPING REHABILITATION IN CALEDON EAST
13-4915
STREETSCAPING REPAIRS IN CALEDONEAST ON AIRPORT ROAD AND OLDCHURCH ROAD. ADDITIONAL FUNDING.
5,500 2,750 550 550 550 550 550TRAFFIC SIGNALS AND STREET LIGHTING14-4400ANNUAL INSTALLATIONS OF TRAFFICSIGNALS AND STREET LIGHTING.
2,000 1,000 200 200 200 200 200VARIOUS SIGNAL PHASING UPDATES14-4405INSTALLATION OF NEW ADVANCE GREENPHASES, TRAFFIC AND PEDESTRIANWARNING AND CONTROL SIGNALSTHROUGHOUT PEEL.
25

GrossDescriptionSub Type
Ten Year Combined Capital Program ($'000)
Yrs 6-1020182017201620152014
TRANSPORTATION
SUMMARY IV
TEN YEAR CAPITAL PLAN
3,850 1,925 0 0 0 965 960CENTRALIZED TRAFFIC CONTROL SYSTEM UPGRADES AND INTELLIGENT TRANSPORTATION SYSTEMS INITIATIVES
14-4410
UPGRADES TO THE CENTRALIZEDTRAFFIC SYSTEMS AND INTELLIGENTTRANSPORTATION SYSTEMSINITIATIVES.
641 0 0 0 0 0 641TRANSIT SUPPORTIVE INITIATIVES - BOVAIRD DRIVE
14-4420
SIGNAL UPGRADES ON BOVAIRD DRIVETO FACILITATE IMPROVED TRAFFICFLOW.
200 0 0 0 0 100 100TRAFFIC SIGNAL COMPONENT REPLACEMENT
14-4430
FUNDING FOR THE PURPOSE OFMAINTAINING CONTROLLER ANDCABINET COMPONENTS IN "GOOD STATEOF REPAIR".
2,510 1,255 251 251 251 251 251TRAFFIC DATA COLLECTION AND ANALYSIS
14-4435
COLLECTION AND ANALYSIS OFTRAFFIC DATA RELATED TO GROWTH.
400 0 0 0 0 200 200PEDESTRIAN COUNTDOWN SIGNALS14-4440INSTALLATION OF PEDESTRIANCOUNTDOWNS AT SIGNALIZEDINTERSECTIONS.
5,000 2,500 500 500 500 500 500NOISE ATTENUATION WALLS14-4510REPLACEMENTS AND MAJOR REPAIRS.
500 200 100 0 100 0 100NOISE ATTENUATION WALL INSPECTION AND ASSET MANAGEMENT
14-4515
INSPECTIONS AND EVALUATIONS OFNOISE ATTENUATION WALLS TO UPDATETHE ROADS ASSET DATABASE.
26

GrossDescriptionSub Type
Ten Year Combined Capital Program ($'000)
Yrs 6-1020182017201620152014
TRANSPORTATION
SUMMARY IV
TEN YEAR CAPITAL PLAN
1,000 500 100 100 100 100 100ROADSIDE SAFETY BARRIERS14-4700UPGRADES/REPLACEMENT AND NEWINSTALLATION OF ROAD SIDE SAFETYBARRIERS.
2,000 1,000 200 200 200 200 200NEW PAVEMENT MARKINGS AND SIGNS14-4710IMPLEMENTATION OF NEW PAVEMENTMARKING TECHNOLOGIES/MATERIALSAND SIGNS THROUGHOUT PEEL.
1,500 750 150 150 150 150 150TRAFFIC SAFETY INITIATIVES14-4750IMPLEMENTATION OF TRAFFIC SAFETYINITIATIVES AND ENHANCEMENTS.
2,000 1,000 200 200 200 200 200LANDSCAPING14-4900RETROFIT AND MAJOR MAINTENANCE.
250 0 0 0 0 0 250STREETSCAPING IMPROVEMENTS IN THE VILLAGE OF ALTON
14-4904
STREETSCAPING IMPROVEMENTS IN THEVILLAGE OF ALTON.
532 376 0 0 156 0 0GROWTH RELATED TRAFFIC SIGNAL INSTALLATIONS
16-4420
INSTALLATION OF TRAFFIC SIGNALSDUE TO GROWTH.
10 YearTotals For: RR Safety & Mitig. 4,715 3,416 2,407 2,151 2,251 13,256 28,196
Roads StudiesEngineering planning and studies.
13,800 6,900 1,380 1,380 1,380 1,380 1,380TRAFFIC ENGINEERING STUDIES14-4300ALLOCATIONS TO UNDERTAKE TRAFFICENGINEERING STUDIES.
3,500 1,750 350 350 350 350 350ROAD PROGRAM PLANNING AND STUDIES14-4310CAPITAL PROGRAMMING AND STUDIES.
27

GrossDescriptionSub Type
Ten Year Combined Capital Program ($'000)
Yrs 6-1020182017201620152014
TRANSPORTATION
SUMMARY IV
TEN YEAR CAPITAL PLAN
1,278 0 0 0 0 0 1,278WINSTON CHURCHILL BOULEVARD CLASS E.A. - HIGHWAY 401 TO EMBLETON ROAD
14-4380
FROM HIGHWAY 401 TO EMBLETON ROAD.
600 300 0 0 0 300 0DEVELOPMENT CHARGES UPDATE15-4320FUNDING FOR THE PREPARATION OFTHE REGIONAL DEVELOPMENT CHARGESUPDATE.
748 0 0 0 0 748 0MISSISSAUGA ROAD CLASS E.A. - FINANCIAL DRIVE TO BOVAIRD DRIVE (4-6)
15-4350
FROM FINANCIAL DRIVE TO BOVAIRDDRIVE. DEPENDENT UPON RESULTS OFFEASIBILTY STUDIES.
957 0 0 0 0 957 0AIRPORT ROAD CLASS E.A. - KING STREET TO OLDE BASE LINE ROAD (2-5)
15-4360
FROM KING STREET TO OLDE BASELINE ROAD.
3,418 3,418 0 0 0 0 0FUTURE STUDIES AND ENVIRONMENTAL ASSESSMENTS
19-4305
ALLOCATIONS FOR FUTURE PROJECTS.
10 YearTotals For: RR Studies 3,008 3,735 1,730 1,730 1,730 12,368 24,301
Accessible Transportation
9,618 4,710 1,208 1,105 1,002 1,002 591TRANSHELP VEHICLE REPLACEMENT14-0245REPLACEMENT OF BUSES FUNDED INPART BY THE FEDERAL GAS TAX ANDONTARIO BUS REPLACEMENT PROGRAM.
5,000 0 0 0 0 0 5,000MAVIS YARD REDEVELOPMENT14-0247REBUIDLING OF MAVIS TO ACOMMODATEACCESSIBLE TRANSPORTATIONOPERATIONS. FUNDED BY FEDERAL GASTAX.
28

GrossDescriptionSub Type
Ten Year Combined Capital Program ($'000)
Yrs 6-1020182017201620152014
TRANSPORTATION
SUMMARY IV
TEN YEAR CAPITAL PLAN
550 200 100 0 0 100 150ACCESSIBLE TRANPORTATION STUDIES/SURVEY
14-0260
TO PROVIDE STUDIES ON ACCESSIBLETRANSPORTATION SERVICES IN PEELAND ASSIST WITH PROGRAM PLANNINGAND CONDUCT A CUSTOMERSATISFACTION SURVEY ASRECOMMENDED BY THE ACCESSIBLETRANPORTATION ADVISORY COMMITTEEIN THE 2010 ANNUAL REPORT.
1,570 105 105 105 1,150 105 0RED CROSS FLEET - ACCESSIBILITY BROKERAGE MODEL
15-0243
PURCHASE AND REPLACEMENT OF REDCROSS DIALYSIS FLEET UNDER THEFAMILY OF SERVICES MODEL FUNDEDBY THE FEDERAL GAS TAX ALLOCATION.
1,150 209 209 209 314 209 0PASSENGER ASSISTANCE PROGRAM - ACCESSIBILITY BROKERAGE MODEL
15-0244
BUSES FOR THE PASSENGERASSISTANCE PROGRAM UNDER THEFAMILY OF SERVICES MODEL FUNDEDBY THE FEDERAL GAS TAX ALLOCATION.
1,180 708 0 236 0 236 0TRANSHELP SPARE BUS FLEET15-0246SPARE BUSES TO BE ROTATED WITHINTHE FLEET TO FACILITATE ROUTINEMAINTENANCE.
6,134 3,465 693 693 693 590 0TRANSHELP VEHICLE PURCHASE15-0248PURCHASE OF GROWTH VEHICLES.
665 285 190 95 0 95 0CALEDON COMMUNITY SERVICES VEHICLE EXPANSION AND REPLACEMENT
15-0250
PURCHASE OF WHEELCHAIR ACCESSIBLEBUSES FOR CALEDON COMMUNITYSERVICES.
29

GrossDescriptionSub Type
Ten Year Combined Capital Program ($'000)
Yrs 6-1020182017201620152014
TRANSPORTATION
SUMMARY IV
TEN YEAR CAPITAL PLAN
1,000 0 0 1,000 0 0 0CALEDON ACCESSIBLE TRANSPORTATION FACILITY
17-0259
JOINT FACILITY WITH PUBLIC WORKSIN CALEDON TO ACCOMODATEACCESSIBLE TRANSPORTATION(TRANSHELP) OPERATIONS INCALEDON. FUNDED BY FEDERAL GASTAX.
10 YearTotals For: Accessible Transport 5,741 2,337 3,159 3,443 2,505 9,682 26,867
Operating Capital - Other
1,000 500 100 100 100 100 100RESTORATION WORKS14-4005INVESTIGATION AND REMEDIATIONWORKS.
3,500 1,750 350 350 350 350 350STORM SEWER REMEDIATION14-4015ALLOCATIONS FOR FUTURE REPAIR,REPLACEMENT, AND RELINING OFREGION OWNED STORM SEWERS.
15,900 8,000 1,600 1,600 1,600 1,600 1,500RED LIGHT CAMERA14-4415TO CONTINUE TO EXPAND AND OPERATEPEEL'S RED LIGHT CAMERA SYSTEM.
900 0 0 0 300 300 300IMPLEMENTATION OF THE ARTERIAL ROADS RATIONALIZATION REVIEW
14-4450
FOR THE IMPLEMENTATION OF THEARRASC RECOMMENDATIONS AND TOUNDERTAKE ASSESSMENT STUDIES FORTHE IMPACTS OF IMPLEMENTATION.
10 YearTotals For: Operating - Other 2,250 2,350 2,350 2,050 2,050 10,250 21,300
Operating Capital - Transportation Planning
30

GrossDescriptionSub Type
Ten Year Combined Capital Program ($'000)
Yrs 6-1020182017201620152014
TRANSPORTATION
SUMMARY IV
TEN YEAR CAPITAL PLAN
3,420 1,710 342 342 342 342 342TRANSPORTATION PLANNING STUDIES14-7711THE WORK PROGRAM CONSISTS OFSEVERAL TRANSPORTATION PLANNINGSTUDIES INTENDED TO DEVELOPTRANSPORTATION POLICIES AND PLANSFOR PEEL REGION.
4,080 0 816 816 816 816 816GOODS MOVEMENT PROGRAM14-7720TO DEVELOP A GOODS MOVEMENTPROGRAM TO ASSIST IN MOVING GOODSMORE EFFICIENTLY WITHIN PEELREGION.
902 456 140 0 136 170 0TRANSPORTATION SURVEYS15-7702THE TRANSPORTATION TOMORROWSURVEY COLLECTS INFORMATION ONTRAVEL PATTERNS EVERY FIVE YEARSIN THE GTHA WITH THE COLLABRATIVEEFFORT OF THE GTHAMUNICIPALITIES, GO TRANSIT, MTOAND TTC.
1,231 846 0 0 0 385 0CORDON COUNT15-7703THE CORDON COUNT IS A GTA WIDEPROGRAM USED IN DETERMINING INTRAAND INTER REGIONAL MOVEMENTS OFVEHICLES AND PERSONS.
5,300 3,000 600 600 600 500 0TRANSPORTATION DEMAND MANAGEMENT INITIATIVES
15-7712
FUNDING FOR TRANSPORTATION DEMANDMANAGEMENT (TDM)/SMART COMMUTEPROGRAM.
31

GrossDescriptionSub Type
Ten Year Combined Capital Program ($'000)
Yrs 6-1020182017201620152014
TRANSPORTATION
SUMMARY IV
TEN YEAR CAPITAL PLAN
1,650 1,000 200 200 150 100 0EMPLOYEE TRIP REDUCTION PROGRAM15-7713TO DEVELOP AND IMPLEMENT EMPLOYEECOMMUTE OPTION PROGRAMS/SERVICESTO ENCOURAGE AND SUPPORTEMPLOYEES IN THE USE OFALTERNATIVES TO DRIVING ALONE ANDREINFORCE THE REGION'S EFFORT ASCHAMPIONS IN PROMOTINGSUSTAINABLE TRANSPORTATION AND TOIMPROVE AIR QUALITY AND EMPLOYEEWELLNESS.
2,200 1,250 250 250 250 200 0ACTIVE TRANSPORTATION MARKETING15-7714TO EDUCATE AND ENCOURAGE PEELRESIDENTS TO USE ACTIVE MODES OFTRANSPORTATION FOR COMMUTING ANDRECREATIONAL TRIPS.
10 YearTotals For: Operating - Trans 1,158 2,513 2,294 2,208 2,348 8,262 18,783
Totals for 10 Year Capital Plan: 106,701 116,587 129,554 138,454 141,070 676,867 1,309,233
32

SUMMARY VTRANSPORTATION
OUTPUT AND OUTCOME MEASURES
Output/Outcome Measures 2013 Budget 2014 Target Commentary
Winter Maintenance- Response time to a winter weather event
Respond within 1 hour of call 100% of the time
Respond within 1 hour of call 100% of the time
Measured in time, from initial observation of snow/ice to time equipment is clearing the roadways.
Winter Maintenance- Achievement of bare pavement on Regional roads
Consistently meet bare pavement to service
level 98 per cent of the time
Consistently meet bare pavement to service
level 98 per cent of the time
Measured by average time from end of storm to reach bare pavement.
Roadway Deficiency Customer Service Request
Acknowledge customer within 3 days and resolve within timelines 75% of
the time
Acknowledge customer within 3 days and resolve within timelines 75% of
the time
Measured by response to request and resolution within prescribed time and parameter for each activity performance standard
Level of Service achievement for road maintenance routine activities N/A
Activities completed, on target, ontime and on
budget 85% of the time
Measured by the total of all factors and all activies for percentage of completion
Incidence of lane closures in construction sites during rush hour (excluding emergency)
98 per cent of the time
Implementation of Traffic Management Plan in construction sites to minimize the level of inconvenience to the public and to facilitate the unimpeded flow of traffic.
Network Pavement Ride Condition Index (RCI)
Network Pavement Ride Condition Index (RCI)
81.7
RCI measures the condition and overall quality of the Regional Road network from the customer perspective (quiter, smoother, safer, more comfortable drive).
Corridor Study (10 corridor per year avg.) to monitor & measure the following indicators:
- travel time along our network
- average speed
- traffic delays
- fuel consumption
- emission levels
Per cent of accessible transportation trips delivered on time 95 per cent
Percentage of trips that are delivered on time.Slight dip in the on time trips performance in 2012 due to the month long strike (no accurate reporting for taxis - not on our AVL system)
Incidence of customer issues per 1,000 trips 0.3 per cent Striving to achieve less than five customer
issues per 1000 trips.
To improve each of the indicators by annual
average of 5 per cent
The indicators of travel time, average speed, traffic delays, fuel consumption and emission levels will help imprive commuter traffic flow.
33

THIS PAGE INTENTIONALLY LEFT BLANK

WASTE MANAGEMENT
PROGRAM BUDGET SUMMARY
Summary I: 2014 Operating Budget Pressures
Summary II: Operating Budget Four-Year Program Forecast
Summary III: 2014 New Capital
Summary IV: Ten Year Capital Plan
Summary V: Output and Outcome Measures

THIS PAGE INTENTIONALLY LEFT BLANK
1

SUMMARY IWASTE MANAGEMENT
2014 CURRENT PRESSURES ($'000)
Total Expenditures
Total Revenue
Net Cost
2013 Revised Budget (2013 Cost of Service) 128,474 27,360 101,114
Base Budget Changes
0 0 0
1,293 445 848
Base Subsidy/Recoveries -780 2,100 -2,880
Economic Factors -1,811 1,811
Other Pressures 493 493
Cost Mitigation -1,145 -1,145
-139 734 -873
2014 Service Demand
185 185
0
0
Other Pressures 750 750 0
Total 2014 Service Demand 935 750 185
2014 New Services
MRF 1-7 Plastics 530 530Cart Implementation 800 800 0
1,330 800 530
2014 Probudget (2014 Recommended Cost of Service) 130,600 29,644 100,956
Total 2014 New Services
PROGRAM NAME
Cost of living/Inflation
Annualization
Subsidy/Recovery Change
Total 2014 Base Budget Changes
Growth
Service Demand
1

SUMMARY IIWASTE MANAGEMENT
OPERATING BUDGET FOUR-YEAR PROGRAM FORECAST
In $'0002014 Budget
Forecasted in 2013 Budget
2014 Budget 2015 Forecast 2016 Forecast 2017 Forecast
Total Expenditures 130,845 130,601 135,021 136,357 137,954 Total Revenue 26,674 29,645 31,295 29,295 28,095 Net Expenditures 104,171 100,956 103,726 107,062 109,859
# of FTEs 164.50 169.50 172.50 175.50 175.50
Key forecast assumptions:
2015 to 2017 includes an annual increase of 2% on CPI, fuel and growth
White Goods Collection will be discontinued in 2016.
An additional four weeks of Yard Waste Collection in 2016.
Program Assumptions
Implementation of the Bi-weekly Cart-Based roll-out was incorporated into the forecast as a one-time cost recovered through working fund reserves.
Adoption of the Bi-weekly Cart-Based Collection will result in annual savings in 2016 waste collection contract. These savings will be reflected in the EFW Savings Reserve.
2

2014 NEW CAPITAL DETAIL
WASTE MANAGEMENT
SUMMARY III
2014 Financing Sources and Funding Status ($'000)
Project #Expense
FundingTotal
Project Name
Approved or Pending
External Internal DCA
2014 Funding Status:
2014(A/P)
Ward
DisposalA 14-6510 LANDFILL MANAGEMENT ABATEMENT 0 807 0 807
ProcessingA 11-6605 PEEL ENERGY RECOVERY CENTRE 445,187 64,000 0 509,187
A 14-6620 PEEL INTEGRATED WASTE MANAGEMENT FACILITY - MRF EQUIPMENT/UPGRADES
0 4,000 0 4,000
A 14-6680 PEEL CURING FACILITY - GORE COVERS 0 1,000 0 1,000
CRC's and Transfer StationsA 14-6530 SOLAR ENERGY - HEARTLAKE AND CLARKSON
CRC 0 400 0 400
A 14-6590 WOOD WASTE PROCESSING EQUIPMENT 0 300 0 300
Operating CapitalA 13-6430 COLLECTION CARTS 0 53,434 0 53,434
A 14-6400 WASTE MANAGEMENT POLICIES AND ENVIRONMENTAL STUDIES
PEEL 0 1,000 0 1,000
A 14-6450 DESIGN CONSULTANT 0 200 0 200
A 14-6570 SITE IMPROVEMENT AND MAINTENANCE 0 876 0 876
3
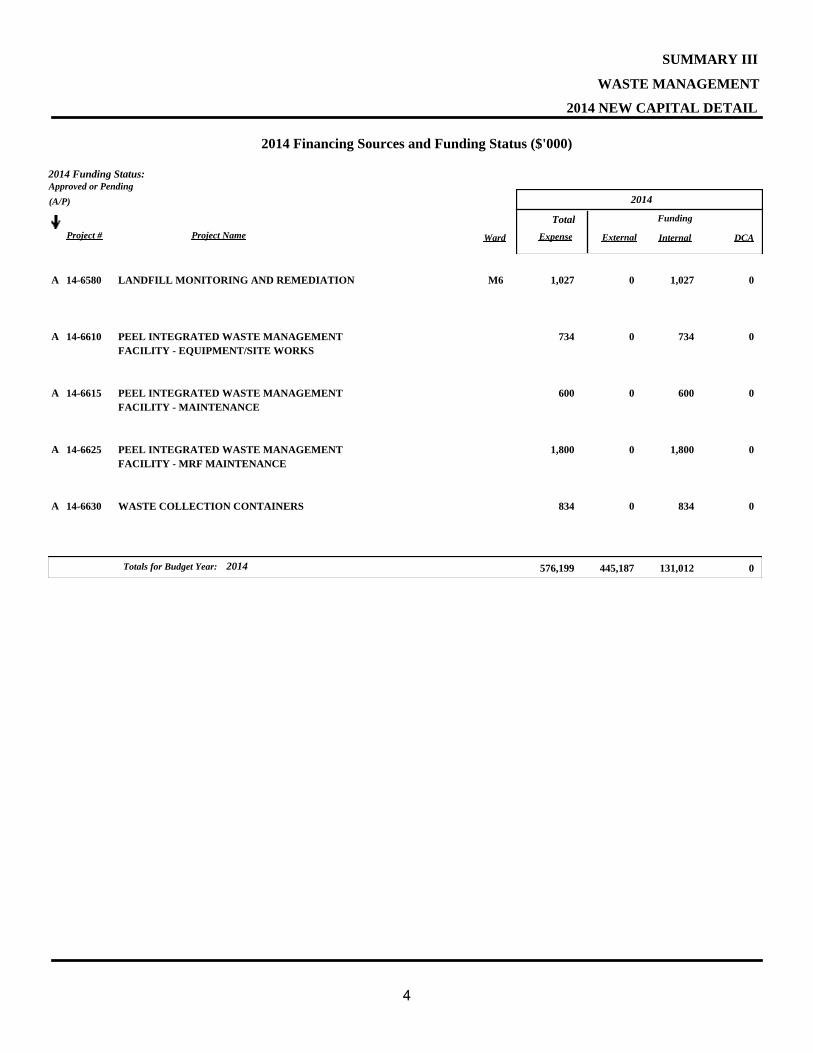
2014 NEW CAPITAL DETAIL
WASTE MANAGEMENT
SUMMARY III
2014 Financing Sources and Funding Status ($'000)
Project #Expense
FundingTotal
Project Name
Approved or Pending
External Internal DCA
2014 Funding Status:
2014(A/P)
Ward
A 14-6580 LANDFILL MONITORING AND REMEDIATION M6 0 1,027 0 1,027
A 14-6610 PEEL INTEGRATED WASTE MANAGEMENT FACILITY - EQUIPMENT/SITE WORKS
0 734 0 734
A 14-6615 PEEL INTEGRATED WASTE MANAGEMENT FACILITY - MAINTENANCE
0 600 0 600
A 14-6625 PEEL INTEGRATED WASTE MANAGEMENT FACILITY - MRF MAINTENANCE
0 1,800 0 1,800
A 14-6630 WASTE COLLECTION CONTAINERS 0 834 0 834
2014Totals for Budget Year: 445,187 131,012 0 576,199
4

GrossDescriptionSub Type
Ten Year Combined Capital Program ($'000)
Yrs 6-1020182017201620152014
WASTE MANAGEMENT
SUMMARY IV
TEN YEAR CAPITAL PLAN
DisposalProjects dealing with remediation, abatement and perpetual care oflandfill sites.
8,070 4,035 807 807 807 807 807LANDFILL MANAGEMENT ABATEMENT14-6510TO ADDRESS CAPITAL EXPENDITURESAT LANDFILL SITES AND WASTEOPERATION'S SITES IN PEEL.
10 YearTotals For: WMDISP 807 807 807 807 807 4,035 8,070
ProcessingProjects dealing with the processing of recyclables, organics andwaste, including the Energy From Waste Facility.
532,865 0 0 0 23,678 0 509,187PEEL ENERGY RECOVERY CENTRE11-6605PRE-ENGINEERING AND DESIGN OFFACILITY FOR PROCESSING /DISPOSAL OF GARBAGE WITH ENERGYFROM WASTE.
86,496 0 65,126 0 1,018 20,352 0LONG TERM ORGANICS13-6670DESIGN AND CONSTRUCTION OFFACILITY FOR PROCESSING ORGANICMATERIAL.
38,000 0 0 0 22,000 12,000 4,000PEEL INTEGRATED WASTE MANAGEMENT FACILITY - MRF EQUIPMENT/UPGRADES
14-6620
MAINTENANCE AND UPGRADES TO THEMRF EQUIPMENT, BUILDING AND SITE.
4,000 2,000 1,000 0 0 0 1,000PEEL CURING FACILITY - GORE COVERS14-6680REPLACEMENT GORE COVERS FOROPERATIONS AT PEEL CURINGFACILITY.
10 YearTotals For: WMPROC 514,187 32,352 46,696 0 66,126 2,000 661,361
CRC's and Transfer StationsProjects dealing with maintenance at community recycling centres andtransfer station(s).
5
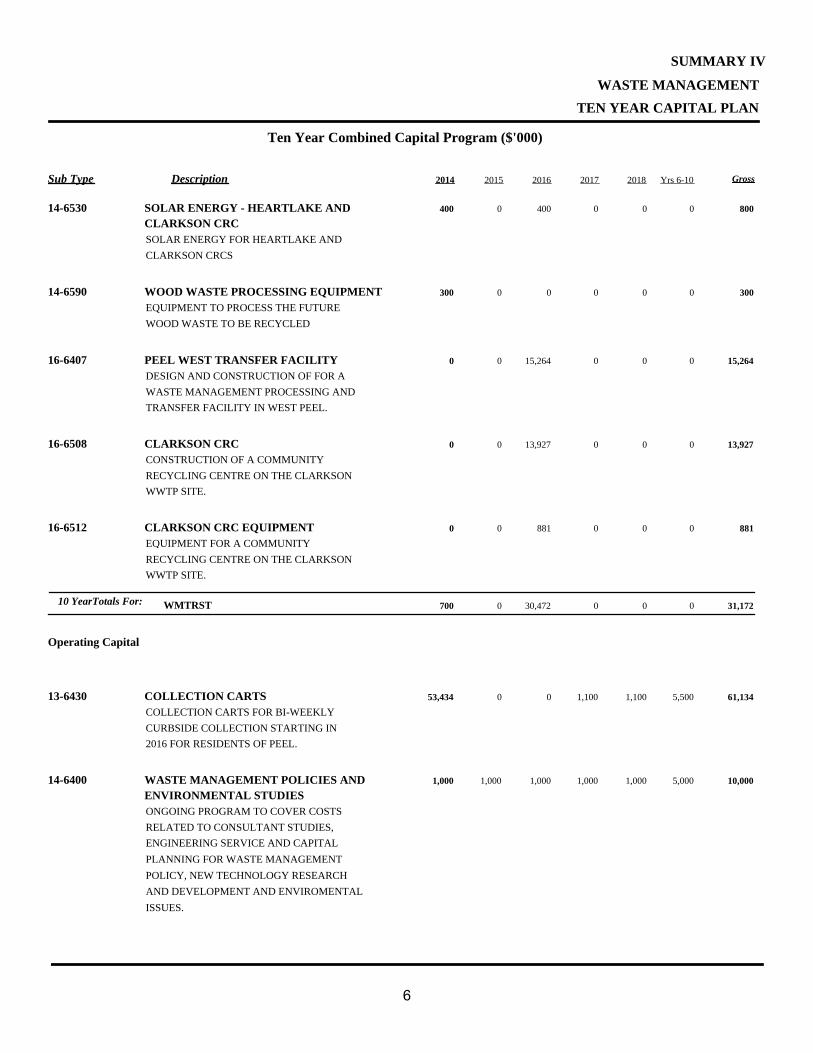
GrossDescriptionSub Type
Ten Year Combined Capital Program ($'000)
Yrs 6-1020182017201620152014
WASTE MANAGEMENT
SUMMARY IV
TEN YEAR CAPITAL PLAN
800 0 0 0 400 0 400SOLAR ENERGY - HEARTLAKE AND CLARKSON CRC
14-6530
SOLAR ENERGY FOR HEARTLAKE ANDCLARKSON CRCS
300 0 0 0 0 0 300WOOD WASTE PROCESSING EQUIPMENT14-6590EQUIPMENT TO PROCESS THE FUTUREWOOD WASTE TO BE RECYCLED
15,264 0 0 0 15,264 0 0PEEL WEST TRANSFER FACILITY16-6407DESIGN AND CONSTRUCTION OF FOR AWASTE MANAGEMENT PROCESSING ANDTRANSFER FACILITY IN WEST PEEL.
13,927 0 0 0 13,927 0 0CLARKSON CRC16-6508CONSTRUCTION OF A COMMUNITYRECYCLING CENTRE ON THE CLARKSONWWTP SITE.
881 0 0 0 881 0 0CLARKSON CRC EQUIPMENT16-6512EQUIPMENT FOR A COMMUNITYRECYCLING CENTRE ON THE CLARKSONWWTP SITE.
10 YearTotals For: WMTRST 700 0 30,472 0 0 0 31,172
Operating Capital
61,134 5,500 1,100 1,100 0 0 53,434COLLECTION CARTS13-6430COLLECTION CARTS FOR BI-WEEKLYCURBSIDE COLLECTION STARTING IN2016 FOR RESIDENTS OF PEEL.
10,000 5,000 1,000 1,000 1,000 1,000 1,000WASTE MANAGEMENT POLICIES AND ENVIRONMENTAL STUDIES
14-6400
ONGOING PROGRAM TO COVER COSTSRELATED TO CONSULTANT STUDIES,ENGINEERING SERVICE AND CAPITALPLANNING FOR WASTE MANAGEMENTPOLICY, NEW TECHNOLOGY RESEARCHAND DEVELOPMENT AND ENVIROMENTALISSUES.
6

GrossDescriptionSub Type
Ten Year Combined Capital Program ($'000)
Yrs 6-1020182017201620152014
WASTE MANAGEMENT
SUMMARY IV
TEN YEAR CAPITAL PLAN
2,000 1,000 200 200 200 200 200DESIGN CONSULTANT14-6450A CONSULTANT ON RETAINER FORCOMPLETING MED-MINOR DESIGNPROJECTS.
14,029 7,979 1,700 1,001 1,714 759 876SITE IMPROVEMENT AND MAINTENANCE14-6570PROVISION FOR REPAIRS ANDMAINTENANCE REQUIREMENTS TO ALLBUILDING FACILITIES.
10,270 5,135 1,027 1,027 1,027 1,027 1,027LANDFILL MONITORING AND REMEDIATION
14-6580
ADMINISTRATION AND STUDIESRELATED TO ENVIROMENTALMONITORING AT REGIONAL LAND FILLSITES.
3,099 1,865 0 0 50 450 734PEEL INTEGRATED WASTE MANAGEMENT FACILITY - EQUIPMENT/SITE WORKS
14-6610
MAINTENANCE AND UPGRADES TO THEMRF EQUIPMENT, BUILDING AND SITE.
6,000 3,000 600 600 600 600 600PEEL INTEGRATED WASTE MANAGEMENT FACILITY - MAINTENANCE
14-6615
MAJOR AND MINOR SITE / PROCESSMAINTENANCE FOR PEEL INTERGRATEDWASTE MANAGEMENT FACILITY.
18,000 9,000 1,800 1,800 1,800 1,800 1,800PEEL INTEGRATED WASTE MANAGEMENT FACILITY - MRF MAINTENANCE
14-6625
MAJOR MAINTENANCE FOR THE MRFEQUIPMENT AT PEEL INTEGRATEDWASTE MANAGEMENT FACILITY, NOTINCLUDED UNDER THE OPERATINGCONTRACT.
5,302 2,000 400 400 834 834 834WASTE COLLECTION CONTAINERS14-6630NEW WASTE MANAGEMENT CONTAINERS(RECYCLING BOXES, CONTAINER, BACKYARD COMPOSTERS AND ORGANIC CARTS.
10 YearTotals For: Operating Capital 60,505 6,670 7,225 7,128 7,827 40,479 129,834
Totals for 10 Year Capital Plan: 576,199 39,829 85,200 7,935 74,760 46,514 830,437
7

SUMMARY VWASTE MANAGEMENT
OUTPUT AND OUTCOME MEASURES
Output/Outcome Measures 2013 Budget 2014 Target Commentary
Residential Waste Diverted
3Rs Diversion 47 per cent
4Rs DiversionN/A per cent
3Rs Diversion 48 per cent
2013 Diversion target is 47% and 4Rs diversion is N/A (including Energy from Waste component). 2014 Diversion is expected to be 48% due to full diversion operations for the year and the opening of Heart Lake CRC in the Fall 2014.
Waste Collection Complaints per 2,000 households served per day 1 1 No major increase of complaints expected in
2014.
Net Cost of Waste Management per Household
$241 $236 With a projected decrease in contracts annual cost due to lower fuel prices and no change from 2013 to 2014 in Waste Management's net budget the net effect is $236 per household.
Net Cost of CRCs per Vehicle Trip $26 $32 An increase to CRC operations due to the additional CRC pilot hours that was introduced in 2013 which run a full year in 2014.
8
DEVELOPMENT SERVICES
PROGRAM BUDGET SUMMARY
Summary I: 2014 Operating Budget Pressures
Summary II: Operating Budget Four-Year Program Forecast
Summary III: N/A
Summary IV: N/A
Summary V: Outputs and Outcome Measures

THIS PAGE INTENTIONALLY LEFT BLANK
SUMMARY IDEVELOPMENT SERVICES
2014 CURRENT PRESSURES ($'000)
Total Expenditures
Total Revenue
Net Cost
2013 Revised Budget (2013 Cost of Service) 2,679 1,777 902
Base Budget Changes
104 105 (1)
Base Subsidy/Recoveries
Economic Factors
Other Pressures
Cost Mitigation
104 105 (1)
2014 Service Demand
Other Pressures
Total 2014 Service Demand - - -
2014 New Services
- - -
2014 Probudget (2014 Recommended Cost of Service) 2,783 1,882 901
Total 2014 New Services
Total 2014 Base Budget Changes
Growth
Service Demand
Subsidy/Recovery Change
PROGRAM NAME
Annualization
Cost of Living/ Inflation
1

SUMMARY IIDEVELOPMENT SERVICES
CURRENT BUDGET FOUR-YEAR PROGRAM FORECAST
In $'0002014 Budget Forecasted in 2013 Budget
2014 Budget 2015 Forecast 2016 Forecast 2017 Forecast
Total Expenditures 2,737 2,783 2,855 2,929 3,005 Total Revenue (1,837) (1,882) (1,930) (2,003) (2,078)Net Expenditures 900 901 925 926 927
# of FTEs 25.00 25.00 25.00 25.00 25.00
2

SUMMARY VDEVELOPMENT SERVICES
OUTPUT AND OUTCOME MEASURES
Output/Outcome Measures 2013 Target 2013 Projection 2014 Target Commentary
Development Planning Applications1 1270 1250 1280 Approximately 80 application will attract fees, while 1200 are no-fee applications.
Engineering submission/ requests 450 450 450 Expect similar levels to 10 year averageWater and Sever Connections 4000 4000 4000 Expect activity similar to 10 year average
3

THIS PAGE INTENTIONALLY LEFT BLANK

OPERATIONS SUPPORT – TAX SUPPORTED
PROGRAM BUDGET SUMMARY
Summary I: 2014 Operating Budget Pressures
Summary II: Operating Budget Four-Year Program Forecast
Summary III: 2014 New Capital
Summary IV: Ten Year Capital Plan
Summary V: Output and Outcome Measures

THIS PAGE INTENTIONALLY LEFT BLANK

SUMMARY IOPERATIONS SUPPORT
2014 CURRENT PRESSURES ($'000)
Total Expenditures
Total Revenue
Net Cost
2013 Revised Budget (2013 Cost of Service) 46,971 46,378 592
Base Budget Changes
1,328 1,328
Base Subsidy/Recoveries 1,328 (1,328)
Economic Factors
Other Pressures
Cost Mitigation (169) (169) -
1,159 1,159 -
2013 Service Demand
-
502 502 -
592 (592)
Other Pressures -
Total 2014 Service Demand 502 1,094 (592)
2014 New Services
89 89 (0)
89 89 (0)
2014 Probudget (2014 Recommended Cost of Service) 48,720 48,720 0-
Total 2014 Base Budget Changes
Growth
Service Demand
Total 2014 New Services
PROGRAM NAME
Cost of Living/ Inflation
Annualization
Subsidy/Recovery Change
Fleet Partnership with the CVC
1

SUMMARY IIOPERATIONS SUPPORT
CURRENT BUDGET FOUR-YEAR PROGRAM FORECAST
In $'0002014 Budget Forecasted in 2013 Budget
2014 Budget 2015 Forecast 2016 Forecast 2017 Forecast
Total Expenditures 5,915 4,679 4,844 4,848 4,856 Total Revenue (4,707) (4,679) (4,844) (4,848) (4,856)Net Expenditures 1,208 0 0 0 (0)
# of FTEs 233.25 235.25 241.25 242.25 242.25
2

2014 NEW CAPITAL DETAIL
OPERATIONS SUPPORT (TAX RATE-SUPPORTED)
SUMMARY III
2014 Financing Sources and Funding Status ($'000)
Project #Expense
FundingTotal
Project Name
Approved or Pending
External Internal DCA
2014 Funding Status:
2014(A/P)
Ward
Vehicle and Equipment ReplacementA 14-9020 VEHICLE AND GAS POWERED EQUIPMENT 0 3,847 0 3,847
Facility Repair and MaintenanceA 14-9040 PW FACILITY REPAIR AND MAINTENANCE 0 1,247 0 1,247
2014Totals for Budget Year: 0 5,094 0 5,094
3

GrossDescriptionSub Type
Ten Year Combined Capital Program ($'000)
Yrs 6-1020182017201620152014
OPERATIONS SUPPORT (TAX RATE-SUPPORTED)
SUMMARY IV
TEN YEAR CAPITAL PLAN
Vehicle and Equipment ReplacementPublic Works asset replacement requirements for vehicles and outsideequipment. Funded by reserve contributions which are determined byCouncil approved policy. Contributions are based on a multi-yearfinancial model incorporating asset inventory, asset life assumptions,replacement costs, depreciation, salvage(auction) values and fundinterest assumptions.
54,516 33,960 3,006 5,385 3,394 4,924 3,847VEHICLE AND GAS POWERED EQUIPMENT14-9020REPLACEMENT OF REGIONAL VEHICLESAND EQUIPMENT AND SYSTEMUPGRADES.ANNUAL RECURRING PROJECT FROM13-9020.
10 YearTotals For: PWISER 3,847 4,924 3,394 5,385 3,006 33,960 54,516
Facility Repair and MaintenancePublic Works asset replacement requirements for building components atCopper Road, Wolfedale and Victoria works yards, as well as replacementof the facilities at the end of their useful life, are funded from theFacility Maintenance reserves. Contributions are determined by Councilbased on a multi-year financial model incorporating asset inventory,asset life assumptions, replacement costs, depreciation, salvage(auction) values and fund interest assumptions.
6,076 3,092 656 350 289 442 1,247PW FACILITY REPAIR AND MAINTENANCE14-9040PLANNED REPAIRS AND REPLACEMENTSAT PW FACILITIES AS INDICATED INBUILDING CONDITION ASSESSMENTS.THE 10-YEAR PLAN HAS BEENMODIFIED BASED ON PHYSICALINSPECTION OF EACH SITE AND THELIST OF PLANNED REPAIRS ANDREPLACEMENTS HAS BEEN AMENDEDACCORDINGLY. NOTE: THIS IS ANANNUAL RECURRING PROJECT, FROM12-9040.
10 YearTotals For: PWISFM 1,247 442 289 350 656 3,092 6,076
Totals for 10 Year Capital Plan: 5,094 5,366 3,683 5,735 3,662 37,052 60,592
4
SUMMARY VOPERATIONS SUPPORT
OUTPUT AND OUTCOME MEASURES
Output/Outcome Measures 2013 Target 2013 Projection 2014 Target Commentary
Construction Complaint Resolution within 3 business days
100 per cent 100 per cent 100 per cent Intended to measure construction inspectors' level of customer service
Percentage of meters tested that exceed bylaws/guidelines
0 per cent 0 per cent 0 per centAll meters have tested within American WaterWorks Association (AWWA) guidelines and Region of Peel by-law.
Percentage of timely accurate bill delivery achieved
95 per cent 98.5 per cent 95 per cent Above target maintains Canada Post incentive rate and ensures clients receive timely bills.
5

THIS PAGE INTENTIONALLY LEFT BLANK

Health Services

THIS PAGE INTENTIONALLY LEFT BLANK

Health Services
2014 Budget Document

THIS PAGE INTENTIONALLY LEFT BLANK

Table of Contents
Section I. Existing Services and Service Levels...............................................................................1 1. Who we are.......................................................................................................................................1
2. Existing Services and Service Levels ...............................................................................................2
3. Key Initiatives in 2013 .......................................................................................................................3
Section II. Issues and Trends .............................................................................................................3 Section III. 2014 Business Focus .......................................................................................................9 Section IV. 2014 Operating Budget ....................................................................................................9 1. 2014 Departmental Operating Budget Overview ..............................................................................9
2. 2014 Proposed Budget ...................................................................................................................10
Section V. 2014 Capital Budget ........................................................................................................13 1. 2014 Departmental Capital Plan Overview .....................................................................................13
2. Existing Capital Projects .................................................................................................................14
3. 2014 Capital Budget and Operating Impact....................................................................................15
4. 2014 – 2023 Ten Year Capital Plan................................................................................................16
Section VI. Output/Outcome Measures............................................................................................17 Section VII. Staffing ...........................................................................................................................18 Section VIII. Future Outlook..............................................................................................................18 Section IX. Disclosure of 2014 Budget Risks and Key Program Assumptions ...........................19 Section X. Useful links ......................................................................................................................19 Appendix 1: 2014 Operating Budget Pressure – Departmental Summary ...................................21

THIS PAGE INTENTIONALLY LEFT BLANK
Health Services – 2014 Budget Document
Section I. Existing Services and Service Levels 1. Who we are Health Services has the overall responsibility to deliver programs for Public Health, five Long Term Care homes, Community Support Services for seniors, and Paramedic Services. The department also works in partnership with other health service providers, agencies and organizations to improve the health of Peel’s communities. Below is a picture of the health system from a Peel perspective with health services that Regional Council governs highlighted in the four shaded boxes.
OOvveerrvviieeww ooff tthhee HHeeaalltthh SSyysstteemm AA RReeggiioonn ooff PPeeeell PPeerrssppeeccttiivvee
1

Health Services – 2014 Budget Document 2. Existing Services and Service Levels Long Term Care
a. Description of Services: • 5 residential Long Term Care homes with a total of 703 beds:
o Davis Centre with 64 beds in Caledon o Malton Village with 160 beds in Mississauga o Peel Manor with 177 beds in Brampton o Sheridan Villa with 142 beds in Mississauga (includes 19 beds for Special Behaviour
Support Unit) o Tall Pines with 160 beds in Brampton
• Adult Day Services at 5 sites – average of 117 spaces/day • Respite care at 1 site • Project Life Saver - equips families with tracking tools to protect wandering family members • Meals on Wheels from Peel Manor and Davis Centre on a fee-for-service basis
b. Key facts • 1,549 clients served in a year • 866,900 meals prepared annually • Over 73,300 annual volunteer hours • Full 3 year Accreditation (2011-2013) by Commission on Accreditation of Rehabilitation
Facilities Paramedic Services
a. Description of Services: • Responsible for out of hospital medical care throughout Peel Region, 24 hours a day, 365
days a year • Advanced Care and Primary Care Paramedic level of service • Engaged in CPR promotion and public education in the community
b. Key facts
• 93,500 911 calls • 64 per cent transferred to hospitals • 50 ambulances on the road at peak times • New provincial response time framework reporting, which commenced in 2013
Public Health
a. Description of Services: • Peel Public Health provides services mandated by the Health Protection and Promotion Act
and the Ontario Public Health Standards. Major functions are: o Health surveillance o Population health assessment o Disease and injury prevention o Health protection and promotion o Reduction of disparities in health status o Preparation for, and response to, health related emergencies o Enhancing the sustainability of the health care system
2

Health Services – 2014 Budget Document
b. Key facts • 850,000 vaccines distributed per year • 97,000 catch basins treated to prevent West Nile Virus • 13,000 Healthy Babies/Healthy Children contacts using the new screening protocols • 9,500 inspections completed at 5,500 food premises • 16,100 visits to sexual health clinics • 50,000 children screened for dental conditions, 11,000 requiring urgent dental treatment • 243,500 student immunization records reviewed (100%)
3. Key Initiatives/Outcomes in 2013
• Opened Tall Pines Adult Day Service and expanded Adult Day Services & spaces in 3 other locations with 100% funding from the Local Health Integration Networks (LHINs)
• Partnered with Community Health Centres to provide cost-effective services to seniors’ dental and children’s dental clients
• 5 Paramedic stations completed, 4 are co-locates • By-law restricting smoking at recreational facilities and other municipal property enacted • Review of Peel Manor building infrastructure completed • Held Food Expo to support continued implementation of School Food and Beverage policy • Engaged in process improvement work at Brampton Civic and Credit Valley hospitals which
has led to a reduction of 5,500 (annualized) paramedic offload hours • Initiated the Aging Population Steering Committee for Council members • Worked with area municipalities to incorporate Health Development Index into planning
documents • Working with all three hospitals, achieved improvement in rates of exclusive breastfeeding
at hospital discharge, and obtained funding for further collaborative work Section II. Issues and Trends The major issues and trends the Health Services Department is facing include the following:
• Changing demographics – population growth, aging and ethnocultural diversity • Population health risks in Peel, especially obesity, diabetes and air quality • Provincial funding constraints • Increased health system collaboration and integration • Increased use of electronic information management in the health sector, including
increased need for privacy
3

Health Services – 2014 Budget Document 1. a) Changing Demographics – Population Growth
Population in Peel 1991‐2031
758,474878,827
1,032,197
1,219,656
1,354,9441,436,425
1,511,4921,576,922
1,639,836
0
200,000
400,000
600,000
800,000
1,000,000
1,200,000
1,400,000
1,600,000
1,800,000
1991
1996
2001
2006
2011
2016 Estimate
2021 Estimate
2026 Estimate
2031 Estimate
Population growth adds approximately 19,000 new Peel residents annually, requiring additional resources and/or innovative service delivery to maintain current service levels. Health Services conducts regular program evaluations and process reviews to maximize the services that can be provided with the resources available. Programs where demand is directly linked to population growth include 911 calls, dental programs, school programs, communicable disease case management, Healthy Babies/Healthy Children and immunization.
4
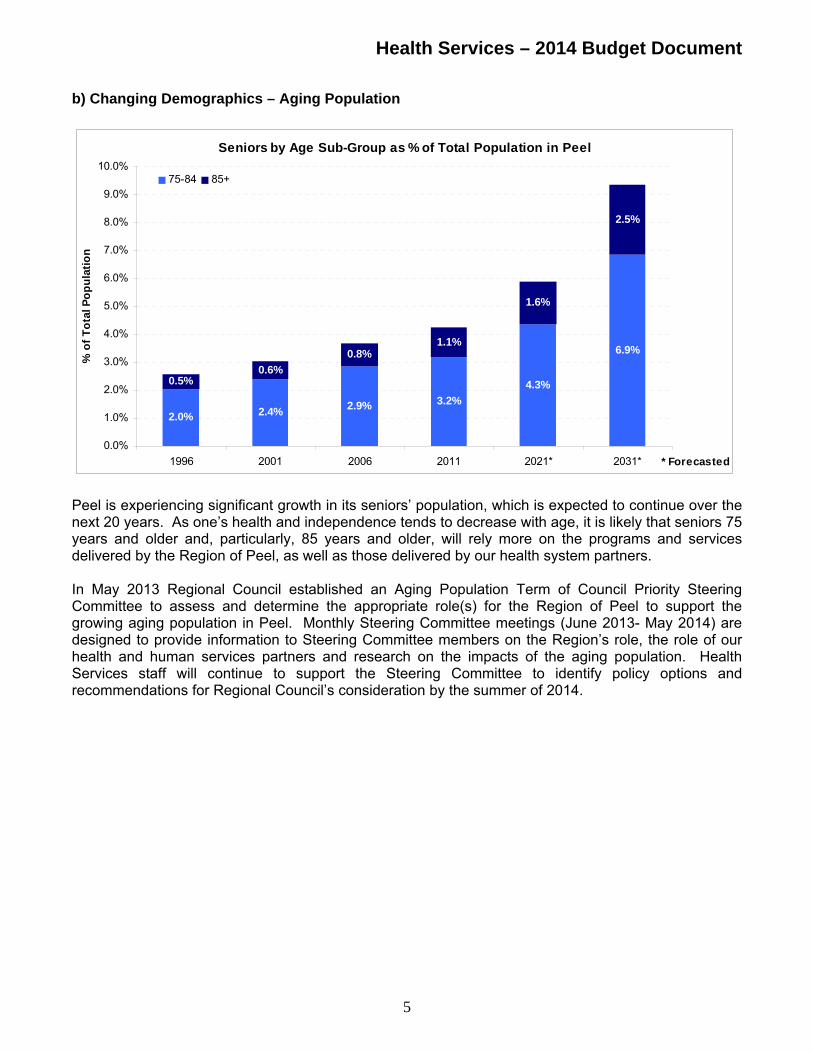
Health Services – 2014 Budget Document b) Changing Demographics – Aging Population
Seniors by Age Sub-Group as % of Total Population in Peel
2.0% 2.4% 2.9% 3.2%4.3%
6.9%
0.5%0.6%
0.8%1.1%
1.6%
2.5%
0.0%
1.0%
2.0%
3.0%
4.0%
5.0%
6.0%
7.0%
8.0%
9.0%
10.0%
1996 2001 2006 2011 2021* 2031* * Forecasted
% o
f Tot
al P
opul
atio
n
75-84 85+
Peel is experiencing significant growth in its seniors’ population, which is expected to continue over the next 20 years. As one’s health and independence tends to decrease with age, it is likely that seniors 75 years and older and, particularly, 85 years and older, will rely more on the programs and services delivered by the Region of Peel, as well as those delivered by our health system partners. In May 2013 Regional Council established an Aging Population Term of Council Priority Steering Committee to assess and determine the appropriate role(s) for the Region of Peel to support the growing aging population in Peel. Monthly Steering Committee meetings (June 2013- May 2014) are designed to provide information to Steering Committee members on the Region’s role, the role of our health and human services partners and research on the impacts of the aging population. Health Services staff will continue to support the Steering Committee to identify policy options and recommendations for Regional Council’s consideration by the summer of 2014.
5

Health Services – 2014 Budget Document c) Changing Demographics - Increase in Paramedic Call Volumes The impact of both population growth and the aging population is especially evident in the call volume projections for Paramedic Services. Currently, over 35% of all calls are supporting the aging population. The below chart indicates the impact of the aging population as the growth of calls from the 75+ is expected to increase at twice the rate of the overall population.
0
20,000
40,000
60,000
80,000
100,000
120,000
140,000
2011
2012
2013
2014
2015
2016
2017
2018
2019
2020
2021
2022
2023
2024
2025
75+50-7425-490-24
NOTE: Chart used to illustrate the call volume by segment and assumes an annual 3% increase in overall call volume d) Changing Demographics - Ethnocultural Diversity Peel has a culturally diverse population and immigrants are an important part of the community. In 2006, immigrants comprised nearly half (49 per cent) of our population, a much higher percentage than that seen in Ontario (28 per cent) or Canada (20 per cent) as a whole. More than half (51 per cent) of Peel’s immigrants were born in Asia and the Middle East, which includes Eastern Asia (including China, Hong Kong), Southeast Asia (including the Philippines), Southern Asia (including India) and the Middle East. Twenty-seven per cent of Peel immigrants were born in Europe. Serving an ethnoculturally diverse community is an important factor in making improvements to the health status for all ethnocultural groups in Peel. In order to do this, it is important to understand the relationships between immigrant status, ethnicity and health outcomes so as to ensure that effective population-based interventions reach the right individuals or groups of individuals in Peel. 2. Population Health Risks There are a number of specific health risks in Peel that will increase demand on existing services, including:
• Physical inactivity and unhealthy eating leading to obesity and diabetes • Tobacco use • Poor dental health • Sexually transmitted infections • Ethno-specific health risk factors
A key focus for Peel Public Health is obesity and diabetes, as projections estimate that currently 1 in 10 adults in Peel has diabetes and that this number is expected to reach 1 in 6 by 2025.
6

Health Services – 2014 Budget Document 3. Provincial Funding Constraints Peel Public Health continues to advocate for sufficient resources to ensure that Peel residents are getting the needed public service. The provincial funding shortfall limits Public Health’s ability to meet Ontario Public Health Standards (OPHS) in the following areas:
• Oral health – not meeting OPHS requirement for follow-up; now screening most children, but at the expense of prevention programs; will need more funding for dental fees as population increases
• Minimal work on falls prevention in seniors • Tobacco Free Living Term of Council Priority– no capacity to address prevention and cessation,
especially in young adult males, ethno-cultural issues; need to scale up support of cessation in primary care
• Need to scale up resources to prevent the adverse effects of alcohol • Supportive Environment for Healthy Weights Term of Council Priority – need to expand work on
built environment and active transportation to prevent diabetes • 21 nurses for 384 schools, this limits our ability to improve children’s health and implement
health promoting policy in schools • Unable to provide a more comprehensive follow-up on gastro intestinal cases • Not currently screening immunization records in daycare centres • No staffing for additional multi-service clinics in Brampton or for extended hours at existing
clinics • Need additional resources for Tuberculosis immigration medical surveillance • Unmet need for support for breastfeeding mothers • Need to scale up work on early childhood development Term of Council Priority, including
nutrition and physical activity initiatives, working with partners serving young children, and parenting services
7

Health Services – 2014 Budget Document
4. Health System Collaboration and Integration – Impact of Partnership with Area Hospitals to Reduce Offload Delay through Process Improvement Initiative
System - Model of Off-load Improvement Initiative
0
10,000
20,000
30,000
40,000
50,000
60,000
70,000
2008 2009 2010 2011 2012 2013estimate
2014estimate
2015estimate
Year
Off-load hours
Off-load before initiative With Off-load Nurses With Process Improvement & Off-load Nurses
A- 2009 start of off load nursesB - 2012 increase off load nursesC -2012 mid-year start of process improvement initiativeD- 2013 BCH Improvement results for the entire year, CVH implemented improvements August 2013E - 2014 BCH and CVH maintain improvements, Trilium will be implemented
B
AC D
E
In 2013, Paramedic Services leveraged its learning from the Brampton Civic Hospital process improvements to reduce the paramedic offload delay hours at the Credit Valley Hospital. Combined with the benefits provided by the additional 100 per cent MOHLTC funded Hospital Nursing Program, this process improvement will lead to a reduction of over 28,000 hours from where the system would have been in 2015. By enabling these service hours to return to active response, this will mitigate system growth pressures by ensuring adequate coverage, even as call volume is projected to increase by 10% over the next 3 years. This graph speaks to the success the program has achieved through Regional Council’s advocacy efforts and strong collaboration with the local hospitals. In addition to this work, the Region has continued to advocate to the province to recognize the role of paramedics in the local health system and work with our municipal partners to encourage reform to the Centralized Ambulance Communication Centre (CACC). Ongoing work under the Community Paramedicine Term of Council Priority will also help to build on these successes. Working with our health system partners, staff are exploring new and innovative ways to reduce the number of non-essential transports to area hospitals and to also support system sustainability and respond to patient needs.
8

Health Services – 2014 Budget Document Section III. 2014 Business Focus In 2014, Health Services Department will continue to focus on the following areas:
• Optimize early child development in Peel* • Explore policy options related to the aging population* • Implementing strategies (eg community paramedicine) to reduce the number of patient
transports to the hospital* • Promote a supportive environment for healthy weights* • Address legislative requirements in Long Term Care Homes Act • Support tobacco free living* • Reduce paramedic response times* • Continue to address paramedic offload delay • Evaluate performance on Province-wide quality care measures/indicators from Health Quality
Ontario * Denotes Approved Term of Council Priority Section IV. 2014 Operating Budget 1. 2014 Departmental Operating Budget Overview Health Services Department 2014 operating budget totals $100.3 million net expenditures, an overall change of $3.9 million, a 4.0 per cent increase from the 2013 budget.
2014 Budget - Net Expenditures (In $’000) 2013 Budget
2013 Projection (As at Aug. 31, 2013)
2014 Budget
Budget Change %2014 vs. 2013
Long Term Care $30,183 $30,043 $30,992 2.7%Paramedic Services $39,712 $40,465 $41,836 5.3%Public Health $25,782 $25,043 $26,728 3.7%Program Support $709 $694 $729 2.8%Total $96,386 $96,245 $100,285 4.0%
Total Expenditures By Type (In $'000 & % ) Total Funding Source By Type (In $'000 & %) Salaries and benefits represent almost 80 per cent of the Health Services gross budget in 2014, relatively unchanged from the 2013 Budget. Grants and subsidies help to fund over $130.0 million of expenses (53 per cent), with Fees and Charges (including accommodation revenue) of $15.9 million (6.4 per cent) and Contribution from Reserves of $1.2 million (0.5 per cent) rounding out the funding sources.
Labor Costs, $179,537,
79%
Operational Costs,
$11,654, 5%
Professional Services, $14,803,
7%
Other, $7,732,
4%
Contribution to Reserves,
$13,903, 6% Regional
Tax, $100,285,
40.5%
Provincial Subsidy,
$130,392, 52.6%
Reserves, $1,243,
0.5%
User Fees, $15,921,
6.4%
9

Health Services – 2014 Budget Document 2. 2014 Proposed Budget The following table summarizes Health Services’ 2014 proposed budget changes.
2014 Budget - Net Expenditures 2014 Proposed Changes
(In $’000)
2013 Budget
A. Base Changes
B. Service Demand
C. New Services
2014 Budget
Long Term Care $30,183 $809 - - $30,992Paramedic Services $39,712 $476 $1,538 $111 $41,836Public Health $25,782 $926 $ $20 $26,728Program Support $709 $20 $ - $729Total $96,386 $2,228 $1,538 $131 $100,285
Note: Please refer to Appendix 1 for details a. Base Budget Changes
The overall budget for Health Services will increase by $3.9 million or 4.0 per cent above the 2013 Budget. The drivers of the budget increase are as follows: Annualization 100% funded Adult Day Service program expansion at Tall Pines Long Term Care facility began in April 2013 and annualization is required to capture the full annual program expenditures/revenues. There is no net impact as a result of the annualization. Inflation Salaries and benefits represent almost 80 per cent of the Health Services budget on an annual basis. Annual wage increases, benefit cost increases, pay equity and progression through pay grade steps will increase the gross budget by $4.8 million. Inflationary pressures will also increase the base cost of goods and services by $1.3 million in 2014. Economic Factors There are no items identified in 2014. Other Base Pressures This section speaks to programs or initiatives that were funded for a short period of time and have ended in 2013. The net impact is zero for 2014 but reflects the end of one time funding from the province for program start up costs for Tall Pines Adult Day Services in Long Term Care, the conclusion of extra resources for the hospital offload process review that was funded from reserves, and the partial completion of the Outdoor Tobacco Bylaw implementation that was also funded from reserves in the 2013 budget. Base Subsidy/Recoveries Subsidy assumptions are provided under Section IX of the Budget document. All programs have costs eligible for subsidy levels that range from 0-100 per cent of gross costs. In 2014, subsidy levels are projected to increase by $3.7 million and offset the base cost pressures listed above. Basic accommodation rates in the long term care homes, set by the Ministry of Health and Long Term Care (MOHLTC), are budgeted to increase by 1.5 per cent in the 2014 budget. Provincial funding in Public Health is projected to increase by 2 per cent in 2014 but this still leaves the program at 64 per cent funding, well short of the 75 per cent funding the MOHLTC has committed to provide. The Region of Peel’s Medical Officer of Health, as co-chair of the Public Health Funding Review working group, will continue to champion Peel’s need for provincial funding to address past and current population growth and local health needs. Continued advocacy from Regional Council will also be required to continue to advance the issue at the provincial level.
10

Health Services – 2014 Budget Document Cost Mitigation Through Efficiencies & Recoveries Health Services staff continually look to improve processes and find efficiencies to offset base budget pressures and keep the tax levy as low as possible. In the 2014 Budget, cost mitigation activities helped to reduce the base budget by $0.2 million and prevent increases in all program budgets. Staff regularly engage in program evaluations and process reviews to ensure the best value for money. Current examples are:
• Review of scheduling at dental health clinics • Offload delay process review at Brampton Civic continues and introduced at the Credit
Valley Hospital • Review of scheduling practices for Long Term Care staff • Public Health multi service clinic review • Paramedic start and end of shift process review • Efficiency review of dietary services; includes ordering, production, inventory and invoicing • Healthy Babies/Healthy Children process review • Review service delivery options pertaining to Make Ready process
Examples of cost mitigation through tangible efficiencies in the 2014 Budget include:
• Successful Larval Control contract savings of $280,000 over the 5 year term (net savings of $70,000 as program is funded 75/25)
• Process review at area hospitals has led to an estimated 5,500 hour reduction in offload delay in 2013 ($1.1M)
• Hospital Nursing Program (100 per cent funded) returns over 11,300 paramedic hours back into active response annually (over $2.25M)
• Use of over 1,800 volunteers, totaling almost 85,000 hours annually • In Public Health, FTE reprioritization to ensure existing staff are focused on key priorities • Preliminary numbers show that the investment in lifts at our LTC homes has resulted in a
decrease of WSIB claims by 30%. This will lead to lower coverage costs and lower WSIB premiums in the outlook years.
In addition to the above savings, Health Services staff continuously seeks to find better ways to deliver services. Many of these solutions will not provide immediate tangible cost savings but enable the department to absorb population growth or avoid costs in the longer term. Some current examples include:
• As part of the regular review of flu immunization clinics, staff recommended the increased use of pharmacies to provide the flu shots and the redeployment of clinic expenditures to underserviced, high risk populations
• Introduction and improvement of Point of Care documentation in Long Term Care homes • Co-locating paramedic stations with area fire services and other regionally operated
programs, where operationally feasible. 17 of 25 stations will be co-located. • Involvement with other partners in research, pilots etc; approximately $5.8M in the last 5
years. Direct benefit to Peel through research/development/training grants is over $1M over the last 5 years.
• Paramedic Rapid Response Units are able to cost effectively reduce response time by an estimated 30 seconds
• Conducting pilot of external service delivery option (s) for Make Ready process, with consideration for 2 future Reporting Stations
11

Health Services – 2014 Budget Document b. Service Demand Population growth and service demand for existing Health Services create pressures on the program to meet Council directed or Provincially-mandated service standards.
Net Cost (In $’000)
Program Service Demands 2014
Budget 2015
Impact
Public Health • All increases related to the expansion of the Malton Clinic, commencing
June 1st, 2014 have been offset by increased OHIP reimbursements and program efficiencies/reductions.
• Note: delayed implementation of Multi Year Plan to meet Ontario Public Health Standards. Provincial funding is required to proceed with hiring the 13 Council-approved FTE that remain unfunded and held vacant.
$0
$0
$0
$0
Paramedic Services • To address call volume growth: Add 5,110 service hours with 9.5
paramedics, starting June 2014. • Increase related to the operational cost of new stations and operational
expenditures required to address population growth and service demand, based on the projected increase in call volume. Examples include fuel, vehicle repair & maintenance, medical supplies, drugs etc.
• Provision of Make Ready process related to the opening of the Fernforest reporting station, service starting December 2014.
• Summer students required to ensure administrative demands are met, due to increasing service demands
• Facility staff costs to support effective operations of new reporting and satellite stations. The FTE’s are being requested in the 2014 Employee and Business Services budget.
$825
$376
$65
$25
$247
$155
$0
$729
$0
$0
Long Term Care • Increase in hours and programs in Community Support Services for
seniors in the community, fully funded by the MOHLTC and Client Fees
$0 $0
Total Service Demands $1,538 $844
12

Health Services – 2014 Budget Document c. Budget for New Services As identified in the Regional Council report on September 12, 2013, the Public Access Defibrillation program is a new request for 2014 that will ensure a region-wide coordinated public access defibrillation program as well as external automated defibrillators in Regional buildings and increase community members trained in CPR. Utilizing the savings identified in the Flu immunization program, resources are being redeployed into investigating ways to ensure underserviced, high risk residents receive their flu shots in 2014.
Net Cost (In $’000
Program New Services/Initiatives 2013
Budget 2014
Impact
Paramedic Services • $181 thousand (gross cost) for the Public Access Defibrillation and CPR
program; including 1.0 FTE.
$111 $0
Public Health • New Flu Immunization initiative to reach the underserviced high risk
populations, using redeployed savings identified through Flu clinic savings.
$20
$0
Total New Services $131 $0
Section V. 2014 Capital Budget 1. 2014 Departmental Capital Plan Overview The following chart provides a financial summary of Health Services’ capital project funding in 2014, including new capital project requests in 2014 and projects carried forward to 2014.
Capital Plan By Funding Source
Carry –Forward from Prior Years
(‘000) 2014 Capital Budget
(‘000) Total Capital In 2014 (‘000)
DC Growth $ 583 $1,695 $2,278Externally Funded $0 $275 $275Non-DC Internal* $21,801 $38,782 $60,583Total Expenditures $22,384 $40,752 $63,1362014 Cash Flow $15,183 $31,341 $46,524# of Projects 61 11 72 * Note: Non-DC Internal capital work includes state of good repair, non-DC growth, service level enhancement and grants to external agencies
13
Health Services – 2014 Budget Document For 2014, Health Services is requesting eleven capital projects totaling just over $40.75 million. A brief description of the new requests:
• $1.7 million for major facility maintenance; $0.6 million for equipment repair at 5 LTC homes • $1.0 million for strategic approach and conceptual plan at the Peel Manor site • $0.4 million added for Panorama project in Public Health • $0.9 million for South Millway Public Health Clinic relocation and Meadowvale clinic
reconfiguration • $1.2 million added for paramedic electronic patient chart record project • $5.1 million for replacement vehicles and vehicles needed to implement the divisional model in
Paramedic Services • $29.6 million for 10 year facility plan and relocations in Paramedic Services • $0.3 million for defibrillators and medical equipment needs in Paramedic Services
The graphs below illustrate the Health Services 2014 Capital Budget by Program & By Funding Source. 2014 Capital Budget By Funding Source
(In $'000 & % ) *
Internal , $38,782,
95% DC Funding, $1,695,
4%
External, $275,
1%
2014 Capital Budget By Program (In $'000 & % )
Paramedic
Services, $36,118,
89%
Public Health, $1,285,
3%
Long Term Care,
$3,349, 8%
* For details on each program’s capital plan by classification, please refer to program summaries. 2. Existing Capital Projects The majority of the existing capital projects in Health Services span over a number of years as they relate to lengthy work on existing or new facilities. Paramedic Services continues to progress with their approved divisional model and are looking to reach substantial completion on all 21 satellite and 4 reporting stations by 2017. The notable capital projects being carried forward are listed below: Long Term Care
• Sheridan Villa redevelopment project is completed, with remaining deficiencies being attended to. $2.1 million is expected to be returned to the reserve in 2014, once deficiencies are resolved.
• There are 27 projects that are underway in the 5 Long Term Care homes. 12 projects are expected to be complete in early 2014 and the remainder is still in the planning stages for completion later in 2014.
• Some projects at Peel Manor are on hold, pending the outcome of the strategic approach and conceptual plan. High priority safety and compliance projects are continuing as planned.
14

Health Services – 2014 Budget Document Paramedic Services
• There are 19 active new facility Projects that are on-going in various stages, with total approved budget of $38.9 million.
• The paramedic electronic patient chart record project (original budget: $2.2 million) has commenced, with an estimated implementation date of 2015.
• The new Paramedic Services defibrillator purchase will be completed in late 2013. • Vehicle replacement projects ($1.3 million balance) will be fully spent in early 2014.
Public Health
• Expecting to complete four of the five projects in 2014 that were carried forward from 2013. (Malton Clinic, electronic medical record feasibility and two general software upgrades/initiatives)
3. 2014 Capital Budget and Operating Impact a. 2014 Capital Budget
The 2014 capital budget contains projects required to maintain Peel Region’s capital assets (state of good repair) and also address growth in our community. A comprehensive list of all the 2014 capital projects can be found in the respective program summary. Some selected highlights: Long Term Care • Major facility maintenance project consists of capital maintenance work to maintain State of
Good Repair on the Region of Peel`s five Long Term Care buildings. Some examples include: balcony tile and grout replacement at Tall Pines, asphalt and interlocking at the Davis Centre, roof membrane repairs at Sheridan Villa and HVAC replacements at Peel Manor.
• Equipment Replacement project consists of costs for the replacement of equipment across the five LTC homes. Some examples include: ceiling lift replacements at 4 homes and mattress/bed replacements at all five homes.
• Peel Manor site strategic approach and conceptual plan to be conducted in 2014, with recommendations being brought back to Regional Council.
Paramedic Services • Purchase of additional ambulances for Paramedic Services to support the new divisional model
and operational needs and regular replacement of existing fleet & support vehicles. • The 10 year facility plan required $29.5 million to address facility development and meet growth
demands. This includes capital funds related to 2 reporting stations in Brampton, 1 reporting station in Mississauga and 10 satellite stations (9 of these 13 stations are co-locates).
Public Health • The Meadowvale Clinic requires a reconfiguration of the front entrance to improve functional
program space and improve client satisfaction. • The relocation of the South Millway clinic in 2014, to improve upon existing clinic space to
maximize client through put and address client confidentiality concerns. • The Panorama project is a mandatory information system that will improve electronic client
record keeping. The project is expected to be funded 75% by the MOHLTC and will lead to long term benefits on our client record keeping and a reduction in data input.
15

Health Services – 2014 Budget Document b. Operating Impact of 2014 Capital Budget The 2014 operating budget includes the impact of previously approved and completed capital projects in Health Services. This includes the additional costs related to operating the newly opened satellite stations in Paramedics, Make Ready process, new facility staff to maintain the buildings, and operational costs related to new clinic leases in Public Health. The details related to the additional costs can be found in the Summary 1 details for each program area but collectively, the net cost is just under $0.5M in 2014. Capital included under the State of Good Repair does not add operating expenses as it is simply ensuring assets are maintained at an adequate level. There are some significant capital projects that will impact on the operating budget in the outlook years:
• The approved 10 Year Facility Plan in Paramedics has capital costs built into the 10 Year Capital Plan but as the reporting and satellite stations are built, they will require operating and staffing expenses to fully transition to the divisional model. Including all Make Ready provisions, additional utilities, decommissioning costs, property management and facility maintenance, the operating impact is expected to be $1.1 million in 2015, $0.5 million in 2016 and $1.1 million in 2017. An evaluation of the make ready process service delivery model is underway and will be reported back to Regional Council before proceeding in the outlook years.
• The electronic patient chart record project in Paramedic Services will be operational in 2015 and will add an estimated $0.4 million (net of 50% subsidy) to the operating budget. This includes 2.0 FTE that will be requested in 2015 to support the project.
• The Public Health Electronic Medical Records feasibility study is underway and therefore there is no operating impact in the current or outlook budget at this time.
4. 2014 – 2023 10-Year Capital Plan The following graph illustrates the breakdown of the 10-year capital plan by program. Almost $87 million (39 per cent) of the 10 year capital plan is identified as State of Good Repair for our existing assets.
2014-2023 10-Year Capital Plan By Program (In $'000 & % )
Paramedic Services,
$114,016, 51%
Public Health,
$7,595, 3%
Long Term Care,
$101,971, 46%
16

Health Services – 2014 Budget Document Health Services Department 10-year capital plan totals $223.6 million. Major capital projects include the following: Long Term Care
• Capital projects contain $48.0 million for major facility maintenance for the five Long Term Care (LTC) sites. An updated number on maintaining the Peel Manor home is included in the 10 year capital numbers
• To address the growth of Peel’s senior population, there is $45.5 million for the development of new LTC services, pending the recommendations from the Aging Population Term of Council Steering Committee
• Equipment replacement at all five homes will cost $7.5 million over the next ten years Paramedic Services
• The 10 Year Facility Plan will cost $59.4 million over the next 2 years, with projected completion dates in 2017 (pending construction and land delays). Site relocations and growth satellite stations account for another $10.2 million
• Replacing end of life vehicles, adding new vehicles tied to approved staff and new reporting stations will cost $33.7 million
• IT Initiatives will cost $3.0 million over the next ten years • Major facility maintenance for our newly owned buildings will start in 2016 and total $0.2 million
over the next 10 years • Defibrillators and other medical equipment replacement costs are $7.5 million
Public Health
• Capital costs of $2.6 million have been identified for new public health clinics required due to growth in population, as well as another $0.9 million for clinic relocations/reconfigurations
• $3.6 million relates to Information Management solutions over the next 10 years, including Electronic Medical Records, which will likely be funded by the Province through one-time grants for capital
The full 10-year capital plan for each program can be found in the individual program summaries. Section VI. Output/Outcome Measures Output and outcome measures are in place for all areas of Health Services and continue to evolve when new reporting requirements are introduced by the MOHLTC. In Long Term Care, the Long Term Care Homes Act requires that each provider establish a performance management reporting system that will report annually to its Committee of Management (Regional Council). Annual reports are tabled to Regional Council. In Paramedic Services, 2013 will mark the first year for the approved legislated response time framework, with annual reporting results being available in 2014. Performance will be measured annually in six categories, with targets approved by Regional Council by the end of October each year. Response time results for the 1st year and other key measures have been tabled with Emergency and Protective Services Committee in October and will be updated annually. In Public Health, Accountability Agreements with the MOHLTC were introduced in 2011 as part of the broader provincial Public Health Performance Management Strategy. 14 indicators have been developed with targets created for each health unit and are tabled annually with Regional Council. Detailed program outcome/output measures can be found in each respective program summary later in the document.
17

Health Services – 2014 Budget Document Section VII. Staffing The Health Services Department is requesting 10.5 FTE of new staff in the 2014 budget. This additional FTE are required to address growth in call volume experienced in Paramedic Services and the region-wide coordinated Public Access Defibrillators (PAD) program. Efficiencies in offload delay and the make ready process ensured that no new staff were required in 2013, but call volume growth of 8% in 2012 (vs 3% budget assumption, plus 3% for 2013 & 2014) makes it unsustainable to achieve 2 years of non-staffing, without compromising service delivery.
2013 Approved FTEs
Proposed
Changes in 2014
2014 Proposed
Total
Change %
2014 vs. 2013
Long Term Care 676.6 0 676.6 0%Paramedic Services 468.5 10.5 479.0 2.2%Public Health 638.8 0 638.8 0%Program Support 48.0 0 48.0 0%Total 1,831.9 10.5 1,842.4 0.6% Section VIII. Future Outlook The table below provides a summary of Health Services’ Operating Budget Four Year Forecast. Net Expenditures (In ‘000)
2014 Budget Forecasted
in 2013 Budget
2014
Budget
2015
Forecast
2016
Forecast
2017
Forecast
Long Term Care $30,917 $30,992 $31,906 $32,884 $33,888Paramedic Services $40,750 $41,836 $45,013 $46,978 $48,701Public Health $26,770 $26,728 $27,938 $29,462 $31,333Program Support $725 $729 $747 $766 $785Total $99,162 $100,285 $105,604 $110,090 $114,707# of FTEs 1,852.3 1,842.4 1,848.9 1,864.9 1,876.9Note: Details of each program’s forecast can be found in the respective program summary. Outlook year increases are primarily related to additional staffing and the operational impact of the Paramedic divisional model. The 2014 Budget is slightly higher than what was forecasted in 2013 due to the inclusion of the new Public Access Defibrillation Program (PAD) direction by Regional Council, lower budget assumption for provincial subsidy in Paramedics and revised budget assumptions on fuel usage and fleet maintenance requirements. Additional staff are projected in Paramedics for 2015 (4.5 FTE), 2016 (9.5 FTE) and 2017 (4.5 FTE) for population growth and demands of an aging population and 2 FTE in 2015 for the rollout of the electronic patient chart records. Additional staff are included for Public Health in 2016 (6.5 FTE) and 2017 (7.5 FTE), as part of the Multi-year plan to address community needs that has seen staffing deferred, due to Provincial funding constraints, since 2011.
18

Health Services – 2014 Budget Document
Section IX. Disclosure of 2014 Budget Risks and Key Program Assumptions 1. Budget Risks
• System demands in Paramedic Services, such as anticipated call volume increase (+3 per cent) or offload delay (-5 per cent), may increase more than expected, this will have a corresponding impact on Paramedic response times and availability of resources
• Potential communicable disease outbreaks are not budgeted for and could impact the operations of all Health programs
• There are some gaps in delivering on all the Ontario Public Health Standards, due to delays in implementing the approved multi-year staffing plan in Public Health. Examples have been provided under Section II, Item 3 of the Health Budget Document (Page 7).
• Uncertainty in provincial funding levels due to fiscal situation at the province 2. Key Program Assumptions The following are the key program assumptions related to funding: Long Term Care
• Increase one and a half per cent in all Level of Care funding per diems • Basic Accommodation fees (set by MOHLTC) are increasing one and a half per cent • Community Support Services funding is increasing zero per cent
Public Health • Assuming two per cent increase (same as 2013 funding increase received), no increases for
100 per cent funded programs • Hire the Region of Peel share (25 per cent of 13 approved FTE; 3 FTE) of existing unfunded
FTE’s, remaining 10 FTE’s contingent upon provincial funding Paramedic Services
• Using MOHLTC funding formula from 2013 grant, plus an increase of 1.5 per cent. Translates to 48.4 per cent funding on eligible operational costs
• 100 per cent funded Hospital Nursing Program to address offload delay • Capital is not funded directly by the MOHLTC but 50% of current amortization is funded
annually
Section X: Useful links
Other useful links are provided as below:
• Public Health Strategic Plan: http://pathways.peelregion.ca/dept/health/staying-ahead/default.shtm • Community Seniors Portal Network : http://www.seniorsinfo.ca/en/welcome • Mississauga Halton Local Health Integration Network (LHIN):
http://www.mississaugahaltonlhin.on.ca/ • Central West Local Health Integration Network (LHIN): http://www.centralwestlhin.on.ca/ • Central West Community Care Access Centre:
http://www.ccac-ont.ca/Content.aspx?EnterpriseID=5&LanguageID=1&MenuID=1 • Mississauga-Halton Community Care Access Centre: http://www.ccac-ont.ca/Content.aspx?EnterpriseID=6&LanguageID=1&MenuID=1 • Health Status website: Peel Public Health: Health Status Data - - Region of Peel
19

THIS PAGE INTENTIONALLY LEFT BLANK

Health Services – 2014 Budget Document Appendix 1
Health Services 2014 Operating Budget Pressures – Departmental Summary
Total
Expenditures Total
Revenue Net Cost
2013 Revised Cost of Service $239,456 $143,070 $96,386 2014 Proposed Budget Changes
a. Base Budget Changes Annualization $393 $393 $0Inflation $6,082 $0 $6,082Economic Factors $0 $0 $0Base Subsidy/Recoveries $811 $4,477 ($3,666)Cost Mitigation ($258) ($71) ($187)Other Pressures ($645) ($645) $0
Subtotal – Base Budget Changes $6,382 $4,154 $2,228
b. Service Demand Growth $1,024 $20 $1,004Service Demand $807 $244 $563Council Directed via Policy Report $0 $0 $0Subsidy/Recovery Change ($29) $0 ($29)Other Pressures $0 $0 $0
Subtotal – Service Demand $1,802 $264 $1,538
c. New Services $201 $70 $131 Subtotal – Service Demand $201 $70 $131 Total 2014 Proposed Budget Changes $8,385 $4,488 $3,897 2014 Proposed Budget (2014 Recommended Cost of Service)
$247,842 $147,557 $100,285
21

THIS PAGE INTENTIONALLY LEFT BLANK

PUBLIC HEALTH
PROGRAM BUDGET SUMMARY
Summary I: 2014 Operating Budget Pressures
Summary II: Operating Budget Four-Year Program Forecast
Summary III: 2014 New Capital
Summary IV: Ten Year Capital Plan
Summary V: Output and Outcome Measures

THIS PAGE INTENTIONALLY LEFT BLANK

THIS PAGE INTENTIONALLY LEFT BLANK

SUMMARY IPUBLIC HEALTH
2014 OPERATING BUDGET PRESSURES ($'000)
Total Expenditures
Total Revenue
Net Cost
2013 Revised Budget (2013 Cost of Service) 82,508 56,726 25,782
Base Budget Changes
- - -
Labour Costs 1,735 - 1,735 Goods and Services 73 - 73 Dental Fees Increase 2% 62 - 62
1,870 - 1,870
Base Subsidy/RecoveriesInflationary Increase of 2% on Mandatory/OPHS Program - 815 (815) Changes in Funding Allocation (mainly Healthy Smiles Ontario, Vector-Borne Diseases, Chief Nursing Officer Initiative and Public Health Nurses Initiative)
283 340 (56)
New Funding for Smoke Free Ontario Prosecution 25 25 - External Recoveries and User Fees (mainly Food Handler Courses and Immunization Services Recovery)
- 19 (19)
End of Funding for designated Public Health Awareness Initiatives (17) (17) - 292 1,182 (890)
Economic Factors - - -
Other PressuresChange in Draw from Reserves for One-Time Initiatives (60) (60) -
Cost MitigationVector-Borne Diseases Larval and Lab Contract Renewals (69) (51) (18) Reduction in Influenza Clinics due to Additional Community Providers (40) (20) (20) Efficiencies from On-call Scheduling Changes (17) - (17)
(126) (71) (55)
1,976 1,050 926 2014 Service Demand
Malton Clinic Expansion (7 months) 54 20 34 Efficiencies to Offset Malton Clinic Expansion (34) - (34)
- - -
- - -
Other Pressures - - -
Total 2014 Service Demand 20 20 - 2014 New Services
Investigation of Flu Immunization Options to Address Underserviced High-risk Populations (using influenza clinic savings) 20 - 20
20 - 20
2014 Budget (2014 Recommended Cost of Service) 84,524 57,796 26,728
Total 2014 New Services
PUBLIC HEALTH
Cost of Living/ Inflation
Annualization
Subsidy/Recovery Change
Total 2014 Base Budget Changes
Growth
Service Demand
1

SUMMARY IIPUBLIC HEALTH
OPERATING BUDGET FOUR-YEAR PROGRAM FORECAST
In $'0002014 Budget Forecasted in 2013 Budget
2014 Budget 2015 Forecast 2016 Forecast 2017 Forecast
Total Expenditures $83,773 $84,524 $86,395 $89,158 $92,306Total Revenue $57,002 $57,796 $58,457 $59,696 $60,973Net Expenditures $26,770 $26,728 $27,938 $29,462 $31,333
# of FTEs 638.80 637.80 637.80 644.30 651.80
2

SUMMARY IIPUBLIC HEALTH
OPERATING BUDGET FOUR-YEAR PROGRAM FORECAST
In $'0002014 Budget Forecasted in 2013 Budget
2014 Budget 2015 Forecast 2016 Forecast 2017 Forecast
Key forecast assumptions:- Mandatory/OPHS funding will increase by 2%- Revenues to increase by 2%- Inflationary pressures of 0% to 2.8% applied to applicable costs- Staff increases in 2016 (6.5) and 2017 (7.5) consistent with multi-year plan and pushed out one year from prior year's forecast
- Does not include operating impact of EMR
- Increased facility costs for annualization of Malton expansion ($33k) and additional leasing costs South Millway expansion ($34k) will be offset by efficiences/program reductions for no net impact
3

2014 NEW CAPITAL DETAIL
PUBLIC HEALTH
SUMMARY III
2014 Financing Sources and Funding Status ($'000)
Project #Expense
FundingTotal
Project Name
Approved or Pending
External Internal DCA
2014 Funding Status:
2014(A/P)
Ward
Information Management SolutionsA 09-5306 PANORAMA Peel 275 100 0 375
Health Clinic and Other Health FacilitiesA 14-5300 SOUTH MILLWAY CLINIC RELOCATION Peel 0 150 600 750
A 14-5302 MEADOWVALE CLINIC ENTRANCE RECONFIGURATION
Peel 0 160 0 160
2014Totals for Budget Year: 275 410 600 1,285
4

GrossDescriptionSub Type
Ten Year Combined Capital Program ($'000)
Yrs 6-1020182017201620152014
PUBLIC HEALTH
SUMMARY IV
TEN YEAR CAPITAL PLAN
New Health Clinics and Other Health Facilities
2,550 1,800 0 750 0 0 0PUBLIC HEALTH CLINICS AND FACILITIES17-5307FUNDS FOR LEASING OF PUBLICHEALTH CLINICS RELATED TO GROWTH
10 YearTotals For: NEWCLINIC 0 0 0 750 0 1,800 2,550
Information Management Solutions
375 0 0 0 0 0 375PANORAMA09-5306PANORAMA IS A PAN-CANAIDAN HEALTHINFORMATION SYSTEM THAT PEEL ISREQUIRED TO TRANSITION TO.
2,250 1,250 250 250 250 250 0PUBLIC HEALTH MANAGEMENT INFORMATION IMPROVEMENTS
13-5306
PUBLIC HEALTH MANAGEMENTINFORMATION IMPROVEMENTS
955 0 0 0 0 955 0ELECTRONIC MEDICAL RECORD (EMR) SYSTEM
13-5309
THIS PROJECT IS FOR THEEXPLORATION OF A COMPREHENSIVE,INTEGRATED ELECTRONIC MEDICALRECORD (EMR) SYSTEM FOR PEELPUBLIC HEALTH CLINICAL PROGRAMS.AN EMR SUPPORTS A VARIETY OFCLINIC-RELATED FUNCTIONS SUCH AS:CLIENT AND STAFF SCHEDULING,DOCUMENTATION OF CLIENT-PROVIDERINTERACTIONS (CHARTING), CLINICSUPPLIES INVENTORY MANAGEMENT,BILLING (WHERE APPLICABLE), AND
REPORTING ON CLINIC STATISTICS.
10 YearTotals For: INFOMGT 375 1,205 250 250 250 1,250 3,580
Vehicle Replacement
5

GrossDescriptionSub Type
Ten Year Combined Capital Program ($'000)
Yrs 6-1020182017201620152014
PUBLIC HEALTH
SUMMARY 1V
TEN YEAR CAPITAL PLAN
255 0 0 0 0 255 0MOBILE DENTAL CLINIC15-5304TO REPLACE MOBILE DENTAL CLINIC
10 YearTotals For: VEHICLE 0 255 0 0 0 0 255
Health Clinic and Other Health Facilities
750 0 0 0 0 0 750SOUTH MILLWAY CLINIC RELOCATION14-5300RELOCATION OF THE SOUTH MILLWAYHEALTHY SEXUALITY CLINIC TOINCREASE AND IMPROVE UPON THECURRENT CLINICAL SPACE. THECURRENT CLINICAL SPACE OF 1528SQUARE FEET IS CONFIGURED SUCHTHAT THE CLIENT WAITING AREA ISVERY SMALL AND OPEN AND EXPOSEDTO THE FRONT RECEPTION AREA.
160 0 0 0 0 0 160MEADOWVALE CLINIC ENTRANCE RECONFIGURATION
14-5302
DEVELOPMENT OF AN ENTRYVESTIBULE, STORAGE ROOM ANDADJACENT STAFF HOTELLING ANDPOSSIBLE CLIENT NEEDLE-EXCHANGEAREA (TO BE FINALIZED DURINGDESIGN). CURRENT FRONT ENTRANCELAYOUT HAS NO WEATHER BUFFER ZONELENDING TO HEAT AND COLD TRANSFERDURING SUMMER AND WINTER SEASONS.IN ADDITION, TWO AREAS AT EITHERSIDE OF THE ENTRANCE DOOR ARE NOTDEFINED FOR EXACT USE AND PRESENT
WASTED PROGRAM SPACE.
6

GrossDescriptionSub Type
Ten Year Combined Capital Program ($'000)
Yrs 6-1020182017201620152014
PUBLIC HEALTH
SUMMARY IV
TEN YEAR CAPITAL PLAN
300 0 0 0 0 300 0150 CPD SUITE 9 CLINIC RECONFIGURATION
15-5302
UPGRADE OF 150 CENTRAL PARK DRIVESUITE 9 CLINIC SPACE TO ALLOWADDITIONAL USEABLEEXAM/COUNSELLING ROOMS AS WELL ASA STAFF/CLIENT WASHROOM ANDLUNCH/STAFF ROOM.
10 YearTotals For: CLINIC 910 300 0 0 0 0 1,210
Totals for 10 Year Capital Plan: 1,285 1,760 250 1,000 250 3,050 7,595
7

SUMMARY VPUBLIC HEALTH
OUTPUT AND OUTCOME MEASURES
Selected Program Output Measures 2013 Target 2013
Projection 2014 Target Commentary
Dental
Total number of children screened
50,000 50,000 50,000 Due to the continuation of the shift in our approach to screening, all publiclyfunded Elementary schools in the ROP will be screened in 2013/14 and ona go forward basis. As a result resources will be focussed on school basedscreening as opposed to clinic based screening. This is our first attempt toscreen all schools as outlined in the OPHS and the upcoming Public HealthAccountability Agreement Indicators. HSO and its portable units will run atnormal capacity.
Total number of children identified in need of urgent treatment
11,000 11,000 11,000 Dependant on number of children screened. Anticipated success ofscreening strategy including extensive follow up could reduce urgent rateidentfication in 2014
Immunization
Number of student immunization records reviewed for students in the Region of Peel, including those registered at PDSB, DPCDSB, French-language and private schools.
242,932 243,480 248,806 This indicator provides a measure of how well the Division is able to meet it's goal to ensure that immunization records for school age children attending PDSB, DPCDSB, Private Schools and French School Boards are reviewed as per to the Immunization of School Pupil's Act (ISPA) for the following antigens: measles, mumps, rubella, diphtheria, tetanus and polio. Through the screening process student records that do not meet immunization requirements as defined by the Ontario Immunization Schedule are identified and brought up-to-date utilizing a series of notices and, if necessary, enforcement of the ISPA through suspension from school until requirements are met. Additions to requirements of ISPA may affect workload in 2014 - waiting for information from MOHLTC.
Percentage of students in Peel whose immunization records are reviewed.
100% 100% 100% The immunization records of all students reported by the Boards ofEducation as registered to Peel schools when the annual screening isinitiated will be screened to determine if requirements are met to identifythose for whom notification and/or enforcement is required.
Vaccine Distribution
Number of doses of vaccine distributed
1,000,000 850,000 900,000 We have been monitoring vaccine distribution and have seen a slightdecline in total doses distributed over the past 3 years. This is attributed toour efforts to reduce vaccine wastage due to overordering of vaccine byhealth care providers, as well as a slight decrease in demand for influenzavaccine. Influenza vaccine distribution accounts for ~50% of vaccinedistributed. We are therefore adjusting our 2014 target to 900,000 dosesand continue to monitor the data. This target may change if additionalvaccines are introduced into the provincially-funded immunizationschedule.
Food Safety
Food Premises Inspection Rate 100% of required
inspections
100% of required
inspections
100% of required
inspections
The Environmental Health Division's targets for 2014 will remainunchanged. All high risk food premises inspections will be inspected threetimes annually (once per trimester).
8

THIS PAGE INTENTIONALLY LEFT BLANK

LONG-TERM CARE
PROGRAM BUDGET SUMMARY
Summary I: 2014 Operating Budget Pressures
Summary II: Operating Budget Four-Year Program Forecast
Summary III: 2014 New Capital
Summary IV: Ten Year Capital Plan
Summary V: Output and Outcome Measures

THIS PAGE INTENTIONALLY LEFT BLANK
1

SUMMARY ILONG TERM CARE
2014 OPERATING BUDGET PRESSURES ($'000)
Total Expenditures
Total Revenue
Net Cost
2013 Revised Budget (2013 Cost of Service) 81,309 51,125 30,183
Base Budget Changes
- - - Labour Costs - from 9 months in 2013 to 12 months in 2014, Community Support Services Programs
306 306
Goods & Services - from 9 months in 2013 to 12 months in 2014, Community Support Services Programs
87 87
Increase in MOHLTC Funding for annualized Community Support Services programs
393 (393)
393 393 -
Labour Costs 1,257 1,257 Goods & Services 623 623
1,880 - 1,880
Base Subsidy/RecoveriesIncrease in preferred resident accommodation revenue (budgeted at 1.5%) 66 (66) Increase in basic resident accommodation revenue (budgeted at 1.5%) 292 (292) Increase in MOHLTC subsidy due to change in Case Mix Index 386 (386) Increase in MOHLTC envelope funding, (budgeted at 1.5%). 327 (327) Increase in Physiotherapy Funding (formerly funded directly by OHIP) 576 576 -
576 1,647 (1,071)
Economic Factors - - -
Other PressuresDecrease in MOHLTC One Time funding for startup costs in 2013. (363) (363) -
(363) (363) - Cost Mitigation
Total 2014 Base Budget Changes 2,485 1,677 809 2014 Service Demand
- - -
- - - Increase in Community Support Services: 100 % Funded by MOHLTC & Client Fees.
172 172 -
172 172 -
- - -
Other Pressures - - -
Total 2014 Service Demand 172 172 - 2014 New Services
Total 2014 New Services - - -
2014 Budget (2014 Recommended Cost of Service) 83,965 52,973 30,992
LONG TERM CARE
Cost of Living/ Inflation
Annualization
Subsidy/Recovery Change
Growth
Service Demand

SUMMARY IILONG TERM CARE
OPERATING BUDGET FOUR-YEAR PROGRAM FORECAST
In $'0002014 Budget
Forecasted in 2013 Budget
2014 Budget 2015 Forecast 2016 Forecast 2017 Forecast
Total Expenditures $82,079 $83,965 $85,670 $87,452 $89,270Total Revenue $52,036 $52,973 $53,764 $54,568 $55,382Net Expenditures $30,043 $30,992 $31,906 $32,884 $33,888
# of FTEs 674.54 676.64 676.64 676.64 676.64
2

SUMMARY IILONG TERM CARE
OPERATING BUDGET FOUR-YEAR PROGRAM FORECAST
In $'0002014 Budget
Forecasted in 2013 Budget
2014 Budget 2015 Forecast 2016 Forecast 2017 Forecast
Key forecast assumptions:
- Inflationary pressure of 0%-2.8% applied to applicable costs- Increase of level of care per diem subsidy by 1.5% for Nursing & Personal Care, Personal Support Services, Raw Food and Other Occupanc- 2014 and future per diem funding have factored in the unfrozen Case Mix Index (CMI)- Basic Accommodation fees increased by 1.5%- Updated preferred occupancy targets for each home to optimize preferred occupancy revenue- 0% increase in funding for Community Support Services- 0 FTE increase for all years
3

2014 NEW CAPITAL DETAIL
LONG-TERM CARE
SUMMARY III
2014 Financing Sources and Funding Status ($'000)
Project #Expense
FundingTotal
Project Name
Approved or Pending
External Internal DCA
2014 Funding Status:
2014(A/P)
Ward
Renovations to Existing FacilitiesA 14-5400 LTC MAJOR FACILITY MAINTENANCE 0 1,708 0 1,708
Long Term Care - Equipment ReplacementA 14-5401 LTC EQUIPMENT REPLACEMENT 0 641 0 641
A 14-5402 PEEL MANOR REPLACEMENT ASSESSMENT PEEL 0 1,000 0 1,000
2014Totals for Budget Year: 0 3,349 0 3,349
4

GrossDescriptionSub Type
Ten Year Combined Capital Program ($'000)
Yrs 6-1020182017201620152014
LONG-TERM CARE
SUMMARY IV
TEN YEAR CAPITAL PLAN
Renovations to Existing FacilitiesProjects are planned for repairs and renovations to LTC facilities.
47,974 24,058 4,847 6,203 6,764 4,394 1,708LTC MAJOR FACILITY MAINTENANCE14-5400TO MEET THE MAJOR FACILITYMAINTENANCE NEEDS OF THE LONGTERM CARE DIVISION
10 YearTotals For: LTC BLDG 1,708 4,394 6,764 6,203 4,847 24,058 47,974
Long Term Care - Equipment ReplacementProjects are planned for equipment and furnishing replacement in LTCfacilities
7,507 3,082 749 661 649 1,725 641LTC EQUIPMENT REPLACEMENT14-5401TO MEET THE EQUIPMENT REPLACEMENTNEEDS OF THE LONG TERM CAREDIVISION
1,000 0 0 0 0 0 1,000PEEL MANOR REPLACEMENT ASSESSMENT
14-5402
THE OBJECTIVE IS TO COMPLETE ACONCEPTUAL DESIGN WHICH PROVIDESFOR THE DELIVERY OF SERVICES,SUITABLE FOR 25 - 40 YEARS INTOTHE FUTURE
10 YearTotals For: LTCEQPRPLC 1,641 1,725 649 661 749 3,082 8,507
Building (or Facility) for the development of new LTC Services
45,490 45,490 0 0 0 0 0BUILDING (OR FACILITY) FOR THE DEVELOPMENT OF NEW LTC SERVICES
18-5401
TO ADDRESS NEEDS OF GROWING FRAILSENIOR POPULATION NEW LONG TERMCARE SERVICES MAY NEED TO BEDEVELOPED.
10 YearTotals For: LTC - New Building 0 0 0 0 0 45,490 45,490
Totals for 10 Year Capital Plan: 3,349 6,119 7,413 6,864 5,596 72,630 101,971
5

SUMMARY VLONG TERM CARE
OUTPUT AND OUTCOME MEASURES
Output/Outcome Measures 2013 Target 2013
Projection 2014 Target Commentary
% of residents who fell 11.50% 14.5% 11.50% Every fall is investigated and preventive measures put in place for each resident. In January 2013, a Divisional Clinical Excellence program was launched which includes a falls prevention component and falls quality circles established within three LTC homes. Although the divisional average has had little movement, the homes are currently modifying practices to incorporate evidence based practices and process improvements for falls prevention.
% of residents physically restrained
7% 6.4% 7% The Clinical Excellence program also focuses on the Resident Restraint Reduction. LTC is committed to least restraints and this program focuses on improving current practices around the use of restraints.
% of residents with unintended weight loss
1.75% 1.9% 1.75% There is a decreasing trend in unintended weight loss. The LTC interdisciplinary team continue to evaluate and improve the weight management program, focusing on the ideology behind resident weight loss and mitigating risk where possible.
% of residents in three or more activities per week
80% 89.8% 80% Attendance at life enrichment activities remains consistently high. Participation is voluntary and the LTC team strives to ensure activities are offered based on residents interests and to meet social, physical, intellectual, spiritual and emotional needs.
% of LTC beds occupied by residents
98% 99.2% 98% A focus for LTC is to ensure residents are placed in the LTC home as efficiently and quickly as possible. The strong partnerships between the homes and CCAC supports the successful results.
% of residents satisfaction with the overall quality of care at the
Centre
90% 90.0% 90% The results of the 2012 Annual Resident Satisfaction Survey is reflected here. The 2013 survey was administered in June and results will be announced shortly. Each year the results are analysed and Divisional and home specific improvement actions implemented.
6

PARAMEDIC SERVICES
PROGRAM BUDGET SUMMARY
Summary I: 2014 Operating Budget Pressures
Summary II: Operating Budget Four-Year Program Forecast
Summary III: 2014 New Capital
Summary IV: Ten Year Capital Plan
Summary V: Output and Outcome Measures

THIS PAGE INTENTIONALLY LEFT BLANK

SUMMARY IPARAMEDIC SERVICES
2014 OPERATING BUDGET PRESSURES ($'000)
Total Expenditures
Total Revenue
Net Cost
2013 Revised Budget (2013 Cost of Service) 74,931 35,218 39,712
Base Budget Changes
Labour Costs 1,628 1,628 Goods & Service 409 409
2,037 2,037
Base Subsidy/RecoveriesBase Subsidy (2013 approved budget+1.5% inflation increase) 1,440 (1,440) Hospital Nursing Program (100% funded by MOHLTC) 207 207 -
207 1,648 (1,440)
Economic Factors
Other PressuresEnd of extra resources (one-time expenses) related to the offload delay process work at area hospitals (Working Fund draw in 2013 budget)
(222) (222) -
(222) (222) -
Cost MitigationDecreased Advanced Care Paramedic class size from 12 to 6 (121) (121)
(121) (121)
1,902 1,426 476
2014 Service Demand
Operating Costs related to the opening of new stations (leasing, utility & maintenance cost)
150 150
To address increased call volume: Add 5,110 Services Hours starting June 1st2014 (9.5 FTEs)
825 825
975 975
Fleet & Equipment repair & maintenance 226 226 Make ready process for new Fernforest reporting station 137 72 65 Additional summer students required to ensure administrative demands are being met
25 25
Facility operation and technical staffing required to support effective operations of new reporting and satelitte stations (3 FTEs requested by Employee and Business Services)
247 247
635 72 563
Other Pressures
Total 2014 Service Demand 1,610 72 1,538
2014 New ServicesImplement Public Access Defibrillation (PAD) program (1 FTE) 181 70 111
181 70 111
2014 Budget (2014 Recommended Cost of Service) 78,622 36,786 41,836
Total 2014 New Services
PARAMEDIC SERVICES
Cost of Living/ Inflation
Annualization
Subsidy/Recovery Change
Total 2014 Base Budget Changes
Growth
Service Demand
1

SUMMARY IIPARAMEDIC SERVICES
CURRENT BUDGET FOUR-YEAR PROGRAM FORECAST
In $'0002014 Budget Forecasted in 2013 Budget
2014 Budget 2015 Forecast 2016 Forecast 2017 Forecast
Total Expenditures $77,453 $78,622 $83,336 $87,593 $91,432Total Revenue $36,703 $36,786 $38,323 $40,615 $42,731Net Expenditures $40,750 $41,836 $45,013 $46,978 $48,701
# of FTEs 491.00 479.00 485.50 495.00 499.50
Key forecast assumptions:-Inflationary pressure of 0%-2.8% each year for applicable items-Base 50/50 funding increase of 1.5% inflation-100% HNP program keeps at 16/24/32hrs for three hospitals with 3% wage increase
New Initiatives are:2015- operational costs for new stations- 1 12 hour vehicle for service enhancement to address calll volume growth (4.5 FTEs and 1.25 casual from June 2015)- operational cost of electronic patient chart records project (2.0 FTE)- Make ready service for third reporting station (Dec 2015)- Facility staffing request for third reporting station
2016- operational costs for new stations- 1 24 hour vehicle for service enhancement to address call voume growth (9.5 FTEs and 2 casual from June 2016)
2017- operational costs for new stations- 1 12 hour vehicle for service enhancement to address call volume growth (4.5 FTEs and 1.25 casual from Jun 2017)- Make ready service for fourth reporting station (Dec 2017)- Facility staffing request for fourth reporting station
2

2014 NEW CAPITAL DETAIL
PARAMEDIC SERVICES
SUMMARY III
2014 Financing Sources and Funding Status ($'000)
Project #Expense
FundingTotal
Project Name
Approved or Pending
External Internal DCA
2014 Funding Status:
2014(A/P)
Ward
Purchase of defibrillatorsA 14-7801 DEFIBRILLATORS AND MEDICAL EQUIPMENT Peel 0 252 120 372
Ambulance fleet vehiclesA 14-7803 AMBULANCE FLEET AND SUPPORT VEHICLES PEEL 0 4,059 152 4,211
A 14-7804 AMBULANCE FOR DIVISIONAL MODEL 0 888 0 888
New Facilities for Ambulance services to meet growth demandsA 14-7800 AMBULANCE FACILITIES - 10 YR CAPITAL PLAN PEEL 0 26,734 823 27,557
A 14-7808 AMBULANCE FACILITY - SITE RELOCATION Peel 0 1,890 0 1,890
IT Related ProjectsA 14-7807 IT INITIATIVES Peel 0 1,200 0 1,200
2014Totals for Budget Year: 0 35,023 1,095 36,118
3

GrossDescriptionSub Type
Ten Year Combined Capital Program ($'000)
Yrs 6-1020182017201620152014
PARAMEDIC SERVICES
SUMMARY IV
TEN YEAR CAPITAL PLAN
Purchase of defibrillatorsPurchase of defibrillators over the 10 year capital period.
7,549 5,189 489 372 621 506 372DEFIBRILLATORS AND MEDICAL EQUIPMENT
14-7801
PURCHASE OF DEFIBRILLATORS ANDMEDICAL EQUIPMENT FOR REPLACEMENTAND GROWTH.
10 YearTotals For: DEFIBPUR 372 506 621 372 489 5,189 7,549
Ambulance fleet vehiclesPurchase of ambulance fleet vehicles over the 10 year capital plan.
31,044 16,977 2,276 1,496 4,719 1,365 4,211AMBULANCE FLEET AND SUPPORT VEHICLES
14-7803
PURCHASE OF AMBULANCES ANDADMINISTRATION VEHICLES FOR PEELREGIONAL PARAMEDIC SERVICESPROGRAM.
2,664 0 0 0 888 888 888AMBULANCE FOR DIVISIONAL MODEL14-7804ADDITIONAL VEHICLE FOR DIVSIONALMODEL
10 YearTotals For: AMBVEHPUR 5,099 2,253 5,607 1,496 2,276 16,977 33,708
New Facilities for Ambulance services to meet growth demands
59,357 0 0 0 0 31,800 27,557AMBULANCE FACILITIES - 10 YR CAPITAL PLAN
14-7800
BUILDING OF AMBULANCE FACILITIESBASED ON 10 YR CAPITAL PLAN
1,890 0 0 0 0 0 1,890AMBULANCE FACILITY - SITE RELOCATION
14-7808
BOLTON SITE RELOCATION
4

GrossDescriptionSub Type
Ten Year Combined Capital Program ($'000)
Yrs 6-1020182017201620152014
PARAMEDIC SERVICES
SUMMARY IV
TEN YEAR CAPITAL PLAN
8,310 5,240 3,070 0 0 0 0AMBULANCE FACILITIES - GROWTH14-7809NEW SATTELLITE STATIONS TOADDRESS GROWTH
10 YearTotals For: AMBFACILITY 29,447 31,800 0 0 3,070 5,240 69,557
IT Related Projects
3,000 1,000 200 200 200 200 1,200IT INITIATIVES14-7807IT RELATED CAPITAL PROJECTS
10 YearTotals For: AMBIT 1,200 200 200 200 200 1,000 3,000
Existing Facilities
202 125 25 12 40 0 0MAJOR FACILITY MAINTENANCE14-7810BASED ON IMPROVEMENTS FOR REFINED10 YEAR PLAN FOR EXISTINGAMBULANCE FACILITIES.
10 YearTotals For: AMBEXISTING 0 0 40 12 25 125 202
Totals for 10 Year Capital Plan: 36,118 34,759 6,468 2,080 6,060 28,531 114,016
5

SUMMARY VPARAMEDIC SERVICE
OUTPUT AND OUTCOME MEASURES
Output/Outcome Measures 2013 Target 2013
Projection 2014 Target CommentaryOverall Total of Offload in System
40,657 38,744 33,261 This target is based on improvements achieved at Brampton Civic Hospital and Credit Valley Hospital. Also Trillium Health Center will undertake improvement project.
Hospital Offload Nursing Program. - staffed hrs by hospitals
24,040 22,850 26,760 Maintain the same HNP hours as 2013. Assumption that all the current hours will be approved by MoH
Annual Response Time based on CTAS level
Sudden Cardian Arrest at 6 min 70% 72% 70% Targets establish as per New Response Time Framework.
CTAS 1 at 8 min 75% 73% 75%CTAS 2 at 10 min 90% 87% 90%CTAS 3 at 13 min 90% 96% 90%CTAS 4 at 14 min 90% 97% 90%CTAS 5 at 14 min 90% 96% 90%% Audit Pass of delegated medical acts
98.5% 98.2% 98.5% This measures medical protocol compliance
Investigations resulting from inquiries or complaints per 1,000 calls
1 0.4 0.7 Reduce target which represent less customer/patient inquiry or complaints for 2014
Customer commendations per 1,000 calls
2.0 0.9 2.0 Maintain the same target
`
6

HEALTH SERVICES PROGRAM SUPPORT
PROGRAM BUDGET SUMMARY
Program Summaries Summary I: 2014 Operating Budget Pressures
Summary II: Operating Budget Four-Year Program Forecast
Summary III: N/A
Summary IV: N/A
Summary V: N/A
Summary VI: N/A

THIS PAGE INTENTIONALLY LEFT BLANK

SUMMARY IHEALTH SERVICE PROGRAM SUPPORT
2014 OPERATING BUDGET PRESSURES ($'000)
Total Expenditures
Total Revenue
Net Cost
2013 Revised Budget (2013 Cost of Service) 709 - 709
Base Budget Changes
- - -
- - - Labour Costs 147 147 Goods & Services 87 87 Public Health Clinic Facility Costs (mainly lease increases for annual CPI and renewals) 60 60
295 295
Base Subsidy/Recoveries - - - Health Administration Services Recovery from 3 Health Programs to Ensure Provincial Subsidy (215) (215) Health Facility Recovery from Public Health (49) (49)
(264) (264)
Economic Factors - - -
Other Pressures - - -
Cost Mitigation - - - Budget assumption change in facility related costs for clinics (11) (11)
20 - 20
2014 Service Demand
- - - Malton Clinic Expansion (7 months) 29 29
- - -
- - - Incremental Facility Recovery for Malton Expansion (29) (29)
Other Pressures - - -
Total 2014 Service Demand - - -
2014 New Services
- - -
2014 Budget (2014 Recommended Cost of Service) 729 - 729
HEALTH SERVICE PROGRAM SUPPORT
Cost of Living/ Inflation
Annualization
Total 2014 Base Budget Changes
Total 2014 New Services
Growth
Service Demand
Subsidy/Recovery Change
1

SUMMARY IIHEALTH PROGRAM SUPPORT
OPERATING BUDGET FOUR-YEAR PROGRAM FORECAST
In $'0002014 Budget Forecasted in 2013 Budget
2014 Budget 2015 Forecast 2016 Forecast 2017 Forecast
Total Expenditures 725 729 747 766 785 Total Revenue - - - - - Net Expenditures 725 729 747 766 785
# of FTEs 48.00 49.00 49.00 49.00 49.00
Key forecast assumptions:- Inflationary pressures of 0% to 2.8% applied to applicable costs- Clinic expansion costs included for Malton (7 months annualization) and South Millway- Clinic lease costs increased by 2% CPI
- Includes increased facility costs for annualization of Malton expansion ($33k) and additional leasing costs for South Millway expansion
2

Human Services

THIS PAGE INTENTIONALLY LEFT BLANK

Human Services
2014 Budget Document

THIS PAGE INTENTIONALLY LEFT BLANK

Table of Contents Composite Case Studies 1 Section I. Existing Services and Service Levels 3
1. What We Do 3 2. Existing Services and Service Levels 4
3. Key Initiatives in 2013 5
Section II. Issues and Trends 6 Section III. 2014 Business Focus 9 Section IV. 2014 Operating Budget 10
1. 2014 Departmental Operating Budget Overview 10
2. 2014 Operating Budget 11
Section V. 2014 Capital Budget 15 1. 2014 Departmental Capital Plan Overview 15
2. Existing Capital Projects 15
3. 2014 Capital Budget and Operating Impact 15
4. 2014 – 2023 10 Year Capital Plan 16
Section VI. Output/Outcome Measures 17 Section VII. Staffing 17 Section VIII. Future Outlook 17 Section IX. Disclosure of 2014 Budget Risks and Key Program Assumptions 18 Section X. Useful Links 20 Appendix 1: 2014 Operating Budget Pressures – Departmental Summary 21 Program Budget Summaries Social Assistance and Employment
Early Learning and Child Care
Housing
Community Investment

THIS PAGE INTENTIONALLY LEFT BLANK

Human Services – 2014 Budget Document
Human Services: Composite Case Studies Human Services uses an Integrated Service Delivery model. What does that mean and why does it matter? It means we streamline access to services, creating for clients the social service equivalent of one-stop shopping. Applicants, often in crisis, now have a single point of entry to multiple services. Once a prospective client enters that portal, s/he is quickly assessed for needs, assigned a worker and guided to required services, whatever combination of social assistance, childcare, employment, housing and/or community referrals s/he requires. Integration is what’s new in this process and here’s why it matters: it dramatically reduces frustration for both applicants and service providers. What’s more, it cuts down on duplication and the associated cost wastage. The following compressed composites illustrate the type of problems our clients face, and the integrated type of services we provide. Jennifer, age 32, Unemployed Single Mother After working as a fulltime accountant for 11 years, Jennifer lost her job when her company closed. She had accounting experience, but not full certification. Jennifer collected unemployment benefits for 12 months, and tried, unsuccessfully, to get a job. With two children and no partner, she was forced to turn to social assistance. Jennifer completed the online application and waited. • The next day, an Assessment worker contacted her to finalize the application • Assessment determined Jennifer had service needs from four Human Services programs
or support areas: financial assistance, child care, housing and employment • Lack of child care emerged as her main employment barrier • Her housing issue: Jennifer had been on the wait list for five years, but was still stalled in
an unaffordable market apartment • The worker completed the child-care application with Jennifer • The worker contacted Peel Access to Housing (PATH) to assess current options for
Jennifer • The worker connected Jennifer with an Employment service worker • Jennifer was soon granted social assistance • She was also accepted into a second-career employment program, which provides
training and paid placement, often leading to a job • Licensed child care came through • Jennifer was offered a “choice-based subsidy,” through Housing Investment Plan, to
cover her rent shortfall Outcome: Jennifer is the type of client likely to use services one time only. She will probably be in the system 12 to 24 months, until fully back on her feet.
1

Human Services – 2014 Budget Document
Mark, 61, a Peel Living Tenant in Crisis After losing his wife to a debilitating illness, Mark, now a widowed tenant residing alone in a Peel Living market unit, has fallen behind on his rent. He has also stopped leaving his apartment, and neighbours have complained about a bad odour coming from his unit. For the last eight months, Mark has refused to allow anyone entry to his home. His building’s superintendent, trained by Peel Living to care not only for the premise but also for its people, is concerned about Mark’s deteriorating behaviour since his wife’s death. • The building superintendent contacts the Human Services outreach team (a multi-
disciplinary group) to discuss situation • Team convenes to determine options and next steps • The team’s goal: avoid eviction, engage tenant, and assess his needs • Though Mark is served an arrears notice, which he ignores, he is not evicted. Rather, he
is offered a meeting with staff - a property manager, a representative from the Outreach Team, plus a Peel Living manager - to discuss options
• Many notices later, Mark agrees to a meeting • 3 staff, including a mental health specialist from outreach, enter the unit • The unit is extremely cluttered and requires professional cleaning • Licence 2 Clean, a St. Leonard’s social enterprise in local community, is hired for the job • Mark agrees to a monthly payment schedule to pay down arrears, and also agrees to
speak with a counsellor Outcome: A mental health community worker will be assigned to monitor Mark until he is stable. Keeping Mark housed, supported by the Outreach Team, and supplemented by a community mental health worker, is less costly in dollars, in human suffering, and in social ripple effects of homelessness, than evicting Mark for non-payment of rent. Everyone wins. Emergency Response : 100 Evacuees • Severe rainstorm in July 2013 forces evacuation of a Peel Region building • After-hours staff from Human Services are deployed to the scene • Police, fire, ambulance, along with city staff and other region reps, are on site • Building inspector determines all tenants must be evacuated for up to 10 days • Human Services staff meet with all tenants to assess for basic necessities, including
• Food, clothing, medications • Temporary accommodation • Travel and transportation to alternate site
• 25 tenants are placed in regional shelters; the remaining 75 themselves arrange to stay with family or friends
• 5 tenants require child-care arrangements for 10 days • Tenants return to building on day 10 • 24 units on first floor suffer severe water damage • 9 residents apply for rental assistance to secure new accommodations • 7 residents, who apply for furniture replacement, are referred to community agencies • 3 residents, on the housing wait list, qualify for housing allowance
2

Human Services – 2014 Budget Document
Outcome: Without the Integrated Service Delivery Model, 100 evacuated tenants, in time of crisis, would be forced to run around to at least three different Human Service departments seeking emergency help. With the integrated model, we are able to minimize frustration for tenants and workers, get help quickly and efficiently, and keep costs down. This diagram, with its shifting circles, illustrates integration among our three program areas. Our integration journey started years ago, and will continue into the future. Our current environment requires us to remain versatile and adaptable in order to meet the changing needs of our communities. Section I. Existing Services and Service Levels
1. What We Do Human Services operates as the Service System Manager (SSM) to oversee planning, funding and delivery of programs. We work through numerous partnerships with community organizations and other levels of government. Our emphasis has shifted from direct “service delivery” to supporting the alignment and integration of resources in the broader human service system to best meet community needs. We invest in individuals and families to enable their participation in the economy and the community. Service system management is partly mandated by Provincial accountabilities; however, responsibilities go farther, and include: Service System Planning: managing the relationship with agencies, community planning bodies, other levels of government and consumer stakeholders to establish local priorities and outcomes Allocation/Reallocation of Available Resources: ensuring resources are allocated in a way that can achieve agreed outcomes Providing Quality Assurance: ensuring systems comply with provincial and municipal expectations, including legislation, policies, directives, etc., and ensuring programs operate within available resources Governing the Service Delivery Organization: determining and implementing the authority and accountability structures to manage the service system People are at the centre of everything we do. The Region of Peel’s Human Services department is therefore structured and operates in an integrated fashion. We aim to seamlessly provide supports no matter the needs. As Service Manager we collaborate with our community partners to ensure the needs of our clients and communities are met.
3

Human Services – 2014 Budget Document
2. Existing Services and Service Levels Social Assistance and Employment Peel is responsible for administering social assistance and employment, including: • Financial subsidies for shelter and basic needs • Employment services and supports • Financial revenue recoveries through eligibility reviews • Cost reduction through other sources of revenue (child support, pensions, employment) Key facts
• 16,800 monthly average caseload for social assistance • 2.6% of the Peel population receives social assistance • $167.8 million in benefits distributed • 8,932 (2012 year end) clients involved in employment-related activities, including life
skills training, employment readiness, internship and wellness programs
Early Learning and Child Care Peel is responsible for system needs planning for children 0 – 12 years of age. Responsibilities include: • managing early year programs including child care • supporting community partners such as Peel Children and Youth Initiative (Success by 6) • partnering with school boards on Schools First Capital Retrofit Plans • providing financial support and service delivery funding oversight to the licensed child-care
sector through: o management of eligibility process for fee subsidy o fee subsidy for eligible children o funding support to special-needs agencies o wage subsidy and improvement funding for licensed centres o operational funding for repair and maintenance, play equipment and materials o support for professional development and quality mentoring initiatives (Raising
the Bar) o capital retrofit and transformation funding o funding to support lease/occupancy/utility costs
Support to families is also available through parenting and family literacy programs, as well as community partnerships, such as Learning in Our Neighbourhoods (LIONS). Key facts
• Elimination of child care wait list (as of January 2013, 3,042 children were awaiting subsidy)
• 30,000 licensed child-care spaces (non-profit and commercial) • 10,000 children served through 7,000 subsidized spaces • 1,235 children with special needs supported • 31,000 participants in Early Literacy, Family Literacy, Parenting and LIONs programs
4

Human Services – 2014 Budget Document
Housing Peel is responsible for system planning and oversight of housing in compliance with the Housing Services Act, 2011, and with the rules of local Peel programs. Responsibilities include:
• managing partnerships with 47 social housing providers • managing the eligibility process for affordable housing, including the Centralized Wait List
(CWL) • providing system sustainability • planning for homelessness prevention and housing, including new affordable housing
development • contributing to, and coordinating housing funding from, all orders of government
Key facts
• 19,005 units/homes/beds total system capacity (includes Peel Living and community-based units, plus shelter and transitional housing)
• 14,143 individuals (including 3,985 children and youth) assisted through shelters and transitional housing
• 12,059 subsidies, including shelter/transitional housing, rent geared-to-income subsidies, rent supplements, down payment assistance
• 13,600 households on the CWL for subsidized housing • Current wait times are at 6-11 years for families, 9 years for singles, 5-7 years for
seniors, and 1-3 years for victims of family violence • 380 families participating in Home in Peel home ownership program • 1,842 homelessness outreach response • 919 households assisted to retain existing housing
Community Investment Human Services extends the strengths of our communities by fostering partnerships to build resilient, effective and sustainable neighbourhoods, and to grow the non-profit sector. The objective: strengthen and improve the range and quality of services available to residents within our communities. We also share information and research to help human services providers become more effective. Key facts
• $4.4 million (2013) delivered to 71 community agencies • 7 high-needs neighbourhoods supported • 7 agencies assisted through Strengthening Organizational Effectiveness Fund • Housing partnerships developed with 3 new housing providers • 16 resident-engagement initiatives funded
3. 2013 Key Initiatives
During 2013, Human Services’ supported the following Term of Council priorities:
Priority #7 Increase supply of appropriate housing options Priority #8 Review core services delivered by Human Services Priority #19 Build community capacity
5

Human Services – 2014 Budget Document
Housing • Consultation with our Housing Provider Liaison group on Local Rules to be implemented
under the Housing Services Act, 2011 • Development of the Long-term Affordable Housing Strategy (LTAHS) • Portable choice-based subsidy option in which applicants search for their own
accommodation • Opening of Norton Lake, Creditvale Mills, Villa Polonia, adding 675 affordable homes • Partnership with Supportive Housing in Peel to develop, own and operate a 205-unit,
mixed- use affordable housing building at $7,500 Regional dollars per unit • 80 families purchased homes through the Home in Peel Home Ownership Program • Additional resources, and focus on homelessness prevention, impacting housing
retention, resulted in 10% decrease in shelter occupancy rates from 2011 and 2012 and average occupancy rates of 67% and 68%
Core Services
• New Child Care Funding and Framework Model to distribute Provincial funding • Development of the Peel Special Needs System Strategy and proposed Peel Inclusion
Resource Services model • Successful negotiation of 11 Learn.Play.Care centre sites to other providers (preserving
702 spaces) • Elimination of the child care wait list as a result of $28.5 million funding increase from
Ministry of Education, of which $15.7 million was invested in fee subsidies. (as of January 2013, 3,042 children were waiting for subsidy)
• Review of business practices, processes and procedures to improve overall service delivery
Community Capacity
• Implementation of Peel Poverty Reduction Strategy targeting: affordable transportation, food security, housing, income security
• New Community Investment Program (CIP) providing three new streams: Sustainability Fund, Organizational Effectiveness Fund and Collaboration Fund
• Partnership with Community Legal Clinics to provide 349 Clients (January – July) with assistance through the Disability Adjudication Unit Appeal Process
• Children’s Aid Society Partnership • PAMA – Precarious Employment Photo Exhibit (PEPSO)
Section II. Issues and Trends Provincial Policy and Legislation The Province continues to transform and modernize the three primary Human Services program areas: Early Learning and Child Care; Housing; Social Assistance and Employment. Changes impact funding, eligibility rules, service delivery models, technology to support client self-service and inter-governmental roles and responsibilities. The Region’s SSM responsibilities will change, along with associated funding formulas. Changes are driven by the:
• Modernization of the Early Learning and Child-Care system • Full-Day Early Learning Statute Law Amendment Act (Bill 242) • Ontario Early Years Policy Framework • Day Nurseries Act Reform • New Provincial Child Care Funding and Framework Model and the resulting development
of local funding models and policies
6

Human Services – 2014 Budget Document
• Housing Services Act requirement for local housing rules and new RGI regulations • Social Assistance Reform and Technology Modernization
Local System Planning The much-needed modernization happening at the Provincial level is partly a result of continued advocacy work by local governments. The resulting transformation is providing local governments with the flexibility to establish local policies to better serve local needs. True to our role as Service System Manager, we continue our shift from “service delivery” to collaborating with our community partners to establish rules ensuring the needs of our clients and communities are met. This collaboration helps determine needs and establish funding models to more adequately support our partners over the long-term. With this era of “local flexibility” comes a greater need for system planning and measurement. With flexibility there are greater demands on accountability. Human Services will continue to evaluate outcomes and investments to ensure our decisions are in line with community needs and council priorities. Growing Community Demands Demand for human services continues to increase, due to many factors, especially population growth, aging, immigration and growing poverty. Population growth adds approximately 18,700 new Peel residents annually. Our population is expected to grow by 25 percent by 2031, seniors (65+) by over 120 percent! Peel also continues to receive the second-largest number of immigrants to Ontario each year. Precarious employment is one of the most pressing issues This type of employment lacks benefits and security and is also characterized by limited control over work schedules, low pay, limited or no benefits and fewer opportunities for career advancement. It often involves unusual job contracts, temporary positions, poor working conditions and high health hazard risks. In 2011, Peel’s residents 15 years of age and over reported the second lowest median after tax income ($27,200) in the Greater Toronto Area (GTA). Moreover, among GTA municipalities, Peel also has the second highest prevalence of low-income (12.6%), of this low-income group, 10.2% are families with children aged 0-6 years. Recent decades have seen a dramatic rise in precarious employment due to forces such as globalization, the shift from the manufacturing to the service sector, and the explosion of information technology. These changes have created an economy demanding workplace flexibility accompanied by a decline in the standard employment relationship. The result? A crisis in precarious employment. Our caseload is one indicator of the economic conditions in Peel. Our average monthly volume has risen year over year, from 16,529 in 2012, to a monthly average of 16,800 (projected for 2013). Over the past five years, our caseload has jumped by nearly 4,000 cases. However, Ontario Works participants, as a percentage of the population, have remained fairly flat at 2.6% of Peel’s population. In 2013, the Provincial government announced policy changes to ease the eligibility criteria for Ontario Works. The impact of those changes is not known at this time. However, our budget is based on a monthly average of 17,000 cases in 2014, to account for the impact of Provincial policy changes.
7

Human Services – 2014 Budget Document
The following chart provides a history of our social assistance caseloads since 1988.
0.0%
1.0%
2.0%
3.0%
4.0%
5.0%
6.0%
7.0%
0
4,000
8,000
12,000
16,000
20,000
24,000
1988
1990
1992
1994
1996
1998
2000
2002
2004
2006
2008
2010
2012
2014
OW CaseloadsBeneficiaries as a % of population
O.W
. Cas
eloa
ds
% of population
2013 Projection - 16,8002013 Budget - 17,0002014 Budget - 17,000
Funding Shifts Many Provincial funding formulas now use demographic statistics to determine local funding needs. This has resulted in a more equitable distribution of funding across the Province and has provided Peel with much-needed support. This past year, the Provincial and Federal governments announced continued support and, in some instances, enhancement of several programs. These include:
• the new Early Learning and Child Care funding formula, which brought an additional $28.5 million in on-going funding
• the Province’s support for the Federal government’s five-year extension of its Investment in the Affordable Housing program (IAH) (last allocation was $30.75 million)
• continued commitment, as outlined in the Provincial-Municipal Fiscal Service Delivery review, to upload the costs of social assistance benefits ($4.5 million impact in 2014)
• Federal government renewal of Homelessness Prevention Strategy (HPS) for five years (2014-2019)(previous allocation totaled $2.8 million)
• $295 million provincially over the next two years for the Youth Employment Strategy to help connect young Ontarians with jobs and enhance the complement of skilled workers
• Increases to Ontario Work benefits and allowable assets ($631 thousand estimated impact)
The 2012 Provincial Budget included provincial funding of $90 million in 2012–13, $68 million in 2013–14 and $84 million in 2014–15 to support child care operators, parents and children to seamlessly transition into full-day kindergarten. This has been an important part of the Early Years vision. It is anticipated that this additional funding will benefit Peel’s Early Learning and Child Care system over the next several years and help mitigate future budget pressures.
Human Services Ontario Works Caseload Trends 1988-2014
8

Human Services – 2014 Budget Document
Section III. 2014 Business Focus Our changing environment, and the resulting complex community issues and increased program pressures, require new solutions. These include:
• Long-term integrated planning • Increased partnerships • New ways of conducting business • Difficult decisions about the business we are in
Over the past several years, Council has had to make some tough decisions—decisions that significantly influence our 2014 service levels and budgetary requirements.
The following are the results of Council direction and decisions:
• Recommendations to strengthen its service system management role in Early Learning and Child Care in five key areas: service delivery and planning, special needs, quality, funding and advocacy.
• Community Investment Program (CIP) Implementation, providing three new streams: Sustainability Fund, Organizational Effectiveness Fund and Collaboration Fund
• Partnering with Supportive Housing in Peel (SHIP) to develop affordable housing • Approval of the Housing Investment Plan and allocation of $17.1 million to address
housing needs • Snelgrove Place affordable housing development built in partnership with the Coptic
Church • Three new developments opened in 2013, a total of 675 “homes”: Villa Polonia,
Creditvale Mills and Norton Lake, built in collaboration with community partners • Three-stream RFP/RFI process to identify different stages of readiness and community
interest in building affordable housing Human Services continues to work on a service system integration vision. We continue to explore the evolution of our department as it relates to the organization’s role as a service system manager. As we update our Human Services Plan, our departmental priorities are in line with the Term of Council Priorities. Human Services 2014 business focus includes:
• Construction of a 205-unit affordable housing building through SHIP (Supportive Housing in Peel)
• Launch of Long-term Affordable Housing Strategy • Launch of newly designed Peel Renovates program • Implementation of local rules under the Housing Services Act • Development of local funding model and new Early Years Plan • Implementation of new service delivery model for children with special needs • Transition of Regionally operated child-care sites to community providers • Collaboration with City of Mississauga and Brampton on an Accessible Transportation
Pilot • Review of Employment programs and services • Development of a measurement framework to monitor Human Services’ community
impacts • Engagement in a charette process for Byngmount Beach (involving Peel Living).
9

Human Services – 2014 Budget Document
Section IV. 2014 Operating Budget 1. 2014 Departmental Operating Budget Overview The 2014 Human Services operating budget totals $187.3 million in net expenditures, a decrease of $1.27 million or 0.7% from the 2013 Budget. The following chart summarizes the year over year budget changes by program.
2014 Budget – Net Expenditures
(In $’000) 2013 Budget2013 Projection
(As at Aug. 31, 2013) 2014 BudgetBudget Change %
2014 vs. 2013Social Assistance and Employment $47,232 $106,304 $43,443 -8.0%
Early Learning and Child Care $23,792 $20,935 $20,792 -12.6%
Housing $111,986 $46,395 $116,513 4.0%
Community Investment $5,599 $5,608 $6,594 17.8%
Total $188,609 $179,242 $187,342 -0.7% Human Services 2014 total gross budget is $508.3 million: $321 million in revenue is received in the form of government subsidies, contribution from reserves and from other sources, resulting in a net budget of $187.3 million. The following charts provide a breakdown of expenditures and revenue by source.
Total Expenditures and Funding Sources by Type
Contribution to
Reserves
$15,380
3%
Grants &
Subsidies
$393,841
77%
Goods &
Services
$29,126
6%
Labor Costs
$69,963
14%
Recoveries
$13,699
3%
User Fees and
Reserves
$9,302
2%
Grants and
Subsidies
$297,967
58%
Regional Tax
$187,342
37%
Expenditures by Type (In Millions) Funding Source by Type (In Millions)
Total Expenditures = $508,310 Total Funding = $508,310
10

Human Services – 2014 Budget Document
Grants and Subsidies paid out to people in need and community partners represent 77% of the total expenditure budget and have increased by more than $83 million over the past 5 years. Upper level governments fund 75% of our grants and subsidies ($298 million of the $394 million), the balance of which is made up of our mandatory cost share and our municipal contributions for non-cost shared programs. 2. 2014 Operating Budget The following is a detailed explanation of the 2014 operating budget changes. It highlights the major financial drivers and requirements to meet growing community demand and support Term of Council priorities. This table summarizes the 2014 budget changes followed by a summary of the major budget impacts. A more detailed analysis of the 2014 budget impacts, including year-over-year budget changes are provided in Appendix I and in the program summaries.
2014 Budget - Net Expenditure Changes
(In $’000) 2013 Budget
a. Base Changes
b. Service Demand
c. New Services 2014 Budget
Social Assistance and Employment $47,232 -$3,789 - - $43,443Early Learning and Child Care $23,792 - -$3,000 - $20,792Housing $111,986 $1,343 $3,184 - $116,513Community Investment $5,599 -$86 $1,081 - $6,594Total $188,609 -$2,532 $1,265 $0 $187,342
2014 Proposed Changes
Note: Refer to Appendix 1 and Program Summaries for details. A. Base Budget Changes The overall base budget for Human Services will decrease by $2.5 million. Impacts on the base budget are provided below, (details can be found in the program budget summaries): Inflation The base budget will be impacted by economic adjustments and inflationary pressures totalling $2.8 million primarily driven by labour cost and increases to the cost of goods and services.
Base Subsidy/Recoveries Adjustments to subsidies and recoveries results in a base budget decrease of $5 million as a result of the continued upload of social assistance and employment benefits. Subsidies and recoveries budget changes include the following: Social Assistance and Employment Net budget reduction of $5.5 million as a result of:
o $5.1 million Provincial upload of social assistance and employment benefit costs net of reserve adjustments
o $2.1 million due to Provincially mandated benefit cost increases o $0.6 million in annualized Administration funding for caseload management as a
result of the Provincial funding formula update in 2013 o Offset, by $2.3 million increase in benefits to clients
11

Human Services – 2014 Budget Document
The social assistance average monthly caseload is forecasted to be 16,800 for 2013, 200 cases lower than budgeted (17,000). The 2014 budget was held at a monthly average of 17,000 cases to take into account provincial Ontario Works eligibility changes which may increase caseloads volumes. The budget also includes an increase to the benefit cost of 1% plus a $14 top up for singles as announced in the 2013 Provincial Budget. The benefit cost increases from $741 in 2013 to $751 for 2014, resulting in a $2.3 million gross increase to recipient benefits (net Regional impact of $266 thousand). Early Learning and Child Care Council’s decision to exit the direct delivery of child care will allow an additional $8.9 million reinvestment to support 21 child care system enhancements in 2014. $821 thousand was reinvested in 2013 for a total of $9.7 million in 2014. Details of the $9.7 million reinvestment plan are provided in the October 31st, 2013 Task Force report “Proposed 2014 Early Learning and Child Care Funding Allocation Approach”. The report also recommends a refocusing of resources from the LPC centres to support the system-wide enhancements. In addition, base funding from the Ministry of Education (MEDU) increases by $1.5 million and will support special needs initiatives. There is no net impact to the budget. Housing Net budget increase of $452 thousand as a result of eliminating reserve draws of $297 thousand for property tax subsidies and including as part of the tax base and $150 thousand reduction in federal funding. Cost Mitigation through Efficiencies and Recoveries The Human Services department is continually looking at opportunities to improve processes and find efficiencies to help mitigate costs. The impact of costs mitigations for 2014 is $335 thousand. Some of the cost savings identified have already been realized in 2013 and have been incorporated into the 2014 budget. Some of the key efficiencies and recoveries achieved in 2013 and 2014 include:
• Implementation of new policies and procedures in Homelessness under the Homelessness Prevention Fund (formerly CSUMB) resulted in $2 million savings which will be redeployed in 2014 to support the Peel Renovates program
• Savings of $220 thousand in 2013 as a result of changes to Discretionary benefit
policies and procedures, without negatively affecting clients by: o Establishing partnerships within the community to find alternate means of
providing discretionary type items and funding o maximizing other provincial and charitable benefits for clients o narrowing eligibility criteria
• Cost reduction in goods and services resulting in $335 thousand savings. $208
thousand will be redeployed to Strategic Planning, Policy and Partnerships to fund two Performance Measurement Specialist positions critical to the achievement of Term of Council priorities and developing measurement frameworks for five divisions in the Human Services department.
12

Human Services – 2014 Budget Document
• Council’s decision to exit the direct delivery of child care will result in a budget reinvestment ($9.7 million in 2014) to support 21 child care system-wide enhancements in the areas of service delivery and planning, special needs, quality, advocacy and funding
• Negotiation of a $33 million external debenture resulting in lower debt costs for
Chapelview resulting in savings of $252 thousand. Surpluses are transferred to working fund reserves which strengthen long-term financial sustainability
• Partnership with SHIP on the development of the 205 unit Hansen housing project
thereby reducing the Region’s capital investment in new buildings from approximately $87,500 per unit to $7,500 per unit, a reduction of $80,000 per unit
In addition to the savings above, efficiencies have also been identified in Human Services that may not be quantifiable immediately, but may have an impact on the budget over the long-term. These include:
• Use of community volunteer hours to build community collaboration and reduce internal costs
• New Housing wait list data reports which provide access to real time accurate data used to determine needs when planning for new builds
• New application process for Child Care Subsidy where eligible families are provided with subsidy immediately (as long as they have a childcare space)
• Elimination of the Child Care wait list resulting in less time spent on administration and more on serving clients
• Implementation of technology (SmartSimple) to support the Community Investment Program which allows for automated application submissions and approvals dramatically reducing the administrative burden for both applicants and the Region
• Implementation of AssetPlanner software to better inform capital investments by housing providers
B. Service Demand The following section highlights the budget impacts associated with additional service demands for 2014. Some have no net budget impact as they are funded through government subsidies or redeployments of budgets as a result of Council decisions and through efficiencies.
Net Cost ($’000) Program Service Demands 2014
Budget 2015
Impact
Early Learning and Child Care
Exiting Direct Delivery of Child Care (LPC Centres) The exit of direct delivery of child care will be completed in 2014 with 11 centres being transferred to external providers. Estimated costs to continue LPC operations during the transition period are $3 million. A $3 million one-time draw from Best Start reserve (R1258) will be used to bridge these costs.
-$3,000
$0
Total Service Demands for Early Learning and Child Care -$3,000 $0
13

Human Services – 2014 Budget Document
Net Cost ($’000) Program Service Demands 2014
Budget 2015
Impact Housing Rent Supplement Supports
$3 million increase in rent supplement supports to address the housing wait list and provide an additional 360 rent supplements. Funded from net budget reductions in other Human Services program areas.
Peel Renovates
$2 million increase in Peel Renovates program to support 128 families. Funded from budget reductions in Homelessness program as a result of policy changes in the Homelessness Prevention Fund. No net impact to Regional budget.
Our Place Peel Increase funding for Our Place Peel to stabilize support at Wilkinson and Cawthra Road shelters specifically for youth housed in adult shelters.
Inflation Adjustments for Contracts and Agency Payments
These agencies provide direct client delivery of services for homelessness shelters, which are faced with the challenges of increasing costs. It is recommended that they are provided with an inflationary adjustment to enable them to maintain the same levels and quality of service. The inflation adjustment is $227 thousand offset by increased funding in Homelessness of $222 thousand.
$3,000
$0
$179
$5
$0
$0
$0
$0
Total Service Demands for Housing $3,184 $0 Community Investment Community Investment Program
$1 million increase in the Region's investment in not for profit sector from $4.5 to $5.5 million to support organization’s overall sustainability and operational health.
Inflation Adjustments for Contract and Agency Payments
These agencies provide direct client delivery of services for neighbourhoods and communities, which are faced with the challenges of increasing costs. It is recommended that they are provided with an inflationary adjustment to enable them to maintain the same levels and quality of service.
$1,000
$81
$0
$0
Total Service Demands for Community Investment $1,081 $0 Total Program Service Demands for Human Services $1,265 $0 C. New Services There are no new service requests for 2014.
14

Human Services – 2014 Budget Document
Section V. 2014 Capital Budget
1. 2014 Departmental Capital Plan Overview The following chart provides a financial summary of Human Services’ capital project funding anticipated to be carried forward to 2014 and the new capital funding request for 2014.
Capital Plan by Funding Source
Carry – Forward from Prior Years
($’000)2014 Capital
Budget ($’000)Total Capital
In 2014 ($’000)DC Growth $0 $0 $0Externally Funded $18,000 $0 $18,000Non-DC Internal* $12,464 $11,823 $24,287Total Expenditures $30,464 $11,823 $42,2872014 Cash Flow $19,200 $11,823 $31,023
# of Projects 15 4 19 *Note: Non-DC Internal capital work includes state of good repair, non-DC growth, service level enhancement and grants to external agencies
For 2014, Human Services is requesting a capital budget of $11.8 million, which includes:
• $10.95 million for housing provider capital repair request • $370 thousand for regular capital maintenance for Regionally-operated emergency
shelters • $300 thousand for consulting work related to Twin Pines community project • $200 thousand for our leased facilities to external child care providers
The 2014 capital overview can be found in Summary III. 2. Existing Capital Projects
The following is a summary of major capital work in progress: Housing
• Supportive Housing in Peel (SHIP) Hansen’s project will add 205 additional units to the housing system in Peel and build capacity in the non-profit sector. Expected completion is early 2016
• Regular repair and maintenance of Regional shelters ($200,000 estimated to be carried forward from prior years)
• Regular repair and maintenance of Regionally owned child care facilities • Housing Technology Initiative which has received final recommendations from KPMG
and is currently at the RFP stage 3. 2014 Capital Budget and Operating Impact a. 2014 Capital Budget The 2014 capital budget contains projects required to maintain capital assets in a state of good repair. This includes funding for capital repairs for housing providers including Peel Living:
15

Human Services – 2014 Budget Document
Housing Contingency for Capital Related to Housing Providers - $11 million The Region of Peel as Housing Service Manager is responsible for ensuring the Region’s supply of affordable housing is kept in a state of good repair and maintains a capital maintenance reserve for social housing providers to help address depleted capital reserve funds. It is anticipated that housing providers will require assistance in the amount of $11 million for 2014. Capital Maintenance for Regionally-operated Emergency Shelters - $370,000 Ongoing capital repairs for emergency shelters. Amount budgeted is in line with Corporate Asset Management (CAM) requirements and consistent to prior year budget requirements. Twin Pines Community Project - $300,000 Work on the development of a long term plan for the future of the Twin Pines lands as directed by the Board. This includes incorporation of its existing use, interests of the existing residents and community and its potential as a public asset to meet Peel Living’s affordable housing mandate. Early Learning and Child Care Capital Maintenance for leased Child Care facilities - $200,000 Ongoing capital repairs for child care facilities leased to external providers. Amount budgeted is in line with Corporate Asset Management (CAM) requirements and consistent to prior year budget requirements.
b. Operating Impact of 2014 Capital Budget
There are Capital related operating impacts as a result of the 2014 Capital budget. However, the Hansen affordable housing project being developed by SHIP will be operational in early 2016 and will require rent supplements for 82 units. The operational impact of funding 82 rent supplement units is estimated to be approximately $688 thousand dollars annually over the next 20 years commencing in 2016. 4. 2014 – 2023 10-Year Capital Plan From 2014 to 2023, Human Services capital plan is $265.1 million. The following is a summary of the capital plan:
• $157.3 million for affordable housing development projects (700 new units over the next 10 years)
• $97.2 million to fund state of good repairs shortfalls for external housing providers • $5.7 million for state of good repair for shelters and lease child care centres • $2.7 million for new homelessness shelter • $1.6 million on Building Condition Assessments and Energy Audits • $0.6 thousand for work related to Twin Pines community project
The capital plan currently includes $157.3 million for 700 affordable housing units over the next 10 years to be funded through Development Charges, Regional reserves and anticipated Federal/Provincial Investment in Affordable Housing (IAH) funding. $2.7 million is planned for a shelter in 2016 funded through Development Charges. A summary of the 10-year capital plan can be found in Summary IV.
16

Human Services – 2014 Budget Document
Section VI. Output/Outcome Measures Summary V provides the Output/Outcome measures for 2014. Human Services has dedicated resources to continue building and maintaining the performance measurement framework within Human Services to support decision making. Section VII. Staffing In 2013, the Region of Peel received an additional $28.5 million from the Ministry of Education increasing Early Learning and Child Care funding by 53% to $81.9 million. With this increased funding, service managers also received the flexibility to develop local funding policies and funding model frameworks. Peel’s exit from the direct delivery of child care will be completed in 2014 and will involve the reinvestment of $9.7 million into 21 system-wide enhancements as recommended by the Early Learning & Child Care Task Force and approved by Council. The system-wide enhancements target service delivery and planning, special needs, quality, advocacy and funding. As mentioned previously, this new era of “local flexibility” requires a greater need for system planning and measurement. As well, with flexibility there are greater demands on accountability. The Early Learning and Child Care Task Force recognized that additional resources are required to support Council’s enhanced service manager role. Resources are required to adequately plan, deliver, manage and support the new level of service and to work with community partners to build and stabilize the Early Learning and Child Care system. Peel’s exit from direct delivery of child care will reduce the number of full-time equivalent (FTE) positions in Human Services in 2014 and 2015. The 2014 LPC reinvestment of $9.7 million includes a refocusing of resources, resulting in a net FTE reduction of 54.5 FTE in 2014. The chart below provides a summary of FTE by program:
Social Assistance and Employment 399.5 - 399.5 0.0%Early Learning and Child Care 248.5 -54.5 194.0 -21.9%Housing 157.5 0.0 157.5 0.0%Community Investment 7.0 0.0 7.0 0.0%
Total 812.5 -54.5 758.0 -6.71%
Change % 2014 vs. 2013
2014 Proposed Total
Proposed Changes in 2014
2013 Approved FTEs*
*Includes 2013 in-year changes
Section VIII. Future Outlook The future outlook for Human Services includes the benefit of the Provincial upload which will see cost sharing increase from 88.6% Provincial/11.4% Regional in 2014 to 100% provincial by 2018. In addition, through its business review, Human Services will continue to work towards identifying efficiencies and cost reductions.
17

Human Services – 2014 Budget Document
Some key program assumptions included in the forecast are:
• Caseloads remaining at a monthly average of 17,000 • Continued Provincial upload - 2014 (88.6%), 2015 (91.4%), 2016 (94.2%), 2017 (97.2%),
2018 (100%) • Administration and employment funding adjusted for 2014-2017 as a result of Provincial
funding formula update (formula is adjusted on a two-year cycle) • Increase in housing supports for rent supplements as described above under Service
Demand • Impact of Council’s decision on Early Learning and Child Care system enhancements
Net Expenditures Forecast
Social Assistance & Employment $44,066 $43,443 $39,579 $36,280 $33,012Early Learning & Child Care $24,364 $20,792 $21,057 $21,330 $21,609Housing $112,873 $116,513 $119,419 $122,228 $125,169Community Investment $5,670 $6,594 $6,757 $6,912 $7,058Total $186,973 $187,342 $186,813 $186,749 $186,848# of FTEs 740 758 684 684 684
2014 Budget Forecasted in 2013 Budget
2017 Forecast (In $’000)
2014 Budget
2015 Forecast
2016 Forecast
The departmental forecast details for each program can be found in Summary II. Section IX. Disclosure of 2014 Budget Risks and Key Program Assumptions Budget risks and assumptions for the 2014 budget include: Social Assistance and Employment
Increasing Caseloads The Region of Peel continues to see high social assistance caseloads levels; the 2014 budget is based on an average of 17,000 caseloads. The impact of the change in eligibility rules is unknown and may result in increased caseload. Increased caseloads could also put pressure on the need for discretionary benefits which are now capped at $10 per case. Continuation of Provincial upload of Social Assistance The Province announced that by 2018, the cost share of the social assistance benefit subsidy and employment subsidies will be 100 per cent, in a phased schedule. The 2014 cost share will be 88.6 per cent Provincial/11.4 per cent Regional. The 2014 budget and forecast period assumes that the upload schedule will continue with full upload by 2018. Early Learning and Child Care
Phased Withdrawal from Direct Delivery There are several variables associated with the phased withdrawal of the centres. For example, the transfer of the centres is currently being negotiated and will vary with each centre. This will impact the timing and amount of funding required to operate the centres. Also, there are legal and other Human Resource costs that will be incurred. These costs are expected to be funded through Regional reserves and surpluses and will not impact the Human Services budget.
18

Human Services – 2014 Budget Document
Capital Retrofit Needs for Child Care Centres With the implementation of full-day kindergarten (FDK), the early learning and child care system is transforming. As the result, existing child care providers will need to retrofit their centres to accommodate services to children from 0-3.8 years of age. The timing of these retrofits may continue past the full implementation of FDK and it is assumed that some capital retrofit funding will continue on an annual one-time basis to accommodate providers past the full implementation of FDK in 2014. Housing
Housing Capital Reserves – New Development The development of new affordable housing is highly reliant on the availability of Federal and Provincial funding. Current Regional housing reserve contributions are insufficient to sustain future development plans for new affordable housing without this additional funding. Development Charges are critical to the housing funding models. While the 10-year capital plan assumes that $40 million in Development Charges will be available, it is unknown if there will be sufficient funds collected to support the development plan. Further study will be needed to determine the overall funding gap and the need for other sources of funding. Housing Capital Reserves – State of Good Repair Peel’s affordable housing stock is rapidly aging and housing providers (including Peel Living) are challenged with the high costs of maintaining and preserving these assets. Peel Region as Service Manager is required to help housing providers in financial difficulty, as such there are concerns about the adequacy of Service Manager funding for necessary social housing infrastructure renewal and increased demand for support from the Service Manager.
Community Investment
Community agencies in Peel are facing some uncertainty as funding partners review their respective mandates, priorities and identify emerging gaps. While funding for this program is provided and administered directly by the Region, there is a small risk from a budget perspective, if more requests for funding surfaces as agencies and other fund partners make changes in their own portfolios.
19

Human Services – 2014 Budget Document
Section X: Useful Links
Human Services Social Services in Peel - http://www.peelregion.ca/social-services/about-sservices.htm Social Assistance and Employment Final Report of the Commission for the Review of Social Assistance in Ontario - http://www.socialassistancereview.ca/ Ontario Works - http://www.peelregion.ca/ow/ Employment Services - http://www.peelregion.ca/ow/ourservices/employment-services.htm Ministry of Community and Social Services - http://www.mcss.gov.on.ca/en/mcss/index.aspx About Social Assistance in Ontario - http://www.mcss.gov.on.ca/en/mcss/programs/social/index.aspx
Early Learning and Child Care Children Services - http://www.peelregion.ca/children/ Early Learning and Child Care Task Force - http://www.peelregion.ca/social-services/background-elcc.htm Ministry of Children and Youth Services - http://www.children.gov.on.ca/ Ministry of Education - http://www.edu.gov.on.ca/eng/ Housing Region of Peel Housing - http://www.peelregion.ca/housing/housing-index.htm Peel’s Housing and Homelessness Plan-http://peelregion.ca/housing/housinghomelessness/index.htm Ministry of Municipal Affairs and Housing - http://www.mah.gov.on.ca/ Ontario Non-profit Housing Association - http://www.onpha.on.ca The Co-operative Housing Federation of Canada - http://www.chfcanada.coop Housing Services Corporation - http://www.hscorp.ca/ Community Investment Investing for Resilience - Community Investment Strategy Review - http://www.peelregion.ca/social-services/comm-progs-find.htm#fundcat
20

Human Services – 2014 Budget Document
Appendix 1 Human Services
2014 Operating Budget Pressures – Departmental Summary
Total Expenditures
Total Revenue
Net Cost
2013 Revised Budget (2013 Cost of Service) 497,819 309,210 188,609 Base Budget Changes
- - -
3,321 482 2,839
Base Subsidy/Recoveries 3,018 8,054 (5,036)
Economic Factors - - -
Other Pressures - - -
Cost Mitigation (335) - (335)
6,004 8,536 (2,532)
2014 Service Demand
- - -
4,487 3,222 1,265
- - -
Other Pressures - - -
Total 2014 Service Demand 4,487 3,222 1,265
2014 New Services - - -
- - -
2014 Probudget (2014 Recommended Cost of Service) 508,310 320,967 187,342
Total 2014 New Services
HUMAN SERVICES DEPARTMENT
Inflation
Annualization
Subsidy/Recovery Change
Total 2014 Base Budget Changes
Growth
Service Demand
21

THIS PAGE INTENTIONALLY LEFT BLANK

SOCIAL ASSISTANCE & EMPLOYMENT
PROGRAM BUDGET SUMMARY
Summary I: 2014 Operating Budget Pressures
Summary II: Operating Budget Four-Year Program Forecast
Summary III: N/A
Summary IV: N/A
Summary V: Output and Outcome Measures

THIS PAGE INTENTIONALLY LEFT BLANK

SUMMARY ISOCIAL ASSISTANCE & EMPLOYMENT
2014 OPERATING BUDGET PRESSURES ($'000)
Total Expenditures
Total Revenue
Net Cost
2013 Revised Budget (2013 Cost of Service) 211,293 164,061 47,232
Base Budget Changes
- - -
Labour Costs 792 - 792 Goods & Services 865 - 865
1,657 - 1,657
Base Subsidy/RecoveriesTotal caseload related costs decreased due to:Caseload net Mandatory cost increase: rate increase by 1%, singles top up by $14 2,333 2,067 266 Net revenue increase due to Ontario Works upload from 85.8% to 88.6%, net of reserve adjustment - 5,059 (5,059) Employment & Administration funding increase due to upload - 649 (649) Employment Related Expense (ERE) program cost increase 11 - 11 Addiction Service Initiative (ASI) Funding increase - 15 (15)
2,344 7,790 (5,446)
Economic Factors - - -
Other Pressures - - -
Cost Mitigation - - -
4,001 7,790 (3,789)
2014 Service Demand - - -
Total 2014 Service Demand - - -
2014 New Services - - -
- - -
2014 Probudget (2014 Recommended Cost of Service) 215,294 171,851 43,443
Total 2014 New Services
SOCIAL ASSISTANCE & EMPLOYMENT
Inflation
Annualization
Total 2014 Base Budget Changes
1
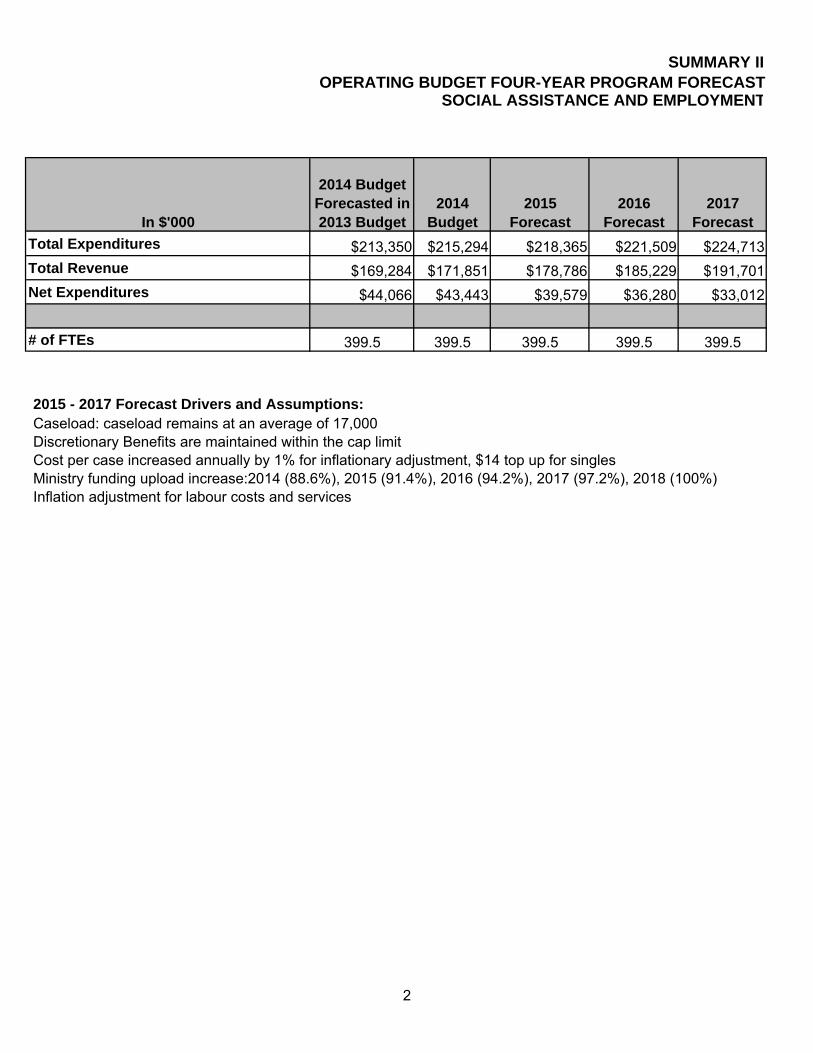
SUMMARY IIOPERATING BUDGET FOUR-YEAR PROGRAM FORECAST
SOCIAL ASSISTANCE AND EMPLOYMENT
Total Expenditures $213,350 $215,294 $218,365 $221,509 $224,713Total Revenue $169,284 $171,851 $178,786 $185,229 $191,701Net Expenditures $44,066 $43,443 $39,579 $36,280 $33,012
# of FTEs 399.5 399.5 399.5 399.5 399.5
2015 - 2017 Forecast Drivers and Assumptions:Caseload: caseload remains at an average of 17,000 Discretionary Benefits are maintained within the cap limit Cost per case increased annually by 1% for inflationary adjustment, $14 top up for singlesMinistry funding upload increase:2014 (88.6%), 2015 (91.4%), 2016 (94.2%), 2017 (97.2%), 2018 (100%)Inflation adjustment for labour costs and services
2017 ForecastIn $'000
2014 Budget Forecasted in 2013 Budget
2016 Forecast
2014 Budget
2015 Forecast
2

SUMMARY VSOCIAL ASSISTANCE AND EMPLOYMENT
OUTPUT AND OUTCOME MEASURES
Measure 2013 Target
2013 Forecast
2014 Target Description
Cost of administration and employment per social assistance case $3,458 $ 3,481 $ 3,546
Gross administration costs per case
Monthly average social assistance caseload 17,000 16,800 17,000
Year to date average social assistance payments, which highlights the trend for social assistance
Social assistance caseload turnover rate 6.0% 5.5% 5.6%
Measures the percentage of people coming on and off social assistance.
Average time on OW assistance (months) 13.0 14.4 13.0
Rolling average, highlights trend for length of time on assistance
Percent of OW caseload with employment income 5.4% 5.4% 5.4%
Influenced by caseload size. Currently the number of earners on the caseload is fairly constant, the increase in caseload of non-earners is affecting the measure negatively.
Average Monthly social assistance benefit cost per case (social assistance component only)
$ 741 $ 746 $ 751
Highlights average benefit cost per caseload, driven by trend in case mix and volume
Percentage of caseload with employment starts 17.0% 16.5% 17.0% Percentage of caseload that
enter/re-enter the labour market
Average monthly percent of OW cases appealing decision 0.17% 0.14% 0.17%
Monthly average percent of terminated caseload appealing the decision
3

THIS PAGE INTENTIONALLY LEFT BLANK

HOUSING
PROGRAM BUDGET SUMMARY
Summary I: 2014 Operating Budget Pressures
Summary II: Operating Budget Four-Year Program Forecast
Summary III: 2014 New Capital
Summary IV: Ten Year Capital Plan
Summary V: Output and Outcome Measures

THIS PAGE INTENTIONALLY LEFT BLANK

SUMMARY IHOUSING
2014 OPERATING BUDGET PRESSURES ($'000)
Total Expenditures
Total Revenue
Net Cost
2013 Revised Budget (2013 Cost of Service) 168,998 57,012 111,986
Base Budget Changes
- - -
Labour Cost 462 144 318 Goods and Services 911 338 573
1,373 482 891
Base Subsidy/Recoveries
Property Tax Subsidy - formerly funded from capital reserves - (297) 297 Federal Funding Decrease - Rent Supplement - (150) 150 Lower debt cost due to Loan refinancing for Chapelview (252) (252) - Debt payments for Creditvale Mills debenture 581 581 - Loan repayments for Millbrook and Summerville 41 41 - Rent Supplement administration and program funding ending ( HA and STRSP) (151) (156) 5 Decrease in AHP Provinical and Federal Payments (289) (289) - Elimination of recoveries for Region of Peel owned housing buildings, managed (105) (105) -
(175) (627) 452
Economic Factors - - -
Other Pressures - - -
Cost Mitigation - - -
1,198 (145) 1,343
2014 Service Demand
- - -
Increase in rent supplement supports to address the housing wait list and provide an additional 360 rent supplements. Funded from net budget reductions in other Human Services program areas. 3,000 - 3,000
Costs reductions in Homelessness Program as a result of policy changes in the Homelessness Prevention Fund (2,000) - (2,000)
Increase in Peel Renovates program supports funded from redeployment of budget reductions in Homelessness program 2,000 - 2,000
Our Place Peel (OPP) funding to provide youth focus services in the adult shelter system 179 - 179
Inflation adjustment for contract and agency payments for Homelessness program funded from the base increase in CHPI funding 227 222 5
3,406 222 3,184
- - -
- - -
Total 2014 Service Demand 3,406 222 3,184
2014 New Services - - -
- - -
2014 Probudget (2014 Recommended Cost of Service) 173,602 57,089 116,513
Total 2014 New Services
HOUSING
Inflation
Annualization
Subsidy/Recovery Change
Other Pressures
Total 2014 Base Budget Changes
Growth
Service Demand
1

SUMMARY IIOPERATING BUDGET FOUR-YEAR PROGRAM FORECAST
HOUSING
Total Expenditures $168,296 $173,602 $176,721 $179,811 $182,476
Total Revenue $57,012 $57,089 $57,301 $57,583 $57,307
Net Expenditures$111,284 $116,513 $119,419 $122,228 $125,169
# of FTEs 157.5 157.5 157.5 157.5 157.5
2015 - 2017 Forecast Drivers and Assumptions:Federal and Provincial Funding changes as per the Ontario Gazette and expiring agreementsIncrease in funding to support Long-term Affordable Housing StrategyInflation adjustment for labour costs and services
Subsidy adjustments for cost index increase for housing providers
2017 ForecastIn $'000
2014 Budget Forecasted in 2013 Budget
2016 Forecast
2015 Forecast
2014 Budget
2

2014 NEW CAPITAL DETAIL
HOUSING PROGRAMS
SUMMARY III
2014 Financing Sources and Funding Status ($'000)
Project #Expense
FundingTotal
Project Name
Approved or Pending
External Internal DCA
2014 Funding Status:
2014(A/P)
Ward
Affordable Housing InitiativesA 14-5032 LAND REDEVELOPMENT - CONSULTING PEEL 0 300 0 300
HomelessnessA 14-0100 SHELTER CAPITAL REPAIR & REPLACEMENT Peel 0 370 0 370
Contingency for Capital Related to Housing ProvidersA 07-5040 PROVIDERS' CAPITAL RESERVES SHORTFALL PEEL 0 10,953 0 10,953
2014Totals for Budget Year: 0 11,623 0 11,623
3

GrossDescriptionSub Type
Ten Year Combined Capital Program ($'000)
Yrs 6-1020182017201620152014
HOUSING PROGRAMS
SUMMARY IV
TEN YEAR CAPITAL PLAN
Affordable Housing InitiativesInvestigate and evaluate new housing initiatives and develop solutionsto improve customer service delivery.
157,340 76,404 0 50,936 0 30,000 0FUTURE PLANS FOR AFFORDABLE HOUSING UNITS
12-5031
THE CURRENT 10 YEAR PLAN TOINCREASE SOCIAL HOUSING STOCKWITHIN PEEL INCLUDES ADDITIONALCONSTRUCTION OF 200 UNITS EVERY 2YEARS FROM 2012-2016 AND 100UNITS EVERY 2 YEARS FROM2017-2021.COST PER UNIT ISTARGETED AT $225,110
600 0 0 0 0 300 300LAND REDEVELOPMENT - CONSULTING14-5032LAND REDEVELOPMENT - CONSULTING
1,644 0 0 0 0 1,644 0PEEL LIVING BCA AUDIT15-5031PEEL LIVING BCA AUDIT
10 YearTotals For: HOUSING 300 31,944 0 50,936 0 76,404 159,584
Homelessness
3,700 1,850 370 370 370 370 370SHELTER CAPITAL REPAIR & REPLACEMENT
14-0100
SHELTERS CAPITAL REPAIR,REPLACEMENT AND REDESIGN FOR 15WILKINSON AND 2500 CAWTHRA RD.
2,697 0 0 0 2,697 0 0NEW SHELTER16-0150CONSTRUCTION OF NEW SHELTER FORONTARIO WORKS TO BE FUNDED BY DCFINANCING
10 YearTotals For: Homelessness 370 370 3,067 370 370 1,850 6,397
Contingency for Capital Related to Housing ProvidersContingency for future capital pressures.
4

GrossDescriptionSub Type
Ten Year Combined Capital Program ($'000)
Yrs 6-1020182017201620152014
HOUSING PROGRAMS
SUMMARY IV
TEN YEAR CAPITAL PLAN
97,162 51,535 10,673 6,387 8,201 9,413 10,953PROVIDERS' CAPITAL RESERVES SHORTFALL
07-5040
CAPITAL EXPENDITURES RELATED TORESERVE SHORTFALL FOR 38 HOUSINGPROVIDERS (NOT UNDER THE FEDERALSUBSIDY PROGRAM) AND PEEL LIVINGBUILDINGS. WILL ENSURE THEBUILDINGS ARE APPROPRIATELYMAINTAINED. PROJECT MANAGEMENTIS INCLUDED IN THIS BUDGET.
10 YearTotals For: PROVCONTING 10,953 9,413 8,201 6,387 10,673 51,535 97,162
Totals for 10 Year Capital Plan: 11,623 41,727 11,268 57,693 11,043 129,789 263,143
5

SUMMARY VHOUSING
OUTPUT AND OUTCOME MEASURES
Measure 2013 Target
2013 Forecast
2014 Target Description
Number of clients on centralized wait list 14,500 13,600 13,000 Highlights number of applicants waiting for subsidy.
Percent of new clients supported with subsidies from centralized wait list 9.0% 7.8% 10.5% Annual average of clients supported
Number of households assisted to buy homes 50 80 50 Number assisted annually
Number of new affordable housing rental units annually 675 675 - Measures the number of new units as
a result of new housing developments.
Number of new housing subsidies funded through $17.1 million investment annually 438 281 438 Outcome of Council's $17.1 million
investment
Average length of stay in Emergency Shelters (days) 9 7.87 9 Year to date average number of days
Monthly average assisted with PHIPP 52 57 52 Number of evictions avoided per month through PHIPP
6

EARLY LEARNING & CHILDCARE
PROGRAM BUDGET SUMMARY
Summary I: 2014 Operating Budget Pressures
Summary II: Operating Budget Four-Year Program Forecast
Summary III: 2014 New Capital
Summary IV: Ten Year Capital Plan
Summary V: Output and Outcome Measures

THIS PAGE INTENTIONALLY LEFT BLANK

SUMMARY IEARLY LEARNING AND CHILD CARE
2014 OPERATING BUDGET PRESSURES ($'000)
Total Expenditures
Total Revenue
Net Cost
2013 Revised Budget (2013 Cost of Service) 111,929 88,137 23,792
Base Budget Changes
Labour costs 325 - 325 Goods & Services 19 - 19
344 - 344
Base Subsidy/RecoveriesAdjustments to LPC budget due to exit of direct deliver of child care (11,196) (2,311) (8,885)
Child care system enhancements approved by Council funded from LPC reinvestment 8,885 8,885 Ministry of Education (MEDU) anticipated funding increase 1,475 1,475 - Adjustment to funding sources for LIONS now funded from LPC reinvestment (459) (450) (9) Lease revenues from lease agreements with external child care providers 376 376 - Capital Retrofit funding carried forward as permitted by MEDU 800 800 -
(119) (110) (9)
Economic Factors - - -
Other Pressures - - -
Cost MitigationCost reductions in goods and services as a result of identified savings, $208,000 redeployed to to fund two Performance Measurement Specialist positions in Strategic Plan, Policy and Partnerships (335) - (335)
(335) - (335)
(110) (110) -
2014 Service Demand
- - -
- - - One-time draw from Best Start reserve (R1258) to bridge costs associated with LPC operations during the transition to external providers - 3,000 (3,000)
- - -
Other Pressures - - -
Total 2014 Service Demand - 3,000 (3,000)
2014 New Services - - -
- - -
2014 Probudget (2014 Recommended Cost of Service) 111,819 91,027 20,792
Total 2014 New Services
EARLY LEARNING CHILD CARE
Inflation
Subsidy/Recovery Change
Total 2014 Base Budget Changes
Growth
Service Demand
1

SUMMARY IIOPERATING BUDGET FOUR-YEAR PROGRAM FORECAST
EARLY LEARNING AND CHILD CARE
In $'000
2014 Budget Forecasted in 2013 Budget
2014 Budget
2015 Forecast
2016 Forecast
2017 Forecast
Total Expenditures $91,391 $111,819 109,667.95 $111,699 $113,773
Total Revenue $67,027 $91,026 $88,611 $90,369 $92,163
Net Expenditures $24,364 $20,792 $21,057 $21,330 $21,609
# of FTEs 176 194 120 120 120
2015 - 2017 Forecast Drivers and Assumptions:Provincial Funding levels are adjusted for inflationLPC Budget redeployed for system-wide enhancementsInflation adjustment for labour costs and services
2

2014 NEW CAPITAL DETAIL
CHILDREN'S SERVICES
SUMMARY III
2014 Financing Sources and Funding Status ($'000)
Project #Expense
FundingTotal
Project Name
Approved or Pending
External Internal DCA
2014 Funding Status:
2014(A/P)
Ward
Renovations to Child Care CentresA 14-0300 RENOVATIONS TO CHILD CARE CENTRES PEEL 0 200 0 200
2014Totals for Budget Year: 0 200 0 200
3

GrossDescriptionSub Type
Ten Year Combined Capital Program ($'000)
Yrs 6-1020182017201620152014
CHILDREN'S SERVICES
SUMMARY IV
TEN YEAR CAPITAL PLAN
Renovations to Child Care CentresA program to address health and safety issues within child care centres.
2,000 1,000 200 200 200 200 200RENOVATIONS TO CHILD CARE CENTRES14-0300CHILD CARE CENTRE RENOVATIONS
10 YearTotals For: CDCRENOV 200 200 200 200 200 1,000 2,000
Totals for 10 Year Capital Plan: 200 200 200 200 200 1,000 2,000
4

SUMMARY VEARLY LEARNING AND CHILD CAREOUTPUT AND OUTCOME MEASURES
Measure 2013 Target
2013 Forecast
2014 Target Description
Number of child care subsidies 6,400 7,000 7,400 Average number of children receiving subsidies
New applicants granted child care subsidy in year 2,000 3,350 2,500 Actual # of new child care
subsidies granted
Number of children with special needs served 800 1,235 1,335
Average number of special needs children receiving subsidies
5

THIS PAGE INTENTIONALLY LEFT BLANK

COMMUNITY INVESTMENT
PROGRAM BUDGET SUMMARY
Summary I: 2014 Operating Budget Pressures
Summary II: Operating Budget Four-Year Program Forecast
Summary III: N/A
Summary IV: N/A
Summary V: Output and Outcome Measures

THIS PAGE INTENTIONALLY LEFT BLANK

SUMMARY ICOMMUNITY INVESTMENT
2014 OPERATING BUDGET PRESSURES ($'000)
Total Expenditures
Total Revenue
Net Cost
2013 Revised Budget (2013 Cost of Service) 5,599 - 5,599
Base Budget Changes
- - -
Labour costs (57) - (57) Goods & Services 5 - 5
(52) - (52)
Base Subsidy/RecoveriesRecognition of Homelessness Partnering Strategy anticipated allocation 967 1,001 (34)
967 1,001 (34)
Economic Factors - - -
Other Pressures - - -
Cost Mitigation - - -
915 1,001 (86)
2014 Service Demand
- - -
Increase in the Region's investment in not for profit sector to support organization’s overall sustainability and operational health 1,000 - 1,000 Inflation adjustment for contract and agency payments 81 - 81
1,081 - 1,081
- - -
Other Pressures - - -
Total 2014 Service Demand 1,081 - 1,081
2014 New Services - - -
- - -
2014 Probudget (2014 Recommended Cost of Service) 7,595 1,001 6,594
Total 2014 New Services
COMMUNITY INVESTMENT
Inflation
Annualization
Subsidy/Recovery Change
Total 2014 Base Budget Changes
Growth
Service Demand
1

SUMMARY IIOPERATING BUDGET FOUR-YEAR PROGRAM FORECAST
COMMUNITY INVESTMENT
Total Expenditures $5,670 $7,595 $7,694 $7,849 $7,995
Total Revenue $0 $1,001 $937 $937 $937
Net Expenditures $5,670 $6,594 $6,757 $6,912 $7,058
# of FTEs 7 7 7 7 7
2015 - 2017 Forecast Drivers and Assumptions:Inflation adjustment for labour costs and servicesFunding levels adjusted for inflation
2017 ForecastIn $'000
2014 Budget Forecasted in 2013 Budget
2016 Forecast
2015 Forecast
2014 Budget
2

SUMMARY VCOMMUNITY INVESTMENT
OUTPUT AND OUTCOME MEASURES
Measure 2013 Target
2013 Forecast
2014 Target Description
Number of non-profit organizations supported through the Regional Community Investment Fund
100 100 117 Number of Non-profit agencies that successfully applied for funding
3

THIS PAGE INTENTIONALLY LEFT BLANK
Internal Services, PAMA & Non-Program

THIS PAGE INTENTIONALLY LEFT BLANK

Internal Services
2014 Budget Document

THIS PAGE INTENTIONALLY LEFT BLANK

Table of Contents
Section I. Existing Services and Service Levels................................................................ 1 1. Who we are ........................................................................................................................... 1 2. Existing Services and Service Levels.................................................................................... 1 3. Key Initiatives in 2013 ........................................................................................................... 2 Section II. Issues and Trends................................................................................................. 3 Section III. 2014 Business Focus........................................................................................... 3 Section IV. 2014 Operating Budget........................................................................................ 4 1. 2014 Departmental Operating Budget Overview................................................................... 4 2. 2014 Proposed Operating Budget ......................................................................................... 4 Section V. 2014 Capital Budget.............................................................................................. 7 1. 2014 Departmental Capital Plan Overview ........................................................................... 7 2. Existing Capital Projects........................................................................................................ 8 3. 2014 Capital Budget and Operating Impact .......................................................................... 8 4. 2014 – 2022 10 - Year Capital Plan ...................................................................................... 9 Section VI. Output/Outcome Measures ............................................................................... 10 Section VII. Staffing................................................................................................................ 10 Section VIII. Future Outlook .................................................................................................. 11 Section IX. Disclosure of 2014 Budget Risks and Key Program Assumptions............... 11 Section X: Useful links........................................................................................................... 11 Summary I: 2014 Operating Budget Pressures – Departmental Summary....................... 13 Summary II: Operating Budget Four-Year Program Forecast………….…………………...14 Summary III: New Capital Detail 2014………………………………………….………………..15 Summary IV: Ten Year Capital Plan 2014………….……………………………………………18 Summary V: Output and Outcome Measures …………………………..…………………… 24

THIS PAGE INTENTIONALLY LEFT BLANK

Internal Services – 2014 Budget Document
1
Section I. Existing Services and Service Levels 1. Who we are – Organizational View The operations of the Internal Services are administered through the following departmental structure.
2. Existing Services and Service Levels Internal Services plan and implement services that enable the Regional Corporation to meet its strategic and operational objectives while managing risk, providing stewardship of assets and maintaining the accountability and transparency of Regional Government. These services include:
• Customer Contact - Service Delivery • Emergency Management Services • Energy Planning and Procurement • Facilities Planning and Construction • Financial Planning and Reporting • Human Resources and Labour Relations • Information Management • Information Technology • Integrated Planning • Inter-Governmental Relations • Internal Audit • Legal Services • Organizational Development • Purchasing • Public and Media Relations • Real Estate Acquisition and Disposal • Regional Council Services • Risk Management • Social Housing Construction and Renovation • Strategic Projects & Services • Arts, heritage and cultural programming
Executive Office
And Council
Corporate Services
Employee and
Business Services

Internal Services – 2014 Budget Document
2
3. Key Initiatives in 2013 Internal Services continues to provide significant value to the Region of Peel. The following are some examples of the work in 2013:
• Introduced Customer Service Integration (CSI) technology into our Customer Contact Centre for selected Health programs to improve the coordination and effectiveness of overall service delivery, assisting the Region to provide the right services to the right people in the right way
• The Region of Peel’s first Energy Management Plan set the foundation for integrating strong energy management principles into corporate practices to reduce corporate greenhouse gas emissions, ensure sustainable energy procurement and maintain regulatory compliance
• Replaced the corporate computing storage equipment to improve reliability, performance and efficiencies
• Replaced over 4,000 computers with updated software and trained staff • Approval of the Long Term Financial Planning Strategy will ensure the long term financial
sustainability of Peel’s services and maintain its high credit rating • All Regional staff and volunteers completed mandatory training on the Integrated
Accessibility Standards Regulation • Approval of the Integrated Risk Management Policy • Enacted a principle based Financial Management By-Law to guide and integrate the
Region’s financial policies • Approval of Budget Policy, Asset Management, Reserve Management Policies • Legal Services in connection with major Council decisions on Public Works programs • Developed Enterprise Information Management enabling strategy to inform decision
making and improve transparency • Human Resources, Clerk’s Services and Communications support for the Early Learning
and Child Care Task Force • Approval of the Regional Official Plan Amendments required for conformity with the
Places to Grow legislation • Developing Procurement Strategy which will address:
• updating Purchasing By-law which will provide higher levels of authority at the staff level and a commitment to provide more enhanced reporting
• Vendor outreach project • Development of new tools to assist staff and client departments in the
procurement process with a focus on reducing procurement cycle times • Centrally managed procurement activity for 2013 was approximately $ 1.06 billion
including the award of Hanlan Contracts #1 & 2 in the amount of $156 million • Collective bargaining continues for CUPE (LTD homes) (mediation) and UFCW • Supported completion of construction of:
• Norton Lake – an affordable housing building in Brampton providing 200 family and senior residential units
• Creditvale Mills – an affordable housing building in Mississauga providing 250 family and senior residential units
• Winding Trail paramedic station (a joint venture with the City of Mississauga) • Valley wood paramedic station (a joint venture with the Town of Caledon) • A new TransHelp headquarters at 2 Copper Road in Brampton • phase one of “Healthy by Design” project at 7120 Hurontario to promote a healthy
lifestyle for Region of Peel employees

Internal Services – 2014 Budget Document
3
• Design was completed and construction has begun on the new data centre at the new Fernforest facility shared with Peel Regional Police.
• Inaugural year of operations for PAMA facility, integrating 4 historic buildings into a museum, archive and art gallery complex
• Awards received • PAMA - 3 major design awards from City of Brampton for its exceptional quality
design • Winding Trail paramedic station - Urban Design Award for its exceptional quality
design • Responded to almost one million customer contacts in the Customer Contact Centre
Section II. Issues and Trends Internal Services recognize that the expectation of government by taxpayers is that government will provide the greatest possible value for the public funds which are entrusted to it. To continue to do this in the current environment of complex services and programs and increasing public demand and need will require internal services to work in collaboration with all Regional Departments to address the issues and trends that face the Region of Peel as a whole. These include:
• Challenging traditional ways of providing service delivery to implement more cost effective ways of conducting business will be necessary in order to provide capacity
• Meeting the publics expectations for increased transparency and accountability in an environment where there is a growing resistance to tax increases
• Integrating appropriate risk management into planning and decision-making so new processes continue to ensure the Region has the proper level of controls in place to manage key risks
• Public expectation regarding easier access to government services and information will drive business process changes and the need for new technology
• Complex community needs will require increased partnership and longer term planning to develop and implement sustainable and responsive strategies and policies which will drive an increasing demand for internal services
• Continuing to attract, develop and maintain a knowledgeable workforce which can effectively respond to the growing Region and changing demographics.
• Focusing on outcomes and the use of evidence-based decision-making to understand what services we should or should not continue to provide.
Section III. 2014 Business Focus Council has developed several key corporate priorities to focus on over its term. The enabling services will play a crucial role in supporting all of these priorities. They will also be directly accountable for the following priorities:
• Reducing greenhouse gas emissions • Implementing a long term financial planning strategy • Influencing other levels of government

Internal Services – 2014 Budget Document
4
• Enhancing the delivery of regional services through integrated service delivery • Initiating the next update of the Regional Official Plan.
Section IV. 2014 Operating Budget 1. 2014 Departmental Operating Budget Overview The total gross budget of the Internal Services is $126.8 million. Almost two-thirds of the budget is for labour costs. Approximately half of the operating costs are allocated to other departments to access non-property tax funding sources such as water and wastewater rates, provincial grants and development charges.
2. 2014 Proposed Operating Budget The following table summarizes 2014 proposed budget changes. It is estimated that the Internal Services will require net funding of $48.6 million to operate in 2014.
2014 Budget - Net Expenditures
2014 Proposed Changes (In $’000)
2013 Budget a. Base
Changes b. Service Demand
2014 Budget
Internal Services $47,701 $ 366 $ 536 $48,603Note: Please refer to Summary I for details.
2014 Total Funding Source by Type (In $'000 & %)
Reserves; 1,479 ; 1%
User Fees and Grants &
Subsidies; 3,499 ; 3%
Current Recoveries; 62,000 ; 49%
Net Budget; 48,603 ; 38%
Capital Recoveries; 11,175 ; 9%
2014 Gross Expenditures by Type (In $'000 & %)
Labour Costs;
81,587 ; 65%
Debt Repayment & Other; 5,505
; 4%
Goods & Services;
25,247 ; 20%
Reserve Contributions
; 14,417 ; 11%

Internal Services – 2014 Budget Document
5
a. Base Budget Changes
Cost Drivers
Increased cost to advance the organizations information and technology governance, security, investment and management initiative and to reduce known deficiencies in the area of attendance management and disability case management. The main driver of the remaining base budget change is the cost of labour.
Cost Mitigation Through Efficiencies & Recoveries
• Lease for office space expiring in 2014 with a saving of $200 thousand and no longer required with the acquisition of 7120 Hurontario.
• A review of the contract for facility maintenance at 7120 Hurontario lead to a
reduction of $315 thousand. • The 2014 budget includes increased recoveries from the Credit Valley Conservation
(CVC) for computer support of $80 thousand.
• The Internal Service areas continue to evaluate the appropriateness of expenditures and proactively pursue opportunities to integrate service delivery and improve processes.
• Energy Management System installed for Public Works’ water system to optimize
pumping operations is expected to save approximately $1 million annually in electricity costs.
b. Service Demand
Net Cost ($’000) Program Service Demands 2014
Budget 2015
Impact Corporate Support
• Investment in business intelligence to inform decision-making and information $ 205 $ 0
• Investment to address deficiencies in attendance management and disability case management $ 331 $ 0
Direct Program Support
• Legal Services to support Public Works capital program $ 0 $ 0• Facility operations to support new Paramedic Services’ stations $ 0 $ 0• Purchasing to support Public Works capital programs $0 $0
Total Service Demands $ 536 $ 0

Internal Services – 2014 Budget Document
6
Strategic investment is needed to develop business intelligence to inform decision-making and protect data. All sectors face significant pressures from exponential data growth, legislated reporting requirements and necessary technology capabilities. This chart shows the historical data growth in gigabytes (GB) trend values since 2003. Funding is also requested for Human Resources to address and focus on operational deficiencies in the area of employee absenteeism, attendance management, disability case management and proactive return to work and accommodation practices. This will improve programs’ abilities to deliver prompt and effective customer service.
Yearly Backup Trend
12,346
22,133
31,049
42,829
52,991
70,231
92,929
125,646
9,9966,628
150,000
0
20,000
40,000
60,000
80,000
100,000
120,000
140,000
160,000
2003
2004
2005
2006
2007
2008
2009
2010
2011
2012
2013
Year
GB
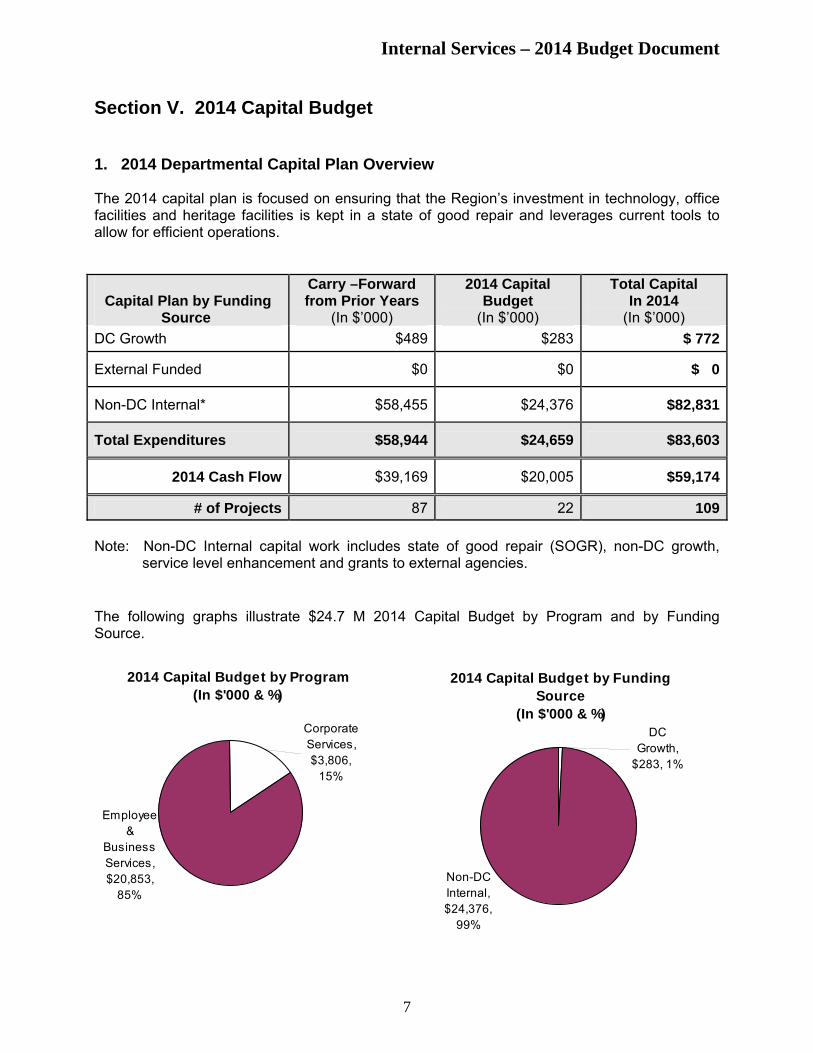
Internal Services – 2014 Budget Document
7
Section V. 2014 Capital Budget 1. 2014 Departmental Capital Plan Overview The 2014 capital plan is focused on ensuring that the Region’s investment in technology, office facilities and heritage facilities is kept in a state of good repair and leverages current tools to allow for efficient operations.
Capital Plan by Funding
Source
Carry –Forward from Prior Years
(In $’000)
2014 Capital Budget
(In $’000)
Total Capital In 2014
(In $’000) DC Growth $489 $283 $ 772
External Funded $0 $0 $ 0
Non-DC Internal* $58,455 $24,376 $82,831
Total Expenditures $58,944 $24,659 $83,603
2014 Cash Flow $39,169 $20,005 $59,174
# of Projects 87 22 109 Note: Non-DC Internal capital work includes state of good repair (SOGR), non-DC growth,
service level enhancement and grants to external agencies. The following graphs illustrate $24.7 M 2014 Capital Budget by Program and by Funding Source.
2014 Capital Budget by Program (In $'000 & %)
Corporate Services, $3,806,
15%
Employee &
Business Services, $20,853,
85%
2014 Capital Budget by Funding Source
(In $'000 & %)
Non-DC Internal, $24,376,
99%
DC Growth,
$283, 1%

Internal Services – 2014 Budget Document
8
2. Existing Capital Projects Internal Services • Technology related projects include implementation of corporate wireless strategy,
implementation of the mobile device management solution and additional licensing to accommodate software upgrades to allow for more efficient operations in the future.
• The utilization of capital projects for the maintenance of Regional office facilities is subject to the results of a technical audit of the requirements to best maintain Suite A at 10 Peel and will be coordinated with Peel’s Asset Management Plan.
3. Operating Impact of 2014 Capital Budget a. 2014 Capital Budget
Internal Services A full list of 2014 capital budget projects can be found in the respective program summaries. The following is a breakdown of the plan into major categories.
b. Operating Impact of 2014 Capital Budget • 2015 operating impact estimates are for the cost of operating the new data centre and the
ongoing software maintenance required to keep applications current. • 2015 operating impacts related to the annual maintenance fees expected to support new
planning and budgeting software. • 2017 operating impacts related to the annual maintenance fees expected to support new
Collection Management System for PAMA.
2014 Capital Budget by Type (In $'000 & %)
Facilities, $10,877, 44%
Technology, $10,171, 41%
Sustainability & Efficiency Initiatives,
$3,611, 15%
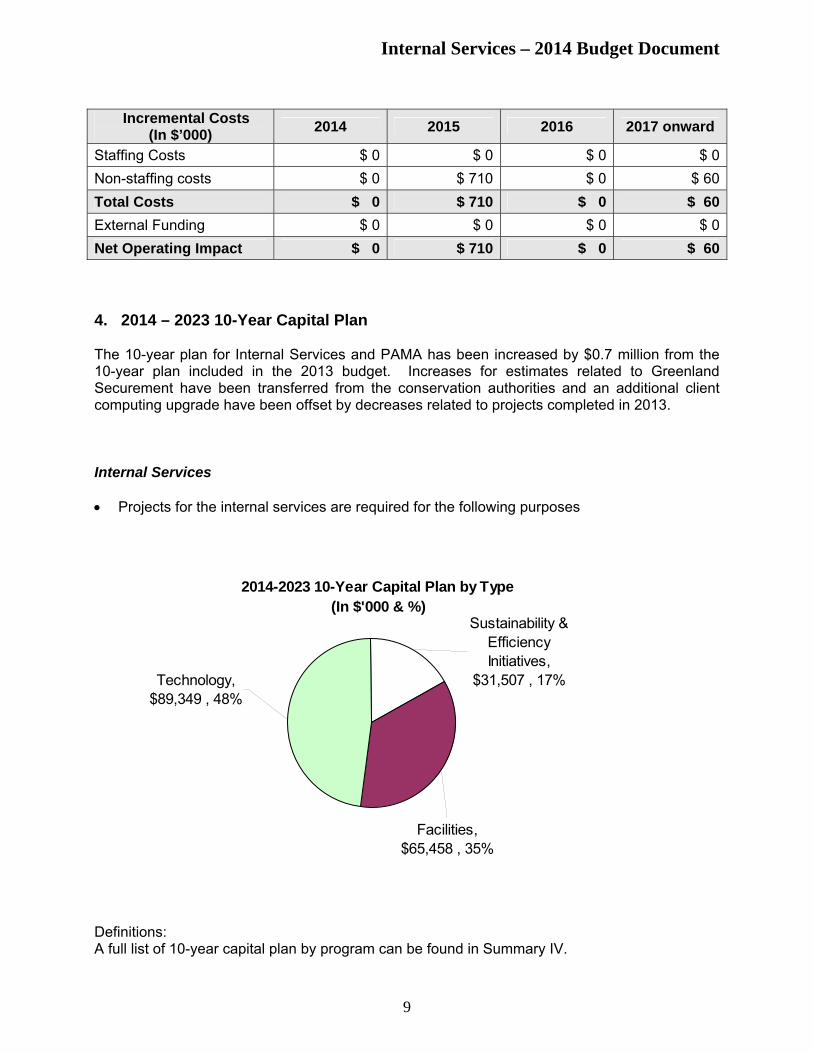
Internal Services – 2014 Budget Document
9
Incremental Costs
(In $’000) 2014 2015 2016 2017 onward
Staffing Costs $ 0 $ 0 $ 0 $ 0Non-staffing costs $ 0 $ 710 $ 0 $ 60Total Costs $ 0 $ 710 $ 0 $ 60External Funding $ 0 $ 0 $ 0 $ 0Net Operating Impact $ 0 $ 710 $ 0 $ 60 4. 2014 – 2023 10-Year Capital Plan The 10-year plan for Internal Services and PAMA has been increased by $0.7 million from the 10-year plan included in the 2013 budget. Increases for estimates related to Greenland Securement have been transferred from the conservation authorities and an additional client computing upgrade have been offset by decreases related to projects completed in 2013. Internal Services • Projects for the internal services are required for the following purposes Definitions: A full list of 10-year capital plan by program can be found in Summary IV.
2014-2023 10-Year Capital Plan by Type(In $'000 & %)
Sustainability & Efficiency Initiatives,
$31,507 , 17%
Facilities, $65,458 , 35%
Technology, $89,349 , 48%

Internal Services – 2014 Budget Document
10
Section VI. Output/Outcome Measures Detailed outcome/output measures for each program can be found in Summary V. Section VII. Staffing • Legal Services is seeking the addition of one FTE law clerk to support the Property Law
Team. The need for one additional law clerk is largely driven by capital projects, and specifically, the needs of our major clients, including Real Property Asset Management (RPAM) and Public Works.
• Business Intelligence (BI) section of the Information Management (IM) division is requesting
2 FTE’s to develop business intelligence to inform decision-making and protect data, address gaps in data management and support emerging business needs in the effective and efficient use of our information assets.
• Purchasing is requesting one FTE to provide support to the Public Works Department with
the Waste Management Project and Hanlan procurements. This position will work collaboratively with Public Works by providing advice and procurement services to ensure that purchasing continues to meet the business needs of the Public Works Department in an efficient and effective manner.
• Real Property and Asset Management Facility Operations is requesting 3 FTE’s to support
the new Paramedic Stations. • Human Resources is requesting 3 FTE’s to help address the operational need to focus on
known deficiencies in the area of employee absenteeism, attendance management, disability case management and proactive return to work and accommodation practices. One FTE is an attendance management specialist to address escalating and related sick-time costs and reduce costs associated with poor and chronic attendance rates and improve programs’ abilities to deliver prompt and effective customer service. Two FTE’s are for disability consultants to facilitate workplace accommodation and expedite employee return to work from illness and injury.
2013 Approved
FTEs *
Proposed
Changes in 2014
2014 Proposed
Total
Change %
2014 vs. 2013
Internal Services 715.56 10.0 725.56 1.40%* Include 2013 in-year approvals/changes

Internal Services – 2014 Budget Document
11
Section VIII. Future Outlook
Net Expenditures
(In $’000) 2014 Budget Forecasted
in 2013 Budget
2014
Budget
2015
Forecast
2016
Forecast
2017
Forecast
Internal Services $47,701 $49,603 $50,558 $51,816 $53,157# of FTEs 725.56 725.56 735.56 745.56 755.56 The preceding forecast includes the anticipated operating impact generated from the existing capital plan and is based on standard corporate assumptions. Section IX. Disclosure of 2014 Budget Risks and Key Program Assumptions The 2014 budget for Internal Services has been developed using the standard corporate assumptions for growth and costs associated with labour. Section X: Useful links
Link to PAMA website http://pama.peelregion.ca/en/index.asp Link to information on Regional Council http://www.peelregion.ca/council/

THIS PAGE INTENTIONALLY LEFT BLANK

Internal Services – 2014 Budget Document
13
Summary I Internal Services
2014 Operating Budget Pressures – Departmental Summary
Total Expenditures
Total Revenue Net Cost
2013 Revised Cost of Service $ 53,591 $ 5,890 $ 47,701 2014 Proposed Budget Changes
a. Base Budget Changes
Annualization (5.5 FTE 2013 Approved positions ) 176 - 176
Economic Adjustments – Net of Allocations 66 - 66
Recovery Change (CVC computer support and reserve draw reductions)
- (598) 598
Cost Mitigation (Expired office space lease for Standish CS reductions and 7120 maintenance)
(903) (429) (474)
Subtotal – Base Budget Changes (661) (1,027) 366
b. Service Demand
Service Demand – Net Cost of 10 FTE’s One time cost for Inaugural and Software Purchase
576
75
40
75
536
-
Subtotal – Service Demand 651 115 536 Total 2014 Proposed Budget Changes (10) (912) 902 2014 Proposed Budget (2014 Recommended Cost of Service) $ 53,581 $ 4,978 $ 48,603

SUMMARY IIINTERNAL SERVICES AND PAMA
OPERATING BUDGET FOUR-YEAR PROGRAM FORECAST
In $'000
2014 BudgetForecasted in2013 Budget
2014Budget
2015Forecast
2016Forecast
2017Forecast
Total Expenditures 55,007 53,581 56,085 57,418 58,837
Total Revenues 5,958 4,978 5,527 5,602 5,680
Net Expenditures 49,049 48,603 50,558 51,816 53,157
# of FTEs 725.56 725.56 735.56 745.56 755.56
Key forecast assumptions:
* Assume growth in resources required to support overall growth in the Region.
* There is an increased investment in keeping technology current to allow for efficient operations of the organization.
14

SUMMARY IIIINTERNAL SERVICES AND PAMA
2014 NEW CAPITAL DETAIL
2014 Funding Status:Approved or Pending (A/P)
TotalProject # Project Name Ward Expense External Internal DCA
EMPLOYEE AND BUSINESS SERVICES
Employee and Business Services General
A 14-7331 COMMUNICATIONS - SOCIAL MEDIA PEEL 1,200 0 1,200 0
Human Resources
A 14-7056 PEEL 1,400 0 1,400 0
Information, Systems and Technology Services
A 14-7514 NETWORK INFRASTRUCTURE REPLACEMENT PEEL 1,005 0 1,005 0
A 14-7533 TECHNOLOGY DISASTER RECOVERY PEEL 293 0 293 0
A 14-7546 453 0 453 0
A 14-7591 PEEL 4,095 0 4,095 0
Real Property Asset Management
A 14-5215 CORPORATE FURNITURE 600 0 600 0
A 14-5220 OFFICE FACILITY MAJOR MAINTENANCE PEEL 7,283 0 7,283 0
A 14-5231 BUILDING CONDITION ASSESSMENTS 400 0 400 0
A 14-5238 FACILITY ACCOMMODATION PROGRAM B8 750 0 750 0
HRMS - PEOPLESOFT APPS SOFTWARE MAINTENANCE / UPGRADE
VERINT SOFTWARE UPGRADE & IMPLEMENTATION PROJECT
NETWORK & TELEPHONE INFRASTRUCTURE ENHANCEMENTS
Funding2014
2014 Financing Sources and Funding Status ($'000)
15

SUMMARY IIIINTERNAL SERVICES AND PAMA
2014 NEW CAPITAL DETAIL
2014 Funding Status:Approved or Pending (A/P)
TotalProject # Project Name Ward Expense External Internal DCA
Funding2014
2014 Financing Sources and Funding Status ($'000)
A 14-7201 PEEL 2,000 0 2,000 0
PAMA
A 14-5170 HERITAGE COMPLEX- MAJOR MAINTENANCE B1 844 0 844 0
A 14-5171 PAMA COLLECTIONS MANAGEMENT SYSTEM 530 0 530 0
Employee and Business Services Totals for Budget Year: 2014 20,853 0 20,853 0
CORPORATE SERVICES
Corporate Asset Management
A 14-7130 CORPORATE ASSET MANAGEMENT PEEL 200 0 200 0
A 14-7131 DEVELOPMENT CHARGE UPDATE PEEL 100 0 0 100
Corporate Services - General
A 14-7113 CORPORATE SERVICES TECHNOLOGY AND PROC Peel 500 0 500 0
A 14-7116 ALTERNATE REOC SITE Peel 1,000 0 1,000 0
A 14-7125 CORPORATE INFORMATION MANAGEMENT Peel 695 0 695 0
Planning
A 14-7707 OFFICIAL PLAN REVIEW PEEL 208 0 104 104
ENERGY CONSERVATION AND RENEWABLE ENERGY INITIATIVES
16

SUMMARY IIIINTERNAL SERVICES AND PAMA
2014 NEW CAPITAL DETAIL
2014 Funding Status:Approved or Pending (A/P)
TotalProject # Project Name Ward Expense External Internal DCA
Funding2014
2014 Financing Sources and Funding Status ($'000)
Planning Studies
A 14-7709 LONG RANGE STUDIES PEEL 158 0 79 79
A 14-7715 CLIMATE CHANGE PEEL 195 0 195 0
Greenland Securement
A 14-3310 GREENLAND SECUREMENT PEEL 750 0 750 0
Corporate Services Totals for Budget Year: 2014 3,806 0 3,523 283
Internal Services and PAMA Totals for Budget Year: 2014 24,659 0 24,376 283
17

SUMMARY IVINTERNAL SERVICES AND PAMA
TEN YEAR CAPITAL PLAN
Sub Type Description 2014 2015 2016 2017 2018 Yrs 6-10 Gross
EMPLOYEE AND BUSINESS SERVICES
Employee and Business Services General
14-7331 COMMUNICATIONS - SOCIAL MEDIA 1,200 0 0 0 0 0 1,200
10 Year Totals For: EBS General 1,200 0 0 0 0 0 1,200
Human Resources
14-7056 1,400 1,200 1,200 300 2,000 3,200 9,300
10 Year Totals For: Human Resources 1,400 1,200 1,200 300 2,000 3,200 9,300
Information, Systems and Technology Services
14-7514 NETWORK INFRASTRUCTURE REPLACEMENT 1,005 856 2,611 922 2,539 8,266 16,199
14-7533 TECHNOLOGY DISASTER RECOVERY 293 322 354 390 429 2,880 4,668
14-7545 CLIENT COMPUTER TECHNOLOGY 0 0 0 0 15,100 15,100 30,200
Ten Year Combined Capital Program ($'000)
THIS ALLOCATION IS FOR THE ENHANCEMENTS REQUIRED FOR DISASTER RECOVERY AND HOT-SITE BACKUP FACILITIES. THIS ALLOCATION APPLIES TO BOTH VOICE AND DATA NETWORKS.
TO REFRESH ALL REGIONAL COMPUTERS. THIS INCLUDES COSTS FOR HARDWARE, INSTALLATION AND SOFTWARE.
INVESTIGATION AND IMPLEMENTATION OF COMMUNICATIONS RELATED TECHNOLOGY AND PROCESSES INCLUDING SOCIAL MEDIA AND WEBSITE IMPROVEMENT
HRMS - PEOPLESOFT APPS SOFTWARE MAINTENANCE / UPGRADEINSTALLATION OF SOFTWARE VERSION UPGRADES TO THE CURRENT RELEASE OF PEOPLESOFT SOFTWARE.
THIS ALLOCATION IS PROVIDED FOR REPLACEMENT OF EXISTING NETWORK SERVERS, NETWORK INFRASTRUCTURE AND TELEPHONE SYSTEM REPLACEMENT.
18

SUMMARY IVINTERNAL SERVICES AND PAMA
TEN YEAR CAPITAL PLAN
Sub Type Description 2014 2015 2016 2017 2018 Yrs 6-10 Gross
Ten Year Combined Capital Program ($'000)
14-7546 453 0 0 0 0 0 453
14-7591 4,095 1,078 1,754 1,136 1,228 9,058 18,349
10 Year Totals For: ISTS 5,846 2,256 4,719 2,448 19,296 35,304 69,869
Real Property Asset Management
14-5215 CORPORATE FURNITURE 600 600 500 300 300 1,500 3,800
14-5220 OFFICE FACILITY MAJOR MAINTENANCE 7,283 5,264 4,766 3,232 877 2,885 24,307
14-5231 BUILDING CONDITION ASSESSMENTS 400 400 400 400 400 400 2,400
THIS ALLOCATION IS FOR THE GROWTH RELATED NETWORK COSTS.
PURCHASE OF CORPORATE FURNITURE TO ACCOMMODATE GROWTH AND REPLACE EXISTING INVENTORY AS REQUIRED.
THIS ALLOCATION PROVIDES FUNDING FOR IDENTIFIED MAJOR MAINTENANCE REQUIREMENTS AT 10 PEEL AND 7120 HURONTARIO.
BUILDING CONDITION ASSESSMENT PROGRAM TO ENSURE MAINTENANCE OF PROPERTY AND BUILDINGS IN GOOD CONDITION TO OPTIMIZE AND PROTECT THE ASSETS AND STRIVE TO AVOID THE RISK OF SERVICE INTERRUPTION DUE TO EQUIPMENT FAILURE.
.
NETWORK & TELEPHONE INFRASTRUCTURE ENHANCEMENTS
VERINT SOFTWARE UPGRADE & IMPLEMENTATION PROJECT
TO IMPLEMENT VERINT IMPACT 360 TO HUMAN SERVICES, PUBLIC WORKS AND ISTS TIER 2 CALL CENTRES UTILIZING THE MOST RECENT VERSION 11.X WHICH INCLUDES THE MODULES: QUALITY MONITORING (QM), WORKFORCE MANAGEMENT (WFM), AND WORKFORCE OPTIMIZATION (WFO).
19

SUMMARY IVINTERNAL SERVICES AND PAMA
TEN YEAR CAPITAL PLAN
Sub Type Description 2014 2015 2016 2017 2018 Yrs 6-10 Gross
Ten Year Combined Capital Program ($'000)
14-5238 FACILITY ACCOMMODATION PROGRAM 750 500 300 250 250 1,250 3,300
14-7201 2,000 2,000 2,000 2,000 2,000 10,000 20,000
17-5245 PARKING STRUCTURE 0 0 0 27,070 0 0 27,070
10 Year Totals For: R.P.A.M 11,033 8,764 7,966 33,252 3,827 16,035 80,877
PAMA
14-5170 HERITAGE COMPLEX - MAJOR MAINTENANCE 844 767 390 445 67 1,068 3,581
14-5171 PAMA COLLECTIONS MANAGEMENT SYSTEM 530 0 0 0 0 0 530
10 Year Totals For: PAMA 1,374 767 390 445 67 1,068 4,111
E&BS Totals for 10 Year Capital Plan: 20,853 12,987 14,275 36,445 25,190 55,607 165,357
COSTS FOR RELOCATING STAFF, RECOVERING VACANT OFFICE SPACE, RECONFIGURATION AND PLANNING FOR FUTURE SPACE REQUIREMENTS.
ENERGY CONSERVATION AND RENEWABLE ENERGY INITIATIVESENERGY INITIATIVES TO IMPROVE ENERGY EFFICIENCY.
DESIGN AND CONSTRUCT A 750 SPACE, 5 LEVELABOVE GROUND PARKING STRUCTURE. LOCATION TO BE DETERMINED. ESTIMATES DO NOT INCLUDE COST OF LAND.
THIS ALLOCATION IS FOR MAJOR MAINTENANCE OF EXISTING HERITAGE FACILITIES.
SYSTEM TO MANAGE PAMA ARTIFACT INVENTORY AND PROVIDE INFORMATION AND ACCESS TO PUBLIC.
20

SUMMARY IVINTERNAL SERVICES AND PAMA
TEN YEAR CAPITAL PLAN
Sub Type Description 2014 2015 2016 2017 2018 Yrs 6-10 Gross
Ten Year Combined Capital Program ($'000)
CORPORATE SERVICES
Corporate Asset Management
14-7130 CORPORATE ASSET MANAGEMENT 200 200 0 0 0 0 400
14-7131 DEVELOPMENT CHARGE UPDATE 100 100 100 100 100 500 1,000
10 Year Totals For: CORPORATE ASSET MGT 300 300 100 100 100 500 1,400
Corporate Services - General
14-7113 500 0 0 0 0 0 500
14-7115 REFURBISHMENT OF THE COUNCIL CHAMBERS 0 0 500 0 0 0 500
ANTICIPATED REFURBISHMENT OF COUNCIL CHAMBERS INCLUDING AUDIO AND VIDEO EQUIPMENT.
COSTS ASSOCIATED WITH UPDATING DEVELOPMENT CHARGES BY-LAW INCLUDING PEER REVIEW AND POTENTIAL APPEALS DEFENSE.
CORPORATE SERVICES TECHNOLOGY AND PROCESSES
THE CORPORATE ASSET MANAGEMENT (CAM) PROGRAM AIMS TO ESTABLISH AN EFFICIENT AND EFFECTIVE ASSET MANAGEMENT METHODOLOGY WHICH ENCOMPASSES ALL REGIONAL ASSETS, AND SPANS ACROSS ALL THE SERVICES THAT THEY SUPPORT. OUTCOME OF THE CAM PROGRAM IS AN OPTIMIZED CAPITAL INVESTMENT STRATEGY, AND A MEASURE OF THE SUSTAINABILITY OF THE TAX AND RATE BASED CAPITAL REQUIREMENTS OVER THE LONG TERM.
OPTIMIZATION AND RENEWAL OF TOOLS FOR CORPORATE SERVICES.
21
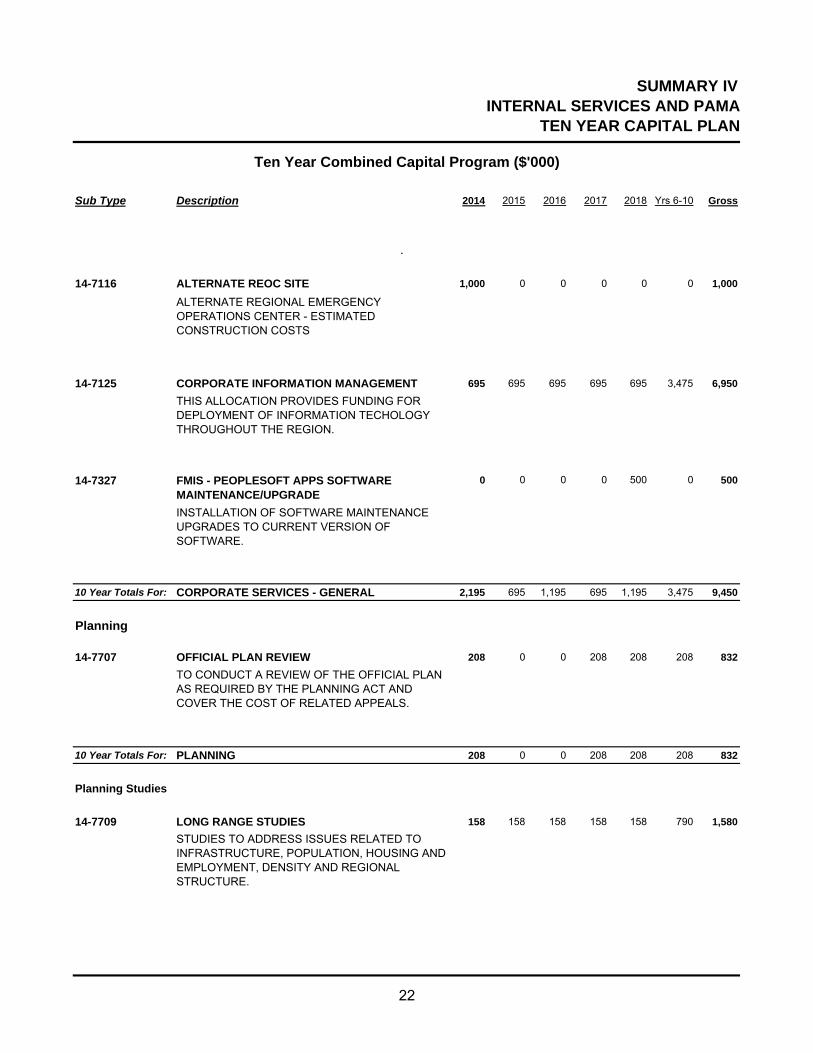
SUMMARY IVINTERNAL SERVICES AND PAMA
TEN YEAR CAPITAL PLAN
Sub Type Description 2014 2015 2016 2017 2018 Yrs 6-10 Gross
Ten Year Combined Capital Program ($'000)
14-7116 ALTERNATE REOC SITE 1,000 0 0 0 0 0 1,000
14-7125 CORPORATE INFORMATION MANAGEMENT 695 695 695 695 695 3,475 6,950
14-7327 0 0 0 0 500 0 500
10 Year Totals For: CORPORATE SERVICES - GENERAL 2,195 695 1,195 695 1,195 3,475 9,450
Planning
14-7707 OFFICIAL PLAN REVIEW 208 0 0 208 208 208 832
10 Year Totals For: PLANNING 208 0 0 208 208 208 832
Planning Studies
14-7709 LONG RANGE STUDIES 158 158 158 158 158 790 1,580
FMIS - PEOPLESOFT APPS SOFTWARE MAINTENANCE/UPGRADEINSTALLATION OF SOFTWARE MAINTENANCE UPGRADES TO CURRENT VERSION OF SOFTWARE.
TO CONDUCT A REVIEW OF THE OFFICIAL PLAN AS REQUIRED BY THE PLANNING ACT AND COVER THE COST OF RELATED APPEALS.
STUDIES TO ADDRESS ISSUES RELATED TO INFRASTRUCTURE, POPULATION, HOUSING AND EMPLOYMENT, DENSITY AND REGIONAL STRUCTURE.
.
ALTERNATE REGIONAL EMERGENCY OPERATIONS CENTER - ESTIMATED CONSTRUCTION COSTS
THIS ALLOCATION PROVIDES FUNDING FOR DEPLOYMENT OF INFORMATION TECHOLOGY THROUGHOUT THE REGION.
22

SUMMARY IVINTERNAL SERVICES AND PAMA
TEN YEAR CAPITAL PLAN
Sub Type Description 2014 2015 2016 2017 2018 Yrs 6-10 Gross
Ten Year Combined Capital Program ($'000)
14-7715 CLIMATE CHANGE 195 0 0 0 0 0 195
10 Year Totals For: PLANNING STUDIES 353 158 158 158 158 790 1,775
Greenland Securement
14-3310 GREENLAND SECUREMENT 750 750 750 750 750 3,750 7,500
10 Year Totals For: GREENLAND SECUREMENT 750 750 750 750 750 3,750 7,500
Corporate Services Totals for 10 Year Capital Plan: 3,806 1,903 2,203 1,911 2,411 8,723 20,957
Internal Services Totals for 10 Year Capital Plan: 24,659 14,890 16,478 38,356 27,601 64,330 186,314
FUNDING TO ALLOW FOR THE PROTECTION OF KEY NATURAL HERITAGE FEATURES, FUNCTIONS AND ATTRIBUTES USING A RANGE OF TOOLS, INCLUDING BUT NOT LIMITED TO PLANNING POLICY; STEWARDSHIP; MONITORING; AND ACQUISITION THROUGH BEQUESTS, EASEMENTS, DONATIONS OR PURCHASE.
STUDIES AND INITIAL ASSESSMENTS TO DEVELOP STRATEGIES FOR THE REGION TO RESPOND TO POTENTIAL CLIMATE CHANGE.
23

SUMMARY VINTERNAL SERVICES and PAMA
OUTPUT AND OUTCOME MEASURES
2013 2013 2014Output/Outcome Measures Target Projection Target Commentary
Incidence of service disruption due to mechanical failure (per cent) <1 per cent 0 per cent <1 per cent 2013 - No service disruptions experienced
2014 - Target will remain the same as 2013
Savings generated by active energy management 4 per cent 5 per cent 4 per cent
2013 - Target will be exceeded this year because the Region's energy procurement is performing significantly better than AMO and weare expecting to receive recoveries from natural gas towards the 4th quarter2014 - Target will remain the same as 2013
Corporate greenhouse gas inventory N/A N/A N/A 2013 - N/A - Completed in 20122014 - N/A
Employee turnover 3.0 per cent 6.21 per cent 5.0 per cent
2013 - As of Nov 4, 2013 (Retirements, Involuntary and Voluntary)2014 - Withdrawal from direct delivery of Child Care Services may inflate the # for 2014
Employee engagement 7.40 7.10 7.10 2013 - 2012 BEST Survey as at Jan 31, 20132014 - New recruiting manager onboard in 2013
Lost time injury frequency 4.75 per cent 4.48 per cent 4.5 per cent
2013 - As at Nov 4, 2013 (# is expected to rise by year end)2014 - New Disability Consultants to be implemented in 2014
Procurement activity dollars centrally managed $1.015 billion $1.06 billion $1.07 billion 2013 - Slightly above target
2014 - Slightly below the 2013Operating costs as a percentage of procurement activity 0.43 per cent 0.41 per cent 0.41 per cent 2013 - Slightly below the target for 2013
2014 - Slight decrease in target for 2014
Procurement cycle times by process in business days (from document approval to award)
n/a n/aRFQ - 29 RFT - 47RFP - 71
2014 - New for 2014
Customer Contact Centre service level80 percent of
calls answered in 20 seconds
60 percent calls answered in 20
seconds
80 percent of calls answered in 30 seconds
2013 - Average handle time per call continues to rise - 2011 2:02 mins, 2012 2:14 mins, 2013 2:23 mins2014 - Recommendation to change target due to continued increase in average handle time
Customer Contact Centre Unit Performance Index 10 out of 10 6.8 out of 10 8.0 out of 10
2013 - Reduced service levels combined with increased wait times2014 - Decreased slightly from 2013
PAMA operating revenue $168,100 $117,226 $168,1002013 - Decline in Education Programs due to strikes in schools2014 - To remain the same as 2013
Corporate Services
Time lapsed from receipt of request for information pursuant to MFIPPA to decision rendered.
95 per cent within 30 days
95 per cent within 30 days
95 per cent within 30 days
2013 - projection meets target2014 - To remain the same as 2013
Employee & Business Services
24

SUMMARY VINTERNAL SERVICES and PAMA
OUTPUT AND OUTCOME MEASURES
2013 2013 2014Output/Outcome Measures Target Projection Target Commentary
Per cent of complete agenda packages delivered on time (to Council members and posted to the Regional website)
95 per cent for all Council & Committee meetings
95 per cent for all Council & Committee meetings
95 per cent for all Council & Committee meetings
2013 - projection meets target2014 - To remain the same as 2013
Rate of return on investments relative to benchmark rate 1.7% 1.3% +1%
2013 - projected to be lower than target due to steady increase in the DEX benchmark rate throughout the year, which increases the average benchmark rate for the year.2014 - Expect DEX benchmark average rate to be slightly higher than in 2013 while investment yields are expected to come in slightly lower based on the current interest rate environment.
Region's Credit Rating AAA/Aaa AAA/Aaa AAA/Aaa 2013 - projection meets target2014 - To remain the same as 2013
Internal Audit Effectiveness Rating as compared to Global Average
Equal to or greater than benchmark
score as determined by IIA database
(global comparison)
Equal to or greater than benchmark
score as determined by IIA database
(global comparison)
Equal to or greater than benchmark
score as determined by IIA database
(global comparison)
2013 - projection meets target2014 - To remain the same as 2013
Percentage of agreed management action plans implemented as a result of internal audits
Equal to or greater than
75 per cent of management action plans
reported.
Equal to or greater than
75 per cent of management action plans
reported.
Equal to or greater than
75 per cent of management action plans
reported.
2013 - projection meets target2014 - To remain the same as 2013
Net Budget Accuracy - % variance to budget - Tax Supported
+ - 3.0 per cent + - 3.0 per cent + - 3.0 per cent 2013 - projection meets target
2014 - To remain the same as 2013
Net Budget Accuracy - % variance to budget - Utility Supported
+ - 3.0 per cent + - 3.0 per cent + - 3.0 per cent 2013 - projection meets target
2014 - To remain the same as 2013
25

Non-Program
2014 Budget Document

THIS PAGE INTENTIONALLY LEFT BLANK

Non-Program 2014 Budget Document
Table of Contents
Section I. Existing Services and Service Levels................................................................ 1
1. Who we are ........................................................................................................................... 1
2. Existing Services and Service Levels.................................................................................... 1
3. Key Initiatives in 2013 ........................................................................................................... 1
Section II. Issues and Trends ................................................................................................. 1
Section III. 2014 Business Focus ........................................................................................... 1
Section IV. 2014 Operating Budget........................................................................................ 2
1. 2013 Departmental Operating Budget Overview................................................................... 2
2. 2013 Operating Budget ......................................................................................................... 2
Section V. 2014 Capital Budget.............................................................................................. 3
Section VI. Output/Outcome Measures ................................................................................. 3
Section VII. Staffing.................................................................................................................. 3
Section VIII. Future Outlook .................................................................................................... 3
Section IX. Disclosure of 2014 Budget Risks and Key Program Assumptions................. 4
Section X: Useful links............................................................................................................. 4
Appendix 1: 2014 Operating Budget Pressures .................................................................... 5

THIS PAGE INTENTIONALLY LEFT BLANK

Non-Program
Section I. Existing Services and Service Levels 1. Who we are –N/A 2. Existing Services and Service Levels The non-program estimates consist of corporate expenses and revenues that are not directly attributable to any individual service program, but do impact the overall tax requirement. These include:
• Contributions to corporate reserves (Capital Investment Plan/Infrastructure Funding) • Supplemental taxation • Tax write offs • Payments in lieu of taxes (PILTS) • Self-insuring benefits program • Federal gas tax program • Other corporate contingencies
3. Key Initiatives in 2013 The Capital Investment Plan is a multi-year initiative to address the under-funding of the Region’s tax funded capital plan by increasing contributions to reserves by an amount equal to one per cent of the tax levy annually. The 2013 Operating Budget included $8.5 million as the 2013 phase of this initiative. These funds were allocated to the Capital Reserve which funds capital projects for state of good repair, growth, service enhancement and other capital needs to support the delivery of Peel’s services and programs. Section II. Issues and Trends The need to maintain the sustainability of the Region’s 10-year capital plan will continue to be a challenge in future years. Lingering effects of the recession also could negatively impact the non-program area through lower supplemental assessments and increased tax write-offs. Section III. 2014 Business Focus Not applicable to this program.
1

Non-Program
Section IV. 2014 Operating Budget 1. 2014 Departmental Operating Budget Overview The Non-Program Budget includes expenses and revenues that are not directly attributable to any individual service program, but do impact the overall tax requirement. These include corporate reserve contributions, federal gas tax program, PILTS, Supplemental taxes, write-offs and other corporate contingencies. The chart below provides the forecasted position of the 2013 Non-Program budget to year end and the 2014 Budget. The 2013 projected variance is largely due to higher than budgeted tax write-offs. This is anticipated to be a one year occurrence and not happen again in 2014.
2014 Budget - Net Expenditures
(In $’000)
2013 Budget
2013 Projection (as at Aug. 31,
2013)
2014 Budget
Budget
Change % 2014 vs. 2013
Non-program ($17,715) ($13,814) ($9,360) 47.2%Total ($17,715) ($13,814) ($9,360) 47.2% 2. 2014 Operating Budget This section provides detailed explanations of 2014 budget changes. It highlights the major drivers of the changes to maintain existing service level delivery, to support existing service level change or to introduce new services to meet service demand and community needs. The following table summarizes the Non-Program 2014 operating budget changes.
2014 Budget - Net Expenditures 2014 Budget Changes
(In $’000)
2013 Budget a. Base Changes
b. Service Demand
2014 Budget*
Non-program ($17,715) ($445) $8,800 ($9,360) Total ($17,715) ($445) $8,800 ($9,360)Note: Please refer to Appendix 1 for details.
* Includes net change in the allocation of corporate internal support costs. a. Base Budget Changes
The base budget changes include:
increases to the roads growth related debt repayment plan, fully recoverable from the development change collections
increase in the Federal gas tax fund revenues and corresponding expenses increase to internal recoveries from the utility rate budget for corporate sustaining costs.
2
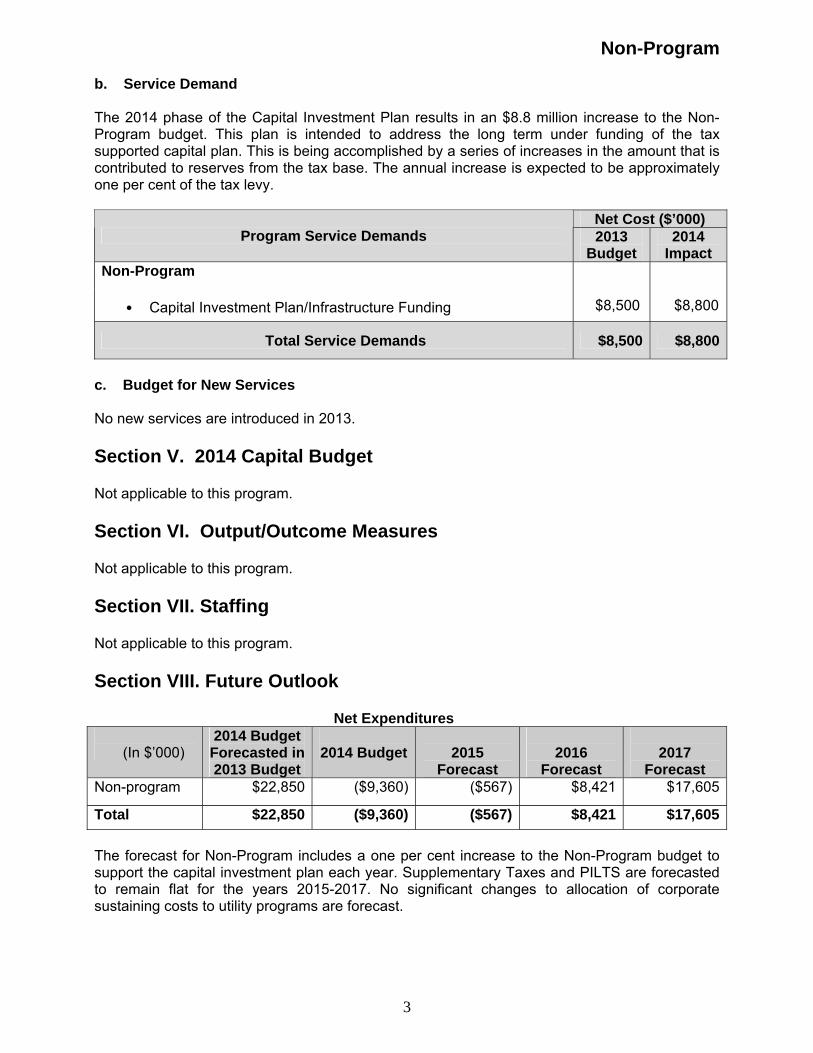
Non-Program
b. Service Demand The 2014 phase of the Capital Investment Plan results in an $8.8 million increase to the Non-Program budget. This plan is intended to address the long term under funding of the tax supported capital plan. This is being accomplished by a series of increases in the amount that is contributed to reserves from the tax base. The annual increase is expected to be approximately one per cent of the tax levy.
Net Cost ($’000) Program Service Demands 2013
Budget 2014
Impact Non-Program
• Capital Investment Plan/Infrastructure Funding $8,500 $8,800
Total Service Demands $8,500 $8,800
c. Budget for New Services No new services are introduced in 2013. Section V. 2014 Capital Budget Not applicable to this program. Section VI. Output/Outcome Measures Not applicable to this program. Section VII. Staffing Not applicable to this program. Section VIII. Future Outlook
Net Expenditures
(In $’000) 2014 Budget
Forecasted in 2013 Budget
2014 Budget
2015
Forecast
2016
Forecast
2017
Forecast Non-program $22,850 ($9,360) ($567) $8,421 $17,605
Total $22,850 ($9,360) ($567) $8,421 $17,605 The forecast for Non-Program includes a one per cent increase to the Non-Program budget to support the capital investment plan each year. Supplementary Taxes and PILTS are forecasted to remain flat for the years 2015-2017. No significant changes to allocation of corporate sustaining costs to utility programs are forecast.
3

Non-Program
Section IX. Disclosure of 2014 Budget Risks and Key Program Assumptions Ongoing effects of the recession could continue to have negative impacts on the levels of supplemental taxation and tax write-offs that the Region experiences. Section X: Useful links (N/A)
4

THIS PAGE INTENTIONALLY LEFT BLANK

Non-Program
Appendix 1 Non-Program
2014 Operating Budget Pressures ($’000)
Total Expenditures
Total Revenue
Net Cost
2013 Revised Cost of Service 69,602 87,317 (17,715) 2013 Budget Changes
a. Base Budget Changes
Increased allocation of corporate sustaining costs to Utility Rate Program
(445)
(445)
Repayment of growth related debt (Roads)
136 136 -
Federal Gas Tax Program 3,541 3,541 -
Reduction in Corporate Benefits Program (281) (281)
-
Subtotal – Base Budget Changes 2,951 3,396 (445)
b. Service Demand
Capital Investment Plan 8,800 - 8,800
Subtotal – Service Demand 8,800 - 8,800 Total 2014 Budget Changes 11,751 3,396 8,355 2014 Operating Budget (2014 Recommended Cost of Service)
(81,353) 90,713 (9,360)
5

THIS PAGE INTENTIONALLY LEFT BLANK

Tax Supported Programs
• Region Financed External Organizations
- Peel Regional Police (P.R.P.) - Ontario Provincial Police (O.P.P.) - Conservation Authorities - Assessment Services

THIS PAGE INTENTIONALLY LEFT BLANK

Peel Regional Police
2014 Budget Document

THIS PAGE INTENTIONALLY LEFT BLANK

Peel Regional Police 2014 Budget Document
Table of Contents
Section I. Existing Services and Service Levels ..................................................... 1
1. Who We Are........................................................................................................... 1 2. Existing Services and Service Levels..................................................................... 1 3. Key Initiatives in 2013 ............................................................................................ 2
Section II. Issues and Trends ................................................................................... 4
Section III. 2014 Business Focus ............................................................................. 7
Section IV. 2014 Operating Budget .......................................................................... 8
1. 2014 Departmental Operating Budget Overview.................................................... 8 2. 2014 Operating Budget .......................................................................................... 9
Section V. 2014 Capital Budget .............................................................................. 10
1. 2014 Departmental Capital Plan Overview .......................................................... 10 2. Existing Capital Projects (2013 and prior) ............................................................ 11 3. 2014 Capital Budget and Operating Impact ......................................................... 12 4. 2014 – 2023 10-Year Capital Plan ....................................................................... 13
Section VI. Output/Outcome Measures.................................................................. 15
Section VII. Staffing .................................................................................................. 17
Section VIII. Future Outlook..................................................................................... 17
Section IX. Disclosure of 2014 Budget Risks and Key Program Assumptions.. 17
Section X. Useful links ............................................................................................. 17
Appendix I. 2014 Operating Budget Pressures – Departmental Summary.......... 18
Appendix II. 2014 Capital Budget ............................................................................ 19
Appendix III. Ten Year Capital Plan......................................................................... 21

THIS PAGE INTENTIONALLY LEFT BLANK

Peel Regional Police
Section I. Existing Services and Service Levels 1. Who We Are Peel Regional Police (PRP), the second largest municipal police service in the Province of Ontario, provides policing services to the 1.3 million residents of the cities of Brampton and Mississauga. Policing services are made available through Divisional Facilities, Community Stations, a Materials Management Centre, the Kestrel Road facility, a Driver Training Track and the Emil V. Kolb Centre for Police Excellence and Police Headquarters. The service delivery area is approximately 538 square kilometres (335 square miles). Bordering Lake Ontario, the Marine Unit patrols all accessible shoreline including inland bodies of water and 105 square miles of water to the international border with the United States. Canada’s busiest airport, Toronto Pearson International Airport is situated in the City of Mississauga and policed by Peel Regional Police under a full cost recovery agreement with the Greater Toronto Airports Authority. Thirty-five million passengers pass through the airport annually. 2. Existing Services and Service Levels Existing policing services made available to the residents of Peel are summarized as follows:
Peel Regional Police
Emergency and Call Response
Investigations Road Safety Services
Community Partnerships and Problem
Solving
Community Education
Emergency and Call Response
• Consists of uniform patrol officers responding to calls for service within the five divisions; • Radio Operations including dispatch; • Tactical; • Canine; • Underwater Search and Recovery; • Public Safety; • Marine unit services; and, • Explosive Disposal units.
Investigations
• Forensic Identification; • Intelligence; • Homicide; • Major Drugs and Vice; • Commercial Auto Crime;
1

Peel Regional Police
• Fraud; • Robbery; • Internet Child Exploitation; • Sex Offender Registry; • Crimes Against Property and Persons; • Technological, and sexual assault investigations; and, • Criminal Investigation units providing investigative services located at each of the divisions.
Road Safety Services
• Traffic enforcement; • Major Collision investigations; and, • Regional breathalyzer testing.
Community Partnerships and Problem Solving
• Street Crime unit targeting lawless public behaviour, street-level alcohol and drug related offences, and damage to property;
• Neighbourhood Policing officers providing police interaction with students and members of the community;
• Family Violence unit assisting families victimized by domestic violence; • Bicycle units providing patrol within the parks; • Community Station staff responding to public inquiries; • Youth Crime; and, • Diversity Relations.
Community Education
• Consists of Crime Prevention; • Drug Education; • Peel Children’s Safety Village; • Internet Safety; and, • Youth education services made available to the residents of Peel.
3. Key Initiatives in 2013
Key initiatives undertaken in 2013 include: • Awarded one of Greater Toronto’s Top Employers and Canada’s Top Employers for Young
People by MediaCorp Canada. • Achieved Level 3 Certification of the Excellence Canada, “Quality and Healthy Workplace”
award. • Amalgamated the Regional Breath Unit and Traffic Unit, under the name of Road Safety
Services, which will provide the region with 24-hour coverage and reflect the primary objective of ensuring road safety for the community.
• The Witness Case Management program resulted in the cancellation of 2,187 officers scheduled to attend court from January to August 2013; thus increasing front-line policing service hours.
• Implemented a computer mapping software system for the Public Safety Unit (PSU) to assist in the management and coordination of searches.
• Launched the on-line Vulnerable Person Registry service that allows caregivers of vulnerable persons to submit vital information to be made available to police and other emergency services during a crisis situation.
2

Peel Regional Police
• Launched the mobile Website optimized for use with the latest operating systems on most mobile devices; provide users with the ability to submit reports to police via their mobile devices.
• Acquired an UbiDuo communication device to assist in communicating with citizens who are deaf, deafened or hard of hearing.
• Implemented the iCAD – Mobile for Public Safety (MPS) Mapping Application, eTime Time and Labour System, and eTime Enhancement – Niche Interface for Court Scheduling.
• Deployed new mobile and portable radios throughout the service. The VCOM Project 25 involves upgrading our voice radio communications infrastructure and user gear to a standards based radio platform technology that increases system flexibility, aids longevity and facilitates interoperability.
• Cyber-Bullying awareness initiative, including the “What if Everyone Did Something” poster/video competition, and involvement of 8 high schools in a program designed to provide students with knowledge and intervention strategies related to cyber-bullying.
• Replaced the existing telephone system and equipment with Voice Over Internet Protocol (VOIP) telephone system at all PRP locations.
• Implemented new standardized Quiet Rooms within PRP facilities for employees to be used for relaxation, sleep, meditation or prayer. These rooms are particularly beneficial to those working shifts, or those who require somewhere to sleep prior to attending court.
• Created the OADO (Ontario Association of Designated Officers) to support all Ontario emergency services in preventing and mitigating the effects of worker exposure to communicable diseases during the course of their duties.
• AODA (Accessibility for Ontarians with Disabilities Act) - Undertook the necessary preparations to establish, implement, maintain and document a multi-year accessibility plan, outlining strategies to prevent and remove barriers, as well as an annual status report on the progress and measures taken to date.
• Conducted surveys of staff related to Employee Satisfaction, and feedback on services and training (i.e. IT Service Desk Survey, Driver Training, etc.).
• Conducted the Community and Business Survey to poll community attitudes and opinions on a variety of safety and service measures.
• Created a Cadet Mentorship program dedicated to the development and training of young people interested in policing as a career.
• Community Support Services participated in an internship program (unpaid) with the University of Toronto Mississauga Campus (UTM), in which fourth year students participated in a 200 hour credit course where they researched or assisted with a number of projects.
• Hired 15 high school students during the summer under the Youth in Policing Initiative Program (YIPI), a program offered in partnership with the Ministry of Children and Youth Services, to provide a safe and positive summer employment opportunity for youth who reside in at-risk communities and are reflective of the cultural diversity of the community.
• Hired 22 additional frontline officers to maintain services for the growing population base and meet emerging service demands.
• Implemented changes and updates to the organizational structure to enhance efficiencies and ensure the organization is well positioned for the future.
• Completed renovation of the Kestrel Road facility and the relocation of various bureaux to that site.
3

Peel Regional Police
Section II. Issues and Trends Emerging community trends described below reflect the environment where policing services are provided. Emerging operational trends describe the delivery of policing services, including traffic and criminal enforcement.
Emerging Community Trends
• Demographics – The policing population served by Peel Regional Police is projected to increase 1.3 per cent (17,000) from 1,280,000 in 2013 to 1,297,000 in 2014. The population is projected to increase 6.3 per cent (80,000) by 2018 to 1,360,000. Within the 2013 policing population, an estimated 22 per cent are in the crime prone age cohort (ages 15 to 29), and approximately 8 per cent are youth (ages of 12 to 17).
• Home Language – The most common non-official languages spoken most often at home
reported in the 2011 Census for Peel are Panjabi (Punjabi), Urdu and Polish.
4

Peel Regional Police
• Vehicles Registered – The number of vehicles registered in the Region of Peel has been increasing, and is projected to increase from 977,654 in 2013 to 1,020,592 in 2018, an increase of an additional 42,938 vehicles (4.4 per cent).
Emerging Operational Trends
• Police Workload - Criminal (21 per cent) versus Non-Criminal (79 per cent) – While per capita crime rates are decreasing, Police workload related to non-criminal events continues to increase. Many services provided by PRP are not directly related to crime, but focus on enhancing community safety and quality of life. A detailed analysis of 2012 calls for service revealed that approximately 21 per cent of all calls for service were criminal occurrences, and 79 per cent were non-criminal occurrences.
• Calls for Service – 911 Calls – From 2011 to 2012, the number of calls to 911 decreased from 405,576 to 381,670 (down 23,906 or 5.9 per cent). In 2013, the number of 911 calls is expected to decrease further by 22,395 or 5.9 per cent, to 359,275. This decrease may by reflective of initiatives to improve community awareness about the use of dialing 9-1-1 for emergencies only.
• Calls for Service – Priority 1 Calls (calls dispatched immediately) - Between 2011 and 2012, the number of emergency calls for service (Priority 1) decreased from 55,320 to 53,584 (down 1,736 or 3.1 per cent). However, these calls are projected to increase by 7.9 per cent (or 4,210) to 57,794 in 2013. The majority of Priority 1 calls for service require multiple unit response, impacting overall workload and the delivery of front line policing.
• Crimes Against Persons – From 2011 to 2012, crimes against persons decreased slightly from 7,809 to 7,775 (down 34 or 0.4 per cent). In 2013, crimes against persons are projected to remain relatively stable with a slight decrease of 39 (0.5 per cent). The decreasing trend in crimes against persons occurrences is consistent across Canada.
• Assaults (non-sexual) – Between 2011 and 2012, assaults (non-sexual) remained relatively stable, with a slight increase from 4,276 to 4,376 (up 100 or 2.3 per cent). In 2013, assaults (non-sexual) are projected to remain relatively stable (4,382).
• Total Sexual Violations – Between 2011 and 2012, total sexual violations increased from 590 to 643 (up 53 or 9.0 per cent). In 2013, total sexual violations are projected to decrease to 544, a decrease of 99 or 15.4 per cent.
5

Peel Regional Police
•
• rimes Against Property – From 2011 to 2012, crimes against property decreased from
Break and Enter – Total – Total break and enters decreased from 2011 to 2012, from 4,128 to
• equest Assistance – Mentally Ill Person – These non-criminal occurrences have been
• ersonal Injury Collisions – Between 2011 and 2012, personal injury collisions increased by
• atal Collisions – From 2011 to 2012, the number of fatal collisions remained stable at 26 in
Enforcement Trends & Activities
nic Device – In 2011, there were 6,566 charges laid, and in 2012
• paired Driving Occurrences – Between 2011 and 2012, the number of impaired driving
• the number of drug occurrences decreased from 4,244 to
• ecline in the number of
• r of persons charged increased slightly
Please note
obberies – Robberies decreased from 2011 to 2012, from 1,086 to 961 (down 125 or 11.5 per cent). In 2013, robberies are projected to increase by 22 (up 2.3 per cent).
R
C25,856 in 2011 to 24,171 in 2012 (a decrease of 1,685 or 6.5 per cent). In 2013, crimes against property are projected to decrease by 2,844 (down 11.8 per cent).
•3,827 (down 301 or 7.3 per cent). In 2013, break and enters are projected to decrease by 355 (down 9.3 per cent). Rsteadily increasing. From 2011 to 2012, request for assistance – mentally ill person occurrences increased from 3,480 to 3,859 (up 379 or 10.9 per cent). In 2013, these occurrences are projected to increase by 121 (up 3.1 per cent) to 3,980. P234 (8.4 per cent), from 2,797 to 3,031. In 2013, personal injury collisions are expected to decrease by 147 (4.8 per cent), to 2,884. Fboth years. In 2013, fatal collisions are projected to increase by 2 (7.7 per cent) to 28 fatal collisions.
• Driving while using Electrothere were a total of 4,616 charges laid. To the end of August 2013, the number of driving while using electronic device charges is up from 2012, from 3,487 to 3,777 (up 290 or 8.3 per cent). Imoccurrences increased from 1,535 to 1,608 – an increase of 73 (or 4.8 per cent). To the end of August 2013, the number of impaired driving occurrences is up 71 (7.4 per cent), from 961 in 2012 to 1,032 in 2013. In 2013, Impaired driving occurrences are projected to increase by 144 (9.0 per cent) to 1,752.
rugs – Between 2011 and 2012,D4,191 (down 53 or 1.2 per cent). To the end of August 2013, drug occurrences have decreased by 53 (1.9 per cent) from 2,851 in 2012 to 2,798 in 2013. In 2013, drug occurrences are projected to decrease by 47 (1.1 per cent) to 4,144.
anadian Criminal Code Offences – From 2011 to 2012, PRP had a dCCanadian Criminal Code offences. Total Canadian Criminal Code offences declined from 39,410 to 37,660 (down 1,750 or 4.4 per cent). In 2013, Canadian Criminal Code offences are projected to decrease by 2,139 (5.7 per cent) to 35,521.
ersons Charged – Between 2011 and 2012, the numbePfrom 17,285 to 17,686 – an increase of 401 (2.3 per cent) persons charged. In 2013, the number of people charged is forecasted to decrease by 542 (3.1 per cent), to 17,144.
that all service delivery projected statistics reflected above are preliminary and subject tochange.
6

Peel Regional Police
Section III. 2014 Business Focus
ollowing:
afety model that addresses the unique needs
• ployees so they are able to make sound and informed decisions.
•
•
mation Management System (RIMS) unit relating n schedule.
In 2014, Peel Regional Police will focus on the f
• Build a collaborative “Made in Peel” community sof our Region.
• Implement the 2014-2016 Strategic Plan, including development of area Management Action Plans to support the plan and revised vision statement – A Safer Community Together.
• Develop the Facilities Plan (2014-2016) to identify the current state of Peel Regional Police facilities, owned or leased by the Region of Peel, and to identify long-term needs for existing and future Police facilities. Continue the Proud to be Peel Guild, introduced in 2013, which is part of a campaign aimed to educate and support em
• Information Technology Services will purchase the necessary tools for, and implementation of, the new Asset Management Program, which will assist with managing the entire life cycle of an asset from procurement through to decommissioning and disposal. Complete the Mobile Data Unit (MDU) wireless network upgrades and modem installation. Complete the upgrade of the legacy VCOM radio system built in• 1997 to a state of the art Project 25 standard compliant public safety grade digital network. The new VCOM system will support all partner agencies: Peel Regional Police, Mississauga, Brampton, and Caledon Fire, Region of Peel Public Works, City of Mississauga, Hydro One Brampton and Canada Border Services Agency. New features include full encryption and data support including, GPS and text messaging capability. Continue to conduct Area Risk Self Assessments (ARSAs) within all operational bureaux/areas. Continue to enhance th• e Incident Command program to prepare for the 2015 Pan AM Games.
• Provide educational programs to the community at large on personal safety and crimeprevention techniques.
• Implement the e-Collision project that will allow electronic entry of Motor Vehicle Collision reports.
• Implement fax server technology. Conduct • a service wide audit by Records Inforto the file classification and retentio
• Continue to enhance impaired enforcement activities and initiatives (Last Drink, Impaired Arrest and Collision Location analysis, by monitoring repeat offender dashboards).
7

Peel Regional Police
Section IV. 2014 Operating Budget
. 2014 Departmental Operating Budget Overview 1
2014 Budget - Net Expenditures
(In $’000)
2013 Budget 2013 Projection (As at Aug. 31, 2013)
2014 Budget Budget Change %
2014 vs. 2013 Peel Regional Police $338,407 $336,907 $349,575 3.3%Total $338,407 $336,907 $349,575 3.3%
eel Regional Police’s 2014 net budget of $349.6 million represents an increase of $11.2 million over
to annualization and cost of living
•
2014 Budget By Type
Pthe 2013 level of spending or 3.3 per cent increase mainly due to: • Base budget increases totalling $7.6 million (primarily related
increases, which is offset by the inclusion of $1.4 million in increased revenue resulting from the phase-in of the Court Security and Prisoner Transportation Upload by the Provincial Government). Service demand increases totalling $3.6 million for 22 additional growth officers.
*Operating costs net of revenue/grants.
8

Peel Regional Police
2. 2014 Operating Budget
s the Peel Regional Police 2014 budget changes.
The following table summarize
2014 Budget - Net Expenditures 2014 Changes
(In $’000)
2013 Budget a. Base Changes
b. Service Demand
c. New 2014 Budget
Services Peel Regional Police 4$338,407 $7,58 $3,584 $0 $349,575Total $338,407 4 $349,575$7,584 $3,58 $0
N pendi ils.
• The cost of annualizing the prior year’s economic wage adjustment amounts to $1.8 million.
Co• The budget includes an increase of $7.8 million for salaries and benefits in accordance with
Recov
• The budget includes a revenue decrease of $0.1 million related to user fees.
Co • The budget includes a revenue increase of $1.4 million for the partial funding of the cost of
expected to be received from the Provincial
Efficie• s a result of an in-depth line by line review of program spending by senior management,
cies of $1.2 million were found which reduced the 2014 budget request.
Other • he budget includes an increase of $0.5 million required to address inflationary pressures
maintenance requirements of new capital projects, hydro and risk management.
ote: Please refer to Ap x 1 for deta
a. Base Budget Changes
Annualization
st of Living
the collective agreements.
eries
urt Security/Prisoner Transportation Upload
Court Security / Prisoner Transportation Government. Peel Regional Police has a contract that provides funding from 2012 - 2014. The program is part of a phased-in commitment that started in 2012 and runs to 2018. ncies Aefficien
Pressures Tsuch as the
9

Peel Regional Police
b. Service Demand
Net Cost ($’000)Program Service Demands 2014 2015
Budget ImpactPeel Regional Police
• Funding has been requested for 22 front line officers (as per the staffing tain existing services for the growing population base and formula) to main
emerging trends.
$3,584 $0
• nded within the base budget arising from the full cost
$0 $0In addition, 6 support positions and 5 part time to full time complement conversions are fuformula for the 2013 additional uniform officers. This formula recognizes that the addition of officers has a direct impact on increased support demands.
Total Service Demands $3,584 $0
. Budget for New Services
duced in 2014.
ection V. 2014 Capital Budget
ng capital budgets carried forward from 2013 (48 rojects), the new capital plan for 2014 (19 projects), and the resulting total capital budget available to
c No new services are being intro S 1. 2014 Departmental Capital Plan Overview The following table lists the unspent portion of existipspend in 2014 ($78.3 million). Of the $78.3 million, PRP staff estimate spending in 2014 to be $52.4 million, primarily related to facilities renovations/expansion, information technology, communications and vehicle requirements. The remainder of the capital projects are required, as per Regional policy, to secure commitments against the projects and to provide a source of funding for multi-year projects.
Capital Plan By Funding Source
Carry –Forward from Prior Years
($’000)
Total Capital 2014 Capital Budget In 2014
($’000) ($’000) DC Growth 2,489 431 2,920 Externally Funded 5,804 1 ,117 6,921 Non-DC Internal* 32,795 35,688 68,483 Total Expenditures 41,088 37,236 78,324
2014 Cash Flow 30,369 22,054 52,423
# of Projects 48 19 67 * Note: Non-DC Internal capita od repair (SOGR), non-DC growth,
level enhancement and grants to external agencies.
l work includes state of go service
10

Peel Regional Police
The following graphs illustrate the 2014 Capital Budget totaling $37.2 million by Category and By unding Source.
2014 Capital Budget By Category 2014 Capital Budget By Funding Source
(in $’000 & %)
F
(in $M & %)
2. Existing Capital Projects (2013 and prior)
223 vehicles will be purchased in 2014: 75 marked vehicles, 51 unmarked, 63 pre-owned, 7 wth, 15 bicycles, 5 motorcycles and 7 specialty vehicles.
Land a
he following projects will be undertaken in 2014: 1 Division.
ta Centre. ccupied by Peel Regional Police at Grenville & William Davis
Info
he following projects will be undertaken in 2014: eTicketing System, and eTokens.
conduct electronic fingerprinting.
tiary and retention
Co• he purchase of digital portable and mobile radio equipment for Peel Regional Police will be
VCOM t
• VCOM Voice Radio infrastructure replacement will be completed in 2014.
Vehicles
•gro
nd Facilities T
• Expansion of 1• Building of a shared secondary Regional Da• Renovations to space o
Courthouse. • Design and development of a New Police Facility.
rmation and Technology & Equipment T
• Replacement of the Mobile Data Units,• The Live Scan project will allow for PRP to • Replacement of Quartermaster Stores Inventory System. • Data Storage project will purchase additional storage necessary for eviden
purposes. • Upgrades to a security system as a result of a Security Review (Phase I).
mmunication Equipment
Tcompleted.
Managemen
11

Peel Regional Police
3. 2014 Capital Budget and Operating Impact
talling $37.2 million focuses on the following areas necessary to enable the eel Regional Police to meet service demands: information technology requirements ($15.5 million),
rojects included in 2014 include:
213 vehicles will be purchased in 2015: 70 patrol vehicles, 14 support, 101 pre-owned, 6 growth
anners.
• zation will commence. II).
gency Support Services, Use of Force,
• e files and disclosure management.
• he Airport Division will receive new mobile data units, computer equipment and vehicles which Greater Toronto Airports Authority.
o
Body armour, pistols, ammunition, radios and vehicles will be purchased for 22 additional meet growth demands.
b. Operating Impact of 2014 Capital Budget
pital projects is $0.1 million. Projects such as the
place ent of the Digital Recording System, Portfolio Management Software, Community Complaints
a. 2014 Capital Budget The 2014 capital budget toPfacilities revitalization and expansion ($11.5 million), ongoing replacement of vehicles within the fleet ($5.1 million), communications equipment ($3.2 million), operational and office equipment ($1.2 million), VCOM Group requirements ($0.5 million) and expenditures recovered from the Greater Toronto Airports Authority ($0.2 million). Further details of the 2014 Peel Regional Police Plan are included in Appendix II & III.
Major P
Non-DC Internal - $35.7 million •
and 22 other vehicles. • Information Technology Equipment is scheduled for replacement each year to refresh desktops,
laptops, printers and sc• Information Technology Development will enhance existing systems.
Communications Centre Revitali• Upgrades to security systems resulting from a Security Review (Phase• Development of a Training Center to be used by Emer
and the COPS program. • Implementation of a disaster recovery plan.
Electronic solution for cas
External - $1.1 million Twill be funded by the
• Wireless Data Backup project for the VCOM Voice Radio system will be undertaken.
Gr wth $0.5 million •
officers required to
In 2014 the ongoing operating impact of care mTracker, Recording of Prisoner Vans, Network Analysis Tools and eToken replacement require software maintenance. (In $’000) 2014 2015 2016 2017 onward Staffing Costs $0 $0 $0 $0Non-staffing costs 130 888 406$ $ $ $76Total Costs $ 1 $ 8 $ 4 $ 30 88 06 76External Funding $0 $0 $0 $0Net Operating Impact $130 $888 $406 $ 76
12

Peel Regional Police
. 2014 – 2023 10-Year Capital Plan
illion. This represents an increase of $24 million over the 2013 n year plan totalling $238.4 million. Details of the Ten Year Peel Regional Police Capital Plan are
tes the Ten Year capital plan by category.
egory (in $M & %)
4 The ten year capital plan totals $262.4 mteincluded in Appendix IV. The following graph illustra
2014 – 2023 10-Year Capital Plan By Cat
Major Projects included in 2015 – 2023 include:
• Infrastructure Refresh (desktop computers, printers, etc.) is scheduled for each year to s, printers and scanners along with Data Storage requirements.
rds
• • eduled in 2016 and 2021.
2. h
• 2,345 vehicles (patrol, support, pre-owned, bicycles, motorcycles and other vehicles) will be ed.
3. Land and Facility
• Construction of a new Police Facility will commence in 2015. n Facility is scheduled for 2020.
4. Replacement of specialized assets, furniture and office equipment.
nt for new police staff.
1. Information Technology
replace desktops, laptop• Various system/software development has been included in the Ten Year plan such as
Electronic Document & Records (2015), Document Imaging (2015), and RecoManagement System (2022). Replacement of the Mobile Data Units is scheduled for 2016 and 2020. Mobile Video Recording is sch
• Recording of Holding Facilities is scheduled in 2015 and 2020.
Ve icles
purchas
• A North Brampto• A Backup Communication Centre is scheduled for 2020. Operational and Office Equipment •• Purchases of operational equipme
13

Peel Regional Police
5. Communication Equipment
Tape Logger/Call Checks system will be upgraded in 2015 and 2020. equipment consisting of portable radios, mobile radios, mobile
purchased each year.
•
6. • COM infrastructure upgrade is budgeted in years 2017 to 2020.
ess Data Backup is scheduled in 2017.
7. r Airport Division will receive new vehicles and equipment as required.
•• New Staff Communication
data terminals, sirens and chargers for new uniform police staff will be • A 9-1-1 Telephone System Upgrade is budgeted in 2017 and 2022.
Portable Officer Radios are scheduled for purchase in 2023.
VCOM V
• Wirel Ai port •
14

Peel Regional Police
Section VI. Output/Outcome Measures
Measure 2013 Target 2013
Projection
2014 Target Commentary
Crime Rates per 100,000 Population
Crimes Against Persons
PRP’s rate for crimes against persons < the national and provincial rates for crimes against persons.
543/100,000 PRP's rate for crimes against persons < the national and provincial rates for crimes against persons.
(√) Based on historical trends, target expected to be attained. Based on 2012 data published in 2013 by the Canadian Centre for Justice Statistics (CCJS), PRP's rate per 100,000 of crimes against persons (564) was well below the national (1,190) and provincial (901) rates.
Crimes Against Property
PRP’s rate for crimes against property < the national and provincial rates for crimes against property.
1,623/100,000 PRP's rate for crimes against property < the national and provincial rates for crimes against property.
(√) Based on historical trends, target expected to be attained. Based on 2012 data published in 2013 by the Canadian Centre for Justice Statistics (CCJS), PRP's rate per 100,000 of crimes against property (1,750) was below the national (3,414) and provincial (2,622) rates.
Solvency Rates
Crimes Against Persons
PRP’s solvency rate for crimes against persons > the national and provincial solvency rates for crimes against person.
74% PRP’s solvency rate for crimes against persons > the national and provincial solvency rates for crimes against persons.
(√) Based on historical trends, target expected to be attained. Based on 2012 data published in 2013 by the Canadian Centre for Justice Statistics (CCJS), PRP's solvency rate for crimes against persons (74%) was above the national (72%) and above the provincial (73%) solvency rates for crimes against persons.
Crimes Against Property
PRP’s solvency rate for crimes against property > the national and provincial solvency rates for crimes against property.
35% PRP’s solvency rate for crimes against property > the national and provincial solvency rates for crimes against property.
(√) Based on historical trends, target expected to be attained. Based on 2012 data published in 2013 by the Canadian Centre for Justice Statistics (CCJS), PRP's solvency rate for crimes against property (34%) was above the national (24%) and provincial (25%) solvency rates for crimes against property.
15

Peel Regional Police
Measure 2013 Target 2013
Projection
2014 Target Commentary
Traffic
Personal Injury Motor
Vehicle Collision
Rate
PRP’s rate of personal injury motor vehicle collisions < the national and provincial rates for personal injury motor vehicle collisions.
251/100,000 update
PRP's rate of personal injury motor vehicle collisions < the national and provincial rates for personal injury motor vehicle collisions.
(√) Based on historical trends, target expected to be attained. PRP's 2012 rate per 100,000 for personal injury motor vehicle collisions (240) was well below the 2010 national (370)* and provincial (477) rates.
Fatal Motor Vehicle
Collisions
PRP’s rate of fatal injury motor vehicle collisions < the national and provincial rates for fatal injury motor vehicle collisions.
2/100,000 update
PRP's rate of fatal injury motor vehicle collisions < the national and provincial rates for fatal injury motor vehicle collisions.
(√) Based on historical trends, target expected to be attained. PRP's 2012 rate per 100,000 for fatal motor vehicle collisions (2.1) was below the 2010 national (6.5)* and provincial (4.3) rates.
Satisfaction Levels Community
Survey results
Residential: satisfaction level ≥
86%
Residential: 87% satisfied (2013 Survey
Results)
Results from the next Community Survey will be available in 2016.
(√) 2013 target attained. Information collected through this consultation process will continue to be utilized for program planning, service delivery, and development of 2014-2016 PRP Strategic Plan.
Business: satisfaction level ≥
85%
Business: 91% satisfied (2013 Survey
Results)
Results from the survey will be available in 2016.
(√) 2013 target attained.
*Source: http://www.tc.gc.ca/eng/roadsafety/tp-1317.htm (Traffic information)
http://www.statcan.gc.ca/tables-tableaux/sum-som/l01/cst01/demo02a-eng.htm (Population information)
16

Peel Regional Police
Section VII. Staffing The table below summarizes the staffing changes at Peel Regional Police.
2013 Approved
FTEs *
Changes in
2014
2014 Total
Change %
2014 vs. 2013 Uniform 1,957 22 1,979 1.12%Civilian 818 11 829 1.34%Cadet 30 0 30 0.0%Total 2,805 33 2,838 1.18%
* Includes 2013 in-year changes The 2014 Budget includes a funding request for 22 front-line officers (as per the staffing formula) to maintain existing services for the growing population base and emerging trends. In addition, 6 support positions and 5 part time to full time complement conversions are funded from the full cost formula for the 2013 additional uniform officers. This formula recognizes that the addition of officers has a direct impact on increased support demands. Section VIII. Future Outlook
Net Expenditures
(In $’000) 2014 Budget
Forecasted in 2013 Budget
2014
Budget
2015
Forecast
2016
Forecast
2017
Forecast Peel Regional Police $353,021 $349,575 $366,071 $381,128 $396,236# of FTEs 2,838 2,838 2,869 2,900 2,931
The 2015-2017 Budget forecast includes funding for additional front line officers (22 per year) and support positions (9 per year) to maintain existing services for the growing population base and emerging trends. The Province of Ontario has committed to upload the cost of court security and prisoner transportation from municipalities. The funding is to be phased-in over a seven year period from 2012 to 2018. However, at this time the Provincial Government has provided funding commitments for 2012 to 2014. Peel Regional Police has included additional revenue in the amount of $1.4 million in 2014. In 2012 $1.3 million and in 2013 $1.4 million were included in the base budget for Peel Regional Police. Section IX. Disclosure of 2014 Budget Risks and Key Program Assumptions The 2014 Budget is based on the best available information at this time. If the additional revenue of $1.4 million, the third installment of the Provincial Upload of Court Security and Prisoner Transportation costs, is not received in total, additional budget pressures will result. Section X. Useful links Peel Regional Police website: http://www.peelpolice.on.ca/en/
17
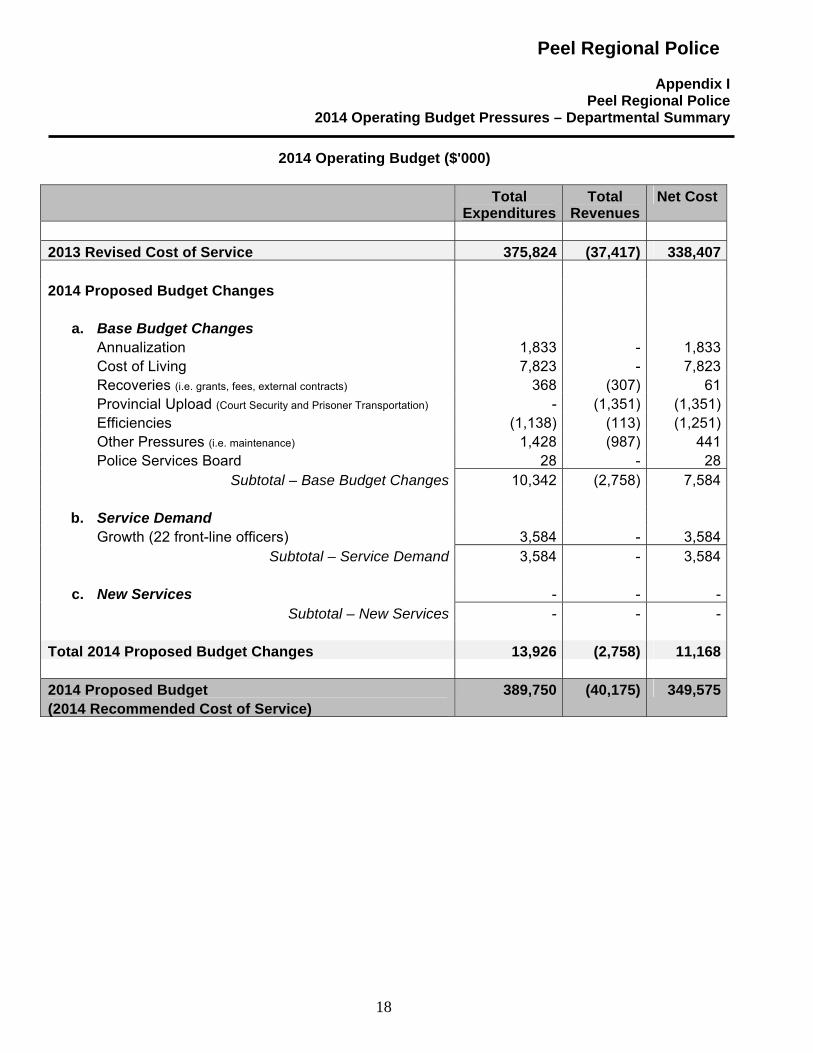
Peel Regional Police
Appendix I Peel Regional Police
2014 Operating Budget Pressures – Departmental Summary
2014 Operating Budget ($'000)
Total Expenditures
Total Revenues
Net Cost
2013 Revised Cost of Service 375,824 (37,417) 338,407
2014 Proposed Budget Changes
a. Base Budget Changes
Annualization 1,833 - 1,833 Cost of Living 7,823 - 7,823 Recoveries (i.e. grants, fees, external contracts) 368 (307) 61 Provincial Upload (Court Security and Prisoner Transportation) - (1,351) (1,351) Efficiencies (1,138) (113) (1,251) Other Pressures (i.e. maintenance) 1,428 (987) 441 Police Services Board 28 - 28 Subtotal – Base Budget Changes 10,342 (2,758) 7,584
b. Service Demand Growth (22 front-line officers) 3,584 - 3,584 Subtotal – Service Demand 3,584 - 3,584
c. New Services - - - Subtotal – New Services - - -
Total 2014 Proposed Budget Changes 13,926 (2,758) 11,168 2014 Proposed Budget (2014 Recommended Cost of Service)
389,750 (40,175) 349,575
18

Peel Regional Police
19
Appendix II Peel Regional Police 2014 Capital Budget
2014 Capital Program Summary ($'000)
The main highlights over the 2014 planning period are as follows:
Description
2014
Total Expense
External
Funding Internal
DCA
Communication Equipment 3,179 0 3,054 125
Projects dealing with the improvement, development, and replacement of radios, communications and telephone systems. Information Technology 15,496 0 15,496 0
Projects dealing with the improvement, development and replacement of information technology assets, systems and infrastructure. Land and Facility 11,530 0 11,530 0
Projects dealing with the development, expansion and maintenance of Police facilities.
Operational and Office Equipment 1,211 0 1,100 111
Projects dealing with the improvement, development, and replacement of operational, specialized and office equipment for police.
Vehicles 5,129 926 4,008 195
Projects dealing with the purchase of vehicles.
Airport 191 191 0 0
Projects dealing with the requirements for the Airport Division including information technology, communications, office equipment, furniture and vehicles.
VCOM Management Group 500 0 500 0
Projects dealing with the capital requirements of the VCOM Management Group, a multi-agency group comprised of Peel Regional Police, Brampton, Caledon, and Mississauga Fire Services, and the Region of Peel Public Works.
Totals for 2014 Capital Plan: 37,236 1,117 35,688 431

Peel Regional Police
20
Appendix III
Peel Regional Police Ten Year Capital Plan
Ten Year Combined Capital Program ($'000)
Sub Type
Description
2014
2015
2016
2017
2018
Yrs 6-10
Gross
Communication Equipment
Projects dealing with the improvement, development and replacement of radios, communications and telephone systems. 14-8600 COMMUNICATIONS SYSTEMS 0 600 0 1,247 0 1,494 3,341
TO UNDERTAKE THE PURCHASE OF COMMUNICATIONS SYSTEMS.
14-8601 COMMUNICATION EQUIPMENT FOR NEW POLICE STAFF
179 179 179 179 179 5,395 6,290
TO UNDERTAKE THE PURCHASE OF COMMUNICATION EQUIPMENT FOR NEW UNIFORM POLICE STAFF.
14-8610 COMMUNICATIONS EQUIPMENT 3,000 0 150 0 0 300 3,450
TO UNDERTAKE THE PURCHASE OF COMMUNICATIONS EQUIPMENT (I.E. RADIOS, DESKTOP TELEPHONES, ETC.).
10 Year Totals For: CE 3,179 779 329 1,426 179 7,189 13,081
Information Technology
Projects dealing with the improvement, development and replacement of information technology assets, systems and infrastructure. 14-8201 ENTERPRISE SOFTWARE 700 940 500 0 0 3,250 5,390
TO UNDERTAKE THE PURCHASE OF COLLABORATIVE SOFTWARE TOOLS THAT ARE PROVIDED TO THE ORGANIZATION.
14-8202 INVESTIGATIVE INFORMATION TECHNOLOGY EQUIPMENT
1,350 0 125 150 1,000 3,315 5,940
TO UNDERTAKE THE PURCHASE OF HARDWARE AND SOFTWARE IN ORDER TO MEET THE DATA NEEDS AND INVESTIGATIVE REQUIREMENTS OF
VARIOUS BUREAUX.

Peel Regional Police
21
Appendix III Peel Regional Police
Ten Year Capital Plan
Ten Year Combined Capital Program ($'000) Sub Type Description 2014 2015 2016 2017 2018 Yrs 6-10 Gross
14-8215 SERVICE ENHANCEMENTS 3,957 6,705 3,700 375 1,865 6,370 22,972
TO IMPLEMENT NEW INFORMATION TECHNOLOGY SOLUTIONS TO MEET THE NEEDS OF THE ORGANIZATION.
14-8220 INFORMATION TECHNOLOGY DEVELOPMENT 1,380 800 1,922 1,300 1,750 9,422 16,574
TO FUND REPLACEMENTS/UPGRADES TO POLICE SERVERS AND INFORMATION TECHNOLOGY INFRASTRUCTURE.
14-8230 ENHANCED TECHNOLOGY SOLUTIONS 619 800 1,200 900 900 4,500 8,919
TO IMPLEMENT INFORMATION TECHNOLOGY SOLUTIONS WITHIN THE ORGANIZATION.
14-8232 RECORDS MANAGEMENT SYSTEM 0 0 0 0 0 8,000 8,000
TO REFRESH THE RECORDS MANAGEMENT SYSTEM.
14-8245 MOBILE DEVICES 0 0 3,500 0 0 3,500 7,000
TO IMPLEMENT INITIATIVES AND REPLACE EXISTING MOBILE DATA AND/OR COMMUINCATIONS DEVICES.
14-8250 CORPORATE SERVICES SYSTEMS 0 1,700 0 350 300 850 3,200
TO UNDERTAKE NEW INITIATIVES AND REPLACE EXISTING HARDWARE AND SOFTWARE INFRASTRUCTURE TO MEET THE INFORMATION TECHNOLOGY REQUIREMENTS OF VARIOUS BUREAUX.
14-8260 DISASTER RECOVERY 4,600 0 0 0 0 0 4,600
TO IMPLEMENT A DISASTER RECOVERY SOLUTION WHICH WILL PROVIDE ADDITIONAL REDUNDANCIES TO INFORMATION TECHNOLOGY ASSETS.

Peel Regional Police
22
Appendix III Peel Regional Police
Ten Year Capital Plan
Ten Year Combined Capital Program ($'000) Sub Type Description 2014 2015 2016 2017 2018 Yrs 6-10 Gross
14-8270 DIGITAL RECORDING 0 1,000 0 500 0 1,000 2,500
TO UNDERTAKE THE IMPLEMENTATION OF DIGITAL RECORDING OF PRP INTERVIEW ROOMS AND HOLDING FACILITIES.
14-8290 INFORMATION TECHNOLOGY EQUIPMENT 2,890 1,819 1,970 1,639 2,532 9,705 20,555
TO PURCHASE INFORMATION TECHNOLOGY ASSETS (IE. DESKTOP COMPUTERS, LAPTOPS, PRINTERS, SCANNERS, VIDEO EQUIPMENT, TELEVISIONS, ETC.) ON AN ONGOING BASIS.
10 Year Totals For: IT 15,496 13,764 12,917 5,214 8,347 49,912 105,650
Land and Facility
Projects dealing with the development, expansion and maintenance of Police facilities. 14-8300 FACILITIES REVITILIZATION 4,730 400 400 400 400 2,000 8,330
TO UNDERTAKE ONGOING MAINTENANCE AND RENOVATIONS OF POLICE FACILITIES.
14-8310 CONSTRUCTION OF A NEW POLICE FACILITY 0 28,000 0 0 0 0 28,000
TO UNDERTAKE CONSTRUCTION OF A NEW FACILITY WITH APPROXIMATELY 85,000 SQUARE FEET.
14-8320 FACILITIES ENHANCEMENT 3,100 0 0 0 250 0 3,350
TO UNDERTAKE BUILDING CONDITION ASSESSMENTS, SPACE FEASIBILITY STUDIES, AND REVIEW FACILITY SECURITY AND IMPLEMENT RESULTING RECOMMENDATIONS.
14-8322 NORTH BRAMPTON DIVISIONAL FACILITY 0 0 0 0 0 17,775 17,775
TO CONSTRUCT A NEW 50,000 SQ. FT. DIVISIONAL FACILITY TO BE LOCATED IN NORTH BRAMPTON.

Peel Regional Police
23
Appendix III
Peel Regional Police Ten Year Capital Plan
Ten Year Combined Capital Program ($'000)
Sub Type Description 2014 2015 2016 2017 2018 Yrs 6-10 Gross
14-8323 BACK-UP COMMUNICATIONS CENTRE 0 0 0 0 0 3,500 3,500
TO CONSTRUCT A NEW BACK UP COMMUNICATIONS CENTRE.
14-8324 TRAINING CENTRE 3,700 0 0 0 0 0 3,700
TO DEVELOP A TRAINING CENTRE FOR USE BY VARIOUS PRP BUREAUX.
10 Year Totals For: LF 11,530 28,400 400 400 650 23,275 64,655
Operational and Office Equipment
Projects dealing with the improvement, development and replacement of operational, specialized and office equipment for police. 14-8400 SPECIALIZED AND OPERATIONAL ASSETS 900 425 425 450 450 2,450 5,100
TO UNDERTAKE THE PURCHASE OF SPECIALIZED AND OPERATIONAL ASSETS.
14-8405 EQUIPMENT FOR NEW POLICE STAFF 111 111 111 111 111 555 1,110
TO UNDERTAKE THE PURCHASE OF UNFORM AND PERSONAL EQUIPMENT FOR NEW UNIFORM OFFICERS.
14-8410 FURNITURE 200 200 200 200 200 1,000 2,000
TO UNDERTAKE THE PURCHASE OF FURNITURE.
10 Year Totals For: OE 1,211 736 736 761 761 4,005 8,210
Vehicles
Projects dealing with the purchase of vehicles. 14-8100 VEHICLES 4,934 6,167 5,558 5,665 5,880 29,535 57,739
TO UNDERTAKE THE PURCHASE OF PATROL, SUPPORT AND SPECIALTY VEHICLES AND RELATED EQUIPMENT.

Peel Regional Police
24
Appendix III Peel Regional Police
Ten Year Capital Plan
Ten Year Combined Capital Program ($'000) Sub Type Description 2014 2015 2016 2017 2018 Yrs 6-10 Gross
14-8100 VEHICLES FOR NEW POLICE STAFF 195 195 195 195 195 975 1,950
TO UNDERTAKE THE PURCHASE OF ADDITIONAL VEHICLES FOR UNIFORM POLICE STAFF.
10 Year Totals For: VH 5,129 6,362 5,753 5,860 6,075 30,510 59,689
AIRPORT
Projects dealing with the capital requirements for the Airport Division including information technology, communications, office equipment, furniture and vehicles. 14-8500 AIRPORT 191 376 322 79 106 210 1,284
THIS PROJECT REPRESENTS AIRPORT DIVISION REQUIREMENTS AND IS ENTIRELY FUNDED BY THE GREATER TORONTO AIRPORTS AUTHORITY.
10 Year Totals For: XA 191 376 322 79 106 210 1,284
VCOM Management Group
Projects dealing with the capital requirements of the VCOM Management Group, a multi-agency group comprised of Peel Regional Police, Brampton, Caledon, and Mississauga Fire Services, and the Region of Peel Public Works.
14-8920 VCOM SOFTWARE/HARDWARE 0 0 0 800 2,000 4,000 6,800
TO PURCHASE A VOICE COMMUNICATIONS SYSTEM, INCLUDING HARDWARE/SOFTWARE AND VCOM TOWER UPGRADES, AS WELL AS AN ASSET
MANAGEMENT SYSTEM.
14-8921 VCOM WIRELESS DATA BACKUP 500 0 0 2,500 0 0 3,000
TO INSTALL VCOM’S PORTION OF THE GTA 700 MHZ BROADBAND DATA NETWORK TO PROVIDE BACKUP COMMUNICATIONS AND INTEROPERABILITY TO GTA AGENCIES.
10 Year Totals For: XV 500 0 0 3,300 2,000 4,000 9,800
Totals for 10 Year Capital Plan: 37,236 50,417 20,457 17,040 18,118 119,101 262,369

Ontario Provincial Police – Town of Caledon
2014 Budget Document

THIS PAGE INTENTIONALLY LEFT BLANK

Table of Contents
Section I. Existing Services and Service Levels ...................................................... 1
1. Who we are.............................................................................................................. 1
2. Existing Services and Service Levels....................................................................... 1
3. Key Initiatives in 2013 .............................................................................................. 2
Section II. Issues and Trends.................................................................................... 2
Section III. 2014 Business Focus.............................................................................. 3
Section IV. 2014 Operating Budget .......................................................................... 4
1. 2014 Caledon OPP Operating Budget Overview ..................................................... 4
2. 2014 Budget............................................................................................................. 5
Section V. 2014 Capital Budget ................................................................................ 6
1. 2014 Caledon OPP Capital Plan Overview – N/A .................................................... 6
2. Existing Capital Projects – N/A ................................................................................ 6
3. 2014 Capital Budget and Operating Impact – N/A ................................................... 6
4. 2014 – 2023 10 - Year Capital Plan ......................................................................... 6
Section VI. Output/Outcome Measures – N/A.......................................................... 6
Section VII. Staffing (Non-Regional Staff) ................................................................ 6
Section VIII. Future Outlook ....................................................................................... 6
Section IX. Disclosure of 2014 Budget Risks and Key Program Assumptions .... 7
Section X. Useful links ............................................................................................... 7
Appendix 1: 2014 Operating Budget Pressures – Summary................................... 9
Appendix 2: Ten Year Capital Plan.......................................................................... 10

THIS PAGE INTENTIONALLY LEFT BLANK
Caledon OPP – 2014 Budget Document
Section I. Existing Services and Service Levels 1. Who we are The Region of Peel provides funding for Ontario Provincial Police (OPP) costs as mandated by the Police Services Act, R.S.O. 1990 for municipal policing services provided to the Town of Caledon. The Caledon OPP detachment provides policing services for both provincial as well as municipal contracts. These costs are segregated and only the municipal costs are charged to the Region of Peel. 2. Existing Services and Service Levels The present five year policing contract with the OPP came into effect October 1, 2010 and will end September 30, 2015. This five year contract included the addition of nine new Constables (one in 2010 and four per year in 2011 and 2012), two part-time Constable positions, one new Court Officer and four new Sergeants for municipal policing. There are no further staffing increases included in the contract or current projections for 2015 to 2017. Municipal and Provincial Contract Commitment (2010 – 2015)
• Community Services • Community Response Unit (CRU) • Street Crimes Unit • Crimes Against Persons (CAP’s) • Major Crime Unit • Schools Resource Officers (SRO’s) • Emergency Response Team (ERT) • Court security officers for Town Provincial Offences Act (POA) courts • Dedicated Traffic Unit • Reduce Impaired Drivers Everywhere (RIDE) • Victim Services • Intelligence/Analytical • Canine Unit • Forensic Identification • Provincial Resources
Key facts:
• 10 Sergeants • 67 Constables • 2 Part Time Police Constables • 1 Full Time Special Constable • 10 Civilian staff • OPP cost per person $196 per person (2014 Budget)
1

Caledon OPP – 2014 Budget Document
3. Key Initiatives in 2013
• Provincial Traffic Safety Program (PTSP) – the PTSP is a proactive, sustainable approach to traffic safety directed at high risk behaviour; occupant restraint, aggressive driving, impaired driving and distracted driving behaviour all of which represent the major causal factors in fatal and serious injury collisions. The RIDE program contributes to the PTSP.
• Commercial Motor Vehicle Road Safety – Focused on awareness, education and
enforcement working with police partners, Ministry of Transportation and Ministry of Environment to improve Commercial motor vehicle safety on roads in Caledon.
• Public Safety utilizing Intelligence Led Policing and Crime Prevention Strategies to
reduce victimization in our community:
• “Lock it or Lose it” – The majority of thefts that occur from motor vehicles are a result of valuables in plain view in an unlocked vehicles. This is a crime of opportunity and awareness and education is paramount in reducing victimization.
• Safeguard Ontario - Crime Prevention measures reflecting the unique needs of
the community was assessed and the “Safeguard Ontario” program which offers target hardening advice is being utilized by the Caledon Auxiliary unit. The Safeguard audit is offered to all Break and Enter victims. Upon acceptance, Caledon Auxiliary officers attend the residence and offer advice on ways to increase home and personal security. Crime Prevention through Environmental Design (CPTED) principals is the basis of this audit.
• Crime Abatement Strategy – This is a crime suppression strategy designed to
deter the criminal activities of repeat offenders. The program will target those offenders that are deemed to be at a high risk to the community and those persons involved in recidivist criminal behaviour. The program is based on the principle that the offender, once involved with the justice system now becomes accountable to the community and police.
Section II. Issues and Trends Three Community Focus Group meetings were held and issues/trends the community would like the Caledon OPP to focus on are as follows: 1. Traffic Safety – Everyone is affected by traffic every day. Traffic safety is a main concern of
members within the community. Caledon OPP has a dedicated traffic unit including twelve officers who focus on service delivery during peak traffic periods, in hotspots, and for commercial traffic while providing education, enforcement, and visibility. The “Hot Spot” program locations have been identified through collision analysis throughout the community.
2. Trouble with Youth – Caledon OPP is committed to working with Caledon youth to
encourage and mentor them as valued members of the community. Caledon OPP has dedicated School Resource Officers in Caledon high schools that are available to respond to calls for service within the school but are also readily available to all students and staff when required.
2

Caledon OPP – 2014 Budget Document
• Caledon OPP also has officers teaching the DARE (Drug Abuse Resistance Education) program, GREAT (Gang Resistance Education and Training) program and bullying / internet safety to our younger students.
• Caledon OPP operates a one week Youth Leadership program each year which allows students within the community to dedicate 40 hours of their time and invest that time back into the community. Students have assisted with picking up garbage in parks, painting over graffiti, gardening for elderly people or community service facilities such as Family Transition Place.
3. Property Crimes: Thefts from motor vehicles and Break and Enters - Over the last year
thefts from motor vehicles in residential areas was identified as a trend. As a result Caledon OPP has increased the visibility of the “Lock It or Lose it” campaign, issued several media releases, acquired weatherproof signs that could be deployed in residential areas as reminders of the program, and directed patrols into areas of concern.
4. OPP Billing Model changes - The 2015-2017 projections are based on the current billing
mode and may change with the OPP billing reform. A new billing model is still in the early stages of development and discussions therefore are not incorporated into the projections at this time.
Section III. 2014 Business Focus • Ontario Mobilization and Engagement Model of Community Policing – Caledon OPP will
work with the Policing Advisory Committee of Caledon (PACC) in order to achieve the implementation of the model in 2014. This model distinguishes from relatively safe areas where situational crime prevention measures such as target hardening and community watch strategies work and areas where broader social problems make such measure impracticable. The model emphasizes crime prevention through social development in areas where police are most often called for assistance. It guides all community partners to select crime prevention measures that work.
• Crime Prevention Strategies – Caledon OPP will continue to use effective programs such as Safeguard Ontario and Crime Abatement. The traffic “Hot Spot” program has proven effective over past years and we will continue to monitor the specified areas to assist in decreasing victimization as a result of serious motor vehicle collisions.
• Youth Initiatives – A Restorative Justice plan to work with youth pre-charge as opposed to
the criminal justice system will continue in 2014. • The Roadwatch subcommittee of PACC is also working with Caledon OPP on a
distracted driver/pedestrian (heads-up) campaign aimed at youth and electronic devices. The aim is to educate our youth and increase their safety while driving, walking or cycling.
• Caledon OPP has partnered with Youth Substance Abuse Program (YSAP) and Caledon schools in order to tackle drugs / substance misuse. As a result of school suspensions due to substance misuse, YSAP has become part of the equation and solution.
• Caledon OPP will continue to offer education in DARE (Drug Abuse Resistance Education), GREAT (Gang Resistance Education and Training), Bullying and Internet Safety to Caledon schools. In 2014 the GREAT program will be revised and additional topics to address respect and relationships will be added. The 2014 program will be called OPP Kids.
3

Caledon OPP – 2014 Budget Document
Section IV. 2014 Operating Budget 1. 2014 Caledon OPP Operating Budget Overview The Caledon OPP 2014 operating budget totals $12.1 million, an overall change of $0.5 million or 4.6 per cent increase from the 2013 budget.
2014 Budget - Net Expenditures
(In $’000)
2013 Budget
2013 Projection (As at Aug. 31,
2013)
2014 Budget
Budget
Change % 2014 vs. 2013
Caledon OPP $11,591 $10,204 $12,124 4.6%Total $11,591 $10,204 $12,124 4.6% Total Expenditures By Type
(In $Millions & %) Note: Funding Source by Type chart includes property tax revenues of $12.1 million and other
revenue of $1.7 million for a total of $13.8 million to match the Total Expenditures.
OPP Contract,
$13.2, 96%
PropertyServices$0.4, 3%
Equipment, $0.2, 1%
,
Total Funding Source By Type (In $Millions & %)
Provincial Grants & Prisoner
Transport, $0.4, 3%
Property Tax, $12.1,
87% OPP Stabilization
Reserve, $0.5, 4%
PSU Credit, $0.8, 6%
4

Caledon OPP – 2014 Budget Document
2. 2014 Budget This section provides detailed explanations of 2014 budget changes. It highlights the major drivers of the changes to maintain existing service level delivery, to support existing service level change or to introduce new services to meet service demand and community needs. The following table summarizes the Caledon OPP 2014 budget changes.
2014 Budget - Net Expenditures 2013 Changes
(In $’000)
2013 Budget
a. Base Changes
b. Service Demand
c. New Services
2013 Budget
Caledon OPP $11,591 $533 $0 $0 $12,124Total $11,591 $533 $0 $0 $12,124Note: Please refer to Appendix 1 for details. a. Base Budget Changes
Contract Costs • Includes an estimated increase due to contract negotiations for salary and benefits for
2014. Revised Direct Operating (non-salary) Expense calculations and rates partially offset by 2012 and 2013 provision for such increases.
• Includes support costs which includes non-salary costs related to uniforms, equipment and telephone.
Cost Mitigation • Costs removed related to the removal of the Civilian data entry clerks. • Increase related to the Prisoner Transport costs being uploaded to Province. • Increase in Provincial Services Usage (PSU) credits for the periods when Caledon
officers are temporarily redeployed to handle provincial matters, to reflect historical actuals have averaged approximately eight per cent of the OPP contract budget over the past four years. The PSU was increased to six per cent in the 2013 budget (an increase from three per cent in 2012 budget) and was further increased by $16 thousand in the 2014 budget based on the projected increase of the OPP contract.
OPP Property Service Costs • The OPP Property Services Costs line is projected to increase by $0.1 million (from $0.3
million in 2013 to $0.4 million in 2014). The OPP Property Services costs increase represents the annualization of the new OPP facility that opened in 2013 and reflects the full cost of operations for the facility.
Draw from Reserve • To mitigate the forecasted increases and to evenly distribute the increases projected for
2014 to 2017, it is recommended that the OPP stabilization reserve fund, held at the Region of Peel, continue to be used to phase-in OPP Budget increases. Draws from the OPP stabilization reserve fund have been budgeted to phase-in the projected OPP increase since 2010. However, with the exception of $0.04 million drawn in 2010, these proposed reserve draws have not been required due to the Caledon OPP Budget surpluses.
b. Service Demand - N/A c. Budget for New Services – N/A
5

Caledon OPP – 2014 Budget Document
Section V. 2014 Capital Budget 1. 2014 Caledon OPP Capital Plan Overview – N/A 2. Existing Capital Projects – N/A 3. 2014 Capital Budget and Operating Impact - N/A 4. 2014 – 2023 10-Year Capital Plan
The Caledon OPP Capital Plan includes one 2015 capital project in the amount of $250 thousand for a 2,000 square foot storefront OPP station in Mayfield West to meet projected growth.
Section VI. Output/Outcome Measures –N/A Section VII. Staffing (Non-Regional Staff) The 2014 Budget does not include any new staff. Note: Effective April 1, 2013 municipal contract costs relative to existing detachment Civilian Data Entry (CDE) operation were eliminated. The OPP CDE function is undergoing a restructuring and expansion resulting in a broader application of the service across the Province of Ontario.
2013 Approved
FTEs
Changes in
2014
2014 Total
Change %
2014 vs. 2013 Uniform Staff 80.32 0.00 80.32 0.0%Civilian 14.50 (4.50) 10.00 (31.0%)Total 94.82 (4.50) 90.32 (4.8%) Section VIII. Future Outlook
Net Expenditures
(In $’000)
2014 Budget Forecasted
in 2013 Budget
2014
Budget
2015
Forecast
2016
Forecast
2017
Forecast
Total Expenditures $13,945 $13,802 $14,293 $14,799 $15,327Total Revenue $1,706 $1,678 $1,519 $1,361 $1,228Net Expenditures $12,239 $12,124 $12,774 $13,438 $14,099# of Non-Region FTEs
94.82 90.32 90.32 90.32 90.32
Note: Total Revenue excludes property tax revenue Increases beyond 2015 are estimates with no change in FTEs forecasted. OPP Service contract expires September 2015.
6

Caledon OPP – 2014 Budget Document
Section IX. Disclosure of 2014 Budget Risks and Key Program Assumptions • Starting with the 2015 Budget, Provincial Services Usage (PSU), a rebate/reduction provided
by the OPP for periods when Caledon officers are temporarily redeployed to handle provincial matters, has averaged approximately eight per cent of the OPP contract budget over the past four years. The PSU was increased to six per cent in the 2013 budget (an increase from three per cent in 2012 budget) and was further increased by $16 thousand in the 2014 budget based on the projected increase of the OPP contract. The PSU or the amount of time Caledon officers spend on Provincial matters is not known with certainty at the beginning of each year.
• To smooth out the 2014 to 2017 Caledon OPP budget impact it is recommended that the
budget be phased in by utilizing the OPP Stabilization Reserve Fund held by the Region of Peel and drawing $975,000 over 2014 to 2016 ($500,000 in 2014, $325,000 in 2015, and $150,000 in 2016)
• The Balance in the Stabilization Reserve Fund is $5.0 million as of September 30, 2013 and
is projected to be $4.02 million if the $975,000 is drawn from 2014 to 2016
• The 2015-2017 projections are based on the current billing model and may change with the new OPP billing reform. It is still in early stages of development and discussions therefore not incorporated in the projections at this time.
Section X: Useful links Caledon OPP page in Town of Caledon’s Website: http://www.caledon.ca/en/live/oppcaledon.asp OPP Home Website: http://www.opp.ca/ecms/index.php
7

Caledon OPP – 2014 Budget Document
8
THIS PAGE INTENTIONALLY LEFT BLANK

Caledon OPP – 2014 Budget Document
9
Appendix 1 Caledon OPP
2014 Operating Budget Pressures – Summary
Total Expenditures
Total Revenue Net Cost
2013 Revised Cost of Service 12,989 (1,398) 11,591 2014 Budget Changes
a. Base Budget Changes Contract Cost Changes: • Contract Salaries & Benefits • Operational Support Costs for non-
salary costs related to uniforms, equipment and telephone
Cost Mitigation: • Elimination of Civilian Data Entry
operations from Contract costs • Additional upload of Prisoner
Transport costs to Province • Increase in PSU Credit
OPP Property Services Costs: Secretariat & Maintenance Costs from Town of Caledon (Property Services) Draw from Reserve: Increase to amount required to mitigate impact of changes
800 110
(200)
103
(14)
(16)
(250)
800 110
(200)
(14)
(16)
103
(250)
Subtotal – Base Budget Changes 813 (280) 533
b. Service Demand – N/A
Subtotal – Service Demand 0 0 0
c. New Services – N/A
Subtotal – Service Demand 0 0 0 Total 2014 Budget Changes 813 (280) 533 2014 Budget (2014 Recommended Cost of Service)
13,802 (1,678) 12,124

GrossDescriptionSub Type
Ten Year Combined Capital Program ($'000)
Yrs 6-1020182017201620152014
ONTARIO PROVINCIAL POLICE (O.P.P.)
Appendix 2
TEN YEAR CAPITAL PLAN
OPP Facilities - New & ExpansionsProjects dealing with new facilities, additions/ expansions for OPPdetachment offices in Caledon.
250 0 0 0 0 250 0OPP STATION - MAYFIELD WEST15-5625TO FUND A POLICE FACILITY
10 YearTotals For: POLICEFACILITIES 0 250 0 0 0 0 250
Totals for 10 Year Capital Plan: 0 250 0 0 0 0 250
10

Conservation Authorities
2014 Budget Document

THIS PAGE INTENTIONALLY LEFT BLANK

Table of Contents
Section I. Existing Services and Service Levels .................................................... 1
1. Who we are.............................................................................................................. 1 2. Existing Services and Service Levels....................................................................... 1 3. Key Initiatives in 2013 .............................................................................................. 3
Section II. Issues and Trends.................................................................................... 5
Section III. 2014 Business Focus.............................................................................. 7
Section IV. 2014 Operating Budget 1. 2014 Conservation Operating Budget Overview ...................................................... 8 2. 2014 Budget........................................................................................................... 10
Section V. 2014 Capital Budget ............................................................................ 13 1. 2014 Capital Plan Overview .................................................................................. 13 2. Existing Capital Projects –N/A ............................................................................... 13 3. 2014 Capital Budget and Operating Impact ........................................................... 13 4. 2014 – 2023 10 - Year Capital Plan ...................................................................... 13
Section VI. Output/Outcome Measures - N/A......................................................... 14
Section VII. Staffing - N/A ......................................................................................... 14
Section VIII. Future Outlook ..................................................................................... 14
Section IX. Disclosure of 2014 Budget Risks and Key Program Assumptions .. 14
Section X. Useful links ............................................................................................. 15
Appendix 1: 2014 Operating Budget Pressures – General & Special Levy Summary .............................................................................................. 17
Appendix 2: 2014 Operating Budget – Special Levy Project List ......................... 18
Conservation Summaries......................................................................................... 21

THIS PAGE INTENTIONALLY LEFT BLANK

Conservation Authorities – 2014 Budget Document
Section I. Existing Services and Service Levels 1. Who we are The Region of Peel provides funding to conservation authorities (CAs) that have jurisdiction within its boundaries as mandated by the Conservation Authorities Act, R.S.O. c. C27 (CA Act). The CA Act mandates CAs to establish and undertake programs to further the conservation, restoration, development and management of natural resources other than gas, oil, coal or minerals. In addition to the CA Act, CAs administer two regulations: one to regulate activities on conservation authority lands and the second to regulate development in hazard lands to protect life and property. In order to financially support their operating and project/capital costs, CAs receive revenues from a variety of sources such as: regional/municipal government funding, self-generated revenues (user fees), and provincial or federal government grants. The Region of Peel provides funding to three of the five CAs located within its boundaries: Credit Valley Conservation Authority (CVCA, CVC), Toronto & Region Conservation Authority (TRCA), and Halton Region Conservation Authority (Conservation Halton, CH). The other two CAs, Nottawasaga Valley Conservation Authority and Lake Simcoe Region Conservation Authority, do not receive funding because only a small portion of their respective watersheds fall within Peel and there is little development within these areas (funding is partially based on a formula using current value assessment). 2. Existing Services and Service Levels CVCA
a. Description of Programs: CVCA’s core business is Watershed Management and Health Management. CVCA services are: Water Management and Restoration; Natural Heritage; Monitoring; Restoration & Stewardship (includes Education); Planning; Land Planning (CVCA Greenlands Securement); Conservation Areas; and Central Services.
b. Key facts
• Responsible for five major dams, one reservoir, one ice-control structure, and several minor water management facilities.
• Fulfill flood forecasting and warning mandate to support watershed municipalities and residents.
• Provide Plan input and review and permitting functions • Natural Areas Inventory and Assessment programs that characterize and analyze
significance for woodlands, wetlands, valley lands, terrestrial and aquatic habitat, and invasive species for planning, land management and restoration.
• Annual monitoring, analysis, and reporting of trends of key environmental components at about 100 sites including climate, streamflow, stream morphology, groundwater, water quality, benthic invertebrates, fish, forests, wetlands and riparian areas.
• Applied research, science development and transfer for natural resource conservation including flow requirements for aquatic and wetland habitats, Natural Heritage Systems, and fisheries management.
• Maintain databases and GIS mapping resources • Lease, own and/or manage over 6,600 acres of greenlands, including 10 active
conservation areas for species and habitat protection, flood management, passive and active recreation.
• Tree Planting and Outreach to rural farm and non farm communities
1

Conservation Authorities – 2014 Budget Document
• Outreach program supporting Source Water Protection Stewardship and Peel’s agricultural sector through Rural Water Quality Program.
• Aquatic and Wetland Restoration partners with landowners to restore streams to enhance water quality and aquatic habitat.
• New nursery supports naturalization efforts • Environmental education programs serve teachers and students, adults and families
through direct program delivery and partnerships. • Urban greening efforts are implemented through the Your Green Yard Program and
the Greening Corporate Grounds Program delivered across Peel, which is a service of Partners in Project Green.
TRCA
a. Description of Programs: TRCA’s vision is for a new kind of community, the Living City, where human settlement can flourish forever as part of nature’s beauty and diversity. TRCA services include: Watershed Management; Planning and Development; Ecology; Restoration; and Parks and Culture.
b. Key facts • Climate projections and risk assessment methodologies produced and applied to key
sectors– Agriculture, Port Credit Shoreline, and Natural Heritage (project ongoing). This project has helped leverage Agriculture Canada support. A $6 million proposal has been submitted to Agri-Innovation Canada to develop tools and climate projections for farmers.
• Managing flood risk in Peel is a top priority for TRCA. TRCA completed the hydrology updates. Additional assessment was completed to select flood protection plans alternatives and determine land suitable for development – Bolton Special Policy Area (SPA). Downtown Brampton Flood Protection Feasibility Study was also completed.
• Urban flooding - Malton Flood Protection Study is being initiated in 2014 (post July 8, 2013 storm)
• Natural channel design implemented on a 500 meter section of Spring Creek within the Etobicoke Creek Watershed to reconstruct a degraded concrete lined channel void of natural morphology or habitat features.
• Over 29,000 trees planted for 16 landowners through private land reforestation program • Approximately 150,000 trees, shrubs and aquatic plants were planted to restore
approximately 26 hectares • Engaged over 1,280 businesses as part of the Partners in Project Green project energy
and materials exchange initiative. • Entered into a plus five year Lease Agreement with Treetop Trekking (TTT) Inc. to
construct and operate a high ropes and zip line course at Heart Lake Conservation Area. Annual TRCA revenue is projected to be approximately $200 thousand.
Conservation Halton (CH)
a. Description of Programs: Halton CA’s mission is to protect and enhance the natural environment, from lake to escarpment, for present and future generations. CH services/programs: Regulatory mandate relating to natural hazards; Protection of the natural environment through environmental planning, monitoring, restoration and stewardship; Parks & Recreation; Environmental Education; and Volunteer & Community.
b. Key facts
• 103,000 trees planted across the watershed in 2013 on 80 acres of Conservation Halton and private land holdings.
2
Conservation Authorities – 2014 Budget Document
• 800,000 visitors to our six conservation areas including the Glen Eden Ski and Snowboard Centre. Visitation continues to increase despite weather challenges. Tax funded revenues are not used to support recreation programs at the conservation areas.
• CH operates four major dam and reservoirs for flood control purposes. Three of the dams are on the Sixteen Mile Creek and one is on the Bronte Creek.
3. Key Initiatives in 2013
CVCA • Expanding CVC’s real-time monitoring network to a total of 54 gauges (streamflow,
precipitation, climate, and water quality) to further augment flood forecasting and warning capabilities to protect watershed residents and property. Acquired water data management system (WISKI) to further augment capabilities.
• Completed a memorandum of understanding (MOU) with the Region, Mississauga, Brampton, and TRCA for the sharing of real-time precipitation data in order to augment our flood forecasting and response capabilities.
• Initiated updated floodplain mapping for the Lake Ontario tributaries in CVC’s jurisdiction (all of which are in Peel Region)
• Engaged and educated more than 250 members of the development community, consulting professionals and government through two sold out Showcasing Leaders in Water Innovation bus tours in June and September 2013.
• Provided stormwater management and Low Impact Development (LID) support to 45 external partners including municipalities, other conservation authorities and the development community. CVC continued to update and promote LID guidance and develop training for design and construction professionals. LID construction course was initiated in 2013 and will be held regularly in 2014.
• Natural Heritage Systems development and implementation (policies) in support of watershed wide standards for Municipal (Mississauga and Brampton) and Regional (Peel) systems to better ensure ecosystem resilience to development and climate change.
• Initiated Natural Heritage Climate Change Vulnerability Analysis with TRCA and Region of Peel.
• Integrated Watershed Monitoring Program study design review ongoing to improve integration of all disciplines and cost effectiveness. Recommendations will be implemented beginning in 2014 field season.
• Credit River Fisheries Management Plan report card and update completed and initiated Brook Trout Recovery Strategy in response to declines documented in monitoring programs.
• Credit Valley Conservation Foundation on track to raise $1 million in donations. • Land Management Plans for core conservation areas (Upper Credit, Island Lake,
Belfountain). • Construction of Terra Cotta Sugar House and Amphitheatre with donor funding;
Completion of the Island Lake Bridges and Boardwalks with donor funding. • Submitting draft Environmental Assessment for Lakeview Waterfront Connection in
December 2013. • Planted 31,600 seedlings, 28,600 larger trees, shrubs and 7400 herbaceous plants
across the watershed. • Rattray Marsh – Phase 1 restoration is underway. • Enhanced delivery of key youth education programs across the watershed, including
Stream of Dreams and partnerships with girl guides, school boards, and Region of Peel’s “Peel Water Story” tours.
3

Conservation Authorities – 2014 Budget Document
• 42,000 adult and youth participants in education programs and events (projected to year end for 2013).
• 250 summer Conservation Youth Corps students planted 9,000 trees and shrubs • Opening of CVC Nursery at Warwick Conservation Area and doubling nursery production
to 25,000 units of potted stock; small wetland nursery also established to support wetland restoration and pond naturalization.
• Launch of “River World”, a program celebrating diverse cultural appreciation of local rivers, funded by the Royal Bank of Canada Blue Water Program and other partners.
TRCA • Completed the Stormwater Management (SWM) Criteria Document and provided training
to Municipal staff and land development industry including a one day workshop. • Completed the Low Impact Development (LID) Discussion Paper in partnership with CVC
and Lake Simcoe Region Conservation Authority (LSRCA). This was completed to raise awareness of the importance of effective SWM and the need for LID in Ontario
• The former group camp area located in the northern section of Heart Lake CA. A restoration plan was developed in 2012 by the Conservation Lands Group and a total of 1,600 trees were planted in 2013.
• Developed nine watershed report cards following guidelines prepared by Conservation Ontario which were released March 2013.
• Completed downtown Brampton Flood Protection Feasibility Study. • Educated students from over 225 Peel Region schools at TRCA outdoor field centres. • Engaged over 18,000 people in education, stewardship and sustainable communities’
projects. • Over 29,000 trees planted for 16 landowners through private land Reforestation program • Approximately 150,000 trees, shrubs and aquatic plants were planted to restore
approximately 26 hectares • 24 farmers growing local food on TRCA lands. • 177 high value Ash trees treated in Peel Region in 2013. 10,922 Ash trees identified for
removals over next 6 years. • Partners in Project Green Energy Consortium saved $1.15M in energy costs in 2012.
Approximately 149 companies took part in Eco-Efficiency Program since 2009, 150 more companies will targeted in 2013-2014. Materials Exchange program engaged 44 companies in Peel. Approximately 216 case studies published.
CH • Long Term Water Management Capital Project plan continues to be implemented.
Limited capital funding was approved by the Ministry of Natural Resources for 2013 resulting in the planned Channel slab replacements being delayed until 2014.
• Hamilton-Halton Source Water Protection Municipal Water Supply Sustainability assessments completed.
• Ongoing community outreach programs including the Children’s Water and Forest Festivals.
• Park improvements including construction of the new $1.3 million Crawford Lake Longhouse that is partly funded by a Community Improvement infrastructure Fund (CIIF) Federal grant and potentially Development Charges.
• Administration Office Parking renovations (to meet Accessibility for Ontarians with Disabilities Act (AODA) legislation) and telephone system replacement.
4

Conservation Authorities – 2014 Budget Document
Section II. Issues and Trends Summary of Issues and Trends: The Conservation Authorities (CAs) are faced with a number of issues that will have implications for their administrative and programmatic responsibilities. These include increasing operational costs related to staff and ongoing maintenance of their conservation areas and facilities. From a revenue perspective, apart from the support provided to the CAs by upper and lower tier municipalities, and the Province, the CAs also charge fees for use of their recreational areas, as well as for plan review function which they perform. With respect to the plan review, the total amount of fees collected is dependent upon a number of factors, such as the amount of development activity, over which the CAs have little or no control. Historically the bulk of the plan review fees have been collected in relation to subdivision development on greenfield sites, however these opportunities are declining especially in areas within the CVCA jurisdiction, as more intensification and redevelopment are occurring. This is likely to cause a reduction in plan review fees as a contributor to total revenues. As a consequence the CAs fees for intensification and redevelopment projects will have to be adjusted to more accurately compensate for staff time dedicated to these projects which are often more complex than regular greenfield type applications. It is important to note that in spite of inflation, support from the province to the CAs have remained constant for some programs e.g. dam maintenance and declined for others e.g. Source Water Protection. The CAs are faced with challenges related to severe weather events associated with climate change. This has resulted in the ever increasing occurrence of severe rain events causing flooding and potential loss of life and damage to property and the required heightened attention for flood alerts, equipment upgrades and maintenance to flood detection and response systems. It is likely that more resources will be needed to address climate change adaptation strategies which is often far more expensive than climate change mitigation strategies. In addition, the CAs are an integral player in addressing other problems such as invasive species (e.g. emerald ash borer) detection, control and elimination given their potential impact on existing urban forest canopy and natural areas. Conservation Areas are also being affected by increased visitor use which will likely require additional resources to facilitate enforcement activities and infrastructure maintenance, and replacement. List of Issues and Trends by CA: CVCA 1. Intense summer storms have resulted in renewed interest in flood management and shifts in
work priorities. The July 8, 2013 storm that impacted much of the Region exceeded the intensity of the 100-year storm at some locations and occurred just four years after the Cooksville Creek storm of August 2009, which also exceeded the intensity of the 100-year storm.
2. 623 structures (326 in Peel Region) are located in the floodplain along the Credit River and an additional 603 structures in the floodplains of the tributaries that drain directly to Lake Ontario (all in Peel Region). Many of these structures have multiple residential and commercial units. Flood mitigation projects should be initiated.
5

Conservation Authorities – 2014 Budget Document
3. Climate change pilot studies focussed on the Credit River Watershed suggest that summer base flows may decrease by as much as 16 per cent in headwater streams, which may impact Island Lake operations and flows available for assimilation of wastewater treatment plant effluent upstream of Peel Region. Source Water Protection Tier 3 study and CVC subwatershed study modelling suggest even larger impacts to base flows could occur due to increasing urbanization and water takings.
4. Need to provide for upgrading and replacement of storm water infrastructure in existing developed areas to manage flood flows and water quality
5. In-stream monitoring is showing wet-weather stream flow is up to three (3) times that of pre-development flows and pollutants contributing to deteriorating water quality in Lake Ontario despite the installation of SWM ponds (to meet current MOE SWM requirements).
6. Low Impact Development has been found across the United States, Australia and Europe and through modeling studies on the Credit River as an effective means of mimicking natural hydrology to reduce urban runoff volume and maintain base flow. Preliminary monitoring results in the Credit are promising, but lack of long-term data is a barrier to wide scale adoption and life cycle costing for asset management.
7. Increased urbanization, recreational pressure and climate change causing habitat loss and degradation including declining water quality and quantity in some areas, widespread decline of fisheries, increasing invasive species issues and more than 40 threatened and endangered species. Loss of forest cover from Emerald Ash Borer will alter the forest community and increase liability where public infrastructure exists
8. Window of opportunity with motivated landowners to leave a land legacy is open; Province at the same time is ending its funding programs for Land Securement;
9. Overall the Region is well below targets for forest and wetland cover. Restoration and Stewardship projects provide or support essential on-the-ground delivery of environmental restoration and protection within the Region.
10. Environmental Education – fostering ecologically literate and engaged adults and youth – continues to be a priority. CVC will deliver a projected 42,000 participant-hours of education programming in 2013, continuing to increase year by year from just 2,000 hours delivered in 2008.
TRCA 1. Increases of two per cent in cost of living effective April and minor benefit cost increases. 2. Reduction in transfer payments from the provincial government. 3. Revenues showing static growth with the exception of development services which is
continuing to increase. 4. More severe rain events requiring heightened attention for flood alerts, equipment upgrades
and maintenance to flood detection and response systems. 5. Need to upgrade aging dams and channels to a good state of repair. 6. Increasing risk to infrastructure from erosion due to July 8, 2013 storm, a detailed inventory
has been completed. 7. Failing infrastructure in harden treatments of kilometers of channels needs natural channel
design allows for resilience of water courses to slow the water down; reduce flooding on parkland and private property, and provide the added benefit of a more healthy riparian corridor and terrestrial habitat.
8. Urban Flooding Solutions such as integrated Flood management studies will be required to address cumulative issues related to infrastructure capacity, lot drainage and riverine flooding.
9. Lakeview Waterfront Park implementation (pending Council approval) 10. Conservation Area environmental compliance and infrastructure upgrades. 11. Enhanced climate monitoring and data.
6

Conservation Authorities – 2014 Budget Document
12. Increasing unauthorized uses and damage on the 3,800 hectares (9,500 acres) of TRCA owned green space in Peel Region.
13. CA communication infrastructure needs CH 1. Staffing costs – two new FTE positions are being added that are partly funded with increased
user fees and chargeback to the Non Tax Supported Programs. Staff positions have been restructured in Environmental Planning to improve response times. Source Protection Program is charging back staff time work on non Source Protection Program work to Watershed Planning.
2. Debt Financing Charges – Infrastructure capital projects such as Dams and Channels Major Maintenance are 50 per cent funded with debt financing received through Halton Region to smooth out capital funding requests. Debt financing is being repaid over 10 years with a market interest rate. The debt financing charges continue to increase as more projects are debt financed.
Section III. 2014 Business Focus (listed by CA) CVCA • Continue to prioritize flood forecasting and warning, dams, and floodplain mapping projects
(e.g., operation of expanded real-time precipitation and streamflow gauge network) to reduce financial and property damage risks and keep up with impacts of climate change and urbanization.
• Add 5 new real-time rain / flow gauges on the west side of the middle watershed, i.e. Caledon and upstream communities
• Bring the WISKI real-time gauge data sharing and extreme weather warning system into full operation
• Low Impact Development (LID) reviewing over 30 plans, supporting 20 new sites, proposed to raise over $3.8 million in funding and completing six guidance documents over the next three years. (Innovative Water Technologies project)
• CVC’s (with input from municipal, provincial staff and BILD) will develop a decision support framework for determining a feasible level of service for stormwater infrastructure to optimize investments, better manage risk in light of climate change.
• Through the infrastructure performance assessment program, CVC will provide Life Cycle Costing data from fieldwork collected LID sites within the Credit Watershed to support the preparation of municipal stormwater asset management plans.
• Watershed Natural Heritage System policy recommendations and implementation plan including stewardship priorities. Input and finalization of municipal led plans for Mississauga, Brampton and Peel.
• Invasive Species management including funding partnership with Ontario Invasive Plant Council and the development and implementation of a CVC Emerald Ash Borer Plan.
• Implement new study design for the Integrated Watershed Monitoring Program to improve integration of all disciplines and cost effectiveness.
• Complete and implement updated Credit River Fisheries Management Plan and Brook Trout Recovery Strategy.
• Significant Wildlife Habitat recommendations including Species of Conservation Concern. • Emergency Preparedness in Conservation Areas; Accessibility Standards for Conservation
Areas and CVC Offices; Trail Management Strategy – design and build standards. • Finalizing Environmental Assessment for Lakeview Waterfront Connection, finalizing detailed
design, and beginning implementation. • Initial implementation of Lake Ontario Integrated Shoreline Strategy.
7

Conservation Authorities – 2014 Budget Document
• Explore targeted residential stewardship and flood risk reduction through SNAP-like program(s).
• Launch “Health and Wellness” education program and continue to support connections between a healthy watershed environment and healthy people.
TRCA • Climate risk identification and quantification to support implementation of Peel Climate
Change Strategy. • Municipal support for growth management and specialized planning studies. • Flood risk assessment of SPA’s and urban flooding. • Updated Hydrologic modeling with updated data from recent storms. • Erosion monitoring and maintenance- significant post July 8th storm • Implementation of Peel Channels Study priorities with a focus on restoring degraded
concrete lined channel void of natural morphology or habitat features • Forest Management - Emerald Ash Borer • Enhanced implementation of Habitat Implementation Plans, outreach and education
activities. • Mater Greenspace accessibility assessment at a watershed scale to promote healthy
communities. • Enhanced business outreach for energy, water and waste efficiencies. • CA environmental compliance and upgrades. • Arsenal Building renovation (multi-year project). • Bolton Camp Site Improvement (multi-year project). • Multiple funding proposals and business development opportunities to leverage Peel money.
CH • Implementation of the Long Term Water Management Capital Project Plan including Milton
and Hager Rambo Channel Slab replacements and reserve funding to increase the Watershed Management Capital Projects reserve balance.
• Implementation of park master plan initiatives at the Conservation Areas and improvements at Glen Eden.
• Administration Office renovations continuing (roof and window replacement, office renovations to expand office space).
Section IV. 2014 Operating Budget 1. 2014 Conservation Operating Budget Overview The 2014 CA budget increase, forecast in last years budget process was $2.1 million. However, as per direction by Regional Council the 2014 Budget amounts submitted were reduced from combined total of $2.1 million to $1.5 million. This funding from Peel is incorporated into each CA’s budget which is then approved by their respective board. The 2014 CA Budget includes a contribution from the utility rate budget of $16 million which is an amount that has not changed since 2008. This results in CA increases only affecting the tax rate. This inadvertently makes the CA increases appear larger than they are. For example the 2014 total CA levy request increased by 4.4 per cent however, the CA net cost increase is 8.3 per cent due to the fact that the contribution from the utility rate has not changed. This is expected to have an impact for future years and is being monitored by staff each year.
8

Conservation Authorities – 2014 Budget Document
2014 Budget - Net Expenditures
(In $’000)
2013 Budget
2013 Projection (As at Aug. 31,
2013)
2014 Budget
Budget
Change % 2014 vs. 2013
Conservation Levies • CVCA $18,072 $18,072 $19,637 8.7%• TRCA $15,795 $15,795 $15,735 -0.4%• CH $423 $423 $431 1.9%Total Conservation Levy Requests
$34,290 $34,290 $35,803 4.4%
Peel Funding Sources • Utility Rate $16,028 $16,028 $16,028 0.0%• Tax Rate $18,262 $18,262 $19,775 8.3%
Total Funding Source By Type
(In $Million & %)
Utility $16.0, 46%
Tax $19.0, 54%
Net Expenditures By Type (In $Millions & %)
TR CA$15.8, 45%
CVCA $19.654%
CH $0.4, 1%
NOTE: Graphs reflect expenditures net of revenues generated by Conservation Authorities.
9

Conservation Authorities – 2014 Budget Document
2. 2014 Budget The following table summarizes Conservation Authorities’ 2014 budget changes which breaks out the various change categories into General and Special Levies and New Projects.
2014 Budget - Net Expenditures 2014 Changes
(In $’000)
2013 Budget
a. General Levies
b. Special Levies
c. New Projects
2014
Budget Conservation Levies • CVCA $18,072 $611 $863 $91 $19,637• TRCA $15,795 $63 ($373) $250 $15,735• CH $423 $11 ($3) - $431Total Conservation Levy Requests
$34,290 $685 $487 $341 $35,803
Peel Funding Sources • Utility Rate $16,028 - - - $16,028• Tax Rate $18,262 $685 $487 $341 $19,775Note: Please refer to Appendix 1 for details. a. General Levy Budget Pressures (listed by category then by CA)
Cost of Living
CVCA • Increase in Personnel Costs (cost of living adjustment (COLA), benefits, merits and
additional staffing) TRCA • 2 per cent COLA increase effective April, 2014 and minor benefit cost increases. CH • Staffing costs including 2 new FTE’s, 1.75 per cent annualized compensation
increases and benefit increases.
Other Pressures CVCA • Slow down of timing of planning fees resulting in reallocation of levies from other
CVC programs to cover planning fee shortfalls. • Provincial reduction of funding for Source Water Protection activities and staff • Computer Reserve Allocation (in 2013 due to cutbacks couldn’t put funds in reserve) • Reduced External Funding relating to MOE grant for Innovative Water Technologies
project TRCA • Minor increase for flow through of property taxes for CA properties charged to TRCA. CH • Debt financing charges • Ministry of Natural Resources (MNR) capital funding uncertainty for completion of
Long Term Water Management Capital Projects. • Facilities and infrastructure aging and limited funding and reserves to address long
term projects. • Land acquisition funding request continues to be deferred in budget due to higher
priority projects.
10

Conservation Authorities – 2014 Budget Document
Cost Mitigation Through Efficiencies & Recoveries
CVCA • Review of environmental monitoring program underway to reduce overlap, eliminate
some parameters and improve efficiency of program delivery • Planning fee revisions and staff reallocations to increase revenue and reduce cost. • Movement within the bands and annualization of 2013 hire, which has been absorbed
within current budget. TRCA • Decrease due to reduction in Current Value Assessment apportionment to Peel (Following items listed are not quantifiable) • Re-engineering financial administration processes to improve effectiveness and
efficiencies such as a new accounting system, electronic protocols for timesheets and purchasing and payments.
• Environmental assessment process and service standards for Peel Region projects. CH • Cost increases have been mitigated with the increase in user fees for Watershed
Planning Services to fund one new staff, staff reorganization and a new chargeback from Source Protection Program. Chargebacks to the Non Tax Supported program have been increased for one new staff person and increased compensation and benefits costs.
• Legal fee budget has been reduced to be consistent with legal fee expenses for the last five years.
• Change in Current Value Assessment (CVA) apportionment resulting in reduction to Peel.
b. Special Levy Budget Pressures Changes to the 2014 Budget are driven by the following listed by CA: CVCA
Watershed • Personnel costs – cost of living and benefits • Urban Subwatershed Restoration - Innovative Water Technologies project; which will
entail developing a series of “How to Guides” and Case Studies that will provide municipalities with tools for implementing LID in developed and developing areas
Climate Change • Urban Subwatershed Restoration - Innovative Water Technologies project; which will
entail developing a series of “How to Guides” and Case Studies that will provide municipalities with tools for implementing LID in developed and developing areas
• Predevelopment support increased to offset short term decrease in planning fees from Greenfield development
Infrastructure • Flood Forecasting and Warning and Floodplain Mapping – New staff positions are
required to support: operation and maintenance of the augmented real-time gauges network and WISKI data management system; updated floodplain mapping and climate change vulnerability assessments for Lake Ontario tributaries.
• Major Maintenance of Dams and Ice Control Structure: Island Lake South Dam, which enables supporting assimilative capacity for Orangeville’s sewage treatment plant; Erindale Ice Control Structure design of erosion mitigation works.
11

Conservation Authorities – 2014 Budget Document
TRCA
Watershed – increases for: • $45,000 for York/Peel/Durham/Toronto (YPDT) Groundwater Management Strategy • Urban Agriculture - Promote partnerships and products through various media,
community meetings and events to help encourage consumer to purchase locally grown goods. Also, to assist with infrastructure requirements for operations such as fencing, greenhouse and water supplies.
• Peel Stewardship – continue to increase the number of Healthy Yards workshops and residential engagement. Delivery of stewardship presentations to businesses in priority areas of Peel Region, including but not limited to, the Partners in Project Green (PPG) target area.
Climate Change – increases for: • Erosion and Remedial Capital Works • Flood Remedial Works • Emerald Ash Borer Response (Habitat Restoration) Infrastructure – decrease due to: • Arsenal Building Renovation budget reduction for 2014 • Heart Lake Plan Implementation project –forecasted budget was reducing in 2014 and
also, the actual budget was reduced by $162,000 in order to meet the 1% budget reduction. This reduction will be funded through carry forward in order to ensure the project remains on target.
CH
Infrastructure • Decrease due to delay in 2013 Dams and Channels work to be completed in 2014 due to
limited Provincial capital funding. Conservation Area priorities for 2014 include completion of the Crawford Lake Longhouse started in 2013 and in the 2013 Budget. The Longhouse will be completed in 2014 to meeting grant requirements.
c. Budget for New Projects/Services
Net Cost (In ‘000) Program New Services 2014
Budget 2015
Forecast CVCA Environmental
• Climate Change 1. Enforcement Program in 2014 2. Green Streets is forecasted to begin in 2015 pending
budget approval Working with municipalities to support design, tendering, construction administration, and monitoring of road reconstruction projects that incorporate innovative storm water practices.
$91
$0
$93
$266
12

Conservation Authorities – 2014 Budget Document
Net Cost (In ‘000)
Program New Services 2014 Budget
2015 Forecast
TRCA Environmental
• Climate Change - Green Accessibility for Human Health • Implement a ‘Greenspace Master Plan’ to align with
TRCA’s Strategic Plan. Infrastructure
• Albion Hills Infrastructure • Install 1.6 kilometres of fibre optic cabling to improve
POS system, staff communication and business applications.
• Parks & Infrastructure Projects • Complete Environmental Compliance Approval
application for Albion Hills Conservation Area and complete septic system retrofits at the Campground (camp sites), Beach Centre and Chalet.
$50
$200
$0
$50
$0
$500
Total New Services $341 $909
Section V. 2014 Capital Budget 1. 2014 Capital Plan Overview The 2014 Capital Budget includes $5.5 million to advance the Lakeview Waterfront Connection project. This is a joint initiative of Credit Valley Conservation and Toronto & Region Conservation Authority in partnership with the City of Mississauga and the Region of Peel. The Region of Peel will manage the Capital Budget. As such these costs are outside and separate from the levies paid by the Region to the conservation authorities. 2. Existing Capital Projects – N/A 3. 2014 Capital Budget and Operating Impact Once fully developed, it is proposed that CVC will retain ownership of the site. The operating costs are expected to begin beyond the current four year operating forecast horizon. These costs will be included in the CVC levy once operational. 4. 2014 – 2023 10-Year Capital Plan The net costs to complete the entire Lakeview Waterfront Connection project are estimated as $30.5 million. Additional financing to complete the project will be sought from funding opportunities, such as Build Canada, as well as tip fees for clean fill. More details will be available once a detailed design has been completed. The net costs will be incorporated into the tax supported capital infrastructure levy.
13

Conservation Authorities – 2014 Budget Document
Section VI. Output/Outcome Measures – N/A Section VII. Staffing - N/A Section VIII. Future Outlook
Net Expenditures
(In $’000) 2014
Budget Forecasted
in 2013 Budget
2014
Budget
2015
Forecast
2016
Forecast
2017
Forecast
Conservation Levies • CVCA $20,164 $19,637 $21,035 $21,986 $22,858• TRCA $15,848 $15,735 $17,162 $18,709 $19,569• CH $446 $431 $442 $468 $494Total CA Levy Requests $36,458 $35,803 $38,639 $41,163 $42,921 Peel Funding Sources • Utility Rate $16,028 $16,028 $16,028 $16,028 $16,028• Tax Rate $20,430 $19,775 $22,611 $25,135 $26,893 # of FTEs n/a n/a n/a n/a n/a Section IX. Disclosure of 2014 Budget Risks and Key Program Assumptions CVCA • Revenues from Conservation Areas and Planning Fees is achieved as projected • Liability from Emerald Ash Borer damage to ash trees on CVC property; ability to identify and
respond quickly enough • Continued financial support for source water protection by the province • Damage to infrastructure from severe weather may increase the level of risk and impact the
budget should immediate attention be required
TRCA • Development fee revenue is projected to increase over 2013, but this is always subject to
building activity. • Major infrastructure failure due to severe weather will increase the level of risk and impact
the budget should immediate attention be required.
CH • Natural Heritage Land Acquisition program continues to be deferred until 2015 due to cost
constraints • Debt financing charges payable to Halton Region continue to increase due to debt financing
funding received for significant Water management capital projects and Administration Office renovations
14

Conservation Authorities – 2014 Budget Document
• Conservation Area improvements to date have been dependent on inadequate reserve funding derived from user fees. Development charges for growth related park improvements have been assumed in the Non Tax Supported Ten Year Capital Forecast for 2014 and beyond, although the proposed Development Charge fees have been appealed.
Section X: Useful links
• Credit Valley Conservation Authority Website: http://www.creditvalleyca.ca/ • Toronto and Region Conservation Authority Website: http://www.trca.on.ca/ • Conservation Halton Website: http://www.conservationhalton.on.ca/ • Conservation Ontario Website: http://www.conservation-ontario.on.ca/
15

Conservation Authorities – 2014 Budget Document
THIS PAGE INTENTIONALLY LEFT BLANK
16

Conservation Authorities – 2014 Budget Document
Appendix 1 Conservation Authorities
2013 Operating Budget Pressures – General and Special Levy Summary
Total Expenditures
Total Revenue
Net Cost
2013 Revised Cost of Service $18,262 0 $18,262 2014 Budget Change
a. General Levy Budget Pressures Cost of Living (CVCA/TRCA/CH) Other Pressures(CVCA/TRCA/CH)
367 382
367 382
Cost Mitigation (TRCA/CH)
(64) (64)
Subtotal – General Levy Budget Pressures $685 $685
b. Special Levy Budget Pressures Environmental (CVCA/TRCA) Watershed Climate Change
1,034 171
1,034 171
Infrastructure (CVCA/TRCA/CH)
(718)
(718)
Subtotal – Special Levy Pressures $487 $487
c. New Pressures
General Levy – N/A Special Levy (CVCA & TRCA)
-
341
-
341
Subtotal – New Services(s) $341 $341 Total 2014 Budget Changes $1,513 0 $1,513 2014 Budget (2014 Recommended Cost of Service)
$19,775 0 $19,775
17

Conservation Authorities – 2014 Budget Document
APPENDIX 2CONSERVATION AUTHORITIES
2014 OPERATING BUDGET - SPECIAL LEVY PROJECT LIST
CA Description 2014 2015 2016 2017 Total
Conservation Authority Projects ($'000)
Ref # Peel's portion of projects shared with other municipalities
Environmental - Watershed14- 1631 * CVC Natural Heritage Mapping 362 383 391 405 1,54014- 1639 * CVC Subwatershed Health Projects 256 286 235 239 1,01514- 1670 * CVC Terrestrial Watershed Monitoring 449 481 500 499 1,92914- 1615 * TRCA Flood Control Works 495 805 1,130 1,081 3,51114- 1632 * TRCA Groundwater Management Strategy 175 175 175 175 70014- 1650 * TRCA Terrestrial Natural Heritage Program 175 195 225 245 84014- 1660 * TRCA Watershed/Subwatershed Planning 510 559 535 519 2,12314- 1686 * TRCA Natural Heritage Regeneration Projects 796 826 857 886 3,36514- 1690 * TRCA Sustainable Communities 988 1,073 1,139 1,122 4,32214- 1696 * TRCA Regional Watershed Monitoring and Reporting 408 408 425 428 1,669
Subtotal For: Watershed 4,614 5,191 5,612 5,598 21,015
Infrastructure14- 3201 * CH HALTON - Capital Works General 15 19 25 31 9114- 3103 ** CVC Maintenance Conservation Properties 751 877 963 778 3,37014- 3301 * TRCA Major Facilities Retrofit 82 82 82 82 32614- 3302 * TRCA Public Use Infrastructure 35 35 35 35 14014- 3306 ** TRCA Conservation Land Planning 1,187 1,187 1,230 1,232 4,83614- 3307 * TRCA Information Technology 47 47 47 47 18614- 3309 * TRCA Living City Campus at Kortright Development 200 200 200 300 90014- 3312 * TRCA Office Accommodation Project 0 165 165 500 830
Subtotal For: Infrastructure 2,316 2,612 2,746 3,004 10,679
Subtotal - Peel's portion of projects shared with other municipalities 6,930 7,803 8,359 8,603 31,694
Projects that are fully funding by Peel
Environmental - Watershed 14- 1625 CVC Brampton Effectiveness 244 258 268 276 1,04614- 1640 CVC Peel Rural Water Quality 144 146 148 175 61314- 1697 CVC Urban Outreach 431 522 601 616 2,17114- 1699 CVC Credit River Water Management Strategy 381 373 391 403 1,54814- 1620 TRCA Environmental Assessment & Review 348 348 362 362 1,420
Subtotal For: Watershed 1,549 1,647 1,770 1,832 6,798
14- 3401 Ed CVC Environmental Education 1,036 1,295 1,330 1,508 5,16914- 3402 W CVC Urban Subwatershed Restoration 2,943 2,623 2,992 3,082 11,64014- 3404 W CVC Emergency Preparedness 518 772 828 847 2,96414- 3406 Ec CVC Stewardship/Ecosystem Projects 2,449 2,855 2,934 3,157 11,39514- 3407 Ec CVC Lands Core 10 Ecosystems Projects 596 608 612 630 2,44614- 3408 Ec CVC Natural Heritage Ecosystem Projects 845 914 939 969 3,66714- 3416 Ed TRCA Pearson Eco Industrial 370 370 350 350 1,44014- 3417 Ec TRCA Claireville Programming & Infrastructure 75 75 75 75 30014- 3418 W TRCA Channel Remediation (Flood works & Restoration) 150 175 175 400 90014- 3424 W TRCA Stormwater Management Innovation 100 100 100 100 40014- 3425 W TRCA Erosion and Remedial Capital Works 700 700 700 700 2,80014- 3426 Ec TRCA Audubon Certification for Parks 50 50 50 50 20014- 3428 Ec TRCA Stewardship Partnership Services 225 237 237 237 93614- 3429 Ec TRCA Habitat Restoration 2,334 2,731 2,919 2,785 10,76914- 3431 Ed TRCA Albion Hills Environmental Weeks 109 112 114 116 45114- 3432 Ed TRCA Sustainable Neighbourhood Retrofit Action Plan 300 300 300 300 1,20014- 3433 Ed TRCA Green Buildings Councils 140 150 150 160 60014- 3434 Ed TRCA Climate Science Applications 170 175 175 180 70014- 3436 Ed TRCA EcoSchools Expansion 331 341 362 361 1,39514- 3437 Ed TRCA Community Transformation 110 350 350 350 1,16014- 3438 Ed TRCA Sustainable Technologies 183 189 195 237 80414- 3439 Ed TRCA Albion Hills Field Centre Retrofit & Renovation 100 100 0 0 200
18

Conservation Authorities – 2014 Budget Document
APPENDIX 2CONSERVATION AUTHORITIES
2014 OPERATING BUDGET - SPECIAL LEVY PROJECT LIST
CA Description 2014 2015 2016 2017 Total
Conservation Authority Projects ($'000)
Ref #
Projects that are fully funding by Peel
14- 3440 W TRCA Flood Remedial Works 512 550 550 800 2,41214- 3441 Ec TRCA Claireville Eco-System Restoration 75 75 75 75 30014- 3442 Ed TRCA Living City Report Card 0 70 200 0 27014- 3444 Ed TRCA Conservation Youth Corps 70 70 90 90 32014- 3445 Ed TRCA Climate Consortium Research/Action/Integration 200 100 100 100 50014- 3446 Ec TRCA Greenspace Accessibility for Human Health 50 50 0 0 100
Subtotal For: Global Warming/Climate Change Mitigation 14,740 16,137 16,901 17,660 65,438
Infrastructure 14- 3104 CVC Capital Projects - Peel Infrastructure 324 332 339 290 1,28614- 3409 CVC Gauge Stations & Floodline Mapping 822 707 714 715 2,95814- 3303 TRCA Campground and Conservation Areas Improvements 400 400 400 400 1,60014- 3305 TRCA Washroom Upgrades 145 0 0 150 29514- 3311 TRCA Heart Lake Master Plan Implementation 338 170 200 200 90814- 3313 TRCA PanAm Games Equestrian Facility 467 467 467 0 1,40114- 3314 TRCA Arsenal Building Renovation 250 250 250 0 75014- 3315 TRCA Bolton Camp Site Improvement 500 500 500 500 2,00014- 3316 TRCA CA Communications Infrastructure 200 0 0 0 20014- 3317 TRCA Parks & Infrastructure Projects 0 500 1,250 2,000 3,750
Subtotal For: Infrastructure 3,445 3,327 4,121 4,255 15,148
Subtotal - Projects that are fully funded by Peel 19,734 21,111 22,792 23,747 87,385
TOTAL Conservation Authority Projects 26,664 28,914 31,151 32,350 119,079
Note: * Current Value Assessment Apportionment applies to the project (cost shared with other municipalities)Note: ** cost shared project
Definitions of categories
Environmental - WatershedProjects related to watershed quality and sustainability.
Environmental - Climate Change/MitigationProj Projects relating to Climate Change/Mitigation.
Infrastructure Projects related to the conservation areas located within regional boundaries
W = WatershedEc = EcologicalEd = Educational
19

Conservation Authorities – 2014 Budget Document
THIS PAGE INTENTIONALLY LEFT BLANK
20

Conservation Authorities – 2014 Budget Document
Conservation Authorities Summaries Credit Valley Conservation Authority……………………………………………22 Summary I: 2014 General and Special Levy Budget Pressures Summary II: General and Special Levy Four-Year Forecast Toronto & Region Conservation Authority……………….……………………. 24 Summary I: 2014 General and Special Levy Budget Pressures Summary II: General and Special Levy Four-Year Forecast Conservation Halton.………………………………………..…..…………………..26 Summary I: 2014 General and Special Levy Budget Pressures Summary II: General and Special Levy Four-Year Forecast Lakeview Waterfront Connection Project ………………………………...........28 Summary III: 2014 Financing Sources and Funding Status Summary IV: Ten-Year Capital Plan
21
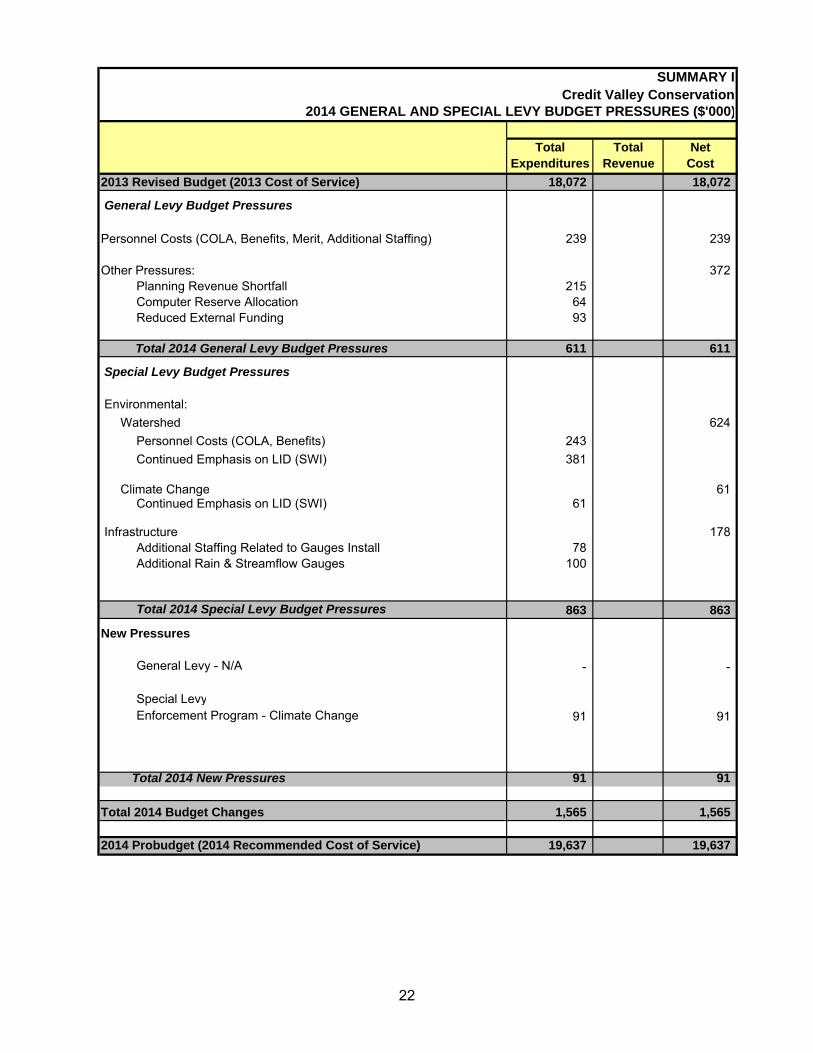
SUMMARY ICredit Valley Conservation
2014 GENERAL AND SPECIAL LEVY BUDGET PRESSURES ($'000)
Total Expenditures
Total Revenue
Net Cost
2013 Revised Budget (2013 Cost of Service) 18,072 18,072
General Levy Budget Pressures
Personnel Costs (COLA, Benefits, Merit, Additional Staffing) 239 239
Other Pressures: 372 Planning Revenue Shortfall 215 Computer Reserve Allocation 64 Reduced External Funding 93
611 611
Special Levy Budget Pressures
Watershed 624 Personnel Costs (COLA, Benefits) 243 Continued Emphasis on LID (SWI) 381
Climate Change 61 Continued Emphasis on LID (SWI) 61
178 Additional Staffing Related to Gauges Install 78 Additional Rain & Streamflow Gauges 100
Total 2014 Special Levy Budget Pressures 863 863
New Pressures
General Levy - N/A - -
Special LevyEnforcement Program - Climate Change 91 91
91 91
1,565 1,565
2014 Probudget (2014 Recommended Cost of Service) 19,637 19,637
Total 2014 Budget Changes
Infrastructure
Total 2014 General Levy Budget Pressures
Environmental:
Total 2014 New Pressures
22
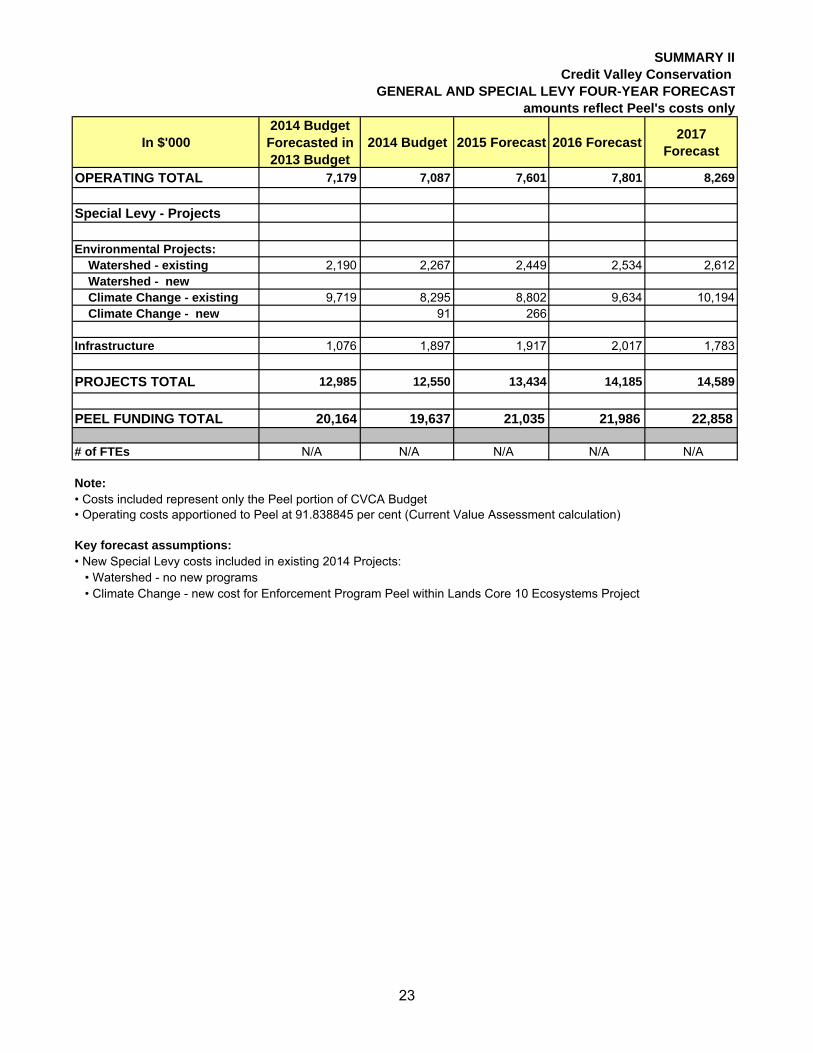
SUMMARY IICredit Valley Conservation
GENERAL AND SPECIAL LEVY FOUR-YEAR FORECAST
In $'0002014 Budget Forecasted in 2013 Budget
2014 Budget 2015 Forecast 2016 Forecast 2017 Forecast
OPERATING TOTAL 7,179 7,087 7,601 7,801 8,269
Special Levy - Projects
Environmental Projects: Watershed - existing 2,190 2,267 2,449 2,534 2,612 Watershed - new Climate Change - existing 9,719 8,295 8,802 9,634 10,194 Climate Change - new 91 266
Infrastructure 1,076 1,897 1,917 2,017 1,783
PROJECTS TOTAL 12,985 12,550 13,434 14,185 14,589
PEEL FUNDING TOTAL 20,164 19,637 21,035 21,986 22,858
# of FTEs N/A N/A N/A N/A N/A
Note:• Costs included represent only the Peel portion of CVCA Budget • Operating costs apportioned to Peel at 91.838845 per cent (Current Value Assessment calculation)
Key forecast assumptions:• New Special Levy costs included in existing 2014 Projects: • Watershed - no new programs • Climate Change - new cost for Enforcement Program Peel within Lands Core 10 Ecosystems Project
amounts reflect Peel's costs only
23

SUMMARY IToronto & Region Conservation Authority
2014 GENERAL AND SPECIAL LEVY BUDGET PRESSURES ($'000)
Total Expenditures
Total Revenue
Net Cost
2013 Revised Budget (2013 Cost of Service) 15,795 15,795
General Levy Budget Pressures
106 106
5 5
Decrease: CVA apportionment and property taxes shift (48) (48)
63 63
Special Levy Budget Pressures
Watershed (Works) Increase includes:Watershed/Subwatershed Planning/Floodmaps 78 Groundwater Management Strategy 45 Terrestrial Natural Heritage 31 Natural Heritage Regeneration Projects 88 Sustainable Communities 133 Regional Watershed Monitoring and Reporting 3 Flood Control Works 20 Environmental Assessment Review 13
Total Watershed (Works) Increase 411
Climate Change increase includes:Watershed Management 152 Ecosystem Management 230 Education - Sustainable Community Projects (272)
Total Climate Change Increase 110
Washroom Upgrades 35 Public Use and Major Facilities Retrofit 2 Heart Lake Master Plan Implementation (432) Conservation Land Care 1 Arsenal Building Renovation (500)
Infrastructure Increase/Decrease (894)
Total 2014 Special Levy Budget Pressures (373) (373)
New Pressures
General Levy - -
Special LevyCA Communications (Infrastructure) 200 200 Greenspace Accessibility for Human Health (Climate Change: Ecosystem) 50 50
250 250
(60) (60)
2014 Probudget (2014 Recommended Cost of Service) 15,735 15,735
Total 2014 Budget Changes
Cost of Living/ Inflation
Infrastructure increase/decrease includes:
Total 2014 General Levy Budget Pressures
Environmental
Total 2014 New Pressures
Property taxes flow-through change
24

SUMMARY IIToronto & Region Conservation Authority
GENERAL AND SPECIAL LEVY FOUR-YEAR FORECASTamounts reflect Peel's costs only
In $'0002014 Budget Forecasted in 2013 Budget
2014 Budget 2015 Forecast 2016 Forecast 2017 Forecast
OPERATING TOTAL 1,636 1,636 1,701 1,769 1,840
Special Levy Projects
Environmental Projects: Watershed - existing 3,716 3,895 4,389 4,848 4,818
Climate Change - existing 6,637 6,304 7,020 7,267 7,466
Climate Change - new 50 50 50
Infrastructure - existing 3,809 3,650 3,502 3,575 3,445 Infrastructure - new 200 500 1,250 2,000
PROJECTS TOTAL 14,212 14,099 15,461 16,940 17,729
PEEL FUNDING TOTAL 15,848 15,735 17,162 18,709 19,569
# of FTEs N/A N/A N/A N/A N/A
Note:• Costs included represent only the Peel portion of TRCA Budget • Operating costs apportioned to Peel at 11.2 per cent (Current Value Assessment calculation) mainly
Key forecast assumptions:Operating:• COLA - 2% increase assumption in April 2014• Staffing - no additional staffing projected at this timeProjects:• New Climate Change Project - Greenspace Accessibility for Human Health (2 year total cost $100 thousand)• New Infrastructure Project - CA Communications Infrastructure (1 year project with total cost of $200 thousand)• New Infrastructure Project starting 2015 - Parks & Infrastructure Projects (in 2015 will assist in the Conservation
Authority Environmental Compliance for Albion Hills)• Increase in Flood Control Works/Warning Project (2015 = $310 thousand and 2016 = 325 thousand) for:
2015 - implement Claireville Dam Safety Review and complete engineering and design for repairsor decommissioning of Albion Hills Dam.2016 - implementation of repairs or removal of Albion Hills Dam as per engineering study
• Reintroduction of Office Accommodation Project starting 2015 in the amount of $165 thousand• Additional cost for PAN AM Games project in 2016 of $467 thousand.• Bolton Camp project increased and extended to 2017
25

SUMMARY IConservation Halton
2014 GENERAL AND SPECIAL LEVY BUDGET PRESSURES ($'000)
Total Expenditures
Total Revenue
Net Cost
2013 Revised Budget (2013 Cost of Service) 423 423
General Levy Budget Pressures
22 22
Other Pressures 5 5
Cost Mitigation (16) (16)
11 11
Special Levy Budget Pressures
Watershed (1) (1) Climate Change - N/A
(2) (2)
Total 2014 Special Levy Budget Pressures (3) (3)
New Pressures
General Levy - N/A - -
Special Levy - N/A - -
- -
8 8
2014 Probudget (2014 Recommended Cost of Service) 431 431
Total 2014 Budget Changes
Cost of Living and Benefits
Infrastructure
Total 2014 General Levy Budget Pressures
Environmental
Total 2014 New Pressures
26

SUMMARY IIConservation Halton
GENERAL AND SPECIAL LEVY FOUR-YEAR FORECAST
In $'0002014 Budget Forecasted in 2013 Budget
2014 Budget 2015 Forecast 2016 Forecast 2017 Forecast
OPERATING TOTAL 424 416 423 443 463
Special Levy - Projects
Environmental Projects: Watershed - - - - - Climate Change - N/A - - - - -
Infrastructure 22 15 19 25 31
PROJECTS TOTAL 22 15 19 25 31
PEEL FUNDING TOTAL 446 431 442 468 494
# of FTEs N/A N/A N/A N/A N/A
Note:• Costs included represent only the Peel portion of CH Budget • Operating and Project costs apportioned to Peel at 5.4334 per cent (Current Value Assessment calculation)
Key forecast assumptions:• Inflation and salary and benefit increases have been included in the forecast at 2.5%• Addition of 1 new FTE every other year starting in 2015
amounts reflect Peel's costs only
• Estimated Debt Financing Charges provided by Halton Region and based on completion of Long Term Capital projects with50% being debt financed through Halton Region
• Dams and Channel major maintenance completed according to Long Term Capital Plan and assuming 50% MNR funding will be approved
27

2014 NEW CAPITAL DETAIL
CONSERVATION AUTHORITIES
SUMMARY III
2014 Financing Sources and Funding Status ($'000)
Project #Expense
FundingTotal
Project Name
Approved or Pending
External Internal DCA
2014 Funding Status:
2014(A/P)
Ward
Infrastructure & AdministrationA 14-3199 LAKEVIEW WATERFRONT CONNECTION M1 0 5,500 0 5,500
2014Totals for Budget Year: 0 5,500 0 5,500
28

GrossDescriptionSub Type
Ten Year Combined Capital Program ($'000)
Yrs 6-1020182017201620152014
CONSERVATION AUTHORITIES
SUMMARY IV
TEN YEAR CAPITAL PLAN
Infrastructure & AdministrationProjects related to the conservation areas located within regionalboundaries. The conservation areas are: Credit Valley Conservation,Conservation Halton, and Toronto and Region Conservation Authority.
30,500 13,800 2,800 2,800 2,800 2,800 5,500LAKEVIEW WATERFRONT CONNECTION14-3199FUNDING TO CONSTRUCT THE LAKEVIEWWATERFRONT CONNECTION. . DESIGNANTICIPATED IN 2014. THIS IS AJOINT INITIATIVE WITH CREDITVALLEY CONSERVATION AND TORONTOAND REGION CONSERVATION, INPARTNERSHIP WITH THE CITY OFMISSISSAUGA TO UNDERTAKEIMPLEMENTATION OF THE LAKEVIEWWATERFRONT CONNECTION.
10 YearTotals For: CONSERVAUTH 5,500 2,800 2,800 2,800 2,800 13,800 30,500
Totals for 10 Year Capital Plan: 5,500 2,800 2,800 2,800 2,800 13,800 30,500
29

THIS PAGE INTENTIONALLY LEFT BLANK

Assessment Services
2014 Budget Document

THIS PAGE INTENTIONALLY LEFT BLANK

Table of Contents
Section I. Existing Services and Service Levels ................................................................. 1
1. Who we are? ......................................................................................................................... 1
2. Existing Services and Service Levels.................................................................................... 1
3. Key Initiatives in 2014 – N/A ................................................................................................. 1
Section II. Issues and Trends ................................................................................................. 1
Section III. 2014 Business Focus ........................................................................................... 1
Section IV. 2014 Operating Budget........................................................................................ 2
1. 2014 Departmental Operating Budget Overview................................................................... 2
2. 2014 Proposed Budget.......................................................................................................... 2
Section V. 2014 Capital Budget – N/A ................................................................................... 3
Section VI. Output/Outcome Measures – N/A ...................................................................... 3
Section VII. Staffing – N/A ....................................................................................................... 3
Section VIII. Future Outlook .................................................................................................... 3
Section IX. Disclosure of 2014 Budget Risks and Key Program Assumptions................. 3
Section X: Useful links – N/A .................................................................................................. 3
Appendix 1: 2014 Operating Budget Pressures – Departmental Summary........................ 5

THIS PAGE INTENTIONALLY LEFT BLANK

Assessment Services – 2014 Budget Document
Section I. Existing Services and Service Levels 1. Who we are? Through the Assessment Services program, the Region of Peel provides funding to the Municipal Property Assessment Corporation (MPAC) which administers the province-wide property assessment service for municipalities. Each year, MPAC prepares an assessment roll for every Ontario municipality which provides the assessed value of all the properties in a municipality. It also prepares supplementary assessment lists, which municipalities use to add in-year tax revenue from new construction or major alterations to properties. 2. Existing Services and Service Levels MPAC is funded by municipalities. The funding formula is set in legislation and allocates MPAC's costs to upper-tier and single tier municipalities using a formula based on assessment value and the number of properties of each municipality as a per cent of the provincial totals. Each element in the allocation formula is assigned a 50 per cent value in order to strike a balance between the number of properties and the value of assessment in each municipality. 3. Key Initiatives in 2014 Not applicable. Section II. Issues and Trends Property taxation for 2014 will be based on January 1, 2012 assessment values. This is the second reassessment under the new rules announced by the Ontario government. Reassessments are now scheduled on a four year cycle. The January 1, 2012 assessment values will be used for the 2013-2016 taxation years. Additionally all reassessment increases are being phased-in (i.e. 25 per cent in each year) during this four year period. The phase-in program will be administered by MPAC who will adjust the annual assessment values of properties to affect the phase-in. The phase-in is designed to assist those taxpayers facing reassessment related tax increases by cushioning the impact over a four year period rather than the one year previously applied. All reassessment decreases will be implemented in the first year of the reassessment period. Peel’s portion of MPAC’s costs has increased by 3.5 per cent on average over the past five years. This trend is likely to continue due to MPAC internal cost pressures as well as the allocation formula which unfavourably impacts higher growth municipalities like Peel. Section III. 2014 Business Focus Funding of assessment services through MPAC is legislated. Municipalities do not have an option to pursue other service delivery alternatives.
1

Assessment Services – 2014 Budget Document
Section IV. 2014 Operating Budget 1. 2014 Departmental Operating Budget Overview
2014 Budget - Net Expenditures
(In $’000)
2013 Budget 2013
Projection (As at Aug. 31,
2013)
2014 Budget
Budget
Change % 2014 vs. 2013
Current Budget $17,222 $17,222 $17,602 2.2% Total $17,222 $17,222 $17,602 2.2% 2. 2014 Proposed Budget For 2014, it is estimated that Peel’s portion of MPAC costs is expected to increase by 2.2 per cent, which is a $0.4 million increase over the 2013 Budget (Appendix I). The total budget is $17.6 million, of which $17.5 million is the MPAC allocation based on the funding formula and $0.1 million is for internal charges for staffing resources dedicated to property tax and assessment policy issues. The following table summarizes the 2014 proposed budget changes.
2014 Budget - Net Expenditures 2014 Proposed Changes
(In $’000)
2013 Budget a. Base Changes
b. Service Demand
c. New Services
2014 Budget
Current Budget $17,222 $380 $17,602 Total $17,222 $ 380 $17,602 a. Base Budget Changes
Peel’s allocation of the MPAC 2014 budget costs is expected to increase by 2.2 per cent over 2013 levels or $0.4 million. This projection is based on historical trends for MPAC budget costs as well as the provincial allocation formula that penalizes high growth municipalities. b. Service Demand Not applicable. c. Budget for New Services No new services are introduced in 2014.
2

Assessment Services – 2014 Budget Document
Section V. 2014 Capital Budget - Not applicable. 1. 2014 Departmental Capital Plan Overview Not applicable. 2. Existing Capital Projects Not applicable. 3. 2014 Capital Budget and Operating Impact Not applicable. 4. 2014 – 2023 10-Year Capital Plan Not applicable. Section VI. Output/Outcome Measures - Not applicable. Section VII. Staffing- Not applicable Section VIII. Future Outlook Based on historical trends, the 2015, 2016 and 2017 increases are forecasted to be in the area of 1.2 per cent annually, as summarized below:
Net Expenditures
(In $’000) 2014 Budget Forecasted
in 2013 Budget
2014
Budget
2015
Forecast
2016
Forecast
2017
Forecast
Current Budget $18,262 $17,602 $17,815 $18,029 $18,246 Total $18,262 $17,602 $17,815 $18,029 $18,246# of FTEs 0 0 0 0 0 Section IX. Disclosure of 2014 Budget Risks & Key Program Assumptions It is expected that Peel’s share of MPAC costs will continue to grow due to inflation as well as the mandated allocation formula. Increases for 2015, 2016 and 2017 were projected at 1.2 per cent annually. MPAC has committed to overall base increases of 0.95% annually from 2014-2016. The Region will see higher increases due to growth rates in excess of provincial averages Section X: Useful links
Not applicable.
3

Assessment Services – 2014 Budget Document
THIS PAGE INTENTIONALLY LEFT BLANK
4

Assessment Services – 2014 Budget Document
Appendix 1 Assessment Services
2014 Operating Budget Pressures – Departmental Summary
Total Expenditures
Total Revenue Net Cost
2013 Revised Cost of Service $17,222 $17,222 2014 Proposed Budget Changes
a. Base Budget Changes Cost of Living – Provincial Cost Sharing Formula
380 380
Subtotal – Base Budget Changes 380 380
b. Service Demand
Subtotal – Service Demand
c. New Service(s)
Subtotal – New Services(s) Total 2014 Proposed Budget Changes 380 380 2014 Proposed Budget (2014 Recommended Cost of Service)
$17,602 $17,602
5
Assessment Services – 2014 Budget Document
THIS PAGE INTENTIONALLY LEFT BLANK
6

Utility Rate Supported Programs

THIS PAGE INTENTIONALLY LEFT BLANK

PUBLIC WORKS
Utility Rate Supported Programs
2014 Budget Document

THIS PAGE INTENTIONALLY LEFT BLANK

Public Works Utility Rate Supported Programs 2014 Budget Document
Table of Contents
Section I. Existing Services and Service Levels................................................................ 1
1. Who we are. ........................................................................................................................... 1
2. Existing Services and Service Levels..................................................................................... 1
3. Key Initiatives in 2013 ............................................................................................................ 3
Section II. Issues and Trends ................................................................................................. 4
Section III. 2014 Business Focus ......................................................................................... 10
Section IV. 2014 Operating Budget...................................................................................... 10
1. 2014 Departmental Operating Budget Overview.................................................................. 10
2. 2014 Operating Budget ........................................................................................................ 11
Section V. 2014 Capital Budget............................................................................................ 13
1. 2014 Departmental Capital Plan Overview .......................................................................... 13
2. Existing Capital Projects....................................................................................................... 14
3. 2014 Capital Budget and Operating Impact .........................................................................15
4. 2014 – 2023 10-Year Capital Plan .......................................................................................16
Section VI. Output/Outcome Measures ...............................................................................18
Section VII. Staffing................................................................................................................18
Section VIII. Future Outlook ..................................................................................................18
Section IX. Disclosure of 2014 Budget Risks and Key Program Assumptions...............19
Section X: Useful links...........................................................................................................19
Appendix I: 2014 Operating Budget Pressure - Deparmental Summary .…...………….. 21 Program Budget Summaries Water
Wastewater
Operations Support (Rate Supported)

THIS PAGE INTENTIONALLY LEFT BLANK

Public Works Utility Rate Supported Programs
Section I. Existing Services and Service Levels 1. Who we are The Utility Rate Supported Section of the Public Works department consists of the following divisions:
• Water and Wastewater Divisions • Utility Rate Supported portion of Operations Support Division: Meter and Billing
operations
Water & Wastewater Divisions Operations Support
Utility Rate Supported Programs
Water &
Wastewater Treatment
Water
Distribution &
Transmission
Wastewater Collection
Water &
Wastewater Planning
& Compliance
Water and
Wastewater Capital Works
SCADA
Meter & Billing
Operations
Water and Wastewater Divisions The Water and Wastewater Divisions deliver high quality drinking water and effluent treatment to ensure drinking water quality and to protect the environment while planning for growth and ensuring the Region’s infrastructure is sustainable. The Water and Wastewater divisions were merged in September 2012 in order to enhance efficiencies and leverage synergies between the two divisions. Meter and Billing operations under Operations Support Division The Operations Support division is an integral partner in the delivery of Public Works programs. The division provides high quality, cost effective complex secondary services to facilitate operations in the Public Works department as well as deliver services directly to the general public. There are an array of services provided by Operations Support including the water meter and water billing operations, fleet, facilities and supply management, information management, engineering technical services and public education programs. These services are funded by a combination of Tax and Utility rate supported Public Works programs. This document’s focus is on the utility rate supported services. 2. Existing Services and Service Levels Utility rate supported programs-Water and Wastewater a. Description of Services:
• Four lake based treatment plants, of which two are for water and two are for wastewater • One wastewater communal treatment plant • Twenty-eight water reservoirs/booster stations • Forty wastewater pumping stations; two of which are storm water and two of which are
waste management
1

Public Works Utility Rate Supported Programs
b. Key Facts: The historical and current water and wastewater treated volumes are illustrated as below:
Water treated flow (ML)
0
50,000
100,000
150,000
200,000
250,000
2004 2005 2006 2007 2008 2009 2010 2011 2012 2013(E)
Year
Flow
Wastewater treated flow (ML)
050,000
100,000150,000200,000250,000
2004 2005 2006 2007 2008 2009 2010 2011 2012 2013(E)
Year
Flow
Billing and Meter Operations- the utility portion of the Operations Support division a. Description of Services:
• Over 300,000 customer accounts b. Key Facts:
# Of meter installations
0
5,000
10,000
15,000
20,000
2005 2006 2007 2008 2009 2010 2011 2012 2013(E)
Year
# of
met
er
inst
alla
tion
2

Public Works Utility Rate Supported Programs
# Of Customers
0100,000200,000300,000400,000
2003 2004 2005 2006 2007 2008 2009 2010 2011 2012 2013(E)
Year
# of
cus
tom
ers
3. Key Initiatives in 2013
• Continued Term of Council Priorities (ToCPs): • #3 – Reduce per capita water consumption
o Water Efficiency Strategy Update • #4 – Improve Storm Water Management with all Stakeholders • #5 – Assess Water and Wastewater Capacity:
o Completing Water and Wastewater master plan updates. • #6 – Enhance Integrity of the Wastewater Collection Systems
o West Trunk Twinning construction underway o Focus on Inflow and Infiltration
• State of good repair program • Development Charge (DC) reviews • Utility Rate Structure Review • Source water protection policy development • Drinking Water Quality Management System and Standard of Care Program long term
strategy and program maintenance plan development • Risk Assessment studies of Transmission system, Distribution system and Groundwater
Well system initiated • Explored efficiency opportunities by reviewing of hours of work and overtime policies in
operation and maintenance of drinking water systems • Trunk Sanitary Sewer Condition Assessment • Implemented the shared service delivery model with internal and contracted services for
Closed Circuit Television (CCTV) pipeline inspections • Outsourced wastewater lab operations • Continued the Inflow and Infiltration Strategy and five-year work plan • Continued Wastewater Pump Station Condition Assessment Program • The Vcom system infrastructure calls for upgraded user gear • Aging Meter Change-Out Program for residential customers • Rolled out current Peel Asset Locator (PAL) application with new technology. • Ranked number one in Ontario by Ecojustice, in an ecosystem-based survey and analysis of
municipal sewage treatment and sewage discharges into the Great Lakes Basin • Seven water inspections (MOE)-with consistent high scores • Seven water audits (DWQMS)- with consistent high level of achievement
3

Public Works Utility Rate Supported Programs
Section II. Issues and Trends 1. Intensification vs. Green Field Development Much of the infrastructure planning in the Water and Wastewater programs is based on the urban planning goals of the local Municipality and Provincial population allotments under Places to Grow legislation. The current Master Servicing Plan and the ongoing Intensification Servicing Studies are addressing the increasing rate of intensification which is quickly becoming an emerging issue in Peel and other cities. Intensification comes with many benefits including more effective use of transit, jobs and tax revenue. However, adding new infrastructure into these areas comes with challenges and additional costs not typical to green field development. In attempts to minimize Peel’s financial exposure and to ensure Peel is not over building infrastructure in new green field areas, the divisions will proceed with the lower cost components of the infrastructure delivery such as EA’s and design for green field developments, but will delay construction until the planning approval of the green field areas is in place and more accurate timelines for occupation are know. This may also provide some opportunities in making projects ready for construction should another stimulus program become available. 2. Development Charge (DC) Capitals The Region has embarked on several key investments to deliver strategic infrastructure, namely, the expansion of water and wastewater treatment plants and systems, to accommodate growth to 2031.
Below illustrates geographically the major growth related projects being added to the 2014 capital plan for the period of 2014 to 2018. The detailed capital discussion and information can be referred to Section V and Appendix V.
4

Public Works Utility Rate Supported Programs
Water Major Growth Related projects from years 2014-2018 by 2014 Capital Plan
5

Public Works Utility Rate Supported Programs
Wastewater Major Growth Related projects from years 2014-2018 by 2014 Capital Plan
6

Public Works Utility Rate Supported Programs
3. Maintain State of Good Repair of aging infrastructure It is increasingly important to maintain state of good repair of aging infrastructure in order to operate at targeted levels of service, standard of care as well as in compliance with safe drinking water. The below is to illustrate the efforts made by the program to ensure that the infrastructure is kept in a state of good repair to mitigate services disruptions to the public.
Total KM of Watermain replaced
0
20
40
60
80
2009 2010 2011 2012 2013 (E) 2014(E)
Year
Leng
th
Total KM of Wastewater Mains replaced or relined
0.0
5.0
10.0
15.0
20.0
2009 2010 2011 2012 2013 (E) 2014(E)
Year
Leng
th
4. Climate change, inflow & infiltration and storm water management Climate change continues to generate more frequent localized storms of increased frequency and intensity. The impact of these storms on Regional waterways, municipal storm water management systems and in the form of inflow and infiltration in the Regional sanitary sewers will continue to put pressure on the performance of the sanitary sewer system during these types of events. The sanitary sewer is not designed to take storm water flows. However, during the intense storm events, the storm water collection system quickly hits capacity with the remaining storm water utilizing overland flow routes. This situation results in much of these extraneous flows entering the sanitary sewer system through manholes and cross connections as direct inflows as well as infiltration from saturate ground water entering the system through cracks in the piped network. The direct interconnection between storm water and sanitary sewer systems and the potential for basement flooding has created a renewed focus on storm water management. The divisions are currently actively developing stakeholder partnerships to identify common areas of concern and resolve issues by looking at the problem from an entire
7

Public Works Utility Rate Supported Programs
watershed basis versus by jurisdiction, and clarify accountabilities and goals and objectives for all stakeholders. Further discussion will need to be considered for all high risk areas across Peel about expanding existing partnerships related to the Basement Flooding Remediation program and related subsidy initiatives to help residents protect themselves from future flooding and removal of extraneous flows from the sanitary system. 5. Corrosion impact Corrosion continues to be a threat to the Region’s infrastructure by impacting the structural integrity of the transmission and collection system resulting in premature infrastructure degradation and/or failure, potentially reducing service life by as much as 50 per cent. Staff initiated infrastructure inspection programs, which assists in identifying areas where corrosion is likely and where there is potential for asset deterioration to arise. Staff also implemented infrastructure remediation and operational programs to address the issues. Significant amounts of funding have been set up in the capital plan to finance those activities. Staff have increased CCTV inspections of Regional infrastructure so that the program can do the remediation in time. A second CCTV truck is being purchased to enhance the program. 6. New and Pending Legislation The Utility rate supported programs are required to comply with a series of regulations and standards that mandate the municipality to take active commitment to continuous review and improvement of the operation, management, technical and financial sustainability. Peel has been actively involved in the industry to minimize the impact of new and pending legislation while positioning itself to do the right thing to protect drinking water supplies and the environment. Much of the new legislation is about transferring risk away from the Province to those that are directly delivering the programs. There needs to be a balance from all levels of Government to ensure that tax payers get value in the services that are delivered. Some new legislation on the horizon is:
• Source Water Protection under the Clean Water Act 2006 • Great Lakes Protection Act • Wastewater Quality Management System – Ministry of Environment (MOE) • Bill 72 Water Opportunities Act • Bill 175 Sustainable Water and Sewer Act • ON 1 call act • Amendments to Drinking Water Quality Management Standard • MOE is currently collecting feedback regarding the current drinking water legislation; it is
anticipated that Regulation 170 under SDWA and other supplementary regulations may be open for review and amendments – considering the uncertainty of timing, this may be done in a more distant future
7. Risk Management There is increasing trend toward managing risk, not only to infrastructure assets, but to human resources, project management, financial management and sustainability, and key services and functions. Risk management is not only an increasing trend within programs at Peel but within the industry as a whole. Risk management is fostering the need to develop more appropriate longer term strategies to look further into the future in many areas of the program such as master planning, state of good repair, operations and maintenance and external forces, such as energy cost fluctuation, climate change, and intensification. Over the following two years, the division will identify infrastructure that is at risk of impacting service levels and manage those risks accordingly. Six Risk Assessment and Infrastructure Strategies are being undertaken:
8

Public Works Utility Rate Supported Programs
• Risk Assessment for Linear Transmission System • Water Distribution System and Wastewater Collection System Long Term State of Good
Repair Strategy • Ground Water Well Long Term State of Good Repair Strategy • New Development Water Distribution System and Wastewater Collection System Long
Term Servicing Strategy • Water and Wastewater Model Management Program and Water Quality Model
Development • Inflow and Infiltration Strategy
8. Continued Decline in customer consumption One of the Term of Council Priorities is to reduce water consumption per capita. By implementing a water efficiency plan managing inside use such as toilet replacement program and humidifier rebate, the division is able to achieve significant results. Driven by the change in the council direction, in the coming years the program’s key focus will be on the outside use such as summer water use. As utility programs are fixed-cost intensive by nature, the declining consumption has a negative impact on the programs’ financial position. Below illustrates both the residential and industrial/commercial/institutional (ICI) downward consumption trends which are driven by weather, economic factors, and water efficiency program
ICI Consumption Per Customer (ML)
00.5
11.5
22.5
33.5
44.5
5
2001 2002 2003 2004 2005 2006 2007 2008 2009 2010 2011 2012 2013*
Residential Consumption Per Customer (ML)
0
0.1
0.2
0.3
0.4
0.5
0.6
2001 2002 2003 2004 2005 2006 2007 2008 2009 2010 2011 2012 2013*
9
Public Works Utility Rate Supported Programs
9. Electricity Over the past several years, the energy markets have impacted the budget both positively and negatively, making it extremely hard to forecast potential budget implications. This trend is not expected to change. Continued instability in electricity pricing continues to impact operational and construction costs. Section III. 2014 Business Focus The utility rate supported programs will continue to work on the Term of Council Priorities and ensure timely deliverables on key milestones. Term of Council Priorities
• Term of Council Priority #3 – Reduce per capita water consumption: • Re-align Water Smart Peel programs with the newly updated water efficiency strategy • Replacement of the water billing application
• Term of Council Priority #4 – Improve Storm water Management: • Term of Council Priority #5 – Assess Water and Wastewater Capacity:
• Completed Water and Wastewater Master Plan and continue to review the planning beyond master plan horizon
• On going intensification servicing studies • Treatment plant expansions and commissioning
• Term of Council Priority #6 – Enhance Integrity of the Wastewater Collection Systems: • West Trunk Twinning • Beechwood Pump Station • the Ten-Year Inflow and Infiltration Work Plan
Other Business Focus: • State of Good Repair for water and wastewater systems • Condition assessment on the existing water and wastewater assets • Municipal coordination between area municipalities and Peel on high level issues such as
storm water management, capital works, etc. • Wolfedale Yard redevelopment • Water Billing Replacement Project and coordination between Region of Peel and City of
Mississauga for storm water billings Section IV. 2014 Operating Budget 1. 2014 Departmental Operating Budget Overview The utility rate supported programs’ 2014 operating budget totals $288.4 million in Net Expenditures (Peel required billings); an overall change of $22.3 million, and an 8.4 per cent increase from the 2013 budget.
10

Public Works Utility Rate Supported Programs
(In $’000)
2013
Budget
2013 Projection (As at Aug,
2013)
2014
Budget
Budget Change %2014 vs.
2013 Water – Net expenditure before Peel and external recoveries $172,246 $171,980 $190,756 10.7%Water – Peel required billings $157,710 $154,710 $174,568 10.7%Wastewater – Net expenditure before Peel and external recoveries $121,222 $114,888 $126,352 4.2%Wastewater – Peel required billings $108,364 $106,064 $113,816 5.0%Utility – Net expenditure before Peel and external recoveries $293,468 $286,868 $317,108 8.1%Utility – Peel required billings $266,074 $260,774 $288,384 8.4%
The following graphs illustrate the net expenditures before Peel required billings and external recoveries by type and funding sources:
Net Expenditures By Type Utility Rate Supported Programs (In $'000)
Other, $14,897, 5%
Conservation Authority,
$16,028, 5%
Labor Costs, $30,721, 10%
Corporate Overhead,
$12,934, 4%
Goods & Services,
$97,214, 31%
Contribution to Reserves, $145,314, 45%
Funding Source By Type Utility Rate Supported Programs (In $'000)
Regional Rate,
$288,384, 91%
External Recovery,
$28,724, 9%
2. 2014 Operating Budget This section provides detailed explanations of the 2014 budget changes. It highlights the major drivers of the changes to maintain existing service level delivery, to support existing service level change or to introduce new services to meet service demand and community needs. The Utility Rate Supported programs’ budget includes expenditures from Water, Wastewater and a portion of Operations Support. The expenditures of the Meter and Billings Operations of the Operations Support division are fully recovered from the utility rate supported programs, while the remainder of the Operations Support programs are recovered from both the tax rate supported and the utility rate supported programs, at a split of 30 per cent versus 70 per cent, respectively. As a result, 100 per cent of the costs associated with Meter and Billing Operations have been reflected in the Water and Wastewater budgets. For details on Operations Support’s Net Expenditures, please refer to the Public Works Tax Rate Supported Programs’ budget document.
11

Public Works Utility Rate Supported Programs
The 2014 Utility Rate Supported Public Works Budget (Peel required billings) has increased by $22.3 million or 8.4 per cent over the 2013 budget, predominately due to capital needs for state of good repair which accounts for $18.3 million of the total increase. The following table summarizes the Utility Rate Supported Programs’ 2014 budget changes.
2014 Budget – Net Expenditures (Peel required billings)
(In $’000)
2013 Budget
2014 Changes 2014 Budget
a. Base Changes
b. Service Demand
c. New Services
Water $157,710 $5,520 $11,339 $0 $174,568Wastewater $108,364 -$1,792 $7,244 $0 $113,816Total Utility $266,074 $3,728 $18,583 $0 $288,384 a. Base Budget Changes I) Inflation An increase of $1.2 million in operating costs such as material & supplies and goods & services is in the 2014 budget, which represents 0.4 per cent of the 2013 program base budget, mostly driven by inflation offset by the cost adjustments.
II) Economic Factors The Regional Energy Services anticipate an electricity unit price increase by 10% compared to 2013 effective budget rate, which aligns with the actual year to date rate. As a result, $2.6 million electricity cost increase is built in 2014 budget, which represents 1.0 per cent of the 2013 program base budget. As energy costs are a large component of the water and wastewater programs’ operating expenditures, the volatility of commodity price continues to be a primary base budget pressure on water and wastewater operations.
III) Other pressures – OCWA contract increase In conjunction with the new ten-year OCWA contract, an increase of $2.7 million has been built into the 2014 budget. The annual amounts for the period of 2010-2020 were built in the new contract and will be revisited on a yearly basis prior to annual budget development in order to capture any operational adjustments and capital impacts. IV) Cost Mitigation through Efficiencies and Recoveries
• External Recovery from Region of York, City of Toronto and Qualitative Sewer Surcharges for industrial Users:
Besides providing water and wastewater services to Peel citizens and businesses, the water and wastewater divisions are also providing services to York Region (both water and wastewater services) and to the City of Toronto (Wastewater services). A total operating recovery increase of $0.5 million, mostly from the qualitative sewer surcharges to industrial users, is forecasted in the 2014 budget. Even though Peel continues to implement a “not for profit” approach, maximizing the capacity usage definitely helps ease the burden on Peel utility rates, given that most of the costs within the treatment plants are fixed. The programs are working with York Region to develop strategies to mitigate the risk associated with volume fluctuations.
12

Public Works Utility Rate Supported Programs
• Wastewater lab operation outsourcing: The program is actively looking for the operating efficiency and improving the services at the same time. The Peel management decided to close the internal wastewater lab operations and outsource the activities to external consultant, resulting in a net laboratory operating budget reduction of $1.8 million in 2014 and a total savings over the five year term of $10.5 million, including the reinvestment of 4 FTEs within the program. • Chemical and gas cost reductions:
The 2014 chemical and gas budget has been reduced by $0.9 million due to continued process improvements at the treatment facilities.
b. Service Demand Service demand increase built into the Utility Rate Supported Public Works 2014 Budget includes:
I) Contributions to Peel stabilization reserves An amount of $18.3 million, equivalent to a seven per cent rate increase, has been built into the 2014 budget to address the diminishing utility stabilization reserves and capital needs for the state of good repair program. Reserve sustainability has been a major concern in the utility program operations. Maintaining a healthy reserve balance is the best way to ease the current financing burden, maintain a good credit rating and meet the drinking water licensing requirements and wastewater system sustainability act. Over the course of the capital budget development, the programs have made great efforts to review and prioritize the capital needs in order to come up with a responsible and financially affordable capital plan.
II) ON 1 call act As suggested by legislated requirements of the ON1call - infrastructure notification system, the Region is required to provide the service locates within 5 business days, which poses challenges on the current operations as well as significant financial burdens. While seeking further guidance from the regulatory body, the program increases the 2014 budget by $0.8 million considering a service level of 10 business days. If 5 business days is mandated, the operating cost will have to be increased significantly. c. Budget for New Services There are no new services introduced into the Utility Rate Supported Public Works 2014 Budget. Section V. 2014 Capital Budget 1. 2014 Departmental Capital Plan Overview The following table/graphs summarize the Utility Rate Supported 2014 capital budget:
13

Public Works Utility Rate Supported Programs
Classification of Capital Plan
Carry – Forward from Prior Years
(In $’000)
2014 Capital Budget
(In $’000)
Total Capital In 2014
(In $’000) DC Growth $925,681 $271,906 $1,197,587Externally Funded $278,436 $6,082 $284,518Non-DC Internal $432,913 $200,947 $633,860Total Expenditures $1,637,030 $478,935 $2,115,965
2014 Cash Flow $351,000 $99,000 $450,000# of Projects 726 72 798
2014 Utility Rate Supported Capital BudgetBy Program (In $'000)
2014 Utility Rate Supported Capital Budgetby Funding source (In $'000)
DC Grow th, $271,906,
57%
Externally Funded,
$6,082, 1%
Non-DC Internal,
$200,947, 42%
Wa
ter, $295,311,
62%
Wastew ater, $172,289,
36%
Operations Support,
$11,335, 2%
2. Existing Capital Projects As of August 31, 2013, there were 726 active capital projects in the Utility Rate Supported Public Works programs with a gross remaining budget of 1,890.6 million.
The key existing capital projects are listed as follows: Lakeview Water Treatment Plant expansion 07-1936 The project is progressing well. The treatment Plant and high lift Pump Station are scheduled to be in service by Spring 2014. Hanlan Transmission Main 10-1205 Design is completed on Contract 1 and Contract 2. Design of Contract 4-Interconnection Chamber is on-going. Contract 1 tender was closed Sept 25th 2013 and award is expected in mid October. Contract 2 was out to tender and was closed October 9, 2013. This project is tied to 10-1121 and contract 3 design for project 10-1121 is 100% complete and was tendered on Oct 9, 2013. Construction is expected to begin in early 2014. Contract 5 Design will begin late 2013 and will be tendered following completion of contracts 1, 2 & 3 as a commissioning contract.
14

Public Works Utility Rate Supported Programs
Mississauga City Centre Feeder 10-1121 Small sub-project was tendered as part of a City of Mississauga Project. Remainder of Project went to Tender on Oct 9, 2013 and expected to close the end of November 2013. Work (other than indirect and consulting costs) is not expected to begin before 2014. Mississauga Replacement Program 13-1345 and 12-1345 Some replacement activities were deferred mainly due to the delayed in the Hanlan Feedermain and council direction. A significant amount of watermain were replaced. Clarkson Wastewater Treatment Plant Expansion 08-2915 The biosolids contract for this project is substantially complete and in the warranty period. The detail design completion for the Co-Gen contract is delayed until late 2013 due to approving agencies (Ontario Power Authority). The tendering for the Co-Gen is anticipated in late 2013/ early 2014 with completion in T3 of 2014. The Turbine project is under construction with anticipated commissioning in T1 of 2014.The Liquids Contract C2-3 is being reviewed for partial substantial completion as of August 30, 2013 West Trunk Sewer Twinning 08-2225 Contract 1 was awarded to McNally Construction Inc in May 2013. The design for contract 2 is underway and the anticipated tender date is Dec 2013. The contractor for contract 2 will be pre- qualified. New Pumping Station Port Credit 06-2935 The project is joint with 06-2405 & 09-2406S. The Regional Council approved expropriation of a part of 501 Lakeshore Road in June 2013. The Region is also actively engaged with Trinity Kingsett-Rio Can Group for relocating the SPS to a mid-block site. 3. 2014 Capital Budget and Operating Impact a. 2014 Capital Budget The 2014 Capital Budget for the Utility Rate Supported Programs is $478.9 million; a $28.8 million dollar increase over the 2014 projected capital budget which was approved in principle through the 2013 Budget submission. A full list of 2014 capital budget projects can be found in each respective program summaries. Council has indicated that maintaining state-of-good-repair (SOGR) should not result in long-term debt for the Region of Peel. In order to maintain the state-of-good-repair for the existing water and wastewater infrastructure, a seven per cent rate increase has been identified for 2014 to build up sufficient capital replacement reserves to avoid debt. The levels of contributions to the replacement reserves to ensure long-term financial sustainability will continue to be studied by staff as Peel’s Corporate Asset Management (CAM) Strategy matures, the impacts of new and more efficient technology and materials can be assessed and changing construction methods are considered (e.g. more tunnelling in urban areas, relining and spot repairs of pipes rather than full replacements). Overall, the ten-year water capital plan aligns with the asset management strategy. As indicated in the CAM stewardship report, the majority of the utility programs’ assets are in an excellent or good state of repair due to proactive asset management practices. Those asset classes are within the target risk ranges and are currently meeting the desired Levels of Service requirements.
15
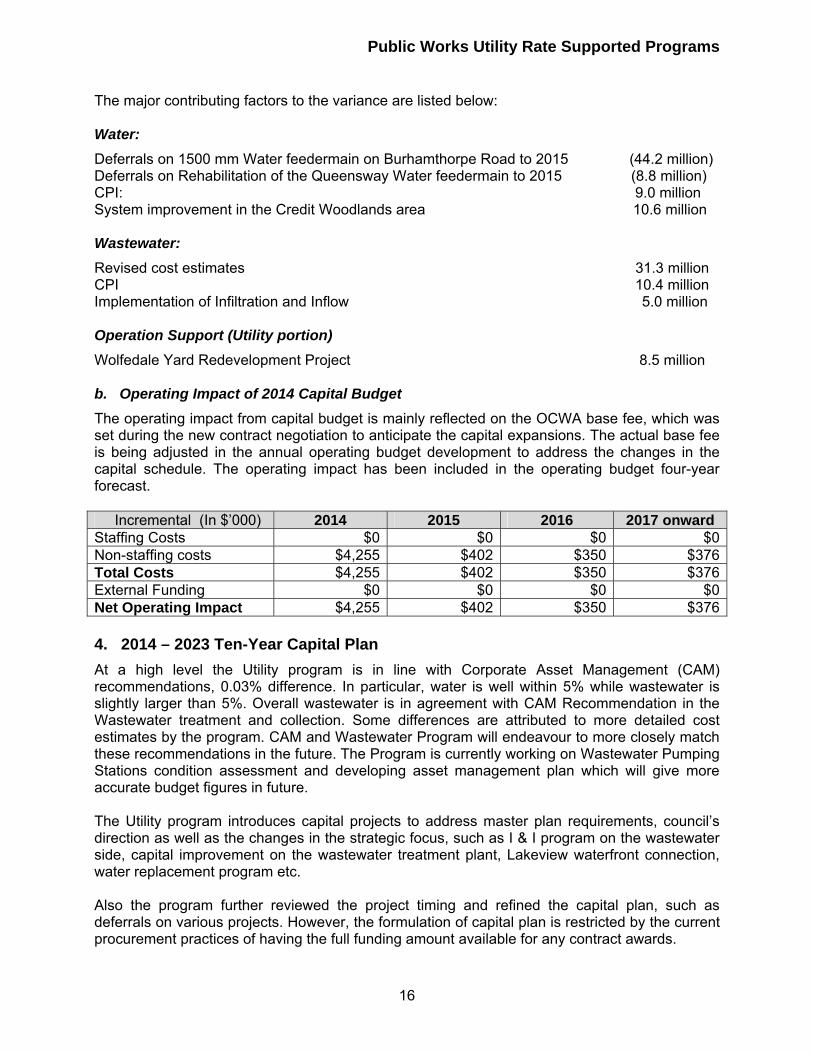
Public Works Utility Rate Supported Programs
The major contributing factors to the variance are listed below: Water: Deferrals on 1500 mm Water feedermain on Burhamthorpe Road to 2015 (44.2 million) Deferrals on Rehabilitation of the Queensway Water feedermain to 2015 (8.8 million) CPI: 9.0 million System improvement in the Credit Woodlands area 10.6 million Wastewater: Revised cost estimates 31.3 million CPI 10.4 million Implementation of Infiltration and Inflow 5.0 million Operation Support (Utility portion) Wolfedale Yard Redevelopment Project 8.5 million b. Operating Impact of 2014 Capital Budget The operating impact from capital budget is mainly reflected on the OCWA base fee, which was set during the new contract negotiation to anticipate the capital expansions. The actual base fee is being adjusted in the annual operating budget development to address the changes in the capital schedule. The operating impact has been included in the operating budget four-year forecast. Incremental (In $’000) 2014 2015 2016 2017 onward Staffing Costs $0 $0 $0 $0Non-staffing costs $4,255 $402 $350 $376Total Costs $4,255 $402 $350 $376External Funding $0 $0 $0 $0Net Operating Impact $4,255 $402 $350 $376 4. 2014 – 2023 Ten-Year Capital Plan At a high level the Utility program is in line with Corporate Asset Management (CAM) recommendations, 0.03% difference. In particular, water is well within 5% while wastewater is slightly larger than 5%. Overall wastewater is in agreement with CAM Recommendation in the Wastewater treatment and collection. Some differences are attributed to more detailed cost estimates by the program. CAM and Wastewater Program will endeavour to more closely match these recommendations in the future. The Program is currently working on Wastewater Pumping Stations condition assessment and developing asset management plan which will give more accurate budget figures in future. The Utility program introduces capital projects to address master plan requirements, council’s direction as well as the changes in the strategic focus, such as I & I program on the wastewater side, capital improvement on the wastewater treatment plant, Lakeview waterfront connection, water replacement program etc. Also the program further reviewed the project timing and refined the capital plan, such as deferrals on various projects. However, the formulation of capital plan is restricted by the current procurement practices of having the full funding amount available for any contract awards.
16

Public Works Utility Rate Supported Programs
The following graphs illustrate the ten-year capital plan by classification and by program. 10 Year Utility Rate Supported Capital
Budgetby Funding Source (In $'000)
DC Grow th, $1,241,589,
46%
Externally Funded, $34,440,
1%
Non-DC Internal,
$1,397,837, 53%
10 Year Utility Rate Supported Capital Budget
By Program (In $'000)
Water, $1,650,654,
61%
Wastew ater, $979,635,
37%
Operations Support, $43,577,
2%
The 2014 ten-year capital plan for the Utility Rate Supported Programs is $2,673.9 million; a $408.9 million dollar decrease compared to the 2013 ten-year capital plan. A full list of 2014 capital budget projects can be found in the respective program summaries.
The major contributing factors to the variance are listed below:
Water: CPI 43.0 million New sub-transmission main on Mayfield Road 28.3 million Advance Beckett Sproule Pumping Station Surge Suppression 16.0 million Revised budget estimate 70.9 million Deferrals on Various projects: West Caledon ET, William Parkway STM phase 3 etc. (80.8 million) Deferrals on Replacement Program (33.5 million) Difference between 1st year in 2013 plan and last year in 2014 plan (497.6 million) - Significant funding associated with Hanlan Feedermain, Mississauga City Center, Replacement Program were put forward in 2013
Wastewater: Implementation of Inflow and Infiltration 45.0 million Capital improvement in treatment plants 44.2 million CPI 19.5 million Revised budget estimates 46.7 million Deferrals on Construction timing of several development-related sewers (9.0 million) Elimination of the planned Alton Village Wastewater servicing (20.0 million) Difference between 1st year in 2013 plan and last year in 2014 plan (74.4 million)
Operation Support (Utility portion) Wolfedale Yard Redevelopment Project 8.5 million
17

Public Works Utility Rate Supported Programs
Section VI. Output/Outcome Measures The measures introduced in the 2013 budget will continue to guide the Utility programs’ performance measures through the year 2014. The Operations Support division recently completed a division-wide Business Performance Management Review pilot project. This pilot is being leveraged at a departmental level to ensure the Public Works as a whole is managing performance in a concise manner, at a strategic and operational level. The outcome/output measure will be adjusted accordingly once the program performance measure is developed and implemented. Detailed program outcome/output measures can be found in respective program summary. Section VII. Staffing The 2013 base line has been adjusted downward by 18 FTEs to reflect the closure of the lab and the restructuring of the program planning area. In addition, one FTE in storm water management was moved in 2013 to Transportation program within the same department as a result of restructuring.
2013 Revised
FTEs *
Changes in
2014
2014 Budget
Total
Change %
2014 vs. 2013 Water 184.00 0.00 184.00 0.00%Wastewater 122.00 0.00 122.00 0.00%Total 306.00 0.00 306.00 0.00%* Includes 2013 in-year approvals/changes Section VIII. Future Outlook The summary table of the Utility Rate Supported Public Works Programs Operating budget Four-Year Forecast is shown below.
Net Expenditures (Peel required billings)
(In $’000) 2014 Budget Forecasted
in 2013 Budget
2014
Budget
2015
Forecast
2016
Forecast
2017
Forecast
Water $170,993 $174,568 $188,768 $197,105 $205,228Wastewater $118,068 $113,816 $121,943 $127,696 $133,564Total $289,061 288,384 $310,711 $324,801 $338,792# of FTEs 327.00 306.00 309.00 312.00 315.00 Going forward, increases in the water and wastewater capital stabilization reserve will continue to impact the programs’ operating cost in 2015 and onwards in order to sustain the capital spending needs in the future. The amount of contribution increase equivalent to six per cent rate increase is factored in the period of 2014 and 2015. An amount equivalent to three per cent is applied to 2016 and 2017 forecasting. However, the actual contribution amount might vary as the Corporate Asset Management (CAM) strategy matures. In conjunction with the new OCWA agreement, the related operating costs will be increased by $1.0-$1.5 million on a yearly basis, mainly resulting from additional operating impact from the new facilities (treatment plant expansion, etc.) if they are completed as planned.
18

Public Works Utility Rate Supported Programs
One of the key cost drivers in the utility programs is electricity, which makes up over ten per cent of the program costs. The price volatility has been spotted in the market in the recent years, which in turn poses a huge challenge in the estimate on the cost of services. A 5% unit price increase is factored in the outlook of 2015-2017. In order to reduce electricity consumption, the water and wastewater divisions have been actively working on the energy optimization initiatives, which will be implemented within the coming years. Inflationary pressures will continue to impact the operations and maintenance budgets. Overall, the utility rate supported programs are facing an average combined increase of 6.0 per cent on an annual basis for the period of 2014-2017. The increase is subject to key assumptions such as the water and wastewater capital stabilization reserve contribution, commodity price, Peel water consumption, and operating planning in the water and wastewater divisions. Section IX. Disclosure of 2014 Budget Risks and Key Program Assumptions The significant risks within the Utility Programs Capital and Operating Budgets are as follows:
• Water and Wastewater flow: The 2014 budgeted flow is based on the current observation and historical trending analysis. The flow is subject to a variety of factors such as weather patterns, consumer behavior, macro-economic environments, etc. The annual budgeted flow intends to capture the dynamics as closely as possible. The actual flows could still show a deviation from the 2014 budget.
• Service locate activities: as suggested by legislated requirements of the on1call -
infrastructure notification system, the Region is required to provide the service locates within 5 business days, which poses huge challenges on the current operations as well as financial burdens. While seeking further guidance from the regulatory body, the program increases the 2014 budget by considering a service level of 10 business days. If 5 business days is mandated, the operating cost will have to be increased significantly.
• Electricity is a critical cost driver for delivering the programs. The risks associated with
electricity volatility may still exist, which will pose huge challenges on rate setting and fee collections.
• The program is making tremendous efforts to develop a responsible capital plan that
currently addresses the state of good repair at a service level of seven watermain breaks. Also an annual increase in the SOGR reserve is being applied in the budget to narrow the gap between the funding needs and affordability. However, condition assessments are currently being conducted on the existing assets, which could identify a larger funding gap and consequently a larger replacement program.
Section X: Useful links Internal web page address http://pathways.peelregion.ca/dept/publicworks/ External web page address http://www.peelregion.ca/pw/
19

THIS PAGE INTENTIONALLY LEFT BLANK
20

Public Works Utility Rate Supported Programs
APPENDIX I Utility Rate Supported Programs
2014 Operating Budget Pressures ($’000)
Total Expenditures
Total Revenue Net Cost (Peel required
billings)
2013 Revised Cost of Service 371,953 (105,880) 266,073
2014 Budget Changes a. Base Budget Changes
Annualization – N/A Inflation: Cost Adjustments 1,151 1,151Economic factors: Hydro 2,634 2,634Efficiencies/Reduction Chemicals (484) (484) Gas (449) (449) Lab services outsourcing (1,800) (1,800)Other Pressures – OCWA Contract 2,676 2,676
Subtotal – Base Budget Changes 3,728 3,728 b. Service Demand Regulation (ON 1 call act) 800 800Increase in Contribution to Water and Wastewater Capital Stabilization Reserves
18,267 18,267
Subsidy/recovery-User fee 49 49Increase in Quality Sewage charge (433) (433)Increase in Toronto Sewage (100) (100)Other offsetting items(DC charge, York billings)
17,919 (17,919) 0
Subtotal – Service Demand 36,986 (18,403) 18,583 c. New services – N/A 0 0
2014 Cost of Service 412,667 (124,283) 288,384
21

THIS PAGE INTENTIONALLY LEFT BLANK
WATER
PROGRAM BUDGET SUMMARY
Summary I: 2014 Operating Budget Pressures
Summary II: Operating Budget Four-Year Program Forecast
Summary III: 2014 New Capital
Summary IV: Ten Year Capital Plan
Summary V: Output and Outcome Measures

THIS PAGE INTENTIONALLY LEFT BLANK

SUMMARY IWATER
2014 OPERATING BUDGET PRESSURES ($'000)
Total Expenditures
Total Revenue Net Cost
2013 Revised Cost of Service 210,346 User fee and DC (38,101) (38,101) York Billings (Operating + Capital) (14,536) (14,536)
2013 Peel Required Billings 157,709
Annualization - N/A
Inflation 1 Cost Adjustments 920 - 920 Subtotal 920 - 920
Economic Factors1 Hydro 2,500 - 2,500 2 Chemcials 200 - 200 Subtotal 2,700 - 2,700
Efficiencies/Reductions
Subtotal - - -
Other pressure1 OCWA Contract Increase as per Agreement 1,900 - 1,900 Subtotal 1,900 - 1,900
2014 Base Budget Changes 5,520 - 5,520 Service Demand - N/AGrowth - - - Regulation (ON 1 call act) 500 - 500 Subsidy/Recovery Change-User fee (13) (13) Other Pressures:Increase in Contribution to Capital Stabilization Reserve R0241 10,852 - 10,852 Increase in Debt charges 17,839 - 17,839 Increase in Contributions from Developer's Reserves (17,839) (17,839)
461 461 (461) (461)
1,191 Increase in York Operating component billings (1,191) - 2014 Service Demand 30,843 (19,504) 11,339 2014 New Services - N/A2014 New Services - - -
2014 Recommended Cost of Service (Net Cost before Billings) 246,709 (72,141) 174,568
Increase in Contribution to York-Peel Reserve R0271 Increase in York capital component billingsIncrease in York operating cost
1

SUMMARY IIWATER PROGRAM
OPERATING BUDGET FOUR-YEAR PROGRAM FORECAST
In $'0002014 Budget Forecasted in 2013 Budget
2014 Budget 2015 Forecast 2016 Forecast 2017 Forecast
Net Expenditures before Peel billings and external recoveries
187,074 190,756 206,040 215,990 226,811
External Recoveries (16,081) (16,188) (17,272) (18,885) (21,583)Net Expenditures (Peel required billings) 170,993 174,568 188,768 197,105 205,228
# of FTEs 188.00 184.00 186.00 188.00 190.00
Key Forecast Assumptions:
Program Assumptions:2014 2015 2016 2017
OCWA Contract per cost schedule $16,514,145 $17,236,967 $17,874,643 $18,468,001York Water (Provided by York Region) in ML 34,310 34,675 35,405 36,135 Peel Treated Water (Increase by 1%) in ML 182,000 183,820 185,658 187,515
Corporate Assumptions: Water Stabilization Reserve Contribution Annual increase by 7% for 2014, 6% for 2015 and 3% for 2016 and 2017
Electricity per KWH $0.1200 $0.1250 $0.1300 $0.1350Labour Costs Annual Increase by 2%Internal Allocations Annual Increase by 3%Other Costs Annual Increase by 2%
2

2014 NEW CAPITAL DETAIL
WATER
SUMMARY III
2014 Financing Sources and Funding Status ($'000)
Project #Expense
FundingTotal
Project Name
Approved or Pending
External Internal DCA
2014 Funding Status:
2014(A/P)
Ward
GeneralA 14-1000 UNALLOCATED FUNDS PEEL 0 1,000 0 1,000
A 14-1003 UNDER MAINTENANCE PROJECT COSTS PEEL 0 900 600 1,500
Water Treatment Plants, Reservoirs and Pumping StationsA 09-1937 LAKEVIEW WATER TREATMENT PLANT
EXPANSION - STANDBY POWERM1 1,984 0 8,916 10,900
A 10-1960 ALLOA RESERVOIR AND PUMPING STATION C2 0 0 55,723 55,723
A 12-1921 LAKEVIEW MAJOR CAPITAL IMPROVEMENT - SEDIMENTATION
M1 0 10,899 0 10,899
A 13-1923 LAKEVIEW MAJOR CAPITAL IMPROVEMENT - FILTRATION AND UV DISINFECTION
M1 0 14,121 0 14,121
A 13-1924 LAKEVIEW MAJOR CAPITAL IMPROVEMENT - INTAKE
M1 0 2,016 0 2,016
A 13-1934 LORNE PARK MAJOR CAPITAL IMPROVEMENT - FILTRATION
M2 0 273 0 273
A 13-1963 NORTH STREETSVILLE ELEVATED TANK HYDRAULIC IMPROVEMENTS
M11 0 1,500 0 1,500
A 14-1903 TRANSMISSION FACILITIES - MAJOR MAINTENANCE
PEEL 0 2,000 0 2,000
3

2014 NEW CAPITAL DETAIL
WATER
SUMMARY III
2014 Financing Sources and Funding Status ($'000)
Project #Expense
FundingTotal
Project Name
Approved or Pending
External Internal DCA
2014 Funding Status:
2014(A/P)
Ward
A 14-1904 TRANSMISSION FACILITIES - EQUIPMENT REPLACEMENT
PEEL 0 2,750 0 2,750
A 14-1906 TREATMENT FACILITIES - MAJOR MAINTENANCE
M1,M2 0 2,100 0 2,100
A 14-1907 TREATMENT FACILITIES - EQUIPMENT REPLACEMENT
M1,M2 0 1,600 0 1,600
A 14-1908 TREATMENT PROCESS OPTIMIZATION PROJECTS
M1,M2 0 250 0 250
A 14-1917 SECURITY SYSTEM IMPROVEMENTS AND UPGRADES
PEEL 0 250 0 250
A 14-1955 RESERVOIR OPTIMIZATION PROGRAM PEEL 0 1,000 0 1,000
A 14-1961 REHABILITATION OF THE BOLTON ELEVATED TANK
C5 0 413 0 413
Transmission System - DevelopmentA 10-1210 VICTORIA TRANSMISSION MAIN C2 0 0 29,765 29,765
A 12-1269 MAYFIELD ROAD SUB-TRANSMISSION MAIN (PHASE 1)
B2,C2 0 0 1,000 1,000
A 14-1201 PROPERTY ACQUISITION FOR LAKE-BASED TRANSMISSION MAINS
B1,B3,B7,B8 0 0 3,000 3,000
A 14-1240 EAST BRAMPTON TRANSMISSION MAIN TWINNING
B3,B7,B8 0 0 11,250 11,250
4

2014 NEW CAPITAL DETAIL
WATER
SUMMARY III
2014 Financing Sources and Funding Status ($'000)
Project #Expense
FundingTotal
Project Name
Approved or Pending
External Internal DCA
2014 Funding Status:
2014(A/P)
Ward
A 14-1256 WILLIAMS PARKWAY SUB-TRANSMISSION MAIN (PHASES 1 AND 2)
B1,B5,B7 0 938 5,314 6,252
A 14-1257 CENTRAL BRAMPTON SUB-TRANSMISSION MAIN
B1,B7 0 1,413 8,010 9,423
Transmission System - Improvements and UpgradesA 13-1406 FLOW AND PRESSURE MONITORING FOR THE
LAKE-BASED WATER SUPPLY SYSTEMPEEL 0 5,000 0 5,000
A 14-1405 INSPECTION AND CONDITION ASSESSMENT OF THE LAKE-BASED TRANSMISSION MAINS
PEEL 0 750 0 750
A 14-1421 1500MM STREETSVILLE TRANSMISSION MAIN - REHABILITATION
M2,M8,M9 0 128 0 128
Feedermain Distribution System - DevelopmentA 09-1140 400MM FEEDERMAIN - THE GORE ROAD B10 0 0 1,000 1,000
A 10-1115 750MM FEEDERMAIN - COUNTRYSIDE DRIVE B10 0 0 1,500 1,500
A 10-1156 400MM FEEDERMAIN - TORBRAM ROAD B9,B10 0 0 2,470 2,470
A 12-1148 400MM FEEDERMAIN - WANLESS DRIVE B6 0 0 1,260 1,260
A 13-1117 600MM FEEDERMAIN - ERIN MILLS PARKWAY AND EGLINTON AVENUE WEST
M8,M9 0 0 4,838 4,838
5

2014 NEW CAPITAL DETAIL
WATER
SUMMARY III
2014 Financing Sources and Funding Status ($'000)
Project #Expense
FundingTotal
Project Name
Approved or Pending
External Internal DCA
2014 Funding Status:
2014(A/P)
Ward
A 13-1118 400MM FEEDERMAIN - EGLINTON AVENUE WEST
M8,M9 0 0 1,983 1,983
A 13-1134 600MM FEEDERMAIN - MAYFIELD ROAD B6,C2 0 0 2,354 2,354
A 13-1152 400MM FEEDERMAIN - CHINGUACOUSY ROAD B6 0 0 1,899 1,899
A 13-1191 400MM FEEDERMAIN - AIRPORT ROAD (CALEDON EAST)
C3 0 0 5,116 5,116
A 14-1122 600MM FEEDERMAIN - BRITANNIA ROAD EAST M5 0 0 866 866
A 14-1129 400MM FEEDERMAIN - SQUARE ONE DRIVE M4 0 0 1,672 1,672
A 14-1133 400MM FEEDERMAIN - FUTURE EAST-WEST SPINE ROAD (MOUNT PLEASANT)
B6 0 0 1,223 1,223
A 14-1135 400MM FEEDERMAIN - FUTURE COLLECTOR ROAD C (MOUNT PLEASANT)
B6 0 0 1,466 1,466
A 14-1137 400MM FEEDERMAIN - FUTURE COLLECTOR ROAD B (MOUNT PLEASANT)
B6 0 0 1,572 1,572
A 14-1164 400MM FEEDERMAIN - MCVEAN DRIVE B10 0 0 285 285
A 14-1165 600MM FEEDERMAIN - MAYFIELD ROAD B10,C4 0 0 926 926
6

2014 NEW CAPITAL DETAIL
WATER
SUMMARY III
2014 Financing Sources and Funding Status ($'000)
Project #Expense
FundingTotal
Project Name
Approved or Pending
External Internal DCA
2014 Funding Status:
2014(A/P)
Ward
A 14-1192 400MM FEEDERMAIN - THE GRANGE SIDEROAD C3 0 0 262 262
Distribution System - Rehabilitation and UpgradesA 09-1390 STREETSVILLE M11 0 2,500 0 2,500
A 13-1346 SYSTEM IMPROVEMENTS IN CENTRAL ERIN MILLS (PHASE 1)
M8 0 2,352 0 2,352
A 13-1355 WATERMAIN REPLACEMENTS IN CONJUNCTION WITH INTERSECTION IMPROVEMENTS
M9 0 114 0 114
A 13-1392 400MM/300MM WATERMAIN - HEART LAKE ROAD AND KING STREET
C2 0 7,818 0 7,818
A 14-1300 WATER DISTRIBUTION SYSTEM - MAJOR MAINTENANCE
PEEL 0 1,100 0 1,100
A 14-1301 REPLACEMENT OF WATER SERVICES PEEL 0 100 0 100
A 14-1302 REPLACEMENT OF WATER VALVES PEEL 0 1,000 0 1,000
A 14-1303 DESIGN FOR THE REPLACEMENT OF WATERMAINS IN PEEL
PEEL 0 4,500 0 4,500
A 14-1304 RURAL HYDRANT ACCESSIBILITY IMPROVEMENTS
PEEL 0 1,000 0 1,000
A 14-1330 REPLACEMENT OF WATERMAINS AND SYSTEM IMPROVEMENTS IN CALEDON
CALEDON 0 1,412 0 1,412
7
2014 NEW CAPITAL DETAIL
WATER
SUMMARY III
2014 Financing Sources and Funding Status ($'000)
Project #Expense
FundingTotal
Project Name
Approved or Pending
External Internal DCA
2014 Funding Status:
2014(A/P)
Ward
A 14-1345 REPLACEMENT OF WATERMAINS AND SYSTEM IMPROVEMENTS IN MISSISSAUGA
MISSISSAUGA 0 32,202 0 32,202
A 14-1346 SYSTEM IMPROVEMENTS IN CENTRAL ERIN MILLS (PHASE 2)
M8 0 886 0 886
A 14-1348 SYSTEM IMPROVEMENTS IN CREDIT WOODLANDS
M6 0 10,603 0 10,603
A 14-1349 300MM WATERMAIN - THE QUEENSWAY WEST M7 0 630 0 630
A 14-1375 REPLACEMENT OF WATERMAINS AND SYSTEM IMPROVEMENTS IN BRAMPTON
BRAMPTON 0 15,918 0 15,918
Groundwater SystemsA 12-1855 CALEDON EAST RESERVOIR EXPANSION C3 0 0 4,006 4,006
A 14-1805 GROUNDWATER SYSTEMS - MAJOR MAINTENANCE AND EQUIPMENT REPLACEMENT
PEEL 0 250 0 250
A 14-1835 CALEDON EAST - NEW GROUNDWATER WELL C3 0 0 945 945
Water StudiesA 14-1504 WATER SERVICING MASTER PLAN UPDATE PEEL 0 0 500 500
Operating CapitalA 13-1522 PROJECT MANAGEMENT IMPROVEMENT
INITIATIVEPEEL 0 250 0 250
8

2014 NEW CAPITAL DETAIL
WATER
SUMMARY III
2014 Financing Sources and Funding Status ($'000)
Project #Expense
FundingTotal
Project Name
Approved or Pending
External Internal DCA
2014 Funding Status:
2014(A/P)
Ward
A 14-1004 MUNICIPAL COORDINATION FOR NON-REGIONAL CAPITAL PROJECTS
PEEL 0 300 0 300
A 14-1520 WATER INFRASTRUCTURE ASSET MANAGEMENT
PEEL 0 500 0 500
A 14-1530 DEVELOPMENT-RELATED WATER INFRASTRUCTURE PLANNING
PEEL 0 0 750 750
A 14-1550 SOURCE WATER PROTECTION, LAND MANAGEMENT AND WELLHEAD PROTECTION
PEEL 0 120 0 120
2014Totals for Budget Year: 1,984 132,856 160,471 295,311
9

GrossDescriptionSub Type
Ten Year Combined Capital Program ($'000)
Yrs 6-1020182017201620152014
WATER
SUMMARY IV
TEN YEAR CAPITAL PLAN
GeneralMiscellaneous works related to the overall regional water system.
10,000 5,000 1,000 1,000 1,000 1,000 1,000UNALLOCATED FUNDS14-1000FUNDING AVAILABLE FOR UNFORESEEN,UNPLANNED OR EMERGENCY WORKS.
1,500 0 0 0 0 0 1,500UNDER MAINTENANCE PROJECT COSTS14-1003FUNDING TO COVER COSTS ASSOCIATEDWITH COMPLETED CAPITAL PROJECTSUNDER MAINTENANCE.
900 500 100 100 100 100 0EASEMENT ACQUISITION15-1002FUNDING FOR THE ACQUISITION OFEASEMENTS FOR EXISTING ANDPROPOSED WATER ASSETS.
10 YearTotals For: General 2,500 1,100 1,100 1,100 1,100 5,500 12,400
Water Treatment Plants, Reservoirs and Pumping StationsGrowth and non-growth related works to upgrade, expand or add to newlake-based plant facilities.
10,900 0 0 0 0 0 10,900LAKEVIEW WATER TREATMENT PLANT EXPANSION - STANDBY POWER
09-1937
CONSTRUCTION OF ADDITIONALSTANDBY POWER IN COORDINATIONWITH THE EXPANSION OF THETREATMENT FACILITY.APPROXIMATELY 18% FUNDED BY YORKREGION.
55,723 0 0 0 0 0 55,723ALLOA RESERVOIR AND PUMPING STATION
10-1960
CONSTRUCTION OF A NEW RESERVOIRAND PUMPING STATION IN THEVICINITY OF MAYFIELD ROAD ANDCREDITVIEW ROAD.
55,000 0 0 0 0 55,000 0VICTORIA RESERVOIR10-1966CONSTRUCTION OF A NEW RESERVOIRIN THE VICINITY OF KING STREETAND HURONTARIO STREET.
10
GrossDescriptionSub Type
Ten Year Combined Capital Program ($'000)
Yrs 6-1020182017201620152014
WATER
SUMMARY IV
TEN YEAR CAPITAL PLAN
10,899 0 0 0 0 0 10,899LAKEVIEW MAJOR CAPITAL IMPROVEMENT - SEDIMENTATION
12-1921
REHABILITATION OF THESEDIMENTATION TANKS AT THELAKEVIEW WATER TREATMENT PLANT.
17,439 0 0 0 17,439 0 0LAKEVIEW MAJOR CAPITAL IMPROVEMENT - FILTRATION
13-1922
REHABILITATION OF THE FILTERS ATTHE LAKEVIEW WATER TREATMENTPLANT.
14,121 0 0 0 0 0 14,121LAKEVIEW MAJOR CAPITAL IMPROVEMENT - FILTRATION AND UV DISINFECTION
13-1923
REHABILITATION OF THE FILTERS ANDCLEAR WELL AND INSTALLATION OF UVDISINFECTION AT THE LAKEVIEWWATER TREATMENT PLANT.
2,016 0 0 0 0 0 2,016LAKEVIEW MAJOR CAPITAL IMPROVEMENT - INTAKE
13-1924
REPLACEMENT OF THE CHEMICAL ANDSAMPLING LINES IN THE INTAKE ATTHE LAKEVIEW WATER TREATMENTPLANT.
273 0 0 0 0 0 273LORNE PARK MAJOR CAPITAL IMPROVEMENT - FILTRATION
13-1934
REHABILITATION OF THE FILTERS ATTHE LORNE PARK WATER TREATMENTPLANT.
2,834 0 0 0 2,834 0 0LORNE PARK MAJOR CAPITAL IMPROVEMENT - RESERVOIR
13-1935
REHABILITATION OF THE RESERVOIRAT THE LORNE PARK WATER TREATMENTPLANT.
11

GrossDescriptionSub Type
Ten Year Combined Capital Program ($'000)
Yrs 6-1020182017201620152014
WATER
SUMMARY IV
TEN YEAR CAPITAL PLAN
1,500 0 0 0 0 0 1,500NORTH STREETSVILLE ELEVATED TANK HYDRAULIC IMPROVEMENTS
13-1963
IMPLEMENTATION OF HYDRAULICIMPROVEMENTS AT THE ELEVATEDTANK, INCLUDING THE INSTALLATIONOF A STATIC MIXING SYSTEM.
23,750 10,500 3,750 2,500 2,500 2,500 2,000TRANSMISSION FACILITIES - MAJOR MAINTENANCE
14-1903
FUNDING FOR PLANNED MAJORMAINTENANCE AT THE LAKE-BASEDPUMPING STATIONS, RESERVOIRS,ELEVATED TANKS, GENERATIONFACILITIES AND TRANSMISSION MAINS.
27,500 13,750 2,750 2,750 2,750 2,750 2,750TRANSMISSION FACILITIES - EQUIPMENT REPLACEMENT
14-1904
FUNDING FOR PLANNED EQUIPMENTREPLACEMENT AT THE LAKE-BASEDPUMPING STATIONS, RESERVOIRS,ELEVATED TANKS, GENERATIONFACILITIES AND TRANSMISSION MAINS.
11,100 5,000 1,000 1,000 1,000 1,000 2,100TREATMENT FACILITIES - MAJOR MAINTENANCE
14-1906
FUNDING FOR PLANNED MAJORMAINTENANCE AT THE LAKE-BASEDWATER TREATMENT PLANTS.
15,100 7,500 1,500 1,500 1,500 1,500 1,600TREATMENT FACILITIES - EQUIPMENT REPLACEMENT
14-1907
FUNDING FOR PLANNED EQUIPMENTREPLACEMENT AT THE LAKE-BASEDWATER TREATMENT PLANTS.
1,000 0 0 250 250 250 250TREATMENT PROCESS OPTIMIZATION PROJECTS
14-1908
FUNDING FOR INVESTIGATIONSRELATED TO THE OPTIMIZATION OFTREATMENT PROCESSES AT THELAKE-BASED WATER TREATMENT PLANTS.
12

GrossDescriptionSub Type
Ten Year Combined Capital Program ($'000)
Yrs 6-1020182017201620152014
WATER
SUMMARY IV
TEN YEAR CAPITAL PLAN
1,250 0 0 0 0 1,000 250SECURITY SYSTEM IMPROVEMENTS AND UPGRADES
14-1917
IMPROVEMENTS AND UPGRADES TO THESECURITY SYSTEMS AT THELAKE-BASED WATER FACILITIES.DESIGN IN 2014.
1,000 0 0 0 0 0 1,000RESERVOIR OPTIMIZATION PROGRAM14-1955PROGRAM TO IMPLEMENT OPTIMIZATIONMEASURES FOR THE RESERVOIRS INTHE LAKE-BASED WATER SUPPLYSYSTEM.
3,163 0 0 0 0 2,750 413REHABILITATION OF THE BOLTON ELEVATED TANK
14-1961
CONDITION ASSESSMENT, CLEANINGAND REHABILITATION OF THE BOLTONELEVATED TANK. DESIGN IN 2014.
5,500 3,000 1,000 1,000 0 500 0PUMP OPTIMIZATION PROGRAM15-1914TESTING, REPLACEMENT ANDIMPROVEMENT PROGRAM FOR THELAKE-BASED PUMPING STATIONS.
545 0 0 0 491 54 0LORNE PARK MAJOR CAPITAL IMPROVEMENT - INTAKE
15-1936
REPLACEMENT OF THE CHEMICAL ANDSAMPLING LINES IN THE INTAKE ATTHE LORNE PARK WATER TREATMENTPLANT. DESIGN IN 2015.
3,814 0 0 0 3,706 108 0LORNE PARK MAJOR CAPITAL IMPROVEMENT - CHEMICAL SYSTEMS
15-1937
IMPROVEMENTS AND UPGRADES TO THECHEMICAL SYSTEMS AT THE LORNEPARK WATER TREATMENT PLANT.DESIGN IN 2015.
13

GrossDescriptionSub Type
Ten Year Combined Capital Program ($'000)
Yrs 6-1020182017201620152014
WATER
SUMMARY IV
TEN YEAR CAPITAL PLAN
1,254 0 0 0 1,090 164 0LORNE PARK MAJOR CAPITAL IMPROVEMENT - LOW-LIFT PUMPING STATION
15-1938
REHABILITATION OF THE LOW-LIFTPUMPING STATION AT THE LORNE PARKWATER TREATMENT PLANT. DESIGN IN2015.
40,250 0 0 35,000 0 5,250 0SILVERTHORN RESERVOIR AND PUMPING STATION - IMPROVEMENTS AND UPGRADES
15-1940
CONSTRUCTION OF MAJORIMPROVEMENTS AND UPGRADES AT THESILVERTHORN RESERVOIR AND PUMPINGSTATION. DESIGN IN 2015.
38,534 31,034 0 0 7,500 0 0REPLACEMENT OF MEMBRANE FILTERS16-1909REPLACEMENT PROGRAM FOR THEMEMBRANE FILTERS AT THELAKE-BASED WATER TREATMENT PLANTS.
9,802 4,000 2,739 0 3,063 0 0REPLACEMENT OF GRANULAR ACTIVATED CARBON FILTER MEDIA
16-1910
REPLACEMENT PROGRAM FOR THEGRANULAR ACTIVATED CARBON FILTERMEDIA USED TO MITIGATE TASTE ANDODOUR AT THE LAKE-BASED WATERTREATMENT PLANTS.
1,199 0 0 1,090 109 0 0LAKEVIEW MAJOR CAPITAL IMPROVEMENT - LOW-LIFT PUMPING STATION
16-1927
REHABILITATION OF THE LOW-LIFTPUMPING STATION AT THE LAKEVIEWWATER TREATMENT PLANT. DESIGN IN2016.
1,090 0 0 872 218 0 0LAKEVIEW MAJOR CAPITAL IMPROVEMENT - RAW WATER WELL
16-1928
REHABILITATION OF THE RAW WATERWELL IN THE LOW-LIFT PUMPINGSTATION AT THE LAKEVIEW WATERTREATMENT PLANT. DESIGN IN 2016.
14

GrossDescriptionSub Type
Ten Year Combined Capital Program ($'000)
Yrs 6-1020182017201620152014
WATER
SUMMARY IV
TEN YEAR CAPITAL PLAN
2,507 0 0 2,180 327 0 0REHABILITATION OF THE SNELGROVE ELEVATED TANK
16-1962
CONDITION ASSESSMENT, CLEANINGAND REHABILITATION OF THESNELGROVE ELEVATED TANK. DESIGNIN 2016.
8,159 0 0 7,322 837 0 0BECKETT SPROULE PUMPING STATION - SURGE SUPPRESSION SYSTEM
16-1972
CONSTRUCTION OF A NEW SURGESUPPRESSION SYSTEM AT THE BECKETTSPROULE PUMPING STATION. DESIGNIN 2016.
7,846 0 0 6,800 1,046 0 0BECKETT SPROULE PUMPING STATION - IMPROVEMENTS AND UPGRADES
16-1973
CONSTRUCTION OF IMPROVEMENTS ANDUPGRADES AT THE BECKETT SPROULEPUMPING STATION. DESIGN IN 2016.
3,000 1,500 750 750 0 0 0TRANSIENT PROTECTION FOR THE LAKE-BASED WATER SUPPLY SYSTEM
17-1911
FUNDING TO IMPLEMENT TRANSIENTPROTECTION MEASURES FOR THELAKE-BASED WATER SUPPLY SYSTEM.
23,120 0 19,800 3,320 0 0 0WEST BRAMPTON RESERVOIR AND PUMPING STATION EXPANSION
17-1945
EXPANSION OF THE FACILITY WITHTHE CONSTRUCTION OF A NEWRESERVOIR CELL AND THEINSTALLATION OF ADDITIONALLOW-LIFT PUMPING CAPACITY.DESIGN IN 2017.
37,043 37,043 0 0 0 0 0FUTURE NON-GROWTH RELATED WATER FACILITIES PROJECTS
19-1998
FUNDING FOR NON-GROWTH-RELATEDWATER FACILITIES PROJECTS IN THESIXTH YEAR OR LATER OF THEREGION'S CAPITAL PLAN FOR THEWATER PROGRAM.
15

GrossDescriptionSub Type
Ten Year Combined Capital Program ($'000)
Yrs 6-1020182017201620152014
WATER
SUMMARY IV
TEN YEAR CAPITAL PLAN
8,051 8,051 0 0 0 0 0FUTURE GROWTH-RELATED WATER FACILITIES PROJECTS
19-1999
FUNDING FOR GROWTH-RELATED WATERFACILITIES PROJECTS IN THE SIXTHYEAR OR LATER OF THE REGION'SCAPITAL PLAN FOR THE WATERPROGRAM.
10 YearTotals For: Treatment Facilities 105,795 72,826 46,660 66,334 33,289 121,378 446,282
Transmission System - DevelopmentInstallations of lake-based transmission mains to sustain Peel's growth.
57,694 0 0 0 0 27,929 29,765VICTORIA TRANSMISSION MAIN10-1210CONSTRUCTION OF A 900MM ZONE 6TRANSMISSION MAIN FROM THE NORTHBRAMPTON PUMPING STATION TO THEFUTURE VICTORIA RESERVOIR AND A1200MM ZONE 6 SUB-TRANSMISSIONMAIN FROM THE FUTURE VICTORIARESERVOIR TO MAYFIELD ROAD.
1,000 0 0 0 0 0 1,000MAYFIELD ROAD SUB-TRANSMISSION MAIN (PHASE 1)
12-1269
CONSTRUCTION OF A 750MM ZONE 6SUB-TRANSMISSION MAIN ON MAYFIELDROAD FROM INDER HEIGHTS DRIVE TOSTONEGATE DRIVE. ADDITIONALFUNDS.
6,000 3,000 0 0 0 0 3,000PROPERTY ACQUISITION FOR LAKE-BASED TRANSMISSION MAINS
14-1201
FUNDING FOR PROPERTY ACQUISITIONFOR LAKE-BASED TRANSMISSION MAINS.
86,250 0 0 0 75,000 0 11,250EAST BRAMPTON TRANSMISSION MAIN TWINNING
14-1240
CONSTRUCTION OF A 1200MM ZONE 4TRANSMISSION MAIN FROM THEBECKETT-SPROULE PUMPING STATIONTO THE EAST BRAMPTON RESERVOIR.DESIGN IN 2014.
16

GrossDescriptionSub Type
Ten Year Combined Capital Program ($'000)
Yrs 6-1020182017201620152014
WATER
SUMMARY IV
TEN YEAR CAPITAL PLAN
37,551 0 14,801 0 16,498 0 6,252WILLIAMS PARKWAY SUB-TRANSMISSION MAIN (PHASES 1 AND 2)
14-1256
CONSTRUCTION OF A 900MM ZONE 5SUB-TRANSMISSION MAIN FROM THEEAST BRAMPTON PUMPING STATION TOMCLAUGHLIN ROAD. IN ADVANCE OFTHE CITY OF BRAMPTON'S ROADPROGRAM. DESIGN IN 2014.
72,243 0 0 0 62,820 0 9,423CENTRAL BRAMPTON SUB-TRANSMISSION MAIN
14-1257
CONSTRUCTION OF A ZONE 5SUB-TRANSMISSION MAIN FROM THEBECKETT-SPROULE PUMPING STATIONTO THE EAST BRAMPTON PUMPINGSTATION. DESIGN IN 2014.
43,696 43,696 0 0 0 0 0FUTURE TRANSMISSION SYSTEM PROJECTS
19-1299
FUNDING FOR TRANSMISSION SYSTEMPROJECTS IN THE SIXTH YEAR ORLATER OF THE REGION'S CAPITALPLAN FOR THE WATER PROGRAM.
10 YearTotals For: WTS-Development 60,690 27,929 154,318 0 14,801 46,696 304,434
Transmission System - Improvements and UpgradesReplacements, upgrades and new facilities related to the lake-basedtransmission system (this category presently has no works planned, butwill be required in the future).
8,786 0 0 0 0 8,786 0REHABILITATION OF THE QUEENSWAY FEEDERMAIN
12-1420
REHABILITATION AND UPGRADE OF THEQUEENSWAY FEEDERMAIN TO UTILIZEIT AS A FULL ZONE 2SUB-TRANSMISSION MAIN.
5,000 0 0 0 0 0 5,000FLOW AND PRESSURE MONITORING FOR THE LAKE-BASED WATER SUPPLY SYSTEM
13-1406
INSTALLATION OF FLOW AND PRESSUREMONITORING EQUIPMENT FOR THELAKE-BASED WATER SUPPLY SYSTEM.
17

GrossDescriptionSub Type
Ten Year Combined Capital Program ($'000)
Yrs 6-1020182017201620152014
WATER
SUMMARY IV
TEN YEAR CAPITAL PLAN
7,500 3,750 750 750 750 750 750INSPECTION AND CONDITION ASSESSMENT OF THE LAKE-BASED TRANSMISSION MAINS
14-1405
INSPECTION AND CONDITIONASSESSMENT PROGRAM FOR THELAKE-BASED WATER TRANSMISSIONMAINS AND IMPLEMENTATION OFREAL-TIME MONITORING.
978 0 0 0 0 850 1281500MM STREETSVILLE TRANSMISSION MAIN - REHABILITATION
14-1421
REHABILITATION OF THE 1500MMSTREETSVILLE TRANSMISSION MAIN.DESIGN IN 2014.
8,000 5,000 1,000 1,000 1,000 0 0REHABILITATION OF THE LAKE-BASED WATER TRANSMISSION MAINS
16-1407
REHABILITATION PROGRAM FOR THELAKE-BASED WATER TRANSMISSIONMAINS IDENTIFIED AS NEEDINGREPAIR DURING THE CONDITIONASSESSMENT PROGRAM.
1,725 0 1,500 225 0 0 02100MM HANLAN TRANSMISSION MAIN - REHABILITATION
17-1422
REHABILITATION OF THE 2100MMHANLAN TRANSMISSION MAIN. DESIGNIN 2017.
10 YearTotals For: WTS-Imp. & Updgrades 5,878 10,386 1,750 1,975 3,250 8,750 31,989
Feedermain Distribution System - DevelopmentInstallations of distribution feedermains to sustain Peel's growth.
1,000 0 0 0 0 0 1,000400MM FEEDERMAIN - THE GORE ROAD09-1140FROM CASTLEMORE ROAD TOCOUNTRYSIDE DRIVE. IN ADVANCE OFTHE REGION OF PEEL'S ROADPROGRAM. ADDITIONAL FUNDS.
18

GrossDescriptionSub Type
Ten Year Combined Capital Program ($'000)
Yrs 6-1020182017201620152014
WATER
SUMMARY IV
TEN YEAR CAPITAL PLAN
1,500 0 0 0 0 0 1,500750MM FEEDERMAIN - COUNTRYSIDE DRIVE
10-1115
FROM GOREWAY DRIVE TO THE GOREROAD. ADDITIONAL FUNDS.
2,470 0 0 0 0 0 2,470400MM FEEDERMAIN - TORBRAM ROAD10-1156FROM MAYFIELD ROAD TOAPPROXIMATELY 100 METRES NORTH OFCOUNTRYSIDE DRIVE. IN ADVANCE OFTHE CITY OF BRAMPTON'S ROADPROGRAM.
1,260 0 0 0 0 0 1,260400MM FEEDERMAIN - WANLESS DRIVE12-1148FROM APPROXIMATELY 200 METRESWEST OF CREDITVIEW ROAD TOMISSISSAUGA ROAD. IN CONJUNCTIONWITH THE CITY OF BRAMPTON'S ROADPROGRAM. ADDITIONAL FUNDS.
4,838 0 0 0 0 0 4,838600MM FEEDERMAIN - ERIN MILLS PARKWAY AND EGLINTON AVENUE WEST
13-1117
ON ERIN MILLS PARKWAY FROM THESTREETSVILLE PUMPING STATION TOEGLINTON AVENUE WEST AND ONEGLINTON AVENUE WEST FROM ERINMILLS PARKWAY TO GLEN ERIN DRIVE.
1,983 0 0 0 0 0 1,983400MM FEEDERMAIN - EGLINTON AVENUE WEST
13-1118
FROM GLEN ERIN DRIVE TO WINSTONCHURCHILL BOULEVARD.
60,000 0 0 0 0 60,000 01500MM FEEDERMAIN - BURNHAMTHORPE ROAD
13-1125
FROM CAWTHRA ROAD TOCONFEDERATION PARKWAY.
2,354 0 0 0 0 0 2,354600MM FEEDERMAIN - MAYFIELD ROAD13-1134FROM THE FUTURE ALLOA PUMPINGSTATION TO MISSISSAUGA ROAD.
19

GrossDescriptionSub Type
Ten Year Combined Capital Program ($'000)
Yrs 6-1020182017201620152014
WATER
SUMMARY IV
TEN YEAR CAPITAL PLAN
1,899 0 0 0 0 0 1,899400MM FEEDERMAIN - CHINGUACOUSY ROAD
13-1152
FROM MAYFIELD ROAD TOAPPROXIMATELY 100 METRES NORTH OFWANLESS DRIVE. IN ADVANCE OF THECITY OF BRAMPTON'S ROAD PROGRAM.
5,116 0 0 0 0 0 5,116400MM FEEDERMAIN - AIRPORT ROAD (CALEDON EAST)
13-1191
FROM THE CALEDON EAST RESERVOIRTO WALKER ROAD.
6,642 0 0 0 0 5,776 866600MM FEEDERMAIN - BRITANNIA ROAD EAST
14-1122
FROM THE HANLAN PUMPING STATIONTO DIXIE ROAD. DESIGN IN 2014.
1,672 0 0 0 0 0 1,672400MM FEEDERMAIN - SQUARE ONE DRIVE14-1129FROM DUKE OF YORK BOULEVARD TOCITY CENTRE DRIVE.
1,223 0 0 0 0 0 1,223400MM FEEDERMAIN - FUTURE EAST-WEST SPINE ROAD (MOUNT PLEASANT)
14-1133
FROM THE FUTURE COLLECTOR ROAD BTO THE FUTURE COLLECTOR ROAD C INMOUNT PLEASANT.
1,466 0 0 0 0 0 1,466400MM FEEDERMAIN - FUTURE COLLECTOR ROAD C (MOUNT PLEASANT)
14-1135
FROM MAYFIELD ROAD TO THE FUTUREEAST-WEST SPINE ROAD IN MOUNTPLEASANT.
1,572 0 0 0 0 0 1,572400MM FEEDERMAIN - FUTURE COLLECTOR ROAD B (MOUNT PLEASANT)
14-1137
FROM MAYFIELD ROAD TO THE FUTUREEAST-WEST SPINE ROAD IN MOUNTPLEASANT.
2,184 0 0 0 0 1,899 285400MM FEEDERMAIN - MCVEAN DRIVE14-1164FROM MAYFIELD ROAD TO COUNTRYSIDEDRIVE. DESIGN IN 2014.
20

GrossDescriptionSub Type
Ten Year Combined Capital Program ($'000)
Yrs 6-1020182017201620152014
WATER
SUMMARY IV
TEN YEAR CAPITAL PLAN
7,099 0 0 0 0 6,173 926600MM FEEDERMAIN - MAYFIELD ROAD14-1165FROM GOREWAY DRIVE TO THE GOREROAD. IN ADVANCE OF THE REGIONOF PEEL'S ROAD PROGRAM. DESIGNIN 2014.
2,009 0 0 0 0 1,747 262400MM FEEDERMAIN - THE GRANGE SIDEROAD
14-1192
FROM THE NEW CALEDON EASTGROUNDWATER WELL ON GRANGESIDEROAD TO AIRPORT ROAD. DESIGNIN 2014.
684 0 0 0 595 89 0400MM FEEDERMAIN - CAMILLA ROAD15-1121FROM DUNDAS STREET EAST TO KINGSTREET EAST. DESIGN IN 2015.
1,743 0 0 0 1,516 227 0600MM FEEDERMAIN - DUKE OF YORK BOULEVARD
15-1123
FROM WEBB DRIVE TO CITY CENTREDRIVE. DESIGN IN 2015.
3,940 0 0 0 3,426 514 0400MM FEEDERMAIN - WEBB DRIVE AND GRAND PARK DRIVE
15-1124
FROM DUKE OF YORK BOULEVARD TOBURNHAMTHORPE ROAD WEST. DESIGNIN 2015.
4,408 0 0 0 3,833 575 0600MM FEEDERMAIN - HERITAGE ROAD15-1138FROM THE MEADOWVALE NORTH PUMPINGSTATION TO STEELES AVENUE WEST.DESIGN IN 2015.
1,363 0 0 0 0 1,363 0400MM FEEDERMAIN - FUTURE STREET (COUNTRYSIDE VILLAGES)
15-1158
FROM THE EAST SIDE OF THE CREEKTO BRAMALEA ROAD.
2,284 0 0 0 0 2,284 0400MM FEEDERMAIN - HURONTARIO STREET
15-1184
FROM DOUGALL AVENUE TO THE FUTUREEAST-WEST COLLECTOR ROAD INMAYFIELD WEST PHASE 2.
21

GrossDescriptionSub Type
Ten Year Combined Capital Program ($'000)
Yrs 6-1020182017201620152014
WATER
SUMMARY IV
TEN YEAR CAPITAL PLAN
1,216 0 0 1,057 159 0 0400MM FEEDERMAIN - WEBB DRIVE16-1128FROM DUKE OF YORK BOULEVARD TOKARIYA DRIVE. DESIGN IN 2016.
1,625 0 0 0 1,625 0 0400MM FEEDERMAIN - FUTURE STREET (COUNTRYSIDE VILLAGES)
16-1159
FROM 310 METRES EAST OF BRAMALEAROAD TO TORBRAM ROAD.
4,924 0 0 4,282 642 0 0750MM FEEDERMAIN - COUNTRYSIDE DRIVE
16-1170
FROM THE GORE ROAD TO CLARKWAYDRIVE. DESIGN IN 2016.
2,619 0 0 2,277 342 0 0400MM FEEDERMAIN - COUNTRYSIDE DRIVE
16-1171
FROM CLARKWAY DRIVE TO COLERAINEDRIVE. DESIGN IN 2016.
3,649 0 0 3,173 476 0 0400MM FEEDERMAIN - HIGHWAY 5016-1176FROM CASTLEMORE ROAD TO COLERAINEDRIVE. DESIGN IN 2016.
1,660 0 0 1,443 217 0 0400MM FEEDERMAIN - CHINGUACOUSY ROAD
16-1185
FROM MAYFIELD ROAD TO THE FUTUREEAST-WEST COLLECTOR ROAD INMAYFIELD WEST PHASE 2. DESIGN IN2016.
4,894 0 4,256 638 0 0 0750MM FEEDERMAIN - BOVAIRD DRIVE17-1130FROM MISSISSAUGA ROAD TO HERITAGEROAD. IN ADVANCE OF THE REGIONOF PEEL'S ROAD PROGRAM. DESIGNIN 2017.
9,419 0 8,190 1,229 0 0 0750MM FEEDERMAIN - GOREWAY DRIVE17-1166FROM CASTLEMORE ROAD TOCOUNTRYSIDE DRIVE. IN ADVANCE OFTHE CITY OF BRAMPTON'S ROADPROGRAM. DESIGN IN 2017.
22

GrossDescriptionSub Type
Ten Year Combined Capital Program ($'000)
Yrs 6-1020182017201620152014
WATER
SUMMARY IV
TEN YEAR CAPITAL PLAN
7,460 0 6,487 973 0 0 0600MM FEEDERMAIN - MAYFIELD ROAD17-1177FROM THE GORE ROAD TO CLARKWAYDRIVE. DESIGN IN 2017.
2,459 0 0 2,459 0 0 0400MM FEEDERMAIN - FUTURE EAST-WEST COLLECTOR ROAD (MAYFIELD WEST PHASE 2)
17-1186
FROM HURONTARIO STREET TOMCLAUGHLIN ROAD.
10,625 0 9,239 1,386 0 0 0600MM FEEDERMAIN - COLERAINE DRIVE17-1192FROM THE BOLTON ELEVATED TANK TOMAYFIELD ROAD. DESIGN IN 2017.
7,601 6,610 991 0 0 0 01050MM FEEDERMAIN - ERIN MILLS PARKWAY
18-1110
FROM THE STREETSVILLE PUMPINGSTATION TO THOMAS STREET. DESIGNIN 2018.
8,349 7,260 1,089 0 0 0 0900MM FEEDERMAIN - ERIN MILLS PARKWAY
18-1111
FROM THOMAS STREET TO BRITANNIAROAD WEST. DESIGN IN 2018.
21,104 18,351 2,753 0 0 0 0600MM FEEDERMAIN - LAKESHORE ROAD18-1119FROM THE LAKEVIEW WATER TREATMENTPLANT TO WESLEY AVENUE. DESIGNIN 2018.
3,683 0 3,683 0 0 0 0400MM FEEDERMAIN - FUTURE FINANCIAL DRIVE (BRAM WEST)
18-1131
FROM HERITAGE ROAD TO WINSTONCHURCHILL BOULEVARD.
6,061 5,270 791 0 0 0 0600MM FEEDERMAIN - HERITAGE ROAD18-1132FROM THE FUTURE EXTENSION OFWILLIAMS PARKWAY TO THE FUTURENEW ROAD A. IN ADVANCE OF THECITY OF BRAMPTON'S ROAD PROGRAM.DESIGN IN 2018.
23

GrossDescriptionSub Type
Ten Year Combined Capital Program ($'000)
Yrs 6-1020182017201620152014
WATER
SUMMARY IV
TEN YEAR CAPITAL PLAN
5,992 5,210 782 0 0 0 0900MM FEEDERMAIN - HERITAGE ROAD18-1133FROM THE WEST BRAMPTON PUMPINGSTATION TO BOVAIRD DRIVE. INADVANCE OF THE CITY OF BRAMPTON'SROAD PROGRAM. DESIGN IN 2018.
2,066 0 2,066 0 0 0 0400MM FEEDERMAIN - FUTURE STREET (MAYFIELD WEST PHASE 2)
18-1187
FROM MCLAUGHLIN ROAD TOCHINGUACOUSY ROAD.
72,812 72,812 0 0 0 0 0FUTURE DISTRIBUTION FEEDERMAIN PROJECTS
19-1199
FUNDING FOR DISTRIBUTIONFEEDERMAIN PROJECTS IN THE SIXTHYEAR OR LATER OF THE REGION'SCAPITAL PLAN FOR THE WATERPROGRAM.
10 YearTotals For: WDS-Development 30,692 80,647 12,831 18,917 40,327 115,513 298,927
Distribution System - Rehabilitation and UpgradesReplacements, repairs and upgrades related to the lake-baseddistribution system.
2,500 0 0 0 0 0 2,500STREETSVILLE09-1390REPLACEMENT OF THE EXISTING 400MMWATERMAINS ON QUEEN STREET SOUTHAND THOMAS STREET INSTREETSVILLE. ADDITIONAL FUNDS.
2,352 0 0 0 0 0 2,352SYSTEM IMPROVEMENTS IN CENTRAL ERIN MILLS (PHASE 1)
13-1346
IMPLEMENTATION OF SYSTEMIMPROVEMENTS IN CENTRAL ERINMILLS TO IMPROVE RESIDUALPRESSURE FOR CUSTOMERS.
24

GrossDescriptionSub Type
Ten Year Combined Capital Program ($'000)
Yrs 6-1020182017201620152014
WATER
SUMMARY IV
TEN YEAR CAPITAL PLAN
45,837 0 0 8,543 8,899 28,395 0SYSTEM IMPROVEMENTS IN SOUTHWEST MISSISSAUGA
13-1347
IMPLEMENTATION OF SYSTEMIMPROVEMENTS IN SOUTHWESTMISSISSAUGA TO IMPROVE WATERQUALITY AND RELIABILITY AND TOIMPROVE RESIDUAL PRESSURE FORCUSTOMERS.
114 0 0 0 0 0 114WATERMAIN REPLACEMENTS IN CONJUNCTION WITH INTERSECTION IMPROVEMENTS
13-1355
REPLACEMENT OF WATERMAINS ANDSYSTEM IMPROVEMENTS INCONJUNCTION WITH REGIONALINTERSECTION IMPROVEMENT PROJECTS.
7,818 0 0 0 0 0 7,818400MM/300MM WATERMAIN - HEART LAKE ROAD AND KING STREET
13-1392
FROM THE FUTURE EAST-WESTCOLLECTOR ROAD IN MAYFIELD WESTTO THE HERB CAMPBELL PUBLICSCHOOL.
11,000 5,500 1,100 1,100 1,100 1,100 1,100WATER DISTRIBUTION SYSTEM - MAJOR MAINTENANCE
14-1300
FUNDING FOR MAJOR MAINTENANCE OFTHE REGION OF PEEL'S WATERDISTRIBUTION SYSTEM.
1,000 500 100 100 100 100 100REPLACEMENT OF WATER SERVICES14-1301FUNDING FOR THE REPLACEMENT OF13-MM (1/2-INCH) WATER SERVICESWITH 20-MM (3/4-INCH) WATERSERVICES.
1,000 0 0 0 0 0 1,000REPLACEMENT OF WATER VALVES14-1302FUNDING FOR THE REPLACEMENT OFVALVES ON WATERMAINS WITH ADIAMETER EQUAL TO OR GREATER THAN400 MM.
25

GrossDescriptionSub Type
Ten Year Combined Capital Program ($'000)
Yrs 6-1020182017201620152014
WATER
SUMMARY IV
TEN YEAR CAPITAL PLAN
45,000 22,500 4,500 4,500 4,500 4,500 4,500DESIGN FOR THE REPLACEMENT OF WATERMAINS IN PEEL
14-1303
FUNDING FOR THE DESIGN OFWATERMAIN REPLACEMENT PROJECTS INTHE REGION OF PEEL FOR THEFOLLOWING YEAR TO FACILITATEON-TIME CONSTRUCTION.
1,000 0 0 0 0 0 1,000RURAL HYDRANT ACCESSIBILITY IMPROVEMENTS
14-1304
FUNDING TO IMPROVE ACCESSIBILITYFOR HYDRANTS IN RURAL AREAS FORREGULAR MAINTENANCE AND FIREFIGHTING PURPOSES.
1,412 0 0 0 0 0 1,412REPLACEMENT OF WATERMAINS AND SYSTEM IMPROVEMENTS IN CALEDON
14-1330
REPLACEMENT OF WATERMAINS, SYSTEMIMPROVEMENTS AND LOOPING OFDEAD-END MAINS IN CALEDON TOIMPROVE WATER QUALITY ANDRELIABILITY OF THE DISTRIBUTIONSYSTEM.
32,202 0 0 0 0 0 32,202REPLACEMENT OF WATERMAINS AND SYSTEM IMPROVEMENTS IN MISSISSAUGA
14-1345
REPLACEMENT OF WATERMAINS, SYSTEMIMPROVEMENTS AND LOOPING OFDEAD-END MAINS IN MISSISSAUGA TOIMPROVE WATER QUALITY ANDRELIABILITY OF THE DISTRIBUTIONSYSTEM.
32,602 0 0 0 0 31,716 886SYSTEM IMPROVEMENTS IN CENTRAL ERIN MILLS (PHASE 2)
14-1346
IMPLEMENTATION OF SYSTEMIMPROVEMENTS IN CENTRAL ERINMILLS TO IMPROVE RESIDUALPRESSURE FOR CUSTOMERS. DESIGNIN 2014.
26
GrossDescriptionSub Type
Ten Year Combined Capital Program ($'000)
Yrs 6-1020182017201620152014
WATER
SUMMARY IV
TEN YEAR CAPITAL PLAN
10,603 0 0 0 0 0 10,603SYSTEM IMPROVEMENTS IN CREDIT WOODLANDS
14-1348
IMPLEMENTATION OF SYSTEMIMPROVEMENTS IN THE CREDITWOODLANDS AREA TO IMPROVERESIDUAL PRESSURE FOR CUSTOMERS.
2,838 0 0 0 0 2,208 630300MM WATERMAIN - THE QUEENSWAY WEST
14-1349
FROM HURONTARIO STREET TOSTAVEBANK ROAD. DESIGN IN 2014.
15,918 0 0 0 0 0 15,918REPLACEMENT OF WATERMAINS AND SYSTEM IMPROVEMENTS IN BRAMPTON
14-1375
REPLACEMENT OF WATERMAINS, SYSTEMIMPROVEMENTS AND LOOPING OFDEAD-END MAINS IN BRAMPTON TOIMPROVE WATER QUALITY ANDRELIABILITY OF THE DISTRIBUTIONSYSTEM.
9,000 5,000 1,000 1,000 1,000 1,000 0REPLACEMENT OF WATERMAINS IN CALEDON
15-1330
REPLACEMENT OF WATERMAINS, SYSTEMIMPROVEMENTS AND LOOPING OFDEAD-END MAINS IN CALEDON TOIMPROVE WATER QUALITY ANDRELIABILITY OF THE DISTRIBUTIONSYSTEM.
191,704 125,000 24,620 24,358 14,492 3,234 0REPLACEMENT OF WATERMAINS IN MISSISSAUGA
15-1345
REPLACEMENT OF WATERMAINS, SYSTEMIMPROVEMENTS AND LOOPING OFDEAD-END MAINS IN MISSISSAUGA TOIMPROVE WATER QUALITY ANDRELIABILITY OF THE DISTRIBUTIONSYSTEM.
27

GrossDescriptionSub Type
Ten Year Combined Capital Program ($'000)
Yrs 6-1020182017201620152014
WATER
SUMMARY IV
TEN YEAR CAPITAL PLAN
93,966 60,000 12,000 12,000 9,966 0 0REPLACEMENT OF WATERMAINS IN BRAMPTON
15-1375
REPLACEMENT OF WATERMAINS, SYSTEMIMPROVEMENTS AND LOOPING OFDEAD-END MAINS IN BRAMPTOM TOIMPROVE WATER QUALITY ANDRELIABILITY OF THE DISTRIBUTIONSYSTEM.
10,515 0 0 0 9,143 1,372 0750MM FEEDERMAIN - GOREWAY DRIVE15-1384FROM QUEEN STREET EAST TOINTERMODAL DRIVE. DESIGN IN 2015.
10 YearTotals For: WDS-Imp. & Updgrades 82,135 73,625 49,200 51,601 43,320 218,500 518,381
Groundwater SystemsReplacements, upgrades, and new facilities related to groundwater basedsystems.
4,006 0 0 0 0 0 4,006CALEDON EAST RESERVOIR EXPANSION12-1855EXPANSION OF THE EXISTINGRESERVOIR TO INCREASE STORAGECAPACITY FOR GROWTH IN CALEDONEAST.
2,500 1,250 250 250 250 250 250GROUNDWATER SYSTEMS - MAJOR MAINTENANCE AND EQUIPMENT REPLACEMENT
14-1805
FUNDING FOR PLANNED MAJORMAINTENANCE AND EQUIPMENTREPLACEMENT FOR THE GROUNDWATERSYSTEMS.
7,245 0 0 0 0 6,300 945CALEDON EAST - NEW GROUNDWATER WELL
14-1835
CONSTRUCTION OF A NEW GROUNDWATERWELL TO SERVICE GROWTH IN CALEDONEAST. DESIGN IN 2014.
750 0 0 0 0 750 0PROPERTY ACQUISITION FOR GROUNDWATER SYSTEM PROJECTS
15-1801
FUNDING FOR PROPERTY ACQUISITIONFOR GROUNDWATER SYSTEM PROJECTS.
28

GrossDescriptionSub Type
Ten Year Combined Capital Program ($'000)
Yrs 6-1020182017201620152014
WATER
SUMMARY IV
TEN YEAR CAPITAL PLAN
10 YearTotals For: Groundwater Systems 5,201 7,300 250 250 250 1,250 14,501
Water StudiesWater Studies, Environmental Assessments and Planning.
2,500 1,000 0 0 1,000 0 500WATER SERVICING MASTER PLAN UPDATE14-1504REVIEW AND UPDATE OF THE REGIONOF PEEL WATER SERVICING MASTERPLAN.
2,000 1,000 0 1,000 0 0 0WATER DISTRIBUTION SYSTEM ASSET MANAGEMENT PLAN UPDATE
17-1509
DEVELOPMENT OF A WATERDISTRIBUTION SYSTEM ASSETMANAGEMENT PLAN FOR THE REGION OFPEEL.
3,000 3,000 0 0 0 0 0FUTURE WATER STUDIES PROJECTS19-1599FUNDING FOR WATER STUDIESPROJECTS IN THE SIXTH YEAR ORLATER OF THE REGION'S CAPITALPLAN FOR THE WATER PROGRAM.
10 YearTotals For: Water Studies 500 0 1,000 1,000 0 5,000 7,500
Operating Capital
500 0 0 0 0 250 250PROJECT MANAGEMENT IMPROVEMENT INITIATIVE
13-1522
INITIATIVE TO IMPROVE PROJECTMANAGEMENT METHODOLOGIES WITHINTHE WATER AND WASTEWATERDIVISIONS OF PUBLIC WORKS.
3,000 1,500 300 300 300 300 300MUNICIPAL COORDINATION FOR NON-REGIONAL CAPITAL PROJECTS
14-1004
FUNDING FOR REGIONAL STAFF TOCOORDINATE WITH THE AREAMUNICIPALITIES ON NON-REGIONALCAPITAL PROJECTS.
29

GrossDescriptionSub Type
Ten Year Combined Capital Program ($'000)
Yrs 6-1020182017201620152014
WATER
SUMMARY IV
TEN YEAR CAPITAL PLAN
5,000 2,500 500 500 500 500 500WATER INFRASTRUCTURE ASSET MANAGEMENT
14-1520
FUNDING FOR THE DEVELOPMENT OFASSET MANAGEMENT PROCESSES ANDPROGRAMS AND SUPPORTING TOOLS ANDDATA COLLECTION TO SUPPORT ASSETMANAGEMENT OF THE REGION'S WATERINFRASTRUCTURE.
7,500 3,750 750 750 750 750 750DEVELOPMENT-RELATED WATER INFRASTRUCTURE PLANNING
14-1530
FUNDING FOR WATER INFRASTRUCTUREPLANNING AND STUDIES RELATED TODEVELOPMENT.
240 0 0 0 0 120 120SOURCE WATER PROTECTION, LAND MANAGEMENT AND WELLHEAD PROTECTION
14-1550
GROUNDWATER-RELATED SOURCE WATERPROTECTION, LAND MANAGEMENT ANDWHPA ISSUES IN PEEL RELATING TOPROVINCIALLY LEGISLATEDREQUIREMENTS UNDER THE CLEANWATER ACT, 2006.
10 YearTotals For: Operating Capital 1,920 1,920 1,550 1,550 1,550 7,750 16,240
Totals for 10 Year Capital Plan: 295,311 275,733 268,659 142,727 137,887 530,337 1,650,654
30

SUMMARY VWATER PROGRAM
OUTPUT AND OUTCOME MEASURES
Output/Outcome Measures 2013 Target 2013 Projection 2014 Target Commentary
Provide water infrastructure to meet all water demands in Peel - no water restrictions.
0 water restrictions
0 water restrictions
0 water restrictions
Power or SCADA failures can impact the water treatment process. Although these types of incidents have occurred and have negatively impacted water treatment production, Peel did not need to issue any water restrictions or boil water advisories from low pressure incidents.
Address customer inquiries on water related issues in a timely fashion
100 per cent of the time 99 per cent 100 per cent
of the time
Problem resolution and length of investigation may depend on the problem type and level of involvement.
Respond to watermain and infrastructure failures within one hour
90 per cent of the time
90 per cent of the time
90 per cent of the time
Immediate investigation on the complaints regarding flooding, low pressure and no water supply.
31

THIS PAGE INTENTIONALLY LEFT BLANK

WASTEWATER
PROGRAM BUDGET SUMMARY
Summary I: 2014 Operating Budget Pressures
Summary II: Operating Budget Four-Year Program Forecast
Summary III: 2014 New Capital
Summary IV: Ten Year Capital Plan
Summary V: Output and Outcome Measures

THIS PAGE INTENTIONALLY LEFT BLANK

SUMMARY IWASTEWATER
2014 OPERATING BUDGET PRESSURES ($'000)Total
ExpendituresTotal
Revenue Net Cost 2013 Revised Cost of Service 161,607
User fee and DC (40,386) (40,386) Billings-York, Toronto & Sewage charge etc. (12,857) (12,857)
2013 Peel Required Billings 108,364
Annualization - N/A
Inflation 1 Cost Adjustments 231 - 231 Subtotal 231 - 231
Economic Factors1 Hydro 134 - 134
Subtotal 134 - 134
Efficiencies/Reductions 1 Chemcials (684) (684) 2 Gas (449) (449) 3 Operating reduction due to lab closure (1,800) (1,800) Subtotal (2,933) - (2,933)
Other pressure1 OCWA Contract Increase as per Agreement 776 - 776 Subtotal 776 - 776
2014 Base Budget Changes (1,792) - (1,792) Service Demand - N/AGrowth - - - Regulation (ON 1 call act) 300 - 300 Subsidy/Recovery Change-User fee 62 62 Other Pressures:Increase in Contribution to Capital Stabilization Reserve R0241 7,415 - 7,415 Decrease in Debt charges (718) - (718) Decrease in Contributions from Developer's Reserves 718 718
(919) (919) 919 919
Increase in York Operating cost 65 Increase in York Operating component billings (65) (65) Increase in Quality sewage charge (433) (433) Increase in Toronto sewage (100) (100) 2014 Service Demand 6,143 1,101 7,244 2014 New Services - N/A2014 New Services - - -
2014 Recommended Cost of Service (Net Cost before Billings 165,958 (52,142) 113,816
Decrease in Contribution to York-Peel Reserve R0271Decrease in York capital component billings
1

SUMMARY IIWASTEWATER PROGRAM
OPERATING BUDGET FOUR-YEAR PROGRAM FORECAST
In $'0002014 Budget Forecasted in 2013 Budget
2014 Budget 2015 Forecast 2016 Forecast 2017 Forecast
Net Expenditures before Peel billings and external recoveries
131,277 126,352 134,767 140,825 146,899
External Recoveries (13,210) (12,536) (12,824) (13,129) (13,335)Net Expenditures (Peel required billings) 118,067 113,816 121,943 127,696 133,564
# of FTEs 122.00 122.00 123.00 124.00 125.00
Key Forecast Assumptions:
Program Assumptions2014 2015 2016 2017
OCWA Contract per cost schedule $15,639,919 $16,180,614 $16,647,888 $17,129,531York Wastewater (Provided by York Region) in ML 13,505 14,235 14,965 15,330 Peel Treated Wastewater in ML 220,390 225,596 230,814 236,681
Corporate Assumptions: Wastewater Stabilization Reserve Contribution Annual increase by 7% for 2014, 6% for 2015 and 3% for 2016 and 2017
Electricity per KWH $0.1200 $0.1250 $0.1300 $0.1350Labour Costs Annual Increase by 2%Internal Allocations Annual Increase by 3%Other Costs Annual Increase by 2%
2

2014 NEW CAPITAL DETAIL
WASTEWATER
SUMMARY III
2014 Financing Sources and Funding Status ($'000)
Project #Expense
FundingTotal
Project Name
Approved or Pending
External Internal DCA
2014 Funding Status:
2014(A/P)
Ward
GeneralA 14-2000 UNALLOCATED FUNDS PEEL 0 1,000 0 1,000
A 14-2001 PRE-ENGINEERING, DESIGN AND RESTORATION WORKS
PEEL 0 375 0 375
A 14-2003 UNDER MAINTENANCE PROJECT COSTS PEEL 0 200 300 500
Wastewater Treatment Plants and Pumping StationsA 06-2935 PORT CREDIT SEWAGE PUMPING STATION M1 0 1,094 2,032 3,126
A 10-2925 G.E. BOOTH WASTEWATER TREATMENT PLANT EXPANSION
M1 4,098 0 22,121 26,219
A 11-2901 ODOUR CONTROL FACILITIES IN SOUTH MISSISSAUGA
M1 0 2,657 886 3,543
A 14-2905 SEWAGE PUMPING STATION REHABILITATION PROGRAM
PEEL 0 1,000 0 1,000
A 14-2906 WASTEWATER TREATMENT FACILITIES - MAJOR MAINTENANCE
M1,M2 0 2,000 0 2,000
A 14-2907 WASTEWATER TREATMENT FACILITIES - EQUIPMENT REPLACEMENT
M1,M2 0 3,000 0 3,000
A 14-2920 G.E. BOOTH MAJOR CAPITAL IMPROVEMENT - PRIMARY TREATMENT
M1 0 656 0 656
3

2014 NEW CAPITAL DETAIL
WASTEWATER
SUMMARY III
2014 Financing Sources and Funding Status ($'000)
Project #Expense
FundingTotal
Project Name
Approved or Pending
External Internal DCA
2014 Funding Status:
2014(A/P)
Ward
A 14-2930 CLARKSON MAJOR CAPITAL IMPROVEMENT - PRIMARY TREATMENT
M2 0 563 0 563
A 14-2970 CALEDON EAST SEWAGE PUMPING STATION - REHABILITATION AND EXPANSION
C3 0 1,250 1,250 2,500
Primary Collection System - DevelopmentA 08-2235 BOLTON/BRAMPTON SANITARY TRUNK SEWER
TWINNINGB10 0 656 1,219 1,875
A 11-2201 EAST BRAMPTON SANITARY TRUNK SEWER TWINNING (PHASE 1)
B10 0 0 37,094 37,094
A 12-2210 ALBION-VAUGHAN ROAD SANITARY TRUNK SEWER
C5 0 0 8,545 8,545
A 14-2221 FLETCHER'S CREEK SANITARY TRUNK SEWER EXTENSION (PHASE 1)
B6 0 0 3,476 3,476
A 14-2225 FLETCHER'S CREEK SANITARY TRUNK SEWER EXTENSION (PHASE 2)
B6 0 0 5,788 5,788
A 14-2229 MOUNT PLEASANT SANITARY TRUNK SEWER B6 0 0 5,569 5,569
Local Trunk Collection System - DevelopmentA 08-2145 600MM SANITARY SEWER - FUTURE FINANCIAL
DRIVE (BRAM WEST)B6 0 0 1,200 1,200
A 11-2102 525MM SANITARY SEWER - FUTURE RIVERMONT ROAD
B6 0 0 1,033 1,033
4

2014 NEW CAPITAL DETAIL
WASTEWATER
SUMMARY III
2014 Financing Sources and Funding Status ($'000)
Project #Expense
FundingTotal
Project Name
Approved or Pending
External Internal DCA
2014 Funding Status:
2014(A/P)
Ward
A 11-2103 525MM SANITARY SEWER - TORBRAM ROAD B9,B10 0 0 1,199 1,199
A 14-2121 375MM SANITARY SEWER - EAST-WEST SPINE ROAD (MOUNT PLEASANT)
B6 0 0 2,127 2,127
A 14-2124 375MM SANITARY SEWER - FUTURE STREET (MOUNT PLEASANT)
B6 0 0 571 571
A 14-2131 375MM SANITARY SEWER - FUTURE STREET (HUTTONVILLE NORTH)
B6 0 0 3,346 3,346
A 14-2165 375MM SANITARY SEWER - FUTURE STREET (COUNTRYSIDE VILLAGES)
B9 0 0 1,818 1,818
A 14-2170 600MM SANITARY SEWER - CLARKWAY DRIVE (HIGHWAY 427 INDUSTRIAL)
B10 0 0 1,843 1,843
Primary Collection System - Improvements and UpgradesA 10-2425 HARBORN ROAD AND QUEENSWAY SANITARY
TRUNK SEWERSM7 0 6,268 6,268 12,536
A 14-2401 PERMANENT FLOW MONITORING PROGRAM PEEL 0 700 0 700
A 14-2429 FLETCHER'S CREEK SANITARY TRUNK SEWER REHABILITATION
B6 0 1,024 0 1,024
Local Collection System - Improvements and UpgradesA 14-2300 LINEAR INFRASTRUCTURE REMEDIATION AND
UPGRADESPEEL 0 20,000 0 20,000
5

2014 NEW CAPITAL DETAIL
WASTEWATER
SUMMARY III
2014 Financing Sources and Funding Status ($'000)
Project #Expense
FundingTotal
Project Name
Approved or Pending
External Internal DCA
2014 Funding Status:
2014(A/P)
Ward
A 14-2301 IMPLEMENTATION PROGRAM FOR INFLOW AND INFILTRATION REMEDIATION
PEEL 0 2,500 2,500 5,000
A 14-2305 REPLACEMENT OF SEWAGE PUMPING STATIONS WITH GRAVITY SEWERS
PEEL 0 5,000 0 5,000
A 14-2306 INSPECTION AND CONDITION ASSESSMENT OF THE LAKE-BASED SANITARY COLLECTION SYSTEM
PEEL 0 3,500 0 3,500
Wastewater StudiesA 14-2502 HYDRAULIC WASTEWATER MODEL UPDATE PEEL 0 250 0 250
A 14-2504 WASTEWATER SERVICING MASTER PLAN UPDATE
PEEL 0 0 500 500
A 14-2512 INFLOW AND INFILTRATION REMEDIATION PROGRAM
PEEL 0 500 500 1,000
Communal Sewage SystemsA 09-2920 INGLEWOOD WASTEWATER TREATMENT
PLANT UPGRADESC2 0 1,563 0 1,563
Operating CapitalA 14-2004 MUNICIPAL COORDINATION FOR
NON-REGIONAL CAPITAL PROJECTSPEEL 0 300 0 300
A 14-2375 BASEMENT FLOODING INVESTIGATION AND REMEDIATION PROGRAM
PEEL 0 200 0 200
A 14-2520 WASTEWATER ASSET MANAGEMENT PROGRAM PEEL 0 500 0 500
6

2014 NEW CAPITAL DETAIL
WASTEWATER
SUMMARY III
2014 Financing Sources and Funding Status ($'000)
Project #Expense
FundingTotal
Project Name
Approved or Pending
External Internal DCA
2014 Funding Status:
2014(A/P)
Ward
A 14-2530 DEVELOPMENT-RELATED WASTEWATER INFRASTRUCTURE PLANNING
PEEL 0 0 250 250
2014Totals for Budget Year: 4,098 56,756 111,435 172,289
7

GrossDescriptionSub Type
Ten Year Combined Capital Program ($'000)
Yrs 6-1020182017201620152014
WASTEWATER
SUMMARY IV
TEN YEAR CAPITAL PLAN
GeneralMiscellaneous works related to the overall regional wastewater system.
10,000 5,000 1,000 1,000 1,000 1,000 1,000UNALLOCATED FUNDS14-2000FUNDING AVAILABLE FOR UNFORESEEN,UNPLANNED OR EMERGENCY WORKS.
3,750 1,875 375 375 375 375 375PRE-ENGINEERING, DESIGN AND RESTORATION WORKS
14-2001
FUNDING FOR PRE-ENGINEERING ANDDESIGN OF WORKS SCHEDULED FORCONSTRUCTION THE FOLLOWING YEARAND FOR RESTORATION WORKS.
500 0 0 0 0 0 500UNDER MAINTENANCE PROJECT COSTS14-2003FUNDING TO COVER COSTS ASSOCIATEDWITH COMPLETED CAPITAL PROJECTSUNDER MAINTENANCE.
900 500 100 100 100 100 0EASEMENT ACQUISITION15-2002FUNDING FOR THE ACQUISITION OFEASEMENTS FOR EXISTING ANDPROPOSED WASTEWATER ASSETS.
10 YearTotals For: General 1,875 1,475 1,475 1,475 1,475 7,375 15,150
Wastewater Treatment Plants and Pumping StationsGrowth and non-growth related works to upgrade, expand or add to newwastewater treatment facilities.
3,126 0 0 0 0 0 3,126PORT CREDIT SEWAGE PUMPING STATION06-2935CONSTRUCTION OF A NEW SEWAGEPUMPING STATION IN THE VICINITYOF LAKESHORE ROAD EAST ANDCOOKSVILLE CREEK. ADDITIONALFUNDS.
8

GrossDescriptionSub Type
Ten Year Combined Capital Program ($'000)
Yrs 6-1020182017201620152014
WASTEWATER
SUMMARY IV
TEN YEAR CAPITAL PLAN
162,817 0 0 0 109,180 27,418 26,219G.E. BOOTH WASTEWATER TREATMENT PLANT EXPANSION
10-2925
EXPANSION OF THE WASTEWATERTREATMENT FACILITY TO INCREASETHE CAPACITY TO 518 ML/D.APPROXIMATELY 16% FUNDED BY YORKREGION.
3,543 0 0 0 0 0 3,543ODOUR CONTROL FACILITIES IN SOUTH MISSISSAUGA
11-2901
CONSTRUCTION OF FOUR NEW ODOURCONTROL FACILITIES IN SOUTHMISSISSAUGA.
4,000 2,500 500 500 500 0 0SEWAGE PUMPING STATIONS - MAJOR MAINTENANCE AND EQUIPMENT REPLACEMENT
14-2903
FUNDING FOR PLANNED MAJORMAINTENANCE AND EQUIPMENTREPLACEMENT AT THE LAKE-BASEDSEWAGE PUMPING STATIONS.
10,000 5,000 1,000 1,000 1,000 1,000 1,000SEWAGE PUMPING STATION REHABILITATION PROGRAM
14-2905
REHABILITATION, UPGRADE ORREPLACEMENT OF SEWAGE PUMPINGSTATIONS IN THE LAKE-BASEDSANITARY COLLECTION SYSTEM.
12,000 5,000 1,000 1,000 1,000 2,000 2,000WASTEWATER TREATMENT FACILITIES - MAJOR MAINTENANCE
14-2906
FUNDING FOR PLANNED MAJORMAINTENANCE AT THE LAKE-BASEDWASTEWATER TREATMENT PLANTS.
18,000 7,500 1,500 1,500 1,500 3,000 3,000WASTEWATER TREATMENT FACILITIES - EQUIPMENT REPLACEMENT
14-2907
FUNDING FOR PLANNED EQUIPMENTREPLACEMENT AT THE LAKE-BASEDWASTEWATER TREATMENT PLANTS.
9

GrossDescriptionSub Type
Ten Year Combined Capital Program ($'000)
Yrs 6-1020182017201620152014
WASTEWATER
SUMMARY IV
TEN YEAR CAPITAL PLAN
5,031 0 625 1,250 1,250 1,250 656G.E. BOOTH MAJOR CAPITAL IMPROVEMENT - PRIMARY TREATMENT
14-2920
RECONSTRUCTION OF THE TRAVELLINGBRIDGES IN THE PRIMARY SETTLINGTANKS. DESIGN IN 2014.
4,313 0 0 1,250 1,250 1,250 563CLARKSON MAJOR CAPITAL IMPROVEMENT - PRIMARY TREATMENT
14-2930
RECONSTRUCTION OF THE TRAVELLINGBRIDGES IN THE PRIMARY SETTLINGTANKS. DESIGN IN 2014.
2,500 0 0 0 0 0 2,500CALEDON EAST SEWAGE PUMPING STATION - REHABILITATION AND EXPANSION
14-2970
REHABILITATION AND EXPANSION OFTHE CALEDON EAST SEWAGE PUMPINGSTATION.
4,500 3,500 0 0 0 1,000 0PROPERTY ACQUISITION FOR LAKE-BASED WASTEWATER FACILITIES
15-2901
FUNDING FOR PROPERTY ACQUISITIONFOR EXISTING AND PROPOSEDLAKE-BASED WASTEWATER TREATMENTFACILITIES AND SEWAGE PUMPINGSTATIONS.
2,070 0 600 600 600 270 0G.E. BOOTH MAJOR CAPITAL IMPROVEMENT - HEADWORKS
15-2921
REPLACEMENT OF THE TRAVELLINGSCREENS IN THE HEADWORKS AT THEG.E. BOOTH WASTEWATER TREATMENTPLANT. DESIGN IN 2015.
1,150 0 500 0 500 150 0G.E. BOOTH MAJOR CAPITAL IMPROVEMENT - DIFFUSERS
15-2922
REPLACEMENT OF THE FINE BUBBLEDIFFUSERS AT THE G.E. BOOTHWASTEWATER TREATMENT PLANT.DESIGN IN 2015.
10

GrossDescriptionSub Type
Ten Year Combined Capital Program ($'000)
Yrs 6-1020182017201620152014
WASTEWATER
SUMMARY IV
TEN YEAR CAPITAL PLAN
1,380 0 0 600 600 180 0CLARKSON MAJOR CAPITAL IMPROVEMENT - HEADWORKS
15-2931
REPLACEMENT OF THE TRAVELLINGSCREENS IN THE HEADWORKS AT THECLARKSON WASTEWATER TREATMENTPLANT. DESIGN IN 2015.
35,904 0 0 0 29,920 5,984 0EAST-TO-WEST DIVERSION SEWAGE PUMPING STATION
15-2971
NEW EAST-TO-WEST SEWAGE PUMPINGSTATION IN THE VICINITY OF DREWROAD AND DIXIE ROAD. DESIGN IN2015.
8,970 4,800 0 3,000 1,170 0 0G.E. BOOTH MAJOR CAPITAL IMPROVEMENT - BIOSOLIDS
16-2923
REPLACEMENT OF THE CENTRIFUGES INTHE BIOSOLIDS BUILDING AT THEG.E. BOOTH WASTEWATER TREATMENTPLANT. DESIGN IN 2016.
9,200 6,000 2,000 1,200 0 0 0G.E. BOOTH MAJOR CAPITAL IMPROVEMENT - INCINERATORS
17-2924
IMPROVEMENT WORKS FOR FOURINCINERATORS AT THE G.E. BOOTHWASTEWATER TREATMENT PLANT.DESIGN IN 2017.
4,600 3,000 1,000 600 0 0 0G.E. BOOTH MAJOR CAPITAL IMPROVEMENT - HEAT EXCHANGERS
17-2925
REPLACEMENT OF THE HEATEXCHANGERS FOR THE FOURINCINERATORS AT THE G.E. BOOTHWASTEWATER TREATMENT PLANT.DESIGN IN 2017.
2,760 1,200 1,200 360 0 0 0CLARKSON MAJOR CAPITAL IMPROVEMENT - BIOSOLIDS
17-2932
REPLACEMENT OF THE CENTRIFUGES INTHE BIOSOLIDS BUILDING AT THECLARKSON WASTEWATER TREATMENTPLANT. DESIGN IN 2017.
11

GrossDescriptionSub Type
Ten Year Combined Capital Program ($'000)
Yrs 6-1020182017201620152014
WASTEWATER
SUMMARY IV
TEN YEAR CAPITAL PLAN
4,600 4,000 600 0 0 0 0G.E. BOOTH MAJOR CAPITAL IMPROVEMENT - EXHAUST SYSTEM
18-2926
REPLACEMENT AND IMPROVEMENTSWORKS FOR THE EXHAUST SYSTEM ATTHE G.E. BOOTH WASTEWATERTREATMENT PLANT. DESIGN IN 2018.
100 100 0 0 0 0 0FUTURE CLARKSON MAJOR CAPITAL IMPROVEMENTS
19-2939
FUTURE MAJOR CAPITAL IMPROVEMENTWORKS AT THE CLARKSON WASTEWATERTREATMENT PLANT.
2,940 2,940 0 0 0 0 0FUTURE ODOUR CONTROL FACILITIES19-2960CONSTRUCTION OF NEW ODOUR CONTROLFACILITIES AT VARIOUS LOCATIONSIN THE REGION OF PEEL.
10 YearTotals For: Treatment Facilities 42,607 43,502 148,470 12,860 10,525 45,540 303,504
Primary Collection System - DevelopmentInstallations of trunk sewers to sustain Peel's growth.
1,875 0 0 0 0 0 1,875BOLTON/BRAMPTON SANITARY TRUNK SEWER TWINNING
08-2235
CONSTRUCTION OF A 1200MM SANITARYTRUNK SEWER ON HIGHWAY 50 FROMCASTLEMORE ROAD TO COLERAINEDRIVE. ADDITIONAL FUNDS.
37,094 0 0 0 0 0 37,094EAST BRAMPTON SANITARY TRUNK SEWER TWINNING (PHASE 1)
11-2201
CONSTRUCTION OF A 1500MM SANITARYTRUNK SEWER FROM HIGHWAY 407 TOQUEEN STREET EAST.
8,545 0 0 0 0 0 8,545ALBION-VAUGHAN ROAD SANITARY TRUNK SEWER
12-2210
CONSTRUCTION OF AN 825MM SANITARYTRUNK SEWER ON ALBION-VAUGHANROAD FROM MAYFIELD ROAD TOWATERBURY STREET. ADDITIONALFUNDS.
12

GrossDescriptionSub Type
Ten Year Combined Capital Program ($'000)
Yrs 6-1020182017201620152014
WASTEWATER
SUMMARY IV
TEN YEAR CAPITAL PLAN
3,476 0 0 0 0 0 3,476FLETCHER'S CREEK SANITARY TRUNK SEWER EXTENSION (PHASE 1)
14-2221
CONSTRUCTION OF A 675MM SANITARYTRUNK SEWER ON WANLESS DRIVE FROMEDENBROOK HILL DRIVE TOCHINGUACOUSY ROAD.
5,788 0 0 0 0 0 5,788FLETCHER'S CREEK SANITARY TRUNK SEWER EXTENSION (PHASE 2)
14-2225
CONSTRUCTION OF A 675MM SANITARYTRUNK SEWER ON CHINGUACOUSY ROADFROM MAYFIELD ROAD TO WANLESSDRIVE.
5,569 0 0 0 0 0 5,569MOUNT PLEASANT SANITARY TRUNK SEWER
14-2229
CONSTRUCTION OF A 675MM SANITARYTRUNK SEWER ON THE FUTUREBRISDALE DRIVE FROM WANLESS DRIVETO MAYFIELD ROAD, WEST OFCHINGUACOUSY ROAD.
58,968 0 0 40,234 7,047 11,687 0EAST-TO-WEST DIVERSION FORCEMAIN/SANITARY TRUNK SEWER
15-2271
FROM EAST OF HIGHWAY 410 ANDHIGHWAY 407 TO WEST OF HIGHWAY407 AND MAIN STREET AND EXTENSIONTO EXISTING CREDIT VALLEY TRUNKSEWER AT EAST OF CREDITVIEW ROADAND HIGHWAY 401. DESIGN IN2015.
13,771 0 10,593 3,178 0 0 0NORTHWEST BRAMPTON SANITARY TRUNK SEWER (PHASE 2)
17-2221
CONSTRUCTION OF A 750MM SANITARYTRUNK SEWER ON A FUTURE STREETFROM HERITAGE ROAD SOUTHEASTERLYTO MISSISSAUGA ROAD. DESIGN IN2017.
13

GrossDescriptionSub Type
Ten Year Combined Capital Program ($'000)
Yrs 6-1020182017201620152014
WASTEWATER
SUMMARY IV
TEN YEAR CAPITAL PLAN
3,341 0 2,570 771 0 0 0NORTHWEST BRAMPTON SANITARY TRUNK SEWER (PHASE 1)
17-2226
CONSTRUCTION OF A 1050MM SANITARYTRUNK SEWER ON THE FUTURESANDALWOOD PARKWAY FROMMISSISSAUGA ROAD TO APPROXIMATELY300 METRES WESTERLY. DESIGN IN2017.
4,749 0 4,192 557 0 0 0ALBION-VAUGHAN ROAD SANITARY TRUNK SEWER
17-2280
CONSTRUCTION OF A 750MM SANITARYTRUNK SEWER ON ALBION-VAUGHANROAD FROM WATERBURY STREET TOQUEENSGATE BOULEVARD. DESIGN IN2017.
23,456 18,234 5,222 0 0 0 0EAST BRAMPTON SANITARY TRUNK SEWER TWINNING (PHASE 2)
18-2261
CONSTRUCTION OF A 1500MM SANITARYTRUNK SEWER FROM HIGHWAY 407 TOSOUTH OF STEELES AVENUE EAST.DESIGN IN 2018.
55,539 55,539 0 0 0 0 0FUTURE PRIMARY COLLECTION SYSTEM PROJECTS
19-2299
ALLOCATION OF FUNDING FOR PRIMARYCOLLECTION SYSTEM PROJECTS IN THESIXTH YEAR OR LATER OF THEREGION'S CAPITAL PLAN FOR THEWASTEWATER PROGRAM.
10 YearTotals For: WWP-Development 62,347 11,687 7,047 44,740 22,577 73,773 222,171
Local Trunk Collection System - DevelopmentInstallations of subtrunk sewers to sustain Peel's growth.
1,200 0 0 0 0 0 1,200600MM SANITARY SEWER - FUTURE FINANCIAL DRIVE (BRAM WEST)
08-2145
FROM MISSISSAUGA ROAD TOAPPROXIMATELY 930 METRESWESTERLY. ADDITIONAL FUNDS.
14

GrossDescriptionSub Type
Ten Year Combined Capital Program ($'000)
Yrs 6-1020182017201620152014
WASTEWATER
SUMMARY IV
TEN YEAR CAPITAL PLAN
1,033 0 0 0 0 0 1,033525MM SANITARY SEWER - FUTURE RIVERMONT ROAD
11-2102
FROM EMBLETON ROAD SOUTHEASTERLYTO THE FUTURE FINANCIAL DRIVE.ADDITIONAL FUNDS.
1,199 0 0 0 0 0 1,199525MM SANITARY SEWER - TORBRAM ROAD
11-2103
FROM COUNTRYSIDE DRIVE TOAPPROXIMATELY 620 METRESNORTHERLY.
2,127 0 0 0 0 0 2,127375MM SANITARY SEWER - EAST-WEST SPINE ROAD (MOUNT PLEASANT)
14-2121
FROM CHINGUACOUSY ROAD TOAPPROXIMATELY 1000 METRESWESTERLY, NORTH OF WANLESS DRIVE.
571 0 0 0 0 0 571375MM SANITARY SEWER - FUTURE STREET (MOUNT PLEASANT)
14-2124
FROM WANLESS DRIVE TOAPPROXIMATELY 365 METRESNORTHERLY, WEST OF CREDITVIEWROAD.
3,346 0 0 0 0 0 3,346375MM SANITARY SEWER - FUTURE STREET (HUTTONVILLE NORTH)
14-2131
FROM MISSISSAUGA ROAD TOAPPROXIMATELY 600 METRESWESTERLY, NORTH OF OSTRANDERBOULEVARD.
1,818 0 0 0 0 0 1,818375MM SANITARY SEWER - FUTURE STREET (COUNTRYSIDE VILLAGES)
14-2165
FROM HEART LAKE ROAD EASTERLY TOHIGHWAY 410, NORTH OF COUNTRYSIDEDRIVE.
1,843 0 0 0 0 0 1,843600MM SANITARY SEWER - CLARKWAY DRIVE (HIGHWAY 427 INDUSTRIAL)
14-2170
FROM COUNTRYSIDE DRIVE TOAPPROXIMATELY 670 METRESNORTHERLY.
15

GrossDescriptionSub Type
Ten Year Combined Capital Program ($'000)
Yrs 6-1020182017201620152014
WASTEWATER
SUMMARY IV
TEN YEAR CAPITAL PLAN
2,507 0 0 0 2,087 420 0450MM SANITARY SEWER - MAYFIELD ROAD
15-2135
FROM CHINGUACOUSY ROAD TOAPPROXIMATELY 1000 METRESEASTERLY. DESIGN IN 2015.
3,934 0 0 0 3,278 656 0600MM SANITARY SEWER - CHINGUACOUSY ROAD
15-2141
FROM MAYFIELD ROAD TOAPPROXIMATELY 1000 METRESNORTHERLY. DESIGN IN 2015.
795 0 0 0 662 133 0375MM SANITARY SEWER - WEBB DRIVE (MISSISSAUGA CITY CENTRE)
15-2151
FROM CONFEDERATION PARKWAY TOREDMOND DRIVE. DESIGN IN 2015.
1,994 0 0 0 0 1,994 0375MM SANITARY SEWER - FUTURE STREET (COUNTRYSIDE VILLAGES)
15-2161
FROM BRAMALEA ROAD NORTHWESTERLYTO MAYFIELD ROAD.
1,566 0 0 0 0 1,566 0375MM SANITARY SEWER - FUTURE STREET (COUNTRYSIDE VILLAGES)
15-2162
FROM MAYFIELD ROAD TOAPPROXIMATELY 800 METRESSOUTHERLY, EAST OF DIXIE ROAD.
2,000 0 0 0 0 2,000 0525MM SANITARY SEWER - FUTURE STREET (COUNTRYSIDE VILLAGES)
15-2163
FROM AIRPORT ROAD TOAPPROXIMATELY 1200 METRESNORTHWESTERLY, SOUTH OF MAYFIELDROAD.
2,078 0 0 0 1,774 304 0375MM SANITARY SEWER - KENNEDY ROAD
15-2167
FROM MAYFIELD ROAD TOAPPROXIMATELY 1000 METRESSOUTHERLY. DESIGN IN 2015.
16

GrossDescriptionSub Type
Ten Year Combined Capital Program ($'000)
Yrs 6-1020182017201620152014
WASTEWATER
SUMMARY IV
TEN YEAR CAPITAL PLAN
928 0 0 0 0 928 0375MM SANITARY SEWER - FUTURE STREET (HIGHWAY 427 INDUSTRIAL)
15-2171
FROM CLARKWAY DRIVE TOAPPROXIMATELY 610 METRESEASTERLY, NORTH OF CASTLEMOREROAD.
1,357 0 0 0 1,357 0 0375MM SANITARY SEWER - FUTURE STREET (MOUNT PLEASANT)
16-2143
FROM MAYFIELD ROAD TOAPPROXIMATELY 600 METRESSOUTHERLY, WEST OF MCLAUGHLINROAD.
1,248 0 0 0 1,248 0 0525MM SANITARY SEWER - FUTURE STREET (COUNTRYSIDE VILLAGES)
16-2164
FROM TORBRAM ROAD TOAPPROXIMATELY 750 METRE WESTERLY,NORTH OF COUNTRYSIDE DRIVE.
1,600 0 0 0 1,600 0 0450MM SANITARY SEWER - FUTURE STREET (COUNTRYSIDE VILLAGES)
16-2167
FROM MAYFIELD ROAD TOAPPROXIMATELY 760 METRESSOUTHEASTERLY, WEST OF AIRPORTROAD.
1,410 0 0 1,174 236 0 0450MM SANITARY SEWER - NUNNEVILLE ROAD (BOLTON)
16-2181
FROM ALBION-VAUGHAN ROAD TORIVERWOOD TRAIL. DESIGN IN 2016.
1,160 0 0 966 194 0 0525MM SANITARY SEWER - ALBION VAUGHAN ROAD (BOLTON)
16-2182
FROM QUEENSGATE BOULEVARD TONUNNEVILLE ROAD. DESIGN IN 2016.
1,126 0 0 898 228 0 0450MM SANITARY SEWER - QUEENSGATE BOULEVARD (BOLTON)
16-2184
FROM LANDSBRIDGE STREET TOALBION-VAUGHAN ROAD. DESIGN IN2016.
17

GrossDescriptionSub Type
Ten Year Combined Capital Program ($'000)
Yrs 6-1020182017201620152014
WASTEWATER
SUMMARY IV
TEN YEAR CAPITAL PLAN
1,348 0 0 1,348 0 0 0375MM SANITARY SEWER - FUTURE STREET (BRAM WEST)
17-2123
FROM HERITAGE ROAD TOAPPROXIMATELY 690 METRESNORTHWESTERLY, NORTH OF STEELESAVENUE WEST.
2,298 0 0 2,298 0 0 0450MM SANITARY SEWER - FUTURE STREET (COUNTRYSIDE VILLAGES)
17-2168
FROM MAYFIELD ROAD TOAPPROXIMATELY 1200 METRESSOUTHEASTERLY, EAST OF BRAMALEAROAD.
1,171 0 0 1,171 0 0 0375MM SANITARY SEWER - FUTURE STREET (HIGHWAY 427 INDUSTRIAL)
17-2172
FROM THE GORE ROAD TOAPPROXIMATELY 710 METRESNORTHEASTERLY, NORTH OFCASTLEMORE ROAD.
512 0 392 120 0 0 0375MM SANITARY SEWER - SANT FARM DRIVE (BOLTON)
17-2182
FROM HARVESTVIEW SEWAGE PUMPINGSTATION WESTERLY TO SANT FARMDRIVE AND SOUTHERLY TO QUEENSGATEBOULEVARD. DESIGN IN 2017.
1,334 0 1,334 0 0 0 0525MM SANITARY SEWER - FUTURE STREET (BRAM WEST)
18-2128
FROM HERITAGE ROAD SOUTHEASTERLYTO EMBLETON ROAD.
1,786 1,488 298 0 0 0 0525MM SANITARY SEWER - COUNTRYSIDE DRIVE
18-2173
FROM CLARKWAY DRIVE TOAPPROXIMATELY 730 METRESEASTERLY. DESIGN IN 2018.
506 0 506 0 0 0 0375MM SANITARY SEWER - RIVERWOOD TRAIL (BOLTON)
18-2185
FROM NUNNEVILLE ROAD TOAPPROXIMATELY 300 METRES WESTERLY.
18

GrossDescriptionSub Type
Ten Year Combined Capital Program ($'000)
Yrs 6-1020182017201620152014
WASTEWATER
SUMMARY IV
TEN YEAR CAPITAL PLAN
25,117 25,117 0 0 0 0 0FUTURE LOCAL COLLECTION SYSTEM PROJECTS
19-2199
FUNDING FOR LOCAL COLLECTIONSYSTEM PROJECTS IN THE SIXTH YEAROR LATER OF THE REGION'S CAPITALPLAN FOR THE WASTEWATER PROGRAM.
10 YearTotals For: WWL-Development 13,137 8,001 12,664 7,975 2,530 26,605 70,912
Primary Collection System - Improvements and UpgradesReplacements, repairs and upgrades related to primary collection system.
12,536 0 0 0 0 0 12,536HARBORN ROAD AND QUEENSWAY SANITARY TRUNK SEWERS
10-2425
TWINNING OF THE HARBORN ROAD ANDTHE QUEENSWAY SANITARY TRUNKSEWERS.
7,000 3,500 700 700 700 700 700PERMANENT FLOW MONITORING PROGRAM
14-2401
INSTALLATION, OPERATION ANDMAINTENANCE OF PERMANENT FLOWMONITORS FOR THE REGION'SLAKE-BASED SANITARY COLLECTIONSYSTEM.
1,024 0 0 0 0 0 1,024FLETCHER'S CREEK SANITARY TRUNK SEWER REHABILITATION
14-2429
REHABILITATION OF THE FLETCHER'SCREEK SANITARY TRUNK SEWER, NORTHAND SOUTH OF SANDALWOOD PARKWAY,INCLUDING SEALING AND RELINING.
4,500 2,500 500 500 500 500 0SANITARY TRUNK SEWER INSPECTION AND CONDITION ASSESSMENT PROGRAM
15-2405
INSPECTION, CLEANING ANDCONDITION ASSESSMENT OF THELAKE-BASED PRIMARY COLLECTIONSYSTEM.
19

GrossDescriptionSub Type
Ten Year Combined Capital Program ($'000)
Yrs 6-1020182017201620152014
WASTEWATER
SUMMARY IV
TEN YEAR CAPITAL PLAN
10,000 0 0 0 5,000 5,000 0CREDIT VALLEY SANITARY TRUNK SEWER REHABILITATION
15-2412
REHABILITATION OF THE CREDITVALLEY SANITARY TRUNK SEWER FROMBRITANNIA ROAD WEST TO DUNDASSTREET WEST.
4,924 0 0 0 0 4,924 0EAST BRAMPTON SANITARY TRUNK SEWER RELINING
15-2430
RELINING OF THE 1350MM SANITARYTRUNK SEWER FROM GOREWAY DRIVE TOTHE CNR.
10 YearTotals For: WWP-Imp. & Upgrades 14,260 11,124 6,200 1,200 1,200 6,000 39,984
Local Collection System - Improvements and UpgradesReplacements, repairs and upgrades related to local collection system.
200,000 100,000 20,000 20,000 20,000 20,000 20,000LINEAR INFRASTRUCTURE REMEDIATION AND UPGRADES
14-2300
FUNDING FOR FUTURE SANITARY SEWERREPAIRS, REPLACEMENTS ANDRELINING INCLUDING ALIGNMENT OFPROJECTS WITH AREA MUNICIPALITIESAND OTHER DIVISIONS.
50,000 25,000 5,000 5,000 5,000 5,000 5,000IMPLEMENTATION PROGRAM FOR INFLOW AND INFILTRATION REMEDIATION
14-2301
FUNDING FOR THE IMPLEMENTATION OFREMEDIATION MEASURES TO REDUCEINFLOW AND INFILTRATION INTO THEREGION'S SANITARY SEWER SYSTEM.
23,000 10,000 2,000 2,000 2,000 2,000 5,000REPLACEMENT OF SEWAGE PUMPING STATIONS WITH GRAVITY SEWERS
14-2305
CONSTRUCTION OF SANITARY SEWERSTO BY-PASS AND REPLACE EXISTINGSEWAGE PUMPING STATIONS.
20

GrossDescriptionSub Type
Ten Year Combined Capital Program ($'000)
Yrs 6-1020182017201620152014
WASTEWATER
SUMMARY IV
TEN YEAR CAPITAL PLAN
26,500 11,000 3,000 3,000 3,000 3,000 3,500INSPECTION AND CONDITION ASSESSMENT OF THE LAKE-BASED SANITARY COLLECTION SYSTEM
14-2306
INSPECTION AND CONDITIONASSESSMENT OF SANITARY SEWERS,SEWER LATERALS, OVERFLOWS, FORCEMAINS AND SEWAGE PUMPING STATIONS.
10 YearTotals For: WWL-Imp. & Upgrades 33,500 30,000 30,000 30,000 30,000 146,000 299,500
Wastewater StudiesWastewater studies, Environmental Assessment and Planning.
750 0 250 0 250 0 250HYDRAULIC WASTEWATER MODEL UPDATE
14-2502
CALIBRATION AND UPDATE OF THEREGION'S HYDRAULIC WASTEWATERMODEL.
2,500 1,000 0 0 1,000 0 500WASTEWATER SERVICING MASTER PLAN UPDATE
14-2504
REVIEW AND UPDATE OF THE REGIONOF PEEL'S WASTEWATER SERVICINGMASTER PLAN FOR THE LAKE-BASEDWASTEWATER COLLECTION SYSTEM.
10,000 5,000 1,000 1,000 1,000 1,000 1,000INFLOW AND INFILTRATION REMEDIATION PROGRAM
14-2512
COLLECTION AND ANALYSIS OF DATAAND DEVELOPMENT OF SOLUTIONS TOREDUCE INFLOW AND INFILTRATION INTHE SANITARY COLLECTION SYSTEM.
100 50 0 0 50 0 0YORK-PEEL CAPITAL INFRASTRUCTURE STUDY
16-2503
VALIDATION OF THE REPLACEMENTCOSTS FOR WATER AND WASTEWATERCAPITAL INFRASTRUCTURE SHARED BYPEEL AND YORK REGIONS.
21

GrossDescriptionSub Type
Ten Year Combined Capital Program ($'000)
Yrs 6-1020182017201620152014
WASTEWATER
SUMMARY IV
TEN YEAR CAPITAL PLAN
251 0 0 251 0 0 0MCVEAN SEWAGE PUMPING STATION AND FORCE MAIN - CLASS EA
17-2552
CLASS EA FOR THE EXPANSION OF THEMCVEAN SEWAGE PUMPING STATION ANDTWINNING OF THE FORCEMAIN FROMTHE SEWAGE PUMPING STATION TOGOREWAY DRIVE.
250 0 0 250 0 0 0EAST BRAMPTON SANITARY TRUNK SEWER TWINNING (PHASE 2) - CLASS EA
17-2561
CLASS EA FOR THE TWINNING OF THESANITARY TRUNK SEWER FROM AIRPORTROAD TO SOUTH OF STEELES AVENUEEAST.
500 500 0 0 0 0 0FUTURE WASTEWATER STUDIES PROJECTS
19-2599
FUNDING FOR WASTEWATER STUDIES INTHE SIXTH YEAR OR LATER OF THEREGION'S CAPITAL PLAN FOR THEWASTEWATER PROGRAM.
10 YearTotals For: Wastewater Studies 1,750 1,000 2,300 1,501 1,250 6,550 14,351
Communal Sewage SystemsReplacements, upgrades, and new facilities related to ground-basedwastewater systems.
1,563 0 0 0 0 0 1,563INGLEWOOD WASTEWATER TREATMENT PLANT UPGRADES
09-2920
IMPROVEMENTS AND UPGRADES TO THEINGLEWOOD WASTEWATER TREATMENTPLANT. ADDITIONAL FUNDS.
10 YearTotals For: Communal Sewage 1,563 0 0 0 0 0 1,563
Operating Capital
22

GrossDescriptionSub Type
Ten Year Combined Capital Program ($'000)
Yrs 6-1020182017201620152014
WASTEWATER
SUMMARY IV
TEN YEAR CAPITAL PLAN
3,000 1,500 300 300 300 300 300MUNICIPAL COORDINATION FOR NON-REGIONAL CAPITAL PROJECTS
14-2004
FUNDING FOR REGIONAL STAFF TOCOORDINATE WITH THE AREAMUNICIPALITIES ON NON-REGIONALCAPITAL PROJECTS.
2,000 1,000 200 200 200 200 200BASEMENT FLOODING INVESTIGATION AND REMEDIATION PROGRAM
14-2375
HOUSEHOLD DRAINAGE SURVEY ANDSUBSIDY PROGRAM FOR BASEMENTFLOODING INVESTIGATION ANDREMEDIATION.
5,000 2,500 500 500 500 500 500WASTEWATER ASSET MANAGEMENT PROGRAM
14-2520
FUNDING FOR THE DEVELOPMENT OFASSET MANAGEMENT PROCESSES ANDPROGRAMS AND SUPPORTING TOOLS ANDDATA COLLECTION TO SUPPORT ASSETMANAGEMENT OF THE REGION'SWASTEWATER INFRASTRUCTURE.
2,500 1,250 250 250 250 250 250DEVELOPMENT-RELATED WASTEWATER INFRASTRUCTURE PLANNING
14-2530
FUNDING FOR WASTEWATERINFRASTRUCTURE PLANNING ANDSTUDIES RELATED TO DEVELOPMENT.
10 YearTotals For: Operating Capital 1,250 1,250 1,250 1,250 1,250 6,250 12,500
Totals for 10 Year Capital Plan: 172,289 108,039 209,406 101,001 70,807 318,093 979,635
23

SUMMARY VWASTEWATER PROGRAM
OUTPUT AND OUTCOME MEASURES
Output/Outcome Measures 2013 Target 2013 Projection 2014 Target Commentary
Main line blockages per 100km of pipe N/A N/A <10
Meeting sewer flushing and condition assessment targets is instrumental in reducing backups. Target is based on historical averages and continuous improvement objectives.
Customer Satisfacton Rating N/A N/A 90 per cent Based on survey card returns and received responses and 3 year average.
Number of Odour complaints @ WWTP per 1,000 people served for WWTP
< 1 per cent
0.009 complaints which is < 1
per cent
< 1 per centThe number of odour complaints is expected to fall within the desired target range for 2013.
24

OPERATIONS SUPPORT – UTILITY RATE SUPPORTED
PROGRAM BUDGET SUMMARY
Summary I: N/A
Summary II: N/A
Summary III: 2014 New Capital
Summary IV: Ten Year Capital Plan
Summary V: N/A

THIS PAGE INTENTIONALLY LEFT BLANK

2014 NEW CAPITAL DETAIL
OPERATIONS SUPPORT (UTILITY RATE-SUPPORTED)
SUMMARY III
2014 Financing Sources and Funding Status ($'000)
Project #Expense
FundingTotal
Project Name
Approved or Pending
External Internal DCA
2014 Funding Status:
2014(A/P)
Ward
Vehicle and Equipment ReplacementA 13-9050 WOLFEDALE YARD EXPANSION 0 8,500 0 8,500
Meter OperationsA 11-7900 COMMERCIAL WATER METER REPLACEMENT PEEL 0 200 0 200
A 14-7910 RESIDENTIAL WATER METER REPLACEMENT 0 2,415 0 2,415
A 14-7930 METER READING EQUIPMENT 0 220 0 220
2014Totals for Budget Year: 0 11,335 0 11,335
1

GrossDescriptionSub Type
Ten Year Combined Capital Program ($'000)
Yrs 6-1020182017201620152014
OPERATIONS SUPPORT (UTILITY RATE-SUPPORTED)
SUMMARY IV
TEN YEAR CAPITAL PLAN
Vehicle and Equipment ReplacementPublic Works asset replacement requirements for vehicles and outsideequipment. Funded by reserve contributions which are determined byCouncil approved policy. Contributions are based on a multi-yearfinancial model incorporating asset inventory, asset life assumptions,replacement costs, depreciation, salvage(auction) values and fundinterest assumptions.
8,500 0 0 0 0 0 8,500WOLFEDALE YARD EXPANSION13-9050EXPANSION OF WOLFEDALE ROADFACILITY TO ACCOMMODATE GROWTH INFACILITY REQUIREMENTS FOR PWPROGRAMS...INCLUDES RENOVATIONSTO OFFICE SPACE, EXPANSIONS TOPARKING GARAGE AS WELL AS FLEETREPAIR GARAGE AND WASHBAYS.
10 YearTotals For: PWISER 8,500 0 0 0 0 0 8,500
Operating Capital
7,580 4,100 840 860 880 900 0WATER EFFICIENCY STRATEGY12-1585THE REGION OF PEEL'S WATEREFFICIENCY STRATEGY PROMOTES THEEFFICIENT USE OF WATER BY PEELRESIDENTS AND BUSINESSES THROUGHSPECIFIC WATER EFFICIENCYMEASURES. THE OBJECTIVES OF THEWATER EFFICIENCY STRATEGY (WES)ARE TO: REDUCE PEAK WATERDEMANDS, MEET LEGISLATIONREQUIREMENTS AND GOALS FOR WATEREFFICIENCY, KEEP REGIONALRESIDENTIAL PER CAPITA WATER
DEMANDS IN LINE WITH OTHERLEADING GTA MUNICIPALITIES, HELP
10 YearTotals For: Operating Capital 0 900 880 860 840 4,100 7,580
Meter Operations
2

GrossDescriptionSub Type
Ten Year Combined Capital Program ($'000)
Yrs 6-1020182017201620152014
OPERATIONS SUPPORT (UTILITY RATE-SUPPORTED)
SUMMARY IV
TEN YEAR CAPITAL PLAN
2,000 1,000 200 200 200 200 200COMMERCIAL WATER METER REPLACEMENT
11-7900
REPLACEMENT OF OBSOLETECOMMERCIAL WATER METERS.
25,057 16,187 1,090 1,214 2,012 2,139 2,415RESIDENTIAL WATER METER REPLACEMENT
14-7910
REPLACEMENT OF OBSOLETERESIDENTIAL WATER METERS.
440 0 220 0 0 0 220METER READING EQUIPMENT14-7930WATER METERS ARE READ BY STAFFUSING HANDHELD READING EQUIPMENT. THIS EQUIPMENT WILL HAVE BECOMEUNRELIABLE/UNSUPPORTED AND ISCOMING TO THE END OF ITS LIFEEXPECTANCY. THEREFORE, THERE ISA NEED TO UPGRADE THIS HANDHELDMETER READING EQUIPMENT (CEHANDHELDS AND READING PROBES).ALSO NEED TO OBTAIN NEW DRIVE BYCOMPUTER SOFTWARE TO BE INSTALLEDIN A VEHICLE TO REMOTELY READ RF
(REMOTE FREQUENCY) WATER METERSVIA CAR.
10 YearTotals For: Meter Operations 2,835 2,339 2,212 1,414 1,510 17,187 27,497
Totals for 10 Year Capital Plan: 11,335 3,239 3,092 2,274 2,350 21,287 43,577
3