Orange-Peel-Derived Carbon: Designing Sustainable and ...
17
Journal of Carbon Research C Article Orange-Peel-Derived Carbon: Designing Sustainable and High-Performance Supercapacitor Electrodes C. K. Ranaweera 1 , P. K. Kahol 2 , M. Ghimire 3 , S. R. Mishra 3 and Ram K. Gupta 1, * 1 Department of Chemistry, Pittsburg State University, Pittsburg, KS 66762, USA; [email protected] 2 Department of Physics, Pittsburg State University, Pittsburg, KS 66762, USA; [email protected] 3 Department of Physics, The University of Memphis, Memphis, TN 38152, USA; [email protected] (M.G.); [email protected] (S.R.M.) * Correspondence: [email protected]; Tel.: +1-620-235-4763 Received: 27 July 2017; Accepted: 7 August 2017; Published: 8 August 2017 Abstract: Interconnected hollow-structured carbon was successfully prepared from a readily available bio-waste precursor (orange peel) by pyrolysis and chemical activation (using KOH), and demonstrated its potential as a high-performing electrode material for energy storage. The surface area and pore size of carbon were controlled by varying the precursor carbon to KOH mass ratio. The specific surface area significantly increased with the increasing amount of KOH, reaching a specific surface area of 2521 m 2 /g for a 1:3 mass ratio of precursor carbon/KOH. However, a 1:1 mass ratio of precursor carbon/KOH displayed the optimum charge storage capacitance of 407 F/g, owing to the ideal combination of micro- and mesopores and a higher degree of graphitization. The capacitive performance varied with the electrolyte employed. The orange-peel-derived electrode in KOH electrolyte displayed the maximum capacitance and optimum rate capability. The orange-peel-derived electrode maintained above 100% capacitance retention during 5000 cyclic tests and identical charge storage over different bending status. The fabricated supercapacitor device delivered high energy density (100.4 μWh/cm 2 ) and power density (6.87 mW/cm 2 ), along with improved performance at elevated temperatures. Our study demonstrates that bio-waste can be easily converted into a high-performance and efficient energy storage device by employing a carefully architected electrode—electrolyte system. Keywords: activated carbon; bio-waste; energy storage; orange peel; supercapacitor 1. Introduction Supercapacitors or electrical double-layer capacitors (EDLCs) are one of the advanced energy storage devices that have been drawing significant attention lately because of their unique advantages such as pulse power supply, rapid charging time, outstanding service life, and operational safety [1,2]. Supercapacitors are emerging as a substitute power source over conventional batteries for a wide range of applications in electrical vehicles, portable electronics, and energy harvesting systems [3,4]. Accumulation of charges on the electrode/electrolyte interface leads to electrical energy storage in EDLCs. Therefore, an electrode with a larger surface area is necessary to maximize the charge storage capacity. So far, various forms of carbons including grapheme [5], carbon nanotubes (CNT) [6], carbon nanofibers [7], and carbon nanospheres [8] have been exploited for supercapacitor applications due to their exceptional electrochemical and physical properties. Tedious synthesis processes and the relatively high cost of these carbon allotropes limit their extensive use in commercial energy storage devices. In contrast, activated carbon represents a cost-effective and facile synthesis process for carbon-based electrodes compared to more advanced carbon allotropes. Activated carbon with a C 2017, 3, 25; doi:10.3390/c3030025 www.mdpi.com/journal/carbon
-
Upload
khangminh22 -
Category
Documents
-
view
1 -
download
0
Transcript of Orange-Peel-Derived Carbon: Designing Sustainable and ...

Journal of
Carbon Research C
Article
Orange-Peel-Derived Carbon: Designing Sustainableand High-Performance Supercapacitor Electrodes
C. K. Ranaweera 1, P. K. Kahol 2, M. Ghimire 3, S. R. Mishra 3 and Ram K. Gupta 1,*1 Department of Chemistry, Pittsburg State University, Pittsburg, KS 66762, USA;
[email protected] Department of Physics, Pittsburg State University, Pittsburg, KS 66762, USA; [email protected] Department of Physics, The University of Memphis, Memphis, TN 38152, USA;
[email protected] (M.G.); [email protected] (S.R.M.)* Correspondence: [email protected]; Tel.: +1-620-235-4763
Received: 27 July 2017; Accepted: 7 August 2017; Published: 8 August 2017
Abstract: Interconnected hollow-structured carbon was successfully prepared from a readilyavailable bio-waste precursor (orange peel) by pyrolysis and chemical activation (using KOH),and demonstrated its potential as a high-performing electrode material for energy storage. The surfacearea and pore size of carbon were controlled by varying the precursor carbon to KOH mass ratio.The specific surface area significantly increased with the increasing amount of KOH, reaching aspecific surface area of 2521 m2/g for a 1:3 mass ratio of precursor carbon/KOH. However, a 1:1 massratio of precursor carbon/KOH displayed the optimum charge storage capacitance of 407 F/g,owing to the ideal combination of micro- and mesopores and a higher degree of graphitization.The capacitive performance varied with the electrolyte employed. The orange-peel-derivedelectrode in KOH electrolyte displayed the maximum capacitance and optimum rate capability.The orange-peel-derived electrode maintained above 100% capacitance retention during 5000 cyclictests and identical charge storage over different bending status. The fabricated supercapacitor devicedelivered high energy density (100.4 µWh/cm2) and power density (6.87 mW/cm2), along withimproved performance at elevated temperatures. Our study demonstrates that bio-waste can beeasily converted into a high-performance and efficient energy storage device by employing a carefullyarchitected electrode—electrolyte system.
Keywords: activated carbon; bio-waste; energy storage; orange peel; supercapacitor
1. Introduction
Supercapacitors or electrical double-layer capacitors (EDLCs) are one of the advanced energystorage devices that have been drawing significant attention lately because of their unique advantagessuch as pulse power supply, rapid charging time, outstanding service life, and operational safety [1,2].Supercapacitors are emerging as a substitute power source over conventional batteries for a widerange of applications in electrical vehicles, portable electronics, and energy harvesting systems [3,4].Accumulation of charges on the electrode/electrolyte interface leads to electrical energy storage inEDLCs. Therefore, an electrode with a larger surface area is necessary to maximize the charge storagecapacity. So far, various forms of carbons including grapheme [5], carbon nanotubes (CNT) [6], carbonnanofibers [7], and carbon nanospheres [8] have been exploited for supercapacitor applications dueto their exceptional electrochemical and physical properties. Tedious synthesis processes and therelatively high cost of these carbon allotropes limit their extensive use in commercial energy storagedevices. In contrast, activated carbon represents a cost-effective and facile synthesis process forcarbon-based electrodes compared to more advanced carbon allotropes. Activated carbon with a
C 2017, 3, 25; doi:10.3390/c3030025 www.mdpi.com/journal/carbon
C 2017, 3, 25 2 of 17
highly porous structure offers a larger surface area for electrolyte ion adsorption and electrostaticdouble layer formation, which enhances the capacity.
Currently, the scarcity of petrochemical feedstock and environmental issues have driven thefocus towards sustainable and renewable resources for energy generation and storage. Therefore,converting bio-waste into useful carbon material is gathering more and more attention. Bamboo [9],corncob residue [10], sugarcane bagasse [11], waste tea leaves [12], rice bran [13], plant leaves [14],and banana peel [15] have been utilized as precursors to prepare activated carbon for electrodes insupercapacitors. Preparation of activated carbons involves two processes: pyrolysis of the precursorin an inert environment, accompanied by chemical or physical activation at a higher temperature.Steam [16] and carbon dioxide [17] are the main physical activators. Chemical activation agents such asKOH [18], NaOH [19], H3PO4 [20], and ZnCl2 [21] have been employed to introduce porosity to carbonfor numerous applications. Among them, KOH is the most attractive chemical reagent for the activationprocess of carbon used in supercapacitors, because it produces high carbon yield, high porosity, precisepore size distribution, and ultrahigh surface area (~1 mL/g and ~3000 m2/g) [22,23]. Apart fromthe surface area and pore characteristics, the charge storage capacity of a supercapacitor dependson the surface functionality. Incorporation of a surface functional group containing oxygen [24],nitrogen [25], and sulfur [26] can induce pseudocapacitive behavior and increase wettability to improvethe capacitance.
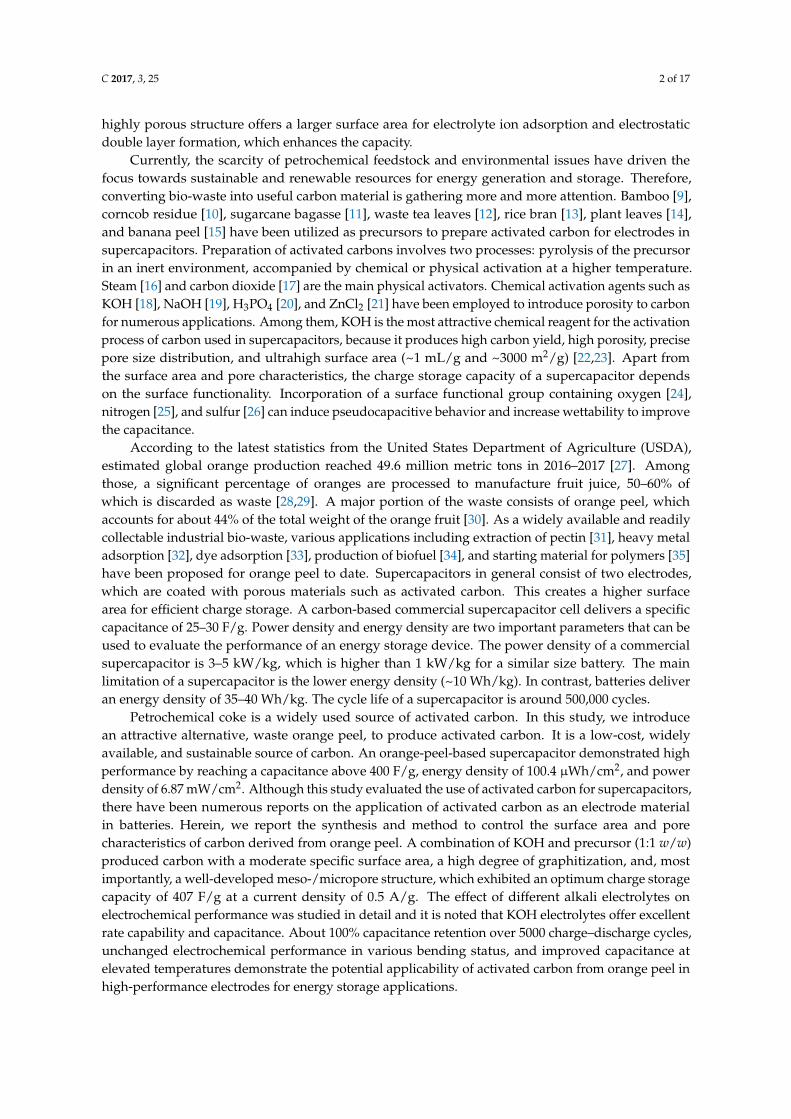
According to the latest statistics from the United States Department of Agriculture (USDA),estimated global orange production reached 49.6 million metric tons in 2016–2017 [27]. Amongthose, a significant percentage of oranges are processed to manufacture fruit juice, 50–60% ofwhich is discarded as waste [28,29]. A major portion of the waste consists of orange peel, whichaccounts for about 44% of the total weight of the orange fruit [30]. As a widely available and readilycollectable industrial bio-waste, various applications including extraction of pectin [31], heavy metaladsorption [32], dye adsorption [33], production of biofuel [34], and starting material for polymers [35]have been proposed for orange peel to date. Supercapacitors in general consist of two electrodes,which are coated with porous materials such as activated carbon. This creates a higher surfacearea for efficient charge storage. A carbon-based commercial supercapacitor cell delivers a specificcapacitance of 25–30 F/g. Power density and energy density are two important parameters that can beused to evaluate the performance of an energy storage device. The power density of a commercialsupercapacitor is 3–5 kW/kg, which is higher than 1 kW/kg for a similar size battery. The mainlimitation of a supercapacitor is the lower energy density (~10 Wh/kg). In contrast, batteries deliveran energy density of 35–40 Wh/kg. The cycle life of a supercapacitor is around 500,000 cycles.
Petrochemical coke is a widely used source of activated carbon. In this study, we introducean attractive alternative, waste orange peel, to produce activated carbon. It is a low-cost, widelyavailable, and sustainable source of carbon. An orange-peel-based supercapacitor demonstrated highperformance by reaching a capacitance above 400 F/g, energy density of 100.4 µWh/cm2, and powerdensity of 6.87 mW/cm2. Although this study evaluated the use of activated carbon for supercapacitors,there have been numerous reports on the application of activated carbon as an electrode materialin batteries. Herein, we report the synthesis and method to control the surface area and porecharacteristics of carbon derived from orange peel. A combination of KOH and precursor (1:1 w/w)produced carbon with a moderate specific surface area, a high degree of graphitization, and, mostimportantly, a well-developed meso-/micropore structure, which exhibited an optimum charge storagecapacity of 407 F/g at a current density of 0.5 A/g. The effect of different alkali electrolytes onelectrochemical performance was studied in detail and it is noted that KOH electrolytes offer excellentrate capability and capacitance. About 100% capacitance retention over 5000 charge–discharge cycles,unchanged electrochemical performance in various bending status, and improved capacitance atelevated temperatures demonstrate the potential applicability of activated carbon from orange peel inhigh-performance electrodes for energy storage applications.

C 2017, 3, 25 3 of 17
2. Results and Discussion
Waste orange peels were converted to porous carbon through pre-carbonization and pyrolysis inthe presence of a chemical activator, as illustrated in the graphical abstract. Subsequently, synthesizedcarbon was utilized to fabricate an electrode for symmetric supercapacitor. Figure 1a displays theXRD patterns of unactivated and activated carbonized OP with different mass ratios of KOH. XRDpeaks centered around 2θ of 24 and 44 in all the activated carbon samples correspond to the (002)and (100) planes of the graphitic carbon. Broad and low-intensity peaks indicate the disorderednature of the carbon samples. The characteristics peaks become broader and reduce intensity withKOH mass ratio increase from 0 to 3, suggesting the decrease in graphitic structure in the OPACs [5].These observations revealed that the degree of graphitization of the carbon sample was governedby a chemical activation agent. Further, the graphitic structure of unactivated and activated carbonswas investigated by Raman spectra (Figure 1b). Two characteristic peaks around 1340 and 1582 cm−1
were assigned for the D-band and G-band of carbon, respectively. The D-band corresponds to the sp3
hybridized disordered carbon phase, while the G-band relates to the sp2 hybridized graphitic phase ofthe carbon [36,37]. The proportion of the disordered carbon presence in a sample can be describedby the relative intensity of the D-band and G-band (the ID/IG ratio). The ID/IG ratio for OPUACwas 0.88, whereas the ID/IG ratios for OPAC-0.5, OPAC-1, OPAC-2, and OPAC-3 were found to be0.91, 0.90, 0.91, and 0.96, respectively—considerably higher than in the unactivated carbon sample.The rise of the ID/IG ratio for the KOH-activated carbon suggests that harsh chemical treatmentdisturbed the structural order of the carbon. However, the graphitization level of our activated carbonmaterials (IG/ID > 1.04) were significantly higher than the IG/ID ratio of commercially activated carbon(0.52) [11], indicating its suitability as an electrode material due to the excellent electrical conductivity.The high electrical conductivity of carbon derived from orange peel will reduce the charge-transferresistance for the electrolyte ions and thus improve the electrochemical properties.
C 2017, 3, 25 3 of 17
2. Results and Discussion
Waste orange peels were converted to porous carbon through pre-carbonization and pyrolysis in the presence of a chemical activator, as illustrated in the graphical abstract. Subsequently, synthesized carbon was utilized to fabricate an electrode for symmetric supercapacitor. Figure 1a displays the XRD patterns of unactivated and activated carbonized OP with different mass ratios of KOH. XRD peaks centered around 2θ of 24° and 44° in all the activated carbon samples correspond to the (002) and (100) planes of the graphitic carbon. Broad and low-intensity peaks indicate the disordered nature of the carbon samples. The characteristics peaks become broader and reduce intensity with KOH mass ratio increase from 0 to 3, suggesting the decrease in graphitic structure in the OPACs [5]. These observations revealed that the degree of graphitization of the carbon sample was governed by a chemical activation agent. Further, the graphitic structure of unactivated and activated carbons was investigated by Raman spectra (Figure 1b). Two characteristic peaks around 1340 and 1582 cm−1 were assigned for the D-band and G-band of carbon, respectively. The D-band corresponds to the sp3 hybridized disordered carbon phase, while the G-band relates to the sp2 hybridized graphitic phase of the carbon [36,37]. The proportion of the disordered carbon presence in a sample can be described by the relative intensity of the D-band and G-band (the ID/IG ratio). The ID/IG ratio for OPUAC was 0.88, whereas the ID/IG ratios for OPAC-0.5, OPAC-1, OPAC-2, and OPAC-3 were found to be 0.91, 0.90, 0.91, and 0.96, respectively—considerably higher than in the unactivated carbon sample. The rise of the ID/IG ratio for the KOH-activated carbon suggests that harsh chemical treatment disturbed the structural order of the carbon. However, the graphitization level of our activated carbon materials (IG/ID > 1.04) were significantly higher than the IG/ID ratio of commercially activated carbon (0.52) [11], indicating its suitability as an electrode material due to the excellent electrical conductivity. The high electrical conductivity of carbon derived from orange peel will reduce the charge-transfer resistance for the electrolyte ions and thus improve the electrochemical properties.
Figure 1. (a) XRD spectra and (b) Raman spectra of OPUAC and OPACs carbons.
We analyzed the pyrolysis behavior of orange peel precursor under a nitrogen atmosphere using thermogravimetric analysis. Thermogravimetric (TG) and its derivative (DTG) curves are given in Figure S1. Generally, the pyrolysis of biomass involves the thermal decomposition of lingocellulosic biomass by releasing volatile matter and leaving char behind. As seen in the DTG curve, the appearance of peaks at temperature ranges of 50–100 °C, 200–300 °C, and 300–400 °C can be attributed to the dehydration of orange peel, the decomposition of hemicellulose, and the decomposition of cellulose, respectively [38,39]. Lignin pyrolyzes steadily over a wide temperature range, and the weaker peak between 430 and 500 °C may represent the decomposition of lignin. Lignin contributes predominantly to the formation of char [40,41]; about 21% char yield was observed at 700 °C. The SEM images in Figure 2 revealed the effect of chemical activation and pyrolysis on the morphology
Figure 1. (a) XRD spectra and (b) Raman spectra of OPUAC and OPACs carbons.
We analyzed the pyrolysis behavior of orange peel precursor under a nitrogen atmosphereusing thermogravimetric analysis. Thermogravimetric (TG) and its derivative (DTG) curves aregiven in Figure S1. Generally, the pyrolysis of biomass involves the thermal decomposition oflingocellulosic biomass by releasing volatile matter and leaving char behind. As seen in the DTGcurve, the appearance of peaks at temperature ranges of 50–100 C, 200–300 C, and 300–400 Ccan be attributed to the dehydration of orange peel, the decomposition of hemicellulose, and thedecomposition of cellulose, respectively [38,39]. Lignin pyrolyzes steadily over a wide temperaturerange, and the weaker peak between 430 and 500 C may represent the decomposition of lignin.Lignin contributes predominantly to the formation of char [40,41]; about 21% char yield was observed

C 2017, 3, 25 4 of 17
at 700 C. The SEM images in Figure 2 revealed the effect of chemical activation and pyrolysison the morphology of carbon synthesized from the orange peel precursor. The pyrolysis of thepre-carbonized precursor in the presence of KOH (the chemical activating agent) produced openchannels with non-uniform honeycomb-like morphologies on the surface (Figure 2a–d). The pyrolysisof the pre-carbonized precursor without employing a chemical activating agent produced a sheet-likestructure (Figure 2e). More prominent and widely spread honeycomb-like structures were observedwith an increasing KOH mass ratio. The schematic of the honeycomb and open tubular channels’structures is illustrated in Figure 2f. The presence of an open channel structure forms porous carbon,which provides electrolyte ions a higher surface area to access and a path for transportation during thecharge storage process [42,43]. The activation of the carbon by KOH at 800 C proceeded according tothe following reaction:
6KOH + C → 2K + 3H2 + 2K2CO3 (1)
Subsequently, K2CO3 decomposed and the resultant products further reacted with the carbon toform hollow channels inside the carbon matrix [44,45].
C 2017, 3, 25 4 of 17
of carbon synthesized from the orange peel precursor. The pyrolysis of the pre-carbonized precursor in the presence of KOH (the chemical activating agent) produced open channels with non-uniform honeycomb-like morphologies on the surface (Figure 2a–d). The pyrolysis of the pre-carbonized precursor without employing a chemical activating agent produced a sheet-like structure (Figure 2e). More prominent and widely spread honeycomb-like structures were observed with an increasing KOH mass ratio. The schematic of the honeycomb and open tubular channels’ structures is illustrated in Figure 2f. The presence of an open channel structure forms porous carbon, which provides electrolyte ions a higher surface area to access and a path for transportation during the charge storage process [42,43]. The activation of the carbon by KOH at 800 °C proceeded according to the following reaction: 6KOH C → 2K 3H 2K CO (1)
Subsequently, K2CO3 decomposed and the resultant products further reacted with the carbon to form hollow channels inside the carbon matrix [44,45].
Figure 2. SEM image of (a) OPAC-0.5, (b) OPAC-1, (C) OPAC-2, (d) OPAC-3, (e) OPUAC, and (f) a schematic diagram of the porous structure in carbon derived from OP.
The nitrogen adsorption–desorption isotherms of OPAC and OPUAC samples are illustrated in Figure 3a. It is evident that the pore structure and specific surface area of the resultant carbon are influenced by the mass ratio of the activating agent. OPAC-2 and OPAC-3 showed type I isotherm curves with the majority of N2 adsorption at relative pressures (P/P0) below 0.3 and a near-parallel slope (to x-axis) of the isotherm above 0.3 of P/P0, which is typical of micropores in carbon. On the other hand, OPAC-0.5 and OPAC-1 showed a combination of type I and IV isotherm curves with a sharp slope at relative pressure less than 0.1, followed by a steady increase in the N2 adsorption and the appearance of distinguishable hysteresis loops at P/P0 over 0.5, demonstrating the existence of both micropores and mesopores [46]. In contrast, very low N2 adsorption of OPUAC indicated the almost non-existence of the porous structure.
These observations were further confirmed by the BJH pore size distribution plot (Figure 3b). The pore size of OPAC-1 and OPAC-0.5 was mainly in the 3–4 nm range, along with a smaller fraction
Figure 2. SEM image of (a) OPAC-0.5; (b) OPAC-1; (C) OPAC-2; (d) OPAC-3; (e) OPUAC; and (f) aschematic diagram of the porous structure in carbon derived from OP.
The nitrogen adsorption–desorption isotherms of OPAC and OPUAC samples are illustrated inFigure 3a. It is evident that the pore structure and specific surface area of the resultant carbon areinfluenced by the mass ratio of the activating agent. OPAC-2 and OPAC-3 showed type I isothermcurves with the majority of N2 adsorption at relative pressures (P/P0) below 0.3 and a near-parallelslope (to x-axis) of the isotherm above 0.3 of P/P0, which is typical of micropores in carbon. On theother hand, OPAC-0.5 and OPAC-1 showed a combination of type I and IV isotherm curves with asharp slope at relative pressure less than 0.1, followed by a steady increase in the N2 adsorption andthe appearance of distinguishable hysteresis loops at P/P0 over 0.5, demonstrating the existence ofboth micropores and mesopores [46]. In contrast, very low N2 adsorption of OPUAC indicated thealmost non-existence of the porous structure.

C 2017, 3, 25 5 of 17
These observations were further confirmed by the BJH pore size distribution plot (Figure 3b).The pore size of OPAC-1 and OPAC-0.5 was mainly in the 3–4 nm range, along with a smaller fractionof pores around 2 nm, whereas OPAC-2 and OPAC-3 did not exhibit a complete distribution at thesmaller pore size end and overwhelmingly consisted of pores with a diameter of less than 2 nm.Therefore, the structure of OPAC-1 and OPAC-0.5 was a combination of meso- and micropores with alarger proportion of mesopores. OPAC-2 and OPAC-3 contained an abundance of micopores. Table 1summarizes the pore characteristics of the carbon materials. The specific surface area of the OPAC-0.5to OPAC-3 continuously increased from 1004 to 2521 m2/g; similarly, pore volume also increased from0.52 to 1.30 cm3/g. We observed significantly lower specific surface area and pore volume for OPUAC(0.852 m2/g and 0.0004 cm3/g, respectively). Nevertheless, pore diameter was reduced in the activatedOP samples from 1.69 to 1.04 nm as the KOH mass ratio increased from 0.5 to 3. It was obvious thatthe progressive increase of the KOH mass ratio during the activation process continued to etch thecarbon matrix deeper, while maximizing the pore volume and surface area, instead of enlarging porediameter. Therefore, a substantial proportion of micropores were created at higher KOH mass ratios.
C 2017, 3, 25 5 of 17
of pores around 2 nm, whereas OPAC-2 and OPAC-3 did not exhibit a complete distribution at the smaller pore size end and overwhelmingly consisted of pores with a diameter of less than 2 nm. Therefore, the structure of OPAC-1 and OPAC-0.5 was a combination of meso- and micropores with a larger proportion of mesopores. OPAC-2 and OPAC-3 contained an abundance of micopores. Table 1 summarizes the pore characteristics of the carbon materials. The specific surface area of the OPAC-0.5 to OPAC-3 continuously increased from 1004 to 2521 m2/g; similarly, pore volume also increased from 0.52 to 1.30 cm3/g. We observed significantly lower specific surface area and pore volume for OPUAC (0.852 m2/g and 0.0004 cm3/g, respectively). Nevertheless, pore diameter was reduced in the activated OP samples from 1.69 to 1.04 nm as the KOH mass ratio increased from 0.5 to 3. It was obvious that the progressive increase of the KOH mass ratio during the activation process continued to etch the carbon matrix deeper, while maximizing the pore volume and surface area, instead of enlarging pore diameter. Therefore, a substantial proportion of micropores were created at higher KOH mass ratios.
Figure 3. (a) Nitrogen adsorption–desorption isotherms and (b) BJH pore size distributions of OPUAC and OPAC carbons.
Table 1. Pore characteristics and surface area of unactivated and activated carbons. a Surface area measured via BET method, b Total pore volume, and c Average pore diameter.
Sample SBET a (m2/g) Vtotal b (cm3/g) Dave c (nm)OPAC-0.5 1004 0.52 1.69 OPAC-1 1391 0.72 1.59 OPAC-2 1960 1.01 1.45 OPAC-3 2521 1.30 1.04 OPUAC 0.852 0.0004 1.16
The existence of both micro- and mesopores is a favorable feature in activated carbon-based electrodes for supercapacitor applications. The presence of micropores provides a larger surface for the adsorption–desorption process of electrolyte ions. Mesopores also ensure a highly accessible surface area and offer wider channels for several electrolyte ions to diffuse at the same time without experiencing geometric resistance [14,47]. Therefore, we presumed superior electrochemical performance in OPAC-1 due to the higher fraction of mesopores and enhanced surface area.
The electrochemical performance of supercapacitor electrodes based on orange-peel-derived carbon was studied by employing a three-electrode system in 3 M KOH electrolyte. Figure 4a compares the cyclic voltammetry curves of OPUAC and OPACs at a scan rate of 10 mV/s. OPAC electrodes exhibited symmetrical rectangular-shaped CV curves. In the absence of any redox peaks, this represents a typical electric double-layer (EDL) mechanism. In contrast, OPUAC had a smaller and highly distorted rectangular CV curve, indicating low charge storage capacity compared to OPAC electrodes. Galvanostatic charge–discharge profiles at a current density of 1 A/g and specific
0.0 0.2 0.4 0.6 0.8 1.0
0
200
400
600
800 OPAC-3
OPAC-2
OPAC-1
OPAC-0.5
Qua
ntity
Ads
orbe
d (c
m3 /g
)
Relative Pressure (P/Po)
OPUAC
[a]
2 4 6 8 10 12 14
0.0
0.5
1.0
1.5
2.0
2.5dv
/dlo
g(D
) (cm
3 /g)
Pore diameter (nm)
OPAC-0.5 OPAC-1 OPAC-2 OPAC-3 OPUAC
[b]
Figure 3. (a) Nitrogen adsorption–desorption isotherms and (b) BJH pore size distributions of OPUACand OPAC carbons.
Table 1. Pore characteristics and surface area of unactivated and activated carbons. a Surface areameasured via BET method, b Total pore volume, and c Average pore diameter.
Sample SBETa (m2/g) Vtotal
b (cm3/g) Davec (nm)
OPAC-0.5 1004 0.52 1.69OPAC-1 1391 0.72 1.59OPAC-2 1960 1.01 1.45OPAC-3 2521 1.30 1.04OPUAC 0.852 0.0004 1.16
The existence of both micro- and mesopores is a favorable feature in activated carbon-basedelectrodes for supercapacitor applications. The presence of micropores provides a larger surface forthe adsorption–desorption process of electrolyte ions. Mesopores also ensure a highly accessiblesurface area and offer wider channels for several electrolyte ions to diffuse at the same timewithout experiencing geometric resistance [14,47]. Therefore, we presumed superior electrochemicalperformance in OPAC-1 due to the higher fraction of mesopores and enhanced surface area.
The electrochemical performance of supercapacitor electrodes based on orange-peel-derivedcarbon was studied by employing a three-electrode system in 3 M KOH electrolyte. Figure 4acompares the cyclic voltammetry curves of OPUAC and OPACs at a scan rate of 10 mV/s. OPAC

C 2017, 3, 25 6 of 17
electrodes exhibited symmetrical rectangular-shaped CV curves. In the absence of any redox peaks,this represents a typical electric double-layer (EDL) mechanism. In contrast, OPUAC had a smallerand highly distorted rectangular CV curve, indicating low charge storage capacity compared toOPAC electrodes. Galvanostatic charge–discharge profiles at a current density of 1 A/g and specificcapacitance at different current densities for the OPUAC and OPACs electrodes are shown in Figure 4b.The symmetric and linear nature of the charge–discharge profiles provided further evidence of theEDL behavior of the electrodes. The shortest discharging time and lowest capacitance of 115 F/g at1 A/g were given by OPUAC. Chemical activation of the pre-carbonized OP significantly enhancedthe capacitance. OPAC-1 provided the highest capacity of 217 F/g at 1 A/g (Figure 4c). OPAC-2 andOPAC-3 had a higher specific surface area than OPAC-1, indicating that increased chemical activatoramount and high surface area did not always improve the charge storage capacity. Higher specificsurface area of the OPAC-2 and OPAC-3 was attained through the substantial presence of micropores.However, very narrow micropores restrict the ion transfer process, reducing the effective surface areafor electrolyte ion adsorption. Therefore, the OPAC-1 electrode provided the maximum capacitance.
Electrochemical properties of the OPAC-1 electrode were studied in detail by performing CV atdifferent scan rates (Figure 4d) and GCD at different current densities (Figure S2). At low scan rates,CV curves exhibited a nearly perfect rectangular shape and the shape was retained even at higher scanrates with a minor distortion, suggesting a rapid and unrestricted charge transfer process, owing tothe meso-/micropore combination of OPAC-1. As seen in Figure S2, the charge–discharge profilesretained their linear and almost symmetrical nature even at higher current densities, indicating anefficient electrolyte ion diffusion process. The IR drop (voltage drop) at the start of the discharge curveaccounts for the total resistance in the electrode [48]. We observed an IR drop of 4 mV at 0.5 A/g and itonly increased to 194 mV even for a high discharge current of 20 A/g (Figure S3).
Figure 4e illustrates the CV curves for different bending angles at a scan rate of 100 mV/s.The shape of the CV curves remained identical, indicating that the OPAC-1 electrode sustained itselectrochemical properties while flexing. This suggested a potential application of OPAC-1 electrode inflexible supercapacitors. The long-term cyclic stability of a supercapacitor is another important featurethat determines its practical applicability. The cyclic stability of OPAC-1 was evaluated by performingcontinuous charge–discharge cycles at 3A/g (Figure 4f). The capacitance for the first 500 cyclesgradually increased until capacitance retention reached 105%, followed by an almost steady capacitancedelivery. The capacitive performance improved to 108% of its initial value over 5000 cycles. The initialimprovement in capacitance was due to the activation of the OPAC-1 electrode by progressive wettingof the electrode with electrolytes [10,49]. The perfectly overlapping charge–discharge profiles of thefirst and last five cycles (inset in Figure 4f) provided further evidence for the excellent long-term cyclicstability of OPAC-1.
C 2017, 3, 25 6 of 17
capacitance at different current densities for the OPUAC and OPACs electrodes are shown in Figure 4b. The symmetric and linear nature of the charge–discharge profiles provided further evidence of the EDL behavior of the electrodes. The shortest discharging time and lowest capacitance of 115 F/g at 1 A/g were given by OPUAC. Chemical activation of the pre-carbonized OP significantly enhanced the capacitance. OPAC-1 provided the highest capacity of 217 F/g at 1 A/g (Figure 4c). OPAC-2 and OPAC-3 had a higher specific surface area than OPAC-1, indicating that increased chemical activator amount and high surface area did not always improve the charge storage capacity. Higher specific surface area of the OPAC-2 and OPAC-3 was attained through the substantial presence of micropores. However, very narrow micropores restrict the ion transfer process, reducing the effective surface area for electrolyte ion adsorption. Therefore, the OPAC-1 electrode provided the maximum capacitance.
Electrochemical properties of the OPAC-1 electrode were studied in detail by performing CV at different scan rates (Figure 4d) and GCD at different current densities (Figure S2). At low scan rates, CV curves exhibited a nearly perfect rectangular shape and the shape was retained even at higher scan rates with a minor distortion, suggesting a rapid and unrestricted charge transfer process, owing to the meso-/micropore combination of OPAC-1. As seen in Figure S2, the charge–discharge profiles retained their linear and almost symmetrical nature even at higher current densities, indicating an efficient electrolyte ion diffusion process. The IR drop (voltage drop) at the start of the discharge curve accounts for the total resistance in the electrode [48]. We observed an IR drop of 4 mV at 0.5 A/g and it only increased to 194 mV even for a high discharge current of 20 A/g (Figure S3).
Figure 4e illustrates the CV curves for different bending angles at a scan rate of 100 mV/s. The shape of the CV curves remained identical, indicating that the OPAC-1 electrode sustained its electrochemical properties while flexing. This suggested a potential application of OPAC-1 electrode in flexible supercapacitors. The long-term cyclic stability of a supercapacitor is another important feature that determines its practical applicability. The cyclic stability of OPAC-1 was evaluated by performing continuous charge–discharge cycles at 3A/g (Figure 4f). The capacitance for the first 500 cycles gradually increased until capacitance retention reached 105%, followed by an almost steady capacitance delivery. The capacitive performance improved to 108% of its initial value over 5000 cycles. The initial improvement in capacitance was due to the activation of the OPAC-1 electrode by progressive wetting of the electrode with electrolytes [10,49]. The perfectly overlapping charge–discharge profiles of the first and last five cycles (inset in Figure 4f) provided further evidence for the excellent long-term cyclic stability of OPAC-1.
Figure 4. Cont.

C 2017, 3, 25 7 of 17
C 2017, 3, 25 7 of 17
Figure 4. (a) CV curves at the scan rate of 10 mV/s. (b) GCD profiles at the current density of 1 A/g. (c) specific capacitances at different current densities. (d) CV curves of OPAC-1 at various scan rates. (e) CV curves of OPAC-1 for various bending angles at the scan rate of 100 mV/s, and (f) cyclic stability of OPAC-1 at current density of 2 A/g for 5000 cycles; inset shows GCD profiles of the first and last few cycles.
To understand the effect of electrolytes, specific capacitance of OPAC-1 was measured in 3 M KOH, NaOH, and LiOH at different current densities (Figure 5a) and scan rates (Figure 5b). According to the results, OPAC-1 in KOH electrolyte delivered superior specific capacitance than NaOH and LiOH electrolytes. The improved electrochemical properties in KOH can be ascribed to the smaller hydrated ionic radius of K+ (3.31 Å), which is lower than the hydrated ionic radius of the Na+ (3.58 Å) and Li+ (3.82 Å). The ionic conductivity of hydrated ions increases with a decrease in ion size [47]. This facilitated access to the innermost pores of OPAC-1 for the K+ and reduced the transition time between the adsorption and desorption processes. Therefore, OPAC-1 in KOH electrolyte exhibited the maximum charge storage capacity. We also observed a different rate behavior of OPAC-1 in these electrolytes. Figure S4 displays the CV curves of OPAC-1 at 10 and 200 mV/s in KOH, NaOH, and LiOH. The areas under the curves were almost equal at a low scan rate, indicating similar charge storage behavior in the three electrolytes. In contrast, charge storage capacity deviated at a high scan rate, increasing in the order of LiOH < NaOH < KOH. The least decay of capacitance in KOH electrolyte can be credited to the smallest hydrated radius of K+ among the three metallic ions. Therefore, hydrated K+ possessed the highest ionic conductivity and shortest relaxation time during the diffusion process, resulting in an increment in the rate capability of OPAC-1 in LiOH < NaOH < KOH, in this order.
Additionally, electrochemical impedance spectra were conducted to understand the electrochemical behavior of OPAC-1 in three different electrolytes. Figure 5c shows the Nyquist plots
Figure 4. (a) CV curves at the scan rate of 10 mV/s; (b) GCD profiles at the current density of 1 A/g;(c) specific capacitances at different current densities; (d) CV curves of OPAC-1 at various scan rates.(e) CV curves of OPAC-1 for various bending angles at the scan rate of 100 mV/s; and (f) cyclic stabilityof OPAC-1 at current density of 2 A/g for 5000 cycles; inset shows GCD profiles of the first and lastfew cycles.
To understand the effect of electrolytes, specific capacitance of OPAC-1 was measured in 3 MKOH, NaOH, and LiOH at different current densities (Figure 5a) and scan rates (Figure 5b). Accordingto the results, OPAC-1 in KOH electrolyte delivered superior specific capacitance than NaOH andLiOH electrolytes. The improved electrochemical properties in KOH can be ascribed to the smallerhydrated ionic radius of K+ (3.31 Å), which is lower than the hydrated ionic radius of the Na+ (3.58 Å)and Li+ (3.82 Å). The ionic conductivity of hydrated ions increases with a decrease in ion size [47].This facilitated access to the innermost pores of OPAC-1 for the K+ and reduced the transition timebetween the adsorption and desorption processes. Therefore, OPAC-1 in KOH electrolyte exhibitedthe maximum charge storage capacity. We also observed a different rate behavior of OPAC-1 inthese electrolytes. Figure S4 displays the CV curves of OPAC-1 at 10 and 200 mV/s in KOH, NaOH,and LiOH. The areas under the curves were almost equal at a low scan rate, indicating similar chargestorage behavior in the three electrolytes. In contrast, charge storage capacity deviated at a high scanrate, increasing in the order of LiOH < NaOH < KOH. The least decay of capacitance in KOH electrolytecan be credited to the smallest hydrated radius of K+ among the three metallic ions. Therefore, hydratedK+ possessed the highest ionic conductivity and shortest relaxation time during the diffusion process,resulting in an increment in the rate capability of OPAC-1 in LiOH < NaOH < KOH, in this order.
Additionally, electrochemical impedance spectra were conducted to understand the electrochemicalbehavior of OPAC-1 in three different electrolytes. Figure 5c shows the Nyquist plots of the OPAC-1electrode in 3 M KOH, NaOH, and LiOH in a frequency range from 10 kHz to 0.05 Hz. Nyquist plots of

C 2017, 3, 25 8 of 17
the three electrolytes had a similar shape: a modest semi-circle at the middle to high frequency range,and a straight line at low frequency. Interception at Zreal axis at a high frequency (inset Figure 5c) wasan indication of the solution resistance [50]. The corresponding values for the solution resistance (RS)were 0.83, 0.58, and 0.36 Ω for LiOH, NaOH, and KOH, respectively. Therefore, the KOH electrolytehad better conductivity than NaOH and LiOH electrolytes. The diameter of the semicircle representedthe charge transfer resistance at the double layer [51], which was decreasing in the following sequence,LiOH > NaOH > KOH. The lowest charge transfer resistance value in KOH electrolyte suggeststhat K+ contributed to an efficient charge adsorption–desorption process on the electrode–electrolyteinterface due to its smaller hydrated ionic radius [52]. At the low frequency range, we observed anear-vertical straight line for KOH electrolyte, indicating perfect capacitive behavior and efficient ionicdiffusion. We simulated the equivalent circuit for the EIS data to obtain the quantitative value for eachelectrochemical component of the electrode. The equivalent circuit and parameters of the OPAC-1in the three electrolytes are given in Figure 5d. Equivalent circuit included the components relatedto solution resistance (RS), charge transfer resistance (RCT), constant phase elements (Q1 and Q2),and capacitance (C). Existence of the constant phase elements in the electrode can be attributed tothe capacitance of the double layer, the chaotic nature of the diffusion process, or irregularities inthe electrode–electrolyte interface [53]. According to the simulated values, total capacitance in threeelectrolytes increased in the order of LiOH < NaOH < KOH, which was consistent with the chargestorage capacitance calculated from GCD and CV measurements (Figure 5a,b). Bode plots (frequencyvs. impedance) of three different electrolytes further confirmed the outstanding rate capability in KOHelectrolyte (Figure S5). At a low frequency range (<1 Hz), differences between the impedances in threeelectrolytes were insignificant. Beyond a frequency of 1 Hz, a low impedance was observed for KOHcompared to NaOH and LiOH, indicating an excellent rate capability in KOH electrolyte.
OPAC-1 produced the optimum specific capacitance of 407 F/g at 0.5 A/g in 3 M KOH electrolyte.However, we noticed a decrease in specific capacitance with increasing current density. This is an effectof limited electrolyte ions’ diffusion to the micropores and decreased the amount of electrolyte ions thataccumulated on the electrode surface, owing to insufficient time at higher current densities [51,54]. Here,we report the specific capacitance for OPAC-1 electrode, superior or comparable to the capacitance ofprevious biomass-derived electrodes. Table 2 displays the capacitive performance of the recentlysynthesized activated carbon from the biomass precursors. It should be noted that the chargestorage capacity of OPAC-1 was higher than commercially available activated carbons (<200 F/g) [55],and even comparable to the more advanced forms of carbons such as graphene-based materials(100–347 F/g) [56], nitrogen-doped graphene (138–326 F/g) [57], and CNT (128–335 F/g) [58]. The highcapacitive performance of our material can be attributed to the higher specific surface area along withthe prominent mesopore structure, with a 3–4 nm pore size. This provided a larger surface area for theadsorption–desorption process of the ions and efficient pathways to ion transfer.
C 2017, 3, 25 8 of 17
of the OPAC-1 electrode in 3 M KOH, NaOH, and LiOH in a frequency range from 10 kHz to 0.05 Hz. Nyquist plots of the three electrolytes had a similar shape: a modest semi-circle at the middle to high frequency range, and a straight line at low frequency. Interception at Zreal axis at a high frequency (inset Figure 5c) was an indication of the solution resistance [50]. The corresponding values for the solution resistance (RS) were 0.83, 0.58, and 0.36 Ω for LiOH, NaOH, and KOH, respectively. Therefore, the KOH electrolyte had better conductivity than NaOH and LiOH electrolytes. The diameter of the semicircle represented the charge transfer resistance at the double layer [51], which was decreasing in the following sequence, LiOH > NaOH > KOH. The lowest charge transfer resistance value in KOH electrolyte suggests that K+ contributed to an efficient charge adsorption–desorption process on the electrode–electrolyte interface due to its smaller hydrated ionic radius [52]. At the low frequency range, we observed a near-vertical straight line for KOH electrolyte, indicating perfect capacitive behavior and efficient ionic diffusion. We simulated the equivalent circuit for the EIS data to obtain the quantitative value for each electrochemical component of the electrode. The equivalent circuit and parameters of the OPAC-1 in the three electrolytes are given in Figure 5d. Equivalent circuit included the components related to solution resistance (RS), charge transfer resistance (RCT), constant phase elements (Q1 and Q2), and capacitance (C). Existence of the constant phase elements in the electrode can be attributed to the capacitance of the double layer, the chaotic nature of the diffusion process, or irregularities in the electrode–electrolyte interface [53]. According to the simulated values, total capacitance in three electrolytes increased in the order of LiOH < NaOH < KOH, which was consistent with the charge storage capacitance calculated from GCD and CV measurements (Figure 5a,b). Bode plots (frequency vs. impedance) of three different electrolytes further confirmed the outstanding rate capability in KOH electrolyte (Figure S5). At a low frequency range (<1 Hz), differences between the impedances in three electrolytes were insignificant. Beyond a frequency of 1 Hz, a low impedance was observed for KOH compared to NaOH and LiOH, indicating an excellent rate capability in KOH electrolyte.
OPAC-1 produced the optimum specific capacitance of 407 F/g at 0.5 A/g in 3 M KOH electrolyte. However, we noticed a decrease in specific capacitance with increasing current density. This is an effect of limited electrolyte ions’ diffusion to the micropores and decreased the amount of electrolyte ions that accumulated on the electrode surface, owing to insufficient time at higher current densities [51,54]. Here, we report the specific capacitance for OPAC-1 electrode, superior or comparable to the capacitance of previous biomass-derived electrodes. Table 2 displays the capacitive performance of the recently synthesized activated carbon from the biomass precursors. It should be noted that the charge storage capacity of OPAC-1 was higher than commercially available activated carbons (<200 F/g) [55], and even comparable to the more advanced forms of carbons such as graphene-based materials (100–347 F/g) [56], nitrogen-doped graphene (138–326 F/g) [57], and CNT (128–335 F/g) [58]. The high capacitive performance of our material can be attributed to the higher specific surface area along with the prominent mesopore structure, with a 3–4 nm pore size. This provided a larger surface area for the adsorption–desorption process of the ions and efficient pathways to ion transfer.
Figure 5. Cont.

C 2017, 3, 25 9 of 17
C 2017, 3, 25 9 of 17
Figure 5. (a) Specific capacitances at different current densities, (b) specific capacitances at various scan rates, (c) Nyquist plots with inset displaying magnification at higher frequency region, and (d) equivalent circuit obtained from simulating the EIS data and fitting values for the components of the equivalent circuit for OPAC-1 electrode.
Table 2. Comparison of the orange-peel-derived carbon to carbon derived from other biomass precursors.
Carbon Source BET Surface Area (m2/g)
Specific Capacitance (F/g)
Current Density (A/g) Electrolyte Reference
Pitch 2602 263 0.05 6 M KOH [59] Porous starch 3251 304 0.05 6 M KOH [60] Celtuce leaves 3404 421 0.5 2 M KOH [61]
Sago bark 58 113 0.02 5 M KOH [62] Corn straw 1413 379 0.05 6 M KOH [63]
Bamboo 3061 258 0.1 6 M KOH [64] Oil palm kernel shell 462 210 0.5 1 M KOH [48]
Rice husk 2696 147 0.1 6 M KOH [65] Ramie 1616 287 0.05 6 M KOH [66]
Camellia oleifera shell 1935 266 0.2 6 M KOH [67] Soybean residue 1950 261 0.2 1 M H2SO4 [25]
Neem dead leaves 1230 400 0.5 1 M H2SO4 [14] Orange peel 1391 407 0.5 3 M KOH This work
Considering the high electrochemical performance of the OPAC-1, a symmetric supercapacitor was fabricated by assembling two OPAC-1 electrodes as the negative and positive electrodes. CV measurements were performed between 0 and 1 V in 3 M KOH electrolyte for various scan rates (Figure 6a). The OPAC-1-based supercapacitor exhibited a rectangular-shaped CV curve at low scan rates and continued to maintain a rectangular shape without major distortion with increasing scan rate, indicating its suitability as a fast charge–discharge supercapacitor device. The charge storage process of an energy storage device can be identified by the power law equation below: i = av (2)
where i is the peak current (A), v is the scan rate (V/s), and a and b are coefficients. The value of coefficient b determines whether the charge storage mechanism is either capacitive (b = 1) or semi-infinite diffusion controlled (b = 0.5) [68,69]. We plotted the logarithms of discharge current density vs. logarithms of scan rate (Figure S6) and obtained 0.89 for coefficient b. This suggests that the charge storage process of the OPAC-1 supercapacitor was based on the accumulation of electrical charges at the electrode–electrolyte interface.
GCD profiles for OPAC-1 supercapacitor at different current densities in Figure 6b resemble a quasi-triangle shape, further confirming the formation of EDL during the charge storage process. IR
Figure 5. (a) Specific capacitances at different current densities; (b) specific capacitances at variousscan rates; (c) Nyquist plots with inset displaying magnification at higher frequency region; and (d)equivalent circuit obtained from simulating the EIS data and fitting values for the components of theequivalent circuit for OPAC-1 electrode.
Table 2. Comparison of the orange-peel-derived carbon to carbon derived from other biomass precursors.
Carbon Source BET SurfaceArea (m2/g)
SpecificCapacitance (F/g)
CurrentDensity (A/g) Electrolyte Reference
Pitch 2602 263 0.05 6 M KOH [59]Porous starch 3251 304 0.05 6 M KOH [60]Celtuce leaves 3404 421 0.5 2 M KOH [61]
Sago bark 58 113 0.02 5 M KOH [62]Corn straw 1413 379 0.05 6 M KOH [63]
Bamboo 3061 258 0.1 6 M KOH [64]Oil palm kernel shell 462 210 0.5 1 M KOH [48]
Rice husk 2696 147 0.1 6 M KOH [65]Ramie 1616 287 0.05 6 M KOH [66]
Camellia oleifera shell 1935 266 0.2 6 M KOH [67]Soybean residue 1950 261 0.2 1 M H2SO4 [25]
Neem dead leaves 1230 400 0.5 1 M H2SO4 [14]Orange peel 1391 407 0.5 3 M KOH This work
Considering the high electrochemical performance of the OPAC-1, a symmetric supercapacitorwas fabricated by assembling two OPAC-1 electrodes as the negative and positive electrodes.CV measurements were performed between 0 and 1 V in 3 M KOH electrolyte for various scanrates (Figure 6a). The OPAC-1-based supercapacitor exhibited a rectangular-shaped CV curve at lowscan rates and continued to maintain a rectangular shape without major distortion with increasingscan rate, indicating its suitability as a fast charge–discharge supercapacitor device. The charge storageprocess of an energy storage device can be identified by the power law equation below:
i = avb (2)
where i is the peak current (A), v is the scan rate (V/s), and a and b are coefficients. The valueof coefficient b determines whether the charge storage mechanism is either capacitive (b = 1) orsemi-infinite diffusion controlled (b = 0.5) [68,69]. We plotted the logarithms of discharge currentdensity vs. logarithms of scan rate (Figure S6) and obtained 0.89 for coefficient b. This suggests thatthe charge storage process of the OPAC-1 supercapacitor was based on the accumulation of electricalcharges at the electrode–electrolyte interface.

C 2017, 3, 25 10 of 17
GCD profiles for OPAC-1 supercapacitor at different current densities in Figure 6b resemble aquasi-triangle shape, further confirming the formation of EDL during the charge storage process.IR drop for the supercapacitor was negligible even for higher current densities, which providedevidence of the minimum internal resistance of the device. Figure 6c shows the specific capacitanceof the OPAC-1-based supercapacitor at various current densities. The specific capacitance of thesupercapacitor decreased from 729 to 697 mF/cm2 as the current density increased from 2 to14 mA/cm2, demonstrating an impressive capacitance retention of 96% across the same currentdensity range. This further confirmed the high rate capability of the OPAC-1 supercapacitor.The well-developed structure of OPAC-1 facilitated the high rate capability by providing an unhinderedpathway to ion transfer.
The energy and power density of the OPAC-1 supercapacitor are illustrated using a Ragoneplot in Figure 6d. The supercapacitor delivered energy density between 100.4 to 93.4 µWh/cm2
for the corresponding power density from 0.99 to 6.87 mW/cm2, while maintaining 93% of itshighest energy density. We compared these values to previously reported supercapacitors basedon other forms of carbon (inset Figure 6d). For example, the energy and power performance ofpolyaniline-deposited CNT (50.98 µWh/cm2 at 28.404 mW/cm2) [70], a graphene oxide–polypyrrolecomposite (16.8 µWh/cm2 at 0.08 mW/cm2) [71], a polypyrrole–MnO2–CNT coated cottonthread (33 µWh/cm2 at 0.67 mW/cm2) [72], CNT-coated carbon microfiber (9.8 µWh/cm2 at0.189 mW/cm2) [73], and graphene–cellulose paper (1.5 µWh/cm2 at 0.01 mW/cm2) [74] were inferiorto our work. The high power capability of the OPAC-1 supercapacitor indicates its potential forapplications where rapid release of energy is required.
C 2017, 3, 25 10 of 17
drop for the supercapacitor was negligible even for higher current densities, which provided evidence of the minimum internal resistance of the device. Figure 6c shows the specific capacitance of the OPAC-1-based supercapacitor at various current densities. The specific capacitance of the supercapacitor decreased from 729 to 697 mF/cm2 as the current density increased from 2 to 14 mA/cm2, demonstrating an impressive capacitance retention of 96% across the same current density range. This further confirmed the high rate capability of the OPAC-1 supercapacitor. The well-developed structure of OPAC-1 facilitated the high rate capability by providing an unhindered pathway to ion transfer.
The energy and power density of the OPAC-1 supercapacitor are illustrated using a Ragone plot in Figure 6d. The supercapacitor delivered energy density between 100.4 to 93.4 µWh/cm2 for the corresponding power density from 0.99 to 6.87 mW/cm2, while maintaining 93% of its highest energy density. We compared these values to previously reported supercapacitors based on other forms of carbon (inset Figure 6d). For example, the energy and power performance of polyaniline-deposited CNT (50.98 µWh/cm2 at 28.404 mW/cm2) [70], a graphene oxide–polypyrrole composite (16.8 µWh/cm2 at 0.08 mW/cm2) [71], a polypyrrole–MnO2–CNT coated cotton thread (33 µWh/cm2 at 0.67 mW/cm2) [72], CNT-coated carbon microfiber (9.8 µWh/cm2 at 0.189 mW/cm2) [73], and graphene–cellulose paper (1.5 µWh/cm2 at 0.01 mW/cm2) [74] were inferior to our work. The high power capability of the OPAC-1 supercapacitor indicates its potential for applications where rapid release of energy is required.
Figure 6. (a) CV curves at various scan rates, (b) GCD profiles at different current densities, (c) specific capacitances at different current densities of supercapacitor based on OPAC-1, and (d) Ragone plot comparing OPAC-1 to previous reports.
The temperature dependence of the OPAC-1 supercapacitor was studied by performing electrochemical measurements in the temperature range between 10 and 80 °C. Figure 7a displays
Figure 6. (a) CV curves at various scan rates; (b) GCD profiles at different current densities; (c) specificcapacitances at different current densities of supercapacitor based on OPAC-1; and (d) Ragone plotcomparing OPAC-1 to previous reports.

C 2017, 3, 25 11 of 17
The temperature dependence of the OPAC-1 supercapacitor was studied by performingelectrochemical measurements in the temperature range between 10 and 80 C. Figure 7a displays theCV curves at 100 mV/s for various temperatures. Nearly rectangular CV curves were observed evenfor the higher temperatures, indicating retention of ideal EDL behavior and excellent stability in abroad temperature range. Figure 7b shows the GCD profiles of a supercapacitor at a current density of10 mA/cm2 for different temperatures. The discharge time continue to increase as the temperatureincreased from 10 to 80 C. As a result, the charge storage capacity improved. We calculated thechange in the capacitance at each temperature relative to capacitance at 10 C (Figure 7c). A nearly34% improvement in the capacitance was observed s the temperature increased from 10 to 80 C atcurrent densities of both 10 and 14 mA/cm2.
C 2017, 3, 25 11 of 17
the CV curves at 100 mV/s for various temperatures. Nearly rectangular CV curves were observed even for the higher temperatures, indicating retention of ideal EDL behavior and excellent stability in a broad temperature range. Figure 7b shows the GCD profiles of a supercapacitor at a current density of 10 mA/cm2 for different temperatures. The discharge time continue to increase as the temperature increased from 10 to 80 °C. As a result, the charge storage capacity improved. We calculated the change in the capacitance at each temperature relative to capacitance at 10 °C (Figure 7c). A nearly 34% improvement in the capacitance was observed s the temperature increased from 10 to 80 °C at current densities of both 10 and 14 mA/cm2.
To investigate the temperature dependence of the charge storage process, we performed EIS measurements at different temperatures. Figure 7d compares the Nyquist plots of the OPAC-1 supercapacitor, measured at 10, 20, 40, and 70 °C. The features of the Nyquist plots, i.e., interception at Zreal axis in the high frequency region, diameter of the semi-circle at the middle–high frequency region, and length of the straight line at a low frequency range were associated with ohmic resistance of the solution, charge transfer resistance at the electrode–electrolyte interface, and ion diffusion resistance, respectively. All of these parameters decreased with an increase in temperature. The decrease in the series resistance was a result of the enhanced kinetic activity of electrolyte ions at elevated temperatures, rather than a change in the electrical properties of the electrode material [75]. The increased mobility of electrolyte ions caused a 34% increment in the capacitance value with increasing temperature. Figure S7 shows the Bode impedance plots at 10, 20, 40, and 70 °C of the OPAC-1 device. It was noted that impedances below 1 Hz are almost equal for the considered temperatures, while for frequencies above 1 Hz, the impedance reduced faster with increasing temperature. These observations suggested that a supercapacitor based on pyrolyzed orange peel induced superior electrochemical performance at elevated temperatures.
Figure 7. (a) CV curves for various temperatures at the scan rate of 100 mV/s. (b) GCD profiles for various temperatures at the current density of 10 mA/cm2. (c) % change of the specific capacitance against temperature and (d) Nyquist plots of selected temperatures with inset displaying magnification at higher frequency region for an OPAC-1 supercapacitor in 3 M KOH.
Figure 7. (a) CV curves for various temperatures at the scan rate of 100 mV/s; (b) GCD profiles forvarious temperatures at the current density of 10 mA/cm2; (c) % change of the specific capacitanceagainst temperature and (d) Nyquist plots of selected temperatures with inset displaying magnificationat higher frequency region for an OPAC-1 supercapacitor in 3 M KOH.
To investigate the temperature dependence of the charge storage process, we performed EISmeasurements at different temperatures. Figure 7d compares the Nyquist plots of the OPAC-1supercapacitor, measured at 10, 20, 40, and 70 C. The features of the Nyquist plots, i.e., interception atZreal axis in the high frequency region, diameter of the semi-circle at the middle–high frequency region,and length of the straight line at a low frequency range were associated with ohmic resistance of thesolution, charge transfer resistance at the electrode–electrolyte interface, and ion diffusion resistance,respectively. All of these parameters decreased with an increase in temperature. The decrease in theseries resistance was a result of the enhanced kinetic activity of electrolyte ions at elevated temperatures,rather than a change in the electrical properties of the electrode material [75]. The increased mobility

C 2017, 3, 25 12 of 17
of electrolyte ions caused a 34% increment in the capacitance value with increasing temperature.Figure S7 shows the Bode impedance plots at 10, 20, 40, and 70 C of the OPAC-1 device. It was notedthat impedances below 1 Hz are almost equal for the considered temperatures, while for frequenciesabove 1 Hz, the impedance reduced faster with increasing temperature. These observations suggestedthat a supercapacitor based on pyrolyzed orange peel induced superior electrochemical performanceat elevated temperatures.
3. Experimental
3.1. Preparation of Orange-Peel-Derived Porous Carbon
The waste orange peels were collected from households and subsequently washed, cleaned,and dried at 60 C. Dried orange peels were crushed into a fine powder. The obtained orange peelpowder was pre-carbonized at 400 C for 2 h under a nitrogen atmosphere. Subsequently, chemicalactivation of the resultant carbon powder was performed using KOH as an activation agent. Carbonpowder (1 g) and KOH pellets (1 g) were thoroughly mixed and pyrolyzed at 800 C for 2 h inside atube furnace under a nitrogen flow. The collected black mass was ground into powder and rinsed with1 M HCl and DI water. The powder was dried at 60 C for overnight. The obtained sample was namedOPAC-1. Accordingly, porous carbons with a different activation level were prepared by changingthe mass ratio of KOH (1:0.5, 1:2, 1:3); these samples were named OPAC-0.5, OPAC-2, and OPAC-3.The sample without KOH activation (OPUAC) was used as the control.
3.2. Structural Characterization
To investigate the crystallite structure of synthesized carbon, X-ray powder diffraction (ShimadzuX-ray diffractometer) was conducted using 2θ-θ scan, employing CuKα1 (λ = 1.5406 Å) as theradiation source. Raman spectroscopy (Model Innova 70, Coherent) was performed using an argonion laser with a wavelength of 514.5 nm as the excitation source. Thermogravimetric analysis(TGA) was performed under nitrogen flow at a rate of 10 C/min on a TA instrument (TA 2980).The morphology and microstructure of the carbon sample were determined by scanning electronmicroscopy (JEOL 7000 FE-SEM). Nitrogen adsorption/desorption isotherms were performed usingan ASAP 2020 volumetric adsorption analyzer (Micrometrics, Norcross, GA, USA) at 77 K. Prior to theanalysis, samples were degassed for 24 h at 90 C. The Brunauer–Emmett–Teller (BET) method andBarrett–Joyner–Halenda (BJH) theory were used to calculate the specific surface area and derive poresize distributions, respectively.
3.3. Electrochemical Measurements
Electrochemical properties of the orange-peel-derived carbon (OPC) were evaluated utilizing athree-electrode system and a supercapacitor device. In both methods, electrodes were prepared bycoating a viscous slurry of 80% (w/w) OPC, 10% (w/w) acetylene black, and 10% (w/w) polyvinylidenedifluoride in N-methyl pyrrolidinone on to a nickel foam substrate. In a three-electrode system,electrochemical properties were studied using OPC-coated nickel foam as a working electrode,a platinum strip as a counter-electrode, and saturated calomel electrode as a reference electrodein three different electrolytes (3 M KOH, NaOH, and LiOH). A symmetrical supercapacitor wasassembled by inserting an ion transporting layer between two identical OPAC-1 electrodes, followedby immersion in 3 M KOH electrolyte. The galvanostatic charge–discharge (GCD), cyclic voltammetry(CV), and electrochemical impedance spectroscopy (EIS) were completed using a VersaSTAT 4-500electrochemical workstation (Princeton Applied Research, Oak Ridge, TN, USA). The frequency rangeof EIS varied from 0.05 Hz to 10 kHz with 10 mV of AC voltage amplitude. The gravimetric capacitance

C 2017, 3, 25 13 of 17
(Cg/Fg−1) for the three-electrode system and areal capacitance (Ca/Fcm−2) for the supercapacitorwere calculated from GCD measurements using the following equations:
Cg =I× ∆t
∆V×m(3)
Ca =I× ∆t
∆V×A(4)
where I is the discharge current (A), ∆t is the discharge time (s), ∆V is the potential window (V),m is the mass (g) of the OPC, and A is the active area (cm2) of the electrode. The energy density(E/Whcm−2) and power density (P/Wcm−2) of the symmetrical supercapacitor device were calculatedaccording to the following equations:
E =Ca × ∆V2
7.2(5)
P =E× 3600
t(6)
where Ca is the areal capacitance (Fcm−2) calculated from galvanostatic charge–dischargemeasurements, ∆V is the potential window (V), and t is the discharge time (s).
4. Conclusions
Sustainable and renewable carbon with a well-developed porous structure was synthesizedvia simple pyrolysis and chemical activation from readily available waste orange peels. A highermass ratio of activation agent produced carbon with a larger surface area and a higher microporefraction. However, it was found that carbon with mesopores and suitable pore size contribute tothe higher capacitive performance. Among the studied alkaline electrolytes, these carbon materialsexhibited optimum charge storage and rate capability in KOH electrolyte, along with 108% capacitanceretention over 5000 cycles and identical electrochemical performance at different bending angles,indicating its potential as a stable and flexible electrode material. The prepared supercapacitor deviceshowed superior energy density (100.4 µWh/cm2) and power density (6.87 mW/cm2), improvedtemperature performance, and negligible IR drop, owing to the suitable pore size and higher degree ofgraphitization. This work presents the creation of proper electrode architecture and the selection ofan efficient electrolyte system to enhance the charge storage capacity of biowaste-derived activatedcarbon for high-performance, sustainable, and cost-effective energy storage.
Supplementary Materials: The following are available online at http://www.mdpi.com/2311-5629/3/3/25/s1.
Acknowledgments: Ram K. Gupta expresses his sincere acknowledgment to the Polymer Chemistry Initiative,Pittsburg State University for providing financial and research support.
Author Contributions: Ram K. Gupta conceived the project and designed the experiments. C. K. Ranaweeraperformed all the synthesis and performed some structural and electrochemical measurements. C. K. Ranaweeraprepared the first draft of the manuscript. M. Ghimire and S. R. Mishra recorded the Scanning Electron Microscopicimages and Raman spectra. All the authors reviewed and commented on the manuscript.
Conflicts of Interest: The authors declare no conflict of interest.
References
1. Beidaghi, M.; Gogotsi, Y.; Wang, Z.L.; Akyildiz, I.F.; Su, W.; Sankarasubramaniam, Y.; Cayirci, E.; Wang, Z.L.;Wu, W.; Wang, Z.L.; et al. Capacitive Energy Storage in Micro-Scale Devices: Recent Advances in Design andFabrication of Micro-Supercapacitors. Energy Environ. Sci. 2014, 7, 867–884. [CrossRef]
2. Merlet, C.; Rotenberg, B.; Madden, P.A.; Taberna, P.-L.; Simon, P.; Gogotsi, Y.; Salanne, M. On the MolecularOrigin of Supercapacitance in Nanoporous Carbon Electrodes. Nat. Mater. 2012, 11, 306–310. [CrossRef][PubMed]

C 2017, 3, 25 14 of 17
3. Choi, N.-S.; Chen, Z.; Freunberger, S.A.; Ji, X.; Sun, Y.-K.; Amine, K.; Yushin, G.; Nazar, L.F.; Cho, J.; Bruce, P.G.Challenges Facing Lithium Batteries and Electrical Double-Layer Capacitors. Angew. Chem. Int. Ed. 2012, 51,9994–10024. [CrossRef] [PubMed]
4. Dyatkin, B.; Presser, V.; Heon, M.; Lukatskaya, M.R.; Beidaghi, M.; Gogotsi, Y. Development of a GreenSupercapacitor Composed Entirely of Environmentally Friendly Materials. ChemSusChem 2013, 6, 2269–2280.[CrossRef] [PubMed]
5. Zhu, Y.; Murali, S.; Stoller, M.D.; Ganesh, K.J.; Cai, W.; Ferreira, P.J.; Pirkle, A.; Wallace, R.M.; Cychosz, K.A.;Thommes, M.; et al. Carbon-Based Supercapacitors Produced by Activation of Graphene. Science 2011, 332,1537–1541. [CrossRef] [PubMed]
6. Niu, Z.; Zhou, W.; Chen, J.; Feng, G.; Li, H.; Ma, W.; Li, J.; Dong, H.; Ren, Y.; Zhao, D.; et al. Compact-DesignedSupercapacitors Using Free-Standing Single-Walled Carbon Nanotube Films. Energy Environ. Sci. 2011, 4,1440–1446. [CrossRef]
7. Xu, B.; Wu, F.; Chen, R.; Cao, G.; Chen, S.; Yang, Y. Mesoporous Activated Carbon Fiber as ElectrodeMaterial for High-Performance Electrochemical Double Layer Capacitors with Ionic Liquid Electrolyte.J. Power Sources 2010, 195, 2118–2124. [CrossRef]
8. Dai, Y.; Jiang, H.; Hu, Y.; Fu, Y.; Li, C. Controlled Synthesis of Ultrathin Hollow Mesoporous CarbonNanospheres for Supercapacitor Applications. Ind. Eng. Chem. Res. 2014, 53, 3125–3130. [CrossRef]
9. Zequine, C.; Ranaweera, C.K.; Wang, Z.; Singh, S.; Tripathi, P.; Srivastava, O.N.; Gupta, B.K.; Ramasamy, K.;Kahol, P.K.; Dvornic, P.R.; et al. High per Formance and Flexible Supercapacitors Based on CarbonizedBamboo Fibers for Wide Temperature Applications. Sci. Rep. 2016, 6, 31740. [CrossRef] [PubMed]
10. Qu, W.H.; Xu, Y.Y.; Lu, A.H.; Zhang, X.Q.; Li, W.C. Converting Biowaste Corncob Residue into High ValueAdded Porous Carbon for Supercapacitor Electrodes. Bioresour. Technol. 2015, 189, 285–291. [CrossRef][PubMed]
11. Wahid, M.; Puthusseri, D.; Phase, D.; Ogale, S. Enhanced Capacitance Retention in a Supercapacitor Made ofCarbon from Sugarcane Bagasse by Hydrothermal Pretreatment. Energy Fuels 2014, 28, 4233–4240. [CrossRef]
12. Peng, C.; Yan, X.B.; Wang, R.T.; Lang, J.W.; Ou, Y.J.; Xue, Q.J. Promising Activated Carbons Derived fromWaste Tea-Leaves and Their Application in High Performance Supercapacitors Electrodes. Electrochim. Acta2013, 87, 401–408. [CrossRef]
13. Hou, J.; Cao, C.; Ma, X.; Idrees, F.; Xu, B.; Hao, X.; Lin, W. From Rice Bran to High Energy DensitySupercapacitors: A New Route to Control Porous Structure of 3D Carbon. Sci. Rep. 2014, 4, 7260. [CrossRef][PubMed]
14. Biswal, M.; Banerjee, A.; Deo, M.; Ogale, S.; Wang, G.; Zhang, L.; Zhang, J.; Frackowiaka, E.; Béguin, F.;Dai, L.; et al. From Dead Leaves to High Energy Density Supercapacitors. Energy Environ. Sci. 2013, 6,1249–1259. [CrossRef]
15. Lv, Y.; Gan, L.; Liu, M.; Xiong, W.; Xu, Z.; Zhu, D.; Wright, D.S. A Self-Template Synthesis of HierarchicalPorous Carbon Foams Based on Banana Peel for Supercapacitor Electrodes. J. Power Sources 2012, 209,152–157. [CrossRef]
16. Wu, F.-C.; Tseng, R.-L.; Hu, C.-C.; Wang, C.-C. Effects of Pore Structure and Electrolyte on the CapacitiveCharacteristics of Steam- and KOH-Activated Carbons for Supercapacitors. J. Power Sources 2005, 144,302–309. [CrossRef]
17. Valix, M.; Cheung, W.H.; McKay, G. Preparation of Activated Carbon Using Low Temperature Carbonisationand Physical Activation of High Ash Raw Bagasse for Acid Dye Adsorption. Chemosphere 2004, 56, 493–501.[CrossRef] [PubMed]
18. Guo, Y.; Zhang, H.; Tao, N.; Liu, Y.; Qi, J.; Wang, Z.; Xu, H. Adsorption of Malachite Green and Iodine onRice Husk-Based Porous Carbon. Mater. Chem. Phys. 2003, 82, 107–115. [CrossRef]
19. Guo, Y.; Qi, J.; Jiang, Y.; Yang, S.; Wang, Z.; Xu, H. Performance of Electrical Double Layer Capacitors withPorous Carbons Derived from Rice Husk. Mater. Chem. Phys. 2003, 80, 704–709. [CrossRef]
20. Girgis, B.S.; El-Hendawy, A.-N.A. Porosity Development in Activated Carbons Obtained from Date Pits underChemical Activation with Phosphoric Acid. Microporous Mesoporous Mater. 2002, 52, 105–117. [CrossRef]
21. Caturla, F.; Molina-Sabio, M.; Rodríguez-Reinoso, F. Preparation of Activated Carbon by Chemical Activationwith ZnCl2. Carbon N. Y. 1991, 29, 999–1007. [CrossRef]
22. Wang, J.; Kaskel, S. KOH Activation of Carbon-Based Materials for Energy Storage. J. Mater. Chem. 2012, 22,23710–23725. [CrossRef]

C 2017, 3, 25 15 of 17
23. Maciá-Agulló, J.A.; Moore, B.C.; Cazorla-Amorós, D.; Linares-Solano, A. Activation of Coal Tar Pitch CarbonFibres: Physical Activation vs. Chemical Activation. Carbon N. Y. 2004, 42, 1367–1370. [CrossRef]
24. Raymundo-Piñero, E.; Leroux, F.; Béguin, F. A High-Performance Carbon for Supercapacitors Obtained byCarbonization of a Seaweed Biopolymer. Adv. Mater. 2006, 18, 1877–1882. [CrossRef]
25. Ferrero, G.A.; Fuertes, A.B.; Sevilla, M.; Choi, N.-S.; Frackowiak, E.; Beguin, F.; Beguin, F.; Presser, V.;Balducci, A.; Frackowiak, E.; et al. From Soybean Residue to Advanced Supercapacitors. Sci. Rep. 2015, 5,16618. [CrossRef] [PubMed]
26. Li, Y.; Wang, G.; Wei, T.; Fan, Z.; Yan, P. Nitrogen and Sulfur Co-Doped Porous Carbon Nanosheets Derivedfrom Willow Catkin for Supercapacitors. Nano Energy 2016, 19, 165–175. [CrossRef]
27. Foreign Agricultural Service/USDA. Citrus: World Markets and Trade; USDA: Washington, DC, USA, 2017.28. Grohmann, K.; Baldwin, E.A. Hydrolysis of Orange Peel with Pectinase and Cellulase Enzymes. Biotechnol. Lett.
1992, 14, 1169–1174. [CrossRef]29. Marín, F.R.; Soler-Rivas, C.; Benavente-García, O.; Castillo, J.; Pérez-Alvarez, J.A. By-Products from Different
Citrus Processes as a Source of Customized Functional Fibres. Food Chem. 2007, 100, 736–741. [CrossRef]30. Widmer, W.; Zhou, W.; Grohmann, K. Pretreatment Effects on Orange Processing Waste for Making Ethanol
by Simultaneous Saccharification and Fermentation. Bioresour. Technol. 2010, 101, 5242–5249. [CrossRef][PubMed]
31. Prakash Maran, J.; Sivakumar, V.; Thirugnanasambandham, K.; Sridhar, R. Optimization of MicrowaveAssisted Extraction of Pectin from Orange Peel. Carbohydr. Polym. 2013, 97, 703–709. [CrossRef] [PubMed]
32. Feng, N.; Guo, X.; Liang, S.; Zhu, Y.; Liu, J. Biosorption of Heavy Metals from Aqueous Solutions byChemically Modified Orange Peel. J. Hazard. Mater. 2011, 185, 49–54. [CrossRef] [PubMed]
33. Khaled, A.; El Nemr, A.; El-Sikaily, A.; Abdelwahab, O. Removal of Direct N Blue-106 from ArtificialTextile Dye Effluent Using Activated Carbon from Orange Peel: Adsorption Isotherm and Kinetic Studies.J. Hazard. Mater. 2009, 165, 100–110. [CrossRef] [PubMed]
34. Martín, M.A.; Siles, J.A.; Chica, A.F.; Martín, A. Biomethanization of Orange Peel Waste. Bioresour. Technol.2010, 101, 8993–8999. [CrossRef] [PubMed]
35. Ranaweera, C.K.; Ionescu, M.; Bilic, N.; Wan, X.; Kahol, P.K.; Gupta, R.K. Biobased Polyols Using Thiol-EneChemistry for Rigid Polyurethane Foams with Enhanced Flame-Retardant Properties. J. Renew. Mater. 2017.[CrossRef]
36. Gao, Y.; Li, L.; Jin, Y.; Wang, Y.; Yuan, C.; Wei, Y.; Chen, G.; Ge, J.; Lu, H. Porous Carbon Made from Rice Huskas Electrode Material for Electrochemical Double Layer Capacitor. Appl. Energy 2015, 153, 41–47. [CrossRef]
37. Cheng, P.; Li, T.; Yu, H.; Zhi, L.; Liu, Z.; Lei, Z. Biomass-Derived Carbon Fiber Aerogel as a Binder-FreeElectrode for High-Rate Supercapacitors. J. Phys. Chem. C 2016, 120, 2079–2086. [CrossRef]
38. Brebu, M.; Vasile, C. Thermal Degradation of Lignin—A Review. Cellul. Chem. Technol. 2010, 44, 353–363.39. Paris, O.; Zollfrank, C.; Zickler, G.A. Decomposition and Carbonisation of Wood Biopolymers—A
Microstructural Study of Softwood Pyrolysis. Carbon N. Y. 2005, 43, 53–66. [CrossRef]40. Kastanaki, E.; Vamvuka, D.; Grammelis, P.; Kakaras, E. Thermogravimetric Studies of the Behavior of
Lignite–biomass Blends during Devolatilization. Fuel Process. Technol. 2002, 77, 159–166. [CrossRef]41. Mi, J.; Wang, X.; Fan, R.; Qu, W.; Li, W. Coconut-Shell-Based Porous Carbons with a Tunable Micro/Mesopore
Ratio for High-Performance Supercapacitors. Energy Fuels 2012, 26, 5321–5329. [CrossRef]42. Li, Y.; Li, Z.; Shen, P.K. Simultaneous Formation of Ultrahigh Surface Area and Three-Dimensional
Hierarchical Porous Graphene-Like Networks for Fast and Highly Stable Supercapacitors. Adv. Mater.2013, 25, 2474–2480. [CrossRef] [PubMed]
43. Wu, Z.-S.; Sun, Y.; Tan, Y.-Z.; Yang, S.; Feng, X.; Müllen, K. Three-Dimensional Graphene-Based Macro-and Mesoporous Frameworks for High-Performance Electrochemical Capacitive Energy Storage. J. Am.Chem. Soc. 2012, 134, 19532–19535. [CrossRef] [PubMed]
44. Ismanto, A.E.; Wang, S.; Soetaredjo, F.E.; Ismadji, S. Preparation of Capacitor’s Electrode from Cassava PeelWaste. Bioresour. Technol. 2010, 101, 3534–3540. [CrossRef] [PubMed]
45. Cheng, P.; Gao, S.; Zang, P.; Yang, X.; Bai, Y.; Xu, H.; Liu, Z.; Lei, Z. Hierarchically Porous Carbon byActivation of Shiitake Mushroom for Capacitive Energy Storage. Carbon N. Y. 2015, 93, 315–324. [CrossRef]
46. Sing, K.S.W. Reporting Physisorption Data for Gas/solid Systems with Special Reference to theDetermination of Surface Area and Porosity (Recommendations 1984). Pure Appl. Chem. 1985, 57, 603–619.[CrossRef]

C 2017, 3, 25 16 of 17
47. Zhong, C.; Deng, Y.; Hu, W.; Qiao, J.; Zhang, L.; Zhang, J.; Burke, A.; Simon, P.; Gogotsi, Y.; Naoi, K.; et al.A Review of Electrolyte Materials and Compositions for Electrochemical Supercapacitors. Chem. Soc. Rev.2015, 44, 7484–7539. [CrossRef] [PubMed]
48. Misnon, I.I.; Zain, N.K.M.; Aziz, R.A.; Vidyadharan, B.; Jose, R. Electrochemical Properties of Carbon fromOil Palm Kernel Shell for High Performance Supercapacitors. Electrochim. Acta 2015, 174, 78–86. [CrossRef]
49. Lee, J.H.; Park, N.; Kim, B.G.; Jung, D.S.; Im, K.; Hur, J.; Choi, J.W. Restacking-Inhibited 3D ReducedGraphene Oxide for High Performance Supercapacitor Electrodes. ACS Nano 2013, 7, 9366–9374. [CrossRef][PubMed]
50. Xie, K.; Li, J.; Lai, Y.; Zhang, Z.; Liu, Y.; Zhang, G.; Huang, H. Polyaniline Nanowire Array Encapsulatedin Titania Nanotubes as a Superior Electrode for Supercapacitors. Nanoscale 2011, 3, 2202–2207. [CrossRef][PubMed]
51. Chang, J.; Gao, Z.; Wang, X.; Wu, D.; Xu, F.; Wang, X.; Guo, Y.; Jiang, K. Activated Porous Carbon Preparedfrom Paulownia Flower for High Performance Supercapacitor Electrodes. Electrochim. Acta 2015, 157,290–298. [CrossRef]
52. Vadiyar, M.M.; Bhise, S.C.; Patil, S.K.; Kolekar, S.S.; Chang, J.-Y.; Ghule, A.V. Comparative Study of Individualand Mixed Aqueous Electrolytes with ZnFe2O4 Nano-Flakes Thin Film as an Electrode for SupercapacitorApplication. ChemistrySelect 2016, 1, 959–966. [CrossRef]
53. Dubal, D.P.; Lee, S.H.; Kim, J.G.; Kim, W.B.; Lokhande, C.D. Porous Polypyrrole Clusters Prepared byElectropolymerization for a High Performance Supercapacitor. J. Mater. Chem. 2012, 22, 3044–3052. [CrossRef]
54. Qian, W.; Sun, F.; Xu, Y.; Qiu, L.; Liu, C.; Wang, S.; Yan, F. Human Hair-Derived Carbon Flakes forElectrochemical Supercapacitors. Energy Environ. Sci. 2013, 7, 379–386. [CrossRef]
55. Divyashree, A.; Hegde, G. Activated Carbon Nanospheres Derived from Bio-Waste Materials forSupercapacitor Applications—A Review. RSC Adv. 2015, 5, 88339–88352.
56. Bose, S.; Kuila, T.; Mishra, A.K.; Rajasekar, R.; Kim, N.H.; Lee, J.H. Carbon-Based Nanostructured Materialsand Their Composites as Supercapacitor Electrodes. J. Mater. Chem. 2012, 22, 767–784. [CrossRef]
57. Salunkhe, R.R.; Lee, Y.-H.; Chang, K.-H.; Li, J.-M.; Simon, P.; Tang, J.; Torad, N.L.; Hu, C.-C.; Yamauchi, Y.Nanoarchitectured Graphene-Based Supercapacitors for Next-Generation Energy-Storage Applications.Chem. A Eur. J. 2014, 20, 13838–13852. [CrossRef] [PubMed]
58. Obreja, V.V.N. On the Performance of Supercapacitors with Electrodes Based on Carbon Nanotubes andCarbon Activated material—A Review. Phys. E Low-dimens. Syst. Nanostruct. 2008, 40, 2596–2605. [CrossRef]
59. Guo, Y.; Shi, Z.; Chen, M.; Wang, C. Hierarchical Porous Carbon Derived from Sulfonated Pitch for ElectricalDouble Layer Capacitors. J. Power Sources 2014, 252, 235–243. [CrossRef]
60. Du, S.; Wang, L.; Fu, X.; Chen, M.; Wang, C. Hierarchical Porous Carbon Microspheres Derived from PorousStarch for Use in High-Rate Electrochemical Double-Layer Capacitors. Bioresour. Technol. 2013, 139, 406–409.[CrossRef] [PubMed]
61. Wang, R.; Wang, P.; Yan, X.; Lang, J.; Peng, C.; Xue, Q. Promising Porous Carbon Derived from CeltuceLeaves with Outstanding Supercapacitance and CO2 Capture Performance. ACS Appl. Mater. Interfaces 2012,4, 5800–5806. [CrossRef] [PubMed]
62. Hegde, G.; Abdul Manaf, S.A.; Kumar, A.; Ali, G.A.M.; Chong, K.F.; Ngaini, Z.; Sharma, K.V. Biowaste SagoBark Based Catalyst Free Carbon Nanospheres: Waste to Wealth Approach. ACS Sustain. Chem. Eng. 2015, 3,2247–2253. [CrossRef]
63. Xie, Q.; Bao, R.; Zheng, A.; Zhang, Y.; Wu, S.; Xie, C.; Zhao, P. Sustainable Low-Cost Green Electrodeswith High Volumetric Capacitance for Aqueous Symmetric Supercapacitors with High Energy Density.ACS Sustain. Chem. Eng. 2016, 4, 1422–1430. [CrossRef]
64. Yang, C.-S.; Jang, Y.S.; Jeong, H.K. Bamboo-Based Activated Carbon for Supercapacitor Applications.Curr. Appl. Phys. 2014, 14, 1616–1620. [CrossRef]
65. Teo, E.Y.L.; Muniandy, L.; Ng, E.-P.; Adam, F.; Mohamed, A.R.; Jose, R.; Chong, K.F. High Surface AreaActivated Carbon from Rice Husk as a High Performance Supercapacitor Electrode. Electrochim. Acta 2016,192, 110–119. [CrossRef]
66. Du, X.; Zhao, W.; Wang, Y.; Wang, C.; Chen, M.; Qi, T.; Hua, C.; Ma, M. Preparation of ActivatedCarbon Hollow Fibers from Ramie at Low Temperature for Electric Double-Layer Capacitor Applications.Bioresour. Technol. 2013, 149, 31–37. [CrossRef] [PubMed]

C 2017, 3, 25 17 of 17
67. Zhang, J.; Gong, L.; Sun, K.; Jiang, J.; Zhang, X. Preparation of Activated Carbon from Waste CamelliaOleifera Shell for Supercapacitor Application. J. Solid State Electrochem. 2012, 16, 2179–2186. [CrossRef]
68. Yang, Y.; Ruan, G.; Xiang, C.; Wang, G.; Tour, J.M. Flexible Three-Dimensional Nanoporous Metal-BasedEnergy Devices. J. Am. Chem. Soc. 2014, 136, 6187–6190. [CrossRef] [PubMed]
69. Cui, H.; Zhu, G.; Liu, X.; Liu, F.; Xie, Y.; Yang, C.; Lin, T.; Gu, H.; Huang, F. Niobium Nitride Nb4N5 as a NewHigh-Performance Electrode Material for Supercapacitors. Adv. Sci. 2015, 2, 1500126. [CrossRef] [PubMed]
70. Yu, J.; Lu, W.; Pei, S.; Gong, K.; Wang, L.; Meng, L.; Huang, Y.; Smith, J.P.; Booksh, K.S.; Li, Q.; et al.Omnidirectionally Stretchable High-Performance Supercapacitor Based on Isotropic Buckled CarbonNanotube Films. ACS Nano 2016, 10, 5204–5211. [CrossRef] [PubMed]
71. Cao, J.; Wang, Y.; Chen, J.; Li, X.; Walsh, F.C.; Ouyang, J.-H.; Jia, D.; Zhou, Y. Three-Dimensional GrapheneOxide/polypyrrole Composite Electrodes Fabricated by One-Step Electrodeposition for High PerformanceSupercapacitors. J. Mater. Chem. A 2015, 3, 14445–14457. [CrossRef]
72. Liu, N.; Ma, W.; Tao, J.; Zhang, X.; Su, J.; Li, L.; Yang, C.; Gao, Y.; Golberg, D.; Bando, Y. Cable-TypeSupercapacitors of Three-Dimensional Cotton Thread Based Multi-Grade Nanostructures for WearableEnergy Storage. Adv. Mater. 2013, 25, 4925–4931. [CrossRef] [PubMed]
73. Le, V.T.; Kim, H.; Ghosh, A.; Kim, J.; Chang, J.; Vu, Q.A.; Pham, D.T.; Lee, J.-H.; Kim, S.-W.; Lee, Y.H. CoaxialFiber Supercapacitor Using All-Carbon Material Electrodes. ACS Nano 2013, 7, 5940–5947. [CrossRef][PubMed]
74. Weng, Z.; Su, Y.; Wang, D.-W.; Li, F.; Du, J.; Cheng, H.-M. Graphene-Cellulose Paper Flexible Supercapacitors.Adv. Energy Mater. 2011, 1, 917–922. [CrossRef]
75. Masarapu, C.; Zeng, H.F.; Hung, K.H.; Wei, B. Effect of Temperature on the Capacitance of Carbon NanotubeSupercapacitors. ACS Nano 2009, 3, 2199–2206. [CrossRef] [PubMed]
© 2017 by the authors. Licensee MDPI, Basel, Switzerland. This article is an open accessarticle distributed under the terms and conditions of the Creative Commons Attribution(CC BY) license (http://creativecommons.org/licenses/by/4.0/).