Proteomics of Chlamydomonas reinhardtii Light-Harvesting Proteins
Yang et al. Biotechnology for Biofuels 2013, 6:118http://www.biotechnologyforbiofuels.com/content/6/1/118
RESEARCH Open Access
De novo transcriptomic analysis of hydrogenproduction in the green alga Chlamydomonasmoewusii through RNA-SeqShihui Yang1*, Michael T Guarnieri1, Sharon Smolinski2, Maria Ghirardi2 and Philip T Pienkos1
Abstract
Background: Microalgae can make a significant contribution towards meeting global renewable energy needs inboth carbon-based and hydrogen (H2) biofuel. The development of energy-related products from algae could beaccelerated with improvements in systems biology tools, and recent advances in sequencing technology provide aplatform for enhanced transcriptomic analyses. However, these techniques are still heavily reliant upon availablegenomic sequence data. Chlamydomonas moewusii is a unicellular green alga capable of evolving molecular H2
under both dark and light anaerobic conditions, and has high hydrogenase activity that can be rapidly induced.However, to date, there is no systematic investigation of transcriptomic profiling during induction of H2
photoproduction in this organism.
Results: In this work, RNA-Seq was applied to investigate transcriptomic profiles during the dark anaerobicinduction of H2 photoproduction. 156 million reads generated from 7 samples were then used for de novoassembly after data trimming. BlastX results against NCBI database and Blast2GO results were used to interpret thefunctions of the assembled 34,136 contigs, which were then used as the reference contigs for RNA-Seq analysis.Our results indicated that more contigs were differentially expressed during the period of early and higher H2
photoproduction, and fewer contigs were differentially expressed when H2-photoproduction rates decreased. Inaddition, C. moewusii and C. reinhardtii share core functional pathways, and transcripts for H2 photoproduction andanaerobic metabolite production were identified in both organisms. C. moewusii also possesses similar metabolicflexibility as C. reinhardtii, and the difference between C. moewusii and C. reinhardtii on hydrogenase expression andanaerobic fermentative pathways involved in redox balancing may explain their different profiles of hydrogenaseactivity and secreted anaerobic metabolites.
Conclusions: Herein, we have described a workflow using commercial software to analyze RNA-Seq data withoutreference genome sequence information, which can be applied to other unsequenced microorganisms. This studyprovided biological insights into the anaerobic fermentation and H2 photoproduction of C. moewusii, and the firsttranscriptomic RNA-Seq dataset of C. moewusii generated in this study also offer baseline data for furtherinvestigation (e.g. regulatory proteins related to fermentative pathway discussed in this study) of this organism as aH2-photoproduction strain.
BackgroundDevelopment of renewable energy sources is crucial for en-ergy security, climate change mitigation, and economic re-covery. It would be desirable to develop various renewableenergy sources such as wind, solar, and geothermal energy,as well as cellulosic biomass-based biofuels and biological
* Correspondence: [email protected] Bioenergy Center, Golden, CO, USAFull list of author information is available at the end of the article
© 2013 Yang et al.; licensee BioMed Central LtCommons Attribution License (http://creativecreproduction in any medium, provided the or
H2, to meet the goal of replacing petroleum-based fuel.One approach for capture of solar energy is the exploit-ation of microalgae, which can photosynthetically produceH2 from water, ferment starch into H2 and organic acids,and convert CO2 into liquid biofuel, providing different re-newable energy forms and concurrently contributing tosolving the greenhouse gas problem [1-4]. The recentlyrevived interest in algal research has witnessed the accu-mulation of large algae strain collections and knowledge
d. This is an Open Access article distributed under the terms of the Creativeommons.org/licenses/by/2.0), which permits unrestricted use, distribution, andiginal work is properly cited.

Yang et al. Biotechnology for Biofuels 2013, 6:118 Page 2 of 17http://www.biotechnologyforbiofuels.com/content/6/1/118
in strain characterization. In addition, genetics tools forvarious algae have been developed, and more accuratetechnoeconomic analyses and downstream processing im-provement have also been published recently [5-7]. Withrecent advances in next-generation sequencing (NGS) andsynthetic biology technologies, more progress can be fore-seen in the future for algae-based renewable energy [8].Chlamydomonas moewusii is a unicellular green alga
capable of evolving molecular H2 under both dark andlight anaerobic conditions. Meuser et al. (2009) previ-ously compared hydrogenase activity, starch catabol-ism, and secreted anaerobic metabolites of Lobochlamysculleus (syn. C. reinhardtii UTEX 1060 (mt-)) and fourC. moewusii strains (UTEX 10 (mt−), UTEX 97 (mt+),UTEX 2018 (mt−), and SAG 24.91 (mt−)) with the modelgreen alga, C. reinhardtii. The results indicated that(i) C. moewusii strains had the most rapid H2-photo-production activity induction, followed by faster loss ofactivity over longer periods of time; (ii) the SAG 24.91strain had the highest in vitro hydrogenase activity ofall strains examined, as well as faster rates of starch ca-tabolism; (iii) although SAG 24.91 had a rate of dark,fermentative H2-production activity similar to that ofC. reinhardtii at earlier times, it and all other C. moewusiistrains lost their dark, fermentative H2-production activ-ity faster than C. reinhardtii over time. Finally, C. moewusiistrains had different profiles of secreted anaerobic metabo-lites [9] when compared to C. reinhardtii [10]. However,with the exception of nearly 160 protein sequences avail-able at NCBI database, including those from the 23-kbmitochondria genome (NC_001872) [11,12], the completenuclear and chloroplast genome sequences of C. moewusiiare not available. Furthermore, although systems biol-ogy approaches of transcriptomics, metabolomics, andproteomics have been applied for the model green algaC. reinhardtii [10,13-25], systematic investigation inC. moewusii has not yet been carried out.The development of energy-related products from
algae could be accelerated with improvements in sys-tems biology tools. Advances in sequencing technologyprovide a platform for the development of novel tran-scriptome analysis approaches although most of thesetechniques are still heavily reliant upon available gen-omic sequence, and only seven genomic sequences areavailable for green microalgae species of Ostreococcustauri, C. reinhardtii, Micromonas sp., Chlorella variabilis,Volvox carteri, Coccomyxa subellipsoidea, and Ostreococcuslucimarinus [26-33]. Recently, quite a few studies have ap-plied NGS-based transcriptomics to species without refer-ence genome sequence, such as the studies to identify andconstruct lipid and starch biosynthesis and catabolismpathways in the microalga Dunaliella tertiolecta [34],to discover gene and reconstruct metabolic network forterpenoid biosynthesis in the hydrocarbon oil-producing
green alga Botryococcus braunii race B [35], to investigatethe triacylglyceride (TAG) accumulation mechanism ofthe unsequenced oleaginous microalgae of Neochlorisoleoabundans and Chlorella vulgaris [36,37], and to un-ravel the putative mechanisms associated with the suc-cessful coastal ecosystems colonization by Ulva linza[38]. This powerful technique has not yet been applied to apotential H2 production green algal strain without a refer-ence genome.In this study, we combine commercial software for
NGS data analysis and statistical analysis to examineC. moewusii transcripts responsive to dark anaerobicinduction of H2 photoevolution through a time-coursetranscriptomic study. Our work supports the metabol-ite difference observed previously between C. moewusiiand C. reinhardtii at transcriptional level, providesinsight into the different anaerobic fermentation and H2
photoproduction patterns observed in C. moewusii andC. reinhardtii, and establishes baseline data for futuremetabolic engineering and modeling using C. moewusii.In addition, the transcriptomic data and the contigs gener-ated through this study can facilitate comparative trans-criptomics studies among different algae.
Results and discussionsHydrogen evolution and RNA-Seq studyThree experiments were carried out to gather H2-photoproduction data and collect the cells for total RNAextraction immediately after H2 production was mea-sured. In the first experiment, cells were harvested fromthe aerobic culture prior to anaerobic induction (zerotime point) [sample ID: 0 M-0508]. In another two exper-iments, cells were harvested at four different time-points,at approximately 15 min [15 M-0427 and 15 M-0502],2 h [2 h-0427 and 2 h-0502], 5 h [5 h-0427], and 10 h[10 h-0502] (Figure 1) following initiation of anaerobicinduction.Together, seven samples were used for total RNA extrac-
tion and RNA-Seq using Illumina GAIIx. RNA-Seq datafrom 0 M-0508 were used for de novo assembly to gener-ate reference contigs only. Three time phases with bio-logical replicate data were used for statistical analysis tounderstand the transcriptomic profiling during inductionof H2 photoproduction: 15 M-0427 and 15 M-0502 usedas the time point for early H2 photoproduction (Phase I);2 h-0427 and 2 h-0502 used as the time point for highH2-photoproduction rates (Phase II); and 5 h-0427and10 h-0502 used as the time point for decreased rates of H2
photoproduction (Phase III) (Figure 1). The gene expres-sion level was indicated by the log2-transformed RPKM(Reads Per Kilobase per Million mapped reads) value. Forthe purpose of clarity, RPKM mentioned throughout thepaper refers to the log2-transformed RPKM unless other-wise noted.
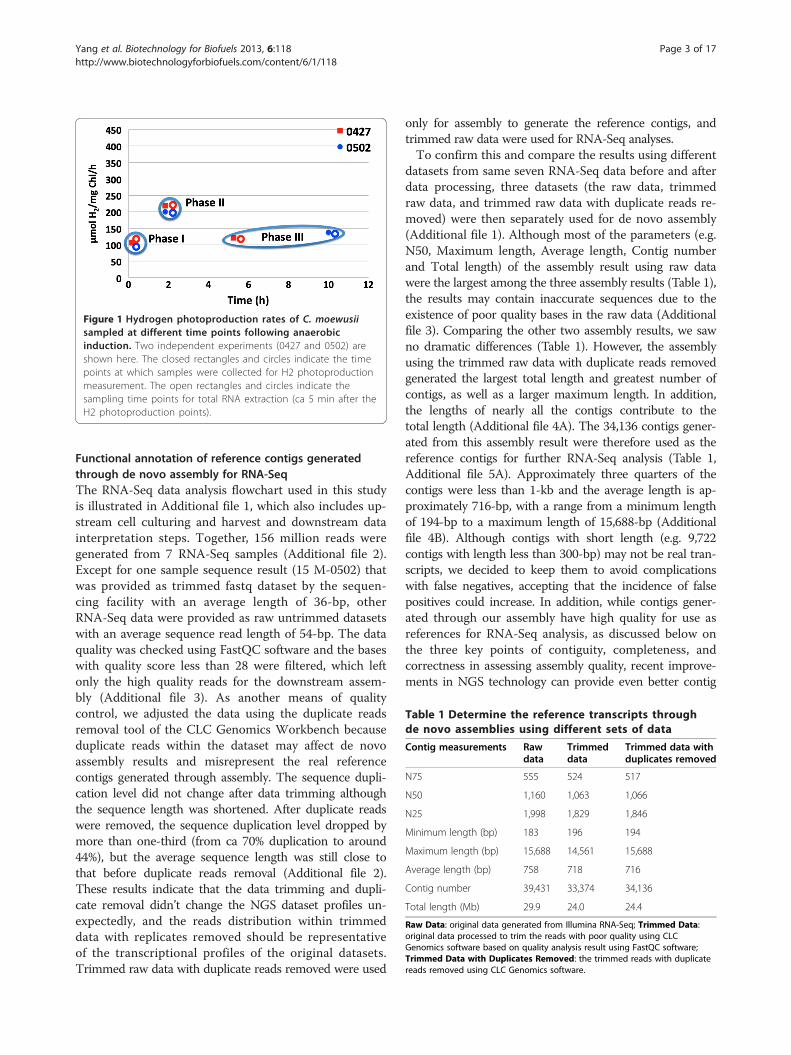
Table 1 Determine the reference transcripts throughde novo assemblies using different sets of data
Contig measurements Rawdata
Trimmeddata
Trimmed data withduplicates removed
N75 555 524 517
N50 1,160 1,063 1,066
N25 1,998 1,829 1,846
Minimum length (bp) 183 196 194
Maximum length (bp) 15,688 14,561 15,688
Average length (bp) 758 718 716
Contig number 39,431 33,374 34,136
Total length (Mb) 29.9 24.0 24.4
Raw Data: original data generated from Illumina RNA-Seq; Trimmed Data:original data processed to trim the reads with poor quality using CLCGenomics software based on quality analysis result using FastQC software;Trimmed Data with Duplicates Removed: the trimmed reads with duplicatereads removed using CLC Genomics software.
Figure 1 Hydrogen photoproduction rates of C. moewusiisampled at different time points following anaerobicinduction. Two independent experiments (0427 and 0502) areshown here. The closed rectangles and circles indicate the timepoints at which samples were collected for H2 photoproductionmeasurement. The open rectangles and circles indicate thesampling time points for total RNA extraction (ca 5 min after theH2 photoproduction points).
Yang et al. Biotechnology for Biofuels 2013, 6:118 Page 3 of 17http://www.biotechnologyforbiofuels.com/content/6/1/118
Functional annotation of reference contigs generatedthrough de novo assembly for RNA-SeqThe RNA-Seq data analysis flowchart used in this studyis illustrated in Additional file 1, which also includes up-stream cell culturing and harvest and downstream datainterpretation steps. Together, 156 million reads weregenerated from 7 RNA-Seq samples (Additional file 2).Except for one sample sequence result (15 M-0502) thatwas provided as trimmed fastq dataset by the sequen-cing facility with an average length of 36-bp, otherRNA-Seq data were provided as raw untrimmed datasetswith an average sequence read length of 54-bp. The dataquality was checked using FastQC software and the baseswith quality score less than 28 were filtered, which leftonly the high quality reads for the downstream assem-bly (Additional file 3). As another means of qualitycontrol, we adjusted the data using the duplicate readsremoval tool of the CLC Genomics Workbench becauseduplicate reads within the dataset may affect de novoassembly results and misrepresent the real referencecontigs generated through assembly. The sequence dupli-cation level did not change after data trimming althoughthe sequence length was shortened. After duplicate readswere removed, the sequence duplication level dropped bymore than one-third (from ca 70% duplication to around44%), but the average sequence length was still close tothat before duplicate reads removal (Additional file 2).These results indicate that the data trimming and dupli-cate removal didn’t change the NGS dataset profiles un-expectedly, and the reads distribution within trimmeddata with replicates removed should be representativeof the transcriptional profiles of the original datasets.Trimmed raw data with duplicate reads removed were used
only for assembly to generate the reference contigs, andtrimmed raw data were used for RNA-Seq analyses.To confirm this and compare the results using different
datasets from same seven RNA-Seq data before and afterdata processing, three datasets (the raw data, trimmedraw data, and trimmed raw data with duplicate reads re-moved) were then separately used for de novo assembly(Additional file 1). Although most of the parameters (e.g.N50, Maximum length, Average length, Contig numberand Total length) of the assembly result using raw datawere the largest among the three assembly results (Table 1),the results may contain inaccurate sequences due to theexistence of poor quality bases in the raw data (Additionalfile 3). Comparing the other two assembly results, we sawno dramatic differences (Table 1). However, the assemblyusing the trimmed raw data with duplicate reads removedgenerated the largest total length and greatest number ofcontigs, as well as a larger maximum length. In addition,the lengths of nearly all the contigs contribute to thetotal length (Additional file 4A). The 34,136 contigs gener-ated from this assembly result were therefore used as thereference contigs for further RNA-Seq analysis (Table 1,Additional file 5A). Approximately three quarters of thecontigs were less than 1-kb and the average length is ap-proximately 716-bp, with a range from a minimum lengthof 194-bp to a maximum length of 15,688-bp (Additionalfile 4B). Although contigs with short length (e.g. 9,722contigs with length less than 300-bp) may not be real tran-scripts, we decided to keep them to avoid complicationswith false negatives, accepting that the incidence of falsepositives could increase. In addition, while contigs gener-ated through our assembly have high quality for use asreferences for RNA-Seq analysis, as discussed below onthe three key points of contiguity, completeness, andcorrectness in assessing assembly quality, recent improve-ments in NGS technology can provide even better contig

Yang et al. Biotechnology for Biofuels 2013, 6:118 Page 4 of 17http://www.biotechnologyforbiofuels.com/content/6/1/118
connectivity with longer reads length for better assemblythan those applied in this study.BlastX and Blast2GO programs [39-41] were then ap-
plied to the FASTA data of the 34,136 contigs generatedfrom the de novo assembly in order to obtain their func-tional assignments (Additional file 1). The BlastX searchhad positive hits for nearly all the contigs, with 2,000contigs related to ribosomal proteins and 1,700 belongingto transcriptional factors; more than one-third (13,920) arehypothetical proteins with unknown function (Additionalfile 5A). Nearly all of the top hits with the best BlastX E-values come from other algae, accounting for more thanfour-fifth of the total contigs (Figure 2). In addition, thehigh similarity of assembled contigs to 40 C. moewusiimitochondrial genes (NC_001872) available in NCBI data-base (Additional file 5B) further supports the use of the an-notated assembled contigs as reference for the followingtime-course transcriptomic study. For example, 30 contigsmatch the C. moewusii mitochondrial genome sequence(Additional file 6A). In addition, the longest assembledcontig (Contig_490, 15688-bp) matches the flagellarouter dynein arm heavy chain gamma of V. carteri with81% identity and 91% similarity (Additional file 6B). Sev-eral other long contigs also match to the dynein heavychain and flagellar components: contig_1136 (8745-bp)matches the dynein heavy chain 6 of C. reinhardtii with78% identity and 88% similarity (Additional file 6C);contig_665 (8079-bp) matches the dynein heavy chainbeta of V. carteri with 83% identity and 92% similarity;contig_2517 (8079-bp) matches dynein heavy chain 9 ofthe same organism with 79% identity and 89% similarity;and contig_649 (9293-bp) matches flagellar-associatedcallose synthase-like protein of C. reinhardtii with 62%
Figure 2 BlastX results showing Top-Hit species distribution for the 3
identity and 78% similarity (Additional file 5A). The highabundance of these flagellar proteins based on RPKM value(ranging from top 25% to 10%) and reads number (rangingfrom top 10% to 2.5%), as well as the existence of manycontigs (>440) related to dynein, also indicate the existenceand importance of the flagellar system in C. moewusii(Additional file 5A, 5C).Additionally, Blast2Go was employed to identify func-
tional categories of these contigs. In total, 37,781 GeneOntology (GO) terms were assigned to 10,356 contigs thathave at least one GO function and more than 14,000contigs have InterPro hits (Additional file 5A), of which6,300 involve in biological processes, 7,851 have molecularfunction, and 4,851 are structural components (Additionalfile 5D, 7A-C). In addition, 3,129 enzyme codes wereassigned to 2,624 contigs (Additional file 5A) matching 123KEGG pathways. All enzymes could be placed into specificpathways, such as the one-carbon pool maintained bythe folate pathway (map00670) and the C4-dicarboxylicacid cycle for carbon fixation in photosynthetic organisms(map00710) (Additional file 7D, E). These observationslend further support to the usage of assembled contigs asreference for the RNA-Seq study.
Time-course transcriptomic profiling during darkinduction of H2 photoproductionThe RPKM values calculated individually for all the 34,136contigs at each time point from seven RNA-Seq datasetsafter data trimming were imported into JMP Genomics forstatistical analyses (Additional file 5C). The data qualityof log2-transformed RPKM values for these 7 RNA-Seqdatasets was checked using parallel plot and heat-mapdendrogram. The results indicated that the RNA-Seq data
4,136 C. moewusii transcripts based on Blast2GO result.

Yang et al. Biotechnology for Biofuels 2013, 6:118 Page 5 of 17http://www.biotechnologyforbiofuels.com/content/6/1/118
were of high quality and evenly distributed (Additionalfile 8). Except for the dataset at 0 min with larger averageRPKM values (discussed below), all other datasets hadsimilar distribution patterns (Additional file 8A). Further-more, the datasets were grouped by different time-pointsinto 4 clusters from all the 3 experiments performed at dif-ferent times, and the Phase I, II, and III datasets were clus-tered together as originally grouped based on time pointsas mentioned above (Additional file 8B).The RNA-Seq dataset at 0 min was excluded for fur-
ther statistical analyses due to the lack of a biologicalreplicate and disproportionately larger RPKM valuesthan other datasets (Additional file 8A). The parallel plotof these six RNA-Seq datasets after Loess normalizationhad a similar distribution pattern (Additional file 8C),and the correlation between the biological replicates wasalso very tight, with correlation coefficient values of 0.90,0.91 and 0.87 for Phase I, II, III samples, respectively(Additional file 8D-F). Three comparisons were investi-gated: Phase I/Phase II from early H2-photoproductioninduction to peak H2-photoproduction rate; Phase II/Phase III from peak H2 photoproduction to a late timepoint with decreased H2-photoproduction rate; andPhase I/Phase III for the transcriptomic profile fromearly H2 photoproduction to the end stage, when H2-photoproduction rate decreased from peak (Figure 1).For purposes of clarity, all the upregulated or down-regulated contigs mentioned below have statistically signifi-cant expression (false discovery rate (FDR) <0.05) with adifferential expression ratio of at least 2-fold unless other-wise mentioned.Although software packages for RNA-Seq data analysis
continue to improve, there is no widely-accepted ap-proach yet, especially for datasets with small sample size[42]. The statistical approach we used previously formicroarray data analysis for different microorganisms,which has high correlation with qPCR results, was there-fore applied in this study [43-45]. A similar approach,using the robust LOWESS normalization was applied ina recent work with good correlation between RNA-Seqand microarray approaches [24]. One-Way ANOVA ana-lysis, using JMP Genomics indicated that 2,633 contigswere significantly differentially-expressed in at least onecomparison (Additional file 9A). When the RPKM valuesof these 2,633 contigs were grouped by Hierarchal Cluster-ing, the transcriptomic profiles in Phase II and Phase IIIare closer than that of in Phase I, and clustered together(Figure 3A) with more contigs significantly differentially-expressed from Phase I to Phase II (985) than that fromPhase II to Phase III (151) (Figure 3B). This indicates thatthe transcriptional profile changed more dramatically fromearly H2 photoproduction to peak H2-photoproductionrate after anaerobic induction (from Phase I to Phase II)than the time period from peak H2 rate to decreased
H2-photoproduction rate (from Phase II to Phase III).These 2,633 contigs can be further divided into 8 clusters(Figure 3A). The expression levels of more than half of the2,633 contigs within cluster 1, 2, 3 are higher in Phase Ithan in Phase II and Phase III. The expression levels forthe rest of the 2,633 contigs increased, with the exceptionof the 36 contigs in Cluster 8 whose expression levels de-creased at the early H2-photoproduction phase and in-creased at late phase, with a decreased H2 production rate(Figure 3A).During the time period from Phase I to Phase II, 985
contigs were significantly differentially-expressed with atleast 2-fold changes, comprising 572 upregulated and413 downregulated. Only 151 contigs were differentiallyexpressed from Phase II to Phase III, with 64 up-regulated and 87 downregulated (Figure 3B, Additionalfile 9A, 10). Thirty-eight contigs were significantlydifferentially-expressed in both comparisons of Phase I/Phase II and Phase II/Phase III (Figure 3B, Additionalfile 9A), 8 contigs were upregulated from Phase I toPhase II and 6 of them were also upregulated fromPhase II to Phase III. The remaining 30 contigs weredownregulated from Phase I to Phase II, and 21 of thesewere also downregulated from Phase II to Phase III(Additional file 9A). However, most of these are hypo-thetical proteins with unknown function. In addition, thedownregulated contigs have more GO functional assign-ments than that of upregulated contigs. The down-regulated contigs are involved in catabolic and biosyntheticmetabolic process, transportation, and response to stimu-lus, showing protein binding, and catalytic activities withinthe cytoplasm, plastid, and mitochondrion cellular compo-nents (Additional file 9A). Interestingly, the expression pat-terns of the 26 common contigs in all three comparisonswere the same, with 5 contigs upregulated and the restdownregulated. However, the expression patterns for the12 contigs that were only common in Phase I/Phase II andPhase II/Phase III comparisons were behaved in the oppos-ite manner. Three contigs were upregulated in the Phase I/Phase II comparison but downregulated in the Phase II/Phase III comparison, and vice versa for the rest 9 contigs(Figure 3B, Additional file 9A).
Comparison with other green algae with referencegenome sequencesContigs generated in this study for C. moewusii were com-pared to the transcripts of four other green algae with ref-erence genome sequences (C. reinhardtii, C. variabilisNC64A, V. carteri, and C. subellipsoidea) by BlastX andBlastN to identify the common transcripts these speciespossess, as well as their function and expression patternsduring H2 evolution.Compared with BlastX results, BlastN results retrieved
fewer hits (Table 2). For example, 5,386 C. moewusii

Figure 3 Clustering analysis of 2, 633 differentially expressed contigs. (A) Hierarchical clustering of 2,633 differentially expressed transcriptabundance in Phases I, II and III of H2 photoproduction; and (B) Venn Diagram of the distribution of differentially expressed transcripts amongthe three different phases of H2 photoproduction.
Yang et al. Biotechnology for Biofuels 2013, 6:118 Page 6 of 17http://www.biotechnologyforbiofuels.com/content/6/1/118
contigs matched 3,886 C. reinhardtii transcripts for BlastNwhen the cut-off E-value was set at 10-6 compared to14,784 C. moewusii contigs matching 7,974 C. reinhardtiitranscripts with a BlastX cut-off E-value of 10-6. Similarpatterns were also observed for the Blast results with theother three green algae at all three cut-off E-values of 0,10-6, or 10-3 respectively (Table 2). This result indicatedthat the conservation level of algae is lower at nucleotidelevel than that of protein level, and the BlastX results weretherefore used for further comparisons.With the decrease of E-value stringency from 0 to
lower than 10-6 and 10-3, the BlastX hits number for eachtranscript increased and the percentage of total contigsmatching reference sequences increased (Table 2). To ex-clude the possible false positives, only those contigs withE-value number of 0 from BlastX results were used forcomparisons. The results indicated these 5 green algaehave high similarity with the majority of 365 contigsheld in common among all species (Figure 4, Additionalfile 11 A). In addition, only 54 of 492 contigs shared be-tween C. moewusii and C. variabilis NC64A are differentfrom those found in C. reinhardtii, with the remaining 438contigs common to these two organisms. Similar resultswere found in all other pairwise comparisons (Figure 4).
Most of the 365 contigs common to all 5 strains werefunctionally conserved with multiple GO and enzyme codeassignments, but their expression was not significantly dif-ferent during the H2-photoproduction process. However,one transcript (contig_4525 encoding a deoxypusine syn-thase 1 with potential role in controlling cell proliferationand growth) was upregulated when H2-photoproductiondecreased, and 48 other contigs (4 upregulated and 44downregulated) were significantly differentially-expressedfrom the beginning of anaerobic induction to the end ofthe H2-photoproduction process (Phase I to Phase III).Nine contigs in this latter category were also signifi-cantly differentially-expressed (1 upregulated and 8 down-regulated) from Phase I to Phase II and one was alsodownregulated from Phase II to Phase III (Additionalfile 11A). The other 4 upregulated contigs 3700, 2894,2517, and 4004 were annotated as aldehyde dehydrogenase,kinesin-like calmodulin binding protein, dynein heavychain 9, and one hypothetical stress-response protein,respectively. The expression pattern of contig_3700(a C. reinhardtii aldehyde dehydrogenase homolog) wassimilar to the qPCR result observed for C. reinhardtiiADHE gene expression, with a dramatic increase in theearly stage after anaerobic induction, as reported previously

Table 2 Comparisons of homologues between C. moewusii and other four green algae with reference genomesequences by mapping, BlastN and BlastX
Algal reference Cre ChlN Coc Vca
Reference Transcripts # 17,114 55,307 65,067 15,285
Refernce Ave Length (bp) 3,117 1,370 1,475 1,817
Mapping
Mapped Transcripts # 680 162 144 304
Mapped Ave Length (bp) 957 759 773 818
Percentage Mapped 1.99 0.47 0.42 0.89
BlastN
Transcript hit (E-value = 0) 135 (126)* 17 (17) 15 (15) 38 (38)
Transcript hit (E-value < =10-6) 5,386 (3,886) 2,767 (2,090) 2,184 (1,712) 3,749 (2,818)
Transcript hit (E-value < =10-3) 14,106 (8,111) 8,559 (4,797) 4,855 (3,323) 10,869 (6,098)
BlastX
Transcript hit (E-value = 0) 972 (876) 492 (466) 942 (849) 633 (591)
Transcript hit (E-value < =10-6) 14,784 (7,974) 10,948 (7,355) 13,615 (7,053) 10,646 (7,266)
Transcript hit (E-value < =10-3) 19,992 (9,735) 14,953 (8,945) 17,960 (8232) 12,956 (8181)
*The number before and within brackets mean: the number of C. moewusii transcripts with Blast hits from reference alga and the number of reference transcriptshit by C. moewusii query transcripts. Cre C. reinhardtii, ChlN C. variabillis N64A, Coc C. subellipsoidea, and Vca V. carteri.
Yang et al. Biotechnology for Biofuels 2013, 6:118 Page 7 of 17http://www.biotechnologyforbiofuels.com/content/6/1/118
[10]. Dynein heavy chain 9 and kinesin-like calmodulinbinding protein may be related to flagellar functions aswell as cell division [46,47]. Most of the downregulatedcontigs are hypothetical proteins within different cellu-lar components (e.g. cytoplasm, mitochondrion, plastid,and peroxisome) with diverse functions including bind-ing, catalytic, hydrolase, peptidase, transferase and motoractivity, and involved in various biological processes such
Figure 4 Venn Diagram of the numbers of C. moewusiitranscripts with BlastX hits from other four green algae withreference genome sequences. The BlastX cut-off value is 0 for thiscomparison. Cre: The number of C. moewusii transcripts with BlastXhits to C. reinhardtii; ChlN: The number of C. moewusii transcriptswith BlastX hits to C. variabillis N64A; Coc: The number of C. moewusiitranscripts with BlastX hits to C. subellipsoidea; and Vca: The number ofC. moewusii transcripts with BlastX hits to V. carteri.
as carbohydrate metabolism, ion transport, stress re-sponse, cellular protein modification, and translation.Four downregulated contigs are related to chaperonincomplex component, and 5 related to 26S proteasomeregulatory complex (Additional file 11A).Since both C. reinhardtii and C. moewusii are hydrogen-
evolving chlorophytes and C. reinhardtii is the modelstrain [9,27], further detailed comparison at the pathwaylevel between C. reinhardtii and C. moewusii was carriedout using both the Algal Functional Annotation Tool, aweb-based comprehensive data-mining suite integratingannotation data from several pathway, ontology, andprotein family databases for algal genomics [48], andChlamyCyc, an integrative systems biology database andweb-portal for C. reinhardtii [49]. Based on the statisticsdata from Algal Functional Annotation Tool website,C. reinhardtii has 266 KEGG pathways, which is similarto the number of pathways (258 pathways) in ChlamyCycdatabase [48,49]. With a cut-off E-value of 10-3, 19,992C. moewusii contigs matched to 9,735 C. reinhardtii tran-scripts, and when the cut-off E-value stringency increasedto 10-6, C. moewusii had 14,784 contigs matching to 7,974C. reinhardtii transcripts (Additional file 11B). Thesedatawere used as query ID for functional characterizationmapped to 246 KEGG, 141 Panther, 438 MetaCyc, and 68Reactome pathways respectively (Additional file 11C) cov-ering most of the 266 KEGG pathways of the model greenalga C. reinhardtii, of which purine metabolism pathwayhad the most hits of 176 contigs (Additional file 12A)followed by pathways for plant hormone biosynthesis, andspliceosome-related genes (Additional file 11C, 12B). Other

Yang et al. Biotechnology for Biofuels 2013, 6:118 Page 8 of 17http://www.biotechnologyforbiofuels.com/content/6/1/118
KEGG pathways with multiple transcript hits encoding fora nearly complete pathway or complex include pyrimidinemetabolism, biosynthesis of alkaloids, terpenoids and ste-roids, carbon fixation, glycolysis/gluconeogenesis, pyruvatemetabolism, TCA cycle and oxidative phosphorylation,fatty acid biosynthesis, RNA polymerase, ribosome, andprotein export system (Additional file 11C, 12C). These re-sults indicate that C. moewusii and C. reinhardtii sharemultiple core functional pathways.In addition, if combined with the protein abundance
information, mRNA abundance can help us understandthe post-transcriptional regulation [50,51] and feature ofevolutionary conserved proteins which will be brieflydiscussed below for transcripts shared among five greenalgae. The average of all the RPKM in three differentphases of Phase I, II, and III for each transcript was calcu-lated and used to represent the transcript expression abun-dance, which ranged from a minimum of −3.68 to amaximum value of 15.19 with a mean of 5.01 (Additionalfile 5C). Based on statistical analysis of RPKM abundancefor the 34,136 contigs, 34,124 had expression value and856 contigs had the top 2.5% RPKM value accounting foralmost 9% of the total expression abundance from all34,124 contigs (Additional file 11D). A similar number ofcontigs (875) had the lowest RPKM values, among which236 contigs are homologous to 180 C. reinhardtii pro-teins based on BlastX cut-off E-value of 10-6 (Additionalfile 11D). However, only a small percentage of thesecontigs was significantly differentially-expressed in at leastone comparison among Phase I, II, and III, which included38 contigs with highest abundance and 43 contigs withlowest abundance (Additional file 11D).In contrast to the contigs with lowest abundance, the
most abundant top 2.5% contigs had a higher number ofhomologues to C. reinhardtii, with 612 C. moewusiicontigs matching 512 C. reinhardtii proteins at thesame cut-off E-value of 10-6 (Additional file 11D). Cor-respondingly, the most abundant contigs were trackedto more metabolic pathways than contigs with thelowest abundance (Additional file 11E). Similarly, thecontigs with the most abundant reads had more positivehits to the KEGG pathways database, GO term, andMapMan ontology numbers than the scarcer ones. Inaddition, the number of contigs within a particular path-way was also higher for the abundant contigs than for thescarcer ones, and this is not related to enzyme numberwithin the pathways. For example, 78 high-abundancecontigs had hits in the ribosome complex and 27 had hitsin the pathways of biosynthesis of phenylpropanoidsand biosynthesis of plant hormones. Conversely, thetop 2 pathways for low-abundance contigs only contained5 and 4 hits to purine metabolism and nitrogen me-tabolism pathways, respectively, which suggest the con-served feature of the abundant contigs and the importance
of these contigs in anaerobic metabolism (Additionalfile 11E).
Expression pattern of hydrogenase and hydrogenaseassembly genesTo identify C. moewusii hydrogenase contigs related toH2 evolution, protein sequences of HYDA1 (Genbank ac-cession: AAT90438.1) of C. moewusii and four hydrogen-ase proteins of C. reinhardtii (HYDEF: XP_001691465.1;HYDG: XP_001691319.1; HYDA1: XP_001693376.1;HYDA2: XP_001694503.1) were Blasted against the 34,136 C. moewusii contigs using tBlastN, and the 34, 136C. moewusii contigs were also Blasted against these 5protein sequences mentioned above using BlastP. TheBlast results identified C. moewusii contigs homologous tothe two C. reinhardtii hydrogenases, HYDA1 and HYDA2,as well as to the two hydrogenase assembly proteins,HYDEF and HYDG (Additional file 9B). In addition,88,159 sequences with annotation related to hydrogenasewere downloaded from NCBI database and used as querysequences to Blast against the 34,136 C. moewusii contigs.Besides the 4 hydrogenase-related genes identified above,2 other contigs (contig_33705 and contig_27051) werehomologous to the fragment of C. reinhardtii HYD3(XP_001693369, 479-aa) with short length of 501-bp and331-bp respectively. However, HYD3 is a NarF-like proteininvolved in Fe-S cluster assembly rather than H2 produc-tion [52,53]. We therefore focus on the 4 conserved hy-drogenases and hydrogenase assembly proteins.C. moewusii contig_2138 and contig_839 have high
similarity to the C. reinhardtii hydrogenase-assemblyproteins HYDEF and HYDG, respectively, and weretherefore assigned as HYDEF and HYDG for C. moewusii(Additional file 9B). The amino acid sequence based oncontig_745 is homologous to that of C. reinhardtii hydro-genase HYDA1 [54], and it also has strong homologywith the C. reinhardtii hydrogenase HYDA2 [55] with abetter E-value of 9E-177 than that of contig_1013 (3E-166).Since contig_745 matches the published C. moewusii hy-drogenase HYDA1 perfectly, with the exception of twoamino acid changes (V53A and A424V) and the lack of thelast amino acid E at the C-terminal, it was assigned asHYDA1 and contig_1013 as HYDA2. Based on the assem-bled contig information of these 2 contigs, the 5′ UTRs ofHYDA1 and HYDA2 are 105 and 126-bp, similar to thosefor C. reinhardtii hydrogenases [56], and slightly longerthan the 74-bp of 5′ UTR as reported before for HYDA2by Rapid Amplification of cDNA Ends (RACE)-PCR [57].Recently, a novel hydrogenase has been identified andcharacterized in Chlorella variabillis NC64A with an an-cestral form of accessory F-cluster (FeS cluster binding do-mains) besides the classical algal hydrogenase H-cluster(HYDA active site) [58]. Similar to the hydrogenases ofC. reinhardtii, the C. moewusii hydrogenases HYDA1

Yang et al. Biotechnology for Biofuels 2013, 6:118 Page 9 of 17http://www.biotechnologyforbiofuels.com/content/6/1/118
and HYDA2 identified in this work contain the H-clusteronly, which is not surprising since C. reinhardtii andC. moewusii are from same Chlamydomonadaceae familywith close phylogenetic relationship. It is also consistentwith the previous phylogenetic analysis result of the loss ofHYDA F-clusters in chlorophycean algae [58].The expression of 2 contigs (contig_745 and contig_1013)
annotated as [FeFe]-hydrogenase HYDA1 and HYDA2[57] matched the pattern of H2 evolution, increasingduring early H2 production and decreasing when theH2−production rate decreased (Additional file 9B). This issimilar to a previous report of hydrogenase (HYDA) geneexpression following anaerobic induction in C. reinhardtii[54-56,59]. Notably, HYDA1 (contig_745) had an elevatedexpression level of log2-based RPKM value after 15 min in-duction jumping from 1.41 at time 0 to about 9, which ismore than a 200-fold increase. The expression of the otherhydrogenase and the 2 hydrogenase assembly genes alsoincreased at least 3-fold from time 0 to 15 min post-induction (Phase I). After 15-min post-induction, thechanges were mostly associated with the two hydroge-nases (contig_745 and contig_1013), with at least a 2-foldincrease from Phase I to Phase II and a 3-fold decreasefrom Phase II to Phase III (Additional file 9B). However,due to the limited sample size and stringent statisticalstandard, the changes observed from Phase I to Phase IIIare not statistically significant, and further investigationinto the transient change immediately after induction isneeded. Combining with the fact that these 2 contigs werealso highly expressed with large RPKM values (Additionalfile 9B), we propose that these are the hydrogenases re-sponsible for H2 production in this organism and thatHYDA1 is the major hydrogenase inducible by the an-oxia as the electron acceptor for reducing equivalentsgenerated during fermentation. All [FeFe] hydrogenasesstudied to date are oxygen sensitive and irreversiblyinactivated by trace amounts of oxygen [56,58,60-62].The relatively abundant expression level of HYDA2(contig_1013) even at time 0 before the anaerobic in-duction suggests that the two hydrogenase genes aredifferentially regulated, and further investigations of thefactors and conditions responsible for transcription ofHYDA1 and HYDA2 genes during anaerobic inductioncould help us understand the synergetic function be-tween these two hydrogenase paralogues and their roleson H2-photoproduction (Additional file 9B).
Transcriptional differences between C. moewusiiand C. reinhardtii in the fermentative pathwayBesides measuring hydrogenase activity, Meuser et al.(2009) also compared starch catabolism and secreted me-tabolites of C. moewusii strains with those of C. reinhardtiiduring dark anaerobic fermentation [9]. The results indi-cated that the C.moewusii SAG 24.91 strain had faster rates
of dark anaerobic starch catabolism than C. reinhardtii,with different profiles of fermentation end-products. For-mate, acetate and ethanol are the dominant anaerobic me-tabolites of C. reinhardtii CC-124 strain with a ratio of2:1:1 or 2:2:1 depending on the strain, culture and assayconditions [9,10]. Instead, the primary fermentation prod-ucts of C. moewusii SAG 24.91 are acetate, ethanol andglycerol, with an approximate ratio of 2:1:1 after 4 h ofanaerobiosis [9].To connect the transcriptomic data from this RNA-
Seq study with previous C. moewusii metabolite profile,the starch catabolism, glycolysis and pyruvate fermenta-tion pathways were reconstructed (Figure 5) based onprevious reports [9,10,23,58,63-67] and ChlamyCyc data-base [49]. The model species C. reinhardtii is well stud-ied, with 261 Sequence Reads Achieve (SRA) datasets(totally 1150 Gb) available at NCBI. However, we searchedthe SRA database and only identified one experimentactually contains RNA-Seq result using samples from45 min and 120 min post anaerobic induction in the darkfor the same C. reinhardtii strain (CC-124) used in ourreference study [9]. The dataset (SRR057469) for thissample (SRS074576) was downloaded and RNA-Seq ana-lysis result for 15, 935 C. reinhardtii reference mRNAwas generated. The transcriptional abundances based onlog2-transformed RPKM values during anaerobic fermen-tation for C. moewusii and C. reinhardtii were comparedto understand the metabolite profile difference at thetranscriptional level.We couldn’t identify any significant pyruvate-formate
lyase (PFL) homologue of C. reinhardtii in the 34,136contigs generated in this study of C. moewusii (Additionalfile 13A), which agrees with the previous hypothesis thatthe absence of formate in the secreted metabolites ofC. moewusii is due to the lack of PFL enzyme activity[9]. In addition, the PFL transcript of C. reinhardtii isupregulated after anaerobic dark induction [10], with alog2-transformed RPKM value of 11.5 (top 0.5% among allthe 15,935 C. reinhardtii reference mRNA), which mayaccount for the dominance of formate in the secretedmetabolites in C. reinhardtii as previously reported [9].Other enzymes with different abundance levels betweenC. moewusii and C. reinhardtii are glycerol-3- phosphatase(GPP), phosphate acetyltransferase (PAT) and acetate kin-ase (ACK), which may account for the relative higher prod-uct ratios of acetate and glycerol in C. moewusii comparedto C. reinhardtii (Figure 5, Additional file 13A).Except for the absence of PFL gene, C. moewusii pos-
sesses similar metabolic flexibility as it produces glycerol,lactate, succinate, ethanol, and acetate. This flexibilitymay help C. moewusii adapt to different environmentalconditions, as suggested for C. reinhardtii (Figure 5). Incontrast to the upregulation of several C. reinhardtii genesencoding PFOR, PTA2, ACK1 and amylase after anaerobic

Figure 5 (See legend on next page.)
Yang et al. Biotechnology for Biofuels 2013, 6:118 Page 10 of 17http://www.biotechnologyforbiofuels.com/content/6/1/118

(See figure on previous page.)Figure 5 Starch catabolism, glycolysis and anaerobic fermentation pathways in C. moewusii constructed based on the informationfrom C. reinhardtii and the transcript abundance of enzymes in C. moewusii and C. reinhardtii. Enzymes are represented by gray diamondboxes, except for PFL, whose gene sequence has not been identified in C. moewusii. The blue diamond boxes indicate that the respective gene isdownregulated, and red color indicates upregulation. The numbers within the stacked rectangle boxes indicate the abundance of the respectivetranscript at Phase I, II and III, from top to bottom, respectively. Multiple columns were included for enzyme with multiple homologues. Thenumbers within the oval boxes represent the transcriptional abundance of homologous transcripts in C. reinhardtii. The abundance of eachtranscript is also represent by the color of the filled boxes, with green, pink or yellow indicating, respectively, the top 0.5%, 2.5% or 10% of all 1transcripts, respectively.
Yang et al. Biotechnology for Biofuels 2013, 6:118 Page 11 of 17http://www.biotechnologyforbiofuels.com/content/6/1/118
induction [10], only 5 contigs among all these enzymesinvolved in starch catabolism, glycolysis, and anaerobic fer-mentation in C. moewusii are significantly differentially-expressed from Phase I to Phase III at the transcriptionallevel. The only upregulated transcript is contig_683,encoding a pyruvate kinase (PYK). Other 4 contigsencoding an amylase (contig_9910), triose phosphate isom-erase (TPI, contig_9498), phosphoenolpyruvate carboxylase(PEPC, contig_5043), and D-lactate dehydrogenase (LDH,contig_14499) were downregulated significantly (Figure 5,Additional file 13A). Considering the different amylasegene expression patterns and starch utilization rate be-tween C. reinhardtii and C. moewusii [9,10], it will be inter-esting to investigate the correlation between the amylasegene expression and starch utilization rate. Notably, threeof the downregulated genes are directly related to enzym-atic NADH-requiring reactions which may be responsiblefor redox balancing under anaerobic conditions (Figure 5).The downregulation of these genes may therefore redirectthe electron reductant from NADH to the hydrogenase re-action for increased H2 photoproduction (Figure 5), andthey could be potential genetic candidates for metabolicengineering to increase H2 photoproduction.However, the implementation of metabolic pathway
engineering towards blocking NADH-utilizing pathwaysas a means of improving fermentative H2 production hasnot yielded desired results so far [63-65]. For example,although the adh1 C. reinhardtii mutant, which lacksthe alcohol dehydrogenase gene is unable to produceethanol, it redirects its metabolism towards other alter-native NADH-utilizing pathways such as those involvedin glycerol and lactate production, instead of towards H2
production, which is unchanged in this mutant [63].Similarly, the disruption of formate production [64,65]as well as double disruption of formate and ethanol pro-duction [64] in C. reinhardtii also results in rerouted fer-mentative pathways, yielding changed metabolite profiles,especially for those metabolites that require NADH asreductant. These mutants show increased levels of lac-tate, ethanol or glycerol. However, dark fermentative H2
production decreased in both the pfl1-1 single mutantand the double mutant (pfl1-1 adh1) [64,65]. The resultsindicate the close connection between fermentation andH2 production. Therefore it is very important to consider
electron transport pathways [68] and redox balancing forthe H2-photoproduction improvement through metabolicengineering.The lack of PFL and accompanying accumulation of
glycerol in C. moewusii, as well as the accumulation ofglycerol and lactate in both the adh1 and the pfl1-1adh1 C. reinhardtii mutants also indicate that glyceroland lactate production could be the major routes forredox re-balancing in green algae. It will be interestingto investigate the role of glycerol in other algae besidesthe well-studied species such as C. reinhardtii, since thepotential for glycerol production is believed to be wide-spread among algae [66]. The existence of alternativefermentative pathways could help green algae to adapt todifferent environments, and the downregulation of genesinvolving in metabolic pathways for glycerol, succinate,and lactate production during H2 photoproduction maybe one of the reasons for the high H2 photoproduction inC. moewusii, besides the rapid increase in HYDA1 geneexpression discussed above from time 0 to Phase I. Inaddition, the differences in hydrogenase expression be-tween C. reinhardtii and C. moewusii may help explain theobserved discrepancies in H2 photoproduction: the expres-sion of HYDA1 and HYDA2 in C. reinhardtii increased, re-spectively, ca 20% and 50-fold in response to anoxia [69],while the expression of HYDA1 in C. moewusii increasedmore than 200-fold and that of HYDA2 only 4.5-fold fromtime 0 to Phase I (15 min post-induction).Although enzymes involved in fermentation and an-
aerobic respiration and their expression have been inten-sively studied, especially within the model species (e. g.C. reinhardtii), only a few reports on regulators control-ling the expression of hydrogenases and fermentativepathway genes despite of growing interests [25,70-72]. TheCopper Response Regulator 1 (CRR1), a SQUAMOSA pro-moter binding protein (SBP) family carrying a characteris-tic zinc finger domain that interacts with the cis-actingDNA sequence GTAC, has been demonstrated to be in-volved in the transcriptional activation of C. reinhardtii hy-drogenase gene HYDA1 and the ferredoxin-encoding geneFDX5 in the absence of copper (Cu) or oxygen [70,71]. AC. reinhardtii CRR1 homologue (contig_4501) was identi-fied in C. moewusii with high similarity (Evalue = 0), and,although the differential expression of CRR1 homologue

Yang et al. Biotechnology for Biofuels 2013, 6:118 Page 12 of 17http://www.biotechnologyforbiofuels.com/content/6/1/118
contig_4501 was not significant, the expression levelof RPKM values decreased from Phase I to Phase III(Additional file 13A). CRR1 is homologous to carboncatabolite repressor protein 4 (CCR4), which forms a con-served 9-subunit CCR4-NOT complex throughout theeukaryotic kingdom with broad roles in gene regulation[73]. For example, the yeast CCR4 protein is required forthe alcohol dehydrogenase gene ADH2 expression, andADH2 expression was shown to be decreased in CCR4mutant [74]. It is possible that persistent anoxia reducedthe expression of this CRR1 homolog leading to decreasedethanol production while re-routing more reducing equiva-lent to faster H2 photoproduction in C. moewusii.In addition, metabolic responses of C. reinhardtii to
sulfur-deprivation-induced anoxia have also been wellstudied [13,25,75-81]. Most of the sulfur-deprivationresponses are controlled by several transcriptional regu-latory Ser/Thr kinases belonging to the protein fam-ily of SNF1 Related Protein Kinase (SNRK) such asSNRK2.1, SAC1 and SAC3 [25,79,80]. A model for sul-fur deprivation–responsive gene regulation among thethree regulatory proteins SAC1, SNRK2.1 and SAC3(same as SNRK2.2) has been proposed: SNRK2.2 inhibitsSNRK2.1-activated expression of sulfur-responsive genes,and the active SAC1 unblocks the inhibition of SNRK2.1by SNRK2.2 in sulfur-deficient conditions for full expres-sion of sulfur-responsive genes [25,81]. SNRK2.1 andSNRK2.2 are plant-specific SNF1-like Ser/Thr proteinkinases, which are conserved in eukaryotes, and the es-sential role of yeast Snf1 on transcriptional control ofglucose-repressed genes is well characterized [82-86].SNRK2.1 also regulated the H2 production-related genes,with the expression level of HYD1, HYDEF, PFR1 andFDX5 upregulated in the snrk2.1 mutant compared to itsparental strain [25].Fifty proteins are classified as SNRKs in C. reinhardtii,
based on iTAK database 13.03 [87]. BlastX identified 28contigs of C. moewusii that are homologous to these 50SNRKs, and the expression values of 15 of them withcomplete Serine/Threonine protein kinase catalytic do-main were extracted (Additional file 13B). Three ofthese contigs are upregulated and 7 downregulated atlevels greater than 2-fold. Contigs 21466 and 8046 weresignificantly downregulated during the transition fromPhase I to Phase II (contig_8046 was also downregulatedfrom Phase I to Phase III), and contig_2540 was the onlyone that was significantly upregulated from Phase I toPhase III. Contig _11669, which is homologous to theC. reinhardtii SAC3 (SNRK2.2), was downregulatedfrom Phase I to Phase II and Phase I to Phase III but notsignificantly (Additional file 13A). The existence of mul-tiple SNRKs with different expression patterns indicatesthe importance of SNRKs on transcriptional control inC. moewusii, although further work especially genetic
studies are needed to fully understand the roles of SNRKson H2 photoproduction and anaerobic fermentation inC. moewusii.Finally, enzymes related to starch catabolism, glycoly-
sis, and anaerobic fermentation, as well as transcriptionalregulators related to anaerobic fermentation were suc-cessfully identified for C. moewusii with high similarity tothose in C. reinhardtii, with the exception of the absenceof PFL and the low similarity of the pyvurate dehydro-genase (PDC) homologue (E-value of 1.58E-7) to thatfound in C. reinhardtii. In addition, several enzymes inC. moewusii contain multiple homologues (e.g., fructose-1,6-biphosphate aldolase (FBA), pyruvate kinase (PYK),MDH, MME4, and amylase) to those of C. reinhardtii,and the transcriptional levels for most of the enzymes in-volved in this pathway are very high, such that nearlyall of them are among the top 10% contigs, with sev-eral among the top 2.5% and even top 0.5% (Figure 5,Additional file 5C, 13B). These results suggest that(i) C. moewusii and C. reinhardtii have inherited similaranaerobic fermentation and H2-photoproduction path-ways from their ancestor, which underscores the im-portance of these pathways in green algae; (ii) theexistence of different enzymes and the differential regula-tion at the transcriptional level between C. moewusii andC. reinhardtii may contribute to their metabolic differ-ence; (iii) the enzymes that had the most abundant tran-scriptional levels in both C. reinhardtii and C. moewusii(e.g. FBA, phosphoglycerate kinase (PGK), phosphoglyc-erate dehydratase (PGH), and HYD) may be responsiblefor key metabolic steps (Figure 5, Additional file 13A).
ConclusionsRNA-Seq data of time course transcriptomics for anunsequenced green alga C. moewusii were analyzed, pro-viding not only a transcriptomic RNA-Seq dataset, butalso biological insights on the expression patterns ofcontigs associated with starch catabolism, glycolysis, an-aerobic fermentation, and H2 photoproduction duringdark anaerobic induction. C. moewusii and C. reinhardtiishare core functional pathways for H2 photoproductionand anaerobic fermentation with metabolic flexibility.The difference between C. moewusii and C. reinhardtiion hydrogenase expression and anaerobic fermentativepathways involved in redox balancing may contribute tothe different profiles of hydrogenase activity and se-creted anaerobic metabolites observed in each species.Even at this cursory level of analysis, it is clear that theapplication of this approach can lead to the generationof interesting hypotheses for both fundamental and ap-plied research. In addition, the identification of commontranscripts among different green algae and their differ-ential expression during H2 production may help eluci-date the physiology and evolution of thechlorophyceans.

Yang et al. Biotechnology for Biofuels 2013, 6:118 Page 13 of 17http://www.biotechnologyforbiofuels.com/content/6/1/118
Materials and methodsStrain and growth conditionsC. moewusii SAG 24.91 was kindly provided by Dr.Matthew Posewitz at the Colorado School of Mines.Tris-Acetate-Phosphate (TAP) plate and liquid mediumwas used for culturing the cells. To generate cultures forH2 measurement and RNA harvesting, C. moewusii SAG24.91 cultures were grown in 1-L Roux bottles using TAPmedia at 25°C, and illuminated continuously with whitefluorescent light (200 μmol photons m-2 s-1). Cultures weresupplemented with 2% CO2 in air and continuously mixedwith a stir bar. Cells were harvested for dark anaerobic in-duction at chlorophyll concentrations of 14 – 23 μgmL-1.Chlorophyll concentration was determined spectrophoto-metrically following extraction in 95% ethanol [9].
Dark anaerobic inductionLiquid cultures grown in Roux bottles were centrifugedat 3000 × g for 1 min and resuspended in 0.1 volume ofAIB buffer (50 mM potassium phosphate, pH 7.2, 3 mMMgCl2). Resuspended cells were transferred to 13-mLglass serum vials and sealed with butyl rubber septa. Vialswere wrapped in aluminum foil and purged with argon toestablish dark anaerobiosis. Cells were sampled at varioustime points prior to and following initiation of anaerobicconditions (Figure 1).
H2 evolution measurementA Clark-type electrode system (ALGI LLC, CO) was usedto measure rates of H2 production using calibrated elec-trodes (YSI Incorporated, OH) in a water-jacketed glasschamber (25°C) illuminated with 2000 μmol photos m-2 s-1.Anaerobically induced cell suspensions were sampled ap-proximately at 0, 10, 110, 300, 600 min, using a gas-tightsyringe (Hamilton Company, NV) purged with argon. Foreach measurement, the chamber was filled with 1.8 mL ofMOPS buffer (50 mM, pH 6.8), and then purged withargon and monitored for O2 using a calibrated electrode.Cell suspension (0.2 mL) was added to chamber, and H2
production rates were assessed from the steepest slope fol-lowing illumination.
Total RNA extraction and RNA-SeqRNA samples were extracted approximately 5 min follow-ing H2 measurement using a gas-tight syringe. Sampleswere immediately centrifuged and RNA was extracted withPlant RNA Reagent, following the manufacturer’s instruc-tions (Life Technologies, NY). RNA was further purifiedusing a Turbo DNA-free kit (Life Technologies, NY) and aQiagen RNeasy Plant Mini Kit (Qiagen, CA), followed bychecking sample quality and quantity with gel electrophor-esis and NanoDrop spectrophotometer (Thermo Scientific,DE). Samples of total RNA were sent to the NationalCenter for Genomic Resources (NCGR) for RNA-Seq
using Illumina GA IIx platform according to the manufac-turer’s instructions. Briefly, mRNA was selected using oligo(dT) probes and then fragmented. cDNA was synthesizedusing random primers, modified and enriched for at-tachment to the Illumina flowcell. The fluorescent im-ages process to sequences, base calling and quality valuecalculation were performed by the Illumina data process-ing pipeline (version 1.5).
Reference contigs determination and their functionalannotationSeven raw fastq datasets generated through Illumina GAIIx were imported into FastQC software (http://www.bioinformatics.babraham.ac.uk/projects/fastqc/) for qualityassessment. The X-axis on the FasrQC output graph ofPer Base Sequence Quality shows the read position (bp),and Y-axis shows the quality scores with higher scorescorresponding to better base calls. The Y-axis was di-vided into three regions with green background for verygood quality calls (Quality score > =28), orange backgroundfor calls of reasonable quality (20 < =Quality score < 28),and red background for poor quality base calls (Qualityscore < 20). The raw fastq datasets were then trimmedusing CLC Genomics Workbench (version 5.1, CLCBio,Denmark) before de novo assembly was carried out usingCLC Genomics Workbench. The parameter used for datatrimming are: Quality trim limit = 0.05; Ambiguous trimlimit = 2; Minimum number of nucleotides in reads = 15;Discard short reads = Yes; Discard long reads =No; Re-move 5′ terminal nucleotides =No; Number of 3′ terminalnucleotides Removed = 9. In addition, the duplicate readswithin the trimmed data were also removed using CLCGenomics Workbench and the seven trimmed data with-out duplicate reads as well as seven original raw data with-out data trimming and duplicate removal were used asinput data for de novo assembly. The parameters used forde novo assembly are: Mapping mode =Map reads back tocontigs (slow); Similarity fraction = 0.8; Minimum contiglength = 200; Mismatch cost = 2; Insertion cost = 3; Dele-tion cost = 3; Update contigs = Yes; Length fraction = 0.5;Perform scaffolding = Yes.Blast2GO [40,41] software was used for BLASTX, GO
term and enzyme code annotation, InterProScans andKEGG pathway analysis of the contigs. InterProScanswas performed against all of the available InterPro data-bases, and KEGG pathway information was retrievedbased on the enzyme commission (EC) numbers [88-90].Blast2GO annotation results were used to generate thecombined graphs of biological process, molecular function,and cellular component. In addition, BLASTX to a non-redundant (nr) protein database from the NCBI GenBankdatabase [91,92] was used to assign the top homologoushits to the assembled contigs. Finally, to compare the dif-ference among C. moewusii and other microalgae with

Yang et al. Biotechnology for Biofuels 2013, 6:118 Page 14 of 17http://www.biotechnologyforbiofuels.com/content/6/1/118
sequenced genomes including C. reinhardtii, V. carteri,C. variabilis, and C. subellipsoidea, C. moewusii contigswere used as query sequence for BLASTN and BLASTXsearch against the transcript and protein sequences ofthese microalgae respectively. The cutoff E-value thresholdis set arbitrarily to < = 10-6.
RNA-Seq data processing and statistical analysisSix trimmed RNA-Seq datasets were used as input sequen-cing reads and the 34,136 contigs generated through denovo assembly using trimmed data with duplicates re-moved were selected as the reference. RNA-Seq analysiswas carried out using CLC Genomics Workbench with thesettings described below: Minimum read count fusion genetable = 5; Minimum length of putative exons = 50; Mini-mum number of reads = 10: Maximum number of mis-matches (short reads) = 2; Unspecific match limit = 10;Additional upstream bases = 0; Minimum exon coveragefraction = 0.2; Minimum length fraction (long reads) = 0.9;and Minimum similarity fraction (long reads) = 0.8.Eexpression levels of RPKM values for each transcript
from each RNA-Seq dataset were exported and log2transformed, which were then combined to provide theRNA-Seq data for statistical analysis using JMP Genomics6.0 (SAS Inc., NC) as described before for data quality con-trol, data normalization, One-Way ANOVA analysis, andK-means Clustering [43-45]. The information of assembledcontigs of Transcriptome Shotgun Assembly (TSA), Se-quence Reads Archive (SRA), and Gene Expression Omni-bus (GEO) has been submitted to NCBI for this study withthe accession of SRP021194 and GSE46225 for SRA andGEO respectively.
Comparisons among other green algae with referencegenome sequencesThe FASTA files of transcripts and proteins of sequencedC. reinhardtii, C. variabilis NC64A, V. carteri, andC. subellipsoidea were downloaded from JGI website(www.jgi.doe.gov) and imported into CLC GenomicsWorkbench. These were used as reference sequences forLocal Blast using the 34,136 C. moewusii transcriptsas query sequences. Two Blast programs were used,BlastX using predicted protein sequences as referenceand BlastN using transcripts as reference sequences. C.moewusii contigs with hits to each reference datasetwere reported and the corresponding homologues withmultiple hits were consolidated.
Additional files
Additional file 1: RNA-Seq data analysis 1 flowchart used in this study.
Additional file 2: General Information about the RNA-Seq Data. Thedataset for 15 M-0502 was originally trimmed by sequencing facility and
the data with red font were therefore not included for statisticalcalculation of the average (AVE) and standard deviation (SD).
Additional file 3: An example of improved RNA-Seq reads qualityafter data trimming. The ×6 axis on the FasrQC output graph of PerBase Sequence Quality shows the read position (bp), and Y-axis showsthe quality scores with higher scores corresponding to better base calls.The Y-axis was divided into three regions with green background for verygood quality calls (Quality score > =28), orange background for calls ofreasonable quality (20 < =Quality score < 28), and red background forpoor quality base calls (Quality score < 20).
Additional file 4: The cumulative contig length with the increase ofcontig numbers (A) and statistical result of the length of assembledcontigs using trimmed raw data with duplicate reads removed (B).X-axis is the number of contigs and Y-axis is the cumulative length of thecontigs (kb) from contig_1 to contig_34136 (A). N: number of contigsused for statistical analysis.
Additional file 5: Annotation result of the 34,136 C. moewusiicontigs based on BlastX and Blast2GO results (A); Top hits of all34,136 assembled C. moewusii contigs to 40 published C. moewusiiSequences (B); Quartiles of expression value for each individualtime point, phase, and all 7 datasets, as well as statistical result oftime-course differential expression for all 34,136 C. moewusiicontigs post anaerobic induction (C); and Blast2GO results of thefunctional roles of the 34,136 C. moewusii contigs in BiologicalProcess, Molecular Function, and Cellular Component (D).
Additional file 6: The relationship between C. moewusii transcriptsgenerated through this study and the published C. moewusiimitochondrial genome sequence (NC_001872) (A), and BlastXresults of two assembled contigs of contig_490 (B) and contig_1136(C). 34,136 contigs were mapped against NC_001872 to investigate theirrelationship. Contigs with green color have same orientation as thereference and contigs with red color have reverse orientation as thereference (A). The graphic of B and C is an overview of NCBI NR databasesequences aligned to the query sequence of contig_490 (the longestone, 15888-bp) and contig_1136 respectively. Alignments are color-coded by score, within one of five score ranges, the larger the number,the more conserved. Multiple alignments on the same databasesequence are connected by a dashed line.
Additional file 7: Blast2GO results of combined graphs for thedistributions of 34, 136 C. moewusii transcripts involved in differentlevels of Biological Processes (A), Molecular Function (B), andCellular Components (C). And examples of enzymes identified byBlast2GO involved in pathways of One Carbon Pool by Folate(map00670) (D), C4-dicarboxylic Acid Cycle of Carbon Fixation inPhotosynthetic Organism (map00710) (E). The enzymes in thepathways of D and E with colors highlighted are enzymes identifiedin C. moewusii, the ones without color highlighted are enzymes withno homologues identified in C. moewusii.
Additional file 8: Parallel plot of RNA-Seq data distribution 1before normalization (A) and Heat map and dendrogram (B), as wellas parallel plot of RNA-Seq data distribution after normalization (C),and correlation scatterplots of the biological replicates at differentphases (D4 F). (D: Phase I; E: Phase II; F: Phase III) using Pairwise methodin JMP Genomics. The X-axis and Y-axis for A and C are the log2-basedRPKM value and its corresponding density.
Additional file 9: RNA-Seq One-Way ANOVA statistical analysisresult of the significantly differentially expressed 2,633 C. moewusiicontigs post-anaerobic induction (A); and the differential expressionof 4 contigs identified as hydrogenases and hydrogenase assemblyproteins as well as the alignment of C. moewusii hydrogenases(Cmo_745_hydA1 and Cmo_1013_HydA2) and C. reinhardtiihydrogenases (Cre_HydA1 and Cre_HydA2).
Additional file 10: Volcano plots of One-Way ANOVA analysisresults (A: Phase I/Phase II; B: Phase II/Phase III; C: Phase I/Phase III)using JMP Genomics 6.0. The X-axis is the log2-based ratio and Y-axisis the value of –log10P-value. The horizontal dashed red line indicatesthe significance level with the values above the level are statisticallysignificant.

Yang et al. Biotechnology for Biofuels 2013, 6:118 Page 15 of 17http://www.biotechnologyforbiofuels.com/content/6/1/118
Additional file 11: RNA-Seq One-Way ANOVA statistical analysis resultof the 365 C. moewusii contigs conserved among five green algae (A);BlastX result of the 34, 136 C. moewusii contigs to C. reinhardtiiproteins (B); the number of C. moewusii contigs identified in differentpathways (C); RNA-Seq One-Way ANOVA statistical analysis result ofthe 686 C. moewusii contigs with the highest log2-based RPKM meanvalue and 875 C. moewusii contigs with the lowest mean value andtheir homologues in C. reinhardtii (D); and C. reinhardtii genesidentified in different pathways that are homologous to C. moewusiicontigs with the highest 2.5% and lowest 2.5% of the log2-basedRPKM mean value (E).
Additional file 12: Examples of KEGG metabolic pathways thatthe 34,136 C. moewusii transcripts with hits to C. reinhardtii. 176C. moewusii transcripts homologous to C. reinhardtii involved in PurineMetabolism (A), 125 C. moewusii transcripts homologous to C. reinhardtiiinvolved in spliceosome (B), and 125 C. moewusii transcripts withhomologous to C. reinhardtii involved in KEGG pathway of Carbon Fixationin Photosynthetic Organisms (C). The enzyme codes with red colorindicate that homologues existing in C. moewusii. The cut-off E-value is10-6 to identify C. moewusii homologues in C. reinhardtii.
Additional file 13: The statistical analysis result of the distributionof 7,940 genes of C. reinhardtii with log2-based RPKM values as wellas all log2-based RPKM values based on published NCBI SRAdataset SRR057469 using the C. reinhardtii RNA extracted at 45 minand 120 min post dark anaerobic induction (SRS074576) for all the15, 935 C. reinhardtii reference mRNA (A); and RNA-Seq result forboth C. moewusii contigs and C. reinhardtii mRNA related to thestructural and regulatory genes involved in starch catabolism,glycolysis, anaerobic fermentation.
AbbreviationsAMY: Amylase; DPE: Alpha-glucanotransferase; AGL: Alpha glucosidase;PHO: Starch phosphorylase; GPM: Phosphoglucomutase; HXK: Hexokinase;PGI: Phosphoglucose isomerase; PFK: Phosphofructokinase; FBA: Fructose-1,6-biphosphate aldolase; TPI: Triose phosphate isomerase; GPD: Glycerol-3-phosphate dehydrogenase; GPP: Glycerol-3- phosphatase;GAPDH: Glyceraldehyde 3- phosphate dehydrogenase;PGK: Phosphoglycerate kinase; GAPN: Glyceraldehyde-3-phosphatedehydrogenase; PGM: Phosphoglycerate mutase; PGH: Phosphoglyceratedehydratase; PYK: Pyruvate kinase; LDH: Lactate dehydrogenase;PDC: Pyvurate dehydrogenase; HYD: Hydrogenase; ADH: Alcoholdehydrogenase; PFOR: Pyruvate-ferredoxin oxidoreductase; FDX: Ferredoxin;PFL: Pyvurate formate lyase; ACS: Acetyl-CoA synthetase; PAT: Phosphateacetyltransferase; ACK: Acetate kinase; DHAP: Dihydroxy-acetone phosphate;G3P: Glycerol-3-phosphate; FMR: Fumarate reductase; FUM: Fumarase;MDH: Malate dehydrogenase; MME4: Malic enzyme;PEPC: Phosphoenolpyruvate carboxylase; PYC: Pyruvate carboxylase.
Competing interestsThe authors declare that they have no competing interests.
Authors’ contributionsMTG, SS, MG and PTP designed the experiment. SS carried out the culturing,H2 measurement and RNA extraction. SY analyzed the data. SY, MTG, SS, MG,and PTP wrote the manuscript. All authors read and approved the finalmanuscript.
AcknowledgmentsFunding for this work was provided by the Laboratory Directed Researchand Development (LDRD) Program at the National Renewable EnergyLaboratory (NREL), LDRD #06510901. The authors wish to acknowledge Dr.Anis Karimpour-Fard at University of Colorado, Denver for preliminary resultsfrom assembly and annotation of the RNA-Seq data.
Author details1National Bioenergy Center, Golden, CO, USA. 2Biosciences Center, NationalRenewable Energy Laboratory, Golden, CO 80401, USA.
Received: 19 February 2013 Accepted: 5 August 2013Published: 23 August 2013
References1. Hannon M, Gimpel J, Tran M, Rasala B, Mayfield S: Biofuels from algae:
challenges and potential. Biogeosciences 2010, 1:763–784.2. Hunter P: The tide turns towards microalgae. EMBO Rep 2010, 11:583–586.3. Pienkos PT, Laurens L, Aden A: Making biofuel from microalgae.
Am Sci 2011, 99:6.4. Pienkos PT, Darzins A: The promise and challenges of microalgal-derived
biofuels Biofuels. Bioprod Biorefin 2009, 3:10.5. Radakovits R, Jinkerson RE, Darzins A, Posewitz MC: Genetic engineering of
algae for enhanced biofuel production. Eukaryot Cell 2010, 9:486–501.6. Gao Y, Gregor C, Liang Y, Tang D, Tweed C: Algae biodiesel - a feasibility
repor. Chem Cent J 2012, 6(Suppl 1):S1.7. Greenwell HC, Laurens LM, Shields RJ, Lovitt RW, Flynn KJ: Placing
microalgae on the biofuels priority list: a review of the technologicalchallenges. J R Soc Interface 2010, 7:703–726.
8. Wang B, Wang J, Zhang W, Meldrum DR: Application of synthetic biologyin cyanobacteria and algae. Front Microbiol 2012, 3:344.
9. Meuser JE, Ananyev G, Wittig LE, Kosourov S, Ghirardi ML, et al: Phenotypicdiversity of hydrogen production in chlorophycean algae reflects distinctanaerobic metabolisms. J Biotechnol 2009, 142:21–30.
10. Mus F, Dubini A, Seibert M, Posewitz MC, Grossman AR: Anaerobicacclimation in Chlamydomonas reinhardtii: anoxic gene expression,hydrogenase induction, and metabolic pathways. J Biol Chem 2007,282:25475–25486.
11. Denovan-Wright EM, Nedelcu AM, Lee RW: Complete sequence of themitochondrial DNA of Chlamydomonas eugametos. Plant Mol Biol 1998,36:285–295.
12. Turmel M, Lemieux B, Lemieux C: The chloroplast genome of thegreen alga Chlamydomonas moewusii: localization of protein-codinggenes and transcriptionally active regions. Mol Gen Genet 1988,214:412–419.
13. Nguyen AV, Thomas-Hall SR, Malnoe A, Timmins M, Mussgnug JH, et al:Transcriptome for photobiological hydrogen production induced bysulfur deprivation in the green alga Chlamydomonas reinhardtii.Eukaryot Cell 2008, 7:1965–1979.
14. Renberg L, Johansson AI, Shutova T, Stenlund H, Aksmann A, et al: Ametabolomic approach to study major metabolite changes duringacclimation to limiting CO2 in Chlamydomonas reinhardtii. Plant Physiol2010, 154:187–196.
15. Doebbe A, Keck M, La Russa M, Mussgnug JH, Hankamer B, et al: Theinterplay of proton, electron, and metabolite supply for photosyntheticH2 production in Chlamydomonas reinhardtii. J Biol Chem 2010,285:30247–30260.
16. Bolling C, Fiehn O: Metabolite profiling of Chlamydomonas reinhardtiiunder nutrient deprivation. Plant Physiol 2005, 139:1995–2005.
17. Matsuo M, Hachisu R, Tabata S, Fukuzawa H, Obokata J: Transcriptomeanalysis of respiration-responsive genes in Chlamydomonas reinhardtii:mitochondrial retrograde signaling coordinates the genes for cellproliferation with energy-producing metabolism. Plant Cell Physiol 2011,52:333–343.
18. Hsieh SI, Castruita M, Malasarn D, Urzica E, Erde J, et al: The proteome ofcopper, iron, zinc, and manganese micronutrient deficiency inChlamydomonas reinhardtii. Mol Cell Proteomics 2012, 12(1):65–86.
19. Mastrobuoni G, Irgang S, Pietzke M, Assmus HE, Wenzel M, et al: Proteomedynamics and early salt stress response of the photosynthetic organismChlamydomonas reinhardtii. BMC Genomics 2012, 13:215.
20. Winck FV, Riano-Pachon DM, Sommer F, Rupprecht J, Mueller-Roeber B:The nuclear proteome of the green alga Chlamydomonas reinhardtii.Proteomics 2012, 12:95–100.
21. Muhlhaus T, Weiss J, Hemme D, Sommer F, Schroda M: Quantitativeshotgun proteomics using a uniform (1)(5)N-labeled standard to monitorproteome dynamics in time course experiments reveals new insightsinto the heat stress response of Chlamydomonas reinhardtii.Mol Cell Proteomics 2011, 10(M110):004739.
22. Terashima M, Specht M, Hippler M: The chloroplast proteome: a surveyfrom the Chlamydomonas reinhardtii perspective with a focus ondistinctive features. Curr Genet 2011, 57:151–168.
23. Dubini A, Mus F, Seibert M, Grossman AR, Posewitz MC: Flexibility inanaerobic metabolism as revealed in a mutant of Chlamydomonasreinhardtii lacking hydrogenase Activity. J Biol Chem 2009,284:7201–7213.

Yang et al. Biotechnology for Biofuels 2013, 6:118 Page 16 of 17http://www.biotechnologyforbiofuels.com/content/6/1/118
24. Toepel JI-KM, Jaenicke S, Straube J, May P, Goesmann A, Kruse O: Newinsights into Chlamydomonas reinhardtii hydrogen production processesby combined microarray/RNA-seq transcriptomics. Plant Biotechnol J 2013,11:717–733.
25. Gonzalez-Ballester D, Casero D, Cokus S, Pellegrini M, Merchant SS, et al:RNA-Seq analysis of sulfur-deprived Chlamydomonas cells revealsaspects of acclimation critical for cell survival. Plant Cell 2010,22:2058–2084.
26. Derelle E, Ferraz C, Rombauts S, et al: Genome analysis of the smallestfree-living eukaryote Ostreococcus tauri unveils many unique features.Proc Natl Acad Sci U S A 2006, 103:11647–11652.
27. Merchant SS, Prochnik SE, Vallon O, et al: The Chlamydomonas genomereveals the evolution of key animal and plant functions. Science 2007,318:245–250.
28. Worden AZ, Lee JH, Mock T, et al: Green evolution and dynamicadaptations revealed by genomes of the marine picoeukaryotesMicromonas. Science 2009, 324:268–272.
29. Blanc G, Duncan G, Agarkova I, Borodovsky M, Gurnon J, et al: TheChlorella variabilis NC64A genome reveals adaptation tophotosymbiosis, coevolution with viruses, and cryptic sex.Plant Cell 2010, 22:2943–2955.
30. Prochnik SE, Umen J, Nedelcu AM, et al: Genomic analysis of organismalcomplexity in the multicellular green alga Volvox carteri. Science 2010,329:223–226.
31. Blanc G, Agarkova I, Grimwood J, et al: The genome of the polareukaryotic microalga Coccomyxa subellipsoidea reveals traits of coldadaptation. Genome Biol 2012, 13:R39.
32. Radakovits R, Jinkerson RE, Fuerstenberg SI, Tae H, Settlage RE, et al: Draftgenome sequence and genetic transformation of the oleaginous algaNannochloropis gaditana. Nat Commun 2012, 3:686.
33. Palenik B, Grimwood J, Aerts A, Rouze P, Salamov A, et al: The tinyeukaryote Ostreococcus provides genomic insights into the paradox ofplankton speciation. Proc Natl Acad Sci U S A 2007, 104:7705–7710.
34. Rismani-Yazdi H, Haznedaroglu BZ, Bibby K, Peccia J: Transcriptomesequencing and annotation of the microalgae Dunaliella tertiolecta:pathway description and gene discovery for production of next-generation biofuels. BMC Genomics 2011, 12:148.
35. Molnar I, Lopez D, Wisecaver JH, Devarenne TP, Weiss TL, et al: Bio-crudetranscriptomics: gene discovery and metabolic network reconstructionfor the biosynthesis of the terpenome of the hydrocarbon oil-producinggreen alga, Botryococcus braunii race B (Showa)*. BMC Genomics 2012,13:576.
36. Rismani-Yazdi H, Haznedaroglu BZ, Hsin C, Peccia J: Transcriptomicanalysis of the oleaginous microalga Neochloris oleoabundans revealsmetabolic insights into triacylglyceride accumulation. Biotechnol Biofuels2012, 5:74.
37. Guarnieri MT, Nag A, Smolinski SL, Darzins A, Seibert M, et al: Examinationof triacylglycerol biosynthetic pathways via de novo transcriptomicand proteomic analyses in an unsequenced microalga. Plos One 2011,6:e25851.
38. Zhang X, Ye N, Liang C, Mou S, Fan X, et al: De novo sequencing andanalysis of the Ulva linza transcriptome to discover putative mechanismsassociated with its successful colonization of coastal ecosystems.BMC Genomics 2012, 13:565.
39. Pirooznia M, Perkins EJ, Deng Y: Batch blast extractor: an automatedblastx parser application. BMC Genomics 2008, 9(Suppl 2):S10.
40. Conesa A, Gotz S, Garcia-Gomez JM, Terol J, Talon M, et al: Blast2GO: auniversal tool for annotation, visualization and analysis in functionalgenomics research. Bioinformatics 2005, 21:3674–3676.
41. Gotz S, Garcia-Gomez JM, Terol J, Williams TD, Nagaraj SH, et al: High-throughput functional annotation and data mining with the Blast2GOsuite. Nucleic Acids Res 2008, 36:3420–3435.
42. Soneson C, Delorenzi M: A comparison of methods for differentialexpression analysis of RNA-seq data. BMC Bioinforma 2013, 14:91.
43. Yang S, Giannone RJ, Dice L, Yang ZK, Engle NL, et al: Clostridiumthermocellum ATCC27405 transcriptomic, metabolomic and proteomicprofiles after ethanol stress. BMC Genomics 2012, 13:336.
44. Yang S, Land ML, Klingeman DM, Pelletier DA, Lu T-YS, et al: Paradigm forindustrial strain improvement identifies sodium acetate tolerance loci inZymomonas mobilis and Saccharomyces cerevisiae. Proc Natl Acad Sci USA2010, 107:10395–10400.
45. Yang S, Tschaplinski TJ, Engle NL, Carroll SL, Martin SL, et al: Transcriptomicand metabolomic profiling of Zymomonas mobilis during aerobic andanaerobic fermentations. BMC Genomics 2009, 10:34.
46. Asai DJ, Wilkes DE: The dynein heavy chain family. J Eukaryot Microbiol2004, 51:23–29.
47. Dymek EE, Goduti D, Kramer T, Smith EF: A kinesin-like calmodulin-bindingprotein in Chlamydomonas: evidence for a role in cell division andflagellar functions. J Cell Sci 2006, 119:3107–3116.
48. Lopez D, Casero D, Cokus SJ, Merchant SS, Pellegrini M: Algal functionalannotation tool: a web-based analysis suite to functionally interpretlarge gene lists using integrated annotation and expression data.BMC Bioinforma 2011, 12:282.
49. May P, Christian JO, Kempa S, Walther D: ChlamyCyc: an integrativesystems biology database and web-portal for Chlamydomonasreinhardtii. BMC Genomics 2009, 10:209.
50. Guarnieri MT, Nag A, Yang S, Pienkos PT: Proteomic analysis of Chlorellavulgaris: Potential targets for enhanced lipid accumulation. J Proteomics2013. doi:10.1016/j.jprot.2013.05.025.
51. Yang S, Pan C, Tschaplinski TJ, Hurst GB, Engle NL, et al: Systems biologyanalysis of Zymomonas mobilis ZM4 ethanol stress responses.Plos One 2013, 8(7):e68886.
52. Balk J, Pierik AJ, Aguilar Netz DJ, Muhlenhoff U, Lill R: Nar1p, a conservedeukaryotic protein with similarity to Fe-only hydrogenases, functions incytosolic iron-sulphur protein biogenesis. Biochem Soc Trans 2005,33:86–89.
53. Balk J, Pierik AJ, Netz DJ, Muhlenhoff U, Lill R: The hydrogenase-like Nar1pis essential for maturation of cytosolic and nuclear iron-sulphur proteins.EMBO J 2004, 23:2105–2115.
54. Happe T, Kaminski A: Differential regulation of the Fe-hydrogenase duringanaerobic adaptation in the green alga Chlamydomonas reinhardtii.Eur J Biochem 2002, 269:1022–1032.
55. Forestier M, King P, Zhang LP, Posewitz M, Schwarzer S, et al: Expression oftwo [Fe]-hydrogenases in Chlamydomonas reinhardtii under anaerobicconditions. Eur J Biochem 2003, 270:2750–2758.
56. Ghirardi ML, Posewitz MC, Maness PC, Dubini A, Yu J, et al: Hydrogenasesand hydrogen photoproduction in oxygenic photosynthetic organisms.Annu Rev Plant Biol 2007, 58:71–91.
57. Kamp C, Silakov A, Winkler M, Reijerse EJ, Lubitz W, et al: Isolation and firstEPR characterization of the [FeFe]-hydrogenases from green algae.Biochim Biophys Acta 2008, 1777:410–416.
58. Meuser JE, Boyd ES, Ananyev G, Karns D, Radakovits R, et al: Evolutionarysignificance of an algal gene encoding an [FeFe]-hydrogenase withF-domain homology and hydrogenase activity in Chlorella variabilisNC64A. Planta 2011, 234:829–843.
59. Melis A, Seibert M, Happe T: Genomics of green algal hydrogen research.Photosynth Res 2004, 82:277–288.
60. Stripp ST, Goldet G, Brandmayr C, Sanganas O, Vincent KA, et al: Howoxygen attacks [FeFe] hydrogenases from photosynthetic organisms.Proc Natl Acad Sci U S A 2009, 106:17331–17336.
61. Vincent KA, Parkin A, Lenz O, Albracht SP, Fontecilla-Camps JC, et al:Electrochemical definitions of O2 sensitivity and oxidative inactivation inhydrogenases. J Am Chem Soc 2005, 127:18179–18189.
62. Ghirardi ML, Togasaki RK, Seibert M: Oxygen sensitivity of algal H2- production.Appl Biochem Biotechnol 1997, 63–65:141–151.
63. Magneschi L, Catalanotti C, Subramanian V, Dubini A, Yang W, et al: Amutant in the ADH1 gene of Chlamydomonas reinhardtii elicitsmetabolic restructuring during anaerobiosis. Plant Physiol 2012,158:1293–1305.
64. Catalanotti C, Dubini A, Subramanian V, Yang W, Magneschi L, et al: Alteredfermentative metabolism in Chlamydomonas reinhardtii mutants lackingpyruvate formate lyase and both pyruvate formate lyase and alcoholdehydrogenase. Plant Cell 2012, 24:692–707.
65. Philipps G, Krawietz D, Hemschemeier A, Happe T: A pyruvate formatelyase-deficient Chlamydomonas reinhardtii strain provides evidence for alink between fermentation and hydrogen production in green algae.Plant J 2011, 66:330–340.
66. Atteia A, van Lis R, Tielens AG, Martin WF: Anaerobic energy metabolism inunicellular photosynthetic eukaryotes. Biochim Biophys Acta 2013,1827:210–223.
67. Catalanotti C, Yang W, Posewitz MC, Grossman AR: Fermentation metabolismand its evolution in algae. Front Plant Sci 2013, 4:150.

Yang et al. Biotechnology for Biofuels 2013, 6:118 Page 17 of 17http://www.biotechnologyforbiofuels.com/content/6/1/118
68. Hemschemeier A, Happe T: Alternative photosynthetic electron transportpathways during anaerobiosis in the green alga Chlamydomonasreinhardtii. Biochim Biophys Acta 2011, 1807:919–926.
69. Meuser JE, D'Adamo S, Jinkerson RE, Mus F, Yang WQ, et al: Geneticdisruption of both Chlamydomonas reinhardtii [FeFe]-hydrogenases:insight into the role of HYDA2 in H2 production. Biochem Bioph Res Co2012, 417:704–709.
70. Pape M, Lambertz C, Happe T, Hemschemeier A: Differential expression ofthe Chlamydomonas [FeFe]-hydrogenase-encoding HYDA1 gene isregulated by the COPPER RESPONSE REGULATOR 1. Plant Physiol 2012,159:1700–1712.
71. Lambertz C, Hemschemeier A, Happe T: Anaerobic expression of theferredoxin-encoding FDX5 gene of Chlamydomonas reinhardtii is regulatedby the Crr1 transcription factor. Eukaryot Cell 2010, 9:1747–1754.
72. Kulik A, Wawer I, Krzywinska E, Bucholc M, Dobrowolska G: SnRK2 proteinkinases–key regulators of plant response to abiotic stresses. OMICS 2011,15:859–872.
73. Miller JE, Reese JC: Ccr4-Not complex: the control freak of eukaryoticcells. Crit Rev Biochem Mol Biol 2012, 47:315–333.
74. Malvar T, Biron RW, Kaback DB, Denis CL: The CCR4 protein fromSaccharomyces cerevisiae contains a leucine-rich repeat region whichis required for its control of ADH2 gene expression. Genetics 1992,132:951–962.
75. Aksoy M, Pootakham W, Pollock SV, Moseley JL, Gonzalez-Ballester D, et al:Tiered regulation of sulfur deprivation responses in Chlamydomonasreinhardtii and identification of an associated regulatory factor.Plant Physiol 2013, 162:195–211.
76. Volgusheva A, Styring S, Mamedov F: Increased photosystem II stabilitypromotes H2 production in sulfur-deprived Chlamydomonas reinhardtii.Proc Natl Acad Sci U S A 2013, 110:7223–7228.
77. Timmins M, Zhou WX, Rupprecht J, Lim L, Thomas-Hall SR, et al: Themetabolome of Chlamydomonas reinhardtii following induction ofanaerobic H2 production by sulfur depletion. J Biol Chem 2009,284:35996–35996.
78. Matthew T, Zhou WX, Rupprecht J, Lim L, Thomas-Hall SR, et al: TheMetabolome of Chlamydomonas reinhardtii following induction ofanaerobic H2 production by sulfur depletion. J Biol Chem 2009,284:23415–23425.
79. Irihimovitch V, Stern DB: The sulfur acclimation SAC3 kinase is requiredfor chloroplast transcriptional repression under sulfur limitation inChlamydomonas reinhardtii. Proc Natl Acad Sci USA 2006,103:7911–7916.
80. Davies JP, Yildiz FH, Grossman A: Sac1, a putative regulator that is criticalfor survival of Chlamydomonas reinhardtii during sulfur deprivation.EMBO J 1996, 15:2150–2159.
81. Gonzalez-Ballester D, Pollock SV, Pootakham W, Grossman AR: The centralrole of a SNRK2 kinase in sulfur deprivation responses. Plant Physiol 2008,147:216–227.
82. Hedbacker K, Carlson M: SNF1/AMPK pathways in yeast. Front Biosci 2008,13:2408–2420.
83. Papamichos-Chronakis M, Gligoris T, Tzamarias D: The Snf1 kinase controlsglucose repression in yeast by modulating interactions between theMig1 repressor and the Cyc8-Tup1 co-repressor. EMBO Rep 2004,5:368–372.
84. Sanz P: Snf1 protein kinase: a key player in the response to cellular stressin yeast. Biochem Soc Trans 2003, 31:178–181.
85. Wilson WA, Hawley SA, Hardie DG: Glucose repression/derepression inbudding yeast: SNF1 protein kinase is activated by phosphorylationunder derepressing conditions, and this correlates with a high AMP:ATPratio. Curr Biol 1996, 6:1426–1434.
86. Ludin K, Jiang R, Carlson M: Glucose-regulated interaction of aregulatory subunit of protein phosphatase 1 with the Snf1 proteinkinase in Saccharomyces cerevisiae. Proc Natl Acad Sci USA 1998,95:6245–6250.
87. Perez-Rodriguez P, Riano-Pachon DM, Correa LGG, Rensing SA, Kersten B, et al:PInTFDB: updated content and new features of the plant transcription factordatabase. Nucleic Acids Res 2010, 38:D822–D827.
88. Bateman A, Haft DH: HMM-based databases in InterPro. Brief Bioinform2002, 3:236–245.
89. Aoki-Kinoshita KF, Kanehisa M: Gene annotation and pathway mapping inKEGG. Methods Mol Biol 2007, 396:71–91.
90. Altermann E, Klaenhammer TR: PathwayVoyager: pathway mappingusing the Kyoto encyclopedia of genes and genomes (KEGG) database.BMC Genomics 2005, 6:60.
91. Altschul SF, Gish W, Miller W, Myers EW, Lipman DJ: Basic local alignmentsearch tool. J Mol Biol 1990, 215:403–410.
92. Benson DA, Karsch-Mizrachi I, Lipman DJ, Ostell J, Sayers EW: GenBank.Nucleic Acids Res 2009, 37:D26–D31.
doi:10.1186/1754-6834-6-118Cite this article as: Yang et al.: De novo transcriptomic analysis ofhydrogen production in the green alga Chlamydomonas moewusiithrough RNA-Seq. Biotechnology for Biofuels 2013 6:118.
Submit your next manuscript to BioMed Centraland take full advantage of:
• Convenient online submission
• Thorough peer review
• No space constraints or color figure charges
• Immediate publication on acceptance
• Inclusion in PubMed, CAS, Scopus and Google Scholar
• Research which is freely available for redistribution
Submit your manuscript at www.biomedcentral.com/submit
Copyright © 2022 FDOKUMEN