
Multimodal Semantic Analysis and Annotation for Basketball Video
Upload
independentCategory
view
3download
0
Surfing Transcriptomic Landscapes. A Step beyond the Annotationof Chromosome 16 ProteomeVíctor Segura,† Juan Alberto Medina-Aunon,‡ Maria I. Mora,† Salvador Martínez-Bartolome,‡
Joaquín Abian,§ Kerman Aloria,∥ Oreto Antunez,■ Jesus M. Arizmendi,∥ Mikel Azkargorta,⊥
Silvia Barcelo-Batllori,▼,⬠ Jabier Beaskoetxea,∥ Joan J. Bech-Serra,▽ Francisco Blanco,#
Mariana B. Monteiro,† David Caceres,◆ Francesc Canals,▽ Monserrat Carrascal,§
Jose Ignacio Casal,○ Felipe Clemente,◆ Nuria Colome,▽ Noelia Dasilva,□ Paula Díaz,□
Felix Elortza,⊥ Patricia Fernandez-Puente,# Manuel Fuentes,□ Oscar Gallardo,§
Severine I. Gharbi,‡ Concha Gil,◆ Carmen Gonzalez-Tejedo,‡ María Luisa Hernaez,◆
Manuel Lombardía,‡ Maria Lopez-Lucendo,○ Miguel Marcilla,‡ Jose M. Mato,⊥
Marta Mendes,○ Eliandre Oliveira,▲ Irene Orera,▼ Alberto Pascual-Montano,‡
Gorka Prieto,∥ Cristina Ruiz-Romero,# Manuel M. Sanchez del Pino,■
Daniel Tabas-Madrid,‡ Maria L. Valero,■ Vital Vialas,◆ Joan Villanueva,§
Juan Pablo Albar,◇,‡ and Fernando J. Corrales*,†,◇
†ProteoRed-ISCIII, Center for Applied Medical Research (CIMA), University of Navarra, Pío XII, 55; Ed. CIMA, 31008 Pamplona,Spain‡ProteoRed-ISCIII, Centro Nacional de Biotecnología - CSIC, UAM Campus Cantoblanco, Darwin, 3, 28049 Madrid, Spain§ProteoRed-ISCIII, CSIC/UAB Proteomics Laboratory, Instituto de Investigaciones Biomedicas de Barcelona-CSIC/IDIBAPS,08193 Bellaterra, Spain∥ProteoRed-ISCIII, Department of Biochemistry and Molecular Biology, University of the Basque Country, UPV/EHU, 48940 Leioa,Spain
⊥ProteoRed-ISCIII, Proteomics Platform, CIC bioGUNE, CIBERehd, ProteoRed, Bizkaia Technology Park, 48160 Derio, Spain#ProteoRed-ISCIII, Osteoarticular and Aging Research Lab, Proteomics Unit, ProteoRed/ISCIII, Rheumatology Division,INIBIC−CHU A Coruna, As Xubias 84, 15006 A Coruna, Spain▽ProteoRed-ISCIII, Proteomics Laboratory, Vall d’Hebron Institute of Oncology, Vall d’Hebron University Hospital, UAB,Passeig Vall d'Hebron 119, Edifici Maternoinfantil Planta 14, 08035 Barcelona, Spain
○ProteoRed-ISCIII, Functional Proteomics, Department of Cellular and Molecular Medicine, Centro de Investigaciones Biologicas(CIB-CSIC), Ramiro de Maeztu 9, 28040 Madrid, Spain
◆ProteoRed-ISCIII, Departamento de Microbiología II, Facultad de Farmacia, Universidad Complutense de Madrid,Plaza de Ramon y Cajal, 28040 Madrid, Spain
□ProteoRed-ISCIII, Centro de Investigacion del Cancer/IBMCC (USAL/CSIC), Departamento de Medicina and Servicio Generalde Citometría, University of Salamanca, IBSAL, Campus Miguel de Unamuno, 37007 Salamanca, Spain
▲ProteoRed-ISCIII, Plataforma de Proteomica, Parc Cientifıc de Barcelona, Universitat de Barcelona, Baldiri Reixac, 10,08028 Barcelona, Spain
▼ProteoRed-ISCIII, Unidad de Proteomica, Instituto Aragones de Ciencias de la Salud, Avenida San Juan Bosco, no. 13,50009 Zaragoza, Spain
■ProteoRed-ISCIII, Biochemistry Department, University of Valencia, C/ Doctor Moliner, 50, 46100 Valencia, Spain
*S Supporting Information
Special Issue: Chromosome-centric Human Proteome Project
Received: July 12, 2013Published: October 21, 2013
Article
pubs.acs.org/jpr
© 2013 American Chemical Society 158 dx.doi.org/10.1021/pr400721r | J. Proteome Res. 2014, 13, 158−172
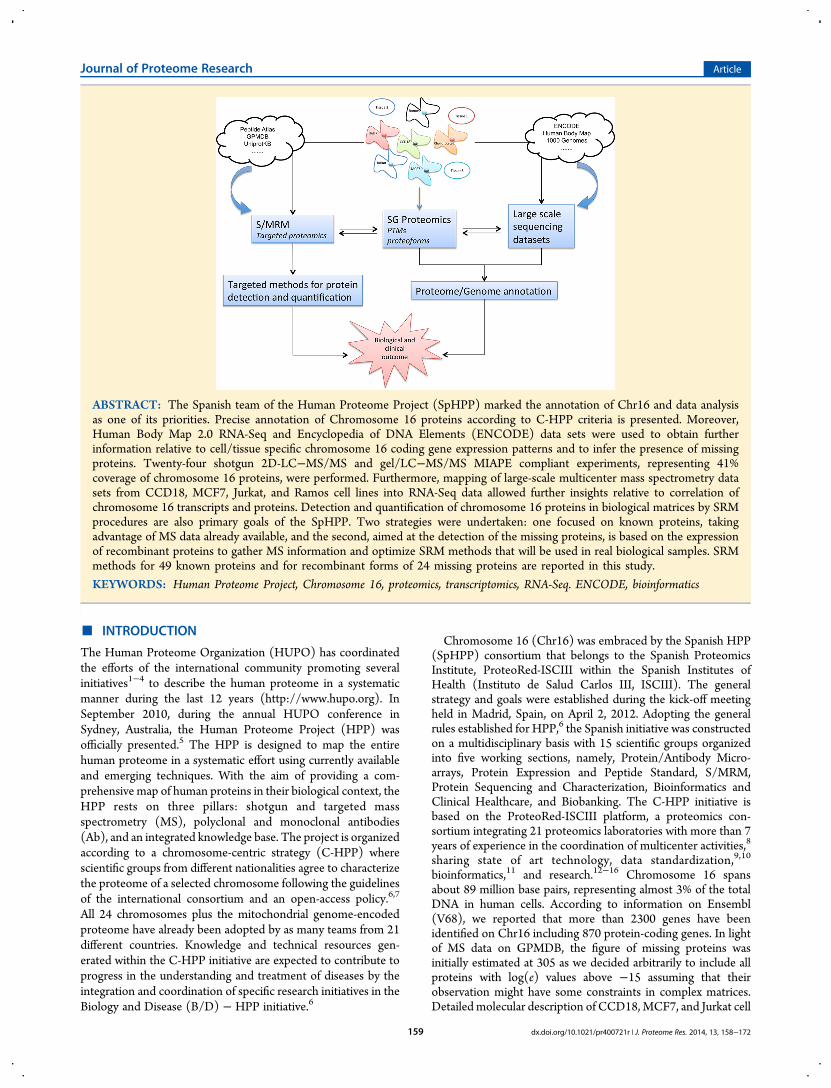
ABSTRACT: The Spanish team of the Human Proteome Project (SpHPP) marked the annotation of Chr16 and data analysisas one of its priorities. Precise annotation of Chromosome 16 proteins according to C-HPP criteria is presented. Moreover,Human Body Map 2.0 RNA-Seq and Encyclopedia of DNA Elements (ENCODE) data sets were used to obtain furtherinformation relative to cell/tissue specific chromosome 16 coding gene expression patterns and to infer the presence of missingproteins. Twenty-four shotgun 2D-LC−MS/MS and gel/LC−MS/MS MIAPE compliant experiments, representing 41%coverage of chromosome 16 proteins, were performed. Furthermore, mapping of large-scale multicenter mass spectrometry datasets from CCD18, MCF7, Jurkat, and Ramos cell lines into RNA-Seq data allowed further insights relative to correlation ofchromosome 16 transcripts and proteins. Detection and quantification of chromosome 16 proteins in biological matrices by SRMprocedures are also primary goals of the SpHPP. Two strategies were undertaken: one focused on known proteins, takingadvantage of MS data already available, and the second, aimed at the detection of the missing proteins, is based on the expressionof recombinant proteins to gather MS information and optimize SRM methods that will be used in real biological samples. SRMmethods for 49 known proteins and for recombinant forms of 24 missing proteins are reported in this study.
KEYWORDS: Human Proteome Project, Chromosome 16, proteomics, transcriptomics, RNA-Seq. ENCODE, bioinformatics
■ INTRODUCTION
The Human Proteome Organization (HUPO) has coordinatedthe efforts of the international community promoting severalinitiatives1−4 to describe the human proteome in a systematicmanner during the last 12 years (http://www.hupo.org). InSeptember 2010, during the annual HUPO conference inSydney, Australia, the Human Proteome Project (HPP) wasofficially presented.5 The HPP is designed to map the entirehuman proteome in a systematic effort using currently availableand emerging techniques. With the aim of providing a com-prehensive map of human proteins in their biological context, theHPP rests on three pillars: shotgun and targeted massspectrometry (MS), polyclonal and monoclonal antibodies(Ab), and an integrated knowledge base. The project is organizedaccording to a chromosome-centric strategy (C-HPP) wherescientific groups from different nationalities agree to characterizethe proteome of a selected chromosome following the guidelinesof the international consortium and an open-access policy.6,7
All 24 chromosomes plus the mitochondrial genome-encodedproteome have already been adopted by as many teams from 21different countries. Knowledge and technical resources gen-erated within the C-HPP initiative are expected to contribute toprogress in the understanding and treatment of diseases by theintegration and coordination of specific research initiatives in theBiology and Disease (B/D) − HPP initiative.6
Chromosome 16 (Chr16) was embraced by the Spanish HPP(SpHPP) consortium that belongs to the Spanish ProteomicsInstitute, ProteoRed-ISCIII within the Spanish Institutes ofHealth (Instituto de Salud Carlos III, ISCIII). The generalstrategy and goals were established during the kick-off meetingheld in Madrid, Spain, on April 2, 2012. Adopting the generalrules established for HPP,6 the Spanish initiative was constructedon a multidisciplinary basis with 15 scientific groups organizedinto five working sections, namely, Protein/Antibody Micro-arrays, Protein Expression and Peptide Standard, S/MRM,Protein Sequencing and Characterization, Bioinformatics andClinical Healthcare, and Biobanking. The C-HPP initiative isbased on the ProteoRed-ISCIII platform, a proteomics con-sortium integrating 21 proteomics laboratories with more than 7years of experience in the coordination of multicenter activities,8
sharing state of art technology, data standardization,9,10
bioinformatics,11 and research.12−16 Chromosome 16 spansabout 89 million base pairs, representing almost 3% of the totalDNA in human cells. According to information on Ensembl(V68), we reported that more than 2300 genes have beenidentified on Chr16 including 870 protein-coding genes. In lightof MS data on GPMDB, the figure of missing proteins wasinitially estimated at 305 as we decided arbitrarily to include allproteins with log(e) values above −15 assuming that theirobservation might have some constraints in complex matrices.Detailed molecular description of CCD18,MCF7, and Jurkat cell
Journal of Proteome Research Article
dx.doi.org/10.1021/pr400721r | J. Proteome Res. 2014, 13, 158−172159
lines was reported by means of transcriptomic and shotgunproteomic analyses and a preliminary version of a bioinformaticsutility for data analysis and uploading into PRIDE andProteomeXchange.17 Combination of gene expression andproteomic information was initiated to suggest preferential celllines where Chr16 proteins might be detected and is currentlyan active working avenue to enhance the biological annotationof Chr16 genes. In fact, this line has been further developedby proposing a methodology to generate a transcriptomic mapof chromosome 16 coding genes using RNA-Seq data fromthe ENCODE project,18 providing an effective mechanismfor identifying cell lines with expression evidence of missingproteins.Understanding of human biology in health and disease is
dependent on integration of all molecular building blocks that arebeing unravelled in genome-wide experiments, according to asystems biology strategy. Modern deep-sequencing techniquescapture the transcriptome of any organism in unprecedenteddetail, and there have been substantial breakthroughs in the denovo assembly of transcriptomes. This huge sequencing capacitypromoted several initiatives to achieve a complete annotationof the human genome and to further understand genetic con-tribution to disease, including ENCODE,18 the related annota-tion initiative GENCODE,19 the 1000 Genomes Project,20
and the Illumina Human Body Map. The data provided bythese initiatives are a detailed inventory of the parts list of thehuman genome, whose structural and functional annotation willbe greatly promoted by complementation with large-scale and
accurate proteomics data,21 such as those being produced withinthe HPP. Proteogenomics has recently emerged as a field at thejunction of genomics and proteomics, although pioneer studieshave underlined the interest of such an integrative approach.22
The main goal is the matching of peptides identified inMS-basedexperiments against genome-wide gene/transcript sequencedata sets for detailed gene annotation,23 a method that hasbeen successfully used to circumvent the limited availabilityof reference protein databases of nonmodel species.24 Theintegration of large amounts of RNA-Seq and MS data poses achallenging problem, starting from the generation of efficientand nonredundant RNA-Seq databases to search MS spectra.25
However, these difficulties have been successfully circumventedto allow integration of high-throughput human proteome quan-tification with DNA variation and transcriptome information toreveal the multiple and diverse regulatory mechanisms of geneexpression.26 Different critical points may benefit from crossinglarge-scale proteomics and transcriptomic/genomic data sets asproteogenomically identified peptides will provide uniqueinformation for gene annotation, such as confirmation oftranslation, determining frame, location of translation start andend sites, identification of exact splicing boundaries, andprediction of novel genes.27 Moreover, tissue/cell specific geneexpression patterns will provide valuable information in thesearch of missing proteins that have not yet been identifiedin proteomic studies and in the identification of proteinvariants resulting from alternative splicing and amino acidpolymorphisms that in combination with posttranslational
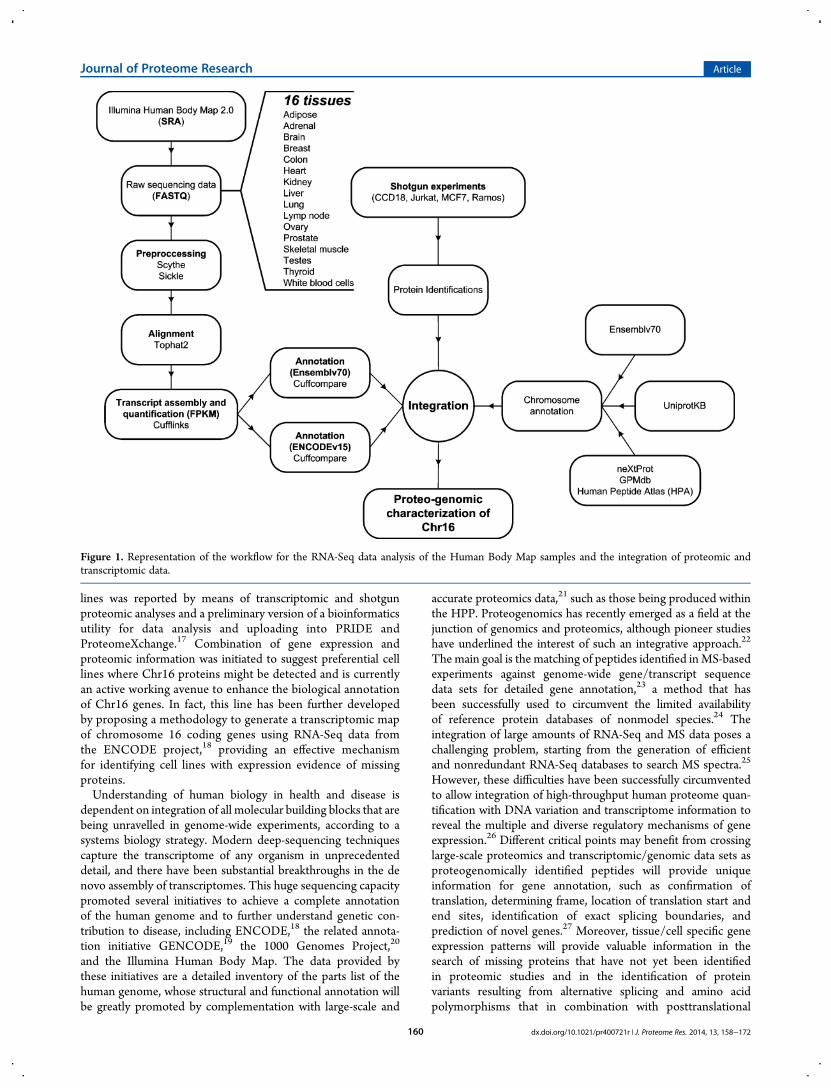
Figure 1. Representation of the workflow for the RNA-Seq data analysis of the Human Body Map samples and the integration of proteomic andtranscriptomic data.
Journal of Proteome Research Article
dx.doi.org/10.1021/pr400721r | J. Proteome Res. 2014, 13, 158−172160

modifications will approach the complexity of protein isoforms inhuman cells.7
In the present study, detailed annotation of chromosome 16protein coding genes using Human BodyMap (HBM) RNA-Seqdata is described. In-depth characterization of CCD18, MCF7,Jurkat, and Ramos cell lines by multicenter shotgun experimentsis presented, and the use of PAnalyzer for protein grouping isdiscussed. Integration of shotgun proteomics data and HBMRNA-Seq data is also presented. Finally, SRM methods fordetection and quantification of 56 chromosome 16 proteins arereported, including 15 missing proteins.
■ MATERIALS AND METHODS
Bioinformatic Analysis of RNA-Seq data from Human BodyMap
Public data sets from the Illumina Human Body Map Project(HBM) were used. HBM integrates transcription profiles fromhigh-throughput sequencing experiments of individual andmixtures of 16 human tissue RNAs (adipose, adrenal, brain,breast, colon, heart, kidney, liver, lung, lymph node, ovary,prostate, skeletal muscle, testes, thyroid, and white blood cells).The accession numbers were GSE30611 in GEO database,E-MTAB-513 in ArrayExpress, and ERX011226 in SRA.All of the selected samples (Supplementary Table 1 in the
Supporting Information) were processed using the same pipeline(Figure 1): (1) the downloaded sra files were converted intofastq files and the quality of the samples was verified usingFastQC (http://www.bioinformatics.babraham.ac.uk/projects/fastqc/); (2) the preprocessing of reads included elimination ofcontaminant adapter substrings with Scythe (https://github.com/vsbuffalo/scythe) and quality-based trimming using Sickle(https://github.com/najoshi/sickle); (3) the alignment of readsto the human genome (hg19) was performed using Tophat2mapper;28 (4) the transcript assembly and quantification usingFPKM (fragments per kilobase of transcript per Millionfragments mapped) of genes and transcripts was carried outwith Cufflinks2;29 and (5) the annotation of the gene locusobtained was performed using Cuffmerge with Ensembl v70 asreference. Further analysis and graphical representations wereperformed using the R/Bioconductor packages Biostrings(manipulation of biological sequences and files), doBy (dataprocessing), and ggplot2 (graphical representation).30
Bioinformatics Analysis of RNA-Seq data from ENCODEProject
NGS technology has revolutionized the world of DNAsequencing due to its lower cost and a genome wide coverage,but despite this the technology still has an observable error ratethat results in background noise that affects accurate read counts.In RNA-Seq assays this results in weakly expressed genes inwhich it is not known if they are really expressed or theexpression is the result of sequencing or aligning errors.To cope with this and determine a more quantitative approach
for gene expression quantification, we followed the method ofRamskold et al.31 to define an appropriate threshold to classify agene as expressed.We selected fastq files from RNA-Seq experiments of long
PolyA+ fraction of whole cells. Raw reads were downloaded fromthe ENCODE ftp site using the information listed in their RNAdashboard index file. The ENCODE consortium provided aguideline to easily access all of their available data (http://genome.crg.es/encode_RNA_dashboard/HOWTO_batch-download.html). Samples were processed following these steps:
(1) sequencing quality was checked using FastQC (http://www.bioinformatics.babraham.ac.uk/projects/fastqc/); (2) Raw se-quencing files were preprocessed for removing adaptors andfractions of reads with poor quality with FASTX-Toolkit (http://hannonlab.cshl.edu/fastx_toolkit/), and in the case of paired-end sequencings, a perl script was used to maintain pairingbetween files after quality filtering; (3) alignment of all reads wascarried out with Tophat v2.0.928 and human genome hg19version as reference; (4) generation of an annotation file ofintergenic regions was developed with BEDTools (https://code.google.com/p/bedtools/) by calculating complementary regionsnot covered by genes. As described in ref 32, we only consideredintergenic regions that were at least 10 kb away from annotatedgenes; and (5) gene quantification was carried out with htseq-count script (http://www-huber.embl.de/users/anders/HTSeq/doc/count.html) for counting fragments, and a customscript was developed to calculate FPKM from these counts usingGENCODE V15 as reference.A comparison of mapped reads between exon and intergenic
regions was then used to estimate a FPKM threshold value thatindicates, with high confidence, a level of gene expression abovebackground level. Expression of all genes and intergenic regions(background) was binned across different RNA-Seq experimentsfrom the same cell line in ENCODE, providing in this wayan effective mean to handle replicates. Cumulative amounts ofgenes and background levels were calculated (SupplementaryFigure 1A in the Supporting Information). The false discoveryrate (FDR) for each expression level was calculated. The truenumber of expressed genes was estimated using FDR as acorrection factor, and the false negative rate (FNR) wascalculated for each expression level according to ref 31.Intersection of the FDR and FNR provides a FPKM thresholdthat can be used to classify genes as expressed or not (Supple-mentary Figure 1B in the Supporting Information). This methodwas applied for all cell lines used by the Spanish Consortium withRNA-Seq data available in ENCODE (MCF-7, K-562, andHepG2). Five levels of expression were defined according to ref31: no expression (FPKM < threshold), weakly expressed(threshold ≤ FPKM < 3), moderately expressed (3 ≤ FPKM <30), highly expressed (30 ≤ FPKM < 100), and very highlyexpressed (FPKM ≥ 100).
Protein Sample Preparation
Cells were grown in the three laboratories from the SpHPPconsortium, following standard growth conditions. At exponen-tial growth, cells were collected and lysed in a CHAPS/urea lysisbuffer (7 M urea, 2 M thiourea, 4% CHAPS, protease andphosphatase inhibitors) for the Jurkat T cell line, an alternativelysis buffer was adopted (8.4M urea, 2.4M thiourea, 5%CHAPS,2 mMTCEP-HCl, supplemented with protease and phosphataseinhibitors). Typically, 100 μg of each cell line was used andseparated by 1D-gel electrophoresis (1D-SDS-PAGE−LC−MS/MS workflow) or digested in-solution (2D-LC−MS/MSworkflow).1D-SDS-PAGE−LC−MS/MS workflow: Each participating
laboratory adopted the same procedure for gel-based proteinseparation. In brief, total cell extracts from each cell line wereloaded on a 12% SDS-PAGE gel. Proteins were visualized byColloidal Coomassie Blue staining (CCB), and whole gel laneswere cut into 15 bands. In-gel protein digestion was carried outfollowing the protocol described by Shevchenko et al., withminor modifications.33 Gel plugs were washed with 50 mMammonium bicarbonate in 50% ACN prior to reduction with
Journal of Proteome Research Article
dx.doi.org/10.1021/pr400721r | J. Proteome Res. 2014, 13, 158−172161

10 mM DTT in 25 mM ammonium bicarbonate solution andalkylation with 55 mM IAA in 25 mM ammonium bicarbonate.Gel pieces were then washed in 50 mM ammonium bicarbonateand then in 50% ACN, and dried in speed vac. Proteomics-gradeTrypsin was used at 1:50 w/w ratio (enzyme/protein) in 25 mMammonium bicarbonate, and digestion was carried out at 37 °Cfor 8 to 16 h. The reaction was stopped by the addition of 0.5%TFA for peptide extraction, and extracted peptides were dried byspeed-vac centrifugation and resuspended in 2% of acetonitrile in99.9% water/0.1% formic acid.2D-LC−MS/MS workflow: For in-solution digestion, cell
lysates were precipitated with methanol/chloroform, asdescribed elsewhere,34 and precipitated proteins were resus-pended in denaturing and reducing buffer (8 M urea, 25 mMammonium bicarbonate, 10 mM DTT) for 1 h at 37 °C andcysteins were alkylated with 50 mM iodoacetamide for 45 minin the dark. Samples were diluted with 25 mM ammoniumbicarbonate to a final concentration of 2M urea, and proteomics-grade trypsin (Sigma Aldrich) was added at a 1:50 ratio(enzyme/protein) for 18 h at 37 °C. Samples were dried in aspeed-vac and kept until off-line peptide fractionation.Off-line chromatography was carried out as described
elsewhere.17 In brief, tryptic peptides were fractionated off-line on a 2.1 × 100 mm C18, 5 μm XBridge column (BEHTechnology, Waters), connected to a Smartline HPLC system(KNAUER). Equilibration conditions were 10 mMNH4OH, pH9.4 (solvent A), and peptides were eluted in a 5−70% gradient ofsolvent B (10 mMNH4OH, pH 9.4, 80% methanol) in 55 min ata flow rate of 150 μL/min. In general, 30 fractions were collectedand pooled to mimic orthogonal separation into 10 fractions thatwere dried in a speed-vac and kept until LC−MS/MS. Blankswere run between samples to avoid carry over.
Liquid Chromatography and Mass Spectrometry Analysis
For both workflows, the second dimension was performed usinga nano liquid chromatography system coupled online to a massspectrometer. Each laboratory used distinct chromatographicconditions, all of which are summarized in SupplementaryTable 2 in the Supporting Information. Settings for the fourMS/MS platforms used (Orbitrap, Q Exactive, MaXis Impact,and 5600 triple TOF) are shown in the corresponding MIAPEdocuments that are included as Supporting Information.
Data Analysis
Raw MS and MS/MS data were translated into mascot generalfile (mgf) format and searched against the UniProtKB/SwissProthuman database (release 2013_06, June 13) that contains 36 852proteins and their corresponding reversed sequences using an in-house Mascot Server v. 2.4 (Matrix Science, London, U.K.).Search parameters were set as follows: carbamidomethyl cysteineas fixedmodification and oxidizedmethionines and acetylation ofthe peptide amino termini as a variable modifications. Peptidemass tolerance was set to 50 ppm, in both MS and MS/MSmodes, and two missed cleavages were allowed. Typically, anaccuracy of ±10 ppm was found for both MS and MS/MSspectra. False discovery rates (FDR≤ 1% at the protein level) forprotein identification were manually calculated.35
Data reporting was conducted as cited in our previous work.17
MS mgf files and their corresponding mzidentML results weresubmitted to the ProteoRed MIAPE web repository11 to createboth MIAPE MS and MSI reports through the ProteoRedMIAPE web toolkit.9 Afterward, MIAPE MS and MSI reportswere translated to PRIDE XML and, together with the rawMS file for each sample fraction, were submitted to the
ProteomeXchange repository (http://www.proteomexchange.org/) following the ProteomeXchange submission guidelines.Globally, 270 files were sent to the ProteomeXchange repositorythrough the recently incorporated ASPERA protocol. The fileswere grouped according to the analyzed cell lines generatingfour data sets, whose ProteomeXchange accession numbers arePXD000442, PXD000443, PXD000447, and PXD000449 forMCF7, Jurkat, Ramos, and CCD18 cell lines.
Recombinant Protein Production
Used clones were selected from the pANT7_cGST clonecollection distributed by Plasmid repository at Arizona StateUniversity Biodesign Institute. Full-length cDNA clones containa T7 transcriptional start sequence as well as an internal ribosomeentry site (IRES), which is compatible with in vitro transcrip-tional-translational reagents. In addition, each clone contains anin-frame fused C-terminal GST tag. Each bacterial clone wasgrown overnight in 5 mL of Luria broth with 100 μg/mLampicillin. Plasmid DNA was extracted using the Mini-Prep Kit(Promega, Madison, WI) following the manufacturer’s in-structions. All plasmids were sequenced using an M13 and T7primers to confirm the identity of the insert and to ensure thatthere was not contamination of the plasmids stocks.Proteins were synthesized from plasmid DNA using the
human in vitro protein expression kit (IVTT) (ThermoLifeS-cience, WI) following the manufacturer’s protocol with a fewminimal modifications to adapt for 1.5 mL eppendorf tubes.Around 1 μg of plasmid DNA was incubated in 25 μL of coupledtranscription/translation reaction mix at 30 °C for 90 min. Toenrich the GST-fusion proteins, we washed 2 mL of glutathione-sepharose 4B (GE Uppsala, Sweden) three times with DPBSbuffer and resuspended it in 12.5 mL of 1× DPBS. An aliquot of125 μL of this bead slurry was added to each tube containing thecompleted translation reaction; then, bead−protein mixture wasrocked end-over-end for 16 h at 4 °C. Bounded protein was thenwashed three times with DPBS and two times with 50 mMammonium bicarbonate.
SRM Analysis
On the basis of both the MS/MS spectra observed in theLC−MS analysis of the samples, predictions derived from thesequences, and data available from databases, several peptideprecursor and fragment ion masses were selected per each pro-tein and assayed for SRM analysis. Analyses were performed onAB Sciex 4000 and 5500 QTRAP instruments. After precolumndesalting, tryptic digests (1 to 2 μg) were separated onC18 nano-columns (75 μm id, 15 cm, 3 μm particle size) (LC Packings,Netherlands; Eksigent, USA; Thermo Scientific, USA) at a flowrate of 300 nL/min, with a 90 min linear gradient from 5 to 40%ACN in 0.1% formic acid. The mass spectrometer was interfacedwith nanospray sources equipped with uncoated fused silicaemitter tips (20 μm inner diameter, 10 μm tip, NewObjective,Woburn, MA) and was operated in the positive ion mode. MSSource parameters were as follows: capillary voltage 2800 V,source temperature 150 °C, declustering potential (DP) 135 V,curtain and ion source gas (nitrogen) 20 psi, and collision gas(nitrogen) medium. The dwell time for each transition was20 ms. Collision energies for each peptide were automaticallycomputed using the embedded rolling collision energy equationsof the MRM Pilot software. Proteotypic peptides were selectedfrom the information available in Peptide Atlas and GPMDB.To confirm the identity of the peptides, an MRM-initiated
detection and sequencing (MIDAS) experiment was performedfor each peptide. Themass spectrometer was instructed to switch
Journal of Proteome Research Article
dx.doi.org/10.1021/pr400721r | J. Proteome Res. 2014, 13, 158−172162

fromMRM to enhanced product ion (EPI) scanning mode whenan individual MRM signal exceeded 500 counts. Each precursorwas fragmented a maximum of two times before being excludedfor 30 s. Data were analyzed by submitting the MS/MS datato the ProteinPilot software (ABSciex, version 4.0). All searcheswere performed against the HPP chromosome 16 database.SRM data were analyzed using the quantitation module of the
Analyst 1.5.1 software (ABSciex) with the IntelliQuant algorithmfor peak integration.
■ RESULTS AND DISCUSSION
Annotation of Chromosome 16
Detailed annotation of chromosomes is a dynamic aspect ofpivotal relevance in the elaboration of the strategies focusing onthe definition of the human proteome parts list. Chr16 contains886 protein coding genes (Ensembl v70) including 669 knownand 187 missing proteins (Supplementary Table 3 in theSupporting Information). The number of missing proteins iscalculated as the difference between the total protein codinggenes in Chr16 and the number of protein coding genes withexperimental evidence at the level of protein in at least one ofthe following databases, according to the criteria adopted withinthe C-HPP: (1) neXtProt (release Nov 2012), gold proteinsmapping 642 protein coding genes in Ensembl; (2) HumanPeptide Atlas (release Dec 2012), canonical proteins mapping423 protein coding genes in Ensembl; and (3) GPMdb (release26 Nov 2012), green proteins mapping 630 protein coding genesin Ensembl (Figure 2A). This Figure closely correlates with thecurrent figure provided by neXtProt (139 missing proteins) thatdiscounts hypothetical protein coding genes. Moreover, HumanProtein Atlas references (Supplementary Table 4 in theSupporting Information) are available for 109 missing proteins.(No filtering criterion was considered, all positive antibodies inany tissue or cell line were included.)To provide further insight into Chr16 annotation, we analyzed
16 tissue specific RNA-Seq data sets from the Illumina HBMinitiative. The number of transcripts detected in the analysis ofthe HBM ranged from 39 970 isoforms recovered in liver sampleto 160 710 transcript assemblies obtained in lymph-nodesamples. The mean number of transcripts for the 16 tissueswas 88 578, including known and novel transcripts. Thecomparison of these transcript structures with the annotationof the genome available in the Ensemblv70 database allowedassignment of 82 942 nonredundant transcripts to the HBM.The minimum number of known isoforms was detected in liversamples (20 429 transcripts), while the maximum number ofisoforms was found in lymph-node samples (36 613 transcripts).The mean number of known isoforms in Ensemblv70 in thetissues sequenced in the HBM was 29 101 transcripts. Similarcalculations were performed for novel isoforms. A minimum of3218 transcripts in the liver samples and a maximum of 18 913for lymph nodes samples were found, with a mean number ofredundant novel transcripts for the 16 tissues of 10 518transcripts. Using ENCODEv15 instead of Ensemblv70 forcomparison purposes, we mapped 83 704 known transcripts inthe HBM data set ranging from 23 123 transcripts in liversamples to 38 979 transcripts in testes sample. Themean numberof known isoforms for the 16 tissues was 31 592 transcripts. Thenovel transcripts ranged from 1823 in liver samples to 14 412in lymph nodes, with a mean value of 7737 redundant novelisoforms. The coverage of known isoforms detected in the HBMsamples for Chr16 was 3230 protein coding transcripts
corresponding to 819 protein coding genes (94.57% of all theprotein coding genes annotated in this chromosome). Thenumber of protein-coding transcripts found using ENCODEv15was 3095, corresponding to 808 protein coding genes (93.31% ofthe total number of protein coding genes).The tissue-specific abundance of transcripts is a useful guide
on which to base the decision of which are the biological sampleswhere a given protein might most probably be found. This isespecially relevant for searching for missing proteins. Eventhough a quantitative correlation between transcripts andproteins levels should not always be necessarily expected, abinary presence/absence transcript analysis across tissues mightprovide a first outline of the tissue specific protein expressionmap. To extend our previous analysis based on microarraytranscriptomic data,17 the expression of Chr16 protein codinggenes was studied across the selected 16 tissue specific RNA-Seqdata of the HBM. The quantification of transcripts is reportedusing FPKM as a measure of abundance. The resulting bimodaldistribution for each of the 16 tissues (Supplementary Figure 2 inthe Supporting Information) is in good agreement with datapreviously reported.21,36 The expression of Chr16 protein codinggenes is widely distributed across the tissues analyzed (Figure2B). Interestingly, the expression levels of those genes coding formissing proteins (187 genes) are statistically (p < 0.05) lowerthan the expression of genes coding for known proteins (699).Some exceptions are, however, observed, in particular, colon,lung, lymph nodes, skeletal muscle, and white blood cells, whereboth Chr16-associated missing and known protein coding genesare expressed at similar levels. These data further support ourprevious analysis17 and provide novel tissues to performed newshotgun experiments in the search for Chr16 missing proteins.
Integration of Chromosome 16 Proteomic andTranscriptomic Profiles
To characterize in detail the proteome of Chr16, we selected fourcell lines, MCF7 breast cancer human epithelial cells, CCD18human colon fibroblasts, Jurkat human T lymphocytes, andRamos B lymphocytes. Shotgun proteomics were conducted inparallel by six independent laboratories resulting in 24 2D-LC−MS/MS and gel/LC−MS/MS experiments following thestandardization principles established previously.17 Assuming aFDR below 1% at the protein level, 8766 protein groups (PGs)were identified, 5072, 4508, 3276, and 6744 in MCF7, CCD18,Ramos, and Jurkat cells (Supplementary Table 5 in theSupporting Information). In terms of accuracy, 78.3% of theidentified protein groups were identified with two or morepeptides and 69.4% with three peptides or more. RegardingChromosome 16, 385 PGs were identified, corresponding to 360genes, 83.4% identified with two or more peptides and 73.2%with three or more. Interestingly, two missing proteins, ZNF200(P98182) and CCDC154 (A6NI56), were detected in theseexperiments.One of the most important variations regarding the previous
data analysis pipeline is the inclusion of the PAnalyzeralgorithm.37 This new feature reinforced the reliability of theresults because it considered the peptide overlap betweenproteins and proposed a rearrangement of identified proteinsinto evidence categories according to their common peptides.The four differentiable categories according to Prieto’s work37
are: conclusive, nonconclusive, ambiguous group, and indis-tinguishable proteins. (In this study, proteins within theindistinguishable category were excluded to avoid over-interpretations.) The PAnalyzer algorithm was inserted in the
Journal of Proteome Research Article
dx.doi.org/10.1021/pr400721r | J. Proteome Res. 2014, 13, 158−172163

data analysis pipeline as a customized library built by PAnalyzer’sdevelopers, and it is called once the data are stored in thedatabase and prior to the final report within the ProteoRedMIAPE Extractor tool (http://www.proteored.org/miape)data workflow (Supplementary Figure 3 in the SupportingInformation). To test the suitability of the new pipeline,we analyzed data from previous experiments,17 resulting in a
99.7% overlapping in terms of protein coverage. Furthermore,the reported entries were PGs with a limited number containingmore than one proteoform such as different isoforms. In termsof accuracy, 76% of the identified PGs were identified withtwo or more peptides and 64.7% with three or more, indicatinga substantial increase in terms of protein identificationconfidence.
Figure 2. Annotation of chromosome 16 using HUPO guidelines. (A) Difference between the protein coding genes in Ensemblv70 and the proteinswith experimental evidence in GPMdb, neXtProt, and Human Peptide Atlas result in the 187 missing proteins group. (B) Distribution of FPKM in the16 tissue samples of HBM comparing known andmissing protein genes. The p values show the statistical significance of the decrease in the expression ofgenes coding for Chr16 missing proteins compared with expression levels of genes coding for Chr16 known proteins.
Journal of Proteome Research Article
dx.doi.org/10.1021/pr400721r | J. Proteome Res. 2014, 13, 158−172164
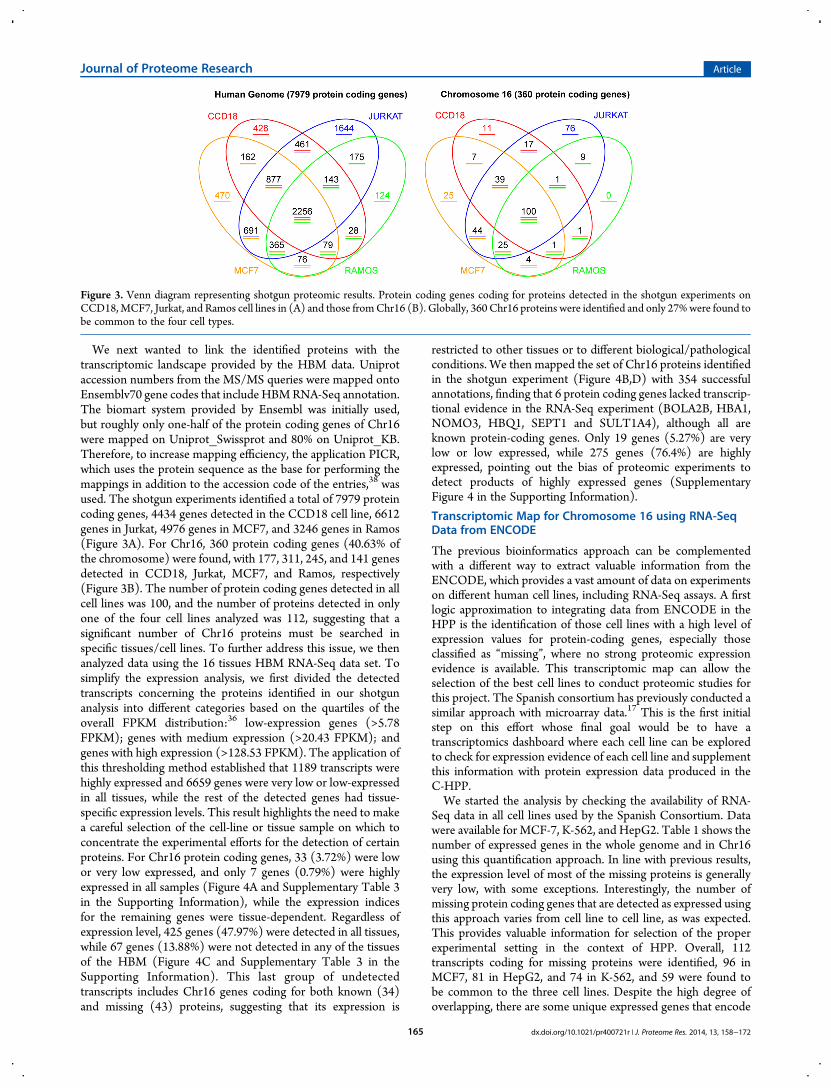
We next wanted to link the identified proteins with thetranscriptomic landscape provided by the HBM data. Uniprotaccession numbers from the MS/MS queries were mapped ontoEnsemblv70 gene codes that include HBMRNA-Seq annotation.The biomart system provided by Ensembl was initially used,but roughly only one-half of the protein coding genes of Chr16were mapped on Uniprot_Swissprot and 80% on Uniprot_KB.Therefore, to increase mapping efficiency, the application PICR,which uses the protein sequence as the base for performing themappings in addition to the accession code of the entries,38 wasused. The shotgun experiments identified a total of 7979 proteincoding genes, 4434 genes detected in the CCD18 cell line, 6612genes in Jurkat, 4976 genes in MCF7, and 3246 genes in Ramos(Figure 3A). For Chr16, 360 protein coding genes (40.63% ofthe chromosome) were found, with 177, 311, 245, and 141 genesdetected in CCD18, Jurkat, MCF7, and Ramos, respectively(Figure 3B). The number of protein coding genes detected in allcell lines was 100, and the number of proteins detected in onlyone of the four cell lines analyzed was 112, suggesting that asignificant number of Chr16 proteins must be searched inspecific tissues/cell lines. To further address this issue, we thenanalyzed data using the 16 tissues HBM RNA-Seq data set. Tosimplify the expression analysis, we first divided the detectedtranscripts concerning the proteins identified in our shotgunanalysis into different categories based on the quartiles of theoverall FPKM distribution:36 low-expression genes (>5.78FPKM); genes with medium expression (>20.43 FPKM); andgenes with high expression (>128.53 FPKM). The application ofthis thresholding method established that 1189 transcripts werehighly expressed and 6659 genes were very low or low-expressedin all tissues, while the rest of the detected genes had tissue-specific expression levels. This result highlights the need to makea careful selection of the cell-line or tissue sample on which toconcentrate the experimental efforts for the detection of certainproteins. For Chr16 protein coding genes, 33 (3.72%) were lowor very low expressed, and only 7 genes (0.79%) were highlyexpressed in all samples (Figure 4A and Supplementary Table 3in the Supporting Information), while the expression indicesfor the remaining genes were tissue-dependent. Regardless ofexpression level, 425 genes (47.97%) were detected in all tissues,while 67 genes (13.88%) were not detected in any of the tissuesof the HBM (Figure 4C and Supplementary Table 3 in theSupporting Information). This last group of undetectedtranscripts includes Chr16 genes coding for both known (34)and missing (43) proteins, suggesting that its expression is
restricted to other tissues or to different biological/pathologicalconditions. We then mapped the set of Chr16 proteins identifiedin the shotgun experiment (Figure 4B,D) with 354 successfulannotations, finding that 6 protein coding genes lacked transcrip-tional evidence in the RNA-Seq experiment (BOLA2B, HBA1,NOMO3, HBQ1, SEPT1 and SULT1A4), although all areknown protein-coding genes. Only 19 genes (5.27%) are verylow or low expressed, while 275 genes (76.4%) are highlyexpressed, pointing out the bias of proteomic experiments todetect products of highly expressed genes (SupplementaryFigure 4 in the Supporting Information).
Transcriptomic Map for Chromosome 16 using RNA-SeqData from ENCODE
The previous bioinformatics approach can be complementedwith a different way to extract valuable information from theENCODE, which provides a vast amount of data on experimentson different human cell lines, including RNA-Seq assays. A firstlogic approximation to integrating data from ENCODE in theHPP is the identification of those cell lines with a high level ofexpression values for protein-coding genes, especially thoseclassified as “missing”, where no strong proteomic expressionevidence is available. This transcriptomic map can allow theselection of the best cell lines to conduct proteomic studies forthis project. The Spanish consortium has previously conducted asimilar approach with microarray data.17 This is the first initialstep on this effort whose final goal would be to have atranscriptomics dashboard where each cell line can be exploredto check for expression evidence of each cell line and supplementthis information with protein expression data produced in theC-HPP.We started the analysis by checking the availability of RNA-
Seq data in all cell lines used by the Spanish Consortium. Datawere available for MCF-7, K-562, and HepG2. Table 1 shows thenumber of expressed genes in the whole genome and in Chr16using this quantification approach. In line with previous results,the expression level of most of the missing proteins is generallyvery low, with some exceptions. Interestingly, the number ofmissing protein coding genes that are detected as expressed usingthis approach varies from cell line to cell line, as was expected.This provides valuable information for selection of the properexperimental setting in the context of HPP. Overall, 112transcripts coding for missing proteins were identified, 96 inMCF7, 81 in HepG2, and 74 in K-562, and 59 were found tobe common to the three cell lines. Despite the high degree ofoverlapping, there are some unique expressed genes that encode
Figure 3. Venn diagram representing shotgun proteomic results. Protein coding genes coding for proteins detected in the shotgun experiments onCCD18,MCF7, Jurkat, and Ramos cell lines in (A) and those fromChr16 (B). Globally, 360 Chr16 proteins were identified and only 27%were found tobe common to the four cell types.
Journal of Proteome Research Article
dx.doi.org/10.1021/pr400721r | J. Proteome Res. 2014, 13, 158−172165

missing proteins differentially among the cell lines. Supple-mentary Table 6 in the Supporting Information contains afunctional analysis of the missing proteins common to the threecell lines as well as those that are unique to each one. Littleoverlapping between the groups is observed, reflecting the needto have a complete picture of the expressed genes in all cell lines.
Similar information is shown in the heatmap of SupplementaryFigure 5 in the Supporting Information, where the non-overlapped functions are more evident.Of the three cell lines previously studied by microarray
technology (MCF7, CCD18, and Jurkat), only MCF-7 wasavailable in ENCODE. There is a 78% agreement between
Table 1. Gene Expression Results Using the Quantification Method Described in This Papera
expression levelno
expressionweak
expressionmoderateexpression
highexpression
extremely highexpression
totalexpressed total
MCF7 (threshold = 0.030) # genes WG 34967 12716 7718 984 295 21713 56680# genes Chr16 1320 624 359 37 8 1028 2348# PC genes Chr1B 195 314 337 34 6 691 886# PC missing 91 86 9 1 0 96 187
K-562 (threshold = 0.035) # genes WG 36418 12206 6902 892 262 20262 56680# genes Chr16 1420 606 289 30 3 928 2348# PC genes Chr16 270 317 273 24 2 616 886# PC missing 113 70 4 0 0 74 187
HepG2 (threshold = 0.038) # genes WG 38241 11433 6142 637 227 18439 56680# genes Chr16 1423 609 287 27 2 925 2348# PC genes Chr16 229 360 271 25 1 657 886# PC missing 106 75 6 0 0 81 187
aFor each of the three cell lines, we report the number of genes detected at each expression level (columns). The first two rows for each cell linecorrespond to the number of genes in the whole genome (WG) and in Chromosome 16, respectively. The third row corresponds to the number ofprotein coding (PC) genes in chromosome 16, while the fourth column reflects the expression status of the genes encoding the missing proteins ofchromosome 16. The expression threshold for each cell line is shown in parentheses.
Figure 4. Integration of proteomic and transcriptomic landscape of Chr16. Expression abundance of all Chr16 protein coding genes in the 16 HBMtissues analyzed in this study (A) and for Chr16 protein coding genes whose encoded proteins were detected in our shotgun experiments (B). Thedistributions of detection as a function of the tissues in which the genes are quantified are also shown (C,D).
Journal of Proteome Research Article
dx.doi.org/10.1021/pr400721r | J. Proteome Res. 2014, 13, 158−172166

Microarrays and RNA-Seq analysis for this sample, which isconsiderably high. When we compared our results with proteinexpression, as described in ref 17, RNA-Seq assay matched in42% of cases, which is higher than the 35% of agreement withmicroarray data. This higher level of agreement is expected dueto the quality and coverage of the RNA sequencing data.
SRM/MRM Data
The development of quantitative methods for Chr16 proteins isone of our main focuses, with special attention to the missingproteins group and proteoforms that may be uncovered by thecombined analysis of large-scale transcriptomic and proteomicsdata sets. Moreover, as has been previously mentioned,transcriptomic profiles provide valuable information relative totissues and cell lines, where the missing proteins can be mostlikely detected by targeted approaches. To deliver reliable SRMmethods, we proposed a stepwise strategy that involves data
sharing and cross-validation across different laboratories, and thisprocess must be optimized under standard conditions. With theaim of establishing workflows and SOPs within the consortium, aset of Chr16 proteins was selected and distributed to six differentlaboratories for SRM assay development. An initial set of 120Chr-16 proteins was selected on the basis of their GPMDBscores, log e in the range −175 to −6000, belonging to the groupdefined as “known” Chr16 proteins. These were sorted bytheir log e, ranked, and distributed sequentially to six differentlaboratories so that a group of 20 proteins spanning a similarrange of log e values was assigned to each laboratory. Eachlaboratory explored the detectability by SRM of the assignedproteins in digests from at least three cell lines used in the Chr16SpHPP consortium: MCF7, CCD18, and Ramos, which areexpected to provide a large coverage of expressed Chr16 proteinsaccording to our previous characterization.17 Additional cell lines
Table 2. Proteins Detected by Targeted SRM Proteomic Analyses
protein accession gene_Id log E no. laboratories no. peptides Ramos Mcf7 Ccd18 Tc28 Huh7 Jurkat Huaecs
A5YKK6 CNOT1 −1186.1 2 1 × ×B5ME19 EIF3CL −339.5 3 4 × × × ×O14983 ATP2A1 −392.6 3 1 × × × ×O43809 NUDT21 −206.8 3 4 × × × ×O60884 DNAJA2 −173.1 3 1 × × × × ×O75150 RNF40 −187.3 2 2 × × ×P00505 GOT2 −564.2 3 3 × × × × ×P00738 HP −1400.2 3 4 × ×P04075 ALDOA −1076.2 3 3 × × × × × ×P15170 GSPT1 −284.5 3 3 × × × × ×P15559 NQO1 −384.3 3 3 × × ×P15880 RPS2 −357.3 3 4 × × × ×P22695 UQCRC2 −361.5 3 4 × × × × ×P31146 CORO1A −598.1 3 5 × × × ×P35637 FUS −365 3 4 × × × ×P49411 TUFM −411.3 3 9 × × × × ×P49588 AARS −543 3 3 × × × × ×P63279 UBE2I −210.9 3 1 × × × × ×P69849 NOMO3 −369.4 3 2 × × × × × ×P80404 ABAT −230.7 2 1 × ×Q08AM6 VAC14 −187.1 3 4 × × × ×Q12789 GTF3C1 −1039.8 3 1 × ×Q12931 TRAP1 −392.6 3 1 × × × × ×Q13509 TUBB3 −901.2 3 7 × × × × ×Q14019 COTL1 −236.4 3 2 × × ×Q14694 USP10 −177.7 3 5 × × × ×Q14807 KIF22 −387.7 2 1 × × ×Q15393 SF3B3 −702 3 4 × × × ×Q16775 HAGH −196.9 3 2 × × ×Q49A26 GLYR1 −271.3 3 2 × × × ×Q53FZ2 ACSM3 −198.8 3 1 × ×Q68EM7 ARHGAP17 −1107.8 2 1 × × × ×Q6P2E9 EDC4 −435.1 3 3 × × × ×Q86W42 THOC6 −179.2 3 4 × × × × ×Q8TBB5 KLHDC4 −285.4 3 1 × × ×Q92793 CREBBP −408.5 2 1 × ×Q93009 USP7 −312.2 3 5 × × × × × ×Q96DA0 ZG16B −265 2 1 × × ×Q96QK1 VPS35 −335.9 3 3 × × × × ×Q9NUI1 DECR2 −185 2 2 × × ×Q9NUU7 DDX19A −203.5 3 7 × × × ×Q9UMR2 DDX19B −219.6 2 1 × ×Q9UQ35 SRRM2 −1962.2 3 3 × × × × × ×
Journal of Proteome Research Article
dx.doi.org/10.1021/pr400721r | J. Proteome Res. 2014, 13, 158−172167

or plasma samples were also assayed in some laboratories(Table 2). Initial selection of proteotypic peptides andtransitions to monitor for each protein was made from databaseavailable data, results, or in silico prediction from the sequence.For 106 out of the 120 proteins selected (88.3%), a minimum
of three coeluting SRM transition signals were observed for anumber of peptides ranging from 1 to 10 per protein, with anaverage of 4.16 peptides/protein. While it is probable that manyof these signals correspond to the detection of the targetedpeptides, only those peptides for which SRM-signal-triggeredMS2 spectra clearly confirmed the sequence were consideredas bona fide SRM assayable peptides. These amounted to172 peptides from 51 proteins (42.5% of those initially selected).It is worth mentioning that as an additional validation 47peptides, belonging to 12 of the assayed proteins, were obtainedby chemical synthesis and analyzed using the developed SRMassays. In all cases, the results confirmed the transitions selected,and the observed retention times closely matched those of theendogenous peptides. The use of synthetic peptides tocorroborate the SRM methods developed will be restricted tothose cases where results are not conclusive. Synthetic labeledpeptides will be used for selected proteins of interest to bemonitored in the associated B/D Chr16 projects.After the initial round of SRM method development at the six
laboratories, a second round of cross-validation was performed,assigning each of the final 51 proteins detected to twolaboratories different from the laboratory that initially developedthe SRMmethod. After this second round of analysis validation, atotal of 149 peptides from 49 proteins (Table 2) met the criteriaof having been successfully detected, with at least three trans-itions per peptide by at least two different laboratories.As indicated in Table 2, in most cases proteins were alsodetected in more than one different sample type. We comparedthe distribution of loge values of the 49 proteins that were
validated to the distribution of the 120 proteins initially selected,and no major differences were observed. Therefore, there is nobias in the validated proteins toward high log e values.Overall, we have been able to develop reliable SRM assays to
monitor 49 Chr16 proteins (40.8% of those initially selected,representing 5% of all Chr16 proteins). The correspondingpeptide and transition information is given in SupplementaryTable 7 in the Supporting Information. All relevant experimentalconditions and peptide and transitions data from all laboratorieshave been gathered in a MySQL relational database constructedto keep track of and query all Chr16 SRM information and fromwhich the curated data will be transferred to public repositoriesover the course of the project.So far we have attained a 41% fulfilment ratio with our current
experimental strategy. Although this could be considered as areasonable ratio taking into account that total cell lysate orplasma digests were used for the analysis, it is clear that otherexperimental options should be explored to complete the SRMgoal. We envisage that in addition to the selection of other tissue/cell lines according to the available transcriptomic datafractionation of samples will be an alternative strategy to pursuein the future development of the Chr16 project, as this shouldincrease the detectability of those proteins underrepresented intotal tissue/cell extracts. Moreover, the use of our accurateMS/MS data set might significantly increase the efficiency of thetargeted experiments. Accordingly, one of our next goals is tobuild a library including all MIAPE compliant MS/MS spectragenerated within the consortium. To examine the suitability ofthis approach, we performed a simple test using Skyline software(MacCoss Lab, Department of Genome Sciences, University ofWashington). All MS/MS spectra reported from one of theshotgun experiments (CNB_Jurkat_R1_HPLCRP) were usedto create the library, and the SRM-detected proteins were addedto map all peptides onto the available spectra. Matching was
Table 3. SRM Results for 24 Missing Proteins Assayeda
protein accession gene_id peptides selected peptides detected peptides detected transitions identified peptides (MS/MS)
O60359 CACNG3 12 9 43 8Q6UXU4 GSG1L 7 5 33 7Q8WV35 LRRC29 9 9 53 9Q96A59 MARVELD3 6 6 34 6Q9NXF8 ZDHC7 7 2 10 2Q6PL45 C16ORF79 7 5 22 0Q8TEW6 DOK4 11 9 44 8Q8TB05 FAM100A 1 1 8 2Q9NWW0 HCFC1R1 7 4 17 2Q9HBE5 IL21R 12 8 36 5O75324 SNN 3 2 28 2Q96B96 TMEM159 3 3 28 2Q9BTX3 TMEM208 3 1 5 0Q96H86 ZNF764 12 6 22 7Q8TAZ6 CKLFSF2 6 2 12 1Q8IZF4 GPR114 11 3 18 1Q6PII5 HAGHL 10 7 43 6Q8TDN1 KCNG4 11 3 12 2Q8N635 C16ORF73 14 4 26 1Q8WTQ4 C16ORF78 10 8 40 2Q8IUW3 SPATA2L 9 9 64 6Q8WVE7 TMEM170A 6 1 6 0P17023 ZNF19 15 3 11 0A8K8V0 ZNF785 10 7 58 7
aPeptide and transition data foi each protein are shown in Supplementary Table S1 in the Supporting Information.
Journal of Proteome Research Article
dx.doi.org/10.1021/pr400721r | J. Proteome Res. 2014, 13, 158−172168
verified for all peptides pertaining to 81.3% of the SRM proteinsfurther supporting the interest of using this approach to designtargeted SRM methods.Finally, for those proteins that cannot be detected directly
upon fractionation as well as for many proteins in the missinggroup we will rely, as discussed, on data from recombinantprotein to design suitable SRM assays. It is worth mentioningthat we have decided to use this strategy for proteins with log evalues above −15, as it was considered that below this thresholdtheir detection would be challenging.17 Up to 28 Chr16 proteinsfrom this group have been expressed on a cell-free system andcharacterized. Data were accepted when the proteins weredetected with at least three precursor ions with three transitionseach. According to this criterion, assays for 24 proteins wereselected (Table 3 and Supplementary Table 8 in the SupportingInformation), most of them verified by MIDAS MS/MS data(exceptions were TMEM208, TMEM170A, ZNF19, andc16orf79). Interestingly, 11 of these 24 proteins are among the139 missing proteins reported in neXtProt for Chr16. In general,the agreement between the theoretical and observed retentiontimes of peptides in the reversed-phase chromatography as wellas the good correlation between the SRM transitions and theintensity of the corresponding fragment ions in the MIDASexperiment reinforce the reliability of the results. These methodsare currently being used for the detection of these proteins inwhole digest of the four cell lines adopted in the consortium.
■ PERSPECTIVES AND CONCLUSIONS
The understanding of human biology relies on the precisedefinition of all of the molecular building blocks and theirinteractions to configure cellular, tissue, and organ functionalmaps. Detailed protein/gene chromosome annotation arisesthen as a pivotal issue that must be addressed by innovativeapproaches such as those focusing on the integration of data fromlarge-scale genomic, transcriptomic, and proteomic experiments.We have developed all bioinformatics workflows to combinedata from UniprotKB, Ensembl, HBM, and our own shotgunproteomics data set from four different cell lines to obtain insightinto the Chr16 proteome. The number of protein-coding genes is886, including 187 that encode proteins without experimentalMS evidence, according to the adopted C-HPP criteria. Tissue-specific expression patterns for Chr16 are estimated, providingvaluable information to select tissues/cell lines to detect andquantitate the missing proteins. Interestingly, expression of 67genes coding for Chr16 proteins were not detected in thecollection of 16 tissue-specific RNA-Seq data sets analyzed, notspecifically pertaining to the group of missing proteins (roughly65%). Databases are currently being implemented to searchMS/MS spectral data and to explore our capacity to assign noveltranscripts and isoforms taking advantage of the large datacollection resulting from the multicenter shotgun proteomicanalysis performed on four independent cell lines that allowedmapping of 41.4% of Chr16 proteins. Our bioinformatics analysisof RNA-Seq experiments from ENCODE projects has shownthe potential to identify those cell lines where strong evidenceof missing protein-coding genes expression is detected. Thisapproach would allow us to create a global dashboard fortranscriptomic evidence of protein coding genes in all celllines used in the ENCODE project. We are planning to extendthis approach to all chromosomes in C-HPP, providing thecommunity with a valuable exploratory tool. Furthermore, theRNA-Seq analysis can also be used to extend the analysis carried
out with the HBM, using RNA-Seq information as a search spacefor MS data.Targeted methods for detection of 49 proteins of Chr16 have
been already developed. All of thesemethods have been validatedin at least two independent laboratories and in three distinct celllines. For Chr16 missing proteins, optimized SRM methods for24 recombinant Chr16 proteins are described in this reportand tests on complex biological matrices are currently ongoing.The next phase has already started, involving five independentresearch units that will focus on delivering the quantitativemethods for the above-mentioned missing proteins and ontargeting 100 additional Chr16 proteins, based on the MS/MSdata from our shotgun experiments.Bioinformatics for the management of proteomics data is
also an active area within the Chr16 consortium. The MIAPEextractor pipeline has been improved, and we are workingtogether with the ProteomeXchange initiative to interface bothapplications and to allow automatic MIAPE compliant datadeposition. Moreover, the beta version of a database for storingand consulting SRM is already in place and will be open access inthe next few months.In summary, Chr16 annotation is being explored in depth
following a proteogenomic approach. The resulting information,in combination with PTMs analysis and the development oftargeted methods for detection and quantitation of proteinisoforms, will surely provide valuable biological information thatwill inspire more ambitious biomedical initiatives for the benefitof diseased individuals.
■ ASSOCIATED CONTENT
*S Supporting Information
Binned expression of all genes and background regions acrossall samples for each cell line and false discovery rate (green)and false negative rates (blue) at each expression levelrepresented for each cell line. Distribution of abundance(FPKM) for the different tissues of HBM. Data managementflow-chart. Expression level distribution of protein codinggenes coding for the proteins detected in CCD18, Jurkat,MCF7 and Ramos cell lines according to the RNASeq datafrom the group of 16 tissues analyzed in the HBM, from lowexpression to high expression. Heatmap that shows the GOBiological Processes terms with those missing proteins thatare unique to each MCF-7, K-562 and HepG2. Samples ofHuman Body Map 2.0 considered in this study. NanoLCconditions used in the SG proteomics analysis. ANNOTA-TION CHR16 ENSEMBLv70. Validated SRMmethods. SRMmethods details for 24 recombinant missing proteins from chr16. This material is available free of charge via the Internet athttp://pubs.acs.org.
■ AUTHOR INFORMATION
Corresponding Author
*Tel: +34948194700. Fax: +34948194717. E-mail: [email protected].
Present Address⬠Proteomics Unit, Cancer Epigenetics and Biology Program(PEBC), Bellvitge Biomedical Research Institute (IDIBELL),Barcelona, Spain.
Author Contributions◇J.P.A. and F.J.C. share senior authorship.
Journal of Proteome Research Article
dx.doi.org/10.1021/pr400721r | J. Proteome Res. 2014, 13, 158−172169

Notes
The authors declare no competing financial interests.
■ ACKNOWLEDGMENTSAll participating laboratories are members of ProteoRed-ISCIII.This work was supported by: ProteoRed and the Carlos IIINational Health Institute Agreement, ProteoRed-ISCIII; theagreement between FIMA and the “UTE project CIMA”; grantsSAF2011-29312 from Ministerio de Ciencia e Innovacion andISCIII-RETIC RD06/0020 to FJC and EU FP7 grantProteomeXchange [grant number 260558]. APM and DTMhave been funded by Spanish grants fromMinisterio de Ciencia eInnovacion BIO2010-17527 and the Government of Madrid(P2010/BMD-2305). BBVA Foundation for its support toHUPO initiatives.
■ REFERENCES(1) Orchard, S.; Hermjakob, H.; Taylor, C. F.; Potthast, F.; Jones, P.;Zhu, W.; Julian, R. K.; Apweiler, R. Second proteomics standardsinitiative spring workshop. Expert. Rev. Proteomics 2005, 2, 287−289.(2) Omenn, G. S. Exploring the human plasma proteome. Proteomics2005, 5, 3223−3225.(3) Hamacher, M.; Marcus, K.; Stephan, C.; Klose, J.; Park, Y. M.;Meyer, H. E. HUPO Brain Proteome Project: toward a code of conduct.Mol. Cell. Proteomics 2008, 7, 457.(4) Yamamoto, T.; Langham, R. G.; Ronco, P.; Knepper, M. A.;Thongboonkerd, V. Towards standard protocols and guidelines forurine proteomics. Proteomics 2008, 8, 2156−2159.(5) Legrain, P.; Aebersold, R.; Archakov, A.; Bairoch, A.; Bala, K.;Beretta, L.; Bergeron, J.; Borchers, C. H.; Corthals, G. L.; Costello, C. E.;Deutsch, E. W.; Domon, B.; Hancock, W.; He, F.; Hochstrasser, D.;Marko-Varga, G.; Salekdeh, G. H.; Sechi, S.; Snyder, M.; Srivastava, S.;Uhlen, M.; Wu, C. H.; Yamamoto, T.; Paik, Y.-K.; Omenn, G. S. Thehuman proteome project: current state and future direction. Mol. Cell.Proteomics 2011, 10, M111.009993.(6) Paik, Y.-K.; Omenn, G. S.; Uhlen, M.; Hanash, S.; Marko-Varga, G.;Aebersold, R.; Bairoch, A.; Yamamoto, T.; Legrain, P.; Lee, H.-J.; Na, K.;Jeong, S.-K.; He, F.; Binz, P.-A.; Nishimura, T.; Keown, P.; Baker, M. S.;Yoo, J. S.; Garin, J.; Archakov, A.; Bergeron, J.; Salekdeh, G. H.;Hancock, W. S. Standard Guidelines for the Chromosome-CentricHuman Proteome Project. J. Proteome Res. 2012, 120326073003006.(7) Paik, Y.-K.; Jeong, S.-K.; Omenn, G. S.; Uhlen,M.; Hanash, S.; Cho,S. Y.; Lee, H.-J.; Na, K.; Choi, E.-Y.; Yan, F.; Zhang, F.; Zhang, Y.;Snyder, M.; Cheng, Y.; Chen, R.; Marko-Varga, G.; Deutsch, E. W.; Kim,H.; Kwon, J.-Y.; Aebersold, R.; Bairoch, A.; Taylor, A. D.; Kim, K. Y.;Lee, E.-Y.; Hochstrasser, D.; Legrain, P.; Hancock, W. S. TheChromosome-Centric Human Proteome Project for cataloging proteinsencoded in the genome. Nat. Biotechnol. 2012, 30, 221−223.(8) Bech-Serra, J.-J.; Borthwick, A.; Colome, N.; ProteoRedConsortium; Albar, J.-P.; Wells, M.; Sanchez del Pino, M.; Canals, F.A multi-laboratory study assessing reproducibility of a 2D-DIGEdifferential proteomic experiment. J. Biomol. Tech. 2009, 20, 293−296.(9)Medina-Aunon, J. A.; Martínez-Bartolome, S.; Lopez-Garcia, M. A.;Salazar, E.; Navajas, R.; Jones, A. R.; Paradela, A.; Albar, J. P. TheProteoRed MIAPE web toolkit: a user-friendly framework to connectand share proteomics standards. Mol. Cell. Proteomics 2011, 10,M111.008334.(10) Martínez-Bartolome, S.; Blanco, F.; Albar, J.-P. Relevance ofproteomics standards for the ProteoRed Spanish organization. J.Proteomics 2010, 73, 1061−1066.(11) Martínez-Bartolome, S.; Medina-Aunon, J. A.; Jones, A. R.; Albar,J. P. Semi-automatic tool to describe, store and compare proteomicsexperiments based on MIAPE compliant reports. Proteomics 2010, 10,1256−1260.(12) Babel, I.; Barderas, R.; Diaz-Uriarte, R.; Moreno, V.; Suarez, A.;Fernandez-Acenero, M. J.; Salazar, R.; Capella, G.; Casal, J. I.Identification of MST1/STK4 and SULF1 proteins as autoantibody
targets for the diagnosis of colorectal cancer by using phage microarrays.Mol. Cell. Proteomics 2011, 10, M110.001784.(13) Pitarch, A.; Nombela, C.; Gil, C. Prediction of the clinicaloutcome in invasive candidiasis patients based on molecular fingerprintsof five anti-Candida antibodies in serum.Mol. Cell. Proteomics 2011, 10,M110.004010.(14) Calamia, V.; Fernandez-Puente, P.;Mateos, J.; Lourido, L.; Rocha,B.; Montell, E.; Verges, J.; Ruiz-Romero, C.; Blanco, F. J.Pharmacoproteomic study of three different chondroitin sulfatecompounds on intracellular and extracellular human chondrocyteproteomes. Mol. Cell. Proteomics 2012, 11, M111.013417.(15) de la Cuesta, F.; Alvarez-Llamas, G.; Maroto, A. S.; Donado, A.;Zubiri, I.; Posada, M.; Padial, L. R.; Pinto, A. G.; Barderas, M. G.;Vivanco, F. A proteomic focus on the alterations occurring at the humanatherosclerotic coronary intima. Mol. Cell. Proteomics 2011, 10,M110.003517.(16) Sanchez-Quiles, V.; Mora, M. I.; Segura, V.; Greco, A.; Epstein, A.L.; Foschini, M. G.; Dayon, L.; Sanchez, J.-C.; Prieto, J.; Corrales, F. J.;Santamaria, E. HSV-1 Cgal+ infection promotes quaking RNA bindingprotein production and induces nuclear-cytoplasmic shuttling ofquaking I-5 isoform in human hepatoma cells. Mol. Cell. Proteomics2011, 10, M111.009126.(17) Segura, V.; Medina-Aunon, J. A.; Guruceaga, E.; Gharbi, S. I.;Gonzalez-Tejedo, C.; Sanchez del Pino, M. M.; Canals, F.; Fuentes, M.;Casal, J. I.; Martínez-Bartolome, S.; Elortza, F.; Mato, J. M.; Arizmendi, J.M.; Abian, J.; Oliveira, E.; Gil, C.; Vivanco, F.; Blanco, F.; Albar, J. P.;Corrales, F. J. Spanish human proteome project: dissection ofchromosome 16. J. Proteome Res. 2013, 12, 112−122.(18) ENCODE Project Consortium; Dunham, I.; Kundaje, A.; Aldred,S. F.; Collins, P. J.; Davis, C. A.; Doyle, F.; Epstein, C. B.; Frietze, S.;Harrow, J.; Kaul, R.; Khatun, J.; Lajoie, B. R.; Landt, S. G.; Lee, B.-K.;Pauli, F.; Rosenbloom, K. R.; Sabo, P.; Safi, A.; Sanyal, A.; Shoresh, N.;Simon, J. M.; Song, L.; Trinklein, N. D.; Altshuler, R. C.; Birney, E.;Brown, J. B.; Cheng, C.; Djebali, S.; Dong, X.; Dunham, I.; Ernst, J.;Furey, T. S.; Gerstein, M.; Giardine, B.; Greven, M.; Hardison, R. C.;Harris, R. S.; Herrero, J.; Hoffman,M.M.; Iyer, S.; Kelllis, M.; Khatun, J.;Kheradpour, P.; Kundaje, A.; Lassmann, T.; Li, Q.; Lin, X.; Marinov, G.K.; Merkel, A.; Mortazavi, A.; Parker, S. C. J.; Reddy, T. E.; Rozowsky, J.;Schlesinger, F.; Thurman, R. E.; Wang, J.; Ward, L. D.; Whitfield, T. W.;Wilder, S. P.; Wu, W.; Xi, H. S.; Yip, K. Y.; Zhuang, J.; Bernstein, B. E.;Birney, E.; Dunham, I.; Green, E. D.; Gunter, C.; Snyder, M.; Pazin, M.J.; Lowdon, R. F.; Dillon, L. A. L.; Adams, L. B.; Kelly, C. J.; Zhang, J.;Wexler, J. R.; Green, E. D.; Good, P. J.; Feingold, E. A.; Bernstein, B. E.;Birney, E.; Crawford, G. E.; Dekker, J.; Elinitski, L.; Farnham, P. J.;Gerstein, M.; Giddings, M. C.; Gingeras, T. R.; Green, E. D.; Guigo, R.;Hardison, R. C.; Hubbard, T. J.; Kellis, M.; Kent, W. J.; Lieb, J. D.;Margulies, E. H.; Myers, R. M.; Snyder, M.; Starnatoyannopoulos, J. A.;Tennebaum, S. A.; Weng, Z.; White, K. P.; Wold, B.; Khatun, J.; Yu, Y.;Wrobel, J.; Risk, B. A.; Gunawardena, H. P.; Kuiper, H. C.; Maier, C. W.;Xie, L.; Chen, X.; Giddings, M. C.; Bernstein, B. E.; Epstein, C. B.;Shoresh, N.; Ernst, J.; Kheradpour, P.; Mikkelsen, T. S.; Gillespie, S.;Goren, A.; Ram, O.; Zhang, X.; Wang, L.; Issner, R.; Coyne, M. J.;Durham, T.; Ku,M.; Truong, T.;Ward, L. D.; Altshuler, R. C.; Eaton, M.L.; Kellis, M.; Djebali, S.; Davis, C. A.; Merkel, A.; Dobin, A.; Lassmann,T.; Mortazavi, A.; Tanzer, A.; Lagarde, J.; Lin, W.; Schlesinger, F.; Xue,C.; Marinov, G. K.; Khatun, J.; Williams, B. A.; Zaleski, C.; Rozowsky, J.;Roder, M.; Kokocinski, F.; Abdelhamid, R. F.; Alioto, T.; Antoshechkin,I.; Baer, M. T.; Batut, P.; Bell, I.; Bell, K.; Chakrabortty, S.; Chen, X.;Chrast, J.; Curado, J.; Derrien, T.; Drenkow, J.; Dumais, E.; Dumais, J.;Duttagupta, R.; Fastuca, M.; Fejes-Toth, K.; Ferreira, P.; Foissac, S.;Fullwood, M. J.; Gao, H.; Gonzalez, D.; Gordon, A.; Gunawardena, H.P.; Howald, C.; Jha, S.; Johnson, R.; Kapranov, P.; King, B.; Kingswood,C.; Li, G.; Luo, O. J.; Park, E.; Preall, J. B.; Presaud, K.; Ribeca, P.; Risk,B. A.; Robyr, D.; Ruan, X.; Sammeth, M.; Sandu, K. S.; Schaeffer, L.; See,L.-H.; Shahab, A.; Skancke, J.; Suzuki, A. M.; Takahashi, H.; Tilgner, H.;Trout, D.; Walters, N.; Wang, H.; Wrobel, J.; Yu, Y.; Hayashizaki, Y.;Harrow, J.; Gerstein, M.; Hubbard, T. J.; Reymond, A.; Antonarakis, S.E.; Hannon, G. J.; Giddings, M. C.; Ruan, Y.; Wold, B.; Carninci, P.;Guigo, R.; Gingeras, T. R.; Rosenbloom, K. R.; Sloan, C. A.; Learned, K.;
Journal of Proteome Research Article
dx.doi.org/10.1021/pr400721r | J. Proteome Res. 2014, 13, 158−172170

Malladi, V. S.; Wong, M. C.; Barber, G. P.; Cline, M. S.; Dreszer, T. R.;Heitner, S. G.; Karolchik, D.; Kent, W. J.; Kirkup, V. M.; Meyer, L. R.;Long, J. C.; Maddren, M.; Raney, B. J.; Furey, T. S.; Song, L.; Grasfeder,L. L.; Giresi, P. G.; Lee, B.-K.; Battenhouse, A.; Sheffield, N. C.; Simon, J.M.; Showers, K. A.; Safi, A.; London, D.; Bhinge, A. A.; Shestak, C.;Schaner, M. R.; Kim, S. K.; Zhang, Z. Z.; Mieczkowski, P. A.;Mieczkowska, J. O.; Liu, Z.;McDaniell, R.M.; Ni, Y.; Rashid, N. U.; Kim,M. J.; Adar, S.; Zhang, Z.; Wang, T.; Winter, D.; Keefe, D.; Birney, E.;Iyer, V. R.; Lieb, J. D.; Crawford, G. E.; Li, G.; Sandhu, K. S.; Zheng, M.;Wang, P.; Luo, O. J.; Shahab, A.; Fullwood, M. J.; Ruan, X.; Ruan, Y.;Myers, R. M.; Pauli, F.; Williams, B. A.; Gertz, J.; Marinov, G. K.; Reddy,T. E.; Vielmetter, J.; Partridge, E. C.; Trout, D.; Varley, K. E.; Gasper, C.;Bansal, A.; Pepke, S.; Jain, P.; Amrhein, H.; Bowling, K. M.; Anaya, M.;Cross, M. K.; King, B.; Muratet, M. A.; Antoshechkin, I.; Newberry, K.M.; McCue, K.; Nesmith, A. S.; Fisher-Aylor, K. I.; Pusey, B.; DeSalvo,G.; Parker, S. L.; Balasubramanian, S.; Davis, N. S.; Meadows, S. K.;Eggleston, T.; Gunter, C.; Newberry, J. S.; Levy, S. E.; Absher, D. M.;Mortazavi, A.; Wong, W. H.; Wold, B.; Blow, M. J.; Visel, A.; Pennachio,L. A.; Elnitski, L.; Margulies, E. H.; Parker, S. C. J.; Petrykowska, H. M.;Abyzov, A.; Aken, B.; Barrell, D.; Barson, G.; Berry, A.; Bignell, A.;Boychenko, V.; Bussotti, G.; Chrast, J.; Davidson, C.; Derrien, T.;Despacio-Reyes, G.; Diekhans, M.; Ezkurdia, I.; Frankish, A.; Gilbert, J.;Gonzalez, J. M.; Griffiths, E.; Harte, R.; Hendrix, D. A.; Howald, C.;Hunt, T.; Jungreis, I.; Kay, M.; Khurana, E.; Kokocinski, F.; Leng, J.; Lin,M. F.; Loveland, J.; Lu, Z.; Manthravadi, D.; Mariotti, M.; Mudge, J.;Mukherjee, G.; Notredame, C.; Pei, B.; Rodriguez, J. M.; Saunders, G.;Sboner, A.; Searle, S.; Sisu, C.; Snow, C.; Steward, C.; Tanzer, A.;Tapanari, E.; Tress, M. L.; van Baren, M. J.; Walters, N.; Washieti, S.;Wilming, L.; Zadissa, A.; Zhengdong, Z.; Brent, M.; Haussler, D.; Kellis,M.; Valencia, A.; Gerstein, M.; Raymond, A.; Guigo, R.; Harrow, J.;Hubbard, T. J.; Landt, S. G.; Frietze, S.; Abyzov, A.; Addleman, N.;Alexander, R. P.; Auerbach, R. K.; Balasubramanian, S.; Bettinger, K.;Bhardwaj, N.; Boyle, A. P.; Cao, A. R.; Cayting, P.; Charos, A.; Cheng,Y.; Cheng, C.; Eastman, C.; Euskirchen, G.; Fleming, J. D.; Grubert, F.;Habegger, L.; Hariharan, M.; Harmanci, A.; Iyenger, S.; Jin, V. X.;Karczewski, K. J.; Kasowski, M.; Lacroute, P.; Lam, H.; Larnarre-Vincent, N.; Leng, J.; Lian, J.; Lindahl-Allen, M.; Min, R.; Miotto, B.;Monahan, H.; Moqtaderi, Z.; Mu, X. J.; O’Geen, H.; Ouyang, Z.;Patacsil, D.; Pei, B.; Raha, D.; Ramirez, L.; Reed, B.; Rozowsky, J.;Sboner, A.; Shi, M.; Sisu, C.; Slifer, T.; Witt, H.; Wu, L.; Xu, X.; Yan, K.-K.; Yang, X.; Yip, K. Y.; Zhang, Z.; Struhl, K.; Weissman, S. M.; Gerstein,M.; Farnham, P. J.; Snyder, M.; Tenebaum, S. A.; Penalva, L. O.; Doyle,F.; Karmakar, S.; Landt, S. G.; Bhanvadia, R. R.; Choudhury, A.;Domanus, M.; Ma, L.; Moran, J.; Patacsil, D.; Slifer, T.; Victorsen, A.;Yang, X.; Snyder, M.; White, K. P.; Auer, T.; Centarin, L.; Eichenlaub,M.; Gruhl, F.; Heerman, S.; Hoeckendorf, B.; Inoue, D.; Kellner, T.;Kirchmaier, S.; Mueller, C.; Reinhardt, R.; Schertel, L.; Schneider, S.;Sinn, R.; Wittbrodt, B.; Wittbrodt, J.; Weng, Z.; Whitfield, T. W.; Wang,J.; Collins, P. J.; Aldred, S. F.; Trinklein, N. D.; Partridge, E. C.; Myers, R.M.; Dekker, J.; Jain, G.; Lajoie, B. R.; Sanyal, A.; Balasundaram, G.;Bates, D. L.; Byron, R.; Canfield, T. K.; Diegel, M. J.; Dunn, D.; Ebersol,A. K.; Ebersol, A. K.; Frum, T.; Garg, K.; Gist, E.; Hansen, R. S.;Boatman, L.; Haugen, E.; Humbert, R.; Jain, G.; Johnson, A. K.;Johnson, E. M.; Kutyavin, T. M.; Lajoie, B. R.; Lee, K.; Lotakis, D.;Maurano, M. T.; Neph, S. J.; Neri, F. V.; Nguyen, E. D.; Qu, H.;Reynolds, A. P.; Roach, V.; Rynes, E.; Sabo, P.; Sanchez, M. E.;Sandstrom, R. S.; Sanyal, A.; Shafer, A. O.; Stergachis, A. B.; Thomas, S.;Thurman, R. E.; Vernot, B.; Vierstra, J.; Vong, S.; Wang, H.; Weaver, M.A.; Yan, Y.; Zhang, M.; Akey, J. A.; Bender, M.; Dorschner, M. O.;Groudine, M.; MacCoss, M. J.; Navas, P.; Stamatoyannopoulos, G.;Kaul, R.; Dekker, J.; Stamatoyannopoulos, J. A.; Dunham, I.; Beal, K.;Brazma, A.; Flicek, P.; Herrero, J.; Johnson, N.; Keefe, D.; Lukk, M.;Luscombe, N. M.; Sobral, D.; Vaquerizas, J. M.; Wilder, S. P.; Batzoglou,S.; Sidow, A.; Hussami, N.; Kyriazopoulou-Panagiotopoulou, S.;Libbrecht, M. W.; Schaub, M. A.; Kundaje, A.; Hardison, R. C.;Miller, W.; Giardine, B.; Harris, R. S.; Wu, W.; Bickel, P. J.; Banfai, B.;Boley, N. P.; Brown, J. B.; Huang, H.; Li, Q.; Li, J. J.; Noble, W. S.;Bilmes, J. A.; Buske, O. J.; Hoffman, M. M.; Sahu, A. O.; Kharchenko, P.V.; Park, P. J.; Baker, D.; Taylor, J.; Weng, Z.; Iyer, S.; Dong, X.; Greven,
M.; Lin, X.; Wang, J.; Xi, H. S.; Zhuang, J.; Gerstein, M.; Alexander, R. P.;Balasubramanian, S.; Cheng, C.; Harmanci, A.; Lochovsky, L.; Min, R.;Mu, X. J.; Rozowsky, J.; Yan, K.-K.; Yip, K. Y.; Birney, E. An integratedencyclopedia of DNA elements in the human genome. Nature 2012,489, 57−74.(19) Harrow, J.; Frankish, A.; Gonzalez, J. M.; Tapanari, E.; Diekhans,M.; Kokocinski, F.; Aken, B. L.; Barrell, D.; Zadissa, A.; Searle, S.;Barnes, I.; Bignell, A.; Boychenko, V.; Hunt, T.; Kay, M.; Mukherjee, G.;Rajan, J.; Despacio-Reyes, G.; Saunders, G.; Steward, C.; Harte, R.; Lin,M.; Howald, C.; Tanzer, A.; Derrien, T.; Chrast, J.; Walters, N.;Balasubramanian, S.; Pei, B.; Tress, M.; Rodriguez, J. M.; Ezkurdia, I.;van Baren, J.; Brent, M.; Haussler, D.; Kellis, M.; Valencia, A.; Reymond,A.; Gerstein, M.; Guigo, R.; Hubbard, T. J. GENCODE: the referencehuman genome annotation for The ENCODE Project. Genome Res.2012, 22, 1760−1774.(20) 1000 Genomes Project Consortium;; Abecasis, G. R.; Auton, A.;Brooks, L. D.; DePristo, M. A.; Durbin, R. M.; Handsaker, R. E.; Kang,H. M.; Marth, G. T.; McVean, G. A. An integrated map of geneticvariation from 1,092 human genomes. Nature 2012, 491, 56−65.(21) Nagaraj, N.; Wisniewski, J. R.; Geiger, T.; Cox, J.; Kircher, M.;Kelso, J.; Paabo, S.; Mann, M. Deep proteome and transcriptomemapping of a human cancer cell line. Mol. Syst. Biol. 2011, 7, 548.(22) Yates, J. R.; Eng, J. K.; McCormack, A. L. Mining genomes:correlating tandemmass spectra of modified and unmodified peptides tosequences in nucleotide databases. Anal. Chem. 1995, 67, 3202−3210.(23) Ansong, C.; Purvine, S. O.; Adkins, J. N.; Lipton, M. S.; Smith, R.D. Proteogenomics: needs and roles to be filled by proteomics ingenome annotation. Briefings Funct. Genomics Proteomics 2008, 7, 50−62.(24) Evans, V. C.; Barker, G.; Heesom, K. J.; Fan, J.; Bessant, C.;Matthews, D. A. De novo derivation of proteomes from transcriptomesfor transcript and protein identification. Nat. Methods 2012, 9, 1207−1211.(25) Woo, S.; Cha, S. W.; Merrihew, G.; He, Y.; Castellana, N.; Guest,C. C.; McCoss, M.; Bafna, V. Proteogenomic database constructiondriven from large scale RNA-seq data. J. Proteome Res. 2013,DOI: 10.1021/pr400294c.(26) Wu, L.; Candille, S. I.; Choi, Y.; Xie, D.; Jiang, L.; Li-Pook-Than,J.; Tang, H.; Snyder, M. Variation and genetic control of proteinabundance in humans. Nature 2013, 499, 79−82.(27) Castellana, N.; Bafna, V. Proteogenomics to discover the fullcoding content of genomes: a computational perspective. J Proteomics2010, 73, 2124−2135.(28) Kim, D.; Pertea, G.; Trapnell, C.; Pimentel, H.; Kelley, R.;Salzberg, S. L. TopHat2: accurate alignment of transcriptomes in thepresence of insertions, deletions and gene fusions. Genome Biol. 2013,14, R36.(29) Trapnell, C.; Williams, B. A.; Pertea, G.; Mortazavi, A.; Kwan, G.;van Baren, M. J.; Salzberg, S. L.; Wold, B. J.; Pachter, L. Transcriptassembly and quantification by RNA-Seq reveals unannotated tran-scripts and isoform switching during cell differentiation. Nat. Biotechnol.2010, 28, 511−515.(30) Gentleman, R. C.; Carey, V. J.; Bates, D. M.; Bolstad, B.; Dettling,M.; Dudoit, S.; Ellis, B.; Gautier, L.; Ge, Y.; Gentry, J.; Hornik, K.;Hothorn, T.; Huber, W.; Iacus, S.; Irizarry, R.; Leisch, F.; Li, C.;Maechler, M.; Rossini, A. J.; Sawitzki, G.; Smith, C.; Smyth, G.; Tierney,L.; Yang, J. Y.; Zhang, J. Bioconductor: open software development forcomputational biology and bioinformatics. Genome Biol. 2004, 5, R80.(31) Ramskold, D.; Wang, E. T.; Burge, C. B.; Sandberg, R. Anabundance of ubiquitously expressed genes revealed by tissuetranscriptome sequence data. PLoS Comput. Biol. 2009, 5, e1000598.(32) van Bakel, H.; Nislow, C.; Blencowe, B. J.; Hughes, T. R. Most“dark matter” transcripts are associated with known genes. PLoS Biol.2010, 8, e1000371.(33) Shevchenko, A.; Jensen, O. N.; Podtelejnikov, A. V.; Sagliocco, F.;Wilm, M.; Vorm, O.; Mortensen, P.; Shevchenko, A.; Boucherie, H.;Mann, M. Linking genome and proteome by mass spectrometry: large-scale identification of yeast proteins from two dimensional gels. Proc.Natl. Acad. Sci. U.S.A. 1996, 93, 14440−14445.
Journal of Proteome Research Article
dx.doi.org/10.1021/pr400721r | J. Proteome Res. 2014, 13, 158−172171
(34) Marcilla, M.; Alpizar, A.; Paradela, A.; Albar, J.-P. A systematicapproach to assess amino acid conversions in SILAC experiments.Talanta 2011, 84, 430−436.(35) Elias, J. E.; Gygi, S. P. Target-decoy search strategy for increasedconfidence in large-scale protein identifications by mass spectrometry.Nat. Methods 2007, 4, 207−214.(36) Klein, I. A.; Resch, W.; Jankovic, M.; Oliveira, T.; Yamane, A.;Nakahashi, H.; Di Virgilio, M.; Bothmer, A.; Nussenzweig, A.; Robbiani,D. F.; Casellas, R.; Nussenzweig, M. C. Translocation-capturesequencing reveals the extent and nature of chromosomal rearrange-ments in B lymphocytes. Cell 2011, 147, 95−106.(37) Prieto, G.; Aloria, K.; Osinalde, N.; Fullaondo, A.; Arizmendi, J.M.; Matthiesen, R. PAnalyzer: a software tool for protein inference inshotgun proteomics. BMC Bioinf. 2012, 13, 288.(38) Cote, R. G.; Jones, P.; Martens, L.; Kerrien, S.; Reisinger, F.; Lin,Q.; Leinonen, R.; Apweiler, R.; Hermjakob, H. The Protein IdentifierCross-Referencing (PICR) service: reconciling protein identifiers acrossmultiple source databases. BMC Bioinf. 2007, 8, 401.
Journal of Proteome Research Article
dx.doi.org/10.1021/pr400721r | J. Proteome Res. 2014, 13, 158−172172
Copyright © 2022 FDOKUMEN