©2012 Academic Journals Surface and subsurface irrigation systems wetting patterns as affected by...
15
African Journal of Agricultural Research Vol. 7(44), pp. 5962-5976, 20 November, 2012 Available online at http://www.academicjournals.org/AJAR DOI: 10.5897/AJAR11.2194 ISSN 1991-637X ©2012 Academic Journals Full Length Research Paper Surface and subsurface irrigation systems wetting patterns as affected by irrigation scheduling techniques in an arid region Hussein Mohammed Al-Ghobari and Mohamed Said Abdalla El Marazky Department of Agricultural Engineering, College of Food and Agriculture Sciences, King Saud University, Riyadh 11451 Saudi Arabia. Accepted 4 June, 2012 This study evaluated the wetting patterns around drip and subsurface irrigation systems (DI and SI), respectively with three irrigation scheduling techniques. The drip and subsurface irrigation systems were used to irrigate a tomato crop. The wetting patterns for each irrigation system and each irrigation scheduling technique was evaluated below the soil surface at different distances and depths from the emitter 24 and 48 h after irrigation. The soil moisture distribution patterns showed that the vertical movement of soil moisture was higher than the horizontal movement under both DI and SI systems. The overall wetted area, delimited by the wetting front was largest for the manually controlled irrigation scheduling with both DI and SI, and smallest for the Smart controller irrigation scheduling under both DI and SI systems. The effect of irrigation scheduling techniques on the water distribution pattern varied at different soil depths. Average coefficients of uniformity values for the DI and SI systems were 84.32 and 88.72%, respectively. The coefficients of uniformity for SI were higher by approximately 4.40% than for DI for all irrigation scheduling techniques, although there was variation in Cus values between the DI and SI systems with all three techniques. It can be concluded that a parameter related to the soil water content is an important consideration in estimation of soil wetting patterns with both DI and SI systems. The results of this research can be used in the design, operation, and management of DI and SI systems. Key words: Drip irrigation; subsurface irrigation; Soil water; Wetting pattern; coefficient of uniformity, Irrigation scheduling techniques. INTRODUCTION Water is one of the most precious and heavily scrutinized natural resources worldwide, particularly in arid regions, and improving agricultural water use efficiency is vitally important in parts of the world that have limited water resources. Innovative irrigation solutions must address the water scarcity problems affecting arid countries. The type of irrigation system is important and the availability of suitable irrigation systems barely meets the needs of agricultural expansion. Irrigation water is rapidly becoming the primary limiting factor for crop production. *Corresponding author. E-mail: [email protected]. Goldberg et al. (1976) described how measuring the consumptive water use of crops grown under protected conditions is a good approach to improve water management and achieve optimum water use efficiency. Drip irrigation (DI) and subsurface irrigation (SI) systems were proven to increase water productivity (Mailhol et al., 2011). The worldwide use of DI and SI systems has increased considerably in recent decades. The main advantage of these systems is the potential to increase crop yields while reducing water application and fertilizer and cultivation costs. The soil moisture distribution pattern around a water emitter depends on: (i) the total volume of water applied; (ii) the emitter flow rate, source
Transcript of ©2012 Academic Journals Surface and subsurface irrigation systems wetting patterns as affected by...
African Journal of Agricultural Research Vol. 7(44), pp. 5962-5976, 20 November, 2012 Available online at http://www.academicjournals.org/AJAR DOI: 10.5897/AJAR11.2194 ISSN 1991-637X ©2012 Academic Journals
Full Length Research Paper
Surface and subsurface irrigation systems wetting patterns as affected by irrigation scheduling techniques
in an arid region
Hussein Mohammed Al-Ghobari and Mohamed Said Abdalla El Marazky
Department of Agricultural Engineering, College of Food and Agriculture Sciences, King Saud University, Riyadh 11451 Saudi Arabia.
Accepted 4 June, 2012
This study evaluated the wetting patterns around drip and subsurface irrigation systems (DI and SI), respectively with three irrigation scheduling techniques. The drip and subsurface irrigation systems were used to irrigate a tomato crop. The wetting patterns for each irrigation system and each irrigation scheduling technique was evaluated below the soil surface at different distances and depths from the emitter 24 and 48 h after irrigation. The soil moisture distribution patterns showed that the vertical movement of soil moisture was higher than the horizontal movement under both DI and SI systems. The overall wetted area, delimited by the wetting front was largest for the manually controlled irrigation scheduling with both DI and SI, and smallest for the Smart controller irrigation scheduling under both DI and SI systems. The effect of irrigation scheduling techniques on the water distribution pattern varied at different soil depths. Average coefficients of uniformity values for the DI and SI systems were 84.32 and 88.72%, respectively. The coefficients of uniformity for SI were higher by approximately 4.40% than for DI for all irrigation scheduling techniques, although there was variation in Cus values between the DI and SI systems with all three techniques. It can be concluded that a parameter related to the soil water content is an important consideration in estimation of soil wetting patterns with both DI and SI systems. The results of this research can be used in the design, operation, and management of DI and SI systems. Key words: Drip irrigation; subsurface irrigation; Soil water; Wetting pattern; coefficient of uniformity, Irrigation scheduling techniques.
INTRODUCTION Water is one of the most precious and heavily scrutinized natural resources worldwide, particularly in arid regions, and improving agricultural water use efficiency is vitally important in parts of the world that have limited water resources. Innovative irrigation solutions must address the water scarcity problems affecting arid countries. The type of irrigation system is important and the availability of suitable irrigation systems barely meets the needs of agricultural expansion. Irrigation water is rapidly becoming the primary limiting factor for crop production. *Corresponding author. E-mail: [email protected].
Goldberg et al. (1976) described how measuring the consumptive water use of crops grown under protected conditions is a good approach to improve water management and achieve optimum water use efficiency. Drip irrigation (DI) and subsurface irrigation (SI) systems were proven to increase water productivity (Mailhol et al., 2011).
The worldwide use of DI and SI systems has increased considerably in recent decades. The main advantage of these systems is the potential to increase crop yields while reducing water application and fertilizer and cultivation costs. The soil moisture distribution pattern around a water emitter depends on: (i) the total volume of water applied; (ii) the emitter flow rate, source
configuration (surface, subsurface, point or line) and initial boundary conditions; (iii) the soil physical properties and their spatial distribution; (iv) plant root activity; and (v) irrigation management (Elmaloglou et al., 2010). Elmaloglou et al. (2010) also identified that DI and SI can increase water use efficiency but only if the system is designed to meet the soil and plant conditions. Drip irrigation can achieve high water use efficiencies, but only when the system is designed correctly, with appropriate emitter spacing, flow rate and installation depth (Phene, 1995).
An analytical solution known as ‘wet up’ can calculate the wetted perimeter for both buried and surface water emitters. Wet up includes a number of assumptions, two of which are that the wetting front is defined by the water content at which the hydraulic conductivity (K) is 1 mmday
-1; and that the flow occurs from a point source
(Cook et al., 2006). Soil wetting patterns under surface and subsurface micro-irrigation have been measured and/or analyzed theoretically by a number of authors (El-Berry et al., 1989; Gommaa, 1996; Baker, 1997; El-Tantawy, 2000; Matter, 2002; El-Berry et al., 2003).
The wetting patterns from emitters are important for the design and management of DI systems. These patterns can be obtained by direct measurements of wetting or by simulations. There are many models that have been developed by different investigators to allow the estimation of wetting patterns from point sources (Bresler, 1978; Assouline, 2002; Lubana and Narda, 2001; Cote et al., 2003; Lanini et al., 2004; Skaggs et al., 2004; Gardenas et al., 2005; Wang et al., 2006; Badr and Taalab, 2007; Lazarovitch et al., 2007; Malek and Peters, 2010). Wetting patterns
Interest in the wetting patterns associated with DI and SI has resulted in a number of studies on topic from both field trials and theoretical investigations.
In a sandy loam soil, Earl and Jury (1977) found that the wetting front from a single surface emitter extended to 0.6 m with a daily irrigation schedule and 1 m under a weekly schedule.
Using soil water tension measurements in a clay loam soil, Hanson et al. (2000) measured lateral wetting past 0.5 m and to a depth of greater than 0.8 m, but in a lighter silt loam, the wetting was restricted to a 0.4 m lateral diameter.
Many investigators have reported that SI offers many advantages over DI (Batchelor et al., 1996; Zur, 1996; Hegazi, 1998; Bainbridge, 2001), as SI methods typically have high water use efficiencies, that is, high crop production per amount of applied water.
The water use efficiency can be affected by the water application rate and system design parameters such as the size, depth, and spacing of pipes, which determine the extent of deep percolation water losses and soil
Al-Ghobari and El Marazky 5963 saturation problems. Another advantage to SI is that evaporative losses are minimized when the wetting front is held below the soil surface. These studies show that the ability to predict the geometry and moisture distribution of the wetted zone for different soils, pipe compositions, and system designs can be very useful for developing guidelines and criteria to optimize the performance of traditional sub-surface irrigation systems.
The percentage of wetted area as a proportion of the irrigated area depends on the emitter discharge rate, spacing and soil type (Keller and Karmeli, 1974). Goldberg and Shmueli (1970) indicated that the rate of horizontal water movement in the soil and the final width of the wetted zone along a drip irrigation line are functions of the amount and rate of water application, and the soil type. Goldberg et al. (1971) reported that it is possible to increase the lateral spread of the wetting front by increasing the emitter discharge rate or the amount of water applied. Hawatmeh and Battikhi (1983) studied the wetting fronts associated with a trickle source in two uncrusted soils in the Jordan Valley.
The wetting patterns from emitters are an important consideration in the design and management of drip irrigation systems. These patterns can be obtained by direct wetting measurements or from simulations. There are many models that allow the estimation of wetting patterns from point sources (Schwartzman and Zur, 1986; Camp, 1998). A simple empirical model is usually more convenient for system design than a dynamic model. Further investigations into the wetting patterns from a surface point source can help refine general design criteria because direct wetting measurements are site specific (Lanini et al., 2004).
Investigations into the effect of the application rate on the water distribution pattern showed that increasing the water application rate allows water to move in the horizontal directions, while decreasing the application rate leads to greater water movement in the vertical direction for a given volume applied. Changes in the wetted surface radius and the vertical wetted depth were monitored during irrigation and the results showed that the increase in the wetted surface radius and the vertical wetted depth with increasing volume applied can be represented by a power function with power values of about 0.3 and 0.45, respectively.Soil wetting patterns under surface and subsurface micro-irrigation have been measured and/or analyzed theoretically by a number of authors (Bresler, 1978; Assouline, 2002; Cote et al., 2003; Skaggs et al., 2004; Gardenas et al., 2005; Singh et al., 2006; Wang et al., 2006; Lazarovitch et al., 2007). The objective of this study was to investigate and evaluate the effect of different irrigation scheduling techniques on soil water distribution under DI and SI systems.
MATERIALS AND METHODS
This study was conducted at the Experimental Farm of the College
5964 Afr. J. Agric. Res.
A B
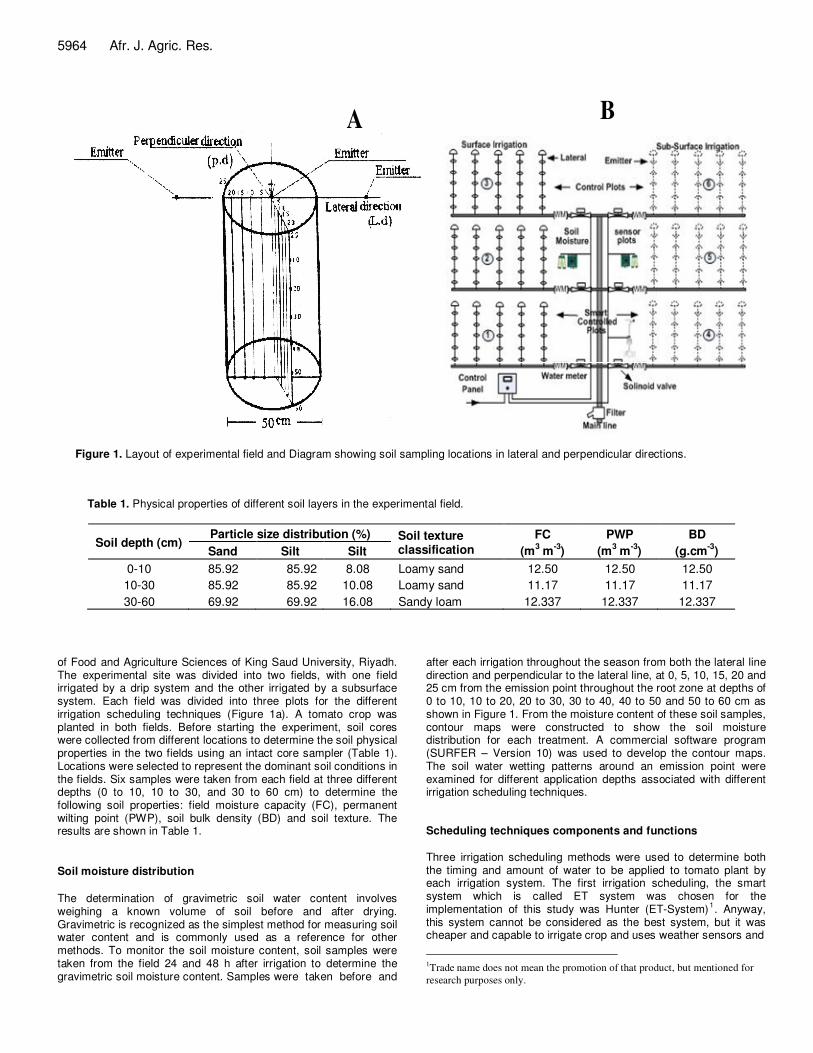
Figure 1. Layout of experimental field and Diagram showing soil sampling locations in lateral and perpendicular directions.
Table 1. Physical properties of different soil layers in the experimental field.
Soil depth (cm) Particle size distribution (%) Soil texture
classification
FC
(m3 m
-3)
PWP
(m3 m
-3)
BD
(g.cm-3
) Sand Silt Silt
0-10 85.92 85.92 8.08 Loamy sand 12.50 12.50 12.50
10-30 85.92 85.92 10.08 Loamy sand 11.17 11.17 11.17
30-60 69.92 69.92 16.08 Sandy loam 12.337 12.337 12.337
of Food and Agriculture Sciences of King Saud University, Riyadh. The experimental site was divided into two fields, with one field irrigated by a drip system and the other irrigated by a subsurface system. Each field was divided into three plots for the different irrigation scheduling techniques (Figure 1a). A tomato crop was planted in both fields. Before starting the experiment, soil cores were collected from different locations to determine the soil physical properties in the two fields using an intact core sampler (Table 1). Locations were selected to represent the dominant soil conditions in the fields. Six samples were taken from each field at three different depths (0 to 10, 10 to 30, and 30 to 60 cm) to determine the following soil properties: field moisture capacity (FC), permanent wilting point (PWP), soil bulk density (BD) and soil texture. The results are shown in Table 1.
Soil moisture distribution
The determination of gravimetric soil water content involves weighing a known volume of soil before and after drying. Gravimetric is recognized as the simplest method for measuring soil water content and is commonly used as a reference for other methods. To monitor the soil moisture content, soil samples were taken from the field 24 and 48 h after irrigation to determine the gravimetric soil moisture content. Samples were taken before and
after each irrigation throughout the season from both the lateral line direction and perpendicular to the lateral line, at 0, 5, 10, 15, 20 and 25 cm from the emission point throughout the root zone at depths of 0 to 10, 10 to 20, 20 to 30, 30 to 40, 40 to 50 and 50 to 60 cm as shown in Figure 1. From the moisture content of these soil samples, contour maps were constructed to show the soil moisture distribution for each treatment. A commercial software program (SURFER – Version 10) was used to develop the contour maps. The soil water wetting patterns around an emission point were examined for different application depths associated with different irrigation scheduling techniques. Scheduling techniques components and functions
Three irrigation scheduling methods were used to determine both the timing and amount of water to be applied to tomato plant by each irrigation system. The first irrigation scheduling, the smart system which is called ET system was chosen for the implementation of this study was Hunter (ET-System)
1. Anyway,
this system cannot be considered as the best system, but it was cheaper and capable to irrigate crop and uses weather sensors and
1Trade name does not mean the promotion of that product, but mentioned for
research purposes only.
automatically determines the crop ET (ETc). This type of system used digital electronic controllers and its platform wired to ET module to sense microclimatic climatic condition. The ET module was plugged into the irrigation controller Pro C (Controller Intelligent Port) to adjust irrigation run times. Scheduling in plots 1 and 4 was controlled by smart controllers which have the ability to add water to the crop when it was needed.
The second irrigation scheduling, the automatic (Watermark 200SS-V)
sensor is a solid-state electrical resistance sensing
device that was used to measure soil water tension. The watermark sensor is a resistive device that responds to changes in soil moisture. Once planted in the soil, it exchanges water with the surrounding soil thus staying in equilibrium with it. Soil water is an electrical conductor thereby providing a relative indication of the soil moisture status. As the soil dries, water is removed from the sensor and the resistance measurement increases. Conversely, when the soil is rewetted, the resistance lowers. Scheduling for plots 2 and 5 was controlled by soil moisture sensors (watermark), which reportedly more adaptable to a wider range of soil textures and irrigation regimes.
The third irrigation scheduling, control system which was based on automatic weather station (Davis Cabled – vantage pro2) set in a location is identical to the conditions of World Meteorological Organization ‘WMO” and close to the experiment field to measure the climate parameters that was used to measure reference evapotranspiration (ETo). These values were then compared with those obtained from the smart and the automatic sensor systems in both DI and SI treatments of tomato crop. Irrigation scheduling for plots 3 and 6 were irrigated manually by method required the evapotranspiration to be calculated from weather data and using Penman – Monteith equation. Layout of irrigation systems
The study site was divided into two main fields, each divided into three plots as shown in Figure 1b. One field had a DI system, while the other had an SI system. Each field was further divided into three plots. Each plot was approximately 4.5 m wide and 7 m long, with five parallel drip lines 0.9 m apart running from west to east. Each plot (5 drip lines) had a common submain at the inlet side of the plot and a common flush line and flush valve at the far end of the plot. Buffer distances of approximately 1.5 m were provided at the edges each plot to reduce the environmental influences between the two systems. The DI and SI systems consisted of 16 mm inside diameter thin-wall drip lines with welded-on emitters (50 cm dripper spacing) and a nominal emitter discharge of 4 L/h at a design pressure of 200 kPa. Before cultivation, the drip lines were either placed on the soil surface (plots 1, 2 and 3), or buried 25 cm deep directly under the soil beds (plots 4, 5 and 6).
The rows of tomato plants were spaced 0.90 m apart, with 0.50 m between tomato plants in each row. After the drip line installation, the soil surface was leveled and firmed. The irrigation amounts were metered separately for each plot using commercial municipal-grade flow accumulators. The timing of irrigation varied between the treatments due to the different irrigation scheduling methods used. Pressure gauges are essential in managing the SI and DI systems. These irrigation systems were designed to achieve high performance and distributed water uniformity throughout irrigation. Uniformity parameter calculations
The uniformity problem of drip irrigation was also concerned because flow pattern of dripped water is expected to cover crops root zone by limited water. An optimum time of irrigation couple DI and SI systems with irrigation strength can be obtained for the best irrigation efficiency. The evaluations of water application uniformity
Al-Ghobari and El Marazky 5965 in this study were calculated with gravimetric method. Assessment of the uniformity of water distribution in the soil profile under each system, in parallel and perpendicular directions to the dip line (Figure 1a), used the coefficient of uniformity (Cu) developed by Christiansen (1942) applied to soil gravimetric moisture contents measured at seven soil depths (0, 10, 20, 30, 40, 50, and 60 cm) at different distances from emitter (0, 5, 10, 20 and 25 cm).
The soil water contents were measured 24 and 48 h after water application ceased. The equation used to evaluate the uniformity of water redistribution below the soil surface was Christiansen’s coefficient of uniformity (Cus). This equation is the most widely and accepted criterion used to define uniformity (Zoldoske et al., 1994). The uniformity of water redistribution below the soil surface used a rewritten form of the non-weighted coefficient of uniformity:
−−=∑
θ
θθ
NCu
i1100
s
(1)
N
N
i
i/∑
=
=1θθ
where; Cus = Christiansen’s coefficient of uniformity of soil water content below soil surface, θi = the measured gravimetric soil water
content at depth i,θ = the mean gravimetric soil water content, and N = number of measured points.
RESULTS AND DISCUSSION
Field measurements of soil moisture distribution from sit plots were made for the different irrigation scheduling techniques. Wetting patterns are characterized by the radial distance of the wetting front and the depth of wetting from the point source (emitter).
To measure the moisture redistribution after irrigation with all three treatments, two sets of moisture measurements were taken during the agricultural season; one set of measurements was taken 24 h after irrigation and the other was 48 h after irrigation. These results were used to produce contour lines both lateral and perpendicular to the irrigation line for each treatment.
The contour lines assume that there was a symmetrical moisture distribution pattern around the irrigation line in both the lateral and perpendicular directions. The ability of different irrigation scheduling techniques to maintain adequate available water in the root zone was evaluated by considering the stored moisture in the soil profile. The results were illustrated in Figures 3 to 8 which show the soil moisture distribution patterns around an emitter for different irrigation scheduling techniques. Figures 3 to 5 show the moisture distribution contour maps for all treatments with DI, while Figures 6 to 8 show the contour maps for the SI system. For each treatment, in each direction (lateral and perpendicular), two moisture distribution contour maps were drawn: one representing the condition 24 h after irrigation; and the other 48 h after irrigation.
5966 Afr. J. Agric. Res.
Parallel - 24 h after Parallel - 48 h after
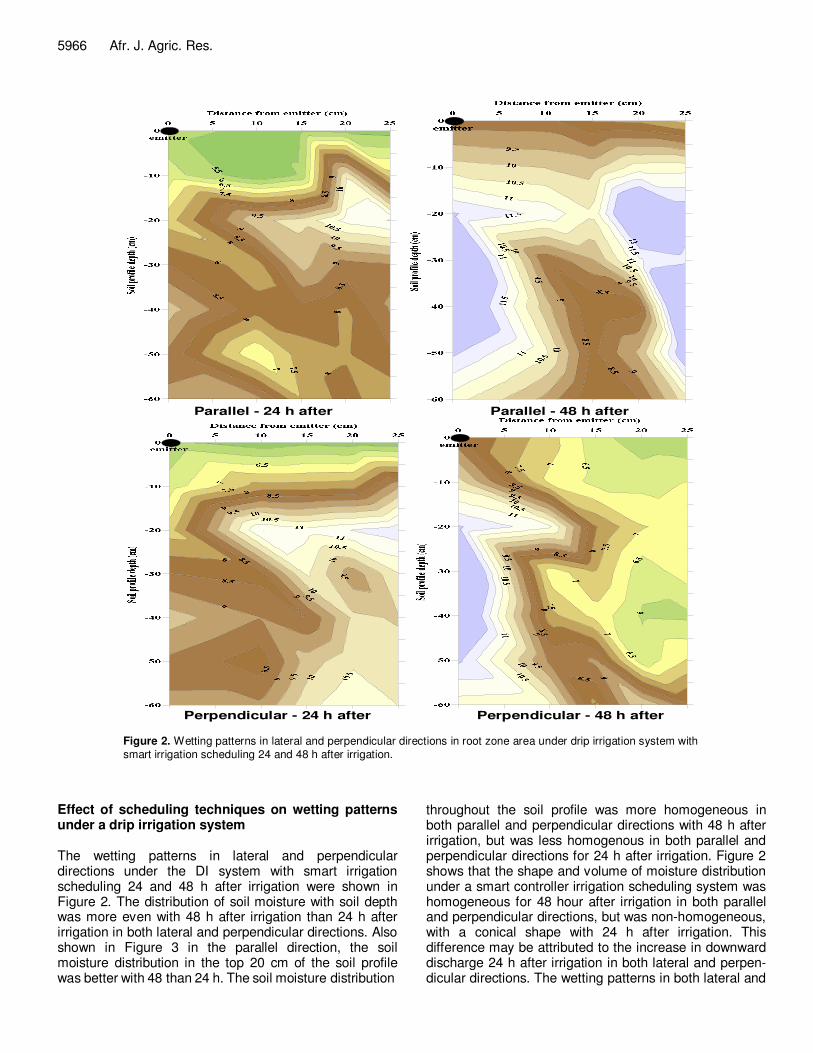
Perpendicular - 24 h after Perpendicular - 48 h after Figure 2. Wetting patterns in lateral and perpendicular directions in root zone area under drip irrigation system with
smart irrigation scheduling 24 and 48 h after irrigation.
Effect of scheduling techniques on wetting patterns under a drip irrigation system The wetting patterns in lateral and perpendicular directions under the DI system with smart irrigation scheduling 24 and 48 h after irrigation were shown in Figure 2. The distribution of soil moisture with soil depth was more even with 48 h after irrigation than 24 h after irrigation in both lateral and perpendicular directions. Also shown in Figure 3 in the parallel direction, the soil moisture distribution in the top 20 cm of the soil profile was better with 48 than 24 h. The soil moisture distribution
throughout the soil profile was more homogeneous in both parallel and perpendicular directions with 48 h after irrigation, but was less homogenous in both parallel and perpendicular directions for 24 h after irrigation. Figure 2 shows that the shape and volume of moisture distribution under a smart controller irrigation scheduling system was homogeneous for 48 hour after irrigation in both parallel and perpendicular directions, but was non-homogeneous, with a conical shape with 24 h after irrigation. This difference may be attributed to the increase in downward discharge 24 h after irrigation in both lateral and perpen-dicular directions. The wetting patterns in both lateral and
Al-Ghobari and El Marazky 5967
Parallel - 24 h after Parallel - 48 h after
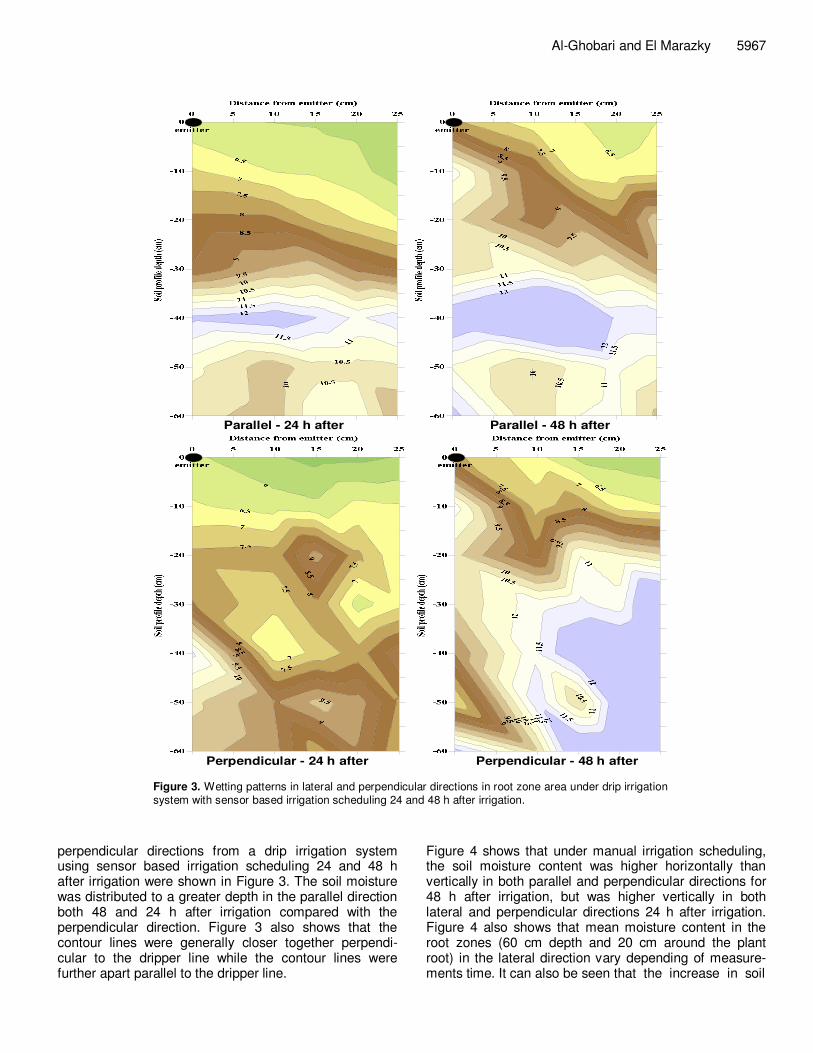
Perpendicular - 24 h after Perpendicular - 48 h after Figure 3. Wetting patterns in lateral and perpendicular directions in root zone area under drip irrigation
system with sensor based irrigation scheduling 24 and 48 h after irrigation.
perpendicular directions from a drip irrigation system using sensor based irrigation scheduling 24 and 48 h after irrigation were shown in Figure 3. The soil moisture was distributed to a greater depth in the parallel direction both 48 and 24 h after irrigation compared with the perpendicular direction. Figure 3 also shows that the contour lines were generally closer together perpendi-cular to the dripper line while the contour lines were further apart parallel to the dripper line.
Figure 4 shows that under manual irrigation scheduling, the soil moisture content was higher horizontally than vertically in both parallel and perpendicular directions for 48 h after irrigation, but was higher vertically in both lateral and perpendicular directions 24 h after irrigation. Figure 4 also shows that mean moisture content in the root zones (60 cm depth and 20 cm around the plant root) in the lateral direction vary depending of measure-ments time. It can also be seen that the increase in soil
5968 Afr. J. Agric. Res.
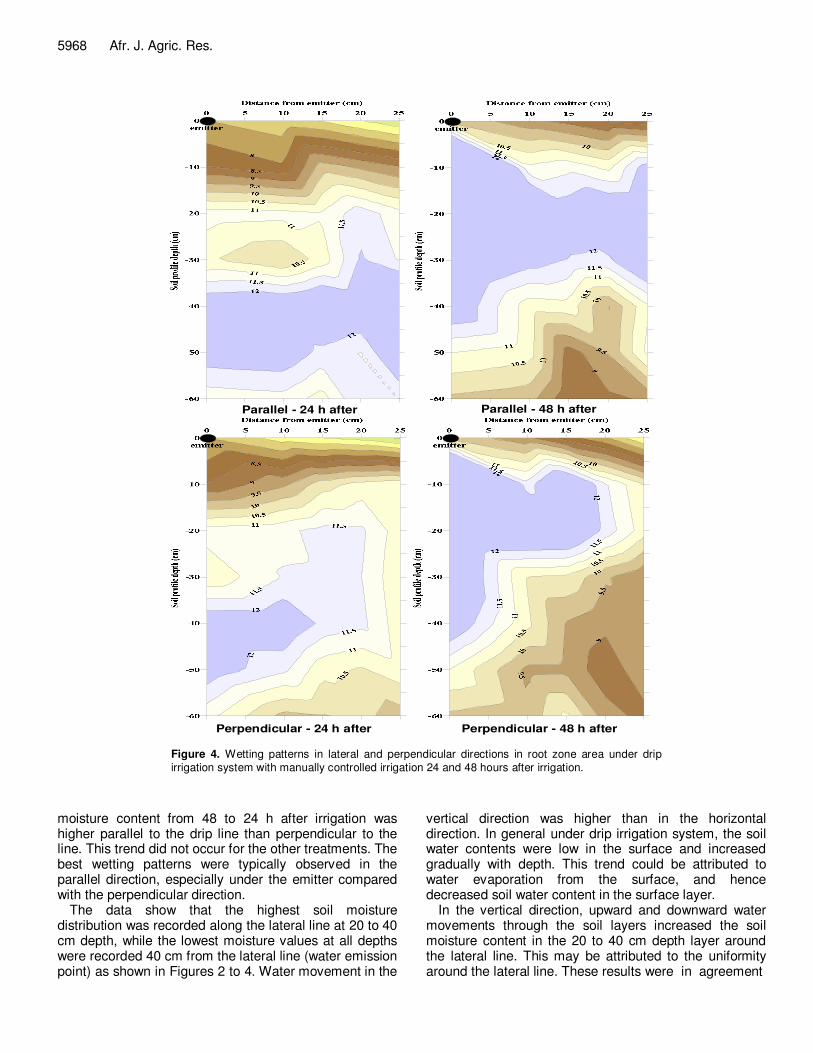
Parallel - 24 h after Parallel - 48 h after
Perpendicular - 24 h after Perpendicular - 48 h after Figure 4. Wetting patterns in lateral and perpendicular directions in root zone area under drip irrigation system with manually controlled irrigation 24 and 48 hours after irrigation.
moisture content from 48 to 24 h after irrigation was higher parallel to the drip line than perpendicular to the line. This trend did not occur for the other treatments. The best wetting patterns were typically observed in the parallel direction, especially under the emitter compared with the perpendicular direction.
The data show that the highest soil moisture distribution was recorded along the lateral line at 20 to 40 cm depth, while the lowest moisture values at all depths were recorded 40 cm from the lateral line (water emission point) as shown in Figures 2 to 4. Water movement in the
vertical direction was higher than in the horizontal direction. In general under drip irrigation system, the soil water contents were low in the surface and increased gradually with depth. This trend could be attributed to water evaporation from the surface, and hence decreased soil water content in the surface layer.
In the vertical direction, upward and downward water movements through the soil layers increased the soil moisture content in the 20 to 40 cm depth layer around the lateral line. This may be attributed to the uniformity around the lateral line. These results were in agreement

with those obtained by El-Berry et al. (1989), Gomaa (1996), Baker (1997), El-Tantawy (2000), Matter (2002), and El-Berry et al. (2003). Effect of scheduling techniques on wetting patterns under subsurface irrigation
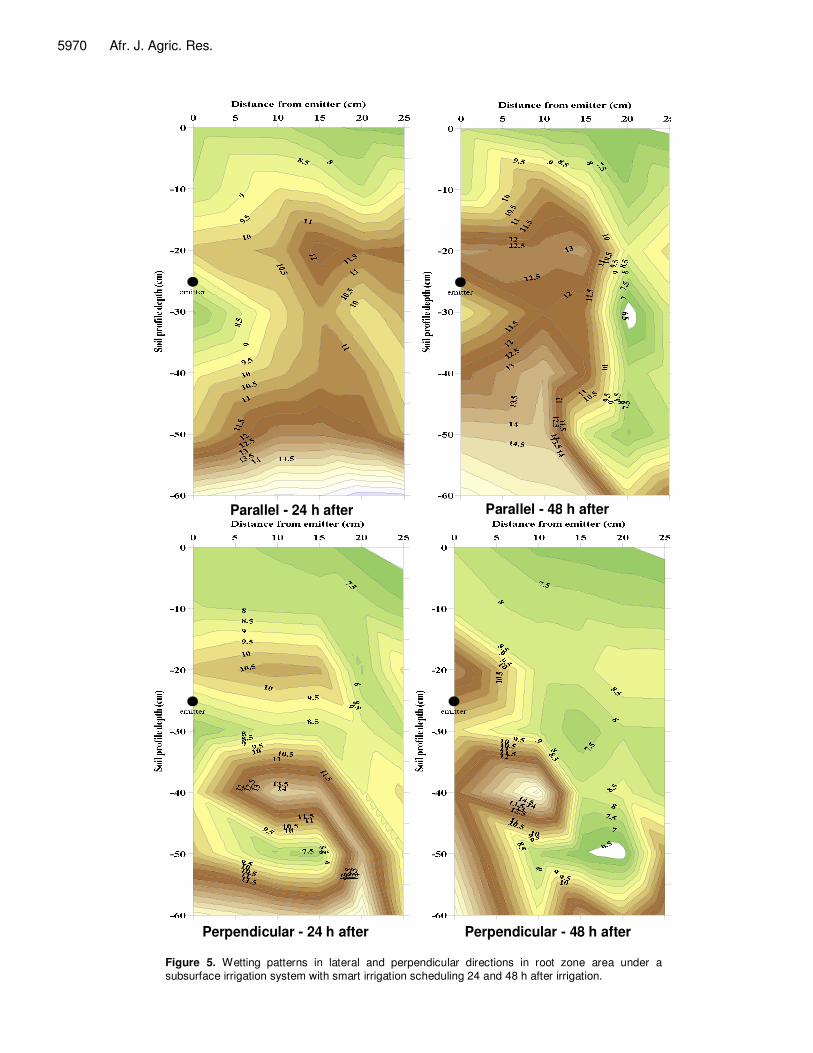
The wetting patterns in lateral and perpendicular directions with smart irrigation scheduling under SI system 24 and 48 h after irrigation were shown in Figure 5. The distribution of soil moisture with depth was greater with 48 h after irrigation than 24 h after irrigation in both lateral and perpendicular directions. It was clear that the soil moisture was distributed deeper for 48 h irrigation. The data show that after irrigation the soil moisture content increased in both horizontal and vertical directions to be near field capacity throughout the soil profile. It was also clear from Figure 6 that perpendicular to the dripper line, the contour lines were very close together, but the contour lines below the dripper line were more widely separated.
The wetting patterns in lateral and perpendicular directions under SI system using sensor based irrigation scheduling 24 and 48 h after irrigation were shown in Figure 6. The distribution of soil moisture against soil depth in the parallel direction, both 24 and 48 h after irrigation was greater than in the perpendicular direction. Also shown in Figure 6, the contour lines in the perpendicular direction were very large under the dripper line compared with the contour lines in the parallel direction which were apart from each other. Figures 5 to 7 show that the soil moisture content and distribution were highly affected by the irrigation scheduling techniques in the lateral direction for 24 h after irrigation. The results indicated that the moisture content with manual irrigation scheduling control was always higher than when irrigation scheduling was done using the smart controller and sensors scheduling irrigation.
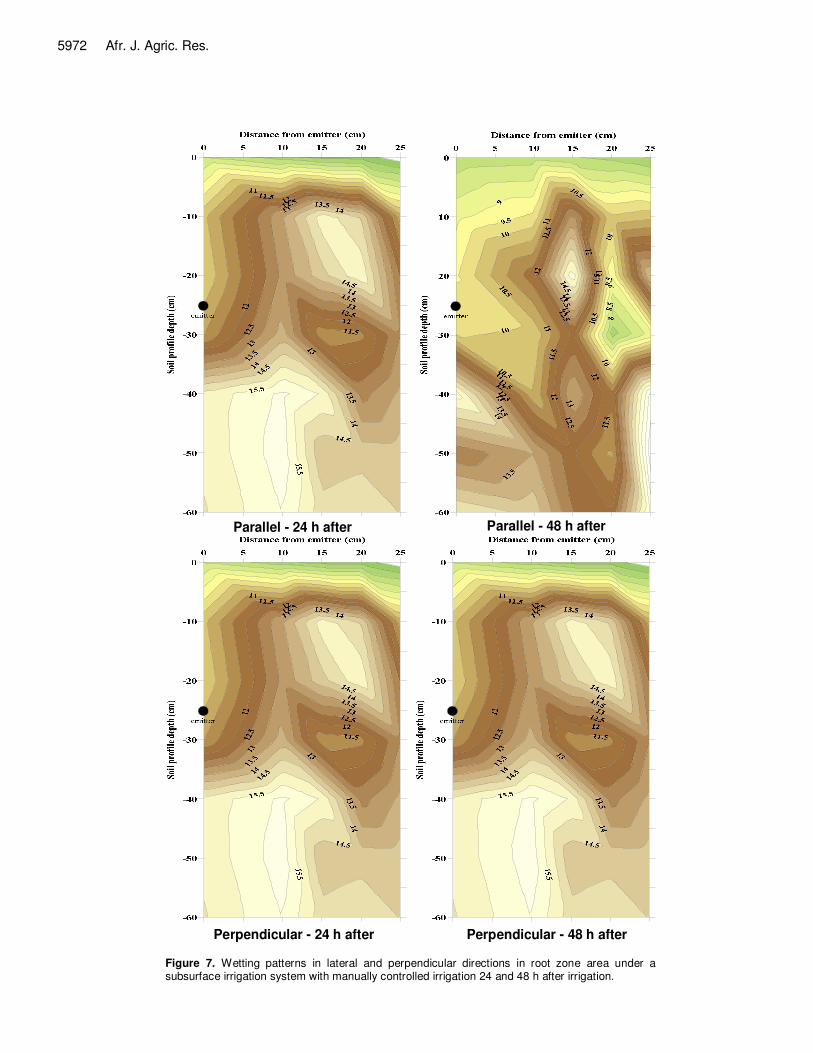
Figures 5 to 7 show that the increase in the soil moisture content under different irrigation scheduling techniques was greater vertically than horizontally, in both lateral and perpendicular directions 24 h after irrigation. Figures 5 to 7 also show that the mean moisture content in the root zone (60 cm depth and 30 cm around the plant roots) were different with measure-ment times in the lateral and perpendicular directions. The minimum and the maximum mean moisture contents in the root zone across all treatments were 6.5 and 17%, respectively for 48 h after irrigation, and 7.5 and 15.5%, for 24 h after respectively. The data illustrated in Figure 7 show the wetting pattern in lateral and perpendicular directions from the subsurface emitter with manual irrigation scheduling. Generally, amount applied decreased with increasing distance from the emitter. Using manual irrigation scheduling, the precipitation rate was lowest in the middle of the wetted area. The soil water content with the SI system was lowest near the
Al-Ghobari and El Marazky 5969 surface and the highest near the drip line (Figures 5 to 7). It was clear from the contour lines shown in Figures 5 to 7 that, in general, the expected soil water distribution agrees with the contour maps created. The contour plots also indicate good consistency between the results of the three irrigation scheduling techniques, with superior results obtained for all treatments using subsurface irrigation, especially immediately above and below the emitter.
Similar wetting distribution patterns were observed for the SI and DI systems except that surface soil layer was not completely wetted with the SI system. The upward capillary movement of water is not sufficient to completely wet the soil surface when irrigated by the SI system, and the soil water content at the surface was significantly lower than for the DI system as most wetting occurred closed to the water source.
The overall wetted area, delimited by the wetting front was largest for the manually scheduled DI and SI systems, and smallest for the smart controller scheduled DI and SI systems, which was consistent with the results reported by Lubana and Narda (2001). Under both irrigation methods, a dry zone developed in the soil profile halfway between the drip lines at 60 cm deep, and this was the largest contour line for the manual irrigation scheduling treatment, and smallest contour line for the smart controller scheduling treatment. This result indicates possible consequences for solute concentration patterns between the rows of drip irrigated crops due to the rapid losses of water by evaporation. It can be concluded that a parameter related to the soil water content is an important component for empirical measurements to estimate wetting patterns for drip irrigation. Subsurface irrigation is the best irrigation management system with higher water use efficiency compared with other irrigation systems. However, under SI, the upper layer (0 to 5cm) had the lowest moisture content both before and after irrigation. Studies have shown that higher soil moisture contents can improve the water distribution and the spreading of the wetted front, depending on the soil properties and texture. Therefore, sandy soils should be studied with different dripper line depths before deciding if it is necessary to use a synthetic soil conditioner to eliminate the problems ofdistance from the emitter. Using manual irrigation water loss and poor moisture distribution at the soil surface.
Figures 2 to 7 show soil moisture content decreased with lateral distance from emitter. Also, for any given distance from the emitter, soil moisture increased with depth. Effect of scheduling techniques on soil water uniformity under a drip and subsurface irrigation systems
A substantial amount of work has been done to evaluate the uniformity of water below the soil surface under two
5970 Afr. J. Agric. Res.
Parallel - 24 h after Parallel - 48 h after
Perpendicular - 24 h after Perpendicular - 48 h after Figure 5. Wetting patterns in lateral and perpendicular directions in root zone area under a
subsurface irrigation system with smart irrigation scheduling 24 and 48 h after irrigation.

Al-Ghobari and El Marazky 5971
Parallel - 24 h after Parallel - 48 h after
Perpendicular - 24 h after Perpendicular - 48 h after Figure 6. Wetting patterns in lateral and perpendicular directions in root zone area under subsurface irrigation system with sensor based irrigation scheduling 24 and 48 h after irrigation.
5972 Afr. J. Agric. Res.
Parallel - 24 h after Parallel - 48 h after
Perpendicular - 24 h after Perpendicular - 48 h after Figure 7. Wetting patterns in lateral and perpendicular directions in root zone area under a subsurface irrigation system with manually controlled irrigation 24 and 48 h after irrigation.
Al-Ghobari and El Marazky 5973
Parallel - 24 h after Parallel - 48 h before
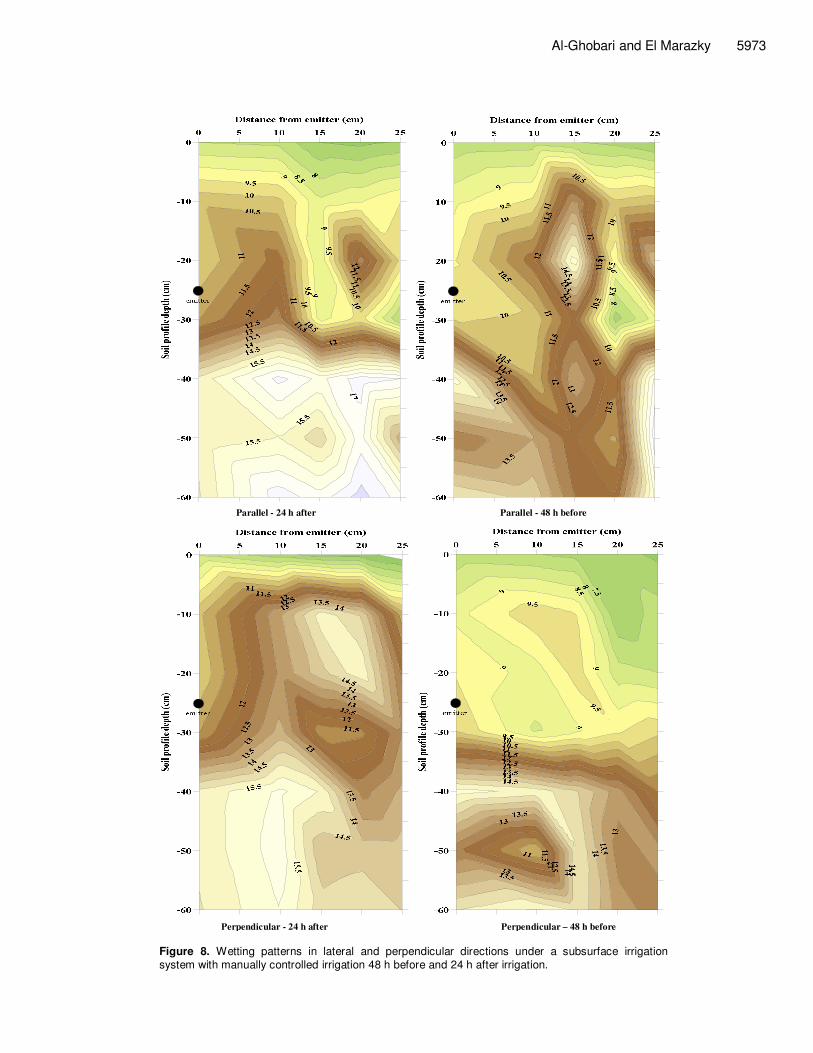
Perpendicular - 24 h after Perpendicular – 48 h before Figure 8. Wetting patterns in lateral and perpendicular directions under a subsurface irrigation
system with manually controlled irrigation 48 h before and 24 h after irrigation.
5974 Afr. J. Agric. Res.
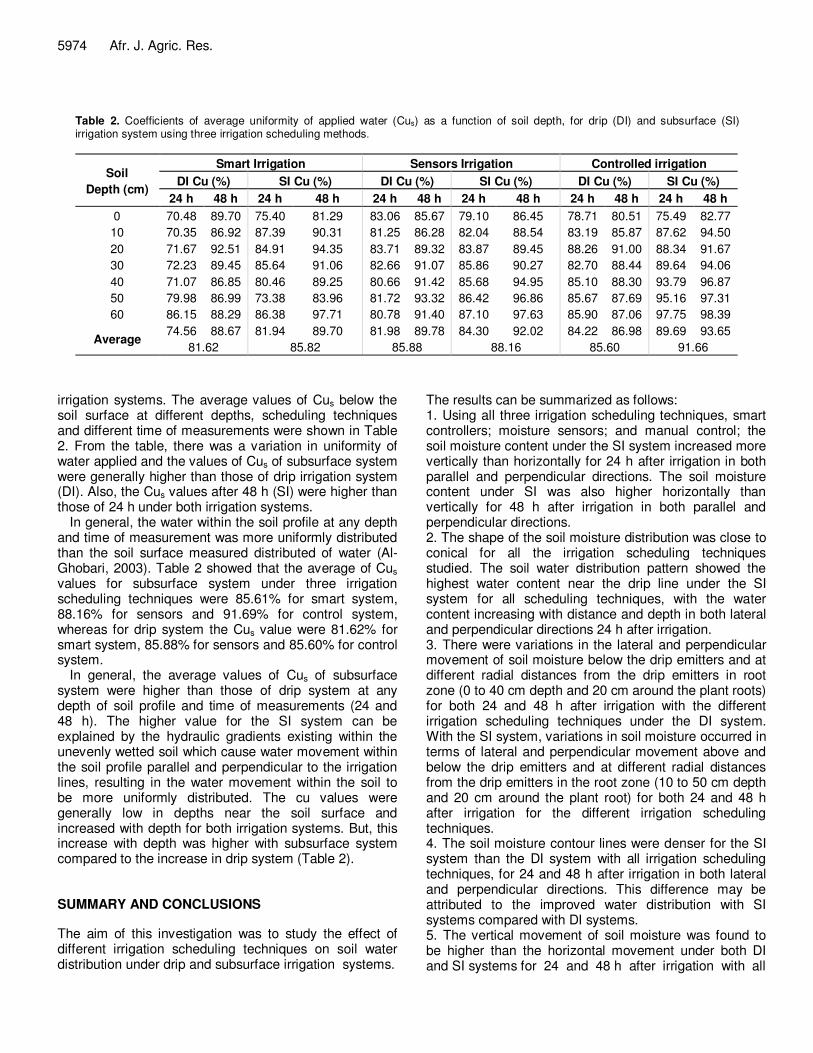
Table 2. Coefficients of average uniformity of applied water (Cus) as a function of soil depth, for drip (DI) and subsurface (SI) irrigation system using three irrigation scheduling methods.
Soil
Depth (cm)
Smart Irrigation Sensors Irrigation Controlled irrigation
DI Cu (%) SI Cu (%) DI Cu (%) SI Cu (%) DI Cu (%) SI Cu (%)
24 h 48 h 24 h 48 h 24 h 48 h 24 h 48 h 24 h 48 h 24 h 48 h
0 70.48 89.70 75.40 81.29 83.06 85.67 79.10 86.45 78.71 80.51 75.49 82.77
10 70.35 86.92 87.39 90.31 81.25 86.28 82.04 88.54 83.19 85.87 87.62 94.50
20 71.67 92.51 84.91 94.35 83.71 89.32 83.87 89.45 88.26 91.00 88.34 91.67
30 72.23 89.45 85.64 91.06 82.66 91.07 85.86 90.27 82.70 88.44 89.64 94.06
40 71.07 86.85 80.46 89.25 80.66 91.42 85.68 94.95 85.10 88.30 93.79 96.87
50 79.98 86.99 73.38 83.96 81.72 93.32 86.42 96.86 85.67 87.69 95.16 97.31
60 86.15 88.29 86.38 97.71 80.78 91.40 87.10 97.63 85.90 87.06 97.75 98.39
Average 74.56 88.67 81.94 89.70 81.98 89.78 84.30 92.02 84.22 86.98 89.69 93.65
81.62 85.82 85.88 88.16 85.60 91.66
irrigation systems. The average values of Cus below the soil surface at different depths, scheduling techniques and different time of measurements were shown in Table 2. From the table, there was a variation in uniformity of water applied and the values of Cus of subsurface system were generally higher than those of drip irrigation system (DI). Also, the Cus values after 48 h (SI) were higher than those of 24 h under both irrigation systems.
In general, the water within the soil profile at any depth and time of measurement was more uniformly distributed than the soil surface measured distributed of water (Al-Ghobari, 2003). Table 2 showed that the average of Cus values for subsurface system under three irrigation scheduling techniques were 85.61% for smart system, 88.16% for sensors and 91.69% for control system, whereas for drip system the Cus value were 81.62% for smart system, 85.88% for sensors and 85.60% for control system.
In general, the average values of Cus of subsurface system were higher than those of drip system at any depth of soil profile and time of measurements (24 and 48 h). The higher value for the SI system can be explained by the hydraulic gradients existing within the unevenly wetted soil which cause water movement within the soil profile parallel and perpendicular to the irrigation lines, resulting in the water movement within the soil to be more uniformly distributed. The cu values were generally low in depths near the soil surface and increased with depth for both irrigation systems. But, this increase with depth was higher with subsurface system compared to the increase in drip system (Table 2). SUMMARY AND CONCLUSIONS
The aim of this investigation was to study the effect of different irrigation scheduling techniques on soil water distribution under drip and subsurface irrigation systems.
The results can be summarized as follows: 1. Using all three irrigation scheduling techniques, smart controllers; moisture sensors; and manual control; the soil moisture content under the SI system increased more vertically than horizontally for 24 h after irrigation in both parallel and perpendicular directions. The soil moisture content under SI was also higher horizontally than vertically for 48 h after irrigation in both parallel and perpendicular directions. 2. The shape of the soil moisture distribution was close to conical for all the irrigation scheduling techniques studied. The soil water distribution pattern showed the highest water content near the drip line under the SI system for all scheduling techniques, with the water content increasing with distance and depth in both lateral and perpendicular directions 24 h after irrigation. 3. There were variations in the lateral and perpendicular movement of soil moisture below the drip emitters and at different radial distances from the drip emitters in root zone (0 to 40 cm depth and 20 cm around the plant roots) for both 24 and 48 h after irrigation with the different irrigation scheduling techniques under the DI system. With the SI system, variations in soil moisture occurred in terms of lateral and perpendicular movement above and below the drip emitters and at different radial distances from the drip emitters in the root zone (10 to 50 cm depth and 20 cm around the plant root) for both 24 and 48 h after irrigation for the different irrigation scheduling techniques. 4. The soil moisture contour lines were denser for the SI system than the DI system with all irrigation scheduling techniques, for 24 and 48 h after irrigation in both lateral and perpendicular directions. This difference may be attributed to the improved water distribution with SI systems compared with DI systems. 5. The vertical movement of soil moisture was found to be higher than the horizontal movement under both DI and SI systems for 24 and 48 h after irrigation with all
irrigation scheduling techniques. However, the moisture distribution pattern indicated that more soil moisture is extracted from the 15 to 40 and 15 to 50 cm soil layers than from other depths under the DI and SI systems, respectively, leading to higher soil moisture values for the manual scheduling treatments under both DI and SI systems for 24 and 48 hours after irrigation in both lateral and perpendicular directions. 6. The lowest soil water content with the DI system occurred in the surface layer and the highest soil water content was in the 20 to 40 cm soil layer. In contrast, the highest soil water content with the SI system occurred near the surface and the highest soil moisture content was measured near the drip line. 7. The moisture distribution in the soil indicated the wetting pattern in lateral directions in both surface and subsurface plots produced wider soil wetting patterns especially near the soil surface compared to the perpendicular direction. 8. The figures show that the soil was the wettest directly beneath the emitter especially after 48 h in both irrigation systems. 9. The uniformity of the drip irrigation system was generally slightly lower than that of the subsurface irrigation system and the coefficients of uniformity changed more noticeably in the upper soil layers than in the lower layers. The coefficients of uniformity for SI were higher by approximately 4.40% than for DI values for all irrigation scheduling techniques, although there was variation in Cus values between the DI and SI systems with all three techniques. The redistribution of water within the soil profile is a function of many irrigation and soil variables, including the depth of water applied, time of irrigation and soil/application rate interactions.
ACKNOWLEDGMENT This project was supported by King Saud University, Deanship of Scientific Research, College of Food & Agriculture Sciences, Research Center.
REFERENCES Al-Ghobari HM (2003).The areal distribution of applied water above and
below soil surface under center pivot sprinkler irrigation system. J. Saudi Soc. Agric. Sci. 2(2):207-220.
Assouline S (2002). The effects of micro drip and conventional drip irrigation on water distribution and uptake. Soil Sci. Soc. Am. J. 66:1630-1636.
Badr MA, Taalab AS (2007). Effect of Drip Irrigation and Discharge Rate on Water and Solute Dynamics in Sandy Soil and Tomato Yield. Australia J. Basic Appl. Sci. 1(4):545-552.
Baker GA (1997). Study on the performance of leaky tube for subsurface irrigation. Misr, J. Ag. Eng. 14(1):156-169.
Bainbridge DA (2001). Buried clay pot irrigation: a little known but very efficient traditional method of irritation. Agric. Water Manage. 48(2):79-88.
Batchelor C, Christopher L, Murata M (1996). Simple microirrigation techniques for improving irrigation efficiency on vegetable gardens.
Al-Ghobari and El Marazky 5975
Agric. Water Manage. 32:37-48. Bresler E (1978). Analysis of trickle irrigation with application to design
problems. Irrig. Sci. 1:3-17. Camp CR (1998). “Subsurface drip irrigation: A review.” Trans. ASAE 41:1353-1367. Christiansen JE (1942). Irrigation by Sprinkling. California Agriculture
Experiment Station Bulletin, No. 670. University of California, Berkley, USA.
Cook FJ, Fitch P, Thorburn PJ, Charlesworth PB, Bristow KL (2006). Modelling trickle irrigation: Comparison of analytical and numerical models for estimation of wetting front position with time. Environ. Model. Softw. 21:1353-1359.
Cote CM, Bristow KL, Charlesworth PB, Cook FJ, Thorburn PJ (2003). Analysis of soil wetting and solute transport in subsurface trickle irrigation. Irrig. Sci. 22:143-156.
El-Berry AM, Afifi MA, Ahmed MH (1989). Effects of irrigation system on moisture pattern productivity and harvesting of fodder in arid lands. Misr J. Agric. Eng. 6 (4):359-371.
El-Berry AM Sharaf GA, Azza H, Ebtsam S (2003). Irrigation scheduling of sunflower with drip irrigation system in newly reclaimed land. Misr J. Agric. Eng. 20(4);993-1010.
Earl KD, Jury WA (1977). Water movement in bare and cropped soil under isolated trickle emitters : II. Analysis of cropped soil experiments. Soil Sci. Soc. Am. J. 41:856-861.
Elmaloglou S, Diamantopoulos E, Diamantopoulos N (2010). Comparing soil moisture under trickle irrigation modeled as a point and line source. Agric. Water Manage. 49 (97):426-432.
El-Tantawy MT (2000). Surface and subsurface drip effects on soil and tomato yield. Misr, J. Ag. Eng. 17(4):154-166.
Gardenas A, Hopmans JW, Hanson BR, Simunek J (2005). Two-dimensional modeling of nitrate leaching for various fertigation scenarios under microirrigation. Agric. Water Manage.74:219-242.
Goldberg D, Gormat B, Bar Y (1971). The distribution of roots, water and minerals as a result of trickle irrigation. J. Am. Soc. Hortic. Sci. 96:645-648.
Goldberg D, Gormat B, Bar Y (1976). The distribution of roots, water and minerals as a result of trickle irrigation. J. Am. Soc. Hortic. Sci. 96:645-648.
Goldberg D, Shmueli M (1970). Drip irrigation-a method used under arid and desert conditions of high water and soil salinity. Trans. ASAE 13:38-41.
Gommaa A (1996). The effect of applying drip irrigation system under certain environmental resources on soil productivity deterioration at North Sinai. Misr, J. Agric. Eng., Cairo Un. Irri. Conf. 3-4:305-326.
Hanson BR, Bendixen WE, May DM (2000). Patterns of soil moisture, soil salinity, and soil nitrate under drip irrigation of row crops. Proceedings of Irrigation Association of Australia National Conference 2000 – Water Essential for Life. Melbourne Exhibition and Convention Centre, 23-25 May.
Hawatmeh N, Battikhi A (1983). Wetting fronts under a trickle source in two soils of the Jordan valley. Dirasat 10(1):17-31.
Hegazi SM (1998). Subsurface irrigation method using porous clay pipe. Progress Report, Iranian Agricultural Education and Research Institute, Agricultural Research, Education and Extension Organiza-tion, Ministry of Agriculture, Iran (in Persian).
Keller J, Karmeli D (1974). Trickle irrigation design parameters. Trans. ASAE. 17:678-684.
Lanini S, Courtois N, Giraud F, Petit V, Rinaudo JD (2004). Socio-hydrosystem modelling for integrated water-resources managemente the He´rault catchment case study, southern France. Environ. Model. Softw. 19:1011-1019.
Lazarovitch, N, Warrick AW, Furman A, Simunek J. (2007). Subsurface water distribution from drip irrigation described by moment analyses. Vadose Zone J. 6:116:123.
Lubana PPS, Narda NK (2001). Modeling soil water dynamics under trickle emitters - a review. J. Agric. Eng. Res. 78:217-232.
Mailhol JC, Ruelle P, Walserb S, Schützeb N, Dejeana C (2011). Analysis of AET and yield predictions under surface and buried drip irrigation systems using the Crop Model PILOTE and Hydrus-2D. Agric. Water Manage. 98:1033-1044.
Malek K, Peters RT (2010). Wetting pattern models for drip irrigation: a new empirical Model. doi:10.1061/(ASCE)IR.1943-4774.0000320.

5976 Afr. J. Agric. Res. Matter MA (2002). The new mechanized technique for sub-surface
irrigation. Ph D. Thesis, Faculty of Agriculture, Engineering Department, Zagazig University. p. 166.
Phene CJ (1995). Research trends in microirrigation. In: Lamm, F.R. (Ed.), Microirrigation for a Changing World: Conserving Resources/Preserving the Environment. Orlando, Florida, USA, 2e6 April 1995. Proceedings of the Fifth International Microirrigation Congress. American Society of Agricultural Engineers, St. Joseph, Michigan. p. 6e24.
Schwartzman M, Zur B (1986). Emitter spacing and geometry of wetted soil volume. J. Irrig. Drain. Eng. ASCE 112 (3):242-253.
Singh DK, Rajput TBS, Singh DK, Sikarwar HS, Sahoo, RN, Ahmad T (2006). Simulation of soil wetting pattern with subsurface drip irrigation from line source. Agric. Water Manage. 83:130-134.
Skaggs TH, Trout TJ, Simunek J, Shouse, PJ (2004). Comparison of HYDRUS-2D simulations of drip irrigation with experimental observations. J. Irrig. Drain. Eng. 30:304-310.
Wang FX, Kang Y, Liu SP (2006). Effects of drip irrigation frequency on
soil wetting pattern and potato growth in North China Plain. Agric. Water Manage. 79:248-264.
Zoldoske DF, Solomon KH, Norum EM (1994). Uniformity measurements for turfgrass: what’s best? [Internet]. Center for Irrigation Technology, California State University, Fresno, USA. Available from: <http://cati.csufresno.edu/cit/rese/94/941102.index.html>.
Zur B (1996). Wetted soil volume as a design objective in trickle irrigation. Irrig. Sci. 16:101-105.