1H NMR-visible mobile lipid domains correlate with cytoplasmic lipid bodies in apoptotic...
20
1 H NMR-visible mobile lipid domains correlate with cytoplasmic lipid bodies in apoptotic T-lymphoblastoid cells Massimo Di Vito a , Luisa Lenti b , Arno Knijn a , Egidio Iorio a , Federica D’Agostino b , Agnese Molinari c , Annarica Calcabrini c , Annarita Stringaro c , Stefania Meschini c , Giuseppe Arancia c , Argante Bozzi d , Roberto Strom e , Franca Podo a ; * a Laboratory of Cell Biology, Istituto Superiore di Sanita ', Viale Regina Elena 299, 00161 Rome, Italy b Department of Experimental Medicine and Pathology, University of Rome ‘La Sapienza’, 00185 Rome, Italy c Laboratory of Ultrastructures, Istituto Superiore di Sanita ', Viale Regina Elena 299, 00161 Rome, Italy d Department of Biomedical Sciences and Technologies, University of L’Aquila, 67100 L’Aquila, Italy e Department of Cellular Biotechnology and Hematology, University of Rome ‘La Sapienza’, 00185 Rome, Italy Received 28 June 2000; received in revised form 16 October 2000; accepted 19 October 2000 Abstract The presence of nuclear magnetic resonance (NMR)-visible mobile lipid (ML) domains in apoptotic lymphoblasts suggests alterations in neutral lipid metabolism and compartmentation during programmed cell death. The detection of similar ML signals in activated lymphocytes raises questions about common mechanisms of ML formation during apoptosis and upon lymphoblast stimulation. Structure and subcellular localization of ML domains were therefore investigated by NMR, fluorescence and electron microscopy in Jurkat T-lymphoblasts either induced to apoptosis (by anthracyclines or dexamethasone or by serum deprivation) or activated by phorbol myristate acetate (PMA) plus ionomycin. ML contents in drug-treated cells correlated linearly with apoptosis, irrespective of the specific inducer and cell cycle arrest phase (r = 0.993, P 6 0.001). Similar ML levels were measured in drug-induced apoptotic cells (AW30^40%) and in non-apoptotic PMA/ ionomycin-treated lymphoblasts (72 h). Lower ML contents were instead formed in serum-deprived apoptotic cells, with respect to controls. Increases in ML signals were associated, in either apoptotic or activated cells, with the accumulation of cytoplasmic, osmophilic lipid bodies (diameter 9 1.0 Wm), surrounded by own membrane, possessing intramembrane particles. The results support the hypothesis that ML are formed in the cytoplasm of drug-induced apoptotic cells during an early, ‘biochemically active’ phase of programmed cell death. ß 2001 Elsevier Science B.V. All rights reserved. Keywords : Apoptosis ; Lymphoblast activation ; Mobile lipid ; 1 H nuclear magnetic resonance ; Anthracycline ; Dexamethasone 1388-1981 / 01 / $ ^ see front matter ß 2001 Elsevier Science B.V. All rights reserved. PII:S1388-1981(00)00165-7 Abbreviations: BrdU, bromodeoxyuridine; FCS, fetal calf serum; FID, free induction decay; FFA, free fatty acid; IMP, intramem- brane particle; ML, mobile lipid; NMR, nuclear magnetic resonance; PC, phosphatidylcholine; PCho, phosphocholine; plA 2 , phospho- lipase A 2 ; plc, phospholipase C; PI, propidium iodide; PMA, phorbol 12-myristate 13-acetate; PUFA, polyunsaturated fatty acid; TCR, T cell receptor; TEM, transmission electron microscopy; TG, triacylglycerol; TNF, tumor necrosis factor * Corresponding author. Fax: +39-6-4938-7144; E-mail: [email protected] Biochimica et Biophysica Acta 1530 (2001) 47^66 www.elsevier.com/locate/bba
-
Upload
independent -
Category
Documents
-
view
0 -
download
0
Transcript of 1H NMR-visible mobile lipid domains correlate with cytoplasmic lipid bodies in apoptotic...

1H NMR-visible mobile lipid domains correlate with cytoplasmic lipidbodies in apoptotic T-lymphoblastoid cells
Massimo Di Vito a, Luisa Lenti b, Arno Knijn a, Egidio Iorio a, Federica D'Agostino b,Agnese Molinari c, Annarica Calcabrini c, Annarita Stringaro c, Stefania Meschini c,
Giuseppe Arancia c, Argante Bozzi d, Roberto Strom e, Franca Podo a;*a Laboratory of Cell Biology, Istituto Superiore di Sanita©, Viale Regina Elena 299, 00161 Rome, Italy
b Department of Experimental Medicine and Pathology, University of Rome `La Sapienza', 00185 Rome, Italyc Laboratory of Ultrastructures, Istituto Superiore di Sanita©, Viale Regina Elena 299, 00161 Rome, Italy
d Department of Biomedical Sciences and Technologies, University of L'Aquila, 67100 L'Aquila, Italye Department of Cellular Biotechnology and Hematology, University of Rome `La Sapienza', 00185 Rome, Italy
Received 28 June 2000; received in revised form 16 October 2000; accepted 19 October 2000
Abstract
The presence of nuclear magnetic resonance (NMR)-visible mobile lipid (ML) domains in apoptotic lymphoblasts suggestsalterations in neutral lipid metabolism and compartmentation during programmed cell death. The detection of similar MLsignals in activated lymphocytes raises questions about common mechanisms of ML formation during apoptosis and uponlymphoblast stimulation. Structure and subcellular localization of ML domains were therefore investigated by NMR,fluorescence and electron microscopy in Jurkat T-lymphoblasts either induced to apoptosis (by anthracyclines ordexamethasone or by serum deprivation) or activated by phorbol myristate acetate (PMA) plus ionomycin. ML contents indrug-treated cells correlated linearly with apoptosis, irrespective of the specific inducer and cell cycle arrest phase (r = 0.993,P6 0.001). Similar ML levels were measured in drug-induced apoptotic cells (AW30^40%) and in non-apoptotic PMA/ionomycin-treated lymphoblasts (72 h). Lower ML contents were instead formed in serum-deprived apoptotic cells, withrespect to controls. Increases in ML signals were associated, in either apoptotic or activated cells, with the accumulation ofcytoplasmic, osmophilic lipid bodies (diameter9 1.0 Wm), surrounded by own membrane, possessing intramembraneparticles. The results support the hypothesis that ML are formed in the cytoplasm of drug-induced apoptotic cells during anearly, `biochemically active' phase of programmed cell death. ß 2001 Elsevier Science B.V. All rights reserved.
Keywords: Apoptosis ; Lymphoblast activation; Mobile lipid; 1H nuclear magnetic resonance; Anthracycline; Dexamethasone
1388-1981 / 01 / $ ^ see front matter ß 2001 Elsevier Science B.V. All rights reserved.PII: S 1 3 8 8 - 1 9 8 1 ( 0 0 ) 0 0 1 6 5 - 7
Abbreviations: BrdU, bromodeoxyuridine; FCS, fetal calf serum; FID, free induction decay; FFA, free fatty acid; IMP, intramem-brane particle ; ML, mobile lipid; NMR, nuclear magnetic resonance; PC, phosphatidylcholine; PCho, phosphocholine; plA2, phospho-lipase A2 ; plc, phospholipase C; PI, propidium iodide; PMA, phorbol 12-myristate 13-acetate; PUFA, polyunsaturated fatty acid; TCR,T cell receptor; TEM, transmission electron microscopy; TG, triacylglycerol ; TNF, tumor necrosis factor
* Corresponding author. Fax: +39-6-4938-7144; E-mail : [email protected]
BBAMCB 55738 2-1-01
Biochimica et Biophysica Acta 1530 (2001) 47^66www.elsevier.com/locate/bba

1. Introduction
Although knowledge on the coordinated, step-wiseevents leading to cellular apoptosis is steadily pro-gressing [1^3], still limited understanding is achievedon molecular and biochemical mechanisms underly-ing programmed cell death. Major attention is fo-cussed on phospholipid metabolism pathways, espe-cially sphingomyelin, phosphoinositide and phos-phatidylcholine (PC) cycles, whose activation leadsto ceramide and diacylglycerol production. Thesesecond messengers may in fact exert either synergicor opposing e¡ects on cell death and proliferationrates [4^6]. Still limited information is however pro-vided on alterations of neutral lipid metabolism andcompartmentation during apoptosis, in spite of in-creasing indications on the involvement of these mo-lecular components in cell physiology regulation [7].
Recent evidence demonstrated the appearance ofnarrow mobile lipid (ML) signals in 1H nuclear mag-netic resonance (NMR) spectra of di¡erent cell types,induced to apoptosis by exposure to either cytotoxicdrugs, Fas antibody or serum deprivation [8,9]. Ac-cumulation of ML enriched in polyunsaturated fattyacid (PUFA) chains has also been reported in exper-imental glioma tumors, induced to apoptosis by invivo gene therapy [10]. Furthermore, Bcl-2 overex-pression inhibited ML formation in doxorubicin-treated HL-60 myeloid cells, consistently with theanti-apoptotic e¡ect of the Bcl-2 gene product [8].Since the ratio of fatty chain methylene ((CH2)n,1.3 ppm) to methyl (CH3, 0.9 ppm) signal intensitywas found to be proportional to the apoptotic cellfraction in Jurkat cells treated with doxorubicin [9],1H NMR has been proposed as a quantitative meth-od for non-invasively quantifying cell apoptosis invitro and in vivo.
The nature of ML domains in apoptotic cells isstill under investigation. The appearance of narrowlipid NMR signals is not a distinct feature of apo-ptotic cells, since similar spectral patterns are alsoreported in activated lymphocytes and lymphoblasts[11,12], in tumors [13,14], and in embryo-derivedcells [15,16]. Di¡erent hypotheses have been pro-posed for the localization of ML domains in intactcells, either at the plasma membrane level, or in thecytoplasm [16^20]. It is however generally acceptedthat ML signals arise from a small fraction (below
10%) of cellular components, mostly triacylglycerols(TG), esteri¢ed sterols and free fatty acids (FFA),organized in non-bilayer lipid domains and endowedof a su¤ciently high level of isotropic mobility, to bedetected in the high resolution NMR time window[21]. In a previous study on an embryo-derived cellline (NIH-3T3 ¢broblasts) we demonstrated that MLsignals were associated with the accumulation of cy-toplasmic osmophilic lipid bodies, possessing a diam-eter distribution peak around 1 Wm and surroundedby a membrane, endowed of intramembrane particles(IMP) [16]. Additional contributions to ML signalswere apparently given by a number of amorphouslipid aggregates of about 60 nm diameter, localizedin the plasma membrane [16].
The detection of ML signals in either apoptotic oractivated lymphoblasts stimulated our interest in thepossible existence of common mechanisms of MLformation in these cell systems. NMR, Nile red £uo-rescence and transmission electron microscopy(TEM) analyses were therefore carried out in thepresent work on human T-lymphoblastoid Jurkatcells, in order to (1) quantify ML domains in cellsexposed to either di¡erent inducers of apoptosis or tocell activators (phorbol 12-myristate 13-acetate(PMA) plus ionomycin) and (2) compare structureand subcellular localization of ML domains formedunder these di¡erent cellular conditions.
2. Materials and methods
2.1. Chemicals
Doxorubicin (also commercialized as adriamycin),daunorubicin (or daunomycin), dexamethasone,PMA, propidium iodide (PI), bromodeoxyuridine(BrdU), Triton X-100 and Tween 20 were purchasedfrom Sigma, St. Louis, MO, USA. Ionomycin waspurchased from Calbiochem and 2P,7P-dichloro£uor-escein diacetate from Molecular Probes (Eugene,OR, USA).
2.2. Cells
The stabilized human T-lymphoblastoid cell lineJurkat was maintained in complete RPMI 1640 me-dium (Gibco), supplemented with 10% fetal calf se-
BBAMCB 55738 2-1-01
M. Di Vito et al. / Biochimica et Biophysica Acta 1530 (2001) 47^6648

rum (FCS, HyClone). The cells, seeded at a densityof 2.5U105 cell/ml, were grown at 37³C in a humidi-¢ed atmosphere of 5% CO2/95% air. Cell viabilitywas determined by a trypan blue exclusion test andby dichloro£uorescein diacetate oxidation.
2.3. Induction and analysis of apoptosis
Cells, seeded at a density of 2.5U105 cell/ml andgrown for 24 h, were exposed for various time inter-vals (24, 48 and 72 h) to di¡erent apoptosis-inducingdrugs, doxorubicin (200 ng/ml), daunorubicin (200ng/ml) or dexamethasone (50 WM). Apoptosis wasalso induced by FCS deprivation (24, 48 or 72 h).As negative controls for apoptosis, cells were eithermaintained untreated or activated with a combina-tion of PMA (1 ng/ml) and ionomycin (300 ng/ml)for 24, 48 or 72 h.
Assays for analysis of apoptosis included electro-phoretic detection of fragmented DNA [22] and £owcytometry of PI-stained cells [23,24]; the latter pro-cedure has been validated in a previous work bysome of us [25].
For £ow cytometric analysis of hypodiploid nuclei,1U106 Jurkat cells were centrifuged, the pellet gentlyresuspended in 1.0 ml of a hypotonic solution con-taining 50.0 Wg/ml PI in 0.1% sodium citrate plus0.1% Triton X-100 and the tubes placed at 4³C inthe dark, overnight. The PI £uorescence of individualnuclei was then measured using an EPICS XL £owcytometer (Coulter, Hialeah, FL, USA) equippedwith a 488 nm argon laser lamp, as already described[23]. Apoptotic nuclei appeared as a broad hypodi-ploid DNA peak, which was easily discriminatedfrom the narrow peak of cells with normal diploidDNA peak. To analyze the G1 to S progression, 24 htreated cells and the relative controls were exposed to45 WM BrdU for 15 min at 37³C, collected and ¢xedwith a 1:5 acetone:methanol solution. Fixed cellswere centrifuged, washed in phosphate-bu¡ered sa-line (PBS)+0.5% Tween 20, incubated in 1 N HClfor 45 min, neutralized, incubated with a monoclonalanti-BrdU antibody (IgG1 clone 2B1, Coulter) for 30min, washed and ¢nally stained with an anti-mouseIgG conjugated to £uorescein isothiocyanate (Coult-er). IgG1 mouse isotypic controls were used. Afterincubation, PI (50 Wg/ml in PBS) was added to thesamples and stored in the dark for 30 min, at room
temperature, before cyto£uorimetric evaluation[24].
2.4. NMR spectroscopy
Intact cells were counted, washed three times inPBS containing bovine serum albumin (2 mg/ml),centrifuged at 600Ug and resuspended in 700 Wl ofPBS in D2O, before transfer to a 5 mm NMR tube(40^60U106 cells). 1H NMR experiments were per-formed at 200 MHz on a Varian Gemini 200 spec-trometer (4.7 T). Analyses on intact cells were carriedout at 25³C, using 60³ pulses preceded by 2.0 s pre-saturation for water signal suppression (acquisitiontime 0.99 s, spectral width 2 kHz, 3968 data points,256 scans). These experimental conditions ensuredthat the spectra were taken at the magnetizationequilibrium.
Trimethylsilyl-2,2,3,3-d4-propionate (10 mM inD2O) was used as an external chemical shift stan-dard. Signal assignments were according to previousstudies, carried out in our and in other laboratories[16,26,27].
2.5. NMR data analysis
Signal processing and quantitative data analysis ofthe one-dimensional (1D) 1H NMR spectra of intactJurkat cell preparations were performed using theMRUI software package [28,29], i.e. by time domainnon-linear least-squares estimation of model functionparameters. The mathematical model chosen to ap-proximate the measured free induction decay (FID)was a sum of complex exponentially dampened sinus-oids, characterized by the following parameters: asignal amplitude ak (proportional to concentrationand/or mobility of protons), a phase Pk, a linewidthKk (inverse of the transversal relaxation time T2) anda frequency Xk (chemical shift) for each individualcomponent k, with a total number of componentsK and a number of complex data points in theFID N, a step time vt and a begin time t0 (thisinstrumental dead-time is presumed to be negligibleon high resolution spectrometers). Lorentzian werepreferred over Gaussian lineshapes, because the for-mer proved to give better residues.
Pre-processing of the FIDs consisted of removal ofthe residual water signal, if necessary, ¢tting it with
BBAMCB 55738 2-1-01
M. Di Vito et al. / Biochimica et Biophysica Acta 1530 (2001) 47^66 49

10 exponentials by a Hankel Lanczos singular valuedecomposition algorithm [30]; no line-broadening orother pre-processing was applied. For quantitativedata analysis the AMARES algorithm was used[31], which was very £exible with regard to the ap-plication of prior knowledge. Extensive testing hasled to implementation of the following prior knowl-edge in the model (see also Table 1 and Fig. 1):
b The frequencies and linewidths of all componentswere constricted within `logical' bounds (see Table1 for values), derived from trial quanti¢cations ofall measurements (n = 53), in order to maximize theaccuracy and robustness of the model function.
b The begin time t0 was constricted to zero.b The 0-order phases of all signals were set to be
equal (Pk = P0, any k).b The linewidths of the resonances at 1.6 and 1.7
ppm were set to be equal (K6 =K7) to guaranteestability (at 200 MHz these signals are not well-resolved).
b If the three resonances between 2.32 and 2.39 ppmarising from glutamate+glutamine+glutathionewere su¤ciently resolved, they could be modeledby three components with the distance betweenthem (v) and their linewidths kept equal(K11 =K12 =K13) ; otherwise, this signal was ap-proximated by just one broad exponential.
b In some spectra the doublet at 1.33 ppm arisingfrom lactate was intense and had to be included inthe model, imposing equal linewidths (K17 =K18)and amplitudes (a17 = a18) for both componentsof its -CH3 doublet.
In the region from 1.1 to 1.5 ppm, 1H NMR spec-tra of intact cells are characterized by an extensiveoverlap of resonances. By modeling this region withthree (or ¢ve if lactate is included) exponentials, itwas possible to quantify the signal exclusively arisingfrom the -(CH2)n- protons of the ML fatty chains(resonating at 1.29 ppm) with one exponential, whilethe contributions from overlapping neighboring
Table 1Mathematical model developed for the quanti¢cation of the monodimensional 1H NMR spectra measured on samples of intact Jurkatcell preparations
k Signals `Hard' and `soft' constraints
Frequency (ppm) Linewidth (Hz) Phase
1 -CH3 lipids+some amino acids 0.85^0.92 256K1 6 36 P0
2 -CH3 lipids+-CH3 (Q1+Q2) valine+-CH3 (Q1+Q2) leucine 0.92^0.99 06K2 6 30 P0
3 unknown 1.18^1.24 06K3 6 30 P0
4 -(CH2)n- lipids 1.26^1.32 106K4 6 32 P0
5 -CH3 (C-6) fucose+-CH3 (C-3) alanine 1.37^1.47 256K5 6 60 P0
6 -OOC-CH2-CH2- lipids+-O-CH2-CH2-lipids+-CH2-CH-(CH3)2 lipids
1.54^1.63 206K6 6 45 P0
7 -CH2- (C-3) lysine+-CH2- (C-3) polyamines 1.65^1.72 K7 =K6 P0
8 broad background signal 706K8 6 318 P0
9 NCH-CH2-CH2- lipids+NCH-CH2-CH3 1.99^2.10 256K9 6 65 P0
lipids+-CH2- (C-5) lysine 1.80^1.9510 -COO-CH2-CH2- lipids+-CH- (C-3) valine 2.20^2.30 206K10 6 50 P0
11 -CH2- (C-4) glutamic acid 2.28^2.42 06K11 6 30 P0
11a -CH2- (C-4) glutamic acid 2.28^2.42 06K11a 6 10 P0
11b -CH2- (C-4) glutamic acid X11b = X11a+v11 K11b =K11a P0
11c -CH2- (C-4) glutamic acid X11c = X11a+2v11 K11c =K11a P0
12 -N�(CH3)3 choline containing compounds 3.10^3.30 06K12 6 15 P0
13 -CHNCH- lipids 5.20^5.40 106K13 6 25 P0
k Additional signals Amplitude (A.U.)
14a -CH3 (C-3) lactic acida 1.30^1.40 06K14a 6 3 P0
14b -CH3 (C-3) lactic acida a14b = a14a 1.30^1.40 K14b =K14a P0
aWith a possible contribution of threonine (CH3).
BBAMCB 55738 2-1-01
M. Di Vito et al. / Biochimica et Biophysica Acta 1530 (2001) 47^6650

peaks (such as lactate, alanine, fucose, etc.) were ¢t-ted by the model with the other two (or four) expo-nentials. Thus, the ratio R of the peak areas of the-(CH2)n- protons with respect to the terminal -CH3
could be calculated with a higher precision.The statistical signi¢cance of di¡erences between
peak area ratios was assessed by two-tailed Student'st-test.
2.6. Fluorescence microscopy and £ow cytometry ofNile red-stained cells
For £uorescence microscopy and £ow cytometryanalyses, cells were resuspended in Hanks' balancedsalt solution (HBSS) and stained with 100 ng/ml Nilered [32,33] at 37³C for 15 min. After washing in PBS,the samples were resuspended in the same bu¡er andimmediately analyzed.
Fluorescence microscopy analysis was carried outon cells deposited on slides, with a Nikon Micro-phot-SA (Nikon Corporation, Tokyo, Japan). TheNile red yellow^gold £uorescence was observedwith the ¢lter set for £uorescein (450^500 nmband-pass excitation ¢lter, 510 nm centered dichroicmirror and 528 nm long pass barrier ¢lter). Photo-graphs of stained cells were taken in black and whiteon Kodak Tri-X pan ¢lm (400 ASA).
Flow cytometry analysis was performed with a
FACScan £ow cytometer (Becton Dickinson, Moun-tain View, CA, USA) equipped with a 15 mW, 488nm air-cooled argon ion laser. Fluorescence emissionwas analyzed by using a laser excitation wavelengthof 488 nm and an emission wavelength of 585 nm(yellow £uorescence). Data were collected and ana-lyzed on a Hewlett-Packard model 310 computer in-terfaced with the FACScan equipment. At least aminimum of 10 000 cells was counted per analysis.The log of the £uorescence intensity was plotted onthe x-axis and the number of cells possessing a givenintensity on the y-axis.
2.7. TEM
For ultrathin section analyses, cells were ¢xed with2.5% glutaraldehyde in 0.2 M cacodylate bu¡er (pH7.4) for 2 h at room temperature, washed and post-¢xed with 1% OsO4 in the same bu¡er for 1 h atroom temperature. Cells were then dehydrated inan alcohol gradient and embedded in epoxy resin(Agar 100 resin, Agar Scienti¢c Ltd., Stansted,UK) by routine procedures. Ultrathin sections, ob-tained with an LKB Ultrotome Nova ultramicro-tome, were stained with uranyl acetate and lead cit-rate and examined with a Philips EM 208Stransmission electron microscope at 60 kV.
For analyses on freeze-fracture replicas, cells were¢xed with 2.5% glutaraldehyde in the culture me-dium. After 20 min of ¢xation, cells were centrifugedfor 10 min at 120Ug, washed twice in HBSS, resus-pended in the same medium containing 25% glyceroland incubated for 20 min at room temperature. Thesuspension was then centrifuged at 170Ug for 15 minand the pellet was put on carriers and quickly frozenin Freon 22, partially solidi¢ed at the liquid nitrogentemperature. The mounted carriers were then trans-ferred into a Bal-Tec BAF 060 freeze-etch unit,cleaved at 3100³C at a pressure of 2^4U1037
mbar, shadowed with 2.5 nm of platinum^carbonand replicated with 20 nm carbon deposits. Plati-num^carbon evaporation (at an angle of 45³) andcarbon evaporation (at an angle of 90³) were per-formed using electron beam guns. The thickness ofthe deposit was evaluated by means of a quartz crys-tal thin ¢lm monitor. Cells were digested for 2 hfrom the replica by Chlorox. The replicas weremounted on naked 300-mesh grids and examined
Fig. 1. Example of signal quanti¢cation using AMARES foranalyzing a 1D 1H NMR spectrum of intact Jurkat cells. Peakassignments are given in Table 1. The Fourier transformed FID(a, measurement) is shown, together with the complex ¢ttedmodel (b), the individual components of the model (c) and thedi¡erence between measurement and ¢tted model (d, residue).
BBAMCB 55738 2-1-01
M. Di Vito et al. / Biochimica et Biophysica Acta 1530 (2001) 47^66 51
with a Philips EM 208S electron microscope at 60kV. For each sample, several replicas were obtainedand examined.
3. Results
3.1. Induction of cell apoptosis by drugs or serumdeprivation
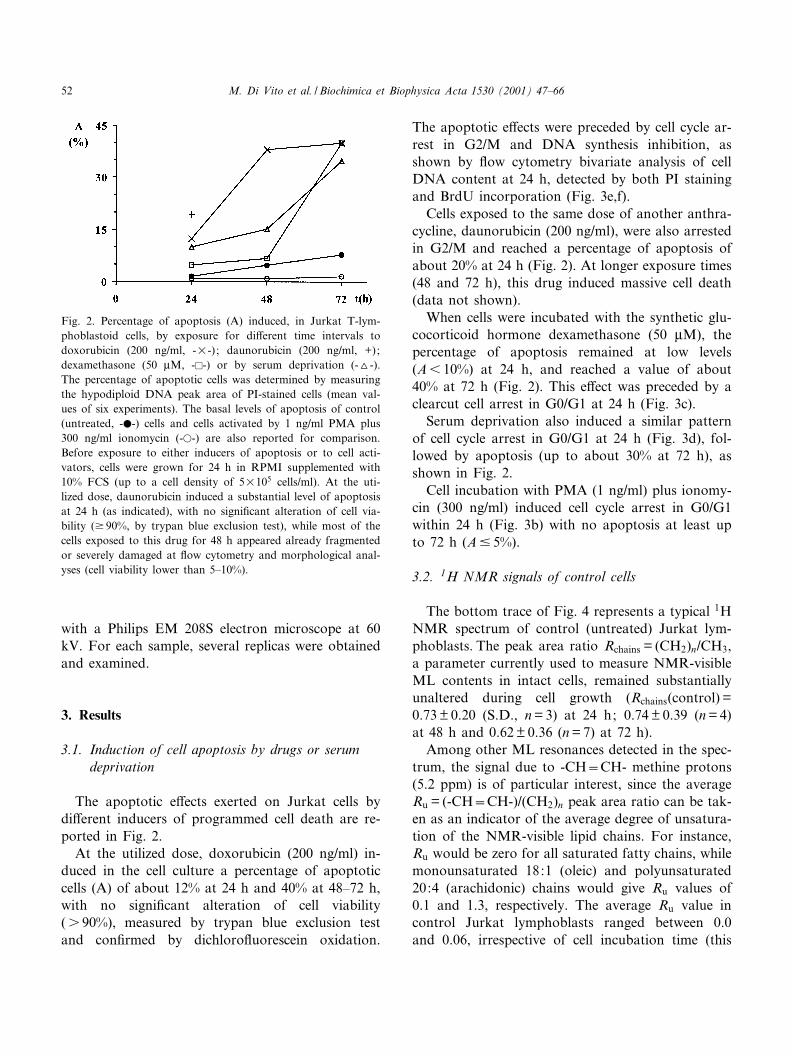
The apoptotic e¡ects exerted on Jurkat cells bydi¡erent inducers of programmed cell death are re-ported in Fig. 2.
At the utilized dose, doxorubicin (200 ng/ml) in-duced in the cell culture a percentage of apoptoticcells (A) of about 12% at 24 h and 40% at 48^72 h,with no signi¢cant alteration of cell viability(s 90%), measured by trypan blue exclusion testand con¢rmed by dichloro£uorescein oxidation.
The apoptotic e¡ects were preceded by cell cycle ar-rest in G2/M and DNA synthesis inhibition, asshown by £ow cytometry bivariate analysis of cellDNA content at 24 h, detected by both PI stainingand BrdU incorporation (Fig. 3e,f).
Cells exposed to the same dose of another anthra-cycline, daunorubicin (200 ng/ml), were also arrestedin G2/M and reached a percentage of apoptosis ofabout 20% at 24 h (Fig. 2). At longer exposure times(48 and 72 h), this drug induced massive cell death(data not shown).
When cells were incubated with the synthetic glu-cocorticoid hormone dexamethasone (50 WM), thepercentage of apoptosis remained at low levels(A6 10%) at 24 h, and reached a value of about40% at 72 h (Fig. 2). This e¡ect was preceded by aclearcut cell arrest in G0/G1 at 24 h (Fig. 3c).
Serum deprivation also induced a similar patternof cell cycle arrest in G0/G1 at 24 h (Fig. 3d), fol-lowed by apoptosis (up to about 30% at 72 h), asshown in Fig. 2.
Cell incubation with PMA (1 ng/ml) plus ionomy-cin (300 ng/ml) induced cell cycle arrest in G0/G1within 24 h (Fig. 3b) with no apoptosis at least upto 72 h (A9 5%).
3.2. 1H NMR signals of control cells
The bottom trace of Fig. 4 represents a typical 1HNMR spectrum of control (untreated) Jurkat lym-phoblasts. The peak area ratio Rchains = (CH2)n/CH3,a parameter currently used to measure NMR-visibleML contents in intact cells, remained substantiallyunaltered during cell growth (Rchains(control) =0.73 þ 0.20 (S.D., n = 3) at 24 h; 0.74 þ 0.39 (n = 4)at 48 h and 0.62 þ 0.36 (n = 7) at 72 h).
Among other ML resonances detected in the spec-trum, the signal due to -CHNCH- methine protons(5.2 ppm) is of particular interest, since the averageRu = (-CHNCH-)/(CH2)n peak area ratio can be tak-en as an indicator of the average degree of unsatura-tion of the NMR-visible lipid chains. For instance,Ru would be zero for all saturated fatty chains, whilemonounsaturated 18:1 (oleic) and polyunsaturated20:4 (arachidonic) chains would give Ru values of0.1 and 1.3, respectively. The average Ru value incontrol Jurkat lymphoblasts ranged between 0.0and 0.06, irrespective of cell incubation time (this
Fig. 2. Percentage of apoptosis (A) induced, in Jurkat T-lym-phoblastoid cells, by exposure for di¡erent time intervals todoxorubicin (200 ng/ml, -U-) ; daunorubicin (200 ng/ml, +);dexamethasone (50 WM, -E-) or by serum deprivation (-O-).The percentage of apoptotic cells was determined by measuringthe hypodiploid DNA peak area of PI-stained cells (mean val-ues of six experiments). The basal levels of apoptosis of control(untreated, -b-) cells and cells activated by 1 ng/ml PMA plus300 ng/ml ionomycin (-a-) are also reported for comparison.Before exposure to either inducers of apoptosis or to cell acti-vators, cells were grown for 24 h in RPMI supplemented with10% FCS (up to a cell density of 5U105 cells/ml). At the uti-lized dose, daunorubicin induced a substantial level of apoptosisat 24 h (as indicated), with no signi¢cant alteration of cell via-bility (v 90%, by trypan blue exclusion test), while most of thecells exposed to this drug for 48 h appeared already fragmentedor severely damaged at £ow cytometry and morphological anal-yses (cell viability lower than 5^10%).
BBAMCB 55738 2-1-01
M. Di Vito et al. / Biochimica et Biophysica Acta 1530 (2001) 47^6652

relatively wide data scattering being due to the di¤-culty of accurately measuring the area of the-CHNCH- peak, close to the water signal). The de-tection of lipid signals at 2.1 and 2.8 ppm (overlap-ping with other resonances), respectively due tomethylene units adjacent to one (NCH-CH2-CH2-)or two methine units (NCH-CH2-CHN), indicated
that the ML fatty chains were partially polyunsatu-rated.
The choline N�(CH3)3 signal at 3.2 ppm was at-tributed to phosphocholine (PCho), by comparisonwith 1H NMR analysis of aqueous cell extracts(data not shown). In intact lymphoblasts this signalprogressively decreased during cell growth: the value
Fig. 3. Bivariate histograms showing DNA content (y-axis, PI £uorescence) and BrdU incorporation (x-axis, log £uorescein isothio-cyanate £uorescence) in Jurkat cells after 24 h of exposure to di¡erent conditions: (a) untreated controls; (b) PMA (1 ng/ml) plus ion-omycin (300 ng/ml); (c) dexamethasone (50 WM); (d) serum deprivation; (e) doxorubicin (200 ng/ml). (f) shows the single-parameter£ow DNA distribution of Jurkat cells exposed to doxorubicin for 24 h. The cells were stained with PI (see Section 2). The percentagesof cells in the G0/G1, S and G2/M phases of the cell cycle (mean þ S.D.) are shown in (g).
BBAMCB 55738 2-1-01
M. Di Vito et al. / Biochimica et Biophysica Acta 1530 (2001) 47^66 53
of the peak area ratio RCho = N�(CH3)3/CH3 wasequal to 0.76 þ 0.07 (n = 3) at 24 h; 0.49 þ 0.10(n = 4) at 48 h (statistical signi¢cance of the di¡erenceversus 24 h, P6 0.01) and 0.39 þ 0.11 (n = 6) at 72 h(P6 0.001 versus 24 h).
3.3. 1H NMR signals of cells undergoing apoptosis
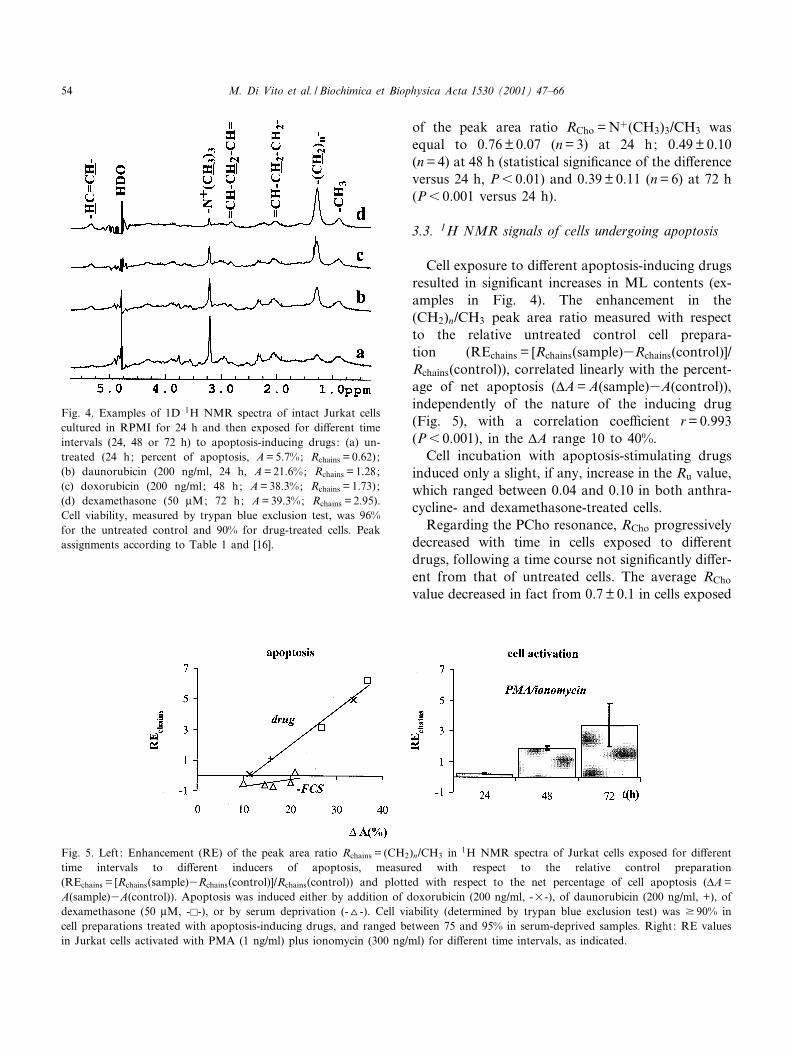
Cell exposure to di¡erent apoptosis-inducing drugsresulted in signi¢cant increases in ML contents (ex-amples in Fig. 4). The enhancement in the(CH2)n/CH3 peak area ratio measured with respectto the relative untreated control cell prepara-tion (REchains = [Rchains(sample)3Rchains(control)]/Rchains(control)), correlated linearly with the percent-age of net apoptosis (vA = A(sample)3A(control)),independently of the nature of the inducing drug(Fig. 5), with a correlation coe¤cient r = 0.993(P6 0.001), in the vA range 10 to 40%.
Cell incubation with apoptosis-stimulating drugsinduced only a slight, if any, increase in the Ru value,which ranged between 0.04 and 0.10 in both anthra-cycline- and dexamethasone-treated cells.
Regarding the PCho resonance, RCho progressivelydecreased with time in cells exposed to di¡erentdrugs, following a time course not signi¢cantly di¡er-ent from that of untreated cells. The average RCho
value decreased in fact from 0.7 þ 0.1 in cells exposed
Fig. 4. Examples of 1D 1H NMR spectra of intact Jurkat cellscultured in RPMI for 24 h and then exposed for di¡erent timeintervals (24, 48 or 72 h) to apoptosis-inducing drugs: (a) un-treated (24 h; percent of apoptosis, A = 5.7%; Rchains = 0.62);(b) daunorubicin (200 ng/ml, 24 h, A = 21.6%; Rchains = 1.28;(c) doxorubicin (200 ng/ml; 48 h; A = 38.3%; Rchains = 1.73);(d) dexamethasone (50 WM; 72 h; A = 39.3%; Rchains = 2.95).Cell viability, measured by trypan blue exclusion test, was 96%for the untreated control and 90% for drug-treated cells. Peakassignments according to Table 1 and [16].
Fig. 5. Left : Enhancement (RE) of the peak area ratio Rchains = (CH2)n/CH3 in 1H NMR spectra of Jurkat cells exposed for di¡erenttime intervals to di¡erent inducers of apoptosis, measured with respect to the relative control preparation(REchains = [Rchains(sample)3Rchains(control)]/Rchains(control)) and plotted with respect to the net percentage of cell apoptosis (vA =A(sample)3A(control)). Apoptosis was induced either by addition of doxorubicin (200 ng/ml, -U-), of daunorubicin (200 ng/ml, +), ofdexamethasone (50 WM, -E-), or by serum deprivation (-O-). Cell viability (determined by trypan blue exclusion test) was v 90% incell preparations treated with apoptosis-inducing drugs, and ranged between 75 and 95% in serum-deprived samples. Right: RE valuesin Jurkat cells activated with PMA (1 ng/ml) plus ionomycin (300 ng/ml) for di¡erent time intervals, as indicated.
BBAMCB 55738 2-1-01
M. Di Vito et al. / Biochimica et Biophysica Acta 1530 (2001) 47^6654

for 24 h to anthracyclines, to 0.4 þ 0.2 ( þ S.D., n = 4)in cells treated for 72 h with dexamethasone.
Di¡erently from cell preparations induced to apo-ptosis by cytotoxic drugs, decreased ML contentswere found in cells induced to programmed celldeath by serum deprivation, with respect to controls(Rchains = 0.31 þ 0.10 (n = 2) at 24 h; 0.48 þ 0.02 (n = 2)at 48 h; 0.54 þ 0.25 (n = 4) at 72 h). The REchains
value was therefore negative in most of these samples(Fig. 5). Moreover, the -CHNCH- resonance wasalways below detection level in serum-deprived cells,
while the PCho signal area signi¢cantly di¡ered fromthat of controls only at 72 h (RCho = 0.18 þ 0.09(P6 0.023)).
3.4. ML signals of cells activated withPMA/ionomycin
In agreement with previous studies on activatedlymphoblasts and lymphocytes [11,12], the incuba-tion of Jurkat cells with PMA/ionomycin also re-sulted in a progressive increase in ML levels with
Fig. 6. Fluorescence microscopy of Nile red-stained Jurkat lymphoblastoid cells : (a) untreated cells (Rchains = 0.39) show few £uores-cent globular bodies in the cytoplasm; (b) upon activation for 72 h with PMA (1 ng/ml) plus ionomycin (300 ng/ml), cells(Rchains = 2.27) display a signi¢cant increase in the number of £uorescent particles; (c) after 72 h exposure to dexamethasone (50 WM;A = 40%; Rchains = 2.82) a high density of Nile red-reacting bodies is detectable both in the cytoplasm of intact cells and outside someapoptotic lymphoblasts. Scale bar, 10 Wm. The lower panels report £ow cytometry histograms of (d) serum-deprived cells (A = 25%;Rchains = 0.19;) ; (e) cells exposed to PMA/ionomycin (the same as b); (f) cells exposed to dexamethasone (same as c), with respect tountreated cells (same sample as a, full line). The respective mean £uorescence intensity values (log scale) are indicated in parentheses.
BBAMCB 55738 2-1-01
M. Di Vito et al. / Biochimica et Biophysica Acta 1530 (2001) 47^66 55

respect to the controls, the average REchains valuegoing from about 0.2 at 24 h to about 2.0 at 48and to 3.5 at 72 h (Fig. 5, right panel).
Although no apoptosis was induced on Jurkat cellsat the utilized doses of PMA/ionomycin, the REchains
value of lymphoblasts exposed for 72 h to these cellactivators was similar to that of cell cultures contain-ing 30^40% of apoptotic cells, following exposure toeither anthracyclines or dexamethasone (Fig. 5).
The average Ru value was not signi¢cantly di¡er-ent in cells induced to apoptosis by either PMA/ion-omycin or drugs.
3.5. Structural characterization of ML domains
Fluorescence microscopy of Nile red-stained cellsshowed the presence of only a few globular lipidbodies in the cytoplasm of control cell preparations(Fig. 6a). The number of these £uorescent particles(whose diameter ranged from resolution limit, 0.1^
Fig. 7. Plot of Rchains ((CH2)n/CH3 NMR peak area ratio) as afunction of yellow^gold £uorescence (585 nm) of Nile red-stained Jurkat cells, under di¡erent experimental conditions:apoptosis induced either by exposure to dexamethasone (50WM, 72 h) or by serum deprivation (72 h); cell activation byPMA (1 ng/ml) plus ionomycin (300 ng/ml, 72 h) or no treat-ment. The two points indicated by 8 were given by two sam-ples of Jurkat cells belonging to a di¡erent clone.
C
Fig. 8. TEM of OsO4-treated Jurkat lymphoblastoid cells :(a) untreated; (b) cells activated for 72 h by PMA (1 ng/ml)plus ionomycin (300 ng/ml); (c) cells induced to apoptosis byexposure to dexamethasone (50 WM, 72 h). Cells in (b) and(c) display a number of osmophilic globular bodies, both nearthe nucleus and in proximity of the plasma membrane. Scalebars, 1 Wm.
BBAMCB 55738 2-1-01
M. Di Vito et al. / Biochimica et Biophysica Acta 1530 (2001) 47^6656

0.2 Wm, to about 1.0 Wm) increased substantially inPMA/ionomycin-treated cells (Fig. 6b) and evenmore markedly in cells induced to apoptosis by 72h exposure to dexamethasone (Fig. 6c). Some apo-ptotic cells apparently released their content of cyto-plasmic lipid bodies to the external medium.
Combined NMR and £ow cytometry analyses ofNile red-stained cells (examples in Fig. 6d^f) demon-strated that Rchains ¢rst increased with the mean yel-low^gold £uorescence intensity (F) and then reacheda plateau value of about 3.5 (Fig. 7). The sameRchains versus F behavior was followed independently
Fig. 9. TEM of freeze-fracture replicas of Jurkat lymphoblastoid cells : (a) protoplasmic fracture face of plasma membrane of a con-trol (untreated) cell, in which numerous IMP, randomly distributed, are visible; (b) cross-fracture of a control cell in which cytoplas-mic organelles with few (if any) lipid bodies are detectable; (c) protoplasmic fracture face of a cell exposed for 72 h to PMA (1 ng/ml) plus ionomycin (300 ng/ml), showing the presence of numerous small, roundish lipid particles of 60^100 nm, embedded in theplasma membrane; (d) cytoplasmic fracture face of a cell similarly exposed to PMA/ionomycin, showing numerous embedded cyto-plasmic lipid bodies. The isolated lipid body located in the central upper part of the panel, fractured through the hydrophobic planeof its enveloping membrane, shows the presence of numerous distinct IMP. The panel also shows several cross-fractured lipid bodies,in which an inner amorphous matrix is clearly surrounded by an outer membrane. The nuclear envelope with nuclear pores is alsovisible on the left side of (d). Scale bars: 1 Wm.
BBAMCB 55738 2-1-01
M. Di Vito et al. / Biochimica et Biophysica Acta 1530 (2001) 47^66 57

BBAMCB 55738 2-1-01
M. Di Vito et al. / Biochimica et Biophysica Acta 1530 (2001) 47^6658
of the experimental conditions of cell growth, cellcycle arrest, apoptosis by dexamethasone, activationby PMA/ionomycin or no treatment. These analysescould not be extended to lymphoblasts incubatedwith doxorubicin or daunorubicin, due to the intrin-sic £uorescence of these drugs, which interfered withthat of Nile red.
3.6. Ultrastructural characterization of ML domains
TEM analyses of ultrathin sections allowed thedetection of a number of electron-dense globular par-ticles (maximum diameter of about 1.0 Wm), locatedin the cytoplasm of both dexamethasone-treated(Fig. 8c) and PMA/ionomycin-activated cells (Fig.8b). These particles were not detected in controlpreparations (Fig. 8a). Due to their strong osmo-philic nature, these structures were attributed to lipidbodies containing a substantial amount of unsaturat-ed fatty chains.
TEM examination of cell freeze-fracture replicasallowed a more detailed study of the structure andlocalization of ML in either apoptotic or activatedlymphoblasts. It is in fact known that, in freeze-frac-tured cells, the fracture runs either through the hy-drophobic plane of the plasma membrane or acrosshydrophobic regions of the cytoplasm, allowing de-tection and ultrastructural analysis of lipid domainsin both compartments.
Fig. 9a shows the protoplasmic fracture face of theplasma membrane of a control Jurkat cell, in whichrandomly distributed IMP could be observed. Ex-amination of these cross-fractured cells allowed, asexpected, the detection of numerous intracellular or-ganelles distributed within the cytoplasm (Fig. 9b).In addition to these structures, typical of intracellularcompartments, examination of PMA/ionomycin-stimulated cells showed the presence of (1) numerouscytoplasmic globular bodies, consisting of an amor-phous lipid core, surrounded by own membrane,with a diameter distribution between 0.5 and 1.0Wm (Fig. 9d) and (2) smooth, roundish lipid particlesof 60^100 nm, embedded in the plasma membrane(Fig. 9c). Both types of lipid aggregates were similarto those already reported in our previous study onML-containing ¢broblasts [16], and were practicallyabsent in untreated Jurkat cells.
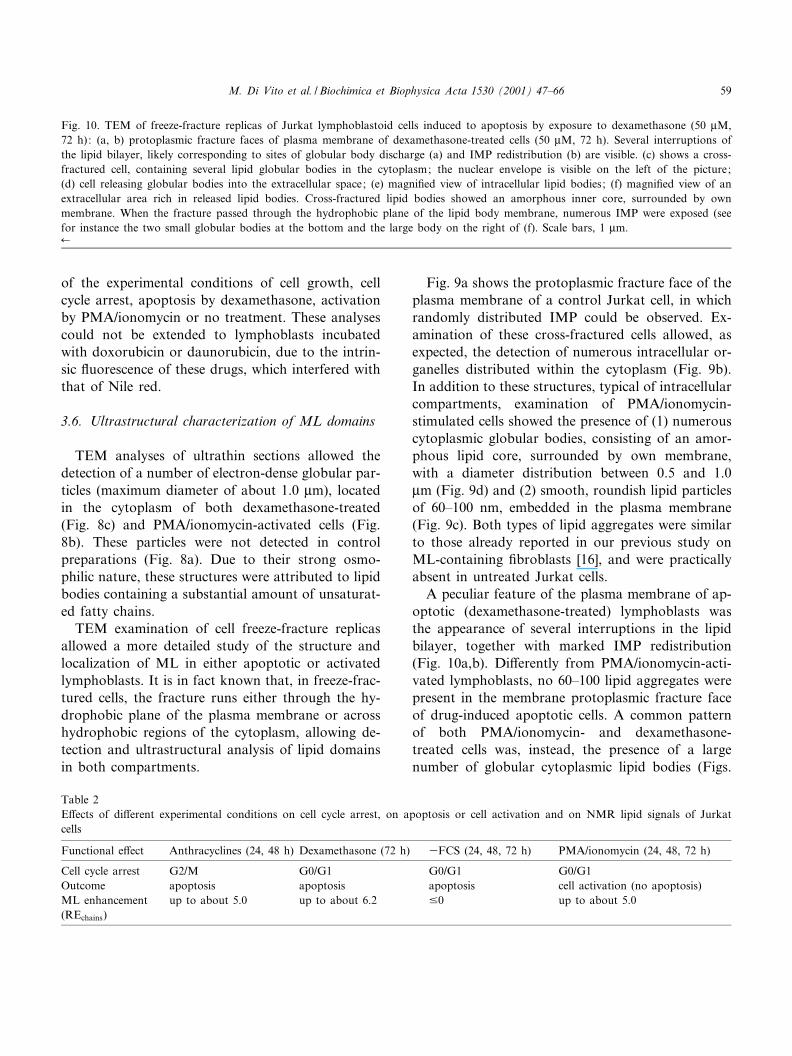
A peculiar feature of the plasma membrane of ap-optotic (dexamethasone-treated) lymphoblasts wasthe appearance of several interruptions in the lipidbilayer, together with marked IMP redistribution(Fig. 10a,b). Di¡erently from PMA/ionomycin-acti-vated lymphoblasts, no 60^100 lipid aggregates werepresent in the membrane protoplasmic fracture faceof drug-induced apoptotic cells. A common patternof both PMA/ionomycin- and dexamethasone-treated cells was, instead, the presence of a largenumber of globular cytoplasmic lipid bodies (Figs.
Table 2E¡ects of di¡erent experimental conditions on cell cycle arrest, on apoptosis or cell activation and on NMR lipid signals of Jurkatcells
Functional e¡ect Anthracyclines (24, 48 h) Dexamethasone (72 h) 3FCS (24, 48, 72 h) PMA/ionomycin (24, 48, 72 h)
Cell cycle arrest G2/M G0/G1 G0/G1 G0/G1Outcome apoptosis apoptosis apoptosis cell activation (no apoptosis)ML enhancement(REchains)
up to about 5.0 up to about 6.2 90 up to about 5.0
Fig. 10. TEM of freeze-fracture replicas of Jurkat lymphoblastoid cells induced to apoptosis by exposure to dexamethasone (50 WM,72 h): (a, b) protoplasmic fracture faces of plasma membrane of dexamethasone-treated cells (50 WM, 72 h). Several interruptions ofthe lipid bilayer, likely corresponding to sites of globular body discharge (a) and IMP redistribution (b) are visible. (c) shows a cross-fractured cell, containing several lipid globular bodies in the cytoplasm; the nuclear envelope is visible on the left of the picture;(d) cell releasing globular bodies into the extracellular space; (e) magni¢ed view of intracellular lipid bodies; (f) magni¢ed view of anextracellular area rich in released lipid bodies. Cross-fractured lipid bodies showed an amorphous inner core, surrounded by ownmembrane. When the fracture passed through the hydrophobic plane of the lipid body membrane, numerous IMP were exposed (seefor instance the two small globular bodies at the bottom and the large body on the right of (f). Scale bars, 1 Wm.6
BBAMCB 55738 2-1-01
M. Di Vito et al. / Biochimica et Biophysica Acta 1530 (2001) 47^66 59

9d and 10c). Moreover, a quite high percentage ofseverely damaged apoptotic cells appeared to releasetheir content of lipid bodies to the external medium(Fig. 10d), con¢rming similar observations in £uores-cence microscopy analyses of Nile red-stained cells(Fig. 6c). When examined at higher magni¢cation,the globular bodies detected either in the cytoplasm(Fig. 10e) or outside the apoptotic cells (Fig. 10f)exhibited thin lamellar structures embedded in anamorphous matrix.
4. Discussion
By detecting the formation of ML in intact tumorcells undergoing apoptosis, NMR recently emergedas an attractive tool to investigate alterations of lipidmetabolism associated with programmed cell death.
There remain, however, a number of open ques-tions regarding the nature and subcellular localiza-tion of ML domains in intact apoptotic cells. Anearly interpretation suggested that ML signals mayoriginate from increased £uidity of the apoptotic cellmembrane [8,9]. This hypothesis has not howeverbeen proven, and by itself could hardly reconcileNMR-visibility of ML with the inherently aniso-tropic motion of fatty chains maintained in a mem-brane bilayer. In a more recent study on experimen-tal apoptotic gliomas, in-vivo-detected ML signalswere found to be associated with the presence ofosmium-stained cytoplasmic lipid bodies in biopticalspecimens [10].
Another question, so far scarcely addressed, con-cerns the relative contribution to ML formation byapoptotic events, as compared to possible contribu-tions from cell proliferation block [20] and/or cellarrest in speci¢c cell cycle phases [34].
Furthermore, it is not clear whether common bio-chemical mechanisms underly the formation of MLdomains observed either in apoptotic or in non-apo-ptotic, activated lymphoblasts or lymphocytes[11,12].
These di¡erent aspects were addressed in thepresent study, by combining quantitative NMR mea-surements with £uorescence and TEM analyses ofJurkat T-lymphoblastoid cells, exposed to di¡erentculture conditions, inducing cell arrest in di¡erentphases of the cell cycle and resulting in either apo-
ptosis or lymphoblast activation, as summarized inTable 2.
The quanti¢cation of NMR signals of ML in in-tact cells was performed by adopting appropriatemodel functions [16], originally developed for invivo NMR analyses [28^31], which allow homogene-ous signal deconvolution criteria and operator-inde-pendent determination of peak areas.
The present study demonstrated that (1) the en-hancement of Rchains directly correlated with drug-induced apoptosis (or cell activation), rather thanbeing a direct consequence of cell cycle arrest(G0/G1 or G2/M); (2) the appearance of ML signalsin the NMR spectra of intact cells was associatedwith the formation of cytoplasmic lipid bodies ineither drug-induced apoptotic or in non-apoptotic,stimulated cells. This body of evidence, discussed indetail in the following sections, supports the hypoth-esis that common biochemical mechanisms mayunderly ML formation in either apoptotic or stimu-lated lymphoblasts.
This study also demonstrated that the PCho signalwas not an index of apoptosis, since the decrease ofRCho during cell incubation with drugs was not sub-stantially di¡erent from that of untreated cells in theprogression from log to stationary phase, a behavioralready described for a number of tumor cells inculture [35]. The much lower RCho value measuredin Jurkat cells deprived of serum for 72 h, could beattributed to impaired biosynthetic activity and/or toleakage of small metabolites from the cells, underthese particular conditions.
4.1. NMR-visible ML domains during drug-inducedapoptosis or cell activation
The intensity of ML signals in tumor cells mayvary according to cell type and culture conditions.Untreated Jurkat cells were characterized by a ratherlow basal ML content, in agreement with previousstudies [8,9]. The latter remained substantially unal-tered during cell growth in culture (up to 96 h afterseeding).
The two anthracyclines selected for this study,doxorubicin and daunorubicin, are among the mostwidely used compounds in cancer chemotherapy ofeither solid tumors or leukemias. Since these drugswere utilized at doses of about 0.3 WM, i.e. below the
BBAMCB 55738 2-1-01
M. Di Vito et al. / Biochimica et Biophysica Acta 1530 (2001) 47^6660

maximum plasma levels reached during chemother-apy (up to 5 WM), their e¡ects are likely representa-tive of drug action in vivo [36]. Anthracyclines arebelieved to exert their antitumor activity mainly byinteracting with cellular DNA [36,37]. Similarly toother DNA cross-linking agents, doxorubicin anddaunorubicin induce, as their ¢rst biological e¡ects,cell cycle arrest in the G2 phase and inhibition ofDNA synthesis [36^38]. Moreover, at pharmacologi-cally relevant concentrations, apoptosis is reported asthe main mechanism of acute lymphoblastic leuke-mia cell killing by both drugs [39,40].
Quantitative NMR and £ow cytometry analyses ofPI-stained cells performed in this study demonstratedthat doxorubicin-induced cell cycle arrest in G2/Mwas almost complete by 24 h, when both apoptosisand ML signals started to rise. These results indi-cated a direct association of ML formation with ap-optotic events, rather than with cell cycle arrest.
A similar conclusion was suggested by experimentson dexamethasone-treated cells. Upon binding tospeci¢c glucocorticoid hormone receptor(s), thisdrug induces cell cycle arrest in G0/G1 and regulatesapoptosis of normal and neoplastic T-lymphocytes[41]. Flow cytometry analyses performed in thisstudy showed that cell cycle arrest (monitored byBrdU incorporation) was practically complete by 24h of cell exposure to the drug, while substantial levelsof both apoptosis and ML formation could only bedetected at much longer incubation times (around72 h).
Similarly, in non-apoptotic PMA/ionomycin-acti-vated cells, substantial ML contents were only mea-sured at 48^72 h of stimulation, i.e. several hoursafter cell cycle arrest in G0/G1, that had almostgone to completion within 24 h.
In all samples exposed to apoptosis-inducingdrugs, a positive enhancement of ML signals abovethe control level could be appreciated only when theapoptotic cell fraction exceeded that of controls bymore than 10%. Above this threshold, the ML con-tent correlated with the extent of DNA fragmenta-tion, an event occurring during the ¢nal phase ofirreversible cell degradation, in the apoptotic pro-gram. Blankenberg et al. [9] similarly reported thatthe (CH2)n signal intensity of doxorubicin-treatedJurkat cells paralleled DNA fragmentation, as wellas other changes occurring during apoptosis, includ-
ing phosphatidylserine transmembrane translocation.No studies have, however, been reported on the pos-sible relationships between ML formation and earlyevents of the apoptotic cascade, such as caspaseactivation and mitochondrial dysfunction. The pos-sible relevance of these aspects is discussed in Section4.3.
Jurkat lymphoblasts induced to apoptosis by se-rum deprivation showed decreased, instead of in-creased, ML contents with respect to control cells.This result is not in agreement with the study byBlankenberg at al. [9], in which increased (CH2)n
signal areas were reported for serum-starved apopto-tic Jurkat cells. A possible explanation for this dis-crepancy could be a di¡erent responsiveness to serumdeprivation of the Jurkat clones used in the two stud-ies. The maximum percentage of apoptosis (mea-sured from a well-delineated sub-G1 peak) was infact about 30% in our serum-deprived cell cultures,as compared to levels of about 50% reported byBlankenberg et al. [9]. On the other hand, a decreaseof ML content in serum-starved cells should not besurprising from a biochemical viewpoint, as it maysimply re£ect consumption of intracellular neutrallipid stores, in cells deprived of external lipid supplyand likely unable to maintain substantial lipid syn-thesis levels.
4.2. Structural characterization of ML domains inapoptotic and in activated lymphoblasts
Increased ML signal intensities were associatedwith the accumulation of cytoplasmic lipid bodiesin apoptotic dexamethasone-treated Jurkat cells, aswell as in non-apoptotic cells activated by PMA/ion-omycin. These lipid bodies, detected either as £uo-rescent particles in Nile red-stained cells (Fig. 6) oras osmiophilic particles in TEM analyses of ultrathinsections (Fig. 8), consisted of an amorphous lipidcore surrounded by a membrane, as demonstratedby TEM analysis of cell freeze-fracture replicas(Figs. 9 and 10). Closely similar morphological fea-tures were also observed in our recent study on cy-toplasmic lipid bodies in ML-rich NIH-3T3 ¢bro-blasts [16]. The presence of cytoplasmic osmophiliclipid bodies (0.2^2.0 Wm) has also been recently re-ported by Hakumaki et al. in TEM analyses of ap-optotic glioma tumor biopsies [10].
BBAMCB 55738 2-1-01
M. Di Vito et al. / Biochimica et Biophysica Acta 1530 (2001) 47^66 61

No lipid bodies were instead detected in the cyto-plasm of serum-starved apoptotic cells, whose Rchains
values were even lower than that of untreated controlcells.
Besides cytoplasmic lipid bodies, a number ofsmall, amorphous lipid aggregates (diameter 60^100nm) was detected at the level of the plasma mem-brane in PMA/ionomycin-activated cells (Fig. 9c).Similar lipid aggregates were also detected in themembrane of NIH-3T3 ¢broblasts [16]. The contri-bution of these membranous lipid particles to MLsignals is still to be clari¢ed. Since, however, theirtotal volume (90.2 Wm3/cell) was much smallerthan that occupied by cytoplasmic lipid bodies (4^8Wm3/cell), their contribution to ML signals should beconsidered accordingly lower [16].
Cytoplasmic lipid bodies may form in a large vari-ety of animal and plant systems, especially underconditions of stress, as recently reviewed by Murphyand Vance [42]. An interesting feature of these or-ganelles is their capability to act as carriers of ara-chidonic acid in macrophages and mast cells [43],and to serve as a reservoir of neutral lipids fromeither endogenous or exogenous sources. The pres-ence of IMP particles on the membrane of lipidbodies, detected by TEM analysis of freeze-fracturereplicas of either activated or apoptotic Jurkat cells(Fig. 9d and 10f) suggests that, besides allowing neu-tral lipid storage, these bodies may also act as areservoir of proteins requiring a hydrophobic envi-ronment or a hydrophobic/hydrophilic interface fortheir transport and function. Further investigationson the actual composition of NMR-visible cytoplas-mic lipid bodies are needed to elucidate their biolog-ical function, also in relation to a possible role in theexchange of lipid messengers and enzymes betweenplasma membrane and cytoplasm.
The release of lipid bodies from lymphoblasts atadvanced stages of apoptosis (see for instance Fig.10d,f)) could represent one of the major mechanismsresponsible for the reported release of lipids (arachi-donic acid and esteri¢ed fatty chains) from apoptoticcells, originally attributed to membrane sheddingphenomena [44]. Lipid body release from apoptoticcells may also facilitate the isolation and chemicalcharacterization of these cytoplasmic particles, anessential requirement for better clarifying their bio-logical role in the cell.
Regarding the possibility (and limits) of quantify-ing NMR-visible lipid bodies in intact cells, it shouldbe noted that under all adopted conditions (drug-induced apoptosis or apoptosis by serum depriva-tion, cell activation or no treatment) there was adirect relationship between Rchains and the intensityof yellow^gold £uorescence in Nile red-stained cells(F). A positive correlation between these two param-eters was found, however, only in a limited Rchains
range (up to about 2.5), after which the Rchains(F)function gradually approached a plateau. This isnot surprising since, while £uorescence is expectedto increase with the amount of neutral lipid domains,Rchains is a complex function of parameters related tothe `NMR-visibility' of fatty chains, including aver-age chain length, degree of unsaturation and `iso-tropic mobility'. Assuming an average fatty chainlength between 17 and 18 [16], and an average degreeof unsaturation of one double bond (correspondingto the measured Ru value of about 0.1), the Rchains of`fully NMR-visible' fatty chains should be between6.0 and 7.0. Therefore, the plateau value of theRchains(F) curve (about 3.5), indicates that the`NMR-visibility' of the saturated (CH2)n segments(normalized to the terminal CH3 group) in our MLdomains is approximately 50% lower than that ex-pected for fully NMR-visible chains (e.g. monodis-persed in organic solvent).
It can therefore be concluded that the Rchains valuemeasured by NMR in intact apoptotic cells can betaken as an `index of ML content' only in the linearportion of the Rchains(F) curve, while the plateau val-ue of this curve provides an indication of the max-imum NMR-visibility of fatty chains, on the basis oftheir dynamic structure.
4.3. Are there common mechanisms of ML generationin apoptotic and in PMA/stimulatedlymphoblasts?
The close similarities (both qualitative and quanti-tative) in the spectral and structural features ofML domains in either apoptotic or activatedlymphoblasts, suggest the hypothesis that MLmay be formed by biochemical mechanisms takingplace during the pre-apoptotic phase, in whichthe cell is still biochemically competent, rather thanduring a late stage of the cell death program,
BBAMCB 55738 2-1-01
M. Di Vito et al. / Biochimica et Biophysica Acta 1530 (2001) 47^6662

dominated by `passive' degradation of cell compo-nents.
Concerning the possible mechanisms of ML for-mation, it is known that combination of a phorbolester (PMA) with a calcium ionophore (ionomycin),mimics the e¡ect of T cell receptor (TCR) stimula-tion in lymphoblasts and lymphocytes [45]. In fact,by respectively stimulating protein kinase C andCa2� in£ux, PMA and ionomycin induce e¡ects sim-ilar to those of the two major second messengers ofthe phosphoinositide cycle, diacylglycerols and inosi-tol 1,4,5-triphosphate. It has also been suggested [12]that alterations in intracellular Ca2� levels, occurringunder these conditions may lead to activation of var-ious phospholipases of the PC cycle, particularlyphospholipases C (plc) and A2 (plA2), with the con-sequent production and turnover of neutral lipids.
Support to the hypothesis that PC hydrolysis mayplay a role in ML formation has been given by thedemonstration that the PC-plc inhibitor D609 (tricy-clodecan-9-yl-xantogenate) also inhibits ML accumu-lation in TCR/CD3-stimulated thymocytes [12], aswell as in NIH-3T3 ¢broblasts [16]. A similar in-volvement of PC-plc may also contribute to ML for-mation during programmed cell death, as this en-zyme has been implicated in cascades of apoptoticevents, such as that triggered by the tumor necrosisfactor K (TNFK) receptor [46].
On the other hand, a possible role of plA2 in MLformation has recently been proposed by Hakumakiet al. [10] to explain the increases in FFA and in thelysoPC-to-PC ratio measured in tissue extracts of ap-optotic gliomas. This hypothesis seems to be furthersupported by studies demonstrating (a) plA2-medi-ated release of arachidonic acid in cells stimulatedby either recombinant TNF or interleukin-1 [47]and (b) caspase-dependent activation of cytosolicplA2 in TNF-induced apoptosis [48] and di¡erentialactivation of phospholipases during apoptosis or ne-crosis [49].
It can therefore be suggested that activation ofphospholipases such as PC-plc and plA2 may con-tribute, in both apoptotic and activated cells, to theformation of NMR-visible neutral lipid pools, bya¡ecting the production and turnover of FFA andTG precursors.
Other factors, such as fatty chain unsaturationmay also in principle contribute to modulating the
NMR-visibility of ML domains in intact cells. Asubstantial accumulation of PUFA, mostly attrib-uted to the TG fraction, has actually been detectedby Hakumaki et al. [10] in apoptotic glioma tumors,on the basis of an increased cross peak between the-CHNCH- resonance and that of bis-allylic protons(2.8 ppm) in two-dimensional correlation spectrosco-py NMR spectra. This result suggested the existenceof a quantitative interrelationship between apoptosisand intracellular PUFA accumulation. In our cellsystem, however, the average Ru value, an index offatty chain unsaturation, did not show a signi¢cantincrease in apoptotic cells with respect to untreatedcontrol cells, indicating that PUFA accumulationduring apoptosis may vary according to cell typeand conditions of cell growth.
Among other biochemical mechanisms which mayin principle also play a major role in ML domainformation in apoptotic cells, the loss of electrochem-ical potential across the inner mitochondrial mem-brane, vVm, deserves particular consideration. Infact, the decrease of vVm, with consequent onset ofpermeability transition across the mitochondrialmembrane, is a central rate-limiting event of apopto-tic cascades, where all `private' pathways of apopto-sis converge, prior to the occurrence of irreversiblealterations at the level of the plasma membrane, nu-cleus and cytoplasm [50]. A decrease or loss of mi-tochondrial vVm in pre-apoptotic cells is expected tobe associated with alterations in the production offatty acids and cholesterol, via the citrate to acetyl-coenzyme A conversion pathways [51], and cantherefore contribute to the formation of cytoplasmicneutral lipid aggregates. A similar loss of feedbackcontrol of cholesterol and fatty acid synthesis mayoccur in activated lymphoblasts, where a long-lastingstimulation by PMA plus ionomycin may induce ex-cessive intracellular Ca2� accumulation, mitochon-drial Ca2� uptake and consequent attenuation ofvVm. The possible role of these pathways in MLformation is therefore worthy of further investiga-tion.
5. Conclusions
1. The increase in NMR-visible ML content, inducedin T-lymphoblastoid Jurkat cells by exposure to
BBAMCB 55738 2-1-01
M. Di Vito et al. / Biochimica et Biophysica Acta 1530 (2001) 47^66 63

either anthracyclines or dexamethasone, corre-lated with the percentage of net apoptosis withrespect to untreated control cells, independentlyof the nature of the inducing agent and of thecell cycle arrest phase (G2/M or G0/G1).
2. There was a close correlation between 1H NMR-visible ML contents and the accumulation of cy-toplasmic lipid bodies in cells undergoing pro-grammed cell death, upon exposure to apoptoticdrugs.
3. Similar NMR-visible ML contents and cytoplas-mic lipid bodies were detected in cell cultures ex-posed to apoptotic drugs (AW30^40%) and innon-apoptotic lymphoblasts stimulated by PMAplus ionomycin (72 h).
4. These analogies support the hypotheses that MLare formed by active biochemical pathways trig-gered in response to cell stimulation, rather thanby mechanisms of cell degradation and loss of cellfunction.
5. These results suggest that ML formation in cellsinduced to apoptosis by exposure to drugs mayoccur during an active phase of lipid synthesisand turnover, within the pre-apoptotic `e¡ector'stage, as a consequence of either phospholipaseactivation and/or loss of the mitochondrial elec-trochemical potential.
6. This active phase of lipid synthesis and turnoverwas lacking in cells induced to apoptosis by FCSdeprivation.
Acknowledgements
We wish to thank Mr. M. Giannini and Mr. M.Giambenedetti for excellent technical assistance inmaintaining the NMR equipment at a high perform-ance level.
References
[1] A.H. Wyllie, J.F.R. Kerr, A.R. Currie, Cell death: the sig-ni¢cance of apoptosis, Int. Rev. Cytol. 68 (1980) 251^306.
[2] C.B. Thompson, Apoptosis in the pathogenesis and treat-ment of disease, Science 267 (1995) 1456^1462.
[3] P. Mesner Jr., I.I. Budihardio, S.H. Kaufmann, Chemother-apy-induced apoptosis, Adv. Pharmacol. 41 (1997) 461^499.
[4] K.N. Kolesnick, M. Kro«nke, Regulation of ceramide pro-duction and apoptosis, Annu. Rev. Physiol. 60 (1998) 643^665.
[5] M.G. Cifone, G. Migliorati, R. Parroni, C. Marchetti, D.M.Millimaggi, A. Santoni, C. Riccardi, Dexamethasone-in-duced thymocyte apoptosis: apoptotic signal involves thesequential activation of phosphoinositide-speci¢c phospholi-pase C, acidic sphingomyelinase and caspases, Blood 93(1999) 2282^2296.
[6] A. Betta|«eb, I. Plo, V.V. Monsat-deMas, A. Quillet-Mary, T.Levade, G. Laurent, J.-P. Ja¡rezou, Daunorubicin- and mi-toxantrone-triggered phosphatidylcholine hydrolysis : impli-cation of drug-induced ceramide generation and apoptosis,Mol. Pharmacol. 55 (1999) 118^125.
[7] A.H. Futerman, R. Ghidoni, G. van Meer, EMBO Work-shop Report `Lipids: Regulatory Functions in MembraneTra¤c and Cell Development', EMBO J. 17 (1998) 6772^6775.
[8] F.G. Blankenberg, R.W. Storrs, L. Naumovski, T. Goralski,D. Spielman, Detection of apoptotic cell death by protonmagnetic resonance spectroscopy, Blood 87 (1996) 1951^1956.
[9] F.G. Blankenberg, P.D. Katsikis, R.W. Storrs, C. Beaulieu,D. Spielman, J.Y. Chen, L. Naumovski, J.F. Tait, Quanti-tative analysis of apoptotic cell death using proton nuclearmagnetic resonance spectroscopy, Blood 89 (1997) 3778^3786.
[10] J.M. Hakuma«ki, H. Poptani, A.-M. Sandmair, S. Yla-Hert-tuala, R.A. Kauppinen, 1H MRS detects polyunsaturatedfatty acid accumulation during gene therapy of glioma: im-plications for the in vivo detection of apoptosis, Nat. Med. 5(1999) 1323^1327.
[11] M.F. Veale, A.J. Dingley, G.F. King, N.J.C. King, 1H NMRvisible neutral lipids in activated T lymphocytes: relationshipto phosphatidylcholine cycle, Biochim. Biophys. Acta 1303(1996) 215^221.
[12] M.F. Veale, N.J. Roberts, G.F. King, N.J.C. King, Thegeneration of 1H-NMR-detectable mobile lipid in stimulatedlymphocytes: relationship to cellular activation, the cellcycle, and phosphatidylcholine-speci¢c phospholipase C,Biochem. Biophys. Res. Commun. 239 (1997) 868^874.
[13] C.E. Mountford, C.L. Lena, W.B. Mackinnon, P. Russell,The use of proton MR in cancer pathology, in: G.A. Webbs(Ed.), Annual Reports on NMR Spectroscopy, Vol. 27, Aca-demic Press, New York, 1993, pp. 173^215.
[14] C.E. Mountford, W.B. Mackinnon, P. Russell, A. Rutter,E.J. Delikatny, Human cancers detected by proton MRSand chemical shift imaging ex vivo, Anticancer Res. 16(1996) 1521^1532.
[15] G.L. May, L.C. Wright, K.T. Holmes, P.G. Williams, I.C.P.Smith, P.E. Wright, R.M. Fox, C.E. Mountford, Assignmentof methylene proton resonances in NMR spectra of embry-onic and transformed cells to plasma membrane triglyceride,J. Biol. Chem. 261 (1986) 3048^3053.
BBAMCB 55738 2-1-01
M. Di Vito et al. / Biochimica et Biophysica Acta 1530 (2001) 47^6664

[16] A. Ferretti, A. Knijn, E. Iorio, S. Pulciani, M. Giambene-detti, A. Molinari, S. Meschini, A. Stringaro, A. Calcabrini,I. Freitas, R. Strom, G. Arancia, F. Podo, Biophysical andstructural characterization of 1H-NMR-detectable mobilelipid domains in NIH-3T3 ¢broblasts, Biochim. Biophys.Acta 1438 (1999) 329^348.
[17] C.E. Mountford, L.C. Wright, Organization of lipids in theplasma membranes of malignant and stimulated cells : a newmodel, Trends Biochem. Sci. 13 (1988) 172^177.
[18] R. Callies, R.M. Sri-Pathmanathan, D.Y.P. Ferguson, K.M.Brindle, The appearance of neutral lipid signals in the 1HNMR spectra of a myeloma cell line correlates with theinduced formation of cytoplasmic lipid droplets, Magn.Res. Med. 29 (1993) 546^550.
[19] C. Remy, N. Fouilhe, I. Barba, E. Sam-La|«, H. Lahrech,M.-G. Cucurella, M. Izquierdo, A. Moreno, A. Ziegler, R.Massarelli, M. Decorps, C. Arus, Evidence that mobile lipidsdetected in rat brain glioma by 1H Nuclear Magnetic Reso-nance correspond to lipid droplets, Cancer Res. 57 (1997)407^414.
[20] M. Barba, M.E. Caban¬as, C. Arus, The relationship betweennuclear magnetic resonance-visible lipids, lipid droplets, andcell proliferation in cultured C6 cells, Cancer Res. 59 (1999)1861^1868.
[21] J.M. Hakuma«ki, R.A. Kauppinen, 1H NMR visible lipids inthe life and death of cells, Trends Biochem. Sci. 25 (2000) 9^14.
[22] K.S. Sellius, J. Cohen, Gene induction by Q-irradiaton leadsto DNA fragmentation in lymphocytes, J. Immunol. 139(1987) 3199^3206.
[23] I. Nicoletti, G. Migliorati, M.C. Pagliacci, F. Grignani, C.Riccardi, A rapid and simple method for measuring thymo-cyte apoptosis by propidium iodide staining and £ow cyto-metry, J. Immunol. Methods 139 (1991) 271^279.
[24] F. Dolbeare, W.J. Kuo, W. Beisker, M. Vanderlaan, J.W.Gray, Using monoclonal antibodies in bromodeoxyuridine-DNA analysis, Methods Cell Biol. 33 (1990) 207^216.
[25] A. De Maria, L. Lenti, F. Malisan, F. D'Agostino, B. To-massini, M.R. Rippo, R. Testi, Requirement for GD3 gan-glioside in CD95- and ceramide-induced apoptosis, Science277 (1997) 1652^1655.
[26] A. Knijn, A. Ferretti, P.J. Zhang, M. Giambenedetti, A.Molinari, S. Meschini, S. Pulciani, F. Podo, Lower levelsof 1H MRS-visible mobile lipids in H-ras transformed tu-morigenic ¢broblasts with respect to their untransformedparental cells, Cell. Mol. Biol. 43 (1997) 691^701.
[27] D.Y. Sze, O. Jardetzky, Characterization of lipid composi-tion in stimulated human lymphocytes by 1H-NMR, Bio-chim. Biophys. Acta 1054 (1990) 198^206.
[28] A. Van den Boogaart, P. van Hecke, S. van Hu¡el, D.Graveron-Demilly, D. van Ormondt, R. de Beer, MRUI:A graphical user interface for accurate routine MRS dataanalysis, in: MAG*MA, Suppl. Vol IV, No II, EuropeanSociety for Magnetic Resonance in Medicine and Biology,abstr. 784, Vienna, 1996, p. 318.
[29] http://www.mrui.uab.es/.
[30] A. van den Boogaart, D. van Ormondt, W.W.F. Pijnappel,R. de Beer, M. Ala-Korpela, Removal of the water reso-nance from 1H magnetic resonance spectra, in: J.G.McWhirter (Ed.), Mathematics in Signal Processing III,Clarendon Press, Oxford, 1994, pp. 175^195.
[31] L. Vanhamme, A. van den Boogaart, S. van Hu¡el, Im-proved method for accurate and e¤cient quanti¢cation ofMRS data with use of prior knowledge, J. Magn. Reson.129 (1997) 35^43.
[32] I. Freitas, P. Pontiggia, S. Barni, V. Bertone, M. Parente, A.Novarina, G. Roveta, G. Gerzeli, P. Stoward, Histochemicalprobes for the detection of hypoxic tumour cells, AnticancerRes. 10 (1990) 613^622.
[33] P. Greenspan, E.P. Mayer, S.D. Fowler, Nile red: a selective£uorescence stain for intracellular lipid droplets, J. Cell Biol.100 (1985) 965^973.
[34] A. Rosi, A.M. Luciani, P. Matarrese, G. Arancia, V. Viti, L.Guidoni, 1H-MRS lipid signal modulation and morpholog-ical and ultrastructural changes related to tumor cell prolif-eration, Magn. Reson. Med. 42 (1999) 248^257.
[35] F. Podo, Tumour phospholipid metabolism, NMR Biomed.12 (1999) 413^439.
[36] D.A. Gewirtz, A critical evaluation of the mechanisms ofaction proposed for the antitumour e¡ects of the anthracy-cline antibiotics adriamycin and daunorubicin, Biochem.Pharmacol. 57 (1999) 727^741.
[37] A. Skladanowski, J. Konopa, Adriamycin and daunomycininduce programmed cell death (apoptosis) in tumour cells,Biochem. Pharmacol. 46 (1993) 375^382.
[38] J. Konopa, G2 block induced by DNA crosslinking agentsand its possible consequences, Biochem. Pharmacol. 37(1988) 2303^2309.
[39] I. Mu«ller, A. Jenner, G. Bruchell, D. Niethammer, B. Halli-well, E¡ect of concentration on the cytotoxic mechanism ofdoxorubicin-apoptosis and oxidative DNA damage, Bio-chem. Biophys. Res. Commun. 230 (1997) 254^257.
[40] R. Bose, M. Verheij, A. Haimovitz-Friedman, K. Scotto, Z.Fuks, R. Kolesnick, Ceramide synthase mediates daunoru-bicin-induced apoptosis: an alternative mechanism for gen-erating death signals, Cell 82 (1995) 405^414.
[41] N. Bansal, A. Houle, G. Menykovych, Apoptosis: mode ofcell death induced in T cell leukaemia lines by dexametha-sone and other agents, FASEB J. 5 (1991) 211^216.
[42] D.J. Murphy, J. Vance, Mechanisms of lipid-body forma-tion, Trends Biochem. Sci. 24 (1999) 109^115.
[43] A.M. Dvorak, H.F. Dvorak, S.P. Peters, E.S. Shulman,D.W. MacGlashan Jr., K. Pyne, V.S. Harvey, S.J. Galli,L.M. Lichtenstein, Lipid bodies: cytoplasmic organells im-portant to arachidonic metabolism in macrophages and mastcells, J. Immunol. 131 (1983) 2965^2976.
[44] J. Zhang, Y.A. Hannun, L.M. Obeid, A novel assay for ap-optotic body formation and membrane release during apo-ptosis, Cell Death Di¡er. 6 (1999) 596^598.
[45] A. Altman, M.I. Mally, N. Isakov, Phorbol ester synergizeswith Ca2� ionophore in activation of protein kinase C(PKC)K and PKCL isoenzymes in human T cells and in
BBAMCB 55738 2-1-01
M. Di Vito et al. / Biochimica et Biophysica Acta 1530 (2001) 47^66 65

induction of related cellular functions, Immunology 76(1992) 465^471.
[46] S. Schu«tze, D. Berkovic, O. Tomsing, C. Unger, M. Kro«nke,Tumor necrosis factor induces rapid production of 1P2P-di-acylglycerol by a phosphatidylcholine-speci¢c phospholipaseC, J. Exp. Med. 174 (1991) 975^988.
[47] R.-W. Godfrey, W.J. Johnson, S.T. Ho¡stein, Recombinanttumor necrosis factor and interleukin-1 both stimulate hu-man synovial cell arachidonic acid release and phospholipidmetabolism, Biochem. Biophys. Res. Commun. 142 (1987)235^241.
[48] D. Wissing, H. Mouritzen, M. Egeblad, G.G. Poirier, M.
Ja«a«ttela«, Involvement of caspase-dependent activation of cy-tosolic phospholipase A2 in tumor necrosis factor-inducedapoptosis, Proc. Natl. Acad. Sci. USA 94 (1997) 5073^5077.
[49] D. De Valck, D. Vercammen, W. Fiers, R. Beyaert, Di¡er-ential activation of phospholipases during necrosis and apo-ptosis : A comparative study using tumor necrosis factor andanti-Fas antibodies, J. Cell. Biochem. 71 (1997) 392^399.
[50] G. Kroemer, N. Zamzami, S.A. Susin, Mitochondrial con-trol of apoptosis, Immunol. Today 18 (1997) 44^51.
[51] P.L. Pedersen, Tumor mitochondria and the bioenergetics ofcancer cells, Prog. Exp. Tumor Res. 22 (1978) 190^274.
BBAMCB 55738 2-1-01
M. Di Vito et al. / Biochimica et Biophysica Acta 1530 (2001) 47^6666