1990-2010 global cardiovascular disease atlas
14
1990-2010 Global Cardiovascular Disease Atlas q Andrew E. Moran*, Gregory A. Roth y , Jagat Narula z , George A. Mensah x New York, NY, USA; Seattle,WA, USA; New York, NY, USA; and Bethesda, MD, USA 1990-2010 GLOBAL CVD ATLAS: INTRODUCTION The global burden of cardiovascular diseases in 2010 and changes between 1990 and 2010 Worldwide, the cardiovascular diseases (CVDs) contributing most to the total global burden of disease in 2010 were ischemic heart disease (5.2% of all disability-adjusted life years [DALYs] lost) and stroke (4.1% of all DALYs). The other major CVDs were hypertensive heart disease, cardio- myopathies, rheumatic heart disease, atrial fibrillation, aortic aneurysm, peripheral vascular disease, and endocarditis. The highest per capita CVD burden fell upon the Eastern Europe and Central Asia regions (Fig. 1). In the large populations of the South Asia and North Africa and Middle East regions, the absolute burden of CVDs is high and more often affects young, working-age adults. CVD burden declined sharply in the world’s high-income regions between 1990 and 2010 (Fig. 2). For both stroke and ischemic heart disease, global age-standardized mortality has decreased, but population growth and aging have increased both the absolute number of CVD deaths and survivors suffering with the late effects of stroke or ischemic heart disease [1,2]. About two thirds of new strokes and more than 70% of stroke burden affect people younger than 75 years of age [2]. Even after adjusting for age, the atrial fibrillation prevalence and incidence increased between 1990 and 2010, and atrial fibrillation mortality about doubled over the same interval [3]. About 200 million prevalent peripheral artery disease cases were estimated for 2010: about 70% of them living in low- or middle-income countries and 55 million of them in the South Asia region [4]. Change in CVD burden compared with changes in other major diseases, 1990-2010 During 1990-2010, burden due to human immunodefi- ciency virus (HIV) increased more than any other single cause. Most noncommunicable diseases decreased. When viewed by proportional change in burden between 1990 and 2010, the 2 CVDs that are among the world’s leading causes of death and disability—ischemic heart disease and stroke—both increased in burden (percent increase in absolute numbers of DALYs [Fig. 3]). The biggest relative increases among the CVDs were in atrial fibrillation and peripheral vascular disease burden. In keeping with the International Classification of Diseases system, heart failure was not designated as an underlying cause of disease in this analysis. Heart failure burden was captured indirectly as a sequela of several underlying diseases (including CVDs like ischemic heart disease, hypertensive heart disease, cardio- myopathies, and rheumatic heart disease). CVD burden attributable to risk factors: Similarities and difference by world region It comes as no surprise that classic risk factors responsible for global CVD burden—dietary risks, high blood pressure, and tobacco smoking—were leading risk factors across all world regions (Fig. 4). Tobacco smoking was ranked comparatively lower as a CVD risk factor in Australasia, Western Europe, and North America, likely due to both aggressive tobacco control measures and shifts in societal attitudes toward tobacco use in recent decades. Elsewhere, in some of the world’s most populous regions like East Asia and Southeast Asia, tobacco is the third leading risk factor behind dietary risks and high blood pressure. Alcohol use ranked as the fifth leading cause of CVD burden in Eastern Europe (likely due to its association there with non- myocardial infarction ischemic heart disease and stroke, and possibly because acute alcoholic deaths were coded as cardiovascular deaths), while alcohol ranked no higher than tenth in all other regions. Ambient (outdoor) partic- ulate matter pollution ranked particularly high (fourth) as a risk factor for CVD in East Asia. Household air pollution ranked high as a cause of CVD burden (third) in South Asia and Sub-Saharan Africa. High body mass index ranked third as a CVD risk factor not only in the Australasia, North America, European, and Central Asia regions, but also in Latin American/Caribbean and North Africa/Middle East. Demographic drivers of regional CVD burden Aging of the population has driven up CVD despite decreased age-standardized rates in many regions. It is well known that the populations of high-income regions, Eastern Europe, and Central Europe are aging, with 10% or more of the population aged >65 years (Fig. 5). In 2 regions with a median life expectancy of >70 years—East Asia and Latin American/Caribbean—between 5% and 10% of the popu- lation is 65 years of age, and these regions will experience a growing per capita burden of CVD. The combination of a young population and an average life expectancy of >70 years of age in North Africa/Middle East may lead to a growing epidemic of CVDs in coming decades in that region. CVD prevention and control: Do health systems have the capacity to respond? Even in regions with declining age-standardized CVD rates, the absolute burden of CVD is on the increase due to longer life expectancy and population growth. In low- and middle- income countries, CVD risk factors are often identified late in disease progression, and patients often must bear acute care and prevention costs out-of-pocket, which can be q This is an open access article under the CC BY-NC- ND license (http:// creativecommons.org/ licenses/by-nc-nd/3.0/). The authors report no relationships that could be construed as a conflict of interest. The views expressed in this article are those of the authors and do not neces- sarily represent the views of the National Heart, Lung, and Blood Institute, National Institutes of Health, Department of Health and Human Services, or any other government entity. From the *Division of General Medicine, Depart- ment of Medicine, Columbia University Medi- cal Center, New York, NY, USA; yInstitute for Health Metrics and Evaluation, and Division of Cardiology, University of Washington, Seattle, WA, USA; zZena and Michael A. Wiener Cardiovascular Institute, Icahn School of Medicine at Mount Sinai, New York, NY, USA; and xCenter for Translation Research and Implementation Science (CTRIS), National Heart, Lung, and Blood Institute, National Institutes of Health, Bethesda, MD, USA. Correspondence: A. E. Moran (aem35@columbia. edu). GLOBAL HEART © 2014 Published by Elsevier Ltd. on behalf of World Heart Federation (Geneva). VOL. 9, NO. 1, 2014 ISSN 2211-8160/$36.00. http://dx.doi.org/10.1016/ j.gheart.2014.03.1220 GLOBAL HEART, VOL. 9, NO. 1, 2014 3 March 2014: 3-16 GLOBAL BURDEN OF CVD gATLAS j
-
Upload
independent -
Category
Documents
-
view
1 -
download
0
Transcript of 1990-2010 global cardiovascular disease atlas
GLOBAL BURDEN OF CVD gATLASj
1990-2010 Global Cardiovascular Disease AtlasqAndrew E. Moran*, Gregory A. Rothy, Jagat Narulaz, George A. Mensahx
New York, NY, USA; Seattle, WA, USA; New York, NY, USA; and Bethesda, MD, USA
qThis is an open access
article under the CC BY-NC-ND license (http://
creativecommons.org/licenses/by-nc-nd/3.0/).The authors report norelationships that could beconstrued as a conflict ofinterest.
The views expressed in thisarticle are those of theauthors and do not neces-sarily represent the viewsof the National Heart,Lung, and Blood Institute,National Institutes of
Health, Department ofHealth and HumanServices, or any othergovernment entity.From the *Division ofGeneral Medicine, Depart-
ment of Medicine,Columbia University Medi-cal Center, New York, NY,USA; yInstitute for HealthMetrics and Evaluation,and Division of Cardiology,University of Washington,
Seattle, WA, USA; zZena
1990-2010 GLOBAL CVD ATLAS: INTRODUCTION
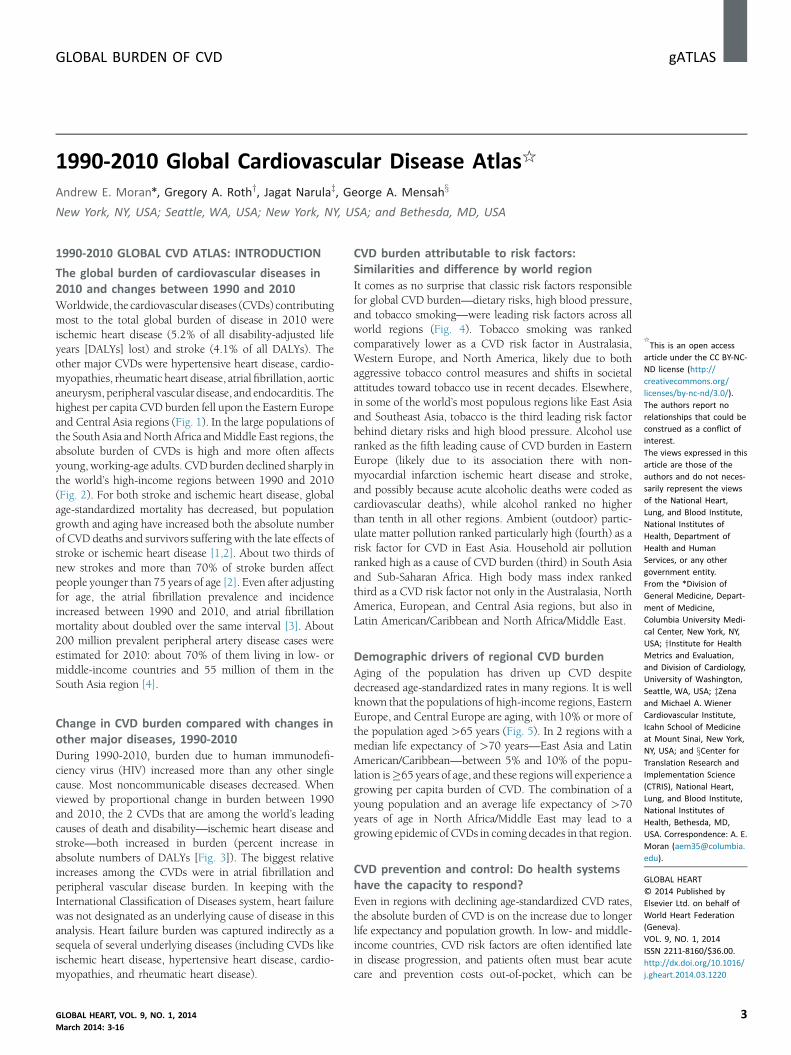
The global burden of cardiovascular diseases in2010 and changes between 1990 and 2010Worldwide, the cardiovascular diseases (CVDs) contributingmost to the total global burden of disease in 2010 wereischemic heart disease (5.2% of all disability-adjusted lifeyears [DALYs] lost) and stroke (4.1% of all DALYs). Theother major CVDs were hypertensive heart disease, cardio-myopathies, rheumatic heart disease, atrial fibrillation, aorticaneurysm, peripheral vascular disease, and endocarditis. Thehighest per capita CVD burden fell upon the Eastern Europeand Central Asia regions (Fig. 1). In the large populations ofthe South Asia andNorth Africa andMiddle East regions, theabsolute burden of CVDs is high and more often affectsyoung, working-age adults. CVD burden declined sharply inthe world’s high-income regions between 1990 and 2010(Fig. 2). For both stroke and ischemic heart disease, globalage-standardized mortality has decreased, but populationgrowth and aging have increased both the absolute numberof CVD deaths and survivors suffering with the late effects ofstroke or ischemic heart disease [1,2]. About two thirds ofnew strokes and more than 70% of stroke burden affectpeople younger than 75 years of age [2]. Even after adjustingfor age, the atrial fibrillation prevalence and incidenceincreased between 1990 and 2010, and atrial fibrillationmortality about doubled over the same interval [3]. About200 million prevalent peripheral artery disease cases wereestimated for 2010: about 70% of them living in low- ormiddle-income countries and 55 million of them in theSouth Asia region [4].
and Michael A. WienerCardiovascular Institute,Icahn School of Medicineat Mount Sinai, New York,NY, USA; and xCenter forTranslation Research andImplementation Science(CTRIS), National Heart,Lung, and Blood Institute,National Institutes ofHealth, Bethesda, MD,USA. Correspondence: A. E.
Moran ([email protected]).
GLOBAL HEART© 2014 Published byElsevier Ltd. on behalf ofWorld Heart Federation(Geneva).VOL. 9, NO. 1, 2014
ISSN 2211-8160/$36.00.http://dx.doi.org/10.1016/j.gheart.2014.03.1220
Change in CVD burden compared with changes inother major diseases, 1990-2010During 1990-2010, burden due to human immunodefi-ciency virus (HIV) increased more than any other singlecause. Most noncommunicable diseases decreased. Whenviewed by proportional change in burden between 1990and 2010, the 2 CVDs that are among the world’s leadingcauses of death and disability—ischemic heart disease andstroke—both increased in burden (percent increase inabsolute numbers of DALYs [Fig. 3]). The biggest relativeincreases among the CVDs were in atrial fibrillation andperipheral vascular disease burden. In keeping with theInternational Classification of Diseases system, heart failurewas not designated as an underlying cause of disease in thisanalysis. Heart failure burden was captured indirectly as asequela of several underlying diseases (including CVDs likeischemic heart disease, hypertensive heart disease, cardio-myopathies, and rheumatic heart disease).
GLOBAL HEART, VOL. 9, NO. 1, 2014March 2014: 3-16
CVD burden attributable to risk factors:Similarities and difference by world regionIt comes as no surprise that classic risk factors responsiblefor global CVD burden—dietary risks, high blood pressure,and tobacco smoking—were leading risk factors across allworld regions (Fig. 4). Tobacco smoking was rankedcomparatively lower as a CVD risk factor in Australasia,Western Europe, and North America, likely due to bothaggressive tobacco control measures and shifts in societalattitudes toward tobacco use in recent decades. Elsewhere,in some of the world’s most populous regions like East Asiaand Southeast Asia, tobacco is the third leading risk factorbehind dietary risks and high blood pressure. Alcohol useranked as the fifth leading cause of CVD burden in EasternEurope (likely due to its association there with non-myocardial infarction ischemic heart disease and stroke,and possibly because acute alcoholic deaths were coded ascardiovascular deaths), while alcohol ranked no higherthan tenth in all other regions. Ambient (outdoor) partic-ulate matter pollution ranked particularly high (fourth) as arisk factor for CVD in East Asia. Household air pollutionranked high as a cause of CVD burden (third) in South Asiaand Sub-Saharan Africa. High body mass index rankedthird as a CVD risk factor not only in the Australasia, NorthAmerica, European, and Central Asia regions, but also inLatin American/Caribbean and North Africa/Middle East.
Demographic drivers of regional CVD burdenAging of the population has driven up CVD despitedecreased age-standardized rates in many regions. It is wellknown that the populations of high-income regions, EasternEurope, and Central Europe are aging, with 10% or more ofthe population aged >65 years (Fig. 5). In 2 regions with amedian life expectancy of >70 years—East Asia and LatinAmerican/Caribbean—between 5% and 10% of the popu-lation is�65 years of age, and these regions will experience agrowing per capita burden of CVD. The combination of ayoung population and an average life expectancy of >70years of age in North Africa/Middle East may lead to agrowing epidemic of CVDs in coming decades in that region.
CVD prevention and control: Do health systemshave the capacity to respond?Even in regions with declining age-standardized CVD rates,the absolute burden of CVD is on the increase due to longerlife expectancy and population growth. In low- and middle-income countries, CVD risk factors are often identified latein disease progression, and patients often must bear acutecare and prevention costs out-of-pocket, which can be
3
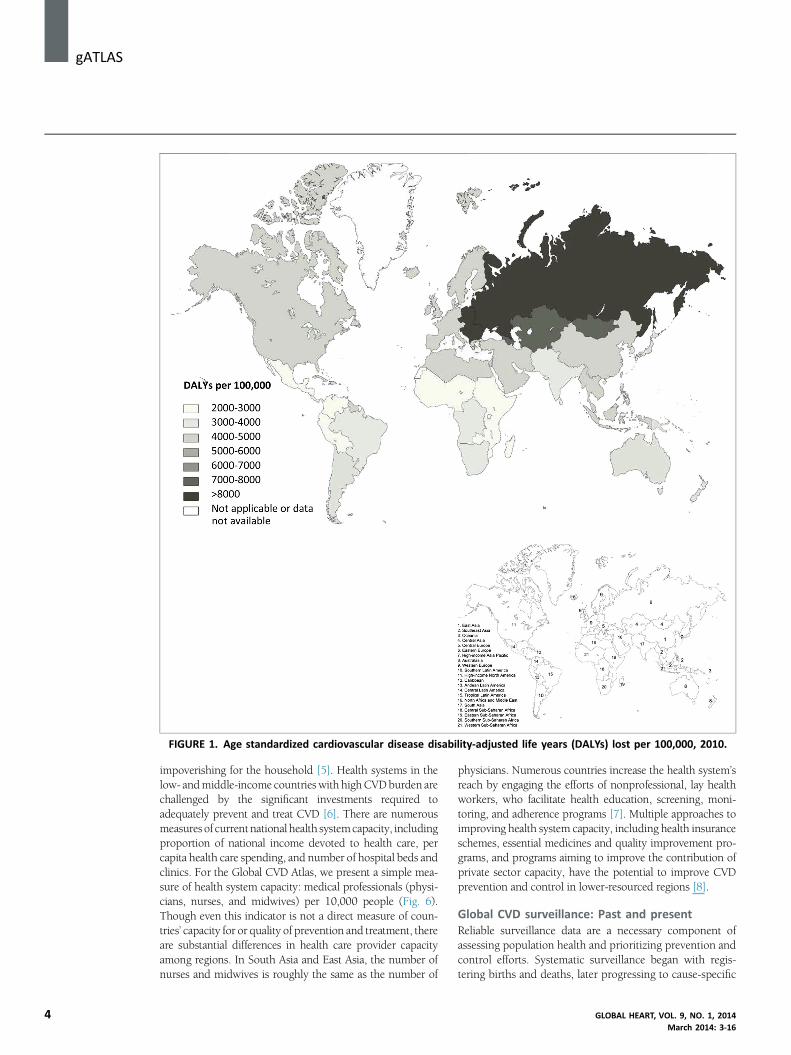
FIGURE 1. Age standardized cardiovascular disease disability-adjusted life years (DALYs) lost per 100,000, 2010.
j gATLAS
4
impoverishing for the household [5]. Health systems in thelow- andmiddle-income countries with highCVDburden arechallenged by the significant investments required toadequately prevent and treat CVD [6]. There are numerousmeasures of current national health systemcapacity, includingproportion of national income devoted to health care, percapita health care spending, and number of hospital beds andclinics. For the Global CVD Atlas, we present a simple mea-sure of health system capacity: medical professionals (physi-cians, nurses, and midwives) per 10,000 people (Fig. 6).Though even this indicator is not a direct measure of coun-tries’ capacity for or quality of prevention and treatment, thereare substantial differences in health care provider capacityamong regions. In South Asia and East Asia, the number ofnurses and midwives is roughly the same as the number of
physicians. Numerous countries increase the health system’sreach by engaging the efforts of nonprofessional, lay healthworkers, who facilitate health education, screening, moni-toring, and adherence programs [7]. Multiple approaches toimproving health system capacity, including health insuranceschemes, essential medicines and quality improvement pro-grams, and programs aiming to improve the contribution ofprivate sector capacity, have the potential to improve CVDprevention and control in lower-resourced regions [8].
Global CVD surveillance: Past and presentReliable surveillance data are a necessary component ofassessing population health and prioritizing prevention andcontrol efforts. Systematic surveillance began with regis-tering births and deaths, later progressing to cause-specific
GLOBAL HEART, VOL. 9, NO. 1, 2014March 2014: 3-16
FIGURE 2. Change in age standardized cardiovascular disease disability-adjusted life years (DALYs) lost per100,000, 2010.
gATLASj
deaths (Table 1). Population demographic, risk factor, andprevalence surveys and nonfatal event registration wereadded to mortality registration, but on a national scale,these surveillance methods were often pursued indepen-dently. It was integration of upstream characteristics anddownstream events in landmark, population-based, car-diovascular disease cohort studies that led to the devel-opment of risk factor epidemiology. The FraminghamStudy first, then the World Health Organization (WHO)MONICA (monitoring trends and determinants in cardio-vascular disease) Study (as well as the Atherosclerosis inCommunities [ARIC] Study and Rochester EpidemiologyStudy in the United States) developed advanced andstandardized surveillance methods aimed at capturing allCVD events in large, defined, subnational populations that
GLOBAL HEART, VOL. 9, NO. 1, 2014March 2014: 3-16
could be translated to changes in CVD event rates over time[9]. Until the 1990s, almost all comprehensive surveillancewas pursued in North America, Australasia, and Europe—for example, in MONICA, China was the only countryoutside of these regions to participate. In addition, while anumber of countries have a broad range of CVD surveil-lance methods, few, even among high-income countries,have achieved complete linkage of community, outpatient,inpatient, and mortality data registries. In many low-resource regions, national all-cause and cause-specificdeaths registration remains incomplete (Fig. 7).
The future of global CVD surveillanceRecent efforts in CVD surveillance have focused on the cre-ation of comprehensive and comparable population-level
5
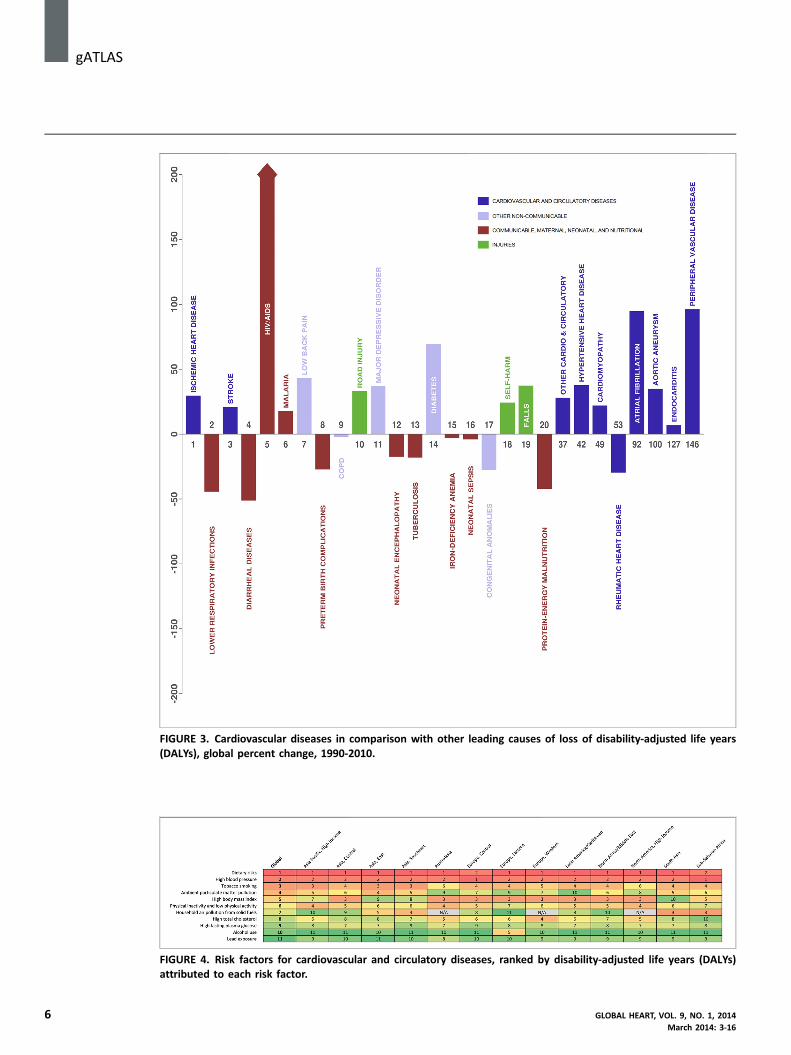
FIGURE 3. Cardiovascular diseases in comparison with other leading causes of loss of disability-adjusted life years(DALYs), global percent change, 1990-2010.
FIGURE 4. Risk factors for cardiovascular and circulatory diseases, ranked by disability-adjusted life years (DALYs)attributed to each risk factor.
j gATLAS
6 GLOBAL HEART, VOL. 9, NO. 1, 2014March 2014: 3-16
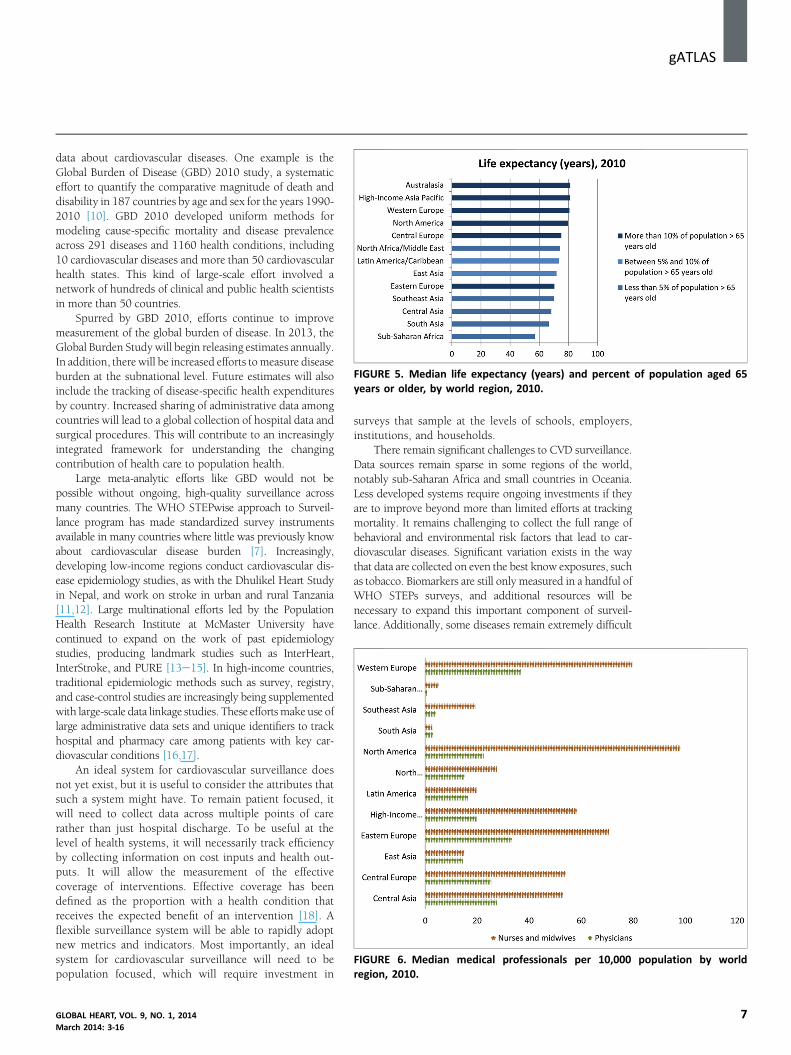
FIGURE 5. Median life expectancy (years) and percent of population aged 65years or older, by world region, 2010.
FIGURE 6. Median medical professionals per 10,000 population by worldregion, 2010.
gATLASj
data about cardiovascular diseases. One example is theGlobal Burden of Disease (GBD) 2010 study, a systematiceffort to quantify the comparative magnitude of death anddisability in 187 countries by age and sex for the years 1990-2010 [10]. GBD 2010 developed uniform methods formodeling cause-specific mortality and disease prevalenceacross 291 diseases and 1160 health conditions, including10 cardiovascular diseases and more than 50 cardiovascularhealth states. This kind of large-scale effort involved anetwork of hundreds of clinical and public health scientistsin more than 50 countries.Spurred by GBD 2010, efforts continue to improvemeasurement of the global burden of disease. In 2013, theGlobal Burden Study will begin releasing estimates annually.In addition, there will be increased efforts tomeasure diseaseburden at the subnational level. Future estimates will alsoinclude the tracking of disease-specific health expendituresby country. Increased sharing of administrative data amongcountries will lead to a global collection of hospital data andsurgical procedures. This will contribute to an increasinglyintegrated framework for understanding the changingcontribution of health care to population health.
Large meta-analytic efforts like GBD would not bepossible without ongoing, high-quality surveillance acrossmany countries. The WHO STEPwise approach to Surveil-lance program has made standardized survey instrumentsavailable in many countries where little was previously knowabout cardiovascular disease burden [7]. Increasingly,developing low-income regions conduct cardiovascular dis-ease epidemiology studies, as with the Dhulikel Heart Studyin Nepal, and work on stroke in urban and rural Tanzania[11,12]. Large multinational efforts led by the PopulationHealth Research Institute at McMaster University havecontinued to expand on the work of past epidemiologystudies, producing landmark studies such as InterHeart,InterStroke, and PURE [13e15]. In high-income countries,traditional epidemiologic methods such as survey, registry,and case-control studies are increasingly being supplementedwith large-scale data linkage studies. These effortsmake use oflarge administrative data sets and unique identifiers to trackhospital and pharmacy care among patients with key car-diovascular conditions [16,17].
An ideal system for cardiovascular surveillance doesnot yet exist, but it is useful to consider the attributes thatsuch a system might have. To remain patient focused, itwill need to collect data across multiple points of carerather than just hospital discharge. To be useful at thelevel of health systems, it will necessarily track efficiencyby collecting information on cost inputs and health out-puts. It will allow the measurement of the effectivecoverage of interventions. Effective coverage has beendefined as the proportion with a health condition thatreceives the expected benefit of an intervention [18]. Aflexible surveillance system will be able to rapidly adoptnew metrics and indicators. Most importantly, an idealsystem for cardiovascular surveillance will need to bepopulation focused, which will require investment in
GLOBAL HEART, VOL. 9, NO. 1, 2014March 2014: 3-16
surveys that sample at the levels of schools, employers,institutions, and households.
There remain significant challenges to CVD surveillance.Data sources remain sparse in some regions of the world,notably sub-Saharan Africa and small countries in Oceania.Less developed systems require ongoing investments if theyare to improve beyond more than limited efforts at trackingmortality. It remains challenging to collect the full range ofbehavioral and environmental risk factors that lead to car-diovascular diseases. Significant variation exists in the waythat data are collected on even the best know exposures, suchas tobacco. Biomarkers are still only measured in a handful ofWHO STEPs surveys, and additional resources will benecessary to expand this important component of surveil-lance. Additionally, some diseases remain extremely difficult
7
TABLE 1. Components of cardiovascular disease surveillance
Types of CVD surveillance programs Purposes Challenges and pitfalls
National or subnational any-cause
mortality registration
Tracking age and place of death allows
for basic demographic trend
projections and identification of
highest mortality groups
Requires infrastructure
National or subnational CVD and other
cause-specific mortality registry or
verbal autopsy system
Complete counts of fatal cases;
tracking specific causes is more
informative regarding prevention
and control
Following sophisticated ICD rules is
difficult and cause misclassification
is common
Causes of unwitnessed sudden deaths
are difficult to identify
Hospital-based and clinic-based event
registration
Allows tracking of temporal trends in
acute cases, tracking the number of
patients under treatment, and
planning hospital and clinic
capacity needs
Out-of-hospital events and out-of-clinic
cases are missed
Spectrum bias may lead to biased
estimates of total case fatality and
severity
National risk factor and prevalence
surveys
Necessary for quantifying risk factor
exposure levels and monitoring
effects of prevention programs
Self-reported measures (e.g., in
telephone surveys) are economical
but sometimes unreliable
Population-based cohort studies Overcomes the limitations of
ecological analysis by linking risk
factors and outcomes at the
individual level
Selection bias; observations may not
be generalizable to the general
population
National or subnational capture of all
fatal and nonfatal CVD cases
Complete counts of fatal and nonfatal
cases, captures full spectrum of
case fatality and severity
If subnational, may not be
generalizable
Active surveillance for cases occurring
in the community is resource
intensive and requires extensive
infrastructure and training
Individual-level linkage of outpatient
characteristics and risk factors,
inpatient events, and cause-of-
death registries
Complete counts of fatal and nonfatal
cases, ability to quantify upstream
risk factors, downstream events
and deaths at the level of the
individual, integrated with
monitoring of clinical practice and
quality of care, allows monitoring
effects of prevention and control
policies
Use of coded data leading to
misclassification bias
Need for propensity score
adjustment
Electronic medical record keeping is an
advantage and not universally
available
CVD, cardiovascular disease; ICD, International Classification of Diseases.
j gATLAS
8
to track in the community, such as atrial fibrillation and stablecoronary artery disease. New methods will be needed tointegrate multiple data sources, correct bias, and calculateuncertainty. These efforts will go a long way to assuring thatcardiovascular surveillance efforts remain timely and policy-relevant well into this new century.
1990-2010 GLOBAL CVD ATLAS: METHODS
The Global Burden of Diseases, Injuries, and RiskFactors 2010 Study (GBD 2010)The Global Burden of Diseases, Injuries, and Risk Factors2010 Study (GBD 2010) used standardized methods toestimate the burden of fatal and nonfatal CVDs andnoncardiovascular disease in the years 1990 and 2010.
The GBD included 187 countries and 291 diseases andinjuries, including 9 distinct major cardiovascular con-ditions as well as a combined category for other minor,less common cardiovascular and circulatory conditions.GBD 2010 Study methods have been reported in detailelsewhere for the overall study and for major CVDs[1e3,10]. The core summary measurement of populationhealth in the GBD 2010 Study was DALYs in the years1990 and 2010. DALYs represent the “health gap” be-tween a population’s actual health and an ideal standard.DALYs are composed of years of life lost (YLL) to pre-mature deaths and years lived with nonfatal diseasedisability (YLD). In order to capture the combined fataland nonfatal burden of CVDs around the world, theglobal CVD atlas reports DALYs.
GLOBAL HEART, VOL. 9, NO. 1, 2014March 2014: 3-16
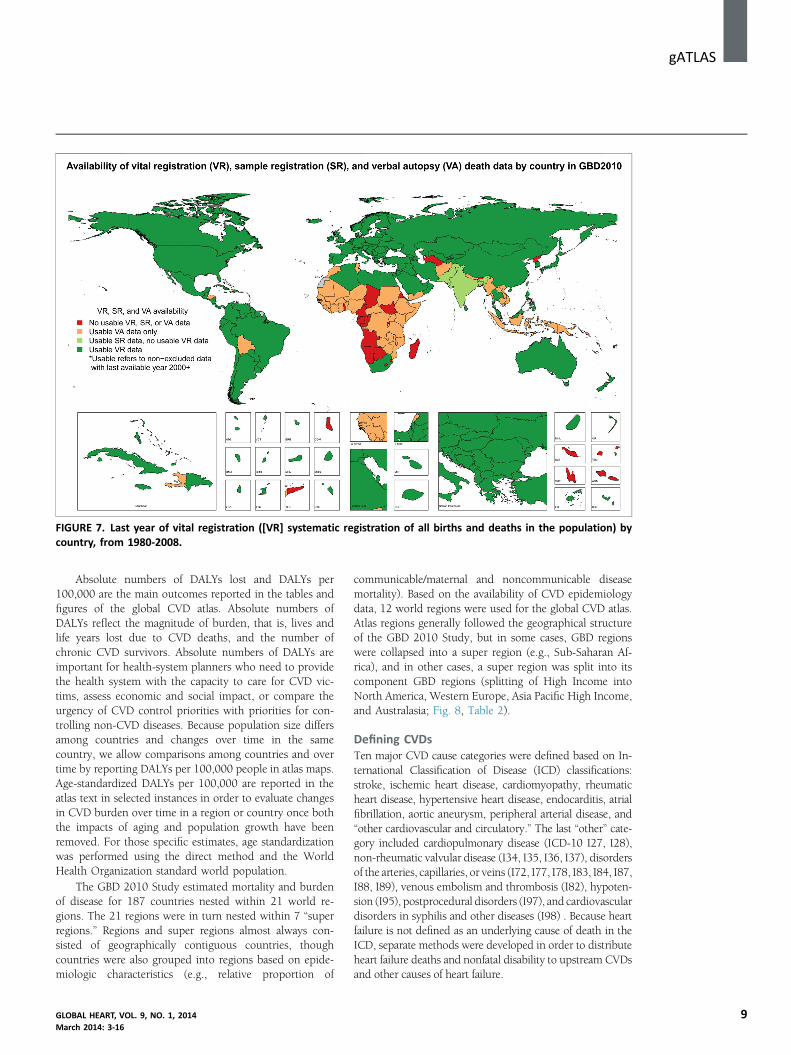
FIGURE 7. Last year of vital registration ([VR] systematic registration of all births and deaths in the population) bycountry, from 1980-2008.
gATLASj
Absolute numbers of DALYs lost and DALYs per100,000 are the main outcomes reported in the tables andfigures of the global CVD atlas. Absolute numbers ofDALYs reflect the magnitude of burden, that is, lives andlife years lost due to CVD deaths, and the number ofchronic CVD survivors. Absolute numbers of DALYs areimportant for health-system planners who need to providethe health system with the capacity to care for CVD vic-tims, assess economic and social impact, or compare theurgency of CVD control priorities with priorities for con-trolling non-CVD diseases. Because population size differsamong countries and changes over time in the samecountry, we allow comparisons among countries and overtime by reporting DALYs per 100,000 people in atlas maps.Age-standardized DALYs per 100,000 are reported in theatlas text in selected instances in order to evaluate changesin CVD burden over time in a region or country once boththe impacts of aging and population growth have beenremoved. For those specific estimates, age standardizationwas performed using the direct method and the WorldHealth Organization standard world population.
The GBD 2010 Study estimated mortality and burdenof disease for 187 countries nested within 21 world re-gions. The 21 regions were in turn nested within 7 “superregions.” Regions and super regions almost always con-sisted of geographically contiguous countries, thoughcountries were also grouped into regions based on epide-miologic characteristics (e.g., relative proportion of
GLOBAL HEART, VOL. 9, NO. 1, 2014March 2014: 3-16
communicable/maternal and noncommunicable diseasemortality). Based on the availability of CVD epidemiologydata, 12 world regions were used for the global CVD atlas.Atlas regions generally followed the geographical structureof the GBD 2010 Study, but in some cases, GBD regionswere collapsed into a super region (e.g., Sub-Saharan Af-rica), and in other cases, a super region was split into itscomponent GBD regions (splitting of High Income intoNorth America, Western Europe, Asia Pacific High Income,and Australasia; Fig. 8, Table 2).
Defining CVDsTen major CVD cause categories were defined based on In-ternational Classification of Disease (ICD) classifications:stroke, ischemic heart disease, cardiomyopathy, rheumaticheart disease, hypertensive heart disease, endocarditis, atrialfibrillation, aortic aneurysm, peripheral arterial disease, and“other cardiovascular and circulatory.” The last “other” cate-gory included cardiopulmonary disease (ICD-10 I27, I28),non-rheumatic valvular disease (I34, I35, I36, I37), disordersof the arteries, capillaries, or veins (I72, I77, I78, I83, I84, I87,I88, I89), venous embolism and thrombosis (I82), hypoten-sion (I95), postprocedural disorders (I97), and cardiovasculardisorders in syphilis and other diseases (I98) . Because heartfailure is not defined as an underlying cause of death in theICD, separate methods were developed in order to distributeheart failure deaths and nonfatal disability to upstream CVDsand other causes of heart failure.
9
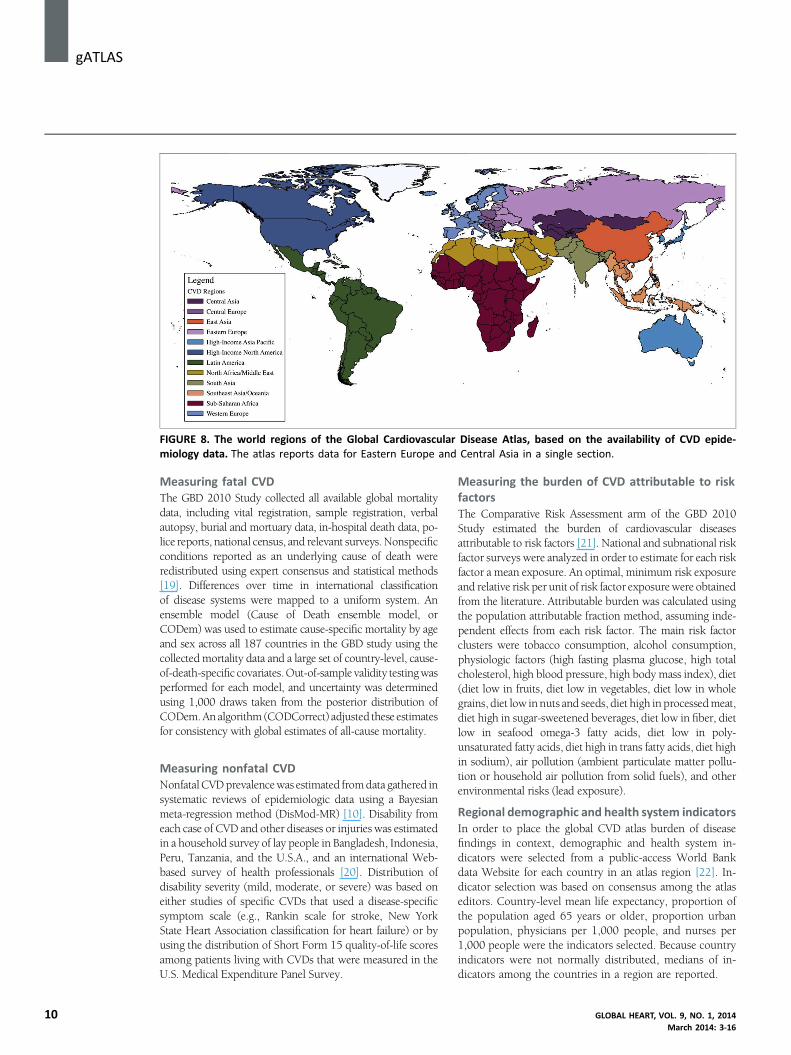
FIGURE 8. The world regions of the Global Cardiovascular Disease Atlas, based on the availability of CVD epide-miology data. The atlas reports data for Eastern Europe and Central Asia in a single section.
j gATLAS
10
Measuring fatal CVDThe GBD 2010 Study collected all available global mortalitydata, including vital registration, sample registration, verbalautopsy, burial and mortuary data, in-hospital death data, po-lice reports, national census, and relevant surveys. Nonspecificconditions reported as an underlying cause of death wereredistributed using expert consensus and statistical methods[19]. Differences over time in international classificationof disease systems were mapped to a uniform system. Anensemble model (Cause of Death ensemble model, orCODem) was used to estimate cause-specific mortality by ageand sex across all 187 countries in the GBD study using thecollectedmortality data and a large set of country-level, cause-of-death-specific covariates.Out-of-sample validity testingwasperformed for each model, and uncertainty was determinedusing 1,000 draws taken from the posterior distribution ofCODem.An algorithm (CODCorrect) adjusted these estimatesfor consistency with global estimates of all-cause mortality.
Measuring nonfatal CVDNonfatalCVDprevalencewas estimated fromdata gathered insystematic reviews of epidemiologic data using a Bayesianmeta-regression method (DisMod-MR) [10]. Disability fromeach case of CVD and other diseases or injuries was estimatedin a household survey of lay people in Bangladesh, Indonesia,Peru, Tanzania, and the U.S.A., and an international Web-based survey of health professionals [20]. Distribution ofdisability severity (mild, moderate, or severe) was based oneither studies of specific CVDs that used a disease-specificsymptom scale (e.g., Rankin scale for stroke, New YorkState Heart Association classification for heart failure) or byusing the distribution of Short Form 15 quality-of-life scoresamong patients living with CVDs that were measured in theU.S. Medical Expenditure Panel Survey.
Measuring the burden of CVD attributable to riskfactorsThe Comparative Risk Assessment arm of the GBD 2010Study estimated the burden of cardiovascular diseasesattributable to risk factors [21]. National and subnational riskfactor surveys were analyzed in order to estimate for each riskfactor a mean exposure. An optimal, minimum risk exposureand relative risk per unit of risk factor exposurewere obtainedfrom the literature. Attributable burden was calculated usingthe population attributable fraction method, assuming inde-pendent effects from each risk factor. The main risk factorclusters were tobacco consumption, alcohol consumption,physiologic factors (high fasting plasma glucose, high totalcholesterol, high blood pressure, high body mass index), diet(diet low in fruits, diet low in vegetables, diet low in wholegrains, diet low innuts and seeds, diet high in processedmeat,diet high in sugar-sweetened beverages, diet low in fiber, dietlow in seafood omega-3 fatty acids, diet low in poly-unsaturated fatty acids, diet high in trans fatty acids, diet highin sodium), air pollution (ambient particulate matter pollu-tion or household air pollution from solid fuels), and otherenvironmental risks (lead exposure).
Regional demographic and health system indicatorsIn order to place the global CVD atlas burden of diseasefindings in context, demographic and health system in-dicators were selected from a public-access World Bankdata Website for each country in an atlas region [22]. In-dicator selection was based on consensus among the atlaseditors. Country-level mean life expectancy, proportion ofthe population aged 65 years or older, proportion urbanpopulation, physicians per 1,000 people, and nurses per1,000 people were the indicators selected. Because countryindicators were not normally distributed, medians of in-dicators among the countries in a region are reported.
GLOBAL HEART, VOL. 9, NO. 1, 2014March 2014: 3-16
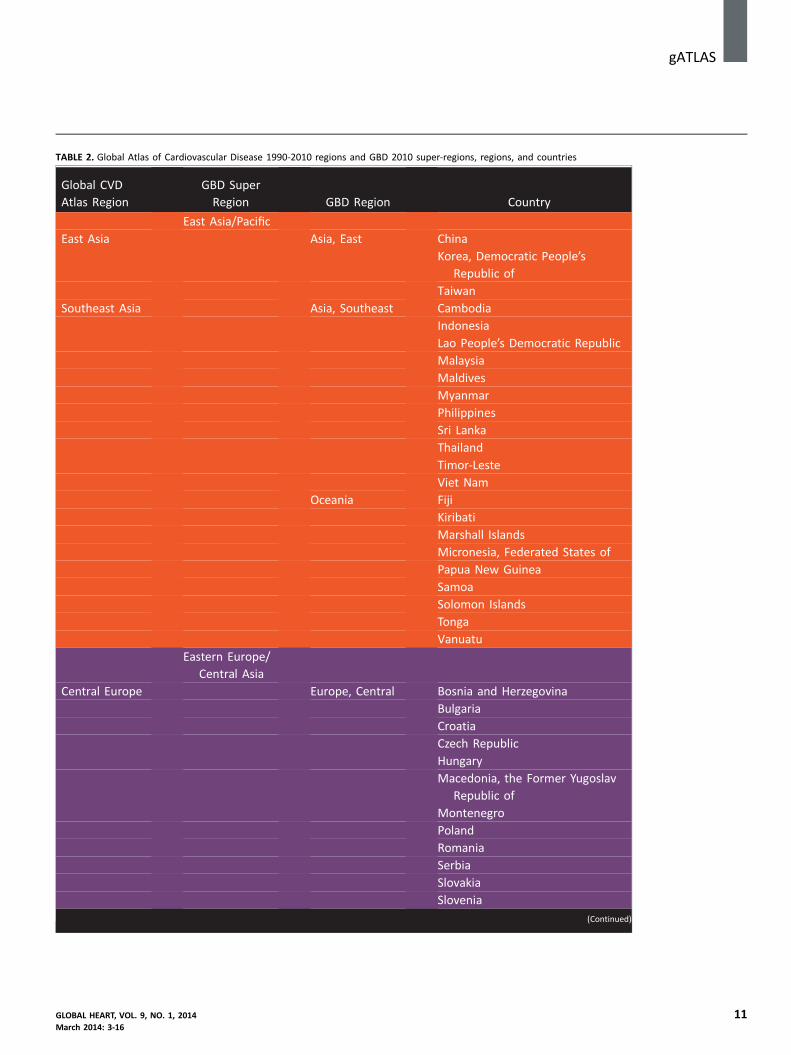
TABLE 2. Global Atlas of Cardiovascular Disease 1990-2010 regions and GBD 2010 super-regions, regions, and countries
Global CVD
Atlas Region
GBD Super
Region GBD Region Country
East Asia/Pacific
East Asia Asia, East China
Korea, Democratic People’s
Republic of
Taiwan
Southeast Asia Asia, Southeast Cambodia
Indonesia
Lao People’s Democratic Republic
Malaysia
Maldives
Myanmar
Philippines
Sri Lanka
Thailand
Timor-Leste
Viet Nam
Oceania Fiji
Kiribati
Marshall Islands
Micronesia, Federated States of
Papua New Guinea
Samoa
Solomon Islands
Tonga
Vanuatu
Eastern Europe/
Central Asia
Central Europe Europe, Central Bosnia and Herzegovina
Bulgaria
Croatia
Czech Republic
Hungary
Macedonia, the Former Yugoslav
Republic of
Montenegro
Poland
Romania
Serbia
Slovakia
Slovenia
(Continued)
gATLASj
GLOBAL HEART, VOL. 9, NO. 1, 2014 11March 2014: 3-16

TABLE 2 Continued
Global CVD
Atlas Region
GBD Super
Region GBD Region Country
Eastern Europe
and Central
Asia
Europe, Eastern Belarus
Estonia
Latvia
Lithuania
Moldova
Russian Federation
Ukraine
Asia, Central Albania
Armenia
Azerbaijan
Georgia
Kazakhstan
Kyrgyzstan
Mongolia
Tajikistan
Turkmenistan
Uzbekistan
High Income
Asia Pacific, High
Income
Asia Pacific, High
Income
Brunei Darussalam
Japan
Korea, Republic of
Singapore
Australasia Australasia Australia
New Zealand
Western Europe Europe, Western Andorra
Austria
Belgium
Cyprus
Denmark
Finland
France
Germany
Greece
Iceland
Ireland
Israel
Italy
Luxembourg
Malta
Netherlands
Norway
Portugal
Spain
(Continued)
j gATLAS
12 GLOBAL HEART, VOL. 9, NO. 1, 2014March 2014: 3-16
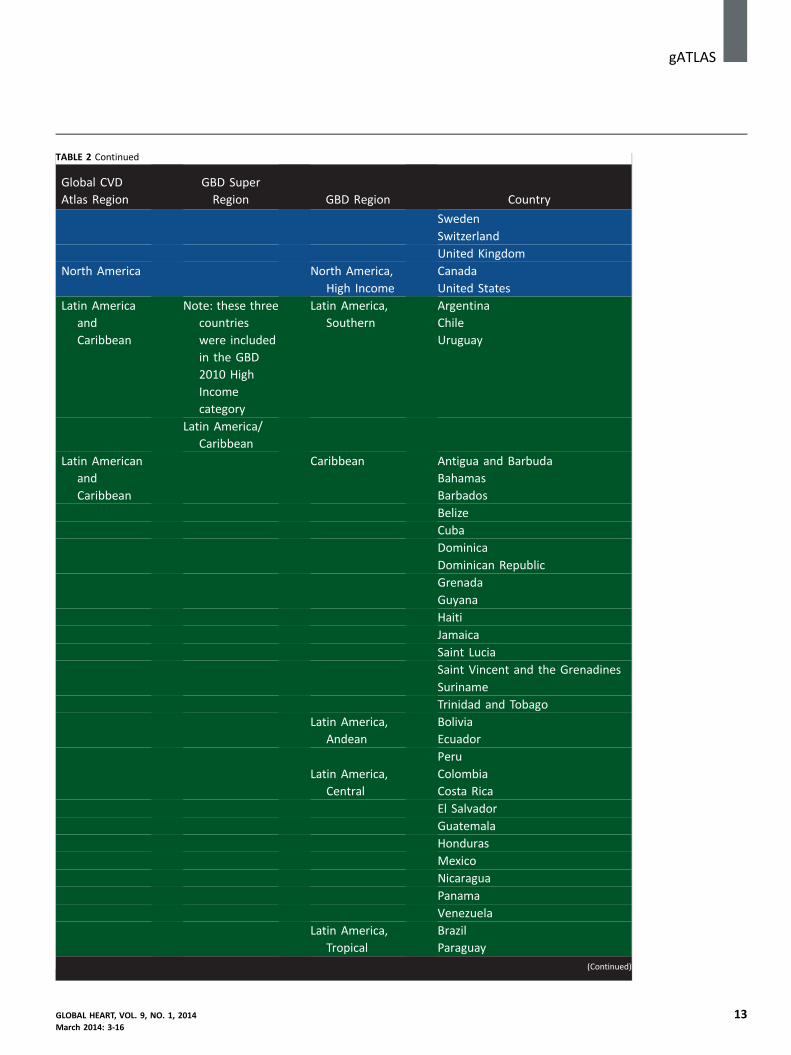
TABLE 2 Continued
Global CVD
Atlas Region
GBD Super
Region GBD Region Country
Sweden
Switzerland
United Kingdom
North America North America,
High Income
Canada
United States
Latin America
and
Caribbean
Note: these three
countries
were included
in the GBD
2010 High
Income
category
Latin America,
Southern
Argentina
Chile
Uruguay
Latin America/
Caribbean
Latin American
and
Caribbean
Caribbean Antigua and Barbuda
Bahamas
Barbados
Belize
Cuba
Dominica
Dominican Republic
Grenada
Guyana
Haiti
Jamaica
Saint Lucia
Saint Vincent and the Grenadines
Suriname
Trinidad and Tobago
Latin America,
Andean
Bolivia
Ecuador
Peru
Latin America,
Central
Colombia
Costa Rica
El Salvador
Guatemala
Honduras
Mexico
Nicaragua
Panama
Venezuela
Latin America,
Tropical
Brazil
Paraguay
(Continued)
gATLASj
GLOBAL HEART, VOL. 9, NO. 1, 2014 13March 2014: 3-16
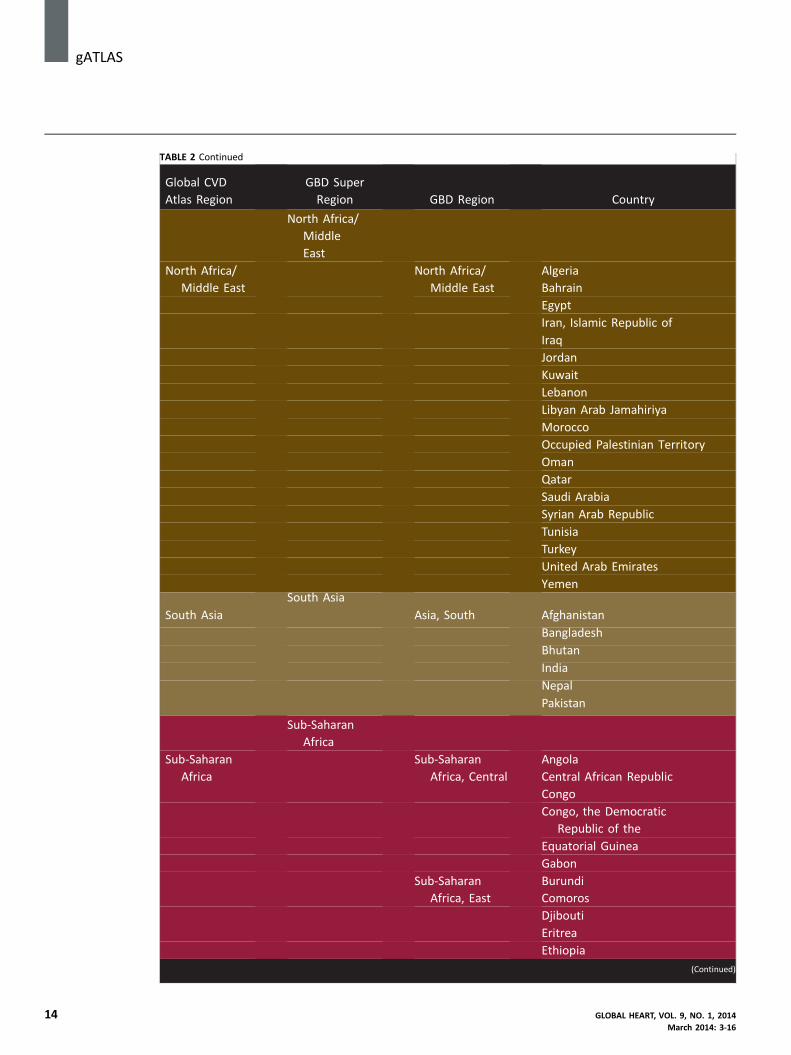
TABLE 2 Continued
Global CVD
Atlas Region
GBD Super
Region GBD Region Country
North Africa/
Middle
East
North Africa/
Middle East
North Africa/
Middle East
Algeria
Bahrain
Egypt
Iran, Islamic Republic of
Iraq
Jordan
Kuwait
Lebanon
Libyan Arab Jamahiriya
Morocco
Occupied Palestinian Territory
Oman
Qatar
Saudi Arabia
Syrian Arab Republic
Tunisia
Turkey
United Arab Emirates
YemenSouth Asia
South Asia Asia, South Afghanistan
Bangladesh
Bhutan
India
Nepal
Pakistan
Sub-Saharan
Africa
Sub-Saharan
Africa
Sub-Saharan
Africa, Central
Angola
Central African Republic
Congo
Congo, the Democratic
Republic of the
Equatorial Guinea
Gabon
Sub-Saharan
Africa, East
Burundi
Comoros
Djibouti
Eritrea
Ethiopia
(Continued)
j gATLAS
14 GLOBAL HEART, VOL. 9, NO. 1, 2014March 2014: 3-16

TABLE 2 Continued
Global CVD
Atlas Region
GBD Super
Region GBD Region Country
Kenya
Madagascar
Malawi
Mauritius
Mozambique
Rwanda
Seychelles
Somalia
Sudan
Tanzania, United
Republic of
Uganda
Zambia
Sub-Saharan
Africa,
Southern
Botswana
Lesotho
Namibia
South Africa
Swaziland
Zimbabwe
Sub-Saharan
Africa, West
Benin
Burkina Faso
Cameroon
Cape Verde
Chad
Cote d’Ivoire
Gambia
Ghana
Guinea
Guinea-Bissau
Liberia
Mali
Mauritania
Niger
Nigeria
Sao Tome and Principe
Senegal
Sierra Leone
Togo
gATLASj
ACKNOWLEDGMENTWe are grateful for the assistance of Mr. Keane Y. Tzong ofthe Division of General Medicine, Columbia University, forhis invaluable assistance with preparing and analyzing data
GLOBAL HEART, VOL. 9, NO. 1, 2014March 2014: 3-16
for the atlas. We also acknowledge Mr. Tom Fleming of theInstitute for Health Metrics and Evaluation, University ofWashington, for his assistance with figures for the Summarysection.
15

j gATLAS
16
REFERENCES1. Moran AE, Forouzanfar MH, Roth G, et al. The global burden of
ischemic heart disease in 1990 and 2010: the Global Burden ofDisease 2010 Study. Circulation 2014 Feb 26 [Epub ahead of print].
2. Feigin VL, Forouzanfar MH, Krishnamurthi R, et al. Global andregional burden of stroke during 1990-2010: findings from the GlobalBurden of Disease Study 2010. Lancet 2014;383:245–54.
3. Chugh SS, Havmoeller R, Narayanan K, et al. Worldwide epidemiologyof atrial fibrillation: a global burden of disease 2010 study. Circulation2014;129:837–47.
4. Fowkes FG, Rudan D, Rudan I, et al. Comparison of global estimates ofprevalence and risk factors for peripheral artery disease in 2000 and2010: a systematic review and analysis. Lancet 2013;382:1329–40.
5. HuffmanMD, Rao KD, Pichon-Riviere A, et al. A cross-sectional study of
the microeconomic impact of cardiovascular disease hospitalization infour low- and middle-income countries. PloS One 2011;6:e20821.
6. Leeder S, Raymond S, Greenberg H, Liu H, Esson K. A Race AgainstTime: the Challenge of Cardiovascular Disease in Developing Coun-tries. New York: Columbia University Center for Global Health andEconomic Development; 2004.
7. World Health Organization. STEPwise approach to surveillance(STEPS). Available at: http://www.who.int/chp/steps/en/. AccessedMarch 7, 2014.
8. Mills A. Health care systems in low- and middle-income countries.N Engl J Med 2014;370:552–7.
9. National Heart, Lung, and Blood Institute, United States National
Institutes of Health. 2006 NHLBI Incidence and Prevalence Chartbook. U.S. Department of Health and Human Services. Available at: http://www.nhlbi.nih.gov/resources/docs/cht-book_ip.htm. Accessed October 4,2010.
10. Murray CJ, Vos T, Lozano R, et al. Disability-adjusted life years (DALYs)for 291 diseases and injuries in 21 regions, 1990-2010: a systematicanalysis for the Global Burden of Disease Study 2010. Lancet 2012;
380:2197–223.11. Vaidya A, Pokharel PK, Nagesh S, Karki P, Kumar S, Majhi S. Preva-
lence of coronary heart disease in the urban adult males of easternNepal: a population-based analytical cross-sectional study. IndianHeart J 2009;61:341–7.
12. Walker R, Whiting D, Unwin N, et al. Stroke incidence in rural andurban Tanzania: a prospective, community-based study. LancetNeurol 2010;9:786–92.
13. Yusuf S, Hawken S, Ounpuu S, et al. Effect of potentially modifi-able risk factors associated with myocardial infarction in 52
countries (the INTERHEART study): case-control study. Lancet 2004;364:937–52.
14. O’Donnell MJ, Xavier D, Liu L, et al. Risk factors for ischaemic andintracerebral haemorrhagic stroke in 22 countries (the INTERSTROKEstudy): a case-control study. Lancet 2010;376:112–23.
15. Yusuf S, Islam S, Chow CK, et al. Use of secondary prevention
drugs for cardiovascular disease in the community in high-income, middle-income, and low-income countries (the PUREStudy): a prospective epidemiological survey. Lancet 2011;378:1231–43.
16. Grey C, Jackson R, Wells S, et al. Maintenance of statin use over3 years following acute coronary syndromes: a national data
linkage study (ANZACS-QI-2). Heart 2014 Jan 16 [Epub ahead ofprint].
17. Roth GA. Statins after acute coronary syndrome: a missed opportu-nity. Heart 2014 Feb 21 [Epub ahead of print].
18. Shengelia B, Tandon A, Adams OB, Murray CJ. Access, utilization,quality, and effective coverage: an integrated conceptual frameworkand measurement strategy. Soc Sci Med 2005;61:97–109.
19. Naghavi M, Makela S, Foreman K, O’Brien J, Pourmalek F, Lozano R.Algorithms for enhancing public health utility of national causes-of-death data. Popul Health Metr 2010;8:9.
20. Salomon JA, Vos T, Hogan DR, et al. Common values in assessinghealth outcomes from disease and injury: disability weights mea-surement study for the Global Burden of Disease Study 2010. Lancet
2013;380:2129–43.21. Lim SS, Vos T, Flaxman AD, et al. A comparative risk assessment of
burden of disease and injury attributable to 67 risk factors and riskfactor clusters in 21 regions, 1990-2010: a systematic analysis forthe Global Burden of Disease Study 2010. Lancet 2012;380:2224–60.
22. World Bank Country Indicators. 2014. Available at: http://data.
worldbank.org/indicator. Accessed December 5, 2013.
GLOBAL HEART, VOL. 9, NO. 1, 2014March 2014: 3-16