
16S Classifier: A Tool for Fast and Accurate Taxonomic Classification of 16S rRNA Hypervariable...
13
RESEARCH ARTICLE 16S Classifier: A Tool for Fast and Accurate Taxonomic Classification of 16S rRNA Hypervariable Regions in Metagenomic Datasets Nikhil Chaudhary 1‡ , Ashok K. Sharma 1‡ , Piyush Agarwal 1,2 , Ankit Gupta 1 , Vineet K. Sharma 1 * 1 MetaInformatics Laboratory, Metagenomics and Systems Biology Group, Department of Biological Sciences, Indian Institute of Science Education and Research Bhopal, Madhya Pradesh, India, 2 Department of Physics, Indian Institute of Science Education and Research Bhopal, Madhya Pradesh, India ‡ These authors contributed equally to this work. * [email protected] Abstract The diversity of microbial species in a metagenomic study is commonly assessed using 16S rRNA gene sequencing. With the rapid developments in genome sequencing technolo- gies, the focus has shifted towards the sequencing of hypervariable regions of 16S rRNA gene instead of full length gene sequencing. Therefore, 16S Classifier is developed using a machine learning method, Random Forest, for faster and accurate taxonomic classification of short hypervariable regions of 16S rRNA sequence. It displayed precision values of up to 0.91 on training datasets and the precision values of up to 0.98 on the test dataset. On real metagenomic datasets, it showed up to 99.7% accuracy at the phylum level and up to 99.0% accuracy at the genus level. 16S Classifier is available freely at http:// metagenomics.iiserb.ac.in/16Sclassifier and http://metabiosys.iiserb.ac.in/16Sclassifier. Introduction In the last decade, metagenomics has emerged as one of the most incredible events in the study of microbial ecology which has made it possible to access, in-principle, almost 100% of the ge- netic material present in unculturable microbes [1]. More than 98% of the bacteria which can- not be cultured using traditional methodologies can be directly sequenced from their natural environments using the metagenomic approaches [2]. Furthermore, the rapid developments in sequencing technologies have made sequencing easier, faster and extremely economical which provide a unique opportunity to explore the microbial diversity of most complex environ- ments. The two common strategies adopted in any metagenomic project are random shotgun approach and targeted approach [3]. The former approach involves the sequencing of all geno- mic fragments and is used to uncover the enormously large functional gene diversity inherent in microbial communities. The latter approach involves the sequencing of a marker gene, such PLOS ONE | DOI:10.1371/journal.pone.0116106 February 3, 2015 1 / 13 OPEN ACCESS Citation: Chaudhary N, Sharma AK, Agarwal P, Gupta A, Sharma VK (2015) 16S Classifier: A Tool for Fast and Accurate Taxonomic Classification of 16S rRNA Hypervariable Regions in Metagenomic Data- sets. PLoS ONE 10(1): e0116106. doi:10.1371/ journal.pone.0116106 Academic Editor: Andrew R. Dalby, University of Westminster, UNITED KINGDOM Received: September 19, 2014 Accepted: December 4, 2014 Published: February 3, 2015 Copyright: © 2015 Chaudhary et al. This is an open access article distributed under the terms of the Creative Commons Attribution License, which permits unrestricted use, distribution, and reproduction in any medium, provided the original author and source are credited. Data Availability Statement: All relevant data are within the paper and its Supporting Information files. Funding: This work was supported by the intramural funding received from Indian Institute of Science Edu- cation and Research Bhopal (IISER Bhopal). The funders had no role in study design, data collection and analysis, decision to publish, or preparation of the manuscript. Competing Interests: The authors have declared that no competing interests exist.
-
Upload
independent -
Category
Documents
-
view
2 -
download
0
Transcript of 16S Classifier: A Tool for Fast and Accurate Taxonomic Classification of 16S rRNA Hypervariable...

RESEARCH ARTICLE
16S Classifier: A Tool for Fast and Accurate
Taxonomic Classification of 16S rRNA
Hypervariable Regions in Metagenomic
Datasets
Nikhil Chaudhary1‡, Ashok K. Sharma1‡, Piyush Agarwal1,2, Ankit Gupta1, VineetK. Sharma1*
1MetaInformatics Laboratory, Metagenomics and Systems Biology Group, Department of Biological
Sciences, Indian Institute of Science Education and Research Bhopal, Madhya Pradesh, India, 2 Departmentof Physics, Indian Institute of Science Education and Research Bhopal, Madhya Pradesh, India
‡ These authors contributed equally to this work.* [email protected]
Abstract
The diversity of microbial species in a metagenomic study is commonly assessed using
16S rRNA gene sequencing. With the rapid developments in genome sequencing technolo-
gies, the focus has shifted towards the sequencing of hypervariable regions of 16S rRNA
gene instead of full length gene sequencing. Therefore, 16S Classifier is developed using a
machine learning method, Random Forest, for faster and accurate taxonomic classification
of short hypervariable regions of 16S rRNA sequence. It displayed precision values of up to
0.91 on training datasets and the precision values of up to 0.98 on the test dataset. On real
metagenomic datasets, it showed up to 99.7% accuracy at the phylum level and up to
99.0% accuracy at the genus level. 16S Classifier is available freely at http://
metagenomics.iiserb.ac.in/16Sclassifier and http://metabiosys.iiserb.ac.in/16Sclassifier.
Introduction
In the last decade, metagenomics has emerged as one of the most incredible events in the study
of microbial ecology which has made it possible to access, in-principle, almost 100% of the ge-
netic material present in unculturable microbes [1]. More than 98% of the bacteria which can-
not be cultured using traditional methodologies can be directly sequenced from their natural
environments using the metagenomic approaches [2]. Furthermore, the rapid developments in
sequencing technologies have made sequencing easier, faster and extremely economical which
provide a unique opportunity to explore the microbial diversity of most complex environ-
ments. The two common strategies adopted in any metagenomic project are random shotgun
approach and targeted approach [3]. The former approach involves the sequencing of all geno-
mic fragments and is used to uncover the enormously large functional gene diversity inherent
in microbial communities. The latter approach involves the sequencing of a marker gene, such
PLOSONE | DOI:10.1371/journal.pone.0116106 February 3, 2015 1 / 13
OPEN ACCESS
Citation: Chaudhary N, Sharma AK, Agarwal P,
Gupta A, Sharma VK (2015) 16S Classifier: A Tool for
Fast and Accurate Taxonomic Classification of 16S
rRNA Hypervariable Regions in Metagenomic Data-
sets. PLoS ONE 10(1): e0116106. doi:10.1371/
journal.pone.0116106
Academic Editor: Andrew R. Dalby, University of
Westminster, UNITED KINGDOM
Received: September 19, 2014
Accepted: December 4, 2014
Published: February 3, 2015
Copyright: © 2015 Chaudhary et al. This is an open
access article distributed under the terms of the
Creative Commons Attribution License, which permits
unrestricted use, distribution, and reproduction in any
medium, provided the original author and source are
credited.
Data Availability Statement: All relevant data are
within the paper and its Supporting Information files.
Funding: This work was supported by the intramural
funding received from Indian Institute of Science Edu-
cation and Research Bhopal (IISER Bhopal). The
funders had no role in study design, data collection
and analysis, decision to publish, or preparation of
the manuscript.
Competing Interests: The authors have declared
that no competing interests exist.
as 16S rRNA, which helps in estimating the diversity, evolutionary distance and relative abun-
dance of different microbes in their complex environments [4]. The 16S rRNA gene has been
the most commonly used genetic marker for reconstructing prokaryotic phylogenies since it is
conserved in all prokaryotes [5, 6]. The distinctive feature of 16S rRNA gene which makes it a
suitable genetic marker is the presence of nine hypervariable regions (HVRs) V1-V9 flanked by
conserved regions which can be used to amplify the variable regions. The sequences of the
HVRs have been used for the taxonomic identification of microbial species in several metage-
nomic studies [7–11].
In the early metagenomic projects, the sequencing of complete 16S rRNA gene was com-
monly performed using the traditional Sanger sequencing methodology [7, 12]. This approach,
though informative, was tedious, laborious, expensive, and provided a limited depth of se-
quencing which was insufficient to uncover the complete bacterial diversity present in a com-
plex environment. The next-generation sequencing technologies provide short reads and
enormous sequencing depth at a much lower cost [13]. Thus, it has shifted the focus towards
sequencing short HVRs of the 16S rRNA gene at greater depths instead of sequencing the com-
plete gene [14]. This approach works primarily because the lengths of different variable regions
of the 16S rRNA gene lie in the range of 100–300 bp which can be easily covered using
short paired-end reads produced by commonly used next-generation sequencing technologies
[15, 16].
The taxonomic classification of environmental 16S rRNA gene sequences is carried out by
using either a homology-based or prediction-based approach. The former approach requires
the alignment of a query 16S rRNA sequence with all the 16S rRNA sequences present in the
reference database [17], such as Ribosomal Database Project [18], Greengenes [19] and SILVA
[20]. Several homology-based tools and pipelines are currently available for the analysis of the
16S rRNA environmental sequences, such as MEGAN [21], PyNAST [22], UCLUST [23],
QIIME [24], EzTaxon [25] and MG-RAST [26]. The major limitations of the above approach
are the large computational time needed for classification and dependence on the availability
of a homologous sequence in the reference database [27]. The prediction-based approaches are
useful in this scenario. One of the most commonly used tools for the taxonomic classification
is the RDP-Classifier which uses a Naive Bayesian Classifier [28, 29]. It performs well on com-
plete 16S rRNA sequences, however, it provides limited accuracy for any selected HVRs which
are short in length [30].
Since the recent metagenomic projects routinely employ the sequencing of only a single
HVR or a combination of two or more HVRs, specialized tools are needed for the accurate
identification and classification of species using short variable sequences. Therefore, 16S Classi-
fier has been developed using Random Forest (RF), a machine learning based approach, for the
taxonomic classification of short 16S rRNA HVRs and complete 16S rRNA gene sequences ob-
tained from metagenomic projects.
Methods
Construction of datasets
A total of 1,262,986 16S rRNA sequences along with their taxonomic information were re-
trieved from the Greengenes database (version 13_5) which provides a curated database of
full length 16S rRNA sequences [19, 31]. A list of primer pairs specific for each HVR and com-
binations of HVRs was prepared based on the information known in the literature (Table A in
S1 File). Since the 16S rRNA sequences display variability in length, the HVRs were extracted
from the complete 16s rRNA gene sequences by aligning the primer pairs using the Fuzznuc
program available in EMBOSS software suite [32]. The primer pairs which could extract the
Taxonomic Classification of 16S rRNA Hypervariable Regions
PLOS ONE | DOI:10.1371/journal.pone.0116106 February 3, 2015 2 / 13

sequences for a HVR from more than 50% of the total sequences present in the database were
selected. V1 and V9 regions were not included since for V1, using the known primers, only up
to 25% sequences could be extracted from the total sequences, and for HVR V9 primer pairs
could not be found. In addition, these HVRs (individually) are not commonly used in metage-
nomic studies. The sequences of each HVR were divided into separate groups based on their
taxonomic ranks from phylum to genus as per the information available in the taxonomy data
retrieved from the Greengenes database.
The sequences in each taxonomic rank group were clustered using CD-HIT (v 4.6) program
[33]. For the complete 16s rRNA gene sequence, clustering was performed at a global sequence
identity threshold of ‘0.999’ for sequences belonging to the taxonomic rank genus, and the
threshold ‘1’ was used for the rest of the higher taxonomic ranks to remove the redundant se-
quences which may lead to over-training. For all HVRs, the clustering was performed at a glob-
al sequence identity threshold of ‘1’ for all taxonomic rank groups. For each taxonomic rank
group, all representative sequences obtained after using CD-HIT were used as the training
dataset for the respective HVR (Table 1).
Random Forest (RF)
RF which is available in the R package (randomForest package, http://cran.r-project.org/) was
the method of choice for developing 16S Classifier because of the following reasons; i) fast and
easy implementation, ii) ability to analyse large datasets due to its robust classification algo-
rithm, iii) ability to accept large number of input variables exclusive of overfitting, and iv) it
can provide very high accuracy along with the information about the importance of variables
Table 1. Summary of the number of HVR sequences which were used for the training and testing of RF*.
16S rRNAregion
Sequencesextracted$
Coverage+ Average lengthof HVR
Taxonomic rankgroups++
Sequences used fortraining
Sequences used fortesting
V2 10,83,423 85.78 220 2,047 2,61,872 1,57,766
V3 12,38,687 98.07 151 2,241 2,12,065 1,24,878
V4 12,28,670 97.28 207 2,250 2,83,614 1,23,994
V5 12,46,013 98.65 106 2,274 1,57,683 1,25,619
V6 9,91,347 78.49 86 1,679 1,14,863 99,873
V7 9,88,968 78.3 107 2,023 1,20,048 99,789
V8 6,63,675 52.55 322 2,251 2,54,065 67,367
V23 10,30,659 81.6 393 1,967 3,52,294 1,03,903
V34 11,46,102 90.74 419 2,233 4,25,582 1,15,600
V35 12,37,047 97.94 542 2,247 5,34,343 1,24,718
V45 12,19,851 96.58 331 2,242 3,81,880 1,22,993
V56 12,04,664 95.38 243 2,126 2,97,368 1,21,414
V67 8,43,613 66.8 236 1,729 1,94,683 85,117
V78 6,39,251 50.61 329 2,128 2,43,846 67,509
Complete# 12,62,986 100 1,401 2,282 8,33,216 1,27,327
$: Number of sequences extracted from the total (complete) number of 16S rRNA sequences present in the database
*: Hypervariable region#: Total number of complete 16S rRNA sequences present in the Greengenes database+: Percentage of sequences for each HVR extracted from the available complete 16S rRNA sequences using the specific primer for that HVR (Table S1 in
File S1)++: Total number of taxonomic rank groups identified for the sequences of each HVR
doi:10.1371/journal.pone.0116106.t001
Taxonomic Classification of 16S rRNA Hypervariable Regions
PLOS ONE | DOI:10.1371/journal.pone.0116106 February 3, 2015 3 / 13

[34]. RF is an implementation of bagging approach where each tree is independently con-
structed and works as an independent model [35]. Further, RF uses ensemble learning method
for the classification and regression by creating many classifier trees and then combining their
results, since the result from an ensemble (combined) are more acceptable than an individual
model [36].
Bootstrapping was used to grow classification trees in the forest using the training dataset.
About two third of the data was randomly selected to grow a classification tree and rest one
third of the data was used for the prediction which is considered as out-of-bag (OOB). At each
split node a subset of variables (mtry) was randomly selected to calculate the variable impor-
tance. Permutation variable importance and gini index can be used to examine the importance
of a particular variable for classification. Among these, the permutation importance value is
most commonly used, and therefore was used in this study since it is directly related to the pre-
dictive ability [37]. The error of RF depends on the correlation between any two trees and the
strength of each tree in the forest which is measured in terms of OOB error [38].
Optimization of parameters
Optimization of parameters was carried out to obtain the best RF model with the lowest OOB
error. The sequences from HVR V3 were used for the optimization since it is commonly used
in metagenomic studies [39]. It has an appropriate length (~150 bp) which can be easily cov-
ered using next-generation sequencing technologies. Furthermore, this region could be ex-
tracted from a large (~98% in this study) diversity of bacterial genomes using its specific
primer pair. The nucleotide k-mers from size 2 to 6 were evaluated as input features for the
training of RF. The frequency of each k-mer in any given sequence was calculated as shown
below.
k �mer frequency ¼total number of occurrences of particular k �mer
total number of k �mers present in the sequence
The performance of different k-mer models was tested using tuneRF function available in
RF package. The tuneRF searches for optimal mtry value (the value with least OOB error) be-
ginning from a given default value for constructing the RF model. The default mtry value for
each k-mer model was calculated as half of the square root of total number of possible k-mers
for that k-mer model, whereas, the ‘stepFactor’ and ‘improve’ values were used as 1.5 and 0.02,
respectively. OOB error for 2-mer and 3-mer models was higher as compared to 4-mer, 5-mer
and 6-mer models (Fig. 1a). Though, the 5-mer and 6-mer models showed marginal (up to
~1%) improvement in the accuracy (lower OOB error) of prediction as compared to 4-mer, the
achieved improvement does not justify the several-fold increase in the time taken to prepare a
model and a larger (up to ~4 times) training data size (Fig. 1b and 1c). Therefore, 4-mer was se-
lected as the k-mer size at mtry = 8 (selected using tuneRF) to construct the RF models.
RF is able to handle large number of predictor variables, yet achieving better or similar accu-
racy using the minimum number of variables is highly desirable for optimal performance. A
total of 256 variables are possible using the k-mer size of 4 and can be used as the input. There-
fore, to select the minimum number of variables required for an optimal prediction, the impor-
tance of each variable at the selected mtry value (mtry = 8) was examined using the
permutation variable importance value obtained from the RF model (Fig. A in S1 File). From
the complete set of 256 variables, subsets were created by removing the 25 least important vari-
ables successively. Using this approach, three new subsets were formed consisting of 231, 206
and 181 variables which were further used as the input to RF at ntree = 100 and mtry = 8. The
OOB error obtained using the above three subsets of variables were compared with the OOB
Taxonomic Classification of 16S rRNA Hypervariable Regions
PLOS ONE | DOI:10.1371/journal.pone.0116106 February 3, 2015 4 / 13

error obtained using the complete set of variables (Fig. 2). It is apparent that the OOB error
showed an increase with the removal of variables from the total set. Hence, all 256 variables
were selected as input variables for constructing the RF model.
To examine the effect of increasing the number of trees (ntree) on OOB error, the value of
ntree (at mtry = 8) was gradually increased to 1000. On increasing the number of trees, a grad-
ual decrease in OOB error was observed which nearly saturated at n = 1000, therefore n = 1000
was selected as the number of trees for constructing the RF models (Fig. 3). The tuneRF func-
tion was used to optimise the value of mtry for constructing the RF models for each HVR sepa-
rately. The final models were created using 4-mer as feature input, using all 256 variables and
ntree = 1000 at optimum mtry value obtained from tuneRF function using 10 fold cross valida-
tion. A decrease in OOB error was observed for each model on increasing the number of trees
(Fig. 4).
Test datasets
Two test datasets were prepared to evaluate the performance of 16S Classifier. The first test
dataset was prepared by randomly extracting ~10% of the HVR sequences from each cluster
belonging to different taxonomic rank groups (Table 1). To examine the effect of sequencing
Figure 1. Optimization of parameters using hypervariable region V3. (a) OOB error at different mtry values for 2-mer, 3-mer, 4-mer, 5-mer and 6-mermodels, (b) Effect of k-mer size on time required for the calculation, (c) Size of the input file (used for training) for different k-mer size. From the figure (a), it isapparent that the OOB error for 2-mer and 3-mer models was higher as compared to 4-mer, 5-mer and 6-mer models. The figures (b) and (c) show that thetime taken and the training data size were several fold higher for 5-mer and 6-mer models as compared to the 4-mer model.
doi:10.1371/journal.pone.0116106.g001
Taxonomic Classification of 16S rRNA Hypervariable Regions
PLOS ONE | DOI:10.1371/journal.pone.0116106 February 3, 2015 5 / 13

errors, 1% mutations were randomly introduced in the HVR sequences using in-house Perl
script. The test datasets were prepared using this approach for all HVRs. The second test data-
set was prepared using real sequence datasets available in public (SRA database of NCBI) data-
base for the different HVRs (Table B in S1 File) [40]. The data for the complete 16S rRNA
sequences was obtained from the oral cavity samples of 10 healthy individuals (GeneBank ac-
cession numbers FJ976202 to FJ976448) [12].
Publicly available programs
The BLAST package (version 2.2.26, NCBI) and RDP Classifier (version 2.2) were used for
comparing the results of 16S Classifier [28, 41]. The same version of Greengenes database
which was used for the training of 16S Classifier was used as the reference data for BLAST and
as the training data for RDP Classifier.
Figure 2. OOB error shows a slight increase on removing variables. The optimizations were carried out using hypervariable region V3, 4-mer as inputand mtry = 8 (The values of these parameters were selected from the Fig. 1).
doi:10.1371/journal.pone.0116106.g002
Taxonomic Classification of 16S rRNA Hypervariable Regions
PLOS ONE | DOI:10.1371/journal.pone.0116106 February 3, 2015 6 / 13

Results and Discussions
Performance Analysis of HVRmodels
The performance of the models was assessed by using the following measures:
Sensitivity ¼TP
TP þ FN
Specificity ¼TN
TN þ FP
Precision ¼TP
TP þ FP
Figure 3. Decrease in OOB error for was observed on increasing the number of trees (ntree) at mtry = 8. This optimization was carried out usinghypervariable region V3, 4-mer as input variable, mtry = 8 and 256 variables
doi:10.1371/journal.pone.0116106.g003
Taxonomic Classification of 16S rRNA Hypervariable Regions
PLOS ONE | DOI:10.1371/journal.pone.0116106 February 3, 2015 7 / 13

Accuracy ¼TP þ TN
TP þ FN þ TN þ FP
G�mean ¼ffiffiffiffiffiffiffiffiffiffiffiffiffiffiffiffiffiffiffiffiffiffiffiffiffiffiffiffiffiffiffiffiffiffiffiffiffiffiffiffiffiffiffiffiffi
Sensitivity � Specificityp
f �measure ¼2� Precision� Recall
Precisionþ Recall
MCC ¼TP � TN � FP � FN
ffiffiffiffiffiffiffiffiffiffiffiffiffiffiffiffiffiffiffiffiffiffiffiffiffiffiffiffiffiffiffiffiffiffiffiffiffiffiffiffiffiffiffiffiffiffiffiffiffiffiffiffiffiffiffiffiffiffiffiffiffiffiffiffiffiffiffiffiffiffiffiffiffiffiffiffiffiffiffiffiffiffiffiffiffiffi
ðTP þ FPÞðTP þ FNÞðTN þ FPÞðTN þ FNÞp
Where, TP = True Positive, FP = False Positive, FN = False Negative, TN = True Negative
The above measures were calculated for all taxonomic rank groups for a given HVR model.
The values for each measure were averaged from all groups to calculate the values for that
HVR model. Since the number (from the confusion matrix) of ‘True Negatives’ was very large
compared to the number of ‘False Positives’, the value of specificity and accuracy was almost
one for all models. Among the models of individual HVRs, the models for V2, V4 and V8
Figure 4. OOB error decreases on increasing the number of trees (ntree) at optimummtry for different HVRs. For all individual hypervariable regionregions mtry value was optimized separately (using 4-mer as input) and was used for constructing the model at ntree = 1000. V2_mtry8 representshypervariable region V2 at optimummtry 8, and similarly represented for other hypervariable regions.
doi:10.1371/journal.pone.0116106.g004
Taxonomic Classification of 16S rRNA Hypervariable Regions
PLOS ONE | DOI:10.1371/journal.pone.0116106 February 3, 2015 8 / 13
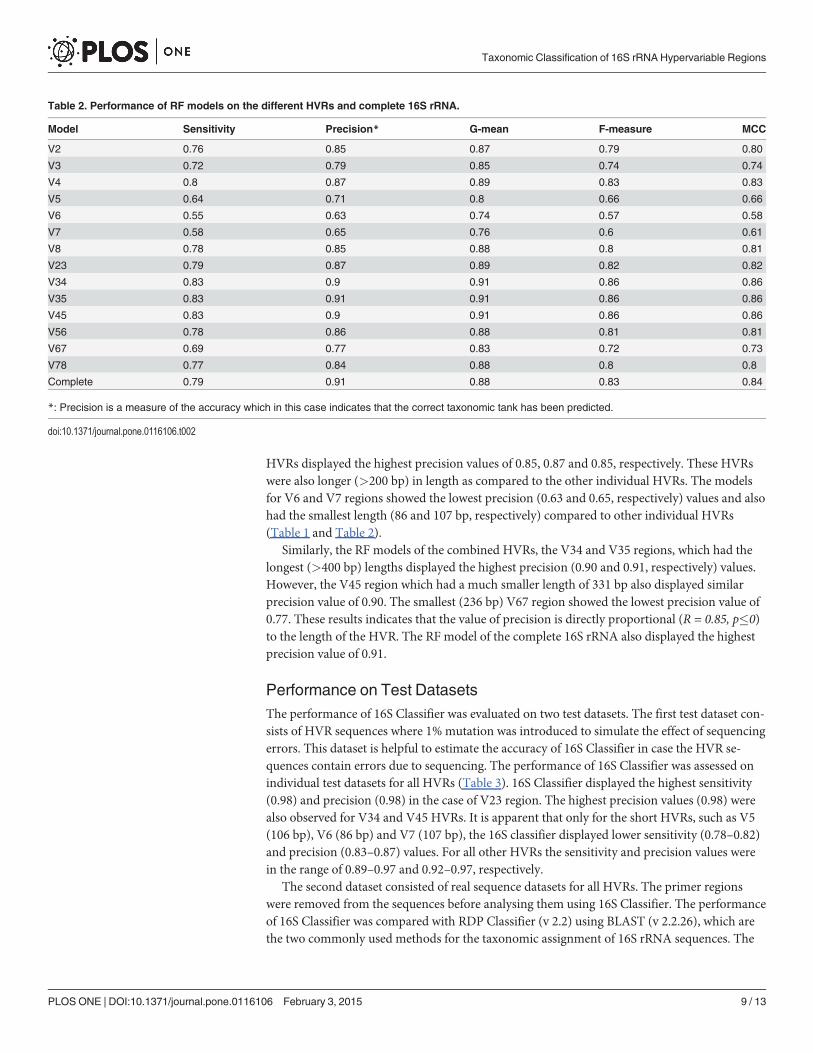
HVRs displayed the highest precision values of 0.85, 0.87 and 0.85, respectively. These HVRs
were also longer (>200 bp) in length as compared to the other individual HVRs. The models
for V6 and V7 regions showed the lowest precision (0.63 and 0.65, respectively) values and also
had the smallest length (86 and 107 bp, respectively) compared to other individual HVRs
(Table 1 and Table 2).
Similarly, the RF models of the combined HVRs, the V34 and V35 regions, which had the
longest (>400 bp) lengths displayed the highest precision (0.90 and 0.91, respectively) values.
However, the V45 region which had a much smaller length of 331 bp also displayed similar
precision value of 0.90. The smallest (236 bp) V67 region showed the lowest precision value of
0.77. These results indicates that the value of precision is directly proportional (R = 0.85, p�0)
to the length of the HVR. The RF model of the complete 16S rRNA also displayed the highest
precision value of 0.91.
Performance on Test Datasets
The performance of 16S Classifier was evaluated on two test datasets. The first test dataset con-
sists of HVR sequences where 1% mutation was introduced to simulate the effect of sequencing
errors. This dataset is helpful to estimate the accuracy of 16S Classifier in case the HVR se-
quences contain errors due to sequencing. The performance of 16S Classifier was assessed on
individual test datasets for all HVRs (Table 3). 16S Classifier displayed the highest sensitivity
(0.98) and precision (0.98) in the case of V23 region. The highest precision values (0.98) were
also observed for V34 and V45 HVRs. It is apparent that only for the short HVRs, such as V5
(106 bp), V6 (86 bp) and V7 (107 bp), the 16S classifier displayed lower sensitivity (0.78–0.82)
and precision (0.83–0.87) values. For all other HVRs the sensitivity and precision values were
in the range of 0.89–0.97 and 0.92–0.97, respectively.
The second dataset consisted of real sequence datasets for all HVRs. The primer regions
were removed from the sequences before analysing them using 16S Classifier. The performance
of 16S Classifier was compared with RDP Classifier (v 2.2) using BLAST (v 2.2.26), which are
the two commonly used methods for the taxonomic assignment of 16S rRNA sequences. The
Table 2. Performance of RF models on the different HVRs and complete 16S rRNA.
Model Sensitivity Precision* G-mean F-measure MCC
V2 0.76 0.85 0.87 0.79 0.80
V3 0.72 0.79 0.85 0.74 0.74
V4 0.8 0.87 0.89 0.83 0.83
V5 0.64 0.71 0.8 0.66 0.66
V6 0.55 0.63 0.74 0.57 0.58
V7 0.58 0.65 0.76 0.6 0.61
V8 0.78 0.85 0.88 0.8 0.81
V23 0.79 0.87 0.89 0.82 0.82
V34 0.83 0.9 0.91 0.86 0.86
V35 0.83 0.91 0.91 0.86 0.86
V45 0.83 0.9 0.91 0.86 0.86
V56 0.78 0.86 0.88 0.81 0.81
V67 0.69 0.77 0.83 0.72 0.73
V78 0.77 0.84 0.88 0.8 0.8
Complete 0.79 0.91 0.88 0.83 0.84
*: Precision is a measure of the accuracy which in this case indicates that the correct taxonomic tank has been predicted.
doi:10.1371/journal.pone.0116106.t002
Taxonomic Classification of 16S rRNA Hypervariable Regions
PLOS ONE | DOI:10.1371/journal.pone.0116106 February 3, 2015 9 / 13

results of taxonomic assignments of BLAST program were considered as the reference to deter-
mine the correct taxonomic lineage of the sequences in the real datasets (Text B in S1 File). The
performance of 16S Classifier and RDP classifier were evaluated on the test dataset for each
HVR.
For all HVRs and at all taxonomic ranks (except at genus rank for V7), the results of 16S
Classifier were more accurate as compared to RDP classifier (Table 4 and Fig. B in S1 File). At
phylum, class, order, family and genus levels, the 16S classifier displayed up to 42.9%, 40.7%,
41.0%, 57.9% and 73.8% higher accuracy as compared to RDP classifier. These results indicate
that 16S classifier shows much higher accuracy at lower taxonomic ranks, such as genus, com-
pared to the RDP classifier and attest to the accuracy of 16S classifier on different HVRs at all
taxonomic ranks. In the case of complete 16S rRNA sequences, both 16S Classifier and RDP
Classifier displayed comparable accuracy. The time taken for taxonomic analysis by 16S Classi-
fier, RDP Classifier and BLAST was compared using a sample dataset of 5,000 HVR sequences
of V3 region on a Linux Workstation with 64 GB RAM and an Intel Xeon 2.4 GHz CPU. The
16S Classifier took ~40 seconds, RDP Classifier took ~300 seconds and BLAST took 32,370 sec-
onds on the same dataset. These results indicate that 16S Classifier is much faster in carrying
out the taxonomic assignments as compared to the other available methods.
Implementation with QIIME pipeline
QIIME pipeline has recently become the most commonly used and standard pipeline for the
taxonomic analysis of 16S rRNA data obtained from metagenomic datasets [42]. It provides
options to use the available methods such as RDP Classifier, BLAST, MOTHUR and RTAX for
the taxonomic classification of the representative Operational Taxonomic Unit (OTU) se-
quences obtained after the clustering step in the pipeline. For the taxonomic assignment of
OTU sequences, the 16S Classifier is compatible with the QIIME pipeline and can be easily
used to carry out the taxonomic assignment using QIIME. It can accept the representative se-
quences of OTUs in QIIME format and produces the output in the format acceptable by the
QIIME pipeline for downstream analysis. Therefore, to the best of our knowledge, the 16S
Classifier is the only available machine learning based tool which can carry out the efficient,
Table 3. Performance of 16S Classifier on the first test dataset.
Model Sensitivity Precision G-mean F-measure MCC
V2 0.95 0.97 0.97 0.96 0.96
V3 0.89 0.92 0.94 0.9 0.9
V4 0.94 0.96 0.97 0.94 0.95
V5 0.81 0.87 0.9 0.82 0.83
V6 0.82 0.87 0.91 0.83 0.84
V7 0.78 0.83 0.88 0.78 0.79
V8 0.93 0.95 0.96 0.93 0.94
V23 0.98 0.98 0.99 0.98 0.98
V34 0.97 0.98 0.98 0.97 0.97
V35 0.95 0.97 0.97 0.95 0.96
V45 0.97 0.98 0.98 0.97 0.97
V56 0.95 0.97 0.97 0.95 0.96
V67 0.92 0.95 0.96 0.93 0.93
V78 0.93 0.95 0.96 0.93 0.93
Complete 0.94 0.97 0.97 0.95 0.95
doi:10.1371/journal.pone.0116106.t003
Taxonomic Classification of 16S rRNA Hypervariable Regions
PLOS ONE | DOI:10.1371/journal.pone.0116106 February 3, 2015 10 / 13

sensitive and accurate taxonomic assignment of any of the 16S rRNA HVRs which are com-
monly used in metagenomic projects. On complete 16S rRNA also, it displayed exceptional
performance. Thus, the wide usage of this tool is anticipated in different metagenomic projects.
The standalone software and the webserver of 16S Classifier are available at http://
metagenomics.iiserb.ac.in/16Sclassifier and http://metabiosys.iiserb.ac.in/16Sclassifier. The in-
structions for installing and using the software have been provided in Text A in S1 File.
Supporting Information
S1 File. Supporting text, tables, and figures. Text A. Instructions for running the stand-alone
version of 16S Classifier on the Linux PC. Text B. Performance evaluation of BLAST. Table A.
Information on the selected primer pairs used for extracting the different HVRs. Table B. In-
formation on the publicly available datasets for different HVRs which were used as the real
datasets for comparative analysis. Table C. Accuracy of BLAST and 16S Classifier on the ran-
domly selected test sequences. Fig. A. List of top 30 variables which displayed significant mean
decrease in accuracy. Fig. B. Comparison of 16S Classifier with RDP Classifier on real datasets.
The results of BLAST were used as the reference for comparing the result of 16S Classifier and
RDP Classifier.
(DOCX)
Acknowledgments
We thank MHRD, Govt of India, funded Centre for Research on Environment and Sustainable
Technologies (CREST) at IISER Bhopal for its support. However, the views expressed in this
manuscript are that of the authors alone and no approval of the same, explicit or implicit, by
MHRD should be assumed.
Table 4. Comparison of the performance of 16S Classifier with RDP Classifier on real datasets.
16S rRNA region Sequences Phylum Class Order Family Genus
16S* RDP+ 16S RDP 16S RDP 16S RDP 16S RDP
V2 2460 98.70 98.25 97.76 97.47 96.11 95.28 94.79 87.80 91.16 80.39
V3 901 96.87 88.27 96.76 80.98 95.58 57.60 86.60 28.75 81.85 8.04
V4 27713 91.82 72.95 91.60 68.39 89.69 57.43 87.77 52.72 83.93 55.15
V5 9633 99.70 97.21 99.38 96.94 99.37 96.77 95.35 94.62 92.96 91.22
V6 2667 96.87 94.65 96.60 90.34 95.04 82.77 96.05 75.97 58.27 43.26
V7 6839 98.96 88.54 97.89 86.61 97.86 83.13 93.26 81.98 70.99 77.15
V8 5767 99.05 96.62 98.80 95.68 98.82 95.32 90.08 82.47 83.91 79.99
V23 783 88.30 64.27 72.05 64.68 71.73 64.73 65.76 57.62 54.31 44.40
V34 6133 99.51 92.26 99.33 92.26 99.72 92.25 99.65 92.34 98.14 94.27
V35 7737 94.87 93.32 93.27 92.74 92.92 91.52 91.34 90.15 86.03 75.05
V45 7171 95.49 52.61 93.34 52.61 93.47 52.51 92.36 52.40 85.99 57.29
V56 5255 95.03 72.03 85.92 72.03 79.95 71.70 87.71 69.25 79.86 69.08
V67 4693 97.44 92.84 96.68 91.84 96.68 91.11 85.07 74.61 80.14 64.56
V78 5995 99.23 97.46 99.00 96.60 99.00 96.35 90.27 83.14 85.07 80.54
Complete 247 94.74 98.38 94.74 98.38 98.32 98.32 99.57 96.56 98.99 100.00
*: 16S refers to 16S Classifier+: RDP refers to RDP Classifier
doi:10.1371/journal.pone.0116106.t004
Taxonomic Classification of 16S rRNA Hypervariable Regions
PLOS ONE | DOI:10.1371/journal.pone.0116106 February 3, 2015 11 / 13

Author Contributions
Conceived and designed the experiments: VKS NC AKS. Performed the experiments: NC AKS.
Analyzed the data: NC AKS AG. Contributed reagents/materials/analysis tools: NC AKS.
Wrote the paper: VKS NC AKS. Contributed to the web server development: PA NC AKS.
References1. Thomas T, Gilbert J, Meyer F (2012) Metagenomics—a guide from sampling to data analysis. Microb
Inform Exp 2: 3. doi: 10.1186/2042-5783-2-3 PMID: 22587947
2. Wooley JC, Godzik A, Friedberg I (2010) A primer on metagenomics. PLoS computational biology 6:e1000667. doi: 10.1371/journal.pcbi.1000667 PMID: 20195499
3. Fuhrman JA (2012) Metagenomics and its connection to microbial community organization. F1000 BiolRep 4: 15. doi: 10.3410/B4-15 PMID: 22912649
4. Venter JC, Remington K, Heidelberg JF, Halpern AL, Rusch D, et al. (2004) Environmental genomeshotgun sequencing of the Sargasso Sea. science 304: 66–74. doi: 10.1126/science.1093857 PMID:15001713
5. Janda JM, Abbott SL (2007) 16S rRNA gene sequencing for bacterial identification in the diagnosticlaboratory: pluses, perils, and pitfalls. Journal of Clinical Microbiology 45: 2761–2764. doi: 10.1128/JCM.01228-07 PMID: 17626177
6. Case RJ, Boucher Y, Dahllöf I, Holmström C, Doolittle WF, et al. (2007) Use of 16S rRNA and rpoBgenes as molecular markers for microbial ecology studies. Applied and Environmental Microbiology73: 278–288. doi: 10.1128/AEM.01177-06 PMID: 17071787
7. Petrosino JF, Highlander S, Luna RA, Gibbs RA, Versalovic J (2009) Metagenomic pyrosequencingand microbial identification. Clinical Chemistry 55: 856–866. doi: 10.1373/clinchem.2008.107565PMID: 19264858
8. Hao X, Chen T (2012) OTU analysis using metagenomic shotgun sequencing data. PloS one 7:e49785. doi: 10.1371/journal.pone.0049785 PMID: 23189163
9. Turnbaugh PJ, Hamady M, Yatsunenko T, Cantarel BL, Duncan A, et al. (2008) A core gut microbiomein obese and lean twins. nature 457: 480–484. doi: 10.1038/nature07540 PMID: 19043404
10. Andersson AF, Lindberg M, Jakobsson H, Bäckhed F, Nyrén P, et al. (2008) Comparative analysis ofhuman gut microbiota by barcoded pyrosequencing. PloS one 3: e2836. doi: 10.1371/journal.pone.0002836 PMID: 18665274
11. Dethlefsen L, Huse S, Sogin ML, Relman DA (2008) The pervasive effects of an antibiotic on thehuman gut microbiota, as revealed by deep 16S rRNA sequencing. PLoS Biology 6: e280. doi:10.1371/journal.pbio.0060280 PMID: 19018661
12. Bik EM, Long CD, Armitage GC, Loomer P, Emerson J, et al. (2010) Bacterial diversity in the oral cavityof 10 healthy individuals. The ISME journal 4: 962–974. doi: 10.1038/ismej.2010.30 PMID: 20336157
13. Desai A, Marwah VS, Yadav A, Jha V, Dhaygude K, et al. (2013) Identification of optimum sequencingdepth especially for de novo genome assembly of small genomes using next generation sequencingdata. PloS one 8: e60204. doi: 10.1371/journal.pone.0060204 PMID: 23593174
14. Mizrahi-Man O, Davenport ER, Gilad Y (2013) Taxonomic classification of bacterial 16S rRNA genesusing short sequencing reads: evaluation of effective study designs. PloS one 8: e53608. doi: 10.1371/journal.pone.0053608 PMID: 23308262
15. Zhang J, Kobert K, Flouri T, Stamatakis A (2014) PEAR: a fast and accurate Illumina Paired-End reAdmergeR. Bioinformatics 30: 614–620. doi: 10.1093/bioinformatics/btt593 PMID: 24142950
16. Aravindraja C, Viszwapriya D, Pandian SK (2013) Ultradeep 16S rRNA Sequencing Analysis of Geo-graphically Similar but Diverse Unexplored Marine Samples Reveal Varied Bacterial Community Com-position. PloS one 8: e76724. doi: 10.1371/journal.pone.0076724 PMID: 24167548
17. Jonasson J, Olofsson M, Monstein HJ (2002) Classification, identification and subtyping of bacteriabased on pyrosequencing and signature matching of 16S rDNA fragments. Apmis 110: 263–272. doi:10.1034/j.1600-0463.2002.100309.x PMID: 12076280
18. Cole JR, Wang Q, Cardenas E, Fish J, Chai B, et al. (2009) The Ribosomal Database Project: improvedalignments and new tools for rRNA analysis. Nucleic acids research 37: D141–D145. doi: 10.1093/nar/gkn879 PMID: 19004872
19. DeSantis TZ, Hugenholtz P, Larsen N, Rojas M, Brodie EL, et al. (2006) Greengenes, a chimera-checked 16S rRNA gene database and workbench compatible with ARB. Applied and environmentalmicrobiology 72: 5069–5072. doi: 10.1128/AEM.03006-05 PMID: 16820507
Taxonomic Classification of 16S rRNA Hypervariable Regions
PLOS ONE | DOI:10.1371/journal.pone.0116106 February 3, 2015 12 / 13

20. Pruesse E, Quast C, Knittel K, Fuchs BM, LudwigW, et al. (2007) SILVA: a comprehensive online re-source for quality checked and aligned ribosomal RNA sequence data compatible with ARB. Nucleicacids research 35: 7188–7196. doi: 10.1093/nar/gkm864 PMID: 17947321
21. Mitra S, Stärk M, Huson DH (2011) Analysis of 16S rRNA environmental sequences using MEGAN.BMC genomics 12: S17. doi: 10.1186/1471-2164-12-S3-S17 PMID: 22369513
22. Caporaso JG, Bittinger K, Bushman FD, DeSantis TZ, Andersen GL, et al. (2010) PyNAST: a flexibletool for aligning sequences to a template alignment. Bioinformatics 26: 266–267. doi: 10.1093/bioinformatics/btp636 PMID: 19914921
23. Edgar RC (2010) Search and clustering orders of magnitude faster than BLAST. Bioinformatics 26:2460–2461. doi: 10.1093/bioinformatics/btq461 PMID: 20709691
24. Caporaso JG, Kuczynski J, Stombaugh J, Bittinger K, Bushman FD, et al. (2010) QIIME allows analysisof high-throughput community sequencing data. Nature methods 7: 335–336. doi: 10.1038/nmeth.f.303 PMID: 20383131
25. Chun J, Lee J-H, Jung Y, Kim M, Kim S, et al. (2007) EzTaxon: a web-based tool for the identification ofprokaryotes based on 16S ribosomal RNA gene sequences. International Journal of Systematic andEvolutionary Microbiology 57: 2259–2261. doi: 10.1099/ijs.0.64915-0 PMID: 17911292
26. Meyer F, Paarmann D, D’Souza M, Olson R, Glass EM, et al. (2008) The metagenomics RAST server–a public resource for the automatic phylogenetic and functional analysis of metagenomes. BMC bioin-formatics 9: 386. doi: 10.1186/1471-2105-9-386 PMID: 18803844
27. Gupta A, Kapil R, Dhakan DB, Sharma VK (2014) MP3: A Software Tool for the Prediction of Pathogen-ic Proteins in Genomic and Metagenomic Data. PloS one 9: e93907. doi: 10.1371/journal.pone.0093907 PMID: 24736651
28. Wang Q, Garrity GM, Tiedje JM, Cole JR (2007) Naive Bayesian classifier for rapid assignment ofrRNA sequences into the new bacterial taxonomy. Applied and environmental microbiology 73: 5261–5267. doi: 10.1128/AEM.00062-07 PMID: 17586664
29. Claesson MJ, Wang Q, O’Sullivan O, Greene-Diniz R, Cole JR, et al. (2010) Comparison of two next-generation sequencing technologies for resolving highly complex microbiota composition using tandemvariable 16S rRNA gene regions. Nucleic Acids Research 38: e200. doi: 10.1093/nar/gkq873 PMID:20880993
30. Qunfeng D, Claudia V (2012) Evaluation of the RDP classifier accuracy using 16S rRNA gene variableregions. Metagenomics 2012.
31. McDonald D, Price MN, Goodrich J, Nawrocki EP, DeSantis TZ, et al. (2011) An improved Greengenestaxonomy with explicit ranks for ecological and evolutionary analyses of bacteria and archaea. TheISME journal 6: 610–618. doi: 10.1038/ismej.2011.139 PMID: 22134646
32. Mullan LJ, Bleasby AJ (2002) Short EMBOSS user guide. Briefings in Bioinformatics 3: 92–94. doi:10.1093/bib/3.1.92 PMID: 12002228
33. Fu L, Niu B, Zhu Z, Wu S, Li W (2012) CD-HIT: accelerated for clustering the next-generation sequenc-ing data. Bioinformatics 28: 3150–3152. doi: 10.1093/bioinformatics/bts565 PMID: 23060610
34. Biau G (2012) Analysis of a random forests model. The Journal of Machine Learning Research 98888:1063–1095.
35. Panov P, Džeroski S (2007) Combining bagging and random subspaces to create better ensembles:Springer.
36. Breiman L (2001) Random forests. Machine learning 45: 5–32. doi: 10.1023/A:1010933404324
37. Strobl C, Boulesteix A-L, Zeileis A, Hothorn T (2007) Bias in random forest variable importance mea-sures: Illustrations, sources and a solution. BMC bioinformatics 8: 25. doi: 10.1186/1471-2105-8-25PMID: 17254353
38. Zhang J, Zulkernine M. A hybrid network intrusion detection technique using random forests; 2006.IEEE. pp. 8 pp.
39. Huse SM, Dethlefsen L, Huber JA, Welch DM, Relman DA, et al. (2008) Exploring microbial diversityand taxonomy using SSU rRNA hypervariable tag sequencing. PLoS genetics 4: e1000255. doi:10.1371/journal.pgen.1000255 PMID: 19023400
40. Leinonen R, Sugawara H, Shumway M (2010) The sequence read archive. Nucleic Acids Research:gkq1019.
41. Altschul SF, GishW, Miller W, Myers EW, Lipman DJ (1990) Basic local alignment search tool. Journalof Molecular Biology 215: 403–410. doi: 10.1016/S0022-2836(05)80360-2 PMID: 2231712
42. D’Argenio V, Casaburi G, Precone V, Salvatore F (2014) Comparative Metagenomic Analysis ofHuman Gut Microbiome Composition Using Two Different Bioinformatic Pipelines. BioMed research in-ternational 2014. doi: 10.1155/2014/325340 PMID: 24719854
Taxonomic Classification of 16S rRNA Hypervariable Regions
PLOS ONE | DOI:10.1371/journal.pone.0116106 February 3, 2015 13 / 13