Resistance of Staphylococcus aureus to antimicrobial agents ...
Upload
independentCategory
view
0download
0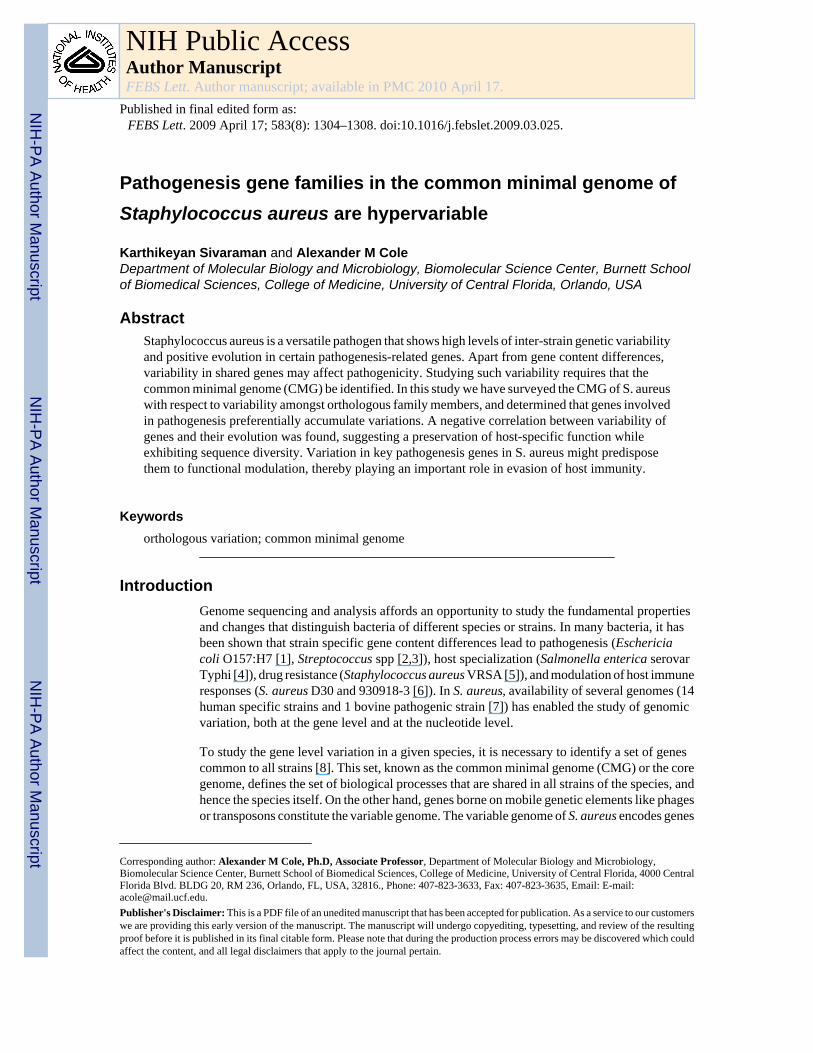
Pathogenesis gene families in the common minimal genome ofStaphylococcus aureus are hypervariable
Karthikeyan Sivaraman and Alexander M ColeDepartment of Molecular Biology and Microbiology, Biomolecular Science Center, Burnett Schoolof Biomedical Sciences, College of Medicine, University of Central Florida, Orlando, USA
AbstractStaphylococcus aureus is a versatile pathogen that shows high levels of inter-strain genetic variabilityand positive evolution in certain pathogenesis-related genes. Apart from gene content differences,variability in shared genes may affect pathogenicity. Studying such variability requires that thecommon minimal genome (CMG) be identified. In this study we have surveyed the CMG of S. aureuswith respect to variability amongst orthologous family members, and determined that genes involvedin pathogenesis preferentially accumulate variations. A negative correlation between variability ofgenes and their evolution was found, suggesting a preservation of host-specific function whileexhibiting sequence diversity. Variation in key pathogenesis genes in S. aureus might predisposethem to functional modulation, thereby playing an important role in evasion of host immunity.
Keywordsorthologous variation; common minimal genome
IntroductionGenome sequencing and analysis affords an opportunity to study the fundamental propertiesand changes that distinguish bacteria of different species or strains. In many bacteria, it hasbeen shown that strain specific gene content differences lead to pathogenesis (Eschericiacoli O157:H7 [1], Streptococcus spp [2,3]), host specialization (Salmonella enterica serovarTyphi [4]), drug resistance (Staphylococcus aureus VRSA [5]), and modulation of host immuneresponses (S. aureus D30 and 930918-3 [6]). In S. aureus, availability of several genomes (14human specific strains and 1 bovine pathogenic strain [7]) has enabled the study of genomicvariation, both at the gene level and at the nucleotide level.
To study the gene level variation in a given species, it is necessary to identify a set of genescommon to all strains [8]. This set, known as the common minimal genome (CMG) or the coregenome, defines the set of biological processes that are shared in all strains of the species, andhence the species itself. On the other hand, genes borne on mobile genetic elements like phagesor transposons constitute the variable genome. The variable genome of S. aureus encodes genes
Corresponding author: Alexander M Cole, Ph.D, Associate Professor, Department of Molecular Biology and Microbiology,Biomolecular Science Center, Burnett School of Biomedical Sciences, College of Medicine, University of Central Florida, 4000 CentralFlorida Blvd. BLDG 20, RM 236, Orlando, FL, USA, 32816., Phone: 407-823-3633, Fax: 407-823-3635, Email: E-mail:[email protected]'s Disclaimer: This is a PDF file of an unedited manuscript that has been accepted for publication. As a service to our customerswe are providing this early version of the manuscript. The manuscript will undergo copyediting, typesetting, and review of the resultingproof before it is published in its final citable form. Please note that during the production process errors may be discovered which couldaffect the content, and all legal disclaimers that apply to the journal pertain.
NIH Public AccessAuthor ManuscriptFEBS Lett. Author manuscript; available in PMC 2010 April 17.
Published in final edited form as:FEBS Lett. 2009 April 17; 583(8): 1304–1308. doi:10.1016/j.febslet.2009.03.025.
NIH
-PA Author Manuscript
NIH
-PA Author Manuscript
NIH
-PA Author Manuscript
for modulation of host immune responses [9] and for certain phenomena such as nasal carriage.However, major reported determinants of staphylococcal pathogenicity like the accessory generegulator (Agr), clumping factors (clfA and clfB) and exotoxins are present in all S. aureusstrains and thus are a part of the common minimal genome (CMG) suggesting a fundamentalrole for these genes in pathogenicity.
Even though differences in gene content explain major differences observed between strains,simple nucleotide level events like mutations, insertions, deletions, truncations and singlenucleotide polymorphisms also play an important role in defining and modulatingpathogenicity. In the bovine pathogenic strain of S. aureus ET3-S, the authors have shownpositive evolution (dN/dS > 1) in several key pathogenesis genes, and argue that these geneshave specifically evolved to adapt to a different host, the cow [10,7]. In other pathogens likeE. coli [11], and Xylella fastidiosa [12], positive evolution of genes has been attributed toadaptation to host type as well as enhancement in pathogenicity.
Positive evolution of genes has been measured using the Yang and Neilson metric (dN/dS ratio)under the assumption that non-synonymous changes would lead to differences in functionality.It is worth noting that there can be high degree of variation that does not manifest itself as adN/dS ratio > 1. While positive evolution of genes and its effect on pathogenicity have beendocumented for several organisms including S. aureus, the role of gene level variations thatdo not lead evolution of the species has been neglected. In this study, we have termed thisphenomenon variation in the absence of evolution while analyzing the effect of variations inthe CMG of S. aureus on the pathogenicity of the organism. We first defined the CMG of S.aureus based on all 14 completely sequenced human specific strains available at the time ofthis study, and demonstrated that variation and evolution are not correlated in these strains.Interestingly, we determined that pathogenesis-related genes in S. aureus preferentiallyaccumulated variations in the absence (dN/dS < 1) of evolution. Such variations, some of whichoccur in key amino acid residues of host adhesion molecules (clumping factors), drugtransporters (QacC) and regulatory proteins (MarR family protein), likely affect their activity.We hypothesize that such variation in pathogenesis-related genes enables the pathogen tomodulate infectivity in response to the host.
Materials and MethodsSequences and functional annotations for protein families
All sequences were obtained from the NCBI sequence database(ftp://ftp.ncbi.nih.gov/genomes/Bacteria). The strains used in this study are N315 [13](NC_002745), Mu50 (NC_002758), COL (NC_002951), MRSA252 (NC_002952),MSSA476 (NC_002953), MW2 (NC_003923), RF122 (NC_007622), USA300 (NC_007793),NCTC8325 (NC_007795), JH1 (NC_009632), JH9 (NC_009487), Mu3 (NC_009782) andUSA300_TCH1516 (NC_010079). Available annotations for each genome were used, inconjunction with the clusters of orthologous groups (COG) classification [14] and manualcuration for functional analysis. When multiple annotations were present, the most descriptiveannotation was manually chosen to represent the function. It should be noted that COG doesnot have a family specific for pathogenicity. Hence, annotations for genes involved inpathogenicity were derived from published material for each such gene.
Sequence analysis for orthology, evolution and variation in gene familiesWe used bidirectional best hit BLAST (gapped Blast reference) to identify orthologs [14].Since we were searching for a common group of orthologs in all the strains, the choice of areference strain was random. We used the first sequenced strain N315 as a reference. All thegenes in N315 that had orthologs in the other 13 human specific strains were considered a part
Sivaraman and Cole Page 2
FEBS Lett. Author manuscript; available in PMC 2010 April 17.
NIH
-PA Author Manuscript
NIH
-PA Author Manuscript
NIH
-PA Author Manuscript
of the common minimal genome (CMG). Protein sequences were obtained by translation ofgene sequences. Multiple alignments were performed on each gene / protein family (containing14 sequences each) using CLUSTALW [15].
In order to study the evolution of genes, we used the PAML package [16]. Conversion of proteinalignments to DNA alignments for use in PAML was performed using pal2nal [17]. Thesealignment files were then used to calculate dN/dS ratio using the Nei-Gojobori method [18].Apart from calculating dN/dS ratio, we calculated the fraction of gaps and mismatches fromthe CLUSTAL alignments. The fraction was calculated as a ratio of number of gaps andmismatches in the alignments to the overall length of the alignment.
We used the TMHMM software [19] for calculating transmembrane regions in the proteins.For the set of genes with truncations, we predicted functional domains by searching againstPFam using hmmpfam [20]. All predictions and alignments were parsed using PERL scripts(supplementary methods).
Functional classification of genes used in the studyWe used the COG classification system for this study [14]. The COG system classifies genesaccording to their function, in a hierarchical manner. There are four major groups of COGsconsisting of a total of 25 specific subgroups. The major groups are: 1) information storageand processing, 2) cellular functions, 3) metabolism, and 4) poorly characterized functions.Information storage and processing (Inf) is comprised of genes involved in replication,transcription and translation along with those for chromatin structure and RNA processing.Cellular functions (Cel in this study) encompass genes involved in cell division, membranebiosynthesis, extracellular structures, signal transduction and protein processing. The groupmetabolism (Met) includes genes involved in all metabolic activities as well as genes thatencode for metabolic transporters. Finally, those genes with a generic assigned function or nofunction at all were classified as poorly characterized (Hypothetical; Hyp in this study).
Gene groups used in this studyFor each orthologous gene family, we calculated the fraction of variation (Fv) as follows: Fv= No. of mismatches or gaps in alignments / length of alignment. We chose the top 10% ofgenes with variation (Fv >=0.11) and named it the high variability group. In the high variabilitygroup, we studied the effects of both truncations and insertion / deletion events on variability.To compare the gene content of the high variability group, we used a set of genes with lowvariability (Fv <= 0.01).
Statistical AnalysisWe compared the distribution of COG families in each of the groups outlined above, using thechi-square test and the Fisher test. A P-value of 0.05 or less in the Fisher test was consideredsignificant. We studied the correlation between dN/dS values and Fv values using Pearson’scorrelation coefficient (PCC). For all these tests, we used the R statistical package(www.r-project.org).
Results and DiscussionsThe common minimal genome (CMG) of S. aureus was derived from 14 human-specific strainsand consisted of 1888 genes (supplementary information 1). The COG distribution of theCMG reveals a large number of genes involved in metabolic activities, followed by cellularfunctions and hypothetical genes, in that order (Figure 1). In this study we analyzed thecorrelation between variation in the CMG and pathogenicity. In the following sections, we
Sivaraman and Cole Page 3
FEBS Lett. Author manuscript; available in PMC 2010 April 17.
NIH
-PA Author Manuscript
NIH
-PA Author Manuscript
NIH
-PA Author Manuscript
compared and contrasted the groups of genes showing high variability with those that showlittle or no variability.
Pathogenesis related genes contain high levels of variationPositive evolution (dN/dS > 1) of pathogenesis-related genes has been documented in bovinemastitis strains of S. aureus but not in the human isolates. In fact, our analysis of the CMGrevealed that none of the known pathogenesis related genes had a dN/dS value of >1. However,we observed high levels of variability in many genes in the CMG. A scatter plot of Fv valuesversus the dN/dS values revealed a slightly negative correlation (PCC = −0.2138) betweenthese two values for a given gene and its protein (Figure 2). Such correlation provides evidencefor variation of genes in the absence of positive evolution, reflecting conservation of functionwith an altered / modulated activity for the gene product. In order to characterize genesexhibiting high-variability in the absence of positive evolution, we studied the top 10% ofvariable genes in the CMG. The choice of top 10% was statistically significant since the Fvcutoff value (Fv >= 0.11) was higher than Q3+1.5IQR (the sum of 3rd Quartile and 1.5 timesthe inter quartile range) of the distribution (data not shown). Apart from the overall functionalcomposition of genes in the high variability group, we were also interested in identifying theprocesses that generate the variations. The high variability group consisted of 189 genes (top10% of the CMG). A majority of them had truncations (117 genes) of which in 23 genes, thetruncation extended into the proteins’ predicted functional domain (PFam prediction)producing putative pseudogenes. However, only two of these 23 genes (RbsU and MarR familyregulatory protein) were associated with pathogenicity.
There were 36 genes that had either an insertion or deletion and variations that accounted formore than 11% of the alignment length. The insertions and deletions in each gene family werecontributed by different strains, eliminating the possibility of variation from one outlier strain(data not shown). The composition of genes with insertions and deletions were significantlydifferent from those of the overall CMG composition. This sub-group also had a high fractionof pathogenesis-associated genes. Notable examples of pathogenesis related genes includedsuperantigen-like proteins (exotoxins), accessory gene regulatory protein B (AgrB), clumpingfactor A, and the virulence protein EssC. These genes are central to staphylococcalpathogenicity and aid in establishing (superantigen-like proteins and EssC) and regulating(AgrB) pathogenicity.
Even outside the high variability group, insertions and deletions in certain genes wereapparently biologically significant. Case in point is the QacA gene, which is involved inresistance to decouplers (phenolics) used extensively in the hospital environment. In a previousstudy, it has been shown that hospital acquired MRSA have evolved strong resistance todecouplers by changes in the Qac locus. In our study, insertion in this gene was observed inonly the hospital acquired MRSA strain (MRSA252), likely a factor in its increased survivalin the chosen environment (hospitals). In genes of the high variability group with atransmembrane domain, insertions / deletions are present in functionally relevant regions. Asimilar trend was observed in genes of the high variability group that had an insertion / deletion.Genes that had an insertion / deletion in their active region (extracellular domain) were AgrB[21], EssC [22], Leukocidin S [23], SdrH [24] and ClfB [25], all of which have reported rolesin pathogenesis. Another interesting protein that had insertions / deletions was a LPXTGdomain protein. This motif is present in several surface associated pathogenesis genes of thispathogen, including sortase A and SdrA proteins [26,24,27]. Despite high levels of intra-familyvariation (within the orthologous family for each gene), none of these genes exhibited a dN/dS >1. These examples reveal the accumulation of variations in pathogenesis genes in theabsence of quantifiable positive evolution (dN/dS < 1). These changes, while not changing the
Sivaraman and Cole Page 4
FEBS Lett. Author manuscript; available in PMC 2010 April 17.
NIH
-PA Author Manuscript
NIH
-PA Author Manuscript
NIH
-PA Author Manuscript
overall function of the protein, may alter the activity by affecting and changing key amino acidresidues.
Of particular interest in the high variability group were the genes involved in nasal colonization.Clumping factors (clfA and clfB) [28,29] and teichoic acid biosynthesis enzyme (tagX) [30]have been shown to be responsible for nasal colonization of S. aureus in humans and micerespectively. High SNP content of these genes may contribute to the high degree of variationin nasal colonization observed across various strains. The clumping factors mediate celladherence (clfA) and nasal colonization (clfB). In both genes, variations are present throughoutthe reading frame with clfA being more variant than clfB. Similarly, in TagX protein (involvedin nasal colonization), variations occur across the length of the protein and are not restrictedto any particular region or domain. These results show that nucleotide level polymorphismsmay play an important role in modulating nasal colonization and carriage of S. aureus. Theseresults may also explain in part the lack uniform results in the search for factors determiningnasal carriage. Figure 3 illustrates the variation in several key genes involved in pathogenicity.
Summarily, 23 of 189 genes (12.3%) of the high variability group were directly implicated inpathogenesis. A comparison with the low variability group (Fv <=0.01) reveals that this is asignificant fraction (the fraction of pathogenesis genes in low variability group was ~0.2%;one gene out of 501). This comparison strongly suggests that pathogenesis genes in S.aureus preferentially accumulated variations at both the nucleotide and protein levels. Thatnone of these genes evolved positively (for the pathogenesis genes, dN/dS < 1) points towardsa functional conservation despite high variability. Some genes in the high variability have beenalready used for sequence typing of S. aureus while others described in this study might besuitable targets for novel typing methods. Our results highlight the importance of variation inthe absence of positive evolution as an important survival strategy in the pathogen, S.aureus.
AcknowledgmentsThis work was funded by National Institutes of Health USA grant (RO1-AI060753), awarded to Alexander M Cole.
References1. Zhang Y, Laing C, Steele M, Ziebell K, Johnson R, Benson AK, Taboada E, Gannon VP. Genome
evolution in major Escherichia coli O157:H7 lineages. BMC Genomics 2007;8:121. [PubMed:17506902]
2. Hols P, Hancy F, Fontaine L, Grossiord B, Prozzi D, Leblond-Bourget N, Decaris B, Bolotin A,Delorme C, Dusko Ehrlich S, Guédon E, Monnet V, Renault P, Kleerebezem M. New insights in themolecular biology and physiology of Streptococcus thermophilus revealed by comparative genomics.FEMS Microbiol Rev 2005;29:435–463. [PubMed: 16125007]
3. Prudhomme M, Libante V, Claverys JP. Homologous recombination at the border: insertion-deletionsand the trapping of foreign DNA in Streptococcus pneumoniae. Proc Natl Acad Sci U S A2002;99:2100–2105. [PubMed: 11854505]
4. Velge P, Cloeckaert A, Barrow P. Emergence of Salmonella epidemics: the problems related toSalmonella enterica serotype Enteritidis and multiple antibiotic resistance in other major serotypes.Vet Res 2005;36:267–288. [PubMed: 15845226]
5. Baba T, Bae T, Schneewind O, Takeuchi F, Hiramatsu K. Genome sequence of Staphylococcus aureusstrain Newman and comparative analysis of staphylococcal genomes: polymorphism and evolution oftwo major pathogenicity islands. J Bacteriol 2008;190:300–310. [PubMed: 17951380]
6. Sivaraman K, Venkataraman N, Tsai J, Dewell S, Cole AM. BMC genomics Genome sequencing andanalysis reveals possible determinants of Staphylococcus aureus nasal carriage. BMC Genomics2008;9:433–433. [PubMed: 18808706]
Sivaraman and Cole Page 5
FEBS Lett. Author manuscript; available in PMC 2010 April 17.
NIH
-PA Author Manuscript
NIH
-PA Author Manuscript
NIH
-PA Author Manuscript
7. Herron-Olson L, Fitzgerald JR, Musser JM, Kapur V. PLoS ONE Molecular correlates of hostspecialization in Staphylococcus aureus. PLoS ONE 2007;2:e1120–e1120. [PubMed: 17971880]
8. Rasmussen TB, Danielsen M, Valina O, Garrigues C, Johansen E, Pedersen MB. Streptococcusthermophilus core genome: comparative genome hybridization study of 47 strains. Appl EnvironMicrobiol 2008;74:4703–4710. [PubMed: 18539806]
9. Lindsay JA, Moore CE, Day NP, Peacock SJ, Witney AA, Stabler RA, Husain SE, Butcher PD, HindsJ. Microarrays reveal that each of the ten dominant lineages of Staphylococcus aureus has a uniquecombination of surface-associated and regulatory genes. J Bacteriol 2006;188:669–676. [PubMed:16385056]
10. Ben Zakour NL, Sturdevant DE, Even S, Guinane CM, Barbey C, Alves PD, Cochet MF, Gautier M,Otto M, Fitzgerald JR, Le Loir Y. Genome-wide analysis of ruminant Staphylococcus aureus revealsdiversification of the core genome. J Bacteriol 2008;190:6302–6317. [PubMed: 18567666]
11. Zhang W, Qi W, Albert TJ, Motiwala AS, Alland D, Hyytia-Trees EK, Ribot EM, Fields PI, WhittamTS, Swaminathan B. Probing genomic diversity and evolution of Escherichia coli O157 by singlenucleotide polymorphisms. Genome Res 2006;16:757–767. [PubMed: 16606700]
12. Doddapaneni H, Yao J, Lin H, Walker MA, Civerolo EL. Analysis of the genome-wide variationsamong multiple strains of the plant pathogenic bacterium Xylella fastidiosa. BMC Genomics2006;7:225. [PubMed: 16948851]
13. Kuroda M, Ohta T, Uchiyama I, Baba T, Yuzawa H, Kobayashi I, Cui L, Oguchi A, Aoki K, NagaiY, Lian J, Ito T, Kanamori M, Matsumaru H, Maruyama A, Murakami H, Hosoyama A, Mizutani-Ui Y, Takahashi NK, Sawano T, Inoue R, Kaito C, Sekimizu K, Hirakawa H, Kuhara S, Goto S,Yabuzaki J, Kanehisa M, Yamashita A, Oshima K, Furuya K, Yoshino C, Shiba T, Hattori M,Ogasawara N, Hayashi H, Hiramatsu K. Whole genome sequencing of meticillin-resistantStaphylococcus aureus. Lancet 2001;357:1225–1240. [PubMed: 11418146]
14. Tatusov RL, Fedorova ND, Jackson JD, Jacobs AR, Kiryutin B, Koonin EV, Krylov DM, MazumderR, Mekhedov SL, Nikolskaya AN, Rao BS, Smirnov S, Sverdlov AV, Vasudevan S, Wolf YI, YinJJ, Natale DA. BMC bioinformatics The COG database: an updated version includes eukaryotes.BMC Bioinformatics 2003;4:41–41. [PubMed: 12969510]
15. Thompson JD, Gibson TJ, Higgins DG. Chapter 2, Multiple sequence alignment using ClustalW andClustalX. Curr Protoc Bioinformatics. 2002Unit 2.3
16. Yang Z. PAML: a program package for phylogenetic analysis by maximum likelihood. Comput ApplBiosci 1997;13:555–556. [PubMed: 9367129]
17. Suyama M, Torrentas D, Bork P. PAL2NAL: robust conversion of protein sequence alignments intothe corresponding codon alignments. Nucleic Acids Res 2006;34:W609–W612. [PubMed:16845082]
18. Nei M, Gojobori T. Simple methods for estimating the numbers of synonymous and nonsynonymousnucleotide substitutions. Mol Biol Evol 1986;3:418–426. [PubMed: 3444411]
19. Sonnhammer EL, von Heijne G, Krogh A. A hidden Markov model for predicting transmembranehelices in protein sequences. Proc Int Conf Intell Syst Mol Biol 1998;6:175–182. [PubMed: 9783223]
20. Eddy SR. Hidden Markov models. Curr Opin Struct Biol 1996;6:361–365. [PubMed: 8804822]21. Ji G, Pei W, Zhang L, Qiu R, Lin J, Benito Y, Lina G, Novick RP. Staphylococcus intermedius
produces a functional agr autoinducing peptide containing a cyclic lactone. J Bacteriol2005;187:3139–3150. [PubMed: 15838041]
22. Burts ML, DeDent AC, Missiakas DM. EsaC substrate for the ESAT-6 secretion pathway and its rolein persistent infections of Staphylococcus aureus. Mol Microbiol 2008;69:736–746. [PubMed:18554323]
23. Monecke S, Kuhnert P, Hotzel H, Slickers P, Ehricht R. Veterinary microbiology Microarray basedstudy on virulence-associated genes and resistance determinants of Staphylococcus aureus isolatesfrom cattle. Vet Microbiol 2007;125:128–140. [PubMed: 17614219]
24. McCrea KW, Hartford O, Davis S, Eidhin DN, Lina G, Speziale P, Foster TJ, Höök M. The serine-aspartate repeat (Sdr) protein family in Staphylococcus epidermidis. Microbiology 2000;146(Pt 7):1535–1546. [PubMed: 10878118]
Sivaraman and Cole Page 6
FEBS Lett. Author manuscript; available in PMC 2010 April 17.
NIH
-PA Author Manuscript
NIH
-PA Author Manuscript
NIH
-PA Author Manuscript
25. DeDent A, Bae T, Missiakas DM, Schneewind O. Signal peptides direct surface proteins to twodistinct envelope locations of Staphylococcus aureus. EMBO J 2008;27:2656–2668. [PubMed:18800056]
26. DeDent AC, McAdow M, Schneewind O. Distribution of protein A on the surface of Staphylococcusaureus. J Bacteriol 2007;189:4473–4484. [PubMed: 17416657]
27. O'Neill E, Pozzi C, Houston P, Humphreys H, Robinson DA, Loughman A, Foster TJ, O'Gara JP. Anovel Staphylococcus aureus biofilm phenotype mediated by the fibronectin-binding proteins,FnBPA and FnBPB. J Bacteriol 2008;190:3835–3850. [PubMed: 18375547]
28. Ganesh VK, Rivera JJ, Smeds E, Ko YP, Bowden MG, Wann ER, Gurusiddappa S, Fitzgerald JR,Höök M. A structural model of the Staphylococcus aureus ClfA-fibrinogen interaction opens newavenues for the design of anti-staphylococcal therapeutics. PLoS Pathog 2008;4:e1000226. [PubMed:19043557]
29. Wertheim HF, Walsh E, Choudhurry R, Melles DC, Boelens HA, Miajlovic H, Verbrugh HA, FosterT, van Belkum A. Key role for clumping factor B in Staphylococcus aureus nasal colonization ofhumans. PLoS Med 2008;5:e17. [PubMed: 18198942]
30. Weidenmaier C, Kokai-Kun JF, Kristian SA, Chanturiya T, Kalbacher H, Gross M, Nicholson G,Neumeister B, Mond JJ, Peschel A. Role of teichoic acids in Staphylococcus aureus nasalcolonization, a major risk factor in nosocomial infections. Nat Med 2004;10:243–245. [PubMed:14758355]
Sivaraman and Cole Page 7
FEBS Lett. Author manuscript; available in PMC 2010 April 17.
NIH
-PA Author Manuscript
NIH
-PA Author Manuscript
NIH
-PA Author Manuscript
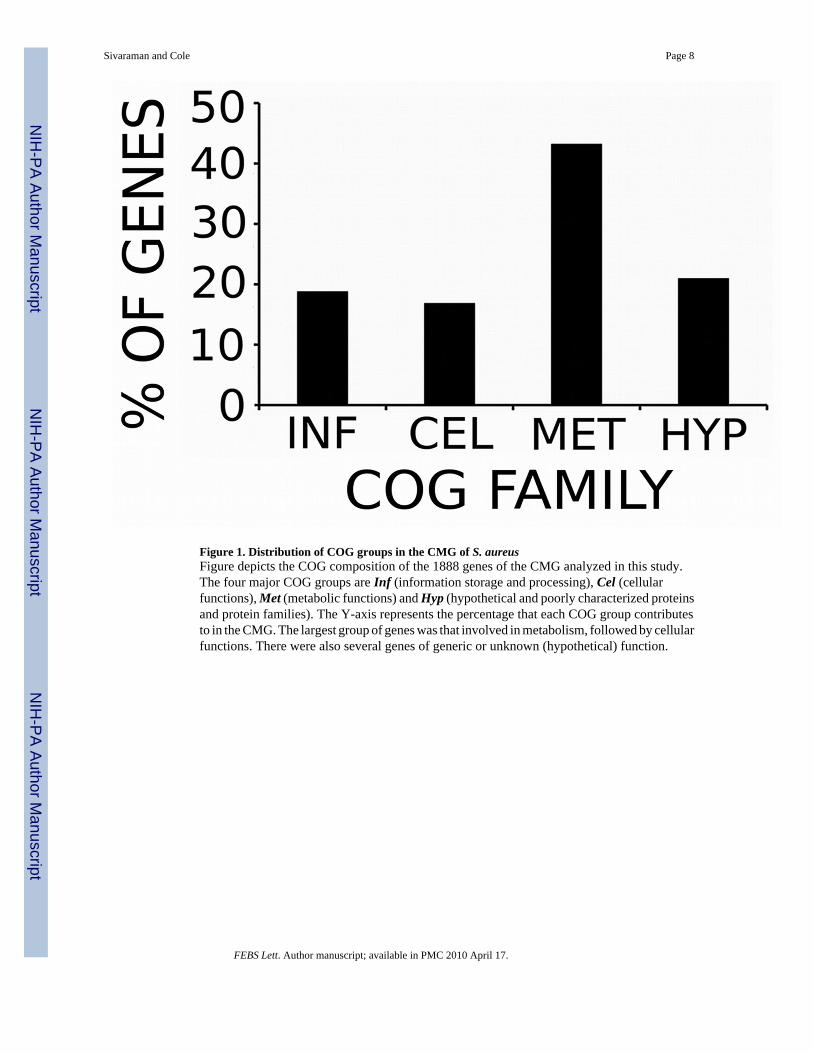
Figure 1. Distribution of COG groups in the CMG of S. aureusFigure depicts the COG composition of the 1888 genes of the CMG analyzed in this study.The four major COG groups are Inf (information storage and processing), Cel (cellularfunctions), Met (metabolic functions) and Hyp (hypothetical and poorly characterized proteinsand protein families). The Y-axis represents the percentage that each COG group contributesto in the CMG. The largest group of genes was that involved in metabolism, followed by cellularfunctions. There were also several genes of generic or unknown (hypothetical) function.
Sivaraman and Cole Page 8
FEBS Lett. Author manuscript; available in PMC 2010 April 17.
NIH
-PA Author Manuscript
NIH
-PA Author Manuscript
NIH
-PA Author Manuscript
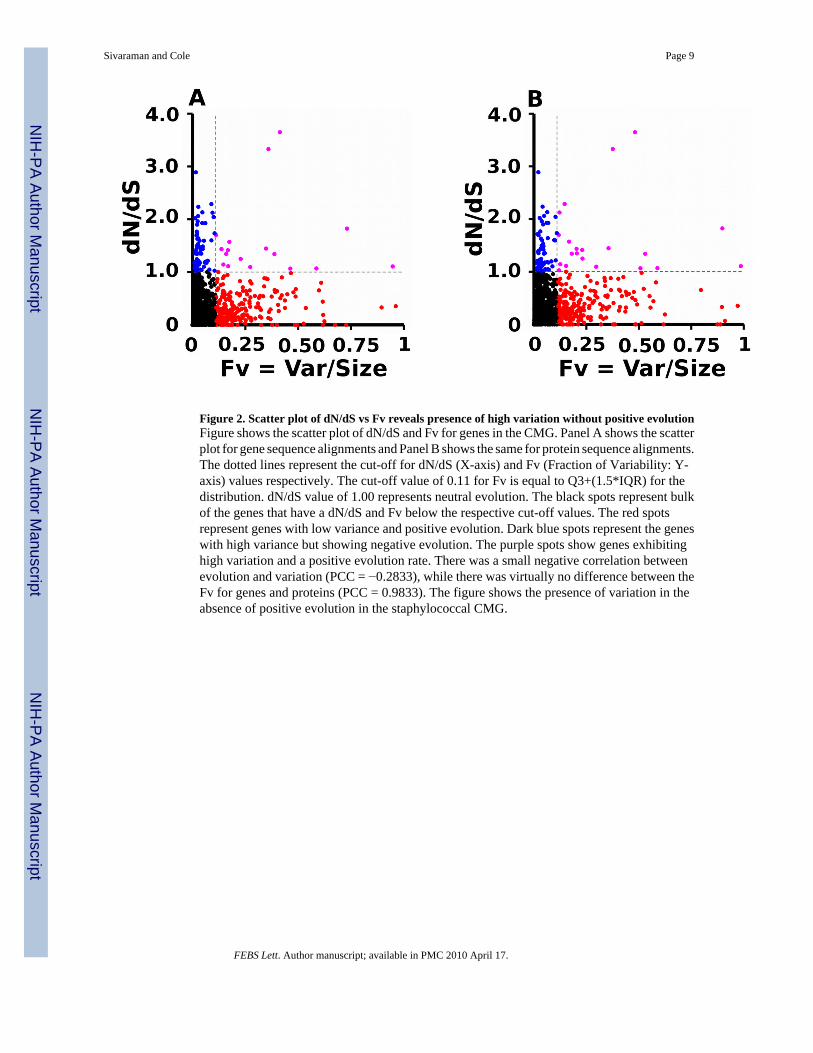
Figure 2. Scatter plot of dN/dS vs Fv reveals presence of high variation without positive evolutionFigure shows the scatter plot of dN/dS and Fv for genes in the CMG. Panel A shows the scatterplot for gene sequence alignments and Panel B shows the same for protein sequence alignments.The dotted lines represent the cut-off for dN/dS (X-axis) and Fv (Fraction of Variability: Y-axis) values respectively. The cut-off value of 0.11 for Fv is equal to Q3+(1.5*IQR) for thedistribution. dN/dS value of 1.00 represents neutral evolution. The black spots represent bulkof the genes that have a dN/dS and Fv below the respective cut-off values. The red spotsrepresent genes with low variance and positive evolution. Dark blue spots represent the geneswith high variance but showing negative evolution. The purple spots show genes exhibitinghigh variation and a positive evolution rate. There was a small negative correlation betweenevolution and variation (PCC = −0.2833), while there was virtually no difference between theFv for genes and proteins (PCC = 0.9833). The figure shows the presence of variation in theabsence of positive evolution in the staphylococcal CMG.
Sivaraman and Cole Page 9
FEBS Lett. Author manuscript; available in PMC 2010 April 17.
NIH
-PA Author Manuscript
NIH
-PA Author Manuscript
NIH
-PA Author Manuscript
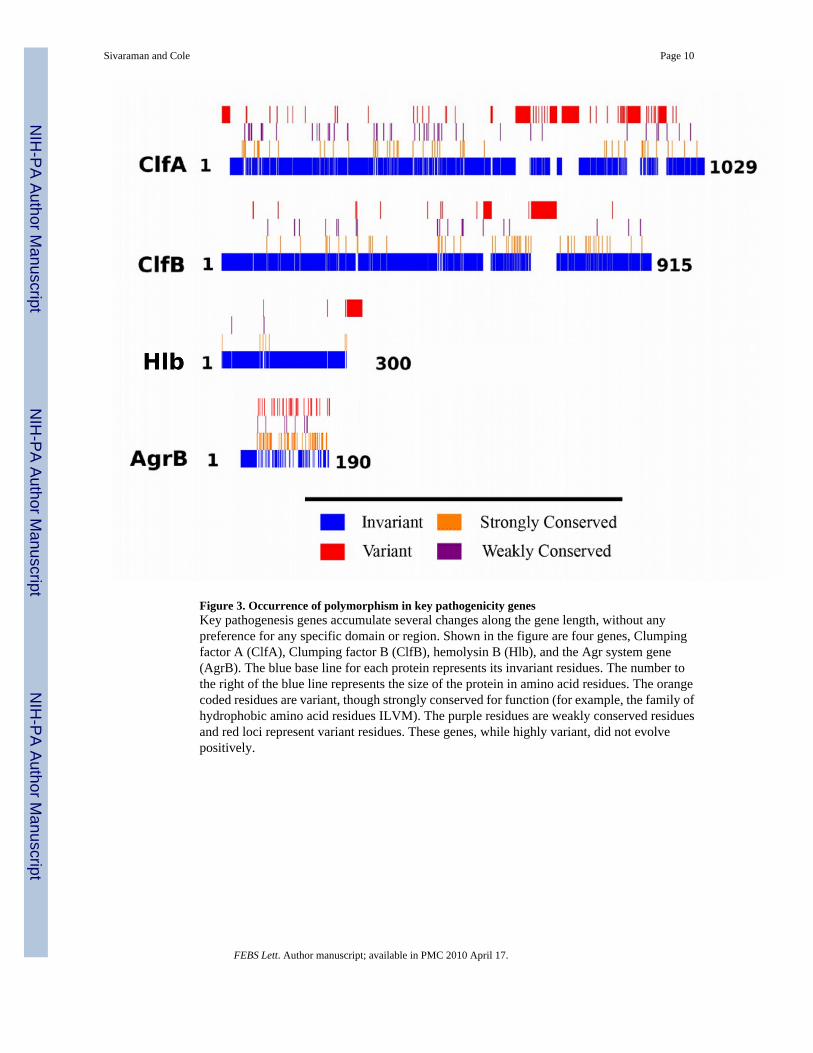
Figure 3. Occurrence of polymorphism in key pathogenicity genesKey pathogenesis genes accumulate several changes along the gene length, without anypreference for any specific domain or region. Shown in the figure are four genes, Clumpingfactor A (ClfA), Clumping factor B (ClfB), hemolysin B (Hlb), and the Agr system gene(AgrB). The blue base line for each protein represents its invariant residues. The number tothe right of the blue line represents the size of the protein in amino acid residues. The orangecoded residues are variant, though strongly conserved for function (for example, the family ofhydrophobic amino acid residues ILVM). The purple residues are weakly conserved residuesand red loci represent variant residues. These genes, while highly variant, did not evolvepositively.
Sivaraman and Cole Page 10
FEBS Lett. Author manuscript; available in PMC 2010 April 17.
NIH
-PA Author Manuscript
NIH
-PA Author Manuscript
NIH
-PA Author Manuscript
NIH
-PA Author Manuscript
NIH
-PA Author Manuscript
NIH
-PA Author Manuscript
Sivaraman and Cole Page 11Ta
ble
1D
istri
butio
n of
CO
G g
roup
s in
the
CM
G, L
oVar
set a
nd se
t of p
rote
ins w
ith tr
ansm
embr
ane
dom
ains
.
Gen
e G
roup
CO
G-I
nfo
CO
G-C
ellu
lar
CO
G-M
etab
olis
mC
OG
-Hyp
othe
tical
No.
of g
enes
with
CO
G
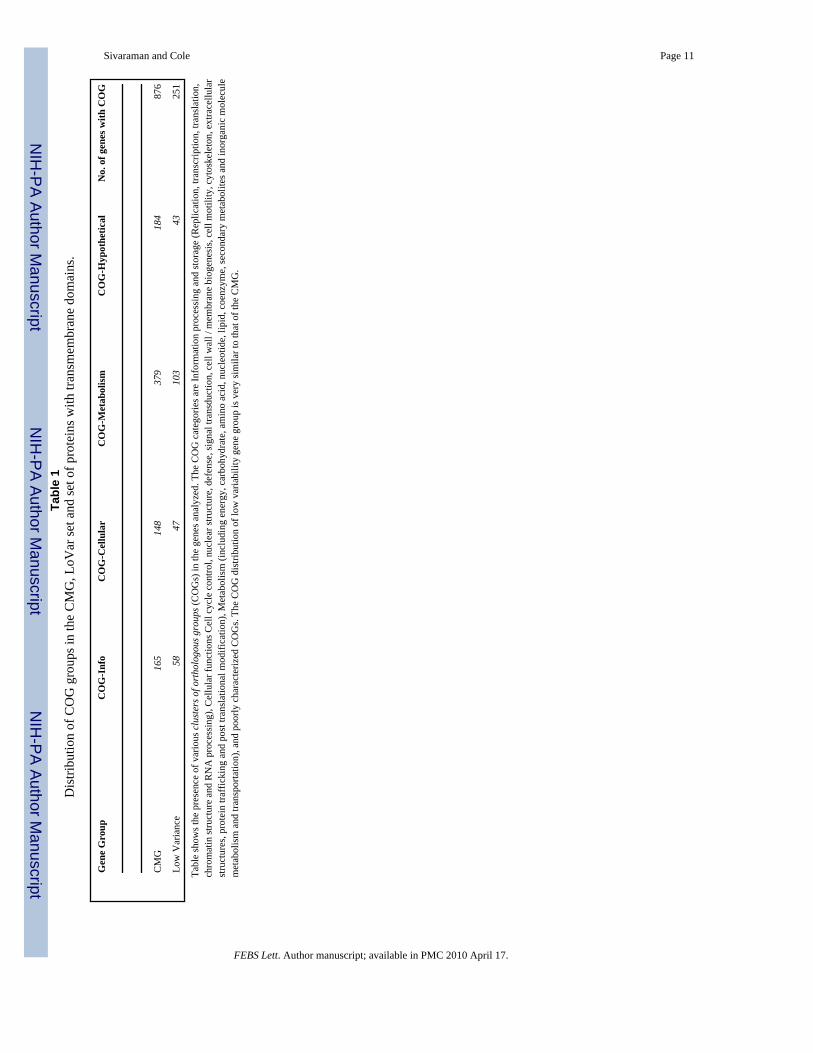
CM
G16
514
837
918
487
6
Low
Var
ianc
e58
4710
343
251
Tabl
e sh
ows t
he p
rese
nce
of v
ario
us c
lust
ers o
f ort
holo
gous
gro
ups (
CO
Gs)
in th
e ge
nes a
naly
zed.
The
CO
G c
ateg
orie
s are
Info
rmat
ion
proc
essi
ng a
nd st
orag
e (R
eplic
atio
n, tr
ansc
riptio
n, tr
ansl
atio
n,ch
rom
atin
stru
ctur
e an
d R
NA
pro
cess
ing)
, Cel
lula
r fun
ctio
ns C
ell c
ycle
con
trol,
nucl
ear s
truct
ure,
def
ense
, sig
nal t
rans
duct
ion,
cel
l wal
l / m
embr
ane
biog
enes
is, c
ell m
otili
ty, c
ytos
kele
ton,
ext
race
llula
rst
ruct
ures
, pro
tein
traf
ficki
ng a
nd p
ost t
rans
latio
nal m
odifi
catio
n), M
etab
olis
m (i
nclu
ding
ene
rgy,
car
bohy
drat
e, a
min
o ac
id, n
ucle
otid
e, li
pid,
coe
nzym
e, se
cond
ary
met
abol
ites a
nd in
orga
nic
mol
ecul
em
etab
olis
m a
nd tr
ansp
orta
tion)
, and
poo
rly c
hara
cter
ized
CO
Gs.
The
CO
G d
istri
butio
n of
low
var
iabi
lity
gene
gro
up is
ver
y si
mila
r to
that
of t
he C
MG
.
FEBS Lett. Author manuscript; available in PMC 2010 April 17.
NIH
-PA Author Manuscript
NIH
-PA Author Manuscript
NIH
-PA Author Manuscript
Sivaraman and Cole Page 12
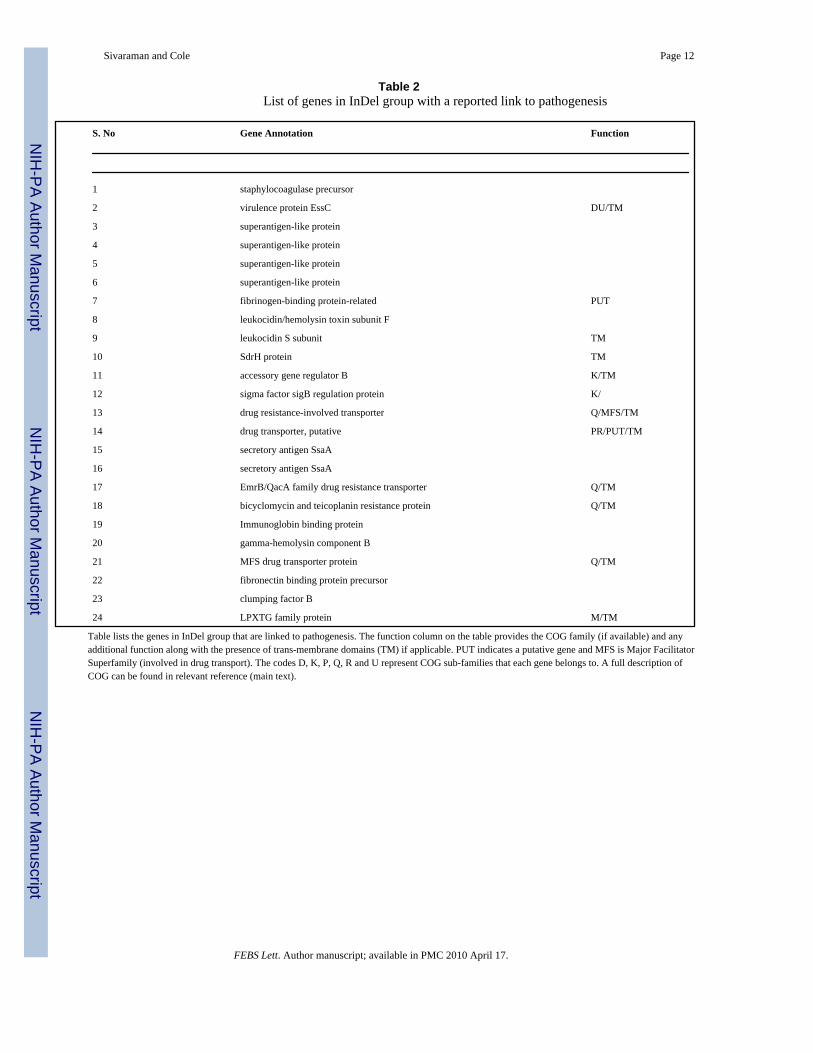
Table 2List of genes in InDel group with a reported link to pathogenesis
S. No Gene Annotation Function
1 staphylocoagulase precursor
2 virulence protein EssC DU/TM
3 superantigen-like protein
4 superantigen-like protein
5 superantigen-like protein
6 superantigen-like protein
7 fibrinogen-binding protein-related PUT
8 leukocidin/hemolysin toxin subunit F
9 leukocidin S subunit TM
10 SdrH protein TM
11 accessory gene regulator B K/TM
12 sigma factor sigB regulation protein K/
13 drug resistance-involved transporter Q/MFS/TM
14 drug transporter, putative PR/PUT/TM
15 secretory antigen SsaA
16 secretory antigen SsaA
17 EmrB/QacA family drug resistance transporter Q/TM
18 bicyclomycin and teicoplanin resistance protein Q/TM
19 Immunoglobin binding protein
20 gamma-hemolysin component B
21 MFS drug transporter protein Q/TM
22 fibronectin binding protein precursor
23 clumping factor B
24 LPXTG family protein M/TM
Table lists the genes in InDel group that are linked to pathogenesis. The function column on the table provides the COG family (if available) and anyadditional function along with the presence of trans-membrane domains (TM) if applicable. PUT indicates a putative gene and MFS is Major FacilitatorSuperfamily (involved in drug transport). The codes D, K, P, Q, R and U represent COG sub-families that each gene belongs to. A full description ofCOG can be found in relevant reference (main text).
FEBS Lett. Author manuscript; available in PMC 2010 April 17.
Copyright © 2022 FDOKUMEN