jaeri 1268 - International Nuclear Information System (INIS)
Upload
khangminh22Category
view
1download
0
International Atomic Energy Agency IWGFR/29
INTERNATIONAL WORKING GROUP ON FAST REACTORS
INTERNATIONAL WORKING GROUP ON FAST REACTORS
Specialists' Meeting
on
THERMODYNAMICS OF FBR FUEL SUBASSEMBLIES UNDER
NOMINAL AND NON-NOMINAL OPERATING CONDITIONS
Karlsruhe, Federal Republic of Germany5-7 February 1978
SUMMARY REPORT

Reproduced by the IAEA in AustriaNovember 1979
79-03403
INTERNATIONAL WORKING GROUP ON FAST REACTORS
Specialists' Meeting
on
THERMODYNAMICS OF FBR FUEL SUBASSEMBLIES UNDER
NOMINAL AND NON-NOMINAL OPERATING CONDITIONS
Karlsruhe, Federal Republic of Germany5 - 7 February 1978
Chairman: F. Hof mannKernforschungszentrum Karlsruhe
Scientific Secretary: E.A. KhodarevInternational Atomic Energy Agency
SUMMARY REPORT
CONTENTS
Introduction 1
Summary and Conclusions 1
A review of theoretical and experimental studies underlying the thermal-hydraulicdesign of fast reactor fuel elements 7C. G. Me A reaver, C. Betts,
Status of thermohydraulic studies of wire-wrapped bundles 23A. Kliairallah. D. Leteinturier. J. Skok
Detailed design consideration on wire-spaced LMFBR fuel subassemblies under theeffects of uncertainties and non-nominal geometries 29//. Uishida
Thermal-hydraulic experiments with simulated LMFBR sub-assemblies undernominal and non-nominal operating conditions 58A'. Miyaguchi, J. Takahaslii
Status of core thermo-hydraulic development in the USA 76R.A. Markley
Status of the LMFBR tliermo- and fluid-dynamic activities at KFK 82//. Hoffmann, F. Hofmann, K. Rehme
Some numerical results obtained from the single version of commix code 107II'. T. S/ia, U.M. Domanus, R.C. Schmitt
Probabilistic design consideration on thermodynamics of LMFBRfuel subassemblies and related future research problems 132//. llishida
Theoretical analysis and experimental evidence of three types of thermohydraulicincoherer.cy in undisturbed cluster geometry 134B. Menant, G. Basque, D. Grand
Analysis of the How and temperature fields in locally blocked LMFBR fuelsubassemblies 1 52K. Miyaguclii
Cobra and cortran code thermal-hydraulic models for LMFBR core widetemperature distribution during a natural convection transient 164E.V. Khan, T.L. George, C.L. Wheeler
Natural convection analyses and verification for LMFBR cores 182R.D. Coffield, R.A. Markley, EU. Khan
Thermohydraulic characteristics of SNR-fuel elements 202G. Weber, G. Comet
Computation of turbulent flow and heat transfer in subassemblies 215W. Slagter
Local pressure and velocity measurements in a water 19-rod bundle using awire wrap spacer system 219A. Sarno, P. Gori, G. Andalo
LMFBR blanket assembly heat transfer and hydraulic test data evaluation 229R.A. Markley, EC. Engel
Theoretical and experimental investigations of the thermohydraulics ofdeformed wire-wrapped bundles in nominal flow conditions 254D. Leteinturicr, L. Cartier
Steady-state thermohydraulic studies in seven-pin bundle out-of-pile experiments:nominal and distorted geometry tests 261L. Falzetti, S. Meneghello, M. Pezzilli
Agenda of the Meeting 271
List of participants 273
INTRODUCTION
the delegates. The agenda of the meeting, a list of participants
and technical papers are reproduced in appendices to this
summary.
The SPECIALISTS MEETING ON THERMODYNAMICS OF FBR FUEL SUBASSEMBLIES
UNDER NOMINAL AND NON-NOMINAL OPERATING CONDITIONS was held at
KFK Karlsruhe, Fed. Republic of Germany.
The meeting was sponsored by the International Atomic Energy
Agency (IAEA) on the recommendation of the International Working
Group on Fast Reactors and was attended by twenty-three partici-
pants from Belgium, France, Fed. Republic of Germany, Italy, Japan,
Netherlands, United Kingdom, United States and two international
organisations: IAEA, CEC.
The purpose of the meeting was to provide a forum for exchange
of information on thermo- and fluiddynamic investigations of
LMFBR-subassembly. Special emphasis was placed on nominal and
non-nominal conditions.
The technical part of the meeting was divided into four sessions,
as follows:
I. Status of the Thermo- and Fluiddynamic Activities
II. Physical and Mathematical Modelling of Single Phase
Rod Bundle Thermohydraulics
III. Experimental Investigations
IV. Future R + D
During the meeting, papers were presented by the delegates on
behalf of their countries or organizations. The papers, which are
included in this report, were either in the form of a general
survey of the subject, or on specific technical subjects. In each
subject area, presentations appropriate to the subject were made
from the submitted papers. The presentations were followed by
discussions of the questions raised and summaries made.
A final meeting was held to discuss the resulting summaries,
conclusions and recommendations, which were agreed upon by
SUMMARY AND CONCLUSIONS
Session I Status of the Thermo- and Fluiddynamic Activities
Six papers were presented at this session. These papers dealt
with theoretical investigations (code development) as
well as experimental investigation. Due to the different design
concepts in the single countries they can be divided into two
main groups:
1. Papers dealing with the problem areas regarding
wires as spacers
2. Papers dealing with the problem areas regarding
grids as spacers
In the frame of each group the following topics are treated:
- nominal and distorted geometry, steady-state hydraulics
- nominal and distorted geometry, forced convection heat transfer
- mixed and natural convection within subassembly.
The first paper (1.1) reviews the theoretical approaches which
have been developed and applied in the UK in the design of LMFBR
fuel and breeder subassemblies, control rods and experimental
clusters. It also presents results of experimental studies under-
taken to develop a better understanding of coolant flovi distri-
bution and mixing problems in these components, and to provide
essential data for computer codes.
Problem areas in this field are highlighted particularly the
difficulties arising due to irradiation induced distortions.
Reference is made to the experimental and theoretical develop-
ments which are in progress, or may be required, to provide
adequate predictions of fuel pin temperatures at high burn-up.
Paper Nr. 1.2 presents a review of the work undertaken in the
CEA to develop and establish the tools necessary for the thermal-
hydraulic design of LMFBR wire-wrapped subassemblies.
Thermal-hydraulic studies cover single-phase flow in nominal and
non-nominal operating conditions, i.e. essentially:
- forced convection in nominal geometry. This is the basic situ-
ation »considered in most design calculations;
- forced convection in distorted geometry. This situation must
be well understood, in view of the assessment of the ability
of the subassembly to accommodate, from the thermal point of
view, the bundle distortions during irradiation;
- local hot spots, due either to the normal contact between clad
and spacer wire, or to possible contacts between clad and
wrapper tube or between clad and clad in extreme cases of
bundle distortion;
- single-phase mixed convection, corresponding to the residual-
power removal with very low flow rates in some incidental or
particular operating regimes.
The next two papers (1.3, 1.4) describe the detailed design
consideration, and thermal-hydraulic experiments for wire spaced
elements in Japan.
The studies cover the following problem areas:
- bowing effects of pins and bundles
- geometry and hydraulic deviations
- influence of spacer/pin contact and coolant mixing on
hot spot temperature
- inter-subchannel cross-flow mixing and edge flow
- local flow blockage.- measurements for reactor operating condition.
The status of the work undertaken in the US is reviewed in paper 1.5.
Mr. Markley gave an overview of the experimental programme completed
and in progress in the different laboratories in the US. The work
covered a wide range of parameters using large scale air models,
full scale Na and water models containing from 19 to 217 rods.
Spacer was mainly wire wrapped; some work on grids was included. The
following main topics v/ere investigated: Cross flow mixing within 2
and between sub assemblies, low flow phenomena, pressure drop and
flov; distribution measurements, vibration, cavitation,flow orificing,
blockages within assemblies.
On the theoretical side a large number of US codes v/ere noted; these
calculated sub-channel flov/ and temperature distributions, including
forced and mixed convection phenomena and transients.
The status report (paper 1.6) of the German Studies is concentrated
mainly on the problem areas regarding grid type spacers. The theore-
tical investigations are concentrated on the development of global
and local computer programs for the calculation of the 3-dim. tempe-
rature field of the fuel pin, the fuel rod bundle, and the whole
core. Heat conduction between the subassembly wrappers as well as
asymmetric bundle geometries are considered.
The experimental investigations aim at the verification and improve-
ment of the input parameters of the global and local computer codes.
The experimental activities concern:
a) Pressure drops of laminar and turbulent flows in rod bundles
without and v/ith spacers, helical and grid spacers, and their
dependence on geometry parameters and the Reynolds number;
b) Interchannel mixing in rod bundles with grids or helical spacers;
c) Temperature distributions in rod bundles with grid spacers v/ith
particular reference to cladding temperatures;
d) Velocity and mass flow distributions in rod bundles without and
v/ith grid spacers.
The most part of the thermo- and fluiddynamic activities performed
at KFK are related to nominal conditions. Up to now first experi-
ments v/ith disturbed geometries (bov/ed rods) have been performed.
The discussion resulted in the following conclusions:
- It was agreed that secondary flow effects are not important in
the presence of spacers, as in the reactor case, but may be
important for bare rod bundles
- for design codes at nominal conditions, sub-channel analysis v/as
agreed to be an adequate tool, but it should be backed up by
releva.it experimental, work including grid or v/ire-v/rap spacers.
In addition computational models should be improved with respect
to spacer induced flow redistribution between sub-channels.
- the thermal hydraulics of non-nominal conditions need calculation
methods and experimental support. As a first step these problems
must be treated by sub-channel analysis. There was also general
agreement that codes dealing with local effects need to be further
developed and experimentally supported to obtain a better under-
standing of physical process.
- we understand non-nominal conditions to include distortions at start
of life as well as irradiation included distortions and bouyoncy
influenced perturbations of flow distribution.
Session II Physical and Mathematical Modelling of Single
Phase Rod Bundle Thermohydraulics
Eight papers were presented at this session. These papers dealt
mainly with theoretical studies for the computation of subassem-
blies. The activities can be subdivived roughly into two catego-
ries:
- development of models concerning global codes, for subchannel
analysis
- development of models concerning detailed codes for multi-
dimensional calculation of the velocity and temperature fields.
In the frame of these two categories already the following topics
are treated:
- wire spacers
- grid spacers
each for
. nominal and distorted geometry, steady-state hydraulics
. nominal and distorted geometry, forced convection heat transfer.
Besides this, two papers dealt with natural convection phenomena.
A review of the application of the theoretical results of thermo-
hydraulic design calculations for LMFBR-fuel elements with grid
and wire-type spacers was presented.
In the first paper (11.1) the inherent shortcomings of the sub- 3
channel analysis were delineated and an alternative approach using
volume porosity, surface permeability and distributed permeability
and distributed resistance and heat source approach has advantages
over the subchannel analysis because of the use of orthogonal
coordinates and geometrically similar control volumes for both
axial and transverse momentum equations. Furthermore, it can
readily be reduced to the volume porosity and distributed resistance
and heat source approach which is a viable method for thermal-
hydraulic analysis for large rod bundles.
Some numerical results presented using this method are given below:
1. Low flov; in a simulated 19-pin LMFBR fuel assembly with 3:1
radial power skew
2. Planar flov/ blockage in a simulated 19-pin bundle fuel assembly.
Paper No. II.2 explains the currently employed basic probabilistic
design philosophy covering LMFBR core thermal and hydraulics
together with the necessity of the related research topics. Some
of the sensitivity parameters affecting core thermodynamics are
listed.
Theoretical prediction (using the BACCHUS code) of the influence
of clearance distribution on flov/ and temperature repartition was
presented in paper No. II.3.
The basis of the approach is the porous body analysis. Such an
approach differs from the subchannel analysis in the choice of the
control volume. In the porous body model, the control volume is
arbitrary containing both coolant channels and the solid matrix.
For the present applications, concentric rings are chosen, i.e.
axial symmetry of the flow and thermal fields is assumed. Under
this assumption, formulation is two-dimensional. The problem of
tolerances and clearance distribution was studied for the following
case:
- 271 pins with nominal diameter D = 8.5 mm
- one helical wire per pin v/ith nominal diameter 1.2 mm
- hexagonal duct of distance between flats H = 163.8 mm.
Paper No. II.4 dealt with the analysis of the flow and temperature
fields in local blocked LMFBR-subassemblies.
A three-dimensional analytical code, UZU was presented. The special
features of this code are as follows: (i) The height of the
blockage is changeable so that either a planar blockage or a
columnar one can be considered (ii). A grid spacer directly placed
on the blockage can be treated. The leakage cross-flov/s through
the slits of grid plates can also be taken into account,
(iii) Either a solid blockage or a porous one can be treated,
(iv) The thermal expansion effect of fluids is considered in the
equation of continuity as well as in the momentum equations. Hence,
the acceleration of the bulk flow velocity due to the fluid tempe-
rature rise can be calculated. The numerical results were compared
to experimental velocity, temperature and pressure distributions.
There was good agreement.
In paper No. II.5 the COBRA and CORTRAN whole core computer program
thermal hydraulic models were described along with their solution
strategy. Results of transient flow and temperature predictions
for LMFBR-assemblies were presented for a natural circulation
transient.
The next paper (II.6) was addressed to the analyses and verifi-
cation needs for core predictions with respect to accounting for
the dynamic inter- and intra-assembly flow and heat redistribution
phenomena that will occur in the core at low flows with natural
convection and which will significantly influence core tempe-
ratures.
Firstly, a review of analytical model requirements for core natural
convection analyses was made and a comparison with experimental
data was made. Also included in this section was a description of
data on low flow rod bundle hydraulic and heat transfer performance
characteristics. Secondly, numerous sensitivity studies were
presented which showed the effect and importanca of various para-
meters on core temperatures during natural circulation. Next, the
paper described a system of codes for making natural circulation
predictions. These were a plant-wide core, a whole-core system code
and a hot rod channel analysis code.
Finally, the overall approach for verifying the core related codes
was presented along with the interaction and linkage between all
the codes. Confirmation that the predictions from this system of
three codes is verified will be through the use of prototypic
data obtained from EBR-2 and FFTF natural circulation experiments.
Thermohydraulic design calculations for SKR fuel elements with
grid and wire type spacers were presented in paper 11.7. First the
calculation methods with the main input data were described.
In the second step, calculation results, i.e., axial mass flow
distribution, radial temperature distribtuion, pressure losses
were given for both nominal arid particularly for non-nominal
conditions.
-Eccentricities of grid type bundles
- Different pin positions in a bundle with spiral wires
- Geometric effects due to residence time.
The last paper (11.8) presented finite element solutions for the
problem of incompressible turbulent flow through subchannels of
rod bundles. The Galerkin method of weighted residuals was applied
to develop the finite element relationship. The method of
successive substitution is used in the solution of the nonlinear
algebraic equations.
The eddy diffusivities were determined by Prandtl's mixing length
modal of turbulence including anisotropic effects. The turbulence
model was formulated in a way which is valid for the laminar
sublayer, transition layer as well as the fully turbulent regionof the flow.
Results obtained for a hexagonal nineteen-rod bundle was shov/n
and compared with measurements of the time-mean velocities. The
agreement between calculated and experimental results was satis-
factory. Preliminary results were shown for heat transfer in a
central subchannel in terms of Nu numbers as v/ell as heat trans-
port between central subchannels in terms of Stanton gap numbers.
- An important point of discussion in the meeting was whether the
more (localised) precise methods are required ;or predictions
of local coolant velocity and temperature distributions than
are available today by means of subchannel analysis. It was
generally agreed that the more precise methods are required for
several reasons (if it was possible to implement them). One
reason is that for nominal geometries one cannot afford to conti-
nue to make experiments for alternative geometries in order to
gain confidence in predictions. Secondly if one were to analyse
distorted bundles a large number of experiments would be extremely
uneconominal and precise methods are most desirable for predic-
ting local velocity and temperature predictions. It was felt that
two different approaches should be pursued. One is the three-
dimensional distributed parameter approach. The second approach
is the sub-subchannel analysis approach. The second approach
will probably be more amenable to solution in the near future.
~ It was generally agreed that the more precise methods may not
be used for designing cores but possibly for calibrating input
coefficients required by less rigourous codes.
- The participants were asked what should be done currently for
analysing distorted bundles, since sophisticated codes will not
be ready in the near future. This question was left unanswered.
It was felt that predictions can still be made but with ax error
band and as more precise methods are developed there will be
more confidence in the predictions.
- An important question was asked to state hov; accurate is accurate
enough as far as predictions in flow and temperature distributions
in rodded bundles are concerned?
- An interesting result was presented in paper No. II. 5. It was
found that predictions of flow and temperature fields in wire
wrapped bundles could be predicted well (when compared with
data and when using the complete form of the equations) even
though the inertial terms in the momentum equation are neglected.
Tiiis was found to be true for both steady-state and slow transient
predictions. It was felt that this significant result could be
useful for T&H analysis of distorted bundles also.
- It was felt that in order to solve the flow and temperature
fields in distorted bundles two major problems have to be tackled:
One is the accurate determination of the physical (geometrical)
shape of the bundle and the second is the development of the
thermal hydraulic methodology.
- The porous media approach presented in paperII-Jhas some novel
features. It appears mathematically sound especially in its
treatment of the transverse momentum equation.
Session III Experimental Investigations
The contributions to this session dealt with out-of-plle and in-pile
experiments in water, sodium and air with bundles of different
size. The aim of these investigations is to provide a data base
for improved confidence in the design of LMFBR-subassemblies.
The papers presented related mainly to
- wire wraps spacer systems but some grid spacer v/ork is included.
In detail the following topics are addressed:
- nominal and distorted geometry, hydraulics
- nominal and distorted geometry, heat transfer
- natural convection within subassemblies.
In the first paper (III.1) the status of nominal bundle measure-
ments for the experimental study on local obstructions was reviewed.
The behaviour of the radial pressure and axial velocity around the
rods, as well as the axial and radial behaviour of static pressure
on a wall of the hexagonal housing, have been determined. It has
been found how the pressure and velocity distributions are affected
by the wire position.
The second paper (III. 2) presented the results of data evaluations
from the US blanket assembly heat transfer and hydraulic programs.
In the hydraulic test programs, laminar, transition and turbulent
parallel flow pressure drop across wire wrapped hexagonal rod
bundles positioned vertically inside a duct were determined in
tests using water, sodium and air.
The rod bundle temperature rise profiles measured in the heat
tranfer tests in sodium using a 61-rod electrically heated mockup
of an LMFBR blanket assembly agree in magnitude and shape with the
predictions of the marching type subchannel codes currently employed
in blanket subchannel analysis. The flow test data demonstrate
increasing bouyancy induced flows in the lower Reynolds number
flov; regime, which significantly reduces peak rod temperatures.
The purpose of the investigations described in paper No. III. 3 is
to find the evolution of sodium temperature inside any size of
subassembly (up to 331 pins) in nominal flow condition and for
usual observed deformations. The experimental work undertaken in
Cadarache on out-of-pile water and in-pile sodium experiments are
reviewed. This experimental program is now underway, but as this
time only results from in-pile experiments are known.
Temperature measurements on a Rapsodie 61-pirn subassembly were
obtained at the beginning of the irradiation and give interesting
informations which u«>y be related to bov/ing and localization of the
bundle inside the wrapper-tube. Results are discussed and compared
with DISTAV-calculations.
In paper (III.4) a rapid review of experimental results and
theoretical work, related to the temperature distribution in parti-
cular geometries, was presented together with a short description
of the developed test section technology.
Two sets of experiments have been performed in sodium with two
seven pin electrically heated bundles: the first with a nominal
pin arrangement, the second with one dummy pin, 2o% enlarged in
diameter, in peripheral position.
The experimental work outlined in paper /«// was presented. The
results of work undertaken to develop a better understanding of
coolant-flow distribution and mixing in both gridded and wire-
wrapped assemblies were reviewed. This work formes the essential
experimental basis of the UK computer codes which calculate
thermal hydraulic performance of UK-FBR subassemblies.
The discussion of the problem areas presented in this session
leads to the following conclusions:
- The necessity of a statement of the experimental accuracy was
stressed. On a long term basis the analysts should make an
attempt to make predictions within the region of "experimental
accuracy". The "experimental accuracy" should also include the
uncertainty associated with parameters such as heat generation
rate, mass flow rate, geometry, instrumentation, etc. The experi-
menter should provide this accuracy by a detailed error analysis.
- The experimental temperature distribution found by in-pile tests
with a rod bundle do not agree with a"so called" nominal geometry
calculations. The reason for the temperature asymmetry is not
yet understood.
- More data are needed for laminar or/and mixed flow conditions.
- I-.xperiments should be most sf.f-cific to reactor conditions,
especially the heater pins used for sinulation should be care-
fully designed. Otherwise one has to apj. ly theoretical methods.
- As in-pile distortions are better understood, testing of
distorted geometry for all flow regions is u fajor area for
future emphasis.
In session IV future RSD-needs were discussed. The results
and recommendations are included in the summaries and
conclusions of the sessions I to III.
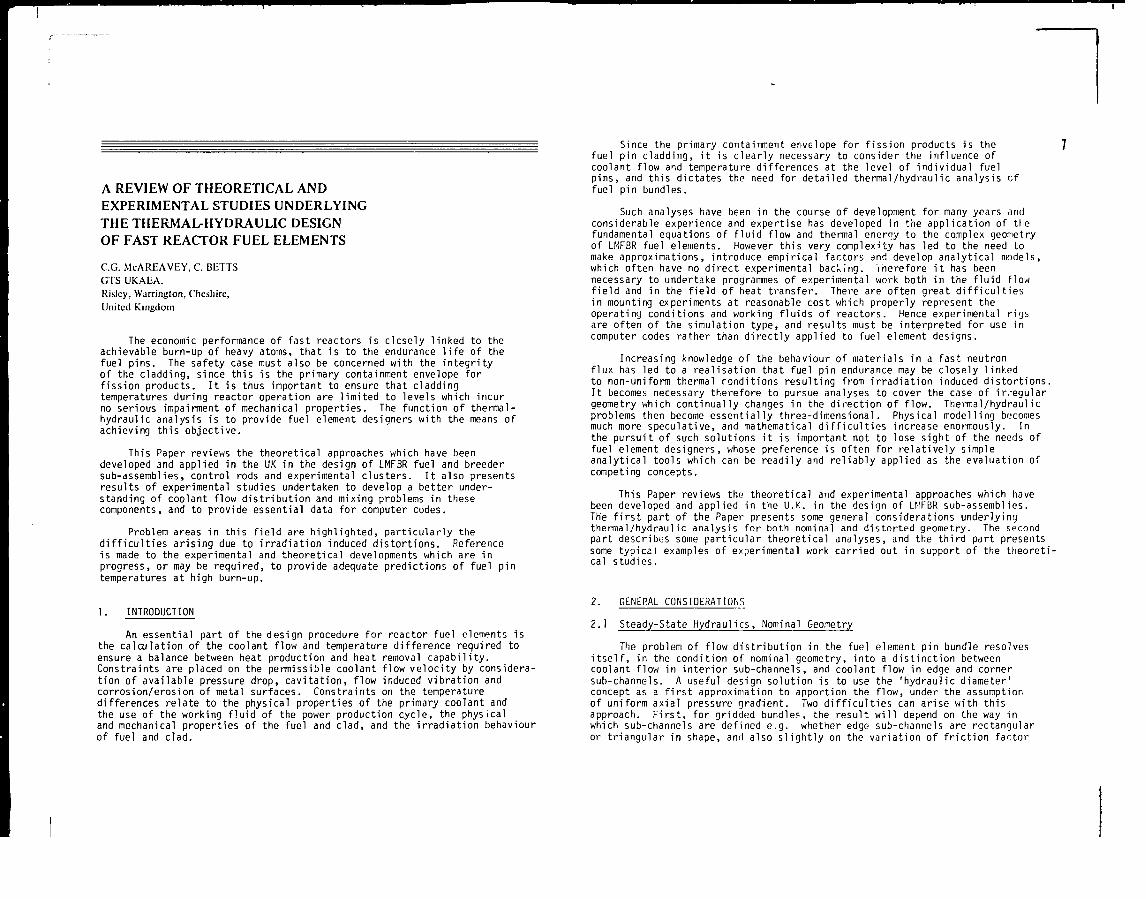
A REVIEW OF THEORETICAL ANDEXPERIMENTAL STUDIES UNDERLYINGTHE THERMAL-HYDRAULIC DESIGNOF FAST REACTOR FUEL ELEMENTS
CG. McAREAVEY, C. BETTSGTS UKAEA.Risley, Warrington, Cheshire,United Kingdom
The economic performance of fast reactors is clcsely linked to theachievable burn-up of heavy atoms, that is to the endurance life of thefuel pins. The safety case must also be concerned with the integrityof the cladding, since this is the primary containment envelope forfission products. It is thus important to ensure that claddingtemperatures during reactor operation are limited to levels which incurno serious impairment of mechanical properties. The function of thermal-hydraulic analysis is to provide fuel element designers with the means ofachieving this objective.
This Paper reviews the theoretical approaches which have beendeveloped and applied in the UK in the design of LMFBR fuel and breedersub-assemblies, control rods and experimental clusters. It also presentsresults of experimental studies undertaken to develop a better under-standing of coolant flow distribution and mixing problems in thesecomponents, and to provide essential data for computer codes.
Problem areas in this field are highlighted, particularly thedifficulties arising due to irradiation induced distortions. Referenceis made to the experimental and theoretical developments which are inprogress, or may be required, to provide adequate predictions of fuel pintemperatures at high burn-up.
1. INTRODUCTION
An essential part of the design procedure for reactor fuel elements isthe calculation of the coolant flow and temperature difference required toensure a balance between heat production and heat removal capability.Constraints are placed on the permissible coolant flow velocity by considera-tion of available pressure drop, cavitation, flow induced vibration andcorrosion/erosion of metal surfaces. Constraints on the temperaturedifferences relate to the physical properties of the primary coolant andthe use of the working fluid of the power production cycle, the physicaland mechanical properties of the fuel and clad, and the irradiation behaviourof fuel and clad.
Since the primary containment envelope for fission products is thefuel pin cladding, it is clearly necessary to consider the influence ofcoolant flow and temperature differences at the level of individual fuelpins, and this dictates the need for detailed thermal/hydraulic analysis cffuel pin bundles.
Such analyses have been in the course of development for many years andconsiderable experience and expertise has developed in the application of thefundamental equations of fluid flow and thermal eneroy to the complex geometryof LMFBR fuel elements. However this very complexity has led to the need tomake approximations, introduce empirical factors and develop analytical models,which often have no direct experimental backing. Therefore it has beennecessary to undertake programmes of experimental work both in the fluid flowfield and in the field of heat transfer. There are often great difficultiesin mounting experiments at reasonable cost which properly represent theoperating conditions and working fluids of reactors. Hence experimental rigsare often of the simulation type, and results must be interpreted for use incomputer codes rather than directly applied to fuel element designs.
Increasing knowledge of the behaviour of materials in a fast neutronflux has led to a realisation that fuel pin endurance may be closely linkedto non-uniform thermal conditions resulting from irradiation induced distortions.It becomes necessary therefore to pursue analyses to cover the case of irregulargeometry which continually changes in the direction of flow. Thermal/hydraulicproblems then become essentially thres-dimensional. Physical modelling becomesmuch more speculative, and mathematical difficulties increase enormously. Inthe pursuit of such solutions it is important not to lose sight of the needs offuel element designers, whose preference is often for relatively simpleanalytical tools which can be readily and reliably applied as the evaluation ofcompeting concepts.
This Paper reviews the theoretical and experimental approaches which havebeen developed and applied in the U.K. in the design of LMFBR sub-assemblies.The first part of the Paper presents some general considerations underlyingthermal/hydraulic analysis for both nominal and distorted geometry. The secondpart describes some particular theoretical analyses, and the third part presentssome typical examples of experimental work carried out in support of the theoreti-cal studies.
2. GENERAL CONSIDERATIONS
2.1 Steady-State Hydraulics, Nominal Geometry
The problem of flow distribution in the fuel element pin bundle resolvesitself, in the condition of nominal geometry, into a distinction betweencoolant flow in interior sub-channels, and coolant flow in edge and cornersub-channels. A useful design solution is to use the 'hydraulic diameter'concept as a first approximation to apportion the flow, under the assumptionof uniform axial pressure gradient. Two difficulties can arise with thisapproach. First, for gridded bundles, the result will depend on the way inwhich sub-channels are defined e.g. whether edge sub-channels are rectangularor triangular in shape, and also slightly on the variation of friction factor
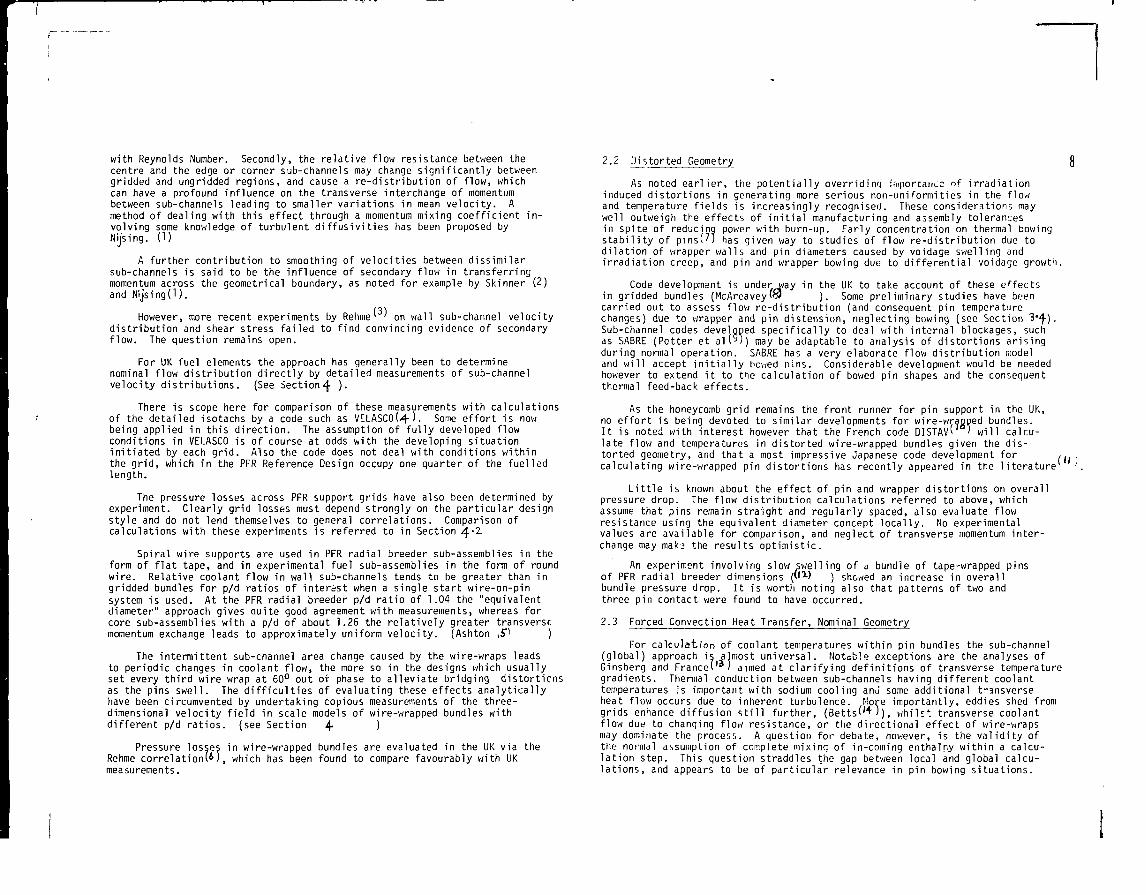
with Reynolds Number. Secondly, the relative flow resistance between thecentre and the edge or corner sub-channels may change significantly betweengridded and ungridded regions, and cause a re-distribution of flow, whichcan have a profound influence on the transverse interchange of momentumbetween sub-channels leading to smaller variations in mean velocity. Amethod of dealing with this effect through a momentum mixing coefficient in-volving some knowledge of turbulent diffusivities has been proposed byNijsing. (1)
A further contribution to smoothing of velocities between dissimilarsub-channels is said to be the influence of secondary flow in transferringmomentum across the geometrical boundary, as noted for example by Skinner (2)and Nijsing(1).
However, more recent experiments by Rehme' ' on wall sub-channel velocitydistribution and shear stress failed to find convincing evidence of secondaryflow. The question remains open.
For UK fuel elements the approach has generally been to determinenominal flow distribution directly by detailed measurements of sub-channelvelocity distributions. (See Section^ )•
There is scope here for comparison of these measurements with calculationsof the detailed isotachs by a code such as VELASCO(4-)- Some effort is nowbeing applied in this direction. The assumption of fully developed flowconditions in VELASCO is of course at odds with the developing situationinitiated by each grid. Also the code does not deal with conditions withinthe grid, which in the PFR Reference Design occupy one quarter of the fuelledlength.
The pressure losses across PFR support grids have also been determined byexperiment. Clearly grid losses must depend strongly on the particular designstyle and do not lend themselves to general correlations. Comparison ofcalculations with these experiments is referred to in Section 4"2-
Spiral wire supports are used in PFR radial breeder sub-assemblies in theform of flat tape, and in experimental fuel sub-assemblies in the form of roundwire. Relative coolant flow in wall sub-channels tends to be greater than ingridded bundles for p/d ratios of interest when a single start wire-on-pinsystem is used. At the PFR radial breeder p/d ratio of 1.04 the "equivalentdiameter" approach gives quite good agreement with measurements, whereas forcore sub-assemblies with a p/d of about 1.26 the relatively greater transversemomentum exchange leads to approximately uniform velocity. (Ashton ,£' )
The intermittent sub-channel area change caused by the wire-wraps leadsto periodic changes in coolant flow, the more so in the designs which usuallyset every third wire wrap at 60° out of phase to alleviate bridging distortiensas the pins swell. The difficulties of evaluating these effects analyticallyhave been circumvented by undertaking copious measurements of the three-dimensional velocity field in scale models of wire-wrapped bundles withdifferent p/d ratios, (see Section 4 )
Pressure losses in wire-wrapped bundles are evaluated in the UK via theRehme correlation!4), which has been found to compare favourably with UKmeasurements.
2.2 Distorted Geometry
As noted earlier, the potentially overriding irnportain-C of irradiationinduced distortions in generating more serious non-uniformities in the flowand temperature fields is increasingly recognised. These considerations maywell outweigh the effects of initial manufacturing and assembly tolerancesin spite of reducing power with burn-up. Early concentration on thermal bowingstability of pinst?) has given way to studies of flow re-distribution due todilation of wrapper walls and pin diameters caused by voidage swelling andirradiation creep, and pin and wrapper bowing due to differential voidatje growth.
Code development is under way in the UK to take account of these effectsin gridded bundles (McAreavey'S» ). Some preliminary studies have beencarried out to assess flow re-distribution (and consequent pin temperaturechanges) due to wrapper and pin distension, neglecting bowing (see Section 3"<J-).Sub-channel codes developed specifically to deal with internal blockages, suchas SABRE (Potter et al(9)) may be adaptable to analysis of distortions arisingduring normal operation. SABRE has a very elaborate flow distribution modeland will accept initially bowed pins. Considerable development would be neededhowever to extend it to the calculation of bowed pin shapes and the consequentthermal feed-back effects.
As the honeycomb grid remains the front runner for pin support in the UK,no effort is being devoted to similar developments for wire-wranped bundles.It is noted with interest however that the French code DISTAV^ ' will calcu-late flow and temperatures in distorted wire-wrapped bundles given the dis-torted geometry, and that a most impressive Japanese code development forcalculating wire-wrapped pin distortions has recently appeared in tne literature
Little is known about the effect of pin and wrapper distortions on overallpressure drop. The flow distribution calculations referred to above, whichassume that pins remain straight and regularly spaced, also evaluate flowresistance using the equivalent diameter concept locally. No experimentalvalues are available for comparison, and neglect of transverse momentum inter-change may maka the results optimistic.
An experiment involving slow swelling of a bundle of tape-wrapped pinsof PFR radial breeder dimensions (''*) ) showed an increase in overallbundle pressure drop. It is worth noting also that patterns of two andthree pin contact were found to have occurred.
2.3 Forced Convection Heat Transfer, Nominal Geometry
For calculation of coolant temperatures within pin bundles the sub-channel(global) approach is almost universal. Notable exceptions are the analyses ofGinsberg and Francef ) aimed at clarifying definitions of transverse temperaturegradients. Thermal conduction between sub-channels having different coolanttemperatures is important with sodium cooling anu some additional t-3nsverseheat flow occurs due to inherent turbulence. More importantly, eddies shed fromgrids enhance diffusion still further, (BettsC* )), whilst transverse coolantflow due to changing flow resistance, or the directional effect of wire-wrapsmay dominate the process. A question for debate, however, is the validity ofthe normal assumption of complete mixing of in-coming enthalpy within a calcu-lation step. This question straddles the gap between local and global calcu-lations, and appears to be of particular relevance in pin bowing situations.
(II)
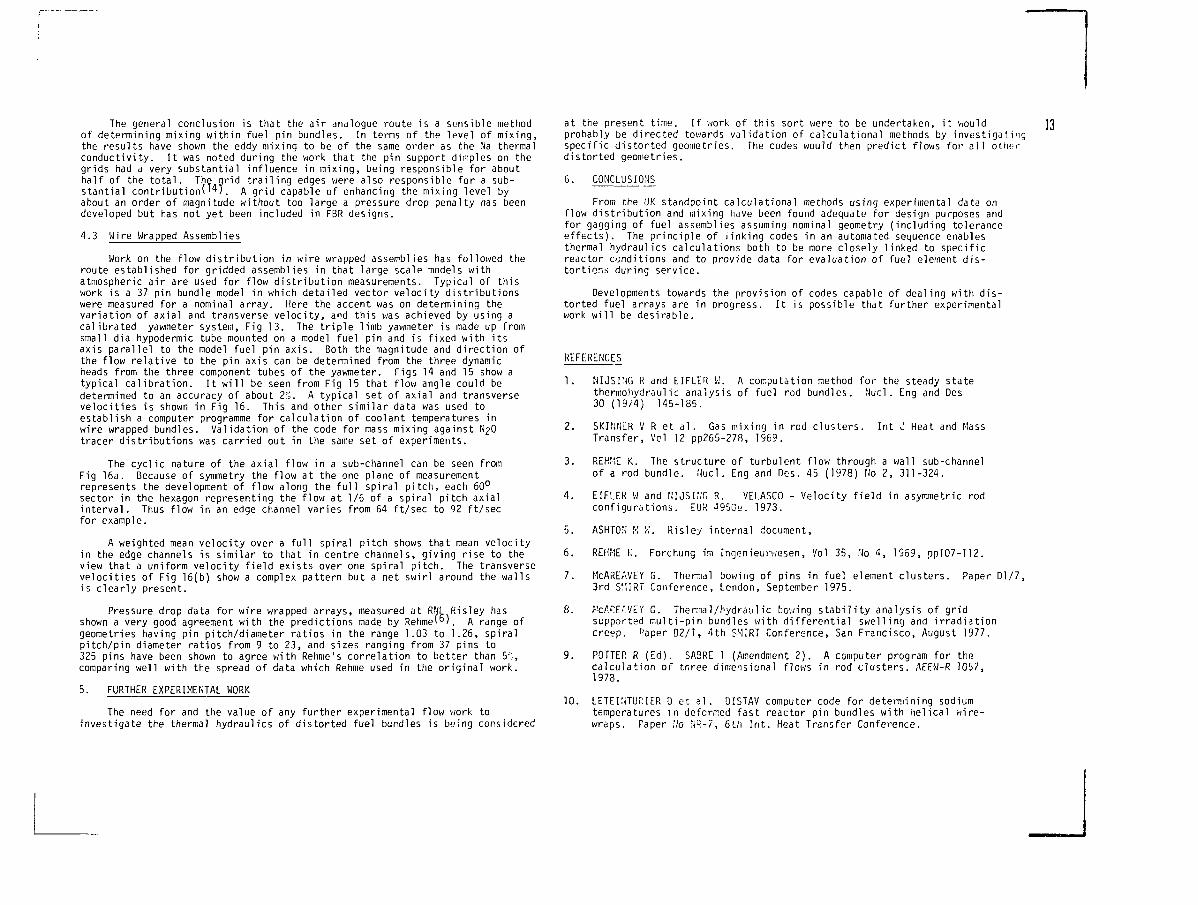
It is well known that although the level of mixing attainable in griddedpin bundles can significantly reduce the temperature difference between adjacentsub-channels, the outlet temperature distribution remains flat (or closelyapproximates any transverse power gradient) until power and flow are reducedto extremely low values (Fig 1). Wire-wraps have a substantially better per-formance in this respect of which advantage can be taken,particularly in gagging for core and breeder locations having a steep transverseflux gradient.
UK codes used for design purposes and for gagging of DFR and PFR sub-assemblies have used the sub-channel approach and a 'marching' calculationprocedure. Thermal conduction is included, and yet again values derived fromgas tracer experiments have been relied upon for mixing parameters in griddedbundles (see Section 4- )• The niceties of the precise transverse dimensionto adopt in defining enthalpy gradients in the heat transfp- codes are thusswept up in the definition of 'effective conductivity'. No distinction is madebetween gridded and ungridded regions nor between types of sub-channel, therate of mixing being assumed axially uniform throughout. Specific recognitionof the gridded region for the PFR Reference Design would involve considerablecomplication because of the grid length/pitch ratio and the associated upstreamand downstream influences of the grids.
Analysis of wire-wrapped bundles has also involved the sub-channel approach.The inadequacy of the diffusive mixing approach was recognised and in preferencecorrelations have been developed from the detailed velocity measurementsreferred to above. These are used in a marching-type computer code to calculatecoolant temperature distribution, (see Section 3-| )
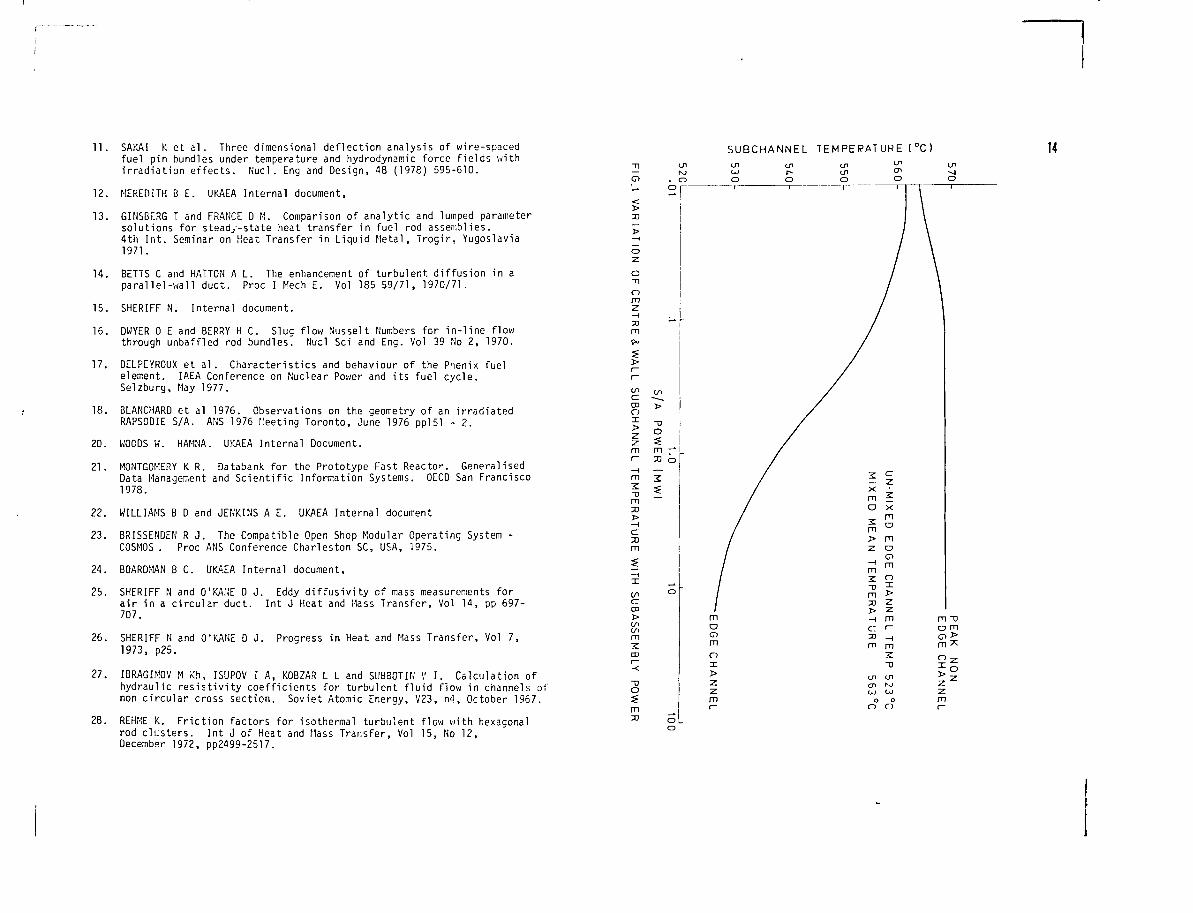
No experimental work in Na heat transfer has been carried out in the UK(except for eddy diffusivity measurements in a round pipe) and from theplethora of analytical and experimental results and correlations, generatedworld wide over many years, it is impossible to select rationally. Withnominal geometry, clad temperatures in the LMFBR are controlled largely bythe coolant temperature distribution, and given the means of calculatingthe latter the heat transfer correlation used has often been a matter ofpersonal choice. Simple recommendations independent of Peclet Number formean heat transfer coefficient and for azimuthal variation of temperature,often used for design purposes, are shown in Fig 2, (sheriff( '^)). Thesehave been found to agree well with calculations by Dwyer(").
Local effects due to the small support pips on UK honeycomb grids arefound to be insignificant. More concern has been expressed about hot streaksunder wire-wraps, but for normal oxide fuel designs calculations using afinite element thermal diffusion code show no evidence of a serious problem.
2.4 Inter Sub-assembly Heat Transfer
Heat flow across the wrapper walls is small in general for core sub-assemblies and usually has no bearing on peak sub-channel temperatures. Itis of great significance however for wrapper temperatures themselves, andit is for this reason that inter-sub-assembly heat transfer has been includedin some UK codes. The basic model is outlined in Section 3-Z , a salientfeature being the assumption of an adiabatic boundary passing through thesecond row of pins in from the wall in adjacent sub-assemblies.
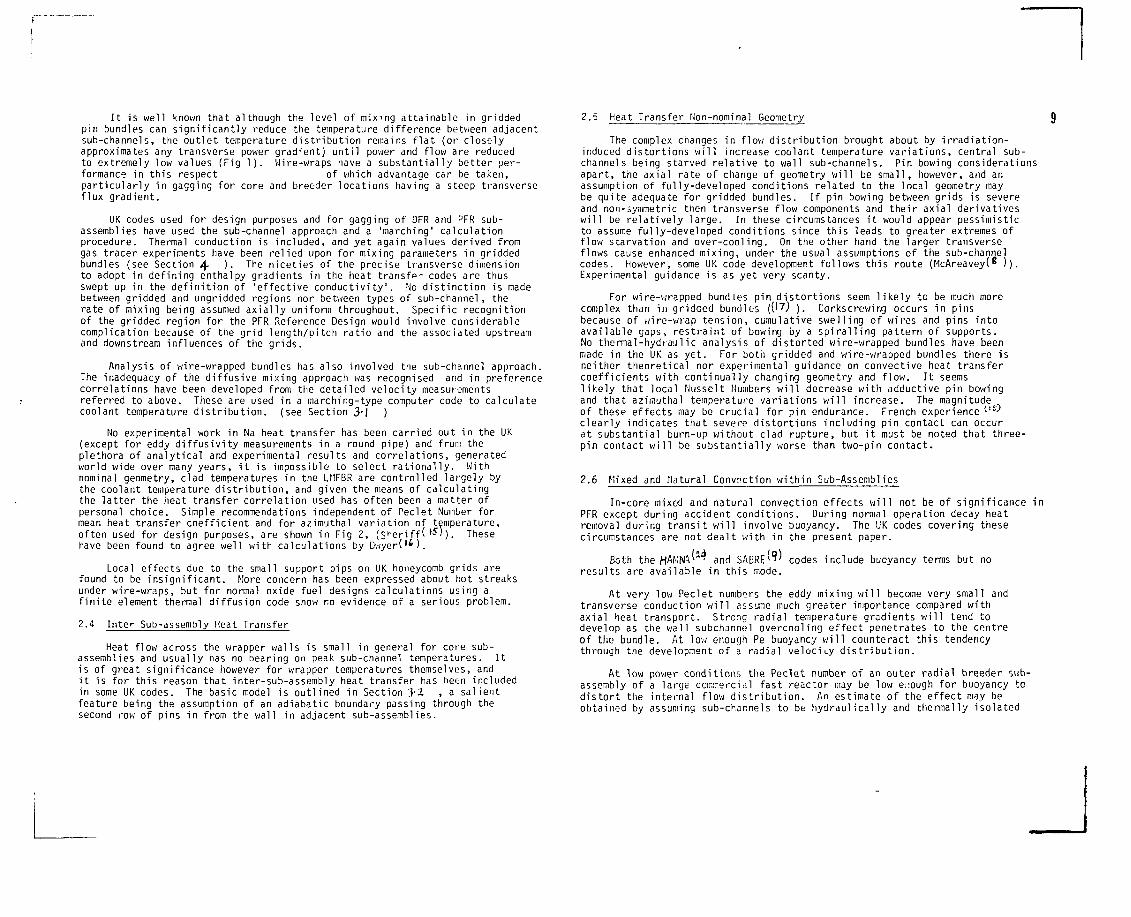
2.5 Heat Transfer Non-nominal Geometry
The complex changes in flow distribution brought about by irradiation-induced distortions will increase coolant temperature variations, central sub-channels being starved relative to wall sub-channels. Pin bowing considerationsapart, the axial rate of change of geometry will be small, however, and anassumption of fully-developed conditions related to the local geometry maybe quite adequate for gridded bundles. If pin bowing between grids is severeand non-symmetric then transverse flow components and their axial derivativeswill be relatively large. In these circumstances it would appear pessimisticto assume fully-developed conditions since this leads to greater extremes offlow starvation and over-cooling. On the other hand the larger transverseflows cause enhanced mixing, under the usual assumptions of the sub-channelcodes. However, some UK code development follows this route (McAreaveyC )).Experimental guidance is as yet very scanty.
For wire-wrapped bundles pin distortions seem likely to be much morecomplex than in gridded bundles ( C v ). Corkscrewing occurs in pinsbecause of wire-wrap tension, cumulative swelling of wires and pins intoavailable gaps, restraint of bowing by a spiralling pattern of supports.No thermal-hydraulic analysis of distorted wire-wrapped bundles have beenmade in the UK as yet. For both gridded and wire-wrapped bundles there isneither theoretical nor experimental guidance on convective heat transfercoefficients with continually changing geometry and flow. It seemslikely that local Nusselt numbers will decrease with adductive pin bowingand that azimuthal temperature variations will increase. The magnitudeof these effects may be crucial for pin endurance. French experience ('t-)
clearly indicates that severe distortions including pin contact can occurat substantial burn-up without clad rupture, but it must be noted that three-pin contact will be substantially worse than two-pin contact.
2.6 Mixed and Natural Convection within Sub-Assemblies
In-core mixed and natural convection effects will not be of significance inPFR except during accident conditions. During normal operation decay heatremoval during transit will involve buoyancy. The UK codes covering thesecircumstances are not dealt with in the present paper.
Both the HAMNv 2^ and SABRE "' codes include buoyancy tenns but noresults are available in this mode.
At very low Peclet numbers the eddy mixing will become wery small andtransverse conduction will assume much greater importance compared withaxial heat transport. Strong radial temperature gradients will tend todevelop as the wall subchannel overcooling effect penetrates to the centreof the bundle. At low enough Pe buoyancy will counteract this tendencythrough the development of a radial velocity distribution.
At low power conditions the Peclet number of an outer radial breeder sub-assembly of a large ccmr.ercinl fast reactor may be low enough for buoyancy todistort the internal flow distribution. An estimate of the effect may beobtained by assuming sub-channels to be hydraulically and thermally isolated
from each other. In laminar flew the isothermal pressure loss over theheated length may be expressed non-dimensionally as
EuR = K/ReR
Assuming uniform static pressure across transverse planes, we can derivethe expression
pin fuel weight
fuel enrichment
grid cell coordinates
wrapper internal across-flats measurements (See Fig. 3)
10
16gS Ao AT uh Ü . 1\\y- 4 ^ So KN (*R-1)
where AT is the coolant temperature rise in the hottest subchannel
N is the number of sub-channels
<j> is the radial power gradient (max/min)
R is the radial subchannel flow ratio (min/max)
W-, is the subchannel flow
h is the heated length
Ao and So are the standard flow cross-sectional area and wettedperimeter used in defining EuR and ReR.
For a typical case, with $ = 3 ReR - 1000 and AT = 200°C the? minimum
temperature rise would be 94 C and R would be 0.71.
3. THEORETICAL ANALYSES
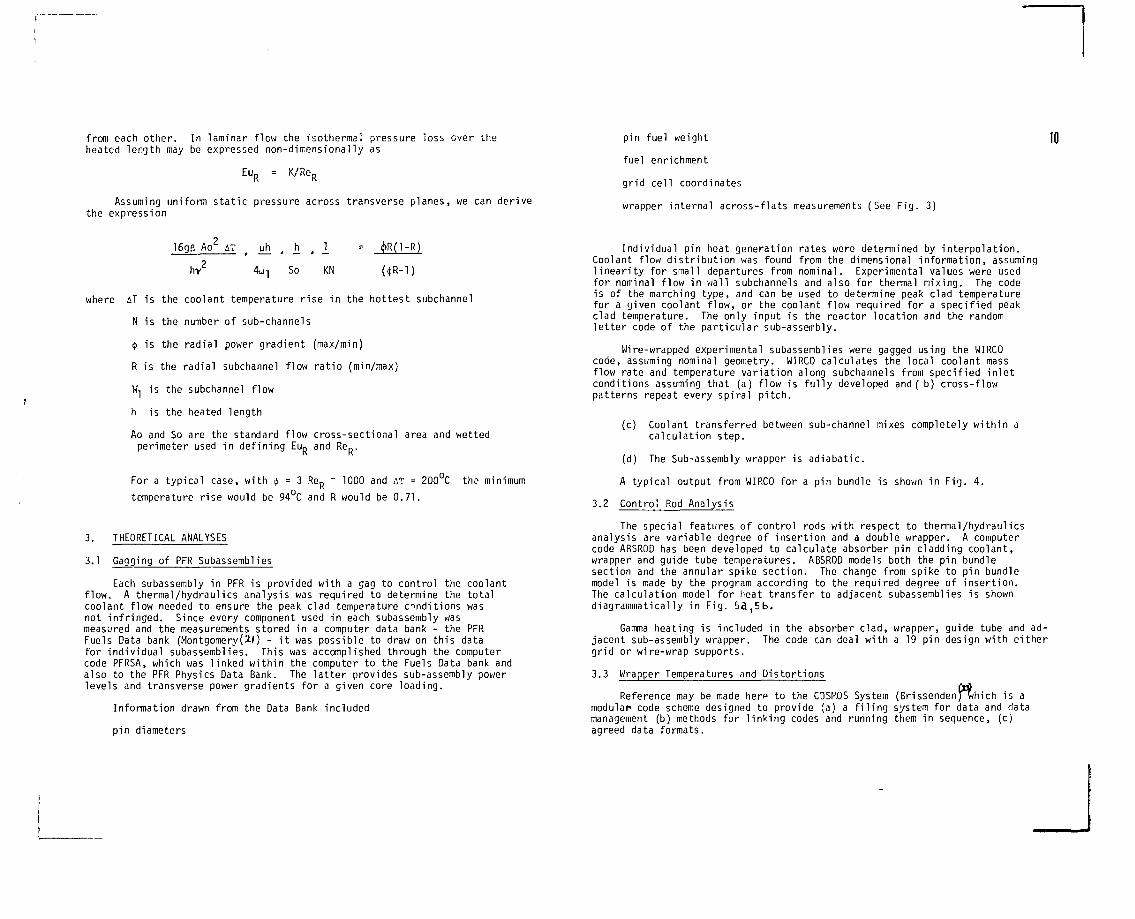
3.1 Gagging of PFR Subassemblies
Each subassembly in PFR is provided with a gag to control the coolantflow. A thermal/hydraulics analysis was required to determine the totalcoolant flow needed to ensure the peak clad temperature conditions wasnot infringed. Since every component used in each subassembly wasmeasured and the measurements stored in a computer data bank - the PFRFuels Data bank (Montgomery(2.l) - it was possible to draw on this datafor individual subassemblies. This was accomplished through the computercode PFRSA, which was linked within the computer to the Fuels Data bank andalso to the PFR Physics Data Bank. The latter provides sub-assembly pov/erlevels and transverse power gradients for a given core loading.
Information drawn from the Data Bank included
pin diameters
Individual pin heat generation rates were determined by interpolation.Coolant flow distribution was found from the dimensional information, assuminglinearity for small departures from nominal. Experimental values were usedfor nominal flow in wall subchannels and also for thermal mixing. The codeis of the marching type, and can be used to determine peak clad temperaturefor a given coolant flow, or the coolant flow required for a specified peakclad temperature. The only input is the reactor location and the randomletter code of the particular sub-assembly.
Wire-wrapped experimental subassemblies were gagged using the WIRCOcode, assuming nominal geometry. WIRCO calculates the local coolant massflow rate and temperature variation along subchannels from specified inletconditions assuming that (a) flow is fully developed and ( b) cross-flowpatterns repeat every spiral pitch.
(c) Coolant transferred between sub-channel mixes completely within acalculation step.
(d) The Sub-assembly wrapper is adiabatic.
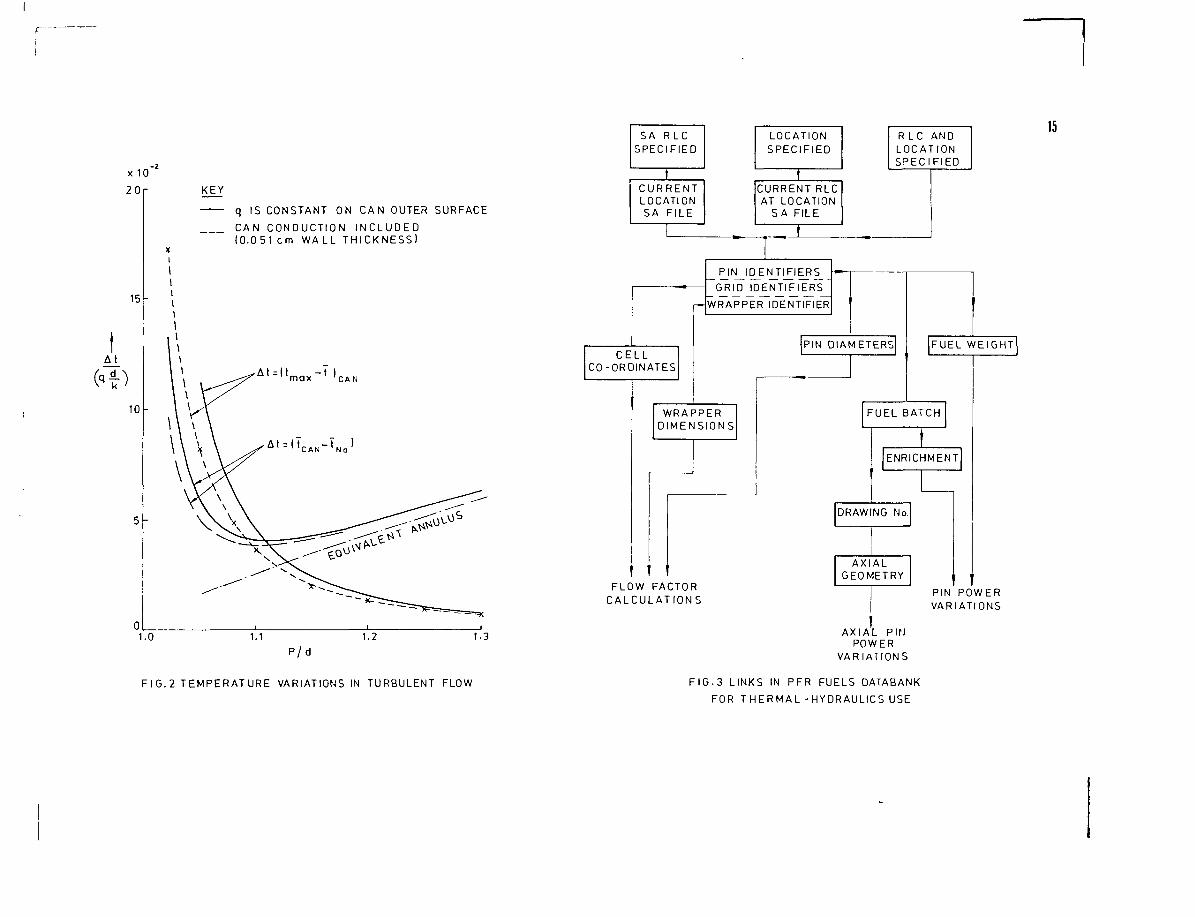
A typical output from WIRCO for a pin bundle is shown in Fig. 4.
3.2 Control Rod Analysis
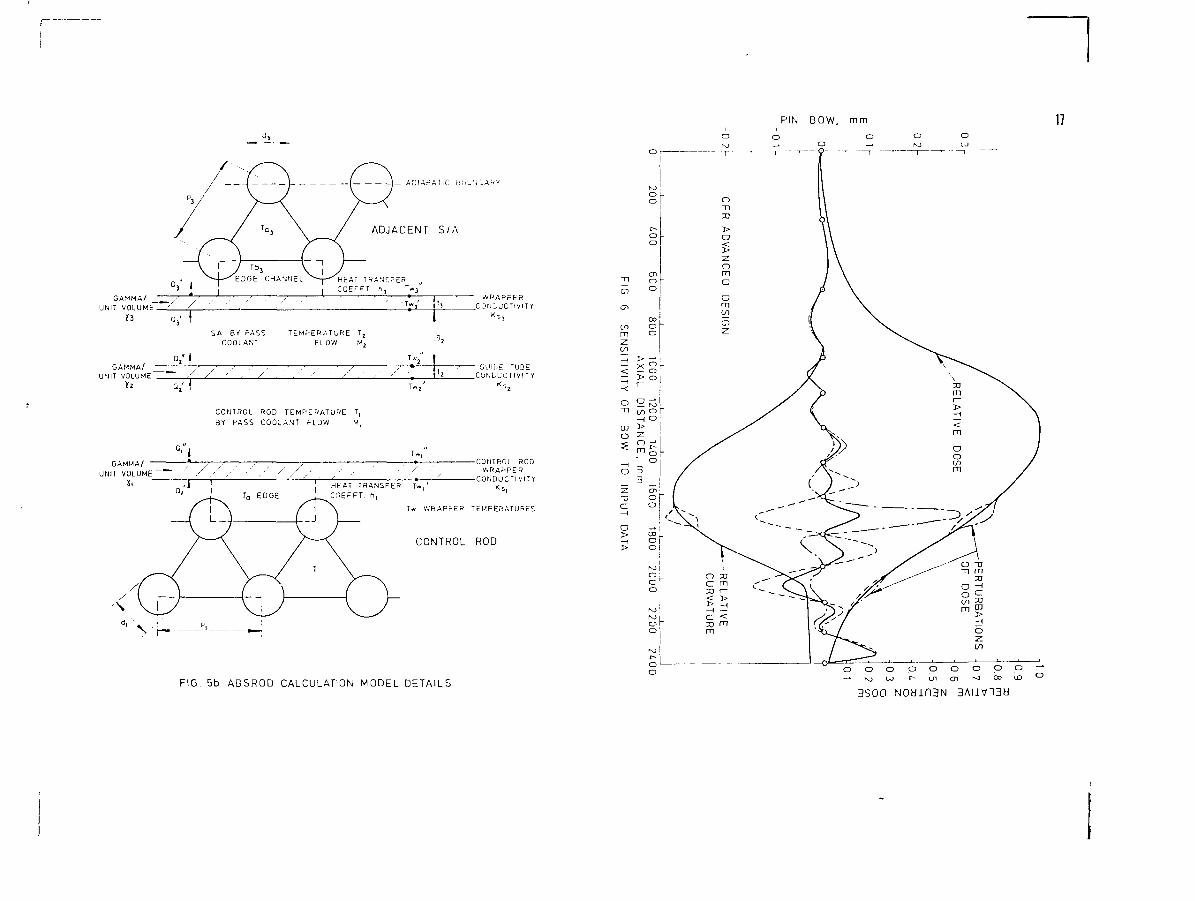
The special features of control rods with respect to thermal/hydraulicsanalysis are variable degree of insertion and a double wrapper. A computercode ABSROD has been developed to calculate absorber pin cladding coolant,wrapper and guide tube temperatures. ABSROD models both the pin bundlesection and the annular spike section. The change from spike to pin bundlemodel is made by the program according to the required degree of insertion.The calculation model for heat transfer to adjacent subassemblies is showndiagrammatical ly in Fig. 53,5 b.
Gamma heating is included in the absorber clad, wrapper, guide tube and ad-jacent sub-assembly wrapper. The code can deal with a 19 pin design with eithergrid or wire-wrap supports.
3.3 Wrapper Temperatures and Distortions
Reference may be made herp to the COSMOS System (BrissendenJwhich is amodular code scheme designed to provide (a) a filing system for data and datamanagement (b) methods for linking codes and running them in sequence, (c)agreed data formats.
All the fast reactor neutronics codes developed in the AEA are linkedinto the COSMOS scheme as well as many of the thermal/hydraulics codes.A highly successful application of the principal of modular code schemes hasbeen the development of a 'task' involving the linking of neutronics, thermal/hydraulics, and wrapper distortion codes so that by specifying all or a groupof PFR sub-assemblies in a specified core loading an automatic sequence ofcalculations is carried out, culminating in an output of sub-assembly wrapperswelling, irradiation creep dilation, bow, and axial extension.
The thermal/hydraulics component of this scheme resided in the WRAPRTcode (**), which was developed to calculate wrapper temperatures for all typesof sub-assemblies in the PFR core, ie. driver fuel, breeder assemblies,experimental sub-assemblies, and reflectors. Absorber rod and guide tubetemperatures are calculated using ABSROD - also within COSMOS. WRAPRT is amarching-type code and will deal with any triangular array of pins up to 331in number, in an hexagonal wrapper, and can handle both gridded and wire-wrapped bundles. Nominal geometry is assumed and experimental values areused for wall subchannel flow and inter-subchannel mixing.
For wire-wrapped bundles diffusive mixing is assumed between all interiorsubchannels using an equivalent conductivity derived from the transverse gapflow correlations of the WIRCO code (Section 3-2.), and a mean value of uni-directional transverse flow is used between wall sub-channels.This approach has been found to give quite good agreement with the morecomplicated and longer running WIRCO code (Fig. 4).
The COSMOS scheme permits automatic recognition of the type andoperating conditions of all the neighbouring sub-assemblies, thusfacilitating the calculation of inter-sub-assembly heat transfer asoutlined in Section 3-2
3.4 Temperature Changes Due to Wrapper and Pin Dilation
As noted earlier some calculations have been done to quantify the effecton pin temperatures of assumed levels of dilation of the wrapper and voidageswelling of the pins. (Boardman(H)). The axial profiles of bulging of thewrapper walls and swelling of the pins do not, of course, coincide, theformer peaking well upstream of the latter. This has been taken intoaccount in determining the coolant flow distribution. The flow split betweensub-channels for undistorted geometry was taken to be that determinedexperimentally, and perturbations due to the distortions were evaluated on theequivalent hydraulic diameter principle. Static pressure was assumed to beuniform across transverse planes and the overall pressure loss was unchanged.
Under these assumptions, for a particular case, the total coolant flowwas found to increase slightly, but it is redistributed in such a way thatcentre sub-channel coolant temperatures at outlet increase by some 20°C whilstwall channel temperatures decrease by about 60°. Edge pin temperature gradientsincrease by some 40°C.
Start of life temperatures were used in determining distortions. Strictlythe calculation should be done incrementally, re-evaluating rate of change ofgeometry according to prevailing temperatures. This work is continuing.
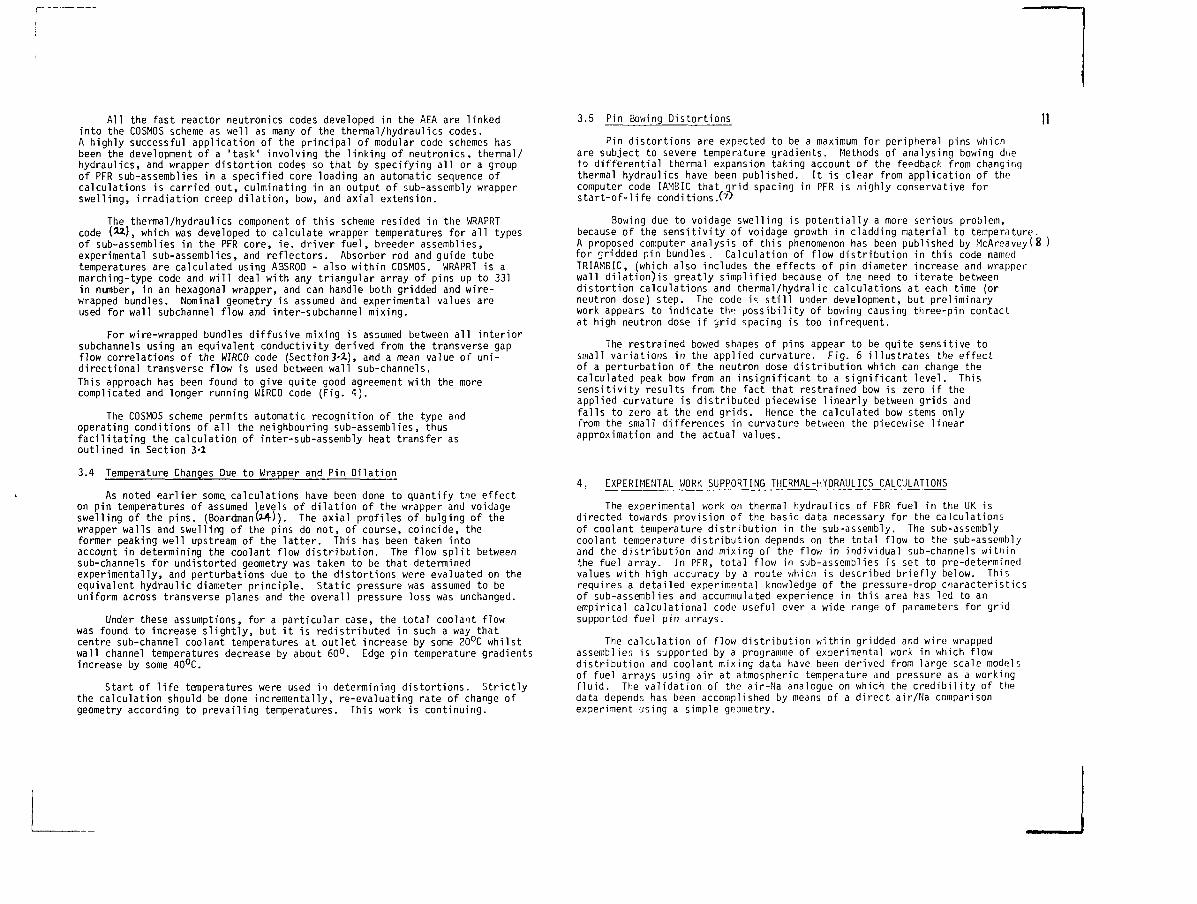
3.5 Pin Bowing Distortions |
Pin distortions are expected to be a maximum for peripheral pins whichare subject to severe temperature gradients. Methods of analysing bowing dueto differential thermal expansion taking account of the feedback from changingthermal hydraulics have been published. It is clear from application of thecomputer code IAMBIC that grid spacing in PFR is highly conservative forstart-of-life conditions/"''
Bowing due to voidage swelling is potentially a more serious problem,because of the sensitivity of voidage growth in cladding material to temperature.A proposed computer analysis of this phenomenon has been published by McAreavey(8for gridded pin bundles. Calculation of flow distribution in this code namedTRIAMBIC, (which also includes the effects of pin diameter increase and wrapperwall dilation)is greatly simplified because of the need to iterate betweendistortion calculations and thermal/hydralic calculations at each time (orneutron dose) step. The code ic. still under development, but preliminarywork appears to indicate the possibility of bowing causing three-pin contactat high neutron dose if jrid spacing is too infrequent.
The restrained bowed shapes of pins appear to be quite sensitive tosmall variations in the applied curvature. Fig. 6 illustrates the effectof a perturbation of the neutron dose distribution which can change thecalculated peak bow from an insignificant to a significant level. Thissensitivity results from the fact that restrained bow is zero if theapplied curvature is distributed piecewise linearly between grids andfalls to zero at the end grids. Hence the calculated bow stems onlyfrom the small differences in curvature between the piecewise linearapproximation and the actual values.
4. EXPERIMENTAL WORK SUPPORTING THERMAL-HYDRAULICS CALCULATIONS
The experimental work on thermal hydraulics of FBR fuel in the UK isdirected towards provision of the basic data necessary for the calculationsof coolant temperature distribution in the sub-assembly. The sub-assemblycoolant temperature distribution depends on the total flow to the sub-assemblyand the distribution and mixing of the flow in individual sub-channels withinthe fuel array. In PFR, total flow in sub-assemblies is set to pre-determinedvalues with high accuracy by a route which is described briefly below. Thisrequires a detailed experimental knowledge of the pressure-drop characteristicsof sub-assemblies and accumulated experience in this area has led to anempirical calculational code useful over a wide range of parameters for gridsupported fuel pin arrays.
The calculation of flow distribution within gridded and wire wrappedassemblies is supported by a programme of experimental work in which flowdistribution and coolant mixing data have been derived from large scale modelsof fuel arrays using air at atmospheric temperature and pressure as a workingfluid. The validation of the air-Na analogue on which the credibility of thedata depends has been accomplished by means of a direct air/Na comparisonexperiment using a simple geometry.
4.1 Determination of Sub-assembly Total Flow The results of th is and other work of a s imi lar nature showed that: 12In PFR, the flow in each sub-assembly is set to be within +2Jci of a
specified value relative to core centre sub-assembly flow. To achieve this,the sub-assembly flow resistance, which varies by a few percent due to toler-ances, is measured to an accuracy of £1" on an atmospheric air rig at DNE.The pressure drop available over the sub-assembly is a function of its positionin the diagrid, and determined from measurements of diagrid and fuel elementcarrier losses. These measurements were done for PFR on a J scale model usingwater as working fluid. An error ±lpsi in driving pressure over a sub-assembly, is unlikely. Knowledge of the sub-assembly flow resistance and thepressure drop over the sub-assembly allows a gag of suitable size to be chosento give the required flow within ±jt\%.
The extrapolation of the sub-assembly flow resistance from the relativelylow Reynolds No of the atmospheric air test to the Reynolds No at reactorconditions is done via a reference curve of Euler No versus Reynolds No measuredin a high pressure CO2 loop. The measurements in this loop define the curveshape to an accuracy of better than i% (95?ö confidence) over the full ReynoldsNo range of interest. Similar curves for the Euler-Reynolds characteristicof the gag design are also required in the procedure.
The overall result of the gag setting procedure is to allow the requiredsub-assembly mixed mean outlet temperature to be achieved with very little un-certainty due to flow rate.
4.2 Flow Distribution Measurements
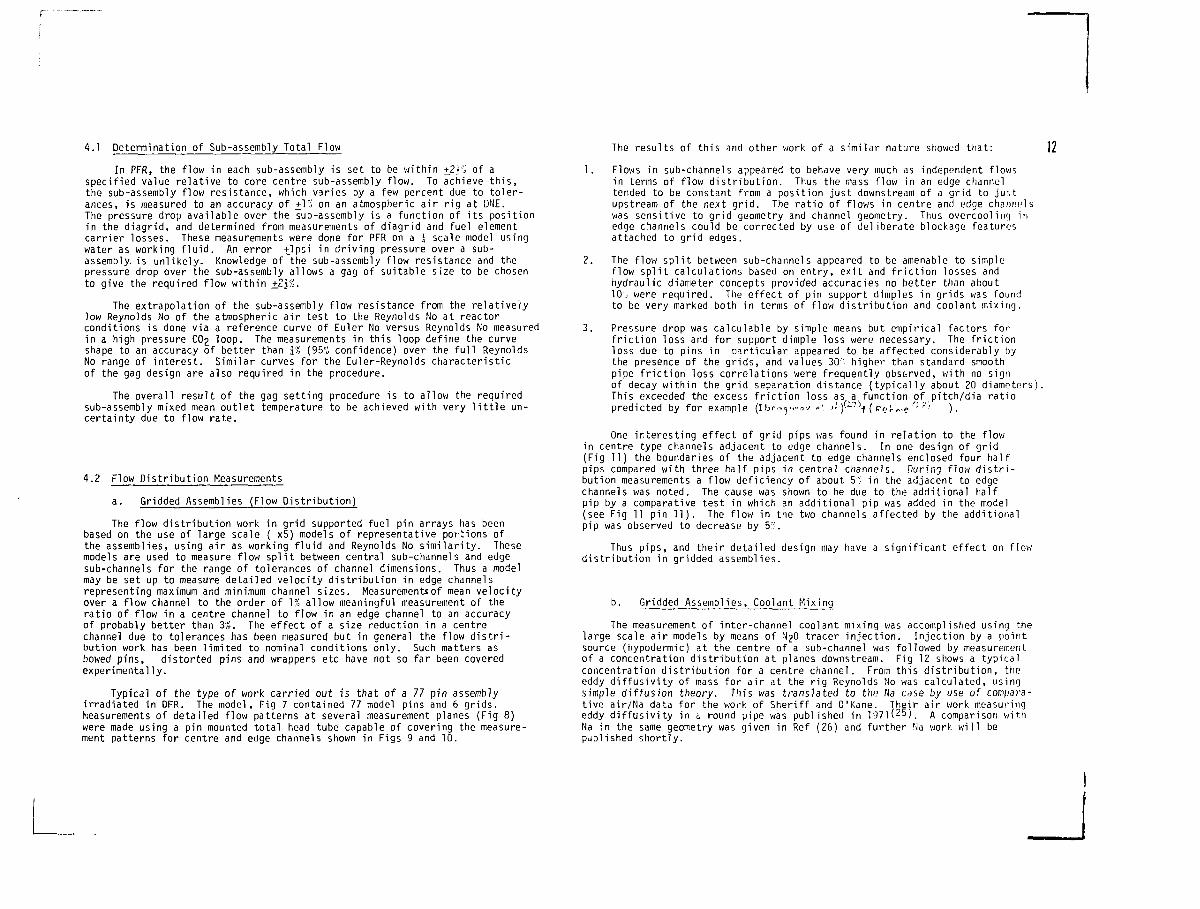
a. Gridded Assemblies (Flow Distribution)
The flow distribution work in grid supported fuel pin arrays has beenbased on the use of large scale ( x§) models of representative portions ofthe assemblies, using air as working fluid and Reynolds No similarity. Thesemodels are used to measure flow split between central sub-channels and edgesub-channels for the range of tolerances of channel dimensions. Thus a modelmay be set up to measure detailed velocity distribution in edge channelsrepresenting maximum and minimum channel sizes. Measurements of mean velocityover a flow channel to the order of 1% allow meaningful measurement of theratio of flow in a centre channel to flow in an edge channel to an accuracyof probably better than 3%. The effect of a size reduction in a centrechannel due to tolerances has been measured but in general the flow distri-bution work has been limited to nominal conditions only. Such matters asbowed pins, distorted pins and wrappers etc have not so far been coveredexperimentally.
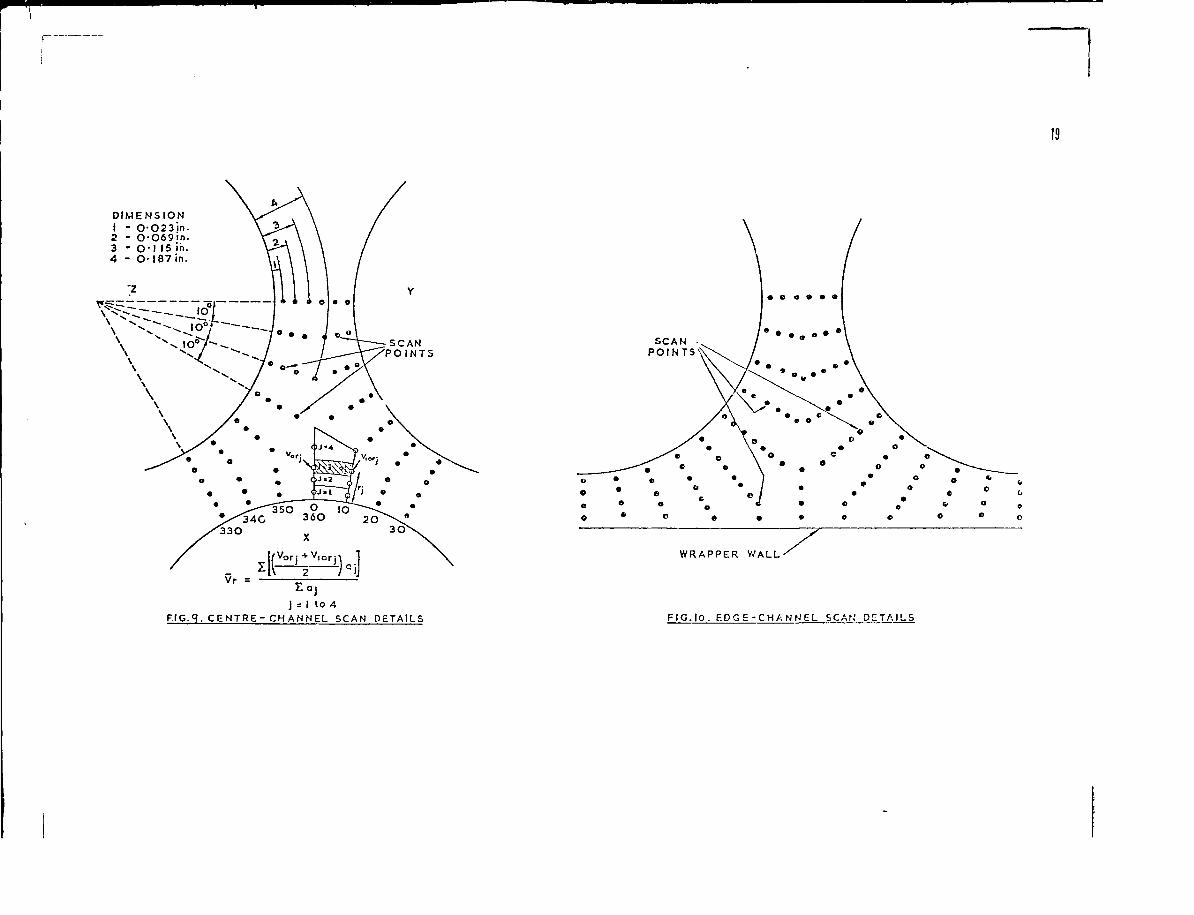
Typical of the type of work carried out is that of a 77 pin assemblyirradiated in DFR. The model, Fig 7 contained 77 model pins and 6 grids.Measurements of detailed flow patterns at several measurement planes (Fig 8)were made using a pin mounted total head tube capable of covering the measure-ment patterns for centre and edge channels shown in Figs 9 and 10.
1. Flows in sub-channels appeared to behave very much as independent flowsin terms of flow distribution. Thus the mass flow in an edge channeltended to be constant from a position just downstream of a grid to jur,tupstream of the next grid. The ratio of flows in centre and edge channelswas sensitive to grid geometry and channel geometry. Thus overcooling inedge channels could be corrected by use of deliberate blockage featuresattached to grid edges.
2. The flow split between sub-channels appeared to be amenable to simpleflow split calculations based on entry, exit and friction losses andhydraulic diameter concepts provided accuracies no better than about10'.. were required. The effect of pin support dimples in grids was foundto be very marked both in terms of flow distribution and coolant mixing.
3. Pressure drop was calculable by simple means but empirical factors forfriction loss and for support dimple loss were necessary. The frictionloss due to pins in Darticular appeared to be affected considerably bythe presence of the grids, and values 30'- higher than standard smoothpipe friction loss correlations were frequently observed, with no signof decay within the grid separation distance (typically about 20 diameters).This exceeded the excess friction loss as a function of pitch/dia ratiopredicted by for example (I br.-.<j .,..,* •>' J! /i'7^ ( pe(. „,e'
: >'•• ).
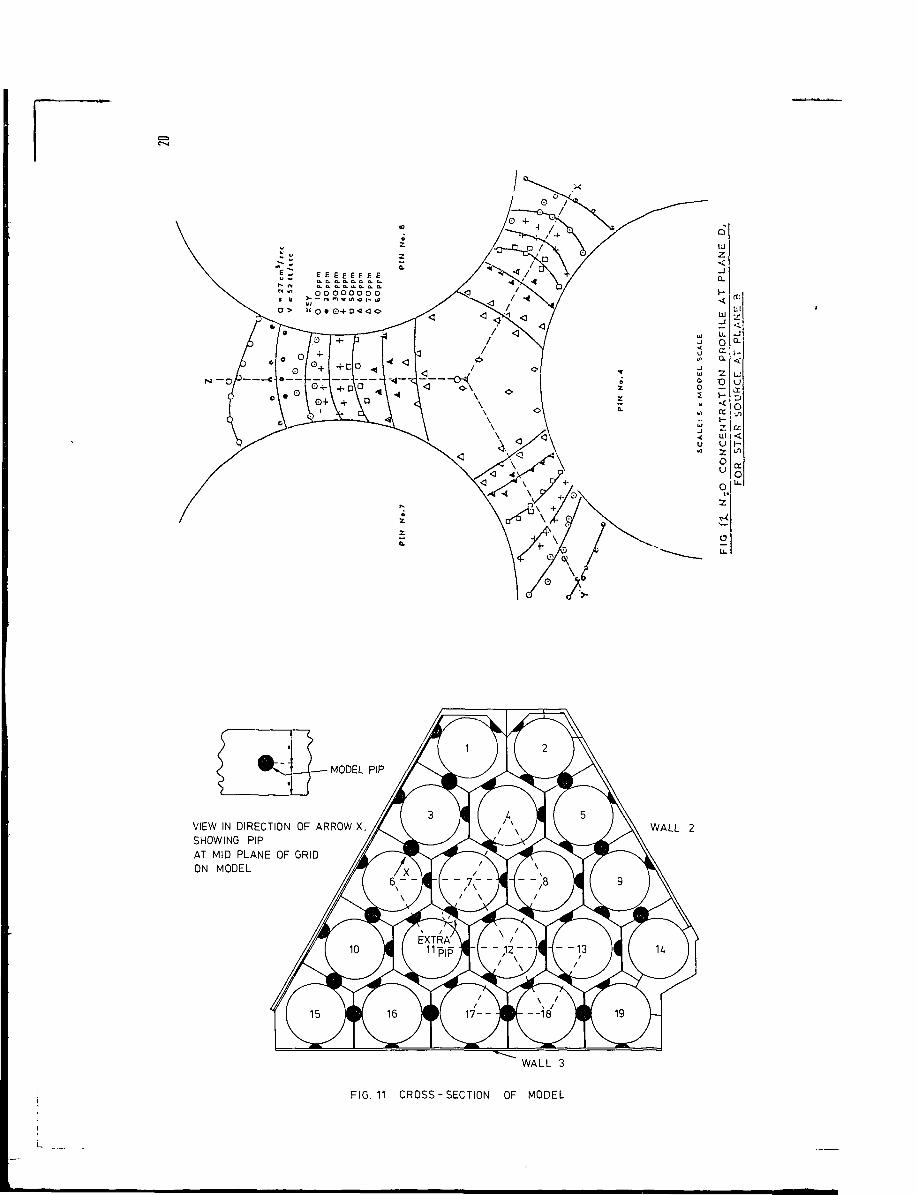
One interesting effect of grid pips was found in relation to the flowin centre type channels adjacent to edge channels. In one design of grid(Fig 11) the boundaries of the adjacent to edge channels enclosed four halfpips compared with three half pips in central channels. During flow distri-bution measurements a flow deficiency of about 5: in the adjacent to edgechannels was noted. The cause was shown to be due to the additional halfpip by a comparative test in which an additional pip was added in the model(see Fig 11 pin 11). The flow in the two channels affected by the additionalpip was observed to decrease by 5".
Thus pips, and their detailed design may have a significant effect on flowdistribution in gridded assemblies.
b. Gridded Assemblies, Coolant Mixing
The measurement of inter-channel coolant mixing was accomplished using thelarge scale air models by means of N2O tracer injection. Injection by a pointsource (hypodermic) at the centre of a sub-channel was followed by measurementof a concentration distribution at planes downstream. Fig 12 shows a typicalconcentration distribution for a centre channel. From this distribution, theeddy diffusivity of mass for air at the rig Reynolds Ho was calculated, usingsimple diffusion theory. This was translated to the Na case by use of compara-tive air/Na data for the work of Sheriff and O'Kane. Their air work measuringeddy diffusivity in 0 round pipe was published in 1971 (25) _ /\ comparison withNa in the same geometry was given in Ref (26) and further Na work will bepublished shortly.
The general conclusion is that the air analogue route is a sensible methodof determining mixing within fuel pin bundles. In terms of the level of mixing,the results have shown the eddy mixing to be of the same order as the Na thermalconductivity. It was noted during the work that the pin support dimples on thegrids had a very substantial influence in mixing, being responsible for abouthalf of the total. The grid trailing edges v/ere also responsible for a sub-stantial contribution^'"). A grid capable of enhancing the mixing level byabout an order of magnitude without too large a pressure drop penalty has beendeveloped but has not yet been included in FBR designs.
4.3 Wire Wrapped Assemblies
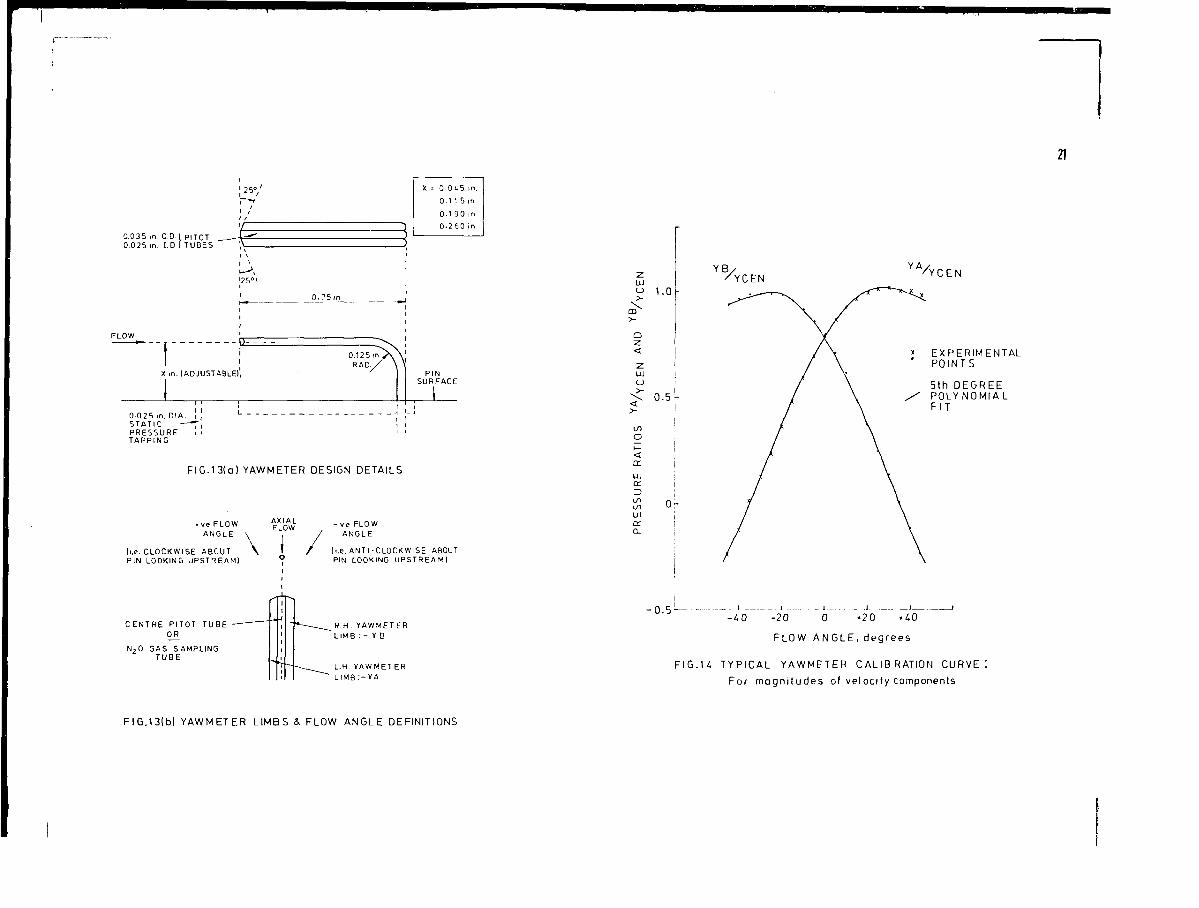
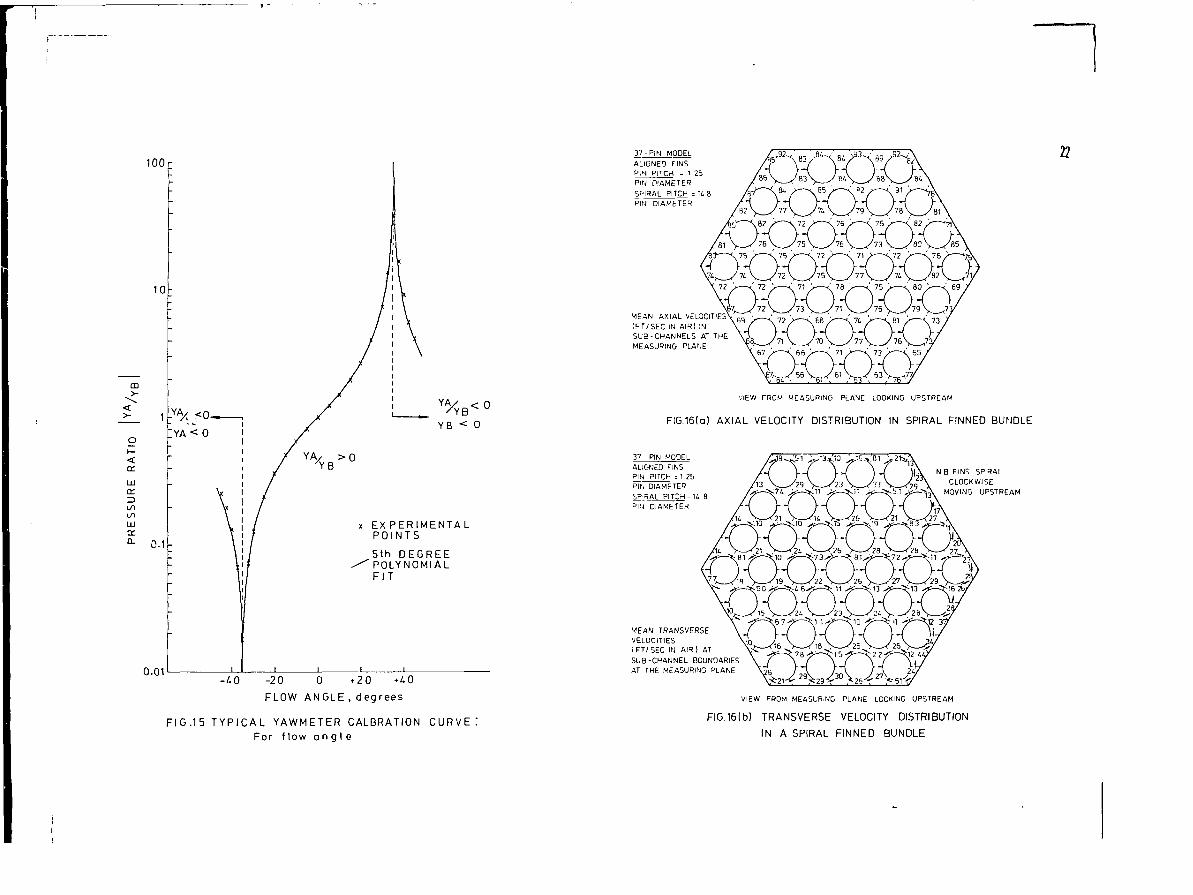
Work on the flow distribution in wire wrapped assemblies has followed theroute established for gridded assemblies in that large scale models withatmospheric air are used for flow distribution measurements. Typical of thiswork is a 37 pin bundle model in which detailed vector velocity distributionswere measured for a nominal array. Here the accent was on determining thevariation of axial and transverse velocity, and this was achieved by using acalibrated yawmeter system, Fig 13. The triple limb yawmeter is made up fromsmall dia hypodermic tube mounted on a model fuel pin and is fixed with itsaxis parallel to the model fuel pin axis. Both the magnitude and direction ofthe flow relative to the pin axis can be determined from the three dynamicheads from the three component tubes of the yawmeter. Figs 14 and 15 show atypical calibration. It will be seen from Fig 15 that flow angle could bedetermined to an accuracy of about 2%. A typical set of axial and transversevelocities is shown in Fig 16. This and other similar data was used toestablish a computer programme for calculation of coolant temperatures inwire wrapped bundles. Validation of the code for mass mixing against N2Otracer distributions was carried out in the same set of experiments.
The cyclic nature of the axial flow in a sub-channel can be seen fromFig 16a. Because of symmetry the flow at the one plane of measurementrepresents the development of flow along the full spiral pitch, each 60°sector in the hexagon representing the flow at 1/6 of a spiral pitch axialinterval. Thus flow in an edge channel varies from 64 ft/sec to 92 ft/secfor example.
A weighted mean velocity over a full spiral pitch shows that mean velocityin the edge channels is similar to that in centre channels, giving rise to theview that a uniform velocity field exists over one spiral pitch. The transversevelocities of Fig 16(b) show a complex pattern but a net swirl around the wallsis clearly present.
Pressure drop data for wire wrapped arrays, measured at RNL Risley hasshown a very good agreement with the predictions made by Rehme(°). A range ofgeometries having pin pitch/diameter ratios in the range 1.03 to 1.26, spiralpitch/pin diameter ratios from 9 to 23, and sizes ranging from 37 pins to325 pins have been shown to agree with Rehrne's correlation to better than 5%,comparing well with the spread of data which Rehme used in the original work.
5. FURTHER EXPERIMENTAL WORK
The need for and the value of any further experimental flow work toinvestigate the thermal hydraulics of distorted fuel bundles is being considered
at the present time. If work of this sort were to be undertaken, it would |3probably be directed towards validation of calculational methods by investigatingspecific distorted geometries. The codes would then predict flows for all otherdistorted geometries.
6. CONCLUSIONS
From the UK standpoint calculational methods using experimental data onflow distribution and mixing have been found adequate for design purposes andfor gagging of fuel assemblies assuming nominal geometry (including toleranceeffects). The principle of iinking codes in an automated sequence enablesthermal hydraulics calculations both to be more closely linked to specificreactor conditions and to provide data for evaluation of fuel element dis-tortions during service.
Developments towards the provision of codes capable of dealing with dis-torted fuel arrays are in progress. It is possible that further experimentalwork will be desirable.
REFERENCES
1. NIOSING R and EIFLER W. A computation method for the steady statethermohydraulic analysis of fuel rod bundles. Nucl. Eng and Des30 (1974) 145-185.
SKINNER V R et al. Gas mixing in rod clusters.Transfer, Vol 12 pp265-278, 1969.
Int J Heat and Mass
10.
REHME K. The structure of turbulent flow through a wall sub-channelof a rod bundle, fluci. Eng and Des. 45 (1978) No 2, 311-324.
EIFLER W and NUSING R. YELASCO - Velocity field in asymmetric rodconfigurations. EUR4950e. 1973.
ASHTO.'i !•! '.•.'. Risley internal document,
REHME K. Forchung im Ingenieurwesen, Vol 35, No 4, 1969, nplO7-112.
McAREAVEY G. Thermal bowing of pins in fuel element clusters. Paper Dl/7,3rd S'ilRT Conference, London, September 1975.
I-'cAREAVEY G. Thermal/hydraulic bowing stability analysis of gridsupported multi-pin bundles with differential swelling and irradiationcreep. Paper D2/1, 4th SMIRT Conference, San Francisco, August 1977.
POTTER R (Ed). SABRE 1 (Amendment 2). A computer program for thecalculation of three dimensional flows in rod clusters. AEEW-R 1057,1973.
LETEI'iTURIER 0 et al . DISTAV computer code for determining sodiumtemperatures in deformed fast reactor pin bundles with helical wire-wraps. Paper No NR-7, 6th Int. Heat Transfer Conference.
11. SAKAI K et al. Three dimensional deflection analysis of wire-spacedfuel pin bundles under temperature and hydrodynamic force fields withirradiation effects. Nucl. Eng and Design, 48 (1978) 595-610.
12. MEREDITH B E. UKAEA Internal document,
13. GINSBERG T and FRANCE D M. Comparison of analytic and lumped parametersolutions for steady-state heat transfer in fuel rod assemblies.4th Int. Seminar on Heat Transfer in Liquid Metal, Trogir, Yugoslavia1971.
14. BETTS C and HATTON A L. The enhancement of turbulent, diffusion in aparallel-wall duct. Proc I Mech E. Vol 185 59/71, 1970/71.
15. SHERIFF N. Internal document.
16. DWYER 0 E and BERRY H C. Slug flow Nusselt Numbers for in-line flowthrough unbaffled rod bundles. Nucl Sei and Eng. Vol 39 No 2, 1970.
17. DELPEYROUX et al. Characteristics and behaviour of the Phenix fuelelement. IAEA Conference on Nuclear Power and its fuel cycle.Selzburg, May 1977.
18. BLANCHARD et al 1976. Observations on the geometry of an irradiatedRAPSODIE S/A. ANS 1976 fleeting Toronto, June 1976 ppl51 - 2.
20. WOODS W. HAMNA. UKAEA Internal Document.
21. MONTGOMERY K R. Databank for the Prototype Fast Reactor. GeneralisedData Management and Scientific Information Systems. OECD San Francisco1978.
22. WILLIAMS B D and JENKINS A E. UKAEA Internal document
23. BRISSENDEN R J. The Compatible Open Shop Modular Operating System -COSMOS . Proc ANS Conference Charleston SC, USA, 1975.
24. BOARDMAN B C. UKAEA Internal document,
25. SHERIFF N and O'KANE D J. Eddy diffusivity of mass measurements forair in a circular duct. Int J Heat and Mass Transfer, Vol 14, pp 697-707.
26. SHERIFF N and O'KANE D J. Progress in Heat and Mass Transfer, Vol 7,1973, p25.
27. IBRAGIMOV H Kh, ISUPOV I A, KOBZAR L L and SUBBOTIN V I. Calculation ofhydraulic resistivity coefficients for turbulent fluid flow in channels ofnon circular cross section. Soviet Atomic Energy, V23, n<l, October 1967.
28. REHME K. Friction factors for isothermal turbulent flow with hexagonalrod clusters. Int J of Heat and Mass Transfer, Vol 15, No 12,December 1972, pp2499-2517.
SUBCHANNEL TEMPERATURE
>•xt
oz
omz
er03oX
m33
c33
xin
ininm
"üo
m33
14
KEY
ON CAN OUTER SURFACEq IS CONSTANT
CAN CONDUCTION INCLUDED( 0 . 0 5 1 c m WALL THICKNESS)
SA RLCSPECIFIED
LOCATIONSPECIFIED
CURRENTLOCATIONSA FILE
_L
R LC ANDLOCATIONSPECIFIED
CURRENT RLCAT LOCATION
SA FILE
CELLCO-ORDINATES
J_
15
P_INJDEN_TIF_IEiRS_
RIU ID~ENTTFI¥R"S
WRAPPER IDENTIFIER
PIN DIAMETERS
WRAPPERDIMENSIONS
|FUEL WEIGHT
FUEL BATCH
ENRICHMENT
DRAWING No.
FLOW FACTORCALCULATIONS
AXIALGEOMETRY
PIN POWERVARIATIONS
FIG.2 TEMPERATURE VARIATIONS IN TURBULENT FLOW
AXIAL PlfJPOWER
VARIATIONS
FIG-3 LINKS IN PFR FUELS DATABANK
FOR THERMAL-HYDRAULICS USE
FIG. 4 WRAPRT-WIRCO COMPARISON FIG 5a. CON.RÜL ROD CROSS-SECTION AND
7 Kg/s NO GRADIENT ADJACENT SUB-ASSEMBLIES
GAMMA/ _'UNIT VOLUME.
J3
Q3 I
GAMMA/ JUMIT VOLUME
0," i
A D J A C E N T S / A
HEAT TRANT.'ER
SA B/ PASS TEMPERATURE T2
COOLANT FLOW M,
*3 |'3 CONJL.'.RAPPER
UCT1VITY
- GUILE TUBE.CONDUCTIVITY
CONTROL ROD TEMPERATURE T,BY PASS COOLANT FLOW M,
GAMMA/ "UNIT VOLUME
CONTROL RODWRAPPER
CONDUCTIVITY, H E A T TRANSFER Tw, '
COEFFT h,
T* WRAPPER TEMPERATURE
CONTROL ROD
FIG. 5b ABSROD CALCULATION MODEL DETAILS
PIN BOW mm 17
3S00 NOHirON 3AliV13d
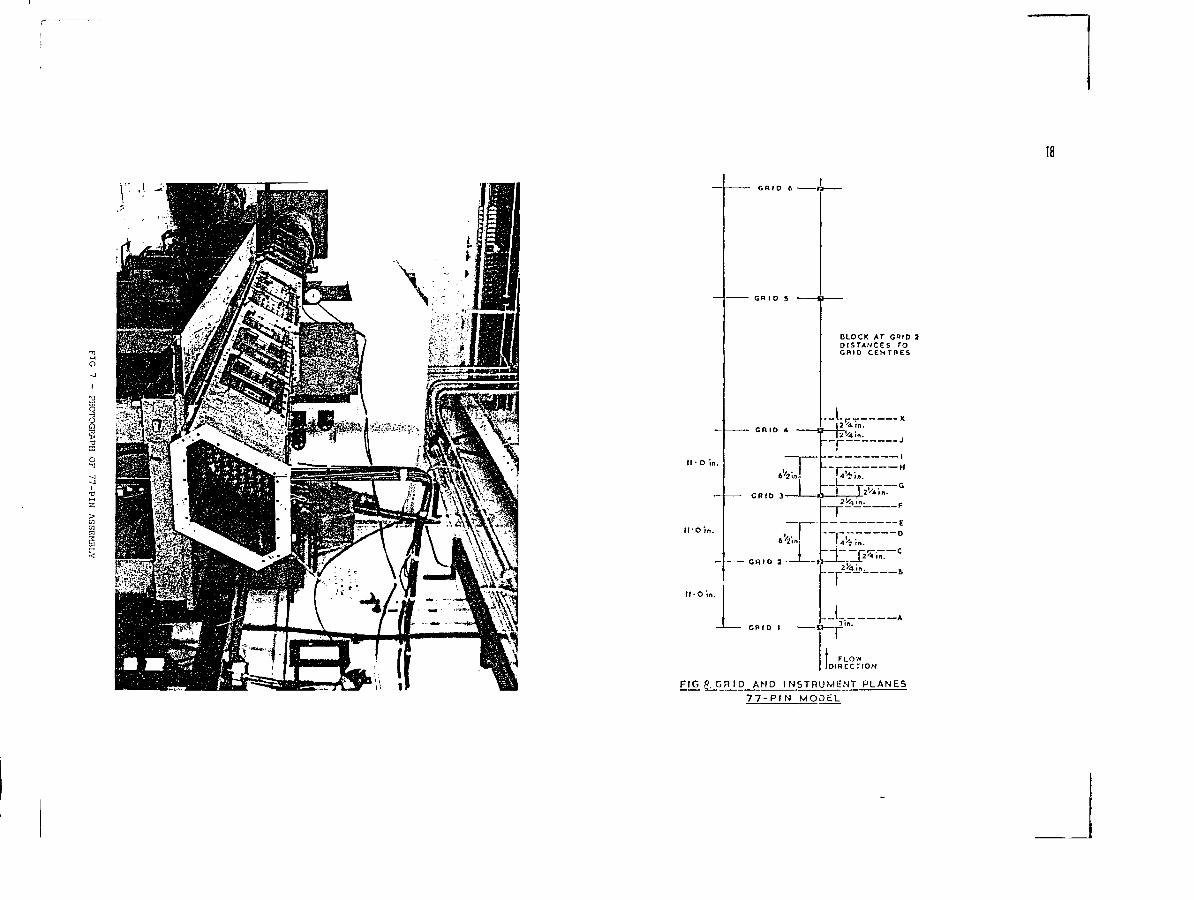
FIGg.GRID AND INSTRUMENT PLANES7 7 - P I N MODEL
19
DIMENSION1 - O-O23ln.2 - O-O69in.3 - O-l 15 in.4 - O - I 8 7 i n .
35O " 1034C 36O 2O
33O 3O
Vr = _
J = I to 4?. CENTRE- CHANNEL SCAN DETAILS
WRAPPER WALL-
FIG.|0. EDGE-CHANNEL SCAN' DETAILS
MODEL PIP
VIEW IN DIRECTION OF ARROW X,
SHOWING PIP
AT MID PLANE OF GRID
ON MODEL
WALL 3
FIG. 11 CROSS-SECTION OF MODEL
WALL 2
21
0.035 in O.DI PITOT0.025<n I . D I T U B E S
X = 0
0
0
0
045
1 1 5
.1 90
.2 6 0
i n .
i n
i n
i n
0 0 2 5 in .DIA.STATIC —PRESSURETAPPING
FIG.13(a) YAWMETER DESIGN DETAILS
• ve FLOWANGLE
[i.e. CLOCKWISE ABOUTPIN LOOKING UPSTREAM]
CENTRE PITOT TUBEO_R
N,0 GAS SAMPLINGTUBE
AXIALFLOW
\ 1 /- ve FLOW
ANGLE
(i.e. ANTI-CLOCKWISE ABOUTPIN LOOKING UPSTREAM)
R>.H. YAWMETERLIMB ••- Y B
L.H YAWMET ERL I M B . - Y A
O>-
>•
Q
UJ<_)>-
1.0
0.5-
LUcc
Z)
tSI
wa:D.
YCEN
EXPERIMENTALPOINTS
5th DEGREEPOLYNOMIA LFIT
i i - .
-4 0 -20- 1. .
0._ .1
• 20 • 4 0
FLOW ANGLE, degrees
FIG.U TYPICAL YAWMETER CALIBRATION CURVE IFor magnitudes of velocity components
FIG.131b) YAWMETER LIMBS & FLOW ANGLE DEFINITIONS
100r
10
CD>-
<>•
LUcc
Q.
0.01
YAX < 0
:YA< o
Y A / Y B <°YB <• 0
EX PERIMENTALPOINTS
5th DEGREEPOLYNOMIALFIT
-40 -20 0 +20 *UQ
FLOW ANGLE , degrees
FIG.15 TYPICAL YAWMETER CALBRATION CURVEFor f low a n g l e
72 > < 72 >—-C 71 >—-<; 78 >—-( 75 > — < 80 > — < 69
22
VIEW FROM MEASURING PLANE LOOKING UPSTREAM
FIG.16(al AXIAL VELOCITY DISTRIBUTION IN SPIRAL FINNED BUNDLE
37 - PIN MODELALIGNED FINSPIN PITCH =1 25PIN DIAMETERbP'RAL PITCH = 14 8PIN DIAMETER
MEAN TRANSVERSEVELOCITIESi FT/SEC IN AIR) ATSUB-CHANNEL BOUNDARIESAT THE MEASURING PLANE
NB FINS SPIRALCLOCKWISE
MOVING UPSTREAM
VIEW FROM MEASURING PLANE LOOKING UPSTREAM
FIG 161b) TRANSVERSE VELOCITY DISTRIBUTION
IN A SPIRAL FINNED BUNDLE
STATUS OF THERMOHYDRAULIC STUDIESOF WIRE-WRAPPED BUNDLES
A. KHAIRALLAH, D. LETEINTURIER, J. SKOKDRNR/SEDC - Centre de Cadarache,St. Paul-lez-Durance,France
Thermal-hydraulic studies cover single-phase flow in nominal 23
and non-nominal operating conditions, i.e. essentially :
- forced convection in nominal geometry. This is the basic situation,
considered in most design calculations;
— forced convection in distorted geometry. This situation must be well
understood, in view of the assessment of the ability of the subasscmbly
to accomodatc, from !«"ie thermal point of view, the bundle distortions
during irradiation;
ABSTRACT -
A status review is presented of the work undertaken in CEA
to acquire good understanding and description of the single-phase thermal-
hydraulic problems in LMFBR wire-wrapped bundles.
Design-type and reference-type calculational tools developed
for the study of forced convection in nominal and distorted bundle geome-
tries are briefly presented. Local hot spots and mixed convection situations
are discussed in some r.iorc details. Out-of-pile and in-pi le experimental
programs designed in support to code development are described.
I.. - INTRODUCTION -
This paper presents a review of the work undertaken in the
C.E.A. to develop and establish the tools necessary for the thermal-
hydraulic design of LMFBR wire-wrapped subassemblies.
The aim of this work is to be able to determine, with a
sufficient precision, the temperature distribution inside the subassembly,
particularly the clad temperatures and operating conditions, at be-
ginning of life and during life-time, so as to contribute to the opti-
mization of the subassembly design for a given target life-time.
- local hot spots, due either to the normal contact between clad and
spacer wire, or to possible contacts between clad and wrapper tube or
between clad and clad in extreme cases of bundle distortion. The in-
vestigation of this problem aims to understand well the clad behaviour
and operating conditions, and finally to take this information into
account for the optimization of the fuel-assembly design;
- single-phase mixed convection, corresponding to the residual-power
removal with very low flow rates in some incidental or particular
operating regimes.
II. - FOKCF.U C-iSVF.CTTON IN NOMINAL GKOKKTIiY -
According to the general approach followed in C.K.A., two
types of calculational tools are developed, in association with an ex-
perimental program for the verification and ;i|justment of the models :
- design-type codes, which are fast codes used for stan-
dard design calculations and which therefore are based on simple models
adjusted on experimental data and are applicable in the parametric range
of the experimental data;
— reference-type codes, which aim to a better and more
refined representation of physical phenomena and bundle geometry and
thus contain as few appi'oxima tions as reasonably possible.
II.1.- Design code and experimental validation -
The design code used for HAP.SOIJIK-KOKTIS.SIMO, HIKNTX and
SUPEIi-PllKNIX wire-wrapped subassemblies is the code TASNA . I'ASNA is
a multi-channel code, which does not solve the coupled continuity,
momentum and energy equations, but uses a simple hydraulic model adjusted
on experimental data. The model is essentially the following :
- initial flow distribution at the bottom of the bundle is
calculated with the assumption of a fully developed flow, i.e. assuming
pressure-drop uniformity;
- axial velocities in triangular sub-channels are taken
constant and equal to their average value. The mixing laws at sub-channel
interfaces are such that, at each axial mesh interval ,1 /,, equal trans-
verse flows go in and out of a given triangular sub-channel. In peripheral
sub-channels, axial velocities are modulated by a periodic sine function
adjusted on experimental data;
- temperature distribution is calculated according to a
heat balance at each axial mesh interval o.z. This balance takes into
account heat transfer by mass transfer, by conduction and by eddy diffu-
sivity (treated as an additional thermal conductivity).
The experimental data on which the mixing laws are
adjusted come from hot-water injection experiments in a 7-pin bundle..
Mot water injections rfere made in various sub-channels and at various
levels in the bundle, and temperature distribution was measured at the
bundle outlet. Individual axial flow rates in sub-channels were also
measured by introducing '.low separators at different levels in the bundle.
The measurements covered the range p/D (pitch over diameter ratio) between
1.06 and 1.35, for different wire leads.
The validity of the temperature-distribution results given
by the code was tested against the results issued from the 7 and 19-pins
single-phase sodium experiments of the CKNa program ~ . The agreement
is satisfactory, the maximum deviation between experiment and calculation
being of the order of 0 r.' of the temperature rise. This represents the 24
global uncertainty, im-ludin:;' not only the cul c . la t i ona 1 model, but
also the uncertainties on the clearences distribution, the possible heat-
flux ani.sotropy and tin- knowledge of the thermal resistance between clad-
thernoconp]es and sodium.
Further cunipar i .suns are made with the data coining fron the
nominal-geometry phases of the exper iment a ] program developed for tin;
study of distorted geometries (see also III.).
Ucsidcs, hydraulic experiments in water are under way t.o
extend TASNA validity range to smaller p/D and to non-standard geometries
(e.g. filling wires in peripheral suh-clianncls, cur'ogated wrapper tubes).
11.2. - Reference codes and experinent.q 1 validation
The reference code presently operationel and used for
detailed calculations or for situations outside TASNA validity range is
the code KI.1CA ' . Some shortcomings of KI.ICA for what concerns
wire-wrapped bundles have motivated the recent development of a new refe-
rence code, THK.SKK. The common features of these reference codes are
that their objective i.s to provide fine description and analysis of the
flow and t.emperature distributions, and therefore they arc applicable
to relatively small bundles of the order of 7<7 to (i I pins.
II.2.1. - The code FI.ICA -
I'l.lCA is a multichannel code which solves the KeynoJds
equation, i.e. tile mass conservation, momentum and energy equations.
The momentum equation is projected on the z axis parallel to the fuel
pin, and on axes perpendicular to the sub-channel interfaces. The cal-
culated quantities, i.e. velocities, pressures and temperatures, are
averaged quantities over the elementary cell limited by the sub-channel
boundaries and the axial mesh interval A z. The most recent versions of
the code contain a semi-empirical wire model describing the effect
I—
of helical wire spacers. This effect is represented in the momentum
equations by adjustable singular pressure-drop coefficients, added to
the friction pressure drop . In the transvers-momentum equation, the
singular coefficients are used only on interfaces crossed by the wire,
and their value is a function of the mass velocity and of the relative
wire and flow directions.
The validity of this wire-model was tested by comparison
with velocity and pressure-drop fine measurements in a 19-pin bundle(6)
in water . This comparison has only partly validated the wire-model.
More recent developments of this model, accounting for the local reduction
of the sub-channel cross section when it is crossed by the wire, have
resulted in a much better agreement between calculation and experiment,
as well for pressure distribution as for transverse-to-axial flow ratios
in peripheral channels.
II.2.2. - The_code_TIIESEE -
The objectives aimed at with the development of THESEE are
essentially two :
— provide a finer description of the flow and temperature
distributions in the bu^ndle sub-channels : one classical sub-channel is
described in THESEE by 13 mesh points. This, by opposition to multi-
channel codes, is intended for the study of local phenomena when needed and
for a better transposition of experimental results (generally local measure-
ments) to reactor conditions (where generally average quantities are
needed);
— provide a more fundamental representation of the helical
wire-wrapper effect, for instance, by improving a boundary condition for
velocity on the wire surface.
Concerning physical models, turbulence is presently simulated £5
by a very crude model, i.e. a constant efldy viscosity. It is anticipated
that this should be replaced in the future by a less simple correlation.
In any case, it does not seem reasonable, given the geometrical complexity,
to use very sophisticated turbulances models.
The hydraulic part of the code is presently operational
for unwrapped-pin bundles, and gives qualitatively good results as com-
pared to data available in the litterature. The development of the wire-
wrapped case is still on hand, in parallel with the solution of the energy
equation.
The first hydraulic experimental tests of the wire-wrapper
version are planned in 1979 - 1980, with fine velocity-measurements in
two 12/l-scale mock-ups with 3 and 19 pins in air. Velocity measurements
use hot wire, Pitot-tube and Doppler-laser anentometry techniques. Doth
time-averaged velocities and velocity fluctuations will be measured, in
order to qualify the turbulence model used and to guide the choice of a
more representative model. Further validation of the code will be based
on comparisons with the results of water tests in a 19-pin bundle ,
and in 37 and Gl-pins bundles in nominal geometry during the program
FAISVAR * 3 ) (see also III).
Experimental tests of the temperature distributions will be
made in particular on tliu results of the single-phase part of the sodium
CKNa program " and on temperature measurements made at CNEN in the
loop ENA 1 .
III. - DISTORTED GEOMETÜY IN FOIiCED CONVECTION -
TIIESEE is based on a finite-element description of the bundle
and discretization of the Reynolds equation in a cross section. The dis-
cretization along the z axis is a finite difference one. The chosen ele-
ments are triangular isoparametric elements, with second-order interpola-
tion polynomials.
Post-irradiation examination of RAPSODIE-FOKTISSIMO and
PHENIX irradiated sub-as.sembl ies have shown the type of distortiion under-
gone by a wire-wrapped bundle, essentially swelling of the clad and
cork-screwing of the whole bundle.
The evaluation of the thermal-hydraulics effects of these
distortionsis part of the studies that participate to the optimization
of the sub-assemblies life-time in the core.
A detailed discussion of the work undertaken in this field
is given in a companion paper . It will just be recalled here that
the basic components of this program are essentially :
- development of a design-type code, UISTAV
- extension of the code FLICA to distorted geometries
- future extension of the code TIIKSEE, as an alternative
reference code for distorted geometries
- hydraulics experimental program l'AISVAR, for both nominal
and distorted geometries in 37 and 61-pin bundles in water
- sodium thermal-hydraulic experiments witli both nominal
and distorted 7-pin bundles, conducted by CNCN in the frame-work of CNEN/
CEA cooperation
- in-pile measurement of the bundle outlet-temperature distri-
bution during its life in the reactor. The present experiment in RAPSODIE
(TETACOUPLE) should eventually be followed by an experiment of the same
type in a PIIENIX sub-assembly.
It is believed that this program, joined to post—irradiation
examinations of a large number of pins and subassemblies coming out of
RAPSODIE and P11ENIX, will provide a good insight in the effects of bundle
distortions.
IV. - LOCAL HOT SPOTS -
There has been recently some concern about the existence
of local clad hot spots behind the wire in wire-wrapped bundles. Moreover,
detailed examination of particular KAPSODIE and PIIENIX irradiated suh-
assemblies have led to the conclusion that a few local contacts, between
clad and wrapper tube and even between clad and clad are possible. Although
no clad failure has been observed in these sub-assemblies, it is clear that
local contacts result in local hot spots that may accelerate clad failure. 26
The problem then arises of correctly evaluating these hot spots, in order
to understand the clad behaviour and operating conditions, and ultimately
to improve the sub-assembly design and life-time.
In this problem, heat removal is essentially dominated by
conduction. That is why up to now, parametric studies have been made
using heat conduction codes, in particular the two-dimensional finite-
element code
assumptions
element code DELKINB . The problem is modelled witli the following
- the contact is not pointwise but extends over a certain
width of the order of the wire diameter
- a more or less stagnant or laminar sodium layer exists in
the sharp angle Qt the contact point. The thickness of this laminar layer,
roughly evaluated by laminar-flow calculations, is also about a fraction
of the wire diameter.
In this laminar layer, radial heat transfer is assumed to be
due to pure conduction. In the rest of the sub-channel, heat removal by
axial mass transfer is simulated by heat sinks, and radial heat transfer
by eddy diffusivity and transverse mass transfer is simulated by an in-
crease of the thermal conductivity.
Parametric calculations show the high sensitivity of the
clad hot spot to the following two parameters :
- contact widtli between clads (or clad and wrapper)
- thickness of the assumed laminar layer.
This sensitivity is illustrated in figure 1, corresponding
to a clad-to-clad contact and to PIIENIX pin diameter and maximum linear
power. It is presently postulated that the more representative case corres-
ponds to the so-called "small laminar layer" and to contact width of 0.5
1o 1 wire diameter. In these conditions, hot spots of the order of 100cC
at the central position and core midplane could be expected. This is tole-
rable at that position.
The figure of 100°C, obtained fron 2 D calculations, i.e.
for a contact of infinite axial length, is reduced when axial heat con-
duction is taken into account. Indeed, separate calculations with the(8)
3-D finite-difference heat-conduction code HEATING have shown that
a 15 to 20 % reduction of the hot spot can be expected for a contact
height of the order of 5 wire diameters. The reduction is much more im-
portant for smaller heights.
For what concerns clad to wrapper-tube contact, evaluations
with the same•assumptions as above lead to hot spots of a little more
than half the figures obtained for clad-to-clad contact.
Finally, for the possible hot spots behind the wire-clad
contact, concern was brought by experimental results obtained during low
flow-rate boiling experiments. Here too, conduction-type parametric cal-
culations with the assumption of a stagnant drag-zone downflow the wire,
were made : These calculations show again the hot-spot sensitivity to
the extent of the assumed stagnant zone. It is believed that the most
representative stagnant-zone thickness is about 1 wire diameter and,
in this case, the evaluated hot spot behind the wire (6 to 12 °C at the
top of fissile column) does not seem to be a problem of real concern.
The parametric studies presented here indicate that local
hot spots due to clad—to-clad or clad-to-wrapper tube contacts may become
a serious problem for clad behaviour if the laminar layers around the
contacts were larger than the assumed ones or if the contacts could take
place near the top of the fuel length. That is why an experimental in-
vestigation of this problem is under study :
1/ Measurements in air and water, with different scales,
and by visualization and Doppler-laser anemometry techniques, of the
velocity distribution around various types of simulated contacts. This
is to evaluate the extent of the assumed stagnant or laminar layer around
the contact.
2/ In a second step, fine measurements of the temperature
distribution, in a sodium test, around the simulated contacts.
V. - MIXED C0NVIXT10S AT LOW FI.OW-UATES - 27This convection type takes place in certain abnormal operr -
ing conditions, related to incidents on the primary circuit or to parti-
cular handling situations. It corresponds to the residual-power removal
by the residual flow given by the pumps inertia or by an auxiliary small
pump. The problem in the core is to insure that the limitations on clad
temperatures are not transgressed. It must be particularly studied for
0.5 to 1 /o of the nominal power and 1 to 2 °6 of the nominal flow.
The thermal hydraulics problem in this case is more com-
plicated than in nominal conditions, because of the feedback of the bundle
temperature distribution on the bundle flow distribution, and possibly on
its hydraulic characteristics (pressure drop/flow characteristics). In-
vestigation of this problem includes the following studies :
1. - Measurement of the global pressure-drop/flow charac-
teristics of various types of sub-assemblies and sub-as.seinbly parts (foot,
bundle, upper neutron shield) down to very low flow rates, as low as
0.5 % of nominal flow-rate. These measurements were made in water and in
isothermal conditions. They aim to establish the flow redistribution in
the core, among different subassembly types. They should be completed
with measurements of the effect of bundle temperature distribution on its
pressure-drop/flow characteristics, by sodium tests.
2. - Development of a design code, TIIKUNAT, based on the
following conservative assumptions :
- In a first step, flow and temperature distributions in
the bundle were calculated as for hydraulica1ly and thermally independent
sub-channels. Flow distribution was based on equalization of the pressure
drop, with no account for buoyancy forces.
- In a second step, buoyancy forces were taken into
account, and flow distributed among sub-channels according to the equaliza-
tion of the sum of friction pressure drop and heated-length integrated
buoyancy forces. This resulted in an appreciable uniforinization of the
temperature distribution.
- In the third stop, thermal coupling between sub-channels
by thermal conduction was introduced. This was motivated by the results
of parametric studies with the code FLICA, tnat showed the importance of
heat conduction between sub-channels in this particular low-flow situation.
The method used is the so-called "isthmes method", generally used for the
calculation of heat exchanger, with the assumption that heat conduction
takes place in the sodium, i.e. neglecting heat conduction by the clad
and fuel.
The present orientation concerns problems more related to 28
finer analyses and to design optimization, namely :
- study of non-standard geometries
- development of reference codes
- evaluation of distorted geometries and local hot spots
- study of particular operating conditions at low power
and flnw.
Temperature distributions in the bundle, given by the code
in its present status, compare already favorably with published experimen-(9)tal results for low-flow convection .. Assessment is under way of the
necessity and practical interest of accounting for heat transfer by mass
transfer (effects of the wire and of flow redistribution due to buoyancy).
3.. - The sodium test-program KETUNA, aimed to provide the
experimental verification and validation of the calculational assumptions,
and to allow the assessment of the effect of the bundle temperature distri-
bution on its global pressure-drop/flow characteristics. A preliminary
test with a 7-pin bundle is under way. and more representative tests with
a 91-pin bundle are planned to begin by the end of this year, with a
possible extension to the study of pure natural-convection conditions.
VI. - CONCLUSIONS -
This paper has summarized the main orientation of the work
done at C.E.A. to study the various single-phase thermal-hydraulics pro-
blems that arise in a wire-wrapped LMFI5R sub-assembly.
V\. to a few years ago, the main orientation was the study
of standar jiominal-geometry in forced convection, which is the basis of
design studies. It is believed that design tools for this situation are
presently satisfactory.
REFERENCES -
1. - J. SKOKMixing of the fluid due to helical wires on fuel pins in atriangular arrayInt. Seminar on Heat Transfer in liquid metals,Trigor, Yougoslavia, (1971)
2. - D. MENANTQuclqucs particularites des ecoulenents de sodium liquide etbouillant dans des grappes d'aiguillcs chauffantesThese Docteur Ingenieur, l'niversitö do Grenoble (Sept. 1976)
3. - D. LETEINTL'KIEU et al.Theoretical and experimental investigations of the thermodydratiLi csof deformed wire-wrapped bundles, in nominal flow conditionsThis meeting
4. - M. FAJEAU -Programme F1-.ICA - Etude thermodynamique d'un reacteur ou d'uneboucle d'essaiRapport CEA R 371G (19G9)
5. - K. I'LASKLICA III, Programme pour l'etudo therniohydraul ique de rönetcurset de boucles d'essaisNote C.F. . N 1302 (1975)
6. - J. HARROIJ, et al.Influence of helical wire-wrap spacer systems in a water19-rod bundleASME 75 Ml' 22 ( 1975)
7. - N. JUIÜNETTechnique de caieul par elements finis do conduction en regimestationnairo ou transitoireCEA-IUST N° 197 (Novembre 1971)
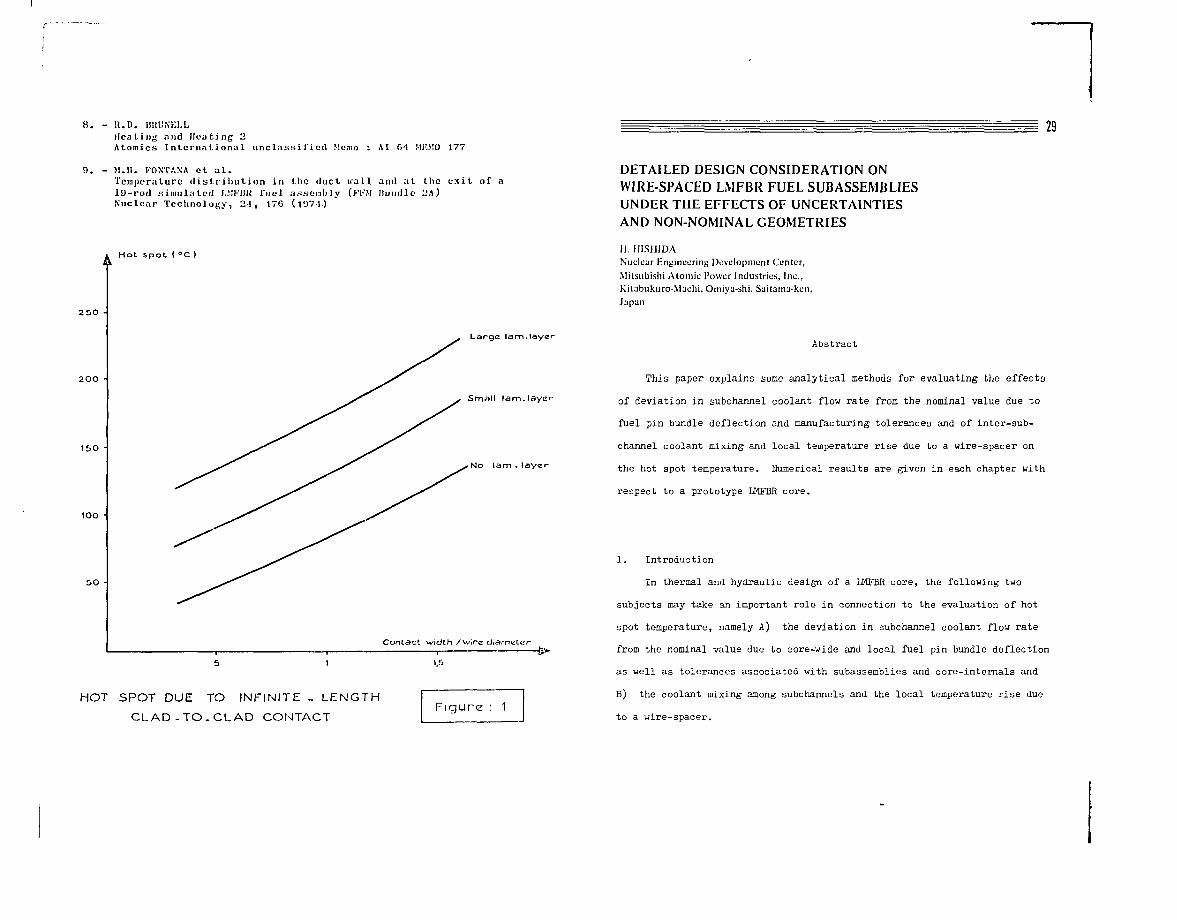
8. -
9. -
2 5O •
2O0 •
150 •
100 •
50 •
Ü.D. BHUNELLHeating and Heating 2Atomics International unclassified Memo : AI G'l MEMO 177
M.I1. FONT AN A et a l .Temjiernturc d i s t r i b u t i o n in the duct wall and at the ex i t of a19-rod simulated I.MI-'BR fuel assonbly (I'KM Iiuudle 2A)Nuclear Technology, 21 , 17G (1971)
Hot spot(°C)
29
Large lam.l
Small lam.layer
No lam - layer
Contact width /wire diameter
1.5
HOT SPOT DUE TO INFINITE - LENGTH
CLAD-TO.CLAD CONTACTFigure : 1
DETAILED DESIGN CONSIDERATION ONWIRE-SPACED LMFBR FUEL SUBASSEMBLIESUNDER THE EFFECTS OF UNCERTAINTIESAND NON-NOMINAL GEOMETRIES
II. HISIIIDA
Nuclear Engineering Development Center,
Mitsubishi Atomic Power Industries, Inc.,
Kitabukuro-Maehi, Omiya-shi, Saitama-ken,
Japan
Abstrac t
This paper explains some analytical methods for evaluating the effects
of deviation in subchannel coolant flow rate from the nominal value due to
fuel pin bundle deflection and manufacturing tolerances and of inter-sub-
channel coolant mixing and local temperature rise due to a wire-spacer on
the hot spot temperature. Numerical results are given in each chapter with
respect to a prototype LMFBR core.
1. Introduction
In thermal and hydraulic design of a LMPBH core, the following two
subjects may take an important role in connection to the evaluation of hot
spot temperature, namely A) the deviation in subchannel coolant flow rate
from the nominal value due to core-wide and local fuel pin bundle deflection
as well as tolerances associated with subassemblies and core-intemals and
B) the coolant mixing among subchannels and the local temperature rise due
to a wire-spacer.
r"
In a LMFBR core, fuel and control rod subassemblies are usually deflected
due to temperature and neutron flux gradient in the vicinity of control rod
subassemblies and across the interfaces of fuel loading zones as well as
coolant flow zones, which influences the reactivity of the core, subchannel
area and the attainable burnup due to channel dilation. Furthermore, fuel
pins in the external layer of a LMFBR fuel subassembly are usually deflected
due to peripheral coolant flow effect, which in turn affects the equilibrium
configuration of the internal fuel pins through mechanical interaction at fuel
pin mutual contact points. Fuel pin bundle deflection is in general facili-
tated due to irradiation effect as burnup advances. The variation in temper-
ature and neutron flux within a LMFBR core may be evaluated in detail through
a whole fuel life taking into account the feedback effect of such core-wide
fuel pin bundle deflection on coolant temperature based on analytical methods
to be discussed in chapters 2 and 3 so that the corresponding core temperature
rise may be covered with appropriate hot spot subfactors.
In addition to the previously mentioned core-wide deflection of a fuel
fin bundle which is of systematic nature, subchannel area is affected locally
under the probabilistic variation in fuel pin gap due to manufacturing and
assembling tolerances associated with all the components of a fuel subassembly.
These uncertainties are correlated with one another with respect to local
pin gap and their contribution is summarized with the knowledge on the sensi-
tivity of each uncertainty in chapter 4.
Tolerances associated with subassemblies, core-internals and flow regu-
lating devices also affect subassembly coolant flow rate. The effect of
local and core-wide uncertainties on the probabilistic variation in subassem-
blies coolant flow rate should be considered in terms of the coolant flow
correlation among all the core-internal coolant channels. With measured or
assumed probabilistic distributions of uncertainties, an analytical method 30
of evaluating the probabilistic variation is discussed in chapter rj.
Some other thermohyd^aulic problems are concerned with the evaluation
of the effect of a wire-spacer on fuel pin temperature and coolant mixing
among adjacent subchannels which may compensate the hot spot temperature rise
due to peripheral coolant flow effect. Experimental investigation on those
effects involves difficulty in the measurement of local temperature and flow
velocity fields so that analytical evaluation should be employed concurrently.
Emphasis will be laid on these topics in chapter 6.
As it is already clear, chapters 2, 3, 4 and 5 mainly deal with subject
A) and chapter 6 with subiict B), on which more extensive and thorough inves-
tigation should be made. Numerical results are given in each chapter with
respect to a prototype LMFBR core showing the influence of deformed subchannel
geometry from both systematic and probabilistic origins on subchannel coolant
flow rate or fuel pin temperature, and the effect of a wire-spacer on coolant
mixing and local hot spot temperature. Detailed analytical procedures are
given especially in chapter 2, for which related papers are not published yet.
2. Deflection of externally constrained fuel subassemblies
Deflection of a fuel subassembly influences subchannel coolant flow
rates especially in few layers of peripheral subchannels where the hot spot
(l 21
may appear and is strongly related with the peripheral coolant flow effect. ' '
Some analytical methods have been published which are applicable to deflec-
tion analyses of a core, ' where the cylindrical symmetry is assumed
to be retained and a radial row of subassemblies whose center axes lie in a
plane through the core center line may be brought into monodirectional deflec-
tion analyses with previously known contact points. However, in reactor
operating condition, due to the patterns of control rod subassemblies and
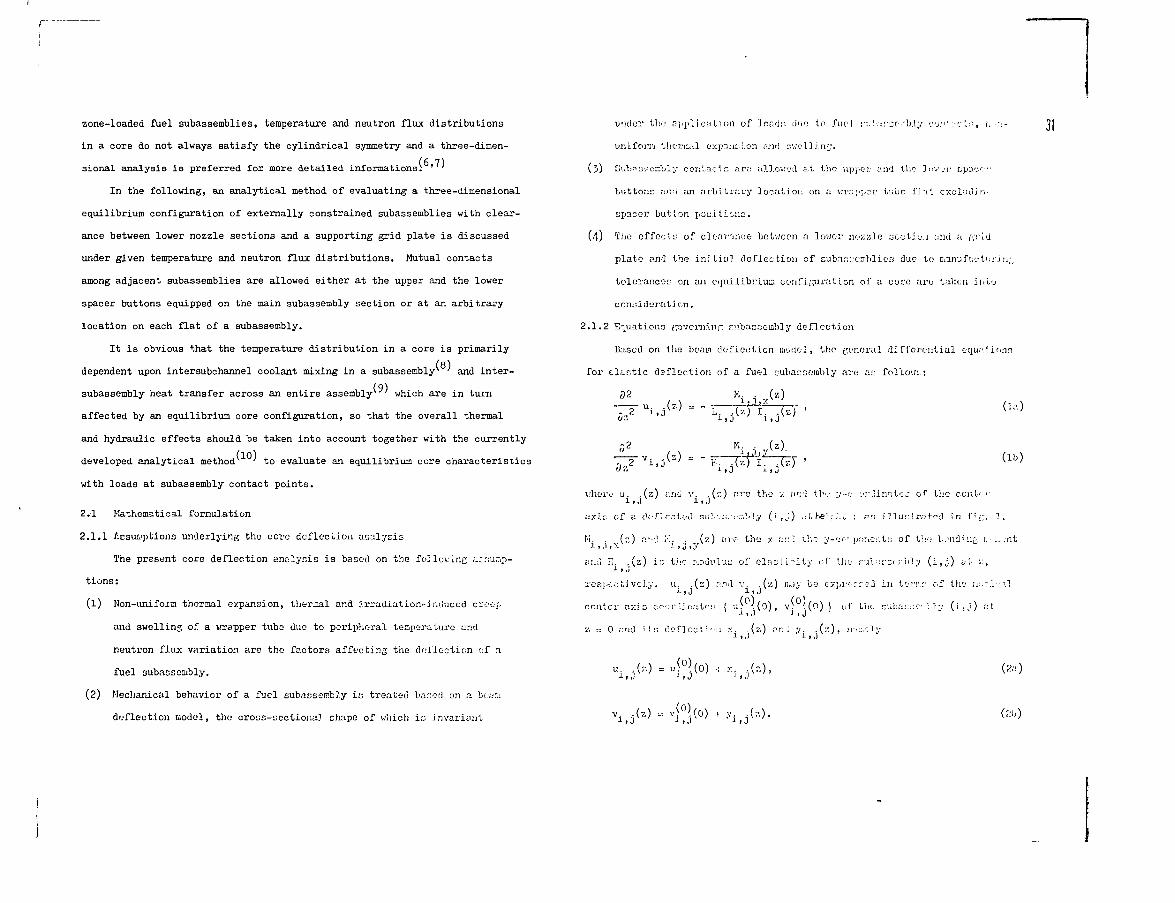
I
zone-loaded fuel subassemblies, temperature and neutron flux distributions
in a core do not always satisfy the cylindrical symmetry and a three-dimen-
sional analysis is preferred for more detailed informations: ' '
In the following, an analytical method of evaluating a three-dimensional
equilibrium configuration of externally constrained subassemblies with clear-
ance between lower nozzle sections and a supporting grid plate is discussed
under given temperature and neutron flux distributions. Mutual contacts
among adjacent subassemblies are allowed either at the upper and the lower
spacer buttons equipped on the main subassembly section or at an arbitrary
location on each flat of a subassembly.
It is obvious that the temperature distribution in a core is primarily
dependent upon intersubchannel coolant mixing in a subassembly^ ' and inter-
(91subassembly heat transfer across an entire assemblyx ' which are in turn
affected by an equilibrium core configuration, so that the overall thermal
and hydraulic effects should be taken into account together with the currently
developed analytical method^ ' to evaluate an equilibrium core characteristics
with loads at subassembly contact points.
2.1 Mathematical fornulaticn
2.1.1 Zcsuiiptions underlying the core deflection analysis
The present core deflection analysis is based on the fcO lovinc ;.cr;u.T,p-
tions:
(1) Non-uniforn thermal expansion, tluermal and irradiation-induced creep
and swelling of a wrapper tube duo to peripheral tercperalure and
neutron flux variation arc the factors affee tins the deflection of a
fuel 3ubaoscnibly.
(2) Mechanical behavior of a fuel subaesembüy is treated baned on a be;;:.:
deflection codul, the cross-sectiomü shape of vhich is invariant
under the application of load.", ilno to fuel :-!.!:;:f:;r-."bly co."1 :•'.• lr-, i;-.\-
uniforn tlic-i'i-al expan:-. i.on and G'.-'ell j n ;.
(j) £lulmu:ieQbly coulactc are allov;ed at the upper and the ] O V _ T rjpacv-
buttons and an arbi. trcry location un a urn;';.or tube f]'i<, cxcludin.
spacer button poultionG.
(4) The effects of cleai'ance between a lov;cr nozzle ücctioii and a f.rid
plate and the initial deflection of Euban:;emMic-3 due to Danufarluri n
tolerances on an equilibrium configuration of a core arc- taken inlo
con.siderati on.
2.1.2 Equations (pverninc rubasoembly deflection
Based on tlie bean deflection iuodc-1, the general differential equal ir.ni
fox tlastic deflection of a fusl subansembly are an folio1./: :
32 H^. x(z)
31
(la)
(lb)
v h e i v u . . ( z ) and v . .(-.-.) r.rc t h e v. a>:d th'_ ; ; - : ^ . i i n - i t c : of" t h e c o n L - r
a x i : : o f a ( i v T l c c t o d Ruli:::i:--.ol.l.y ( ; . , j ) .:!. he-:.;.L : an i l l u r l r a t ^ d i n fif; . 1 .
I-i. . ( z ) a-.d /I . . ( z ) a r e t h e y. t : :d t!-,o y-'jor.poriO;-:t:; o f V.:<J L.Mid.in.'-. 1. ;-.jnti 1.) 1 ">- - 1J > y
atiii K. . ( z ) i r ; t i :C r . ^ d u l u u o f c l a u L i rity o f Die- r u i - ' i r s e n b l y ( i , j ) ill 1; 11 1 J
r e s i i f . c t i v c l y . u . . ( z ) a n d v . . ( z ) i;«iy b e eypv :c?J in t en : . : - , o f t h e I I : . " . L - - I 111J ii J
c e n t e r a x i s coo u>°<(o), v>°<ordjnrito:. : ( u ^ . ( o ) , v ) ^ ( o ) ) o f t h e ^ b a ; - - : l y ( i , , i ) a
7. = 0 r.iid j i n c e f l e c t i - : ! i x. (z) a n ; y . . ( z ) , i v c c j y11J J-1 J
v. .{7.) = u ^ ( 0 ) , r.. .( = ) ,
a t
v. .(z) ,, V^0).(0) . y. .(z).
(2a)
(2b)
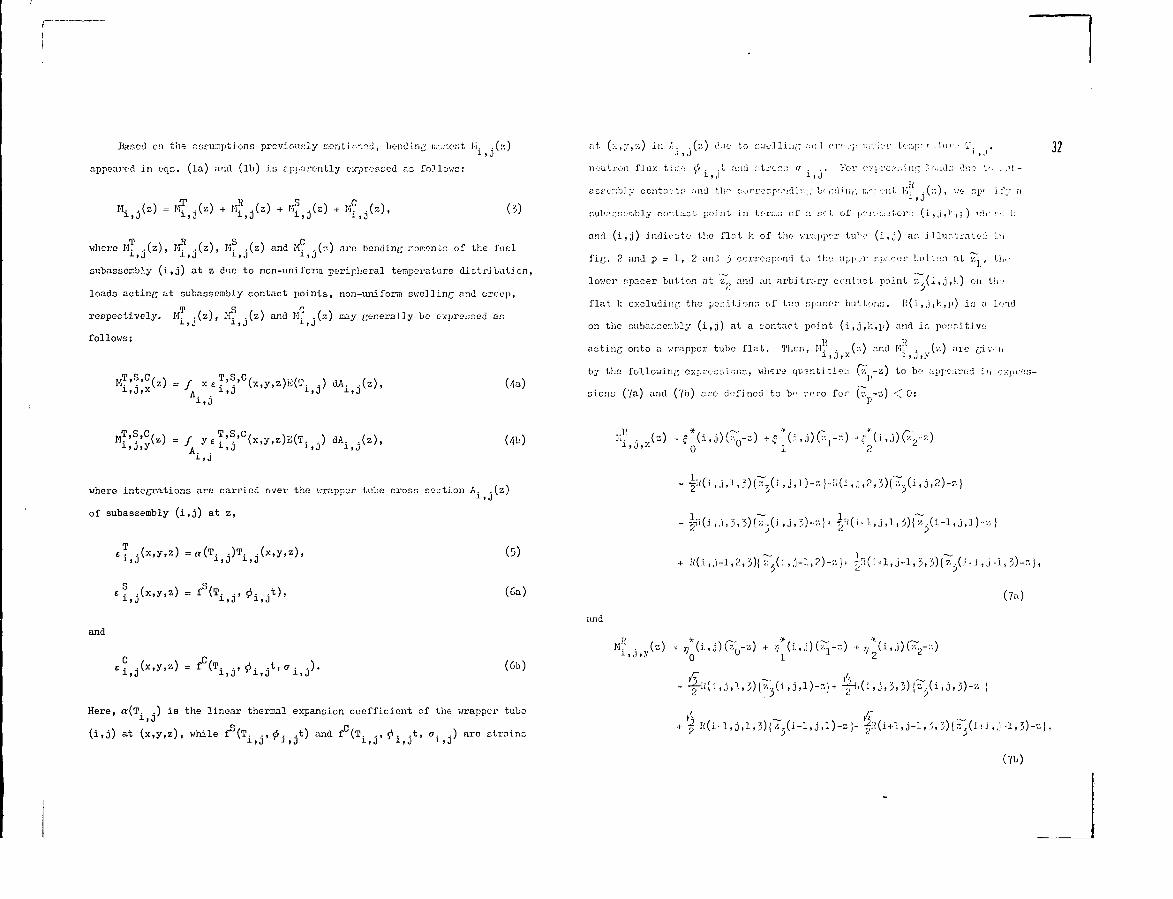
Based on the assumptions previously mentioned, bending i.Yji-.cnt I-i. .(a)
in oqo. (la) and (lb) is apparently expressed as follows:
where H. . (z), Mr . (z), H, . (z) and K. . (z) are bending -opener, of the fuel
subassembly (i,j) at z due to non-uniform peripheral temperature distribution,
Ioad3 acting at subacserobly contact points, non-uniform swelling and creep,
rp o r>respectively. M. -(z), N. .(z) and \-\1 .(z) may generally be expressed as
i » 0 1 1 0 i » 0
follows:
= / .T,S,C, (4a)
a t . ( x , y , z ) i n / . .. ( z ) i ' i e t o ; r . . ' e 1 l i i i , ; ; r . - i i ! r - r ' v j ; i i : i - i c - > - t , c : : i i > : r : t u /'•; V . . ,
n e u t r o n f l u x t i ; : " '',< . X a : n i j - . t r e n : ? f/ . . . r ' o v c v i a ' c : « - i n / T 3 i . ; ' . d r . ; ! i : c t ' . ; - . ! ( -
3 D i H : : " . b ] v c o n t a v t » u n d U m e o r r e r p o i K i L v : ; Vjc-i ir i i l i j - , i : . ^ ; - : : - n ; K . • ( : ' . ) > l ' - ' c p r i f v a11 J
Eubncr:'':ihly oontait point in ter;;i:; of a rrt of p- iv:.. _•'. CIV: (i,,i,^,iO v;1-'' '-'- ';
and (i,j) indicate the flat k of the v:rappCT tul'-:> (i,.j) a:-. Jlluntrated Ln
fifj. 2 and p = 1, 2 and 3 correspond to the upp.'r r.j/acer but ten at •/., , the
lower spacer button at z o and an arbitrary cont'ict point :'..(i,j,K) on l!io
flat k excluding the poritionn of t\:o npaccr buttons. R(i,j,k,p) is a l'/-id
on the subacser.-ibly (i,j) at a contact point (i,j,k,p) and in possitive
acting onto a wrapcer tube flat. Then, H. . (z) and K. . (z) are givvi1 1 J i y- 11.1 > ,V
by the following expressions, whore quantities (z -z) to be appeared in expre
sions (7a) and (Y'o) are defined to be rero for (r. -z) <C 0:
32
A . .i . O
dAl
(4b)
where integrations are carried over the wrapcer tube cross section A. .(z)
of subassembly (i,j) at z,
,(x,y,z) =«(T .)iJ i>J
and
(5)
(6a)
(6b)
and
+ K(.i,j-1,2, jJl^i.j-l,?)-::}+ ^(i+l.j-l, 3, (^(jni , j •]., 3)-"),
(7a)
//(
Here, a(T. .) is the linear thermal expancion coefficient of the wrapper tubex> J
(i,0) at (x,y,z), while fS(T ,0 t) and fC(T ,^ t, a .) are stroins1)3 1)0 l]J 1)J J>0
(7b)
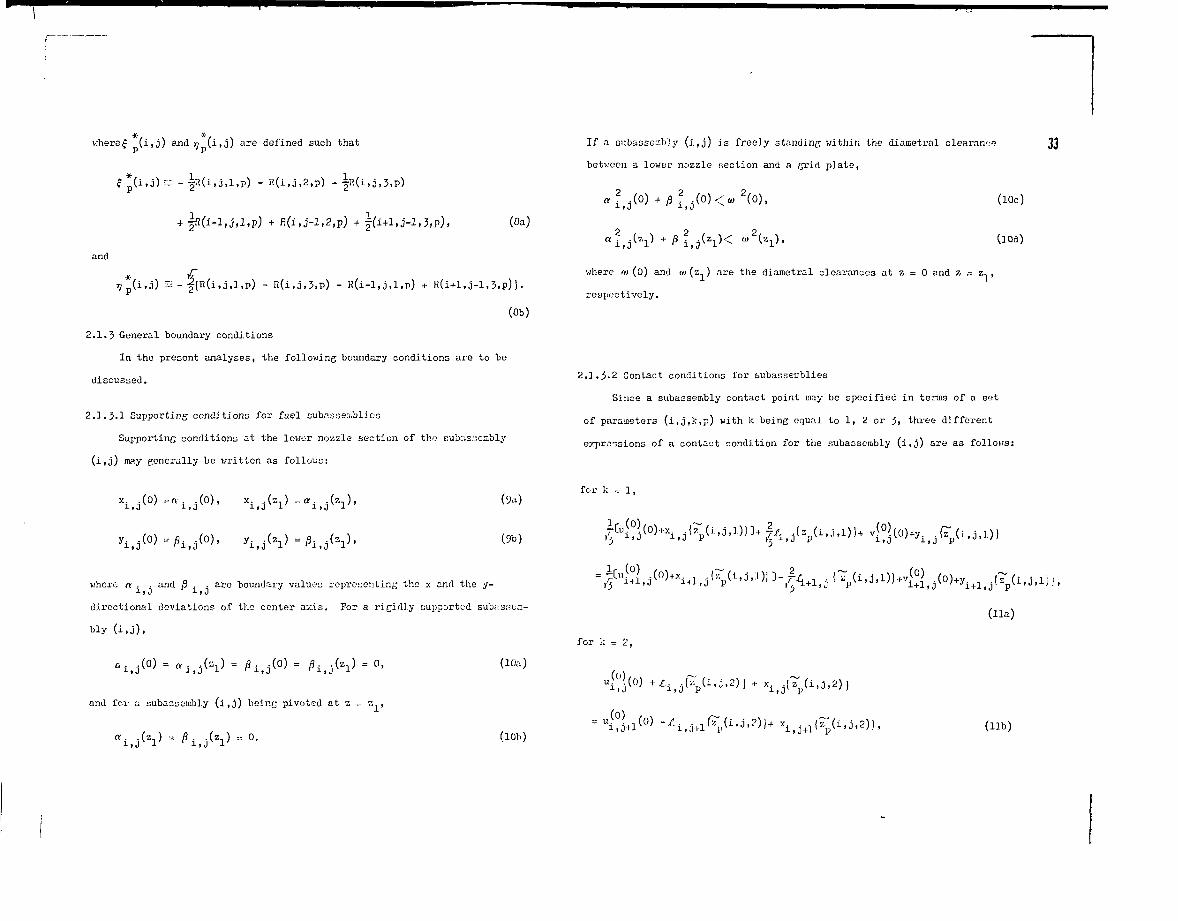
•A- 'X'
where£ (i,j) and); (i,o) are defined such that
, 3-1,3,p), (8a)
and
(6b)
2.1.5 General boundary conditions
In the present analyses, the following boundary conditions are to be
discussed.
2.1.3.1 Supporting conditions for fuel subasse.'i&lies
Supporting conditions at the lower nozzle section of the subasscably
(i,j) may generally be written as follows:
x (0) = n (0), x (z ) =a (z ),
yi
(9a)
(9b)
where a . . and ß . . are boundary values representing the x and the y-
directional deviations of the center axis. For a rigirUy supported subas:;e,"i-
(10a)
If a subasse:r.Wy (i,j) js freely standing within the diametral clearance
between a lower nozzle section and a ^rid plate,
(0) + ß ( o )< 2(0) (
where m (0) and w (z,) are the diametral clearances at z = 0 and z = z,,
respectively.
2.1.3.2 Contact conditions for bubassemblies
Since a subassembly contact point may be specified in terms of a set
of parameters (i,j,k,p) with k being equal to 1, 2 or 3> three different
expressions of a contact condition for the subasscmbly (i,j) are as follows:
for k =: 1,
A,at
for k = 2,
33
(lla)
and for a subassembly (i,j) beinc pivoted at z = 7. ,
(10b)
- „(o)(lib)
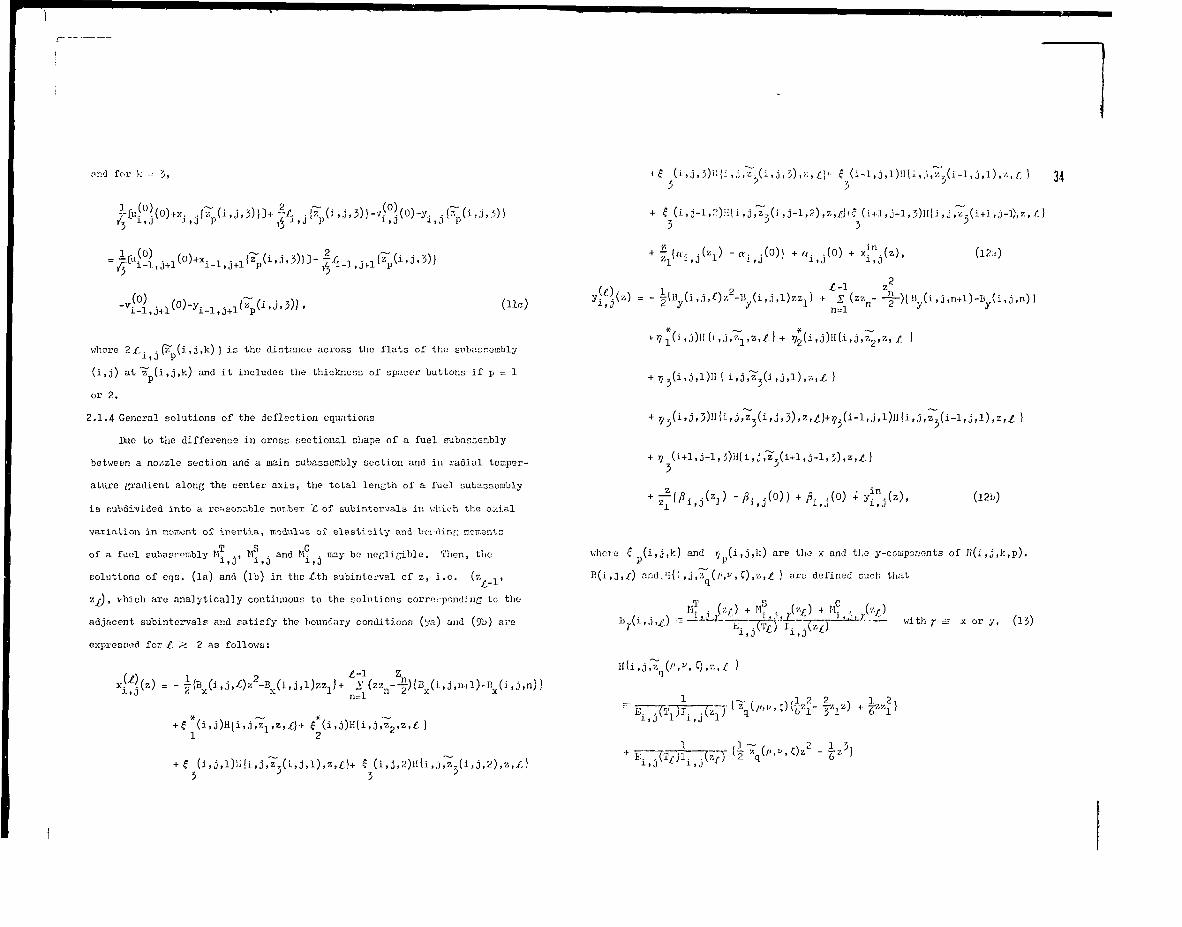
;nvj for \. •-; 'j, 34
where ?-£.• (^(1 tl V
(lie)
is the distance across the flats of tlio subasr.embly
(i,j) at"? (i,j,k) and it includes the thickness of spacer buttons if p = 1
or 2.
2.1.4 General solutions of the deflection equations
Duo to the difference in crnss sectional chape of a fuel subascenbly
between a nozzle section and a main subassembly section and in radial temper-
ature gradient along the center axis, the total length of a fuel subasrierably
is subdivided into a reasonable number ~Z of subintervals in \:hlch the ay.ial
variation in tno;ncnt of inertia, modulus of elasticity and bei fling moments
T S Cof a fuel subasrombly M. ., M'. . and K. . may be negligible. Then, the
1,0 i»0 1,0
solutions of ccjs. (la) and (ib) in the £th subinterval of z, i.e. (z .,
Z£J, v'hich are analytically continuous to the solutions corresponding tc the
adjacent subintervals P.nd satisfy the boundary conditions (ya) and (9b) are
expressed for £. <> 2 as follows:
i{B ( 2'(zz --^)
n—1
wheie g (i, j ,k) and ?/ (iij,l:) are ilio x and tl.e y-comporjonts of Ii(i , j ,k,p).
B(i,j,^-) andJl{i,j,z'(/'^,C),z,£ ) are defined euch that
= x or y.
1 2,E. ..(1 i J
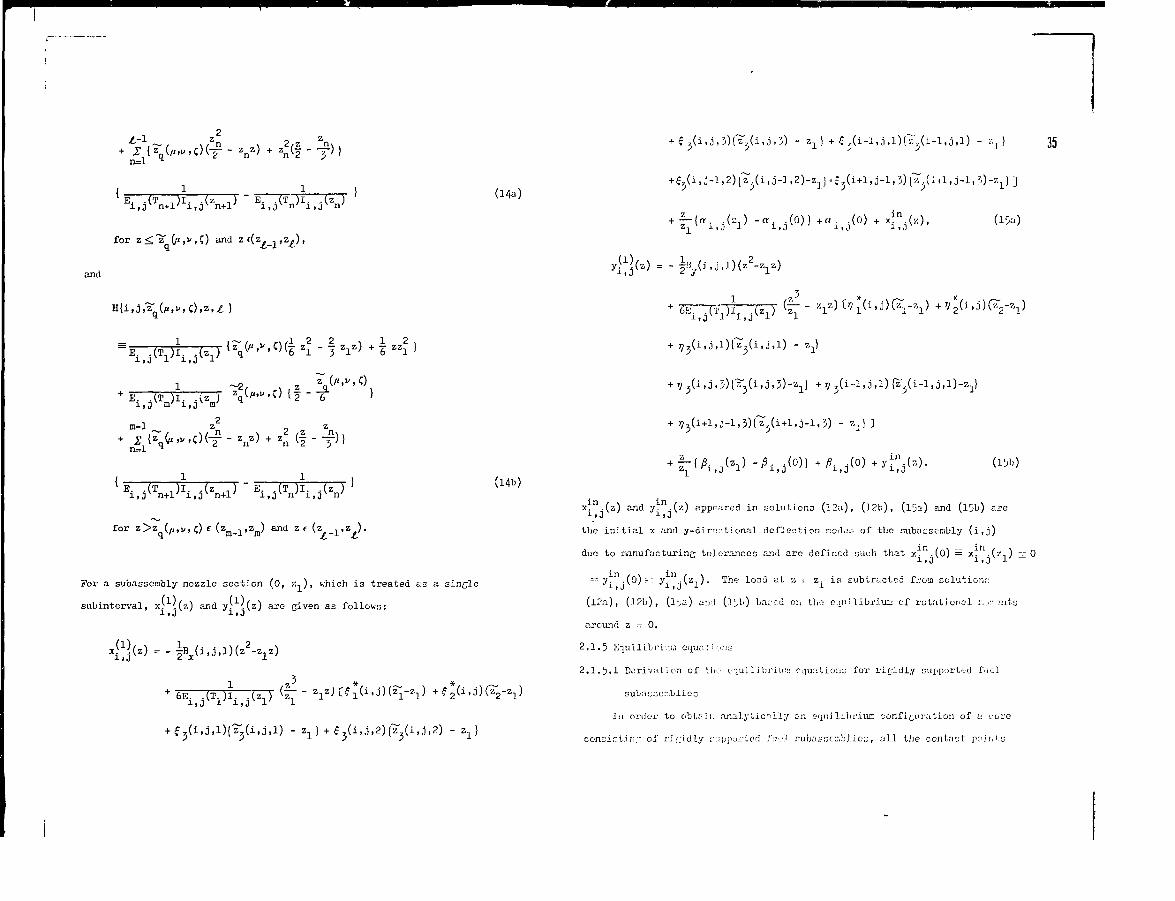
I [n=l
and
2,z Zn-,Zn% " T>
for z ^ l f (f'.yiC) and z
zi - f z z
(14a)fj(i ij-l I2) (^(iij-^f 2)^)^^(1+1,0-1, 3) {^(
f-(a (s ) -« (0)} +«. (0) +xf 00,
i,jv
+ i?j(i.0.1)1^(1.J.I) "
+ V 3(1»0 > . 3 .1) (z"3(i-l 1 j .1)-
35
z o zn
'" > C ) ( T " znz ) + zn ( I " ~
(14b)
for z>zq(p,y,c) E (zm_i'
zm) and ze (z ^
For a subassembly nozzle section (0, s,), which is treated as a single
subinterval, x: .(z) and y. .(z) are given as follows:lid 1>J
x (
6E. . ( T j l . . ( z n )
x. .(z) and y. .(z) appeared in solutions (I2a), (12b), (15a) and (ljb) arei i J iiJ
t l i e i n i t i a l x and y - d i r c - . ' t i o n a l d e f l e c t i o n rcodoc o f t h e cubai jscr jb ly ( i , j )
due t o m a n u f a c t u r i n g t o l e r a n c e s and a r e d e f i n e d s u c h t h a t x . . ( 0 ) = x . . ( z . ) =j 01 » J 1 » J J
— 7. . ( 0 ) L : y. .(•/.). The load al. s -^ z, ir. sublracted from solut ion; :1, j 1 1 J 1 1
( l?a) , ( l?b), (li;a) an:l (l^b) bacc-d on the e-iuilibriun of rotat iorol r.y-juts
around z - 0.
2.1.5 Equilibriua equnHons
2.1.5.1 Dorivittion of tlio eaui 3 ibj-iun: rquatioru for rigidly tmiiportoü fiio]
subH:;ce"iblies
In order to obtain analyticr'liy an equilibrium configuration of a core
concinlirr; of rjf.'i.dly :;iip|iijrtctl fwSi fmbas.'X^blie:;, a l l tlie contact pciii'G
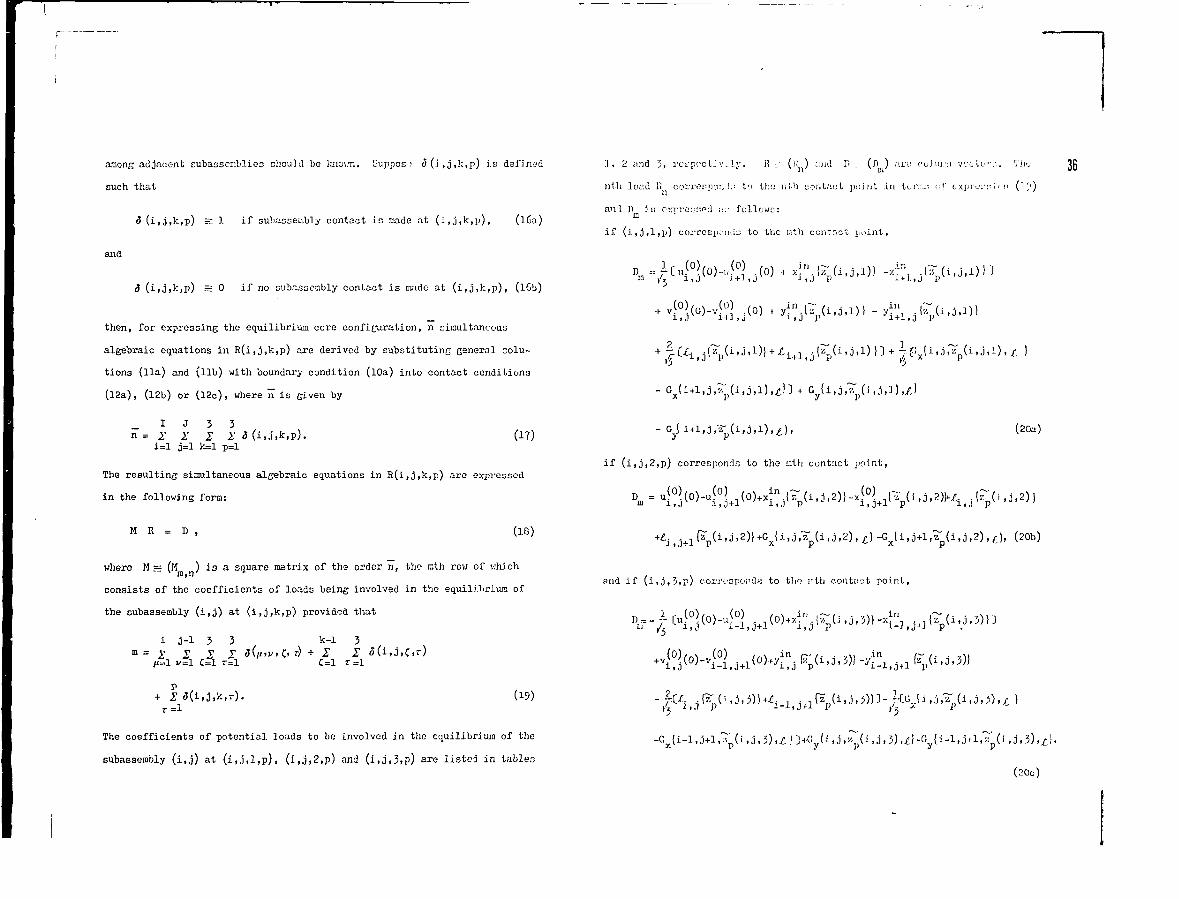
among adjacent cubasscmblieo should lie known. Guppos ; <5(i,j,k,p) is defined
such that
5 (i,j,k,p) = 1 if subasseiribly contact is made at (i,j,k,p), (l6a)
and
$ (i,j,kiP) =• 0 if no subasseobly contact is made at (i,j,k,p), (l6b)
3 , 2 ;uid 3, rct-ppct; v - l y . ii •_• (i! ) and H . (fl ) arc; coJui.':] VCJ to-v . rJ' 1 I •_•
ntli load 1! coiTtfspor, !.•• to the ni-'i contac t point in terirn: cf c x p i v i r i n i (l-'.1)
and I) j.u omroMiPd c.-. fol lcwc:m
i f ( i , j , l , p ) corrOEi>Cii."iL; to the mtli contac t p o i n t ,
then, for expressing the equilibrium core configuration, n simultaneous
algebraic equations in R(i,j,k,p) are derived by substituting general solu-
tions (lla) and (lib) with boundary condition (10a) into contact conditions
(12a), (12b) or (12c), where n is given by
_ I J 3 3n = I 1 2 I
i=l j=l k=l p=l(17)
The resulting simultaneous algebraic equations in R(i,3,k,p) are expressed
in the following form:
M R = D , (16)
where M = (M ) is a square matrix of the order n, the mth row of whichin i n
consists of the coefficients of loads being involved in the equilibrium of
the subasseobly (i,o) at (i,3,k,p) provided that
i j-l 3 3 k-l 3m = £ 2 S I d(ti>v,C>r) + 2 ' I <5(i,j,C.r)
/<tl y=l C=l r=l C=l r=l
P(19)
The coefficients of potential loads to be involved in the equilibrium of the
subassembly (i,j) at (i,j,l,p), (i,j,2,p) and (i,j,3,p) are listed in tables
,3 ,1) 1 3 + |
i f ( i , j , 2 ,p ) corrospondn to the Ulli contact point,
and i f ( i . j , 3 , r ) cori'^npondK to the mtli contact point,
(20a)
(20b)
(20c)
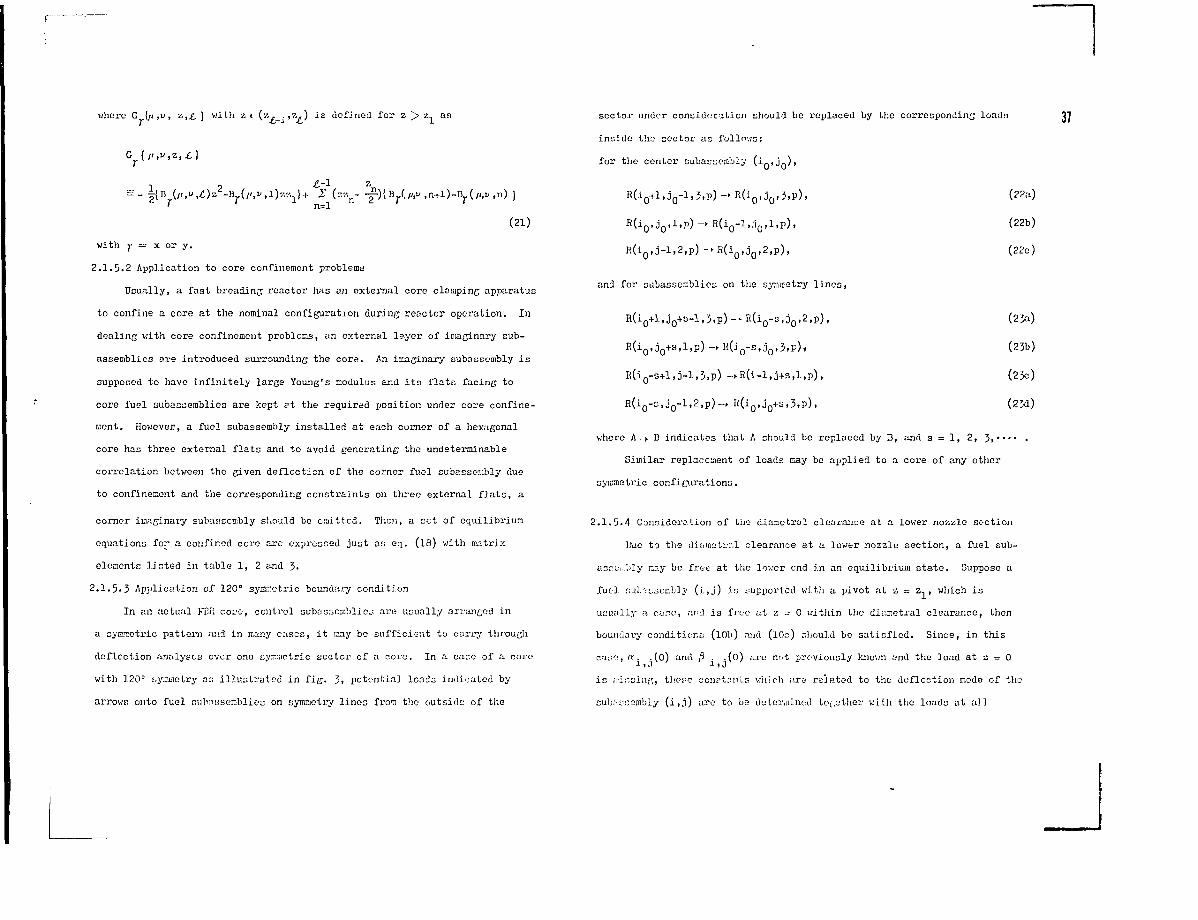
where G {ji ,v, z,£. ) v;.ith z c (z , . ,?.,) i s defined for z > z, as
n=l
(21)
with j- =-: x or y.
2.1.5.2 Application to core confinement problems
Usually, a fast breading reactor has an external core clamping apparatus
to confine a core at the nominal configuration during reactor operation. In
dealing vith core confinement problems, an external layer of imaginary sub-
aasemblies are introduced surrounding the core. An imaginary subaüsombly is
supposed to have infinitely large Young's modulus and its flats facing to
core fuel cubasserablies are kept at the required position under core confine-
ment. However, a fuel subassembly installed at each corner of a hexagonal
core has three external flats and to avoid generating the undeterminable
correlation between the given deflection of the corner fuel Eubassembly due
to confinement and the corresponding constraints on three external flats, a
corner imaginary subiu;sen;bly should be omitted. Then, a set of equilibrium
equations for a confined core arc expressed just as eq. (18) with matrix
elements .Tinted in table 1, 2 and 3.
2.1.5.3 Application of 120° symmetric boundary condition
In an actual FBR core, control subnsscmblies are usually arranged in
a symmetric pattern and in many cases, it nay bo sufficient to carry through
deflection analyses over one syrraetric sector of a core. In a case of a core
with 120° symmetry as illustrated in fig. 3, potential loads indicated by
arrows onto fuel ciilviuscnsblic-y on symmetry linos froTi the outside of the
sector under consideration should be replaced by the corresponding loads
inside the sector as follows:
for the center subasseicMy (i-,j„),
R(io+l,Jo-l,3,p)->R(io,Jo,3.p), (22=0
R(iQ,jo,l,p) -> R(iQ-],jo,l,p), (22b)
37
and for cubassemblies on tlie symmetry lines,
R(io+l,jo+o-l,3,p) -^ R(io-s,jo,2,p),
R(i0,jo+s,l,p) -> H(io-s,jo,3,p),
R(io-s,jQ-l,2,v)~, n(io,jo+s,3,p),
(23a)
(23b)
(23c)
(23d)
where A-> B indicates that A should be replaced by B, and s = 1, 2, 3,"*" •
Similar replacement of loads may be applied to a core of any other
Symmetrie configurations.
2.1.5.4 Consideration of the diametral clearance at a lower nozzle section
]>ae to the di;<raetr:n.l clearance at a lower nozzle section, a fuel sub-
asrOi.My nay be free at the lov.'cr end in an equilibrium state. Suppose a
fuel :;uL.Tc.scc:bly (i,j) is supported with a pivot at z = z, , which is
usually a ca.^e, cml is fj'ee at z -: 0 witliin the diametral clearance, then
boundary conditions (10b) and (lOo) should be satisfied. Since, in this
ca:;e, a. . (0) and ß . .(o) arc net previously known and the load at z = 0
is /nir.sing, tiiese conptmiLs v;iiich are related to the deflection node of tlie
cub;jcccmb2y (i,j) are to be (jeter.nined togctlier with the loads at all
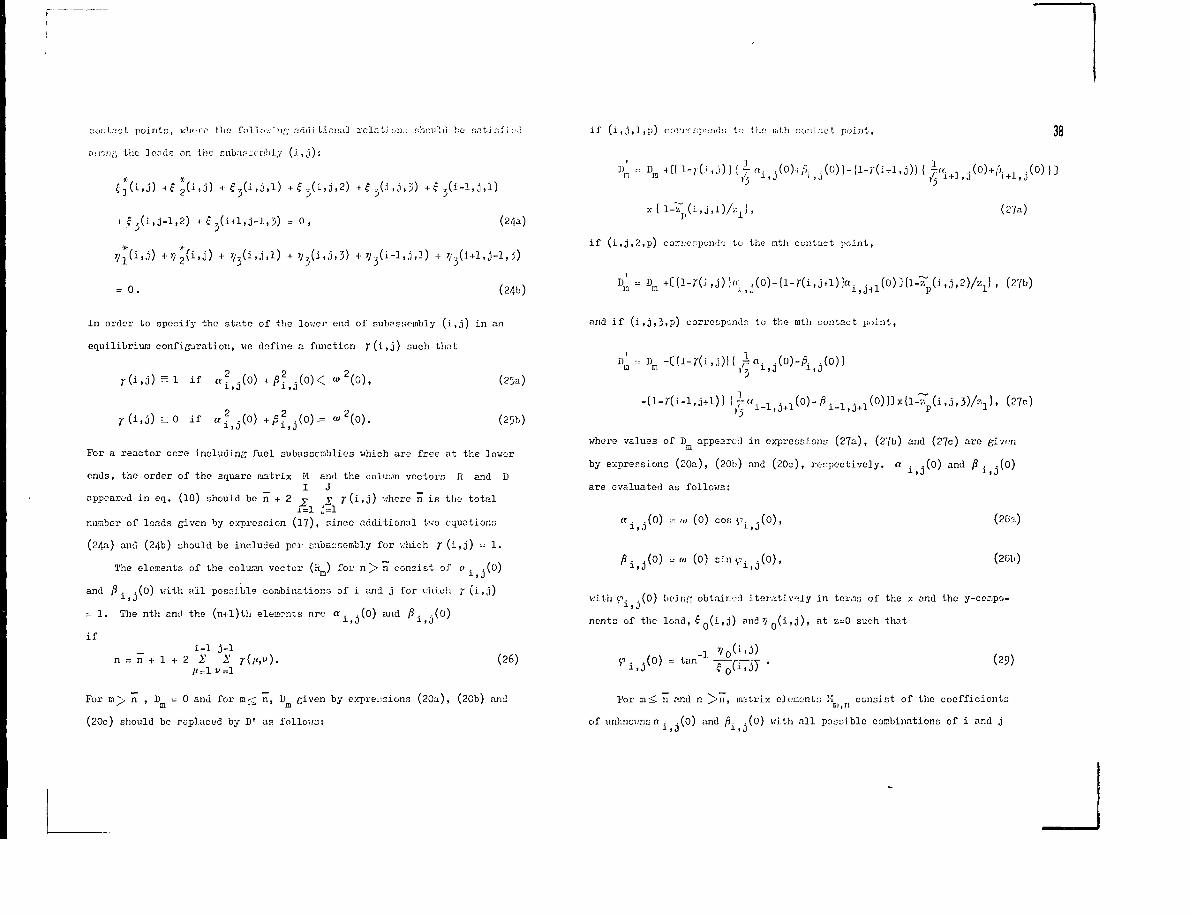
r'
conl.-vjt p o i n t s , v:!n-rr trie fo l io . ; ' nr; nddi LiniKil r e l a U oil.: should tie sntJ sf j c.l
«n,i';ii;; the loads on the suoasjcnMy ( i , j ) :
i f ( i , j , 3 ,])) correspond» to the mth conlr.ut point, 38
3 ( i , 3 - l , 2 ) + c 3 ( i + l , j - l , 5 ) = 0 , (21a)
If (i,j,l?,p) correr.jiondr; to the mth contact point,
(27a)
= 0. (24b)
In order to specify the s tate of the lower end of r>ub?sneinbly ( i , j ) in an
equilibrium configuration, vie define a function r ( i , j ) such tli.it
r ( i , j ) = l i f a2 ( 0 ) -i ß\ ( o ) < < » 2 ( 0 ) ,
if
(25a)
(25b)
For a reactor cere including fuel subasscablies which are free at the lower
ends, the order of the square matrix M and the colir/m vectors H and D_ I J _
appeared in eq. (10) should be n + 2 y % 7(1, j) where n is the total
number of loads given by expression (17), since additional two equations
(24a) and (24b) should be included per subassembly for v.iiich 7 (i,j) = 1.
The elements of the column vector (H ) for n ]> n consist of o . .(o)m !> J
and ß . . (0) v/ith a i l pos s ib l e combinations of i and j for vitich 7 ( i , j )
= 1 . The n th and the (n-i l) th elements a re a . . (0) and ß . . (0)
i f
n = n + 1 + 2 Xj °v r(,,,v). (26)
Dm " Dm
and if (i,j,3,p) corresponds to the rath contact point,
}h«i,i
/z:L] , (27b)
1 ) . (27c)
where values of D appeared in expressions (27a), (27b) and (27c) are given
by expressions (20a), (20b) and (20c), respectively, a . .(0) and ß . .(o)
are evaluated as follows:
a (0) =<„ (0) cos v (0),
ß (0) -oi (0) siny> .(0),1 I J 1 ) J
(20a)
(28b)
with ">. .(0) being obtaimvl iterativ^ly in tornn of the x and the y-eoinpo-1> 3
nents of the load, ?n(i,j) .ind >? „(i, j), at z=0 such that
(29)
For m]> n , D - 0 and for m < n, B given by expressions (20a), (2Cb) ajid
(20c) should be replaced by D' as follows:
For m< n and n ^>n, matrix o3enenlG M consist of the coefficientsnj,n
of unlmounsn- . .(o) and ß. .(o) v/ilh a l l possible combinp.tions of i and j1 1 0 x » J
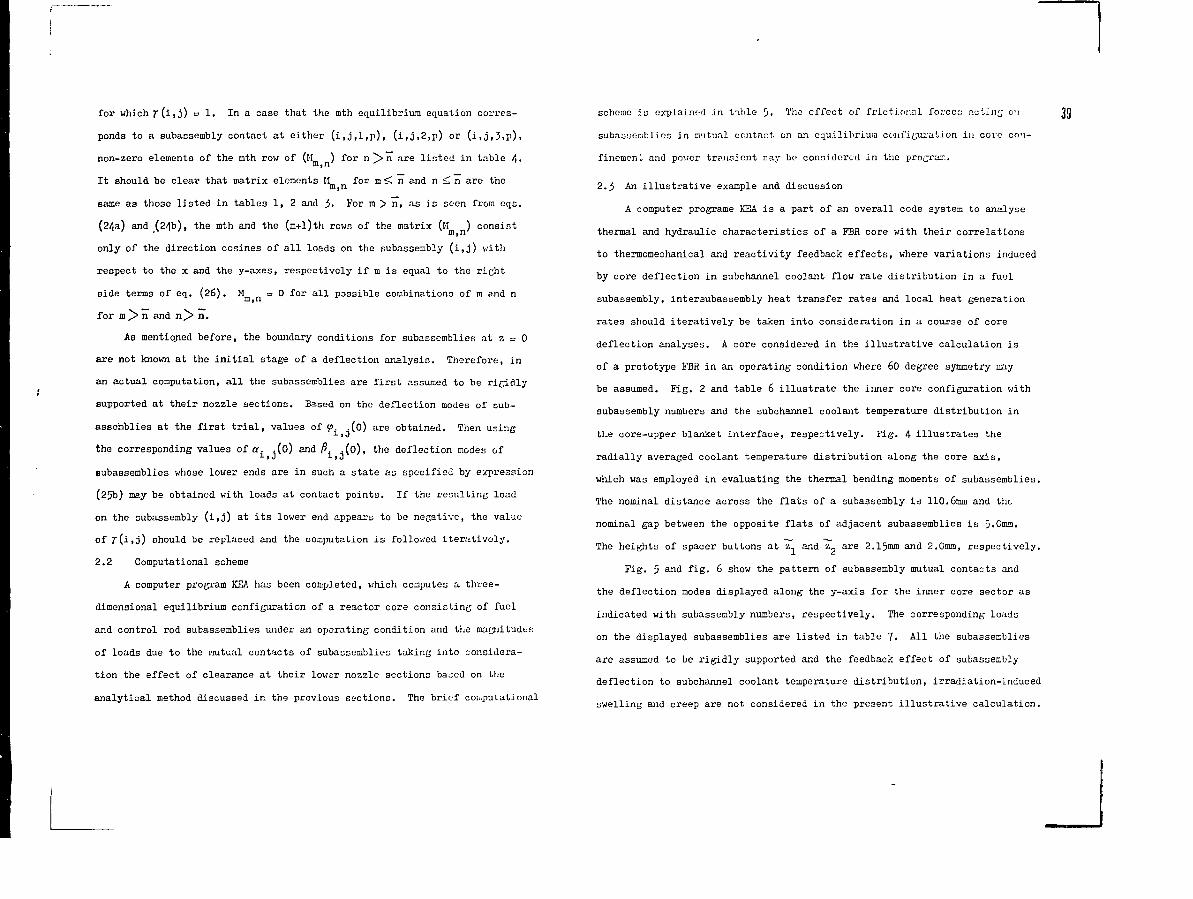
for which r(i,;j) = 1> In a case that the mth equilibrium equation corres-
ponds to a subassembly contact at either (i,j,l,p), (i,Ö,2,p) or (i,j,3,p),
non-zero elements of the mth rov; of (H ) for n "> n are listed in table 4.iii| n
It should be clear that matrix elements 11 for m <, n and n < n are them,n
same as tho3O listed in tables 1, 2 and 3- For m > n, as is seen from eqs.
(24a) and (24b), the mth and the (m+l)th rows of the matrix (H ) consist* m j n
only of the direction cosines of all loads on the subassembly (i,j) v/ith
recpeot to the x and the y-axes, respectively if m is equal to the rieht
side terms of eq. (26). Mm n = °
f o r a 1 1 possible combination:; of m and n
for m > n and n^> n.
As mentioned before, the boundary conditions for subassemblies at z = 0
are not known at the initial stage of a deflection analysis. Therefore, in
an actual computation, all the subassemblies are first assumed to be rigidly
supported at their nozzle sections. Based on the deflection modes of sub-
assemblies at the first trial, values of <p. . (o) are obtained. Then using1 »0
the corresponding values of a^ .(o) and ß^ ..(0), the deflection modes of
eubassemblies whose lower ends are in such a state as specified by expression
(25b) may be obtained with loadc at contact points. If the resulting load
on the subassembly (i,j) at its lower end appears to bo negative, the value
of r(i,j) should be replaced and the computation is followed iteratively.
2.2 Computational scheme
A computer program KEA has been completed, which computes a three-
dimensional equilibrium configuration of a reactor core consisting of fuel
and control rod subassemblies under an operating condition and the magnitudes
of loads due to the mutual contacts of subassemblies taking into considera-
tion the effect of clearance at their lower nozzle sections ba:;ed on the
analytical method discussed ir. the previous sections. The brief computational
scheme is explained in tnble 5. The effect of fricti.onal force:; acting OM
subasuerablics in mutual contact on an equilibrium configuration in core con-
finement, and pov/er transient rcay bo considered in the
39
2.3 An illustrative example and discussion
A computer programe KEA is a part of an overall code system to analyse
thermal and hydraulic characteristics of a FBH core with their correlations
to thennomechanical and reactivity feedback effects, where variations induced
by core deflection in subchannel coolant flow rate distribution in a fuel
subassembly, intersubassembly heat transfer rates and local heat generation
rates should iteratively be taken into consideration in a course of core
deflection analyses. A core considered in the illustrative calculation is
of a prototype FBR in an operating condition where 60 degree symmetry may
be assumed. Pig. 2 and table 6 illustrate the inner core configuration with
subassembly numbers and the subchannel coolant temperature distribution in
tl.e core-upper blanket interface, respectively. Fig. 4 illustrates the
radially averaged coolant temperature distribution along the core axis,
which was employed in evaluating the thermal bending moments of subassemblies.
The nominal distance across the flats of a subassembly is 110.6mm and the
nominal gap between the opposite flats of adjacent subassemblies is 5.0mm.
The heights of spacer buttons at z, and z„ are 2.15mm and 2.0mm, respectively.
Fig. 5 and fig. 6 show the pattern of subassembly mutual contacts and
the deflection modes displayed along the y-axis for the inner core sector as
indicated with subassembly numbers, respectively. The corresponding loads
on the displayed subassemblies are listed in table 7. All the subassemblies
are assumed to be rigidly supported and the feedback effect of subassembly
deflection to subchannel coolant temperature distribution, irradiation-induced
swelling and creep are not considered in the present illustrative calculation.
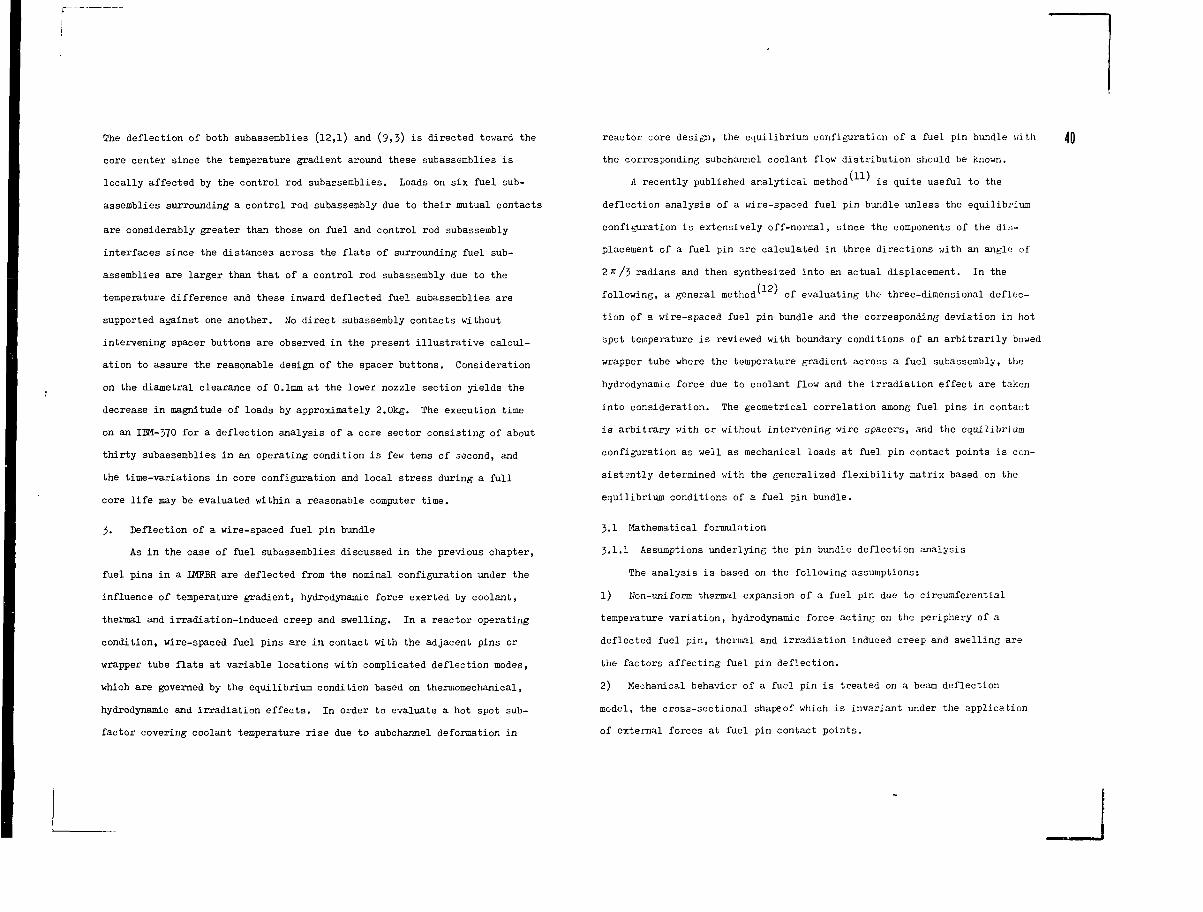
r •
The deflection of both subassemblies (12,l) and (9,5) is directed toward the
core center since the temperature gradient around these subassemblies is
locally affected by the control rod subassemblies. Loads on six fuel sub-
assemblies surrounding a control rod subassembly due to their mutual contacts
are considerably greater than those on fuel and control rod subassembly
interfaces since the distances across the flats of surrounding fuel sub-
assemblies are larger than that of a control rod subassembly due to the
temperature difference and these inward deflected fuel subassemblies are
supported against one another. No direct subassembly contacts without
intervening spacer buttons are observed in the present illustrative calcul-
ation to assure the reasonable design of the spacer buttons. Consideration
on the diametral clearance of 0.1mm at the lower nozzle section yields the
decrease in magnitude of loads by approximately 2.0kg. The execution time
on an IBM-370 for a deflection analysis of a core sector consisting of about
thirty subassemblies in an operating condition is few tens of socond, and
the time-variations in core configuration and local stress during a full
core life may be evaluated within a reasonable computer time.
3. Deflection of a wire-spaced fuel pin bundle
As in the case of fuel subassemblies discussed in the previous chapter,
fuel pins in a IMPBR are deflected from the nominal configuration under the
influence of temperature gradient, hydrodynamic force exerted by coolant,
thermal and irradiation-induced creep and swelling. In a reactor operating
condition, wire-spaced fuel pins are in contact with the adjacent pins or
wrapper tube flats at variable locations with complicated deflection modes,
which are governed by the equilibrium condition based on thermomechanical,
hydrodynamic and irradiation effects. In order to evaluate a hot spot sub-
factor covering coolant temperature rise due to subchannel deformation in
reactor core design, the equilibrium configuration of a fuel pin bundle with
the corresponding subchannel coolant flow distribution should be known.
A recently published analytical method is quite useful to the
deflection analysis of a wire-spaced fuel pin bundle unless the equilibrium
configuration is extensively off-normal, since the components of the dis-
placement of a fuel pin are calculated in three directions with an angle of
2!t/3 radians and then synthesized into an actual displacement. In the
(121
following, a general method ' of evaluating the three-dimensional deflec-
tion of a wire-spaced fuel pin bundle and the corresponding deviation in hot
spot temperature is reviewed with boundary conditions of an arbitrarily bowed
wrapper tube where the temperature gradient across a fuel subassembly, the
hydrodynamic force due to coolant flow and the irradiation effect are taken
into consideration. The geometrical correlation among fuel pins in contact
is arbitrary with or without intervening wire spacers, and the equilibrium
configuration as well as mechanical loads at fuel pin contact points is con-
sistently determined with the generalized flexibility matrix based on the
equilibrium conditions of a fuel pin bundle.
3.1 Mathematical formulation
3.1.1 Assumptions underlying the pin bundle deflection analysis
The analysis is based on the following assumptions:
1) Non-uniform thermal expansion of a fuel pin due to circumferential
temperature variation, hydrodynamic force acting on the periphery of a
deflected fuel pin, thermal and irradiation induced creep and swelling are
the factors affecting fuel pin deflection.
2) Mechanical behavior of a fuel pin is treated on a beam deflection
model, the cross-sectional shape of which is invariant under the application
of external forces at fuel pin contact points.
40
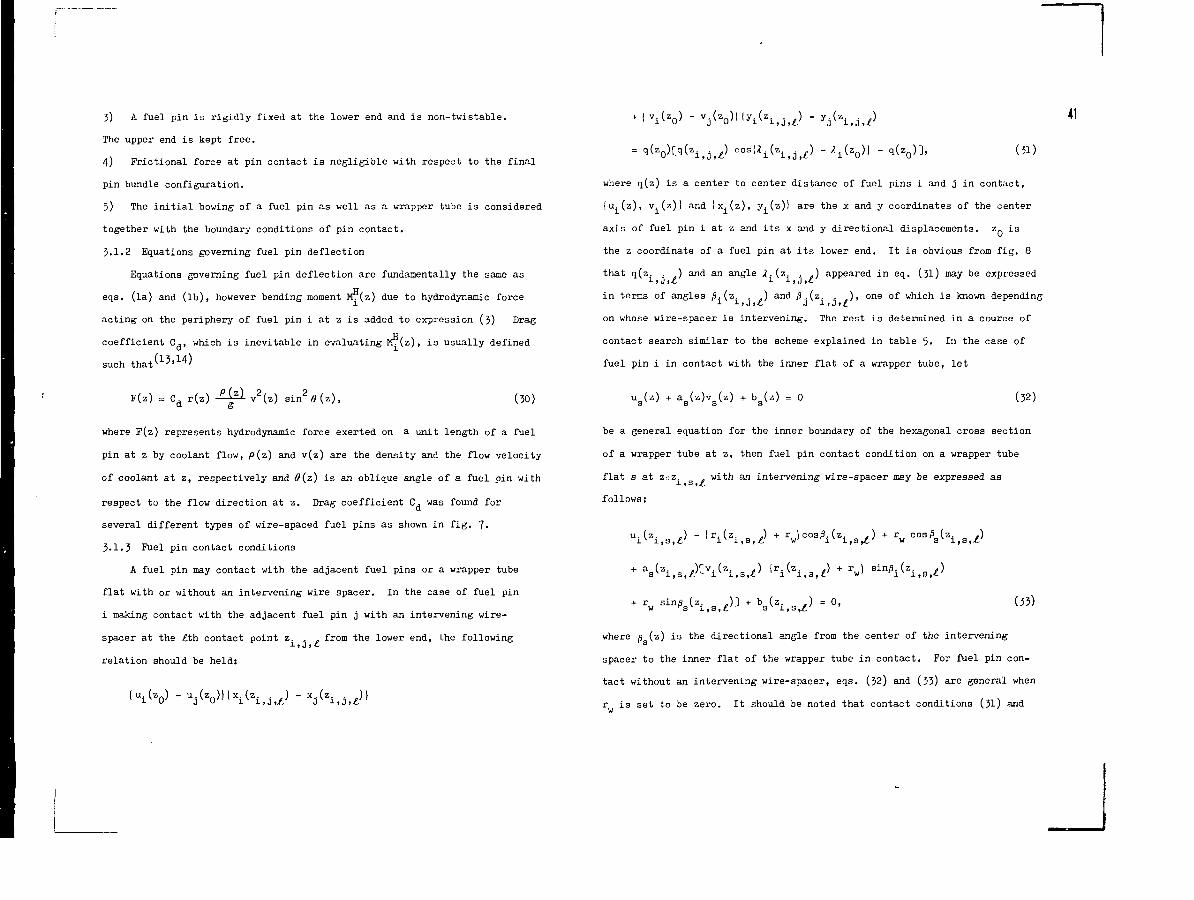
3) A fuel pin is rigidly fixed at the lower end and is non-twistable.
The upper end is kept free.
4) Frictional force at pin contact is negligible with respect to the final
pin bundle configuration.
5) The initial bowing of a fuel pin as well as a wrapper tube is considered
together with the boundary conditions of pin contact.
3.1.2 Equations governing fuel pin deflection
Equations governing fuel pin deflection are fundamentally the same as
eqs. (la) and (lb), however bending moment M7(z) due to hydrodynamic force
acting on the periphery of fuel pin i at z is added to expression (3)- Drag
coefficient C^, which is inevitable in evaluating Mv(z), is usually defined
such that(13'14)
(50)
41
F(z) = Cd r(z) ^iSi v2(z) sin2 0 (z),
where F(z) represents hydrodynamic force exerted on a unit length of a fuel
pin at z by coolant flow, p(z) and v(z) are the density and the flow velocity
of coolant at z, respectively and 0(z) is an oblique angle of a fuel pin with
respect to the flow direction at z. Drag coefficient C^ was found for
several different types of wire-spaced fuel pins as shown in fig. 7•
3.1.3 Fuel pin contact conditions
A fuel pin may contact with the adjacent fuel pins or a wrapper tube
flat with or without an intervening wire spacer. In the case of fuel pin
i making contact with the adjacent fuel pin j with an intervening wire-
spacer at the lXt\ contact point z. . - from the lower end, the following
relation should be held:
where q(z) is a center to center distance of fuel pins i and j in contact,
{u.(z), v.(z)) and Ix.(z), y.(z)) are the x and y coordinates of the center
axis of fuel pin i at z and its x and y directional displacements. z„ is
the z coordinate of a fuel pin at its lower end. It is obvious from fig. 8
that q(z. . ) and an angle /i.(z. . .) appeared in eq. (31) may be expressed
in terms of angles ß.(z. . ) and /3.(z. . ), one of which is known depending
on whose wire-spacer is intervening. The rest is determined in a oource of
contact search similar to the scheme explained in table 5. In the case of
fuel pin i in contact with the inner flat of a wrapper tube, let
ag(z)vg(z) = 0 (32)
be a general equation for the inner boundary of the hexagonal cross section
of a wrapper tube at z, then fuel pin contact condition on a wrapper tube
flat s at z=z. with an intervening wire-spacer may be expressed as1, s ,.£
follows:
where ß (z) is the directional angle from the center of the intervening
spacer to the inner flat of the wrapper tube in contact. For fuel pin con-
tact without an intervening wire-spacer, eqs. (32) and (33) are general when
r is set to be zero. It should be noted that contact conditions (31) and
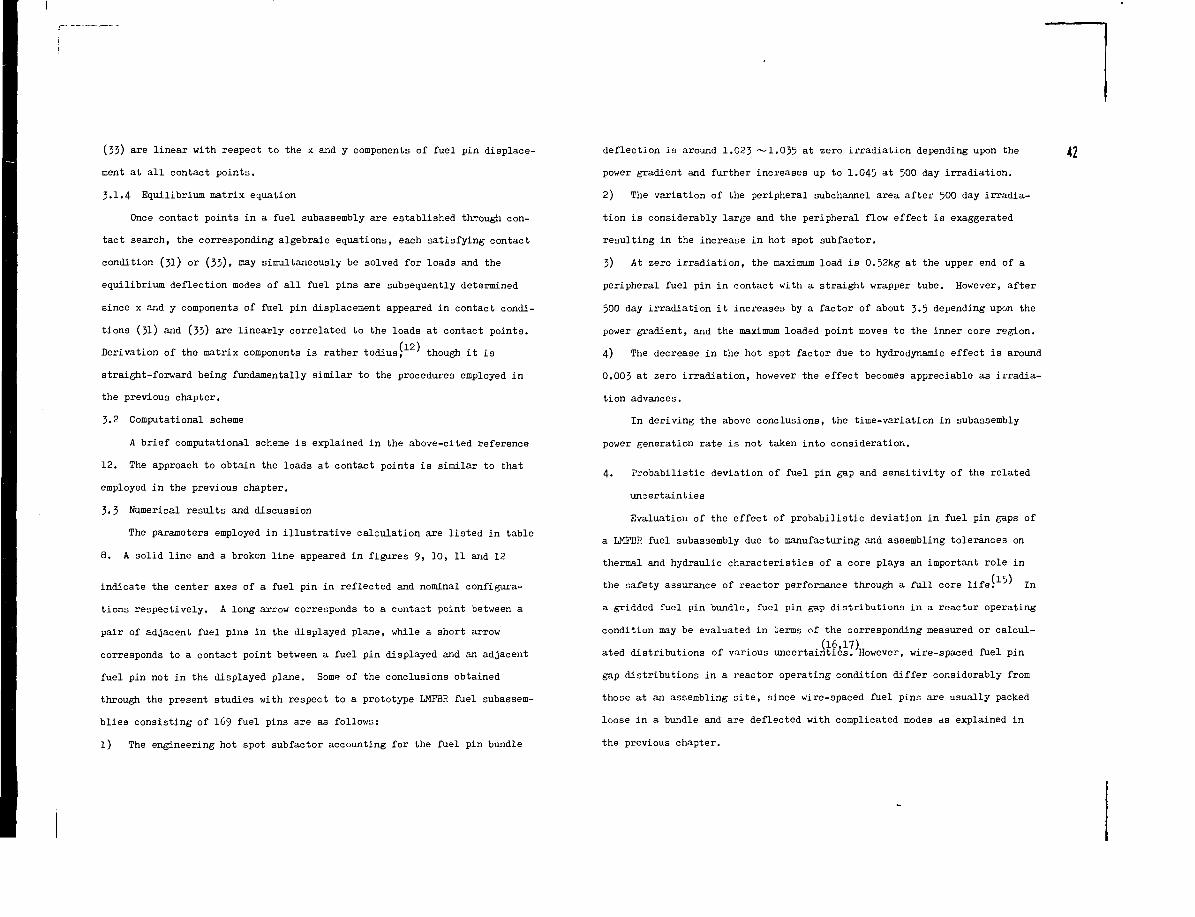
(33) are linear with respect to the x and y components of fuel pin displace-
ment at all contact points.
3.1.4 Equilibrium matrix equation
Once contact points in a fuel subassembly are established through con-
tact search, the corresponding algebraic equations, each satisfying contact
condition (31) or (33). n^y simultaneously be solved for loads and the
equilibrium deflection modes of all fuel pins are subsequently determined
since x and y components of fuel pin displacement appeared in contact condi-
tions (31) and (33) are linearly correlated to the loads at contact points.
(12)Derivation of the matrix components is rather tedius; ' though it is
straight-forward being fundamentally similar to the procedures employed in
the previous chapter.
3.2 Computational scheme
A brief computational scheme is explained in the above-cited reference
12. The approach to obtain the loads at contact points is similar to that
employed in the previous chapter.
3.3 Numerical results and discussion
The parameters employed in illustrative calculation are listed in table
8. A solid line and a broken line appeared in figures 9, 10, 11 and 12
indicate the center axes of a fuel pin in reflected and nominal configura-
tions respectively. A long arrow corresponds to a contact point between a
pair of adjacent fuel pins in the displayed plane, while a short arrow
corresponds to a contact point between a fuel pin displayed and an adjacent
fuel pin not in thfc displayed plane. Some of the conclusions obtained
through the present studies with respect to a prototype LMFBR fuel subassem-
blies consisting of 169 fuel pins are as follows:
l) The engineering hot spot subfactor accounting for the fuel pin bundle
deflection is around 1.023 ~l.O35 at zero irradiation depending upon the
power gradient and further increases up to 1.045 at 500 day irradiation.
2) The variation of the peripheral subchannel area after 500 day irradia-
tion is considerably large and the peripheral flow effect is exaggerated
resulting in the increase in hot spot subfactor.
3) At zero irradiation, the maximum load is 0.52kg at the upper end of a
peripheral fuel pin in contact with a straight wrapper tube. However, after
500 day irradiation it increases by a factor of about 3-5 depending upon the
power gradient, and the maximum loaded point moves to the inner core region.
4) The decrease in the hot spot factor due to hydrodynamic effect is around
0.003 at zero irradiation, however the effect becomes appreciable as irradia-
tion advances.
In deriving the above conclusions, the time-variation in subassembly
power generation rate is not taken into consideration.
4. Probabilistic deviation of fuel pin gap and sensitivity of the related
uncertainties
Evaluation of the effect of probabilistic deviation in fuel pin gaps of
a LMFBR fuel subassembly due to manufacturing and assembling tolerances on
thermal and hydraulic characteristics of a core plays an important role in
(15)the safety assurance of reactor performance through a full core life: ' In
a gridded fuel pin bundle, fuel pin gap distributions in a reactor operating
condition may be evaluated in ierms of the corresponding measured or calcul-
ated distributions of various uncertainties. However, wire-spaced fuel pin
gap distributions in a reactor operating condition differ considerably from
those at an assembling site, since wire-spaced fuel pins are usually packed
loose in a bundle and are deflected with complicated modes as explained in
the previous chapter.
42
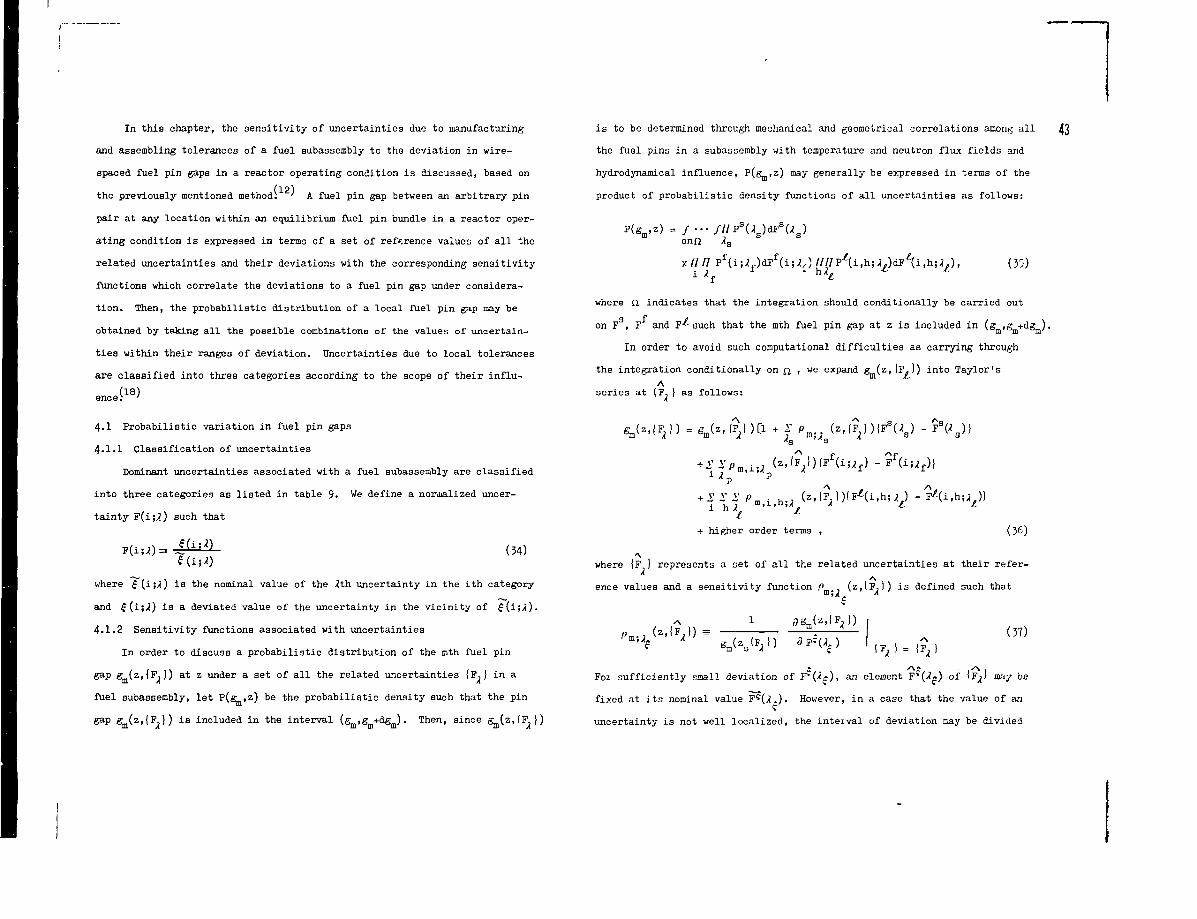
In this chapter, the sensitivity of uncertainties due to manufacturing
and assembling tolerances of a fuel subassembly to the deviation in wire-
spaced fuel pin gaps in a reactor operating condition is discussed, based on
(121the previously mentioned method: ' A fuel pin gap between an arbitrary pin
pair at any location within an equilibrium fuel pin bundle in a reactor oper-
ating condition is expressed in terms of a set of reference values of all the
related uncertainties and their deviations with the corresponding sensitivity
functions which correlate the deviations to a fuel pin gap under considera-
tion. Then, the probabilistic distribution of a local fuel pin gap may be
obtained by taking all the possible combinations of the values of uncertain-
ties within their ranges of deviation. Uncertainties due to local tolerances
are classified into three categories according to the scope of their influ-
encei18)
4.1 Probabilistic variation in fuel pin gaps
4.1.1 Classification of uncertainties
Dominant uncertainties associated with a fuel subassembly are classified
into three categories as listed in table 9. We define a normalized uncer-
tainty F(i;>i) such that
(34)
where £ (ij-0 is the nominal value of the <!th uncertainty in the ith category
and £ (i;>!) is a deviated value of the uncertainty in the vicinity of £(i;/i).
4.1.2 Sensitivity functions associated with uncertainties
In order to discuss a probabilistic distribution of the mth fuel pin
gap g_(z,{F,}) at z under a set of all the related uncertainties {F.) in a
fuel subassembly, let P(g_,z) be the probabilistic density such that the pin
gap S - C Z J I F , ) ) is included in the interval (g_>g +dgL). Then, since g_(z,(F. ))
is to be determined through mechanical and geometrical correlations among all
the fuel pins in a subassembly with temperature and neutron flux fields and
hydrodynamical influence, P(g , z) may generally be expressed in terms of the
product of probabilistic density functions of all uncertainties as follows:
B 3
onn A3
xflll Pf(i;/)f)dFf(i;^;(///P/(i,h;,!z)dF^i,h;,!,), (35)
i i ' "<<£
where Q. indicates that the integration should conditionally be carried out
on F , F and F* such that the mth fuel pin gap at z is included in (g ,g +dg ).
In order to avoid such computational difficulties as carrying through
,)the integration conditionally on n , we expand g (z,(F,)) into Taylor's
A{series at {F.} as follows:
s
n > B l . , (z.lF )){Ff(
1 ! ' ' P
+ higher order terms , (36)
where (F } represents a set of all the related uncertainties at their refer-
ence values and a sensitivity function p (z,lF3)) is defined such that
1
(37)
For sufficiently small deviation of , an element of may be
fixed at its nominal value F?(/).). However, in a case that the value of an
uncertainty is not well localized, the interval of deviation may be divided
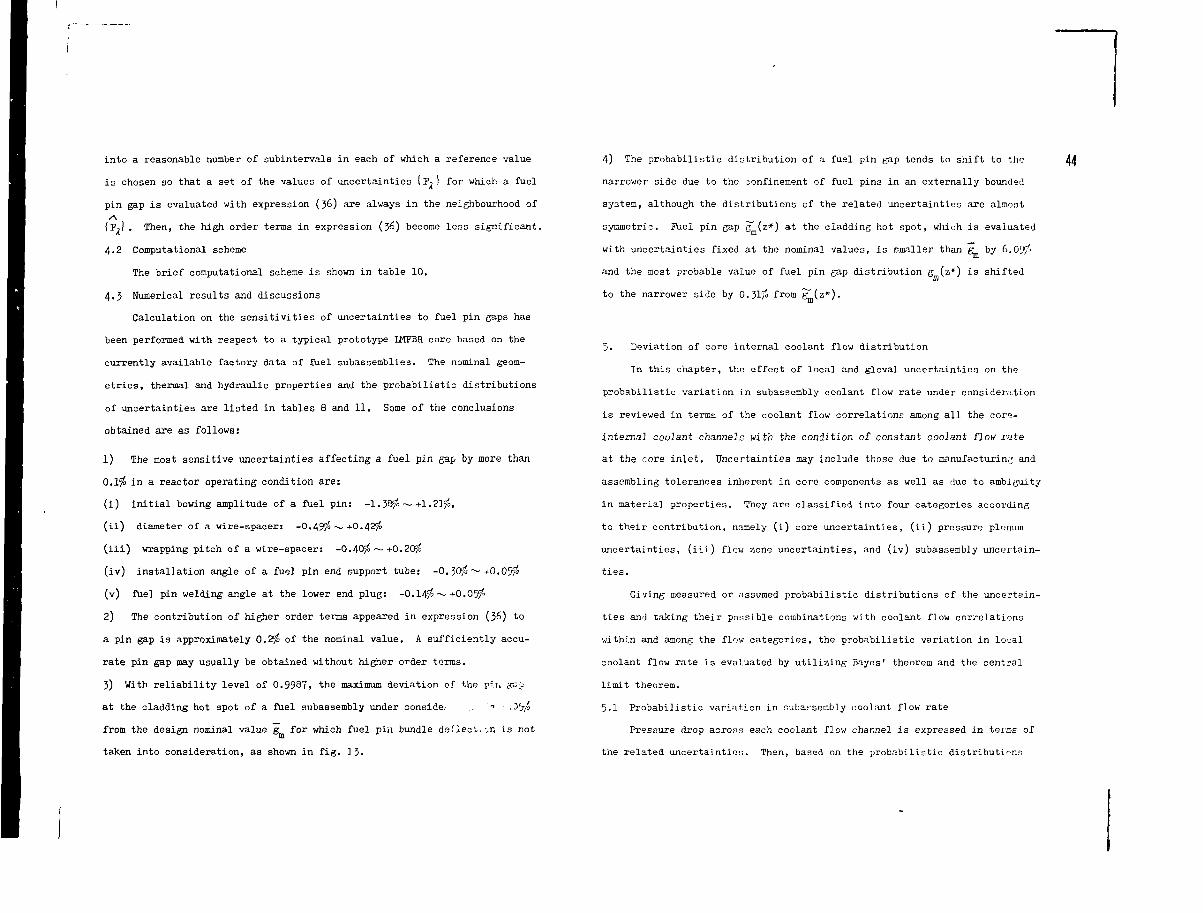
into a reasonable number of subintervals in each of which a reference value
is chosen so that a set of the values of uncertainties (F^1 for which a fuel
pin gap is evaluated with expression (36) are always in the neighbourhood of
{Fj} . Then, the high order terms in expression (36) become less significant.
4.2 Computational scheme
The brief computational scheme is shown in table 10.
4.3 Numerical results and discussions
Calculation on the sensitivities of uncertainties to fuel pin gaps has
been performed with respect to a typical prototype IMFBR core based on the
currently available factory data of fuel subassemblies. The nominal geom-
etries, thermal and hydraulic properties and the probabilistic distributions
of uncertainties are listed in tables 8 and 11. Some of the conclusions
obtained are as follows:
1) The most sensitive uncertainties affecting a fuel pin gap by more than
0.1$ in a reactor operating condition are:
(i) initial bowing amplitude of a fuel pin: -1.38$ — +1.21$,
(ii) diameter of a wire-spacer: -0.49$ ~~ +0.42$
(iii) wrapping pitch of a wire-spacer: -0.AO/o ~ +0.20$
(iv) installation angle of a fuel pin end support tube: -0.3>OTO~ +0.05$
(v) fuel pin welding angle at the lower end plug: -0.14$ ~ +0.05$
2) The contribution of higher order terms appeared in expression (36) to
a pin gap is approximately 0.2$ of the nominal value. A sufficiently accu-
rate pin gap may usually be obtained without higher order terms.
3) With reliability level of 0.9987, the maximum deviation of the piii RC.J
at the cladding hot spot of a fuel subassembly under conside- .. " -^/o
from the design nominal value g for which fuel pin bundle deflector« is not
taken into consideration, as shown in fig. 13.
4) The probabilistic distribution of a fuel pin gap tends to shift to the
narrower side due to the confinement of fuel pins in an externally bounded
system, although the distributions of the related uncertainties are almost
symmetric. Fuel pin gap g (2*) at the cladding hot spot, which is evaluated
with uncertainties fixed at the nominal values, is smaller than g by b,Ocffi
and the most probable value of fuel pin gap distribution g (z*) is shifted
44
to the narrower side by 0.31$ from g~(z*).
5. Deviation of core internal coolant flow distribution
In this chapter, the effect of local and gloval uncertainties on the
probabilistic variation in subassembly coolant flow rate under consideration
is reviewed in terms of the coolant flow correlations among all the core-
internal coolant channels with the condition of constant coolant flow rate
at the core inlet. Uncertainties may include those due to manufacturing and
assembling tolerances inherent in core components as well as due to ambiguity
in material properties. They are classified into four categories according
to their contribution, namely (i) core uncertainties, (ii) pressure plenum
uncertainties, (iii) flow zone uncertainties, and (iv) subassembly uncertain-
ties.
Giving measured or assumed probabilistic distributions of the uncertain-
ties and taking their possible combinations with coolant flow correlations
within and among the flow categories, the probabilistic variation in local
coolant flow rate is evaluated by utilizing Bayos' theorem and the central
limit theorem.
5.1 Probabilistic variation in subacsembly coolant flow rate
Pressure drop across each coolant flow channel is expressed in terms of
the related uncertainties. Then, based on the probabilistic distributions
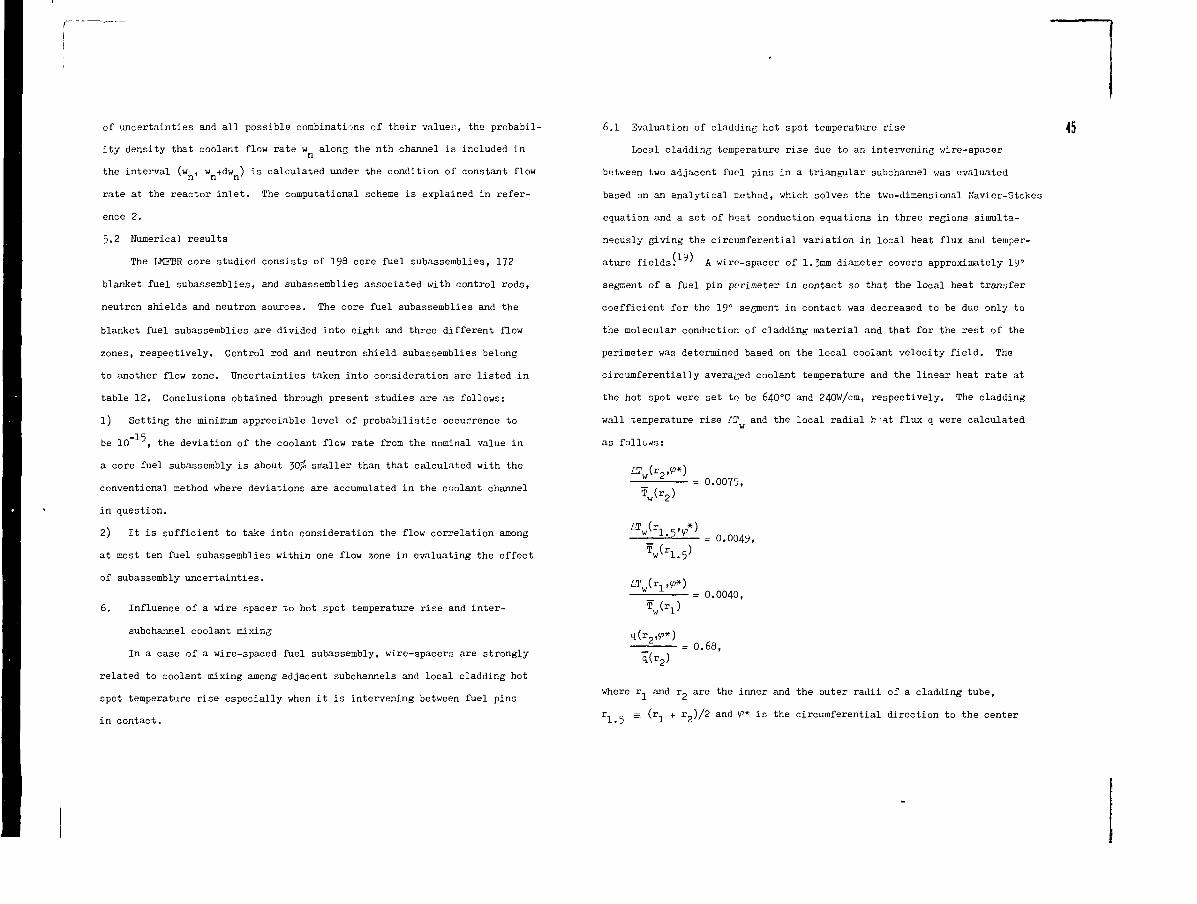
of uncertainties and all possible combinations of their values, the probabil-
ity density that coolant flow rate w along the nth channel is included in
the interval (w , w +dw ) is calculated under the condition of constant flow
rate at the reactor inlet. The computational scheme is explained in refer-
ence 2.
5.2 Numerical results
The LMFBR core studied consists of 198 core fuel subassemblies, 172
blanket fuel subassemblies, and subassemblies associated with control rods,
neutron shields and neutron sources. The core fuel subassemblies and the
blanket fuel subassemblies are divided into eight and three different flow
zones, respectively. Control rod and neutron shield subassemblies belong
to another flow zone. Uncertainties taken into consideration are listed in
table 12. Conclusions obtained through present studies are as follows:
1) Setting the minimum appreciable level of probabilistic occurrence to
be 10~ , the deviation of the coolant flow rate from the nominal value in
a core fuel subassembly is about 3C$ smaller than that calculated with the
conventional method where deviations are accumulated in the coolant channel
in question.
2) It is sufficient to take into consideration the flow correlation among
at most ten fuel subassemblies within one flow zone in evaluating the effect
of subassembly uncertainties.
6. Influence of a wire spacer to hot spot temperature rise and inter-
subchannel coolant mixing
In a case of a wire-spaced fuel subassembly, wire-spacers are strongly
related to coolant mixing among adjacent subchannels and local cladding hot
spot temperature rise especially when it is intervening between fuel pins
in contact.
6.1 Evaluation of cladding hot spot temperature rise
Local cladding temperature rise due to an intervening wire-spacer
between two adjacent fuel pins in a triangular subchannel was evaluated
based on an analytical method, which solves the two-dimensional Navier-Stokes
equation and a set of heat conduction equations in three regions simulta-
neously giving the circumferential variation in local heat flux and teuiper-
(19)ature fields. ' A wire-spacer of 1.3mm diameter covers approximately 19°
segment of a fuel pin perimeter in contact so that the local heat transfer
coefficient for the 19° segment in contact was decreased to be due only to
the molecular conduction of cladding material and that for the rest of the
perimeter was determined based on the local coolant velocity field. The
circumferentially averaged coolant temperature and the linear heat rate at
the hot spot were set to be 64O°C and 240W/cm, respectively. The cladding
wall temperature rise /T and the local radial h-at flux q were calculated
as follows:
45
= 0.0075,
= 0.0049,
q(r,,v>*)
= 0.0040,
= 0.68,
q(r2)
where r. and r„ are the inner and the outer radii of a cladding tube,
r^ . = (z^ + rg)/2 and V* is the circumferential direction to the center
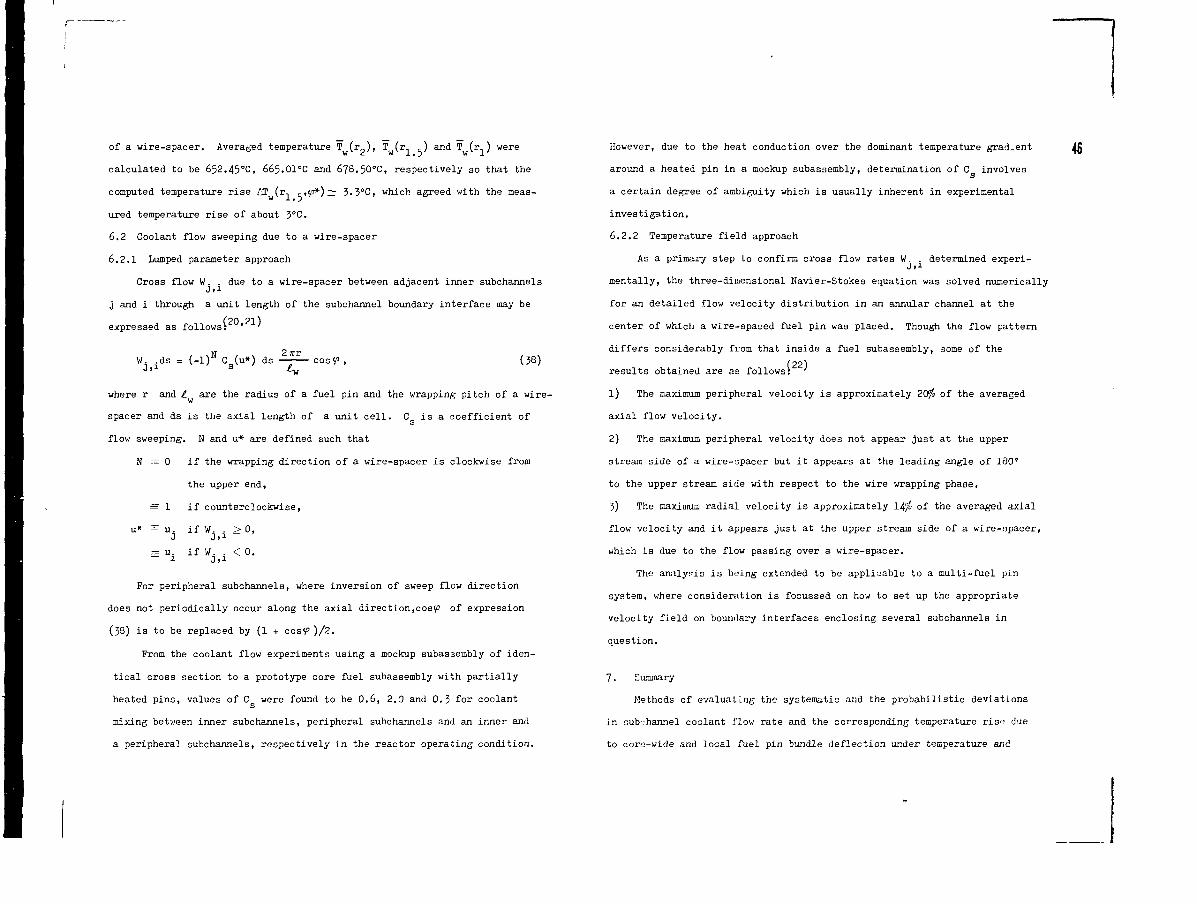
of a wire-spacer. Averaged temperature T (r„), T (r. _) and T (r,) were
calculated to be 652.45°C, 665.01°C and 678.50°C, respectively so that the
computed temperature rise £T (r. j-,p*)~ 3-3°C, which agreed with the meas-
w x • j
ured temperature rise of about 3°C.
6.2 Coolant flow sweeping due to a wire-spacer
6.2.1 Lumped parameter approach
Cross flow W. . due to a wire-spacer between adjacent inner subchannels
j and i through a unit length of the subchannel boundary interface may be
expressed as follows: ' '
, ,N , 2 7rrW ds = (-1)" C (u*) ds — cosy (38)
where r and t. are the radius of a fuel pin and the wrapping pitch of a wire-
spacer and ds is the axial length of a unit cell. C is a coefficient of
flow sweeping. N and u* are defined such that
N = 0 if the wrapping direction of a wire-spacer is clockwise from
the upper end,
s i if counterclockwise,
u* = u. if W. . > 0,J J.i ~
= u. if W. . < 0.
For peripheral subchannels, where inversion of sweep flow direction
does not periodically occur along the axial direction,cosy of expression
(38) is to be replaced by (1 + cosy )/2.
From the coolant flow experiments using a mockup subassembly of iden-
tical cross section to a prototype core fuel subassembly with partially
heated pins, values of C were found to be 0.6, 2.0 and 0.3 for coolant
mixing between inner subchannels, peripheral subchannels and an inner and
a peripheral subchannels, respectively in the reactor operating condition.
However, due to the heat conduction over the dominant temperature gradient
around a heated pin in a mockup subassembly, determination of C involves
a certain degree of ambiguity which is usually inherent in experimental
investigation.
6.2.2 Temperature field approach
As a primary step to confirm cross flow rates W. . determined experi-Ji1
mentally, the three-dimensional Navier-Stokes equation was solved numerically
for an detailed flow velocity distribution in an annular channel at the
center of which a wire-spaced fuel pin was placed. Though the flow pattern
differs considerably from that inside a fuel subassembly, some of the(22)
results obtained are as follows:
1) The maximum peripheral velocity is approximately 20fa of the averaged
axial flow velocity.
2) The maximum peripheral velocity does not appear just at the upper
stream side of a wire-spacer but it appears at the leading angle of 180"
to the upper stream side with respect to the wire wrapping phase.
3) The maximum radial velocity is approximately 14$ of the averaged axial
flow velocity and it appears just at the upper stream side of a wire-spacer,
which is due to the flow passing over a wire-spacer.
The annlypis is being extended to be applicable to a multi-fuel pin
system, where consideration is focussed on how to set up the appropriate
velocity field on boundary interfaces enclosing several subchannels in
question.
7. Summary
Methods of evaluating the systematic and the probabilistic deviations
in subchannel coolant flow rate and the corresponding temperature rise due
to core-wide and local fuel pin bundle deflection under temperature and
46
neutron flux gradient and manufacturing tolerances of core components are
summarized. For the local temperature rise and the coolant mixing due to
a wire-spacer, some available techniques being currently employed in proto-
type LMPBR core design are reviewed.
Numerical results are shown for every individual factor, however in
actual core design, contributions from those factors are taken into consid-
eration as a whole in relation to the core hot spot temperature. Detailed
study on the flow sweeping due to a wire-spacer is under progress and the
related topics will be presented in the other paper.
Acknowledgement
Most of the work presented in this paper was performed under the con-
tract between the Power Reactor and Nuclear Fuel Development Corp. and
Mitsubishi Atomic Power Industries, Inc.
References
1) K. Sakai, Y. Okubo and H. Hishida, Trans. ANS, 24 (1976) 460.
2) E. Sakai and H. Hishida, Nucl. Eng. Des. 44 (1977) 235.
3) J. A. DeShong, Jr., ANL-7529 (1969).
4) D. A. Kucera and D. Mohr, ANL/EBR-014 (1970).
5) K. Ohmae, A. Morino, N. Nakao and S. Hirao, Nucl. Eng. Des. 23 (1972)
309.
6) H. Hishida, et al., Trans. At. Energy Soc. Japan, Nov. (1975) E10.
7) H. Hishida, et al., PNC Heport SJ3O6 76-09 (1976).
8) D. S. Rowe, BNWL-I695 (1973).
9) M. D. Cerelli and C. W. Bach, Trans. ANS, 21 (1975) 393.
10) H. Hishida, Y. Nakai and T. Suzuki, to be published in Nucl. Eng. Des.
11) K. Miki, J. Nucl. Sei. Tech. 14 (1977) 791.
12) K. Sakai, Y. Okubo and H. Hishida, Nucl. Eng. Des. 48 (1978) 596.
13) G. Taylor, Proc. Roy. Soc. A214 (1952) 158.
14) P. Y. Chen and P. E. Doepker, Trans. ASI1E, May (1975) H O .
15) K. Sakai, H. Hishida, Y. Hakai and S. Saito, Nucl. Eng. Des. 48 (1978)
505.
16) H. Hishida and M. Higashi, Nucl. Eng. Des. 35 (1975) 191.
17) 11. Higashi, K. Sakai and H. Hishida, to be published in Nucl. Eny. Des.
18) A. Amendola, KFK 1134-ETTR 3687 (1970).
19) H. Hishida, Nucl. Eng. Des. 26 (1974) 408.
20) K. Takahashi, K. Miyaguchi and E. Ishibashi, PNC Report SN941 73-44
(1973).
21) K. Takahashi, E. Ishibashi and J. Takahashi, PNC Report SN941 76-136
(1976).
22) Y. Yamashita and K. Sakai, private communication.
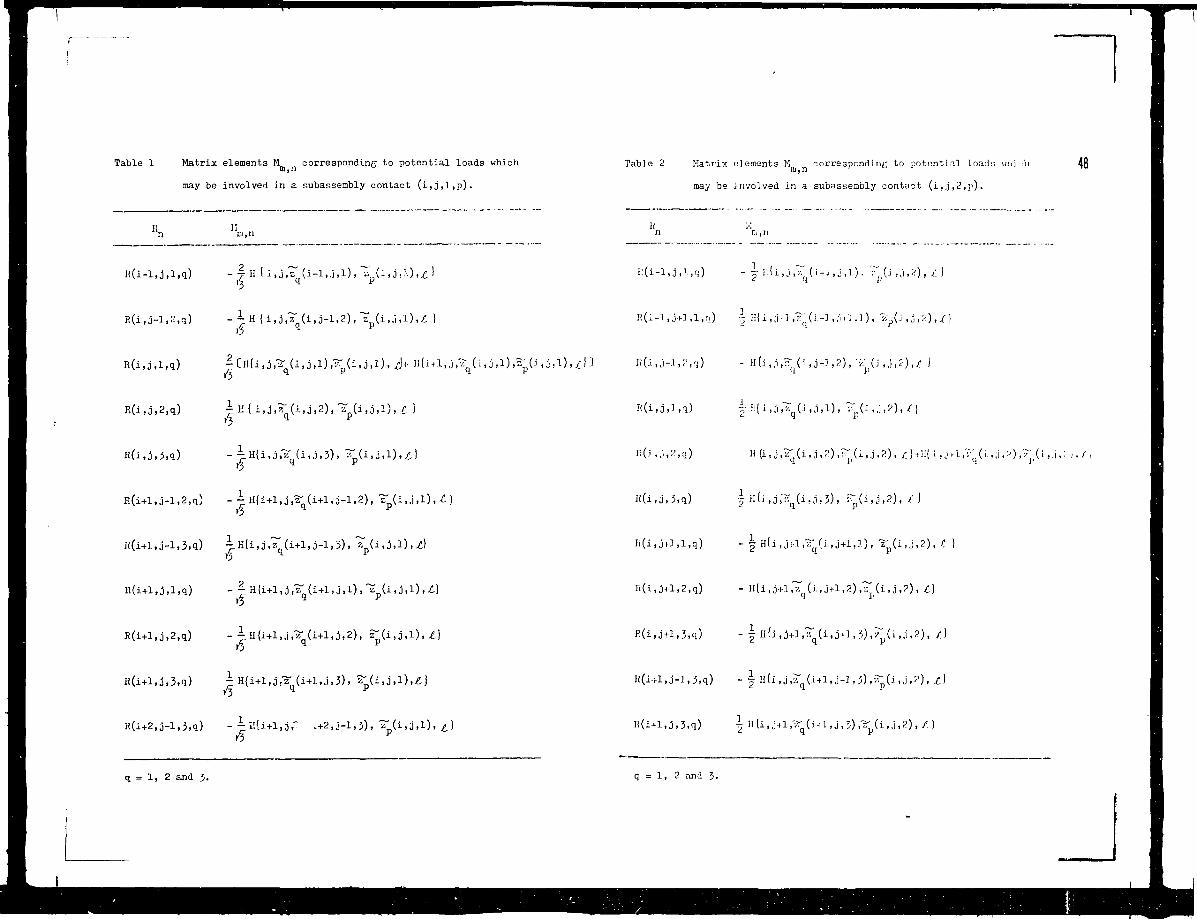
Table 1 Matrix elements M corresponding to potential loads which
may be involved in a subassembly contact (i,j,l,p).
Table 2 Matrix elements M corresponding to potential loads wlü :h
may be involved in a subassembly contact (i,j,2,p).
2 w 1 ,
R(i,3-1,2,q) - H ( 1,3,^(1,0-1,2),
M l H i , 3,^(1, j, l ) , ~ p (i, 3,1) .^ (: ,3 ,l), fj 'i
i '•" ' V ' J > ; > "jiV
7i15
,3,3),
2"']'J'V-J';'' r
2 „,. ,3,z (i+1,3,1), z (i,3,l),1 i-
R(i,34l,2,q)
2 «•.i,J+l,::qU.J + J,.V.i'pV
R(i+2,3-l,3,q) --H{i+l,j,T .+2,3-1,3), a (i,3,1), 77 H
q = 1, 2 and 3. q = 1, 2 and 3.
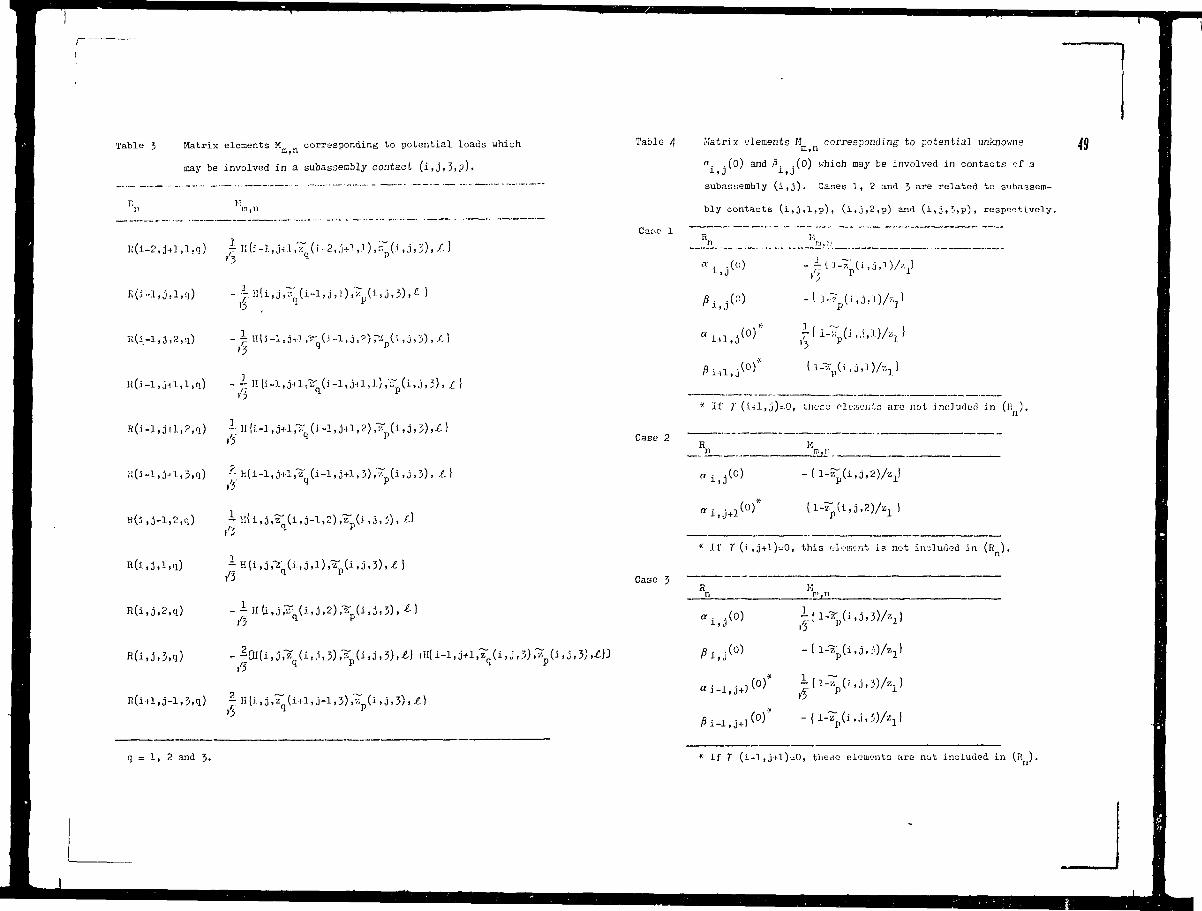
Table 3 Matrix elements M corresponding to potential loads which
may be involved in a subassembly contact (i,jf3iP)•
n,n
~ J!(j-l
(i-1,3+1,1,0.) - i H(i-:i
11(1-1, j..l, J,q) ^h(i-l
(1-1, j+1,2) ,~p(i,j,5),^}
(i-l,o+l, 3) ,~p(i,3,3), JL\
R(i,3,2,q)
L,3.V
-
^
f: H{i,3,^(1,1,3-1,3)
q = 1, 2 and 3.
Table 4 Matrix elements M corresponding to potential unknownsin, n
«. .(0) and ß. .(0) which may be involved in contacts of a
subassembly (i,j). Cases 1, 2 and 3 are related to subassem-
bly contacts (i,3,l,p), (i,j,2,p) and (i,3,3.p). respectively.
Car.o 1
If ?' (ill ,j)=-0, tliece Plo:r;ciil,D arc not included in (li ) .
Case 2
Case 3
* if r (i,3+l)--^0, this tiloment is not included in
a. .(0)
, a, ;.)
* If ?" (i-l,3+l)--0, thedo elements are not included in (li ).
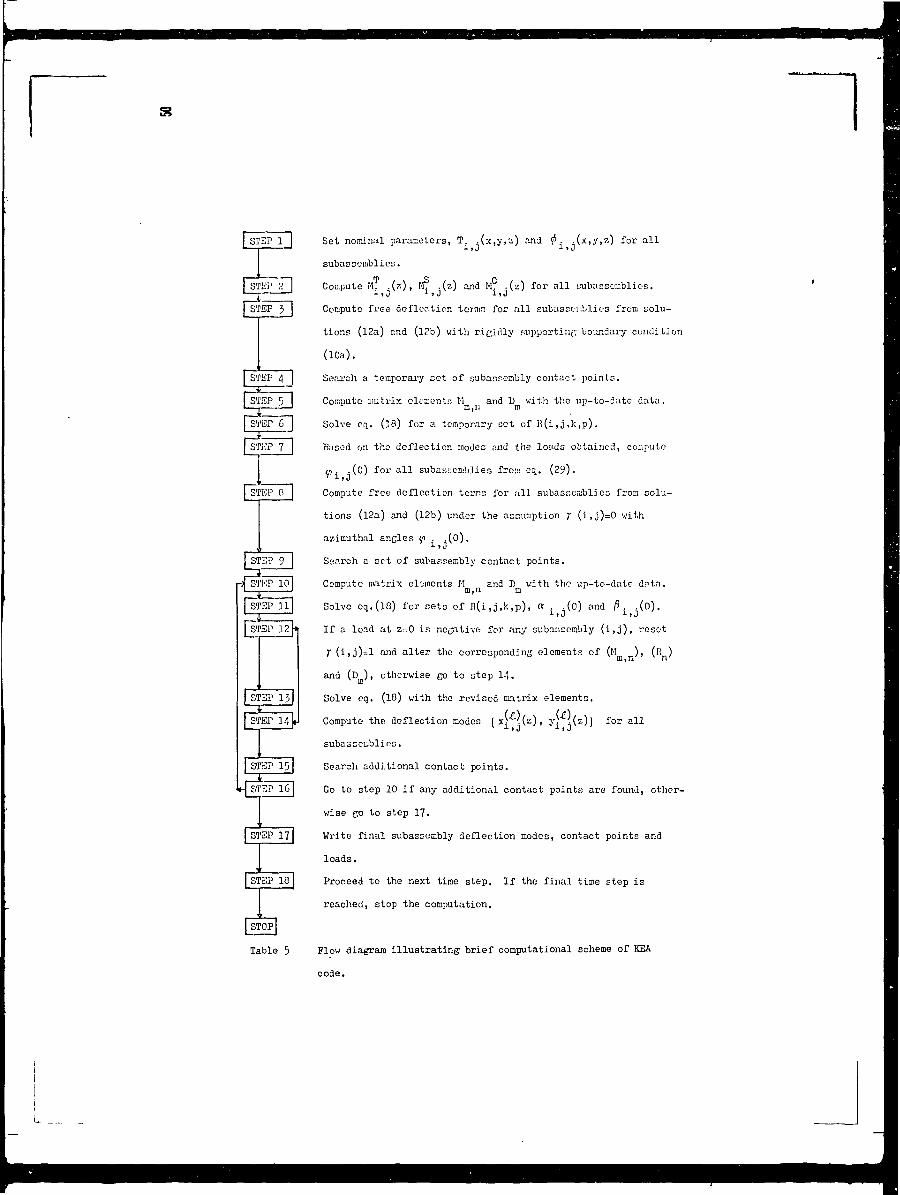
I STEP 1 |
STEP 9
| STEP 14
STEP 15|
e| STEP 16]
STEP 17
STEP 18
Set nominal parameters, T. .(x,y,s) and 0. .(x,y,z) for all1 J J ^ I J
subassemblies.
Compute H .(?.). M -(s) and M? . (z) for a l l subasEeaiblics.
Compute free deflection teraiR for a l l subascei'iblifes from solu-
tions (12a) and (12b) with rieidly Fupportinc; boundary condition
(10a).
Search a temporary cet of subasrenbly contact points.
Compute matrix elements M and D with the up-to-date data.* m,n m
Solve cq. (18) for a temporary set of R( i , j ,k ,p ) .
Based on the deflection modes and the loads obtained, confute
m . .(0) for a l l subasseniblies from eq. (29).
Compute free deflection terms for al l subasr.cinbli es from solu-
tions (12a) and (12b) under the assumption y ( i , j)=0 with
azimuthal anßles y . . (0).
Search a set of subassembly contact points.
Compute matrix el-.-ments M and I) with the up-to-date data.m,n m
Solve eq.(l8) for seta of H(i , j ,k ,p) , a . .(o) and ß. .(o).
If a load at z=0 i s notjativc; for any subassembly ( i , j ) , reset
7 ( i , j )= l and a l te r the corresponding elements of (M ), (li )ID jli il
and (D, ), otherwise go to step 14.
Solve eq. (10) with the revised matrix elements.
Compute the deflection modes Ixp(s), yr((z)] for all
subasseublins.
Search additional contact polnt3.
Go to step 10 if any additional contact points are found, other-
wise GO to step 17.
Write final subassembly deflection modes, contact points and
loads.
Proceed to the next time step. If the final time step is
reached, stop the computation.
Flow diagram illustrating brief computational scheme of KEA
code.
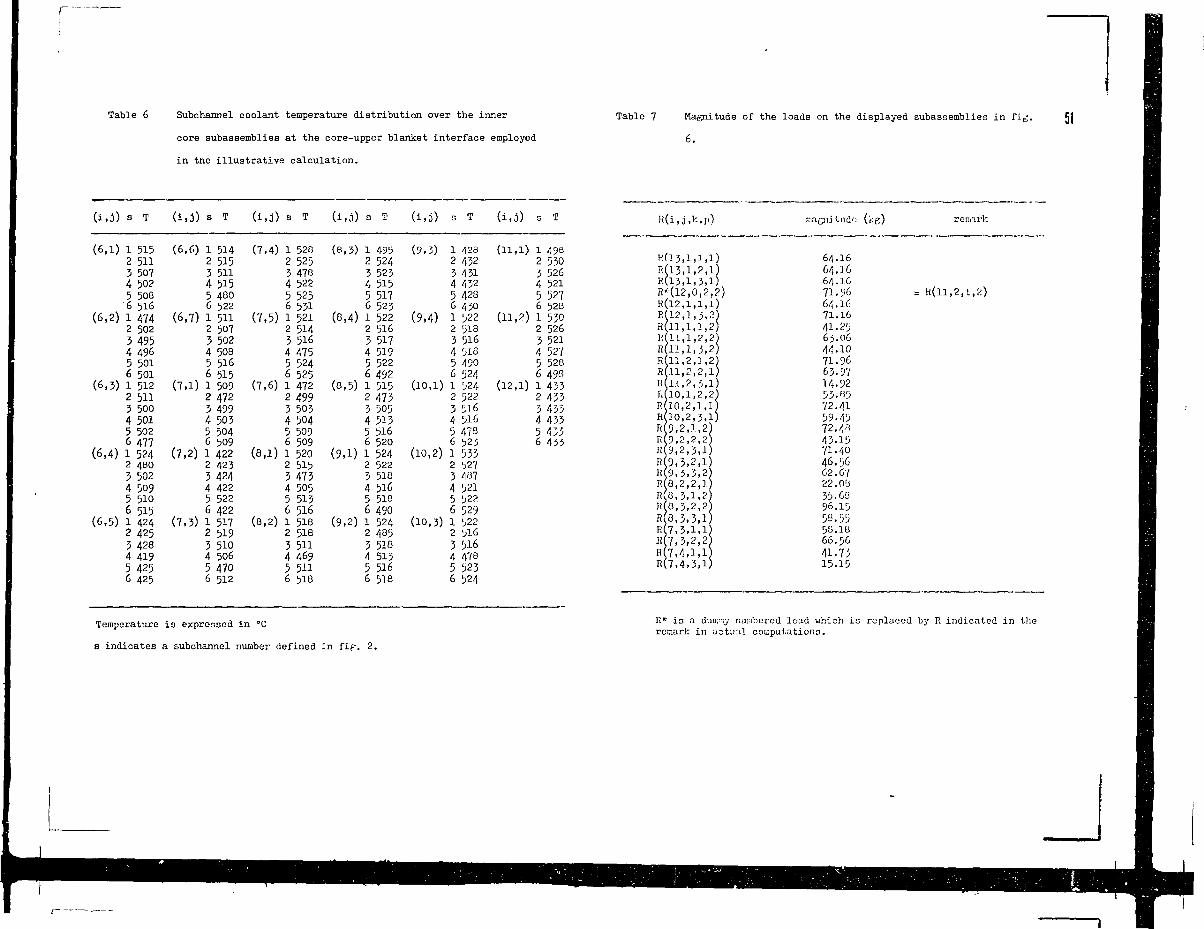
Table 6 Subchannel coolant temperature distribution over the inner
core subaasemblies at the core-upper blanket interface employed
in tne illustrative calculation.
Table 7 Magnitude of the loads on the displayed subassemblies in fig. 51
s T
(6,1) 515511507502508
(6,2)6 516
(6,3)
474502495496501501512
2 511
(i.J) s T 3 T
(6,6) 1 5142 5153 5114 515480
(6,7)6 522
(7,1)
3 5004 5015 5026 477
(6.4) 1 524 (7,2)2 4805 5024 5095 5106 515
(6.5) 1 424 (7,3)2 4253 4284 4195 4256 425
511507502508516
6 5151 5092 4723 4994 503504509422423424422522422517519
3 5104 5065 4706 512
(7,4) 1 528 (8,3)
(7,5)
(7,6)
(8,1)
(8,2)
525478
4 5225 5256 531521514516
4 4755 5246 525472499503504509
6 509520515473505515516518518
3 5114 4695 5116 5I8
1 4952 5243 5234 5155 5176 523
(8,4) 1 5222 5163 517519522492515473505
(8,5)
4 5135 5166 520
(9,1) 1 5242 522518516518490524485
3 5184 5135 5166 518
(9,2)
(9,3) 1 428 (11,1)2 4323 431
(9,4)
4 4325 4286 430522518
518490
3 516456 524
(10,1) 1 5242 5223 5164 5165 4786 5231 533527407521522529522516516
(10,2)
(10,3)
4 478523524
498530526
4 5215 5276 528
(11,2) 1 5302 5263 5214 527
(12,1)
528498433433435433
5 4356 433
K(i,3,k,p)
RÜ3,1,1,1)R(13,1,2,1)R(13,1,3,1)R*(l2,0,2,2)R(12,1,1,1)RR]<
RSRRRRRHRKRRRRRRRRRR
12,1,3,211,1,1,211,1,2,211,1,3,211,2,1,211,2,2,111,2,3,110,1,2,2)10,2,1,1)10,2,3,1)9,2,1,2)9 ,2 ,2 ,2 )9,2,3,1)9,3,2,19,3,3,28,2,2,18,3,1,2)0,3,2,2)8,3,3,1)7,3,1,1)7,3,2,2)7,4,1,1)7,4,3,1 )
magnitude (kg]
64.I664.1664.I671.9664.I671.1641.2563.O644.1071.9663.9714.9253.8572.4159-4572./|043.1571.4046.5662.6722.0335.6096.1558.555S.1866.5641.7315.15
remark
Temperature is expressed in °C
s indicates a subchannel number defined in fip. 2.
R* is a duir.-iy numbered load which is replaced by R indicated in theremark in actual coLoputationo.
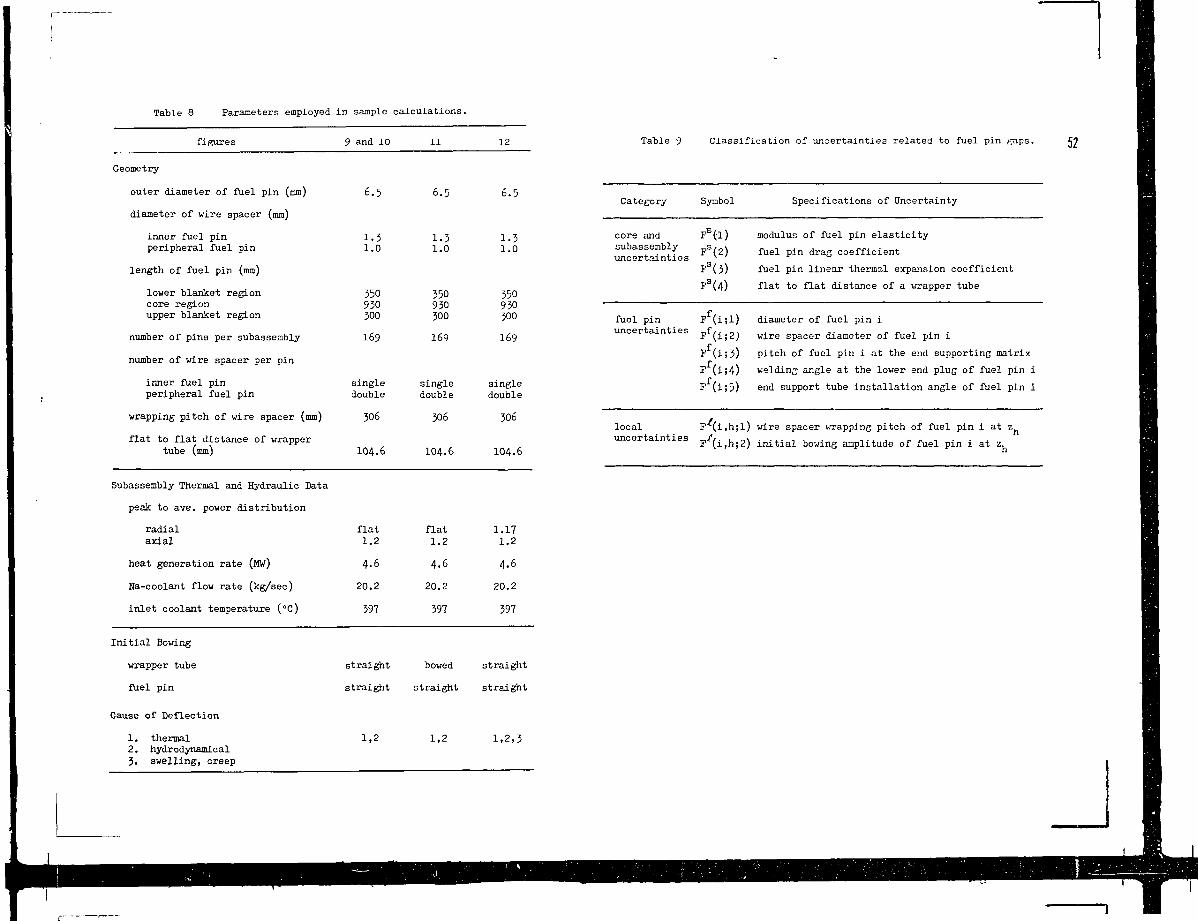
Table 8 Parameters employed in sample calculations.
figures 9 and 10 11 12 Table 9 Classification of uncertainties related to fuel pin gnps. 52Geometry
outer diameter of fuel pin (mm)
diameter of wire spacer (mm)
inner fuel pinperipheral fuel pin
length of fuel pin (mm)
lower blanket regioncore region
upper blanket region
number of pins per subassembly
number of wire spacer per pininner fuel pinperipheral fuel pin
wrapping pitch of wire spacer (mm)
flat to flat distance of wrappertube (mm)
6.5
1.31.0
350930300
169
Subassembly Thermal and Hydraulic Data
peak to ave. power distribution
radialaxial
heat generation rate (MW)
Na-coolant flow rate (kg/sec)
inlet coolant temperature (°C)
Initial Bowing
wrapper tube
fuel pin
6.5
1.31.0
350930300
169
6.5
1.31.0
350930300
169
singledouble
306
104.6
singledouble
306
104.6
singledouble
306
104.6
flat1.2
4.6
20.2
397
flat1.2
4.6
20.2
397
1.171.2
4.6
20.2
397
straight bowed straight
straight straight straight
Category Symbol Specifications of Uncertainty
core andsubassemblyunc ertainti e s
fuel pin
FE(l) modulus of fuel pin elasticity
Fs(2) fuel pin drag coefficient
Fs(3) fuel pin linear thermal expansion coefficient
F (4) flat to flat distance of a wrapper tube
Ff(i;l) diameter of fuel pin i
uncertainties F f ( i ; 2 ; w i r e spacer diameter of fuel pin i
F (i;3)
F (i;4)
pitch of fuel pin i at the end supporting matrix
welding angle at the lower end plug of fuel pin i
end support tube installation angle of fuel pin i
local F^i,h;l) wire spacer wrapping pitch of fuel pin i at z
uncertainties p/(ijh.2) initial bowing amplitude of fuel pin i at z
Cause of Deflection
1. thermal2. hydrodynamical3. swelling, creep
1,2 1,2 1,2,3
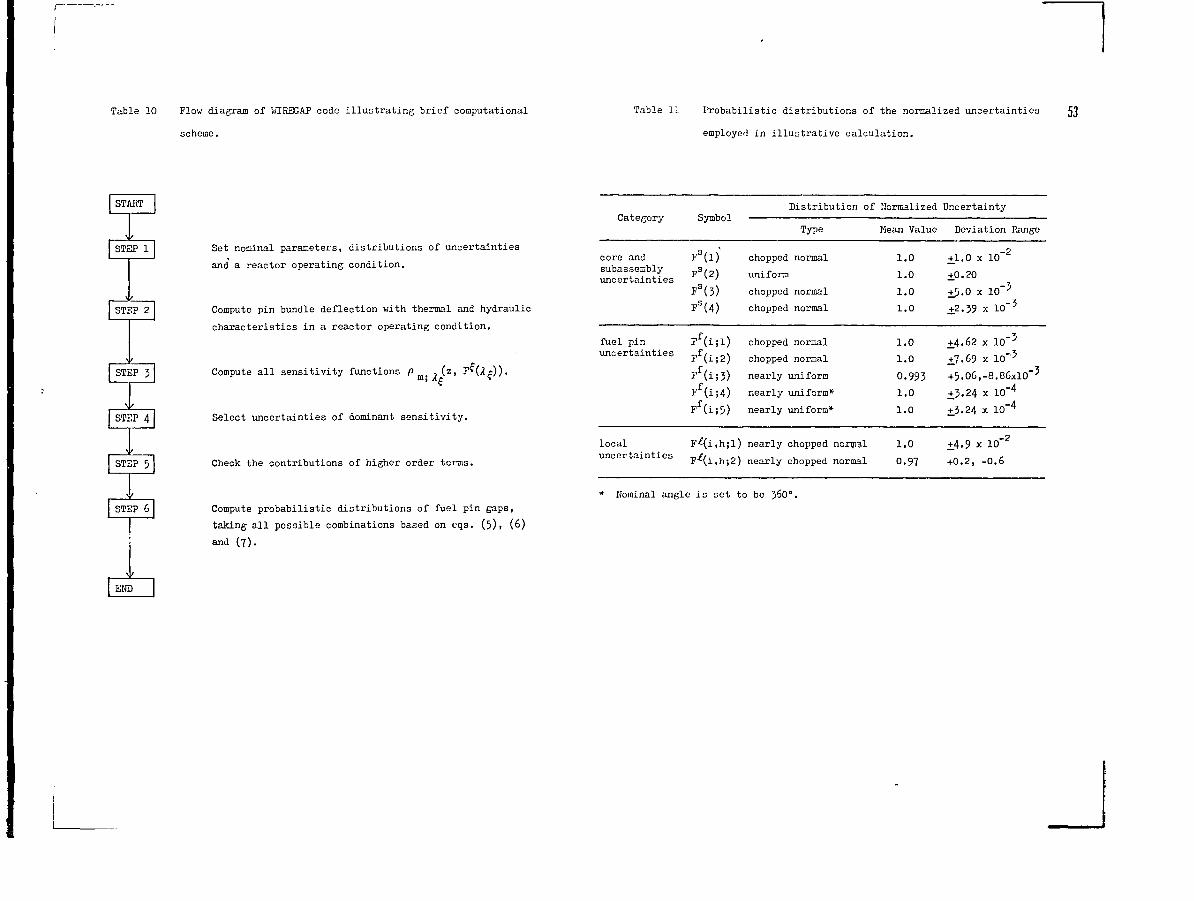
Table 10 Flow diagram of WIREGAP code illustrating brief computational
scheme.
Table 11 Probabilistic distributions of the normalized uncertainties
employed in illustrative calculation.
53
START
\STEP
v
STEP
STEP
\STEP
STEP
STEP
1
2
3
4
5
6
iEND
Set nominal parameters, distributions of uncertainties
and a reactor operating condition.
Compute pin bundle deflection with thermal and hydraulic
characteristics in a reactor operating condition.
Compute all sensitivity functions p , - (z,
Select uncertainties of dominant sensitivity.
Check the contributions of higher order terms.
Compute probabilistic distributions of fuel pin gaps,
taking all possible combinations based on eqs. (5), (6)
and (7).
Category
core andsubassemblyuncertainties
fuel pinuncertainties
localuncertainties
Symbol
FS(Dr
FS(2)
Fs(3)
Fs(4)
Ff(i;l)
Ff(i;2)
Ff(i;3)
Ff(i;4)
Ff(i;5)
F^i.hjl)
F^i,h;2)
Distribution of
Type
chopped normal
uniform
chopped normal
chopped normal
chopped normal
chopped normal
nearly uniform
nearly uniform*
nearly uniform*"
nearly chopped normal
nearly chopped normal
normalized
Mean Value
1.0
1.0
1.0
1.0
1.0
1.0
0.993
1.0
1.0
1.0
0.97
Uncertainty
Deviation Range
+1.0 x 10"2
+0.20
+5.0 X 10" 5
±2.39 x 10" 5
±4.62 x 10" 3
£7.69 x 10" 3
+5.06,-8.86x10"3
+3.24 x 10" 4
+.3.24 x 10" 4
+4.9 x 10" 2
+0.2, -0.6
* Nominal angle is set to be 36O0.
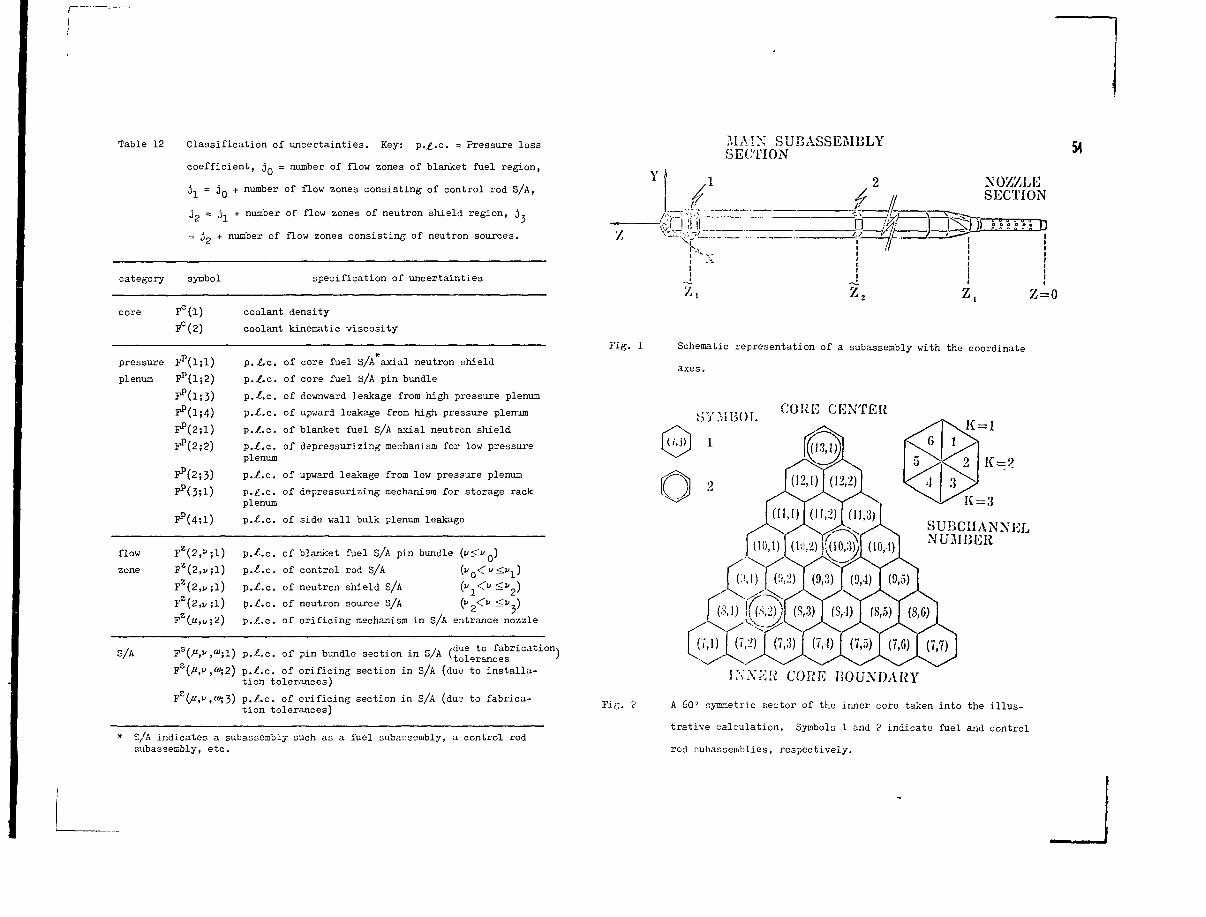
Table 12 Classification of uncertainties. Key: p./.c. = Pressure loss
coefficient, j Q = number of flow zones of blanket fuel region,
0-, = JQ + number of flow zones consisting of control rod S/A,
j = j + number of flow zones of neutron shield region, j ,
= 3 2 + number of flow zones consisting of neutron sources.
category symbol specification of uncertainties
F°(l) coolant density
F (2) coolant kinematic viscosity
pressure
plenum
^(1:4)
Fp(2;2)
FP(2;3)
P./.O.
p./.c.
p./.c.
p./.c.plenum
p./.c.
p./.c.plenum
p./.c.
of core fuel S/A axial neutron shield
of core fuel S/A pin bundle
of downward leakage from high pressure plenum
of upward leakage from high pressure plenum
of blanket fuel s/A axial neutron shield
of depressurizing mechanism for low pressure
of upward leakage from low pressure plenum
of depressurizing mechanism for storage rack
of side wall bulk plenum leakage
flow Fz(2,";l) p./.c. of blanket fuel S/A pin bundle ("<"0)
zone FZ(2,i/;l) p./.c. of control rod S/A (1/ <y<>/ )
FZ(2,i>;l) p./.c. of neutron shield S/A (y <V <V^)
FZ(2,^;l) p./.c. of neutron source S/A (",<" —"5)
F (u,i,;2) p./.c. of orificing mechanism in S/A entrance nozzle
S/A Ts{M,»,»>il) p./.c. of pin bundle section in S/A (to
Ys(p,v ,<i>;2) p.I.e. of orificing section in s/A (due to installation tolerances)
p./.c. of orificing section in S/A (due to fabrica-tion tolerances)
* S/A indicates a subassembly such as a fuel subassembly, a control rodsubassenbly, etc.
Y
Fig. 2
MAJN SUBASSEMBLYSECTION
2
y-JL
54
NOZZLESECTION
HF-
z, z=o
Fig. 1 Schematic representation of a subassembly with the coordinate
axes.
CORE CENTERK =
2 K = ?
K=3
SUBCHANNELNU3IBER
(8,1) |f(S,2))| (S,3) I (8,1) I (8,5) I (8,6)
(ID (7,2) (7,
INXKK CORE BOUNDARY
A 60' symmetric sector of the inner core taken into the illus-
trative calculation. Symbols 1 and 2 indicate fuel and control
rod subassemblies, respectively.
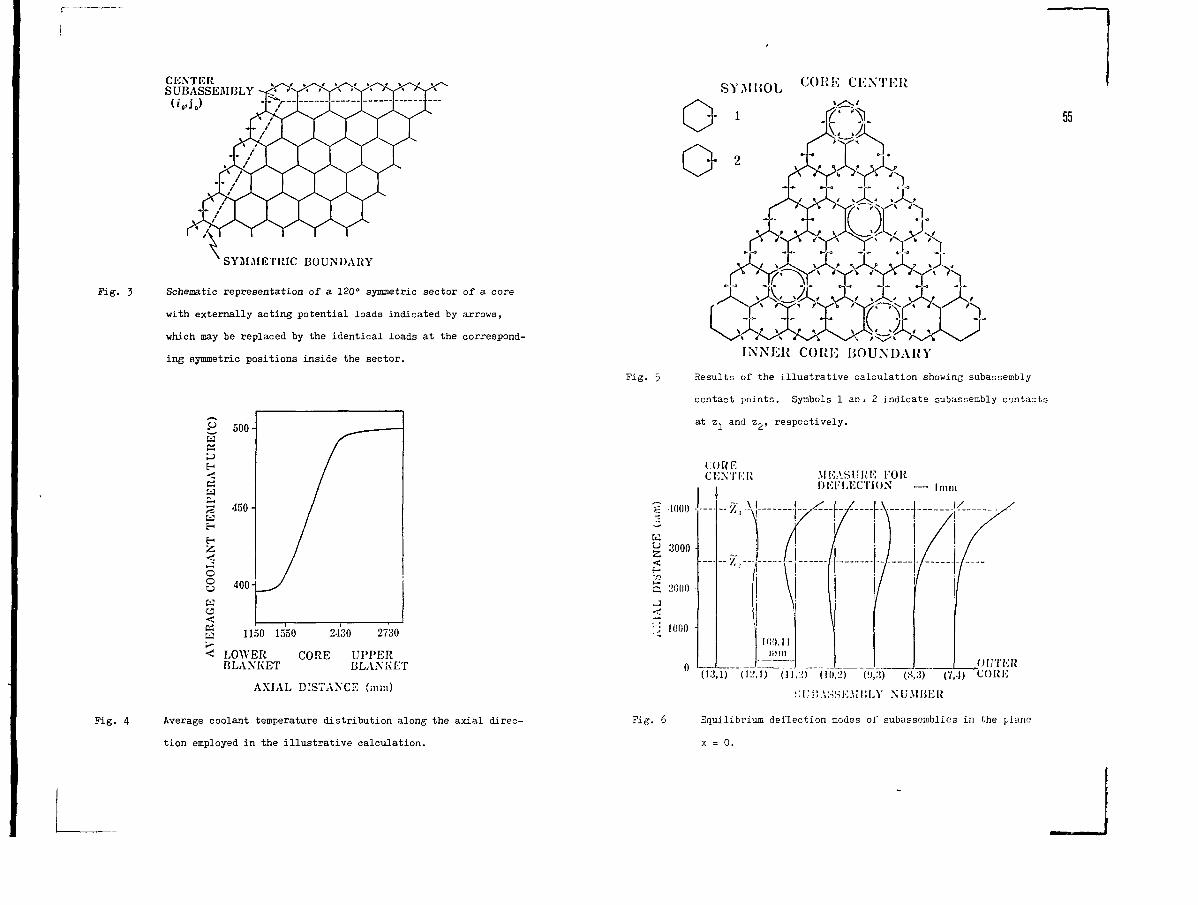
CENTERSUBASSEMBLY
SYMMETRIC BOUNDARY
Fig. 3 Schematic representation of a 120° symmetric sector of a core
with externally acting potential loads indicated by arrows,
which may be replaced by the identical loads at the correspond-
ing symmetric positions inside the sector.
BS
a
CO
OL
AI
AG
E
500-
450-
400-
/
/
JK 1150 1550 2-130
5 LOWER COREBLANKET
2730
UPPERBLANKET
AXIAL DISTANCE (mm)
Fig. 4 Average coolant temperature distribution along the axial direc-
tion employed in the illustrative calculation.
SYMBOL C 0 U ! ' ' CENTER
1 55
INNER COKE BOUNDARY
Fig. 5 Results of the illustrative calculation showing subasseinbly
contact points. Symbols 1 an J. 2 indicate subasseinbly contacts
at z. and 7.r, respectively.
CORECENTER MEASURE I'OR
DEFLECTION — !,„„,
H-/--HV"-}"-",g 1000 -
^ 3000 •
t-p.
a 2000 •j
;'; 1000 •
.OUTER(1L',1) (11,2) (10,2) (!),:!) (S,:i) (7,1) CORE
SUii.VSSEMBLY NUMBER
Fig. 6 Equilibrium deflection modes of subassemblies in the plane
x = 0.
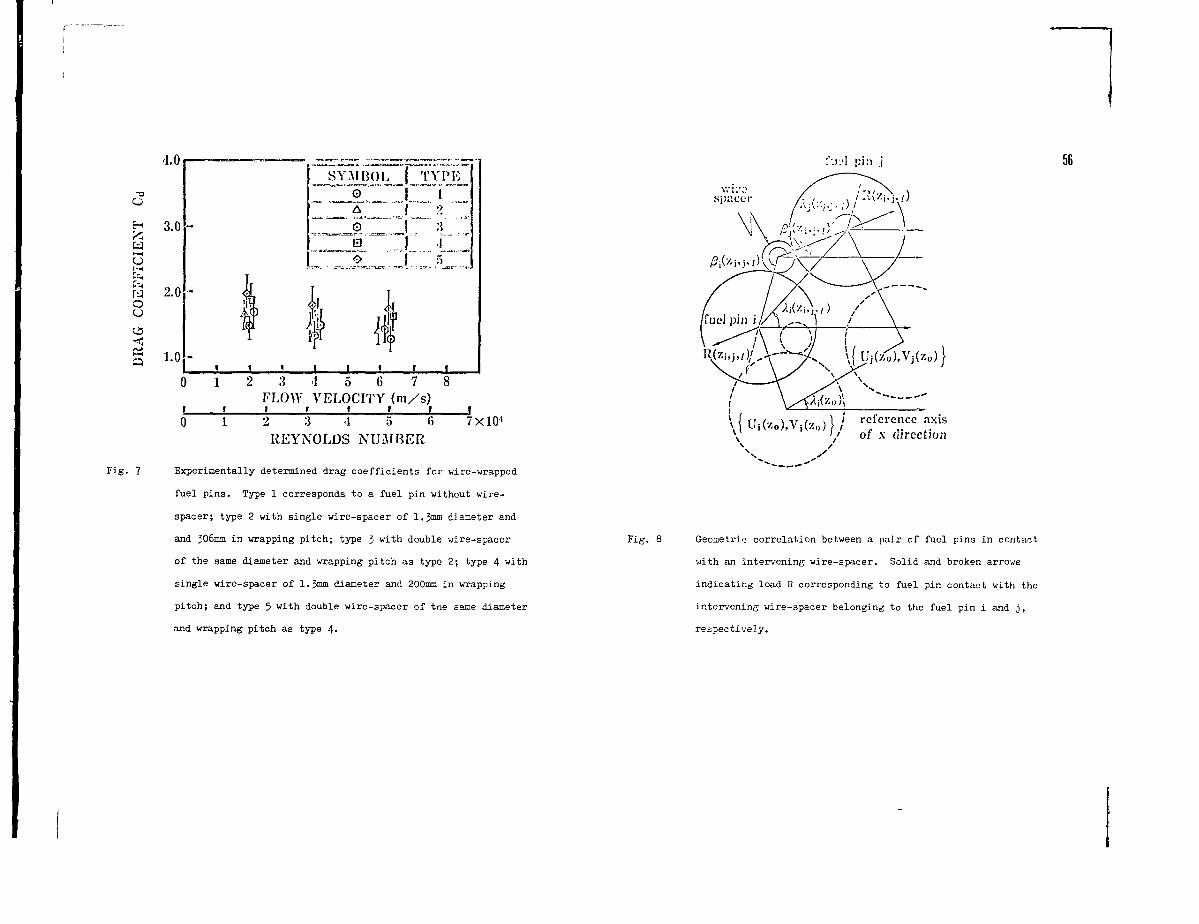
oo
Fig. 7
4.0
3.0
2.0
1.0
SYMBOL
Tu
TYPE
61 2 3 4 5FLOW VELOCITY (m/s)
! I I I I I I1 2 3 4 5«
REYNOLDS NUMBER7X104
Experimentally determined drag coefficients for wire-wrapped
fuel pins. Type 1 corresponds to a fuel pin without wire-
spacer; type 2 with single wire-spacer of 1.3mm diameter and
and 306mm in wrapping pitch; type J with double wire-spacer
of the same diameter and wrapping pitch as type 2; type 4 with
single wire-spacer of 1.3mm diameter and 200mm in wrapping
pitch; and type 5 with double wire-spacer of trie same diameter
and wrapping pitch as type 4.
fj?I pin j
spacer
56
, \\ ' reierence axis',' of x direction
Pig. 8 Geometric correlation between a pair of fuel pins in contact
viith an intervening wire-spacer. Solid and broken arrows
indicating load R corresponding to fuel pin contact with the
intervening wire-spacer belonging to the fuel pin i and j,
respectively.
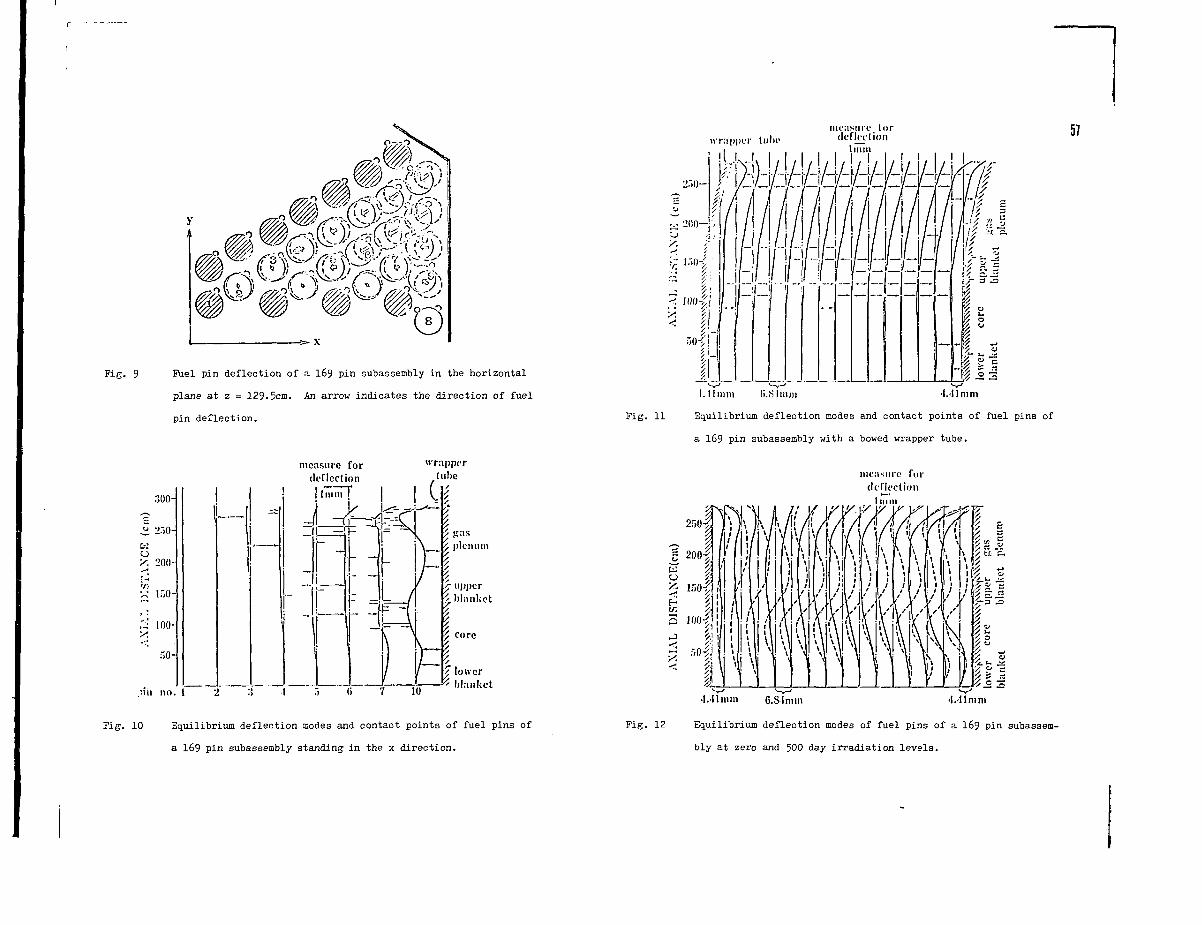
Fig. 9 Fuel pin deflection of a 169 pin subassembly in the horizontal
plane at z = 129.5cm. An arrow indicates the direction of fuel
pin deflection.
measure fordeflection
300-
Ü 250-KU
y, 200-
ir,o-100
r>o-
no. 1 2 5 (i 7 10
wrapperlube
__ J plenum
upperblanket
core
lower
blanket
Fig. 10 Equilibrium deflection modes and contact points of fuel pins of
a 169 pin subassembly standing in the x direction.
wrapper
I
57
I. II mm (i.Sliiiin 1.11 mm
Fig. 11 Equilibrium deflection modes and contact points of fuel pins of
a 169 pin subassembly with a bowed wrapper tube.
measure fordeflection
1 in 111
1.11 mm 6.81mm 'l.'llmm
Fig. 12 Equilibrium deflection modes of fuel pins of a I69 pin subasaem-
bly at zero and 500 day irradiation levels.
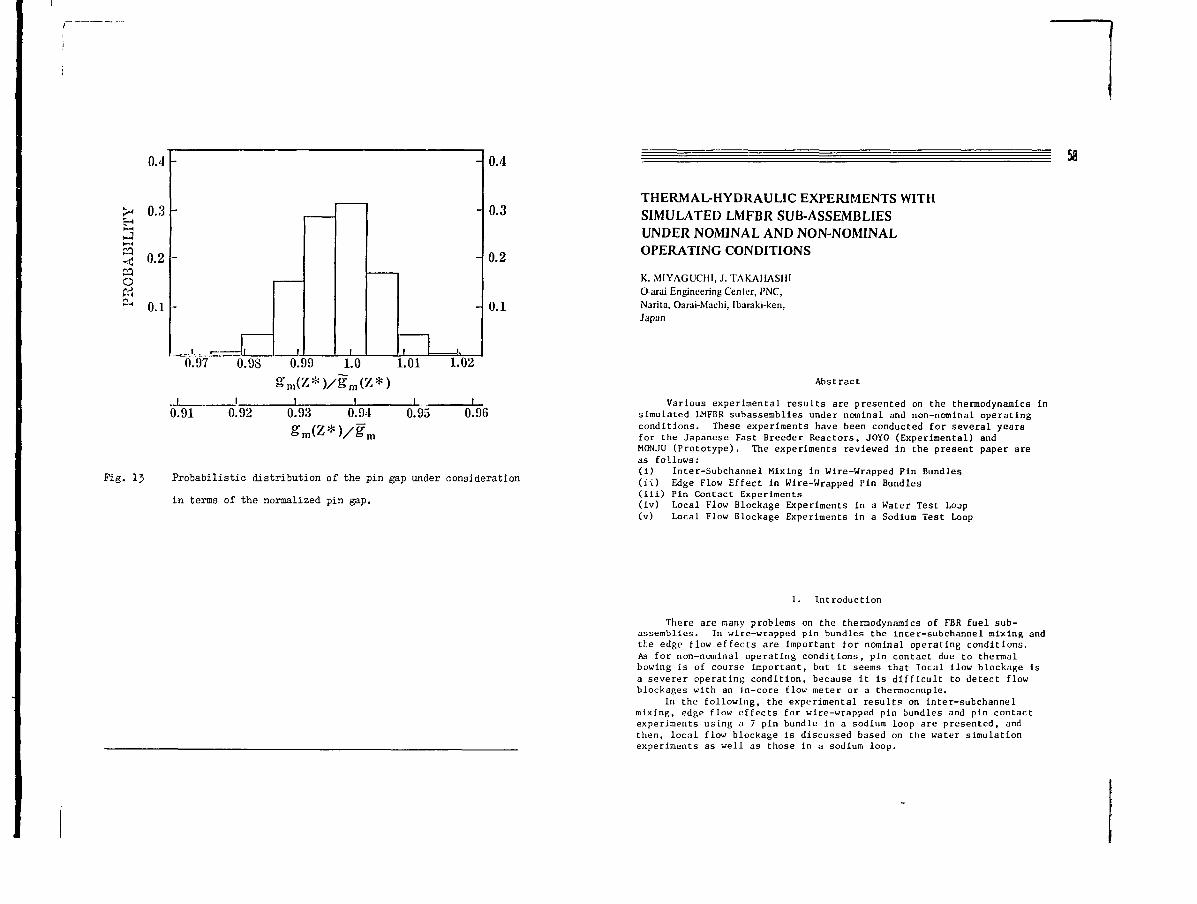
0.4
>< 0.3H
" 0.2
O
C H 0 .1
-
-
L _J
-
71 ,
- 0.4
0.3
0.2
-10.1
0.97 0.9S 0.99 1.0 1.01 1.02
.j i I I I i_0.91 0.92 0.93 0.94 0.95 0.96
gm(Z*)/gm
Pig. 13 Probabilistic distribution of the pin gap under consideration
in terms of the normalized pin gap.
THERMAmYDRAULIC EXPERIMENTS WITHSIMULATED LMFBR SUB-ASSEMBLIESUNDER NOMINAL AND NON-NOMINALOPERATING CONDITIONS
K. MIYAGUCHI, J. TAKAHASHIO-arai Engineering Center, PNC,Narita, Oarai-Machi, Ibaraki-ken,Japan
Abstract
Various experimental results are presented on the thermodynamics insimulated LMFBR subassemblies under nominal and non-nominal operatingconditions. These experiments have been conducted for several yearsfor the Japanese Fast Breeder Reactors, JOYO (Experimental) andMONJU (Prototype). The experiments reviewed in the present paper areas follows:(i) Inter-Subchannel Mixing in Wire-Wrapped Pin Bundles(ii) Edge Flow Effect in Wire-Wrapped Pin Bundles(iii) Pin Contact Experiments(iv) Local Flow Blockage Experiments in a Water Test Loop(v) Local Flow Blockage Experiments in a Sodium Test Loop
1. Introduction
There are many problems on the thermodynamics of FBR fuel sub-assemblies. In wire-wrapped pin bundles the inter-subchannel mixing andthe edge flow effects are important for nominal operating conditions.As for non-nominal operating conditions, pin contact due to thermalbowing is of course important, but it seems that local flow blockage isa severer operating condition, because it is difficult to detect flowblockages with an in-core flow meter or a thermocouple.
In the following, the experimental results on inter-subchannelmixing, edge flow effects for wire-wrapped pin bundles and pin contactexperiments using a 7 pin bundle in a sodium loop are presented, andthen, local flow blockage is discussed based on the water simulationexperiments as well as those in a sodium loop.
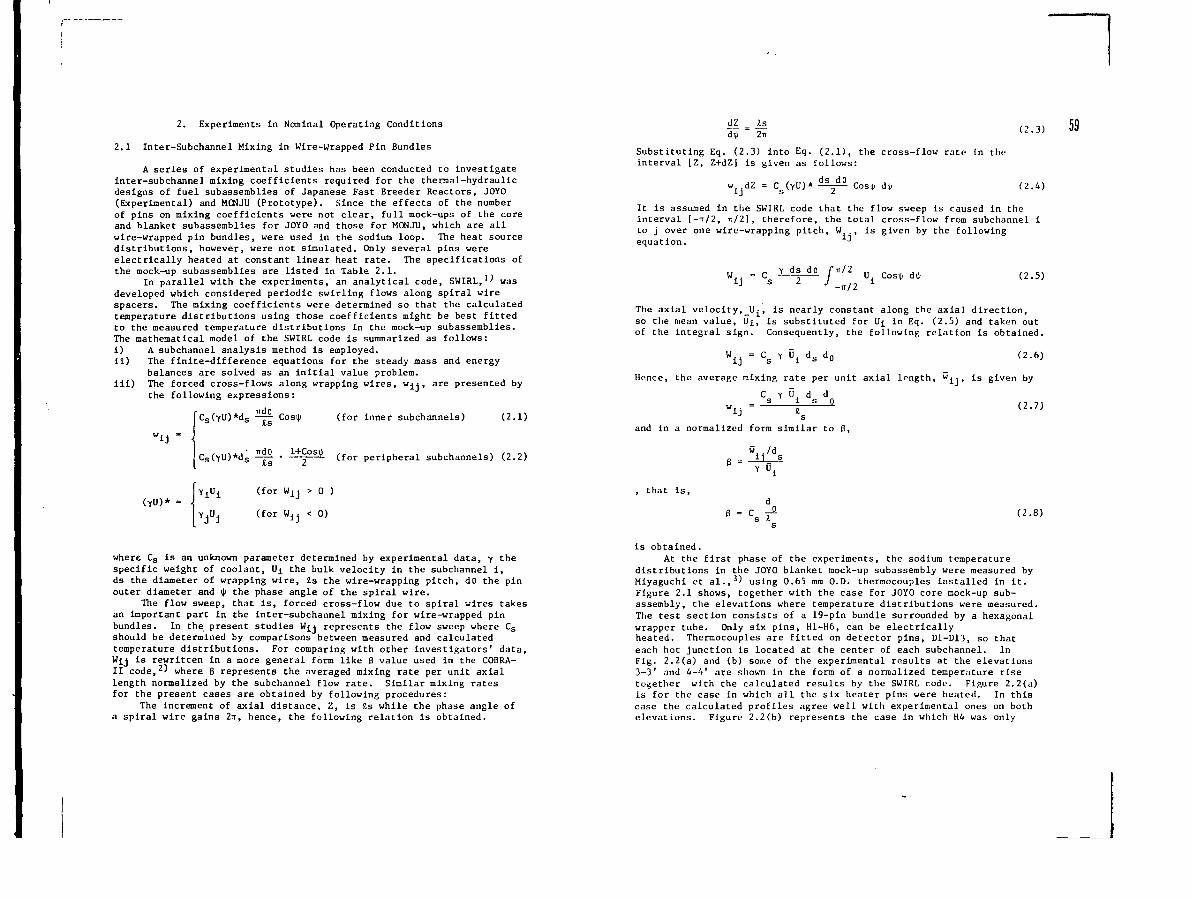
2. Experiments in Nominal Operating Conditions
2.1 Inter-Subchannel Mixing in Wire-Wrapped Pin Bundles
A series of experimental studies has been conducted to investigateinter-subchannel mixing coefficients required for the thermal-hydraulicdesigns of fuel subassemblies of Japanese Fast Breeder Reactors, JOYO(Experimental) and MCNJU (Prototype). Since the effects of the numberof pins on mixing coefficients were not clear, full mock-ups of the coreand blanket subassemblies for JOYO and those for MONJU, which are allwire-wrapped pin bundles, were used in the sodium loop. The heat sourcedistributions, however, were not simulated. Only several pins wereelectrically heated at constant linear heat rate. The specifications ofthe mock-up subassemblies are listed in Table 2.1.
In parallel with the experiments, an analytical code, SWIRL,'^ wasdeveloped which considered periodic swirling flows along spiral wirespacers. The mixing coefficients were determined so that the calculatedtemperature distributions using those coefficients might be best fittedto the measured temperature distributions in the mock-up subassemblies.The mathematical model of the SWIRL code is summarized as follows:i) A subchannel analysis method is employed.ii) The finite-difference equations for the steady mass and energy
balances are solved as an initial value problem.iii) The forced cross-flows along wrapping wires, wj4, are presented by
the following expressions:
(TU)'
Cs(YU)*ds -fL cos*
Cs(YU)*ds ^
(for W ^ > 0 )
(for W,• < 0)
(for inner subchannels) (2.1)
(for peripheral subchannels) (2.2)
where Cs is an unknown parameter determined by experimental data, y thespecific weight of coolant, Ui the bulk velocity in the subchannel i,ds the diameter of wrapping wire, Jls the wire-wrapping pitch, do the pinouter diameter and I|I the phase angle of the spiral wire.
The flow sweep, that is, forced cross-flow due to spiral wires takesan important part in the inter-subchannel mixing for wire-wrapped pinbundles. In the present studies W y represents the flow sweep where Cs
should be determined by comparisons between measured and calculatedtemperature distributions. For comparing with other investigators' data,W^j is rewritten In a more general form like B value used in the COBRA-II code,2) where 3 represents the averaged mixing rate per unit axiallength normalized by the subchannel flow rate. Similar mixing ratesfor the present cases are obtained by following procedures:
The increment of axial distance, Z, is £s while the phase angle ofa spiral wire gains 2TT, hence, the following relation is obtained.
dZ2n
Substituting Eq. (2.3) into Eq. (2.1), the cross-flow rate in theinterval [Z, Z+dZ] is given as follows:
w dZ = C S ( Y U ) * d S
2d ° Cos* d*
(2.3)
(2.4)
It is assumed in the SWIRL code that the flow sweep Is caused in theinterval [--/2, it/2], therefore, the total cross-flow from subchannel ito j over one wire-wrapping pitch, W. ., is given by the followingequation.
W. .,
59
y ds do /•TI/2
"ij s 2/ U Cos* d*J -TT/2
(2.5)
The axial velocity, U^, is nearly constant along the axial direction,so the mean value, Ui, is substituted for Ui in Eq. (2.5) and taken outof the integral sign. Consequently, the following relation is obtained.
Ui (2.6)s • "± " s " 0
Hence, the average mixing rate per unit axial length, w..9 is given by
C y Ü. d ds 1 s 0
Tand in a normalized form similar Co ß,
Vds
( 2- 7 )
that is,
_ c
d
I(2.8)
is obtained.At the first phase of the experiments, the sodium temperature
distributions in the JOYO blanket mock-up subassembly were measured byMiyaguchi et al.,3) using 0.65 mm O.D. thermocouples installed in it.Figure 2.1 shows, together with the case for JOYO core mock-up sub-assembly, the elevations where temperature distributions were measured.The test section consists of a 19-pin bundle surrounded by a hexagonalwrapper tube. Only six pins, H1-H6, can be electricallyheated. Thermocouples are fitted on detector pins, D1-D13, so thateach hot junction is located at the center of each subchannel. InFig. 2.2(a) and (b) some of the experimental results at the elevations3-3' and 4-4' are shown in the form of a normalized temperature risetogether with the calculated results by the SWIRL code. Figure 2.2(a)is for the case in which all the six heater pins were heated. In thiscase the calculated profiles agree well with experimental ones on bothelevations. Figure 2.2(b) represents the case in which H4 was only
heated. This case was done to investigate the effect of the swirlingflow between the wrapper tube and the peripheral pins and to confirmthe flow sweep rate in peripheral subchannels. As a whole, the calculatedresults agree well with the experimental ones also in this case, but atthe elevation 3-3' some discrepancies between the calculation and theexperiment are found since the radial temperature profile is so steepat the elevation that experimental errors are large. In the abovecalculations the coefficients for flow sweep, Cs, are identical for bothcases. In the present study the Cs value for Reynolds number = 20000 is0.7 for inner region, 2.0 for peripheral one and 0.35 between inner andperipheral ones, respectively. For other temperature profiles, notcited in the present paper, good agreements between calculations andexperiments were obtained using the same Cs values. This fact indicatesthat the Cs values decided from the present experiment may be appliedto any temperature calculations in the same geometry as the present testsection.
After the first phase of the experiments, similar experiments wereconducted by K. Takahashi et al. for the JOYO and M0NJU core subassem-blies.'*)»5) Some of the results are shown in Fig. 2.3 to Fig. 2.5.Figures 2.3(a) and (b) show the measured temperature profiles togetherwith calculated results by the SWIRL code for a 91-pin bundle simulatingJOYO core subassembly. The calculated results agree well with theexperimental ones in this case, too. Figures 2.4(a) and (b) show thesimilar temperature profiles for a 169-pin bundle simulating MONJU coresubassembly. In MONJU mock-up subassembly axial temperature distribu-tions were also measured which are shown in Fig. 2.5(a) and (b).Figures 2.4 and 2.5 indicate that the calculated results by the SWIRLcode are consistent with the experimental data not only in horizontalprofiles but also in axial ones.
It can be said from all the above results that the SWIRT, code canbe applied even for large pin bundles. The Cs values determined by thecomparisons between the experimental data and the SWIRL calculations arelisted in Table 2.2. They tend to increase gradually with Reynolds number.
Normalized mixing rate, ß, for rfire-wrapped pin bundles seems to beinversly proportional to the slope of wrapping wire, as indicated in theexperiments by Baumann and Hoffmann.6) Therefore, a new parameter, K,as equated to ßx(£s/p) should be nearly constant for any wire-wrappedbundles. The comparison between the < values for our data and otherinvestigators' data is shown in Table 2.3. As expected, the table showsa nearly constant K value of about 0.6 except that the value based onMarian and Hines (No.l) is considerably large.
It is concluded from the present studies that the dimensionlessmixing rate, K, is nearly constant for many wire-wrapped pin bundleswith different p/d and different S.s/p and that the SWIRL code canpredict temperature distributions even for large pin bundles spaced byspiral wires.
2.2 Edge Flow Effect in Wire-Wrapped Pin Bundles
In a LMFBR fuel subassembly, the coolant temperature differencebetween the peripheral and the inner subchannels is considerably
large due to the edge flow effect. The coolant temperature differencedepresses reactor thermal efficiency and causes deflection of a fuel pinbundle. In thermal and hydraulic design of a prototype LMFBR, the edgeflow coefficient f„ is defined such that
ave"in
(2.9)
where w a v e is an averaged coolant flow rate per fuel pin while w^n isan averaged coolant flow rate per fuel pin belonging to the innersubchannels.10' Since the temperature form factor1'' of a subchannel isalmost proportional to fu, fu takes an important role in the design ofa fuel subassembly.
The performance of peripheral flow restraint devices in- differentdesign is evaluated by ITO et al.9) based on fuel subassembly flow testsusing a water loop. The corresponding values of fw were obtained byanalyzing the local subchannel coolant velocity fields in terms of themeasured pointwise flow velocities taking Into consideration the influenceof deformed subchannel configuration due to pin deflection underhydraulic effect. For the measurement of a pointwise coolant velocity,the temperature fluctuation correlation technique was used. Thirty fourpairs of thermocouple separated by 30mm to the flow direction weremounted on each fuel pin bundle and temperature fluctuation correlationfunctions were obtained by injecting a small amount of cold water to thesubchannel flow kept at about 80°C at the upstream of each pair ofthermocouple.
The fuel subasserablies brought into water flow tests consist of 169wire-spacered fuel pins arranged in a hexagonal lattice. The diametersof a fuel pin and a spacer-wire are 6.5mm and 1.3mm respectively and thep/d ratio is 1.215. Five types of fuel subassemblies were tested withor without different peripheral flow restraint devices as follows: 1. astandard subassembly without restraint device, 2. a subassembly whoseperipheral fuel pins are doubly wire-spacered with a wire of l.Oirmdiameter and the leading angle of 90°, 3. a similar subassembly to thesecond type with zero leading angle between two spacer-wires, 4. asubassembly whose spacer-wires are shaved at contact with wrapper tubeflats, and 5. a subassembly consisting of a standard fuel bundle withperipheral flow restraint bands welded on the inner flats of a wrappertube.
Some of the results obtained through the flow tests are as follows:
i) The edge flow effect was appreciably improved as shown in Fig. 2.6
by providing the peripheral fuel pins or the peripheral sub-
channels with flow restraint devices.ii) fw of the standard fuel subassembly of type 1 was about 1.09 while
those of the fuel subassemblies with flow restraint devices werebetween 1.03 and 1.06. The corresponding improvement in temper-ature form factor is about 2^5%.
iii) The present flow tests showed that fw may be evaluated based onthe temperature fluctuation correlation technique within theerror of ±0.016.
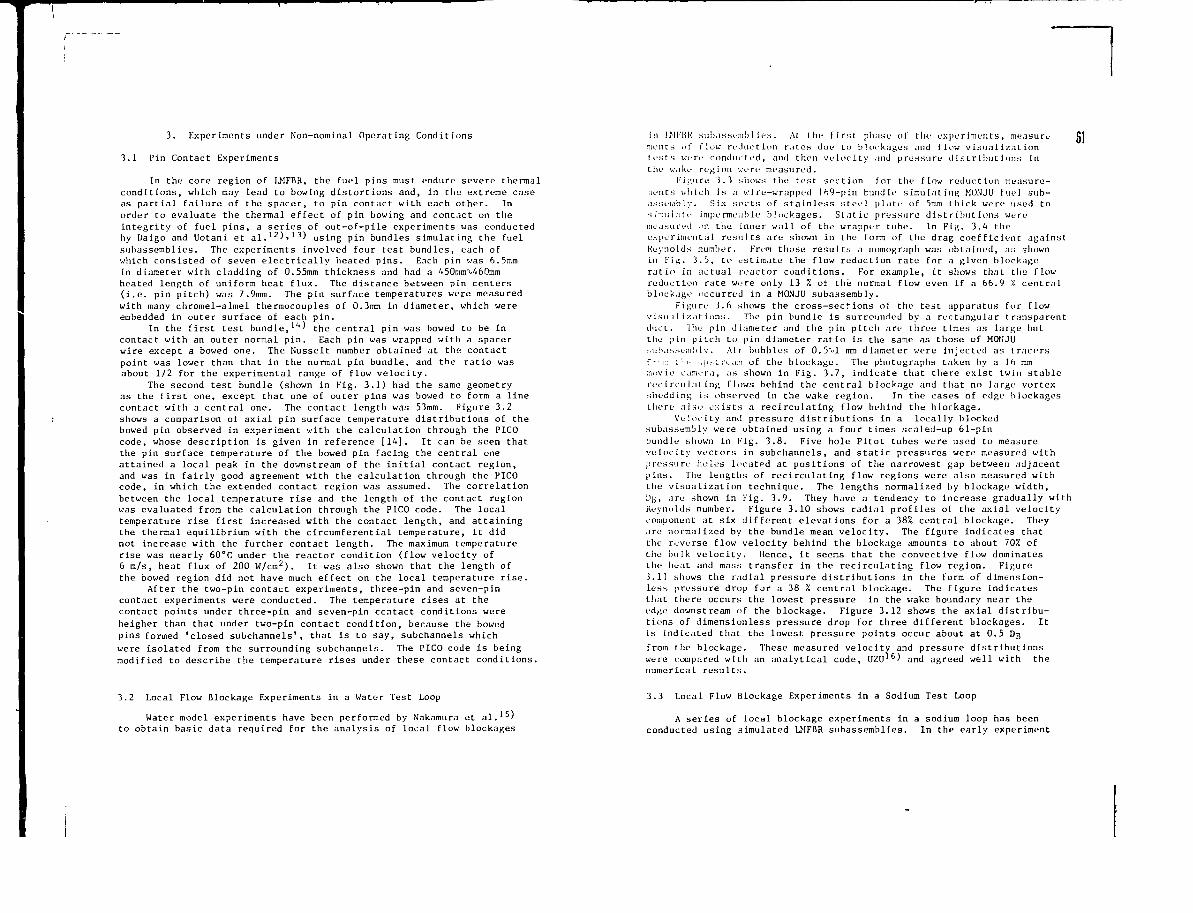
3. Experiments under Non-nominal Operating Conditions
3.1 Pin Contact Experiments
In the core region of LMFBR, the fuel pins must endure severe thermalconditions, which may lead to bowing distortions and, in the extreme caseas partial failure of the spacer, to pin contact with each other. Inorder to evaluate the thermal effect of pin bowing and contact on theintegrity of fuel pins, a series of out-of-pile experiments was conductedby Daigo and Uotani et al.12)>13) using pin bundles simulating the fuelsubassemblies. The experiments involved four test bundles, each ofwhich consisted of seven electrically heated pins. Each pin was 6.5mmin diameter with cladding of 0.55mm thickness and had a 450mim-46Ommheated length of uniform heat flux. The distance between pin centers(i.e. pin pitch) was 7.9mm. The pin surface temperatures were measuredwith many chromel-almel thermocouples of 0.3mm in diameter, which wereembedded in outer surface of each pin.
In the first test bundle, '**' the central pin was bowed to be incontact with an outer normal pin. Each pin was wrapped with a spacerwire except a bowed one. The Nusselt number obtained at the contactpoint was lower than that in the normal pin bundle, and the ratio wasabout 1/2 for the experimental range of flow velocity.
The second test bundle (shown in Fig. 3.1) had the same geometryas the first one, except that one of outer pins was bowed to form a linecontact with a central one. The contact length was 53mm. Figure 3.2shows a comparison of axial pin surface temperature distributions of thebowed pin observed in experiment with the calculation through the PICOcode, whose description is given in reference [14]. It can be seen thatthe pin surface temperature of the bowed pin facing the central oneattained a local peak in the downstream of the initial contact region,and was in fairly good agreement with the calculation through the PICOcode, in which the extended contact region was assumed. The correlationbetween the local temperature rise and the length of the contact regionwas evaluated from the calculation through the PICO code. The localtemperature rise first increased with the contact length, and attainingthe thermal equilibrium with the circumferential temperature, it didnot increase with the further contact length. The maximum temperaturerise was nearly 60°C under the reactor condition (flow velocity of6 m/s, heat flux of 200 W/cm 2). It was also shown that the length ofthe bowed region did not have much effect on the local temperature rise.
After the two-pin contact experiments, three-pin and seven-pincontact experiments were conducted. The temperature rises at thecontact points under three-pin and seven-pin ccntact conditions wereheigher than that under two-pin contact condition, because the bowedpins formed 'closed subchannels', that is to say, subchannels whichwere isolated from the surrounding subchannels. The PICO code is beingmodified to describe the temperature rises under these contact conditions.
3.2 Local Flow Blockage Experiments in a Water Test Loop
Water model experiments have been performed by Nakamura et al.15)to obtain basic data required for the analysis of local flow blockages
in LMI'BK subasscmbl ies. At Lhe first phase of the experiments, measure jj]raents .it flow reduction rates due to blockages and flow visualizationtests were conducted, and then velocity and pressure distributions inthe wake region were measured.
Figure 3.3 shows the test section for the flow reduction measure-ments which is a wire-wrapped 169-pin bundle simulating MONJLJ fuel sub-• isseubly. Six sorts of stainless steel plate of 5mm thick were used tosimulate impermeable blockages. Static pressure distributions weremeasured .n\ the inner wall of the wrapper tube. In Fig. 3.4 theexperiniental results are shown in the form of the drag coefficient againstReynolds number. From those results a nomograph was obtained, as shownin Fig. 3.5, to estimate the flow reduction rate for a given blockageratio in actual reactor conditions. For example, it shows that tlie flowreduction rate were only 13 % of the normal flow even if a 66.9 X centralblockage occurred in a MONJU subassembly.
Figure 3.6 shows the cross-sec!" ions of the test apparatus fur flowvisualizations. The pin bundle is surrounded by a rectangular transparentduct. The pin diameter and the pin pitch are three times as large butthe pin pitch to pin diameter ratio is the same as those of MONJU•uihassemhly. Air bubbles of 0.5"»l mm diameter were Injected as tracersf" ::: I '' <- .:*:-. L re.in of the blockage. The photographs taken by a 16 mmmovie camera, as shown in Fig. 3.7, indicate that there exist twin stablerecircul.iting flows behind the central blockage and that no large vortexshedding is observed in the wake region. In the cases of edge blockagesthere also exists a reelrculating flow behind the blockage.
Velocity and pressure distributions in a locally blockedsubassembly were obtained using a four times scaled-up 61-pinbundle shown in Fig. 3.8. Five hole Pitot tubes were used to measurevelocity vectors in subchannels, and static pressures were measured withpressure holes lncatpd at positions of the narrowest gap between adjacentpins. The lengths of recirculating flow regions were also measured withthe visualization technique. The lengths normalized by blockage width,H]}, are shown in Fig. 3.9. They have a tendency to increase gradually withReynolds number. Figure 3.10 shows radial profiles of the axial velocitycomponent at six different elevations for a 38% central blockage. Theyare normalized by the bundle mean velocity. The figure indicates thatthe reverse flow velocity behind the blockage amounts to about 70% ofthe bulk velocity. Hence, it seems that the convective flow dominatesthe heat and mass transfer in the recirculating flow region. Figure3.11 shows the radial pressure distributions in the form of dimension-less pressure drop for a 38 % central blockage. The figure indicatesthat there occurs the lowest pressure in the wake boundary near theedge downstream of the blockage. Figure 3.12 shows the axial distribu-tions of dimensionless pressure drop for three different blockages. Itis indicated that the lowest pressure points occur about at 0.5 Dgfrom the blockage. These measured velocity and pressure distributionswere compared with an analytical code, UZU'6) and agreed well with thenumerical results.
3.3 Local Flow Blockage Experiments in a Sodium Test Loop
A series of local blockage experiments in a sodium loop has beenconducted using simulated LMFBR subassemblies. In the early experiment
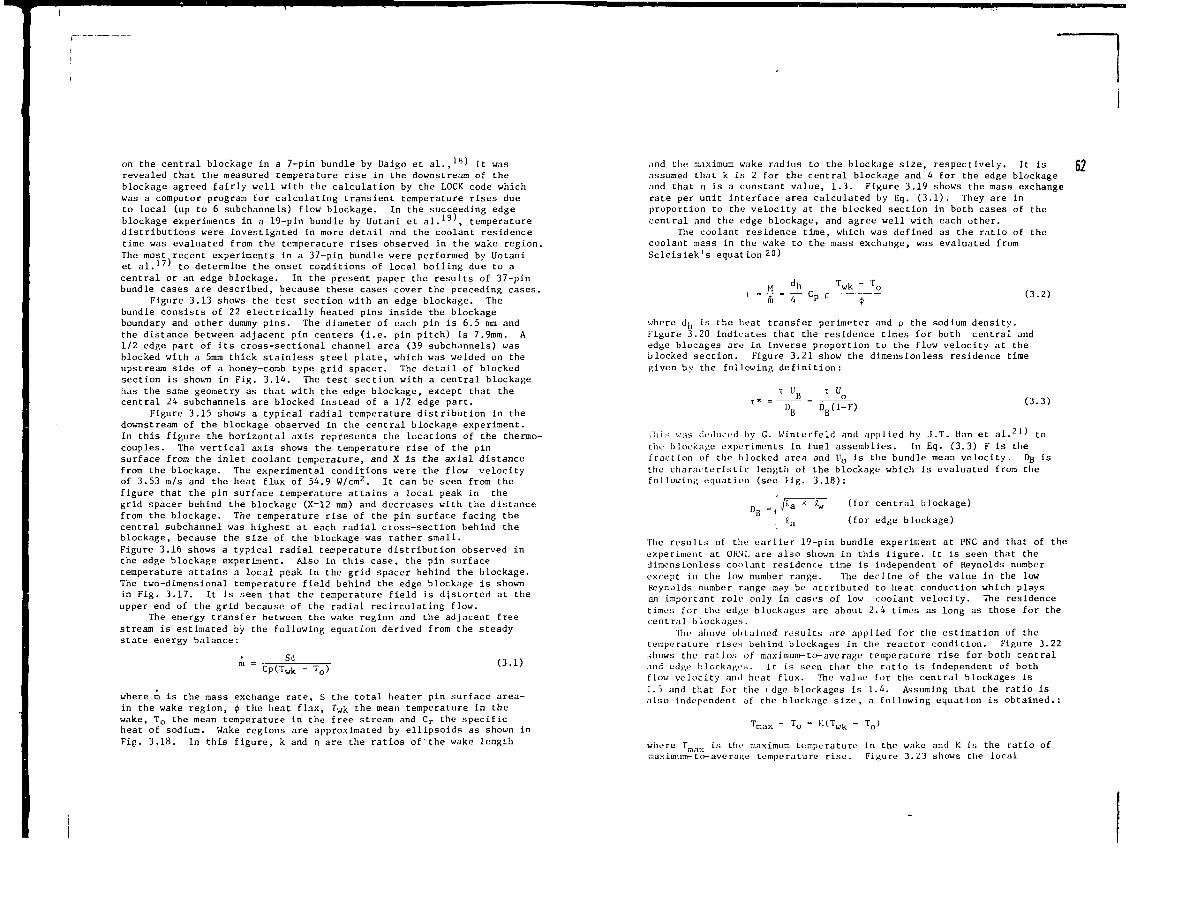
on the central blockage in a 7-pin bundle by Daigo et al.,1(J) it wasrevealed that the measured temperature rise in the downstream of theblockage agreed fairly well with the calculation by the LOCK code whichwas a computor program for calculating transient temperature rises dueto local (up to 6 subchannels) flow blockage. In the succeeding edgeblockage experiments in a 19-pin bundle by Uotani et al.'^', temperaturedistributions were investigated in more detail and the coolant residencetime was evaluated from the temperature rises observed in the wake region.The most recent experiments in a 37-pin bundle were performed by Uotaniet al. 1 7' to determine the onset conditions of local boiling due to acentral or an edge blockage. In the present paper the results of 37-pinbundle cases are described, because these cases cover the preceding cases.
Figure 3.13 shows the test section with an edge blockage. Thebundle consists of 22 electrically heated pins inside the blockageboundary and other dummy pins. The diameter of each pin is 6.5 mm andthe distance between adjacent pin centers (i.e. pin pitch) is 7.9mra. A1/2 edge part of its cross-sectional channel area (39 subchannels) wasblocked with a 5mm thick stainless steel plate, which was welded on theupstream side of a honey-comb type grid spacer. The detail of blockedsection is shown in Fig. 3.14. The test section with a central blockagehas the same geometry as that with the edge blockage, except that thecentral 24 subchannels are blocked instead of a 1/2 edge part.
Figure 3.15 shows a typical radial temperature distribution in thedownstream of the blockage observed in the central blockage experiment.In this figure the horizontal axis represents the locations of the thermo-couples. The vertical axis shows the temperature rise of the pinsurface from the inlet coolant temperature, and X is the axial distancefrom the blockage. The experimental conditions were the flow velocityof 3.53 m/s and the heat flux of 54.9 W/cra2. It can be seen from thefigure that the pin surface temperature attains a local peak in thegrid spacer behind the blockage (X=12 mm) and decreases with the distancefrom the blockage. The temperature rise of the pin surface facing thecentral subchannel was highest at each radial cross-section behind theblockage, because the size of the blockage was rather small.Figure 3.16 shows a typical radial temperature distribution observed inthe edge blockage experiment. Also in this case, the pin surfacetemperature attains a local peak in the grid spacer behind the blockage.The two-dimensional temperature field behind the edge blockage is shownin Fig. 3.17. It is seen that the temperature field is distorted at theupper end of the grid because of the radial recirculating flow.
The energy transfer between the wake region and the adjacent freestream is estimated by the following equation derived from the steadystate energy balance:
- TQ)(3.1)
where m is the mass exchange rate, S the total heater pin surface area-in the wake region, ij> the heat flax, Twk the mean temperature in thewake, T o the mean temperature in the free stream and Cr the specificheat of sodium. Wake regions are approximated by ellipsoids as shown inFig. 3.18. In this figure, k and n are the ratios of the wake length
and the maximum wake radius to the blockage size, respectively. It Isassumed that k is 2 for the central blockage and 4 for the edge blockageand that n is a constant value, 1.3. Figure 3.19 shows the mass exchangerate per unit interface area calculated by Eq. (3.1). They are inproportion to the velocity at the blocked section in both cases of thecentral and the edge blockage, and agree well with each other.
The coolant residence tijne, which was defined as the ratio of thecoolant mass in the wake to the mass exchange, was evaluated fromScleisiek's equation20)
62
- T(3.2)
where d^ is the heat transfer perimeter and p the sodium density.Figure 3.20 indicates that the residence times for both central andedge blocages are in inverse proportion to the flow velocity at theblocked section. Figure 3.21 show the dimensionless residence timegiven by the following definition:
T* = -
T U
DD(1-F)(3.3)
i'iiis vas deduced by G. Winterfeld and applied by J.T- Han et al.~ ' tothe blockage experiments in fuel assemblies. In Eq. (3.3) F is thefraction of the blocked area and Uo is the bundle mean velocity. Dg isthe characteristic length of the blockage which is evaluated from thefollowing equation (see tig. 3.18):
(for central blockage)
(for edge blockage)
Die results of the earlier 19-pin bundle experiment at PNC and that of theexperiment at ORNI. are also shown in this figure. It is seen that thedimensionless coolant residence time is independent of Reynolds numberexcept in the low number range. The decline of the value in the lowReynolds number range may be attributed to heat conduction which playsan important role only in cases of low coolant velocity. The residencetimes for the edge blockages are about 2.4 times as long as those for thecentral blockages.
Tliij above obtained results are applied for the estimation of thetemperature rises behind blockages in the reactor condition. Figure 3.22shows the ratios of maximum-to-average temperature rise for both centraland edge blockages. It is seen that the ratio is independent of bothflow velocity and heat flux. The value for the central blockages is1.5 and that for the i dge blockages is 1.4. Assuming that the ratio isalso independent of the blockage size, a following equation is obtained.:
Tmax " To = *(T w k - V
where T is the maximum temperature in the wake and K is the r a t i o ofmaximum-Co-average temperature r i s e . Figure 3.23 shows the loca l
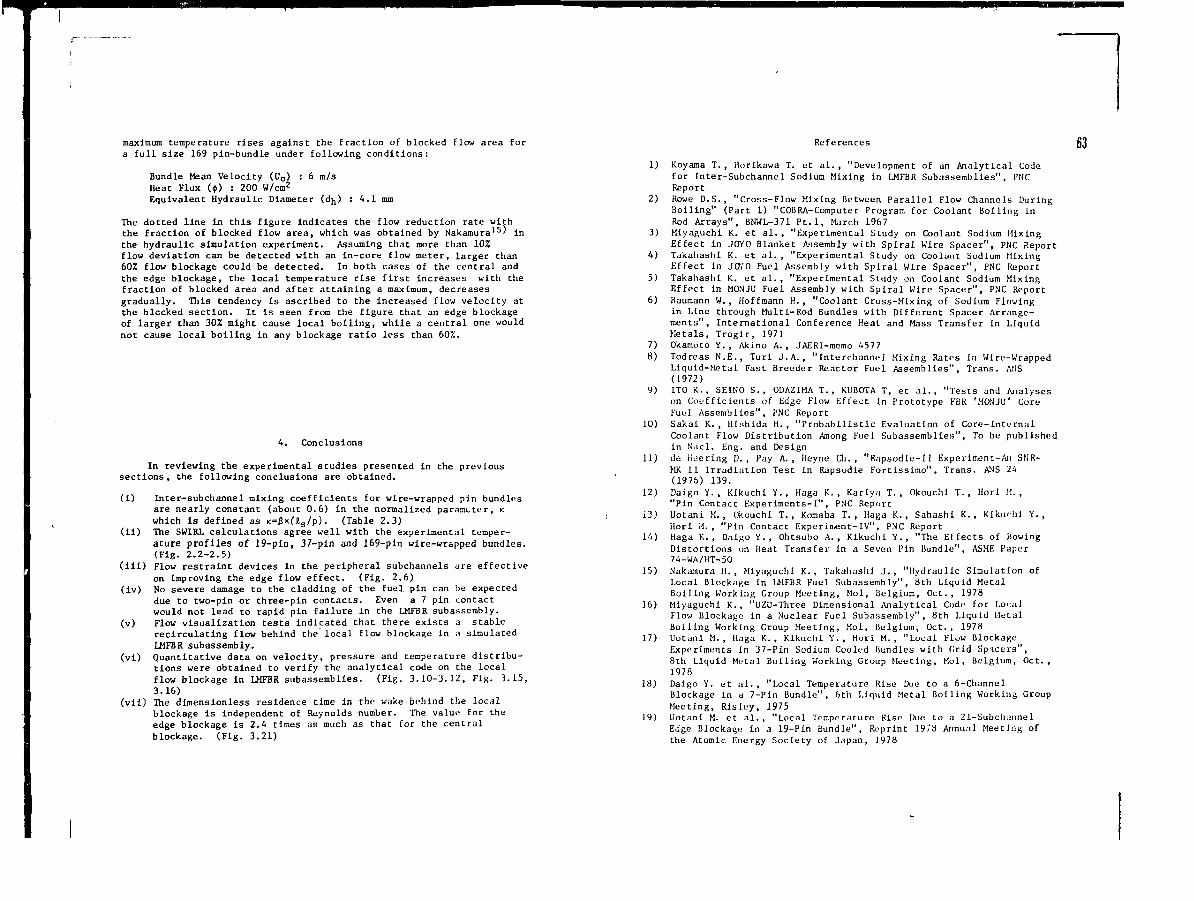
maximum temperature rises against the fraction of blocked flow area fora full size 169 pin-bundle under following conditions:
Bundle Mean Velocity (Uo) : 6 m/sHeat Flux ($) : 200 W/cm2
Equivalent Hydraulic Diameter (dn) A.I mm
The dotted line in this figure indicates the flow reduction rate withthe fraction of blocked flow area, which was obtained by Nakamura15' inthe hydraulic simulation experiment. Assuming that more than 10%flow deviation can be detected with an in-core flow meter, larger than60% flow blockage could be detected. In both cases of the central andthe edge blockage, the local temperature rise first increases with thefraction of blocked area and after attaining a maximum, decreasesgradually. This tendency is ascribed to the increased flow velocity atthe blocked section. It is seen from the figure that an edge blockageof larger than 30% might cause local boiling, while a central one wouldnot cause local boiling in any blockage ratio less than 60%.
4. Conclusions
In reviewing the experimental studies presented in the previoussections , the following conclusions are obtained.
(i) Inter-subchannel mixing coefficients for wire-wrapped pin bundlesare nearly constant (about 0.6) in the normalized paramtter, Kwhich is defined as K=ßx(£s/p). (Table 2.3)
(ii) The SWIRL calculations agree well with the experimental temper-ature profiles of 19-pin, 37-pin and 169-pin wire-wrapped bundles.(Fig. 2.2-2.5)
(iii) Flow restraint devices in the peripheral subchannels are effectiveon improving the edge flow effect. (Fig. 2.6)
(iv) No severe damage to the cladding of the fuel pin can be expecteddue to two-pin or three-pin contacts. Even a 7 pin contactwould not lead to rapid pin failure in the LMFBR subassembly.
(v) Flow visualization tests indicated that there exists a stablerecirculating flow behind the local flow blockage in a simulatedLMFBR subassembly.
(vi) Quantitative data on velocity, pressure and temperature distribu-tions were obtained to verify the analytical code on the localflow blockage in LMFBR subassemblies. (Fig. 3.10-3.12, Fig. 3.15,3.16)
(vii) The dimensionless residence time in the wake behind the localblockage is independent of Reynolds number. The value for theedge blockage is 2.4 times as much as that for the centralblockage. (Fig. 3.21)
References 631) Koyama T., Horikawa T. et al., "Development of an Analytical Code
for Inter-Subchannel Sodium Mixing in LMFBR Subassemblles", PNCReport
2) Rowe D.S., "Cross-Flow Mixing Between Parallel Flow Channels DuringBoiling" (Part 1) "COBRA-Computer Program for Coolant Boiling inRod Arrays", BNWL-371 Pt.l, March 1967
3) Miyaguchl K. et al., "Experimental Study on Coolant Sodium MixingEffect in JOYO Blanket Assembly with Spiral Wire Spacer", PNC Report
4) Takahashi K. et al., "Experimental Study on Coolant Sodium MixingEffect in JOYO Fuel Assembly with Sptral Wire Spacer", PNC Report
5) Takahashi K. et al., "Experimental Study on Coolant Sodium MixingEffect in MONJU Fuel Assembly with Spiral Wire Spacer", PNC Report
6) Baumann W., Hoffmann H., "Coolant Cross-Mixing of Sodium Flowingin Line through Multi-Rod Bundles with Different Spacer Arrange-ments", International Conference Heat and Mass Transfer in LiquidMetals, Trogir, 1971
7) Okamoto Y. , Akino A., JAERI-memo 45778) Todreas N.E., Turi J.A. , "Interchannel Mixing Rates in Wire-Wrapped
Liquid-Metal Fast Breeder Reactor Fuel Assemblies", Trans. /MIS(1972)
9) ITO K., SEINO S., ODAZIMA T., KUBOTA T, et al., "Tests and Analyseson Coefficients of Edge Flow Effect in Prototype FBR 'MONJU' CoreFuel Assemblies", PNC Report
10) Sakal K., Hishida H., "Probabilistic Evaluation of Core-InternalCoolant Flow Distribution Among Fuel Subassemblies", To be publishedin Nucl. Eng. and Design
11) de Heering D. , Pay A., Heyne Ch. , "Rapsodie-II Experiment-Ail SNR-MK II Irradiation Test in Rapsodie Fortissimo", Trans. ANS 24(1976) 139.
12) Daigo Y., Kikuchi Y., Haga K., Kariya T., Okouchi T., Hori M.,"Pin Contact Experiments-I", PNC Report
13) Uotani M., Okouchi T., Komaba T., Haga K., Sahashi K. , Kikuchi Y.,Hori M., "Pin Contact Experin,ent-IV", PNC Report
14) Haga K., Daigo Y., Ohtsubo A., Kikuchi Y., "The Effects of BowingDistortions un Heat Transfer in a Seven Pin Bundle", ASME Paper74-WA/HT-5O
15) Nakamura H., Miyaguchi K., Takahashi J., "Hydraulic Simulation ofLocal Blockage in LMFBR Fuel Subassembly", 8th Liquid MetalBoiling Working Group Meeting, Mol, Belgium, Oct., 1978
16) Miyaguchi K., "UZU-Three Dimensional Analytical Code for LocalFlow Blockage in a Nuclear Fuel Subassembly", 8th Liquid llet_alBoiling Working Group Meeting, Mol, Belgium, Oct., 1978
17) Uotani M., Haga K., Kikuchi Y., Hori M., "Local Flow BlockageExperiments In 37-Pin Sodium Cooled Bundles with Grid Spacers",8th Liquid Metal Boiling Working Group Meeting, Mol, Belgium, Oct.,1978
18) Daigo Y. et al., "Local Temperature Rise Due to a 6-ChannelBlockage in a 7-Pin Bundle", 6th Liquid Metal Boiling Working GroupMeeting, Risley, 1975
19) Uotani M. et al., "Local Temperature Rise Due to a 21-SubchannelEdge Blockage in a 19-Pin Bundle", Reprint 1978 Annual Meeting ofthe Atomic Energy Society of Japan, 1978
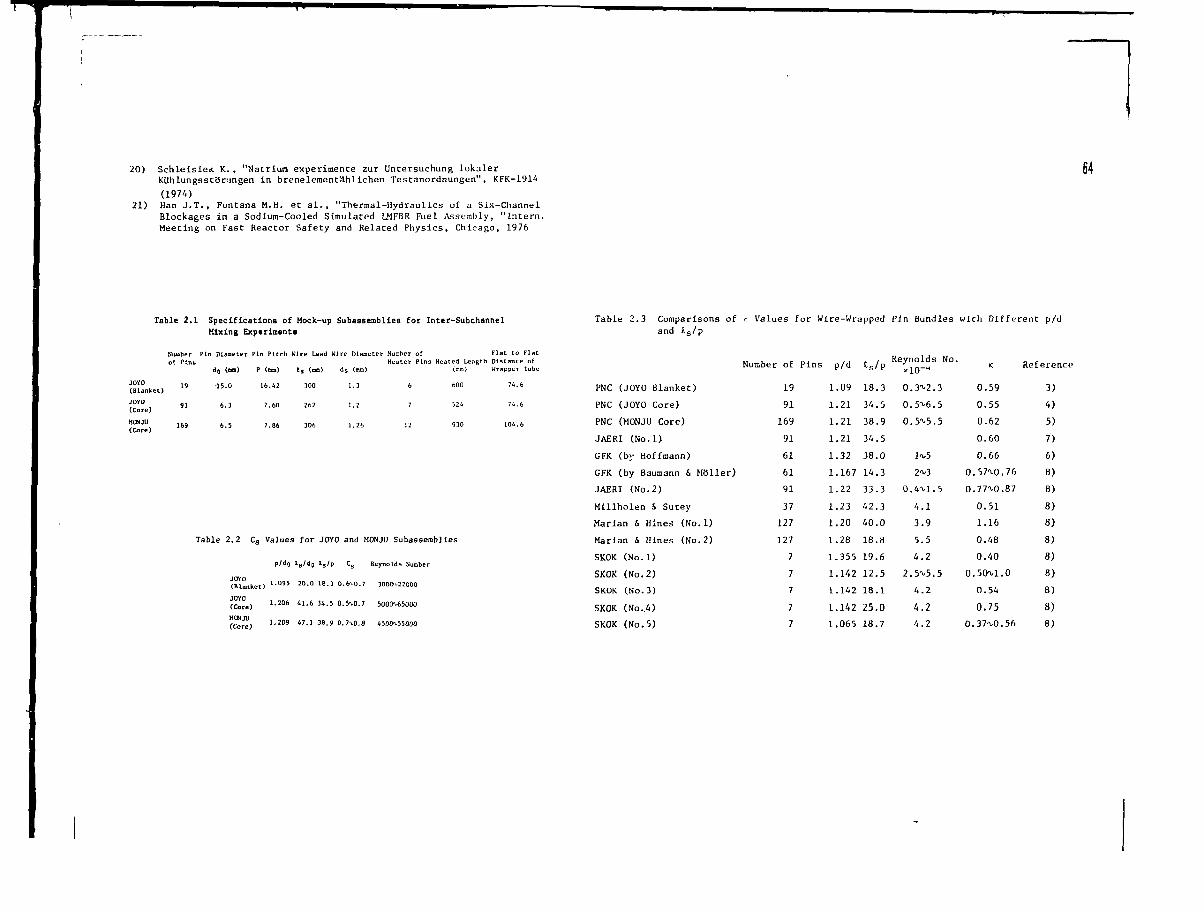
20) Schlelsie* K., "Natrium experimente zur Untersuchung lokalerKUhlungsstöringen in breneleraentählichen Testanordnungen", KFK-1914
(1974)21) Han J.T., Fontana M.H. et al., "Thermal-Hydraulics of a Six-Channel
Blockages in a Sodium-Cooled Simulated LMFBR Fuel Assembly, "Intern.Meeting on Fast Reactor Safety and Related Physics, Chicago, 1976
64
Table 2.1 Specifications of Mock-up Subassemblies for Inter-SubchannelMixing Experiments
Number Pin Diameter Pin Pitch Wire Lead Wire Diameter Number of Flat to Flato! Pins Heater Pins Heated Length Distance of
d0 (tun) P (mm.) ts (mm) ds (mm) Com) Wrapper Tube
JOYO(Blanket)
JOYO(Core)
HONJU(Core)
19
91
169
15.0
6 . 3
6 . 5
16.42
7.60
7.86
300
262
306
1
1
1
. 3
. 2
.26
600
524
930
74.6
74.6
104.6
Table 2.2 Cs Values for JOYO and HONJU Subassemblies
p/d0 t s / d 0 *5 /p Cs Reynolds Number
(Blanket) 1 - 0 9 5 2 0 - ° 1 8 -3 O.6MJ.7 3OOCK22OOO
1.206 41.6 34.5 0.5\0.7 5000x65000
1.209 47.1 38.9 0.7x0.8 45001.55000
JOYO(Core)
Table 2 .3 Comparisons ofand 8.s/p
Values for Wire-Wrapped Pin Bundles with Diffurent p/d
PNC (JOYO Blanket)
PNC (JOYO Core)
PNC (MONJU Core)
JAERI (No.l)
GFK (by Hoffmann)
GFK (by Baumann & Höl ler )
JAERI (No.2)
Millholen 5, Sutey
Marian & Hines (No.l)
Marian & Hines (No.2)
SKOK (No.l)
SKOK (No.2)
SKOK (No.3)
SKOK (No..4)
SKOK (No.5)
Number of
19
9 1
169
91
6 1
61
91
37
127
127
7
7
7
7
7
Pins p/d
1.09
1.21
1.21
1.21
1.32
1.167
1.22
1.23
1.20
1.28
1.355
1.142
1.142
1.142
1.065
e s /P
18.334.5
38.934.5
38.0
14.333.3
42.340.0
18.8
19.6
12.518.1
25.0
18.7
Reynolds No.
0.3^2.30.5^6.5
0.5^5.5
l<v,5
2V)
0.4^1.5
4 . 1
3 . 9
5 . 5
4 . 2
2.5^5.54 . 2
4.24 . 2
K
0.59
0.55
0.62
0.60
0.66
O.57M3.76
0.77^-0.87
0.511.16
0.48
0.400.50^1.0
0.54
0.750.37-X.0.56
Reference
3)
4)
5)
7)
6)
8)
8)
8)
8)
8)
8)
8)
8)
8)
8)
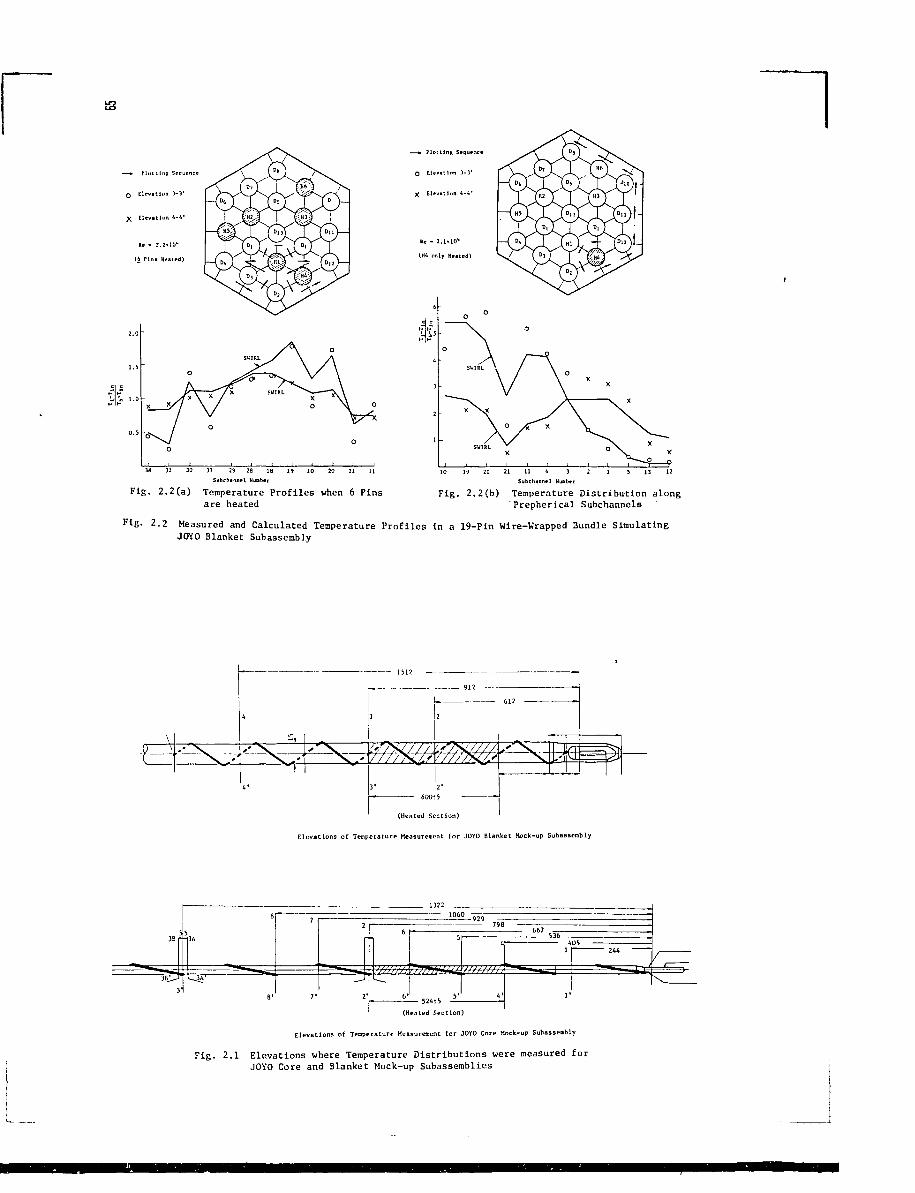
Fig- 2.2 Measured and Calculated Temperature Profiles in a 19-Pin Wire-Wrapped 3undle SimulatingJOYO Blanket Subassembly
Elevations of Temperature Measurement for JOYO Core Mock-up Subassembly
Fig. 2.1 Elevations where Temperature Distributions were measured forJOYO Core and Blanket Mock-up Subassemblies
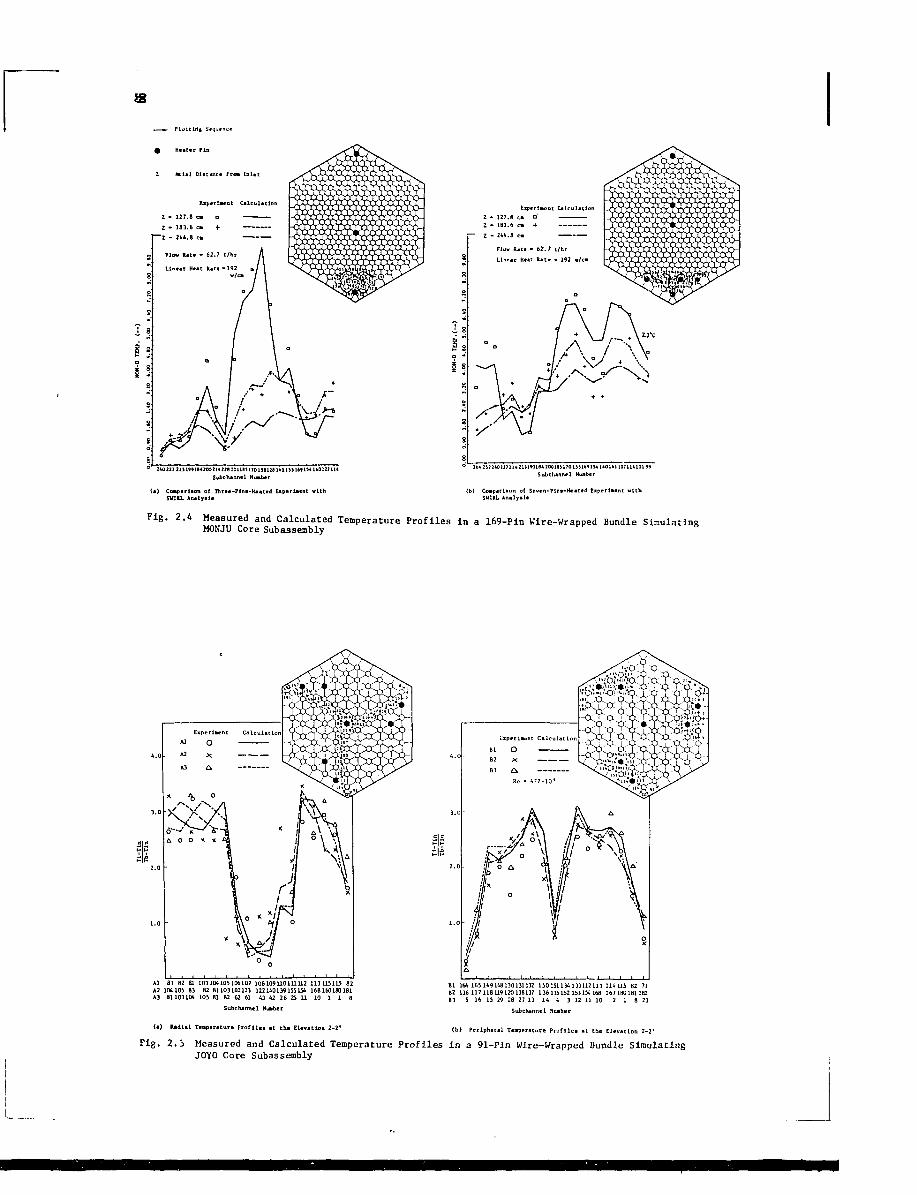
Fig. 2.4 Measured and Calculated Temperature Profiles in a 169-Pin Wire-Wrapped Bundle SimulatingMONJU Core Subassembly
(.) mdl.l Te.p.r.tur« Profil., . t th. El.v.tlon 2-2- (b) Periph.,.! T r a p , r l t u « p r o f u < . . . t t h . Elev.tlon 2-2'
Fig. 2.3 Measured and Calculated Temperature Profiles in a 91-Pin Wire-Wrapped Bundle SimulatingJOYO Core Subassembly
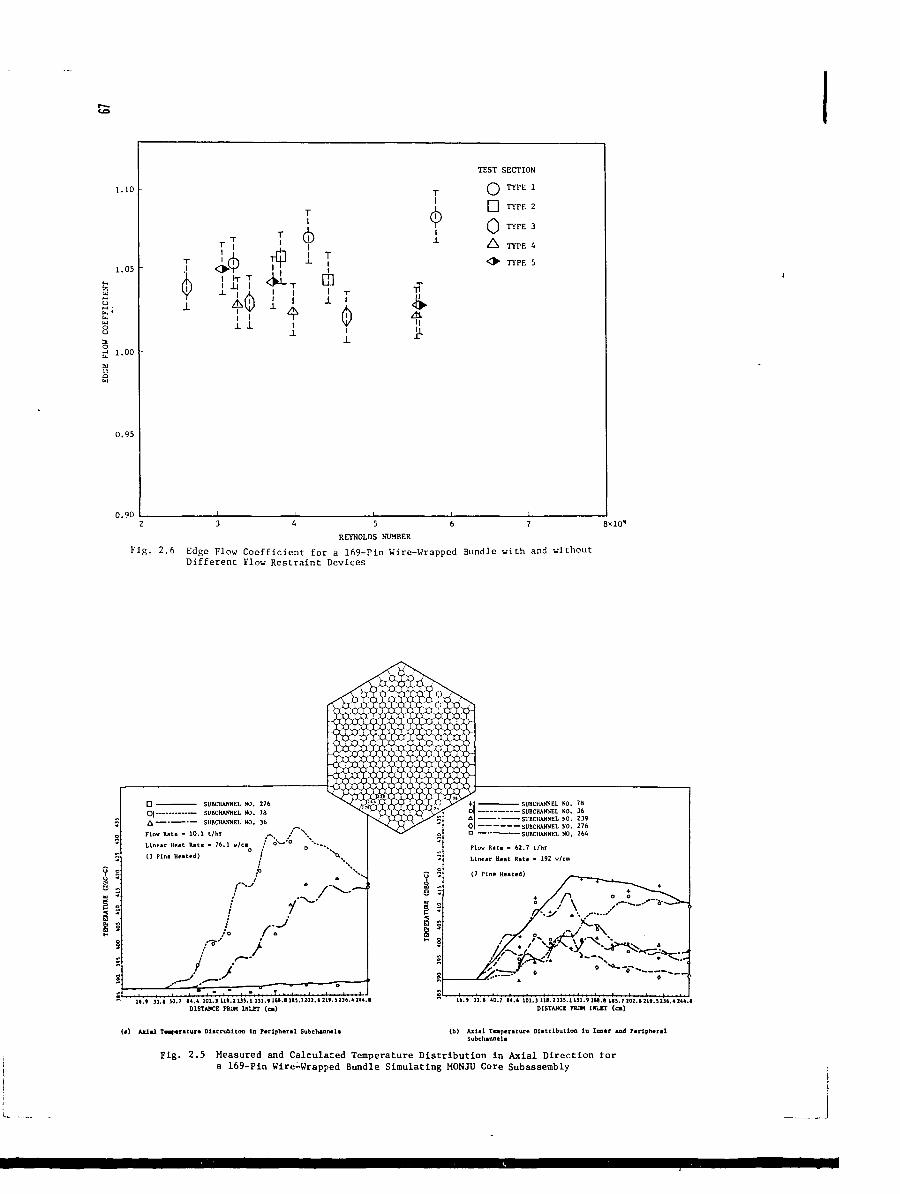
REYNOLDS NUMBER
Fig. 2.6 Edge Flow Coefficient for a 169-Pin Wire-Wrapped Bundle with and withoutDifferent Flow Restraint Devices
Fig. 2.5 Measured and Calculated Temperature Distribution in Axial Direction tora 169-Pin Wire-Wrapped Bundle Simulating MONJU Core Subassembly
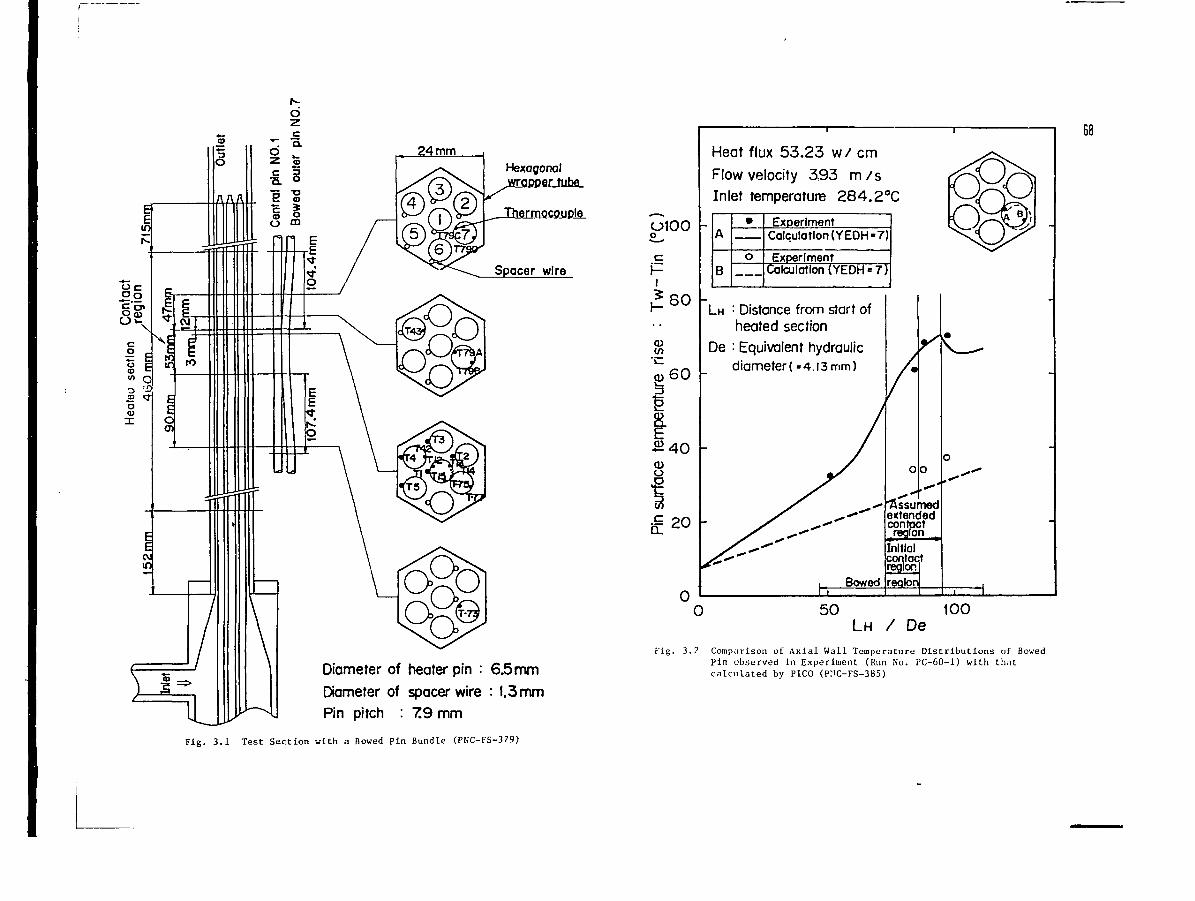
Diameter of heater pin : 6 5 mm
Diameter of spacer wire : 1.3 mm
Pin pitch : 7 9 mm
Fig. 3.2 Comparison of Axial Wall Temperature Distributions of BowedPin observed In Experiment (Run No. PC-60-1) with thatcalculated by PICO (P:iC-FS-385)
Fig. 3.4 Drag Coefficients of the Pin Bundle Containingthe Blockage
Fig. 3.3 Test Rig and Blockages used in theMeasurement of the Drag Coefficientof a Pin Bundle Containing a Blockage
Fig. 3.7 Observations of the Wake Flow Pattern
Fig. 3.9 Length of Recirculating Flow Fig. 3.10 Mean velocity Distribution behind 38%R e g i o n Central Blockage
Fig. 3.13 Locally blocked 37-Pin Bundle Test Section
Fig. 3.11 Static Pressure Distribution in the Recircula- Fig. 3.12 Static Pressure Distribution along the Axialting Flow Region behind 38% Central Blockage Direction in the Recirrulatlng Flow Region
behind Blockage
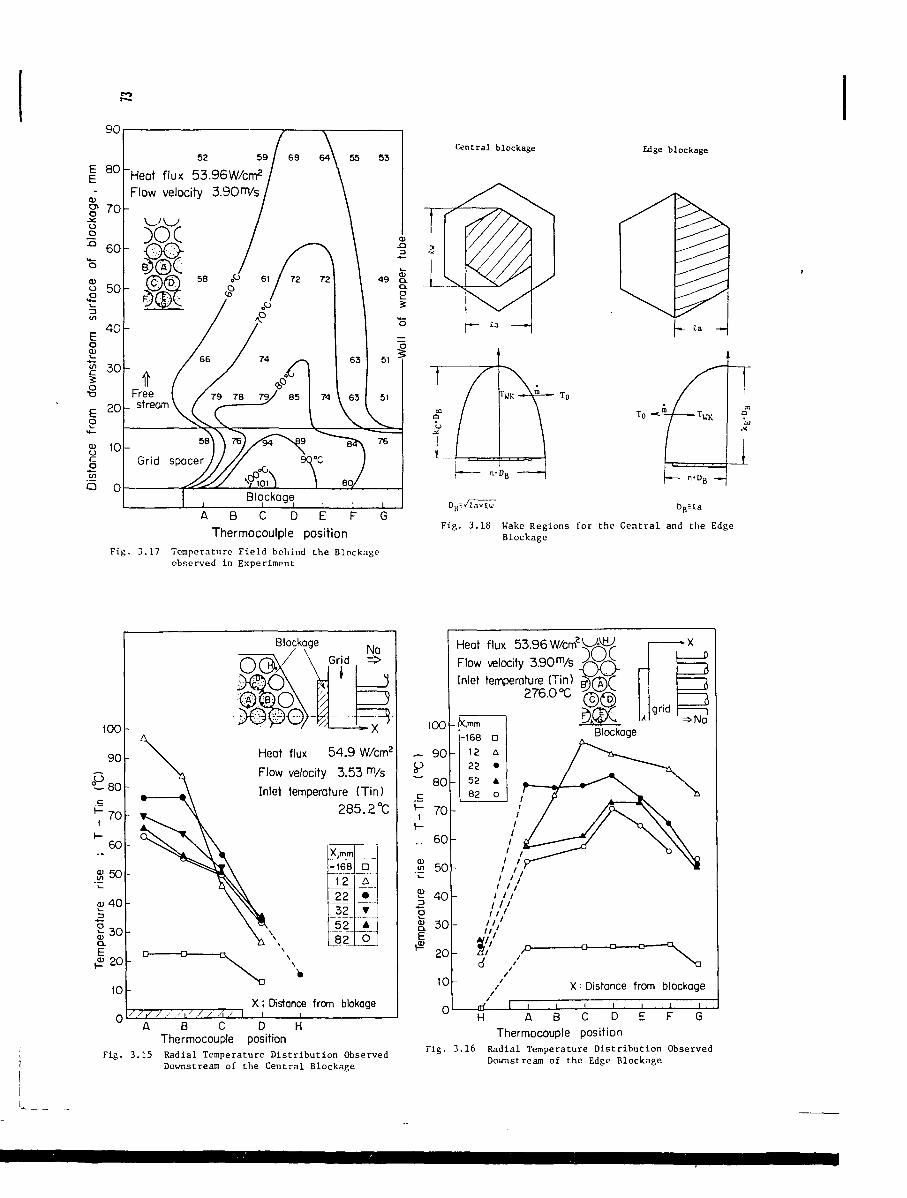
* i i ^ ^ a i l l ^^ ^^^ *^ • k ^ • w ^^ v s w i l l \ ^ I I
Fig. 3.17 Temperature Field behind the Blockageobserved in Experiment
Fig. 3.18 Wake Regions for the Central and the EdgeBlockage
Thermocouple position Thermocouple positionFig. 3.15 Radial Temperature Distribution Observed F i g' 3" 1 6 ^ a d i a l Temperature Distribution Observed
Downstream of the Central Blockage Downstream of the Edge Blockage
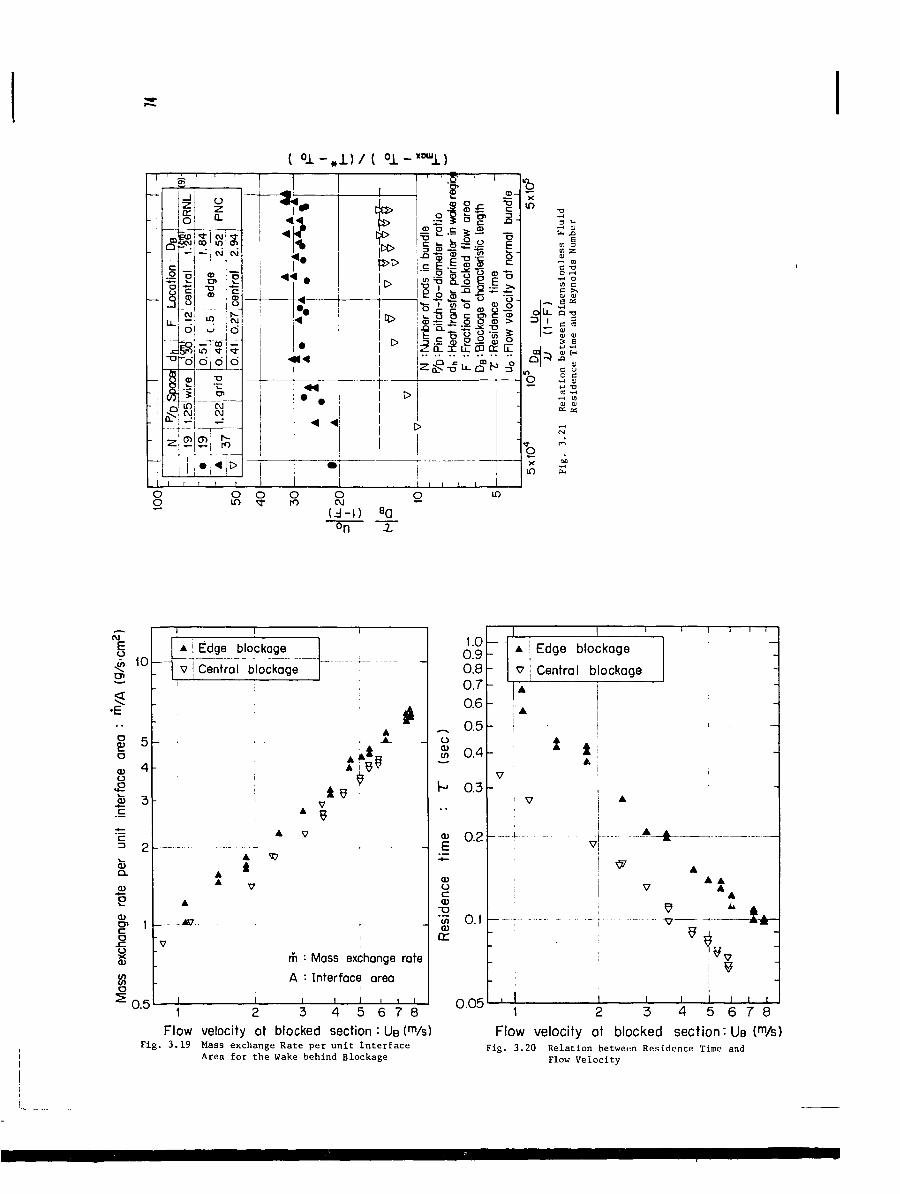
Flow velocity at blocked section : UB (m/s) Flow velocity at blocked sect ion-UB (m/s)Fig. 3.19 Mass exchange Rate per unit Interface F i g. 3 - 2O Relation between Residence Time and
Area for the Wake behind Blockage Fl o u Velocity
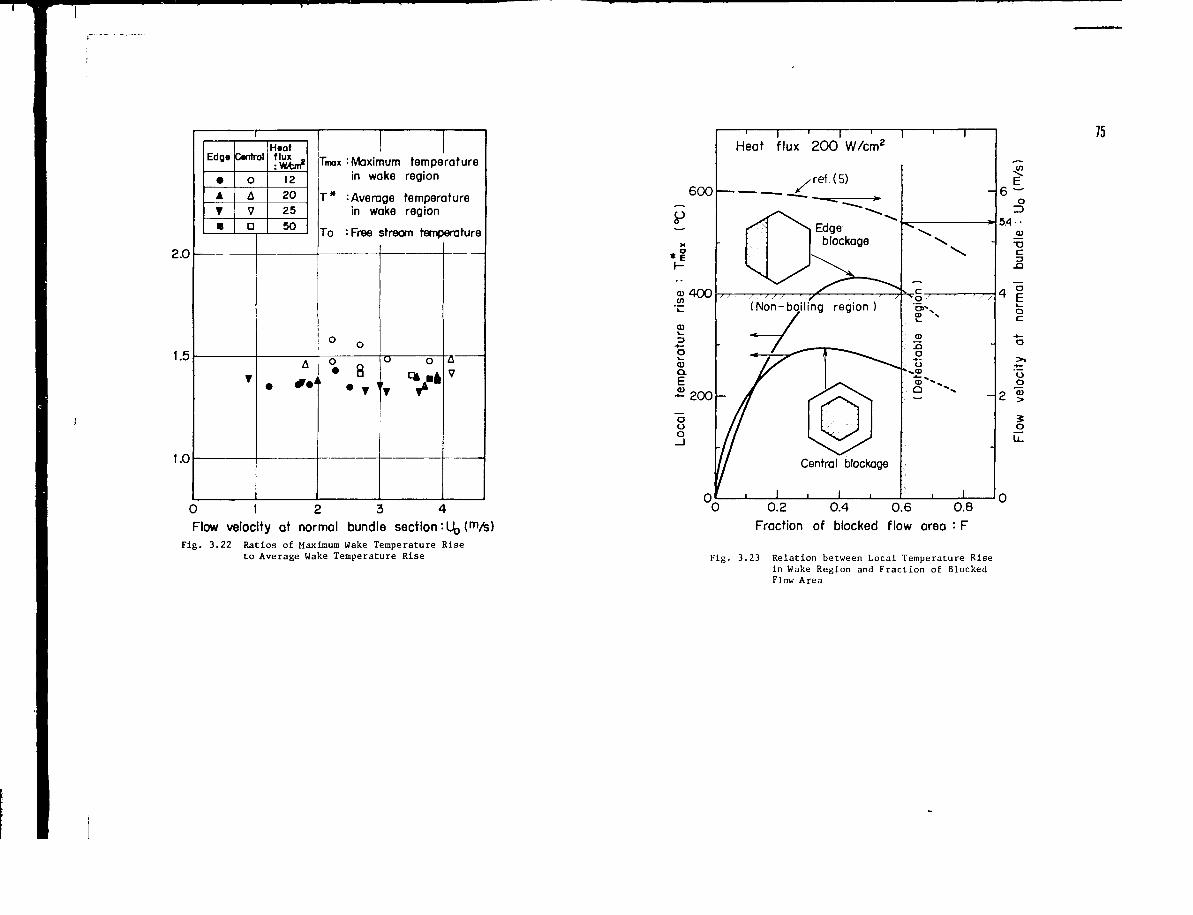
Flow velocity at normal bundle section: L^ (m/%) Fraction of blocked flow area "• FFig. 3.22 Ratios of Maximum Wake Temperature Rise
to Average Wake Temperature Rise F i g . 3.23 Relation between Local Temperature Risein Wake Region and Fraction of BlockedFlow Area
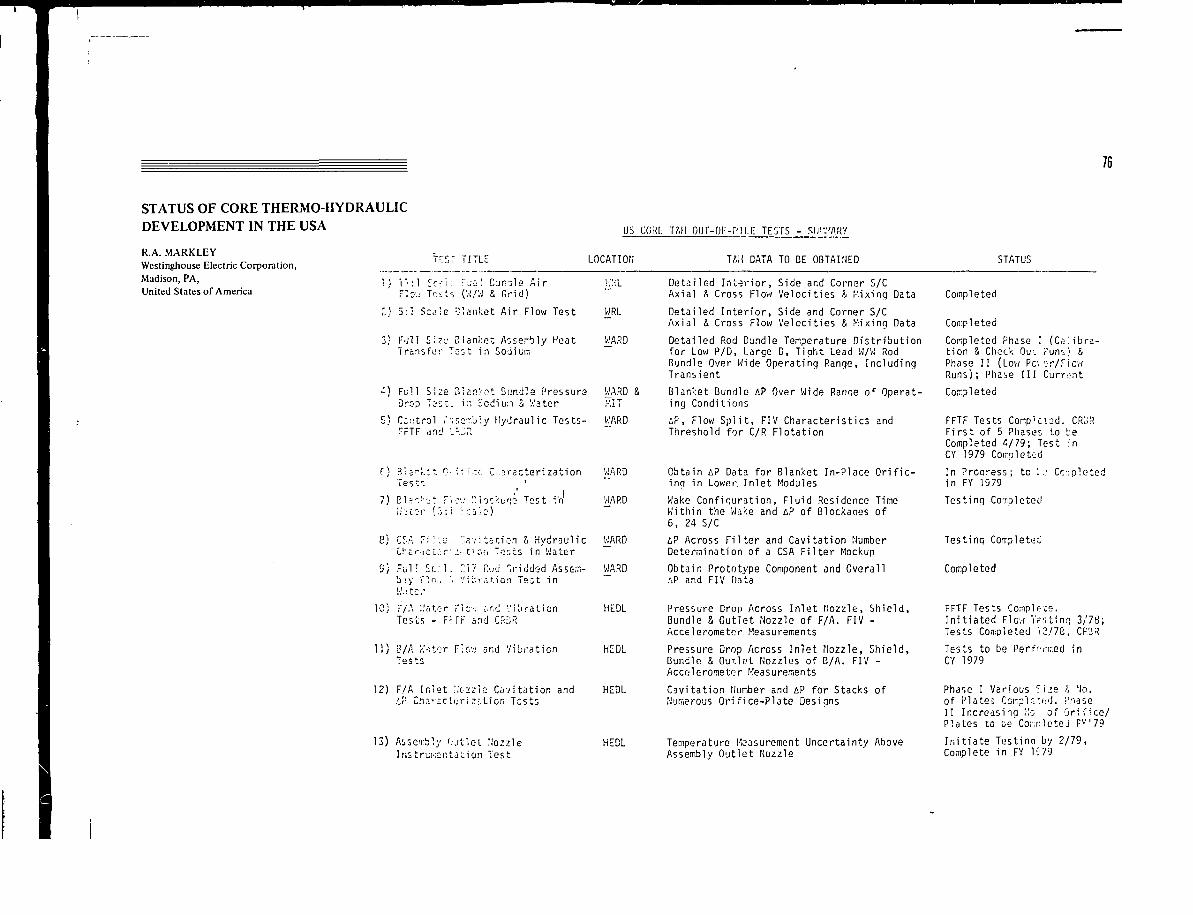
76
STATUS OF CORE THERMO-HYDRAULICDEVELOPMENT IN THE USA
R.A. MARKLEYWestinghouse Electric Corporation,Madison, PA,United States of America
TCSr TITLE
us CONK TAU our-or-r'ii.E TESTS - SI
LOCATION TÄU DATA TO BE OBTAINED STATUS
1"'.-1 C f - i : r ^ i ! C- jno ls A i r H.'-lF"io-.: Tes t s (W/'J & G r i d )
5 :1 S C J ' E b l a n k e t A i r F low T e s t V/RL
3} F . j l l Size B l a n k e t Assembly Hea t WARDTransfur Tost i n Sodium
•:) Fu l l Size 31a.i':,-»t Bundle Pressurs WARD &Drop Test , i n Scdiu: i a Water I-'.IT
S) Centra l /" ' .so-bly Hydrau l i c Tests- WARDrFTF and '/-or;
r) B : ; - k : t 0' \', >-•-. C,;?.racterization WARDTest-.
7) E ls ' ! - - t ?'.•::•.: " lockige Test in WARD
8) CSA Ti:::, "avitatic.n ä Hydraulic WARDCrEr,icc.":ri .:• tisn Toots in Water
S) Full Sf.;l. '17 r.od "i-iddsd Ass&.ii- WARDbiy Flo.. .'. \'-;L;r;itic:i Tect in
Detailed Interior, Side and Corner S/CAxial R Cross Flow Velocities h Mixinq Data
Detailed Interior, Side and Corner S/CAxial & Cross Flow Velocities S Mixing Data
Detailed Rod Bandle Temperature Distributionfor Low P/D, Large D, Tipht Lead W/W RodBundle Over Wide Operating Range, IncludingTransient
Blanket Bundle AP Over Wide Ranae of Operat-ing Conditions
iP, Flow Split, FIV Characteristics andThreshold for C/R Flotation
Obtain £p Data for Blanket In-Place Orific-ing in Lower. Inlet Modules
Wake Configuration, Fluid Residence TimeWithin the Wake and AP of Blockages of6, 24 S/C
&? Across Filter and Cavitation NumberDetermination of a CSA Filter Mockup
Obtain Prototype Component and OverallAP and FIV Data
Completed
Completed
Completed Phase I (Calibra-tion & Check Ou-c runs) hPhase II (Low Po; sr/FlowRuns); Phase III Current
Completed
FFTF Tests Compkisd. CR[JRF i rs t of 5 Phases to beCompleted 4/79; Test inCY 1979 Corr.nletid
In Proaress; tc \ :. Cc~plctedin FY 1979
Testing Completed
Testing Corr.pletüi
Completed
IC; T/.\ 'Autor Tic-; -jf.d V i b r a t i o n HEDLTests - Ff TF and CP.SR
11) B/A » to r Flew and Vibration HEDLTests
12) F/A I n l e t :,'c-2zle C a v i t a t i o n and HEDLl? C h i - i c t o r i z r . t i o n Tests
13) Assembly O.itlei UozzleInstruivsr.tition Test
HEDL
Pressure Drop Across Inlet Nozzle, Shield,Bundle & Outlet Nozzle of F/A. FIV -Accelerometer Measurements
Pressure Crop Across Inlet Nozzle, Shield,Bundle ä Outlet Nozzles of B/A. FIV -Accolc-rometer Measurements
Cavitation Number and AP for Stacks ofNumerous Orifice-Plate Designs
Temperature Measurement Uncertainty AboveAssembly Outlet Nozzle
FFTF Tests Complece.I n i t i a t ed Flow Testinrj 3/78;Tests Completed '2/78, CRBR
Tests to be Perfrnr.ed inCY 1979
Phase I Various Si^e ?. No.of Plate: CcmpU.:f!d. PnaseII Increasing Mo of Orifice/Plates to be"Cor;i:leteJ FY ' 79
I n i t i a t e Test ina by 2 /79 ,Complete i n FY li '79
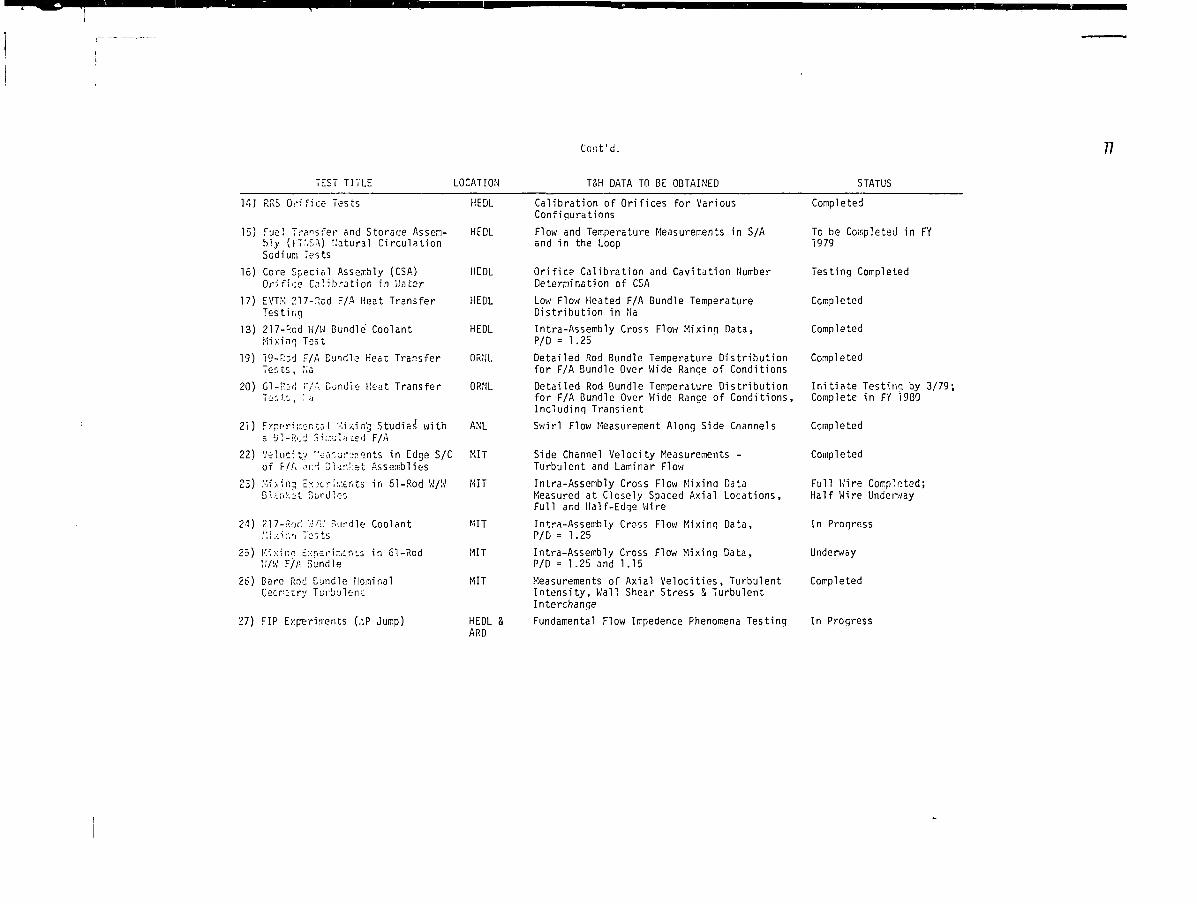
Co.'it'd. 77
TEST TITLE LOCATION TSH DATA TO BE OBTAINED STATUS
K.J RaS O r i f i c e Tests HEDL
15) fue l Trans fer and Storaae Assen- HEDLbly (F7:.S-\) natural CirculationSodium Tests
16) Core Special Assexbly (CSA) HEDLOrifice Calibration in Water
17) EVTM 217-Rod F/A Heat Transfer HEDLTesting
13) 217-Rod W/W Bundle Coolant HEDLMix ing Tost
19) 19-F:Dd F/A Bundle Heat T rans fe r ORNl.Ten ts , Na
20) G l -P j ' i r/A Dandle Heat T rans fe r ORNL
21) F.xrc-ri;:.cr.-.:,l n i x i n g Studies' w i t h ANLa Ü1-R..Ü Si e l a t e d F/A
22) Ve1.ncity "ä-j-.-j!-.;p»nts i n Edge S/C MITof F/A o.r.'i D"un!:et Assemblies
23) M i * i us Experiments i n 61-Rod W/WU dl
MIT
24)
25)
26)
27)
217-
!•'.•: xiW/W
Bare
FIP
•VK!
nn £F/A
Rod
':'./':•'. ".jndle Coolant
xp-ari-icnts in 61-RodBundle
Eyndle üominalTuibulont
Experiments (AP Jump)
MIT
MIT
MIT
HEDLARD
Calibration of Orifices for VariousConfigurations
Flow and Temperature Measurements in S/Aand in the Loop
Orif ice Calibration and Cavitation NumberDeterpiination of CSA
Low Flow Heated F/A Bundle TemperatureDistr ibution in Na
Intra-Assembly Cross Flow Mixing Data,P/D = 1.25
Detailed Rod Bundle Temperature Distr ibutionfor F/A Dundle Over Wide Ranqe of Conditions
Detailed Rod Bundle Temperature Distr ibut ion In i t i a te Testing by 3/79;for F/A Bundle Over Wide Range of Conditions, Complete in FY 1980Including Transient
Completed
To be Corr.pleted in FY1979
Testing Completed
Completed
Completed
Completed
Swirl Flow Measurement Along Side Channels
Side Channel Velocity Measurements -Turbulent and Laminar Flow
Intra-Assembly Cross Flow Mixing DataMeasured at Closely Spaced Axial Locations,Full and Half-Edge Wire
Intra-Assembly Cross Flow Mixing Data,P/D = 1.25
Intra-Assembly Cross Flow Mixing Data,P/D = 1.25 and 1.15
Measurements of Axial Veloci t ies, TurbulentIntensi ty, Wall Shear Stress & TurbulentInterchange
Fundamental Flow Impedence Phenomena Testing
Completed
Completed
Full Wire Completed;Half Wire Underv/ay
In Progress
Underway
Completed
In Progress
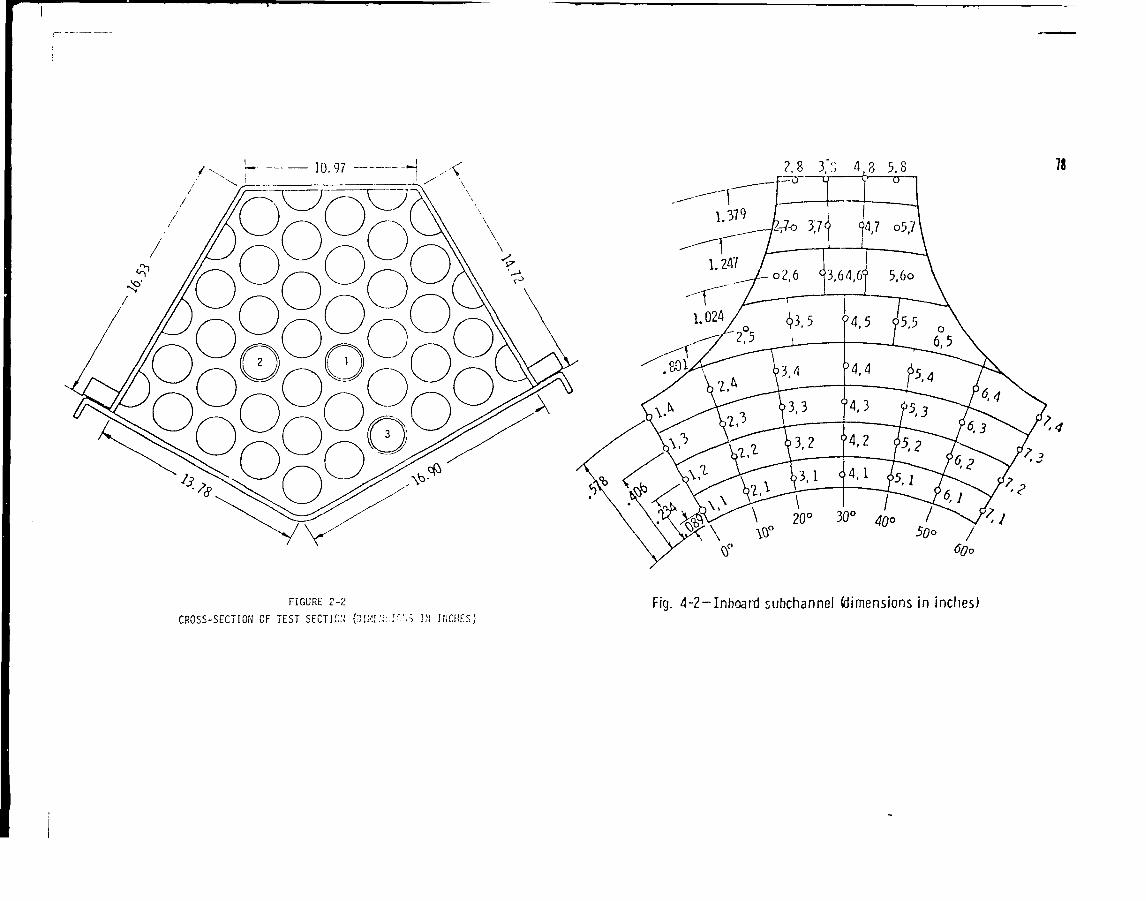
FIGURE 2-z Fig. 4-2-Inboard subchannel (dimensions in inches)CROSS-SECTION OF TEST SECTION (DIXL'ii.IC'ö IM INCHES)
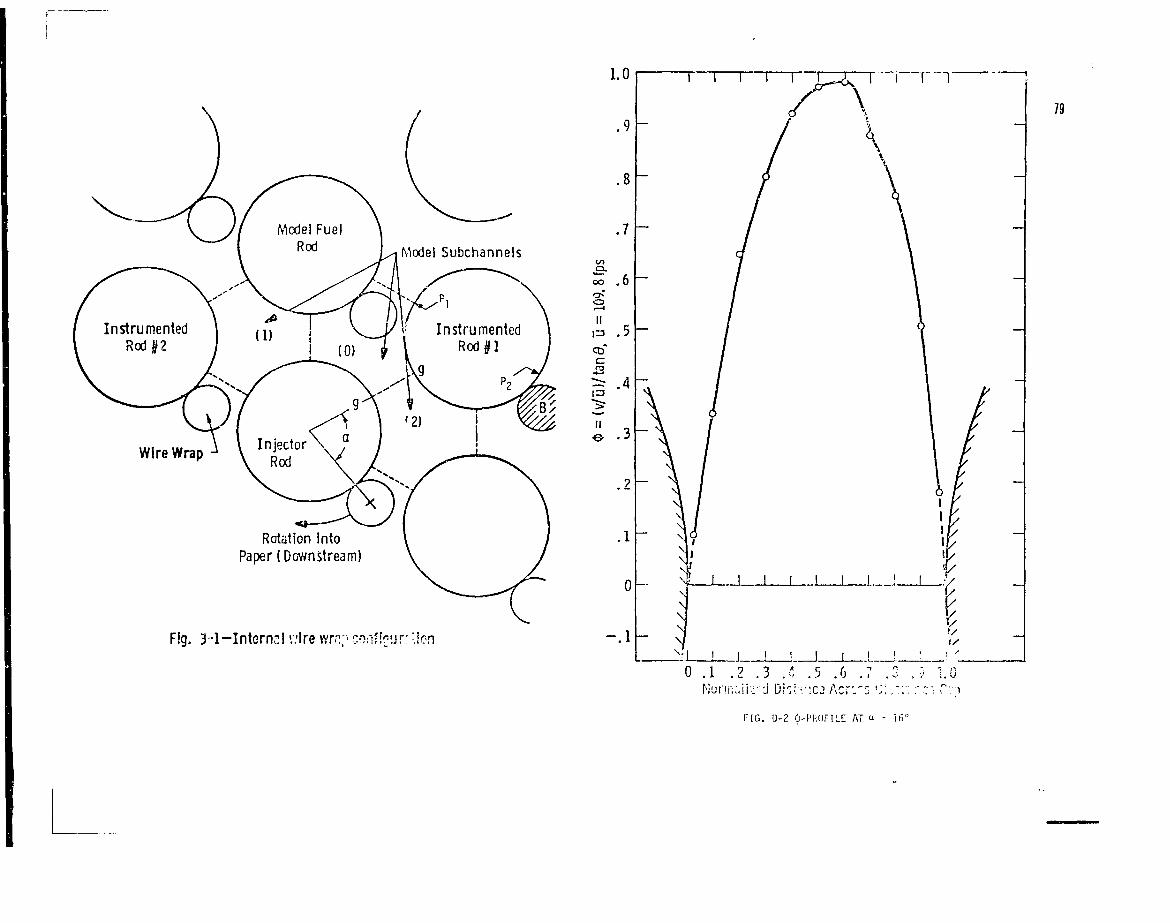
Wire Wrap
Rotation IntoPaper (Dcwnstream)
F!g. 3 1—Intorn^i wire wrc;> con ^jr: -Ion
0 . 1 . 2 . 3 .4 .5 .6 .7 .2
79
FIG. Ü-2 0-l'KOFILE AT " = 16"
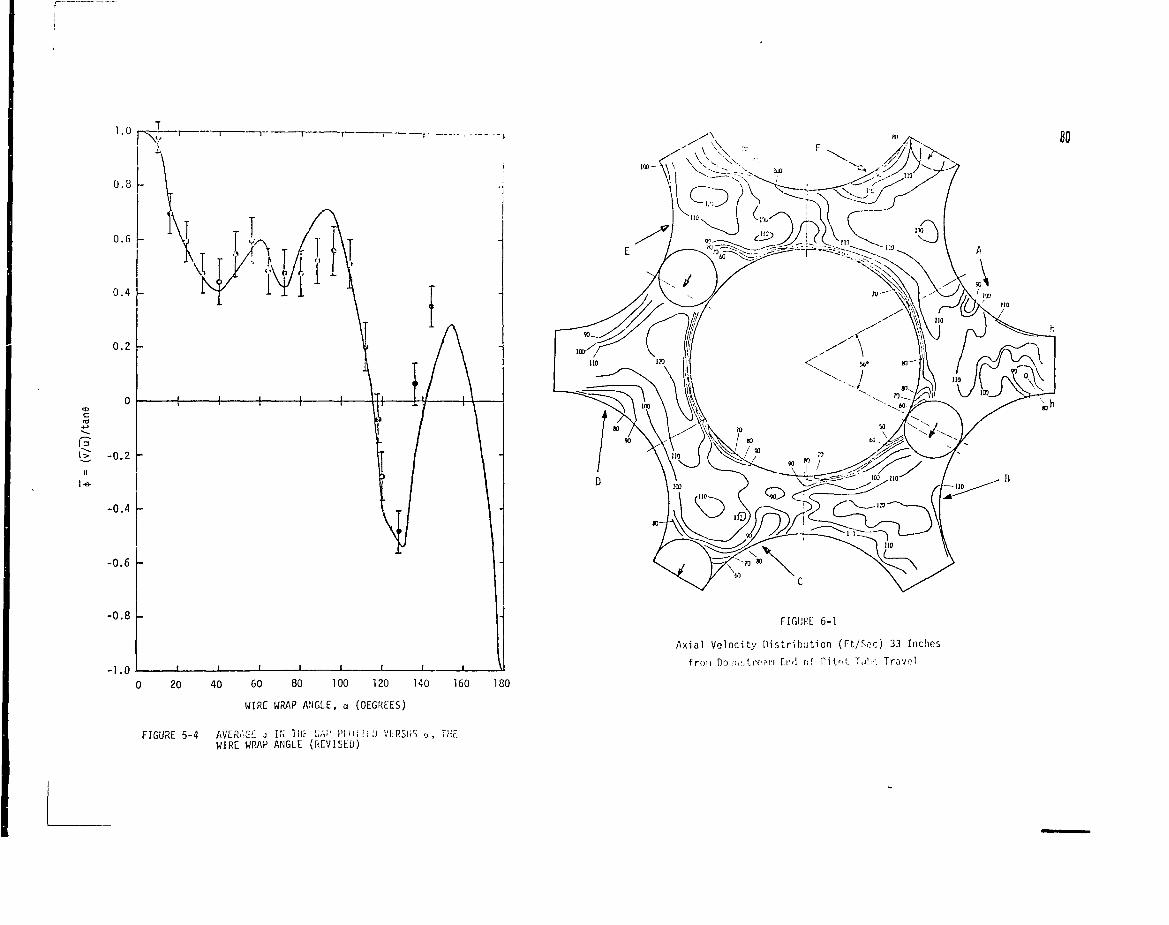
t—
80
FIGURE 6-1
Axial Velocity Distribution (Ft/Soc) 33 Inches
frou ' f ln Cr->i of Pi l r , ! ; T, i l •:. T ravo l
0 20 40 60 80 100 120 140
WIRE WRAP ANGLE, a (DEGREES)
FIGURE 5-4 AVERAGE .•> Hi Tilt G,Y,' PLn'liiD VERSUS u, THEWIRE WRAP ANGLE (REVISED)
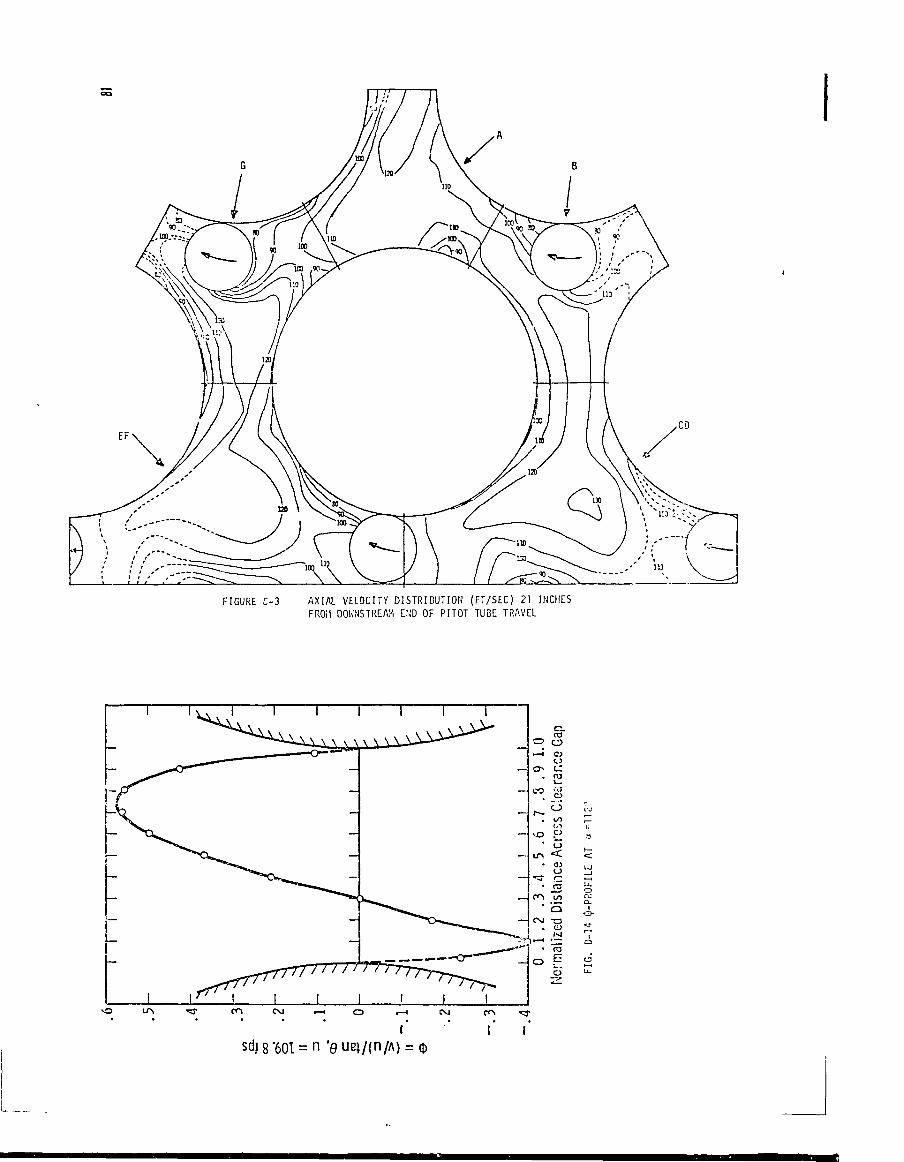
FIGURE C-3 AXIAL VELOCITY DISTRIBUTION (FT/SEC) 21 INCHESFROM DOWNSTREAM END OF PITOT TUBE TRAVEL
or—1
•
CO
vO•
•
•
en
CM
r—1
•
t—\
O
oOoo!*">CJ^ -
o<O
_roi / >
' Q-aoM
E
'i;
<
UJI
U-oCL:a.
io< ?
Tao
I .
STATUS OF THE LMFBR THERMO-AND FLUID-DYNAMIC ACTIVITIES AT KFK
H. HOFFMANN, F. HOFMANN, K. REHMEKernforschungszentrum Karlsruhe,Karlsruhe,Federal Republic of Germany
1. Introduction
The aim of the thermo- and fluiddynamic analysis is to determine
the spatial velocity and temperature distributions in LMFBR-core
elements with high accuracy. Knowledge of these data is a necessary
prerequisite for determining the mechanical behavior of fuel rods
and of structural material.
Three cases are distinguished:
Nominal geometry and steady state conditions
Non-nominal geometry and quasi-steady state conditions
Nominal geometry and non-steady state conditions.
The present situation for the design calculations of fuel elements
is based mainly on undisturbed normal operation.
The most part of the thermo- and fluiddynamic activities performed
under the Fast Breeder Programme at KFK are related to this case.
The present status of theoretical and experimental research work
briefly presented in this paper, can be subdivided into the follo-
wing main topics:
I. Physical and mathematical modelling of single phase rod bundle
thermo- and fluiddynamics
These investigations are concentrated on the development of global
and local computer programs for the calculation of the 3-dim. tempe-
rature field of the fuel pin. the fuel rod bundle, and the whole core.
Heat conduction between the subassembly boxes as well as asymmetric
bundle geomtries are considered. Further code developments deal with
the hot spot analysis.
II. Experimental Investigations on Heat Transfer and Fluid Flow J2
in Rod Bundles
These investigations aim at the verification and improvement of
the input parameters of the global and local computer codes. The
experimental activities concern:
a) Pressure drops of laminar and turbulent flows in rod bundles
without and with spacers, helical and grid spacers/and their
dependence on geometry parameters and the Reynolds number
b) Interchannel mixing in rod bundles with grids or helical spacers
c) Temperature distributions in rod bundles without and with spacers,
with particular reference to cladding temperatures,
d) Velocity and mass flow distributions in rod bundles v/ithout and
with grid spacers.
Non-nominal geometry and quasi-steady state conditions include
local disturbances of the flow within the subassembly (e.g.
swelling, bowing, effects which are a function of operation time).
In the next step of our R and D-program emphasis will be put on
this topic. Up to now experiments with bowed rods have been
performed. Problems with respect to non-steady thermo- and
fluiddynamics will be dealt with mainly within the framework of
accident analyses and will not be considered in this paper.
2. Physical and Mathematical Modelling of Single Phase RodBundle Thermo- and Fluiddynamics
The codes presently available for the computation of fuel elements
can be subdivided into two categories:
- global codes for subchannel analysis
- detailed codes for multidimensional calculation
of the velocity and temperature fields.
Doth categories comprise only the single-phase region (Fig. 1).
2-1 Qlobal_Codes
Thermo- and fluiddynamic design calculations are performed by the
so called subchannel analysis technique, i.e. the mass flow distri-
bution in the subchannels is calculated only globally (mean value).
As a consequence, it is impossible to calculate with sufficient
accuracy the behavior of fuel rods with respect to detailed tempe-
rature distribution in the cladding, especially near the wrapper
tube. The reason for the procedure adopted so far, on the one hand,
is the absence of computer programs for detailed analysis, on the
other hand, the lack of experimental information about flow and
temperature distributions in subchannels of subassemblies which could
either be used as input data for such computer programs or are
necessary to back up the codes.
In the global codes typically the subassembly geometry to be calcu-
lated is subdivided into a matrix of subchannels. Such a subchannel
comprises the fuel rod, the fluid region, the spacers and the
wrapper tube. For each of the subchannels the balance equations
of mass, momentum and energy are set up and solved numerically for
the desired matrix (determination of mean values). Coupling at the
boundaries of the different subchannels by the transports of mass,
momentum and energy is done by way of global coefficients, in the
simplest case by a mixing coefficient describing the three trans-
port phenomena, in the more refined case by special treatment of
thermal conduction, turbulent mixing and diversion cross flow.
The main advantage of the techniques lies in the coupling and
calculation even of complicated geometries of the fuel element,
taking into account both grid and helical spacer designs. The
calculations can now also be carried out for three-dimensional
flows under steady-state conditions, whereas mixed convection
events such as those which may occur in greatly throttled flows
are not taken into account (part load).
For fuel element design the following codes are available at KFK:
difference method. The grid drag is considered to be smeared over
the length of the subassembly. The pressure loss is calculated by
/I/MISTRAL II
ARTIS
THECA
MISTRAL_II=Cgde
The code permits the steady-state three-dimensional calculation of
the bulk temperatures and velocities in a rod subassembly (7 to
217 rods) with triangular rod arrangements and spacers (grids and
wires). The momentum and energy equations are solved by the finite
For the central zones of the subassembly and the exchange between
the inner channels and the side channels a global mixing rate is
used which is obtained experimentally for a hexagonal array of in-
finite extensions /4/:
In the case of grid type spacers this mixing ratio is corrected
for the exchange among side channels by the ratio of the free
distances between rods and between rods and the wall, respectively.
In the case of helical spacers the additional exchange coefficient
of the boundary channels in the code is calculated according to
14 D . T7 • S . EF . , (
Thermal conduction in the coolant is represented in the program
by a thermal conduction pathway which has the mean channel
temperatures at both ends;
(4)
Thermal conduction in the rod or wrapper tube is neglected.
The code allows the consideration of rod bundles excentrically
positioned inside the v/rapper tube.
ARTIS_Cgde
In the ARTIS computer program for hexagonal rod arrangements in
different axial steps the balance equations for mass and enthalpy
are solved for each subchannel with its cross connections to the
neighboring channels. In the solution of the coupled system of
equations, unlike MISTRAL II, the following effects are taken
into account separately: wall friction, impact losses, radial and
azimuthal turbulent momentum and energy transports (coolant cross
mixing) , mass redistribution due to friction and drag.
The exchange of momentum and energy is described in the following
physical model setups:
Momentum Transport:
I = -
Energy Transport:
q = -'Mr
(5)
(6)
All these equations are related to each individual subchannel.
Due to the model of net mass transport it is only possible to
take into account grid type spacers in the ARTIS program. The size
of the subassembly does not raise any problems. Beside the whole
subassembly any section of the subassembly can be calculated.
For each channel an individual mass flow and power can be considered
as input (e.g., for simulation of non-uniform mass flow distri-
bution at the inlet or y -heating of the wrapper tube.
The program also allows individual rods to be assumed as displaced
or bent and their effects on mass and temperature distributions
to be calculated.
THECA ..Code
While the MISTRAL and ARTIS code mainly serve for the design of
single fuel elements, the THECA code is concentrated chiefly on
determining the temperature distribution throughout the core
(with shutdown positions, with various enrichment zones), taking
into account heat transfer between the fuel elements. At the same
time, this is connected with a detailed hot spot analysis.
The temperature distribution in the individual elements is deter-
mined in a way similar to the procedure adopted in the MISTRAL code.
Up to four types of rod subassemblies can be computed (e.g., fuel
elements, blanket elements, control rods, shutdown rods).
The necessary power distribution can be computed in two ways: ß
(1) by inputting the axial development of the linear rod powers
at 7 support points per subassembly: central rod and 6 corner
rods and proper interpolation;
(2) by transferring the neutron flux distribution and fission
cross sections from a neutron physics diffusion program.
For calculation of the temperature distribution throughout the
whole core or a representative core section the pov/er data can !>o
quoted individually for each position(consideration of local flux
and power depressions, respectively). For calculation of the
Y-heating in the wrapper tube the input of axial gamma hcatin'j
rates depending on position and time is possible.
The thermal interaction between the different subassemblies is
treated as a thermal conductivity problem. The real geometry is
replaced by a network connecting the center points of the indiv. iu.il
computation meshes by so-called "thermal conductivity pathways".
(Fig. 2 ) . Each thermal conductivity pathway is assigned the heat:
transport coefficient resulting for the volume element represented
by the thermal conductivity pathway. In this way, an energy balance
can be drafted for each center of a mesh.
In the wrapper tube/coolant channel coupling the pertinent heat
transfer coefficient^ is not easily determined. The situation
roughly resembles a flat plate type flow in which one side (fuoi
rods) is heated strongly, whereas the other is heated only weakly
or even cooled, depending on whether heat flows through the box
wall into or out of the subassembly.
In a simplified assumption for the heat transfer between the box
wall and the coolant channel the heat transfer coefficient of an
inner channel is assumed as a reference value. By adding the
suitable input parameters this value can be corrected in accordance
with the direction of the heat flow.
If there should be a leakage flow in the gap between the box walls
a one-dimensional flow design is assumed. In a simplified technique
the heat transfer coefficient of a laminar, fully developed and
symmetrically heated flat plate flow is assumed.
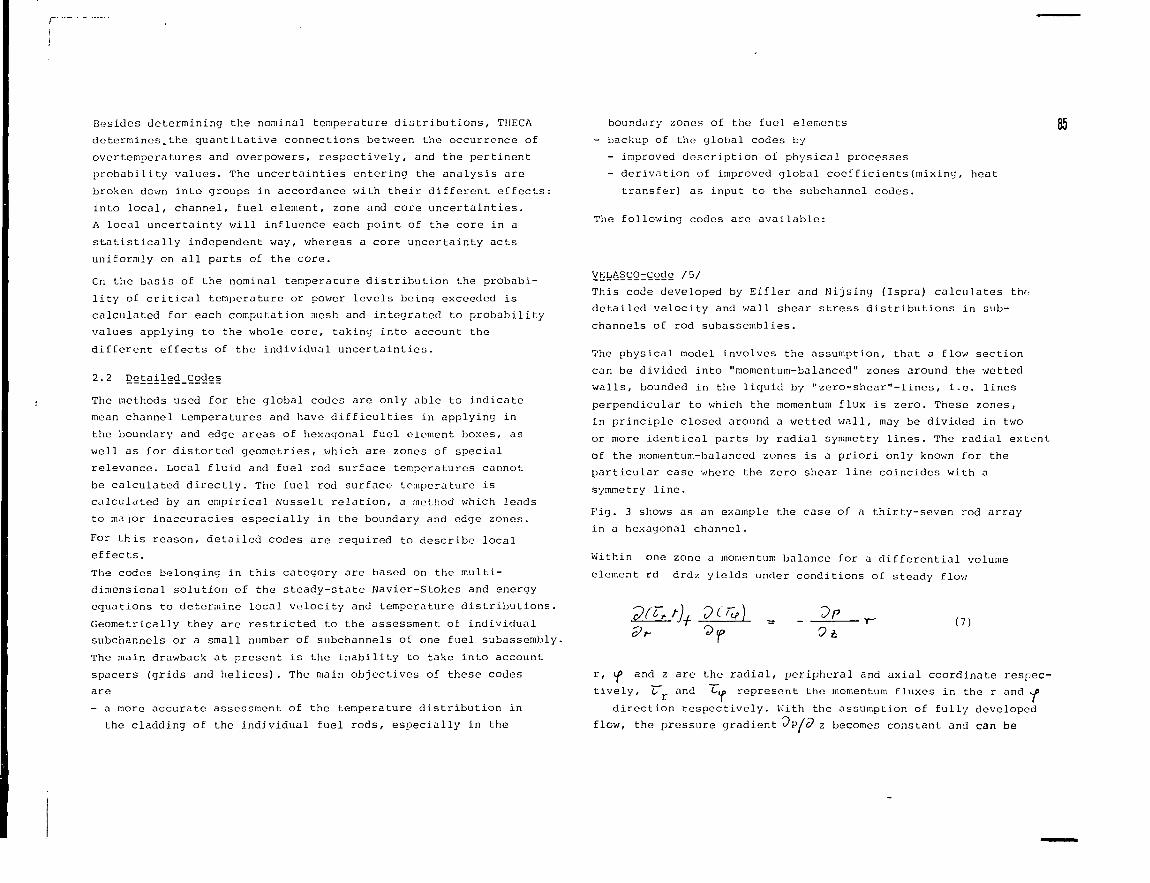
Besides determining the nominal temperature distributions, THECA
determines.the quantitative connections betvreen the occurrence of
overtemperatures and overpowers, respectively, and the pertinent
probability values. The uncertainties entering the analysis are
broken down into groups in accordance with their different effects:
into local, channel, fuel element, zone and core uncertainties.
A local uncertainty will influence each point of the core in a
statistically independent way, whereas a core uncertainty acts
uniformly on all parts of the core.
On the basis of the nominal temperature distribution the probabi-
lity of critical temperature or power levels being exceeded is
calculated for each computation mesh and integrated to probability
values applying to the whole core, taking into account the
different effects of the individual uncertainties.
2.2 Detailed_Cgdes
The methods used for the global codes are only able to indicate
mean channel temperatures and have difficulties in applying in
the boundary and edge areas of hexagonal fuel element boxes, as
well as for distorted geometries, which are zones of special
relevance. Local fluid and fuel rod surface temperatures cannot
be calculated directly. The fuel rod surface temperature is
calculated by an empirical Nusselt relation, a method which leads
to major inaccuracies especially in the boundary and edge zones.
For this reason, detailed codes are required to describe localeffects.
The codes belonging in this category are based on the multi-
dimensional solution of the steady-state Navier-Stokes and energy
equations to determine local velocity and temperature distributions.
Geometrically they are restricted to the assessment of individual
subchannels or a small number of subchannels of one fuel subassembly.
The main drawback at present is the inability to take into account
spacers (grids and helices). The main objectives of these codes
are
- a more accurate assessment of the temperature distribution in
the cladding of the individual fuel rods, especially in the
boundary zones of the fuel elements
- backup of the global codes by
- improved description of physical processes
- derivation of improved global coefficients(mixing, heat
transfer) as input to the subchannel codes.
The following codes are available:
VELASCO-Code /5/
This code developed by Eifler and Nijsing (Ispra) calculates the
detailed velocity and wall shear stress distributions in sub-
channels of rod subassemblies.
The physical model involves the assumption, that a flow section
can be divided into "momentum-balanced" zones around the v/etted
walls, bounded in the liquid by "zero-shear"-lines, i.e. lines
perpendicular to which the momentum flux is zero. These zones,
in principle closed around a v/etted wall, may be divided in two
or more identical parts by radial symmetry lines. The radial extent
of the momentum-balanced zones is a priori only known for the
particular case where the zero shear line coincides with a
symmetry line.
Fig. 3 shows as an example the case of a thirty-seven rod array
in a hexagonal channel.
Within one zone a momentum balance for a differential volume
element rd drdz yields under conditions of steady flov;
(7)
r, i and z are the radial, peripheral and axial coordinate respec-
tively, ~ü~r and C,«, represent the momentum fluxes in the r and ^fi
direction respectively. Kith the assumption of fully developed
flow, the pressure gradient Jp/c? z becomes constant and can be
r'
determined from a momentum balance applied to the entire flow
section:
(8)
I. Iav l s the average wall shear stress, d^ the hydraulic diameter
of the rod array considered.
For the determination of the radial velocity distribution different
expressions are used for:
wall region:
(9)
For the center region of smooth channels the following expression
was derived:
+ +
The parameters u and y are defined as
\T(11)
U is a constant and has the value 14.7 . y is a measure for theo -* o
thickness of the viscous wall region, which is assumed to have the
value 21 . K and Te are parameters depending primarily on the local
geometry.
The momentum flux ^ is assumed to be made up of a turbulent
diffusion and of a convective transport term, as expressed by
(12)
'.»is the eddy diffusivity for momentum transport in the peripheral
direction, £ is the density of the fluid, U is the axial velocity
and v the peripheral secondary flow component.
nipwas found to be represented well by the relation
(13)
For the peripheral secondary flov; component v the previously given
expression
»e sec "sec 41
Cos C»v)( 1 4 )
is used with
( 1 !
" es e is the peripheral extent along the wall of a closed secondary
flow vortex.
Lecause of major deviations from existing experimental results
especially for low P/D-ratios the model setups for anisotropy
and secondary flov; are in need of revision.
The program system calculates the velocity and temperature fields
of turbulent flows in subchannels of rod assemblies by means of
curvilinear-orthogonal coordinates (Fig. 4).
VERA/TERA mainly consists of two modules, namely the module
needed to establish the system of coordinates and the module
used to calculate the flov;; both modules are available in two
variations, for central and for v/all channels.
In calculating tlie velocity and temperature fields anisotropic
transport of momentum and heat is taken into account.
The eddy viscosity normal to the wall, f is determined by
Prandtl's mixing length theorem / 7 / , while the mixing length
is calculated by means of Nikuradse's realtion /9/ corrected
by Van Driest /8/:
- 0.03 (1- (16)
The eddy viscosity parallel to the wall is also calculated
by Prandtl's mixing length theorem:
(17)
T l y*jmeans the maximum velocity grandient normal to
the W E 1 1 , 9 U ^ ? X » the maximum azirauthal velocity gradient. For
calculation of the mixing length l2 a r a m P function according
to /!/ is applied.
JI o.14 y at other points (18)
Wall channels are treated in an analogous manner.
The eddy conductivity £„ can be determined from the eddy visco-
sity i „ by means of a suitable conversion function If = £ /£ ..
VERA/TERA can be used for this conversion to be made by means
of different relations /1o/.
Presently one central channel and one wall channel versions
are available. The model for the exchange of momentum needs to
be improved, coupling of the subchannels is required.
This coupling is already included in the VITESSE code /11/
developed by Slagter (ECN). For this reason, this code is
presently used for interpretation of KFK-experiments and is also
being developed further.
TURBIT-3_Code /12,13/
The TURBIT code was developed for numerical Simulation, by mean.:
of a finite difference method, of non-steady state, three dimen-
sional turbulent flow and temperature fields in channel flows fr r
fluids of constant physical properties. The method is based on .i
difference form of the complete equations of the conservation o:
mass, momentum including buoyancy terms, and enthalpy. The fluxes
of momentum and heat within the grid cells are described by sub-
grid scale models. The momentum sub-grid scale model introduced
here is applicable to low Reynolds numbers, rather coarse grids
and to channels with space dependent roughness distributions.
The temperature sub-grid scale model introduced in addition tak'-s
into account the influence of the molecular Prandtl number. At
the very low molecular Prandtl number of liquid metals the model
shows that complete resolution of all relevant temperature-fluctu-
ations can be achieved on the basis of presently realizable grids.
The method allows the simulation of laminar and turbulent flows
in parallel plane channels and concentric annuli. In addition to
pure forced convection, both forced convection influenced by
bouyancy and also pure natural convection can be taken into acco-int
(Bernard convection and Rayleigh convection).
The numerical results for the flow field show a slight influence-
of changes in model parameters. Agreement with experimental results
is fairly good for smooth, rough and partly roughed channels with
secondary flov/s, even when *-ather coarse grids are used. The simu-
lated temperature fields are very insensitive to changes of model
parameters. The results determined numerically are in good agree-
ment with consistent, reliable experimental results /12/. The
accuracy of the numerical results makes it possible to compute
quantities which so far have not been determined experimentally,
but v/hich are of decisive importance in the development of highe;
order statistical turbulence models.
2.i Assessment of the Global Codes Used for Design Calculations
The existing subchannel codes are similar in structure. However,
they use different models for momentum and energy exchange bctwo.-n
adjacent subchannels. To examine the qualitiy of such codes, inter-
comparison calculations were performed in two steps within the
framework of Kerntechnische Gesellschaft/Fachgruppe Thermo- und
Fluiddynamik.
Step._l
The mean subchannel temperatures, the wall temperatures around the
circumference of rods and wrapper tubes, and pressure losses were
precalculated for subassemblies with the following distinguishing
features:
- different rod numbers (19 and 61)
- different rod arrangements (P/D, W/D ratios)
- different types of spacers (grids, helical wires)
- different types of heating (numbers and positions of heated
rods in the subassemblies).
The criteria for distinction and the operating conditions were
taken from existing experimental results which, however, were not
generally known and which should be used for comparison with the
computed results. In some cases e.g., the problems implied extreme
load cases not to be expected in a core element. The computer
programs for this reason had to meet requirements which they would
not have to meet normally.
The results of this intercomparison study can be described as
follows and, at the same time, demonstrates the need for further
code improvements and experiments:
- The precalculated pressure drops differ by up to 15%
- comparison of the precalculated temperatures shows that
. trends are generally predicted correctly
. peak temperatures are generally precalculated
at the same levels
. the variations of mean coolant temperatures and the respective
wall temperatures on the circumference of characteristic rods
differ greatly in some cases(by a factor of 2),
- Comparison between precalculated temperatures and those deter-
mined experimentally shows
that the precalculated values agree with experiment.il finding:;
only trendwise, and do so the better the simpler tin' subassv; nly
geometries wore and the less complicated tho thermo'lyiianiic
and fluid-dynamic conditions were.
for comparison the computed and experimental moan subchannel teni: .:-
ratures are shown in Fig. 5 for the example of a 61-rod subassoiir:. ly
with grid type spacers and only two heated rods (central rod/rod
in the center of tho row near the wall).
Step__2_/15/:
Supplementary to the thormodynamic calculations of step 1 calcu-
lations were performed for a fully heated 61 rod subasr.c rnbly wit:-,
the following conditions:
- with and without power gradient over the subassembly cross set-- ion
- cosine shaped axial powor distribution
- grid and helical wire type spacers.
The following parameters had to be calculated:
- the mean mass flow rates of the subchannels,
- the mean coolant temperatures in the subchannels
. at the end of the heated subasr.embly section (core end)
. at the end of the upper blanket (end of subassembly)
the pressure drops over the le: fths of the subasscnblies.
No experimental results were available for the studies. Accordii. :ly,
intercomparison of the results was possible only for th1? compute:
values.
Again the result can be summarized briefly and indicates the
direction in which further studies must be performed:
- Precalculation of pressure drops leads to satisfactory result:;
(deviations C 7%)
- Comparison of precalculated temperatures shows that
. trends are generally predicted correctly
. the maximum levels of temperatures differ from each other
by up to 1 5 >, of the temperature rise
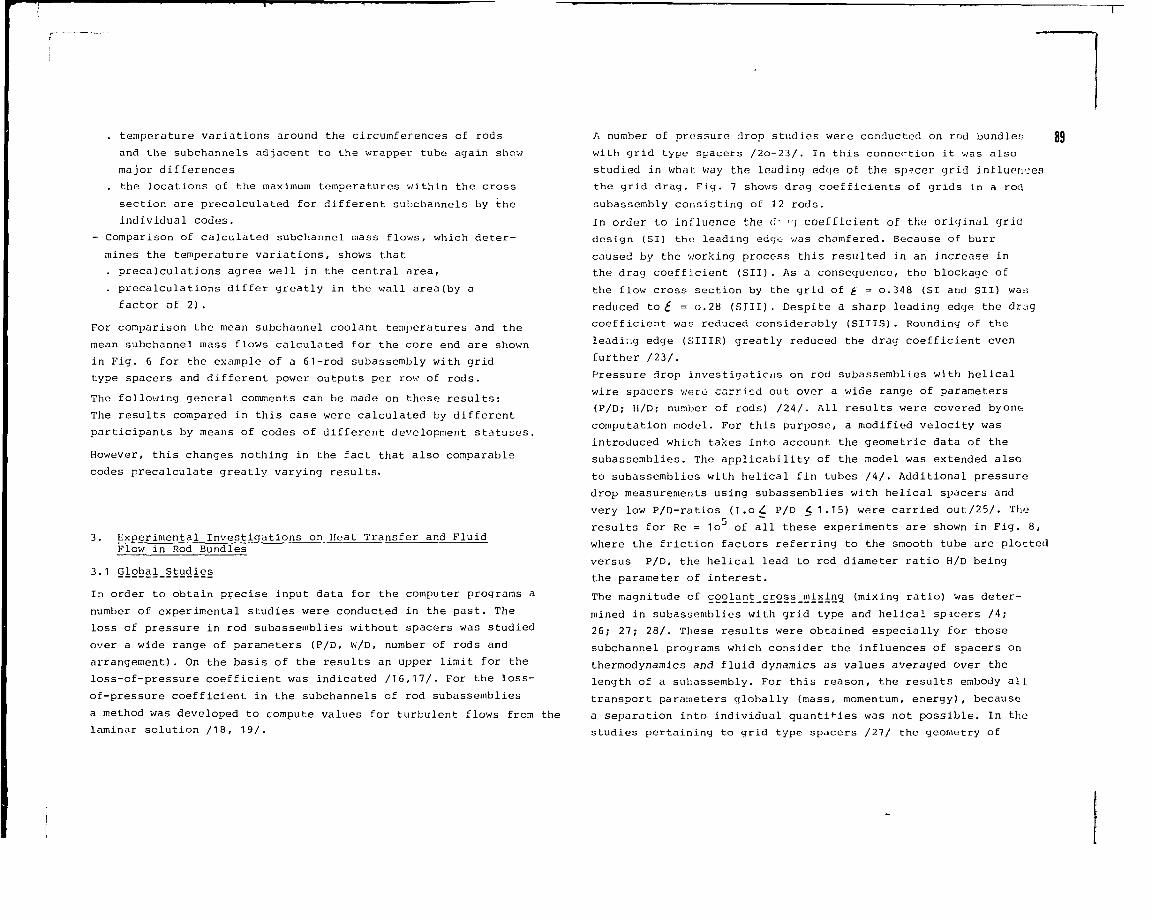
. temperature variations around the circumferences of rods
and the subchannels adjacent to the wrapper tube again show
major differences
. the locations of the maximum temperatures within the cross
section are precalculated for different subchannels by the
individual codes.
- Comparison of calculated subchannel mass flows, which deter-
mines the temperature variations, shows that
. precalculations agree well in the central area,
. precalculations differ greatly in the wall area(by a
factor of 2).
For comparison the mean subchannel coolant temperatures and the
mean subchannel mass flows calculated for the core end are shown
in E'ig. 6 for the example of a 61-rod subassembly with grid
type spacers and different power outputs per row of rods.
The following general comments can be made on these results:
The results compared in this case were calculated by different
participants by means of codes of different development statuses.
However, this changes nothing in the fact that also comparable
codes precalculate greatly varying results.
3. Experimental Investigations on Heat Transfer and FluidFlow in Rod Bundles
3.1 Global_Studies
In order to obtain precise input data for the computer programs a
number of experimental studies were conducted in the past. The
loss of pressure in rod subassemblies without spacers was studied
over a wide range of parameters (P/D, W/D» number of rods and
arrangement). On the basis of the results an upper limit for the
loss-of-pressure coefficient was indicated /16,17/. For the loss-
of-pressure coefficient in the subchannels of rod subassemblies
a method was developed to compute values for turbulent flows from the
laminar solution /18, 19/.
A number of pressure drop studies were conducted on rod bundle;-,
with grid type spacers /2o-23/. In this connection it was also
studied in what way the loading edge of the spacer grid influences
the grid drag. Fig. 7 shows drag coefficients of grids in a rod
subassembly consisting of 12 rods.
In order to influence the c' 17 coefficient of the original grit]
design (SI) the leading edge was chamfered. Because of burr
caused by the working process this resulted in an increase in
the drag coefficient (SII). As a consequence, the blockage of
the flow cross section by the grid of £ = O.348 (SI and SII) was
reduced to £ = O.28 (SIII) . Despite a sharp leading edge the drag
coefficient was reduced considerably (SIIIS). Rounding of the
leadir.g edge (SIIIR) greatly reduced the drag coefficient even
further /23/.
Pressure drop investigations on rod subassemblies with helical
wire spacers weit carried out over a wide range of parameters
(P/D; H/D; number of rods) /24/. All results were covered byone
computation model. For this purpose, a modified velocity was
introduced which takes into account the geometric data of the
subassemblies. The applicability of the model was extended also
to subassemblies with helical fin tubes /4/. Additional pressure
drop measurements using subassemblies with helical spacers and
very low P/D-ratios (1.o<! P/D C 1.15) were carried out/25/. The
results for Re = 1o of all these experiments are shown in Fig. 8,
where the friction factors referring to the smooth tube are plotted
versus P/D, the helical lead to rod diameter ratio H/D being
the parameter of interest.
The magnitude of coolant_cross_mixin2 (mixing ratio) was deter-
mined in subassemblies with grid type and helical spacers /4;
26; 27; 28/. These results were obtained especially for those
subchannel programs which consider the influences of spacers on
thermodynamics and fluid dynamics as values averaged over the
length of a subassembly. For this reason, the results embody all
transport parameters globally (mass, momentum, energy), because
a separation into individual quantifies was not possible. In the
studies pertaining to grid type spacers /27/ the geometry of
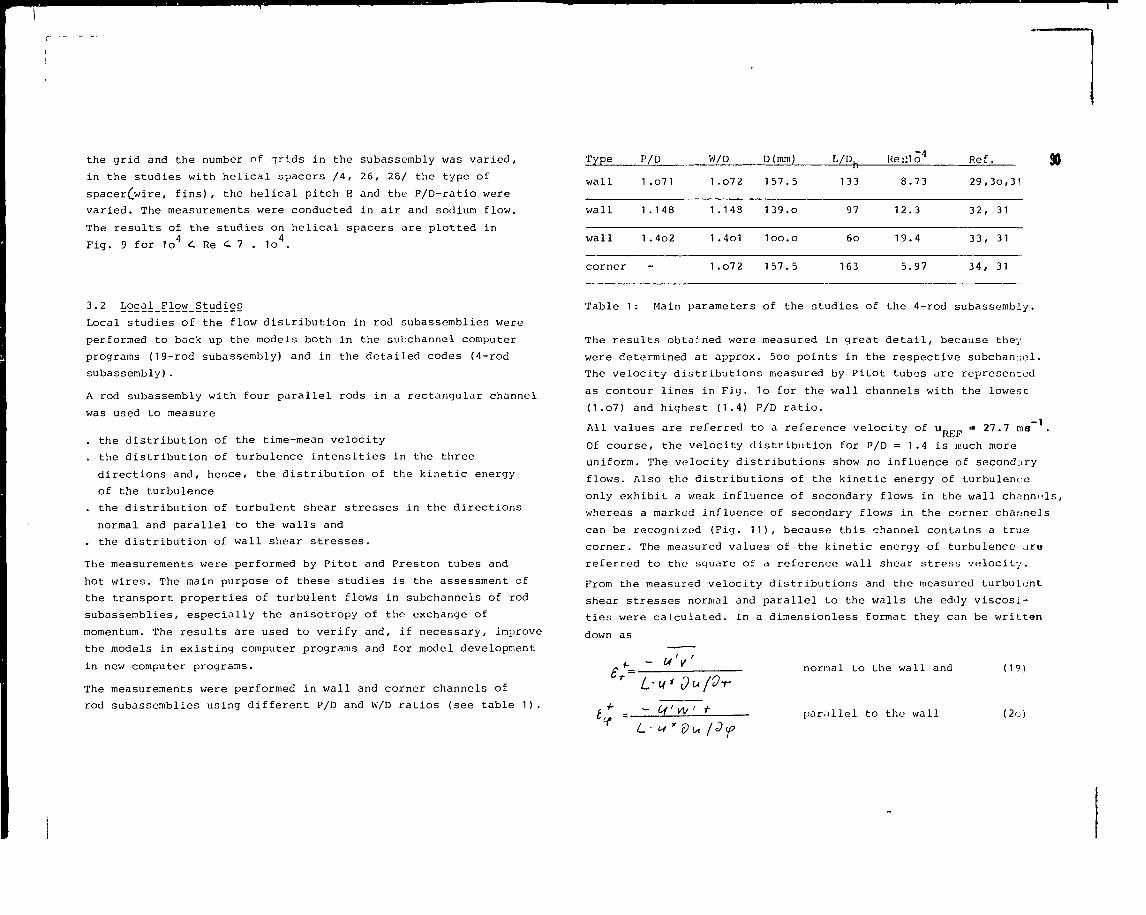
the grid and the number of grids in the subassembly was varied,
in the studies with helical spacers /4, 26, 28/ the type of
spacer£wire, fins), the helical pitch H and the P/D-ratio were
varied. The measurements were conducted in air and sodium flow.
The results of the studies on helical spacers are plotted in
Fig. 9 for 1o4 i Re 4 7 . 1o4.
3.2 Local_Flow_Studies
Local studies of the flow distribution in rod subassemblies were
performed to back up the models both in the subchannel computer
programs (19-rod subassembly) and in the detailed codes (4-rod
subassembly).
A rod subassembly with four parallel rods in a rectangular channel
was used to measure
. the distribution of the time-mean velocity
. the distribution of turbulence intensities in the three
directions and, hence, the distribution of the kinetic energy
of the turbulence
. the distribution of turbulent shear stresses in the directions
normal and parallel to the walls and
. the distribution of wall shear stresses.
The measurements were performed by Pitot and Preston tubes and
hot wires. The main purpose of these studies is the assessment of
the transport properties of turbulent flows in subchannels of rod
subassemblies, especially the anisotropy of the exchange of
momentum. The results are used to verify and, if necessary, improve
the models in existing computer programs and for model development
in new computer programs.
The measurements were performed in wall and corner channels of
rod subassemblies using different P/D and W/D ratios (see table 1).
Type
w a l l
w a l l
w a l l
corner
P/D
1 .o71
1 .148
1 .4o2
-
W/D
1 .o72
1.148
1 .4o1
1 .o72
D(mm)
157.5
139.o
1oo.o
157.5
L / D
133
97
6 0
163
Re::1o4
8.73
12.3
19.4
5.97
R e f
2 9 ,
3 2 ,
3 3 ,
3 4 ,
3o,31
31
31
31
90
Table 1: Main parameters of the studies of the 4-rod subassembly.
The results obtained were measured in great detail, because they
were determined at approx. 5oo points in the respective subchannel.
The velocity distributions measured by Pitot tubes are represented
as contour lines in Fig. 1o for the wall channels with the lowest
(1.o7) and highest (1.4) P/D ratio.
All values are referred to a reference velocity of uR„„ • 27.7 ms
Of course, the velocity distribution for P/D = 1.4 is much more
uniform. The velocity distributions show no influence of secondary
flows. Also the distributions of the kinetic energy of turbulence
only exhibit a weak influence of secondary flows in the wall channels,
whereas a marked influence of secondary flows in the corner channels
can be recognized (Fig. 11), because this channel contains a true
corner. The measured values of the kinetic energy of turbulence are
referred to the square of a reference wall shear stress velocity.
From the measured velocity distributions and the measured turbulent
shear stresses normal and parallel to the walls the eddy viscosi-
ties were calculated. In a dimensionless format they can be written
down as
normal to the wall and (19)
parallel to the wall (2o)
—
-
V
lAf ' *
L-«* du/Of
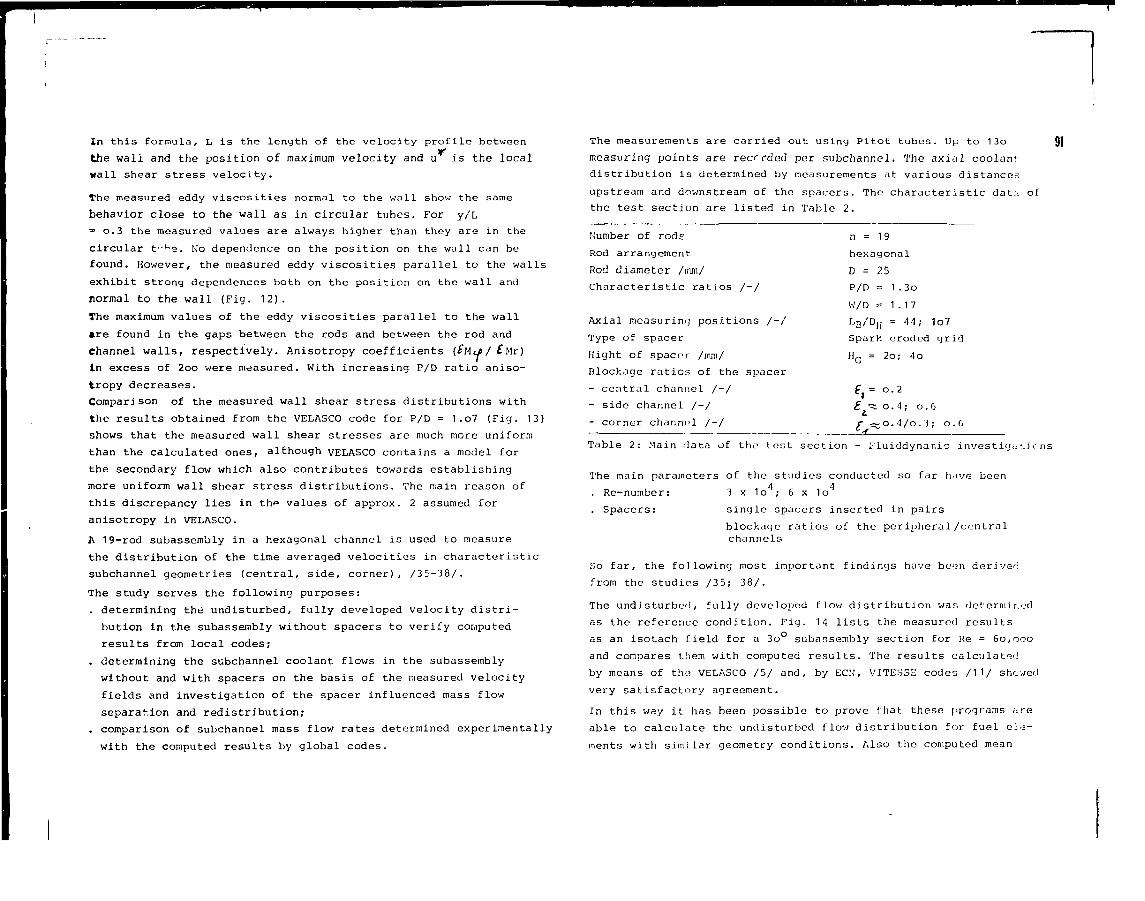
In this formula, L is the length of the velocity profile between
the wall and the position of maximum velocity and u is the local
wall shear stress velocity.
The measured eddy viscosities normal to the wall show the same
behavior close to the wall as in circular tubes. For y/L
=o.3 the measured values are always higher than they are in the
circular ti-K°. No dependence on the position on the wall can be
found. However, the measured eddy viscosities parallel to the walls
exhibit strong dependences both on the position on the wall and
normal to the wall (Fig. 12).
The maximum values of the eddy viscosities parallel to the wall
•re found in the gaps between the rods and between the rod and
Channel walls, respectively. Anisotropy coefficients (£M<^/ £.Mr)
in excess of 2oo were measured. With increasing P/D ratio aniso-
tropy decreases.
Comparison of the measured wall shear stress distributions with
the results obtained from the VELASCO code for P/D = 1 .o7 (Fig. 13)
shows that the measured wall shear stresses are much more uniform
than the calculated ones, although VELASCO contains a model for
the secondary flow which also contributes towards establishing
more uniform wall shear stress distributions. The main reason of
this discrepancy lies in th<=> values of approx. 2 assumed for
anisotropy in VELASCO.
A 19-rod subassembly in a hexagonal channel is used to measure
the distribution of the time averaged velocities in characteristic
subchannel geometries (central, side, corner), /35-38/.
The study serves the following purposes:
. determining the undisturbed, fully developed velocity distri-
bution in the subassembly without spacers to verify computed
results from local codes;
. determining the subchannel coolant flows in the subassembly
without and with spacers on the basis of the measured velocity
fields and investigation of the spacer influenced mass flow
separation and redistribution;
. comparison of subchannel mass flow rates determined experimentally
with the computed results by global codes.
The measurements are carried out using Pitot tubes. Up to 13o 91
measuring points are recorded per subchannel. The axial coolant
distribution is determined by measurements at various distances
upstream and downstream of the spacers. The characteristic data of
the test section are listed in Table 2.
Number of rods
Rod arrangement
Rod diameter /mm/
Characteristic ratios /-/
Axial measuring positions /-/
Type of spacer
Hight of spacer /mm/
Blockage ratios of the spacer
- central channel /-/
- side channel /-/
- corner channel /-/
n = 19
hexagonal
D = 25
P/D = 1.3o
W/D =1.17
LB/DH = 44; 1o7
Spark eroded grid
HG = 2o; 4o
f,-o.2
£ ~ o. 4 ; 0.6
c ~ o. 4/o. 3 ; o . (1JI2L
Table 2: Main data of the test section - FluiddynaTiic investiy.i r.i < ns
The main parameters of the studies conducted so far have been4 r , 4Re-number:
Spacers:
3 x 1o ; 6 x 1o
single spacers inserted in pairs
blockage ratios of the peripheral/centralchannels
So far, the following most important findings have been derived
from the studies /35; 38/.
The undisturbed, fully developed flow distribution was determined
as the reference condition. Fig. 14 lists the measured results
as an isotach field for a 3o° subassembly section for Re = 60,000
and compares them with computed results. The results calculated
by means of the VELASCO /5/ and, by ECN, VITESSE codes /11/ showed
very satisfactory agreement.
In this way it has been possible to prove that these programs are
able to calculate the undisturbed flow distribution for fuel ele-
ments with similar geometry conditions. Also the computed mean
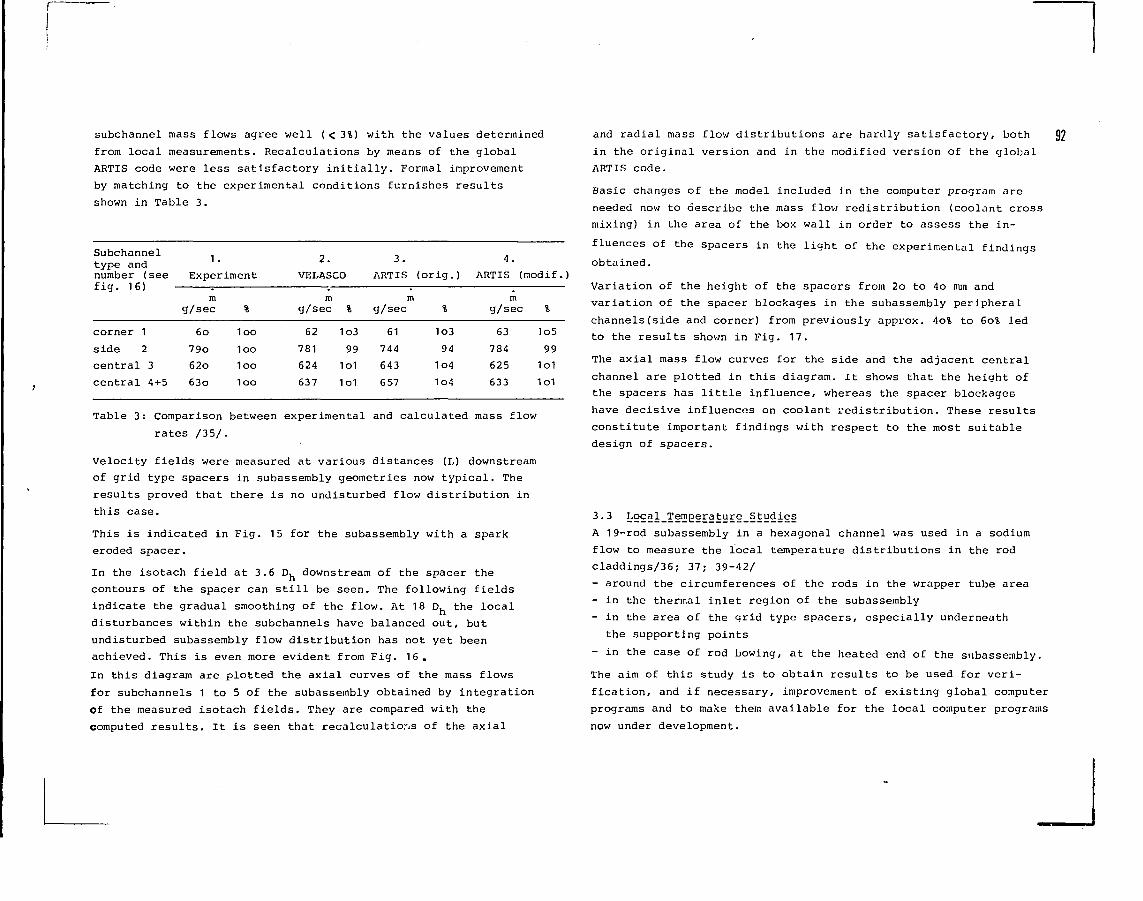
subchannel mass flows agree well ( < 3%) with the values determined
from local measurements. Recalculations by means of the global
ARTIS code were less satisfactory initially. Formal improvement
by matching to the experimental conditions furnishes results
shown in Table 3.
Subchanneltype andnumber (seefig. 16)
corner 1
side 2
central 3
central 4+5
1 .
Experiment
mg/sec
6o
79o
62o
63o
%
1oo
1oo
1oo
1oo
2.
VELASCO
mg/sec %
62 1o3
781 99
624 1o1
637 1o1
3.
ARTIS
mg/sec
61
744
643
657
(orig.)
%
1o3
94
1o4
1o4
4.
ARTIS (modif.
mg/sec %
63 1o5
784 99
625 1o1
633 1o1
Table 3: Comparison between experimental and calculated mass flow
rates /35/.
Velocity fields were measured at various distances (L) downstream
of grid type spacers in subassembly geometries now typical. The
results proved that there is no undisturbed flow distribution in
this case.
This is indicated in Fig. 15 for the subassembly with a spark
eroded spacer.
In the isotach field at 3.6 Dh downstream of the spacer the
contours of the spacer can still be seen. The following fields
indicate the gradual smoothing of the flow. At 18 Dh the local
disturbances within the subchannels have balanced out, but
undisturbed subassembly flow distribution has not yet been
achieved. This is even more evident from Fig. 16.
In this diagram are plotted the axial curves of the mass flows
for subchannels 1 to 5 of the subassembly obtained by integration
of the measured isotach fields. They are compared with the
computed results. It is seen that recalculations of the axial
and radial mass flow distributions are hardly satisfactory, both 92
in the original version and in the modified version of the global
ARTIS code.
Basic changes of the model included in the computer program are
needed now to describe the mass flow redistribution (coolant cross
mixing) in the area of the box wall in order to assess the in-
fluences of the spacers in the light of the experimental findings
obtained.
Variation of the height of the spacers from 2o to 4o mm and
variation of the spacer blockages in the subassembly peripheral
channels(side and corner) from previously appiox. 4o% to 6o% led
to the results shown in Fig. 17.
The axial mass flow curves for the side and the adjacent central
channel are plotted in this diagram. It shows that the height of
the spacers has little influence, whereas the spacer blockages
have decisive influences on coolant redistribution. These results
constitute important findings v/ith respect to the most suitable
design of spacers.
3.3 kocal_Temp_erature_Studies
A 19-rod subassembly in a hexagonal channel was used in a sodium
flow to measure the local temperature distributions in the rod
claddings/36; 37; 39-42/
- around the circumferences of the rods in the wrapper tube area
- in the thermal inlet region of the subassembly
- in the area of the grid type spacers, especially underneath
the supporting points
- in the case of rod bowing, at the heated end of the snbassembly.
The aim of this study is to obtain results to be used for veri-
fication, and if necessary, improvement of existing global computer
programs and to make them available for the local computer programs
now under development.
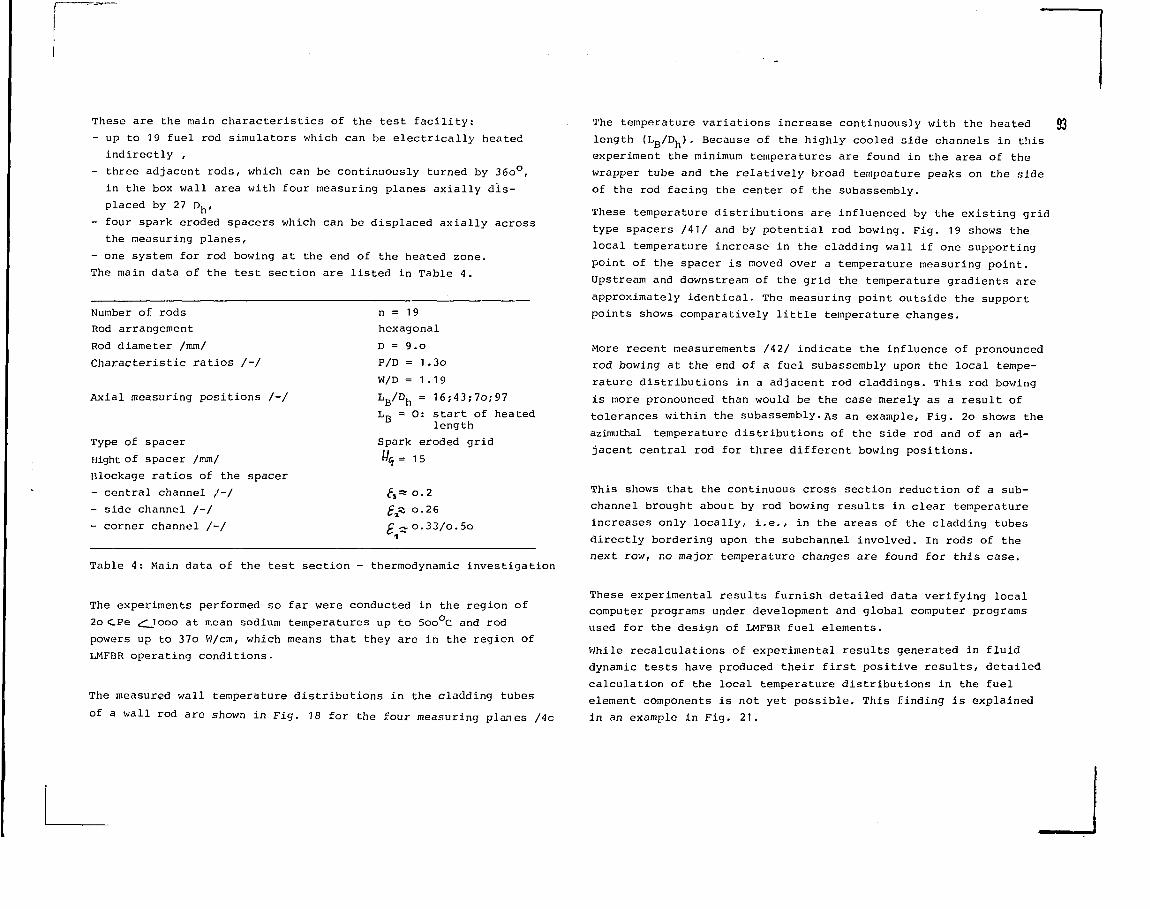
These are the main characteristics of the test facility:
- up to 19 fuel rod simulators which can be electrically heated
indirectly ,
- three adjacent rods, which can be continuously turned by 36o°,
in the box wall area with four measuring planes axially dis-
placed by 27 Dh,
- four spark eroded spacers which can be displaced axially across
the measuring planes,
- one system for rod bowing at the end of the heated zone.
The main data of the test section are listed in Table 4.
Number of rods
Rod arrangement
Rod diameter /mm/
Characteristic ratios /-/
Axial measuring positions /-/
Type of spacer
Hight of spacer /mm/
Blockage ratios of the spacer
- central channel ,'-/
- side channel /-/
- corner channel /-/
n = 19
hexagonal
D = 9.o
P/D = 1.3o
W/D =1.19
Lß/Dh = 16;43;7o;97L„ = 0: start of heated
length
Spark eroded grid
Wfi = 15
S^ O.26
C ~ o.33/o.5o1"*
Table 4: Main data of the test section - thermodynamic investigation
The experiments performed so far were conducted in the region of
2o CPe s" looo at mean sodium temperatures up to 5oo C and rod
powers up to 37o W/cm, which means that they are in the region of
LMFBR operating conditions.
The measured wall temperature distributions in the cladding tubes
of a wall rod are shown in Fig. 18 for the four measuring planes /4c
The temperature variations increase continuously with the heated
length (LB/Dn). Because of the highly cooled side channels in this
experiment the minimum temperatures are found in the area of the
v/rapper tube and the relatively broad tempeature peaks on the side
of the rod facing the center of the subassembly.
These temperature distributions are influenced by the existing grid
type spacers /41/ and by potential rod bowing. Fig. 19 shows the
local temperature increase in the cladding wall if one supporting
point of the spacer is moved over a temperature measuring point.
Upstream and downstream of the grid the temperature gradients are
approximately identical. The measuring point outside the support
points shov/s comparatively little temperature changes.
More recent measurements /42/ indicate the influence of pronounced
rod bowing at the end of a fuel subassembly upon the local tempe-
rature distributions in a adjacent rod claddings. This rod bowing
is more pronounced than would be the case merely as a result of
tolerances within the subassembly.As an example, Fig. 2o shows the
azimuthal temperature distributions of the side rod and of an ad-
jacent central rod for three different bowing positions.
This shows that the continuous cross section reduction of a sub-
channel brought about by rod bowing results in clear temperature
increases only locally, i.e., in the areas of the cladding tubes
directly bordering upon the subchannel involved. In rods of the
next row, no major temperature changes are found for this case.
These experimental results furnish detailed data verifying local
computer programs under development and global computer programs
used for the design of LMFBR fuel elements.
While recalculations of experimental results generated in fluid
dynamic tests have produced their first positive results, detailed
calculation of the local temperature distributions in the fuel
element components is not yet possible. This finding is explained
in an example in Fig. 21.
93
In addition to the measured azimuthal temperature distribution
of the side rod the mean values of the subchannel temperatures
computed by means of ARTIS and the mean temperatures of cladding
tube sectors calculated on this basis by various heat transfer
relations are plotted. The maximum azimuthal differential tempe-
ratures compared here, which stem for calculations and experiments,
result in computed values which are lower by a factor of 2...6.
This clearly results in the need to improve global codes and to
develop local 'codes and adapt them to suitable experiments so as
to permit more precise calculations to be performed in the criti-
cal zones (wrapper tube region) of fuel elements /36/.
4. Conclusions for Future Work
In the light of the experience obtained in current design calcu-
lations and experimental studies and also in the light of ex-
periences accumulated in the core element behavior of reactors now
in operation, a number of further studies are thought to be
urgently required in view of future code developments.
For improvement of the subchannel computer programs it is necessary
to
- determine with more precision the distribution of the fuel rod
cladding temperature, especially in the edge zones of the fuel
elements, also in nominal geometries,
- calculate with a higher degree of reliability the mass flow
redistributions in the area of grid type spacers.
for this purpose, knowledge of the drag coefficients in the
subchannels is decisive,
- make amenable to calculation temperature distribution in
disturbed geometries by effects depending on burnup, such as
swelling and bowing of structures,
- include the calculations flow conditions in mixed convection.
To achieve these goals, more experimental studies are needed.
However, global experimental studies can achieve progress with
respect to these goals only through a large number of expensive
experiments with sufficient statistical data, because the number
of parameters to be fitted and empirical relations to be intro-
duced into the models is large and also because the individual
effects cannot be separated from global studies. For this reason,
it is proposed to perform more detailed analyses than would be
possible in subchannel computer programs for such important
subareas as
- temperature distribution in the side/corner channels
- effects of flow development
- non-nominal geometries
- effects of spacer grids on flow and temperature distributions.
The empirical dependencies to be introduced into the subchannel
computer programs can then be obtained by parameter studies by
means of detailed codes. For this reason speedy further develop-
ment of detailed codes is necessary which must also be backed
experimentally. Experimental studies on the verification of de-
tailed codes can be performed in simpler geometries on an enlarged
scale at reasonable expenditure. This includes studies of the
velocity distribution, distributions of the kinetic energy of
turbulence, eddy viscosities and secondary flows and wall shear
stresses in characteristic subchannels of rod subassemblies, i.e.,
- without spacers for fully developed and developing flows
- in the spacer region and in the flow area affected by the
spacer grids and
- for non-nominal geometries and flow situations.
To calculate detailed temperature distributions in the fuel rod
and fluid regions it is also necessary to determine experimentally
in sodium the turbulent thermal conductivities and turbulent
Prandtl numbers, respectively, and their anisotropy and dependence
on geometry, in characteristic subchannels of rod subassemblies
- without spacers for fully developed and developing flows
- in the region of the flow zone affected by spacers and
- for non-nominal geometries and flow situations.
For verification of the code developments a final experimental
study in sodium in a rod subassembly withal 9 rods with grid
type spacers and the possibility to simulate bows and geometry
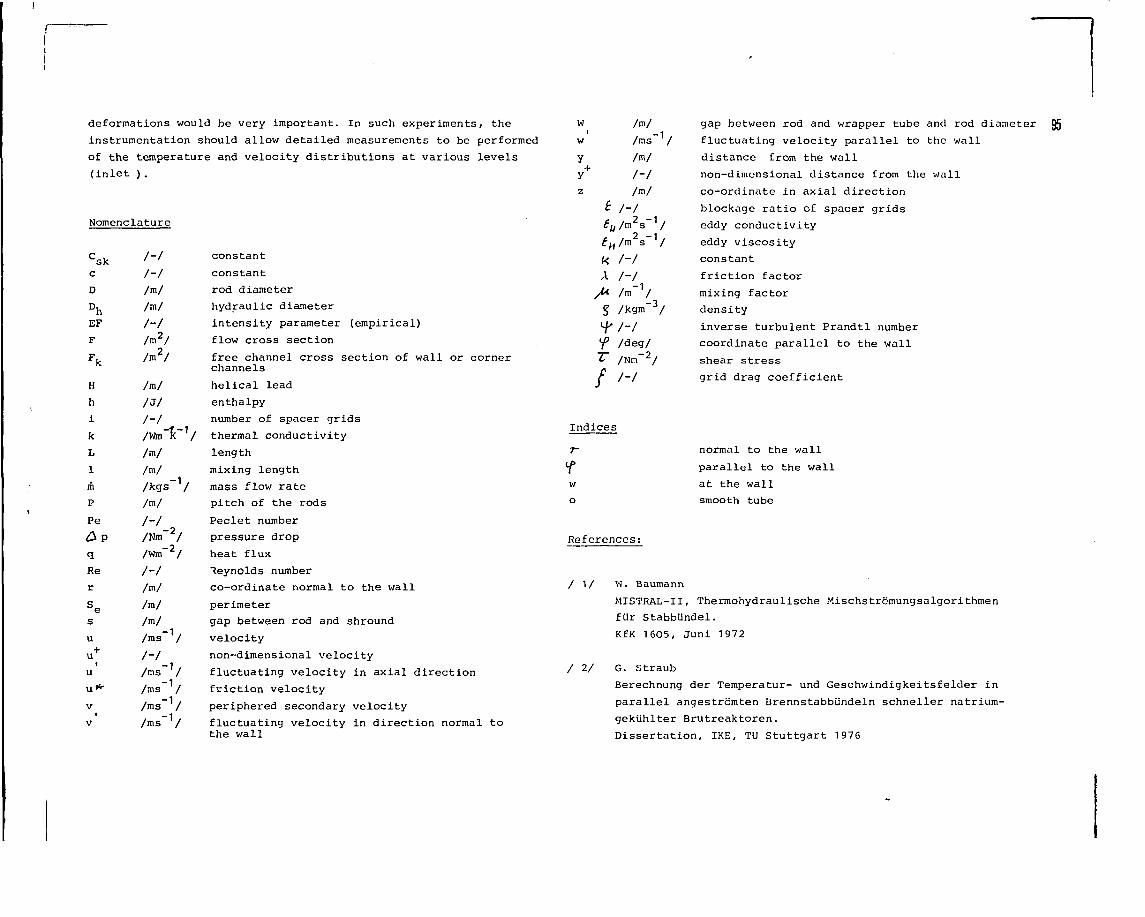
deformations would be very important. In such experiments/ the
instrumentation should allow detailed measurements to be performed
of the temperature and velocity distributions at various levels
(inlet ).
Nomenclature
CskcD
DhEF
F
Fk
H
h
i
k
L
1
mP
Pe
& Pq
Re
r
Ses
u+u f
uu*-
V
V
/-/
/-/
/m/
/m/
/-/lm2l
/m2/
/m/
/J//-/
/Wmi("1
/m/
Im/Ags"1//ml
/-//Nm~2/
/Vfm'2/
/-/
/m/
/mlIml/ms"1/
I ~ I/ms"1/
/ms"1/
/ms"1/
/ms"1/
constant
constant
rod diameter
hydraulic diameter
intensity parameter (empirical)
flow cross section
free channel cross section of wall or cornerchannels
helical lead
enthalpy
number of spacer grids
thermal conductivity
length
mixing length
mass flow rate
pitch of the rods
Peclet number
pressure drop
heat flux
Reynolds number
co-ordinate normal to the wall
perimeter
gap between rod and shround
velocity
non-dimensional velocity
fluctuating velocity in axial direction
friction velocity
periphered secondary velocity
fluctuating velocity in direction normal tothe wall
w1
w
y
yz
A>*
/m//ms"1/
Im/l-l/ml
l-l
r/mV1/
,/ni2s-1/
/-/
/-/
/m"1//kgm"3/
/deg/
/Nin"2/
Indices
gap betv/een rod and wrapper tube and rod diameter 95
fluctuating velocity parallel to the wall
distance from the wall
non-dimensional distance from the wall
co-ordinate in axial direction
blockage ratio of spacer grids
eddy conductivity
eddy viscosity
constant
friction factor
mixing factor
density
inverse turbulent Prandtl number
coordinate parallel to the wall
shear stress
grid drag coefficient
fwo
References:
normal to the wall
parallel to the wall
at the wall
smooth tube
/ 1/ W. Baumann
MISTRAL-II, Thermohydraulische Mischströmungsalgorithmen
für Stabbündel.
KfK 1605, Juni 1972
/ 2/ G. Sträub
Berechnung der Temperatur- und Geschwindigkeitsfelder in
parallel angeströmten Brennstabbündeln schneller natrium-
gekühlter Brutreaktoren.
Dissertation, IKE, TU Stuttgart 1976
/ 3/ K. Doetschmann, A. Amendola
THECA - Ein Programmsystem zur dreidimensionalen thermo-
hydraulischen Auslegung, schneller Reaktorkerne.
KfK 2372, März 1977
/ 4/ H. Hoffmann
Experimentelle Untersuchung zur Kühlmittelquervernischung
u. zum Druckabfall in Stabbündeln mit wendeiförmigen Ab-
/ standshaltern.
KfK 1843, Dez. 1973
/ 5/ W. Eifler, R. Nijsing
VELASC0 - Velocity Field in Asymmetrie Rod Configurations.
EUR-495Oe (1973)
/ 6/ Z. Farago
interner Bericht (1978)
/ 7/ L. Prandtl
über die ausgebildete Turbulenz
ZAMM 5 (1925) 146
/ 8/ R. van Driest
On turbulent flow near a wall
J. Aerosp. Sei. 23(11) (1956)
/ 9/ J. Nikuradfe:
Gesetzmäßigkeit der turbulenten Strömung in glatten Rohren.
V.D.I. Forsch. 281, 1926
/10/ R. Meyder
Bestimmung des turbulenten Geschwindigkeits- und Tempera-
turfeldes in Stabbündeln mit Hilfe von krummlinig-ortho-
gonalen Koordinaten.
KfK 2029 (1974)
/11/ W. Slagter, H.A. Roodbergen, N.h.Decker:Prediction of Fully Developed Turbulent Flow in Non Circular Channelsby the Finite Element Method, NATO Advanced Study Institute,Istanbul,(1978)
/12/ G. Grötzbach
Direkte numerische Simulation turbulenter Geschwindigkeits-
Druck- u. Temperaturfelder bei Kanalströmungen
KfK 2426, Okt. 1977
/13/ G. Grötzbach
Num. Untersuchungen der Quervermischung bei auftriebsbe-
einflußter turbulenter Konvektion in einen vertikalen Kanal
KfK 2648, Juni 1978
/14/ H. Hoffmann
Ergebnisse der Vergleichsrechnungen von Temperaturfeldern
bei Natriumkühlung, in: Thermo- und fluiddynamische Unter-
kanalanalyse der Schnellbrüter-Brennelemente und ihre Re-
lation zur Brennstabmechanik.
KfK 2232 (1975), p. 39-108
/15/ H. Hoffmann
Unterkanalanalyse und Brennelementauslegung, Zusatzaufgaben
in den Vergleichsrechnungen)
unveröffentlicht (1977)
/16/ K. Rehme '
Pressure drop performance of rod bundles in hexagonal
arrangements.
Int. J. Heat Mass Transfer 1_5, 2499-2517 (1972)
/17/ J. Marek, K. Maubach und K. Rehme
Heat transfer and pressure drop performance of rod bund-
les arranged in square arrays.
Int. J. Heat Mass Transfer 16, 2215-2228 (1973)
96
/18/ K. Rehme
Laminar flow through rod bundles,
Chemie-Ing.-Technik 4_3, 962-966 (1972)(in German)
/19/ K. Rehme
Simple method of predicting friction factors of turbulent
flow in non-circular channels.
Int. J. Heat Mass Transfer J_6/ 933-950 (1973)
/20/ K. Rehme
Drag coefficients of spacer grids in fuel elements.
ATKE J_5, 127-130 (197O) (in German)
/21/ K. Rehme
Pressure drop correlation for fuel element spacers.
Nucl. Technology V7, 15-23 (1973)
/22/ K. Rehme
Pressure drop of spacer grids in smooth and roughened
rod bundles.
Nucl. Technology 3_3, 314-317 (1977)
/23/ K. Rehme
The pressure drop of spacer grids in rod bundles of 12
rods with smooth and roughened surfaces.
Report KfK 2697 (1978)
/24/ K. Rehme
Systematische experimentelle Untersuchung der Abhängig-
keit des Druckverlustes von der geometrischen Anordnungif
für langsdurchströmte Stabbündel mit Spiraldrahtabstands-haltern.
Dissertation TU Karlsruhe (1967)
/25/ P.E. Huber
Experimentelle Untersuchungen des Druckabfalles in eng
gepackten Stabbündeln mit wendeiförmigen Abstandshaltern.
Studienarbeit (1978) (unveröffentlicht)
/26/ W. Baumann, R. Möller
Experimental Study of coolant cross-mixing in multirod-
bundles.
Atomkernenergie 14-56 (1969)
/27/ H. Hoffmann, E. Baumgärtner, H.H. Frey
Experimentelle Untersuchungen zur Kühlmittelquervermischung
an Stabbündeln mit gitterförmigen Abstandshaltern bei tur-
bulenter Natrium-Strömung.
KfK 2360 (1977)
/28/ E. Baumgärtner, H. Hoffmann
Untersuchungen zur Kühlmittelquervermischung in natriumge-
kühlten Brennelementen.
KfK 1275/2 (1975), p. 126/8 -10
/29/ K. Rehme
Experimental investigation of the turbulent flow through
a wall subchannel of a rod bundle.
Report KfK 2441 (1977) (in German)
/37/ H. Hoffmann, R. Möller, H. Tschöke, G. Trippe, D. Weinberg
Thermo- und fluiddynamische Untersuchungen an Brennstab-
bündeln.
KfK-Nachrichten, Vol. 10, 3/4 (1978), p. 32-36
/38/ G. Trippe
Experimentelle Untersuchung der Strömung in axial durch-
strömten Stabbündeln hexagonaler Anordnung bei großen Re-
Zahlen und unter Berücksichtigung der Wirkung von gitter-
förmigen Abstandshaltern.
(1979) - unveröffentlicht
/39/ R. Möller, H. Tschöke, M. Kolodziej
Experimentelle Bestimmung von Temperaturfeldern in Natrium-
durchströmten Bündeln mit hexagonaler Stabanordnung und
gitterförmigen Abstandshaltern.
KfK 2356 (1977)
97
~
/40/ R. Möller, H. Tschöke
Experimental Determination of Wall Temperature Fields in
Rod Bundle Geometries with Turbulent Sodium Flov;,
6th International Heat Transfer Conf.;Vol 5, p. 29-34,
Toronto 1978
/41/ R. Möller, H. Tschöke
Experimentelle Bestimmung der lokalen Temperaturfeldände-
rung in den Hüllrohren eines natriumdurchströmten Stab-
bündels durch gitterförmige Abstandshalter.
DatF/KTG-Reaktortagung, Hannover, 1978, p. 110-113
/42/ R. Möller, H. Tschöke
Influence of Rod Bowing on the Measured Local Temperature
Distribution in Fuel Rod Cladding Tubes with Sodium Cooling.
European Nuclear Conf., Hamburg 1979
/34/ K. Rehme jJJMeasurements of the velocity-, turbulence-, and wall shear
stress distributions in a corner subchannel of a rod bundle.
Report KfK 2512 (1977) (in German)
/35/ G. Trippe, D. Weinberg
Experimental and Theoretical Investigations of Turbulent
Velocity Distribution in Rod Bundles With and Without
Grid-Type Spacers.
NATO Advanced Study Institute, Istanbul (1978)
/36/ R. Möller, D. Wäinberg, G. Trippe, H. Tschöke
Experiments on the Fluiddynamics and Thermodynamics of
Rod Bundles to Verify and Support the Design of SNR-300
Fuel Elements. - Status and Open Problems.
IAEA-SM-225/34, Bologna 1978
/3O/ K. Rehme
The structure of turbulent flow through a wall subchannel
of a rod bundle.
Nucl. Engng. Design £5, 311-323 (1978)
/31/ K. Rehme
Non-isotropic eddy viscosities in turbulent flov; through
rod bundles.
NATO Advances Study Institute, Istanbul (1978)
/32/ K. Rehme
Turbulent flow through a wall subchannel of a rod bundle.
Report KfK 2617 (1978) (in German)
/33/ K. Rehme
Velocity and turbulence distributions in a wall subchannel
of a rod bundle.
Report KfK 2637 (1978) (in German)
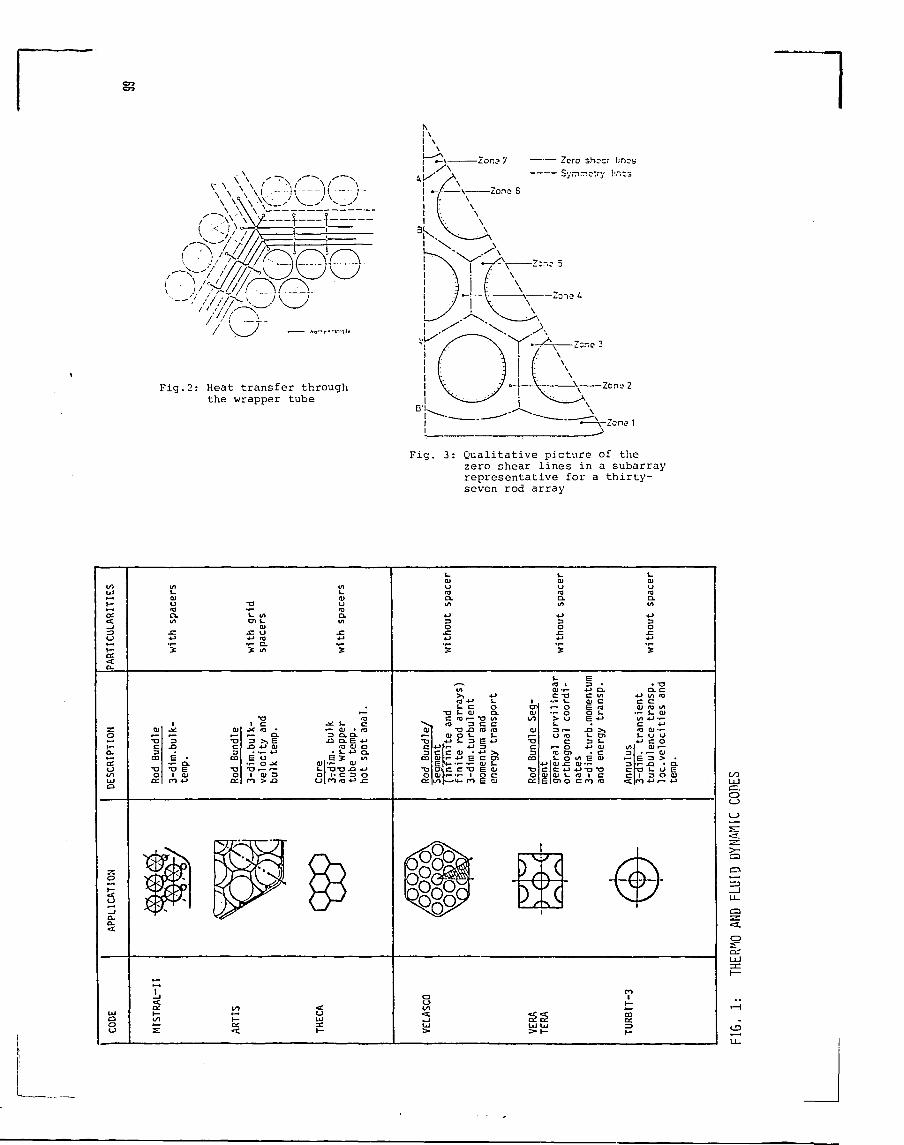
Fig.2: Heat transfer throughthe wrapper tube
Fig. 3: Qualitative picture of thezero shear lines in a subarrayrepresentative for a thirty-seven rod array
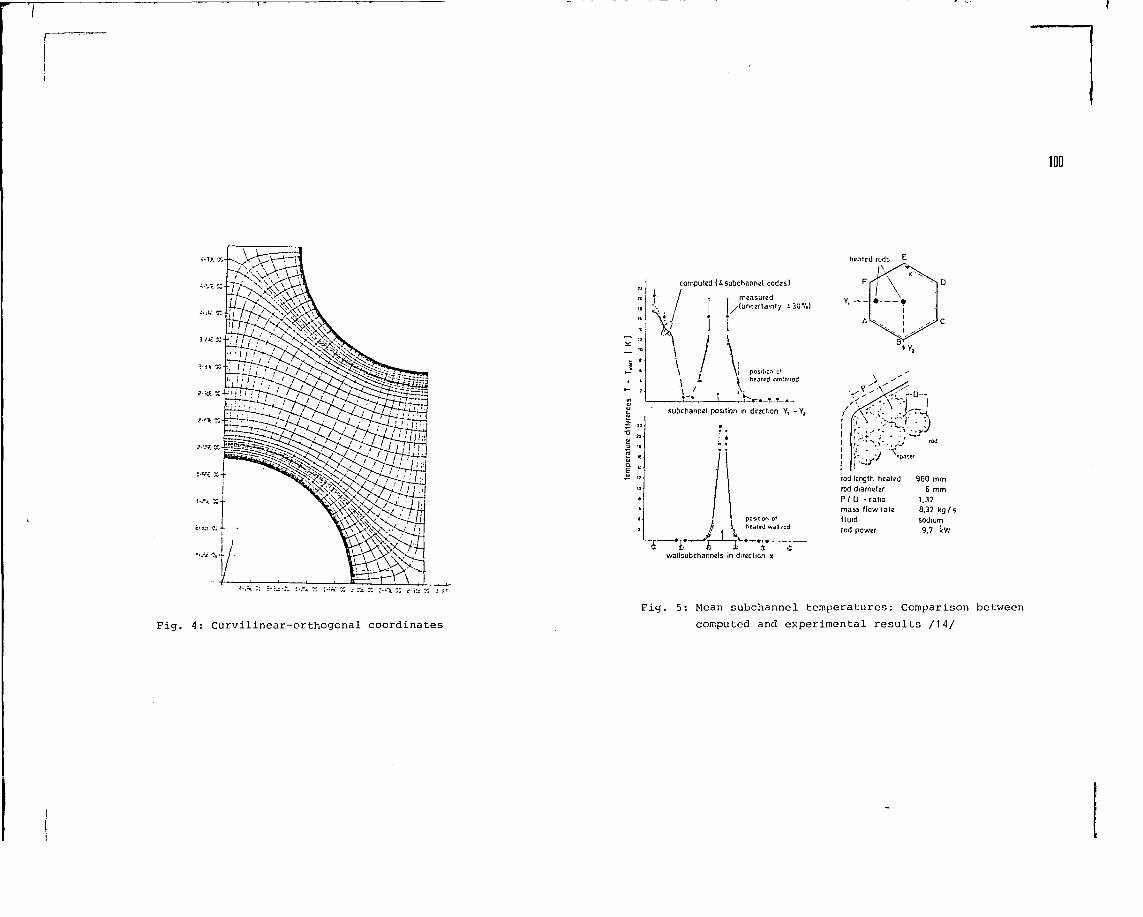
100
hentcd rod
computed {^subchannel codes)
measured• (uncertainty i3U7.)
position otheated anttitod
subchannel position in direction Y, - Y:
' position ot£ i heated wall ro<
b i) ftwallsubchannels in direction x
rod length heated 960 mmrod diameter 6 mmPI D -ratio 1,32mass flow rate 8,32 kg/sfluid sodiumrod power 9,7 kW
Fig. 4: Curvilinear-orthogonal coordinates
Fig. 5: Mean subchannel temperatures: Comparison betv/een
computed and experimental results /14/
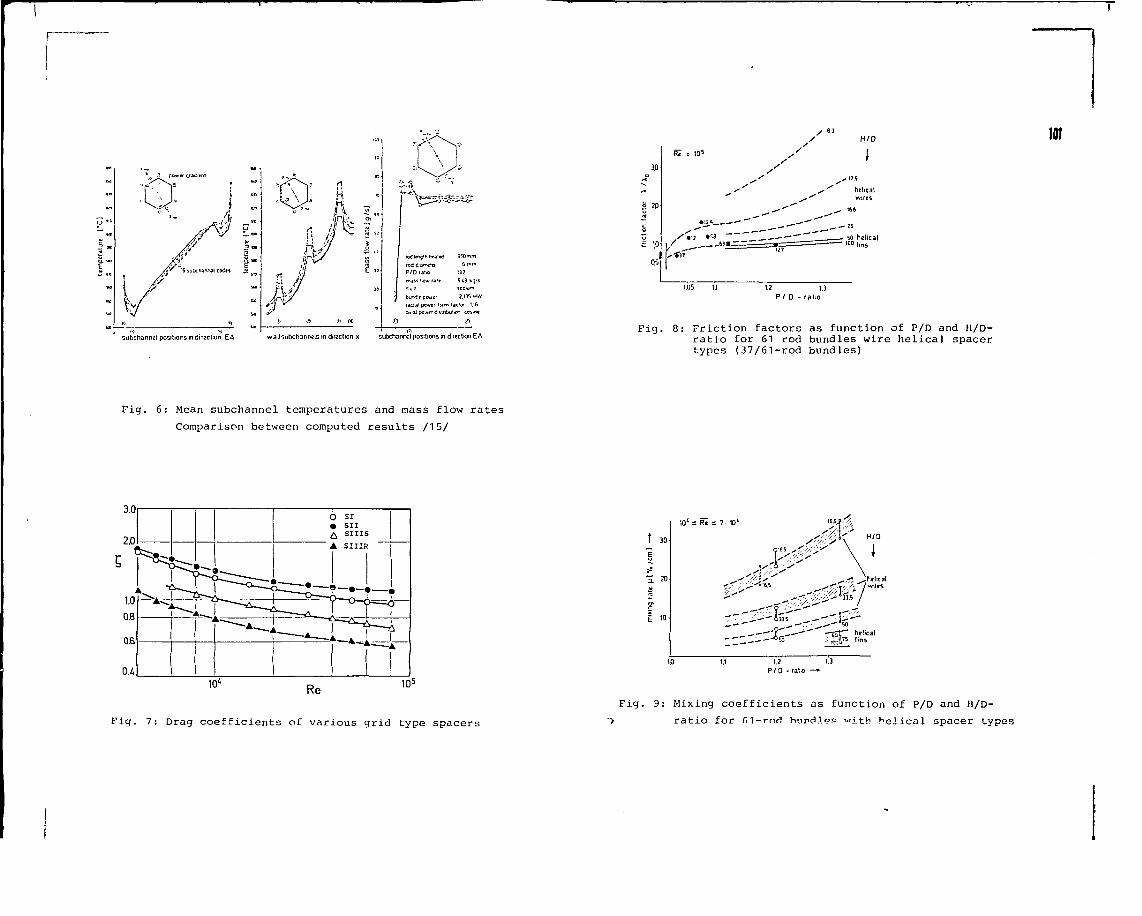
£1
rod dPID tat« 1.J2
rras*. flew n't G (3 <>g't
flud icCnjm
t<jr.l'.i pov.tr ?.)KMW
(ad-al perwtr l- im tattw 1.16
Subchannel positions indirection EA wallsubchanncls in direction x subchannel positions m direction EA
/ H/D Iffl
/ - -
1.05
r-g, •"
.'.8»» j r ^ r
1.2P/ D
—-*"
' " "
u• rado
hcticatwires
^ 166
—-JS
— M helica- m Um•a i.o
0.5
Fig. 8: Friction factors as function of P/D and H/D-ratio for 61 rod bundles wire helical spacertypes (37/61-rod bundles)
Fig. 6: Mean subchannel temperatures and mass flow rates
Comparison between computed results /15/
Fig. 7: Drag coefficients of various grid type spacers
1 10
10's Re s 7 10' M>»-' HIO
; helical/wit«
ID 1.1 1.2 1.3P / D -rat«) —»
Fig. 9: Mixing coefficients as function of P/D and H/D-
"> ratio for fi1 -rnri hi.ipcU.op '-'ith helical spacer types
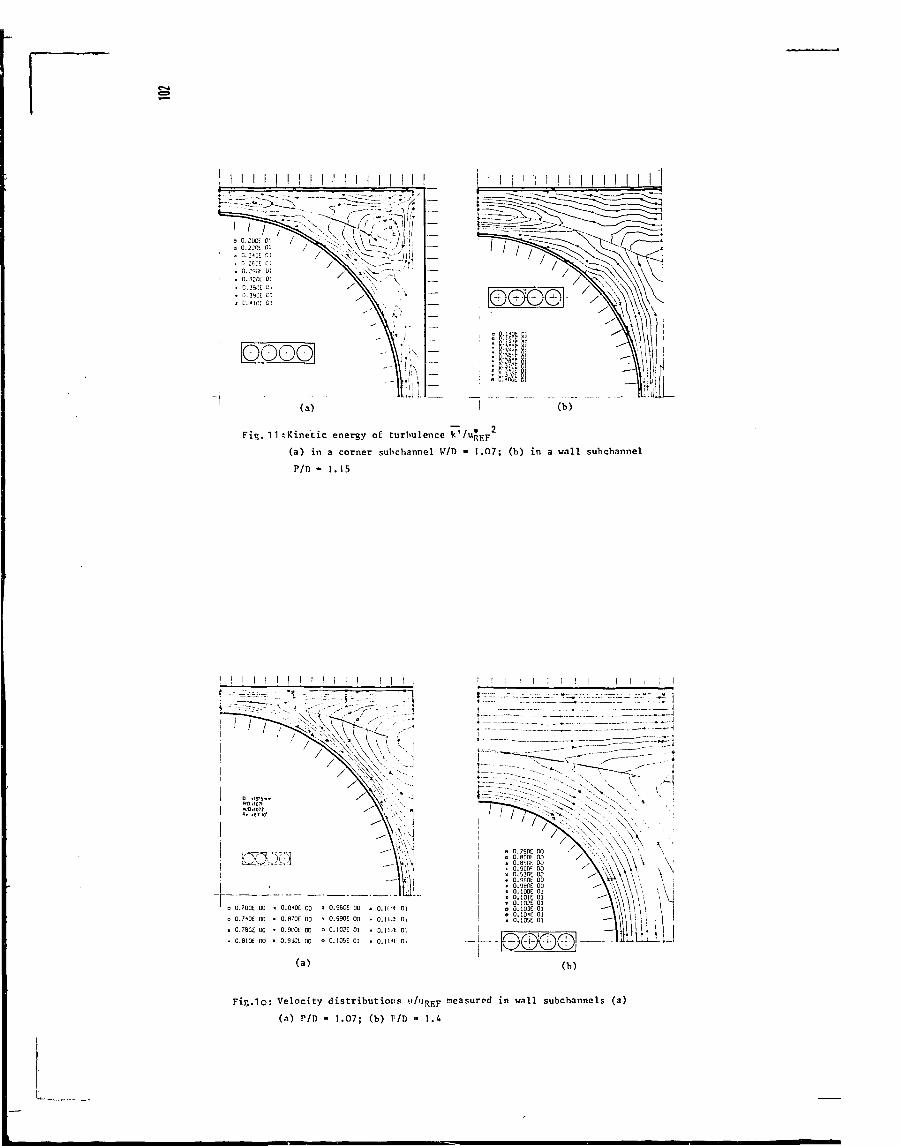
Fig. 1 1 ;Kinetic energy o£ turbulence k'/u^EF
(a) in a corner subchannel W/n » 1,07; (b) in a wall subchannel
P/D -1.15
Fig.io: Velocity distributions "/HREF measured in wall subchannels (a)
(a) P/D - 1.07; (b) P/D =• 1.4
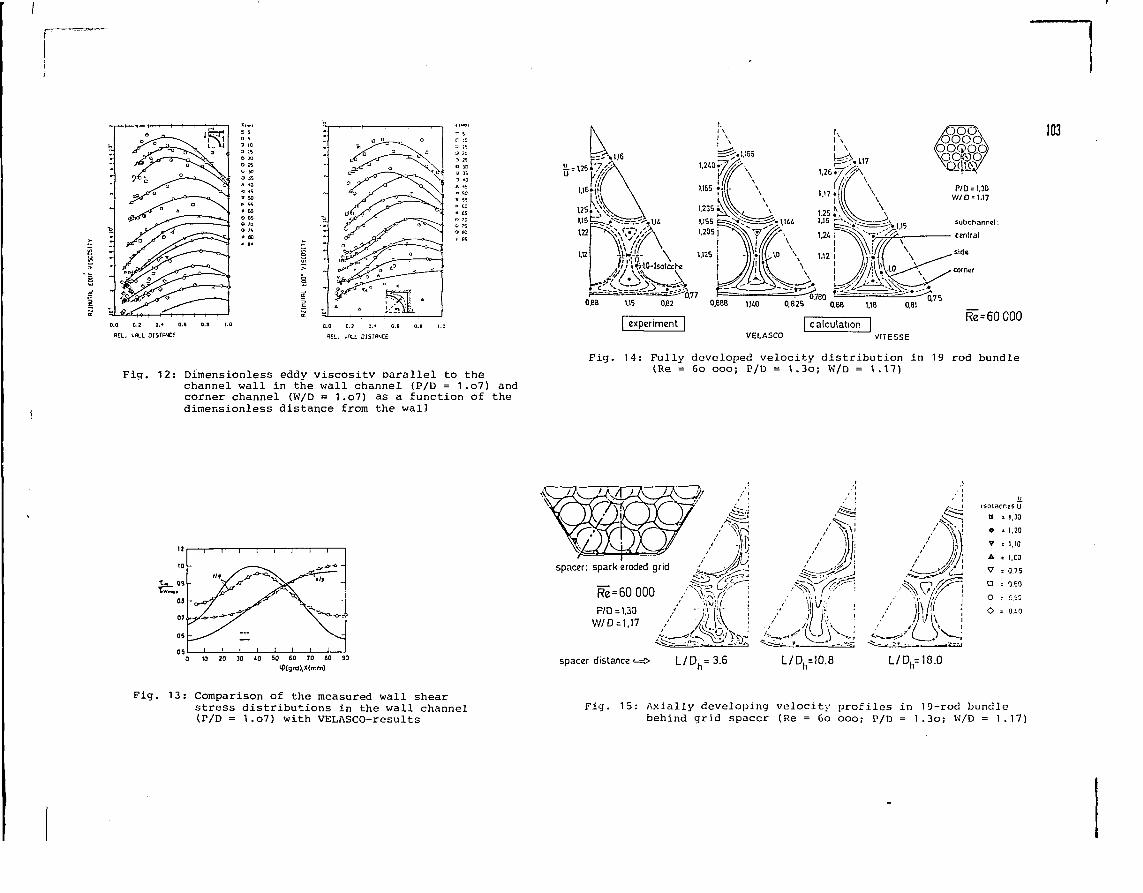
REU t f lU OISTWJCE H£L. ami Disr
Fig. 12: Dimensionless eddy viscosity Darallel to thechannel wall in the wall channel (P/D = 1.o7) andcorner channel (W/D = 1.o7) as a function of thedimensionless distance from the wall
103
0.75
Re=60 000
VELASCO VITESSE
Fig. 14: Fully developed velocity distribution in 19 rod bundle(Re = 6o ooo; P/D = 1.3o; W/D = 1.17)
spacer: spark eroded grid
Ri=60 000 /^^fP/D = 1.30 / -ff'/r
i^ff^^ 4-i^iä0 10 20 30 iO 50 60 70 60 90
<P(grd),Xtmm)spacer distance <=c> L / D h = 3.6 L/Dh=!0.8 L/Dh=18.0
Fig. 13: Comparison of the measured wall shearstress distributions in the wall channel(P/D = 1.o7) with VELASCO-results
Fig. 15: Axially developing velocity profiles in 19-rod bundlebehind grid spacer (Re = Go ooo; P/D = 1.3o; W/D = 1.17)
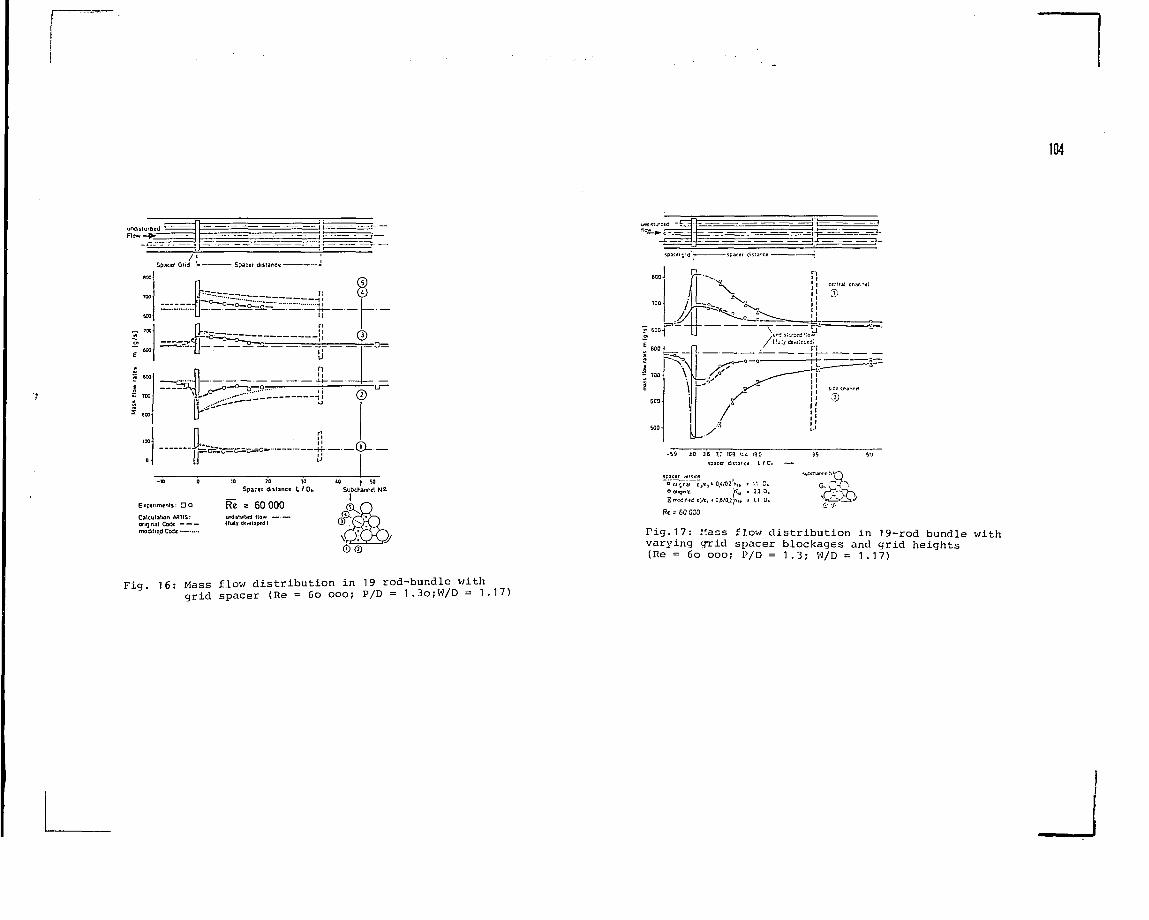
Flo-* -
E«p«rim«nts: D O
Calculation AflllS:anginal Cod«modified Code-
Spacer distance I / Dh
Re = 60 000lit-JbnJ Haw —..ly ö*vtlop*t)l
Fig. 16: Mass flow distribution in 19 rod-bundle withgrid spacer (Re = 6o ooo; P/D = 1.3o;W/D = 1.17)
104
= TT V=™
-59 JO 3.6 7.: IQ9
modiffi i|Ai • 0.6/0J;hi»
13 0L /D .
11 0 .2 2 D.U 0 .
Re = 60 0C0
Fig.17: ."ass flow distribution in 19-rod bundle withvarying grid spacer blockages and grid heights(Re = 6o ooo; P/D = 1.3; W/D = 1.17)
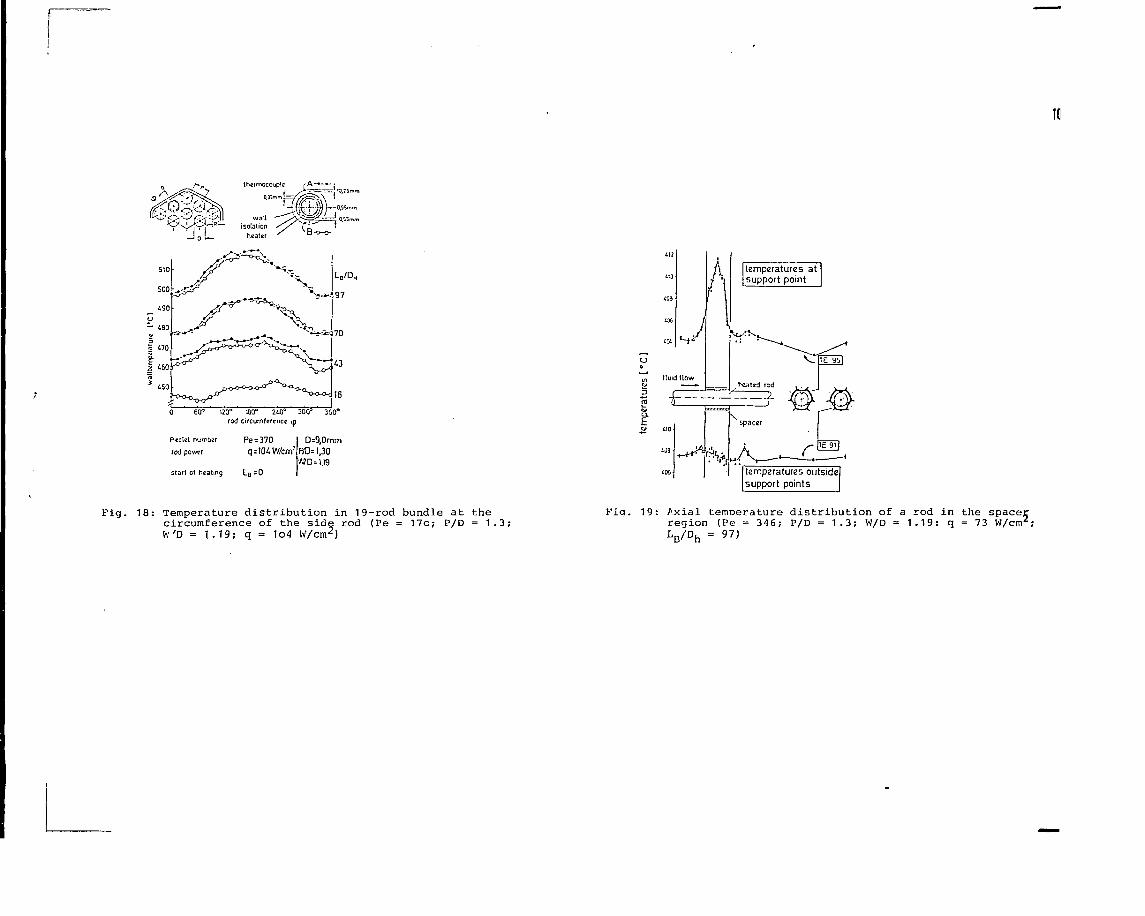
r"mr/'/^^_O.SSmm
LB/D„
60° 120° 180° 210° 300° 360°rod circumference tn
Pedet number
rod power
start of heating
Pe=370q=I04V//cm'
Le=0
D=9,0mmP/D=l,30
Fig. 18: Temperature distribution in 19-rod bundle at thecircumference of the side rod (Pe = 17o; P/D = 1.3;lv 'D = 1.19; q = 1o4 W/cm2)
temperatures atsupport point
temperatures outsidesupport points
Fia. 19: Axial temoerature distribution of a rod in the spacerregion (Pe = 346; P/D = 1.3; W/D = 1.19: q = 73 W/cm2;
V Dh = 97>
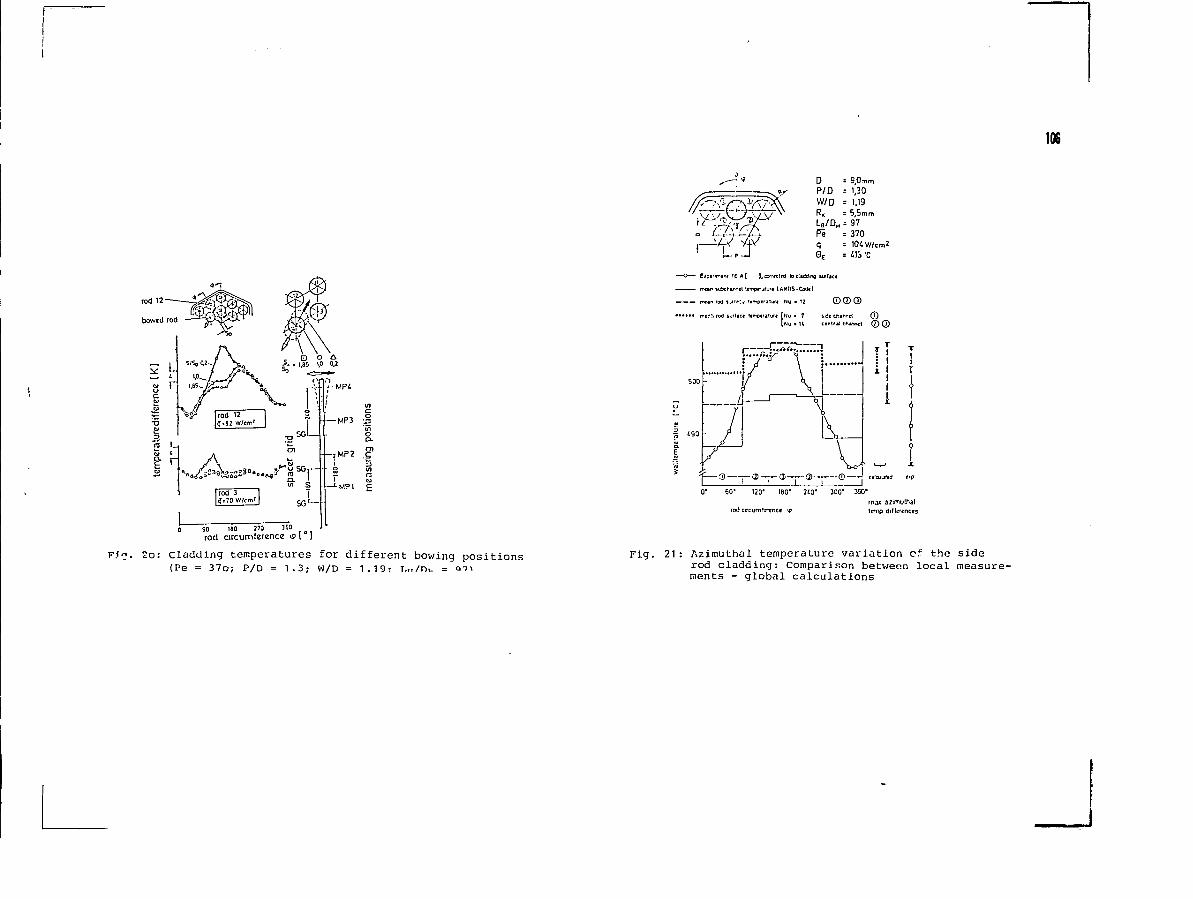
MP3 ~
MP2 c
MP1 £
90 180 2?0rod circumference ip t " 1
F5?. 2o: cladding temperatures for different bowing positions(Pe = 37o; P/D = 1.3; W/D = 1.19: 1,,,/nv = on
D = 9,0mmP/D = 1,30W/D = 1,19RK = 5,5 mmL a /D H = 97Pi = 370q = 104w/cm20E = i l i 'C
J.corrcetttJ t
n rod » j l » % ttrrpcraturt Nu • 12 ©CD CD
irr.t ©
f-®—pa-^o—s—-®-J -««0' 60* 120' 180' 240* 300* 360*
max azimtemp diffe
106
Fig. 21: Azimuthal temperature variation of the siderod cladding: Comparison between local measure-ments - global calculations
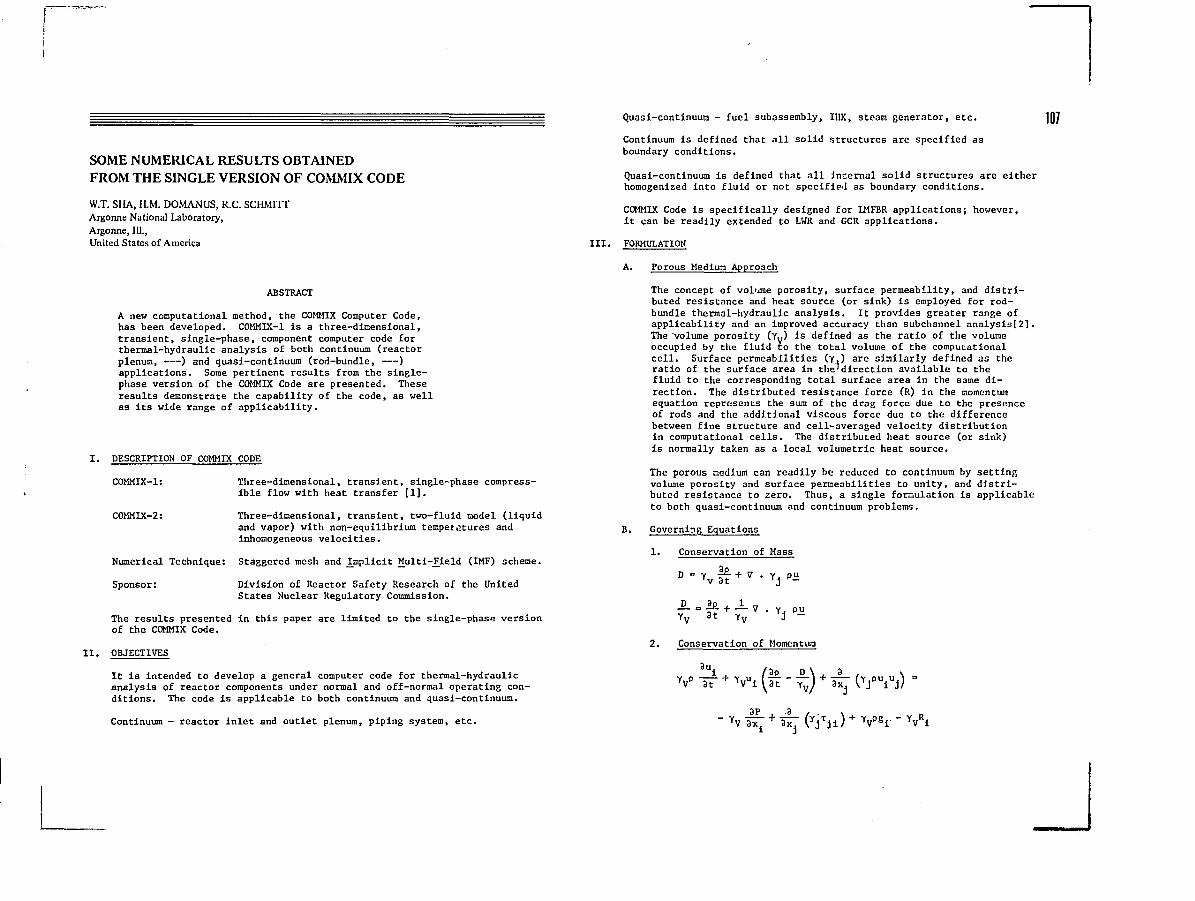
SOME NUMERICAL RESULTS OBTAINEDFROM THE SINGLE VERSION OF COMMIX CODE
W.T. SHA, H.M. DOMANUS, R.C. SCHMITTArgonne National Laboratory,Argonne, 111.,United States of America
ABSTRACT
A new computational method, the COMMIX Computer Code,has been developed. COMMEC-1 is a three-dimensional,transient, single-phase, component computer code forthermal-hydraulic analysis of both continuum (reactorplenum, ) and quasi-continuum (rod-bundle, )applications. Some pertinent results from the single-phase version of the COMMIX Code are presented. Theseresults demonstrate the capability of the code, as wellas its wide range of applicability.
I. DESCRIPTION OF COMMIX CODE
COMMIX-1:
COMMIX-2:
Three-dimensional, transient, single-phase compress-ible flow with heat transfer [1].
Three-dimensional, transient, two-fluid model (liquidand vapor) with non-equilibrium temperatures andinhomogeneous velocities.
Numerical Technique: Staggered mesh and implicit Multi-Field (IMF) scheme.
Sponsor: Division of Reactor Safety Research of the UnitedStates Nuclear Regulatory Commission.
The results presented in this paper are limited to the single-phase versionof the COMMIX Code.
II. OBJECTIVES
It is intended to develop a general computer code for thermal-hydraulicanalysis of reactor components under normal and off-normal operating con-ditions. The code is applicable to both continuum and quasi-continuum.
Quasi-continuum - fuel subassembly, IHX, steam generator, etc.
Continuum is defined that all solid structures are specified asboundary conditions.
Quasi-continuum is defined that all internal solid structures are eitherhomogenized into fluid or not specifie<] as boundary conditions.
COMMIX Code is specifically designed for LMFBR applications; however,it can be readily extended to LWR and GCR applications.
III. FORMULATION
A. Porous Medium Approach
The concept of volume porosity, surface permeability, and distri-buted resistance and heat source (or sink) is employed for rod-bundle thermal-hydraulic analysis. It provides greater range ofapplicability and an improved accuracy than subchannel analysis[2].The volume porosity (Yv) is defined as the ratio of the volumeoccupied by the fluid to the total volume of the computationalcell. Surface permeabilities (y.) are similarly defined as theratio of the surface area in the^direction available to thefluid to the corresponding total surface area in the same di-rection. The distributed resistance force (R) in the momentumequation represents the sum of the drag force due to the presenceof rods and the additional viscous force due to the differencebetween fine structure and cell-averaged velocity distributionin computational cells. The distributed heat source (or sink)is normally taken as a local volumetric heat source.
The porous medium can readily be reduced to continuum by settingvolume porosity and surface permeabilities to unity, and distri-buted resistance to zero. Thus, a single formulation is applicableto both quasi-continuum and continuum problems.
B. Governing Equations
1. Conservation of Mass
YY v 3t
Yj P-
2. Conservation of Momentum
V IT + Vi
Continuum - reactor inlet and outlet plenum, piping system, etc. i- " YV Ri
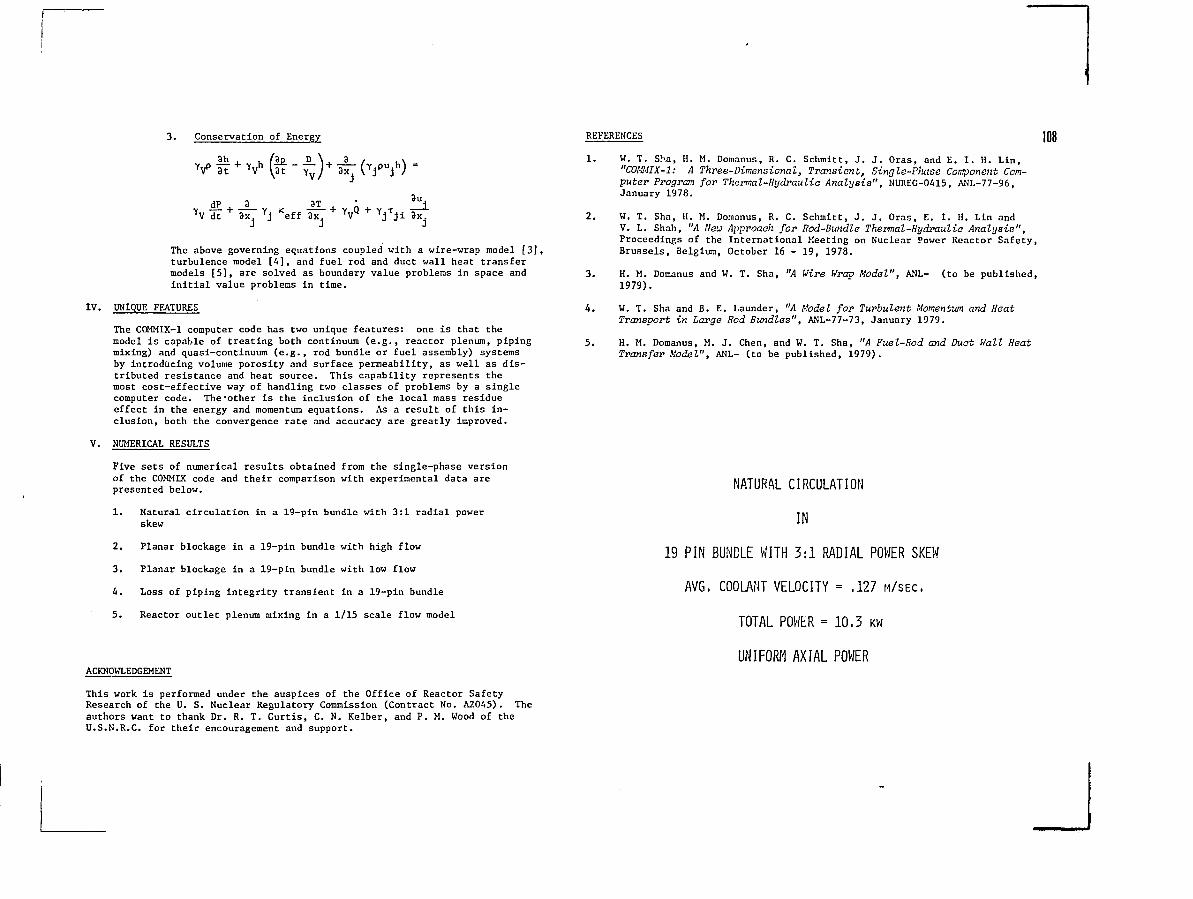
3. Conservation of Energy REFERENCES 108
3T
JKeff
YVQ3x.
The above governing equations coupled with a wire-wrap model [3],turbulence model [4], and fuel rod and duct wall heat transfermodels [5], are solved as boundary value problems in space andinitial value problems in time.
IV. UNIQUE FEATURES
The COMMIX-1 computer code has two unique features: one is that themodel is capable of treating both continuum (e.g., reactor plenum, pipingmixing) and quasi-continuum (e.g., rod bundle or fuel assembly) systemsby introducing volume porosity and surface permeability, as well as dis-tributed resistance and heat source. This capability represents themost cost-effective way of handling two classes of problems by a singlecomputer code. The-other is the inclusion of the local mass residueeffect in the energy and momentum equations. As a result of this in-clusion, both the convergence rate and accuracy are greatly improved.
V. NUMERICAL RESULTS
Five sets of numerical results obtained from the single-phase versionof the COMMIX code and their comparison with experimental data arepresented below.
1. Natural circulation in a 19-pin bundle with 3:1 radial powerskew
2. Planar blockage in a 19-pin bundle with high flow
3. Planar blockage in a 19-pin bundle with low flow
4. Loss of piping integrity transient in a 19-pin bundle
5. Reactor outlet plenum mixing in a 1/15 scale flow model
ACKNOWLEDGEMENT
This work is performed under the auspices of the Office of Reactor SafetyResearch of the U. S. Nuclear Regulatory Commission (Contract No. A2045). Theauthors want to thank Dr. R. T. Curtis, C. N. Kelber, and P. M. Wood of theU.S.N.R.C. for their encouragement and support.
W. T. Sha, H. M. Domanus, R. C. Schmitt, J. J. Oras, and E. I. H. Lin,"COH4IX-1: A Three-Dimensional, Transient, Single-Pfiase Component Com-puter Program for Thermal-Hydraulic Analysis", NUREG-0415, ANL-77-96,January 1978.
W. T. Sha, H. M. Domanus, R. C. Schmitt, J. J. Oras, E. I. H. Lin andV. L. Shah, "A Neu Approach for Rod-Bundle Thermal-Hydraulic Analysis",Proceedings of the International Meeting on Nuclear Power Reactor Safety,Brussels, Belgium, October 1 6 - 1 9 , 1978.
H. M. Domanus and W. T. Sha, "A Wire Wrap Model", ANL- (to be published,1979).
W. T. Sha and B. E. Launder, "A Model for Turbulent Momentum and HeatTransport in Large Rod Bundles", ANL-77-73, January 1979.
H. M. Domanus, M. J . Chen, and W. T. Sha, "A Fuel-Rod and Duct Wall HeatTransfer Model", ANL- ( to be publ i shed , 1979).
NATURAL CIRCULATION
IN
19 PIN BUNDLE WITH 3:1 RADIAL POWER SKEW
AVG. COOLANT VELOCITY = .127 M/SEC.
TOTAL POWER = 10,3 KW
UNIFORM AXIAL POWER
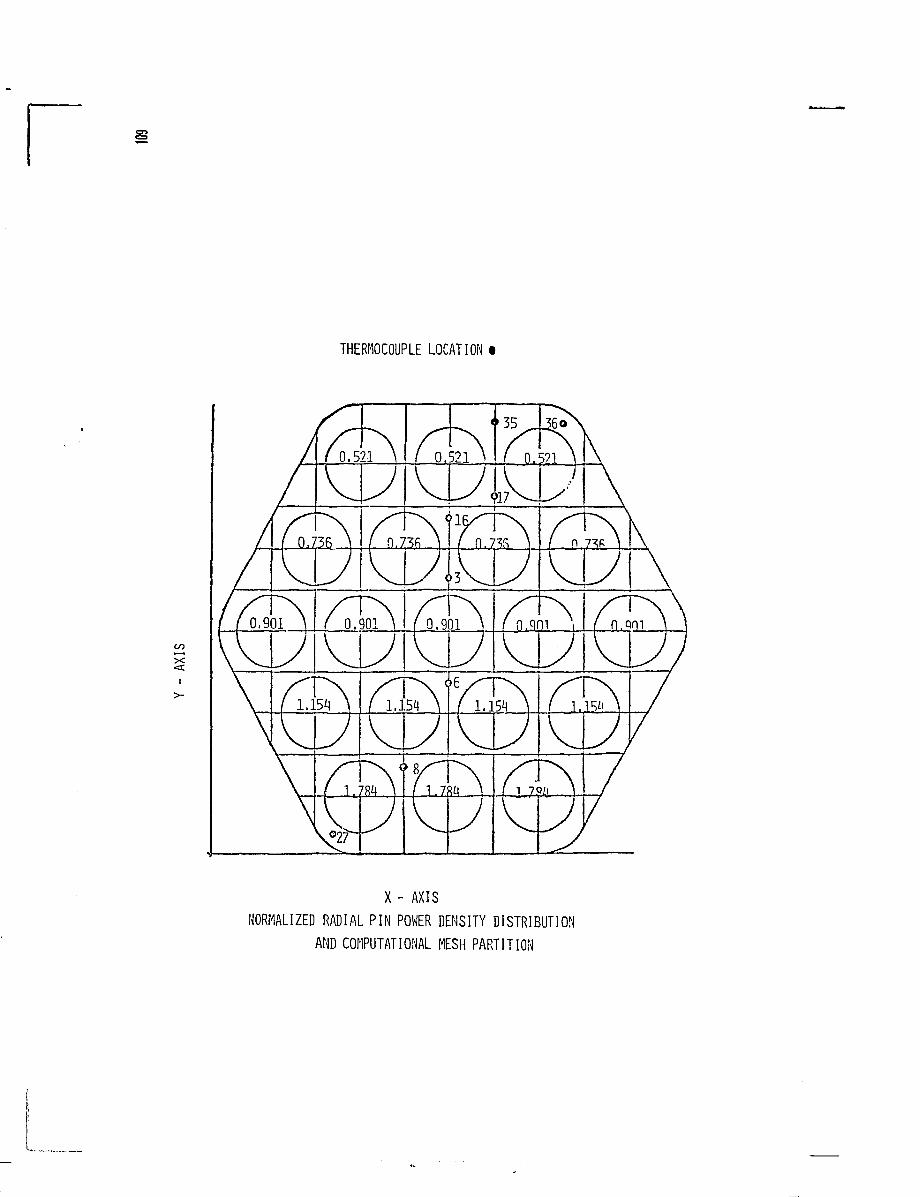
X - AXISNORMALIZED RADIAL PIN POWER DENSITY DISTRIBUTION
AMD COMPUTATIONAL MESH PARTITION
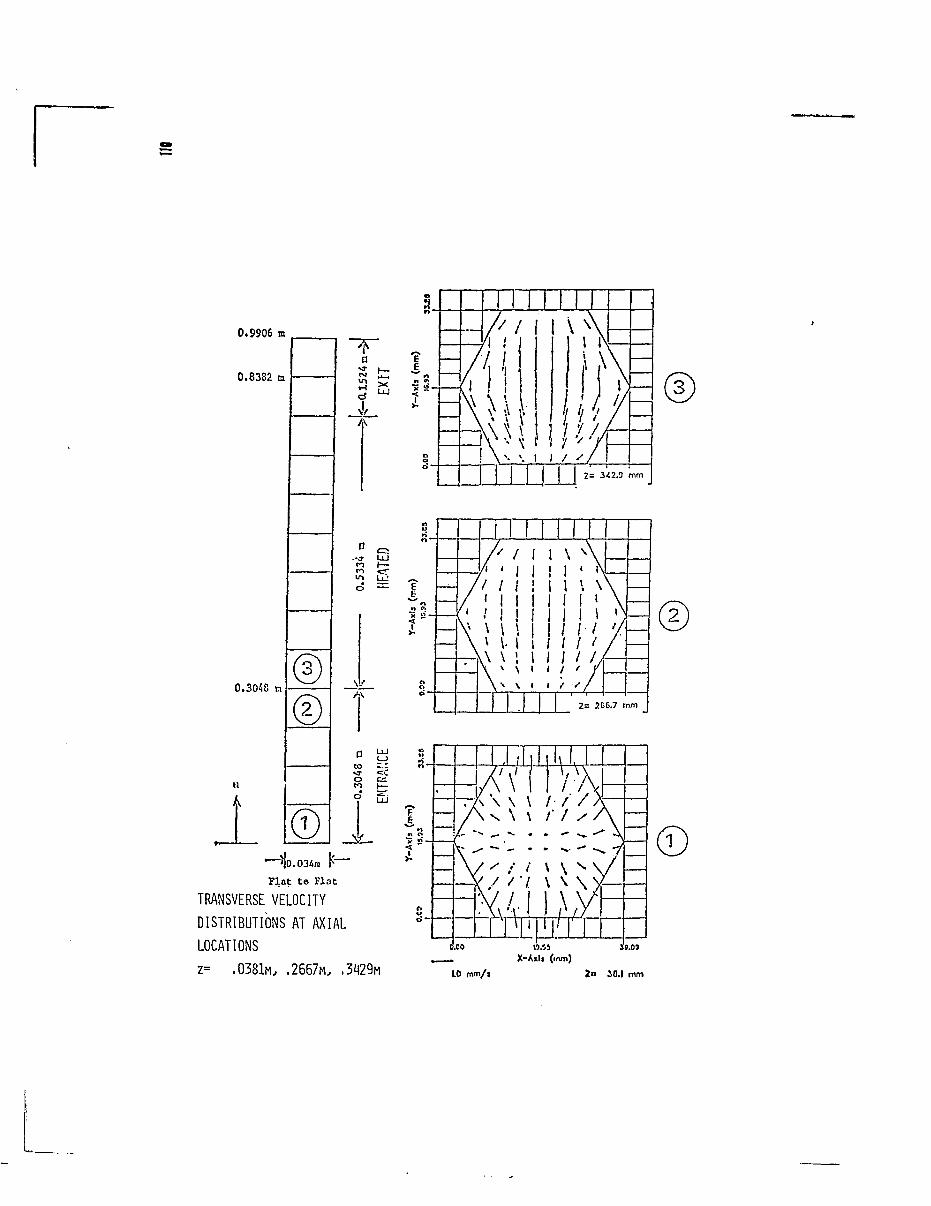
TRANSVERSE VELOCITYDISTRIBUTIONS AT AXIALLOCATIONSz= .0381M, .2667M, .3429M
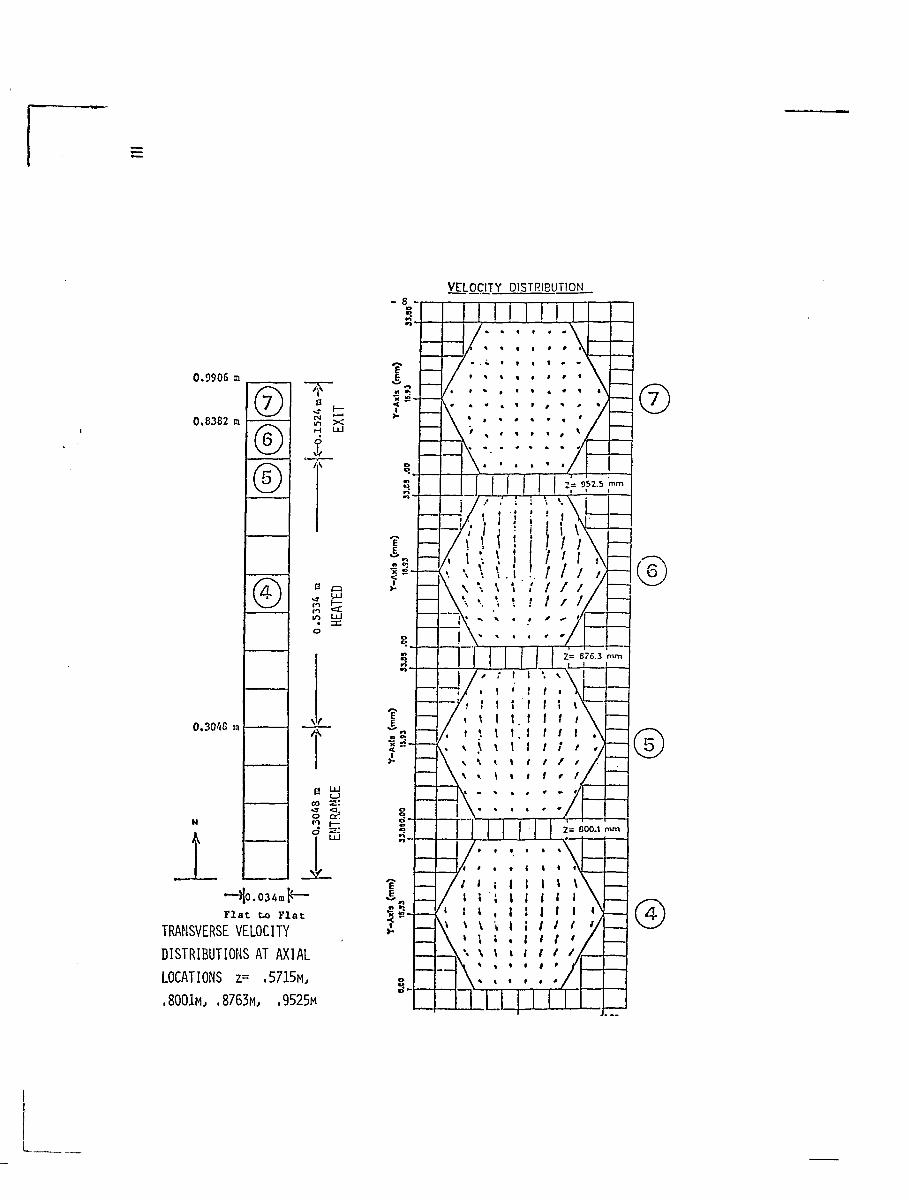
TRANSVERSE VELOCITYDISTRIBUTIONS AT AXIALLOCATIONS z= .5715M,
.8001M, .8763M, ,9525M
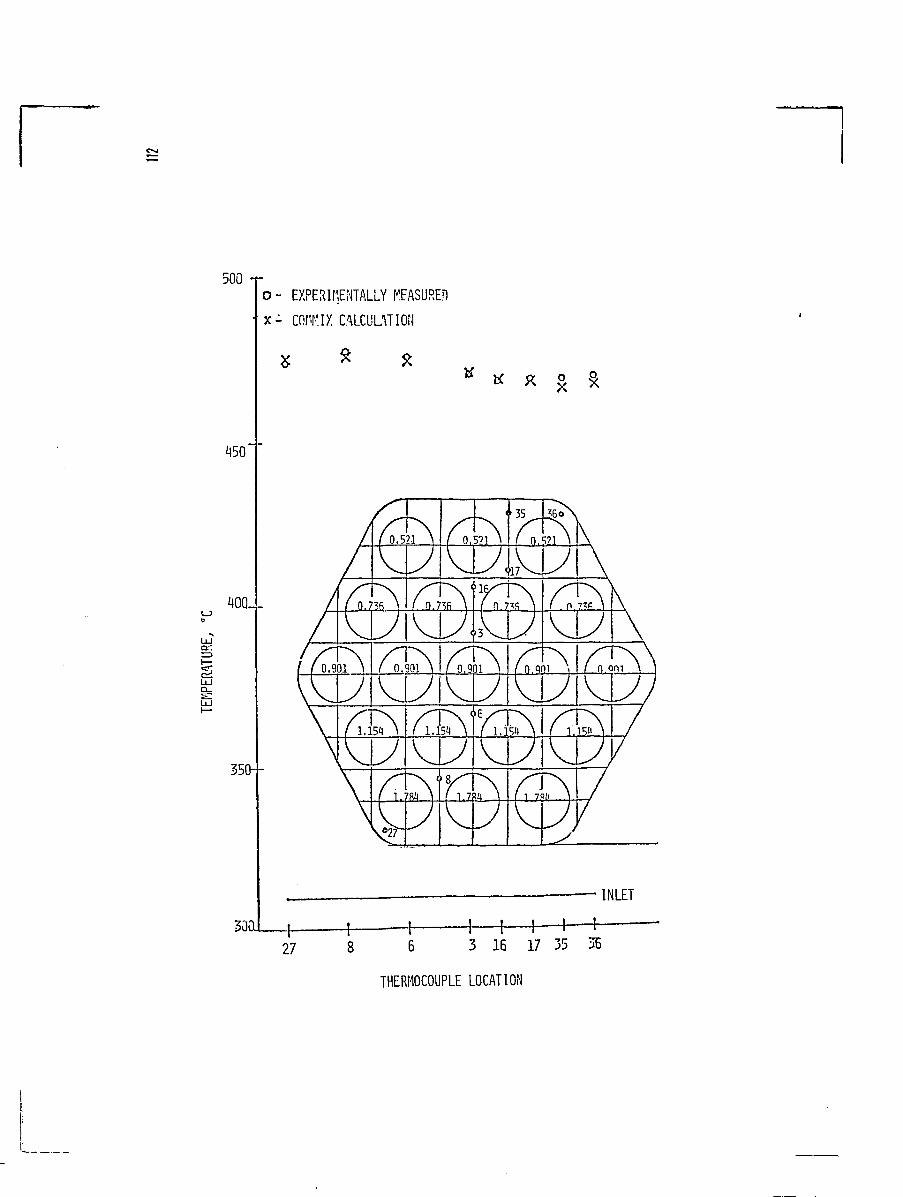
EXPERIMENTALLY MEASURED
cnrv-'.ix CALCULATION
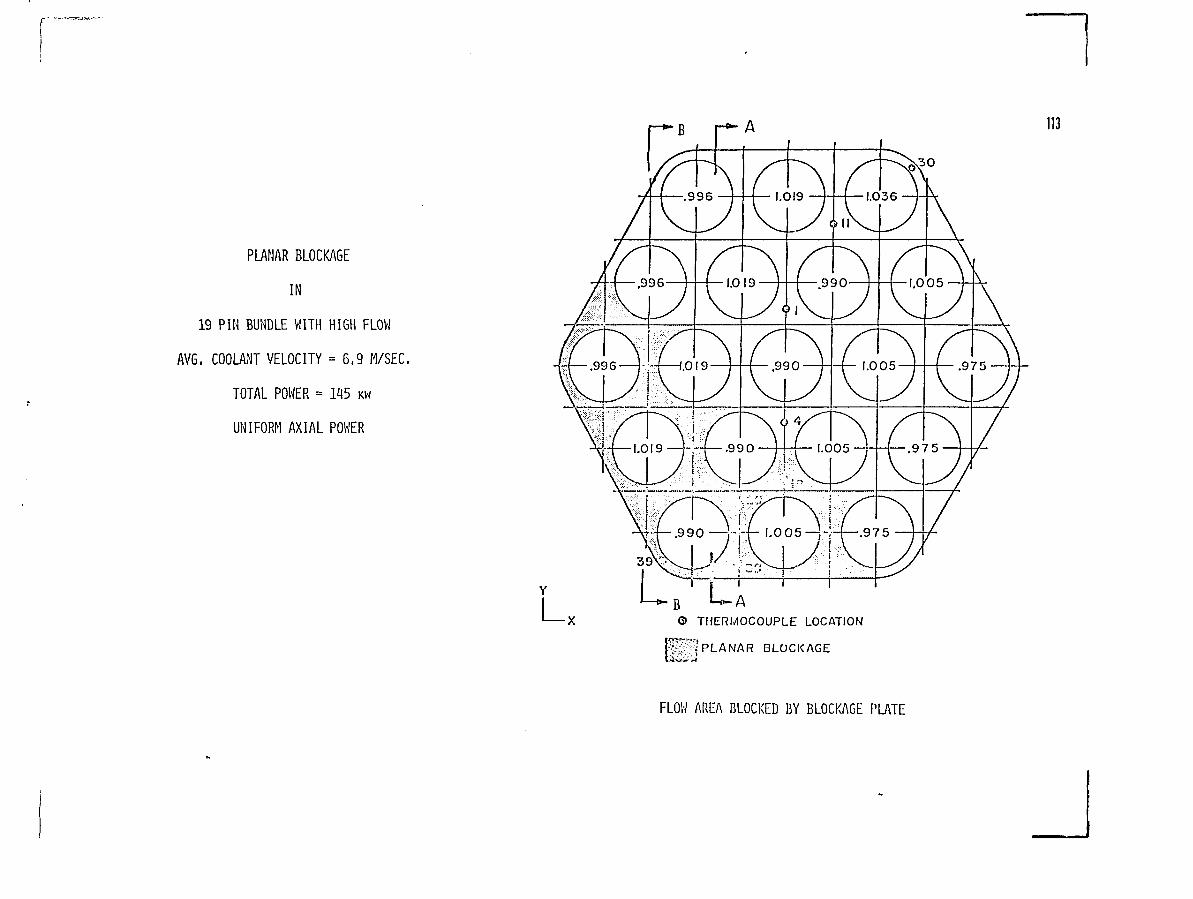
PLANAR BLOCKAGE
IN
19 PIN BUNDLE WITH HIGH FLOW
AVG. COOLANT VELOCITY = 6.9 M/SEC.
TOTAL POWER = 145 KW
UNIFORM AXIAL POWER
FLOW AREA BLOCKED BY BLOCKAGE PLATE
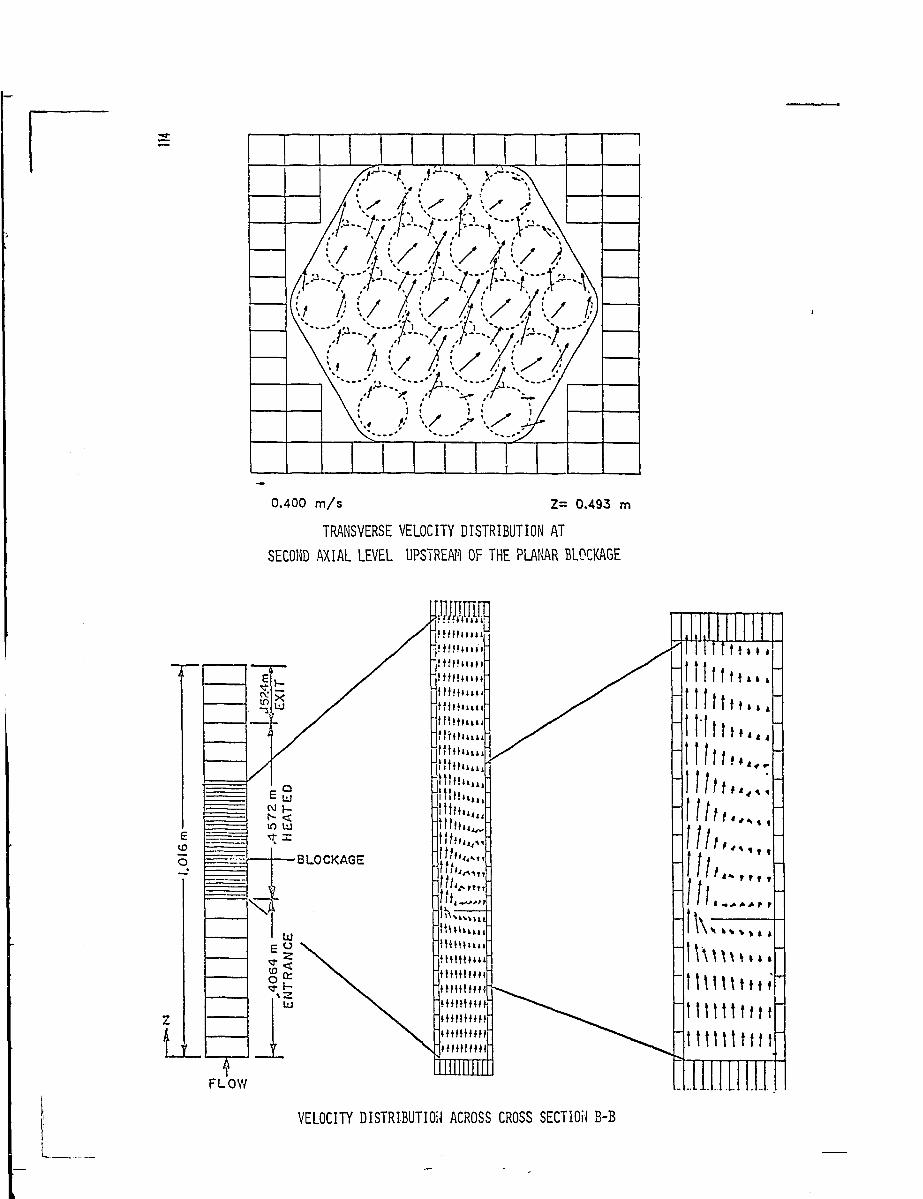
VELOCITY DISTRIBUTION ACROSS CROSS SECTIOil B-B
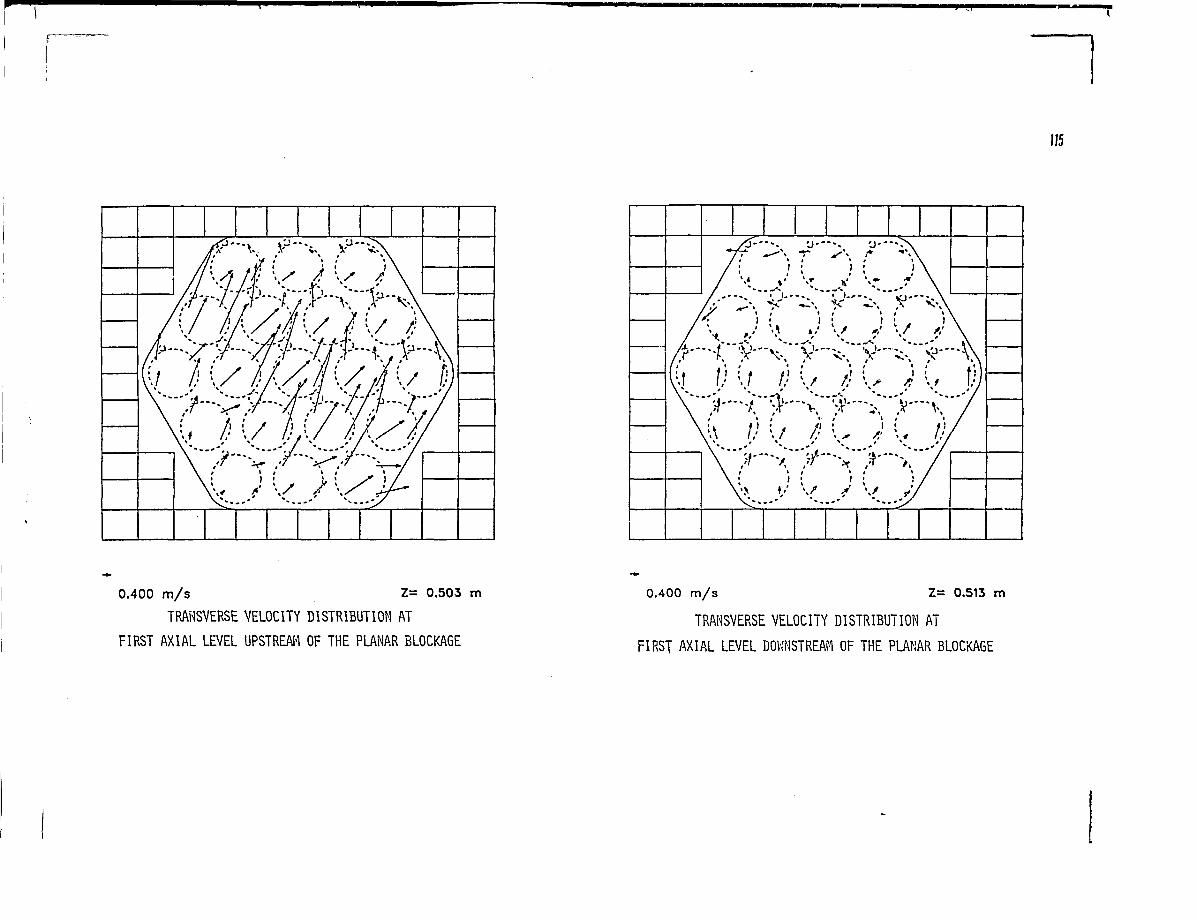
0.400 m/s Z= 0.503 m 0.400 m/s Z= 0.513 m
TRANSVERSE VELOCITY DISTRIBUTION AT TRANSVERSE VELOCITY DISTRIBUTION ATFIRST AXIAL LEVEL UPSTREAM OF THE PLANAR BLOCKAGE FIRST AXIAL LEVEL D0KMSTREAr1 0F THE PLANAR BLOCKAGE
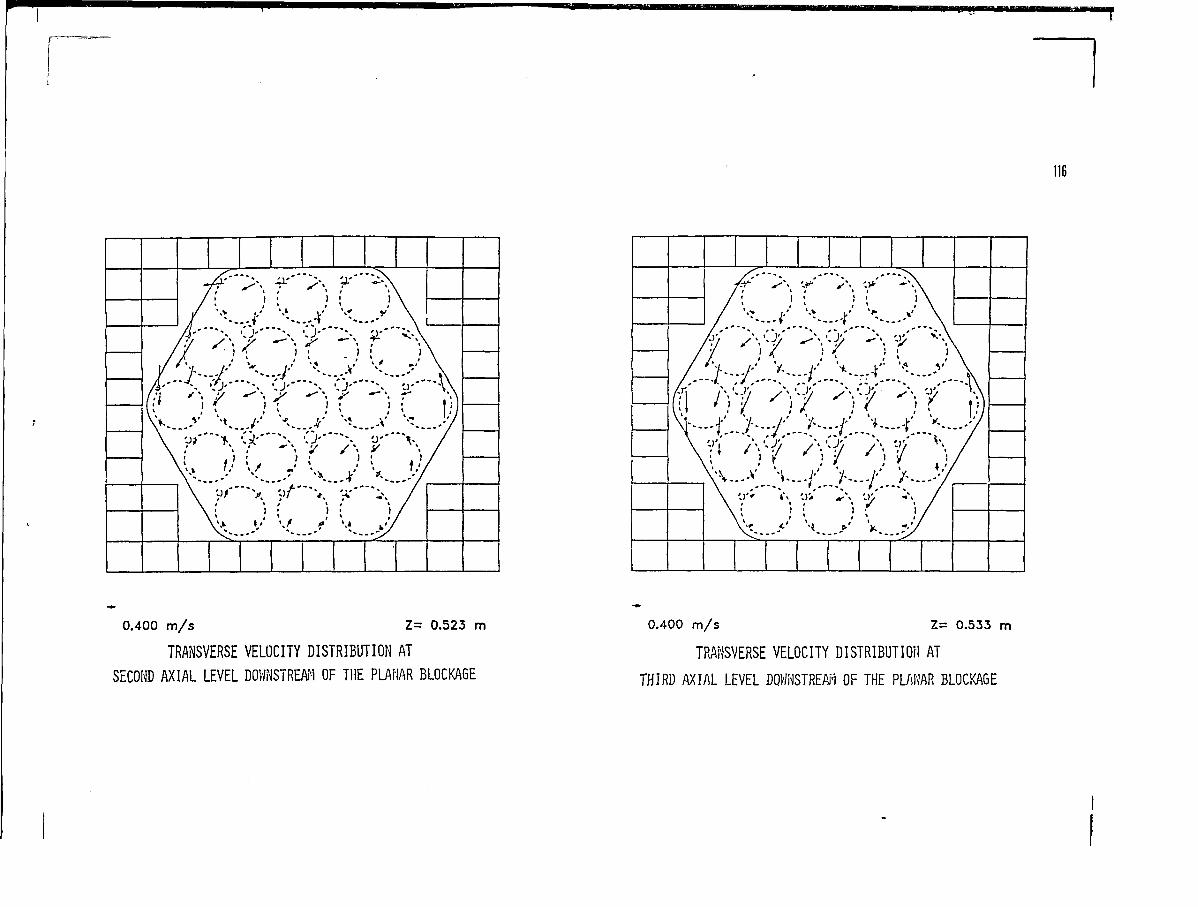
0.400 m/s Z= 0.523 m 0.400 m/s Z= 0.533 m
TRANSVERSE VELOCITY DISTRIBUTION AT TRANSVERSE VELOCITY DISTRIBUTION ATSECOND AXIAL LEVEL DOWNSTREAM OF THE PLANAR BLOCKAGE THIRD m^L LEVEL DQHHSTREAH 0F THE PLANAR BLOCKAGE
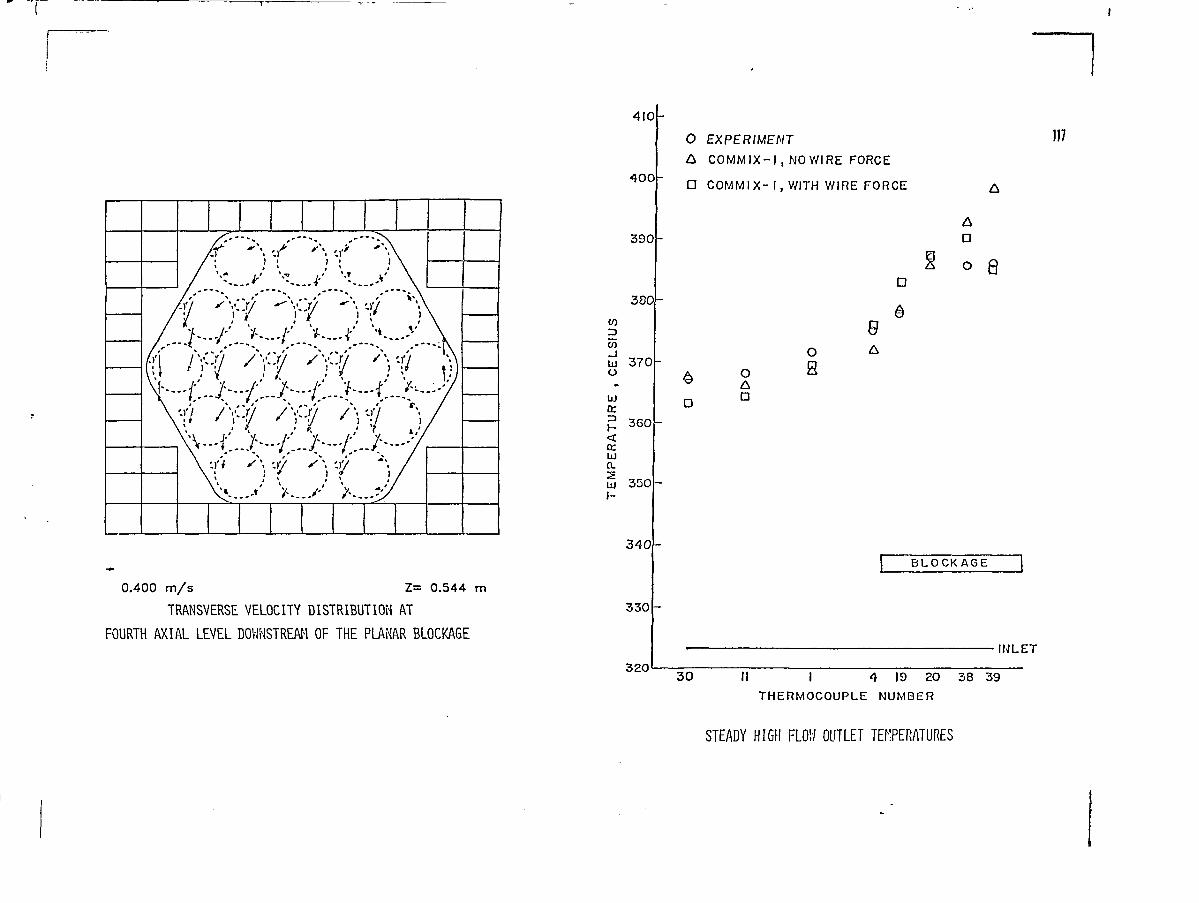
0.400 m/s Z= 0.544 m
TRANSVERSE VELOCITY DISTRIBUTION AT
FOURTH AXIAL LEVEL DOWNSTREAM OF THE PLANAR BLOCKAGE
STEADY HIGH FLO!'/ OUTLET TEMPERATURES
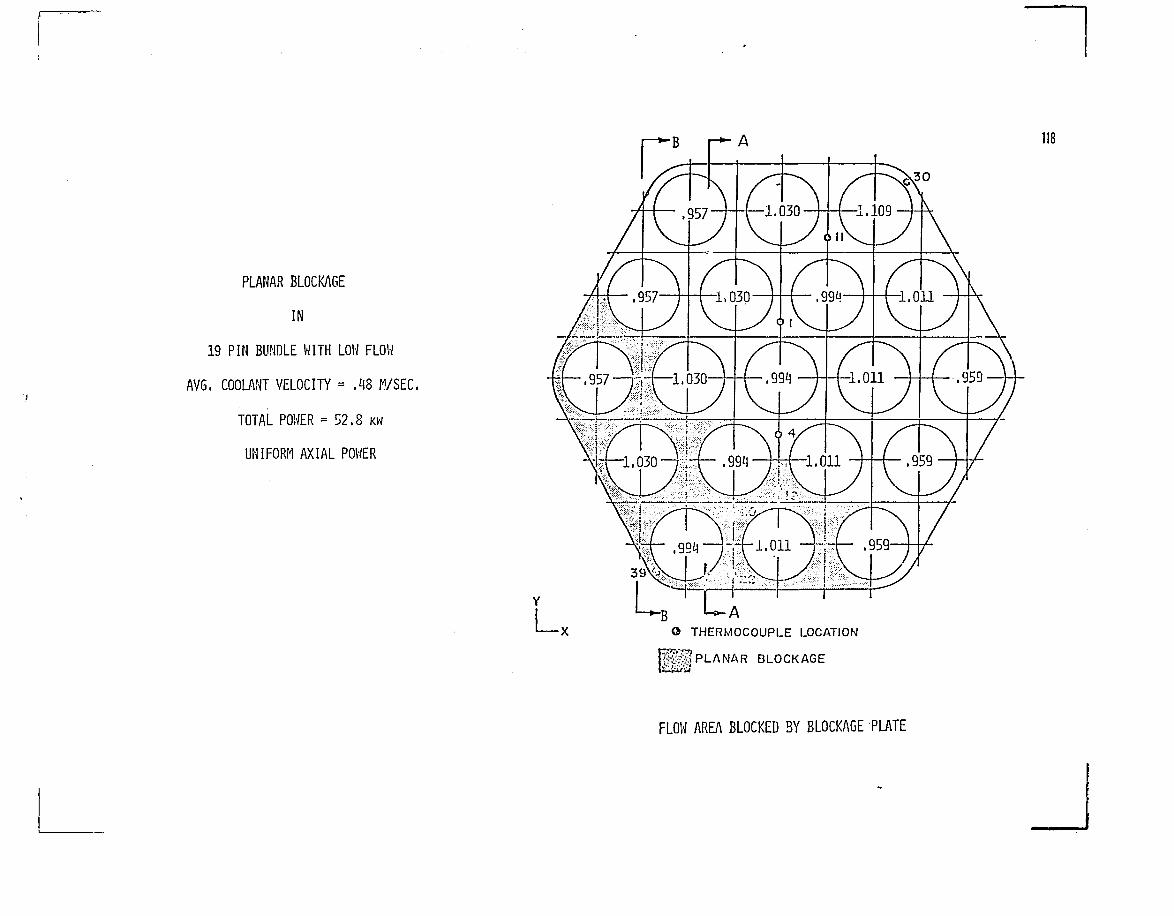
PLANAR BLOCKAGE
IN
19 PIN BUNDLE WITH LOW FLOW
AVG. COOLANT VELOCITY = .48 MSEC.
TOTAL POWER = 52.8 KW
UNIFORM AXIAL POWER
FLOW AREA BLOCKED BY BLOCKAGE PLATE
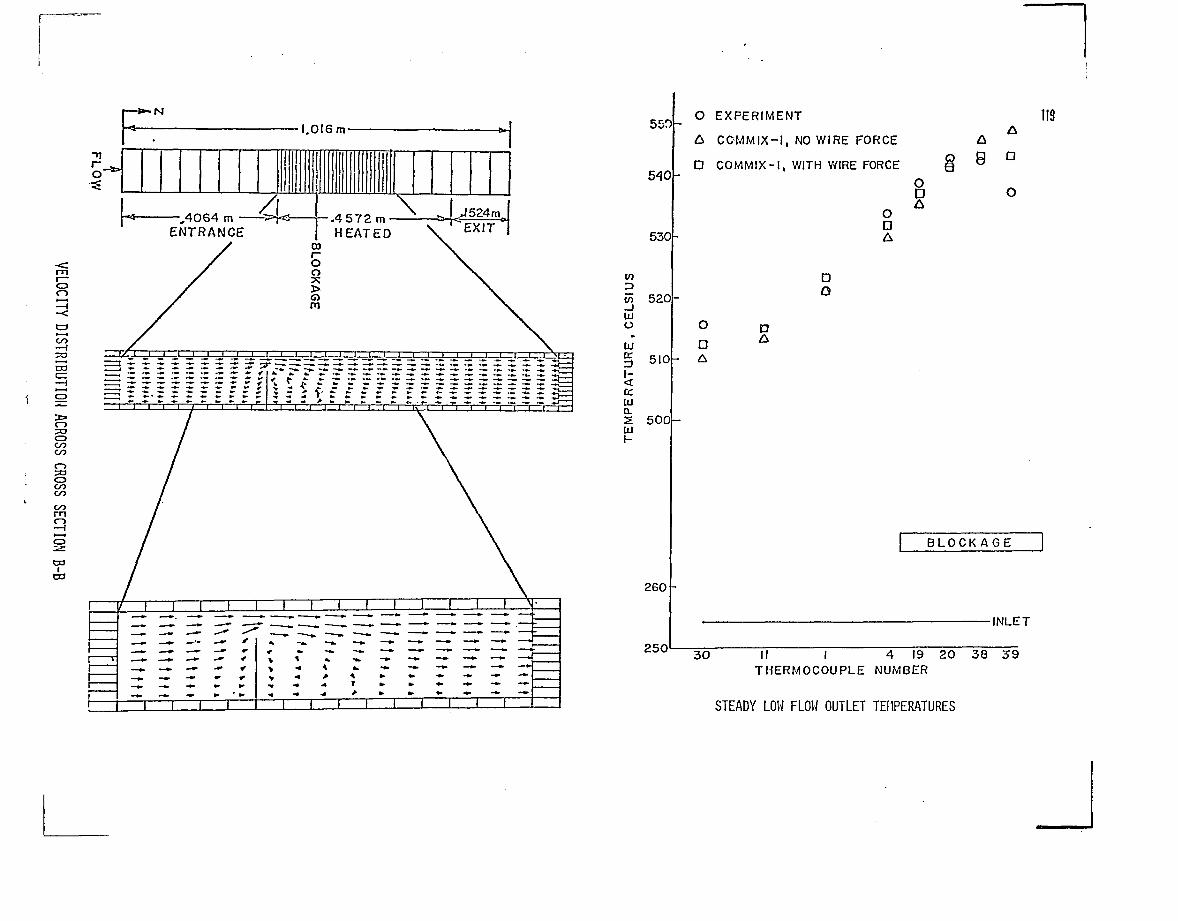
,4064 m -ENTRANCE
~ » r r r •* - * • r ? l ' t *" £ ~ ~ ~ ~ ^ : Z ~ ~ ~ ~ ~ — — : r ~ :£CD
3CDGOGO
oGOCO
DO
da
I ' I i i * i i i i — r * ' ' '
1 / 1 1 1 1 1
— - —«• - » • * • <
1 1 1 1
* —
> *
1
1 1 1
A «. • • -« .
1 1 1
1 1 1 \
* — . _ _ _
1 1 1
to
UJÜ
u
<
550
540
530
520
510
DL2 500UJ
2601-
250
O EXPERIMENT
A COMMIX-I, NO WIRE FORCE
D COMMIX-I, WITH V/IRE FORCE
D
ODA
DA
nA
oDA
119
\ B L O C K A G E
-INLET
30 II I 4 19 20 38 39THERMOCOUPLE NUMBER
STEADY LOW FLOW OUTLET TEMPERATURES
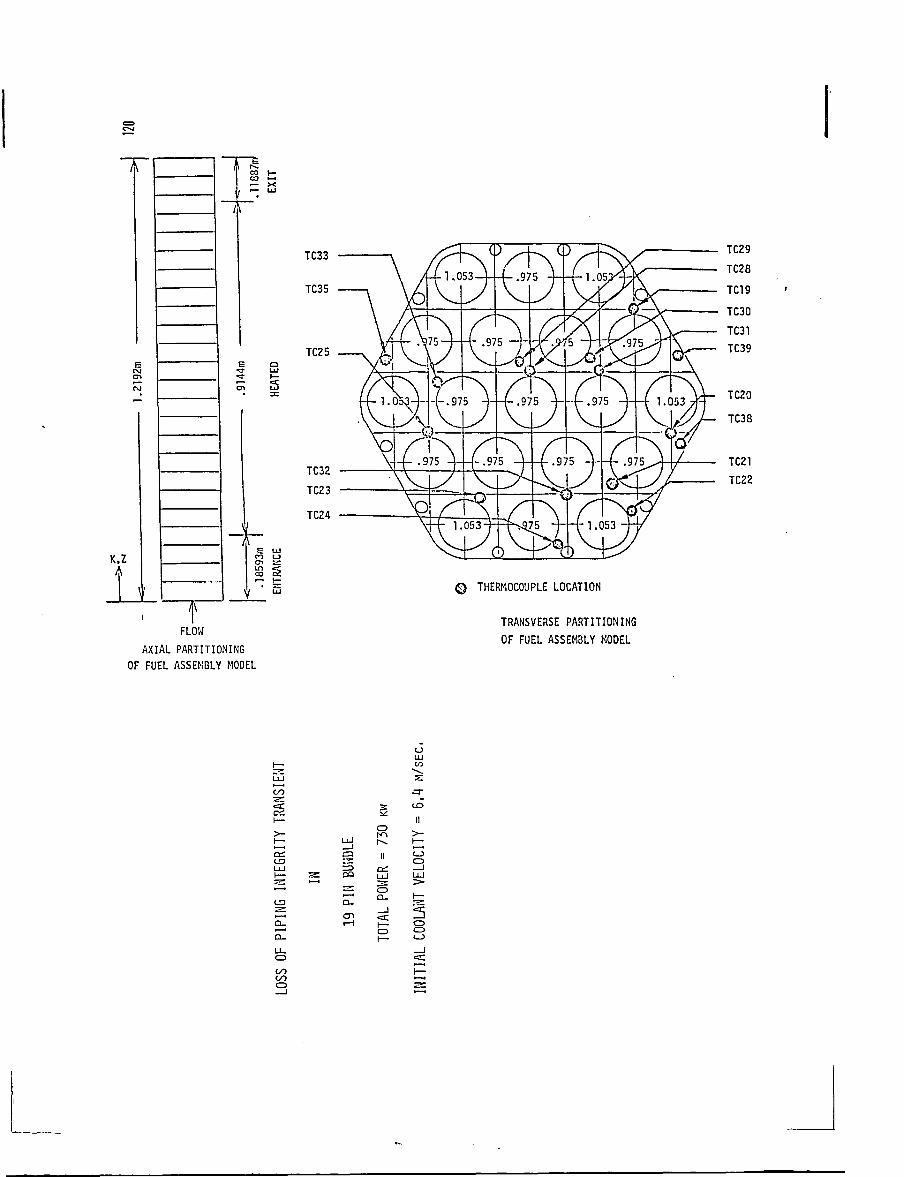
CM
K.Z
A
s si— XI— LU
S UJn oen E:
I
FLOW
AXIAL PARTITIONING
OF FUEL ASSEMBLY MODEL
TC24
© THERMOCOUPLE LOCATION
TRANSVERSE PARTITIONING
OF FUEL ASSEMBLY MODEL
oLUto
H — '' i
fr* f 1
LU E5I— :z eo
II
CD
5CD
CO
o
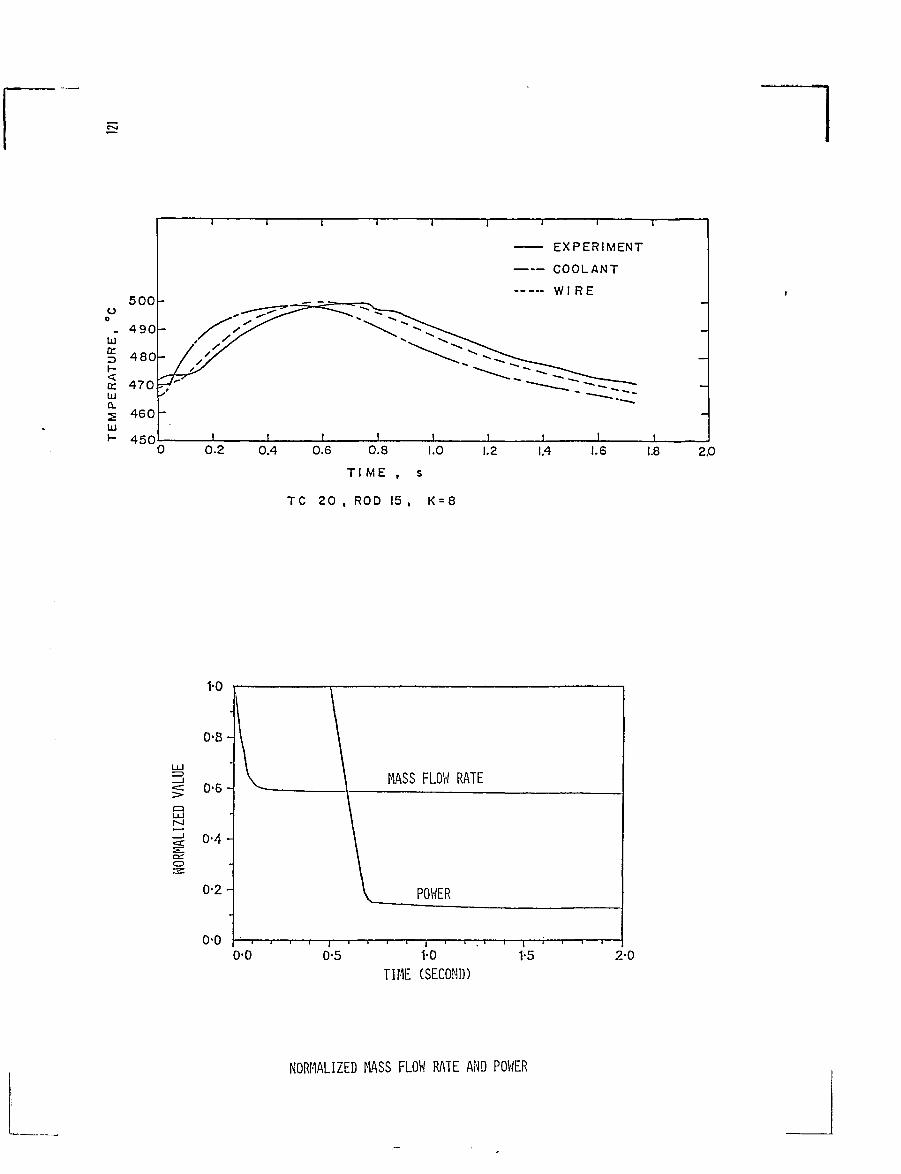
ü0
„hia:z>
DZUQ.2UJ1-
5 0 0
4 9 0
4 8 0
4 7 0
460
4 5 0
— EXPERIMENT
— COOLANT
— WIRE
I
0.2 0.4 0.6 0.8 1.0
T I M E , s
TC 20 , ROD 15 , K = 8
1.2 1.4 1.6 1.8 2.0
1-0
0-8-
0-6-
0-4-
0-2-
0-0
V \ MASS
\
FLOW
POWER
RATE
* . • ' i • • * *
0-0 0-5 1-0TIME (SECOND)
1-5 2-0
NORMALIZED MASS FLOW RATE AND POWER
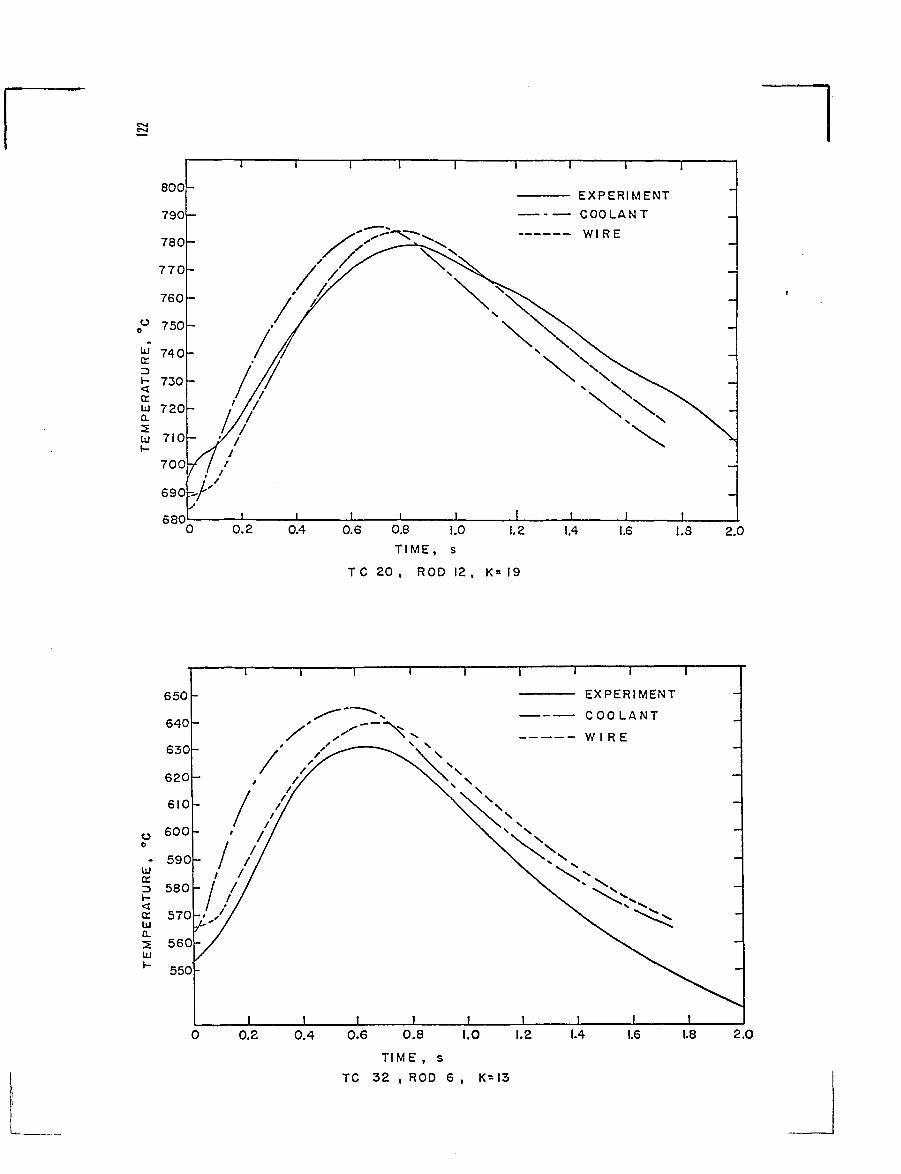
EXPERIMENT
COOLANT
WIRE
6800.4 0.6 0.8 1.0 1.2
TIME, s
TC 20 , ROD 12 , K= 19
1.4 1.6 1.8 2.0
T 1 r• EXPERIMENT
• COOLANT
W I R E
550
_L J_0.2 0.4 0.6 0.8 1.0
T I M E , s
TC 32 , ROD 6 , K=I3
1.2 1.4 1.6 1.8 2.0
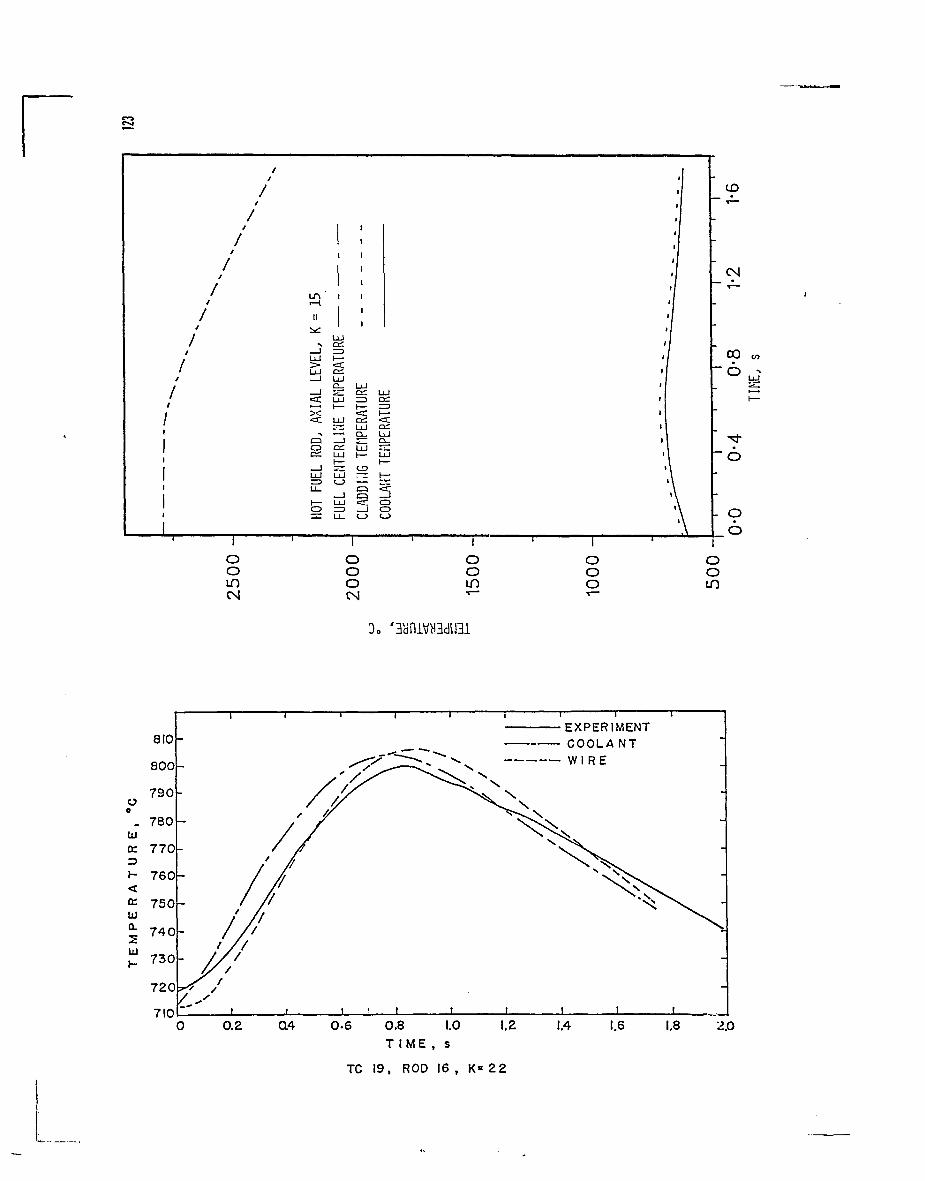
1!
11
1 1
1
UJ
1ooi nCM
1<rX
cao
•——J
UJu_1—CD
«=: a:UJ =3"~ <1 l 1 t~r*
rr UJ•—i r\j -—
ci LIJUJ I—
UJ rz(_; ^ -
-J gUJ •=£=3 1U_ l_>
1
oooCM
UJ
« ^
UJn_^~*UJ
CDCD< _ }
' I
oomT~
•3%dniVW3dlSl
CO
ö
• 9öooo
ooin
EXPERIMENTCOOLANT
0.2 Q4 0-6 0.8 1.0T I M E , s
TC 19, ROD 16 , K= 2 2
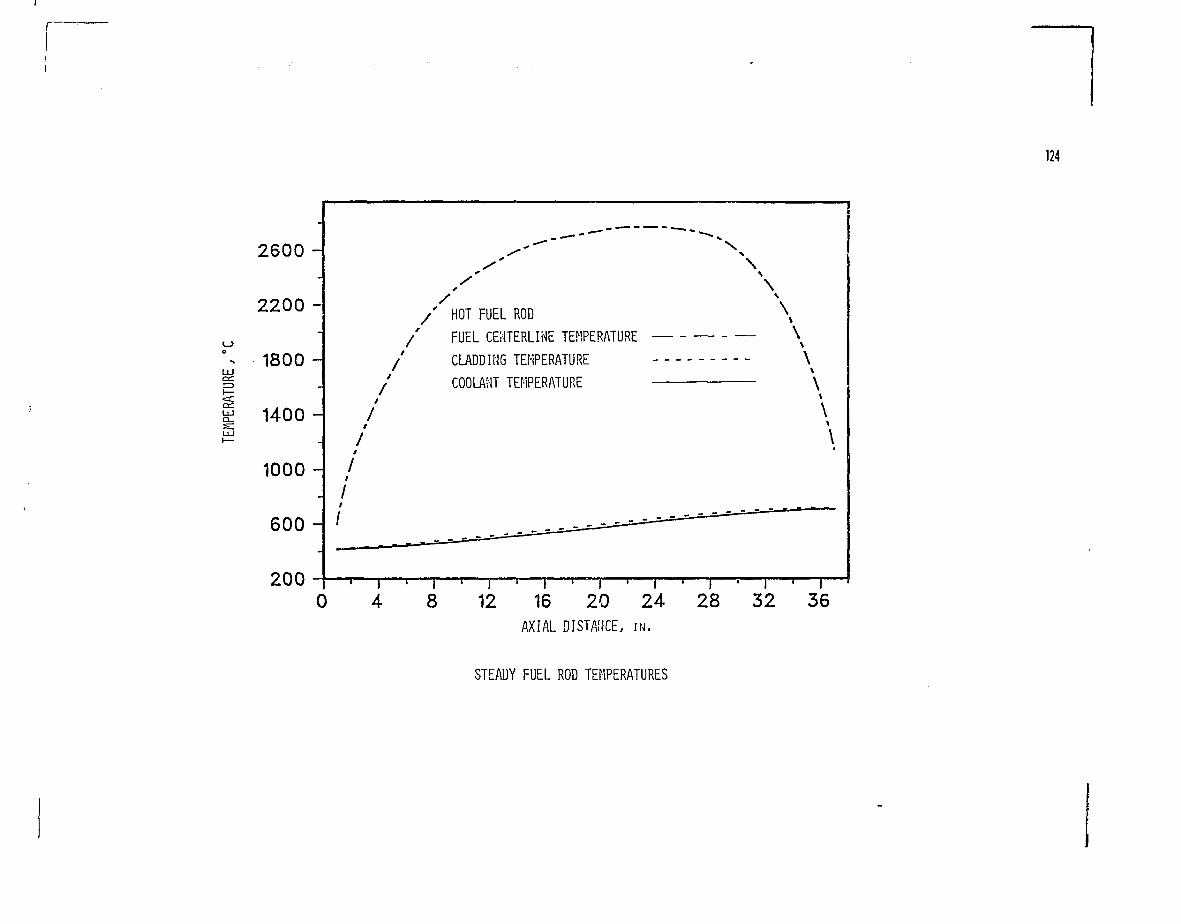
124
2600 -
2200 -
^ 1800UJ
I 1400
1000
600 H
/
/
/ HOT FUEL ROD \
/ FUEL CENTERLINE TEMPERATURE \CLADDING TEMPERATURE \COOLANT TEMPERATURE \
0
\
1
4i
8i
12i
16AXIAL
i
20DISTANCE,
i
24I N .
1
28i
32i
36
STEADY FUEL ROD TEMPERATURES
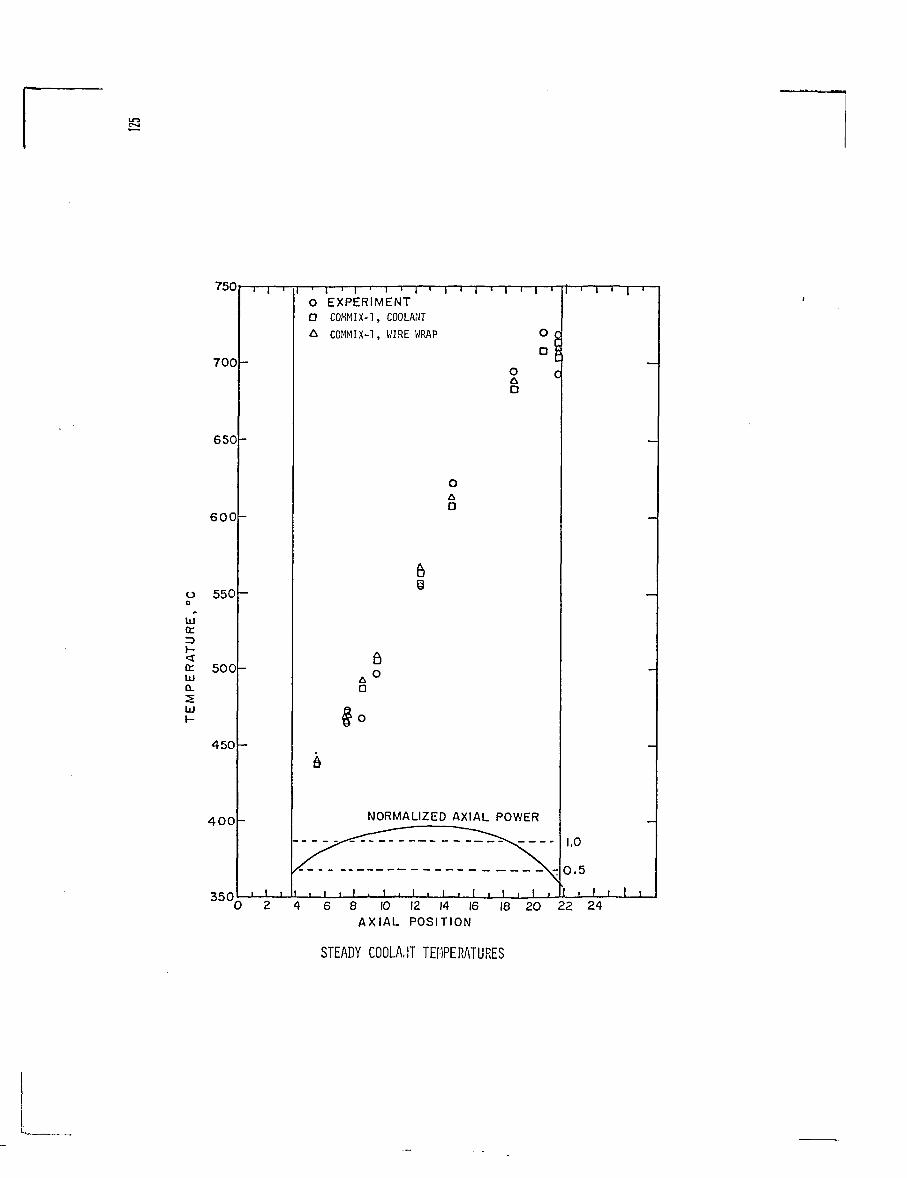
750r
700h
650h
oo
lü
UJD.2W
600h
550h
500h
450h
400h
350]
i—>—i—i—i—> i—i r^~O EXPERIMENTO COMMIX-1, COOLANTd, COMMIX-1, WIRE WRAP
6o
oD
a
NORMALIZED AXIAL POWER
i • I i I i I
i.o
0.5
6 8 10 12 14 16AXIAL POSITION
18 20 22 24
STEADY COOLA.IT TEMPERATURES
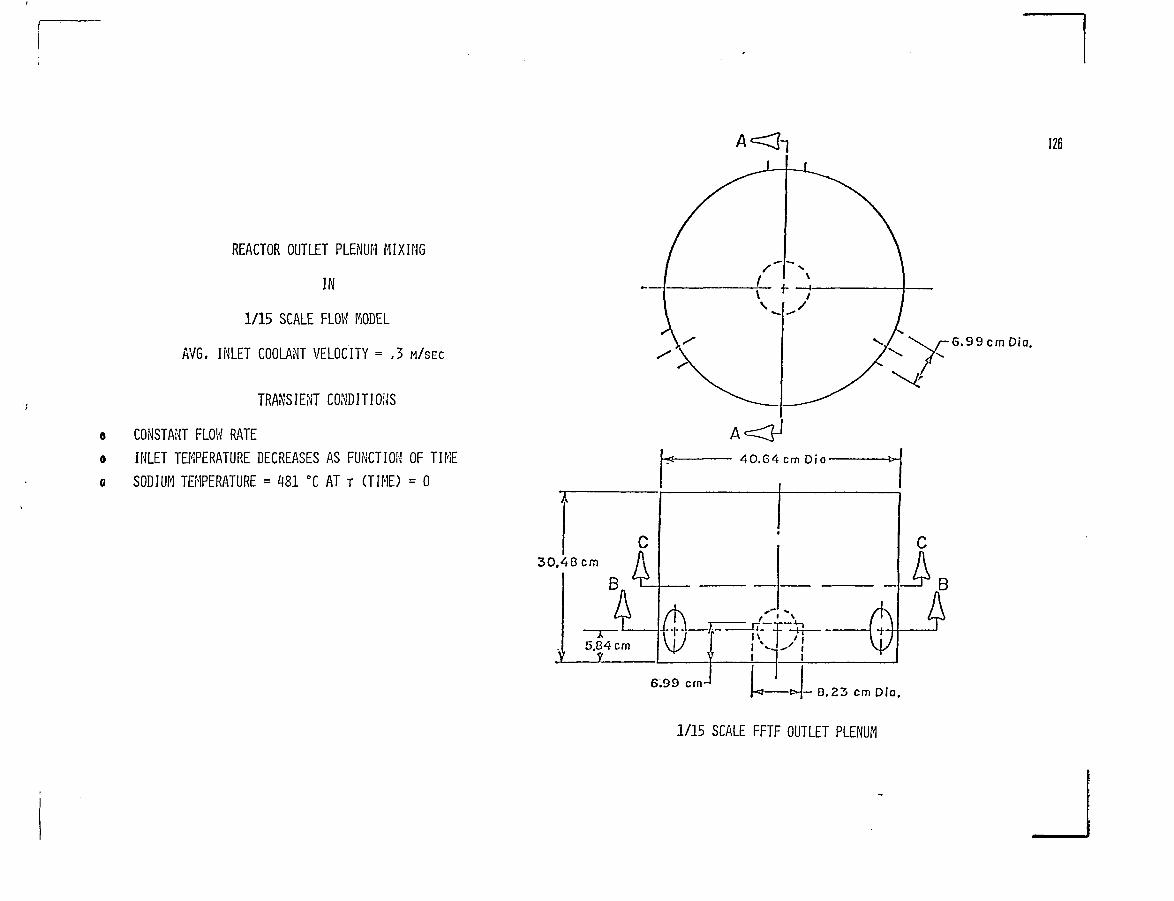
REACTOR OUTLET PLENUM MIXING
IN
1/15 SCALE FLOW MODEL
AVG. INLET COOLANT VELOCITY = .3 M/SEC
TRANSIENT CONDITIONS
CONSTANT FLOW RATEINLET TEMPERATURE DECREASES AS FUNCTION OF TIMESODIUM TEMPERATURE = 481 °C AT i (TIME) = 0
126
30.48 cm
6.99 cm Dia.
6.99 cm8.23 cm Dia.
1/15 SCALE FFTF OUTLET PLENUM
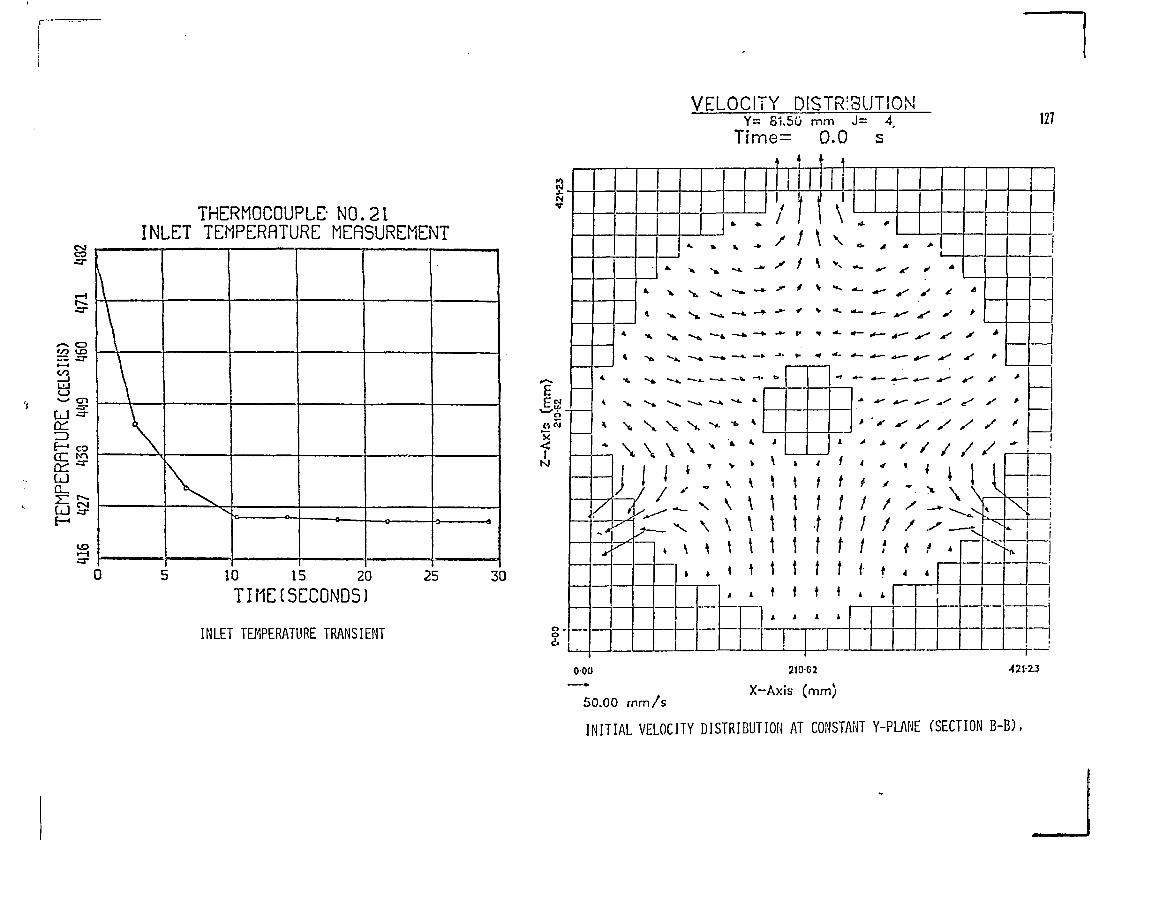
t—
•a-
3
IDf- co
DJQ_
LJ -=r£-•
10t
THERMOCOUPLE- N0.21INLET TEMPERflTURE MERSUREMENT
\
\
\
V1 i
10 15 20
TIME(SECONDS)
INLET TEMPERATURE TRANSIENT
25 30
a*4
?
00-0
VELOCITY DISTRIBUTIONY= S1.5O mm J= 4,
Time= 0.0 s4
i~7 I
s.* *
^ X V N.
W \ ^
—-». —»
•b *\
/
y
T V ^ ' > * ' < < 1 J
, v \ ^ ^ / f f y -
V \ \ t t f / / / • -W l l l l ! / / / / .^ t I 1 M f / i t / -» * t t t t f f f
* t t t f * *
\
\ \I
4 A 4 t
127
000
50.00 mm/s
210-G2
X-Axis (mm)
42IO3
INITIAL VELOCITY DISTRIBUTION AT CONSTANT Y-PLANE (SECTION B-B).
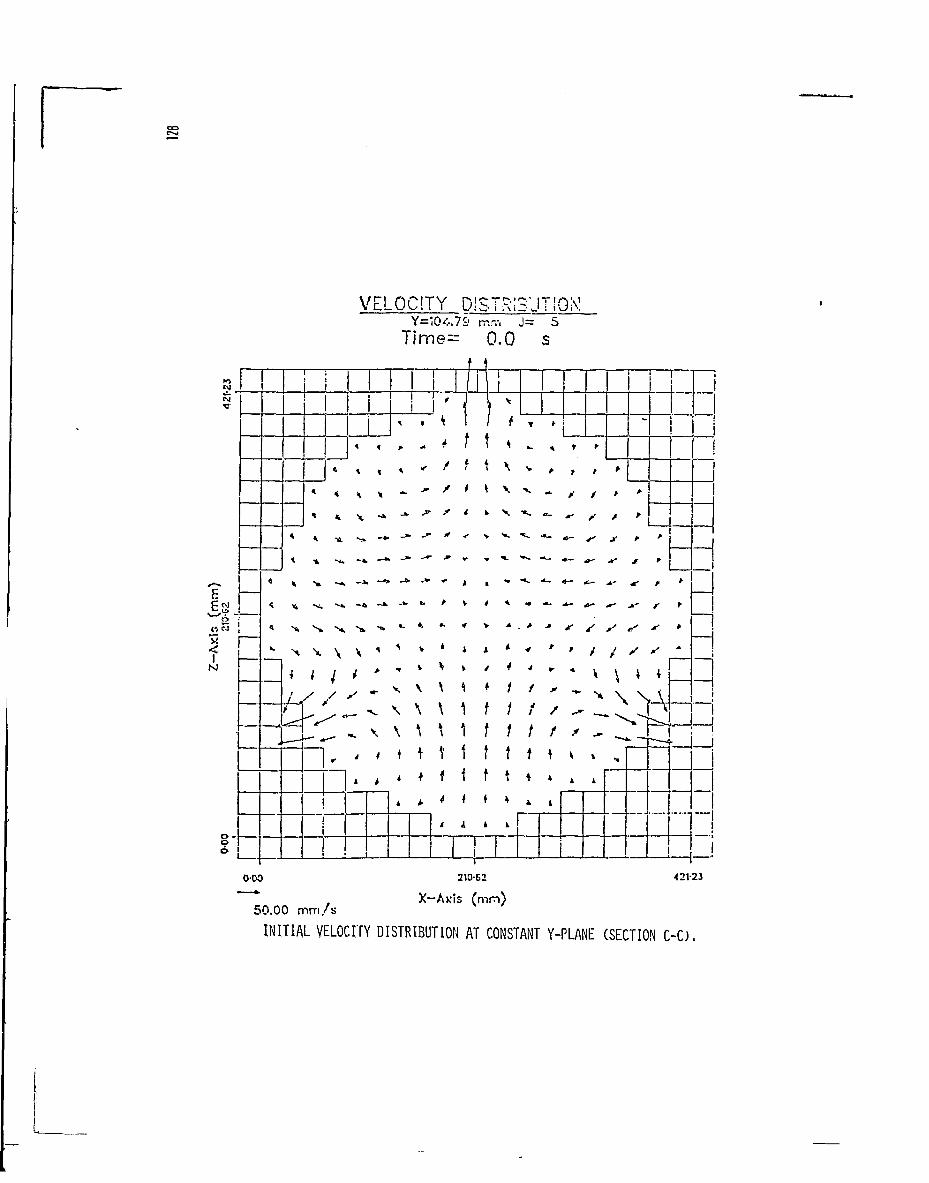
VELOCITY D!STS;SJT!QJN!Y=10<-.79 mm J= S
= 0.0 s
oo6
t
i—
—
i
: 1
-
* \ \ \
* * \ x *
* V X •* "*
* \ t •*» * * "*"
* X •*« - * — * "•*•
« , •» v - ^ -
< ^ ^ -v - * - ^ - -
* •» s \ \ •« "•
i 1 1 t " "
i ,
'A/
4
— *
^ *
r—•
y
4
I
\ \
4 i
t *
i
t
T
- *
V
V
\
\
I
*
1
*
*
*
*
\
\
\
\
1
*t
1
, V
I 1i
f 1 \/ \ v
< k y.
•r v V
A > "•
V / A
< V *
i I *
V / ^
1 • /
1 f /1 f /t t tt t i
A » k
* * i
>- - y f > A
"«• - - • / »
1
^ - - ^ ^ A '
^ * - - * - ^ ^ , »
- * • * - ^ ~ - * - r >
* •* 4f y y s * *
* ' ' t / y y '
' ' * M M T
t / ^t f y
t » » V
1
\
-
V
1
1
J
ii
i
JLJ
i
j
j
1
000 210-62
X—Axis (mm)
421-23
50.00 mm/s
INITIAL VELOCITY DISTRIBUTION AT CONSTANT Y-PLANE (SECTION C - Ü .
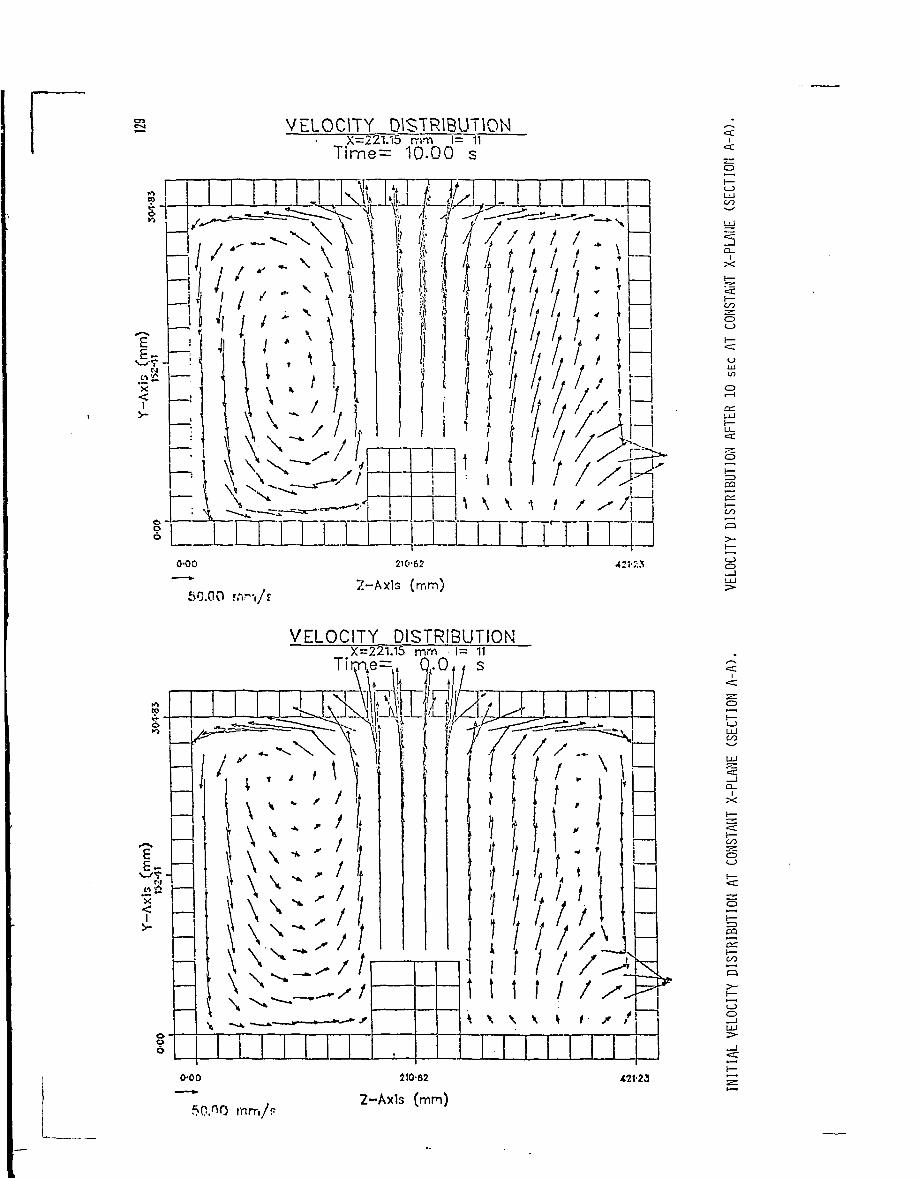
VELOCITY DISTRIBUTIONX=221.15 rriTi 1= 11
Time= 10.00 s
• f ' / ' / J • •' '/ 7 7 '
7 7 ''/ 7 7 '
0-00
50.C1O r.-.r-,/r
210-62
2-Axls (mm)
o
oUJ
U J
oI—PSazi—to
so
VELOCITY DISTRIBUTIONX=221.15 mm l= 11
i 0O s
0-00
mrr,/p
210-62
2-Axls (mm)421-23
«a:
C_5UJCO
UJ
IX
C/5
CD
PQ
Ü2
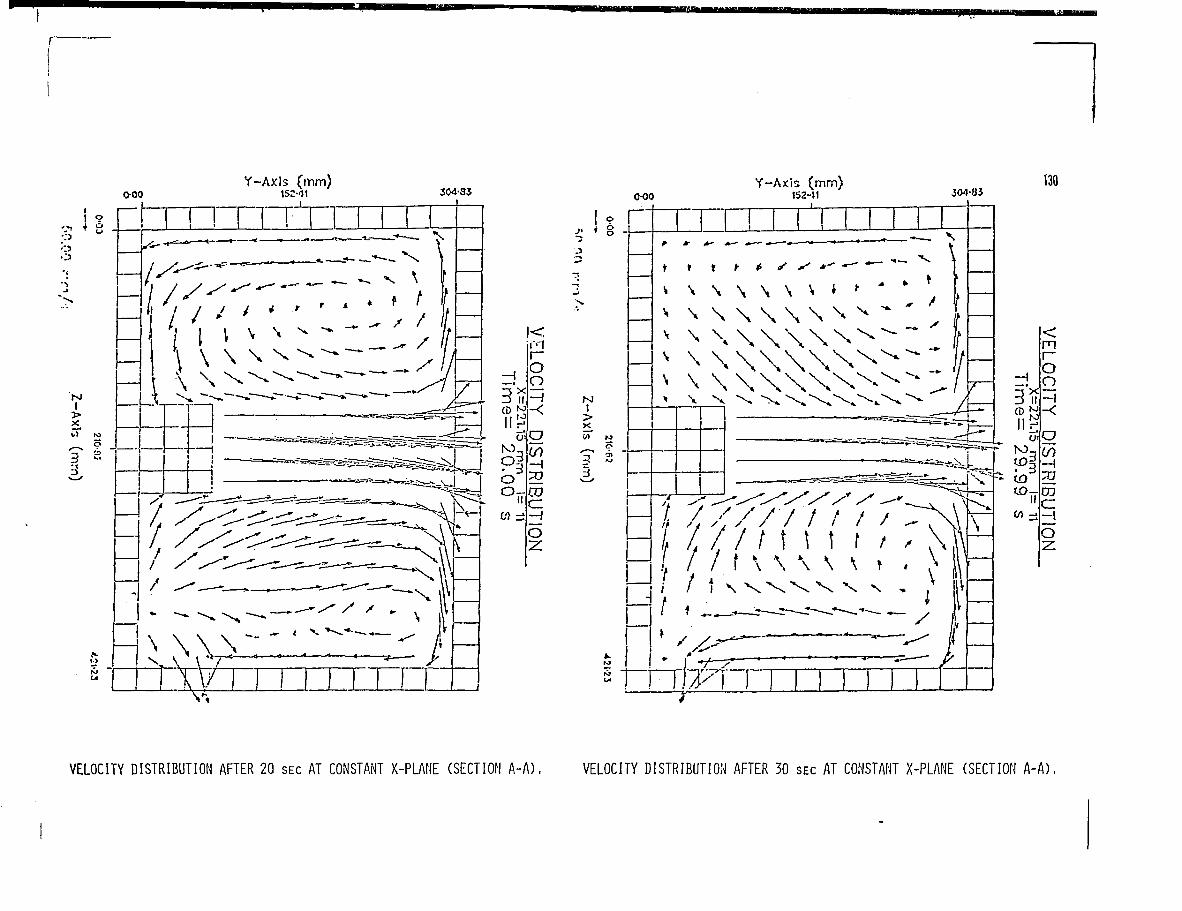
0-00Y-Axls (mm)
152-41JL
304-35
I ?
oO
M
i <
-Vx3 II
oHII g1
a
pio°Tflt/i = ;
OO-H-<
;o
o
0-00Y-Axis (mm)
152-11 304-83130
I
I A///'ft / / / -| / /i / / r \ \ \ \ \ t * N|
/H i . — . • - t -
\
CD
mr~Oo—i
gif)-\
c:
o•z.
VELOCITY DISTRIBUTION AFTER 20 SEC AT CONSTANT X-PLANE (SECTION A-A). VELOCITY DISTRIBUTION AFTER 30 SEC AT CONSTANT X-PLANE (SECTION A-A),
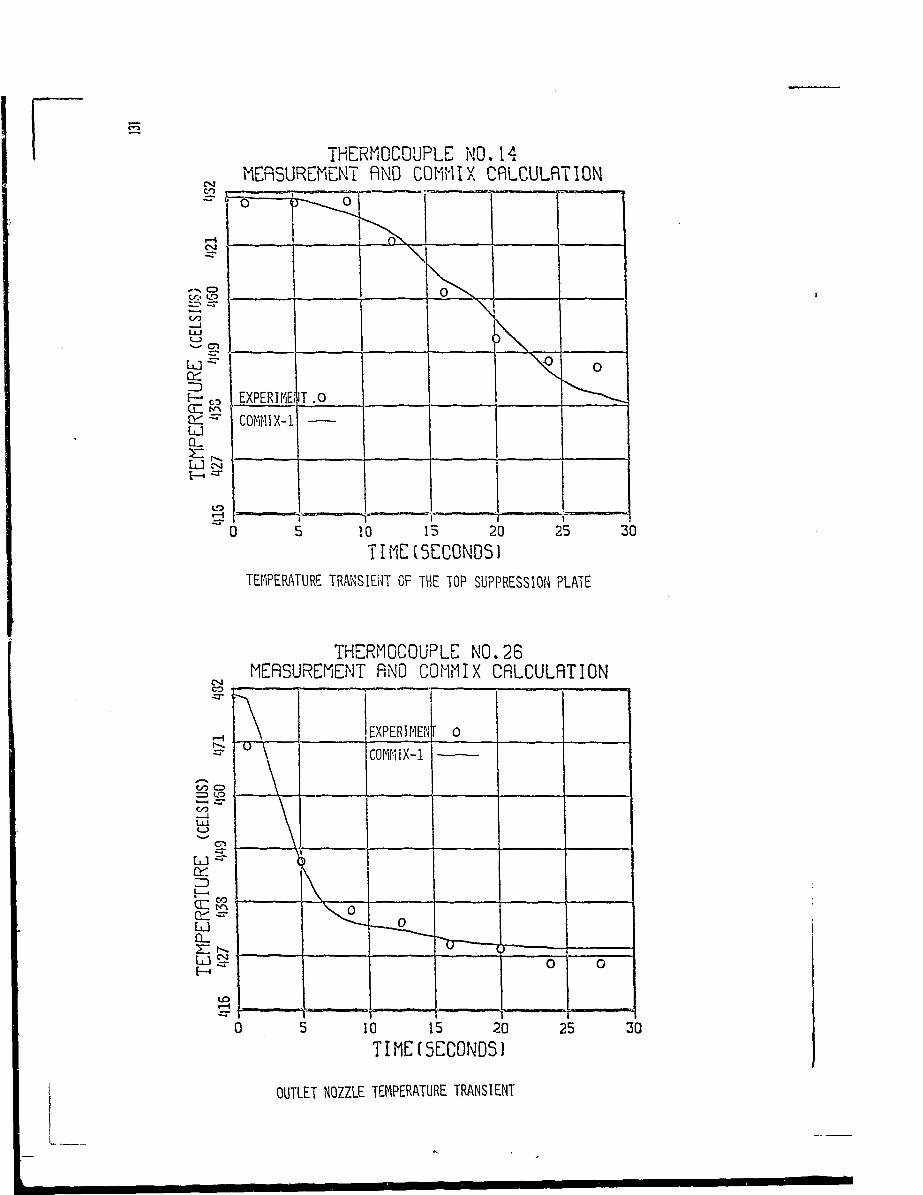
TEMPERATURE TRANSIENT OF THE TOP SUPPRESSION PLATE
OUTLET NOZZLE TEMPERATURE TRANSIENT
PROBABILISTIC DESIGN CONSIDERATION ONTHERMODYNAMICS OF LMFBR FUEL SUBASSEMBLIESAND RELATED FUTURE RESEARCH PROBLEMS
H. HISHIDA
Nuclear Engineering Development Center,
Mitsubishi Atomic Power Industries, Inc.,
Kitabukuro-Machi, Omiya-shi, Saitama-ken,
Japan
Abstract
This paper explains the currently employed basic design philosophy
covering MFBR core thermal and hydraulics together with the necessity of
the related research topics.
1. Basic design philosophy currently employed
Some of the sensitive parameters affecting core thermohydrodynamics are
listed in table 1. Because of the mutual dependencies among core design
parameters due to thermomechanical and coolant flow correlations within and
among fuel subassemblies, the core hot spot temperature cannot substantially
be computed in terms of individual hot spot subfactors evaluated independently.
A hot spot factor corresponding to confidence level A should be determined
taking into consideration the above-mentioned mutual dependencies. At present,
a hot spot factor is expressed in terms of two subfactors being responsible
for the inner-subassembly correlations and the inter-subassembly correlations
for computational convenience, as shown in table 1.
The conditional probabilistic distribution of hot spot temperature within
the rth fuel subassembly P(Tr I Wj.) due to variation in thermal and hydraulic
parameters as well as structural design parameters is evaluated taking into
consideration the deflection of fuel pins in bundle and the subchannel coolant
flow correlations under the condition of constant subasserably coolant flow
rate w_. On the other hand, the conditional probabilistic distribution of the
rth fuel subassembly coolant flow rate P(wr|w ) due to variation in hydraulic
parameters is also evaluated taking into consideration the flow correlations
among incore coolant flow channels under the condition of constant flow rate
Tw at the core inlet. Then, the probabilistic distribution of hot spot temper-
ature P(Tr|w ) under constant w is to V; computed as shown in table 1 with
the corresponding hot spot factor H.S.F.(//) with confidence level // based
on the single spot model.
2. Future problems
2.1 Some of the future analytical problems associated with inner-subassembly
characteristics
1) Three-dimensional coolant velocity fields in inner and peripheral sub-
channels under the effect of a wire-spacer, which is important in relation
with evaluating subchannel coolant mixing and local cladding wall temperature,
should be studied to improve the conventional computer codes based on lumped
parameter techniques. Transient and steady state flow velocity fields in an
annular channel with a wire-spaced fuel pin at the center may be computed at
present and the computational scheme is being extended to a multi-fuel pin
geometry, where consideration should be focussed on how to set up an appro-
priate velocity field on the surrounding boundary interface as reported in
reference 1.
2) Local heat transfer and temperature field within nominal and deformed
subchannels including a wire-spacer should be studied to evaluate the local
cladding temperature rise due to a wire-spacer.
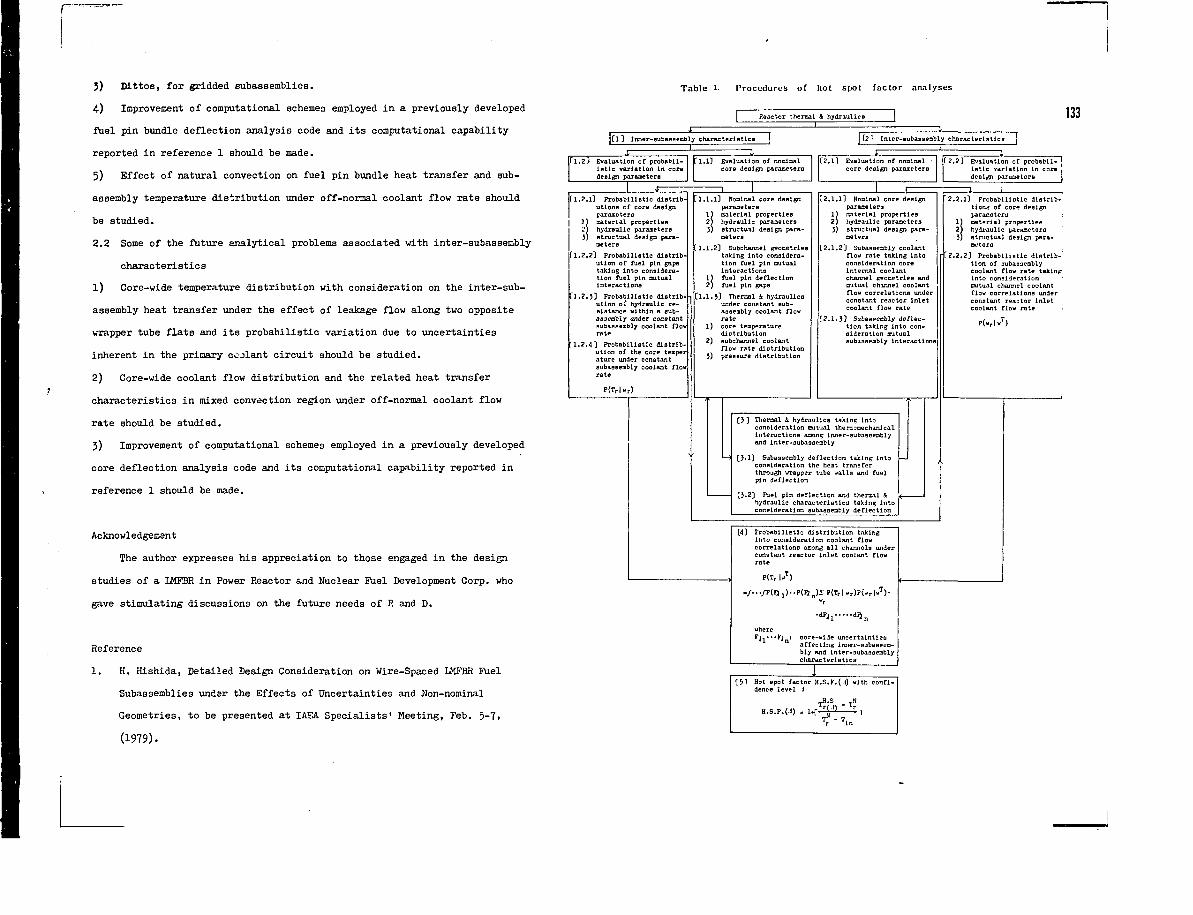
3) Dittos, for gridded subassemblies.
4) Improvement of computational schemes employed in a previously developed
fuel pin bundle deflection analysis code and its computational capability
reported in reference 1 should be made.
5) Effect of natural convection on fuel pin bundle heat transfer and sub-
assembly temperature distribution under off-normal coolant flow rate should
be studied.
2.2 Some of the future analytical problems associated with inter-subassembly
characteristics
1) Core-wide temperature distribution with consideration on the inter-sub-
assembly heat transfer under the effect of leakage flow along two opposite
wrapper tube flats and its probabilistic variation due to uncertainties
inherent in the primary cc-jlant circuit should be studied.
2) Core-wide coolant flow distribution and the related heat transfer
characteristics in mixed convection region under off-normal coolant flow
rate should be studied.
3) Improvement of computational schemes employed in a previously developed
core deflection analysis code and its computational capability reported in
reference 1 should be made.
Acknowledgement
The author expresses his appreciation to those engaged in the design
studies of a LMFBR in Power Reactor ind Nuclear Fuel Development Corp. who
gave stimulating discussions on the future needs of R and D.
Reference
1. H. Hishida, Detailed Design Consideration on Wire-Spaced IMFBR Fuel
Subassemblies under the Effects of Uncertainties and Non-nominal
Geometries, to be presented at IAEA Specialists' Meeting, Feb. 5-7,
(1979).
Table 1. Procedures of hot spot factor analyses
Reactor thenaal & hydraulicB 133jtl3 Inner-subasaembly characteristics I f21 Inter-subassembly characteristic
1.2 3 Evaluation of probabil-istic variation in coredesign parameters
f1.2.13 Probabilistic distrib-utions of core designparameters
j 1) material properties-') hydraulic parameters3) structual design para-
meters
fl.2.23 Probabilistic distrib-ution of fuel pin gapstaking into considera-tion fuel pin mutualinteractions
1.2.33 Probabilistic distrib-ution oi hydraulic re-sistance within a sub-assembly under constantsubassembly coolant flcrate
1.2.4 3 Probabilistic dlstribution of the core temperature under constantsubasBembly coolant flo<rate
P(T r |w r)
1,1} Evaluation of nominalcore design parameters
f2 . l l Evaluation of nominal -core design parameters
.1.13 Nominal core designparameters
1) material properties2) hydraulic parameters3J structual design para-
meters
.1.23 Subchannel geometriestaking into considera-tion fuel pin mutualinteractions
1) fuel pin deflection2) fuel pin gaps
.1.33 Thermal & hydraulicsunder constant sub-assembly coolant flowrate
1) core temperaturedistribution
2) subchannel coolantflow rats distribution
3) pressure distribution
-U2,l.l] Nominal core design
parameters1) material properties2) hydraulic parameters3) structual design para-
meters
2.1.23 Subassembly coolantflow rate taking intoconsideration coreinternal coolantchannel geometries andmutual channel coolantflow correlations underconstant reactor inletcoolant flow rate
"2.1.33 Subassembly deflec-tion taking into con-sideration mutualflubaosembly interactions
[3 3 Thermal & hydraulics taking intoconsideration mutual thermomechanicalinteractions among Inner-subassemblyand inter-subaseembly
[3.13 Subassembly deflection taking intoconsideration the heat transferthrough wrapper tube walls and fuelpin deflection
[3.2] Fuel pin deflection and thermal &hydraulic characteristics taking intoconsideration subassembly deflection
fZ.2] Evaluation of probabil-istic variation In cor«design parameters
1
2.2.13 Probabilistic dlstrib-!tions of core design jparacetera )
1) material properties |2) hydraulic parameters3) structual design para- !
meters j
2.2.23 Probabilistic dlstrib-Jtion of nubasaembly |coolant flow rate taking1
into consideration ;mutual channel coolantflow correlations underconstant realtor inletcoolant flow rate '•
[43 Probabilistic distribution takinginto consideration coolant flowcorrelations among all channels underconstant reactor inlet coolant flowrate
F(Tr |wT)
whereFj.. • • • Fj 1 core-wide uncertainties
affecting inner-aubassem-bly and Inter-subassemblycharacteristics
Hot Bpot factor H.S.dence level
H s.r.(.f)
1
i?i
r
F .
s
< • • ) «
-TÜ
T i n
i t h
1
confl-
P(wr|wT)
1. SYNTHESIS OF THE GR.19 Eb EXPERIMENTS 134
THEORETICAL ANALYSIS AND EXPERIMENTALEVIDENCE OF THREE TYPES OFTHERMOHYDRAULIC INCOHERENCY INUNDISTURBED CLUSTER GEOMETRY
B. MENANT, G. BASQUE, D. GRANDSTT/STML - Centre de Grenoble,Grenoble Cedex,France
8UMUARY
After a brief" presentation of the main results of the GR 19 Eb
sodium boiling experiments, the BACCHUS P code is described and its
predictions validated on the experimental results. The agreement between
experiments and calculations beeing quite good, further computation predictions
of local boiling in a 271 pin subassembly are presented.
INTRODUCTION
The first experiments of sodium boiling performed in rod bundles at
the Heat Transfer Laboratory of Grenoble pointed out some special boiling
flow patterns due to the incoherency of coolant thermohydraulics (see fig. 1.1).
The purpose of the BACCHUS P code and of the GR.19 Eb experiments,
presented in this paper, is to get to a better analysis of these phenomena
of local boiling under steady boundary conditions.
J. COSTA, B. MENANT
Sodium boiling experiments in a "9 pin bundle : two phase coolant dynamics,
Chicago, October 1976.
1.1. The experimental device
a) The GR.19 Eb bundle was nearly similar to the first 19 pin bundle
tested in our laboratory (see fig. 1.2) :
- 19 tantalum sheated pins (8.65 mm outer diameter; 600 mm heated length with
uniform heat generation; 494 mm downstream not heated length),
- one helical spacer wire of 1.28 mm diameter and 180 mm pitch around each
pin,
- hexagonal duct of 45.85 mm between flats.
b) Instrumentation_of the GR . "• 9_Eb bundle
We used the same hexagonal duct as for the GR.19 experiments (see
fig. 1.3); it was instrumented with :
- 5 electromagnetic flowmeters
- 5 pressure transducers
- many thermocouples
- »a/e guides for accoustical detection of boiling
The bundle itself was fitted with about 80 thermocouples located
in the helical wires, mostly in the downstream twelfth of the heated length.
The details on the position of these thermocouples is given in table I (see
fig. 1.2 for the position of pins and helical wires).
It was hoped that the high density of thermocouples in the assumed
local boiling region would be useful to get a precoce detection of local
boiling and dry-out and an accute descriptions of their extension.
c) The experimental runs_were_perfo_rmed_on_the CFNa loop under really
Iteady boundary conditions both for single phase and for local boiling
experiments :
•• entry temperature T = 400°C,
•• saturation temperature at the top of the heated length T = 92O°C,
sat
- constant sodium flow imposed through the bundle Q spreading between
2250 gs~1 and 260 gs~ 1,
- constant power generated in the bundle.
uniform repartition of clearance in the bundle which has a great influence
on thermohydraulics especialy if the P/D ratio is low (1.15 for GR.19 Eb).
Furthermore, the effect of oriented mixing classicaly attributed to the
helical wires cannot be clearly evidenced; but it's likely one more
contribution to the dispersion of measured temperatures in the bundle.
b) Sodium boiling
As one pin failed at the end of the single phase tests, boiling
was performed with only 18 heated pins (see fig. 2) generating 10 kW each.
135
1.2. Physical interpretation of the GR.19 Eb experiments
a) Single_phase_tests
Preliminary single phase tests were performed with 19 heated pins
and uniform power. The results presented on figure 1.4 illustrate well the
dispersion of temperature measurements which spread between - 19 % and + 35 %
around the mean value obtained by thermal balance.
The analysis of these temperature maps leads to two conclusions :
- in such a geometry of bundle with helical spacers, the temperature of the
wall subchannels is lower than the temperature of the central subchannels
(classical result).
- the level of temperature incoherency in the central part of the bundle is
high. A comparison of the temperature maps at different levels shows that
the hottest zone does not turn with the helical wire. One hot channel appears
around pins 1, 6, 7, 2 and 5; this is probably a consequence of a non
B. MENANT,
How local sodium boiling in rod bundles under realy steady state boundary
conditions is achieved on the CFNa loop,
7th LMBWG Meeting; 1-3 June 1977; Petten.
The temperature at the entry was 400°C and the saturation temperature
was aoout 92O°C at the top of heated length.
The flow was decreased by tiny steps in order to get an acute
description of local boiling and of the transition to gross boiling. The
timing and main results of this succession of steady states are summarised
in table II.
Let us point out two interesting details :
- accoustical detection of noise similar to cavitation noise and fluctuations
on some thermocouples are the first evidences of hot spot boiling in highly
subcooled surrounding.
- fully stable dry-out was detected by two thermocouples m the conditions
of transition between local and gross boiling. It «as observed during more
than 1 minute (run n° *28-i29) before the boiling experiment «as
interrupted by a slow power decrease.
These t»o details are evidences of a third scale of tnermohyaraulic
incoherercy : acute local hot spots may develop around scacer devices.
These hot spots reduce significantly the probability of any initial
boiling superneat; in tne conditions of tne tantalum pin G^.19 Eb experiments
they had not much influence on mean thermohydraulics, and the interpretation
with the "macrochannel" permanent boiling code 3ACCHUS «as easy.
With these approximations tne local time-averaged eauations may be |3(j
written :
(i) mass :
2. PRESENTATION OF THE BACCHUS CODE
2.1 . BACCHUS physical model
The development of BACCHUS is based upon the experimental evidences
mentionned in preceeding chapter and upon the requirement of an evolutive
program handling from the beginning the difficulty of sodium boilinn. The
model and the results presented are relevant to the steady state study which
was first completed. A transient version is now under development.
The basis of the approach is the porous body analysis. Such an
approach differs from the subchannel analysis in the choice of the control
volume. In the porous body model, the control volume is arbitrary containing
both coolant channels and the solid matrix as shown in fig. 2.1. cor the
present applications, concentric rings are chosen as shown in fig. 2.2, i.e.
we assume axial symetry of the flow and thermal fields. Under this assumption,
the formulation is two-dimensional.
The two-phase modelisation is the simplest possible, since we use
a homogeneous equilibrium model. The scarecity and uncertainties of the
experimental results in sodium boiling are such that sophistication of the
two phase model is not needed at the present stage.
7 . ov = 0
Cii) axial momentum :
7 . (pvw) = - - ^ + 7 . ( T . K ) - e g
(2.1)
(2.2)
7 . (pvni = n :p + 7 . a (2.3!
where p is the density, v the velocity vector and w its 2-component, p is the
pressure, h is the specific enthalpy. The stress tensor "J^and the heat flux
q contain turbulent contributions.
Sy integration of these local equations on the volume of coolant
channels vc contained in the control volume v, we have :
(i) mass :
— (z < pw >) * - / mda = 0iz M
a(2.-1)
In the coolant the conservation equations may be written in their
local form. They are simplified by the following assumptions :
- homogeneous equilibrium model is used for the two-phase flow,
- the flow is steady,
•• the boundary layer approximation is valid : uniform pressure in a cross-
section, negligible longitudinal diffusion.
Cii) axial momentum :
3 , 2mwda = - — I'e < p
( vt . k i . rda - z < o >g
"• k l
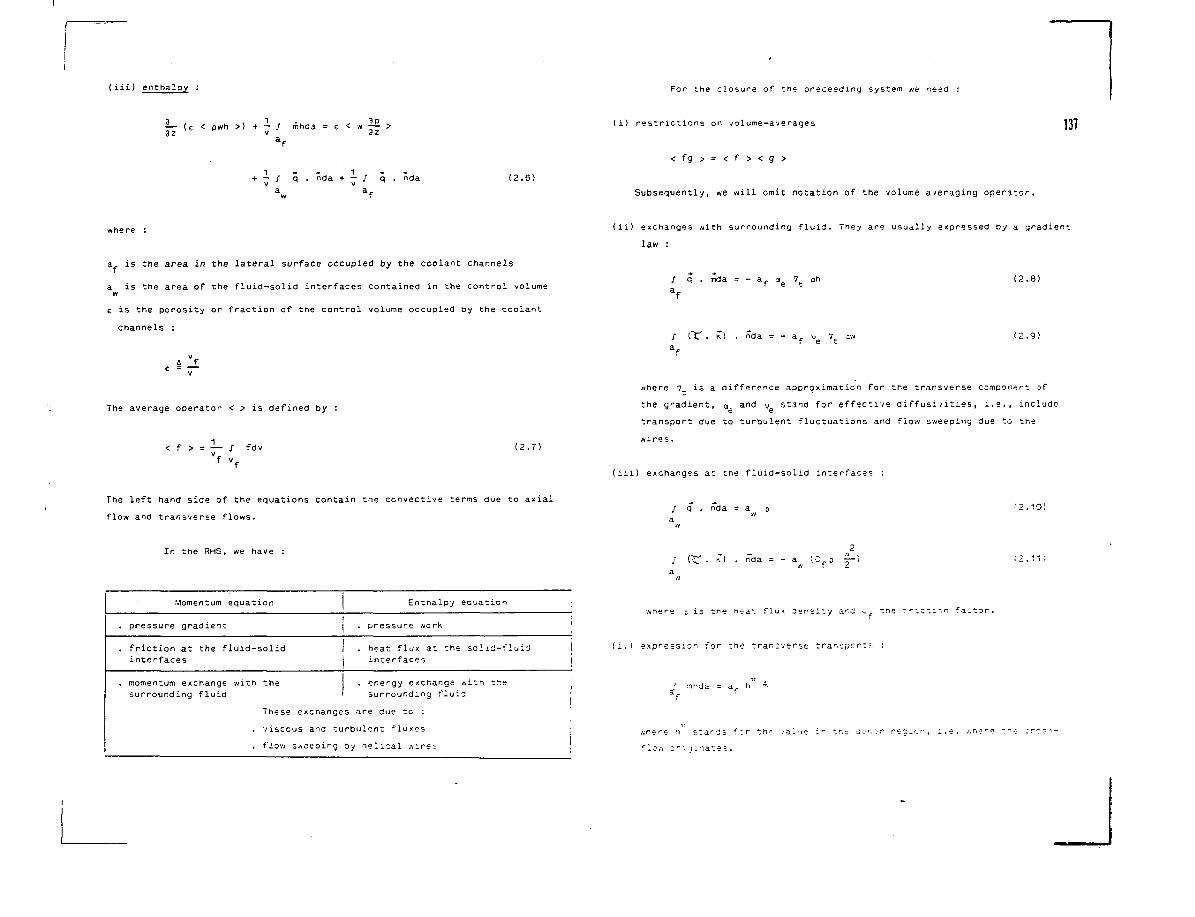
(iii) enthalpy : For the closure of the preceeding system /ve need
— (e < pwh >) + - / mhda = € < w — >
— / q . nda + — / q . nda (2.6)
(i) restrictions on volume-averages
< f g > = < f > < g >
Subsequently, we will omit notation of the volume averaging operator.
137
a. is the area in the lateral surface occupied by the coolant channels
a is the area of the fluid-solid interfaces contained in the control volumew
E is the porosity or fraction of the control volume occupied by the coolant
channels :
(ii) exchanges with surrounding fluid. They are usually expressed by a gradient
law :
/ q . nda =
a.7t o h
/ C£ . k) . nda = -
(2.8)
(2.9)
The average operator < > is defined by
< f > = — / fdv
f
(2.7)
The left hand side of the equations contain the convective terms due to axial
flow and transverse flows.
«here 7_ is a difference approximation for the transverse component of
the gradient, a and v stand for effective diffusivities, i.e., include
transport due to turbulent fluctuations and flow sweeping due to the
wires.
(iii) exchanges at the fluid-solid interfaces :
/ q . nda = a (2.10)
In the RHS, we have :. k*> . nda = - a (C.D — ) (2.11)
Momentum equation
. pressure gradient
. friction at the fluid-solidinterfaces
. momentum exchange with thesurrounding fluid
These
Enthalpy ecuation
. pressure work
. heat flux at the solid-fluidinterfaces
. energy exchange with thesurrounding fluid
exchanges are due to :
. viscous and turbulent fluxes
, f Mow sweeping by helical :iire =
j
i
where t is the hea^ flu< der'$i~y the 5ricti~n fa-tor
(iv'i expression for the transverse transport" :
;• mhda = a r h r\
«r.ere !i stands fcr th-e .-al-j
flow ori-j_>-ate;.
t n r ^ er: r regier, i.e. /. n e r e
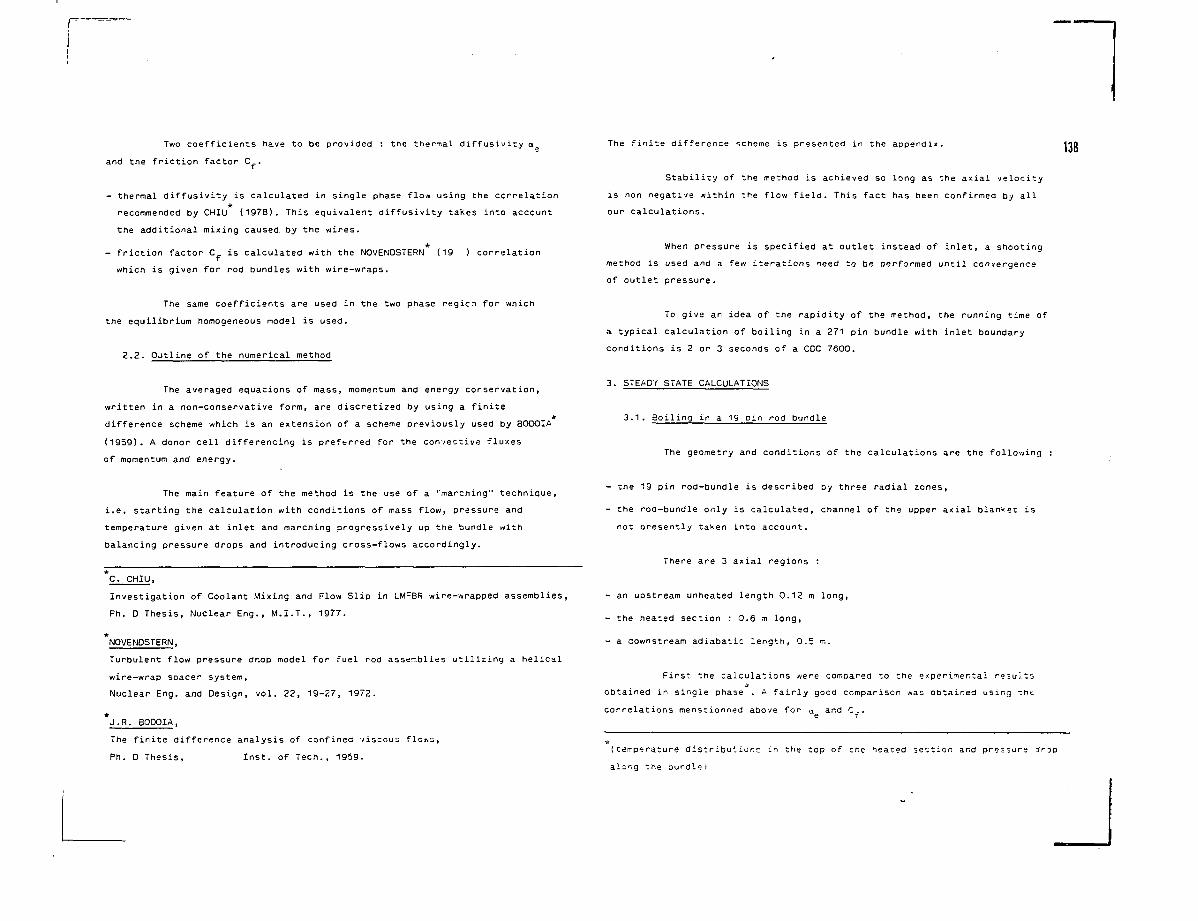
Two coefficients have to be provided : the thermal diffusivity aa
and the friction factor C f.
- thermal diffusivity is calculated in single phase flow using the correlation
recommended by CHIU (1978). This equivalent diffusivity takes into account
the additional mixing caused, by the wires.
*- friction factor C is calculated with the NOVENDSTERN (19 ) correlation
which is given for rod bundles with wire-wraps.
The same coefficients are used in the two phase regicn for which
the equilibrium homogeneous model is used.
2.2. Outline of the numerical method
The averaged equations of mass, momentum and energy conservation,
written in a non-conservative form, are discretized by using a finite*
difference scheme which is an extension of a scheme previously used by BODOIA
(1959). A donor cell differencing is preferred for the convective fluxes
of momentum and energy.
The main feature of the method is the use of a 'marching" technique,
i.e. starting the calculation with conditions of mass flow, pressure and
temperature given at inlet and marching progressively up the bundle with
balancing pressure drops and introducing cross-flows accordingly.
C. CHIU,
Investigation of Coolant Mixing and Flow Slip in LMFBR wire-wrapped assemblies,
Ph. D Thesis, Nuclear Eng., M.I.T., 1977.
*NOVENDSTERN,
Turbulent flow pressure dr.op model for fuel rod assemblies utilizing a helical
wire-wrap spacer system,
Nuclear Eng. and Design, vol. 22, 19-27, 1972.
J.R. BODOIA,
The finite difference analysis of confined viscous flows,
Ph. 0 Thesis, Inst. of Tech., 1959.
The finite difference scheme is presented in the appendix. lop
Stability of the method is achieved so long as the axial velocity
is non negative within the flow field. This fact has been confirmed by all
our calculations.
When pressure is specified at outlet instead of inlet, a shooting
method is used and a few iterations need to be performed until convergence
of outlet pressure.
To give an idea of the rapidity of the method, the running time of
a typical calculation of boiling in a 271 pin bundle with inlet boundary
conditions is 2 or 3 seconds of a CDC 7600.
3. STEADY STATE CALCULATIONS
3.1. Boiling in a 19 pin rod bundle
The geometry and conditions of the calculations are the following :
- the 19 pin rod-bundle is described by three radial zones,
- the rod-bundle only is calculated, channel of the upper axial blanket is
not presently taken into account.
There are 3 axial regions :
- an upstream unheated length 0.12 m long,
- the heated section : 0.6 m long,
- a aownstream adiabatic length, 0.5 m.
First the calculations //ere compared to the experimental results
obtained in single phase . A fairly good comparison was obtained using :nt
correlations menstionned above for a and C_.
{temperature distributions in the top of the heated section and pressure drop
along the bundlei
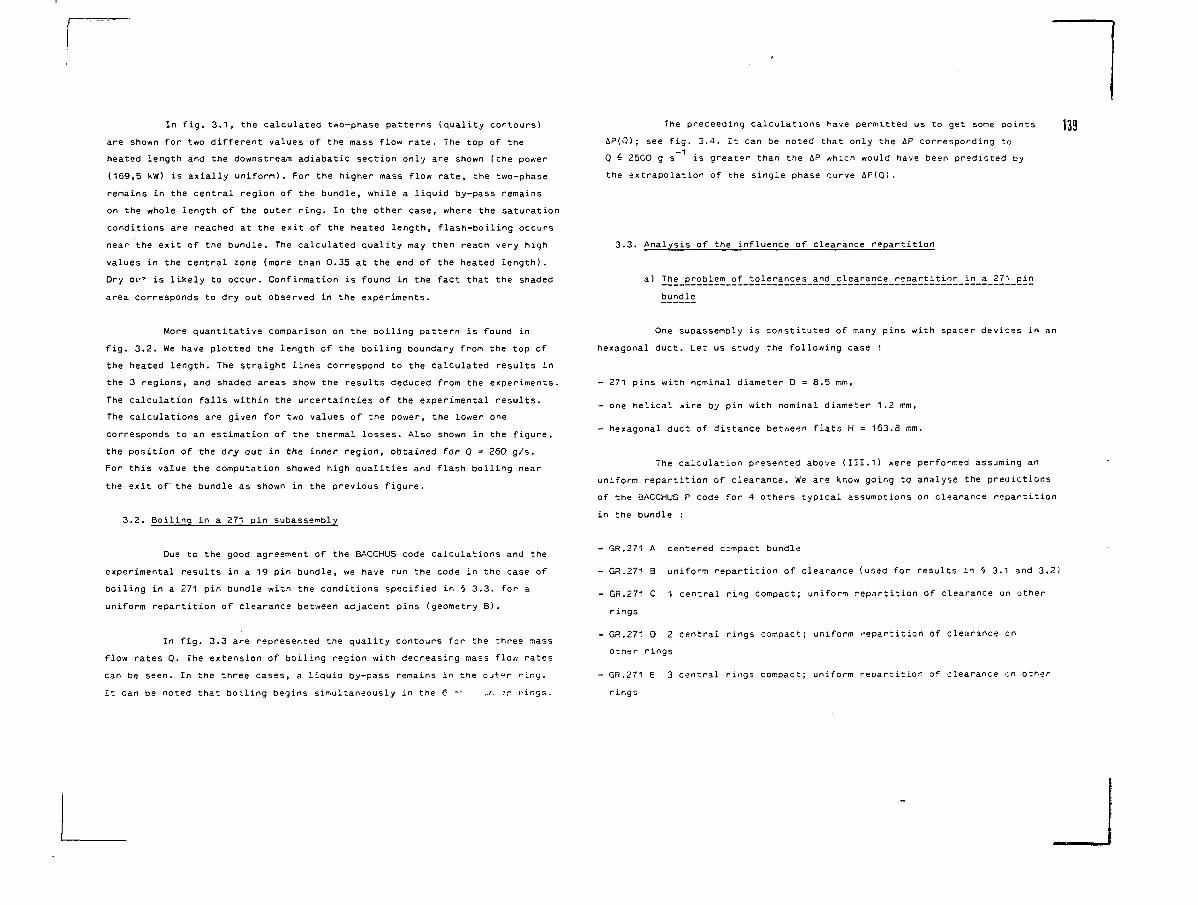
In fig. 3.1, the calculated two-phase patterns (quality contours)
are shown for two different values of the mass flow rate. The top of the
heated length and the downstream adiabatic section only are shown (the power
(169,5 kW) is axially uniform). For the higher mass flow r-ate, the two-phase
remains in the central region of the bundle, while a liquid by-pass remains
on the whole length of the outer ring. In the other case, where the saturation
conditions are reached at the exit of the heated length, flash-boiling occurs
near the exit of the bundle. The calculated quality may then reacn very high
values in the central zone (more than 0.35 at the end of the heated length).
Dry OL'' is likely to occur. Confirmation is found in the fact that the shaded
area corresponds to dry out observed in the experiments.
The preceeding calculations have permitted us to get some points
; see fig. 3.4. It can be noted that only the AP corresponding to
0 ^ 2500 g s is greater than the 4P which would have been predicted by
the extrapolation of the single phase curve AP(Q).
3.3. Analysis of the influence of clearance repartition
a) The problem of tolerances and clearance repartition in a 271 pin
bundle
139
More quantitative comparison on the boiling pattern is found in
fig. 3.2. We have plotted the length of the boiling boundary from the top of
the heated length. The straight lines correspond to the calculated results in
the 3 regions, and shaded areas show the results deduced from the experiments.
The calculation falls within the uncertainties of the experimental results.
The calculations are given for two values of the power, the lower one
corresponds to an estimation of the thermal losses. Also shown in the figure,
the position of the dry out in the inner region, obtained for 0 = 260 g/s.
For this value the computation showed high qualities and flash boiling near
the exit of the bundle as shown in the previous figure.
3.2. Boiling in a 271 pin subassembly
Due to the good agreement of the BACCHUS code calculations and the
experimental results in a 19 pin bundle, we have run the code in the case of
boiling in a 271 pin bundle with the conditions specified in § 3.3. for a
uniform repartition of clearance between adjacent pins (geometry B ) .
In fig. 3.3 are represented the quality contours for the three mass
flow rates 0. The extension of boiling region with decreasing mass flow rates
can be seen. In the three cases, a liquia by-pass remains in tne ojt^r ring.
It can be noted that boiling begins simultaneously in the 6 * -*. 'r rings.
One suoassembly is constituted of many pins with spacer devices in an
hexagonal duct. Let us study the following case :
- 271 pins with nominal diameter D = 8.5 mm,
- one helical wire by pin with nominal diameter 1.2 mm,
- hexagonal duct of distance between flats H = 163.8 mm.
The calculation presented above (III.1) were performed assuming an
uniform repartition of clearance. We are know going to analyse the predictions
of the BACCHUS P code for 4 others typical assumptions on clearance repartition
in the bundle :
- GR.271 A centered compact bundle
- GR.271 B uniform repartition of clearance (used for results in § 3.1 and 3.2)
- GR.271 C 1 central ring compact; uniform repartition of clearance on other
rings
- GR.271 D 2 central rings compact; uniform repartition of clearance on
other rings
- GR.271 E 3 central rings compact; uniform repartition of clearance on other
rings
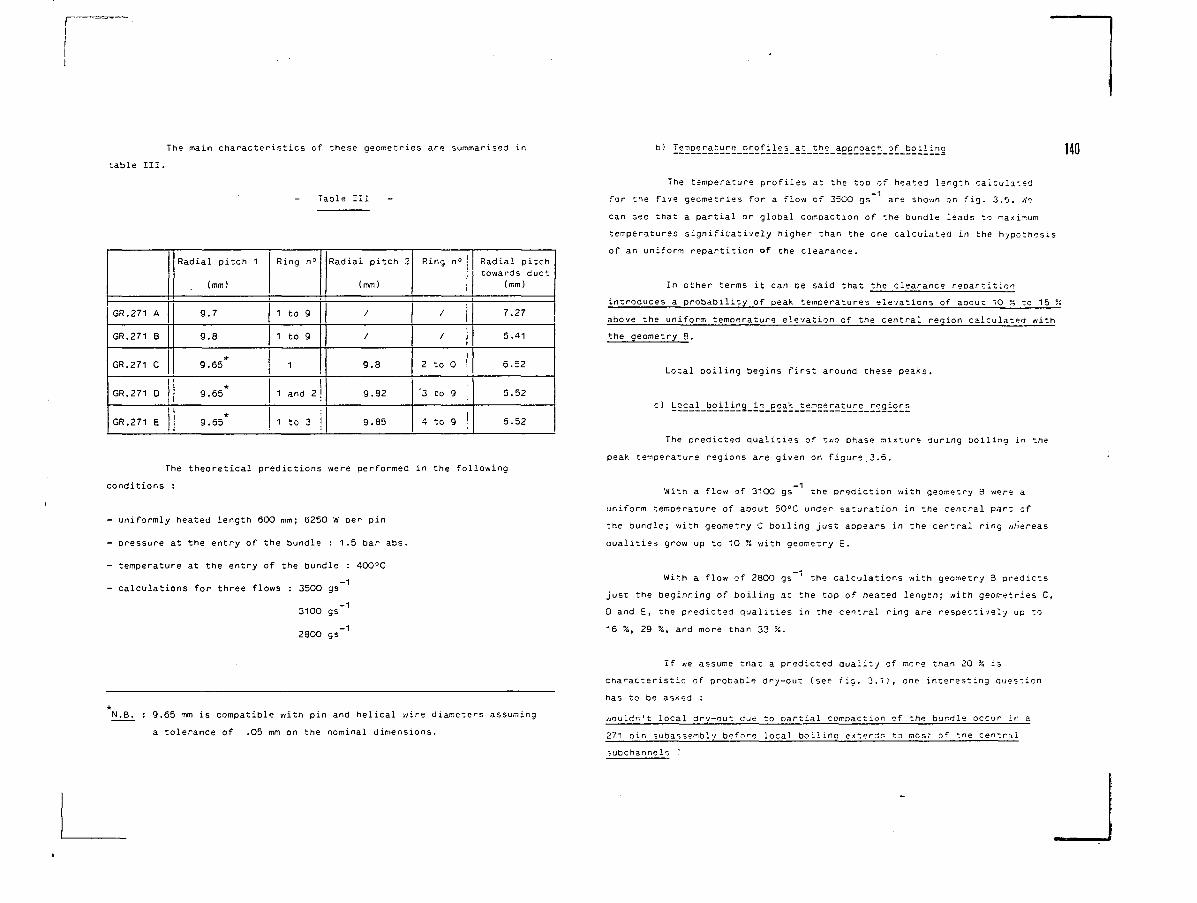
The main characteristics of these geometries are summarised in
table III.
Table III
GR.271 A
GR.271 8
GR.271 C
GR.271 D
GR.271 E
Radial pitch 1
{mm)
9.7
9.8
9.65*
9.65*
*9.65
i
Ring n°
1 to 9
1 to 9
1
1 and 2
1 to 3
Radial pitch 2
(mm)
/
/
9.8
9.82
9.85
Ring n°
/
/
2 to 0
'3 to 9
4 to 9 !
Radial pitchtowards duct
(mm)
7.27
6.41
6.52
6.52
6.52
The theoretical predictions were performed in the following
conditions :
- uniformly heated length 600 mm; 6250 W per pin
- pressure at the entry of the bundle : 1.5 bar abs.
- temperature at the entry of the bundle : 400°C
- calculations for three flows : 3500 gs
3100 gs
2800 gs-1
N,B. : 9.65 mm is compatible with pin and helical wire diameters assuming
a tolerance of .05 mm on the nominal dimensions.
b) Temperature orofiles at the approach of boilinq 14Q
The temperature profiles at the top of heatsd length calculated
for the five geometries for a flow of 3500 gs are shown or, fig. 3.5. ',•(?
can see that a partial or global compaction of the bundle leads to maximum
temperatures significatively higher than the one calculated in the hypothesis
of an uniform repartition of the clearance.
In other terms it can ae said that the clearance repartition
introduces a probability of peak temperatures elevations of about 10 :; to 15 %
above the uniform temperature elevation of the central region calculated with
the geometry B.
Local boiling begins first around these peaks.
c) Local boiling_in peak temperature_regions
The predicted qualities of t/jo phase mixture during boiling in the
peak temperature regions are given on figure.3.6.
With a flow of 3100 gs the prediction with geometry 3 were a
uniform temperature of about 50°C under saturation in the central part of
the bundle; with geometry C boiling just appears in the central ring whereas
aualities grow up to 10 % with geometry E.
With a flow of 2800 gs ' the calculations with geometry 3 predicts
just the beginning of boiling at the top of heated length; with geometries C,
D and E, the predicted qualities in the central ring are respectively up to
16 %, 29 %, and more than 33 %.
If we assume that a predicted quality of mere than 20 % is
characteristic of probable dry-out (see fig. 3.1), one interesting question
has to be asked :
wouldn't local dry-out due to partial compaction of the bundle occur jr, a
271 pin subassembly before local boiling exterj- to mes^ of tne central
subchannels T
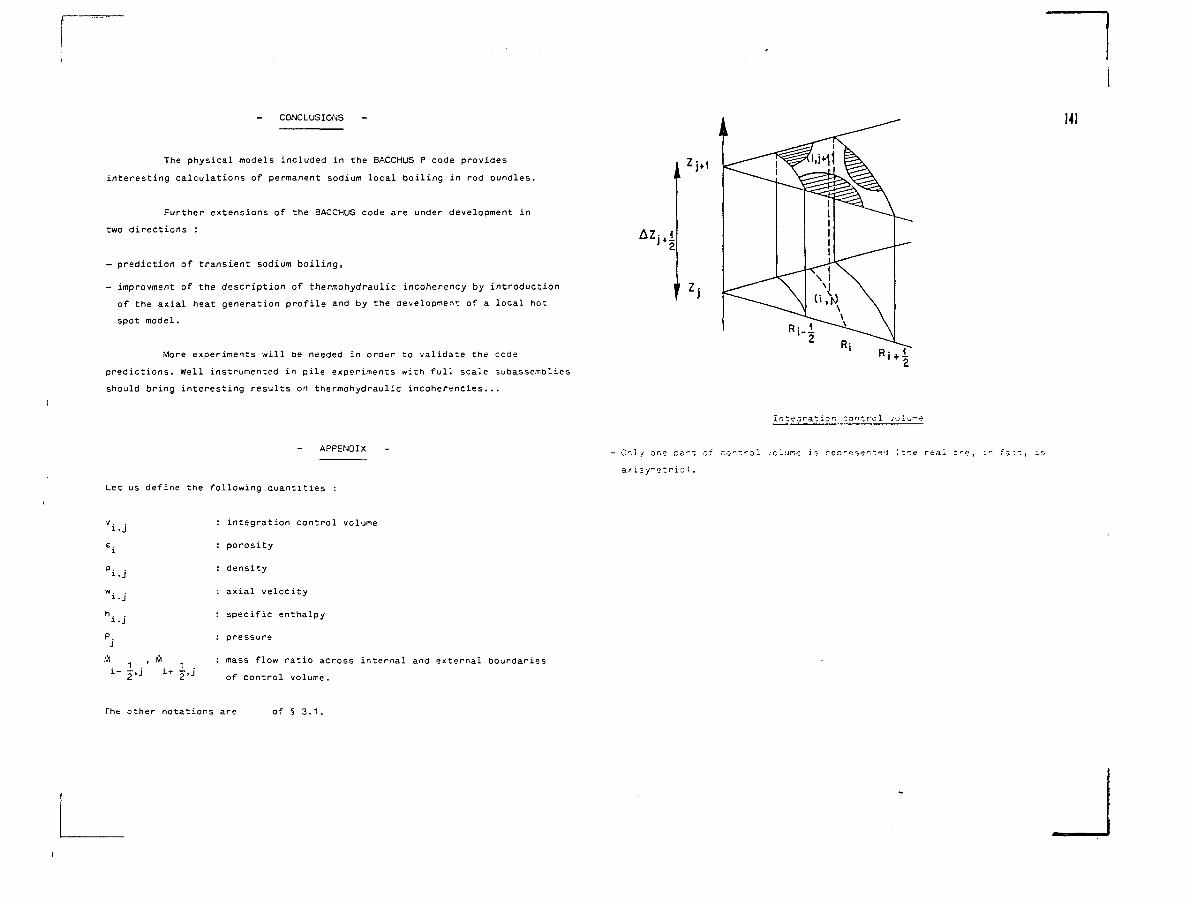
CONCLUSIONS
The physical models included in the BACCHUS P code provides
interesting calculations of permanent sodium local boiling in rod bundles.
Further extensions of the BACCHUS code are under development in
two directions :
— prediction of transient sodium boiling,
- improvment of the description of thermohydraulic incoherency by introduction
of the axial heat generation profile and by the development of a local hot
spot model.
More experiments will be needed in order to validate the code
predictions. Well instrumented in pile experiments with full scale subassembiies
should bring interesting results on thermohydraulic incoherencies...
APPENDIX
Ml
Oily one oa': of
a/isy-etric).
Integration control
control vcluH-r is rearesente'J (tne real or?.
Let us define the following quantities
v .
PJ
. 21- 21
: integration control volume
: porosity
: density
: axial velocity
: specific enthalpy
: pressure
: mass flow ratio across internal and external boundaries
of control volume.
The other notations are of § 3.1.
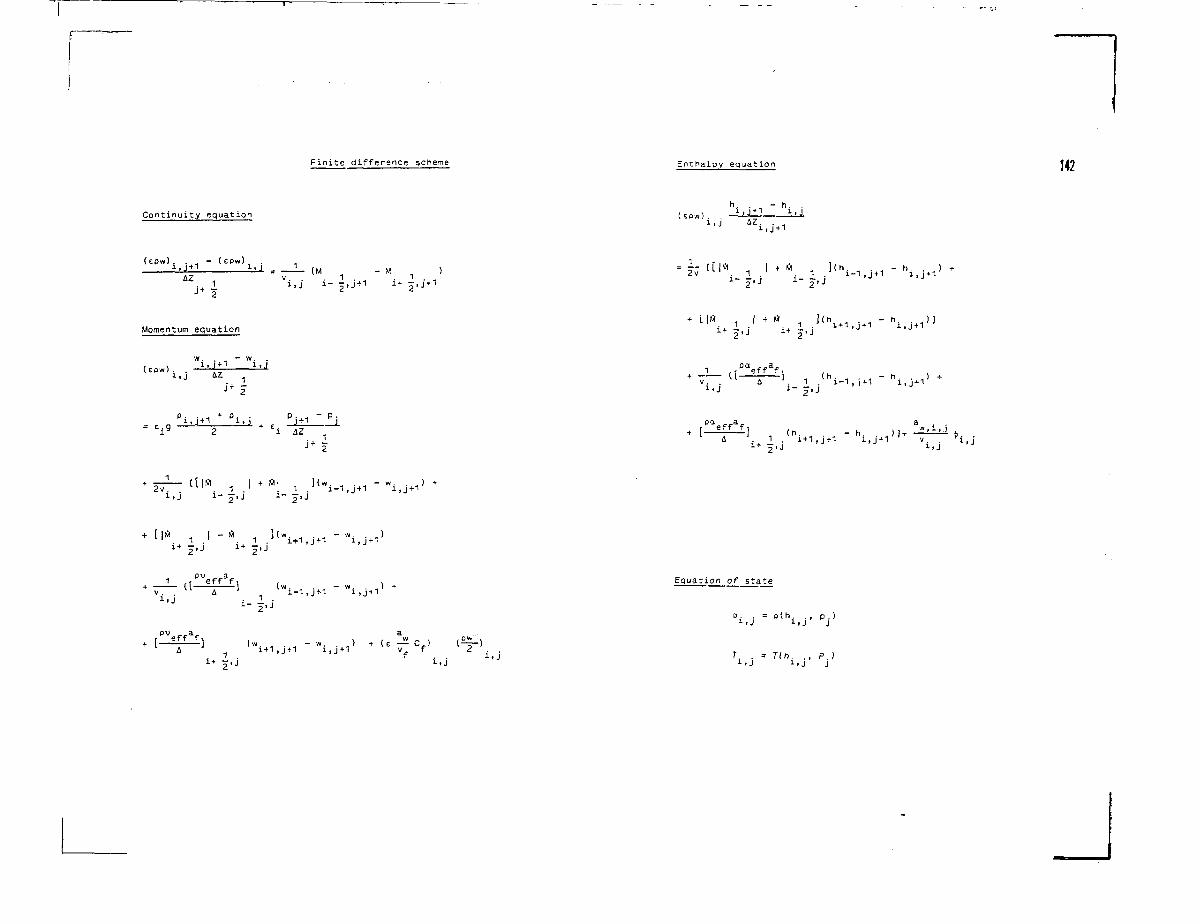
Finite difference scheme Enthalpy equation 142
Continuity equationh. . - h.
Up.,,,. . _ i ^. h.
" ( e p w )
(M 1 . 'J
Vi,j+i " hi,j+i'
Momentum equation
(cow) , .w. . - w.1. 1 + 1 i,.i
= E,-9pi,J +
i M 2j + 1 - p j
1
Equation of state
a. . = o(h. . , p .)!>J i .J J
1+1,j +- w. . ..) + (c — C.)
i.j+1 vf f
i.jT. . = T(h. . , P )
!.J i.J J
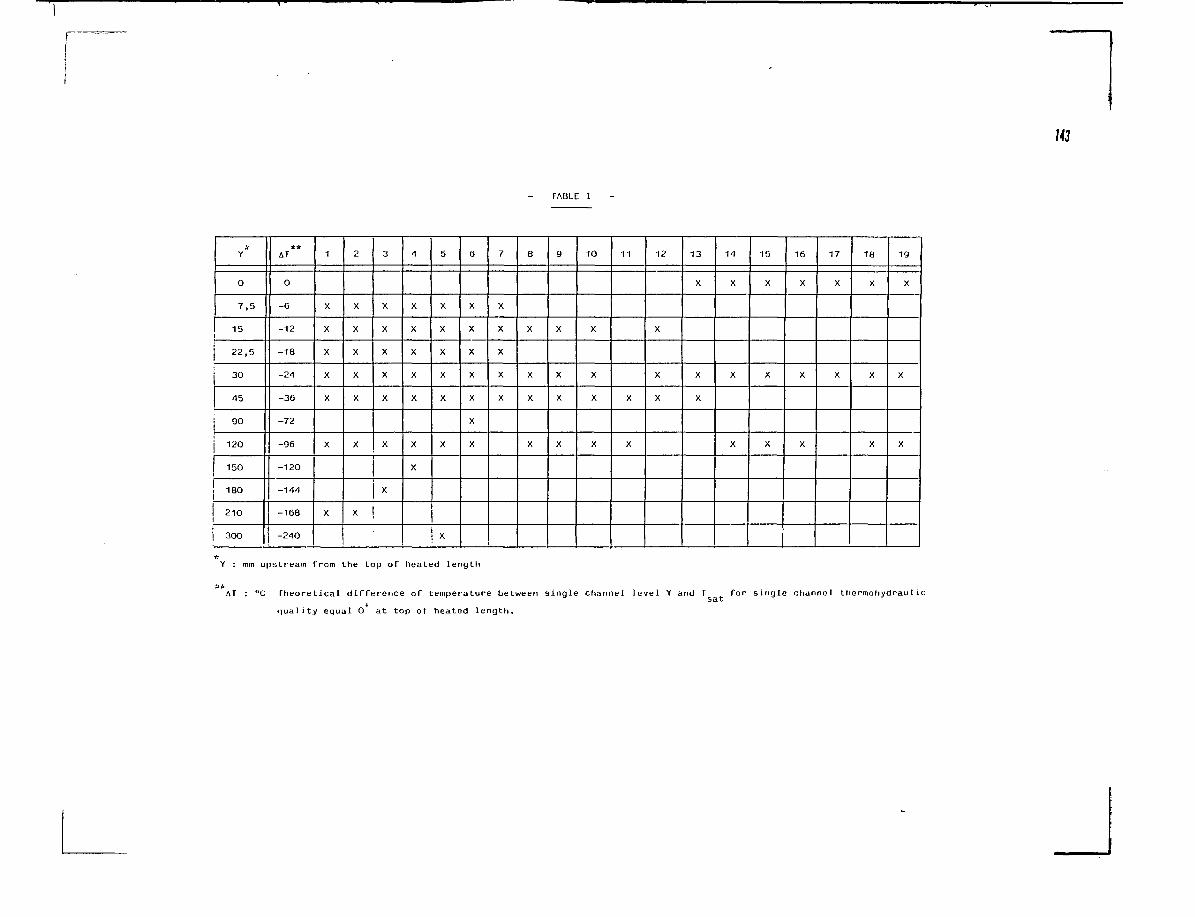
TABLE I
-AY
0
7,5
15
22,5
30
45
90
120
150i
180
210
300
**AT
0
-G
-12
-18
-24
-36
-72
-96
-120
-144
-168
-240
1
X
X
X
X
X
X
X
2
X
X
X
X
X
X
X
3
X
X
X
X
X
X
X
4
X
X
X
X
X
X
X
5
X
X
X
X
X
X
X
6
X
X
X
X
X
X
X
7
X
X
X
X
X
8
X
X
X
X
9
X
X
X
X
10
X
X
X
X
11
X
X
12
X
X
X
13
X
X
X
14
X
X
X
15
X
X
X
16
X
X
X
17
X
X
18
X
X
X
19
X
X
X
I43
Y : mm upstream from the top of heated length
AT : °C Theoretical difference of temperature between single channel level Y and T for single channel thermohydraulic
*iuality equal 0 at top of heated length.
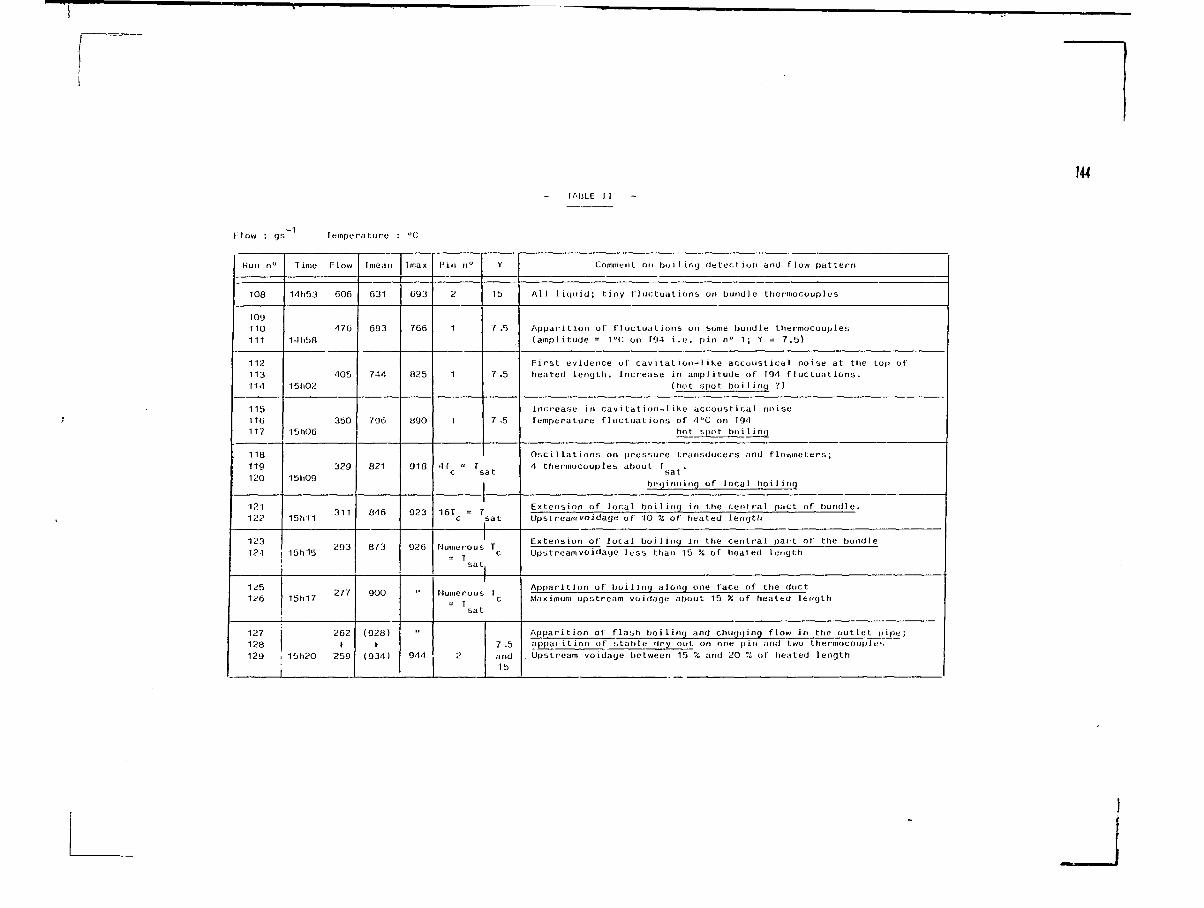
lAljLE I I
144
I 1ow : gs- 1
Temperature : "C
Hun n°
108
1091 10111
112113114
11b116117
118119120
121122
123124
126
127128129 ,
I
Time Flow
14h53 606
47614h'.)8
40515hO2
3501bhO6
32915hO9
15M1
15hi5 2J3
1bh17
2621
10h20 259
fmean
631
693
7-44
706
821
846
873
90O
(928)\
(934)
Tmax
693
766
825
890
918
923
926
••
944
FJin n°
2
1
1
1
4[ = Tc s
161" = rc
Numerous
= Tsat
Numerous
= Tsat
Y
1b
/ .5
7 .5
7 -b
at
sat
c
Tc
7.5andIS
Comment on boil ing detection and flow pattern
All liquid; tiny fluctuations on bundle thermocouples
Apparition of fluctuations on some bundle thermocouples(amplitude = 1"(; on F04 i.e. pin nD 1 ; Y = 7.b)
First evidence of cavitation-1ike accoustical noise at the top ofheated length. Increase in amplitude of 194 fluctuations,
(hot spot boiling '!)
Increase in cavitation-1ike accoustical noiselemperature fluctuations of 4"C on T94
hot spot boiling
Oscillations on pressure transducers and flowmeters;4 thermocouples about 1
satbeginning of local boiling
Extension of local boiling in the central pact of bundle.Upstreamvoidage of 10 X of heated length
Extension of local boiling in the central part of the bundleUpstreamvoidage less than 15 % of heated length
Apparition of boiling along one face of the ductMaximum upstream voidage about 1b % of heated length
Apparition of flash boiling and chugging flow in the outlet pipe;apparition of stable dry out on one pin and two tfiermocoupl e*iUpstream voidage between 1b % and 20 % of heated length
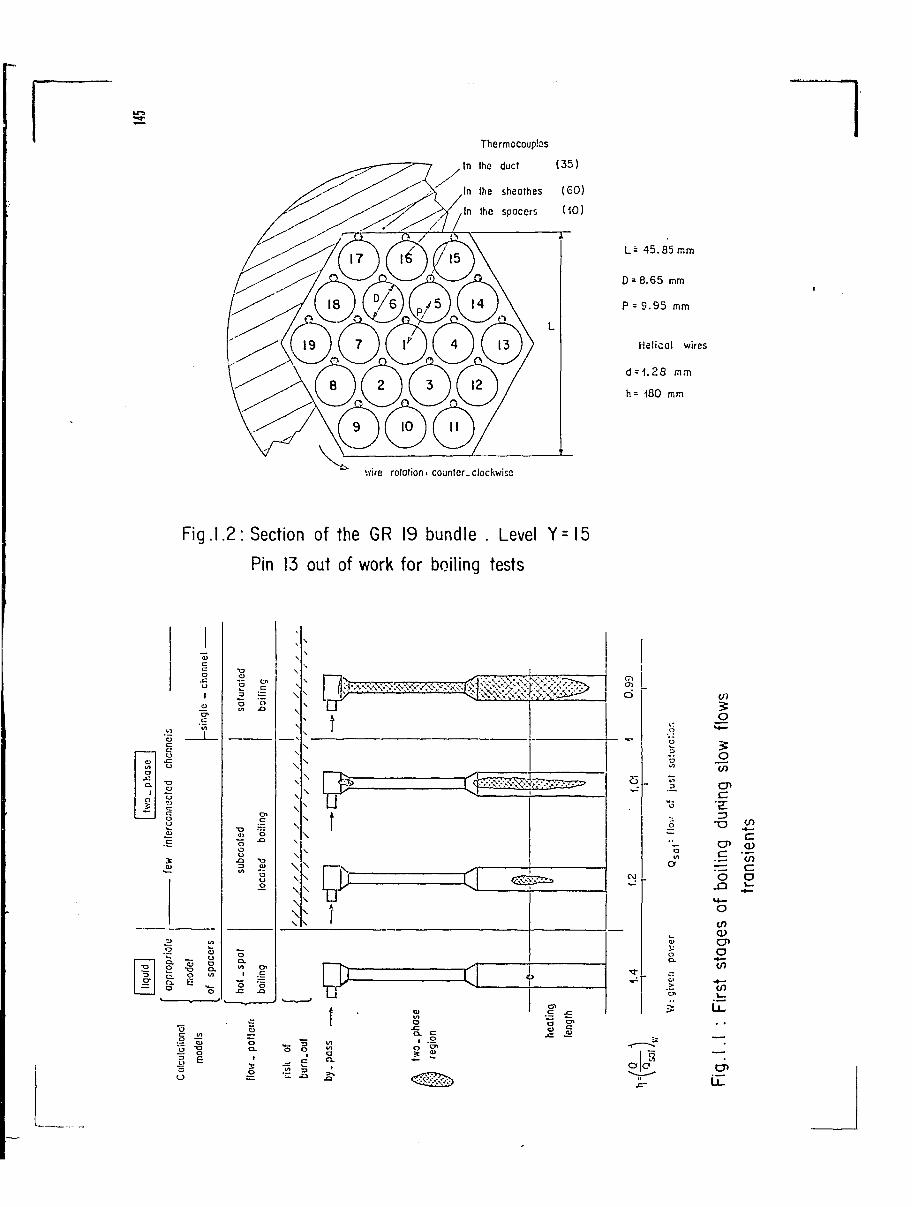
F i g . 1 . 2 : Section of the GR 19 bundle . Level Y = I 5
Pin 13 out of work for boiling tests
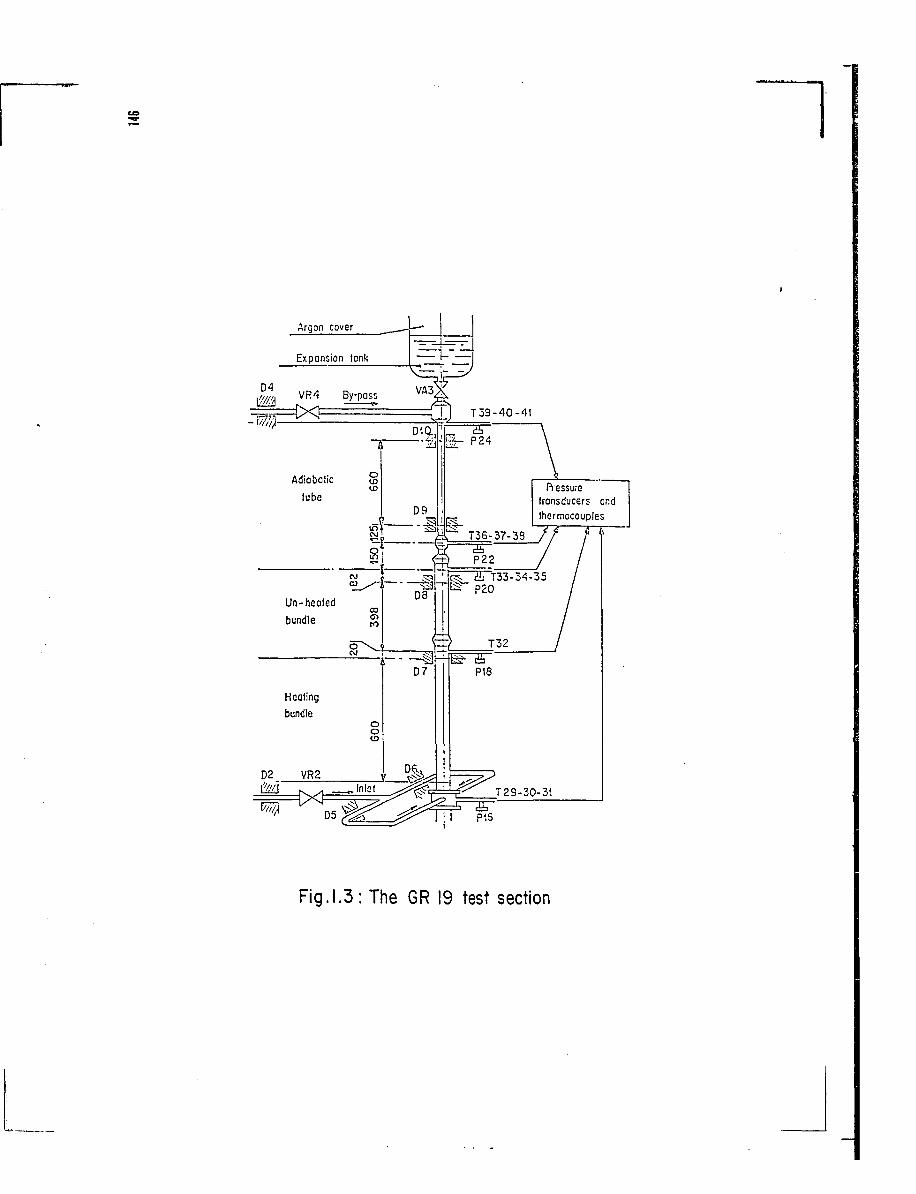
Fig.1.3: The GR 19 test section
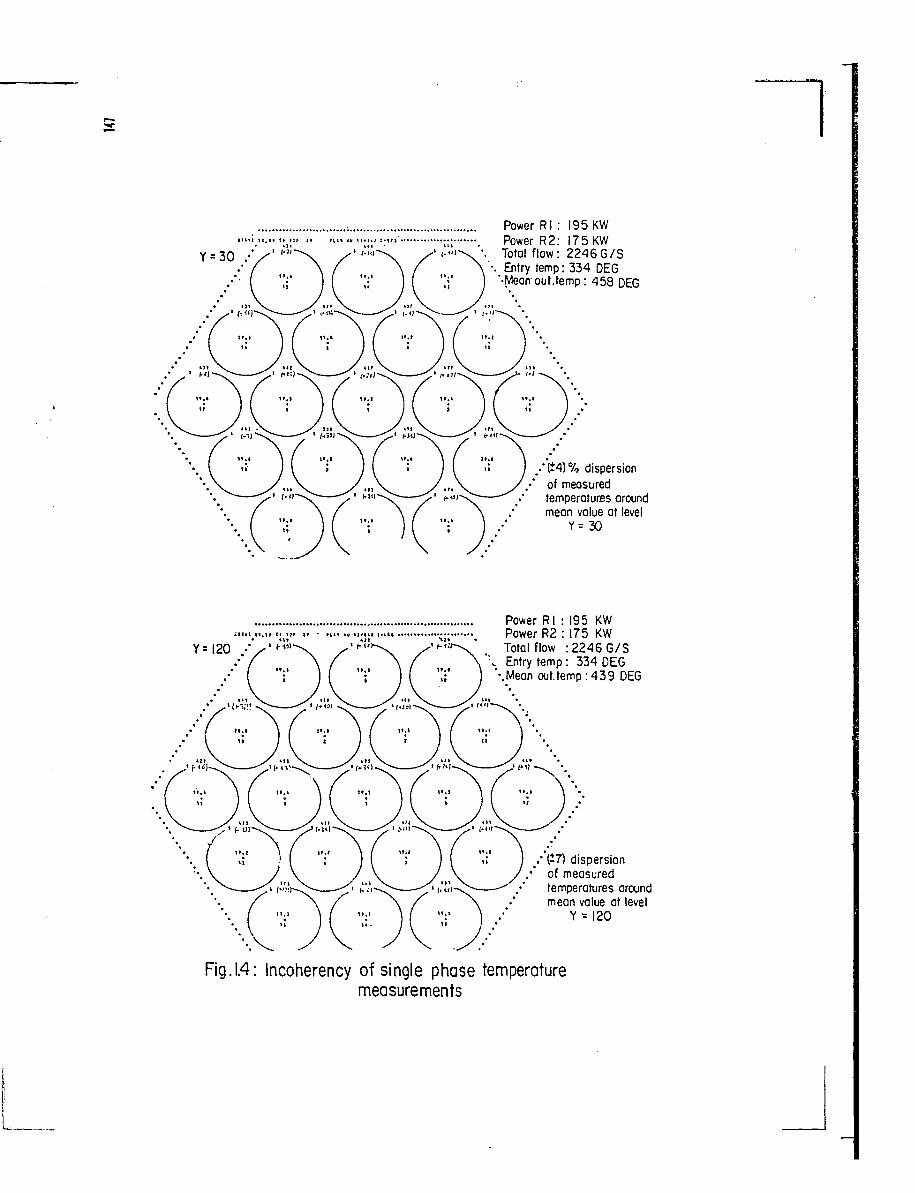
Power Rl : 195 KWPower R2: 175 KWTotal flow: 2246G/SEntry temp: 334 DEG
'•Mean out.temp: 458 DEG
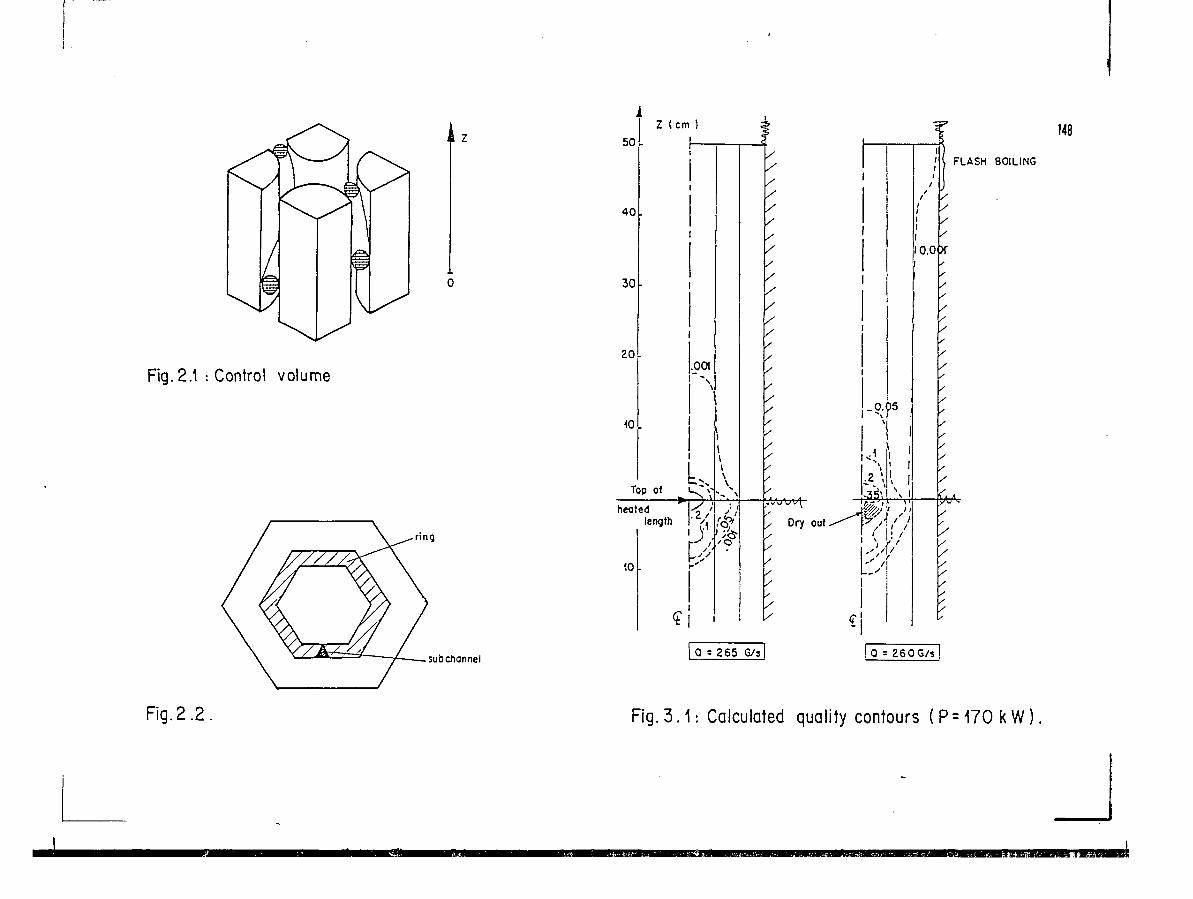
F i g . 3 . 1 : Calculated qual i ty contours ( P = 1 7 0 k W ) .
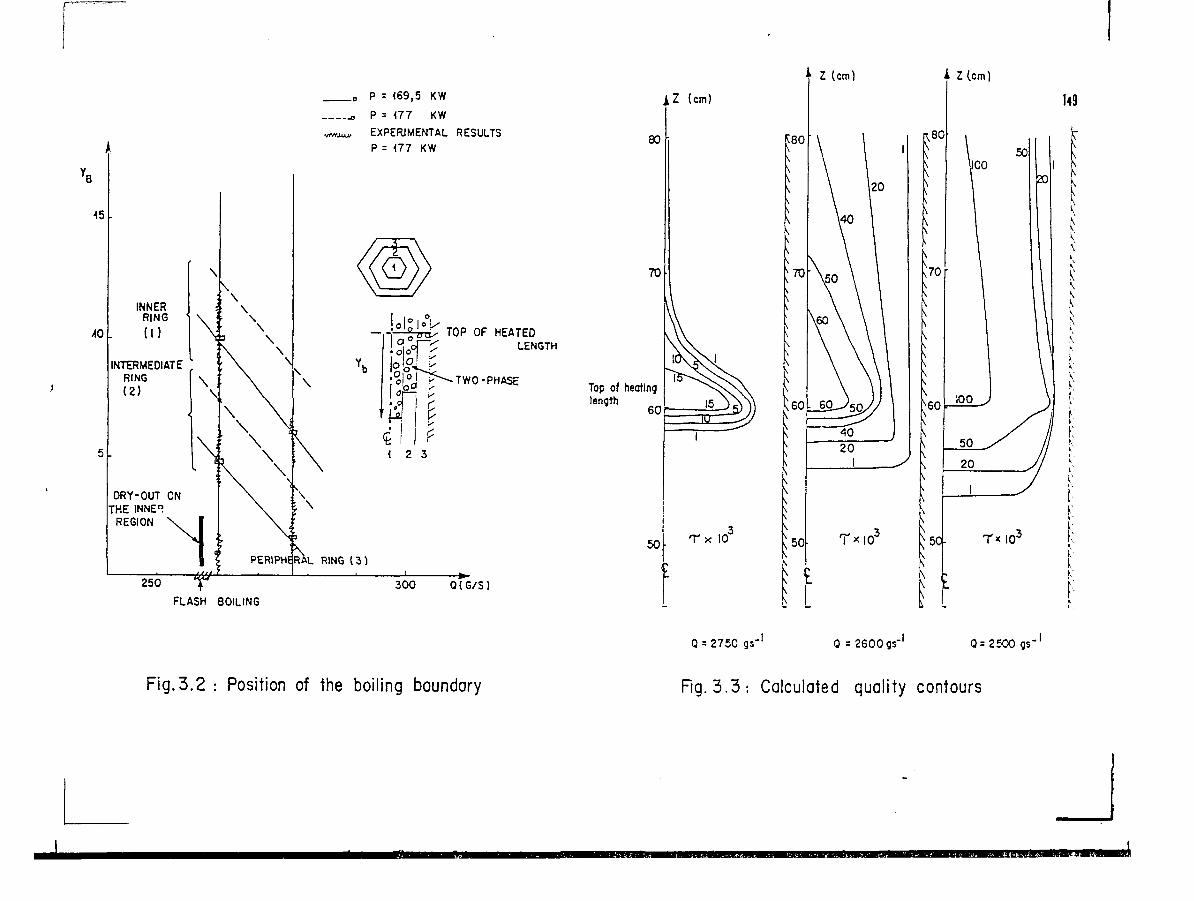
Fig.3.2 : Position of the boiling boundary Fig. 3 .3 : Calculated quality contours
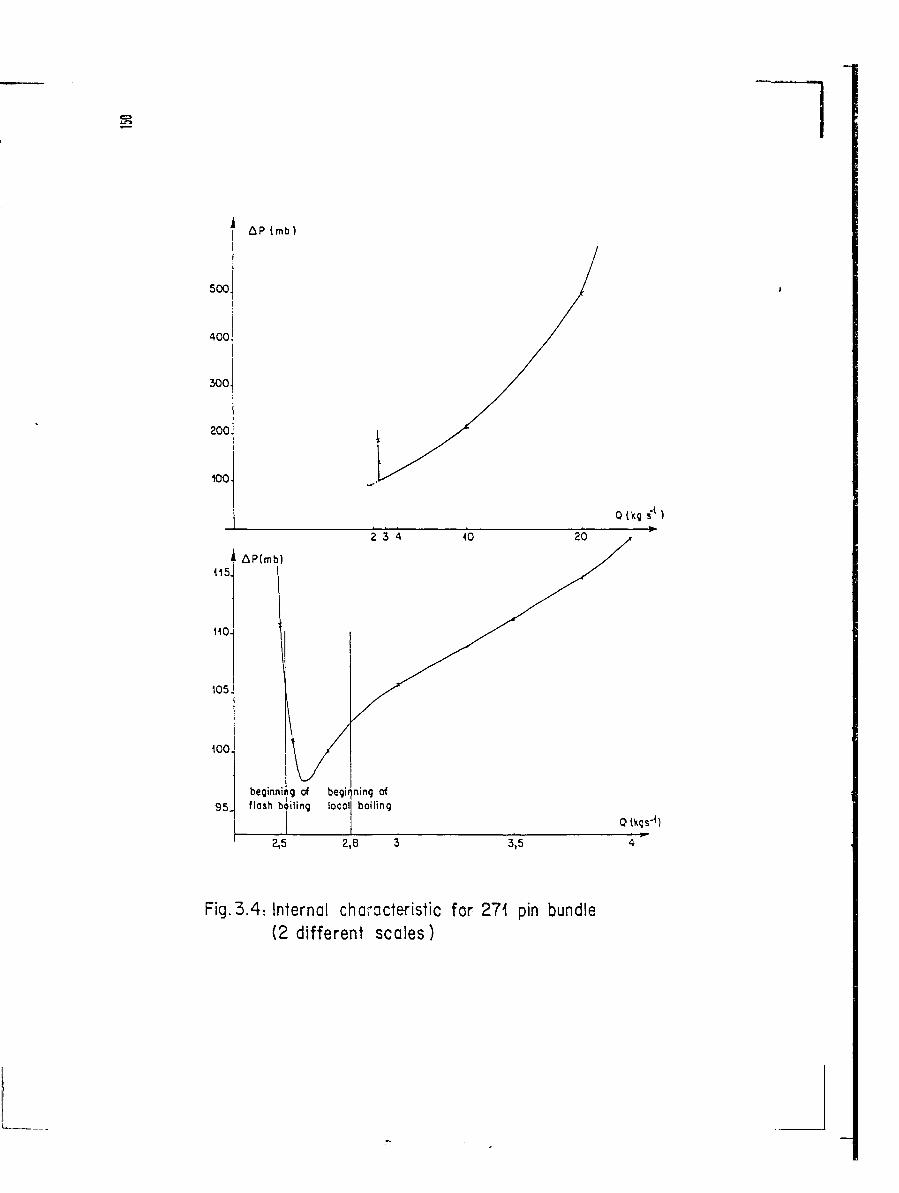
Fig.3.4: Internal characteristic for 271 pin bundle(2 different scales)
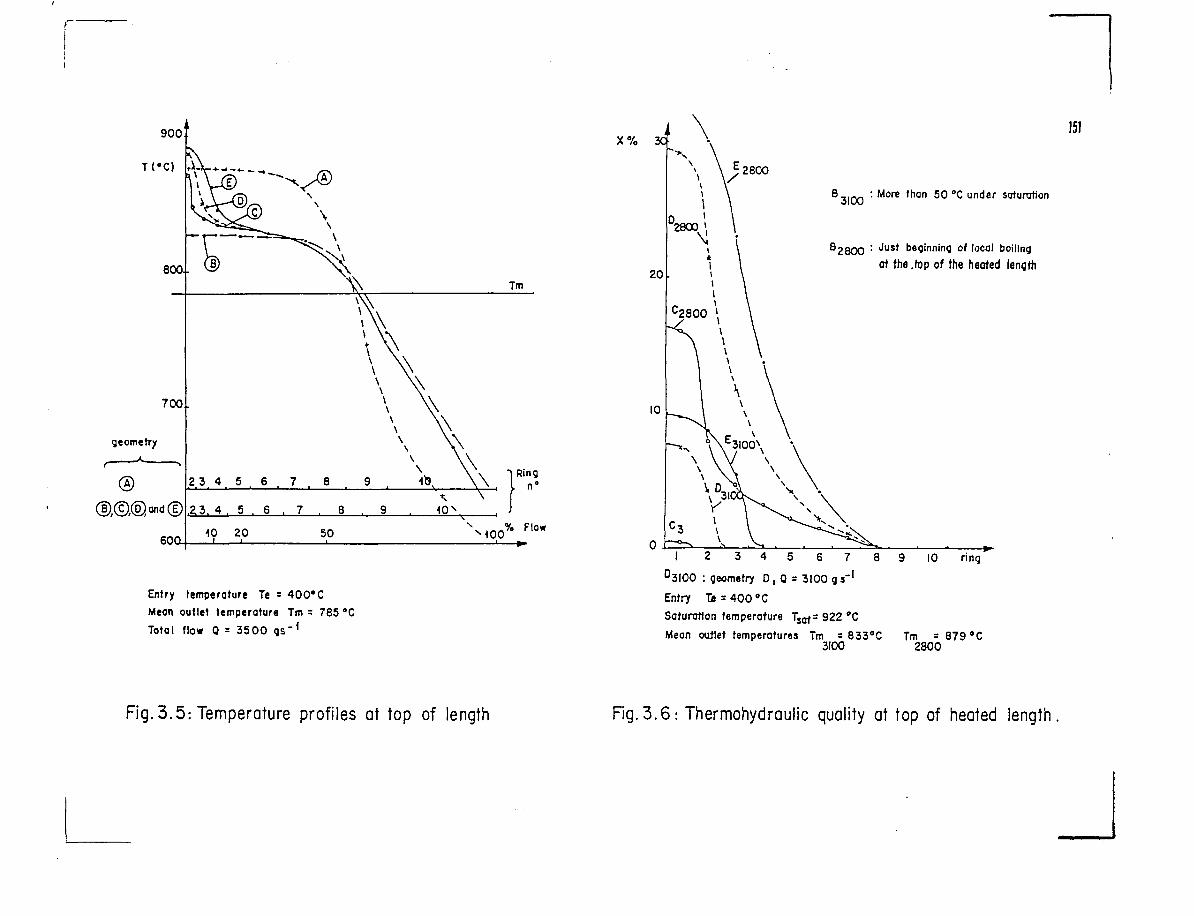
900
TCO
800
700
geometry
600.
Tm
2 3 4 5 6 7 8
2 3. 4 . 5 , 6 , 7 . 8 . 9
40 20 50
Entry temperoture Te = 4 0 0 * C
Mean outlet temperature Tm = 785 °C
Total flow Q = 3 5 0 0 q s ' 1
Ring
X % 3C
B : More than 50 °C under saturation
beginning of local boiling
of the .top of the heoted length
151
I 2 3 4 5 6 7 8 9 10 ring'
°3IOO : geometry D, Q = 3100 g s"1
Entry T J B = 4 0 0 ° C
Saturafion temperature TSQf = 922 PC
Mean outlet temperatures Tm = 833°C Tm = 879 °C3100 2800
Fig. 3.5: Temperature profiles at top of length Fig. 3.6: Thermohydraulic quality at top of heated length
ANALYSIS OF THE FLOW ANDTEMPERATURE FIELDS IN LOCALLY BLOCKEDLMFBR FUEL SUBASSEMBLIES
K. MIYAGUCHIO-arai Engineering Center, PNC,Narita, Oarai-Machi, Ibaraki-ken,Japan
Abstract
A three-dimensional analytical code, UZU is presented for calculatingflow and temperature fields in locally blocked LMFBR subassemblies.The special features of this code are as follows : (i) The height of theblockage is changeable so that either of a planar blockage or a columnarone can be considered, (ii) A grid spacer directly placed on the blockagecan be treated, and besides, the leakage cross-flows through the slits ofgrid plates can be taken into account, (iii) Either of a solid blockage ora porous one can be treated, (iv) The thermal expansion effect of fluid isconsidered in the equation of continuity as well as in the momentun equations.Hence, the acceleration of the bulk flow velocity due to the fluid temperaturerise can be calculated.
The effects of some important calculation parameters are investigated,and then the numerical results are compared with the measured velocity andpressure distributions in the water model experiment and with the temperaturedistributions in the sodium flow experiment. Finally, future works needed forlocal blockage analysis will be discussed.
1 . Introduction
Local flow blockages in LMFBR subassemblies have been investigatedin the category of safty analysis, but it should be noted t i l l they arethe most serious cases of non-nominal operating conditions. In severalcountries many experimental and analytical studies have been conducted toinvestigate local blockage problems, and even three dimensional computorcodes have been developed. SABRE1' and ASFRE2' employ a subchannelanalysis method, while COMIX-13' uses a quasi-continum approach.The numerical results by these codes are qualitatively correct, but it doesnot seem that they are sufficiently proved through the comparisons with experi-mental data for various cases. In the O-arai Engineering Center of PNC,Japan a series of hydraulic simulation experiments4' and in-sodium simulationexperimentsS), 6) have been performed, and in parallel with those experimentsa three dimensional computor code, UZU has been developed. A subchannelanalysis approach is employed in the UZU code, too.
Since the results of the hydraulic experiment4'indicate that there existsa stable recirculating flow behind the blockage, the time-averagedequations for momentum, mass and energy balancess are solved in the UZUcode. The turbulent stresses in the momentum euqations are expressedusing lateral and axial eddy diffusivities of momentum. The temperature-dependence of coolant physical properties is entirely considered in thesystem equations. The finite-difference schemes corresponding tothe system equations are solved by the SOR method.
The purpose of this paper is to compare the numerical results by theUZU code with the experimental flow and temperature fields, and moreover,to show the effects of some important parameters, such as eddy diffusivities,Reynolds number, thermal expansion of fluid and so on. Finally, futureworks needed for local blockage analysis will be discussed.
152
2. Mathematical Model
The code calculates the flow and temperature field in a locally blockedpin bundle surrounded by a hexagonal wrapper tube as shown in Fig. 2.1 .The following are basic assumptions used in the mathematical formulation ofthe UZU code :
i) The flow is imcompressible and quasi-steady.ii) Fuel pins are arranged on a regular triangular lattice.iii) The blockage is prism-shaped, and its height can be changed.
The cross-section is hexagonal for a central blockage and trapezoidalfor a edge blockage. It is either permeable or impermeable.
iv) Grid spacers are used for fuel pin spacing.v) Both velocity and temperature distributions are fully developed at
the bundle outlet.
The solution method is below summarized in brief.
i) A subchannel analysis method is employed,ii) Upwind-differencing is used for all the system equations,iii) The finite difference equations are solved by the successive over
relaxation (SOR) method.
All physical properties of the coolant are treated as functions of localtemperature, because the temperature gradient around the blockage isvery large. The lateral eddy diffusivity of momentum, efj,, is expressedby the following relationship:
ec = C . W..
where Cj.- is the controidal distance between adjacent subchannels i and j ,Wj-j the average axial velocity in those two subchannels and ß the turbulentinter-subchannel mixing coefficient given as the function of a local Reynoldsnumber by Rowe and Angle8' , 9 ' . The drag coefficient for cross-flow,f is derived from the correlation by Fishenden and Saunclers10' as :
= f„
where Rc is a local Reynolds number based on the cross-flow velocity andthe pin,diameter, and £p the distance between adjacent pin centers.f , f and 0 are constants determined by the experimental data in pin
! C
Boundary conditions employed are as follows :
i) At the bundle inlet the pressure distribution is uniform and cross-flowcomponents do not exist.
ii) At the bundle outlet both velocity and temperature distributions arefully developed.
iii) On the planes of symmetry the normal gradients of pressure, tempe-rature and axial velocity are equal to zero.
iv) On the blockage surfaces the shear stresses are replaced by frictionforces. The normal components of velocity all vanish there for animpermeable blockage, however in the case of a porous blockagethe axial velocity components on the lower and upper surfaces areidentified with the leak flow velocities through the blockage.
v) Grid spacers suppress both lateral convection and cross-flow mixingbetween adjacent subchannels, and besides, increase the axial dragforce.
The special features of the UZU code are :
i) Peripheral subchannels are treated separately from inner ones.ii) The height of the blockage is changeable so that either of a planar
blockage or a colummar one can be treated, and in the colummar casethe temperature distribution within the blockage can be calculated.
iii) A gid spacer directly placed on the blockage can be considered.iv) The leakage cross-flow through the slits of grid plates can be taken
into account.v) Either of a solid blockage or a porous one can be dealt with.vi) The thermal expansion effect of fluid is considered in the equation of
continuity as well as in the momentum equations. Hence, the accele-ration of the bulk flow velocity due to the fluid temperature r ise canbe calculated.
3. Numerical Results
In this section not only temperature distributions but also velocityfields are presented. In the following the effects of some importantcalculation parameters are investigated, then the calculated results arecompared with the experimental data *), 6) .
A calculated flow pattern and temperature distribution in a locallyblocked pin bundle are pictured in Fig. 3.1 and 3.2 , respectively.Figure 3.1 indicates that behind the blockage there exists a recirculatingflow of which center is located near the edge downstream of the blockage.Figure 3.2 shows a perspective view of the temperature rise behind theblockage. The peak temperature point is also near the edge immediatelydownstream of the blockage.
3.1 Effects of Calculation Parameters 1533 . 1 . 1 Effects of Reynolds number and Eddy diffusivities on the Wake
Flow Pattern
Two geometrically similar systems in an isothermal condition givothe same dirnensionless velocity distribution if only the Reynolds numbersand the eddy diffusivities of momentum aro identical in the two systems.It is therefore im urtant to investigate how these parameters influencethe flow pattern behind a blockage. Figure 3.3 shows how the Reynoldsnumber affects dimensionless velocity profiles downstream of a centralblockage. In this figure the diagonal profiles of the axial velocitycomponent are plotted at five different levels for two Reynolds numbers.( For convenience diagonal profiles are always used in the following,
too. ) In this case the normalized eddy diffusivities of momentum areequal to unity both in axial direction and in lateral one, that is, equal tothose in an unbaffled pin bundle. For the case of Re = 7.6 x 10^ thereverse flow velocity behind the blockage is larger and the distortedvelocity profile is preserved farther downstream than for the case ofRe = 4.0 x 10 . This means that the axial length of a recirculation zoneincreases as Reynolds number increases. But the calculations in thewider range of Reynolds numbers suggest that it tends to be saturated athigher Reynolds numbers.
Figure 3.4 shows similar velocity prifiles at Re = 4 x 10 for threedifferent lateral eddy diffusivities of momentum (cress-flow mixingcoefficients). It is seen from the figure that the cross-flow mixing hasa strong influence on the wake flow pattern and that the largest mixingcoefficient ( E c =. 10 ) makes the velocity profile flat more rapidly thanthe other cases. The velocity distribution for E c =0.1 is not so muchdifferent from that for E c = 1 . It can be said from these facts that thelarger cross-flow mixing coefficient results in the shorter length ofa recirculation zone and that the increase of cross-flow mixing coefficienthas qualitatively the same effect on the wake flow pattern as the decreaseof Reynolds number.
Figure 3.5 shows how the wake flow pattern depends on the axialeddy diffusivity of momentum. One can see the trend that the reverse flowvelocity near the blockage is smaller for Ea = 1 0 than for E a = 1,however, downstream after Z/Xg = 1.25, the velocity profiles are littlfeinfluenced by the axial eddy diffusivity.
3.1.2 Effects of Thermal Expansion of Sodium on the Wake Flow andTemperature Fields
The lateral temperature distribution in the sodium flow will havenatural convection superimposed on the forced flow, and the bulk temperaturerise causes the acceleration of the bulk flow. These phenomena result fromthe thermal expansion of sodium, and have an influence on the temperaturedistribution behind the blockage.A following Richardson number, Rj is defined to specify the ratio ofthe buoyancy to the inertia force :
R i =B ß ( T m a x - T m ) L
where V is the bulk velocity, Tm a x the maximum temperature in the wake,Tm the mean temperature over the level where the maximum temperature isfound, L the heated length above the blockage, ß the thermal expansioncoefficient of sodium and g the gravity constant. For the present calculationsRj is equal to 1 .27 x 1 0 .
Figure 3.6 shows the effects of the sodium thermal expansion on thewake flow pattern. In this figure the normalized axial velocity profiles indiagonal direction are plotted for five different levels. Solid linescorrespond to the case in which sodium thermal expansion is considered, anddashed lines to the isothermal case, respectively. When the thermal expan-sion of sodium is considered, the axial flow for less than Z = 192 mm isaccelerated in the central region of the higher temperature, and is deceleratedin the peripheral region of the lower temperature because of the buoyancyeffect of sodium. The flow for Z = 284 mm, however, is accelerated notonly in the central region but also in the peripheral one. It indicates thatthe bulk flow acceleration is caused by the bulk sodium temperature rise.This effect was found by considering the thermal expansion of sodium inthe continuity equation as well as in the momentum equation.
The effects of the sodium thermal expansion on the temperature profileis shown in Fig. 3.7 in which the temperature rises from the inlet temperatureare plotted against subchannel numbers in diagonal direction. Solid linesand dashed ones stand for the cases with and without the thermal expansioneffect of sodium, respectively. In the former case the velocity distributionwas calculated considering sodium thermal expansion, in the latter case,however, the velocity calculation was executed in the isothermal condition.In the temperature calculations all physical properties of sodium were thefunctions of local temperature for either case. Hence, the differencesbetween the two cases resulted only from the difference in the velocitydistribution. Immediately downstream of the blockage ( Z = 7.5 mm ) thebuoyancy reduces the recirculatingflow, therefore the peak temperaturebecomes higher when the ther;nal expansion is considered. But upstream{ Z = -18 mm ) or farther downstream ( Z = 64.2 mm ) the temperature becomeslower because of the bulk acceleration of the flow when the thermal expansionis considered. It can be said from these results that if the thermal expansionof sodium is neglected, the peak temperature is understimated and the bundleoutlet temperature is overestimated.
3.1.3 Effects of the Grid Spacer directly placed on the Blockage onthe Flow Pattern and the Temperature Profile
In a grid-spaced subassembly flow blockages seem to occur most probablyimmediately upstream of a grid spacer. It is therefore necessary to investi-gate how the grid spacer influences the flow and temperature fields behindthe blockage. Figure 3.8 (a), (b) and (c) show how the flow pattern is alteredby the grid spacer directly placed on the blockage. Figure 3.8 (a) correspondsto the case of no spacer. Figure 3.8 (b) represents the flow pattern includingthe effect of a grid spacer where no cross-flow between subchannels ispermitted (no slit model), while Figure 3.8 (c) shows the effect of a gridspacer where the cross flow exists through the slits of the grid plates.( an overstimated slit model as shown in Fig. 3.14 (b) ) It is seen from thecomparison between Fig. 3.8 (a) and 3.8 (b) that a grid spacer with no slitmakes the recirculating flow region move downstream, and diminishes thesize of the region. However, Figure 3.8 (c) indicates that a grid spacerwith slits does not have those effects so much.
Normalized temperature distributions in diagonal direction are shownin Fig. 3.9 in which solid lines are for the case of no grid spacer anddashed lines are for the case with a grid spacer directly placed on theblockage. In these calculations only central 19 pins wore heated forthe convenience of the later comparison with the experimental data6' .Inspection of this figure indicates that immediately downstream of theblockage ( Z/X„= 0.27 ) the peak temperature position moves to No.2subchannel from No.3 subchannel at the edge of the blockage when thegrid spacer is inserted. The temperature distribution at Z/Xß = 0.64is higher for the case with the grid spacer than for the case with no gridspacer. This means that the high temperature region behind the blockageis shifted downstream by the grid spacer. This phenomenon correspondsto the fact that the recirculating flow region is moved downstream.The axial temperature distributions for the same calculation are shown inFig. 3.10 which indicates clearly that the temperature distribution at No.1subchannel is somewhat downstream shifted by the grid spacer and tliatthe peak temperature within the grid spacer is considerably higher thanfor no grid spacer. In outer subchannels the temperature distributionsare almost the same for the two cases.
154
3.2 Comparisons with Experimental Results
3.2.1 Comparison of Velocity Distributions
Calculated and measured velocity profiles in diagonal direction arecompared in Fig. 3.11 where the normalized axial velocity components areplotted at six different levels. The eddy diffusivities employed in thiscalculation are those values known for unbaffled pin bundles, that is, bothEa and Ec are equal to unity. It should be noted that experimental velocitieswere measured with five holes Pitot tubes at the center of each subchannel,while numerical values represent subchannel-average velocities.The numerical results agree well witli the experimental data except inthe peripheral subchannel No. 8 where experimental velocities are largerthan calculated ones. It is now being investigated what caused the dis-crepancy in the peripheral subchannel.
•0
3.2.2 Comparison of Pressure Distributions
A comparison between calculated and measured pressure distributionsis shown in Fig. 3.12 where the dimensionless pressure drops behind theblockage are plotted against the normalized axial distance downstream fromthe blockage. The dimensionless pressure drop Cp was obtained by sub-tracting the friction loss in an unbaffled pin bundle from the total pressuredrop and thereafter dividing by the dynamic pressure based on the bulkvelocity. Hence, it includes nothing but the form loss caused by theblockage. It should be noted that the experimental static pressures weremeasured at the positions of the narrowest gap between adjacent pins, whilethe calculated pressures represent those averaged in each subchannel.The agreement between the calculation and the experiment is fairly goodexcept that the calculated pressure recovers somewhat more rapidly thanthe measured one downstream of the minimum point.
3.2.3 Comparison of Temperature Distributions
Also in this case, like in Section 3.1.3, temperature distributions arecalculated for a 37-pin bundle ( only central 19 pins are heated ) with a gridspacer on a 27$ central blockage. Comparisons with experimental data6'are shown in Fig. 3.13.
The grid spacer used in the experiment has slits as shown in Fig. 3.14(a) of which dimensions are 3 mm high and 1.5 mm wide. Consequently,the sodium within the grid spacer was not completely stagnant, but the cross-flows through the slits existed between adjacent subchannels. Therefore,calculations are performed for two extrem cases ; one is for a grid spacerwith no slits and another is for an overestimated slit model as shown in Fig.3.14 (b), that is, the mid 1/3 part of the grid spacer is excluded and sodiumflow is not at all constrained there. Bulk velocity and heat flux are, thesame as the experimental conditions, 3.52 m/s and 54.9 W/cm', respectively.In Fig. 3.13 temperature rises from the inlet temperature are plotted againstaxial distance from the blockage. It should be also noted that numericalresults are subchannel-averaged temperatures, while experimental dataindicate local clad surface temperatures. In this case experimental datawere corrected by -4°C before plotting. In the figure the calculated tempe-rature in No.1 subchannel is compared with the measured values at the positionB and C ( round symbols ), the calculated result in No.2 subchannel with themeasured values at the positions D and E ( square symbols ) and the calculatedresult in No.5 subchannel with the measured values at the position G ( triangularsymbols ), respectively. Solid lines represent the calculation for the over-estimated slit model and dashed lines correspond to no slit model. Within andimmediately downstream of the grid spacer dashed lines indicate very highertemperatures than solid lines in No.1 and No.2 subchannels.Experimental data drop between the solid and dashed lines. This fact suggeststhat the temperature distribution calculated for the proper slit model couldagree well with the experimental data even within the grid spacer. Furtherdownstream and upstream of the blockage there is not so much differencebetween two models. Upstream of the blockage the agreement between thecalculation and the experiment is very good. Behind the grid spacer thecalculated results in No.2 agree well with the experimental data at the positionD ( square sysmbols ). The experimental data at the position G ( triangularsymbols ) are somewhat higher than the calculated result in No.5 subchannel,because No.5 subchannel is surrounded by one heater pin and two dummy pins.As for No.1 subchannel, the calculated temperatures begin to rise at about40 mm downstream of the blockage, while the experimental data at the positionB ( round symbols ) still continue to decline even 80 mm downstream.This is the only one contradiction between the calculation and the experiment.The cause of the contradiction is now under investigation.
4. Conclusions
Survey calculations and comparisons with the experimental data yieldthe following conclusions.
i) The reverse flow velocity behind a blockage becomes larger andconsequently the length of a recirculation zone becomes longer asReynolds number increases and as eddy diffusivities decrease.Among these parameters the lateral eddy diffusivity, that is, the cross-flow mixing has the strongest influence on the wake flow pattern.
ii) If the thermal expansion of sodium is neglected in calculations, lthe peak temperature behind the blockage is underestimated andthe bundle outlet temperature is overestimated. For example, about3$ underestimation of the peak temperature is found in the presentcalculation in which Richardson number is equal to 1 .27 x 10" 2.
iii) A grid spacer directly placed on a blockage makes the recirculating flowregion moves downstream, and consequently the higher temperaturezone behind the blockage shifts also downstream. If the grid spacerhas slits which permit cross-flows between adjacent subchannels,the peak temperature near the blockage edge immediately downstreamof the blockage disappears.
iv) The calculated velocity and pressure distributions using the eddydiffusivities known for unbaffled pin bundles agree well with the measureddata in the hydraulic experiment1*' for a 61-pin bundle with a 38$ centralblockage and with no spacer.
v) In the case of a 37-pin bundle with a 27$ central blockage immediatelyupstream of a grid spacer, the calculated temperature distributionsagree well with the experimental data6' in the sodium flow, exceptwithin the grid spacer. The measured temperatures within the gridspacer drop between the two extreme calculations by no slit model andby an overestimated slit model. Hence, the temperature rise could bepredicted even within the grid spacer if a proper slit model were assumed.
5. Future Works Needed for Local Blockage Analysis
Local flow blockages are difficult to find out with sensing devices, suchas a flow meter or a thermometer installed at the outlet of a subassemblyuntil the blockage ratio is so large that the sodium coolant starts boiling.It should be therefore noted that local flow blockage can be the most seriouscase of non-nominal operating conditions. Several computor codes for thisproblem have been developed, but they are not yet proven. Hence, it seemsto be necessary to compare numerical results by those codes with a lot ofreliable experimental data and if possible, to compare those codes with eachother.
F>Ec
WW
6. Nomenclature
Dimensionless Pressure Drop due to BlockageNormalized Eddy Diffusivity of Momentum in Axial DirectionNormalized Cddy Diffusivity of Momentum '.n Cross-Flow DirectionReynolds Number based on Bulk Velocity anJ Hydraulic EquivalentDiameterLocal Sodium TemperatureBulk Sodium TemperatureInlet Sodium TemperatureLocal Axial VelocityBulk VelocityBlockage Width ( Flat to Flat Distance )Downstream Distance from Blockage
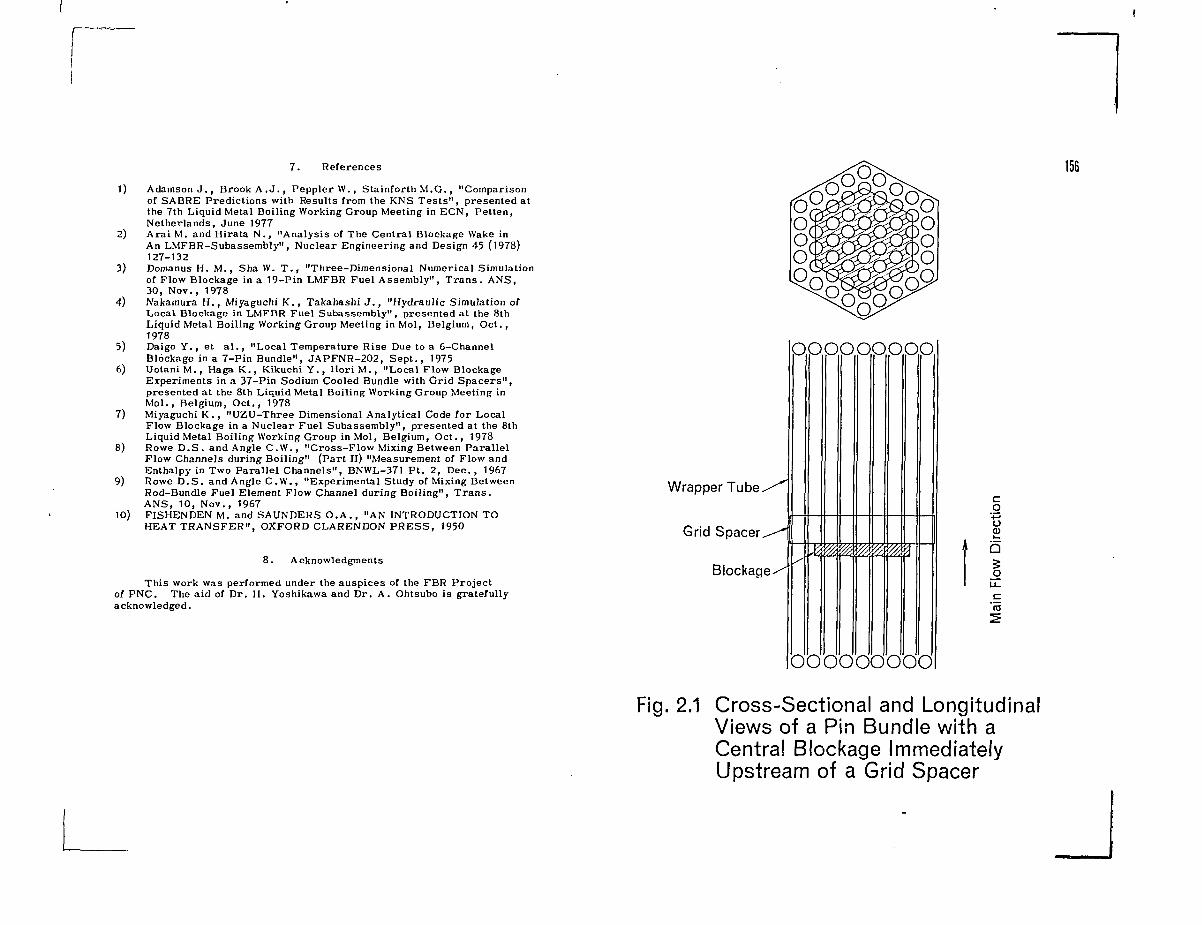
7. References
1) AdamsonJ., Brook A . J . , Peppier W., Stainforth M.G., "Comparisonof SABRE Predictions with Results from the KNS Tests", presented atthe 7th Liquid Metal Boiling Working Group Meeting in ECN, Petten,Netherlands, June 1977
2) Arai M. and Hirata N . , "Analysis of The Central Blockage Wake inAn LMFBR-Subassembly", Nuclear Engineering and Design 45 (1978)127-132
3) Domanus H. M., Sha W. T . , "Three-Dimensional Numerical Simulationof Flow Blockage in a 19-Pin LMFBR Fuel Assembly", Trans. ANS,30, Nov., 1978
4) Nakamura H., Miyaguchi K., Takahashi J . , "Hydraulic Simulation ofLocal Blockage in LMFBR Fuel Subassembly", presented at the 8thLiquid Metal Boiling Working Group Meeting in Mol, Belgium, Oct.,1978
5) Daigo Y. , et a l . , "Local Temperature Rise Due to a 6-ChannelBlockage in a 7-Pin Bundle", JAPFNR-202, Sept. , 1975
6) UotaniM., HagaK. , KikuchiY., HoriM., "Local Flow BlockageExperiments in a 37-Pin Sodium Cooled Bundle with Grid Spacers",presented at the 8th Liquid Metal Boiling Working Group Meeting inMol., Belgium, Oct., 1978
7) Miyaguchi K., "UZU-Three Dimensional Analytical Code for LocalFlow Blockage in a Nuclear Fuel Subassembly", presented at the 8thLiquid Metal Boiling Working Group in Mol, Belgium, Oct., 1978
8) Rowe D .S . and Angle C.W., "Cross-Flow Mixing Between ParallelFlow Channels during Boiling" (Part II) "Measurement of Flow andEnthalpy in Two Parallel Channels", BNWL-371 Pt . 2, D e c , 1967
9) Rowe D . S . and Angle C.W., "Experimental Study of Mixing BetweenRod-Bundle Fuel Element Flow Channel during Boiling", Trans .ANS, 10, Nov., 1967
10) FISHENDEN M. and SAUNDERS O.A . , "AN INTRODUCTION TOHEAT TRANSFER", OXFORD CLARENDON PRESS, 1950
8. Acknowledgments
This work was performed under the auspices of the FBR Projectof PNC. The aid of Dr. H. Yoshikawa and Dr. A. Ohtsubo is gratefullyacknowledged.
156
Wrapper T u b e ^
Grid Spacer^
Blockage-
3
C
D
<(\
0
D
C
D
f%
:
0
c
3
2
O
C
D
A
:
D
:
cg
b5
c'to
Fig. 2.1 Cross-Sectional and LongitudinalViews of a Pin Bundle with aCentra! Blockage ImmediatelyUpstream of a Grid Spacer
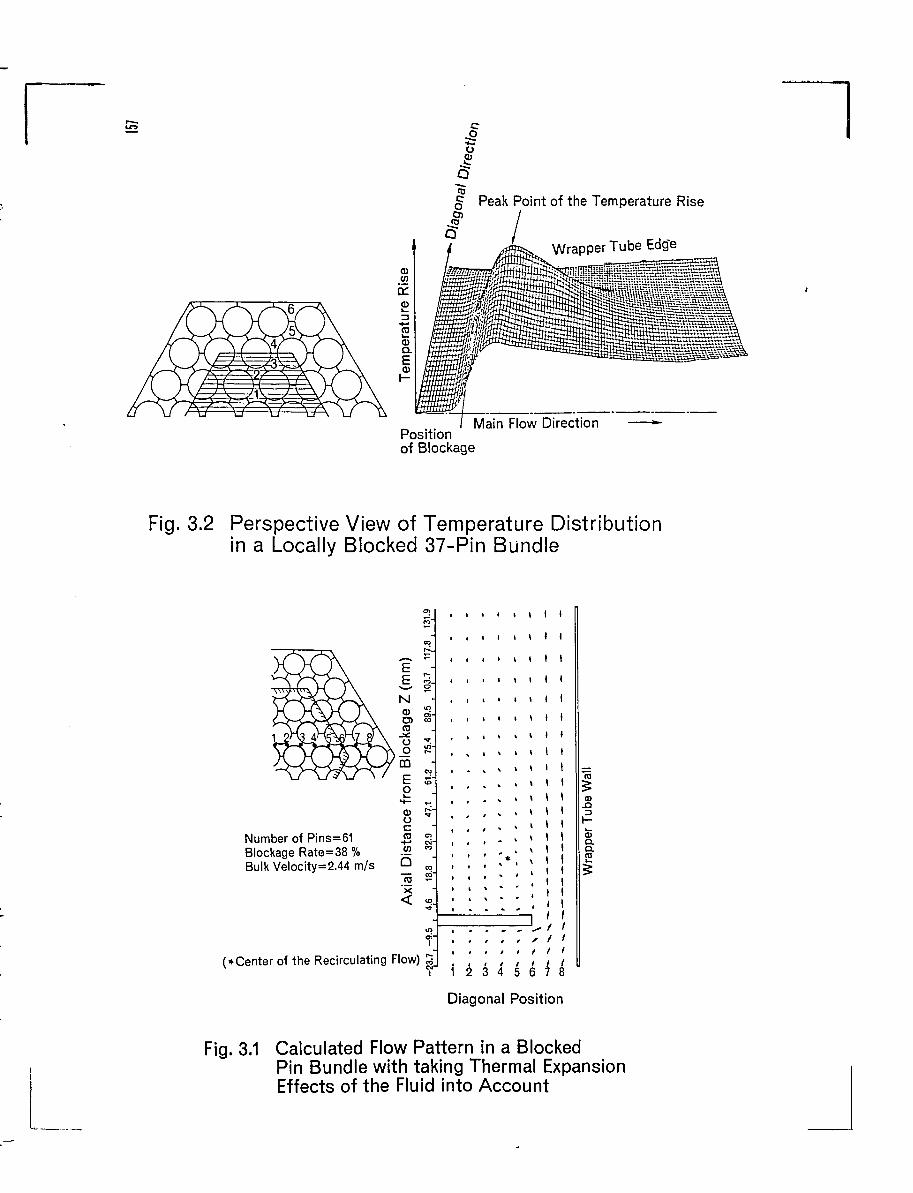
Fig. 3.1 Calculated Flow Pattern in a BlockedPin Bundle with taking Thermal ExpansionEffects of the Fluid into Account
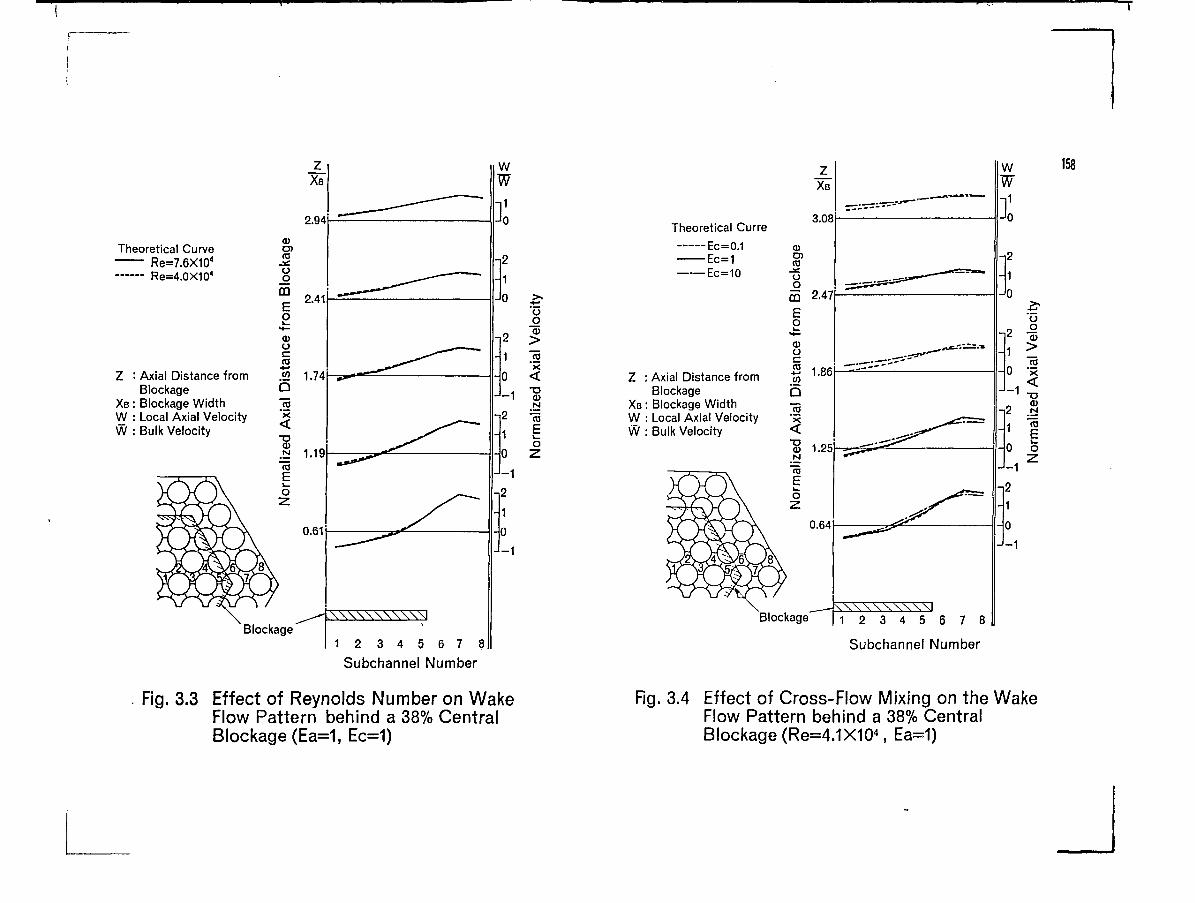
. Fig. 3.3 Effect of Reynolds Number on Wake Fig. 3.4 Effect of Cross-Flow Mixing on the WakeFlow Pattern behind a 38% Central Flow Pattern behind a 38% CentralBlockage (Ea=1, Ec=1) Blockage (Re=4.1X10⁴, Ea=1)
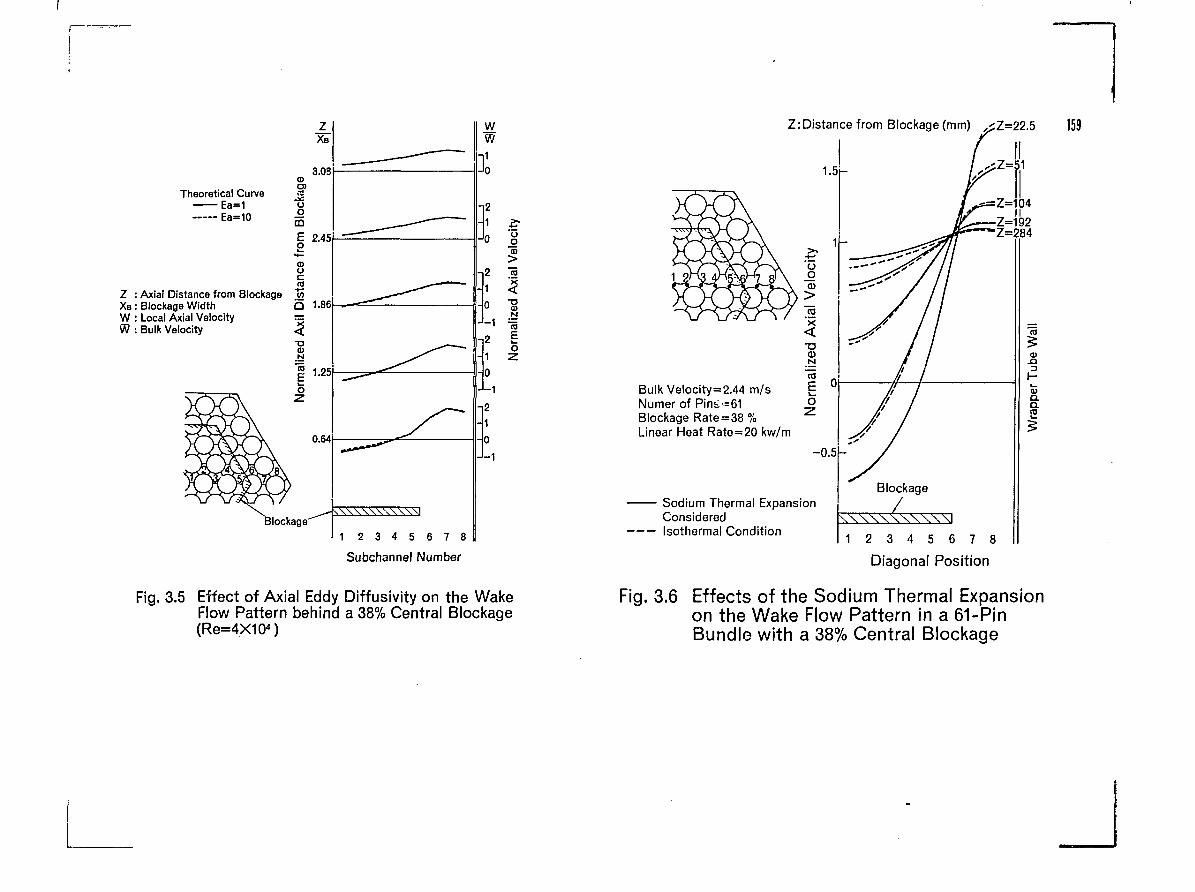
Fig. 3.5 Effect of Axial Eddy Diffusivity on the Wake Fig. 3.6 Effects of the Sodium Thermal ExpansionFlow Pattern behind a 38% Central Blockage on the Wake Flow Pattern in a 61-Pin(Re=4Xio<) Bundle with a 38% Central Blockage
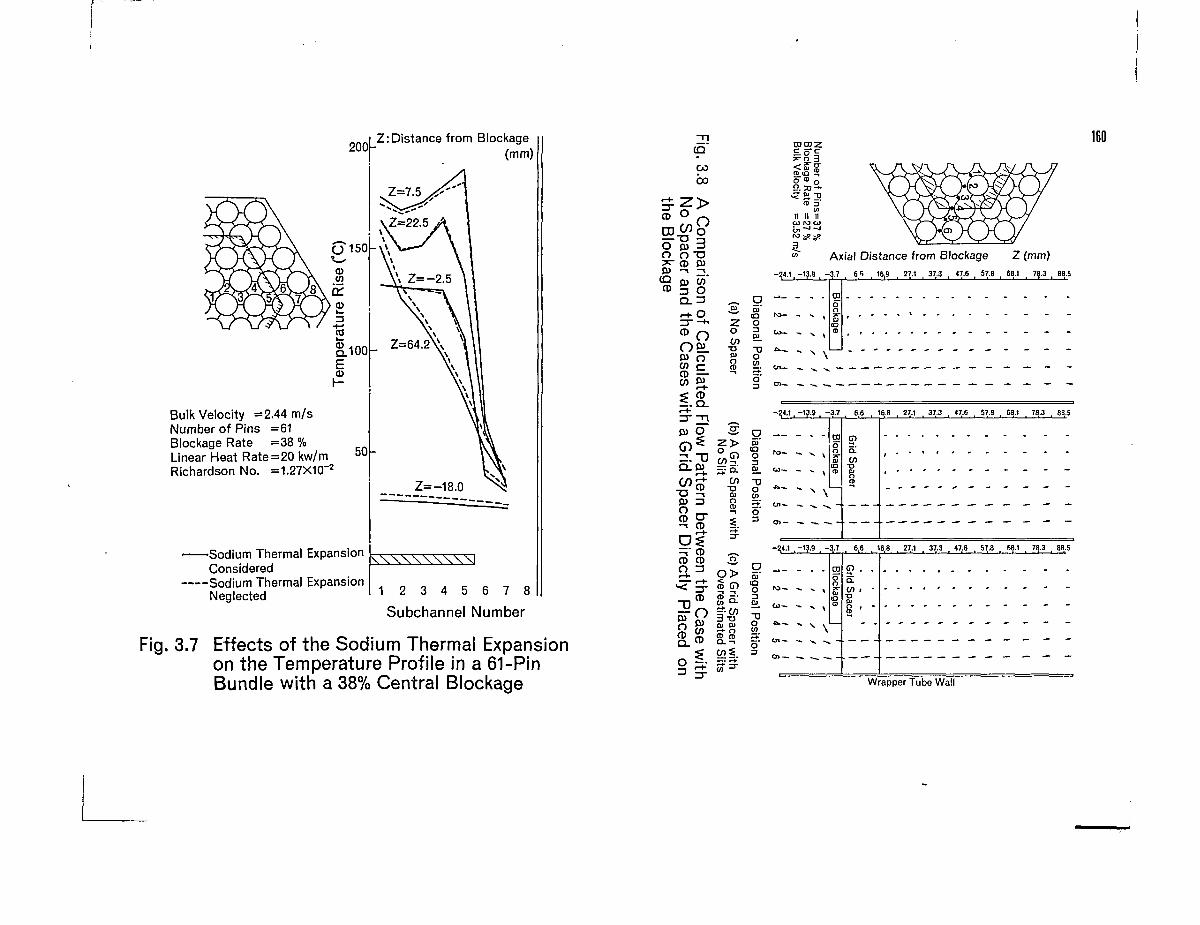
Fig. 3.7 Effects of the Sodium Thermal Expansionon the Temperature Profile in a 61-PinBundle with a 38% Central Blockage
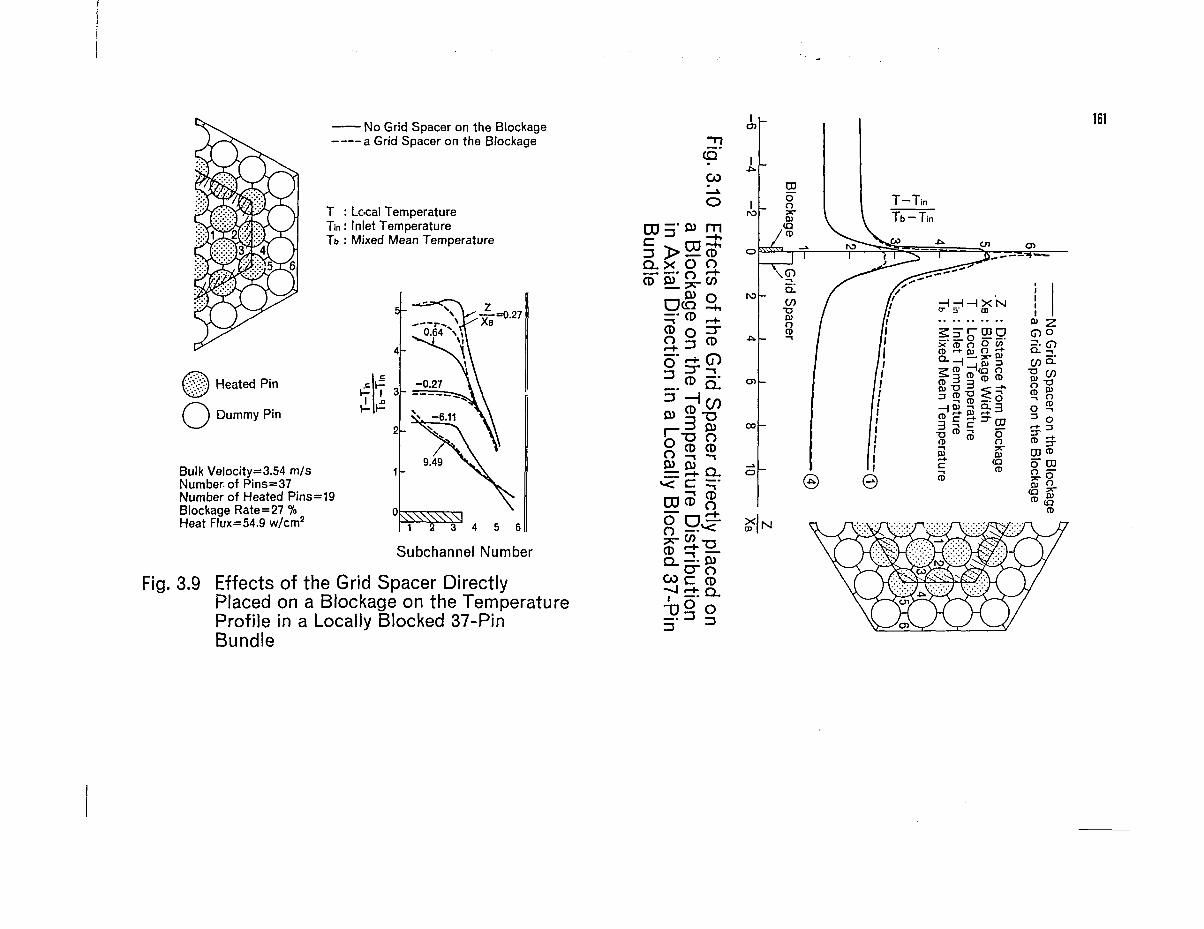
Fig. 3.9 Effects of the Grid Spacer DirectlyPlaced on a Blockage on the TemperatureProfile in a Locally Blocked 37-PinBundle
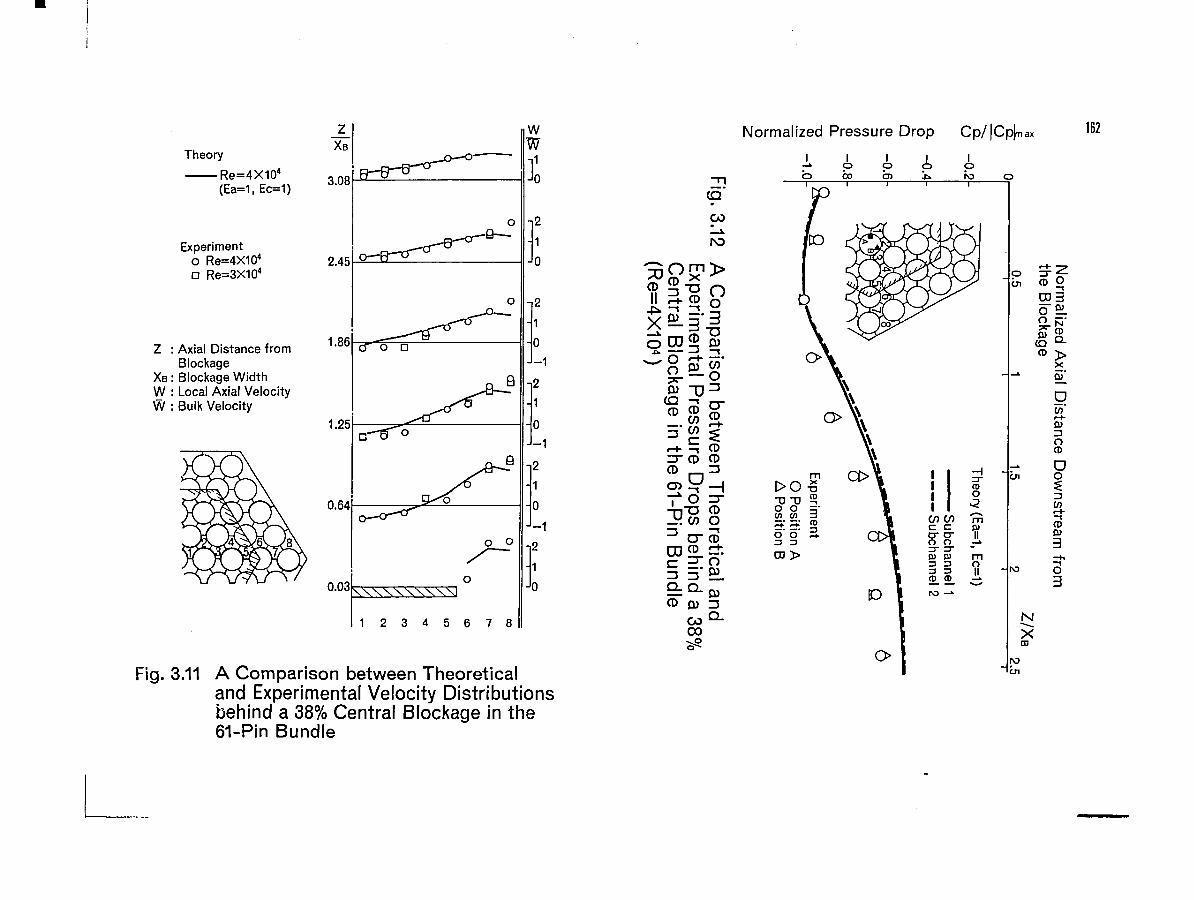
Fig. 3.11 A Comparison between Theoreticaland Experimental Velocity Distributionsbehind a 38% Central Blockage in the61-Pin Bundle
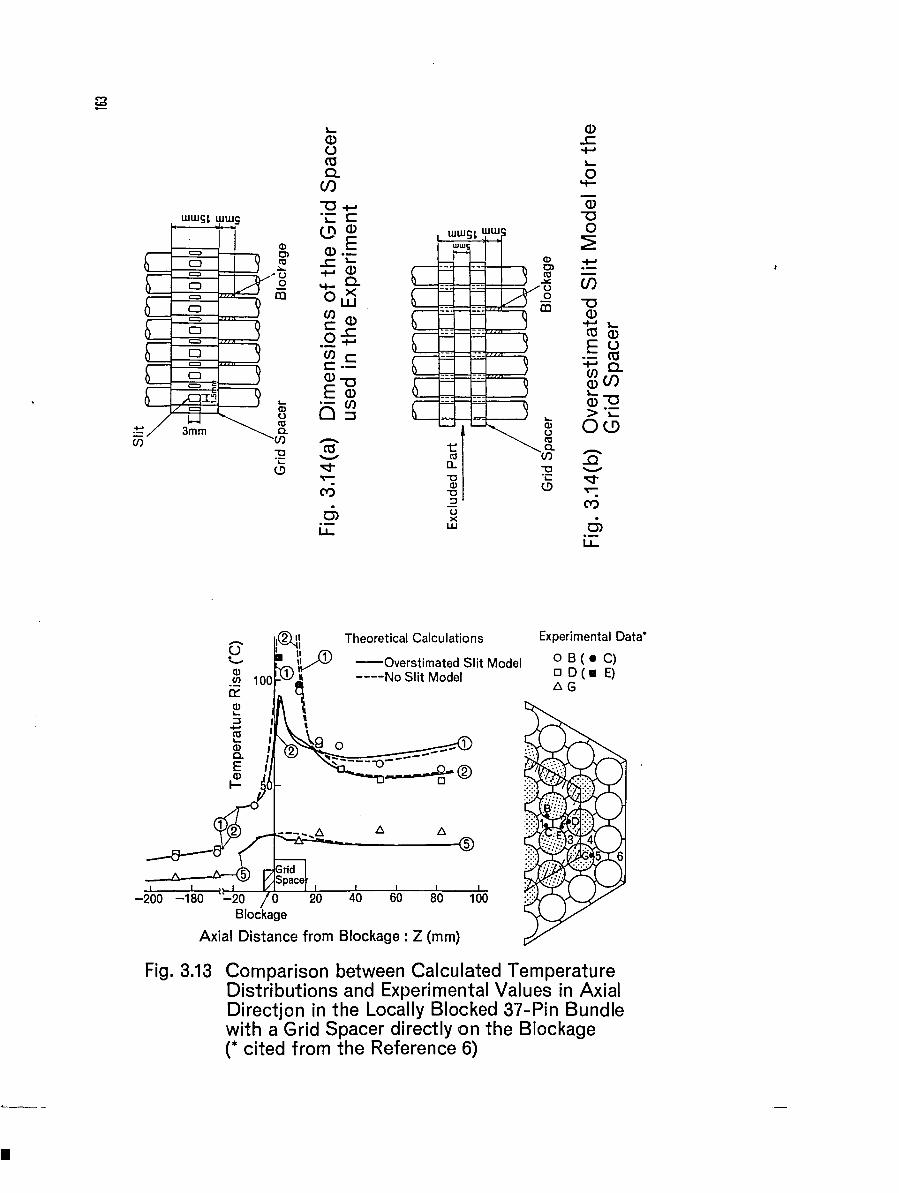
Fig. 3.13 Comparison between Calculated TemperatureDistributions and Experimental Values in AxialDirection in the Locally Blocked 37-Pin Bundlewith a Grid Spacer directly on the Blockage(* cited from the Reference 6)
COBRA AND CORTRAN CODETHERMAL-HYDRAULIC MODELS FOR LMFBRCORE WIDE TEMPERATURE DISTRIBUTIONDURING A NATURAL CONVECTION TRANSIENT
E.U KHAN, T.L. GEORGEBattelle Pacific Northwest Laboratory,Richland, Wash.,United States of America
C.L. WHEELERUS-NRC RSR Representative,DSN/SES - Centre de Cadarache,St. Paul-lez-Durance,France
INTRODUCTION
The design of LMFBR cores requires accurate prediction of the peak
rod and coolant temperatures to ensure that certain economic and safety
considerations will be met. The predictions must be made for a wide
range of operating conditions, including a (reactor scram with) flow
coastdown to natural circulation. During the early transition into the
natural circulation mode of cooling, the effect of dynamically approaching
low flow with "worst case" decay heat load results in a power to flow
ratio greater than one. A concern is that the core may overheat to the
point that coolant boiling is possible. Recent out-of-pile experimental
data^ ' and in-pile data from the EBR-II reactor' ' ' show that one-
dimensional predictions are overly conservative and would lead to economic
penalties. At the low flow rate conditions prevalent within the assemblies
during the natural circulation transient, several multidimensional
thermal-hydraulic phenomena become important, which have a net effect of
significantly mitigating the overall core transverse temperature gradient,
thermal-hydraulic phenomena include interassembly heat transfer and flow
redistribution, intra-assembly heat transfer, and intra-assembly flow
The
redistribution, due to buoyancy, flow reversals in colder assemblies,
and in bypass flow, etc. These phenomena affect each other, and their
degree of coupling is such .hat they cannot be analyzed separately.
Figures 1 and 2 show the significant reduction in the assembly and core-
wide temperature gradients in EBR-II at low flow conditions. It is,
therefore, necessary to develop computational models that take these
effects into account simultaneously on a core-wide basis. The U.S.
effort has focused on the development of the COBRA-VIC (Whole-Core)
computer program and also on a simplified method which is incorporated
into the CORTRAN' ' (Core-Wide Transient Thermal-Hydraulic Analysis)
computer program.
The COBRA-IV code, as it was originally written, was a multi-
purpose code with capabilities to handle single and two-phase flows in
LMFBR and LWR's. Thp COBRA-WC code is a streamlined version of the
original COBRA code and has been specifically developed for the thermal-
hydraulic analysis of LMFBR assemblies. Further simplifications in the
COBRA-WC methodology have been made in order to reduce computation
time. This has resulted in the development of the CORTRAII code. The
models and the range cf applications of the two codes for LMFBR assembly
transient thermal-hydraulic are described in the present paper.
COBRA-WC (WHOLE CORE) MODEL AND EQUATIONS
The version of the COBRA code, described below, has been developed
specifically for the analysis of LMFBR assemblies, including the multiple
assembly effects. In particular, the code is intended to be used to
predict the core-wide heat and flow redistribution during a natural
circulation transient. The new version of COBRA, COBRA-WC, calculates a
solution to the incompressible, single-phase subchannel conservation
equations for mass and momentum, and solves energy equations for the
coolant, fuel and clad, and other heat conducting media in the core.
The equations are all solved fully implicit to allow the use of large
time steps suitable for a natural circulation transient, as well as
providing steady-state solutions. The subchannel modeling approach used
in CCBRA-WC makes the code suitable for obtaining detailed flow and
temperature distributions for one or more assemblies or less detailed
results on a core-wide basis.
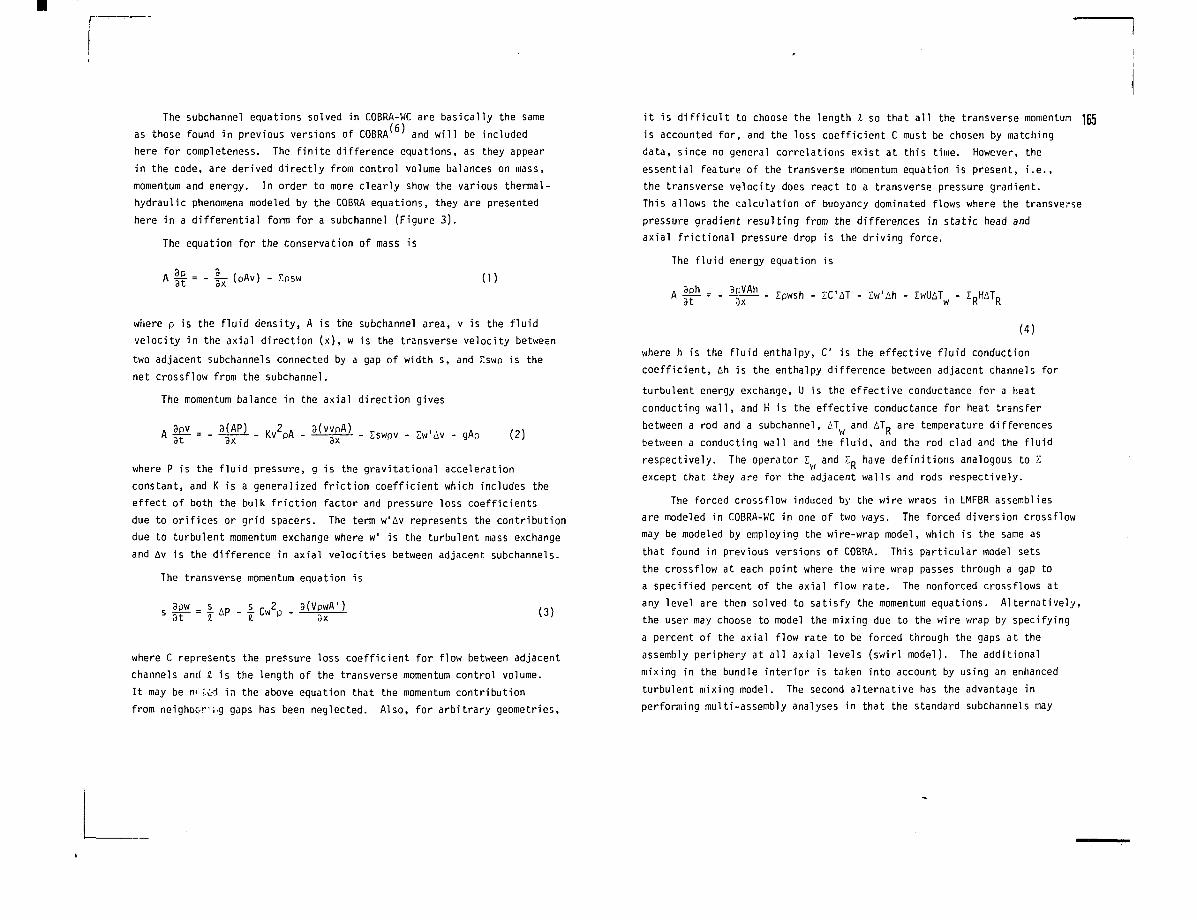
The subchannel equations solved in COBRA-WC are basically the same
as those found in previous versions of COBRA* ' and will be included
here for completeness. The finite difference equations, as they appear
in the code, are derived directly from control volume balances on mass,
momentum and energy. In order to more clearly show the various thermal-
hydraulic phenomena modeled by the COBRA equations, they are presented
here in a differential form for a subchannel (Figure 3 ) .
The equation for the conservation of mass is
A H = - h (l)
where p is the fluid density, A is the subchannel area, v is the fluid
velocity in the axial direction (x), w is the transverse velocity between
two adjacent subchannels connected by a gap of width s, and £swp is the
net crossflow from the subchannel.
The momentum balance in the axial direction gives
(2)
where P is the fluid pressure, g is the gravitational acceleration
constant, and K is a generalized friction coefficient which includes the
effect of both the bulk friction factor and pressure loss coefficients
due to orifices or grid spacers. The term w'Av represents the contribution
due to turbulent momentum exchange where w1 is the turbulent mass exchange
and Av is the difference in axial velocities between adjacent subchannels.
The transverse momentum equation is
(3)
where C represents the pressure loss coefficient for flow between adjacent
channels and I is the length of the transverse momentum control volume.
It may be n> Cid in the above equation that the momentum contribution
from neighoc-r-jg gaps has been neglected. Also, for arbitrary geometries,
it is difficult to choose the length I so that all the transverse momentum ]
is accounted for, and the loss coefficient C must be chosen by matching
data, since no general correlations exist at this time. However, the
essential feature of the transverse momentum equation is present, i.e.,
the transverse velocity does react to a transverse pressure gradient.
This allows the calculation of buoyancy dominated flows where the transverse
pressure gradient resulting from the differences in static head and
axial frictional pressure drop is the driving force.
The fluid energy equation is
3ph _ 3pVAh3t
,,- - - Ipwsh - IC'AT - Zw'Ah - ZwllAT - IDHATD
(4)
where h is the fluid enthalpy, C is the effective fluid conduction
coefficient, Ah is the enthalpy difference between adjacent channels for
turbulent energy exchange, U is the effective conductance for a heat
conducting wall, and H is the effective conductance for heat transfer
between a rod and a subchannel, AT and ATD are temperature differencesW K
between a conducting wall and the fluid, and ths rod clad and the fluid
respectively. The operator t and z^ have definitions analogous to I
except that they are for the adjacent walls and rods respectively.
The forced crossflow induced by the wire wraps in LMFBR assemblies
are modeled in COBRA-WC in one of two ways. The forced diversion crossflow
may be modeled by employing the wire-wrap model, which is the same as
that found in previous versions of COBRA. This particular model sets
the crossflow at each point where the wire wrap passes through a gap to
a specified percent of the axial flow rate. The nonforced crossflows at
any level are then solved to satisfy the momentum equations. Alternatively,
the user may choose to model the mixing due to the wire wrap by specifying
a percent of the axial flow rate to be forced through the gaps at the
assembly periphery at all axial levels (swirl model). The additional
mixing in the bundle interior is taken into account by using an enhanced
turbulent mixing model. The second alternative has the advantage in
performing multi-assembly analyses in that the standard subchannels may
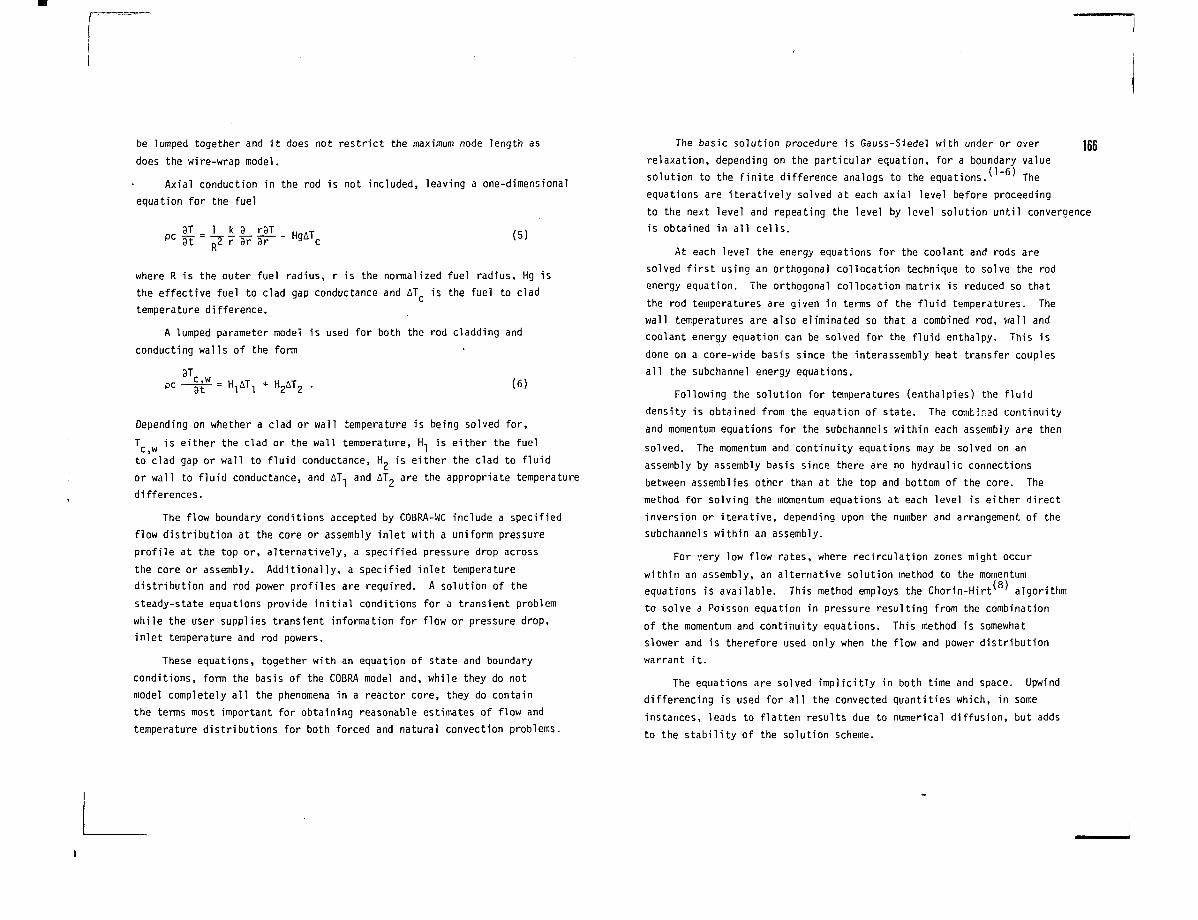
be lumped together and it does not restrict the maximum node length as
does the wire-wrap model.
Axial conduction in the rod is not included, leaving a one-dimensional
equation for the fuel
3T 1 k d r3T „ ,pc ät-^FäFS?-- HgATc (5)
where R is the outer fuel radius, r is the normalized fuel radius, Hg is
the effective fuel to clad gap conductance and ATC is the fuel to clad
temperature difference.
A lumped parameter model is used for both the rod cladding and
conducting walls of the form
3Tpc if = (6)
Depending on whether a clad or wall temperature is being solved for,
T is either the clad or the wall temperature, H, is either the fuelC ) W '
to clad gap or wall to fluid conductance, H» is either the clad to fluid
or wall to fluid conductance, and AT, and AT„ are the appropriate temperature
differences.
The flow boundary conditions accepted by COBRA-WC include a specified
flow distribution at the core or assembly inlet with a uniform pressure
profile at the top or, alternatively, a specified pressure drop across
the core or assembly. Additionally, a specified inlet temperature
distribution and rod power profiles are required. A solution of the
steady-state equations provide initial conditions for a transient problem
while the user supplies transient information for flow or pressure drop,
inlet temperature and rod powers.
These equations, together with an equation of state and boundary
conditions, form the basis of the COBRA model and, while they do not
model completely all the phenomena in a reactor core, they do contain
the terms most important for obtaining reasonable estimates of flow and
temperature distributions for both forced and natural convection problems.
The basic solution procedure is Gauss-Siedel with under or over jßß
relaxation, depending on the particular equation, for a boundary value
solution to the finite difference analogs to the equations. The
equations are iteratively solved at each axial level before proceeding
to the next level and repeating the level by level solution until convergence
is obtained in all cells.
At each level the energy equations for the coolant and rods are
solved first using an orthogonal collocation technique to solve the rod
energy equation. The orthogonal collocation matrix is reduced so that
the rod temperatures are given in terms of the fluid temperatures. The
wall temperatures are also eliminated so that a combined rod, wall and
coolant energy equation can be solved for the fluid enthalpy. This is
done on a core-wide basis since the interassembly heat transfer couples
all the subchannel energy equations.
Following the solution for temperatures (enthalpies) the fluid
density is obtained from the equation of state. The comtinsd continuity
and momentum equations for the subchannels within each assembly are then
solved. The momentum and continuity equations may be solved on an
assembly by assembly basis since there are no hydraulic connections
between assemblies other than at the top and bottom of the core. The
method for solving the momentum equations at each level is either direct
inversion or iterative, depending upon the number and arrangement of the
subchannels within an assembly.
For very low flow rates, where recirculation zones might occur
within an assembly, an alternative solution method to the momentum(8)
equations is available. This method employs the Chorin-Hirtv ' algorithm
to solve a Poisson equation in pressure resulting from the combination
of the momentum and continuity equations. This method is somewhat
slower and is therefore used only when the flow and power distribution
warrant it.
The equations are solved implicitly in both time and space. Upwind
differencing is used for all the convected quantities which, in some
instances, leads to flatten results due to numerical diffusion, but adds
to the stability of the solution scheme.
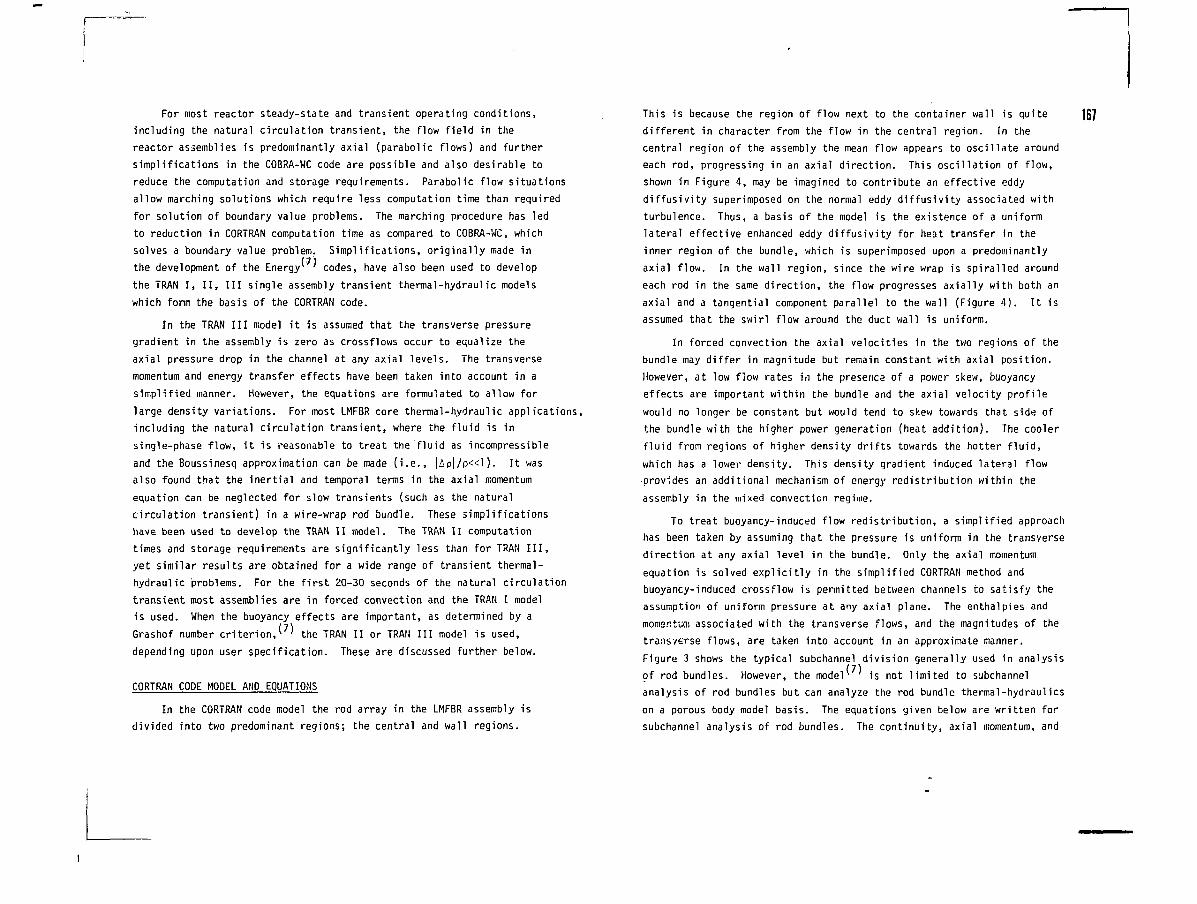
For most reactor steady-state and transient operating conditions,
including the natural circulation transient, the flow field in the
reactor assemblies is predominantly axial (parabolic flows) and further
simplifications in the COBRA-WC code are possible and also desirable to
reduce the computation and storage requirements. Parabolic flow situations
allow marching solutions which require less computation time than required
for solution of boundary value problems. The marching procedure has led
to reduction in CORTRAN computation time as compared to COBRA-WC, which
solves a boundary value problem. Simplifications, originally made in
the development of the Energy* ' codes, have also been used to develop
the TRAN I, II, III single assembly transient thermal-hydraulic models
which form the basis of the CORTRAN code.
In the TRAN III model it is assumed that the transverse pressure
gradient in the assembly is zero as crossflows occur to equalize the
axial pressure drop in the channel at any axial levels. The transverse
momentum and energy transfer effects have been taken into account in a
simplified manner. However, the equations are formulated to allow for
large density variations. For most LMFBR core thermal-hydraulic applications,
including the natural circulation transient, where the fluid is in
single-phase flow, it is reasonable to treat the fluid as incompressible
and the Boussinesq approximation can be made (i.e., |£p|/p«1). It was
also found that the inertial and temporal terms in the axial momentum
equation can be neglected for slow transients (such as the natural
circulation transient) in a wire-wrap rod bundle. These simplifications
have been used to develop the TRAN II model. The TRAN II computation
times and storage requirements are significantly less than for TRAN III,
yet similar results are obtained for a wide range of transient thermal-
hydraulic problems. For the first 20-30 seconds of the natural circulation
transient most assemblies are in forced convection and the TRAN I model
is used. When the buoyancy effects are important, as determined by a
Grashof number criterion/ ' the TRAN II or TRAN III model is used,
depending upon user specification. These are discussed further below.
CORTRAN CODE MODEL AND EQUATIONS
In the CORTRAN code model the rod array in the LMFBR assembly is
divided into two predominant regions; the central and wall regions.
This is because the region of flow next to the container wall is quite
different in character from the flow in the central region. In the
central region of the assembly the mean flow appears to oscillate around
each rod, progressing in an axial direction. This oscillation of flow,
shown in Figure 4, may be imagined to contribute an effective eddy
diffusivity superimposed on the normal eddy diffusivity associated with
turbulence. Thus, a basis of the model is the existence of a uniform
lateral effective enhanced eddy diffusivity for heat transfer in the
inner region of the bundle, which is superimposed upon a predominantly
axial flow. In the wall region, since the wire wrap is spiralled around
each rod in the same direction, the flow progresses axially with both an
axial and a tangential component parallel to the wall (Figure 4). It is
assumed that the swirl flow around the duct wall is uniform.
In forced convection the axial velocities in the two regions of the
bundle may differ in magnitude but remain constant with axial position.
However, at low flow rates in the presence of a power skew, buoyancy
effects are important within the bundle and the axial velocity profile
would no longer be constant but would tend to skew towards that side of
the bundle with the higher power generation (heat addition). The cooler
fluid from regions of higher density drifts towards the hotter fluid,
which has a lower density. This density gradient induced lateral flow
•provides an additional mechanism of energy redistribution within the
assembly in the mixed convection regime.
To treat buoyancy-induced flow redistribution, a simplified approach
has been taken by assuming that the pressure is uniform in the transverse
direction at any axial level in the bundle. Only the axial momentum
equation is solved explicitly in the simplified CORTRAN method and
buoyancy-induced crossflow is permitted between channels to satisfy the
assumption of uniform pressure at any axial plane. The enthalpies and
momentum associated with the transverse flows, and the magnitudes of the
transverse flows, are taken into account in an approximate manner.
Figure 3 shows the typical subchannel division generally used in analysis
of rod bundles. However, the model is not limited to subchannel
analysis of rod bundles but can analyze the rod bundle thermal-hydraulics
on a porous body model basis. The equations given below are written for
subchannel analysis of rod bundles. The continuity, axial momentum, and
167
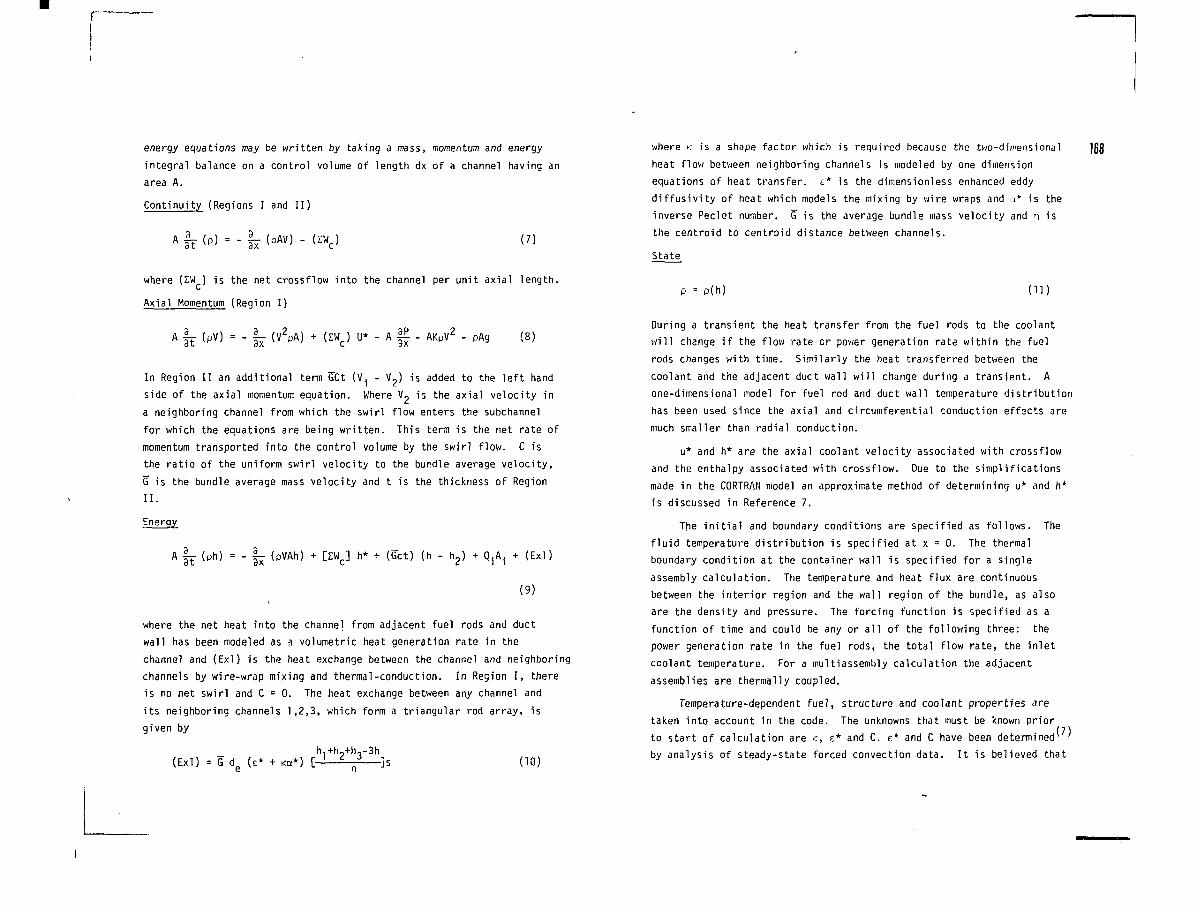
energy equations may be written by taking a mass, momentum and energy
integral balance on a control volume of length dx of a channel having an
area A.
Continuity (Regions I and II)
ft (p) = - h (pAV) • (7)
where (IW ) is the net crossflow into the channel per unit axial length.
Axial Momentum (Region I)
A |f (pV) = - |^ (V2PA) + (s:wc) U * - A | - AKpV2 - pAg (8)
In Region II an additional term GCt (Vi - V2) is added to the left hand
side of the axial momentum equation. Where V- is the axial velocity in
a neighboring channel from which the swirl flow enters the subchannel
for which the equations are being written. This term is the net rate of
momentum transported into the control volume by the swirl flow. C is
the ratio of the uniform swirl velocity to the bundle average velocity,
G~ is the bundle average mass velocity and t is the thickness of Region
II.
A |r- (ph) = - |- (pVAh) + [EW ] h* + (Get) (h - M + Q.A. + (Exl)
(9)
where the net heat into the channel from adjacent fuel rods and duct
wall has been modeled as a volumetric heat generation rate in the
channel and (Exl) is the heat exchange between the channel and neighboring
channels by wire-wrap mixing and thermal-conduction. In Region I, there
is no net swirl and C = 0. The heat exchange between any channel and
its neighboring channels 1,2,3, which form a triangular rod array, is
given by
(Exl) = G de (e*h,+h,+h.,-3h[
where K is a shape factor which is required because the two-dimensional
heat flow between neighboring channels is modeled by one dimension
equations of heat transfer. £* is the dimensionless enhanced eddy
diffusivity of heat which models the mixing by wire wraps and a* is the
inverse Peclet number. G is the average bundle mass velocity and n is
the centroid to centroid distance betv/een channels.
168
State
P = P(h) (n:
During a transient the heat transfer from the fuel rods to the coolant
will change if the flow rate cr power generation rate within the fuel
rods changes with time. Similarly the heat transferred between the
coolant and the adjacent duct wall will change during a transient. A
one-dimensional model for fuel rod and duct wall temperature distribution
has been used since the axial and circumferential conduction effscts are
much smaller than radial conduction.
u* and h* are the axial coolant velocity associated with crossflow
and the enthalpy associated with crossflow. Due to the simplifications
made in the CORTRAN model an approximate method of determining u* and h*
is discussed in Reference 7.
The initial and boundary conditions are specified as follows. The
fluid temperature distribution is specified at x = 0. The thermal
boundary condition at the container wall is specified for a single
assembly calculation. The temperature and heat flux are continuous
between the interior region and the wall region of the bundle, as also
are the density and pressure. The forcing function is specified as a
function of time and could be any or all of the following three: the
power generation rate in the fuel rods, the total flow rate, the inlet
coolant temperature. For a multiassembly calculation the adjacent
assemblies are thermally coupled.
Temperature-dependent fuel, structure and coolant properties are
taken into account in the code. The unknowns that must be known prior
to start of calculation are <, t* and C. e* and C have been determined (7)
]s (10)by analysis of steady-state forced convection data. It is believed that
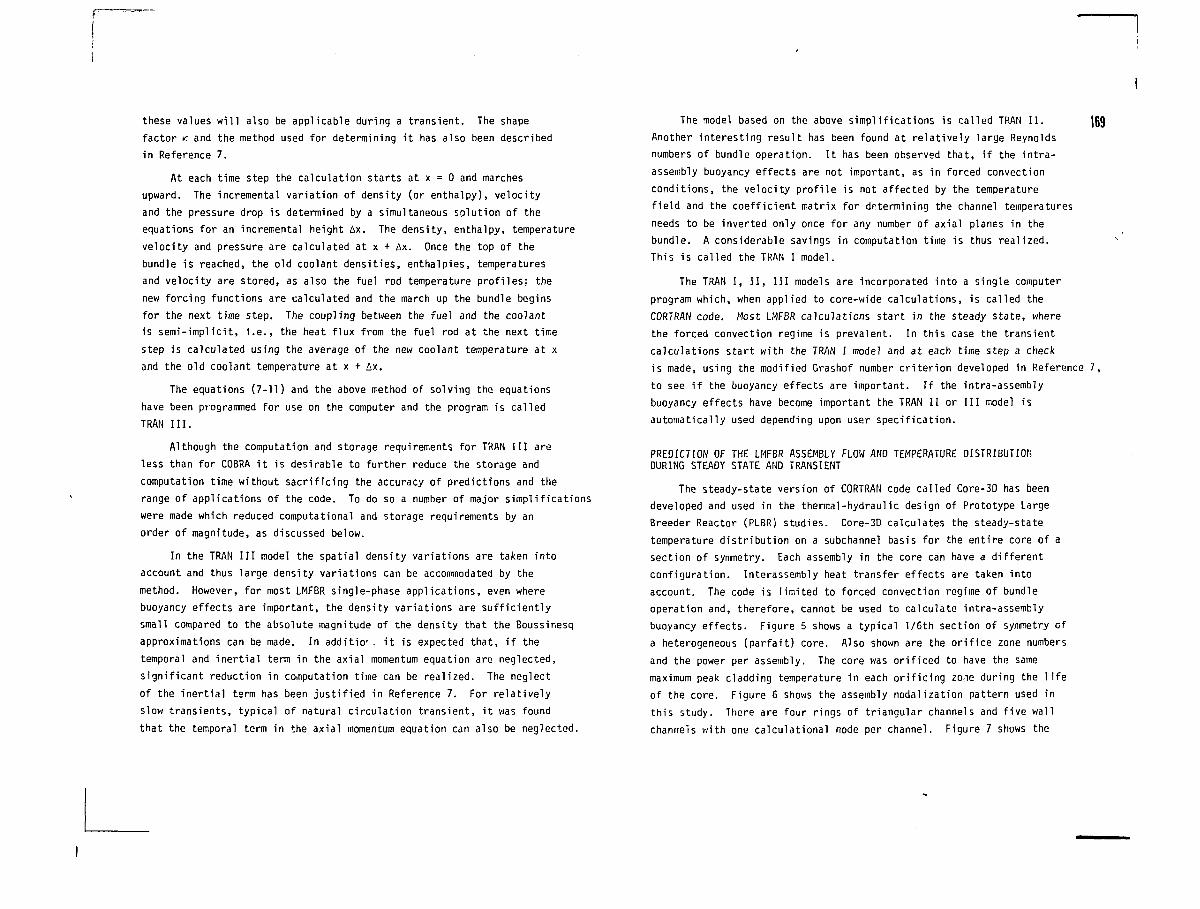
these values will also be applicable during a transient. The shape
factor K and the method used for determining it has also been described
in Reference 7.
At each time step the calculation starts at x = 0 and marches
upward. The incremental variation of density (or enthalpy), velocity
and the pressure drop is determined by a simultaneous solution of the
equations for an incremental height Ax. The density, enthalpy, temperature
velocity and pressure are calculated at x + Ax. Once the top of the
bundle is reached, the old coolant densities, enthalpies, temperatures
and velocity are stored, as also the fuel rod temperature profiles: the
new forcing functions are calculated and the march up the bundle begins
for the next time step. The coupling between the fuel and the coolant
is semi-implicit, i.e., the heat flux from the fuel rod at the next time
step is calculated using the average of the new coolant temperature at x
and the old coolant temperature at x + Ax.
The equations (7-11) and the above method of solving the equations
have been programmed for use on the computer and the program is called
TRAN III.
Although the computation and storage requirements for TRAN III are
less than for COBRA it is desirable to further reduce the storage and
computation time without sacrificing the accuracy of predictions and the
range of applications of the code. To do so a number of major simplifications
were made which reduced computational and storage requirements by an
order of magnitude, as discussed below.
In the TRAN III model the spatial density variations are taken into
account and thus large density variations can be accommodated by the
method. However, for most LMFBR single-phase applications, even where
buoyancy effects are important, the density variations are sufficiently
small compared to the absolute magnitude of the density that the Boussir.esq
approximations can be made. In additio'- it is expected that, if the
temporal and inertia! term in the axial momentum equation are neglected,
significant reduction in computation time can be realized. The neglect
of the inertial term has been justified in Reference 7. For relatively
slow transients, typical of natural circulation transient, it was found
that the temporal term in the axial momentum equation can also be neglected.
The model based on the above simplifications is called TRAN II. |ß9
Another interesting result has been found at relatively large Reynolds
numbers of bundle operation. It has been observed that, if the intra-
assembly buoyancy effects are not important, as in forced convection
conditions, the velocity profile is not affected by the temperature
field and the coefficient matrix for determining the channel temperatures
needs to be inverted only once for any number of axial planes in the
bundle. A considerable savings in computation time is thus realized.
This is called the TRAN I model.
The TRAN I, II, III models are incorporated into a single computer
program which, when applied to core-wide calculations, is called the
CORTRAN code. Most LMFBR calculations start in the steady state, where
the forced convection regime is prevalent. In this case the transient
calculations start with the TRAN I model and at each time step a check
is made, using the modified Grashof number criterion developed in Reference 7,
to see if the buoyancy effects are important. If the intra-assembly
buoyancy effects have become important the TRAN II or III model is
automatically used depending upon user specification.
PREDICTION OF THE LMFBR ASSEMBLY FLOW AND TEMPERATURE DISTRIBUTIONDURING STEADY STATE AND TRANSIENT
The steady-state version of CORTRAN code called Core-3D has been
developed and used in the thermal-hydraulic design of Prototype Large
Breeder Reactor (PLBR) studies. Core-3D calculates the steady-state
temperature distribution on a subchannel basis for the entire core of a
section of symmetry. Each assembly in the core can have a different
configuration. Interassembly heat transfer effects are taken into
account. The code is limited to forced convection regime of bundle
operation and, therefore, cannot be used to calculate intra-assembly
buoyancy effects. Figure 5 shows a typical l/6th section of symmetry of
a heterogeneous (parfait) core. Also shown are the orifice zone numbers
and the power per assembly. The core was orificed to have the same
maximum peak cladding temperature in each orificing zoie during the life
of the core. Figure 6 shows the assembly nodalization pattern used in
this study. There are four rings of triangular channels and five wall
channels with one calculational node per channel. Figure 7 shows the
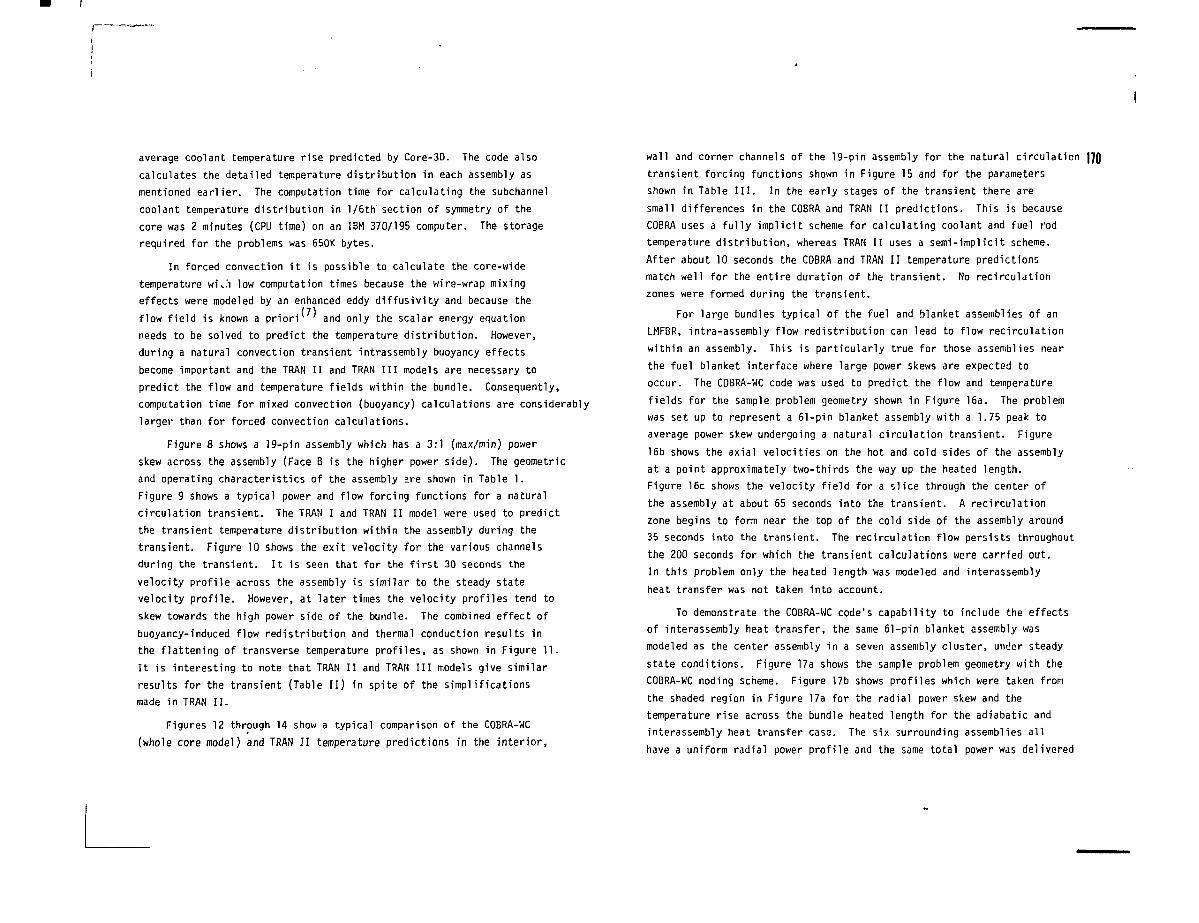
average coolant temperature rise predicted by Core-3D. The code also
calculates the detailed temperature distribution in each assembly as
mentioned earlier. The computation time for calculating the subchannel
coolant temperature distribution in l/6th section of symmetry of the
core was 2 minutes (CPU time) on an IBM 370/195 computer. The storage
required for the problems was 650K bytes.
In forced convection it is possible to calculate the core-wide
temperature wi\.'i low computation times because the wire-wrap mixing
effects were modeled by an enhanced eddy diffusivity and because the
flow field is known a priori* and only the scalar energy equation
needs to be solved to predict the temperature distribution. However,
during a natural convection transient intrassembly buoyancy effects
become important and the TRAN II and TRAN III models are necessary to
predict the flow and temperature fields within the bundle. Consequently,
computation time for mixed convection (buoyancy) calculations are considerably
larger than for forced convection calculations.
Figure 8 shows a 19-pin assembly which has a 3:1 (max/min) power
skew across the assembly (Face B is the higher power side). The geometric
and operating characteristics of the assembly ;re shown in Table 1.
Figure 9 shows a typical power and flow forcing functions for a natural
circulation transient. The TRAN I and TRAN II model were used to predict
the transient temperature distribution within the assembly during the
transient. Figure 10 shows the exit velocity for the various channels
during the transient. It is seen that for the first 30 seconds the
velocity profile across the assembly is similar to the steady state
velocity profile. However, at later times the velocity profiles tend to
skew towards the high power side of the bundle. The combined effect of
buoyancy-induced flow redistribution and thermal conduction results in
the flattening of transverse temperature profiles, as shown in Figure 11.
It is interesting to note that TRAN II and TRAN III models give similar
results for the transient (Table II) in spite of the simplifications
made in TRAN II.
Figures 12 through 14 show a typical comparison of the COBRA-WC
(whole core model) and TRAN II temperature predictions in the interior,
wall and corner channels of the 19-pin assembly for the natural circulation
transient forcing functions shown in Figure 15 and for the parameters
shown in Table III. In the early stages of the transient there are
small differences in the COBRA and TRAN II predictions. This is because
COBRA uses a fully implicit scheme for calculating coolant and fuel rod
temperature distribution, whereas TRAN II uses a semi-implicit scheme.
After about 10 seconds the COBRA and TRAN II temperature predictions
match well for the entire duration of the transient. No recirculation
zones were formed during the transient.
For large bundles typical of the fuel and blanket assemblies of an
LMFBR, intra-assembly flow redistribution can lead to flow recirculation
within an assembly. This is particularly true for those assemblies near
the fuel blanket interface where large power skews are expected to
occur. The COBRA-WC code was used to predict the flow and temperature
fields for the sample problem geometry shown in Figure 16a. The problem
was set up to represent a 61-pin blanket assembly with a 1.75 peak to
average power skew undergoing a natural circulation transient. Figure
16b shows the axial velocities on the hot and cold sides of the assembly
at a point approximately two-thirds the way up the heated length.
Figure 16c shows the velocity field for a slice through the center of
the assembly at about 65 seconds into the transient. A recirculation
zone begins to form near the top of the cold side of the assembly around
35 seconds into the transient. The recirculation flow persists throughout
the 200 seconds for which the transient calculations were carried out.
In this problem only the heated length was modeled and interassembly
heat transfer was not taken into account.
To demonstrate the COBRA-WC code's capability to include the effects
of interassembly heat transfer, the same 61-pin blanket assembly was
modeled as the center assembly in a seven assembly cluster, under steady
state conditions. Figure 17a shows the sample problem geometry with the
COBRA-WC noding scheme. Figure 17b shows profiles which were taken from
the shaded region in Figure 17a for the radial power skew and the
temperature rise across the bundle heated length for the adiabatic and
interassembly heat transfer case. The six surrounding assemblies all
have a uniform radial power profile and the same total power was delivered
/—
to all seven assemblies. The inclusion of the interassembly heat transferresults in a flattened radial temperature profile for the center bundlewith the cold side of the assembly seeing the largest effect. In thisparticular sample problem the peripheral swirl model was not used whichmay account for the relatively large temperature rise on the cold sideof the assembly.
transient situations are available, a number of steady state comparisonshave been made ' and a comparison of the results predicted by the twocodes has been made.
171
CONCLUSIONS
The thermal-hydraulic models in the COBRA-WC and CORTRAN computerprograms have been described and the results of calculating the coolanttemperature distribution during a natural circulation transient havebeen presented. The COBRA-WC code solves a complete set of subchannelequations including a transverse momentum equation for all flow regimes.The CORTRAN code includes three thermal-hydraulic models, TRAN I, II andIII, which use various simplifying assumptions, depending upon the flowregime, resulting in considerable reduction in computation time andstorage requirements for many problems. TRAN I is applicable to onlythe forced convection regime of bundle operation and TRAN II and III areapplicable not only to forced convection but also to combined forced andfree convection regimes. Computation time for TRAN II is an order ofmagnitude smaller than for TRAN III because the inertia! terms in theaxial momentum equation are neglected in TRAN II.
The COBRA code obtains a boundary value solution to the conservationequations which allows it to calculate core-wide flow redistribution andblockage effects while the CORTRAN code solves an initial value problemwhich requires that the steady state core flow distribution be specifiedor be obtained by iteration. However, during the transient the previoustime step coolant temperature distribution is used to determine the flowredistribution between assemblies. Both codes model the radial temperaturedistribution in the rods and include the effects of interassembly heattransfer.
Results have been presented to show the code capabilities over a
wide range of geometrical and flow conditions including a single and
multiassembly problem. At this time, while no comparison with data for
References
1. J. Juneau and E. U. Khan, "Analysis of Steady State Mixed ConvectionData in Rod Bundles," to be sent for publication.
2. R. M. Singer and J. L. Gillette, "Experimental Study of Whole CoreThermal-Hydraulic Phenomena in EBR-II," Nuclear Engineering andDesign, Vol. 44, 177-186, 1977.
3. R. M. Singer and J. L. Gillette, "Measurement of Subassembly and CoreTemperature Distribution in LMFBR," to be published in Chem. Eng. Prog.Symposium.
4. T. L. George, R. E. Masterson, and K. L. basehore, "A Modified Versionof COBRA for Whole-Core LMFBR Transient Analysis," Invited Paper to theAtlanta ANS Meeting, June 1979.
5. E. U. Khan and A. Hinds, "Thermal-Hydraulic Models in the CORTRAN Codefor Core Wide Temperature Predictions in an LMFBR During a NaturalCirculation Transient," Invited Paper to the Atlanta ANS Meeting,June 1979.
6. C. W. Stewart, C. L. Wheeler, et al., "COBRA-IV: The Model and theMethod," BNWL-2214, Battelle, Pacific Northwest Laboratories,Richland, WA, July 1977.
7. E. U. Khan, W. M. Rohsenow, A. A. Sonin, and N. E. Todreas, "A PorousBody Model for Predicting Temperature Distributions in Wire-WrappedFuel and Blanket Assemblies of an LMFBR," Nuclear Engineering andDesign, Vol. 1, No. 35, December 1975; also see MIT report numberCOO-2245-16TR, February 1975.
8. L. D. Cloutman, C. W. Hirt and N. C. Romero, "SOLA-ICE: A NumericalSolution Algorithm for Transient Compressible Fluid Flows, "LA-6236,Los Alamos Scientific Laboratory (1976).
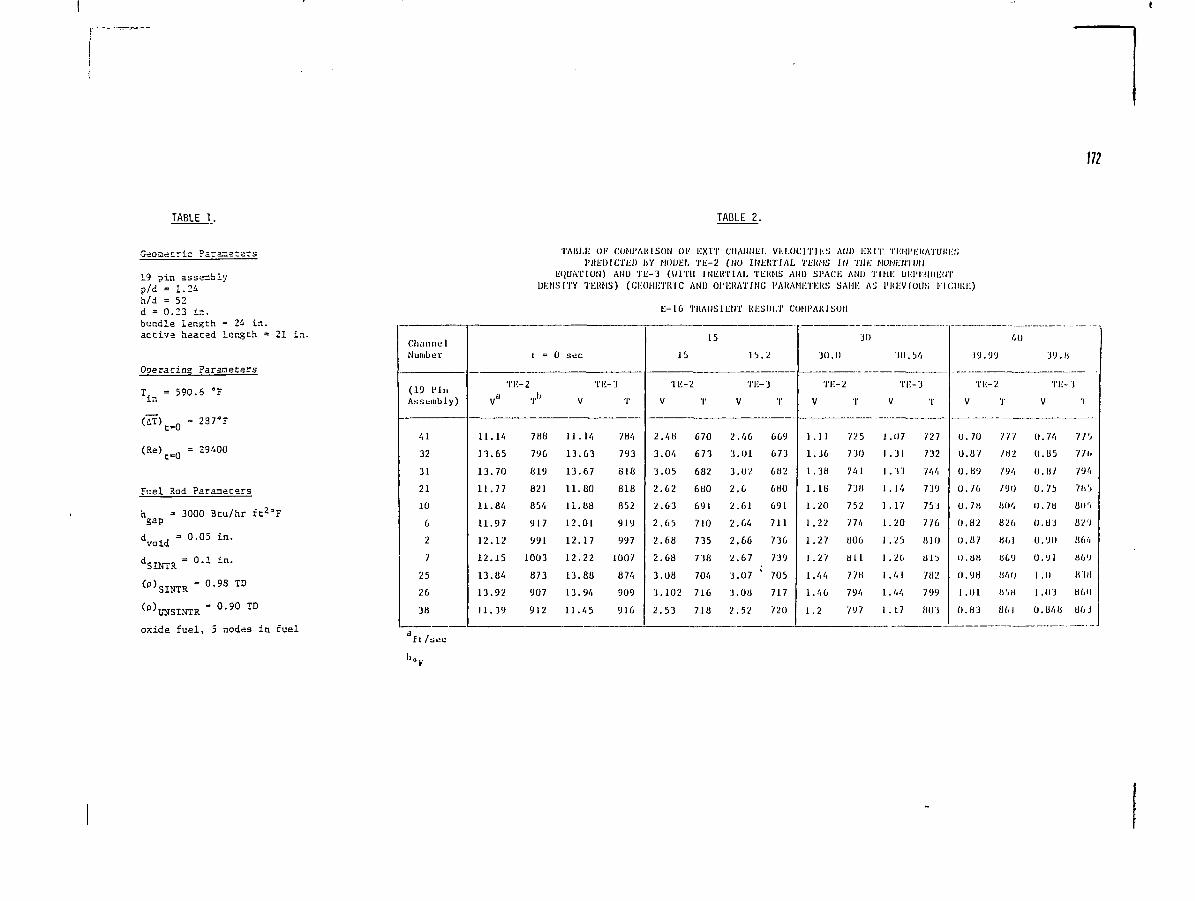
172
TABLE 1 . TABLE 2.
G^oaetric Parameters
19 pin assemblyp/d = 1.24h/d = 5 2d = 0.23 in.bundle length = 24 in.active heaced length = 21 in.
Operating Parameters
T, = 590.5 °Fin
(IT). „ = 237°F
(Re) _ Q = 29400
Fuel Rod Parameters
h =gap
dvoid
dSINTR
3000
= 0.05
(p)SINTR = °
(P) r a s
oxide
INTR =
fuel.
3tu/hr
i n .
i n .
.98 TD
0.90 T
5 nodes
fC2°F
D
in fuel
TAIil.li OK COMI'AKISON Of EXIT CHANNEL VELOCITIES AND EXIT TEMPEKATUKEj;PUEDICTED IIY KOUEI, T E - 2 (NO IHEKTIAL TEKNS IN TIII; MOMENTUM
EQUATION) ANU Tli -3 (WITH 1NEKTIAL TliltllS AND SPACE AND TIHIi DEPENDENTDENSITY TKUHS) (CIX)METUIC ANU Ol'KHATING l'AUAMETEKS SAME AS I'KICVIOUK [•'ICIIUE)
E-16 TKANS1LNT UESIM.T CUMI'AKISUM
Channt i lNumber
(19 P i nA s s t m b i y )
4 1
32
31
21
10
6
2
7
25
26
38
va
1 1 . 1 4
1 3 . 6 5
1 3 . 7 0
11.77
11.84
11.97
12.12
12.15
13.84
13.92
11.39
t =
l-E-2
T"
788
7'J6
819
821
854
917
991
1003
873
907
912
0 sec
TE-
V
11.14
13.63
13.67
11.80
11.88
12.01
12.17
12.22
13.88
13.94
11.45
3
T
784
793
618
818
852
919
997
1007
874
909
916
15
TE-2
V
2.48
3.04
3.05
2.62
2.63
2.65
2.68
2.68
3.08
3.102
2.53
15
T
670
673
682
680
691
710
735
738
704
716
718
15 2
TE-3
V T
2.46
3.01
3.02
2 . 6
2.61
2.64
2.66
2.67
3.07
3.08
2.52
669
673
682
680
691
711
736
739
705
717
720
30
'I1
V
1.11
1.36
1.38
1.1H
1.20
1.22
1.27
1.27
1.44
1.46
1.2
30
.0
E-2
725
7 30
741
738
752
774
806
811
via794
797
3(1.54
TK-3
V
1.1)7
1.31
1.33
1 . 1 4
1 . 17
1.20
1.25
1 .20
1.41
1.44
1.L7
T
727
732
744
739
75J
776
810
815
7H2
799
803
39.99
TI:-2
V
0. 70
0.8 7
0.8'J
IJ./6
0.78
0.82
0.87
O.U8
0.98
1.01
0.83
40
T
77/
Itil
7'J'i
7'JIJ
804
826
86)
869
«40
ti'Ai
HI, I
3'J.H
V
I).lit
0.85
0 . 8 /
0.75
0. 78
0.83
o.yo
o . y i
1.0
1 .03
0.848
)
T
7 7'J
77ii
794
7ir>
Ud'i
82'J
86'i
86'J
«III
«60
86 J
ft/sec
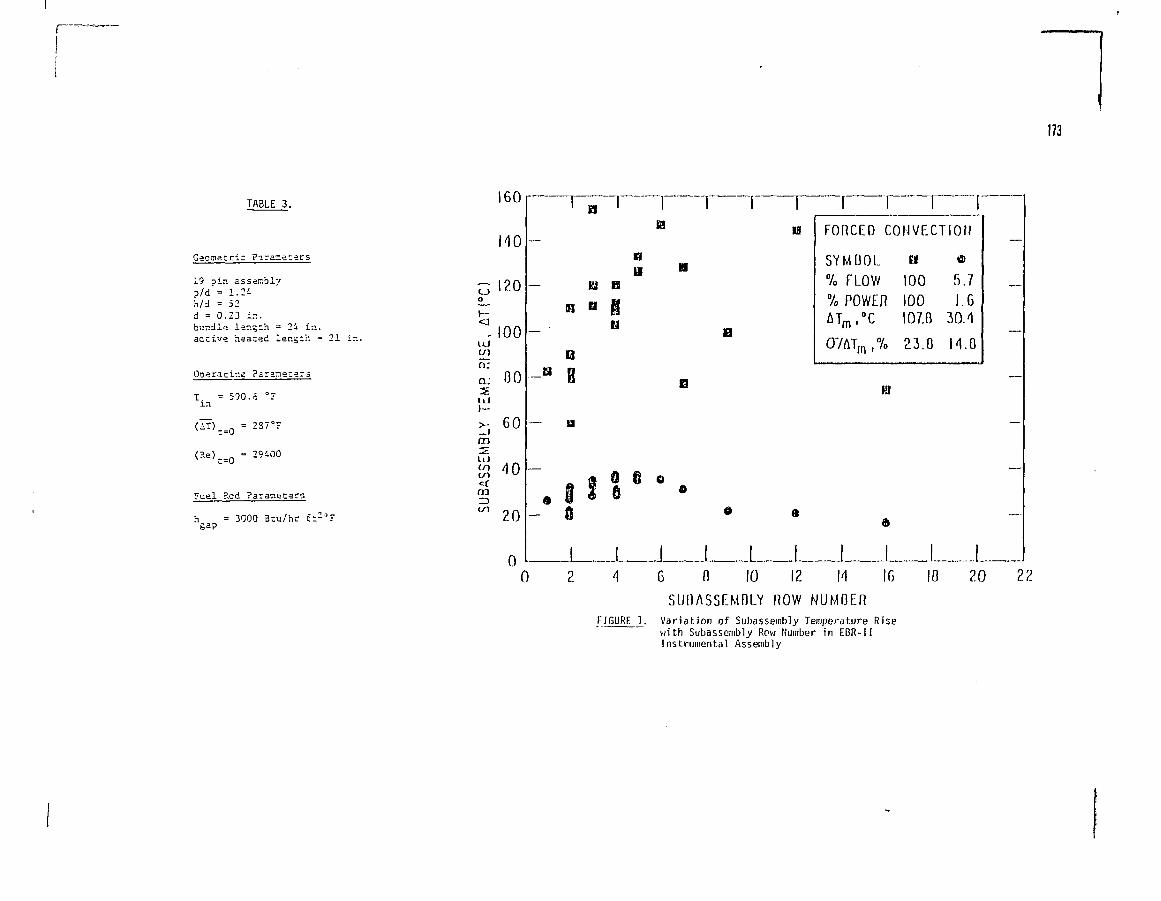
173
TABLE 3.
ri: Parameters
19 Di?/d =h/d =d = 0bundi
ass^"-blv1.2452
.23 in.e ler.§th = 24 in.
active heated length =
Ooeratini Paraneters
T in =
(P-e)£
Fuel
' 590.6 °~
= 2S7°r'
= 29400
R.cd Paramecers
h = 3000 Bcu/hr :-2°?gap
CJo
U J
n:o:
1-_ i
i i iinmOT
co
IDU
MO
120
100
00
60
40
20
n
1
—
S3
•
Q
EI D
— U
—
3- 0
1
KI B
« i
I 6
i—r
nu H
6 o
0J L
FORCED CONVECTION
SYMOOL
% FLOW
% POWERA Tm , ° C
07AT m ,%
El
100
100107.0
23.0
e>
5.
1.30.
M
764
0
10
FIGURE 1 .
6 0 10 12 M IG
SUI1ASSEMDLY ROW NUMDERVariation of Subasseinbly Temperature Risewith Subassembly Row Number in EBR-IIInstrumental Assembly
10 20 22
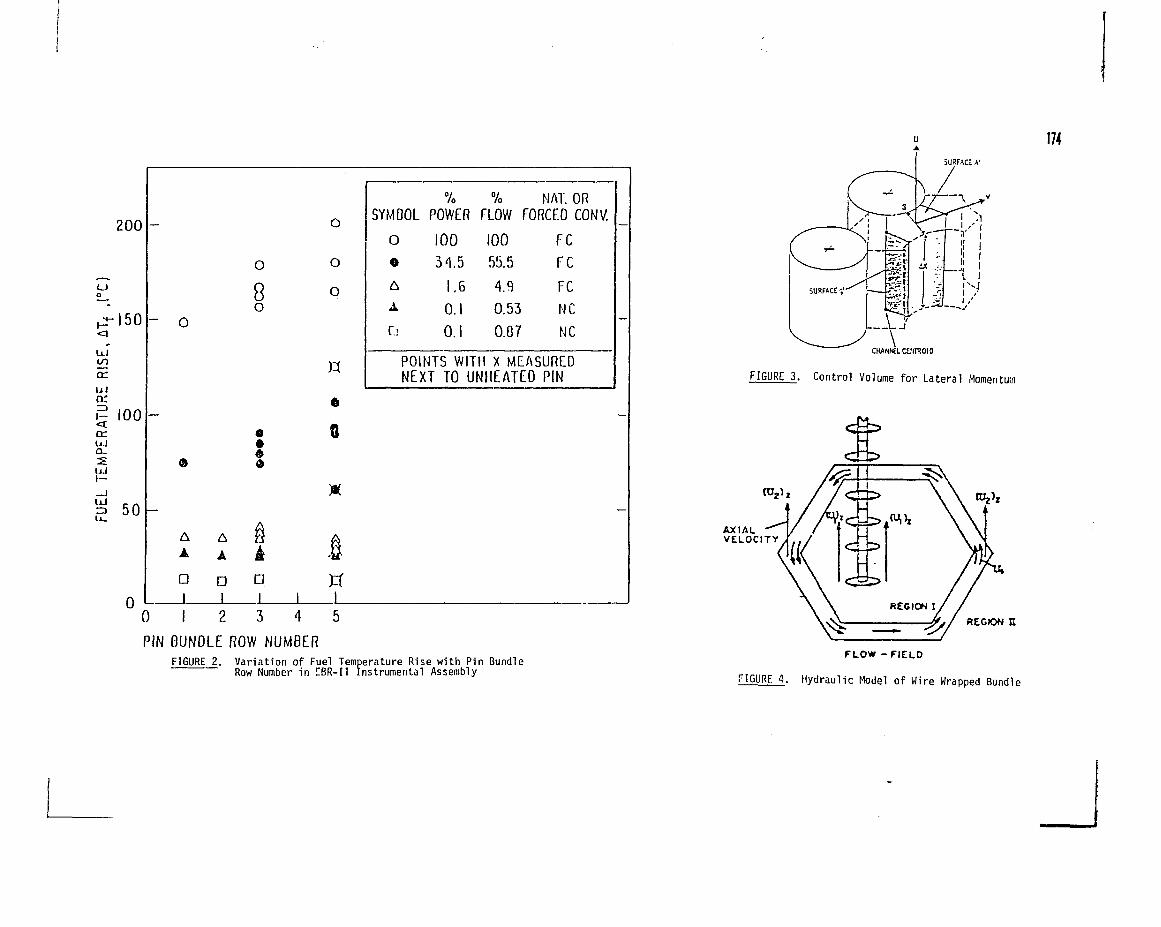
174
200
oo
UJCO
a:
or
150
.- 100
UJ
uj
o
0 L0
0
AAa
_ iI
AA
ai2
o8o
0
i_
SURFACE A'
O
o
o
6
n
% % NAT. ORSYMBOL POWER FLOW FORCED CONV.
0
e
A
CJ
100 1003 1 5 55.5
1.6 4.90.1 0.530.1 0.07
FCFC
FCNCNC
POINTS WITH X MEASUREDNEXT TO UNHEATEO PIN
CHANNEL (X'lIHOlO
FIGURE 3. Control Volume for Lateral Momentum
AXIALVELOCITY
4
PIN GUNDLE ROW NUMBERFIGURE 2. Variation of Fuel Temperature Rise with Pin Bundle
Row Number in CBR-II Instrumental AssemblyFLOW - FIELD
FIGURE 4. Hydraulic Model of Wire Wrapped Bundle

175
FIGURE 6. Location of Nodes in One Sixth Section of a Duct
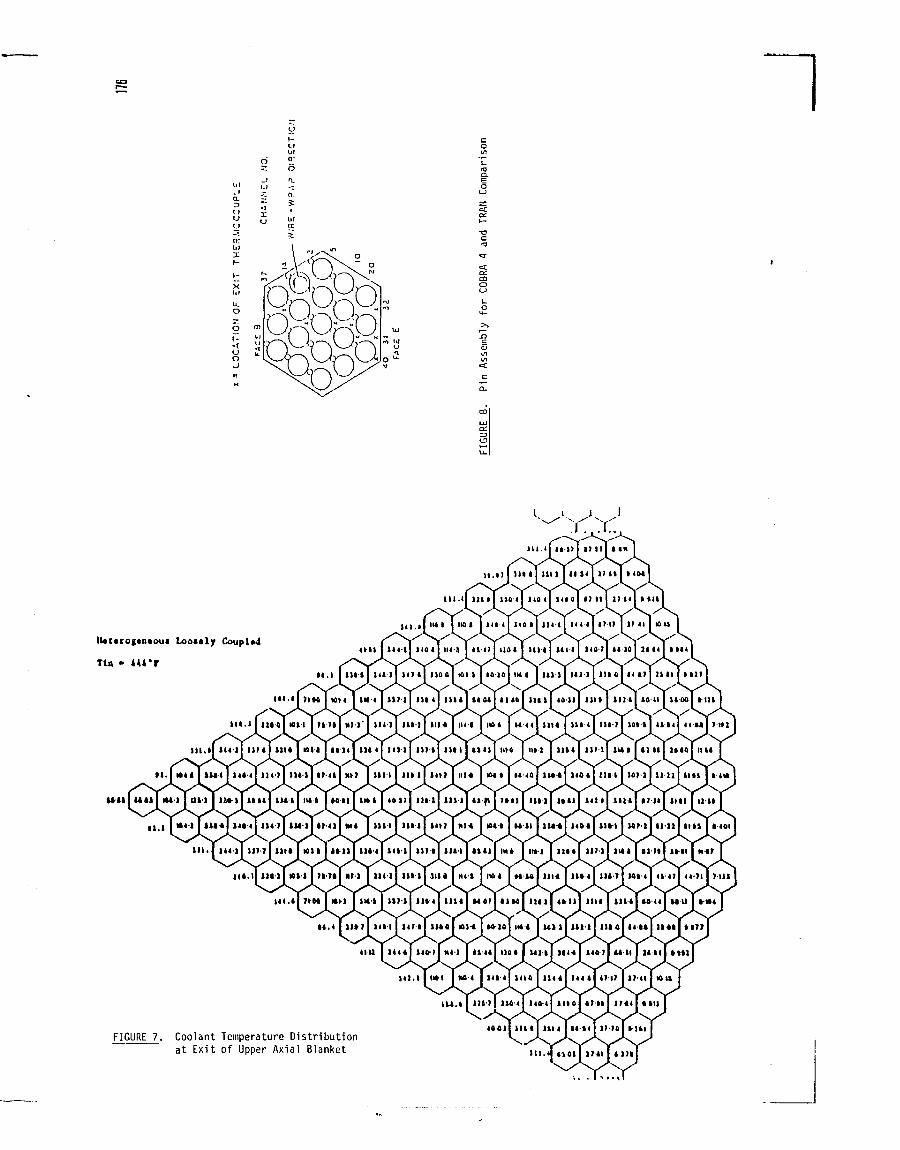
u.o
I -tjo_J
U«t«rag*o*oui
TU - Hl't
FIGURE 7. Coolant Temperature Distributionat Exit of Upper Axial Blanket
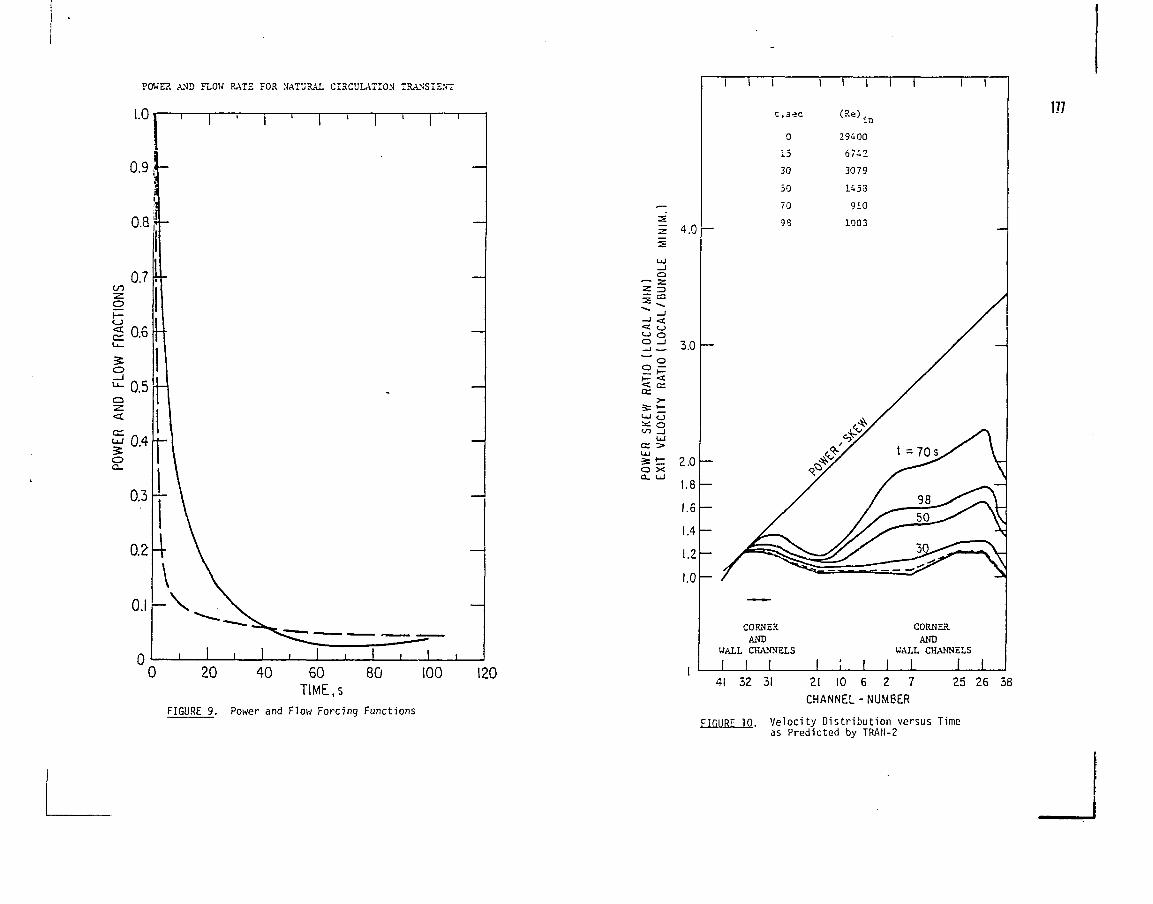
POWE?. AND FLOW RATS FOR ilATUXAL CIRCULATION TRANSIENT
1.0 i r
0.9
0 20 40 60 80 100 120TIM£,s
FIGURE 9. Power and Flow Forcing Functions
5 4.0
Q
C3
<_> o3 d 3.0
^ oUJ
O XQ_ LJ
2.0
1.8
1.6
1.4
1.2
1.0
I i I I I i 1 T
0
15
30
50
70
98
29400
67^2
3079
Ü53
910
1003
CORNERAND
WALL CHANNELS
I I I
CORNER.AND
WALL CHANNELS
I I
117
41 32 31 21 10 6 2 7
CHANNEL-NUMBER
25 26 38
FIGURE 10. Veloci ty D is t r ibu t ion versus Timeas Predicted by TRAN-2
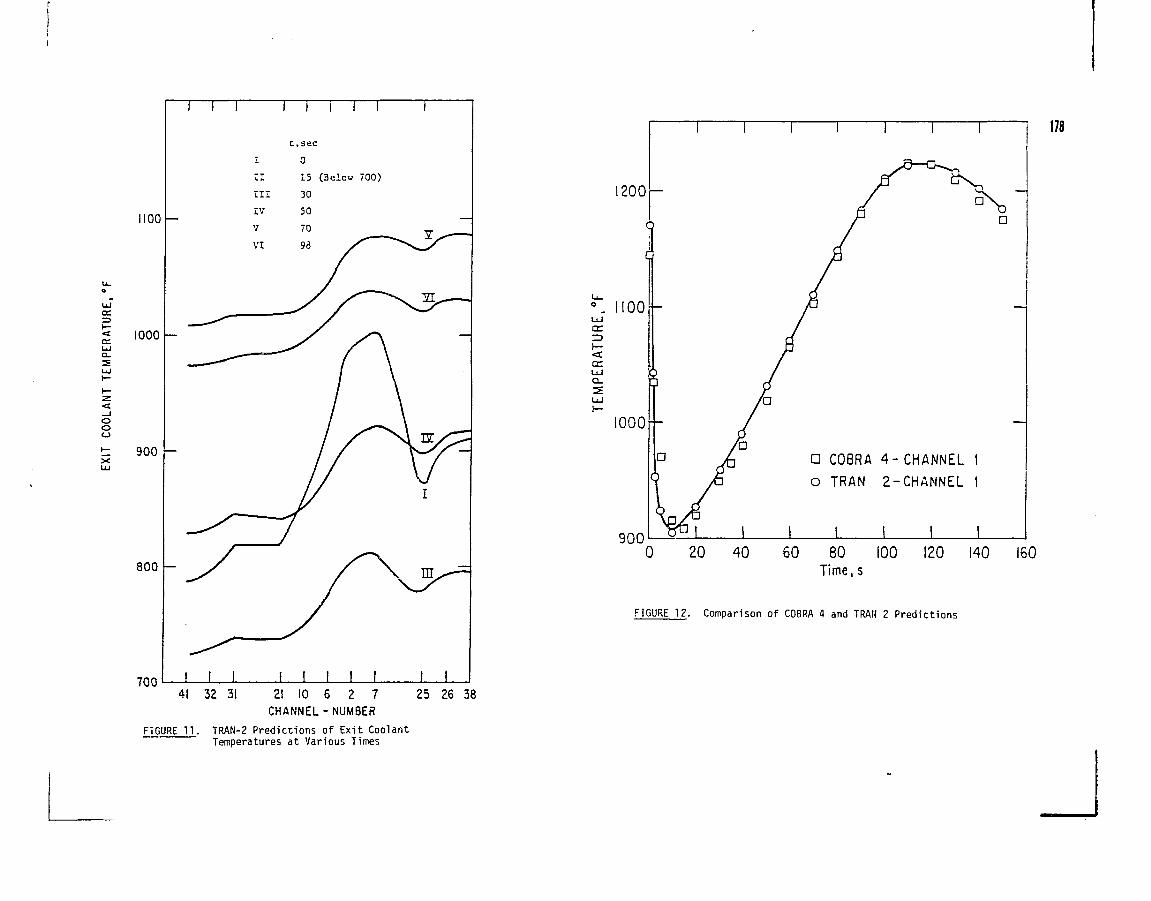
1100
1000
oo
*=. 900
800
700
1 1 i i r
I
II
III
IV
7
VI
t.sec0
15 (3elow 700)
30
50
70
98 / " " "
I I 141 32 31
i i2i 10 6 2 7
CHANNEL-NUMBER
FIGURE 11. TRAN-2 Predictions of Exi t CoolantTemperatures at Various Times
25 26 38
1200
LLJ
cn
ccLÜa_
1000
900
1 r 178
G COBRA 4-CHANNEL 1
O TRAN 2-CHANNEL 1
0 20 40 60 80 100 120 140 160Time.s
FIGURE 12. Comparison of COBRA 4 and TRAN 2 Predictions
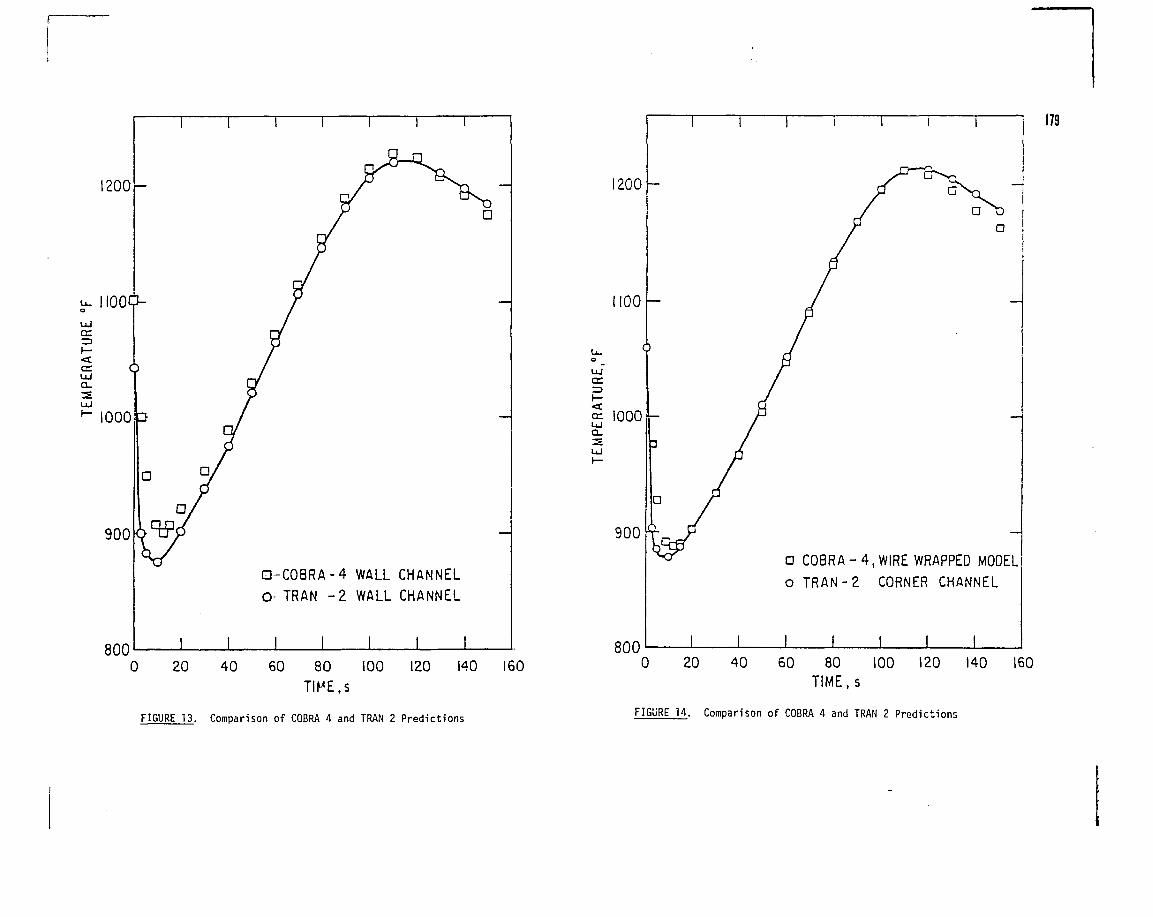
i r i r
1200
UJcr
UJ o
1000 3
800
D-C08RA-4 WALL CHANNEL
O- TRAN - 2 WALL CHANNEL
I I I I I
0 20 40 60 80 100 120 140 160
TIME.s
1200
UJ
900
800
179
G COBRA-4, WIRE WRAPPED MODEL
o TRAN-2 CORNER CHANNEL
I I
0 20 40 60 80 100 120 140 160TIME, s
FIGURE 13. Comparison of COBRA 4 and TRAN 2 Predictions FIGURE 14. Comparison of COBRA 4 and TRAN 2 Predictions
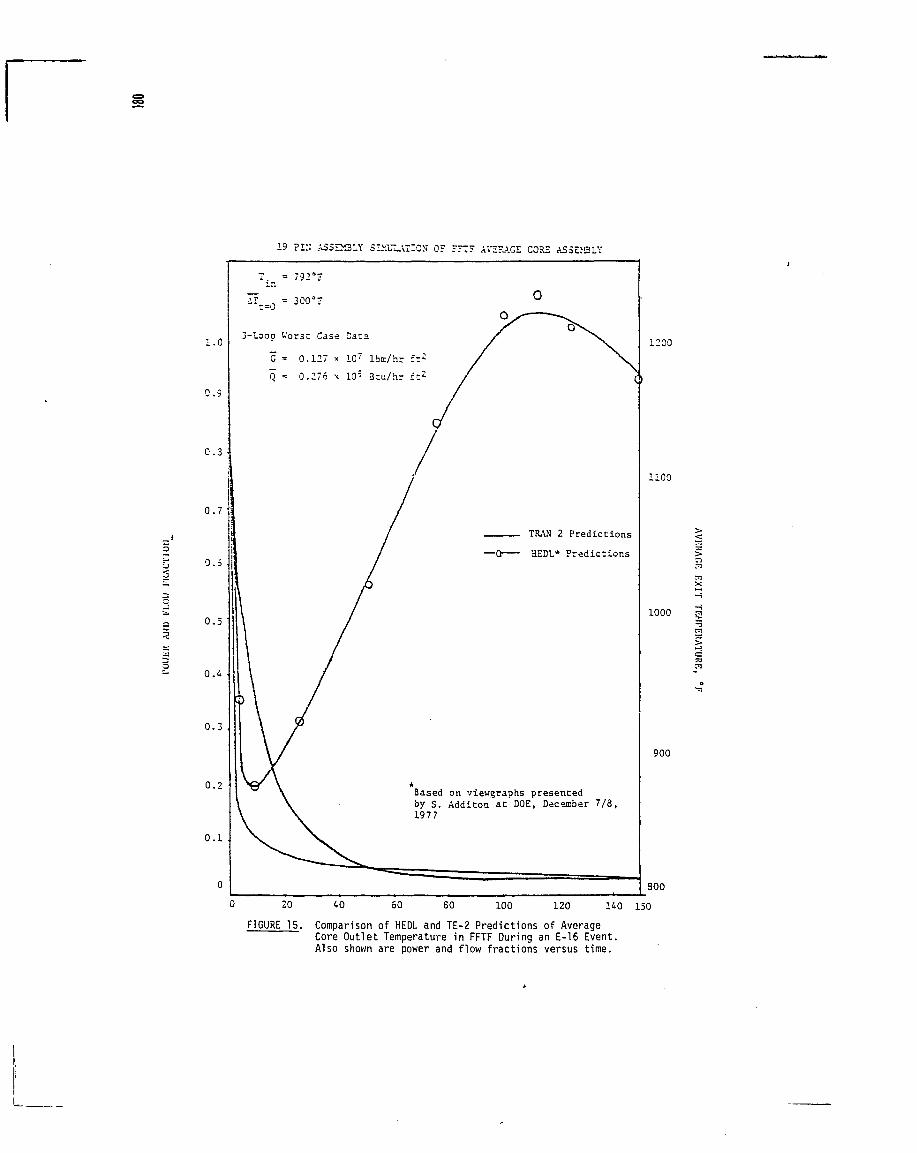
19 PIN A5SEM3LY SI>fl"LAi:OS 0 ? FFT? AVERAGE CORE ASSEMBLY
i .O
0.9
0 .3
0 .7
0.5
0 .5
0 . 4 •
0 .3
0 .2
0 . 1
T ^ = 792°r
I ? . = o = 300=-
3-Loop Worst Case Data
C3 = 0.127 * 107 lbc/hr :=2
Q = 0.276 x 1CP 3tu/hr : t 2
20
TRAN 2 Predictions
HEDL* Predictions
Based on viewgraphs presentedby S. Additon at DOE, December 7/8,1977
1100
1000
900
SOO
60 80 100 120 140 150
FIGURE 15. Comparison of HEDL and TE-2 Predictions of AverageCore Outlet Temperature in FFTF During an E-16 Event.Also shown are power and flow fractions versus time.
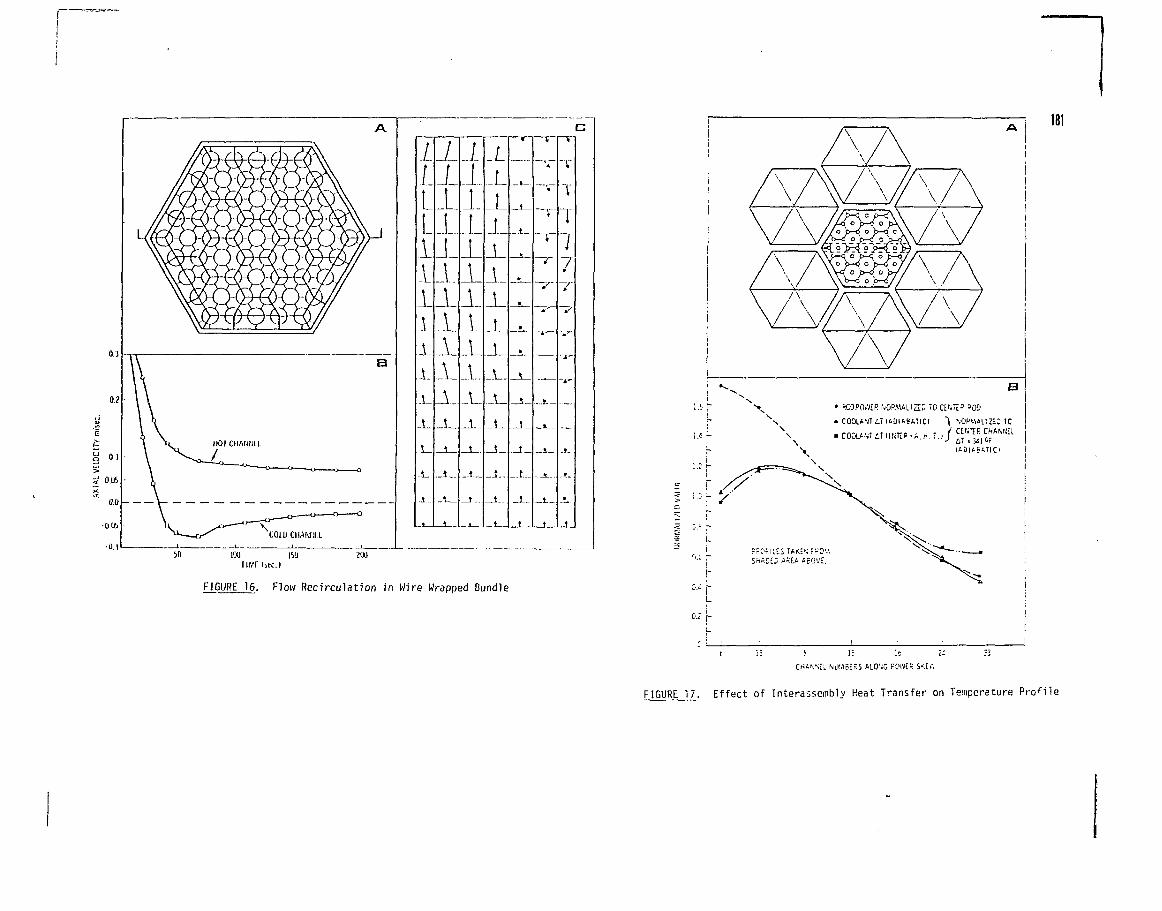
II\L\1\\\\A_
\
±±It11\\\\
11
IX\\
-
— J - .
_L_L1
J_1
t
4
K.
v
•
t
t
4
. t
'V
T
IT
"7
*
200iec.l
FIGURE 16. Flow Recirculation in Wire Wrapped Bundle
181
• R03P0WER NORMALISE TOCtNitR
COOLANT i.T IA0l«8«.TICI "\ NOPMALIZil TCi_
_ i
_
r
\ »COOl\
\\
F.:Of ILES TAKE*. FSOV.SHADE; A=.EA ABOVE.
_AN7 'T I INTER.; H T J / C ^ R CHANNEL-/ AT > 5 1 "F
(ADlA^TICl
5 15 It
CHA' ;MLL NUMBESS ALO'VG POWER S<£>*.
FIGURE 17. Effect of Interassembly Heat Transfer on Temperature Profile
NATURAL CONVECTION ANALYSESAND VERIFICATION FOR LMFBR CORES
R.D. COFFIELD, R.A. MARKLEYWestinghouse Electric Corporation,Madison, PA
E.U. KHANBattelle Pacific Northwest Laboratory,Richland, Wash.,United States of America
I. INTRODUCTION
The normal mode of core heat removal upon reactor shutdown is by forcedcirculation from AC powered pony motors which have emergency backup powerfrom batteries and/or diesel generators driving the primary pumps. However,most LMFBR plants have been designed to have the added capability of ade-quate cooling by means of natural circulation. The thermal driving headdeveloped by the thermal center of the IHX being elevated above that ofthe core (plus the respective elevation differences in the intermediateloops and steam generator system) provides this inherent emergency coolantflow.
During the early transition into the core natural convection cooling mode,the affect of dynamically approaching low flow with worst case decay heatloads results in a power-to-flow ratio greater than one. Consequently,core temperatures increase and the natural convection phenomena associatedwith inter- and intra-assembly flow redistribution due to different thermalheads and hydraulic characteristics of the core assemblies become significant.In general, the core thermal head is as large as the form and friction lossacross the core at about 3 to 4S of full flow (assuming P/F = 1.0). Coupledwith the flow redistribution, significant heat redistribution on an inter-and Intra-assembly basis occurs throughout the core due to large temperaturedifferentials and a significant heat transport time (low power assemblies canhave a transport time of over 20 seconds). These effects (i.e., natural con-vection flow and heat redistribution) are found to significantly reduce maximumcore temperatures as found in the EBR-II natural circulation experiments'- *.
This significant attenuation of maximum core temperatures has important core jj)2design implications. Since the natural circulation transient is a worst caseduty cycle event in the emergency category, and thus, limits LMFBR fuel andblanket rod lifetime capability (i.e., this transient, when added to the steadystate and other transient cumulative damage determines the lifetime limit offuel and blanket rods), any decrease in the predicted maximum core tempera-tures during the natural circulation event will then provide significanteconomic benefits by allowing increased fuel and blanket burnups. In addi-tion, the flattening of the radial core temperature profile will greatlyreduce assembly cross-duct temperature gradients (hence, bowing) therebyreducing core transverse forces on the core restraint system during thenatural circulation transient. These aspects, coupled with the fact thatlower maximum core temperatures always enhance reliability by providinggreater margins to design and safety limitations, help emphasize the impor-tance of taking credit for all the coupled phenomena that occur In the corewhile operating in the natural convection cooling mode.
II. ANALYTICAL MODELS FOR NATURAL CONVECTION ANALYSES
The conservation of mass and momentum equations can be written for each coreassembly in the form (for one-dimensional flow neglecting the variation influid properties, velocity and pressure in the direction normal to the fluidflow):
atiic oaz
at + äl (G /p) = "aT" 2D, - pg
(1)
(2)
where p = coolant densityG = coolant mass velocityD = equivalent diametert = time after start of transientz = axial position measured from inlet of assemblyf = friction factorg = acceleration of gravityp = static pressure
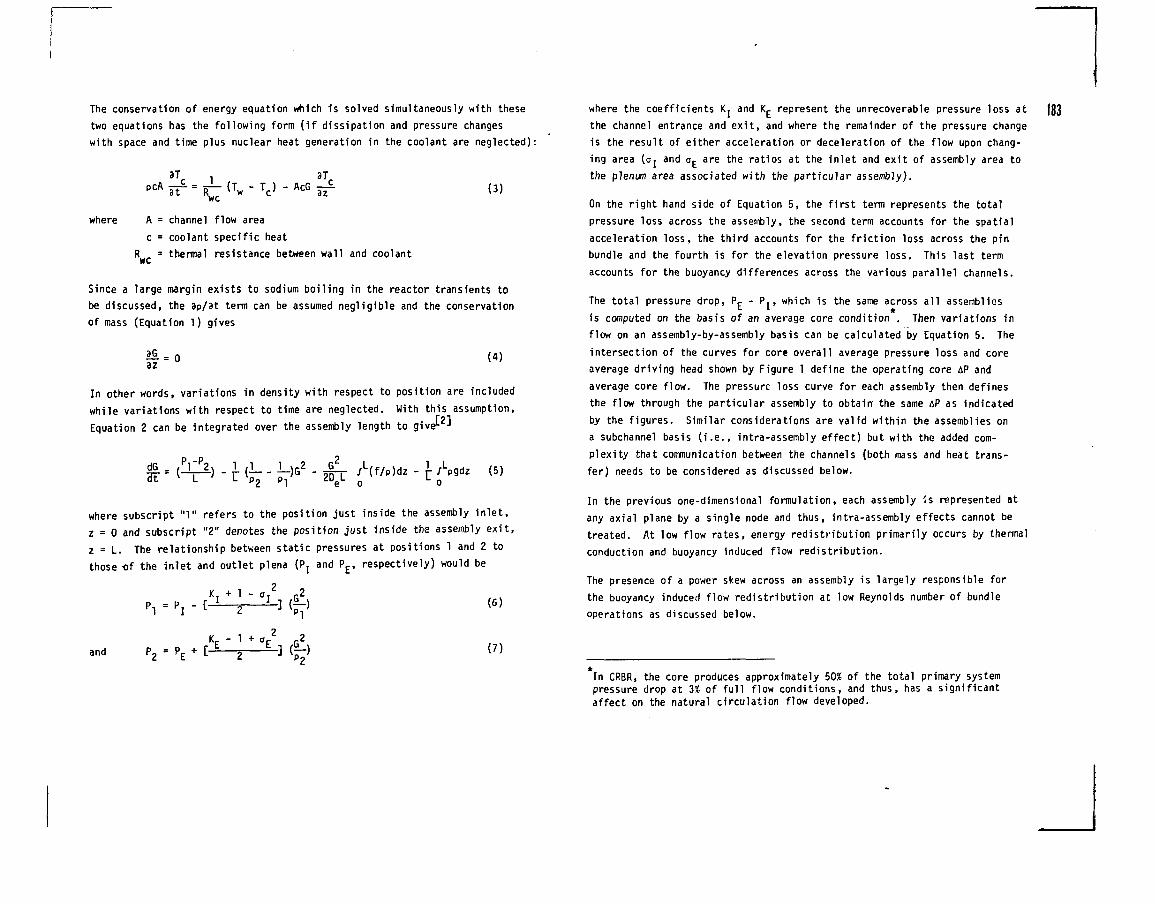
The conservation of energy equation which is solved simultaneously with thesetwo equations has the following form {if dissipation and pressure changeswith space and time plus nuclear heat generation in the coolant are neglected):
where
3T ,
inr=R^<Tw- V -
channel flow area
coolant specific heat
3T(3)
R = thermal resistance between wall and coolant
Since a large margin exists to sodium boiling in the reactor transients tobe discussed, the 3p/3t term can be assumed negligible and the conservationof mass (Equation 1) gives
3z = 0 (4)
In other words, variations in density with respect to position are includedwhile variations with respect to time are neglected. With this assumption,Equation 2 can be integrated over the assembly length to give1- ••
(5)
where subscript "1" refers to the position just inside the assembly inlet,z = 0 and subscript "2" denotes the position just inside the assembly exit,z = L. The relationship between static pressures at positions 1 and 2 tothose of the inlet and outlet plena (Pj and PE, respectively) would be
2KT + 1 -
= PI " 2
and P2 =A"
(6)
(7)
where the coefficients K. and K, represent the unrecoverable pressure loss atthe channel entrance and exit, and where the remainder of the pressure changeis the result of either acceleration or deceleration of the flow upon chang-ing area (o, and o^ are the ratios at the inlet and exit of assembly area tothe plenum area associated with the particular assembly).
On the right hand side of Equation 5, the first term represents the totalpressure loss across the assembly, the second term accounts for the spatialacceleration loss, the third accounts for the friction loss across the pinbundle and the fourth is for the elevation pressure loss. This last termaccounts for the buoyancy differences across the various parallel channels.
The total pressure drop, Pr- - P., which is the same across all assembliesL i *is computed on the basis of an average core condition . Then variations inflow on an assembly-by-assembly basis can be calculated by Equation 5. Theintersection of the curves for core overall average pressure loss and coreaverage driving head shown by Figure 1 define the operating core aP andaverage core flow. The pressure loss curve for each assembly then definesthe flow through the particular assembly to obtain the same iP as indicatedby the figures. Similar considerations are valid within the assemblies ona subchannel basis (i.e., intra-assembly effect) but with the added com-plexity that communication between the channels (both mass and heat trans-fer) needs to be considered as discussed below.
In the previous one-dimensional formulation, each assembly Is represented atany axial plane by a single node and thus, intra-assembly effects cannot betreated. At low flow rates, energy redistribution primarily occurs by thermalconduction and buoyancy induced flow redistribution.
The presence of a power skew across an assembly is largely responsible forthe buoyancy induced flow redistribution at low Reynolds number of bundleoperations as discussed below.
In CRBR, the core produces approximately 50* of the total primary systempressure drop at 3* of full flow conditions, and thus, has a significantaffect on the natural circulation flow developed.
183
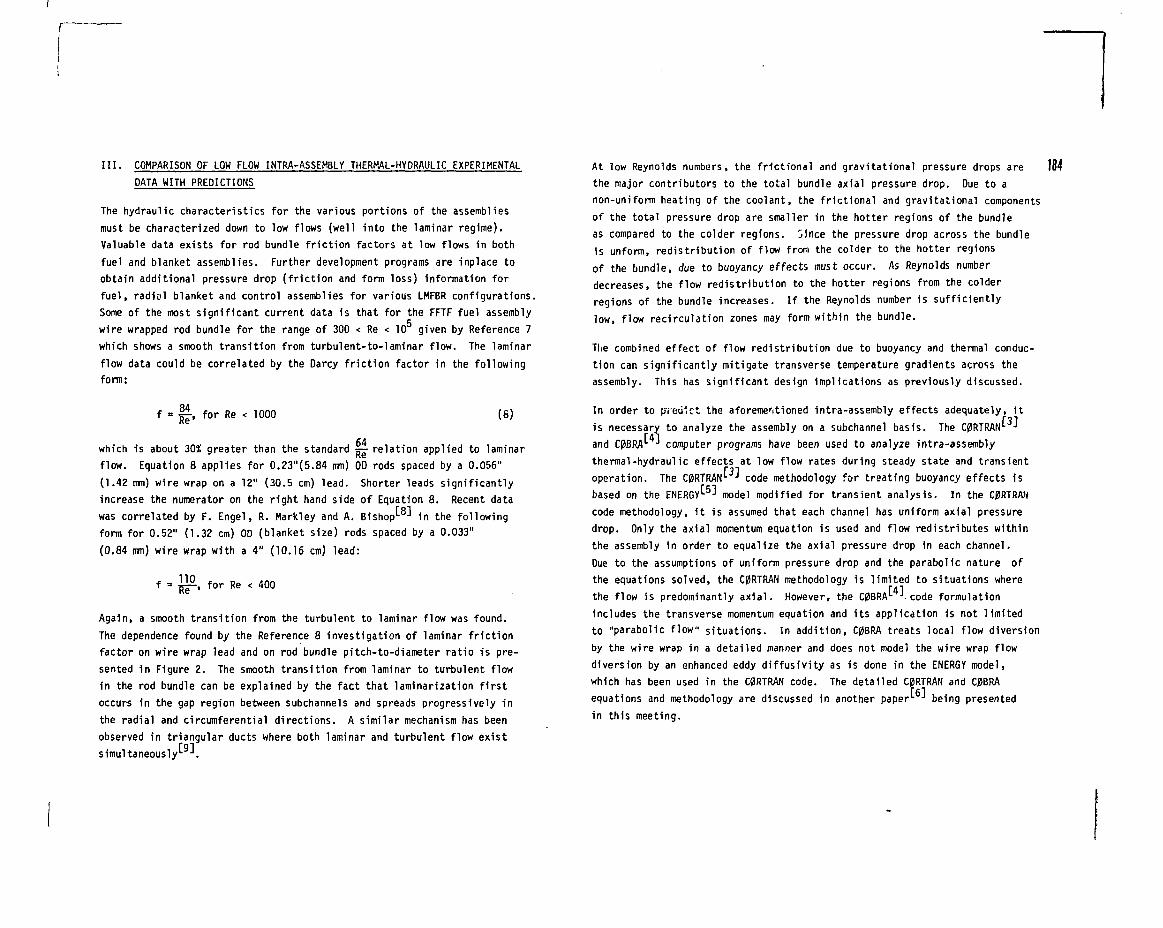
III. COMPARISON OF LOW FLOW INTRA-ASSEMBLY THERKAL-HYORAULIC EXPERIMENTALDATA WITH PREDICTIONS
The hydraulic characteristics for the various portions of the assembliesmust be characterized down to low flows (well into the laminar regime).Valuable data exists for rod bundle friction factors at low flows in bothfuel and blanket assemblies. Further development programs are inplace toobtain additional pressure drop (friction and form loss) information forfuel, radtc-1 blanket and control assemblies for various LMFBR configurations.Some of the most significant current data is that for the FFTF fuel assemblywire wrapped rod bundle for the range of 300 < Re < 10 given by Reference 7which shows a smooth transition from turbulent-to-laminar flow. The laminarflow data could be correlated by the Darcy friction factor in the followingform:
84Re' (8)
64which is about 30% greater than the standard j^- relation applied to laminarflow. Equation 8 applies for 0.23"(5.84 urn) OD rods spaced by a 0.056"(1.42 mm) wire wrap on a 12" (30.5 cm) lead. Shorter leads significantlyincrease the numerator on the right hand side of Equation 8. Recent datawas correlated by F. Engel, R. Harkley and A. Bishop'- * in the followingform for 0.52" (1.32 cm) OD (blanket size) rods spaced by a 0.033"(0.84 im) wire wrap with a 4" (10.16 cm) lead:
110 for Re < 400
Again, a smooth transition from the turbulent to laminar flow was found.The dependence found by the Reference 8 investigation of laminar frictionfactor on wire wrap lead and on rod bundle pitch-to-diameter ratio is pre-sented in Figure 2. The smooth transition from laminar to turbulent flowin the rod bundle can be explained by the fact that laminarization firstoccurs in the gap region between subchannels and spreads progressively inthe radial and circumferential directions. A similar mechanism has beenobserved in triangular ducts where both laminar and turbulent flow exist
At low Reynolds numbers, the frictional and gravitational pressure drops arethe major contributors to the total bundle axial pressure drop. Due to anon-uniform heating of the coolant, the frictional and gravitational componentsof the total pressure drop are smaller in the hotter regions of the bundleas compared to the colder regions. Since the pressure drop across the bundleis unform, redistribution of flow from the colder to the hotter regionsof the bundle, due to buoyancy effects must occur. As Reynolds numberdecreases, the flow redistribution to the hotter regions from the colderregions of the bundle increases. If the Reynolds number is sufficientlylow, flow recirculation zones may form within the bundle.
The combined effect of flow redistribution due to buoyancy and thermal conduc-tion can significantly mitigate transverse temperature gradients across theassembly. This has significant design implications as previously discussed.
In order to predict the aforementioned intra-assembly effects adequately, 1tis necessary to analyze the assembly on a subchannel basis. The C0RTRAN ^and C0BRA'- ^ computer programs have been used to analyze intra-assemblythermal-hydraulic effects at low flow rates during steady state and transientoperation. The C0RTRAfr * code methodology for treating buoyancy effects isbased on the ENERGY^ model modified for transient analysis. In the C0RTRANcode methodology, it is assumed that each channel has uniform axial pressuredrop. Only the axial momentum equation is used and flow redistributes withinthe assembly in order to equalize the axial pressure drop in each channel.Due to the assumptions of uniform pressure drop and the parabolic nature ofthe equations solved, the C0RTRAN methodology is limited to situations wherethe flow is predominantly axial. However, the C0BRA -code formulationincludes the transverse momentum equation and its application is not limitedto "parabolic flow" situations. In addition, C0BRA treats local flow diversionby the wire wrap in a detailed manner and does not model the wire wrap flowdiversion by an enhanced eddy diffusivity as is done in the ENERGY model,which has been used in the C0RTRAN code. The detailed C0RTRAN and C0BRA
184
equations and methodology are discussed in another paperin this meeting.
[6] being presented
simultaneously [9]
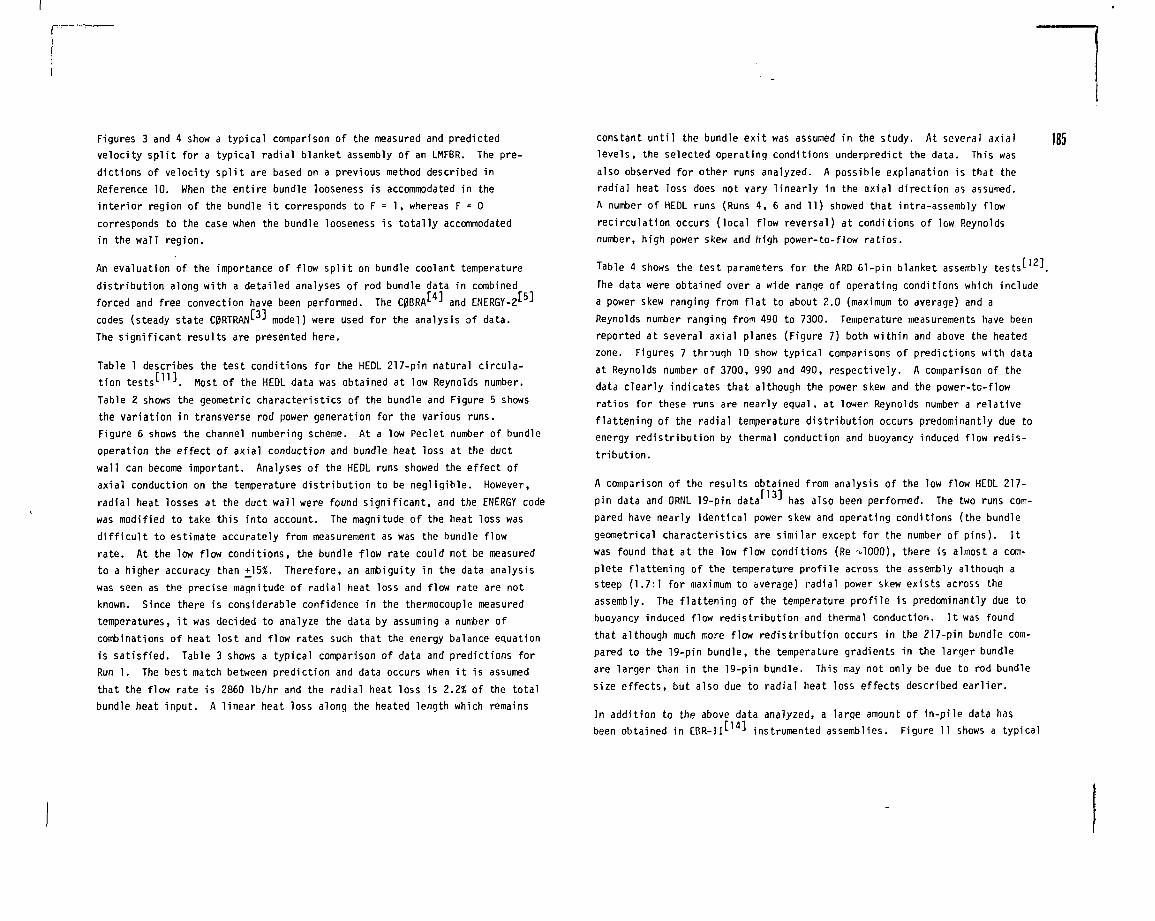
Figures 3 and 4 show a typical comparison of the measured and predictedvelocity split for a typical radial blanket assembly of an LMFBR. The pre-dictions of velocity split are based on a previous method described inReference 10. When the entire bundle looseness is accommodated in theinterior region of the bundle it corresponds to F = 1, whereas F = 0corresponds to the case when the bundle looseness is totally accommodatedin the wall region.
An evaluation of the importance of flow split on bundle coolant temperature
distribution along with a detailed analyses of rod bundle data in combined
r/n rforced and free convection have been performed. The C0BRAL J and ENERGY-2L
codes (steady state C0RTRAN •• model) were used for the analysis of data.The significant results are presented here.Table 1 describes the test conditions for the HEDL 217-pin natural circula-tion tests^ . Most of the HEDL data was obtained at low Reynolds number.Table 2 shows the geometric characteristics of the bundle and Figure 5 showsthe variation in transverse rod power generation for the various runs.Figure 6 shows the channel numbering scheme. At a low Peclet number of bundleoperation the effect of axial conduction and bundle heat loss at the ductwall can become important. Analyses of the HEDL runs showed the effect ofaxial conduction on the temperature distribution to be negligible. However,radial heat losses at the duct wall were found signif icant, and the ENERGY codewas modified to take this into account. The magnitude of the heat loss wasd i f f i cu l t to estimate accurately from measurement as was the bundle flowrate. At the low flow conditions, the bundle flow rate could not be measuredto a higher accuracy than +15%. Therefore, an ambiguity in the data analysiswas seen as the precise magnitude of radial heat loss and flow rate are notknown. Since there is considerable confidence in the thermocouple measuredtemperatures, i t was decided to analyze the data by assuming a number ofcombinations of heat lost and flow rates such that the energy balance equationis satisfied. Table 3 shows a typical comparison of data and predictions forRun 1. The best match between prediction and data occurs when i t is assumedthat the flow rate is 2860 lb/hr and the radial heat loss is 2.2% of the totalbundle heat input. A linear heat loss along the heated length which remains
cons tan t u n t i l the bundle e x i t was assumed i n the s tudy . At seve ra l a x i a l |85levels, the selected operating conditions underpredict the data. This wasalso observed for other runs analyzed. A possible explanation is that theradial heat loss does not vary linearly in the axial direction as assumed.A number of HEDL runs (Runs 4, 6 and 11) showed that intra-assembly flowrecirculation occurs (local flow reversal) at conditions of low Reynoldsnumber, high power skew and high power-to-flow ratios.
Table 4 shows the test parameters for the ARD 61-pin blanket assembly tests'- .The data were obtained over a wide range of operating conditions which includea power skew ranging from f la t to about 2.0 (maximum to average) and aReynolds number ranging from 490 to 7300. Temperature measurements have beenreported at several axial planes (Figure 7) both within and above the heatedzone. Figures 7 thnuqh 10 show typical comparisons of predictions with dataat Reynolds number of 3700, 990 and 490, respectively. A comparison of thedata clearly indicates that although the power skew and the power-to-flowratios for these runs are nearly equal , at lower Reynolds number a relativeflattening of the radial temperature distribution occurs predominantly due toenergy redistribution by thermal conduction and buoyancy induced flow redis-tribution.
A comparison of the results obtained from analysis of the low flow HEDL 217-pin data and ORNL 19-pin data has also been performed. The two runs com-pared have nearly identical power skew and operating conditions (the bundlegeometrical characteristics are similar except for the number of pins). I twas found that at the low flow conditions (Re i/lOOO), there is almost a com-plete flattening of the temperature profile across the assembly although asteep (1.7:1 for maximum to average) radial power skew exists across theassembly. The flattening of the temperature profile is predominantly due tobuoyancy induced flow redistribution and thermal conduction. I t was foundthat although much more flow redistribution occurs in the 217-pin bundle com-pared to the 19-pin bundle, the temperature gradients in the larger bundleare larger than in the 19-pin bundle. This may not only be due to rod bundlesize effects, but also due to radial heat loss effects described earlier.
In addition to the above data analyzed, a large amount of in-pile data hasbeen obtained in EBR-II"- * instrumented assemblies. Figure 11 shows a typical
result which emphasizes the effects of heat transfer between assemblies. Asignif icant heat loss from the test assembly to surrounding assemblies isdepicted by the decrease in coolant temperatures from the top of core posi-tion to the assembly outlet position. In general, the EBR-II data has ind i -cated that the entire core approaches a uniform temperature distr ibutionamong the assemblies due to the strong inter- and intra-assembly flow redis-tr ibution and neat transfer coupling under natural convection'- .
IV. SENSITIVITY OF HOT CHANNELS TO KEY PARAMETERS
The cri ter ion for judging the natural circulation decay heat removal capabi-l i t y is most often based on the maximum core temperatures. In part icular,the core hot channel temperatures are assessed relative to the coolantsaturation temperature to assure that boiling does not occur^ ' .
Various experimental data such as that in Section I I I plus a review of thebasic thermal-hydraulic relationships described in Section I I emphasize thefact that the core performance is sensitive to inter- and intra-assemblyflow and heat redistribution under natural convection cooling conditions.Figure 12 shows the calculated typical magnitude of inter-assembly flowredistribution in fuel and blanket assemblies (neglecting intar-assemblyheat transfer and intra-assembly 'low and heat redistr ibution). As can beseen, some assemblies are expected to lose and gain flow as time progressesthrough the transient. I t is signif icant to note that the hot fuel andblanket assemblies (which would contain hot channels) receive enhanced coolingduring their peak temperature period, as can be seen by examining the timingof the peak temperatures in Figure 13, which predicts the maximum temperatureswith no assistance from flow and heat redistr ibution. Furthermore, any flowdecrease which occurs w i l l be more than offset by intra-assembly effectswhen considered on an integrated core system basis as w i l l be evaluated byths whole-core type code which w i l l be described in Section V.
(*) At low flow, the hot spot coolant temperature has a saturation temperatureover 1700°F determined by the reactor sodium height above its axial loca-tion and the reactor cover gas pressure.
Studies of shutdown to natural circulation operation after sustained prioroperation at full power, indicate that the core thermal response is sensitiveto the rate of flow coastdown of the primary pumps. Figures 14 and 15 showthe effect of various rates of flow decay on the cladding temperature response
[01
of the hot rod in the fuel and blanket assemblies. F0RE-2ML J was used tocalculate these temperatures using primary loop flow rates calculated withthe plant simulation code DEMj)'- *. Again, dynamic flow and heat redistri-bution effects were neglected. The initiation of the transient is a totalloss of on-site and off-site power. Flow decay starts at time zero andcontrol rod trip occurs after 0.5 seconds from the loss-of-electrical power(LOEP) trip signal. As indicated by the fiqure, it takes 37 seconds or morefor the primary loop flow to decay below 5 percent of full flow due to systeminertia effects. The significant difference between temperature response ofthe two types of hot rods is due to the larger stored heat and decay heat ofthe radial blanket rod. The bigger blanket rod has about a factor of 9larger time constant and about a 30? larger decay heat generation. Thislatter effect is due to a relatively larger fraction of its operating powerbeing from transuranium (U-239, Np-239) isotope decay energy release. Forthe longer flow coastdowns, more stored energy is released from the rodsduring the higher flow portion of the transient, and thus, less heat isavailable later in the transient when the maximum temperature is attained.Although the longer flow coastdown helps decrease core temperatures, theeffect on structures exposed to the core effluent (e.g., upper internals inthe outlet plenum) becomes worse for other events such as a normal scram.Thus, the flow coastdown is usually designed for a moderate value, asexemplified by Cases B through C on the figures.
Recent studies show that fuel type and rod diameter are very significant'- -\Figure 16 shows the limitations on initial steady state operating temperaturesdue to these parameters. The lower the maximum steady state operating tem-perature shown, the more restrictive the condition. As with flow coastdown,rod inertial effects influence the transient temperatures. The degradationof the lew thermal conductivity (e.g., oxide) fuel and blanket rods aboverod diameters of 0.46 in. OD is due to stored heat affects (coupled with theflow coastdown). For the high thermal conductivity fuels (e.g., carbide andnitrides), the performance is somewhat worsened over that for the oxides in
the diameter range (<0.46 in . ) due to the rod more closely following the
power/flow and the lack of iner t ia l effects delaying the temperature rise to
values indicative of early shutdown powers.
Core natural convection performance is also a strong function of fuel-cladding
gap conductance and shutdown power generation. Figure 17 shows the variation
in performance for the fuel and blanket hot rods with gap conductance. The
large diameter blanket rods have large stored heat af fects, and thus, their
performance is a strong function of the fuel-cladding gap conductance whereas
the fue l , which has a relat ively small stored heat, exhibits a low sensi t iv i ty .
Figure 18 shows the effect of control system shutdown worth. The curve shows
that the fuel hot rod temperatures become insensitive to shutdown worth beyond
9$. Early in the shutdown, the power source is from both delayed neutrons
and decay heat, and i t is the delayed neutron portion that is affected by the
scram worth. After the f i r s t several hundred seconds following shutdown,
the delayed neutron effect becomes small and the shutdown power is basically
from f ission product and transuranium isotope decay. As would be expected,
the shutdown thermal performance is also a very strong function of this
parameter. Core temperature would vary approximately 8°F for each one percent
variation on the shutdown power.
V. ANALYTICAL PREDICTIONS OF NATURAL CIRCULATION/CONVECTION
The following system of three codes w i l l be ut i l ized for predicting natural
circulation/convection behavior on a plant-wide basis:
A. Plant-Wide Code, e .g . ,
A plant system-wide code is needed to predict the coupled thermal-hydraulic
performance of an LMFBR. The code includes neutron kinetics and decay
power tables for the reactor thermal power model and a simulation of the
fuel assembly and radial blanket assembly heat transfer and f lu id flow.
A pump and piping dynamic model provides the simulation of forced or
natural c irculat ion in the primary and intermediate sodium loops. The
natural circulat ion driving heads are calculated in the sodium loops and
steam generator water loops as the sum of temperature-dependent densities
around the loops. To provide accurate results for the plant as a wholeand yet maintain the code as an amenable tool with regard to computerstorage requirements and running time, localized phenomena, which do notaffect the system as a whole, are not given detailed modeling. Anexample of this is flow/heat redistribution between core assemblies atlow flow. To consider these localized phenomena with the requiredresolution requires a separate computer code which analyzes the corein greater detail. In general then, given a natural circulation event,a code like DEM0 will provide a verified prediction of the overallsystem state variables such as net flow through the reactor and bulktemperatures entering and exiting the core.
187
B. Whole-Core System Code, e . g . , and
Knowing the bulk reactor flow reaching the core as a function of time
for natural circulat ion leaves open the question of just how the flow
and heat redistr ibute between the numerous paral lel flow paths in the
core. This phenomena requires the detailed core-wide dynamic code type
of analysis. Even though only one localized plant region ( i . e . , the
core) is under consideration, the analysis is s t i l l extremely compli-
cated because of the strong interaction between the fuel assemblies,
radial blanket assemblies, control assemblies, plus other core regions
and bypass flows which a l l act as highly coupled parallel flow channels
with heat transfer between them. Since natural c irculat ion results 1n
a low flow/high coolant temperature condition, buoyancy effects must be
considered. With model development, the core-wide dynamic codes w i l l
y ield a flow-versus-time prof i le for a peak rod in the fuel and radial
blanket assemblies given the problem boundary conditions such as total
reactor in le t flow and bulk temperature from the plant-wide code, ind i -
vidual assembly powers and individual assembly thermal-hydraulic
information.
C. Hot Channel Rod Analysis Code, e.g. , F0RE-2M^2J
Given the localized peak channel flows as a function of time s t i l l is
not detailed enough to predict the hot channel coolant temperature for
natural c i rculat ion. I t is this hot channel temperature that is often
used as the basis for determining the adequacy of natural circulation
for decay heat removal of LMFBR's. To have a veri f ied hot rod predic-
t ion , one must account for such effects as: fuel restructuring , fue l -
cladding gap conductance, stored heat in rod, stat is t ical significance
of physics and engineering uncertainties in power, f low, dimensions and
properties, localized hot spots on the rod due to the wire wrap
or pel let eccentricity, localized decay heat variations, and localized
assembly power skews.
Since the hot channel analysis code is used solely for core analysis with
input from the plant and the core-wide codes, extreme detail in nodaliza-
tion can be incorporated to assure accurate temperature predictions. This
level of detail cannot currently be part of the core-wide and plant-wide
predictions since the sorgate requirements and computer running times
would make the codes impractical. In addition, a code such as F0RE-2M
provides a detailed nuclear physics prediction for the prompt and delayed
neutron f ission power as a function of time from shutdown with the capa-
b i l i t y of considering Doppler, sodium density, and radial/axial core
expansion feedback plus the effects of control system worth and PPS
functions.
Table 5 i l lustrates the interfacing of these code systems for detailed core
natural convection analyses.
Component experimental data is a basic ingredient to this system of codes.
The philosophy is that i f a system is well understood and veri f ied in
terms of i t s component parts, then performance calculations of the i n -
tegrated system have the required c red ib i l i t y . Therefore, the primary
thrust of the component testing is directed to: 1) validate component
models by showing that the essential thermal, hydraulic and mechanical
phenomena are considered, and 2) provide empirical data such as flow
pressure drops, on a component-by-component basis. However, in addition, the
verif icat ion includes confirmation of the codes with EBR-II and FFTF systems
test data."- •• These tests w i l l confirm that the codes properly integrate
the verif ied input data to correctly predict overall system natural c i r -
culation performance. I f the codes predict and/or umbrella experimental
system performance data, i f experimental prototypic data input has been
used in the codes, and i f the mathematical/programming aspects of the
codes have been ver i f ied; the objective w i l l be met of analytically and
experimentally verifying numerical models for prediction of LMFBR per-
formance when making transit ion to or operating in the natural ciruclation
mode.
VI . VERIFICATION OF CORE NATURAL CONVECTION PREDICTIONS
As discussed above, veri f icat ion of the plant-wide, core system and hot
rod code calculations w i l l be based on experimental d a t a ^ J . For the core
veri f icat ion work (Reference 17 addresses the veri f icat ion approach for
other plant hardware):
A. The codes w i l l be checked on an assembly basis by comparison to low flow
and power high temperature single assembly data described in Section I I I .
Various power-to-flow ratios and power skew data are available that are
prototypic and/or enveloping of natural circulation conditions.
B. The codes w i l l be confirmed on a core-wide basis by comparing
to quasi-steady state and dynamic data from natural circulation
tests in EBR-II and FFTF. In EBR-II, detailed flows and tem-
peratures w i l l be available from the instrumented XX08 as-
sembly which w i l l be in the core during the testing. Similar
FFTF data w i l l be available from Open Test Assemblies (OTA's).
Both XX08 and the FFTF OTA's have flow meters and numerous
thermocouples at various axial and radial locations through-
out the rod bundles.
C. Detailed fuel rod phenomena such as fuel restructuring
characteristics and fuel/cladding gap conductance w i l l be
based on irradiat ion data from EBR-II for fuel and blanket
type rods.
D. Decay power predictions w i l l be based on ZPPR test data from
cr i t i ca l experiments for capture and f ission rates and HEDL
ENDF/B-IV experimental data l ibrary used to provide kernels
plus uncertainties for the f ission product isotopes and
fissionable isotopes.
Current test plans in EBR-II include:
A. Loss of forced circulation flow transients initiated from^5% full flow and various decay heat loads and IHX coolingrates;
B. Loss of forced circulation flow with scram transients ini-tiated from various fission power and flow levels and withseveral fission product inventory levels.
And in FFTF, as part of their Acceptance Test Program (ATP)"- *:
A. Low power steady state testing with fission heating;
B. Loss of power and transition into the natural circulation mode from75 to 100% flow (small core decay heat loads);
Both programs should provide extremely meaningful data for verifying the coreanalysis codes as sufficiently accurate data are obtained. The experimentsof each Project become more meaningful to the verification effort the higherthe operating powers and flow from which the transient test is initiated(preferably full power and flow). The core data would then include thechange from turbulent to laminar flow with all its related effects whenconsidered on a coupled core-wide basis.
VII. SUMMARY
Natural circulation cooling of the core exhibits one of the few LMFBR coredesign transients where low power/high temperature conditions exist. Dueto the long coolant transport time and low pressure drop for the core, whiletranscending into and operating in this mode, core inter-assembly and intra-assembly flow/heat redistribution become significant with regard to accuratelypredicting temperatures. The core flow and heat redistribution decrease themaximum hot rod channel temperatures (as calculated neglecting these effects).
Three computer codes will be utilized for LMFBR natural circulation verifica-tion. One for plant-wide natural circulation analysis, another for coresystem natural convection analyses, and one for the detailed localized hot
rod predictions. Coupling the output of the three codes is complicatedbut practical. Verification of the codes consists of:
A. Developing code models using prototypic data, as required;
B. Using verified data in the codes once they are fully developed; and
C. Proving the accuracy of the code predictions by comparing the calcula-tional results to actual system-wide natural circulation data fromEBR-II and FFTF.
Current design estimates indicate that the final analyses of the core hotrods as calculated with the verified computer codes will exhibit severalhundred degrees margin to allowable limits. This will add significantcredibility to LMFBR's using natural circulation cooling as an independentand redundant decay heat removal means to the pumps, thus eliminating theneed for extra hardware for decay heat removal and extra backup powersupplies to the diesels (e.g., batteries) when combined with judiciousnatural circulation considerations in the plant design, such as adequateplant component thermal center differential, pump inertia, system pressuredrops, etc.
REFERENCES
1. R. M. Singer and J. L. Gillette, "Measurements of Subassembly and CoreTemperature Distributions in an LMFBR", AIChE Symposium Series, 73_,p. 184, 1977.
2. J . V. M i l l e r and R. D. Co f f ie ld , "F0RE-2M: A Modified Version of theF0RE-II Computer Program for the Analysis of Fast Reactor Transients",CRBRP-ARD-0142, March 1976.
3. E. U. Khan and A. Hinds, "Thermal-Hydraulic Models in C0RTRAN Code forCore-Wide Temperature Predictions during a Natural Circulat ion Transient",Invi ted paper to the Atlanta ANS Meeting, 1979.
4. T. L. George, R. A. Masterson, K. L. Basehore, "A Modified Version ofC0BRA for Whole-Core LMFBR Transient Analysis", Invited paper to theAtlanta ANS Meeting, 1979.
189
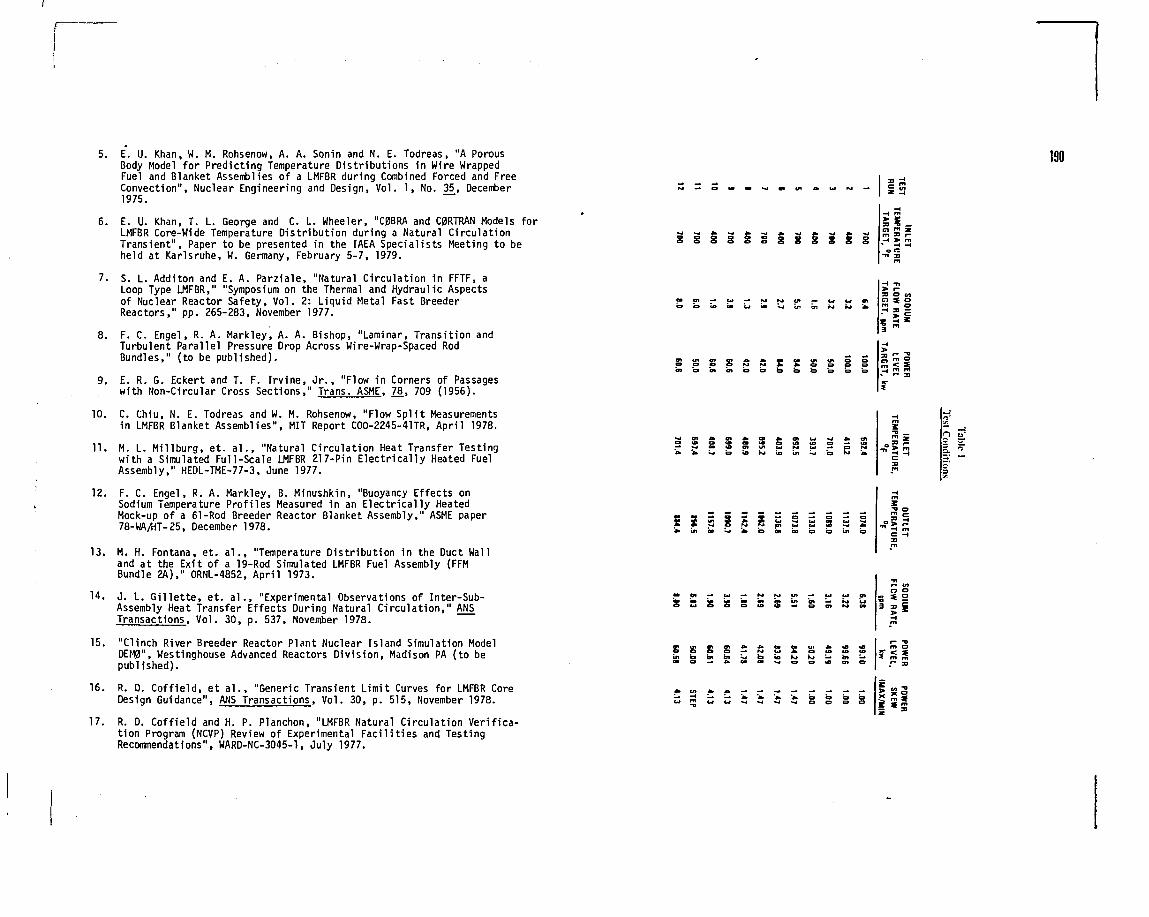
5. E. U. Khan, W. M. Rohsenow, A. A. Sonin and N. E. Todreas, "A PorousBody Model fo r Predict ing Temperature Distr ibut ions in Wire WrappedFuel and Blanket Assemblies of a LMFBR during Combined Forced and FreeConvection", Nuclear Engineering and Design, Vol. 1 , No. 35, December1975. ~~
6. E. U. Khan, T. L. George and C. L. Wheeler, "C0BRA and C0RTRAN Models forLMFBR Core-Wide Temperature Dis t r ibut ion during a Natural Circulat ionTransient", Paper to be presented in the IAEA Special ists Meeting to beheld at Karlsruhe, W. Germany, February 5-7, 1979.
7. S. L. Additon and E. A. Parziale, "Natural Ci rculat ion in FFTF, aLoop Type LMFBR," "Symposium on the Thermal and Hydraulic Aspectsof Nuclear Reactor Safety, Vol . 2: Liquid Metal Fast BreederReactors," pp. 265-283, November 1977.
8. F. C. Engel, R. A. Markley, A. A. Bishop, "Laminar, Transit ion andTurbulent Paral lel Pressure Drop Across Wire-Wrap-Spaced RodBundles," (to be published).
9. E. R. G. Eckert and T. F. I r v ine , J r . , "Flow in Corners of Passageswith Non-Circular Cross Sections," Trans. ASME, 78_, 709 (1956).
10. C. Chiu, N. E. Todreas and W. M. Rohsenow, "Flow S p l i t Measurementsin LMFBR Blanket Assemblies", MIT Report C00-2245-41TR, Apr i l 1978.
11. M. L. M i l l bu rg , e t . a l . , "Natural Circulat ion Heat Transfer Testingwith a Simulated Full-Scale LMFBR 217-Pin E lec t r i ca l l y Heated FuelAssembly," HEDL-TME-77-3, June 1977.
12. F. C. Engel, R. A. Markley, B. Minushkin, "Buoyancy Effects onSodium Temperature Prof i les Measured in an E lec t r i ca l l y HeatedMock-up of a 61-Rod Breeder Reactor Blanket Assembly," ASME paper78-WA/HT-25, December 1978.
13. M. H. Fontana, e t . a l . , "Temperature D is t r ibu t ion in the Duct Walland at the Exit of a 19-Rod Simulated LMFBR Fuel Assembly (FFMBundle 2A)," ORNL-4852, Apr i l 1973.
14. J . L. G i l l e t t e , e t . a l . , "Experimental Observations of Inter-Sub-Assembly Heat Transfer Effects During Natural C i rcu la t ion , " ANSTransactions, Vol . 30, p. 537, November 1978.
15. "Clinch River Breeder Reactor Plant Nuclear Island Simulation ModelDEW, Westinghouse Advanced Reactors Div is ion, Madison PA (to bepublished).
16. R. D. Co f f ie ld , et a l . , "Generic Transient Limit Curves for LMFBR CoreDesign Guidance", ANS Transactions, Vol. 30, p. 515, November 1978.
17. R. D. Cof f ie ld and H. P. Planchon, "LMFBR Natural Circulat ion Ver i f i ca -t ion Program (NCVP) Review of Experimental Fac i l i t i es and TestingRecommendations", WARD-NC-3045-1, July 1977.
190
OB O» — W -• JS» M
s s s s s s t s s« n o b t o t o o b o o
> r-33 O Vta ag om o
•" > s« H C
~3< *r- 3D
5 s s I s i5 .5 a S i S s
n E1
5 T
S S S S 5 Si b U f c
•S S 23 i
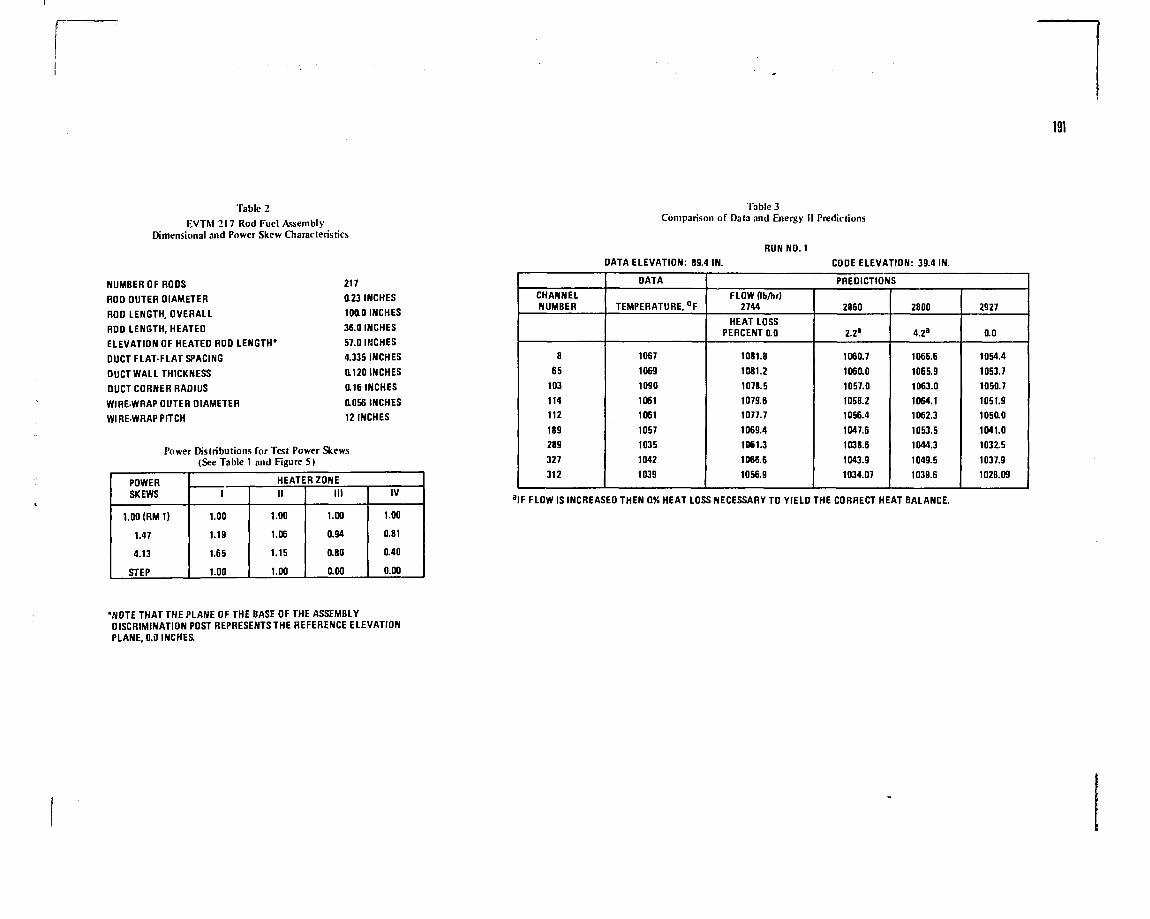
r~
191
Table 2EVTM 217 Rod Fuel Assembly
Dimensional and Power Skew Characteristics
NUMBER OF RODS
ROD OUTER DIAMETER
ROD LENGTH, OVERALL
ROD LENGTH, HEATED
ELEVATION OF HEATED ROD LENGTH*
DUCT FLAT-FLAT SPACING
DUCT WALL THICKNESS
DUCT CORNER RADIUS
WIRE-WRAP OUTER DIAMETER
WIRE-WRAP PITCH
217
0.23 INCHES
100.0 INCHES
36.0 INCHES
57.0 INCHES
4.335 INCHES
0.120 INCHES
0.16 INCHES
0.056 INCHES
12 INCHES
Power Distributions for Test Power Skews(See Table 1 and Figure 5)
POWERSKEWS
1.00 (RM1)
1.47
4.13
STEP
HEATER ZONE1
1.00
1.19
1.65
1.00
II
1.00
1.06
1.15
1.00
III
1.00
0.94
0.80
0.00
IV
1.00
0.81
0.40
0.00
Table 3Comparison of Data and Energy II Predictions
RUN NO. 1
CHANNELNUMBER
8
65103
114
112
189
289
327
312
DATA ELEVATION: 89.4 IN.
DATA
TEMPERATURE, °F
1067
1069
1090
1061
1061
1057
1035
1042
1039
CODE ELEVATION: 39.4 IN.
PREDICTIONS
FLOW (Ib/hr)2744
HEAT LOSSPERCENT 0.0
10«1.8
1081.2
1078.5
1079.6
1077.7
1069.4
1061.3
1066.6
1056.9
2860
2.2«
1060.7
1060.0
1057.0
1058.2
1056.4
1047.6
1038.6
1043.9
1034.07
2800
4.2»
1066.6
1065.9
1063.0
1064.1
1062.3
1053.5
1044.3
1049.5
1039.6
2927
0.0
1054.4
1053.7
1050.7
1051.9
1050.0
1041.0
1032.5
1037.9
1028.09
aIF FLOW IS INCREASED THEN QK HEAT LOSS NECESSARY TO YIELD THE CORRECT HEAT BALANCE.
•NOTE THAT THE PLANE OF THE BASE OF THE ASSEMBLYDISCRIMINATION POST REPRESENTS THE REFERENCE ELEVATIONPLANE, 0.0 INCHE&
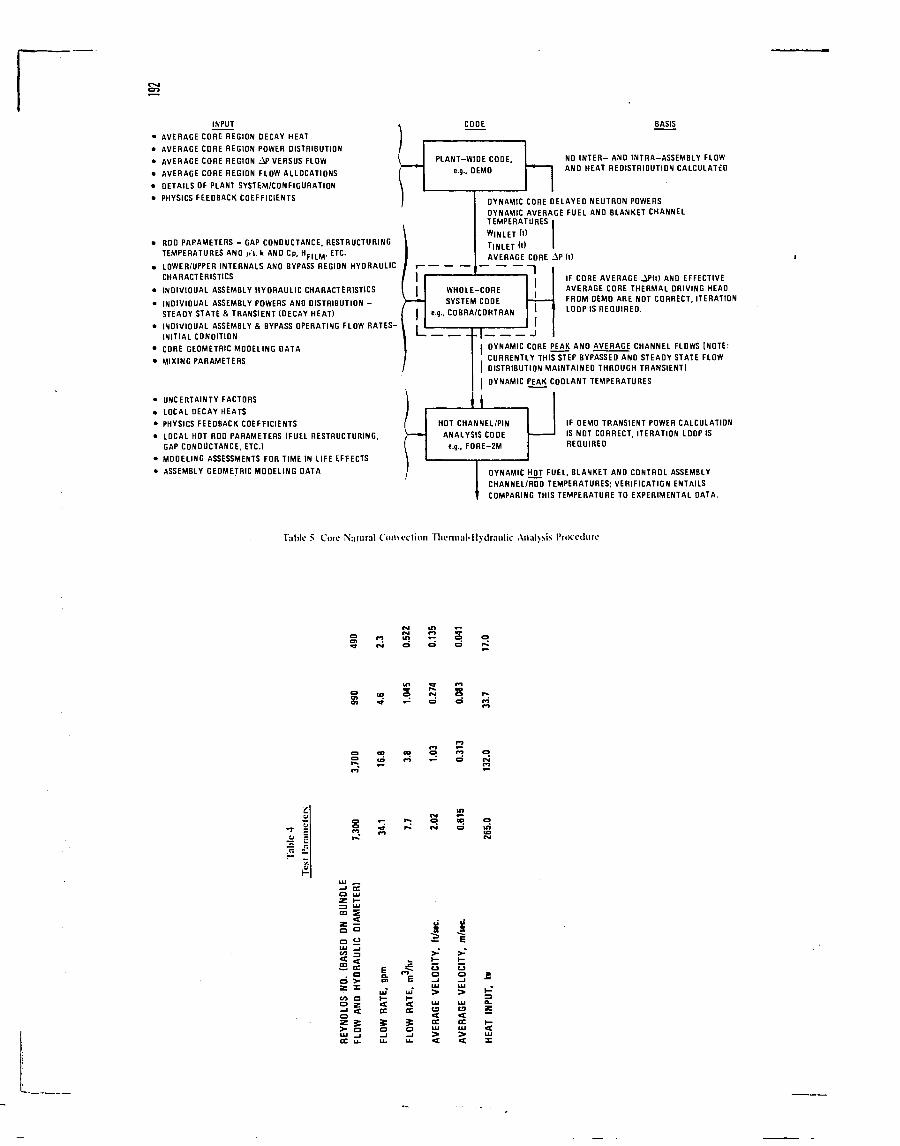
INPUT
AVERAGE CORE REGION DECAY HEAT
AVERAGE CORE REGION POWER DISTRIBUTION
AVERAGE CORE REGION AP VERSUS FLOW
AVERAGE CORE REGION FLOW ALLOCATIONS
DETAILS OF PLANT SYSTEM/CONFIGURATION
PHYSICS FEEDBACK COEFFICIENTS
ROO PARAMETERS - GAP CONDUCTANCE, RESTRUCTURINGTEMPERATURES AND /it. k AND Cp. H f | L M , ETC.
LOWER/UPPER INTERNALS AND BYPASS REGION HYDRAULIC
CHARACTERISTICS
INDIVIDUAL ASSEMBLY HYDRAULIC CHARACTERISTICS
INDIVIDUAL ASSEMBLY POWERS ANO DISTRIBUTION -STEAOY STATE & TRANSIENT (DECAY HEAT)INDIVIDUAL ASSEMBLY & BYPASS OPERATING FLOW RATES- IINITIAL CONDITION
CORE GEOMETRIC MOOELING DATA
MIXING PARAMETERS
UNCERTAINTY FACTORS
LOCAL OECAY HEATS
PHYSICS FEEDBACK COEFFICIENTS
LOCAL HOT ROD PARAMETERS (FUEL RESTRUCTURING.
GAP CONDUCTANCE. ETC.)
MODELING ASSESSMENTS FOR TIME IN LIFE EFFECTS
ASSEMBLY GEOMETRIC MOOELING DATA
CODE
PLANT-WIDE CODE,e.g.. DEMO
BASIS
NO INTER- AND INTRA-ASSEMBLY FLOWAND HEAT REDISTRIBUTION CALCULATED
DYNAMIC CORE DELAYED NEUTRON POWERSOYNAMIC AVERAGE FUEL AND BLANKET CHANNELTEMPERATURES
«INLET (0
AVERAGE CORE AP It)
e.g.
WHOLE-CORESYSTEM CODECOBRA/CORTRAN
L 4.1I
IF CORE AVERAGE .IPItl ANO EFFECTIVEAVERAGE CORE THERMAL DRIVING HEADFROM DEMO ARE NOT CORRECT, ITERATIONLOOP IS REQUIRED.
I DYNAMIC CORE PEAK AND AVERAGE CHANNEL FLOWS (NOTE:CURRENTLY THIS STEP BYPASSEO ANO STEADY STATE FLOW
| DISTRIBUTION MAINTAINED THROUGH TRANSIENTI| OYNAMIC PEAK COOLANT TEMPERATURES
IHOT CHANNEL/PIN
ANALYSIS CODEe.g.. F0RE-2M
IF OEMO TRANSIENT POWER CALCULATIONIS NOT CORRECT, ITERATION LOOP ISREQUIRED
DYNAMIC HOT FUEL, BLANKET ANO CONTROL ASSEMBLYCHANNEL/ROD TEMPERATURES; VERIFICATION ENTAILSCOMPARING THIS TEMPERATURE TO EXPERIMENTAL DATA.
Table 5 Core Natural Convection Thermal-Hvdraulic Analysis Procedure
= s
8 r>
_ "T r»
Zo
3 TY,
E>"
Ea
1 LU
E 2 2LU LU
LU > >
CC CCLU
CC LU U. U- 4
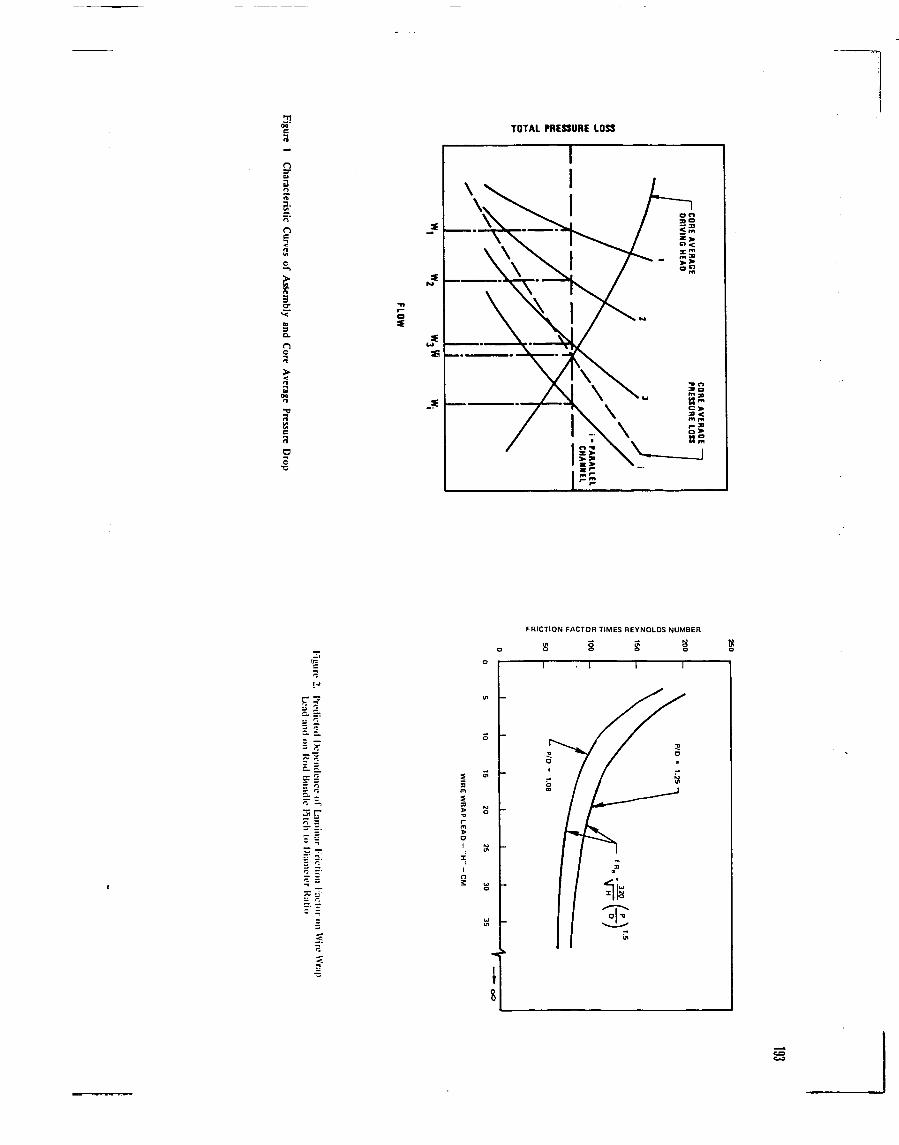
TOTAL PRESSURE LOSS
n
3
ID
FRICTION FACTOR TIMES REYNOLDS NUMBER
B 9 S S
3 r
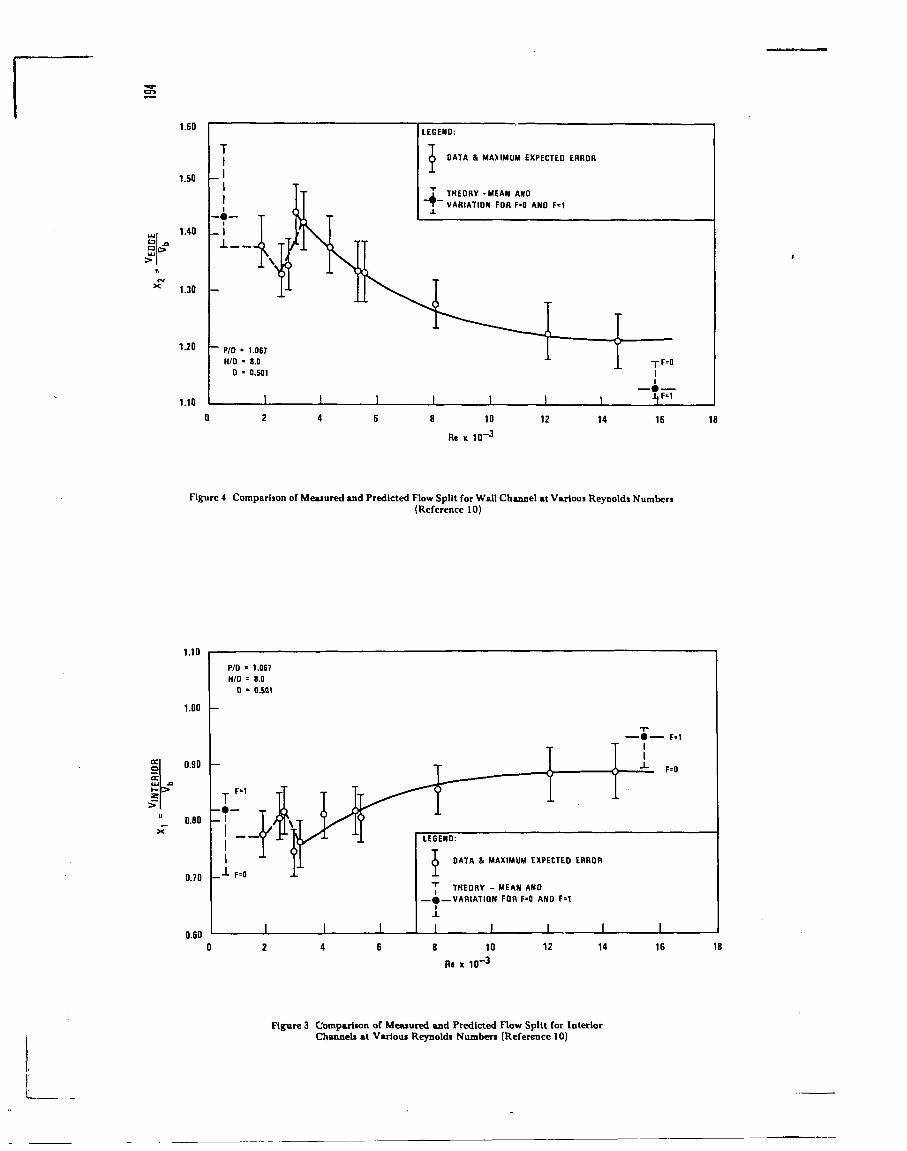
1.60
1.50 -
1.40 _
1.30 -
1.20 -
1.10
T1I11
1
- 11
-
~ P/D =H/D =
D -
T 1Y> T
-I rM TT
1.0678.00.501
I I I
LEGEND:
A DATA & MAXIMUM EXPECTED ERROR
7 THEORY -MEAN AND~ T VARIATION FOR F=0 AND F*1
X
-
11 I 1
II -J-F=O
1
~*FM"
10
Re x 1 0 ~ 3
12 14 16 IB
Figure 4 Comparison of Measured and Predicted Flow Split for Wall Channel at Various Reynolds Numbers(Reference 10)
1.10
1.00
0.90
0.80
0.70
0.60
P/D - 1.067H/D = 8.0
D * 0.501
T
1
DATA & MAXIMUM EXPECTED ERROR
j THEORY - MEAN AND— «- .VARIATION FOR F-0 AND FM
i
Re x 10
10
- 3
12 14
F=0
16 18
Figure 3 Comparison of Meiuured and Predicted Flow Split for InteriorChannels at Various Reynolds Numbers (Reference 10)
L_
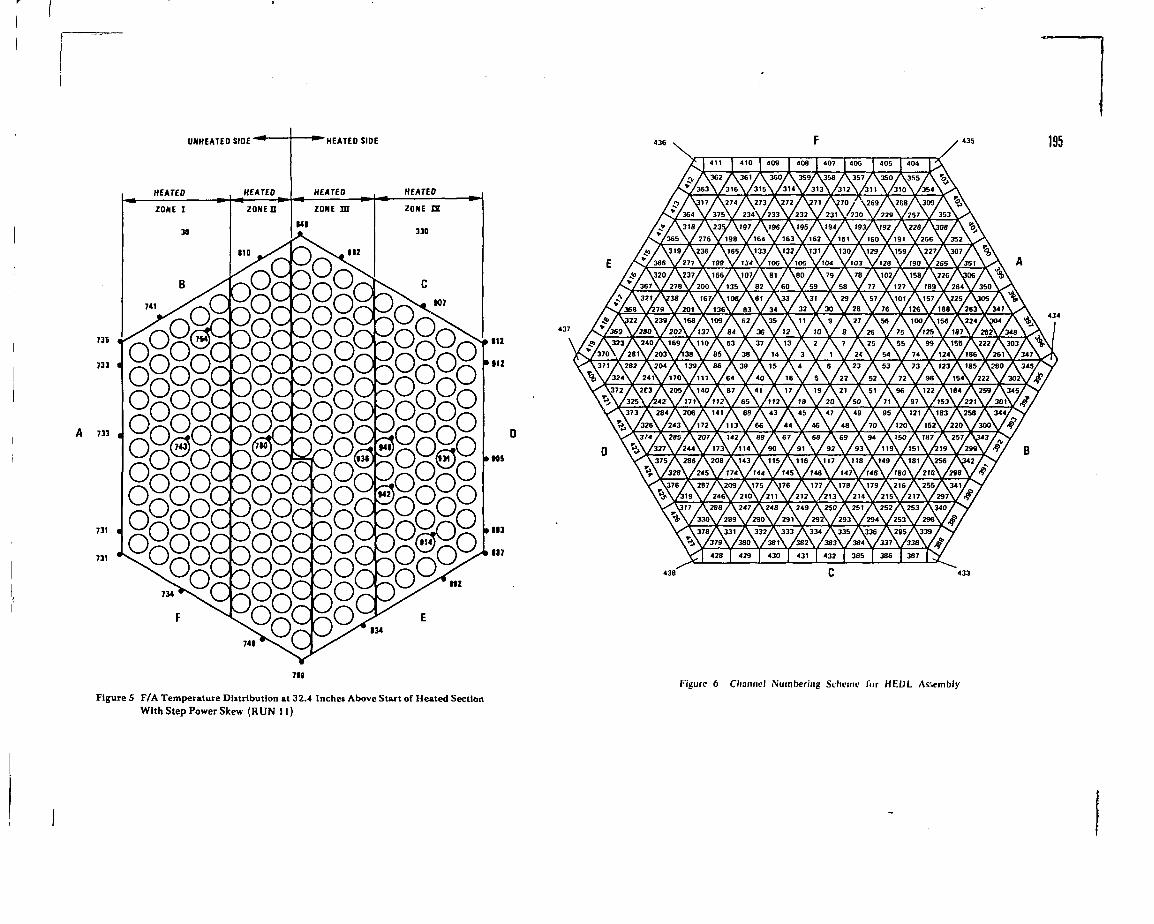
Figure 6 Channel Numbering Scheme for HEUL AssemblyFigure 5 F/A Temperature Distribution at 32.4 Inches Above Start of Heated Section
With Step Power Skew (RUN 11)
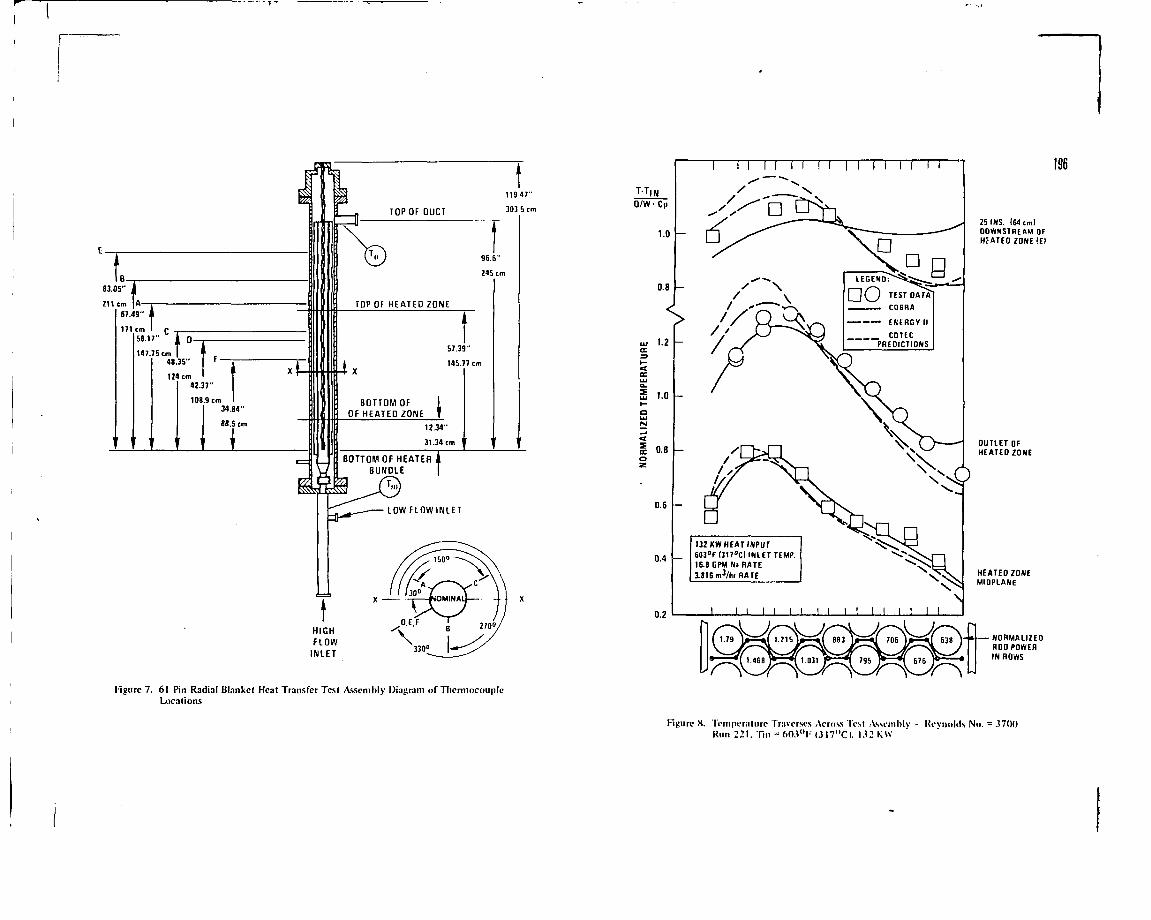
r~
12.34"
31.34 cm
BOTTOM OF HEATER,BUNDLE
T,,
IOWFLOWINLET
HIGHFLOW
INLET
Figure 7. 61 Pin Radial Blanket Heat Transfer Test Assembly Diagram of ThermocoupleLocations
25 INS. 164 cmlDOWNSTREAM OFHEATED ZONE IEI
I I II M II II II II II
COBRA
ENERGY II
_ _ COTECPREDICTIONS
132 KW HEAT INPUT603°F(317°CMNLETTEMP.1E.8GPM N J R A T E
1816 m3/hr RATE HEATED ZONEMIOPLANE
I I I I I I I I I I I I
196
0.2
NORMALIZEDROD POWERIN ROWS
Figure X. Tempera I urc Traverses Across Test Assembly - Reynolds No. = 3700Run 221. Tin = 603"F (3I7"C). 132 KW
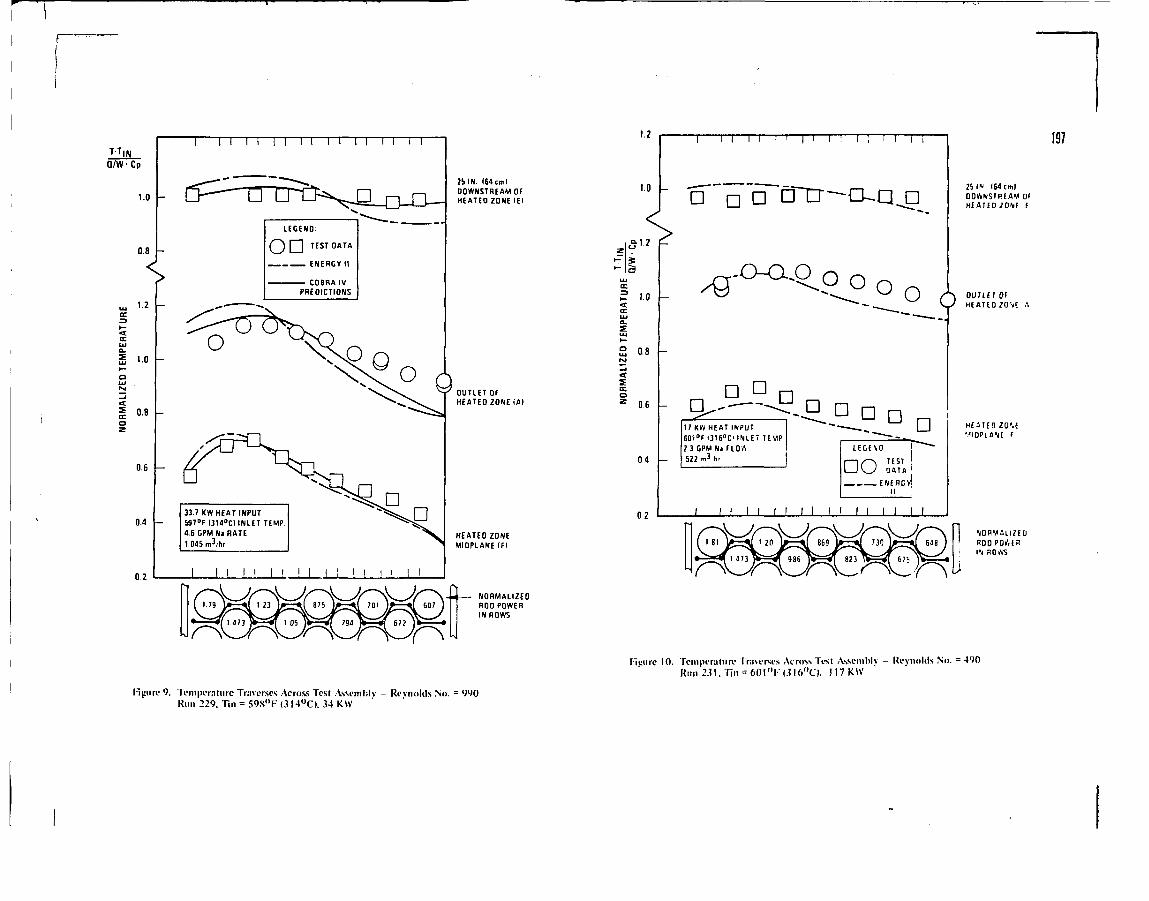
T-T|W
Q/W-Cp
1.0
i n M n n
0.8 -
s1.2
0.B
0.6
0.4 -
02
LEGEND:
TEST DATA
ENERGY II
— COBRA IVPREDICTIONS
o
26 IN. (64cmlDOWNSTREAM OFHEATED ZONE IEI
33.7 KW HEAT INPUT597°F (314°C) INLET TEMP.4.6 GPMNi RATE1.045 m'/hr
DD
I I i I ! M l
OUTLET OFHEATEO ZONE iAI
HEATEO ZONEMIOPLANE IFI
NORMALIZEDROD POWERIN ROWS
Figure 9. Temperature Traverses Across Test Asscmhly - Reynolds No. = 990Run 229. Tin = 598°K (314°C). 34 KW
1.2
1.0
i i i n
D • D
? '0<LUa.LUI—
2 as
ccoz 0.6
0 4
02
o
2b IN IMcmlDOWNSTREAM OfHEATEO ZOME f
6
17 KW HEAT INPUT6OiDF(316°C' INLET TEMP2 3 GPMNi FLO/.522 m3 h.
a a D D DL E G E V O
TESTI ! \_J QftTA !
tNERGvl
I I I I I I [ I I 1 I I I I I I I
OUTLET 0»HEATEO ZOf»E
HEMEO ZO'.EV I D P I A « F
NORMOLIZEDROD P O / . f\\ ROWS
197
Hgurc 10. Temperature Traverses Across Test Assembly - Reynolds No. - 4 9 0
Rim 231 . Till = 6 0 l " r < 3 l 6 ° C ) . I I 7 K W
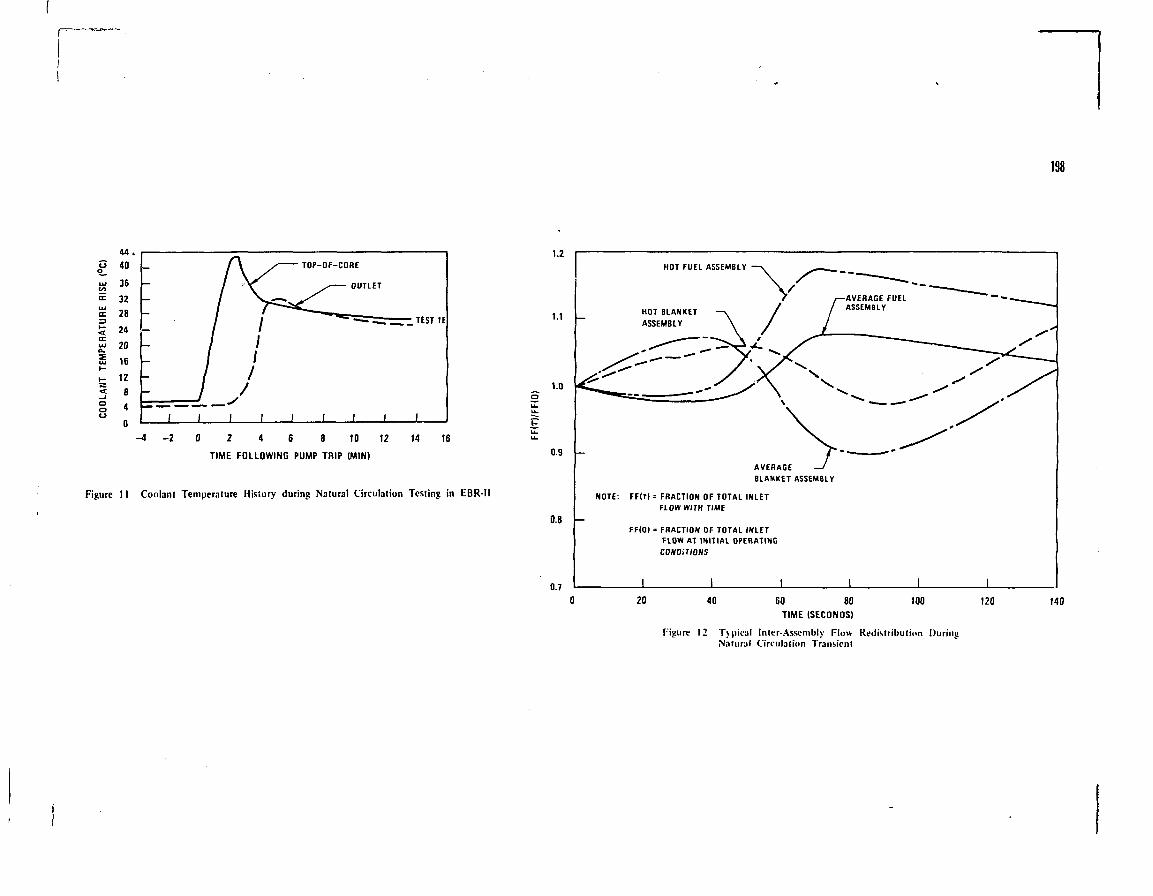
198
44.40
36
32
28
24
20
16
12
8
4 F—
-
-
1 1
/ V,/ // /
1 1 1
- TOP-OF-CORE
1
— OUTLET
1 1
TEST IE
1
- 4 - 2 0 2 4 6 8 10 12
TIME FOLLOWING PUMP TRIP (MIN)
14 16
Figure I I Coolant Temperature History during Natural Circulation Testing in EBR-II
1.2
1.1
1.0
0.9
0.8
0.7
HOT FUEL ASSEMBLY
HOT BLANKETASSEMBLY
AVERAGEBLANKET ASSEMBLY
NOTE: FF(r)= FRACTION OF TOTAL INLETFLOW WITH TIME
FF(O) = FRACTION OF TOTAL INLETFLOW AT INITIAL OPERATING
CONDITIONS
20 40 60 80TIME (SECONDS)
100 120 140
Figure 12 Typical Inter-Assembly Flow Redistribution DuringNatural Circulation Transient
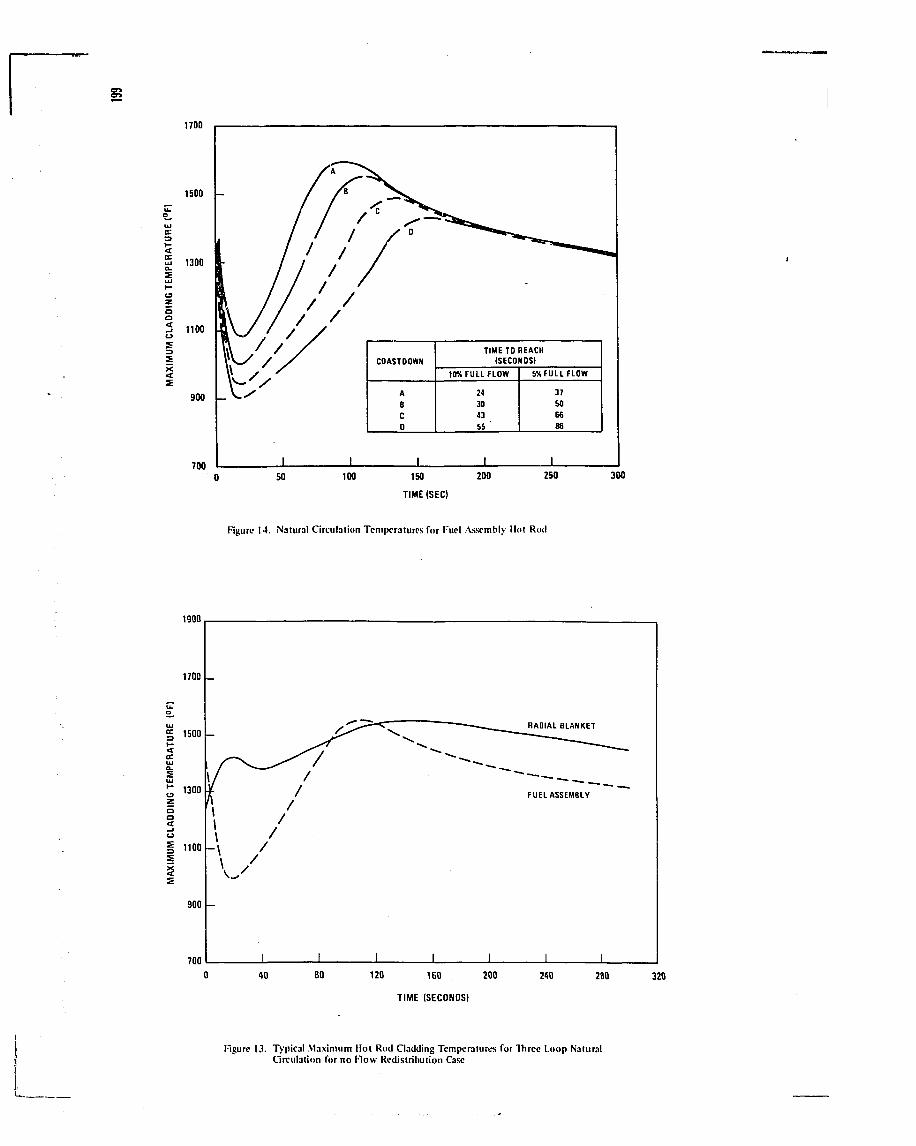
Figure 14. Natural Circulation Temperatures for Fuel Assembly Hot Roil
Figure 13. Typical Maximum Hot Rod Gadding Temperatures for Three Loop NaturalCirculation for no Flow Redistribution Case
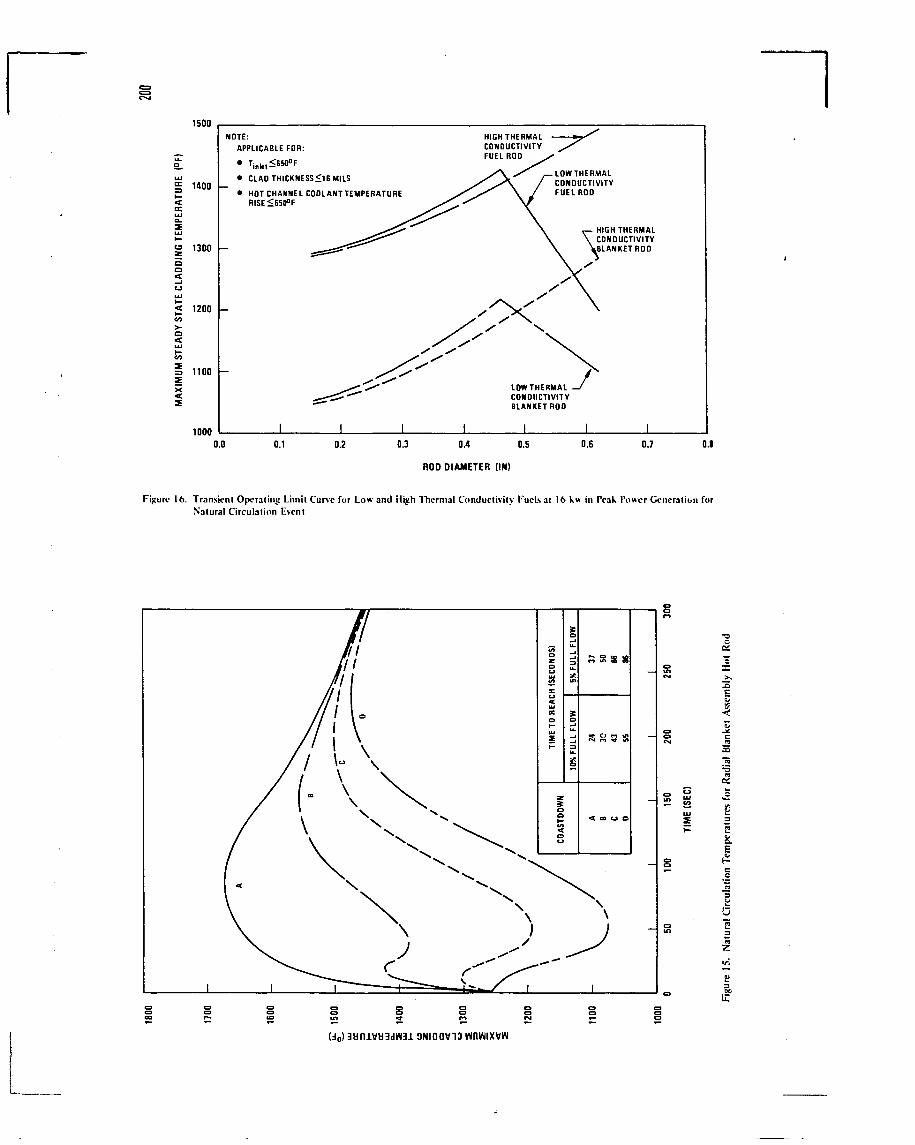
Figure 16. Transient Operating Limit Curve for Low and High Thermal Conductivity Fuels at 16 kw in Peak Power Generalien forNatural Circulation Event
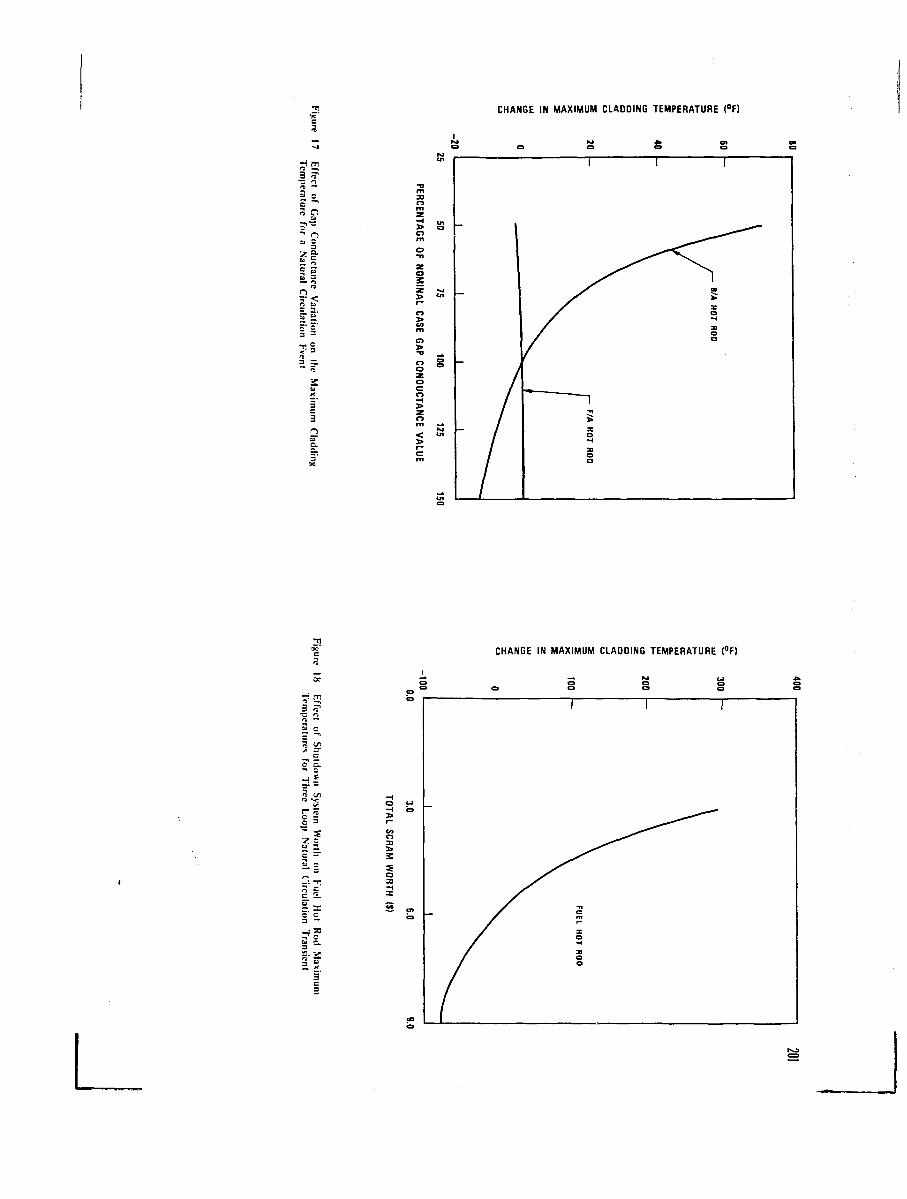
CHANGE IN MAXIMUM CLADDING TEMPERATURE (°F)
-im3 7
n
5!C 3
§8
sz>
oo
/
- /
/
1
, /
/
/
i—
F/A
HO
TR
OD
1
Xo
RO
D
CHANGE IN MAXIMUM CLADDING TEMPERATURE (°F)
c c
;?
o
- 1 »
THERMOHYDRAUUC CHARACTERISTICSOF SNR-FUEL ELEMENTS
G. WEBERINTERATOM,liergisch-Gladbach,Federal Republic of Germany
G. CORNETBclgonuclSaire,Brussels,Belgium
1. Design of the investigated fuel subassemblies
Different fuel element types of the SNR-reactor have been
designed and investigated by thermohydraulic calculations.
These element types differ by their spacing system of the
pins inside the wrapper tube. The grid type bundle of the
SNR 300 Mk la has been improved for the SNR 300 Mk II and
the SNR 2 by a special attachment of the grids to the
wrapper tube. On the basis of the Mk II bundle geometry a
wire bundle was investigated to find out the behaviour
of the different pin spacing concepts. The main data of
the investigated fuel subassemblies are:
- SNR 3OO Mk la: Reference element
The fuel element irradiated in the first core of the SNR
300 is equipped with a honeycomb spacer grid. This grid
is fabricated from steel straps adequately shaped and
spotwelded together. The grid is fixed by three tie rods
positioned at the fifth row of pins around the central
pin. The main geometric data of the bundle and the shape
of the grid are given in fig. 1.
- SNR 3OO Mk la: "Sonder" element 202
The geometric data of this element is identical with that
of the Mk la reference element, except the grid, which is
fabricated by spark erosion. The shape of the grid is
drawn on fig. 2.
- SNR 300 Mk II: Reference element
The second load of the SNR 300-core obtains fuel elements
with pins of increased diameter compared to the first
load due to economical reasons. As this larger pin dia-
meter must be compatible with the wrapper of the Mk la
element the number of pins is decreased from 169 to 127.
The spacer grids»fabricated by spark erosion,are positioned
in the wrapper tube by means of so - called "skirts", as
illustrated lr> fig. 3. These skirts are small steel
plates (six for one grid) which are spot welded to the
grid and to the wrapper tube. The advantage of this
grid fixation compared to the tie rod fixation is that
all pin positions can be used for fuel pins and the
favourable behavior of these skirts on the thermohydraulic
results.
- SNR 3OO Mk II: Former design of the back up concept
with wires
This wire type bundle is based on the geometry (pin dia-
meter, wrapper tube dimension) of the Mk II reference
element. The spiral wires have a diameter of 1.195 mm and
a winding pitch of 160 mm. To reduce the bypass flow in
the wall subchannels filling wires of 1.95 mm diameter
are inserted (fig. 4 ) . These filling wires are welded
at both ends of the bundle on metal straps.
- SNR 2: Fuel element
The spacer grid and the grid attachment of the SNR 2
element is similar to the Mk II reference design but
the number of pins have been increased to 271 and the
pitch to diameter ratio have been increased slightly
(fig. 5).
2. Thermohvdraullc calculations under nominal conditions
2.1 Calculation method
The thermohydraulic calculations have been performed with
the subchannel analysis code CIA (CIA means C0BRA-^NTERATOM,
which is the IA-version of the code C0BRA II /~1_7» a n d
with the subchannel analysis code NADIA (BELGONUCLEAIRE
The subchannel codes calculate the steady-state flow and
enthalpy in the subchannels of rod bundle nuclear fuel
elements. The programs use a mathematical model that in-
cludes the effects of turbulent and diversion crossflow
mixing between the subchannels. The equations of the
mathematical model are solved as an initial value problem
by using finite differences.Distorted bundles may be analyzed
by selecting variable subchannel areas and gap spacing
along the length. Spacer pressure loss and forced diversion
crossflow can be considered.
With the CIA-code grid and wire type bundles are calculated.
At Belgonucleaire wire type bundles are calculated with
the code SPIRALE £~2j.
The bundle is divided into subchannels as illustrated in
fig. 6. Each subchannel is characterized by the flow area
and the wetted perimeter. The heat conduction between
adjacent subchannels is calculated on the basis of the gap
spacing and the centroid-to-centroid distance between these
subchannels.
The other input data depend on the pin fixation, grid or 203
wire:
- Grid type bundle
The friction pressure loss coefficient is calculated
according to the Me. Adams formula /_ 3_7. A correction
factor taking into account the bundle geometry is applied
which is deduced by global bundle pressure loss measure-
ments.
The grid pressure loss coefficient is calculated as
shown on fig. 6 for a wall subchannel with a grid with
skirts. This formula is applied to each subchannel; if
there are no skirts the ratio between A^/A1 is equal one.
The Reynolds-dependency is defined with the aid of
experiments.
For all grid type bundles a mixing rate of 1% of the mass
flow rate of the subchannel per cm at each subchannel
boundary is used.
Wire type bundle
The friction pressure loss is calculated with the No-
vendstern correlation / 4_7 (fig. 7).
For the mixing between subchannels two different models
are applied.
In the CIA code a two zone model is applied Zone no.1
is formed by all triangular subchannels and is characterized
by a turbulent crossflow without net mass transport between
the subchannels (this is marked by two arrows in opposite
direction on fig. 7). The corresponding mixing rate is
derived from experiments and has a value cf 5,4%/cm and
each boundary. Zone no. 2 is formed by the wall and corner
subchannels and is characterized by a flow sweeping around
the periphery of the bundle (marked by one arrow on fig. 7).
The sweeping crossflow per length unit is proportional
to the percentage of the subchannel flow area which is
occupied by the spacer wire and inverse proportional to
the winding pitch. There is no turbulent crossflow assumed
in zone no. 2. At the boundary between the two zones»turbu-
lent crossflow of zone no. 1 is assumed only.
The code SPIRALE is using a mixing model which takes into
account an axial variable forced crossflow due to the
spiral wire. The sweeping crossflow is assumed to be pro-
portional to: the wire slope, the mass velocity in the
donor subchannel, the width of the pin to pin gap, and
a sine function of the distance of the wire to the gap
at the axial level under consideration.
2.2 Calculation results
The fuel subassemblies are calculated with operating data
(power, mass flow, inlet temperature) which are typical for
the central position of the SNR 300 and SNR 2 - cores.
Grid type bundle
The grid type bundle has been calculated under the assump-
tion of a centered bundle inside the wrapper tube. The re-
sults of the thermohydraullc calculations for the nominal
case are drawn in fig. 8 - fig. 12.
The mass flow distribution is shown for three typical sub-
channels over a length of about 600 mm. The dot-dash line
at the axial coordinate O.O m denotes the core mid plane.
Comparing the mass flow distribution in the axial direction
of the wall subchannel (fig. 8 and fig. 9, full line) it
can be seen that the mass flow rates in the wall subchannels
of the Mk la bundles are less influenced by the grid as the
wall subchannels of the Mk II and SNR 2 bundle. The mass
flow rate of the wall subchannel of the Mk II bundle is
decreased by 50% in the calculation step where the grid is
considered. This can be explained by the lower pitch-over-
diameter ratio of 1.15 for the Mk II-bundle and 1.20 for
the ENR 2 bundle compared to 1.32 for the two Mk la-bundles.
Because a minimum pin to wrapper tube wall distance is
needed for the grid structure, the irass flow rate in the
inner part of the bundle would decrease due to the higher
flow resistance and increase in the wall region (constant
bundle mass flow rate). This has to be compensated by the
grid obstructions to reach a flat temperature distribution
across the bundle.
204
The radial temperature distributions at core outlet (fig. 10
and fig. 11) show for all four bundles a characteristic low
temperature increase for the wall region compared to the
inner region of the bundle. The reason for this can be
found in the criteria applied for the bundle optimization:
Even if non-nominal conditions (bundle eccentricity) are
taken into account, it should be avoided that the small
number of wall subchannels are the hottest ones. The reason
for the .noticeable smaller difference of the temperature
increase between the inner and the wall region of the
bundle for the Mk II and SNR 2 element compared to the
Mk la-bundles will be explained in chapter 3.1.1.
The pressure loss in axial direction is shown on fig. 12
over the same length (600 mm) as the mass flow distribution.
The contribution of the grid pressure loss to the total
pressure loss is about 58% for the Mk la reference element
with a honeycomb grid. This contribution is lower for the
Mk la "Sonder" element (42%) as the thickness of the grid
structure is decreased due to the spark erosion fabrication
method. The higher contribution of the grid pressure loss
to the total pressure loss of the Mk II reference element
(f5%) and the SNR 2 element (5O%) results from the smaller
p/d ratio of these bundles (the thickness of the grid
structure cannot be reduced to any small value), and the
large flow redistribution at the spacer grid level.
bundle inside the wrapper tube for the grid or other distri- 205
butions of the gaps between pins and wrapper and pins for
the wire.
Wire type bundle
Detailed computer calculations for a wire type bundle have
been performed for the Mk II former back up solution element
with the SPIRALE code. This bundle has been calculated on
the conservative assumption of a compact bundle (no gaps
between wires and pins) centered inside the wrapper tube.
The results are shown on fig. 13.
The mass flow rates in the central subchannels are axially
constant; the average mass flow rate of the wall subchannel
is more than a factor 2 greater than the mass flow rate of
the inner subchannel. This results in a high temperature
difference bi-tween the inner region and the wall region
of the bundle. The bundle pressure loss follows a linear
function versus the length, it is 35% lower than the pressure
loss of the Mk II grid type bundle for the same mass flow
rate.
3. Thermohydraulic calculations under non-nominal conditions
3.1 Non-nominal conditions at BOL
The components of the bundle (pins, spacer, wrapper tube)
are fabricated with tolerances. To ensure an easy intro-
duction of the bundle into the wrapper a gap has to be
provided. From the tolerances and insertion clearances
a gap results at begin of life (BOL) between the grid
outer size and the wrapper tube inner size for the grid
bundle, and gaps result between the pins themselves and
between the pins and the wrapper tube inner size for the
wire type bundle. For the nominal case a position of the
bundle or the pins is assumed. Other positions of the bundle
or the pins are possible, e.g. eccentricity of the whole
3.1.1 Eccentricity of the grid type bundle
The thermohydraulic calculations have been performed on
bundles fully eccentered towards one corner of the
hexagonal wrapper tube. A comparison of the influence
of the eccentricity on the temperature distribution lias
been made for the four examined subassemblies. The main
difference between the four investigated subassemblies
is the grid attachment. The grids of the Mk la-elements
are fixed with tie rods, the grids of the Mk II and the
SNR 2 elements are attached with skirts to the wrappers.
A schematic illustration how the skirt influences the
flow resistance of the wall subchannels is given on fig.14.
Under the assumption of an eccentricity of the bundle which
in this case increases the flow area of the wall subchannels,
the following differences between the grid attachments can
be stated: with increasing eccentricity the flow resistance
of friction is decreased for both attachments due to the
increasing flow area of the subchannel; the flow resistance
of the grid without skirt is decreased as the free flow area
in the grid level is increased; the flow resistance of
the grid with skirt is increased as the free flow area
of the grid level is kept constant and therefore the
losses due to expansion behind the grid increases. These
effects lead to the following behaviour of the total
flow resistance of the wall subchannels with increasing
eccentricity. The grid without skirt shows a decreased
total flow resistance due to the addition of the friction
and grid resistance which are both decreased. A lower
total flow resistance in the wall subchannel means higher
mass flow rate and therefore lower temperature increase:
The temperature distribution is disturbed under eccentric
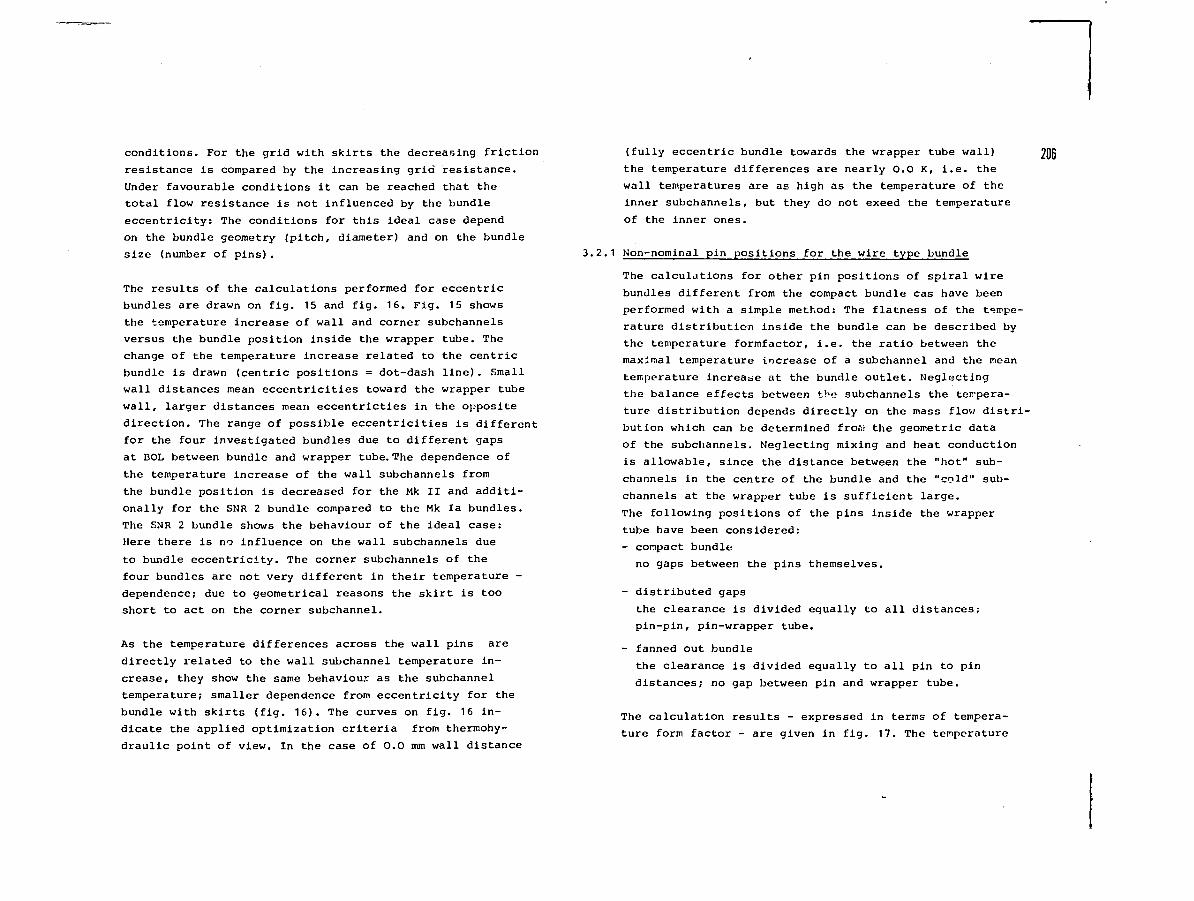
conditions. For the grid with skirts the decreasing friction
resistance is compared by the increasing grid resistance.
Under favourable conditions it can be reached that the
total flow resistance is not influenced by the bundle
eccentricity: The conditions for this ideal case depend
on the bundle geometry (pitch, diameter) and on the bundle
size (number of pins).
The results of the calculations performed for eccentric
bundles are drawn on fig. 15 and fig. 16. Fig. 15 shows
the temperature increase of wall and corner subchannels
versus the bundle position inside the wrapper tube. The
change of the temperature increase related to the centric
bundle is drawn (centric positions = dot-dash line). Small
wall distances mean eccentricities toward the wrapper tube
wall, larger distances mean eccentricties in the opposite
direction. The range of possible eccentricities is different
for the four investigated bundles due to different gaps
at BOL between bundle and wrapper tube. The dependence of
the temperature increase of the wall subchannels from
the bundle position is decreased for the Mk II and additi-
onally for the SNR 2 bundle compared to the Mk la bundles.
The SNR 2 bundle shows the behaviour of the ideal case:
Here there is no influence on the wall subchannels due
to bundle eccentricity. The corner subchannels of the
four bundles are not very different in their temperature -
dependence; due to geometrical reasons the skirt is too
short to act on the corner subchannel.
As the temperature differences across the wall pins are
directly related to the wall subchannel temperature in-
crease, they show the same behaviour as the subchannel
temperature; smaller dependence from eccentricity for the
bundle with skirts (fig. 16). The curves on fig. 16 in-
dicate the applied optimization criteria from thermohy-
draulic point of view. In the case of 0.0 mm wall distance
(fully eccentric bundle towards the wrapper tube wall)
the temperature differences are nearly 0.0 K, i.e. the
wall temperatures are as high as the temperature of the
inner subchannels, but they do not exeed the temperature
of the inner ones.
3.2.1 Non-nominal pin positions for the wire type bundle
The calculations for other pin positions of spiral wire
bundles different from the compact bundle cas have been
performed with a simple method: The flatness of the tempe-
rature distribution inside the bundle can be described by
the temperature formfactor, i.e. the ratio between the
maximal temperature increase of a subchannel and the mean
temperature increase at the bundle outlet. Neglecting
the balance effects between the subchannels the tempera-
ture distribution depends directly on the mass flow distri-
bution which can be determined froin the geometric data
of the subchannels. Neglecting mixing and heat conduction
is allowable, since the distance between the "hot" sub-
channels in the centre of the bundle and the "cold" sub-
channels at the wrapper tube is sufficient large.
The following positions of the pins inside the wrapper
tube have been considered:
- compact bundle
no gaps between the pins themselves.
- distributed gaps
the clearance is divided equally to all distances;
pin-pin, pin-wrapper tube.
- fanned out bundle
the clearance is divided equally to all pin to pin
distances; no gap between pin and wrapper tube.
The calculation results - expressed in terms of tempera-
ture form factor - are given in fig. 17. The temperature
206
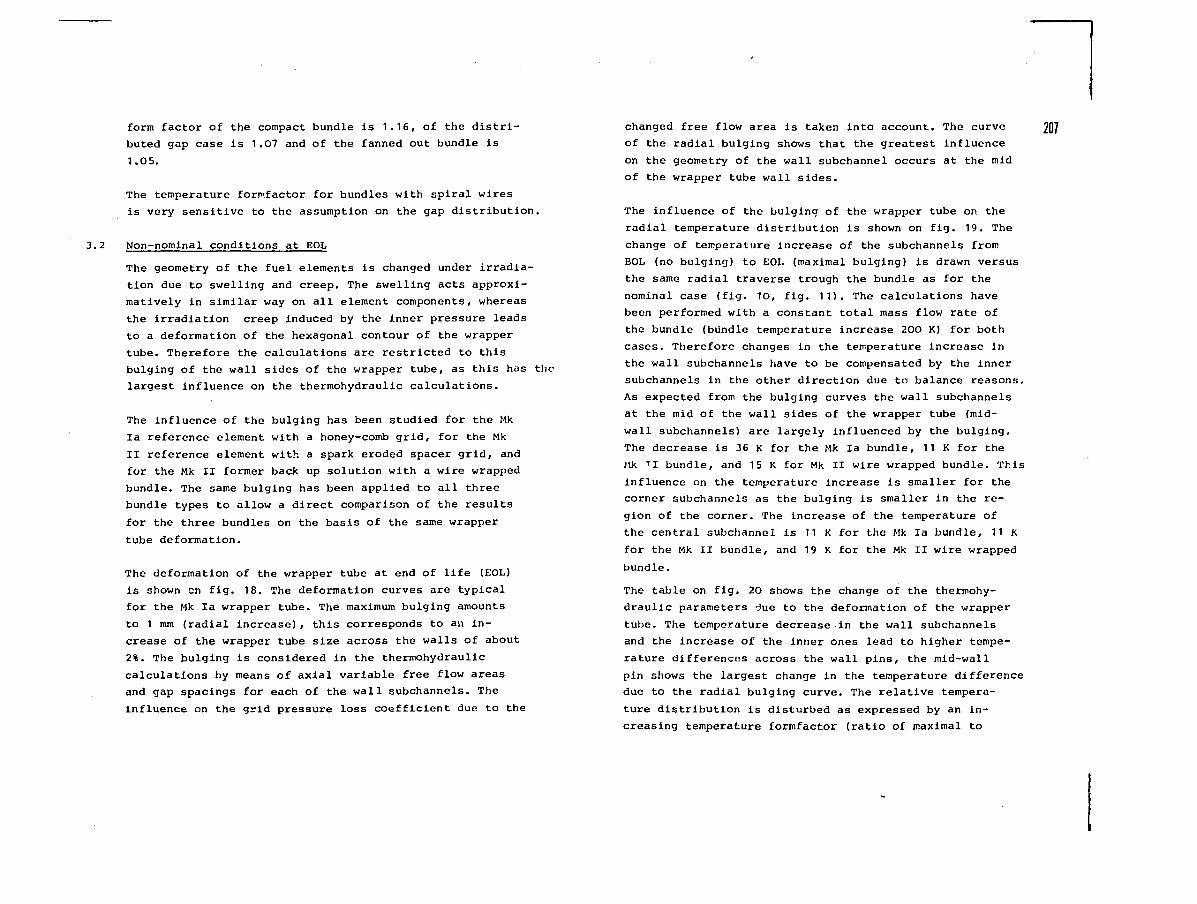
form factor of the compact bundle is 1.16, of the distri-
buted gap case is 1.07 and of the fanned out bundle is
I .05.
The temperature formfactor for bundles with spiral wires
is very sensitive to the assumption on the gap distribution.
3.2 Non-nominal conditions at EOL
The geometry of the fuel elements is changed under irradia-
tion due to swelling and creep. The swelling acts approxi-
matively in similar way on all element components, whereas
the irradiation creep induced by the inner pressure leads
to a deformation of the hexagonal contour of the wrapper
tube. Therefore the calculations are restricted to this
bulging of the wall sides of the wrapper tube, as this has the
largest influence on the thermohydraulic calculations.
The influence of the bulging has been studied for the Mk
la reference element with a honey-comb grid, for the Mk
II reference element with a spark eroded spacer grid, and
for the Mk II former back up solution with a wire wrapped
bundle. The same bulging has been applied to all three
bundle types to allow a direct comparison of the results
for the three bundles on the basis of the same wrapper
tube deformation.
The deformation of the wrapper tube at end of life (EOL)
is shown en fig. 18. The deformation curves are typical
for the Mk la wrapper tube. The maximum bulging amounts
to 1 mm (radial increase), this corresponds to an in-
crease of the wrapper tube size across the walls of about
2%. The bulging is considered in the thermohydraulic
calculations by means of axial variable free flow areas
and gap spacings for each of the wall subchannels. The
influence on the grid pressure loss coefficient due to the
changed free flow area is taken into account. The curve
of the radial bulging shows that the greatest influence
on the geometry of the wall subchannel occurs at the mid
of the wrapper tube wall sides.
The influence of the bulging of the wrapper tube on the
radial temperature distribution is shown on fig. 19. The
change of temperature increase of the subchannels from
BOL (no bulging) to EOL (maximal bulging) is drawn versus
the same radial traverse trough the bundle as for the
nominal case (fig. 10, fig. 11). The calculations have
been performed with a constant total mass flow rate of
the bundle (bündle temperature increase 200 K) for both
cases. Therefore changes in the temperature increase in
the wall subchannels have to be compensated by the inner
subchannels in the other direction due to balance reasons.
As expected from the bulging curves the wall subchannels
at the mid of the wall sides of the wrapper tube (mid-
wall subchannels) are largely influenced by the bulging.
The decrease is 36 K for the Mk la bundle, 11 K for the
Mk TI bundle, and 15 K for Mk II wire wrapped bundle. This
influence on the temperature increase is smaller for the
corner subchannels as the bulging is smaller in the re-
gion of the corner. The increase of the temperature of
the central subchannel is 11 K for the Mk la bundle, 11 K
for the Mk II bundle, and 19 K for the Mk II wire wrapped
bundle.
The table on fig. 20 shows the change of the thermohy-
draulic parameters -5ue to the deformation of the wrapper
tube. The temperature decrease in the wall subchannels
and the increase of the inner ones lead to higher tempe-
rature differences across the wall pins, the mid-wall
pin shows the largest change in the temperature difference
due to the radial bulging curve. The relative tempera-
ture distribution is disturbed as expressed by an in-
creasing temperature formfactor (ratio of maximal to
207
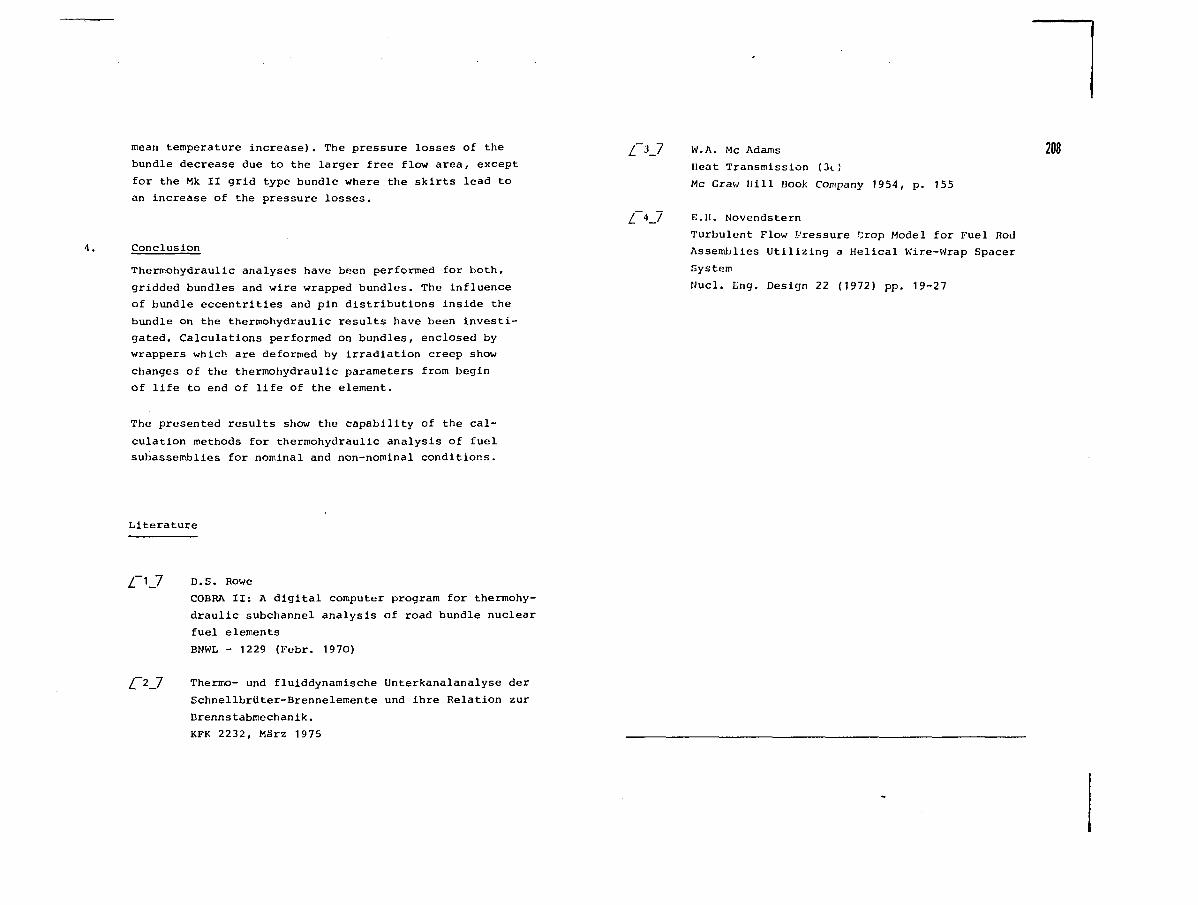
mean temperature increase). The pressure losses of the
bundle decrease due to the larger free flow area, except
for the Mk II grid type bundle where the skirts lead to
an increase of the pressure losses.
4. Conclusion
Thermohydraulic analyses have been performed for both,
gridded bundles and wire wrapped bundles. The influence
of bundle eccentrities and pin distributions inside the
bundle on the thermohydraulic results have been investi-
gated. Calculations performed on bundles, enclosed by
wrappers which are deformed by irradiation creep show
changes of the thermohydraulic parameters from begin
of life to end of life of the element.
The presented results show the capability of the cal-
culation methods for thermohydraulic analysis of fuel
subassemblies for nominal and non-nominal conditions.
Literature
/ 1_7 D.S. Rowe
COBRA II: A digital computer program for thermohy-
draulic subchannel analysis of road bundle nuclear
fuel elements
BNWL - 1229 (Febr. 1970)
/~2_7 Thermo- und fluiddynamische Unterkanalanalyse der
Schnellbrüter-Brenneleir.ente und ihre Relation zur
Brennstabmechanik.
KFK 2232, März 1975
/ 3_7 W.A. Mc Adams
Heat Transmission (3t)
Mc Graw Hill Book Company 19 54, p. 155
/~4_7 E.H. Novendstern
Turbulent Flow Pressure Crop Model for Fuel Rod
Assemblies Utilizing a Helical Wire-Wrap Spacer
System
Nucl . t n g . Design 22 (1972) p p . 19-27
208
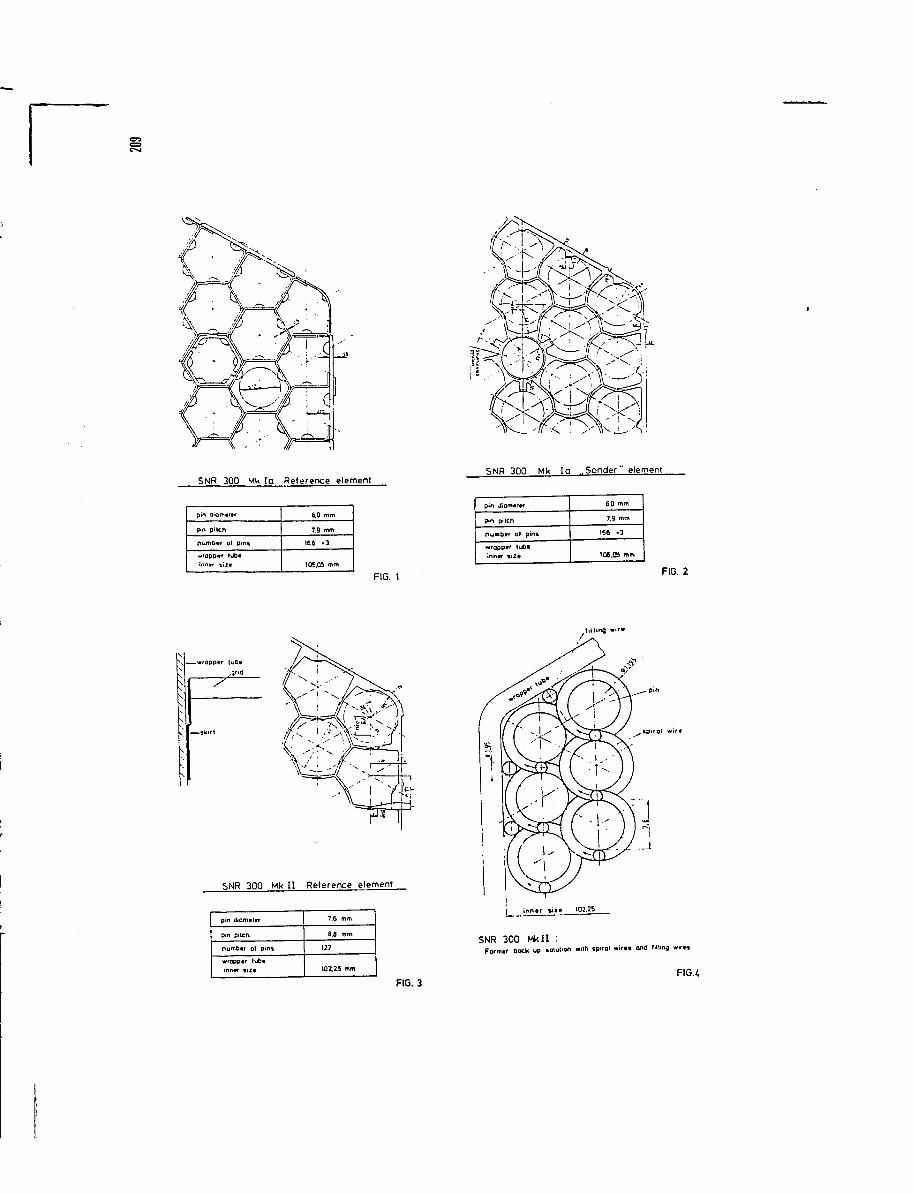
SNR 300 Mk Io Reference element
pin diamvltf
P>n pilch
nuTtb«) of p«n\
••'oppvr tub*Inn«* i,jt
6,0 mm
7.9 mm
166 *3
105.05 mm
FIG. 1
SNR 300 Mk la ..Sonder" element
pin diam«l«f
P>n pilcr»
Pumbtf ot pin»
wrapptr lubt>nn«r %iz«
6.0 mm
7.9 mm
166 *3
1Cft.CS mm
FIG. 2
— wrapper tub»
SNR 300 Mk I I Reference element
pm diamittf
pin pitch
numb it ol pins
wrappar lubtmntr wi%
7.6 mm
fl.fl mm
127
102.25 mm
FIG. 3
| >s.
SNR 300 Mk l l :Farmer back up solution with ipirol wirt» and lilting WIT»«
FIG.4
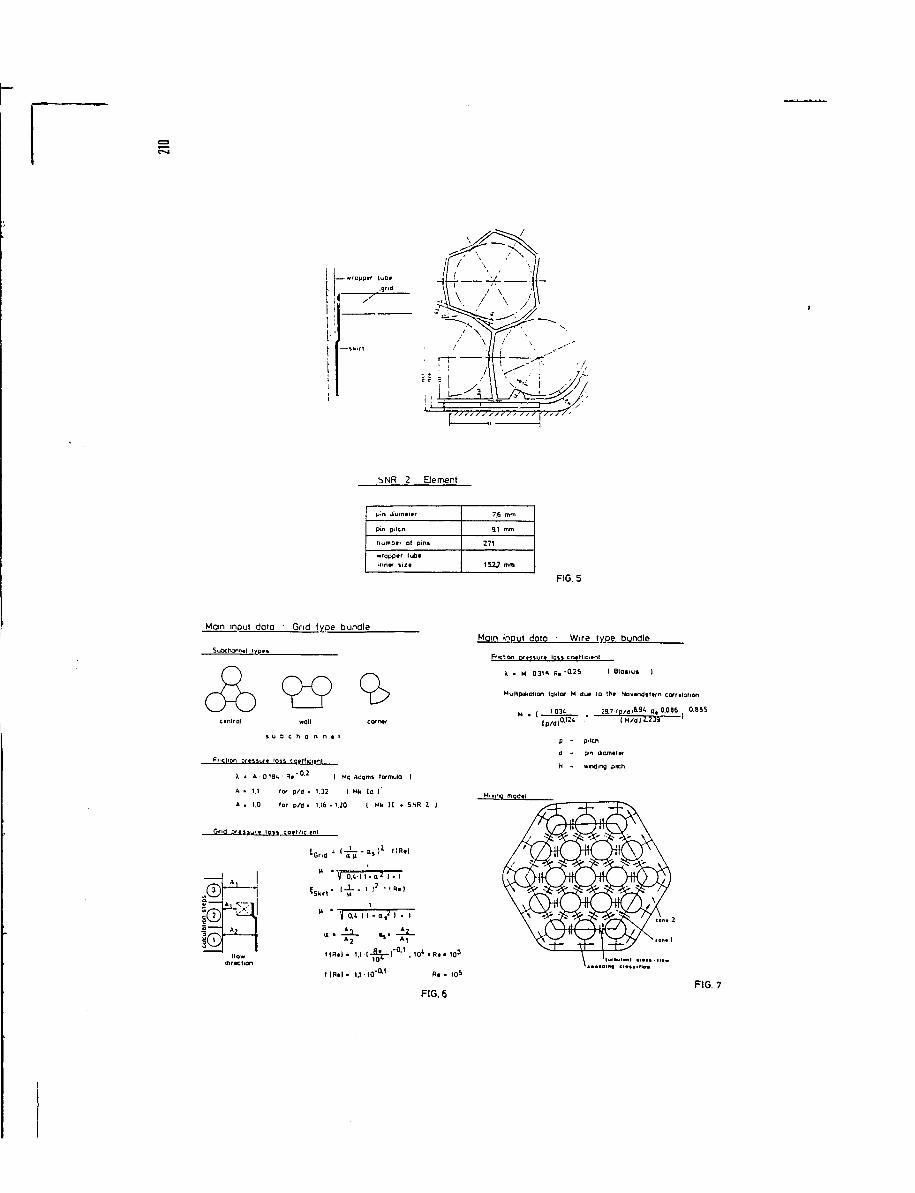
I I—•wtapptrr tuO*
I ,.<l'.d
T
SNR 2 Bement
pin Jiufn«(»r
pin ptlcn
numbri ot pink
«ropptr tub*
inntr MX«
7.6 mm
9.1 mm
271
1517 mm
FIG. 5
Main input data Grid type bundle
Suhchqfn«!
ctnlrai wall cornw
4 u ö c h a n n • I
sr<|ion CfHiuft 'oss eo«Hicienl
\ 4 A • Q.ifli. • Rt I Me Adams formula |
A • 1.1 lor p/d * 1.32 I Mk la 1
A . 1.0 tor p/d • 1.16 - 1.20 I Mk 11 . SNR 2 I
I©So
K O . t l i - a ^ I • 1
a< 11 - a,' I • I
t | R « I - I.t - I 0" 0 - 1 R« «
FIG. 6
Mom input doto • Wir? type bundle
X - H 0.311 f) . -0.25 I Blo«iu« I
ilhpuhotion taklor H dut io th« Nov»nd*tt<-n correlation
I p / d l 0 ' 1 2 4 ( H ' - I
d - p"i ttomtltf
H - wnding pilch
\ 'lutbuUnt tfo
FIG. 7
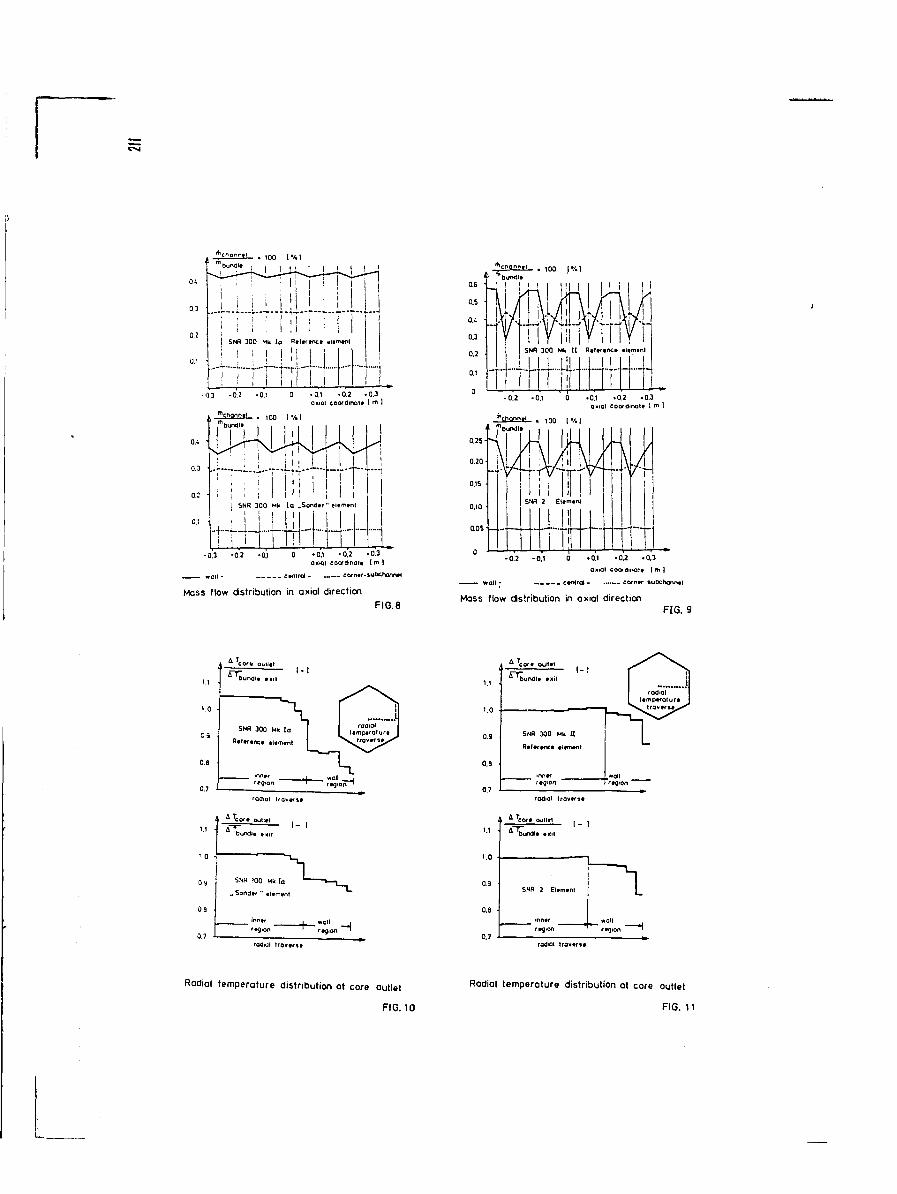
0.3
0.2
0.1
. 100 [%l
i ! ! • 11 i
- 1 ! 1 1 !! i ! : i!! SNR 300 Mb l a R
i ! I I 1 !,.-i i—
i ii '
i\
i
i 1 ii
wv:t
. . . .
_.
elernent
-0.3 -0,2 -0.1 0 -0.1 -0.2 -0.3oxial coordinate ( m 1
'Vgnnel . 1 0 0 I ' A I"bundle , ,
SNR 3Q0 Mk l a
—r-T-t-l
-Soi
-0.3 -0*2 -oÜ 0 -0.1 -o!2 -0.3
axial coordinate I m I
wail - eintrat- corn«r-suDchann*l
Mass flow distribution in axial directionFIG.8
* " " » " . 100 IV.1i *bu"«Jl»
-0.2 -0.1 0 0.1 -0.2 .0.3
oxial coordinate [m I
central- corner subchannel
Mass flow distribution in axial directionFIG. 9
4 Tcor« oullell - l
radial trav«Mt
l.t 1 4 I - I
S M >00 Mh la
.. Sonder " clement
_ innerregion
_ wall jreaion '
1.0
0.9
0.3
0.7
radial traverse
4 Tcore outlet I - 1
SNR 2 Element
»allregion
radial traverse radial traverse
Radial temperature distribution at core outlet
FIG. 10
Radial temperature distribution at core outlet
FIG. 11
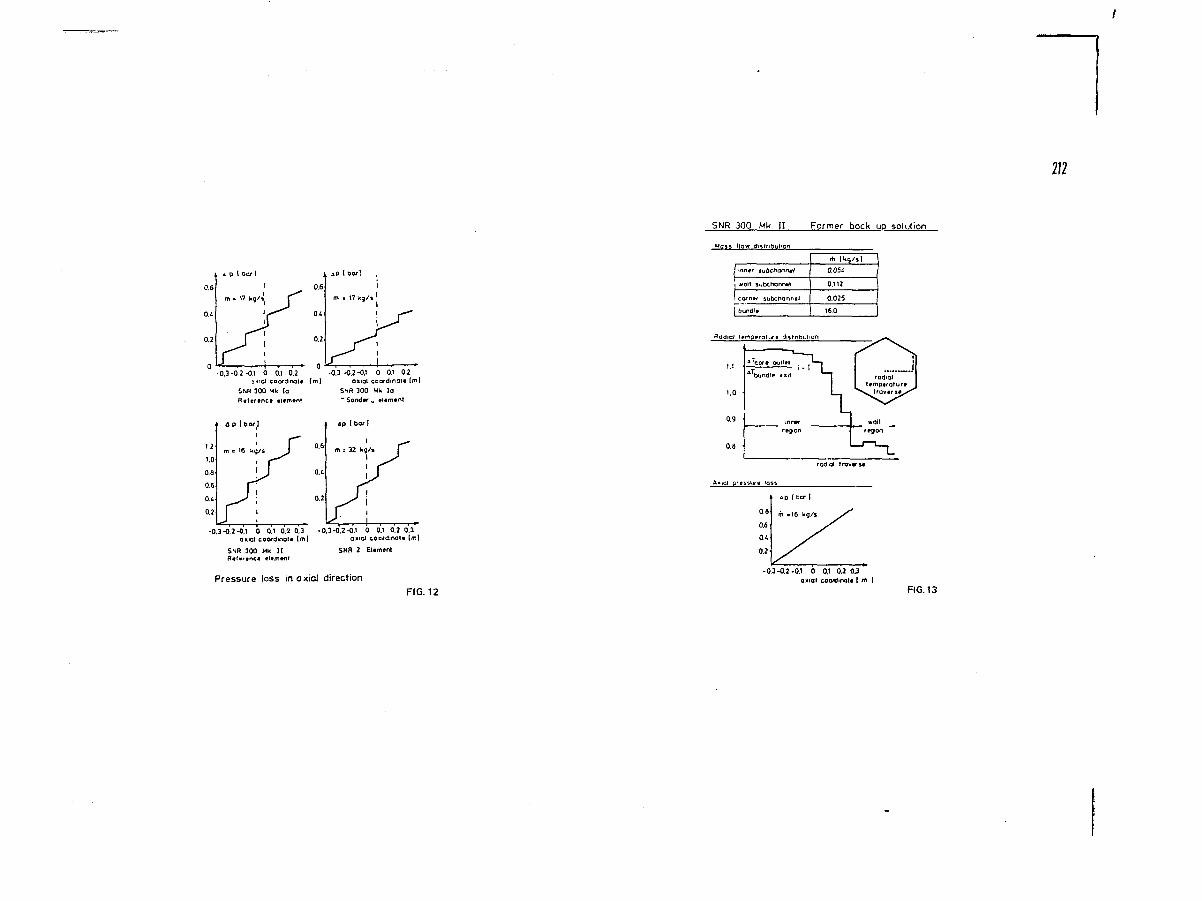
212
0.6
P I Dor!
• 17 kg/I1
-0.3-0 2-0.1 0 0.1 0.2 -0.3-0.2-0.1 0 0.1 0.2j t'Ol coordinate {ml axial coordinate Iml
SNR 300 Mk la SNR 300 MU laReference elemen!
-0,3-0.2-0.1 0 0.1 0.2 0.3 -0.3-0.2-0.1 0 0.1 0.2 0.3axial coordinate Iml oxiol coordinate Iml
SNR 300 Mk I I SNR 2 ElementR*!»r»tc« element
Pressure loss in axial direction
SNR 300 Mk II Former bock up solution
MQSS Ho* atsfnpul'Qn
«all si
corntf
ubcf>ann»l
bchonrwl
sutxhannel
m IU9/»I
0.05i
0.112
0.025
ISO
ap I ha- |
m »16 kg/s
-0.3-0.2-0.1 0 0.1 0^ 03axial coonfinolt I m |
FIG. 12 FIG. 13
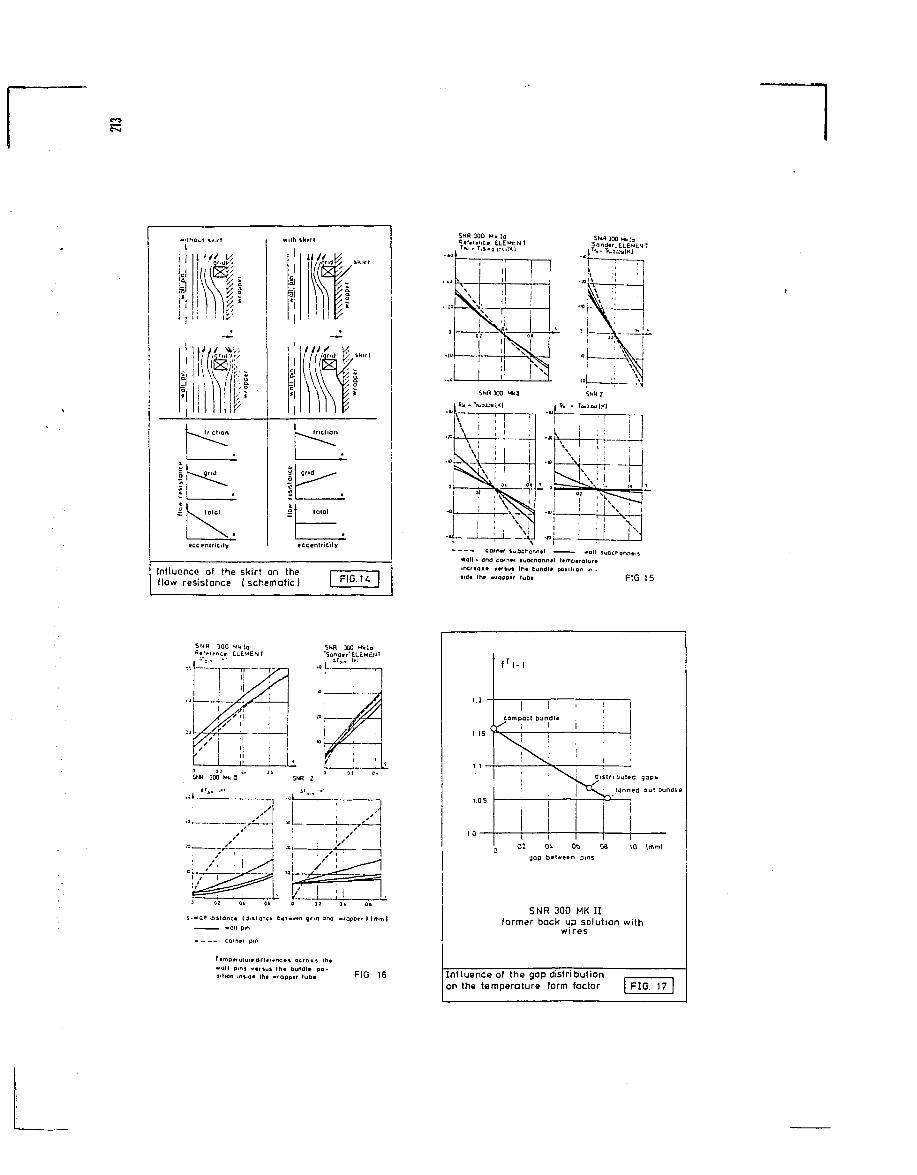
i Igrid
eccentricity
Influence of the skirt on theflow resistance (schematic) FlG.U
Wall- and cotni jubchann»! t»mp«rolyr»trvcrtoa* ¥tfiut Irt« bundl» position >n •»idi lh# *fopptr lubt F IG 15
*
t-wQlt jtitonci (dniancn D«tw«tn gno and wrapptr I (mm I— . ^ ^ won pin
- — - - corner pm
wall pms wtfiui lh» Dundl» pa-»lion tnsid« Iht «rappir tub» F IG 16
f i - i
compact bundl« i
I " \ J di*tn Düted gap*
| ^ * s ^ : tanned out Dundle
02 0i 06 08 10 (mml
gop btlween pins
SNR 300 MK IIformer back up solution with
v/i res
Influence of the gap distributionon the temperature form factor | FIG. 17 |
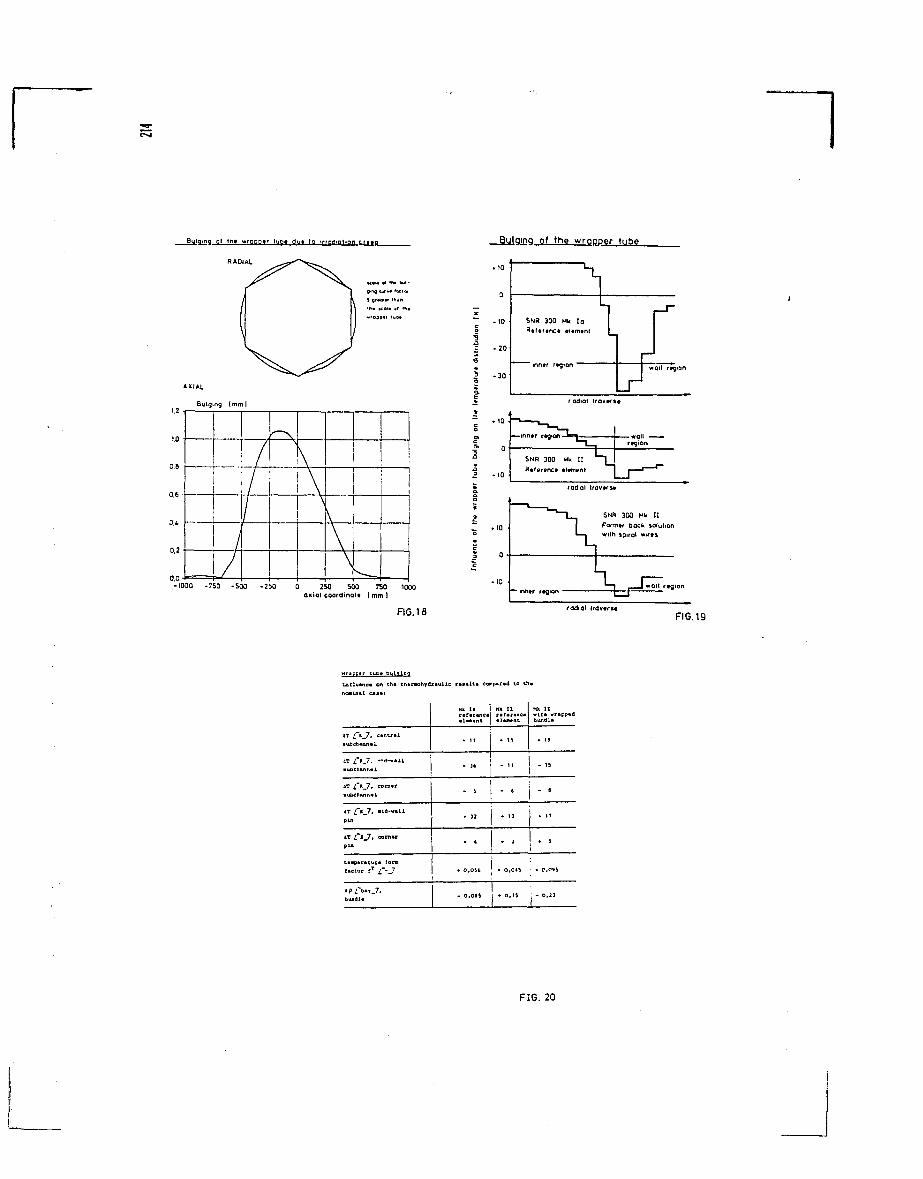
Bulging Q( th» »ropptr l b* dti* to irte^lion t r »a_
RADIAL
Bulging of the wrapper tube
AXIAL
Bulging [mm I
1.0
—
', /
/
/
/
\
\
\0.2
0.0-1000 -750 -500 -250 0 250 500 750 1000
axial coordinal* I mm ]
FIG. 18
i
0
10
20
30
lSNR 300 Mk laRtltrtnct «Itmint _
r1 wall region
radial Iravwt»
radial trovers*
SNR 3X Hk IIForm«/ back solutionwith spiral wirti
rodtal iravtrMFIG.19
Inllu^nc« on 1
4T C
• ubca
Hk l a
• 11
- J6
Hk IZ
• 11
- 11
Mk 11
* 19
- 15
• ubch
p i n
4T CplA
t.np*
».7. .id-..ii
I_7, oomu
ratuc« lorn
• 13
* 4
* U
* 1
* 17
• 3
bundI« • O.OM I * O, IS j - 0,11
FIG. 20
COMPUTATION OF TURBULENT FLOWAND HEAT TRANSFER IN SUB ASSEMBLIES
W. SLAGTERNetherlands Energy Research Foundation (ECN),Pctten,Netherlands
INTRODUCTION
This research is carried out in order to provide information on the
thermohydraulic behaviour of fast reactor subassemblies.
The research work involves the development of versatile computation me-
thods and the evaluation of combined theoretical and experimental work
on fluid flow and heat transfer in fuel rod bundles.
The computation method described here rests on the application of the
distributed parameter approach. The conditions considered cover steady,
turbulent flow and heat transfer of incompressible fluids in bundles of
bare rods. Throughout 1978 main efforts were given to the development of
the VITESSE program and to the validation of the hydrodynamic part of the
code.
In its present version the VITESSE program is applicable to predict the
fully developed turbulent flow and heat transfer in the subchannels of
a bundle with bare rods.
In this paper the main features of the code are described as well as the
present status of development.
THE MAIN FEATURES OF THE COMPUTER PROGRAM
The finite element method has been adopted to solve the flow and heat
transfer problem in a rod bundle. This computational method has the
advantage of providing accurate descriptions of complex bundle geometries.
Moreover, regions with large gradients can be easily refined, whereas 215
boundary conditions are expressed in a convenient way.
The idealization of these complicated coolant flow areas can be achieved
by introduction of cylindrical and Cartesian coordinate systems.
The flow area of the bundle cross-section is subdivided into quadrilateral
"nd triangular finite elements with nodes at each vertex. In the VITESSE-
code finite element meshes can be generated automatically by means of a
mesh generator.
In order to solve the resulting set of non-linear equations, both the
Neuton-Raphson as well as the direct iteration technique are used. The
necessary initial guess values are obtained by the solution of the la-
minar flow problem.
For predicting turbulent fluid flow, additional information on turbulent
shear stresses of the flow is required. The turbulent shear stresses have
been expressed by liuussinesq's concept of eddy viscosity, derived from
numerical models of turbulence. Both the mixing length and kinetic energy
models of turbulence are incorporated in the current version of the VITESSE-
code. The former model was applied to rod bundle fluid flow by Meyder
[ 1 ] while the latter was introduced by U'olfshstein [ 2 ] for one-dimen-
sional flows. The computational procedures of botii models have been
applied through the boundary layer right up to the wall. In order to verify
the model predictions of the hydrodynamic part of the code, a number of
computations has been carried out simulating the experiments of Kjellström
[ 3 ] and Rehme [ 4 ] on rod bundle fluid flow.
In particular, the measured results pertaining to a wall subchannel [4]
reveal that the momentum transport is highly anisotropic in the rod bundle
fluid flow. The anisotropy of the momentum transport confirms our findings
when attempting to adjust the VITESSE-code to the measured results.
Improvement of the computational results could only be obtained by intro-
ducing anisotropic eddy diffusivity distributions. A detailed comparison
of the experimental data with Prandtl's mixing length model predictions
is given for a central subchannel [ 5 ] and for a wall subchannel [ 6 ] .
This Prandtl's model of turbulence has the disadvantage of having zero
eddy diffusivities in those regions of zero velocity gradients.
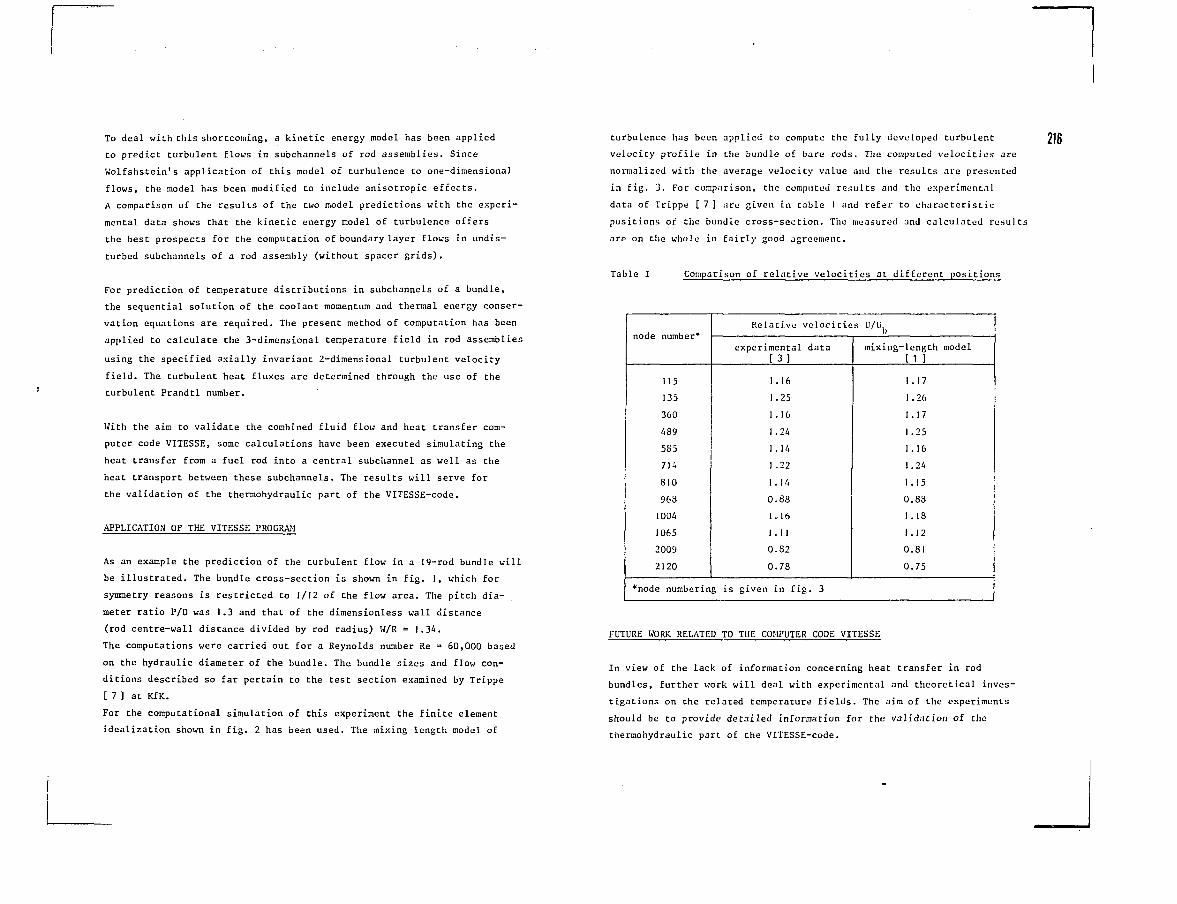
To deal with this shortcoming, a kinetic energy model has been applied
to predict turbulent flows in subchannels of rod assemblies. Since
Wolfshstein's application of this model of turbulence to one-dimensional
flows, the model has been modified to include anisotropic effects.
A comparison of the results of the two model predictions with the experi-
mental data shows that the kinetic energy model of turbulence offers
the best prospects for the computation of boundary layer flows in undis-
turbed subchannels of a rod assembly (without spacer grids).
For prediction of temperature distributions in subchannels of a bundle,
the sequential solution of the coolant momentum and thermal energy conser-
vation equations are required. The present method of computation has been
applied to calculate the 3-dimensional temperature field in rod assemblies
using the specified axially invariant 2-dimensional turbulent velocity
field. The turbulent heat fluxes are determined through the use of the
turbulent Prandtl number.
With the aim to validate the combined fluid flow and heat transfer com-
puter code VITESSE, some calculations have been executed simulating the
heat transfer from a fuel rod into a central subchannel as well as the
heat transport between these subchannels. The results will serve for
the validation of the thermohydraulic part of the VITESSE-code.
APPLICATION OF THE VITESSE PROGRAM
As an example the prediction of the turbulent flow in a 19-rod bundle will
be illustrated. The bundle cross-section is shown in fig. I, which for
symmetry reasons is restricted to 1/12 of the flow area. The pitch dia-
meter ratio P/D was 1.3 and that of the dimensionless wall distance
(rod centre-wall distance divided by rod radius) W/R = 1.34.
The computations were carried out for a Reynolds number Re = 60,000 based
on the hydraulic diameter of the bundle. The bundle sizes and flow con-
ditions described so far pertain to the test section examined by Trippe
[ 7 ] at KfK.
For the computational simulation of this experiment the finite element
idealization shown in fig. 2 has been used. The mixing length model of
turbulence has been applied to compute the fully developed turbulent
velocity profile in the bundle of bare rods. The computed velocities are
normalized with the average velocity value and the results are presented
in fig. 3. For comparison, the computed results and the experimental
data of Trippe [ 7] are given in table 1 and refer to characteristic
positions of the bundle cross-section. The measured and calculated results
are on the whole in fairly good agreement.
216
Table I Comparison of relative velocities at different positions
node number*
115
135
360
489
585
714
810
968
1004
1065
2009
2120
Relative velocities U/iJ.
experimental data[3]
1.16
1.25
1.16
1 .24
1. 14
1.22
1.14
0.88
1.16
1.11
0.82
0.78
mixing-length model[1 ]
1.I7
I .26
1.17
1.25
1.16
1.24
1.15
0.88
1.18
1.12
0.81
0.75
*node numbering is given in fig. 3
FUTURE WORK RELATED TO THE COMPUTER CODE VITESSE
In view of the lack of information concerning heat transfer in rod
bundles, further work will deal with experimental and theoretical inves-
tigations on the related temperature fields. The aim of the experiments
should be to provide detailed information for the validation of the
thermohydraulic part of the VITESSE-code.
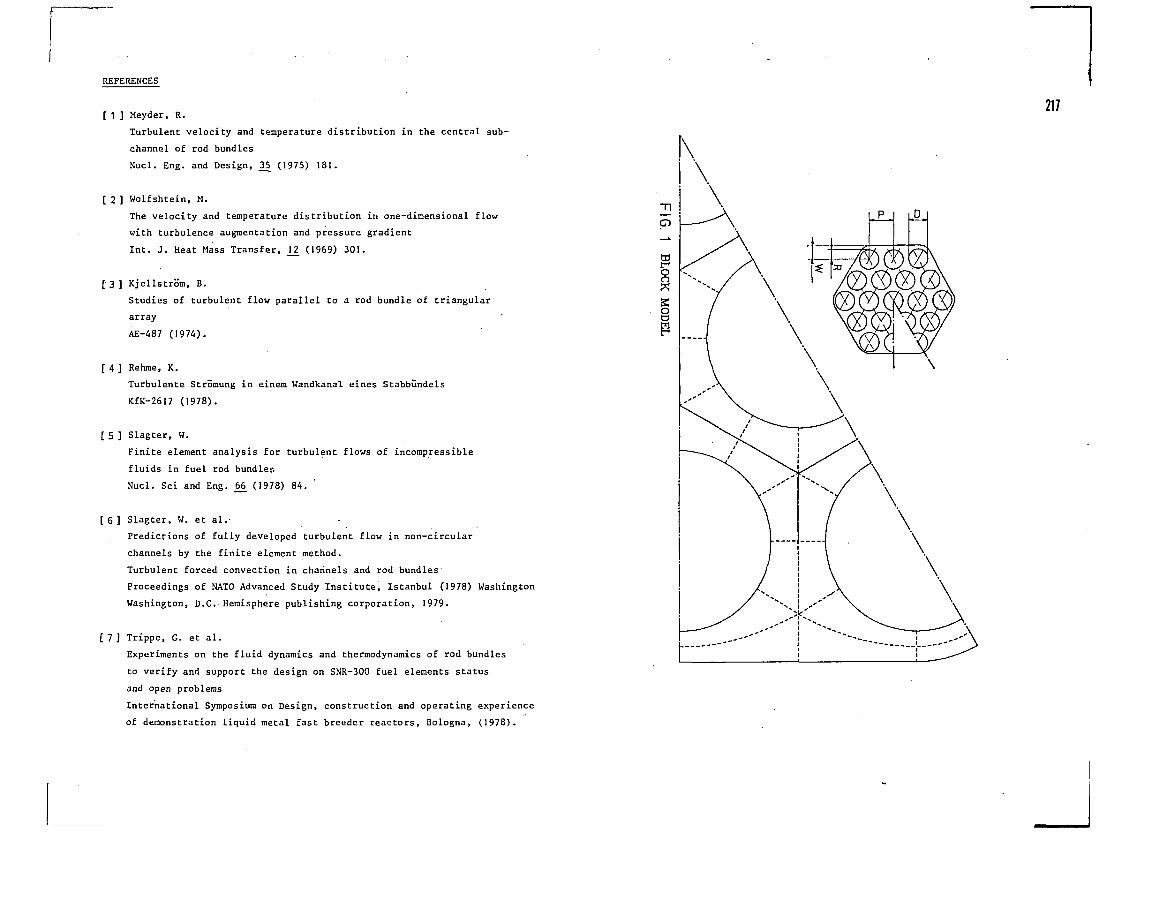
REFERENCES
[ 1 ] Meyder, R.
Turbulent velocity and temperature distribution in the central sub-
channel of rod bundles
Nucl. Eng. and Design, 35^ (1975) 181.
[ 2 ] Wolfshtein, M.
The velocity and temperature distribution in one-dimensional flow
with turbulence augmentation and pressure gradient
Int. J. Heat Mass Transfer, JJ2 (1969) 301.
[3 ] KjellstrSra, B.
Studies of turbulent flow parallel to a rod bundle of triangular
array
AE-487 (1974).
[ 4 ] Rehrae, K.
Turbulente Strömung in einem Wandkanal eines Stabbündels
KfK-2617 (1978).
[ 5 ] Slagter, W.
Finite element analysis for turbulent flows of incompressible
fluids in fuel rod bundles.
Nucl. Sei and Eng. j>6 (1978) 84.
[ 6 ] Slagter, W. et al.-
Predictions of fully developed turbulent flow in non-circular
channels by the finite element method.
Turbulent forced convection in channels and rod bundles
Proceedings of NATO Advanced Study Institute, Istanbul (1978) Washington
Washington, D.C. Hemisphere publishing corporation, 1979.
[7] Trippe, G. et al.
Experiments on the fluid dynamics and thermodynamics of rod bundles
to verify and support the design on SNR-300 fuel elements status
and open problems
International Symposium on Design, construction and operating experience
of demonstration liquid metal fast breeder reactors, Bologna, (1978).
217
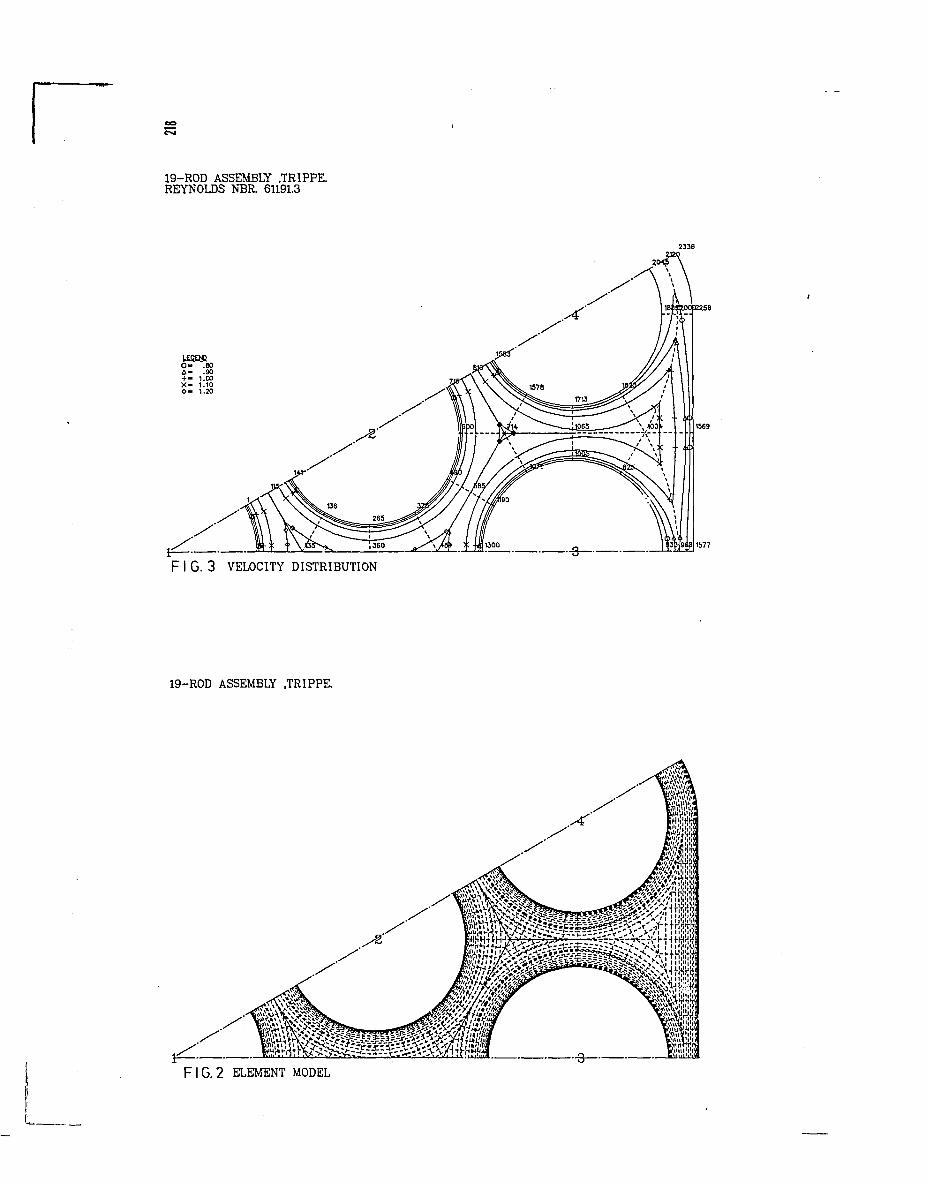
19-ROD ASSEMBLY .TRIPPE.REYNOLDS NBR. 61191.3
USQfiO - .80a- .90+ - 1.00X - 1.100 - 1.20
F I G. 3 VELOCITY DISTRIBUTION
19-ROD ASSEMBLY .TRIPPE.
F I G . 2 ELEMENT MODEL
LOCAL PRESSURE AND VELOCITY MEASUREMENTSIN A WATER 19-ROD BUNDLE USING AWIRE WRAP SPACER SYSTEM
A. SARNO, P. GORI, G. ANDALOCNEN VEL Brasimone,Bologna,Italy
Abstract
The first stage of nominal bundle measurements for the
experimental project on local obstructions has been comple-
ted.
The behaviour of the radial pressure and axial velocity
around the rods, as veil as the axial and radial behaviour
of static pressure on a wall of the hexagonal housing, ha-
ve been determined. This work was carried out in a 19-rod
bundle using a wire-wrap spacer system with water as the
wording fluid.
It has been found ho«; the pressure and velocity dis tr i -
butions in a bundle section are affected by the wire posi-
tion.
INTRODUCTION
A new experimental technique has been used t o i n v e s t i -
gate the coolant flow in a IiMFB"? fuel assembly. I t cons i s t s
of instrumenting the rods with a r o t a t i n g par t equipped with
a Pitot- tube and a s ta t ic pressure intake.
The main purpose of th i s work was to verify the r e l i a -
b i l i t y of th is new technique and to improve our knowledge
of the flow behaviour within a rod-bundle.
Furthermore the resul ts provide important data both
for an optimal thermohydraulic design of the fuel subassemb-
ly and an accurate analysis of the safety problems connec-
ted with local accidents,<ruch as obstructions, whose effects
on hydrodynamic conditions will be the subject of a subse-
quent investigation.
The present work i s part of the "safety" act ivi ty l ine
of the general outline of the CNEIJ-CEA agreement concer-
ning the fast reactors .
Some preliminary r^ .u l t s of th is experimental stage ha-
ve been presented in /_ 3_/
1 . TEST SECTION AMD IHST ll!ETlT;.TIOII
T-ie tes t section consisted of a hexagonal housing with
two opposing trasparent faces and a bundle composed of 19
rods in a tr iangular array and separated by wire. The dimen-
sions of the bundle were as follows: the rods Vad an outs i -
de diameter of 8.63 mm v/it!- a 9.93 nun pitc'^; the wire had
an outside diameter of 1.28 mm v.dth a 180 rwn wrap pitcho
The wire was wund as a right-hand hel iy. Tho tes t section
was assembled on a closed water c i rcu i t , ~EF1, -it the CHEN
Laboratories at Brasimone, Fig« 1.
Each rod was provided with a rotat ing pert equipped
with a 0.3 mm s t a t i c pressure intake and a 0.6 im hole for
acconodating a 0.5 x 0.27 m-\ Fitot-t'.ibe, 10 nun in length
and located 0.75 ("-"i from the rod wall. The rotating pert
of the rod was rotated through 36C° in the absence of the
219
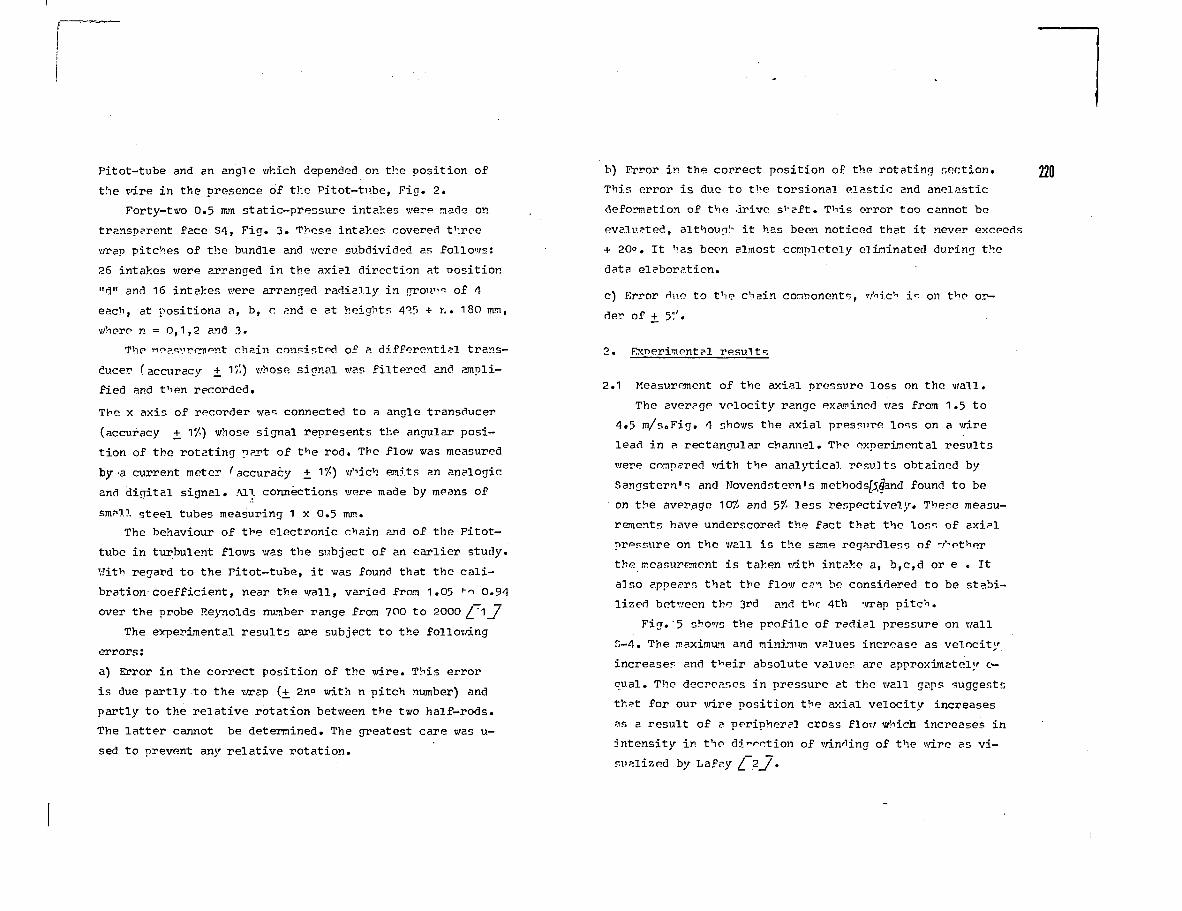
Pitot-tube and an angle which depended on the position of
the vdre in the presence of the Pitot-tw.be, Fig. 2.
Forty-two 0.5 mm static-pressure intakes were made on
transparent face S4, Fig. 3. These intaV.es covered three
wrap pitches of the bundle and were subdivided as follows:
26 intakes were arranged in tlie axiel direction at oosition
"d" and 16 intakes were arranged radially in nrou"^ of 4
each, at positiona a, b, c and e at heights 4°-? + r,. 180 mm,
where n = 0,1,2 and 3«
The r-ioasvrrment chain consisted of a differential trans-
ducer (accuracy ± 1/') whose signal war. filtered and ampli-
fied ar.d then recorded.
The x axis of recorder was connected to a angle transducer
(accuracy +_ 1$) whose signal represents the angular posi-
tion of the rotating part of the rod. The flow was measured
by a current meter ^accuracy + 150 w ich emits an analogic
and digital signal. All. connections were made by means of
sm?7.1 steel tubes measuring 1 x 0.5 mm.
The behaviour of the electronic chain and of the Pitot-
tube in turbulent flows was the subject of an earlier study.
VJith regard to the Pitot-tube, i t was found that the cali-
bration coefficient, near the wall, varied from 1.05 |-n 0.94
over the probe Reynolds number range from 700 to 2000 / " 1 _ /
The experimental results are subject to the following
errors:
a) Error in the correct position of the wire. This error
is due partly to the wrap (+ 2n° with n pitch number) and
partly to the relative rotation between the two half-rods.
The latter cannot be determined. The greatest care was u-
sed to prevent any relative rotation.
b) Error in the correct position of the rotating section.
This error i s due to the torsional elastic and anelastic
deformation of the Jrive shaft. This error too cannot be
evaluated, although i t has been noticed that i t never exceeds
+ 20°. It 'ias been almost completely eliminated during the
data elaboration.
c) Error flno to the chain connonents, whic1-1 i - on the or-
der of +5?'.
2. Experimental results
2.1 Measurement of the axial pressure loss on the wall.
The average velocity range examined was from 1.5 to
4.5 m/soFig. 4 shows the axial pressure loss on a wire
lead in a rectangular channel. The experimental results
were compared with the analytical results obtained by
Sangstern's and Novendstern's mothods fland found to be
on the average 1C# and 5% less respectively. There measu-
rements have underscored the fact that the loss of axial
pressure on the wall is the same regardless of -.'''ethfir
the measurement i s taken with intake a, b,c,d or e . I t
also appears that the flow c?n be considered to be stabi-
lized between the 3rd and t^c 4th wrap pitch.
Fig.'5 shows the profile of radial pressure on wall
C-4. The maximum and minimum values increase as velocity
increases and t^eir absolute values are approximately e-
qual. The decreases in pressure at the wall gaps suggests
th?t for our wire position the axial velocity increases
as a result of ? peripheral cross flow which increases in
intensity in the di^Ttion of winding of the wire as vi-
sualized by Lafr.y {_ 2_/.
220
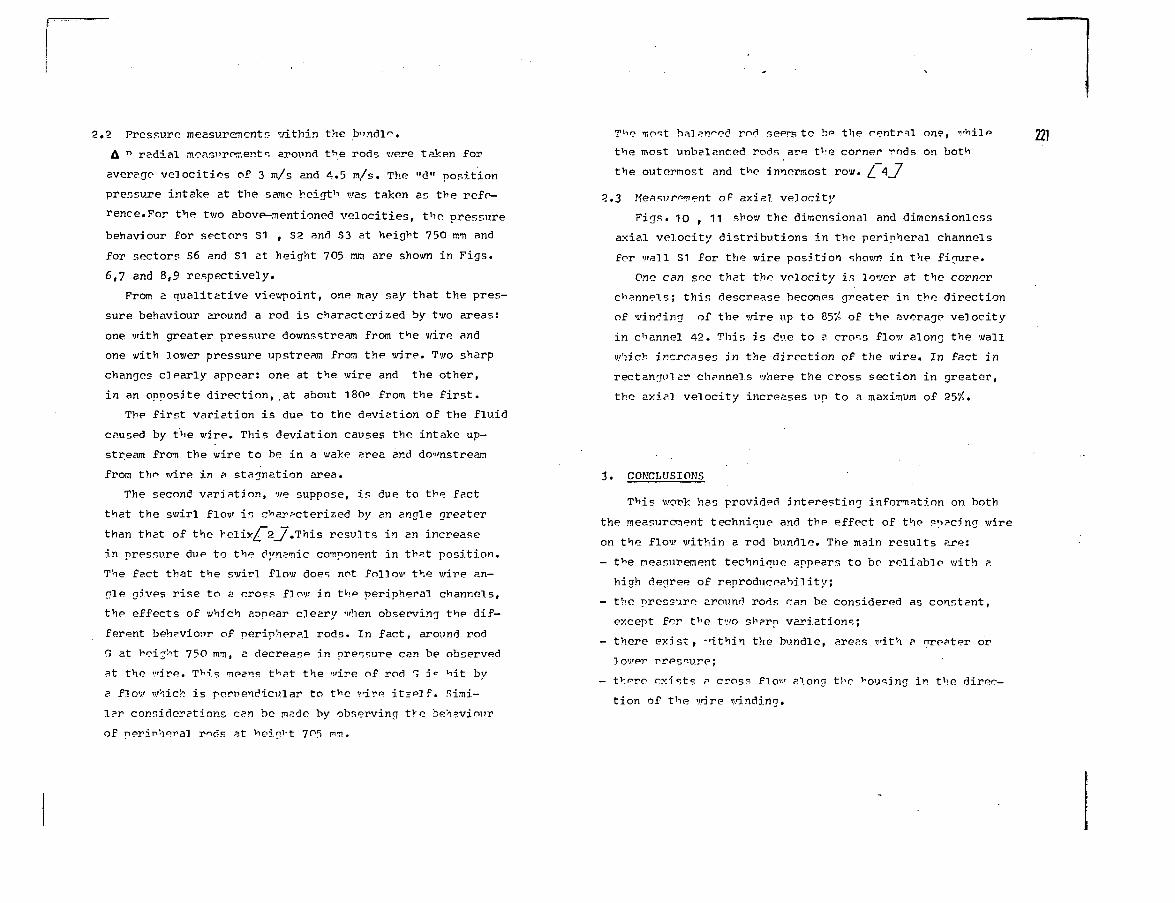
2.2 Pressure measurements within the b".ndl^.
A P radial measurements around t'->e rods were taken for
average velocities of 3 m/s and 4.5 m/s. The "d" position
pressure intake at the same heigt'1 v/as taken as the refe-
rence.For the two above-mentioned velocities, the pressure
behaviour for sectors S1 , S2 and S3 at height 750 rr.ii and
for sectors S6 and S1 at height 705 nun are shown in Figs.
6,7 and 8,9 respectively.
From a qualitative viewpoint, one may say that the pres-
sure behaviour around a rod is characterized by two areas:
one with greater pressure downsstream from the wire and
one with lower pressure upstream from the wire. Tv/o sharp
changes clearly appear: one at the wire and the other,
in an opposite direction, at about 180° from the first.
The first variation is due to the deviation of the fluid
caused by t*ie wire. This deviation causes the intake up-
stream from the wire to be in a wake erea and downstream
from thr> wire in a stagnation area.
The second variation, we suppose, is due to the Pact
that the swirl flow is characterized by an angle greater
than that of the heliy^ 2_/.This results in an increase
in pressure due to the dynamic component in that position.
The fact that the swirl flow does not follow the wire an-
gle gives rise to a cross flow in the peripheral channels,
the effects of which aopear deary when observing the dif-
ferent behaviour of peripheral rods. In fact, around rod
(5 at heig'-it 750 mm, a decrease in pressure can be observed
at the '"ire. TM.s mea .s t^at the «ire of rod T i? M t by
a flov which is perpendicular to t^e vire itself. Simi-
lar considerations can be made by observing tVe behaviour
of perir>h°ral rnds at ^eig^t 7^5 prn.
T'ie most balanced rod seen; to be the central one, v^ile
the most unbalanced rods are the corner rods on both
the outermost and t^e innermost row. f_ A_y
2.3 Measurement of axial velocity
Figs. 10 , 11 show the dimensional and dimensionless
axial velocity distributions in the peripheral channels
for vail S1 for the wire position shown in the figure.
One can see that the velocity is lover at the corner
channels; thir, descrease becomes greater in the direction
of winding of the wire up to 85% of the average velocity
in channel 42. This is dve to ?. cross flow along the wall
which increases in the direction of the wire. In fact in
rectangular channels where the cross section in greater,
the axial velocity increases up to a maximum of
221
3. CONCLUSIONS
This work has provided interesting information on both
the measurement technique and the effect of the spacing wire
on the flow within a rod bundle. The main results are:
- the measurement technique appears to be reliable with ?.
high degree of reproduceability;
- the pressure around rods can be considered as constant,
except for tVle two sharp variations;
- there exist, •••ithin the bundle, areas with a oreater or
Hower pressure;
- there exists P cross flo<" along the housing i.y the direc-
tion of the wire windina.
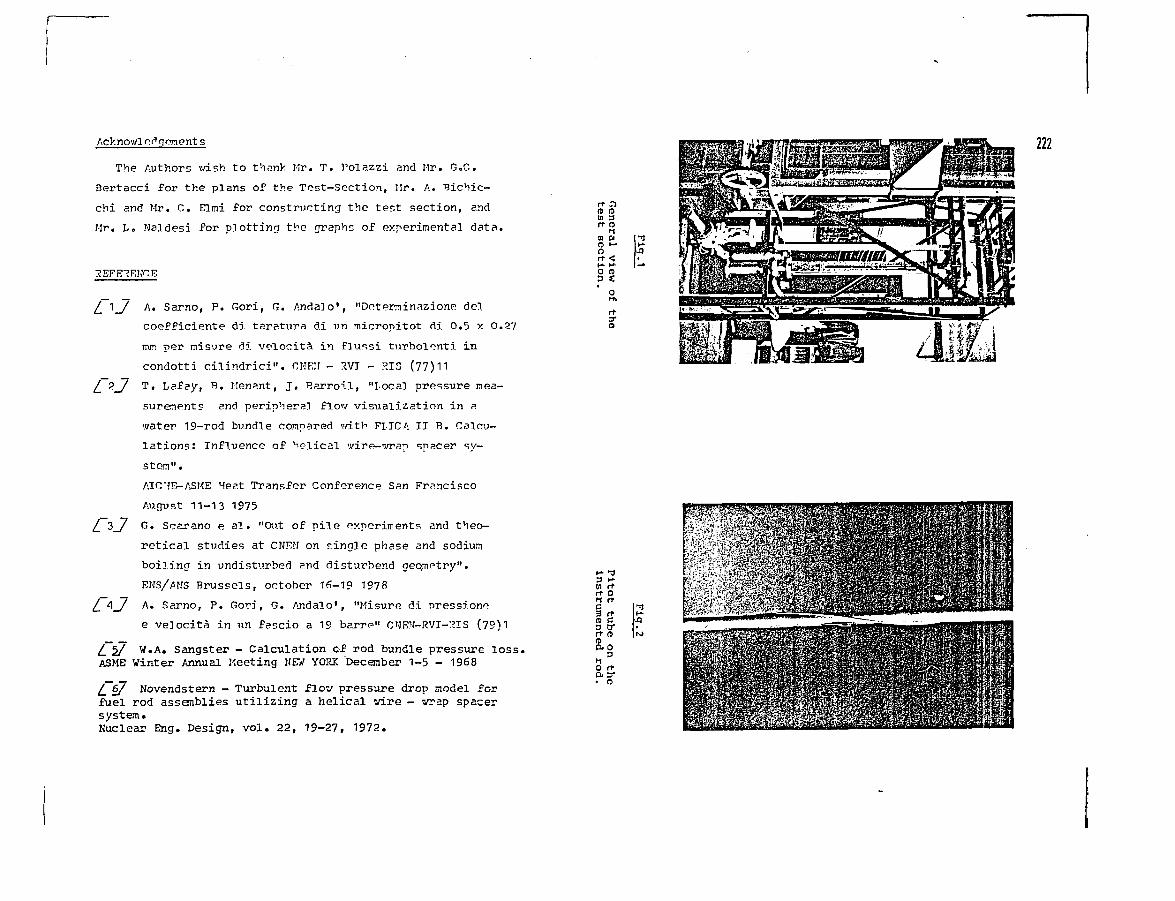
Acknowledgements
The Authors wish to thank Mr, T. Polazzi and Mr. G.C.
Bertacci for the plans of the Test-Section, Mr. A. Bichic-
chi and Mr. C. Elmi for constructing the test section, and
Mr. L. Naldesi for plotting the graphs of experimental data.
/_ 1_/ A. Sarno, P. Gori, G. Andalo1, "Deteminazione del
coefficiente di taretura di vn micropitot di 0.5 x 0.27
mm per misure di velocitä in flUFisi turbolonti in
condotti c i l indrici" . CHEI! - 2VT - HIS (77)11
[_ 2_/ T. Lafay, B. Men .nt, J . Barroil, "local pressure mea-
surements and peripheral flow visualization in a
water 19-rod bundle compared with FLICA II B. Calcu-
lations: Influence of 'i<?lical wire-'vrap spacer sy-
stem".
AICHB-ASME Meat Transfer Conference San Francisco
August 11-13 1975
l_ 3_7 G» Scarano e a l . "Out of pile experiments and theo-
ret ical studies at CNF:?! on single phase and sodium
boiling in undisturbed and disturbend geometry".
EMS/AKS Brussels, October 16-19 1978
[_ 4_/ A. Sarno, P. Gori, G. Andalo1, "Misure di nressione
e velocitä in \m fescio a 19 barre" CWEW-RVI-2IS (79)1
[_ 5_/ W.A. Sangster - Calculation of rod bundle pressure loss.ASME Winter Annual Meeting NEV YORK December 1-5 - 1968
l_ 6/ Novendstern — Turbulent flou pressure drop model forfuel rod assemblies uti l izing a helical vire - vrap spacersystem.Nuclear Eng. Design, vol. 22, 19-27, 1972.
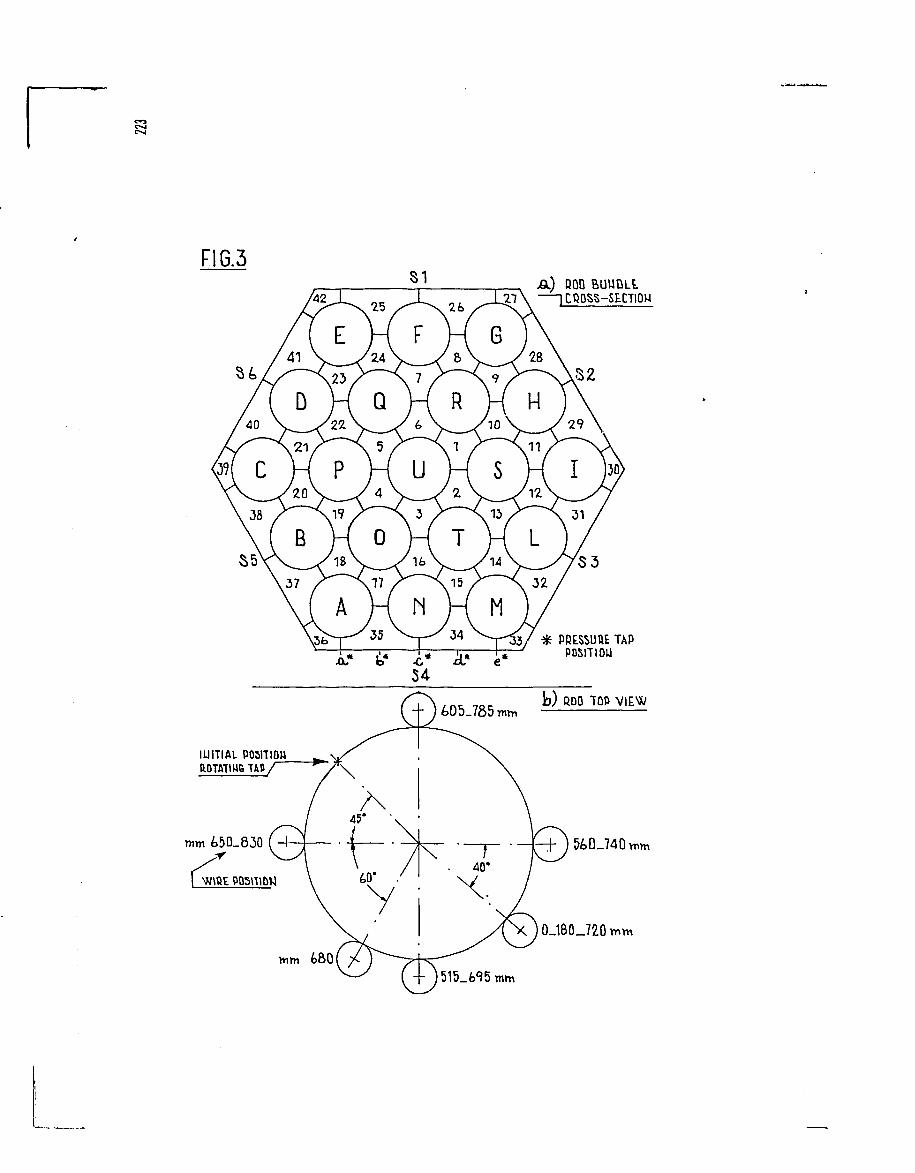
FI6.3A ) POD BUUOLL
CR0SS-SE.CTI014
* PRESSURE TAPPOSITION
ODD TOP VIEW
IUITIAL POMTIOUP.DTATIHGTAP/
mm
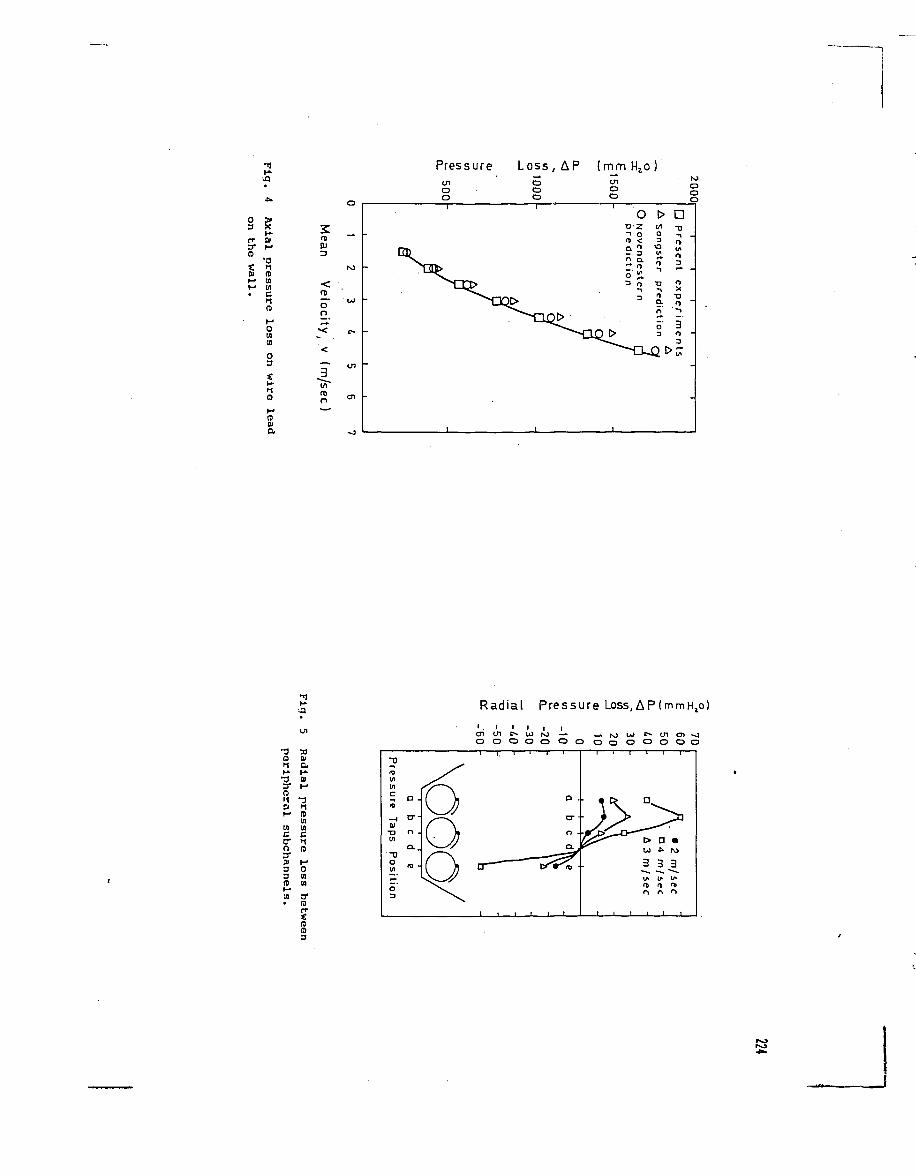
-1 Pressure L o s s , A Pinoo
ooo
inoo
roooo
o3
rry
^
Dl(-•I-»
XKDJ
•a(9Uin
nr-*0in01
03
HaroSI&
n>
3
<0)loci
«-«•
<
i"Ulroo
—
M
W
r-
U l
en
i i
*
ED
•
o• o z1 O
n a"* n3 „
ID >
t>i/i
a3va*
odietion
D t
a-i -
x
• " »
i3
> "
-
-
n•3n>
(-•
inctro3 "D33
aat•
•a
m
SJDl&
Dl
•3f»Uluc(9p-f
0inin
er19rr003
Radial Pressure Loss, APImmH.o]
O) en c*» t*i ro "•* —» fo w ** in oi "*jo o o o o o o o o o ^ o o o
•v
Ulsure
TapsP
ositi
o3
O .
cr-
o .
o.
pobcr •
n -
3 ^
^ ^ " " ^ > a •
n n n
i i t • i t
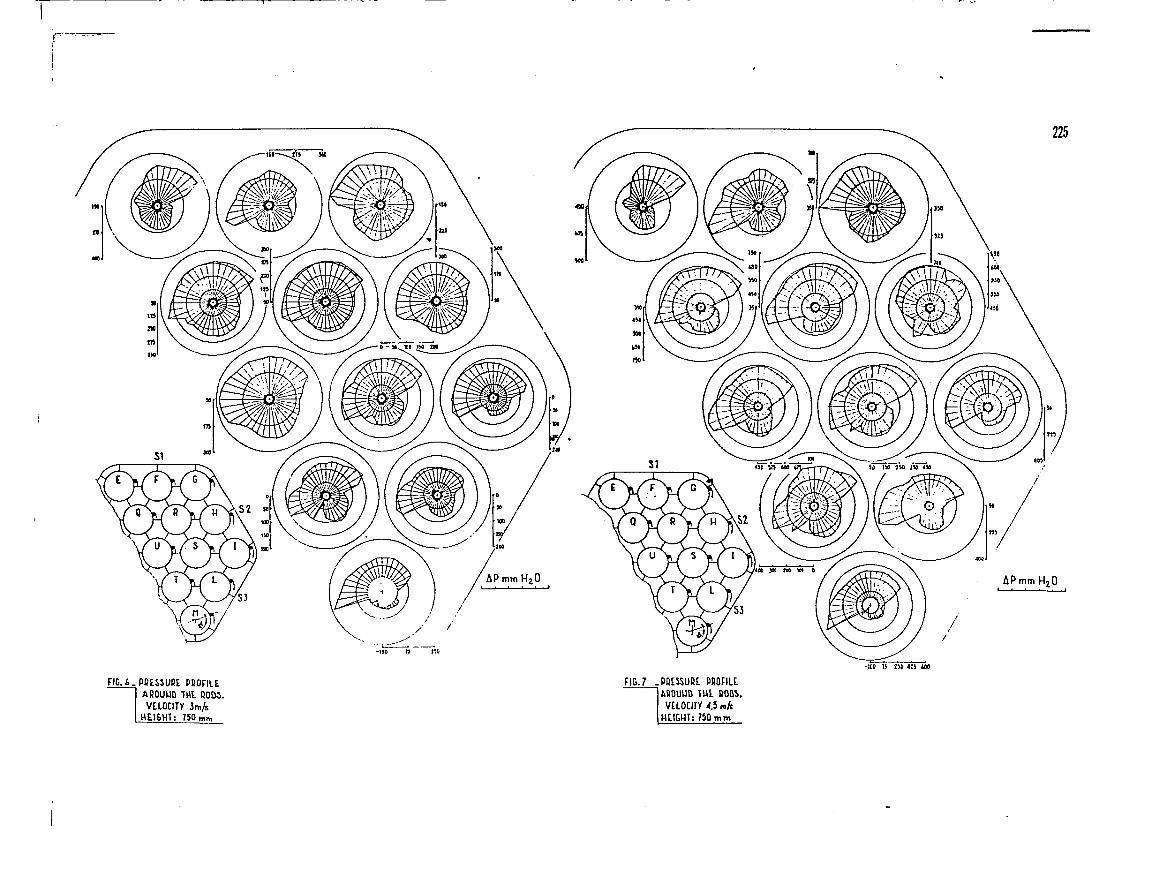
FIE, f. PRESSURE PROFILEAROUUD 1HL RODS.VELOCITY in/s.
HCI6HT: 750 wm
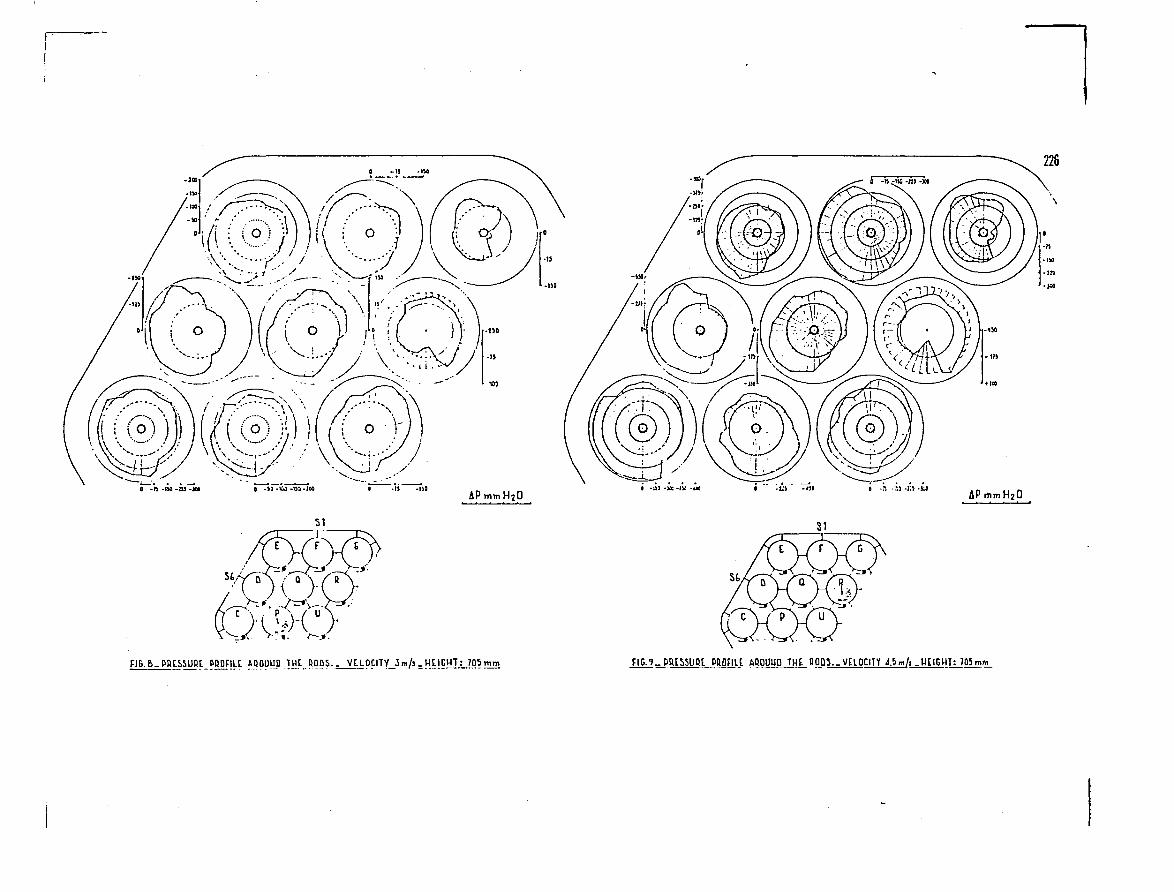
FI6.B-PRESSU1U paOf!^ AD PpyP IlL1 »DPS.- VELOCITY 3 m/s .»EIGHT: 705 mm FIG.1?-PRESMJttL PBOHU ABOUUO THE OOPS.-VELOCITY » m / i -UtlCHT: 7O5min
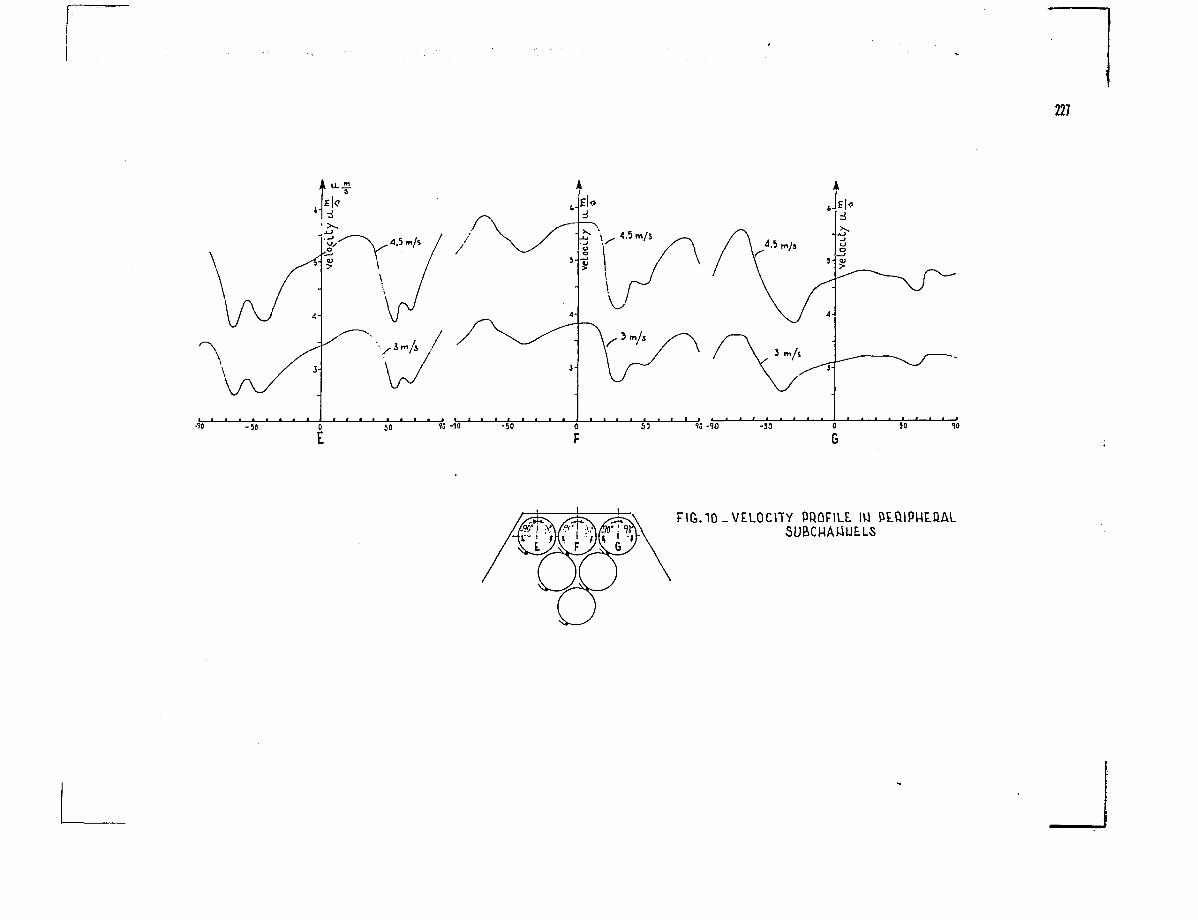
227
FIB. 10 -VELOCITY PROFILE. IU PLQIPHLQALSUBCUAUULLS
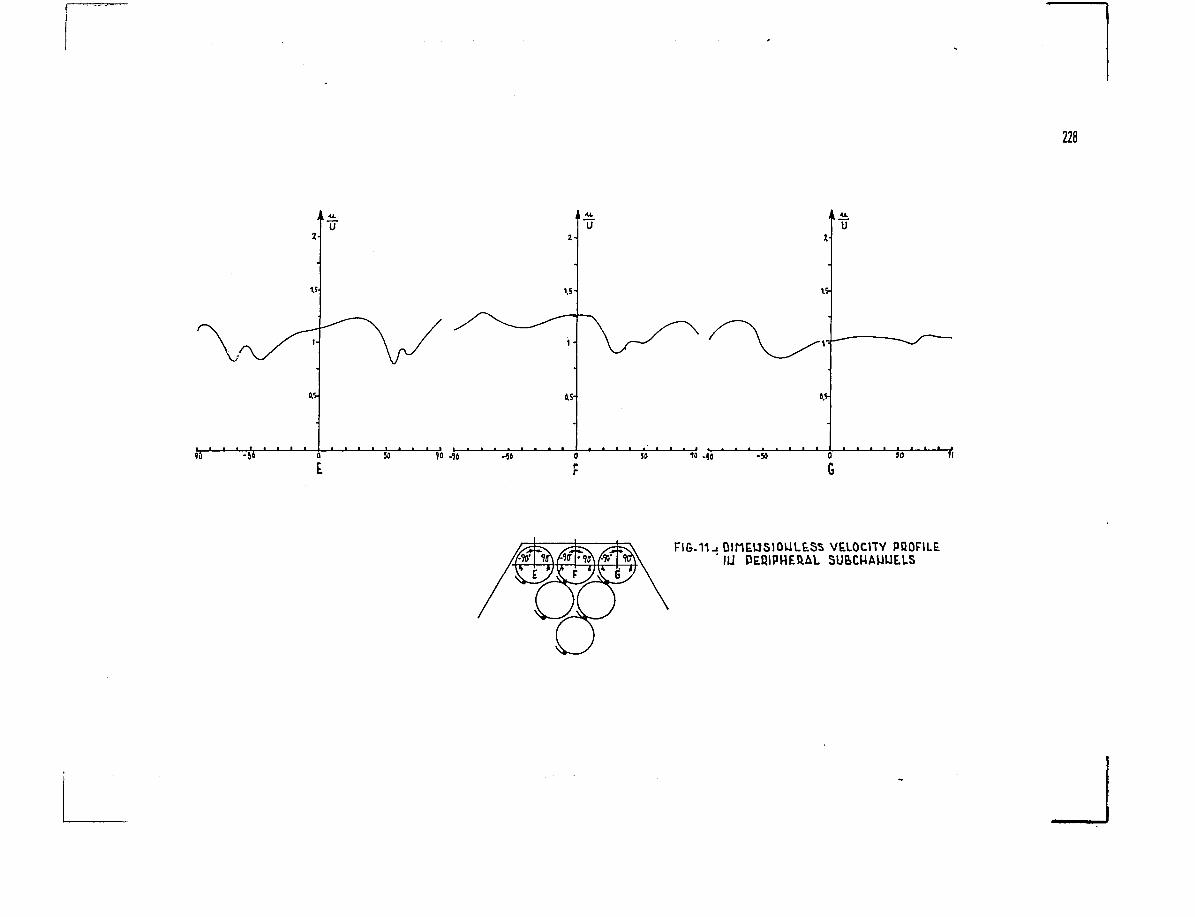
228
1.S-
0.5-
1.5 15-
«r -14 -59 -50 0
G50 II
VELOCITY PQOFILEIÜ PERIPHERAL 5US.CHAUUE.LS
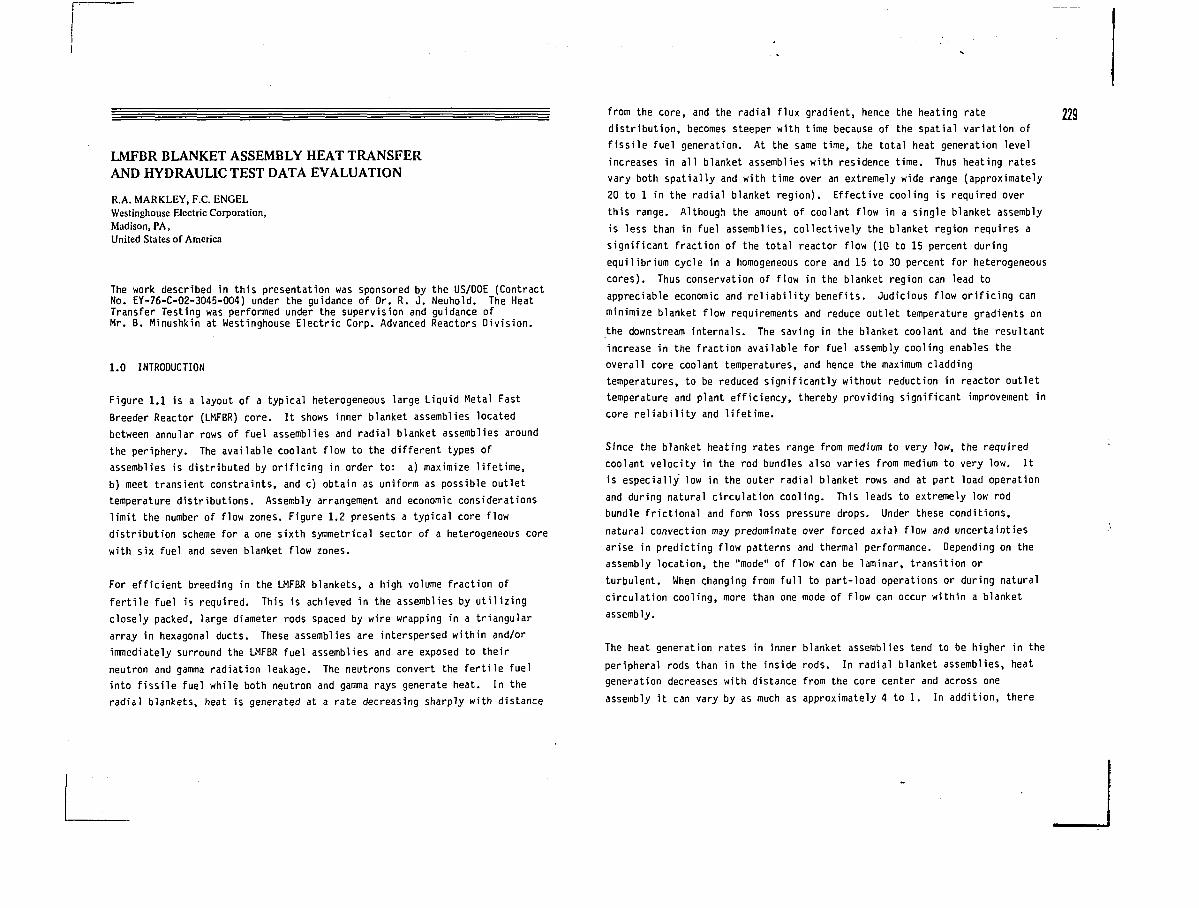
LMFBR BLANKET ASSEMBLY HEAT TRANSFERAND HYDRAULIC TEST DATA EVALUATION
R.A. MARKLEY, F.C. ENGELWestinghouse Electric Corporation,Madison, PA,United States of America
The work described in this presentation was sponsored by the US/DOE (ContractNo. EY-76-C-02-3045-004) under the guidance of Dr. R. J. Neuhold. The HeatTransfer Testing was performed under the supervision and guidance ofMr. B. Minushkin at Westinghouse Electric Corp. Advanced Reactors Division.
1.0 INTRODUCTION
Figure 1.1 is a layout of a typical heterogeneous large Liquid Metal Fast
Breeder Reactor (LMFBR) core. It shows inner blanket assemblies located
between annular rows of fuel assemblies and radial blanket assemblies around
the periphery. The available coolant flow to the different types of
assemblies is distributed by orificing in order to: a) maximize lifetime,
b) meet transient constraints, and c) obtain as uniform as possible outlet
temperature distributions. Assembly arrangement and economic considerations
limit the number of flow zones. Figure 1.2 presents a typical core flow
distribution scheme for a one sixth symmetrical sector of a heterogeneous core
with six fuel and seven blanket flow zones.
For efficient breeding in the LMFBR blankets, a high volume fraction of
fertile fuel is required. This is achieved in the assemblies by utilizing
closely packed, large diameter rods spaced by wire wrapping in a triangular
array in hexagonal ducts. These assemblies are interspersed within and/or
immediately surround the LMFBR fuel assemblies and are exposed to their
neutron and gamma radiation leakage. The neutrons convert the fertile fuel
into fissile fuel while both neutron and gamma rays generate heat. In the
radial blankets, heat is generated at a rate decreasing sharply with distance
from the core, and the radial flux gradient, hence the heating rate
distribution, becomes steeper with time because of the spatial variation of
fissile fuel generation. At the same time, the total heat generation level
increases in all blanket assemblies with residence time. Thus heating rates
vary both spatially and with time over an extremely wide range (approximately
20 to 1 in the radial blanket region). Effective cooling is required over
this range. Although the amount of coolant flow in a single blanket assembly
is less than in fuel assemblies, collectively the blanket region requires a
significant fraction of the total reactor flow (10 to 15 percent during
equilibrium cycle in a homogeneous core and 15 to 30 percent for heterogeneous
cores). Thus conservation of flow in the blanket region can lead to
appreciable economic and reliability benefits. Judicious flow orificing can
minimize blanket flow requirements and reduce outlet temperature gradients on
the downstream internals. The saving in the blanket coolant and the resultant
increase in the fraction available for fuel assembly cooling enables the
overall core coolant temperatures, and hence the maximum cladding
temperatures, to be reduced significantly without reduction in reactor outlet
temperature and plant efficiency, thereby providing significant improvement in
core reliability and lifetime.
Since the blanket heating rates range from medium to very low, the required
coolant velocity in the rod bundles also varies from medium to very low. It
is especially low in the outer radial blanket rows and at part load operation
and during natural circulation cooling. This leads to extremely low rod
bundle frictional and form loss pressure drops. Under these conditions,
natural convection may predominate over forced axial flow and uncertainties
arise in predicting flow patterns and thermal performance. Depending on the
assembly location, the "mode" of flow can be laminar, transition or
turbulent. When changing from full to part-load operations or during natural
circulation cooling, more than one mode of flow can occur within a blanket
assembly.
The heat generation rates in inner blanket assemblies tend to be higher in the
peripheral rods than in the inside rods. In radial blanket assemblies, heat
generation decreases with distance from the core center and across one
assembly it can vary by as much as approximately 4 to 1. In addition, there
229
is an approximate 2 to 1 increase in power level from initial to final
operation. Considering inter-assembly heat transfer, the resultant
cross-assembly temperature gradient is in the order of 20 to 100°F (11 to
55°C). This gradient, in addition to radiation induced swelling across the
duct, must be handled by the core restraint designer. Because of the low flow
velocities in some of the outer radial blanket assemblies, the heat transfer
from rods to coolant can take place in a mixed mode of natural convection
{i.e., buoyancy effects superimposed onto forced convection). Under these
conditions secondary, recirculating flow patterns may arise, which make
prediction of the temperature distribution difficult.
In summary, the range of operating conditions for blanket assemblies is
extremely wide. To permit use of a similar assembly design throughout the
region, elaborate coolant flow management is required. A tabulation of the
range of typical design and operating thermal and hydraulic parameters for
LMFBR blanket assemblies is presented in Table 1-1. Figures 1.3 and 1.4
illustrate typical blanket thermal and hydraulic lifetime histories.
2.0 BLANKET ASSEMBLY HEAT TRANSFER AND HYDRAULIC DATA EVALUATION
Coolant flow and temperature distributions in blanket rod bundles are
calculated by subchannel analysis computer codes of the marching type which
take account of energy transport by momentum exchange, thermal conduction,
turbulent mixing and flow sweeping by the wire wraps. Many of these
analytical methods were developed and calibrated for fuel assemblies. Their
direct applicability to blanket assemblies with their tighte- P/D ratios,
larger diameter rods and shorter wire wrap lead has to be confirmed by
testing. Table 2-2 summarizes the design areas where heat transfer and
hydraulic test programs can significantly reduce uncertainties. In summary,
data are needed to (a) support predictions of the magnitude of peak cladding
and duct temperatures and their gradients across ducts and rods, (b) reduce
uncertainties in coolant requirements, (c) assess the effect of adjacent
assemblies, (d) determine performance at off-normal operating conditions, such
as start-up transients and natural convection conditions and (e) characterize
rod bundle hydraulic performance to assure adequate cooling over the entire
range of operating conditions.
A. Pressure Drop in Blanket Rod Bundles
1. Test Description
LMFBR blanket rod bundles have larger diameter rods, tighter P/D ratios and
shorter helical leads of the wire wrap than fuel rod bundles. Pressure drop
information in the literature was mostly for the wider spacings and longer
helical leads of the latter. In the U.S.A. hydraulic tests were recently
performed in water, air and in sodium of typical blanket rod bundles of
approximately 1.08 P/D and 4.0 (10 cm) lead. Pressure drop data were obtained
using: 1) 61-rod blanket bundle, 600°F (316°C) isothermal sodium tests at
230
WARDg
and 2) 61-rod blanket bundle isothermal water tests at(2)and MIT.* ' The sodium testing covered the Reynolds number range from 300
to 25,000. The WARD water testing Reynolds number range was 50 to 4,000. The
MIT water testing was performed over a Reynolds number range from 200 to
10,000. The two WARD tests were performed with a H/D ratio of 8.0, while the
MIT tests were made with two wire wrap leads of H/D = 4.0 and 8.0. Two
pressure drop data points were also obtained with a 5 to 1 scale partial
blanket rod bundle using air. Table 2-2 lists the principal test section
dimensions and operating parameters of the aforementioned tests and those of
other pertinent tests reported in the literature.
2. Test Results
The rod bundle pressure drop data were expressed in terms of the Darcy
friction factor:
f =
and were plotted against the Reynolds number.
Contrary to the hydraulic loss pattern established for round tubes, the
transition from turbulent to laminar flow was smooth, continuous and a sinqle
valued function of Reynolds number. Figure 2.1 summarizes the test data
obtained from the WARD and MIT water, sodium and air tests as well as
correlations for the turbulent region from the literature. The Figure 2.1
data are all based on pressure drop measurements by wall taps and on the
average velocity and hydraulic diameter for the entire assembly. The MIT
data' ' which is included in Figure 2.1 is presented separately in Figure
2.2 for a P/D ratio of 1.067. There were no systematic differences in the
measurements of the WARD data at the three faces of the water test section and
1n the data obtained at 41 in. (104 cm) and 82 in. (208 cm) tap locations.
However, the pressure measurements of the central rod differed consistently
from those of the duct wall taps. Because the side channel and internal
channel geometries differ, the subchannel flow velocities and the hydraulic
diameters differ also. Measurements of Chiu and Todreas^) for a similar
geometry gave the ratios of subchannel-to-average velocity ratios of 0.80 and
1.375 for inside and side subchannels, respectively, for laminar flow.
Employing these parameters, friction factors and Reynolds numbers were
calculated for the laminar flow regime from the test data for side and inboard
subchannels and were plotted in figure 2.3 together with the bundle average
results. Although the Reynolds numbers at the same operating point differ
from each other for the different subchannels, the laminar flow friction
factors fall within the experimental data spread (^10%) of the curve through
the assembly averaged values.
3. DISCUSSION AND CORRELATION OF RESULTS
Transition from Turbulent to Laminar Flow
Figure 2.1 shows that a continuous, smooth friction factor transition occurs
as the flow regime progresses from laminar to turbulent flow. The smooth
transition flow range hehavior can be explained by the assumption that when
the flow rate is reduced, laminar flow is reached first in the narrow throat
between rods, while the channel average Reynolds number is still about
5,000^). on further flow reduction, the extent of the laminar region
increases; however, the flow in the center of the subchannel does not become
completely laminar until the channel average Reynolds number is less than 500.
Straight line plots of the laminar and turbulent data as shown in Figure 2.1
terminate at values of Reynolds numbers equal to 400 and 5,000 respectively.
Within the Reynolds number range of 400 to 5,000, the bundle average friction 231
factor data can be expressed within +15% in the form
f = Re0.25
T Ri~
where f = (Re - 400)/4600; for <400 Re <5000
(1)
Physically T, which is sometimes called the intermittency factor and whose
value ranges from zero to unity, can be considered to represent the fraction
of the flow field that is turbulent in a specified flow subchannel.
Laminar Flow Friction Factors
In laminar flow, it is well known that the product of the friction factor and
Reynolds number is constant. However, the.constant becomes a different
numerical value for each specific geometry. The friction factor and Reynolds
number product for a wire wrapped rod bundle is a function of the
pitch-to-diameter ratio and the wire wrap lead, i.e.:
fRe = F (P/D, H/D) (2)
For the bundles tested, the pitch-to-diameter radios were approximately 1*08
and,
fRe = 110 (3)
compared to corresponding values equal to 64 and 96, respectively, for
circular tubes and annuli. The friction factor Reynolds number product for a
bare rod bundle having the same pitch-to-diameter ratio as the reference rod
bundle tested is deduced to be approximately 60, based on the results in
Reference (6) and an interpretation of the graphical data in Reference (7).
The effects of P/D and H are shown in Figure 2.4 for the limited wire wrapped(2 8 9)rod bundle laminar flow friction data available ' . In deriving an
empirical correlation to fit the data, no attempt was made to account for the
effect of bundle to duct clearance, rod eccentricity or manufacturing
tolerances. Over the range of data cited in Table 2-2, the laminar flow
average rod bundle preliminary friction factor is correlated by
fRe = 2° (P/D)1-5 (H in cm.); fRe = *^°- (P/D) 1 - 5 (H in inches) (4)IT Ai»IT
Turbulent Flow Friction Factors
Ai
In the fully turbulent region (5000 < Re < 40,000), the friction factor
can be expressed as
0.55
Re0.25(5)
This expression differs by less than 14% from Novendsterns* ' correlation,0 25which gives O.62/Re ' for the geometry and flow range tested. Equation
(5) should not be used much beyond the test Reynolds number range (5000 £
Re £40,000). Also, as shown in Figure 2.1, Rehme's^ data for P/D equal
to 1.125 are slightly higher and Hoffman's' ' data for P/D = 1.32 are
slightly lower than the data obtained by the authors. There is good agreement
between the WARD test data*17) and the results of Chiu and Todreas*2).
B. Blanket Assembly Heat Transfer Tests in Sodium
1. Test Section Description
Tests are underway with a full sized electrically heated mock-up of a blanket
rod bundle. This bundle was constructed to simulate blanket assembly
operation over a wide range of conditions which include:
a. Radial blanket conditions from 4:1 to 1:1 maximum to
minimum steady state power generation gradients across
flats and corners of the hexagonal array - at full or
part load operation over 1.5 to 100% flow and power range.
b. Dished type power generation patterns specific to inner
blanket assemblies adjacent to fuel assemblies and
control assemblies at full or part load operation.
c. Steady state operation with heat transffcr to and from
adjacent assemblies simulated by auxiliary ducts and rod
bundles with separate flow and power control.
d. Transient coastdown from full or part load to residual
power operation.
e. Natural convection operation at residual power generation
rates.
The 61-rod bundle blanket heat transfer test section, shown
schematically in Figure 2.5 consists of the following major
components:
a. A 61-Rod Bundle Assembly of 0.520 in. (13.18 mm) diameter
electrically heated fuel rod simulators (Figure 2.6).
The rods have a 45-inch heated zone with a chopped cosine
axial power distribution and a rated peak heat flux of
14.8 kW/ft (48.5 kW/m) and a maximum rated power of 40 kW
at 240 volts.
A 0.037 in. (0.94 mm) spacer wire is wrapped helically
around each heater on a 4 in. (10.16 cm) pitch. The wire
wrap simulators on most heater rods are sheathed
thermocouoles containing three Type K junctions. These
are axially spaced within the sheath for location at
pre-selected elevations along the heater rods when the
wire is wrapped on the rod. Details of heater rod and
multiple thermocouple construction were presented in
reference 11).
232
The rods are electron-beam welded into a tube sheet which
is in turn welded to a flange which forms the top closure
of the vertically oriented blanket rod bundle test
section. The rods are spaced on a 0.560 in. (14.25 cm)
triangular pitch with a pitch-to-diameter ratio of 1.08.
The bottom ends of the heaters are free to expand
downward on rails attached to a sodium inlet nozzle.
b. A bundle clamp (main duct) surrounds the 61-rod bundle.
The inside surface of this duct simulates the flow
boundary formed by the Blanket Assembly hexagonal duct.
c. Two auxiliary ducts are positioned adjacent to two
opposite faces of the main duct. These contain five
additional heaters which provide a means for simulating
inter-assembly heat transfer. Flow is fed via a
separately controlled, measured line.
d. A 10-inch stainless steel containment vessel into which
are installed the rod bundle, main and auxiliary duct
assemblies and all instrumentation and internal hardware
for supporting, aligning, assembling and providing sodium
flow to the test bundle and auxiliary ducts.
The heater bundle, main duct, and sodium inlet region dimensions and
configuration were selected to mock-up, as closely as practical, corresponding
features of an LMFBR blanket assembly reference design. The 45-inch (114.3
cm) long heater zone and axial cosine power distribution represents the active
blanket fuel rod length. The heater alignment plug, rails, rail holders and
sodium inlet nozzle are prototypic of a blanket assembly, thus ensuring
prototypic sodium inlet flow conditions. The sodium space outside of the duct
is compartmentalized in order to avoid natural circulation flows.
The test section is instrumented to measure sodium flow, pressure drop, power
input and temperature. The test section contains over 800 thermocouples,
about half of which are spares. Thermocouples are located at the test section
inlet and outlet and at six axial planes along the test section. At each
plane the thermocouples provide a network of measurement points needed to
experimentally establish the temperature profile. Figure 2.7 shows the
temperature measurement planes. Thermocouples are attached to the heater
sheath wall ID and inside the wire wrap spacers to provide temperature
measurements within the rod bundle without disturbing flow. All heater rods
contain thermocouples at the "A", "B" and "C" planes. Each wire wrap contains
three thermocouples located at either the "A", "D", "E", or at the "B", "C",
and "F" planes. There are additional thermocouples at each plane, attached to
the main and auxiliary duct walls, the containment vessel 0.0. and in the
stagnant sodium within the vessel. Table 2-3 summarizes significant test
section design and operating parameters.
A cross section of the test assembly, Figure 2-8, shows the 61-rod bundle in
the main duct and the two auxiliary ducts with five heater rods each and some
details of rod construction. Radial blanket tests are run with power the same
to all rods in one row as illustrated. Later internal blanket power
generation patterns which do not have a continuous gradient but show a dished
or trough-like distribution oriented across corners will be simulated. Figure
2-9 illustrates temperature sensor placement at one level. Only one of the
three T/C's located internal to the cladding wall at one level is connected to
the data acquisition system at one time.
2. TEST PROGRAM, RESULTS AND EVALUATION
Table 2.4 summarizes the test program and its current status. The planned
radial blanket steady state testing is summarized in Tables 2-5 and 2-6. To
date, medium and low power runs were performed with 2.8 to 1 and 1 to 1
(uniform) heat input gradients (configurations 2 and 6 in Table 2.6).
The temperature distribution data obtained during each test are mapped for
each level of instrumentation after calibration corrections have been
applied. The temperature results reported are averages of 500 data sets taken
when steady state was reached over a 10 minute time interval. Corrections
were obtained by isothermal operation allowing for axial and radial gradients
233
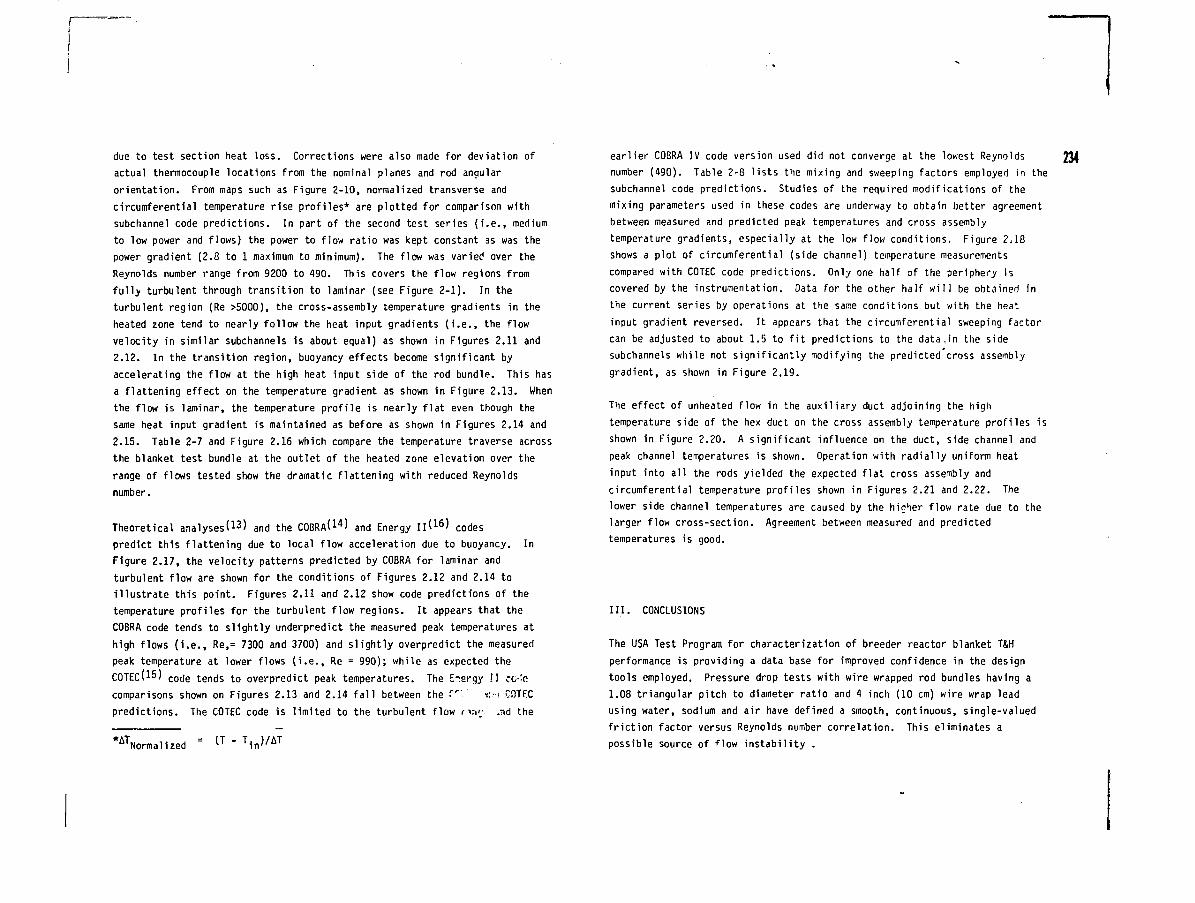
due to test section heat loss. Corrections were also made for deviation of
actual thermocouple locations from the nominal planes and rod angular
orientation. From maps such as Figure 2-10, normalized transverse and
circumferential temperature rise profiles* are plotted for comparison with
subchannel code predictions. In part of the second test series (i.e., medium
to low power and flows) the power to flow ratio was kept constant as was the
power gradient (2.8 to 1 maximum to minimum). The flow was varied over the
Reynolds number fange from 9200 to 490. This covers the flow regions from
fully turbulent through transition to laminar (see Figure 2-1). In the
turbulent region (Re >5000), the cross-assembly temperature gradients in the
heated zone tend to nearly follow the heat input gradients (i.e., the flow
velocity in similar subchannels is about equal) as shown in Figures 2.11 and
2.12. In the transition region, buoyancy effects become significant by
accelerating the flow at the high heat input side of the rod bundle. This has
a flattening effect on the temperature gradient as shown in Figure 2.13. When
the flow is laminar, the temperature profile is nearly flat even though the
same heat input gradient is maintained as before as shown in Figures 2.14 and
2.15. Table 2-7 and Figure 2.16 which compare the temperature traverse across
the blanket test bundle at the outlet of the heated zone elevation over the
range of flows tested show the dramatic flattening with reduced Reynolds
number.
Theoretical analyses(13) and the C 0 B R A ( 1 4 ) and Energy Il(16) codes
predict this flattening due to local flow acceleration due to buoyancy. In
Figure 2.17, the velocity patterns predicted by COBRA for laminar and
turbulent flow are shown for the conditions of Figures 2.12 and 2.14 to
illustrate this point. Figures 2.11 and 2.12 show code predictions of the
temperature profiles for the turbulent flow regions. It appears that the
COBRA code tends to slightly underpredict the measured peak temperatures at
high flows (i.e., Re,= 7300 and 3700) and slightly overpredict the measured
peak temperature at lower flows (i.e., Re = 990); while as expected the
C0TEC(15) C 0 ( ] e tends to overpredict peak temperatures. The Energy II cc-'c
comparisons shown on Figures 2.13 and 2.14 fall between the f" tin CDTFC
predictions. The COTEC code is limited to the turbulent flow rw;-. ,nd the
*AT Normalized = CT-T 1 n)/AT
earlier COBRA IV code version used did not converge at the lowest Reynolds 234
number (490). Table 2-8 lists the mixing and sweeping factors employed in the
subchannel code predictions. Studies of the required modifications of the
mixing parameters used in these codes are underway to obtain better agreement
between measured and predicted peak temperatures and cross assembly
temperature gradients, especially at the low flow conditions. Figure 2.18
shows a plot of circumferential (side channel) temperature measurements
compared with COTEC code predictions. Only one half of the periphery is
covered by the instrumentation. Data for the other half will be obtained in
the current series by operations at the sarce conditions but with the heat
input gradient reversed. It appears that the circumferential sweeping factor
can be adjusted to about 1.5 to fit predictions to the data,in the side
subchannels while not significantly modifying the predicted cross assembly
gradient, as shown in Figure 2.19.
The effect of unheated flow in the auxiliary duct adjoining the high
temperature side of the hex duct on the cross assembly temperature profiles is
shown in Figure 2.20. A significant influence on the duct, side channel and
peak channel temperatures is shown. Operation with radially uniform heat
input into all the rods yielded the expected flat cross assembly and
circumferential temperature profiles shown in Figures 2.21 and 2.22. The
lower side channel temperatures are caused by the higher flow rate due to the
larger flow cross-section. Agreement between measured and predicted
temperatures is good.
III. CONCLUSIONS
The USA Test Program for characterization of breeder reactor blanket T&H
performance is providing a data base for improved confidence in the design
tools employed. Pressure drop tests with wire wrapped rod bundles having a
1.08 triangular pitch to diameter ratio and 4 inch (10 cm) wire wrap lead
using water, sodium and air have defined a smooth, continuous, single-valued
friction factor versus Reynolds number correlation. This eliminates a
possible source of flow instability .
The rod bundle temperature rise profiles measured in the heat transfer tests
using a prototypic blanket rod bundle agrees in magnitude and shape with the
predictions of the marching type sub-channel codes currently employed in
blanket subchannel analysis. The low flow test data demonstrates increasing
buoyancy induced flows in the lower Reynolds number flow regime. This and the
remaining test data will supply a base for calibration of the mixing momentum
exchange and conduction factors employed in the subchannel analysis codes;
which will contribute to the confidence of the blanket design predictions and
reduce the uncertainties which are commonly expressed as hot channel/spot
factors,
IV. REFERENCES
1. C. Chiu and N. E. Todreas, "Flow Split Measurements in an LMFBR RadialBlanket Assembly," Trans. Am. Nucl. Soc, 26, pp. 455-456 (1977).
2. C. Chiu, J. Hawley, W. M. Rohsenow and N. E. Todreas, "Pressure DropMeasurements in LMFBR Wire Wrapped Blanket Assemblies," C00-2245-42TR,July 1977.
3. K. Rehme, "Pressure Drop Correlations for Fuel Element Spacers," NuclearTechnology, 17, no. 1, pp. 15-23, (1973).
4. H. Hofmann, "Experimental Investigations on Coolant Cross Mixing andPressure Drop in Rod Bundles with Helical Spacers," EURFNR-1161, December1973.
5. H. Ramm, K. Johannsen and N. E. Todreas, "Single Phase Transport withinBare Rod Arrays at Laminar, Transition and Turbulent Flow Conditions,"Nucl. Eng. and Design, 30, no. 2, pp 136-204 (1974).
6. K. Rehme, "Laminar Stroemung in Stabbuendeln," Chem. Ing. Technik, 43,No. 17, pp. 962-966 (1971).
7. K. Rehme, "Pressure Drop Performance of Rod Bundles in HexagonalArrangements," International Journal Heat and Mass Transfer, 15, no. 12,pp. 2499-2517 (1972).
8. A. S. Hanson and N. Todreas, "Fluid Mixing Studies in a Hexagonal 61-PinWire Wrapped Rod Bundle," C00-2245-51TR, August 1977.
9. W. L. Thorne, "Pressure Drop Measurements in FFTF Fuel Vibration Tests,"HEDL-TC-812, April 1977. Availability: U.S. DOE, Technical InformationCenter.
10. E. H. Novendstern, "Pressure Drop Model for Wire Wrapped FuelAssemblies," Trans. Am. Nucl. Soc. 1±, pp. 660-661, (1971).
11. B. Minushkin, F. C. Engel, R. J. Atkins, and R. A. Markley, "HeatTransfer Tests of an Electrically Heated 7-Rod Mock-Up of an LMFBR RadialBlanket Assembly," ASME Paper 76-WA/HT-80.
12. F. C. Engel, R. A. Markley and B. Minushkin, "Buoyancy Effects on SodiumCoolant Temperature Profiles Measured in an Electrically Heated Mock-Upof a 61-Rod Breeder Reactor Blanket Assembly," ASME Paper 78WA/HT-25.
13. C. Tsai, A. A. Bishop, R. A. Markley, "Effects of Buoyancy Force on theVelocity and Temperature Distributions in an LMFBR Radial Blanket FuelRod Assembly," ASME Paper 73-HT-58.
14. C. L. Wheeler, C. W. Stewart, R. J. Cena, D. S. Rowe, and A. M. Sutey,"COBRA-IV-1: An Interim Version of COBRA for Thermal-Hydraulic Analysisof Rod Bundle Nuclear Fuel Elements and Cores," BNWL-1962, March 1976.
15. E. H. Novendstern, "Mixing Model for Wire Wrap Fuel Assemblies," Trans.Am. Nuclear Soc, lj>, pp. 866-67 (1972).
16. Chen and N. E. Todreas, "Prediction of the Coolant Temperature Field in aBreeder Reactor Including Interassembly Heat Transfer," NuclearEngineering and Design, 35_, no. 3, pp. 423-440 (1975).
17. F. C. Engel, R. A. Markley and A. A. Bishop, "Laminar, Transition andTurbulent Parallel Flow Pressure Drop Across Wire Wrap Spaced RodBundles", Nuclear Science and Engineering, (To be published in 1979).
V. NOMENCLATURE (CONSISTENT UNITS)
A flow cross section
D rod OD
D^ hydraulic diameter = 4A/PE
d wire wrap diameter
f Darcy friction factor = AP x DH x 2g/(L p V2)
g acceleration of gravity
H wire wrap lead
L axial distance
Nn number of rods in a rod bundle
P triangular rod pitch
PE wetted perimeter
Re Reynolds number D H V p/u
S distance between duct wall and rods
V fluid axial velocity
AP pressure drop
p density
i|> function representing fraction of cross section in turbulent flow in
transition region, >ji = (Re = 40O)/4600
u viscosity
235
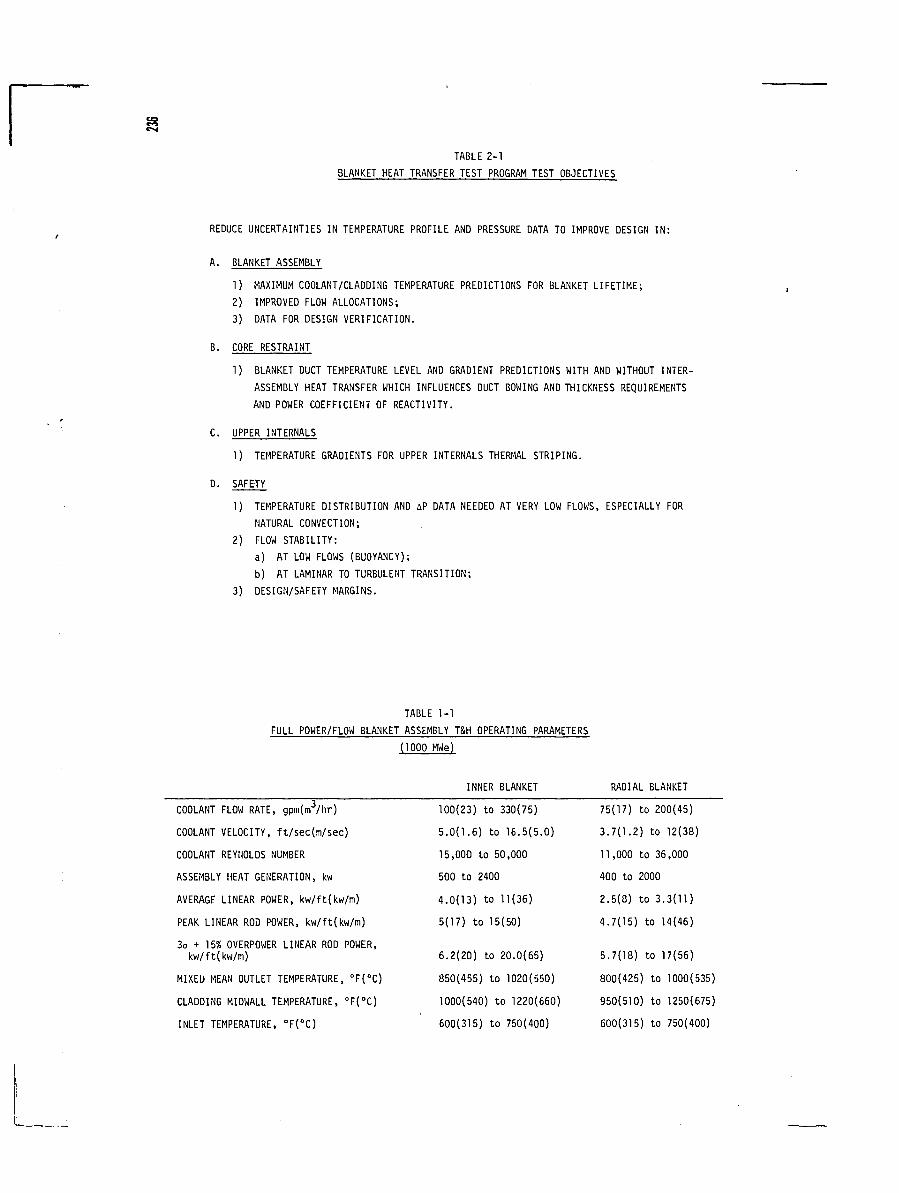
TABLE 2-1BLANKET HEAT TRANSFER TEST PROGRAM TEST OBJECTIVES
REDUCE UNCERTAINTIES IN TEMPERATURE PROFILE AND PRESSURE DATA TO IMPROVE DESIGN IN:
A. BLANKET ASSEMBLY
1) MAXIMUM COOLANT/CLADDING TEMPERATURE PREDICTIONS FOR BLANKET LIFETIME;2) IMPROVED FLOW ALLOCATIONS;3) DATA FOR DESIGN VERIFICATION.
B. CORE RESTRAINT
1) BLANKET DUCT TEMPERATURE LEVEL AND GRADIENT PREDICTIONS WITH AND WITHOUT INTER-ASSEMBLY HEAT TRANSFER WHICH INFLUENCES DUCT BOWING AND THICKNESS REQUIREMENTSAND POWER COEFFICIENT OF REACTIVITY.
C. UPPER INTERNALS
1) TEMPERATURE GRADIENTS FOR UPPER INTERNALS THERMAL STRIPING.
D. SAFETY
1) TEMPERATURE DISTRIBUTION AND AP DATA NEEDED AT VERY LOW FLOWS, ESPECIALLY FORNATURAL CONVECTION;
2) FLOW STABILITY:a) AT LOW FLOWS (BUOYANCY);b) AT LAMINAR TO TURBULENT TRANSITION;
3) DESIGN/SAFETY MARGINS.
TABLE 1-1FULL POWER/FLOW BLANKET ASSEMBLY T&H OPERATING PARAMETERS
(1OOO MWe)
INNER BLANKET RADIAL BLANKET
COOLANT FLOW RATE, gpm(m3/hr)
COOLANT VELOCITY, ft/sec(m/sec)
COOLANT REYNOLDS NUMBER
ASSEMBLY HEAT GENERATION, kw
AVERAGE LINEAR POWER, kw/ft(kw/m)
PEAK LINEAR ROD POWER, kw/ft(kw/m)
3o + 15% OVERPOWER LINEAR ROD POWER,kw/ft(kw/m)
MIXED MEAN OUTLET TEMPERATURE, °F(°C)
CLADDING MIDWALL TEMPERATURE, °F(°C)
INLET TEMPERATURE, °F(°C)
100(23) to 330(75)
5.0(1.6) to 16.5(5.0)
15,000 to 50,000
500 to 2400
4.0(13) to 11(36)
5(17) to 15(50)
6.2(20) to 20.0(65)
850(455) to 1020(550)
1000(540) to 1220(660)
600(315) to 750(400)
75(17) to 200(45)
3.7(1.2) to 12(38)
11,000 to 36,000
400 to 2000
2.5(8) to 3.3(11)
4.7(15) to 14(46)
5.7(18) to 17(56)
800(425) to 1000(535)
950(510) to 1250(675)
600(315) to 750(400)
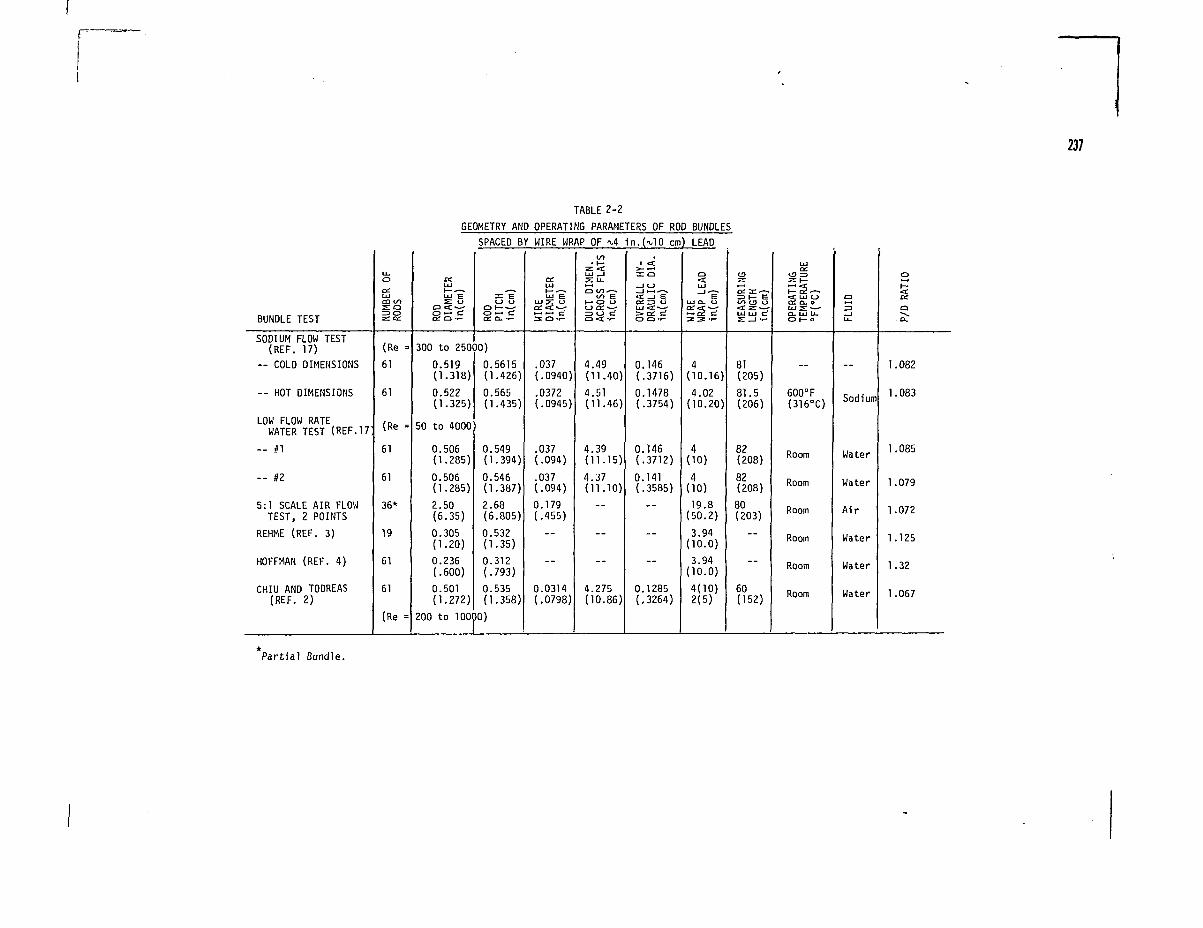
237
TABLE 2-2GEOMETRY AND OPERATING PARAMETERS OF ROD BUNDLES
BUNDLE TEST
SODIUM FLOW TEST(REF. 17)
— COLD DIMENSIONS
— HOT DIMENSIONS
LOW FLOW RATEWATER TEST (REF.17
— #1
-- n
5:1 SCALE AIR FLOWTEST, 2 POINTS
REHME (REF. 3)
HOFFMAN (REF. 4)
CHIU AND TODREAS(REF. 2)
U .O
CCUJCÜ COso=>oz: en
(Re =
61
61
(Re =
61
61
36*
19
61
61
(Re =
CCUJ
300 to 250
0.519(1.318)
0.522(1.325)
50 to 4000
0.506(1.285)
0.506(1.285)
2.50(6.35)
0.305(1.20)
0.236(.600)
0.501(1.272)
200 to 100
SPACED BY WIRE WRAP OF -\A
5?C£ O- -r-
10)
0.5615(1.426)0.565(1.435)
0.549(1.394)
0.546(1.387)2.68(6.805)0.532(1.35)0.312(.793)0.535(1.358)
a.Uli— — -UJ Eus: u
3 O-r-
.037(.0940)
.0372(.0945)
.037(.094)
.037(.094)0.179(.455)
—
—
0.0314(.0798)
CO
Q c/v—c/> E
HOU
= o eO «C-r-
4.49(11.40)4.51(11.46)
4.39(11.15)
4.37(11.10)
—
—
--
4.275(10.86)
in. HO cm) LEAD
_J o
UJ <-—•^ a: do Q •>-
0.146(.3716)0.1478(.3754)
0.146(.3712)0.141(.3585)
- -
—
—
0.1285(.3264)
o•a:
UJ
LUO. U
HI
4(10.16)4.02
(10.20)
4(10)4
(10)19.8
(50.2)3.94
(10.0)3.94
(10.0)4(10)2(5)
= t- EI/1O U< z~-rUl UJ dE _1 " -
81(205)81.5(206)
82(208)
82(208)80(203)
—
—
60(152)
UJCC
«£ UJ t_>a: o_ oUJ 2 : —Q. LU LL.Ol—O
- -
600°F(316°C)
Room
Room
Room
Room
Room
Room
CD
Z3_ lU -
- -
Sodium
Water
Water
A i r
Water
Water
Water
0
ia.
1.082
1.083
1.085
1.079
1.072
1.125
1.32
1.067
Partial Bundle.
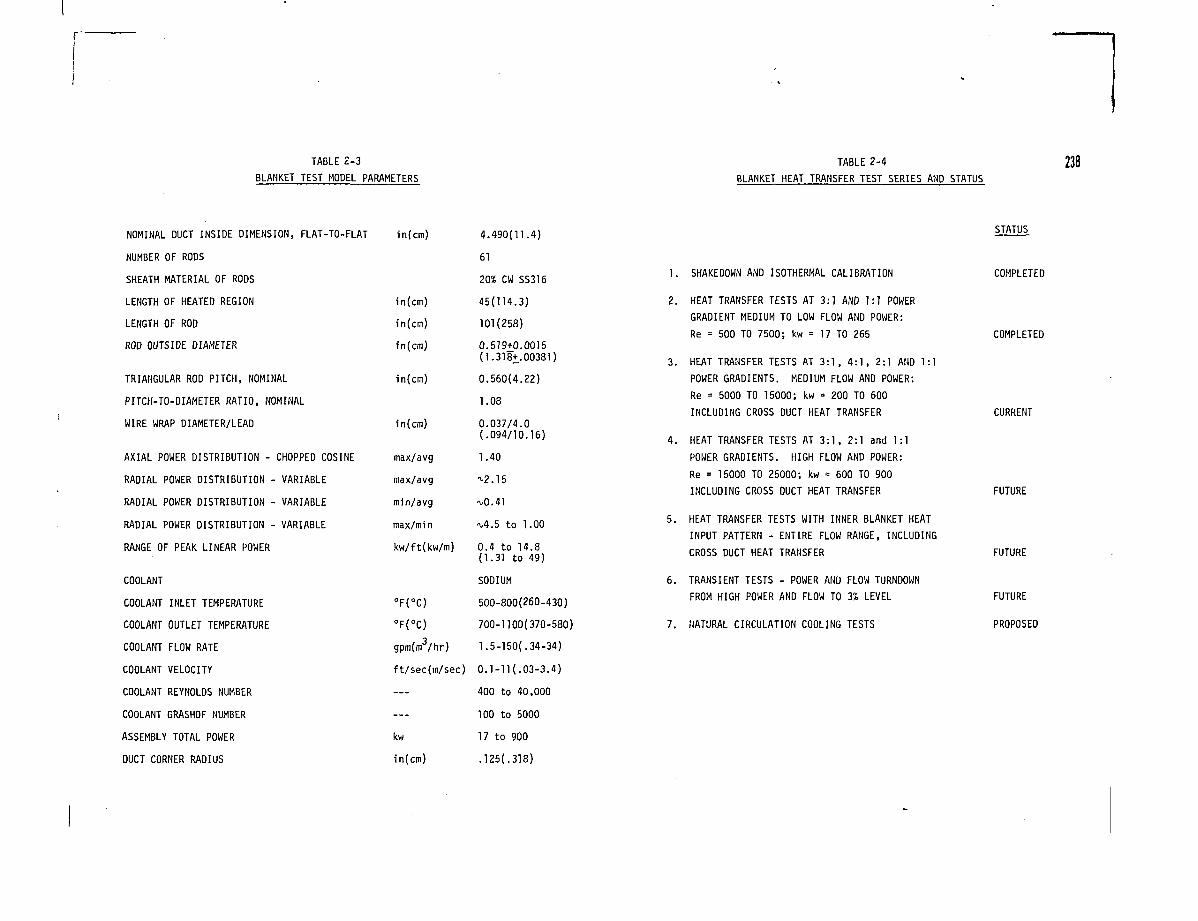
TABLE 2-3
BLANKET TEST MODEL PARAMETERSTABLE 2-4
BLANKET HEAT TRANSFER TEST SERIES AND STATUS238
NOMINAL DUCT INSIDE DIMENSION, FLAT-TO-FLAT
NUMBER OF RODS
SHEATH MATERIAL OF RODS
LENGTH OF HEATED REGION
LENGTH OF ROD
ROD OUTSIDE DIAMETER
TRIANGULAR ROD PITCH, NOMINAL
PITCH-TO-DIAMETER RATIO, NOMINAL
WIRE WRAP DIAMETER/LEAD
AXIAL POWER DISTRIBUTION - CHOPPED COSINE
RADIAL POWER DISTRIBUTION - VARIABLE
RADIAL POWER DISTRIBUTION - VARIABLE
RADIAL POWER DISTRIBUTION - VARIABLE
RANGE OF PEAK LINEAR POWER
COOLANT
COOLANT INLET TEMPERATURE
COOLANT OUTLET TEMPERATURE
COOLANT FLOW RATE
COOLANT VELOCITY
COOLANT REYNOLDS NUMBER
COOLANT GRASHOF NUMBER
ASSEMBLY TOTAL POWER
DUCT CORNER RADIUS
in(cm)
in(cm)
in(cm)
in(cm)
in(cm)
in(cm)
max/avg
max/avg
min/avg
max/min
kw/ft(kw/m)
°F(°C)
°F(°C)
gpm(m /hr)
ft/sec(m/sec)
—
—
kw
in(cm)
4.490(11.4)
61
20% CW SS316
45(114.3)
101(258)
0.519+0.0015(1.318+.00381)
0.560(4.22)
1.08
0.037/4.0(.094/10.16)
1.40
^2.15
-vO.41
%4.5 to 1.00
0.4 to 14.8(1.31 to 49)
SODIUM
500-800(260-430)
700-1100(370-580)
1.5-150(.34-34)
0.1-11(.03-3.4)
400 to 40,000
100 to 5000
17 to 900
.125(.318)
1. SHAKEDOWN AND ISOTHERMAL CALIBRATION
2. HEAT TRANSFER TESTS AT 3:1 AND 1:1 POWER
GRADIENT MEDIUM TO LOW FLOW AND POWER:
Re = SOO TO 7500; kw = 17 TO 265
3. HEAT TRANSFER TESTS AT 3:1, 4:1, 2:1 AMD 1:1
POWER GRADIENTS. MEDIUM FLOW AND POWER:
Re = 5000 TO 15000; kw = 200 TO 600
INCLUDING CROSS DUCT HEAT TRANSFER
4. HEAT TRANSFER TESTS AT 3:1, 2:1 and 1:1
POWER GRADIENTS. HIGH FLOW AND POWER:
Re = 15000 TO 25000; kw = 600 TO 900
INCLUDING CROSS DUCT HEAT TRANSFER
5. HEAT TRANSFER TESTS WITH INNER BLANKET HEAT
INPUT PATTERN - ENTIRE FLOW RANGE, INCLUDING
CROSS DUCT HEAT TRANSFER
6. TRANSIENT TESTS - POWER AND FLOW TURNDOWN
FROM HIGH POWER AND FLOW TO 3% LEVEL
7. NATURAL CIRCULATION COOLING TESTS
STATUS
COMPLETED
COMPLETED
CURRENT
FUTURE
FUTURE
FUTURE
PROPOSED
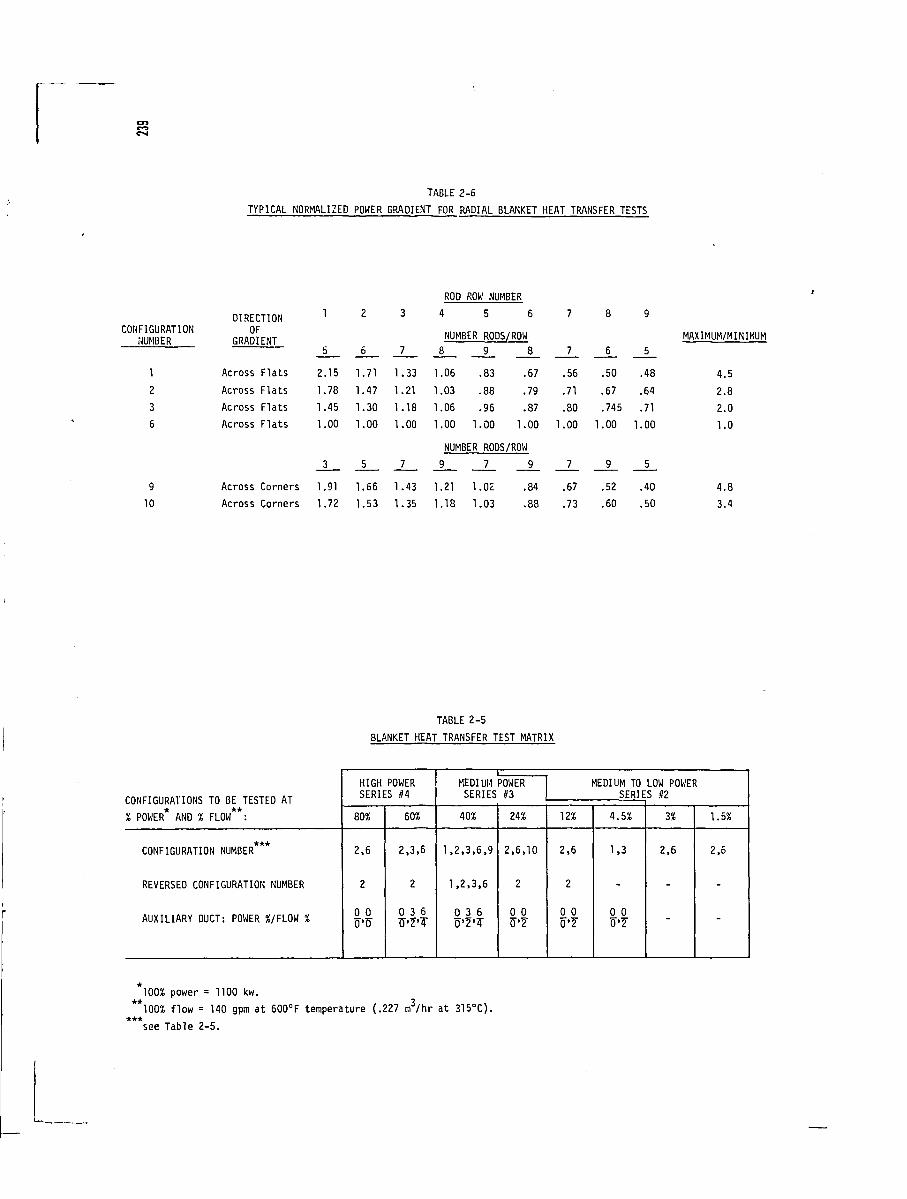
TABLE 2-6
TYPICAL NORMALIZED POWER GRADIENT FOR RADIAL BLANKET HEAT TRANSFER TESTS
CONFIGURATIONNUMBER
1
2
3
6
9
10
DIRECTIONOF
GRADIENT
Across Flats
Across Flats
Across Flats
Across Flats
Across Corners
Across Corners
1
5
2.15
1.78
1.45
1.00
3
1.91
1.72
2
6
1.71
1.47
1.30
1.00
5
1.66
1.53
3
7
1.33
1.21
1.18
1.00
7
1.43
1.35
ROD ROW NUMBER4
NUMBER8
1.06
1.03
1.06
1.00 1,
NUMBER
9
1.21
1.18
1,
1,
5
RODS/ROV9
.83
.88
.96
.00 1.
RODS/ROV
7
.02
.03
6
J8
.67
,79
.87
.00
J
9
.84
7
7
.56
.71
.80
1.00
7
.67
.73
8
6
.50
.67
.745
1.00
9
.52
.60
9
5
.48
.64
.71
1.00
5
.40
.50
MAXIMUM/MINIMUM
4.5
2.8
2.0
1.0
4.8
3.4
TABLE 2-5
BLANKET HEAT TRANSFER TEST MATRIX
CONFIGURATIONS TO BE TESTED AT
% POWER AND % FLOW :
CONFIGURATION NUMBER***
REVERSED CONFIGURATION NUMBER
AUXILIARY DUCT: POWER %/FLOW %
HIGH POWERSERIES #4
80%
2,6
2
0 0
60%
2,3,6
2
0 3 6
MEDIUMSERIES
40%
1.2,3,6,9
1,2,3,6
0 3 6Tj'2'4
POWER#3
24%
2,6,10
2
0 0Ö'2
1
12%
2,6
2
0 0Ö-2
CDIUM TO LOW POWEFSERIES HZ
4.5%
1,3
-
0 00'2
3%
2,6
-
-
t
1.5%
2.6
-
-
100% power = 1100 kw.
**100% flow = 140 gpm at 600°F temperature (.227 m3/hr at 315°C).
see Table 2-5.
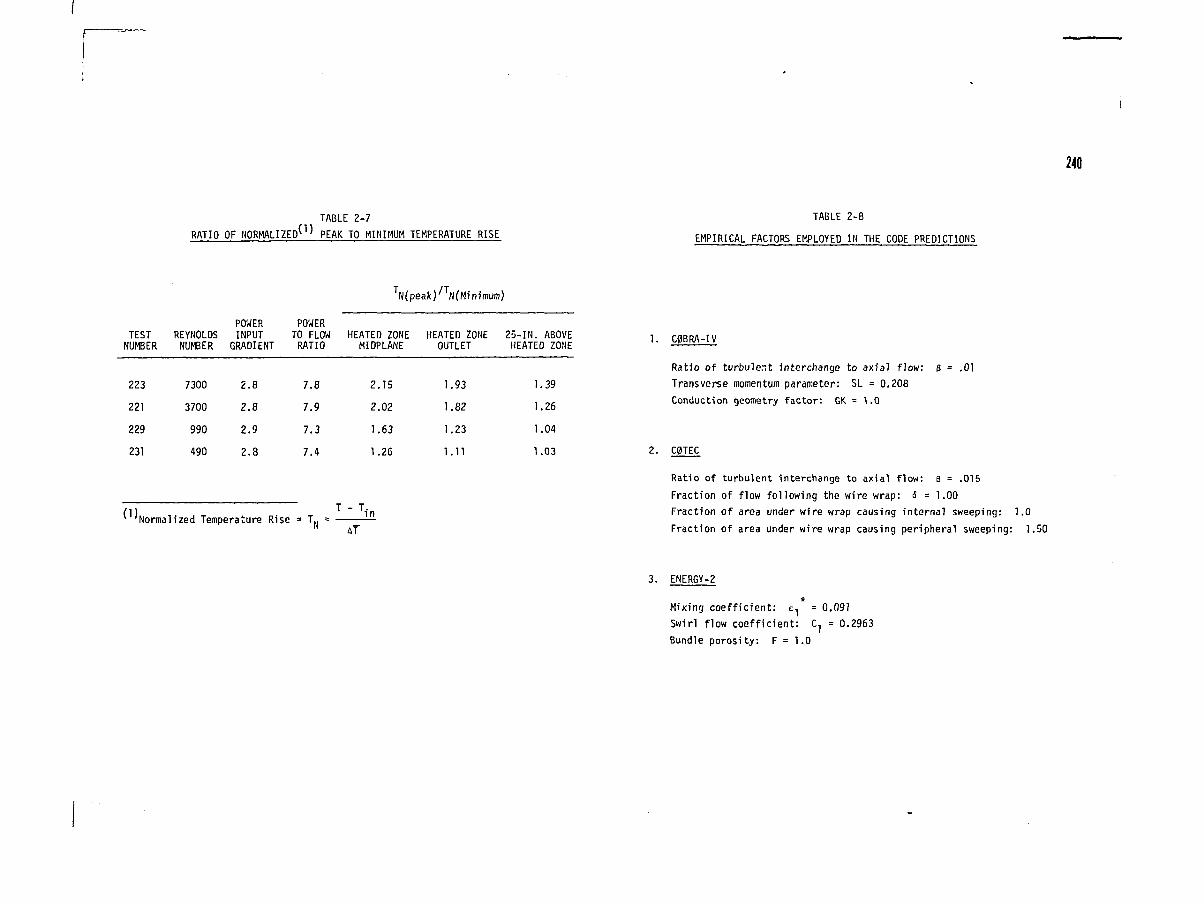
240
RATIO OF NORMALIZED^
TABLE 2-7
PEAK TO MINIMUM TEMPERATURE RISE
TABLE 2-8
EMPIRICAL FACTORS EMPLOYED IN THE CODE PREDICTIONS
TN(peak) / TN(Minimum)
TESTNUMBER
223
221
229
231
REYNOLDSNUMBER
7300
3700
990
490
POWERINPUT
GRADIENT
2.8
2.8
2.9
2.8
POWERTO FLOWRATIO
7.8
7.9
7.3
7.4
HEATED ZONEMIDPLANE
2.15
2.02
1.63
1.26
HEATED ZONEOUTLET
1.93
1.82
1.23
1.11
25-IN. ABOVEHEATED ZONE
1.39
1.26
1.04
1.03
' 'Normalized Temperature Rise = TM = —" AT
1. C0BRA-IV
Ratio of turbulent interchange to axial f low: ß = .01
Transverse momentum parameter: SL = 0.208
Conduction geometry fac tor : GK = 1.0
C0TEC
Ratio of turbulent interchange to axial flow: B = .015
Fraction of flow following the wire wrap: & = 1.00
Fraction of area under wire wrap causing internal sweeping: 1.0
Fraction of area under wire wrap causing peripheral sweeping: 1.50
3. ENERGY-2
Mixing coefficient: e-|Swirl flow coefficient:Bundle porosity: F = 1.0
= 0.091
C] = 0.2963
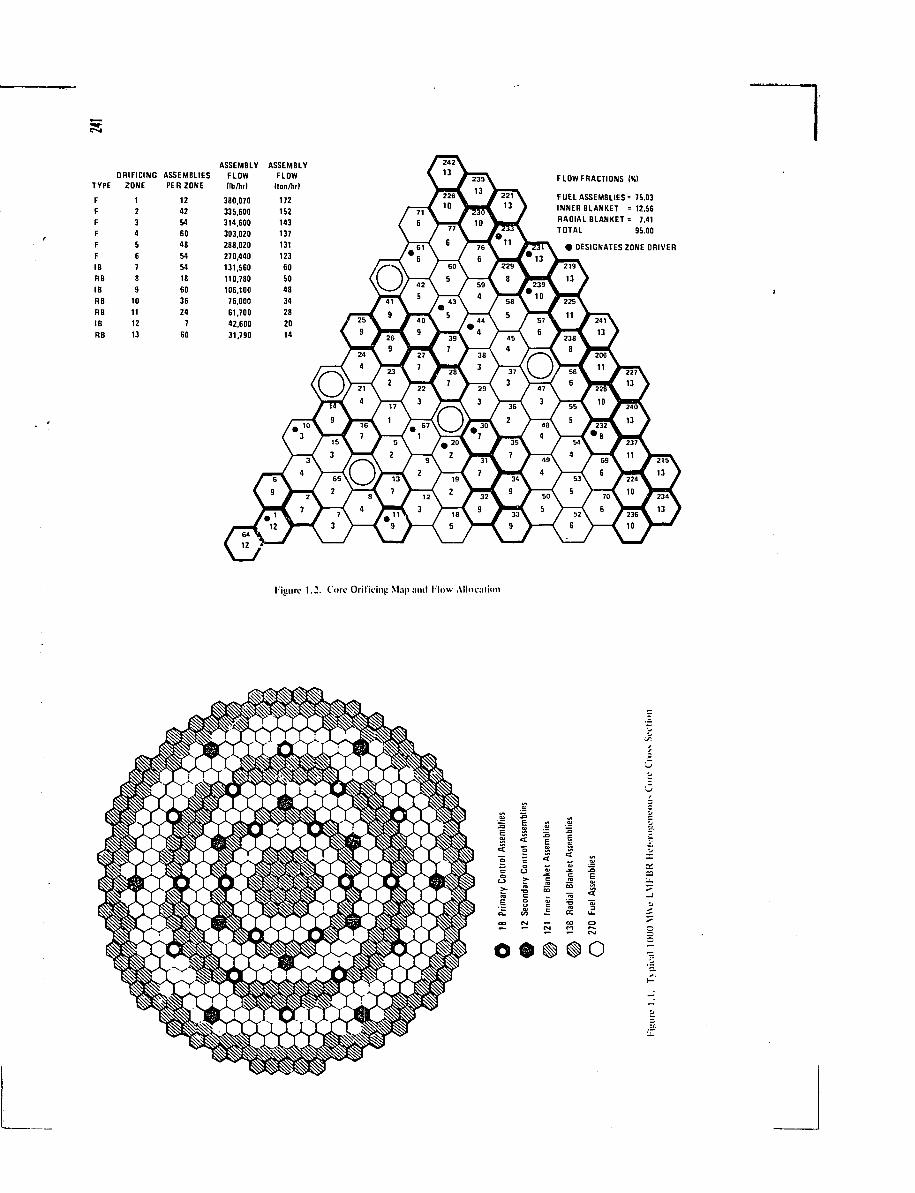
ASSEMBLY ASSEMBLYORIFICING ASSEMBLIES FLOW FLOW
TYPE ZONE PER ZONE (Ib/hr) (lon/lul
F 1 12 380.070 172F 2 42 335.600 152F 3 54 314.600 143F 4 60 303.020 137F 5 48 28B.020 131F 6 54 270.440 123IB 7 54 131,560 60RB 8 18 110.780 50IB 9 60 100,100 4BRB 10 36 76.000 34RB 11 24 61,700 28IB 12 7 42.600 20RB 13 GO 31.790 14
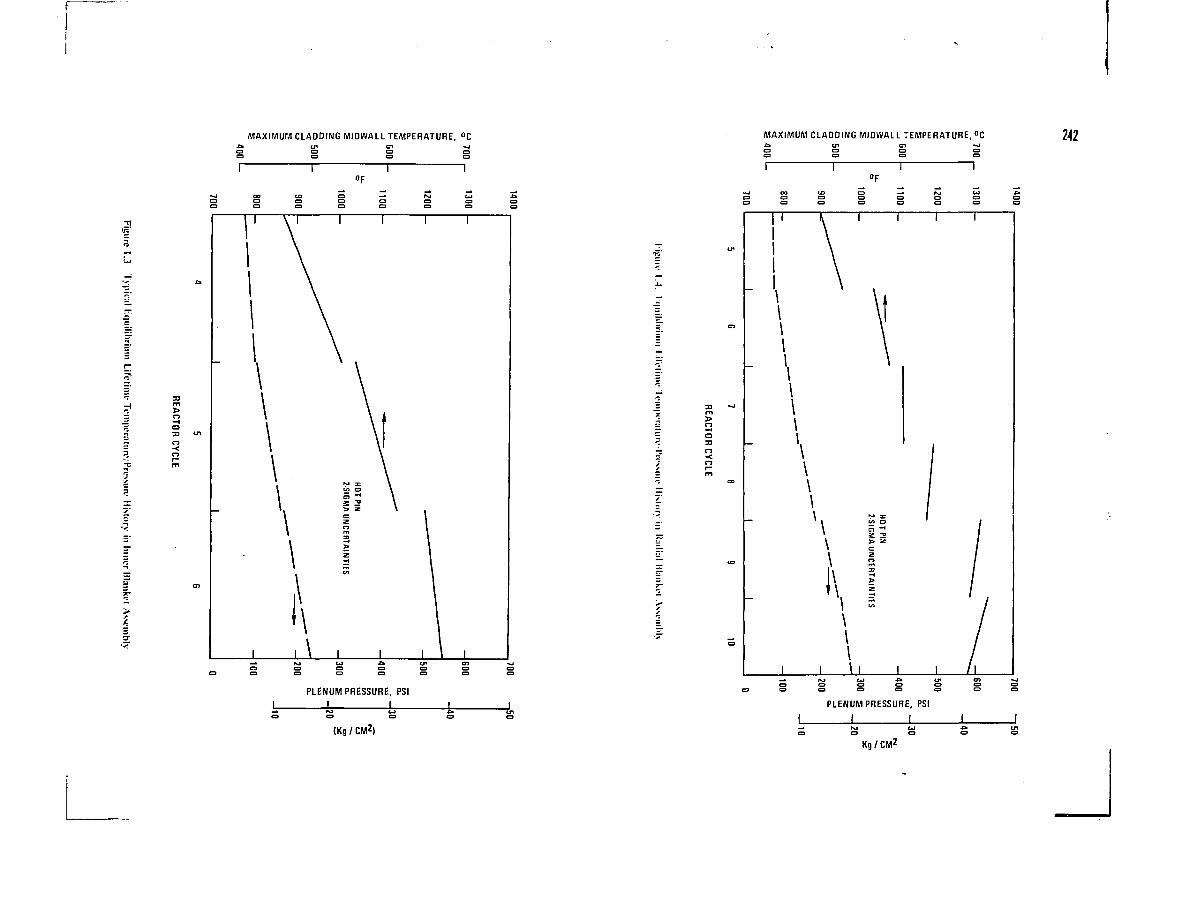
MAXIMUM CLADDING MIDWALL TEMPERATURE, °C MAXIMUM CLADDING MIDWALL TEMPERATURE, °C 242
°F °F
o
PLENUM PRESSURE. PSI
(Kg/CM2)
PLENUM PRESSURE, PSI
I I
Kg / CM2
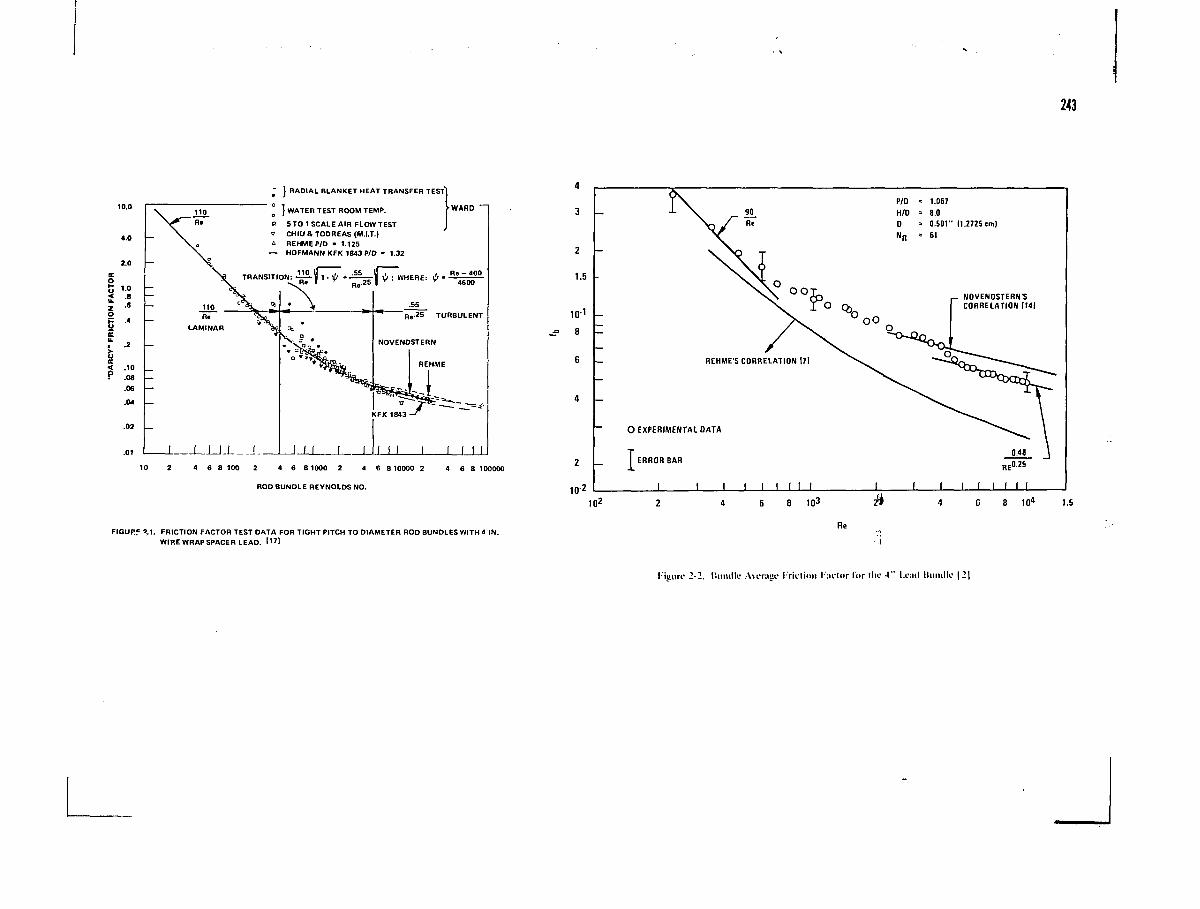
243
2.0
h< .10r .08
.06
.04
.01
~ ) RADIAL BLANKET HEAT TRANSFER TEST)
° ] WATER TEST ROOM TEMP. >WARD
a ST0 1 SCALE AIR FLOW TEST" CHIU & TODREAS (M.I.T.)=• REHMEP/D - 1.125
— HOFMANN KFK 1843 P/D • 1.32
TRANSITION: —• | 1 - il • — 1| 6 ; WHERE:
.55R, .25 TURBULENT
4 6 8 100 2 4 6 8 1000 2 4 6 8 10000 2
ROD BUNDLE REYNOLDS NO.
4 6 8 100000
FIGUPf ?.1. FRICTION FACTOR TEST DATA FOR TIGHT PITCH TO DIAMETER ROD BUNDLES WITH 4 IN.WIRE WRAP SPACER LEAD. I 1 "
4
3
2
1.5
10 1
102
P/D = 1.067H/D = 8.00 - 0.501" 11.2725 cm)NR = 61
REHME'S CORRELATION 171
O EXPERIMENTAL DATA
ERROR BAR
I I I I I I I
G 8 10 3
Re
, - NOVENDSTERN'SCORRELATION 1141
I I I
G 8 I D 4 1.5
r'iaiirc 2-2. I ' u i u l l o A \ c r : i g c I r k t i i n i I ' m l i i r f u r t h v 4 " L I M I I I l i n u l l i ' | 2 |
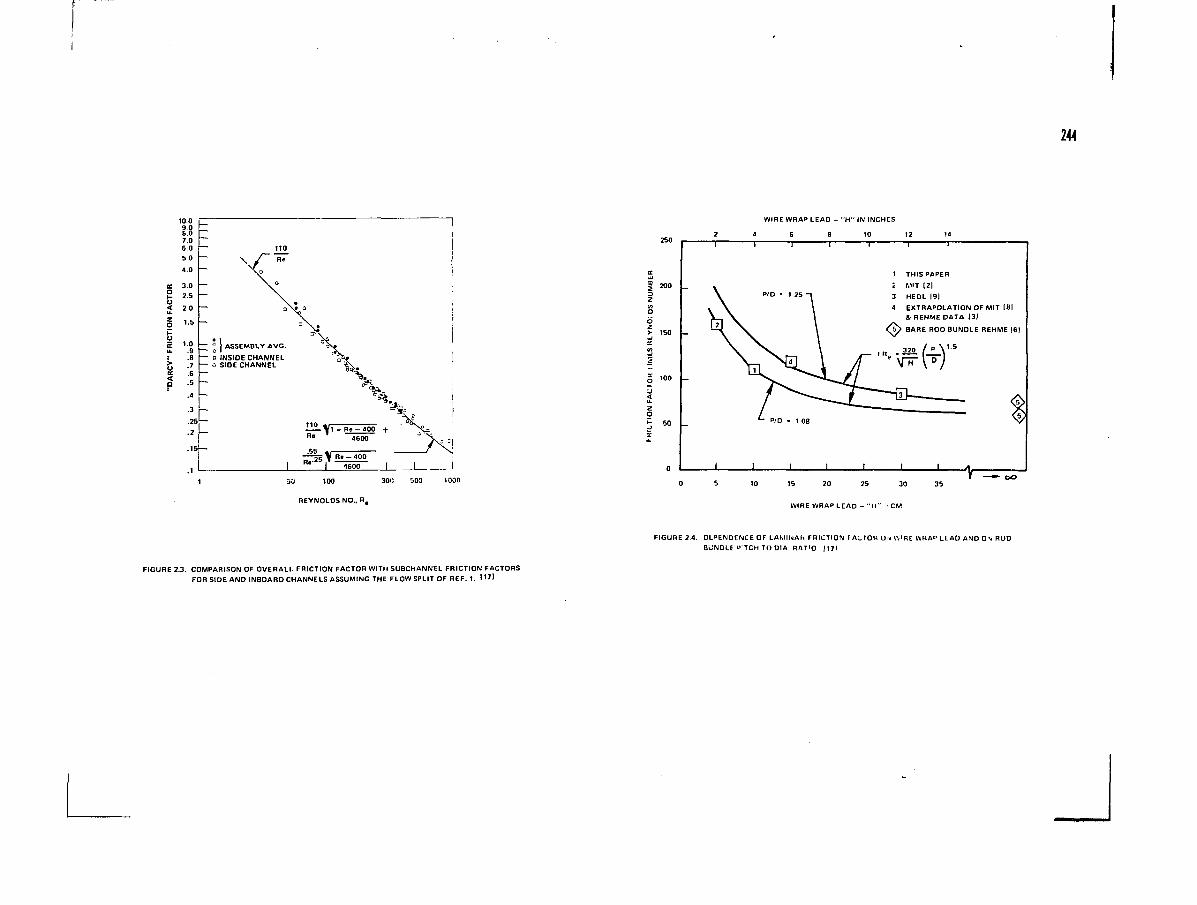
FIGURE 2.4. DEPENDENCE OF LAMINAR FRICTION FACTOR Oiv WIRE WRA" LEAD ANO ON RUDBUNDLE "TCH TO DIA RAT'O 1171
FIGURE 2.3. COMPARISON OF OVERALL FRICTION FACTOR WITH SUBCHANNEL FRICTION FACTORSFOR SIDE AND INBOARD CHANNELS ASSUMING THE FLOW SPLIT OF REF. 1. M7]
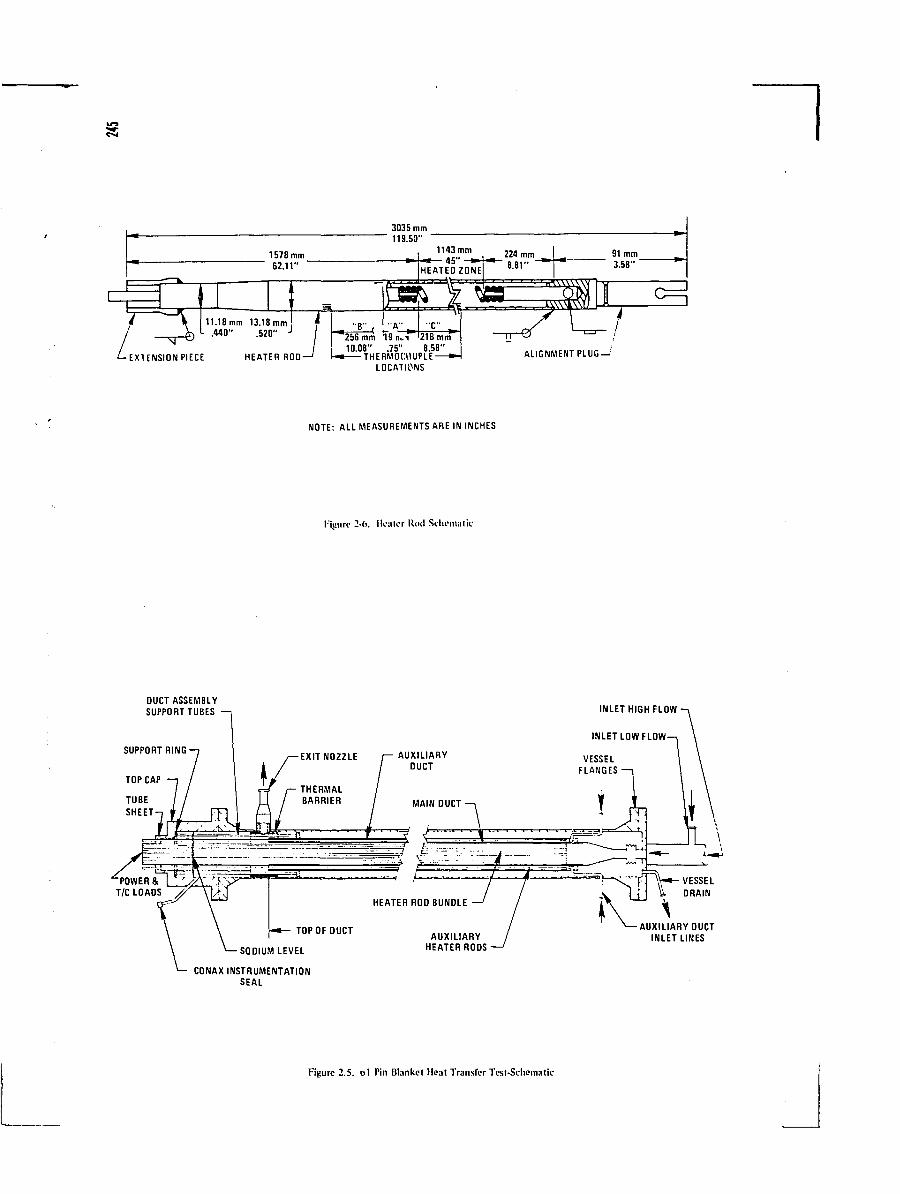
1578 mm62.11"
3035 mm119.50" "
1143 mm- » — 4 5HEATED ZONE
224 mm8.81" "
91 mm3.58" '
pg> v to11.18 mm 13.18 mm
.440"
EXTENSION PIECE
.520"
HEATER ROD
"C"218 mm
10.08" .75" 8.58"THERMOCI1UPLE •
LOCATIONS
ALIGNMENT PLUG-
NOTE: ALL MEASUREMENTS ARE IN INCHES
I'imire 2-6. Heater Roil Schematic
DUCT ASSEMBLYSUPPORT TUBES
SUPPORT RING
TOP CAP
TUBESHEET
INLET HIGH FLOW
AUXILIARY DUCTINLET LINES
CONAX INSTRUMENTATIONSEAL
Figure 2.5. oi Pin Blanket Heat Transfer Test-Schematic
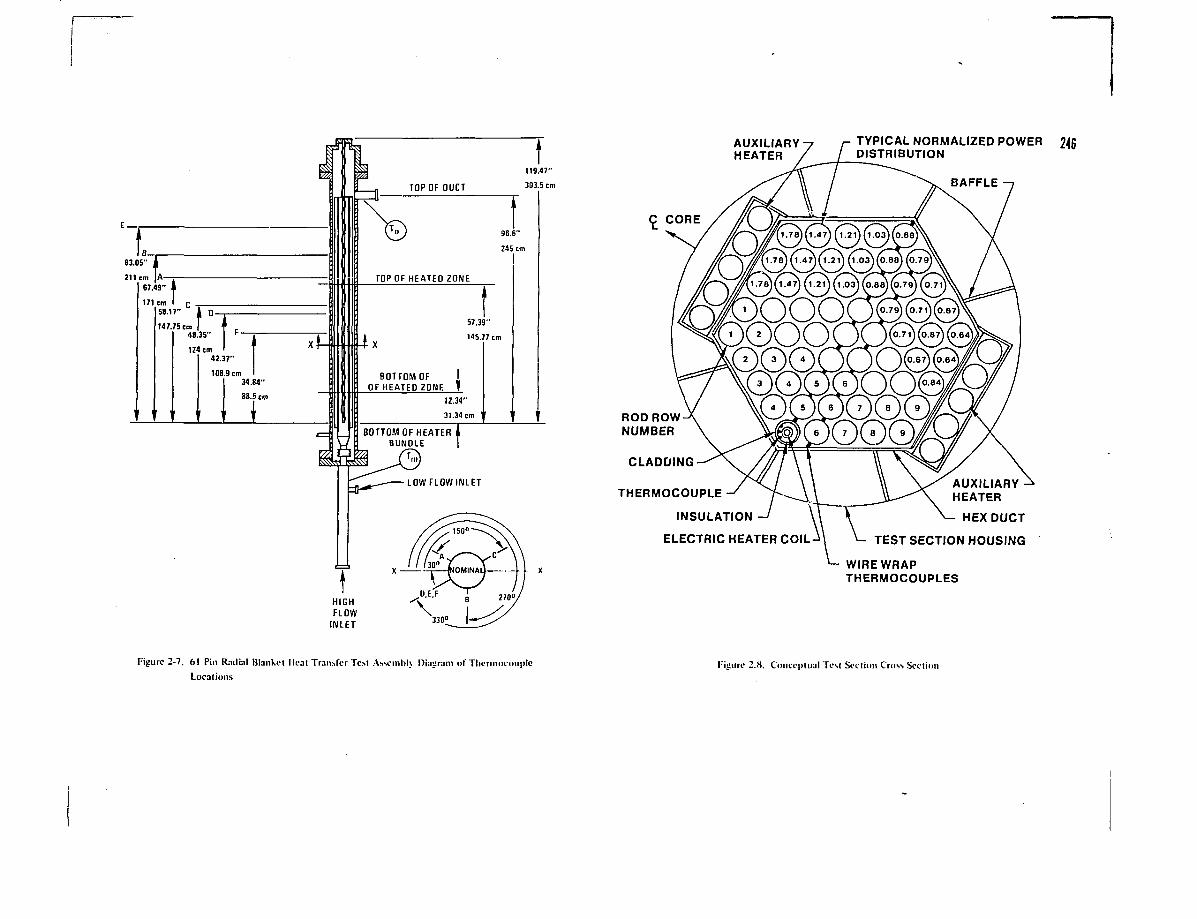
_ 0 BOTTOM OF HEATER7B BUNDLE
AUXILIARYHEATER
TYPICAL NORMALIZED POWER 246DISTRIBUTION
0°O°OQ
ROD ROWNUMBER
CLADDING
THERMOCOUPLE
INSULATION
ELECTRIC HEATER COIL
HEX DUCT
TEST SECTION HOUSING
WIRE WRAPTHERMOCOUPLES
HIGHFLOW
INLET
Figure 2-7. 61 Pin Radial Blanket Heal Transfer Test Assembly »iauram of Thermocouple
LocationsKigurc 2.8. Conceptual Test Section Cross Section
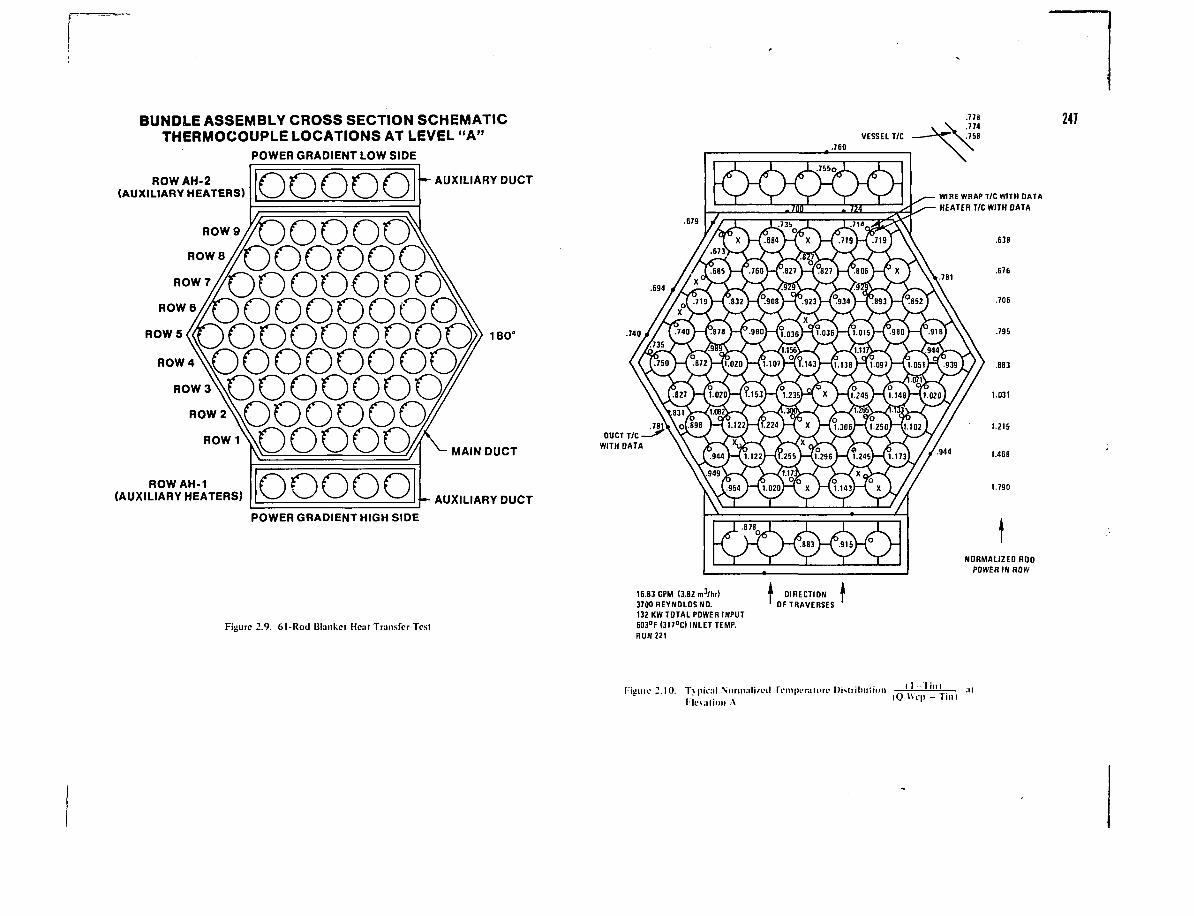
BUNDLE ASSEMBLY CROSS SECTION SCHEMATICTHERMOCOUPLE LOCATIONS AT LEVEL "A"
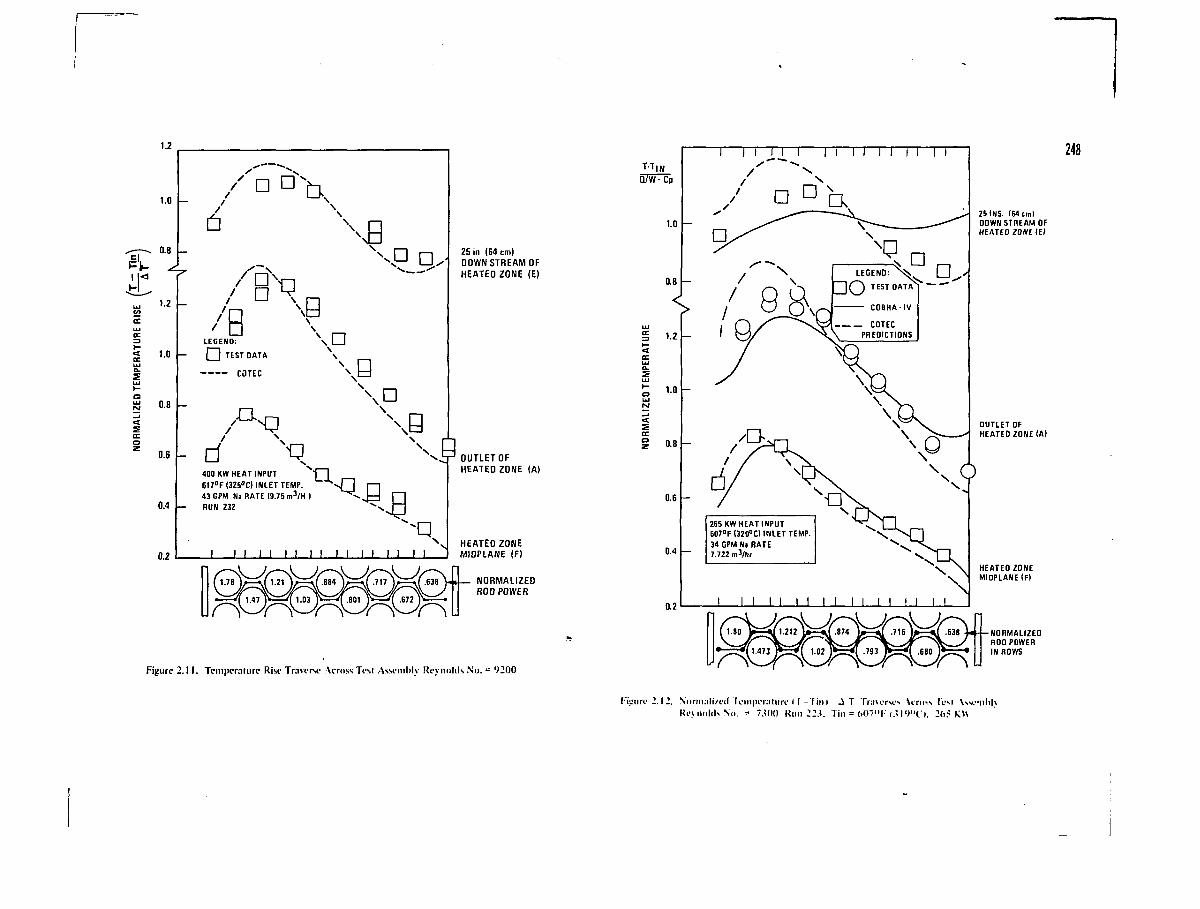
Figure 2.11. Temperature Rise Traverse Across Test Assembly Reynolds No. = 9200
Kistire 2.1 2. Normalized Temperature i T - T i n I J T Traverses \ITOSS Test \ssewM)Re> nolds No. = 7MW Run 22.?. Tin = 607'>F i.?l ')"Cl. 265 KW
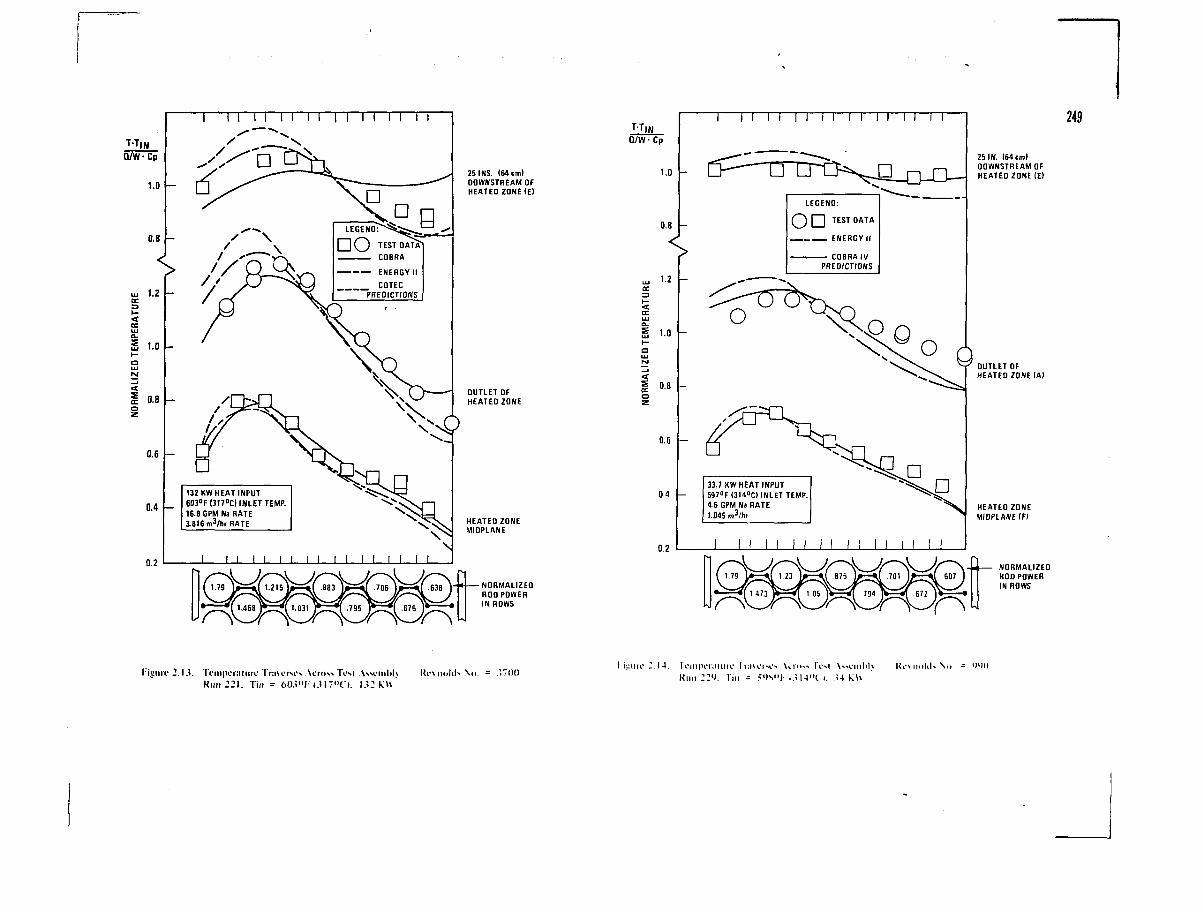
I iiMiiv ' .14. ri"iii|K'i;iiiiiv li.ni'i~i> Urn*» IVNI W a n l ' h KV\ iinM« \ u = '»'IIIrijuin* 2.1.1. Teiiipcrntiiri1 Tnncrsi's Across Tfsl Assomhlv KcMinlds Nu. = .'/DO ., , , t ) . _ ^g^ni ; i - l " ( i4 k h
Run 221. Tin = (iO.i"ri.H7"Ci. 132 KW '" " " ' '"
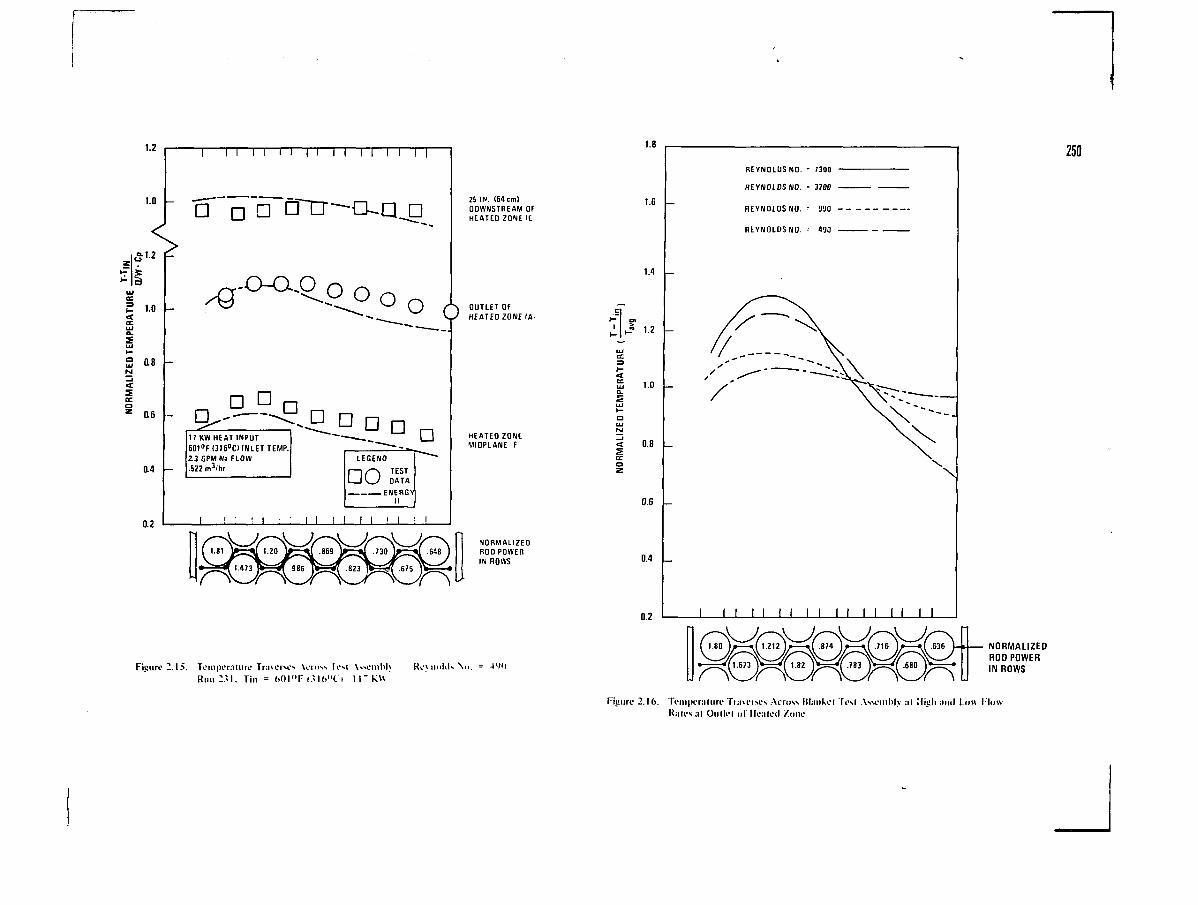
Figure-.15. Temper:! I lire Tr:ner-.e\ Vcrn« Ti>t \^einhl> KevnuUK Nu. = 4WURun 2i\. Tin = 6 0 I " F I . ? I 6 " C i I I ' K U
Figure 2.16. Teinpeniluri' Tr:i\erses Across Bhinkel Test Asscinl)|v :il High :nul Ln« l l owK.iti-s :il On 111-1 ul llentetl /cine
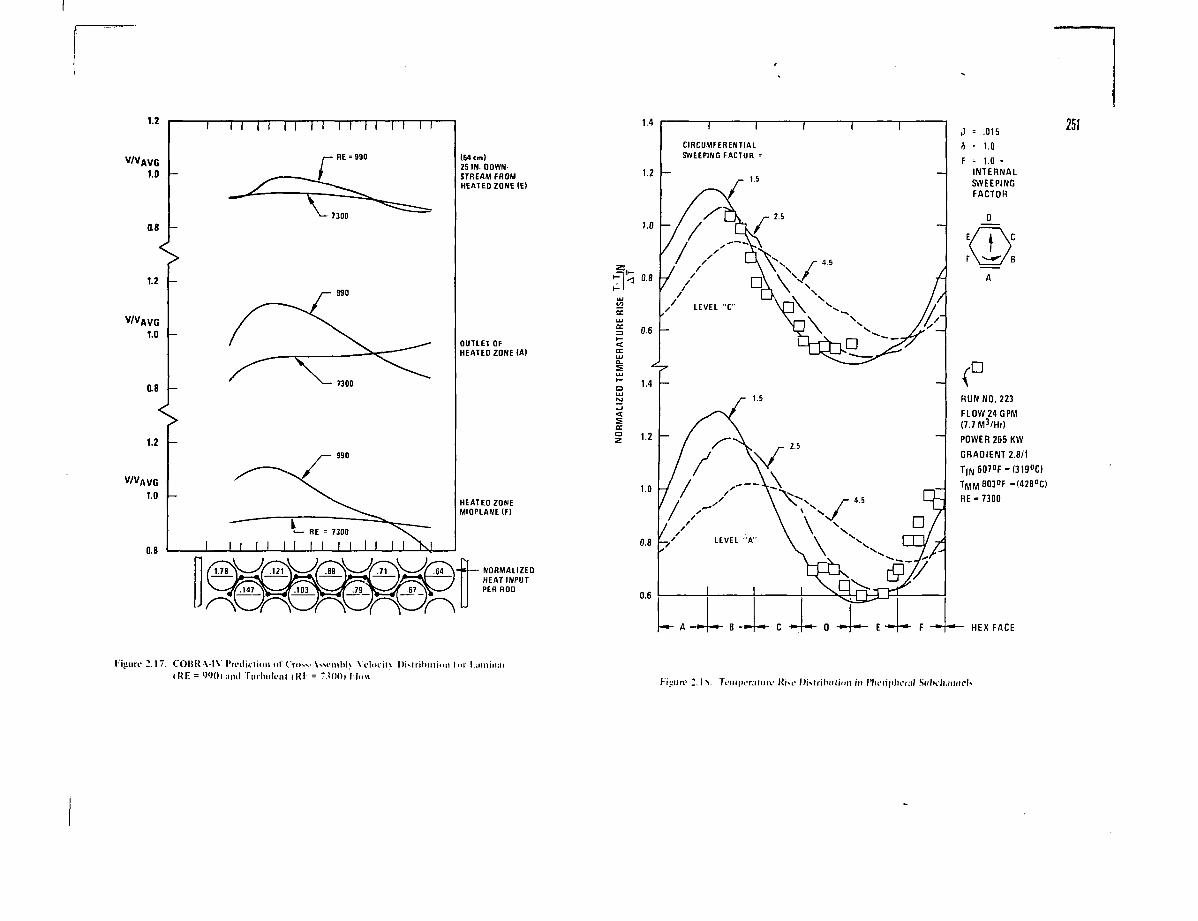
1'iuuri- 2.17. COUR \-IV I'roilitlioii of Cross- \%.MMHI>I\ Vdoc in llMrihiiiinii fm I .nniiiar(RE = W O I I I I H I Tiirlmli-nl iKl •. = T.!(IOi I -In« ... , , r „ l v .. . , , ,- , ,
I lullrv . . I s . ri'inpiTMlinv KIM" Disirilnilinii in l'lu'nplu'nil SuhclunnrU
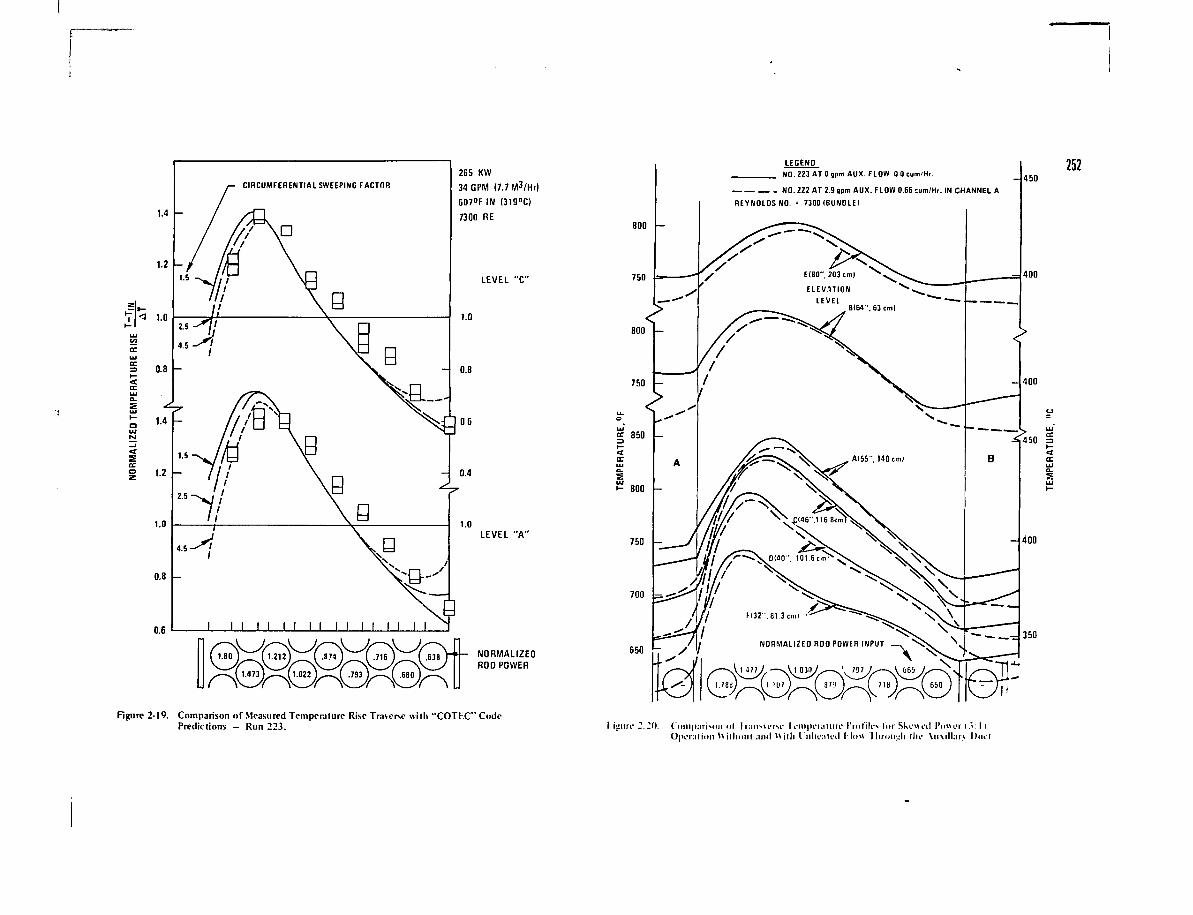
I — I I
Figure 2-19. Comparison of Measured Temperature Rise Traverse with "COTEC" CodePredictions — Run 223. Hsurc 2.20. tompat iv i i i ul IraiiMoiM' li-nipi'ratnri* I 'mf i lo Im Ske»i'il I'mu-i•!.»: I i
O|H'iMtinn ^ i i l i i u i l and VN i 11 I I nhcaU'd l l n » I In < uiuli ilic \ i i \ i l larv Duct
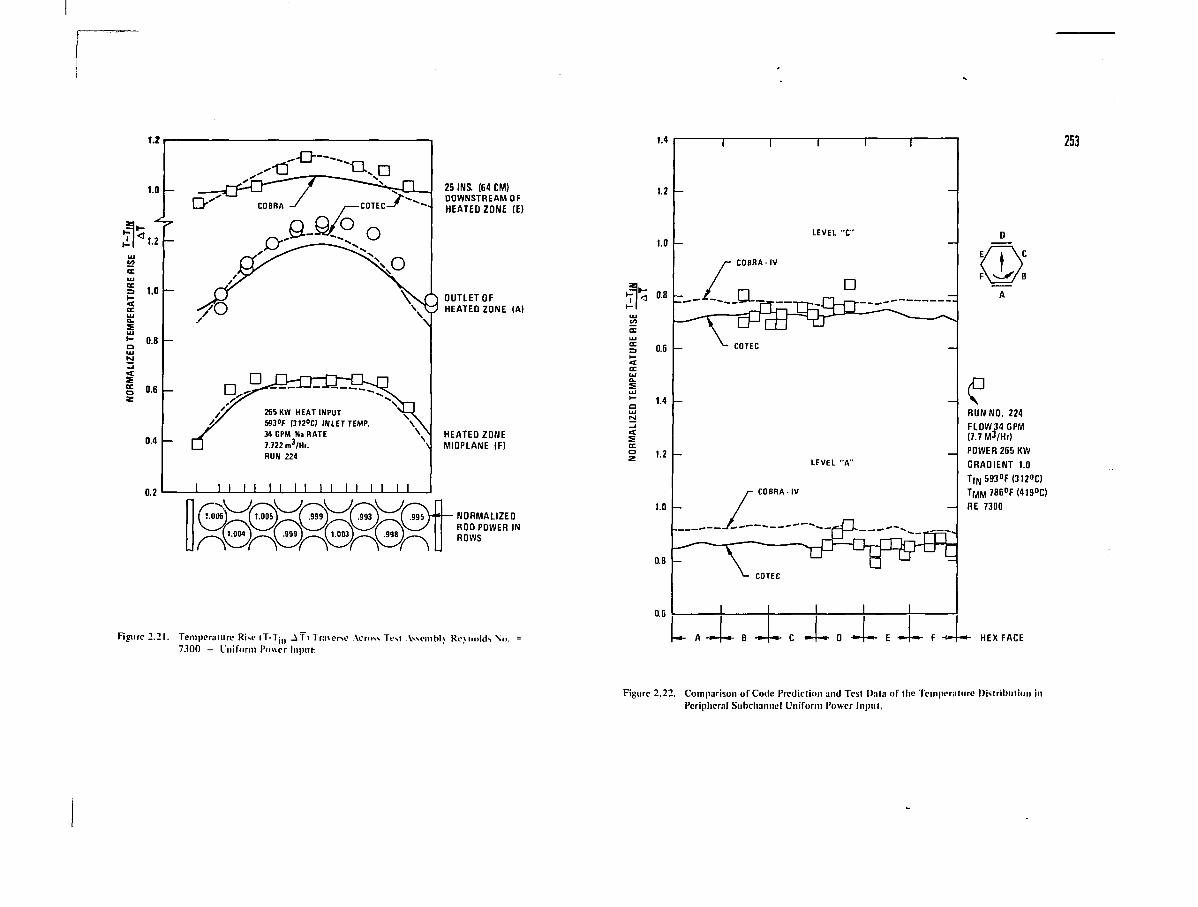
Figure 2.21. Temperature Rise lT-T in _iTl Trn\erse Across Test VsscnibK Re\ holds Nu. =7300 - Uniform Power Inpitt-,
Figure 2.22. Comparison of Code Prediction and Test Data of the Tcinperature Distribution inPeripheral Subchannel Uniform Power Input.
THEORETICAL AND EXPERLMENTAL INVESTIGATIONSOF THE THERMOHYDRAULICS OF DEFORMEDWIRE-WRAPPED BUNDLES IN NOMINAL FLOW CONDITIONS
D. LETE1NTURIER, L. CARTIERCEA/CEN Cadarache,St. Paul-lez-Durance,France
SUMMARY
Theoretical and experimental studies undertaken in CEN
Cadarache on deformed subassemblies are presented. After the
mainlines description of this program first temperature distribu-
tion results are given on an in-pile experiment in RAPSOD1E (61
pins). Comparison with calculation is made.
NOMENCLATURE
Dha
H
Ljn
d jn
<S>r
N c
mj
ma
Axa
pin nominal diameter
diameter of pin r at height z + Az/2
wire nominal diameter
hydraulic diameter of subchannel j
hydraulic diameter of the bundle
helical wire lead
distance between subchannel centers j and n at height z + Az/2
gap witch between two pins adjacent to subchannels j and n at
height 2 + Az/2
angle of the pin r adjacent to subchannel j at height z + Az/2
number of subchannels
mass velocity of subchannel j at height z
average mass velocity of the. bundle at height z + Az/2
, Axj : pressure drop of the bundle, of subchannel j at step hz
hj mass enthalpy of subchannel j at height z
qr heat flux of pin r at step Az
Fj Axial flow rate of subchannel j at height z
Fjn Transversal flow rate at the junction j-n
X Thermal conductivity
Cp Specific heat
p Macs density
K Eddy thermal diffusivity
1./ INTRODUCTION
A FBR wire-wrapped fuel subassembly is submitted to
deformations during its life in the reactor core. There are
different causes of non-nominal geometry. With differential
thermal gradients in clads, pins bow at the beginning of life.
During irradiation, pins and wrapper-tube undergo slower defor-
mations, due to phenomena as swelling and creep. These phenomena
induce interactions between pin and wire, pin and pin, bundle and
wrapper tube, producing different patterns in the bundle :
compacted bundle with bowing, twisted bundle with swelling* The
generated deformations can have an influence on the sodium flow-
rate distribution in subchannels, and hence on the fluid and
cladding temperature distribution.
Our purpose is to find the evolution of sodium tempe-
rature inside any size of subassembly (up to 331 pins) in nominal
flow condition' and for usual observed deformations. As it is not
realistic to resolve all the thermohydraulic equations with an
undue consumption of computer time, we made the following choices
in our work :
- deformed geometries are known by post-irradintion
measurements,
- the computer program needs semi-empirical assumptions
to find the flow-rate distribution in the subchannels
and then calculate by thermal equilibrium the mean
temperature inside each subchannel,
- out-of-pile velocity measurements in water and
temperature measurements in sodium accompany
the code development to verify the hydraulic model used.
- in-pile temperature measurements in sodium must
validate the computer program fitted with out-of-pile
experiments.
The description of the computer program DISTAV and of
out of pile experiments have already been made l_ 1_7- The main
lines will be recalled. The out—of—pile temperature measurements
In sodium is carried out by the CNEN on bundle of small size
(7 and 19 pins). We will describe only the experimental work under-
taken in Cadarache on out-of-pile water and in-pile sodium experiments.
This experimental program is now under way, but at this
time only results from in-pile experiments are known. Temperature
measurements on a Rapsodie 61 pins subassembly were obtained at
the beginning of the irradiation and give interesting informations
on bowing and localization of the bundle inside wrapper-tube.
Results are discussed and compared with DISTAV calculations.
2./ MAIN LINES OF DISTAV AND OF OUT OF PILE EXPERIMENTS FAISVAR
2.1.- DISTAV code
A subassembly with bundle and wrapper tube can be
divided in interior subchannels (triangular) or edge subchannels
(rectangular and trapezoidal) (figure 1).
DISTAV calculates sodium temperature inside subchannels
step by step ( Az) along the vertical axis oz. Computation is
decomposed in several parts :
- A geometry routine, called GEOHAS, computes the
geometrical data necessary for thermohydraulics calculations
and obtained from post-irradiation measurements : swelling curve
along pin clads and distances between pins and wrapper tube (for
twisting).
In a second step, the code determines the hydraulic 255
boundary conditions at z = o. A length without deformation is
assumed at the bottom of the bundle, which permits to have a
steady hydraulic flow with this geometry, when deformation starts.
This assumption is generally verified on standard bundles.
Then at each step Az, the fluid distribution between
subchannels is calculated. The axial flow is divided according
to equalization of pressure drop. The transverse flow is computed
at (Nc/2 + 1) gaps between pins, assuming the velocity is the
same as in nominalgeometry, and the transversal surface given by
GEOMAS. On the remaining (Nc-I) gaps, we use the (Hc-1) continuity
equations in relation with each subchannel.
The calculation is ended at step Az by the determination
of temperatures. An energy balance is made in each subchannel,
which leads to a system of linear equations, the resolution of
which gives subchannel enthalpies at position z + Az.
Vie conclude this paragraph by recalling the main
formulas used at the different steps of calculation :
* Mixing /~2 7 /~3 7
At the gap between two subchannels j-n, we introduce
the ratio kjn between transversal and axial velocity :
j-n triangular subchannels
kjn= (2Tr2/3nrT) (Da - Df/2) CoEl sin (^jp)
j-n edge subchannels :
kjn = ( TT(Da + Df)/H) COTRA (1 + cos (^-jp) )
Where CoEl and COTRA are fitted parameters (near unity
for standard wrapper tube)
* Axial flow
Axj/ Ax (mj + Amj/2)/ma)2"ncons tant
* Transverse flow
Fj.n = F j - £ fjr
Energy balance on Az
- Fj hj + I (pK+A-)^(hn+^i - ^ ^ M ) Az
+ Z Fjn (hd+ Ahd/2)+ ^ Dr. $ r Az qr/2ir
We recognize the connecting terms between subchannels :
conduction (#r-) eddy diffusivity (pK) and mixing flow (fjn). The
last term represents the power source from the bordering pins with
the assumption of the syir.etric heat flux.
2.2.- Out of pile experiments FAISVAR
In a water loop, velocities and pressures are measured
in the subchannels of nominal and deformed bundles. The siz°s of
the bundles are 37 and 61 pins with a scale 2.3 .Reynolds number4
can reach 5.10 • Among the pins, eight are instrumented, four for
pressure measurements and four for velocity measurements. The
measurements along the pins are spaced one sixth of wire lead, on
a length of five leads. The instrumented pins are shifted to ob-
tain a velocity and pressure map inside the bundle. The velocity
measurements use turbulent correlation between two points of the
fluid. Microbubbles are injected in a subchannel lit by a special
luminous pin. Two photo-electric cells separated by an axial
length Ax give two signals, the analysis of which permits to
obtain the autocorelation function and the transit time T. At
the edge of the bundle, vizualisation of the flow can be made
to obtain the direction of fluid lines.
These measurements provide axial velocities in interior
subchannels and axial and transversal velocities in edge sub-
channels .
The bundle geometries studied represent observed
geometries in irradiated subassemblies. Three kinds of deformations
are studied :
- Reduction of several interior-subchannel areas,
associated to swelling of adjacent pins.
- Reduction of interior subchannel areas caused by
shift of helical wire 256
- Reduction of edge subchannels, associated with the
bundle twisting.
3./ IN-PILE EXPERIMENT : TETACOUPLE
After the description of the main lines of the irra-
diation in Rapsodie results obtained during fifty days irradiation
and comparison with DISTAV calculations are given.
3 . I . - Description of the experiment:
The irradiation Tetacouple is designed to follow during
a long period, the temperature distribution on the top of a
61 pins-fuel bundle. It is located at the central position in the
core .
The nominal geometry of the bundle is near the standard
one in Rapsodie.
Axially the fission-gaz chamber has been reduced above
the pins, to permit a temperature measurement at 4.5 cm from the
top of the fuel length.
Thermocouples are introduced by the head of the sub-
assembly (figure 2) inside a measurement plug. There are 36
thermocouples, 28 are localized at five millimeters above the
top of bundle pins along the axis of interior sodium subchannels ;
6 thermocouples are two centimeters behind and measure an average
temperature of the edge subchannels (see detail of figure 2 ) , the
sodium of which flows at the outlet of the bundle, between wrapper-
tube and the bottom of the plug. The two remaining thermocouples
measure the outlet sodium temperature of the subassembly at 50cm
above the top of the bundle. The thermocouples localizations and
their numbers are represented in figure 1 .
The measurement plug can be rotated 120° and 240° from
the position shown in figure 1, thus covering a larger number of
subchannels. However, these rotations cannot be made when the
reactor is in power and have been made only once during the
CO days of irradiation.
3.2.- Temperature measurements obtained
Thermocouples 6 and 35 (one of the outlet thermocouples)
were out of order at the beginning of the irradiation.
The evolution of temperature distribution at the bundle
outlet was observed during the first power rise. On figure 3 is
represented the normalized temperature rise ATc/ ATm, observed
along the line EB of figure 1. ATc is the temperature rise in
a subchannel above the inlet temperature and ATm the
temperature rise of the subassembly, calculated as an average of
the 34 thermocouples above the bundle.
Two profiles are plotted for two core powers (figure 3).The calculated profile with the generally used assumption ofuniform distribution of the clearances, is added for comparison.
With these results, several remarks can be made :
- The temperature distribution is not symmetric. The
hottest temperatures are not in the central subchannels of the
bundles, but are shifted towards the wall EF of the wrapper-tube
- this dissymetry exists already at low power
- when the power increases the profiles become sharper
This behaviour can be explained by the pin bowingduring the power rise.
_ for nominal power, ATc/ATm has a value very close
to the one obtained in the design-type calculation (distributedclearances).
During fifty days of irradiation, after the first powerrise, no significant change in the temperature was observed.
At the end of these fifty days, two tests were carried
out : the rotation of the measurement plug from o = 0° (figure 1)
to a «* 120° and a = 240° ; the rotation of the subassembly from
6 = 0° to ß= 120°, the plug being at position a = 240°.
These two tests had the following purposes :
- improve the determination of the temperature distribution
- Bring theproof that the noticed temperature dissymetry
is not a consequence of disturbances introduced by the plug or by 257
the subassembly surroundings, but comes from the inside of the
Tetacouple subasscmbly.
By the rotation of the plug, many subchannels are
scanned two or three times, according to the orientation a of
the plug. In these cases the temperature rises are very close,
deviations being less than I %, except one position close to
the plug cylinder where deviation is 3' %.
On the other hand, rotation of the subassembly with
a similar relative position between plug and subassembly
(o = 120 - ß = 0 , a = 240 - ß = 120), give the same temperature
distribution to better than 2 % of temperature rise. The dissy-
metry rotates with the subassembly and therefore is independant
of the subassembly surroundings. The dissymetry proceeds from
Tetacouple subassembly. Several causes to explain it can be
listed :
- A difference in fuel mass between the pins
- A flow-rate dissymetry connected to the wire position.
- A flow-rate dissymetry connected to the different
clearances between pins, introducing flow areas smaller in some
groups of subchannels and larger in others.
The first cause does not exist in the Tetacouple sub-
assembly : the average fuel mass of U235+Pu odd1por p i n *s cxactly
the same in the hot DEFA area (fig. I) as in the cold one DCBA.
The second cause is not to -reject completely but seems
improbable. Indeed in out-of-pile experiments with 19 pin bundle
in nominal flow condition, the temperature distribution observed
is not dissymetric (1) (4), and no twist of these distributions
has been noticed with the position of the wire along the vertical
axis. Furthermore in the Tetacouple experiment, measured tempe-
ratures are the result of heating along the full fuel length.
Along this length every interior subchannel "saw" practically
the same number of times t'.*<! presence of wire and its effect on
the flow rate and thus the outlet-temperature distribution should not
be affected.
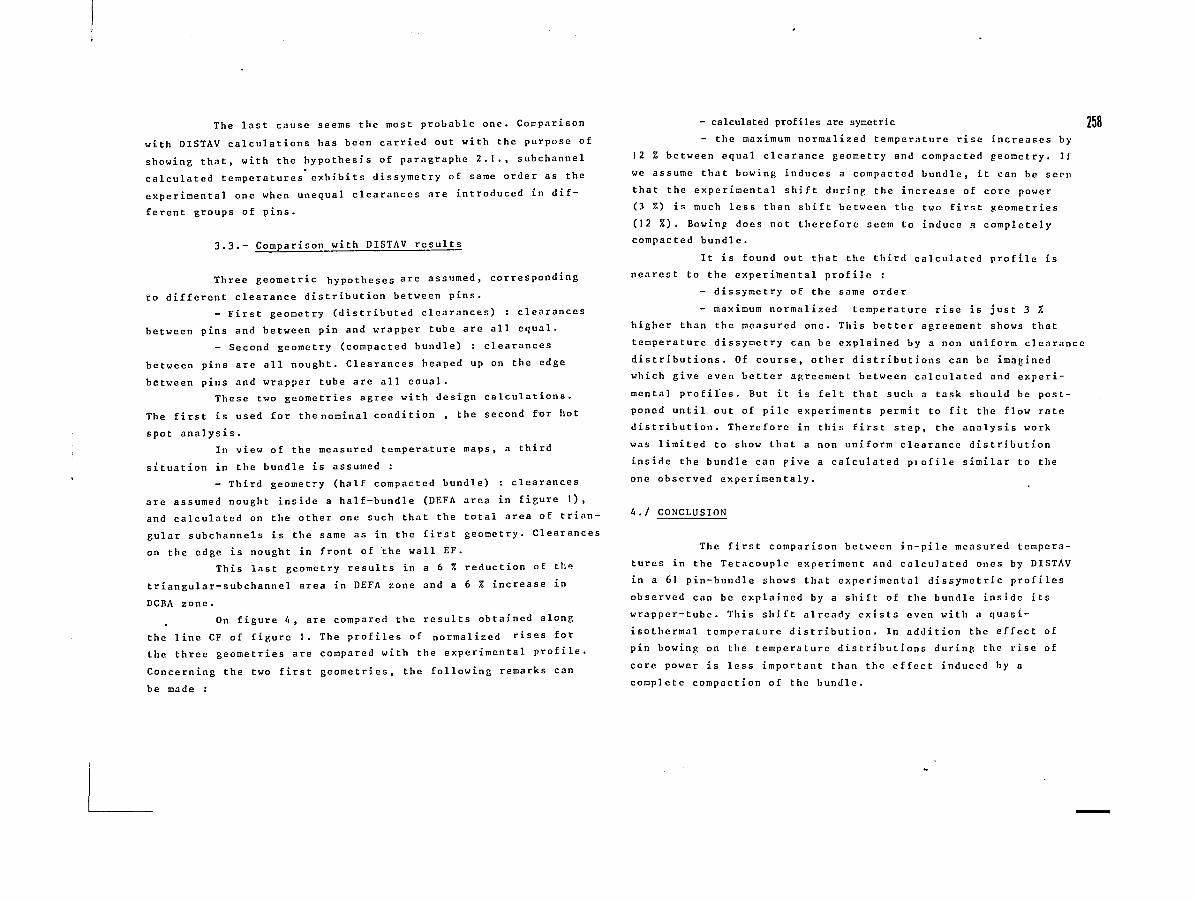
The last cause seems the most probable one. Comparison
with DISTAV calculations has been carried out with the purpose of
showing that, with the hypothesis of paragraphe 2.1., subchannel
calculated temperatures exhibits dissymetry of same order as the
experimental one when unequal clearances are introduced in dif-
ferent groups of pins.
3.3.- Comparison with DISTAV results
Three geometric hypotheses a " assumed, corresponding
to different clearance distribution betveen pins.
- First geometry (distributed clearances) : clearances
between pins and between pin and wrapper tube are all equal.
- Second geometry (compacted bundle) : clearances
between pins are all nought. Clearances heaped up on the edge
between pins and wrapper tube are all eaual.
These two geometries agree with design calculations.
The first is used for thenominal condition , the second for hot
spot analysis.
In view of the measured temperature maps, a third
situation in the bundle is assumed :
- Third geometry (half compacted bundle) : clearances
are assumed nought inside a half-bundle (DEFA area in figure 1),
and calculated on the other one such that the total area of trian-
gular subchannels is the same as in the first geometry. Clearances
on the edge is nought in front of the wall EF.
This last geometry results in a 6 % reduction of th<?
triangular-subchannel area in DEFA zone and a 6 % increase in
DCBA zone.
On figure A, are compared the results obtained along
the line CF of figure 1. The profiles of normalized rises for
the three geometries are compared with the experimental profile.
Concerning the two first geometries, the following remarks can
be made :
- calculated profiles are symetric 258
- the maximum normalized temperature rise increases by
12 % between equal clearance geometry and compacted geometry. If
we assume that bowing induces a compacted bundle, it can be seen
that the experimental shift during the increase of core power
(3 %) is much less than shift between the two first geometries
(12 % ) . Bowing does not therefore seem to induce <i completely
compacted bundle.
It is found out that the third calculated profile is
nearest to the experimental profile :
- dissymetry of the same order
- maximum normalized temperature rise is just 3 %
higher than the measured one. This better agreement shows that
temperature dissymetry can be explained by a non uniform clearance
distributions. Of course, other distributions can be imagined
which give even better agreement between calculated and experi-
mental profiles. But it is felt that such a task should be post-
poned until out of pile experiments permit to fit the flow rate
distribution. Therefore in this first step, the analysis work
was limited to show that a non uniform clearance distribution
inside the bundle can five a calculated piofile similar to the
one observed experimentaly.
A./ CONCLUSION
The first comparison between in-pile measured tempera-
tures in the Tetacouple experiment and calculated ones by DISTAV
in a 61 pin-bundle shows that experimental dissymetric profiles
observed can be explained by a shift of the bundle inside its
wrapper-tube. This shift already exists even with a quasi-
isothermal temperature distribution. In addition the effect of
pin bowing on the temperature distributions during the rise of
core power is less important than the effect induced by a
complete compaction of the bundle.
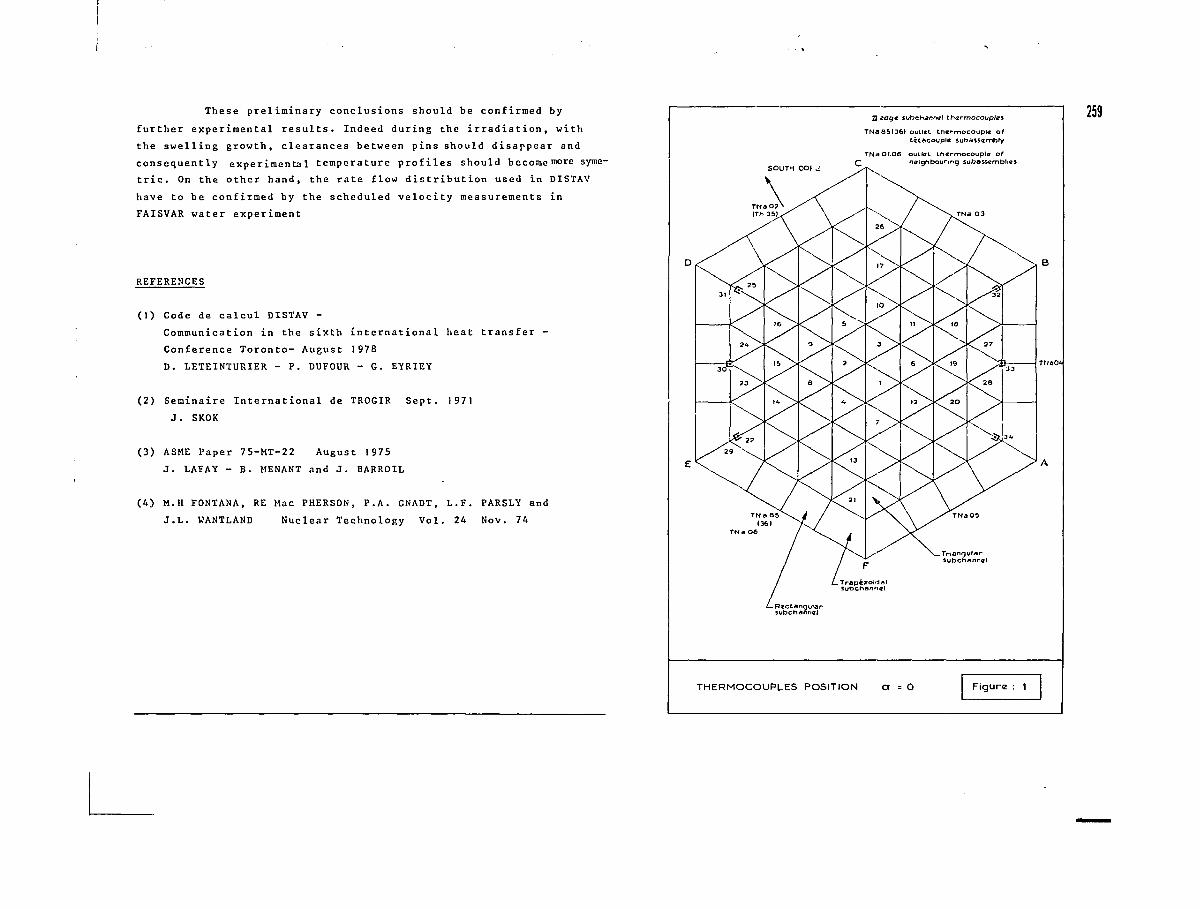
These preliminary conclusions should be confirmed by
further experimental results. Indeed during the irradiation, with
the swelling growth, clearances between pins should disappear and
consequently experimental temperature profiles should become>n°re syme-
tric. On the other hand, the rate flow distribution used in DISTAV
have to be confirmed by the scheduled velocity measurements in
FAISVAR water experiment
REFERENCES
(1) Code de calcul DISTAV -
Communication in the sixth international heat transfer -
Conference Toronto- August 1978
D. LETEINTURIER - P. DUFOUR - G. EYRIEY
(2) Seminaire International de TROGIR Sept. 197]
J. SKOK
(3) ASME Paper 75-MT-22 August 1975
J. LAFAY - B. MENANT and J. BARROIL
(4) M.H FONTANA, RE Mac PHERSON, P.A. GNADT, L.F. PARSLY and
J.L. WANTLAND Nuclear Technology Vol. 24 Nov. 74
SOUTH COt i£
3 tdqz Subchannel thermocouples
TNa 65136) outlet thermocouple ortetacouple subassembly
TNa 01-06 outlet thermocouple ofQ neighbouring subassemblies
259
.TriangularSubchannel
THERMOCOUPLES POSITION a = O Figure : 1
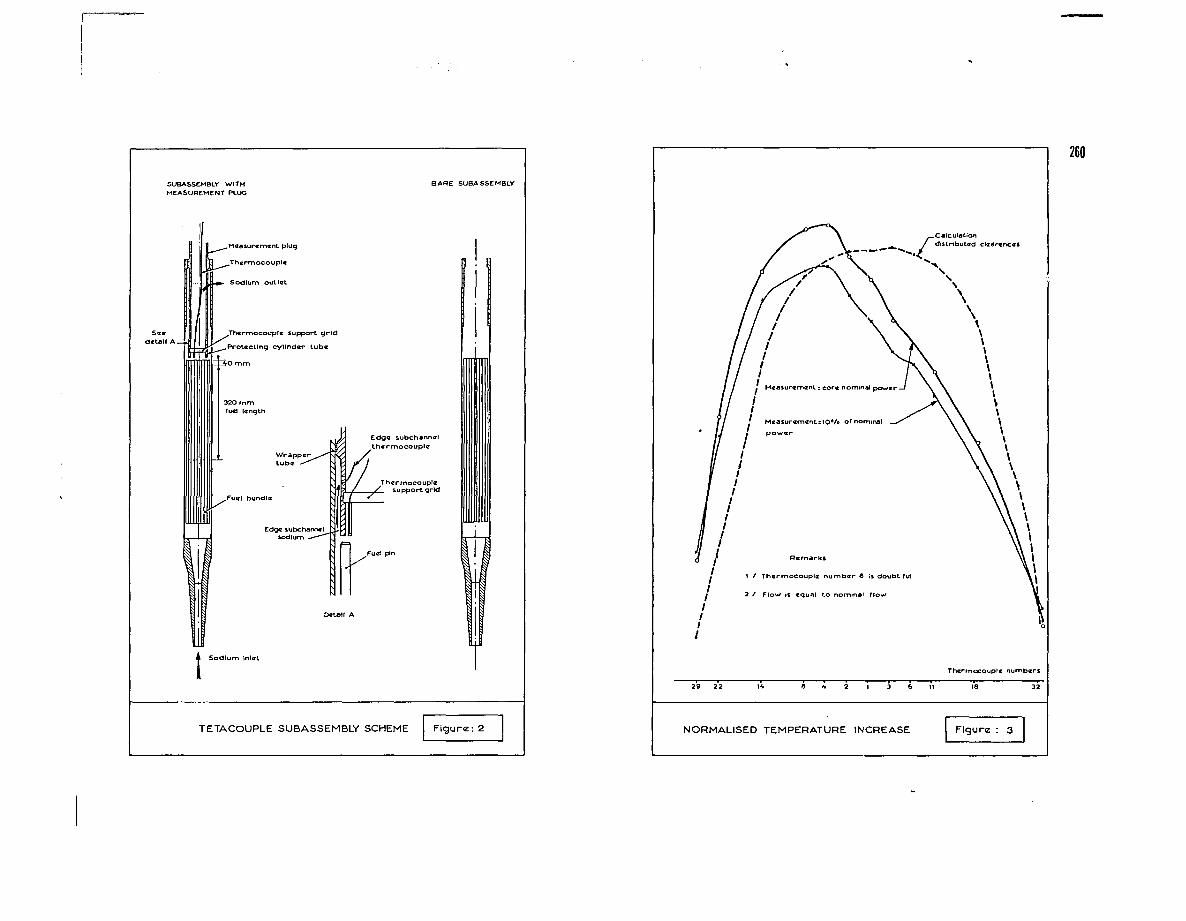
TETACOUPLE SUBASSEMBLY SCHEME
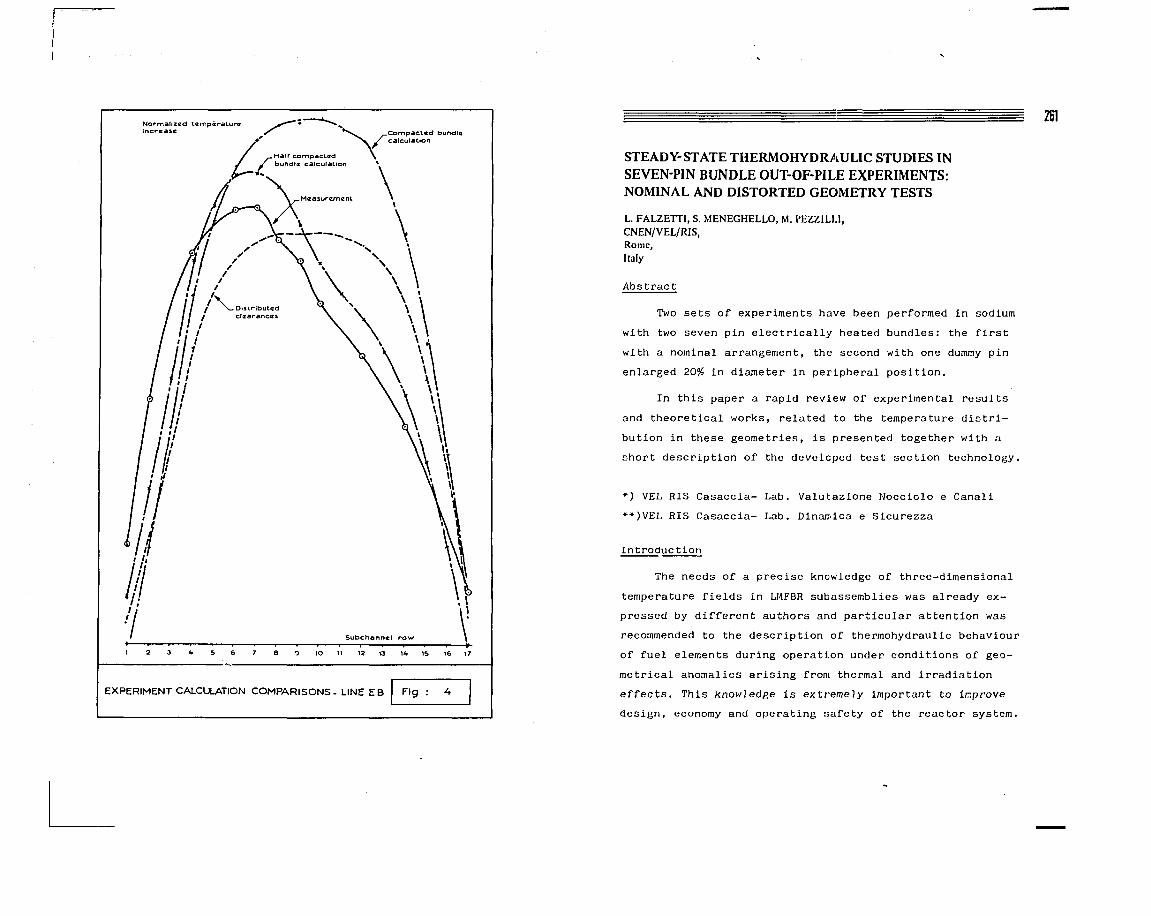
= = — ^ 261
STEADY-STATE THERMOHYDRAULIC STUDIES INSEVEN-PIN BUNDLE OUT-OF-PILE EXPERIMENTS:NOMINAL AND DISTORTED GEOMETRY TESTS
L. FALZETTI, S. MENEGHELLO, M. PEZZILU,CNEN/VEL/RIS,Rome,Italy
Abstract
Two sets of experiments have been performed in sodium
with two seven pin electrically heated bundles: the first
with a nominal arrangement, the second with one dummy pin
enlarged 20% in diameter in peripheral position.
In this paper a rapid review of experimental results
and theoretical works, related to the temperature distri-
bution in these geometries, is presented together with a
short description of the developed test section technology.
*) VEL RIS Casaccia- Lab. Valutazione Nocciolo e Canali
**)VEL RIS Casaccia- Lab. Dinaffica e Sicurezza
Introduction
The needs of a precise knowledge of three-dimensional
temperature fields in LHFBR subassemblies v/as already ex-
pressed by different authors and particular attention was
recommended to the description of thermohydraulic behaviour
of fuel elements during operation under conditions of geo-
metrical anomalies arising from thermal and irradiation
effects. This knowledge is extremely important to improve
design, economy and operating safety of the reactor system.
To betcer understand the thermohydraulic behaviour
in tightly packed rod bundles and to validate the hypotheses
to be utilized in the computation codes for subassembly
design, out of pile tests in simple bundle geometries were
performed as a direct way to experience, under the optimum
conditions of hydraulic and thermal simulation, the tempe-
"rature distribution in such complicated configurations.
This experimental program and the related theoretical
work are carried out by the Research & Development Division
of the CNEN Fast Reactor Department, in the context of the
CNEN-CEA Agreement on FBR.
Utilizing a well qualified technology developed in the
past years for the fabrication of electrical graphite RAF
heaters, simulating fuel pin actual diameters and linear
powers, two seven pin bundles were tested in sodium in. no-
minal and deformed geometric conditions.
In this paper an up to dated review of experimental
results and theoretical works is presented, together with
a short description of the developed test section technology.
Technology and Instrumentation for electrically heated
Rod Bundles
The study of the thermohydraulic behaviour of a fuel
element under real operating conditions requires, from an
experimental point of view, a through examination of many
practical problems involving the sodium loop technology,
heater development, instrumentation and test section assembly.
The experimental approach was possible thanks to the
technological effort performed in the past years by the
Sodium Laboratories of CSN Casaccia (now in the R & D 262
Division of DRV) v/ith the cooperation of other laborato-
ries of the Casaccia Center.
V/ith regard to instrumented, electrically heated rods
and test section assembly, the principal results obtained
so far are:
- Development and testing of the RAF electrically heating
rods. The rod has a graphite resistor, heating length
of 300 mm, insulated by boron nitride in a stainless-
steel clad, with total O.D. 0.8 mm, total length 700 mm
/ 1 /. These pins were already used for in sodium boiling
tests up to 600 W/cm in single pin geometry, up to 300 W/cm
in 7 pin bundle geometry, 1050°C surface temperature.
Axial heat flux distribution with cosinus form was also
realized and tested in sodium / 1 /,/ 2 /.
- Instrumentation of the RAF heater cladding. Particular
techniques have been developed for embedding three or
four thermocouples 0 0.25 mm in the clad of each heating
pin without perturbing sodium flow and surface continuity.
Since measurements of temperature differences of few
degrees are expected in a very compact geometry, a complex
of experimental procedures and computation technics was
set up for the calibration of these thermocouples. Various
heaters were individually calibrated in a water loop, under
tieat flux conditions similar to those of sodium experiments,
by comparing the values indicated by each thermocouple with
the wall incipient boiling temperature. Data were compared
with the results of a finite element computation code
simulating the real location of the thermocouple in the
clad.
- Rod bundle assembly. Using RAF heaters, two seven pin
bundles were firstly realized in the CNEN laboratories,
and already tested in sodium. Other two seven pin bundles
have been delivered by FIAT S.P.A.-Torino, within a CNEN-
FIAT contract, and will be utilized in the next experimental
program. The seven rods are arranged in a S.S.hexagonal
box, produced by extrusion with close tolerances, spaced
by helical wires. Besides the instrumentation in the clads
of the heaters, 25 thermocouples are penetrating in the
hexagonal box using small passage tubes brazed with nickel-
base alloys and 7 thermocouples are placed one in each
spacer wire (see Tab. 1 for bundle characteristics).
For what concerns characterization of the test section,
a complex of technics was set up to carry out pre- and
post-test examination (e.g. dimensional analysis, infra-
red thermovision tests to reveal thermal inomogeneities
in the heaters, distillation and cleaning after in sodium
tests, plastic filling and cutting technics for post-test
inspection -see Fig. 1-).
- Fabrication of deformed pins for non-nominal geometry si-
mulation. The specifications to be attained for the con-
struction of a deformed pin for significant thermohydraulic
tests were:
a) choice of the pin design as close as possible similar
to the deformation expected in wire wrapped pins;
b) possibility of arrangement in a bundle without modifying
the hexagonal array of undeformed pins;
c) characterization of the geometry for a suitable mathe-
matical modeling in the computation codes.
As a first stage, a dummy pin was realized in the shape
sketched in Fig. 2, and placed in the periphery of the
second seven pin bundle tested in sodium. This form was
already produced on the cladding tube of an heating pin,
giving the possibility of utilizing deformed heating rods
for the next experimental program.
263
Experimental program
Two sets of experiments were performed in the EMA 2
sodium loop at CSN Casaccia with two different seven pin
bundles: the first with an arrangement of seven heated pins
in nominal configuration, the second with one dummy pin, en-
larged 20% in diameter in the shape described above, placed
in a corner position.
The aim of these tests can be summarized as follows:
- measurements of temperature peripheral distribution on
the cladding, in particular for the pins under dissymmetry
conditions of heat flux and sodium flow (peripheral pins);
- measurements of temperature differences on the box walls,
to be related to helical wire recirculation effects and,
in the deformed situation, to the swelling phenomena;
- analysis and evaluation of thermal and hydraulic parame-
ters for the goal to produce a mixing model in nominal
and deformed situation.
A large number of tests has been performed changing the
power configuration (each pin can be heated indipendently),
varying test parameters in the following ranges:
sodium velocity
Re number
linear power/pin
0.15 + 3 m/sec
1500+ 30000
max 320 W/cm (4 pins heated)
Inlet temperature was 400°C, the mean axial temperature
increase of 100°C was generally reached.
Temperature data by thermocouples, flow rate signals by
electromagnetic flow-meter and inlet-outlet differential
pressure data were multiplexed at a rate of 50 data/sec and
collected on magnetic tape Ampex recorder. Temperature distri-
bution was then obtained after decoding procedures and data
elaboration done by computer.
Analysis of the experimental results
The thermocouple data, giving the temperature in the
real location point, cannot be directly utilized for the
comparison •. ith thermohydraulic codes,e.£. COSMO and IDRAX
codes developed in this laboratory, in which the temperature
field (together with velocity and pressure) is described as
mean values in different subchannels. Large differences can
arise for several reasons:
- large radial temperature gradients, in particular in the
seven pin geometry, but in any case present in larger bun-
dle peripheral subchannels;
- non uniformity of circumferential heat flux distribution
in the rods subjected to large radial temperature gradients;
- effects of temperature profile in the cladding when embed-
ded thermocouples are considered.
The above described effects reveal that the classical
heat transfer coefficient concept is not adequate for a fine
analysis of the temperature field in pin bundle geometry.
To relate the thermocouple data to the mean temperature
distribution in the near subchannel, a finite element two- 264
dimensional code NCEL / 3 / was developed, which gives the
temperature distribution over the whole section of the seven
pin bundle (Fig. 3). The following hypotheses were made:
- the axial heat removal is simulated by heat sinks in the
coolant region under conditions of subchannel slug-flow
approximation and axially stabilized thermal profile;
- anisotropy in the thermal conductivity was introduced in
the peripheral and corner subchannels, to simulate a dif-
fuse turbulent effect of the swirl flow induced by wire-
wrap in the periphery of the bundle.
The results obtained by this code cannot account for the
local effects induced by the wire wrap, depending on the axial
coordinate not considered here; nevertheless temperature dif-
ferences between adjacent measuring points were compared with
the computation differences with a good agreement (Fig. 4)i
This result confirms that the correlation of one local tempe-
rature to the temperature distribution in the adjacent re-
gion, obtained by the code, can be extrapolated to the expe-
rimental results as far as each thermcouple is related to
the facing subchannel.
From the measured values and for the conditions of each
test, the mean temperature of subchannels was then derived.
In Fig. 5 the radial temperature distribution on three instru-
mented planes is sketched. The sequence in the abscissa was
chosen according to the wire position, from the subchannel
left by the wire to that where the v/ire is going. Along this
direction a negative temperature gradient between the opposite
wall subchannels is evident, related to the helical flow in-
duced by the wire.
Deformed geometry tests
Having only one deformed pin, unheated, in a corner po-
sition (Fig. 6), no large effects in the temperature distri-
bution were expected. Furthermore a lot of informations were
lost, due to the failure of the thermocouples in the deformed
pin. Nevertheless very interesting results have been obtained.
From the hydraulic point of view, a notable increase in
the pressure losses was observed, as reported in Fig. 7.
This effect can be explained taking into account the reduction
of the peripheral gaps near the deformed pin and the conse-
quent disturbance induced in the helical recirculation around
the box walls.
The modification of the temperature map agrees with this
hypothesis. Following the rotation of the wire, a temperature
decrease in the subchannel before the obstacle, where the
axial velocity is expected to increase, has been observed;
in the stagnant region behind the deformed pin, a consequent
temperature increase has been detected. These results are
summarized in Fig. 8, where the data in nominal and defor-
med conditions are compared.
Conclusions
The work presented here is the first approach of this
laboratory to the thermohydraulic studies in nominal and
deformed pin bundles; the activity is in progress following
two main directions:
- development of the test section technologies; a 19 pin bun-
dle has been designed and heating deformed pins, already
mentioned, will be used for a more realistic simulation
of the non-nominal conditions expected in FBR subassemblies;
- improvement of the mathematical models describing hydraulic 265
and thermal behaviour in multichannel geometry. The local
effects described above cannot be satisfactory accounted
by the actual codes developed in this laboratory. For thi;;
reason, no comparison was presented here.
Acknowledgements
The authors wish to acknowledge the contribution given
to this activity by other laboratories of the CSH Casaccia:
- the FUNZ-CSNC-OFFICINA, for the irreplaceable contribution
to the realization of deformed pins and test sections;
- the TERM-RIS-FLUIDVIB laboratory, for the accurate realiza-
tion and calibration of thermocouple miniaturized joints;
- the COGEP-GSI-SCC for the set up of the data acquisition
procedure;
- the RIT-MAT-MATERIAL laboratory for the technical support
in the test section brazing procedures.
Finally, the authors express their acknowledgements
to the people of the DRIIR-SEDC of the CEM Cadarachu, for
the open discussions and for the stimulating interest de-
voted to this activity.
References
/ 1 /- L. Falzetti, G. Tomassetti:"Riscaldatori simulant!
l'elemonto di combustibile per prove di scambio termico
in sodio ad alta tempera turn", CNEH, RT/IIJG(71)2i?
/ 2 /- S. Meneghello, M. PezziJli, G. Scarano:"Influence of
the axial distribution of heat flux on sodium boiling
in forced convection",International Meeting on Fast
Reactor Safety and Related Physics, Chicago 5-9 Oct.l97</>
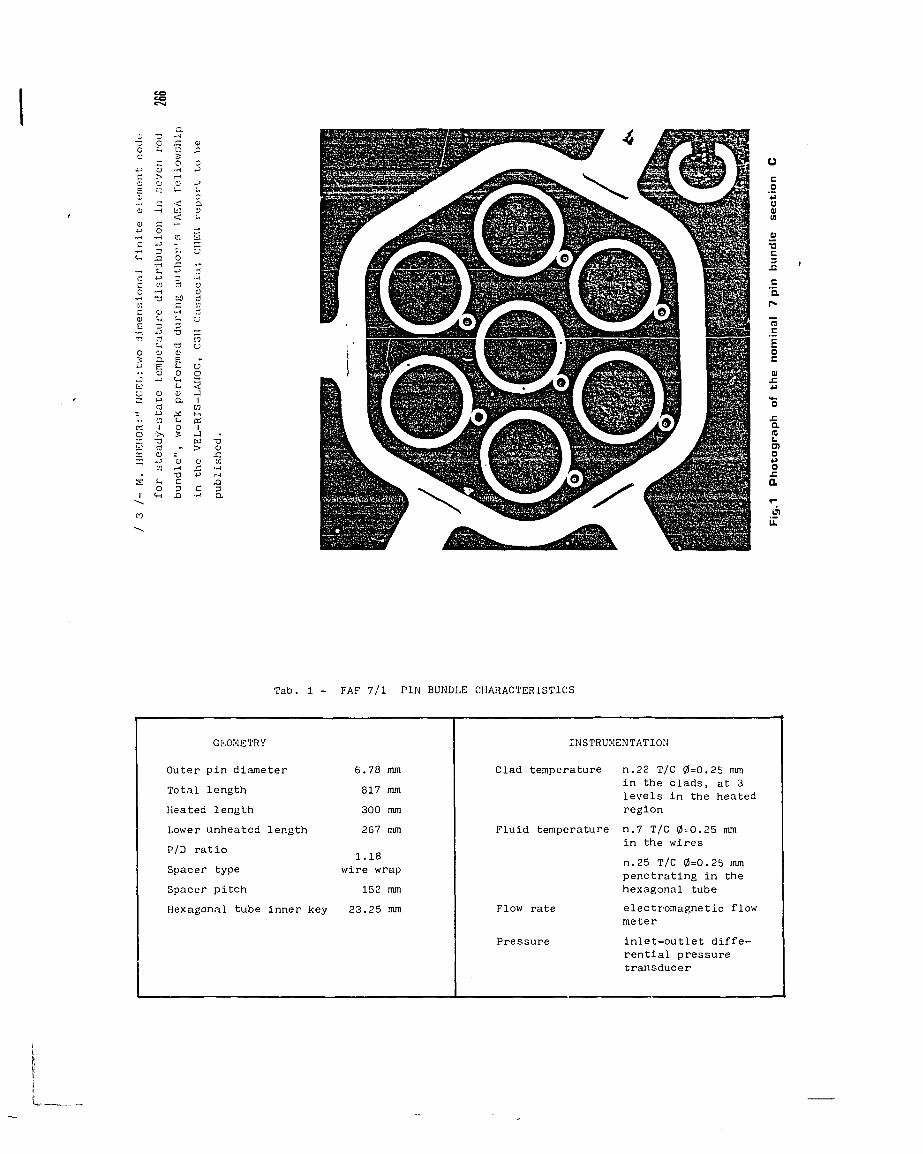
Tab. 1 - FAF 7/1 PIN BUNDLE CHARACTERISTICS
GEOMETRY INSTRUMENTATION
Outer pin diameter 6.78 mm Clad temperature n.22 T/C 0=0.25 mm*. , -i o„r, i n t n e clads, at 3Total length 817 mm n .levels in the heated
Heated length 300 mm region
Lower unheated length 267 mm Fluid temperature n.7 T/C 0=0.25 mm. . . in the wires
P/D ratio, n.25 T/C 0=0.25 mm
Spacer type wire wrap *.*... • J-V.H J penetrating in the
Spacer pitch 152 mm hexagonal tubeHexagonal tube inner key 23.25 mm Flow rate electromagnetic flow
meterPressure inlet-outlet diffe-
rential pressuretransducer
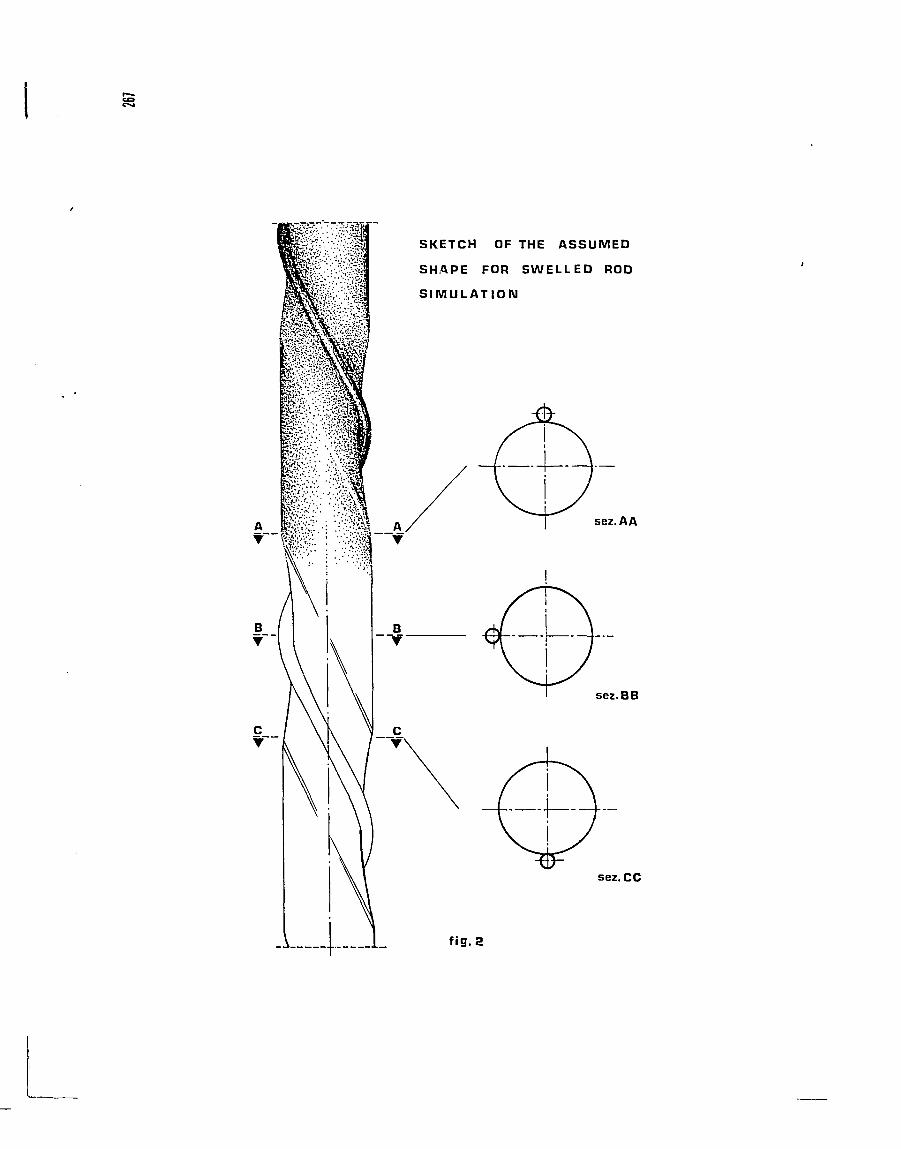
SKETCH OF THE ASSUMED
SHAPE FOR SWELLED ROD
SIMULATION
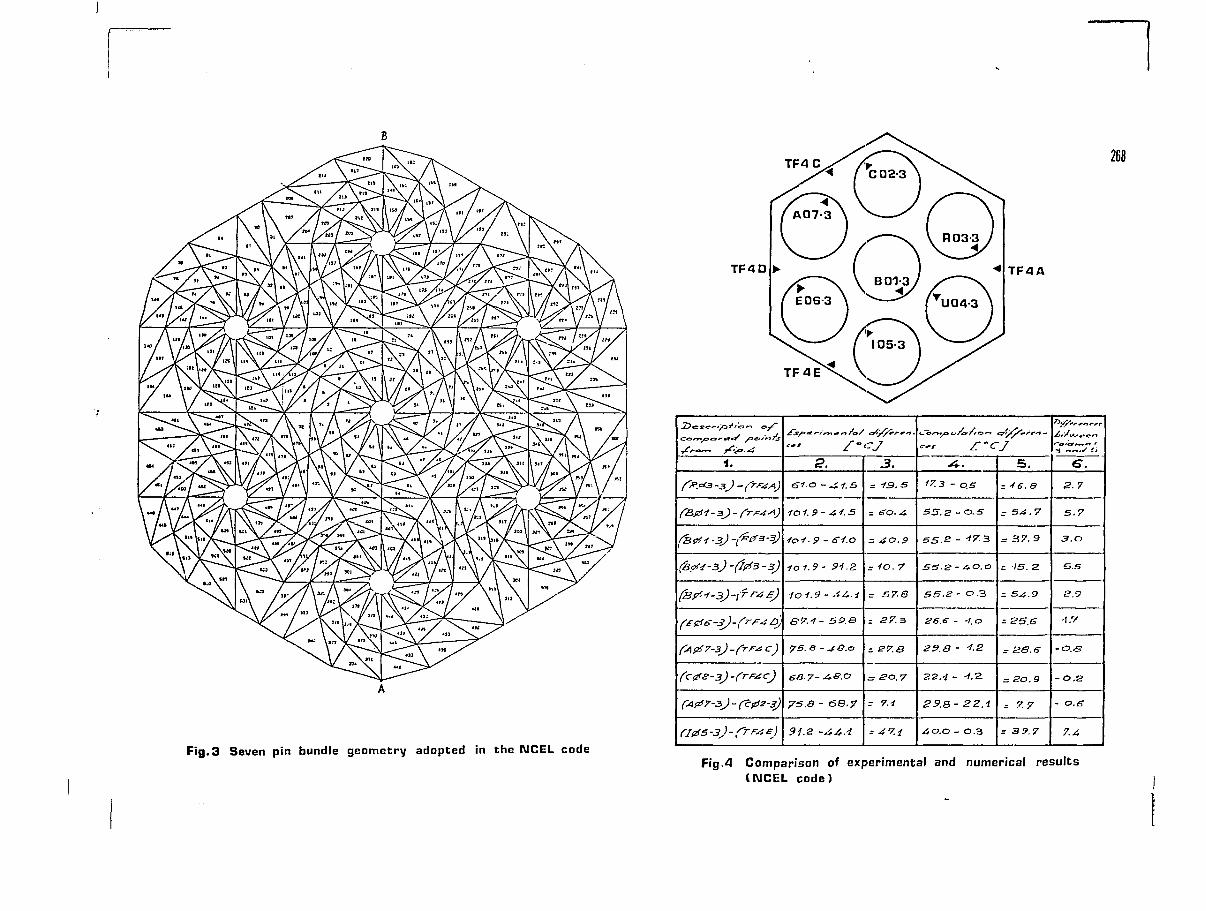
Fig. 3 Seven pin bundle geometry adopted in the IMCEL code
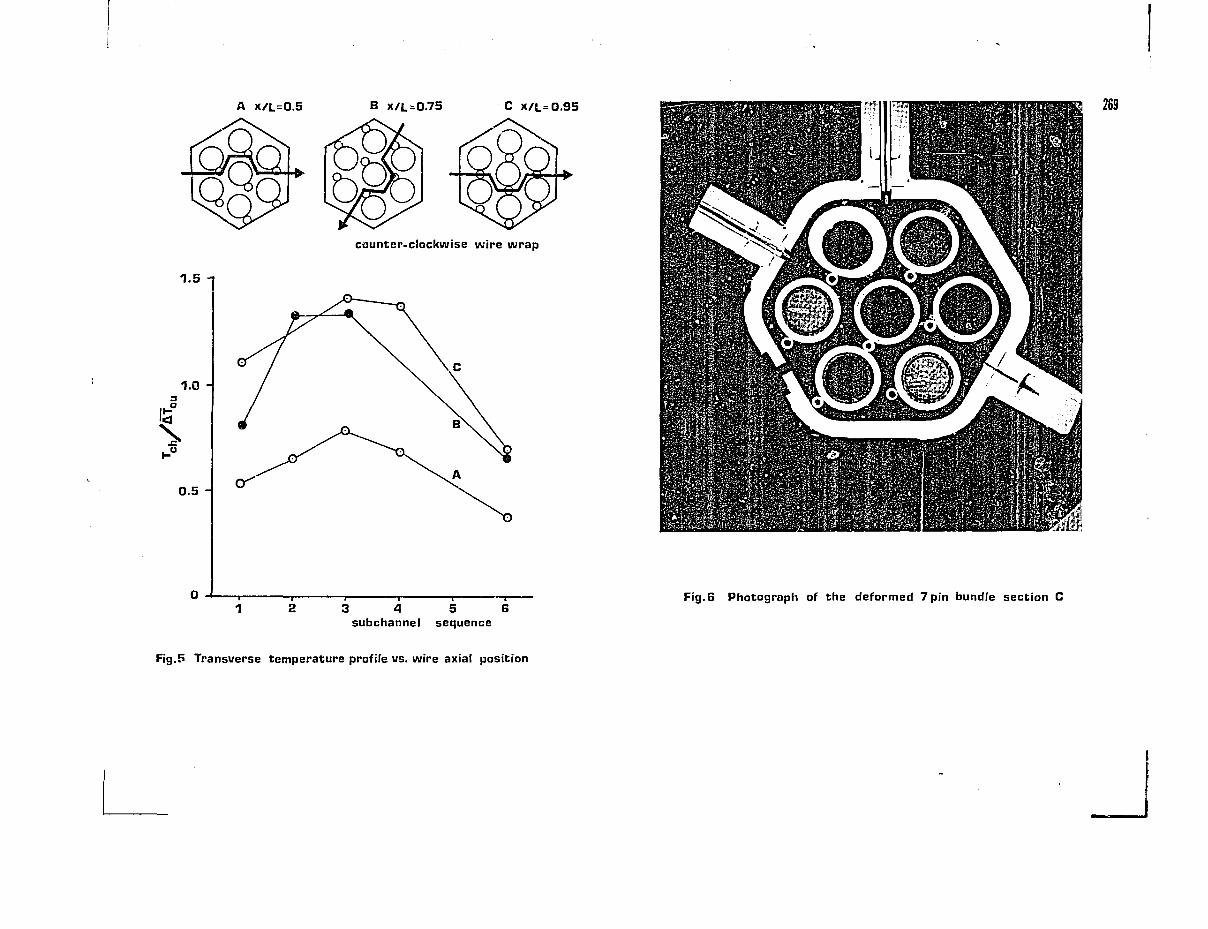
Fig.5 Transverse temperature profile vs. wire axial position
Fig. 6 Photograph of the deformed 7 pin bundle section C
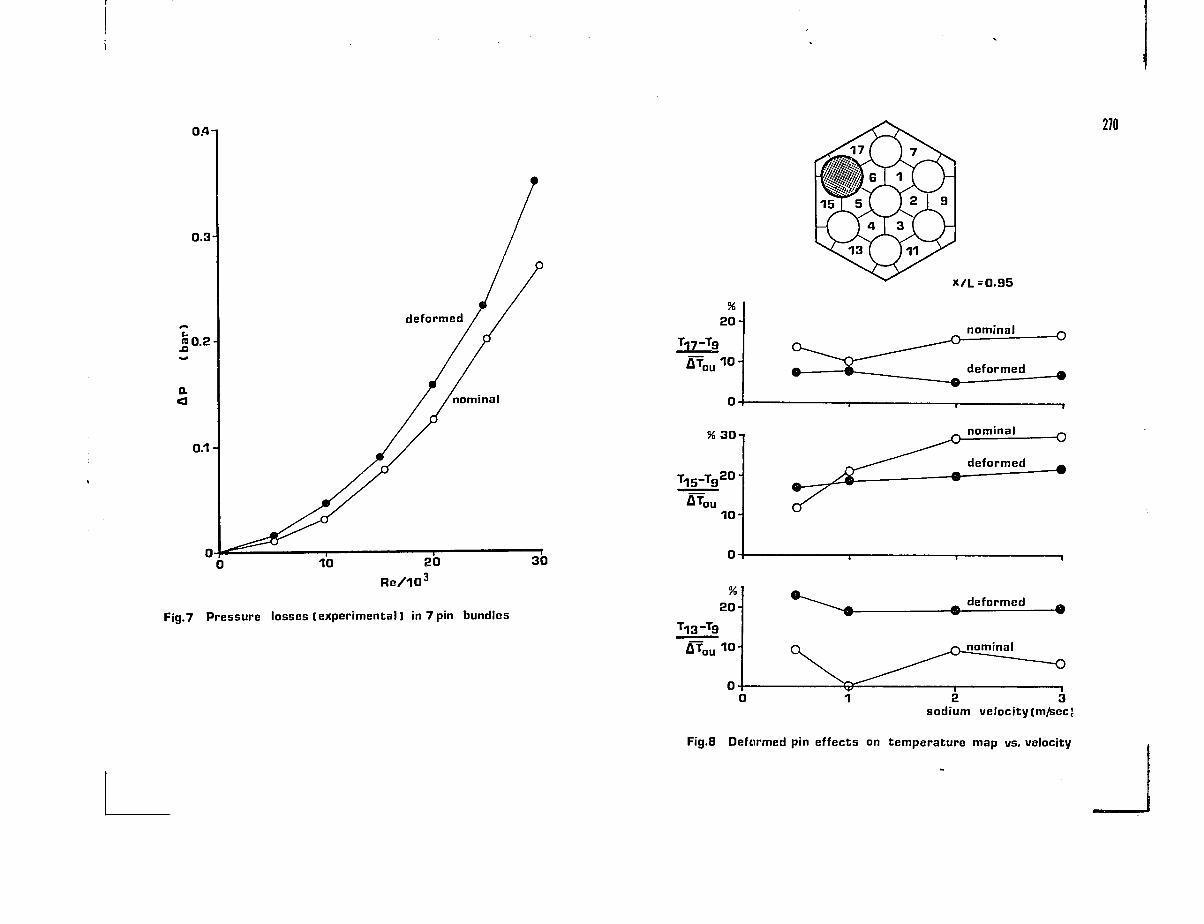
Fig.7 Pressure losses (experimental) in 7 pin bundles
Fig.8 Deformed pin effects on temperature map vs. velocity
AGENDA OF THE MEETING
14.30 Discussion and Conclusion
16.30 End
Formulation of Summary
271
Monday, February 5, 1979
9.30 Welcome Address and Opening Remarks
Confirmation of Proposed Agenda
10.15 Session I: Status of the Thermo- and Fluiddynamic
Activities
1.1 A Review of Theoretical and Experimental
Studies Underlying the Thermal-hydraulic
Design of Fast Reactor Fuel Elements
G.McAreavey, C. Betts
1.2 Status of Thermohydraulic Studies of Wire-wrapped
Bundles
A. khairallah, D. Leteinturier, J. Skok (CEA)
1.3 Detailed Design Consideration on Wire-spaced FBR
FuelSubassemblies under the Effects of Uncertain-
ties and Non-nominal Geometries
H. Hishida
1.4 Thermal-Hydraulic Experiments with Simulated
LMFBR Subassemblies under Nominal and Non-nominal
Operating Conditions - Status Report
K. Miyaguchi
12.30 L u n c h
13.3O 1.5 ev. Status Report of the Activities in USA
(E.A. Markley)
1.6 Status of LMFBR Thermo- snd Fluiddynamic Acti-
vities at KfK
H. Hoffman,, F. Hofmann, K. Rehme
Tuesday, February 6, 1979
9.30 Session II: Physical and Mathematical Modelling of
Single Phase Rod Bundle Thermohydraulics
11.1 Some Numerical Results obtained from Single
Phase Version of COMMIX-Code
W.T. Sha (AND
11.2 Probabilistic Design Consideration on Thermo-
dynamics of FBR Fuel Subassemblies and Related
Future Research Problems, Topical Paper
H. Hishida
11.3 Theoretical Analysis and Experimental Evidence
of Three Types of Thermohydraulic Incoherency
in Undisturbed Cluster Geometry
G. Basque, D. Grand, B. Menant (CEA)
11.4 Analysis of the Flow and Temperature Fields
in Locally Blocked LMFBR Subassemblies using
"UZU" Core, Topical Paper
K. Miyaguchi
11.00 Discussion and Conclusion
11.45 II.5 Cobra and Cortran Code Thermalhydraulic Models
for LMFBR Core Wide Temperature Distribution
during a Natural Convection Transient
U. Khan, T.L. George, C.L. Wheeler
II.6 Natural Convection Analyses and Verification for
LMFBR Cores
R.D. Coffield, R.A. Markley, E.U. Khan
12. 30 L u n c h
13.30 Discussion and Conclusion
14.15 II.7 Thermohydraulic Characteristics of SNR-fuel
Elements
G. Weber, G. Cornet
II.8 Predictions of Turbulent Flows in Central and
Wall Subchannels of Rod Bundles with Liquid
Metal Cooling
W. Slagter
15.00 Discussion and Conclusion
16.30 End
Formulation of Summary
19.00 D i n n e r
III .4 Steady State Thermohydraulic Studies in Seven 272
Pin Bundle out-of-pile Experiments: Nominal
and Distorted Geometry Tests
L. Falzett i , S. Meneghello, M. Pezzilli
11.00 Discussion and Conclusion
12.30 L u n c h
13.30 Session IV: Future R&D Needs
15.30 Discussion of Summary Reports and Recommendation
Closing Remarks
16.30 End of the Meeting.
Wednesday, February 7, 1979
9.30 Session III: Experimental Investigation
111.1 Local Pressure and Velocity Measurements in a
Water 19-Rod Bundle Using a Wire Wrap Spacer
System
A. Sarno, P. Gori, G. Andalo
111.2 LMFBR Blanket Assembly Heat Transfer and
Hydraulic Test Data Evaluation
R.A. Markley, F.C. Engel
111.3 Theoretical and Experimental Investigations of
the Thermohydraulics of Deformed Wire-Wrapped
Bundles in Nominal Flow Conditions
D. Leteinturier, L. Cartier (CEA/CEN)
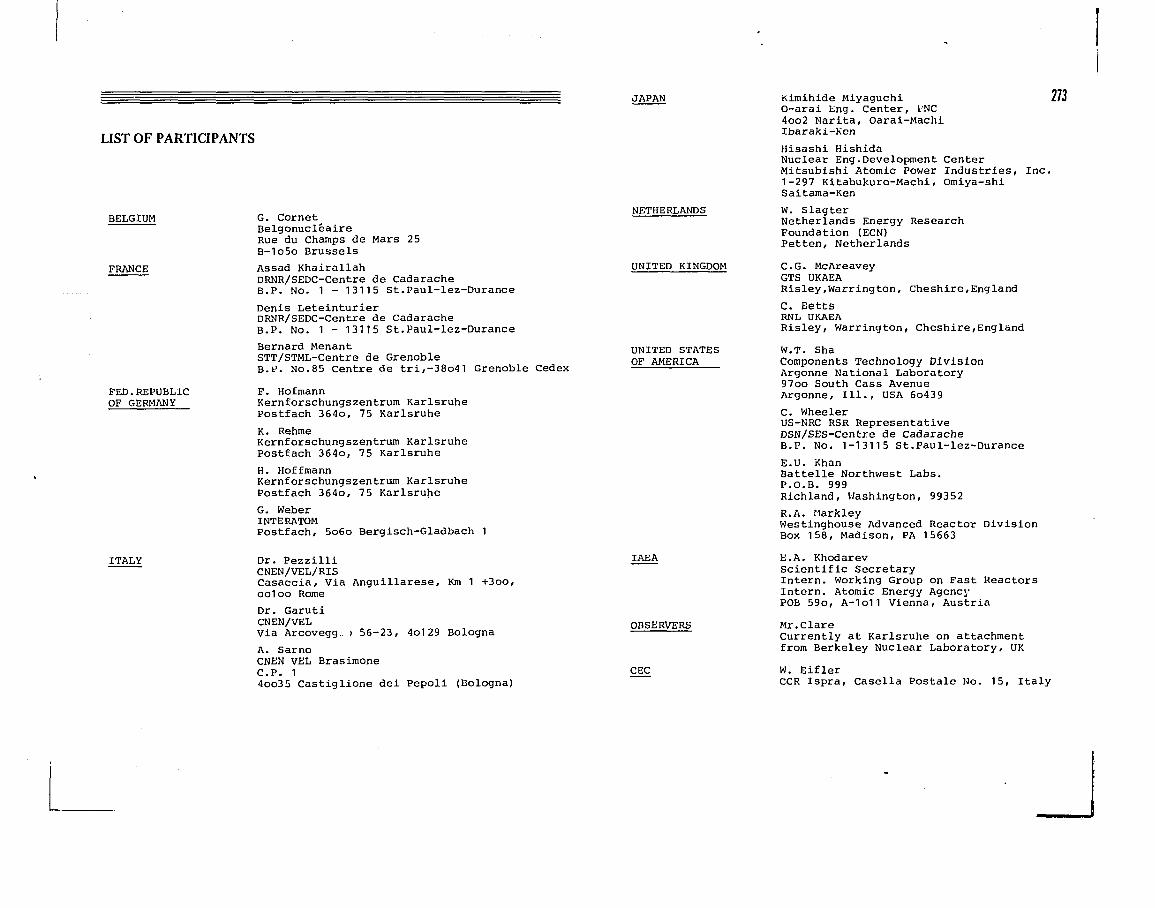
JAPAN
LIST OF PARTICIPANTS
BELGIUM
FRANCE
FED.REPUBLICOF GERMANY
ITALY
G. CornetBelgonucleaireRue du Champs de Mars 25B-1o5o Brussels
Assad KhairallahDRNR/SEDC-Centre de CadaracheB.P. No. 1 - 13115 St.Paul-lez-DuranceDenis LeteinturierDRNR/SEDC-Centre de CadaracheB.P. No. 1 - 13115 St.Paul-lez-DuranceBernard MenantSTT/STML-Centre de GrenobleB.P. No.85 Centre de tri,-38o41 Grenoble Cedex
F. HofmannKernforschungszentrum KarlsruhePostfach 364o, 75 Karlsruhe
K. RehmeKernforschungszentrum KarlsruhePostfach 364o, 75 KarlsruheH. HoffmannKernforschungszentrum KarlsruhePostfach 364o, 75 KarlsruheG. WeberINTERATOMPostfach, 5o6o Bergisch-Gladbach 1
Dr. PezzilliCNEN/VEL/RISCasaccia, Via Anguillarese, Km 1 +3oo,ooloo Rome
Dr. GarutiCNEN/VELVia Arcovegg.
NETHERLANDS
UNITED KINGDOM
UNITED STATESOF AMERICA
) 56-23, 4o129 Bologna
A. SarnoCNEN VEL BrasimoneC.P. 14oo35 Castiglione dei Pepoli (Bologna)
IAEA
OBSERVERS
CEC
Kimihide Miyaguchl 273O-arai Eng. Center, L'NC4oo2 Marita, Oarai-MachiIbaraki-Ken
Hisashi HishidaNuclear Eng.Development CenterMitsubishi Atomic Power Industries, Inc.1-297 Kitabukuro-Machi, Omlya-shiSaitama-Ken
W. SlagterNetherlands Energy ResearchFoundation (ECN)Petten, Netherlands
C.G. McAreaveyGTS UKAEARisley,Warrington, Cheshire,England
C. BettsRNL UKAEARisley, Warrington, Cheshire,England
W.T. ShaComponents Technology DivisionArgonne National Laboratory97oo South Cass AvenueArgonne, 111., USA 6o439
C. WheelerUS-NRC RSR RepresentativeDSN/SES-Centre de CadaracheB.P. No. 1-13115 St.Paul-lez-DuranceE.U. KhanBattelle Northwest Labs.P.O.B. 999Richland, Washington, 99352
R.A. HarkleyWestinghouse Advanced Reactor DivisionBox 158, Madison, PA 15663
E.A. KhodarevScientific SecretaryIntern. Working Group on Fast ReactorsIntern. Atomic Energy AgencyPOB 59o, A-1o11 Vienna, Austria
Mr.ClareCurrently at Karlsruhe on attachmentfrom Berkeley Nuclear Laboratory, UK
W. EiflerCCR Ispra, Casella Postale No. 15, Italy
Copyright © 2022 FDOKUMEN