11007625.pdf - Enlighten: Theses
207
https://theses.gla.ac.uk/ Theses Digitisation: https://www.gla.ac.uk/myglasgow/research/enlighten/theses/digitisation/ This is a digitised version of the original print thesis. Copyright and moral rights for this work are retained by the author A copy can be downloaded for personal non-commercial research or study, without prior permission or charge This work cannot be reproduced or quoted extensively from without first obtaining permission in writing from the author The content must not be changed in any way or sold commercially in any format or medium without the formal permission of the author When referring to this work, full bibliographic details including the author, title, awarding institution and date of the thesis must be given Enlighten: Theses https://theses.gla.ac.uk/ [email protected]
-
Upload
khangminh22 -
Category
Documents
-
view
3 -
download
0
Transcript of 11007625.pdf - Enlighten: Theses

https://theses.gla.ac.uk/
Theses Digitisation:
https://www.gla.ac.uk/myglasgow/research/enlighten/theses/digitisation/
This is a digitised version of the original print thesis.
Copyright and moral rights for this work are retained by the author
A copy can be downloaded for personal non-commercial research or study,
without prior permission or charge
This work cannot be reproduced or quoted extensively from without first
obtaining permission in writing from the author
The content must not be changed in any way or sold commercially in any
format or medium without the formal permission of the author
When referring to this work, full bibliographic details including the author,
title, awarding institution and date of the thesis must be given
Enlighten: Theses
https://theses.gla.ac.uk/

STUDIES ON THE VARIABILITY OF HUMAN BASAL
METABOLIC RATE .
A thesis presented for the degree of
Doctor of Philosophy
by
Carole Lowis, BSc (Hons).
December 1990 Institute of Physiology,
Faculty of Medicine,
University of Glasgow,
Scotland.

ProQuest Number: 11007625
All rights reserved
INFORMATION TO ALL USERS The quality of this reproduction is dependent upon the quality of the copy submitted.
In the unlikely event that the author did not send a com p le te manuscript and there are missing pages, these will be noted. Also, if material had to be removed,
a note will indicate the deletion.
uestProQuest 11007625
Published by ProQuest LLC(2018). Copyright of the Dissertation is held by the Author.
All rights reserved.This work is protected against unauthorized copying under Title 17, United States C ode
Microform Edition © ProQuest LLC.
ProQuest LLC.789 East Eisenhower Parkway
P.O. Box 1346 Ann Arbor, Ml 48106- 1346

"Much more research lies ahead before we can begin to understand
why one person can live on half the calories of another".
Dr. Elsie Widdowson (1947).
I hope the work contained in this thesis takes us a little closer to the
answer.

SUMMARY.
The studies presented in this thesis examine some of the factors responsible
for variation in basal metabolic rate (BMR, defined as the energy expended by an
individual lying quietly at rest in a thermoneutral environment, at least 12 hours
postabsorptive). They are particularly concerned with the parts played by
differences in body composition and cellular metabolic activity, under the influence
of thyroid hormones and catechloamines, in explaining variability in BMR.
In the great majority of people, and certainly most of those living in an
industrialised society, BMR accounts for the largest part of daily energy
expenditure, often making up more than two thirds of the total. Study of the
factors that effect BMR is therefore central to our understanding of the causes of
variation in daily energy needs.
The first study undertaken sought to explore some of the general
relationships between BMR and body composition in a group of 97 healthy
women. BMR was measured using the Douglas bag technique, and body
composition assessed by measurements of weight, height, body fat content
(skinfold and densitometry estimates), circumferences and diameters. Differences
in BMR between the women were found to be large (CV = 11.8%, standard
deviation 159 kcal/day) and could be best explained by differences in FFM,
accounting for 45 % of the total variance. The relationship between BMR and FFM
was unaffected by body fatness or age. However, at a given FFM considerable
variation in the BMR of individual women was evident. Moreover, for the
purposes of predicting an individual's BMR, FFM was found to be no better than
body weight. Simple differences in the weight of the FFM therefore, could only
partially explain the variation in BMR between the women. A further observation
from the study was that BMR expressed per kg body weight or per kg FFM tended
to decline form light to heavy individuals. This finding has implications for the

use of FFM as a metabolic reference standard, and it is suggested that it may relate
to differences in the composition of the FFM.
The role of the catecholamines was considered in a study which
investigated the effect of B-adrenergic blockade on basal metabolic rate. The
BMRs (measured using a ventilated hood system) of a group of 18 patients
receiving beta blocker drugs in the treatment of cardiovascular disorders were
compared to those of 28 healthy control subjects. In relation to the FFM
(estimated from skinfold thicknesses) the BMRs of the B-blocker patients were
found to 8% lower than that of the controls, equivalent to 136 kcal/day. The study
revealed a potentially important side effect of this widely prescribed group of drugs
and moreover, suggested that BMR has an adrenergically mediated component.
A further study was undertaken with the aim of elucidating the causes of
the marked variation in BMR relative to the FFM observed in the initial
investigation. Two groups of women characterised by particularly high or low
BMRs in relation to their FFM were selected for further study. Repeat
measurements of BMR suggested that part of the differences between the groups,
and by extension the initial study also, resulted from within-subject variation in
BMR. Error in measurement of the FFM (estimated by skinfolds, total body water
and densitometry) was found to be small and its potential contribution considered
minor. It was estimated that genuine inter-individual variation in BMR in relation
to the FFM was in the region of 100 kcal/day. Thyroid hormone levels were
found to be significantly greater in the high BMR group than in the low and it was
postulated that these differences were likely to be responsible for at least part of the
variance in BMR relative to FFM. Thyroid status did not however, provide the
complete explanation, a residual standard deviation approximately 70 kcal/day
remained. It was considered likely that differences in the composition of the FFM
were involved in explaining the remaining variance. Urinary catecholamine levels
were comparable in both groups, however the possibility that differences in an

adrenergically mediated process may have contributed to the differences in BMR
could not be ruled out.
Traditionally, differences in BMR have been ascribed to differences in
body size, age, sex, race, climate and nutritional status. The studies presented in
this thesis suggest however, that that these may have a common basis in that they
relate to differences in one or both of the major determinants of BMR; to
differences in body composition - primarily to the mass of fat-free tissue and to the
relative proportions of its component parts - and to hormonally induced metabolic
activity of the tissues. Moreover, it has been possible to make some assessment of
the relative importance of these factors in explaining variations in BMR: 45% of
the variance observed in BMR in the original cross-sectional study was found to
result from differences in FFM. It was estimated that around 15% of the variance
was attributable to within-subject differences and a further 20% to differences in
thyroid hormone levels. The remaining 20% can probably be accredited to
differences in the size of the metabolically active organs.

Acknowledgements
I am deeply indebted to all of the following :
- My supervisor, Dr Mark Lawrence - for his invaluable guidance through out
the course of this project.
-Professor John Dumin - for his interest and encouragement.
-Professor Shelia Jennett - for allowing me to work in the Institute of Phsiology.
- Mr John Wilson and Mr Paul Paterson - for providing able technical assistance
(and the entertainment).
- Drs Fraser Logue, Tom Aitchison, Bill Ferrell and Craig Daly - for much
appreciated help with non-nutritional matters.
- Dr Michael Dickson - for his friendship and limitless supply of good ideas
and advise, even from across the Channel.
- Mary Rouse, Joyce Kinabo and Teresa Espinosa - for a great deal of moral
support.
- My flatmates and friends - for their constant encouragement, and especially
Irene and Kenny, for a summer of tea and sympathy.
-My parents and family - for everything.

LIST OF TABLES.
Table 1.1
Table 1.2
Table 1.3
Table 1.4
Table 3.1
Table 3.2
Table 3.3
Table 4.1
Page
Studies which have investigated intra-individual
differences in BMR. 18
Contributions of organ and tissue metabolic rates to
BMR in man. 21
Variations in the proportions of the organs and tissues
occupying the FFM. 24
Variations in the proportions of muscle and bone
occupying the adipose tissue-free mass (ATFM) of the
Brussels study cadavers 26
Anthropometric data and BMR results of the 97 women. 85
Univariate correlations for BMR with age and body
composition variables. 88
Univariate correlations between age and weight, height,
FFM, % fat and BMR. 92
Physical characteristics and BMR results of 15-blockade
and control subjects. 116
v
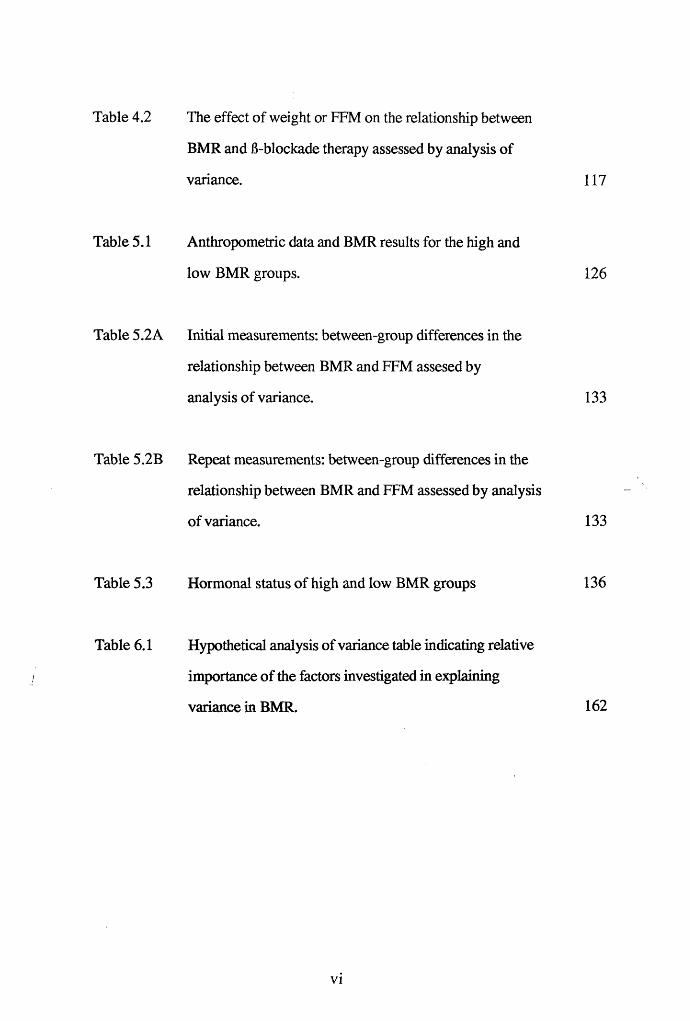
Table 4.2 The effect of weight or FFM on the relationship between
BMR and 15-blockade therapy assessed by analysis of
variance.
Table 5.1
Table 5.2A
Table 5.2B
Table 5.3
Table 6.1
Anthropometric data and BMR results for the high and
low BMR groups.
Initial measurements: between-group differences in the
relationship between BMR and FFM assesed by
analysis of variance.
Repeat measurements: between-group differences in the
relationship between BMR and FFM assessed by analysis
of variance.
Hormonal status of high and low BMR groups
Hypothetical analysis of variance table indicating relative
importance of the factors investigated in explaining
variance in BMR.

LIST OF FIGURES.
Page
Figure 1.1 Scatterplots relating the percentages of muscle and bone
in the adipose tissue-free mass (ATFM) of the Brussels
study cadaver to ATFM. 29
Figure 1.2 Scatterplot relating organ weight (liver, kidney, heart &
brain) to body weight in the Greenwood & Brown (1913)
cadavers. 31
Figure 1.3 Thyroid hormone production and metabolism. 34
Figure 2.1 Body density by underwater weighing: the subject is
shown with head above the water before the procedure
begins. 49
Figure 2.2 Underwater weighing: the subject's whole body is
completely submerged. 50
Figure 2.3 Collection of expired air using the Douglas bag system. 65
Figure 2.4 Schematic representation of the ventilated hood system. 71
Figure 3.1 Relationship between percentage fat estimated by
densitometry and percentage fat estimated by
skinfolds. 83
vii
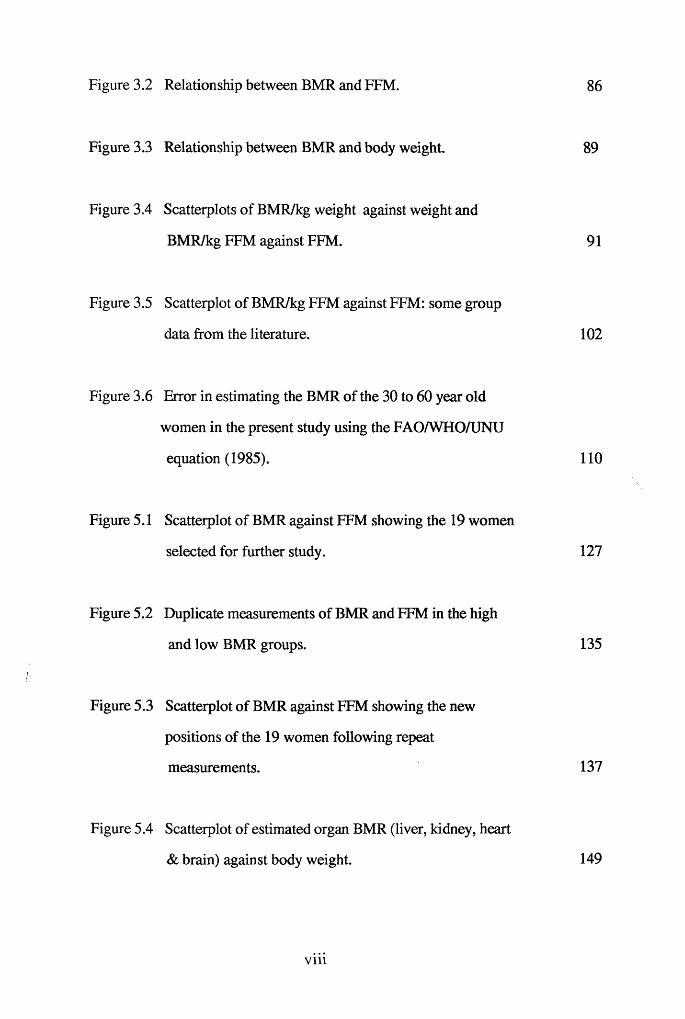
Figure 3.2 Relationship between BMR and FFM. 86
Figure 3.3 Relationship between BMR and body weight. 89
Figure 3.4 Scatterplots of BMR/kg weight against weight and
BMR/kg FFM against FFM. 91
Figure 3.5 Scatterplot of BMR/kg FFM against FFM: some group
data from the literature. 102
Figure 3.6 Error in estimating the BMR of the 30 to 60 year old
women in the present study using the FAO/WHO/UNU
equation (1985). 110
Figure 5.1 Scatterplot of BMR against FFM showing the 19 women
selected for further study. 127
Figure 5.2 Duplicate measurements of BMR and FFM in the high
and low BMR groups. 135
Figure 5.3 Scatterplot of BMR against FFM showing the new
positions of the 19 women following repeat
measurements. 137
Figure 5.4 Scatterplot of estimated organ BMR (liver, kidney, heart
& brain) against body weight. 149
viii

CONTENTS
Page
Summary i
Acknowledgements iv
List of Tables v
List of Figures vii
CHAPTER 1 INTRODUCTION 1
Definition of BMR 2
Functional basis of BMR 2
An overview of the factors thought to
influence BMR 4
Effect of body composition on BMR 10
Metabolic activity of the tissues 32
CHAPTER 2 GENERAL METHODOLOGY 42
Measurement of body composition 43
Measurement of energy expenditure 62
CHAPTER 3 BMR AND BODY COMPOSITION 78
Introduction 79
Subjects and Methods 81
Results 84
Discussion 90
CHAPTER 4 THE EFFECT OF 8-ADRENERGIC
BLOCKADE ON THE BMR OF PATIENTS
WITH CARDIOVASCULAR DISORDERS 111

Introduction 112
Subjects and Methods 113
Results 115
Discussion 118
CHAPTER 5 ANALYSIS OF THE FACTORS RESPONSIBLE
FOR VARIATION IN BMR IN RELATION TO
THE FFM 124
Introduction 125
Subjects and Methods 129
Results 132
Discussion 138
CHAPTER 6 GENERAL DISCUSSION 155
REFERENCES 167
APPENDIX 194

CHAPTER 1
INTRODUCTION.
1
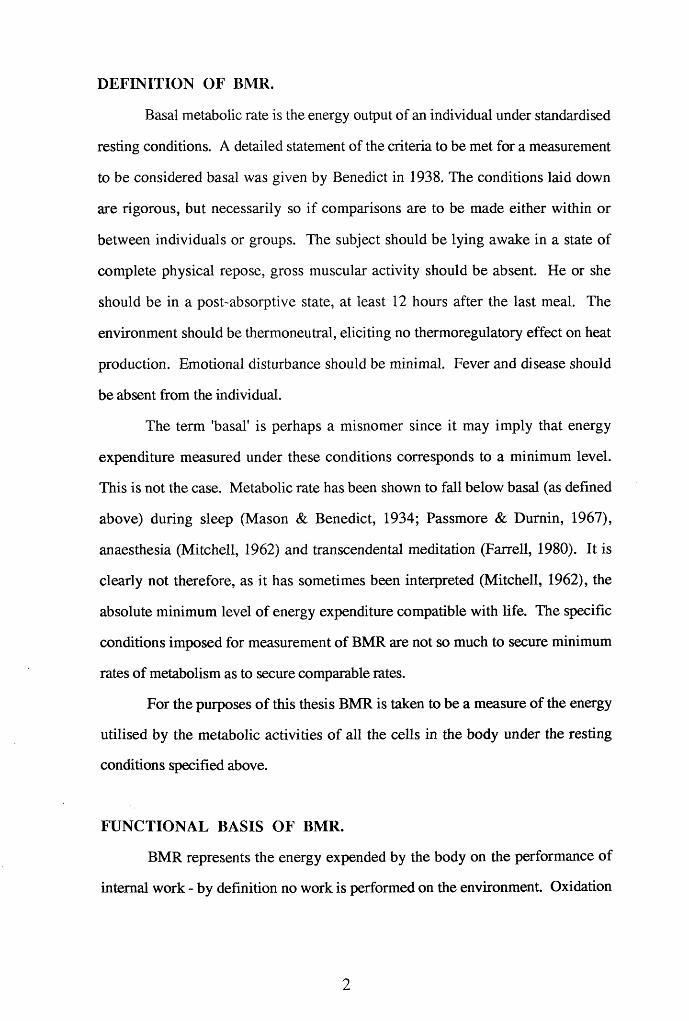
DEFINITION OF BMR.
Basal metabolic rate is the energy output of an individual under standardised
resting conditions. A detailed statement of the criteria to be met for a measurement
to be considered basal was given by Benedict in 1938. The conditions laid down
are rigorous, but necessarily so if comparisons are to be made either within or
between individuals or groups. The subject should be lying awake in a state of
complete physical repose, gross muscular activity should be absent. He or she
should be in a post-absorptive state, at least 12 hours after the last meal. The
environment should be thermoneutral, eliciting no thermoregulatory effect on heat
production. Emotional disturbance should be minimal. Fever and disease should
be absent from the individual.
The term 'basal' is perhaps a misnomer since it may imply that energy
expenditure measured under these conditions corresponds to a minimum level.
This is not the case. Metabolic rate has been shown to fall below basal (as defined
above) during sleep (Mason & Benedict, 1934; Passmore & Durnin, 1967),
anaesthesia (Mitchell, 1962) and transcendental meditation (Farrell, 1980). It is
clearly not therefore, as it has sometimes been interpreted (Mitchell, 1962), the
absolute minimum level of energy expenditure compatible with life. The specific
conditions imposed for measurement of BMR are not so much to secure minimum
rates of metabolism as to secure comparable rates.
For the purposes of this thesis BMR is taken to be a measure of the energy
utilised by the metabolic activities of all the cells in the body under the resting
conditions specified above.
FUNCTIONAL BASIS OF BMR.
BMR represents the energy expended by the body on the performance of
internal work - by definition no work is performed on the environment. Oxidation
2
of nutrients in the body provides ATP which is utilised to accomplish this work.
Internal work can be subdivided into three components:
(1) Mechanical work, which is mostly the pressure-volume work of
propulsion, subsequently dissipated as fluid friction to appear as heat. Mechanical
work includes the work of the heart, lungs and gut.
(2) Work done in the synthesis of new chemical compounds from monomers
and their subsequent breakdown. A typical example is that of protein turnover.
Also included are the substrate or 'futile' cycles which exist at certain key points in
intermediary metabolism. Here the actions of pairs of enzymes lead to substrate /
product cycles resulting in the expenditure of energy with little net metabolism of
the substrate. The interconversions of glucose and pyruvate, glucose and glucose
6-P, glucose phosphorylation and triglyceride turnover in adipose tissue are all
examples of so-called futile cycles.
(3) Work done in the transport of ions and molecules in secretion, absorption
and the maintenance of electrochemical gradients in cells. For example sodium and
other ion pumps and all processes of active transport. The contribution of
mechanical work to basal energy expenditure is thought to be very small, probably
accounting for only 3% of the total (Agriculture Research Council & Medical
Research Council, 1974). Work done in biosynthetic and ion transport processes
are less easy to quantify. Various reports, summarised by Reeds et at. (1985),
have estimated the contribution of protein turnover to BMR to be somewhere in the
region of 11-15%. In general the work done in ion transport is considered to be of
greater importance. To date the contribution of the Na+/K+pump has received most
attention. Sims (1987) believes that a large part of our metabolic energy, perhaps
up to 50%, ’is still devoted to keeping the primordial brine out of our cells'. Other
investigators give more conservative estimates. Sestoft (1980) for example,
suggests that the Na+/K+ pump is unlikely to account for more than 5-10% of
BMR, The discrepancies seem to arise from differences in the cellular integrity of

the various preparations used. Similarly, the precise contribution of the energy
costs of substrate cycles to basal expenditure is not known; Reeds et al. (1985)
estimate that it may well be in the region of about 15%, other investigators put the
potential contribution substantially higher (Newsholme, 1980). Clearly, the
amount of internal work performed determines an individual's basal energy
requirements. Differences in work will be manifest in differences in BMR. This
thesis will consider some of the factors responsible for the differences in the
amount of internal work performed and consequently therefore, for variations in
BMR.
For the great majority of individuals BMR makes up the largest part of daily
energy expenditure, accounting in the sedentary for around two thirds of the total.
Consequently, differences in BMR are likely to be the most important determinant
of differences in daily energy expenditure. In view of this, the study of factors
affecting BMR would seem essential to our understanding of the causes of inter
individual variability in daily energy needs.
AN OVERVIEW OF THE FACTORS THOUGHT TO AFFECT BMR:
The purpose of the following section is to briefly review some of the factors
thought to affect BMR. It is not intended to be fully comprehensive but rather to
provide some background to the subject and to introduce concepts and ideas which
will be expanded upon in subsequent sections.
(1) Body Size.
From the first, investigators have acknowledged that the size of the body
will influence BMR and have made attempts to take this into account when making
comparative measurements. It was recognised early on that some form of
'normalisation' for differences in size was required if the effects on metabolism of
4

factors other than body size, for example race, disease and nutritional status, were
to be considered.
For many years it was customary to express BMR on a surface area basis.
This practice stems from the observation of Rubner in 1883 that the fasting
metabolism of seven dogs varying in body weight from 3 to 31kg was
approximately constant when expressed per unit area of body surface.
Subsequently Rubner's pupil, Voit, published results in 1901 which showed that
the fasting metabolisms of a number of different species were also proportional to
their surface areas (Kleiber, 1947). It was largely on the basis of these inter
specific results that surface area became the attribute of body size to which basal
metabolism of humans was referred. This in itself is a potential criticism of the use
of surface area as a metabolic reference standard in man. However, perhaps more
fundamental is the assumption implicit in the ’surface area law’ that in a basal state
an individual is producing heat primarily to keep the body warm. On this basis, the
greater the surface area the greater the heat loss to the environment and
consequently the greater the metabolic rate must be to generate sufficient heat to
maintain body temperature. This is not so. One of the prerequisites for
measurement of BMR is a thermoneutral environment. Energy is produced for
physiological work, in the accomplishment of which heat is produced and
dissipated. It is the magnitude of the work to be performed that determines BMR,
not the need to maintain body temperature. As Garrow (1978) points out, if BMR
was determined by the rate of heat loss energy expenditure would be higher if an
individual was lying spread-eagled, and thus presenting the maximum area for heat
loss than if curled up in a small a volume as possible, but this is not so. Another
criticism of the use of surface area as a reference standard has been the questionable
accuracy of its estimation. Most commonly surface area is calculated from weight
and height using the formula of Du Bois & Du Bois (1916). Mitchell et ah (1971)
showed that the Du Bois1 formula underestimates surface area by about 7% relative
5

to the true area measured by a photometric technique. Heusner (1985) believes that
the surface area law has become an example of Cantor's Law of the Conservation
of Ignorance: "A false conclusion once arrived at and widely accepted is not easily
dislodged and the less it is understood the more tenaciously it is held"!
An alternative way of taking into account differences in body size is simply
to express BMR in relation to weight. This also has its problems however, in that
BMR is not constant per unit of weight; rather there is a tendency for BMR/kg to
decline as weight increases (Scofield, 1985a; Owen et al., 1986; Lawrence et al.,
1988). Consequently, BMR has sometimes been related to a power function of
body weight. Between species of animals Kleiber (1947) observed BMR was
constant when expressed in relation to weight0-75. The 'three-quarters power rule'
has also been applied to man, but with seemingly little justification. The
relationship is an empirical one, based on observation and not on theoretical
considerations. The explanation for the observed decline in BMR/kg probably lies
in differences in body composition between light and heavy individuals. This
relationship will be discussed in some depth in a later section.
(2) Age.
The way in which age affects BMR is not the same at all stages of life. The
metabolism of the new bom infant is characteristically low but increases rapidly to
reach a peak in relation to body weight in the first year of life (Widdowson, 1981).
When expressed per unit weight, BMR is higher in children than at maturity. This
can partly be attributed to the energy cost of growth (Spady et al., 1976; Millward
et al., 1976) however, differences in body composition between adults and infants
in relation to their weight may also play a part.
Once adulthood is reached the general view is that basal metabolism tends to
fall. On the basis of cross-sectional data Shock (1972) has estimated that between
the ages of 30 and 80 years BMR/day declines by about 200 kcal in men. Before
6

the age of 60 the fall in BMR in relation to weight is thought to be comparatively
small, only about 1-2% per decade, but to become more pronounced thereafter
(FAO/WHO/UNU, 1985). Much of the decline in BMR with age has been
attributed to changes in body composition, (Keys et al., 1973; Cunningham, 1980).
There is still some conjecture however, as to whether age-related changes in the
metabolic rates of the tissues themselves also occur - slowing as we become older.
The respective roles of changes in the body composition and of tissue metabolism
will be discussed in some depth later in this thesis.
(3) Sex.
When expressed in relation to body weight women have lower BMRs than
men. The difference between the sexes becomes apparent in early adolescence and
remains throughout adult life. It is thought to be largely attributable to differences
in body composition - at a given weight women are on average fatter and less
muscular than men - and not to reflect any inherant metabolic differences between
men and women (Webb, 1981; Cunningham, 1980 & 1982).
(4) Race.
A number of studies have attempted to assess the possibility of ethnic
differences in BMR. Results have sometimes been conflicting but several reports
have suggested that in relation to body weight, Asian subjects have lower BMRs
than their North American or North European counterparts (Quenouille et al., 1951;
Shetty, 1984; Scofield, 1985a; McNeill e ta l, 1987; Drummond, 1988). It is often
difficult to decide whether this is a result of genuine genetic differences between
Asians and other racial groups or relates to, for example, differences in nutritional
status, diet, climate or body composition. Recently Lawrence et al. (1988) have
shown that differences in the BMRs of Scottish, Gambian and Thai women could
be explained by differences in the amount of fat free tissue in the body and found
7

race, climate and nutritional status to have little effect. The results of this study
suggest that differences in body composition may play an important part in
explaining ethnic variations in BMR, but the issue has yet to be conclusively
resolved.
(5) Climate.
It is clear that ambient temperature affects metabolic rate. Exposure to severe
cold can double resting metabolism (Buskirk et al., 1963; Wyndham et al., 1968 &
Rochelle & Horvath 1969) and even moderate cold exposure, such as might occur
in normal life, has been shown to increase metabolic rate. Dauncey (1981) found a
6% rise in metabolic rate with a fall in environmental room temperature from 28°C
to 22°C. A similar drop was reported by Blaza and Garrow (1983) for women at
the lower end of their 'thermal comfort zone*. The converse would also seem to
apply, an increase in ambient temperature has been reported to reduce metabolic rate
(Mason & Jacob, 1972).
It should be remembered however, that one of the stipulations of a proper
BMR determination is thermo-neutralility. From the available data it is unclear
whether BMR is affected by climate if the measurement condition of a
thermoneutral room temperature is strictly adhered to. Buskirk et al. (1957) studied
soldiers at military bases with ambient temperatures ranging from -25°C to 34°C and
found no significant relationship between BMR and temperature. On the other hand
Mason and Jacob (1972) report data from individuals whose BMRs were altered by
a change from a tropical to a temperate climate or vice versa. Recent FAO/WHO
committees on energy requirements have not made an allowance for climatic factors
in predictions of BMR, but concede that further investigation is required before it
can be concluded for certain that temperature and humidity have no important affect
on BMR (FAO/WHO, 1973; FAO/WHO/UNU, 1985). The question of whether
BMR in its strict sense is affected by climate may be only of academic interest.
8

Dumin (1981) has argued that differences in metabolic rate at the individual's usual
environmental temperature may be of greater practical significance.
(6) Nutritional Status.
BMR is reduced by under-nutrition. This was clearly shown by Benedict et
al. (1919) in their classical study of calorie restriction in normal young men, and
confirmed in the Minnesota experiment undertaken by Keys and his colleagues 30
years later (Keys et a l, 1950). It has been demonstrated on numerous occasions
since.
Much of the drop in BMR can be explained by loss of the fat free tissue
which accompanies negative energy balance. Many authors however, have also
reported a decrease in BMR over and above that expected from tissue loss alone
(Keys et al., 1950; Grande et al., 1958; James et al., 1978; Bessard et al., 1983;
Finer et al., 1986; Barrows & Snook, 1987). Two explanations for this reduction
have been offered: (1) There may be an alteration in the composition of the lean
tissue mass. There is some evidence that during energy restriction tissues with high
metabolic rates such as the liver are initially lost at a proportionately greater rate than
other less active tissues (Grande et al., 1958). If this were the case a fall in the
overall metabolic rate of the fat-free tissue would result. (2) The alternative
proposal is that the metabolic activity of the individual tissues themselves fall (Keys
et al., 1950; James et al., 1978). The decrease in thyroid hormone and
catecholamines levels associated with energy restriction have been suggested to
bring about such a change (Jung et a l, 1980; Shetty et al., 1979). The above
hypotheses are not mutually exclusive and it may well be that the decrease in BMR
per unit weight of tissue is the result of a combination of them both.
The effect of over-feeding on BMR is a contentious issue. Chronic over
nutrition undoubtedly leads to an increase in body weight - the mass of both fat and
fat-free components of body weight increase. BMR rises as a result. The area of
9

dispute lies however, in the observation by some investigators that weight gain is
not always as great as would be predicted from the energy surplus. Consequently it
has been postulated that over-feeding stimulates an increase in BMR over and above
(and preceding) that resulting from changes in body composition (Sims, 1976;
Schutz et al., 1982). Again it has been suggested that this occurs through
hormonally-induced alterations in the metabolic activity of the tissues. The
existence of a such a mechanism to limit the consequences of overeating, so-called
luxus consumption, is by no means universally accepted.
Traditionally then, differences in BMR have been attributed to the factors
outlined above - to differences in body size, age, sex, race, climate and nutritional
status. It should have become clear in the course of the preceding review however,
that much of the variance seems to have a common basis, in that it appears to relate
to differences in just two factors; either to differences in body composition - to the
relative amounts of fat and lean tissue in the body and to the composition of the lean
tissue - or to differences in the metabolic activity of the tissues - to differences in the
basic energy demanding processes at cellular level. Much of this thesis is devoted
to investigating the parts played by these two factors in explaining variability in
BMR.
EFFECT OF BODY COMPOSITION ON BMR.
In human biology the term body composition has come primarily to refer to
the fat and fat free components of body mass. Fat is defined as the ether-extractable
constituent of the body, fat free mass (FFM) as the mass of all the tissues and fluids
in the body less fat. This distinction is a chemical one, its anatomical analogue is
the division of body weight into adipose tissue and lean body mass (LBM).
Adipose tissue is made up not only of fat (roughly 80%) but also of about 2%

protein and the remainder water. Clearly, fat and adipose tissue are not the same, in
the literature however, the terms are often used synonymously.
It is desirable to know how much fat is present in the body for a number of
reasons and various techniques have been developed to quantify fat and FFM in
living subjects. Body fat content influences morbidity and mortality, alters the
efficacy of drug and anaesthetic action and influences the tolerance to cold and
starvation. It is also recognised that the degree of body fatness will affect metabolic
rate, such that at a given weight the greater the fat content the lower the metabolic
rate. To make some allowance for differences in body fatness it has become
common practice to express BMR in relation to the FFM. The adoption of FFM as
a metabolic reference standard can be traced back to the work of Miller and Blyth
(1950). In a series of experiments with 48 college students who had fat contents,
estimated from body density, varying from 3% to 44%, they found better relations
of basal oxygen consumption to FFM than to either body weight or surface area.
Subsequent studies (discussed below) have reported that differences in BMR in
relation to age, sex, obesity and ethnic origin largely disappear when differences in
FFM are taken into account.
Between-Group Differences in BMR.
Sex
Several studies have reached the conclusion that differences in BMR
between the sexes are, for the most part, attributable to differences in FFM
(Bernstein et al., 1983; Ravussin et al., 1986; Owen et al., 1987; Weststrate,
1989). Employing regression analysis to data derived from relatively large
numbers of men and women these workers all found that once differences in FFM
had been taken into account, sex had no significant influence on BMR. In other
words, men and women with a similar FFM had a similar BMR. In a re-analysis of
data from some 200 subjects, which provided the basis for the Harris-Benedict

equations (1919), Cunningham (1980) also found FFM to be the best single
predictor of BMR, the influence of sex adding little to the estimation. As evidence
against a characteristically 'masculine' or 'feminine metabolism' this study is
perhaps the most widely quoted, it is however, open to criticism, in that the FFM of
the subjects was not measured. Rather, using the equations developed by Moore et
al. (1962), Cunningham estimated total body water from age and body weight and
used this to predict FFM. The main body of evidence does however, seem to
support Cunningham’s conclusion that differences in BMR between the sexes are a
reflection of differences in FFM - no investigation has found to the contrary. At a
given weight women are on average fatter and have a lighter FFM than men, and
consequently, it is suggested, a lower metabolic rate. On this basis there have not
been thought to be any inherant differences in the metabolic activity of the tissues
themselves between men and women. The observation that athletic training which
negates differences in body fatness and FFM between the sexes also reduces
differences in oxygen consumption at a given body weight is consistent with this
idea (Cunningham, 1982). However, in one obvious way the 'metabolisms' of the
sexes do differ; in women BMR may be affected by the menstrual cycle (Soloman
et al., 1982; Bisdee et al., 1989), no such cyclical changes are apparent in men.
Age
Keys et al. (1973) suggest that almost all of the decrease in BMR they
observed in longitudinal studies of aging can be explained by changes in the relative
proportions of fat and FFM making up body weight. They estimated that the
reduction in BMR attributable to age per se was only about 1 % per decade over the
age range 20-75 years. Results of the Baltimore Longitudinal Study of Aging
(Shock, 1972) also appear to support the conclusion that age-related changes in
BMR are a consequence of changes in the mass of fat-free tissue. Both these
analysis rely on the assumption that the FFM has a relatively constant composition

and a fairly uniform metabolic rate, ie. a 10% reduction in the FFM will be
accompanied by a 10% reduction in BMR. This assumption is almost certainly not
justified (see later). However, the results of several cross-sectional studies would
seem to add weight to the general conclusions drawn from the above investigations.
Using regression analysis Cunningham (1980), Webb (1982), Bernstein et a l
(1983), Ravussin et a l (1986) and Owen et a l (1987) have all found that once
differences in FFM have been taken into account age has no significant affect on
BMR. The findings of two groups of workers however, are contrary to the main
body of opinion. In a group of 58 Indian men, McNeill et al. (1987) found that in
relation to the FFM, BMR was not constant with age, but in fact showed a small
but significant decline with increasing years. Similarly Dore et al. (1982) report
that in a group of obese women resting energy expenditure decreased with age even
after adjusting for differences in weight of the FFM.
Race
There is some evidence to suggest that variation in BMR between ethnic
groups may be explained by differences in FFM. Recently, Lawrence et a l (1988)
reported that differences in the BMRs of Scottish, Gambian and Thai women were
largely eliminated when differences in the FFM were taken into account; women
from all three countries with a similar FFM were found to have a similar BMR. In
this investigation however, FFM was estimated from skinfold thicknesses using the
equations of Dumin & Womersley (1974). A possible criticism of this approach is
that these prediction equations (derived from studies on Scottish subjects) may not
be applicable to Gambian and Thai women. Whether the lower BMR/kg body
weight of Indian subjects compared to their North European and North American
counterparts (Shetty, 1984; Schofield, 1985; McNeill et a l , 1987; Drummond,
1988) is also a consequence of differences in FFM relative to weight has yet to be
established.
1 3

O besity.
The majority of investigations which have examined the effect of body
fatness on metabolic rate have found no significant difference in the relation
between BMR and FFM in lean and obese subjects; individuals with the same FFM
have a similar BMR no matter what their body fat content (James et al., 1978;
Halliday et al., 1979; Dore et al., 1982; Ravussin et al., 1982; Garrow & Webster,
1985; Lawrences al, 1987; Weststrate, 1989).
For the most part, the above data would seem to suggest that much of the
variation in BMR between groups, of different age, sex, body fatness and race may
be largely explained by differences in FFM. On this basis, with some reservations
(see below), FFM may serve as a useful reference standard. It probably represents
a suitable 'normalisation' factor to allow comparison of metabolic rate between the
young and elderly, men and women, lean and obese and those of differing ethnic
origin.
In contrast however, differences in the mass of fat-free tissue appear to
explain comparatively little of the difference in BMR apparent within groups of
individuals.
Within-Group Variation in BMR.
Within a relatively homogeneous group, comparable in terms of age, sex,
race and body fatness, correlations between BMR and FFM are relatively low
(Bernstein et al., 1983; Lawrence et al., 1988). Rarely is FFM able to account for
more than about half of the total variance. Moreover, in such groups BMR is not,
in general, more highly correlated with FFM than it is with body weight (Bernstein
et a l, 1983; Lawrence et al.., 1988; Owen et al, 1986 & 1987). For example, in a
group of 60 male subjects Owen et al. (1987) report a correlation between BMR

and FFM estimated from skinfolds of 0.78, the correlation between BMR and body
weight was only marginally lower, 0.75. For the purposes of predicting of an
individual's BMR, the two variables are comparable. It has therefore been argued
the ease with which weight can be measured makes it preferable to FFM in the
estimation of BMR within a group.
Individual Variations in BMR in Relation to the FFM.
At a given FFM, BMR may vary considerably between individuals. The
literature reveals many examples of physically very similar individuals with widely
divergent basal or resting metabolic rates. Garrow (1985) cites the case of two
female students who had almost the same mass of fat free tissue (45.07kg and
43.56kg respectively) yet whose BMRs differed by some 35%. Similarly Durnin
(1988) found a standard deviation of about 10% in the BMR of a group of thirty
men selected to have a similar FFM. This implies that 15 % of the men at the lower
end of the range had BMRs which were about 450-500 kcal/day less than the
BMRs of the 15% at the top end of the range. Individual variations in BMR in
relation to the FFM of a similar order of magnitude are also indicated by the residual
standard deviations of regression equations of BMR against FFM. For instance,
Lawrence et al. (1988) correlated BMR with FFM for groups of women in three
countries, Scotland, The Gambia and Thailand, and found that the residual standard
deviations around the regression lines ranged from 95 kcal/day (7% of the mean) to
152 kcal/day (10% of the mean). Bogardus et al. (1986) reported a residual
standard deviation of 141 kcal/day for the equation they derived for predicting BMR
from FFM in North American Indians. It would seem that 500 kcals or more a day
may separate the BMRs of people with the same measured FFM.

Systematic Differences in BMR/kg FFM.
Lawrence et al. (1988) have observed that BMR/kg FFM is not constant
with weight but tends to be lower in heavier compared to lighter individuals. In
their study they report a 15% difference in BMR/kg FFM between women with a
FFM of 33kg compared to those with a FFM of 50kg. Miller & Blyth's data
(1953) also showed that BMR/kg FFM was not constant in individuals of different
body weight but declined as weight increased, although they did not specifically
comment on this. A recent investigation by Weststrate (1989) found that BMR/kg
FFM was significantly lower in the heavier men who took part in the study
compared to the lighter women (27.3 kcal/kg FFM/day and 30.0 kcal/kg FFM/day
respectively, p < 0.001). Observations on undergraduate students in our own
laboratory have also suggested that BMR/kg FFM is higher in women than in men.
Superficially this may seem at odds with the assertion that there are no differences
in the BMR of men and women once FFM has been taken into account. The two
findings are not however contradictory. Weststrate's results also confirmed that at
a given FFM men and women have a similar BMR. Since the difference in
BMR/kg FFM is not related to sex per se, it may simply be a reflection that
BMR/kg FFM is lower in those individuals with a relatively large FFM - men
compared to women. By the same reasoning the lower BMR/kg FFM found in
some obese subjects may be a consequence of a relatively enlarged FFM (Ravussin
et al., 1982; James, 1985; Weststrate, 1989).
As Lawrence et al. (1988) have pointed out, the variation observed in
BMR/kg FFM between light and heavy individuals has implications for the use of
FFM as a metabolic reference standard, in that it may not be appropriate to express
BMR 'per kg FFM'. In their own study they calculated that BMR was
approximately constant when divided by the square root of FFM (BMR/kg FFM0-5)
and suggest that as a standard of reference it might be more appropriate to use
FFM0-5 rather than FFM itself.
1 6

Clearly, simple differences in the mass of fat-free tissue between individuals
fall far short of explaining all the variation evident in BMR. It would appear that
several hundred kcal/day may separate individuals with the same FFM. Moreover,
BMR/kg FFM seems to show systematic changes with body weight. The
following sections are concerned with examining the causes of such variation. The
possible roles of intra-individual variation, erroneous estimates of FFM, differences
in the composition of the FFM and differences in metabolic activity of the tissues
will be discussed. For the sake of clarity they are considered separately, it is likely
however, that differences in BMR in relation to the FFM may result from a
combination of them all.
Intra-individual Variation.
A component of the large individual differences observed in BMR relative to
FFM is likely to arise from differences in basal metabolic rate within subjects -
intra-individual variation. Differences in the preceding day's energy intake, level of
exercise and - for women - the stage of the menstrual cycle are all suggested to
contribute to day to day or short-term fluctuations in BMR and therefore to intra
individual variation. A portion of within-subject variation is also likely to be
methodological, resulting from errors in measurement of energy expenditure.
Making repeat measurements of BMR in the same individual allows some
quantification of the extent of intra-individual differences and of their potential
contribution to between-subject variation. The results of some of the studies which
have made an attempt at this are summarised in Table 1.1. The conditions under
which the investigations were performed differed markedly. In some cases
antecedent diet and exercise were extremely carefully controlled to look, for
example, at the effect of the menstrual cycle on BMR. In others, subjects could be
described as ’free-living1 with no fixed dietary or exercise regimes. Methods of
measuring BMR also varied, and included the Douglas bag technique, ventilated

Table 1.1
Studies which have investigated intra-individual differences in BMR.
Reference n Sex CV
(%)
Apparatus Conditions:Diet&Activity
Berkson & Boothby 10 F 4.7 Douglas bag Controlled(1938)Mahedeva etal.
232
M?
3.57.5 Douglas bag Unspecified
(1953)Jequier & Schultz 14 7 2 .0 Calorimeter Controlled(1981)Soloman et al. 6 F 9.0 Douglas bag Controlled(1982) Garby et al. 8 M 4.3 Douglas bag Habitual(1984)Garby & Lammert 23 M 3.4 Douglas bag No control(1984)Soares & Shetty 5 M 3.2 H.B. No control(1986)Ravussin et al. 12 M 6 .0
MetabolatorVentilated No control
(1986)Bogardus et al. 26
F7 4.0
HoodVentilated No control
(1986)Murgatroyd et al. 4 M 6 .0
HoodCalorimeter Strict control
(1987) Bisdee et al. 8 F 6.4 Calorimeter Strict control(1989)Weststrate 49 M 6 .0 Ventilated No control(1989) 54 F 6 .0 Hood
CV, coefficient of intra-individual variation

hood system and respiratory chamber. Coefficients of intra-individual variation in
BMR ranged from about 3% up to 6 % or 7%. The estimated 'method-free'
variation (total variance less that estimated to be attributable to measurement error)
from about 2% to 6 % (not shown in Table 1.1). There appears to be no clear cut
distinction in the extent of variation between those studies where conditions were
carefully controlled and those in which regimes were much less strict. In general
the results suggest that intra-individual variation in BMR is smaller than the large
inter-individual differences that have been reported. The indications are therefore,
that a significant proportion of variation observed in BMR relative to the FFM is the
result of genuine differences between individuals.
Error in measurement of the FFM.
It is also possible however, that a component of the variation observed in
BMR relative to FFM will be the result of errors in measurement of FFM; under- or
over-estimation of fat-free tissue will necessarily introduce a degree of variation
with methodological rather than biological cause. Erroneous estimates of FFM
could result from experimental error, for example not measuring a skinfold at
exactly the correct sight, but will also arise if the fundamental assumptions upon
which the techniques are based - for skinfolds that the ratio of subcutaneous to
internal fat is relatively constant, for density, that the density of the FFM is 1100
kg/m-3, and so on - are violated. Analysis by Womersely & Durnin (1977)
suggests that both densitometry and the skinfold technique are associated with
errors of around ±2% - 3% body weight. Errors of this magnitude are perhaps
unlikely to account for a large proportion of variation in BMR relative to the FFM.
No attempt however, seems to have been made to quantify their contribution more
exactly.

Composition of the FFM.
The FFM is very much heterogeneous in composition. By definition it
comprises all the 'non-fat' tissues and fluids in the body and therefore includes
tissues as structually and functionally diverse as the visceral organs, muscle, bone,
blood and connective tissue. The metabolic rates of the various components of the
FFM differ widely (see Table 1.2). The viscera, notably the liver, kidneys and the
heart and brain have very high energy requirements. It has been estimated that the
metabolism of these four organs alone, accounts for around 60% of resting oxygen
consumption yet they represent only about 6 % of the FFM in terms of weight
(Brokek & Grande, 1955). Skeletal muscle on the other hand, making up about
half the weight of the FFM, has a relatively low metabolic rate at rest and
contributes less than 25% to basal metabolism (Table 1.2). The picture is one of a
small mass of organs with high energy requirements under resting conditions, and
a much greater mass with a relatively low metabolic rate, mainly constituted by
bone and skeletal musculature (Brozek & Grande, 1955).
The heterogeneity of the FFM in terms of the metabolic rates of its
components seems to have been lost sight of by some investigators. Conceptually
there is tendency to regard the fat-free body as comprising of a mass of uniformly
active tissues. Clearly this is erroneous. Yet the temptation to extrapolate the
chemical division of fat and FFM into an all encompassing functional one has been
too great for some. Clearly the amount of active tissue in the body will influence
BMR. To view this however, solely in terms of fat compared to fat-free tissue is
restrictive. FFM may well provide a useful metabolic reference standard but to gain
a greater understanding of the nature of variation that exists in BMR it may be
necessary to look at the relative amounts of 'active' and 'inactive' tissue within the
FFM.
2 0

Table 1.2
Contribution of organ and tissue metabolic rates to BMR in man.*
Organ Weight BMR kcal/day % of whole body
BMR
Liver 1.60 482 27
Brain 1.40 338 19
Heart 0.32 122 7
Kidney 0.29 187 10
Muscle 30.00 324 18
Remainder by 19
difference
Total 70.00 1800
* 70 kg adult male
Adapted from table complied by Dumin, FAO/WHO/UNU (1985)

Possible Influence of Differences in Composition of the FFM on
BMR.
Clearly, since FFM is made up of tissues of very different metabolic rates
differences in the relative proportions of 'active' compared to 'inactive' tissues
could produce differences in the average metabolic rate of the FFM. It is therefore
conceivable that some of the differences observed in BMR are a result of
differences in the composition of the FFM. Lawrence et al, (1988) have suggested
that systematic differences in the composition of the FFM may provide an
explanation for the finding that BMR/kg FFM tends to be lower in heavier
compared to lighter individuals. The observed decrease in BMR/kg FFM with
increasing weight could feasibly be produced if, as weight increases, the proportion
of the FFM occupied by metabolically active organs declined and concurrently the
proportion of relatively inactive tissue such as muscle increased.
In individuals who are heavy because they are obese it has been suggested
that their relatively enlarged FFM contains a greater proportion of muscle than that
of their lighter counterparts - presumably occasioned by the greater physical effort
required in moving the obese body around (James, 1985; Dumin, 1988). If this is
the case it could provide at least part of the explanation for the low BMR/kg FFM
found in some obese subjects (Ravussin et al., 1982; James, 1985; Weststrate,
1989). Similarly, Weststrate's (1989) finding that BMR/kg FFM is lower in
heavier men compared to lighter women could result from a greater proportion of
muscle making up the larger FFM of men.
The potential importance of differences in the contribution of muscle in
determining BMR per kg of lean tissue is illustrated by the high value for BMR/kg
in patients who have undergone substantial weight loss in illness where preferential
muscle wasting is common (Roza & Shizgal, 1984). Similarly, Montgomery
(1963) suggested that the high BMR in children recovering from protein-energy
2 2

malnutrition (PEM) may be partially due to the relatively large proportion of internal
organs compared to muscle making up the FFM.
The finding by Dore et al (1982) and McNeill et al (1987) that in relation
to the FFM, BMR is not constant with age could also result from differences in the
composition of the FFM. Cohn et a l (1980) have suggested that the muscular
component of the FFM is preferentially reduced in the ageing process. Differential
rates of atrophy of the components of the fat free tissue could produce changes in
the composition of the FFM and consequently in BMR in relation to FFM.
Differences in BMR of individuals with a similar mass of fat free tissue
might also result from differences in the proportions of active and inactive tissue
making up the FFM.
The above hypotheses are based on the premise that the composition of the
FFM in healthy adults is variable. In first making the case for the utility of FFM as
a metabolic reference standard, Miller and Blyth (1950) suggested that the FFM
"should be relatively constant in composition and incorporate, as a constant
fraction, the 'active tissue masses'". Most common techniques for estimating body
fat and FFM, including densitometry, whole body counting and total body water
measurement, also rely on the assumption that the composition of the FFM does
not alter between individuals. It therefore becomes necessary to ask the question,
does the composition of the FFM vary, and if so does it vary in such a way as to
explain some of the differences observed in BMR ?
Is the Composition of the FFM[ Constant ?
Direct evidence from cadaver analysis is extremely scarce. The literature
reveals only four reliable adult human dissections for which the composition of the
FFM is known (Mitchell et a l, 1945; Forbes et a l, 1953, 1956). Nevertheless
even such limited data shows quite clearly that the relative proportions of the tissues
and organs making up the FFM are far from fixed (Table 1.3).
23

Table 1.3
Variations in the proportions of the organs and tissues occupying the FFM.
% of FFM
Range CV (%)
Muscle 34.9% - 50.6% 15.9%
Bone 14.1% - 16.4% 6.7%
Liver 2.9% - 3.9% 12 .1%
Kidneys 0.58% - 0.72% 9.8%
Heart 0.65% - 0.89% 13.0%
CV, coefficient of variation.
Complied from data of Mitchell et al .(1945) & Forbes et al .(1953), (1956)

Although the values for the heart should be viewed with some caution since
three of the four men died of cardiovascular related illness there is no reason to
suppose that the proportions of the other tissues and organs were abnormal. In
these four men the muscular component of the FFM would seem particularly
variable.
In 1984 Clarys, Martin & Drinkwater (the Brussels study) shed further light
on the variability of the lean compartment of the human body with the dissection
and analysis of a further twenty-five cadavers (thirteen females and twelve males).
The Brussels study did not include fat determinations and therefore provides no
direct information on the composition of the FFM. They considered instead
however, the adipose tissue-free mass (ATFM) which consists of body mass less
all dissectible adipose tissue (analogous to the LBM). While the composition of the
ATFM and FFM are not identical, compositional changes in one will clearly be
reflected in the other. Again, variability in the relative proportions of muscle and
bone between individuals was very much in evidence (Table 1.4)
The cadavers analysed in the Brussels study were elderly (mean age, 76
years) and this may have some bearing on the variability of ATFM. The high
coefficient of variation of bone in the female subjects (16.8%) may reflect
differential degrees of osteoporosis; a relatively common condition which affects
women primarily after the menopause. It is possible that in a younger population
the variation in the proportion of bone may not have been so pronounced.
However, this does suggest that ageing may have an important effect on the
composition of the FFM and potentially therefore on BMR in relation to the FFM.
Clarys & Martin (1985) also present data from twelve 19th century
dissections (three female, nine male) for which gross tissue weights were reported
and hence the composition of the ATFM known. Muscle was found to range from
33.1% to 54.0% of the ATFM (CV 11.5%), bone from 19.4% to 23.0% (CV
6 .2%).
25

Table 1.4
Variations in the proportion of muscle and bone occupying the adipose tissue-free
mass (ATFM) of the Brussels study cadavers.*
% of ATFM
Range CV(%)
Female cadavers muscle, 41.9% -54.8% 10 .0 %
bone, 17.4% - 25.7% 16.8%
Male cadavers muscle, 45.3% - 59.4% 8.3%
bone, 16.3% - 24.8% 12.0 %
Overall range muscle, 41.9% -59.4% 8 .8 %
bone, 16.3% - 25.7% 12 .6 %
CV, coefficient of variation
* Clarys, Martin & Drinkwater (1984).
2 6

When all the above data are combined the coefficient of variations for the
components of the ATFM are as follows:
Muscle, female 8.3%
male 11 .6 %
Bone, female 11.7%
male 10 .0 %
Clarys et al. (1985) suggest that variability in the proportion of muscle and
bone is likely to be even greater. They echo Bakker and Struikenkamp's (1977)
comment that the amount of direct cadaver data available can "merely suggest an
order of magnitude for the inter-individual variation that may be expected".
Further reports in the literature regarding the extent of the variability in the
proportions of bone and muscle making up the FFM are essentially limited to
indirect measurements. Again these suggest that variation is large - further analysis
of some data presented by Bisdee et al. (1989) suggested that the percentage of the
FFM occupied by muscle in women (estimated by creatinine excretion) ranged from
33% to 63% - these will however, obviously include a component related to errors
in estimation.
The above, allbeit limited data, suggests that bone may account for between
about 14% to 26% of the FFM and muscle from 30% to 60%.
Blehnke (1958) reports that the coefficient of variation for the weights of
organs such as the liver, heart and kidneys is usually in the range 10% to 14%.
Greenwood & Brown (1913) suggest that the viscera are even more variable than
this, reporting coefficients of variation for liver, kidney and heart weight of some
20%. Data on organ weight in relation to the FFM however, is extremely sparse
and essentially seems to be limited to the four cadavers discussed above (Mitchell et
21

al.. 1945; Forbes et al., 1953, 1956). These would suggest that organ size does
vary in relation to the FFM, perhaps by around 10%.
Some evidence for systematic variations in the composition of the
FFM:
As discussed above, Lawrence et al. (1988) have proposed that the
differences they observed in BMR/kg FFM between light and heavy individuals
may result form systematic differences in the composition of the FFM; a decline in
'active' tissue and a concurrent increase in 'inactive' tissue. Further analysis of the
cadaver data presented by Clarys et al. (1985) provided the opportunity to
investigate the possibility that the muscle and bone content of the ATFM, might
vary in a systematic way.
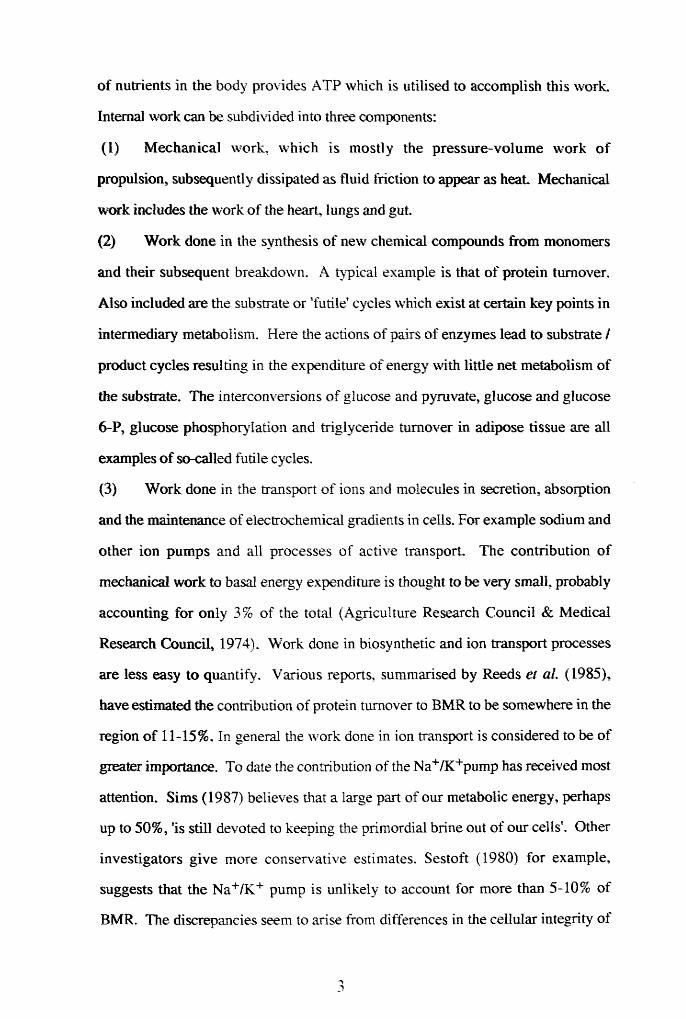
Figure 1.1 A clearly shows that as ATFM increased so too did the
proportion of muscle it contained (r = 0.76, p < 0.001, n = 25) lending some
support to Lawrence et al's suggestion that individuals with a large FFM are more
muscular. However, in an elderly population such as this, the tendency may be
exaggerated, since muscle lost as part of the ageing process (Forbes & Reina,
1970; Tzankoff & Norris, 1978; Cohn et al., 1980) is likely to result in a reduction
in the fat-free or adipose tissue-free mass. The male cadavers generally had larger
ATFMs than the females and therefore proportionately more muscle. This may go
someway to explaining the lower BMR/kg FFM Weststrate (1989) reported in
males compared to females. However, the regression analysis revealed that once
differences in ATFM had been taken into account sex had no influence on the
percentage of muscle. In other words, the single regression line shown described
the relationship between ATFM and percentage muscle in both males and females.
This implies that at a given ATFM men and women had the same amount of
muscle. Intuitively one might have expected men to have more, but no adequate
data exist against which to compare this observation. It should perhaps be
28
Bone
%
of AT
FM
61-,594
574
55-h
t i i r 1------1 i
26-,
25 H
23 H
22 A
21 A
20 A19 H
18 H
17 4
16-1T
ATFM (kg)
Figure 1.1S c a t t e rp lo t s r e l a t i n g the percentages of muscle and bone in the adipose t i s s u e - f r e e mass (ATFM) of the Brussels study* cadavers with ATFM.* Clarys e t a l . (1984)

remembered that the advanced ages of the cadavers may have some bearing on this
and also the numbers involved are relatively small.
In contrast to muscle, the skeleton was found to form proportionately less
of the ATFM as ATFM increased (r = - 0.65, p < 0.001, n = 25) (See Figure
1.1B). Once again however, the relationship did not differ between males and
females. Since both muscle and bone have relatively low metabolisms these
changes may tend to offset one another other with respect to average metabolic rate
of the FFM.
The literature does not appear to contain any data regarding the possibility
that organ size may vary in a systematic way with FFM in man. Some early data
from a study by Greenwood and Brown (1913) however, suggests that in relation
to body weight at least, the viscera account for a proportionately smaller fraction in
heavy compared to light individuals. Greenwood and Brown recorded body mass
and liver, kidney, heart and brain weight in seventy nine male cadavers between the
ages of twenty-five and fifty-five years. In general the men were in good health
before death, in most cases due to accident, and body composition would therefore
be expected to be relatively normal. Further analysis of the data presented by these
workers reveals a clear decline in the proportion of body weight occupied by the
four organs as weight increases (r = - 0.74, p < 0.001) (Figure 1.2). However,
since no fat determinations were included in Greenwood and Brown's study the
possibility that changes in organ size relative to body weight were a reflection of
concomitant changes in percentage fat cannot be ruled out. Indeed in cattle,
Kraybill et a l (1954) have established that heart, liver and kidney weight increase
in direct proportion to lean body mass.
Ho et al. (1980) investigated the relationship between brain and body
weight in 1,261 adult cadavers. They found a positive relationship between the
two. However, proportionately brain weight made up a smaller fraction of total
body mass as weight increased. Again, increases in weight may reflect increases in
30

ocr>
_ o r~ 00
Mf. •c . I
• • • • •
* /*•:•
/00 CD
(q.y6 i0M Apoq J.0 %) SU B 6J0 t7 J.0 J1J6I0M
o
oCD
oLT\
Ocr
Body
w
eigh
t (k
g)
Figu
re
1.2
Scat
terp
lot
rela
ting
or
gan
wei
ght
(hea
rt/
live
r/
kidn
ey
& br
ain)
to
body
w
eigh
t In
the
Gree
nwoo
d s
Brow
n (1
913)
ca
dave
rs.

body fatness, and the relative decrease in brain weight can not necessarily be
construed to mean that the brain forms a smaller proportion of the lean part of the
body. Dekaban and Sadowsky (1978) have also looked at the relationship between
brain size and body weight. Their data, derived from almost 5000 cadavers, seems
to show that for both males and females up until about 55 years the ratio of brain
weight to body weight decreases very slightly but has a tendency toward lower
values thereafter.
METABOLIC ACTIVITY OF THE TISSUES.
It has been proposed that in addition to depending on the mass and relative
proportions of the various organs and tissues in the body, BMR has a second major
component relating to the metabolic activity of the tissues, to the rate of energy
utilisation by the basic energy demanding processes at cellular level (James,
Dauncey & Davis, 1979). Differences in this component will be manifest in
differences in metabolic rate per unit weight of tissue. The idea that BMR is, in
part, dependant on the metabolic activity of the tissue stems largely from
observations of the apparant metabolic changes which accompany under- or over
feeding. A fall in BMR is an early response to energy shortage (Keys et a l , 1950;
Ferro-Luzzi et a l, 1990). The decline precedes any measureable change in body
weight and this has been taken to indicate that in response to the energy deficit a
change in the rate of cellular thermogenesis has occured; the metabolic activity of
the tissues has declined (Shetty et a l, 1979). Moreover, as energy restriction
proceeds and weight is lost, a decline in BMR has been reported which exceeds that
predicted from loss of lean tissue alone (eg. Keys et a l, 1950; James et al, 1978;
Bessard et a l, 1983; Barrows & Snook, 1987). Whilst it is possible that this
observation and the initial fall in BMR may to some extent reflect a change in the
composition of the FFM, for example a more rapid loss of metabolically active

tissue, it is generally accepted that some degree of metabolic adaptation does occur
in response to energy restriction (James, 1987). Much more controversially, it has
also been suggested that an alteration in the metabolic activity of the tissues takes
place with over-feeding, whereby energy expenditure increases over and above that
predicted from the increased tissue mass to promote the dissipation of excess
calories (Sims etal., 1976; Schutz etal., 1982).
The metabolic activity of the tissues is to some extent thought to be under
hormonal control. Both thyroid hormones and catecholamines have been implicated
in the regulation of cellular thermogenesis.
Certainly, there can be little doubt that thyroid status affects metabolic rate.
A classical symptom of hyperthyroidism is of course an elevated BMR, in
hypothyroidism the converse is true and BMR is depressed. Until relatively
recently in fact, measurement of basal oxygen consumption was an integral part of
the diagnosis of thyroid disease. 3,5,3’-triiodothyronine (T3 ), mainly produced by
peripheral deiodination of thyroxine (T4 ), (the inter-relationships between the
thyroid hormones are shown in Figure 1.3) is the most biologically active of the
thyroid hormones and is known to be a thermogenic agent (Himmus-Hagen, 1983;
Danforth & Burger, 1984; Gelfand et al., 1987). The decline in BMR which
accompanies energy restriction is associated with a fall in the serum concentration
of T3 and an increase in its inactive analogue, reverse 3,3',5-triiodothyronine
(rT3 ), thyroxine levels show little change (Bray, 1969; Vagenakis et al., 1977;
Jung et al., 1978; O'Dea et al., 1982; Acheson & Burger, 1980 & Mathieson et al.,
1986; Mansell & Macdonald, 1988). Consequently, it has been suggested that the
decline in BMR evident in semi-starvation may be mediated by the reduction in T3
levels. This is supported by the observation that physiological doses of exogenous
T3 are able to prevent the fall (Bray et al., 1973; Shetty et al., 1979; Rozen et al.,
1986). The role for T3 in the regulation of metabolic rate is not entirely clear cut
however. For example Acheson and Burger (1980) induced a fall in T3 in
3 3

Thyroid gland
Thyroxine
PERIPHERAL DEIODINATION
In ac t iv a t io n Activation
rT3
3,3* ^'-Triiodothyronine J^^'-Triiodothyronine
Figure 1 .3Thyroid hormone production and metabolism.
34

euthyroid subjects by administration of iopanoic acid which partially blocks the
conversion of T4 to T3 but failed to observe a fall in metabolic rate. Similarly
Serog et al. (1982) produced changes in T3 levels by manipulation of carbohydrate
intake in a group of nine subjects but report no significant change in oxygen
consumption. Despite a decline in T3 levels, Shetty et al. (1979) were able to
prevent RMR falling on semi-starvation by administration of the catecholamine
precursor, levodopa.
As alluded to earlier, catecholamines are also thought to play a regulatory
role in cellular thermogenesis. Much research effort has been directed at the ability
of catecholamines to produce an increase in metabolic rate. There is little doubt that
catecholamines are thermogenic. Numerous studies in animals and now also in
man have shown that acute or long-term administration of adrenaline, noradrenaline
or adrenergic agonists produce an increase in metabolic rate (Steinberg et al., 1964;
Havel et al., 1964; Sjostrum et al., 1983; Scheidegger et al., 1984; Fellows et al.,
1985; Staten et al., 1987; Connacher, 1988). Increased sympathetic nervous
system activity is also associated with an elevated metabolism (Engelmen et al.,
1964; Welle et al., 1980; Landsberg & Young, 1983). As a consequence of their
calorigenic action, catecholamines have been implicated in the thermic response to
cold exposure and to food, although their role in the latter is not without contention
(for review see Landsberg & Young, 1983). Like T3 , levels of plasma or urinary
noradrenaline, and so by implication sympathetic nervous system activity, have
been found by most investigators to fall on energy restriction in association with the
decline in BMR (Shetty et al., 1979; DeHaven et al., 1980; O'Dea et al., 1982;
Sowers et al., 1982). The exception being a study by Mansell & MacDonald
(1988), which reported considerable metabolic adaptation to underfeeding but could
find no evidence that these changes were associated with a decrease in sympathetic
nervous system activity. Urinary excretion of 4-hydroxy-3-methoxy mandelic acid
(HMMA), the principle metabolite of catecholamines and indicative of the rate of
3 5

catecholamine turnover, has also been found to be reduced in conditions of energy
deprivation (Jung et al., 1979 & 1980; Shetty et al., 1979). Moreover,
administration of the catecholamine precursor, levodopa can prevent the decline in
BMR associated with semi-starvation (Shetty et al., 1979). This would certainly
suggest a role for the catecholamines in the determination of BMR. Further
evidence for their involvement was provided by Jung and colleagues in 1980.
These workers found that administration of the 6 -adrenergic antagonist,
propranolol, to obese subjects on a weight maintenance diet resulted in a significant
reduction in BMR. This suggested to Jung and co-workers that BMR has a
component which is adrenergically mediated. Scheidegger et al. (1984) also found
a reduction in resting energy expenditure with acute propranolol administration.
However, several groups have reported that acute 8 -adrenergic blockade with
propranolol has no effect on BMR (Acheson et al., 1983; Welle & Campbell, 1983;
Defronzo et al., 1984; Seaton et al., 1984; Vemet et al. 1987; Gelfand et al., 1987).
It is suggested that T3 and noradrenaline probably interact to influence
metabolic rate. At least part of the thermogenic effect of the catecholamines is
thought to be due to their ability to increase circulating levels of T3 by stimulating
the peripheral conversion of thyroxine to T3 (Galton, 1965; Rothwell et al., 1982;
Scheidegger et al., 1984). Propranolol reduces this conversion and results in a
decline in T3 concentrations (Lotti et al., 1977; Eisenstein et al., 1978; Jung et al.,
1980; Jones et al., 1981). However, it is likely that noradrenaline also has a direct
action on a thermogenic mechanism. The results of Shetty et al.'s study (1980)
suggests that a major action of propranolol in lowering RMR occured by direct
inhibition of an energy requiring mechanism normally responsive to catecholamines
rather than by its effects on peripheral thyroid metabolism. Catecholamines and
thyroid hormones are also known to interact at cellular level, where T3 may
modulate a thermogenic action of noradrenaline most probably through regulation
of the catecholamine stimulated adenylate cyclase - cAMP system (see below).
36

The precise mechanisms by which thyroid hormones and catecholamines
may regulate metabolic rate are not entirely understood. Presumably they must act
on one or more of the energy requiring processes at cellular or molecular level.
Alterations in the rate of protein turnover, substrate cycling and ionic pumping have
all been implicated. Certainly, all the above systems are sensitive to thyroid
hormones. Changes in the activity of the Na+/K+ pump in response to alterations
in thyroid status have been particularly well documented. An increase in thyroid
hormone produces an increase in both Na+/K+ pump number and activity in a
variety of tissues including skeletal muscle, liver and kidney (Edelman & Ismail-
Beigi, 1974; Clausen, 1986; Simmons et al., 1986; Everts & Clausen, 1988).
Thyroid hormones have also been shown to increase the rate of membrane
Ca+pumping, at least in skeletal muscle (Everts et al., 1989). Both protein
turnover (Brown & Millward, 1980) and some substrate - ’futile' - cycles increase
in association with increased level s of thyroid hormones (Sestoft, 1980; Shulman et
al., 1985). The triglyceride-fatty acid cycle for example, is accelerated in several
different tissues taken from hyperthyroid animals (Sestoft, 1980) and Shulman et
al. (1985) have demonstrated that substrate cycling between glucose and glucose-6-
phosphate and between fructose-6 -phosphate and fructose-1 ,6 -diphosphate is
decreased in hypothyroidism and elevated in hyperthyroidism compared to the
euthyroid state.
Another potential site of metabolic regulation by thyroid hormones is at the
level of the mitochondria themselves. An increase in thyroid status is thought to
bring about a change in the properties of the mitochondria such that their rate of
respiration increases even though they remain in a coupled state (Himmus-Hagen,
1983; Brand & Murphy, 1987; Dauncey, 1990). This may be brought about
through a thyroid induced change in membrane fatty acid or polypeptide
composition or by a direct interaction of T3 with receptors in the mitochondria
(Himmus-Hagen, 1983; Brand & Murphy, 1987). In addition, thyroid hormones
3 7

are also reported to increase total mitochondrial mass and thereby increase oxygen
consumption, although the way in which mitochondrial proliferation is brought
about is not clear (Himmus-Hagen, 1983; Brand & Murphy, 1987).
Like thyroid hormones, catecholamines are also known to influence
substrate cycling (Newsholme, 1985) and have a direct action on the Na+/K+pump
(Phillis & Wu, 1981; Himmus-Hagen, 1983; Clausen, 1986). In addition, it has
been suggested that at least part of the calorigenic effects of the catecholamines are
linked to their lipolytic actions. The catecholamines are potent lipolytic agents,
activating the principle lipolytic enzyme - hormone-sensitive lipase - via interaction
with 8-1 adrenergic receptors and stimulation of the adenylate cyclase - cAMP
system, and thereby inducing a prompt rise in plasma free fatty acids (FFA). As
circulating FFA levels rise, fatty acid uptake and oxidation by the tissues are
increased since these events in part depend on blood levels (Eisenstein & Singh,
1980). Increased rates of FFA mobilisation and oxidition have been shown by
several investigators to be associated with an increase in metabolic rate (Havel et
al., 1964; Steinberg et al., 1964; Englemen et al., 1964; Jung et al., 1981;
Scheidegger et al., 1984). However, Havel et al. (1964) observed that reducing
levels of FFA by injections of nicotinic acid produced no change in BMR, which
casts some doubt on the importance of FFA availability in determination of
metabolic rate under ordinary resting conditions. Moreover, in starvation lipolysis
is increased (Engfeldt et al., 1982) and yet BMR declines. Thyroid hormones are
known to modulate the adenylate cyclase - cAMP system at several different sites -
including alteration of B-receptor numbers, augmentation of receptor coupling to the
adenylate cyclase system and direct modulation of the activity of regulatory and
catalytic components of the cyclase - and thereby have the potential to influence
catecholamine stimulated lipolysis and FFA oxidation - and indeed other adrenergic
effects mediated through this system (Williams et al., 1977; Tsai et al., 1978; Jung
et al., 1979; Kunos, 1981; Malbon & Greenberg, 1982; Lansberg & Young, 1983;
3 8

Lefkowitz et al., 1984). Allied to this, is the observation of accelerated FFA
turnover in hyperthyroidism and a reduced rate in hypothyroidism (Hagenfeldt et
al., 1981; Kunos, 1981).
At the present time there is little evidence in man that either thyroid
hormones or catecholamines can regulate energy expenditure by altering the
efficiency of mitochondrial oxidative phosporylation, so called uncoupling
(Danforth & Burger, 1984; Dauncey, 1990).
Assuming that BMR is to some extent dependant on metabolic activity at
celluar level, and the evidence presented above would seem to point to this,
differences in this component between individuals represent a potential source of
variation in BMR. The extent to which subtle differences in the control of celluar
thermogenesis are able to explain differences in BMR at a given FFM however,
does not appear to have been investigated.
Bogardus et al. (1986) found that in Pima Indians 11% of the variance in
RMR, independent of the effects of FFM, sex and age, could be attributed to family
membership. The cause of these familial differences was not elucidated, but
Bogardus and co-workers suggest that they may relate to differences in the
efficiency of energy requiring processes between families. The possibilities
suggested include variation in the activities of the sympathetic nervous system,
cellular pumping of Na+ and K+, rates of protein turnover and gluconeogenesis.
Since the metabolic activity of the tissues is thought to be under hormonal
control it seems reasonable to postulate that some of the differences in BMR in
relation to the FFM may be related to differences in the levels of thermogenic
hormones between individuals or in tissue responsiveness to them.
Data regarding the effect on BMR of differences in thyroid status between
normal, clinically euthyroid, individuals is extremely scanty. However, for the
most part, the limited reports that are available do seem to indicate that variation in
thyroid hormone levels within the normal physiological range may play a part in
39

explaining differences in BMR between individuals. Bernstein et al. (1983)
measured free T3 (FT3) levels in a group of 154 women and observed a weak but
significant positive correlation (r = 0.2, p < 0.05) between this index and resting
metabolic rate. MacRitchie (1988) found a similar relationship between BMR and
both serum T3 and T4 in a small group of euthyroid control subjects. BMR was
expressed as the % deviation from standard values predicted using the Mayo Clinic
equations (Boothby, Berkson & Dunn, 1936); the greater the positive deviation
between the actual and predicted BMR, the greater the serum T3 or T4 concentration
(r = 0.47, p < 0.01 & r = 0.5, p < 0.01 respectively). This study is particularly
interesting in that by expressing the results in relation to values predicted on the
basis of surface area some degree of 'normalisation' for body size was achieved. In
this group then, there is an indication that at a given body size the higher the T3 or
T4 levels, the higher the BMR. Danforth (1983) reports a positive correlation (r =
0.59, p < 0.01) between free T3 serum concentrations and the number of calories
per kg FFM required a day for 16 subjects to maintain weight during a three week
stay in a metabolic unit. Since under the circumstances imposed on the metabolic
ward BMR is likely to make up the largest proportion of daily energy expenditure it
may well be that the correlation is also illustrative of the relationship between T3
and BMR/kg FFM. If this is indeed the case, it would seem to suggest that high
levels of T3 are associated with a high BMR/kg FFM. In a group of patients
following a 1000 kcal/day diet Moore et al. (1980) observed that the patients who
lost the most weight were, not surprisingly, those who had the highest RMRs, but
that these individuals also had the highest T3 levels. They took this to imply that in
these patients T3 had a role in the regulation of RMR.
Data regarding differences in sympathetic nervous system activity and
catecholamine levels between individuals and the part they might play in explaining
some of the variability in BMR is even more scanty. Weststrate (1989) observed
that high BMRs/kg FFM were associated with high rates of fatty acid oxidation.
40

Since fatty acid oxidation is enhanced by increased catecholamine levels he suggests
that this may reflect a greater degree of sympathetic activity in these individuals and
provide a possible explanation for the high BMR/kg FFM.
AIMS
The studies presented in this thesis sought to examine some of the causes
of variation in basal metabolic rate. The respective roles of differences in body
composition and hormonally mediated metabolic activity were explored.

CHAPTER 2
GENERAL METHODOLOGY
■■a:; cyh-i:. a -a^y s ' r d k i - r * O d (
■ . • ••yx N^aKi'Ov; H><a 'i-'saa? ih;> :a n v-'a;U 0 s ;U5
• ; h ^ ; - ’ a i ' :"' ' 7 :V" f ' - o - ^ r - - - V ' : . - ./< ■'.??'?■•"•-'31
• a - ' - . i . " a ' A;-';5.. A ;. x . A ..A A'J*.: : -X r . x A ■ ■ a : a -. w'. *,a- >r: ' ■ -X
a ; : j k' a : ; / x 'X .-v A; . x'aaAX- : ^x ; ■ vvx.s Ci'ScC
ly ;t; ; * v,-* ‘ ' 'y - >■ - ' - u '
‘ ;■ A X t X - A X . x ;V: , v r. ...v> . . . . , y ; X X , : A / ■_■-A ; : •
• yviia-a y.;x- y-cy ;r--:.;-,ii' >\ a a ax ■• ..:-:r.:: .xaa
4 2

MEASUREMENT OF BODY COMPOSITION.
All measurements were made by one observer, the author. They were all
performed during the morning when the subjects were in a fasted state.
Body Weight.
Weight was recorded using an Avery beam balance (model no. 3302). The
subjects were clothed only in underwear, a swim suit or a light dressing gown (the
weight of which was subsequently deducted) and were weighed after emptying
their bladders. Readings were taken to the nearest 0.1 kg. The weighing scales
were calibrated frequently.
H eight.
Height was measured using a wall stadiometer (Holtain Ltd. Grymych,
Dyfed, UK). Each subject stood (without shoes) on the horizontal platform of the
stadiometer, with heels together and arms by their side, stretching upward to their
fullest extent. The subject's back was as straight as possible against the vertical
bar and the so-called Frankfort plane (Weiner & Lourie, 1981) was checked to be
horizontal. The subjects were asked to breathe in deeply to make them stretch up,
and the head-bar brought down gently on to the head. The subject's heels were
always watched to make sure they remained on the floor. Readings were taken to
the nearest mm.
Circum ferences.
Measurement of circumferences in various parts of the body give an
indication of muscle mass. All circumference measurements were made using a
4 3

flexible steel tape (Harpenden Anthropometry tape (2m) Holtain Ltd. Grymych,
Dyfed, UK). The tape was placed firmly around the position of measurement and
the reading was recorded to the nearest mm.
1. Upper Arm: - the subjects arm hung relaxed, just away from their side. The
circumference was measured horizontally at the same level as the triceps skinfold
thickness (see below).
2. Calf: - the subject sat on the table with their legs hanging freely and the back of
the knee touching the table. By moving the tape up and down the leg the
maximum horizontal circumference was located and measured.
3. Buttocks: - the maximum circumference over the buttocks was measured with
the subject standing with their feet together.
4. Thigh: - the subject stood with their feet slightly apart and with their weight
distributed evenly on both feet. The measurement was taken with the tape placed
around the thigh horizontally with its top edge just under the gluteal fold.
5. Waist: - this was measured midway between the lower rib margin and the iliac
crest. The subjects were asked to breathe out gently at the time of the
measurement to prevent them from contracting their muscles or holding their
breath.
Bone Diameters.
Bone diameter measures may give some indication of 'frame size1. Wrist
and knee breadths were measured using a sliding caliper (Holtain Ltd., Grymych,
Dyfed, UK.). Biacromial and bi-iliac diameter measurements were made using a
44

long arm anthropometer (Holtain Ltd., Grymych, Dyfed, UK.). In all cases
pressure was exerted to compress the tissues overlying the bone. Measurements
were recorded to the nearest mm.
1. Ulna or wrist breadth: - the breadth was taken across the styloid processes
(oblique to the long axis of the arm).
2. Bicondvlar femur or knee breadth: - the subject sat on a table with knees bent to
a right angle, and the width across the outermost parts of the lower end of the
femur was measured.
3. Biacromial diameter: - to give maximum shoulder width the subject stood with
their shoulders relaxed. Standing behind the subject, the outside edges of the
acromion processes were located which could be felt as ridges just above the
shoulder joints. The two arms of the anthropometer were then placed along the
lateral boarders of the acromion processes and the measurement taken.
4. Bi-iliac diameter: - the subject stood with their heels together and the
anthropometer arms were brought into contact with the iliac crests which gave the
maximum diameter. Strong pressure was applied to the anthropometer blades to
push aside any fat covering the bone. This measurement was taken standing
behind the subject.
Methods of Measuring Body Fat Content:
All the methods which will be described for estimating body fat content
rely on one or more assumptions, usually with regard to the constancy of
composition of the FFM. As already discussed the contention that the FFM is of
constant composition is not entirely justified. However, the validity and
4 5

consequences of these suppositions will not be discussed in great depth here,
when describing the techniques, but rather in a subsequent chapter in the light of
the results the various methods yielded.
(1) Densitometry.
The basic assumption made when estimating body fat by densitometry is
that the body consists of two compartments, fat and FFM, which have distinctly
different and constant densities. At body temperature FFM has been estimated to
have an average density of about 1100 kg.m-3 (Behnke et al, 1942), while fat
(lipid) has a significantly lower density of 900 kg.m~3 (Keys & Brozek, 1953).
As Benhke first realised, a determination of body density can therefore provide an
estimate of the relative proportions of fat and FFM.
There are several methods available for measuring whole body density.
Probably the most widely used is the underwater weighing technique, and this was
the method employed in the studies presented here. Since the density of the body
is equal to its weight per unit volume, the object of this method is really to
determine body volume (weight is easily measured). Archimedes’ principle is
employed, which states that the volume of an object submerged in water equals the
volume of water the object displaces. The subject is weighed in air and then
weighed again when totally submerged in water. The difference between the two,
corrected for the density of the water, is equal to the volume of the body.
Whole body density = whole body mass total body volume
Total body volume = fat mass fat-free mass fat density fat-free density
46

Volume of the body = weight in air - weight in water J density in water
However, this volume will include the volume of gas present in the lungs
and gastrointestinal tract at the time of submersion. The subject is usually asked to
take a maximal expiration before going underwater, however, the contribution
from residual lung volume is still sizeable (1-2 litres) and it is therefore necessary
to measure and deduct this component. The volume of gastrointestinal gas is
usually considerably smaller (about 100 ml) and is not measured.
-p. j j v weight in airo y ensi y - ^0(jy voiume _ residual volume
Body fat content can then be estimated according to Siri's equation (1956):
Body fat (kg) = ^ s i t y " 4,50 x weight
or
% fat = den'shy ' 450
To recap, determination of density by the underwater weighing method requires
three measurements; weight in air, weight underwater and residual lung volume.
Weight in air:
The subject was weighed on an Avery beam balance as described above.
Underwater weight:
The apparatus used for this part of the procedure consists of a tank (1.38m
x 1.19m x 1.19m) containing water at 36.5°C. A canvas seat on a metal frame is
suspended in the tank by means of nylon cords, attached first to a wheatstone
bridge resistance type strain gauge (Western Load Cell Co. Ltd. Scotland) and
47

then to the ceiling. The strain gauge produces a signal according to the weight
applied to it (ie. the weight of the subject sitting in the chair). This signal is
diverted to a load cell digital display, calibrated to read the weight in kg.
After being weighed in air, the subject (wearing a swim suit) climbed into
the tank and positioned themselves on the chair. The subject held on to the sides
of the chair and their feet rested on a cross bar just below the seat. Their heads
were above water at this stage. (See Figure 2.1). The procedure was explained to
them and once they felt relaxed and confident they began the following protocol:
1. A nose clip was fitted.
2. The subject was asked to make a full expiration.
3. With the mouth firmly closed and still holding their breath, the subject bent
gently forwards until the head was completely immersed in water. (See Figure
2 .2).
4. This positon was maintained, keeping as still as possible, until the digital
display on the load cell stabilised (about 10-15 seconds). The underwater weight
was recorded at this point.
5. The subject was then given a signal, banging on the side of the tank, to
slowly surface.
Residual lung volume:
This was determined using the nitrogen wash-out technique (Durnin &
Rahaman, 1967; Durnin & Womersley, 1974).
1. After the subject had surfaced a mouth piece, attached to one limb of a
three way tap, was placed in between the lips. The other end of the tap was
connected to a rubber anaesthetic bag containing a known volume of pure oxygen
(measured using a spirometer). The subject continued to hold their breath until the
lips were tightly over the mouth piece.
48

Figure 2.1
Body density by underwater weighing: the subject is shown with her head above the water before the procedure begins

Figure 2.2
Underwater weighing: the subject's whole body is completely submerged

2. The tap was then opened and the subject inhaled deeply from the bag,
followed by a large exhalation back into the bag. This was repeated twice more,
thereby allowing the nitrogen in the lungs to mix with the oxygen in the bag. At
the end of the third expiration the tap was closed.
3. The expired air was then analysed for oxygen and carbon dioxide content, as
described later, and nitrogen content determined by difference (ie. % N2 = 100% -
% 02 + % C02).
According to Rhan et a l (1949) at the end of the third expiration the gases in the
respiratory passages and the lungs are almost in complete equilibrium with those in
the anaesthetic bag. The total volume of the system will therefore be equal to
residual volume in the lungs (R) plus the volume in the anaesthetic bag (V). The
volume of the bag before rebreathing and the amount of nitrogen contained in the
bag after rebreathing are known and can be utilised to compute residual lung
volume as follows:
Nitrogen content of lungs = Nitrogen content of whole
and bag before rebreathing. system after rebreathing.
'25' is the volume of the three-way tap and 'n' is the volume of nitrogen
contaminating the oxygen in the anaesthetic bag. The equation condenses to:
m ( R + v +25)
Residual lung volume F. N. (V + 25) - 2000 - (V.n) 80 - N
5 1

'F is a correction factor to account for atmospheric pressure, body temperature,
the saturated vapour pressure of air in the lungs and in the spirometer, and for the
temperature of the spirometer.
Calculations of residual volume, whole body density and subsequently
body fat content were all made using a BBC microcomputer (model B). This
ensured that the results of the underwater weighing procedure were obtained
quickly while the subject was still in the tank. Routinely two measurements (plus
an initial practice run) were made. On the occasions that the body fat content
calculated from these measurements differed by more than 3% of body weight a
third measurement was made before the subject was allowed out of the tank. The
mean of the two, or three, measurements was taken.
This technique obviously requires an extremely high degree of co
operation from the subject. Nevertheless we found that almost all the individuals
recruited (95 out of 97) were able to complete the test in a satisfactory manner,
even those who were unable to swim.
(2) Total body water (TBW).
The total body water method is based on the finding that stored triglyceride
is essentially anhydrous, whereas water occupies a relatively fixed fraction (73%)
of the FFM (Pace & Rathbum, 1945). Measurement of TBW will therefore yield
an estimate of the relative proportions of fat and FFM.
FFM = TBW x -?y
TBW is measured by the administration of a tracer which will mix
throughout the total body water pool. The subsequent concentration of the tracer
in a sample of body water (eg. saliva, urine or plasma) once equilibrium has been
52

reached (or the increase in concentration if the tracer is already present in the body)
provides an estimate of TBW.
c = and TBW = 2
Where 'C' is the concentration or increase in concentration of the tracer, and 'D'
the dose given. Several tracers are available, including the isotopes deuterium
(D2 ), tritium (2H) and lsO, a stable heavy isotope of oxygen. Tritium has the
advantage of being easy to measure by scintillation counting. It is however,
radioactive which precludes its general use. D2 and lsO on the other hand are
naturally occuring, stable isotopes and are therefore preferable for use in man.
Deuterium oxide (D2 O) was chosen as the tracer for this investigation (Sigma
Chemical Co., Poole, Dorset, England).
Dose of deuterium oxide.
The dose of the isotope given to the subjects must be large enough to
produce a readily measurable increase in the deuterium oxide concentration of the
body, ie. 'C' must be large in relation to the precision with which it can be
measured. It was estimated that for analytical error to be < ±1%, an increase in
D2 O concentration of at least 180ppm was necessary, this is equivalent to a dose
rate of 0.1 g D20/kg TBW. In practice, to allow a slightly greater margin of error,
a dose of 0.12g of D2 0 /kg TBW was utilised.
To determine the appropriate dose for each subject it was therefore
necessary to first make an estimate of their TBW. This was done by using body
weight and skinfold thicknesses to estimate FFM, (see below) and assuming TBW
to represent 73% of the FFM.
In advance of the study a 40% solution of deuterium oxide had been made
up (ie. two parts D2 O to three parts tap water). This had then been used to prepare
5 3

individual doses corresponding to range of FFMs. These were sealed and
refrigerated until required. This procedure was necessary as deuterium oxide is
hygroscopic and as such tends to absorb water vapour from the air. Repeated
opening of the stock solution to make up individual doses on a daily basis would
have changed the composition of the solution during the course of the study.
On the basis of the subjects estimated TBW the appropriate diluted dose of
deuterium was selected and administered to the subject.
Pre-dose saliva sample.
As deuterium is naturally present in body water it is necessary to establish
the background level of the isotope before any additional dose is given. This was
done by determining the concentration of deuterium in a sample of saliva.
Throughout the investigation saliva was taken as the representative body fluid. It
was chosen in preference to other examples of body water such as urine, plasma,
tears etc as its collection is the least inconvenient and stressful for the subjects. In
addition the equilibriation of deuterium with saliva is achieved more rapidly than it
is with urine - 2-3 hours compared to 4-6 hours - minimising the time the
volunteers were required to spend in the laboratory.
The saliva was collected by wrapping a small piece of cotton wool around
a stick and asking the subjects to work this around their mouths until it was
'soggy'. The cotton wool was then transfered, using tweezers to avoid
contamination, to a 2 ml plastic syringe and the saliva squeezed out into an
appropriately labelled 1.5ml sample tube. This procedure was repeated until
sufficient saliva had been collected, about 1ml. The sample was then sealed and
frozen at -20°C until analysis.
When using saliva it is important to ensure that it is not contaminated with
water from either food or drink. This did not present a problem in this study
however, as all the subjects were in a fasted state.
5 4

Administration of the dose.
1. The dose selected for the subject (inclusive of bottle and lid) was weighed
on a balance accurate to 0 .0 lg.
2. The subject then drank as much of the isotope as possible using a plastic
drinking straw (the weight of the straw had previously been recorded).
3. The straw was pushed down inside the bottle and the lid put back on. The
whole thing was then reweighed.
4. It was then possible to calculate exactly how much of the diluted isotope
the subject had drunk. From which, according to the dilution factor and the
percentage of deuterium in dosing solution, the amount of deuterium oxide
ingested could be computed (see below).
Post-dose saliva samples.
Saliva samples were collected two and three hours after the administration
of the dose using the same procedure as described above. Complete equilibration
of the deuterium with the body water pool should have been achieved after about
two hours. The concentration of D2 O at plateau however, was taken as the mean
of the two samples. This approach to some extent allowed for any random
fluctuations in D2 O concentration at equilibrium and further, provided
confirmation that the plateau stage had infact been reached.
Measurement of deuterium oxide in saliva.
The deuterium oxide concentrations of the saliva samples were determined
by isotope ratio mass spectometry at the Scottish Universities Research and
Reactor Centre, East Kilbride. This measurement is based on the principle that the

hydrogen atoms in deuterium oxide (2H2 0 ) have a different mass from those of
normal water (H2 O). Consequently mass spectrometry can elucidate the relative
proportions of the two forms of hydrogen in a sample of fluid, in this case saliva.
Water from the sample is reduced to hydrogen gas before measurement. Because
relatively little deuterium is present in the samples (<500 ppm) there is very little
chance of any D2 molecules forming and it is the ratio of DH/H2 that is measured.
It is then necessary to convert the isotope ratio (in ppm) into a concentration.
Calculation of total body water.
(1) Conversion of ratio to concentration:
R = result in ppm obtained from the mass spectrometer.
R x JO-6 = parts P H K x 1U parts H2
andparts D20.5 x R x IQ"6 = parts H2
parts D2 O parts H2 O
For measurement of TBW R<600, and ratios can be considered equivalent, ie. the
concentration of D2 O in parts D20/parts of water can be taken to be 0.5 x R xlO-6-
(2) Conversion of parts to weights:
mol wt H2 O =18, M olwtD 2 O = 20
therefore,
g D2 O = parts D2 O x 2 0
5 6

g H2 O = parts H2 0 x 18
0.5 x R x 10-60.9
and the concentration of D2O in water, in g/kg
R" 1800
(3) Calculation of TBW:
TBW = g
r Rs - RpC “ 1800
where p and s denote pre- and post-dose samples respectively and
rTO,„ 1800d ,= R s - HRp equation 1
Calculation of dose.
The deuterium oxide content of the dose solution was measured at the same
time as the samples. A sample of the dose ('a1 g) was diluted to a total weight of
'W' g with tap water.
From equation 1,
_ isooyw " Ra - Rt
5 7

where 'y* is the amount of D2 O in a grams of dose, 'Ra' is the concentration of
D20 in the diluted dose and 'Rt' the concentration of D2 O in the tap water used to
prepare the diluted dose.
Re-arranging,v - w - Rt)y - w 1800
and % D2O in the dose
= 100 x ^ =- Y Xx R^ g equation 2
If 'A' g dose are administered, then the weight of the D2 O administered.
d = A x ^ * 1*800 ^ equation 3
Calculation of results.
From equation 1,TBW = 1800dRs - Rp
The dose, d, was calculated from the weight of the diluted dose consumed and the
% D2O in the dose.
TBWBody fat (kg) = Wt -
% Body fat - 100 - 0 .0073 x Wt

The use of deuterium oxide as a tracer results in the over-estimation of
TBW by about 4%, because some of the deuterium in the dose exchanges with
hydrogen atoms in protein and fat molecules. Therefore,
True TBW = -C—ul-f ^ -TBW 1.04
In the calculation of % fat the correction factor 1.04 was therefore applied,
TBWBody fat (kg) = Wt -
TRW% Body fat = 100 - 0 .00759 x Wt
(3) Skinfold Thickness.
Measuring the thickness of folds of skin at various sites on the body gives
an indication of the amount of fat located just beneath the skin's surface. Since
most of the fat in the body is suggested to be stored subcutaneously (Edwards,
1950) it is therefore possible to make an estimate of total body fat content.
Equations for the prediction of body fat from skinfold thicknesses have been
developed and would appear to give a relatively good measure of fat content, at
least in the populations from which they were derived (Durnin & Womersley,
1974; Jackson & Pollock, 1978; Jackson et al., 1980). The skinfold technique
relies on three assumptions. The first is that the ratio of subcutaneous to total
body fat is relatively constant. The second, that the sites selected for measurement
represent the average thickness of subcutaneous adipose. Thirdly, it is assumed
59

that the compressibility of the skinfolds is constant. Errors in estimation of body
fat arise if these assumptions are violated. Possibly the best established prediction
equations are those of Durnin and Womersley (1974). These authors developed
regression equations to predict body density, and hence body fat, using the
logarithmic transformation of the sum of four skinfolds (biceps, triceps,
subscapula and supra-iliac), age and sex. The mathematical transformation of the
sum of the skinfold thicknesses is needed because body density is not linearly
related to subcutaneous fat. Inclusion of age and gender takes into account
differences in fat distribution related to these factors.
The skinfold technique is inexpensive and requires the minimum of
equipment, its relatively simple and quick to perform and not difficult to master, all
of which make it particularly suitable for use in a field situation. Moreover, in the
hands of a trained observer the error is estimating body fat is reportedly only about
±3% of body weight (Durnin & Womersley, 1974).
Measurement of skinfolds in the studies presented in this thesis were made
as follows:
Harpenden calipers (Holtain Ltd. Grymych, Dyfed, UK), calibrated to
exert a constant pressure of 10g/mm2? were used throughout the study. Skinfold
thicknesses were always measured on the right side of the body while the subject
was standing in a relaxed fashion. The skinfold was picked up between the thumb
and forefinger and pulled gently away from the underlying muscle. The calipers
were applied to the the fold a little below the point where the skinfold was being
held, at exactly the sites described below. The caliper jaws were allowed to exert
their full pressure on the skinfold and the reading taken after 2-3 seconds when the
measurement began to stabilize. The values were recorded to the nearest 0.2mm.
Each skinfold was measured and recorded in triplicate and average value to the
nearest 0.5mm taken. A total of four skinfold thicknesses were measured and
60

body fat content estimated from the sum of the four, using the equations of Durnin
and Womersley (1974).
1. Biceps: - the skinfold was picked up on the front of the arm directly above
the centre of the cubital fosa. The calipers were applied to the skinfold at the
midpoint (or the "belly") of the muscle.
2. Triceps: - the skinfold was taken at the back of the arm halfway between
the inferior border of the acromian process and the tip of the olecranon process,
directly in line with the point of the elbow and the acromian process. (The site
was marked on every subject.)
3. Subscapular: - the skinfold was picked up just below the tip of the right
scapula at an angle of about 45° to vertical, and with the fingers touching the bone.
4. Supra-iliac: - the vertical skinfold was picked up immediately above the
anterior iliac spine in the mid axillary line. On the rare occasions that this proved
too difficult, in a very obese subject for example, the horizontal skinfold was taken
at the same site.
Reproducibility of skinfold measurements.
A preliminary study was carried out to assess the reproducibility of repeat
measurements taken by the observer. Skinfold thicknesses (biceps, triceps,
sub scapula and supra-iliac) were measured in a group of 13 undergraduate
students, 7 males and 6 females, and body fat content calculated using the Durnin
and Womersely equations (1974). A week later the measurements were repeated.
The average difference in % fat measured on the two occasions was found to be
only 0.2% (SD ±1.0) suggesting that the reproducibility of the repeat
measurements taken by the observer was high.
6 1

MEASUREMENT OF ENERGY EXPENDITURE.
Resting energy expenditure can be assessed by direct or indirect
calorimetry.
Direct Calorimetry:
Direct calorimetry involves the measurement of heat loss from the body. It
is based on the principle that the sum of the heat lost - by radiation, conduction,
convection and as latent heat arising from the vapourisation of water - equals, in
the long-run, the heat released by metabolism in the body. It is the oldest of the
techniques for measuring energy expenditure, dating back to the time of Lavoiser
at the end of the 18th century. Today three types of calorimeters are in use to
assess heat loss in man:- the isothermal calorimeter, pioneered by Atwater and
Benedict (1903), the gradient layer calorimeter (Benzinger & Kitzinger, 1949) and
a water cooled garment developed by Webb et a l (1972).
Direct calorimetry is considered to be extremely accurate for measurements
of energy expenditure over relatively long periods of time (a day or more).
However, because of the body's capacity to store heat energy and the consequent
delayed response between heat production and heat loss, it is not suitable for
short-term assessment of energy expenditure such as measurement of BMR, the
thermic effect of food or exercise. Nor is it appropriate for measurement of energy
expenditure in large numbers of free living subjects. Moreover, the equipment is,
on the whole, complex and expensive to construct.
6 2

Indirect calorimetry:
The term indirect calorimetry is employed to describe those methods of
estimating heat production or energy expenditure which are based on
determinations of gaseous exchange; oxygen consumption and carbon dioxide
production. If it is assumed that all the oxygen consumed by an individual is used
to oxidise degradable fuels and that all the carbon dioxide so liberated is recovered,
it is possible to calculate the total amount of energy ’produced1. When the rate of
nitrogen excretion is also known, the type and rate of fuel utilisation can also be
deduced.
Indirect calorimetry has a short response time due to the body's inability to
store oxygen. It is therefore suitable, and indeed widely used, to assess the acute
effects on metabolic rate of stimuli such as food or exercise and for measurement
of BMR.
Indirect calorimetry techniques fall into one of two categories, they are
either open or closed-circuit.
(1) Closed-circuit
The subject breaths pure oxygen which is, as the name suggests, circulated
around a closed system. Expired air is passed through soda lime to remove carbon
dioxide and the remaining oxygen returns to the system. The decrease in the
volume of oxygen over a set time gives a measure of oxygen consumption. By
using appropriate conversion factors the metabolic rate (kcal/min) of the individual
can be estimated.
(2) Open-circuit
In open-circuit indirect calorimetry the subject breaths normal atmospheric
air and their expired gases are collected and analysed for oxygen and carbon
dioxide content.
63

Several open-circuit methods are available (for review see McLean &
Tobin, 1987). These range from sophisticated respiration chambers suitable for
the measurement of energy expenditure over several days, to the simple Douglas
bag system (Douglas, 1911) which being light, portable and inexpensive is often
the method of choice in a field situation.
In the studies presented here, energy expenditure was measured by open-
circuit indirect calorimetry in one of two ways, either using the Douglas bag
technique or using a ventilated hood system.
The Douglas Bag Technique.
Apparatus.
The apparatus consists of a large gas impermeable plastic bag - the Douglas
bag - of either 100 or 200 litres capacity (Cranlea & Co., Birmingham, UK). This
is connected via a three-way aluminium tap to a length of flexible corrugated
plastic tubing, which in turn attaches to a two-way Rudolf valve (Kansas City
MO. USA). A rubber mouth piece is fitted onto the Rudolf valve.
Collection of expired air.
(See Figure 2.3)
The subject's nose is closed off with a nose clip, so they are able to breath
only through the mouth piece. The Rudolf valve, to which the mouth piece is
attached, allows the volunteer to draw air from the atmosphere but all expired gas
is directed down the tubing toward the Douglas bag. Depending on the position of
the three-way tap, the expired air can either enter the collection bag or pass back to
the atmosphere. For the first few minutes of a measurement (usually 3-5
depending on the specific protocol) the tap is in the latter position and expired air
returns to the room. This allows the subject to 'settle down' and become used to
the apparatus before the actual collection begins. After the appropriate run-in
6 4

Colle
ction
of
expir
ed
air u
sing
the
Doug
las
bag
syst
em

period the tap is opened and expired air collected into the Douglas bag for a
specified time. The tap is then closed off once again, the bag disconnected from
the breathing system and taken away for gaseous analysis.
Analysis of expired air.
A paramagnetic oxygen analyser (Servomex model 570 SYBRON,
Servomex Ltd., Crowbridge, Sussex, England) and an infrared carbon dioxide
analyser (PK Morgan Ltd., Chatham, Kent, England) were used for the analysis
of the subject's expired air. A sample of expired air was introduced into the
analysers through a side tube attached to the Douglas bag. One minute was
allowed for the readings on the analysers to stabilise (equivalent to 0.5 litres of gas
passing from the bag) and the carbon dioxide and oxygen contents recorded. The
side tube was closed off and the volume of the expired air then measured using a
gas meter (Parkinson-Cowan Ltd., London, England), taking into account the 0.5
litres already used for analysis. The temperature of the air passing through the
meter was recorded by an attached thermister. The volume of expired air was
corrected to standard temperature, pressure and saturation (STPD) using the
appropriate 'atmospheric correction factor' obtained from a nomogram on the basis
barometric pressure and temperature (Consolazio et al., 1963).
Calibration of the gas analysers.
The oxygen and carbon dioxide analysers were calibrated each morning
prior to the start of the experiments. They were first set at zero by introducing
oxygen-free nitrogen and then 'spanned' using standard gas mixtures containing
either 4.05% C02 : 16.30% 02 or 6.06% CO2 : 15.62% 02- The span of the
oxygen analyser was checked to be 20.93% using atmospheric air. Oxygen-free
nitrogen was then reintroduced to check the zero setting of the analysers.

All gases were supplied by the British Oxygen Co. Ltd., Brentford,
England.
Calculation of Metabolic Rate.
Metabolic rate was calculated according to the following equation:
Metabolic rate = 02 consumption x calorific equivalent 02
(kcal/min) (1/min) (kcal/1)
(1) Oxygen consumption
0 2 consumption = 'true'oxygen x ventilation rate
Ventilation rate is equal to the total volume of air expired per minute, and is usually
expressed as litres of dry air at standard temperature and pressure (STPD). It is
obtained by multiplying the metered volume of expired air by the 'atmospheric
correction factor' (see above), and dividing this by the duration of the sample
collection:
metered volume (1) x correction factor Ventilation rate =------ -sample duration (mins)
(1/min at STPD)
If the volume of the inspired air is equal to the volume of expired air, then oxygen
consumption can be obtained simply from the difference between the volume of
0 2 inspired and that expired:
0 2 consumption = vol0 2 insp - vol0 2 exp

20.93 %0 2 e100 x Vl " 100 x Ve
20.93 - %02e—— Iqq x Ve (equation 1)
Where Vi = vol air inspired
Ve = vol air expired
20.93 = % 02 in inspired air
%0 2 e = % 0 2 in expired air
However, when Vi and Ve are not equal, as is the case when the RQ is less
than 1 , an adjustment is required to derive the 'true1 value for the oxygen
difference. This computation is based on the fact that the volume of nitrogen
breathed in (Ni) will always equal the volume of nitrogen breathed out (Ne):
Ni . . %NeVl x 100 = Ve x Too
and Vi = Ve x (Ni = 79.1%)
Taking equation 1 and substituting:
20.93 %Ne %02e0 2 consumption = , q q x Ve 7 g ~ y ■ j q q x Ve
20.93 x %Ne %02e - ve x 100 x 79.1 " 100
'true' oxygen
Thus the 'true' oxygen value can be derived, and when multiplied by
ventilation gives a measure of oxygen consumption. In this study for speed and
6 8

ease of calculation 'true' oxygen, was obtained using a nomogram (Consolazio et
al., 1963).
(2) Metabolic rate.
In this study metabolic rate was calculated according to Weir's equation
(1949). Previously the estimation of metabolic rate by indirect calorimetry
involved measuring urinary nitrogen excretion, in addition to gaseous exchange, in
order to determine the proportions of the different nutrients oxidised in the body.
The calculations involved were so cumbersome that the effect of protein
metabolism was commonly ignored. In 1949 however, Weir developed an
equation which took into account the effect of protein metabolism, without the
necessity of having to measure nitrogen excretion. The equation is based on the
assumption that a fixed percentage (12.5%) of the total calories expended by the
body arise from protein metabolism and of an RQ equal to 1. If this is the case,
Weir calculated that the amount of heat released for every litre of 02 used, the
calorific equivalent of 02, would be 5 kcal/1.
Thus,
Metabolic rate = 20.93 - %02e x Ve x 5
20.93 - %02e— x Ve20
If however, the RQ is less than 1 (and consequently Ve is le^s than Vi - see
above) the volume of oxygen inspired and therefore the metabolic rate calculated
according to this equation, will be under-estimated. However, as RQvfiffls. the
calorific equivalent of oxygen also falls tending to over-estimate metabolic rate.
Under normal circumstances these two errors cancel out and the Weir equation
gives an accurate assessment of metabolic rate.
69

The Ventilated Hood.
In studies investigating the effect of B-adrenergic blockade on energy
expenditure (see later for details) BMR was measured using a ventilated hood
system. It was used in preference to the Douglas bag technique because
measurements were usually carried out away from the laboratory (in hospital or the
subjects' place of work) and no gas meter was available. In addition, hospital
staff reported that, in their experience, the group of patients involved were ill at
ease using a mouthpiece and noseclip. Like the Douglas bag technique, the
ventilated hood is an example of open-circuit indirect calorimetry.
The principle of the ventilated hood system is that atmospheric air is drawn
past the subject's face at a controlled rate, mixing with and collecting any expired
gases as it does so. The concentration of 02 in the mixture of room and expired
air leaving the hood is measured. With a knowledge of the 02 content of inspired
air and the rate of air flow through the hood (ie. ventilation rate) the volume of
oxygen utilised can be calculated and metabolic rate determined as above.
Apparatus and Procedure (See Figure 2.4)
The ventilated hood system used in these studies was designed and built in
the Institute of Physiology by Dr. Mark Lawrence. It consists of a flexible clear
plastic hood, of the type used in the chemical industry (Wavelock protecting hood,
Plysu Industrial Ltd., Milton Keynes, England) which was placed over the
subject's head and shoulders. Room air was drawn through the hood, and up past
the volunteer's face by a negative pressure gradient created by a centrifugal
exhauster pump located 'downstream' of the hood (Air Control Instruments
(Chard) Ltd., Chard, Somerset, England). Interposed between the hood and
exhauster pump are a flow meter and flow controller; the former was connected to
70

analyser
Flow meter
valve
Samplepump
Samplelin e
V en tila tedhood — i
pump
Rooma ir
Figure 2 ASchematic r ep re sen ta t io n of v e n t i l a t e d hood system.
FM = Flowmeter, FC = Flow C o n t ro l le r , CE pump = Centrifugal Exhauster Pump.
7 1

the hood via a length of corrugated plastic tubing. Air was drawn through the
hood at a rate of approximately 1 litre per kilogram of body weight per minute.
This rate was chosen so as to to prevent stimulation of ventilation by an increased
C02, and yet not produce excessive dilution of the subject's expired air to a level
that exceeded the resolution of the gas analysers. The exact rate at the beginning
and end of each measurement run was recorded and the mean taken. This was
multiplied by the appropriate atmospheric correction factor to derive the ventilation
rate at STPD (see above). After the flow meter, a small and constant quantity, (0.4
1/min) of the air leaving the hood was drawn off by means of an airtight pump
(The Analytical Development Co. Ltd., Hoddeson, England) for gas analysis.
The oxygen content of the air, a mixture of room air and the subject's expired
gases, was determined using a paramagnetic oxygen analyser (Servomex model
570 SYBRON, Servomex Ltd., Crowbridge, Sussex, England). The gas was
dried on route to the analyser by passing it through silica gel. Calibration of the
02 analyser took place each morning in the same way as described above. During
a measurement run a simultaneous collection of room air was always made (by
means of an airtight pump and 1-litre gas-impermeable plastic bag) and later
analysed to provide a mean estimate of the oxygen content of inspired air.
Calculation of metabolic rate.
As with the Douglas bag studies (see above), metabolic rate was calculated
using the Weir equation (Weir, 1949):
%C>2 in - %C>2 out Metabolic rate = V x-----------2 0 -----------
Where,
V = Ventilation rate litres/min at STPD (air flow through the hood)
%0 2 in = % oxygen in inspired (room) air
%0 2 out = % oxygen in air leaving the hood (room air + expired air)
72

As the air leaving the hood is a mixture of both room air and expired gases,
the difference in oxygen content between it and inspired air will be small. The
potential impact of fluctuations in inspired 0 2 content on the calculated metabolic
rate will therefore be great. For this reason the 02 concentration of inspired air
was always measured rather than assumed to be 20.93%
Unfortunately no carbon dioxide analyser was available for use with the
ventilated hood system and consequently RQs could not be determined.
Calibration of the ventilated hood system:
All the component parts of the ventilated hood system, including tubing
and connections, were deamed to be airtight. However, the system was checked
for leaks and calibrated, both before and after the study, by a series of gas
recovery tests. These involved introducing nitrogen into the system at a measured
rate and comparing this value to the rate calculated from the reduction in 0 2
content of the air leaving the hood.
A flow rate of nitrogen approximately one fortieth of the flow rate of room
air through the hood was used, since this produced a drop in 0 2 concentration of
similar magnitude to that encountered with a subject under the hood. The rate of
nitrogen flow into the hood was measured by means of a wet gas meter (Alexander
Wright & Co. (Westminster) Ltd., London, England) and corrected to STPD.
Simultaneously, samples of the air leaving the hood and room air entering it were
collected and analysed for 02 content. Nitrogen flow was calculated as follows:
%0 2 in - %0 2 outN2 flow rate = Ventilation rate x %Q2in--------
This procedure was carried out a total of twenty times using a number of
different flow rates over the range used for the subjects. The mean difference
73

between the measured and calculated flow rates was found to be 0.42% ± 1.78.
Thus it was evident that the system did not contain any leaks and had an error
which compares favourably to that of other indirect calorimetry techniques -
suggested by Garrow (1978) to be in the range 2-5%.
MEASUREMENT OF BASAL METABOLIC RATE.
Conditions for measurement
As discussed in the introduction, in this thesis BMR is defined as the rate
of energy produced under the standardised resting conditions outlined by Benedict
(1938). To recap, the subject should be:
- lying awake in a supine position, at complete physical rest (immobile).
- postabsorptive, at least 12 hours after the last meal.
- in a thermoneutral state.
- emotionally undistrubed.
- without disease or fever.
In all measurements of BMR every attempt was made to meet each of the
above criteria.
In the recent past the impression seems to have arisen that for a
measurement to be properly defined as basal it must be made just after wakening,
prior to the subject getting out of bed (Schutz, 1984). Whatever the merits of
imposing these conditions they are certainly not the ones under which almost all
the fundamental work on BMR was carried out (Benedict, 1915; Du Bois, 1927;
Boothby et al., 1936; Benedict, 1938). In all these cases, subjects were not
required to stay overnight before a BMR measurement. Similarly in our studies
subjects arrived at the laboratory, or other place of measurement, early in the
74

morning (about 9.00am) after spending the night in their own homes. The
exception was the 13-blockade study, where some of the volunteers were hospital
inpatients (the specific details are discussed later). In all cases however, subjects
were required to lie quietly at rest, for at least thirty minutes before any
measurements began.
In order that they should be in a post-absorptive state, the subjects were
instructed not to eat or drink anything after 9.00pm on the day preceding their
measurements and to continue the fast on the morning of the test. There is some
dispute however, as to how long the thermic effect of food (TEF) lasts. Dauncey
(1980) has shown that on a diet supplying only 3.7 MJ/day, an elevation of
metabolism of 6 % was present 15 hours after the last meal. Similarly Schutz et al.
(1985) report a study in which the thermic effect of a large meal was still evident
the following morning. It is likely that the duration of TEF will depend to some
extent on the size and composition of the meal; the effect on metabolic rate of a
large, high calorie meal will likely last longer than that of a light snack. With this
in mind, the subjects were asked not 'stock up' with an extra large meal just prior
to the 9.00pm deadline. They were also asked to consume their usual quantity of
food on the day before the measurement, to avoid the effects that acute overfeeding
may arguably have on BMR.
A similar cautionary policy was adopted with regard to the previous day's
exercise. Again, reports of the after-effects of exercise on metabolic rate are
conflicting. However, most of the studies which report a carry-over effect to the
following day have generally involved prolonged periods of high intensity activity
(Passmore & Johnson, 1960; Hermansen et al., 1984; Bielinski et al., 1985). It
seems doubtful whether a moderate degree of activity, such as that likely to be
undertaken by volunteers in our studies, would affect BMR on the morning
following the exercise session (Pacy et al., 1985; Freedman-Akabas et al., 1985;
Shah et a l, 1988; Weststrate, 1989; Bingham et al, 1989; Buckley et al, 1989).
T S

Subjects were therefore requested to refrain only from strenuous exercise on the
preceding day. (In reality it is likely that most of the subjects took no exercise at
all on the day before their tests, since a questionnaire (see later) revealed that over
two thirds of the participating volunteers could be classified as sedentary). On the
test day itself, all subjects either walked to the lab or came by car or bus - none
cycled or jogged - in which case the 30 minute rest period prior to the
measurement (see above) should have been sufficiently long for metabolic rates to
return to basal levels.
The entire measurement procedure was always explained to the subjects
very carefully at the outset, and they were shown and familiarised themselves with
the equipment. This helped to ensure that they were as relaxed and confident as
possible. It was impressed upon the volunteers that they must remain very still
throughout the measurements. With the studies involving the ventilated hood the
observer stayed in the room with the subject and was able to ensure that they did
indeed remain immobile. This was not possible with the Douglas bag studies
however, where measurements on two or three subjects were often being made
simultaneously.
In all studies a thermoneutral room temperature of between 18°C and 22°C,
depending on what felt most comfortable to the subject, was maintained.
Measurement procedure.
(1) Douglas bag.
After a half hour rest period the subject was fitted with the nose clip and
mouth piece. A 5 minute run-in period followed, allowing the subject to become
accustomed to breathing through the apparatus. Two consecutive 10 minute
collections of expired air were then made. After the second collection the subject
was allowed to take out the mouth piece and nose clip and rest for a few minutes
before a third and final 10 minute measurement got underway. This last bag was
76

preceded by a 3 minute run-in. At the end of each collection heart rate was
measured using the radial pulse. Bags were analysed and metabolic rate calculated
as described above. Unless an obvious malfunction had occured, the average of
all three bags was taken to represent the BMR of the subject.
(2) Ventilated hood.
A 30 minute rest period was followed by a 30 minute measurement run.
During the rest period the subjects wore the ventilated hood. This allowed them to
become used to the apparatus and also provided the opportunity for the observer to
monitor when oxygen consumption had reached a steady state. This was usually
achieved after 2 0 minutes or so, routinely however, the acclimatisation period was
allowed to proceed for the full half an hour. The measurement run followed on
without a break. The oxygen concentration of the air leaving the hood was
recorded at 30 second intervals and the mean concentration per 10 minute period
calculated. A sample of room air was collected simultaneously and analysed at the
end of each measurement period to provide a mean estimate of inspired of content.
Flow rate at the beginning and end of each 10 minutes was recorded and the mean
taken. This data was then used to calculate metabolic rate for each of the three 10
minutes periods. BMR was taken to be the mean of the three measurements.
77

CHAPTER 3
BMR AND BODY COMPOSITION.
78

INTRODUCTION
In healthy adults BMR can vary over a three fold range (Harris &
Benedict, 1919; Boothby & Sandiford, 1929). These differences have
traditionally been attributed to differences in body size, age, sex, race, climate and
nutritional status. More recently however, several studies have observed that
differences in BMR between groups of individuals, of differing age, sex, race and
so on, are largely eliminated when the size of the FFM is taken into account (eg.
Cunningham, 1980; Bernstein et al., 1983; Ravussin et al.., 1986; Lawrence et
al.., 1988). This has led to the widespread use of FFM as a metabolic reference
standard and, by extension, to the tendency by some investigators to regard simple
differences in body composition - the mass of fat-free tissue - as the genesis of all
variation in BMR. More critical evaluation of the data would suggest that this is
not so. At a given FFM for example, BMR can vary considerably between
individuals (Bogardus et al, 1986; Ravussin et al., 1986; Lawrence et al, 1988)
and there is some suggestion that in relation to the FFM, BMR may decline with
age (Dore et al., 1983; McNeill et al., 1987). Moreover, it has been observed that
BMR/kg FFM is not constant with weight but tends decline from light to heavy
individuals, bringing into question the validity of expressing results in this way
when groups of differing body size are to be compared (Lawrence et al., 1988).
The aim of the present study was to investigate the part played by
differences in body composition, assessed primarily in terms of weight, height, fat
and FFM, in explaining variability in BMR in a group of healthy women. In view
of the important role generally accredited to differences in the mass of fat-free
tissue it was of particular interest to determine how much of the differences
between the women could be attributed to differences in FFM. Could for
example, any age related changes in BMR - an area not well documented in
women - be explained entirely in terms of FFM (Cunningham, 1980) or, as
79

observed by Dore et al. (1983) and McNeill et al. (1987), are there age differences
even when the size of the FFM has been taken into account ? Past work has
tended to concentrate on women in their twenties and thirties, it was intended
therefore to extend observations on BMR and FFM over a wider age range.
As noted above, Lawrence et al. (1988) have found that BMR/kg FFM has
a tendency to fall from light to heavy individuals. They concede however, that this
observation may to some extent have a statistical, rather than physiological, basis,
relating to error in estimation of FFM using the skinfold technique; measurement
error will have the effect of reducing the slope of the regression line relating BMR
to FFM and exaggerate any tendency for BMR/kg FFM to fall as weight increases.
Since there is some uncertainty as to the error involved in the skinfold method -
one analysis has suggested 2% to 3% of body weight (Womersley & Durnin,
1977) - in the present study it was decided to also measure FFM using
densitometry. This technique is generally thought to be more accurate than the
skinfold method and there is a greater degree of confidence as to the error involved
(Lukaski, 1987). It was postulated that if error in skinfold method was an
important factor in explaining the decrease in BMR/kg FFM from light to heavy
individuals one might expect a less of a fall in BMR/kg FFM when FFM was
measured by densitometry.
It has been suggested that variation observed in BMR in relation to the
FFM and to the apparant fall in BMR/kg FFM with increasing weight may result
from differences in the composition of the FFM, to the relative proportions of
'active' organs compared to 'inactive' tissues such as muscle. Circumference and
diameter measurements were therefore made on the women in the expectation that
these might provide an estimate of relative muscularity and skeletal size, allowing
this to be investigated further.
80

SUBJECTS AND METHODS.
Subjects.
97 women living in and around Glasgow participated in the study.
Volunteers were members of the general public and were largely recruited through
the distribution of leaflets (see Appendix 1) to libraries and commercial
organisations. It was hoped that this approach would yield a broad cross section
of volunteers. Most of the subjects were employees of Strathclyde Regional
Council and British Telecom.
All the women were in apparant good health and reported no previous history of
diabetes mellitus, thyroid disease or other metabolic disorders. None were
receiving any drugs or medication apart from the contraceptive pill and, in the case
of two older women, hormone replacement therapy. Stage of the menstrual cycle
was recorded or note taken if the women had reached the menopause. None of the
women were on reducing diets at the time of the measurements.
Details were also obtained of the women's usual activity and exercise habits. On
the basis of this information volunteers were very roughly classified as either very
active - participating in a sporting activity or exercise session 4 or more times a
week; moderately active - exercising 2 to 3 times a week; or sedentary -
undertaking no additional activity or exercising only infrequently, once a week or
less. None of the women had physically active jobs - most were office workers -
so classifications were based solely on leisure time activities.
Measurement of BMR.
BMR was determined using the Douglas bag technique under the
standardised conditions described in Chapter 2.
8 1

Body Composition.
Body weight, height, circumference and diameter measurements were
made as described in Chapter 2. Body fat content was estimated from the sum of
four skinfold thicknesses (biceps, triceps, subscapular and supra-iliac) according
to the equations of Durnin & Womersley (1974) and from body density
determined by underwater weighing. (Details of procedures are given in Chapter
2).
There was no significant difference in mean fat content of the group
assessed by the two techniques:
% fat skin folds = 30.3 % (± 5.8)
% fat density = 30.2 % (± 7.3)
A good correlation (r = 0.86, p < 0.001) was found between the methods,
with the slope of the regression line being close to one (Figure 3.1). Furthermore,
differences between the measurements were found not to be related to the degree
of body fatness. In the light of these observations the results for body fat content,
and consequently FFM, are reported throughout the study as the mean of the two
estimates. The implications of adopting this approach with respect to the
correlation between BMR/kg FFM and FFM will be discussed in the appropriate
section below.
Statistical methods.
The linear relationships between BMR and the various body composition
variables were assessed using univariate regression analysis. A stepwise
regression analysis was performed to determine which of the body composition
variables best explained differences in BMR. This yielded the regression equation
relating BMR to FFM. In addition a multiple regression analysis was carried out
to derive the regression equation relating BMR to body weight. The statistical
significance of the difference in the residual standard deviations of the regression
82

10 . 7e f a t dens i ty = (% f a t S . f . x 1.09) - 2 . 6i r i-------- 1--------1-------- 1-------- 1-------- 1
1S 23 27 31 35 39 H3 l\7
% f a t sk ln fo lds
Figure 3,1Relat ionship between percentage f a t estimated by d e n s i t e i e t r y and percentage f a t estimated by sk in fo ids .

equations derived between BMR and FFM and BMR and weight and also between
BMR and calf circumference was assessed using an F-test. Finally, univariate
regression analysis was used to derive the linear relationships between between
age and body weight, height, % fat and FFM. All procedures were performed
using the SPSSx statistical language.
RESULTS.
The anthropometric data and BMR results of the women who took part in
the study are shown in Table 3.1.
Variation in BMR between individual women, either in absolute terms or when
expressed per kg of body weight or per kg FFM, proved large, with a coefficients
of variation of 11.8%, 13.6% and 9.6% respectively.
In order to determine which of the variables, or combination of variables,
listed in Table 3.1 were best able to explain these differences in BMR, a stepwise
regression analysis was performed on the data. The following equation was
derived:
BMR (kcal/day) = (FFM x 22.4) + 403
r = 0.67, r2 = 0.45, p < 0.001 (residual SD 118)
Differences in FFM accounted for 45% of the total variance in BMR. Once
differences in FFM had been taken into account, none of the other variables were
able to explain a significant portion of the remaining variance. In other words the
relationship between BMR and FFM (see Figure 3.2) was independent of age,
weight, height, differences in body fatness, circumferences, bone diameters and
so on. The residual standard deviation about the line of best fit (118 kcal/day,
8.7% of the mean) indicated however, that in relation to the FFM there was
considerable variation in the BMR of individual women.
84

Table 3.1
Anthropometric data and BMR results of the 97 women.
Mean (SD) Range
Age (yrs) 34.5 11.4 17 - 66
Body weight (kg) 61.1 9.8 42.2 - 91.8
Height (cm) 162.4 5.8 150.2 - 174.7
BMI (kg/m2) 23.1 3.5 17.0 - 33.3
% Body fat 30.2 6.5 15.0 - 44.0
FFM (kg) 42.0 4.7 34.0 - 55.8
Circumferences:
Upper arm (cm) 27.4 3.2 20.4 - 36.6
Buttocks (cm) 96.8 6.9 84.5 - 117.8
Thigh (cm) 55.6 5.2 45.0 - 70.0
Calf (cm) 35.9 2 .8 29.2 - 42.0
Diameters:
Biacromial (cm) 37.0 1.7 32.0 - 41.1
Bi-iliac (cm) 30.7 2.3 22.0 - 36.0
Ulna (cm) 5.2 0.3 4.6 - 5.8
Knee (cm) 9.4 0.5 8.5 -10.8
BMR:
kcal/day 1346 157 950 - 1670
kcal / Wt kg / day 22.3 3.0 16.4 - 29.7
kcal / FFM kg /day 32.2 3.1 24.8 - 40.2
85

BMR
kcal
/day
1670-
1598-
1526-
1454-
1382-
1310-
1238-
1166-
1094-
34 38 42 46 50 54
FFM (kg)
Figure 3.2Relat ionship between BMR and FFM.
86

Univariate correlations were also performed between BMR and the other
body composition characteristics of the women. The results are presented in Table
3.2.
There was no significant correlation between BMR and age. All other
variables however were positively correlated with BMR. Although, as might be
expected from the results of the stepwise analysis, FFM showed the highest
correlation with BMR, correlation coefficients for other anthropometric variables,
in particular body weight and calf circumference, were not substantially lower.
The regression equations for these two variables are shown below:
(1) BMR (kcal/day) = (Weight x 9.0) + 797
r = 0.55, r2 = 0.31, p < 0.001. (residual SD = 132)
(See Figure 3.3 for scatterplot)
(2) BMR (kcal/day) = (Calf Circ. x 31.7) + 205
r = 0.57, r2 = 0.32, p < 0.001 (residual SD = 130)
An F-test revealed that the residual standard deviations of the three
equations - BMR with FFM, weight and calf circumference - were not
significantly different, indicating that in these women FFM was no better a
predictor of BMR than weight or calf circumference.
However, in contrast to FFM, multiple linear regression analysis of BMR
on weight, showed that the inclusion of age significantly increased the proportion
of variance accounted for, from 31% to 41%. In relation to weight therefore,
BMR was lower in older women. Addition of height significantly improved the
correlation still further, explaining 46% of the total variance in BMR. The
equation is shown below:
BMR (kcal/day) = (Weight x 9.2) - (Age x 4.2) + (Ht x 657) - 144
r = 0.68, r2 = 0.46
87

Table 3.2
Univariate correlations for BMR with age and body composition variables.
Independent variables Correlation coefficients
( r )
Statistical significance
(P < )
Age (yrs) - 0.11
Body weight (kg) 0.55 0.001
Height (cm) 0.45 0.001
BMI (kg/m2) 0.37 0.001
Body fat (%) 0.37 0.001
FFM (kg) 0.67 0.001
Circumferences:
Upper arm (cm) 0.32 0.001
Buttocks (cm) 0.51 0.001
Thigh (cm) 0.52 0.001
Calf (cm) 0.57 0.001
Diameters:
Biacromial (cm) 0.26 0.01
Bi-iliac (cm) 0.37 0.001
Ulna (cm) 0.34 0.001
Knee (cm) 0.48 0.001
88

BMR
(kca
l/da
y)
1670
1598 -
• •1 5 2 6 -
1 3 8 2 -
1 3 1 0 -m
1 2 3 8 - • •
1166 -
1022 -
950 -
42 48 54 60 66 72
Weight (kg)
Figure 3.3Rela t ionship between BMR and body weight.

Lawrence et al. (1988) have observed that BMR expressed per kg body
weight or per kg FFM tends to be lower in heavier compared to lighter women.
To investigate whether this was also true in these women BMR/kg body weight
was correlated with weight and BMR/kg FFM with FFM. The scatterplots are
presented in Figure 3.4A & Figure 3.4B. It is evident that as the weight of the
women increased so BMR/kg declined. Subjects weighing 55kg had a BMR/kg of
about 24.6 kcal/day, a value which fell by about 17% to approximately 20.5
kcal/day in women weighing 70kg. Similarly, BMR/kg FFM declined as FFM
increased, such that women with a FFM of 55kg had a BMR/kg FFM 15% lower
than women with a FFM of 35kg.
The univariate correlations between age and weight, height, FFM, %fat
and the BMR of the subjects are shown in Table 3.3. Height, FFM and BMR did
not change significantly as the women became older. There was however, a clear
increase, in both body weight and body fat content with increasing years.
Details obtained on the volunteers’ activity and exercise habits revealed that
the majority (56 out of 97) could be classed as sedentary, exercising infrequently
or not at all. 32 of the women were moderately active and only 9 fell into the very
active classification.
DISCUSSION
As alluded to in the Introduction, BMR can vary enormously between
individuals. Three fold differences in the BMR of healthy adults - ranging from
under 1000 kcal/day to over a 3000 - have been reported in studies which have
encompassed different races, both sexes and extended across the spectrum of body
size and age (eg. Harris & Benedict, 1919; Boothby & Sandiford, 1929; Ravussin
et al., 1986). With respect to the diversity of the participating subjects, the present
study differs from many of its predecessors. The women who took part were not
90

3 2 1
3 0 -
2 8 -
BMR 26 Wt 2 4 -
2 2 -
2 0 -
18
*>' 16 —CD 1TD
•• *•3.4 A
* • • •
•* * * * *
f V f . / . ' •
V • • •
• • • • v !
• • # • • • •
CT>I I I 1-------- 1---------1-------- 1-------- 1-------- 1---------1
42 48 54 60 66 72 78 84 90 96
8 W -Weight (kg)
BMRFFM
3 8 -
3 6 -
3 4 -
3 2 -
3 0 -
2 8 -
2 6 -
2 4 -
3.4B• • •
u*t. • •• • • • •* • 4 •
• M H M • • • •• • r * • ft •
• m
1- - - - - - - - - 1- - - - - - - - - 1- - - - - - - - - 1- - - - - - - - 1- - - - - - - - - 1 I I I I34 38 42 46 50 54 58 62 66 70
FFM (kg)
Figure 3.4S c a t te rp lo ts of BMR/kg weight aga in s t weight and BMR/kg FFM aga ins t FFM.
9 l

Table 3.3
Univariate correlations between age and weight, height, FFM, % fat and BMR.
Independent variables Correlation coefficients
( r )
Statistical significance
(P < )
Weight (kg) 0.34 0.001
Height (cm) -0.03 NS
% Body fat 0.56 0.001
FFM (kg) 0 .0 1 NS
BMR ( kcal/day) -0 .11 NS

selected for extremes of body size or age, rather it was hoped they would represent
a relatively normal cross-section of healthy Glaswegian women, with the aim of
quantifying, and hopefully subsequently explaining, differences in BMR in such a
group.
Variation in BMR among the women proved large, to the extent that some
500 kcal/day separated the 15% of the women at the top end of the range from the
15 % at the bottom. Over recent years we have become happy to accept that a large
part of such variation can be attributed to differences in body composition, in
particular to differences in the mass of fat-free tissue. Studies which have
extended across groups of individuals, incorporating in their analysis data from
both men and women, different races and extremes of age and body size, generally
report high correlations between BMR and FFM, with FFM explaining upwards
of 65% of variability in BMR (Cunningham, 1980; Webb, 1981; Ravussin et al,
1982; Bernstein et al., 1983; Ravussin et al., 1986; Bogardus et al., 1986;
Weststrate, 1989). In such investigations BMR is usually found to be more highly
correlated with FFM than with body weight. Moreover, differences in BMR
which are evident between groups in relation to weight, are largely eliminated
when differences in FFM are taken into account. For instance, Owen et al. (1987)
found that when weight was used to predict BMR, the regression equations
derived for men and women were significantly different. In contrast, the
relationship between BMR and FFM was found to be statistically indistinguishable
between the sexes. Similarly, at a given weight, BMR is usually found to differ
according to age but at a given FFM, most groups have reported that BMR is
independent of age (eg, Keys et al., 1973; Bernstein et al., 1983; Ravussin et al.,
1986; Owen et al., 1987) (see below). Much of the variation in BMR between
groups of individuals, of different age, sex, body fatness and race can, this would
suggest, be largely explained by differences in the FFM.
93
In the present study it was also observed that once differences in the FFM
of the women had been taken into account, none of the other variables measured
had any significant influence on BMR. The relationship between FFM and BMR
was independent of age, weight, height, differences in body fatness,
circumference or diameter measurements. The effect of age on the relationship
between BMR and FFM will be discussed below. However, with regard to body
fatness, the observation that individuals with a similar FFM had a similar BMR
irrespective of differences in body fat content is in accord with several previous
investigations (James et a l , 1978; Halliday et a l , 1979; Dore et a l , 1982;
Ravussin et a l, 1982; Garrow & Webster, 1985; Lawrence et a l, 1988;
Weststrate, 1989). In those women with the same mass of fat-free tissue yet a
different percentage fat, in one respect at least, the composition of the FFM will
differ - the fatter individual will have a greater proportion of nonfat adipose tissue
occupying the FFM. This would appear to have little impact on BMR. A
possible explanation may be that the metabolic rate of fat-free component of
adipose tissue approximates to the average metabolic rate of the rest of the FFM,
and as such differences in the relative proportion it occupies have no discernible
effect on BMR. In its entirety adipose tissue has a relatively low metabolic rate per
unit weight. The metabolic rate of the nonfat component - constituted by
cytoplasm of the adipose cell - is however, likely to be somewhat greater since it is
involved in the energy transformations which occur in adipose tissue including the
constant cycle of breakdown and re-esterfication of triglycerides. Its rate of
energy expenditure may be sufficient to equate to the average metabolic rate of the
rest of the FFM.
Although a single equation could be used to predict BMR from FFM - age,
body fatness and so on having little additional effect once the amount of fat-free
tissue had been taken into account - differences in FFM were able to explain less
than half of the total variance observed in the basal metabolic rate of the women,
94

some 45%. Other investigations which have also looked at relatively
homogeneous groups - of single sex and race and over a narrower age range -
have similarly observed lower correlations with FFM than those reported between
divergent groups of individuals (Bernstein et a l, 1983; Lawrence et a l, 1988).
For example, in Scottish women aged between 20 and 35 years Lawrence et al
(1988) found a correlation coefficient for BMR against FFM of 0.31; only 10% of
the variance in BMR could be attributed to differences in FFM. Within groups of
individuals, and in contrast to observations between groups, it would seem that
differences in FFM are able to explain relatively little of the variation in BMR,
usually no more than about half.
Furthermore, the residual standard deviation of the regression equation
describing the relationship between BMR and FFM in this study (118kcal/day,
8.7% of the mean) indicates that at a given FFM considerable variation exists in
the BMR of individual women. Two women with the same mass of fat-free tissue
may have BMRs that differ by as much as 400 kcal/day. Other studies have
reported differences in BMR in relation to the FFM of a similar order of magnitude
(Bogardus et a l, 1986; Lawrence et a l, 1988; Durnin, 1988). Assuming a
sedentary lifestyle, (activity data suggested that most of the women were indeed
relatively inactive) this translates to a difference in total daily energy expenditure in
the region of 600 kcal/day. Clearly, this has practical implications for the women.
The individual with the low level of energy expenditure must match this with a
corresponding low intake if she is to remain in energy balance and avoid gaining
weight. For many years the debate has raged as to whether those with a low level
of energy expenditure are predisposed to obesity. Unfortunately, study in this
area has often been limited to comparing the metabolic rates of the lean with those
of the obese. This approach is fraught with difficulties, not least because it gives
no indication of the metabolic rates of obese subjects before they gained weight
9 5

Recently however, Ravussin and colleagues (1988) conducted a series of
prospective studies to determine the relative rates of weight gain in persons with
low metabolic rates (after adjusting for age, sex and differences in FFM) compared
to those with high metabolisms. The results showed that those with low adjusted
energy expenditures were at significantly greater risk of gaining weight. It must of
course, be perfectly possible to have a low level of energy expenditure relative to
FFM and remain lean, but in an affluent Western society where food is abundant it
is not too difficult to envisage how this may prove a problem for some. In
contrast, in a situation where food is in relatively short supply, as is the case in
many developing countries today, a relatively low level of energy expenditure may
well be advantageous.
Clearly, the large differences observed in BMR in relation to the FFM have
potentially important practical implications. To look in more depth at the possible
causes of such variation two groups of women, characterised by particular high or
low BMRs relative to FFM, were selected from this study for further
investigation. The results are presented in Chapter 5.
Although FFM was found to have highest correlation with BMR, the
correlation coefficients of some other body composition variables, in particular
body weight and calf circumference, were only slightly lower (Table 3.2).
Indeed, as indicated by the 'F ratios of the residual standard deviations, for the
purposes of predicting the BMR of an individual, FFM was no better than body
weight or calf circumference. The predictive ability of the circumference
measurements, exemplified by the calf, probably results from the fact that they are
highly correlated to FFM (r = 0.71, p < 0.001, for the calf) and are essentially
providing an estimate of FFM. The parity of FFM and body weight in predicting
BMR may be a consequence of two factors. The first may relate to the
heterogeneity of the FFM in terms of the metabolic rates of its component organs
96

and tissues. If, as suggested, the composition of the FFM - the relative
proportions of active and 'inactive' tissue - can vary between individuals and
potentially result in very different metabolic rates for a given mass of fat-free
tissue, it is perhaps not surprising that in a group of individuals of relatively
normal body size, the use of whole body mass gives as good an estimate of BMR
as does FFM. As alluded to above however, when groups of very different body
size, particularly of extremes of body fatness, are compared this is not found to be
the case. A second possible reason, linked with the first to a certain extent, may
relate to differences in measurement error. No technique of estimating FFM is free
from error. In addition to experimental error, any deviation for the assumptions
upon which the techniques rely - a difference in the composition of the FFM for
example - will lead to a spurious result. Body weight on the other hand can be
determined extremely accurately. Day to day fluctuations in weight do occur - for
most women these probably do not exceed 0.5kg (Garrow, 1978) - however, any
error resulting from deviations from the 'true' mean will apply equally to an
estimate of FFM derived from body weight as to weight itself. It could be argued
that the ease and accuracy with which body weight can be measured makes a good
case for the use of this variable to predict BMR in preference to FFM. The
observation that, as a predictor of BMR, body weight is little, if any, better than
FFM is not an isolated one, Owen et al. (1986, 1987) and Lawrence et al. (1988)
have also found that within a group of individuals the use of weight was
comparable to the use of FFM. However, the large residual standard deviations
for both FFM and weight casts doubt on the usefulness of either variable in
predicting an individual's BMR (this is discussed subsequently in Chapter 6).
As noted by Scofield (1985a), Owen et al. (1987) and Lawrence et al.
(1988), BMR/kg body weight was found to decline as the weight of the women
increased. This may be partially explained by the relative increase in adipose
97

tissue, with its low metabolic rate, from light to heavy individuals. However, in
accord with Lawrence et al's (1988) study and the earlier work of Miller & Blyth
(1953) BMR expressed per kg FFM also tended to be lower in heavier compared
to lighter women, suggesting that the increase in body fat content may be be only
part of the explanation.
It was pointed out in the Introduction that part of the reason for the decline
in BMR/kg FFM may be statistical rather than physiological. If FFM is either
under- or over-estimated it follows that BMR expressed per kg FFM will appear
either higher or lower than in reality. Outlying points have a disproportionate
effect on the slope of the regression line, and in the regression of BMR/kg FFM
against FFM these outlying points will tend to be from small subjects whose FFM
is under-estimated (high BMR/kg) or from large subjects whose FFM is over
estimated (low BMR/kg). Any tendency for the BMR/kg FFM to fall as the
weight of the FFM increases will therefore be exaggerated by measurement error.
Lawrence et al (1988) acknowledge that the decline in BMR/kg FFM from light to
heavy women observed in their study may be partly a consequence of this sort of
statistical artifact, resulting from errors in estimation of FFM using the skinfold
technique. In the present study FFM was measured using both the skinfold
method and densitometry. It was postulated that if the error in the skinfold method
was an important factor in explaining the decrease in BMR/kg FFM, the slope for
the regression line relating BMR to FFM estimated by densitometry would be
steeper than that relating BMR to FFM estimated from skinfolds. In the event
however, the slopes of the lines were not found to be statistically different:
Skinfold, BMR (kcal/day) = 23.0FFM + 375
Density, BMR (kcal/day) = 20.9FFM + 462
98

There are two possible explanations for this. The first is that both methods
were equally inaccurate, each having an error of + 10% of body weight - using
data simulations it is possible to show that the error in measuring FFM would have
to be in the region of ± 10% to account for the 15% difference in BMR/kg FFM
between light and heavy women. The alternative possibility is that the decline in
BMR/kg FFM with increasing weight of the FFM is the result of physiological
variation. It seems very unlikely that the skinfold and density techniques are both
associated with a 10% error. The residual standard deviation of regression
equation relating skinfolds to density was 3.7%, suggesting in fact that the error
was much less, around ± 2-3% of body weight. This is consistent with the
analysis of Womersley & Dumin (1977) and would seem to indicate much of the
fall in BMR/kg FFM with increasing weight of the FFM must have a physiological
explanation.
It might have been expected that the approach adopted in this study of
taking the average of the two estimates of FFM would result in a regression line
with a steeper slope than for that for the skinfold or densitometry estimates alone
since taking the mean of the estimates should reduce measurement error. This was
not found to be the case.
Skinfold + Density, BMR (kcal/day) = 22.4FFM + 403
There were no significant differences in the three slopes. However, it is
likely that if the measurement errors associated with the two techniques were
small, taking an average would not result in very much change in the slope. This
again suggests that errors in estimation were small and unlikely to be responsible
for the fall in BMR/kg FFM. The indications are therefore, that the observed
decline has a physiological basis.
99

A decrease in BMR/kg FFM from light to heavy individuals could feasibly
be produced if, as weight increased, the proportion of the FFM occupied by the
metabolically active tissues such as the liver, kidneys, heart and brain declined
and concurrently the proportion of tissues with comparatively low metabolic rates
increased. In this group of women the fat-free component of adipose tissue would
certainly have accounted for a greater proportion of the FFM in heavy compared to
light individuals, since those with a large FFM also tended to be fatter. However,
it is debatable, as discussed above, whether nonfat adipose tissue can be
considered to have a low metabolic rate. Furthermore, regression analysis has
shown that, once differences in FFM have been taken into account there is little
correlation between percentage fat and BMR. This would indicate that the
increasing fraction of the FFM made up of nonfat adipose tissue can not explain
the observed fall in BMR/kg FFM. It is therefore necessary to look for other
differences in the composition of the FFM between light and heavy women which
may be responsible for this decline.
Lawrence et al. (1988) have suggested that perhaps the most likely
difference would be the proportion of skeletal muscle. They contend that it would
not be too surprising if heavier individuals were more muscular, as well as fatter,
than their lighter counterparts. The literature contains very little data from which to
assess this possibility. The only direct evidence appears to be that from the study
of Clarys, Martin & Drinkwater (1984). The Brussels group examined the
composition of the adipose tissue-free mass (ATFM, body mass less all dissectible
adipose tissue) in twenty five elderly Belgian cadavers. A further analysis of the
data presented by these authors clearly showed that as the ATFM increased so too
did the proportion of muscle it contained (see Introduction for details), adding
some credence to the suggestion that heavy individuals are more muscular than
their lighter counterparts. However, because of the small numbers involved in this
100

investigation and the advanced years of the cadavers, the results must be
interpreted with some caution and can not necessarily be taken as evidence that this
sort of relationship exists in other groups.
In the present study the circumference measurements unfortunately proved
too crude an index of muscularity to test the hypothesis that the heavy women had
a greater proportion of muscle making up their FFM than the light individuals - a
possible explanation for their lower BMR/kg FFM. As pointed out above,
circumferences are highly correlated with FFM, since the larger the FFM, the
greater the absolute amount of muscle, it follows that the greater the circumference
the greater the muscle mass. They are not however, a measure of muscle which is
independent of the size of the FFM and cannot therefore be utilised to determine
the proportion of muscle occupying the FFM of the light and heavy women.
As discussed above, it has been shown in this and previous studies that in
relation to the FFM, BMR is not affected by body fatness (eg. James et al., 1978;
Halliday et al., 1979; Lawrence et al., 1988) nor does the relationship appear to
differ between the sexes (eg. Cunningham, 1980; Bernstein et al., 1983; Owen et
al., 1987; Weststrate, 1989). In other words, those with a similar FFM will have
a similar BMR whether they are male or female and whatever their body fat
content. However, it has been noted that when expressed 'per kg' of FFM men
have a higher BMR than women (Weststrate, 1989) and some groups of obese
subjects a higher BMR than their lean counterparts (Ravussin e ta l, 1982; James,
1985; Weststrate, 1989). Since men generally have a greater FFM than women
and the obese a relatively enlarged FFM compared to the lean it may be that these
observations fit into a general picture of a decline in BMR/kg FFM as the weight
of the FFM increases. Data from several studies (n = 15), including the present
one, where FFJVI and BMR are given were collated and the mean BM^R/kg FFM!
for each group plotted against the mean FFM (Figure 3.5). The data are diverse,
101

BMR/
FFM
(kca
l/kg
/day
) • •
31-
30-
29-
27-
36 52 56 60 68
FFM (kg)
Figure 3.5S c a t te rp lo t of BMR/kg FFM aga ins t FFM: some groupdata from the l i t e r a t u r e *
*Ravussin et al (1982); Ravussin et al (1986); Owen et al (1986); Bogardus et al (1986); McNeill e t al (1987); Owen et al (1987); Lawrence et al (1988); Weststrate (1989) .
102

including groups of predominantly obese subjects, single sex studies, groups
described as living at a low plane of nutrition' and groups of the same race, as
well as those extending across the entire range. FFM was measured by a number
of different techniques. The use of the mean values for FFM should largely
eliminate the statistical problems associated with errors in estimation of FFM,
which can affect this type of correlation when performed within a group (see
above).
A strong negative correlation between BMR/kg FFM and FFM was
apparant (r = - 0.86, p < 0.001); BMR/kg FFM declined as the weight of the FFM
increased. This is consistent with the relationship observed for the women in the
present study. It seems to suggest that irrespective of why the FFM is a particular
size - whether the result of obesity, sex, nutritional status or ethnic origin - there is
a general trend for BMR/kg FFM to decline as the weight of the FFM increases.
This observation has important implications for the use of FFM as a
metabolic reference standard. Expressing BMR 'per kg FFM' could potentially
result in misinterpretation of data when the groups or individuals concerned are of
different body size. Superficially for example, it might suggest that the metabolic
rate of the obese is lower than the lean or the BMR of women is greater than men,
when this is apparently not the case if differences in the weight of the FFM are
taken into account. 'Normalising' BMR data in this way could be a particular
hazard when investigating the possibility of metabolic adaptation in those exposed
to chronically low energy intakes since studies in this area often involve comparing
groups of markedly different body size (eg. Shetty, 1984). Certainly in those
groups with different weights of fat-free tissue a difference in BMR/kg FFM
cannot necessarily be taken as an indication of differences in metabolic activity at
cellular level.
Miller & Blyth’s data (1953) indicated that in the college students they
studied BMR was not constant when divided by FFM itself but rather by FFM 0- 4
103

By correlating log BMR against log FFM in the same way, Lawrence et al (1988)
found BMR in their groups of women to be approximately constant when divided
by the square root of FFM (BMR/kg FFM0- ). Adopting the same approach in the
present study revealed that in these women BMR was constant when the
demoninator was FFM0-7. In the combined studies BMR was similar in all groups
when divided by FFM0-48. These data would seem to suggest that for use as a
reference standard it might be more appropriate to relate BMR to a power function
of FFM rather than to simply express metabolic rate per kg FFM.
Age Related Changes in BMR and Body Composition.
Age related changes in the BMR of women have not been well
documented. The present study provided the opportunity to investigate the effect
of age on BMR, particularly in relation to body composition, in a relatively large
number of healthy women aged between 16 and 66 years.
No significant change in BMR per day was observed in the women as age
increased. Other cross-sectional investigations covering a comparable age range
have obtained similar results. Data presented by Harris & Benedict (1919) from
103 women aged between 15 and 74 years suggests little decline in basal heat
production before about 50 to 60. Mackay & Patton (1936) reached a similar
conclusion. In a study of 73 women aged between 35 and 70 years they found
that basal metabolism remained relatively constant until the age of about 50 and
declined thereafter. More recently, in a group of 44 women aged 18 to 65, Owen
et al. (1986) report age to have little influence on RMR. Dore et al. (1982) did
find a decrease in BMR with age in a group of obese women, the numbers
involved were small however, and the relation weak (r = - 0.22). From the limited
data available the indications are that an appreciable decrease in the BMR of
104

women does not take place before about 50 to 60 years. This may to some extent
reflect maintenance of the FFM until this time.
Over the age range of the women in this study FFM showed no significant
decrease with age. A large scale anthropometric assessment of almost 1200
women undertaken by Dumin et al. (1985) similarly reports no obvious difference
in the size of the FFM over the age range 20 to 60 years, a finding supported by
Owen et al's study (1986) and by that of Cohn et a l (1980). Forbes & Reina
(1970), who analysed data from over 3,000 women investigated by four groups of
workers, suggest that an appreciable reduction in the size of the FFM does not
occur in women until after the menopause, around 50 to 60 years. The numbers
of women in the present study in this higher age bracket was relatively small; 13
out of 97 were over 50 and of these only 7 were post-menopausal. On this basis,
it may have been surprising if FFM had shown a significant decrease with age.
Forbes & Reina (1970) based their conclusions on the finding that the potassium
content of the women changed little before the age of about 50. This suggests that
little muscle (rich in potassium) had been lost. Womersley et al. (1976),
comparing a group of young sedentary women with a group of older nonobese
women (mean age 58), also report only a small decreament in body potassium
with advancing years. Cohn et al. (1980) reach a similar conclusion. Using total
body potassium and nitrogen measurements to parcel out muscle and non-muscle
components of the FFM, these workers did not find an appreciable decrease in
muscle mass before the age of about 60 in women. In the present investigation
circumference measurements made on the women suggest that here too, muscle
mass was little different in the older compared to the younger subjects. The
interpretation of circumference data as an index of muscularity is complicated by
the effect that body fatness has on the measurement; any circumference will
necessarily be the product of both muscle and fat. For a given muscle mass the
greater the amount of overlying fat, the greater the circumference. By the same
105

reasoning, for a given amount of fat, the more muscle present the greater the
circumference. Using regression analysis we were able to show that at a given
skinfold thickness, - an estimate of subcutaneous fat - age had no effect on the
circumference measurement. If muscle mass had declined with age one would
have expected a smaller circumference for a given amount of fat in older compared
to younger women but this was not the case. This implies that muscle mass did
not decline in these women.
The other component of FFM which might have been expected to show
some loss with increasing years is bone. There is some controversy as to the
onset of bone demineralisation in women; as early as 20 years has been suggested
(Riggs et al., 1982), others put the figure closer to 40 or 45 years (Vaughan,
1970; Nordin et al., 1972; Cohn et al, 1980; Munro, 1988). It is generally agreed
however, that loss is accelerated, and therefore most significant, after the
menopause. Dumin & Womersley (1974) suggest that it is probable that between
the ages of 45 and 75 years women lose between 18% and 30% of their total
mineral content. These workers report a fall in the density of the FFM from about
1,100 kg m-3 in young women to between 1,092 and 1,095 kg n r3 by the age of
about 60 which they attribute primarily to bone mineral depletion (Womersley et
a l, 1976). Some loss of bone may have occured in the women in the present
study. However, bearing in mind the relatively small number of older - fifty plus -
women and the even smaller number of post-menopausal volunteers this is
unlikely to be substantial and would probably have little effect on the mass of fat-
free tissue.
One component of the FFM is however, likely to have shown significant
change with age. As the the women became older they also became fatter and
consequently the nonfat component of adipose tissue would have increased.
Rough calculations based on weight gain over the age range suggest that this
probably equates to around 0.5kg per decade. All other things being equal FFM
106

would have been expected to increase. It did not appear to however, suggesting
that some other component of the FFM must have decreased. Muscle and bone
might have been thought the most likely candidates. As discussed above however,
it seems unlikely that any appreciable loss of muscle occured over the age range.
Similarly, although some demineralisation of the skeleton may have occured, it
would be very surprising if this could match the calculated gain in nonfat adipose
tissue. Indeed it is difficult to envisage which component of the FFM could have
declined sufficiently to have offset this apparently large gain in adipose tissue and
by so doing allowed the mass of fat free tissue to remain relatively constant.
Several studies have reported that once differences in FFM have been taken
into account age has little influence on BMR (eg. Cunningham, 1980; Bernstein et
al., 1983; Owen et al., 1986, 1987). In the present investigation FFM remained
constant with increasing years and so too did BMR, supporting the contention that
the relationship between the two is not affected by age; women with a similar FFM
had a similar BMR, no matter how old they were. It would seem that the
increasing proportion of nonfat adipose tissue occupying the FFM of the older
women had little impact. This is consistent with the general observation that
differences in body fatness have no effect on BMR once differences in FFM have
been taken into account (see above).
In contrast to the findings of this study, McNeill et a l (1987) and Dore et
a l (1982) both report a small but significant decline in BMR in relation to FFM
with increasing years; at a given FFM older individuals have a lower BMR. The
differential results are not readily explained but may be associated with differences
in age-related changes in body composition or perhaps even the metabolic activity
of the individual tissues in the groups considered by these workers compared to
our own; McNeill et a l (1987) studied Indian men, Dore et a l (1982) obese
women.
107

The present study gives no indication of a fall with age in metabolic rate
per unit of tissue - a 'slowing of metabolism' at cellular level. However since little
age-related change in body composition is obvious in these women (apart from
progressive fat accumulation) it would have perhaps been surprising if the data had
indicated otherwise.
The lack of an affect of age on the relationship between BMR and FFM
would suggest that over the age range of the women in this study at least, a single
equation could be used to predict BMR from FFM. Using body weight in a
similar way would not be appropriate. In relation to weight BMR was found to
decline with increasing years. For a given weight BMR was some 12% lower in a
women of 50 compared to a 20 year old; equivalent to a decline in relation to
weight of some 4% per decade. This fall is in excess of the 1 % per decade cited in
the FAOAVHO/UNU report (1985) but in relatively good agreement with the 5%
reported for women in Harris & Benedict's analysis (1919). The decline is
probably the result of changes with age in the proportion of the body weight made
up as fat. Over the age range of the women in this study weight was found to
increase. As already discussed, this is essentially a consequence of an increase in
body fat content, FFM remaining relatively constant. At a given weight therefore,
an older woman is likely to have a greater proportion of body fat and less FFM
than her younger counterpart, and consequently her BMR is likely to be lower.
The decrease observed in BMR in relation to body weight of women
between the ages of 2 0 and 60 in this study brings into question the age categories
chosen for the FAO/WHO/UNU equations (1985). A single equation is used to
predict BMR from body weight for women between 30 and 60 years. Since this
study has shown that over these years BMR falls significantly in relation to
weight, the equation might not be equally applicable over the entire range. To test
this contention the percentage differences between the measured BMR for women
of 30 to 60 and that predicted using the appropriate WHO equation were plotted
108

against age (Figure 3.6). A significant positive correlation was obtained (r = 0.32,
p = 0 .0 1 ) indicating that the error associated with prediction did indeed change
with age. Overall, the equation over-estimated the BMR of the women by some
4%. At 30 years the error was small; as age increased, the over-estimation became
progressively greater. This would suggest that the equation may be more
applicable to women at the younger end of the age range rather than to older
individuals. A review of the relevant literature revealed that over half of the
measurements from which the 30 to 60 years equation had been derived
(Schofield, 1985b) were made on women between the ages of 30 and 40. This
inclusion of a disproportionate number of younger women by Scofield may
explain the over-estimation of BMR in older women in the present study
therefore.
It appears that age related changes in the proportion of body weight made
up of fat and FFM may also affect the usefulness for older males of the WHO
equation for 30 to 60 year old men, see Chapter 4.

% e
rror
36 -x
31 -
2 6 -
21 -
16-
• • •
6 -
m- 9 -
2317 29 35 53 59Age (years)
Figure 3.6Error in estimating the BMR of 30 to 60 year old women in the present study using the FAO/WHO/UNU equation (1985).
110

CHAPTER 4
THE EFFECT OF fi-ADRENERGIC BLOCKADE
THERAPY ON THE BMR OF PATIENTS WITH
CARDIOVASCULAR DISORDERS.

INTRODUCTION.
It has been suggested that BMR has two major components: one that relates
simply to the mass of the individual organs and tissues in the body, and one to the
metabolic activity of those tissues - to the energy demanding processes at cellular
level (James et al, 1979). Together these will determine BMR and differences in
either component will be manifest in differences in metabolic rate, thus representing
potential sources of variation between individuals. Jung et a l (1980) have
suggested that the metabolic activity of the tissues is at least partly under the control
of the sympathetic nervous system. They found that administration of the B-
adrenergic blocker propranolol over the course of a week to a group of obese
women on a weight maintenance diet resulted in a fall in RMR of almost 9%. They
took this to imply that BMR has a component which is adrenergically mediated.
Scheidegger et a l (1984) also report a decrease in BMR after acute B-adrenergic
blockade in lean men. However, the effect of B-blockade and the part played by
catecholamines in determining BMR is controversial. Several groups have found
acute administration of propranolol to have no significant effect on basal or resting
metabolic rate (Acheson et a l ,1983; Welle & Campbell, 1983; Deffonzo et al,
1984; Seaton et a l, 1984; Vemet et al, 1987; Gelfand et a l, 1987). In Vemet et
al's study a trend for BMR to decline was observed but the decrease just failed to
reach statistical significance. The reason for the discrepancy between the various
studies is not clear. It may relate to the doses of B-blocker given or to the manner
in which they were administered. In the studies where no effect of propranolol was
observed the dose was generally - with the exception of Vemet et al s study (1987)
- lower than that given by Jung et a l (1980) who found an effect. In addition,
propranolol was administered by IV infusion over relatively short periods of time,
typically 3 -4 hours, in contrast with the oral doses given over the course of a week

in Jung's study. It may be that longer term administration is necessary to produce a
change in BMR.
Since 13-adrenergic blockers are routinely prescribed in the treatment of a
number of common cardiovascular complaints, including hypertension, angina and
cardiac arrhythmias, the question arises as to whether the doses of 13-blockers used
in the management of such disorders could cause a reduction in BMR. A
significant lowering of basal metabolism could have important implications
regarding energy balance in patients taking 13-blockers. Since somewhere in the
region of 10% of the male population of the UK over the age of 40 are estimated to
be receiving 13-blockade therapy this is an issue of some importance.
The doses of propranolol and the manner of administration employed in
Jung et al's study (1980) are probably most akin to those used clinically, although
their doses maybe somewhat higher. In this case RMR was reduced, but the issue
is far from resolved.
The aim of the present study therefore, was to investigate the effect on
BMR of clinically prescribed doses of 13-adrenergic blockers. The BMRs of a
group of patients undergoing 13-blockade treatment - with propranolol or, more
commonly, another 13-blocker - were compared to those of control subjects. As
well as examining a potentially important and apparently over-looked side effect of
this widely used group of drugs, the study provided the opportunity to investigate
the contention that BMR has an adrenergically mediated component, possibly
involved in the regulation of the metabolic activity of the tissues.
SUBJECTS AND METHODS.
Subjects.
18 male subjects receiving 13-blockade therapy and 28 healthy controls
participated in the investigation. The study took place in collaboration with the
Department of Cardiac Surgery at Glasgow's Royal Infirmary and all 13-blockade
113

subjects were inpatients at the hospital. Most of the patients were being treated for
angina pectoris. Two, however, were in hospital for more serious cardiovascular
complaints and subsequently underwent bipass operations. The majority of
patients were receiving cardio-selective 6-1 adrenergic blockers such as metropolol
(Lopressor) and atenolol (Tenrmin). Less commonly, propranolol (Inderal), a 6-1
& 2 antagonist, had been prescribed. Unfortunately, information on the specific
drug and dose received by each patient is not available.
The control subjects were male employees with Strathclyde Regional
Council. All had recently been screened as part of Greater Glasgow Health
Board's 'Good Hearted Glasgow' campaign and were free from cardiovascular
disease, receiving no medication and deemed in generally good health.
Measurement of BMR.
In all subjects BMR was determined using the ventilated hood system, as
described in Chapter 2. 6 -blockade patients were measured at the hospital where
they had spent the night - all had been 'up and about' for sometime before their
measurements - control subjects at their place of work, having arrived from home
early in the morning. In both cases a quiet room was set aside specifically for the
purpose of the study. All subjects were in a fasted state and rested for half an hour
before the measurements began.
Anthropometry.
Subjects were weighed after emptying their bladders and when wearing
only pyjamas or underwear. Their weight was recorded to the nearest 0.1 kg.
Height was measured to the nearest mm. (See Chapter 2). BMI (Wt (kg) / Ht
2(m2) was determined from these two variables.
Body fat content was assessed from the sum of four skinfold thicknesses
(biceps, triceps, subscapular and supra-iliac) according to the equations of Dumin
114

& Womersely (1974), see Chapter 2. Other methods of determining percentage
body fat were not considered practical in this study.
Statistical methods.
Two tailed Student's t-tests were used to evaluate differences between B-
blockade and control subjects. Analysis of variance and co-variance were used to
compare the BMR of the groups, adjusted for differences in FFM or weight.
Linear regression analysis was used to derive the regression equations relating
BMR to weight, and to FFM. All procedures were performed using the SPSSx
statistical language
RESULTS.
The physical characteristics of the B-blockade and control subjects are
presented in Table 4.1. Although attempts were made to match the controls as
closely as possible with the patients, in the event the B-blockade patients proved to
be significantly heavier and had a greater BMI and FFM than the controls. There
were no significant differences in the ages, heights or body fat contents of the two
groups.
The absolute BMRs of the groups were not different. However, when
expressed per kg of body weight or per kg FFM, the BMR of the B-blockade
subjects was found to be 10% lower than that of the controls (Table 4.1). In
Chapter 3 we have shown that as weight increases BMR/kg tends to fall, similarly
BMR/kg FFM declines as the FFM increases. It may not be appropriate therefore,
to compare the BMRs of groups who differ in weight or FFM. To overcome this
problem an analysis of variance was carried out using weight or FFM as
covariables. The results, (Table 4.2), demonstrate that after adjusting for
differences in weight or FFM in this way, there was a significant difference

Table 4.1
Physical characteristics and BMR results of B-blockade and control subjects.
B-blockade
(n = 18)
mean (SD)
Control
(n = 28)
mean (SD) P
Age (yrs) 53.6 6.3 53.3 6 .6 0.9
Weight (kg) 81.9 8.9 74.1 8.5 0.005
Height (cm) 173.7 3.6 173.4 5.2 0 .8
BMI (kg/m2) „27.2 2.7 24.5 2.5 0 .0 0 2
% Body fat 26.4 4.3 26.1 2.9 0.78
FFM (kg) 60.1 4.6 54.6 5.4 0 .0 0 1
BMR:
kcal/day 1544 199 1546 177 0.97
kcal/kg Wt//day 18.9 1.9 2 1 .0 2.3 0 .0 0 2
kcal/kg FFM/day 25.6 2.3 28.4 2 .6 0 .0 0 1
% diff WHO* -14.2 8.5 -9.6 8.5 0.08
* % difference from BMR predicted according to the equations of the
FAO/WHO/UNU (1985).
1 1 6

Table 4.2
The effect of weight or FFM on the relationship between BMR and
B-blockade therapy assessed by analysis of variance.
Dependent variable: BMR
(Residual df = 44)
A. Source of variation: df F-ratio
Weight 1 22.2
B-blockade therapy 1 3.9
B. Source of variation: df F-ratio
FFM 1 33.5
B-blockade therapy 1 7.8
df = degrees of freedom.
Statistical significance of F-ratio, * P <0.005, ** P < 0.01,
*** P < 0.001
*
*
1 1 7

between the BMR of the B-blockade and control subjects. Using linear regression
analysis the following equations were derived which best described the relationship
between BMR and weight, and BMR and FFM in the two groups:
BMR = (Weight x 12.6) + 615 - (GpxlOO)
BMR = (FFM x 24.3) + 216 - (Gpx 136)
Where Gp = 1 for the B-blockade patients and Gp = 0 for the controls.
These indicate that in relation to weight the BMR of the B-blockade patients
was 100 kcals/day lower than that of the controls, in relation to FFM, 136 kcal/day
less. At a weight of 75kg and a FFM of 57kg this is equivalent to a difference of
6 % and 8 % respectively.
In comparison with standard values predicted from FAO/WHO/UNU
equations (1985) the BMR of the B-blockade patients was some 14% lower than
expected (Table 4.1). The BMR of the control subjects was also less than
predicted, by about 10%. The difference between the groups just failed to reach
statistical significance.
DISCUSSIO N.
The results of this study indicate that clinically prescribed doses of B-
adrenergic blockers reduce BMR. When adjusted for differences in FFM the BMR
of the B-blockade patients was some 8 % lower than that of the control subjects.
Both Jung et al. (1980) and Scheidegger et al. (1984) have observed that B-
blockade with propranolol reduces BMR, this study suggests however, that B-
1 18

blockers other than propranolol can produce this effect. The majority of patients in
the study were receiving 13-1 blockers such as atenolol and metroprolol. This
reflects the general trend away from the clinical use of propranolol - a 13-1 & 2
antagonist - because of the increase in airway resistance which can accompany its
cardiovascular effects, a potential danger to asthmatics. The inhibitory effects of 13-
1 drugs, unlike propranolol, are generally limited to the cardiovascular system,
although none are entirely cardio-selective (Weiner 1987).
It would seem then, that a reduction in BMR may be a side effect of both
propranolol and, of greater clinical relevance, the more usually administered 13-1
antagonists. The usefulness of 13-blockade therapy in the management of
cardiovascular disease is undisputed, however, even when set against the
undoubted beneficial effects of the drugs, a depressed BMR is a potentially
important side effect. The quantitative importance of BMR to the total daily energy
expenditure (TEE) of subjects such as the 13-blockade patients who, because of the
nature of their cardiovascular disorders, are essentially sedentary means that a
reduced BMR will necessarily result in a reduced TEE. If the energy intake of the
patients remains unchanged in the face of a reduced energy expenditure positive
energy balance and weight gain will ensue. Some of the patients did in fact report
that they had put on weight, but this may not necessarily be the result of 13-blockade
therapy. If however, through a reduction in BMR and TEE, 13-blockers did lead to
weight gain this could potentially exacerbate the very conditions these drugs are
prescribed to treat. Obesity is recognised to be a complicating factor in
cardiovascular disease.
It is possible that BMR may not be the only component of TEE to be
affected by 13-blockade, the thermic effect of food (TEF) might also be reduced;
there is some evidence to suggest that it too has an adrenergically mediated
component (Robertson & Porte, 1974; Welle et ah, 1980; Acheson et al., 1983; Le
119

Blanc et al., 1984; DeFronzo et al., 1984). If this is the case, the result would be
to lower TEE still further and increase the potential risk of weight gain.
Whether the result of B-blockade therapy or not, the patients in this study
could certainly be classified, from either body fat content or BMI, as moderately
obese and would probably benefit from weight loss. It is well established that
weight loss is useful means of reducing blood pressure (Ramsey et al., 1978;
Reisen et al., 1978; Jung et al., 1979a; Sowers et al., 1982) and other
cardiovascular conditions may also become more manageable with weight reduction
(Jung et al., 1980). Moreover, a very obese individual might be required to slim
down prior to surgery. Jung et al's data (1980) suggest that should these patients
decide to diet their weight loss will not be slowed by B-blockade therapy. The rate
of weight loss during energy restriction depends on the extent of the energy deficit
incurred. On a given intake the lower the BMR and therefore TEE, the smaller the
deficit and the slower the rate of weight loss. A fall in BMR would therefore be
expected to reduce the efficacy of a slimming diet. However, Jung et al. (1980)
found propranolol to have no effect on the BMR of obese women already following
a semi-starvation diet, presumably because the adrenergic component of BMR was
already minimal.
To date, the fact that 6 -blockers have any effect on metabolic rate does not
appear to have been recognised. Certainly, the authoritative text, Goodman and
Gilman's 'The Pharmacological Basis of Therapeutics1 makes no mention of a
depression in BMR when discussing the possible untoward effects of B-blockade
treatment (Weiner, 1987).
Aside from the clinical relevance of a reduction in BMR with 6 -blockade
therapy, the results of this study support the view that BMR has an adrenergically
mediated component (Jung et a l, 1980). They provide no clue however, as to the
precise way in which the sympathetic nervous system is involved in the
determination of BMR. The B-blockade may have inhibited a direct action of the
120

catecholamines on an energy requiring process at cellular level - the Na+/K +pump
and certain substrate cycles are known to be sensitive to catecholamine levels
(Newsholme, 1985; Himus-Hagen, 1983; Clausen, 1986). It is also possible that
the depression in BMR resulted from inhibition of catecholamine stimulated
lipolysis and FFA oxidation. Several investigators have suggested that at least part
of the calorigenic response to catecholamine infusion or increased sympathetic
nervous system activity results from the concomitant increase in FFA mobilisation
rate (Havel et al. , 1964; Steinberg et al., 1964; Eisenstein & Singh, 1980;
Scheidegger et al., 1984). Since the lipolytic effects of the catecholamines are
thought to be mediated through 15-1 receptor stimulation (Eisenstein & Singh, 1980;
Kunos, 1981) both propranolol, a 15-1 & 2 antagonist, and the 15-1 antagonists
administered to the patients in this study are likely to have reduced the rate of FFA
mobilisation. In retrospect it would have been interesting to compare the rates of
substrate oxidation between 15-blocker and control subjects. However, a lower rate
of fat oxidation in the 15-blockade patients would not necessarily be indicative of a
cause and effect relationship between inhibition of lipolysis/fat oxidation and the
reduced BMRs. Havel et al. (1964) found that a reduction in plasma FFA levels
caused by nicotinic acid injections had no effect on BMR, suggesting that the
availability of FFA as a fuel may not be an appreciable influence on resting
metabolic rate under normal circumstances. Weststrate (1989) noted that high
BMRs/kg FFM were associated with high rates of fat oxidation but whether the
high metabolic rates were caused by the high rates of fat oxidation or by another
manifestation of increased sympathetic activity is unclear.
It has been suggested that at least part of the thermogenic effect of the
catecholamines results from their actions on peripheral thyroid metabolism.
Catecholamines are able to increase circulating levels of T3 by stimulating the
peripheral conversion of T4 to T3 (Galton, 1965; Rothwell et al., 1982;
Scheidegger et a l , 1984). Propranolol has been shown to inhibit this conversion
121

and so reduce circulating levels of T3 (Lotti et a l, 1977; Eisenstein et a l, 1978;
Jung et a l, 1980; Jones et a l, 1981). However, inhibitory effects on peripheral
T3 production may vary from one B-antagonists to another. Atenolol for instance,
has been shown to have no significant effect on T3 levels (Jones et a l, 1981). In
retrospect it would have been informative to measure, and compare, T3 levels in B-
blocker and control subjects. If the reduction in BMR with B-blockade is caused, at
least in part, by its actions on peripheral thyroid metabolism this may explain the
lack of any appreciable effect in previous investigations where propranolol was
administered acutely (Acheson et a l, 1983; Welle & Campbell, 1983; Seaton et a l,
1984; DeFronzo et a l, 1984; Vemet et a l, 1987; Gelfand et a l, 1987) compared to
the long-term administration in this and Jung et al's study (1980). Most of the
effects of thyroid hormones appear to be mediated by activation of nuclear receptors
that lead to formation of RNA and subsequent protein synthesis, for example
formation of Na+/K+ATPase (Dauncey, 1990). Consequently, a time lag can be
expected between changes in thyroid status and the resultant metabolic effects. Any
depression of metabolic rate caused by a B-blocker reduction in T3 levels is unlikely
therefore, to have become evident in experiments lasting only a few hours.
The BMR of the B-blockade patients was found to be 14% below standard
values predicted on the basis of age and weight by FAO/WHO/UNU equations
(1985). However, the BMR of control subjects was also lower than expected, by
some 10%, which seemed to suggest that WHO equations may not be applicable to
this group of men.
The control subjects were all aged between 41 and 64 years, BMR was
therefore predicted from body weight according to one of two equations:
(1) 30 - 60 years BMR (kcal/day) = (11.6 x WT) + 879
or
(2) Over 60 BMR (kcal/day) = (13.5 x WT) + 487
122

Since the majority of the men, 25 of the 28, were covered by the 30 - 60 year
equation the results are essentially reflecting a tendency for this equation to over
estimate BMR. In view of the findings for the female subjects in Chapter 3, it was
suspected that this may again suggest that the 30 - 60 year equation might be more
applicable to men at the younger end of the age range rather than to our older, 40
plus, group. An examination of the relevant literature provided confirmation; it was
found that only about half of the measurements from which the equation was
derived (Scofield, 1985b) were made on men over 40. Assuming that for men too,
as in the female subjects, there is an increase in the proportion of the body weight
made up as fat with increasing years (eg. Keys et a l , 1953; Shock et a l, 1973) at a
given weight the over 40s are likely to have more fat and a lower FFM than their
younger counterparts and consequently a lower BMR. This could well explain the
over estimation of BMR in the control subjects, especially as most were near the
upper end of the 30 to 60 range (mean age 53).
Since the WHO equation for men over 60s gives a lower estimate for BMR in
relation to weight it may be a better predictor of BMR in those between 40 and 60.
Indeed when using this equation to estimate the BMR of all the control subjects -
both those above and below 60 - a mean difference of only + 4.1% was found
between the actual and predicted values, this did not prove to be statistically
significant (p > 0.05). However, aside from the apparent merits of this equation,
the results certainly suggest that the equation for 30 to 60 year olds may not be
applicable to those at the upper end of this age range and this is likely due to the
preponderance of measurements which were made on younger individuals.
123

CHAPTER 5
ANALYSIS OF FACTORS RESPONSIBLE FOR
VARIATION IN BMR IN RELATION TO FFM.
124

INTRODUCTION.
Over recent years differences in 'body composition' - generally taken to
mean differences in the mass of fat-free tissue - has become the standard, 'text
book', explanation for variation in BMR. The study described in Chapter 3
however, showed that even when differences in the weight of the FFM had been
taken into account there was still considerable variation in the BMR of individual
women. At a given FFM, BMR could differ by as much as 400 kcal/day. This
observation is by no means isolated, others studies have found the residual standard
deviations of regression equations relating BMR to FFM to be of a similar
magnitude (Bogardus et al., 1982; Lawrence et a l, 1988) and several authors have
pointed to apparently comparable individuals with widely divergent BMRs
(Garrow, 1985; Dumin, 1988). The nature of such variation has not however,
been comprehensively studied and is largely speculative. The aim of the present
investigation was therefore to elucidate more fully the reasons why, at a given
FFM, BMR can apparently vary between individuals by several hundred kcal/day.
Two groups of women, characterised by particularly high or low BMRs in
relation to their FFM, were selected from the initial study for further investigation
(see Figure 5.1). As shown in Table 5.1, on average the two groups were
relatively closely matched in terms of body weight, FFM and percentage body fat,
yet differed in basal energy requirements by almost 300 kcals a day. The
contribution of the above factors to the differences between the groups was
examined. It was hoped that understanding the causes of the very marked
differences evident in these women would shed some light on the inter-individual
variation in BMR relative to FFM evident in the initial study.
It was postulated that part of the variance may be the result of intra
individual differences in BMR; day to day or short-term fluctuations in a subject's
BMR; day to day or short-term fluctuations in an individual's BMR, affected by
125

Table 5.1
Anthropometric data and BMR results for the high and low BMR groups.
High(n = 9 )
Low( n = 10)
Age (yrs) 28 (12) 32 (13) NSWeight (kg) 57.8 (5.5) 62.7 (13.5) NSHeight (cm) 160.3 (4.0) 164.9 (4.6) 0.05BMI (kg/m2) 22.4 (2.6) 23.0 (1.8) NS% Body fa t:Skinfolds 29.3 (6 .8) 29.1 (29.1) NSDensity 30.6 (6.3) 27.3 (7.1) NSTBW 33.1 (6.2) 32.8 (8.3) NS
FFM (kg):Skinfolds 40.6 (2.7) 44.2 (6 .6) NS
Density 39.9 (1.9) 44.9 (6.0) 0.05
TBW 38.9 (6.2) 42.1 (11.1) NSCircumferences:Upper arm (cm) 27.1 (2.3) 26.9 (3.4) NS
Buttocks (cm) 94.6 (5.1) 96.5 (9.6) NS
Upper thigh (cm) 55.5 (3.7) 55.8 (7.8) NS
Calf (cm) 36.8 (1.8) 36.5 (4.0) NS
Diameters:Biacromial (cm) 35.7 (0.9) 38.2 (1.5) 0 .001
Bi-iliac (cm) 29.3 (1.6) 30.1 (3.7) NS
Wrist (cm) 5 .2 (0 .2 ) 5.3 (0.3) NS
Knee (cm) 9.3 (0.3) 9.5 (0.6) NS
BMRkcal/day 1509 (75) 1227 (64) NS
kcal/Wt kg/day 26.3 (2.6) 19.8 (1.8) NS
kcal/FFM kg/day * 37.5 (1.3) 27.5 (1.7) NS
* FFM, mean of the skinfold and density estimates, see text for explanation.
126

BMR
kcal
/day
1670—,
1598
1526-
□□1382-
• t N •1310-
1238-• • • •
1166- □ High group
o Low group
950-
38 5850
FFM (kg)
Figure 5.1S c a t t e r p l o t o f BMR a g a in s t FFM showing the 19 women s e l e c t e d fo r f u r t h e r s tudy .
127

factors such as the preceding day's energy intake, level of exercise and - for women
- stage of the menstrual cycle. To make some assessment of the extent to which
intra-individual variation in BMR contributed to the differences between the groups,
the BMRs of the women were remeasured. FFM was also measured again, on the
premise that any error in its initial estimation could also have contributed to the
variance. In the first study the FFM of the women had been estimated by TBW,
densitometry and skinfold techniques, it was hoped that comparison of the three
methods would also provide information as to the possible error involved in
measurement of FFM. It seemed reasonable to assume that at least some portion of
the variance would be due to genuine differences in the relationship between BMR
and FFM. Two possible, hypothesis were proposed. The first relates to
composition of the FFM. Since FFM is made up of tissues and organs with very
different metabolic rates it is possible that differences between the groups could
have arisen through differences in the relative proportions of 'active' tissue, such as
the liver,kidney, heart and brain, compared to 'inactive* tissue, much for example,
making up the FFM. Alternatively, there may have been differences in the
metabolic activity of the tissues between the groups - differences in the rate of
energy demanding processes at cellular level. The metabolic activity of the tissues is
thought to some extent to be under hormonal control; the results of the 6 -blockade
study, Chapter 4, certainly suggested BMR has an catecholamine mediated
component and thyroid hormones are also implicated in the control of celluar
thermogenesis. It was postulated that differences in the levels of these hormones
may a play at part in explaining variation between the groups. To test this
hypothesis plasma levels of the thyroid hormones and urinary catecholamine
concentrations were determined in the women.
128

SUBJECTS AND METHODS.
Subjects.
The nineteen women selected for study (see above) made a return visit to the
laboratory and the measurements detailed below were carried out. The time interval
between the first and second visits was variable, ranging from 2 to 9 months, the
majority of the repeat measurements however, took place within 3 months of the
first visit.
It is evident from Figure 5.1 that the women chosen were not necessarily
those in the group with the absolute highest and lowest BMRs in relation to their
FFM (this is particularly true with regard to the low group). They were however,
as close as possible to this ideal within the practical constraints of the subjects being
willing and able to return for a second visit.
Measurement of B1MR.
To make some assessment of the contribution of intra-individual variation to
the differences observed between the groups, the BMRs of the nineteen women
were remeasured. As on the first occasion the Douglas bag technique was
employed and metabolic rate calculated as described in Chapter 2. All the
conditions prerequisite for determination of BMR were again carefully adhered to.
Body Composition.
The body weight and body fat content of the women were also remeasured.
Body fat was estimated from the sum of four skinfolds (biceps, triceps,
subscapular and supra-iliac) according to the equations of Dumin & Womersley
(1974) and from body density determined by underwater weighing. Details of
procedures are given in Chapter 2.
129

On the first visit to the laboratory percentage body fat had also been
estimated from measurement of total body water (TBW). (See Chapter 2 for
details).
Hormonal Status.
Serum Thyroid Hormones:
Following measurements of BMR and body composition, and whilst the
subject was still in a fasted state, a 10ml sample of blood was taken from a brachial
vein. The blood was allowed to coagulate, spun down and the serum drawn off.
Aliquots of the serum were then frozen until required for analysis. Assays were
subsequently performed for total serum thyroxine (T4 ), free T4 (FT4 ), tri
iodothyronine (T3 ) and thyroid stimulating hormone (TSH) concentrations. T4 and
T3 were measured by 'in house' radioimmunoassay (RIA) using SAPU antibody
(Scottish Anitibody Production Unit); TSH, by 'in house' two-site RIA using
SAPU; FT4 , by 'in house' RIA using microencapsulated antibody. All analyses
were carried out by the Department of Clinical Biochemistry at Glasgow’s Royal
Infirmary.
Urinary Catecholamines:
Each of the women performed a 24 hour urine collection, usually beginning
on the morning following the visit to the laboratory. The subjects were instructed
to empty their bladders soon after getting up (this urine was discarded) and to begin
timing the collection from this point. All subsequent urine was collected until the
same time the following morning when the subjects again voided their bladders,
this time adding the urine to that already collected. 2 -litre plastic bottles were
provided for this purpose, which contained 50 ml hydrochloric acid to act as a
preservative. The bottles were subsequently uplifted from the subjects' homes by
130

the investigator. The total volume of the urine was carefully measured and small
aliquots kept frozen ready for analysis.
Urinary adrenaline (A) and noradrenaline (NA) concentrations were
subsequently determined using high performance liquid chromotography (HPLC)
and excretion per 24 hours calculated. The analyses were again carried out at the
Department of Clinical Biochemistry, Glasgow Royal Infirmary. Urinary levels of
the catecholamines were measured in preference to plasma concentrations since the
latter tend to be susceptible to short term fluctuations, affected by factors such as
posture, stress and even the physical discomfort involved in the collection of blood
samples (Barrand & Callingham, 1983).
Ethical permission for this study was granted by the Ethical Committee of
the Greater Glasgow Health Board.
Statistical Methods.
Differences within-subjects in the estimate of percentage body fat obtained
by the skinfold, density and TBW methods were evaluated using paired Student's t-
tests. Two tailed Student’s t-tests were used to evaluate differences in body
composition, BMR and hormonal levels between the 'high' and 'low' BMR
groups. Analysis of variance and co-variance were used to compare the BMR of
the two groups, adjusted for differences in FFM. Linear regression analysis was
used to derive regression equations relating BMR to FFM. Coefficients of variation
were calculated for the repeat measurements of BMR and FFM. All the procedures
were performed using the SPSSx statistical language.
13 1

R ESU LTS.
As pointed out in the Introduction, on the basis of the first set of
measurements the two groups of women appeared physically quite similar (Table
5.1). There was a tendency however, for the low BMR group to be somewhat
’bigger' than the high. They were both taller and, on the basis of shoulder width,
broader than their high BMR counterparts. They also tended to be slightly heavier,
although the difference failed to reach statistical significance. Consequently, the
FFM of the low BMR group was slightly larger; significantly so when measured by
densitometry but not for the skinfold and TBW estimates. None of the three
techniques revealed any significant difference between the % body fat contents of
the groups. Age, BMI, circumferences and diameters - with the exception of the
biacromial - were also comparable.
In absolute terms or when expressed per kg body weight or per kg FFM,
the BMRs of the groups differed markedly (Table 5.1). As pointed out in Chapter
3 however, expressing BMR/kg FFM may not be an appropriate way to compare
groups of differing FFM. In view of the tendency for the low BMR group to have a
slightly larger FFM than the high, an analysis of variance was carried out using
FFM as a covariable. The results, (Table 5.2A), indicated that in relation to the
FFM there was a significant difference in BMR between the two groups.
In this instance, and in the BMR ’per kg’ FFM computation, FFM was
taken as the mean of the skinfold and densitometry estimates since this was the way
the results were presented in the first study and the basis on which the subjects
were selected. However, analysis of variance indicated that whether in relation to
FFM measured by TBW, skinfolds, densitometry or the mean of the estimates, the
BMRs of the two groups still differed significantly.
Using multiple linear regression analysis, the following equation was
derived which best described the relationship between BMR and FFM in the two
groups:
132

Table 5.2k
Initial measurements : between - group differences in the relationship between
BMR and FFM assessed by analysis of variance.
Dependant variable:
(Residual df =
BMR
: 16)
Source of variation: df F - ratio
FFM 1 89.7 ***
Group 1 168.0 ***
Statistical significance of F-ratio, *** p < 0.001
Table 5.2B
Repeat measurements : between - group differences in the relationship between
BMR and FFM assessed by analysis of variation.
Dependant variable: BMR
(Residual d f =16)
Source of variation: df F - ratio
FFM 1 19.7 ***
Group 1 13.6 **
Statistical significance of F-ratio , *** p < 0.001, ** p < 0.01
133

BMR (kcal/day) = (FFM x 30.1) + 295 - (Gp x 411)
Gp = 0 for the high BMR group and Gp = 1 for the low BMR group.
This indicates that at a given FFM, the BMR of the low group was some
400 kcal/day less than that of the high, equivalent to a difference of 26% at a FFM
of 42kg.
The results of the duplicate measurements of BMR and FFM are shown in
Figure 5.2. Very little difference was apparant in the FFM of either of the groups
on the two occasions, with a coefficient of variation of only 1.3% for the high and
1.0% for the low group. BMR however, was more variable. In the high group it
tended to fall from the first to the second measurement, on average by some 9.0%.
In contrast, the BMRs of the low group tended to rise, by an average of 6 %. The
intra-individual coefficient of variation for BMR in the whole group was 6.5%.
This is equivalent to a within-subject variation (standard deviation) of 96 kcal/day.
The new relationship between BMR and FFM for each of the women is
shown in Figure 5.3. Clearly, some regression towards the mean has occured.
For the most part this is a consequence of differences in BMR on the two occasions
rather than to differences in FFM. The average BMR of the groups was no longer
significantly different, 1385 kcal/day in the high group compared to 1305 kcal/day
in the low (p = 0.2). An analysis of variance of the repeat measurements indicated
however, that in relation to the FFM the BMRs of the two groups were still
significantly different (Table 5.2B). The difference had however, approximately
halved. The regression equation describing the relationship between BMR and
FFM (see below) indicated that at a FFM of 42kg, the BMR of the low group was
now 1 2 % lower than that of the high compared to a 26% difference with the initial
measurements.
134

FFM
(kg)
BM
R (k
cal/
day)
HIGH LOW
1700- 1 s t
1600- I*
1500- 62• 21400-
1300-
1200-
1100-
1000-
900-
1 s t 2nd
CV = 6.9% CV = 5.4%
56 -
54 -52-50-
48-
46-
44- •42- •
40- •38-36-
••
34-
i
CV = 1 .3% CV = 1.0%
Figure 5.2D uplica te measurements of BMR and FFM in the high and low BMR groups.
135

Table 5.3
Hormonal status of high and low BMR groups.
High
( n = 9)
mean (SD)
Low
( n = 1 0 )
Mean (SD) P >
Thyroid Hormones:
T4 (nmol/1) 126.2 27.7 91.0 14.8 0 .0 0 1
T3 (nmol/1) 2.5 0.56 2 .0 0.47 0.05
TSH (mU/1) 1.32 0.77 1.51 0.63 NS
FT4 (pmol/1) 15.11 2.47 12.44 2.35 0.05
Catecholamines:
NA (n.mol/24 hr) 222.5 84.7 236.6 126.3 NS
A (n.mol/24 hr) 78.8 64.9 155.6 98.8 NS
1 3 6

BMR
kcal
/day
1670—,
1598-
1526-
1382-
1310-
1238-
1166-
□ HighGp ARepeat measurement
OLow Gp ARepeat measurement
1022 -
950-
38 5850
FFM (kg)
Figure 5 .3S c a t t e r p l o t o f BMR a g a in s t FFM showing the new p o s i t io n s of th e 19 women fo l low ing repea t measurements.
137

BMR (kcal/day) = (FFM x 22.5) + 480 - (Gp x 185)
Gp = 0 for the high BMR group, and 1 for the low BMR group.
The levels of catecholamines and thyroid hormones in the two groups are
shown in Table 5.3. In all the women concentrations were within the normal
reference ranges. Significant differences were apparant in the plasma levels of T4 ,
T3 and FT4 between the groups; the women in the high BMR group had
significantly higher levels of these hormones than the low BMR group. There was
no significant differences in the concentrations of TSH or of the catecholamines -
noradrenaline and adrenaline - between the groups.
DISCUSSIO N.
Intra-individual Variation:
It is apparant from the duplicate measurements of BMR that part of the large
difference in basal metabolic rates between the two groups of women was a
consequence of intra-individual variation, a within-subject variance of 96 kcal/day
was observed. A regression to the mean at the second measurement - a tendency for
the BMR of the high group to drop and the low group to increase - was clearly
evident. This is perhaps not too surprising. Simply by virtue of the fact that the
BMRs of these women were extreme, particularly high or low, it is likely that on
the first occasion when measured BMR was, with respect to any short-term
fluctuations (ie intra-individual variations), also at an extreme; at a peak for the high
group and at a trough for the low group. Consequently when remeasured, the BMR
of the low group is likely to increase to some extent, the BMR of the high group to
fall.
On both occasions when BMR was determined, the measurement was made
under strictly controlled conditions. As standard procedure the room temperature
138

was thermoneutral, the women had fasted for at least 12 hours prior to the
measurement and rested for 30 minutes before the test began. On both occasions it
was impressed upon the volunteers that they must remain quiet and immobile
throughout the procedure. However, in most instances it was not possible to stay
with the subject during the measurement to ensure that they complied. It may be,
therefore, that part of the intra-individual variation observed resulted from
differences in a volunteer's behaviour on the two occasions; perhaps restless during
one measurement compared to the other. Some indication of the subject's state of
relaxation on a particular day can be gleaned from the variability of the three 10
minute determinations; big differences between bags might suggest the subject was
restless. However, as none of the women showed significantly more variation in
metabolic rate during one set of measurements compared to the other this seems to
suggest that with regard to small movements or fidgeting the subjects' behaviour
did not differ markedly between days and is therefore unlikely to contribute
significantly to the intra-individual variability. In those women whose BMR was
lower on the second occasion compared to the first (particularly noticeable in the
'high' group) it is possible that they were initially nervous or anxious and less so at
the subsequent measurement when they had became more familiar with the
technique. Stress could have induced an elevated metabolic rate through stimulation
of the sympathetic nervous system or possibly even through an increase in muscle
tone. One might have expected increased sympathetic nervous system activity to be
characterised by an elevated heart rate. Certainly in some subjects whose BMR was
higher on the first occasion heart rate was also relatively increased (5 out of 10), but
this was by no means universal. Furthermore, in three women whose heart rate fell
from the first to the second occasion BMR increased or remained the same.
It has also been suggested that the preceding day's energy intake and level
of exercise can affect BMR and contribute to differences within a subject. In
recognition of this, diet and exercise were, to some extent, controlled on the two
139

occasions. As mentioned above, prerequisite for any BMR measurement was a 12
hour fast, in addition subjects were always asked to avoid 'stocking up1 with an
extra large meal just prior to the start of their fast and to try to consume their usual
quantity of food on the day before the measurement - factors thought most likely to
affect BMR on the following morning (Dauncey, 1980; Schutz et al., 1985). To
avoid any possible carry-over effects of exercise, the women were requested to
refrain from strenuous activity on the day preceding the measurement, light exercise
was permitted, although usually not undertaken. Since these were the limits to the
control exercised over antecedent diet and activity it is conceivable that some
differences could have occured on the two occasions. However, their contribution
to the between-day differences would probably, at most, have been small.
Weststrate (1989) found no marked difference in intra-individual variation in BMR
between a group of 'free-living' subjects and a group following a carefully
controlled dietary and activity regime. Furthermore, a review of the literature
reveals no clearcut difference in the extent of between-subject variation in those
studies where diet and exercise have been rigorously controlled (Jequier & Schutz,
1981; Murgtroyd et al., 1987; Soloman et al., 1982; Bisdee et al., 1989) compared
to those where energy intake and activity varied (Garby & Lammert, 1984; Garby et
al., 1984; Soares & Shetty, 1986; Weststrate, 1989) (also see Introduction, Table
1. 1).
Reports of the influence of the menstrual cycle on BMR are conflicting.
Several studies have found no effect (Blunt & Dye, 1921; Wiltshire, 1921;
Weststrate, 1989), others however, have reported cyclical changes in BMR
corresponding to the stage of the menstrual cycle - with BMR peaking just prior to
menstruation and falling to a low point before ovulation (Snell et al., 1920;
Wakeman, 1923; Soloman et al., 1982; Bisdee et a l, 1989). In studies made under
carefully controlled conditions where energy intake and physical activity of the
women were held constant, coefficients of intra-individual variation in the region of
140

6 % or 7% have been reported (Soloman et al., 1982; Bisdee et al., 1989).
Assuming only small contributions from measurement noise and perhaps stress, the
authors have attributed most of this variation to differences in the stage of the
menstrual cycle. If this is the case, it is possible that a relatively large proportion of
within-subject variation in the present study could result from this source - no
attempt was made to standardise for day or stage of the cycle between first and
second measurements and consequently several of the women differed in this
respect on the two occasions. Measurements of the author’s BMR during the
course of several menstrual cycles revealed a coefficient of variation of 3.4% which
could not be readily attributed to any factor other than the stage of the cycle. This
would again seem to suggest that the affect of the menstrual cycle on BMR could
potentially account for a sizeable portion of the differences found within the
women.
Some portion of the variation is also likely to have been methodological,
sometimes termed measurement noise, resulting from errors in determination of
energy expenditure. For some types of calorimetry the contribution of
measurement noise to intra-individual variation is relatively easy to quantify. The
measurement error of a respiratory chamber or ventilated hood system for instance,
can be assessed by means of simple gas recovery tests or alcohol combustion.
Studies which have used such techniques, have generally found measurement noise
to be a small component of the total within-subject variance, somewhere between
about 10% and 20% (Ravussin et al., 1986; Murgatroyd et al., 1987; Weststrate,
1989). The error incurred in measuring metabolic rate using the Douglas bag
technique (the method employed in the present study) is much more difficult to
assess. Garby & Lammert (1984) suggest that an estimate can be derived from the
variance of multiple determinations of BMR made on the same day. However, this
approach fails to take into account differences between measurements due to the
subject and not to the method itself (see above). In reality, quantification of
141

measurement error using the Douglas bag technique is probably impossible.
However, there seems little reason to suppose that when used competently, the
error incurred is markedly greater than that with the respiratory chamber or
ventilated hood. Studies by both Segal (1987) and Owen et al. (1986) have found
the Douglas bag and ventilated hood techniques to give very comparable estimates
of resting metabolic rate. It therefore seems unlikely that in the present study
measurement noise would make up a large part of the difference in BMR on the two
occasions.
For some of the women there was a relatively long interval between the first
and second measurement, up to 9 months in one case. Over the intervening period
changes in body weight were evident in some of the volunteers. This was
particularly marked in one woman who had managed to lose over 6 kg - she had
ceased dieting some weeks before the second measurement. Changes in body
weight and body composition would have affected BMR and can be expected to
account for part of the intra-individual variability.
The overall coefficient of within-subject variation in this study, 6.5%
(corresponding to a standard deviation of 96 kcal/day) is, perhaps not surprisingly
considering the nature of the investigation, at the upper end of the individual
fluctuations reported in previous studies; coefficients of intra-individual variation
have ranged from 2% up to about 7% (eg. Garby & Lammert, 1984; Soares &
Shetty, 1986; Murgatroyd et al., 1987; See Introduction, Table 1.1 for details). As
pointed out above, in selecting subjects with particularly high or low BMRs it is
also likely that we selected those individuals whose BMRs were, with respect to
daily fluctuations, also particularly high or low. Consequently an estimate of intra
individual variation obtained from measuring BMR a second time is likely to be
high. In addition, the relatively long time interval between the first and
measurements, sometimes months rather than days or weeks, is likely to increase
the estimate of within-subject variance. Relating the measure of intra-individual
142

variation obtained from these highly selected groups to the original study is
therefore problematic. However, on the assumption that the within-subject variance
in the 97 women is the same as that observed in the 19 (ie. 96 kcal/day) one can
calculate the relative contributions of inter- and intra-individual differences to the
total variance observed in BMR in relation to the FFM (118 kcal/day):
SD2 total = V SD2 intra + SD2 inter
1182 = V962 + SD2 in ter
SD2 inter = V l l 8 2 + 9 6 2
SD inter = 70 kcal/day
For the reasons given above, the degree of intra-individual variance is
almost certainly an over-estimate, and as such inter-individual variation will
probably be somewhat greater than this.
An alternative approach is to assume that within-subject variance in the
initial study represents the same proportion of the total variance it does in the 19
women, as shown below:
In the 19 women:
2032 total = V962 intra + 1802 inter
In the 97 women:
1182 total = >/SD2 in tra + SD2 inter
143

SD2 inter = ' \ / 1 1 8 2 - 962 x 11822032
SD inter = 104 kcal/day
SD2 intra = V(2032 total - 1042 inter.
SD intra = 56 kcal/day
Clearly neither estimate of intra-individual variance is entirely satisfactory,
but it seems reasonable to assume that the real value probably lies somewhere
between the two - between 60 and 100 kcal/day and correspondingly, inter
individual variance between 70 and 100 kcal/day. The literature in this area
suggests the intra-individual variation may be closer to the lower estimate. An
average figure for the coefficient of within-subject variance seems to be around 3%
to 4%, compared to our value of 6.4%. The relative contributions of intra- and
inter-individual variance to the total variance in BMR in relation to the FFM has
important implications for the usefulness of FFM in predicting an individual’s
BMR. This will be discused in Chapter 6 .
Since intra-individual differences in BMR fall short of explaining all the
differences in BMR in relation to the FFM other factors must therefore be involved
in explaining inter-individual differences in BMR in relation to the FFM. One
possibility that could potentially cause variation is an error in estimation of the
FFM.
Errors in the measurement of FFML
Any error in the measurement of the FFM will necessarily distort the true
relationship between BMR and FFM introducing a degree of variation with
144

technical rather than biological cause. With respect to the differences between the
two groups, it is possible that high BMRs relative to FFM may be partially the
result of under-estimation of the fat-free tissue, conversely relatively low BMRs,
from an over-estimation of FFM. The very low coefficients of variation, only
1.3% and 1.0% for the high and low groups respectively, suggest that
reproducibility of the estimation of FFM was high, especially since a component of
this will have resulted from genuine differences in the FFM - as mentioned above,
the body weight of some women had changed. However, this in itself tells us
relatively little about actual error of the measurement. It is possible that with respect
to the true value, FFM could have been consistently over- or under-estimated.
Both the TBW and densitometry techniques for measuring body fat and
FFM rely on assumptions regarding the constant composition of the fat-ff ee tissue;
for TBW that the FFM is 73% water, for densitometry that the density of the FFM
1100 kg/m^ and so on. If these assumptions are not always justified, and limited
cadaver analysis (see Introduction) suggests they are not, some degree of error in
estimating FFM will be incurred. It is possible that deviations from the assumed
composition could have resulted in erroneous estimates of FFM in the two groups.
However, within each group, both densitometry and TBW techniques
employed gave a similar estimate of FFM (as did the skinfold method). Since the
assumptions involved in each case are essentially independent - a deviation from
the assumed density of the FFM will not necessarily be accompanied by a change in
the proportion of water it contains and the converse is also true - this implies that
the composition of the FFM did not differ substantially from the ’norm’ in either of
the groups and on this basis suggests error in the estimation of FFM is on average
likely to be small. The similarity of the skinfold estimates adds further weight to
this argument. It is difficult to envisage how within each group all three methods
could produce the same spurious result - under-estimation for the high group, over
estimation for the low.
145

The observation that in relation to any one of the three estimates of FFM the
BMRs of the two groups were significantly different also suggests that the
differences between the groups were not wholly attributable to measurement error.
The comparability of the three methods within each group takes this further
however, suggesting that error in estimation of FFM was small and its contribution
to the differences between the groups therefore, likely to be minor. It seems
reasonable to suggest that the same would apply to the initial study.
Having then, on the basis of the data from the two groups, made some
estimate of the contribution of intra-individual variance to the total variance
observed in BMR in the initial study and assuming error in measurement of FFM to
be very small, the remaining variance - in the region of 100 kcal/day - is likely to
be to genuine differences in BMR in relation to the FFM. Two explanations are
possible. The first relates to differences in the levels of Jhermogenic hormones.
Again these possibilities were investigated in the high and low BMR groups and the
results related back to the original cross-sectional study of the 97 women.
Composition of the FFM.
It is possible that differences in BMR between the two groups are a
consequence of differences in the composition of the FFM. As alluded to above,
the parity of the three methods of estimating FFM within each group would to some
extent suggest that the composition of the FFM did not differ markedly between the
groups. However, differences in composition would probably not have to be
particularly large to account for the differences observed. It has been estimated that
the metabolic rates of just four organs - the heart, brain, liver and kidneys - are
responsible for about 60% of BMR, yet in terms of weight they make up only about
6 % of the FFM (Brozek & Grande, 1958; also see Table 1.2). Skeletal muscle on
the other hand constitutes about half the weight of the FFM but has a relatively low
146

resting metabolism and accounts for less than 25% of the BMR (Brozek & Grande,
1955). Relatively subtle variations in the relative proportions of ’active’ compared
to ’inactive' tissues therefore, could potentially have a major impact on BMR. The
difference between the two groups could theoretically arise through a difference of
about 3 % in the proportion of the FFM accounted for by the liver, heart, kidneys
and brain. However, whether or not the sizes of these organs are sufficiently
variable in relation to FFM to explain these sorts of differences is difficult to
ascertain from the literature since available data essentially seems to be limited to
only four cadavers (Mitchell et al., 1945; Forbes et al., 1953, 1956). Calculations
based on data presented by Greenwood & Brown (1913) however, do suggest that
in relation to body weight at least, quite a large proportion of variation in BMR
could potentially be explained by differences in organ size. Greenwood & Brown
recorded body mass, liver, kidney, heart and brain weight in 79 male cadavers,
aged between 25 and 55 years. In general the men were in good health at the time
of death, in most cases due to accident, and body composition would therefore be
expected to be relatively normal. Using this information and the literature value for
resting energy expenditure per unit weight of each of the organs (see Table 1.2), it
was possible to make an estimate of the overall daily metabolic rate of the four
organs.
147

Taking the example of two cadavers:
Cadaver 1 Cadaver 2
age 44, body wt 66.7kg age 45, body wt 65.3kg
Organ Weight Contribution Weight Contribution
to BMR to BMR
(kg) (kcal/day) (kg) (kcal/day)
Heart 0.28 108 0.38 145
Brain 1.46 352 1.40 338
Kidneys 0 .2 2 142 0.31 206
Liver 1.79 539 1.96 590
Total 1141 1279
In this example the cadavers were closely matched in terms of age and body
weight yet the estimated BMR of the four organs differed by some 140 kcal/day
(10%). This would seem to suggest that differences in organ size at a given weight
could potentially account for quite large differences in BMR. This point is further
illustrated when the estimated metabolic rate of the four organs is correlated with the
weight of the cadaver (Figure 5.4). The residual standard deviation around the line
of best fit is 100 kcal/day. This is of a similar magnitude to the residual standard
deviations observed when BMR is correlated with body weight. In the study
presented in Chapter 3 for example, the residual standard deviation for BMR
against body weight was 132 kcal/day; for the FAO/WHO/UNU (1985) equations
the figure is around 110 kcal/day in females, 150 kcal/day in males and so on. This
does seem to suggest that differences in organ size could potentially explain a
relatively large portion of the variation in BMR at a given weight.
148

oCD
CD TD
TD — < $ - CD CD O
TDc oCD O
-4— > t —
CO
O00
o4->
TD CD
CO > CD CD
C £ TD
OCD
CD
OOOOCO
OOCM
OOOOO00
ooCD
(Aep/ieo>|) su b6 jo (7 ^0 awg
Body
w
eigh
t (k
g)
Figu
re
5.4
Scat
terp
lot
of es
tim
ated
or
gan
BM
R(l
iver
, ki
dney
, he
art
s br
ain)
ag
ains
t bo
dy
wei
ght.

The potential importance of organ size is further illustrated by a series of
animal studies reported by Koong & Ferrell (1990). These workers observed that
the large differences (up to 40%) in BMR (fasting heat production) between animals
of the same weight and age but who had been subject to different nutritional
regimes could be almost entirely explained by differences in the mass of the
metabolically active organs making up body weight. Correlations between BMR
and the weights of organs such as the liver and kidneys had 'r' values in the region
of 0.98 and 0.99.
In the present study we have no indication of relative organ size in the two
groups of women; initially it had been hoped to make some estimation of this.
However, the available techniques for in vivo measurement, proved either
insufficiently accurate for our purposes, eg. ultra sound, or were prohibitively
expensive, eg. nuclear magnetic resonance (NMR). This is certainly an area with
much potential for future investigation.
Assuming however, the low BMR group did indeed have a proportionately
smaller mass of 'active' organs, it follows that they must have had more 'inactive'
tissue; most probably more muscle. Superficially, circumference data would
suggest that this was not the case since there were no significant differences in the
measurements between the groups. As discussed previously however, the
tendency for groups to have a slightly different FFM makes this sort of inference
unreliable. Moreover, even with the same mass of fat-free tissue circumferences
measurements are probably too crude an index of muscle mass to discriminate the
relatively small differences which may have occured.
Hormonal Status
Thyroid hormone levels were found to differ significantly between the two
groups of women - the high BMR group had significantly greater levels of T3 , T4
and FT4 and the low group. It seems reasonable to postulate that these differences
150
in thyroid status had apart to play in explaining differences in BMR in relation to the
FFM between the two groups. None of the women had thyroid disease; T3 , T4
and FT4 were within the normal reference ranges for all the individuals and
euthyroid status was confirmed by the normal TSH levels which did not differ
significantly between the groups. Two reports are available which lend support to
the inferences of the present study. In a group of 12 healthy volunteers MacRitchie
(1988) found a significant positive correlation between BMR, expressed as the %
deviation from standard values predicted using the Mayo Clinic equations
(Boothby, Berkson & Dunn, 1936), and both serum T3 and T4 levels (r = 0.47, p
< 0.01 & r = 0.5, p < 0.01, respectively). In expressing the results in relation to
values predicted on the basis of surface area some degree of ’normalisation’ for
body size was achieved. In this group then, there is an indication that at a given
body size, if not specifically FFM, the higher the T3 of T4 levels the higher the
BMR. Danforth (1983) reports a positive correlation (r = 0.59, p < 0.01) between
free T3 serum concentrations and the number of calories per kg FFM required for
16 subjects to maintain weight during a three week stay in a metabolic unit. Since
under the circumstances imposed on the metabolic ward BMR is likely to make up
the largest proportion of daily energy expenditure it may well be that the correlation
is also illustrative of the relationship between BMR/kg FFM. If this is the case, it
implies that high levels of T3 are associated with a high BMR/kg FFM.
In line with our own work, the studies by Danforth (1983) and MacRitchie
(1988), certainly suggest that differences in thyroid status are involved in
explaining differences in BMR in relation to the FFM, the results of the present
investigation allow us to go further however, and make some quantitative estimate
of their contribution.
When residual BMR (the difference between the measured BMR and that
predicted from FFM according to the regression equation derived in the original
study) is correlated with T3 levels in the 19 women, the residual standard deviation
151

catecholamine levels in urine or plasma (Landsberg & Young, 1983). The lack of a
significant difference in 24 hour urinary adrenaline and noradrenaline levels
between the two groups in this study would seem to indicate that sympathoadrenal
activity did not differ. However, these results should probably be interpreted with
some caution. Their reliability depends upon an accurately timed and complete
urine collection. Since the onus for this was placed upon the subject and not
vindicated by means of an independent check (eg.PABA) we cannot be certain that
this was achieved in every case. The large variability in the results suggests it may
not have been. In addition, it has been suggested that whilst urinary (or plasma)
catecholamine levels are a relatively good index of sympathoadrenal activity within
an individual they may be of less use for inter-individual comparisons (Barrand &
Callingham, 1983). However, even accepting that the catecholamine results
genuinely reflect comparable sympathetic nervous system activity in the two
groups, this does not necessarily rule out the possibility that differences in an
adrenergically mediated process may have contributed to the differences in BMR -
the groups may have differed in their responsiveness to catecholamines. There is
certainly some evidence to suggest that catecholamine sensitivity can differ between
individuals. Jung et al. (1979b) for example, have reported a lower thermogenic
response to noradrenaline infusion in groups of obese and post-obese subjects
compared to lean. Sjostrom et al. (1983) have also found noradrenaline sensitivity,
assessed by changes in parameters such as metabolic rate, respiratory frequency
and blood pressure, to differ between individuals. Interestingly, thyroid status is
known to alter adrenergic reactivity; elevated levels of thyroid hormones increase
catecholamine sensitivity, reduced levels have the opposite effect The lipolytic
response to noradrenaline for example, is decreased in both hypothyroidism and
fasting (Kunos, 1981). Gelfand et al. (1987) found noradrenaline infusion to
produce a proportionately greater increase in metabolic rate in volunteers with
experimentally induced thyrotoxicosis than it did when they were in a euthyroid
152

about the regression line was 94 kcal/day. Making an allowance for the component
of this variance likely to be attributable to within-subject differences (60 kcal/day,
see above) we are left with a residual standard deviation of 70 kcal/day
(942 - 602 = 722). This then, is an estimate of the variance remaining when
FFM, within-subject differences and T3 levels have been taken into account and
compares to the estimated 100 kcal/day residual standard deviation when allowance
has been made for FFM and within-subject variance alone. This is obviously a
rather rough estimation based on the limited data available, it would clearly have
been more satisfactory to measure thyroid hormone levels in all 97 women. It does
however, give us some idea of the relative importance of differences in thyroid
status in explaining differences in BMR in euthyroid individuals - an area which has
received little investigative attention to date.
The variance remaining when differences in thyroid status have been taken
into account may be attributable to differences in a catecholamine mediated
component of BMR, acting alone or perhaps in concert with thyroid hormones to
determine the metabolic activity of the tissues (see below). Alternatively we are
again brought to the possibility that differences in the composition of the FFM may
be involved.
The lowered BMR of those undergoing B-blockade therapy reported in this
thesis and by other workers (Jung et al., 1980; Scheidegger et al., 1984) suggests
that BMR has an adrenergically mediated component. Potentially therefore,
differences in BMR could arise through differences in adrenal medulla or
sympathetic nervous system activity - collectively termed the sympathoadrenal
system. Weststrate (1989) has suggested that the differential rates of fatty acid
oxidation he observed between two groups characterised by either a high or low
BMR/kg FFM, may reflect a different degree of sympathetic nervous system
activity, and provide a possible explanation for the differences in BMR.
Assessment of sympathoadrenal activity is usually based on the measurement of
153

state. Thyroid hormones have been shown to alter the number and affinity of
adrenoreceptors, to modulate receptor coupling to the effector system and to alter
the activity of the effector system's regulatory and catalytic components (Tsai et al.,
1978; Kunos, 1981; Malbon & Greenberg, 1982; Lefkowitz et al., 1984). Whether
or not the differences in thyroid hormone levels between the two groups in this
study induced differences in catecholamine responsiveness and if so, whether this
contributed to the differences in BMR between the groups cannot be deduced.
Summary
Investigation of the high and low BMR groups allowed us to make some
assessment of the factors responsible for variation in BMR in relation to the FFM.
The data suggested that the contribution of error in measurement of the fat-free
tissue is likely to have been small. In contrast, within-subject differences clearly
had a more important effect. When these had been taken into account it was
estimated that the genuine inter-individual variance in BMR in relation to the FFM
was in the region of 100 kcal/day. The hormonal results strongly suggested that
this was at least in part attributable to differences in the levels of thyroid hormones.
Thyroid status did not however, provide the complete explanation, leaving a
residual variance of around 70 kcal/day. It seems probable that differences in the
composition of the FFM are also likely to be involved, although the study provided
no adequate data to test this contention. In addition the possibility that differences
in a catecholamine process may also have contributed, cannot be ruled out.

CHAPTER 6
GENERAL DISCUSSION.
155

The studies presented in this thesis have been concerned with variability in
in basal metabolic rate, examining the extent of differences between individuals and
their cause. In particular the roles of differences in body composition and
hormonally mediated metabolic activity were explored. In the majority of people
BMR accounts for the largest part of daily energy expenditure, study of the factors
that affect BMR is therefore central to our understanding of the causes of variation
in daily energy needs.
Measurements in almost 100 healthy women indicated that variability in
BMR was large; some 500 kcal/day separated the 15% of the women at the top end
of the range from the 15% at the bottom, equivalent to a standard deviation of 159
kcal/day. The differences were initially investigated in terms of differences in body
composition. It was found that the between-subject differences could best be
explained by differences in FFM, which accounted for 45% of the total variance.
In accord with several previous investigations it was found that once differences in
the mass of fat-free tissue had been taken into account neither age nor body fatness
any any significant effect on BMR (James et al., 1978; Bernstein et al., 1983;
Garrow & Webster, 1985; Ravussin et al., 1986; Lawrence et al., 1988).
However, the residual standard deviation of the regression equation describing the
relationship between BMR and FFM (118 kcal/day) suggested that at a given FFM
considerable variation existed in the BMR of individual women; as much as 400
kcal/day could apparently separate the BMR of physically comparable women.
Two groups of women characterised by particularly high or low BMRs in relation
to their FFM were selected for further investigation with the aim of elucidating the
factors responsible for these very large differences.
Repeat measurements of BMR in the two groups suggested that part of the
variance in BMR relative to FFM, could be attributed to within-subject differences
in BMR rather than to genuine between-subject variation. The data did not allow
for an exact quantification of the contribution of intra-individual differences to the
156

118 kcal/day residual standard deviation, but it was possible to make a reasonable
estimate that it lay somewhere between about 60 and 100 kcal/day. This would
leave a between-subject variation in the region of 70 to 100 kcal/day. Based on data
from other studies it seems likely that the intra-individual variance is probably
closer to the lower estimate, 60 kcal/day, and correspondingly inter-individual to
the upper estimate, 100 kcal/day.
The magnitude of real inter-individual variation has implications as to the
accuracy with which an individual's BMR can be predicted from their FFM. With
a variance as large as the residual standard deviation would at first suggest, around
120 kcal/day a great deal of uncertainty would be attached to the prediction. If
however, this figure is partly a reflection of wthin-subject differences and inter
individual variation is less, closer to 70 kcal/day one can have much more
confidence of obtaining a reasonable estimate of an individual's basal metabolic
rate. This is an issue of some practical importance. The most recent
FAO/WHO/UNU committee on energy and protein requirements has adopted the
principle that total energy expenditure (TEE), and therefore requirements, should be
calculated as multiples of the BMR; 1.56 x BMR for women with a light level of
activity, 1.82 x BMR for heavy activity and so on (FAO/WHO/UNU, 1985).
Although originally envisage for use only in groups, it can often be instructive to
make an estimate of an individual's energy expenditure in this way, to assess for
example, how much weight a person could reasonably be expected to lose on a
given diet. In most cases BMR cannot be conveniently measured and it is
necessary to make a prediction. It follows that any error in the estimation of BMR
will translate through to an error in estimation of daily energy requirements.
Whilst variation in BMR in relation to the FFM was found to be less than
the residual standard deviation of the regression equation at first indicated, it did
exist. As pointed out above, it was estimated to be in the region of 100 kcal/day.
Differences in the mass of fat-free tissue are not therefore, a complete explanation
157

for differences in BMR between individuals. The tendency to regard them as such,
likely stems from the observations that variation in BMR between groups in
relation to sex, race age and so on, is largely eliminated when the weight of the
FFM is taken into account. As pointed out above, the studies presented here were
able to confirm that the relationship between BMR and FFM was essentially
independent of both differences in body fatness and age. Findings such as this do
not justify however, the assumption that FFM is the genesis of all differences in
BMR - clearly when only 45 % of variance in BMR in the 97 women could be
explained in these terms it cannot be - nor do they allow the extrapolation that FFM
is the 'active' portion of body weight. It certainly includes the most metabolically
active tissues and organs, the liver, brain and so on, yet the very fact that
approximately half its weight is constituted by relatively inactive muscle precludes
its designation as the 'active' fraction of body mass. Indeed, it is probably in the
heterogeneity of the fat-free tissue that at least part of the explanation for variation in
BMR lies.
Reworking of the cadaver data presented by Greenwood & Brown (1913)
suggested that differences in the composition of the FFM, specifically differences in
the size of the metabolically active organs, could potentially explain much of the
variation observed in BMR in relation to weight The residual standard deviation of
the regression equation relating the estimated metabolic rate of the liver, kidneys,
heart and brain to body weight was 100 kcal/day. This compares to the residual
standard deviations observed when BMR is correlated with weight which lie in the
region of 110 to 150 kcal/day. The results of animal studies reported by Koong &
Ferrell (1990) also emphasised the potential importance of variations in organ size.
In the studies presented here, it was not possible to determine the contribution of
differences in the composition of the FFM to the observed variance in BMR. It had
been hoped to make at least some qualitative assessment by measuring organ - liver,
kidney, heart and brain - size in the high and low BMR groups. None of the
158

a.v'iukble.- techniques proved suitable however. Ultra sound was not judged
..i.fticiently accurate, the ionising radiation involved in computerized axial
tomography ((, f ) precluded its use and nuclear magnetic resonance (NMR), which
seemed-the most promising, was prohibitively expensive. Similarly, no adequate
estimate of muscularity was obtained in the women. Limb circumference
measurements pioved too crude an index to assess the exact proportion of of
muscle, occupying the FFM. Other more sophisticated techniques are available,
creatinine and 3-methyl histidine excretion for example. Even these however,
cannot provide an exact' measure of muscle mass (Lukaski, 1987). Accurate
assessment of of the composition of the FFM is probably not possible with
currently available techniques. This is certainly an area deserving future/
investigation, because until we are able to quantify the composition of the FFM
more precisely I would suggest that our understanding of the nature of variation in
BMR cannot be complete.
The other possibility investigated in this thesis was that variation in BMR
may be a con sequence of differences in the metabolic activity of the tissues. Since
both thyroid hormones and catecholamines have been implicated in the control of
cellular thermogenesis the studies were particularly concerned with the role of these
hormones in determining BMR. The relatively reduced BMR of the patients under
going B-blockade therapy compared to the control subjects strongly suggested that
BMRTias an adrenergically mediated component, supporting the work of Jung et al.
(1980). On this basis it seemed reasonable to postulate that differences in
sympathoadrenal activity may be responsible for some of the differences observed
in BMR in relation to the FFM. However, when the hypothesis was subsequently
put to the test by measuring urinary catecholamine levels in the high and low BMR
groups no significant differences were evident. It is difficult to interpret this
finding with any certainty. Firstly there is some suggestion that urinary
catecholamines may not be an adequate index of sympathoadrenal activity between

individuals. However, even accepting that they are, it is possible that the two
groups may have differed in their responsiveness to catecholamines. The
possibility that differences in adrenergically mediated process may contributed to
the differences in BMR cannot therefore be excluded.
Aside from pointing to a role for the catecholamines in determination of
BMR, the observation that the 6 -blockers depress basal metabolism has
implications for the clinical use of these drugs. The weight gain which could
potentially result from a lowered BMR would certainly not be desirable in the
cardiovascular patients to whom 6 -blockers are widely prescribed. The general
usefulness of 6 -blockade therapy is undisputed but I would suggest that this side
effect is sufficiently important to warrant further investigation.
The significantly different levels of thyroid hormones between the high and
low BMR groups certainly suggests that differences in thyroid status are involved
in explaining variation in BMR in relation to the FFM. It was possible to take this
further however, and make an estimate of the extent of their contribution. The data
suggested that differences in T3 levels are probably responsible for around 2 0 % of
the total variance in BMR and for about 35 % of the variance at any given FFM (see
below for derivation of these estimates). In view of the great deal of research effort
that has focused on the general area of thyroid status and metabolic rate it is perhaps
surprising that this appears to be one of the few studies to specifically explore the
relative importance of differences in thyroid levels in explaining variations in BMR
in normal, euthyroid individuals. It seems reasonable to assume that under the
influence of thyroid hormones, the the metabolic activity of the tissues and organs
of the women differed. Quite what form these differences may take is a matter pf
some conjecture. The precise effects of the thyroid hormones, or indeed the
catecholamines, on energy requiring processes at cellular level - protein turnover,
substrate cycling, ionic pumping and so on - remains to be fully elucidated. Even
more fundamentally, the relative contributions of these processes to basal energy
160

expenditure are far from clear. For instance, estimates of the contribution of the
Na+/K+ pump activity to BMR have ranged form 5% (Sestoft, 1980) to 50%
(Sims, 1987). This is an area where much work remains. It would certainly aid
our understanding of the part played by thyroid hormones and catecholamines in the
determination of BMR if we knew the relative importance of the processes they are
thought to affect.
Taken together, the studies presented here have allowed us to make an
assessment of the respective roles of the various factors investigated in explaining
variance in basal metabolic rate. The findings are summarised in the form of a
hypothetical analysis of variance table (Table 6.1).
(1) Total variance:
In the original cross-sectional study of the 97 women the total variance in
BMR was equal to 25316.
(2) FFM:
It was calculated that 45% of this variance - 11392 - could be explained by
differences in the mass of fat-free tissue, leaving a residual variance of 13924.
ie. 25316 - 11392 = 13924.
(3) Within-subject variance:
On the basis of the repeat measurements of BMR in the group of 19 women
it was estimated that within-subject variance in BMR lay between 60 kcal and 100
kcal/day. Comparison with other studies in the literature suggests that the lower
estimate is perhaps likely to be the more realistic. Taking the 60 kcal/day value
therefore,
161

Table 6.1
Hypothetical analysis of variance table indicating relative importance of the factors
investigated in explaining variance in BMR
Explained. Residual VResid % total
variance
% variance
at given FFM
(1) Total 25316 159
(2) FFM 11392 13924 118 45 %
(3) Within 3600 10324 104 15 % 25 %
(4) T3 5088 5236 72 20% 35%
Other 20% 40%
162

within-subject variance = 602
= 3600
On this basis approximately 15% of the total variance in BMR in the initial study
can be attributed to within-subject differences and some 25% of variance in relation
to the FFM. A residual variance of 10324 remains,
ie. 13924 - 3600 = 10324
(4) 13:
After adjusting for differences in FFM and T3 in the group of 19 women the
residual standard deviation was found to be 94 kcal/day, equal to a residual
variance of 8836 (942). Making an allowance for the contribution of intra
individual variance (3600, from above) it is possible to arrive at an estimate of the
contribution of differences in T3 levels to total variance in BMR and of the residual
variance which remains:
Residual variance = 8836 - 3600
= 5236
T3 variance = 10324 - 5236
= 5088
This estimate suggests that differences in T3 are able to explain in the region
of 20% of the total variance in BMR and some 35% of the variance at any given
FFM.
Having then, taken into account variance attributable to FFM, T3 and
within-subject variance we are left with a residual variance of 5236; 20% of the
total variance in BMR is left unexplained and about 40% of the variance in relation
to the FFM. The residual variance in BMR when FFM alone has been taken into
account corresponds to a residual standard deviation of 118 kcal/day. When an
estimate of within-subject variance is allowed for, this value falls to about 100
163

kcal/day, and further to approximately 70 kcal/day when T3 levels are taken into
account. It seems reasonable to assume that the remaining variance is probably
attributable to differences in the size of the metabolically active organs - liver,
kidney, heart and brain.
It is not suggested that these estimates are by any means the definitive
values - they are 'best guesses' with the data available. They are likely however,
to be of the right order of magnitude and give some insight into the relative
importance of the factors responsible for variation in BMR. At the least, they
provide a peg on which to hang future work.
In the course of the investigations - the primary consideration of which was
to explain variance in BMR - other related issues were highlighted which are worth
comment. One particularly salient point to emerge was the observation that BMR
expressed kg FFM is not constant with weight but tends to be higher in lighter
compared to heavier individuals. Those with relatively enlarged FFMs - men, the
obese - generally have a lower BMR/kg FFM than those with less fat-free tissue -
women, lean individuals and so on. It was postulated that these differences may
again to be a consequence of differences in the composition of the FFM, to the
relative proportions of active and inactive tissues. The observation has important
implications for the use of FFM as a metabolic reference standard. Expressing
BMR 'per kg FFM' could potentially lead to misinterpretation of data when the
groups or individuals concerned are of different body size. This is precisely the
situation which the use of a reference standard is intended to avoid. FFM may still
be useful in this role however. It was found, in the present studies and those by
Miller & Blyth (1953) and Lawrence et al. (1988), that BMR was approximately
constant, across or between groups, when divided by a power function of FFM
rather than FFM itself; by FFM0 *7 in our group of 97 women, FFM0 *5 for
Lawrence et al's analysis and so on. As a reference standard therefore, it might be
164
more appropriate to relate BMR to o power function of FFM than than to simply
express metabolic rate 'per kg' FFM.
The studies also highlighted a potential problem with the FAOAVHO/UNU
(1985) equations for predicting the BMR of 30-60 year olds. It became clear that
both the male and female equations had a tendency to over-estimate the BMRs of
those individuals at the upper end of the age range. An inspection of the relevant
literature revealed that in both cases over half the measurements from which the
equations were derived (Schofield, 1985b) were made on individuals between the
ages of 30 and 40. The inclusion of a disproportionate number of younger men and
women likely explains the over-estimation in our older individuals, The
FAOAVHO/UNU (1985) report states that in relation to weight, BMR declines little
over the age range 30 to 60, only about 1 % per decade. The study presented in
Chapter 3 however, suggests that the fall is greater than this, closer to 4% per
decade, occasioned by the progressive increase in the proportion of fat making up
body mass. It is perhaps not surprising therefore, that equations derived from
measurements made on predominantly younger individuals over-estimate the BMRs
of those at the upper end of the age range. The age ranges for the WHO equations
were not made by inspecting the data, but rather were selected to approximate to the
commonly used clinical divisions of human life span (Schofield, 1985a). In view
of the age-related changes in body composition which occur over the years 30 to 60
and their effect on the relationship between BMR and weight this particular
subdivision may not be the most appropriate.
It is perhaps appropriate to end, as this thesis began, with the quote from
Dr. Elsie Widdowson, " Much more research lies ahead before we can begin to
understand why one person can live on half the calories of another." I would like
to think the work on BMR presented here has taken us way forward and, at the
least, highlighted areas deserving further investigation. Fifty years on however,
165

Dr. Widdowson's remarks still hold true and there is much to occupy the attentions
of future investigators.

REFERENCES.

Acheson, K.J. & Burger, A. (1980): A study of the relationship between
thermogenesis and thyroid hormones. J. Clin. Endocrinol. Metab. 51, 84-89.
Acheson, K.J., Jequier, E. & Wahren, J. (1983): Influence of B-adrenergic
blockade on glucose-induced thermogenesis in man. J. Clin. Invest. 72, 981-986.
Agricultural Research Council (ARC) & Medical Research Council (MRC) (1974):
Food and Nutrition Research. London: HMSO.
Atwater, W.O. & Benedict, F.G. (1903): Experiments on the metabolism of energy
and matter in human biology. United States Department of Agriculture, Office of
Experimental Stations, Bulletin No. 136. Washington DC: Government Printing
Office.
Bakker, H.K. & Struikenkamp, R.S. (1977): Biological variability and lean body
mass estimates. Hum. Biol. 53, 181-225.
Barrows, K. & Snook, J.T. (1987): Effect of high-protein, very-low-calorie diet
on resting metabolism, thyroid hormones, and energy expenditure of obese middle-
aged women. Am. J. Clin. Nutr. 45, 391-398.
Behnke, A.R., Feen, B.G. & Welham, W.C. (1942): The specific gravity of
healthy men; Body weight and volume as an index of obesity. J. Am. Med. Ass.
118, 495-498.
168

Behnke, A.R. (1958): The liver in relation to the body as a whole. In Liver
function; a symposium on approaches to the quantitative description of liver
function, ed. R.W. Brauer, pp. 43-58. American Institute of Sciences, Washington
DC.
Benedict, F.G. (1915): Factors affecting basal metabolism. J. Biol. Chem. 20,
263-299.
Benedict, F.G. (1938): Vital energetics. A study in comparative basal metabolism.
Carnegie Institute Washington Publ. No. 503.
Berkson, J. & Boothby, W.M. (1938): Studies of the energy metabolism of normal
individuals. The interindividual and intraindividual variability of basal metabolism.
Am. J. Physiol. 121, 669-683.
Bernstein, R.S., Thornton, J.C., Yang, M.U., Wang, J., Redmond, A.M.,
Pierson, R.N., Pi-Sunyer, F.X. & Van Itallie, T.B. (1983): Prediction of resting
metabolic rate in obese patients. Am. J. Clin. Nutr. 37,595-602.
Bessard, T., Schultz, Y. & Jequier, E. (1983): Energy expenditure and
postprandial thermogenesis in obese women before and after weight loss. Am. J.
Clin. Nutr. 38, 680-93.
Bezinger, T.H. & Kitzinger, C. (1949): Direct calorimetry by means of the gradient
layer principle. Rev. Sci. Inst. 20, 849-860.
Bielinski, R., Schutz, Y. & Jequier, E. (1985): Energy metabolism during post
exercise recovery in man. Am. J. Clin. Nutr. 42, 69-82.
169

Bingham, S.A., Goldberg, G.R., Coward, W.A., Prentice, A.M. & Cummings,
J.H. (1989): The effect of exercise and improved physical fitness on BMR. Br. J.
Nutr. 61, 155-173.
Bisdee, J.T., James, W.P.T. & Shaw, M.A. (1989): Changes in energy
expenditure during the menstrual cycle. Br. J. Nutr. 61, 187-199.
Blaza, S. & Garrow, J.S. (1983): Thermogenic response to temperature, exercise
and food stimuli in lean and obese women, studied by 24 h direct calorimetry. Br.
J. Nutr. 49, 171-180.
Blunt, K. & Dye, M. (1921): Basal metabolism of normal women. J. Biol. Chem.
47, 69-87.
Bogardus, C., Ravussin, E., Lillioja, S., Abbott, W., Zawadzki, J.K., Young,
A., Knowler, W.C., Jacobowitz, R. & Moll, P.P. (1986): Familial dependence of
the resting metabolic rate. N. Engl. J. Med. 315, 96-100.
Boothby, W.M., Berkson, J. & Dunn, H.L. (1936): Studies of the energy
metabolism of normal individuals: a standard for basal metabolism with a
nomogram for clinical application. Am. J. Physiol. 116,468-484.
Booyens, J. & McCance, R.A. (1957): Individual variations in expenditure of
energy. Lancet. 2, 225-229.
Brand, M.D. & Murphy, M.P. (1987): Control of electron flux through the
respiratory chain in mitochondria and cells. Biol. Rev. 62,141-193.
170

Brown, J.G. & Millward, D.J. (1980): The influence of thyroid status on skeletal
muscle protein metabolism. Biochem. Soc. Trans. 8 , 366-369.
Buskirk, E.R., Iampietro, P.F. & Welch, B.E. (1957): Variations in resting
metabolism with changes in food, exercise and climate. Metabolism 6,144-153.
Buskirk, E.R., Thompson R.H. & Whedon, G.D. (1963): Metabolic response in
relation to cold air in men and women in relation to total body fat content. J. Appl.
Physiol. 18, 603-612.
Cohn, S.H., Vartsky, D., Yasumura, S., Sawitsky, A., Zanzi, I., Vaswani, A. &
Ellis, K.J. (1980): Compartmental body composition based on total body nitrogen,
potassium and calcium. Am. J. Physiol. 239, E524-530.
Connacher, A. A., Jung, R.T. & Mitchell, P.E.G. (1988): Weight loss in obese
subjects on a restricted diet given BRL 26830A, a new atypical B-adrenoreceptor
agonist. BMJ. 296, 1217-1220.
Clarys, J.P., Martin, A.D. & Drinkwater, D.T. (1984): Gross tissue weights in the
human body by cadaver dissection. Hum. Biol. 56,459-473.
Clarys, J.P. & Martin, A.D. (1985): The concept of adipose tissue-free mass. In
Human body composition and fat distribution, ed. N.G. Norgan. Euro-Nutr report
8 , pp. 49-61. Wageningen: Euro-Nutr.
Clausen, T. (1986): Regulation of active Na-K transport in skeletal muscle.
Physiol. Rev. 6 6 , 542-580.
171

Consolazio, C.F., Johnson, R.E. & Pecora, L.J. (1963): Physiological
measurements of metabolic function in man. New York: McGraw Hill.
Cunningham, J.J. (1980): A reanalysis of the factors affecting basal metabolic rate
in normal adults. Am. J. Clin. Nutr. 33, 2372-2374.
Cunningham, J.J. (1982): Body composition and resting metabolic rate: the myth
of feminine metabolism. Am. J. Clin. Nutr. 36, 721-726.
Danforth, E. (1983): The role of thyroid hormones and insulin in the regulation of
energy metabolism. Am. J. Clin. Nutr. 38, 1006-1017.
Danforth, E. & Burger, A. (1984): The role of thyroid hormones in the control of
energy expenditure. Clin. Endocrinol. Metab. 13,581-595.
Dauncey, M J. (1980): Metabolic effects of altering the 24-hour energy intake in
man using direct and indirect calorimetry. Br. J. Nutr. 43, 257-269.
Dauncey, M.J. (1981): Influence of mild cold on 24hr energy expenditure, resting
metabolism and diet induce thermogenesis. Br. J. Nutr. 45,257-267.
Dauncey, M.J. (1990): Thyroid hormones and thermogenesis. Proc. Nutr. Soc.
49, 203-215.
Debakan, A.S. & Sadowsky, D. (1978): Changes in brain weight during the span
of human life: relation of brain weights to body heights and body weights. Ann.
Neurol. 4, 345-356.
172

DeFronzo, R.A., Thorin, D., Felber, P.J., Simonson, D.C., Thiebaud, D.,
Jequier, E. & Golay, A. (1984): Effect of beta- and alpha-adrenergic blockade on
glucose-induced thermogenesis in man. J. Clin. Invest. 73, 633-639.
DeHaven, J., Sherwin, R., Hendler, R. & Felig, P. (1980): Nitrogen and sodium
balance and sympathetic-nervous-system activity in obese subjects treated with a
low-calorie protein or mixed diet. N. Engl. J. Med. 302, 477-482.
Dore, C., Hesp, R., Wilkins, D. & Garrow, J.S. (1982): Energy requirements of
obese patients after massive weight loss. Hum. Nutr.: Clin. Nutr. 36C, 41-48.
Douglas, C.G. (1911): A method for determining the respiratory exchange in man.
J. Physiol. 42, 17P-18P.
Drumond, S. (1988): Seasonal variations in energy balance in rural Indian women.
PhD Thesis, University of Glasgow, UK.
Du Bois, D. & Du Bois, E.F. (1916): Clinical calorimetry. Tenth paper. A formula
to estimate the approximate surface area if weight and height are known. Arch. Int.
Med. 17, 863-872.
Du Bois, E.F. (1927): Basal metabolism in health and disease. Philadelphia: Lea &
Febiger.
Dumin, J.V.G.A. & Rahaman, M.M. (1967): The assessment of the amount of fat
in the human body from measurements of skinfold thickness. Br. J. Nutr. 21, 681-
689.
173
Durnin, J.V.G.A. & Womersley, J. (1974): Body fat assessed from total body
density and its estimation from skinfold thickness: measurements on 481 men and
women aged 16 to 72 years. Br. J. Nutr. 32, 77-97.
Durnin, J.V.G.A., McKay, F.C. & Webster, C.I. (1985): A new method of
assessing fatness and desirable body weight, for use in the armed services. A
survey of 9000 adults in the UK. Report to Ministry of Defence: London.
Durnin, J.V.G.A. (1988): Diet and obesity. In A balanced diet? ed. J. Dobbing.
Spriner-Verlag: New York.
Edelman, I.S. & Ismail-Beigi, F. (1974): Thyroid thermogenesis and active sodium
transport. Recent Prog. Horm. Res. 30, 235-257.
Edwards, D.A.W. (1950): Observations on the distribution of subcutaneous fat.
Clin. Sci. 9, 259-270.
Engfeldt, P., Arner, P. & Ostman, J. (1982): Changes in phosphodiesterase
activity of human subcutaneous adipose tissue during starvation. Metabolism. 31,
910-916.
Englemen, K., Mueller, P.S. & Sjoerdsman, A. (1964): Elevated plasma free fatty
acid concentrations in patients with pheochromocytoma; changes with therapy and
correlations with basal metabolic rate. N. Engl. J. Med. 270, 865-870.
Everts, M.E. & Clausen, T. (1988): Effects of thyroid hormone on Na-K transport
in resting and stimulated rat skeletal muscle. Am. J. Physiol. 225, E604-612.

FAO/WHO (1973): Ad Hoc Expert Committee Report. Energy and protein
requirements. Rome: FAO/Geneva: WHO.
FAO/WHO/UNU. (1985): Energy and protein requirements. Report of a joint
FAO/WHO/UNU Expert Consultation. Tech. Rep. Series, No. 742. Geneva:
WHO.
Farrell, D.J. (1980): The reduction in metabolic rate and heart rate in man during
meditation. In Energy metabolism, ed. L.E. Mount, pp. 279-82. London:
Butterworths.
Fellows, I.W., Bennett, T. & MacDonald, I.A. (1985): The effect of adrenaline
upon cardiovascular and metabolic functions in man. Clin. Sci. 69,215-222.
Ferro-Luzzi, A., Scaccini, C., Taffese, S., Aberra, B. & Demeke, T. (1990):
Seasonal energy deficiency in Ethiopian rural women. Eur. J. Clin. Nutr. 44,
(Suppl. 1), 7-18.
Finer, N., Swan, P.C. & Mitchell, F.T. (1986): Metabolic rate after massive
weight loss in human obesity. Clin. Sci. 70, 395-398.
Forbes, R.M., Cooper, A.R. & Mitchell, H.H. (1953): The composition of the
adult human body as determined by chemical analysis. J. Biol. Chem. 203, 359-
366.
175

Forbes, R.M., Mitchell, H.H. & Cooper, A.R. (1956): Further studies on the
gross composition and mineral elements of the adult human body. J. Biol. Chem.
223, 969-975.
Forbes, G.B. & Reina, J.C. (1970): Adult lean body mass declines with age: some
longitudinal observations. Metabolism 19, 653-663.
Freedman-Akabas, S., Colt, E., Kissileff, H.R. & Pi-Sunyer, F.X. (1985): Lack
of sustained increase in V02 following exercise in fit and unfit subjects. Am. J.
Clin. Nutr. 41, 545-549.
Galton, V.A. (1965): Thyroid hormone-catecholamine interrelationships.
Endocrinology, 77, 278-284.
Garby, L., Lammert, O. & Nielsen, E. (1984): Within-subjects between-weeks
variability in 24-hour energy expenditure for fixed activity. Hum. Nutr.: Clin.
Nutr. 38C, 391-394.
Garby, L. & Lammert, O. (1984): Within-subject between-days-and-weeks
variability in energy expenditure at rest. Hum. Nutr.: Clin. Nutr. 38C, 395-397.
Garrow, J.S. (1978): Energy balance and obesity in man. Amsterdam: North-
Holland Publ.
Garrow, J.S. & Webster, J. (1985): Are pre-obese people energy thrifty ? Lancet
1, 670-671.
176

Garrow, J.S. (1985): Resting metabolic rate as a determinant of energy expenditure
in man. In Substrate and energy metabolism in man, ed. J.S. Garrow & D.
Halliday, pp. 102-107. London: J. Libbey.
Gelfand, R.A., Hutchinson-Williams, K.A., Bonde, A.A., Castellino, P. &
Sherwin, R.S. (1987): Catabolic effects of thyroid hormone excess: the
contribution of adrenergic activity to hypermetabolism and protein breakdown.
Metabolism. 36, 562-569.
Grande, F., Anderson, J.T. & Keys, A. (1958): Changes in basal metabolic rate in
semi-starvation and refeeding. J. Appl. Physiol. 12, 230-238.
Greenwood, M. & Brown, J.W. (1913): A second study of the weight, variability
and correlation of the human viscera. Biometrika. 9,473-485.
Haismen, M.F. (1972): Energy expenditure of soldiers in warm and humid climate.
Brit. J. Nutr. 27, 357-381.
Harris, J.A. & Benedict, F.G. (1919): A biometric study of basal metabolism in
man. Carnegie Institute Washington Publ. No. 279.
Havel, R.J., Carlson, L.A., Ekelund, L.G. & Holmgren A. (1964): Studies on the
relation between mobilisation of free fatty acids and energy metabolism in man:
effects of norepinepherine and nicotinic acid. Metab. Clin. Exp. 13,1402-1411.
Hermansen, L., Grandmontagne, M., Moehlum, S. & Ingnes, I. (1984): Post
exercise elevation of resting oxygen uptake: possible mechanisms and physiological
significance. Med. Sports. Sci. 17, 119-129.
177
Heusner, A.A. (1985): Body size and energy metabolism. Ann. Rev. Nutr. 5, 267-
93.
Himmus-Hagen, J. (1983): Thyroid hormones and thermogenesis. In Mammalian
Thermogenesis, ed. L. Girardier & M J. Stock, pp. 141-177. Chapman & Hall:
London.
Ho, K., Roessmannn, U., Straumfjord, J.V. & Monroe, G. (1980): Analysis of
brain weight; adult brain weight in relation to body height, weight and surface area.
Arch. Pathol. Lab. Med. 104, 640-645.
Jackson, A.S. & Pollock, M.L. (1978): Generalised equations for predicting body
density of men. Br. J. Nutr. 40, 497-504.
Jackson, A.S., Pollock, M.L. & Ward. A. (1980): Generalised equations for
predicting body density in women. Med. Sci. Sports Exerc. 12,175-182.
James, W.P.T., Davis, H.L., Bailes, J. & Dauncey, M.J. (1978) Elevated
metabolic rates in obesity. Lancet, 2, 1122-1125.
James, W.P.T., Dauncey, M.J. & Davies, H.L. (1978): Elevated metabolic rates in
obesity. Lancet, 2,472. (letter)
James, W.P.T. (1985): Is there a thermogenic abnormality in obesity ? In Substrate
and energy metabolism in man, ed. J.S. Garrow & D. Halliday, pp. 108-118. John
Libbey: London.
178

James, W.P.T. (1987): Research relating to energy adaptation in man. In Chronic
energy deficiency: consequences and related issues, ed. B. Schurch & N.
Scrimshaw, pp. 7-36. Lausanne: IDECG.
Jequier, E. & Schutz, Y. (1981): The contribution of BMR and physical activity to
energy expenditure. In The body weight regulatory system: normal and disturbed
mechanisms, ed. L.A. Cioffi, W.P.T. James & T.B. Van Italie, pp. 89-96. New
York: Raven Press.
Jequier, E., Acheson, K. & Shultz, Y. (1987): Assessment of energy expenditure
and fuel utilization in man. Ann. Rev. Nutr. 7, 187-208.
Johansen, K., Hansen, J.M. & Skovsted, L. (1978): The preferential role of
triiodothyronine in the regulation of basal metabolic rate in hyper- and
hypothyroidism. Acta. Med. Scand. 204, 357-359.
Jones, M.K., Birtwell, J., Owens, D.R., Jones, G.R. & Lewis, M. (1981): 6 -
adrenoreceptor blocking drugs and thyroid hormones in hyperthyroid subjects.
Postgrad. Med. J. 57, 207-209.
Jung, R.T., Shetty, P.S., Barrand, M., Callingham, B.A. & James, W.P.T.
(1979a): Role of catecholamines in the hypertensive response to dieting. Br. Med.
J. 1, 12-13.
Jung, R.T., Shetty, P.S., James, W.P.T., Barrand, M. & Callingham, B.A.
(1979b): Reduced thermogenesis in obesity. Nature, 279, 322-323.
179
Jung, R.T., Shetty, P.S. & James, W.P.T. (1980): The effect of 13-adrenergic
blockade on metabolic rate and peripheral thyroid metabolism in obesity. Euro. J.
Clin. Invest. 10, 179-182.
Jung, R.T., Shetty, P.S., James, W.P.T., Barrand, M.A. & Callingham, B.A.
(1981): Caffeine its effects on catecholamines and metabolism in lean and obese
humans. Clin. Sci. 60, 527-536.
Keys, A., Brozek J., Henschel A. & Mickelson O. (1950): The biology of human
starvation. Minneapolis: University of Minneapolis Press.
Keys, A. & Brozek, J. (1953): Body fat in adult man. Physiol. Rev. 33, 245-325.
Keys, A., Taylor, H.L. & Grande, F. (1973): Basal metabolism and age of adult
man. Metabolism. 22, 579-587.
Kleiber, M. (1947): Body size and metabolic rate. Physiol. Rev. 27,511-541.
Kleiber, M. (1961): The Fire of Life. New York: Wiley.
Koong, L.J. & Ferrell, C.L. (1990): Effects of short term nutritional manipulation
on organ size and fasting heat production. Eur. J. Clin. Nutr. 44, (Suppl. 1), 73-
77.
Kraybill, H.F., Hiner, R.L. & Farnworth, V.M. (1954): The relation of organ
weight to lean body mass and empty body weight in cattle. J. Animal Sci. 13,548-
555.
180
Kunos, G. (1981): Modulation of adrenergic reactivity and adrenoceptors by
thyroid hormones. In Adrenoceptors and catecholoamine action, ed. G. Kunos, pp.
297-333. New York: John Wiley & Sons.
Landsberg, L. & Young, J.B. (1983): The role of the sympathetic nervous system
and catecholamines in the regulation of energy metabolism. Am. J. Clin. Nutr. 38,
1018-1024.
Lawrence, M., Thongprasert, K. & Durnin, J.V.G.A. (1988): Between-group
differences in basal metabolic rates: an analysis of data collected in Scotland, The
Gambia and Thailand. Eur. J. Clin. Nutr. 42, 877-891.
Le Blanc, J., Diamond, P., Cote, J. & Labrie A. (1984): Hormonal factors in
reduced postprandial heat production of exercise-trained subjects. J. Appl. Physiol.
56, 772-776.
Lefkowitz, R.J., Caron, M.G. & Stiles, G.L. (1984): Mechanisms of membrane
receptor regulation: biochemical, physiological and clinical insights derived from
studies of the adrenergic receptors. N. Engl. J. Med. 310, 1570-1579.
Lotti, G., Delitali, C., Devilla, L., Alagana, S. & Masala, A. (1977): Reduction in
plasma triiodothyronine (T3) induced by propranolol. Clin. Endocrinol. 6 , 405-
410.
Lukaski, H.C. (1987): Methods of assessment of human body composition: old
and new. Am. J. Clin. Nutr. 46, 537-556.
181

McLean, J.A. & Tobin, G. (1987): Animal and human calorimetry. Cambridge:
Cambridge University Press.
MacMillan, M.G., Reid, C.M., Shirling, D. & Passmore, R. (1965): Body
composition, resting oxygen consumption and urinary creatinine in Edinburgh
students. Lancet 1, 728-9.
McNeill, G., Rivers, J.P.W., Payne, P.R., de Britto, J.J. & Abel, R. (1987):
Basal metabolic rate of Indian men: no evidence of metabolic adaptation to low
plane of nutrition. Hum. Nutr.: Clin. Nutr. 41C, 473-484.
MacRitchie, K.A.N. (1988): Cyclic AMP and basal metabolic rate in clinically
euthyroid patients receiving thyroxine replacement therapy for primary
hypothroidism. BSc thesis, University of Glasgow, UK.
Mahadeva, K., Passmore, R. & Woolf, B. (1952): Individual variations in the
metabolic cost of standardised exercises: the effects of food, age, sex and race. J.
Physiol. 121, 225-231.
Malbon, C.C. & Greenberg, M.L. (1982): 3,3',5 - triiodothyronine administration
in vivo modulates the hormone sensitive adenylate cyclase system of the rat. J.
Clin. Invest. 69, 414-426.
Mason, E.D. & Benedict F.G. (1934): The effect of sleep on human basal
metabolism with particular reference to South Indian women. Am. J. Physiol. 108,
377-83.
182

Mason, E.D. & Jacob, M. (1972): Variations in basal metabolic rate responses to
changes between tropical and temperate climates. Hum. Biol. 44, 141-172.
Mathieson, R.A., Walberg, J.L., Gwazdauskas, F.C., Hinkle, D.E. & Gregg,
J.M. (1986): The effect of varying carbohydrate content of a very-low-calorie diet
on resting metabolic rate and thyroid hormones. Metabolism, 35, 394-398.
Miller, A.T. & Blyth, C.S. (1952): Lean body mass as a metabolic reference
standard. J. Appl. Physiol. 5, 311-316.
Mitchell, H.H. (1962): Comparative nutrition of men and domestic animals, Vols.
1 & 2. New York: Academic Press.
Mitchell, H.H., Hamilton, T.S., Steggerda, R.F. & Bean H.W. (1945): The
chemical composition of the adult human body and its bearing on the biochemistry
of growth. J. Biol. Chem. 158, 625-637.
Mitchell, D., Strydom, N.B., Van Grann, C.H. & Van der Walt, W.H. (1971):
Human surface area: comparison of the Du Bois formula with direct photometric
measurement. Pflugers Arch. 325,188-190.
Montgomery, R.D. (1963): Changes in basal metabolic rate of the malnourished
infant and their relation to body composition. J. Clin. Invest. 41,1653-1663.
Moore, R., Grant, A.M., Howard, A.N & Mills, I.H. (1980): Treatment of obesity
with triiodothyronine and a very-low-calorie liquid formula diet. Lancet, 1, 223-
226.
183

Munro, H.N. (1988): Ageing. In Nutrition and metabolism in patient care, ed. O.E.
Owen, J.M. Kinney, K.N. Jeejeebhoy & G.L. Hill, pp. 145-166. Philadelphia,
P.A.: W.B. Saunders.
Murgatroyd, P.R., Davies, H.L. & Prentice, A.M. (1987): Intra-individual
variability and measurement noise in estimates of energy expenditure by whole
body indirect calorimetry. Br. J. Nutr. 58, 347-356.
Newsholme, E.A. (1980): A possible metabolic basis for the control of body
weight. N. Engl. J. Med. 302, 400-405.
Newsholme, E.A. (1985): The roles of substrate cycles in the precision of
metabolic control and in energy expenditure. In Proceedings of the X I11
International Congress of Nutrition, ed. T.G. Taylor & N.K. Jenkins, pp. 399-
403. London: John Libbey.
Nordin, B.E.C., Aaron, J., Gallagher, J.C. & Horsman, A. (1972): Calcium and
bone metabolism in old age. In Nutrition in Old Age. 10th Symposium of the
Swedish Nutrition Foundation, ed. L.A. Carlson, pp. 77-85. Almqvist & Wiksell:
Uppsala.
O'Dea, K., Esler, M., Leonard, P., Stockigt, J.R. & Nestel, P. (1982):
Noradrenaline turnover during under- and overeating in normal weight subjects.
Metabolism, 31, 896-899.
Owen, O.E., Kavle, E., Owen, R.S., Polansky, M., Caprio, S., Mozzoli, M.A.,
Kendrick, Z.V., Bushman, M.C. & Boden. G. (1986): A reappraisal of caloric
requirements in healthy women. Am. J. Clin. Nutr. 44, 1-19.
1 84

Owen, O.E., Holup, J.L., D'Alessio, D.A., Craig, E.S., Polansky, M., Smalley,
K.J., Kavle, E.C., Bushman, M.C., Owen, L.R., Mozzoli, M.A., Kendrick, Z.V.
& Boden, G.H. (1987): A reappraisal of the caloric requirements of men. Am. J.
Clin. Nutr. 46, 875-85.
Pace, N. & Rathburn, E.N. (1945): Studies on body composition. 3. The body
water and chemically combined nitrogen content in relation to fat content. J. Biol.
Chem. 158, 685-691.
Pacy, P.J., Barton, N., Webster, J.D. & Garrow, J.S. (1985): The energy cost of
aerobic exercise in fed and fasted subjects. Am. J. Clin. Nutr. 42,764-768.
Passmore, R. & Johnson, R.E. (1960): Some metabolic changes following
prolonged moderate exercise. Metabolism. 9,452-455.
Passmore, R. & Durnin, J.G.V.A. (1967): Energy, Work and Leisure. London:
Heinemann Educational Books.
Phillis, J.W. & Wu, P.H. (1981): Na/K ATPase and adrenoreceptors. In
Adrenoreceptors and catecholamine action, ed. G. Kunos, pp. 273-296. New
York: John Wiley & Sons.
Quenouille, M.H., Boyne, A.W., Fisher, W.B. & Leitch, I. (1951): Statistical
studies of recorded energy expenditure in man. 1. Basal metabolism related to sex,
stature, age climate and race. Commonwealth Bureau of Animal Nutrition Technical
Communication, No. 17.
1 85

Ramsey, L.E., Ramsey, M.H., Hettiarachchi, J., Davies, D.L. & Winchester, J.
(1978): Weight reduction in blood pressure clinic. Br. J. Med. 2, 244-245.
Rahn, H., Fenn, W.O. & Otis, A.B. (1949): Daily variations in vital capacity,
residual air, and expiratory reserve, including a study of the residual air method. J.
Appl. Physiol. 1, 725-736.
Ravussin, E., Burnand, B., Schutz, Y. & Jequier, E. (1982): Twenty-four-hour
energy expenditure and resting metabolic rate in obese, moderately obese and
control subjects. Am. J. Clin. Nutr. 35, 566-573.
Ravussin, E., Lillioja, S., Anderson, T.E., Christin, L. & Bogardus, C. (1986):
Determinants of 24-hour energy expenditure in man. J. Clin. Invest. 78, 1568-
1578.
Ravussin, E., Lillioja, S., Knowler, W.C., Christin, P.H.L., Freymond, D.,
Abbot, W.G.H., Boyce, V., Howard, B.V & Bogardus, C. (1988): Reduced rate
of energy expenditure as a risk factor for body weight gain. N. Engl. J. Med. 318,
467-472.
Reeds, P.J., Fuler, M.F. & Nicholson, B.A. (1985): Metabolic basis of energy
expenditure with particular reference to protein. In Substrate and energy metabolism
in man, ed. J.S. Garrow & D. Halliday, pp. 46-57. London: J. Libbey.
Reisen, E., Abel, R., Modan, M., Silverberg, D.S., Eliahou, H.E. & Modan, B.
(1978): Effect of weight loss on salt restriction on the reduction of blood pressure
in overweight hypertensive patients. N. Engl. J. Med. 298, 1-6.
186

Riggs, B.L., Wahner, H.W., Seeman, E., Offord, K.P., Dunn, W.L., Mazess,
R.B., Johnson, K.A. & Melton, L.J. (1982): Changes in bone mineral density in
the proximal femur and spine with aging. Differences between the postmenopausal
and senile osteoporosis syndromes. J. Clin. Invest. 70, 716-723.
Robertson, R.P. & Porte, D. (1974): Plasma catecholamine response to
intravenous glucose in normal man. J. Clin. Endocrinol. Metab. 39, 403-405.
Rochelle, R.H. & Horvarth, S.M. (1969): Metabolic responses to food and acute
cold stress. Am. J. Physiol. 27, 710-714.
Rothwell, N.J., Saville, M.E. & Stock, M.J. (1982): Sympathetic and thyroid
influences on metabolic rate in fed, fasted and refed rats. Am. J. Physiol. 243,
R339-R346.
Roza, A.M. & Shizgal, H.M. (1984): The Harris Benedict equation reevaluated:
resting energy requirements and body cell mass. Am. J. Clin. Nutr. 40,168-182.
Scheidegger, K., O'Connell, M., Robbins, D.C. & Danforth, E. (1984): Effects of
chronic 6-receptor stimulation on sympathetic nervous system activity, energy
expenditure and thyroid hormones. J. Clin. Endocrinol. Metab. 58, 895-903.
Schutz, Y. (1981): Use of non-calorimetric techniques to assess energy expenditure
in man. In Recent advances in obesity research: 3, ed. P. Bjomtorp, M. Cairella &
A. Howard, pp. 153-158. London: J. Libbey.
187
Schutz, Y., Acheson, K., Bessard, T. & Jequier, E. (1982): Effect of a 7-day
carbohydrate (CHO) hyperalimentation on energy metabolism in healthy
individuals. Clin. Nutr. 1, Suppl. F I00.
Schutz, Y. (1984): Glossary of energy terms and factors used for calculations of
energy metabolism in human studies. In Human energy metabolism: physical
activity and energy expenditure measurements in epidemiological research based
upon direct and indirect calorimetry, ed. A.J.H. Van Es, Euro-Nut report 5, pp.
169-181. Wageningen: Euro-Nut.
Schutz, Y., Acheson, K.J. & Jequier, E. (1985): 24 h EE and thermogenesis:
response to progressive CHO overfeeding in man. Int. J. Obes. 9 (suppl. 2), 111-
114.
Scofield, C. (1985b): An annotated bibliography of source material for basal
metabolic rate data. Hum. Nutr.: Clin. Nutr. 39C, Suppl. 1,42-91.
Scofield, W.N. (1985a): Predicting basal metabolic rate, new standards and review
of previous work. Hum. Nutr.: Clin. Nutr. 39C, Suppl. 1, 5-41.
Seaton, T., Welle, S., Alex, S., Lilavivat, U., Campbell, R. (1984): The effect of
adrenergic blockade on glucose induced thermogenesis. Metab. Clin. Exp. 33,415-
419.
Segal, K.E. (1987): Comparison of indirect calorimetric measurements of resting
energy expenditure with a ventilated hood, face mask and mouth piece. Am. J.
Clin. Nutr. 45, 1420-1423.
188

Sestoft, L. (1980): Metabolic aspects of the calorigenic effect of thyroid hormone in
mammals. Clin. End. 13, 489-506.
Shah, M., Geissler C.A. & Miller, D.S. (1988): Metabolic rate during and after
aerobic exercise in post obese and lean women. Euro. J. Clin. Nutr. 42,455-464.
Shetty, P.S. (1984): Adaptive changes in basal metabolic rate and lean body mass
in chronic undernutrition. Hum. Nutr.: Clin. Nutr. 38C, 443-451.
Shetty, P.S., James, W.P.T. & Jung, R.T. (1979): The effect of catecholamine
replacement with levodopa on the metabolic response to semistarvation. Lancet 1,
77-79.
Shock, W.N. (1972): Energy metabolism, caloric intake, and physical activity of
the ageing. In Nutrition in Old Age (10th Symposium of the Swedish Nutrition
Foundation), ed. L.A. Carlson, pp. 12-23. Uppsala: Almqvist & Wiksell.
Shulman, G.I., Ladenson, P.W., Wolfe, M.H., Rideway, E.C. & Wolfe, R.R.
(1985): Substrate cycling between gluconeogenesis and glycolysis in euthyroid,
hypothyroid and hyperthyroid man. J. Clin. Invest. 76, 757-764.
Sims, E.A.H. (1987): Energy balance in human beings: problems of plenitude. In
Vitamins and hormones, vol. 43, ed. G.D. Auerbach & D.B. McCormick, pp. 1-
101. New York: Academic Press.
Sims, E.A.H. (1976): Experimental obesity, dietary-induced thermogenesis and
their clinical implications. Clin. Endocrinol. Metab. 5,377-395.
1 89

Siri, W.B. (1956): The gross composition of the human body. In Advances in
Biological and Medical Physics, vol. 4, ed. C.A. Tobias & J.H. Lawrence, pp.
239-280. New York: Academic Press.
Sjostrom, L., Schutz, Y., Gudinchet, F., Hegnell, L., Pittet, P.G. & Jequier, E.
(1983): Epinephrine sensitivity with respect to metabolic rate and other variables in
women. Am. J. Physiol. 245, E431-E432.
Snell, A.M., Ford, F. & Rowntree, L.G. (1920): Studies in basal metabolism.
JAMA. 75, 515-523.
Soares, M.J. & Shetty, P.S. (1986): Intra-individual variations in resting metabolic
rates of human subjects. Hum. Nutr.: Clin. Nutr. 40C, 365-369.
, Soloman, S.J., Kurzer, M.S. & Calloway, D.H. (1982): Menstrual cycle and basal
metabolic rate in women. Am. J. Clin. Nutr. 36, 661-616.
Sowers, J.R., Nyby, M., Stem, N., Beck, F., Baron, F., Catonia, R. & Vlachis,
N. (1982): Blood pressure and hormone changes associated with weight reduction
in the obese. Hypertension, 4, 686-691.
Spady, D.W., Payne, P.R., Picou, D. & Waterlow, J.C. (1976): Energy balance
during recovery from malnutrition. Am. J. Clin. Nutr. 29, 1073-1078.
Staten, M.A., Matthews, D.E., Cryer, P.E. & Bier, D.M. (1987): Physiological
increments in epinepherine stimulate metabolic rate in humans. Am. J. Physiol.
253, E322-E330.
19 0

Steinberg, D., Nestel, P.J., Elsworth, R.B. & Thompson, R.H. (1964):
Calorigenic effect of norephinepherine correlated with plasma free fatty acids
turnover and oxidation. J. Clin. Invest. 43, 167-176.
Tzankoff, S.P. & Norris, A.H. (1977): Effect of muscle mass decrease on age-
related BMR changes. J. Appl. Physiol. 43, 1001-1006.
Tsai, J.S. & Chen, A. (1978): Effect of L-triiodothyronine on (-) 3H-
dihydroalprenol binding and cyclic AMP response to (-) adrenaline cultured heart
cells. Nature, 275, 138-140.
Vagenakis, A.G., Portnay, G.I., O'Brian, J.T., Rudolph, M., Arky, R.A.,
Ingbar, S.H. & Baverman, L.E. (1977): Effect of starvation on the production and
metabolism of thyroxine and triiodothyronine in euthyroid obese patients. J. Clin.
Endocrinol. Metab. 45, 1305-1308.
Vaughan, J.M. (1970): The Physiology of Bone. Oxford: Claredon Press.
Vemet, O., Nacht, C.A., Christin, L., Schutz, Y., Danforth, E. & Jequier, E.
(1987): B-adrenergic blockade and intravenous nutrient-induced thermogenesis in
lean and obese women. Am. J. Physiol. 253, E65-E71.
Wakeman, G. (1923): Basal metabolism and the menstrual cycle. J. Biol. Chem.
56, 555-567.
Webb, P., Annis, J.F. & Troutman, S.J. (1972): Human calorimetry with a water
cooled garment. J. Appl. Physiol. 32, 412-418.
191

Webb, P. (1981): Energy expenditure and fat free mass in men and women. Am. J.
Clin. Nutr. 34, 1816-1826.
Weiner, J.S. & Lourie, J.A. (1981): Practical Human Biology. London: Academic
Press.
Weiner, N. (1985): Drugs that inhibit adrenergic nerves and block adrenergic
receptors. In Goodman & Gilman's The Pharmacological Basis of Therapeutics,
ed. A. Goodman Gilman, L.S. Goodman, T.W. Rail & F. Murad, pp. 181-214.
New York: Macmillan Publishing Co., Inc.
Weir, J.B. (1949): New methods for calculating metabolic rate with special
reference to protein metabolism. J. Physiol. 109, 1-9.
Welle, S., Lilavivathna, U. & Campbell, R.G. (1980): Increased plasma
norepinephrine concentrations and metabolic rates following glucose ingestion in
man. Metabolism, 29, 806-809.
Welle, S. & Campbell, R.G. (1983): Stimulation of thermogenesis by carbohydrate
overfeeding. Evidence against sympathetic nervous system mediation. J. Clin.
Invest. 71, 916-925.
Weststrate, J.A. (1989): Resting metabolic rate and diet-induced thermogenesis:
studies in humans on individual differences and on the impact of nutritional and
non-nutritional factors. PhD Thesis, Wageningen Agricultural University,
Netherlands.
192

Widdowson, E.M. (1981): Energy regulation in animals and man. Nutrition in
Health and Disease and International Development: Symposium from X I1 Int.
Congr. Nutr. pp 29-34.
Widdowson, E.M. (1947): A study of individual children's diets. Spec. Rep. Ser.
Med. Res. Counc. No. 257. pp. 196. London: HMSO.
Williams, L.T., Lefkowitz, R.J., Watanabe, A.M., Hathaway, D.R. & Besch,
H.R. (1977): Thyroid hormone regulation of adrenergic receptor number. J. Biol.
Chem. 252, 2787-2789.
Wiltshire, M.O.P. (1921): Some observations on basal metabolism in
menstruation. Lancet, 2, 388-389.
Womersley, J., Dumin, J.G.V.A., Boddy, K. & Maffy, M. (1976): Influence of
muscular development, obesity, and age on the fat-free mass of adults. J. Appl.
Physiol. 41, 223-229.
Womersley, J. & Durnin, J.G.V.A. (1977): A comparison of the skinfold method
with the extent of 'overweight' and various weight-height relationships in the
assessment of obesity. Br. J. Nutr. 38, 271-284.
Wyndham, C.H., Williams, C.G. & Loots, H. (1968): Reactions to cold. Am. J.
Physiol. 24, 282-287.
193