10390894.pdf - Enlighten: Theses
493
https://theses.gla.ac.uk/ Theses Digitisation: https://www.gla.ac.uk/myglasgow/research/enlighten/theses/digitisation/ This is a digitised version of the original print thesis. Copyright and moral rights for this work are retained by the author A copy can be downloaded for personal non-commercial research or study, without prior permission or charge This work cannot be reproduced or quoted extensively from without first obtaining permission in writing from the author The content must not be changed in any way or sold commercially in any format or medium without the formal permission of the author When referring to this work, full bibliographic details including the author, title, awarding institution and date of the thesis must be given Enlighten: Theses https://theses.gla.ac.uk/ [email protected]
-
Upload
khangminh22 -
Category
Documents
-
view
0 -
download
0
Transcript of 10390894.pdf - Enlighten: Theses

https://theses.gla.ac.uk/
Theses Digitisation:
https://www.gla.ac.uk/myglasgow/research/enlighten/theses/digitisation/
This is a digitised version of the original print thesis.
Copyright and moral rights for this work are retained by the author
A copy can be downloaded for personal non-commercial research or study,
without prior permission or charge
This work cannot be reproduced or quoted extensively from without first
obtaining permission in writing from the author
The content must not be changed in any way or sold commercially in any
format or medium without the formal permission of the author
When referring to this work, full bibliographic details including the author,
title, awarding institution and date of the thesis must be given
Enlighten: Theses
https://theses.gla.ac.uk/

THANG SIEU HANBSc (Honours), Physiology & Sports Science, Glasgow
MSc, Human Nutrition and Metabolism, Aberdeen
A thesis submitted for the degree of Doctor of Philosophy
to
The University of Glasgow
May 1997
From research conducted at the
Department of Human Nutrition, University of Glasgow
Glasgow Royal Infirmary
Glasgow, Scotland
r.5. Han

ProQuest Number: 10390894
All rights reserved
INFORMATION TO ALL USERS The quality of this reproduction is dependent upon the quality of the copy submitted.
In the unlikely event that the author did not send a complete manuscript and there are missing pages, these will be noted. Also, if material had to be removed,
a note will indicate the deletion.
uestProQuest 10390894
Published by ProQuest LLO (2017). Copyright of the Dissertation is held by the Author.
All rights reserved.This work is protected against unauthorized copying under Title 17, United States Code
Microform Edition © ProQuest LLO.
ProQuest LLO.789 East Eisenhower Parkway
P.Q. Box 1346 Ann Arbor, Ml 48106- 1346

y v
I GLASGOW W T^R Sm UBRARL

CONTENTS
PAGES
SUMMARY AND CONCLUSIONS OF THE FINDINGS IN THE
PRESENT THESIS
viii
Summary viii
Conclusions xii
ACKNOWLEDGEMENTS xiv
DECLARATION OF PERSONAL INVOLVEMENT AND EXTENT
OF COLLABORATIONS IN THE PRESENT THESIS
XV
ABBREVIATIONS USED IN THE PRESENT THESIS XV i
CHAPTER ONE: LITERATURE REVIEW 1
1.1 Introduction 2
1.2 Body fat, overweight and fat distribution: an overview 21.2.1 What is overweight? 21.2.2 What causes overweight? 31.2.3 Body fat distribution 51.2.4 Regional fat cell metabolism 61.2.5 Methods of measuring body fat 81.2.6 Assessment of body fat distribution 91.2.7 Legends of figures in chapter 1.2 10
1.3 Skeletal structure 171.3.1 A global view of the trends in height changes over time 171.3.2 Nutritional status and height 171.3.3 Height and health 18
11

1.3.4 Limb lengths in relation to height 18
1.4 Muscle morphology and function 191.4.1 Characteristics of muscle fibres 191.4.2 Muscle morphology: nature or nurture? 201.4.3 Electrical stimulation and muscle morphology 221.4.4 Ageing and muscle morphology 231.4.5 Muscle morphology and metabolic disorders 231.4.6 Other effects on muscle morphology 24
1.5 Evidence linking early malnutrition and altered body 25morphology
1.5.1 Birth weight and body fat distribution 251.5.2 Early nutrition and the development of body stature 25
251.6 Relationships between early nutrition and health in later life 261.6.1 The ‘thrifty phenotype’ hypothesis 271.6.2 The ‘programming’ hypothesis 27
CHAPTER TWO: AIMS, HYPOTHESES, RESEARCH QUESTIONS AND 28
RATIONALE OF THE PRESENT THESIS
2.1 Aims, hypotheses and selection of research questions 29
2.1.1 Development of simple and practical methods for assessing body 29
morphology
2.1.2 Relationships between body morphology and metabolic disorders 30
2.1.3 Some determinants of body morphology and metabolic disorders 30
2.1.4 Implications of altered body morphology on health risks applied 32
towards health promotion
2.2 Rationale for selection of study designs and methods for the 32
present thesis
2.3 Statistical considerations for experimental designs in 33
research
2.3.1 Measurement error 33
2.3.2 Sensitivity, specificity, and predictive values 36
111

2.4 Study designs in the present thesis 37
2.5 Statistical methods applied in data analyses in the present 38
thesis
CHAPTER THREE: ASSESSING AND DEVELOPING METHODS OF 40
BODY COMPOSITION MEASUREMENTS
3.1 Predicting body composition by body density from simple 41
anthropometric measurements
3.2 Limb lengths as indices of stature in adults, and alternatives 73
to body mass index for chair- or bed-bound subjects
3.3 Influences of body compartments on bioelectrical impedance 91
analysis and densitometry
CHAPTER FOUR: DEVELOPMENT OF SIMPLE ANTHROPOMETRIC 107
INDICES FOR HEALTH PROMOTION
4.1 Waist circumference as a measure for indicating need for 108
weight management: development of cut-offs for health
promotion
4.2 Waist circumference as a screening tool for cardiovascular 121
risk factors: evaluation of receiver operating characteristics
(ROC)
4.3 The influences of height and age on waist circumference as 143
an index of adiposity in adults
IV

4.4 Predicting intra-abdominal fatness by magnetic resonance 162
imaging and computerised tomography from anthropometric
measures for health promotion: the influence of stature
4.5 Relationship between volumes and areas from single 182
transverse scans of intra-abdominal fat measured by
magnetic resonance imaging
CHAPTER FIVE: EPIDEMIOLOGY OF BODY MORPHOLOGY AND 193
ASSOCIATED ILL HEALTH IN A CROSS-SECTIONAL POPULATION
SURVEY
5.1 Associations between body fat distribution and lifestyle 194
factors
5.2 Waist circumference Action Levels in the identification of 212
cardiovascular risk factors
5.3 The prevalence of low back pain and associations with body 229
fatness, fat distribution and height
5.4 Symptoms of respiratory insufficiency in relation to body 147
mass and fat distribution
5.5 Associations of stature, body mass and fat distribution with 262
non-insulin-dependent diabetes mellitus
5.6 Quality of life in relation to overweight and fat distribution 276
V

CHAPTER SIX: APPLICATION OF STANDARD CUT-OFF VALUES OF 292
BODY MASS INDEX AND WAIST CIRCUMFERENCE TO PREDICT ILL
HEALTH IN A CROSS-SECTIONAL EPIDEMIOLOGICAL SURVEY
6.1 Impairment of health and quality of life in the overweight 293
according to standard cut-offs of body mass index
6.2 Impairment of health and quality of life from abdominal fat 316
accumulation, using waist circumference Action Levels
CHAPTER SEVEN: WEIGHT MANAGEMENT: RELATING CHANGES IN 340
BODY MORPHOLOGY AND CARDIOVASCULAR RISK FACTORS
7.1 Waist reduction and cardiovascular benefits during weight 341
management in women
CHAPTER EIGHT: SKELETAL STRUCTURE IN RELATION TO 361
METABOLIC DISORDERS: A CROSS-SECTIONAL SURVEY OF ADULTS
8.1 Skeletal proportions and metabolic disorders in adults 362
CHAPTER NINE: NATURAL SPORTING ABILITY IN RELATION TO 375
BODY MORPHOLOGY AND HEALTH IN LATER LIFE: A
RETROSPECTIVE FOLLOW-UP STUDY
9.1 Natural sporting ability, birth weight and predisposition to 376
cardiovascular disorders
CHAPTER TEN: SELF ASSESSMENT OF BODY MORPHOLOGY FOR 394
HEALTH PROMOTION
10.1 Development and evaluation of the ‘Waist Watcher’ tape 395
measure for assessment of waist circumference in free living
subjects
VI

CHAPTER ELEVEN: GENERAL DISCUSSION OF THE FINDINGS AND 415
CONCLUSIONS OF THE PRESENT THESIS
11.1 Overall conclusions of the findings and answers to research 416
questions
11.1.1 Development of simple anthropometric methods for assessing 416
body morphology
11.1.2 Relationships between body morphology and metabolic disorders 416
11.1.3 Some determinants of body morphology and metabolic disorders 417
11.1.4 Implications of altered body morphology on health risks applied 418
towards health promotion
11.2 Validity of conclusions, limitations of the studies in the 418
present thesis, and future research directions
11.2.1 Validity and limitations of the studies and further research needs 418
11.2.2 Future research directions 419
REFERENCES 423
PUBLICATIONS ARISING FROM THE PRESENT THESIS 469
Vll

SUMMARY AND CONCLUSIONS OF THE FINDINGS IN THE PRESENT
THESIS
SummaryThe present thesis has drawn on a wide range of studies employing a variety of
methodologies, aiming to explore the importance of hody composition and morphology
in relation to health and disease in adults, with a principle consideration of the need for
health promotion. To achieve these aims, a series of hypotheses were postulated and a
number of research questions were asked, followed by hypothesis testing and data
analyses to gain new understanding, and to establish firmly the associations o f body
morphology with health and disease.
Recognising the limited success in reversing the increasing trends in overweight has
prompted the need to design new strategies in promoting public awareness of the risk of
ill health associated with overweight and central fat distribution. These studies were
carried out in this context to develop simple methods for assessing body composition, to
enable health professionals and general public to assess and identify people with
increasing health risks associated with overweight and increased intra-abdominal fat
accumulation. The use of body mass index is established hut is too complex for lay use,
and does not take accoimt of fat distribution as an indicator of ill health. Waist
circumference was explored since it reflects both fatness and central fat distribution. It
was shown that height correlated weakly or not at all with waist circumference. Analysis
of magnetic resonance imaging and computerised tomography data showed that height
correlated weakly with intra-abdominal fat and had limited influence on the strong
relationship between waist circumference and intra-abdominal fat. Thus waist
circumference could be used as an index of adiposity and health risk without the need of
incorporating height to create complex ratios (height adjustment). New equations
employing simple anthropometric variables including a single measurement of waist
circumference have been derived and cross-validated in an independent Dutch
population. These equations were found to be valid for assessing total hody fatness.
Vlll

Cut-offs of waist circumference were derived to identify people with high body mass
index (overweight) or with high waist to hip ratio (central fat distribution): Action Level
1 (94 cm in men, 80 cm in women) identifies those with body mass index above 25
kg/m^ or waist to hip ratio above 0.95 in men or above 0.80 in women. Action Level 2
(102 cm in men, 88 cm in women) identifies those with body mass index above 30
kg/m^ or waist to hip ratio above 0.95 in men or above 0.80 in women. Receiver
operating characteristic (ROC) analysis showed that Action Level 1 was close to the
optimal (at the point where sensitivity equals specificity) value for identifying people
with cardiovascular risk factors, including hypertension, hypercholesterolaemia or low
high density lipoprotein (HDL) cholesterol.
Excessive accumulation of the metabolically active intra-abdominal fat is associated
with metabolic disorders. Magnetic resonance imaging and computerised tomography
studies conducted in Aberdeen and The Netherlands have shown that waist
circumference is closely related to intra-ahdominal fat. Epidemiological studies in the
present thesis showed that large waist circumference was associated with poor quality of
life and a cluster of metabolic disorders and symptoms of clironic diseases including
non-insulin-dependent diabetes mellitus (NIDDM), respiratory symptoms, low back
pain, and high blood pressure, high total plasma cholesterol and low HDL cholesterol.
In our cross-sectional study, low hip circumference was related to NIDDM
independently of waist (abdominal fat), suggested that reduced muscle mass (i.e.
reduced postural, mainly type 1 muscle fibres) may be a consequence of NIDDM.
Analysis of data from a weight reduction follow-up study of free living women showed
that moderate reduction (5-10 cm) of waist circumference was associated with 85%
chance of improving at least one of the major cardiovascular risk factors in overweight
women who had not been selected for high cardiovascular risk.
IX

Features of metabolic syndrome including insulin resistance, NIDDM, Cushing’s
syndrome, hypertension, and increased intra-ahdominal fat accumulation have
previously been found to associate with increased type 2b, glycolytic, white muscle
fibres. Athletes who specialise in power sports tend to have higher proportions of type
2b muscle fibres than those who specialise in endurance sports who tend to have greater
proportion of oxidative, type 1 muscle fibres. A retrospective study of former physical
trainees was carried out to test the hypothesis that those with a natural ability in power
sports (a presumed marker of type 2 muscle fibre predominance) might have increased
risks of cardiovascular disorders compared to those with a natural ability in endurance
sports (a marker of type 1 muscle fibre predominance). It was found that compared to
men who had a natural ability in endurance sports, those who had a natural ability in
power sports were more likely to report the development of cardiovascular disorders.
Epidemiological studies of Barker and colleagues have produced compelling evidence
for the associations between small birth weight (presumed to reflect failure in early
growth) with health risks tlirough metabolic diseases (coronary heart disease, stroke,
non-insulin dependent diabetes mellitus) in later life. The diseases under question are
those associated with the ‘metabolic syndrome’ linked by insulin resistance and with
central fat distribution. Our previous studies and that of Law et al have foimd women
and men who had small birth weights had increased abdominal fat deposition, indicated
by large waist circumference or high waist to hip ratio. Amongst the same women from
our previous study, low birth weight also tended to relate to elevated blood pressure and
heart rate. The ‘thrifty phenotype’ and ‘programming’ hypotheses were assessed as ways
to explain possible influences of early nutrition on the development of visceral organ
morphology and function to relate to health in later life. It is surprising that little is
known about the development and function of the musculoskeletal system, which is the
biggest and arguably most expendable organ of all, in relation to metabolic disorders in
adulthood. In the present thesis, birth weight was found to correlate negatively with
cardiovascular disorders and had an additive effect with natural ability in power sports.
Compared to men who had a natural ability in endurance sports and above median birth
X

weight, those with a natural ability in power sports and below median birth weight were
more likely to develop CHD and/or risk factors (age, current body mass index, and
lifestyle factors adjusted odds ratio = 10.5, 95% confidence interval: 1.9 to 59.5),
compared to men in the endurance group with above median birth weight.
Skeletal structure based on measured body dimensions including height, lower leg
length and demi-arm span was studied to investigate the influences from age and gender,
and as marker for adaptation to the effects of early growth development, to relate to
coronary heart disease and predisposing risk factors. Analysis of variance with
adjustments for age, social class and smoking showed that in men, short height, lower
leg length or demi-arm span was associated with hypercholesterolaemia, and long lower
leg length was associated with diabetes mellitus. In women, short height or lower leg
length was associated with coronary heart disease. High ratio of lower leg lengthiheight
or lower leg length:demi-arm span was associated with diabetes mellitus in ruen. In
women, high ratio of demi-arm span:height or low ratio of lower leg length:demi-arm
span was associated with coronary heart disease.
A specially made tape measure, the ‘Waist Watcher’, was developed based on Action
Level cut-offs to provide guidelines for target waist circumference. As part of a health
promotion directed at general public, a prospective study was designed to assess the
usefrilness of the Waist Watcher for weight management in 600 men and women.
Baseline data were available for analysis of the accuiacy of self-reported body weight,
height, and waist circumference in 101 men and 62 women. Classifications using waist
Action Level 1 or Action Level 2 by the investigator were used as the reference method.
Using the ‘Waist Watcher’ with different colour bands based on the Action Level, and
photographic instructions to assess waist size, subjects classified themselves into correct
categories according to Action Level 1 with sensitivities of 100% and 94.3%, and
specificities of 95.0% and 96.3%, and according to Action Level 2 with sensitivities of
97.1% and 100%, and specificities of 100% for both sexes. Only 2% of the sample
misclassified themselves into the wiong categories of waist circumference Action
XI

Levels. The findings suggest that the Waist Watcher tape measure and photographic
instructions can be used by the general public to assess their own waist circmnference,
alerting those who need weight management and screening for cardiovascular risk
factors, and providing a target of desirable range of waist circumference.
Conclusions1. New equations for men and women using simple anthropometric variables including
a single measurement of waist circumference have been developed and cross
validated. These equations are rohust in predicting body fatness with little error or
bias from extremes of fat distribution and age. A single measurement of waist
circumference provides a convenient way to assess body fatness in epidemiology
and clinical situation.
2. Cut-offs of waist circumference at Action Level 1 (94 cm in men and 80 cm in
women) and Action Level 2 (102 cm in men and 88 cm in women) have been
derived to identify men and women at risk of overweight or central fat distribution.
These Action Levels are useful in alerting public awareness of health risks
associated with overweight and intra-abdominal fat accumulation.
3. Waist circumference Action Level 1 in men and in women is close to the optimal
cut-offs from ROC analysis for identifying hypertension, hypercholesterolaemia or
low HDL cholesterol.
4. Height has very limited influence on waist circumference as an index of adiposity,
and can be neglected for practical applications.
5. Lai'ger waist circmnference associates with increased risks o f chr onic diseases and
symptoms, cardiovascular risk factors and poor quality of life. Those with large
waist circmnference should take action in lifestyle modification and weight
management to prevent further weight gain, and should be urged to lose weight.
xir

6. Reduced hip circumference (i.e. reduced postural, mainly type 1 muscle fibres) was
related to NIDDM independently of waist circumference (abdominal fat).
7. A moderate reduction of waist of 5-10 cm may he a useful guideline for achieving
realistic targets in weight management and improving cardiovascular risks.
8. Short stature and limb lengths, and also altered skeletal proportions, which may
reflect interrupted growth, are associated with several metabolic disorders. Skeletal
disproportion associates with diabetes mellitus in men and CHD in women.
9. Men with natural ability in power sports are more likely in later life to develop
CHD and/or predisposing risk factors than those with a natural ability in endurance
sports, suggesting that muscle fibre composition may play important roles in
cardiovascular disorders. Low birth weight has an independent additive effect on
these disorders.
10. Waist circumference measmed using the ‘Waist Watcher’ tape measure by subjects
agrees to within (95% confidence interval limits of agreement) 6.5 cm in men and
5.3 cm in women. Using the ‘Waist Watcher’ tape measure, subjects self-classify
their waist circumference according to Action Level 1 (<94 cm in men, <80 cm in
women) or Action Level 2 (>102 cm in men, >88 cm in women) with sensitivities
and specificities above 94%. ‘Waist Watcher’ tape measure provides a valuable tool
for screening health risks associated with intra-abdominal fat accumulation, in
health promotion directed at the general public.
11. The findings of the present thesis contribute new Imowledge in the aetiology of
diseases, and also they provide an opportimity to use morphological markers of
musculoskeletal development and body composition so that those who are at risk
could be targeted better by health promotion directed at the general public.
X lll

ACKNOWLEDGEMENTS
Research studies in the present thesis were guided by Professor Michael EJ
Lean (Department of Human Nutrition, Glasgow Royal Infirmary, University of
Glasgow) and Professor Jacob C Seidell (Department of Chronic Diseases
and Environmental Epidemiology, National Institute of Public Health and the
Environment, Bilthoven, The Netherlands). Your teachings have provided solid
foundation in my thinking and understanding of scientific research, and paved
the way for my career in Medicine. I am forever in your debts.
I appreciate the continuing interest and support of my career progress from
Professor WPT James (Rowett Research Institute, Aberdeen), Dr Geraldine
McNeill (Department of Medicine and Therapeutics, University of Aberdeen),
and Professor Lawrence T Weaver (Department of Child Health, Yorkhill
Hospital for Sick Children, University of Glasgow).
Thanks are due to all colleagues at the University of Glasgow and the
Department of Chronic Diseases and Environmental Epidemiology, National
Institute of Public Health and the Environment, Bilthoven, The Netherlands, and
staff from the Army School of Physical Training, Aldershot.
I cannot thank all colleagues individually who are listed in the list publications,
but special thanks to Irene Kelly, Aarti Son:, Caroline Morrison, Anneke
Blockstra, Ruth Wouters, and Annie Anderson.
I cannot apologise enough to my family (The Han Clan) for being away so long,
but I have nearly finished studying - just another five and a quarter years,
perhaps.
XIV

DECLARATION OF PERSONAL INVOLVEMENT AND EXTENT OF
COLLABORATIONS IN THE PRESENT THESIS
The present thesis has used a variety of study designs, requiring large amounts of human
data collection through questionnaires and measurements. I have personally designed
and conducted all the analyses, personally made all the measurements and collected all
the data for chapter 3, chapter 4 chapter 8, chapter 9 and chapter 10 (a total of 852
subjects) . Data from cross-sectional studies were made available tfrrough collaborations
with the Dutch MORGEN Project, and WHO Glasgow MONICA Project on
epidemiology for chapters 4-6. Primary data for the validation study in chapter 3.1 were
provided by Dr P Deuienberg (University of Wageningen). The study of the influence of
height on waist circumference as an index of adiposity re-examined data collected hy
myself during my MSc Magnetic Resonance Imaging Study (originally supervised by Dr
G McNeill, University of Aberdeen) and also analysed data from Professor JC Seidell’s
Computerised Tomography Study, conducted in Wageningen. A study of the benefits
from waist reduction used data from Professor MEJ Lean’s follow up study of weight
loss in Aberdeen.
The extent of collaborations and my personal input to the research are indicated in each
chapter.
THANG SIEU HAN
Dr J Womersley
Internal examiner
University o f Glasgow
Dr A Prentice
External examiner
University o f Cambridge
Professor J McKillop
Convenor
University o f Glasgow
XV

ABBREVIATIONS USED IN THE PRESENT THESIS
AT
BF
BIA
BMI
BMR
adipose tissue
body fat
bioelectrical impedance analysis
body mass index
basal metabolic rate
CT
Cl
computerised tomography
confidence interval
Demi-AS demi-arm span
FFA
FFM
free fatty acids
fat free mass
HDL high density lipoprotein
IDDM insulin-dependent (type 1) diabetes mellitus
LLL lower leg length
MONICA
MORGEN
MRI
Monitoring Cardiovascular disease (WHO study)
Monitoring van Risicofactoren en Gezondheid in Nederland
(Monitoring Risk Factors and Disease in The Netherlands)
magnetic resonance imaging
NIDDM non-insulin-dependent (type 2) diabetes mellitus
OIP optimal index power
XVI

OR odds ratio
PAR population attributable risk
r correlation coefficient
explained variance
ROC receiver operating characteristics
SD standard deviation
SEE standard error of the estimate
SF skinfold
UWW underwater weighing
WHO World Health Organisation
xvii

I I CHAPTER ONE
LITERATURE REVIEW
11 CONTENTS OF CHAPTER ONE PAGES
1.1 introduction 2
1.2 Body fat, overweight and fat distribution: an overview 21.2.1 What is overweight? 21.2.2 What causes overweight? 31.2.3 Body fat distribution 51.2.4 Regional fat cell metabolism 61.2.5 Methods of measuring body fat 81.2.6 Assessment of body fat distribution 91.2.7 Legends of figures in chapter 1.2 10
1.3 Skeletal structure 171.3.1 A global view of the trends in height changes overtime 171.3.2 Nutritional status and height 171.3.3 Height and health 181.3.4 Limb lengths in relation to height 18
1.4 Muscle morphology and function 191.4.1 Characteristics of muscle fibres 191.4.2 Muscle morphology: nature or nurture? 201.4.3 Electrical stimulation and muscle morphology 221.4.4 Ageing and muscle morphology 231.4.5 Muscle morphology and metabolic disorders 231.4.6 Other effects on muscle morphology 24
1.5 Evidence linking early malnutrition and altered body morphology
25
1.5.1 Birth weight and body fat distribution 251.5.2 Early nutrition and the development of body stature 25
251.6 Relationships between early nutrition and health in later life 261.6.1 The 'thrifty phenotype’ hypothesis 271.6.2 The 'programming’ hypothesis 27

1.1 introductionThe associations of overweight and fat distribution with metabolic complications are
well established (Bjdrntorp, 1992), but the causal links remain unclear. Genetic and
enviromnental factors and their interactions have long been considered as the main
determinants of body fatness and fat distribution (Bouchard, 1990). Recent evidence
emerged from studies of Barker and colleagues (1992) suggests that early malnutrition
could result in irreversible damage to vital organs in order to sustain the development of
the nervous system, ‘programming’ such subjects to greater susceptibility to metabolic
disorders in certain enviromnent, which could persist through to adult life. Early
nutrition could thus be important in the development of body morphology and health,
acting with genetic and environmental factors.
Studies of muscle composition have shown type 2b muscle fibres were associated with
features of metabolic syndrome, including non-insulin-dependent diabetes mellitus
(NIDDM) (Marin et al, 1994), decreased insulin sensitivity (Lillioja et al, 1987),
Cushing’s syndrome (Rebuffé-Scrive et al, 1988), raised insulin and glucose
concentrations (Krotkiewski et al, 1990), and increased intra-abdominal fat
accumulation (Seidell et al, 1989a). All these studies found increased type 2h muscle
fibres were associated with central fat distribution.
This chapter is a literatuie review which aims firstly to review existing studies on the
development of overweight and fat distribution, skeletal structure, and muscle
morphology, secondly to review the relationships between early nutrition and health in
later life, and thirdly to seek evidence of early growth in relation to hody morphology,
including weight, skeletal structure (height and limb lengths), and muscle composition.
1.2 Body fat, overweight and fat distribution: an overview
1.2.1 What is overweight?
Overweight implies an excessive fat storage in an expanded adipose tissue mass. There
are many methods of measuring body fat, ranging from simple antlu'opometric to

complex computerised scamiing techniques. This issue will he considered in Chapter 3.
Because of the ease of the measurements, body mass over the of height squaie (kg/m^),
known as the Quetelet index (Quetelet, 1869) or body mass index (BMI), is a useful
method for assessing the degree of overweight in epidemiological studies. BMI is now
almost universally accepted as the measiue of body fatness, the range 20-25 is
considered as desirable. These figures were derived from the relationships between BMI
and mortality rates (Royal College of Physicians, 1991). Garrow (1981) further defined
the ranges between 25-30 and 30-40 to indicate different grades of overweight.
In Western societies, the rising prevalence of overweight adults, whose BMI exceeds 30
kg/m^, has now reached 15-20% (Gregory et al, 1990; Kuczmai'ski et al, 1994; Beimett
et al, 1995; Seidell, 1995a). Overweight clearly relates to premature death (Lew and
Garfmkle, 1989) and a cluster of morbidity such as NIDDM, cardiovascular disease
(CVD), and certain cancers. Quality of life in such persons is surprisingly less
established, in view of their increased risk of disability (Stewart et al, 1983; Launer et
al, 1994). Overweight is now increasingly accepted as a disease per se, imposing
enormous burdens on health care resources (Colditz, 1992; Office of Health Economics,
1994; German Society for Obesity Research, 1995; Institute of Medicine, 1995; Levy et
al, 1996; Seidell, 1995b; Sjostrom et al, 1995; Wolf and Colditz, 1996).
1.2.2 What causes overweight?
Weight gain (i.e. fat gain) occurs when energy intake exceeds energy expenditure. The
energy balance cycle (Figure 1.2.1) consists of many variable components. Energy
intake normally in the form of ingested foods, is influenced by appetite, i.e. palatability
of the food, sight and smell, which are controlled by the satiety/hunger centre located in
the hypothalamus. In Western societies, food supply is not a limiting factor, but some
40% of all people consciously limit their food intake to control weight. Basal metabolic
rate is the largest component of energy expenditure (-75%), influenced mainly by the
proportion of lean body mass. Physical activity occupies on average about 15%, and
thermo genesis about 10% of energy expenditure, foods, especially carbohydrate increase

thermo genesis tlii'ough dietary induced thermogenesis. Weight change results from
changes in one or a combination of these components, which involves many factors in
humans, making the task of identifying the aetiology of overweight extremely difficult.
Genetics, environment, behaviour and medical conditions are some of major influencing
factors. Although the presence of unlimited food, without the need for physical exertion
to obtain it, promotes obesity, not everyone becomes overweight under those conditions.
Differences between individuals in their tendency to weight gain are ultimately genetic,
and genetic mechanisms may in principle operate through appetite, tluough power of
restraint, or tlii’ough metabolic mechanisms. The genetic basis of most obesity in
humans is polygenic, but some potential major genetic factors are the subject o f current
research elsewhere. Recent epidemiological evidence suggests that early nutrition may
play an important role in the development of overweight (Barker, 1992). This issue will
be addressed in later sections of this chapter.
Obesity appears to run in families, though whether this reflects a genetic effect or is the
consequence of a common family environment is unclear. Garn and Clark (1976)
showed that the likelihood that a child will be obese is 40-50% if one parent is obese and
70-80% if both are ohese. Stunkard et al (1986) compared the similarities between
related individuals who were exposed to different enviromnent and non-related
individuals living together. They studied 540 Danish adult adoptees and both their
biological and adopted parents. BMI of adopted children was observed to continue to
resemble their biological parents, particularly for mothers and daughters, but there was
no significant relationship with the adoptive parents.
Bouchard et al (1985) studied 917 subjects aged 8-26 years from more than 400 families
to examine the roles of genetic and environmental influences on obesity and fat
distribution. The sample included 80 pairs of adopted siblings, 95 pairs of cousins, 370
pairs of biological siblings, 69 pairs of dizygotic twins and 87 pairs of monozygotic
twins. Increasing similarity in fatness and fat distribution was observed between
siblings, dizygotic and monozygotic twins, but none was detected between adopted

siblings. The greater heritahility between dizygotic twins than between siblings must be
reflecting environmental factors, since their gene similarity (50%) is the same as in
siblings, on the other hand, differences in intra-uterine growth of twins - even
monozygotic twins, are well described, and this could affect later growth. Significant
genetic (#fects were found for BMI, subcutaneous fat, fat distribution, body density and
fat free mass. Similarities found between children and parents and between adoptive
children and foster parents indicate an influence of enviromnental factors. Intraclass
correlations for BMI and skinfold thicknesses were almost identical in the biological and
adoptive families, but extremity/trunlc ratio and the proportion of total fat mass in
subcutaneous sites were more closely correlated in natural than adoptive relations.
Further studies by Bouchard’s group (1988) used a path analysis technique in 1698
French Canadians, including adoptive, biological, and twin relations to determine
genetic and non-genetic familial influences. They found genetic transmission explained
5-30% of total variance for total body fat and fat distribution, and familial environment
explained transmission of 10-30%. The ratio of subcutaneous fat from six skinfold
thicknesses to fat mass from underwater weighing explained 40% of total variance
transmissible between generations, from which 25% was accounted for by genetic and
15% by environmental factors, indicating fat distribution is accounted for by a large
genetic component. Studies of overfeeding in twins by Foehlman et al (1986) and
Bouchard et al (1990) suggest interactions between genetic and enviromnental factors in
developing overweight.
1.2.3 Body fat distribution
Over the last ten years, fat patterning research in relation to health has re-emerged forty
yeai’s since it was first suggested by Jean Vague (1947 & 1949). People with central fat
distribution tend to have large proportion of body fat situated at the abdominal regions,
accompanied hy a relative increase in fat mass deposited within the abdomen (Ashwell
et al, 1985; Seidell et al, 1988). Increased abdominal fat has been observed to relate to
high risk of developing ill health, acting independently from obesity.

People with central fat distribution in both sexes tend to have a distinct body shape, said
to resemble that of an apple (Figure 1.2.2), a physical characteristic of men, so termed
‘android’ by Vague, and tend to associate with metabolic abnormalities and chronic
diseases (Vague, 1956; Kissebah et al, 1982; Lapidus et al, 1984; Larsson et al, 1984;
Ohlson et al, 1985). There is also evidence suggesting central fat distribution is related
to increased proportion of fast glycolytic muscle fibres (Krotkiewski et al, 1990),
another masculine characteristic (Simoneau and Bouchard, 1989), and these people have
been observed to have poor endurance but not poor strength in physical performance
(Seidell et al, 1989a).
1.2.4 Regional fat cell metabolism
Studies of abdominal subcutaneous fat cells in subjects with central fat distribution
showed a change in morphology with significant increase in eell volume, accompanied
by an increase in androgenic/oestrogenic activity (Rebuffé-Scrive and Bjorntorp, 1985).
Higher rate of basal and adrenaline-stimulated lipolysis was observed and these cells
showed diminished sensitivity to antilipolytic action of insulin (Kissebah et al, 1986)
and more responsive to lipolytic effect of catecholamines (Lafontan et al, 1985).
Increased central fat deposition relates specifically to an increase in intra-abdominal fat
area on single computerised tomography (CT) scans (Ashwell et al, 1985; Seidell et al,
1988). This intra-abdominal (visceral) adipose tissue which includes the omental fat
mass, has been observed to have much greater lipolytic capacity than subcutaneous fat,
and contains a similar concentration of the imier mitochondrial membrane uncoupling
protein (32 Kd) to that in perirenal and periadrenal fat masses (Lean and Trayhurn,
1987). This protein has been considered unique to the functionally distinct brown
adipose tissue found in internal fat masses in humans, and its mRNA is detectable in
insignificant amounts in subcutaneous fat (Riquier et al, 1984). More recently a variant
uncoupling protein-2 has been identified in white adipose tissue.

Regulation of lipolysis probably depends on both insulin and catecholamines. Omental
fat cells have been shown to be even less sensitive than abdominal subcutaneous fat cells
to the antilipolytic effect of insulin (Bolinder et al, 1983). An increased lipolytic
responsiveness to catecholamines was also observed in these cells. This may be related
to a less pronounced adrenergic receptor response and a decrease in the ratio of
receptor sites on these cell membrane (Lafontan et al, 1985). Changes in response to
insulin and catecholamines may have effects on the increased mobilisation of free fatty
acids (FFA) that drain at high levels directly into the portal vein (Rebuffé-Scrive and
Bjorntorp, 1985), this may influence the insulin clearance by the liver (Smith, 1985).
Diminished extraction and removal of insulin could be the result o f direct influence by
androgens (Kissebah et al, 1982). Increased hepatic exposure to FFA reduces hepatic
clearance of insulin that may lead to increased posthepatic insulin delivery and
hyperinsulinaemia (Bjorntorp, 1991).
The associations between increased intra-abdominal fat mass and metabolic disorders,
NIDDM and CVD may be explained if an increase in plasma FFA flux is indeed a
feature of central fat deposition, which may evoke and/or exacerbate the metabolic
disorders. FFA may inhibit peripheral glucose metabolism and reduce insulin sensitivity.
This reduction correlated inversely with the amount of glucose metabolised by
peripheral tissues. (Randle et al, 1963; Randle et al, 1964). Increased FFA probably
contributes to insulin resistance more than to hyperinsulinaemia, and to eventual
exhaustion of P-cells of the pancreas (DeFronzo, 1988). Increased hepatic availability of
FFA could stimulate hepatic FFA estérification and increase synthesis of very low
density lipoprotein, thus increasing plasma triglyceride concentration, leading to raised
small dense LDL, which is highly atherogenic (Austin et al, 1990; Griffin et al, 1994).
FFA may inhibit cholesterol esterifying capacity and thus decrease the acquisition of
cholesterol by high density lipoprotein particle.

1.2.5 Methods of measuring body fat
Underwater weighing is the conventional ‘reference standard’ (Figure 1.2.3) for a two-
compartment model, which measures body density from which fat and lean mass content
are estimated assuming standard figures for density of these components (Siri, 1961).
Other robust methods include the total body potassium method measuring intracellular
fluid by detecting the natiual radioactive isotope (Boddy et al, 1972), and
measurement of the total body water by dilution of a deuterium labelled water dose
(Schoeller et al, 1980). The principles for these techniques are described in detail
elsewhere (Brodie, 1980; Garrow, 1983; Shephard, 1991). More complicated multi
compartment models of body composition including bone mass are under development.
For routine clinical and epidemiological use, simpler and cheaper antlnopometric
measuiements have been used to predict body composition in relation to body density by
imderwater weighing. Various combinations of anthropometric measurements have been
used as independent variables. Shephard (1991) reviewed the extensive literature and
found few truly practical antlnopometric approaches to predict body density or fat
content. The most widely used method, that of Durnin and Womersley (1974) used the
log 1 0 sum of four skinfolds measured at biceps, triceps, subscapular and suprailiac sites
(Figure 1.2.4). Jackson and his colleagues (Jackson and Pollock, 1978; Jackson et al,
1980) used the sum of tlrree or seven skinfolds in combination with waist and forearm
circumferences or gluteal circumference, and age for generalised regression equations.
These approaches have not been subjected to systematic validation in separate samples
or populations. Recently, Deurenberg et al (1991) suggested that BMI with age and sex
can predict body density with an accuracy similar to that of skinfold methods in a large
sample of Dutch population. McNeill et al (1991) observed skinfold method to be as
good as bio electrical impedance, body water dilution, and better than counting
methods relating to underwater weighing in normal weight and overweight women.
Reilly et al (1994) found the skinfold method (Durnin and Womersley, 1974) to
underestimate body fat in small sample (#= 16) of 70 year old women.

1.2.6 Assessment of body fat distribution
The re-emergence of fat patterning studies was further advanced by the invention of the
CT scanner. This approach enables scientists to ‘view directly’ the fat masses distributed
over different sites in the body, and relate them to metabolic variables (Seidell et al,
1989b). Due to a radiation exposure of 2 mSieverts/exposure (annual permitted exposure
to X-rays in Britain is 5 mSieverts), X-ray CT use is limited in vivo. Only small numbers
of volunteers have been studied by a few centres, with limited number of scans made.
Abdominal (intra-abdominal and subcutaneous) fat areas calculated from CT scans were
used to validate anthropometric indices of fat distribution such as ratios waist to hip
(Ashwell et al, 1985) or waist to thigh (Seidell et al, 1988), and various body diameters
(van der Kooy et al, 1993), and in a variety of clinical conditions (Lean, 1986).
Fat volumes estimated by thi'ee dimension reconstruction from adjacent scans may
provide a more meaningfiil pictiue of fat distribution than cross-sectional areas. The use
of magnetic resonance imaging (MRl) (Figure 1.2.5) is safer than CT scanning, thus
more images can be made to calculate fat volumes in human subjects, and the procedure
may be repeated on the same subject for observations of changes in body composition
and fat distribution. McNeill et al (1991) showed a good agreement between total body
fat calculated from the sum of fat volumes obtained by MRI and the established
underwater weighing method in women. Sohlstrom et al (1993) used an MRI machine
with low magnetic field strength (0.02 Tesla), and observed similarly good agreement
with underwater weighing teclinique for estimating total body fat in Swedish women.
Abate et al (1994) compared subcutaneous and intra-abdominal fat volumes estimated
by MRI (0.35 Tesla), and the actual fat volumes dissected from three human cadavers,
ineluding two males and a female showed the two methods only differed slightly (mean
difference = 0.08 kg; 95% confidence interval = 0.01 to 0.15 kg). Potentially, MRI could
be used as the ‘reference method’ for measuring body fat distribution and for validating
anthropometric measures including waist and hip circumferences (Figure 1.2.6).

1.2.1 Legends of figures in chapter 1.2
Figure 1.2.1. The energy balance cycle (page 11).
Figure 1.2.2. Silhouette photographs showing variation in body fat distribution in men
(a & b) and in women (c & d). Subjects have similar body mass index, but the male (b)
and female (d) patients with non-insulin dependent diabetes mellitus have higher waist
to hip ratio, indicating a more centralised fat distribution (page 12).
Figure 1.2.3. Measuring total body density by underwater weighing to estimate body
composition (page 13).
Figure 1.2.4. Common sites for measuring subcutaneous skinfold thicknesses to predict
total body fat by underwater weighing (page 14).
Figure 1.2.5. Magnetic resonance imaging (MRI) machine for scanning body tissues
(page 15).
Figure 1.2.6. Measuring body fat distribution using antlu'opometry according to the
World Health Organisation (1995) standaid recommendation. Waist circumference
between the lowest rib margin and top of the lateral iliac crest (a), and maximum hip
circumference at the greater trochanters (b) (page 16).
10

APPETITE
Foods & Nutrient
composition
ENERGYINTAKE
Energystores(fat)
ENERGYEXPENDITURE
BMR Physical Thermogenesis Activity
Figure 1.2.1. The energy balance cycle.
11

Waist to hip ratio 1.10
Body mass index (kg/m^) 28.0
Male
Female Waist to hip ratio
Body mass index (kg/m^)
Fema e
Figure 1.2.2. Silhouette photographs showing variation in human body fat distribution.
12

Figure 1.2.3. Measuring total body density by underwater weighing.
13

Figure 1.2.4. Measuring skinfold thicknesses using skinfold calipers.
14

i
Figure 1.2.5. Magnetic resonance imaging (MRI) machine for scanning body tissues.
15

Waist circumference A
Hip circumference B
Figure 1.2.6. Assessing body fat distribution from body circumferences.
16

1,3 Skeletal structure
1.3.1 A global view of the trends in height changes over time
Average height varies between countries, races, areas, and social classes etc. Like body
weight or body fatness, genetic and environmental factors are thought to be the main
determinants, but their relative contributions are not apparent. There exists a wide range
of adult heights in various parts of Africa. Just 200 years ago, Norwegian men who are
now amongst the tallest in the world were only as tall as the Buslimen’s present height
(Eveleth and Tamier, 1976). Martorell and Habicht (1986) found that although there
were height differences amongst the tallest boys in high social class from different
countries, height differences between social classes within a country were much wider,
particularly in countries where there is a huge gap between the rich and the poor. In
India, the height gap between classes in the nineteen-eighties was similar to that existed
in Britain over 150 years ago (Floud et al, 1990), reflected in the military recruits at
Sandhurst (high social class) and Marine Society (low social class from the London
Slums). Height differences between social classes have been narrowing steadily in
Britain, but the gap is wider than that of many European countries. In general, there has
been steady trends towards height increase over the past 100 yeai's in developed
countries (Floud, 1990).
1.3.2 Nutritional status and height
Malnutrition or nutrition depletion through infection affects height growth during early
development. Martorell and Habicht (1986) have shown that the length of children up to
2 months old hom developing countries is near' the 50th percentile of the growth chail,
but begins to fall after that. Explanations for this trend may be that at the early stage, the
child receives enough energy and anti-infective property from breast milk, but growth
begins to fail if it continues to breast feed since energy from breast milk cannot
adequately provide the growing child, or if the child begins to wean, there is a higher
chance of contact with infected substances. Nutrition and health care clearly help infants
grow better in developing countries.
17

There is no direct evidence for height as a marker of nutritional status, but historical
evidence has provided remarkable parallel trends in changes in height with various
factors that can influence nutritional status. For example, the rapid gain in height of
English working-class children coincides with the steep rises in life expectancy in
England, wages, and consumers’ expenditure, all occurred around the same time at about
1820-1850 (Floud et al, 1990).
1.3.3 Height and health
Height has long been used as an indicator of health. Army and police recruits must
achieve a certain height for selection. Taller slaves were bought at a higher price as they
were thought be stronger, thus more productive (Fogel, 1986). Subjects of short stature
have been shown to have increased risk of premature death (Waaler, 1984), particularly
in younger age groups, indicated by steeper gradients. Similar to body mass index
(Andrés et al, 1985), the differences in mortality rates become less marked between
groups in the elderly. A study of Fogel et al (1986) has shown that Union Army (United
States) rejection rates due to poor health were higher in shorter subjects.
1.3.4 Limb lengths in relation to height
Whilst different body proportions exist between adults of different races (Reeves et al,
1996), and that it has been suggested that growth failure in utero at different periods of
pregnancy may result in altered body morphology (Bai'ker, 1994), evidence has
indicated that improved standards of living with adequate nutrition has brought the body
proportions of Japanese children nearer to the reference standards of the British (Tanner
et al, 1982). Increase in height, or specifically leg length reflects improvement in health
and growth (Tamier et al, 1982).
Early growth is clearly affected by imder feeding in experimental animals (McCance,
1968). Disproportionate growth, e.g. longer or shorter legs than expected for height
occurs with delayed puberty (Tanner, 1971), but associations with metabolic disorders
are not described.
18

1.4 Muscle morphology and function
1.4.1 Characteristics of muscie fibres
The primary function of the skeletal muscles is performing contractions. The muscle is
not homogeneous. All human skeletal muscles have a mixture of muscle fibres.
Different muscles contain different types of fibres in vaiying proportions, serving a wide
range of demands. The content o f different fibre types associates closely with the speed,
intensity, duration and types of contractions.
In terms of the speed of contractions, human muscle fibres are classified as type 1 (slow
twitch), and type 2 (fast twitch). Based on histologic profile, type 2 (fast twitch) fibres
are further subdivided into at least 2 different types, 2a and 2b (Brooke and Kaiser,
1970). Based on their dynamic and metabolic behaviour, type 1 muscle fibres are known
as slow oxidative, type 2a as fast oxidative-glycolytic and type 2b as fast glycolytic.
Other muscle fibres have also been identified. Type 2c are thought to be transitional
fibres between type 1 and 2. There may be ‘dormant’ stem cells which may function as
replacement for damaged fibres (Jones and Round, 1990).
Type 1 muscle fibres have high oxidative capacity, with high mitochondrial and
capillary densities and are red in appearance. Their major substrates are circulating FFA
and intra-muscular glycogen, being utilised by the oxidative phosphorylation pathway.
Type I muscle fibres are highly fatigue resistant at slow speed of contraction, such as
postural maintenance during habitual activity.
In contrast to type 1, type 2b muscle fibres have low respiratory capacity and high
glycolytic enzyme activity. They have low mitochondrial and capillary densities and
appear white. The main substrate is muscle glycogen, used anaerobically (not dependent
on oxygen) by the glycolytic pathway producing lactic acid. These muscle fibres can
contract rapidly with very high power output for explosive activity, but they fatigue
easily with an associated accumulation of lactic acid.
19

Type 2a fibres are intermediate between type 1 and type 2b muscle fibres. They are high
in both glycolytic and oxidative enzyme activities. These muscle fibres can perform fast
contractions and relatively fatigue resistant, using glycogen as their main substrate with
moderate amount of FFA.
There is a hierarchical recruitment of muscle fibres according to functional demands
(Henneman, 1965). Type 1 muscle fibres are recruited at both low and high speed of
contraction, whereas type 2 muscle fibres are relatively inactive at low speed and
recruited when type 1 muscle fibres are fatigued or at high speed of contraction, such as
in sudden bursts of action, and high workload.
The choice for fuel utilisation mainly depends on energy demands. More glycogen is
used with increasing rate and intensity of workload, as energy is converted much faster
from glycogen than FFA. Endurance training can have a glycogen sparing effect by
increasing the capacity for FFA oxidation for a given workload. Other factors could also
affect substrate preference include diet composition, substrate availability, and hormonal
and enzymatic activities (Âstrand and Rodahl, 1986).
1.4.2 Muscle morphology: nature or nurture ?
On average, healthy subjects have about half and half of slow and fast twitch fibres in
the commonly biopsied vastus lateralis, deltoid and gastronemius muscles, but the range
of type 1 muscle fibres varies from 10% to 90% between individuals (Saltin and
Gollnick, 1983). Athletes who specialise in ‘aerobic’ sports, such as marathon runners,
tend to have high proportion of slow twitch (type 1) muscle fibres, while those who
specialise in anaerobic sports, such as 100 m sprinters or weight lifters, tend to have
high proportion of fast twitch (type 2a and 2b) muscle fibres (Âstrand and Rodalil, 1986;
Fox et al, 1988).
It is unclear whether the difference of muscle composition between athletes engaging in
different types of sport is primarily due to genetic or training effects. Howald (1982)
2 0

suggested self selection for sports activities may exist in early life. Young people with
predominant type 1 muscle fibres may be more physiologically suited, and so attracted
to endurance sports, while those with higher type 2 fast twitch fibres prefer sprinting
events. Komi et al (1977) showed monozygotic twins have more similar proportion of
slow twitch type 1 muscle fibres than dizygotic twins in the vastus lateralis, with
estimated heritability of 99.5% in males and 92.2% in females. Trained athletes
including cyclists, canoeists, rumiers, weight lifters had similar proportion of muscle
fibres in the vastus lateralis (leg) as the deltoid (upper body), whereas enzyme activities
were higher in muscles associated with frequent use (Gollnick et al, 1972).
Studies of physical training have shown conflicting results as to whether training can
have an effect on muscle fibres transformation (Andersen and Henriksson, 1977, Saltin
et al, 1968). Endurance training is associated with increased aerobic capacity of the
muscle, such as increased capillary (Andersen and Heniiksson, 1977) and mitochondrial
proliferation, accompanied by increased oxidative enzyme activities (Heniiksson and
Reitman, 1977). These results do suggest some capacity towards a greater functional
similarity to type 1 muscle fibres.
Decreased physical demands tend to shift muscles towards type 2 muscle fibre
characteristics. Animals with spinal cord section, where the muscles are inactive and
relieved from all neural influence, have most of their type 1 muscle fibres transformed to
type 2b (Salmons and Vrbova, 1969). Paraplegic patients have high proportion of type 2
muscle fibres (almost 100%) in their paralysed lower limbs, whereas their unaffected
upper limbs have similar proportions of fibre types to healthy subjects (Grimby et al,
1978). Detraining in an Olympic cross country skier due to injuries decreased his type 1
muscle fibres from 81% to 57% (cited by Howald, 1982). Similarly, Howald (1982)
reported a decrease in type 1 muscle fibres from 73% to 69%, and an increase in type 2
muscle fibres in a long distance runner who reduced his training intensity due to health
problems for 6 months, from 100 km/week to 40 km/week. Wlien the intensity increased
to 110 km/week, type 1 muscle fibres increased to 77% with a corresponding decrease in
2 1
type 2 muscle fibres. Patients who had knee surgery also reduced their type 1 muscle
fibres in just 5 weeks (Haggmark et al, 1981).
1.4.3 Electrical stimulation and muscle morphology
Almost by chance, Buller et al (1960) discovered that when the nerves of fast twitch,
white muscle (flexor digitorum longus) and slow twitch red muscle (soleus) of cats were
crossed over, after a period of time, the speed of contraction of the fast twitch white
muscle became slower and this muscle became red in appearance resembling that of the
slow twitch red muscle. Similarly, the slow twitch red muscle fibres became faster and
whiter. These workers ruled out the influence of neural impulse, and postulated that the
transformation was induced by a chemical substance from the supplying nerve.
Severing of the tendon (tenotomy) of the slow twitch soleus muscle from the bone
Vrobova (1963) or immobilising the limbs (Fischbach and Robbins, 1969) has the effect
of increasing the speed of contraction of the slow twitch soleus muscle. The change to
fast speed could be prevented by low frequency electrical stimulation (5 or 10 Hz), but
not by higher frequencies (20 or 40 Hz) within 3 weeks (Salmons and Vrobova, 1969).
Later, it was shown in rabbits that after cross innervation, the slow twitch red muscle
(soleus) which was supplied by the nerve originally from the fast twitch white muscle
(extensor digitorum longus) acquired the physiological and biochemical characteristics
similar to the fast twitch white muscle, and this transformation could be prevented by
electrical stimulation to the supplying nerve at low frequency (10 Hz) in 8 weeks
(Salmons and Sréter, 1976). These observations demonstrated that muscle
transformation was probably independent of any chemical substance released from the
serving nerve suggested by Buller et al (1960), and that muscle fibre characteristics are
greatly influenced by the patterns of neural impulse and duration of stimulation. The
transformation is reversible, Sréter et al (1975) have shown the initial rabbit fast twitch
white muscles became red slow twitch muscles as a result of low frequency electrical
stimulation, regained their former characteristics when the stimulus was removed.
2 2

1.4.4 Ageing and muscle morphology
Histological evidence of muscle specimens from the elderly at autopsy often shows
areas of fibre type grouping, i.e. the whole fascicle containing only type 1 muscle fibres
(Jones and Round, 1990), suggesting that all adjacent fibres are re-imieiwated by one
type of motor neuron, and the there is probably an increase in size of the motor unit (an
increase in the number of fibres innervated by each nerve). As a consequence, fine motor
control in the elderly is diminished, resulting in shaking of the hands and fingers etc.
1.4.5 Muscle morphology and metabolic disorders
Bonen et al {\9S \) have shown predominant type 1, slow twitch red muscle (soleus) of
rats are more sensitive to insulin than white, fast twitch muscles (plantaris and extensor
digitorum longus). Single animal type 1 muscle fibres are more sensitive to insulin than
type 2 muscle fibres (Bisenburg, 1983; Hom and Goodlier, 1984). In non-diabetic men,
increased proportion of type 1 muscle fibres and capillary density aie associated with
higher insulin sensitivity (Lillioja et al, 1987).
Before puberty, boys and girls (6 years old) have been shown to have higher proportion
of type 1 muscle fibres than adults (Bell et al, 1980). Men tend to have higher
proportion of type 2 muscle fibres than women (Simoneau et al, 1989). Wade et al
(1990) have observed that compared to leaner subjects, overweight subjects have lower
proportion of type 1 muscle fibres and they oxidised less FFA during aerobic exercise.
Subjects with central fat distribution and those with NIDDM have been shown to
associate with increased proportion of fast twitch type 2 white fibres and decreased
capillary density (Lillioja et al, 1987; Marin et al, 1994). Holmang and co-workers have
shown strong relationships between different hormones and muscle morphology and
function. Excess cortisol (Holmang et al, 1992a) and testosterone (Holmang et al,
1992b) in female rats have been shown to shift the muscle towards type 2 muscle fibres
and reduce capillary density with diminished sensitivity to insulin. Rats made
hyperinsulinaemic by implantation of osmotic mini-pump increased the proportion of
type 2 muscle fibres in 7 days, but in contrast to cortisol and testosterone, capillary
23

density and insulin sensitivity were increased in all fibre types (Holmang et al, 1993).
These workers suggested that capillary density (blood supply) is important for
determining insulin sensitivity, and that muscle composition may be a consequence
rather than a cause of hyperinsulinaemia. In humans, hyperinsulinaemia have also been
observed to strongly associate with increased capillary density in all muscle fibres,
especially around type 2b muscle fibres (Eriksson et al, 1994) in prediabetic men: These
subjects had impaired glucose tolerance and after 15 yeai's, developed NIDDM.
Oestrogen causes a decrease in rat muscle fibre diameter (Suzuki et al, 1985). Lithell et
al (1981) have observed high correlations between serum insulin {r = 0.87, P <0.001)
and blood glucose (r = 0.51, P <0,05) with muscle fibres area/capillary ratio.
Physical activity can protect against development of NIDDM (Manson et al, 1991),
cardiovascular disease (Morris et al, 1953a & b; Faffenbager et al, 1970), and increase
life expectancy of IDDM (Moy et al, 1993). NIDDM has an important genetic
component. The muscle fibre type of children of NIDDM parents has not been examined
previously. However NIDDM is associated with a relative lack of exercise, which itself
may favour a shift of metabolic activity towards type 2 muscle fibres.
Cross-sectional studies have found associations between type 2b muscle fibres and
features of metabolic syndrome X (Lillioja et al, 1987; Lillioja & Bogardus, 1988;
Rebuffé-Scrive et al, 1988; Krotkiewski et al, 1990; Marin et al, 1994).
1 A. 8 Other effects on muscle morphology
Increased oxygen supply to muscle is probably a feature of endurance training,
associated with type 1 muscle fibre predominance. It seems possible that hypoxia, e.g.
smoking, vascular disease, and sleep apnea could lead to an adaptive response of the
muscle towards characteristics of type 2, glycolytic muscle fibres.
24

1.5 Evidence linking early malnutrition and altered body morphology
Barker and colleague’s studies centred on the relationships between early development
and metabolic disorders in later life. Although Barker (1994) mentioned the importance
of the skeletal muscle and body morphology in describing the ‘tlorifty phenotype’ and
‘programming’ hypotheses, it is surprising that there has been only one published study
on body fat distribution in relation to early growth in men by Barker’s group (Law et al,
1992), we have since performed similar studies on women (Han, 1994; Han et al,
1995a).
We have found only one study by Barker’s group on skeletal structure (height) in
relation to early growth and metabolic diseases (Barker et al, 1990). Development of
stature has previous been examined in detail by many studies, notably those of Tamier
(1989). Floud et al (1990) have gathered a huge amount of historical evidence of the
influence of nutrition on height development.
1.5.1 Birth weight and body fat distribution
In a large retrospective study of men born in Hertfordshire {n = 845) and Preston (n ^
239), Law et al (1992) have shown the men’s current waist to hip ratio significantly (P
<0.05) increased with low birth weight, and low birth weight relative to placental
weight, adjusted for BMI. We have performed similar analysis on 46 women and shown
that low birth weight was associated with large waist circumference (Han et al, 1995a),
indicating increased intra-abdominal fat mass deposition (Flan et al, 1995b). In the same
study of the women, low birth weight was also associated with a tendency for elevated
blood pressure and heart rate, indicating poor cardiovascular function (Han et al, 1996a).
Valdez et al {\99 \) found an inverse relationship between birth weight and the ratio of
sub scapular' to triceps skinfold thickness rather than with waist to hips ratio.
1.5.2 Early nutrition and the development of body stature
The main factors affecting height growth have been identified as low social class, lower
birth order, low mother’s height, lai’ge numher of siblings, low birth weight, young
25

mother (<25 years), and heavy smoking mother during pregnancy (Floud et al, 1990).
Amongst these factors, birth weight appears to have a big influence on height. Martorell
and Habicht (1986) have emphasised the limiting factor of early growth in the
development of body statur e as, “After early childhood, it is rare for the rate of growth
to be fast enough for children to regain the centile position in height which they had in
early infancy, and this period of restricted growth therefore leaves a permanent legacy:
(1) growth impairment during the first few years of life largely determines the small
stature exhibited by adults from developing countries; and (2) with a malnourished
population, those who exliibit a greater degree of stunting as young children are those
who are the shortest as adults.”
Boyd OrT (1928) was probably the first to note the importairce of early nutrition on body
development. Children aged between 5-14 years were given milk or biscuits of the same
calories in addition to their school diet. After seven months, those who received either
fresh or skimmed milk grew 20% taller than control group (without supplements), while
those who had biscuits as supplements did not differ from control group. This study
showed the importance of protein in body development of children, which led to
subsequent guidelines for growth improvement in children (FAO/WHO/UNU, 1985).
1.6 Relationships between early nutrition and health in later lifeSo far in the review, only genetic and environmental factors have been considered as
determinants of body morphology and diseases. The past ten years saw Barker and
colleagues (1992 & 1994) produce a host of evidence showing striking relationships
between poor early growth and metabolic disorders in later life. Two hypotheses, the
Tlirifty phenotype’ and ‘programming’, were used to describe these relationships to
suggest that early exposure to adverse conditions, including fetal malnutrition as
reflected by low birth weight, or perinatal nutrition depletion (infection), as reflected by
infant weight and mortality rates at the time the subjects were born, may predispose
subjects to higher susceptibility to develop chronic diseases including bronchitis,
ischaemic heart disease and NIDDM.
26

1.6.1 The 'thrifty phenotype’ hypothesis
In describing the associations between body size at birth and impaired glucose tolerance
in later life, Barker has suggested that, poor nutrition in fetal and early life is
detrimental to the development and fiinction of the (3 cells of the islets of Langerhans,
and changes in tissues, primarily muscle, which respond to insulin production or in the
sensitivity of the tissues to it disposes to the development of NIDDM; adult influences,
including obesity, ageing, and physical inactivity, determine the time of onset and
severity of the disease.
According to the ‘tlirifty phenotype’ hypothesis, NIDDM is the outcome of the
undernourished fetus and infant having developing with some reduction in size and/or
function o f vital organs, including the endocrine pancreas. For as long as the individual
remains undernourished, its limited glucose-insulin metabolism is adequate. A move to
over- or good nutrition with expansion of adipose tissue mass, however, exposes the
deficiencies in (3 cell function, and tissue sensitivity to insulin action, impaired
carbohydrate tolerance and diabetes results.”
1.6.2 The ‘programming’ hypothesis
Lucas (1991) proposed the ‘programming’ hypothesis to suggest that a stimulus or insult
at a critical period of development has lasting or lifelong significance, has led to
Barker’s (1994) arguments that, “...undernutrition in utero and during infancy
permanently changes the body’s structure, physiology, and metabolism, and leads to
coronary heart disease and stroke in adult life. Four underlying principles of the
‘programming’ were established based on animal studies. First, undernutrition in eai'ly
life has permanent effects. Second, undernutrition has different effects at different times
in early life. Third, rapidly growing fetuses and neonates are more vulnerable to
undernutrition. Fourth, the permanent effects of undernutrition include reduced cell
numbers, altered organ structure, and resetting of hormonal axes.”
27

CHAPTER TWO
AIMS, HYPOTHESES, RESEARCH
QUESTIONS, AND RATIONALE OF THE
PRESENT THESIS11 CONTENTS OF CHAPTER TWO PAGES
2.1 Aims, hypotheses and selection of research questions 29
2.1.1 Development of simple and practical methods for assessing body 29
morphoiogy
2.1.2 Relationships between body morphoiogy and metaboiic disorders 30
2.1.3 Some determinants of body morphology and metabolic disorders 30
2.1.4 Implications of altered body morphology on health risks applied 32
towards health promotion
2.2 Rationale for selection of study designs and methods for the 32
present thesis
2.3 Statistical considerations for experimental designs in 33
research
2.3.1 Measurement error 33
2.3.2 Sensitivity, specificity, and predictive values 36
2.4 Study designs in the present thesis 37
2.5 Statistical methods applied in data analyses in the present 38
thesis
28

2.1 Aims, hypotheses and selection of research questions
The present thesis aimed to achieve four major objectives in the study of components of
body morphology (adiposity, skeletal structure, muscle composition) and related
metabolic disorders.
1. Firstly to develop simple scientifically valid and practical methods for assessing
specific components of body morphology.
2. Secondly to establish the relationships between measures of body morphology and a
range of metabolic disorders and ill health.
3. Thirdly to study some determinants of body morphology and related metabolic
disorders.
4. Subsequently, the findings on the implications of altered body morphology on
health risks were applied towards health promotion, to devise elements for strategies
directed at general public.
• The following hypotheses and research questions were postulated and tested to
achieve the main objectives listed above.
2.1.1 Development of simple and practical methods for assessing body
morphology
Existing evidence prior to the present thesis
The current increasing trends in prevalence of overweight and the lack progress
prevention and treatment of this ‘disease’ are probably due both to the lack of public
awareness of health risks associated with overweight, and the lack of readily available
methods for health professionals to assess both body composition and adverse fat
distribution, combined with unattainable and inappropriate targets for management.
29

Hypothesis
A novel simple anthi'opometric measure can be validated for identifying those with
excess fat or adverse fat distribution.
Research questions
Are existing methods of measuring body morphology satisfactory in terms of accuracy
and practicality?
Can a better novel method be derived to reflect central fat and total adiposity?
2.1.2 Relationships between body morphology and metabolic disorders
Existing evidence prior to the present thesis
Waist circumference is amongst a variety of different antlnopometric indicators o f intra
abdominal fat. Excessive intra-abdominal fat accumulation is associated with increased
metabolic risks. Body composition studies using scanning teclmique have identified the
waist circumference as its proxy.
Hypothesis
Waist circumference identifies those at increased health risk.
Research question
How well does waist circumference relate to metabolic disorders compared to the
existing methods of body mass index and waist to hip ratio?
2.1.3 Some determinants of body morphology and metabolic disorders
Existing evidence prior to the present thesis
Animal studies have shown diet imbalance during early growth can affect skeletal
structure.
30

Cross-sectional studies have found associations between type 2b muscle fibres and
features of metabolic syndrome X. Athletes who are specialised in power sports tend to
have type 2b muscle fibre predominance. Further, according to the ‘tlnifty phenotype'
hypothesis used to explain the relationships between early growth and metabolic
disorders, muscle morphology may also be affected by early growth. It is possible that
there may be many more hierarchical steps to sustain growth of more vital organs, e.g.
the nervous system, visceral organs and musculoskeletal system in that order. In the
present studies, it is hypothesised that the musculoskeletal system may be one of the first
body organs to be ‘sacrificed’.
Hypotheses
People with limb lengths longer or shorter than expected, which may reflect interrupted
early growth, are more at risk of metabolic disorders in later life.
People with a natural ability in power sports (a presumed marker of type 2 muscle
fibres) more likely to develop metabolic disorders than those with a natural ability in
endui’ance sports (a presumed marker for type 1 muscle fibres) in later life, and low birth
weight influences their relationship.
Research questions
Does disproportionate stature (limb lengths relative to height) associate with health
hazards?
Is the musculoskeletal system affected by low birth weight, contributing to altered body
functional capacity in adult life?
Do individuals with declared natural ability in power sports suffer higher rate of
coronary heart disease?
31

2.1.4 Implications of altered body morphology on health risks appiied towards
health promotion
Existing evidence prior to the present thesis
Failure to check increase in obesity urges the need for the use of the simple
measurement of waist circumference for assessing health risk, directed at the general
population.
Hypothesis
Self measurement of waist circumference is a robust guide to the need for weight
management.
Research questions
Is self-reported waist circumference reliable?
Does a patent ‘Waist Watcher’ tape measure improve self-measurement?
2.2 Rationale for selection of study designs and methods for the
present thesisTo be able to address the hypotheses satisfactorily in the present thesis, a wide range of
multi-disciplinary approaches was employed, including cross-sectional and longitudinal
laboratory based studies of physical measures, epidemiological studies of
antlu'opometric and biochemical variables, and retrospective questioimaire studies based
on reported information. Details of methodologies will be described in each chapter.
To answer all the research questions, a large database was needed, which was not
available locally. The epidemiological studies were made possible tlirough international
collaboration with the ongoing MORGEN (Bilthoven, The Netherlands) and WHO
MONICA (Glasgow, Scotland) projects. The study of waist reduction and
cardiovascular risk factors employed data collected in the Aberdeen follow up study of
weight loss (Lean et al, 1997). In all these cases, raw data had been collected by
32

collaborating researchers, but the analysis were novel and originated from the need to
answer hypotheses in the present thesis.
The hypothesis that those with predominant type 2b muscle fibre proportions might be
more likely to develop metabolic disorders could not be tested directly, as it would
require muscle biopsies and a long term follow up. Instead, a retrospective study was
designed using natural ability in sporting performance as presumed marker for muscle
composition, relying on the findings of associations of type 1 and type 2 muscle fibre
predominance with endurance and power athletes respectively (Âstrand and Rodahl,
1986), to relate to cardiovascular disorders. The subjects recruitment was conducted in
collaboration with the Army School of Physical Training (Aldershot, England) in order
to maintain anonymity of the former soldiers.
In a cross-sectional study, 1189 subjects were recruited specifically in Glasgow, to
investigate the associations of altered body proportion in adults (used as presumed
makers for the effects of poor nutrition at different time of early intra-uterine growth) to
relate to coronary heart disease and predisposing risk factors.
2.3 Statistical considerations for experimental designs in research
Starting a research study requires cai'eful plans in experimental design to recognise and
minimise potential error and bias, in order to infer correctly and interpret the results with
confidence. This section addresses some of the fundamental considerations for the
development of protocols for scientific studies, and then relates these issues to the work
in the present thesis.
2.3.1. Measurement error
The reason for recruiting more than one subject in experiments is that there will be
differences between individuals for any measurable characteristic, or response to an
intervention, and all measurements have a range of error attached. Measurement error
can be minimised by increasing precision to reduce random error, which includes
33

sampling error. The primary way to reduce random errors is by increasing sample size.
Another way of minimising random error is by increasing validity to reduce systematic
error: inferences to actual subjects in the study (internal validity) and to subjects outside
the study (external validity). With respect to internal validity, selection bias, information
bias and confounding play a role.
Subject selection
Methods of subject recruitment depend on the questions asked to test the hypothesis
raised, and the distribution and variability of variable of interest. In practice, we are
normally limited to subjects who are easily available to us. This may have an effect on
the outcome of the experiment. The lower the variability between the subjects is, the
better chance we have of detecting a ti'eatment difference if it exists. Although it is
helpful to restrict to a paiticular subset for uniformity, it may lead to difficulties, for
example a treatment may be effective in one group, but not in others. When human
subjects are involved, study design becomes important for ethical reasons to avoid
wasting time, resources and goodwill in projects based on inappropriate aims or
methods.
Random Sampling
Random sampling is required to ensure the subjects ai*e representative of the population,
to eliminate biases such as volunteer bias. There are several methods for sampling
including the simple random sampling from a table of random sampling numbers (Fisher
and Yates, 1974) which will be representative provided it is large enough. Stratified
random sampling in sections of populations uses identifiable categories such as age, sex,
race, geographic area, demographic and lifestyle factors, to ensure that the sample
represents these aspects within the general population.
It has to be recognised that volunteer subjects may have some unusual qualities such that
they are not entirely representative of the general population.
34

Sample size
The larger the sample size, the closer it reflects the ‘true’ population (Kline, 1954), but
limits must be set in most laboratory based experiments due to the time and the costs.
Excessive sample sizes also expose unnecessary numbers of subjects to the research and
thus become unethical. To obtain a minimum sample size for a study, the statistical
power must be set, and the number calculated for determining the differences that the
study aims to detect or exclude. This calculation requires some estimate o f the
variability in measurement of the variable of interest, either tlirough experience or pilot
tests. The sample size therefore depends on the standard error of the variable to be
estimated including biological variability, measurement error and random errors (Kahn
and Sempos, 1989). In human studies, the size of the sample recruited must allow for the
potential rates of response and drop out. In practice, original research often addresses
topics where in formation necessary for a formal power estimation is not available, and
reasonable assumption have to be made.
Controls
Controls are required to eliminate the influence of as many confounding factors as
possible. A common method used in cross-sectional research is matched pair control.
For intervention studies, treatment and control group recruited from the same population
should be randomly allocated. A cross-over design is often used in longitudinal studies
being highly economical in numbers of subjects, but parallel control method avoids the
need for a washout period and carry-over effects, and it also reduces problems related to
subject fatigue. Studies using controls allow better assessment of the effectiveness of
treatment on the variable of interest. There are several ways of designing controls. One
way is just not to give the treatment to the control subjects, the other is to give them a
placebo treatment (e.g. a dummy pill) so that the ‘placebo effects’, in which the potential
response from the physical appearance or taste etc. of taking the pill, can be eliminated,
and so the ‘true effect’ of the treatment can be obtained.
35

An internal control group, e.g. bottom tertile of a variable can be used as the reference
group to look for explanatory factors in a high tertile group. To avoid bias from post hoc
stratification of the sample, this type of analysis needs to be plaimed in advance.
Repeatability, accuracy and precision
The results of a study must be reproducible within reasonable limits of errors. Factors
within this are that the method of measurements should be accui'ate and precise. The
accuracy of a method is a function of its ability to yield results that are close to the true
value. An accurate result provides specific and unbiased results. The precision of a
method is related to its ability to provide the same result every time. A precise method
yields small ‘spread’ of observed repeated measurements made on one specimen. A
precise (highly repeatable) method is not necessarily accurate (close to the true
measurement). To assess the validity, the results must be tested in an independent
sample, and cross-validated to assess for potential biological bias. The Bland and
Altman (1986) method offers a useful way to compare two methods by assessing
accui'acy and bias.
2.3.2 Sensitivity, specificity, and predictive values
A good method used to screen subjects with a particular health risk would ideally have
high sensitivity and specificity. High sensitivity conectly identifies most people with the
disease, and high specificity correctly identifies most people without the disease.
Because no test is perfect, and the distributions of sensitivity and specificity normally
overlap each other in disease and non-disease populations, the two tests cannot both
reach 100% at a single point. Receiver operating characteristic (ROC) analysis can be
used to identify the level where maximum mean value of sensitivity plus specificity
occurs. The level can be defined based on the trade-offs between misclassification and
resources etc, A screening test should be cheap and simple, relatively non-invasive,
provides acceptable sensitivity and specificity, used where screening has practical value.
Values of positive prediction (percentage of positive results that are true positive) and
negative prediction (percentage of negative results that are true negative) test results aie
36

used to assess the diagnostic value of the results of the tests. A test with high sensitivity
may yield low positive prediction if the prevalence of the disease of interest is low.
2.4 Study designs in the present thesis
Cross-sectional population survey
In the MORGEN study, a stratified random sampling method was used to recruit
subjects, by sampling randomly from civil registries from Amsterdam, Maastricht, and
Doetinchem. To obtain similar numbers of subjects at each age, the recruitment was
stratified by sex and five year age group. The numbers were planned to be analysed by
tertiles, but not large enough to be divided by quintiles for most outcome variables.
Longitudinal follow up is underway, but was not available for analysis in the present
thesis. When the prevalence of outcome variable increases, analysis in smaller groups
(e.g. quintiles) will be possible.
In the body composition studies, an opportunistic approach was used to select volunteers
to match the general population profile (Gregory et al, 1990; Bennett et al, 1995) in
terms of age, sex, height, weight and fat distribution. Using this approach, the risks of
bias from a non-randomised recruitment are reduced when the range and distribution of
variables of interest match those in a random sample.
Retrospective follow up study
In the study of early natural sporting ability in relation to metabolic disorders in later life
in former British soldiers, subjects were selected as a population of interest because of
their probable relative homogeneity in terms of health, fitness, dietary and other lifestyle
behaviours at the same age. Subjects were surveyed using postal questionnaires to
determine to recalled determinants. The numbers of subjects recruited were based on a
pilot study to determine the response rate and the incidence of the disease of interest. It
was considered that recall bias in birth weight, medical history, and natural ability in
sport type would be unlikely to confound analysis by explanatory variables of interest.
37

Diet intervention
A randomised cross-over design was used in a study of overweight volunteers in the
study of waist reduction and improvement in cardiovascular risk factors. All subjects
were treated with moderately low calorie diets, with one group receiving high, and the
other low proportion of energy from cai'bohydrate for tlii'ee months. Each subject group
receiving the alternative diet for a second tliree month period. The numbers of subjects
and statistical power to detect the differences were determined prior to the trial. The
main sources of bias may come from the volunteers’ self interest in weight loss studies
and expectation of the diets.
Follow up study
In the study of the effectiveness of the Waist Watcher tape measure in weight
management, one group of subjects received the tape and dietary and exercise
recommendations, and the other, serving as control, received nothing. Subjects were
recruited by stratified random sampling from a random sample of 1800 subjects who
participated in the MONICA 4 project one year previously, based on age, sex, and waist
circumference. Quota sampling method was used in order to assign approximately equal
number in each cell.
2.5 Statistical methods applied in data analyses in the present thesis
In the present thesis, a variety of statistical methods were employed to analyse the data,
with the aid of computer software including SPSS (Version 6, Chicago, USA) and SAS
(version 6.1, Cary, USA). Specific statistical handling is described in each section.
Data summary and presentation
Information of data collected was examined by calculating numbers from the data
(statistics). There were three types of data; qualitative data, e.g. sex, discrete quantitative
data, e.g. number of people in a household, and continuous quantitative data, e.g.
weight. Data were summarised to examine the frequency distributions. The average of
the sample was presented as mean, and the measures of dispersion were presented as
38

standard deviation and range. The summary extracted from the data were presented in
the form of tables and graphs to convey information.
Measures o f association
The present thesis used (multiple) linear regression, for continuous dependent variables,
and (multiple) logistic regression analyses, for dichotomous dependent variables, to
determine the associations between variables, presented as regression coefficients and
odds ratios, respectively. Standard error and 95% confidence interval of the samples
were calculated to determine the precision of the estimates of the populations from
which they were drawn. Analyses of residuals from multiple linear regression were used
to determine the relative contribution of individual variables which correlated closely to
each other, e.g. body mass index, waist circumference and hip circumference.
Comparing data
Differences between groups were compared using chi-square tests, and t-tests. Where
two methods of measurements were being compared, an adopted Bland and Altman
(1986) method was used to estimate the magnitude of errors and biases at extreme ends
of measurements, and to examine systematic differences between methods. These
differences were plotted against factors such as age and other biological measurements
to examine possible bias.
Sensitivity and specificity, and predictive values
The sensitivities and specificities were calculated to evaluate the performance of the test
methods to identify the number of subjects with health risks, and those without a risk.
The positive and negative prediction values were calculated to assess the results of the
tests. Analyses of receiver operating characteristics (ROC) were performed to determine
an ‘optimal’ cut-off point that identified the maximum numbers of those with risk
(sensitivity) and the maximum numbers of those without a risk (specificity).
39

CHAPTER THREE
ASSESSING AND DEVELOPING METHODS
OF BODY COMPOSITION MEASUREMENTS
11 CONTENTS OF CHAPTER THREE PAGES
3.1 Predicting body composition by body density from simple 41
anthropometric measurements
3.2 Limb lengths as indices of stature in adults, and alternatives 73
to body mass index for chair- or bed-bound subjects
3.3 Influences of body compartments on bioelectrical impedance 91
analysis and densitometry
40

3.1
PREDICTING BODY COMPOSITION BY BODY DENSITY FROM
SIMPLE ANTHROPOMETRIC MEASUREMENTS
This section has been peer reviewed and has been published as
Lean MEJ, Han TS. Deurenberg P. Predicting body composition by
densitometry from simple anthropometric measurements. American Journai of
Clinical Nutrition 1996; 63:4-14.
41

ABSTRACTNew equations have been developed to predict body fat (percent BF) calculated from
body density measured by underwater weighing from simple anthropometric
measurements, using stepwise multiple regression analysis in 63 men and 84 women.
Logio sum of 4 skinfold tliicknesses explained 80.1% (SE = 3.8) of variance of percent
BF in men and 76.4% (SE = 4.6) in women. Alternative equations using limb lengths
instead of height may be valuable for epidemiological and clinical work, with particular
advantages for the very overweight and the chair- or bed-bound for whom no previous
predictive equations existed. Five equations combining triceps skinfold thickness with
other antlrropometric measurements explained >80% (men) and 77% (women) of
vai'iance. The most powerful prediction was from waist circumference and triceps
skinfold thickness, which explained 86.6% (SE = 3.2) of variance of percent BF in men
and 79.0% (SE = 4.0) in women. Percent BF for men = 0.353 x waist (cm) + 0.756
triceps (mm) + 0.235 x age (years) - 26.4; for women = 0.232 x waist (cm) + 0.657 x
triceps (mm) + 0.215 x age (years) - 5.5. The equations were tested in a sepai'ately
studied validation sample of 146 men and 238 women aged 18-83 years. Skinfold
thickness measurements continued to give good predictions of mean body density, but
with significant bias at extremes of body fat and of age. The most robust prediction with
least bias was from waist circumference adjusted for age. Percent BF for men = 0.567 x
waist (cm) + 0.101 x age (year’s) - 31.8; and for women = 0.439 x waist (cm) + 0.221 x
age (years) - 9.4.
Keywords: antliropometry, body composition, body mass index, fat distribution
42

INTRODUCTIONMany techniques have been developed to assess body composition in humans. Direct
measui'ement by chemical analysis, either by macroscopic dissection or by lipid
extraction is of limited value as it cannot be done in vivo. The conventional standard is
underwater weighing (UWW) for a two-compartment model, which measures body
density from which fat and lean mass content are estimated assuming standard figures
for density of these components (Siri, 1961). Other robust methods include the total
body potassium method, measuring intracellular fluid by detecting the natural
radioactive isotope (Boddy et al, 1972), and measurement of the total body water by
dilution of a deuterium-labelled water dose (Schoeller, 1980). The principles for these
techniques are described in detail by Brodie (1980), Garrow (1983), Gibson (1990) and
Shephard (1991). More complicated multi-compailment models of body composition
including bone mass are under development.
For routine clinical and epidemiological use, simpler and cheaper anthropometric
measurements have been used to predict body composition in relation to body density by
UWW. Various combinations of antliropometric measurements have been used as
independent variables. Shephard (1991) reviewed the extensive literature and found few
truly practical anthi'opometric approaches to predict hody density or fat content. The
most widely used method, that o f Durnin and Womersley (1974) used the log sum of
four skinfold thicknesses to develop regression equations for males and females of
different age groups. Jackson and Pollock (1978) and Jackson et al (1980) used the sum
of three or seven skinfold thiclmesses in combination with waist and forearm
circumferences or gluteal circumference and age for generalised regression equations.
These approaches have not been subjected to systematic validation in separate samples
or populations. Recently, Deurenberg et al (1991) suggested that body mass index
(BMI) with age and sex can predict body density with an accuracy similar to that of
skinfold methods in a large sample of Dutch population. McNeill et al (1991) observed
skinfold-thiclmess method to be as good as bioelectrical impedance, body water dilution,
and better than counting methods relating to UWW in lean and overweight groups
43

of women. Reilly et al (1994) found the skinfold-thickness method to underestimate
body fat in small sample (« = 16) of 65-79 year old women.
The present study was designed to develop regression equations from different
combinations of simple anthi'opometric measurements, age, and sex to obtain the best
equations to predict body density from UWW. Recognising possible errors from the
influence of fat distribution on prediction of body composition (Lean and Mann, 1991)
from the conventional skinfold-thickness method of Durnin and Womersley (1974), we
included waist and hip circumferential measurements, because waist (Han et al, 1995a;
Pouliot et al, 1994; Ross et al, 1992; Ross et al, 1993; Seidell et al, 1989) or waist to hip
ratio (Han et al, 1995a; Pouliot et al, 1994) has been found to correlate with the ratio of
visceral to subcutaneous fat. Alternative methods were considered for very obese
subjects, i.e. BMI >37 kg/m^, whose skinfold thicknesses exceed the size of the calipers,
or where the use of skinfolds is inconvenient or unacceptable, and arm span and lower
leg length were considered for subjects whose height cannot he measured. The equations
developed were then tested in a validation study employing a large data set obtained in a
different population.
METHODS
1. Determination study (Glasgow)Subjects and recruitment
Ethical approval was obtained from Glasgow Royal Infirmary’s Ethical Committee.
Healthy adult white volunteers (63 men and 84 women) were recruited from Greater
Glasgow area by local advertisement. Volunteers with known diabetes were not
included. Physical characteristics of subjects are shown in Table 3.1.1. Subjects were
recruited to provide an even distribution by age (Figure 3.1.1), but not selected for any
other criteria.
44

Measurements of subjects were made in the morning after overnight fasting, with an
empty bladder, wearing a swimsuit. All measurements were made by the same
investigator in every subject, thus n = 147, or 63 for men, 84 for women in all analyses.
Densitometry by underwater weighing
A metal chair was suspended in a hydrotherapy pool, attached to a strain gauge
(Mecmesin Ltd, Horsham, England) with a ±20-kg range, and sensitivity to 0.01 kg.
Subjects sat in the chair, with water up to their necks, holding the arm-rests of the chair
and with their feet on a bar attached to the chair. Their noses were sealed by a nose clip.
In full expiration, subjects gently lowered their head under water. Weight was recorded
using a pen recorder that was calibrated with known weights.
Residual lung volume
The residual lung volume was measuied simultaneously with UWW by the tliree-breath-
nitrogen technique modified from Womersley (1974). Four 6-litre anaesthetic bags
(Olnneda pic, Hatfield, UK) were filled with a known volume of 100% oxygen
measuied by a dry rolling seal spirometer (PK Morgan, Kent, UK), about 3 litres for
women and 4 litres for men (Wilmore et al, 1980). On raising their heads from under
water, a 3 5-ml mouth piece connected to an anaesthetic bag was inserted into the
subject’s mouth. Subjects then breathed in and out deeply tlnee times. After the last
complete expiration, the bag was sealed and the gas mix obtained was immediately
analysed for oxygen (Polarographic, PK Morgan, Kent, United Kingdom) and carbon
dioxide (Infra-red, PK Morgan, Kent, UK) content. Nitrogen content (%N) of the gas
mix was calculated from differences in oxygen (%0 2 ) and carbon dioxide (%C0 2 ):
(% A = 100% - % 0 i - %COi) . Residual volmne (RV) was calculated as:
80% - N%
where V is the initial volume of 100% oxygen in the gas bag, 0.035 / is the volume of
the dead space in the mouth piece, with nitrogen content of the alveoli air before the test
45

assumed to be 80%, and a correction factor (F) was included for standard temperature
and pressure in dry condition (STPD):
273 + Th P aim — PsF - ----------- X--------------------- ,273 + Tg P atm — Pa
where Tb and Tg are the temperature of body (37 °C) and gas in the spirometer
respectively, Patm is atmospheric pressure, Pa and P s are saturated vapour pressure of
water in the lungs (assumed to be 47.1 mmHg) and spirometer (assumed to be 18.63
mmHg) respectively (Womersley, 1974).
Subjects were first allowed to practise the teclmiques for holding breath, bending down
and up, and breathing to the mouth-piece adequately outside the pool. They also
practised in the water to familiarise themselves with the environment. Finally,
measurements were made after allowing the water to become absolutely calm. The
temperature of the pool was kept at exactly 36.5 °C throughout the studies.
Anthropometry
Height was measured with the subject standing, back to stadiometer, in bare feet. The
head was adjusted so that the Frankfurt plane (the line from the auditory meatus to the
lower border of the eye orbit) was horizontal. Feet were kept parallel with the heels
together. The subject was encouraged to stretch upwards by applying gentle pressure at
the mastoid processes (Gibson, 1990). The moving arm of the stadiometer was lowered
to touch the top of the head and height was measured to the nearest 1 mm.
Arm span was measured from the distance between the tips of the longest fingers in each
hand, with arms stretched horizontally while in standing position and with the back
against a wall. Lower leg length was taken from the mean of the two legs. The subject
sat in a chair, with bare feet, and lower legs vertical and parallel. Lower leg length was
measured as the distance between the floor and the top of the patella.
46

Weight was measured to the nearest 0.05 kg by a beam balance, which was calibrated
daily using ten 8 kg test weights. Waist, hip, thigh, and mid-upper arm circumferences
(MUAC) and skinfold thicknesses were made with subjects standing, with intended sites
marked on the skin, except hip and thigh circumferences. A flexible steel tape was used
(Holtain Ltd, Crymych, UK). All measurements were made twice, and the mean was
used in regression equations. Waist circumference was measured midway between the
lateral lower ribs and iliac crests (WHO, 1989). Subjects were asked not to tuck the
stomach in, and the measurement was taken in gentle expiration. Their clothes were
loosened around the waist area. Hip circumference was taken at the widest part over the
trochanters. Feet were kept 25 to 30 cm apart, (WHO, 1989). Thigh circumference was
measured for both legs 2 cm below the gluteal fold, with the weight on the non
measured leg, i.e. the leg being measured relaxed. The average of the two legs was used
in regression equations.
MU AC was measured on the right arm at the midpoint between the tip of the acromion
and the tip of olecranon, elbow bent at 90°. Four skinfold thicknesses were measured
according to the protocol described by Durnin and Womersley (1974). All
measurements were made on the right side of the body with calipers (Holtain Ltd,
Crymych, UK). Biceps and triceps skinfold thicknesses were taken at the midpoint {see
MU AC) of the upper arm. Subscapular skinfold thickness was measured with subject’s
shoulders relaxed. The measurement of supra-iliac skinfold thickness was taken with the
subject breathing gently. In some obese subjects whose skinfold thiclcness exceeded the
range of the calipers (50 mm), an estimate was made with a ruler.
Statistics
Data were analysed using the MINITAB statistical programme (Clecom, Birmingham,
UK). Linear regression equations were developed using stepwise multiple regression
analysis. Body density by UWW was used as the dependent (response) variable,
anthropometric measurements and age used as independent (explanatory) variables for
men and women separately.
47

Measurements of UWW and residual lung volume were made three times for each
subject, and twice for body circumferences and the mean taken. The experiment was
repeated if the CV for the repeated measurements was >1%. The SD of repeated
measurements on the same subject was calculated by the equation given by Bland
(1987): SD = (xi - y j where xi and yt are pairs of measurements for i = 1
to n. The CV was calculated as SD/overall mean.
2. Validation study (Wageningen)Data were made available from earlier studies by Deurenberg et al (1991) from 146 men
and 238 women, including body density measured by UWW with residual volume
estimated by simultaneous helium dilution; waist and hip circumferences; biceps;
triceps; subscapular and suprailiac skinfold thicknesses; weight; height, age; and sex.
Anthropométrie measurements used the same protocols as in the present study except
that skinfold-thickness measurements were made on the left. This sample was used as an
independent population to test the validity of the equations derived from the Glasgow
determination study. Measurements of arm span, lower leg length, and MU AC were not
available in the validation sample. Skinfold-thickness measurements were available in
143 men and 236 women.
Statistics
The Bland and Altman analysis (Bland and Altman, 1986) used to assess the mean and
95% CIs of errors of body fat prediction as the difference in percent body fat estimated
by regression equations from percent body fat measured by the reference UWW method.
RESULTS
1. Determination studyDetails of subjects and the antlnopometric data are given as mean ±SD in Table 3.1.1.
Sixty-three males aged 17-65 years and 84 females aged 18-64 years were studied under
48

standard fasting conditions, with even distributions over wide ranges of weight, BMI,
waist circumference, waist to hip ratio, skinfold thicknesses and body density. The mean
height, weight and BMI were similar to average figures in the British adult population
(Gregory e /a/, 1990).
Diurnal variations were studied for certain measurements made in the morning fasting
and then in late afternoon for weight in 15 men, mean age 25 (range 20 to 46 yeai's) and
35 women, mean age 25 (range 21 to 35) years, and height of 65 men, mean age 42.3
yeai's (range: 16.8-65.4) and 69 women, mean age 43.1 years (range: 22.3-70.7), On
average, there was a significant increase in body weight, mean +0.26 kg (95% Cl: 0.16
to 0.35, P < 0.05) and a decrease in height, mean -0.8 cm (95% Cl: -1.0 to -0.6, P <
0.001) in the afternoon compared with the morning. These effects are compounded in
estimates of BMI so on average, BMI (weight/height^) would increase by 0.3 kg/m^
(1.2%) during the day. The CVs for repeated measurements of UWW, and waist and hip
circumferences were 0.16%, 0.44% and 0.20% respectively.
Figure 3.1.1a shows the age distribution, separately for men and women, in relation to
body density. In general, body density decreased with increasing age. Females had
consistently lower body density than males at a given age.
A plot between body density and waist circumference (Figure 3.1.1b) demonstrates an
almost linear relationship (men: r = -0.88 and women: r = -0.79). Both men and women
showed approximately the same gradient, with lower intercept in females. For a given
waist circumference, the women tended to be less dense (fatter) than men, reflecting the
greater central (visceral) fat deposition in men. Waist to hip ratio gave good prediction
in men, but no better than waist circumference alone.
A plot between body density and triceps skinfold thickness (Figure 3.1.1c) shows the
regression lines for males and females almost shared an identical intercept and slope,
suggesting triceps skinfold thickness reflects proportionally the same amount of fat for
49

the two sexes. Men tended to be leaner with smaller triceps skinfold thickness (10.9 ±4.6
mm) than women (19.1 ±5.4 mm).
Linear regression: single variables
Table 3.1.2 shows the 17 significant (P < 0.001) correlations between body density and
single antliropometric variables for men and women. Body density correlated most
closely with waist circumference in both sexes (r = -0.88 in men and -0.79 in women).
Thigh circumference correlated only moderately with body density, slightly higher in
women (r = -0.58) than in men (r = -0.53). Correlation coefficients between body
density and individual skinfolds ranged from -0.61 to -0.76 in men and from -0.66 to -
0.77 in women. The sum of four skinfold thicknesses correlated with body density more
closely than single or combinations of two or tlnee skinfolds in men (r = -0.772) but not
in women (r = -0.763). A search was made for a better nonlinear relation (quadratic or
logarithmic transformation), but no improvement in or SE was found, except for the
relation with skinfold thicknesses. As in the study of Durnin and Womersley (1974)
logarithmic transformation of the sum of four skinfold thicknesses increased the
correlations significantly (P < 0.05) with body density in both men (r = -0.81) and
women (r = -0.78).
Stepwise multiple regression analysis
When all 20 anthropometric measurements or selected ratios (Table 3.1.2) were
considered separately for each sex as possible explanatory variables, the best prediction
(highest r^) of body density for men was Waist circumference + Triceps skinfold
thickness + Age. This equation accoimted for 86.6% of variance of body density. The
best prediction of body density in women was from BMI + Triceps skinfold thickness +
Age, explaining 80.2% of variance, but this equation was only slightly better than other
simple equations, which included Waist circumference + Triceps SF + Age (r^ = 79.0%).
Other antlu’opometric variables combining with triceps skinfold thickness also gave
good prediction of body density explaining >76.0% of variance (Table 3.1.3). Log]o
50

sum of four skinfold thicknesses (log^oZ^SF) gave a similar power of prediction of body
density in the present study (men: r ' = 80.1 %; women: = 76.4%) to the published
equations (highest revalue of 81%) of Durnin and Womersley (1974).
Figures 3.1.2a-d show the relationships between the observed body density and
predicted body density from some selected anthi’opometric variables. Tables 3.1.4 and
3.1.5 contain six pairs of regression equations (numbers 1-6) validated in the
Wageningen study to predict body density and equivalent percent body fat estimated
from Siri’s equation (1961): Percent body fat = (4.95/body density - 4.5) x 100%.
For subjects whose height camiot be measured, arm span and lower leg length were
considered as alternatives. Height correlated with arm span (men: r - 0.76 and women: r
^ 0.81) and lower leg length (r ^ 0.85 for both men and women). These variables gave
prediction of body fat as good as other commonly used variables (Table 3.1.3).
Equations 7-12 incorporating these variables which could not be validated in the
Wageningen validation study.
2. Validation study
Subjects in the validation sample had wider range of ages (18-83 years) than the
determination study. Both samples had similar BMIs but the validation sample was
fatter and had higher waist circumference and waist to hip ratio, indicating an
accumulation of abdominal fat mass associated with older subjects in this sample (Table
3.1.6).
Percentage body fat was predicted by equations 1-6 derived from the determination
study, and by that of Durnin and Womersley (1974) for comparison. The prediction
enors of each equation were calculated from the difference between predicted body fat
and body fat measured by UWW.
51

Table 3.1.7 shows the mean body fat of the Wageningen validation sample predicted by
equations derived from the Glasgow determination study correlated highly (r >0.82; P
<0.001) with body fat by UWW. The mean difference (prediction errors) with its SE and
SD for each of the derived equations and those of Durnin and Womersley (1974) were
similar, ranging from 4 to 5% of body weight, i.e., 95% Cl limits for errors of 8 to 10%
of body weight about the mean errors. Body fat prediction from triceps skinfold
thickness in men gave the worst SD of 6.6% of body weight (95% Cl limits of eiTor:
13% of body weight). Although the mean errors of all equations were close to zero,
almost all equations had significant positive or negative slopes for a plot of errors
relative to body fat measuied by the reference UWW method. This indicates systematic
errors or bias in predicting body fat in individuals at extreme ends of body fat spectrum
(Table 3.1.8). Densitometry makes an assumption the fat free mass has a constant
density of about 1.1 kg/1 (Siri, 1961); error in the reference method may relate to the
possibility that the density of fat free mass is lower than this in the obese subjects, and
higher than this in the very thin subjects because of different relative contribution of the
organs (Shephard, 1991).
Using waist circumference alone, adjusted for age, gave equally good prediction of body
fat, with similar SE and SD to other equations using more than one variable or
measurement, including the Durnin and Womersley equations (Figures 3.1.3a-j^. The
mean enors were close to zero in both men (-0.95 % of body weight) and women (-0.93
% of body weight), with a negative slope of errors almost identical to those found using
Durnin and Womersley equations for men (Figure 3.1.3c). The slope was less steep for
women (Figure 3.1.31) indicating that body fat is less likely to be underestimated in
fatter subjects using the waist circumference equations than those from Durnin and
Womersley.
All equations containing triceps-skinfold measurement, including those from Dmnin and
Womersley had significant positive or negative slopes for a plot of enors in predicting
body fat against age (Table 3.1.9). Negative slopes were observed for predicting errors
52

with increasing age by Durnin and Womersley (1974) equations, but there was no
systematic bias in percent body fat prediction with age using waist equations in both
sexes (Figures 3.1.4a & b). The mean and 95% CIs of errors of percent body fat
prediction in different age groups are presented in Table 3.1.10 showed that the
skinfold-thickness method (Durnin and Womersley, 1974) gave good prediction of
percent body fat in younger subjects (age <60 years), but underestimated percent body
fat of subjects aged 60-83 years up to 15% of body weight, whereas the waist
circumference equations from the present study continued to give good prediction of
percent body fat in 60 -83 years.
DISCUSSION
The present study has examined all the simple antliropometric measures currently in use,
in predicting body density to estimate percentage body fat. The numbers of subjects (63
men and 84 women) studied met the minimal number (n = 50) for generating prediction
equations, recommended by Katch (1985), and allowed power of prediction at least
equal power to those currently employed. The age distribution of subjects permits
confidence over a wide range of ages. The validation sample had been studied under
similar rigorous conditions, but by other observers and in an entirely different white
population.
The equations from the present study were derived from a healthy white population
broadly representative of the UK adult population, including very few athletes or
unusually thin individuals. Barata et al (1993) recently found the equation of Jackson
and Pollock (1978) better than those of Durnin and Womersley (1974) for athletes.
Caution should be exercised when applying the equations to other population groups, or
to subgroups with unusual physical chai’acteristics.
Stepwise multiple regression analysis for the combination of single measurements found
waist circumference and triceps skinfold thickness, together with age, to provide the best
prediction (highest r^) of body density, explaining 86.6% and 79% of variance in men
53

and women, respectively, in the population from which the equations were derived. This
equation applied less well in the validation study, which probably reflects differences
between observers in triceps skinfold-thickness measurements. The prediction of body
density from waist measurement alone, corrected for age (Table 3.1.3), is remarkably
good (men: = 77.8%; women: = 70.4%). Age adjusted BMI also showed good
prediction of body density(men: = 67.0%; women: = 74.5%). Thus, for
epidemiological work, both waist circumference and BMI may be useful simple
measurements. Several other combinations of body circumferences and skinfold
thicknesses (biceps, triceps, subscapulai*, suprailiac) also gave good correlation with
body density, but no better than the combination of waist circumference and triceps
skinfold thickness. Age and triceps skinfold thickness combined with BMI, the ratios of
body mass to arm span or body mass lower leg length gave similar prediction power for
body density in both sexes. The classical equation of Durnin and Womersley (1974)
using log^oZ^SF still gives a useful prediction, but BMI (with age and sex corrections)
also demonstrated high predictive value ( / ^ 80.0%; not shown in tables) for body
density, confirming previous observations from Deurenberg et al (1991). Equations with
BMI + Triceps skinfold thickness gave better predictions of body density (men: -
84.5%; women: = 80.2%) than did logioZ^SF. The best four equations obtained from
stepwise multiple regression analysis in the Glasgow determination study, which all
included triceps skinfold thickness measurement and either waist circumference or body
mass, were significantly more powerful (P < 0.05) than log^qE^SF prediction equations
in the population used to derive them.
A major advantage of waist circumference and triceps skinfold-thickness methods lies in
their practical use (Tables 3.1.4 and 3.1.5). The four skinfold method requires a little
practice to be reproducible, and may present some difficulties when subjects are clothed,
or when skinfold thickness exceeds 50 mm (the limit of the calipers). This eliminates
mainly obese subjects. With BMI above 37 kg/m^, subscapular and supra-iliac skinfolds
usually exceed 50 mm and can only be roughly estimated.
54

The equations based on Waist circumference + Triceps skinfold thickness offer another
advantage over skinfold only methods by taking account of body fat distribution. For
example, people with heart disease and with non insulin dependent diabetes mellitus
have exaggerated central (visceral) fat distribution (Bjorntorp, 1985). In subjects with
the highest quartile of waist to hip ratio including subjects with diabetes, we have found
that equations using waist circumference are significantly better than methods based on
subcutaneous skinfold thicknesses or BMI (Han and Lean, 1994). Waist circumference
reflects intra-abdominal fat, as distinct from the subcutaneous fat which is reflected in
triceps measurement, although both reflect total fat as well. Magnetic resonance imaging
(Han et al, 1995a; Ross et al, 1992; Ross et al, 1993) and computerised tomograhy
studies (Pouliot et al, 1994; Seidell et al, 1989) showed that waist circumference
correlated with fat fi'om all sites, including intra-abdominal fat (r range 0.73-0.94; P <
0.001) and total body fat (r >0.94; P < 0.001) in both men and women, although triceps
skinfold thickness correlated highly with subcutaneous fat (r range 0.69-0.89; P < 0.05)
and poorly with intra-abdominal fat {r ~ 0.39; P = not significant) in both men and
women.
Equations using the simple measurement of waist circumference and age proved to be
remarkably robust for body fat prediction, as good as the existing method of combining
4 skinfolds in men and better in fatter women where the Dm'nin and Womersley
systematically imderestimates body fat. Figures 3.1,3c & f suggest some bias in
predicting body fat with increasing body fatness. Measurement of residual lung volume
by helium in Wageningen and nitrogen in Glasgow were the only méthodologie
difference, but this does not readily explain any bias. An alternative explanation for the
bias could be the difference in body fat distribution in the Dutch population, possibly
related to physical activity, smoking, and alcohol consumption. These equations based
on waist circumference (Tables 3.1.4a and 3.1.5a; equation 1) are also applicable to
older subjects without the systematic underestimation of body fat shown by the four
skinfold method. This bias may indicate altered density in lean body mass with age
55

(Reilly et al, 1994), but there is little independent evidence for altered lean body mass in
elderly people. Altered body fat distribution with aging is a more plausible explanation,
which is taken into account by the waist circumference method.
Waist measurement is the a highly practical method and its percentage measurement
error is low due to its large circumference. Only a flexible tape is required, with minimal
training to use bony landmarks. The only drawback would be in the very obese (BMI
>45 kg/m^) when a large apron of abdominal fat would invalidate waist measurement.
Wlien waist circumference and skinfold measureiuents are not available, BMI from body
mass and height could be used as alternative method to predict body fat. The bias could
be from one of the UWW protocols. The Glasgow method was tested against the earlier
Durnin and Womersley tank as its replacement, showing no difference between the two
methods on the same subjects. The Wageningen has been well established and has been
used in many published studies (Deui'enberg et al, 1991). Because of their distance from
one another, the Glasgow and Wageningen UWW methods cannot be compared directly.
Alternatives to BMI were developed using the ratios of body mass over arm span in
kg/cm or lower leg length in kg/cm. These indices were analysed with other single
antliropometric variables adjusted for age and sex. The best equations obtained were for
the ratios of body mass to arm span (r^ = 80.0%), and body mass to lower leg length {r"
= 79.3%). There was no significant difference when various powers were applied to
variables. Triceps skinfold thickness was added to these equations (sepamte sexes)
resulting in similar’ improvement for the prediction of body density as other multiple
regression equations, for the ratios of body mass to arm span, / ^ 84.4% (men) and
79.9% (women) and body mass to lower leg length, r" - 83.5% (men) and 79.3%
(women). These equations may be of value for the elderly, chair-bound and bedridden
subjects, and use of lower leg length instead of height may occasionally be helpful
clinically and in field work. To keep errors to a minimmn in routine use, training of
observers is urged, even for simple procedures.
56

CONCLUSIONSThe twelve equations for each sex group (Tables 3.1.4 and 3.1.5) use simple
anthropometric measurements to predict body composition. All equations, except mid
upper arm circumference in men, gave acceptable accuracy and low error of prediction
(Table 3.1.3), and thus can be used for clinical and epidemiological purposes. The time,
equipment, and skill required for these measurements vaiy. An equation using waist
circumference adjusted for age, as well as giving a prediction with low error and
freedom &om bias with age or fatness, is also amongst the most convenient and avoids
errors associated with altered fat distribution. Log sum of four skinfold thicknesses still
gives very acceptable prediction of body composition, but with some underestimation in
elderly subjects and in fat women, and BMI can be used satisfactorily when these
measures are unavailable. The most powerful prediction of body fat, from waist
circumference and triceps skinfold thickness performed less well in a validation sample,
and is probably dependent on individual technique of triceps skinfold thickness
measuiement. For the elderly, chair-bound and those with amputations, arm span or
lower leg length can be used instead of height.
57

Table 3,1.1. Chaincteristics of men and women in the determination study.
Men {n = 63) Women {n = 84)
Mean SD Range Mean SD Range
Age (years) 40.1 13.1 16.8-65.4 39.9 14.1 18.0-64.3
Height (m) 1.75 0.06 1.61-1.87 1.62 0.06 1.43-1.78
Weight (kg) 76.5 13.1 58.8-128.4 65.4 11.9 46.1-97.3
Body mass index (kg/m^) 24.9 4.3 18.9-41.2 24.9 4.3 18.3-37.7
Waist circumference (cm) 88.1 12.5 68.7-129.1 78.3 11.8 60.4-116.1
Hip circumference (cm) 98.0 6.8 87.6-125.5 101.2 9.3 83.8-133.0
Thigh circumference (cm) 55.3 5.1 45.8-70.2 56.6 4.6 49.2-69.9
MUAC (cm) 31.3 3.1 25.9-41.4 29.5 3.8 23.4-43.8
Waist to hip ratio 0.90 0.08 0.77-1.11 0.77 0.08 0.62-0.99
Lower leg length (cm) 53.6 2.2 48.3-57.9 49.6 2.9 40.4-57.6
Armspan (m) 1.76 0.07 1.60-1.90 1.61 0.08 1.40-1.78
Triceps skinfold (mm) 10.9 4.6 3.9-22.7 19.1 5.4 6.1-32.4
E^skinfold (mm) 51.2 25.7 19.7-161.9 63.2 24.2 23.4-126.1
Body density (kg/1) 1.049 0.023 1.003-1.087 1.024 0.020 0.987-1.061
Body fat (% of body weight) 22.3 8.9 5.2-43.7 33.75 8.7 16.4-51.7
MUAC = mid-upper arm circumference; Z^skinfbid = sum o f biceps, triceps, subscapular and supra-iliac
skinfolds.
58

Table 3.1.2. CoiTelation coefficients between body density and anthropometric
measurements.
Men (« = 63) Women {n = 84)
Age -0.572*** -0.687***
Height 0.104 0.182
Weight -0.713*** -0.691***
Body mass index -0.755*** -0.781***
Waist circumference -0.878*** -0.790***
Hip circumference -0.707*** -0.713***
Thigh circumference -0.531*** -0.575***
Mid-upper arm circumference -0.586*** -0.790***
Waist to hip ratio -0.841*** -0.536***
Waist to thigh ratio -0.714*** -0.570***
Hip to thigh ratio -0.015 -0.328*
Lower leg length -0.009 -0.011
Armspan 0.323* -0.065
MAR -0.768** -0.747***
MLR -0.745** -0.727***
Biceps skinfold -0.730*** -0.695***
Triceps skinfold -0.612*** -0.768***
Subscapular skinfold -0.678*** -0.661***
Suprailiac skinfold -0.763*** -0.694***
Z^skinfold -0.772*** -0.763***
LogioZ^skinfbld -0.809*** -0.781***
MAR = ratio o f body mass to armspan; MLR = ratio o f body mass to lower leg length; Z^skinfold = sum
o f biceps, triceps, subscapular and supra-iliac skinfolds. <0.001; <0.05.
59

Table 3.1.3. Explained variance (r ) and SEE for predictions of body density and
percent BF by regression equations from Tables 3.1.4 and 3.1.5 and by selected
published equations.
Men {n = 63) Women {n = 84)
Equation r SEE SEE SEE SEE
% kg/1 % body % kg/1 % body
weight weight
1. Waist circumference 77.8 0.0092 4.1 70.4 0.0100 4.7
2. Triceps 76.9 0.0094 4.3 75.1 0.0092 4.3
3. BMI 67.0 0.0113 5.0 74.5 0.0093 4.4
4. Waist + Triceps 86.6 0.0072 3.2 79.0 0.0085 4.0
5. BMI + Triceps 84.5 0.0077 3.4 80.2 0.0082 3.9
6. LogioZ^skinfbld 80.1 0.0088 4.0 76.4 0.0090 4.2
7. MAR 69.1 0.0109 4.9 73.0 0.0096 4.5
8. MLR 61.1 0.0111 5.0 72.2 0.0097 4.6
9. MUAC 57.3 0.0128 5.8 73.3 0.0095 4.5
10. MAR + Triceps 84.4 0.0077 3.4 79.7 0.0083 3.9
11. MLR + Triceps 83.5 0.0078 3.4 79.3 0.0084 4.0
12. MUAC + Triceps 80.7 0.0084 3.8 77.0 0.0088 4.2
LogioZ^SF (D&W)* 81.0t 0.0084 3.8 81.0t 0.0102 4.6
LogioSySF+WC+FC (J&P)* 84.1 0.0073 3.2
LogioSySF+GC (J etal)^ 75.2 0.0079 3.6
S4SF = sum o f biceps, triceps, subscapular and supra-iliac skinfolds; MAR = ratio o f body mass to
armspan; MLR = ratio o f body mass to lower leg length; MUAC = mid-upper arm circumference; WC,
FC and GC = waist, forearm and gluteal circumferences, respectively. * figures obtained from other
published equations are shown for comparison. References: D&W = Durnin and Womersley (1974); J&P
= Jackson and Pollock (1978); i et al - Jackson et a l (1980). fhighest value quoted. P <0.001 for all
equations.
60

Table 3.1.4a. Regression equations predicting (a) body density (BD) and (b) the
equivalent body fat (BF %) in 63 men.
Equation 1. Waist circumference
a) BD = 1.1674 - (0.00125 x Waist) - (0.000231 x Age)
b) BF % = (0.567 X Waist) + (0.101 x Age) - 31.8
Equation 2. Triceps skinfold thickness
a) BD = 1.1181 - (0.00289 x Triceps) - (0.000953 x Age)
b) BF % = (1.31 X Triceps) + (0.430 x Age) - 9.16
Equation 3. Body mass index (BMI)
a) BD = 1.1419 - (0.00290 x BMI) - (0.000527 x Age)
b) BF % = (1.33 X BMI) + (0.236 x Age) - 20.2
Equation 4. Waist circumference and triceps skinfold thickness
a) BD = 1.1554 - (0.000761 x Waist) - (0.00170 x Triceps) - (0.000532 x Age)
b) BF % = (0.353 X Waist) + (0.756 x Triceps) + (0.235 x Age) - 26.4
Equation 5. Body mass index and triceps skinfold thickness
a) BD = 1.1414 - (0.00160 x BMI) - (0.00213 x Triceps) - (0.000747 x Age)
b) BF % = (0.742 X BMI) + (0.950 x Triceps) 4- (0.335 x Age) - 20.0
Equation 6. Logig sum of four skinfold thicknesses
a) BD = 1.1862 - (0.0684 x Log]o%4 skinfold) - (0.000601 x Age)
b) BF % = (30.9 X LogioS4 skinfold) + (0.271 x Age) - 39.9
Units o f measurements: waist circumference (cm); skinfolds (mm); BMI (kg/in'^); age (years). / and SEE
values are given in Table 3.1.3.
61

Table 3.1.4b. Regression equations predicting (a) body density (BD) and (b) the
equivalent body fat (BF %) in 63 men.
Equation 7. Ratio of body mass to arm-span (MAR)
a) BD = 1.1425 - (0.167 x MAR) - (0.000529 x Age)
b) BF % = (76.7 X MAR) + (0.237 x Age) - 20.4
Equation 8. Ratio of body mass to lower leg length (MLR)
a) BD = 1.1471 - (0.0530 x MLR) - (0.000571 x Age)
b) BF % = (24.2 X MLR) + (0.256 x Age) - 22.6
Equation 9. Mid-upper aim circumference (MUAC)
a) BD = 1.1828 - (0.00333 x MUAC) - (0.000745 x Age)
b) BF % = (1.52 X MUAC) + (0.336 x Age) - 38.7
Equation 10. MAR and triceps skinfold thickness
a) BD = 1.1407 - (0.092 x MAR) - (0.00205 x Triceps) - (0.000746 x Age)
b) BF % = (42.6 X MAR) + (0.917 x Triceps) + (0.334 x Age) - 19.6
Equation 11. MLR and triceps skinfold thickness
a) BD = 1.1423 - (0.0280 x MLR) - (0.00209 x Triceps) - (0.000777 x Age)
b) BF % = (13.0 X MLR) + (0.933 x Triceps) + (0.348 x Age) - 20.4
Equation 12. MUAC and triceps skinfold thiclmess
a) BD = 1.1613 - (0.00165 x MUAC) - (0.00238 x Triceps) - (0.000882 x Age)
b) BF % = (0.757 X MUAC) + (1.07 x Triceps) + (0.398 x Age) - 29.0
Units o f measurements: MUAC (cm); MAR and MLR (kg/cm); age (years). / and SEE values are given
in Table 3.1.3.
62

Table 3.1.5a. Regression equations predicting (a) body density (BD) and (b) the
equivalent body fat (BF %) in 84 women.
Equation 1. Waist circumference
a) BD = 1.1145 - (0.000924 x Waist) - (0.000465 x Age)
b) BF % = (0.439 X Waist) + (0.221 x Age) - 9.4
Equation 2. Triceps skinfold thickness
a) BD = 1.0851 - (0.00200 x Triceps) - (0.000586 x Age)
b) BF % = (0,944 X Triceps) + (0.279 x Age) + 4.6
Equation 3. Body mass index (BMI)
a) BD = 1.1088 - (0.00254 x BMI) - (0.000551 x Age)
b) BF % = (1.21 X BMI) + (0.262 x Age) - 6.7
Equation 4. Waist circumference and triceps skinfold thickness
a) BD = 1.1062 - (0.000482 x Waist) - (0.00140 x Triceps) - (0.000453 x Age)
b) BF % = (0.232 X Waist) + (0.657 x Triceps) + (0.215 x Age) - 5.5
Equation 5. Body mass index and triceps skinfold thickness
a) BD = 1.1039 - (0.00148 x BMI) - (0.00122 x Triceps) - (0.000505 x Age)
b) BF % = (0.730 X BMI) + (0.548 x Triceps) + (0.270 x Age) - 5.9
Equation 6. Logjo sum of four skinfold thicknesses
a) BD = 1.1622 - (0.0654 x LogioZ^skinfold) - (0.000574 x Age)
b) BF % = (30.8 X Logio2 4 skinfold) + (0.274 x Age) - 31.7
Uiiiitf o f measurements: waist circumference (cm); skinfolds (mm); BMI (kg/m^); age (years), and SEE
values are given in Table 3.1.3.
63

Table 3.1.5b. Regression equations predicting (a) body density (BD) and (b) the
equivalent body fat (BF %) in 84 women.
Equation 7. Ratio of body mass to arm-span (MAR)
a) BD = 1.1108 - (0.155 X MAR) - (0.000603 x Age)
b) BF % = (73.6 X MAR) + (0.287 x Age) - 7.6
Equation 7. Ratio of body mass to lower leg length (MLR)
a) BD = 1.1101 - (0.0466 x MLR) - (0.000630 x Age)
b) BF % = (22.0 X MLR) + (0.300 x Age) - 7.2
Equation 9. Mid-upper arm circumference (MUAC)
a) BD = 1.1299 - (0.00291 x MUAC) - (0.000512 x Age)
b) BF % = (1.38 X MUAC) + (0.243 x Age) - 16.7
Equation 10. MAR and triceps skinfold thickness
a) BD = 1.1047 - (0.0867 x MAR) - (0.00129 x Triceps) - (0.000582 x Age)
b) BF % = (41.3 X MAR) + (0.607 x Triceps) + 0.253 x Age) - 4.7
Equation 11. MLR and triceps skinfold thickness
a) BD = 1.1040 - (0.0252 x MLR) - (0.00133 x Triceps) - (0.000546 x Age)
b) BF % = (12.0 X MLR) + 0.626 x (Triceps + 0.260 x Age) - 4.3
Equation 12. MUAC and triceps skinfold thickness
a) BD = 1.1091 - (0.00139 x MUAC) - (0.00126 x Triceps) - (0.000518 x Age)
b) BF % = (0.676 X MUAC) + (0.582 x Triceps) + (0.246 x Age) - 7.1
Units o f measurements: MUAC (cm); MAR and MLR (kg/cm); age (years), r and SEE values are given
in Table 3.1.3.
64

Table 3.1.6. Characteristics of 146 men and 238 women from the independent
validation (Wageningen) sample.
Men {n = 146) Women {n = 238)
Mean SD Range Mean SD Range
Age (years) 45.9 17.4 18.0-82.0 36.9 17.5 20.0-83.0
Height (cm) 179.9 7.7 151.3-202.0 167.7 7.0 150.7-185.9
Weight (kg) 81.1 11.7 54.4-120.8 67.75 12.9 43.7-109.6
Body mass index (kg/m^) 25.1 3.4 19.2-34.8 24.15 4.71 17.4-40.9
Waist circumference (cm) 93.3 10.8 70.5-115.0 82.6 11.96 62.0-113.0
Hip circumference (cm) 100.3 6.1 87.5-123.0 101.3 9.01 85.0-138.0
Waist to hip ratio 0.93 0.07 0.73-1.13 0.81 0.07 0.68-1.04
Triceps skinfold (mm) 13.6 6.0 4.0-35.5 20.0 7.7 7.0-44.0
Z^skinfbld (mm) 57.8 25.5 18.8-152.7 69.2 30.5 22.8-155.6
Body density (kg/1) 1.034 0.02 1.008-1.079 1.023 0.02 0.984-1.062
Body fat (% body weight) 26.7 7.7 8.9-41.0 34.1 8.8 16.3-53.1
MUAC = mid-upper arm circumference; Z^skinfold
skinfolds.
sum of biceps, triceps, subscapular and supra-iliac
65

Table 3.1.7. Mean body fat predicted by equations derived from determination study
and by underwater weighing and their correlations, mean difference and standard errors
(SE) and standard deviation of the difference in 146 men and 238 women from
validation study.
Percentage body fat Difference (Pre-UWW)
Pre UWW r Mean SE SD
Men {n ~ 146)
Waist 25.71 26.65 0.839 -0.95 0.35 4.20
Triceps 28.33 26.65 0.823 1.67 0.55 6.64
BMI 24.01 26.65 0.843 -2.65 0.34 4.13
BMI + Triceps 26.87 26.65 0.850 0.22 0.46 5.55
Waist + Triceps 27.55 26.65 0.861 0.89 0.41 4.93
LogioZ^skinfold 25.88 26.65 0.867 -0.61 0.33 3.98
LogigZ^skinfbld (D&W) 24.47 26.65 0.843 -2.01 0.35 4.14
Women {n = 238)
Waist 35.03 34.06 0.868 0.97 0.28 4.38
Triceps 33.80 34.06 0.862 -0.26 0.33 5.12
BMI 32.19 34.06 0.879 -1.87 0.28 4.28
BMI + Triceps 32.67 34.06 0.883 -1.39 0.31 4.77
Waist + Triceps 34.76 34.06 0.883 0.70 0.29 4.54
LogioZ^skinfoId 33.88 34.06 0.882 -0.07 0.27 4.20
LogigZ^skinfbld (D&W) 32.32 34.06 0.860 -1.63 0.29 4.51
Pre = predicted body fat by anthropometric equations derived from the determination study; UWW =
underwater weighing. D&W = Durnin and Womersley equations (1974).
66

Table 3.1.8. Slopes of the difference of body fat prediction by derived equations
(adjusted for age) and body fat measured by underwater weighing plotted against body
fat measured by underwater weighing in 146 men and 238 women.
Men {n = 146) Women {n = 238)
Slope r P Slope r P
Waist -0.787 -0.432 <0.001 -0.933 -0.464 <0.001
Triceps 0.288 0.249 0.002 -0.042 -0.024 0.710
BMI -0.957 -0.515 <0.001 -0.651 -0.316 <0.001
BMI + Triceps 0.277 0.200 0.015 0.056 0.030 0.642
Waist + Triceps 0.191 0.123 0.134 -0.133 -0.069 0.292
LogioZ^skinfold -0.446 -0.232 0.005 -0.616 -0.296 <0.001
Log 1 0^ 4 skinfold (D&W) -0.859 -0.464 <0.001 -1.212 -0.624 <0.001
D&W = Durnin and Womersley equations (1974).
Table 3.1.9. Slopes of the difference of body fat prediction by derived equations
(adjusted for age) and body fat measured by underwater weighing plotted against age in
146 men and 238 women.
Men {n = 146) Women {n = 238)
Slope r P Slope r P
Waist -0.226 -0.055 0.512 0.303 0.076 0.242
Triceps 1.515 0.579 <0.001 1.034 0.303 <0.001
BMI 0.439 0.104 0.210 0.653 0.160 0.013
BMI + Triceps 1.344 0.430 <0.001 1.180 0.322 <0.001
Waist + Triceps 1.163 0.330 <0.001 0.779 0.202 0.002
LogioS4skinfold 1.214 0.276 <0.001 0.726 0.174 0.007
Logio24skinfold (D&W) -1.003 -0.237 0.004 -1.355 -0.349 <0.001
D&W = Durnin and Womersley equations (1974).
67

Table 3.1.10. Mean and 95% confidence limits of errors of body fat prediction by
equations based on waist circumference, and skinfolds (Durnin and Womersley, 1974)
from body fat measured by densitometry in different age groups of 146 men and 238
women aged 18 to 83 years.
Equation type and age groups
Men {n = 146) Women {n = 238)
Mean 95% Cl n Mean 95% Cl n
Waist circumference
18-39 -0.5 -9.2, 8.2 48 0.6 -7.7, 8.9 138
40-59 -1.4 -9.0, 6.1 58 0.9 -8.7, 10.5 60
60-83 -0.7 -9.6, 8.2 40 0.9 -7.4, 9.3 40
Skinfold thicknesses (D&W)
18-39 -1.6 -8.7, 5.5 47 -0.9 -8.6, 6.7 138
40-59 -1.4 -9.8, 7.0 56 -0.5 -9.5, 8.5 58
60-83 -3.4 -12.0,5.2 40 -5 J -14.8,3.4 40
D&W = Durnin and Womersley equations (1974).
68

1.12
1 1.10
1g1.08
1.06
1.04
1.02X)
f1.00
0.98T30.96
OQ 0.94
1.12
1 1 10
&1.08<Dg 1.06
I 1 04XJ
1.02XJ
1.00
g 0.98XI
0.96om 0.94
1 12
1 1.10
& 1,08
1 1.06
B 1 04
1.02X100
1 0,98
0,96om 0.94
• * • • • • •
• M: /■ = -0.57, P <0.001 a F: /• = -0.69, P <0.001
a □ □ e
a
••
□ °o ^
15 20 25 30 35 40 45 50 55 60 65 70Age (years)
• M: /■ = -0.88, P <0.001 □ F: /• = -0.79, P <0.001
□ %
50 60 70 80 90 100 110 120 130Waist circumference (cm)
• M: r = -0.61, F <0.001 Û F: r - -0.77, f <0.001
ID* CM□
a m° • cyo" %]
5 10 15 20 25 30Triceps skinfold thickness (mm)
35
Figure 3.1.1. Relations between body density by underwater weighing and age (a), waist
circumference (b), and triceps skinfold thickness (c) in 63 males (M) and 84 females (F)
in the determination study.
69

• M; r2 = 77.8, SEE = 0.0092, P <0,001 □ F: r^ = 70.4, SE E =0.0I00 ,P<0.00!
0.98 1.00 1.02 1.04 1.08 1.10 1.12Predicted body density by waist circumference (kg/l)
1.10• M; ;•’ = 77.8. SEE = 0.0092, P <0.001 □ F: = 70.4, SEE = 0.0100, P <0.0011.08
1.06
1,04
1.02
1.00
0.981.000.98 1.02 1.04 1.08 1.10 1.12
Predicted body density by body mass index (kg/l)
1.10. M: /-2 = 80.1, SEE = 0.0088, P <0.001 □ F: = 76.4, SEE = 0.0090, P <0.001
g 1.02
1.00 1.02 1.04 1.08 1.10 1.12Predicted body density by log,,, sum of four skinfolds (kg/l)
1.10
• M: f) = 86.8, SEE = 0.0072, P <0.001 □ F: = 79.0, SEE = O.OOSS, P <0.0011.08
1.06
1.04
1.02
1.00
0.980.98 LOO 1.02 1.04 1.08 1.10 1.12
Predicted body density by waist + triceps skiiifoid (kg/l)
Figure 3.1.2. Relation between observed body density by underwater weighing and
predicted body density by waist circumference (a), body mass index (b), log sum of four
skinfold thicknesses (c), and waist + triceps skinfold thickness (d), adjusted for age, in
63 males (M) and 84 females (F) in the determination study.
70

Slope - -0.79, r ~ -0.43, P <0.001
*v>* +2SD
M ean
-2SDMen
10 15 20 25 30 35 40 45
Slope = -0. 93, r = -0.46, P <0.001
-1-2 SD
-2 S D
Women15 20 25 30 4035 45 50 55
Body fat by reference densltoinetric incthod (% of body weight) Body fat by reference densltoinetric incthod (% o f body w eight)
I Slope = -0.86, r = -0.46, P <0.001
+ 2 S D
M ean
Men -2 S D
10 15 20 25 30 35 40 45
Slope = -1.21, r = -0.62,1’ <0.001
3-2 SD
M ean
Women••g 15-2SD
15 20 25 30 35 40 45 50 55Body fat by reference densitonietric inetliod (% o f body weight) Body fat by reference densiloinetric inelhod (% o f body weight)
'fl? 20
15
10
■J3 5•y 0&y 5É 10
V 15
20
• Waist slope = -0.79, r = -0.43, P <0.001 o D&W slope = -0.86, r = -0.46, P <0.001
M ean
M en10 15 20 25 30 35 40 45
Body fat by reference densitonietric inelhod (% o f body w eight)
• Waist slope - -0.79, r = -0.43, P <0.001
o D&W slope = -0,86, r = -0.46, P <0.001
! 'a.
W omen
£8n «■
] to
15 20 25 30 35 40 45 50 55Body fat by reference densltoinetric method (% of body weight)
Figure 3.1.3. Plots of prediction errors of body fat (predicted minus reference
densitometric method) by waist circumference in 146 men (a) and 238 women (d), and
by the Durnin and Womersley (D&W) skinfold equations in men (b) and in women (e)
against body fat measured by densitometry in the Wageningen validation sample. The
errors of the two predictive methods are plotted against body fat by densitometry for
comparison in men (c) and women (f).
71

• Waist slope = -0.23, r = -0.06, P = 0.51
□ D&W slope = -1,00, r = -0.14, f <0.01
□9□
- aa
Meanerror
45 55A ge (years)
65 75 85
II
§
20
15
10
2 5o
! 0
g15Ü
20 cu
• Waist slope = 0.30, r = -0.08, P =0.24
□ D&W slope = -1.34, r = -0.35, P <0.001
. -& -Æ
3^Women
15 25
□ □
□
•^v
35 45 55A ge (years)
65 75
Meanerror
85
Figure 3.1.4. Plots of prediction errors of body fat (predicted minus reference
densitometric method) by waist circumference and by the Durnin and Womersley
(D&W) skinfold equations in 146 men (a) and in 238 women (b) against age in the
Wageningen validation sample.
72

3.2
LIMB LENGTHS AS INDICES OF STATURE IN ADULTS, AND
ALTERNATIVES TO BODY MASS INDEX FOR CHAIR- OR BED
BOUND SUBJECTS
This section has been peer reviewed and has been published as
Han TS. Lean MEJ. Lower leg length as an index of stature in adults.
International Journal of Obesity 1996; 20:21 -27.
73

ABSTRACTObjective'. To derive regression equations using lower leg length (knee height) or arm
span to predict height, and equations using ratios of weight/lower leg length or
weight/arm span to predict body mass index and % body fat.
Subjects'. Determination sample of 78 men and 82 women aged 17-70 years, and
validation sample of 53 men and 121 women aged 18-82 years.
Measurements: Height, weight, lower leg length measured from the top of the patella
with knee flexed at 90°, arm span, % body fat by densitometry, and age.
Results: Lower leg length gave good prediction of height (men: = 79%, SEE = 3.2 cm;
women: = 73%, SEE = 3.4 cm). Weight/lower leg length ratio was highly predictive
of body mass index (men: r^ =95%, SEE =1.1 kg/m^, women: = 94%, SEE =1.1
kg/m^), and gave an estimation comparable to that of body mass index for predicting %
body fat (men: r^= 68%, SEE = 5.0% of body weight; women: r^= 72%, SEE = 4.6% of
body weight). Applying these equations hased on lower leg length and weight/lower leg
length ratio to a separate sample of men and women showed 95% of the errors of height
estimate were within 6.5 cm, and of body mass index estimate were within 2 kg/m^. The
same analysis for arm span showed the errors of body composition prediction were
imacceptably high.
Conclusion: Lower leg length is useful for estimating hody composition when height
measurement is not available.
Keywords: Anthropometry, height, knee height, ageing, stature, hody mass index, body
composition, body fat.
74

INTRODUCTIONBody mass index (BMI) and other indices which include height are used as measures of
body size and composition. Measuring height is often difficult in the critically ill, the
elderly, the chair/bed bound and people with musculo-skeletal injury. Standing height
differs significantly fi'om body length measured in supine subjects (Watt et al, 1994).
Height has been predicted from demi-arm span in healthy men and women (Bassey,
1986), but Chumlea et al (1985) found knee height to give better prediction in the
elderly.
The recent paper by Roubenoff and Wilson (1993) recommended that knee height may
have an advantage over height as an index of stature in expression of body composition.
The present study aimed to evaluate limb lengths as possible substitutes for height in
body composition indices when height measurement is unavailable or not reliable.
METHODS
SubjectsHealthy subjects were recruited from the Glasgow area by invitations in the local press.
Measurements of body stature and body composition were made in the determination
sample of 78 men and 82 women aged 17-70 years, and validation sample of 53 men
and 121 women aged 18-82 years available from the separate Glasgow MONICA study.
This study was approved hy the Glasgow Royal Infirmary's Ethical Committee.
Body composition measurements
Body weight was measured by calibrated scales (Seca, Germany) to the nearest 100 g,
and height was measured to the nearest millimetre with the subjects standing, back to the
stadiometer (Castlemead, Herts, UK) in bare feet. The head was adjusted so that the
Frankfort plane was horizontal. Feet kept parallel with heels together. The subject was
encouraged to stretch upwards by applying gentle pressiue at the mastoid process.
Lower leg length (LLL) was measured (Figure 3.2.1) with subjects sitting in a chair
adjusted to about their knee height, and the lower legs and bare feet flexed at 90°. The
75

lower legs, 25-30 cm apart, were adjusted to vertical position both side (Figure 3.2.1a)
and front views (Figure 3.2.1b). A ruler standing on its edge was placed on top of the
patellae. Lower leg length was taken to the nearest mm from the midpoint of the ruler to
the floor by wooden metre rule, which was calibrated against a steel tape (Holtain,
Crymych, UK) before use. This teclmique based on bony points aimed to reduce
possible errors such as fi'om varying mass of the quadriceps (Chumlea et al, 1985). Arm
span (AS) was measured between finger tips with subjects standing against the wall,
both arms fully stretched horizontally. Diurnal variations in morning and afternoon
height and weight of 15 men and 25 women aged 20-46 years, and intra- and inter
observer differences in LLL and AS of 65 men and 69 women aged 17-71 years were
studied.
Body density of subjects was estimated by underwater weighing, the detailed technique
being described in the previous C hapter 3.1 (Lean et al, 1996). Percent body fat was
calculated from body density (Siri, 1961).
Statistical analysesDetermination study: Linear regression analysis was used to derive equations based on
LLL or AS (independent variables) to predict morning height (dependent variable), and
equations based on the ratios of weight/LLL or weight/AS to predict BMI or body fat,
with the aid of MINITAB statistical programme {Clecom, Birmingham, UK). The
standard error (.y) of repeated measurements on the same subject was calculated as:
5 = .^ 1 / 2l% X ^ (X ; - y i )
where x,- and y,- are pairs of measurements for z = 1 to n, and the CV was calculated as
5/overall mean (Bland, 1987).
Validation study: Errors of height and BMI predictions from equations based on LLL
and AS, applied to the validation sample, were calculated as the difference of the
measured values from the predicted values (Gregory et al, 1990).
76

RESULTSThe mean values of anthropometric measurements of the determination sample was
similai' to those of the population derived MONICA validation sample for the respective
sexes, except women were slightly older in the validation sample (Table 3.2.1), on this
basis body density and percent body fat are expected to represent larger general
population. The distribution of height and BMI is similar to that of the general
population (Gregory et al, 1990). The sample was not selected to be representative of the
population so height loss with ageing well known from longitudinal studies could still
exist (Shephard, 1991).
Reproducihility between trained observers for LLL and AS, as CV were 0.55% and
0.72%, and within observer were 0.23% and 0.27% respectively. Study of diurnal
variations (paired Mest) showed on average, weight increased by +0.26 (95% Cl: 0.16,
0.35; P <0.05) and height decreased by -0.08 cm (-1.0, -0.6; P <0.001) in the afternoon
compared to morning. These effects are compounded in estimates of BMI, so on
average, BMI (weight/height^) would increase by +0.3 k%!m (1.2%) during the day.
Determination study
Equations based on LLL and AS were derived to predict height in 78 men and 82
women (Table 3.2.2). With the addition of age, both equations using LLL for men and
women improved significantly {P <0.05). However, AS were less highly predictive of
height than LLL and an age factor did not improve the prediction significantly.
Limb lengths were used instead of height, with body weight to develop indices to predict
BMI (Table 3.2.3) and with age to predict percentage body fat (BF%) measured by
densitometry (Table 3.2.4) in 63 men and 75 women with wide ranges of BF% and age.
The ratios of weight/limb length using various index powers ranging from 0.1 to 2 for
the denominator showed weight/LLL and weight/AS^ related most strongly to BMI in
both sexes. This is due to a mathematical phenomenon previously explained by
77

Roubenof and Wilson (1993). These ratios explained more than 91% of variance of
BMI, and with age adjustment, explained >68% and 72% of variance of BF% in men
and women respectively.
Validation study
The derived equations (Tables 3.2.2 and 3.2.3) from the present study were used to
estimate height in a separately studied sample of 53 men and 121 women (65 women did
not have arm span measurement). Mean errors and 95% confidence interval limits of
estimated height from measured height of each corresponding equation are presented in
Table 3.2.5, showing LLL predicted height to within 6.5 cm (Equations la & lb)
There was little improvement in height prediction when equations based on LLL were
adjusted for age (Equations 2a & b). Weight/LLL predicted BMI to within 2 kg/nf
(Equations 4a & b). Plots of individual errors showed a systematic bias towards
overestimating height in shorter subjects and underestimating height in taller subjects
(Figures 3.2.2a & b). There was no systematic bias of height prediction in men of
different ages (Figure 3.2.3a), but increasing overestimation of height in older women
(Figure 3.2.3b). BMI prediction from LLL (Equations 4a & 4b) showed no systematic
bias from degree of overweight (Figures 3.2.4a & b). There were large errors (Table
3.2.5) in predicting height (Equations 3a & 3b) and BMI (Equations 5a & 5b) from
AS.
DISCUSSIONLower leg length from the present study showed good prediction of height and BMI,
while prediction from AS introduced unacceptable eiTors. This is not surprising perhaps,
since LLL is part (about 30%) of height. Height prediction from LLL in men was not
affected by age (Figure 3.2.1a), but tended to be overestimated in older women (Figure
3.2.3b), which may be due to their decreasing in height as the result of ageing
(Shephard, 1991), while LLL may be less affected. Therefore the estimated height could
well be closer to their “true” height when the older women were at younger age. In the
present study, there were no significant correlations between height and age in men from
78

the determination sample (r = -0.183; P = 0.109) and validation sample (r = -0.182; P =
0.191) or women (r = -0.117; P = 0.294) in the determination sample, but there was a
significant negative correlation between height and age in women from the validation
study (r = -0.417; P <0.001), which included women who were older than the rest.
The equations in the present study were derived and validated in a Caucasian population
only. Subjects were free from diseases that may have greatly affected their standing
height or LLL, but some did have difficulty in holding their arm horizontal for the AS
measurement. When applying LLL to estimate height, increased errors may occur in
those who have deformed lower legs, or subjects of other races, whose limb/height
proportion may be very different.
The derived equations based on LLL alone (Equations la & lb) may be more practical
for height estimation, since they showed comparable prediction errors to equations based
on LLL with age adjustment (Equations 2a & 2b) when applied to the validation
sample (Table 3.2.5).
There are various clinical situations where it is not possible to measure height or
compute BMI directly. Various limb lengths have been used to predict height (Table
3.2.6). Bassey (1986) found a conelation coefficient of 0.75 (r^= 56%) between height
and demi-arm span in adult men and women. Higher prediction of height by knee height
was observed by Chumlea et al (1985) in elderly men (r^ = 67%) and women (r^ = 56%),
and increased when age was added to the equation (r^ =65% ) in women, but not men.
The age coiTection probably compensates for vertebral degeneration particularly in older
women. In oui* determination study, entering age into the equations that were based on
LLL significantly increased height prediction by 2% in men (r = -2.7; P < 0.01) and 4%
in women (/ = -3.5; P <0.001).
Lower leg length and AS were highly reproducible in our study with CV less than 1%.
Chumlea et al (1985) found knee height measurement in the elderly was more
79

reproducible between obseiwers when lying recumhent (CV 0.52%) than sitting (CV
1.26%). With increasing age in women knee height was shorter by 0.06 cm per year in
their study, probably because their measurement included a small, variable, amount of
quadriceps muscle. Some of the prediction errors in the present study may have come
from the diurnal variations of height and weight.
In a cross-sectional study, Dequeker et al (1969) used AS to detect differences in supine
hody length of women aged between 30 and 94 years, observed that AS was relatively
constant tlnoughout all age groups, but their lying body length and length/AS ratio were
lower in older women. Rouhenoff and Wilson (1993) showed knee height to he a better
index than height for detecting changes in lean body mass with age. However they
observed height was significantly lower in both older men and older women than
younger subjects. Genant et al (1982) observed a lower vertebral bone density in those
above the fifth decade or older. Since these studies were cross sectional, the effects of
age or secular trend on height and limb length could not he deduced. However, some of
the variance, particularly women may relate to spinal shortening with age in the present
study. It is interesting that, within the women we studied, the ratio of measured
height/LLL coiTelated negatively {r = -0.30; P <0.05) with age. If an arbitrary cut-off
above age 45 years is taken in women, then there is a stronger negative correlation {r = -
0.45, P <0.01) between height/LLL ratio and age. A more detailed longitudinal study of
height/LLL in pre- and post-menopausal women would be of interest.
CONCLUSIONSLower leg length measured to the patella is a valuable index for estimating body
composition when height measurement is not available, and it gives better estimates than
arm span.
80

Table 3.2.1. Personal data of 78 men and 82 women in the determination study, and 53
men and 121 women in the validation study.
Mean (SD)
Determination sample Validation sample
Men
{n = 78)
Women
{n = 82)
Men
(M = 53)
Women
{n = 121)
Age (year's) 43.9 (14.4) 43.1 (13.3) 44.1 (13.2) 46.5 (14.6)
Range 16.8-66.6 22.3-70.7 17.9-66.6 17.6-81.8
Height (cm) 175.7 (5.8) 161.8(6.2) 175.7 (7.4) 159.8(6.6)
Range 156.0-188.9 141.0-178.0 155.2-190.0 142.5-180.0
Weight (kg) 79.4(15.7) 67.0(12.1) 77.3 (11.2) 61.0 (9.7)
Range 58.8-136.5 46.1-97.3 55.8-101.1 41.0-90.0
Body mass index (kg/m^) 25.9 (4.6) 25.8 (4.9) 25.1 (3.5) 24.0 (4.0)
Range 18.9-41.2 16.6-44.0 19.4-36.7 15.5-39.2
Lower leg length (cm) 53.6 (2.6) 49.4 (3.1) 54.2 (2.7) 48.2 (2.7)
Range 45.8-59.6 40.4-57.6 46.8-58.8 41.2-57.8
Arm span (cm) 176.5 (7.0) 160.2 (7.9) 171.4(10.6) 157.8 (9.4)*
Range 160.0-192.5 139.8-178.0 151.8-196.2 133.5-179.1
Body fat % (% of weight) 22.3 (8.9) 33.8(8.7)
Range 5.2-43.7 16.5-51.7
{n - 63) (% = 75)
*65 women in the validation study did not have arm span measured.
81

Table 3.2.2. Equations to predict height derived from 78 men and 82 women in the
determination study.
From lower leg length (LLL) in cm:
Equation la Men: Height = (2.31 x LLL) + 51.1
Equation lb Women: Height = (1.84 x LLL) + 70.2
From lower leg length (LLL) in cm and age in years:
Equation 2a Men: Height = (2.30 x LLL) - (0.063 x Age) + 54.9
Equation 2b Women: Height = (1.91 x LLL) - (0.098 x Age) + 71.3
From aim span between finger tips in cm:
Equation 3a Men: Height = (0.762 x Arm span) + 40.7
Equation 3b Women: Height = (0.693 x Arm span) + 50.3
95% confidence intervals of regression coefficients of independent variables and
constants, and explained variance (r^) and standard error of the estimate to predict %
body fat in equations 1, 2 and 3 to predict height.
Sex 95% Cl of coefficient and constant
Independent variable Constant r^ (SEE)
LLL
M Equation la 2.04, 2.58 36.6, 65.7 79 (3.2)
F Equation lb 1.59,2.09
LLL Age
73 (3.4)
M Equation 2a 2.03, 2.56 -0.110, -0.017 40.7, 69.1 81 (2.9)
F Equation 2b 1.67, 2.14
AS
-0.154, -0.043 59.7, 83.0 76 (3.2)
M Equation 3a 0.632, 0.891 17.8, 63.5 64 (4.0)
F Equation 3b 0.587, 0.798 33.4, 67.2 68 (3.7)
All coefficients and constant are significant, P <0.05; LLL = lower leg length; AS = armspan; M = male;
F = female.
82

Table 3.2.3. Equations to predict BMI derived from 78 men and 82 women in the
determination study.
From weight/lower leg length (Wt/LLL) in kg/cm:
Equation 4a Men: BMI = (17.3 x Wt/LLL) + 0.24
Equation 4b Women: BMI = (20.0 x Wt/LLL) - 1.35
From weight/arm span between finger tips (Wt/AS^) in kg/m^:
Equation 5a Men: BMI = (0.936 x Wt/AS^) + 1.99
Equation 5b Women: BMI = (0.989 x Wt/AS^) + 0.04
95% confidence intervals of regression coefficients of independent variables and
constants, and explained variance (r^) and standard error of the estimate to predict %
body fat in equations in equations 4 and 5 to predict body mass index.
Sex 95% Cl of coefficient and constant r (SEE)
Independent variable Constant
Wt/LLL
M Equation 4a 16.4, 18.3 -1.16,1.64"' 95 (1.1)
F Equation 4b 19.2,21.3 -2.81,0.11"' 94(1.1)
W t/A^
M Equation 5a 0.878, 0.994 0.49, 3.49 93(1.2)
F Equation 5b 0.923, 1.055 -1.72, 1.78"' 91 (1.5)
All coefficients and constant are significant, P <0.05 except ns = not significant; LLL = lower leg length;
AS = armspan; M = male; F = female.
83

Table 3.2.4. Equations to predict % body fat derived from 63 men and 75 women in the
determination study.
From weight/lower leg length (Wt/LLL) in kg/cm and age in years:
Equation 6a Men: % Body fat = (24.2 x Wt/LLL) + (0.256 x Age) -22.6
Equation 6b Women: % Body fat = (21.9 x Wt/LLL) + (0.321 x Age) - 8.1
From weight/arm span between finger tips (Wt/AS^) in kg/nE and age in years:
Equation 7a Men: % Body fat = (1.27 x Wt/AS^) + (0.215 x Age) - 17.8
Equation 7b Women: % Body fat = (1.13 x Wt/AS^) + (0.312 x Age) - 7.4
From body mass index (weight/height^) in kg/m^ and age in years:
Equation 8a Men: % Body fat = (1.33 x BMI) + (0.236 x Age) - 20.2
Equation 8b Women: % Body fat = (1.20 x BMI) + (0.287 x Age) - 7.8
95% confidence intervals of regression coefficients of independent variables and
constants, and explained variance (r^) and standard error of the estimate to predict %
body fat in equations 6, 7 and 8.
Sex 95% Cl of coefficient and constant (SEE)
Independent variable Constant
Wt/LLL
M Equation 6a 18.4,30.0 0.160, 0.352 -30.5, -14.7 68 (5.0)
F Equation 6b 17.2, 26.6
Wt/AS^
0.207, 0.371 -15.7, -3.8 72 (4.6)
M Equation 7a 0.97, 1.57 0.118, 0.312 -24.6,-11.0 69 (4.9)
F Equation 7b 0.88, 1.38
BMI
0.227, 0.397 -13.4, -1.4 72 (4.6)
M Equation 8a 1.01, 1.65 0.137,0.335 -27.6, -12.8 67 (5.0)
F Equation 8b 0.97, 1.43 0.156, 0.316 -13.2, -2.4 75 (4.4)
All coefficients and constant are significant, P <0.05; Wt = body weight; LLL = lower leg length; AS =
armspan; BMI = body mass index; M = male; F = female.
84

Table 3.2.5. Mean errors and 95% confidence interval of height and BMI predictions
from equations (Tables 3.2.2 & 3.2.3) based on lower leg length and arm span, adjusted
for age where appropriate, applied to the validation sample of 53 men and 121 women.
Dependent vaiiable
Height (cm) Mean error 95% Cl BMI (kg/m ) Mean error 95% Cl
Men Equation la 0.7 -5.0, 6.4 Equation 4a -0.2 -2.2, 1.9
Women Equation lb -1.0 -6.6, 4.7 Equation 4b 0.1 -1.8, 1.9
Men Equation 2a 1.1 -4.5, 6.8 Equation 5a 1.7 -2.2, 5.5
Women Equation 2b -1.1 -6.3, 4.2 Equation 5b 1.1 -3.2, 5.4
Men Equation 3a -4.4 -15.2, 6.5
Women Equation 3b -1.8 -10.8, 7.1
BMI = body mass index.
85

Table 3.2.6. Selected studies reporting accuracy and errors of height prediction ftom
regression equations based on limb lengths in Caucasian men and women.
Reference Sex n Age
(years)
Predictor Height (dependent
variable)
r SEE
(%) (cm)
Han and Lean M 78 17-67 LLL 79 3.2
Han and Lean F 82 22-71 LLL 72 3.4
Chumlea a/ (1985) M 106 60-90 Knee Fit 67 3.8
Chumlea et al (1985) F 130 60-90 Knee Ht 67 3.8
Han and Lean
Han and Lean
Chumlea a/ (1985)
Chumlea et al (1985)
M 78 17-67 LLL+Age 81 2.9
F 82 22-71 LLL+Age 76 3.2
M 106 60-90 Knee Ht+Age 56 4.0
F 130 60-90 Knee Ht+Age 65 3.5
Han and Lean
Han and Lean
Bassey (1986)
Bassey (1986)
M 78 17-67 Arm span 64
F 82 22-71 Arm span 68
M 63 35 (SD 9.7) Demi-arm span 56
F 62 34(SD 9.1) Demi-arm span 55
4.0
3.7
4.2
3.3
M = male; F = female; LLL = lower leg length; Ht = height.
86

Lower IcK len g th
. \k__
Figure 3.2.1. Methods o f measuring lower leg length (see text for details).
87

JCD)
IS -10■a Men
155 160 165 170 175 180 185 190Mean of predicted and measured height (cm)
Women
14 16 18 20 22 24 26 28 30 32 34 36 38 40
Mean of predicted and measured BMI (kg/m^)
Figure 3.2.2. Plot of errors (predicted height - measured height) of height prediction by
regression equations (Equation la and lb) based on lower leg length against mean of
predicted height and measured height in 53 men (a) and 121 women (b).

e10.ic
.Q)(Dsz
Men
15 20 25 30 35 40 45 50 55 60 65 70Age (years)
15Eo-4—< 10.O)(D_C 5TJP=3 0.COCDE1 -5
“O0)Ü -10.■aPCL -15
• •• c ,
Womenr-i-rnm-T" rr~r > -
15 20 25 30 35 40 45 50 55 60 65 70Age (years)
Figure 3.2.3. Plot of errors (predicted height - measured height) of height prediction by
regression equations (Equation la and lb) based on lower leg length against age in 53
men (a) and 121 women (b).
89

• •
-4."O
Men-10
18 20 22 24 26 28 30 32 34 36 38
Mean of predicted and measured BMI (kg/m^)
iCO•O23
sE
ID
10_
Women
14 16 18 20 22 24 26 28 30 32 34 36 38 40
Mean of predicted and measured BMI (kg/m^)
Figure 3.2.4. Plot of errors (predicted BMI - measured BMI) of BMI prediction by
regression equations (Equation 4a and 4b) based on lower leg length against mean of
predicted height and measured height in 53 men (a) and 121 women (b).
90

— 3.3 —
THE INFLUENCE OF BODY COMPARTMENTS ON
BIOELECTRICAL IMPEDANCE ANALYSIS AND DENSITOMETRY
This section has been peer reviewed and has been published as
Han TS Carter R, Gurrall JEP, Lean MEJ, The influence of fat free mass on
prediction of body composition by bioelectrical impedance analysis and by
densitometry. European Journal of Clinical Nutrition 1996; 50:542-48.
91

ABSTRACT
Objective: To examine the effect of varying size of fat free mass (FFM) on the precision
and bias of body composition prediction by bioelectrical impedance analysis (BIA) from
four equations of Segal et al (BIA-Segal), Gray et al (BIA-Gray), Lukaski et al (BIA-
Lukaski) and those from a manufacturer (BIA-EZC), by body mass index (BMI), and by
skinfold methods with reference to estimation by densitometry.
Subjects: 73 men and 77 women aged 17-71 years, were measured for height, weight,
FFM, bio electrical impedance, and age.
Results: BIA-Segal gave the highest precision (men: = 83%, women: = 75%) and
the least bias (men: slope = 0.88; women: slope = 0.81) of all BIA methods. There were
poorer precision (r^ <50%) and more bias (slope <0.70) by BIA-Lukaski and BIA-EZC
in both sexes, which were comparable to the simpler BMI method. The skinfold method
gave - 83% and slope = 0.84 in men, and r" = 61% and slope = 0.86 in women. Bland
and Altman analysis showed BIA-Segal gave prediction of FFM within ±6 kg of 95%
confidence interval limit of agreement of that estimated by UWW in most subjects.
Other BIA methods presented unacceptably large underestimates of up to 15-17 kg in
FFM.
Conclusions: The BIA-Segal provide the best predictions of the methods tested, but
using BMI- or waist-specific equations may be more practical than the original BIA-
Segal method, which requires the subjects’ % body fat to be laiown in order to apply the
correct equation. Other BIA methods are affected by large FFM, and not better than
anthropometric methods in predicting FFM.
Keywords: fat free mass size, bioelectrical impedance, anthropometry, densitometry.
92

INTRODUCTIONBody composition can be indirectly estimated by a variety of methods which take
advantage of different physical, physiological and biochemical characteristics of body
tissues. Multi-compartment models are being developed in attempts to reduce errors
resulting from assumptions inherent in conventional two compartment models of body
composition prediction, but estimation of each new compartment introduces new
sources of error, and traditional two-compartment models such as underwater weighing
(UWW) and total body potassium counting are still widely used as reference standards.
Most simple anthropometric methods are derived from UWW data, such as equations
from body mass index (weight/height^) (Deurenberg et al, 1991), waist circumference
(C hapter 3.1; Lean et al, 1996) skinfold thicknesses (Diunin and Womersley, 1974),
and from bioelectrical impedance analysis (BIA) (Segal et al, 1988; Gray et al, 1989,
Lukaski et al, 1986).
It not clear how well these methods predict body composition in subjects of different
size of fat free mass (FFM). The present study, was part of larger body composition
studies which have generated and validated new equations to predict body composition
from anthi'opometric measurements (C hapter 3.1; Lean et al, 1996). Here we have
tested the influence of FFM on the precision and bias of FFM prediction and limits of
agreement by BIA, calculated from thi'ee published somces, Segal et al (1988), Gray et
al (1989), Lukaski et al (1986), and from a manufacturer (EZ Comp 1500), and the two
antliropometric methods using BMI (Deurenberg et al, 1991) and skinfolds thicknesses
(Durnin and Womersley, 1974) in 150 adult men and women aged 17 to 71 years, who
had a wide range of body weight.
METHODS
SubjectsAfter obtaining ethical approval (Glasgow Royal Infirmary's Ethical Committee), 73
healthy Caucasian men and 77 women aged between 17-71 years were recruited by local
advertisement. Body composition was assessed in the morning after an overnight fast.
93

All 150 subjects had UWW, BIA and antlu'opometric measurements made for
comparison in the UWW study.
AnthropometryBody weight in light clothes was measured to the nearest 100 g, by electronic scales
(SECA, Germany), calibrated with 8x10 kg standard weights before use. Height was
measured by fixed stadiometer (Castlemead, Herts, UK) to the nearest mm with the
Frankfliit plane horizontal. Skinfold thicknesses were measured at biceps, triceps,
sub scapular and supra-iliac by calipers (Holtain, Crymych, UK) to the nearest 0.2 mm
(Chapter 3.1; Lean et al, 1996; WHO, 1989). Percent body fat and thus FFM, was
estimated from equations based on BMI (Deurenberg et al, 1991) and skinfold
thicknesses (Durnin and Womersley, 1974) both of which corrected for age and sex.
Underwater weighing
Body density was taken as the mean of 4 measurements in each subject by UWW, with
simultaneous 3-breath nitrogen dilution technique to correct for residual lung volume.
The mean body fat was calculated from body density (Siri, 1961). Details for measuring
body density are described elsewhere (Chapter 3.1; Lean et al, 1996).
Bioelectrical impedance analysis
Measurements were made with a tetrapolar BIA machine (EZ Comp 1500, Birmingham,
UK) following the manufacturer's instructions. Subjects rested supine on a couch for 15-
20 minutes in an enclosed thermoneutral (24-26 °C) room, without touching any
metallic object. All jewellery was removed. The skin at the sensor pad sites was
cleansed with alcohol to remove dead skin and oil, and dried by clean cloth. Two sensor
pads were placed on the back of the right hand (on adjacent to the third metacarpal head,
and the other on the arm just behind the wrist), and two on the right foot (one between
the first and second metatarsals, and the other at the level of the malleoli). Arms were
positioned at the sides without touching the trunk with the palm flat and prone. Legs
were kept straight and apart. Subjects’ weight, height, age and sex were entered into the
94

BIA machine for analysis with the measured bioelectrical impedance to calculate body
composition from the manufacturer’s equations (BIA-EZC). Measurements were
repeated tluee times replacing the sensor pads on each occasion. The impedance (Ohms)
from the BIA machine was recorded for FFM and body fat determination using the
published equations of Segal et al (1988) (BIA-Segal). They provide specific equations
for men above and below 20 % body fat and for women above and below 30 % body fat.
The data were also used in the equations of Gray et al (1989) (BIA-Gray) who give one
general equation for men and two fatness-specific equations for women (above and
below 48 % body fat). Finally, the equations of Lukaski et al (1986) (BIA-Lukaski)
which aie only sex-specific, were applied.
Analysis
FFM estimations by BIA methods from four different somces (BIA-Segal, BIA-Gray,
BIA-Lukaski, and BIA-EZC), by BMI, and by skinfold methods were compared with
FFM measured by UWW method as reference standard. There were two issues in the
comparison (Dunn, 1989). The first was estimation precision, or how well a
measurement on the reference method predicted a value on the test method, estimated by
the statistic which measured the percentage of the variation in the test method
explained by the variation in the reference method. The limits of this statistics were
100% if the precision was perfect and 0% if there was no relationship between test and
reference. The second was the bias of the test method relative to the reference method,
or the degree to which there was not a one to one correspondence between the reference
and the test scales. In this work we estimated the bias by the slope of a straight line
regression of the test method on the reference method. If there was no bias or the bias
was constant, the line would have a slope of 1. None of the methods under test showed
constant bias and the non-constant bias was therefore proportional to the increase or
decrease in the slope from 1.
The Bland and Altman analysis (1986) was performed to determine the magnitude of the
mean error of FFM prediction of the test methods, calculated as the FFM predicted by
95

each test method minus the mean FFM estimated by each test method and the reference
UWW method. The 95% confidence intervals for the limit of bias and limit of
agreement of the mean error of FFM prediction were calculated as ±2 SE and ±2 SD of
the mean error, respectively.
RESULTS
Men and women had similar means and ranges of age and BMI, but on average women
had a larger proportion of fat than men (Table 3.3.1), Table 3.3.2 summarises the
precision and bias estimates of FFM for each of the test methods relative to underwater
weighing and illustrates the relative effect of the bias at high and low values of FFM.
The fatness-specific equations of BIA-Segal gave the highest precision both in men (r^ =
83%) and in women (r^ = 75%), and the least bias (men: slope = 0.88; women: slope =
0.81) of all BIA methods. BIA-Lukaski and BIA-EZC both gave poor precision (r^
<50%) and high bias (slope <0.70) for both sexes, and were thus no better than the
simpler BMI method. BIA-Gray gave intermediate precision (men: = 62%; women:
= 66%) and bias (men: slope = 0.78; women: slope = 0.74).
The skinfold method gave precision - 83%) and bias (slope = 0.84) of FFM
prediction similar to the BIA-Segal in men, and poorer precision {r' = 61%), but slightly
less bias (slope = 0.86) than BIA-Segal in women (Table 3.3.2).
The effect of bias of FFM prediction at either large FFM (men: 80 kg, women: 55 kg) or
small FFM (men: 45 kg, women: 30 kg), was assessed from regression equations using
the reference UWW method to predict a value from each of the test methods. All
methods overestimated FFM of small subjects and underestimated that of large subjects.
The consequence of this is that the test methods compressed the range of FFM values
relative to the reference (UWW). The degree of bias from size of FFM was smallest by
BIA-Segal both in small subjects (men: +1.3; women: +3.1 kg FFM), and in large
subjects (men: -3.0, women: -1.7 kg FFM) of all BIA methods. The effect of bias of
96

FFM prediction by skinfold method was similai*, overestimating by +2.5 kg in small
men and +3.3 kg in small women, and miderestimating by -3.1 kg in large men and -0.3
kg in large women. The degree of bias from size of FFM in other methods, particularly
BIA-Lukaski and BIA-EZC were relatively large, overestimating up to 5 kg in small and
underestimating 10 kg of FFM in large subjects (Table 3.3.2).
Figures 3.3.1a-f show FFM predicted by selected test methods plotted against FFM
measured by UWW to demonstrate the precision and bias of selected test methods. If
there was no bias, the regression line would be identical to the line of equality. The
closer the dots to the line of equality, the higher the precision of FFM prediction by test
methods.
The Bland and Altman analysis (1986) was used to determine the mean prediction errors
and their 95% confidence intei*vals of the limit of bias (+2 SE of the mean error) and
limit of agreement (±2 SD of the mean error) in subgroups of subjects divided into
tertiles of FFM. All methods except for the BIA-Segal and skinfold methods had
significant bias in underestimating FFM of largest subjects (third tertile of FFM in men)
(Table 3.3.3; Figure 3.3.2), and all but BIA-Gray method, had significant bias in
overestimating FFM of smallest subjects (first tertile of FFM in women) (Table 3.3.4;
Figure 3.3.2). The limits of agreement between each predicted method and reference
method of UWW showed BIA-Segal equation gave prediction mostly within (95%
confidence interval) 6 kg of FFM, except a slightly higher underestimation of FFM in
largest men (-8.5 kg). BMI and skinfold methods gave similai' limits of agreement in
women. The worst prediction of FFM by other BIA equations appeared to be affected by
large FFM. BIA- Gray miderestimated by 15 kg FFM, and BIA-Lukaski and BIA-EZC
by more than 17 kg of FFM in largest men.
The major disadvantage of the equations of Segal et al (1988), which was recognised by
the authors, is that body fat of test subjects above or below 20% (men), 30% (women)
97

must be known before hand so that the appropriate equations can be applied. Since %
body fat estimated by UWW is highly (P <0.0001) correlated with waist circumference
(men: r = 0.83; women: r = 0.78) or BMI (men: r = 0.75; women: r ~ 0.81), it is
possible to apply their equations on the basis of waist or BMI. Regression analysis
showed waist circumference cut-offs at 87 cm for men and 75 cm for women or BMI 23
kg/m^ for men and 22 kg/m^ for women were equivalent to body fat 20% in men and
30% in women (Han and Lean, unpublished observations).
DISCUSSION
This study tested the influence of vaiying size of FFM on the precision and bias of fat
free mass prediction, using underwater weighing as the reference method, by four
different equations of BIA and two anthi’opometric methods in healthy subjects. These
methods are in general use for estimating body composition based on to the two
compartment approach.
Although BIA methods investigated in this study used the same physical measurements,
BIA-Segal and BIA-Gray equations included height and bioelectrical impedance as
separ ate variables, whereas BIA-Lukaski uses the ratio of height/bioelectrical impedance
(Z) as a single variable. The BIA-Segal equations were derived from a large pooled
sample of four different laboratories containing 1069 men and 498 women, with fatness-
specific equations to reduce systematic errors. The BIA-Gray equations, based on Segal
et a /’s (1988) fatness-specific equations for very obese women (>48% of body weight as
fat), did not improve prediction or bias on the BIA-Segal method.
BIA methods use equations containing data identical to the BMI method {i.e. weight,
height, age and sex) but with the extra impedance measurement, which requires a
standardised protocol and the availability of the BIA machine. In terms of precision,
bias, and limits of agreements of FFM prediction with reference to UWW, the simple
BMI method was as good as the two methods of BIA-Lukaski and BIA-EZC.
98

It is well known that body composition prediction is influenced by ageing (Demenberg
et al, 1989; Reilly et al, 1994) and by body fatness (Chapter 3.1; Lean et al, 1996) and
fat distribution (Han and Lean, 1994). Hydration will affect body density by UWW and
BIA methods. Increasing fatness is accompanied by increased intra-abdominal fat mass
(Han et al, 1995a), and the errors of body composition prediction from subcutaneous
skinfolds will be exaggerated in those with increased intra-abdominal fat mass. The
major confounding influence on the BMI method is muscularity. Variation in
muscularity is most marked in men, so this may explain the particularly poor precision
of FFM prediction in men by this method.
CONCLUSIONS
Of the four BIA formulae compared, body composition prediction by bioelectrical
impedance analysis using different equations according to the fat content, developed by
Segal et al (1988), had the best precision and least bias, and closest agreement of FFM
prediction with reference to the UWW method. The other methods were affected by
varying size of FFM and no better than the simple BMI method (Deurenberg et al,
1991). Although the fatness-specific BIA-Segal equation (Segal et al, 1988) was
comparable to the skinfold method (Durnin and Womersley, 1974), it is not practical as
subjects’ percentage body fat must be known before hand for applying appropriate
equations. Using waist- or BMI-specifrc equations may be more practical.
99

Table 3.3.1. Characteristics of subjects.
Men {n = 73) Women {n = 77)
Mean SD Range Mean SD Range
Age (years) 43.7 14.3 16.8-66.6 42.9 13.4 22.3-70.7
Weight (kg) 79.0 14.5 58.8-122.1 66.7 12.4 46.1-97.3
Height (m) 1.75 0.06 1.61-1.88 1.62 0.06 143-1.78
Body mass index (kg/m^) 25.7 4.4 18.9-41.2 25.6 4.8 18.3-37.5
Fat free mass (kg)* 59.6 7.6 46.3-82.8 42.6 4.9 31.6-55.7
Body fat (% of body weight)* 23.6 8.5 5.2-43.7 34.8 8.9 16.5-51.7
* Estimated by underwater weighing (% body weight).
100

Table 3.3.2. The precision of estimation (as measur ed by R ) and bias (as measured by
regression slope) of fat free mass estimated by different test methods: bioelectrical
impedance, body mass index and skinfold, calibrated against fat free mass estimated by
underwater weighing as a reference method. Estimates of fat free mass on the test
methods for fat free mass by underwater weighing of 45 and 80 kg for men and 30 and
55 kg for women are given to illustrate the effect of bias at both ends of the range of
subjects in the study.
Method
Men (n = 73) Women {n = 77)
R^
(%)
Slope
(SE)
45 kg
(SE)
80 kg
(SE)
R^
(%)
Slope
(SE)
30 kg
(SE)
55 kg
(SE)
BIA-Segal 83 0.88 46.3 77.0 75 0.81 33.1 53.3
(0.046) (0.75) (1.00) (0.053) (0.72) (0.71)
BIA-Gray 62 0.78 45.8 72.9 66 0.74 33.2 51.8
(0.071) (1.18) (1.57) (0.062) (0.83) (0.82)
BIA-Lukaski 48 0.68 46.7 70.5 50 0.69 34.7 52.0
(0.084) (1.38) (1.84) (0.079) (1.07) (1.05)
BIA-EZC 46 0.69 46.2 70.4 47 0.68 35.0 51.9
(0.087) (1.43) (1.90) (0.082) (1.10) (1.08)
BMI 70 0.65 49.2 71.9 58 0.68 33.9 50.8
(0.050) (0.82) (1.09) (0.066) (0.89) (0.87)
Skinfold 83 0.84 47.5 76.9 61 0.86 33.3 54.7
(0.045) (0.74) (0.99) (0.079) (1.07) (1.05)
BIA = bioelectrical analysis; BMI = body mass index.
101

Table 3.2.3. Mean errors of FFM prediction and limits of bias and limits of agreement
by different methods for subjects in each tertile of mean FFM in men.
95% confidence interval limits
Mean errorf Bias;]: Agreement §
First tertile o f FFM {n = 24)%
BIA-Segal -0.3 -1.4, 0.7 -5.5, 4.8
BIA-Gray -2.0 -4.0, 0.0 -11.8,7.9
BIA-Lukaski -3.0* -4.8, -1.2 -11.8,5.8
BIA-EZC -3.8* -5.3, -2.3 -11.3,3.7
BMI -0.3 -1.7, 1.1 -7.2, 6.6
Skinfold 0.8 -0.2, 1.8 -4.1, 5.7
Second tertile o f FFM (n = 25)%
BIA-Segal -0.3 -1.4, 0.9 -5.9, 5.4
BIA-Gray -2.4* -4.0, -0.8 -10.3,5.6
BIA-Lukaski -2.4* -4.9, -0.0 -14.7, 9.8
BIA-EZC -2.8* -5.6, -0.0 -16.9, 11.2
BMI 0.6 -1.0, 2.1 -6.9, 8.0
Skinfold 0.0 -1.3, 1.4 -6.7, 6.8
Third tertile o f FFM {n = 24)%
BIA-Segal -0.9 -2.5, 0.7 -8.5, 6.7
BIA-Gray -3.1* -5.5, -0.7 -14.7, 8.5
BIA-Lukaski -3.5* -6.4, -0.6 -17.7, 10.8
BIA-EZC -3.3* -6.2, -0.5 -17.2, 10.6
BMI -3.1* -5.0, -1.3 -12.0, 5.8
Skinfold -0.3 -1.8, 1.1 -7.3, 6.6
FFM = fat free mass; BMI ^ body mass index; BIA == bioelectrical impedance analysis. Significance
level: <0.05; fmean error = FFM by each test method minus FFM by UWW; $ limit o f bias = ±2 SE o f
the mean errors; § limit o f agreement = ±2 SD o f the mean errors; ^mean FFM = (FFM by each test
method + FFM by UWW)/2.
102

Table 3.2.4. Mean errors of FFM prediction and limits of bias and limits of agreement
by different methods for subjects in each tertile of mean FFM in women.
95% confidence interval limits
Mean errorf Biasf Agreement§
First tertile o f FFM {n = 26)%
BIA-Segal 1.1* 0.4, 1.8 -2.4, 4.6
BIA-Gray 0.7 -0.2, 1.5 -3.7, 5.0
BIA-Lukaski 1.0* 0.1, 2.0 -3.7, 5.7
BIA-EZC 1.0* 0.0, 2.3 -4.0, 6.0
BMI 0.8* 0.0, 1.6 -3.3, 4.9
Skinfold 1.4* 0.3, 2.5 -4.2, 7.0
Second tertile o f FFM (n — 25)%
BIA-Segal 0.9 -0.2, 2.0 -4.6, 6.4
BIA-Gray 0.1 -1.2, 1.4 “6.3, 6.6
BIA-Lukaski 1.1 -0.4, 2.1 -6.5, 8.6
BIA-EZC 1.3 -0.3, 2.9 -6.8, 9.4
BMI -0.4 -1.9, 1.1 -7.9, 7.2
Skinfold 1.1 -0.2, 2.5 -5.7, 7.9
Third tertile o f FFM (n = 26)%
BIA-Segal 0.1 1.0, 1.1 -5.2, 5.3
BIA-Gray -0.8 -2.0, 0.4 -6.9, 5.3
BIA-Lukaski 0.4 -1.5, 2.2 -8.8, 9.5
BIA-EZC 0.4 -1.4, 2.2 -8.7, 9.5
BMI -1.0 -2.3, 0.3 -6.7, 5.7
Skinfold 1.9* 0.3, 3.5 -6.1, 9.9
FFM = fat free mass; BMI = body mass index; BIA = bio electrical impedance analysis. Significance
level: *P <0.05; fmean error = FFM by each test method minus FFM by UWW; f limit o f bias = ±2 SE o f
the mean errors; §limit o f agreement = ±2 SD of the mean errors; %mean FFM = (FFM by each test
method + FFM by UWW)/2.
103

a■a
9085807570656055504540
R2 = 83%; Slope = 0.1
Men
40 45 50 55 60 65 70 75 80 85 90
60
R2 = 75%; Slope = 0 .8 155
50
45
40
35 W omen30
30 35 40 45 50 55 GO
FFM cstimnted by densitometry FFM estimated by densitometry
9085807570656055504540
R^ = 48%; Slope = 0.68
Men
40 45 50 55 60 65 70 75 80 85 90
60
R^ = 50%; Slope = 0.6955
50
45
40
35 W omen
30 35 40 45 50 55 60
FFM estimated by densitometry FFM estimated by densitometry
9085807570656055504540
R2 = 83%; Slope = 0.84
Men
40 45 50 55 60 65 70 75 80 85 90
60
R2 = 81%; Slope = 0.8655
50
45
40
35 W omen30
30 35 40 45 50 6055
FFM estimated by densitometry FFM estimated by densitometry
Figure 3.3.1. Plots of fat free mass (FFM) predieted by bioelectrical impedance analysis
(BIA) using equations from Segal et al (a and b), Lukaski et al (c and ), skinfold method
(e and f) against FFM estimated by densitometry, showing the precision (R^) and bias
(slope) of FFM prediction in 73 men and 77 women. Solid line indicates line of
regression, and dashed line indicates line of equality.
104

•§i^ ga I
Slope = -0 .0 4 3 ;? = 0.391 a
- ______ -
! : * •
Tertiles: 1st [ 2nd ] 3rd Men
40 45 50 55 60 65 70 75
Mean FFM (kg) (BIA-Segal plus UWW)/2
85 90
Slope = -0.077; P = 0.211
Tertiles: 1st , 2nd , 3rd W omen
Mean FFM (kg) (BIA-Segal plus UWW)/2
y "
I f
Slope = -0 .0 1 7 ; P = 0.836
1 • *]•• I 7 ,*
Tertiles: 1st 1 2nd 1 3rd Men
40 45 50 55 60 65 70 75 80 85 90
M ean FFM (kg)(BIA-Gray plus UWW)/2
Slope = - 0 .0 9 6 ; ? = 0.199
• a •WJ
Tertiles: 1st , 2nd , 3rd
40 50
Menu FFM (kg) (BIA-Gray plus UWW)/2
W omen
55 60
IS I II
l l
Slope = -0.017; ? = 0.865 eI* ,
1 ; • *^ V
—• -----------1 • • • *• •
* ■1 *# /
Tertiles: 1st |2n|;[J 3rd . Men
40 45 50 55 60 65 70 75
Mean FFM (kg) (BIA-Lukaski plus UWW)/2
85 90
"bSo2015
.5 g10
l i50
O u -10-15-20
Slope = -0.035; P = 0,714
Tertiles: 1st 2nd 3rd
40 45 50
W omen
55 60
Mean FFM (kg) (BIA-Lukaski plus UWW)/2
Figure 3.3.2. Plots of errors of FFM prediction (FFM predicted by test method minus
FFM estimated by reference UWW method) against mean FFM (test method and the
reference UWW method), for the test methods using equations from; a and b (Segal et
al, 1988); c and d (Gray et al, 1989); e and f (Lukaski et al, 1986). Vertical dashed lines
separ ate tertiles of mean FFM.
105

ISlope = -0 .0 1 0 ;/’ = 0.920 g
• iN *1 • •
_____ . its'LV: - ________
* 1 . fVTertiles: 1st i 2ndi 3rd ,
1 *1 • Men
40 45 50 55 60 65 70 75 80 85 90
Mean FFM (kg)(BIA-EZC plus UW W )/2
liSlope = -0.026; P = 0.792
2 ' . ' I
Tertiles: 1st 2nd 3rd
40 45
W omen
Mean FFM (kg) (BIA-EZC plus UW W )/2
55 60
I2 0 ,
15
10
5
0
-5
-1 0 '
-15 '
-20
Slope = -0 .2 7 6 ; P <0.001
• I , I
1 1 •Tertiles: 1st 1 2nd 1 3rd Men
40 45 50 55 60 65 70 75 80 85 90
Mean FFM (kg)(BM l plus UW W )/2
iiSlope = -0 .1 3 9 ; P = 0.100
Tertiles: 1st i 2nd , 3rd
30 35 40 45 50
Mean FFM (kg) (BM l plus UWWV2
W omen
55 60
II2 0 .
15
10 5
0 .
-5 '
-10 . -15 -20 ,
Slope = -0 .0 8 3 ; /’ = 0.108
Men
40 45 50 55 60 65 70 75 80 85 90
Mean FFM (kg)(Skinfold plus UWWV2
I Slope = 0.103; f = 0.204
Tertiles: 1st 2nd I 3rd W omen
30 35 40 45 50 55 60
Mean FFM (kg) (Skinfold plus UWWy2
Figure 3.3.2. - continued. Plots of errors of FFM prediction (FFM predicted by test
method minus FFM estimated by reference UWW method) against mean FFM (test
method and the reference UWW method), for the test methods using equations from; g
and h (from a manufacturer); i and j, from BMl (Deurenberg et al, 1991); k and 1, from
skinfolds (Durnin and Womersley, 1974). Vertical dashed lines separate tertiles of mean
FFM.
106

CHAPTER FOUR
DEVELOPMENT OF SIMPLE
ANTHROPOMETRIC INDICES FOR HEALTH
PROMOTION
11 CONTENTS OF CHAPTER FOUR PAGES
4.1 Waist circumference as a measure for indicating need for 108
weight management: development of cut-offs for health
promotion
4.2 Waist circumference as a screening tool for cardiovascular 121
risk factors: evaluation of receiver operating characteristics
(ROC)
4.3 The influences of height and age on waist circumference as 143
an index of adiposity in adults
4.4 Predicting intra-abdominal fatness by magnetic resonance 162
imaging and computerised tomography from anthropometric
measures for health promotion: the influence of stature
4.5 Relationship between volumes and areas from single 182
transverse scans of intra-abdominal fat measured by
magnetic resonance imaging
107

4.1
WAIST CIRCUMFERENCE AS A MEASURE FOR INDICATING
NEED FOR WEIGHT MANAGEMENT: DEVELOPMENT OF CUT
OFFS FOR HEALTH PROMOTION
This section has been peer reviewed and has been published as
Lean MEJ, Han TS, Morrison CE. Waist circumference as a measure for
indicating need for weight management. British Medical Journal 1996; 311:158-
61.
Collaboration with WHO MONICA project.
108

ABSTRACT
Objective: To test the hypothesis that a single measurement, waist circumference, might
be used to identify people at health risk both from being overweight and from having a
central fat distribution.
Design: A community derived random sample of men and women and a second,
validation sample.
Setting'. North Glasgow.
Subjects'. 904 men and 1014 women (first sample); 86 men and 202 women validation
sample.
Main outcome measures: Waist circumference, body mass index, waist:hip ratio.
Results: Waist circumference >94 cm (37”) for men or >80 cm (31.5”) for women
identified individuals with high body mass index >25 kg/m^ and those with lower body
mass index but high waistihip ratio (>0.95 for men, >0.80 women) with a sensitivity of
>96%, and specificity >97,5%. Waist circumference >102 cm (40”) for men or >88 cm
(34.5”) for women identified subjects with body mass index >30 kg/m^ and those with
lower body mass index but high waistihip ratio with a sensitivity of >96% and
specificity >98%, with only about 2% of the sample being misclassified.
Conclusions: Waist circumference could be used in health promotion programmes to
identify individuals who should seek and be offered weight management. Men with
waist circumference >94 cm for men and women with waist circumference >80 cm
should gain no further weight; men with waist circumference >102 cm and women with
waist circumference >88 cm should reduce their weight.
Keywords: body mass index, waist circumference, waistihip ratio, weight loss, obesity,
risk factors.
109

INTRODUCTION
About half of all British adults have a body mass index (weight (kg)/height (m^)) of >25
kg/m^, almost 15% >30 kg/m^ and these proportions are rising (Gregory et al, 1990;
Bermett et al, 1995). Given the lack of success of the management of obesity and
increasing associated health costs (Secretary of State for Health, 1991; Scottish Office,
1992), greater emphasis on prevention is needed, particularly in young people, who
often have little contact with health services. Wliile many health professionals are now
familiar with the acceptable range for body mass index (20-25 kg/m^) (Beimett et al,
1995; Cardiovascular Review Group Committee on Medical Aspects of Food, 1994)
most members of the public cannot readily calculate their index to establish their own
risk or need for weight management. Charts developed by the Health Education
Authority (1991) are helpful, but are still not understood by many. Height must be
measured accurately as small errors in the denominator are exaggerated by squaring.
The major metabolic cardiovascular risk factors (high blood pressure, plasma lipids,
insulin resistance) all aggregate independently with both body mass index and waistihip
ratio (Bjorntorp, 1987; Seidell et al, 1989b) and improve with weight loss (Casimirri et
al, 1989; den Besten et al, 1988; Dennis et al, 1993; Kanaley et al, 1993; van Gaal,
1990). The circumference of the waist relates closely to body mass index and is also the
dominant measui'ement in the waistihip ratio, which reflects the proportion of body fat
located intra-abdominally, as opposed to subcutaneously (Bjorntorp, 1987), and waist
circumference is the best indicator of changes in intra-abdominal fat during weight loss
(van der Kooy et al, 1993).
We evaluated waist circumference as a simple predictor of health risk from being
overweight and through the central distribution of fat to indicate levels at which
individuals should take action.
110

METHODS
SubjectsDetermination study
We randomly recruited of 904 men and 1014 women, aged 25 to 74 years, fi'om the
general population of north Glasgow between January and August 1992, excluding only
those who were chair bound.
Validation study
We recruited separately 86 men and 202 women by advertising locally to test the
proposed Action Level (levels at which individuals may at risk from being overweight)
derived in the determination study.
AnthropometryAll measurements were made by trained observers with standard techniques (World
Health Organisation, 1989): weight by digital scales (Seca, Germany) to within lOOg,
without heavy clothing; height barefoot by portable stadiometer (Holtain, Crymych,
United Kingdom) to 0.5 cm; circumferences to within 1 rmn with plastic tapes calibrated
weekly, with waist mid-way between the lowest rib and iliac crest with the subject
standing at the end of gentle expiration, and hips at the greater trochanters. We used the
same methods determine and validate studies by different researchers.
Methods of analysisCombination with indices in the range height^'* to height^ did not improve the
correlations of waist circumference alone with body mass index ( r= 0.89; P <0.001 for
both sexes). According to the criteria of Kliosla and Lowe (1967), height was therefore
not used with waist circumference for further analyses.
We determined by cross tabulation between variables (Noruàis, 1993) two Action Level
for waist circumference for weight management to identify most subjects with body
mass index >25 kg/in^ (Action Level 1) and >30 kg/m^ (Action Level 2), while
111

including a minimum of subjects who had lower body mass index and low waistihip
ratio to maximise sensitivity and specificity (Hanson, 1988). High body mass index was
defined at two levels as >25 or >30 k%!m for both men and women (Health Education
Authority, 1991). On the basis of consensus from previous studies (Casimirri et al,
1989; Den Besten et al, 1988; Dennis et al, 1993; Kanaley et al, 1993; van Gaal, 1990),
high waistihip ratio was defined as >0.95 for men and >0.80 for women and low
waistihip ratio as below these cut-offs.
RESULTS
Determination Study
The mean age (range 25 to 74 years), body mass index, and hip circumference were
similar for men and for women (Table 4.1.1). However, men were heavier and taller and
had a larger waist circumference and waistihip ratio than women. In both sexes,
waistihip ratio correlated positively with body mass index (men, r = 0.63; womeni r =
0.39; both P <0.001) (Table 4.1.2). Waist circumference correlated weakly with height
in men (r = 0.19; P <0.05), but not women (r = 0.06, P = 0.06). On average, men with
waist circumference above ‘Action Level V were 2 cm taller than those below,
accounting for 0.7 cm difference in waist circumference, but Action Level for waist
circumference determined for four different height categories (not shown) did not differ.
Figure 4.1.1 shows distributions of the waist circumference related to body mass index
divided by the proposed Action Level. Table 4.1.3 show the numbers in different
categories of waist circumference, body mass index, waistihip ratio. ‘True positive’
subjects were those with high body mass index and those with lower body mass index
but high waistihip ratio; ‘true negative’ subjects were those with low body mass index
and those with high body mass index but low waistihip ratio. ‘False positive’ subjects
were those with waist circumference above the Action Level but with low body mass
index and waistihip ratio; false negative’ subjects were those with waist circumference
below the Action Level but with high body mss index and waistihip ratio. These
112

numbers were used to determine the sensitivity and specificity for waist circumference
as an indicator of need for weight management (Table 4,1.4).
False negative subjects, who would be missed by health education, targeted using waist
circumference, would represent under 1.5% of the population. 'False positive'
individuals (1.7% of the total population) would he included inappropriately by health
promotion directed at those with high waist circumference. Amongst false positives at
Action Level, men had body mass indices 23.2-24.8 kgim and waistihip ratios 0.91-
0.95, and women had body mass indices 23.0-24.9 kg/m^ and waistihip ratios 0.77-0.80.
Amongst false positives at Action Level 2, men had body mass indices 26.9-29.7 kg/m^
and waistihip ratios 0.88-0.94, and women had body mass indices 28.7-29.6 kglm and
waistihip ratios 0.79-0,80. Misclassified individuals were thus close to the levels at
which weight loss would be recommended, and hazards of health promotion hased on
waist circumference Action Levels would be minimal.
Validation study
The validation sample was younger than the determination sample, but had similar
ranges of antliropometric measurements(Table 4.1.1). The Action Levels of waist
circumference showed similarly high sensitivity (>94%) and specificity (>97%) for
identifying high risk individuals in need of weight management (Tables 4.1.3 & 4.1.4).
There was no significant relationship between waist circumference and height in either
men {r = 0.07; P = 0.54) or women {r = -0.13; P ~ 0.07).
DISCUSSIONThe influences of body mass index and waistihip ratio on metabolic and cardiovascular
disease are multiplicative (Lapidus et al, 1984; Larsson et al, 1984; Ohlson et al, 1985),
so weight loss should be urged for all those with high body mass index, and can also be
justified for those with lower body mass index but high waistihip ratio. Consensus
emerging from prospective studies suggests cut-offs of waistihip ratio 0.95 in men and
0.80 in women as figures above which health risk increases importantly. Metabolic risk
113

factors, particularly serum triglycerides and high density lipoprotein cholesterol improve
most from weight loss in men (Sonnichsen et al, 1992; Houmard et al, 1994; Wing et al,
1992) with waistihip ratio >0.95 and women (den Besten et al, 1988; Dermis et al, 1993;
Kanaley et al, 1993) with waistihip ratio >0.80 (Table 4.1.5). In the present study, 48%
of the women and a 33% of the men had waistihip ratios above these figures (Table
4.1.2); well over half had body mass indices above 25 kg lm . The interaction between
body mass index and waistihip ratio offers through waist circumference an opportunity
to target individuals at highest risk in order to maximise the benefits of interventions
(Davey Smith era/, 1993; Yudkin, 1993).
Many analyses have found strong positive correlations between waist circumference and
body mass index. This relationship alone allows only limited prediction of body mass
indexi in the present study, waist circmnference would misclassify about 4% men and
7% women in attempting to identify those with body mass index >25 kg/m^, or 10%
men and 11% women at body mass index >30 kg/m^. Health promotion targeted by
waist circumference at those with body mass index >25 kg/m^ would miss about 21% of
the total at risk population (>25 kg/m^), and about 10% of those identified would be
targeted inappropriately. However, most of those with high waist circumference but
body mass index below these conventional cut-offs have high waistihip ratio, which still
justifies weight management. Most of those with higher hody mass index but waist
circumference below the Action Level have low waistihip ratio, which would indicate a
lower health risk, and less benefit from slimming. The Action Level for waist
circumference derived here, based on both body mass index and waistihip ratio, are
robust in that they misclassified only 1.5% of the overweight men and women.
The simplicity of measurement and its relation to hoth body weight and fat distribution
are major advantages for waist circumference over body mass index and waistihip ratio.
Self measurement and reporting of waist circumference has been reported to be
acceptable in recent epidemiological studies (Rimm et al, 1990; Chan et al, 1994) but
114

better information will be needed about possible self-reporting bias, and ability to
monitor changes with weight management. Proof of the value of waist circumference
measurements in predicting health risks will require longitudinal follow-up of morbidity
and mortality, however waist circumference is more highly associated with metabolic
function than waistihip ratio in adults (Houmard et al, 1994) and in children (Flodmark
et al, 1994) and predicts myocai’dial infai’ction (Lapidus et al, 1984). The proposed
Action Levels match the results of Chan et al (1994), who found progressively
increasing relative risk of developing type 2 diabetes in men as waist circmnference rose
fi'om 73.7-87.6 cm to 91.7-96.5 cm (relative risk = 2.2) and to those above 102.0 cm
(relative risk = 12). Pouliot et al (1994) observed exponential increases in cardiovascular
risk factors with waist circmnference above 87 cm in men and 78 cm in women, which
correspond to waist circumference of Action Level 1, and further risk factor increases
with waist circmnferences above Action Level 2. Proof of the value of waist
circmnference will require longitudinal follow up of morbidity and moiJality.
Longitudinal data from the Framingham study suggest that waist predicts mortality
better than other antliropometric measures (Higgins et al, 1988).
CONCLUSIONS
Action Levels of waist circmnference (measmed using bony landmarks, midway
between the iliac crests and the lowest rihs) identified in the present study could form
the basis for health promotion to raise awareness, or to urge action in terms of weight
reduction. The lower Action Level 1 of waist circumference 94 cm (men) and 80
(women) represents a tlneshold above which health risks are increase - particularly for
young men (Chan et al, 1994; Must et al, 1992). Fmther weight gain and rise in waist
circmnference from Action Level 1 towards Action Level 2, should be prevented. The
upper Action Levels 102 cm for men and 88 cm for women eorrespond with the point
when symptoms of breathlessness and arthiitis begin to develop from overweight, and
health risks are such that medical consultation and active weight loss should be urged.
115

Table 4.1.1. Characteristics of subjects in determination sample and independent
validation sample.
Determination sample Validation sample
Men
{n = 904)
Women
{n = 1014)
Men
in = 86)
Women
(n = 202)
Mean SD Mean SD Mean SD Mean SD
Age (years) 51.0 14.1 50.8 14.0 44.9 14.1 37.5 12.6
Weight (kg) 75.9 13.7 65.9 14.5 80.3 16.1 66.6 13.5
Height (cm) 170.7 7.0 158.2 6.5 174.9 6.6 162.2 6.7
BMl (kg/m2) 26.0 4.1 26.3 5.5 26.2 4.7 25.4 5.3
Waist (cm) 93.3 11.9 82.0 12.3 93.1 14.8 80.1 14.2
Hips (cm) 100.5 7.7 101.7 11.1 99.8 8.1 101.7 9.8
Waistihip ratio 0.93 0.07 0.80 0.07 0.93 0.09 0.79 0.10
BM l = body mass index
Table 4.1.2. Number of subjects in determination sample in different categories of body
mass index and waistihip ratio.
Body mass index (kg/m^)
<20 20- 25- >30 Total
Men
0.72-<0.95 99 241 201 23 564
0.95-1.13 0 52 183 105 340
Total 99 293 384 128 904
Women
0.65-<0.80 61 267 143 54 525
0.80-1.20 13 139 186 151 489
Total 74 406 329 205 1014
116

Table 4.1.3. Number of men and women in different categories of body mass index and
waistihip ratio in groups classified by waist circumference Action Level in
determination sample and validation sample.
Determinationsample
Validationsample
Men«=904
Women«=1014
Men«=86
Women«=202
Action Level 1 Waist >94 cm for men and 80 >cm for women 422 512 24 88
With body mass indexi>25 389 437 16 81<25 33 75 9 7<25 but high waistihip ratio 25 68 2 4<25 and low waistihip ratio* 8 7 0 3
Waist <94 em for men and 80 <cm for women 482 502 61 114With body mass indexi
<25 359 405 61 107>25 13 97 0 7>25 but high waistihip ratio 113 83 9 7>25 and low waistihip ratiot 10 14 2 0
Action Level 2 Waist >102 cm for men and 88 >cm for women 210 292 35 50
With body mass indexi>30 116 184 33 30<30 94 108 2 20<30 but high waistihip ratio 82 106 9 19<30 and low waistihip ratio* 12 2 0 1
Waist <102 cm for men and 88 <cm for women 694 722 55 156With body mass indexi
<30 682 701 40 151>30 12 21 11 5>30 but high waistihip ratio 8 19 0 1>30 and low waistihip ratio | 4 2 0 0
High waistihip ratio >0.95 for men and >0.80 for women; low waistihip ratio <0.95 for men and <0.80 for
women; * false positive subjects; Jfalse negative subjects.
117

Table 4.1.4. False positive and false negative subjects and sensitivity and specificity for
men and women in determination sample and in validation sample by waist
circumference to identify those with body mass index and >25 or >30 and those with
lower body mass index but waistihip ratio >0.95 (men) or >0.80 (women).
Body mass index
(kg/m^)
Waist
(cm)
False
positive
False
negative
Sensitivity
(%)
Specificity
(%)
Determination samplei
Men (n = 904)
25- >94 8/340 10/280 96.8 98.2
>30 >102 12/541 4/105 97.9 97.8
Women (« = 1014)
25- >80 7/328 14/337 96.5 98.3
>30 >88 2/471 2/151 99.2 99.6
Validation samplei
Men (« = 86)
25- >94 0/38 2/32 94.1 100
>30 >102 0/49 0/15 100 100
Women {n = 202)
25- >80 3/98 0/63 100 97.1
>30 >88 1/120 0/28 100 99.2
negatives/(true negatives + false positives).
118

n
fItD
i
I.aoo
î%
I1
fIJi
H
W3
u
i
g "g
'WD
' ê 'Opq
i<
ao
a
s
ooo
vo
oM3
OO00ON
<UPQC5
enO n
M3
OOm
f -i >o
pCD
CM d " MNM3 OO
V
p pO
M3 oo O CMON d ON O n
p
en
o
I% .5 .5T3 "d T3 "d d.Si .Si .Si .Si .Si1-, M s-, Go o o oces ces ces ces cesu O ü O o
O o O O OU -Q >-) hJ U
o ooen en MN
' + i +
oo
C<
?
Mlen
Q Q
a
Q
^ ^ enen ONON ONON
GG
%)%) 3 n
.JQ 1o
T3
■%
Iu
po?
g g
r -oCM
CMO N
O npO
NOen
f" oo CM
[J-l P h ÜH t t , l i , ( i , ü .
"co
1 d 1 11 i ■M1 11 1 1 1 îS g s s S1
h J1
p 1 1d 1p r-- CD MD <p ? +
ON CM ID- P _NO en ?M3 ON ON ON MD
en NO
oo en pNO ON oo
?
ON OO00 l < ON M3 v6
CD CM CMMD Ml OO NO MI)
ON C ' C"OOCM
oô<N
enen MDen
*np z NO
pMDp P
c d d d d
p M3 CD MD C '
MDt<MD 5 R
Oen NO 5 §ü . k P-,
O nON
Q)>> I
%I I I
<D CDJ hJ
ON
eno
R
oCM
O
CM
- d
iI
CM <
°£ %
g g
OOON
esM3
CMO
ooON
NO C '- On ON O O
en
en
s s
s
a
îces
X )
IIx )
t
SON
0)
I
ON

45
40
1 30 %I 25
o 20 CO
15
Men °
% . . . ”. . L i \ ) °
: . .
H & W " .p...
60 70 80 90 100 110 120
Waist circumference (cm)130 140
Women
50 60 70 80 90 100 110 120 130 140
Waist circumference (cm)
Figure 4.1.1. Relation between waist circumference and body mass index in men and in
women from determination sample and the two Action Levels of waist circumference
that identify subjects with body mass index >25 or >30 kglva and with waistihip ratio
>0.95 for men and >0.80 for women. Dotted line shows Action Level 1, solid line
Action Level 2. O Waistihip ratio >0.95 men, >0.80 womeni false negative in upper left
quadrant; # waistihip ratio <0.95 men, <0.80 womeni false positives in lower right
quadrant. Linear regressioni body mass index = (0.307 x waist circumference) - 2.6
(men); body mass index = (0.394 x waist circumference) - 6.0 (women).
120

4.2
WAIST CIRCUMFERENCE AS A SCREENING TOOL FOR
CARDIOVASCULAR RISK FACTORS: EVALUATION OF
RECEIVER OPERATING CHARACTERISTICS (ROC)
This section has been peer reviewed and has been published as
Han TS. van Leer ME, Seidell JC, Lean MEJ. Waist circumference as a
screening tool for cardiovascular risk factors: evaluation of receiver operating
characteristics (ROC). Obesity Research 1996; 4:533-47.
Collaboration with MORGEN project
121

ABSTRACTObjective'. To evaluate the receiver operating characteristics (ROC) to determine the cut
offs of waist circumference as a potential population directed screening tool for
hypercholesterolaemia (>6.5 mmol/1), low high density lipoprotein cholesterol (<0.9
mmol/1), and hypertension (treated and/or systolic >160 and/or diastolic blood pressure
>95 mmHg), in 2183 men and 2698 women aged 20-59 years selected at random from
Dutch civil registries.
Main outcome measures'. Height, weight, body mass index (BMl) waist circumference,
total plasma cholesterol and high density lipoprotein cholesterol concentrations, and
blood pressure.
Results'. ROC curves showed that sensitivity equalled specificity at waist circumferences
between 93-95 cm in men and 81-84 cm in women for identifying individual risk
factors, and 92 cm in men and 81 cm in women for identifying those with at least one
risk factor. Sensitivity and specificity were equal at levels between 61% to 69% for
identifying individual risk factors, with positive predictions (56.8% in men and 37.8% in
women) within 2% of those using previously defined ‘Action Level 1’ of waist
circumference 94 cm in men and 80 cm in women (58.8% in men and 37.4% in women).
Risk prediction by antlnopometric methods is relatively low: ROC areas for identifying
each risk factor hy waist varied from 55 to 60%, and reached about 65% for identifying
at least one risk factor. Height accoimted for less than 0.3% of variance in waist
circumference. Using BMl at 25 kg/m^ gave similar prediction to waist, hut its
combination with waist did not improve predictive values.
Conclusions: Measurement of waist circumference ‘Action Level 1’ at 94 cm (37
inches) in men and 80 cm (32 inches) in women could be adopted as a simpler valid
alternative to BMl for health promotion, to alert those at risk of cai'diovascular disease,
and as a guide to risk avoidance by self-weight management.
Key words: epidemiology, fat distribution, health, obesity, weight management
122

INTRODUCTION
Large waist circumference reflects both high hody fatness (body mass index) and central
fat distribution (waist to hip ratio) (Chapter 4.1; Lean et al, 1995). Waist circumference
has also heen shown to relate closely to the metabolically active intra-abdominal fat
(Pouliot et al, 1994; Seidell et al, 1988), Després and his colleagues (1990) have
suggested that waist circumference may be the most important anthiupometric index of
fat distribution as a predictor of cardiovascular risk, in preference to waist to hip ratio.
We have proposed two ‘Action Levels’ of waist circumference for health promotion
purposes, to identify subjects with increasing (‘Action Level 1’: men 94 cm, women 80
cm) or high (‘Action Level 2’: men 102 cm, women 88 cm) health risk (Chapter 4.1;
Lean et al, 1995). These ‘Action Levels’ of waist circumference have been replicated in
different populations and shown to classify individuals at increased cardiovascular risk
both in men and women (Chapter 5.2; Han et al, 1995c).
The present study was designed to examine whether different criteria or ‘cut-offs’ of
waist circumference are necessary to identify individuals who are at increased risks of
different risk factors, i.e. hypercholesterolaemia (European Atherosclerosis Society,
1987; WHO MONICA Project, 1988), low plasma high density lipoprotein cholesterol
(European Atherosclerosis Society, 1987), hypertension (WHO MONICA Project,
1988), and at least one of these risk factors. We are aware that total cholesterol/high
density lipoprotein cholesterol ratio may give a better index of cai'diovascular risk than
single measures. This will be addressed in future study, but the present paper is limited
to single measures and the category of any one risk factor includes both total cholesterol
and high density lipoprotein cholesterol. The ‘Action Levels’ of waist circumference
proposed on the basis of body mass index and waist to hip ratio by Lean et al (1995)
were related to the cut-offs of waist circumference that identified the highest nmnbers of
subjects with and without the risk factors, i.e. where sensitivity and specificity of
prediction were equal for different risk factors (Sturmans, 1984).
123

METHODS
SubjectsA random sample of 2183 men and 2698 women aged 20-59 years was selected fi’om the
civil registries in Amsterdam, Maastricht and Doetinchem, as part of the MORGEN
(monitoring risk factors and health in The Netherlands) project to determine the prevalence
of risk factors for chi’onic diseases, and also other specific clnonic conditions in a sample
of the general population living in various par ts of the Netherlands. The measurements
were made in basic health service centres in Amsterdam (the capital city in the West),
Doetinchem (a small town in the East) and Maastricht (a town in the South). To obtain
equal numbers in each age group, the sample was stratified according to gender and five
year age groups. The response rate was approximately 50% in Amsterdam and Maastricht,
and 80% in Doetinchem.
Anthropometry
All measurements were made by trained investigators. Body weight in light clothes was
measured to the nearest 0.1 kg, and height to the nearest 0.5 cm. Body mass index was
calculated as weight/height^ (kg/m^). Waist circumference midway between lower rib
and iliac crest, and hip circumference at the level of the great trochanters were measured
in duplicate using flexible tape to the nearest mm (WHO Expert Committee, 1995).
Cardiovascular risk factors
Sitting blood pressure was measured using random zero sphygmomanometer, by
technicians who had been trained by a physician. Small ( 9x18 cm), medium (size 12 x 23
cm) or large (15 x 33 cm) cuff was used to fit upper arms of different sizes. Systolic (frrst-
phase Korotkoff) and diastolic (fifth-phase Korotkoff) hlood pressure were measured twice
on the left upper arm, and the average was used for analysis.
Total and high density lipoprotein-cholesterol were determined enzymatically using
Boehringer test kit (Katterman et al, 1984). High density lipoproteins were isolated by
precipitating apo-B containing lipoproteins with magnesium phosphotungstate described
124

by Lopes-Virella et al (1977). This method used a mixture a 2 ml of plasma, 200 pi of
sodium phosphotungstate solution, and 50 pi of MgCl2 . All cholesterol analyses were
performed at the Clinical Chemistry Laboratory, University Hospital of Dijkzigt in
Rotterdam, which is part of the standar dization program (WHO Regional Lipid Center for
Em'ope in Prague, Czechoslovakia, and the Centers for Disease Control in Atlanta, USA).
AnalysisThe criteria for cut-offs of cardiovascular risk factors were selected before analysis, based
on consensus figur*es from the European Atherosclerosis Society (1987) and the World
Health Organization (1988). Hypercholesterolaemia was defined as plasma cholesterol
>6.5 mmol/1 (European Atherosclerosis Society, 1987; WHO MONICA Project, 1988),
low high density lipoprotein-cholesterol as <0.9 mmol/1 (European Atherosclerosis
Society, 1987), and hypertension as systolic blood pressure >160 mrnHg and/or diastolic
blood pressure >95 mmHg and/or the use of antihyperfensive agents (WHO MONICA
Project, 1988).
Statistical methodsThe numhers of subjects at different levels of waist circumference with or without
cardiovascular risk factors were determined by cross tabulation, and these numbers were
used to determine the receiver operating characteristics of waist circumference in the
identification of risk factors. Sensitivity was defined as the percentage of the total
number of subjects with risk factor who were identified correctly by high (above the cut
off level) waist circumference, and specificity as the percentage of the total number of
subjects without risk factor who were correctly identified hy low (below cut-off level)
waist circumference. Positive prediction was calculated as the percentage of subjects
with waist circumference above the cut-off level who had the risk factor, and negative
prediction as the percentage of those with waist circumference below cut-off level who
did not have the risk factor (Sturmans, 1984),
125

Sensitivity and specificity for predicting risk factor prevalence by various waist
circumferences were plotted against waist circumference. The cut-offs where waist
circumference identified the highest numbers of subjects with and those without the risk
factors were obtained by interpolation from the intersect at which the lines of sensitivity
and specificity crossed each other (i.e. where sensitivity equalled specificity) (Stimnans,
1984). The areas of the receiver operating characteristic (ROC) curves for waist
circumference in identifying risk factors were examined using the modified equations of
Hanley and McNeill (1982).
Adjustments for body mass index and waist to hip ratio were not made because of
multicollinearity with waist circumference (Belsley et al, 1980). Height accounted for
less than 0.3% of variance in waist circumference (Figures 4.2.1a & b), and was not
subsequently used in analysis of waist circumference. Statistical analyses performed
SAS computer prograimne (SAS Institute, Gary, USA).
RESULTSMean age, body mass index, hip circumference and total cholesterol were similar- in men
and women. Men had higher waist circumference, waist to hip ratio and blood pressure,
and lower high density lipoprotein cholesterol than women (Table 4.2.1). Waist
circumference coixelated significantly {P <0.001) with body mass index (men: r = 0.860,
women: r = 0.850) and waist to hip ratio (men; r ~ 0.84, women: r = 0.81). Body mass
index also correlated significantly {P <0.001) with waist to hip ratio both in men {r =
0.64) and women (r = 0.51). The relationships between waist circumference and height
(Figures 4.2.1a & b) were extremely weak, and therefore waist circumference was not
adjusted for height.
The numbers (%) of subjects who had cholesterol >6.5 mmol/1 were 323 (14.9%) in men
and 401 (15.0%) in women, 564 (26.0%) men and 159 (6.0%) women had high density
lipoprotein <0.9 mmol/1, 191 men (9.7%) men and 198 (7.3%) women were considered
126

to be hypertensive, and there were 887 (40.6%) men and 657 (24.4%) women who had
at least one of these risk factors.
The levels of waist circumference that coixectly identified the maximum numbers of
subjects with and without the risk factors, i.e. the highest value of (sensitivity +
specificity)/2, were around 95 cm in men (Figure 4.2.2a) and 80 cm in women (Figure
4.2.2b). The exact cut-offs that identified the maximum numbers of subjects with and
without the risk factors were obtained by inteipolation from the point at which sensitivity
crossed specificity. These cut-offs were very close to waist circumference at the
proposed ‘Action Level 1’ (94 cm in men, 80 cm in women) in both men and women
(Tables 4.2.2a & b; Figures 4.2.3 & 4.2.4): the cut-offs for identifying each risk factor
tended to be a little higher than ‘Action Level V in women, and below ‘Action Level 1 ’
in men, but the differences were mostly less than 2 cm. The cut-offs for identifying
those with at least one risk factor in men (92 cm) were 2 cm below ‘Action Level 1’ (94
cm), but almost identical to ‘Action Level V (80 cm) in women (80.6 cm).
The differences in sensitivity and in specificity between the cut-offs and ‘Action Level
r were within 10 % (within 5 % in most cases) of each other. The differences in
positive and in negative predictions of risk factors were very small between these levels.
Positive prediction of those with at least one or more risk factors was higher than that of
each individual risk factor, both in men (56.8 %) and women (37.8 %), but negative
predictions were slightly lowered (Tables 4.2.2a & b).
Table 4.2.3 shows that waist circumference ‘Action Level V performed similarly to
body mass index 25 kgtm for identifying those with risk factors (positive prediction)
and those without risk factors (negative prediction) both in men and women. Including
subjects with waist circumference below ‘Action Level 1’ but whose body mass index
was above 25 kg/m^ did not further improve the prediction of cardiovascular risk factors.
The cut-off of waist circumference for identifying at least one risk factor (92 cm) was
used as the general cut-off for each individual risk, showed slightly better negative
127

prediction but was less good in positive prediction than ‘Action Level 1’ (Table 4.2.4).
The equivalent cut-offs of waist in women (80.6 cm) was not analysed further, since it
was so close to ‘Action Level 1’ (80 cm).
The estimated areas of the receiver operating characteristic curves for waist
circumference in identifying each risk factor varied between 55-60%, and about 65% for
identifying at least one risk factor.
DISCUSSION
Waist circumference correlated highly (r >0.8; P <0.001 hoth in men and women) with
body mass index and waist to hip ratio in the present study, and can identify those with a
combination of high or low body mass index and high waist to hip ratio (Chapter 4.1;
Lean et al, 1995). The ‘Action Levels’ of waist circumference for men and women were
derived to indicate the need for weight management (Chapter 4.1; Lean et al, 1995),
based on the conventional cut-off of body mass index 25 kgiva or 30 kgim and waist to
hip ratio in men 0.95 and 0.80 in women. These ‘Action Levels’ have been proposed for
use in health promotion as likely to indicate increasing risks from obesity related
complications, avoiding the need to calculate body mass index, or errors from inaccurate
height measuiement (Chapter 3.1; Lean et al, 1996). The present study provides
justification for ‘Action Level 1’ (94 cm in men, 80 cm in women) on the ground that it
is remarkably close to the cut-offs of waist associated with increased risk (92 cm in men,
80.6 cm in women) of any one or more major cardiovascular risk factors. On this basis,
use of a cut-off of waist circumference allows prediction as good as body mass index for
all the major cardiovascular risk factors, and for the total number of people at risk.
The cut-offs in the present study for men and women are different, since the derivation
were based on relative risk within each sex. Our previous study of the same subject
sample showed men and women have the same absolute prevalence of cardiovascular
risk factors for a given waist circumference (Chapter 5.2; Han et al, 1995c). Pouliot et
al have suggested a cut-off of waist circumference in predicting health risks o f 100 cm
128

both for men and for women (Pouliot et al, 1994). However, although a cut-off of 100
cm will give a valid cut-off for absolute level of risk, irrespective of gender, a larger
number of women with risk of preventable disease would not be identified.
The areas of the receiver operating characteristic curves for waist circumference in
identifying individual risk factors of 55-60% and at least one risk factor of 65% were
thus relatively low, but similar to the level expected from other anthropometric
measurements in identifying health risks (WHO Expert Committee, 1995). Using waist
circumference as a tool to screen for risk factors would inevitably misclassify at least 35
% of subjects by falsely including subjects who have waist circumference above the cut
off but without risk factors, and excluding those whose waist circumference below the
cut-off but with risk factors. The figures used as cut-offs for total cholesterol >6.5
mmol/1 (European Atherosclerosis Society, 1987; WHO MONICA Project, 1988), for
high density lipoprotein cholesterol <0.9 mrnol/1 (European Atherosclerosis Society,
1987) and for systolic >160 and diastolic blood pressure >95 mmHg (WHO MONICA
Project, 1988) are widely used to indicate elevated cardiovascular risk, but fairly
conservative. The yield of individuals who would fulfil risk factor criteria at a lower-
level of risk, e.g. high density lipoprotein <1.0 rnmol/1, total cholesterol >5.2 mmol/1,
would be greater than those identified by the risk factor levels employed in the present
paper, and would lower the intersect where sensitivity equals specificity by waist
circumference of about 3 cm (data not shown). We have examined the relationships
between waist circumference and risk factors, including plasma triglyceride, elsewhere
(Chapter 7; Han et al, 1997a). Unfortunately, plasma triglyceride, which relates closely
to waist circumference, and metabolic risk, was not available for the present analysis.
It is theoretically possible that age might modify the amount of intra-abdominal fat at
any given waist circumference. Examination of waist circumference for two separate age
groups of 20-39 and 40-59 years showed that compai-ed to the cut-off for the whole
population (Figures 4.2.3 4.2.4), the intersect where sensitivity equalled specificity in
129

predicting risk factors was about 3 cm lower in younger subjects, and 3 cm higher in
older subjects in both sexes (data not shown). This observation agrees with other
suggestions that higher body mass index is not strongly associated with coronary heart
disease in older subjects. If the criteria used to define levels of risk were slightly lowered
for younger subjects, and raised for older subjects (on the basis that for any given level
of metabolic risk factor, younger subjects are more likely to develop premature
cardiovascular disease), then the age specific cut-offs of the two age groups would he
even huther apart. On this hasis, adopting lower waist circumference ‘Action Level 1’
for younger people - say 90 cm (35 inches) in men and 76 cm (30 inches) in women,
could be justified.
Sensitivity and specificity are inversely related. The decision for choosing a cut-off
depends on the purpose and potential use (WHO, 1995). Lowering the cut-off of waist
circumference would increase sensitivity for risk identification, but include more
subjects who do not have the risk factors (false positives). Selecting a higher cut-off
would increase specificity, but more subjects who have the risk factors (false negatives)
would be missed from screening for potential health risks. The figures for waist
circumference ‘Action Levels’ (Chapter 4.1; Lean et al, 1995) were proposed to alert
people to increasing health risks. Subjects with waist circumference helow ‘Action
Level 1 ’ do not need to lose weight but should be aware of potential health risks when
their waist approaches this level, used as the first line of warning. In the range between
‘Action Level 1’ and ‘Action Level 2’, termed the ‘Alert Zone’ (94-102 cm in men, BO
SS cm in women), subjects should not further gain weight, with lifestyle modification
such as increasing physical activity level, and some self-managed weight loss if
possible. Patients in this waist range of ‘Alert Zone’ with problems like non-insulin-
dependent diabetes mellitus, hypertension, or angina would benefit from more active
weight loss. Above this range, termed the ‘Action Zone’(>102 cm in men, and >88 cm
in women), every body should be urged to take action to seek professional help to
achieve sustained weight loss and for risk factor screening.
130

Although justified by several lines of evidence, cut-offs ai'e always slightly arbitrary.
Increased risks of breast cancer in women (den Tonkelaar et al, 1995), type 2 diabetes in
men (Chan et al, 1994), and other risk factors of diabetes and of heart disease (Pouliot et
al, 1994) have been shown to associate with waist circumference levels that are
remarkably close to the ‘Action Level V both in men and in women, suggesting that
waist circumference may have a wider value, but the present paper has concentrated on
cardiovascular risk factors. Financial constraints could favour the choice of higher cut
offs to reduce screening costs for lai’ge numbers of subjects. Using lower cut-offs may
have greater health benefits, particularly if young people can be alerted to a developing
weight problem or adverse fat distribution, and thereby encouraged to prevent weight
gain at an early age. It is now increasingly recognised that overweight is a disease per se
(Stunkard, 1996), and preventing weight gain for those with waist circumference
approaches the ‘Action Level V (94 cm in men, 80 cm in women) may be more
effective than attempting weight loss for those with waist circumference has reached the
‘Action Zone’ (>102 cm in men, and >88 cm in women).
Because of the high correlations between waist circumference, waist to hip ratio and
body mass index with one another, pairing these variables together in statistical analysis
for adjustments would not be appropriate due to the effect of multicollinearity (Belsley
et al, 1980). This was confirmed when body mass index and waist circimiference were
combined, with little more improvement in predictive values for identifying risk factors
(Table 4.2.3). Most subjects with adverse risk factors have both waist circumference
above ‘Action Level 1’ and body mass index above 25 kg/m^. Conversely most subjects
without risk factors have both waist circumference below ‘Action Level 1’ and body
mass index below 25 kg/m^. Combining body mass index and waist to hip ratio also
gave no improvement of risk factor prediction over waist circumference alone (results
not shown).
Earlier studies ofhody composition and body fat distribution to identify subjects at risk
of cardiovascular disease and type 2 diabetes have mainly focused on body mass index
131

and waist to hip ratio (Lapidus et al, 1984; Larsson et al, 1984). Recently, waist
circumference has been recognised as a good measure of abdominal fat and particularly
the more metabolically active intra-abdominal fat (Pouliot et al, 1994; Ross et al, 1992
& 1993; Seidell et al, 1988; Seidell et al, 1992). Large waist includes most overweight
subjects either with or without central fat distribution (Chapter 4.1; Lean et al, 1995).
Young and Gelskey (1995) have suggested that overweight subjects with low waist to
hip ratio have similar risk factors as those who are overweight with high waist to hip
ratio. However, the absolute size of intra-abdominal fat mass may be the critical factor
(already increased by high body mass index), and this was not considered by these
authors. It is possible that certain risk factors relate more to body mass index than to
waist to hip ratio, but using the waist circumference for health promotion simplifies this
problem. The term ‘central obesity’ is confusing, since distribution may be central of
peripheral, independent of body mass index, whilst those with high body mass index all
tend to a more central fat distribution. In relation to metabolic risk factors, waist
circumference is consistently more indicative of complications than any other
anthropometric methods (Chan et al, 1994; den Tonkelaar et al, 1995; Edwards et al,
1994; Giovannucci et al, 1995; Pouliot et al, 1994; Seidell et al, 1992), but the positive
predictions of cardiovascular risk for waist circumference of about 15-40% individual
risks are not particularly high. The classification of subjects’ level of risk is improved
when any one or more risk factor is included (and 60% in men and 40% in women).
Risk not accounted for by anthropometric measures might be identified for health
promotion from a family history of premature heart disease, non-insulin dependent
diabetes mellitus or hypertension.
CONCLUSIONS
The waist circumference ‘Action Level 1’ proposed by Lean et al (1995) to indicate the
need for weight management, reflecting both high body mass index and high waist to
hip ratio, corresponded closely to the levels of waist circumference associated with
increased risk of each individual cardiovascular risk factor and the combination of any
one or more of these risk factors. ‘Action Level 1’ at 94 cm (37 inches) in men and 80
132

cm (32 inches) in women may be useful thi'ough health promotion with a message to
avoid weight gain (and thus to avoid hypeiiipidaemia or hypertension) as pait o f the
measures designed to prevent cardiovascular disease. Application of the data in this
study should be restricted to white populations only. Further validation for other etlinic
groups such as blacks or Asians is required, since body density, fat distribution and
statui'e may be different.
133

Table 4.2.1. Physical and metabolic characteristics of 2183 men and 2698 women.
Men Women
Mean SD Mean SD
Age (years) 42.7 10.5 42.5 10.7
Weight (kg) 81.4 11.9 68.3 11.3
Height (cm) 177.9 7.4 165.1 6.8
Body mass index (kg/m^) 25.7 3.4 25.1 4.2
Waist circumference (cm) 91.6 10.4 80.3 10.9
Hip circumference (cm) 101.7 6.4 102.1 8.3
Waistihip ratio 0.90 0.07 0.79 0.07
Total cholesterol (mmol/1) 5.4 1.1 5.4 1.1
HDL cholesterol (mmol/1) 1.1 0.3 1.4 0.4
Systolic blood pressure (inmHg) 122.8 15.6 115.5 15.4
Diastolic blood pressure (mmHg) 77.8 10.4 74.1 9.9
HDL = high density lipoprotein.
134

ICO
dfNH
IH
IIIlU
ê
oo
foe
I t
IÎ
m00
(Na ,g
I
II
II1A
II
II§
Î>
i■tg
CO
O
U
u
»<
Io
'=4 T—1 G\ 0rn vd rn
o \ 00 o^ !>•1—T oT 1—100 00 0000 c^ o \
C 0 00 \ocK cn 000 00 o \ o
II
IΧ
0
1
ONr—4 rn NO vno \ 00 ONT f in ' rq00 ON Tf- 000 ON t>
0 t> m CO0 t—H vn o iON 00 ON
rn 00 0 r—< CN IN- 000 00 CN ON ON
<N r-H NO CN m vnON m CN vn CO IN- 0 0000 rn vn 00 rn rn
m wn m un
NO un NO CO un IN IN 00.—1 l< un 06 r—H NO NOCN m un CN m un
ON N- un 0 ON rnun GO un rn rn ONNO NO NO IN NO NO NO NOIN NO un NO NO 1—1 T—( 00 rn 0 ON 00 (ON un o iNO NO NO NO un un NO NO
rn CN 00 un (N NOrn NO rn CN 0 r—1 IN T|-NO NO NO IN NO NO NO NO
un , CN rn un ON IN.—1 0 0 NO un rn INNO NO IN NO NO NO IN NOON un CN c - un un un un
rn 00 rn un IN 0 T—1un un NO un un un NO NO
CN 00 CN 0 00 un CN NO00 NO 1 1 0 INun un un NO NO NO NO
0 0 0 0 CN NO CN 0T{- TT T|- '=t rn CN un CNCTN ON ON ON ON On ON ON
%O
I"âs
I• t
f
&Oi
IIu
1 0m

c3Id
Ic/3(NfS
Î
M
IIIIIX)
g
Î%
I
Iê
II&
t :tSIIt
soo$CN
It3
II
1ÎI
III>
• t
a><8-
t
SC/3
a
unON
O
unON
OunON
U
unO n
I §
r - 1 IN t—H rn NO '4- unCN NO OO NO t—[ NO CN unON C3N ON OO ON O n ON 00'—1 NO un (N m NO (ONON TT NO CN od '=^ un r~HOO (ON O n OO oo (On O n oo
NO NO m un oo NO un IN(d un IN 'sT (ON un NO rnON (ON (ON OO OO ON CON oo
CNIN- ON
'= O
CNON
rnod
p
m
un p o Thd rn IN
m
ON ON CN NO
§o6un § 3
On (ON T—1 INunun
rnun
unun
ONun
p CNooun
NOun
INun 8
o ON CNOÔNO
KNO 8 $
r-T NO un 1--1
s ININ S
m CN OO un
:g unNO
(ONIN 3
p p O p(doo
doo
doo
doo
II
IrX
I0
1
00rnCN( d
NO
coT
mIN
NOd
d 'ON od d un
m
t-' o oo
Md un IN
rn
(ON c-- un un
3 8 g NONO
ON (ON (oT rnONun
odun
NONO 3
p oo IN '=t
NOdNO
o6NO 3
IN oo CN o
3INNO
unIN
CN OO CN oodun
rnun S
dNO
p oo N -
NOdNO
odNO 3
p p NO p
OO oornoo
doo
%<3
II
I■c
0o
aO
IIIÏ■p
I
IIH-f
NOrn

IêX)
II.B
Î 1op.
dl
IIs■IIÎI
}I
IIêIw un A oi
I§
IIcd
•5
(DCOëo
IXI
i0CL,
nNTf
1H
1U*
Ii
■S'
I1SII
un<NiII
•S'.E
S
§
1aI§
I>o
II1>
COO
Ph
o
unON
O
unON
a
unON
U
unON
IN IN CN oorn NO od odON OO ON CN1—1 cT <d rnd CN NO rnON OO ON IN
p m T—( Ot**4 d IN NOON oo ON IN
OO NO t-H .—1
,—t d un INCN m r-H unrn CNIN CN 1 ■ t T—H
rn ' ' un
un oo oo pON rn CN d
m un
sS-I I
'Ss
Il o"C
i0
1
ON oo TTCN NO od INON ON ON oo
o d no" o d NOON d NO rnoo ON ON oo
p IN NO unÏ—H un IN unON ON ON oo
m CN un '=3* CN OO T—Hod 3 un
CN rn NO 9p" 'sd u d NO o d r d On"od un
mrn NO
unON ON d NO
m
p CO o p un p un pCN
odm
d dNO
d d
IN CN IN p un un oo8! NOOO IN
ON ONNOION IN
ONdoo
1—1 NO d 1—< ■ d rdONoo OO un
ON 8! odoo
unON oo
ON ON NO IN NO un un odON
rnoo
NOON ? ON
oounON
NOON
rnoo
CN
Runcd
rnod
II
III
un
NOd
(NONmCNrnrn
p p NO und d CN NOCN rn
I•c
Io
a
11
I.s
.9
I
CNm
svn(N
I
1
043
1I

TO
.a§g
II§Iccj
I
Ia
IIX)&iop.
O
unON
UUNON
p rn 1—1 O ' T—1
8^ dOOdON UN
O' 8 idON
odON
doo
rn 1—( d r»H d un" dONCO
doo
UNON
dO'
ONOO s
dON
P UN M oo P O' CN UNdON 8
dON
dON
unON
dON
UN00
UN m oo OO O' Pcn(N
ONm
d ONUN rn
CNd
un" ' d p O'" CN rn ON p0Ô rn
md rn
UNd od N"
m
p m p p p odm
dUN CN
d rn dm
o
I8
Î%I
Iê
I
IgÎ
IIt>wo
P h
O
UNON
o
unON
T—( ON O 1-H O ' T—Hr-H rn d rn d d od dON oo ON O ' ON ON ON oo
o> O' VO UN O 'od od d od ON d doo o ON oo ON ON oo
O ' O '—I P p O ' CN UNON d d d d UN d UNOO oo ON o ON ON ON OO
p OO o oo ONd od d rn d<N T—1 VO CN ' 1 '=3-
ON m CN UN (N r*7 p ood rn UN ON od T—J dm UN t-H rn
p UN VO OO p O ot—H d UN od r—1 d d d<N m 1—1 UN CN '—1 m
COm
I•tsOTI o
oCO
%•n( 2KI
III
I§I
§
IJ'C0o
a
ICl§I
I'Ss
II
0
1
.9
IÎI

150Eü r = 0.051
P <0.018Men
1308C2a
110
E II::'3Eü
70
150 160 170 180 190 200 210
a Height (cm)
^ 150
^ 1300
2 110
1gü
■(D
90
70
50
r = -0.036 P <0.063
Women
'r':; A:;:\ v : •
ill?!:
140 150 160 170
Height (cm)180 190
Figure 4.2.1. The relationship between waist circumference and height in 2183 men (a)
and 2698 women (b), showing regression line (solid) and the line of zero correlation
(dashed).
139

MEN
■t
I
66
64
54
75 80 85 90 95 100 105Waist circumference (cm)
WOMEN
1§
CO
70
66
65 70 75 80 85 90 95 100 105Waist circumference (cm)
Figure 4.2.2. The average values of the sum of sensitivity plus specificity for waist
circumference to identify subjects above or below 6.5 mmol/1 of plasma cholesterol (T ),
0.9 mmol/1 of high density lipoprotein cholesterol (A), 160 mmHg of systolic blood
pressure or 95 mmHg of diastolic blood pressure (■), and with or without any one or
more cardiovascular risk factor ( • ) plotted against waist circumference in 2183 men (a)
and 2698 women (b).
140

M EN: H y p e rc h o le s le ra la e m ia MEN: Low high d e n s ity lipopro te in c h o le s te ro l
100
00
SPE C IFIC IT Y - -SENSITIVITY40
20
70 75 80 85 90 95 100 105 110 115
10080
i 60SPEC IFIC ITY - -SENSITIVITY
40
70 75 80 85 90 95 100 105 110 115W a ist c irc u m fe re n c e (cm ) W a ist c i rc u m fe re n c e (cm )
MEN: H y p e rten sio n MEN: At le a s t o n e risk fa c to r
100
m 60SPEC IFIC ITY . -SENSITIVITY
I 40S.
20
70 75 80 85 90 95 100 105 110 115W a ist c irc u m feren ce (cm )
100
80
2" 601 SPEC IFIC ITY -
40S.
20
70 75 80 85 90 95 100 105 110 115W a ist c irc u m fe re n c e (cm )
Figure 4.2.3. Percentile plot of sensitivity and speeificity values for waist circumferenee
to identify subjects above or below 6.5 mmol/1 of plasma cholesterol (a), 0.9 rmnol/1 of
high density lipoprotein cholesterol (b), 160 mmHg of systolie blood pressure or 95
mmHg of diastolic blood pressure(c) and with or without any one or more
cardiovascular risk factors in 2183 men (d).
141

W O M EN : H y p a rc h o le s te ro la e m ia W O M EN : Low h ig h d e n s ity lip o p ro te in c h o le ste ro l
100
80
% 60
1 S PE C IFIC IT Y . lENSITIVITY
20
60 65 70 75 80 85 90 95 100 105
100 ^
® 60
SPE C IFIC IT Y - -SEN SITIV ITY40
20
60 65 70 75 80 85 90 95 100 105W a is t c i rc u m fe re n c e (cm ) W a ist c irc u m fe re n c e (cm )
W O M EN: H y p e rten sio n W O M EN : At le a s t o n e risk fa c to r
100
80
SPEC IFIC ITY - lENSITIVITY
120
60 65 70 75 80 85 90 95 100 105
100
80
I SPEC IFIC ITY - -SENSITIVITY
20
60 65 70 75 80 85 90 95 100 105W a ist c irc u m fe re n c e (cm ) W a is t c i rc u m fe re n c e (cm )
Figure 4.2.3. Percentile plot of sensitivity and specificity values for waist cireumference
to identify subjects above or below 6.5 mmol/1 of plasma cholesterol (a), 0.9 mmol/1 of
high density lipoprotein cholesterol (b), 160 mmHg of systolic blood pressure or 95
mmHg of diastolic blood pressure(c) and with or without any one or more
cardiovascular risk factors in 2698 women (d).
142

4.3
THE INFLUENCES OF HEIGHT AND AGE ON WAIST
CIRCUMFERENCE AS AN INDEX OF ADIPOSITY
This section has been peer reviewed and has been published as
Han TS. Seidell JC, Currall JEP, Morrison CE, Deurenberg P, Lean MEJ. The
influences of height and age on waist circumference as an index of adiposity in
adults. International Journal of Obesity 1997; 21:83-89.
Han TS. Seidell JC, Lean MEJ. Waist circumference remains useful predictor of
coronary heart disease. British Medical Journal 1996; 312:1227-28. [Letter]
Collaboration with MORGEN project
143

ABSTRACTObjective'. To assess the influences of height and age on the differences in waist
circumference between individuals of different stature.
Subjects'. 3319 males and 4358 females from four studies in the UK and the Netherlands.
Measurements'. Waist circumference, body weight, height, and age.
Results'. Lineal' regression analysis of logio height as the independent variable on log^o
waist as the dependent variable was used to determine the optimal index power (OIP) (*’)
to minimise the influence of height in the relationships of waist/height^. Six out of eight
samples of men and women had OIP of height not significantly different from zero, with
the remaining two groups had OIP between 0.15-0.58, indicating that height had very
limited influence on the differences in waist circumference measurement between
individuals. Age adjustment increased the relationship between waist and height, with
OIP of 0.19-0.89 in men and 0.02-0.58 in women. Without age adjustment, height
explained 0.3-3.5% and 0.1-2.5% variance in waist in men and in women respectively,
and the corresponding variances were 0.4-7.5% in men and 0.0-2.6% in women with age
adjustment. A similar analysis of weight and height showed the OIP of height in
weight/height^ ratio ranged from 1.32-2.25 in men, and 0.87-1.74 in women without age
adjustment, and from 1.47-2.24 in men and 1.25-1.96 in women with age adjustment.
Conclusion'. Height and age had limited influences on the differences in waist between
Caucasian subjects of different statme. Waist alone may be used to indicate adiposity or
to reflect metabolic risk factors. In contrast, the influence of height on body weight is
important.
Keywords', body mass index, cardiovascular disease, epidemiology, fat distribution,
obesity, stature
144

INTRODUCTION
Body mass index (BMI) relates highly to total body fatness by densitometry (Chapter
3.1; Lean et al, 1996; Deurenberg et al, 1991), and has been widely used to indicate
risks of overweight related morbidity and mortality (Royal College of Physicians, 1983).
More recent understanding of the importance of the more metabolically active
abdominal fat mass, particularly intia-abdominal fat mass, resulted in many ratios being
proposed as anthropometric indicators, which include waist measurement as the
dominant var iable, since waist circumference or diameter is highly related to abdominal
fat mass (Han et al, 1995b; Seidell et al, 1989a; Pouliot et al, 1994; Ross et al, 1992;
Ross et al, 1993, van der Kooy et al, 1993). Height has been used as the denominator of
abdominal fat mass indicators in efforts to eliminate a presumed relationship between
waist circumference and stature Kamiel et al, 1991; Valdez et al, 1991; Richelson et al,
1995; Higgins et al, 1988). Another proposed index involving height is the abdominal
sagittal diameter/height ratio, to indicate subjects with increased metabolic risk factors
(Richelson et al, 1995). The initial rationale for deriving ratios with waist measurement
as the numerator was that metabolic risk factors are related more highly to central fat
distribution than to total body fat, which is mainly located in areas other than the
abdomen. The ratio waist to hip was thus developed, using the hip cireumference to
control for subcutaneous body fatness or body size and to accentuate the relationship
with fat distribution. The ratio of waist to thigh was derived, since the size of the thigh
reflects muscularity. More recently, it has been suggested that it is the absolute amount
of intra-abdominal fat which influences health risk, not the distribution pattern (Kahn,
1993).
The present study aimed to determine the influences of height and age on the differences
in waist circumference between individuals of different stature from four separately
recruited Caucasian samples from Scotland and The Netherlands, based on the principles
for determining adiposity (Khosia and Lowe, 1967).
145

METHODS
The principles for developing anthropometric ratios to indicate adiposity
Anthi'opometric ratios such as weight for height ai*e derived so that differences in the
variable of interest between individuals can be compaied, while the influences of other
structural variables are eliminated (Khosia and Lowe, 1967; Berm, 1971). Since body
weight correlates significantly with height, taller individuals are generally heavier than
shorter ones. Thus in order to compare the differences in adiposity (the vaiiable of
interest) between individuals it is the relative weight that matters, so differences in
height must be eliminated. A simple method described by Khosia and Lowe to
determine the optimal index power of height (•’) in the relationship weight/height*’ for a
set of individuals is to regress logjo height (independent variable) on logio weight
(dependent variable). The regression coefficient ((3) of logio height obtained in the
equation is the optimal index power (*’) of height in the weight/height*’ ratio, at which the
differences of the derived ratio between subjects are dependent on body weight and
uncorrelated with height (Khosia and Lowe, 1967).
An example from one of the male groups (MORGEN) in the present study shows that
weight correlates positively (r = 0.441; P <0.001) with height. After logarithmic
transformation, logio height is used as independent variable and logio weight as the
dependent variable in linear regression analysis, to obtain the equation: logio weight =
1.57 X logio height " 1-62. The regression coefficient 1.57 is the optimal index power of
w eight/height^ratio: w eight/height^has a zero correlation with height in this sample
(Table 4.3.3). The conventional BMI (weight/height^) had a low correlation with height
(r - -0.140) in this sample.
Subjects and measurementsFour separate samples of 4881 Dutch men and women from the MORGEN study and
384 from Wageningen body composition studies, and 1918 Scots fiom the Glasgow
MONICA study and 494 from the Glasgow body composition studies, had
antliropometry measured following essentially identical standard protocols (WHO,
146

1989). Waist circumference was measured with flexible tape to the nearest mm, midway
between the lateral iliac crest and lowest rib, at the end of gentle expiration. Weight in
light clothes was measured to the nearest 100 g, and height barefoot and head in the
horizontal Frankfort plane using a stadiometer to the nearest 0.5 cm. All measuring
instruments were calibrated with standards before use. The men and women from the
MORGEN and MONICA studies were randomly recruited from the general population,
so they are expected to be representative of entire population of the Netherlands and
Glasgow respectively. The other two groups were healthy subjects recruited for a variety
of physiological measurements, and exhibit wide ranges of anthropometric variables
(Chapter 3.1; Lean et al, 1996; Deurenberg et al, 1991).
AnalysisThe relationships between height and waist circumference and body weight were
assessed by linear regression analysis. Optimal index powers ( ) in the ratios
waist/height^ or weight/height^ for men and for women in the four separate studies were
obtained from the linear regression coefficient between logio height (independent
variable) and logio waist or logio weight (dependent variable).
RESULTSSubjects had wide ranges of age and antlu'opometry (Table 4.3.1). Dutch men and
women were taller than the Scots. Mean waist circumference and body mass index were
similar between the groups of men and between the groups of women, except that
Glasgow women had higher values than the other female groups.
Plots from the MORGEN study show a significant {P <0.001) positive correlation
between weight and height (Figures 4.3.1a & b), and this correlation decreased towards
zero (Figures 4.3.2a & b) when height^ was incorporated as its denominator (BMI). On
the other hand, waist circumference alone had an almost zero correlation with height in
both sexes (Figures 4.3.3a & b). Similar trends were observed in the other thi'ee studies
(Table 4.3.2).
147

Height coiTelated significantly (P <0.001) with body weight in men {r range 0.375 to
0.505) and in women (r range 0.165 to 0.320) (Table 4.3.2). As expected, the
correlation of height with BMI (weight/height^) was much less, and tended to be
negative both in men (r range -0.213 to 0.064), and in women (r range -0.248 to -0.054).
In the same subjects from all four studies, height explained no more than 1.6% of
vai'iance of waist circumference in seven out of eight groups, except the male group
from the Glasgow MONICA study which was slightly higher {r^ = 3.3%). The
relationship between height and weight or waist became more positive when adjusted for
age (Table 4.3.2), while age adjustment appealed not to alter the relationship between
height and BMI.
Without age adjustment, regression analysis to derive the optimal index power in the
waist/height*’ ratio (Table 4.3.3) showed this value was close to zero in all the samples
studied, indicating that there was no significant lineai* relationship between height and
waist measurement. Only the MONICA men and MORGEN men did the 95%
confidence interval excluded zero. The MORGEN sample was large enough to analyse
by decades of age, and this resulted in optimal power between 0.36 to 0.58 in men and
0.06 to 0.26 in women.
Weight/height ratio included for comparison showed one group with optimal index
power of height reasonably close to the index power 2 of body mass index in men. The
remaining tliree groups had optimal index power of height close to 1.5. Three out of four
female groups had optimal index power of height close to 1, and the remaining group
value was close to 1.5. The index power 2 (namely BMI) was included within the 95%
confidence intervals for thr ee of the eight ten year age bands in the MORGEN sample.
In the samples studied, age correlated positively (P <0.001) with waist circumference (r
range from 0.214 to 0.612 in men, and 0.197 to 0.464 in women), and age correlated
negatively (P <0.001) with height (r range -0.200 to -0.508 in men, and -0.216 to -0.269
148

in women), which in cross sectional studies could reflect either height loss through
ageing or alternatively a secular trend towards a taller population (van Leer et al, 1992.
The possible influence of age on the relationship between waist circumference or weight
and height was examined by stratifying subjects into four groups, 20-29, 30-39, 40-49,
and 50-59 years in the MORGEN sample (Table 4.3.3), or by regression analysis of
logio height on logio waist or on logio weight adjusting for age in each sample (Table
4.3.4), showed the optimal index powers increased to between 0.19-0.89 in men and
between 0.02-0.58 in women for waist/height*’, and between 1.47-2.38 in men and
between 1.25-1.96 in women for weight/height^.
Correlations between height and waist/height^ ratios with various index powers of height
ranging from 0 to 1 in the MORGEN study group showed the weakest correlation
coefficients occuiTed when the index powers (‘’) of waist/heighf’ were between 0.25-0.50
in men and 0-0.25 in women. Age adjustment for the MORGEN sample of all ages
showed the weakest correlation between waist/height*’ and height were 0.50 in men and
0.25 in women (Table 4.3.5).
Without age adjustment, height explained 0.3-3.5% and 0.1-0.8% of variance of waist
circumference in men and in women respectively, and the corresponding values with age
adjustment were 0.4-7.5% in men and 0.0-2.6% in women.
The relationship between waist circumference and height was fiirther analysed in the
MORGEN sample. Subjects were stratified into two groups according to the waist
circumference ‘Action Level V (94 cm in men, 80 cm in women) (Chapter 4.1; Lean et
al, 1995). Table 4.3.6 shows that there were weak but significant associations between
height and waist circumference in men and women with waist circumferences below the
‘Action Level ’. The proportion of variance in the waist circumference explained by
height in those with a waist circumference above the ‘Action Level ’ was 0.64% in men
and 0.03% in women.
149

DISCUSSIONWithout age adjustment, the optimal index power of height in the waist/heighf’ ratio was
consistently close to zero in both sexes of all eight samples studied. Men generally have
higher optimal index powers than women in the weight/height^ relationship, indicating a
greater influence of height on weight in men. Adjustment of age by regression analysis
or by dividing the population into ten yeai' age bands accentuated the relationship
between height and waist or weight. By stratifying subjects fi'om the MORGEN sample
according to ‘Action Level 1’ (94 cm in men and 80 cm in women) (C hapter 4.1; Lean
et al, 1995), we have shown that height correlated slightly higher with waist in those
with a waist circumference below ‘Action Level V, but in those with a waist ahove
‘Action Level 1% the proportion of age adjusted vaiiance in waist circumference
explained by height was only 0.64% {P <0.05) in men and 0.03% (P = not significant) in
women (Table 4.3.6). Thus in those who need weight management, height does not
importantly influence variations in waist circumference. In their studies of coronary
heart disease in relation to the physique of London busmen, Eleady et al { \96 \) came to
the same conclusion that height adjustment for waist circumference was not necessary,
since little difference was made to the results.
In mathematical terms, the indices reflecting adiposity such as BMI and waist
circumference respectively should have a zero correlation with height to eliminate the
influence of stature. Deurenberg et al (1991) have demonstrated that weigh/height*’
index as a measure of body fatness does not necessarily have to be completely
independent of height, due to significant correlation between body fatness and height.
The relationship between intra-abdominal fat mass and height in 20 women, aged 20-51
years, has been examined in a study using magnetic resonance imaging (C hapter 4.4;
Han et al, 1997b). Intra-abdominal fat mass did not correlate significantly with height
{r' = 1.3%, P = 0.40), but coiTelated more highly with waist circumference (r^ = 77.8%,
P <0.001), abdominal sagittal diameter (r^ == 77.4%, P <0.001) transverse diameter (r^ =
77.4%, P <0.001) and body mass index (r^ = 72.3%, P <0.001) than with waist hip ratio
(r^ = 32.5%, P <0.05). Ratios of waist/height’’ of different index powers did not increase
150

upon the variance in intra-abdominal fat mass explained by waist circumference alone.
Neither intra-abdominal fat mass (P = 0.40) nor waist circumference (P = 0.31) related
significantly to height in these women.
It is perhaps surprising to find that physical stature as indicating by height has such
limited influence on waist circumference. However waist circumference is a body
dimension which contains relatively little bone (only the spine). The relationship in men
is very weak and limited to certain age bands. In women, spinal shortening from
osteoporosis could tend to increase waist circumference, and this may be more
pronounced so reducing any relationship in older and shorter women, thus accounting
for the inverse relationships (Figure 4.3.3b).
Practicality must be taken into account when deriving antliropometric indices (WHO,
1995), to establish the advantage of ratios or other complex expressions over the single
variable alone, ease of computation of the ratio (Berm, 1971), the availability of the
variables for measurement, and reliability of measurement in the field. If the
measurements for a ratio are easy to obtain and it gives much better prediction than the
single variable, then using the ratio is justified. For example, many attempts (Khosia and
Lowe, 1967; Beim, 1971) have been made to derive new indices of adiposity fiom
weight and height in order to better the body mass index (weight/height^), but most of
these ratios are sex or population specific, as confirmed in the present study. By
consensus, weight/height^ is still the ratio of choice. Although the BMI does not have a
perfect zero correlation with height, it is a reasonable approximation for many purposes,
the index power 2 is rather conveniently remembered, and easy to calculate. Although
weight/height^ ratio was originally derived from Caucasian populations it is commonly
used to assess body weight in other ethnic groups. Examination of its validity may still
be required in these groups.
The slight differences in optimal index powers between the four study populations
(Table 4.3.3) could be explained by systematic differences in anthropometric
151

measurements between centres, although no such differences in teclinique have been
identified, and the same measurement protocols were used (WHO, 1989). Alternatively
there may be minor morphological differences between the populations related to factors
such as physical activity, diet, and use of hormone replacement therapy. There were
differences in age ranges, the Wageningen sample contained subjects up to 83 years,
whereas other samples were mostly less than 70 years (MONICA and Glasgow) or less
than 60 years (MORGEN). All subjects studied were older than 18 years. With age
adjustment, optimal index powers between samples became more similar to each other.
The influence of age on the association between waist circumference and height in the
large MORGEN sample was relatively small and probably not o f practical importance
for most purposes.
Studies of magnetic resonance imaging (Chapter 4.4; Han et al, 1997b; Ross et al,
1992; Ross et al, 1993) and computed tomography (Pouliot et al, 1994) showed waist
explained 80- 90% of variance in total body fat. We have shown that large waist
circumference alone identifies most subjects with high BMI or high waist to hip ratio
(Chapter 4.1; Lean et al, 1995), and can be used to predict total body fat as measured
by densitometry, at least as well as by the conventional skinfold method and without
bias when fat distribution is altered (Chapter 3.1; Lean et al, 1996). Waist
circumference also relates strikingly to cardiovascular risk factors (Pouliot et al, 1994;
Chapter 5.2; Han et al, 1995c). Waist/height ratio correlates tightly with BMI (r >0.9).
Seidell et al (1992) have previously shown waist/height ratio was no better than
waist/thigh ratio or waist circumference alone in predicting cardiovascular risk factors.
CONCLUSIONS
Height and age have limited influence on the differences in waist circumference between
individuals of different statme. Waist alone may be a useful indicator of adiposity in
either men or women in Caucasian populations without the need to adjust for height.
This is in contrast to measures of weight, where a positive correlation with statme
necessitates adjustment for height, as the conventional weight/height^ ratio for BMI.
152

Table 4.3.1. Characteristics of subjects from the Netherlands and Scotland.
Study
n (M/F)
Dutch Scots
All studies
3319/4358
MORGEN
2183/2698
Wageningen
146/238
MONICA
904/1014
Glasgow
86/408
Mean SD Mean SD Mean SD Mean SD Mean SD
Men
Age (years) 42.7 10.5 45.9 17.4 51.0 14.1 44.9 14.1 45.2 12.6
Waist (cm) 91.6 10.4 93.3 10.8 93.3 11.9 93.1 14.8 92.2 11.0
Weight (kg) 81.4 11.9 81.1 11.7 75.9 13.7 80.3 16.1 79.8 12.8
Height (m) 1.78 0.07 1.80 0.08 1.71 0.07 1.75 0.07 1.76 0.08
BMI (kg/m^) 25.7 3.4 25.1 3.4 26.0 4.1 26.2 4.7 25.8 3.6
Women
Age (years) 42.6 10.7 36.9 17.5 50.8 14.0 43.5 14.3 44.3 12.9
Waist (cm) 80.3 10.9 82.6 12.0 82.0 12.3 86.3 14.3 81.4 11.8
Weight (kg) 68.3 11.3 67.8 12.9 65.9 14.5 75.9 16.9 68.4 13.0
Height (m) 1.65 0.07 1.68 0.07 1.58 0.07 1.61 0.06 1.6.3 0.07
BMI (kg/m^) 25.1 4.2 24.2 4.7 26.3 5.5 29.2 6.5 25.7 4.9
BMI = body mass index
153

Table 4.3.2. Correlation coefficients, unadjusted and age adjusted, between height
(independent variable) and body weight, body mass index, and waist circumference in
Dutch and Scottish men and women.
Study n
Weight BMI Waist
Crude Age
adjusted
Crude Age
adjusted
Crude Age
adjusted
Men
MORGEN 2183 0.441*** 0.490*** -0.140*** -0.063** 0.051* 0.193***
Wageningen 146 0.375*** 0.361*** -0.213** -0.159": -0.150": 0.061":
MONICA 904 0.505*** 0.506*** 0.064": 0.090** 0.186*** 0.275***
Glasgow 86 0.385*** 0.497*** -0.018": 0.085": 0.068": 0.245*
Women
MORGEN 2698 0.252*** 0.304*** -0.248*** -0.198*** -0.036": 0.054**
Wageningen 238 0.173** 0.283*** -0.248*** -0.119": -0.057": 0.162*
MONICA 1014 0.320*** 0.338*** -0.054": -0.011": 0.059": 0.137***
Glasgow 408 0.165*** 0.238*** -0.188*** -0.113* -0.088": -0.001":
<0.05; <0.01; <0.001; ns = not significant
154

Table 4.3.3. Optimal index powers (when height has zero correlation with the derived
ratios) of the denominator height in the ratios of waist/height and weight/height derived
from regression analysis of logigheight on log^gwaist, and on lo g w eig h t respectively,
with foui' age bands in the MORGEN study.
Waist/height^ Weight/height^
Study n OIP SE 95% Cl OIP SE 95% Cl
Men
MORGEN
20-29 333 0.36 0.13 0.10, 0.62 1.72 0.15 1.42, 2.02
30-39 544 0.56 0.11 0.33, 0.78 1.85 0.14 1.57, 2.13
40-49 672 0.38 0.10 0.18, 0.58 1.68 0.13 1.48, 1.93
50-59 634 0.58 0.10 0.39, 0.77 1.86 0.12 1.63,2.10
All ages 2183 0.15 0.06 0.03, 0.26 1.57 0.07 1.44, 1.70
Wageningen 146 -0.42 0.22 -0.86, 0.02 1.32 0.25 0.82, 1.82
MONICA 904 0.58 0.10 0.39, 0.78 2.25 0.12 2.01,2.50
Glasgow 86 0.17 0.44 -0.71, 1.05 1.78 0.49 0.82, 2.75
Women
MORGEN
20-29 448 0.10 0.14 -0.17,0.37 1.14 0.18 0.79, 1.49
30-39 644 0.23 0.11 0.02, 0.44 1.45 0.13 1.19, 1.71
40-49 817 0.26 0.11 0.04, 0.48 1.23 0.13 0.97, 1.48
50-59 789 0.06 0.11 -0.15, 0.28 1.15 0.13 0.89, 1.41
All ages 2698 -0.11 0.06 -0.23, 0.01 1.04 0.07 0.90, 1.18
Wageningen 238 -0.18 0.22 -0.61, 0.26 0.87 0.28 0.32, 1.42
MONICA 1014 0.22 0.11 0.00, 0.43 1.74 0.15 1.45,2.03
Glasgow 408 -0.38 0.21 -0.79, 0.02 0.89 0.27 0.35, 1.42
OIP = optimal index power
155

Table 4.3.4. Optimal index powers (when height has zero correlation with the derived
ratios) of the denominator height in the ratios of waist/height and weight/height derived
from regression analysis of log^gheight on log^Qwaist, and on logioweight respectively,
with age adjustment.
Study
Waist/height^ Weight/height*^
n OIP SE 95% Cl OIP SE 95% Cl
Men
MORGEN 2183 0.51 0.05 0.41,0.62 1.82 0.07 1.68, 1.95
Wageningen 146 0.19 0.24 -0.28, 0.67 1.47 0.29 0.89, 2.05
MONICA 904 0.89 0.10 0.69, 1.09 2.38 0.13 2.12,2.63
Glasgow 86 0.73 0.34 0.05, 1.41 2.24 0.44 1.38,3.11
Women
MORGEN 2698 0.17 0.06 0.06, 0.29 1.25 0.07 1.11, 1.39
Wageningen 238 0.58 0.21 0.16, 0.99 1.49 0.29 0.92, 2.06
MONICA 1014 0.54 0.11 0.31,0.76 1.96 0.16 1.65, 2.27
Glasgow 408 0.02 0.20 -0.38,0.41 1.39 0.27 0.87, 1.92
OIP = optimal index power
156

Table 4.3.5. Correlations between height and waist/height*^ ratios of various index
powers in the MORGEN study in all subjects with and without age adjustment, and in
four different age bands.
Age group Correlation coefficients
(years) n Waist Waist/Ht"-^' Waist/Ht"'"" Waist/Ht"'" Waist/Ht
Men
20-29 333 0.140* 0.038"' -0.064"' -0.164** -0.259***
30-39 544 0.192*** 0.104* 0.013"' -0.077"' -0.166***
40-49 672 0.138*** 0.046"' -0.047"' -0.139*** -0.228***
50-59 634 0.228*** 0.130** 0.029"' -0.074"' -0.174***
All ages 2183 0.051* -0.042"' -0.132*** -0.220*** -0.303***
fAll ages 2183 0.193*** 0.098*** 0.001"' -0.096*** -0.191***
Women
20-29 448 0.024"' -0.058"' -0.139** -0.216*** -0.289***
30-39 644 0.080* -0.009"' -0.097* -0.184*** -0.266***
40-49 817 0.077* -0.001"' -0.076* -0.151*** -0.224***
50-59 789 -0.018"' -0.063"' -0.143*** -0.220*** -0.293***
All ages 2698 -0.036"' -0.112*** -0.186*** -0.258*** -0.325***
t All ages 2698 0.054** -0.028"' -0.109*** -0.188*** -0.263***
*P <0.05; <0.01; ***P <0.001; ns = not significant; ns = not significant; Ht, height; fage adjusted.
157

Table 4.3.6. Correlation coefficients between height and waist circumference in subjects
identified by waist circumference ‘Action Level 1% in the MORGEN study (94 cm in
men, 80 cm in women).
Men Women
Age (y) Waist <94 cm Waist >94 cm Waist <80 cm
*P <0.05; **P <0.01; <0.001; fage adjusted.
Waist >80 cm
n r n r n r n r
1 20-29 285 0.198** 48 -0.001 363 0.123* 85 -0.125
30-39 386 0.202*** 158 -0.043 442 0.153** 202 -0.038
40-49 374 0.138** 298 0.092 417 0.120* 400 0.032
50-59 267 0.157* 367 0.120* 259 0.102 529 -0.022
All ages 1312 0.053 871 0.049 1481 0.056* 1217 -0.040
fAll ages 1312 0.192*** 871 0.080* 1481 0.131*** 1217 -0.018
158

140r = 0.441 P <0.001
Men120
O)100
O)
60
40150 160 170 180 190 200 210
a Height (cm)
140r = 0.252 P <0.001
Women120
O)100
O)
60
40140 150 160 170 180 190
b Height (cm)
Figure 4.3.1. The relationship between body weight and height in men 2183 (a) and
2896 women (b), showing the regression line (solid) and line of zero correlation
(dashed).
159

CM
Eg
50
400■o.5 30(/)(/)(DE 20 ■o t§ 10
r = -0.140 f <0.001
150 160
a170 180 190
Height (cm)
Men
200 210
50CM
E^ 400■D.£ 30
E 20*oœ 10
r = -0.284 f <0.001
140
Women
-------
150 160 170 180
Height (cm)190
Figure 4.3.2. The relationship between body mass index and height in 2183 men (a) and
2896 women (b), showing the regression line (solid) and line of zero correlation
(dashed).
160

150§ r = 0.051
P <0.018Men
1308C2SE32
110
90I;!: :' !!
ü
ï 50150 160 170 180 190 200 210
a Height (cm)
Eü
8c2
132 ü
‘cD
150
130
110
90
70
50
r = -0.036 P <0.063
Women
AÈËÊiË
140 150 160 170
Height (cm)180 190
Figure 4.3.3. The relationship between waist circumference and height in men 2183 (a)
and 2896 women (b), showing the regression line (solid) and line of zero correlation
(dashed).
161

4.4
PREDICTING INTRA-ABDOMINAL FATNESS BY MAGNETIC
RESONANCE IMAGING AND COMPUTERISED TOMOGRAPHY
FROM ANTHROPOMETRIC MEASURES FOR HEALTH
PROMOTION: THE INFLUENCE OF STATURE
This section has been peer reviewed and will be published as
Han TS. McNeill G, Seidell JC, Lean MEJ. Predicting intra-abdominal fatness
from anthropometric measures: the influence of stature. International Journal of
Obesity ^9Q7', (in press).
Collaboration with Professor JC Seidell
162

ABSTRACT
Objective: To investigate the influence of height on the relationships between the intra
abdominal fat and anthi'opometric measui'cs.
Subjects: Twenty healthy female volunteers aged 20 to 51 years from Aberdeen, and 71
men and 34 women aged 19 to 85 years from Nijmegen, The Netherlands.
Outcome measures: Intra-abdominal fat volumes by magnetic resonance imaging (MRI)
in Aberdeen and cross-sectional areas at L4-L5 level by computerised tomography (CT)
in Nijmegen, height, body mass index (BMI), waist circumference, waist sagittal and
transverse diameters, waist to hip ratio, and skinfolds.
Results: In the MRI study the women with BMI 20-33 kg/m^, waist circumference 62-97
cm, height 148-172 cm, and intra-abdominal fat volume 0.07-2.66 kg, waist
circumference gave the highest correlation of simple indices with intra-abdominal fat
volume, explaining 77.8% of variance. Single cross-sectional MRI cuts predicted
volume with r = 0.94-0.99. Height in various levels of index power was not related to
waist circumference, waist diameters, BMI, or skinfolds and did not improve prediction
o f intra-abdominal fat volume or of cross-sectional intra-abdominal fat ai'ea at any level.
The CT study of men and women with BMI 18-32 kg/m^ and 19-38 kg/m^, waist
circumference 71-112 cm and 74-125 cm, height 158-197 cm and 151-182 cm, and
intra-abdominal fat area 13-274 cm^ and 19-221 cm^ respectively, height also had little
influence on the relationships of intra-abdominal fat area with waist circumference or
with any other indices of adiposity in linear' or quadratic model. Compared to younger
subjects, intra-abdominal fat area was higher in older subjects for a given waist.
Conclusion: Height does not importantly influence the differences in measui'es of
adiposity or intra-abdominal fat volume in women, or intra-abdominal fat area in both
sexes. Age does influence the prediction of intra-abdominal fat from waist
circumference, but waist circumference alone has a predictable simple relationship with
intra-abdominal fat volume or ai’ea, which is likely to relate to the prediction of health
risk for health promotion.
Key words: body fat distribution, cai'diovascular disease, computerised tomography,
health promotion, height, magnetic resonance imaging, obesity.
163

INTRODUCTION
Increasing international concern about obesity, and its rising prevalence (Gregory et a/,
1990; Bennett et al, 1995) and the recognition of the independent importance of body fat
distribution has stimulated interest in identifying or predicting those at greatest health
risk. For the purpose of health promotion directed at the general public, a single
measurement of waist girth has been proposed as an indicator for alerting people to
increased health risks associated with both total fatness and intra-abdominal fat
accumulation (C hapter 4.1; Pouliot et al, 1994; Lean et al, 1995). We have shown that
differences in waist circumferences between subjects are virtually unaffected by
differences in heights, particulaily amongst those who need weight management, namely
waist above 94 cm in men, 80 cm in women (C hapter 4.3; Han et al, 1996b). These
conclusions are not entirely new. In their studies of body shape and related health risk of
London busmen, Morris and colleagues initially adjusted the size of trouser waist (proxy
for waist circumference) for height (Morris et al, 1956), but in subsequent studies which
also included the measurement of waist circumference, these authors realised that height
adjustment made little difference in the comparisons of waist circumference between
subjects of different stature (Heady et al, 1961). Sanders (1959) came to the same
conclusion that height should be ignored when comparing differences in skinfold
thicknesses, since there was no relationship between the two variables.
A recent study of a mixed group of 16 men and 31 women suggested that the cross-
sectional area of intra-abdominal fat (in a single computerised tomography cut at the L4-
L5 level) related slightly more highly with waist to height ratio (r = 0.83) than waist
circumference alone (r = 0.75). A separate study of 97 men and 60 women found that
intra-abdominal fat area was related linearly to waist in women but quadratically in men,
and that the total variance was lower in men than in women (Sclireiner et al, 1996).
The present study examined the influence of stature on the relationships between
measures of adiposity and intra-abdominal fat volume estimated from the tliree
164

dimensional volume measuied by magnetic resonance imaging in women, and intra
abdominal fat ai'ea measured by computerised tomography in both sexes.
METHODS
Subjects
From larger studies of the influence of intra-uterine growth on fat distribution in 110
women in Aberdeen (Han, 1994), twenty healthy premenopausal women agreed to take
part in detailed body composition assessment using magnetic resonance imaging. Data
from a previous study in The Netherlands of body composition using computerised
tomography scans in 71 men and 34 women in whom structural abnormalities had been
excluded, referred to the Radiodiagnostic Institute of the University hospital in
Nijmegen (Seidell et al, 1987), were analysed.
Intra-abdominal fat volume using magnetic resonance imaging
Intra-abdominal fat volume was measured by magnetic resonance imaging (Aberdeen
Mark II, 0.08 Tesla). The pulse sequence teclinique using inversion/saturation recovery,
with gain factor of four, repetition time of 1000 ms, and slice thickness of 20 mm, was
used to synthesise the images in order to distinguish fat from other tissues. Intra
abdominal fat ai’eas were determined from four cross-sectional images of equal distance
between xiphisternum and anterior iliac crest, traced by hand using the computer
‘mouse’. The number of pixels were converted to Système Internationale units from
calculated values of % (3.15 mm) and y (3.95 mm) axes of the computer screen. Fat
volume was calculated using a truncated cone model (Kvist et al, 1988) and then
converted to fat mass assuming adipose tissue contains 80% of fat, 2% protein, 18% of
water with negligible minerals (Garrow, 1974), with corresponding densities of 0.900,
1.34 and 0.993 kg/1 (Siri, 1961), giving an average adipose tissue density of 0.9255 kg/1.
Thus fat mass was converted from adipose tissue by a factor of 0.9255 x 80%.
165

Intra-abdominal fat area using computerised tomography
Methodology has been described in detail by Seidell et al (1987). In brief, a single scan
was made at the level of foui-th-fifth lumbar vertebrae using computerised tomography
scanner (Siemens UB Med, Germany). Data from the scans were analysed using
histogram-based volumetric analysis technique to determine fat area set at the range of
-150 to -50 Hoimsfield units. The area of intra-abdominal fat was obtained using a light
pen cursor tlii'ough the muscles separating the subcutaneous and intra-abdominal fat.
Anthropometry
In the magnetic resonance imaging study, weight in light clothes was measured to the
nearest 100 g, and height was measured barefoot with head in the horizontal Frankfort
plane, using a stadiometer to the nearest 0.1 cm. Waist circumference midway between
the lateral lower ribs and the iliac crest, and hip circumference at the widest part over the
greater trochanters were measured according to standard protocols (World Health
Organisation, 1989). Waist sagittal and transverse diameters were measured by
pelvimeter (CMS Weighing Ltd, London) at the same level as for waist circumference,
in standing position to the nearest mm. Skinfold thicknesses were measured at biceps,
triceps, subscapular, and supra-iliac using skinfold calipers (Holtain, Crymych, UK). All
measuring instruments were calibrated with standards before use. In the computerised
tomography study, measurements of weight and height were obtained using similar
methods. Waist circumference was measured at the umbilical level, and hip
circumference was taken from the widest level. Two skinfold thicknesses at the sites of
abdomen and supra-iliac crest were measured (Seidell et al, 1987).
Statistical analysis
Multiple lineal' regression analysis was performed to determine the relationships
between measui'es of adiposity and intra-abdominal fat measures. Analyses used the
SPSS statistical package (SPSS Inc., version 6.1.1, Chicago, Illinois).
166

RESULTS
Magnetic resonance imaging study
Subjects’ characteristics are shown in Table 4.4.1. The body mass index distribution
was similar to that of the British population (Gregory et al, 1990; Bennett et al, 1995).
All four cross-sectional intra-abdominal fat areas correlated highly with the intra
abdominal fat volume. The area at L4, just above the iliac crest gave the lowest
prediction (r = 0.94) and that at the 2/3 distance from xiphisternum to anterior iliac crest
gave the highest (r = 0.99). Table 4.4.2 shows that intra-abdominal fat areas between
xiphisternum and iliac crests and intra-abdominal fat volume correlated highly and
similarly with all measurements including waist circumference, and with body mass
index but less well with waist to hip ratio or other antliropometric ratios. In this single
sex study, dividing waist by height did not improve prediction of cross-sectional fat area
compared to waist circumference alone, at every level between the xiphisternum and
iliac crest. Waist circumference measured at the umbilical level was used instead of that
measured between lowest rib margin and iliac crest in the analysis with intra-abdominal
fat and the influence of height gave almost identical results (data not presented). In a
larger study of 110 women which included the magnetic resonance imaging study (Han,
1994), waist circumference measuied at the umbilical level (mean = 87.3, SD 15.5 cm)
was 10% (mean difference = 8.0, SD 4.3 cm) bigger than that at the standardised level
(World Health Organisation, 1989) midway between lowest rib margin and the iliac crest
(mean = 79.3, SD 13.4 cm). Multiple linear regression analysis showed that the addition
of age (/ value for age = -0.308, P = 0.762) did not change the relationships between
waist circumference and intra-abdominal fat volume. Table 4.4.3 shows that height did
not significantly correlate with intra-abdominal fat volume or any other indices of
adiposity. Waistdieight*’ ratios of different levels of index power (p) for height were
calculated. Waist circumference alone (waistiheight^) (Figure 4.4.1a) was related more
closely to intra-abdominal fat volume than waist to height ratio (waist:height^) (Figure
4.4.1b). Logaritlrmic or quadratic transformation showed waist to height ratio produced
no further improvement in predicting intra-abdominal fat volume over waist alone (data
not shown). Table 4.4.4 shows that waist to height ratios of different levels of index
167

power did not improve correlations with intra-abdominal fat volume over waist
circumference alone.
Computerised tomography study
Subject characteristics are shown on Table 4.4.5. Compared to women in the magnetic
resonance imaging study (Table 4.4.1), women in the computerised tomography study
were older, and had similar body mass index (26.0 kg/m^ versus 25.2 kg/m^) but larger
waist circumference (94.6 cm versus 78.6 cm). The difference in waist circumference
between the women in the two studies is likely to result from different landmarks being
used (umbilical for computerised tomography study, midway between lowest rib margin
and iliac crest in magnetic resonance imaging study), and the difference would be much
less if the same level were used (see result section of the magnetic resonance imaging
study). Multiple linear regression analysis in Table 4.4.6 shows that age was
significantly related to intra-abdominal fat area in both sexes and to indices of adiposity
in women only. The addition of height to the model did not significantly improve
prediction in either sex. Low correlation between body mass index and age in men was
partly explained by their non-linear relationship, weight increased up to 55 years and
then decreased (figure not presented).
Table 4.4.7 shows that waist to height ratio was similar to waist circumference alone in
predicting intra-abdominal fat area in men and women. Adjusting for age using partial
correlation analysis increased all significant correlations between intra-abdominal fat
area and all antluopometric indices except waist to height ratio (decreased) in men. Thus
waist to height ratio and waist circumference were similar in prediction of intra
abdominal fat area after age adjustment. In women, all significant correlations decreased
when adjustment was made for age. Subjects were stratified into two age groups at 50
years (Table 4.4.8). Variances were determined using curve estimation to see if there
were curvilinear relationships between intra-abdominal fat area and waist circumference
or waist to height ratio. There were slight differences in variances between the linear and
quadratic relationships, and only men aged >50 years showed any evidence for
168

difference between waist and waist to height ratio. The data set is too small to be
confident that this is a real result.
Figures 4.4.2a & b show, for men and women sepai'ately, that dividing the subjects into
two groups above and below 50 years, intra-abdominal fat area was linearly related to
waist circumference. For a given waist circumference, younger men had significantly
lower intra-abdominal fat area than older men. The gradients between the two age
groups in women were not significantly (P >0.05) different from each other.
DISCUSSION
The magnetic resonance imaging study in healthy female volunteers confirms the robust
prediction of intra-abdominal fat volume from a simple waist circumference. The results
on tln'ee-dimensional fat volume strengthens the data obtained from oui* study of single
cut computerised tomography in men and in women sepai'ately. Neither waist
circumference nor any other indices of adiposity nor intra-abdominal fat volume
correlated with height. Therefore dividing indices by height to create ratios would
violate the principle for deriving indices of adiposity (Benn, 1971). There may be
sepai'ate influence of height on health risks, independent of body fat, but height does not
contribute in measurement of intra-abdominal fat or fatness.
For use in health promotion, waist alone is already becoming established as a better
predictor of risk factors related to body fat than more complicated ratios, such as waist
to hip ratio or waist to height ratio, firstly because of ease of communication, and
secondly because it is at least as powerful in predicting risk (Chapter 5.2; Han et al,
1995c) and mortality (Higgins et al, 1988) as the ratios. We have previously
demonstrated a lack of association between height and waist circumference (Chapter
4.3; Han et al, 1996b; Han et al, 1997c). Changes in waist circumference have been
shown to correlate (P <0.05) with changes in intra-abdominal fat (r = 0.81) (Lemieux et
al, 1996a), and changes in a variety of cardiovascular risk factors including total
cholesterol {r = 0.31), low density lipoprotein cholesterol {r = 0.35) and blood pressure
169

(r = 0.26) ill women (C hapter 7; Han et al, 1997a). Changes in waist to hip ratio were
not related to changes in either intra-abdominal fat (Lemieux et al, 1996a) or changes in
cardiovascular risk factors (C hapter 7; Han et al, 1997a; Lemieux et al, 1996a).
Suggestions that a ‘waist to height ratio’ should be used in health promotion have been
made, based on a study of single computerised tomography image just above the iliac
crest (L4-L5) in a mixed group of 16 men and 31 women (Ashwell et al, 1996).
However, it may not be appropriate to analyse men and women together, since the
intercepts for the two sexes were significantly different (Ashwell et al, 1996). Our
present computerised tomography analysis, combining 71 men and 34 women produced
a small difference in the opposite direction: intra-abdominal fat area at L4-L5 correlated
higher with waist circumference alone (r = 0.79, r = 0.77 after age adjustment) than with
waist to height ratio (r = 0.77, r = 0.72 after age adjustment). Pouliot et al (1994)
analysed 81 men and 70 women separately, and found waist circmnference correlated
with intra-abdominal fat area measured by computerised tomography at L4-L5 similarly
to our single magnetic resonance images (r = 0.87) in women, and a correlation of 0.77
in men. Treuth et al (1995) observed a correlation of 0.84 between intra-abdominal fat
area and waist circumference in women. These authors came to the same conclusion as
ours, recommending the use of waist circumference as an index for intra-abdominal fat
accumulation and associated morbidity. Waist sagittal diameter gave similar results to
waist circumference in the present magnetic resonance imaging study.
In the present study, the close correlations between the volume and single cuts of intra
abdominal fat justify the use of a single scan in lai'ger studies in terms of time and costs.
Table 4.4.2 shows that the best single scan was at the level of 2/3 the distance between
xiphisternum and anterior iliac crest, approximately at the L2-L3 level in most subjects
with / = 0.98. The present study of magnetic resonance imaging had a relatively small
sample of 20 women but the small sample size was compensated for by multiple scans,
thus the results would be expected to be more robust than single scans. A recent study of
170

magnetic resonance imaging (Abate et al, 1997) in 49 men showed similar results with
best prediction of volume from a single cut at L2-L3 ~ 0.85).
Intra-abdominal fat area was linearly related to waist circumference (Table 8) in both
sexes, therefore the present study did not support the findings of Sclireiner et al (1996),
who observed a quadratic relationship in men. Age had important effects on fat
distribution. When the subjects were divided into two age groups separated at 50 years
in either sex, the gradients of the relationships between intra-abdominal fat area and
waist circumference were significantly different in men (Figure 4.4.2a), but not in
women (Figure 4.4.2b), namely for a given waist circumference, men above 50 years
had significantly more intra-abdominal fat than those below 50 years. Significant
differences in women of different age group might emerge if more extreme age groups
could be compared, for example those above 60 versus those below 40 years. Similarly,
it was observed that for a given body mass index, older subjects tended (not significant)
to have more intra-abdominal fat than younger ones (data not presented). Lemieux et al
(1996b) found similar results and have proposed higher cut-offs of waist circumference
for younger people (below 40 years) to identify those with an intra-abdominal fat area
above 130 cm^. However, separate cut-offs in different age groups could only be
justified if evidence is produced to indicate different associations of health risk with the
same amount of intra-abdominal fat at different ages. Furthermore, other factors could
influence intra-abdominal fat deposition, including illnesses such as non-insulin
dependent diabetes mellitus, smoking and alcohol drinking. Separate cut-offs for these
people might give greater predictive accuracy, but would complicate the whole issue in
terms of health promotion directed at the general public.
CONCLUSIONSWaist circumference alone explained 78% of the variance in intra-abdominal fat volume
by magnetic resonance imaging in women, and there was no further improvement using
waist:height^ ratios of different levels of index power. In both men and women, height
did not greatly influence the relationship between intra-abdominal fat area by
171

computerised tomography. In men, the slope of the relationship between intra-abdominal
fat area and waist circumference was greater in those over 50 yeai's than those under 50
years, so a given waist circumference is associated with more intra-abdominal fat area in
older people than younger people. A similar trend was observed in women, but the
difference in slopes was not significant. However, before this finding is used to derive
different cut-off values for health screening, we would argue that the relationships
between waist circumference and risk factors at different ages need to be further
examined.
172

Table 4.4.1. Chai'acteristics of 20 women in the magnetic resonance imaging study.
Mean SD Range
Age (years) 34.4 10.0 20.0-51.1
Weight (kg) 66.8 14.0 46.0-96.1
Height (cm) 162.3 6.5 148.4-171.9
Body mass index (kgW ) 25.2 4.5 19.6-33.0
Waist circumference (cm) 78.6 10.7 61.6-97.3
Waist sagittal diameter (cm) 20.5 3.6 15.5-27.0
Waist transverse diameter (cm) 27.7 3.0 23.1-33.0
Waist to hip ratio 0.78 0.07 0.67-0.89
Subcutaneous skinfolds (mm)'* 67.4 27.2 30.3-122.5
Intra-abdominal fat volume (kg) 0.96 0.77 0.07-2.66
*Sum o f skinfolds measured at biceps, triceps, subscapular and supra-iliac sites.
173

I%
I
I■S
1-§
I§
rO
8
18
!Tf
S
I
Ia1• §I
II
I
^ -3r n P h
CN 'X
ë8
m
* •X' * * * ** * * * * * ** * * * * * *o \ VO OV oo xt*CO o - o VO XT xToo CO oo oo in oo !>;o o o o o o CO
* ■X* * ** * * * * * ** * * -X- * •X- * *m VO o CN m ooOV oo o o r- COVO C-; r- m r- vo Ovo o <d> o o o o o
* -X- -X- * * * •X-* * * * ■3Î- -X- * ** * * * * * -X- •X-o oo o 0 \ o CN CNo CN in m o T—4 CN OVoo oo oo oo VO oo r- o \o o o o o o CO o
I$
s:ao
$
-X- -X- * * * * X-* •X- ■X- * * X- * -X-* -X- * * * * * *oo p v CN C-- o \ oo (Ov oo VO oo TT 0 0CTn 0 0 oo oo m oo C-s o \CO o o CO <d <d (d (d
X- * X- X- X- X- X-X- * * X- X- X- X-X- X- X- X- X- X- X- X-o m r- m VO ON CNON VO oo VO CN oo cn VOoo oo oo oo in oo r - ONCO cd o o <d (d cd cd
I
‘S
f-
i'Ii
9 -
g'.a%X)
I
V
oo
9

Table 4.4.3. Proportions of the variance of intra-abdominal fat volume (measured by
magnetic resonance imaging) and indices of adiposity explained by height in 20 women,
using linear regression analysis.
Adjusted / P
Intra-abdominal fat volume 0.013 0.394
Waist circumference 0.004 0.312
Waist sagittal diameter 0.005 0.354
Waist transverse diameter 0.006 0.201
Waist to hip ratio 0.002 0.339
Body mass index 0.020 0.334
Subcutaneous skinfolds* 0.010 0.522
*Sum o f skinfolds measured at biceps, ti'iceps, subscapular and supra-iliac sites.
Table 4.4.4. Variances of intra-abdominal fat volume (measured by magnetic resonance
imaging) explained by waist to height ratios of different levels of index power for height
in 20 women, using linear regression analysis.
Waist to height*’ ratios of different levels of index power
^050 ^025 O.OOt Ô25 Ô5Ô 0/75 l.OOJ
Adjusted / (%) 77.0*** 77.8*** 77.8*** 77.1*** 75.4*** 72.9*** 69.6***
***P <0 .0 0 1 ; fw aist to height" - waist circumference alone; Jwaist to height' = waist to height ratio.
175

Table 4.4.5. Characteristics of 71 men and 34 women in the computerised tomography
study.
Men (n = 71) Women (« = 34)
Mean SD Range Mean SD Range
Age (years) 52.0 17.2 19.4-84.7 52.6 13.3 19.4-72.1
Weight (kg) 73.5 11.3 54.0-102.0 69.6 12.3 50.0-103.0
Height (cm) 177.6 8.5 158.4-197.0 164.2 6.3 151.3-182.0
Body mass index (kg/m^) 23.4 3.1 17.8-31.6 26.0 5.0 19.4-38.3
Waist circumference (cm) 90.9 9.5 71.4-111.5 94.6 14.7 74.0-125.4
Waist to hip ratio 0.96 0.05 0.08-1.10 0.94 0.08 0.79-1.09
Subcutaneous skinfolds (mm)* 32.4 15.6 9.5-80.0 50.2 22.0 13.2-87.5
Intra-abdominal fat area (cm^) 89.9 53.0 12.7-274.0 91.8 52.7 18.8-221.0
*Sum o f skinfolds measured at abdomen and supra-iliac sites.
176

Table 4.4.6. Proportions of variance and t values of intra-abdominal fat area measured
by computerised tomography and anthr opometric indices explained by age and height in
71 men and 34 women, using multiple linear regression analysis.
Men {n = 71) Women (n = 34)
Predictor: Age
ÜA fA Pa UA (a Pa
Intra-abdominal fat area 0.141 3.540 <0.001 0.272 3.748 <0.001
Waist circumference -0.001 0.978 0.332 0.262 3.663 <0.001
Waist to hip ratio -0.007 0.721 0.473 0.093 2.089 0.045
Body mass index -0.013 0.235 0.235 0.121 2.411 0.021
Subcutaneous skinfolds* 0.043 -2.042 0.045 0.091 2.100 0.044
Predictors: Age + Height
6-1 pR Ufi+A 6-1 Pr
Intra-abdominal fat area 0.147 -1.029 0.231 0.289 -1.354 0.185
Height 0.361 -6.409 <0.001 0.038 -1.543 0.132
Waist circumference -0.009 0.663 0.510 0.275 -1.272 0.212
Waist to hip ratio -0.013 -0.761 0.450 0.148 -1.762 0.088
Waist to thigh ratio 0.497 0.401 0.690 0.372 -1.552 0.131
Body mass index 0.008 -1.576 0.120 0.216 -1.721 0.095
Subcutaneous skinfolds* 0.032 0.463 0.645 0.107 -1.257 0.218
u = variance proportion (adjusted); t ^ t value; A age; H = height; u^+a == total o f variance proportions
from height and age combined; *sum o f skinfolds measured at abdomen and supra-iliac sites.
177

Table 4.4.7. Correlation coefficients between intra-abdominal fat ai*ea measured by
computerised tomography and anthropometric indices in 71 men and 34 women, with
and without age adjustment.
Men (n = 71) Women (« = 34)
Unadjusted Age adjusted:}: Unadjusted Age adjusted:}:
Waist circumference 0.820*** 0.847*** 0.800*** 0.719***
Waist to height ratio 0.890*** 0.873*** 0.795*** 0.713***
Waist to hip ratio 0.748*** 0.778*** 0.503*** 0.401***
Body mass index 0.752*** 0.805*** 0.806*** 0.770***
Subcutaneous skinfoldsf 0.550*** 0.720*** 0.702*** 0.653***
Height -0.008"' 0.080"' -0.313"' -0.216"'
***p <0.001, ns = not significant; fsum o f skinfolds measui'cd at abdomen and supra-iliac sites; Jpartial
correlation analysis.
Table 4.4.8. Variances of intra-abdominal fat area (measured by computerised
tomography) explained by waist circumference or waist to height ratio in 71 men and 34
women, using linear or quadratic regression analysis.
Men (n = 71) Women ( n - 34)
<50 years
/ ( % )
>50 years
/ ( % )
<50 years
/ ( % )
>50 years
/ ( % )
Waist circumference Linear 75.7 71.8 49.1 58.9
Quadratic 76.8 71.8 52.0 59.5
Waist to height ratio Linear 76.4 77.9 53.4 58.6
Quadratic 76.4 79.0 55.4 59.0
178

bp 3.0
s 2.5
1 2.0
1.5
1 1.0OXi 0.5d1 0.0a
r2 = 77.8%: SEE = 0.362
60 65 70 75 80 85 90 95 100Waist circumference (cm)
I>a
Ia12
3.0= 69.6%; SEE = 0.424
2.5
2.0
1.5
1.0
0.5
0.00.35 0.40 0.45 0,50 0.55 0.60 0.65
Waist to height ratio
Figure 4.4.1. Plots between intra-abdominal fat volume measured by magnetic
resonance imaging and waist circumference (intra-abdominal fat volume = 0.0641 x
waist circumference - 4.072) (a), and waist to height ratio (intra-abdominal fat volume =
10.126 X waist to height ratio - 3.943) (b) in 20 women.
179

îcd
iegI d
IA
300
Men250 >50 years
<50 years200
150
100
O O50
0S 70 75 80 85 90 95 100 105 110 115
Waist circumference (cm)
Figure 4.4.2a. Plots between intra-abdominal fat area measured by computerised
tomography and waist circumference for separate age groups above and below 50 years
in 71 men [<50 year age group: intra-abdominal fat area = 3.96 (95% Cl: 3.11 to 4.81) x
waist circumference - 288.9 (95% Cl: -366.1 to -211.7); >50 year age group: intra-
abdominal fat ai'ca = 5.04 (95% Cl: 3.98 to 6.09) x waist circumference - 356.3 (95%
Cl: -453.1 to -259.6)]. Differences between gradients are significant {P <0.05).
180

Women ■ >50 years o <50 years
1 ”
I "^ 201
^ 151
. a
II ’
I 'a 70 75 80 85 90 95 100 105 110 115 120 125 130
Waist circumference (cm)
Figure 4.4.2b. Plots between intra-abdominal fat ai'ea measured by computerised
tomography and waist circumference for sepai’ate age groups above and below 50 years
in 34 women [<50 year age group: intra-abdominal fat area = 1.98 (95% Cl: 0.82 to
3.13) X waist circumference - 114.3 (95% Cl: -216.0 to -12,5); >50 year age group:
intra-abdominal fat area = 2.85 (95% Cl: 1.67 to 4.03) x waist circumference - 170.5
(95% Cl: -290.0 to -51.0)]. Differences between gradients are not significant (P >0.05).
181

— 4.6 —
RELATIONSHIP BETWEEN VOLUMES AND AREAS FROM
SINGLE TRANSVERSE SCANS OF INTRA-ABDOMINAL FAT
MEASURED BY MAGNETIC RESONANCE IMAGING
This section has been prepared for publication as
Han TS, Kelly IE, Walsh K, Greene R, Lean MEJ. Relationship between
volumes and areas from single transverse scans of intra-abdominal fat
measured by magnetic resonance imaging, (in preparation).
182

ABSTRACTObjective: To determine the level of a single transverse scan of intra-abdominal fat
between LI to L5 that best predicts intra-abdominal fat volumes.
Subjects: Sixteen male and seven female patients with non-insulin-dependent diabetes
mellitus, aged 44-74 years.
Outcome measures: Volumes and areas fi'om single scans of intra-abdominal fat
measured by magnetic resonance imaging with a 1.5 Tesla magnetic field.
Results: Intra-abdominal fat volumes calculated from fat areas between 8 to 9 cross-
sectional transverse single scans of 20 mm thickness. Men and women, respectively, had
mean body mass index of 27.9 (SD 3.0) and 31.6 (SD 4.7) kg/m^, and intra-abdominal
fat volumes 2.3 (SD 0.5) and 2.5 (SD 0.6) kg. Intra-abdominal fat area of the fourth scan
(in the direction of LI to L5) gave the highest prediction of total intra-abdominal fat
volumes both in men (r = 0.959, P <0.001) and in women (r = 0.973, P <0.001). The
intra-abdominal fat area of the third scan gave an almost as good prediction. These third
and fourth levels of scans corresponded to L2 and L3 vertebrae in most subjects. The
intra-abdominal fat areas scamied from the sixth and seventh level, corresponded to the
frequently used L4-L5, had lower correlations with intra-abdominal fat volumes. There
were no sex differences in the prediction o f volumes from areas of intra-abdominal fat.
Intra-abdominal fat ai'eas from the fourth scan explained 93% of variance (SEE = 0.14
kg) of total intra-abdominal fat volumes.
Conclusions: In large studies of intra-abdominal fat using magnetic resonance imaging,
a single intra-abdominal fat area at the levels between L2 and L3 vertebrae, i.e. close to
the level for measuring waist circumference as defined by the World Health
Organisation (1995), offers a cheaper and faster method, with high prediction of total
intra-abdominal fat volumes.
Keywords: fat distribution, health promotion, methodology, obesity, visceral fat.
183

INTRODUCTION
Increased accumulation of the metabolically active intra-abdominal fat (Kissebah et al,
1982) is thought to be responsible for a variety of metabolic disorders (Bjorntorp, 1990).
This topic has been reviewed in detail in Chapter 1. Measuring total abdominal fat
using magnetic resonance imaging (MRI) requires a series of consecutive images in
order to calculate the volume. Measuring total volume in studies of large numbers of
subjects is not practical due to time consuming and high costs. Oui' previous MRI study
of twenty women has shown that a single cut at 2/3 the distance between xlphisternum
and anterior iliac crest, approximately at the L2-L3 level in most subjects gave the
highest correlation with intra-abdominal fat volume (Chapter 4.4, Table 4.4.2). This
section, describes the methods for measuring extra- and intra-abdominal fat volumes
using multiple MRI scans, and determines the level of a single transverse scan of intra
abdominal fat between LI to L5 that best predicts intra-abdominal fat volumes.
METHODS
SubjectsSixteen men and seven women with non-insulin-dependent diabetes mellitus took part in
a randomised, double blind twelve week follow up study of the effects of troglitazone (a
thiazolidinedione compound which enhances the effects of insulin in peripheral tissues
and the liver) on intra-abdominal fat mass. Subjects underwent comprehensive
physiological assessments as well as body composition measurements using a variety of
standard techniques including underwater weighing, anthropometry and MRI (Kelly et
al, 1997). This section presents only the analysis of baseline MRI data.
Magnetic resonance imaging
The tissues of the abdomen were scanned using MRI machine (Siemens, Germany) (see
Figure 1.2.5, page 15 of Chapter 1) with a magnetic field strength of 1.5 Tesla.
Ordinary spin echo sequences was used with repetition time (TR) of 350 ms and echo
time (TE) of 12 ms for the abdomen measurement.
184

Abdominal fat measurementCalibrations o f lipid and water
A lump of lard (lipid) was placed next to a container of water in the MRI scanner to
simulate lipid in adipose tissue (AT) and lean tissue in vivo. The scan was analysed to
obtain the threshold value where only the fat in the lard could be imaged (whilst the
imaging of water just disappears). Pilot tests determined the tlireshold value to be at 300
(arbitrary units) for every subject for subsequent calculations.
Abdominal fa t imaging
Four sagittal images of the trunk were scamied to find the vertebral column. To obtain
reproducible imaging volumes, the volume of the abdomen was taken to extend from the
bottom of the inferior plate of the LI vertebra to the bottom of inferior plate of the L5
(Figure 4.5.1a). Data were collected from as many 20 mm thick sections (Figure
4.5.1b) as could completely fit within that interval. This imaging volume approximately
corresponds to the levels from xlphisternum to anterior iliac crest in our previous MRI
studies (Han et al, 1997b, see Chapter 4.4), but was more reproducible.
Calculations o f intra-abdominal and extra-abdominal adipose tissue and fa t volumes
After setting an appropriate threshold value (300 window level) that separates fat (lipid)
from lean tissues (water), the volume of intra-abdominal and extra-abdominal AT were
calculated. The number of pixels for total abdominal AT was obtained from the region
of interest by encircling the whole abdomen contents with an ovoid line (Figure 4.5.1c).
To obtain the number of pixels for intra-abdominal AT, the ovoid line was then reduced
to encircle the intra-abdominal contents at the position of the fascial plane to separate
intra-abdominal from extra-abdominal AT (Figure 4.5.1d). Total volume of abdominal
AT (mm^) was obtained by summing the AT areas in eight (or nine in eight men)
transverse scans obtained in each subject, and multiplied by 20 mm (slice thickness). A
factor of 10'^ was used to convert mm^ to litre of AT volume, and then to volume of fat
(kg) assuming AT contains 80% of fat, 2% protein, 18% of water with negligible
minerals (Garrow, 1974), with corresponding densities of 0.900, 1.34 and 0.993 kg/1
185

(Siri, 1961), giving an average AT density of 0.9255 kg/1. Thus fat was converted from
AT by a factor of 0.9255 x 80%. The difference between the total volumes of abdominal
fat and intra-abdominal fat provides the total volume of extra-abdominal fat.
Statistical analysis
Relationships between volumes and single areas of intra-abdominal fat were determined
using linear regression analysis in each sex separately, and partial coirelation in both
sexes together, to control for sex.
RESULTS
Table 4.5.1 shows the chaiacteristics of sixteen men and seven women. Most subjects
were overweight with large intra-abdominal fat deposition, as expected in patients with
non-insulin-dependent diabetes mellitus.
Table 4.5.2 shows the coirelations between single intra-abdominal fat areas scanned at
20 imn intervals between the LI and L5 vertebrae. Eight cross-sectional images of intra
abdominal fat areas between LI and L5 were obtained in most subjects, and nine images
in eight men with longer trunk. All single areas correlated highly with total volumes of
intra-abdominal fat. Intra-abdominal fat areas in the fouifri (in the direction of LI to L5)
gave the best correlation with the volumes both in men (r = 0.959, P <0.001) and in
women (r = 0.973, P <0.001). Correlations between these two variables remained
highest when men and women were analysed together, with or without adjustment for
sex. Figure 4.5.2 shows the close relationship between total intra-abdominal fat
volumes and intra-abdominal fat areas taken at the fourth scan. Table 4.5.3 shows the
regression equations to predict volumes from areas of intra-abdominal fat sepai'ately for
men and women and for both sexes combined. The areas from the fourth scan explained
93% of variance (SEE = 1 . 4 kg) of the volumes of intra-abdominal fat in men and
women together. Adjusting for sex in multiple linear regression analysis did not improve
the prediction and sex was not a significant factor (data not presented). The gradients
and intercepts of the regression lines were not significantly different between the two
186

sexes. Intra-abdominal fat areas from the third scan also correlated well with the total
volumes. The third and foui’th scanning levels in the present study corresponded
approximately to the L2 and L3 vertebrae in most subjects. Intra-abdominal fat areas
from the sixth and seventh levels corresponded to that from the frequently used L4-L5
level for a single image, had lower con'elations with intra-abdominal fat volumes.
DISCUSSION
In the present study, after a pilot study, a single tlireshold (300) was set for all subjects
to distinguish fat tissue from other tissues. Because intra-abdominal fat locates within an
almost circular perimeter of fascial plane (Figure 4.5.1c-d), an ovoid was used to
encircle this region of interest for calculations. The coefficient of variation using this
method for repeated calculations (Bland, 1987) was less than one percent, which
improved on the previous ‘hand drawn’ method in the earlier MRI study (Chapter 4.4).
Measuring total intra-abdominal fat volume is time consuming, requiring many scans,
which adds on to the high costs. The present study has shown that both in men and in
women, the intra-abdominal fat areas in the third and fourth scans (in the direction of LI
to L5), which approximately correspond to the levels of L2 and L3 vertebrae, gave the
highest prediction of intra-abdominal fat volumes. Single intra-abdominal fat areas from
levels 6 and 7, which correspond to the frequently used L4-L5 level in scanning
teclmique (Lemieux et al, 1996b), had lower correlations with the volumes. These
findings are supported by our previous MRI study of women and the very recent
publication of Abate et al (1997), suggesting that a single scan at L2-L3 is valid for
estimating total intra-abdominal fat volumes.
CONCLUSIONSThe present study employed a novel method for intra-abdominal fat calculations. Intra
abdominal fat area from a single transverse cross-sectional scan at approximately L2-L3,
is a valid estimate of total intra-abdominal fat volume, which could be used in studies of
large number of subjects to save time and costs.
187

Table 4.5.1. Characteristics of 16 men and 7 women.
Men (n = 16) Women (n = 7)
Mean SD Range Mean SD Range
Age (years) 56.2 6.3 44.1-65.7 62.3 9.1 49.1-74.1
Weight (kg) 81.1 11.7 61.7-107.2 77.6 11.5 61.8-94.0
Height (cm) 171.0 6.8 159.0-183.0 156.9 4.2 149.0-162.0
Body mass index (kg/m^) 27.9 3.0 22.9-34.1 31.6 4.7 24.6-37.1
Waist circumference (cm) 100.3 9.9 82.1-122.5 107.1 9.0 96.2-120.6
Intra-abdominal fat area from
LI to L5 vertebra (cm^)
Level 1 232.2 47.5 145.3-308.2 205.2 59.5 110.9-275.8
Level 2 199.7 51.5 108.9-287.2 178.5 66.6 77.0-261.7
Level 3t 210.2 53.3 124.0-291.7 209.9 62.2 100.6-278.7
Level 41- 194.3 41.3 135.3-245.0 208.9 57.9 136.1-298.3
Level 5 200.4 51.7 135.1-299.4 232.4 63.6 155.1-322.2
Level 6X 175.5 43.2 116.1-245.9 218.2 57.5 137.6-300.7
Level 7:|: 158.2 35.2 106.4-203.9 219.2 52.4 156.7-287.4
Level 8 139.1 29.8 83.8-187.3 226.4 47.8 155.2-295.2
Level 9§ 140.8 28.8 95.9-179.1
Total fat volume from
LI to L5 vertebra (kg)T|
Abdominal fat 3.90 0.52 3.14-4.85 6.04 1.15 4.42-7.53
Intra-abdominal fat 2.34 0.47 1.71-2.99 2.52 0.63 1.64-4.64
Extra-abdominal fat 1.56 0.09 1.00-2.06 3.53 0.67 2.70-4.36
tCorrespond to the levels o f L2 and L3 vertebrae, i.e. close to the level for measuring waist
circumference as defined by the World Health Organisation (1995); ^correspond to the levels o f L4 and
L5 vertebrae; §nine transverse scans were fitted in between LI and L5 in eight men; jsee methods section
for calculations o f total abdominal fat volumes from cross sectional transverse abdominal fat areas.
188

Table 4.5.2. Correlation coefficients between total intra-abdominal fat volumes and
intra-abdominai fat areas from single transverse scans of at different levels between LI
to L5 vertebrae, measured by magnetic resonance imaging in 16 men and 7 women.
Both sexes together
Men Women Unadjusted Sex adjustedj'
Scan level
Level 1 0.864*** 0.802*** 0.763*** 0.839***
Level 2 0.840*** 0.846*** 0.789*** 0.842***
Level 3 J 0.921*** 0.958*** 0.921*** 0.933***
Level 4:j: 0.959*** 0.973*** 0.966*** 0.965***
Level 5 0.883*** 0.957*** 0.910*** 0.912***
Level 6§ 0.909*** 0.949*** 0.902*** 0.925***
Level 7§ 0.913*** 0.881*** 0.813*** 0.897***
Level 8 0.864*** 0.872*** 0.675*** 0.864***
Level 9^ 0.912*** — 0.912*** —fPartial correlations; fcorrespond to the levels o f L2 and L3 vertebrae; §correspond to the levels o f L4
and L5 vertebrae; Ifnine transverse scans were fitted in between LI and L5 in eight men.
189

Table 4.5.3. Regression equations to predict intra-abdominal fat volume from intra
abdominal fat area separately and together for men and women.
Dependent variable: Independent variable: Intra-abdominal fat area
Intra-abdominal (cm^)
fat volume (kg)
Gradient (xlO) Intercept r SEE
P 95% Cl P 95% Cl (%) (kg)
M ent 0.110*** 0.091,0.129 0.204"' -0.165,0.572 91.4 0.139
Womenf 0.105*** 0.077,0.134 0.316"' -0.303, 0.934 93.6 0.158
Both sexes 0.108*** 0.095,0.121 0.244"' -0.026, 0.513 92.9 0.138
tN o differences in gradients or intercepts between men and women, P >0.05; ***? <0.001, ns = not
significant.
190

53 M GLAXO I :
%
WiE C : l / t IWM:
§
Figure 4.5.1. Abdominal fat images from magnetic resonance imaging (MRI).191

■s Men: r = 0.959, f <0.001
• " " Women: r = 0.973, P <0.001
100 150 2 0 0 2 5 0 3 0 0
Intra-abdominal fat area (cm )3 5 0
Figure 4.5.2. Relationship between total volumes and single transverse cross-sectional
ai’eas of intra-abdominal fat scanned at the fom-th level of the distance from LI to L5
vertebra, measured by magnetic resonance imaging, in 16 men and 7 women.
Regression equation for both sexes (adjusted variance = 92.9%, SEE = 0.138 kg): Intra-
abdominal fat volume (kg) = 0.1082 (95% Cl: 0.0949 to 0.1214, P <0.001) x 10 x
Intra-abdominal fat area (cm^) + 0.2436 (95% Cl: -0.0262 to 0.5134, P = 0.074),
192

CHAPTER FIVE
EPIDEMIOLOGY OF BODY MORPHOLOGY
AND ASSOCIATED ILL HEALTH IN A
CROSS-SECTIONAL POPULATION SURVEY
11 CONTENTS OF CHAPTER FIVE PAGES
5.1 Associations between body fat distribution and lifestyle 194
factors
5.2 Waist circumference Action Levels in the identification of 212
cardiovascular risk factors
5.3 The prevalence of low back pain and associations with body 229
fatness, fat distribution and height
5.4 Symptoms of respiratory insufficiency in relation to body 147
mass and fat distribution
5.5 Associations of stature, body mass and fat distribution with 262
non-insulin-dependent diabetes mellitus
5.6 Quality of life in relation to overweight and fat distribution 276
193

5.1
ASSOCIATIONS BETWEEN BODY FAT DISTRIBUTION AND
LIFESTYLE FACTORS
This section has been submitted for publication as
Han TS. Bijnen FCH, Lean MEJ, Seidell JC. Separate associations of waist and
hip circumference with lifestyle factors, (submitted).
Collaboration with MORGEN project
194

ABSTRACT
Objective-. To study the associations of lifestyle factors with waist circumference, hip
circumference, and body mass index.
Design-. Cross-sectional study in a random sample of 5887 men and 7018 women aged
20-59 years, selected from the civil registries of Amsterdam, Maastricht and
Doetinchem, in the Netherlands.
Results-. Results were compared to those in reference groups: non-smokers, occasional
drinkers, highest educated, physically active, employed subjects, women who had no
live births, or 20-29 year-olds. In multivariate logistic regression analysis, odds ratios
(95% confidence interval) for those with a waist above the previously defined Action
Level 2 (>94 cm in men, >88 cm in women) were significantly lower in smokers, and
higher in heavy drinkers, inactive subjects, unemployed persons, those educated below
secondary level, women who had >3 live births, and older age. Mean waist to hip ratio
adjusted for body mass index and age were higher in these subjects. Residual analysis
showed that the risk of having larger waist than expected from their body mass index
were 1.2 times (1,1 to 1.4) in male smokers, 1.4 times (1.2 to 1.7) in male and 1.7 times
(1.3 to 2.2) in female heavy drinkers, 1.6 times (1.5 to 1.8) in inactive men, and 1.3
times (1.1 to 1.5) in unemployed women. The risk of having smaller hips than expected
from body mass index were 1.2 times (1.1 to 1.4) in male and 1.2 times (1.0 to 1.3) in
female smokers, 1.2 times (1.1 to 1.3) in men and 1.1 times (1.0 to 1.2) in women who
were inactive.
Conclusions-. Each lifestyle factor may influence the size of waist and the hips
differently, and understanding these influences is important for health promotion
directed at general public.
Keywords-. Body shape, drinking, health promotion, physical activity, smoking.
195

INTRODUCTION
When waist circumference approaches Action Level 1 (94 cm in men, 80 cm in women),
subjects should be aware of the increased health risks. In the ‘Alert Zone’ between
Action Level 1 and Action Level 2 (94-102 cm in men, 80-88 cm in women), people
should not further gain weight, most should modify lifestyle such as increasing physical
activity level, and some would benefit from self managed weight loss. Above this range,
in the ‘Action Zone’ (>102 cm in men, >88 cm in women), every body should be urged
to take action to seek professional help to achieve sustained weight loss and for risk
factor screening (Chapter 4.2; Han et al, 1996c).
Associated with overweight, indicated by high body mass index, and adverse body fat
distribution, indicated by high waist to hip ratio or large waist circumference, are
clusters of symptoms and associated secondary chronic diseases, which are confounded
by smoking (Shimokata et al, 1989; Lissner et al, 1992; Troisi et al, 1991), physical
inactivity (Troisi et al, 1991), parity (den Tonkelaar et al, 1990), and low educational
level (Seidell et al, 1986a). The relationship between alcohol consumption and body
fatness is still unclear (Prentice, 1995). Published relationships between lifestyle factors
and body fat distribution are difficult to interpret because they involve the waist to hip
ratio, which could be related to either or both the waist and hip circumferences. Waist to
hip ratio is related to both increased visceral fat and reduced leg muscle areas in men
(Seidell et al, 1989a). Higher frequency of impaired glucose tolerance in Indian
compared to Swedish men has been shown to relate to the ratio of lower leg muscle to
total body muscle, not to excess visceral fat (Chowdhury et al, 1996). Patients with
Cushing’s syndrome have both increased visceral fat and peripheral muscle wastage
(Rebuffé-Scrive et al, 1988). High waist to hip ratio in alcoholic men is related to
reduced gluteal muscle (Kvist et al, 1993). Dissociating the relative contributions of the
two measui'es in waist to hip ratio in the associations with lifestyle factors may have
important implications in terms of the interpretations of the associations between
metabolic complications and the distribution of body ‘fat’ or ‘muscle’.
196

The present study addressed two main issues: firstly, to highlight the associations of
measures of overweight and abdominal fat distribution, with the main focus on the waist
circumference Action Levels, with age and lifestyle factors, and secondly, to elucidate
the associations of the lifestyle factors with waist and hip circumferences.
METHODS
SubjectsMen {n ~ 5887) and women {n = 7018) aged 20-59, recruited into the ongoing
MORGEN (Monitoring of Risk Factors and Health in The Netherlands) study in the
1993 to 1995 cohorts.
Anthropometry and lifestyle factors
All anthropometric measurements were made according to the World Health
Organisation (1989) recommendations by paramédical personnel. Subjects wore light
clothes dui'ing measurements of body weight to the nearest lOOg using calibrated scales,
height in bare feet to the nearest mm, waist circumference in duplicate at the level
between the lowest rib margin and iliac crest, and hip circumference at the widest
trochanters to the neai'est mm, the mean values of circumferences were used in analysis.
Waist to hip circumferential ratio was computed, and body mass index was calculated as
weight (kg) divided by height squared (m^). Lifestyle factors were obtained from a
questionnaire.
Statistical analysis1. Associations between lifestyle factors with adiposity
The prevalence of overweight and adverse fat distribution in each lifestyle group were
determined by cross tabulation. Independent dummy variables were created for age and
lifestyle factors (Appendix 5.1,1).
Logistic regression analysis used fat distribution and overweight, dichotomised at pre
selected cut-off based on published criteria, as dependent variables. Waist circumference
197

was dichotomised at Action Level 2 (102 cm in men and 88 cm in women) (Chapter
4.1; Lean et al, 1995), body mass index at 30 kg/m^ (WHO, 1989), and waist to hip ratio
at 0.95 in men and 0.80 in women (US Department of Agriculture and US Department
of Health and Human Services, 1990). Linear regression analysis using least squares
means to adjust body mass index and age for obtaining the mean values o f waist to hip
ratio, in different lifestyle groups.
2. Residuals analysis to determine the relative contributions o f waist and hip
circumferences in their associations with lifestyle factors
Linear regression analysis using body mass index as independent predictor of waist or
hip circmnference was used to determine their respective residuals with and without age
adjustment. Figure 5.1.1 illustrates the relationship between waist circumference and
body mass index. The residuals obtained (measured circumference minus circumference
predicted from their body mass index) were dichotomised to create dependent variables,
the lower (negative residuals) waist than expected group and the higher (positive
residuals) hips than expected group were used as reference groups (value of 0) for higher
waist than expected and lower hips than expected (value of 1) respectively.
RESULTS
1. Associations o f waist circumference Action Level 2, body mass index and M>aist to
hip ratio with age and lifestyle factors
Subject characteristics are shown in Table 5.1.1. Compared to the reference groups: 20-
29 years, non-smokers, occasional alcohol drinkers, physically active subjects, most
educated subjects, those currently employed, and women who never had a live birth
(Appendix 5.1.1), Tables 5.1.2a & b show that heavy drinkers and non-drinkers
(women only), inactive subjects, those with lower education (below educational level 2),
unemployed subjects, housewives, and women who had given to 3 or more live births,
were more likely to associate with waist circumference above Action Level 2. Smokers
were associated with small waist circumference.
198

Lifestyle factors related to body mass index similai'ly to waist circumference (for clarity,
results not presented), but there were some differences in there relationships with waist
to hip ratio. The odds ratios for those with waist to hip ratio >0.95 in men and >0.80 in
women were not significantly different between smokers and non-smokers. Compared to
their respective reference groups (Appendix 5.1.1), odds ratios for high waist to hip
ratio (>0.95 in men, >0.80 in women) (US Department of Agriculture and US
depailment of Health and Human Services, 1990) were significantly higher in older
subjects, heavy drinkers, inactive subjects, the least educated, unemployed subjects
(women only) and housewives, and women who had given to live births (data not
presented). Figures 5.1.2a & b show the mean values of waist to hip ratio for selected
lifestyle factors, with adjustments for body mass index and age. Compared to the
reference groups (Appendix 5.1.1), mean values of waist to hip ratio were higher in
smokers, physically inactive subjects, heavy drinkers and unemployed women. Older
age, lower educated subjects, women who had given to live birth, and housewives were
also significantly associated with high waist to hip ratio (results not shown).
2. Residuals analysis to determine the influences o f lifestyle factors on expected waist
and expected hips fo r a given body mass index
Compared to their reference groups (Appendix 5.1.1), Tables 5.1.3a & b show that
those with waist circumference larger than expected for their body mass index were
significantly associated with increasing age, smoking in the past and present (men only),
heavy alcohol consumption, inactivity (men only), lower education, unemployment and
high parity (women only). Hip circumference smaller than expected was significantly
associated with increasing age, smoking in the past (men only) and in the present,
inactivity, lower education, and high parity in women. Early retired subjects were less
likely to have waist lai'ger (men only) or hips smaller than expected.
199

DISCUSSION
Some of the associations described in the present paper have been found for individual
lifestyle factors in other studies (Seidell, 1991). We have, however, been able to conduct
a systematic epidemiological analysis for lifestyle effects on waist circumference,
referring to the previously defined Action Level 2 (Chapter 4.1; Lean et al, 1995), body
mass index at 30 kg/m^ (WHO, 1989), and waist to hip ratio (0.95 in men, 0.80 in
women) (US Department of Agriculture and US department of Health and Human
Services, 1990), and explored the appropriate adjustments for confounders. The results
also provide valuable information for health promotion aiming to prevent adiposity and
its consequences. We have also examined the associations between lifestyle factors and
waist circumference defined at Action Level 1 (94 cm in men, 88 cm in women) or body
mass index at 25, and found similar trends to the associations with higher cut-offs, but
with lower odds ratios (data not presented).
Aging, which is not modifiable, was the most important determinant for large waist
circumference. Lifestyle factor relations to waist circumference were very similar to
those for body mass index. This is because the two measures correlate very strongly (r
>0.85). Waist to hip ratio showed more disparities from these two indices in the
associations with lifestyle factors. Relationships with a ratio are difficult to interpret.
The present study used residual analysis to describe the relative associations of waist
and hip circumferences with lifestyle factors, and to identify possible effects of certain
lifestyle factors on specific part of the body.
Although waist and hip circumferences correlated highly with body mass index (r >0.8),
there are mean residuals of ±4 cm in waist and ±3 cm in hips (Tables 5.1.3a & b). A
measured waist circumference larger than expected may indicate excess abdominal
subcutaneous fat or visceral fat accumulation, whereas a hip circumference less than
expected may reflect reduced femoral fat, small pelvic bone structure or gluteo-femoral
muscle atrophy. Previous studies largely referred the waist to hip ratio as an indicator of
fat distribution. In cross-sectional studies, residuals analysis provides a relatively simple
200

method to dissociate individual associations of waist and hips circumferences. For
example, both heavy drinkers (Figures 5.1.2a & b) and those in the lowest educational
level (data not shown) had a high waist to hip ratio, but residuals analysis revealed that
heavy drinkers had waist larger than expected, whereas those in the lowest educational
level had hips lower than expected for a given body mass index (Tables 5.1.3a & b).
Wliereas male smokers appeared to have normal waist to hip ratio, they were shown to
have larger waist and smaller hips than expected.
In both sexes, smokers had lower body mass indices than non smokers, agreeing with
previous findings (Shimokata et al, 1989; Lissner et al, 1992), and also smaller waist
circumferences, but their waist was larger (not significant in women) and hips were
smaller than expected for their body mass index. A tliree year longitudinal study has
shown that smokers gained waist more and hips less than predicted from gain in body
mass, thus a gain in waist to hip ratio was observed findings (Shimokata et al, 1989).
Lissner et al (1992) found women who continued to smoke gained significantly more
waist to hip ratio than those who stopped smoking. In the present study, male ex
smokers had waist larger and hip circumference smaller than expected from their body
mass index, but less so than smokers. Female ex-smokers had measured waist and hips
as expected from their body mass index. Thus smoking cessation reduces the likelihood
of excessive abdomen and recessive hips.
Heavy drinkers, especially men, had large waist circumferences, supporting the
commonly observed ‘beer belly’ phenomenon. There was some evidence (not
significant) for smaller hips than expected, perhaps in keeping with Kvist et al (1993)
who found alcoholic men have reduced femoral muscle mass compared to non-drinkers.
In the present study, only male heavy drinlcers were associated with body mass index
>25 kg/m^, whereas female heavy drinkers had a similar body mass index to those who
drank occasionally (results not shown). Previous studies even found an inverse
relationship in women (Colditz et al, 1991). This paradoxical relationship in women has
201

been discussed by Prentice (1995), who suggested that other lifestyle factors such as
increased level of physical activity may offset the additional energy from alcohol.
Least educated men and women were twice and fours times, respectively, more likely to
have a waist circumference exceeding Action Level 2 (>102 cm in men, >88 cm in
women) and high waist to hip ratio, than the highest educated group, but they also had
high body mass indices. For both sexes waist was as predicted from body mass index,
but hips were smaller than expected. Less educated subjects within and between
countries are generally more overweight, and have more adverse fat distribution (Seidell
et al, 1986a; Seidell, 1995a). Lack of knowledge or interest in healthy lifestyle, and poor
eating habits associated with lower educational level may explain this phenomenon.
Subjects who were least physically active were more likely to have waist above Action
Level 2, and waist larger (not significant in women) and hips smaller than expected from
their body mass index. It is likely that the association between physical inactivity and
high waist to hip ratio (Figures 5,1.2a & b) indicates both increased abdominal fat
deposition and skeletal muscle atrophy. Wlien other leisure physical activities were
incorporated to sport participation to create physically active group who did both sport
and other leisure activities and inactive group who did neither, it was found that inactive
women were 1.5 times more likely to have waist larger than expected fr*om their body
mass index (data not shown). This analysis was not presented because the question for
other leisuie activities was not available in 1993 cohort. Our findings support recent
health promotion message, encouraging a more physically active lifestyle (Pate et al,
1995; Blair et al, 1996a), which may prevent weight gain or lead to more favourable
tissue distribution (Houmard et al, 1994; Kanaley et al, 1993) and a variety of other
health benefits (Blair et al, 1996b; Bouchard et al, 1994).
Compared to those who had a job, unemployed persons had increased risk of lai’ge waist
circumference. It has been shown that unemployed people more frequently seek medical
consultations than those who have a job (Carr-Hill et al, 1996). Weight gain has been
202

observed in those who lost their job (Eley et al, 1997; Morris et al, 1992). Housewives
had higher body mass index, waist to hip ratio and waist circumference. Exposure to
food may explain these associations. Women who had more children also had higher
waist and waist to hip ratio, and their waist was larger and hips were smaller than
expected. Women with high waist to hip ratio are less likely to conceive compared to
those who had lower waist to hip ratio (Zaadstra et al, 1993), but den Tonkelaar et al
(1990) have shown women with high parity were associated with increased waist to hip
ratio.
CONCLUSIONS
Overweight and adverse fat distribution are associated with increasing age,
unemployment, parity in women, low education, and by poor lifestyle factors, including
physical inactivity, heavy alcohol consumption, and smoking. Each lifestyle factor
influences the size of waist and the hips differently and imderstanding these influences is
important for health promotion. Thus modifiable lifestyle factors such as smoking
cessation, drinking less heavily, and a more physically active lifestyle should all be
encouraged, leading to an overall healthier body shape.
203

Table 5.1.1. Characteristics of 5881 men and 7018 women.
Men Women
Mean SD Mean SD
Age (yeai’s) 42.9 10.7 42.2 11.0
Weight (kg) 82.0 12.0 68.5 11.5
Height (cm) 178.4 7.3 165.7 6.7
Body mass index (kg/m^) 25.8 3.5 25.0 4.2
Waist circumference (cm) 92.3 10.8 81.0 11.1
Hip circumference (cm) 101.8 6.6 102.2 8.4
Waist to hip ratio 0.905 0.072 0.791 0.070
204

Table 5.1.2a. Odds ratios waist circmnference above Action Level 2 (>102 cm) in
different groups of lifestyle factors in men.
Independent variables f n Proportion:]: Odds ratio 95% confidence interval20-29 years 909 4.4 1.0030-39 years 1389 11.3 2.63**» 1.83,3.8040-49 years M i l 19.3 q qy*** 3.15,6.3550-59 years 1812 28.6 6.42*** 4.54, 9.07
297
Non smokers 1788 14.7 1.00Ex-smokers 1946 22.4 1.04 0.87, 1.24Smokers 2129 16.7 0.77* 0.64, 0.93
41
Occasional drinkers 1393 18.2 1.00Non-drinkers 1021 15.5 0.99 0.79, 1.24Moderate drinkers 2215 16.4 1.05 0.85, 1.30Heavy drinkers 1258 22.6 1.45** 1.15, 1.81
X 26
Physically active 2858 12.1 1.00Physically inactive 3026 23,6 1.72*** 1.48,2.00
X 132
Educational level 3 1523 11.4 1.00Educational level 2 1733 14.1 1.48*** 1.19, 1.83Educational level 1 2631 24.4 2.08*** 1.71,2.51
X 135
Employed 4508 16.6 1.00Early retirement 432 14.6 0.99 0.73, 1.35Unemployed 721 28.2 1.32** 1.09, 1.61
X 62***P <0.001, **P <0.01, <0.05; fall independent variables were entered simultaneously in
multivariate analysis; $ percentage o f subjects with waist circumference above Action Level 2.
205

Table 5.1.2b. Odds ratios waist circumference above Action Level 2 (>88 cm) in
different groups of lifestyle factors in women.
Independent variables^ n Proportion^ Odds ratio 95% confidence interval20-29 years 1263 7.6 1.0030-39 years 1585 13.8 1.53** 1.16, 2.0240-49 years 2150 25.1 2.90*** 2.22, 3.7850-59 years 2020 40.7 4.83*** 3.70, 6.31
% 589
Non smokers 2526 24.2 1.00Ex-smokers 1860 26.7 1.11 0.95, 1.29Smokers 2620 21.6 0.84* 0.73, 0.97
IL 16
Occasional drinkers 3503 21 .\ 1.00Non-drinkers 1651 19.5 1.30*** 1.12, 1.52Moderate drinkers 1560 21.2 1.06 0.88, 1.28Heavy drinkers 304 24.3 1.20 0.88, 1.64
'I 43
Physically active 3274 17.5 1.00Physically inactive 3743 29.4 1.30, 1.66
' i 136
Educational level 3 1378 10.7 1.00Educational level 2 1765 14.8 1.66*** 1.32,2.08Educational level 1 3875 2.7 2.61*** 2.14,3.19
% 379
Employed 3471 17.6 1.00Early retirement 450 14.7 1.08 0.80, 1.46Unemployed 676 32.5 1.42*** 1.16, 1.72Housewives 2151 33.0 1.14* 0.99, 1.30
% 222
No live birth 2137 12.8 1.001-2 live births 3172 26.1 1.16 0.97, 1.393 or more live births 1709 33.5 1.42*** 1.17, 1.73
% 240<0.001, <0.01, *P <0.05; fa ll independent variables were entered simultaneously in
multivariate analysis; ^percentage o f subjects with waist circumference above Action Level 2.
206

Table 5.1.3a. Odds ratios for waist circumference larger or hip circrmiference smaller
than expected for a given body mass index in subjects in different groups of lifestyle
factors in men.
Independent variables §
Waist larger than expected j" (Mean 4.28, SE 0.06 cm)
Hip smaller than expected;j; (Mean 3.28, SE 0.05 cm)
Odds ratio 95% confidence interval
Odds ratio 95% confidence interval
20-29 years 1.00 1.0030-39 years 2.10*** 1.72, 2.56 1.48*** 1.24, 1.7840-49 years 3.50*** 2.88, 4.26 1.92*** 1.60,2.3150-59 years 5.72*** 4.68, 6.98 2.63*** 2.18,3.18
Non smokers 1.00 1.00Ex-smokers 1.23* 1.03, 1.37 1.17* 1.02, 1.35Smokers 1.23** 1.07, 1.42 1.21** 1.05, 1.39
Occasional drinkers 1.00 1.00Non-drinkers 0.90 0.76, 1.08 1.04 0.88, 1.24Moderate drinkers 1.04 0.88, 1.22 1.05 0.90, 1.22Eleavy drinkers 1.40*** 1.18, 1.70 1.10 0.92, 1.31
Physically active 1.00 1.00Physically inactive 1.64*** 1.46, 1.84 1.18* 1.05, 1.32
Educational level 3 1.00 1.00Educational level 2 1.00 0.86, 1.16 j 44*** 1.24, 1.67Educational level 1 1.06 0.92, 1.22 1.87*** 1.63,2.15
Employed 1.00 1.00Early retirement 0.74** 0.59, 0.94 0.73** 0.59, 0.91Unemployed 0.94 0.79, 1.11 1.05 0.89, 1.25
<0.001, <0.01, <0.05; fmeasured waist greater than predicted waist using BMI (predicted
waist ^ 2.639 x BMI + 24.283; ^ 74.7%, P <0.001); $ measured hip greater than predicted hip using
BMI (predicted hip = 1.414 x BMI + 65.369; = 56.9, P <0.001); §all independent variables were
entered simultaneously in multivariate analysis with adjustment for waist residual in hip analysis, and hip
residual in waist analysis.
207

Table 5.1.3b. Odds ratios for waist circumference larger or hip circumference smaller
than expected for a given body mass index in subjects in different groups of lifestyle
factors in women.
Independent variables §
Waist larger than expectedf (Mean 4.85, SE 0.07 cm)
Hip smaller than expected^ (Mean 3.45, SE 0.04 cm)
Odds ratio 95% confidence interval
Odds ratio 95% confidence interval
20-29 years 1.00 1.0030-39 years 1 80*** 1.50,2.15 1.36*** 1.14, 1.6240-49 years 2.32*** 1.93,2.80 1.53*** 1.28, 1.8350-59 years 3.50*** 2.89, 4.25 1.80*** 1.49,2.17
Non smokers 1.00 1.00Ex-smokers 0.99 0.87, 1.13 0.92 0.81, 1.04Smokers 1.10 0.98, 1.24 1.15* 1.03, 1.30
Occasional drinkers 1.00 1.00Non-drinkers 0.99 0.87, 1.12 1.24*** 1.09, 1.40Moderate drinkers 1.14 0.98, 1.31 1.10 0.95, 1.27Heavy drinkers 1.68*** 1.29,2.18 1.19 0.92, 1.54
Physically active 1.00 1.00Physically inactive 1.09 0.98, 1.21 1.10* 1.00, 1.22
Educational level 3 1.00 1.00Educational level 2 1.12 0.96, 1.30 1.24*** 1.06, 1.44Educational level 1 1.05 0.91, 1.22 1.56*** 1.36, 1.80
Employed 1.00 1.00Early retirement 0.90 0.73, 1.12 0.77* 0.62, 0.95Unemployed 1.27** 1.06, 1.51 1.17 0.98, 1.39Housewives 1.10 0.97, 1.25 1.14 1.01, 1.29
No live birth 1.00 1.001-2 live births 1.03 0.90, 1.19 1.10 0.96, 1.26>3 more live births 1.29** 1.10, 1.51 1.25** 1.07, 1.47***p <0.001, **P <0.01, *P <0.05; treasured waist greater than predicted waist using BMI (predicted
waist = 2.232 x BMI + 25.224; / = 71.3%, P <0.001); ^measured hip greater than predicted hip using
BMI (predicted hip = 1.697 x BMI + 59.809; / = 72.2%, P <0.001); §all independent variables were
entered simultaneously in multivariate analysis with adjustment for waist residual in hip analysis, and hip
residual in waist analysis.
208

so( Uocp* - l
1 5 6Bo
‘o4 - »c /3
c3
" O
% 6 43c / 3cd( D
s
MenWaist = 2.639 x body mass index + 24.283 r2= 74.7%; P <0.001
Residuals
15 5 0Body mass index (kg/m^)
Subjects with waist circumference:T larger, or -I less than expected
Figure 5.1.1. Illustration of residuals obtained from regression between waist
circumference and body mass index in men.
209

o 1.000 -|
0.980 -Î-H 0.960 -
■t 0.940 -
o 0.920 '4-»%
0.900 -
'c30.880 -
0.860 “
0.840 -
a
Men
0.805 1
% 0.800 H
ÇL 0.795 -
0.790 -
0.785
0.780 -
Women 4: * *
\ \
V \
**4:
3 -
\ "
Figure 5.1.2. Mean values o f waist to hip ratio with adjustments for body mass index
and age in different categories of selected lifestyle factors in men (a) and in women (b).
210

Appendix 5.1.1. Categories of lifestyle factors as independent variables to predict waist
circumference, body mass index, and waist to hip ratio.
Reference group Dummy variables
1 2 3
Age (years) 20-29 30-39 40-49 5& j9
Smoking Non-smokers Ex-smokers Current smokers
Alcohol
consumption
(glasses/day)
Occasional
(<1)
Non-drinkers
(0)
Moderate
(1 to <3)
Heavy
Physical activity Physically active
(sport participation)
Physically inactive
(do not do sport)
Educational level Level 3
(higher vocational
or university)
Level 2
(vocational or
higher secondary)
Level 1
(lower than
secondary) '
Employment Cuirently
employed
Unemployed Housewives Early
retirement
Parity (live births) None 1-2 >3
211

— 5.2 —
WAIST CIRCUMFERENCE ACTION LEVELS IN THE
IDENTIFICATION OF CARDIOVASCULAR RISK FACTORS
This section has been peer reviewed and has been published as
Han TS. van Leer EM, Seidell JC, Lean MEJ. Waist circumference Action
Levels in the identification of cardiovascular risk factors: prevalence study in a
random sample. British MedicalJournal 1996; 311:1041-45.
Collaboration with MORGEN project
212

ABSTRACT
Objective: To determine the frequency of cardiovascular risk factors of individuals
categorised by previously defined Action Levels of waist circumference.
Design: Prevalence study in a random sample.
Setting: The Netherlands.
Subjects: 2183 men and 2698 women aged 29-59 years selected at random fi’om the civil
registry of Amsterdam, Maastricht, and Doetinchem.
Main outcome measures: Waist circumferences, waist to hip ratio, body mass index
(weight (kg)Zheight (m^)), total plasma eholesterol concentration, high density
lipoprotein cholesterol concentration, blood pressure, age and lifestyle.
Results: A waist circumference exceeding 94 cm in men or 80 cm in women correctly
classified subjects with body mass index >25 kgim and waist to hip ratio >0.95 in men
and >0.80 in women with a sensitivity and specificity >96%. Men and women with at
least one cardiovascular risk factor (total cholesterol >6.5 mmol/1, high density
lipoprotein cholesterol <0.9 mmol/1, >160 mmHg systolic, >95 mmHg diastolic blood
pressuie) were identified with sensitivities of 57% and 67% and specificities of 72% and
62% respectively. Compared with those with waist measmements below Action Levels,
age and lifestyle adjusted odds ratios for having at least one risk factor were 2.2 (95%
confidence interval: 1.8, 2.8) in men with a waist measui'ement of 94-102 cm and 1.6
(1.3, 2.1) in women with a waist measurement of 80-88 cm. In men and women with
larger waist measurements these age and lifestyle adjusted odds ratios were 4.6 (3.5,6.0)
and 2.6 (2.0,3.2) respectively.
Conclusions: Waist circumference identifies people at with increased cardiovasculai'
risks.
213

INTRODUCTIONLean et al (1995; see Chapter 4.1) recently proposed waist circumference as a simple
measurement to indicate the need for weight management. Waist circumference related
both to body mass index and waist to hip ratio. Two Action Levels of waist
circumference were determined to identify people whose health risks were increasing
(Action Level 1: men 94 cm, women 80 cm) or high (Action Level 2: men 102 cm,
women 88 cm).
The ongoing Dutch Monitoring Project on Risk Factors for Clironic Diseases
(MORGEN project) which started in 1993, offered the opportunity in a large sample of
men women to validate the Action Levels in a large sample of men and women and to
assess the prevalence of cardiovascular risk factors and relative risks of subjects
according to their waist circumference.
METHODS
SubjectsA random sample of 2183 men and 2698 women aged 20-59 years was selected from the
civil registry in Amsterdam, Maastricht and Doetinchem. Sampling was part of the
MORGEN-proj ect to determine the prevalence of risk factors for clironic diseases, and
also other specific clironic conditions in the general population living in various parts of
The Netherlands. Measurements were made in basic health services in Amsterdam (in
the West), Doetinchem (a small town in the East) and Maastricht (in the South). To
obtain similar numbers of subjects at each age we stratified the sample by sex and five
year age group. The response rate to invitations was roughly 50% in Amsterdam and
Maastricht, and 80% in Doetinchem. All measurements were by trained investigators.
Anthropometry
Body weight in light clothes was measured to the neaiest 0.1 kg, and height to the
nearest 0.5 cm. Body mass index was calculated as weight (kg) divided by height (m^).
Waist circumference midway between lower rib and iliac crest and hip circumference at
214

the level of the great trochanters were measured in duplicate to the nearest mm using
flexible tape (WHO, 1989).
Cardiovascular risk factors
Sitting blood pressure was measured using a random zero sphygmomanometer, small (9
X 18 cm), medium (12 x 23 cm) and large (15 x 33 cm) cuffs being used as appropriate.
Systolic (Korotkoff phase I) and diastolic (Korotkoff phase V) blood pressure was
measured twice on the left upper arm and the average used for analysis. Total and high
density lipoprotein cholesterol concentrations were determined enzymatically with a
Boehringer kit (Katterman et al, 1984). High density lipoprotein was isolated by
precipitating apolipoprotein B containing lipoproteins with magnesium
phosphotungstate (Lopes-Virella et al, 1977). All cholesterol analyses were performed at
the clinical chemistry laboratory, University Hospital of Dijkzigt, Rotterdam, under
standardisation programmes (World Health Organisation Regional Lipid Centre for
Europe in Prague, Czechoslovakia, and the Centres for Disease Control, Atlanta).
AnalysisHypercholesterolaemia was defined as plasma cholesterol >6.5 mmol/1 (European
Atherosclerosis Society, 1987; WHO, 1988), low high density lipoprotein-cholesterol as
<0.9 mmol/1 (European Atherosclerosis Society, 1987), and hypertension as systolic
blood pressure >160 mmHg, or diastolic blood pressure >95 mmHg, or use of
antihypertensive agents (WHO, 1988). Subjects were placed in either of two categories
for each of tlnee lifestyle factors: smoking (current cigarette smokers or non-smokers),
drinking (alcohol drinkers or non-drinkers), and physical activity (affirmative or
negative answers to the question “Are you performing sports, including jogging and
fitness training?”).
215

Statistical methods
Sensitivity was defined as the percentage of all subjects with a risk factor who were
identified correctly by high (above Action Level) waist circumference, and specificity as
the percentage of all subjects without a risk factor who were identified correctly by low
(below Action Level) waist circumference. Positive prediction was calculated as the
percentage of subjects with a waist circmnference above Action Level who had the risk
factor, and negative prediction as the percentage of subjects with a waist circumference
below Action Level who did not have a risk factor (Sturmans, 1984; Swinscow, 1983).
Linear regression analysis and partial correlations were used to determine the
relationships between variables. Logistic regression analysis was employed to determine
the relative risk o f prevalence of cai'diovascular risk factors for subjects categorised by
the two waist circumference Action Levels, with adjustments for age, alcohol
consumption, cigarette smoking, physical activity, and education level. We did not
adjust for body mass index and waist to hip ratio because of multicollineaiity with waist
circumference (Belsley et al, 1980). Height accounted for less than 0.3% of variance in
waist circumference and was excluded from the analysis. Statistical analyses used the
SAS/STAT computer programme (SAS Institute, Philadelphia).
Cross tabulation was used to determine the sensitivity and specificity (Sturmans, 1984)
of waist circumference Action Levels defined by Lean et al (1995; Chapter 4.1), Action
Level 1 : men 94 cm, women 80 cm; Action Level 2: men 102 cm and women 88 cm - to
identify subjects with body mass index values above 25 or above 30 kg/m^ for men and
for women (the conventional cut-off points) and waist to hip ratio above 0.95 for men
and 0.80 for women. Cross tabulation with waist measurement cut-offs defined by Lean
et al (1995; Chapter 4.1) at Action Levels 1 and 2 were used to determine the
sensitivity, specificity, and positive and negative predictions (Sturmans, 1984) of
cardiovascular risk factors (high cholesterol concentration, low high density lipoprotein
concentration, hypertension) at levels defined by the World Health Organisation (1989)
and the European Atherosclerosis Society (1987).
216

RESULTS
Mean age, body mass index, hip circumference and total plasma cholesterol were similar
in men and women. Men had a higher waist circumference, waist to hip ratio and blood
pressure and lower high density lipoprotein cholesterol concentration (Table 5.2.1).
1. Replication of Action Levels to identify subjects with high body mass
index and high waist to hip ratio
The Action Levels defined by Lean et al (1995; Chapter 4.1), using waist
circumference (Action Level 1: men 94 cm, women 80 cm; Action Level 2: men 102
cm, women 88 cm), were applied to this sample to identify subjects with a high body
mass index (>25 or >30 kglm in men and in women) and high waist to hip ratio (>0.95
in men, >0.80 in women). Sensitivity was over 97.5% and specificity over 96.0% with
only 2% false positive results and 0.8% false negative results with Action Level 1 and
1.4% false positive results and 0.3% false negative results in Action Level 2 for the
entire sample (Table 5.2.2).
2. Implications of Action Levels on cardiovascular risk factors
The prevalence (Figure 5.2.1) and mean (Table 5.2.3) values of adverse cardiovascular
risk factors (except decreases in high density lipoprotein cholesterol concentration)
increased with waist circumference in men and women. Correlations of waist
circumference, body mass index and waist to hip ratio with risk factors (total cholesterol
concentration, high density lipoprotein cholesterol concentration, systolic and diastolic
blood pressure) were similar and remained significant in partial correlations controlling
for age, alcohol consumption, cigarette smoking, physical activity and education (Table
5.2.4).
Sensitivity and specificity for identifying risk factors from waist circumference (Table
5.2.5) at Action Level 1 were between 57-72% both in men and women, with positive
prediction varying between 16-38% in men and 10-22% in women for individual risk
217

factors. Positive prediction increased to 59% in men and 37% in women who had one or
more risk factors. Negative prediction was much higher, varying between 81 and 96%
for individual risk factors and 71% in men and 85% in women who did not have any risk
factors. Both positive and negative predictions by Action Level 1 were higher than the
prevalence of subjects with (positive) and without (negative) risk factors in the whole
population. Positive predictions of cai’diovascular risk factors increased further in
subjects identified by Action Level 2, with a reduction in negative prediction (Table
5.2.5).
The relative risk of adverse cardiovascular risk factors identified by using odds ratios
(adjusted for age, alcohol consumption, cigarette smoking, physical activity and
education levels by logistic regression) with reference to subjects with waist
circumference below Action Level 1, increased significantly as waist circumferences
rose above Action Levels 1 and 2 (Table 5.2.6; data adjusted for age, and lifestyle). For
health promotion simple waist circumference cut-off points would be used. Differenees
in prediction with or without adjustments were similar, with the same patterns of relative
risks (data not shown).
DISCUSSION
The present study supports our eailier finding that waist Action Levels identify those
with high body mass and central fat distribution with high sensitivity and specificity
(Chapter 4.1; Lean et al, 1995). In addition, the study shows a close relation between
waist circumference and cardiovaseular risk factors. Waist circumference cut-off
measurement identified (positive prediction) cardiovascular risk factors at one and a half
times to twice the prevalence in the whole population at Action Level 1 and two and a
half to three times at Action Level 2 (Table 5.2.6). Negative prediction by the Action
Levels remained higher than the prevalence in the entire population. These results
suggest that Aetion Levels using waist circumference may provide a valuable, simple
method for alerting people at increased risk of cardiovascular disease who might benefit
from weight management. The risk factor criteria used (cholesterol concentration >6.5
218

mmol/1, high density lipoprotein concentration <0.9 mmol/1, blood pressure >160/95
mmHg) are conservative. Figures for risk prevalence would be higher if lesser levels of
risk were assessed.
Waist circumference has previously been related to cardiovascular risk factors (Higgins
et al, 1988; Kannel et al, 1991; Seidell et al, 1992), In this study waist circumference
correlated similaiiy to body mass index and waist to hip ratio with most of the
cardiovascular risk factors. Adjusting for influences such as age, education and lifestyle
had little effect. Higgins et al (1988) reached similar conclusions in the Framingham
study, showing that waist circumference was associated with 24 year age adjusted
mortality and also that waist circumference gave better risk prediction amongst smokers.
In this study after adjustment for age and other lifestyle factors, smokers of both sexes
had consistently more cardiovascular risk factors than non-smokers in any category of
waist circumference (results not shown). With increasing age the serum cholesterol
concentration increases substantially in women. Covariance between age and waist
measurement prevents further increase in predictive power of waist circumference for
high cholesterol concentration above Action Level 2.
Seidell (1995c) reviewed anthiopometric methods to assess abdominal fat, concluding
that waist circumference alone was probably the most practical measurement for use in
health promotion. For that purpose, practical cut-off measurements of waist
circumference are required. Waist circumference relates closely to intra-abdominal fat
mass (Seidell et al, 1988; Ross et al, 1992; Ross et al, 1993; Fouliot et al, 1994), and
changes in waist circumference reflect changes in cardiovascular risk factors
(Sonnichsen et al, 1992; Wing et al, 1992; Wing et al, 1995; Hellenius et al, 1993).
Positive prediction of individual risk factors was fairly low but increased considerably
when one or more of the risk factors were being identified (Table 5.2.5). Recent studies
find large waist circumference strongly associated with risk factors of insulin resistance
syndrome in women (Edwards et al, 1994) and non-insulin-dependent diabetes mellitus
in men (Chan et al, 1994), and risks of breast cancer in women (den Tonkelaar et al.
219

1995) and colonic cancer in men (Giovamiucci et al, 1995), suggesting that waist
circumference may have a wider value as a measure for total health risks.
CONCLUSIONS
Action Levels of waist circumference proposed previously could be employed to
identify sections of the population at high risk of chr onic disease from high total plasma
cholesterol concentration, low high density lipoprotein cholesterol concentration, and
hypertension who might benefit from weight management.
2 2 0

Table 5.21. Physical and metabolic characteristics of2183 men and 2698 women.
Men Women
Mean SD Mean SD
Age (years) 42.7 10.5 42.5 10.7
Weight (kg) 81.4 11.9 68.3 11.3
Height (cm) 177.9 7.4 165.1 6.8
Body mass index (kg/m^) 25.7 3.4 25.1 4.2
Waist circumference (cm) 91.6 10.4 80.3 10.9
Hip circumference (cm) 101.7 6.4 102.1 8.3
Waist to hip ratio 0.90 0.07 0.79 0.07
Total cholesterol (mmol/1) 5.4 1.1 5.4 1.1
HDL cholesterol (mmol/1) 1.1 0.3 1.4 0.4
Systolic blood pressure (mmHg) 122.8 15.6 115.5 15.4
Diastolic blood pressure (mmHg) 77.8 10.4 74.1 9.9
HDL = high density lipoprotein.
2 2 1

Table 5.2.2. False positive and false negative findings, sensitivity and specificity in
categorising men and v/oinen by waist circumference to identify those with body mass
index >25 at Action Level 1 or >30 kg/m^ at Action Level 2 and those with lower body
mass index but waist to hip ratio >0.95 (men) or >0.80 (women).
Action Level of
waist circumference
False False
cm positive negative
Sensitivity
(%)
Specificity
(%)
Men (n = 2183)
Action Level 1 >94 cm 40/1035 22/475 97.42 97.03
Action Level 2 >102 cm 45/1603 7/151 97.80 97.61
Women (n = 2698)
Action Level 1 >80 cm 59/1219 16/710 98.64 96.17
Action Level 2 >88 cm 22/1778 6/303 98.99 98.96
True positive describes people with high body mass index and those with lower body mass index but high
waist to hip ratio, correctly identified by waist circumference above Action Level. True negative
describes people with low body mass index and those with higher body mass index but low waist to hip
ratio. False positive describes people with waist circumference above Action Level but low body mass
index and low waist to hip ratio. False negative describes people with waist circumference below Action
Level but with high body mass index and high waist to hip ratio. These numbers were used to detennine
the sensitivity and specificity (Sturmans, 1984).
2 2 2

Table 5.2.3. Mean serum lipid concentrations and blood pressuie of men and women in
different categories of waist circumference.
Waist Total HDL Systolic Diastolic
circumference cholesterol cholesterol blood pressure blood pressure
(cm) (mmol/1) (mmol/1) (mmHg) (mmHg)
n Mean (SE) Mean (SE) Mean (SE) Mean (SE)
Men (n = 2183)
<94 1312 5.17(0.03) 1.15(0.01) 119.4 (0.4) 75.3 (0.3)
94-<102 515 5.71 (0.05) 1.04 (0.01) 126.8 (0.6) 80.4 (0.4)
>102 356 5.88 (0.06) 0.98 (0.02) 129.6 (0.7) 83.4 (0.4)
Women (n = 2698)
<80 1481 5.14(0.03) 1.47 (0.01) 111.2 (0.4) 71.3 (0.2)
80-<88 608 5.59 (0.04) 1.37(0.01) 117.5 (0.6) 75.4 (0.4)
>88 609 5.78 (0.04) 1.26 (0.01) 123.9 (0.6) 79.6 (0.4)
All categories significantly different (analysis o f variance), P <0.001; HDL = high density lipoprotein.
223

Table 5.2.4. Correlation coefficients between waist circumference, body mass index and
waist to hip ratio and risk factors unadjusted and adjusted for alcohol consumption,
cigarette smoking, physical activity, education levels and age.
Waist circumference Body mass index Waist to hip ratio
Un
adjusted
Adjusted Un
adjusted
Adjusted Un
adjusted
Adjusted
Men (n = 2183)
Total cholesterol 0.344 0.232 0.319 0.247 0.335 0.189
HDL cholesterol -0.269 -0.305 -0.287 -0.311 -0.249 -0.292
Systolic blood pressure 0.336 0.249 0.306 0.239 0.348 0.244
Diastolic blood pressure 0.371 0.283 0.354 0.287 0.384 0.288
Women (n = 2698)
Total cholesterol 0.265 0.106 0.217 0.099 0.290 0.114
HDL cholesterol -0.261 -0.280 -0.254 -0.245 -0.242 -0.269
Systolic blood pressure 0.372 0.237 0.335 0.226 0.301 0.188
Diastolic blood pressure 0.374 0.261 0.345 0.250 0.330 0.203
HDL = high density lipoprotein.
224

o
1 •g iT3
K 1<D a
118
Où 'o 1vis B ’S
SS 73
Ph ^ ^
H S: A\
1
I1
moo(M
I
•t
I
IIOP4
a?
1
ëI
6 ? F ? u n
v dM D
o dv o
v n\ o
T Tr -
r T \ o u n N O
o
w2
O
wS
e n ( N Y— H
2\ Dv o 2
C NI N
oo
I
uT r ? (7?t-H o oNO NO i> NOON un <N INN" en od enun un NO unCN oo CN ood NO ,— i c<un un IN un
Tj; r-4 ON O
ON enOO
NOON
enIN
1—1 ON IN Y— 1
ods s
odS
odNO
N O OO NOONOO oo un
ONOIN
en oo o T— (
o od CNCN N* 1—t NOoT en M unod N* en un
en unNO un NO 0 0
l< un odCN en 1— 1 un
en
mrn
oo
II13
-affi
(NoôCNvT
s\dM
Ig
I
o\cK\o6oô
(NenTT
ONen
II
ë' ot•a
I0
1
cT (o ' 0 \IN ON IN CN00 OO OO ONun CN Th ThTT NO ooo 00 OO w
IN o N;NO IN NO T~HOO OO oo ON
Vzy*oen
o
s'— fAls
fo
Q
CM
II
0 ^N- CN un CNen en N- enen oo" CN Y--1un <N un ene s e s e s e so en N'o N O INen (N N- CN
>—1 O ON INONoo
ONIN
N"lON
NONO
Y—1 cn" e r fNOOO
unè 2
NO oo unINOO
ININ
enOn NO
6 7 (c7 0 \ N?ON un
en N" CN N-NO CN Tk CNCN ON IN une s en NOen NO ONIN '4- 1--f ONCN CN NO
MD
00
Mod(N
Sv6<N
ONOn
VO
C-'od
CN
Onen
ë' m'C
go
aO
Pu
mH
rO

o
I s ?
g I
i
I0unON
1I
I6-
i(/)
I
'B'
i
43
■f5
6 7 6 7 c ?o od o N"NO un NO NOON ON T—H INun en un ONun un un un
N- p CNod NO IN CNun un un NO
0Al
1
fII
o ' 6 7 (1? 6 7od IN CN ONNO NO OO NOIN NO un ONCN CN enNO NO IN NOen CN oo unNO un o \ NONO NO IN NO
IN 1—4 'TCN NO od NOON ON ON OO
NO un INON NO CNs s e s ON OO
NO NO en unO un t< N"ON ON ON 00
oornCNcn"ON
un
CN
(NNO
unen
N-
II1■as
ensspo
ONINONONNO
I1t-JgI
o\N"ON
Oen
enod' r6enl<
gII
?
esINen
o
(NINenCN
unCN
'mO
6 7 C3N d ? d ?
ooOOO od OQ
oo NOIN
Êod
un T—1 T-1 CNONIN
ON Ooo
en00
I
IIIo
unodm
ON oNO
ON un NOoCx £ S
un NO
enun'tf
NOun
67 o ' 67odoo
NOO n
NOON
o ' cn" ONOw s
unes
un Y—< ONINoo
unON
unON
CNNO ON
INo 'SONNO
enodN-"NO
enIN
NOunesunON
O n
oounooIN
CNO
CN IN un enNOCN
NOM
od
un" r f en'o un o
00 o en
sod
5
OINCNINene
unCN
I
0
1
I
CL
Pu
NO
H

J
I
<L>
I8
unOn
00N -
ONON
CN un
g 0 6IN
0 6
drnCN
INunCN
_, o \ONCN
,—tun s
000CN rn
8 o 'rn 8w d
sununCN
un N- mun 0
cn $
"O
ÜÛ
Al
§
S
Io
I
I1ounON
I1unON
unON NOON
CN unoo cn
cn
ooON
(N
Ioo
o
un0 0
INmCN
drnO
pCN
o0 0
unINds
oo
INCN
I<N|II
§OO
0 00 0CNIN
0 0
NOIN
0 0cnCN
s
un
rnrnNOrn0 0
drnCNN-
N"od
ONununONundo0 0
p P N- N- r-( 0ON CNm 5 'd' NO N-
«J
1I
G
IO
II
I8
unON
IN00 N" 00
ON00rn CN Y—i
0p CN
pINp
0p NO
pr-H
c s c s0 0p
ONCN un 2CN T—(
cn IN CN CN 0 00 IN IN
CN ON 0CN
cd
S CNOV Al
o"v
0 0
10 0
0 0
A

Action level Action levelMen
40o0) § 2 0 > -in
Q .
<80 80 - 84- 8 8 - 92- 96- 100- >104
Number 271 241 317 325 341 223 210Waist circumference (cm)
255
Action level Action levelWomen40
< 70 7 0 - 74 - 78- 82- 8 6 - 9 0 - >94
Number 407 445 417 388 323 221 117 320Waist circumference (cm)
Figure 5.2.1. Prevalence rates of men and women with low high density lipoprotein
cholesterol concentration (<9 mmol/1), hypercholesterolaemia (>6.5 mmol/1),
hypertension (treatment with hypertensive agents, or systolic pressure >160 mmHg, or
diastolic pressure >95 mmHg), and any one or more risk factors.
228

5.3
THE PREVALENCE OF LOW BACK PAIN AND ASSOCIATIONS
WITH BODY FATNESS, FAT DISTRIBUTION AND HEIGHT
This section has been peer reviewed and will be published as
Han TS, Schouten JSAG, Lean MEJ, Seidell JC. The prevalence of low back
pain and associations with body fatness and fat distribution and height.
InternationalJournal of Obesity ^Q97 (in press).
Collaboration with MORGEN project
229

ABSTRACT
Objective: To examine the associations of low back pain symptoms with waist
circumference, height, waist to hip ratio and body mass index, and to test the
interactions between (1) waist circumference and height, and (2) waist to hip ratio and
body mass index.
Setting: Cross-sectional study set in The Netherlands of random sample of 5887 men
and 7018 women aged 20-60 years.
Results: The prevalences of low back pain in men and women in the past 12 months
were 46% and 52%, of whom 17% and 21% had low back pain for a total of 12 or more
weeks, and 13% and 18% had symptoms suggestive of intervertébral disc herniation.
After adjustments for age, smoking and education, more women in the highest tertile of
waist circumference reported low back pain in the past 12 months (odds ratio = 1.2, 95%
confidence interval: 1.1 to 1.4), low back pain for a total of 12 or more weeks (odds ratio
= 1.5, 95% confidence interval: 1.3 to 1.8), and intervertébral disc herniation symptoms
(odds ratio = 1.3, 95% confidence interval: 1.1 to 1.6) than women in the lowest waist
tertile. Corresponding values of low back pain symptoms for women with high body
mass index or high waist to hip ratio were similai' to those with high waist. There were
no significant differences between men in different tertiles of waist, waist to hip ratio or
body mass index reporting low back pain symptoms. Tallest subjects did not report low
back pain symptoms more often than shortest subjects. There were no significant
interactions between waist and height or between waist to hip ratio and body mass index
on low back pain symptoms.
Conclusion: Women who are overweight or with a laige waist have a significantly
increased likelihood of low hack pain. There are no significant interactions between
waist and height, or waist to hip ratio and body mass index on low back pain symptoms.
Key words: body mass index, fat distribution, low back pain, obesity, stature, weight.
230

INTRODUCTION
Low back pain is one of the commonest symptoms in Western societies, responsible for
an enormous burden of cluonic disease, and is associated with high medical health cai’e
and social costs (Wells, 1985). Overweight, indicated by high body mass index is
associated with poor subjective ill health and poor musculoskeletal functioning (Seidell
et al, 1986a). Overweight persons more frequently seek medical care for
back/joint/muscle complaints (Seidell et al, 1986b).
It is generally assmned that overweight and low back pain are related (Popkess-Vawter
and Patzel, 1992). However, scientific evidence to support this relationship is scanty
(Garzillo and Garzillo, 1994) and some is conflicting (Brennan et al, 1987; Croft and
Rigby, 1994; Wright et al, 1995). Associations between body fat distribution and low
back pain aie not well documented, although it may be postulated that subjects who
carry excessive abdominal fat mass over a long period may be at risk of low back pain,
as a result of altered postui'e to counterbalance the protruding fat mass. Prolapsed
intervertébral disc is commonly believed to be more frequent in taller people
(Heliovaara, 1987). Height may relate independently to low back pain from large
abdominal fat mass, and may aggravate back pain associated with stooping especially in
those with large waist or large abdominal fat mass. These persons may require more
reactive forces to counteract the gravitational pull on this fat mass to achieve balance,
especially when bending forward for lifting or when walking down stairs, as a result,
more strain may be exerted on their lower back. The same hypothesis could be proposed
for those with central fat distribution, indicated by high waist to hip ratio, who may be at
increased risk of low back pain independently from total fatness, measured by body
mass index.
The present study examined the associations of low back pain symptoms with waist
circumference, height, waist to hip ratio and body mass index, and to test the
interactions between (1) waist circumference and height, and (2) waist circumference to
hip ratio and body mass index on low back pain symptoms.
231

METHODS
Subjects
In the present study, the 1993 to 1995 cohorts were available from the ongoing
MORGEN (Monitoring of Risk Factors and Health in The Netherlands) project, which is
undertaken as a public health surveillance to monitor cluonic diseases, risk factors and
their consequences. Subjects were randomly recruited from tlnee towns, Amsterdam,
Maastricht and Doetinchem. To obtain similar numbers of subjects at each age, the
sample was stratified by sex and five year age group. The numbers of 5887 men and
7018 women aged 20-60 years in the present study represent those who attended the
health centres for measurements including antliropometry. Those who did not attend the
health centres or were of non-Dutch nationality were excluded bom analyses.
Measurements
Symptoms of low back pain were obtained from questionnaire. Those who responded
affirmatively to having low back pain in the past 12 months, were then asked whether
they had radiating pain to the knees or feet, to indicate symptoms of intervertébral disc
herniation. This symptom was only accepted in the presence of low back pain, to avoid
including those with other causes of radiated pain. The subjects were asked about the
total duration of low back pain in the past 12 months. Those who had low back pain for
a total of twelve weeks or more were classified as having chronic low back pain. The
reference groups for the tlnee classes o f low back pain were composed of those who did
not fulfil the criteria for the symptom under analysis, thus the reference group when
analysing one symptom included some subjects with other symptom(s) of low back pain.
All anthi’opometric measurements were made according to the World Health
Organisation (1995) recommendations by trained field scientists. Subjects wore light
clothes during measurements of body weight to the nearest lOOg using calibrated scales,
height in bare feet to the nearest mm, waist circumference in duplicate at the level
between the lowest rib margin and iliac crest, and hip circumference at the widest
232

trochanters to the nearest mm. Waist to hip circumferential ratio was computed, and
body mass index was calculated as weight (kg) divided by height squaied (m^).
Males and females were analysed separately. Confounding factors were divided into
classes for analysis. Age: 10 year groups (20-29 year group as reference), smoking: non-
smokers, ex-smokers and current smokers (non-smokers as reference), educational
levels: secondary education or lower, vocational or higher secondary education, and
higher vocational or university education (higher vocational or university education as
reference).
Statistical analysis
The prevalence of low back pain symptoms, using cross tabulation, were computed in
quintiles of waist circumference, height, body mass index, and waist to hip ratio, and
plotted to examine the type of curve for the relationships between low back pain
symptoms and adiposity indices.
Statistical analyses were performed using SAS version 6.1 (Cary, USA). All cut-off
points were decided before analysis. Tertiles of antlnopometric variables in the present
sample were identified at 86.9, 95.9 cm in men and 75.0, 84.0 cm in women for waist
circumference; and 175.0, 181.5 cm in men and 162.5, 168.5 cm in women for height;
0.872, 0.936 in men and 0.756, 0.815 in women for waist to hip ratio; 24.1, 26.9 kg/m^
in men and 22.8, 25.9 kg/m^ in women for body mass index.
Logistic regression analysis was also performed to estimate the relative risks (odds ratios
and 95% confidence intervals) of low back pain symptoms in different categories of
anthi'opometry. Crude, age adjusted, and age, smoking status and educational level
adjusted odds ratios were calculated.
The adjusted prevalence of low back pain symptoms in combination of tertiles of waist
and height, and combination of tertiles of waist to hip ratio and body mass index were
233

calculated using analysis of vaiiance, adding age, smoking and education as covariates.
Logistic regression analysis was used to estimate the maximum likelihood of the models
to examine the interaction between waist circumference and height, and waist to hip
ratio and body mass index. Calculations were made for the difference of log likelihood
(X ) obtained in the model predicted by dummy variables of waist tertiles (two variables)
and height tertiles (two variables) subtracted bom % obtained in the same model with an
addition of four dummy variables from combinations of waist tertile 2 and height tertile
2, waist tertile 2 and height tertile 3, waist tertile 3 and height tertile 2, and waist tertile 3
and height tertile 3, with reference to the group of lowest waist tertile combined with
lowest height tertile. This analysis was repeated for waist to hip ratio and body mass
index in the relationship with low back pain symptoms. Interaction between variables
was considered if the resultant % value exceeded the 5% significance level (4 degrees of
beedom).
RESULTS
Subject characteristics are shown in Table 5.3.1. Tables 5.3.2a & b and Figures 5.3.1a
& b (only chronic low back pain was selected for illustration) show the prevalence of
clu'onic low back pain and intervertébral disc herniation increased with increasing waist,
waist to hip ratio, and body mass index in both men and women, with women having
more complaints of low back pain symptoms than men. About half of the population
studied had low back pain in the past 12 months, 20% reporting symptoms which lasted
a total of twelve weeks or more, and 15% had symptoms of intervertébral disc
herniation. The pattern between low back pain and height was weak in women but more
consistent in men, with shortest men (tertile 1) showing the greatest frequency of low
back pain symptoms. Examination of plots did not reveal any tendency to low back pain
in the very tall.
The relative risks (odds ratios) of low back pain symptoms in those with antliropometric
measurements in the upper two tertiles were compared to those in the lowest tertile
234

(Table 5.3.3a & b). Without adjustments, more subjects with large waist circumference,
high waist to hip ratio and high body mass index reported symptoms of low back pain,
with the exception of low back pain in the past 12 months in men. The relationships
were weaker after adjustments for age, smoking and education, but more women with
large waist circumference continued to report symptoms of low back pain than those
with smallest waist circumference. Relative risks from being overweight, assessed by
body mass index, were slightly lower than bom those having large waist circumference
for each symptom of low back pain. In women, high waist to hip ratio significantly
associated only with clironic low back pain. There was no evidence of taller subjects
being more at risk of low back pain than shorter subjects.
The age, smoking and education adjusted prevalence of low back pain symptoms (only
clii'onic low back pain was selected for illustration) in different combinations of tertiles
o f waist and height (Figures 5.3.2a & b), and body mass index and waist to hip ratio
(Figures 5.3.3a & b) were plotted. Analysis of maximum likelihood (adjusted for age,
smoking and education) showed that waist circumference and height did not interact on
any symptom of low back pain (x^ range 1.6-4.6, P >0.5) either in men or in women, the
interaction between high waist to hip ratio and high body mass index on symptom of
intervertébral disc herniation did not reach the 5% signibcance level in either men (x^ -
6.8, P <0.2) or women (x^ = 8.5, P <0.1). In men, little evidence for an interaction
between waist to hip ratio and body mass index on chionic low back pain was obseiwed
(Figure 5.3.3a), but there was some suggestion for this effect in women {% = 8.0, P
<0.1) (Figure 5.3.3b). There was no evidence for an interaction between waist and
height or waist to hip ratio and body mass index on low back pain in the past 12 months
in either sex. Thus, the present study did not bnd that stratification by height or body
mass index was necessaiy when assessing the associations between low back pain and
waist circumference, and waist to hip ratio respectively.
235

DISCUSSIONAs well as investigating the associations between low back and pain and body mass, the
present study examined its relationships with body fat distribution. Clironic low back
pain (lasting a total of twelve weeks or more in the past 12 months), and symptoms of
intervertébral disc herniation (low back pain during the past 12 months with radiating
pain to the knees or feet) were more prevalent in those with increased abdominal fatness,
indicated by large waist circumference, and in overweight subjects (high body mass
index). After adjusting for confounding factors (aging, smoking and low educational
level), no significant relationship remained between low back pain and any of the
indices of adiposity in men. The relationships were stronger in women, and remained
significant for waist circumference and body mass index. There was little evidence for
any interactions between waist circumference and height, or body mass index and waist
to hip ratio on symptoms of low back pain.
Using body mass index to indicate overweight may misclassify people with excessive
muscularity rather than excessive fatness (Wellens et al, 1996), and does not take
account of fat distribution. We have found that chronic low back pain (Figures 5.3.3a &
b) or symptoms of intervertébral disc herniation (Figures not presented) were most
common in those with high waist to hip ratio when they are overweight. A prolonged
burden of excess weight may cause low back pain tlirough increased load compression
on the intervertébral discs (Eklund and Corlett, 1984), or increased stress on the spine
when bending to lift objects or stepping down stairs. Excess central fat might have
specific mechanical effects including altered gait, which may affect the efficiency of
shock absorbance by the bearing joints, leading to increased stress and strain on the
spine. Biomechanical studies in subjects with large abdominal fat mass, indicated by
large waist circumference, may help clarify the aetiology of low back pain.
Crude odds ratios for chionic low back pain and symptoms of intervertébral disc
herniation in different categories of indices of adiposity were all significant. The present
study defined the symptom of chronic low back pain as a total of twelve or more weeks
236

of back pain in the past 12 months. This cut-off point was arbitrary. Alternative analyses
using Tow back pain lasting a total of seven weeks or more in the last 12 months’, or
employing reference group as those who did not have any low back pain in the past
twelve months were also performed. The results obtained showed no substantial
differences to the results presented herein. After adjustments for age, smoking and
education, only women with high body mass index and large waist remained
significantly at risk of low back pain. Age had the most powerful confounding effect
(data not shown).
The analysis between indices of adiposity and low back pain is complicated by smoking,
since smokers tend to have higher waist and smaller hips than expected compared to
non-smokers (Shimokata et al, 1989). In the present study, smokers were at significantly
increased risk of low back pain symptoms, independently from all the other factors
considered (results not shown), confirming previous findings (Wright et al, 1995; Deyo
and Bass, 1989). Data in the present study were not adjusted for occupation or physical
activity because of their unknown causal relationships with low back pain. Education is
probably a more valid adjustment than occupation in relation to low back pain, because
occupations change.
Comparing the relative risks of low back pain in subjects of highest quintiles and lowest
quintiles of anthropometry would increase the contrast (Figure 5.3.1), thus give higher
odds ratios, but with wider 95% confidence intervals due to smaller numbers in each
category. The odds ratios for symptoms of low back pain only changed by less than 0.1
unit (results not shown) when subjects in extreme quintiles of antliropometric
measurements were compared instead of tertiles. To test interactions between
measurements, employing tertiles was more appropriate, since very few subjects had a
combination of body mass index in the highest quintile and waist to hip ratio in the
lowest quintile.
237
Using unadjusted prevalence, there were more shorter subjects with low back pain.
However older subjects are generally shorter than younger subjects (C hapter 3.2; Han
and Lean, 1996; van Leer et al, 1992), due to both losses in height associated with aging
and secular trends towards taller populations (van Leer et al, 1992). After age and
lifestyle adjustments, there was no association between height and low back pain. Other
evidence on symptoms of low back pain and height is conflicting. Heliovaara (1987)
foimd men above 180 cm and women above 179 cm had 2 and 4 times the risk of
herniated lumbar intervertébral disc compared to the those who were 10 cm shorter.
Other studies have found no association between height and low back pain (Kelsey,
1975; Kelsey et al, 1984). A study of men and women with low back pain has shown
spinal mobility decreases with increasing body weight, whilst height had negligible
effects (Mellin, 1987).
CONCLUSIONSThere are no significant interactions between waist circumference and height or waist to
hip ratio and body mass index in the relationships with symptoms of low back pain.
Women who are overweight, or those with a predominant abdominal fat mass, indicated
by large waist circumference, are at greatly increased risk of low back pain. Associations
between anthropometric measui'es and low back pain are much weaker or non
significant in men. Although the relative risks of low back pain symptoms related to
overweight or large waist circumference were comparatively low in women, the high
prevalence of these symptoms indicates a huge burden on the health care resouices
attributable to overweight, and the absolute impact of overweight on low back pain
imposes an enormous claim on medical care facilities (Wells, 1985).
238

Table 5.3.1. Characteristics of 5887 men and 7018 women.
Men Women
Mean SD Range Mean SD Range
Age (years) 42.9 10.7 20.3-60.0 42.2 11.0 20.2-59.9
Weight (kg) 82.0 12.0 44.4-157.0 68.5 11.5 36.6-153.0
Height (cm) 178.4 7.3 152.0-210.0 165.7 6.7 134.5-190.0
Body mass index (kg/m^) 25.8 3.5 15.7-50.1 25.0 4.2 14.9-58.3
Waist circumference (cm) 92.3 10.8 64.0-155.0 81.0 11.1 56.5-150.0 .
Hip circumference (cm) 101.8 6.6 69.0-150.0 102.2 8.4 76.4-165.0
Waist to hip ratio 0.905 0.072 0.621-1.369 0.791 0.070 0.567-1.302
Non-smokers (%) 30.5 36.1.
Ex-smokers (%) 33.2 26.6
Current smokers (%) 36.3 37.4
Secondaiy education or lower
Vocational or higher
44.7 — — 55.2 — —
secondary education
Higher vocational or
29.5 — — 25.2 — —
university education 25.8 — --- 19.6 — —
239

Table 5.3.2a. Prevalence of symptoms of low back pain in tertiles of anthropometric
measurements in 5887 men.
Low back pain in
the past 12 months
(%)
Cluonic low
back painf
(%)
Symptoms of
intervertébral
disc herniation^
(%)
Total prevalence 45.6 16.6 13.4
Waist circumference tertile 1 45.2 13.3 10.2
Waist circumference tertile 2 44.1 15.5 12.9
Waist circumference tertile 3 47.5 20.7 16.7
5.0 40.9*** 36.6***
Height tertile 1 47.7 19.6 15.4
Height tertile 2 44.0 16.0 12.3
Height tertile 3 45.6 14.6 12.6
5.5 17.9** 9.4**
Waist to hip ratio tertile 1 44.4 13.2 8.9
Waist to hip ratio tertile 2 46.1 16.4 14.3
Waist to hip ratio tertile 3 46.4 20.1 16.8
1.8 34.1*** 55.2***
Body mass index tertile 1 43.3 13.6 9.9
Body mass index tertile 2 45.5 17.0 14.1
Body mass index tertile 3 48.1 20.3 16.1
x'§ 9.3** 32.2*** 33.3***
"I'Low back pain for a total o f 12 weeks or more in the past 12 months; :];low back pain with radiating pain
to the knees or feet; §differences in prevalence between tertiles o f anthropometry: <0 .0 0 1 , **P
<0 .0 1 .
240

Table 5.3,2b. Prevalence of symptoms of low back pain in tertiles of anthropometric
measurements in 7018 women.
Low back pain in
the past 12 months
(%)
Chronic low
back painf
(%)
Symptoms of
intervertébral
disc herniationf
(%)
Total prevalence 52.3 20.5 17.6
Waist circumference tertile 1 48.2 14.8 13.5
Waist circumference tertile 2 52.7 20.5 16.6
Waist circumference tertile 3 55.9 25.9 22.4
28.1*** 89.2*** 66.5***
Height tertile 1 52.7 23.1 19.3
Height tertile 2 52.0 19.2 17.5
Height tertile 3 52.3 19.5 16.2
0.2 13.1** 7.6*
Waist to hip ratio tertile 1 49.2 15.0 14.3
Waist to hip ratio tertile 2 51.4 21.1 16.3
Waist to hip ratio tertile 3 56.1 25.0 21.9
23.5*** 72.4*** 50.3***
Body mass index tertile 1 48.3 16.8 14.1
Body mass index tertile 2 53.1 20.0 16.1
Body mass index tertile 3 55.7 24.9 22.8
26.1*** 48.6*** 66.4***
-{ Low back pain for a total o f 12 weeks or more in the past 12 months; JIow back pain with radiating pain
to the knees or feet; §differences in prevalence between tertiles o f anthi'opometry: < 0 .0 0 1 ,
<0.01, <0.05.
241

Table 5.3.3a. Logistic regression analysis to predict low back pain by body mass index,
waist to hip ratio, waist circumference and by height, entered the model individually,
unadjusted and adjusted for age, smoking and education, in 5887 men.
Independent variables §
Low back pain in the past 12 months
Chroxric low back paixif
Symptoms of intervertébral disc
herniationfOR 95% Cl OR 95% Cl OR 95% Cl
UnadjustedWaist tertile 1 1.00 1.00 1.00Waist tertile 2 0.96 0.84, 1.09 1.19 1.00, 1.43 1.30* 1.06, 1.58Waist textile 3 1.10 0.97, 1.25 1.70*** 1.43,2.01 1.76*** 1.46, 2.13
Height tertile 1 1.00 1.00 1.00Height tertile 2 0.86* 0.76, 0.98 0.78** 0.66, 0.92 0.77** 0.64, 0.93Height tertile 3 0.92 0.81, 1.05 0.70*** 0.59, 0.83 0.79* 0.66, 0.95
WHR tertile 1 1.00 1.00 1.00WHR tertile 2 1.07 0.94, 1.22 1.29** 1.08, 1.54 1.71*** 1.40,2.09WHR tertile 3 1.08 0.96, 1.23 1 66*** 1.40, 1.96 2.07*** 1.70,2.52
BMI tertile 1 LOO 1.00 1.00BMI tertile 2 1.09 0.96, 1.24 1.20* 1.01, 1.44 \ 49**^ 1.23, 1.82BMI textile 3 1.22* 1.07, 1.38 1.61*** 1.36, 1.91 1.74*** 1.44, 2.11
Adjusted fo r age, smoking and educationWaist textile 1 1.00 1.00 1.00Waist textile 2 0.89 0.78, 1.02 0.94 0.78, 1.14 0.99 0.80, 1.21Waist tertile 3 0.97 0.85, 1.12 1.13 0.94, 1.37 1.13 0.92, 1.39
Height textile 1 1.00 1.00 1.00Height tertile 2 0.91 0.80, 1.03 0.93 0.79, 1.10 0.93 0.77, 1.12Height tertile 3 1.00 0.88, 1.15 0.97 0.81, 1.17 1.15 0.94, 1.40
WHR textile 1 1.00 1.00 1.00WHR textile 2 0.97 0.85, 1.11 0.93 0.77, 1.13 1.24 1.00, 1.53WHR textile 3 1.00 0.79, 1.06 0.98 0.80, 1.19 1.23 0.99, 1.53
BMI textile 1 1.00 1.00 1.00BMI textile 2 1.05 0.93, 1.20 1.01 0.84, 1.21 1.23* 1.01, 1.51BMI textile 3 1.11 0.97, 1.28 1.15 0.96, 1.38 1.21 0.99, 1.490 R = odds ratio; Cl = confidence interval; WHR = waist to hip ratio; fL ow back pain for a total o f 12 weeks or more in the past 12 months; :|;low back pain with radiating pain to the knees or feet; §reference to tertile 1 (odds ratio = 1.00) o f each anthropometric variable; <0.001, <0.01, <0.05.
242

Table 5.3.3b. Logistic regression analysis to predict low back pain by body mass index,
waist to hip ratio, waist circumference and by height, entered the model individually,
unadjusted and adjusted for age, smoking and education, in 7018 women.
Independent
Low back pain in the past 12 months
Chx'onic low back painf
Syxnptoms of intervertébral disc
herxiiationfvai'iables§ OR 95% Cl OR 95% Cl OR 95% Cl
Waist tertile 1 Waist tertile 2 Waist tertile 3
1.001.20**1.36***
1.07, 1.34 1.22, 1.53
Unadjusted1.001.48*** 1.27,1.73 2.01*** 1.74,2.33
LOO1.28**1.85***
1.08, 1.50 1.59,2.16
Height tertile 1 Height textile 2 Height tertile 3
1.000.970.98
0.87, 1.09 0.88, 1.10
1.000.79**0.81**
0.69, 0.91 0.70, 0.93
1.000.890.81**
0.76, 1.03 0.70, 0.94
WHR textile 1 WHR tertile 2 WHR textile 3
1.001.091.32***
0.98, 1.23 1.18, 1.48
1.001.51***1.89***
1.30, 1.76 1.63,2.19
LOO1.161.68***
0.99, 1.37 1.44, 1.95
BMI textile 1 BMI tertile 2 BMI tertile 3
1.001.21**1.34***
1.08, 1.36 1.20, 1.51
1.001.24**1.65***
1.07, 1.44 1.43, 1.91
1.001.171.80***
LOO, 1.38 1.55,2.09
Waist tertile 1 Waist tertile 2 Waist textile 3
1.00 1.12 1 21**
Adjusted fo r age, smoking and education 1.00 1.00
1.00,1.27 1.26** 1.08,1.48 1.06 1.06,1.37 1.49*** 1.27,1.75 1.32***
0.90, 1.25 1.12, 1.57
Height textile 1 Height tertile 2 Height tertile 3
1.001.031.12
0.91, 1.16 0.99, 1.26
1.000.891.06
0.77, 1.03 0.91, 1.22
1.001.001.06
0.86, 1.17 0.91, 1.25
WHR tertile 1 WHR textile 2 WHR textile 3
1.001.021.14*
0.91, 1.15 1.01, 1.30
1.001.27**1.35***
1.09, 1.50 1.15, 1.58
1.000.951.14
0.80, 1.12 0.96, 1.35
BMI textile 1 BMI tertile 2 BMI textile 3
1.001.15*1.21**
1.02, 1.29 1.06, 1.37
1.001.071.23**
0.92, 1.24 1.05, 1.44
LOO1.001.35***
0.85, 1.18 1,15, 1.60
OR= odds ratio; Cl == confidence interval; WHR = waist to hip ratio; fL ow back pain for a total o f 12 weeks or more in the past 12 months; :{:low back pain with radiating pain to the knees or feet; §reference to tertile 1 (odds ratio ^ 1.00) o f each anthropometric variable; ***p <0.001, **P <0.01, *P <0.05.
243

A ^
^ &cd —
I0
1
22M EN
20
18
16
14
121 2 3 4 5
P h ^
^ &M (D
II<L)
oI
Qintiles o f anthropometry
28W O M E N26
- o24
22
18
14—c5
1 2 3 4 5
Qintiles o f anthropometry
Figure 1. Plots of the prevalence of chronic low back pain against quintiles of
antln’opometry: • waist circumference, A height, O waist to hip ratio, and ■ body mass
index in 5887 men (a) and in 7018 women (b).
244

MEN
3 2 1
Height tertiles a
WOMEN
u 20
ct3 10
3 2 1
Height tertiles b
Figure 2. Prevalence (adjusted for age, smoking and education) of chronic low back
pain in tertiles of waist circumference and tertiles of height in 5887 men (a) and in 7018
women (b).
245

MEN
« 10
Body mass index tertiles
WOMEN
I ' 20s
15 10
3 2 1Body mass index tertiles
Figure 3. Prevalence (adjusted for age, smoking and education) of chronic low back
pain in tertiles of waist to hip ratio and tertiles of body mass index in 5887 men (a) and
in 7018 women (b).
246

5.4
SYMPTOMS OF RESPIRATORY INSUFFICIENCY IN RELATION
TO BODY FAT AND FAT DISTRIBUTION
This section has been submitted for publication as
Han TS. Smit HA, Lean MEJ, Seidell JC. Symptoms of respiratory insufficiency
in relation to fat and fat distribution, (submitted).
Collaboration with MORGEN project
247

ABSTRACT
Objective: To relate respiratory symptoms to measures of abdominal fat distribution and
overweight, in people with and without evidence of underlying lung disease.
Design: Random sample of 5887 men and 7018 women aged 20-59 years, in a cross-
sectional study set in The Netherlands.
Measures: Shortness of breath, wheezing, coughing, and bringing up phlegm.
Results: Compared to the lowest tertile with adjustments for age and lifestyle factors,
those with waist circumference in the highest tertile were 2.4 times (95% confidence
intervals 2.0 to 3.0) in men and 2.6 times (2.2 to 3.0) in women more likely to have
shortness of breath when walking uphill or upstairs, 1.8 times (1.4 to 2.4) in women to
be woken up by shortness of breath. Women with large waist were about 1.5 times more
likely to wheeze when not having a cold, to cough or to bring up phlegm for more than 3
months a year. Respiratory symptoms related to body mass index or to waist to hip ratio
were similar to waist circumference. The relationships with shortness of breath were
present as aggravating factors in smokers and people with indicators of underlying lung
disease (wheeze, cluonlc productive cough), and remained as symptoms of abdominal
fat distribution or overweight in non-smokers and those without evidence of any
underlying lung disease.
Conclusions: Increased waist circumference, body mass index and waist to hip ratio all
associate with a variety of respiratory symptoms. These important symptoms of
abdominal fat distribution and overweight represent an important burden of ill health at
a population level.
Keywords: Health promotion, lung disease, obesity, quality of life, smoking.
248

INTRODUCTION
The prevalence of overweight, body mass index (weight/height^) greater than 30 kg/m^,
in Western countries is more than 10% (Bennett et al, 1995; Kuczmarski et al, 1994;
Seidell, 1995a). These persons aie at increased risk of many chronic diseases such as
diabetes, cardiovascular diseases and premature death (Manson et al, 1995; Simopoulos
and van Itallie, 1984). Extreme overweight is associated with poor lung function (Luce,
1980; Zerah et al, 1993). Compared to non-overweight subjects, the total work of
breathing while at rest in overweight subjects is about twice as high (Sharp et al, 1964).
Decreased respiratory compliance is thought to play an important role. Luce (1980) has
suggested that decreased chest wall compliance associated with overweight (Sharp et al,
1964a; Naimark and Cherniak, 1960) may be explained by the accumulation of fat in
and ai'ound the ribs, diaphragm and abdomen. Respiratory compliance in these subjects
has been observed to markedly reduce when lying recumbent, it was calculated that the
mass loading of excessive fat mass was similar to having weight loaded on a person
(Shaip et al, 1964b). Large abdominal fat mass may compress the lungs, which may
cause hypoventilation, leading to mismatch in ventilation/perfusion, hence hypoxia
(Luce, 1980; Bedell et al, 1958; Farebrother et al, 1974; Holley et al, 1967). Sleep apnea
is common in overweight subjects and has been related to large waist circumference
(Grunstein et al, 1993; Wilcox et al, 1994), and weight loss improves this symptom
(Surratt et al, 1992).
Although most overweight people are aware of breathlessness on exertion (Dempsey et
al, 1966), the nature of the relationships between overweight, particularly with increased
waist to hip ratio or increased waist circumference, and symptoms of respiratory
insufficiency are not well established. The present study aimed to examine the
associations between respiratory symptoms and high body mass index, high waist to hip
ratio, or large waist circumference.
249

METHODS
SubjectsMen (n = 5887) and women (n = 7018), aged 20-59 years were randomly recruited from
three towns, Amsterdam, Maastricht and Doetinchem in the Netherlands from 1993 to
1995, in the ongoing MORGEN (Monitoring of Risk Factors and Health in The
Netherlands) study undertaken as a public health surveillance to monitor chronic
diseases, risk factors and their consequences. To obtain similar numbers of subjects at
each age, the sample was stratified by sex and five year age group. The response rate to
invitations was about 50%. The numbers of subjects in the present study represent those
who attended the health centres for measurements including anthropometry. Those who
did not attend the health centres or were of non-Dutch nationality were excluded from
analyses.
Respiratory symptoms were obtained from a selection of questions that were used in the
European Respiratory Health survey (Burney et al, 1994). Eight symptoms were
selected for analysis including wheezing in the past twelve months when not having a
cold, coughing daily (day or night) for a total of 3 or more months per year, bringing up
phlegm daily (day or night) for a total of 3 or more months per year, chronic productive
cough (periods of cough with phlegm in the past 3 years for at least 3 weeks per year,
being woken up by shortness of breath during past 12 months, shortness of breath when
walking uphill/stairs, and shortness of breath when walking at normal pace with people
of the same age.
Anthropometric measurements were made according to the World Health Organisation
(1995) recommendations by paramedical personnel. Subjects wore light clothes during
measui'ements of body weight to the nearest lOOg using calibrated scales, height in bare
feet to the nearest mm, waist circumference in duplicate at the level between the lowest
rib mai'gin and iliac crest, and hip circumference at the widest trochanters to the nearest
mm. Waist to hip circumferential ratio was computed, and body mass index was
calculated as weight (kg) divided by height squared (m^).
250

Statistical methods
All statistical analyses were performed using SAS version 6.1 (Cary, USA). Respiratory
symptoms were dichotomous. Tertiles for anthropometric variables were created to
define the levels of overweight (body mass index), central fat distribution (waist to hip
ratio), and waist circumference was examined since waist reflects both overweight and
fat distribution (C hapter 4.1; Lean et al, 1995). The age adjusted prevalence of
respiratory symptoms was calculated for subjects in tertiles of anthropometry, using
analysis of variance, adding age as a covaiiate. Logistic regression analysis, unadjusted,
adjusted for age, and adjusted for age and lifestyle factors, was performed to estimate
the relative risk (odds ratios and 95% confidence intervals) o f respiratory symptoms in
different tertiles of antliropometry. Separate analysis in different groups of smoking
status was performed, since smoking is a strong determinant of respiratory symptoms,
thus eliminating possible residual confounding effects of smoking. For convenience of
presentation, only odds ratios with adjustments for age and lifestyle factors were
tabulated.
Males and females were analysed separately, potential confounding factors considered
dummy variables of age: divided into 10 year groups (20-29 year group as reference),
smoking: non-smokers, ex-smokers, and current smokers (non-smokers as reference),
educational level: secondaiy education or lower (educational level 1), vocational or
higher secondary education (educational level 2), and higher vocational education or
imiversity education (educational level 3) (educational level 1 as reference), leisure
activity: non participants, and participants in leisure sport (non-participant as reference).
Thiee types of subjects with chronic productive cough, wheeze, and smokers were
considered in a separate group to assess the possible aggravation of shortness of breath
from obesity. Those who never smoked and who did not have chi'onic productive cough
or wheeze were considered separately to assess the impact of overweight or abdominal
fat on shortness of breath in people with normal lungs.
251

RESULTS
Subject characteristics are shown in Table 5.4.1. In general, the age adjusted prevalence
of subjects with respiratory symptoms significantly increased with increasing
anthropometric measurements, and more strongly in women (Tables 5.4.2a & b). In
men (Table 5.4.2a), non-linear relationships between anthr opometric measurements and
wheezing when not having a cold and chi'onic productive cough, and an inverse
relationship between body mass index and bringing up phlegm were observed.
Age and lifestyle factors adjusted odds ratios to estimate relative risks of having
respiratory symptoms (Table 5.4.3) showed that those who had large waist
circumference (tertile 3) were associated with 2 to 2.5 times the risk of having shortness
of breath when walking uphill/stairs, about 2 times in men and 2.5 to 3.5 in women the
risk of having shortness of breath when walking at normal pace with others of their age.
In women only, the risks of wheezing without a cold, of being woken up by shortness of
breath and chionic productive cough, were all increased by about 1.5 times in tertile 3
compared to those with low (tertile 1). Compared to men with waist circumference in
tertile 1, odds ratio for chi'onic productive cough in men with waist in tertile 2 were
significantly less than 1, i.e. chronic productive cough was associated with low waist
circumference. Compared to the lowest tertile, the odds ratios for these respiratory
symptoms in subjects with high body mass index or with high waist to hip ratio (results
not shown) were similar (mostly to within 0.1 unit of odds ratios) to the odds ratios
presented in Table 5.4.3 for waist circumference.
Figures 5.4.1a & b show that within separate groups of non-smokers and smokers, the
prevalence of those with shortness of breath when walking uphill or upstairs increased
with increasing waist circumference, and significantly (P <0.001) higher in smokers for
each level of waist circumference. After excluding subjects with underlying lung disease
(wheezing and chronic productive cough) in non-smokers (Tables 5.4.4a & b), the risk
for shortness of breath continued to persist in those with large waist circumference, high
body mass index, or high waist to hip ratio.
252

DISCUSSIONThe present study shows that the age adjusted prevalence of respiratory symptoms
increased with increasing waist circumference, body mass index and waist to hip ratio.
Compared to the lowest tertile those with waist circumference, body mass index, or
waist to hip ratio in tertile 3 were at 2-3 times more likely to have shortness of breath
when walking uphill or walking with their peers (same age) at normal pace. Women
with high measures of adiposity also had significant risks of other respiratory symptoms
such as wheezing, coughing, and being woken up by attack o f shortness of breath, the
latter could indicate sleep apneas or coronary disease.
Shortness of breath is usually taken to indicate respiratory disease, but can in fact be a
symptom of overweight per se, i. e. excessive body mass and central fat distribution, as
demonstrated in subjects who did not have chronic productive cough or wheeze and
those who have never smoked (Tables 5.4.4a & b). One of the most distinctive features
of overweight is poor physical fitness. These persons are less able to perform physical
work effectively. The excessive body mass requires increased effort by overweight
subjects for movement (Dempsey et al, 1966). Subject to exercise testing, overweight
subjects demonstrate increased O2 consumption and CO2 production, leading to
increased ventilation (Dempsey et al, 1966). Thus, these subjects ai'e more likely to be
out of breath more easily than leaner subjects for a given work load.
Data from the present study show subjects with chionic productive cough were most
prevalent both in the highest and in the lowest tertile of body mass index and waist
circumference. Smoking was more prevalent in those with productive cough (about 50%
in both sexes) than other subjects (<35%) making the analysis more complicated. It is
known that smoking is related to relatively low body mass index and low waist
circumference (accompanying paper), but the risk of having shortness of breath in
smokers with a waist in lower tertiles was similar to that in non-smokers with the largest
waist circumference (Figures 5.4.1a & b). Within the group of smokers and those with
symptoms of lung disease, shortness of breath continued to increase in those with higher
253

body mass, high waist to hip ratio or larger waist circumference (Tables 5.4.4a & b).
There was no evidence for residual confounding effects of smoking when separate
analysis were made for subjects in different smoking status (data not shown). Subjects in
the advanced stage of chronic productive cough (clii'onic bronchitis) may be prone to
weight loss (Mitchell and Filley, 1964; Vandenbergh et al, 1967). Different types of
patients of different anthropometric characteristics, e.g. the overweight, hypoxic ‘blue
bloaters’ and the underweight, emphysematous ‘pink puffers’, exist in those with
chronic broncliitis (Filley et al, 1968) may explain these differences. In patients with
established respiratory disease, a vicious cycle with limited physical activity contributes
to weight gain, and increased frequency of acute infective exacerbation. Cachexia is also
common in patients with severe lung disease (Mitchell et al, 1964; Wilson et al, 1989),
and malnutrition or negative energy balance in this group aggravates respiratory distress
through wasting of respiratory muscles (Vandenbergh et al, 1967; Donahoe et al, 1989;
Openbrier ef a/, 1983; Thurlbeck, 1978).
The relationship between body weight and subjects with clironic productive cough, a
diagnosis for clironic bronchitis, is less clear than that with emphysema, which
associates with severe weight loss (Filley et al, 1968; Donahoe et al, 1989; Green and
Muers, 1992). Openbrier et al (1983) found all four bronchitic patients in their study had
body weight above standard weight, whereas Steele and Heard observed the mean
weight of 12 patients was lower than the control group (Steele and Heard, 1973).
CONCLUSIONS
Overweight men and women, and those with central fat distribution or increased waist
circumference are all at increased risk of respiratory symptoms, particularly shortness of
breath when performing basic activities such as climbing stairs or walking at normal
pace with people of their age. These symptoms are aggravated by smoking and by
underlying lung disease. Preventing weight gain and healthy lifestyle should be
recommended to decrease the risk of these symptoms associated with adiposity.
254

Table 5.4.1. Characteristics of 5881 men and 7018 women.
Men Women
Mean SD Range Mean SD Range
Age (years) 42.9 10.7 20.3-60.0 42.2 11.0 20.2-59.9
Weight (kg) 82.0 12.0 44.4-157.0 68.5 11.5 36.6-153.0
Height (cm) 178.4 7.3 152.0-210.0 165.7 6.7 134.5-190.0
Body mass index (kgW ) 25.8 3,5 15.7-50.1 25.0 4.2 14.9-58.3
Waist circumference (cm) 92.3 10.8 64.0-155.0 81.0 11.1 56.5-150.0
Hip circumference (cm) 101.8 6.6 69.0-150.0 102.2 8.4 76.4-165.0
Waist to hip ratio 0.905 0.072 0.621-1.369 0.791 0.070 0.567-1.302
255

îoooo
I»•s
1
lIAu-i0
1 !
dM
IH
iIIo
PQ
M
IG'ÈB%"d
(N
en
<N
s<N|
V3S----
I
§§%O s
sOs
§"-M
Os"~1
* ** * *
* -X- * * * *ON O <N IT) en OnCN in en On NO ON odrn en CN Th IN CN
oo (N en o '=1- t-HO od od NÔ Tj: t>’~ ' T—( CN
ON vn en O CN (N oo[< NO NO 1—1 CNT—t 1-H
O O j ON CN OO in NOON NO ON r™H en
* -X- ** -X- ** * -X- * * *O NO ON oo <N CN INt>- in in (N CN CN
en en t—1 en oo en
en 00 NO OO IN r-H lOod od ir ! l o
T—1 CN
o CN ON oo00 od NO CN CN
t-H T-H
es en en enod NO NO IN o en
* *-X- -X- ** * * *
oo oo M CN enoo en en NO CNO (N en (N CN NO CN
(N NO vn NOo NO vn en NO
CN
o (N N NO oo CNON NO NO Tf- CN en
t-H T—1
r - r~ NO en OC) OO INod od ON N en
iIAI
t§H
IPQ
!Ja0
1
I<H-IO
I§■I
IfIiPQ
.u
g1Ito
orO%
JD
IIex
I"S
I ^I I8
I•I— •5H-
.S
Ia
A
I
'sOin(N

0tN. S
1§■
<4H0
I.g
1
Io<Dt
• S
' S
ImÔCN
i
îIII
II' êo
$
IIio
PQ
i .
C,"--INhCN
• o
en<N
S
Q>
en<N
ON-en<N
OoenenCN
Ooen
c ,
%Sî
* * * * * X-* * * * X- X-* * * * X- X-
oo un CNO NO ON NO
un ON un
oo ON en un NOo ON un od
enM
m OO NO (N (N untN NO TT od un
HNO
en en un un IN r-H
NO od Tt"
-X- ■X- * * X- X-* * * X- * X-* * * •X- X- X-CN 'd " ON o ONO o i oo '= d ; 'd - <N IN
NO (N IN N - en
IN 'd* IN o N- unO ON NO od CN
en , -H
N- OO NO (N CNIN IN T h od un
RIN
r-H un o IN NOIN un Tf- od
-X- * •X- * X- X--X- -X- -X- * X- X-•X- * -X- X- X- X-o \ oo ON en CN un ON
oo NO ON ON INNO od NO 1 1 od ON NO
o \ t-H O t - ' ooOs ON NO od od
enen
0 0 oo 'd- O IN unIN NO od un
(NNO
NO NO OO en un NO OIN NO ON N"
RQ)
I
’o0 cd
fï1f
i!Albû
§O
!Al
§■
fPQ
tü
Ia0
1
I• s
8
I&
I
IIbO
§
I8
ex
.ü
1Ito
s
IatX)%
X
lI
Iex.a
■I
I-8
cdM f—(
^ PQ PQ
Iâ
a.aI
'E
f
un(N

Table 5.4.3. Odds ratios of respiratory symptoms in different tertiles of waist
circumference, adjusted for age, smoking, physical activity, and education.
Waist circumference
Tertile 1 Tertile 2 Tertile 3
Odds Odds 95% Cl Odds 95% Cl
ratio ratio ratio
MEN {n - 5887)
Wlieezing when not having a coidf 1.00 0.90 0.71, 1.15 1.21 0.96, 1.54
Coughing for >3 months/year^ 1.00 1.13 0.87, 1.47 1.19 0.91, 1.55
Bring up phlegm >3 months/year]: 1.00 0.96 0.73, 1.26 1.04 0.79, 1.37
Chronic productive cough§ 1.00 0.83* 0.70, 0.99 0.96 0.80, 1.15
Woken by shortness of breath 1.00 0.87 0.63, 1.20 1.18 0.86, 1.62
Shortness of breath - uphill/stairs § 1.00 1.11 0.89, 1.37 2.41*** 1.97, 2.96
Shortness of breath - normal pace^ 1.00 0.81 0.55, 1.20 1.80*** 1.27, 2.54
WOMEN {n = 7018)
Wheezing when not having a coldf 1.00 1.06 0.84, 1.34 1.64*** 1.31,2.07
Coughing for >3 months/year J 1.00 1.10 0.86, 1.41 1.55*** 1.21, 1.98
Bring up phlegm >3 months/yearj 1.00 1.08 0.81, 1.45 1.39* 1.04, 1.86
Chronic productive cough§ 1.00 1.01 0.86, 1.17 1.13 0.96, 1.33
Woken by shortness of breath 1.00 1.13 0.86, 1.49 1.82*** 1.40,2.38
Shortness of breath - uphill/stairs§ 1.00 1.45*** 1.24,1.69 2.55*** 2.19, 2.98
Shortness of breath - normal pace^j 1.00 1.64*** 1.24,2.17 2.25,3.84
***P <0.001, * *P <0.01, <0.05; Cl = confidence interval; "| in the past 12 montlis; :|:in the past 3 years;
§coughing with phlegm >3 weeks/year in the past 3 years; §when walking uphill/stairs ^when walking at
normal pace with others o f the same age.
258

1m
IU
g
t - '(N
X-*X-Q!uS
X-X-X-U~)o(N
s;INNO(NCN
X-XX-cnCN'=d'
'=d-cnCNo'm
*XXINOO
oouS
rn
XXXNOcn
mINCN
NO
XX-X-CN
IN CN
IIIT3t
III
a
(N<D
I
I
‘3
II
a
inON
gIo
gIo
&I‘S
8
I
INNO
OOOO
NJ
oo
ONINNO
NOON
OOm
INO
Oo
in<N?5
N-OOOCN
mmoo
s
oo
IIONINNO
mo
oo
m(N
o ;â:On O 'd* oo, -H cN
mincTm
X
&IN(N
OO
tONINNO
m
NOOO
oo
in
NO 'd 'ON O
OOI CN
Ei.B
AI
EJd
tiotUD
'I
ONin(N
t
1Id
IH
0Û
o p
A
'"O
II
Ixi
TT
I
IITd
II
Ino
1
II
II
ITd
ICO
?
8VOx

TO
Op
Iop
f
rn
I
CN
I
s
U
inON
GIo
uinON
SIo
g
Io
VOinIN
n t CN
II
cnCNCN
-X-X-X-mCN
VOoo(NVOcn
*XXooON
OO
min
ooON
XXX
ntni
XXXoocn
oo
CN
In ï—Ioo oo O cn CN cn
II-Td
II
ITd
I
CN
XX-XooO n
CN
XX-
oo
I§t
inm
oON
XXX-ocn
rn CN
Tt-in
VOo
XXoo<N
8
(N
INoooCN
IITd
II
oocnc n
*1—
IIT d
I
oocn(NVO
XXXVOVO
in
s
oo
g'-RaS
inm
II
oooCNOTt-
XXXOOON
n-
CNo'
XXXinin
oo
CN
n>ooR
II
OOcnc n
-3—ITd cS
Td
Ic/3
ImIë
IA
A
IIII0
1II
V
oo
V
§CN

Difference between smokers and non-smokers: <0.001 Smokers
S 20$ Non-smokers
5 MEN0
First tertile Second tertile Third tertile
a<87 cm 87-96 cm
Waist circumference
>96 cm
^ 40 -I
I
35 30 25 - 20 -
^ 15 -t 8 10 4
I 5 4 0
Difference between smokers and non-smokers: <0.001
Smokers
-" i Non-smokers
First tertile <75 cm
Second tertile 75-84 cm
Waist circumference
WOMEN
Third tertile >84 cm
Figure 5.4.1 . Age adjusted prevalence (SE) of shortness of breath when walking
uphill/stairs in different tertiles of waist in men (a) and women (b) who never smoked
(dashed line) and those who were cmrent smokers (solid line).
261

5.5
ASSOCIATIONS OF STATURE, BODY MASS AND FAT
DISTRIBUTION WITH NON-INSULIN-DEPENDENT DIABETES
MELLITUS
This section has been submitted for publication as
Han TS, Feskens EJM, Lean MEJ, Seidell JC. Associations of stature, body
mass and fat distribution with Type 2 (non-insulin-dependent) diabetes mellitus.
(submitted)
Collaboration with MORGEN project
262

ABSTRACT
Objective'. To establish the associations of statui’e, body mass index, waist to hip ratio
and waist circumference with Type 2 (non-insulin dependent) diabetes mellitus.
Setting'. Random sample of 5887 men and 7018 women aged 20-59 years, in a cross-
sectional study set in The Netherlands.
Results'. The crude prevalence of Type 2 diabetes (overall 1.58% in men, 0.94% in
women) was significantly (P <0.01) higher in shorter subjects and those with high body
mass index, high waist to hip ratio and larger waist circumference. Compared to the
tallest tertile, age adjusted odds ratios (95% confidence intervals) for Type 2 diabetes
were 5.1 (2.0 to 13.3) in men and 2.1 (1.1 to 4.0) in women whose height was in the
shortest tertile. Compared to the lowest tertile, the age adjusted odds ratios for Type 2
diabetes were 19.7 (4.7 to 83.5) in men and 6.3 (2.4 to 16.4) in women with waist to hip
ratio in the highest textile, 4.4 (2.2 to 9.0) in men and 2.5 (1.2 to 4.9) in women with
body mass index in the highest tertile, and 5.2 (2.2 to 12.3) in men and 3.2 (1.4 to 7.0) in
women with waist circumference in the highest tertile. Additional adjustments for
cigai’ette smoking, alcohol consumption, physical activity and educational level slightly
redueed the strength of these associations, and odds ratio for shoidest women became
non-significant.
Conclusions'. Although in longitudinal studies waist is a powerful predictor o f diabetes
incidence, Type 2 diabetes in a cross-sectional survey is associated with shoitness in
stature, as well as large waist circumference and high body mass index, and particularly
strongly with high waist to hip ratio, suggesting that the development of Type 2 diabetes
may modify hip circumference independently of body fat.
Keywords'. Body constituent, early growth, health promotion, height, skeletal muscle
263

INTRODUCTION
Type 2 (non-insulin-dependent) diabetes mellitus is a disease o f nutrient storage and
metabolism which associates with several other metabolic aberrations such as
hyperlipidaemia and hypertension. Increased visceral fat mass is a major characterising
featui'e, possibly aetiologically important through increased fatty acid release into the
portal system (Bjorntorp, 1991; Bjorntorp, 1996) but these mechanisms have not been
elucidated. It is well established that the measure of waist to hip ratio strongly relates
with the development o f Type 2 diabetes (Hartz et al, 1983; Ohlson et al, 1985; Chan et
al, 1994). This association has usually been interpreted as the result of central fat
distribution, central obesity, upper body obesity, or truncal fatness. However, waist
circumference is more highly predietive of intra-abdominal fat than waist to hip ratio
(Seidell et al, 1988; Pouliot et al, 1994).
Type 2 diabetes has also been suggested as a consequenee of developmental failure of
vital organs, such as the pancreas and the liver, particularly in those who were exposed
to poor nutritional conditions at a critical stage of fetal development (Barker, 1994). It is
well established that short stature can reflect underdevelopment during the critical
growth periods (Floud et al, 1990).
The present study aimed to assess the prevalence and relative risks of Type 2 diabetes in
relation to body statuie and to body fatness and fat distribution.
METHODS
Subjects
Dutch men (n = 5887) and women {n = 7018) aged 20-59, recruited into the ongoing
MORGEN (Monitoring of Risk Factors and Health in The Netherlands) study in the
1993 to 1995 cohorts from Amsterdam, Maastricht, and Doetinchem. To obtain similar
numbers of subjects at each age, the sample was stratified by sex and five year age
group.
264

Anthropometry
Anthropometric measurements were made according to the World Health Organisation
recommendations (WHO, 1989) by trained field scientists. Subjects were wearing light
elothes during measurements of body weight to the nearest lOOg using calibrated scales,
height without shoes to the nearest mm, waist circumference in duplicate at the level
between the lowest rib margin and iliac crest, and hip circumference at the widest
trochanters to the nearest mm. Waist to hip circumferential ratio was computed, and
body mass index was calculated as weight (kg) divided by height squared (m^).
Definition o f non-insulin dependent diabetes mellitus (Type 2 diabetes)
Subjects with known diagnosed Type 2 diabetes or with newly diagnosed Type 2
diabetes from random blood glucose concentration of >11.1 mmol/1 (WHO, 1985) in the
present survey, were selected as having the disease. Five men and nine women treated
with insulin were excluded. Blood glucose was measuied by World Health Organisation
standardised laboratory at the Academic Dijkzig Hospital of the Erasmus University in
Rotterdam.
Statistical methodsStatistieal analyses were performed using SAS version 6.1 (Cary, USA). Tertiles were
created for height, body mass index, waist to hip ratio and waist circumference. The
prevalence of Type 2 diabetes were determined for subjects in each tertile of
antliropometry, using cross tabulation with Chi square statistic. Logistic regression
analysis for unadjusted and adjusted for age and lifestyle factors was performed to
estimate the relative risks (odds ratios and 95% confidence intervals) of Type 2 diabetes
in tertiles of height, body mass index, waist to hip ratio and waist circumference. We
have already demonstrated the lack of significant correlation between waist and height
in these subjects for the 1993-1994 cohorts (Chapter 4.3; Han et al, 1996b; Han et al,
1997c). Thus waist to height ratio was not created. Height was entered in multivariate
logistic regression analysis as independent variable in the assoeiations of Type 2
diabetes with waist or with waist to hip ratio.
265

Confounding factors
Males and females were analysed separately. Dummy variables were created for the
following confounding factors; age: stratified by 10 year age categories, smoking: non-
smokers, ex-smokers, and cmrent smokers, alcohol: non-drinkers, occasional drinkers
(<1 glass per day), moderate drinkers (1 to 2 glasses per day), and heavy drinkers (>3
glasses per day), educational level: secondary education or lower (educational level 1),
vocational or higher secondary education (educational level 2), and higher vocational
education or university education (educational level 3), physical activity: non
participants, and participants in leisure sport.
RESULTS
Table 5.5.1 shows subjects with known Type 2 diabetes and those with newly diagnosed
Type 2 diabetes were similar in age. It is clear that both of these groups of subjects with
metabolic complications were older, shorter, heavier, and they had higher body mass
index, higher waist to hip ratio and larger waist circumference than subjects without
Type 2 diabetes. Mean (SD) duration of known Type 2 diabetes was 5.5 (6,7) years in
men and 7.6 (9.1) in women, and age of diagnosis was 45.6 (9.7) in men and 43.3 (9.1)
in women.
Tables 5.5.2a & b show that the unadjusted prevalence of Type 2 diabetes was
relatively high in categories of short stature, higher body mass index, higher waist to hip
ratio and larger waist circumference. In both sexes, compared to lowest tertile (highest
tertile in the case of height) the age adjusted odds ratios for Type 2 diabetes were
significantly higher in the shortest tertile of height, third tertile of waist to hip ratio,
body mass index and waist circumference (Figure 5.5.1). Table 5.5.3 shows that after
additional adjustment for cigarette smoking, alcohol consumption, educational level and
physical activity, the strength of the associations was slightly reduced, and the
relationship between Type 2 diabetes and height in women became non-significant.
266

Adjustments for height and waist to hip ratio, or height and waist circumference had no
substantial changes to odds ratios (within 0.1 unit) of either height, waist to hip ratio or
waist cireumference. Excluding the 30 men and 15 women who were newly diagnosed
with Type 2 diabetes (random blood glucose >11.1 mmol/1), did not change the results
considerably (within 0.1 unit of odds ratios: results not presented).
DISCUSSION
The present study confirmed previous findings for the associations between high waist
to hip ratio, high body mass index, and large waist eircumference with Type 2 diabetes,
hyperglycaemia and insulin resistance (Bjorntorp, 1991; Bjorntorp, 1996; Jolmson et al,
1992; Kohit et al, 1993; Weidner et al, 1995). After age adjustment, shorter men were 5
times and shorter women were 2 times more likely to have Type 2 diabetes compared to
taller subjects. Shorter men remained to associate significantly with Type 2 diabetes
even additional after adjustments for educational level, smoking and physical activity
level, suggesting that this association was independent of social class and lifestyle
habits. Our findings support previous studies of Brown et al{\99V) who have observed a
negative correlations between glucose tolerance and height, and that of Mooy et al
(1995) who have shown that shortness of statui’e was a significant determinant of
glucose intolerance. Since both short stature (Floud et al, 1990) and Type 2 diabetes
(Barker, 1994) reflect reduced development during the critical periods of growth, these
factors may be linked in the aetiology of Type 2 diabetes. Early growth
underdevelopment, refleeted by low birth weight, has been shown to associate with high
waist to hip ratio in men (Alvarsson et al, 1994) and inereased waist circumference in
women (Jarrett and Fitzgerald, 1992). All these adverse antlii’oponietric measures are
characteristics of poor health. Barker et al (1990) have shown that shorter populations
have higher risks of mortality from cai'diovascular disease, chronic bronchitis, and
cancers in men and women. A study of diabetes in rural Tanzania has shown that the
prevalence of impaired glucose tolerance, but not diabetes, tended to be higher in shorter
men and shorter women (McKeigue, 1991). According to the thrifty phenotype
hypothesis (Hales and Baiker, 1992), the risk of diabetes for shorter subjects in the study
267

of Swai et al (1992) would not be great, since rural Tanzanians were not be exposed to
overnutrition.
Our observations indieate greater risk of Type 2 diabetes in shorter people, particularly
men, even after adjusting for age, lifestyle factors and body fat distribution, and this
would be in broad agreement with the findings of Barker’s group (Law et al, 1992). A
possible mechanism would be the alterations in mass of metabolically important tissues
- pai'ticularly skeletal muscle. Indeed, high waist to hip ratio was most strongly related
to Type 2 diabetes in the present study. If intra-abdominal fat were the only influence on
development o f Type 2 diabetes, then waist cireumference alone should be at least as
strongly assoeiated with Type 2 diabetes as waist to hip ratio, sinee the waist reflects
intra-abdominal fat (Seidell et al, 1988, Pouliot et al, 1994) (itself determined by total
fatness and by fat distribution), whilst the hip circumference includes contributions from
the bone structure of the pelvis, and the truncal muscles which make up one of the main
organs for glucose metabolism and insulin action (DeFronzo, 1988). Our study (Seidell
et al, 1997) of the same subjects, using residual analysis to dissociate the contributions
of the waist and hip circumference to Type 2 diabetes, showed clearly that as well as
large waist, a smaller hip circumference than expected from a given body mass index
was importantly associated with Type 2 diabetes, these assoeiations were independent of
height. Hartz et al (1984) used discrimination analysis to adjust for relative weight, age
and hips or waist found that waist cireumference was positively and hip circumference
was negatively associated with diabetes in women. It is possible that increased intra
abdominal fat precedes the development o f Type 2 diabetes, and muscle atrophy follows
afterwards, since insulin action and glucose clearance are related similarly (Carey et al,
1996) or more highly with waist circumference than with waist to hip ratio in non
diabetic subjects (Pouliot et al 1994; Weidner et al, 191995). This could explain the
consistently different associations with Type 2 diabetes in longitudinal and cross-
sectional studies. Ohlson et al (1985) have shown that waist circumference was at least
as strong (P = 0.0012) as waist to hip ratio (P = 0.0037) in predicting the development
o f Type 2 diabetes over thirteen and a half year s in men, even after body mass index was
268

accounted for. A five year follow up study in men (Chan et al, 1994) confirmed these
findings showing that with reference to those in the lowest quintile, prediction of Type 2
diabetes development in men with waist eircumference in the fifth quintile (age adjusted
relative risk 12) was more strongly than those with waist to hip ratio in the fifth quintile
(age adjusted relative risk 4). Lemieux et al (1996a) have found that seven year changes
in indices of glucose-insulin homeostasis were related to changes in visceral fat and
waist circumference, but not to waist to hip ratio in non-diabetic women. If muscle loss
leads to lower hips when Type 2 diabetes develops, then only waist would prediet the
development of Type 2 diabetes, whilst waist to hip ratio would be a better marker of
existing Type 2 diabetes. This would require prospective study.
Prentice and Jebb (1995) have suggested that physical inactivity may be an important
factor contributing factor to the rising prevalence of overweight (Greogory et al, 1990;
Bemiett et al, 1995) since average energy intake in Britain has apparently declined. The
prevalences of overweight (Knowler et al ,1981) and associated Type 2 diabetes in Pima
Indians are amongst the highest in the world (Knowler et al, 1978), and Fontvieille et al
(1993) have shown that Pima Indian children are less physically active than Caucasian
children. In a study of 24 healthy men, Seidell et al (1989a) have shown that those with
increased waist to hip ratio were associated with relatively less thigh muscle, raised
insulin and decreased musele endurance. These findings point towards an important role
of peripheral muscle in the association between altered body morphology and related
diseases such as Type 2 diabetes. The link of diabetes with redueed oxidative muscle
fibres is established (Lillioja et al, 1987). Exercise can prevent muscle atrophy or
increase muscle mass, and alter muscle morphology towards higher oxidative capacity
by increased vaseularisation (Âstrand and Rodahl, 1986), increased oxidative enzymes
and mitochondrial density, upregulation of insulin receptors and increased insulin
sensitivity (Devlin et al, 1992). It has been suggested that regular exercise may prevent
the development of Type 2 diabetes (Helmrich et al, 1991). We have found that those
who are physically inactive have a smaller hip circumference than expected for their
given body mass index (C hapter 5.1).
269

CONCLUSIONSAlthough in longitudinal studies waist is as least as powerful as waist to hip ratio in
predicting diabetes incidence, Type 2 diabetes in a cross-sectional survey is associated
with shortness in statuie, large waist circumference and high body mass index, and
particularly strong with high waist to hip ratio, suggesting that the development of Type
2 diabetes may modify hip eircumference independently of body fat.
270

Table 5.5.1. Characteristics of subjects with known Type 2 diabetes, newly diagnosed
Type 2 diabetes (random blood glucose concentration of >11.1 mmol/1), and other
subjects.
Known Type 2
diabetes
Newly diagnosed
Type 2 diabetes
Other subjects
Mean SE Mean SE Mean SE
MEN (n = 63) (n == 30) (n =
Age (years) 51.1 0.91 53.1 1 . 0 2 42.7 0.14
Weight (kg) 85.6 1.99 97.2 3.37 81.9 0,16
Height (cm) 173.1 0.83 176.4 1.36 178.5 0 . 1 0
Body mass index (kg/m^) 28.5 0.56 31.2 0.95 25.7 0.05
Waist circumference (cm) 1 0 0 . 0 1.58 1 1 1 . 2 2.56 92.1 0.14
Hip circumference (cm) 1 0 2 . 1 1.09 109.4 2.31 101.7 0.09
Waist to hip ratio 0.977 0.007 1.017 0 . 0 1 2 0.904 0 . 0 0 1
Age (years) 50.8 1.03 51.8 2.13 42.1 0.13
Weight (kg) 79.3 2.28 71.9 4.29 68.4 0.14
WOMEN (n =■51) (n =-1 5 ) (n =
Height (cm) 162.9 0.83 159.7 1.53 165.7 0.08
Body mass index (kg/m^) 29.9 0 . 8 8 28.2 1 . 6 6 24.9 0.05
Waist circumference (cm) 96.7 2.13 92.3 3.68 80.9 0.13
Hip circumference (cm) 108.5 1.82 103.5 3.41 1 0 2 . 2 0 . 1 0
Waist to hip ratio 0.891 0.013 0.891 0.018 0.790 0 . 0 0 1
271

Table 5.4.2a. Crude prevalence and age adjusted odds ratios for Type 2 diabetes in
different tertiles of anthropometry, in 5887 men.
Prevalence Odds
ratio
95% confidence
interval
n = 93t
Body mass index tertile 1 (<24.1 kg/m^) 0.46 1 . 0 0
Body mass index tertile 2 (24.1-26.9 kg/m^) 0.87 1.30 0.57, 2.94
Body mass index tertile 3 (>26.9 kg/m^) 3.41 4.40*** 2.16, 8.95
x :i: 65***
Waist to hip ratio tertile 1 (<0.872) 0 . 1 0 1 . 0 0
Waist to hip ratio tertile 2 (0.872-0.936) 0 . 6 6 4.07 0.90, 18.52
Waist to hip ratio tertile 3 (>0.936) 3.98 19.70*** 4.65, 83.51
X^î 1 1 1 ***
Waist circumference tertile 1 (<86.9 em) 0.32 1 . 0 0
Waist circumference tertile 2 (87.0-95.9 cm) 0.98 1.89 0.75,4.81
Waist circumference tertile 3 (>96.0 cm) 3.33 5.22*** 2.21, 12.34
x"î
Height tertile 3 (>181.5 cm) 0.60 1 . 0 0
Height tertile 2 (175.0-181.3 em) 1.64 1.20, 8.49
Height tertile 1 (<174.8 cm) 2.61 5.13*** 1.98, 13.26
x'$ 24***
<0.001, <0.01, *P <0.05; fnumber o f subjects with Type 2 diabetes; ^difference in prevalences
between tertiles.
272

Table 5.5.2b. Crude prevalence and age adjusted odds ratios for Type 2 diabetes in
different tertiles of anthropometry, in 7018 women.
Prevalenee Odds
ratio
95% confidence
interval
n = 661
Body mass index tertile 1 (<22.8 kg/m^) 0.51 1 . 0 0
Body mass index tertile 2 (22.8-25.9 kg/m^) 0.34 0.52 0.21, 1.32
Body mass index tertile 3 (>25.9 kg/m^) 2 . 0 1 2.47* 1.24, 4.90
x ' t
Waist to hip ratio tertile 1 (<0.756) 0 . 2 1 1 . 0 0
Waist to hip ratio tertile 2 (0.756-0.815) 0.30 1.05 0.33,3.38
Waist to hip ratio tertile 3 (>0.815) 2.31 6.27*** 2.40, 16.41y jsHîHHî
Waist circumference tertile 1 (<75.0 cm) 0.35 1 . 0 0
Waist circumference tertile 2 (75.0-84.0 cm) 0.39 0.78 0.28, 2.04
Waist circumference tertile 3 (>84.0 cm) 2.03 3.16** 1.44, 6.96
x h
Height tertile 3 (>168.5 cm) 0.49 1 . 0 0
Height tertile 2 (1630-168.0 cm) 0.80 1.31 0.63, 2.74
Height tertile 1 (<162.5 cm) 1.55 2.07* 1.06,4.04
X^î 15**
<0.001, <0.01, *P <0.05; fnnmber o f subjects with Type 2 diabetes; $ difference in prevalences
between tertiles.
273

Table 5.5.3. Odds ratios for Type 2 diabetes in different tertiles of anthi’opometry,
adjusted for age, smoking, alcohol consumption, physical activity, and education, in
5887 men and 7018 women.
Men {n = 93 f) Women (n ~ 6 6 f)
Odds
ratio
95% confidence
interval
Odds
ratio
95% confidence
interval
Body mass index fertile 1 1 . 0 0 1 . 0 0
Body mass index tertile 2 1.34 0.59, 3.06 0.52 0.21, 1.30
Body mass index tertile 3 4.07*** 1.98,8.35 2.07* 1.03,4.19
Waist to hip ratio tertile 1 1 . 0 0 1 . 0 0
Waist to hip ratio tertile 2 4.16 0.91, 19.00 0.98 0.31,3.14
Waist to hip ratio tertile 3 18.36*** 4.29, 78.49 5.31*** 2.02, 13.96
Waist tertile 1 1 . 0 0 1 . 0 0
Waist tertile 2 1.93 0.76, 4.94 0.75 0.28, 1.98
Waist tertile 3 2.07, 11.70 2.67* 1.20,5.91
Height tertile 3 1 . 0 0 1 . 0 0
Height tertile 2 3.07* 1.70,8.16 1.25 0.60, 2.62
Height tertile 1 4.42** 1.26, 11.51 1.62 0.82,3.18
***p <0.001, **P <0.01, *P <0.05; fnumber o f subjects with Type 2 diabetes.
274

c/3
<D
'S si S
<D
l io 1(U
II.a1
i
3.5
3.0
2.52.0
1.5
1.0
0.50
□ MEN
■ WOMEN
1 2 3W aist circum ference tertiles
Figure 5.5.1. Prevalence of Type 2 diabetes mellitus in different tertiles of waist
circumference (in men: fertile 1 <87.0 cm, tertile 2 = 87.0-96.0 cm, tertile 3 >96 cm; in
women: tertile 1 <75.0 cm, tertile 2 = 75.0-84.0 cm, tertile 3 >84 cm).
275

5.6
QUALITY OF LIFE IN RELATION TO OVERWEIGHT AND FAT
DISTRIBUTION
This section has been submitted for publication as
Han TS. Tijhuis MAR, Lean MEJ, Seidell JC. Quality of life in relation to
overweight and body fat distribution, (submitted).
Collaboration with MORGEN project
276

ABSTRACT
Objective: To examine the quality of life in overweight subjects and those with high
body mass index and adverse fat distribution.
Design: Cross-sectional study.
Setting: Monitoring Risk Factors and Health in The Netherlands (MORGEN) project.
Subjects: 1885 men and 2156 women aged 20-59 years, randomly sampled from the
civil registries of Amsterdam, Maastrieht and Doetinchem in 1995.
Main outcome measures: Measures of quality of life using SF-36 questiomiaire.
Results: Compared to those in the lowest tertile, subjects with largest waist
circumference were 1.8 times (95% confidence interval 1.3 to 2.4) in men and 2.2 times
(1.7 to 2.9) in women more likely to have difficulties bending, kneeling or stooping, 2.2
times (1.4 to 3.7) in men and 1.7 (1.2 to 2.6) in women to have difficulties in walking
several blocks, and 1.3 times (1.0 to 1.9) in men and 1.5 times (1.1 to 1.9) in women to
have difficulties in lifting or canying groceries. Anthropometric measines were less
strongly associated with items from other health concepts concerning social fmictioning,
role limitations due to physical problems or due to emotional problems, mental health,
vitality, pain, or health change in one year. Quality of life measmes related to body mass
index and waist to hip ratio similarly to waist cireumference.
Conclusions: People who have large waist circumference, high body mass index or high
waist to hip ratio are more likely to have impaired quality of life, with poor self rated
health, and limitations in the basic activities of daily living.
Keywords: epidemiology, health promotion, obesity, subjective health.
277

INTRODUCTION
In Western countries, 10-20% of men and women have a body mass index (BMI) above
30 k g W and figures have been increasing (Bennett et al, 1990; Kuczmarski et al, 1994;
Seidell, 1995a). Although overweight and central fat distribution are associated with
increased risks of clironic diseases such as diabetes (Ohlson et al, 1985), cardiovascular
diseases (Lapidus et al, 1984; Lars son et al, 1984), caneers (den Tonkelaar et al, 1995;
Giovaimucei et al, 1995), and premature death (Manson et al, 1995; Simopoulos and
van Itallie, 1984), it is surprising that the quality of life in overweight subjects is less
well documented.
Early studies have indicated that overweight subjects aie more likely to have poorer
physical functioning status, a measure of quality of life (Stewart et al, 1983). With
advancing age, overweight persons aie more likely to develop serious limitations in
performing basic daily activities (Launer et al, 1994). These persons impose an
enormous burden on health care resouices (Seidell, 1995b; Colditz, 1992). Poor physical
function and quality of life attributable to overweight is important in terms of public
health, and should be addressed by preventive measures, and promotion of healthy
living. The quality of life in subjects with adverse fat distribution, i.e. large waist
circumference and high waist to hip ratio (WHR), to our laiowledge, has not been
reported in the literatuie. The present study examined the quality of life in overweight
subjects, and those with central fat distribution and large waist circumference.
METHODS
Subjects
1885 men and 2156 women aged 20-59 were recruited randomly from eivil registries for
the ongoing MORGEN (Monitoring Risk Factors and Health in The Netherlands)
project 1995 cohort, from Amsterdam, Maastricht, and Doetinchem. To obtain similar
numbers of subjects at each age, the sample was stratified by sex and five year age group
(Smit et al, 1994). The response rate to invitations was about 50%.
278

Anthropometry
All anthropometric measurements were made according to the World Health
Organisation recommendations (1989) by trained paramedic personnel. Subjects wore
light clothes during measurements of body weight to the nearest lOOg using calibrated
scales, height in bare feet to the nearest mm, waist circumference in duplicate at the
level between the lowest rib margin and iliae crest, and hip cireumference at the widest
trochanters to the nearest mm. Waist to hip circumferential ratio was computed, and
BMI was calculated as weight (kg) divided by height squared (m^).
Quality of lifeNine ‘health concepts’ were calculated from thirty-six items rated by subjects using the
standardised RAND-36 questionnaire, Dutch version (van der Zee and Sanderman,
1995), which was adapted from the standardised SF-36 Health Sui'vey (Medical
Outcomes Trust, 1994). These health concepts comprised measures of functioning - the
ability to perform daily tasks and activities, and measures o f well being - subjective
internal states including how people feel physieally and emotionally and how they think
and feel about their health (Stewart et al, 1994). The nine health concepts were physieal
functioning, role functioning limitations due to poor physical health, bodily pain,
general health, vitality, social functioning, role functioning limitations due to poor
emotional health, mental health, and health transition in one year.
Lifestyle and demographic factors as confounding factorsDummy variables (Appendix 5.6.1) for possible confounding factors were created to
adjust for the associations between adiposity and health concepts and individual items.
Statistical methods
Statistical analyses were performed using SAS version 6.1 (Cary, USA). All thirty-six
items of the nine health eoneepts were examined in relation to anthi’opometrie
measurements.
279

Standardising scores for the nine health concepts
Thirty-six items of reported health were appropriately converted and standardised into
percentage scale based on the equation described by van der Zee and Sanderman (1995)
and Medical Outcomes Trust (1994). These items were grouped accordingly to make up
the nine health concepts (Table 5.6.1).
Definition o f ‘good' and ‘poor'fo r the nine health concepts
Distributions of standai'dised scores were examined from the plots (not shown) to
determine arbitrary cut-offs for the health concepts. It was decided that subjects with
less than 66.7% of the standardised score were elassified as having a ‘poor’ health
concept, and those with 66.7% or above (i.e. upper tertile of the scores) were considered
as having a ‘good’ health concept. For the health transition concept, which had only a
two point scale, seores below 50% were considered as poor health, and 50% or above as
good health. These cut-offs classified between 10 to 25% subjects as having ‘poor’
health for most concepts, except higher proportion subjects (40-50%) who had ‘poor’
vitality and ‘poor’ general health (Appendix 5.6.2).
Definition o f ‘good' and ‘poor ' health fo r the 36 individual items
Each item was arbitrarily dichotomised such that scores above average for items with an
odd numbered scale (3 or 5 points) were considered as "good' health and average or
lower as "poor' health. For items with even scale (2, 4 or 6 points), the scores for "good'
health and "poor ' health were evenly divided.
Logistic regression analysis
Odds ratios and 95% confidence intervals (Cl) were determined to estimate the relative
risks of ‘poor’ health in those with high BMI, WHR and large waist circumference,
adjusted for age, lifestyle and demographic factors. Possible interactions between height
and WHR, and height and waist circmnference were examined using maximum
likelihood analysis for the differenee of chi square statistic when the interaction terms
(combinations of tertiles) were added to the model, with referenee to tallest subjects who
2 8 0

had lowest (tertile 1) WHR, or lowest waist circumference. Similar analysis for the
interaction between BMI and WHR was performed to see if fat distribution accentuated
poor self-rated health in subjects of different fatness, with reference to those with lowest
BMI and lowest WHR. Interactions between age and antlii'opometric measurements on
health concepts were also examined, with reference to the youngest group (20-29 years)
who had lowest BMI, lowest WHR, lowest waist circumference, or were tallest.
RESULTSSubject characteristics are shown in Table 5.6.1. Tertiles of anthropometric variables in
the present sample were identified at 87.3, 96.1 cm in men and 74.8, 84.0 cm in women
for waist circumference; and 175.5, 181.5 cm in men and 163.0, 168.0 cm in women for
height; 0.873, 0.938 in men and 0.756, 0.816 in women for WHR; 24.15, 26.84 kg/m^ in
men and 22.67, 25.63 k%/m in women for BMI.
The present study examined a wide range of quality of life measures, found that they
were related similarly to all indices of adiposity currently in use. For clarity of
presentation, only results for items from the health concepts of physical functioning ( 1 0
items) and general health (5 items) in relation to waist circumference are tabulated in the
present study.
Risks o f ‘poor ' health indicated by the nine health concepts
After adjustment for age, and lifestyle and demographic factors, compared to those in
tertile 1, those with waist circumference (Figures 5.6.1a & b), in tertile 3 were two to
thi’ee times more likely to associate with ‘poor’ physical functioning (score <66.7%) and
less strongly with other health concepts (results not shown). Similar results (data not
presented) were observed for BMI and WHR.
Risks o f ‘p o o r’ health indicated by the 36 individual items o f health concepts
Results for items of physical functioning (10 items) and general health (5 items) are
presented in Tables 5.6.2 and 5.6.3. Compared to those in the lowest tertile, the odds
281

ratios, adjusted for age, lifestyle and demographic factors, for limitations in physical
functioning were significantly higher in those with highest tertile of waist circumference
(Tables 5.6.2a & b), and most marked in women in that they had more problems of
lifting or carrying groceries, walking one flight of stairs or walking a distance of one
block.
In men, those in the highest tertile of waist expected their health to get worse more often
than those in the lowest tertile, and reported the answer for ‘excellent’ health as ‘don’t
Icnow’ or as a ‘false’ statement. In women, those with largest waist circumference
considered their health in general as ‘not good’.
O f the remaining 16 items from the health concepts concerning social functioning, role
limitations due to physical problems or emotional problems, mental health, vitality,
pain, and health change since last year, only a few were related to anthropometry. For
clarity, only significant odds ratios for high or low tertiles are reported in this section.
Compared to subjects with lowest tertile, men with largest waist were 1.80 times (95%
confidence interval 1.18 to 2.28) more likely to feel worn out a good bit to all the time
(vitality item), women with largest waist were 1.33 times (1.00 to 1.72) more likely to
feel they accomplished less than they would like with work or other regular daily
activities in the past four weeks as a result of physical health problems (physical role
functioning item), and 1.27 times (1.00 to 1.61) to not feel that they have a lot of energy
a good bit to all the time (vitality item) with waist in the third tertile.
Analysis fo r interactions between anthropometric measures and age
Examination of interactions between anthropometric variables on the nine health
concepts showed there were weak interactions range 8 to 10 with 4 degrees of
freedom, P <0.05) in men and in women for only a few relationships. Logistic
regression analysis was performed to identify the subgroup most related to poor health
concepts. Compared to subjects with a combination of lowest BMI and lowest WHR, the
odds ratio for role limitations due to physical problems was 9.5 (1.2 to 74.8) in men, and
282

‘poor’ general health was 1.98 (1.14 to 3.43) in women with highest BMI and highest
WHR. Compared to those with both smallest waist and tallest height, the odds ratio for
women who had ‘poor’ physical functioning was 2.01 (1.05 to 3.83) for those with
largest waist and shortest height, and 2.95 (1.30 to 6.69) in women with both largest
waist and tallest height. Adjusted odds ratio for women who had more bodily pain was
2.07 (1.20 to 3.57) in tallest women with largest waist. There was only one interaction
between anthiopometric measurements and age on health concepts, which was height in
women {% = 22.8, 6 degrees of freedom, P <0.01). Compared to those 20-29 years and
tallest, the odds ratio for ‘poor’ general health was 1.62 ( 1 . 0 1 to 2.61) in women aged
50-59 with height in tertile 2. There was no evidence for subjects with low BMI and
high WHR having different health concepts from those with low BMI and low WHR.
DISCUSSIONIn the present study quality of life measures related similarly to waist circumference,
BMI and WHR. Compared to the lowest tertile, subjects with high BMI, high WHR or
large waist circumference were more likely to have ‘poor’ physical functions, limiting
many common, basic activities of daily living, including difficulties in walking several
blocks and bending, kneeling or stooping. Women with adverse anthropometry had
more severe problems than men such as walking one block, or one flight of stairs, lifting
or carrying groceries. These results suggest that subjects who are overweight, with
adverse fat distribution may be less able to care for themselves, their quality of life and
possibly that of their relatives would be affected.
Examination of items from the general health concept showed that subjects with large
waist were more likely to expect their health to get worse (men) and to consider their
health in general as not good (women). The subjects’ current indices of adiposity did not
relate to reported change in health since one year previously, perhaps because some had
changed weight and fat distribution as well as their health. Poor subjective health is a
determinant of mortality independent o f physical health status (Mossey and Shapiro,
1982; Kaplan and Camacho, 1983; Idler et al, 1990; Pijls et al, 1993). It has been shown
283

that subjects who performed activities of daily living with difficulties were at 2 to 3
times more at risk of death (Kaplan et al, 1988).
Unadjusted odds ratios were higher (results not shown), age had the most powerful
confounding effects on the relationships between anthiopometric variables and quality
of life. We found no important interactions between height and waist circumference or
WHR, or interactions between age and BMI, WHR or waist circumference.
The present study defined ‘good’ health based on the 9 health concepts as equal or above
66.7% and ‘poor’ health as below 66.7% (except for health transition health concept
which used 50%) standardised scores respectively. There are no definitive cut-offs for
these health concepts, but Stewart et al (1994) have shown that patients with chronic
diseases who were more physically active had scores mostly above 66.7% and those
who were less active had scores mostly below 66.7%. ‘Good’ health indicated by the 36
individual items was defined as above average scores and poor health items as average
or below scores. These cut-offs were arbitrary, if good self rated health was defined
more broadly, i.e. average or above scores, then the prevalence of poor self rated health
would be lower. Launer et al (1994) also categorised fair and poor scores together, based
on their strong association with disability. Previous findings have shown that elderly
subjects above 65 years who rated their health as fair had twice the risk of death within
two years compared to those who rated their health as excellent (Mossey and Shapiro,
1982), and Schoenfeld et al (1994) found the risk of death in those whose self rated
health was fair was similar to subjects with poor rating. There may be an overrating of
health amongst those who consider their health as fair (Maddox and Douglass, 1973;
LaRue et al, 1979). Poorly rated health was associated with adverse adiposity, but
questions were not designed to assess self rated health addressing the subjects own
perception of this link.
Quality of life may include many dimensions, psychosocial health is probably one
example, and its association with overweight and fat distribution has been extensively
284

studied. Negative attitudes towards overweight (Staffieri, 1978), peer pressure, and
social discrimination impose heavy pressme upon these persons (Allon, 1979; Sobal et
al, 1995). Severely overweight men (BMI >34 kg/m^) and women (BMI >38 kg/m^)
have been shown to rate their current health as poorer and mood states less positive than
non-overweight subjects (Sullivan et al, 1993). Even at an early age (9 years),
overweight children have been shown to have low self-esteem (Hill and Silver, 1995).
The fear of being overweight may lead to behavioural changes such as slimming,
particularly in women who are not even overweight (Seidell et al, 1986a). Despite their
apparent associations with unfavourable perceptions by others, and with poor physical
health, there was little evidence in the present study to suggest that overweight subjects,
those with central fat distribution, or large waist were having more non-physical
problems such as mental health, social fimctioning, or role limitations due to emotional
problems.
CONCLUSIONThis study provides convincing evidence that large waist circumference, high WHR and
high BMI are important indicators of physical difficulties with simple daily activities.
The data present a very wonying profile of ill health and disabilities, affecting a large
and increasing proportion of adults.
285

Table 5.6.1. Characteristics, and raw and standardised self rated health scores of 1885
men and 2156 women. Low scores indicate poor health, and high scores indicate good
health.
CharacteristicsMen Women
Mean SD Range Mean SD RangeAge (years) 42.7 10.9 20.3-60.0 41.4 1 1 . 0 20.2-59.9Weight (kg) 82.2 12.3 45.7-157.0 68.4 11.5 38.6-153.0Height (m) 1.79 0.07 1.52-2.06 1 . 6 6 0.07 1.42-1.89Body mass index (kg/m^) 25.7 3.6 15.7-50.1 24.8 4.1 16.5-58.3Waist circumference (cm) 92.2 1 1 . 0 64.0-155.0 80.9 1 1 . 1 60.0-135.5Hip circumference (cm) 1 0 1 . 6 6 . 8 69.0-150.0 1 0 1 . 8 8.3 74.4-160.0Waist to hip ratio 0.907 0.073 0.621-1.369 0.793 0.072 0.603-1.302
Raw scorePhysical fimctioning 28.1 3.2 10.0-30.0 27.5 3.4 10.0-30.0Social functioning 9.0 1 . 6 2 .0 - 1 0 . 0 8.7 1 . 8 2 .0 - 1 0 . 0
Role limit-physical:{: 7.4 1 . 2 4.0-8.0 7.2 1.4 4.0-8.0Role limit-emotional§ 5.5 0.9 3.0-6.0 5.4 1 . 0 3.0-6.0Mental health 24.0 3.9 6.0-30.0 23.0 4.1 5.0-30.0Vitality 17.6 3.5 4.0-24.0 16.7 3.6 4.0-24.0Bodily pain 51.9 1 0 . 2 11.0-60.0 50.0 10.7 11.0-60.0General health 19.2 3.5 5.0-25.0 19.1 3.5 5.0-25.0Health transition 3.0 0 . 6 1.0-5.0 3.1 0.7 1.0-5.0
Standardised score'^Physical functioning 90.3 15.8 0 .0 - 1 0 0 . 0 87.6 16.8 0 .0 - 1 0 0 . 0
Social functioning 86.9 20.4 0 .0 - 1 0 0 . 0 83.5 2 2 . 1 0 .0 - 1 0 0 . 0
Role limit-physicalj" 84.7 29.5 0 .0 - 1 0 0 . 0 79.7 34.0 0 .0 - 1 0 0 . 0
Role limit-emotionalj 85.0 30.3 0 .0 - 1 0 0 . 0 80.4 34.9 0 .0 - 1 0 0 . 0
Mental health 76.2 15.6 4.0-100.0 72.2 16.4 0 .0 - 1 0 0 . 0
Vitality 67.9 17.4 0 .0 - 1 0 0 . 0 63.5 17.9 0 .0 - 1 0 0 . 0
Bodily pain 83.5 20.9 0 .0 - 1 0 0 . 0 79.7 21.9 0 .0 - 1 0 0 . 0
General health 70.8 17.4 0 .0 - 1 0 0 . 0 70.4 17.7 0 .0 - 1 0 0 . 0
Health transition 49.6 15.5 0 .0 - 1 0 0 . 0 52.2 17.3 0 .0 - 1 0 0 . 0
* Calculated using equation from van der Zee and Sanderman (1995); frole limitations due to physical
functioning problems; :j:role limitations due to emotional problems.
286

Table 5.6.2. Age and lifestyle adjusted odds ratios of poor scores (<67.7% of
standardised scores) for individual items describing physical functioning in second and
third tertiles (first tertile as reference) of waist circumference.
Tertile 1 Tertile 2 Tertile 3
Items ofphysical functioning
Odds
ratio
Odds
ratio
95% Cl Odds
ratio
95% Cl
MEN (« = 1885)
Vigorous activities 1 . 0 0 1 . 2 1 0.95, 1.55 1 .6 8 *** 1.29,2.17
Moderate activities 1 . 0 0 1.04 0.70, 1.54 1.58* 1.08,2.33
Lifting or carrying groceries 1 . 0 0 1.03 0.73, 1.45 1.34 0.95,1.90
Walking several flights of stairs LOO 0.99 0.67, 1.45 2.16*** 1.50,3.11 '
Walking one flight of stairs 1 . 0 0 0 . 6 6 0.37, 1.17 1.27 0.75,2.13
Bending or kneeling 1 . 0 0 1 . 1 1 0.82, 1.50 1.75*** 1.30, 2.36
Walking more than a mile 1 . 0 0 1.28 0.88, 1.87 2.31*** 1.60,3.34
Walking several blocks 1 . 0 0 1.04 0.61, 1.77 2.23** 1.36,3.65
Walking one block 1 . 0 0 0.95 0.52, 1.74 1.71 0.97,3.01
Bathing or dressing 1 . 0 0 1.25 0.62, 2.52 1.83 0.93,3.60
WOMEN {n = 2156)
Vigorous activities 1 . 0 0 1 . 2 0 0.96, 1.49 1 .6 8 *** 1.32,2.13
Moderate activities 1 . 0 0 1.27 0.95, 1.69 1.78*** 1.34, 2.36 ^
Lifting or carrying groceries 1 . 0 0 1 . 1 1 0.86, 1.43 1.45** 1.12, 1.87
Walking several flights of stairs 1 . 0 0 1.19 0.89, 1.60 1.87*** 1.40,2.49
Walking one flight of stairs 1 . 0 0 1 . 1 1 0.70, 1.76 1 .8 8 ** 1.22,2.90 )
Bending or kneeling 1 . 0 0 1.24 0.95, 1.63 2 .2 0 *** 1.68, 2.87
Walking more than a mile 1 . 0 0 1.15 0.85, 1.57 1.75*** 1.29,2.38
Walking several blocks 1 . 0 0 1 . 0 0 0.65, 1.54 1.73** 1.15,2.58
Walking one block 1 . 0 0 1 . 0 1 0.62, 1 . 6 6 1 . 2 2 0.75,1.97
Bathing or dressing 1 . 0 0 1.04 0.55, 1.99 0.80 0.40, 1.59
***? <0.001, <0.01, *P <0.05; Cl = confidence interval.
287

Table 5.6.3. Age and lifestyle adjusted odds ratios of poor scores (<67.7% of
standardised scores) for individual items describing general health in second and third
tertile (first tertile as reference) waist circumference.
Items o f general health
Tertile 1
Odds
ratio
Tertile 2 Tertile 3
Odds
ratio
95% Cl Odds
ratio
95% Cl
MEN (%= 1885)
Poor health in general 1 . 0 0 1.04 0.71, 1.53 1.23 0.83, 1.81
Getting sick a little easier 1 . 0 0 1.17 0.84, 1.64 1.23 0.86, 1.75
Health not as good as anybody 1 . 0 0 1.14 0.89, 1.45 0.97 0.75, 1.27
Expecting worse health 1 . 0 0 1.28* 1 .0 1 , 1.62 1.39* 1.08, 180
No excellent health§ 1 . 0 0 1.30 0.98, 1.73 1.35* 1 .0 0 , 1.82
WOMEN {n = 2156)
Poor health in general 1 . 0 0 0.91 0.64, 1.27 1.52* 1.09,2.13
Getting sick a little easier 1 . 0 0 0.85 0.64, 1.12 1.18 0.89, 1.57
Health not as good as anybody 1 . 0 0 1 . 1 1 0.88, 1.40 0.97 0.76, 1.24
Expecting worse health 1 . 0 0 1.03 0.82, 1.28 0.96 0.75, 1.21
No excellent health§ 1 . 0 0 1.09 0.84, 1.41 1.28 0.99, 1.67
***? <0.001, **P <0.01, *P <0.05; Cl = confidence interval; §responded as “don’t know” or “false” to
the question “ do you rate your health as excellent? (dont’t know, true or false)”.
288

sIO
5.0
4.0
3.0
2.0
1.0
0
M EN4: * *
11
Reference■
Significantly different fromtertile 1: <0.001
Tertile 1 <87 cm
Tertile 2 >87-96 cm
Tertile 3 >96 cm
a W aist circumference
2CO
so
3.0
2.5
2.0
1.5
1.0
0.5
0Tertile 1 <75 cm
WOMEN
11
Reference ,1
Significantly different fromtertile 1: <0.001
Tertile 2 >75-84 cm
Tertile 3 >84 cm
b Waist circumference
Figure 1. Odds ratios (95% confidence intervals) for subjects with ‘poor’ (<66.7% of
standardised scores) physical functioning health concept in different tertiles of waist
circumference in men (a) and in women (b) (Odds ratios were adjusted for age, cigarette
smoking, alcohol drinking, physical activity, educational level, marital status,
employment, household composition, intimate contact, and parity (in women).
289

Appendix 5.6.1. Age, lifestyle and demographic factors as possible confounders
considered in analysis of the associations of quality of life with body mass and fat
distribution.
Reference group Dummy variables1 2 3
Age (years) 20-29 30-39 40-49 50-59
Smoking Non-smokers Ex-smokers Currentsmokers
Alcohol consumption (glasses/day)
Occasional(<i)
None(0 )
Moderate (1 to <3)
Heavy( ^ )
Physical activity Active (do sport)
Inactive (do no sport)
Educational level Level 3 (higher vocational or university)
Level 2 (vocational or higher secondary)
Level 1 (lower than secondary)
Marital status Single Married or cohabiting
Divorced or widowed
Employment Currentlyemployed
Unemployed Housewives Retired*
Household composition Living with someone
Living with no one
Intimate contact')' No one 1 - 2 3-5 > 6
Parity (live births) None 1 - 2 >3^Retired early; fDiscussing personal matters with other people.
290

Appendix 5.6.2. Proportions of subjects with standardised scores below 66.67% for the
nine health concepts in the RAND-36 questionnaire.
Men (%) Women (%)
Physical functioning 8.44 10.76
Social functioning 17.24 23.47
Role limit-physical:): 16.82 23.01
Role limit-emotional § 23.45 27.92
Mental health 21.49 30.10
Vitality 43.98 54.27
Bodily pain 15.44 2 1 . 1 0
General health 37.61 38.78
Health transition 13.32 12.52
291

I I CHAPTER SIX
EPIDEMIOLOGICAL MORPHOLOGY AND
ASSOCIATED ILL HEALTH BASED ON
STANDARD CUT-OFFS VALUES OF
ANTHROPOMETRIC MEASURES
11 CONTENTS OF CHAPTER SIX PAGES
6.1 Impairment of health and quality of life in the overweight 293
according to standard cut-offs of body mass index
6.2 Impairment of health and quality of life from abdominal fat 316
accumulation, using waist circumference Action Levels
292

6.1
IMPAIRMENT OF HEALTH AND QUALITY OF LIFE IN THE
OVERWEIGHT ACCORDING TO STANDARD CUT-OFFS OF
BODY MASS INDEX
This section has been submitted for publication as
Lean MEJ, Han TS. Seidell JC. Impairment of health and quality of life in the
overweight according to standard cut-offs of body mass index, (submitted).
Collaboration with MORGEN project
293

ABSTRACT
Objective’. To estimate the prevalence and risks of chronic disease, secondary symptoms
and poor quality of life associated with overweight, using standardised body mass index
(BMI) cut-offs (25 and 30 kgW ).
Design: Cross-sectional study in a random sample set in the Netherlands.
Subjects: 5887 men and 7018 women aged 20-59 years selected from the civil registry of
Amsterdam, Maastricht and Doetinchem.
Main outcome measures: Symptoms of respiratory insufficiency, low back pain, type 2
diabetes, caidiovascular risk factors, and physical functioning.
Results: People with BMI below 25 kg/m^ were considered the reference group, with
low prevalence of symptoms of obesity-related diseases and good subjective health.
Between 25-30 kg/m^, the prevalences of these all increased, and above 30 kg/m^ were
greatly increased. After adjustments for age and lifestyle factors, odds ratios (95%
confidence intervals) in those with a BMI >30 kg/m^ were 3.5 (2.8 to 4.4) in men and
3.3 (2.8 to 3.9) in women for shortness of breath when walking upstairs, 4.6 (2.4 to 8 .8 )
in men and 5.4 (2.8 to 10.5) in women for type 2 diabetes, 5.5 (4.5 to 6 .6 ) in men and
2.9 (2.4 to 3.4) in women for at least one major cardiovascular risk factor. Both men and
women with BMI >30 kg/m^ were twice as likely to have difficulties in performing a
range of basic daily physical activities. Compared to women with BMI <25 kg/m^, those
with BMI >30 kg/m^ were 1.5 times more likely to have symptoms of intervertébral disc
herniation. Significantly more overweight women had problems associated with low
back pain including hindrance to their daily business, absence from work and medical
consultation. The calculated population attributable risks to estimate the excess risk of ill
health attributable to overweight were between 10-40%.
Conclusions: Health risks for a range of problems aie presented using the standard BMI
cut-offs. Overweight is associated with increased risks of clironic disease, secondary
symptoms and impairment of quality of life, which could amoimt to huge health care
expenditure.
294

INTRODUCTION
Health service burdens are heavily imposed by clusters of symptoms, risk factors and
secondary diseases associated with overweight and adverse fat distribution, leading to
coronary heart disease, strokes, non-insulin dependent diabetes mellitus (NIDDM), and
several cancers. Recent estimates costs per aimum for treating this ill health were 195
million pounds in Britain (Office of Health Economics, 1994), and 70 billion dollars in
the United States (Institute of Medicine, 1995). These figures present major concerns to
the health service, since the prevalence of overweight is still rising in many countries
(Kuczmarski, 1992; Seidell 1995a; Bemiett et al, 1995; Gregory et al, 1990).
Estimating total burdens of disease and financial costs associated with overweight has
been hampered by a lack of consistent evidence using standard cut-offs for body mass
index (BMI) and standardised referent populations. From the ongoing MORGEN project
(monitoring cardiovascular health in The Netherlands), we have shown that waist
circumference, BMI and waist to hip ratio all relate closely and similarly to a variety of
symptoms and clironic diseases (C hapter 5). Hitherto, data have been analysed by
tertiles of BMI, and division by median, tertiles, and quintiles have been performed for
epidemiological research for statistical reasons.
The present study summarises the prevalence of major chronic diseases, symptoms and
impairment of quality of life related to overweight, and calculated the odds ratios
according to the BMI categories adopted by World Health Organisation (1995) - i.e.
BMI >25 kg/m^, or BMI >30 kg/m^, with reference to BMI <25 kg/m^.
METHODS
Subjects
Dutch men (n ~ 5887) and women (« = 7018) aged 20-59 were recruited randomly from
civil registries for the ongoing MORGEN (Monitoring Risk Factors and Health in The
Netherlands) project 1993 to 1995 cohorts, from Amsterdam, Maastricht, and
Doetinchem. To obtain similar numbers of subjects at each age, the sample was
295

stratified by sex and five year age group. The response rate to invitations was about
50%. Information on quality of life was available in the 1995 cohort of 1885 men and
2156 women. The numbers of subjects in the present study represent those who attended
health centres for biochemical and physiological measurements.
MeasurementsAll anthropometric measurements were made according to the World Health
Organisation (1995) recommendations by trained paramedical persomiel. Subjects wore
light clothes during measurements of body weight to the nearest lOOg using calibrated
scales, height in bare feet to the nearest mm. BMI was calculated as weight (kg) divided
by height squared (m^). Lifestyle factors were obtained from a questionnaire.
Symptoms and diseases
Major symptoms and diseases associated with overweight were selected from our
previous studies (C hapter 5). Symptoms of respiratory insufficiency included shortness
of breath, wheezing, coughing and bringing up phlegm (C hapter 5.4). Risk factors for
cardiovascular disease included hypercholesterolaemia (plasma total cholesterol >6.5
mmol/1), low high density lipoprotein cholesterol (<0.9 mmol/1) and hypertension
(systolic blood pressure >160 mmHg and/or diastolic blood pressure >95 mmHg and/or
the use o f antihypertensive agents) (C hapter 5.2; Han ei al, 1995c). Known and newly
diagnosed (random blood glucose >11.1 mmol/1) NIDDM were included, and Insulin
treated patients were excluded as indistinguishable from insulin dependent diabetes
mellitus (C hapter 5.5; Seidell et al, 1997). Symptoms of low back pain were obtained
fi'om questionnaire. Those who responded affirmatively to having low back pain in the
past 12 months, were then asked whether they had radiating pain to the knees or feet, to
indicate symptoms o f intervertébral disc herniation. This symptom was only accepted in
the presence of low back pain, to avoid including those with other causes of radiated
pain. The subjects were asked about the total duration of low back pain in the past 12
months. Those who had low back pain for a total of twelve weeks or more were
296

classified as having chronic low back pain. The reference groups for the tlnee classes of
low back pain were composed of those who did not fulfil the criteria for the symptom
under analysis, thus the reference group when analysing one symptom included some
subjects with other symptom(s) of low back pain (Chapter 5.3; Han et al, 1997d). From
ten items rated by subjects using the standardised Dutch RAND-36 questionnaire, which
has been adapted from the standardised SF-36 Health Survey the concept of physical
functioning, was calculated to represent quality of life. Distributions of standardised
scores were examined from the plots (not shown) to determine arbitrary cut-offs for the
health concepts. It was decided arbitrarily that subjects with less than 66.7% o f the
standardised score would be classified as having a 'poor ’ health concept, and those with
66.7%) or above were considered as having a ‘good’ health concept. This cut-off
classified 8.4% of all men and 10.8% of all women as having ‘poor’ physical
functioning. Each of the ten items comprising the physical functioning health concept
was arbitrarily dichotomised such that scores above average (with an odd numbered
scale of 3 or 5 points) were considered as 'good’ health, and average or lower scores
were classed as 'poor ’ health. For items with even scale (2, 4 or 6 points), the scores for
'good’ health and 'poor’ health were evenly divided (C hapter 5.6).
Lifestyle and demographic factors as confounding factors
Dummy variables (Appendix 6.1.1) for possible confounding factors were created to
adjust for the associations between adiposity and health concepts and individual items.
Statistical methods
Statistical analyses were performed using SAS version 6.1 (Cary, USA). Logistic
regression analysis was used to estimate the odds ratios and 95% confidence intervals of
symptoms of disease and ‘poor’ quality of life in those with BMI in the categories of
between 25-30 kg/m^ and >30 k.g!m, compared to those with body mass index <25
kg/m^, adjusted for age, lifestyle and demographic factors (Appendix 6.1.1).
297

Population attributable risk
The population attributable risk, i.e. the proportionate excess risk of ill health associated
with exposure to the risk of overweight based on BMI cut-off at 25 kg/m^ (PAR2 5 ) was
calculated as (Kalni and Sempos, 1989; Kleinbaum et al, 1982):
“ 1*25^ (O R 25 " 1)4^25 ^ (G R 25 " 1 )] + 1 )
where P2 5 is the proportion of subjects exposed to the risk of overweight, i.e. all subjects
with BMI >25 kg/m^, OR2 5 is the age and lifestyle adjusted odds ratio for a symptom or
disease in subject group with BMI >25 kg/m^ compared to the reference group with BMI
<25 kg/m^. Population attributable risk using BMI cut off at 30 kg/m^ (PAR30) was
calculated the same way, with the proportion of subjects exposed to BMI >30 kg/m^,
and the odds ratios for a disease in subjects with BMI >30 kg/m^ compared to the
reference group with BMI <30 kg/m^. The difference between PAR2 5 and PAR3 0 gives
PAR2 5 . 3 0 for BMI between 25-30 kg/m^. This equation is valid only when the odds ratio
is equal or greater than 1 .
RESULTSCharacteristics of subjects are shown in Table 6.1.1. Overall prevalence of disease,
symptoms and poor quality of life is shown in Table 6.1.2. There were 45% men and
31% women whose BMI were between 25-30 kg/m^ and 11% men and 11% women
above 30 kg/m^. The prevalence of these health risks increased with increasing BMI
(Tables 6.1.3a & b), and highest in those with BMI above 30 kg/m^. Figures 6.1.1a &
b show that within separate groups of non-smokers and smokers, the prevalence of those
with shortness of breath when walking uphill or upstairs increased with increasing BMI,
and significantly (R <0.001) higher in smokers for each level of BMI.
After adjustments for age and appropriate lifestyle factors, compared to those with BMI
below 25 kg/m^, the risk for clironic disease, symptoms and quality of life increased
significantly (Tables 6.1.4a & b), with the highest risk in those with BMI above 30
kg/m^. Figure 6.1.2 shows the proportions of subjects whose daily life activities were
298

affected by low back pain. About a third of men and women reported that, due to low
back pain, their daily business was hindered, they had to be absent from work, and more
than forty percent sought medical consultation as a result of low back pain. Table 6.1.5
shows that after adjustments for age and lifestyle factors, the proportions of these
consequences of low back pain were significantly higher in women with BMI above 30
kg/m^ compared to women with BMI below 25 kg/m^. The proportion of daily business
hindered due to low back pain was significantly higher in men with BMI 30 kg/m^
compared to men with BMI below 25 kg/m^. Figure 6.1.3 shows the odds ratios (95%
confidence interval limits) for ‘poor’ physical function health concept were two and half
times higher in subjects with BMI above 30 kg/m^ compared to those with BMI below
25 kg/m^.
Tables 6.1.6 a & b show the proportions of subjects ‘exposed’ to overweight, with BMI
above 25, or 30 kg/m^, and the odds ratios for ill health. These values were used to
calculate the population attributable risks for symptoms of disease and ‘poor’ quality of
life in those with BMI >25 or >30 kg/m^. Table 6.2.7 shows that the excess proportions
of subjects with poor health attributable to overweight (BMI >25 kg/m^) were
approximately 10 to 40 percent. The difference in population attributable risks from
BMI categories of >25 and >30 kg/m^ is the population attributable risk for those with a
BMI between 25 to 30 kg/m^. This difference of population attributable risk was as high
as the values for category above 30 kg/m^.
DISCUSSIONAttempts to quantify the impact of obesity on health and health service costs have been
confused by lack of standardisation. For example, the relative risks for NIDDM have
been quoted as up to 40 for men with BMI above 30 kg/m^ or 93 for women with BMI
above 35 kg/m^, depending on the reference population used (Chan et al, 1994; Colditz
et al, 1995). Some use all those below the cut-off, others obtain very high relative risks
by using the lowest risk group, e.g. BMI <22 kg/m^ as the reference population. Many
299

epidemiological studies have compared risks in tertiles of populations often with BMI
tertile range (25-27 kg/m ). Surprisingly few studies have estimated health risks in
groups which would be considered obese, i.e. BMI >30 kg/m^ (WHO, 1995). The
present study has combined data from a number of analyses which have shown that
overweight, indicated by BMI in the highest tertile is associated with increased risk of
chronic disease, symptoms and risk factors of major diseases, and poor quality of life in
terms of difficulties in performing basic activities of daily living (Chapter 5). The data
are presented here in a standardised format, relating prevalences of a range of health
problems in the overweight to those in a referent population with BMI <25 kg/m^. Using
this approach it is now possible to derive population attributable risks (Table 6.1.6) in a
consistent way for estimating the cost obesity in different countries. The BMI cut-offs
employed (BMI 25-30, >30 kg/m^) are conventional for most of the world, and have
been adopted by WHO (1995). Even in this relatively large, detailed study, numbers
preclude divisions into smaller categories, e.g. by BMI 28 kg/m^, or BMI >35 kg lm .
The Dutch population studied has physical characteristics similar to those of most
Western/Caucasian populations, so the data can probably be generalised with caution.
The patterns of health problems associated with being overweight are similar to those
identified by analysis of tertiles, so most are significantly affected by BMI class. For
some symptoms the increased prevalence with BMI >30 kg/m^ is particularly striking,
e.g. shortness of breath when walking upstairs or uphill is present in 46% of women and
34% of men, chionic low back pain in 25% women, 20% men. It is also clear that the
BMI range 25-30 kg/m^ is not benign, with respect to elevated cardiovascular risk
factors in both sexes, and a wide range of important symptoms in women (Table 6.1.4).
The increased prevalence of shortness of breath is again striking at almost 30% of
women with BMI 25-30 kglvci and we have previously shown that overweight affects
shortness of breath in both smokers and non-smokers (Chapter 5.4).
300

In addition to these analyses, which should be of value to health economics and policy
makers. Table 6.1.5 presents new data on some major social consequences of being
overweight. Again it is clear that BMI 25-30 kg/m^ after appropriate adjustments for age,
smoking and education, has a significant impact amongst women, although these
problems only become apparent with >30 kg/m^ in men. Odds ratios are likely to be
overestimated if the prevalence is high (Lee, 1994). Thus the results of some items of
the physical fimctioning health concept (Tables 6.1.3a & b) in the present study should
be interpreted with caution.
It is a potential limitation of the present analysis that the age range of subjects was 20-59
years. Some of the conditions and symptoms under study (e.g. NIDDM, shortness of
breath) are well known to be much more prevalent in the elderly - indeed the majority of
NIDDM patients are aged over 60 years. On the other hand, the impact of overweight or
obesity, measured as odds ratio may not be age related, and the present study did not
find any such relationship. In the present study there were too few NIDDM subjects for
subgroup analysis, but compared to the reference group (BMI <25 kg/m^), the odds
ratios for respiratory symptoms and cardiovascular risk factors in the overweight (BMI
25-30 kg/m^ or >30 kg/m^) remained similar’ in different age bands. In the absence of
directly comparable data in elderly subjects it therefore seems reasonable to apply
standard figures of odds ratios for men and women, of all ages. Table 6.1.7 shows the
population attributable risks based on BMI 25 and 30 kg/m^, providing standard values
for estimating excess costs of ill health due to overweight.
CONCLUSIONSThe results of this study provide justification for using BMI 25 and 30 k g W as cut-offs
to indicate medical concern for a range of complications. The data for the first time
allow prediction of the burden of disease to be made in a consistent way using standard
WHO (1995) cut-offs of BMI.
301

Table 6.1.1. Characteristics of 5887 men and 7018 women.
Men Women
Mean SD Range Mean SD Range
Age (years) 42.9 10.7 20.3-60.0 42.2 1 1 . 0 20.2-59.9
Weight (kg) 82.0 1 2 . 0 44.4-157.0 68.5 11.5 36.6-153.0
Height (cm) 178.4 7.3 152.0-210.0 165.7 6.7 134.5-190.0
Body mass index (kg/m^) 25.8 3.5 15.7-50.1 25.0 4.2 14.9-58.3
Waist circumference (cm) 92.3 1 0 . 8 64.0-155.0 81.0 1 1 . 1 56.5-150.0
Hip circumference (cm) 1 0 1 . 8 6 . 6 69.0-150.0 1 0 2 . 2 8.4 76.4-165.0
Waist to hip ratio 0.905 0.072 0.621-1.369 0.791 0.070 0.567-1.302
302

Table 6.1.2. Unadjusted prevalence in total population of 5887 men and 7018 women
(1885 men and 2156 women had information on quality of life) with clironic disease,
symptoms and poor quality of life.
Men% 95% Cl
Women% 95% Cl
Respiratory symptomsWheezing when not having a cold 9.2 8.5, 10.0 8.4 7.7, 9.2Woken up by shortness o f breath 5.0 4.4, 5.6 6 . 1 5.5, 6.7Coughing for more than 3 months 7.7 7.0, 8.4 7.5 6 .8 , 8 . 2
Bring up phlegm for more than 3 months 6 . 8 6.2, 7.5 5.0 4.3, 5.6Shortness of breath when walking uphill/stairs 16.0 15.1, 17.0 24.7 23.7, 25.6Shortness of breath when walking with others 4.6 4.0, 5.1 7.4 6.9, 7.9
Cardiovascular risk factorsHigh total cholesterol (>6.5 mmol/1) 14.6 13.7, 15.5 13.5 12.7, 14.3Low HDL-cholesterol (<0.9 mmol/1) 21.3 20.3, 22.3 5.1 4.6, 5.6Hypertension* 10.3 9.5, 11.1 8.3 7.7, 8.9At least one risk factor 38.0 36.8,39.3 23.5 22.5, 24.5
DiabetesNon-insulin dependent diabetes mellitus 1 . 6 1.3, 1.9 0.9 0.7, 1.2
Symptoms o f low back painClironic low back pain (total >12 weeks/year) 16.6 15.6, 17.6 20.5 19.6,21.4Symptoms of intervertébral disc hermiation 13.4 12.5, 14.3 17.6 16.7, 18.4
‘Poor ' quality o f life Difficulties in physical functioningVigorous activities! 50.1 47.8, 52.4 54.0 51.7,56.3Moderate activities! 13.7 12.1, 15.3 24.1 22.5, 25.7Lifting/carrying groceries! 17.5 15.8, 19.3 32.6 30.8, 34.3Walking several flights of stairs! 15.8 14.1, 17.4 2 2 . 2 20.5, 23.9Walking one flight of stairs! 6.4 5.2, 7.5 8.9 7.8, 10.0Bending, kneeling! 25.4 23.4, 27.4 28.2 26.2, 30.2Walking more than a mile! 15.2 13.5, 16.8 18.4 16.7, 20.0Walking several blocks! 8 . 0 6 .8 , 9.3 9.4 8.2, 10.7Walking one block! 5.5 4.4, 6.5 6.5 5.4, 7.5Bathing or dressing! 4.0 3.1, 4.9 3.1 2 .2 , 4.0‘Poor’ physical functioning concept! 8.4 7.2, 9.7 1 0 . 8 9.5, 12.0* Systolic >160 or diastolic blood pressure >95 mmHg or medication for hypertension; fsingle items of
physical functioning concept; $<66.7% standardised scores.
303

Table 6.1.3a. Unadjusted prevalence of subjects with chronic disease, symptoms and
poor quality of life in different categories of body mass index, in men.
Men Body mass index (kg/mQ<25 25-30 >30 X
Proportions of subjects (44.0) (10.8)Respiratory symptoms
Wheezing when not having a cold 8.5 9.3 1 2 . 1 7.9*Woken up by shortness of breath 4.6 5.1 6.5 4.0Coughing for more than 3 months 7.9 7.6 7.4 0 . 2
Bring up phlegm for more than 3 months 6 . 6 6 . 8 7.7 0.9Shortness of breath when walking uphill/stairs 1 1 . 2 16.4 34.3 203.3***Shortness of breath when walking with others 3.1 4.3 113
Cardiovascular risk factorsHigh total cholesterol (>6.5 mmol/1) 9.4 17.2 24.6 1 2 2 .0 ***Low HDL-cholesterol (<0.9 mmol/1) 13.5 24.5 39.7 239.0***Hypertension! 3.7 13.1 25.7 308.4***At least one risk factor 23.6 45.1 66.9 510.2***
DiabetesNon-insulin dependent diabetes mellitus 0 . 6 1 . 8 4.7
Low back painChronic low back pain (total >12 weeks/year) 14.5 17.9 2 0 . 0 17.1***Symptom of intervertébral disc hermiation 10.9 15.0 16.4 24.6***
‘Poor ’ quality o f life Difficulties in physical functioningVigorous activities! 43.9 52.1 66.4 36.0***Moderate activities! 1 0 . 8 14.8 20.4 14.7***Lift/carry groceries! 14.2 18.4 26.5 18.6***Walking several flights of stairs! 1 0 . 8 16.9 30.8 52.0***Walking one flight of stairs! 5.3 6 . 1 11.9 12.4***Bending, kneeling! 20.9 24.7 45.5 53.8***Walking more than a mile! 11.5 15.9 26.1 28.4***Walking several blocks! 5.8 8.7 14.2 17.2***Walking one block! 4.7 5.0 10.4 11.4***Bathing or dressing! 2.9 4.1 8 . 1 11.4***‘Poor’ physical functioning concept§ 5.3 9.1 18.0 36.2***
<0.001, **P <0.01, <0.05; ! systolic >160 or diastolic blood pressure >95 mmHg or medication
for hypertension; Jsingle items of physical functioning concept; §<66.7% standardised scores.
304

Table 6.1.3b. Unadjusted prevalence of subjects with symptoms of disease and poor
quality of life in categories of body mass index, in women.
Women
Proportions of subjects
Body mass index (kg/m ) <25 25-30 >30
(58.1) (30.6) (11.4)X
Respiratory symptomsWheezing when not having a cold 7.1 9.2 13.3 35.8***Woken up by shortness of breath 5.1 7.4 8 . 2 19.6***Coughing for more than 3 months 6 . 2 8.9 10.7 27.6***Bring up phlegm for more than 3 months 4.2 5.4 7.6 ly y***Shortness of breath when walking uphill/stairs 18.4 28.5 46.4 304.8***Shortness of breath when walking with others 4.5 9.5 19.6 226.9***
Cardiovascular risk factorsHigh total cholesterol (>6.5 mmol/1) 9.4 19.1 19.8 143.4***Low HDL-cholesterol (<0.9 mmol/1) 3.4 5.8 1 1 . 8 1 0 1 .8 ***Hypertension! 3.9 1 0 . 6 24.6 395.8***At least one risk factor 15.4 30.8 45.4 424.2***
DiabetesNon-insulin dependent diabetes mellitus 0.4 1 . 0 3.8 82.4***
Low back painClii'onic low back pain (total >12 weeks/year) 17.8 24.2 24.7 44 9*%^Symptom of intervertébral disc hermiation 14.9 2 0 . 0 25.1 59 9* :*
‘Poor ’ quality o f life Difficulties in physical functioningVigorous activities! 47.9 60.3 72.4 60.6***Moderate activities! 18.4 31.7 36.0 60.7***Lift/carry groceries! 25.7 40.9 49.1 76.1***Walking several flights of stairs! 16.2 28.4 39.5 80.6***Walking one flight of stairs! 5.4 1 1 . 6 21.5 69.7***Bending, kneeling! 20.7 36.7 48.3 103.3***Walking more than a mile! 14.4 2 1 . 8 31.6 45.4***Walking several blocks! 6.7 11.3 2 0 . 2 45.2***Walking one block! 4.5 7.3 15.4 38.8***Bathing or dressing! 2 . 8 2.9 5.7 5.7‘Poor’ physical fimctioning concept§ 7.1 14.1 2 2 . 8 59.6******p <0.001, **P <0.01, *P <0.05; fsystolic >160 or diastolic blood pressure >95 mmHg or medication
for hypertension; $single items of physical functioning concept; §<66.7% standardised scores.
305

Table 6.1.4a. Odds ratios for clironic disease, symptoms and poor quality of life in
categories of body mass index, adjusted for age and lifestyle factors (see Appendix
6 .1 .1 ), in men.
Men Body mass index (kg/m^)25-30 >30
ORt 95% Cl O Rt 95% ClRespiratory symptoms
Wheezing when not having a cold 1.14 0.94, 1.40 1.50** 1.13,2.01Woken up by shortness of breath 1.04 0.80, 1.35 1 . 2 2 0.84, 1.79Coughing for more than 3 months 0.98 0.79, 1.21 0 . 8 8 0.62, 1.25Bring up phlegm for more than 3 months 1 . 0 0 0.79, 1.25 1.06 0.75, 1.50Shortness of breath when walking uphill/stairs 1.43*** 1.20, 1.69 3.51*** 2.82, 4.38Shortness of breath when walking with others 1.18 0.87, 1.59 2.85*** 2.01,4.04
Cardiovascular risk factorsHigh total cholesterol (>6.5 mmol/1) 1.58*** 1.33, 1.88 2 .2 2 *** 1.76, 2.81Low HDL-cholesterol (<0.9 mmol/1) 2.26*** 1.94, 2.63 4.78*** 3,87, 5.90Hypertension:); 2.89*** 2.27, 3.68 5.88*** 4.43, 7.79At least one risk factor 2.37*** 2.09, 2.69 5.45*** 4.48, 6.63
DiabetesNon-insulin dependent diabetes mellitus 1.98* 1.10,3.60 2.41,8.78
Low back painClii'onic low back pain (total >12 weeks/year) 1 . 0 2 0 .8 8 , 1 . 2 0 1.05 0.83, 1.32Symptom of intervertébral disc hermiation 1.31 0.95, 1.34 1 . 1 2 0.87, 1.44
‘Poor ' quality o f life Difficulties in physical functioningVigorous activities § 1.13 0.92, 1.40 1.78*** 1.27, 2.51Moderate activities § 1.15 0.83, 1.58 1.38 0.89, 2.14Lift/carry groceries § 1.06 0.80, 1.42 1.42 0.96, 2.11Walking several flights of stairs § 1.44* 1.05, 1.96 2 .6 8 *** 1.79,4.00Walking one flight of stairs§ 0 . 8 6 0.55, 1.36 1.46 0.83,2.58Bending, kneeling § 0.95 0.74, 1.22 2 \ 1.54,3.06Walking more than a mile§ 1.33 0.98, 1.81 2.16*** 1.44,3.24Walking several blocks § 1.26 0.84, 1.90 1.84* 1.08,3.12Walking one block§ 0 . 8 6 0.53, 1.40 1 . 6 8 0.92, 3.04Bathing or dressing§ 1.15 0.65, 2.02 1.97 0.99, 3.92‘Poor’ physical functioning concept# 1.36 0.88, 2.09 2.55*** 1.51,4.30
<0.001, **P <0.01, *P <0.05; |'odds ratio with reference to body mass index <25; Jsystolic >160 ordiastolic blood pressure 2:95 mmHg or medication for hypertension; §single items of physical functioningconcept; #<66.7% standardised scores.
306

Table 6.1.4b. Odds ratios for ciironic disease, symptoms and poor quality of life in
categories of body mass index, adjusted for age and lifestyle factors (see Appendix
6.1.1), in women.
Women Body mass index (kg/m )25-30 >30
ORt 95% Cl ORt 95% ClRespiratory symptoms
Wheezing when not having a cold 1.35** 1.11, 1.65 \ qq*** 1.55,2.57Woken up by shortness of breath 1.41** 1.23, 1.77 1.47** 1.08, 1.99Coughing for more than 3 months 1.46*** 1.89, 1.80 1.64*** 1.25,2.17Bring up phlegm for more than 3 months 1.24 0.96, 1.60 1.69** 1.22, 2.34Shortness of breath when walking uphill/stairs 1.61*** 1.41, 1.83 3.27*** 2.76,3.89Shortness of breath when walking with others 1.91*** 1.54, 2.37 3.89*** 3.04, 4.97
Cardiovascular risk factorsHigh total cholesterol (>6.5 mmol/1) 1.52*** 1.29, 1.79 1.38** 1.10, 1.72Low HDL-cholesterol (<0.9 mmol/1) 1.67*** 1.29,2.17 2.30*** 2.45, 4.44Hypertension^ 1.95*** 1.57,2.43 4.75*** 3.72, 6.07At least one risk factor 1.72*** 1.50, 1.97 2.87*** 2.40,3.43
DiabetesNon-insulin dependent diabetes mellitus 1.67 0.84,3.31 5.38*** 2.77, 10.4Ê
Low back painChronic low back pain (total >12 weeks/year) 1 .2 0 ** 1.05, 1.36 1.14 0.95, 1.37Symptom of intervertébral disc hermiation 1.17* 1.01, 1.35 1.48*** 1.22, 1.79
Poor ’ quality o f life Difficulties in physical functioningVigorous activities § 1.35** 1.10, 1.67 2.06*** 1.48, 2.87Moderate activities § 1.52*** 1.19, 1.92 1.48* 1.06, 2.07Lift/caiiy groceries§ 1.42** 1.14, 1.77 1.62** 1.19, 2.22Walking several flights of stairs § 1.64*** 1.28, 2.09 2.26*** 1.63,3.13Walking one flight of stairs § 1 .6 6 ** 1.16,2.39 2.81*** 1.83,4.13Bending, kneeling§ 1 .6 8 *** 1.34, 2.10 2.28*** 1.67,3.12Walking more than a mile§ 1.41** 1.08, 1.83 1.96*** 1.39, 2.76Walking several blocks § 1.47* 1.03,2.09 2.38*** 1.58,3.63Walking one block§ 1 . 2 2 0.80, 1.87 2.36*** 1.45,3.83Bathing or dressing § 0.80 0.43, 1.48 1.60 0.77,3.30‘Poor’ physical functioning concept# 1.61** 1.15,2.24 2.41*** 1.60,3.63***P <0.001, **P <0.01, *P <0.05; fodds ratio with reference to body mass index <25; $ systolic >160 ordiastolic blood pressure >95 mmHg or medication for hypertension; §single items of physical functioningconcept; #<66.7% standardised scores.
307

Table 6.1.5. Prevalence of subjects whose daily life were affected due to low back pain
in the past twelve months {n = 2467 men, 3448 women) in different categories of body
mass index, adjusted for age, smoking and education.
Men Women
Body mass index (kg/nV) Body mass index (kg/m^)
<25 25-30 >30 <25 25-30 >30
Proportions (% )t (42.1) (46.2) (11.7) (56.0) (31.9) ( 1 2 .2 )
Daily business hindered 28.2 27.4 34.9* 25.3 30.2** 32.3**
Absence from work 25.4 23.0 27.6 18.8 23.2* 28.4**
Medical consultation 39.3 40.9 40.5 39.6 44.7** 45.7**
Job redundancy 1 1 . 2 1 2 . 2 15.2 8 . 2 9.2 10.9
Job modification 8.7 8.3 8.7 7.0 7.7 3.2*
mass index category.
308

Table 6.1.6a. Odds ratios of symptoms of chi’onic diseases and poor subjective health in
different categories o f body mass index, adjusted for age and lifestyle factors (see
Appendix 6.1.1), in men.
Men Body mass index>25 >30
ORt 95% Cl ORtt 95% ClRespiratory symptoms P = 0.560:1: P - 0.108:):
Wheezing when not having a cold 1 .2 2 » 1.01, 1.48 1.39* 1.07, 1.82Woken up by shortness of breath 1.07 0.84, 1.38 1 . 2 0 0.84, 1.69Coughing for more than 3 months 0.97 0.78, 1.19 0.89 0.65, 1.24Bring up phlegm for more than 3 months 1 . 0 1 0.81, 1.25 1.07 0.78, 1.47Shortness of breath when walking uphill/stairs 1.76 1.50,2.07 2.83*** 2.34,3.44Shortness of breath when walking with others 1.50 1.13, 1.98 2.57*** 1.9.1,3.45
Cardiovascular risk factors P = 0.560:1: P = 0.108:):High total cholesterol 1.69»»» 1.43,2.00 1.67*** 1.36, 2.04Low HDL-cholesterol 2.62*** 2.26, 3.03 2 .8 8 *** 2.40, 3.46Hypertension 3.42»»» 2.71,4.31 2 yq*** 2.26,3.45At least one risk factor 2.75*** 2.44,3.10 3.25*** 2.71,3.89
Diabetes P =: 0.560:): P = 0.108$Non-insulin dependent diabetes mellitus 2.51*** 1.42, 4.44 2.82*** 1.78,4.46
Symptoms o f low back pain P == 0.560 P == 0.108Chronic low back pain (total >12 weeks/yeai’) 1.03 0.89, 1.19 1.03 0.83, 1.28Symptom of intervertébral disc hermiation 1.13 0.96, 1.33 1.04 0.82, 1.30
‘Poor ’ quality o f life Difficulties in physical functioning
P == 0.566* P == 0 . 1 1 2 :):
Vigorous activities § 1.23* 1.00, 1.50 1 .6 6 ** 1.21,2.28Moderate activities § 1.19 0 .8 8 , 1.62 1.27 0.85, 1.88Lifting carrying groceries§ 1.13 0.86, 1.49 1.37 0.96, 1.96Walking several flights of stairs§ 1 .6 6 *** 1.24, 2.23 2.15*** 1.51,3.04Walking one flight of stairs § 0,99 0.64, 1.52 1.60 0.97, 2.64Bending, kneeling§ 1.14 0.90, 1.44 2.23*** 1.64,3.05Walking more than a mile§ 1.49** 1.11, 1.98 1.82** 1.27, 2.60Walking several blocks§ 1.38 0.93,2.04 1.59* 1.01,2.52Walking one block§ 1.03 0.65, 1.61 1.83* 1.08,3.09Bathing or dressing§ 1.32 0.78, 2.24 1.81* 1.01,3.25‘Poor’ physical frinctioning concept^ 1.60* 1.06, 2.40 2 .1 0 ** 1.35,3.26***p <0.001, **P <0.01, *P<0.05; odds ratio with reference to body mass index group fbelow 25 and tjb e lo w 30 kg/m^; ;|:P = proportion o f subjects ‘exposed’ to the risk o f overweight; §single items o f physical functioning concept; %<66.7% standardised scores.
309

Table 6.1.6b. Odds ratios of symptoms of chronic diseases and poor subjective health in
different categories of body mass index, adjusted for age and lifestyle factors (see
Appendix 6.1.1), in women.
Women Body mass index>25 >30
ORt 95% Cl ORtt 95% ClRespiratory symptoms P = 0.419} P = 0.114}
Wheezing when not having a cold 1.52*** 1.27, 1.82 1.75*** 1.38, 2 . 2 2
Woken up by shortness of breath 1.44*** 1.16, 1.77 1.25 0.94, 1.67Coughing for more than 3 months 1.52*** 1.25, 1.84 1.39* 1.07, 1.80Bring up phlegm for more than 3 months 1.34*** 1.08, 1.73 1.55** 1.15, 2.09Shortness of breath when walking uphill/stairs 1.96*** 1.74, 2 . 2 1 2.62*** 2.23, 3.07Shortness of breath when walking with others 2.40*** 1.97, 2.92 2.81*** 2.27, 3.48
Cardiovascular risk factors P = 0.419} P = 0.114}High total cholesterol 1.48*** 1.27, 1.72 1 . 1 0 0.90, 1.35Low HDL-cholesterol 2 .1 1 *** 1 .6 6 , 2.67 :L56*** 1.96, 3.33Hypertension 2.59*** 2 . 1 2 , 3.17 3.31*** 2.70, 4.07At least one risk factor 1,98*** 1.74, 2.24 2 .2 1 *** 1.87, 2.61
Diabetes P = 0.419} P = 0.114}Non-insulin dependent diabetes mellitus 2.71*** 1.48, 4.96 4.04*** 2.41, 6.75
Symptoms o f low back pain P = 0.419} P = 0.114}Clironic low back pain (total >12 weeks/year) 1.19** 1.05, 1.35 1.05 0 .8 8 , 1.26Symptom of intervertébral disc hermiation 1.25** 1.09, 1.42 1.38*** 1.15, 1.64
Poor ’ quality o f life P = 0.395} P = 0.106}Difficulties in physical functioningVigorous activities § 1.50*** 1.23, 1.81 1.84*** 1.33, 2.53Moderate activities§ 1.51*** 1 .2 1 , 1 . 8 8 1.24 0.90, 1.70Lifting carrying groceries § 1 .2 0 , 1.80 1.40* 1.04, 1.90Walking several flights of stairs# pyq*** 1.43, 2.24 1.82*** 1.34, 2.48Walking one flight of stairs# j qy*** 1.42, 2.74 2 .2 0 *** 1.50, 3.24Bending, kneeling# 1.82*** 1.48, 2.24 1.83*** 1.36, 2.47Walking more than a mile# 1.55*** 1 .2 2 , 1.96 1.69* 1 .2 2 , 233Walking several blocks# 1.71*** 1.25, 2.35 2 .0 0 *** L36, 2.95Walking one block# 1.53** 1.05, 2 . 2 2 2.16*** 1.39, 3.36Bathing or dressing# 1 . 0 0 0.59, 1.70 1.75 0 .8 8 , 3.46‘Poor’ physical functioning concept^ 1.82*** 1.34, 2.47 \ qq**$ 1.33, 2.82***p <0.001, **P <0.01, *jP<0.05; odds ratio with reference to body mass index group fbelow 25 and ttb e lo w 30 kg/m^; $P = proportion o f subjects ‘exposed’ to the risk o f overweight; §single items o f physical functioning concept; ^<66.7% standardised scores.
310

Table 6.1.7. Population attributable risks of ill health due to overweight.
Population attributable risk (%) WomenMen
>25* >30 A A >25* >30 AA
Respiratory symptomsWheezing when not having a cold 1 1 . 0 4.0 17.9 7.8Woken up by shortness of breath 3.8 2 . 1 15.6 2 . 8
Coughing for more than 3 months NA NA 17.9 4.3Bring up phlegm for more than 3 months 0 . 6 0 . 8 12.5 5.9Shortness of breath when walking uphill/stairs 29.9 16.5 28.7 15.6Shortness of breath when walking with others 21.9 14.5 37.0 17.1
Cardiovascular risk factorsHigh total cholesterol 27.9 6 . 8 16.7 1 . 1
Low HDL-cholesterol 47.6 16.9 31.7 15.1Hypertension 57.5 16.2 40.0 2 0 . 8
At least one risk factor 49.5 19.6 29.1 1 2 . 1
DiabetesNon-insulin dependent diabetes mellitus 45.8 16.4 41.7 25,7Symptoms o f low back painClironic low back pain (total >12 weeks/year) 1.7 0.3 7.4 0 . 6
Symptom of intervertébral disc hermiation 6 . 8 0.4 9.5 4.2
Poor ’ quality o f life Difficulties in physical functioning\Vigorous activities} 11.5 6.9 16.5 8 . 2
Moderate activities} 9.7 2.9 16.8 2.5Lifting carrying groceries} 6.9 4.0 15.7 4.1Walking several flights of stairs} 27.2 11.4 23.8 8 . 0
Walking one flight of stairs} NA 6.3 27.7 11.3Bending, kneeling} 7.3 1 2 . 1 24.5 8 . 1
Walking more than a mile} 21.7 8.4 17.9 6 . 8
Walking several blocks} 17.7 6 . 2 21.9 9.6Walking one block} 1.7 8.5 17.3 1 1 . 0
Bathing or dressing} 15.3 8.3 0 . 0 7.4‘Poor’ physical functioning concept} 25.4 1 1 . 0 24.5 9.1N A = not applicable as OR <1; reference group with body mass index * below 25 and **below 30 kg/m ; fsingle items o f physical functioning concept; %<66.1% standardised scores.
311

£ . 45 I 40 J 35«+H
S 30
II 20<s 15
I 10" scsj J
I 0
SmokersDifference between smokers and non-smokers: <0 . 0 0 1
I Non-smokers
MEN
<25 25-30 >30
a Body mass index (kg/m^)
60 Difference between smokers and non-smokers: < 0 . 0 0 1
Smokers50
* * $
Non-smokers40
^ 30I ^ 20
10WOMEN
0Ph<25 25-30 >30
b Body mass index (kg/m^)
Figure 6.1.1. Age adjusted prevalence of shortness of breath when walking uphill or
upstairs in smokers and non-smokers in different categories of body mass index based
on the WHO (1995) standard cut-offs, in men (a) and in women (b).
312

e
<DO
«COao
!
50
40
30
20
10
0
■ MEN
□ WOMEN
A
Oj% % ;
% %O, % % o
Figure 6.1.2. The proportions of subjects whose daily activities were affected by low
back pain in the past twelve months.
313

5.0
4.5
4.0
o 3.5
3.0î-( 2 5C/]
2 0
O 1.5
1.0
0.5
0.0
a
Significantly different from body mass index <25 kg/m^; <0.001
Reference
* * *
MEN
<25 25-30 >30
Body mass index (kg/m^)
4.0
3.5
3.0
2.5
2.0
1.5
1.0
0.5
0.0
Significantly different from body mass Index <25 kg/m^; **P <0.01, ***P <0.001
Reference ■-----
WOMEN
<25 25-30 >30
Body mass index (kg/m^)
Figure 6.1.3. Odds ratios for poor physical functioning (standardised scores <66.7%) in
men (a) and women (b) in different categories of body mass index based on the standard
WHO (1995) cut-offs. Odds ratios adjusted for age, lifestyle and demographic factors.
314

Appendix 6.1.1. Age, lifestyle and demographic factors as possible confounders
considered in analysis of the associations of symptoms of clnonic disease and impaired
quality of life with body mass index.
Reference group Dummy variables ' 1
1 2 3 1
Age (years)^’*’’ ’ ’ 20-29 30-39 40-49 50-59
Smoking"^'"’*'’''’" Non-smokers Ex-smokers Current smokers
Alcohol consumption (glasses/day)^’'’’‘’®
Occasional(< 1 )
None(0 )
Moderate (1 to <3)
Heavy(>3)
Physical activity Active (do sport)
Inactive (do no sport)
Educational level Level 3(higher vocational or university)
Level 2 Level 1 (vocational or (lower than
higher secondary) secondary)
Marital status^ Single Married or cohabiting
Divorced or widowed
Employment'^ Currentlyemployed
Unemployed Housewives Retiredearly
Householdcomposition*^
Living with someone
Living with no one
Intimate contactf^ No one 1 - 2 3-5 > 6
Parity (live births)*^ None 1 - 2 >3
diabetes, ‘ low back pain, and Equality o f life; fdiscussing personal matters with other people.
315

6.2
IMPAIRMENT OF HEALTH AND QUALITY OF LIFE FROM
ABDOMINAL FAT ACCUMULATION, USING WAIST
CIRCUMFERENCE ‘ACTION LEVEL’
This section has been submitted for publication as
Han TS. Lean MEJ, Seidell JC. Impairment of health and quality of life from
abdominal fat accumulation, using waist circumference Action Levels,
(submitted).
Collaboration with MORGEN project
316

ABSTRACT
Objective', To estimate the prevalence and risks of clii'onic disease, secondary symptoms
and poor quality of life associated with waist circumference, using standardised cut-offs.
Design'. Cross-sectional study in a random sample set in the Netherlands.
Subjects'. 5887 men and 7018 women aged 20-59 years selected from the civil registiy of
Amsterdam, Maastricht and Doetinchem.
Main outcome measures'. Symptoms of respiratory insufficiency, low back pain, non
insulin-dependent diabetes, cardiovascular risk factors, and physical functioning.
Results'. People with waist below Action Level 1 (<94 cm in men, <80 cm in women)
were considered the reference population with low prevalence of symptoms of obesity
related diseases and good subjective health. Between Action Level 1 and Action Level
2: 94-102 cm in men, 80-88 cm in women), the prevalence of these all increase, and
above Action Level 2 (>102 cm in men, > 8 8 cm in women) greatly increased. After
adjustments for age and lifestyle factors, odds ratios (95% confidence intervals) in those
with a waist above Action Level 2 were 3.1 (2.5 to 3.7) in men and 2.7 (2.3 to 3.1) in
women for shortness of breath when walking upstairs, 4.5 (2.5 to 7.8) in men and 3.8
(1.9 to 7.3) in women for non-insulin-dependent diabetes, 4.2 (3.6 to 5.0) in men and 2.8
(2.4 to 3.2) in women for at least one major cardiovascular risk factor. Both men and
women with waist above Action Level 2 were twice more likely to have difficulties in
performing a range of basic activities of daily living. Women with waist above Action
Level 2 were 1.5 times more likely to have low back pain for a total >12 weeks a year or
symptoms of intervertébral disc herniation, and significantly more of them had problems
associated with low back pain including hindrance to their daily business, absence from
work, medical consultation, and job redundancy. The calculated population attributable
risks to estimate the excess risk of ill health attributable to waist above the Action
Levels were between 10-40%.
Conclusions'. Symptoms and secondary diseases related to lai’ge waist share a huge
health cai’e expenditure, demanding major health promotion programme. The data justify
the employment of Action Levels of waist circumference for health promotion.
317

INTRODUCTION
National health burdens are aggravated by clusters of secondary symptoms associated
with overweight and adverse fat distribution, including coronary heart disease, strokes,
non-insulin dependent diabetes mellitus (NIDDM), and several cancers. Recent
estimates costs per aimum for treating this ill health were 195 million pounds in Britain
(Office of Health Economics, 1994), and 70 billion dollars in the United States (Institute
of Medicine, 1995). These figures present major concerns to the health service, since the
prevalence of overweight is still rising in many countries (Kuczmarski, 1992, Seidell
1995a; Bennett et al, 1995; Gregory et al, 1990).
From the ongoing MORGEN project (monitoring cardiovascular health in The
Netherlands), we have shown that waist circumference, body mass index and waist to
hip ratio all relate closely and similarly to a variety of symptoms of cluonic diseases
(Chapter 5). For the purpose of public health promotion. Action Levels of waist
circumference, based on body mass index and waist to hip ratio have been derived as a
simpler method of risk assessment than by attempting to combine these two rather
complex indices (Chapter 3.1; Lean et al, 1995). Waist does not need to adjusted for
height as an index of adiposity and fat distribution (Chapter 4.3; Han et al, 1997c),
although height may have separate association with health.
The present study summarised the risks of symptoms from major clironic diseases and of
poor subjective health in relation to waist circumference categories based on the
previously derived Action Levels (Chapter 3.1; Lean et al, 1995).
METHODS
Subjects
Dutch men (n = 5887) and women (% = 7018) aged 20-59 were recruited randomly from
civil registries for the ongoing MORGEN (Monitoring Risk Factors and Health in The
Netherlands) project 1993 to 1995 cohorts, from Amsterdam, Maastricht, and
Doetinchem. To obtain similar numbers of subjects at each age, the sample was
318

stratified by sex and five year age group. The response rate to invitations was about
50%. Information on quality of life was available in the 1995 cohort of 1885 men and
2156 women. The numbers of subjects in the present study represent those who attended
the health centres for biochemical and physiological measui'cments.
Measurements
All measurements and questiomiaire assessment were performed by trained paramedical
persomiel. Waist circumference was measured in duplicate at the level between the
lowest rib margin and iliac crest (WHO, 1995).
Symptoms of disease
Major symptoms and diseases associated with overweight were selected from our
previous studies (C hapter 5). Symptoms of respiratory insufficiency included shortness
of breath, wheezing, coughing and bringing up phlegm (C hapter 5.4). Risk factors for
cardiovascular disease included hypercholesterolaemia (plasma total cholesterol >6.5
mmol/1), low high density lipoprotein cholesterol (<0.9 mmol/1) and hypertension
(systolic blood pressure >160 mmHg and/or diastolic blood pressure >95 mmHg and/or
the use of antihypertensive agent) (C hapter 5.2; Han et al, 1995c). Known and newly
diagnosed (random blood glucose >11.1 mmol/1) NIDDM were included, and insulin
treated patients were excluded as indistinguishable from insulin dependent diabetes
mellitus (C hapter 5.5; Seidell et al, 1997). Symptoms of low back pain were obtained
from questionnaire. Those who responded affirmatively to having low back pain in the
past 12 months, were then asked whether they had radiating pain to the laiees or feet, to
indicate symptoms o f intervertébral disc herniation. This symptom was only accepted in
the presence of low back pain, to avoid including those with other causes of radiated
pain. The subjects were asked about the total duration of low back pain in the past 12
months. Those who had low back pain for a total of twelve weeks or more were
classified as having chronic low back pain. The reference groups for the three classes of
low back pain were composed of those who did not fulfil the criteria for the symptom
319

under analysis, thus the reference group when analysing one symptom included some
subjects with other symptom(s) of low back pain (Chapter 5.3; Han et al, 1997d). From
ten items rated by subjects using the standardised Dutch RAND-36 questionnaire, which
has been adapted from the standardised SF-36 Health Survey the concept of physical
functioning, was calculated to represent quality of life. Distributions of standardised
scores were examined from the plots (not shown) to determine arbitrary cut-offs for the
health concepts. It was decided arbitrarily that subjects with less than 66.7% o f the
standardised score would be classified as having a 'poor ’ health concept, and those with
66.7% or above were considered as having a 'good’ health concept. This cut-off
classified 8.4% of all men and 10.8% of all women as having ‘poor’ physical
functioning. Each of the ten items comprising the physical functioning health concept
was arbitrarily dichotomised such that scores above average (with an odd numbered
scale of 3 or 5 points) were considered as 'good’ health, and average or lower scores
were classed as 'poor ’ health. For items with even scale (2, 4 or 6 points), the scores for
'good’ health and 'poor ’ health were evenly divided (C hapter 5.6).
Lifestyle and demographic factors as confounding factors
Dummy variables (Appendix 6.2.1) for possible confounding factors were created to
adjust for the associations between adiposity and health concepts and individual items.
Statistical methods
Statistical analyses were performed using SAS version 6.1 (Cary, USA). Logistic
regression analysis was used to estimate the odds ratios and 95% confidence intervals of
symptoms of disease and ‘poor’ quality of life in those with waist circumference in the
categories o f between ‘Action Level 1 and Action Level 2 (94-102 cm in men and 80-88
cm in women) or above Action Level 2 (>102 cm in men and > 8 8 cm in women),
compaied to those with waist below Action Level 1 (<94 cm in men and <80 cm in
women), adjusted for age, lifestyle and demographic factors (Appendix 6.2.1).
320

Population attributable risks
The population attributable risk, i.e. the proportionate excess risk o f ill health associated
with exposure to the risk of large waist based the waist circumference Action Level 1
cut-off (PAR^li) was calculated as (Kahn and Sempos, 1989; Kleinbaum et al, 1982):
P A P - a l i P a l i ^ ( O R a l i " I V P a l i ^ ( C I R a l i " 1 ) ] ^ L
where P^li is the proportion of subjects exposed to the risk of large waist circumferenee,
i.e. all subjects with waist above Action Level 1, OR^^i is the age and lifestyle adjusted
odds ratio for a symptom or disease in subject group with waist above Aetion Level 1
compared to the reference group with waist below Action Level 1. Population
attributable risk using waist circumference cut-off at Action Level 2 (PARal2 ) was
calculated the same way, with the proportion of subjects exposed to waist above Action
Level 2, and the odds ratios for a disease in subjects with waist above Aetion Level 2
compared to the reference group with waist below Action Level 2. The difference
between PARali and PARal2 gives PARali-al2 for waist circumference between Action
Levels 1 and 2. This equation is valid only when the odds ratio is equal or greater than 1.
RESULTS
Characteristics of all subjects studied from 1993 to 1995 are shown in Table 6.2.1. The
characteristics were similar each year’s cohort and are described elsewhere (Chapter 5).
The number of subjects and the overall prevalence for each symptom studied are
presented in Table 6.2.2. The prevalence of symptoms and ‘poor’ quality of life rose
with increasing waist circumference (Table 6.2.3). After adjustments for age and
appropriate lifestyle factors, compared to those with waist below Aetion Level 1, those
with waist above Action Level 2 were several times more likely to be at risk of poor
health (Tables 6.2.4a & b).
Figures 6.2.1a & b show that within separate groups of non-smokers and smokers, the
prevalence of those with shortness of breath when walking uphill or upstairs increased
with increasing BMI, and significantly {P <0.001) higher in smokers for each level of
321

waist circumference. Figure 6.2.2 shows the proportions of subjects whose daily life
activities were affected by low back pain. About a third of men and women reported
that, due to low back pain, their daily business was hindered, they had to be absent from
work, and more than foidy percent sought medical consultation as a result of low baek
pain. Table 6.2.5 shows that after adjustments for age and lifestyle factors, the
proportions of these consequences of low back pain were significantly higher in women
with waist circumference above Action Level 2 compared to women below Action Level
1. The proportion of job redundancy due to low back pain was significantly higher in
men with waist circumference above Action Level 2 compaied to men below Action
Level 1. Those with large waist circumference had lower scores for physical functioning
(Figure 6.2.3) and the odds ratios (95% confidence interval limits) for ‘poor’ physical
function health concept were two and half times higher in subjects with waist
circumference above Action Level 2 compared to those below Action Level 1.
Tables 6.2.6 a & b show the proportions of subjects ‘exposed’ to large waist, with waist
above Action Level 1 or Action Level 2, and the odds ratios for ill health. These values
were used to calculate the population attributable risks for symptoms of disease and
‘poor’ quality of life in those with waist circumference above Action Level 1 or above
Action Level 2. The difference in population attributable risks between categories above
Action Level 1 and above Action Level 2 is the population attributable risks for those
with a waist circumference in between the two Action Levels.
Tables 6.2.6 a & b show the proportions of subjects ‘exposed’ to large waist, with waist
circumference above Action Level 1 or Action Level 2, and the odds ratios for ill health.
These values were used to calculate the population attributable risks for symptoms of
disease and ‘poor’ quality of life in those with waist above Action Level 1 or Action
Level 2. Table 6.2.7 shows that the excess proportions of subjects with poor health
attributable to large waist (above Action Level 1) were approximately 10 to 40 percent.
The difference in population attributable risks from categories of waist circumference
Action Levels 1 and 2 is the population attributable risk for those with a waist between
322

Action Level 1 to Action Level 2. This difference of population attributable risk was as
high as the values for category above Action Level 2.
DISCUSSION
Body mass index has become the conventional index for classifying adiposity (WHO,
1995), and we have analysed the present data set using conventional BMI cut-offs
(Chapter 6.1). On the other hand, BMI is not a perfect index, since it still has some
relationship with height (Chapter 4.3; Han et al, 1997c) and BMI fails to take account
of fat distribution in its relationship with ill health. Waist circumference is an alternative
measure with some advantages. It is now recognised that adverse central fat distribution
has a separate impact on simiiai* health problems as overweight. The present study
examined the relationships between several chronic diseases and quality life with waist
circumference, which reflects both BMI and central fat deposition (Chapter 3.1; Lean et
al, 1995). We have already shown that those with large waist (i.e. highest tertile) are at
several times more at risk of symptoms of disease and having difficulty in perform basic
daily activities, as assessed by quality of life (Chapter 5.6).
The present study has brought together data from analyses, several health associations
and has applied standardised cut-off of waist circumference which we have previously
defined as representing Action Levels for health promotion. Using waist circumference
cut-offs, some 20% of adults exceed Action Level 2, and can be seen to need weight
management. These include 90% of those with BMI >30 kg/m^ and also those with BMI
25-30 who also have central fat distribution (Chapter 3.1; Lean et al, 1995). Chan et al
(1994) have shown that compared to men in the lowest 20% of waist circumference
(<34.5 inches), men in the top 20% of waist circumference (>40 inches) had age and
lifestyle adjusted relative risk of 11 (95% confidence interval: 6 to 19) for developing
NIDDM in a five year follow-up survey. This top quintile cut-off coincides with our
Action Level 2. Standard cut-offs based on the Action Levels allow comparisons
323

between studies, such as population attributable risks (Table 6.2.6) to highlight the
excessive costs of adverse fat distribution in different populations.
Health Economic evaluations of overweight has been hampered by lack of consistent
analyses using standai'dised criteria, and particularly criteria for the reference
population. There is an additional practical problem in the need for accurate, calibrated
equipment to measure height and weight in siu'veys. Given that waist circumference
does not vary importantly with height as an index of adiposity (Chapter 4.3; Han et al,
1997c), there are practical attractions to its use in health surveys.
In the present study, there were 24% men and 18% women with waist circumference
above Action Level 2, who clearly had increased health problems of all kinds. There was
also a significant, intermediate element of risk for those with waist circumference
between Action Level 1 and Action Level 2 for many health problems. In this regard,
waist circumference cut-offs can be seen to perform at least as well as the corresponding
BMI cut-offs (25-30, >30 kg/m^). The grades of risk are similar for waist above Action
Level 2 and BMI above 30 kg/m^ in both men and women for all the outcome measures.
On the other hand, the range Action Level 1 to Action Level 2 several significant
impairments of physical function in men, but not women whereas BMI 25-30 kg/m^ was
associated with significantly impaired physical function in women but not in men. Odds
ratios are likely to be overestimated if the prevalence is high (Lee, 1994). Thus the
results of some items of the physical functioning health concept (Tables 6.2.3a & b) in
the present study should be interpreted with caution.
It is important that those with waist circumference above Action Level 2 should be
urged to undergo screening for metabolic risks including hypertension, dislipidaemia
and particularly NIDDM. It is a common knowledge that most people who have
NIDDM are unaware of it (Harris et al, 1992), even with complications (UKPDS Group,
1990). Table 6.2.7 shows the population attributable risks based on waist circumference
324

Action Level 1 and Action Level 2, providing standard values for estimating excess
costs of ill health due to overweight.
CONCLUSIONS
There is no strong a priori reason to prefer BMI or waist circumference for categorising
adiposity or predict preventable ill health. There are some minor differences in the
patterns of disease and symptoms associated with intermediate categories of BMI or
waist circumference, but above Action Level 2 or BMI 30 kg/m^, a wide range of
problems will have developed in a large population of adults. The greater number above
Action Level 2 (20% of adults) than above BMI 30 kg/m^ (15%) reflects those with
central fat distribution which BMI still in the range 25-30 kg/m^. The aims o f health
promotion and of effective long term treatment should be to prevent progression into the
highest categories, very substantial reductions in health care costs and social costs are
likely if that is achieved.
325

Table 6.2.1. Characteristics of 5887 men and 7018 women.
Men Women
Mean SD Range Mean SD Range
Age (years) 42.9 10.7 20.3-60.0 42.2 1 1 . 0 20.2-59.9
Weight (kg) 82.0 1 2 . 0 44.4-157.0 68.5 11.5 36.6-153.0
Height (cm) 178.4 7.3 152.0-210.0 165.7 6.7 134.5-190.0
Body mass index (kgW ) 25.8 3.5 15.7-50.1 25.0 4.2 14.9-58.3
Waist circumference (cm) 92.3 1 0 . 8 64.0-155.0 81.0 1 1 . 1 56.5-150.0
Hip circumference (cm) 1 0 1 . 8 6 . 6 69.0-150.0 1 0 2 . 2 8.4 76.4-165.0
Waist to hip ratio 0.905 0.072 0.621-1.369 0.791 0.070 0.567-1.302
326

Table 6.2.2. Unadjusted prevalence in total population of 5887 men and 7018 women
(1885 men and 2156 women had information on quality of life) with chronic disease,
symptoms and poor quality of life.
Men% 95% Cl
Women% 95% Cl
Respiratory symptomsWheezing when not having a cold 9.2 8.5, 10.0 8.4 7.7, 9.2Woken up by shortness o f breath 5.0 4.4, 5.6 6 . 1 5.5, 6.7Coughing for more than 3 months 7.7 7.0, 8.4 7.5 6 .8 , 8 . 2
Bring up phlegm for more than 3 months 6 . 8 6.2, 7.5 5.0 4.3, 5.6Shortness of breath when walking uphill/stairs 16.0 15.1, 17.0 24.7 23.7, 25.6Shortness of breath when walking with others 4.6 4.0, 5.1 7.4 6.9, 7.9
Cardiovascular risk factorsHigh total cholesterol (>6.5 rmnol/1) 14.6 13.7, 15.5 13.5 12.7, 14.3Low HDL-cholesterol (<0.9 mmol/1) 21.3 20.3, 22.3 5.1 4.6, 5.6Hypertension* 10.3 9.5, 11.1 8.3 7.7, 8.9At least one risk factor 38.0 36.8,39.2 23.5 22.5, 24.5
DiabetesNon-insulin dependent diabetes mellitus 1 . 6 1.3, 1.9 0.9 0.7, 1.2
Symptoms o f low back painChr onic low back pain (total >12 weeks/year) 16.6 15.6, 17.6 20.5 19.6,21.4Symptoms of intervertébral disc hermiation 13.4 12.5, 14.3 17.6 16.7, 18.4
'Poor ’ quality o f life Difficulties in physical functioningVigorous activitiest 50.1 47.8, 52.4 54.0 51.7, 56.3Moderate activities f 13.7 12.1, 15.3 24.1 22.5, 25.7Lifting/canying groceriesj' 17.5 15.8, 19.3 32.6 30.8, 34.3Walking several flights of stairsf 15.8 14.1, 17.4 2 2 . 2 20.5,23.9Walking one flight of stairs')' 6.4 5.2, 7.5 8.9 7.8, 10.0Bending, kneeling')' 25.4 23.4, 27.4 28.2 26.2, 30.2Walking more than a mile')' 15.2 13.5, 16.8 18.4 16.7, 20.0Walking several blocks')' 8 . 0 6 .8 , 9.3 9.4 8.2, 10.7Walking one blockf 5.5 4.4, 6.5 6.5 5.4, 7.5Bathing or dressing')' 4.0 3.1, 4.9 3.1 2.2, 4.0‘Poor’ physical frinctioning concept:); 8.4 7.2, 9.7 1 0 . 8 9.5, 12.0* Systolic >160 or diastolic blood pressure >95 mmHg or medication for hypertension; { single items of
physical functioning concept; :):<66.7% standardised scores.
327

Table 6.2.3a. Unadjusted prevalence of subjects with clironic disease, symptoms and
poor quality of life in categories of waist circumference Action Levels, in men.
Men Waist circumference (cm)<94 94-102 > 1 0 2 X
Proportions of subjects (18.0)Respiratory symptoms
Wheezing when not having a cold 8.5 9.1 11.9 11.3**Woken up by shortness of breath 4.3 5.7 6.4 9.6**Coughing for more than 3 months 7.2 8 . 2 8 . 8 3.4Bring up phlegm for more than 3 months 6.3 7.2 8 . 0 4.1Shortness of breath when walking uphill/stairs 10.4 17.1 31.5 261***Shortness of breath when walking with others 2 . 8 4.7 1 0 . 0 97.1***
Cardiovascular risk factorsHigh total cholesterol (>6.5 mmol/1) 9.5 18.0 26.4 202.5***Low HDL-cholesterol (<0.9 mmol/1) 15.3 26.5 33.5 192.1***Hypertension! 4.7 12.3 25.3 382.8***At least one risk factor 26.0 47.4 64.2 571.4***
DiabetesNon-insulin dependent diabetes mellitus 0 . 6 1 . 8 4.5 82.8***
Low back painChi'onic low back pain (total >12 weeks/year) 14.1 19.5 2 1 . 1 39.8***Symptom of intervertébral disc hermiation 1 1 . 1 16.5 16.5 37.3***
'Poor ’ quality o f life Difficulties in physical functioningVigorous activities:): 42.2 59.9 62.6 66.4***Moderate activities:): 1 0 . 2 16.3 21.3 30.7***Lift/carry groceries{ 13.7 2 0 . 2 2 & 2 31.3***Walking several flights of stairsj 10.4 17.9 29.9 77.6***Walking one flight of stairs J 4.7 5.7 1 2 . 6 28.8***Bending, kneeling:}: 18.7 28.6 42.5 82.1***Walking more than a mile:): 1 0 . 8 18.1 25.0 45.8***Walking several blocks:): 4.9 9.3 16.1 46.0***Walking one block:): 3.8 5.2 10.9 25.8***Bathing or dressing:): 2.7 4.1 8 . 1 19.2***‘Poor’ physical functioning § 4.8 1 0 . 2 17.5 57.4***
<0.001, **/* <0.01, *P <0.05; fsystolic >160 or diastolic blood pressure >95 mmHg or medication
for hypertension; :|:single items of physical functioning concept; §<66.7% standardised scores.
328

Table 6.2,3b. Unadjusted prevalence of subjects with cluonic disease, symptoms and
poor quality of life in categories of waist circumference Action Levels, in women.
Women Waist circumference (cm)<80 80-88 > 8 8 X
Proportions of subjects (2 ^ . 0 (23.9)Respiratory symptoms
Wheezing when not having a cold 7.1 8.5 11.3 27.2***Woken up by shortness of breath 4.8 6.9 8 . 2 25.8***Coughing for more than 3 months 6.3 7.5 10.3 27.2***Bring up phlegm for more than 3 months 4.3 4.4 6.9 18.0***Shortness of breath when walking uphill/stairs 17.4 25.5 39.4 300***Shortness of breath when walking with others 4.5 7.9 14.6 166***
Cardiovascular risk factorsHigh total cholesterol (>6.5 nunol/1) 8 . 0 16.6 22.4 222.7***Low HDL-cholesterol (<0.9 mmol/1) 3.2 4.4 9.9 108.7***Hypertension! 3.2 7.6 19.9 414.8***At least one risk factor 13.6 26.0 42.5 540.7***
DiabetesNon-insulin dependent diabetes mellitus 0.4 0.5 2.7 y2
Low back painChronic low back pain (total >12 weeks/yeai’) 16.5 2 2 . 8 26.9 83.3***Symptom of intervertébral disc hermiation 14.4 18.0 24.1
'Poor ’ quality o f life Difficulties in physical functioningVigorous activities! 46.9 55.2 6 8 . 8 6 8 .8 ***Moderate activities! 17.6 24.9 37.8 79.8***Lift/carry groceries! 25.2 33.5 48.0 83.5***Walking several flights of stairs! 16.2 223 35.7 78.1***Walking one flight of stairs! 5.6 8.4 16.8 54.7***Bending, loieeling! 19.6 28.3 47.4 135***Walking more than a mile! 14.0 18.9 27.7 44 5 * * *Walking several blocks! 6.9 8 . 2 16.2 36.8***Walking one block! 4.8 5.4 1 1 . 1 24.5***Bathing or dressing! 2 . 8 3.0 3.9 1.5‘Poor’ physical functioning § 7.1 1 0 . 0 19.7 59.1******/> <0.001, <0.01, <0.05; fsystolic >160 or diastolic blood pressure >95 mmHg or medication
for hypertension; ;j:single items o f physical functioning concept; §<66.7% standardised scores.
329

Table 6.2.4a. Odds ratios for cluonic disease, symptoms and poor quality o f life in
categories of waist Action Levels, adjusted for age and lifestyle factors (see Appendix
6.2.1), in men.
Men Waist circumference94-102 > 1 0 2
ORt 95% Cl ORt 95% Cl
1 . 1 0 0.88, 1.40 1.42** 1 . 1 1 , 1.801 . 2 2 0.91, 1.64 1.29 0.94, 1.771.14 0.89, 1.45 1 . 1 1 0.85, 1.451.07 0.83, 1.38 1 . 1 0 0.83, 1.461.50*** 1.24, 1.81 3.05*** 2.53, 3.671.37 0.98, 1.91 2.67*** 1.96, 3.64
Respiratory symptoms Wheezing when not having a cold Woken up by shortness of breath Coughing for more than 3 months Bring up phlegm for more than 3 months Shortness of breath when walking uphill/stairs Shortness o f breath when walking with others
Cardiovascular risk factorsHigh total cholesterol (>6.5 mmol/1) 1.55*** 1.28, 1 . 8 6 2.35*** 1.94,2.85Low HDL-cholesterol (<0.9 mmol/1) 2.29*** 1.95, 2.70 3.28*** 2.75,3.92Hypertension! 2 .0 0 *** 1.59, 2.52 4.29*** 3.43, 5.36At least one risk factor 2.24*** 1.95,2.57 4.23*** 3.61,4.95
DiabetesNon-insulin dependent diabetes mellitus 2.04* 1.11,3.76 q 45*** 2.54, 7.79
Low back painChronic low back pain (total >12 weeks/year) 1.16 0.97, 1.37 1.17 0.97,1.41Symptom of intervertébral dise hermiation 1 .2 2 * 1.01, 1.37 1 . 1 2 0.91,1.37 ,
'Poor ’ quality o f lifeDifficulties in physical functioningVigorous activities § 1.59*** 1.25,2.03 1.59*** 1.21,2.09Moderate activities § 1.34 0.95, 1.90 1.57* 1.09,2.26Lift/carry groceries § 1 . 2 0 0.88, 1.65 1.46* 1.05,2.03Walking several flights of stairs § 1.47* 1.05,2.06 2.60*** 1.85,3.63Walking one flight of stairs § 0 . 8 8 0.51, 1.49 1.82* 1.23,2.94Bending, kneeling§ 1.31* 1.00, 1.73 2.26*** 1.69,3.01Walking more than a mile§ 1 67** 1.20,2.32 2.28*** 1.62,3.22Walking several blocks § 1.62* 1.03,2.56 2.63*** 1.69,4.11 ;Walking one block § 1.18 0.67, 2.06 2.31** 1.38,3.86Bathing or dressing§ 1.24 0.66, 2.33 2 .2 1 ** 1.23,3.99‘Poor’ physical functioning# 1.75* 1.10,2.78 2.78*** 1.77,4.38
<0.001, <0.01, *P <0.05; fodds ratio with reference to waist circumference <94 cm (belowAction Level 1); Jsystolic >160 or diastolic blood pressure >95 mmHg or medication for hypertension;§single items of physical functioning concept; #<66.7% standardised scores.
330

Table 6.2.4b. Odds ratios for chi'onic disease, symptoms and poor quality of life in
categories o f waist circumference Action Levels, adjusted for age and lifestyle factors,
in women (see Appendix 6.2.1).
Women Waist circumference Action Levels80-88 >88
ORt 95% Cl ORt 95% ClRespiratory symptoms
Wheezing when not having a cold Woken up by shortness of breath Coughing for more than 3 months Bring up phlegm for more than 3 months Shortness of breath when walking uphill/stairs Shortness of breath when walking with others
Cardiovascular risk factors High total cholesterol (>6.5 mmol/1)Low HDL-cholesterol (<0.9 mmol/1)HypertensionJAt least one risk factor
DiabetesNon-insulin dependent diabetes mellitus
Low back pain Chronic low back pain (total >12 weeks/year) Symptom of intervertébral disc hermiation
‘Poor ’ quality o f life Difficulties in physical functioning Vigorous activities §Moderate activities §Lift/carry groceries §Walking several flights of stairs §Walking one flight of stairs§Bending, kneeling §Walking more than a mile§Walking several blocks§Walking one block§Bathing or dressing§‘Poor’ physical functioning#
1 .2 3 0 .9 9 , 1 .5 3 1 .6 4 * * * 1 .3 2 , 2 .0 4
1 .4 7 * * 1 .1 4 , 2 .1 5 1 .6 7 * * * 1 .3 0 , 2 .1 5
1 .1 9 0 .9 4 , 1 .5 0 1 .5 6 * * * 1 .2 4 , 1 .9 7
0 .9 7 0 .7 2 , 1 ,3 0 1 .4 6 * * 1 .1 1 , 1 .9 2
1 .5 2 * * * 1 .3 1 , 1 .7 5 2 .6 7 * * * 2 .3 2 , 3 .0 9
1 .6 2 * * * 1 .2 7 , 2 .0 6 2 .8 2 * * * 2 .2 5 , 3 .5 3
1 .5 3 * * * 1 .2 7 , 1 .8 4 1 .7 5 * 1 . 4 6 , 2 . 1 0
1 .4 6 * 1 .0 7 , 1 .9 8 3 .3 4 * * * 2 .5 4 , 4 .4 0
1 .5 7 * * * 1 . 2 1 , 2 . 0 5 3 .9 1 * * * 3 .1 0 , 4 .9 4
1 .5 9 * * * 1 .3 7 , 1 .8 6 2 .7 7 * * * 2 . 3 8 , 3 . 2 1
0 .8 4 0 .3 4 , 2 .0 5 3 .7 6 * * * 1 .9 4 , 7 .3 1
1 .2 6 * * * 1 .0 9 , 1 .4 7 1 .4 1 * * * 1 .2 1 , 1 .6 4
1 .0 9 0 .9 3 , 1 .2 7 1 .4 1 * * * 1 .2 0 , 1 .6 5
1 .1 4 0 .9 1 , 1 .4 3 j y y * * * 1 .3 9 , 2 .2 6
1 .1 8 0 .9 0 , 1 .5 6 1 .7 6 * * * 1 . 3 5 , 2 . 3 0
1 .0 8 0 .8 4 , 1 .3 9 1 .5 4 * * * 1 .2 1 , 1 .9 8
1 .2 3 0 .9 3 , 1 .6 3 2 .0 0 * * * 1 . 5 3 , 2 . 6 2
1 .1 9 0 .7 8 , 1 .8 2 2 .0 3 * * * 1 .3 9 , 2 .9 6
1 .2 9 * 1 .0 0 , 1 .6 8 2 .4 3 * * * 1 . 8 9 , 3 . 1 2
1 .3 1 0 .9 8 , 1 .7 6 1 .8 4 * * * 1 .3 8 , 2 .4 5
1 .0 5 0 .7 0 , 1 .5 9 1 .3 2 , 2 .7 5
0 .9 0 0 .5 5 , 1 .4 8 1 .5 4 * 1 .0 0 , 2 .3 8
0 .9 1 0 .4 7 , 1 .7 6 0 .9 7 0 .5 1 , 1 .8 4
1 .1 7 0 .7 9 , 1 .7 4 2 .1 0 * * * 1 . 4 8 , 3 . 0 0
<0.001, <0.01, *P <0.05; fodds ratio with reference to waist circumference <94 cm (belowAction Level 1); f systolic >160 or diastolic blood pressure >95 inmHg or medication for hypertension;§single items of physical functioning concept; #<66.7% standardised scores.
331

Table 6.2.5. Proportions of subjects whose daily life were affected due to low back pain
in the past twelve months {n ~ 2467 men, 3448 women) in different categories of waist
circumference Action Levels, adjusted for age, smoking, and education.
Men Women
Waist circumference (cm) Waist circumference (cm)
<94 94-102 > 1 0 2 <80 80-88 > 8 8 ;
Proportions (%)f (56.6) (24.6) (18,8) (48.8) (25.1) (26.1)
Daily business hindered 28.0 27.4 32.0 25.9 26.8 32.0**
Absence from work 23.8 218 25.3 19.4 21.4 25.0*
Medical consultation 38.6 43.6* 40.6 39.7 41.7 46.3** f
Job redundancy 1 0 . 6 1 2 . 0 16.8** 7.4 8 . 6 1 1 .8 **
Job modification 8 . 2 7.4 1 0 . 8 7.2 6 . 6 6 . 2
Difference from waist <94 cm in men or <80 cm in women; <0.01, ^P <0.05; i'proportions o f
subjects in each waist circumference category.
332

Table 6.2.6a. Odds ratios of symptoms of chronic diseases and poor subjective health in
different categories of waist circumference Action Levels in men, adjusted for age and
lifestyle factors (see Appendix 6.2.1).
Waist circumference>94 (Action Level 1) >102 (Action Level 2)ORt 95% Cl O R tt 95% Cl
Respiratory symptoms P = 0.421$ P = 0.180$Wheezing when not having a cold 1.24* 1.02, 1.50 1.36** 1.09, 1.70Woken up by shortness of breath 1.25 0.97, 1.61 1.18 0.89, 1.56Coughing for more than 3 months 1 . 2 1 0.91, 1.39 1.06 0.82, 1.36Bring up phlegm for more than 3 months 1.08 0.87, 1.35 1.08 0.83, 1.40Shortness of breath when walking uphill/stairs 2.09*** 1.79, 2.45 2.57*** 2.18,3.04Shortness of breath when walking with others 1.92*** 1.46, 2.54 2.33*** 1.79,3.05
Cardiovacular risk factors P = 0.421$ P = 0.180$High total cholesterol 1 ,8 6 *** 1.59, 2.19 1.64,2.31Low HDL-cholesterol 2 .6 6 *** 2.31,3.07 2.31*** 1.97,2.71Hypertension 2.89*** 2.37, 3.52 3.08*** 2.56, 3.71At least one risk factor 2.89*** 2.56, 3.25 3.06*** 2.65, 3.54
Diabetes P = 0.421$ P = 0.180$Non-insulin dependent diabetes mellitus 3.10*** 1.83,5.24 3.08*** 2.00,4.72
Symptoms o f low back pain P = 0.421$ P = 0.180$Chronic low back pain (total >12 weeks/year) 1.16* 1.00, 1.35 1 . 1 0 0.93, 1.31Symptom of intervertébral disc hermiation 1.17 1.00, 1.38 1.03 0.85, 1.24
‘Poor ’ quality o f life P = 0.419$ P = 0.185$Difficulties in physical functioningVigorous activities § 1.59*** 1.29, 1.96 1.34* 1.04, 1.74Moderate activities § 1.45*** 1.08, 1.97 1.39 1.00, 1.94Lifting carrying groceries§ 1.32* 1.01,1.73 1.36* 1.00, 1.84Walking several flights of stairs § 1.92*** 1.44, 2.55 2 .2 0 *** 1.63,2.98Walking one flight of stairs § 1.29 0.84, 1.96 1.92** 1.25,2.95Bending, kneeling§ 1 .6 8 *** 1.33,2.12 2.03*** 1.56, 2.64Walking more than a mile§ 1.91*** 1.44,2.54 1.84*** 1.35,2.50Walking several blocks§ 2.05*** 1.39,3.01 2 .1 2 *** 1.44,3.13Walking one block§ 1 .6 6 * 1.06,2.61 2.16*** 1.37,3.14Bathing or dressing§ 1 . 6 6 0.99, 2.78 2 .0 2 *** 1.20,3.39‘Poor’ physical functioning^ 2.19*** 1.48,3.25 2.15*** 1.46,3.18***p <0.001, **P <0.01, *P <0.05; odds ratio with reference to waist fbelow Action Level 1 (<94 cm)and tfbelow Action Level 2 (<102 cm); JP = proportion of subjects ‘exposed’ to the risk of large waistaccording to Action Levels; §single items of physical functioning concept; ^standardised scores <66.7%.
333

Table 6.2.6b. Odds ratios o f symptoms of chronic diseases and poor subjective health in
different categories of waist circumference Action Levels in women , adjusted for age
and lifestyle factors (see Appendix 6.2.1).
Waist circumference Action Levels>80 (Action Level 1) ORt 95% Cl
> 8 8 (Action Level 2) O R tt 95% Cl
Respiratory symptoms P = 0.483$ p = 0.239$Wheezing when not having a cold 1.41*** 1.17, 1.70 1.51*** 1.24, 1.84Woken up by shortness of breath 1.56*** 1.26, 1.94 1.41** 1.13, 1.77Coughing for more than 3 months 1.36** 1 . 1 2 , 1 . 6 6 1.46*** 1.18, 1.79Bring up phlegm for more than 3 months 1 .2 0 *** 0.95, 1.52 1.48** 1.15, 1.89Shortness of breath when walking uphill/stairs 199*** 1.76, 2.25 2.24*** 1.97, 2.55Shortness of breath when walking with others 2.17*** 1.77, 2.66 2.28*** 1 .8 8 , 2.76
Cardiovacular risk factors P = 0.483$ P = 0.239$High total cholesterol 1.64*** 1.39, 1.92 2 42*** 1 .2 1 , 1.67Low HDL-cholesterol 2.28*** 1.78,2.92 2 .8 6 *** 2.25, 3.62Hypertension 2 .6 6 *** 2.14,3.31 3.12*** 2.60, 3.76At least one risk factor 2 . 1 0 *** 1.85,2.39 2.24*** 1.97, 2.56
Diabetes p = 0.483$ P = 0.239$Non-insulin dependent diabetes mellitus 2.34*** 1.24, 4.43 4.07*** Z35, 7.04
Symptoms o f low back pain P = 0.483$ P =: 0.239$Clironic low back pain (total >12 weeks/year) 1.33*** 1.17,1.51 1.27*** 1 .1 2 , 1.45Symptom of intervertébral disc hermiation 1.23** 1.08, 1.41 1.36*** 1.18, 1.57
‘Poor ’ quality o f life P = 0.469$ p = 0.238$Difficulties in physical functioningVigorous activities§ 1.39*** 1.15, 1.68 1.70*** 1.35, 2.14Moderate activities§ 1.44** 1.15, 1.80 1 .6 6 *** 1.31, 2 . 1 1
Lifting carrying groceries§ 1.28* 1.04, 1.58 1.51*** 1 .2 1 , 1.90Walking several flights of stairs § 1.56*** 1.24, 1.96 1 . 8 6 1.46, 2.37Walking one flight of stairs § 1 61** 1.15,2.27 1.89*** 1.36, 2.64Bending, kneeling§ 1.43,2.19 2 .2 0 *** 1.75, 2.76Walking more than a mile§ 1.53*** 1.20, 1.95 1 .6 6 *** 1.28, 2.16Walking several blocks§ 1.46* 1.06, 2.03 1 .8 8 *** 1.35, 2.61Walking one block§ 1.23 0.83, 1.81 1.62* 1 .1 0 , 2.39Bathing or dressing§ 0.94 0.55, 1.62 1 . 0 1 0.56, 1.82‘Poor’ physical fmictioningTj 1.56** 1.15,2.16 1.97*** 1.44, 2.70
<0.001, **P <0.01, *P <0.05; odds ratio with reference to waist j'below Action Level 1 (<80 cm)and fl'below Action Level 2 (<88 cm); $P = proportion of subjects ‘exposed’ to the risk o f large waistaccording to Action Levels; § single items of physical functioning concept; ^standardised scores <66,7%.
334

Table 6.2.6. Population attributable risks of symptoms due to large waist circumference
111 men.
Population attributable risk (%)Men Women
>94* >1 0 2 ** >80* >8 8 **Respiratory symptoms
Wlieezing when not having a cold 9.2 6 . 1 16.5 10.9Woken up by SOB 9.5 3.1 21.3 8.9Coughing for more than 3 months 8 . 1 1 . 1 14.8 9.9Bring up phlegm for more than 3 months 3.3 1.42 8 . 8 10.3SOB when walking uphill/stairs 31.5 2 2 . 0 32.4 22.9SOB when walking with others 27.9 19.3 36.1 23.4
Cardiovacular risk factorsHigh total cholesterol 26.6 14.5 23.6 9.1Low HDL-cholesterol 41.1 19.1 38.2 30.8Hypertension 44.3 27.3 44.5 33.6At least one risk factor 44.3 27.1 34.7 22.9
DiabetesNon-insulin dependent diabetes mellitus 46.9 27.3 39.3 42.3
Symptoms o f low back painChronic low back pain (total >12 wks/yr) 6.3 1 . 8 13.8 6 . 1
Symptom of intervertébral disc hermiation 6.7 0.5 1 0 . 0 7.9
‘Poor ' quality o f life Difficulties in physical functioning'^Vigorous activities t 19.8 5.9 15.5 14.3Moderate activities^ 15.9 6.7 17.1 13.6Liftingcan-ying groceries! 1 1 . 8 6 . 2 1 1 . 6 1 0 . 8
Walking several flights of stairs! 27.8 18.2 2 0 . 8 17.0Walking one flight of stairs! 1 0 . 8 14.5 2 2 . 2 17.5Bending, kneeling! 2 2 . 2 16.0 26.5 2 2 . 2
Walking more than a mile! 27.6 13,5 41.8 28.3Walking several blocks! 30.6 17,2 17.8 17.3Walking one block! 21.7 17.7 9.7 12.9Bathing or dressing! 21.7 15.9 NA 0 . 2
‘Poor’ physical functioning! 33.3 17.5 2 0 . 8 18.8*NA, not applicable as odds ratio <1; reference group with waist circumference *below Action Level 1
(<94 cm in men, <80 cm in women) and **below Action Level 2 (<102 cm in men, < 8 8 cm in women);
'{"single items o f physical fimctioning concept; $<66.7% standardised scores.
335

^ Difference between smokerscd 3 5 - and non-smokers: <0.001
Smokers
25 -Non-smokers
15 -
MEN
94-102<94 >102
a Waist circumference (em)
Smokers1 Difference between smokers ~ and non-smokers : * * <0 . 0 0 1
"i Non-smokers
25 -
WOMEN
<80 80-88 >88
b Waist circumference (cm)
Figure 6.2.1. Age adjusted prevalence of shortness of breath when walking uphill or
upstairs in smokers and non-smokers in different categories of waist circumference
based on Action Levels (Lean et al, 1995) in men (a) and in women (b).
336

M E NT 3 4 0
□ W O M EN^ 3 0
% % %
Figure 6.2.2. The proportions of subjects whose daily activities are affected by low back
pain in the past twelve months.
P hysical functioning
I'g
C/l
1
100M E N W O M EN
< 9 4 9 4 -1 0 2 > 1 0 2 < 8 0 8 0 -8 8 > 8 8
Waist divided by Action Levels (cm)
Figure 6.2.3. Standardised scores of physical functioning concept in men and women in
different categories of waist circumference based on Action Levels (Lean et al, 1995).
337

5 .0 T
4.5 ■
4 .0 ■
o 3.5 .
cd 3 .0 ■Vh
C/l 2.5 '"O 2 .0 '
O 1.5 ’
1 .0 ’
0.5 ■
0 .0 i
a
3.5 '
3 .0 .
o 2 .5 '
cd 2 .0 .
CO" O 1.5 .
o 1 .0 •-
0 .5 '
0 .0 ^
b
Significantly d ifferent from w aist below A ction L evel 1 : * * * P <0.001
Reference
M EN
<94 94-102 >102
Waist circumference (cm)
Sign ifican tly d ifferent from w aist b elow A ction L e v e l 1: < 0.001
* * *
Reference
W OM EN
<80 80-88 > 8 8
W aist circumference (cm)
Figure 6.2.4. Odds ratios for poor physical functioning (standardised scores <66.7%) in
men (a) and women (b) in different categories of waist circumference based on Action
Levels (Lean et al, 1995). Odds ratios adjusted for age, lifestyle and demographic
factors.
338

Appendix 6,2.1. Age, lifestyle and demographic factors as possible confounders
considered in analysis of the associations of symptoms of chronic disease and impaired
quality of life with waist circumference.
Reference group Dummy variables ' :1 2 3
Age (years) ' ' ' '^ 20-29 30-39 40-49 50-59
Smoking'*’' ’"’ ’" Non-smokers Ex-smokers Current smokers
Alcohol consumption (glasses/day)^’ ’' ’
Occasional(< 1 )
None(0 )
Moderate (1 to <3)
Heavy(>3)
Physical activity Active (do sport)
Inactive (do no sport)
Educational level Level 3(higher vocational or university)
Level 2 Level 1 (vocational or (lower than
higher secondary) secondary)
Marital status^ Single Married or cohabiting
Divorced or widowed
Employment® Currentlyemployed
Unemployed Housewives Retiredearly
Householdcomposition®
Living with someone
Living with no one
Intimate contactf® No one 1 - 2 3-5 > 6
Parity (live births)® None 1 - 2 >3b 1* * 1 j
“diabetes, ‘‘low back pain, and Equality o f life; f discussing personal matters with other people.
339

CHAPTER SEVEN
WEIGHT MANAGEMENT: RELATING TO
CHANGES IN BODY MORPHOLOGY AND
CARDIOVASCULAR RISK FACTORS
11 CONTENTS OF CHAPTER SEVEN PAGES
7.1 Waist reduction and cardiovascular benefits during weight 341
management in women
340

7.1
WAIST REDUCTION AND CARDIOVASCULAR BENEFITS
DURING WEIGHT MANAGEMENT IN WOMEN
This section has been peer reviewed and has been published as
Han TS. Richmond PR, Avenell A, Lean MEJ. Waist circumference reduction
and cardiovascular benefits during weight management in women. International
Journal of Obesity 1997; 21:127-34.
Collaboration with Aberdeen Weight Loss study
341

ABSTRACTObjective'. To examine the relationship between waist circumference and cardiovascular
risk factors duiing weight loss, and to consider possible waist reduction targets for
weight management.
Design’. Single strand six month weight loss study on food based diets in 110 women
aged 18-68 years, and body mass index >25 kg/m^ set at an outpatient clinic.
Main outcome measures'. Waist circumference, weight, body mass index (BMI), total
plasma cholesterol, low (LDL) and high density lipoprotein (HDL) cholesterol,
triglyceride, and blood pressuie.
Results’. Antliropometric and metabolic measuiements improved with mean weight loss
of 4.9 (SE ±0.4) kg at tlnee months and 6.2 (SE ±0.4) kg at six months. Weight loss
closely related to waist reduction (%Weight loss = 0.85 x Waist reduction (cm) - 2.09', r
= 0.79). The proportion of subjects with waist circumference below 80 cm (Action Level
1) or above 8 8 cm (Action Level 2) were 9% and 60% at baseline, 29% and 38% at three
months and 36% and 33% at six months. Waist reduction (adjusted for age, smoking,
alcohol consumption, diet treatment and baseline dependent and independent variables)
correlated significantly with falls in total cholesterol (r = 0.31; P <0.01), LDL
cholesterol (r = 0.35; P <0.01) and diastolic blood pressure (r = 0.32; P <0.01), but not
significantly with HDL cholesterol, triglyceride or systolic blood pressure. BMI showed
similar correlations, whereas waist to hip ratio changes were not associated with changes
in any cardiovascular risk factors. Amongst those whose waist fell by >5 cm, 45 at tlnee
months and 43 at six months, there were >10% improvements in at least one risk factor
for 71% and 84% respectively. Amongst those whose waist fell by 5 to 10 cm, 40
women at three months and 30 at six months, at least one risk factor improved in 70%
and in 83% respectively.
Conclusions'. Waist reduction of 5 to 10 cm in Caucasian women, across a range of
baseline BMI 25-50 kgim or waist circumference 72-133 cm, may be used as guideline
to encourage overweight women to achieve a realistic target with a high probability of
health benefits.
342

INTRODUCTION
Obesity, a preventable disease with a huge burden of symptoms and secondary health
problems, is rising in prevalence in Britain (Gregory et al, 1990; Bennett et al, 1995).
Treatment of obesity is difficult, many people become disillusioned with their
apparently slow progress and fluctuations in body weight during slimming often in the
context of unreasonable targets. Maintaining modest weight loss may lead to more
sustained health benefits and thus a greater overall health improvement than attempting
the large weight loss required to achieve ideal body weight (Lean et al, 1990; Goldstein
et al, 1992; Dattilo et al, 1992; Atkinson et al, 1993; Williamson et al, 1995; Wadden et
al, 1996).
Waist circumference reduction is a rewarding consequence of slimming and has been
suggested as a better motivator than weight change (Egger et al, 1995). We have
recently proposed the use o f waist circumference for health promotion as a simple
method for detecting overweight (body mass index) and central fat distribution (waist to
hip ratio) (Chapter 4.1; Lean et al, 1995) , and for identifying people with
cardiovascular risk factors (Chapter 5.2; Han et al, 1995c; Chapter 4.2; Han et al,
1996c). People with waist circumference between Action Level 1 and Action Level 2,
(the ‘Alert Zone’, >94-102 cm in men, >80-88 cm in women) have increased
cardiovascular risks, and above Action Level 2 (the ‘Action Zone’, >102 cm in men, > 8 8
cm in women), the cardiovascular risks are approximately tripled (Chapter 5.2; Han et
al, 1995c).
The present study examined the relationships between anthropometric measurements
and cardiovascular risk factors during six months of weight loss, and considered
possible targets for weight management based on changes in waist circumference.
343

METHODS
Subjects and dietary advice
Women aged 18 to 6 8 years, body mass index >25 kg/m^, free from active disease or
drugs known to affect body weight, were recruited for a study of six month weight
management. Two 1200 kcal/day diets were randomly allocated, after pilot studies to
determine acceptability, containing 58% energy {n = 57) or 35% energy from
carbohydrate {n = 53). Dietary advice, given by the same dietitian (PR), employed food
exchanges supported by appropriate recipes.
Anthropometry
Body weight was measiued to the nearest 0.1 kg in light clothes and height to the nearest
0.1 cm. Body mass index was calculated as weight (kg) divided by height squared (m^).
Waist circumference midway between the lowest rib margin and the iliac crest and hip
circumference level with the greater trochanters were measured to the nearest mm
(Chapter 3.1; Lean et al, 1996; World Health Organisation, 1989). Body fat (as % body
weight) was calculated from waist circumference (Chapter 3.1; Lean et al, 1996),
Skinfold thicknesses were measured (Duinin and Womersley, 1974) but gave identical
results for body fat, as calculated from waist, so data are not presented.
Risk factor measurements
Total plasma cholesterol, high density lipoprotein cholesterol, and triglyceride were
measured using standard laboratory methods, and low density lipoprotein cholesterol
was calculated (Fiedewald et al, 1972). Systolic and diastolic blood pressures (first and
fouidh Korotkoff sounds) were recorded with subjects lying and rested five minutes.
Information on alcohol consumption (units/week) and smoking (cigarettes per day) were
assessed by questiomiaire.
Statistical methods
Subjects were categorised into tlnee groups according to the previously defined cut-offs
o f waist circumference for women: below Action Level 1 (<80 cm), between Action
344

Level 1 and Action Level 2 (>80-88 cm), and above Action Level 2 ( > 8 8 cm) (C hapter
4.1; Lean et al, 1995). Improvements in risk factors were defined as >10%. Cross
tabulation was used to determine the proportions of subjects who improved risk factors
tlnough waist reduction, and to test (Chi square) the differences in improvements
according to waist circumference.
RESULTSSeventeen percent (« = 19) of recruits dropped out before three months and 25.5% (M =
28) by six months. The dropouts were 13 years younger {P <0.001) than those who
continued. There were no significant differences in body mass index (P = 0.24 at tlnee
months and P = 0.38 at six months) or in waist circumference (P = 0.18 at three months
and P = 0.25 at six months) between the two diet groups (high carbohydrate or low
carbohydrate). The numbers and ages o f dropouts were not significantly different
between the two diet groups tlnoughout the study. Baseline measurements and changes
in anthropometry and cardiovascular risk factors were not significantly different
between the two diet groups at three months (Table 7.1.1) or at six months (Table
7.1.2), so all 110 women were analysed together to examine the relationships between
changes in antlrropometry and changes in cardiovascular risk factors. Characteristics of
all 110 women are shown in Table 7.1.3.
Anthr opometric rneasrrrernents followed similar patterns with 60-70% of total decreases
within the first three months, with associated improvements in blood lipid. At six
months, total cholesterol and triglyceride remained significantly below the baseline
values, but high density lipoprotein cholesterol retrrrned to the baseline value. Low
density lipoprotein cholesterol and blood pressures did not change significantly (Table
7.1.4).
At thr'ee months of weight management, the proportion of women with waist
circmnferences in the ‘Action Zone’ ( > 8 8 cm) was reduced from 59.6 to 38.2% of the
345

sample, and those with waist below Action Level 1 (<80 cm) increased from 9.2 to
29.2%. By six months, women with baseline waist > 8 8 cm decreased to 33.3%, whilst
those with waist <80 cm increased to 35.8%. The proportion of women with waist >80-
8 8 cm remained between 29-31% throughout the study (Figure 7.1.1). Amongst those
whose baseline waist was in the ‘Action Zone’, 26.0% at tlnee months and 29.8% at six
months moved into the ‘Alert Zone’, and 6 % at three months and 13% at six months fell
to below Action Level 1. Amongst those whose baseline waist was in the ‘Alert Zone’,
56.7% at tlnee months and 56.0% at six months dropped to below Action Level 1 of
waist circumference. The relationship between changes in weight and waist (Table
7.1,5) or changes in cardiovascular risk factors (Table 7.1.6) was not significantly
influenced by baseline waist circumference.
At tlnee months, decreases in total cholesterol, low density lipoprotein cholesterol and
triglyceride correlated significantly with decreases in body weight and body mass index.
At six months, decreases in total cholesterol, low density lipoprotein cholesterol, and
diastolic blood pressure correlated with body weight, body mass index and waist
circumference (Table 7.1.7). Changes in waist to hip ratio did not correlate with changes
in any of the cardiovascular risk factors throughout the study.
Changes in waist circumference related closely to changes in body weight (Figure
7.1.2). Regression analysis showed reduction in waist circumference correlated more
strongly with percentage change in body weight (r = 0.70 at three months and r = 0.75 at
six months) than with changes in the absolute amount of body weight (r = 0.63 at three
months and r = 0.68 at six months). Reduction of 5 to 10 cm of waist circumference
predicted 6.3 to 10.6% of weight loss (Equation 1). Weight loss of 5 to 10% predicted
4.7 to 8.0 cm of waist reduction (Equation 2).
Amongst women who improved risk factors by >10%, plasma triglyceride reduction
accounted for 54% at tliree months and 56% at six months. Other risk factors improved
346

by >10% for 17-27% of women at tlnee months and 27-30% at six months, and about
three quarters of all subjects improved at least one of the five risk factors considered by
>10% (Table 7.1.8). In general, amongst women with waist reductions of 5-10 cm, 70%
improved at least one risk factor by >10% at three months and 83% at six months
(Table 7.1.9). The improvements with waist reduction were similar for women with
different categories of waist circumference at baseline (data not shown).
DISCUSSION
There are currently no imiversally accepted standards or criteria defining successful
weight management. From Table 7.1.7 it can be seen that weight, body mass index and
waist circumference related to major cardiovascular risk reduction during slimming. The
results are similar to those studies of weight loss. In our free living subjects, energy
balance was restored at about 3 months in most subjects. The changes in certain
measurements reflect the independent effects of acute energy reduction and of weight
loss, for example the biphasic changes in plasma high density lipoprotein cholesterol
(Dattilo et al, 1992). Recognising the ease of measurement and motivational value, we
have focused on waist reduction using cut-offs defined in an earlier study of body mass
index and waist to hip ratio (Chapter 4.1; Lean et al, 1995). The ‘Gutbuster’
programme in Australia using waist circumference to encourage weight management in
men, with a target of 1% of waist reduction a week, showed 75% of men maintained
more than 5% of waist reduction at 2 year's (Egger et al, 1995).
Risk factor improvements of 10% probably have major long term benefits (Law et al,
1994; Verschuren, 1995). Amongst women who achieved waist reduction from 5 to 10
cm in the present study, over 80% had improved at least one risk factor by > 1 0 %, and
since weight loss was almost complete by three months, this improvement is likely to
reflect loss of weight, not acute negative energy balance. Risk factor improvements were
no greater in those who lost >7.5 or >10 cm of waist (Table 7.1.9), and did not differ
with baseline waist (Table 7.1.6). Few comparable data exist, by Andersen et al (1995)
347

found that a 5.6% reduction of body weight in overweight women improved total
cholesterol by 2 1 % and triglyceride by 19%, and these improvements in cardiovascular
risk factors were as great as in those who had achieved 11% weight loss. The same study
showed similar pattern of weight loss and waist reduction in 6 6 overweight women,
treated with a diet of 925 kcal/day for 3 months followed by 1500 kcal/day for 15
months. A 16.4% weight loss at six months was accompanied by 13 cm of waist
reduction, falls in total cholesterol and triglyceride, and high density lipoprotein
cholesterol returned to baseline value after a temporary decrease dm'ing the phase of
negative energy balance (at two months) (Anderson et al, 1995). Colman et al (1995)
found 9 kg weight loss reduced waist circumference by 7 cm in men, with waist
circumference being the strongest predictor of improved glucose tolerance.
Using Action Level derived from lai'ge population study (Chapter 4.1; Lean et al, 1995;
Chapter 5.2; Han et al, 1995c), it is proposed that those with waist circumference below
Action Level 1, who have relatively little of the intra-abdominal fat (Pouliot et al, 1994),
do not need to lose weight but should be awai'e of potential health risks when their waist
approaches this level. In the ‘Alert Zone’ (>94-102 cm in men, ^80-88 cm in women),
subjects should avoid weight gain, and some self-managed weight loss by lifestyle
modification such as increasing physical activity level (Blair, 1993; Kempen et al, 1995;
Racette et al, 1995; Wood, 1993). Patients in this ‘Alert Zone’ of waist range with
problems like non-insulin dependent diabetes mellitus, hypertension, or angina would
benefit from more active weight loss (Schuler et al, 1992; Yamanouchi et al, 1995).
Above this range, termed the ‘Action Zone’ (>102 cm in men, and > 8 8 cm in women),
professional help should be sought to achieve sustained weight loss and for risk factor
screening.
CONCLUSIONS
The present study extends the value of waist measurement into management. In
conclusion, reduction in waist circumference, weight or body mass index produces
348

beneficial effects on certain cardiovascular risk factors, whereas waist to hip ratio
reduction is less powerful predictor o f risk factor improvements. Modest weight loss
associated with 5 to 10 cm of waist reduction appears a reasonable initial target for
weight management in overweight Caucasian women irrespective of body mass index or
baseline waist circumference, and will produce beneficial effects on cardiovascular risk
factors.
349

Table 7.1.1. Changes from baseline values in anthropometric and metabolic
measurements of women who continued on the study until tlnee months on a high
carbohydrate (58% of energy) or low carbohydrate (35% of energy).
High carbohydrate diet Low carbohydrate diet
P%n M eant 95% Cl n Mean t 95% Cl
Weight (kg) 48 -5.3, -3.3 43 -5.6*** -6 .8 , -4.3 0.109
BMI (k g W ) 48 - 1 7*** -2.1,-1.3 43 -2 .2 *** -2.6,-1.7 0.104
Waist (cm) 48 -4.2*** -5.4, -3.0 41 -5.0*** -6.3,-3.8 0.331
Hips (cm) 48 -3.5*** -4.5, -2.5 41 -4.0*** -5.1,-3.0 0.503
Waist to hip ratio 48 -0.013** -0.022, -0.004 41 -0.017** -0.028, -0.006 0.512
Percent body fat§ 48 - 1 .8 *** -2.4,-1.3 41 -2 .2 *** -2.8, -1.7 0.331
Cholesterolll 46 -0.33** -0.55,-0.10 38 -0 .2 1 "' -0.43, 0.02 0.446
LDL1 43 -0.23* -0.43, -0.02 36 -0 .0 1 "' -0.20, 0.19 0.114
HDL% 43 -0.05* -0.10, -0.03 36 -0.03"' -0.10, 0.04 0.579
Triglyceride^ 44 -0.15"^ -0.32, 0.03 36 -0.28** -0.48, -0.08 0.323
SBP (mmHg) 40 -2 .0 "' -7.2, 3.2 38 -1.9"' -7.8, 4.1 0.973
DBP (mmHg) 40 -1.3"' -4.7, 2 . 2 38 -2 . 1 "' -6.4, 2.1 0.745
fPaired Mest compared to baseline: ***p <0.001; <0.01; *P <0.05; ns, not significant; :|:independent
?-test for differences between groups o f the changes in anthropometry and cardiovascular risk factors;
§percent body fat (percent o f body weight) estimated from waist circumference, adjusted for age (Lean et
al, 1996); ^unit = o f measurement = mmol/1; BMI == body mass index; LDL = low density lipoprotein
cholesterol, HDL = high density lipoprotein cholesterol; SBP = systolic blood pressure; DBP = diastolic
blood pressure.
350

Table 7.1.2. Changes from baseline values in anthi’opometric and metabolic
measurements of women who continued on the study until six months (completers) on a
high carbohydrate (58% of energy) or low carbohydrate (35% of energy).
High carbohydrate diet Low carbohydrate diet
P%n M eant 95% Cl n M eant 95% Cl
Weight (kg) 42 -5.6»** -7.1,-4.1 40 -6 .8 *** -8.4, -5.2 0.283
BMI (kg/m^) 42 -2 .2 *** -2.7,-1.6 40 -2 .6 *** -3.3, -2.0 0.257
Waist (cm) 41 -5.7*** -7.2, -4.2 40 -6.5*** -8.1,-4.9 0.470
Hips (cm) 41 -5.2*** -6 .6 , -3.8 40 -5.7*** -7.0, -4.4 0.577
Waist to hip ratio 41 -0.015** -0.026, -0.004 40 -0.019** -0.030, -0.007 0.624
Percent body fat§ 41 -2.5*** -3.2,-1.9 40 -3.5, -2.2 0.470
Cholesterol^ 40 -0.34** -0.56, -0.13 37 -0 . 1 2 "' -0.42,0.17 0.233
LDLf 37 -0.17"' -0.36, 0.02 34 -0.03"' -0.29, 0.24 0.368
HDLIf 37 -0 .0 2 "' -0.08, 0.05 34 +0.05"' -0.03,0.14 0.180
Triglyceride^ 39 -0.27** -0.45,-0.10 34 -0.25* -0.44, -0.06 0.828
SBP (mmHg) 38 - 1 .1 "' -6 .6 , 4.4 36 -0.3"' -6.1, 5.6 0.836
DBP (mmHg) 38 -2.7"' -6.4, 1.1 36 -2.3"' -6.1, 1.5 0.894
tPaired Mest compared to baseline: <0.001; **P <0.01; *P <0.05; ns, not significant; ^Independent
^-test for differences between groups o f the changes in anthropometry and cardiovascular risk factors;
§Percent body fat (percent o f body weight) estimated from waist circumference, adjusted for age (Lean et
al, 1996); ^unit o f measurement = mmol/1; BMI = body mass index; LDL = low density lipoprotein
cholesterol, HDL = high density lipoprotein cholesterol; SBP = systolic blood pressure; DBP = diastolic
blood pressure.
351

Table 7.1.3. Baseline physical and metabolic characteristics of 110 women.
Mean SD Range
Age (years) 50.6 13.7 18.0-68.0
Weight (kg) 84.3 15.8 62.9-152.7
Height (m) 1.61 0.06 1.46-1.77
Body mass index (kg/m^) 32.6 5.3 24.5-49.8
Waist circumference (cm) 92.5 11.7 72.0-133.0
Hip circumference (cm) 113.6 11.7 97.5-152.5
Waist to hip ratio 0.814 0.053 0.706-0.948
Body fat (% of body weight)* 42.4 5.3 30.1-55.7
Cholesterol (mmol/1) 6.64 1.35 4.10-11.40
Low density lipoprotein (mmol/1) 4.47 1.05 2.60-7.00
High density lipoprotein (mmol/1) 1.46 0.37 0.80-2.60
Triglyceride (mmol/1) 1.48 0.85 0.40-5.50
Systolic blood pressure (mmHg) 136.2 22.5 92.0-194.0
Diastolic blood pressure (mmHg) 85.1 1 2 . 1 60.0-120.0
Mean arterial blood pressure (mmHg) 1 0 2 . 1 14.8 72.0-141.3
A ll variables were not significantly different between the two diet treatment groups. Note: Recalculations
o f body mass index found two subjects whose baseline values were below 25 kg/m^ (24.5 and 24.9);
*body fat calculated from waist circumference (Lean et al, 1996).
352

Table 7.1.4. Changes in antliropometric and metabolic measurements of women who
had 1 2 0 0 kcal/day diets from baseline to six months.
Baseline to 3 months Baseline to 6 months
n Meant 95% Cl n M eant 95% Cl
Weight (kg) 91 _4 -5.7, -4.1 82 -6 .2 *** -7.3,-5.1
BMI (kg/mh 91 -2 .2 , - 1 . 6 82 -2.4*** -2 .8 , -2 . 0
Waist (cm) 89 -4.6*** -5.4, -3.7 81 -6 . 1 *** -7.2, -5.0
Hips (cm) 89 -3.8*** -4.5, -3.0 81 -5.4* * * -6.4, -4.5
Waist to hip ratio 89 -0.015** -0 .0 2 2 , -0.008 81 -0.017** -0.024, -0.009
Percent body fatj 89 -2 .0 *** -2.4,-1.6 81 -2.7*** -3.1,-2.2
Cholesterol§ 84 -0.27** -0.43, -0.11 77 -0.24* -0.42, -0.06
LDL§ 79 -0.13 -0.27, 0.01 71 -0 . 1 0 -0.26, 0.05
HDL§ 79 -0.04* -0.08, -0 . 0 0 71 0 . 0 2 -0.03, 0.07
Triglyceride § 80 -0 .2 1 ** -0.34, -0.07 73 -0.26*** -0.39, -0.14
SBP (mmHg) 78 -1.9 -5.8, 1.9 74 -0.7 -4.6, 3,3
DBP (mmHg) 78 -1.7 -4.3, 1.0 74 -2.5 -5.1, 0.1
MAP (nrniHg) 78 - 1 . 8 -7.4, 1.6 74 -3.5 -7.9, 0.9
tPaired t-test; <0.001; **P <0.01; " P <0.05; Jbody fat (percentage o f body weight) fat calculated
from waist circumference (Lean et al, 1996); §unit o f measurement = mmol/1; LDL - low density
lipoprotein cholesterol, HDL = high density lipoprotein cholesterol; SBP = systolic blood pressure; DBP
= diastolic blood pressure; MAP = mean arterial blood pressure.
353

Table 7.1.5. Changes in waist circumference and body weight in women classified into
groups according to their Action Levels of waist circumference at baseline.
Baseline waist
(cm)*
Baseline to 3 months Baseline to 6 months
n Mean 95%CI F t P Mean 95%CI F t P
Waist reduction (cm)
<80 1 1 -3.2 -4.9,-1.5 -5.1 -7.7, -2.4
80-88 34 -4.8 -6 .1, -3.5 0.61 0.55 -6.1 -8.9, -5.4 0.26 0.78
> 8 8 65 -4.7 -5.9, -3.5 -6.3 -8.2, -4.9
Waist reduction (%)
<80 1 1 -4.1 -6.3,-1.8 -6.5 -9.9, -3.1
80-88 34 -5.7 -7.3, -4.2 0.61 0.55 -7.2 -8.9, -5.4 0.14 0.87
> 8 8 65 -4.8 -6.1,-3.5 -6.5 "8.2, -4.9
Weight loss (kg)
<80 1 1 -4.1 -5.8, -2.4 -5.3 -7.6, -2.9
80-88 34 -4.7 -5.7, -3.6 0.42 0.66 -5.9 -7.4, -4.5 0.30 0.74
> 8 8 65 -5.2 -6.4, -4.0 -6.5 -8.2, -4.9
Weight loss (Vo)
<80 1 1 -6 . 1 -8 .8 , -3.4 -7.8 -11.5, -4.1
80-88 34 -6 . 2 -7.6, -4.8 0.12 0.89 -7.7 -9.5, -5.9 0.14 0.87
> 8 8 65 -5.7 -7.3, -4.2 -7.1 -8 .8 , -5.4
* Subject groups classified according to baseline waist circumference Action Levels (Action Level 1 = 80
cm, Action Level 2 = 8 8 cm (Lean et al, 1995)); fanalysis o f variance to determine whether losses in
anthropometry were different in women whose baseline waist circumferences were in different groups
according to Action Levels.
354

Table 7.1.6. Changes in cai'diovascular risk factors in women classified into groups
according to their Action Levels of waist circumference at baseline.
Baseline waist Baseline to 3 months Baseline to 6 months(cm)*
n Mean 95%CI F f P Mean 95%CI F f PTotal cholesterol
<80 1 1 -0.33 -1.07, 0.41 -0.26 -0.73, 0.2280-88 34 -0 . 2 1 -0.45, 0.03 0.15 0.86 -0.30 -0.58, -0.03 0.14 0.87
> 8 8 65 -0.30 -0.52, -0.07 -0 . 2 0 -0.47, 0.07
<80 1 1 -0.14Low density lipoprotein cholesterol
-1.01,0.73 -0.21 -0.72,0.2980-88 34 -0.09 -0.27, 0.09 0.07 0.93 -0.16 -0.39, 0.06 0.35 0.71
> 8 8 65 -0.15 -0.34, 0.05 -0.05 -0.28,0.19
<80 1 1 -0.04High density lipoprotein cholesterol
-0.17,0.10 -0.02 -0.21,0.1680-88 34 -0.03 -0.10,0.04 0.14 0.87 0.00 -0.09, 0.08 0.43 0.65
> 8 8 65 -0.05 -0 .1 1 , 0 . 0 0 0.04Triglyceride
-0.03,0.11
<80 1 1 -0 . 2 0 -0.45, 0.05 -0 . 2 0 -0.40, 0.0080-88 34 -0.08 -0.26,0.10 0.96 0.39 -0.23 -0.36, -0.09 0.17 0.84
> 8 8 65 -0.28 -049, -0.07 -0.29 -0.50. -0.09
Systolic blood pressure
<80 1 1 -4..3 -15.6, 7.0 1.9 -9.1, 12.980-88 34 -2 . 0 -9.2, 5.1 0.11 0.90 -4.2 -11.7,3.2 0.84 0.44
> 8 8 65 -1.4 -6 .8 , 4.0 1 . 0 -4.4, 6.4
<80 1 1 -7.8 -17.6,2.1Diastolic blood pressure
-2.9 -11.0,5.280-88 34 -3.1 -7.1, 0.9 2.17 0.12 -5.1 -9.2, -0.9 1.14 0.32
> 8 8 65 0.5 -3.3,4.3 -0 . 8 -4.6, 3.0
<80 1 1 -6 . 6 -16.2, 2.9Mean arterial blood pressure
-1.3 -9 .2 ,6 . 6
80-88 34 -2.7 -7.3, 1.8 1.14 0.33 -4.8 -9.6, 0.5 1.18 0.31> 8 8 65 -0 . 2 -4.1,3.8 -0 . 2 -4.1, 3.7
* Subject groups classified according to baseline waist circumference Action Levels (Action Level 1 = 8 0 cm, Action Level 2 = 8 8 cm (Lean et al, 1995)); fanalysis o f variance to determine whether losses in cardiovascular risk factors were different in women whose baseline waist circumferences were in different groups according to Action Levels.
355

Table 7.1.7. Correlation coefficients between changes in antlnopometric measurements
and changes in risk factors adjusted for age, alcohol consumption, cigarette smoking,
diet treatments and baseline dependent and independent variables of each corresponding
pair of correlate.
Weight Body mass index Waistt Waist to hip ratio
Baseline to three months
Total cholesterol 0.365** 0.372** 0.219 -0.039
Low density lipoprotein 0.256** 0.271* 0.166 -0.073
High density lipoprotein 0.125 0.129 0.058 -0.077
Triglyceride 0.372** 0.349** 0.230* 0.126
Systolic blood pressure -0.083 -0.081 -0.067 0.080
Diastolic blood pressuie -0.075 -0.063 -0.039 0.159
Mean blood pressure -0.076 -0.068 -0.049 0.139
Baseline to six months
Total cholesterol 0.336** 0.339** 0.311** 0.183
Low density lipoprotein 0.333** 0.333** 0.347** 0.177
High density lipoprotein 0.029 0.025 0 . 0 1 1 0.042
Triglyceride 0.248* 0.251* 0.199 0 . 2 0 1
Systolic blood pressure 0.092 0.081 0 . 1 1 2 0.123
Diastolic blood pressure 0.287* 0.284* 0.319** 0.025
Mean blood pressure 0.228 0 . 2 2 0 0.259* 0.139
Significance levels: <0.01; <0.05; tbody fat (% o f body weight) calculated from waist
circumference equation (Lean et al, 1996) gave identical correlation coefficients.
356

Table 7.1.8. The percentage of women whose waist reduced by different amounts, and
those who improved cardiovasculai* risk factors by > 1 0 %, during six months of weight
management.
Improvement
criterion
At 3 months
n = 89*
%*
At 6 months
M = 81*
%:!:
Waist circumference T <5.0 cm 49.4 46.9
Waist circumference 4 >5.0 cm 50.6 53.1
Waist circumference 'i' >7.5 cm 18.0 39.5
Waist circumference 4 > 1 0 cm 5.6 16.0
Waist circumference 4 5-10 cm 44.9 37.0
Total cholesterol i > 1 0 % 27.4 28.6
Low density lipoprotein \L>io% 26.6 29.6
High density lipoprotein f > 1 0 % 16.5 26.8
Triglyceride 4/> 1 0 % 53.8 56.2
Mean blood pressure i > 1 0 % 23.1 2 1 . 6
At least one risk factor > 1 0 % 73.5 80.0
*The number o f subjects who completed the weight management programme; fpercentage o f subjects
whose waist were reduced by different amounts, and those who improved cardiovascular risk factors by
> 10%.
357

Table 7.1.9. The numbers of women who underwent waist reduction of different
amounts and who improved specific cardiovascular risk factors by >10 %, during six
months of weight management.
<5 cm >5 cm >7.5 cm >10 cm 5-10 cm
in = 44*) in = 45)* (n = 16)* {n = 5)* (n - 40)*
%t %t %t %t %t
Three months
Total cholesterol 17.1 37.2 37.5 50.0 34.2
Low density lipoprotein 15.0 38.5 33.3 33.3 38.2
High density lipoprotein 17.5 15.4 13.3 16.7 14.7
Triglyceride 53.7 53.8 73.3 83.3 50.0
Mean blood pressure 20.5 25.6 33.3 33.3 23.5
At least 1 risk factor 63.6 71.1 87.5 80.0 70.0
Six months
(M = 38)* {n = 43)*' (n ~ 32)* (%=13)* (n = 30)*
Total cholesterol 19.4 36.6 43.8 42.9 32.1
Low density lipoprotein 12.5 43.6 54.8 42.9 42.3
High density lipoprotein 31.4 28^ 25.8 35.7 23.1
Triglyceride 55.9 56.4 61.3 64.3 53.8
Mean blood pressure 11.4 30.8 27.6 16.7 35.7
At least 1 risk factor 65.8 83.7 87.5 84.6 83.3
*The number o f subjects whose waist was reduced by <5, >5, >7.5, >10, or 5-■10 cm; tthe percentage o f
subjects amongst those who improved risk factors by > 1 0 % through different amounts o f waist reduction;
improvement o f at least one risk factor in those who lost 5-10 cm did not differ from that in those who
lost >10 cm at 3 months (x^ = 0.22, P = 0.64) and at six months = 0.01, 7* = 0.92).
358

70
-£2 60CJ(U 500t/3 40CmO
300
.2 20
o 10o
Ph 0
W aist circum ference
Below Action Level 1□ Alert Zone
Action Zone
Baseline Three months Six months
Duration of weight management
Figure 7.1.1. Distribution of waist circumference at baseline, three months and six
months of weight management in women. Waist circumference: Action Level 1 = 80
cm, Alert Zone = 80-88 cm, and Action Zone >88 cm.
359

<D
Iq-40
1I
21 o Waist circumference (cm)
■ Weight (kg)° Weight (%)0
-1
■2•34
56
78
Baseline Three months Six months
Duration of weight management
Figure 7.1.2. The pattern of change in weight loss and waist circumference reduction
during six months of weight management in women. Equation I. Predicting % weight
loss from waist reduction (r = 55.0%; SEE = 3.6 %weight): % Weight loss = 0.85 (95%
confidence interval: 0.68 to 1,01) x Waist reduction (cm) - 2.09 (95% confidence
interval: -3.40 to -0.77); Equation 2. Predicting waist reduction from % weight loss (r
= 55.0%; SEE = 3.2 cm): Waist reduction (cm) = 0.66 (95% confidence interval: 0.52 to
0.79) X %Weight loss - 1.35 (95% confidence interval: -2.54 to -0.16).
360

CHAPTER EIGHT
SKELETAL STRUCTURE: BODY
DIMENSIONS IN RELATION TO METABOLIC
DISORDERS: A CROSS-SECTIONAL
SURVEY OF ADULTS
11 CONTENTS OF CHAPTER EIGHT PAGES
8.1 Skeletal proportions and metabolic disorders in adults 362
361

8.1
SKELETAL PROPORTIONS AND METABOLIC DISORDERS IN ADULTS
This section has been submitted for publication as
Han TS. Hooper J, Morrison CE, Lean MEJ. Skeletal proportions: the influences
of age and gender with metabolic disorders in adults, (submitted).
362

ABSTRACTObjective: The present study investigated the associations of stature, lower leg length
(LLL) and demi-arm span (demi-AS) with major predisposing cardiovascular risk
factors and coronary heart disease.
Study design and subjects: Cross-sectional study set at Glasgow Royal Infirmary of a
subsample of 543 men and 646 women aged 25-66 years from the random MONICA
sample.
Outcome measures: Blood pressure, plasma total cholesterol, diabetes mellitus and
coronary heait disease (angina, angioplasty, heart attack, and coronary artery bypass
graft).
Results: Results were adjusted for age, social class and smoking. Analysis of variance
showed that in men, shortness of height, LLL or demi-AS were all associated with
hypercholesterolaemia. Long LLL, high ratios of LLLiheight or LLL:demi-AS was
associated with diabetes mellitus. In women, shortness of height or LLL was associated
with coronary heart disease. High ratio of demi-AS:height or low ratio of LLL:demi-AS
was associated with coronary heart disease.
Conclusions: Short stature and limb lengths, and also altered skeletal proportions, which
may reflect interrupted early growth, are associated with several metabolic disorders.
Skeletal disproportion associates with diabetes in men and coronaiy heart disease in
women.
Key words: age, coronary heart disease, diabetes mellitus, growth, statuie, limb lengths.
363

INTRODUCTION
It has been suggested that growth failure in utero at different periods of pregnancy may
result in altered body moiphology (Barker, 1994). Early growth is clearly affected by
under feeding in experimental animals (McCance, 1968). Disproportionate growth, e.g.
longer or shorter limbs than expected for height occurs with delayed puberty (Tarmer et
al, 1971), but associations with metabolic disorders ai’e not described. Different body
proportions exist between adults of different races (Reeves et al, 1996), but improved
standards of living with adequate nutrition has brought the body proportions of Japanese
children nearer to the reference standar ds of the British (Tanner et al, 1982). Increase in
height, or specifically leg length reflects improvement in health and growth (Tamrer et
al, 1982).
The present study investigated the sex and age differences in limb lengths relative to
height and the associations of height, limb lengths and their relative proportions with
hypertension, hypercholesterolaemia, diabetes mellitus and coronaiy heart disease.
METHODS
Subjects
From the Glasgow MONICA project to monitor cardiovascular disease in the West of
Scotland (Morrison et al, 1997), a subsample of 543 men and 646 women had additional
measurements o f limb lengths.
Anthropometry
Weight to the nearest 100 g, height to the nearest 1 mm, waist circumference and hip
circumference to the nearest 1 mm were measured according to standard protocols
(WHO, 1995). Lower leg length (LLL) was measured to the nearest mm, as the distance
from the top of the patellae to the soles lying supine, and demi-arm span (demi-AS) as
the horizontal distance from the web space between middle and fourth fingers to the
midpoint of the sternal notch to the nearest mm, in sitting position.
364

Physiological and biochemical assessment
A non-fasting venous blood sample was taken to determine plasma cholesterol. Systolic
blood pressure and diastolic blood pressure, first and fifth Korotkoff sound respectively,
were measured in sitting position after 15 minute rest. Coronary heart disease and
known diabetes were assessed from questionnaire, defined as having angina and/or
angioplasty and/or coronary heart bypass graft and/or heart attack. Diabetes mellitus was
defined as having been told be doctor to have diabetes.
Statistical analyses
All analyses were performed using SPSS statistical package (Version 6.1, Chicago,
USA). Analysis of variance (simple factorial) was carried out to determine the
relationships between body lengths (independent variables) and metabolic disorders
(dependent variables) with adjustments made for age, social class and smoking as
possible confounding factors (covariâtes).
RESULTS
Table 8.1.1 shows the characteristics of subjects. Men and women had similar profiles
of age and body mass index. Men were heavier and taller, with longer limbs and higher
ratios of LLLdieight, demi-ASiheight and LLL:demi-AS than women. For a given limb
length, men had lower height than women (Figures 8.1.1a & b), and for a given LLL,
men had shorter demi-AS than women (Figure 8.1.1c).
Table 8.1.2 shows the proportions of hypertension, hypercholesterolaemia and coronary
heait disease were significantly greater with shorter height in both sexes. The
proportions of hypercholesterolaemia in men and coronary heart disease in women were
elevated in those with shorter LLL.
Analysis of variance with adjustments for age, social class and smoking (Table 8.1.3)
showed that in men, shortness of height, LLL or demi-AS were all associated with
hypercholesterolaemia. Long LLL and high ratios of LLL:height and LLL:demi-AS
365

were associated with diabetes mellitus. In women, shortness of height or LLL, high ratio
of demi-AS rheight or low ratio of LLL:demi-AS were all associated with coronary heart
disease. For a given age, there were no differences in LLL;demi-AS ratio in men with or
without coronary heart disease (Figure 8.1.2a). Women with coronary heart disease had
lower ratio of LLL:demi-AS than women of similar age with coronary heart disease
(Figure 8.1.2b). Compared to men without diabetes mellitus of similar’ age, men with
diabetes mellitus had an elevated ratio of LLL: height (Figure 8.1.3a). Women with and
without diabetes mellitus did not differ in the ratio of LLL:height (Figure 8.1.3b). There
were no associations between other ratios of limb lengths to height with metabolic
disorders in the present study.
DISCUSSION
In the present study, some body disproportions appear to relate to specific metabolic
disease differently in each sex group. Men with high ratio of LLL:height or LLL:demi-
AS (longer LLL than expected of height or demi-AS) were associated with diabetes
mellitus, and women with a high ratio of demi-AS :height or low ratio of LLL:demi-AS
(longer demi-AS than expected of height or lower LLL than expected of demi-AS) were
associated with coronary heart disease. Skeletal growth in children has been monitored
extensively (Tanner, 1989). It is well established that short stature is related to poor
standards of living (Floud et al, 1990). Several recent reports have indicated that
diabetes mellitus and impaired glucose tolerance are associated with short stature
(Chapter 5.5; Brown et al, 1991; Mooy et al, 1995; Alvai’sson et al, 1994; Williams et
al, 1991), although McKeigue (1991) found no relationships between height and
impaired glucose tolerance.
Classie studies of McCance (1968) have shown that protein and energy deficient diets
have sepai’ate adverse effects on skeletal development in pigs. Low energy intake but
balanced macronutrients resulted in a proportionally small stature. Adequate energy
intake but lack of protein resulted in reduced skeletal structure but the size of the skull
was preserved. It is possible that there may be hierarchical steps to sustain growth of
366

vital organs, e.g. the nervous system, visceral organs and musculoskeletal system in that
order, under conditions of stress or nutritional deprivation. Thus the musculoskeletal
system, arguably the most expendable organ, may be amongst the first organ to be
‘sacrificed’. Different limb lengths relative to height or relative to one another’s length
may reflect growth failure in early life. Under certain environmental conditions, subtle
alterations in funetion of visceral organs and endocrine systems may become manifest as
later development of metabolic disorders.
According to the ‘thrifty phenotype’ hypothesis (Hales and Barker, 1992) used to
explain the relationships between eaiiy growth failure, abnormal organ morphology and
function, and metabolic disorders, it is possible that musculoskeletal structure might be
abnormally developed in people who were malnourished at critical times during intra
uterine development. In such adverse condition, blood (nutrients) may be diverted
towards the brain at the expense of peripheral organs. This hypothesis is supported by
several studies of blood distribution. Chr onic hypoxia, produced by embolisation of the
uteroplacental bed in fetal lamb, led to blood redistributed towards the brain (Reuss et
al, 1982; Block et al 1984). Blood flow redistributed towards the brain has also been
shown in asymmetrical growth retarded human foetuses, with large head relative to
waist circumference (Al-Ghazali et al, 1989). In the most extreme situation, early
malnutrition or stress will lead to low birth weight (known to relate to later metabolic
diseases). The present results suggest that subtle alterations in skeletal size might be a
subclinical indicator. The present study did not have information on subjects’ body
proportions or body weight at birth.
CONCLUSION
Short stature and limb lengths, and also altered skeletal proportions, which may reflect
interrupted growth, are associated with several metabolic disorders. Skeletal
disproportion associates with coronary heart disease in women and diabetes mellitus in
men.
367

Table 8.1.1. Subjects’ characteristics.
Men {n = 543) Women (n = 646)
P fMean SD Range Mean SD Range
Age (years) 46.3 11.4 25.5-65.8 45.2 11.9 25.7-65.4 ns
Weight (kg) 78.8 13.9 42.0-130.7 66.8 13.5 42.7-124.6 4= * *
Height (cm) 172.2 7.1 140.1-194.7 159.3 6.4 137.5-188.6
BMI (kgW ) 26.6 4.3 16.4-42.1 26.3 5.0 17.3-50.9 ns
LLL (cm) 51.5 2.9 40.5-59.5 47.1 2.7 40.2-57.6 =i= ^
Demi-AS (cm) 79.4 4.0 64.2-90.3 72.9 3.5 63.0-88.5
LLL to height ratio 0.299 0.010 0.269-0.334 0.296 0.010 0.256-0.341 * $ *
Demi-AS'.height ratio 0.461 0.014 0.410-0.510 0.457 0.013 0.405-0.497 * * $
LLL to demi-AS ratio 0.650 0.026 0.577-0.747 0.647 0.024 0.557-0.743
Systolic BP (mmHg) 133.1 18.9 82.0-252.0 123.7 19.4 88.8-211.0
Diastolic BP (mmHg) 81.7 11.5 51.0-129.0 73.7 11.3 35.0-121.0 * $
Cholesterol (mmol/1) 5.99 1.12 3.00-9.92 5.94 1.25 3.26-10.17 ns
tIndependent H est for the differences in variables between men and women: *^*p <0.001; P <0.05, ns =
not significant; BMI ~ body mass index; LLL == lower leg length; AS = arm span; BP = blood pressure.
368

Table 8.1.2. Regression equations for predicting height from lower leg length and demi-
arm span, and for predicting demi-arm span from lower leg length in 543 men and 646
women.
Predicting height from lower leg length (LLL)
Equation la Men Height = 2.050 x LLL + 66.593
Equation lb Women Height = 1.982 x LLL + 65.992
Predicting height ftom demi-arm span (demi-AS)
Equation 2a Men Height = 1.442 x demi-AS + 52.978
Equation 2b Women Height = 1.459 x demi-AS + 57.768
Predicting demi-aim span fi'om lower leg length (LLL)
Equation 3a Men Height = 1.024 x LLL + 26.568
Equation 3b Women Height = 0.982 x LLL + 26.590
SEE
95% confidence interval (%) (cm)
Independent Constant
variable
Equation la Men 1.929 to 2.171 60.334 to 72.851 69.9 3.91
Equation lb Women 1.862 to 2.102 60.342 to 71.642 67.6 3.64
Equation 2a Men 1.353 to 1.530 50.730 to 64.807 65.4 4.17
Equation 2b Women 1.367 to 1.552 46.200 to 59.755 62.4 3.97
Equation 3 a Men 0.940 to 1.108 22.229 to 30.906 54.70 2.7
Equation 3 b Women 0.907 to 1.057 23.051 to 30.128 56.69 2.28
369

Ifû1
I
m«rr
I0
1IIrô00
H
a
IQ
Î
I I
Ipj
II
I
I
I
VO oo m cn oo NO c r On cno O o c3 t-H ni <d> ni o
M m NO NO Tj* m oo ON cnr n cn ni o cn o cn cn cn
*o oo oo *
* in t> M * t-H m V-H inrn n ;
"sfcn
od NO od z ni1—1
in cnV--' TT V—1 oo m o V-- ' ON oo ni oo
oo t-H in ON ON CO On in ’ '
»>■ * ON M nin tn On 00 NO ni cn cn j(N m cn m cn cn ni m
-X-*(>• o in o cn n ; n- * ON ooON t-H oo cn r-4 Tf- cn cn ni , 1 T-H
cn m cn cn 00 r r cn cn in
m ON o * in M tn ON n inON On
tnni in ,-H o ni
**-X-in NO oo oo O ON oo cn M
o in NO in o od in ,-Hcn m m ni in ni m ni
<N(U
I(D (N
I ImCO
Ol(D Hi
I I I d d dhJ hJ J
cn m T—H
<u <D d)ro ro■-H 1d 1d<D Q
Cj
K TOA K00 W
-A -A<u o OJ
Q Q Q
a.
I
II
d
occn

CO
àa
00
1I
mITioo
ooCOoo
oON
ID'
CDONO 'cn
s ;CO
VD
CD 04o <d o O CD CD CD o
[Jh o <o> 'X-ID' oo cn
*ON
o o CD CO CD CD to r-H
(NON
COCOON
CO
O) 3
ONS
ONcnCD
O
OOC ) o CD CD o CD CD o
P-i v n o O 0 4 , O) *cn CD
o o CD CD CD TT CD
oi r i\o
o O
S
OON
CDO 'p
cn0 4p
cn04
o o CD CD CD CD CD CD
P4 (N o -X-cn p cn p
o o CD to CD cn 04
v n
cn
oC-'
§
OOOcn
CDCDncn
O 'CDcn
O^NO
o o CD CD CD CD CD CD
P h Th-X-(N (N O O ; p M
o CO CD O CD r-H CD
CO
CO ocntoON I s
oo
<NCDp
cn
p
O 'NO04
o o CD CD CD CD CD CD
pL, Tf-*cn CD t-H
*0 4 p
o to CD CD> MD t-H
CL,o
sp
OO
cnscn
OOooON
CD
P
NOONO '
o o
*
CD CD CD CD CD CD
P h oo T--1 O oo p•X*O ' r-H
ON CD CD CD NO CD
i
II
IÎII I
a
aII
I
ÎI
«j
1I
Io
I
IQ
a ,
I00.1II
III
d
?
V
cn

200
190
160%5 170Vf
160
% ISO
140
130
a Men; r = 0.837• W omen: r = 0.823 “ 0
\ . •
• • •
'■ * a38 40 42 44 46 48 50 52 54 56 58 60
Lower leg length (cm)
Men; r = 0,809 Women: /• = 0.790 Ï9 ~
D) 160 0)3: 150
70 75 80 85
Demi-arm span (cm)
95o Men; r = 0.740 • Women: /• = 0.753
85
Q. 80
38 40 42 44 46 48 50 52 54 56 58 60
Lower leg length (cm)
Figure 8.1.1. Plots and regression lines between height and lower leg length (a),
between height and demi-arm span (b) and between lower leg length and demi-arm span
(c) in 543 men (□ , solid line) and 646 women (# , dashed line).
372

0.80Coronary heart d isease
g 0.75 CO
CO 0.70 < ^ JE 0.65 Rp
20 30 40 50
Age (years)60 70
0.80
10.75
0.70
iTJ0.65
o_J__1
0.60
0.55
0.50
Coronary heart d isease
# . o ° ° D D % O
Women
20 30 40 50Age (years)
60 70
Figure 8,1.2, Distribution of coronary heart disease ( • ) in different ratios of lower leg
length to demi-arm span (LLL to demi-AS) relative to age in 543 men (a) and 646
women (b).
373

0.36
0 0.34
1t; 0.32 o>‘5) 0.30 x :° 0.28 _J
0.26
0.24
Diabetes mellitus
% «
Men
20 30 40 50Age (years)
60
a
70
szO)
0.36• Diabetes mellitus
0.34
0.32
0.30
0.28
0.26Women
0.2420 30 40 7050 60
Age (years)
Figure 8.1.3. Distribution of diabetes mellitus ( • ) in different ratios of lower leg length
height (LLL to height) relative to age in 543 men (a) and 646 women (b).
374

CHAPTER NINE
NATURAL SPORTING ABILITY IN RELATION
TO BODY MORPHOLOGY AND HEALTH IN
LATER LIFE: A RETROSPECTIVE FOLLOW-
UP STUDY
11 CONTENTS OF CHAPTER NINE PAGES
9.1 Natural sporting ability, birth weight and predisposition to 376
cardiovascular disorders
375

9.1 —
NATURAL SPORTING ABILITY, BIRTH WEIGHT AND
PREDISPOSITION TO CARDIOVASCULAR DISORDERS
This section has been submitted for publication as
Lean MEJ, Han TS. Natural sporting ability, birth weight and predisposition to
cardiovascular disorders, (submitted).
376

ABSTRACTObjective: To test the hypothesis that people with a natural ability in “power sports” (a
presumed marker for predominanee of type 2, glycolytic muscle fibres) might have
increased risks of coronary heart disease (CHD) compared to those with a natural ability
in “endurance sports” (as a marker for predominance of type 1, oxidative muscle fibres),
and that early growth as reflected by birth weight might influence these relationships.
Design and subjects: Retrospective self-reported study of 231 male former soldiers, aged
34-87 years who had undergone a course in physical training in the Army School of
Physical Training, Aldershot, (UK).
Outcome measures: Subsequent cardiovascular disorders.
Results: The proportions who had CHD, defined as angina and/or coronary angioplasty
and/or coronary artery bypass graft and/or heart attack were 18.7% in power group
compared to 9.7% in endurance group (difference: % ~ 3.9, P = 0.05). The proportions
with CHD and/or risk factors rose to 39.3% in power group compared to 25.8% in
endurance group (difference: % = 4.8, P = 0.03). Birth weight related negatively to CHD
(p = -0.18, P == 0.38), and to CHD and/or risk factors (P = -0.31, P = 0.03). Men in the
power group with birth weights below median were more likely to develop CHD and/or
risk factors (age, current body mass index, and lifestyle factors adjusted odds ratio =
10.5, 95% confidence interval: 1.9 to 59.5), compared to men in the endumnce group
with birth weights above median.
Conclusion: Men with a natural ability in power sports are at increased risk of
developing cardiovascular disorders when compared to men with a natural ability in
endurance sports. Low birth weight has an independent additive effect. These findings
suggest the hypothesis that a predominance of type 2, glycolytic muscle fibres,
presumably of genetic origin, predisposes to cardiovascular disorders.
377

INTRODUCTION
In the history of modern medicine, coronary heart disease (CHD) and related disorders
including hypertension and dyslipidaemia have probably been more intensively studied
than most other diseases. Recent epidemiological studies have produced compelling
evidence for associations of growth retardation in early life, using birth weight as the
marker, with cardiovascular disorders and other metabolic diseases (Barker et al, 1992).
Barker (1994) has proposed the use of the ‘thrifty phenotype’ and ‘programming’
hypotheses as ways to explain these relationships.
Several studies have suggested that features related to metabolic syndrome may be
associated with a muscle metabolism which tends to rely predominantly on the
glycolytic pathway (as opposed to oxidative pathway). Type 2b, glycolytic, white
muscle fibres are less sensitive to insulin action than type 1, oxidative, red muscle fibres
in rats (Bonen et al, 1981; James et al, 1985; Richter et al, 1984). In a study of non
diabetic Caucasian {n = 23) and Pima Indian {n = 41) men, Lillioja et al (1987) have
shown that insulin action correlated positively with the proportion of type 1 fibres (r =
0.29, P = 0.02) and negatively with the proportion of type 2b muscle fibres (r = -0.38, P
= 0.003). In women, Ki'otkiewski et al (1990) found that type 2b muscle fibres
correlated positively {P <0.05) with fasting insulin and glucose. Men and women with
NIDDM (Marin et al, 1994) and women with Cushing’s syndrome (Rebuffé-Scrive et al,
1988) have significantly higher proportions of type 2b muscle fibres than ‘healthy’
controls. All the aforementioned studies of muscle fibres and related metabolic disorders
showed type 2b muscle fibres were associated with another feature related to metabolic
syndrome, abdominal fat distribution (indicated by high ratio of waist to hip or to thigh
circumference). Men with intra-abdominal fat accumulation (measured by computerised
tomography), associated with metabolic disorders including raised insulin concentration
and blood pressure, have low capacities for endurance (aerobic) exercise (Seidell et al,
1989a). The range of type 1 fibres varies from 10% to 90% between individuals (Saltin
and Gollnick, 1983). Men tend to have higher proportion of type 2 muscle fibres than
women (Simoneau et al, 1989). Athletes who specialise in aerobic sports, such as
378

marathon runners, tend to have high proportion of slow twitch (type 1) muscle fibres,
while those who specialise in anaerobic sports, such as sprinters or jumpers, tend to have
high proportion of fast twitch (type 2a and 2b) fibres (Âstrand and Rodahl, 1986).
Hypothesis
The present study aimed to test the hypothesis that subjects with a natural ability in
power sports (a presumed marker for type 2 muscle fibre predominance) might have
increased risks of developing cardiovascular disorders compared to those with a natural
ability in endurance sport (as a marker for type 1 muscle fibre predominance), and that
the relationships may be influenced by birth weight, reflecting early growth.
METHODS
Subjects and study designBritish male former soldiers who had undergone a course in physical training at the
Army Physical Training School, Aldershot were studied retrospectively on the basis of
their interest in physical activity and probable relative homogeneity in terms of health,
fitness, dietary and other lifestyle behaviours. Five hundred names of former ai’my
soldiers were selected randomly from the computer database, and 231 (response rate =
46.2%) of these subjects aged 34 to 87 years returned self-completed questionnaires.
QuestionnairesQuestionnaires were designed based on the Glasgow MONICA Personal Health
Questionnaire (Morrison et al, 1997). Lists of events associated with endurance and
another associated with power sports were presented. Subjects were asked to select only
one list which best described the events for which they thought they had better natural
ability when aged between 16-40 years (Table 9.1.1). This information provided two
separate groups of subjects, ‘endurance’ and ‘power’ (Dirix et al, 1991) for analysis.
Subjects provided self measured anthi'opometric variables, and were asked to provide
their birth weight if known, confirmed with elder relatives if possible. The accuiacy of
379

reported birth weight could not be validated in the present study, but birth weight self-
reported by women aged 27-44 years (Troy et al, 1996) or recalled from mothers (Troy
et al, 1996; Lumey et al, 1994) or both paients (Pless and Pless, 1995) has been found to
be valid for epidemiological analysis. The questiomiaires contained lists o f medical
history including angina, coronary angioplasty, coronaiy artery bypass graft, heart
attack, hypertension, hypercholesterolaemia, diabetes mellitus, and medications for these
conditions, i.e. aspirin for heart disease, medications for angina, high blood pressure and
high cholesterol. Lifestyle factors were also reported including smoking, alcohol
drinking, current physical activity level, education. Recent dietaiy consumption was
obtained using a short food frequency questionnaire (developed for the Scottish Health
Survey), including meat, fish, potatoes/rice/pasta, and raw vegetables consumption.
Statistical analyses
Clusters of outcome measures were made for coronary heart disease (CHD) {n ~ 32,
prevalence = 13.9%), defined as having angina and/or coronary angioplasty and/or
coronary artery bypass graft and/or heart attack), and for CHD and/or hypertension
and/or hypercholesterolaemia and/or diabetes mellitus, and/or medications fo r these
conditions (CHD and/or risk factors) {n = 74, prevalence = 33.0%). Statistical analyses
were performed using SPSS Version 6 (Chicago, USA). Independent /-tests were used to
test for the differences between groups’ characteristics, and Chi-square tests for the
differences in prevalenees of cardiovascular disorders. Linear multiple regression
analysis was used to determine the relationships between birth weight and CHD or CHD
and/or risk factors, with age adjustment. Logistic regression was performed to test the
interaction between sporting ability and birth weight in relation to cardiovascular
disorders (CHD or CHD and/or risk factors) with age adjustment. The relative risk of
eardiovascular disorders was estimated by odds ratios in logistic regression analysis,
adjusted for age, body mass index, lifestyle factors and, and types of food consumed.
Ninety-five percent confidence interval limits were calculated as the exponential of (p
±1.96 X standai'd enor) (Kleinbaum et al, 1982).
380

RESULTS
Table 9.1.2 shows that for the whole sample {n = 231), age and height did not differ
significantly between endurance and power groups, and similar numbers of subjects
reported natural ability for power or endurance events. The power group had higher
body weight and body mass index when they were in the army and at the time of the
study. There were 111 subjects who provided a reported birth weight. Ten subjects (6
endurance and 4 power) reported that they had been born prematurely, and were
excluded in analyses involving birth weight. In the remaining 101 subjects, there were
no significant differences in age or any antliroponietric variable between endurance and
power groups (Table 9.1.2). There were no differences in proportions of current lifestyle
behaviours between endurance and power groups (Table 9.1.3).
Table 9.1.4 shows that compared to the endurance group, there was a tendency for
higher prevalences in the power group in all cardiovascular conditions, predisposing risk
factors, medications for these cardiovascular disorders. There were no age differences
between endurance and power groups who had CHD (age = 70.3 versus 70.5, P = 0.97)
or CHD and/or risk factors (age = 66.7 versus 66.0, P = 0.79). Compared to endurance
group, the power group had higher risk of CHD {P = 0.05) and CHD and/or risk factors
(P = 0.03) (Table 9.1.5, Figure 9.1.1).
Linear multiple regression analysis with age adjustment, showed that birth weight was
negatively related to CHD (P = -0.18, P = 0.38), and to CHD and/or risk factors (P = -
0.31, P = 0.03), supporting previous findings of Barker et al (1992). Birth weight was
therefore incorporated as a possible confoimder in the analysis of the relationships of
CHD or CHD and/or risk factors with natural sporting ability. There were no
interactions (age adjusted) between birth weight and natural sporting ability in relation
to cardiovascular disorders (results not shown).
Table 9.1,6 shows that compared to the endurance group, with age and birth weight
adjustments, the power group had significant risks of CHD and/or risk factors (P <0.01).
381

The relationships between sporting ability and CHD and/or risk factors were analysed
separately in two groups of birth weight above and below the median (3402 g) (Table
9.1.2, Tables 9.1.6 & 9.1.7). Figure 9.1.2 shows that the prevalence of CHD and/or risk
factors was higher for the power group than the endurance group for any birth weight.
The lowest prevalence of CHD and/or risk factors was observed in the endurance group
with large birth weight, and highest in the power group with low birth weight. Those in
the power group with large birth weight had higher prevalence of CHD and/or risk
factors than those in endurance group with low birth weight. Similar findings were
observed for association between sporting ability with existing CHD (data not shown).
Endurance subjects with large birth weight were used as the reference group. After age
adjustment, power subjects with small birth weight had the highest odds ratio of CHD or
CHD and/or risk factors (Table 9.1.6). Endurance subjects with small birth weight were
at lower risk than power subjects with large birth weight. There were slight changes in
these relationships when adjustments were made for current body mass index and
lifestyle factors (Table 9.1.7). The additional adjustment for current frequency
consumption of meat, carbohydrate foods, and raw vegetables changed the odds ratio to
10.7 (95% confidence interval: 1.8 to 61.4, P <0.01) for CHD and/or risk factors.
DISCUSSION
The present study has produced novel data to suggest that men with a natural ability in
power sports, as a presumed marker for type 2 muscle fibre predominance, had increased
incidence of cai'diovascular disorders in later life. A low birth weight, indicating early
growth retardation, had an independent additive effect. These findings suggest that
increased glycolytic, type 2 muscle fibres predispose to the development of
cardiovascular disorders. This conclusion from the present study is supported by
previous studies showing associations of increased type 2 muscle fibres with features
related to the metabolic syndrome including diminished insulin action (Lillioja et a/,
1987; Krotkiewski et al, 1990), NIDDM (Mâiin et al, 1994), Cushing’s syndrome
(Rebuffs-Srive et al, 1988), and abdominal fat distribution (Lillioja et al, 1987; Rebuffé-
382

Srive et al, 1988; Seidell et al, 1989a; Ki’otkiewski et al, 1990). Although it is also well
established that physical activity improves most cardiovascular risk factors, and delays
CHD (Morris et al, 1980; Monis et al, 1990; Paffenbai'ger et al, 1986), it has not been
possible to sepaiate the effects of training horn underlying physiological factors.
Subjects in the present study were all sports enthusiasts, and mostly homogenous in
terms of their standard physical training programme, their diet exposure, and other
lifestyle behaviours when they were in the Army, There was no evidence for differences
in their current physical activity, cigarette smoking, alcohol drinking, educational level
or selected dietary components currently consumed (Table 9.1.3). The risks of
developing cardiovascular disorders in those with natural ability in power sports with
small birth weight remained significantly higher than those with a natural ability in
endurance sports with large birth weight, even when other possible confounding factors
including age, current body mass index, smoking, current leisure activity, alcohol
drinking and education were made. Additional adjustments for current consumption
frequencies of meat, carbohydrate foods (potatoes/rice/pasta) and raw vegetables did not
change the odds ratios significantly.
The results from the present study cannot explain how natural ability in power sports led
to the increased risk of cardiovascular disorders, but muscle composition and sporting
ability are probably genetically determined. As Klissouras (1976) put it: “Natural
tendency inevitably asserts itself’, most of men in the present study (about 95%) who
considered themselves to have natural ability in one type of sport actually performed
sport events of that same type. The quote “endurance (or power) athletes are born, not
made” is fittingly supported by studies of monozygotic and dizygotic twins (Klissouras,
1971 & 1976; Klissouras et al, 1973; Komi et al, 1977) to determine the heritability
estimate. Heritability estimate has been found to be 93% for maximum oxygen uptake,
81% for maximum blood lactate, and 86% for maximum heart rate (Klissouras, 1971).
Komi et al (1977) have shown that heritability estimate for percentage type 1 muscle
fibres o f the vastus lateralis muscle was 99.5% in males and 92.8% in females.
383

Furthermore, no changes in muscle fibre composition have been observed by either
endurance (Gollnick et al, 1973) or strength training (Thorstensson et al, 1975).
The measurements of natural sporting ability, cardiovascular disorders and birth weight
were self-reported. It is possible that some of the answers were unreliable, leading to
random errors and probably imderestimating the ‘true’ associations between variables
(bias towards the null hypothesis). It seems unlikely that the answers on natural sporting
ability and birth weight were influenced by disease state (recall bias).
The observations of the associations of type 2b muscle fibres with abdominal fat
distribution (Lillioja et al, 1987; Rebuffé-Srive et al, 1988; Krotkiewski et al, 1990) and
poor endurance with intra-abdominal fat accumulation (Seidell et al, 1989a), and the
associations o f low birth weight with abdominal fat distribution in men (Law et al,
1992) and in women (Han et al, 1995a) suggest possible mechanisms linking abnormal
fat metabolism and type 2 muscle fibres with early growth retardation (Figure 9.1.3).
The present study found no interactions between birth weight and natural sporting
ability in relation to cardiovascular disorders. Natural ability in power sports and low
birth weight had an additive effect on the development of coronary heart disease and
related disorders. It has been suggested that malnutrition at different period of fetal
growth has an adverse effect on organs differently, depending on the time when cell
differentiation for a particular organ is most prolific (Barker, 1994). Thus muscle fibre
composition may be influenced by growth failure at different time during development
in utero. The present study did not have this information.
CONCLUSIONS
Men with a natural ability in power sports are at higher risk of developing
cardiovascular disorders than those with a natural ability in endurance sports, and low
birth weight has an independent additive effect. The results fi'om the present study
suggest that muscle fibre composition may play a role in developing cardiovascular
disorders in later life.
384

Table 9.1.1. Question and lists of ‘endurance’ and ‘power’ sport events adapted from
The Olympic Book of Sports Medicine (Dirix et al, 1991).
Between 16-40 years, was your NATURAL ABILITY highest for endurance sports or
power sports? please tick ONE BOX ONLY
ENDURANCE SPORTS
Examples of endurance sports
Running 1 mile or more
Cross country
Cross-country skiing
Triathlon
Road cycling
Orienteering
Long distance swimming
Canoeing
Walking long distance
or POWER SPORTS
Examples of power sports
100 yard dash
Sprint running 100 m, 200 m
Long jump
High jump
Weight lifting
Discuss tlirowing
Shot putting
Javelin throwing
Pole vaulting
385

Table 9.1.2. Chai'acteristics of 231 male former soldiers. All antliropometric measures
were converted to metric units from reported empirical units.
Natural ability in
‘endurance sports’ {n = 124)
Natural ability in
‘power sports’ (n = 107)
Mean SE Range Mean SE Range
All subject
Age (years) 59.7 1.2 34.4-86.8 62.4 1.2 37.3-87.3 0.11
Current weight (kg) 75.0 0.7 44.5-103.9 l l A 0.8 60.3-101.6 0.03
Height (cm) 173.9 0.5 158.8-190.5 174.1 0.7 152.4-193.0 0.78
Current BMI (kg/m^) 24.8 0.2 15.8-34.8 25.5 0.2 21.5-31.9 0.04
Weight in army (kg) 69.6 0.6 54.0-82.6 71.3 0.6 54.0-101.6 0.05
BMI in army (kgW ) 23.0 0.2 19.1-27.8 23.5 0.2 19.1-30.7 0.03
Those with reported birth weight, excluding those born prematurely (n - 10)
n == 52 n == 49
Age (years) 58.2 1.8 34.4-83.9 60.8 1.7 37.3-83.8 0.29
Current weight (kg) 76.6 0.9 61.0-95.3 79.0 1.2 60.3-101.6 0.13
Height (cm) 174.6 0.8 163.8-190.5 175.3 1.1 160.0-193.0 0.53
Current BMI (kg/m^) 25.2 0.3 20.8-30.1 25.7 0.4 21.7-31.9 0.24
Weight in army (kg) 70.8 0.8 57.2-82.6 72.0 1.0 54.4-101.6 0.38
BMI in army (kgW ) 23.3 0.2 19.2-26.1 23.5 0.3 19.5-28.8 0.60
Birth weight (kg) 3.39 0.08 1.36-4.59 3.54 0.11 1.42-5.44 0.25
* Independent ^-test for the differences in characteristics between groups; BMI = body mass index.
386

Table 9.1.3. Comparison of lifestyle factors and dietary intake between men with
natural ability in ‘endurance sports’ versus ‘power sports’.
Proportions (%)
‘Endurance ‘Power
group’ group’
(M = 124) (M = 107) p*
Exercise at least once a week 61.0 61.7 0 . 0 1 0.91
Currently smoking 12.9 1 1 . 2 0.15 0.70
Alcohol drinking >3 units/day 18.5 2 0 . 6 0.15 0.70
Education level at secondary or below 39.0 42.9 0.35 0.56
Meat eaten >2 times a week 79.0 80.4 0.06 0.80
Potatoes, pasta or rice eaten >2 times a week 87.1 8 8 . 8 0.15 0.70
Raw vegetables eaten >2 times a week 70.2 74.8 0.61 0.44
* Chi-square test for the differences in proportions between the two groups.
387

Table 9.1.4. Prevalence of coronaiy heart disease, predisposing risk factors and
medications for these conditions, and family history of heart disease in 124 men with a
natnial ability in ‘endurance sports’ and 107 men in ‘power sports’.
Prevalence‘Endurance sports’
(N= 124)‘Power sports’
(# = 1 0 7 )n % n % X * P* 1
List 1: Coronary heart diseaseAngina 3 2.4 9 8.4 4.19 0.04 1Coronary angioplasty 1 0 . 8 2 1.9 0.51 0.48 1Coronary artery bypass graft 1 0 . 8 5 4.7 3.39 0.07Heart attack 1 1 8.9 17 15.9 2.65 0 . 1 0
List 2: Predisposing risk factorsHypercholesterolaemia 9 7.3 14 13.1 2.17 0.14Hypertension 16 12.9 19 17.8 1.05 0.31Diabetes mellitus 3 2.4 3 2 . 8 0.03 0 . 8 6
List 3: MedicationsAspirin for the heart disease 1 1 8.9 13 1 2 . 1 0 . 6 6 0.42 ;Medication for angina 2 1 . 6 5 4.7 1.83 0.18Medication for hypertension 4 3.2 1 2 1 1 . 2 5.69 0 . 0 2
Medication for hypercholesterolaemia 2 1 . 6 6 5.6 2.74 0 . 1 0
Medication or diet for diabetes 2 1 . 6 2 1.9 0 . 0 2 0 . 8 8
ClustersCHDf 1 2 9.7 2 0 18.7 3.91 0.05CHD and/or risks and/or medications:): 32 25.8 42 39.3 4.77 0.03* Chi-square test for the differences in prevalence between the two groups; f coronary heart disease =
angina and/or coronary angioplasty and/or coronary artery bypass graft and/or heart attack (list 1);
:|:coronary heart disease (list 1) and/or predisposing risks factors (list 2) and/or medications (list 3).
388

Table 9.1.5. Odds ratios for coronary heait disease and coronary heart disease and/or
predisposing risk factors and/or medications for these conditions, in 107 men with a
natural ability in ‘power sports’ compared to 124 men with a natural ability in
‘endurance sports’.
Odds ratio 95% Cl P
Dependent variable: coronary heart disease"}"
Predictors:
‘Endurance group’ (reference)
‘Power group’
1 . 0 0
2.15 1.00, 4.63 0.05
Dependent variable: coronary heart disease and/or
risks and/or medications:};
Predictors:
‘Endurance group’ (reference) 1 . 0 0
‘Power group’ 1 . 8 6 1.06,3.25 0.03
tCoronary heart disease = angina and/or coronary angioplasty and/or coronary artery bypass graft and/or
heart attack (Table 9.1.4, list I); fcoronary heart disease and/or predisposing risks factors and/or
medications (Table 9.1.4, lists 1-3).
389

Table 9.1.6. Odds ratios for coronary heart disease and/or predisposing risk factors
and/or medications for these conditions, in subjects with birth weight reported (49 men
with a natural ability in ‘power sports’ compared to 52
‘endurance sports’), adjusted for age.
men with a natural ability in
Odds
ratio
95% confidence
interval
P
Dependent variable: CHD and/or predisposing risk
factors and/or medications'^
Predictors:
‘Endurance group’ (reference) 1 . 0 0
‘Power group’ 4.73 1.75, 12.80 0 . 0 0
Birth weight above mediant (reference) 1 . 0 0
Birth weight below mediant 2.70 1.01,7.17 0.05
Dependent variable: CHD and/or predisposing risk
factors and/or medications*
Predictors (combined terms):
‘Endurance’ and birth weight above median (reference) 1 . 0 0
‘Endurance’ and birth weight below median 2.31 0.52, 10.29 0.27
‘Power’ and birth weight above median 4.08 0.95, 17.59 0.06
‘Power’ and small birth weight below median 12.30 2.40, 63.00 0 . 0 0
* Coronary heart disease and/or predisposing risks factors and/or medications (Table 9.14, lists 1-3);
fmedian value o f birth weight = 3402 g.
390

Table 9.1.7. Odds ratios for coronary heart disease and/or predisposing risk factors
and/or medications for these conditions, in subjects with birth weight reported (49 men
with a natural ability in ‘power sports’ compared to 52 men with a natural ability in
‘endurance sports’), adjusted for age, education, current body mass index, smoking,
alcohol drinking and physical activity.
Odds
ratio
95% confidence
interval
P
Dependent variable: CHD and/or predisposing risk
factors and/or medications*
Predictors:
‘Endurance group’ (reference) 1 . 0 0
‘Power group’ 4.31 1.48, 12.55 0 . 0 1
Birth weight above medianj" (reference) 1 . 0 0
Birth weight below medianf 2.65 0.77, 9.17 0.07
Dependent variable: CHD and/or predisposing risk
factors and/or medications*
Predictors (combined terms):
‘Endurance’ and birth weight above median (reference) 1 . 0 0
‘Endurance’ and birth weight below median 1.83 0.38, 8.78 0.45
‘Power’ and birth weight above median 3.01 0.64, 14.21 0.16
‘Power’ and small birth weight below median 10.51 1.86, 59.46 0 . 0 1
* Coronary heart disease and/or predisposing risks factors and/or medications (Table 9.14, lists 1-3);
jmedian value of birth weight = 3402 g.
391

•I-G ^ o ^
50
45
§ § 40
0 3 "«4-1 O
BI
!I30
25
20
Group difference; '2-=4.8;P = 0.03
‘ Endurance group ’ ‘ Power group ’Natural sporting ability
Figure 9.1.1. Proportions of subjects with coronary heart disease and/or predisposing
risks and/or medications in groups with natural ability in endurance or power sports.
o ^
§ §
§ 1
II0 U
1
B irth weight□ Above median (>3402 g)
Below median (<3402 g)
‘Endurance group’ ‘Power group’Natural sporting ability
Figure 9.1.2. Proportions o f subjects with coronary heart disease and/or predisposing
risks and/or medications in groups with natural ability in endurance or power sports,
with large or small birth weight.
392

>SE g>< D . 2 t n
III15« E .O
0 ) EHi
o ^Z2 <
oC mO
= Q
i fQ .<DÛ
c c ( 0 o ^r i iiTv 3 .O H- Q)
5 (TJ <D6 E
393

I I CHAPTER TEN
SELF A SSESSM EN T OF BODY
MORPHOLOGY FOR HEALTH PROMOTION
11 CONTENTS OF CHAPTER TEN PAGES
10.1 Development and evaluation of the ‘Waist Watcher’ tape 395
measure for assessment of waist circumference in free living
subjects
394

10.1
DEVELOPMENT AND EVALUATION OF THE 'WAIST WATCHER'
TAPE MEASURE FOR ASSESSMENT OF WAIST
CIRCUMFERENCE IN FREE LIVING SUBJECTS
This section has been submitted for publication as
Han TS Morrison CE, Lean MEJ. ‘Waist Watcher’ tape measure as a screening
tool to identify people at increased health risk through intra-abdominal fat
accumulation, (in preparation).
395

ABSTRACT
Objective'. To evaluate the accuracy of self-reported and self-measured waist by subjects
using the ‘Waist Watcher’ tape measure, designed to monitor waist circumference.
Study design and setting: Random sample of 101 men and 62 women aged 28-67 years
in a cross-sectional study, based at Glasgow Royal Infirmary.
Outcome measures: Self-reported and self-measured waist circumference, and self-
classification according to the previously defined waist Action Level 1 (94 cm in men,
80 cm in women) and Action Level 2 (102 cm in men, 8 8 cm in women), and waist
circumference measured by investigator using the ‘Waist Watcher’ tape measure.
Results: Waist circumference measured by the investigator was used as the reference
method. The mean errors (95% confidence interval limits of agreement) for self-reported
waist (se lf reported minus reference) were -7.1 cm (-21.5 to 7.2) in men and -5.2 (-22.2
to 11.9) in women, and for subjects’ self-measured waist made by the ‘Waist Watcher’
(self-measured minus reference) were -0.6 cm (-6.5 to 5.4) in men and -0.6 (-5.3 to 4.5)
in women. Classifications using waist Action Level 1 or Aetion Level 2 by the
investigator were used as the reference method. S e lf reported waist circumference of
men and women, respectively, would be classified correctly in different categories based
on Action Level 1 with sensitivities of 57.4% and 74.3%, and specificities of 92.5% and
100%, and Action Level 2 with sensitivities of 32.4% and 27.8%, and specificities of
98.5% and 93.2%. Using the ‘Waist Watcher’ with different colour bands based on the
Action Levels to assess waist size, subjects classified themselves into correct categories
according to Action Level 1 with sensitivities of 100% and 94,3%, and specificities of
95.0% and 96.3%, and according to Action Level 2 with sensitivities of 97.1% and
100%, and specificities of 100% for both sexes. Only 2% of the sample misclassified
themselves into the wrong categories of waist circumference Action Levels.
Conclusions: ‘Waist Watcher’ tape measure offers advantages over self-reported home-
assessed measui'ement of waist circumference, and may be used as a screening tool for
self-classifying the risk of ill health through intra-abdominal fat accumulation.
Key words: abdominal fat distribution, health promotion, waist circumference.
396

INTRODUCTION
Obesity, a wholly preventable disease, is increasing 2-5% per decade and has now
reached an epidemic proportion, affecting more than 15% in most Western countries
(Seidell et al, 1995a; Kuczmai'ski et al 1994). On the basis of current epidemiology and
trends, targets set by health authorities to reduce the rising prevalence by the year 2 0 0 0
will inevitably fail.
Health promotion and batlnoom scales have hitherto made no impact on the upward
trend in overweight and obesity. Obesity is partly explained by genetic predisposition
but also requires an appropriate environment, e.g. over-provision of food without the
need for physical activity, to express itself (Bouchard et al, 1990; Stunlcard et al, 1990).
The recent success in cloning of human obese gene responsible for producing leptin
(Zhang et al, 1994) has caused great excitement amongst the scientific community and
the popular press, but the world is still waiting for its successful application in obesity
treatment. Although genetic predisposition is a logical necessity to explain why only
some people become obese, mechanisms are not yet clear and ‘gluttony and sloth’
(Prentice and Jebb, 1995) are frequent victim-blaming explanations.
Fatter than ever, people in the UK and other urban societies are increasingly suffering
from a catalogue of symptoms of obesity and secondary diseases, including tiredness,
sweating, breathlessness, back pain, ailhritis, menstrual and fertility disorders,
cardiovascular disease, non-insulin-dependent diabetes mellitus and several major
cancers. These lead to impaired quality of life, depression and premature death. Recent
estimates o f costs per annum for treating obesity are 195 million pounds in Britain
(Office of Health and Economics, 1994), and 70 billion dollars in the United States
(Institute of Medicine, 1995). The limited success in reversing the increasing trends in
obesity attributable to the lack of public awareness of self-assessment of obesity and a
sense of medical impotence in management, uiges the development of new strategies.
Clinical guidelines for improved medical management are available in several countries
397

(Institute of Medicine, 1995; Scottish Intercollegiate Guidelines Network, 1996, German
Society of Obesity Research, 1995).
Given the complex interactions between cosmetic and health impact of body shape and
size, a waist circumference reduction is a rewarding consequence of slimming and has
been suggested as a better motivator than weight change (Egger et al, 1995). We have
recently proposed the use of waist circumference as a simple method for detecting
overweight (body mass index) and central fat distribution (waist to hip ratio) (Chapter
4.1; Lean et al, 1995), and for identifying people with cardiovascular risk factors
(Chapter 4.2; Han et al, 1996c). The figures for waist circumference Action Level 1 (94
cm in men, 80 cm in women) and Action Level 2 (102 cm in men, 8 8 cm in women)
were identified for health promotion to alert people to increasing health risks. A patent
‘Waist Watcher’ tape measure was manufactured specifically for the present study based
on these Action Levels. The present study was designed to evaluate the ‘Waist Watcher’
tape measiu'e (Figure 10.1.1) in s e lf measurement and self-classification of waist
circumference categories aceording to the Action Levels.
METHODS
Subjects
A random sample of subjects who participated in the MONICA 4 project one year
previously were recalled by letter and telephone. They were selected based on the
predetermined values according to their previous measui'ed waist circumference and age
available from the MONICA 4 database. A maximum of 1800 subjects were available
for recruitment. The response rate was about 50%. From these, quota sampling was used
in order to assign approximately equal number in each subgroup aiming for 50 men and
50 women in each of 12 subgroups defined by sex, waist circumference Action Levels
(below Action Level 1, between Action Level 1 and Action Level 2, and above Action
Level 2), and age (below and above 50 years) . Subjects were randomised within each
subgroup. One group received general advice about weight management and were given
the ‘Waist Watcher’ tape measure with which to monitor their waist circumference and
398

guidance in its use. The other group, serving as controls, did not receive advice or the
tape measure. In the present study, baseline self-reported, self-measured and self
classified waist circumference according to the Action Levels were compared to those
made by the investigator, in 94 men and 45 women who were available at the time of
analyses.
AnthropometryReported measurements
Subjects were asked to complete a postal questionnaire about euirent body weight,
height, waist and hips at home. Additional data to be analysed later includes information
on subjects’ selection of body shapes based on silhouette photographs of men and
women with a wide range of body fatness and fat distribution, history of weight
management, lifestyle habits, family and medical history. Subjects will be recalled to
measui'e waist circumference and body weight after six months to assess the
effectiveness of the ‘Waist Watcher’ tape measure in self-weight management,
compared to the control group. Long term monitoring of weight management is planned.
Self-measurement using the ‘Waist Watcher ‘ tape measure
The ‘Waist Watcher’ tape measure (Figure 10.1.1) was made to help subjects measure
their waist cireumferenee easily. The tape can be made into a complete loop and fitted
firmly around the waist by a spring meehanism, controlled by a push-button. This allows
subjects with free hands for adjusting the tape. The measurement can be conveniently
read by removing the tape fi’om the waist, which is particulaiiy helpful to overweight
subjects who find it hard to read bending down. The tape has the conventional numbers
in centimetres and inches on each side, and tlnee colour bands separated by Action
Levels: green band to indicate waist below Action Level 1 (<94 cm in men, <80 cm in
women); amber band between ‘Action Level 1 and ‘Aetion Level 2; (94-102 cm in
men, 80-88 cm in women); and red band above Action Level 2 (>102 cm in men, > 8 8
cm in women). The meaning of the band colours aie explained in the handout
‘'Recommendations fo r Weight Management^ which includes a set of step-by-step
399

photographie instructions to guide subjects how to measure their waist circumference
without any assistance from the investigator (Figure 10.1.2).
Waist circumference measured by investigator
At the end of the experiments, subjeets were asked to be measured by the investigator,
thus subjects would not know beforehand that their measui'ement of the waist would be
checked. Also, the investigator did not see the subjects’ measurement values.
Analysis
The accmacy of self-reported waist circumference, self-measured and self-classification
of waist circumference into categories according to the Action Levels using the ‘Waist
Watcher’, were compared to those made by the investigator, which were considered as
the reference method. Statistical and graphical presentation based on the Bland and
Altman (1986) methods were used to chaiacterise the bias, errors and limits of
agreement of measurements in relation to sex, waist size and age. The proportions of
subjects classified into categories of waist circumference Action Levels based on their
waist circumference measured by the investigator were used as reference groups for
large waist, above Action Level 1 (>94 cm in men, >80 cm in women) or above Action
Level 2 (>102 cm in, and > 8 8 cm in women). Sensitivities and specificities (Bland,
1987) were calculated to assess subjects’ ability to classify themselves correctly into
categories according to waist circumference Action Level 1 or Action Level 2.
RESULTS
Table 10.1.1 shows the subjects’ characteristics. The mean values of self-reported
measurements and those made by the trained investigator were similar. Nearly all
subjects reported all the measurements, except only 36% men were able to provide their
hip measurement.
400

Waist circumference measurements made by the investigator were used as the reference
values. The errors of self-reported home-assessed waist circumference from subjects
(self-reported minus reference) were -7.1 cm (95% confidence interval: -21.5 to 6.5) in
men and -5.2 cm (95% confidence interval: 22.2 to 11.9) in women (Table 10.1.1,
Figures 10.1.3a & b). There was a systematic bias in errors of self-reported waist in
men (r = -0.63, P <0.001) and in women (r = -0.48, P <0.001) of different waist size
(Figures 10.1.3a & b), i.e. subjects with smaller waist tended to overestimate and those
with a larger waist to underestimate their waist size, compared to the reference values.
The errors of waist circumference measured by subjects using the ‘Waist Watcher’ tape
measure (self-measured minus reference) were -0.6 cm (95% confidence interval: -6.5 to
5.4) in men and -0.6 cm (95% confidence interval: -5.3 to 4.5) in women (Table 10.1.1,
Figures 10.1.4a & b). There was a systematic bias in errors of self-measured waist
circumference (r = -0.36, P = 0.01) in men of different waist size (Figure 10.1.4a), i.e.
men with smaller waist tended to obtain higher and those with larger waist tended to
obtain lower waist measurements, compared to the reference values. No bias in the
errors of self-measured waist circumference was observed (r = 0.02, P = 0.88) in women
of different waist size (Figure 10.1.4b). The variability (spread) in the errors of self
measured waist circumference was similar throughout the range of waist circumference,
i.e. subjects with larger waist gave the same limits of errors as those with smaller waist
(Figures 10.1.4a & b).
There were no significant systematic biases in the errors of self-reported waist with age
in men (r = 0.19, P = 0.6) and in women (r = -0.23, P = 0.07) (Figures 10,1.5a & b), or
in the errors of self-measured waist with age in men (r = 0.11, P = 0.26) and in women
(r = -0.01, P = 0.92) (Figures 10.1.6a & b). In younger men and younger women below
40 years (Figures 10.1.6a & b), the variability (spread) o f eiTors of self-measured waist
circumference was less than in the older groups.
401

Table 10.1.2 shows that the proportions of subjects in each categories of waist
circumference Action Levels were roughly equal (35%) using reference measurement
made by investigator. This was expected as quota sampling was employed to ensure
approximately equal numbers of subjects in each category were recruited, based on their
waist circumference measured one year previously. Subjects tended to underreport their
waist, such that there were fewer numbers in the lowest (below Action Level 1) waist
category based on self-reported waist measurement. The distribution of subjects in each
category based on waist circumference measured by subject using the ‘Waist Watcher’
was almost identical to the reference.
In Table 10.1.3, subjects in categories of waist Action Level 1 or Action Level 2
identified by the investigator were used as reference. Self-reported waist circumference
of men and women, respectively, would be classified correctly in different categories
based on Action Level 1 with sensitivities of 57.4% and 74.3%, and specificities of
92.5% and 100%, and Action Level 2 with sensitivities of 32.4% and 27.8%, and
specificities of 98.5% and 93.2%. With the aid of the ‘Waist Watcher’ tape measure and
photographic instructions, men and women, respectively, self-classified their waist
circumference correctly according to Action Level 1 with sensitivities of 100% and
94.3%, and specificities of 95.0% and 96.3%, and according to Action Level 2 with
sensitivities of 97.1% and 100%, and specificities of 100% (both sexes). There were less
than 2 % of subjects who misclassified themselves into the vw’ong categories of waist
based on the Action Levels.
DISCUSSION
We have addressed the public health needs, using a single measurement of waist
circumference to alert the general public to their risks of ill health, and their need to seek
professional help based on the Action Levels of waist circumference (Chapter 4.1; Lean
et at, 1995). Both men and women undeiTeported their waist circumference, thus the
specificities for classification of subjects into the lower categories of waist Action
Levels were high (>93%), but the sensitivities for identifying those with larger waist in
402

higher categories of waist Action Levels were very low - 57-74% based on Action Level
1 and about 30% based on Action Level 2. With the aid of the ‘Waist Watcher’ tape
measure (Figure 10.1.1) and photographic instructions (Figure 10.1.2) which were
designed specifically for the present study, to help subjects measure their waist easily,
most subjects could identify themselves correctly in different categories of waist
circumference according to the Action Levels with sensitivities and specificities above
94%, thus the ‘Waist Watcher’ tape measure provides a useful screening tool, in health
promotion, for self-classification of increased health risk through intra-abdominal fat
accumulation, otherwise would be missed from self-reported waist circumference.
Our previous findings indicate clearly that large waist circumference is associated with
symptoms of obesity and secondary diseases (Chapter 5) imposing enormous burdens
of ill health on health services and society (Chapter 6). Waist circumference as an index
of adiposity is minimally influenced by height (Chapter 4.3; Han et al, 1997c),
although height does have an influence on health independent of adiposity. Thus, a
single measurement of waist circumference is a valid and simple indicator of ill health.
If waist circumference is to be used for health promotion programmes for weight
management in the general public, it is essential that the subjects should be able to
measure their waist correctly. Some previous studies have shown waist circumference
measured by trained observers is reliable (Rimm et al, 1990; Hall and Young, 1989,
Ferrerio, 1995), but recent study on self-reported weight and height in British teenagers
(16-17 years) found that shorter and fatter individuals overestimated their height and
underestimated their weight, while conversely taller and thimier subjects underestimated
their height (Crawley and Portides, 1995). The agreement between self-reported and
self-measured values for height and weight were within 1 cm and 1 kg respectively, but
they varied (95% confidence interval) by 7 cm and 7 kg respectively (Nakatsuka et al,
1995). In these studies, conventional tape measures were used, and these may be
problematic for the very obese who camiot see their waist. The ‘Waist Watcher’ allows a
more reliable ‘blind’ measurement. The present study found that the variability of eiTors
(spread of errors about the mean error) of self-measui*ed waist circumference was similar
403

in subjects o f different of waist size (Figures 10.1.4a & b), and younger people were
able to measure their waist more accurately than older groups (Figures 10.1.6a & b). In
the present study, while nearly all subjects were able to report all home-assessed
measurements, only 36% men offered hip circumference measurement. These results
provide further support for the use of a single measurement of waist circumference in
health promotion directed at general public.
The present study is part of a larger prospective study. At baseline, waist size self-
reported and self-measured by the subjects using the ‘Waist Watcher’ tape measure were
compared to that measured by the investigator. Subjects will be recalled in six months to
assess the effectiveness of the ‘Waist Watcher’ tape, used as a motivational tool to
prevent weight gain in those with waist below Action Level 1, and to encourage weight
loss in those with waist above Action Level 1. In addition, comparisons between weight
and height measured by the investigator and those reported by the subjects, and the
influences of body image perception on the differences between self-reported or self
measured anthropometry and assessment by an investigator will be evaluated.
The practical value of this research is that a single measurement of waist circumference
can be adopted confidently both by health professionals and the general public as a tool
for alerting individuals who need weight management. Health promotion can contribute
to weight management by alerting people to their level of risk and the need to take
action. This implies the need to establish specialised obesity clinics to serve these needs.
Individuals with waist circumference below Action Level 1 do not need to lose weight
but should be awaie of potential health risks if their waist exceeds this level. In the range
between Action Level 1 and Action Level 2, people should not further gain weight, with
lifestyle modification such as increasing physical activity level and some self-weight
management. Everybody above Action Level 2, should be urged to take action and to
seek professional help to achieve sustained weight loss. These waist Action Levels have
already been recognised by epidemiologists in the field of public health (Carey et al,
1997), and adopted for national health promotion by British Diabetic Association
404

(Walker, 1997), Health Education Board for Scotland (1997), and Scottish
Intercollegiate Guidelines Network (1996). Loss of 5-10 cm in circumferentially
challenged individuals is a goal warrants major congratulations (Chapter 7; Han et al,
1997a), and will help health service planners to rest easy!
CONCLUSIONS
A ‘Waist Watcher’ tape measure with photographic instructions offers advantages over
self-reported measurement of waist in self-classifying waist size, and provides a useful
tool for screening people at increased health risk tlnough intra-abdominal fat
accumulation.
405
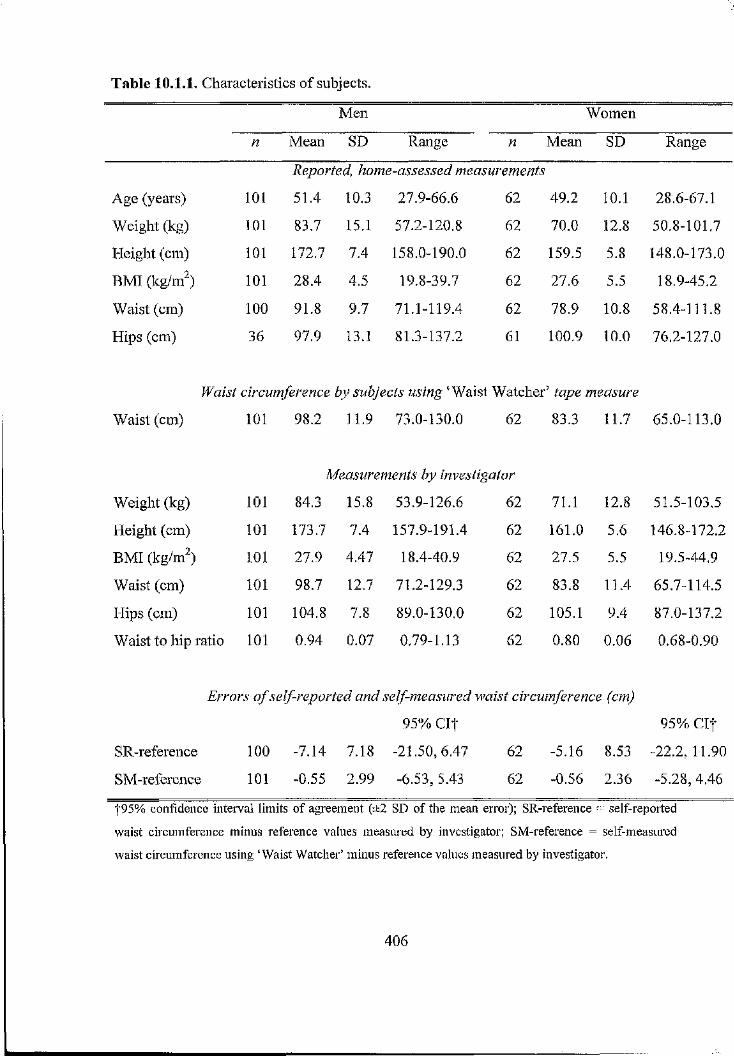
Table 10.1.1. Characteristics of subjects.
Men Women
n Mean SD Range n Mean SD Range
Reported, home-assessed measurements
Age (years) 1 0 1 51.4 10.3 27.9-66.6 62 49.2 1 0 . 1 28.6-67.1
Weight (kg) 1 0 1 83.7 15.1 57.2-120.8 62 70.0 1 2 . 8 50.8-101.7
Height (cm) 1 0 1 172.7 7.4 158.0-190.0 62 159.5 5.8 148.0-173.0
BMI (kg/m^) 1 0 1 28.4 4.5 19.8-39.7 62 27.6 5.5 18.9-45.2
Waist (cm) 1 0 0 91.8 9.7 71.1-119.4 62 78.9 1 0 . 8 58.4-111.8
Hips (cm) 36 97.9 13.1 81.3-137.2 61 100.9 1 0 . 0 76.2-127.0
Waist circumference by subjects using ‘Waist Watcher’ tape measure
Waist (cm) 1 0 1 98.2 11.9 73.0-130.0 62 83.3 11.7 65.0-113.0
Measurements by investigator
Weight (kg) 1 0 1 84.3 15.8 53.9-126.6 62 71.1 1 2 . 8 51.5-103.5
Height (cm) 1 0 1 173.7 7.4 157.9-191.4 62 161.0 5.6 146.8-172.2
BMI (kgW ) 1 0 1 27.9 4.47 18.4-40.9 62 27.5 5.5 19.5-44.9
Waist (cm) 1 0 1 98.7 12.7 71.2-129.3 62 83.8 11.4 65.7-114.5
Hips (cm) 1 0 1 104.8 7.8 89.0-130.0 62 105.1 9.4 87.0-137.2
Waist to hip ratio 1 0 1 0.94 0.07 0.79-1.13 62 0.80 0.06 0.68-0.90
Errors o f self-reported and self-measured waist circumference (cm)
95% C It 95% C It
SR-reference 1 0 0 -7.14 7.18 -21.50, 6.47 62 -5,16 8.53 -22.2, 11.90
SM-reference 1 0 1 -0.55 2.99 -6.53, 5.43 62 -0.56 2.36 -5.28, 4.46
|95% confidence interval limits of agreement (±2 SD of the mean error); SR-reference = self-reported
waist circumference minus reference values measured by investigator; SM-reference = self-measured
waist circumference using ‘Waist Watcher’ minus reference values measured by investigator.
406

Table 10.1.2. Proportions of subjects in different categories of waist circumference
Action Levels identified from measuiements made by investigator (reference), from self-
reported, and from subjects self-measmements using the ‘Waist Watcher’ tape measure.
By investigator
(reference)
Self-reported Self-measured
Waist circumference (cm) n % n % n %
Men {n = 101)
<94 40 39.6 63 62.4 38 37.6
94-102 27 26.7 26 25.7 30 29.7
> 1 0 2 34 33.7 1 2 11.9 33 32.7
Women (n = 62)
<80 27 43.5 36 58.1 28 45.2
80-88 17 21A 18 29.0 16 25^
> 8 8 18 29.0 8 12.9 18 29.0
407

Table 10.1.3. Sensitivities and specificities of the identification of subjects into different
waist circumference Action Level categories based on their reported and self-measured
waist circumference, using groups classified from measurements made by the
investigator as reference.
Self-reportedf Self-measured:|:
Sensitivity
(%)
Specificity
(%)
Sensitivity
(%)
Specificity
(%)
Men {n = 101)
Action Level 1 (94 cm) 57.4 92.5 1 0 0 95.0
Action Level 2 (102 cm) 32.4 98.5 97.1 1 0 0
Women {n = 62)
Action Level 1 (80 cm) 74.3 1 0 0 94.3 96.3
Action Level 2(88 cm) 27.8 93.2 1 0 0 1 0 0
fWaist circumference was reported by subjects from home-assessment; :|:self-classification into waist
circumference categories by subjects was aided by ‘Waist Watcher’ tape measure which has three band
colours separated by Action Levels (Figure 10.1.2).
408

i
Figure 10.1.1. The ‘Waist Watcher’ tape measure.
409

I
II
p f
f T"
c/5 c3
Ü CX, Ç/)•5 T3 PQI
o 1c m
.2 c
(U
111g g W
i i | I I 1i !lÇ2 T3
it■ ".s I^ s- a
& i ai | lCLhri
ÛÛ(u S
0 >= IM Sb ^
.è'>
oTf

§ î0 )
l î1 1o . 0 c 0 0
11*-(g y -ro 0^ W
30
20
1 0
0
- 1 0
-20
Men
+2SD
A ction A ction L evel 1 L evel 2
r = -0.627, P <0.001
•••
-2 SD
_ 3 0 1 » 1 « 1 « I « r— » 1 « 1 ' 1 1— I • 1 » 1 » 1 « 1 < 1 «—
7 0 7 4 7 8 82 86 90 94 98 102 106 110 114 118 122 126 130
a Reference waist circumference (cm)
S e 's aI s ^ s
i l
I I4-4 I-.52 ±:I 1
30
20
10
0
-10
-20
-30
Women
+2 SD
A ction A ction L evel I L evel 2*
r = -0.447, P <0.001
"% #: -g —
-2 SD
60 64 68 72 76 80 84 88 92 96 100 104 108 112 116 120
b Reference waist circumference (cm)
Figure 10.1.3. Plots of errors of self-reported waist circumference (subjects’ self-
reported values minus reference values measured by investigator) against reference
values, in 101 men (a) and 62 women (b). Solid line indicates mean eiTor, and dashed
lines indicate 95% confidence interval limits of agreement (±2 SD of the mean error).
411

J }T3 0
§ 1I .E 2
I sE
i t
20
15
10
5
0
-5
-10
-15
-20
Men
+2SD
A ction A ction L evel 1 L evel 2
r = -0.363, P <0.001
-2 SD
70 74 78 82 86 90 94 98 102 106 110 114 118 122 126 130
a Reference waist circumference (cm)
IIIf"O 0
| iI ?ZJ 3
I s0 E
i t
20
15
10
5
-10
-15
-20
Women
+2SD
-2 SD
A ction A ction L evel 1 L evel 2
r = 0.020, P = 0.877
% »
6 0 6 4 6 8 72 7 6 80 84 88 92 96 100 104 108 112 116 120
b Reference waist circumference (cm)
Figure 10.1.4. Plots of errors of self-measured waist circumference using ‘Waist
Watcher’ tape measure (subjects’ self-measured values minus reference values measured
by investigator) against reference values, in 101 men (a) and 62 women (b). Solid line
indicates mean error, and dashed lines indicate 95% confidence interval limits of
agreement (±2 SD of the mean eiTor).
412

§ Men r = 0.189, P = 0.060
+2 SD
I #*• # *
• • •
-2 SD
30 40 45 50 55 60 65 7025 35
a Age (years)
i 1 I s ' t §O <D
S m
E 0
I Iw 4 _ 0 ^ (/)
30
20
10
0
-10
-20
-30
b
Women
+2SD
r --0 .2 3 0 , f -0 .0 7 3
-2 SD
• #
25 30 35 40 45 50 55 60 65 70
Age (years)
Figure 10.1.5. Plots of errors of self-reported waist circumference (subjects’ self-
reported values minus reference values measured by investigator) against subjects’ age,
in 101 men (a) and 62 women (b). Solid line indicates mean eiTor, and dashed lines
indicate 95% confidence interval limits of agreement (±2 SD of the mean eiTor).
413

Men r = 0 .113,^ = 0.263
II"O g) +2SDP
-2SD
I ^% eg % -20
25 30 4035 5545 50 60 65 70
a Age (years)
Ig
If"O 0
§ 1
I IÜ) £
> p .
20
15
10
5
0
-5
-10
-15
-20
Women
+ 2 S p _________
- # . * %
r =-0.013, f = 0.919
***—*■* #
-2 SD
25 30 35 4 0 45 50 55 6 0 6 5 7 0
b Age (years)
Figure 10.1.6. Plots of errors of self-measured waist circumference using ‘Waist
Watcher’ tape measure (subjects’ self-measured values by minus reference values
measured by investigator) against subjects’ age, in 101 men (a) and 62 women (b). Solid
line indicates mean error, and dashed lines indicate 95% confidence interval limits of
agreement (±2 SD of the mean eiTor).
414

CHAPTER ELEVEN
GENERAL DISCUSSION OF THE FINDINGS
AND CONCLUSIONS OF THE PRESENT
THESIS
11 CONTENTS OF CHAPTER ELEVEN PAGES
11.1 Overall conclusions of the findings and answers to research 416
questions
11.1.1 Development of simple anthropometric methods for assessing 416
body morphology
11.1.2 Relationships between body morphology and metabolic disorders 416
11.1.3 Some determinants of body morphology and metabolic disorders 417
11.1.4 Implications of altered body morphology on health risks applied 418
towards health promotion
11.2 Validity of conclusions, limitations of the studies in the 418
present thesis, and future research directions
11.2.1 Validity and limitations of the studies and further research needs 418
11.2.2 Future research directions 419
415

11.1 Overall conclusions of the findings and answers to research
questions
11.1.1 Development of simple anthropometric methods for assessing body
morphology
Recognising the limited success in preventing the rising prevalence of overweight in
Western countries, the studies in the present thesis have focused on the development and
validation of a simple method for assessing adiposity. Several approaches were taken to
re-examine, develop and validate a wide range of methods to determine adiposity. The
research question “ylre existing methods o f measuring body morphology satisfactory in
terms o f accuracy and practica lity^ was answered in Chapter 3.1. It was shown that
conventional skinfold method ai’e not entirely satisfactory because it underestimated
body fat in extreme central fatness and older age. Waist circumference method showed
no bias in these groups. The advantages of the waist circumference method are the
convenience and ease of measurement. The equations employing waist circumference
were found to be robust in cross-validation with a Dutch sample. Research question
“Caw a better novel method be derived to reflect central fa t and total adiposityT" was
posed. In Chapter 4.1, it is argued that the waist circumference is better by virtue of
practicality, and also its better reflection of both total fat and central (intra-abdominal)
fat. Further more, ROC analysis has shown that waist circumference ‘Action Level 1 ’
coincided with the ‘optimal’ cut-offs, where sensitivity equals specificity for identifying
major cardiovascular risk factors.
11.1.2 Relationships between body morphology and metabolic disorders
It is now well accepted that excessive intra-abdominal fat aecumulation is a health
hazard, and that waist circumference reflects this fat mass. To answer the research
question “LTow well does waist circumference relate to metabolic disorders compared to
the existing methods o f body mass index and waist to hip ra tioT \ A series of cross-
sectional epidemiological studies in Chapter 5 showed that waist circumference related
at least as well as other commonly used antlrropometric indices of body mass index and
waist to hip ratio, to a cluster of symptoms and clironic diseases including
416

cardiovascular risk factors, respiratory insufficiency, diabetes mellitus, symptoms of low
back pain and impairment of quality of life. Analyses in chapter 4 show that there is no
need to adjust waist circmnference for height.
11.1.3 Some determinants of body morphology and metabolic disorders
Animal studies have shown imbalance diet during early growth can affect skeletal
structiue. The research question ''Does disproportionate stature (limb lengths relative to
height) associate with health hazardsT was answered in a study of body lengths in
Chapter 8. Men and women with body disproportions appeared to relate to specific
metabolic disorders. This was a relatively small study in relation to the prevalence of
disease, so the apparent difference between men and women should ideally be confirmed
in larger samples.
Several studies have indicated that increased proportions of type 2b muscle fibres are
associated with featuies related to metabolic syndrome X. It has previously been
established that athletes who are specialised in power sports tend to have higher
proportions of type 2 b muscle fibres, as opposed to type 1 muscle fibre predominance in
athletes who are specialised in endurance sports. The research questions "Is the
musculoskeletal system affected by low birth weight, contributing to altered body
functional capacity in adult lifel and "Do individuals with declared natural ability in
pow er sports suffer higher rate o f coronary heart diseaseT were answered in a
retrospective self reported study of former soldiers in Chapter 9. The data supported
Barker et al, in showing a significant relationship between low birth weight and CHD.
There was an indication that those who reported having a natural ability in power sports
at the age between 16-40 to have increased risk of coronary heart disease and
predisposing risk factors, compared to those who considered themselves as having a
natural endurance sporting ability. There was no interaction between birth weight and
sporting ability on metabolic disorders. Compaied to men with a natural ability in
endurance sports and above median birth weight, those with a natui'al ability in power
417

sports and below median birth weight were more likely to develop cardiovascular
disorders later in life.
11.1.4 Implications of altered body morphology on health risks applied towards
health promotion
Waist circumference has been suggested as a simple method for assessing associated
health risk, directed at the general public. Research questions posed in the present thesis
"Is self-reported waist circumference reliableT'' and "Does a patent W aist Watcher'
tape measure improve self-measurement?'’ was answered by a study of reported home-
based measurement and waist measurement using the ‘Waist Watcher’ tape measure.
Results in Chapter 10 showed that the error was reduced with the use of the ‘Waist
Watcher’ and that more than 95% of subjects were able to self-classify themselves
con'ectly into different categories according to the waist ‘Action Levels’.
Conclusion
An attempt to synthesise the findings in this thesis, together with evidence collected by
other, is made in Figure 11.2.1, as a progression from the simple model shown in
Figure 1.2.1. Some of the new links are firmly established by evidence, others remain
speculative.
11.2 Validity of conclusions, limitations of the studies in the present
thesis, and future research directions
In this section, the validity of the conclusions and limitations of the studies in the
present thesis, and future research direction are discussed. Possible mechanisms linking
body morphology, early growth and metabolic complications will be formulated to
postulate further hypotheses for future studies.
11.2.1 Validity and limitations of the studies and further research needs
The present thesis has drawn on a wide range of studies to explore the importance of
body morphology in relation to metabolic disorders in adults. The assoeiations of
418

overweight and fat distribution with metabolic disorders were obtained mostly from
cross-sectional studies. To be able to confirm aetiological relationship, a longitudinal
follow up is necessary, and this is underway in the MORGEN study. The retrospective
follow up study of natural sporting ability and coronary heart disease in later life used
indirect markers and reported information rather than actual physical and biological
measurements. Prospective studies using measured variables should be conducted to
confirm the findings from this study. This study, and the analysis of limb length and
disease aie both limited by relatively small size in relation to the prevalences of diseases
in the samples.
The present thesis has derived a number of anthiopometric methods based on waist
circumference measurement to identify body fatness. Measurements of waist
circumference was highly reproducible. Derived predictive equations and standard cut
offs of waist circumference to define body mass index and waist to hip ratio were found
to be robust in cross-validation on different populations. The same cut-off points were
found using different methodological and analytical approaches, e.g. analysis of risk
factors. Waist circufmerence, strongly reflects intra-abdominal, correlated consistently
with a variety of symptoms and indices o f ill health. Thus the methods employing waist
circumference can be applied for assessing health risk associated with obesity and
abdominal fat accumulation confidently by health professionals, and in health promotion
directed at the general public.
11.2.2 Future research directions
Extensive research into the aetiology of overweight and body fat distribution as
indicators of ill health and metabolic disorders has focused on genetic and
environmental factors and their interactions. However, recent evidence emerged from
the epidemiological studies of Barker and colleagues has pointed towards early
malnutrition, reflected by poor growth, as a major determinant of the same metabolic
diseases in adulthood, including cai’diovascular disease, diabetes and lung disease. These
authors’ interpretations of the associations between increased risks of diseases in adults
419

and their low weight at birth or at one year were based on the ‘tlirifty phenotype’
hypothesis which suggests that growth and development of vital organs ar e sacrificed to
sustain brain growth when mifavourable conditions occur (e.g. malnutrition). If this
occm's during the critical period of early growth, the ‘programming’ hypothesis suggests
vital organs may be permanently damaged; these functional defects can persist into adult
life, rendering subjects greater susceptibility to ill health.
Does muscle fibre composition have a direct influence on metabolic diseases, or does it
require the metabolism of the muscle fibres through different metabolic pathways to
express the metabolic risks exerting on the cardiovascular system and other organs? Is it
possible that failure in growth at a specific time of pregnancy and/or the severity of the
insult determines the composition, and thus functional capacity of skeletal muscles?
According to the ‘tlirifty phenotype’ hypothesis used to explain the relationsliips
between early growth and metabolic disorders, muscle morphology may also be affected
by early growth. It would be expected that type 2 muscle fibres are more predominant in
people who were malnouiished (low birth weight) during intra-uterine development. In
such adverse condition, blood may be diverted towards the brain at the expense of
peripheral organs. This hypothesis is supported by several studies of blood distribution.
Clironic hypoxia, produced by embolisation of the unteroplacental bed in fetal lamb, led
to blood redistributed towards the brain (Reuss et al, 1982; Block et al 1984). Blood
flow redistributed towards the brain has also been shown in asymmetrical, relatively
larger head than waist circumference, growth retaided human foetuses (Al-Ghazali et al,
1989). Thus in such situation of peripheral blood (nutrient) deprivation, the skeletal
muscles would probably adapt towai'ds a metabolic system relying less on oxidative, i.e.
more glycolytic, less vascularised type 2 muscle fibres. The morphology and function of
the skeletal muscles would then be permanently ‘programmed’ for life, limiting subjects
to rely on glycolytic metabolism, with a decreased ability to perform physical activities
involving oxidative metabolism, whereas the ability to perform power activities which
are not dependent on oxygen would probably not be impaired. Barker (1994) has
proposed that early growth restraint, including undernutrition at different stages of
420

pregnancy may result in disproportionate body size, accompanied by abnormal
development of organs, reflected by altered organ size, morphology and function, and
this may persist tlnoughout an individual’s life. It is possible that there may be many
more hierarchical steps to sustain growth of more vital organs, i.e. the nervous system,
vital organs and musculoskeletal system in that order. In the present study, we
hypothesise that the musculoskeletal system may be one of the first body organs to be
‘sacrificed’. This is in agreement findings from development of pigs reared on different
diet composition and energy intake (McCance, 1968).
Emerging from the present thesis, several future reseai'ch projects can be proposed.
1. Longitudinal studies of waist circumference and ill health.
2. Physiological measures of muscle function and metabolic status in different clinical
situations.
3. Follow up study of the effectiveness of the ‘Waist Watcher’ tape measure in self
weight management in free living subjects.
4. Long term intervention for primary prevention of obesity employing waist
circumference in high risk individuals.
421

HEALTH PROMOTION
Will power and restraint (negative)
Oxidative/glycolyticcapacity
Muscle fibre composition
TAPPETITE
(negative)
\Genetic x Environment Interactions including Thrifty Phenotype and Programming Effects
Foods & Nutrient
composition
ENERGYINTAKE
ENERGY STORES
(FAT)
ENERGY EXPENDITURE
^ ^ V A TBMR Physical Thermogenesis |
Activity
Aerobic/anaerobic performance abilitydistribution
METABOLIC DISORDERS & ILL HEALTH
I
Symptoms and poor
quality of life
Figure 11.2.1. Synthesis of possible links of substrate storage and utilisation with body morphology and metabolic disorders, incorporating results from the present thesis and those from research elsewhere, described in Chapter 1, as a progression from the simple model shown in Figure 1.2.1 The red indicates links strengthened by work in the present thesis.
422
REFERENCES
1. Abate N, Bums D, Peshock RM, Garg A, Gmndy SM. Estimation of adipose
tissue by magnetic resonance imaging: validation against dissection in human
cadavers. J Lipid Res 1994; 35:1490-96.
2. Abate N, Garg A, Coleman R, Grundy SM, Peshock RM. Prediction of total
abdominal, intraperitoneal, and retroperitoneal tissue masses in men by single
axial magnetic resonance imaging slice. Am J Clin Nutr 1997; 65:403-08.
3. A1 Ghazali W, Chita SK, Chapman MG, and Allan LD. Evidence of redistribution
of cardiac output in asymmetrical growdi retaidation. Br J Obstet Gynaecol 1989;
96:697-704.
4. Allon N. Self-perceptions of the stigma of overweight in relationship to weight-
losing patterns. Am J Clin Nutr 1979; 32:470-80.
5. Alvarsson M, Efendic S, Grill VE. Insulin response to glucose in healthy males are
associated with adult height but not with birth weight. J Intern M ed 1994;
236:275-79.
6 . Andersen P, Henriksson J. Capillary supply of the quadriceps femoris muscle of
man: adaptive response to exercise. J Physiol (Lond) 1977; 270:677-90.
7. Andersen RE, Wadden TA, Bartlet SJ, Vogt RA, Weinstock RS. Relation of
weight loss to changes in serum lipids and lipoproteins in obese women. Am J Clin
1995;62:350-57.
8 . Andrés R, Elahi D, Tobin JD, Muller DC, Brant L, Impact of age on weight goals.
Ann Intern M ed 1995; 103:1030-33.
423

9. Ashwell M, Cole TJ, Dixon AK. Obesity: new insight into the anthropometric
classification of fat distribution shown by computed tomography. Br M ed J 1985;
250:1692-94.
10. Ashwell M, Cole T, Dixon A. Ratio of waist circumference to height is strong
predictor of intra-abdominal fat. Br M ed J 1996; 313:559-60. [Lett].
11. Âstrand P-0, Rodahl K. Textbook o f work physiology. Physiological bases o f
exercise (3rd edn). New York: McGraw-Hill, 1986.
12. Atkinson RL. Proposed standards for judging the success o f the treatment of
obesity. Ann Intern M ed 1993; 119:677-80.
13. Austin MA, King M-C, Vranigan KM, Kimiss RM. Atherogenic lipoprotein
phenotype: a proposed genetic marker for coronary heart disease. Circulation
1990; 82:495-506.
14. Barata J, Schoen T, van Dijk T, Wilmore J. Comparison of two generalised
skinfolds protocols for assessing fat mass in young adult population engaged in
sport. Int J Obes 1993; 17(suppl 2):16. [Abstr].
15. Barker DIP, Osmond C, Golding J. Height and mortality in the counties of
England and Wales. Ann Hum Biol 1990; 17:1-6.
16. Barker DJP. Fetal and infants origins o f adult disease. London: BMJ Publishing
Group, 1992.
17. Barker DJP. Mother, babies, and disease in later life. London: BMJ Publishing
Group, 1994.
424

18. Bassey EJ. Demi-span as a measui'e of skeletal size. Ann Hum Biol 1986; 13: 499-
502.
19. Bedell G, Wilson W, Seebohm P. Pulmonary function in obese persons. J Clin
Invest 1958; 37:1049-60.
20. Bell RD, MacDougall JD, Billetter R, Howald H. Muscle fibre types and
moiphometric analysis of skeletal muscle in six-year-old children. M ed Soi Sports
Exerc 1980; 12:28-31.
21. Belsley DA, Kuh E, Welsch RE. Regression diagnostics: identifying influential
data and sources o f collinearity. New York: Wiley & Sons, 1980.
22. Benn RT. Some mathematical properties of weight-for-height indices used as
measures of adiposity. Br JP rev Soc M ed 1971; 25:42-50.
23. Bennett N, Dodd T, Flatley J, Freeth S, Bolling K. Health survey fo r England
1993: a survey carried out by the social survey division o f OPCS on behalf o f the
department o f health. London: HMSO, 1995.
24. Bjorntoip P. Adipose tissue in obesity (Willendorf Lecture). In: Hirsh J, Van
Itallie T (eds). Recent advances in obesity research IV, ppl63-70. London: John
Libbey, 1985.
25. Bjorntoip P. Classification of obese patients and complications related to the
distribution of surplus fat. Am J Clin Nutr 1987; 45 (suppl 5): 1120-25.
26. Bjorntoip P. Metabolic implications of body fat distribution. Diabetes Care 1991;
12:1132-43.
425

27. Bjôrntorp P. Biochemistry of obesity in relation to diabetes. In; Alberti KGMM,
DeFronzo RA, Keen H, Zimmet P. International textbook o f diabetes mellitus,
pp551“68. London: John Wiley & Sons, 1992.
28. Bjôrntorp P. The regulation of adipose tissue distribution in humans. Int J Obes
1996; 20:291-302.
29. Blair SN. Evidence for success of exercise in weight loss and control. Ann Intern
M ed 1993; 119:702-06.
30. Blair SN, Booth M, Gyarfas I, Iwane H, Marti B, Matsudo V et al. Development
of public policy and physical activity initiatives internationally. Sports M ed 1996a;
21:157-63.
31. Blair SN, Horton E, Leon AS, Lee I-M, Drinkwater BL, Dishman RK et al.
Physical activity, nutrition, and chronic disease. M ed Soi Sports Exerc 1996b;
28:335-49.
32. Bland JM, Altman DG. Statistical methods for assessing agreement between two
methods of clinical measurement. Lancet 1986; i:307-10.
33. Bland M. An introduction to medical statistics. Oxford: Oxford University Press,
1987.
34. Block BS, Llanos AJ, Creasy RK. Responses of the growth-retarded fetus to acute
hypoxemia. Am J Obstet Gynecol 1984; 148:878-85.
35. Boddy K, King PC, Hume R, Weyers E. The relation of total body potassium to
heights, weights, and age in normal adults. JC/zn Pathol 1972; 25:512-17.
426

36. Bolinder J, Kager L, Ostman J, Arner T. Differences at the receptor and post
receptor levels between human omental and subcutaneous adipose tissue in the
action insulin lipolysis. Diabetes 1883; 32:117-23.
37. Bonen A, Tan MH, Watson-Wright WM. Insulin binding and glucose uptake in
rodent skeletal muscle. Diabetes 1981; 30:702-04.
38. Bouchard C, Savard R, Després JP, Tremblay A, Leblanc C. Body composition in
adopted and biological siblings. Hum Biol 1985; 67:61-75.
39. Bouchard C, Pérusse L, Leblanc C, Tremblay A, Thériault G. Inlieritance of the
amount and distribution of human body fat. Int J Obes 1988; 12:205-15.
40. Bouchard C, Tremblay A, Després J-P, Nadeau A, Lupien PJ, Thériault G et al.
The response to long-term overfeeding in identical twins. N Engl J M ed 1990;
322:1477-82.
41. Bouchard C, Shephard RJ, Stephens T (eds). International proceedings and
consensus statement. Physical activity, fitness, and health. Champaign, II: Human
Kinetics Publishers, 1994.
42. Boyd-Orr J. Milk consumption and the growth of school children. Lancet 1928;
1:202-03.
43. Bremian GP, Ruhling RO, Shultz BB, Jolmson SC, Andrews BC. Physical
characteristics of patients with herniated intervertébral lumbar discs. Spine 1987;
12:699-702.
427

44. Brodie DA. Tecliniques of measuring body composition. Part I. Sports Medicine
1980;5:11-40.
45. Brooke MH, Kaiser KK. Muscle fibre types; how many and what kind? Arch
Neurol 1970; 23:369-79.
46. Brown DC, Byrne CD, Clark PM, Cox BD, Day NE, Hales CN. Height and
glucose tolerance in adult subjects. Diahetologia 1991; 34:531-33.
47. Buller AJ, Eccles JC, Eccles RM. Interactions between motorneurons and muscles
in respect to the characteristic speed of their responses. J Physiol (Lond) 1960;
150:417-39.
48. Burney PGJ, Luczynska C, Chinn S, Jarvis D. The European community
respiratory health survey. Eur Respir J \ 99A; 1:954-60.
49. Carey DG, Jenldns AB, Campbell TV, Freund J, Chisholm DJ. Abdominal fat and
insulin resistance in normal and overweight women. Diabetes 1996; 45:633-68.
50. Carey VJ, Walters EE, Colditz GA, Solomon CG, Willett WC, Rosner BA,
Speizer FE, Manson JE. Body fat distribution and risk of non-insulin-dependent
diabetes mellitus in women. The nurses’ health study. Am J Epidemiol 1997;
145:614-19.
51. Carr-Hill RA, Rice N, Roland M. Socioeconomic determinants of rates of
consultation in general practice based on fourth national morbidity sui'vey of
general practices. Br M ed J 1996; 312:1008-13.
428

52. Cai’diovascular Review Group Committee on Medical Aspects of Food.
Nutritional aspects o f cardiovascular disease: report o f food policy. London:
HMSO, 1994.
53. Casimirri F, Pasquali R, Cesari MP, Melcliionda N, Babara L. Intenelationships
between body weight, body fat distribution and insulin in obese women before and
after hypo caloric feeding and weight loss, Ann Nutr Metab 1989; 33:79-87.
54. Chan JM, Rimm EB, Colditz GA, Stampfer MJ, Willett WC. Obesity, fat
distribution, and weight gain as risk factors for clinical diabetes in men. Diabetes
Care 1994; 17:961-69.
55. Chowdhury B, Lantz H, Sjostrom L. Computed tomography-determined body
composition in relation to cardiovascular risk factors in Indian and matched
Swedish males. Metabolism 1996; 45:634-44.
56. Chumlea WC, Roche AF, Steinbaugh, ML. Estimating stature from knee height
for persons 60 to 90 years of age. J Am Geriatr Soc 1985; 33: 116-20.
57. Colditz GA. Economy costs of obesity. Am J Clin Nutr 1992; 55:503S-07S.
58. Colditz GA, Giovannucci E, Rimm EB, Stampfer MJ, Rosner B, Speizer FE et ah
Alcohol intake in relation to diet and obesity in women and men. Am J Clin Nutr
1991;54:49-55.
59. Colditz GA, Willett WC, Rotnitzky A, Manson JE. Weight gain as a risk factor for
clinical diabetes in women. Ann Intern M ed 1995; 122:481-86.
60. Colman E, Katzel LI, Rogus E, Coon P, Muller D, Goldberg AP. Weight loss
reduces abdominal fat and improves insulin action in middle-aged and older men
429

with impaired glucose tolerance. Metabolism: Clinical and Experimental 1995;
44:1502-8.
61. Crawley HF, Portides G. Self-reported versus measured height, weight and body
mass index amongst 16-17 year old British teenagers. Int J Obes 1995; 19:579-84.
62. Croft PR, Rigby AS. Socioeconomic influences on back problem in the
community in Britain. J Epidemiol Comm Health 1994; 48:166-70.
63. Dattilo AM, Kris-Etheiton PM. Effects of weight reduction on blood lipids and
lipoproteins: a meta-analysis. Am J Clin Nutr 1992; 56:320-28.
64. Davey-Smith G, Song F, Sheldon TA. Cholesterol lowering and mortality: the
importance o f considering initial level of risk. Br M ed J 1993; 306:1367-73.
65. DeFronzo RA. The triumvirate: p-cell, muscle, liver. A collusion responsible for
Type 2 diabetes. Diabetes 1988; 37:667-87.
6 6 . Dempsey JA, Reddan W, Balke B, Rankin J. Work capacity determinants and
physiologic cost of weight supported breathing in obesity. J Appl Physiol 1966;
21:1815-20.
67. Den Besten C, Vansaiit G, Weststrate JA, Deurenberg P. Resting metabolic rate
and diet induced thermogenesis in abdominal and gluteal femoral obese women
before and after weight reduction. Am J Clin Nutr 1988; 47:840-47.
6 8 . Dennis KE, Goldberg AP. Differential effects of body fatness and body fat
distribution on risk factors for cardiovascular disease in women. Arterioscler
Thromb 1993; 13:1487-94.
430

69. Den Tonkelaar I, Seidell JC, van Noord PAH, Baanders-van Halerwijn EA,
Ouwehand IJ. Fat distribution in relation to age, degree of obesity, smoking habits,
parity and estrogen use: a cross sectional study in 11 825 Dutch women
participating in the DOM-project. Int J Obes 1990; 14:753-61.
70. Den Tonkelaai' I, Seidell JC, Collette HJA. Body fat distribution in relation to
breast cancer in women pailicipating in the DOM-project. Breast Cancer Res
Treat \995\M iSS-6 \.
71. Dequeker JV, Baeyens JP, Caessens J. The significance of stature as a clinical
measurement of ageing. J Am Geriatr Soc 1969; 17: 169-79.
72. Després J-P, Mooijani S, Lupien PJ, Tremblay A, Nadeau A, Bouchaid C.
Regional distribution of body fat, plasma lipoproteins, and cardiovascular disease.
Arteriosclerosis 1990; 10:497-511.
73. Deurenberg P, Weststrate JA, van der Kooy K. Is an adaptation of Siri’s formula
for the calculation of body fat percentage from body density in the elderly
necessary? Eur JC linN utr 1989; 43:559-67.
74. Deurenberg P, Weststrate JA, Seidell JC. Body mass index as a measure of body
fatness age- and sex- specific prediction formulas. B rJN u tr 1991; 65:105-14.
75. Devlin JT. Effects of exercise on insulin sensitivity in humans. Diabetes Care
1992; 15 (suppl4): 1690-93.
76. Deyo RA, Bass JE. Lifestyle and low-back pain: the influence of smoking and
obesity. Spine 1989; 14:501-06.
431

77. Dirix A, Knuttgen HG, Tittel K (eds). The Encyclopaedia o f Sports Medicine: The
Olympic Book o f Sports Medicine, Oxford: Blackwell Scientific Publications,
1991.
78. Donalioe M, Rogers RM, Wildon DO, Pennock BE. Oxygen consumption of the
respiratory muscles in normal and in malnourished patients with clnonic
obstructive pulmonary disease. Am Rev Respir Dis 1989; 140:385-91.
79. Dunn G. Design and analysis o f reliability studies: the statistical evaluation o f
measurement errors. New York: Oxford University Press, 1989.
80. Duinin JVGA, Womersley J. Body fat assessed from total body density and its
estimation from skinfold thickness: measurements on 481 men and women from
16 to 72 years. Br JN utr 1974; 32:77-97.
81. Edwards KL, Austin MA, Newman B, Mayer A, Krauss RM, Selby JV.
Multivariate analysis of insulin resistance syndrome in women. Arterioscler
Thromb 1994; 14:1940-45.
82. Egger G, O'Neill M, Bolton A, Freeman D. Results of an abdominal obesity
reduction program for men only: the gutbuster ‘waisf loss program. Int J Obes
1995; 19 (suppl2):37. [Abstr].
83. Eldund JAE, Corlett EN. Shrinkage as a measirre of the effect of load on the spine.
Spine 1984;9:189-94.
84. Eisenburg BR. Quantitative ultrastructure of mammalian skeletal muscle. In: Hand
book o f physiology: skeletal muscle, p p 7 3 -lll. Peachey LD, Adrian RH, Geiger
SR (eds). Baltimore, MD: Williams and Willkins, 1983.
432

85. Eley S, Anderson AS, Lean MEJ, Paisley CM, Sparks P, Shepherd R. Constraints
on dietary choice: the experience of an involuntary decrease in household income.
In: Kohler BM, Feichtinger E, Bariosius E, Dowler E (eds). Poverty and fo o d in
welfare societies, pp 186-95. Berlin: Edition Sigma, 1997.
8 6 . Eriksson KF, Saltin B, Lindgarde. Increased skeletal muscle capillary density
precedes diabetes development in men with impaired glucose intolerance.
Diabetes 1994; 43:805-08.
87. European Atherosclerosis Society. Strategies for the prevention of coronary heart
disease: a policy statement of the European Atherosclerosis Society. Eur Heart J
1987;8:77-88.
8 8 . Eveleth PB, Tanner JM. Worldwide variation in human growth. Cambridge:
Cambridge University Press, 1976.
89. FAO/WHOAJNU. Energy and protein requirements. Report o f a jo in t
FAO/WHO/UNU expert consultation. Geneva, WHO: WHO teclmical report series
724, 1985.
90. Farebrother M, McHardy G, Munroe J. Relation between pulmonary gas exchange
and closing volume before and after substantial weight loss in obese subjects. Br
Met/T 1974; 3:391-93.
91. Ferrerio M, Carpenter MA, Chambless LE. Reliability of body fat distribution
measurements. The ARIC study baseline cohort results. Int J Obes 1995; 19:449-
57.
433

92. Filley GF, Beckwitt HJ, Reeves JT, Mitchell RS. Chronic obstructive
bronchopulmonary disease: II. Oxygen transport in two clinical types. Am J M ed
1968;44:26-38.
93. Fischbach GD, Robbins N. Changes in contractile properties of disused soleus
muscles. J Physiol (Lond) 1969; 201:305-20.
94. Fisher RA, Yates F. Statistical tables fo r biological, agricultural and medical
research. Table XXXIIL London: Longman Group, 1974.
95. Flodmark CE, Sveger T, Nilsso-Ehle P. Waist measurement correlates to a
potential atherogenic lipoprotein profile in obese 12-14 year-old children. Acta
Paediatr 1994; 83:941-5.
96. F loud R, Wachter K, Gregory A. Height, health and history: nutritional status in
the United Kingdom, 1750-1980. Cambridge: Cambridge University Press, 1990.
97. Fogel RW. Long-term changes in nutrition and the standard o f living. Proceedings
of Section B7. Ninth International Economic History Congress. Bern, 1986.
98. Fogel RW, Pope CL, Scrimshaw N, Temin P, Wimmer LT. The aging of Union
Army men: a longitudinal study. Mimeo: Center for Population Economics.
University of Chicago, 1986.
99. Fontvieille AM, Kiiska A, Ravussin E. Decreased physical activity in Pima Indian
compared with Caucasian children. Int J Obes 1993; 17:445-52.
100. Fox EL, Bowers RW. Ross ML. The physiological basis o f physical education and
athletics (4th edn). Dubuque, Iowa: Wm C Brown Publishers, 1988.
434

101. Friedewald WT, Levy RI, Fredrickson DS. Estimation of the concentration of low
density lipoprotein eholesterol in plasma without the use of preparative
ultracentrafugation. Clin Chem 1972; 18:499-502.
102. Garn SM, Clark DC. Trends in fatness and the origins of obesity. Pediatrics 1976;
57:433-56.
103. Garrow JS. Energy and obesity in man. New York: Elsevier, 1974.
104. Garrow JS. Treat obesity seriously: a clinical manual. London: Churehill
Livingston, 1981.
105. Garrow JS. Indices of adiposity. Nutritional Abstract Reviews: Reviews in Clinical
Nutrition 1983; 53:697-708.
106. Garzillo MJ, Garzillo TA. Does obesity cause low back pain? J Manipulative
Physiol Ther 1994; 17:601-04.
107. Genant HK, Cann CE, Faul DD. Quantitative computed tomography for assessing
vertebral bone mineral. In: Dequeker J, Jolinston CC, Jr (eds). Non-invasive bone
measurements: methodological problems, pp215-49. Oxford: IRL Press, 1982.
108. German Society of Obesity Research (Deutche Gesellschaft fur
Adipositasforschung). Statement of the German Society of Obesity Research:
guidelines for the treatment o f obesity. Adipositas 1995; 9:6-10.
109. Gibson RS. Principles of nutritional assessment. Oxford: Oxford University Press,
1990.
435

n o . Giovaiinucci E, Ascherio A, Rimm EB, Coditz GA, Stampfer MJ, Willett WC.
Physical activity, obesity, and risk for colon cancer and adenoma in men. Ann
Intern Med 1995; 122:327-34.
111. Goldstein DJ. Beneficial health effects of modest weight loss. Int J Obes 1992;
16:397-415.
112. Gollnick PD, Armstrong RB, Saubert CW et ah Enzyme aetivity and fibre
composition in skeletal muscle of untrained and trained men. J Appl Physiol 1972;
33:312-19.
113. Gollnick PD, Armstrong RB, Saltin B, Sauber CW, Sembrowitsch WL, Shephard
RE. Effect of training on enzyme activity and fiber composition of human skeletal
muscle. J Appl Physiol 1973; 34:107-11.
114. Gray DS, Bray GA, Gemayel N, Kaplan K. Effect of obesity on bioelectrical
impedance. Am J Clin Nutr 1989; 50:255-60.
115. Green JH, Muers MF. Comparisons between basal metabolic rate and diet indueed
thermogenesis in different types of chronic obstructive pulmonary disease. Clin
Sci 1992; 83:109-16.
116. Gregory J Foster K Tyler H, Wiseman M. The dietary and nutritional survey o f
British adults. Office of Population Consensus and Surveys. Social Survey
Division. London: HMSG, 1990.
117. Griffin BA, Freeman DJ, Tait GW, Thomson J, Caslake MJ, Packard CJ, Shepherd
J. Role of plasma triglyceride in the regulation of plasma low density lipoprotein
(LDL) subtractions: relative contribution of small, dense LDL to coronary heart
disQeiSQ Atherosclerosis 1994; 106:241-253.
436

118. Grimby G, Broberg C, Krotkiewski K, Ki'otkiewski M. Muscle fibre composition
in patients with spinal cord lesion. Scand JRehabil M ed 1976; 8:37-42.
119. Grunstein R, Wilcox I, Yang TS, Gould Y, Hedner J. Snoring and sleep apnea in
men: association with central obesity and hypertension. Int J Obes 1993; 17:533-
40.
120. Haggmark T, Jansson, Eriksson E. Fibre type aiea and metabolic potential of the
thigh muscle in man after knee surgery and immobilization. Int J Sports M ed
1981;2:12-17.
121. Hales CN, Barker DJP. Type 2 (non-insulin-dependent) diabetes mellitus: the
thrifty phenotype hypothesis. Diabetologia 1992; 35:595-601.
122. Hall TR, Young TB. A validation study of body fat distribution as determined by
self-measurement of waist and hip circumferences. Int J Obes 1989; 13:801-07.
123. Han TS. Intra-uterine growth, body fa t distribution and body composition in
women. MSc Thesis: University of Aberdeen, 1994.
124. Han TS, Lean MEJ. Body composition in patients with non-insulin-dependent
diabetes and central fat distribution. Diabetic Medicine 1994; ll(suppl 1):S39.
[Abstr].
125. Han TS, McNeill G, Campbell DM. The relationship between women’s birth
weight and their current intra-abdominal fat mass. Proc Nutr Soc 1995a; 54:182A.
[Abstr].
437

126. Han TS, McNeill G, Baras P, Foster MA. Waist circumference predicts intra
abdominal fat better than waist:hip ratio in women. Proc Nutr Soc 1995b;
54:152A. [Abstr].
127. Han TS, van Leer EM, Seidell JC, Lean MEJ. Waist circumference action levels
predict cardiovascular risk factors: prevalence study in a random sample. Br Med J
1995c; 311:1401-05.
128. Han TS, Lean MEJ. Lower leg length as an index of stature in adults. Int J Obes
1996; 20:21-7.
129. Han TS, McNeill G, Campbell DM. The relationship between women’s birth
weight and their current cardiovascular function. Proc Nutr Soc 1996a; 55:253A.
[Abstr].
130. Han TS, Lean MEJ, Seidell JC. Waist circumference remains useful predictor of
coronary heart disease. Br Med J 1996b; 312:1227-28. [Lett].
131. Han TS, van Leer EM, Seidell JC, Lean MEJ. Waist cireumference as a screening
tool for cardiovascular risk factors: evaluation of receiver operator characteristies
(ROC). Obesity Research 1996c; 4:533-47.
132. Han TS, Richmond P, Avenell A, Lean MEJ. Waist circumference reduction and
cardiovascular benefits during weight management in women. Int J Obes 1997a;
21:127-34.
133. Han TS, McNeill G, Seidell JC, Lean MEJ. Predicting intra-abdominal fatness
from antlir'opometric measures: the influence of stature. Int J Obes 1997b (in
press).
438

134. Han TS, Seidell JC, Currall JEP, Morrison CE, Deurenberg P, Lean MEJ. The
influence of height and age on waist circumference as an index of adiposity in
adults. Int J Obes 1997c; 21:83-89.
135. Han TS, Schouten JSAG, Lean MEJ, Seidell JC. The prevalence of low back pain
and associations with body fatness, fat distribution and height. Int J Obes 19916.
(in press).
136. Hanley JA, McNeill BJ. The meaning and use of the aiea under of receiver
operating characteristic (ROC) curve. Radiology 1982; 143:29-36.
137. Hanson P. Clinical exercise testing. In: Blair SN, Painter P, Pate RR, Smith LK,
Taylor CB (eds). Resource manual fo r guidelines fo r exercise testing and
prescription, pp205-22. Philadelphia: Lea & Febiger, 1988.
138. Harris MI, Klein R, Welborn TA, Kneiman MV. Onset of NIDDM occurs at least
4-7 yr before clinical diagnosis. Diabetes Care 1992; 15:815-19.
139. Hartz AJ, Rupley DC, Rimm AA. Relationship of obesity to diabetes: influence of
obesity level and body fat distribution. Prev M ed 1983; 12:351-57.
140. Hartz AJ, Rupley DC, Rimm A A. The association of girth measurements with
disease in 32,856 women. Am J Epidemiol 1984; 119:71-80.
141. Heady JA, Morris JN, Kagan A, Raffle PAB. Coronary heart disease in London
busmen. A progress report with particular reference to physique. Br J Prev Soc
Meri 1961; 15:143-53.
142. Health Education Authority. Obesity and overweight. London: HEA, 1991.
439

143. Health Education Board for Scotland. Eating fo r health. Edinburgh; Health
Edueation Board for Scotland, 1997.
144. Heliovaara M. Body height, obesity, and risk of herniated lumbar intervertébral
disc. Spine 1987; 12:469-72.
145. Hellenius ML, de Faire U, Berglund B, Hamsten A, Krakau I. Diet and exercise
are equally effective in reducing risk for cardiovascular disease. Results of a
randomised controlled study in men with slightly to moderately raised
cardiovascular risk factors. 1993; 103:81-91.
146. Helmrich SP, Ragland DR, Leung RW, Paffenbai'ger RS. Physical activity and
reduced occurrence of non-insulin-dependent diabetes mellitus. N Engl J M ed
1991;325:147-52.
147. Henneman E, Somjen G, Carpenter D. Functional significance of cell size in spinal
motor neurons. J Neurophysiol 1965; 28:599-620.
148. Henriksson J, Reitman JS. Time course of changes in human skeletal muscle
succinate dehydrogenase an cytoclii'ome oxidase activities and maximal oxygen
uptake with physical activity and inactivity. Acta Physiol Scand 1977; 99:91-97.
149. Higgins M, Kannel W, Garrison R, Pinsky J, Stokes III J. Hazards of obesity - the
Framingham experience. Acta M ed Scand 1988; 723(suppl);23-36.
150. Hill AJ, Silver EK. Fat friendless and unhealthy: 9-year old children’s perception
of body shape stereotypes. Int J Obes 1995; 19:423-30.
151. Holmang A, Bjorntorp P. The effects of cortisol on insulin sensitivity in muscle.
Acta Physiol Scand 1992a; 144:425-31.
440

152. Holmang A, Larsson BM, Brezezinska Z, Bjôrntoip P. The effects of short-term
testosterone exposure on insulin sensitivity of muscles in female rats. Am J
Physiol 1992b; 262:E851-55.
153. Holmang A, Brezezinska Z, Bjorntorp P. Effects of hyperinsulinemia on muscle
fibre composition and capillarization in rats. Diabetes 1993; 42:1073-81.
154. Holley J, Milic-Emili J, Becklake M, Bates D. Regional distribution of pulmonaiy
ventilation and perfusion in obesity. T C/m Invest 1967; 46:475-81.
155. Horn FG, Goodner CJ. Insulin dose-response characteristics among individual
muscle and adipose tissues measured in the rat in vivo with ^(H)2-deoxyglucose.
Diabetes 1984; 33:153-59.
156. Houmard JA, McCulley C, Roy LK, Bruner KR, McCammon MR, Israel RG.
Effects of exercise training on absolute and relative measurements of regional
adiposity. Int J Obes 1994; 18:243-48.
157. Howald H. Training-induced morphological an functional changes in skeletal
muscle. Int J Sports Med 1982; 3:1-12.
158. Idler EL, Kasl SV, Lemke JH. Self-evaluated health and mortality among the
elderly in New Haven, Coimecticut, and Iowa and Washington Counties, Iowa,
\9S2-19S6. Am J Epidemiol 1990; 131:91-103.
159. Institute of Medicine. Weighing the options. Criteria fo r evaluating weight
management programs. Thomas PR (ed). Institute of Medicine. Washington DC;
National Academic Press, 1995.
441

160. Jackson AS, Pollock ML. Generalised equations for predicting body density of
men. Br JN utr 1978; 40:497-504.
161. Jackson AS, Pollock ML, Ward A. Generalised equations for predicting body
density of women. Med Sci Sports Exerc 1980; 12:175-82.
162. James DE, Jenkins AS, Kraegen EW. Heterogeneity of insulin action in individual
muscles in vivo. Am JPhsyio l 1985; 248:E567-74.
163. Jarrett RJ, Fitzgerald AP. Height and glucose tolerance. Diabetologia 1992;
35:191-92. [Lett].
164. Johnson D, Prud’homme D, Després J-P, Nadeau A, Tremblay A, Bouchard C.
Relation of abdominal obesity to hyperinsulinaemia and high blood pressure in
men. Int J Obes 1992; 16:881-90.
165. Jones DA, Round JM. Skeletal muscle in health and disease. A text book o f muscle
physiology. Manchester: Manchester University Press, 1990.
166. Kahn HA, Sempos CT. Statistical methods in epidemiology. Oxford: Oxford
University Press, 1989.
167. Kahn HS. Choosing an index for abdominal obesity: an opportunity for
epidemiologic clarification. J Clin Epidemiol 1993; 46:491-94.
168. Kannel WB, Cupples LA, Ramaswami R, Stokes J III, Kreger BE, Higgins M.
Regional obesity and risk of cardiovascular disease; the Framingham study. J Clin
Epidemiol 1991; 44:183-90.
442

169. Kanaley JA, Andersen-Reid ML, Oemiing L, Kottle BA, Jensen MD. Differential
health benefits of weight loss in upper-body and lower-body obese women. Am J
C/mVwm 1993; 57:20-6.
170. Kaplan GA, Camacho T. Perceived health and mortality: a nine-year follow-up of
the human population laboratory cohort. Am J Epidemiol 1983; 117:292-304.
171. Kaplan G, Bareli V, Lusky A. Self rated state of health and survival in elderly
adults. J Gerontol Social Sci 1988; 43:S114-20.
172. Katch V. Assessment of body composition: comments on prediction. In: Human
body composition and fa t distribution. Morgan NG (ed). Wageningen: Stichting
Netherlands Instituât voor de Voeding [distr], 1985 (Euro Nut report); 8:15-30.
173. Katterman R, Jaworek D, Moller G. Multicenter study of a new enzymatic method
of cholesterol determination. J Clin Chem Clin Biochem 1984; 22:245-51.
174. Kelly IE, Han TS, Wallaee AM, Walsh K, Lean MEJ. Body composition and
serum leptin in non-insulin dependent diabetes. Int J Obes 1997 (in press).
175. Kelsey JL. An epidemiological study of acute herniated lumbar intervertébral
discs. Rheum Rehabil 1975; 14:144-59.
176. Kelsey JL, Githens PB, O ’Conner T, Weil U, Calogero JA, Holford TR, et al.
Acute prolapsed lumber intervertébral disc: an epidemiologic study with special
reference to driving automobiles and cigarette smoking. Spine 1984; 9:608-13.
177. Kempen KPG, Saris WHM, Westerterp KR. Energy balance duimg an 8-wk
energy-restricted diet with and without exercise in obese women. Am J Clin Nutr
1995; 62:722-29.
443

178. Khosla T, Lowe CR. Indiees of obesity derived fiom body weight and height. Br J
Prev Soc Med 1967; 21:122-8.
179. Kissebah AH, Vydeligum N, Murray R et al. Relation of body fat distribution to
metabolic complications of obesity. J C/m Endocrinol Metab 1982; 54:254-260.
180. Kissebah AH, Peiris A, Evans DJ. Mechanisms associating body fat distribution
with the abnormal metabolic profile in obesity. In: Berry EM, Blondheim SH,
Eliahou HE, Shafiir E (eds). Recent advances in obesity research V, pp54-59.
London: John Libbey, 1986.
181. Kleinbaum DG, Kupper LL, Morgenstern H. Epidemiological research principles
and quantitative methods. California: Lifetime Learning, 1982.
182. Kline M. Mathematics in Western Culture. London: George Allen & Unwin, 1954.
183. Klissouras V. Heritability of adaptive variation. J Appl Physiol 1971 ; 31:338-44.
184. Klissouras V, Pirnay F, Petit J. Adaptation to maximal effort: genetics and age. J
Appl Physiol 1973; 35:288-93.
185. Klissoui’as V. Prediction of athletic performance: genetic considerations. Canad J
Appl Sport Sci 1976; 1:195-200.
186. Knowler WC, Bennett PH, Hamman RF, Miller M. Diabetes incidence and
prevalence in Pima Indians: a 19-fold greater incidence than in Rochester,
Minnesota. Am J Epidemiol 1978; 108:497-505.
444

187. Knowler WC, Pettitt DJ, Savage PJ, Bennett PH. Diabetes incidence in Pima
Indians: contributions of obesity and parental diabetes. Am J Epidemiol 1981;
113:144-45.
188. Kohrt WM, Kirwan JP, Staten MA, Bourey RE, King DS, Holloszy JO. Insulin
resistance in aging is related to abdominal obesity. Diabetes 1993; 42:273-81.
189. Komi PV, Vootasalo JHT, Havu M et al. Skeletal muscle fibres and muscle
enzyme activities in monozygotic and dizygotic twins of both sexes. Acta Physiol
Scand \911-, 100:385-92.
190. BCi'otkiewski M, Seidell JC, Bjorntorp P. Glucose tolerance and hyperinsulinaemia
in obese women: role of adipose tissue distribution, muscle fibre characteristics
and androgens. J Intern Med 1990; 228:385-92.
191. Kuczmarski RJ, Flegal KM, Campbell SM, Johnson CL. Increasing prevalence of
overweight among US adults. The National Health and Nutrition Examination
Surveys 1960-1991. 1994; 272:205-11.
192. Kvist H, Chowdhury B, Grangaid U, Tylen U, Sjostrom L. Total and visceral
adipose-tissue volumes derived from measurements with computed tomography in
adults men and women. Am J Clin Nutr 1988; 48:153-61.
193. Kvist H. Hallgren P, Jonsson L, Petterson P, Sjoberg C, Sjostrom L, Bjorntorp P.
Distribution of adipose tissue and muscle mass in alcoholic men. Metabolism
1993;42:569-73.
194. Lafontan M, Mauriege P, Galitzki J, Berlan M. Adrenergic regulation of regional
adipocyte metabolism. In: Vague J, Bjorntorp P, Guy-Grand B, Rebuffé-Scrive,
445

Vague P (eds). Metabolic Complications o f Human Obesities, ppl61~72.
Amsterdam: Elsevier, 1985.
195. Lapidus L, Bengtsson C, Larsson B, Pennert K, Rybo E, Sjostrom L. Distribution
of adipose tissue and risk of cardiovascular disease and death. 12 year follow-up of
participants in the population study of women in Gothenburg, Sweden, Br Med J
1984; 289:1261-63.
196. Larsson B, Svardsudd K, Welin L, Wilhelmsen L, Bjorntorp P, Tibblin G.
Abdominal adipose tissue distribution, obesity, and risk of cardiovascular disease
and death: 13 year follow-up of participants in the study of men born in 1913. Br
M e d J \9 U \ 228:1401-04.
197. LaRue A, Bank L, Jarvik L, Hetland M. Health in old age: how do physicians
ratings and self ratings compare? J 1979; 34:687-91.
198. Launer LJ, Harris T, Rumpel C, Madans J. Body mass index, weight change, and
risk of mobility disability in middle-aged and older women: the epidemiologic
follow-up study of NHANES I. JAMA 1994; 271:1093-98.
199. Law CM, Barker DJP, Osmond C, Fall CHD, Simmonds SJ. Early growth and
abdominal fatness in adult life. J Epidemiol Comm Health 1992; 46:184-86.
200. Law MR, Wald NJ, Wu T, Hackshaw A, Baily A. Systematic underestimation of
associations between serum cholesterol concentration and ischemic heart disease
in observation studies; data from the BUPA study. Br M edJ\99A \ 308:363-6.
201. Lean MEJ. Brown adipose tissue in humans. MD Thesis: University of
Cambridge, 1986.
446

202. Lean MEJ, Trayhurn P. Brown adipose tissue in humans. Journal o f Obesity and
Weight Regulation 1987; 6:234-53.
203. Lean MEJ, Powi'ie JK, Anderson AS, Garthwaite PH. Obesity, weight loss and
prognosis in type 2 diabetes. Diabetic Medicine 1990; 7:228-33.
204. Lean MEJ, Mann JI. Obesity, body fat distribution and diet in the aetiology of
non-insulin-dependent diabetes mellitus. In: Piekup J & Williams G (eds).
Textbook o f diabetes, ppl81-91. Oxford: Blackwell Scientific Publications, 1991.
205. Lean MEJ, Han TS, Morrison CE. Waist circumference indicates the need for
weight management. Br M edT 1995; 311:158-61.
206. Lean MEJ, Han TS, Deurenberg P. Predicting body composition by densitometry
from simple antliropometric measurements. Am J Clin Nutr 1996; 63:4-14.
207. Lean MEJ, Han TS, Riclnnond P, Avenell A. Weight loss with high and low
carbohydrate 1200 kcal diets. Eur J Clin 1997; 51:243-48.
208. Lee J. Odds ratio or relative risk for cross-sectional data? Int J Epidemiol 1994;
23:201-03.
209. Lemieux S, Prud'homme D, Nadeau A, Tremblay A, Bouchard C, Després J-P.
Seven year changes in body fat and viscera adipose tissue in women. Associations
with indexes of plasma glucose-insulin homeostasis. Diabetes Care 1996a;
19:983-91.
210. Lemieux S, Prud’homme D, Bouchard C, Tremblay A, Després J-P. A single
thi'eshold value of waist girth identifies normal-weight and overweight subjects
with excess visceral adipose tissue. Am J Clin Nutr 1996b; 64:685-93.
447

211. Levy E, Levy P, Le Pen C, Basdevant A. The economic cost of obesity: the French
s i t u a t i o n . J (90^5 1995; 19:788-92.
212. Lew EA, Garfinkle L, Variations in mortality by weight among 750 000 men and
womQn. J Chron Dis 1979; 32:563-76.
213. Lillioja S, Young AA, Cutler CL, Ivy JL, Abbott WC, Zawadzki JK et al. Skeletal
muscle capillary density and fibre type are possible determinants of in vivo insulin
resistance in man. J Clin Invest 1987; 80:415-24.
214. Lillioja S, Bogardus C. Insulin resistanee in Pima Indians. Acta Med Scand 1988;
723 (suppl): 102-19.
215. Lissner L, Bengtsson C, Lapidus L, Bjorkelund C. Smoking initiation and
cessation in relation to body fat distribution based on data from a study of Swedish
women. Am J Public Health 1992; 82:273-75.
216. Lithell H, Lingarde F, Hellsing K, Lundqvist G, Nygaaid E, Vessby B, Saltin B.
Body weight, skeletal muscle morphology, and enzyme activities in relation to
fasting serum insulin concentration and glucose tolerance in 48-year-old men.
Diabetes 1981; 30:19-25.
217. Lopes-Virella MF, Stone P, Ellis S, Colwell JA. Cholesterol determination in
high-density lipoproteins separated by three different methods. Clin Chem 1977;
23:882-84.
218. Lucas A. Programming by eaiJy nutrition in man. In: Bock GR, Whelan J (eds).
The childhood environment and adult disease, pp38-55. Chichister: John Wiley &
Sons, 1991.
448

219. Luce J. Respiratory complications of obesity. Chest 1980; 78:626-31.
220. Lukaski HC, Bolonchuk WW, Hall CB, Siders WA. Validation of tetrapolar
bioelectrical impedance method to assess human body composition. J Appl
Physiol 1986; 60:1327-32.
221. Lumey LH, Stein AD, Ravelli AC. Maternal recall of birthweights of adult
children: validation by hospital and well baby clinic records. Int J Epidemiol 1994;
23:1006-12.
222. McCance RA. The effect of calorie deficiencies and protein deficiencies on final
weight and stature. In: McCance RA, Widdowson EM (eds). Calorie deficiencies
and protein deficiencies, pp319-28. London: Churchill, 1968.
223. McKeigue PM. Impaired glucose tolerance and height. Br Med J 1991; 303:365.
[Lett].
224. McNeill G, Fowler PA, Maughan RJ, McGaw BA, Fuller MF, Gvozdanovic D,
Gvozdanovic S. Body fat in lean and overweight women estimated by six
methods. Br JN utr 1991; 65:95-103.
225. Maddox GL, Douglass E. Self assessment of health: a longitudinal study of elderly
subjects, J Health Soc Behav 1973; 14:87-93.
226. Manson JE, Rimm EB, Stampfer MJ et al. Physical activity and incidence of non-
insulin- dependent diabetes mellitus in women. Lancet 1991; 338:774-78.
227. Manson JE, Willett WC, Stampfer MJ, Colditz DJ, Hunter DJ, Hankinson SE et
al. Body weight and mortality among women. New Engl J Med 1995; 333:677-85.
449

228. Marin P, Andersson B, Ki'otkiewski M, Bjorntorp P. Muscle fibre composition and
capillary density in women and men with NIDDM. Diabetes Care 1994; 17:382-
86 .
229. Maitorell R, Habicht J-P. Growth in early childhood in developing countries. In:
Falkner F, Tanner JM. 1986, Vol 3:241-59.
230. Medical Outcomes Trust (2nd printing). How to score SF-36 health survey.
Boston: Medical Outcomes Trust, 1994.
231. Mellin G. Correlations of spinal mobility with degree of chronic low back pain
after correction for age and antlnopometric factors. Spine 1987; 12:464-68.
232. Mitchell RS, Filley GF. Chronic obstructive bronchopulmonary disease: I. Clinical
feature. Am Rev Resp Med 1964; 89:360-71.
233. Mooy JM, Grootenhuis PA, De Vries H, Valkenburg HA, Bouter LM, Kostense
PJ, et al. Prevalence and determinants of glucose intolerance in Dutch Caucasian
population. Diabetes Care 1995; 18:1270-73.
234. Morris JK, Cook DG, Shaper AG. Non-employment and changes in smoking,
drinking, and body weight. Br Med J 1992; 304:536-41.
235. Morris JN, Heady JA, Raffle PAB, Roberts CG, Parks JW. Coronary heart disease
and physical activity of work. Part I. Lancet 1953a; ii: 1053-57.
236. Morris JN, Heady JA, Raffle PAB, Roberts CG, Parks JW. Coronary heart disease
and physical activity of work. Part II. Lancet 1953b; ii: 1112-20.
450

237. M onis JN, Heady JA, Raffle PAB. Physique of London busmen. Epidemiology of
uniforms. Lancet 1956; ii;569-70.
238. Morris JN, Everitt MG, Pollard R, Chave SPW. Vigorous exercise in leisure-time:
protection against coronary heart disease. Lancet 1980; ii: 1207-10.
239. Morris JN, Clayton DG, Everitt MG, Seminence AM, Burgess EH. Exercise in
leisure-time: coronary heart attack and death rates. Br Heart J 1990; 63:325-34.
240. Morrison CE, Woodward M, Leslie W, Tunstall-Pedoe H. Effect of
socioeconomic group of, management of, and survival after myocardial infarction
and coronary death: analysis of connnunity coronary event register. Br Med J
1997;314:541-46.
241. Mossey JM, Shapiro MA. Self-rated health: a predictor of mortality among the
elderly. Am J Public Health 1982; 72:800-08.
242. Moy CS, Songer TJ, LaPoit RE, Doman JS, Kiiska AM, Orchard TJ, Becker DJ,
Drash AL. Insulin-dependent diabetes mellitus, physical activity, and death. Am J
Epidemiol 1993; 137:74-81.
243. Must A, Jaques PF, Dallai GE, Bajema CJ, Dietz WH. Long term morbidity and
mortality of overweight adolescents: a follow-up of the Harvard growth study of
1922 to 1935. N E n g lJM ed 1992; 327:1350-05.
244. Naimark A, Cherniak RM. Compliance of the respiratory system and its
components in health and obesity. J Appl Physiol 1960; 15:377-82.
451

245. Nakatsuka H, Satoh H, Watanabe T, Ida Y, Nishigouri M, Ikeda M. The
reproducibility of reported height and body weight in repeated questionnaire
surveys. Int J Obes 1995; 19:50-56.
246. Noruàis MJ. Base System User’s Guide, SPSS for Windows: Release 6. SPSS inc.,
Chicago, II 1993.
247. Office of Health Economics. Obesity. London: Office of Health Economics, 1994.
248. Ohlson LO, Larsson DC, Svardsudd K Wellin L, Erikson H, Wilhelmsen L et al.
The influence of body fat distribution on the incidence of diabetes mellitus - 13.5
years of follow-up of the paidicipants in the study of men born in 1913. Diabetes
1985;34:1055-58.
249. Openbrier DR, Irwin MM, Rogers RM, Gottlieb GP, Dauber JH, van Thiel DH,
Pennock BE. Nutritional status and lung function in patients with emphysema and
chronic bronchitis. Chest 1983; 83:17-22.
250. Paffenbarger RS, Laughlin ME, Gima AS, Black RA. Work activity of
longshoremen as related to death from coronary heart disease and stroke. N Engl J
MW 1970; 282:1109-14.
251. Paffenbarger RS, Hyde RT, Wing AL, Hsieh C-C. Physical activity, all-cause
mortality, and longevity of college alumni. N Engl J Med 1986; 314:605-13.
252. Pate RR, Pratt M, Blair SN et al. Physical activity and public health: a
recommendation from the Centers for Disease Control and Prevention and the
American College of Sports Medicine. JAMA 1995; 273:402-07.
452

253. Pijls LTJ, Feskens EJM, Kromhout D. Self-rated, mortality, and chronic diseases
in elderly men: the Zutphen study, 1985-1990. Am J Epidemiol 1993; 138:840-48.
254. Pless CE, Pless IB. How will they remember. The accuracy of parent reports. Arch
Pediatr Adolesc Med 1995; 149:553-58.
255. Poehlman ET, Tremblay A, Després J-P, Fontaine E, Pérusse L, Thériault G,
Bouchard C. Genotype-controlled changes in body composition and fat
morphology following overfeeding in twins. Am J Clin Nutr 1986; 43:723-31.
256. Popkess-Vawter S, Patzel B. Compounded problem: low back pain and
overweight in adult females. Orthop Nurs 1992; 11:31-35.
257. Pouliot M-C, Després JP, Lemieux SL Mooijani S, Bouehard C, Tremblay A,
Nadeau A, Lupien PJ. Waist circumference and abdominal sagittal diameter: best
simple anthropometric indexes of abdominal visceral adipose tissue accumulation
and related cardiovasculai' risk in men and women. Am J Cardiol 1994; 73:460-68.
258. Prentice AM. Alcohol and obesity. Int J Obes 1995; 19(suppl 5):S44-S50.
259. Prentice AM, Jebb SA. Obesity in Britain: gluttony or sloth? Br Med J 1995;
311:437-39.
260. Quetetlet LAJ. Physique Sociale. Brussels: C Musquardt, 1869; Vol 2:92.
261. Racette SB, Schoelloer DA, Kushner RF, Neil KM. Exercise enhances dietary
compliance during moderate energy restriction in obese women. Am J Clin Nutr
1995; 62:345-49.
453

262. Randle PJ, Garland PB, Hales CN, Newsholme EA. The glucose fatty-acid cycle:
its role in insulin sensitivity and the metabolic disturbances of diabetes mellitus.
Lancet 1963; 1:785-89.
263. Randle PJ, Newsholme EA, Garland PB. Regulation of glucose uptake by muscle.
8. Effects of fatty acids, ketone bodies and pyruvate, and of alloxan-diabetes and
starvation, on the uptake and metabolic fate of glucose in rat heart and diaplnagm
muscles. Biochem J 1964; 93:652-65.
264. Rebuffé-Scrive M, Bjôrntoip P. Regional adipose tissue metabolism in man. In:
Vague J, Bjorntorp P, Guy-Grand B, Rebuffé-Scrive, Vague P, eds. Metabolic
Complications o f Human Obesities, pp 149-59. Amsterdam: Elsevier 1985.
265. Rebuffé-Scrive M, Ki'otkiewski M, Elfverson J, Bjorntorp P. Muscle and adipose
tissue morphology and metabolism in Cushing’s syndrome. J Clin Endocrinol
Metab 1988;67:1122-28.
266. Reeves SL, Varakamin C, Henry CJK. The relationship between arm-span
measurement and height with special reference to gender and ethnicity. Eur J Clin
Nutr 1996; 50:398-400.
267. Reilly JJ, Muiray LA, Durnin JVGA. Measuring the body composition of elderly
subject: a comparison of methods, Br JN utr 1994; 72:33-44.
268. Reuss ML, Parer JI, Haris JL, Ki’ueger TR. Haemodynamic effects of alpha-
adrenergic blockade during hypoxia in fetal sheep. Am J Obstet Gynecol 1982;
142:410-15.
454

269. Richelsen B, Pedersen SB. Association between different anthropometric
measurements of fatness and metabolic risk parameters in non-obese, healthy,
middle-aged men. Int J Obes 1995; 19:169-74.
270. Richter EA, Garetto LP, Goodman MN, Ruderman NB. Entranced muscle glucose
metabolism after exercise: modulation by local factors. Am J Physiol 1984;
246:E476-82.
271. Rimm EB, Stampfer MJ, Colditz GA, Chute GC, Litin LB, Willet WC. Validity of
self-reported waist and hip circumferences in men and women. Epidemiology
1990; 1:466-73.
272. Riquier D, Moiy G, Bouillaud F, Thibault J, Wiessenbach J. Rapid increase of
mitochondrial uncoupling protein and its mRNA in stimulated brown adipose
tissue. FEBS Lett 1984; 178:240-44.
273. Ross R. Léger L. Moris D, de Guise J, Guardo, R. Quantification o f adipose tissue
by MRI: relationship with antliropometric variables. J Appl Physiol 1992;72:787-
95.
274. Ross R, Shaw KD, Martel Y, de Guise J, Avruch, L. Adipose tissue distribution
measui’ed by magnetic resonance imaging in obese women. Am J Clin Nutr 1993;
57:470-75.
275. Roubenoff R, Wilson PWF. Advantage of knee height over height as an index of
stature in expression of body composition in adults. Am J Clin Nutr 1993; 57:609-
13.
276. Royal College of Physicians. Obesity. A report of the Royal College of
Physicians. Journal o f the Royal College o f Physicians 1983; 17:6-65.
455

277. Salmons. S, Vrbovâ G. The influence of activity on some contractile
characteristics of mammalian fast and slow muscles. JPhysio l 1969; 201:535-49.
278. Salmons S, Sréter FA. Significance of impulse activity in the transformation of
skeletal muscle type. Nature 1976; 263:30-34.
279. Salmons S, Henriksson J. The adaptive response of skeletal muscle to increased
use. Muscle and Nerve 1981; 4:94-105.
280. Saltin B, Blomqvist B, Mitchell JH et al. Response to exercise after bed rest and
after training. Circulation 1968; 38:1-77.
281. Saltin B, Gollnick PD. Skeletal Adaptability: significance for metabolism and
performance, in: Peachey LD, Adrian RH, Geiger SR (eds). Hand book o f
physiology: skeletal muscle, p555. Baltimore, MD: Williams and Wilkins, 1983.
282. Sanders K. Coronary-ailery disease and obesity. Lancet 1959; ii:432-35.
283. Schoeller DA, van Santen E, Paterson DW, Dietz W, Jaspan J, Klein PD. Total
body water measurement in human with and labelled water. Am J Clin Nutr
1980; 33:2686-93.
284. Schoenfeld DE, Malmrose EC, Blazer DG, Gold DT, Seeman TE. Self-rated
health and mortality in the high-functioning elderly - a closer look at healthy
individuals: MacArthur field study of successful aging. J Gerotol 1994; 49:M109-
15.
285. Schreiner PJ, Terry JG, Evans GW, Hinson WH, Crouse JR III, Heiss G. Sex-
specific associations of magnetic resonance imaging-derived intra-abdominal and
456

subcutaneous fat areas with conventional anthropometric indices. Am J Epidemiol
1996; 144:335-45.
286. Schuler G, Hambrecht R, Schlierf G, Niebauer J, Hauer KJ, et al. Regular physical
exercise and low-fat diet: effect on progression of coronary artery disease.
Circulation 1992; 86:1-11.
287. Scottish Intercollegiate Guidelines Network. Obesity in Scotland. Integrating
prevention with weight management. Edinburgh: Scottish Intercollegiate
Guidelines Network, 1996.
288. Scottish Office. "Scotland’s health. A challenge to us alV. Edinbiugh: HMSG,
1992.
289. Secretary of State for Health. The health o f the nation. A consultative document
fo r health in England. London: HMSG, 1991.
290. Segal KR, Van Loan M, Fitzgerald PI, Hodgdon JA, Van Itallie TB. Lean body
mass estimated by bioelectrical impedance analysis: a four site cross-validation
study. Am J Clin Nutr 1988; 47:7-14.
291. Seidell JC. Overweight and fa t distribution - associations Mdth aspects o f
morbidity. PhD Thesis: University of Wageningen, The Netherlands, 1986.
292. Seidell JC, Bakx KC, Deurenberg P, Burem J, Hautvast JGAJ, Huygen FJA. The
relation between overweight and self rated health according to age, social class,
slimming behavior and smoking habits in Dutch adults. Am J Public Health
1986a; 76:1410-15.
457

293. Seidell JC, de Groot LCPGM, van Sonsbeek JLA, Deurenberg P, Hautvast JGAJ.
Associations of moderate and severe overweight with self-reported illness and
medical care in Dutch adults. Am J Public Health 1986b; 76:264-69.
294. Seidell JC, Oosterlee A, Thijssen MAO, Buiema J, Deurenberg P, Hautvast GAJ
et al. Assessment of intra-abdominal and subcutaneous fat: relation between
anthropometry and computed tomography. Am J Clin Nutr 1987; 45:7-13.
295. Seidell JC, Oosterlee A, Deurenberg P, Hautvast JGAJ, Ruijs JHJ. Abdominal fat
depots measured with computed tomography: effects of degree of obesity, sex, and
age. Eur J Clin Nutr 1988; 42:805-15.
296. Seidell JC, Bjorntorp P, Sjostrom L, Sannerstedt R, Krotkiewski M, Kvist H.
Regional distribution of muscle and fat mass in men - new insight into the risk of
abdominal obesity using computed tomography. Int J Obesity 1989a; 13:289-303.
297. Seidell JC, Hautvast JGAJ, Deurenberg P. Overweight: fat distribution and health
risk. Epidemiological observations. Infusionstherapie 1989b; 16:276-81.
298. Seidell JC. Environmental influences on regional fat distribution. Int J Obes 1991;
15:31-5.
299. Seidell JC, Cigolini M, Charzewska J, Ellsinger B-M, Deslypere JP, Cruz A. Fat
distribution in European men: a comparison of anthropometric measurements in
relation to cardiovascular risk factors. Int J Obes 1992; 16:17-22.
300. Seidell JC. Obesity in Europe - scaling and epidemic. Int J Obes 1995a; 19(suppl
3):S1-S4.
458

301. Seidell JC. The impact of obesity on health status: some implications for health
care costs. Int J Obes 1995b; 19(suppl 6);S13-S16.
302. Seidell JC. Are abdominal diameters abominable indicators? In: Angel A,
Bouchard C (eds). Progress in obesity research, pp303-06. London: John Libbey,
1995c.
303. Seidell JC, Han TS, Feskens EJM, Lean MEJ. Narrow hips and broad waist
circumferences independently contribute to increased risk of NIDDM. J Intern
Med 1997 (in press).
304. Sharp J, Henry J, Sweany S, Meadows W, Pietras R. The total work of breathing
in normal and obese men. J C/m Invest 1964a; 43:728-38.
305. Sharp J, Henry J, Sweany S, Meadows W, Pietras R. Effects o f mass loading the
respiratory system in man. JA pp l Physiol 1964b; 19:959-66.
306. Shephard RJ. Body composition in biological anthropometry. New York:
Cambridge University Press, 1991.
307. Shimokata H, Muller DC, Andrés R. Studies in the distribution of body fat. JAMA
1989; 261:1169-73.
308. Simoneau J-M, Bouchard C. Human variation in skeletal muscle fiber type
proportion and enzyme activity. Am J Physiol 1989; 257:E567-72.
309. Simopoulos AP, Van Itallie TB. Body weight, health and longevity. Ann Intern
M e d \9 U : 100:285-95.
459

310. Sjostrom L, Narbo K, Sjostrom D. Costs and benefits when treating obesity. Int J
Obes 1996; 19 (suppl 6):S9-S12.
311. Siri WE. Body composition from fluid spaces and density analysis of methods. In:
Brozeck J, Henschel A (eds). Techniques For Measuring Body Composition,
pp223-44. Washington DC: National Academy of Sciences/National Research
Council, 1961.
312. Smit HA, Verschuren WMM, Bueno de Mesquitoa HB, Seidell JC. Monitoring
van risicofactoren en gezondheid in Nederland (MORGEN-project):
doelstellingen en werkwije. Raaportnummer 263200001, februari 1994.
313. Smith U. Obesity and insulin resistance - potential importance of adipose tissue
metabolism. In: Vague J, Bjorntorp P, Guy-Grand B, Rebuffé-Scrive, Vague P,
eds. Metabolic Complications o f Human Obesities, ppl73-78. Amsterdam:
Elsevier, 1985.
314. Sobal J, Nicolopoulos V, Lee J. Attitudes about overweight and dating among
secondary school students. Int J Obes 1995; 19:376-81.
315. Sohlstrom A, Wahlund L-O, Forsum E. Adipose tissue distribution as assessed by
resonance imaging and total body fat by magnetic resonance imaging, underwater
weighing, and body-water dilution in healthy women. Am J Clin Nutr 1993;
58:830-38.
316. Sonnichsen AC, Richter WO, Schwandt P. Benefit from hypocaloric diet in obese
men depends on the extent of weight loss regarding cholesterol, and on a
simultaneous change in body fat distribution regarding insulin sensitivity and
glucose tolerance. Metabolism 1992; 41:1035-40.
460

317. Sréter FA, Elzinger M, Salmons S et al. The Nx-methylhistodine content of
myosin in stimulated and cross-innervated skeletal muscles o f the rabbits. FEBS
Tert 1975; 57:107-11.
318. Staffieri JR. A study of social stereotype of body image in children. J Pers Soc
Psychol 197^; 7:101-04.
319. Steele RH, Heard BE. Size of the diaphragm in chronic bronchitis. Thorax 1973;
28:55-60.
320. Stewart AL, Brook RH. Effects of being overweight. Am J Public Health 1983;
73:171-78.
321. Stewart AL, Hays, RD, Wells KB, Rogers WH, Spritzer KL, Greenfield S. Long
term functioning and well-being outcomes associated with physical activity and
exercise in patients with chronic conditions in the medical outcomes study. J Clin
Epidemiol 1994; 47:719-30.
322. Stunkard AJ, Sorensen TIA, Hanis C, Teasdale YW, Chakraboily R, Schull WJ,
Schulsinger F. An adoption study of human obesity. New Engl J Med 1986;
314:193-98.
323. Stunkard AJ, Harris JR, Pedersen NL, McClearn GE. The BMI of twins who have
been reared apart. N Engl J Med 1990; 322:1483-87.
324. Stunkard AJ. Current views on obesity. Am J Med 1996; 100:230-36.
325. Sturmans F. Epidemiology: Theorie, Methoden en Toepassing. Nijmegen: Dekker
& van de Vegt, 1984.
461

326. Sullivan M, Karlsson J, Sjostrom L, Backman L, Bengtsson C, Bouchard C et al.
Swedish obese subjects (SOS) - an intervention study of obesity. Baseline
evaluation of health psychosocial functioning in the first 1743 subjects examined.
Int J Obes 1993; 17:503-12.
327. SuiTatt PM, McTier RF, Findley LJ, Pohl SL, Wilhoit SC. Effect o f very-low-
calorie diets with weight loss on obstructive sleep apnea. Am J Clin Nutr 1992;
56:182S-84S.
328. Suzuki S, Yamamuro T. Long-term effects of estrogen on rat skeletal muscle.
Exper Neurol 1985; 87:291-99.
329. Swai AB, Kitange H, Masuki G, Kilima PM, Alberti KGMM, McLarty DG. Is
diabetes mellitus related to undernutrition in rural Tanzania? Br Med J 1992;
305:1057-62.
330. Swinscow TDV. Statistics at square one. London: British Medical Association,
1983.
331. Tanner JM, Whitehouse RH, Hughes PCR, Vince FP. Effect of human growth
hormone treatment for 1 to 7 years on growth of 100 children, with growth
hormone deficiency, low birth weight, inherited smallness. Turner’s syndrome,
and other complaints. Arch Dis Childh 1971; 46:745-82.
332. Tanner JM, Hayashi T, Preece MA, Cameron N. Increase in length of leg relative
to trunk in Japanese children and adults from 1057 to 1977: comparison with
British and with Japanese Americans. Ann Hum Biol 1982; 9:411-23.
333. Tanner JM. Foetus into man: physical growth from conception to maturity.
London: Castlemead Publishing, 1989.
462

334. Thorstensson A, Sjodin B, Karlsson J. Enzyme activities and muscle strength after
“sprint training” in man. Acta Physiol Scand 1975; 94:313-18.
335. Thurlbeck WM. Diaphragm and body weight in emphysema. Thorax 1978;
33:483-87.
336. Treuth MS, Hunter GR, Kekes-Szabo T. Estimating intraabdominal adipose tissue
in women by dual X-ray absorptiometry. Am J Clin Nutr 1995; 62:527-32.
337. Troisi RJ, Heinold JW, Vokonas PS, Weiss ST. Cigarette smoking, dietary intake,
and physical activity: effects on body fat distribution - the normative aging study.
Am J Clin Nutr 1991; 53:1104-11.
338. Troy LM, Michels KB, Hunter DJ, Spiegelman D, Manson JE, Colditz GA et al.
Self-reported birthweight and history of having been breastfed among younger
women: an assessment of validity. Int J Epidemiol 1996; 25:122-27.
339. UK Prospective Diabetes study Group. UK Prospective Diabetes Study 6.
Complications in newly diagnosed type 2 diabetic patients and their association
with different clinical and biochemical risk factors. Diabetes Res 1990; 13:1-11.
340. US Department of Agriculture and US Department of Health and Human Services.
Dietary guidelines fo r Americans (3rd edn). Washington, DC: Publication GPO-
273-930, 1990.
341. Vague J. La différenciation sexuelle, facteur determinant des formes de l’obésité.
Presse Med 1947; 53:339.
342. Vague J. Le diabète de la femme androide. Presse Med 1949; 57:835.
463

343. Vague J. The degree of masculine differentiation o f obesity - factor determining
predisposition to diabetes, atherosclerosis, gout and uric calculus. Am J Clin Nutr
1956;4:20-34.
344. Valdez R. A simple model-based index of abdominal adiposity. J Clin Epidemiol
1991;44:955-56.
345. Vandenbergh E, van de Woestijne KP, Gyselen A. Weight changes in the terminal
stages of chronic obstructive pulmonary disease. Am Rev Respir Dis 1967; 95:556-
66 .
346. Van der Kooy K, Leenen R, Seidell JC, Deurenberg P, Hautvast JG. Effect of a
weight cycle on visceral fat accumulation. Am J Clin Nutr 1993; 58:853-57.
347. Van der Zee KI, Sanderman R. Het me ten van de algemene gezondheidstoestand
met de RAND-36: een handleiding. Groningen: Noordelijk Centrum voor
Gezondheidsvraagstukken, NCG, 1995.
348. Van Gaal LF. Body fa t distribution: endocrine, metabolic and therapeutic aspects
related to atherosclerosis. PliD Thesis: Universiteit Antwerpen, Antwerp,
Belgium, 1990.
349. Van Leer EM, van Noord PAH, Seidell JC. Components of adult height and height
loss: secular trend and effects of aging in women in the DOM project. Ann
Epidemiol 1992; 2:611-15.
350. Verschuren WMM. Blood cholesterol - a public health perspective. PhD Thesis:
Landbouwuniversiteit Wageningen, The Netherlands, 1995.
464

351. Vrbovâ G. Changes in the motor reflexes produced by tenotomy. J Physiol 1963;
192:39-40.
352. Waaler HT. Height, weight and mortality. The Norwegian experience. Acta Med
Scand Supplement 1984; 679:1-56.
353. Wadden TA, Steen SN, Wingate BJ, Foster GD. Psychosocial consequences of
weight reduction: how much weight loss is enough? Am J Clin Nutr 1996; 63
(suppl):461S-5S.
354. Wade AJ, Marbut MM, Round JM. Muscle fibre type and aetiology of obesity.
Lancet 1990; 335:805-08.
355. Walker L. Going down? Balance 1997; (issue 156, Mardi/April), pp41-45.
356. Watt T, Dodd F, Keegan M, Campbell IT. Accuracy and precision of techniques
used for measuring height in critically illness. Proc Nutr Soc 1994; 53: A67.
[Abstr].
357. Weidner MD, Gavigan KE, Tyndall GL, Hickey MS, McCammon MR, Houmard
JA. Wliich antlii’opometric indices of regional adiposity are related to insulin
resistance of aging. Int J Obes 1995; 19:325-330.
358. Wellens RI, Roche AF, Khamis HJ, Jackson AS, Pollock ML, Siervogel RM.
Relationships between body mass index and body composition. Obesity Research
1996; 4:35-44.
359. Wells N. Back pain. London: Office of Health Economics, 1985.
465

360. Wilcox 1, Collins FL, Grunstein RR, Hedner J, Kelly DT, Sullivan CE.
Relationship between chemo sensitivity, obesity and blood pressure in obstructive
sleep apnea. Blood Press 1994; 3:47-54.
361. Williams DRR, Byrn C, Clark PMS, Cox L, Day NE, Tauman G, Wang T, Hale
CN. Raised proinsulin concentration as early indicator of p cell dysfunction. Br
1991; 303:95-96.
362. Williamson DF, Pamuk E, Thun M, Flanders D, Byers T, Heath C. Prospective of
intentional weight loss and mortality in never-smoking overweight US white
women aged 40-64 years. Am J Epidemiol 1995; 141:1128-41.
363. Wilmore JH, Vodak PA, Parr RB, Girandola RN, Billing JE. Further
simplification of a method for determination of residual lung volume. Med Sci
Sports Exerc 1980; 12:216-18.
364. Wilson DO, Rogers RM, Wright EC, Anthonisen NR. Body weight in clironic
obstructive pulmonary disease: the National Institutes of Health Intermittent
Positive Pressure Breathing Trial. Am Rev Respir Dis 1989; 139:1435-38.
365. Wing RR, Jefferey RW, Burton LR, Kuller LH, Thorson C, Folsom AR. Change
in waist-hip ratio with weight loss and its association with change in
cardiovascular risk factors. Am J Clin Nutr 1992; 55:1086-92.
366. Wing RR, Jefferey RW. Effect of modest weight loss on changes in cardiovascular
risk factors: are there difference between men and women or between weight loss
and m a i n t e n a n c e ? J O t e 1995; 19:67-73.
367. Wolf AM, Colditz GA. Social economic effects of body weight in the United
States. Am J Clin Nutr 1996; 63(suppl):466S-69S.
466

368. Womersley J. Obesity: its assessment, significance and control. PhD Thesis:
University of Glasgow, 1974.
369. Wood PD. Impact of experimental manipulation of energy intake and expenditure
on body composition. Crit Rev Food Sci Nutr 1993; 33:369-73.
370. World Health Organization Study Group on Diabetes Mellitus. Diabetes mellitus.
World Health Organization Tech Rep Ser 1985; 727:1-113.
371. World Health Organization. Geographical variation in the major risk factors of
coronary heart disease in men and women aged 35-64 years. The MONICA
Project. World Health Stat Q 1988; 41:115-40.
372. World Health Organisation. Measuring obesity - classification and description o f
anthropometric data. Report on a WHO consultation on the epidemiology o f
obesity. Copenhagen: WHO Regional Office for Europe, 1989. [EUR/ICP/NUT
125,0612v.]
373. World Health Organisation. Expert Committee on Physical Status: The use and
interpretation o f anthropometry: report o f a WHO expert committee. Geneva:
World Health Organization Tech Rep Ser, 1995.
374. Wright D, Barrow S, Fisher AD, Florsley SD, Jayson MI. Influence of physical,
psychological and behavioui'al factors on consultation for back pain. Br J
Rheumatol 1995; 34:156-61.
375. Yamanouchi K, Shinozaki T, Chikada K, Nishikawa T, Ito K, Shimizu S, et al.
Daily walking combined with diet therapy is a useful means of obese NIDDM
467

patients not only to reduce body weight but also to improve insulin sensitivity.
Diabetes Care 1995; 18:775-78.
376. Young TK, Gelskey DE. Is noncentral obesity metabolically benign? JAMA 1995;
274: 1939-41.
377. Yudkin JS. How can we best prolong life? Benefits of coronary risk factor
reduction - non-diabetic and diabetic subjects. Br Med J 1993; 306:1313-18.
378. Zaadstra BM, Seidell JC, Van Noord PAH, te Velde ER, Habbema JDF, Vrieswijk
B, Karbaat J. Fat and female fecundity: prospective study of effect of body fat
distribution on conception rates. Br Med J 1993; 306:484-87.
379. Zerali F, Harf A, Perlemuter L, Lorina J, Torino AM, Atlan G. Effects of obesity
on respiratory resistance. Chest 1993; 103:1470-76.
380. Zhang Y, Proenca R, Maffei M, Barone M, Leopold L, Friedman JM. Positional
cloning of the mouse obese gene and its human homologue. Nature 1994;
372:425-32.
468

PUBLICATIONS ARISING FROM THE PRESENT THESIS
Peer reviewed original papers published or in press
L Lean MEJ, Han TS. Morrison CE. Waist circumference as a measure for
indicating need for weight management. British Medical Journal 1995; 311:158-
161.
2. Han TS. van Leer EM, Seidell JC, Lean MEJ. Waist circumference action levels
in the identification of cardiovascular risk factors: prevalence study in a random
sample. British Medical Journal 1995; 311:1041-45.
3. Han TS. Lean MEJ. Lower leg length as an index of stature in adults.
International Journal o f Obesity 1996; 20:21-27.
4. Lean MEJ, Han TS. Deurenberg P. Predicting body composition by body density
from simple antliropometric measurements. American Journal o f Clinical
Nutrition 1996; 63:4-14.
5. Han TS. Carter R, Currall JEP, Lean MEJ. The influence of fat free mass on
prediction of densitometric body composition by bioelectrical impedance analysis
and by antliropometry. European Journal o f Clinical Nutrition 1996; 50:542-48.
6 . Han TS. van Leer EM, Seidell JC, Lean MEJ. Waist circumference as a screening
tool for cai'diovascular risk factors: evaluation of receiver operating characteristics
(ROC). Obesity Research 1996; 4:533-47.
7. Han TS. Seidell JC, Currall JEP, Morrison CE, Deurenberg P, Lean MEJ. The
influences of height and age on waist circumference as an index of adiposity in
adults. International Journal o f Obesity 1997; 21:83-89.
469

8. Han TS. Riclimond P, Avenell A, Lean MEJ. Waist circumference reduction and
cardiovascular benefits during weight management in women. International
Journal o f Obesity 1997; 21:127-34.
9. Han TS. McNeill G, Seidell JC, Lean MEJ. Predicting intra-abdominal fatness
from anthropometric measures: the influence of stature. International Journal o f
Obesity 1997 (in press).
10. Han TS Schouten JSAG, Lean MEJ, Seidell JC. The prevalence of low back pain
and associations with body fatness, fat distribution and height. International
Journal o f Obesity 1997 (in press).
11. Seidell JC, Han TS. Feskens EJM, Lean MEJ. Narrow hips and broad waist
circumferences independently contribute to increased risk of NIDDM. Journal o f
Internal Medicine 1997 (in press).
Peer reviewed original papers submitted
12. Han TS. Tijhuis MAR, Lean MEJ, Seidell JC. Quality of life in relation to
overweight and body fat distribution.
13. Han TS. Smit HA, Lean MEJ, Seidell JC. Symptoms of respiratory insufficiency
in relation to body fat and fat distribution.
14. Han TS. Feskens EJM, Lean MEJ, Seidell JC. Associations of stature, body mass
and fat distribution with non-insulin dependent diabetes mellitus.
15. Han TS. Bijnen FCH, Lean MEJ, Seidell JC. Separate associations of waist and
hip circumference with lifestyle factors.
470

16. Lean MEJ, Han T S. Natural sporting ability, birth weight and predisposition to
cardiovascular disorders.
17. Lean MEJ, Han TS. Seidell JC. Impairment of health and quality of life in the
overweight according to standar d cut-offs of body mass index.
18. Han TS. Lean MEJ, Seidell JC. Impairment of health and quality of life from
abdominal fat accumulation, using waist circumference Action Levels.
19. Han TS. Morrison CE, Lean MEJ. Skeletal proportions and metabolic disorders in
adults.
20. Han TS. Kelly IE, Walsh K, Greene R, Lean MEJ. Relationship between volumes
and areas from single transverse scans of intra-abdominal fat by magnetic
resonance imaging.
21. Han TS. Morrison CE, Lean MEJ. ‘Waist Watcher’ tape measure as a screening
tool to identify people at increased health risk tlirough intra-abdominal fat
accumulation.
Letters
22. Han TS. Lean MEJ, Seidell JC. Waist circumference remains useful predictor of
coronary heart disease. British Medical Journal 1996; 312:1227-28 [Lett].
471

Published abstracts from presentation at scientific meetings
1. H an TS. Lean MEJ. Body composition estimation when height is unavailable.
Proceedings o f the Nutrition Society 1994; 53:102A.
2. Han TS. Richmond P, Currall JEP, Lean MEJ. Waist circumference reflects
changes in cardiovascular risk factors in women during weight loss. International
Journal o f Obesity 1995; 19(suppl 2):95.
3. Han TS. van Leer EM, Seidell JC, Lean MEJ. Waist circumference identifies
cardiovascular risk factors. Proceedings o f the Nutrition Society 1995; 54:172A.
4. H an TS. Morrison CE, Lean MEJ. Waist circumference indicates the need for
weight management. Proceedings o f the Nutrition Society 1995; 54:180A.
5. H an TS. Deurenberg P, Lean MEJ. Predicting body composition in adults.
Proceedings o f the Nutrition Society 1996; 55:85A.
6. Han TS Richmond P, Lean MEJ. Benefits of waist reduction and its use as
guideline for weight management in women. FASEB Journal 1996; 10:1207.
7. Han TS. Richmond P, Lean MEJ. Weight management in women using 1200 kcal
diets o f high and low carbohydrate. International Journal o f Obesity 1996;
20(suppl 4):48.
8. H an TS. Smit HA, Lean MEJ, Seidell JC. Respiratory symptoms in relation to
body mass and fat distribution. International Journal o f Obesity 1997; (in press).
472

9. Han TS. Tijhuis MAR, Lean MEJ, Seidell JC. Quality of life in relation to
overweight and body fat distribution. International Journal o f Obesity 1997; (in
press).
10. Han TS. Bijnen FCH, Lean MEJ, Seidell JC. Separate associations o f waist and
hip circumference with lifestyle factors. International Journal o f Obesity 1997; (in
press).
11. Han TS. Hooper JP, Morrison CE, Lean MEJ. Associations of skeletal
proportions with metabolic disorders in adults. Proceedings o f the Nutrition
Society 1997; (in press).
12. Kelly IE, Han TS. Wallace AM, Walsh K, Lean MEJ. Body composition and
serum leptin in non-insulin diabetes. International Journal o f Obesity 1997; (in
press).
13. Han TS. Lean MEJ. Natui’al sporting ability, birth weight and predisposition to
cardiovascular disorders: study of British former soldiers. Proceedings o f the
Nutrition Society 1997; (in press).
473
eSlASGOWUNIVERSITYLIBRARY