10647263.pdf - Enlighten: Theses
317
https://theses.gla.ac.uk/ Theses Digitisation: https://www.gla.ac.uk/myglasgow/research/enlighten/theses/digitisation/ This is a digitised version of the original print thesis. Copyright and moral rights for this work are retained by the author A copy can be downloaded for personal non-commercial research or study, without prior permission or charge This work cannot be reproduced or quoted extensively from without first obtaining permission in writing from the author The content must not be changed in any way or sold commercially in any format or medium without the formal permission of the author When referring to this work, full bibliographic details including the author, title, awarding institution and date of the thesis must be given Enlighten: Theses https://theses.gla.ac.uk/ [email protected]
-
Upload
khangminh22 -
Category
Documents
-
view
0 -
download
0
Transcript of 10647263.pdf - Enlighten: Theses

https://theses.gla.ac.uk/
Theses Digitisation:
https://www.gla.ac.uk/myglasgow/research/enlighten/theses/digitisation/
This is a digitised version of the original print thesis.
Copyright and moral rights for this work are retained by the author
A copy can be downloaded for personal non-commercial research or study,
without prior permission or charge
This work cannot be reproduced or quoted extensively from without first
obtaining permission in writing from the author
The content must not be changed in any way or sold commercially in any
format or medium without the formal permission of the author
When referring to this work, full bibliographic details including the author,
title, awarding institution and date of the thesis must be given
Enlighten: Theses
https://theses.gla.ac.uk/

ÆCÜTK (}L0>B3RÜL0Nl!',PHRITIS s A STUDY OP CERTAIN ASPECTS
Dy
Jota G. Maclaurin M.B., Oh,B,».M,R.C,I>. (Glas. & Jîdln.)
T H B S I S ' submitted to the.
UNIVERSITY of .GLASGOW for the degree of
DOCTOR of MÈDIOINB
March, 1966.

ProQuest Number: 10647263
All rights reserved
INFORMATION TO ALL USERS The quality of this reproduction is dependent upon the quality of the copy submitted.
In the unlikely event that the author did not send a com p le te manuscript and there are missing pages, these will be noted. Also, if material had to be removed,
a note will indicate the deletion.
uesL
ProQuest 10647263
Published by ProQuest LLO (2017). Copyright of the Dissertation is held by the Author.
All rights reserved.This work is protected against unauthorized copying under Title 17, United States C ode
Microform Edition © ProQuest LLO.
ProQuest LLO.789 East Eisenhower Parkway
P.Q. Box 1346 Ann Arbor, Ml 48106- 1346

A O m O l f L E D e m N T S
The work to be described was carried out in the Royal Hospital' for Sick Ohlldren# Glasgow. I am greatly indebted to Professor Stainloy Graham for encourageBient when the methodology was originally being established, to Profeaaor-J.H, Hutchison for aecess to patients and much helpful criticism, to Dr.R,A. tShanks for access to patients and to Dr,H,B.C. Wilson for much advice on the biochemical aspects of the problem.
The determinations of body water distribution on 66 normal childz'on were carried out by the author; the remaining estimations of body water, the electrolyte and the oleotrophoretie studies wore done jointly by Mr, Harry Boyle, toclmlcian,, and the author with the exception of the elobtrophox^etio patterns fr'om twenty normal children provided by courtesy of the Biochemistry Department under Dr. Wilson,
Dr, B.A, Robb ,. Department of Mathematics Glasgow University, computed the quadratic regre^s1on equation quoted in Chapter Fotir and v/as kind enough to domonstx' ate the Analysis of Oovariance used in Chapter Bight together with answering numerous methodological

quoetions All other statistical calculations were carried out by the author using a ‘Facit* Electric Calculator*
The data comprising the frequency tables in Chapter Seven were extracted on a ICDF/3 computer belonging to the .University of Glasgow* ' My particular thazdcs in this respect are due to Mias Christine Duff, medical programmer to the Computer Department.
Mrs. Priscilla Myles did the bulk of the illustrations and. Mr.'vT Devlin carried out the photography * My sincere thanks are duo to them both.
Finally X wish to thank the staff of the Biochemistry Department, Royal Hos%3ital for Sick Children together with -the imrsimg staffs both there and at the Royal. Maternity Hospital, Glasgow for continuous help and good-humoured forbearance,
Part of the expensos of the project was defx'ayed by a grant from the Rankin H©search Ihind of the University of Glasgow»

C O N T E N T S
PROLOGUEPage3
BOTIOM omi Tim TOOLS
OmPTBR 0NB The.body water compartments In childhoods their definition and measurement #- 8
OmPTBR TWO The selected methodology of body water di a tribution #
OHAPTBR TIimB Body water distribution in normal childrensXé 'The. age group T|*-lî' years. 6l
CHAPTER FOUR Body water distribution in noxmal' childrens
. The first two weeks of life* 79
CmPTBX^ Flim other methods* 121
i

SBOTXON TWO - THF PROBLEMPag©
CHAPTER SIX Aout© glomeruXoiioplirltiBS A short reyiow of ©xlsting thaorio© ©onoemlng oedema, 135
CHAPTER SEVEH Clarifying the problems A atudy'of the-- came records' from 170 children with aotzteglomaruionephr111s * - Xh7
CHAPTER BIGHT Body water distribution in acute, glomerulonephritis # 168
CHAPTER MIME The diureaia of acute glomorulonepbri tie 195
CmpTBR TEH Other aspectsrX* Electrophoretic patterns# 23^
CHAPTER BLBVBH Other aapecta? ■II,The chest X^ray picture and
changes in the radiological heart volume#
CHAPTER TWLVB The ayntheaia
SPECULATIVE EPILOGUE o83
HEFSrffiHOES 268

ABBREVIATIONS
Whero applicable units of measuremont used are bracketted, &
AGN Acute glomerulonephritis,BV Total blood volume (ml,)B.Wt, Body weight (kg,)cy. Tota3, red cell mass (ml*)
Delta ï= Change of*EGW Extracellular . watcz volume (lit res).XC¥ Intracellular water volume (litres)*XB¥ Xnteiretitial water volume (litres),K Total axe’lmngoabl© potassium (moq* ) l
Kfa Total exclicmgoablo sodium (meq.)
Na Total extracellular sodium# (meq,)eoTotal interstitial sodium (meq,)
(Ha. ) Concentration of sodium in interstitialwater (meq*/l)
Serum or'plasma sodium ooneentrâtion (meq$/l.)
PV Plasma volume (ml*)Pif Plasma water volume (ml*)

Standax‘d deviation
S.Ig, Standard error of mean X - Xn - 1
N.B. In both of the above the Bee solcorrootion has been used in all samples in which n 30*
Total body water (litres)*

On the evening of the 23rd of September i960 a ten-year old girX was brought by her parents to the Admission lïaü of tho Roy mi Xlospitai for Sick Ohildren, Giaegow* The history of her ilinesa was one of veiy shoz't duration, and distinotiy unusual* Until two hours previously she had been in apparently normal Itealth* She had then become acutely breathless, in which state she had remained until her arrival at Hospital* She had not been cougîzing* and there was nothing in her past history to suggest heart^diaeaao*
On clinical examination she was seen to be tachypnoeic, somewhat paie, and her face was minimally puffy * Her heart^rate was 62/minute * cardiomegmly was rèadily detectable $ but a short Grade 2 murmur at the base of her heart did not suggest tXie presence of an organic heart lesion* The blood pressure was normal* A few fine crepitations were audible throughout both l%mg^fields, but no other abnormality was clinically obviozzs, and the urine was chemically and micz osccpically nommai.
The appearances of a chest X*^ray (Piguze l,a* ) wei e striking $ oonsidcrablo enlargement of the heart was combined with appearances which the radiologist

F I G . 1 . 1
(a)
(b)
(c)
V
Patient A.G. for details
See text

cpïisiderod to bç those of pulmonary oodema due to left vontriouXar.: failure* ■ '
Hera vaa an urgent olinieal problem i a tén^year old child presenting with apparent heart failure of obacure origin and recent, acute onset.She was put to bed forthwith and within half an hour some improvement was evident- before any empirical treatment had been administered# %u a further two hours she was no longer breathless# The following mozming she looked well# and 3C^ray of her chest (Figure l,b, ) showed that her heart was reduced somewhat in s i a l t h o u g h not yet normals on the other hand, the Appearances of .acute p%#monary oedema visible on the previous evening had quite disappeared*
Three days later a trace of proteinuria togetXzer with minimal microscopic erytlirocyturia was observed* These signs porsisted for a few days* the girl-.being thereafter well,. The normal chest %-rmy appearances at this time are shown in Figure l#c.
The final clue to the eolutiem of this pu- isle ■ was tha level of the anti^streptciysih titre* At 2,500 units/ml, * this left no doubt tlmt an active Btreptococcal infection had been recently present.

.This child was therefore retrospectively diagnosed as having an unusual variant of acute glomerulonephritis, Unusual, since signs were present indicative of considerahle ahnormality of body fluids in the absence of urinaiy evidence of renal disease^ The demonstration that these abnomalitieB could occur and return towards normal with such speed was to we fascinating, and posed numerous questions:
To what testent were these caused directly by the kidneys, and by what multitude of weohaniswB?
%n the absence of the usual evidence of renal diaoasa,* could extrarenal mechanisms be playing a pmrtŸ if so, of what nature?
The rapidity of the apparent changes could suggest fluid shifts to m profound degree within the subject# although as a general phenomenon evidence in the literature to support such a concept was scanty,
Acute glcmerulonephritis presenting in this way im of course by no means unknown (37 , 15)i it was well described* for example occurring in soldier# of the Austrian army fighting on the Italian front during World War 1, These men frequently presented, acutely ill, with oedema and initially normal urine* For a time they were referred to as cases of

7
until the- truly nephritic nature oftlm disease was demonstrated (85 ),
The prehiem time pz^esented wàs' olear- outi hmnely# the Investigation of the nature and caase of the fluid-^dietnrhmzees in acute giomeruXonephrltls* The-'most oWious direct approach to such a problem ' ■ was to midert^cè the measurement of hddy water in its three Azhdamental eompartments- 4. the intraeaiiuiar the interatltiml and tX%e\ ihtrmmseuiar, This Thesi-aia ail attempt to’follow the naturmi and ' logical trend of investIgative thought which such an objective has dictated*

8
CHAPTER 1THE BODY WATER COiMPAHTMEMTS XN CHILDHOOD;
THEIR DEFINITXOH^AND MEABUHEMEHT
- Water has posaoasod a considérable fascination for man throughout the ages. By its nature indispensable and irreplaceable# v/ater has provided man with one of the essential elixirs of life, with à substance vital to his cz'ops, with an object of worship# and with an object of fear. Water has . given man a medium for trade and travel# a bulwark for litis safety# the driving force for his machines, a-means- of waging- aggressive war# and has been the subject of some of the greatest masterplecoa of his artistic genius.
In science# and especially in the biological sciences, water might well be regarded as the paramount substance. It is the medium which makes electrolytic dissociation possible# and in which enzymatic reactions t dco place. This is true also in the mammalian body in which the place of water is certainly unique and its functions legion. It acts as a solvent and as a lubricant. It protects the brain from injury and

transporté solutes# cells ami heat, Gravé'illness may be caused by its relative absonee or by its auperabuïidanoo* Gonsequeu-tly ‘ a soieutiflc studyinvolving measuraments of body water poamoesee at the outset #- fuWaWntality wbleh iuveets this type of work with a special ' fasoiuation*
While the anoieut litoraturo'contains ■ scattered referoucoa alluding to water metabolism, it is omly withiu the past century that actual moasuromenta of'tlio amount'of" water'pzk^aent-in tiio body bave boon cafriod out#- TIm earliest investigators in this field used dosiccation of cadavers■for this purpesoy and it ie noteworthy that their results bear comparison with tboae from.' the most sophisticated techniques' in usé today* liowever, to 'the physician - t'he measurement of water in the iiving body natzizally présenta muCli greater poBslbilitieaj with tho intfoductioti of indicator dilution substances in the present çentuzy .the possibility 'has ■become reality# and it is no ac.oident that tïic whole ocionca- of-.fluid replacomont therapy has; developed conctzrz'ently * Atthe.'éaiîî.o time it müat be remembered# and will be made, clear in the coming clmpters, that tho study of body

10
water is even new in its tefanoy# Tizis is particularly true of pathologieai e. tat es-, .wîiere ooneoptB hitlierto regarded aë... fuiidamentml are tmdargelng constant modification, dntil tXiey have frequently become tmrèoogniBablç.
This thesis# it ia felt,- reflects one such 'Change * ■
The Body Water Gompartmcjuts.Xt ie conventional #. convenient # and more or
leas accurate to divide body water into compartments The main suhdivioien ia into the intracellular and extraceiiular pXmaca, and-the latter .is further divided into tho i%ztràvaocular (plasma) and the inters ti'tial compartments*
The torn# to tgj body water refera to all the .water in th# body* including that in the bladder and ■in-tX o gastro^intestinal tract # Tissuoe vaz y greatly in their .pi oportion of water# from P'3# in blood plasma to les a than lOfI in body fat#
Intraoellular water refers t# all body water;stirrpunded'by tlie coll«*membranc- of an individual celli it doea not thez^cfore include water aituateci witliin the acini ,of .endocrine glands # The vital diEitinguiehing

1 1
point compartment ■ ip. that : due te theremaÿkàhie ' prepertiém., éf,.eell#memhr#%ep. ite elaetfolytio eompépitieù différa profoùndly-'from-that ef tlié emtrweXlhimr -epmee, Freely,permeable te ■water# ■
. tWeo membranes '#re iiwwiee ,pç#%ehbl.#' te most mWiepôeimted emàii méiewiem while maintaining eritiemX.'éçpàretioh h#, ienié; pwtiéXe#*.
. ,: , #%#., definition Çf extraoellvlar spqoe ia ■.■eeneidoréhiÿ mere complex^ . ânatemiCàlly# it -dèfinea :#%e . Véiumé =#f - fihid wliiçh eurfetmde thé - ceiie * âs !#èli he piaema'-wmter # W ■ihterpti.tiai water- (e.*g#-# lymphatic ; fluid) # thie te^m imelWe# the èènneotive tiaeue',. wûter ih.heh#' mid 'eàrtiiag#*- Ÿheee three majer cempehehtà. eeiieétiveïy 'ttàke-up- hheut- #0# ef the"hody, weight 4n thé mature àhimai' (26 )*-,Furtîxérmore,# it îmèïûdea fluid in the geetro^-inteatihai tract#/the:earehro^épinal fiuid, and water in t W eye# péri^oardium # ■ pleura, and joihte ♦ • Bin## oktraceiiuiarwater mmat creae celi. ■mémhrànéa . ether than theae ef eapiitariea- te reach them# imat named areae# %Um term:’'^^traBaeeiiuiar water**' hââ heen-prapeaed ( 26) to cover thep# rather'smai'i veii#e$ '-of fluid*
. /The ihtrWhéeuiar diviaipm .ef - the. extratelluiar apace ihthe hieecl'plasma* :■ The red eelie# aurreuhded

12
by this medium, form part of the intraoellular space but differ from the great bulk of body cells lu coutaiulug water with a relatively high chloride content (XIO).
Xn recent years it has become increasingly evident that tho concept of such a clear-cut diviaien between tîio intra«» and extracellular compartments may well need extensive rovalimtion»As knowledge of the nature- of cell membranes, progresses, a atz'onger, impression of dynamism is gained* ■ Thus not.only,water but extraoelluiarly situated ions are in continuous circulation (232), a balanced state- which may bo x‘*aaclily altered in the presence of disease (6?)* A more modern concept# and one stronglysupported by the.revelations of electron microscopy Is of enormous numbers of "membranes** throughout -the cell and not merely at its surface# Those appoor .infinitely reduplicated and of' fantastic complexity and surface area*. They-may well be giant.molecules of living protoplasm exchanging water and electrolytes throughout their structure■and■according'to■ 'their ncoda * Thenecessary supply of energy is presumably derived from local,transfer of electrons (136). --Such a view mustappeal greatly to those .who .have constantly pointed out

13
that # ^ h a s . t o %%mp bu mmhyattriWtes that it Bh#B|d hê iWhee ttiiefe # W .slotihg ■ he fiercelythe. ihte^ihr ef a.nueiear rehetor (137).
'Meaehrèmofitt; ..the ■ Whthr .GomD#rtm#mta,'heeittatihh of o # d # e qarfiod out by
oiàeâioai'''é^porit^ #ueh ## von RegaoW in .IBgy-' ( 15j, nmWr#iiy g#va.- roenite f w 'total body water .onïÿ,.:. VBovofhi ùppm&ol%0& Xmvb hohh m W ô to the’’ l^robibm in '##- living anbjoot# the #o$t gonormliy 'praotioai .'invoiving- the- nao of iwiontor diintion :e%%b$tano#e#. #%e principal, of - #n$h a method i# ,to i%%jeet' a known quantity of m eubstnnoo which ie ' 'dietribntod only. in, the ■ ep#b# to, be monénrod* One# ;oqniiib#tion ' h#e '"token piote the conoontyation of tx%# .indiohtor ' ia çétim&téd* Th# équation governing 'éùcb' a 'roiotionehip i#%
-%#er0..@ ,4^ . ' Amount of indlontbr injobtw#
" Ag w 4é%énnt ieet during équilibration period*
■ %f çir Volume of apaba to be moamnrod*and - 0 ^ . eenoontration of indicator, at oquiiibrium#

I k
'an iiidicatçf’tô' W of value it. must pOBe#e# : certain b3%#cWtefiat4ce.$
■' '■ • 1 *. 'G0.mplata. éàfety 'and i-pméom from,: side . . effeotè.*
■ ■ ■ 2# A Volume of ditetiod which can.be accurately ' ###e#aéd# and of .wfoich the ï aeic ; do
■ ' '. : : "not àltér With dieoaee,3* 'Uniform die tribu ti cm 4* Rdpid-'équilibration,*.
. ■ '#* slow. çmer6%içm%; '6# •capable of aWwate i%% plasma, '
. .1$ ie evident ' thW éuc%i mt. exacting liet of;re$#ir#m.cnt# will..never'be entirely .#atiêfiôd in'praetioe* I# general it. i# tw#e available. fur measuring oxtraoeliular' y#itme wXiicl'i. fall shdftdot ‘ of tl;ïiB ideal #tandar<Xi- \$t i# evident twt radioactive . .;indicator# will à priori p###ee# Certain of théaç çhmrmêteristiê##, ..with modarn t.eohniqueo tracer de##$ iiuv# 'Wen reduced to # lev.el,wx%i#X$ :m#y,. w.$|.|. no##k\to the paediatric pati#iit«: -Bixmu factual ■êVidèmoB on Wi#' point'-ie lacking it im#.' decided #t the; cmtsot to. ciieçae atahl#' indiomterm*' The. onlyexception;- to. thla- ha# %mm .the measurement oftotal exchangeable aodWa in fone patient^ using

15
exccàdingty. àmàli- .wcwts- (weè Ghaptor 7)
/; ,. .lîroa ■WaÀ 'thç firm# muhetanq© *c te used m# te" 4teiè#teTfçr tte.'eatimatiCm -Cf "total tedy water, by BteéWll ted- %viç in ;|#|4 ( 134) * teter inditetor# teçd : tev4,bé#n#. teuterite, . (teovy water) # (96 )# teiptepamidè ( 158), thiter##: iki )# tritium bxidé/-(tediptetiv#'w#t#r)# (157)# and antipyrine (ptete^enë)# (201)* ,
, ' .Th###' ' #e#t generally teed have te#n tetipyritie■■ate.tte/itetope#''0f water*- .The. latter muffcr from ‘ the. di#,teytet# c ' tiimt m% êP'rçr - là' introduite due té,'#xtete% ..uf ''Imbilb bydrogan atoma from, thé aeli'd' ■ ' :etepti^tent#7of ; ttpiniy. pretein ( 74 )* Whiletbi#'" ê%'$ or','ia relatively - ate can- be .■milmfed- f'er'(-i'88)'$'. it -bte bete àbewà tWt ' the. antipyrins- te^ame 'of ' dilntite. 'rcpteetet# .t w rloseet ■àpp:#$i$#tlte' to .tte vaiu#. - bbtaited -by deaictetlcn ( i67),i,- .
' . ;■ '' Àntipyÿite:w#$ erigitelly IntrWuted.as a 'dteg''W#b :mild .teti^P^retic-'-prepertlea* It i# nbtetbèif'*;'the', eniy...tecbrted '$id.e affect being m%
, Wry, 'tete'..eqcm$ipnb u -teidv tratei##$■#- eryttemmteue rate'.(80 Tte tetei = eXcretiemirate i# negligible'

16
(0# 3-0 # of the dcso in 4 Wure) $ but it ia motaboliaed by tin© liver at-a rate of appro iîiiatéiy &p par liimv
{zoi)\ ,si.ù0é 0 qui libra ti o$% takoa about one miû à half' Wura,# it 1# meceB#ary to. obtain èeveral- blood aamplea at mpeç-ificd timéâ ' thoroaftor*. The piaama ■çcmooitt.ratiOîia are then plotted on aemi- logaritlittsio.., paper, when'■ extrteulation; give# the theoretical ; oohoentratioh at .more time* had mixing boea ihatantaiiecme t
Benetratioh \of - antipyrime i.nt© Oedema fluid in adult a., ia rather slow# tt the degree of oedema i#' severe# this fact renders'■■antipyrine imauitabie ■fof ■ the" .purpose ( lOO) *.. 7
The estimation - of antipyrino' in plasma ' originally-présentod aome diffiènltie# - (" 23^42 ), but these .have, bean'removed with the method devia-od by . - Wendelsoim and Levin in_I960 (135)*
Thl.s .me.thod has been used throughout tho proBont a.èrieë-*- The tel#' _ total body water thus refera to the'Volut’Die of dilution of antipyrino#
Extraoèlluiàr If p. ter # ..
; No ideal' .indicator has yet bean, feted, for the eâtimàtion of extracellular'water*. For a number

17
of, reaaona- it-is llkelÿ': tWt .e#eh. a sUbataneo never ' ■ will/'be diseèvèrecî* The: blgg##t problem, reaidoa.in tho ■difficulty.; in de.flming'th0 prwlao veiimm of ■ dilution çf any given indicator# Somiq penetrate '• to-a 'éignificiant dogroe into cells, a tendency %#ioh; -mny' altor In-disenao, - while - othora fail to- .diétrifonte ■tîièmfielvça-- throng|xont the ■ ontire ■ànatomloal ext r no ollniar;. ç ompàr tment #
. Ak'-nnmW.r ' Of aaeChari'dO' non^olectrolytoa have bo.on'nsod# -for example 'mamiltol (i48), inulin ■ (113)V and, ÇnoroBo (44 )*. It has boon shown, ..however that these .snhstànçèe .fai-i'%to. ponetmt# to any 'extentiho. **trana# 00lWlar water", and only to a , limited, extent the extfàoëllnlar water contained ■ in ;oennootive; t-iaano and in hone (34 ) * ■ , Thus à oonaidoraM,©, nnder-e#timat# of the oxtracollnlar' - volteo may 'hd'oxpoctod on' wing these inclleato.rs*,
Bltetrolyto-s which lmv«'.been ■Used most are s thio.oyanate."(35 ) » snlphato (116 ), bromide (222A) and thiosnlphate, (78 ),* ■ Badioaotiv# el©ot»iyt©;s froqntetly .nsëd-have ■ teen sodium (106}, and ohlofida(235)* *
It was at one time considered ( 45) that 2te40ÿî of total .body-.Ohiorid© was intraoellnlar, and

18
that estimate# ; of ext tec al lul ar baaod on -the■distribution-of chloride or bromide would therefore bè Wuoh too high* From the résulta of a aerie G of p mine taking studies., Cheek (26 ) . oonçlucîed thot'ho more - than', iop of chloride le situated in oella It là'-generally'■ consido.rod that the bromide apaoe Corrected for - this phenomenon', together with eorréetlénè-.for serum water mtû Ponnan equilibrium représenta thç most accurate theoretical -estimate of extracellular water* The main diaadvazKtage e.f'Using ' stable;: hrom.ide - is- that the. estimation of the' 'ion in plasma ia ■diffieult and 'time'- consmiing#
■ Thiemilphate is very rapidly excreted from the body, and for^this -a large correction factor .necessary*
The use of thiocyanate has certain ' ohvioizs advantagos*. -.In low concentratio.n-,the ion ia entirely non^toxic* , It'equilibrates very rapidly# 'even in oedematous subjects { II6), and its rate of excretion ■is low# some thing of the order of %p per hour # Itsuffers » ' however, from certain disadvantagoB # Thethiooyanate ion has 'been shown, to bo bound to plasma lipide ( 181) * It ia also, iooso'ly bound to proteins (187), a property which'is, .shared to a amallor extent

19
by other univalent ions iné.iudiz'ig bromide (l86)* Àgroomeùt; has .meverthoieoe boon found between the ■tiriooyamte voiteo -of'■diiution and that of chloride '(235) # and' it- will he shown in Chapter 3 that welinigh perfeçt agreement hetwoen the thieoyanato. space and the * eorrehtod*: hromide space can he damcmstrated in normal .dhlidron* Since' any'method for estimating extraceiiuiar water can only approximate . to the truth# the important ■ point # as Ely and Sntow {61 ) have pointed ont* is one of proportionality* i*e# whether the réaaita : obtained lend 'theme el VOS/to valid inter'- snhdect comparison,- A largo volimo éf- literatnre oitggests this to be . tm%e- of ' the thiocyanate space' to, the nonmi enbJeCt (116,235)#
Tt was.;de'monstrat0d,many years age. by Overman (.154); that, in-monlceys tojocted with' two typos .of malaria paraeit©' the tMoCyanate /epace could rise to approach that of total body water# ..A similar cliéçrepâhcy wàa- found in pati.anto. with .septicaemia and certain' other infective conditions# and it was' suggested' that this wâà a general, phenomenon accompahytog, febrile mttatë'ë?#oaH ovo-z#an inclined

20
that -pemmifxmbil 1 ty- of à0l%.ii%#mb:e#meë %m$ - %*eealtlmg ''Im: eato'eaalve, ii%traoellti%.ar P0%mt#atl0a: hy tlio thlocya^Atô iaa^ Mao^raith ' amd h&tthouû in I p. 6 2 ( 1.3 Btiggeeted a3,tei?aiativ©'■ e,i pla0ati<m aaa Ld, be- that t W r$^e ef extraoq liular - volume Was rea.1 mml 4ua to o 'shift of ■ wator f ’om' tho iittmo.oilalar. epaoe* Botm evidoaoe . fooai. tog m% this palat vill ho'-p,rosoùté4 im' Ohaptor- 7 *
-■f.n-..epi.t0 of thaao .shoftéoitaings tho thiooyaaato method has heoh aeiootoci for .the, -Of:extmceiiaiàf wato**.» tJaing' a ajodifioatioh of the method,, of Bowior^ (20 ) the dotezmirmtio# of the , eonoetitratiott tn i iasma is: easy, aad, oàiti be cUme on eapiila^y biood* The oaly eotloh ,applied ha# bë'éh for the eone eat rat i oa in piaema water..
' I I I .Q.e.d V o in m e
The eariios-t dote%minatione of blood volumewere oarried out by peat moi'tom o^^sanguination (2 2 6),The first indicator dilution aubatanea to be lused was Congo Hod in %9%3 ■' (ill ) *■ but this ' bubstanoe gave highly inaeourato results ■ in, the preaenoe of haomolyais^ The blue asO' .dye T^lBàb (Bvans. Blue)'was introdtiaed by - 0ibaon and Bvana in lf?,37 { 75) and has been easily '

21
tlie-înost widely uBed';0;f ,tîio nén xwlioaotive. inclioators* Other ■dyè^Bubstanëeé uaed for .meàBuring bleed véluti\eîmve been: Hose Bengal. (l93 )7' nnd, çeigy Blue ( i4 ).Ooomaaàie ■ Bluej rnuoh uaed In .rlye- diltitien s.tudiea of he#rt^eutp%%t été# la quite mi mil table for blood volume determinatiom sinoe a high proportion of the injected dose la eliminated from the intravaacitlar ■ oompartmant witliln ton mimtoa ( 160) »
■ Apart ' from dypa pertain other non^^radioaotlvo Indlqatorâ bave ; been %'oéoWendéd # ■ ■polyvlnylpyrrolidono (p.V;##* ) (166)^ a auWtànoô of, large molecular weight with a aip ilar volume of distribution, to pl'aama ' albumin. The. colour reaction ttaed in estimating' tbio, compound ùnf or t unat ely doe a not obey tba_ do Beer^^bambort baw» rondering' the method. cm%bo3?0ome and relatively inaccurate, ia. Iiowever of valuefor à number of purpose's when 'tagged'' with yamagucbi ( 237) used eodimn para- amino bippurato for tbb simultaneous dletcnitination of plasma- volume and renal 'plusma-flow, Using- a joetrand*# (195) method for ostiomting'total body bacmoglCbin$ icarlberg and bind (107)' measured blood'- volume - in obildren with a neat appnrattts utilising measuremont of carbon

22
moBo^icto.absorption of "expired: air*Thtsf motlmd tms ttie grèatv advmitpge of roqulring no .oà«q>lo'of .blood other thati for^.çBtimation of' haemogiobin ' concentration Tiitravenoua 'iron**de:H:tran' (i.Xirtfcron*-)', Ima' aisO'-'bbeB used .{130), bnt\the. occurrence■of occasional allergic reactions cauOod the method to fall - into diefmwui* (191)V
In recent years- radioactive indicators ■ Imve , W e n widely - employed' in all’ save paediatric, patients,. yhoap. moat;'Oft on. UBéd have; been albmain labelled with ■
(77 ), and red colls tabeiled wlthVeitWr( 7 ) or ( 206),
,T^1B24 '(Byans Blue)'T W concentration of 'T lBak was originally '■
estimated by 'direct colorimetry of plasma> but the -pre#Wce of turbidity in many samples rendered'this,; ' . . . . . X . . . ' / .
generally .quito nnsati-a.factory, Â number of'-aarly- attempta at■extracting the dye-gave variable results and;were -mostly' time-consuming; ( 88 ,j 38 , l4l). -A notable advance" .'came in tpgl. /wlion Allen ( 3 ) obtained ■consistent recoveries-by •adserbing the dye "on ' shredded 'tissue paper, - This .princlp'le foriAed. tiie

23
Bas.is of thé method of Beclweil. ot ai* ( 1 3) wMoh is .highly aceuratU and not mMuly long thy, .Some more raoaùt iiiodifioatlons of those toçîmiquçs have failed to.' dlaplay ’ any, further ’blgi%lflcant hclvantages ( 97^104),
A vast literature exista' on the hehhviour of T-ÏB'24 ih ' the body # Thia has hoen ahly sùmmarlBeciby 0rOgersen;and haweon (84 ) who have done a high proportion of - the work* , The dye 1$ known.'to bèoomè attached to the lyëihe'groups'of- the plasma albumin .moiéeuie (174) • _ ■'.. ■Binding ■is estromely rapid and -appoara to be .complete up to a oonoe.titra.tion of 4 mg/-* 100 ml, .Ï# .this come ont rat iOh ..i#'. exoeedod -extravasation into ' the ■interstititial apace occura and the patient turns etinioally 'blue (174), This ia-more likely to -ocotir when serial, blood voliimo doto-Minations are o.arried ■ ont at daily'., intervals i as. 'is- the, rare toxic man'ifestatioh of vomiting (178)^
.FroiOi el at al* ,.{ 71) found 'that the total ■diatribution .oompartment and the -biologioal hal^v ■ life ,of ' T*-1824 in normal, adults did not differ■ aignifiqantly'from ■ tho,0é'of ^ 1 * label 1 ad albimin ( J*.The. results of 'Eipf 'et al• (240) showed'a slightly . higher raean .pla.sma volume when T^1B24 %me used# and in

2k
their feuBcIs ^ g a V e more' -
■eoBBlatétit rdatilta# -■ ;## #&, ( 10^ W ve àhom%goad /hetwea# $$# t W i# thehemmto,
I t tW W fer# pwbmh'i# ftmt f#r children
%W' UB#' of, fviSg4 with .^xtrwMoh -## the dy# hy
Édweli’ B metWd remalùe th# mioat m#cu##e %my te
/estimate - vol mia #%# hm# - beom w e d throughout ■thé■present werk, , '
T# - total ’bicttdvVoiinne'plaamu
v61mK3 mn accurate measurement ef the imwatoCrit ia
obviw#ly re<|Uired* Using tilntrebe wuem Bpmt at
$#G0# ;W rrçétien fw-tl ie of plasam:.
trapped, bétweç# the W d colls wba Uoéçàsury (25 ),Modem micro-^ îmomatoèrit oohtrifugoo spinning -ut
%Si#W; r,'pnm#' have oliminattd'tit© itocd #o-r this (211)#The ratio of total body to vptioaa liuomatoorit $b usually t#k#i am 0#91 (76 ). #r in tlie iiowbem as
'0*87. (i4o|,
ÛônoiùéionIfTKiLiW*!' iiij iiil'imii
- ' • TW ffro0oiUg' di$c#maie#. $%#.# nivon- in outline
amm éf- tW- prcblomâ eoWnming ég- timàtWna of'Wdy
%fatçrdi#trWu**^^h.together with for showing
the spaoifA-è indicatora wed in tW proè'oiit'wrk«

23
mmiODObOGY OF BODY mSTRimOTION
Imt r o clue t i o ii *'Xn tlie p.revioiia Olmpter the reason# ftn?
oWoslm# T-*182%, thloeymwte miû antipyrine to ost-imate blood volamo extraeellular water and total body water have been diseaasod* %ti general, all these methods, depending as they do on the concentration of the indicator dilution snbetanoos at oqitilibration have certain features in cotimien, Thus the absolute accuracy of éuoh i% method depend# on the following factors I
1,‘ Administration of dose*2, Betimation of the concentration of the
indicator in plasma*3, . The oharacteriBtio behaviour of the
individual indicator with regard to its rate of élimitnation and the time taken to reach eciuilibriwa with Ita' ultiamte volume of dilution.
The 80 headings will now be die cue sod In detail.

26
Admimlstrat1cm of dose,llhçB radioactive Indicator's are ueod,
meaeuremant of the given close le a simple matter; tho activity of tlm adminl a taring syringe là measured before and' aft 03? usé and the dose.' obtalnod-by aub tract ion, ■
Witlf radio**-#table indicator,s tlio problem is soiiutfwhat harder' to solve eatlsfactorily. The three eubstanoce used, here have all been given intravo.notialy . throughout, , It la indeed feasible to give sodium thiocyâimte and autlpyriue orally, but the additional variable iuourrod by el owe 3? di a tribut ion makes this inadvi s abl o *■'
- hoses' given front a eyriuge - may be measured hyt 1, . 'Weighing,'2# Colorimetry*To 'weigh a syringe before-, and after 'use has
theoretical’advantages, : In practicB this method issatisfactory whan in j act ion is made directly through'a rigid- needle, .as when working With adult Bubjects* 'With children, the inevitability- of young subjects moving during the procedure malws it imperative to employ a flexibla ay stem a'uoh as a polythene scalp-^vein needle attachment «
The metiiod evolved in tîiè present Investigation has been as follow© r-

27
A set of all-glas 8 syringe# ofvarious sizes were IndividiiaXly selected for tightness etc, 9 and suitably marîceci for idontificatioia purposes.*Fine- soratch-marMs were made on both piston and cylinder to allow accurate alignment* Tliie is particiilariy essential in the case of T- 1824, the deep colour of which obscures the end of the piston* Tiioeo scratoli-marto were placed to allow giving a close ■approximation of the required doae. Other apparatus reiiuired consiotad of a polythene scalp-vein set with 23-Gauge needle, a carafally selected Luer-Lock two- way tap, and a ^ Bratmule polythene cmimila, si ,0 0 *
Procedure*îinder local .anaaathesia, - the ^ Braunulé' cannula
was placed in any suitable vein* All blood smsples were obtained'through this, ■ avoiding stasis and further Venepuncture. After removal of each sample a drop of hepariniBed Halino' was put into the cannula before sealing with the stopper provided. Thé scalp- vein set was attached to the two-way tap and the ayetern filled with sterile isotonic saline from a 20 ml. syringe on the direct arm of the tap* This need3.e was introduced into any auitablu vein other than In tlie 11 mb with the cannula. Thus for each set of determinationG

the child was subjected to' a total of two 'neoella- 28
punctures, both of which .were from extremely .small noodles# On'the'-majority-'of occasions, tlio Investigation carried out, when the; routine management of the child domanded a vanepuhothro.Om humane grounds, it thercfarc appear# to the author that the technl >U0 for body water détermination carried out in-this d ray ' ia tiuexcoptl'ouablo.
The syrliigoa contaiuiiïg: autipÿrinô, sodium thlocyamate. and- were 'them, successively 'discharged'..in. that order through the side-arm of the two-way tap. The do so of indicator was injected* always pushing the plunger right home * The indicator remaining in the .side-arm was ■•■then washed hack into the ' syringe with' approximately. 2- ml, saline from t3ic 'reservoir syringe;. and ' 'the indicator'.syringe removed * ■With the tap closed, tho next, indicator'syringe was then-att'achc d. and the procces fopçatqd, ■■ 'Finally after the T-l;B24;had bean ’ discharged the- -.'polythene 'tube' and noédlo. word:'flUBhêd-''with saline ■until no- blue colour was'viaiblei approximately 2 ml* of saline were ' required'for this- oondition to he fulfilled*
For the- -sake of roprodUeibility'.it was, ctmsldorod'an cssbntial part of this te-ohnique to use

29
the Bçtîiie syringes throughout everal doses of 'theiiidieators were - eelected to give, in. clilldrexi'of widely differing weight, the following approximate plasma eenoentrationa:
TADm 2.1*
indicatorRequired■plasma concn.
mg/lOOmi #
Dosemg/kg#
Sblutio.navailable
T-1824 0.4 - Aqueous 0 . T>Clurr.),,Thi 0 cy ana 10 7 15. Aqueous #7 (T '& H Smith)'Ant ipyrime 5. 25 Aqueous. 20;#j, (b.».h. )
Standardization of dasoaThe'individual doses 0 0■derived'war©
etandiardizGd by repoating 'preeisely the aama process of injection into volnmetrio flasks. ■ The actual quantity Injected.was; then determined colorimotrically with its standard deviation of-the error involved, the figure being ■ealculàted from ton such injections' into- the same voium.etric flask# T-1824 was used throughout to standardiae all the doses, it being assumed that the volume of fluid injected would not vary with the indicator. ' Ueing the dye natuimlly meant that the

30
only i'Titrinale''.error - of tlil# part- of tliO- etandardlzation procédùro; laywith tlw oolbrimeter ^bvlepeki ) ; \it-was /luioXiiy'■■■ verified that-'tie'■.sigiiifieâîit 'variatiom',' oàme : from thi# sotirce# '
/The-average- S'*:B.,- of tlieso acimxBiaterreci-doso's- -waa " .lÿ giving.,an'-error,-Ih.-praotio'e of 25# TheeCTo:r was--'in •■goîie-ral'l-'esB for the greater Volume# andB iiglit ly- '■ greater,V with the ' email or ■ volumes $ - Xhdiyidual .
correction fae-tox s- eouldqtXma'he .calculâtod for eaoh, ■-do-so., and - tliO'tesialts ; réchebhed--ét :-the .end of the 'Boriae'.when -no -..significant differenaea. 'from 'the.' originalfaotoi'^h-Wa0'.(foimd* '.An example of one such set' of-results and the ■ oalcnlâti-où: of ■ thé - derived; correotion-factor i a ' \B e t '. out la el o w : .
Experiment '1,;.indicator? - /T^1824# '
: Aq>pfoximatc;4oB'a.'admihistar.0cli 6- mg* (6ml. of ■ 0*1S| ’ ao'lntion)- ' .This':-'quantity injected into 50Ô ml #; VOiiimetrie-'flash'-and made up to mark with dia-tillèd--watef-:M0an. bf '-10' colcrim'eter, readings S.-B.)? 0 , 2 9 0
(-1 0,003)' ' B'tandarcl (triplicated) % 6 ml.pipetted into aame flask?' 0 * 3 0 1
Actual doae, administered -6 x'. ' Mg# - 5* 79. mg,

31
The full table of'Correct eel doses used la the - series Is- sot out bolo-w
. . .TABLE 2.2 . . -Syzinge calibrations (all qiiltntities in-mg. )
- T^1B24 '" ' ' '/ v- ..Syringe dose 6 , a - ' 1Corrected 5,79 , 3.9Ü 2.86 1.9? - 0.98
Sodium thiooyanate
Syringe dOé-é ".yap " ■, 480 360 - 240 - 120Ûorrecto’d 729 48a '- 358 344 ' 132
'iliitipyrine
Syringe doe# laoo 800 600 400 200Oor.roeted 1190 798 '6ai 4oo 197
The above procedure may sound somowhat cumborsomo; once these oalibrationa were available^ .however no - ■ further checks wore noceseary. imtll tlio ooiivplotion of the experiment, Close reprodwdibility has been throughout the paramount object ; thus -when serial observations were

32
made on the emim child, tlio same dose (and therefore the éàiiio' ayx'iïige) - was ■ titiXlsed.
Bstimatioii of'indioatora in plaema.Bloqd a ample# were withdrawn througlt the ■
polythene cannula at the following times s-I. Bro-injeetién; Z ml# # as eontx^ols-for
tiilooyannte and antlpyrlne estimations#2* ' Fost. injeetion* Id mins # : B ml #, for
, estimation of T^l#24,3# ■ F0st,*injoction, U houra ; B ml#, for -
■estimation of thiooyanate and antipyrlne#3# and 4#' ' Fost-injection, 3 and 5 hours g
each 1 ml# for anti^pyrlno estimation only%n a few aubjeote larg0:r volumes were withdrawn
at 3 hours pe st«#inj eotion for 'T- 1824 and thiocyanato éliminâti€m studies# ;
All aamples wo.ro witlidrawn into tubes oontalnlng dxded liepririn and Sealed with paraffin- paper# : Plasma was immediately separated by centrifugation. Xf it was not directly practicable to carry out the estimations, the nmtpXpB wore stored at. 4^ 0# ThXm is particularly important, In the case of T-lS-B^r if plasma albumin, to • which the dye is attached, undergoes significant

33
au'télysi-s of tho-àyé- booomosi.ùO0îiipiç te #
Blood- voitûaa.»Tho; oQtimatlon .of ; in piasma,
T-IB'24, Ima- boon ostimutocl throughout using oitX%er' '#%0 - method; of 'Bodwëll et al# $ (13 ) or a Ëioro modifioatioù of the ©àmo mothod.i ; . Tîio fowor wàs- dosiguod to utili##■'4’ ml # of plaetna :&i#%ougl)i : half thié mmoûut m%ÿ W Ueed without ei^ifioaut' ioes' of àooùraoy, Tho modîfiod method Uees ,û*5- mi# of piaema# ' Tîito furthor minor modifientiouâ suggested hy -liuîdownoy (l45)- were' incorporated into botli methods#. ", The princâpio of both is the extraction of dyO' ' in, a column of apeclally prepared celXuioso, and tlioh/ to . elute with 35# acetone'* The whole opération la ■carried out at 30%#
: ÂQparatua. fh© <mtraction^ column la made frbm two’'glaas';tubes, fuaed togetherthe internal diameters being-13 tm.* - mid - %- mm* - This is surrounded by a glass watèf«*4âcjkët througXi which water l.a syphoned- from - a ‘water -ba'th '.at 52%-# %en_ three such columns are used simultanoeusly#- as in Flguye ; 0# 1 , the temperature of the

F I G . 2 . 1 .3 4
,1f !
Columns for extracting T-1824 from plasma. The small-bore column for semi-micro quantities is on the right. Water at 50^0 syphons from the water-bath (left) through the jackets surrounding each column

35
third jacket - ie around 46* ©■* This gradient does not appear to. bo^material#
TWagopt^/*'1, ' 30# Teepoi-imter /
./'#* • i/S00 Teepoi'^saline. 1 ml* .of-.Teepel diluted to 000 ml* with: iaetouie balihe#-
3* 35# acetoue^ater.* ' '■4# ,®5# ■Salicyl'aulphenie acid* 23 0m* of
sallcyl . mulpheuie acid diluted to I W ml-. with water#S', éelliilose*" degraded amerphoua ■
çelluloae: (Grade FM*3l.) is; dissolved in 200. ml* of 95# =aeeteue* ' It is '.them precipitated with 10 ml. of 0,3
and allowed'to stand for 5 mine. This is ■eentrifitged in 6 % "I**- tOst tubes for a 3, miua* at■IS'OO - ' :Xt is washed three times with isotonicBaliù0-r, lodaehing'from:' the hot'tom of the tost-tubos each'time to-maïce" sure''the oeliuloae does- not hoe erne stuck togetl#'r* sineo T«iS24 tonde té stick to lw%pa,It is then'déeanted into a 100 ml* volumotrie flask with a aline and'made hp to the mark* Tîiis reagent- cannot he used if more-'than a week; eld#
6# GOlite* folite- 54g#. powdered filter medium*7 * . -Ohemieal cot ton-, , Type '13*

36
Brooedure». ■ The following tubes are placed in awaterébatlt at 52%. t
1, A tube containing about 1®* of Oolite andhalf filled with'1/200■Teopol-salina*
2.,'- .Tbree tuboa each containing Oolite suffieient to 'Cover the bottom, of the tube and B ml. - of cellulose reagent.
■/3» For 'each-plà'àma sample a tube containing 4 ml * of plasma with 2 ml* of 50# Teopol.
■■ 4* 4 tube containing ■ 1/200'''Toépol-^oaline'Only-.5* À tube containing 35# acetone only*
Hoe* 4 and $■ are refilled me required* The abovequantitiea are sufficient to carry out throe- extractions #
The column la- now plugged at the narrow neck with chemical cotton to allow §Q drope per minute#Throe VPaatour. ..pipettefulla* from tube Ho % are added and allowed to settle and then, very carefully# the contont'a: of tube Ho* 2 are add'Od* using a Pasteur %3ipette round the- sides, of the flit or Column*
This layer is allowed to settle m%d the sidesof the column'arc 'Washed down with the eontente ofTube Ho*4' to remove -all traces- -of ''cellulose* When the solutiena.ln thé, column, have: octtlccl. and- the level of

37
■tlie 1/200;'TçCpoi i'0 nbmit above the surface of the flltextihg'medium .the contents' of tube' Bo* 3 are oarafttlly.'added and the- tub os - washed out to give - a qimi&titatïvé .addition, The Colm%m 4s,waah#d several
with: the Teepoi - eolutioh' w%til' Mio aluato is free- from, protoih as- tostod With aalioyi suiphonio hcido. ■ ■ " '
, ; .When; tho. coimm'has■ very nearly dried -35#'■ àco tone''i'0; added* This ' o'arriea. the dye before'it, to, ba./.ooilodtoti-'itt a 10 ml# meaemring cylinder♦.standard* .■'-: 1- ml*': ;is takon .frorn-tlio dye remaining inthèz ampPui.o da eel for the test .and. diluted to gO .ml* 'with diatill.od water $ 1#5 ml* of thièi# .made; np tç.'fo ml#-with '35#'''a.ootono*''
■ Since " ail ' .traces. ni piaWa are ' washed ont .dn.ri.%3g.. éxtràcti'oh # np- 'plasmaf blank \deton%3ination, is ro.qnifod unidaa hlo.od voinh# hâ'a h m m ■ mnaBWPû within the prévioue- two -wocka*
p omi rmicro ..modificat'i onThe method 'daponda on the fact that si ace U: ..
reduction of ' the ■voiiimo . of ■ fluid in the celubhi - will not - pass' through spontaneously# pressure is applied' tô the column* This iï3- .carried out either as' gentle

38
suctiqm from below by applying cautipusly pressure from■an air-fillod'syringe to the top of the - column. The rat© of \f low oha thus he very easily ragulatecU The Interiml diamotors' of the two tubes Tormimg the - ■ooluimi- are k mm* -'and' 2 .mm# ... : ■ ,
Ail ■ reagent S''hfe-'the ' same as used in the maoro^metho'd * '0*5' ml# of - plasma with O * 25 ml* of■50#''TeepéT are put through %%md - the eluato made'up to •3 ml * ■ Th©', #ame standard'i's' used*
■■ 'All ■readings have been made on a Mil go r :*l|y.i-spoîc* photo- eleotriO' colorimeter-at 620 A.If*
■ lïaèmatôcrit detexi'«inatibUB wore made with a - .micro hàematoorlt centrifuge (Hawkaley), apinning at' 1:5,000 r*p*m. for 5 minutes*- Miosi this, machine .is' itaed, ;'it'ia generally agreed that pa0ki.ng ,ef red ' cells is complete.and■that no correction'for■trapped plasma isv roi uired- (211 ) # Total body Imematocrlt has been calculated .-UBing the factor 0.*P1 (yjgq ) *
. V ■ ■' - ■ ' '■The■computatiàn of, blood yolumo is.as foilowe :' l3oae.'of ‘ T’,1824 administored D mg*■ Volume of plasma extracted V ml * ^. .Plasma reading (colorimeter) U
1 ml* - Plasma ,T

39
30 ygîii.. ©taùdard (ooloriiBeter) S "-' ■
m ' ■ T ' "* . * - éomcemtratiom in 1 ml* - plasma Zi 30 G
■■ ' Plasma' volume - «'' p ml*
. Total body-liâçmatocrit=(Obsorved'.hot* ) x 0*91' : - : . ' n
, Gell Volume - ■ Oô ' ml*
Bleed volume {P,^ Go) ml*
Control- B.xporimohts 1 * . linoarlty*.
' .- - Bxperii^ent 2 ■*.. A éelution of T'*1824 ' in aqufôous33# ■ acotoTO'obeyed the do Beer* la'mbort ' Law' (Figure 2*2)*
2*; Ëocoyerieo-
BxpériMéht. 3* 0 * Ê3 ml * - of O * 1# T## 18,24.. added. te■'.1* ' 30' ml., of -’âquaous 33# acoton©* ■■2* 50 ml* r#f plasma (reomtatitutèd#. dried) *
4 ml * of 1 *. ■ madé ■ np to ■ 10:, ml * with . 33# acetone' as, ’ standard * Ifr. ml * ,;.ôf • 2* extracted and made.’U|> to 10 ml * -with 3.5# acetone. , . .
Hea-gl.tai z(Readings'from-tJviapek) *■: '■■Standaivk-:'0 #136. (dnplicated)-.-

koFIG.2.2.
T-1824 - COLORIMETRIC PROPERTY
COLORIMETERREADING
0 2801
0'240 -
0 * 200 -
0*160
0 * 120-
0*080 -
0*040 -
0*4 0*8 1*2 2*0 2*4 2*8 3*2 3*6 4*01*6CONCENTRATION (pgm./ml.)

kl
Teats Moan of 10 aucli oatimationà- 0.1348 - (s.»,) 0.00376
Tîilg represonts a raoavi I’ocovoi-y of - (S»B.) 3.0)&,Ho oorx'ectlon îma made for this a mall mean losaof dye#
Tho total error of estimating blood volm^o by this method is tUex eforo estimated at appro?simatoly
3* Recoveries semi-mioro method»E:K:periinout k 0*5 ml* of 0*l?i T*-lBr 4 made np
to 100 ml* with: 1* Distilled water2. Plasma,
Qf the w 0 BGIntione,1* Standard: 0*5 ml * made np to
3 ml* with 55% acetone*2 Test ; 0*5 ml * extracted and
made up to 3 ml* with 35 acetone*Heeglt^s (Readings from üvispek)
Standard: 0*0885 (dnplicatod)*Teat: Mean of 10 * such eatimations
- ' 0*0879 - (S*B# ) 0*0018This represent G onco afiain a mean recovery of 99*3/4 -(s.*D* ) 2 *oÿL

42
4. ■ Ooe3£iateiiC0- of T-*"lS.24 wltli . sodinm tliio.eyatiate and ■ a ù t i p y r '- _ in plasma #
■ gxpeyimont 5# . Injection of 1V 1S24,. thiocyatiato amd amtipyrine- into recçnatitnted dried himan plasma' (which çoBtaina'0,4 4 aoditim# acid eitrhtOt'} , '
Boaos àdministeredo
T-1824 . ' 3\%t)l. - 3 m ..#od. thiooyanate' 1 mi, 60
Antipyrino 0.4 ml* - ' 80 mg. 'Siiitable- %iuantitiee' of - plasma mixtmro were then taken coneontmtione of the throe -indioatare estimated and the apparent total velmne èompàtéd fer each substance,-
Be suits: ; Measured y o lime of plasma mixture = 1,000 mi>'-'(For'; thiecyanate_ and-antipyrine résulté see under appropriate heading), T-1B24 volume of /dilution - 99 ml. (mean of two),
int ernretat ion : ' Thex' e’ is no évidence that - the , preecnoe of thiocyanâte and.antipyrine'in plasma interferes with 'the extraction of T-1824, .
3* 'Bvauoration ' of 35% acetone at 50^0This ' experiment • was, carried out to see if an .'
occasional failure,to elute'could be accounted for by a chaxigo Of / c one entrât ion of the eluting solution placed

43
Xti a' water-biat'h ât
Bxn0riment .6, , io ml# of 33/4 àqueouè aootoneaoiutloii in a graduated', omhtrifuge i tube ware maintainedi.
at SO C in a wator-bath* ' Mo sign|.fioant‘'aiteraticm of the voiume- ims apparent after 3# mina,
ExtracGiluXar. Hater The B^timation .of.. %ieqyan#te_in. Plâenm. ,.. ■
Thiocyanate has been 'estimated using the method , of'Bowior (19- )j or d simple mioro-modifioation of this, method devised by the. author*-', ' The former- roauiros %': mi* of :plasma$ ' the latter,.0.,2# Heparin Jsbouid bo used to ■■ antiçonguiate the a amnios $ sinoe citrate is . imown.’to interfex^e with the oelcmr-reaction in this estimation* This finding has-' been olieoked (-see Ifixpts*9 and 10*) .
1. .30$ .triohioracetio. acid*2*' Ferri.G nitrateynitrib acid reagent-*,
80 Gm* of ferric nitrate pi^O are' dissoivadin ;250 mi, of W - nitric .acidt' made up to 500 mi* with ' distiiied water and filtered#- ' -

44
To 1 ml, of plaàma in a,te0t-Wb# la, acidod - 6,5 ml, of diatill-ed water followed by e.,5'mi,' of ti iohleraeoti'o aold# The tub© la inverted ,s.overal times and allowed to.stand for S' mlimtos* tct io' .' timt filtered using Ihatman, Mo,, .43 papers. and S ml, ' - of the clear' enpemata$it plpotted into a fi rther . . tube, -In anbdttod artificial (ifiuo-iTOBoont) .light 3 ml,, of the ferric nitrate reagont are'added and the coioiif read as ao.on as aoseihle at 4?d togethorwith plasma and water hianke,
-tfhorevor foasihle antomatio' pipettea have - hOon ■ employed.
The miortWflo.difioatlon has oonaiatod- simply of tising i/5 <|nan.tities ' thronghottt,. Beparatlon of -the enpornatant aliquots was by nentrifage ' rather than hy filtration, -Thi.s - metl%od has- given- results throughout indi#tinguiahahla from the original*
The' oomputation of ox.traoollul.ar- water is asfOliowO-i
hose of sodium thiooyanato admini-eto-red m D mg, Plasma"reading.(oolorimoter).- #Plasma hlank reading - a b--'Standard (3 mg*/100 # 1 $

k5
. t Plaama concontimtion 3 - Cmg;#/100 ml*After t%io woi% of Purano^ (170 )> tlio
concentration, in piaoma water 1b by:
w ^ ^ 100- Pt
where ' Fr ••- the concentration of plasma proteins .in Om*/iOO ml. In normal anbjccts this has throughon,t boen_ assnraed to bo 7
T-hiooymmtc apace ^ttres.
Centrol . Bxpe.rimont a1. Ifinearlty
Bxperimont 8» IMthin wide limits (0-20 ml, ) the colcmr produced from thiocyanato by
this method obeyed the do Becr-Lainboi t haw#
2, .Reoovorioa *X jcnorimeir . 8. 10 m,l. of 6*p •sodium thiocyanate
wèro made up to 30 ml. with distilled water# 0.2ml: ofthis solution was then made up tot
l:v 23-ml.r with dis til led wat or*2. 23 ml. with hoparinisçcl plasnia (obtained
from a normal" adults
k6
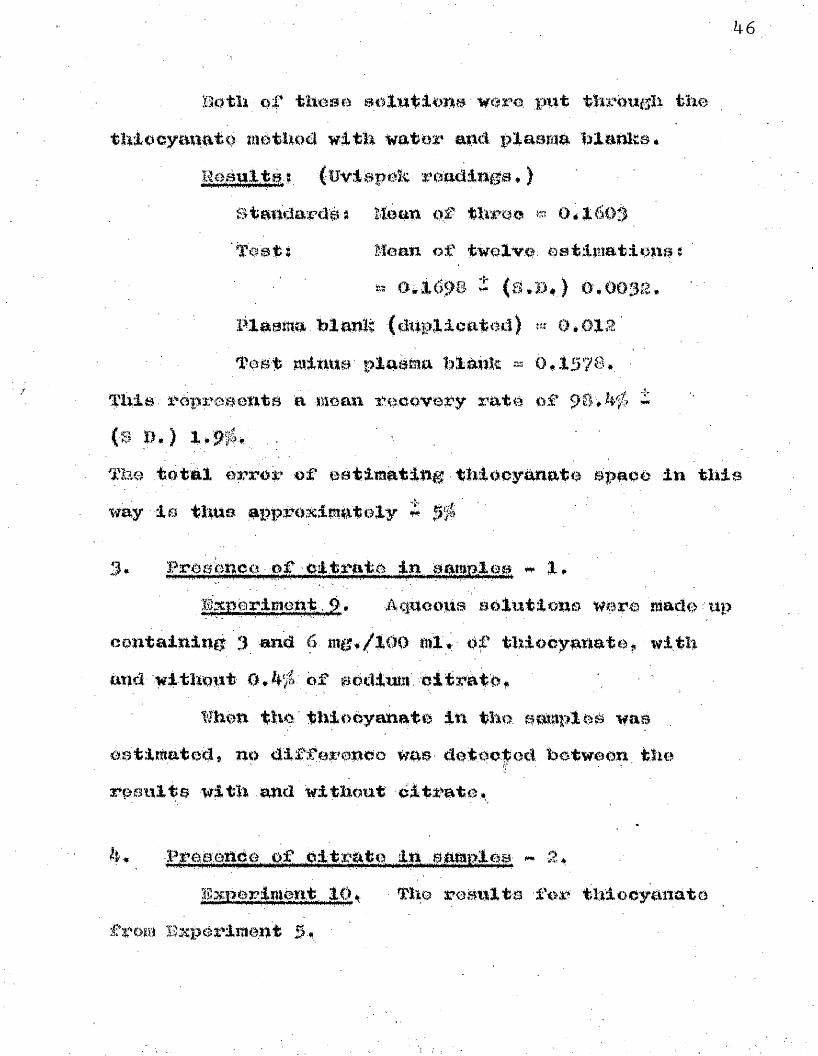
Bath - of thoee aolutiohe ■ vera .put thethiacyaimtè with water and plasma blanl?s* .
Baèulté-? (uviapeh rdadinga.)Standards-s -Mean o,f three OélâOB 'l?aat $ . Moan of twelv#. eatimatlena :
2 (>*]L(SS»33 2: ([fs.%)* ) () + 003*;2.'Plasma, blanïl -(duplioated) *«■ 0*012 Teat minus' plasma blmde - 0.1578. -
yhia.' Pèpreaents a -mean rooovofy rate of -($ B.) l»9Wo ' '
The total error of estimating.thieoyanato apaoe in this 'way "is thus apppamimhtely
3* Presence yof citrate In.., a amples 1.Bxnerimont:. 0, AgUeene e élu tiens were made up
containing 3 and 6. mg*/iOD ml - of thiocymatoj with and-without- of .sddiim'/nltrate, ' '
tfhon -the" thiodyanate in the smaplw was estimated, no d'lfforenoe was- detectod between, the results with and without dltrate.
4# -p.reqend.e,...of citrate in ...samples - 2*:Bmuerim.en.t. 1.0.» ■ The results 'for thloeyanate
from B%pêriment 5. '

47
Actual .Yolumo of plasmm. 1000 ml* 'Apparent volwi# computed from oatimated
ooncontrat’ioh'of''thiocyanato-t"t; B#8 ml*
Interpfôtàtioii. g 10.. Oit rate- Û 00 B: not lùtorfer# with the - -
tillocyahato Method ,wh0-u both are in aqueous soiutloa* %#eh :îh plaema.*. howeyer the chromogenioity of. the thieeyaiiate'^^oompiex ie significantly onhancèd» _(W;*B,*/TîicA-pdsaiMiity .of interfere,nee due to the prcaenco' çf T^1B24 and antipyrine %## éliminât ad ' by - repeating' a -modification 'of thie- experiment using ,, ■ heparinlsod plasiiiai _ the results' for the- three indicators: ■then-Shewed ; cl p SO" Cor relation * )
Total hody'tfat'erTile. Bstimatien - of '.Antiwrine. .in, P'lasm'a* . ^
Ant.ipyrine 'has been. 'estimated throughout using the, method-'Of -Mantlelsohn and ' Leyi-n (135)» ■which utilieeà 0*2\#1* of - plasma* It^doeC not matter .which anticoagulant ia. used* but .it.,is' important - that the' ■ child should not' have received any .form Of sulphoumiido drug during the previous f'ortiiight * Sip-o'e autipyrine, ia :eiiiaiimted rolatively' ràpidly from the body* the .estimation was carried out,ou.2 hr** 3 hr. * ami g - lir # '

48
samples together with a plasma blank.The principle of the method is to nitrosate the
antipyrlne in a protein-free aliquot with sodium nitx'ite, and to couple the resulting compound with N (1-naphthy1)-ethylenediamine dihydrochloride in strong acid to form a blue azo-dye*
Reagents.1. Cadmium reagent; 5.2 Cm. of cadmium
sulphate (3CdS0^. 811 0) are dissolved in 25*4 ml, of 1*0 N sulphuric acid and made up to 50 ml, with distilled water,
S. 1* O N sodium hydroxide*3* Glacial acetic hcid, analytical grade*4. 15/ aqueous sodium nitrite, freshly prepared.5. 75/ aqueous ammonium sulphamate, freshly
prepared,6. Concentrated hydrochloric acid, analytical
reagent grade*7• N (1-naphthyl)-ethylenediamine dihydro chio ride
(chemically pure): 0*5 Gm. made up to 100 ml* with distilled water. Kept in dark bottle, may be used for one week*

49Procedure
Xu a centrifuge tube are placed ,0.2- xnl* plasma0.2 ml.'cadmium reagent and 0.2 ml. NaOH^ and thoroughly mixed* Xt is thou centrifxiged at 3*000 f.p.m. for5. minutes * 0.2 ml. ' clear superrmtant fluid aretransferred to a stoppered tube? 0.4 ml, of glacial acetic acid are added. then O.1 ml. of sodium nitrite, and the tube allowed to stand for 4 minutes, 0.1 ml.of ammonim* sulphamate are then, added and the mixture ■ and the tube is shaken, very Vigo m u aiy y un til no more gas is evolved. Xt is of crucial importance that this step is carried out thoroughly, 0,08 ml. oonc* iiOl are then added# then 0,4 ml, of the ethyicnodiamihe reagent, and the tubes are mixed and placed in a water-baith at 80^0 for 20 minutes. After cooling they'arc read at 590 A.O. against water and plasma blanks. The standardhas in each case, been prepared from the aixtpoule of the particular test to give a solution of antipyrlne 4 mg./100 ml * water. Reproducibility was probably improved by using a marked set* of iiiioro-pipettes, most of which were self-levelling and each'used only for its particular reagent (Figure 2,3),
The camputation of total body water has been as followa?'

FIG. 2.3.50
-A
<'
i 1
- !H j
!
1
■ i !
f ] 1 i '
A4W
'f«3 COCH
y
ê
!7!!■
p..
Set of micro-pipettes used throughout for estimation of antipyrine

31
Tlio colorimeter reading for the plaama blank waa -otib true ted from each of the j>laama teat :eoadings and, the reonlte plotted on aemi-*logarithmic papez' again31 time'.
i.e. Log, (conen. ) time, an oxpououtlal relationship'which is illaotratod in Figaro 2,5# Extx’apolating'hack to e,ero time gives the theoretical reading (T) had complete mixing of the indicator • throughout its vaittmo of diltition boon instantaneous #
■ Then, whore dose administorod - D mg.4 mg./lOO ml. standard reading S.
** T ■* # plasma concontratiou 0 -* ^ % 4mg*/lO0 ml*Plasma watox’ concentration 0 O kw 100-Pr.
'ÎAntipyrine space litres
From the Pacc^Rcithhun equation (156), (q.v# ), wo can say that:
IQf)Lean body mass Antipyx>ine space x -nrr kg.
Control Ikipoxirtient.s. *1• hinoarity
Exporimexit 11* Obedience to the do Becx^-Lambox’t La%f was verified for concentrations 0,,1O mg./lOO ml.

• . 52
2 * Rccoverie#*— P" .,» y JI P„.#n„#ir,„
~ .Pxpariiuent.' .1.2 * 2 Ml 4- of antipyrinéverb made up to -SO mi* with ,dièî-tillad water, ''0,2 'ml*- of this aoltttipii-were made up toi ■■ ■ - -
1 * 10 ml*-'with distilled water-* ■%# 10 ml# with-liepàrlM'aed-plasma (from'ho%#al
adult)* -Bo til of th0s.e ' Bolutiou8\ were pat through the -
method- with wate.r a#d plasMa hiaîdts*Résulta'3 " ; (tîviapok readings * )Standard - 0*417 '(MeaU' Of three)* / ■ ■Plasma blank -i;'’C>.#OÔO- (Bupiicated).
' ■ ’ Test; Mean of aeven plasma eatimatious r:0*4i7 t (s*D*) 0*005
This reprosautS: a mean recovery of' iOOfi- i (s ,D* )1 *'25#4 '-The total ■ error of eatimatiUg ■ antipyrine - apaeo by -this îuethod ia -thus rather less than SjS'-
3* Fro.aoneo ;':of ,.T-1-B24. and. ..thiooyanate in- aamui'ea. * -
Bxperittiemt 13»- The results- for antipyrine from ISxperimont g*
Actual volume of plasma 1,000 ml*
Apparent volume computed froiii oatimated conoentration of antipyrine 990 ml#

33
EXimiiiation of Zndicatqra from FIasma. ■ ■It can'readily he aîiowi (Figuaroé 2,4, 2,3,
and 2,6) tïmt once T :i824, thiooyanate and antipyrino liavo equilibrated with thoir x’ospectivo volumeB of dilution, the .dlsappearanca of each from plasma with time la exponential.
1.0. where 0 t=- %)làèmà. concentrationtime after injection
then Log C a T or Log C # k.T,
where K is a constant. .This constant'must ho dependant on a number of factors such as tho nature of the indicator', the pres once of pathology such as abnoraal capllla 'y pe3rmoebi 11 ty, etc. _ Xn other words,
varies with différent subjects and also at different times within the same subject.
T-1824.A typical oilminaticm cœare for this substance
is shotm in Figure 2. 4, Bisappeafance becomes exponential after npproximatoly 15 minutes, indicating that complete mixing has taken place. - Thereafter the moderate rate of disappoarance is similar to that occurring in adults# and also to that of I^labollod X.H.S.A# ( 82 , 71). The'disappoaranco rate in newbo.m '

5 ^
F I G . 2 . h.
T -1824 ELIMINATION
OpticalDensity
0 - 100-
0-075-
0-050-
0 5 15 30 60 mins.
A typical plasma elimination curve for T-1824, ’becoming exponential after 15 mins

55
Infante i a ■ s omewhat f as ter r Bt.lt tîiat of ■ 1 * H • S # çmielderahlÿ more 00 (105^103)^
Oxearly' tte'iBoet ' aoeurate way te ' evalààte tlio' T-l6^A Bt^aco'ié to plot tto'oeneentratic?as 'after 13 iBinutes . m d 'extrapolate Imok to mere time# % e Volanié of bload r égal rod prohibits buoÎ a prooodure in ohildron, mxû ^ro^orOon '(83,- ) 'dernooBtratod that a single' ooncontration at ton miinatoe wonld glv#' a oatisfaotory estimate of plasma volume* Figure ? *3 indioateB the'relationship of suoli a -sample to tlio general - oXijminatipn^ourve # and: this proooduro lias ‘ boon UBod; ttoouglioiit tiie. prOBOiit aerie.e* ' ■■tiegier ot al- (105) found that a aingië ten mluute sample would yield'oompâïmblo .reaults'in the nowbom period.
Till oey qua te. The ràt-e of ezoretlou of tM-ooyanato ie
es troinoly slowy t W ' figure usually quoted being lose : thrni- lÿl per lipuar (l45) * This" alow rate- has boon. oonfirïïied (l^iguro . At the aame timeequilibration with its volume of dilution is relmtiValy fast» all the o%?idenoo pointing to eomplato mining in under two hours even in the oedematoua eubjeot (Figure 2\.5). This 1# confirmed by the exponential

56
P I G . 2 . 5 -
ACUTE NEPHRITIS THIOCYANATE ELIMINATIONOPTICAL
DENSITY9 0
807 0
6 0
5 0
4 0
30,
Elimination of tliiocyanate from an oedematous subject wi til AGN

57
clia3?acter of t W _ at two lionvB ±ii Buolt a -aubjoct, Binco if équilibration witix oedema fluid woro still taking piaoo t'ho concentration plotted ut this timo-would lie above tbo-straight ■■lino drawn tlirou 'U tbo later values,
' . T h u s a ' s i n g l o t w o * * * h o u r o a m p l o - l i a e b e e n u o n d
tlirougbout tbo Box'ioo* no oorroction bdin made for tlie small loss wlxicb will bavo occurred by this tlmo,
Antipyriuo,Antipyrlne. is cscroted faster than thlooyanate*
nocGBsitating tho uao of tho extrapolation toclmiquo already referred 'tOf Elimination la exponential by two hours, even in the mildly oedematous BUbjoct (fi^ro 2,6), This is in genorai not true of the grossly ■oedematoiiB subject in whom the slow rate of equilibration renderei antipyrino uneuitable for determining total body water (lOo), This- finding was confirmed here in throe children with nephrotic syndrome, in none of whom had the exponontial ouxnrc straightened'by■ foux" hours, ■and in oho caao, by'eight hours.
Xn the normal subject, and the mildly oodematous acute nephritic, aamplcG taken at two, three and five hours post**injection Ixmro invariably produced a

F I G 2 . 6 . 58
acute nephritis antppyrine elimination
03Q
0*20'
CASE 4B.O 15
w OMO — 0 0 9m 0 08C 0 0 7s; 0 0 6
005 _ 0 04
u 0 0 3•mmm
CLO 0 02
Ô 2 4 6 8 lO 12 14 16 18 20 22 24 HRS.
Exponential elimination over 2k lars, of antipyrine from oedematous subject witli AGN

39
lia# 'wUmt plotted#Tli0 newboTO is oimracteriscd by very alow
excrotioîH of antipyrine ( 133)# A einglO santplo taken at two tuniTB %B therefore probably a at is f ao t o3?y dari;o( tlio first few days of life# , In tho present eeriea of■ newborn infants (Ohaptor 4)* however, throe samples have boon iisod thz'ongi hont.
be.riyatioîi of iutracellul.ar an<l .: nterstitialwlnmM<
Sinoo the valttos for both thiocyauato arid âhtipyrine space deto;tiiïlnationa have been expressed in.torjïîs of.volumes of water, it is poitaissible to enbtaract one from tho other to obtain an estimâto of intracoilular water (X#C*W#)
i#b* threnglioiit this series :i#0#W. Antipyrine space thiocyanato space. Intracellnlar epaoo can be anbdivldod by
snbtraotit%' ono part of it which has been measured separately, iimtiely, the red coll mass. Since tho latter has not been expressed in toxins of coll water, the two are not strictly comparable* but the difference botv/een red coll vcli,ime and red coll water smtet bo rather small# Ho obvious additional information has

6 0
become apparent studying the results of sucha division in the pxH>sent work# ■
Interstitiai water*To dex'ive a value for iwterstiti-al water
(l#8*W#), the plasma volume (T-»1B;>4 epaoo) must first be converted to plasma water:
Plasma water s- T.*18itfe apace x 0, 3, assuming a plasma in otoiu c emc out rati oh of 7B^m#/iOO ml#, Xn diseased subjects the observed value for plasma'proteins has boon subatitutod in this equation#
Thou* X.8 #If# Thiecyanate space plasma water.
Body . sol ids" #Tho differeuce be two eu body weight and total
body water, has been referred to' 'thrmighout- as represonting body •solids’# The two largest single compouottts of this are body fàt, with au average water contèut of 10#, and the inorganic component of bone#Tho ratio of oollda to water varies betwoon subjects and between tissues# ' further theoretical aspects of this parameter have boeu discussed in Dhaptor 1#

61
ClgAPTBR 3BODY m T E R DISTRIBUTION IN NORmL CUILDREN
I# T m AGB GllOim 1& - 12 YEARS
Much fundamental work .on body water distribution tlirougliout ebildhood has been carried out in the last twenty years. In this context the work of EriiS“Hansen is x>re-eminent# This worker, in a series' of ninety three childreti ranging from birth to sixteen years,, showed a decrease in the proportion of both extracelltilar water and total foody water to body weight occurring throughout childhood* The greatest rate of decrease was during the first year of life { ?4). The results of other workers have tended to confirm these observations (142,123,26)* The whole subject of the growth and development of these and other parameters has been extensively diseussed by Forbes ( 69)*
The decrease in the proportion of extracellular water- is confined to the interstitial compartment, since the plasma volume remains remaikably couBtant throughout growth at around 30 ml*/kg* foody weight (l84,6l ,143).
Xu the present work, the study of foody water

62
cîistrltatiou in normal children has been carried out with three aims in view $
1. The formation of a oontrol group to provide a haaia for oompariaou with the changea observed in acute nephritla*
2* In order to gain peraonal experience of the practical methodology of determining foody water cli B tribut 1 on *
3* The addition of a small cont%ifoution to the g€»neral literature on the subject# Ab stated above, this is extensive * but it has appeared to the author that information cmicerning certain relationships in ohildrou is deficient. For example, Muldowney showed in 1937 ( 143) that in normal adult a there is an extremely close linear correlation between lean body mass and red cell maasi in the same subjects the correlation between red cell mass and total foody weight was relatively poor* A relationship of this kind has not so far been demonstrated in childhood*Xn calculating lean foody mass, Muldowney used the relationship Î bean foody mass ^ Total foody water x ^h^g^Bted by Pace and Eathfouno ( 136) * The proportion of water in the lean body mass in infancy is considerably greater than 73# (233), but the adult

63figure ie thought in this respect to be reached around 2 years of âge. ( ?4 ) *
The Series #Twenty children have been studied. ' Since
the group was intended primarily as a control for the miephrltic aeries, no children under eighteen months old have been included $ acute nephritis is rare in children younger than this# Although referred to throughout as a Normalemriea, the basis for this designation must be called in question.
Definite' criteria for ecdection#1 * The height and weight to lie above tho
third percentile of mean for age {190).■■ 2, A haemoglobin level within the‘accepted
normal range for age (214}#
Less Definite■CriteriaMost of the children wer€ investigated following
recovery from the disease leading to admission to ' hospital, and therefore immediately prior to going home, Any child whose disease had been associated with oedema or other obviouB abnormality of body water distribution (a.g* diabetes mollitus,, dehydration.

64
children on steroid drugs), was oxoXuded* Three cases presented as behaviour problems without demonstrable disease, but in this category encopretics wore excluded in view of the possibility of abnormal extracellular volume due to the presence of large amounts of bowel water*
Results and CommentTho basic data for the group is given in
Table 3-1* Tlio individual results have been expressed throughout in absolute terms, together with tho aritlimetical moans for the group* Also indicated are the moan values (with Standard Error of the moan) of the results expressed in ml./kg. body weight.
From these mean absolute values a block diagram (Fig. 3.1.) has been constructed to represent tho body water distribution of an average normal child of this age group*
ReproducibilityA second determination of bdoy water distribution
was carried out on three of the subjects ono week later. The mean deviation between results was for total body water i-O-8# (range * 1,M ^ 4- 2.1#) for extracellular water 4 0*3# (- 0*5 - 1*3#)* and for plasma volume *• 0.8# (- 2.2 -> 1.6#). These deviations are

fAnm 3.165
BtibjectHo. Years-
Weightkg.
;Y.B.W. litres
B.O.W.litres
F.V.wl
B.V.ml
' % -11*34- 33.0 fjo*9o 8,OB 1203 1965' n '' 7.84 -8-3,6 ■ 14.34 6,33- - 129ft ■. 20103 ' ■ 8.97 ao*4 12.33 3.12 933 1377h -SI* 03.10 .5- 3.96 2.79 485 6935 , 1 .50,11.8 6.30' 3,49 498 764
' 6. 8.5d 13.6 ' 7.19 3.16 688 ' 10447 ■ 11.97 33,8 17.36 6,46 1074 ' 1/39 ■■ 8 a, 08 -11.3 9,06 3.64 425 ,'■6489 3.58 11.2 3.92 3*34 507 745to 7.97 26,6 13,80 5.89 1136 181711 6.35 22.6 14.76 3.34 1019 16331Ê 1 0 . # 26,7 13,70 6,29 1203 .306313 11.97 45.7 23,90 11.35, .2350 349014 il, 89 36.3 17*43 9.36 1750 364013 _ 7.98 27.3 18.64 8.21 1330 191216 7.41 25.6 16,60 7.89 .-1430 -‘3111- '17- la-,17 39.3 22.67 ' 9,82 1693 347418 11,04 23,6 17,. 38 7.67 1735 375019 5.75 16.3 9.33 4,73 796 1160130 8,50 30,1 11.37 5.59 -, 1060 , 1586
Moan 7.66 2337 13.97 . 6,24 1120 1732
Meanvalues In ml./ké. 598 270 47.4 72.9 '
S.B. 17.9 6,55 1.33 3.43

PIG.3.1 66
Body Water Distribution Average of 20 Normal Children 2-11 Years
lOQ
9 08 0706050
4 03 020J
IQO
r. R.B.C.Plasm aINTERSTITIÀLWATER
CELLWATER
SOLID incl. FAT
777/////8 - 7 ]
224 CMS
303 Antip y r i n e
40
Block diagram representing mean percentage values for body water and solids. The volumes of distribution of the three indicators utilised are shown

67
oonsidorably leas than the theoretical maxirami error of the methods, described in Chapter
Ro^rooaion of Measured ParametersThe linear regression of rod cell mass on
loan body mass, and red cell mass on total body weight are shown in Fig* 3*2# The overall correlation represented in the two graphs is similar, with a slightly higher value for the correlation coefficient pertaining to total body weight (O,9083 as compared with 0*8813).
Using soattorgrams (not illustrated), tho regression of all the parameters measured, both with each other and also with body weight, has been shoxm to be roughly linear* That with tho highest correlation coefficient of those tested was R*C*W* against body weight (r 0,96p6).
A list of all these linear correlation coefficients is shown in Table 3*2*, together with regression equations for all the values of ’r’ greater than 0*9# Xt is clear that with such a table a number of calculations are possible; tho individual scatter of results however makes it in practice ïiîore realistic to regard - those equations as a general guide#

_LLr . J . d.20 NORMAL CHILDREN
68
Kg
TOTALBODYMASS
40-
30-
20 -
r=0 9085
Kg
L E A NBODYMASS
30-
20 -
••• r = 0 8812600 1400200 1000
RED CELL M A S S ( ml . )
The regression of red cell mass on lean body mass and total body mass in normal children. The similarity ©f the patterns is evident

69
I.C.W,0.V.
TABU? 3.2
*■ r Rsgression equation
1.0.W. T.B.W. 0.9775 yÎ5.C.W. B.Vf 0,9696 y
T.B.V. O,1 .5 .W . B.W+ 0 . 9 6 # y «1 . 5 . V , T .B .W * 0 .9 5 9 9 y «E.O.W. ' T .B.W. 0 .957É
P .V , ® ,C ,W . ■ 0 .9 5 1 6 ' y =B .y . E .Ô ,¥ , 0 . 9 # 4 y ~
T ,B ,¥ . B.¥+- 0 .9 ^ 2 1 ' y ==P.V» B.Wr!- 0 .9 3 3 9 yB .V . B.¥-î- 0 .9 3 3 5 , y «P.V. ' T*è'»¥, 0'.9a74; '■ , y >=B .V . . ï.s.¥. . 0 .9 1 9 8 ' yC .V . 0 ,9 0 8 5 y «C .V . . E .C .V , 0 . 9 07a y s
0 .4 1 9 4" ( 0 ,5 8 3 ) X
0 ,654 ( 0 . 2 3 7 ) X
0 ,4 0 3 -t. ( 0 ,5 3 8 ) X
0 ,6 3 7 ■ q- (0 .1 9 f t ) X0 .4 0 0 f ( 0 . 3 4 4 ) X
0»419 4'" ( 0 .4 1 7 ) X
8 7 ,2 9 .,j. ( I 9 3 . 4 8 ) x1 3 9 .9 4- ( 2 99 , 9 ) X
1 .5 3 4‘ ( 0 , 5 2 8 ) X
2 7 .3 7 + ( 4 6 , 3 6 ) X
2 5 .5 5 4-. (72 38 ) X
7 2 .4 3 •f ( 8 2 9 . 3 l ) x115 . S "i" (3 3 5 ,2 5 )x1 ,6 1 ( 2 6 , 0 2 ) X
5 2 .4 4 ( I 0 6 . 4 3 ) x
y ■ 3c- ' r- ■ y xB.V, T.B.tf. 0 .8 9 4 4 Ï.G,V,-0*V,'•TI-.S.W. 0,8646P.V, T,B,¥. 0.8885 Ï.O*V,-C,V, 0,0519C.V. T.B.V. 0,8013 C.V. I»0,.¥. O.8I5Ii.s.w.' ' l.C.V. 0.8809 B.V. ÏÏC.-W. 0,8099B.Ç.V, ■ï.c.w, ' 0 .8 7 4 5 P.V. l.C.W, 0 .7 9 4 9
B.W* 0.8714 C.V. l.G.W.wC.V. 0 .7 8 2 9
* VaiViBa. TTor. x ''aW - y ' are orkiTogya^ae, axeapt foy .plaamà. réd oèlî and blood voiuméà, wbieb-âro ôxpxbséed'd«'ml.

70
¥ai’iàtio» with age*There 1# no slgniflemnt eorrelation between
T expreseed In ml,/kg. * either with age or withhog (Age) (r - 0*0403) * The same Is true of plasmavolume (ml*/kg.) against age (r # 0*1612), and of1,0*W. (r ^ 0*1181).
When B.C.W* 1» correlated with Log (Age) # there Is a negative trend which with this small number of oases is not signifiomnt (r ** 0.3864, F>0*i).
With l.S.tl* the correlation with Log (Age) becosies significant (r ^ 0.4484, P < O.Og) * This is a clear log* linear relationship which is depicted in fig. 3*4. The appropriate regression equation for this is:
y - S31*4 - 3*4 (%*og 3).Where y X»terstitlal Water (ml ,/kg* )
and % ^ Age in'years, (a^l2 inclusive* )The standard deviatioji of regression, however la such (l4*BO) that the equation is of little practical value for calculating interstitial water* For this purpose the e iuatlon linking this parameter with body weight the equation liidcing this parameter with body weight (Table 3*a) is more suitable.

FIG,3.3. 71
20 NORMAL CHILDREN
ml •/kg
InterstitialW a te r
Plas ma
Water
280
200
120 -
40-
Years
Log-1inear regression of interstitial water and plasma water on age. The slope of the upper regression line is significant.

72
In general, the patterns of regression demonstrated between the various components of body water distribution and body weight are approximately linea%\ although the small sis:e of the group make absolute verification of this unsatisfactory* Various workers have compared body water distribution with other parameters j such as height, surface area» and a combination of the latter with body weight,
( » 18^* For practical purposes, body weightin childhood appears to be as satisfactory a reference as any* It has been shown that for both total body water ( 74 ) and for extracellular water ( 26 )» there is close agreement with body weight from early foetal life to around six weeks post ««natal age. After that age the slope of the regression line is slightly less but once again straight, and extrapolation no longer passes through the point of origin of the graph.It is thought {26} that body composition matures and approximates much more closely to the adult pattern from that time on. Since the age*«range of tho present group is older than this critical value, a break in the linearity would not be expected and has not been found*

73
Xt has also boon suggested ( i42) that one of tho aspects of this maturing process is the changing of the proportion, of water in the iemm body mas.# to the adult figure of ?3;S i,e% the time whence tho Paco:«"Bat1d)%m equation become# operative* It will readily be ' appreciated that if this aquation i# applied to young infant# tto values for **iean body iaa»0 \ so obtained wiil frequently emceed the infant’s total weight* ■ It will be shown in the next chapter of this work that the moan total body water in the newbo%m infant is around 71^ ml./kg* Accepting■fCiddowson^s figure (233) for’body fat .## comprising 16# of body weight at this age, the p.ropox'tion. of water in the lean body mass can immediately be calculated at around 8,3$* In other woixl#, the ■ Pace-Bathbun equation should at this age bo modified to :
. bean - body muss 'fetal body water k
The fact that the proportio.n of total body water to body weight througltout childhood is greater than in adult s.. #uggc#ts either ^ 1* that children have lee» body fat than adults, or 2-* that the maturation proceaa i# a gradual one extending at least

74
to puberty* Huldowney’a results (145) showing well-nigh perfect correlation between r-ed cell mass and loan body mass but poor correlation with body weight in notmal adults appears to illustrate a quite fundamental principle* The fact that such a distinction is not àt all brought out in childhood by the results of the present series seems strong evidence of basic differences in body composition between the pre««pubertal and the mature.
The practical use of equations for calculating an unknown component of body water composition is tempered by the fact that any given equation refers only to the particular indicator dilution substance used in deriving the results. Thus whether or not the volumes of dilution measured represent an accurate determination of the true water^#^spaces is clearly fundamental. There is general agreement that in the cases of T.1824 and antipyrine, the representation of the plasma volume and of total body water is a fair one, within the limits mentioned in Chapter 1. With thlooyanate there is less agreement, due to the peculiar properties of this ion, alréaüy described*Cheek ( 26), in a scholarly discussion of the definition and measurement of extracellular volume.

75
came to the conclusion, based on much evidence, that the most accurate determination of this parameter is represented by the volume of dilution of stable bromide, corrected for 10# intracellular penetration. For thirty children whose weights ranged from 10*-30 kg. # he derived the regression equations
Corrected bromide space *■-
Where (Cl)^ is the concentration of chloride per litre of water in a serum ultrafiltrate#
Assuming an average normal value for (Cl)^ of 110 ntaq* * this equation becomes:
Corrected bromide space 0#323 0.261 weightThis compares with the comparable equation for
thiocyanate space given in Table 3*2:
Thio* space 0.634 i 0.237 weight These two regression equations are shown graphically in Figure 3.4. The close agreement in this weight.* range is obvious, and supplements evidence pointing to the same conclusion from the early work of bavièto» et# al# (116).
Similarly it will be shown in Chapter 4 that reasonably close agreement between the corrected bromide space and the thiocyanate space holds also in the

76
FIG. 3.4
E.C. WATER ( Litres)
10-1
2 -
10 15 20 25 30
W E IG H T (Kg.)
Regimession lines illnstrating estimation of extracellular water from ttie ’corrected’ bromide space - from results of Cheek (26), and from the thiocyanate space (present series.)

77
of -tbi» lle$ of eq#&tfobs' for prmotiebf %se fdr e^#mple* the pfêbblm^ of Imtravèmoiis th#r#py le therefore fait to■ he 4aatiffed*
ft w W etated emrly dm- thie Cîhapter that tho prime roasoit for Ibveetlg&tlmg m series- of normal chiidren was to form m eontrol pie tare with whloh te compare the. results phtalmlng in acute- uephritis# The M o eld diagram appearing mm- figure $*% is the outcome of this* it is of course a composite picture, repr as en ting the mean values for children of widely differing ai:%#s* However,- the fact there is no alteration.^ with age in ' the proportion .of plasma volmme^ or total body water juBtifiee the application of-a, singie mean value* The values for interstitial water do indeed ■ decrease proportionately with age; thl# decreaso is Of the order of eome'lO ml ,/hg# occurring hetwoen two ' and twelve ‘ yaara and has been therefore' ignored*
Summary1. The mean values for body water .distribution
measured in twenty normal' children wore;as follow*: Total body Water: 5'p8 ml*/kg*

78
water. 27Ù ml#/kg#Plasma vaiume 47*4..mi#/kg,Biaod..volume 7^*9 ml#/kg#.
. -a# A ' list regression equations linking the ■ oomponenta of body ' distributloit with bodyweight, ha# boan drawn Up: ■ for ■ prme tical use * The theoretical aecuraey of ouch oqaatiomB 1# dmaoaeBed.
. 3#:- The fundament ally close ■correlation,. between red cell 'masm :'mid,--loan body -mas# obtaining in noaimal adt%lte/waè 'not -fonâd-'-in- the preaent scries. The ai^ifioanco■' bf-'this, finding is discussed.

79
Bomr m mi^mL oHTtDmN. %!.- Tim FIRST % m mBKs OF i^im
'Introduotioh ■ '
Zu order' to render more oowplete the pioturo ■of body water distribution in normal chi i dr on .a ' study of the ' noWbom period has boon undertaken#: ' In theoMor* child, it aeoms that, diaaaso-^stataa-apart ■ watef**'dâàtributi0n remaiua fairly atàticw The i&miediata poét**#mtal period'however-reproaenta a time of goneraliaed^ body« -chati05a, the dogroe-'of'which-ds certainly imequalied at any other age* It would bo aurpfising therefore if .body Water-di# mot play a large part in those alterations, some of which have Hlîîdoed been documented* It is neteworthy that opiating . Studies' of body water dietributiom tend to ■ show at -this.'age’'wide ■eublect^to^-aubloct ■■ variation# both in. fuil^tcrm infants ( 68, 73, 86) and in thepremature* ( 28,200)*
It has mppoared to the author that acme ■promaturo infants. accepted in the lliterature as ♦normal*, may in fact by virtue of mn immature inability to control their own body water, readily become abnormal

80in tîiiâ respect, Xt le possible that such changes might he aesooiated with osceasiva aXtaratioh of Wat er-di s trihut 1 oh » àiwaya. meemalmg such changes to he part, of ' the normal pie.tnre* Bhifts of fluid ■batwean'-'tha:, intravascular and the interstitial compartmants; have been shown to occur during the first twelve hours of life C 29,216)* Tho possibilité 'of ehiftm - occurring between the intracellular and the •extraceliüiar ■■■ spaoos* has net however been .adequately investigated,: A pointer towards such a ' possibilitylies-in the .clinical ebses’vation that an infto-t-with little or no demonstrable oedema at birth may become oedcmatous .duriîîg the first twenty four hours (212), Buring this -period -%might*^loss will certainly, have occurred,- and the infant may well have îiad no fluid» intake,':
ease Material and Methods#Forty six apparently healthy Infants b o m by
spontaneous vertem delivery in the Royal. Maternity Hospital, 01aagoWt were the subjects of the study#Ho standaWimation of time-interval re^rding clamping of tho cord was introduced# The birth weights varied frcmr l#6a leg, to 3*-63 kg and the ages from k hours to

81X3 days* Four of the Zxifrntta (Hos, 10, l4, IB and 2X) were cXiniealiy mildly oedematous at the time of the determination* Thix’ty nine 'wovo examined during the first six days of life, and form a special part of the invastigation*
In each ouhjeot the weight was recorded daily for tîie first week or until body watex' determination was carried out, whichever was the greater* Xn forty four of tho infants oral fluids wore ■ started, at twenty four hours ; two (Hcs* 11 and RO) were started at twelve hours, Water was offered twice, four hours apart, the quantities boiiig decided by the infants* Fifteen or thi.rty ml.* of Imlf oT-omx milk was then offered three or four»hourly according to the individual infant * # siK c, with increments dependant on demand*
Forty»six doterminations were made of extracellular space and blood volume-; total body water was estimated in 30 of the aame infants* The i)roG0dure was as previously described (Ohap* 2:), with the following modifications:
A pre^injcction sample of capillary blood was obtained from the infant by heel»#tab. A No, 27 gauge acalp»veia Üeher needle was introduced into a

82
suitable scalp vein. The needle was attached to 6 cm* of 40 gauge polytheno tubing with a No. 23 intradermal needle pushed into tho other end# This was connected to a carefully select ad luer lock two» way tap and the ays tern filled with isotonic saline prior to use.
The indicator dilution substances were given from the same three 1 ml# Tuberculin syringes used throughout the study. The method of use and standard! station of the doses was as previously described# The indiodtors were employed in the following dosess
Antipyrine Thiocyanate T»1824 Infants under 2.00 kg* 30 mg. 30 mg* 0*4 mg.
2.01 » 3.00 kg 60 mg. 4o mg. 0.3 mg*over 3*00 kg. 80 mg, 60 mg. 0*7 mg.
A venous eamp3e (5 ml*) was withdrawn 10 minutes pos.t»injection for T»182%-# haematocrlt and# in 3% subjects, hawmoglobin detexmination* Capillary samples were withdrawn at 2 hours, 3 hours and 5 hour’s.
Total body haematoerit was calculated using the factor 0,8? as suggested by Molli son et al,, {i4o)*

83Be terminât ion of haemoglobin was by the
cynmethaomoglobin method, the results being read bn an ♦BEL* photoelectric coiorlraeter• :
Xt is worth noting that in the great majority of infanta the ooneentration of antipyrine at five hours did not differ aignifieantXy from that at two hours, indicating a slow rate of excretion which must be limited to the neonate. Thus a single blood sample at two hours would appear to be sufficient fox? estimating total body water at this age# indeed, in four instances tho concentration of antipyrine at five hours slightly exceeded that at two, presumably indicating' greater loss of water relative to antipyrine during the-tcet period. This pheBomenon'was' only noted in infants lees than 48 hours old, and in these cases calculation.of the antipyrine space-was made from the two hour concentration#Results
The data obtained for body weight, total water, thiocyanate space, Intracellular and interstitial water, plasma volume, haematoorit and haemoglobin determinations are shown'in,Table 4.1# ■ Absolute values for total water,, intra» and .extracellular water against weight are shown, in Figs 4,1 » 4,3.' ' ,
Total body water-expressed,Im ml./kg# body weight'imB been, plotted, against weight in Fig 4#i.

%
s
H-,{/)
1 )
\v iH H
\0 W
D V) W Vj W L) N W Na Di B. G. 0. (1 0. A gL A N N M H H G A G A D.
M va H M
W M MM "SI Cf".
N H ro w w
G A G
V ü) s:'
'ë* i-r> yy {î y H 4
N 05tO 05 M «O M O N V3
VI H O O D M W *:0 fP M H fJ \9 \0 f r Q M O O i\) ; JLa v; M \0 V3 O w " 0\ \o v;i
Cn
w
o
;üo
I r
MO
U l
N
f r0 \
e»
# i
M
WM
H-C\
00
I fo
k
o W V* \ 0 M
W I f rM M
i î «% O -W V)*" ^ w
V) LO va V) w V3 W fr V) W W W D W W fr V) La M U) W W W W V:QO W \n V) OOWOOS!HC\ir-w\00-COMO ONi\Ù4r*rv»ViO O'M 4:- M '-a \C Cr\ A ' \a V ) V» O O V( W 05 fs) V I % V ' \0 - W U« ' . îc
W W W W W VM v% «si vm -4) I i wn-00 O 0) f N Où
t t I V> V M ^ «\3 f tV f M 4 rV) O GO O *vo V M üs
V
LaI t
t m V vjï n f ui f V $" M'hJMNWW fOC\ %jt fr f VI <r L3 f V) V A" V VI L) #" fOVlN'P'O\000ùWfMfCV)O^fWfOO00MC\MO4rWfrMOViOVi'VO o C\ o S3 VI o
W W W 4:" fr fr 4y f W W 4f!V % \ 0 " 4 W W W ~ 3 W O 0 \ (%
^ 4sr 4r Vt 00 A) M t* ro f r VI $r f r * " VI ^ W V I VîCO 0 \ V) \0 ^ V3 “..î M W O
OS O O V I H M N H ' © 05 03 H 0 \ 03 W V i La M 'O \ 0 4P" 0 \ 4:' 0 \ s ; w
t tM W M M MV I V I C\ V I o♦ # * -, # #H 00 M o M
*"* h] M W C\ O Sj0\ W Ln W t t
M H M N f" s3 Cl lO0\ CO (V W I I
H K) M M M MVI O 0\ W s3 ..j\ 0 M O W V ) fP
O% m o m
B SW
> '(R
O
\ Pë ?
• < P
m &
c g g '"&# l
§ 3

ri“
a e a Ko o G 4-, 0Ë (* P f 4r 45" ■P- 45* 45* 45*-. P W W va W wa V4 va va va va M A3 A)# P C\ VJl f w JV H 3 va OO s3 OV VA 45" va M H 0 va 00 s ]
# ■»' 1 +Ww P
W
H M HW N IV va OO 0 \ C\ VA VA Va Va VA Va VA 45* 4=* 45* 45* 45* 45"
A A A A A A A A A A A A A A A A A A A A
IV M M fv P N W M M W N M M M N W M M A3 M M M• 'w W VO -3 b M VA 0) 00 © 45" O va M M O N 45" 0 \ O va O VAM w VO Ui Vt 03 s ) Sf s j O VA S3 S3 S3 O M 45" 0 \ M M M 4P m
S3 SIH HM 00Ul 0 \ C\ s ] ÜV CD 0 \ va S] Ov Ov GV 00 Os s3 s3 S3 " 3
vo f r H O U OV 1 t OV H 45" va H 1 t 45" 45* S3 4r VA 11 + N O 4S" 0 \ M va ,4- M s3 M va 45* va 45" M 45*H b MO O4S* m
w wVt VAso Pw w w £* u W w W W %• L4 va W va va W va va va va va va 45*
w vo o "•4 45* 45* @v 00 s3 H N 45* 45 4? va s3 Vf« s i VA 0 \ N1 > \o 00 H N VI 00 00 M 1 î' M 45* M QO M 00 va Ov S3 M va va va
f r b S3
03 VA
w VJUl OsC\ ' Ovf r w w W N 45* W O va w va va 45* M va va va
w 4P H W 00 iV 1 1 va O N 45* S3 1 1 ov va O 00 00 1\Q M W 4r o\ M 1 i o va o Vjî LO 00 la h) N VAM w MO 00M VA
4ï* 45*< j 00'*H VAVI
VI Vn 45* Ov vn Va VA * + Va 45- a* 45" VA VA 4P Va 45* va 4r VA* : N W W M 0 \ M 45" Va M @\ H 45* 0 \ S3 H Os Va U va 00 00
HH M W u O oo 0 \ © 0 \ Va M 45* N va va G\ Ov O 00 va a i M
o \O 45*w
4P 45*s3 00W S3
45* f r 45* 45* 45* Va VA 45* 45" Va 45* * r a* VA 45* 45* V I VA VA1 + s3 00 s3 M o N ov H 00 SI va V^ 4::: H Ov O VA va o ta NO H O 4P 0 \ S3 0 \ va 00 O O 45* H s3 =00 GO va va M va o va OV
00 vaVs s3
M H0 \ s ]
\o VA03 M M M H H> M H H M H H H H H M H M
0 \ S3 Vn f Ov va 00 1 4- s3 SI 00 C\ Va 0 \ CD 00 SI SI1 .;. i • t '» f i
■vl -45* M N O Va N H 45* VA va M w av va OO va \o? Mw s ]0)
fgCP
%
K-yg.'ff'
m
a ww »AP ■h" e:m *
g.”A.Pf?
ri
!S o ?îH
S>g IA
oo\JV

J.' _L cr . . _L
NEONATE SERIES86
TOTAL BODY WATER. 30 Subjects
TOTALBODY
WATER
Litres 2*4 -
2*0 “
r = 0 9360
2*21*4 3*0 3*8W E IG H T (Kg.)
Open circles refer to seven subjects with ’abnormal’ total body water (see text)

F I G . 4 . 2 .
NEONATE SERIES
INTRACELLULAR WATER. 30 Subjects
87
Litres
INTRACELLULAR
WATER
0 8 -
oo
r = 0 7533
0 * 4 -
1*4 2*2 3*0 3-8W E I G H T (Kg.)
Open circles - as in Figure 4.1.

FIG.4.3.NEONATE SERIES
EXTRACELLULAR WATER. 4 6 Subjects
88
Litres
EXTRACELLULAR
WATER
0* 8 -
r=0 9127
2*2 3*01*4 3-8W E IG H T (Kg.)

89
Tîi© infamts hav© îseen divided into tlxoso of three «lays and leas (closed circles) and those of more than three days old (crosses) o It should he noted that thé linear regression line with its confidonoe limits refers only to the 15 infants aged three days and lesBw These are negatiyely correlated (r 0.8083) this correlation heing highly ai^lfleant (F<0»00i,)»Of tho Infants older than three days* all those heavier than 0*20 kg^ at the time of eatisiation show results within the same confidence limits. Seven of the ten infants halow this weight however lie well outside.
The results for intracel,lular water against weight shown in Figure 4*5: indicate a similar significant negative correlation (r 0.752<i» P<0.01) to total body water. The instability of total body water in the smaller infants over three days old is shown to be mainly associated with altérât ions in this compartment j five of the same seven infants (ox>en circles) lying outaide tbe 95$. Confidence limits.
The amae treatment of the thibcyaeate spaces (Figurés 4.$) reveals a different relationship* Hera the proportion of e%tracellular water is constant (r 0*0106, F>0.l)i the coefficient of .regs'ession does

9 0
PIG.4.4.
r = -O' 8083 P< O'OOl
800
600
2-4 28 32 36WEIGHT kg
The regression line and its 95^confidence limits refen only to infants aged three days and younger (closed circles.)Crosses indicate older subjects. Note the seven ’abnormal’ values are all from infants weighing less than 2.2 kg.

91F I G . h . 5.
r =-0-7526p<o*oi450
e 350lij
250
2 0 24 28WEIGHT
32 36
Closed circles, crosses, regression line and 95^ confidence limits as in Figure k,k. The open circles apply to the seven infants with 'abnormal' total body water.

92FIG. .6.
CCLÜ
$450
0 ^
3 1 3 5 0
UJ
wg 250X Uj
K .X • «
* *° O . *0*
••• #•
K
Mean = 359-8 ml./ kg.S.D.± 35-2
r = -0-013: P>O I1-6 2-0 2-4 2*8
WEIGHT3-2 , 3-6
kg
Subjects denoted as in Figure 4.5. The ratio of extracellular water to body weight is constant.

93
PIG.4.7.
üJ _ 2 60_J .q s
< J 4 02 to< ___p 20 0.
■ : . V . • .o .*
• »
» R*^»x
e•
-------------------------------- #---------------------1------
X ••
# #
#
16
Mean =45-1 ml./kg.S.D.±6-8
r * -0*015: P>0-l2 0 24 28
WEIGHT3*2 36
kg
Subjects denoted as in Figure 4.5.

94not therefore differ significantly from ; ero and hence tho arithmetical mean with two standard deviations has been interpolated on the graph. Once more these lines refer only to the infants aged three days and less. Within these limits it appears that after throe days the extracollular apace is more effectively maintained than the intracoSilnlar; the vaines for all the infants shown to have an * abnormal^ total body water lie within two standard deviations from tho mean. A very similar relationship applies to plasma volnmc (Figure 4 7 ).
From the above evidence it seemed reasonable to cenclnde that certain of the subjects should be considered to have an abnormal proportion of total body water. These infants have therefore been omitted from the remainder of tho investigation* Following the same argument, all values for thiocyanate space, and all save one (No. .44) of tho results for plasma volume, may bo conBldored to be normal and have therefore been used in the second part of the investigation.
It was clear that in this series the variability of the proportion of extracellular water to body weight was relatively great; the factor of alteration with

93time was analysed. Values for a^gtracellularwater during tîic first six days of life wax'e available in 39 infants, the number of observations per day a%^eraglng 6.3 {vrni B 3-8). Tho moan S#B. ) for each day is seen plotted in Figure 4.8 * the connecting line is parabolic in shape, with an immediate rise from the. first' to the second day of life. The maximum occurs on the fourth day, with return towards the birth'-values by the sixth day*
Using tlie* method of least squares, a calculated %)arabola wua fitted to these results* The appropriate regression equation ia
y «. 292.32 -i- k7.2Qk X - 6.359 :« ;i whore Y - iSxtraceliulai» water (ml */kg« ) and X - Day of life within tho period under
study (1-6).Analysis of variance Indicatea tlmt tho parabolic component of the above equation ia highly significant (f 9 *90, P<0*0l)* The calculated parabola has a maximtun at 3*7 days, and tho closeness of fit to the observed results is seen in Figure 4.8*
During the first six days of life, important changes are taking place in body weight. It does not necessarily follow that the above changes in proportional

FIGURE 4.8.96
c r
<r C7>400
- I E 3 6 0LUu n< L Ü( r \ -
I— < c
LU
320
# 5 ^ 5 0
" § Ï 3 0CL 2 3 4 5 6DAYS
Results from 39 infants (mean + S.E.) plotted against time Tîie broken line represents the calculated parabolic regression curve which has a maximum at 3 .7 days,

97
extraeelluiar water reflect absolute changes occurring in this compartment. Serial alteration of the weights of all 39 infants (mean ^ S*E*} are indicated at the top of Figure 4*9, Xt it ia assumed that water-dis trihut ion is going to behave in a roughly similar fashion during this period irrespective of hirth-weight, then it heeemes justifiable to apply the curve derived in Figure 4*8 to these changes in weight. Further, the demonstrated lack of corrélation between the extraceilular water in ml./kg, and the weight means that no further modification of the values ia required for the general concept to be mathematically valid# The reaults of this are indicated in Table 4#^, and suggest that a significant absolute rise in extracellulmr water does in fact occur during the first four days* Since only one of the infants measured during the second day of life had been given oral fluids# it follows that the increase at this time can only have been derived by transfer of water from the intracellular space.
These absolute changes in extracellular water are depicted in Figure 4, 9# Subtraction of the value for each day from the mean measured weight gives a value which should correspond with the stmt of

*
Iimi
t
I
%%t
*3o
- O'# * *■
G A *M m
4:^|23 m
0
W)
#' * # .O Ad m•u -î'Ix.
SI ê
s
p;00 *H+»d0 >*§ 09 to0
h i
Ov0\ts
m
mCOCOCO
£>ÎACO
m P:<Ar^m
CO \D 4T| r-. \o
Cvî
98tn m^ oCO OQ
V:) m V) .0^ COtS Cr.- ÎS CO
•>t 'h 1 4-1 4-1
0 0 0 0 ■0 00 H m \D ON CM
n w Cs| Ci m01 eî Cvj CM
r^ in CM 0CO M H H COf $ •M 4'* '■r 1 ■M
Ci CO CM \o mm VO V) 00 c-m m m m cn m
ÎV

PIG.4 .9 .99
2 5 . 24
e n
^ 23 2 2
BODY WEIGHT (Mean±S.E.)
. '-6
h 1514
l-C WATER +'SOLIDS'
0 9tn 0 8
i ^ O - 7
06E-C WATER
I 2 3 4 5 6DAYS
Upper curve represents daily ch.anges in observed body weights Lower curve derived as in Table 4.2. Middle curve represents body weight minus extracellular water,

100
intraoellular water mid ,* solids n Similar eurves ■ could not be derived far total body water or intracellular water, 'Since after- elimination of m number of the cases for. the reasons previously discussed, the scatter of the remaining results was" such that they did not correspond to # calculated curve to a-statistically- significant degree# (For total ’ b o ^ water, after correction for variable proportion of body weight, W ^ a#93, P 4 0#10).
Should this general concept of progressive transfer at intrmcellular water to the extiucellular phase be valid, one might expect to find evidence of relative' intracellular dehydration, affecting also the rod bleed cells* Xt the mamk cerpuscular îmemeglobln • concentration Is determined, the cella can be said to act ae simple osmometers#• dlemrly# .osmotic shift of water into the celle- will result in deprcsmlon of the M*0#îï*d'*" and vice versa* haomogiobin determinations %mre available in thirty four aubjects, and the changes In daily M*0#H#C* -readings (mean Î 8 E.*} are Indicated' in Figure 4* iQ. A clemr rise ©ccura, with the maximum at four days corresponding with the maximum demonstrated extraceilular' volume* The values than decreasesomewhat-# From the sixth day the st^dard error

1 0 1
FIG. 4.10
39373533
2 3 4 5DAYS— rnàm mm7-14
Results from 3^ infants indicate a peak on Day 4 corresponding with, the maximum for extracellular water (Figure 4.8.)

102beoomos and the? means almost constant,suggesting that tho osmotic changes of the first few days are by that time becoming stabilised. The probability that Intracellular hydration is not tho only factor is suggested by the following reasoning: from the curve drawn for values of extracelltilar water (Fig» 4*8) it seems that osmotic fluid shifts are occurring from Day A Day 5* The results from before and after this period are unlikely to be affected by this factor* But the means for those two periods, i.e. Day 1 on the one hand, and Day 6 and thereafter on the other, are significantly different;(t Pc0#OH), The possible implications ofthis are discussed later.
The daily changes in plasma volume, expressed in ml ,/kg, (Mean i S,E, ) , are also shown in Figure 448;A slight rise between days one and two occurs, corresponding to the increase in total extracellular water during this period. Thereafter the mean values remain constant, not sharing in the decrease of total extracellular water between days four and six. No statistically significant trend is apparent from these results. It is therefore not Justifiable to estimate them in absolute terms in the same way as has been done
1 0 3
with the ' tliiocyana-te- -apaoe.. M u m the ratio '
profile emerges (Figure 4 Jl) * An increase in the ratio from day on# ■ to day two is- followed by almoat exact constancy until day five, after which the ratio starts, t© increase- towards the values of later infancy and childhood* This ultimate increase is due. almost ont.irely to relative decrease of the interstitial volume, the plasmt volume when expressed in ml^/kg*. remaining' fairly constant#
Discussion.%m. the analysis of' these • results, three possible
variables have been sought and aeparàted, nmimly:1# %%rinbility of proportions of body^ater ,
distribution naeo'ciatod with infm&ts of ' '■ differing weigiits#
2,# Variability of hody^wator- diatrihution due. to•■ extrinsic factora rendering: the values ataormal in- this respect.
3. Day to day variability- during the period imder . investigation.' In general the values obtained. Using these
methods agree %mll with the results of previous investigators*

104PIG. 4,11
I-
EtnO(L
0 20 |o i8 Î O I 6
# 0 4 4tnkOI2
& I O
/)
f
XXX
XX
X
2 3 4 5 6 DAYS
7-14Days
2-10Years
Tlie increase in the ratio shown here is due to decrease in relative size of the interstitial compartment. Value for older children derived from results given in Chapter 3.

105mid Gh.ë#% ( 64 }$ ub%ix^ atahle bromide
apàee eo^sraoted for mm^extrae ell%l w bromide » Bonmma eqitillbritm» atid sérum wator but mtoerracted tm?•biudlU0 <ré- tbé lou bÿ plasma albumlu* ébtaiued à meam valiia .for twaut . tofanta .âît the first day at X±tQ of 35B %' cl>3 (B'Æ,.) The roaulta ofthe .preaaut' series of ei^bt Infauta during the first day of life-4' corrected ouly for serum tauter @ are 334 & 8,0 (S.®.)
it hue hemt ahewu previouely by .Otapp et al *, ■ (28-) that iu-premature imfaute there i# eigtiificaut negative correlation het%een total body water» expresBed in $ -hud body weight. . Thec'ox'relatirm ceeffieiemt obtained by these workers, wnwê h «4. 59*6, In the present merles the cerrea%)ending value for h is 59*8^ this- including some full- terra' as well as- premature infants 4, A similar relationship holds for intracellular water* %il# tîie proportion of extracellular'Watto - body weight is imomt to decreaso throughottt- childltocci (?4 )> there is less unanimity in the literature regarding this correlation in the lmmd±mt0-- post-natal %)eriod; Check ( 26) by combining four of his' own results with five from the work of Finlay 'and Hare (65 showed a negative

1 0 6
oorrelation to bo present in prematures* However Finlay and Hare’s aeries of full-term neonates show no significant correlation* Clapp et al *, ( 28) indeed show a slight tout significant correlation, tout when their results are further analysed it is seen that this is due to the high proportion of extracellular water in the Infants less than 1*5 kg.The meaas of the groups heavier than this are not significantly different. Xn deriving these correlations » it has been assumed throughout that all the infant subjects without evidence of disease, and given approximately the same fluid regime » could toe regarded as normal, Xn the present series it was artoitrarily Surmised that, given reasonatole uniformity of handling, it was unlikely that atoaormalitles of watér-distritoùtlon would toe manifest prior to the age of three days * These correlations were accordingly derived using thé results from Infants of this age and under* When the older infants are included, those with weights above 2*2 kg, all lie well within the 95# confidence limits from the regression line. The fact that seven out of ten results for total body water from infants below this weight lie outside the same limits suggasts that infants of smaller birth weight

107lack the same measure of control over the volume of their body water -* a fact by no means mtoxpocted*
It is parhape lass immediately comprehensible that thie instability ià ©hown to be due to variation in the intraeellular compartment rather than the 0%trace 1 lular. The present state of knowledgeregarding tho factors regulating the volume and composition of extracellular and intracellular fluid has recently been aummarised by Bartter ( ll). Thus extracellular fluid solute concentration is regulated prlmai\lly by alterations in the ronal excretion of free-water, dependant on secretion of anti-dilittretic hormone. Veruey (220 ) showed that secretion of this hormcme ras%)onds to changes in total solute concentration, the receptors being sited in the region of tho supraopticohypophyseal tract* While this is probably the meet important regulator of secretion^ there is strong evidence indicating that under certain circumstance© alteration© in extracellular fluid volume also play a parti furthermore it seems likely that such an effect is mediated primarily by changes in the intravaec%%lar volume rather than by the extracellular volume., as a whole (II7 )* Control of extracellular fluid volume depends essentially on control of total extracellular fluid solute* The

108
meehmniama toy which this is brought about have been only partly defined* Wesson et al. , (229 ) showed that ' hypertonie expansion of the extracellular space resulted in inor*ease of the ' gioiiieruXar filtration rate with-a rise in urinary ■ sodiUBU The renal ronin-angiotensin axia has recently roeaived much attention in this reapact* Xt is considered that angiotensin acts -as’' the’trophic- substance for-adrenal secretion of aldoBterone ( 8 ) * thus regulating activermaal reabaorption of sodium,' Ronal -production- of renin, the activator of plasma angiotensin, has been shown to be associated with changés in granularity of tho Juxtamedullary apparatus ( 90 )1 and it is fairly certain that alterations'of intravasoulax* ■ volume represent the primary initiating factor horo.
The: contx ol of imtracellula%* fluid volume and solute coneent% ation depends on the fact that under normal cirmmstances the total solute concentration of intracellular fluid is the same as that of extracellular fluid ( 133). Thus changes in the latter result in passive ■ osmotic shift of wate;e with alteration of intracellular voltuae to render the oemolaritiea once again equal, -

109Increase in extracellular osmolar!ty is
therefore associated with the following changes s1. Passive transfer of watex" from tho intracellular
to tho extracellular compartment. Theesmolarity of both x>hases following this adjustment will lie appx^oximately midway between the two original values, assuming the intra- and extracellular volumes to bo roughly equal.
2* lacx^oased secretion of A.D.IL 3* The result of 1. and 2. above is to cause an
increase in tho extracellular volume, and hence incx’easa of glomerular filtration rate and prcsuiaabiy inhibition of renin secret ion*The nett effect is Increaso of urinary oamolarity.
4. Following the completion of these adjustments, extracellular oamolarity villX be restored to its original level. Inevitably the intracellular osmolar!ty and volume will likewise have been restored*The above sequence of events is clearly operative
in the maturely functioning human* Xt is now nocessary to examine the situation in the neonate*
Renal function in the newborn infant has been shown to differ from that of tho older child and adult

110
in certain important respecte. Xt liaa been demonstrated'that'oxoretion of solutes is-low, especially in px^ematuras ( 126» 239* 46 )* Available data oh glomerular filtration rate in the first few ' days of life indicate that this alao ie very iow’(10 * 230 5 •
While infants deprived of water during the first.three days after birth produce urine'of higher osmolàx^ity thm% those given water directly from birth, it Boems clear from the results of a number of investigators ’ that the young infant is unable to concentx ata- urine to- a degree oompax^able to that of adults* Thus, in a study of thirty normal newbox'n - infants deprived of water for the first twenty four hours, Fisher at al# (66) showed a memi urinaxy osmolarity of 309 mOsm*/litre at 2h hours, a value only minimally hypertonic to plasma* Similar findings have been reported in newbox 'n x'ats, when compared with adults of the species (92 )* On the basis of these and other studies, it is considered {55 ) that the maximum urinary concent rat ion #f which the newborn infant is capable is around 700 mOsm*/litre, which compares with the figux es of approximately l400 m%Osm./litre attainabl# by adults, A number of factors

I l l
are no dimbt Involved In. e.ausing tîiia. Bititation*Xnade<iuatô-prodttotion -of, &t roaponse to, antidit%retlc hoxTiioïio raBroaOHt an possibility*Heller miû 7nii:aia ( 9 3)-however ©lm?od that A.ÏI.II* production in- tlm mmlnrmif Although Xeas tlhui that of adulte, ia probably adequate, 'SluàXtmty Barnett et al * fio ) . have notéd a definite ability ; to respond to Pitroos-iti* This 'rosponso -is Imuyj,"' than that of . aclnlts tlio dit isiishscl glemeienlar filtration :r#to and l%m rate of sointo o.Kerstloa probably playing important
part» (118). ■ Tho length of Honle*a loop has boonfounil to oowelato positively. with maximal conooutmting ability in vari^ms animal sspooios (163)., , %t Ib, knownto l>o- abort in', infaiioy and to lengthon witli ago (198}*There .appear to- be no figtjroa available- either .for plasma angiotonain levels in noonatos or for secretion rates of nldoatorone during - the first few days of life*
llo-sponBO" to wat or-4o ad lug - in tho nowbcom ahowa both A smaller and a -delayed diuresis when compared to adult 11 ( 6 5 20 ) * - Xt -seem© I'ikoly that this £m due both toInwer glomerular ■ filtra tio n raton unû- laW r rate© of
aoXato exorotlen ( 55}*Thus i t el oar iûmt In-th î maint enanoo of
oxtx’acoiX'Ulnr volumetho newborn’s inability to handle

112either salt or water loads as efficiently or as rapidly as older children or adults will result primarij.y in alterations in extracellular solute concentration. As v/as made clear above, the maintenance of intracellular volume is entirely dependant on this factor. The nexYborn is also peculiarly vulnerable on account of the high
pointed out by 01mstead (152). In adults this ratio io around 0*6 «• 0*7 (l45), while in infants It is closer to imity* ■ The .greater the relative ■ oxtrÈvcollular volume, alteration of the total o©molarity of this compartmont nmat result in propo:rtioBatoly greater compensatory shift of intracellular xmter.Hence under those circumstances greater changes of intracellular volume and osmolarlty may be expected*
During tho first woeXc of life, a number of studies are available of serial alteration of urinary volume and osmolar!ty and plasma osmolar!ty*(196,87,50,165)• From these and many others it ie clear that diffari.ug regimes of oral fluid in tho first fox/ days result in markedly different patterns of urine concentration and of haemoconcontration, Insensible fluid^loss must also play its parti O’Brien et al* (151) slioxmd that whom tho respiratory component,

. 113usually cemsidered to represent 60$ of the total insensible loss . was - eli^ainated hy placing infants in atmosphères of 100$ - Wmidity * no-inèreèse In semm . ebiorido: eeneontration was, ■evident after ?â hour a - water dopri va t i on *,
In :tbé; present aeries,-^the-oral-fluid regime has' not been rigidly standàrdiaadi rather have the infante studied been on : m fairly typioàl day to. day neonatal .departmental .regime.*' rnie of the infant# became .olinioally over or under hydrated* Neverthele#» the -infants- whose - results afti?r three days lay within the same oonfidpnoe limita-:as the younger group show .marked dày to. day fluctuation, This variation, delineated - accurately only with .regard to the extracellular compartment, .-pre.sum'ably. represents hypertonic withdrawal of intracellular, fluid during the fi-rst tlirao days. IncrBUsing the fluid intW<c has been associated with deerease of the- extracellular, space dxxring: the next- three .days-',, but it. is-noteworthy that a si^ifleant time^lag exists here between .starting fluids and comm.oncing' dee-roas.o ±n ■extracellular voltime ? indeed , it would seem reasonable to regard infants ma îxandlçd as ’normal’ and .--it' might be past%#a.ted - that hypertonic' withdrawal of tXxiXd .from the intracellular to the

114oxtx*acelluiax^ phase 1© u normal phenomenon during the fix'st 48 hours of life. Xt be intox^eetlngto know if such a meoXianism could j>rolong the px^esence of oedema pX'esent £toih birth or indeed play soma part In Its genesis. Bnthor'lsesnci et al, (212) measux^ed inox'oasing leg^volûmes during this early phase in promatm^o infants with hyaline urembx ano disease. The Incidences of both oedema and px ei!satux\ity are high in this condition mid it may be of significance that hypotonic -arinç passed during %'fator-deprivation has been sioted principally in px’omatiires ( 3 3 )• The four oedematous infants in the present series had in general the highest values for extracellular fluid » but in only one of them is a value for intiuce.ll'uiar volume available, Xt is thex’efo-ro not poasibie on the present evidence to comment fux- tlicr along these lines, Hypertonic expansion of the extracellular fluid has been previously demons t x at ed in infants put on salt'-loaded dicta (127), and in premntu'ré infants cliangod ' from brest*-milk to cow’s milk (219), but this appeax's to be the first time such expansion has been moasux'od sor 1 ally in infants tinder ’noxiiial’ nursery coudltlonnr The results of Hamia (86 ) to some extent confirm this %) at tern; that

115author showed an inoroaso in oxtracoXiular water and in blood volume in infants aged three to four days as compared with infants measured shortly after birth.The results are however expressed in percentage body weight and it is therefore not possible to state if the increase is an absolute one as demonstrated here* Serial measurement of body water distribution in the same infant would presumably give a more direct picture but was decided against in the present series on ethical grounds# Hanna was able also to show a diminution over the same period of total body water; once again however the results are expressed as percentages of body weight* Xn the present investigation, elimination of the results from the subjects regarded as ’abnormal’ has meant that the numbers of results available for each day were insufficient to derive a statistically significant pattern. The trend for total body water however indicates as might be expected moderate reduction during the first four days* Xn view of the increase of extracellular volume, this loss of water must be entirely derived from the intracellular pliase. Loss of body weight appears to be greater than that of body water; energy catabolism of fat, protein and carbohydrate renders this inevitable* Some of the

1 1 6
intracellular water lost may indeed be releasedin this way, as indicated by the studies of Kicolopoulosand Smith (l49)*
Xt is interesting to derive support for these findings from analysis of changes in the values for mean corpuscular haemoglobin concentration. The state of hydration of the red cells is almost proportional to their volume, and determination of the M.C.H.C* probably represents tho simplest and most accurate way to demonstrate such changes, the correlation, of course being negative (208), t^hilo a large literature exists on basic values for M.C.H.C. at all ages, day to day alterations using modem methods do not appear to îiave been analysed in the first few days of life. Although the rod cells at birth tend to be large ( 36 ) partly owing to the presence of a high reticulocyte count, the M.C.H.O* at that age is reported to be similar to that of adults ( 144, 99 }* Mean red cell volume and M.C.H.C. are also affected by blood pH (161,70 ). Tho correlation is positive in the case of M.C.H.C. and is presumably associated with chloride shift and changes of ionic dissociation within the cells. The known low blood pH at birth ( 155) $ and its rapid correction.

could account for the significantly different mean ^17M.O.H.O. readings of Day one on the one hand, and of Day six and subsequently on the other. The higher levels occurring between these times are presumably more related to changes of cell^hydratlon due to hypertonic withdrawal, and it is significant that the peaks for both and extracellular volume(Bay four) ahould coincide.
The factors determining the distribution of fltiid between the intravasculax’ and interstitial compartments comprise a subject which in the neonate has -received - remarlcably little attention# Xu general * the nett fluid transfer across tho capillaries depends mainly on plasma colloid osmotic pressure, capillary permeability, and intràoapillary hydrostatic pressure.Tho third of these itself depends on various factors including mean arterial and venous pressures, and also on precapillary and postcapillary flow resistances (176), The latter have bean shown to be under neurogenic control (150), and are thought to represent the major control mechanism by which adjustment to relatively acute changes such as haemorrhage, is mediated.

118
in the newborn, plasma colloid osmotic pressure is similar to the adult level of àO-**23 WB# Hg ( 197} * Ihtràcapillarÿ prossûte in thé adult ia similar to this {II5) t and the very few results available for neonates do not suggest this to hû any higher ( 197), Capillary resis.tahce^y / as measured by the appearance of pétechiae during auction àppliod to tho skin, has been shown to bo low in newborn, especially prematures (238), and capillary résistance increases during the first weak, particulaxly in the first twenty four hours (221). Further suggestive evidence comes from the fact that both T^1824 dye (bound in the plasma to albumin) and radio--iodlnated serum albumin# disappear much faster from the intravaacular compartment of the neonate than of the adult (105,103).
Much work, the results of some of it conflicting, has been done to investigate changes in the plasma and blood volumes during the first twenty four hours of life. Thus Steele ( 205) and Clark and Cairdixer { 29 ) demonstrated reduction of plasma volume durixig the first hour of life, while the results of Sisson and Hhalen ( 194) suggested the reverse to be true* The latter author’s results, however relate to the period 4**6 hours after birth as do the results of Usher et al. # ( 216) , who felt that these discrepancios were duo to

119
failure to take into account tho %)rosence or aba one e of placental transfusion# Theix». x*c suits ■ , showed an absolute increase in plasma volxuue occux^ring between four and twenty four tiomPB of ago, wiiich agrees with tho evidence from the pres ont work^ They suggested .that this increase might bo duo to local- inex’oaso in circulation affacting perhaps" tho gastrointestinal tract. %ile this may be txtie, the present findings su vgeat that àt least part of the increase in plasma-''irolume is ' due: to the - goneral expansion of extracellular fluid taking plaoo at tl%is time# ' Xt is-■ interesting that after tho . first 24-hourstho ratio sî oulcl bo so accaratolymaintained during the period of osmotic change, and that wîmi the interstitial volume decreases' at the fifth to sixth day, this decrease is not apparently shared by the intravascular compartment# Presumably tho conaidcrablo instability of this compartment during the initial period has by now stabilised. What factor 037 factors aré however operative in causing the subsequent gradual alteration in the subdivision of the extracellular fluid towards the adult picture must remain a itjystery undex' present knowledge.

120
ConclueionThe m&jor findings of this ecrioa relevant
to the general theme is the demonetratlen of fluid ehifts from the intracellular to the extracellular space taking place In the first few days of life.The way in which thia observation finds a parallel with the changes occurring in acute glomerulonephritis will be made clear to the reader in the second part of this Thesi#,

121
cmpTmi 3
j_ûataJ!ù0tê 0 f mPmâs nmd,. tâîih $W ei}taMiBh^mnt o f
tfmmti$ati0n tn s nnintemna^' ûf
m m , ojv?/ ismB âoUbt cost on the. poim of a Mown ferninXa,
Xt will be made clear in Part 2 o f this X'hesis that the shiftb o f body water distribution taking place in acute giomeralouephritiB are considérable, and their nature at first sight unoxpectod* Those results will accoxdingly be seen to pose a x>roblom which thé iatcr chapters will attempt to aolvo# Xt ' is the attempt to fitid a solution that necessitated using a'nràïbbr of standard biochemical methods, a list of which now follows*
Serum and urinary sodium and potassium were - done by standard flame photometry, using an--.*BEb* instrament.
Serum and urinary chl^rido wore estimated using an XDBL* chloride .meter.
Serum calcium and magpie si urn estimations were ■ doîitO' OÎ.1 the. miero* titx ator, using murexido asthe indioatox" for calcium, and eriochrome black as the

122
âiidi-oat.Q.r for the stm of. tW'two imiBt ■ the level ■■ of ,magïi00iuïïi was' obtaitiecl as tho difference between ' the two - readings# Me attempt w.aa madO' to astimate .thO'.ibnio' fraetie.ù''of caiGi'Um*'
' _ , . ■ - S e r u m ' n r e a w a s , e a t i m a t W b y t h e m i e r o ' ^ i c j e l d a h l
method, ' with - W'è#al.0rie#tiom# , The usual" modifioatiou,of thia method {217} wa# used to' estimate serumtotal, uroteiua.»
Serum-' ,el-ect.foph.Q.re.al.s was done on tflmtmau Mo*3 mm* .■ paper at " ' p H ' o f sox' tm for 16 liourB at/ 3O0 volts .amps,"- The .strips wore■stalm^d-‘with biss.amlu0 0reéu and - t W patterns roaû on U Loèbél *(hiromosoau^ - .which was. found to give highly' reproduoibl# fesuite*
BoTtm. t.Q.taj. ; osmoi.arity. was estimated by 'clepx eaBlou of fraeèlug point on a Fiske Osmometer,' uein^ standards of 100# 300 and' gOO mOsm,/kg* water. ■
# ormal. ValuesThe reàult,a ' of ■ estimatiouB oarrled out on the
plasma of twentym.twe uor#i.al cbildren were aa follows^

123
Estimation Moan (S.B.)
Bodium 138,7 (4.17) moq./iPotassium 4.37 (o .333)m s 'î./1.Ghleride 103.7 (2.80) aeq./l.Urea 32.9 (9 .05) rag./lOO ml.Total protein & 83 ■ (0.30) 0m,/l0O ml.Total osmolarity 2.84.5 (4.61) mOara./kg,water
The no:mal values for the se rim eleotrepUorotlc pattern iflll bo detailed in Obaptcx* 0*
Mer«mi biplogical variationAn important aspect of the investigative
procedure detailed in Chapter B will be the daily biocUomlcal assessment of acute iiopliritics over a critical period of around one week. To determine the significance of tho changes demonstrated, it was considered a necessary preliminary to gain some information regarding tho range of biological variation in noraial subjects in a day- tp- day study over a%3proximatoly the same period of time, Or, to put it

X 2 k
another way# an. attempt has .boon made, to ascertain •the limits .within which normal subjects maintain these aspects' of. their hie chemical status# ■ ^
Material and .methods./Four nc%mml adult physicians#.- throe male' and
one female, whose, age^range was. ;27' 33 years# had a venous. bloods sample removed wi th minimal s tasia on . eight consecutive days * -Samples were .obtained at x andom times of - day between OpOO and' -hrs. Thewoman was in approximately mid^mehatrual cycle.
The following estimations wore carried outs Serumaodiwn# potassium'# ohlox^ide, urea,
total protein and total- osmolarity# Samples wore in all cases atored at 4' 0 * .until the last spocimona had boon obtained* Each sot of estimations was then done me a single batch by the same observer*..'
BosuitaThe mean values with S.*lh fox* eight daily
estimations- on, the four subjects are shown in Table 5*2* togèthor with the average.# for the grow as a whole.# •
It can be seen that, while there' ie little , difforoncof; .betwea.n the means for each subject # tho standax*d deyiati.one- are in general small# indicating

125
mi
I,1
I•rt
1
4PImu0
m
II
u0)>3 4P4PGÎU •
mH ^#
%o fôM
iH^ 1 O
& èo
BCi O p o
éB
u y
g :
ITi Hd ïT +> © o U A<
i H*H •V -if O 0m a .
4Pt
■§
KO O ■ VO r>o Ç\ . H CM- H O OSH» * # $ 4 m ■ * # • *O K\ H • ■ C\UV N C\ OK'w* Cx-w» 0\v» 0\^CM CVÎ CM i\t
KO m ■ 0\ oO o VO iA ^ co CO *4 r^KO»A iT\ KO H ^ o CM m ^ CM* * • * ■ à * ■ # * * #r- o . *>o A*0 ow
>*#svo tn ■ CAH iAM o;) ..ïÿ ^ KO.* o # ♦ Ok • M #\oC'J * *- Q • O # o tCM CA CA CM n m CACASwik' ■ w*
■ <<»*% /»*AiA H ■ 0\ iA *> H-sî' f4• kA * KO * O * C%)n • V."i* • ïA .# >.A • .vV *o H o N O M O Ô o HH ’w*' iH W' H*^
«-s.o m CM <h V)m m H iA -;t m sù ç-iCÀ q\ # co * ■ ^ # m *,% O • o. J o ♦ O # O
4* ifCO Ch - M 0 H '00 H KO CO f.-‘• CA • M . « • Om # M • H $ <M ■ * 0 *CAM H ^ CSI M AïH W- M-Swf
fq'I’J
m# t)r'iiVXj*t,.w
A#0g

1 2 6
close maintenance of these levels hy the individual subjects.
To carry this investigation further, an analysis of variance technique has hccn employed.The variances separated have boon 1. the between^ subject variances and 2* the within aubject variance. The results of this analysis arc seen in Table 3.3.
Xntbrpfe tati on %Xt Is clear that the maintenance of a constant
level of sodium, potassium, chloride and total px*otoin is within oxtrcmeiy fine limits in those noiwal subjects. This is pa%*11 cularly true of sodium and potassium. The maintenance of urea and plasma osmolarity is less exact.
Comment*Much work on normal biclogical variation has
been done, cspecially in the field of dluimal variation affecting renal excretion of olectrolytos ( 122). Urinary electrolyte out%)ut is in general matched by urinary water output, hence ho distinct diuxmal variation of plasma electrolyte levels has been domcnetrated ( 139)# To parallel the conditiona of

I'm¥
mg
coi w
■
i
%
%
.#
#hJ
t5t??%
s.#m:t*iÎ
m«I'Vt?
(%«1VS; *
%é.' JSI #
sN
#
4
M
II%
127
.#
AA
I(3)-,
I
feî'

128ii'iveotijgatioîi of tlio mcplxritic bXood $ ample aV0TÙ obtained at random times of day ' dnvtn(^ an oigUt' Ixoxtr apan# The results have olea rly indieatod the. flue'limits if 1thin which four.of these quantities are regulated#. The fact that urea is loss oloBely maintained ia not particularly surprising because it seems likely that such factors as food ingoation will have an imstabling influonco* one would howovox" expoct plasma csmolarity to be maintained within closer limits than has been demonstrated lu this experiment # It will bo remembered that tho %ithiuM.aubjoct** variance derived represents the sum of biological and methodoiogical variation# Xt has been assumed that the methodological variation must affect the teat and controi groups equally^ this factor waa not. therefore specifically isolated•Xiowevor in view of the relatively greater within- aubjoct variances affc;cting urea and osmolarity* the rex'ïroclucibility of the method was checked. The reaUlts suggoet that the major part of the variation of x inama urea is biological, Xmt of tho osmolarity, methodological# This fact will bo borne in mind whexi analysing tho results of the U0x>hritic group#
Two ftxrthor important difforoxxcas botweeu the groups remain to bo diecussed# Firstly» tho

1 2 9
fact, that tho ccmtrols aro adults mid the nopiiritics children#■ .It was ooneidored dthieally unjustifiable ' to auhjeet normal ohildfon to stich an axperlmc^nt •, Comparable figures for childhdod arc net to. the author* s knowledge available tmd it is mot therefore' possible to. ooimont on tiiis 'distimotiom#
■The second differenoe is of gfeUtex? importamoei nainely# ’ the fact that the comtrol group were on normal diet# wiiéreàs the nephritic s', were throughout mhimtainod on .a low'^sodinm diet# The response normal adults to a ■ low^eoditaîï'diet is ' howoyer well documented in the 'literatures ' :for. example the ■ result O’, of lAtetschor et al# (i24 ) showed that., following 6 day© on an inta3w of 11 mod* of '©odihm daily, thé plasma ''sodium level© docroased by hn average of only 2,5) buki,/litre, duo of course to progroasive renal consefvatian nf salt,Thé main object of the pres on t study ha$ however been simply to .define normal biological- variation^-using/ this 'à© a background, the variations in acute nepliritl© will be indicated in due course# ,
Total -nlasma;oamolarityThere is a frequently quoted formula for
caiculating, the total plasma'■ osrao.làrity ( 180 ).» It

130
is ae'fo lIowa
) = 2(Ma / It) f 'fcea - 8
■■Sodium and pqtaaeium aro ox|>roBsoch in raeq*/X* and urea in m#Mois./i i#o#, SS tZ SSEâ,*
Xt is cl ear that such a formula must give a rough approximation to tho o©molarity only#%othor or not it oan be relied ui on oven to thia extent has been the subject of a small study#
Resuits and OommentThe results are in. two p'prtsi firstly, from
twenty-ono normal childreni secondly, utilising the roanIts.from the nephritic group, many of which arc outwith tlie noî-tual range*
The results.from 21 normal children for observed o©molarity against osmolarity derived from tho above equation are illustrated in.Figure 3#1*Tho arithmetical means are almost identical - 284.g { observed ) as compared with 2 84 # 7 - (■ cal oui at ed ) ,MovertholOS© the variances arc different,■ respectivcly 21*23 and 67*80# A variance ratio tost 'indicates that this difforonca is highly sigiiificant (F - 3*191» F <0*01*) Xn otlior words, while themean's are the same, tho scatteir around tlie means is

131PIG. 5.1.
PLASMA OSMOLAR ITY
21 Normal Children
mOsm
OBSERVED
310-1
ee2 9 0 -e#
2 7 0 -r = - 0*1581 P > 0*1
250 “T-------T310 mOsmy I.270 290
EQUATION

132
fïolent'ly - dormit. to ' aigmlfiqa%tly .
û t t t o v i . n g p s k T m i t Hqaeo it .ifi,-nottimt, tîioW:' i$ no ow-roX'atlw betwemi .fto
re^uitp' .(# 0#i58if -F>0vi*}'®io; %?:0enit@ for the bephritiofa iiioi-ud© 'a
f air number of obnorniaXly higli--readings - They' oompriPê.64 olmervatieùa from nine, cliildrén. ' The value'fe .have been "plotted „ im ,P i g w 0 3 *'^ where diyiaion into, two' groupe:'is .soou#;. namely,- abD-yè and below- .the - obéervod value of 300 moaiif/i * '
" 'For . tW";38 values ' of MpO .àùd lea# g-... h . ai ilaar piotûrê to’that: of the normal'-group''is“ aeonr the : 'observed-meau ’ is 883,#.3 agaiuat'a oaloulated. moan of 881*1* '■ phoo again the variàwbs are significantly ■differ out (f - - 4 * y,4 #' F < 0:* Q). /). ' mid ' there is ' uo e.orrolatiou' (r F>p.*l* )
The higher group (observed oéEiolarity, ' 290) had meaus of 30?*0 - (observod) pud i!9?.*2' (oalc.ula.tocl) * Thes.e meauo are aiguifio'ahtly'..different (t - 8 *838, F < 0 *0l).s— and again there Is uo'siguifioatit .corrélation although 'a slight positive'tromt io- now evident (r 0.8670» F > 0 1)*
Tt is only Whou the. whole group of 64 .roadingois eoneidorod that any relationship begins to- emerge*

133
FIG. 5.2.
PLASMA OSMOLARITY64 Observations in 9 Subjects
mOsm.y^l.330-1
ee
310-
OBSERVED 290 -
270 -r = 0*569 P<G*001
250330 mOsm./1310270 290
EQUATION

134
Hovovor, altinmgh tho' çorrolatloiA m m MgUXy Qlg^nificant {F < 0*OOX ) it ia in fact so poor (r - 0 ,5690) that it ia cliir.t)?,iouXt to thisoquation i'or calouXating oemoXax’its as being of any vainQ what0oever*
Conolnsion
Xt was originally anticipated that the oalcnlation of o^molarity nsing the above equation would bo anfficiently accurate to obviate' the necessity to make direct observations, which require 1 mi. of plasma* . The above- results, combined with the impression that values for this parameter m'ight well prove to bo of real importance in tho investigation of acute glomeintlonophrltiB, Xxavo jp romp tod tUo atxtîior to carry out direct estimations throUghoTit *

135
mAPTmi 6 AÙÙTB GLOmRULOmDPimiTIS i
A Short Review of B%:iatiag Theories Oonccmiiig tXio Oedema of Acute Giomcrulonopteitis^ and a Biscuseion
on their Bhortcominge
DefinitionAcute giomert ionopl'iritlH was first doocribod
foil owing Bçariet fever by hiilio* TIoIle in 1810 (227). doîm BlAcknli in 1813 vas well familiiur withbreathlessness as an unusual symptom of tX%o disease (17 ) but it is Biohard ■ Bright to the main credit isjustly given for tîio painstaking clinical descriptions in 1827 of the several conditions collectively designated for mere than a century »Brightks Disease»*( 21 ) * The realisation tîjat this overall term iucixtded a number of widely differing clinical and pathological ontitlos resulted in a problem of semantics ' of ' a complexity which it is hoped will never iiavo an equal. We aro indeX>ted to Bllia (60 ) for first devising a c la a a i f ic at i on of Bright is- Dlaoaao whicXi was oimplo and had tho supremo merit of being based on a study of = the natural history of the various

1 3 6
diseases included under the general title* A later generation has modified his classification in detail only, and paodiatxdcians in particular have tended to select certain of tho earlier nomonolaturo# Thus Bllis* »Typc X nephritis* is now generally refwred to as acute (post^streptoceccal) haemorrhagio glomox'ulonophritis (or as acute glomorulonophritis) j) and »Typa XX nephritis * as idiopathic nephrosis*
Xil t r oduc t i onAcute gloniexulonophritis is a disease with
which clinicians are well familiar# Approximately 50-60 cases arc admitted yearly to tho Royal Hospital for Sick Children, Glasgow, the incidence hding grdatest during tho winter months# Tho association of the disease with infection by the -haemolytic sti'eptococous has long been recognised, and the more puK^iling aspects of its epidemiology have been clarified by tho demonstration that only certain strains of this organism are nophritogonio (lyi). While in adults tXxo disease carries a significant mortality, in children it is essentially benign*Xn the past this fact has tended to be under^ emphasised (lOl)#

137
ît %mé Hrôd im ( 22} # 4# d r wliurticular attention in print to what W 4 pinwiously. 'bê#$% clinically obvioTtà* Thîà is tlio- striking toiïëemcy of tliû dieéao'è- to full iîito two plmsoa#The Tirât, which ill Bred*a adult qaaee iasted up to a iiiontti he doscribed a# 'tho. acute or oodomatouo phase*, ■ TMa; i.e cliarnOterisod by o.edema, hypo:#aneio#$ the prp'àOîioe éf'biopds aiwrnin'apd caate in th# tirlno, raiàod orythroçyté éedlmontatio# rate, and blopd.Woa, a iowerod .fiitràtion - rate and - thea.0pi%tion\of-feduéed amoimto. .of dilute wine, The ■second:' stage, referred to-'a# .the'post^diuretie or ■rodovéiy phase, ia notable for the dia.appearancfO of e%tra^r#hai;,manifoatati#ms ,l#aving only winary abnorïïmlititôo and a- raised ,. both of wtxioh.steadily' recover in the #nç'ompl.ioated daaé# At the , emiè - ti#e he ' reoogniaed that,- some patients may have Oedema with or withont ' transient hypertension and little or - no -nrinary aWosmality, %#ile others mayhave ipti-te. ■Qon.eiderahle. evidence of renal i%%airment'
' - " ■ ' \ ' ' - ' : hut .à''Complete ahaenOe of -ê^tra^reimi signa* ' . Bred 'alee felt that, the"pragnehis ■tended ta vary with tho ■ ’dnratioh eT-the firat otage* jicmoo hie reommmndatiem'that any .of therapy "ahpnld'he directed tmmrdé

138
tho encoitrugoment of oarlior dlureaia (22)* It is my own viow that any Investigation which talces no account of these stages is likely to be of little value.
The Oedema of Acute GlomerulonephritisThe nature and source of oedema fluid
occurring in acute glomerulonephritis have given rise to considerable controversy. A number of conflicting theories have consequently been advanced.
Xn the view of many (l, 39# 62, 192) AGN is a generalised disease affecting the entire capillary bed* This stems from Beckmanns original observation in 1921 (12) that the protein content of the oedema fluid was increased and could be as high as 2.5 Gm./lOO ml. Thus the moderate reduction of plasma protein concentration found during the oederaatous phase of the disease could be readily explained. Reduced plasma colloid osmotic pressure would favour further transfer of protein plus fluid from the intravasoular to tho interstitial space. Tho result would clearly bo a reduction of tho plasma volume, but all experimental evidence indicates that this volume

139
is incraaBCd ciuring tU# 'eWematoue phwc (125,17,9, 57).To aobomt ■ for-tixiâ disioropancy a rodmetlon- W th# ■» € fToo'tiyo»''" voi#*#- hma- b e w auggosted (39 ),the mooimniêti ' being aiwiiW- to - that doeoribod initeMPt failure- (207)# ' To ctotcrno direct, evidence
. ' . ' ' ' ' ; oxiâtâ to Bupport- auoh & .Contention* ..
More, .roceni uming more delicateM&tlmûB to '-oatiwato'- the protein content, of ' th# . oedema fluid hay© àhôwn, ieyel» ut 0,4 0-,6 om^/ioo ml%' (224), ■ Thoa© valdaa nvu] the aamo- ae-tiioao- noted,by the -Bmnu invootigatora-in .ttimy undoubted tronimdatea (202), Zf tlm figtmm are aocopted, the theory of goderaiia#d iticreaoo of - oapiilnry,' permeability beoomoB; untenable* ■• At the earn© time ' it - i o w o r t h i î ï J i d v i î % t h e . o b e e w a t i o n t h a t , g i v e n ■ x x o x m a l
protein ©onoontratiod and an incroaâo in-the voimm of iriterotitlni fluid, it 6t' onoe _ followe: that the total amount of protein in-thiB ■ootopartmont'-imxBt b© inereàsed* ' ■ Thia point will be fnrtjn r'-dieatioood- in dhapter.-Mne* -
. The •.occmrrenoe of » heart faiini^oi ' in AGH wao firrit deaerlbed by-Gdodhàrt in-1S79, ( 79-),Further doéeriptioné were . fnmi.ehed. dhrin# the

l4o
ninotoen thirtloB ( H 9# 59 #231)5 when it became ojoar that eodema.’ Is one of a group of s'ymptoms and signs incinding orthopnoca, the- preaèncé ut various transudates 5 cardioW#gaIy.and typical radiological appe.arancco of thé chost* ' These arc. generally designated, with ciuestionahlo accuracy# the congoetivo change B of AGN *
In 1944 baPuo (ll4) propoBod that the congoativo changes were truly cardiac in origin-and roproBontod a true form of congestive failure* That author cmpUasieed the causative importance of hyp or tens ion * Further evidence, favouring aprimarily cardiac nature of the phouomonoxx o m m from tlxo work of Gore and Saphir ( 81 ) who demonstrated hiptolçgical clmnges in the. myocardiuiïi ouggeetlng a form.of myocarditis. Potera in 1953 (162) and Mu‘rphy and Murphy a year latex' ( l4?) while agreeing with the g-oneral ■ theme were unable to aup%)ly a further explanation■cf why the heart in AGH should sometimes fail* Xt was immediately obvious that tho duration of hyi>artension in tliis diaoase la exceedingly teicf. Thi# would ïîiaïco unlikely hoart failure duo solely to this factor* Further, tlio degree of histologioul daiîmgo mentioned above ie in fact rather mild and

l 4 l
non-apeoifle # ■ As EasBix'or. imd Bctoart ^ havo pointedout ( 108) 5 the myocardium io unremarkable In appearance in 'many patients .who die as a resultapparently of cirealatcry congestion»
Idieu true.- congCBtivo 1.ica3,'t failuro and that of AGH avo analysed in ■ renal axxd liaomodynaittic tcmis, some'striking differonceo appear. Thus in congeetivé heart failure 'due to hypertension or to cox'onary artery dleaaeo the heart output Is x oclitcod, the circulation time prolonged-, ■and the art or 1 p venous oxygon saturation difference is incroaeod.* In the kidney the renal plasma,.flox is reduced to a greater extent than the glomemlaf filtration rate resulting in an increase of the filtration fraction. The congestive picture of AGH typically ohowa a normal OX’ aoîîîotimoa incrouBOd cardiac output, normal circulation time and a normal .artoriovvenoua oxygen difference. The glomez’uiar filtration rate shows a nmTïtoû degree of réduction, but tho renal plasma floxf is gonorally well maintained and tho filtration fraction is ooneoquantiy much I?alow normal ( 4?, 51*56, 91,177g2o4). Xn view of the number and constancyof these basic di ffarone ça. it becomes unrealistic to regard tho congestive changes of AGH as being due

142
to heart failure *it was Progar in 1941 (169) who first suggested
that' the oedema, and other congestive changes in AGH might he explained on a basis of* retention of salt and water,■ The first experimental evidohce to support auch a contention came from tho work of MaoArtîmr ( 125 ) who demonstrated a incroaso in the blood volwtao to be present during ■ the oedematous %)haae of the diaeaso. He further showed that this incsreàao affected the plasma alone#, and that on diuresis it returned to normal values* This work has- been amply oonfirmed using various techniques ( 57)* It later became clear tlmt the entire syndrome of circulatory congestion Including peripheral oedema may be p.roducoii. in, normal subjects either by the rapid infusion of saline solution or by inducing tho kldïieyo to retain salt and water by tho prolonged administration of cox'tiaone or corticotrophin ( 2 ), %t has also been ■shown that botli the pulmonary and systemio venous proSBuros increase on expanding tho blood volume of healthy doga (95). - The alight reduction of-the Uaomatocrit and of the plasma protein concentrâtion aro thus duo to a simple dilution phenomenon , ( 17 , and both'the increased intravascular proasure and the

14-3reduction of the plasma colloid osmotic pressure facilitate xmssaga of fluid to the intoratitial space #
Reduction of tho glomomlar filtrate, recognised for many years, %)rovides the most likely source .of retained fluid* It should howevor be pointed out that diuresis has been knoim to occur x rithout demeustrablo change of the GFB, and convcraely that an occasional case with massive oedema has been found to have a GPB within the accepted normal range ( 5l).At the sajTie time the relatively crude mothods available for carrying out this measurement may well be insufficiently sensitive to detect slight changes which could still account for largo alterations in tho excretion of sodium and xfater.
While some degree of tubular impairment is froquently found, this is in general considerably loss eovoro than the functional abnormality affecting the glomeruli ( 51). A reduced amount of glomerular filtrate perfusing tubules whoso function is relatively intact might be expected to favour more complete reabsorption of salt and Vater ( 108) a state generally re for rod t o a b gl omortil o tubul ar imbal anc o *

l44
Xt may be reasonably stated that most authorities at present accept the viaxf that tho oadoum of acute giomenilonephritis, togothor xfith tho other congestivo- phonemona associated x-jith the cliaeaBO areaccountable cm the above basis { 32,223, 16, 52)*
What romaine to bo pointed out? Xa there any respect in xfhich tho above theory fail a to explain the observed facts? Xn tho author' a vioxf there aro txfo major objections to the acceptanco of this view in to to Firstly» the rate at which oedema .collocts. is in AGH remarkable. Xn most patients it is indeed the first symptom of'the dieease. Xt is ,weil ostubliahod that an increase of body f lui ci to tho tune of of body weight imiat bo prosont foroodomà to-ho- clinically demonstrable* For example, in the studies of Albert ot al# referz'od to above ( 2 ) fluid retention was induced in iton* cardiac sUhjceta by prolonged administration of A.G.T.h# mid cortisone* Botcctablo oodoma ap%)eared only in subjects who retained 16 Iba* of fluid or more « Theauthors state the.surface areas of thoir subjects but not unfortunately their body weights* lîox ever unless all thqir patients wore under five'feét tall $ this ■ ammmt of fluid represents an ace^mulation of at

1^5
3.oa3t 15^ of Ijody weiglit, With an avorago dally hx'inary, cmtpat of arotmd 700 ml # m .70 kg# child mxiBt take quite a immbom* of daya to retain the two to three lltroa of water-nocosaary* ■ This hardly fit a with the appearance of oedema at thé apparent outset '.of ,the illuoea^ imlese one .poàtulatea a'prior period of asymptomatic halt' and water.rotoution* Xt isclearly almost■impossible to obtain direct evidence oil this point> and in tho author’s oxporlenco the pati.cntB ’ histcrioa tend to be in this respoot uninformative*
- % o second objection is baaed on a comparison' of AdH with acute x enal. ' failliro due to lower nophron nephrosis.# While oedema atay occur in the latter condition^ it usually follows the administration of oxcoesivo fluid# Casas Initially pros ont ing may be %)rofoundly oliguric, but, us Bymxn- and Morrill have pointed out. in a classical study of eighty five auoh oases, absence of pariorbitai oedema is strongiy in favour of acute renal failure #* (213)# As will be soon in thochaptara to follow, many patients, with ACH are only modox'ately oliguric and yet develop oedema early#

Ik6
' To àutliw it therefore eéeme' that . ' while max%y of the tcneta-'of pré'eçnt opinion rest
squarely oil tho- rook of experimental evidence, a , factor is still mise-ing from ■ the pUsa le Addition . of "fluid by ' réduction of thé renal output oihmot. ' b-0 regarded as the final Wèwef

ÇIïAf TEH 7' - GLàniFYIW Tlfe‘ PHOBmiA Study of the 0asO"-roGOx"d3 fx'om 170 CHildron
. with Aouto 01omoxn.ilouox>h'rlii»
The basic purpose of this study has boon to abstract from cuae'-records evox'y availablo clinical ■ fact, to aapax'ute the cases into thoao with and those without oodoma and to carry out a statistical analysie to identify any. gross- differenoea' be two on the groups.
Matori.ai' -and., Mo the daTho records have been analysed from all
children diac^oscd as sufferi%%g from acute glomoruloncphx'itis and admitted to tho Royal. Hospital for Bich Ohlldron, Glasgow between 1st # January 1S?67and ^lat December Ip64# Those hhvo totalled I70,
' '10% boy6 and 66 girls. The ago -x ango was 1#6-17#8 years # Four cases rotx’ospootivoly diagtioaocl ushaemolytict^uraemiu syndrome havo been -excluded# together with three children who had albuniinuria and hnematuria but a predominantly nephrotic .sertxm elootx-’ophorctic pattern togethe r with a normal A.8*0* titre#

148
The cases have been looked after in two medical units employing basically the same therapeutic regime, Pehiciilin, oral or intramascular has been given to all patients but for varying periods of time (see below)* Diet : all subjects have beenmaintained for tho first week or until diuresis was complete on a low sodium, low calorie, restricted fluid diet consisting of one litre of half-strength milk daily, with boiled sweets ad lih Meandaily intake was therefore approximately 600 calories and 14 meq* of sodium* The diet was thereafter gradually increased. Four children who wore severely orthopnoeic on admission together with two others who had marked oliguria were put on a modified Bull regime for a few days. The combination of semi-starvation with the rapid onset of diuresis has resulted in eaxdy loss of weight in all save five patients, these being in the oedema-free group*Daily weighing was carried out as a routine* The weights recorded in this study have been (l) on admission (2) the lowest weight attained, usually after a period of 6 - 9 days; (3) on dismissal* These weights have been expressed as a percentage of the mean expected weight for age obtained from the table in standard

14-9use at tho honpital(190)• In calculating thisporcontagOÿ allowtmoo hae booh I'iiado for the periodelapsing between the throe obsoryations * patients liavo boon allowed up when the B#S*E# ratnmed to nox'mal and wore diomlsBod homo on an average of two weeks after albiiminm'*ia and haonmturih have cloafed#A small nnmber of children in whom those signs wore unduly prolonged ware discharged when no further Imprevoment was observed#
•■-Details-. of hew the various observât ions were made and recorded are sot out below* Frequency tables were drawn up on a l\BF/9 Electronic Computer operated by the Gomxniter Dopairtmont of tho University of Glasgow.
Results and Comments' Oedotna.*,.
Tho presence or absence of oedema during the first few days has boon recorded in all patients* Xt was observed in 104 Ail the features whichare analysed below have been aoparatod into. two - groups on this basis»
Fi r 31 B ymp t omXn the vast majority of -cases, the first

150oyRiptoni of AQU ia either dieooieux’ation of tho urino or puffinoso- of tho face* A clear otatomont of which came fix'st was obtained from 1 3 9 case records* Piiffinoss of tho face, occurred first in 8 6 of thorn- (5'W') * O f tho 9 % eaaos with, oedema» 7 6
developed facial swelling first, whereas in the (>3 Bon-oGdomatoxxa. childron 33 .(83 &.). complained first of discolouration of the tirino* Xt is concluded that if eedema is going to occur it is genex^ally tho earliest evidence of the dieoaso*
Ünuaual presenting feature*Four children, all oedcmhtaxis, presented
with ox'thopnoea* Two oases, one from each group# exhibited hypertensive ohcephalo%)athio fits
Weight.Histograms showing the diatributioiiB of
percentage expected weights at the thx ee soloctcd times are shown in Figure 7*1* This includes all ohiidreh# with or without oedoîîsa and it is clear that tho xfeights both on admission and dismissal centre around 100>6* Tho aritWetical means for the tlzroc ùh m or va t i ims ■ are ?

FIG. 7.1.ACUTE NEPHRITIS 151
Changes in Body W eight. 168 Patients
PATIENTS60-1
40—
20 -
0
6 0 -
4 0 -
20-
0
60n
40
204
ON ADMISSION
FOLLOWING DIURESIS & LOW CALORY DIET
ON DISCHARGE
80 100 120PERCENTAGE
Expected W eight

1521, on ■ Eimeat weight . . 3*On "dismissal
. . . : ,'.100*92# i 9â%73# / - iôo*3i# '
'At first sight it soemod surprising that 'the weights am -admiesian siiduid not average above''' ' 100## Since the, great majority had recantly Buffered ,frém "a atroptodoooal : infection, . it ■■is , . possible that weiglit^lose; ,en this aao'oun.t eonld "h.e balancacl by-fiuld ;'retentioh* ■ This whs checked by division into the oedemht.ons- ' and tho oedema^free 'groups* T W 'results are as follows (mean.^
TABLE \
' Weight 1- ' Weight 2 Weight 3
Oedema- ■ Present' '.... ■ _.M.: ■. io4.Q(4 .63) 93.8(1 ,06) loi.a(i.a‘7)
O'Odema^ abS'xmt ' 9^.,2(%:,62.) ■ 9a.o(i;,53) 100.6(1, its)
The -mean vainea for xfeight. 1 # highly aigixifioantly different' '(t 3 ,8 2 3 # - P c 0*0005), The diff'erenoeabetxfoen .the, mehn vhiue.s for 'tho other two groups are not • aignifieantly différent. ■(t %: 0* 6891 0• 5,. > ■ F > #*%, and t - 0v6%5, O# 6 - > p > 0#5 'reapéotively) * . Thus it ■ is blear : that the ostomtous group are-initially the '

153heavier, as wotîicl bo; expacted- The magnitude of-this'difforonoo -is novertholesp of oonaidoroble interest. If, tbv the a mice of argument the oodema* -free group have no diuresie,-., the loss- of xfeight reeorcclecl in these patients amounting to mùetroproaélit loee. of .body s-oIIcIb only. 8'imçe the dietary imtWce has been uniform ttooughout, it would bo'reasonable to ospéOt tho ehme degree of'"solid, weight lose to affect also the oedema tous group* ' it foilox B that the loss of weight aa fluid from •■ the oedematous group would then be only 6 * 6#*Xf the îuux-ooclèmatous ohild.ren do in fact lose some fluich the fluid weight lésa ih' the Oedema tous group -Qixn still be no more than . 10%*0 93*7 lo.S##Evou. this ■ïîiaximim figixre is aignifiohntly lass than, for - example the figures qxxoted in Chapter 6, in ■which; doted table oedema only .appeared in- -eubjeets ' - gaining i6#- or more-of body Xfoight as'aeeumulatecl fluid*
A point of further interest- lies in the. fact that-out'of the 10% chiidren xdtth oedema, 3% (33.7#) had -a peroentagb expected weight: which was- .greater on admi-asien- than .on diOTisaal? eleven of.. thesethe oedema was. generalieed while in the remaining

154
twenty three it wae dotoctablo in tho- faco -only*Tho avorâgo (with B#B#) of the percentage weights for this group is as foiiowas
Weight 1 ■. ■ Weight .2, ■ .Weight 398,1 (2.31) 91.5 (1.96) 108.6 (8.19)
Mono of those values differ slgnlfloantly from thoao of the non-^oodematouB, gr<mp (l* t 0 .697#0.23 > F > 2. t 0,1B1., 0.45>.p>0»4O;3* t - 0.992# 0.*2>p>0,#l5* ) It would not appear ' possible that this group could aimply Imvo lost ■oxeessivo ’solid’ weight. prior', to the onset of nephritis# since one would then have expected weight ■No#2 to bo lower than in the other gx oups* Xt Is clear that this group in particular mu^t have retained x’cmurkably little fluid and aoïîïo other explanation for tho genes is of the oedema tmxnt bo sought *
Tho distribut!on of the chiidran’s ngao was as'foil owe ' (poo ■ also Fifrare 7 * 2* a) :

FIG(a) AGE
Co ses
30-1
20-
10
0I
3 4 6 8 >
Cases
8
H O S P IT A L DAYS 155
Years
(c) DAY OF ADMISSION
40 50 60 70 80 >80 Days
4 0 -
30 -
Cases 20
10
0
%I f%I
3 6 9 >9Days
(d) BLOOD UREA
40
3 0 4
Cases 20
10
0
i140 60 100 200mg y 100ml
BLOOD PRESSURE
Systolic
40 —
3 0 -Coses
20 -
10-
85 105 125 145 175 >175 mm. Hg.
Diastolic( f ) 5 0 -
Cases
65 85 105 115 >115 mm. Hg.
Oedematous cases (Uatoîied blocks) compared with, non-oedematous (solid lines).

1 5 6
.'.3 . Wi-. .^^6 '7-8 . 8
Oedema proeeat 10 1? 30 gi g 6
. Oedema .ahseat ' . $ 22 so 14 5
Thôsô dîletributlono are e f : l oa#tly #lf#ere#t
(x - ô#0% > p .> .0 ,01);, Oeâema ■ tlata. towdàto be pro e eat ; ill older clitldrea witfe MIDI*
'Se%' ■ the a e t ribat 1 oa wa$ alma at idèntioai
'hettfoesi the two . rmipa »
HisterF. . eC Brevleae. liiteot.lmi*A o'kçmz^' l%tB-i»0T y of the preamièe or aWeaoe
of #a lïifeotioïi wlthia the thro# we#ke prior 'to. the onaet of nephritis w4^ available in lâs eases 117 (yi*8#) gave sitoîi a hi'a.torvs either of throaty ea%s or non-^apecifio apper raspiratoi’v infeetio#
) % the diâtriWt'ion was ae follow® 1

157
- 'TAiam ?.3.
Tliroat mtxr mil
h edema pro a ont' 54 10 9 27
Oedema absent Z9 8 7 19
ThpBo distrihutiona ■ are- almoa-t Idetitioal '
< « 1.098,- a,& > p ^ Q,7,)
Titre-The valttea, for À,##0* titre dene on admission
were'-available in 163 patiente, These were .divided lïitdtiormal-and abner^ial'gÿ'oupe {abnormal iOO .tmits/ml » ) The die tribu tien bo Ween oedema-^free and oedematous groups 'was also almost identical { • >«. 0*0??, 0*B > p > 0,?ji .
PUV' of .Die.ease .when A.dmitt.ed to IlospitaiThere was an oWlous- possibility thaf cases
.free-"of oedema--on admission,-might already, have had a dinreaia,. -Â . clear-cut hl-istè'i:»y of ' the date ' -of 'onset, of eymptoma was .available in 164 cases *

158
The distributions are illustrated in Figureà#d wére as follows :
.TA39W?.4#
Bays aftoî* o»»i9ot of syjrtptotüg .
1-3 4-6 . 7-9 9
Oedema present 44 ' 3Q ul 5Oedema.absent 38 Î.4 6 6
There is a trend in thee# result# - which 'fails - t.o foacli significant level ( . 7»09, 0*1 > P > 0,05)*Xt is intoresting that the treüd ehotmid bo towards' oarlief admiasioix of the non-oedemàtoué cames # which effectively disposes ■of the possihility that those children wero admitted to- hospital in, the post- diuretic phase of the disease.
Bloocl'-.ilroa,■ x t appeared reasonable at first sight to
postulate : that the oedema ton# group'ropro-sêutod tho more sowroly ' affect.ed end of tins •clinical spectrum of A0H* Xt oedema i.e; entirely due to dimini shod

159GFR ono would expect tîio blood uroa to reach Digulficaiitly higher levels i>n thia. group* The .éatimiatioïi was carried out on adî-iissiou in 159 caeos and it was roj eatad in 51 Children at variable times during .tho rocovery x>haao*
.The. arithmetical moans for the initial estimation were ;
Oodoma present (n =: 9B) s 55*8 mg,/l00ml*. Oedema abaent (n 61) $ 51*0 mg*/100ml *
These values must .bo interproted with caution since tho distribution of tho results is in each case •Poiaeon and-.not .Momalf For tho aame'reason a 't*-test is not valid* A analysis is more inf ox iiativo ;
'TABLE, 7 45*
Blood uroa (mg./lOOml*)4o and less 4i-60 .61-100 101-200,ir--- p 'r'l 'i-Ttf-i ■■■■ -1-1 -.r r'ii .- - - - , , ■,■--t ,
0 edema present 41 as %5 7
Oedema- absent 35 16 5 5
ih.B* This analysis e?r.clud©s tho, value of ^26m0 */lOOml* oociirring in ono oodcmatoùs child# tho only fatality of tho sorieeï*

1 6 0
These results (illustrated in Figure 7 • 2 *d*) reveal a trend which is just significant (x^ = 7 «88, 0,05 P 0.025), indicating that the levels do tend to
be higher in the oedematous cases. Two features
seem to the author to be of interest. Firstly, the rather marginal difference separating the groups, when a somewhat larger one might have been expected.
Secondly, the occurrence of a small number of oedema-free patients with early evidence of severe nitrogen retention (blood urea 100-200 mg./100ml.)
One such case, an eight year old boy who had a
blood urea of 200 mg./lOOml, made an uncomplicated recovery, albumin being absent from his urine after six weeks. He was discharged home, remaining
clinically well for six months, during which time
his urine was examined on three occasions, being normal each time. After this period he underwent a second episode of A O N , slighter milder than the
first but in other respects identical. His blood
urea on this occasion was 137 mg,/100ml, and again no oedema could be detected. The condition rapidly cleared and eighteen months later he remains w e l l .Xt is possible that such cases of brisk severity but
from oedema could exhibit a different pattern

l6l
ot .Toxml patUolbgy, oortainiy in tlto i\inctionnX ' and |>oB#:lbly also f:mm a histologicâ,! viowpoint*-
The reeitits of 51 ostimatlone of blood daring the rooovery pliaea-. abow similar - 'Significant trônd. ■ /The valuèa from all fifteen of 'tîm non** oedomatotia group woree no:mal ( ■ 40-mg./lOOmi. )■# whoroa# of-tho 3â-oldlldron originally oodomàtons $22 (6l'/>) of the results wero loo® than 40 mg./100ml*-, nine wore between 40 and 50, and the rci iaining five above 50, This- trend is also just sigtiifleant ■{ x --- 6.73* 0 .0 3 > P >0.023).
Albuminuria, and BrytbrocyturiaAn attom%)t was made to analyse tho degree
of albuminuria and- eryttoooyturia, wiiilc roeo#iieing that the many variables and apprexlmat 1 one inherent In such a procedure must render the results of doubtful value,
-A.lbuminU3?i a » The routine method for testing foralbuminuria-in ■ this Ixespital is the boiling method# carried out by house phyaicl-ans. Grading into three catogories of aeverity is aUbjoative, A' iman of the oatima-toa for- tho’ first' four days followittg'admission to hospital was rocofclod for - the purpose of the present

1 6 2
study# ' ■ ' ' ,
rytteoGyturiu» A mixod up mpooime# of uriu©- wassxamiusd and' reooWed as calls' per high power fioidx, Ouco again- the mea# of tho first tmkt dayshas been used hero* Grade 1 dlï 0
30; 3 - :.-30. • '
'Analysis .of the résulta shows nci aipiificaiit't clifforenoo for oittor moaauromowt# In M xb oaao of the fed oelia.#' the - diatrihutiouB hotwooh tho oodcmatouo and nom^oSdamateue' groups are aimost ' identical ;■( ,X. >#^>0.40), Mth'aibumuriav aclear trend ( x 4*35* '0i2'>"P >- O..#!,). .suggoBtS- . that this tends: to be heavier in the childfon with oedema#,' '
Bipod ,.Préa.0ure . ■ ■ • -Far-and away the-■moat’ striking difforoncoa
associated: With the - preeenoo or'ahaenoo of oed.oma -are those affecting the h|,èo4 .preésuro., hath ayetolio -end.-diaatolib# ■ . The value .use.d in tMh -analyai#' 'hàa ■beep.in each ease the highest individual'value‘quoted from' a daily blood prooaurO' chart#-' ■ Mo ■considération . has- beeti given to - the duration, of hypertensiOat#

163
The results# whi-cm .apeak for- themseivea-# are illustrated in Figure 2, e, and ,f, and are aafoXtmmr
7a6.......:„v.,..... 1 , .
83-104.. „3.03*.|,a4, ,.,,1S3-I4?i' ,145-174' ..174Oedema' present 8 ' - . '17 3.9 ' B9 11
Oedema, absent . 6 43 11 6 0.2X » 47.aSi P < O',0005
TAWM 7.7.
, . ©iast.olio■ B.P.-..(.m5i-i,|:l:)__..._.65 63-84 85-104 105-114 114
Oedema present 11 -19 47 • l4 13
Oedema absent 9 47 . '. 9 . 0
, - x'“tw.t m ..i..n,r.,..i J ,.,.ttTATnnJ( ..I,.t, I r '1 . ,.«4l*Jul.i).Æi..'-.., 1 .T.111.1..... '." A
« 36+5. p < 0,0005
SzÉâMââ*The. highest temperature recorded in "all
p a t i / o n t e - d u r i n g - : t h e f i r s t w e e k h a s b e é n - a n a l y s e c i # --a u c l

164
it. wae tomxd - that tho wto.lê Mio pon-ciàçîomateus patient#; ■■tended -to Imve' the temperatures *■This result is - just Biguificaiat C- x'" 9 * B#, 0*05>: :P > #.'*
TreatHient ;witht Peniclllim■ . ■0emimràMlitÿ ef ■ treatment, of tho t W groups
waB ■ tested'by dividing ! tho easee primarily into' theee receiving pmttoXXXin top periods longer or - ■■ s h o r t e r t h a n f o u r t e e n d a y a « .. ■ a n d s ^ e o o n c l l y # ' . i n t o - t h o s e
in whom treatment, had been .Started within çroàftor- ■ two days follpifing admisBion to hoapltai, Mo ai,gaifioant ' dlfféi'enoOé were "found ( ' x~ 4#o4*0*3 > P >,0*2)*
Outcome - '4 oomprehènsive follow-up survey' has not
heçh"-;Citt.empt-aàA largely ainoe thé-period 1$ 'not' yet ■long enough'for thié+.to be. possible#, ¥to eignlf.leant difc.erchee was found between,...the groupa with, regard ■ to ' the'dnration'of hosi>itali-0ât'ion ( x 6*9%#'0#3- > P > O# B) . The ..resuit#. #3?.# illustrated in Figure. ?,g#b* and reveal "it slight-trend-towards lo.|i00r periods- on the part' of. tho oedewatous, group*

,165
There Imvô to date been-ten recurrenoee# five from each group# - tite-ra tliiri has eeeurred# tîie ■ ^hiuration of albuminuria’® (aee. below) refers only to the first ep.iaodo'#
only one clehth has so far oecurred %n the seriest a mortality of 0#6flr This wae in a si s year old boy who wae from the out sot the case moat ■ aeVorely mffoatod# ile was initially grooaly eedematotta but norme tensive $ had a blood iiroa of . 326*/10G ml* and wàe oligurio for tho nnusually long period of fourteen days.# While' this was followed by diuresis# a eenaiderablo" degro.e of : albmitinuria and haematuria peraioted#' Ho developed a .progressive aub- aoute form of the diaeàâe and died after nine months, '
0n the ■ ether- hand the outcome in a .further fourteen is uncertain* Ten of these defaulted from o\xt*-patient follow-up# mostly aoon after, discharge from hoapital # Whe.n'laat seen proteinuria was • preaent. in all * but it .soerne likely that a number would later, return to- hom#l# ' ' Four patients (s.4$) # two of whioh were ' from each group have peraiatont albuminuria after m,oro than a year#

16 6
. The 'vast Biajerity of the'cases had à favourahle out come # ‘ the Airiue becoming frao- from'■" albumin ànd rW- 'cells at variable times as foil owe :
TABbB 7*8* / '.' ' .
2
Oategorie#
. \ B ' y : 3
Oedema présent ?8 is 5 ,
Oedema'absent %9 V : t
0*#, 0*7 > F > #*6
Categories^ '
Xm Crime clear before diamiasal from hoepital', 2* %ine\ olear 1-6 'monthé after dismissal*3* Crime clear 7*»iB momtW".after dismissal*-
Tho close mgréémènt in Category 1 (urine clear before dismiaaal)# nWoly# - %9 of the oedema**^free-group ■and ?8 (ëCS)-'-of ■■ the-oedematous, grotip-is typical of ' these results and .strongly, éaggèsts that tto presence, of oedema can hardly be an importaiit factor in tb# pr.ognosis of AGM* ' At - the smao time it is appreciated ■tiiat the disappearance-'.of protein and erythrocytes

167
from the urtno cannot neaoseaxdiy be taken as a final criterion of recovery from the disease# Minor-degreew of residual renal dysftmotion not sought in this study could ultimately lead to renal failuxo# a possibility which must obviously be checked by long-term follow-up.
Su!iynary »The recorda from 1?0 children with AGN have
boon divided into two groupa depending on the proBonco or absence of oedema at tho outaot*
The oedematous child tonde to bo older# and loses loss weight on diux^oeia than Would bo expected if the entire source of oedema flxtid was derived from renal retention#,- Ho is strikingly prone to hypertension and has a slightly higher initial blood urea* On the other hand he is loss pyrexial while the amounts of protein and erythirooytoa in his urine together with hie rate of recovery and probably hi a ulti^tato progitiosia do not differ significantly from those of hie non-oodomatoue ceuntox^oart *

168
- BODY. .WATMR D%8TB,IBÜT%0M IN ACDTB ' - - GLommuLommmiTia'
The â^mnBtratîon of intm&BlluIar dehydration
Ab stated ' in ■ Fax" t One, of this The aie, the stadia's'oh-body water distribution doaoribad have been ‘ioading up to the appiio.atiou. of the so, met hods to acute giomaruionophritis*-' It was- made oioar that whereas oase-'to^caao variation of the values obtained was relatively great# subjects appear to «mintai%% their indiyidual-. body hmtm^ distribution - within relatively fiUe-limits* ilmioe* as Boxiadis and Gairdnox* pointed out soma years ago (49), an experiment pùxpoftixig to demoxistrate changes in bodywater dietribütioïi muet htillso results obtained from
1. 'aerial'estimations oarriod out in the same subjsot*
'Material - and .Methods *'The investigation has been carried oat cm
ton children# six boys and four girls of average age - 6,4 years# The clinical data àre tabulated in Table' 8*1' and indicate that in each case the

H
m
i!
OH
Ü\
00
IN
\Ù
m
o?
H
mf,».
%O
■4
to#î-5
#
'#0
#A*
m
m
mX
ItfjSK-4.
îl|
H ! H iA \0* ' N. tA VQ0 \ : > H H H
0!
co#
€AO <7s -iA V , OS CO 'Ç\
b4
. o io •M iNfH M H |H
\Mo U M o H h Ih
-o^ . * .. \Q 0 , ÇA Aî O H W O lO M 0\ 03 0\ N CMiJ î h Ih
O ^ ^ ., H -P a «y * O- d OIN PX 0 H
H#
\0
OH#Vf
CM\D
•Pd q0 H
1 "
% Vf § H
dI 00wH
N Aî 0|0ü\ O N NAi CMH H|H
0 \ OS O lOex o SD H M o N H H|H
# \o o|oo o 01 o -Oîk© MH H H |
lA m O lOO H CA CM CM H , H H iH
Q O î>- vt q\ O \0M
OlO , ■C\f *n |h h
h | n
OM
fm
Vf
H rM' o O - Os O H H
I. V) Cl os ^ Os os Ov
O lO C* M 0|*N CM H
M O oknH De Cvîh !
p00
. m § #' # 4md
*H H CA 0 •0 p P Ag Z 0 * « , u •d - A 0 P p P m m0 m pD p
F 44 pm >4 # . « # d d md # P. pj a q 0f y > X H H g m
M ÿ 0 f4 A N b •%}0 : 0 U ' d m •Hm m < m AK 0 0 M
dI
H H ' r * - * oCA o. CM
H H O mVf ■ CA CA
H H A- MA VO CM
H
OÇA H m O CA ÎAN
CA H CA © lA O
iA
cA CM O CA Vf CA
m
CA CA CA m N- ÇA
CA
Or4 H o o Vf ÏA
CM
OCA CM r-v O CM lA
(M
OO
ÇA H CA iA CA CM
i -'Nw*' M
J IU O, 0 * 0 , 0 H *m <
o mpto dm o
m#
I
§I
I
h
169
q ■ q

170
qf tlie cait liarcllf* be doiibtocl.Eigkt ef tltm tod o.edema elâniea1,lydotée table 0ti admia#iom. The s omainlsii ts o gave a. el.oa bi. to:r:ÿ ef. oiiaét of the dleeaee witliia the pf eviouB 4S' hears aad are ttoO. aaiikoly.; to haVO boeh . isi the peat-^diaretie'-phase#
Body'” toter .diàtributiou was oatimated-ia each patiomt twiées 1* Within"two hoars of ■ admission# a # - Ifhem diuresis was judged to bo oOBiplete* The time iiitervai'B botweau. estimations varied from Six- to ; twelve,' days * Mo obvious-■ diureais was obsarved • to'oobur with the two non**oedematoua ohiidren and' the second aatimatious were carried out after am 'arbitrary’period of nine. days,. The moasurameute parried':out have bean total body water*. ei straceiluiar water and plasma volume*. using the sema indicatora emd 'precisely \the same oiethodology as has ' already ‘ been ' described*' Repeat estimations .have in all cases been carried out using the same, administering syringes and-doses as for the initial dotermination* Plasma water concentrations of antipyrine and of thiOoyanato have boon calculated using moasured concentrationa of plasma' proteina. in each'caac*Rates of elimination of T 18;î4 and of thiocyanat©

FIG. 8.1.
ACUTE NEPHRITIS Body Water Distribution
1 7 1
vOvO
■a
Litres.
22
20
I#
12
IP QP_ Q
2
Block d.iagrams representing mean body water distribution of ten cbildren with. AGN before and after diuresis. Comparison is made in each case with water distribution, in an average normal child of appropriate size.The compartments, in order downwards are: red cell mass, plasma volume, interstitial water, intracellular water, and body solids.

172
detamnlmqd'by five htmr shmploa aa welXme the ten minute or two', hour Bàmpie uaeci'for the standard_ ëatiriïation* This whs'' done in the easeof T iB:34 in Bi% aubjeeta and with thiodynnate in five* - .
. Xti' ease Wo *.10 total-.osohangoable sodium'was oatimnteci. with 20. ue,.t>f ^ Wu using the method de^oribed by Veall and Vetter (218)» This was carried out,-at the aame time as the two do terminât ions' ' -- of.body water dietribution* . '
HosuXtB, ' '
The results of .the two eatimations of body water: distribution on ton - 'aubjeota are Indicated in Table 8,2 together with the arlttootioal'm^ana 'for the .groups, ' 'These means are illustratod'in Figure B#1. where comparison is made with the body water distribution of normal Ohildron of 'like, size.The normal • values are taken from the study. of t%fenty ■ normal "ohiIdren ■ described. in Chapter 3 $ and i31uatrated in the ^similar block,, diagram’ of .I'igttro '3*1 The values for the iiephritioa have boon e^^preased in ■ absolute, tema, ràther than as 'ml*/kg, body weight, einoe, th# marked change in if eight (moan 2*00 kg,)

8MO
VO 00 "s3 Os Va 4P va M H
1CiW
>k ©
%
M
r
Qb b
Ob
«1h
ww
MW
M M M M N H M H M M N H W H W H M M N H M M
M N MWG\(A0\C\
4P4S* H 4P03 VO W O
M MW w
O §
M M GVO)Va Va va O
VO-Cva O
O MH H05 00va 4P O O
Î\J PO ro os
S 8
S t f
§ &
M M
S I
H HVOV0H fS3 M 4P
H HW 42*
S t f
ÎO w WVJl
ÿ s
05 00vnvo O H
H MPJ M
è f e
H Hvow
8 i
H Mw W
Ü 8
M H O H
8 8
H HM 4PVO U W O
H PJ 0) NCi b•o Va
MVO OVa 4P4P»-3
H MO O
â -8
W *<i • #po W M
MVP HVO m 0\O
.P*UlM 05 00 VO
4PC\4PMWVO
Osvow O N O
va <iO M 00 va
va va4PVD*s3 H
VavoVf1 MN 00
H“S3 Ob Va © 4P
4P OSO"^fo q
Va OsH HOs 4P
C 0\Ut 4ï* 4ï”4s*
H HW W8 4S*U
w bM M
GO 0\ 4*W00 VO
GS 4POS va05 4P
00 OsM va va Va
va va♦ 4N M V4 H
-VÏ 4P4P"© M N
H H M H
k ü
vu w va*<!W -NÎ
va 4Pro s3 4P Os
H HO M 4x*4ï- OO O
H !\i Vn 3 0\ 4P 0 ,0O
05 VÛva 4PVO J\3
M H
g §
M H M H va vaVSS o
"■■3 *sî co® ©V4S i
M M!\) V3
H Hy g
M-s3 O&-Î3
VOSO4P 05 Q M
4=*Ot W O ejl0 5 4P
ro w o w
4p 4p N W "•jVO
4P 4Pw wOVa va «si
w w Va Vaosm Va O
’8 © H 00
M 4Pva IN3 00 va
4P4P M <S5 Os OS
Uïts ü o m ^ S ï -
v% o
H Hw w05 05C\H
H M0\<ï
M MIS SPes- h* M@gM Va
M M
H H
H Mlî H HVa 4P OSO GSOO
G\C3\-S3 4P •S3 H
•S3 0\ ♦ •4p-aW ï\3
va W0\ 4P 05 VO
Va os
M Gv
0\-s]00 H M O
OS osCOS3N V0
os os4P va vaw
os vaVa Os05 va
•s] 0\îiS •s) Wo 05M Va
g
çpCIS c! « #
» •
r HH" •rt- aCD Sj 03 •
&P * <
&P • <
fi3 % o m^0 Ia05
IIgIH
H
gÏ
03
H<}V-Û

174
rende re'the ueo-of euoli û preportionni mennlngleea *
'%t le clear that, whoroaà the poet^diureslà rèéulta-are-Btibetantiaiiy .normalè .the'iBitial .or px^ediurétio yaiuea ..bIhow .a dharaotoriatio ypattorm* .
The expected, inoroaaos in piamm and total ’ ■ ,o^tràoellùlàr volumeà are presents hut there Is a ■marked deoreaeo in the intaraeollular volume. The valueÔ' for total body water show à slight -inoreaao above mo#aal #
■ The o.onaiatanoy of. these changea àro imlioatéd in Figure - 8#2 which show# the porcentago alterations im individ%%alsubjectè of the components', of body water.distribution from the firat to the Eécond .estimation# Nine out of the ten sûbjoots load %feight -and total water# All ton.' show very, considérable Xooa of o;^traçailular water, but-in nine it is clear that this ■occtira ifhilo the iiitrac'ellular volume expands « The tenth (casé no#3)' shows a very s.iight. contraction of his intraoeliular space*
Xn short @ the average child Of uround 20 kg* in the first Week of hoapitalization loses 8 kg* weight,Ikg of• which is water# The loaa of 1 kg... solid weight fallowing a week*a somi^starvation éaoma net unreasonable.

FIG. 8.2.
ACUTE NEPHRITIS Changes in Body Weight &
Water Distribution lO Cases
175
+ 6 0
+ 5 0
+ 4 0
+ 3 0
Z + 2 0Oh-+ lO<2i °
-10oP-
-20
- 3 0
- 4 0
- 5 0
4
2
9
7»
6
8
1
1
__ J O _______
3175
3
3
V Ç i ' ~ ~
4 2
Weight TB.W. EC Space. 1C. Space.
Individual changes in body water distribution occurring with diuresis. Small figures refer to case-numbers.

1 7 6
At the same time, His etraoeXXu 1 ar space dacroasoe by appT'oxijnatoly B XItree, X litre of which appears .to repXeniah a depXetod ' iittraceXXuXar space while tUo othex X Xitro is prestttnabXy qxeroted in the fora of a - diureais # '
Xt Is clear that these ohangos are cotisidorably more marked in the oedematous chlXdrmi than in those fx'oe of this eigi . Patients • nda * '1 and 3 exhibit alterations in volumes corresponding to about one half of tho mean values for tho whole Bcries* HovortheXoBs it ie of interest that the aame phenomona, namely decrease of tho andincrease of the X*C*W. should be proa ont in those cases also.
The slight Inoroase of total foody xmter occurring in subject no.8 is difficult to comprehend at first sight. However it seems possible that the factor of starvation may result in excessive production of endogenous water by breakdown of body fat. Such water when fix st roloasod would certainly be intraoeXluXar and may account for the relatively largo increase of tho compartment seem in this child following diuresis,

177
Pa t i mit no* 10, 'xûio was ■ mi 1 ûly o edemat eus and. by. far tîio-biggast child in tho sari0 0 , ahowod a moderato doçreaso in .hia but a comparâtivelyslight rise in his lut%'aoëllular apaoe# Xt may foo of sigtilfiçanüo.ï ,aiîd\will;.J->e'damoustx'^ated. in Ohhpter ÿ, thàt àt tiio time of îiis fir at estimât ion of
hid. diux çsia had .already ;eommoneed* A few hours after completion of the• inv0atigàti03% (.24 hours after admission), oedema was .no longer approeiablè*.'
Thé ait orations .In volume oonfirm theresults of previous Investigators * .'The'decrease withdiuresis affects mainly the plasma volump, the two non -oodomatous, .children showing.the smaileat dooroanea* There I0 unexpectedly a' significant deçrëaae in the rod cell mass, biit -inspeotion of the résulta shows that this is almost, entirely due to the .excessive 1 oases in caees nos. 2 and. 10 (.163 and 166 ml* raapootively) # ■ Between, the eatisiiatipna, both children, suffered from'copious epiataxwB which presumably, account, for the inordinate loss os*
The plasma protoin concentrations » us ed in ., the oa3.otilation of antipyrin a atid- thicvcyaiiate spaces, are also Btmxm in Table B*2 and show a slight mean rise following diuresis* The variations and

178
behaviour of this quantity will howovor bo dealt with in detail in Chaptor 9,
S tatiotica.l. Anal y sisXn analysing thoao results two approaches
havo’. boon made If Demonstration that the changes occurring Within tho subjecta are statistically significant#2, Comparison of tho results before and after diuresis with in the normal child#
Changes thin, the subject # Serial alt oration in subjects can ' usually. be ■■ analysed • by the • * paired t-tost ♦ technique. Xts à.pi>lioati'on to: the present series requires caro. If the volume a az'e expressed in ml#/kg$' body ’ w àlghttho' alteration 'of ' weight renders tlio test invalid, When the rosults are oxpressed. in absolute terms, the large range of total body weight mus t bo includeû - in tho ' calculati on * Forexample, a ,S litre alteration of, say X?.0,V# 00cunning in a child weighing 10 oloaxly has a différentphysiological significance.from'the sumo -change in volume occurring in a child of 40 kg. For this reason the use of ratios is indicated, and if logaritlm;

179
are taken the agroom out with u.o mal dis tribut! ou is more satisfactory i,o. .Log (Raadiug 1 ) -* Log{Reading 2) The value for *t’ has thou beou calculated by dividing the mean of thoeo values by thoir standard error* With nine degrees of freedom^ the probabilitloB ares■
Weight. ' t 5/109, p < 0.001 ■T.B.W. t - 3.834, P c 0,005E.e.W. t'- 7*118, P c 0.001!,(%¥. ' ’ t 3.757, P <0*005
Those results are all highly aigxiiflcaut.Plasma .vol. t c, 3.265, P < 0.01Ooll vol : t 1 .925, 0.1 > P > 0.05Blood vol t 3.219, P < 0.02
changes Iri tho plasma and total, blood ■ volumes are • ctatistlcaily significant whereas those affocting cell volume on this number of subjects are not.
Comparison with normal The mean weights oftho nephritic group (23.66 kg. before diuresis and 21.66 kg. after diuresis) compare satisfactorily with that of the twenty normal subjects (23*57 kg.). To el.iminate tho variable arising from the large range of body weight, an analysie of Co-variance technique

180
ha$ been used# The result» are seen in Table 8.3# where the eemparisens which are significant are underlined. Thus in the pre-diuretic phase extracellular water is significantly increased and intracellular water significantly reduced. Following diuresis neither of these spaces differ significantly from normal. Total body water is not significantly abnormal in either comparison, Xt is probable that this underlines the weakness of analysing such results in this way. Evidence has already been presented that total foody water decreases significantly with diuresis,: Since initial increase inferred thus ispreetmably responaifole for an increase in foody weight, the expression of water as a percentage results in an apparently mmaller increase than is occurring in absolute terms. The same may foe said for the failure to demonstrate significant increase of the plasma volxime# This factor could also to some extent account for the significantly low values for rod cell volumes in the pre-diuretic phase, since their proportion of body weight must decrease when total water rises, Xn addition# the decrease of the total intracellular volume presumably affects also the red cells.

«cq00
mH
0
1imS
mBmi
i
IIê0)H
I
• o cq «M* CA « £v #> * , • # »A m H O )# H CM o • O »m E> • !î Üîio O
#> 0\ QQ O lA VO, » • * lA r^ lA
H H m -ït O (X) ON CM • # * «
lA O ■.V OV V
' *> H m a) # CM $• ' * « O (/} CM ü)
CM P\ ÎN H . * O #lA * *
CA O
#O co 0\ H j o' * • • # '■O 'A ï> *o ir\ o CO O CA m• VC> lA CM # • t #H CM (A CA --i*: O O %
V
,\o 00 ÜA C\« * # gsJH ,o CM H Ù\ VO O O 0)« •4* \o # « • #
m n CM CM H O ; o ÎÆÎV
■ \o CM ÏN CA* * . CA * Aî .m. . i> (M fO CMm CM V)m o CM 0\ « * *B MO \0 ÎlA O |2i ■ O leî
•H Nm m :p P $ * • *♦H H 6% P4•P •P (d•H ♦H PH H0P. P* ^ '0) 0 «ïî H CM
181
ChcdQ)
t—!ueuî>oen00oT—IHF:o
m0■po2;

182
Notes on Table 8# 3.,
2*
1. Nephritios Is Moan of results obtained inpre-diuretic phase.
Neptoitics 2t Mean of results obtained inpost-diuretic phase*
Norîïmlî Moan of results from series analysedin Chax>ter 3#
All values expressed im ml,/kg* body weight*
♦F* re%)r0sents throughout tho ratiot2,
''Adjusted mean* variance Variance common to compared groups
3# Comparable regression coefficients have in all cases beencompared by a separata variance ratio tost.No significant differences have boon found.

183Following dittréeis tlie red ooll • voltiino ia again elgnifioantiy low* _ Tlie .exooeaivG loos of blood by two of the anbjebta hae "already foeott oomwontod - tip on, and when these .reeulta .omitted, tho mean of the remaining, eight tinsBp, {uB. h ml-♦/kg.) no longer eignifîèantly from .normal (t&"i.. 87% *0.1 > P >. 0 .05). '
The .Fosalhility of Artefact .Xt is tempting to meenme immdiately that
tho interpretation ' of the above roenlto ia that tho oedema fluid# 'represented by an additional moan . voinaie of two litres of - extraoelinlar water# has been-derived by fonal ret-ehtion of one litre and tranafer of the aeoond litre from the intraoellular apace. Sinoo oedema fonaed' in this manner représente a oonofôpt new to theîliteratureç it ie imperative here and now-to oonaider carefully the validity of the results.
The ■ close . corrélation of the value© o.btained after diuresis -with the' normal p.attern -is a fairly strong argument, in favour - -of the so reeults being' accurate* It is clearly'.the-eat’ii ex* ' figiir es which must bo called in qtxeation.--

184The pattern of tho volumes could bo caused
by :1 * An artificially low antipyrlne volume of dilution.2. An artificially high tliiocyanate voluHie of dilution.
Antipyrine penetrates rathei' slowly into oedema fluid# and its use for the determination of total body water in the grossly oedematous adulthas been called in question ( lOO) . Incomplete
\mixing with its ultimate volume of dilution results inevitably in a curved disappearance slope when the concentrations in plasma are plotted against time on 8emik 1 ogar 1 tlimic paper i.e. when the elimination is not exponential. Xt is obvious why this should be so; ohco complete mixing has taken %)lace, the substance is metabolised and excreted at a rate at any given moment directly proportionally to the concentration, thus giving an exponential slope. The addition of the mixing factor must therefore cause an increased rate of disappearance as long as equilibration is occurri%ig, and this in its tux'n results in an excessively high level of indicator in the plasma and an artificially low apparent volume of dilution. It follows that when the elimination

185curve is exponential, mixing is already complete and the result obtained is likely to be accurate. It may bo necossaty to study the elimination slope over a considerable period to ensure that this condition is operative. The disappearance of antipyrine was determined over a period of twenty hours in two subjects in the prosent series (nos, 7 and lO),The exponential nature of the slopes in both was undoubted# that from no,10 being illustrated in Figure 2,5, P.56*
The possible entry of tliiocyanate into cells is the next point for consideration. Such a phenomenon has been described in pyroxial states by Overman (154), When the ratio of the first to the second estimation of thiocyanate space is plotted against the observed body temperature at the time of the first estimation (Figure 8,3) no correlation is demonstrable, Xt is also worth stating that tho ratio of first to second interstitial volume correlates roughly with the clinical assessment of the amount of oedema present, (Figure 8.4),
If the behaviour of any of these indicator . dilution substances differed basically from one estimation to the second, it is possible that this

ACUTE NEPHRITIS 186
99 lOO lOI 102 Temp. •F.Changes in tliiocyanate volume of dilution showing no correlation with body temperature

L’ J - V J * • -t-
ACUTE NEPHRITIS O no oedema
187
1 oedema of face only2 mod. gen. oedemaiSW,
ISW.
Oedema
Rough, correlation demonstrated between changes in observed interstitial space and degree of clinical oedema.

188
could be reflected in a conaistently different rate of elimination^ o,g. if albumin, to wbicb T-1824 is attached wore being lost to the interstitial space at an increased x'ata, this might well cause an increase in the rate of elimination. Similarly if thiocyanate were penetrating cells to a significant extent a similar effect might be shown, Tho elimination curves for T«*182 (6 cases) and thiocyanate (5 subjects) are shown in Figures 8.5 and 8*6, Mo conaistent trend is evident# Mathematically, the rate of elimination reprosented by tho constant X, is given by the expressions
hog C. - Log C “ — - 't
where and 0 , are the ooncentrationa of the indicator In plasma at times t and t* respectively.
These values have been calculated for each slope# When the mean of the differenooB between tho values for relating to tho first and seconddeterminations are divided by their standard error, it is clear that the variations in slope are quite insignifleantÎ

FIG. 8.5.
ACUTE NEPHRITIS189
EVANS BLUE ELIMINATION
YE.
4
J
K.L.2
4
AON, ©■
j.a e-- —
_A.M.
O 2 3 4 5 6 HRS.
Individual T-1824 elimination curves before diuresis (solid lines) and after (broken lines)

FIG. 8.6.
ACUTE NEPHRITIS THIOCYANATE ELIMINATION
190
OPTICAL 9 DENSITY 8
7654
KL.
-0-"
Ô-
98765
4 B.MfC
98765 ■Ô—AON.
9876
4
3
987654
3
J.S
-o-
- -o _
— a------- -
AM.6 HRS.
Individual thiocyanate elimination curves before diuresis (solid lines) and after (broken lines)

191
T - 1824 ; t 0.9898, P>0,3Tliiocyemeito ; t 1.033, P > 0.3
A similar result has boon obtained for antipyi'ine (t T.: 0.1666, P > 0.8.)
The final piece of evidence to bo presented in this context has boennobtained from measuring the total exchangeable sodium in Patient No. 10 using20 c. of a . This was done simultaneously with
*
both the estimates of body water determination.Results : 1, Na^ - 2015 moq. (44*7 moq#/kg.)
2. Na^ 1550 meg * (37.0 meg./kg. ) ,a difference of 465 moq.
Since the plasma sodium concentrations at therelevant times' are knowî i, it is immediately possibleto calculate the total extracellular sodium (Na )' cc'using this and the thiocyanate space.
Plasma sodium 1. l46 meq./Iitre,2, 130 meq,/litre,
First estimation;Total i lasma sodium Na^ ™ l46 x 2.24 (P.V. in litres)
- 3:27.0 meq.The cone on t r a t i on of sodium in intei'stltial
fluid is given by:

192 95
8
where 95 _ Bonnau equilibrium constant for (Cations ( 228) ,
and 93*28 Plasma water concentration ™100 - plasma protein concentration
c3 14B.7 meq./L*Xn a similar way the interstitial space may be calculated after modifying the observed tliiocyanate space using tho Doiinan factor of 105.for anions ( 228). The total interstitial sodium thus derived is 1356 meq, giving a total extracellular sodium of 1688 meq,
S econd estimation sUsing a similax' process the second estimate
of extracellular sodium is I285 meq# # a diffex'ence of 398 meq# This compares with tho difference between the two estimâtOB of total exchangeable sodium of 465 meq.Xf significant amounts of thiocyanate wore entering cells ; the difference between the two values for extrac01lular sodium would bo expected to be much gi’eator# It is int ores ting that the percentage ratios of oxtracollular to oxchangoablo sodium for the two estimations should bo almost identical ( 83# 5/ and 82.95 respectively). Thus this slight difference

193between 465 meq, and 398 meg. may represent the body's natural conservation of the intra- and extracellular sodium ratio#
An alternative possibility which must be considered is that of abnormal sodium entry into cells at the time of the first estimation# If soditm enters colls in abnormal amounts, undo:* most circumstances an osmotioally equal amount of potassium will leave the cells to preserve equilibrium# Since practically all body potassium is intraoellular* one would expect to find a reduction of the total exchangeable potassium (îC ) demonstrable. The values for in the same patient have boon calculated using the Fdolman equation ( 53 ) ;
, (Ha^) - li X 4 Ke e o / \T,B,¥-# .....
The value for the ponttant 1C has been obtained from the regression equation derived by Muldownoy and Williams ( l46) , This equation is ?
y - /:(o,88x) "4 39 ■ (2)
where y , ^
and X - (Wa^)
By substituting in equation (l) above,

194the values for can bo readily oalculatod andhave boon found e luai to ;
1, 2160 meq, (48,1 meq./kg,)2* 2015 meq, (48,1 mo(i./kg, )On this reasoning it seems unlikely that
significant intracellular migration of sodium can be occurring, and it is of great interest that tho body would appear to maintain its potassium in this way, Fux'ther important applications of this principle will be considered in Ghaptox* 9.
Body water distribution has boon estimated in ten children with acute glomertilonophx^itis before and after diuresis. The results suggest that the oedema fluid is derived at least in part by transfer of water from the intracellular to the extracellular Xdiaoe. The woxic has been carefully scrutinised to exclude artefact, and it is concluded that tho weight of evidence strongly suggests that the results are valid.

195
CHAPTER 9THE DXHRESXS OP ACUTE GLWSERlULICOmS'PHRITIS
A ihi ee' tm«nai«nai «tuAy of tfu retmtion and aiganétion of watar anS aiaetrolyiM
Xntroduetion^The préseno© of oedema coe cirstin with a degree
of iatx^aGelXuiar dehydration has been demonstxmted in the preceding Chapter# This combination was to the author ah unexpected and surprising discovery* , intracellular dehydxmi-ion is a comparatively rare, phenomenon in clinical medioihe# , Xti childhood, the most completely • authonticatech e sampXe ia probably that of hypertonic dehydration due to water deprivation, a condition which is not uncommon during the first two years of life (63 ). In this instance deprivation of water leads ' to extracellular- hypex^tonioity \and componsatoi-*y withdrawal of water from colls. The extracellular volume is by this., means relatively well maintained but only at the expense of the Intracellular, The condition is associated with a sabstàntial mortality and a common sequel- is damage to the centrEtl nervous system. The total body water falls below noxmial and this would appear to differentiate it radically from the

1 9 6
situation occurring in AGN, Indeed the only other oiroumstance known to the author paralleling this xmttern is the progressive intracellular? dehydration inferred from the results described in chaptex' 4 of the x)resent Thesis# The reader will x'ecall that in newborn infants deprived of fluid, progressive expansion of the extracellular fluid compartments was demonstrated. When discussing those results it wassuggested that a fluid shift would almost certainly be duo to alterations of extracellular osmolarity# It is now fully accepted that under all circumstances the total intracellular osmolarity equals precisely the osmolarity of the fluid immediately outwith the cells.
Bearing these facts in mind it was clear to the author that the line of investigation most likely to provide an explanation of the observed facts would be in the realms of conservation and excretion of water £tnd electrolytes. This chapter is an account of the experiment which was designed kto fulfill these needs.
Material and MethodsThirteen children with acute glomerulonephritis
have provided the case material for this study# Two (case Nos, 6 and 10) formed a xiart of the study of the

197previous Chapter, The clinical details of the romalndor are indicated in Table 9,1# With the exception of No. 17 (P*McC*) the children in this group are on average older tlmn the other group. There wore t%fo reasons for this : firstly, the procedure to bedescribed involved venepunotîlire on each day for a period of nine days. Only children not objecting to this wax'o utilised, and this factor in several instances ,resulted in rejéction. of cases after four or five days. Secondly, the collection of total urinary output is clearly facilitated by older and more oo^opexmtivo children. Xn coneoquence of those facts, the collection of this small series took almost a year.
Ttfclvo of the series wore initially oedcmatous, Nos. 12 and 21 grossly so. The solitary non-oedematous child (No,16) is the boy who was described in some detail in Chapter 7 (P, i6o), Ho novértholoss had a small but recognisable diuresis and his results have therefore been included, F.McG# (No,17) was severely orthopnocic on admission and was too ill to be weighed. His youth precluded repeated venepunott^ro and his contribution in common with aome others is that of urinary data alone.

a
C\H
Q*
*id
*m*.Pi
CO ■iH "S
^ t: fE443»n <1* oVO pjg
a;Mi\'h1
M«4
"NOCs
M
§
O QIQo î> n if\|oM r4gc
^ oloO a* .Aflo H H|H
m %A|oH r*» H ^\o N «H|H
G?m m m in
o oH N, N m o m
<n oc\! m m rj* o
198
mi"tolA
i
COH
V)H
H
H
mM
M
è0Js1m
#A
I#A#OàA
Aê
*o
#o4
PEl*
*#*
I
« S
COiGO
mo\
4? #rt »0 m* i I I■ VO I Os
0
1.2■ fp>
Q
g _ U «rta >
H ÿ C Itom < çk
030 N1
a
VO dOs $
Os. r
-it m
r*'<X)
I
os
s
§
# *H « cn9 04 ,4» # 4*-P * t ^ ’A
» èm m% '
m \D N OlPï Os V1|Nh Ih
o . m w oH *4
g H O *H HI
-4* 0|*nO H H VOjcO H Hi
VO 0|»AO PÏ H ^|0\ H Hi
CO CV3 ..03 0|0 Os ^lOsH i
04 cn m W m ^ HlH
VO oioO 0.Î H VOIH H HIH
t
ID^ g
« I I
4OiA-P
I
n ocn 03 04 00 m
VO o 0Î H H 0\ Om
<n. H H o o 03 in
Es. Om m H om
o eOï 04 H ?N Om
C\ ocn cn H r* m :
o o<n 0Ï 0Î CO o H 0Î
cn OÎ
» m
iN o H Q in' ^ HHVPs«8 J sw* H: 4S 2
CO •PIS 1 °l a
(Hcd0)H0t>OHOs0H■3PoCQ04O
p 4

199
Notes to Table 9.1
1. Case Noe. 11-17 (plus No^6) constitute the * early*diuretic * group,
2, Case Nos* 18-21 (plus no*10) constitute the ’latodiuretic’ group,
3* The facts hero have been categorized as in Table 8 .1 *

2 0 0
The procedure was a one. From the timeof admission all urine was collected with the utmost care by a nursing staff co-oporating to the fullest capacity. Collections were divided into 24 hour periods and maintained for a period of eight to ten days, by which time all cases had lost their oedema and diuresis was considered complete. The total volumes together with the oonoentrâtions of sodium, potassium and chloride were measured. Checks on the completeness of the 24 hour collections, such as the endogenous creatinine output, were not used. On the slightest suspicion that a collection might foo incomplete that sample was discarded.
On each day throughout the same period a 4 ml. venous blood sample was withdrawn with minimal stasis. After estimating the haomatocrit the plasma was separated, all the samples being stored at 4^0, until the period of collection was complete. The estimations were then carried out in ono batch by the same observer. Sodium, potassium, chloride, calcium, magnesium, urea, total protein and total plasma osmolaxvity were determined on each sam%3l0. The methodology 1ms already been described.

2 01
The clinical managoment of all patients was
closcribed in Chapter 8* The dietetic part of the
therapeutic regime is in this study of extreme
importance* The daily intakes are repeated here ;
Fluid 1 litre (Half-strongth m i l k ) *Calories 600
Sodium l4 meq*
Potassium 4 meq*Chloride 20 meq,
(These values have been calculated by determining the electrolyte-concentratipns in full-strength milk and
also in the glucose sweets given to the children %
Milk: Sodium 25 moq*/lPotassium 3*3 meq./l
Ghloxide 36 meq./lSweets (average of three)%
Height 5.77 Om,Sodium 0*13 meq.Potassium 0*03 meq.
Chloride 0*30 meq.)
A complete balance technique has not been
attempted, but with the Intake and urinary output
accurately known it ia felt that this ideal is not far

2 0 2
from being realised, provided it is valid to assume that the loss of faecal and ’insensible* water and eloctrolytos remains constant. None of the patients developed diarrhoea, and in the relatively stable environment represented by bed-rest in a hospital ward maintained constantly at 36^0 (68^F) it seems reasonable to assume that variability of insensible loss can hardly have boon an important factor.
Results and Gomimnt,At the outset, a recognisable pattern was
sought in order to render comparison between subjects possible. Since the patients wore about to lose their oedema, a volume of urine increasing day by day was confidently expected. In fact this pattern was found in only eight (Nos. 6, and 11-17 inclusive) of the total series of thirteen patients, Xn the remainder, the average urine output was greater and showed no recognisable pattern. Xt was immediately apparent that there must be some basic differonce between the subjects making up the two groups. The simplest explanation appeax'ed to bo the possibility that the group showing a distinct pattern were in the very early phase of diuresis, while the second group

203
were ±n a somewhat later phase, their diureses having presumably commenced before admission to hospital* These groups are accordingly designated "early diuretic group’* and "late diuretic group’* and all the results to follow have been presented on this basis* While evidence bearing on the validity of this assumption will be presented at several points of this Chapter, it would be as well to point out Immediately that according to the case-histories the ’early* group were admitted to hospital sooner following the onset of the disease than the ’late* groups:
Early group: Mean ~ 2*5 days admitted afteronsetLate group: Mean = 5*2 days admitted afteronset.
Those means are significantly different (t = 2.25,P < 0 . 0 5 ) .
Early Diuretic Phase.This group comprises eight subjects. Results
from the urinary part of the investigation are available from all, and daily blood determinations have been carried out on five of the children. All the graphs illustrating this investigation have been drawn to a standard pattern, which is the arithmetical mean for

■ 204the group - one S.D* plotted against time*
To find a pattern for those results it has been necessary to eliminate one variable* This is inherent in the fact that the day of pnatt of diuresis need bear no x'elation to the day of admission to hospital, which has necessarily been the first day of study* Thus some patients may start to have their diuresis within a few hours of admission, while in others the onset has been delayed for severla days,To deal with this, an attempt has boon made to ’fit* . the results from the different subjects together by adjusting the commencing day of study with this in mind. The adjustments resulting have been remarkably slight, since no child in this group had an onset of diuz'èsis later than throe days after admission to hospital *
While the increasing urinary volumes gave a sound basis fox' comparison, that afforded by the patterns of sodium excretion is much better, and accordingly the entire study has boon based on the demonstrated ’fit’ of the total amounts of sodium excreted daily*
The pattox'n of total soditxm exex*etion is shown in the lowest graph of Figure 9.1# Xt is clear that

FIG. 9.1ACUTE NEPHRITIS
EARLY DIURETIC PHASE
Urine : 8 Cases
203
Na CONCN. meq/l.
VOLUMEml.
160
120
80
40
01600
1200
800
400
0160 n
120 -
TOTAL Na meq. 80-
40-
4 532 6 7 8 DAYS
N.B. The graphs throughout this chapter represent daily mean + S .D .

2 0 6
during tUe first two days of the study there is a profound degree of sodium retention, and that the sodium duirosis which foilows is intense, the daily 0mounts rising from a mean of 8 meq. to a mean of S3 meq, in four days a more than ton-fold increase,Xt is significant that this pattern occurs despite the low sodium intake, which in the normal subject would bo manifested within this period by a reduction of the sodium output.
The pattern of water excretion also depicted in Figure 9,1 reveals a picture of much smaller change# Xn the oliguric phase the volume is only moderately reduced to a mean of 480 ml,, rising steadily to a mean of 94? ml# after four days# The relationship) of these findings is clearly shown when sodium concentration is coneidex'od, as shown in the upper graph of Figure 9#1# The increase here is from 21 to 92 meq#/litre after four days#
A very similar pattern typifies the excretion of chloride (Figure 9,2)#
Xt is immediately clear that the oliguric phase in these patients must bo characterised by hypertonic retention of salt, and that the reverse holds true with

CONCN.m e q /1 .
ACUTE NEPHRITISEARLY DIURETIC PHASE
Urinary Chloride: 8 Cases
207
160 n
1 2 0 -
80 -
40 -
TO T A Lmeq.
160 -I
120 -
8 0 -
40 —
1 2 3 4 5 76 8 DAYS

.208the onset of dinresie. Xt would further appear clear that diuresis was not complote at the end of the study period in this group#
An entirely different picture emerges when urinary potassium is considered (Figure 9*3)* %t has not been possible to sopa.ratè the potassium derived from cx^ythrocyturia fx’om that secx'etod by the kidney# Nevertheless» the total output of potassium remains strikingly constant in spite of the immense changes affecting the excretion of sodium# chloride and water. The concentration of potassium does show a slight moan drop during the first five days (from 58 to 29 moq#/litre)» and when those values arc correlated with time the reduction is found to be significant# (r - 0.4684# P < 0.01)#
ITlion the concentrations of sodium in scx um and urine ax'o censiderod together in the five patients in whom this is possible, a fact of great im%)ortanco becomes clear (Figux'o 9.4) # Nith the subjects on a constant intake of salt and watox*» it might bo anticipated that a rising concentration of urinary sodium would bo associated with a fall in the concentration of this ion in the blood. No such fall occurs. The author feels that the démonstration of

CONCN.m e q /l .
j? j-u -. y • j> •
ACUTE NEPHRITISEARLY DIURETIC PHASE
Urinary Potassium ; 8 Cases
209
160 —I
1 2 0 -
8 0 -
40 -
TOTALmeq.
160 -|
120 -
8 0 -
40 -
6 74 5 8 DAYS2 31
Note relative constancy of potassium excretion as compared with, sodium and chloride

SERUMm e q /l .
ACUTE NEPHRITISEARLY DIURETIC PHASE
Sodium Concn. : 5 Cases
210
160-1
140-
120
URINEmeq/1.140-1
120 -
100 -
80-
60 -
40-
20 -
7 8 DAYS5 6321 4
Marked increase in urinary sodium concentration while the plasma sodium remains constant

*211
this tact is of cruciai aii^hlficance* There are in his view oaly three poasibXe interpretations of this piimioménoni
X» Goincidental transfer of water from the extracellular space (of which the plasma is a part) to the intracellular*
Transfer of sodium- from the intracellular to the extracellular phase, and hence directly excreted in the urine*
3. A oomhination of 1* and 2*, above*The evidence su^^estin^ which of these
interpretations is moat likely to be correct will be discussed in Chapter 12* Hie constancy of the values for ûCTxmx sodium has been verified by applying; the Analysis Of Variance technique described in Chapter 5* Xn this series# the *within subject* variance is considerably greater than in the controls indicating that the sodium levels are less stable. Idien the ♦between days♦ varimice ia taken out, its value is found to be quite insignificant (F % 0*32?)# confirming the lack of any overall day»*-to-day trend*
The same pattern is seen with urinary and serum chloride concentrations (Figure 9*5)« The reduction of urinary potassium concentrations is

ACUTE NEPHRITISEARLY DIURETIC PHASE
Chloride Concn. : 5 Cases
212
SERUMmeq j I.120
100 H
80
URINEm eq/l .
140 -1
1 2 0 -
100 -
80 -
60 -
40 -
20 -
8 DAYS

213
aoBociatocl witîi a sliglit lowering of the serum potassium from 6*2 to 5*3 meq»/litre* When correlated against time, this is just significant (r - O*3802» P c 0.05)* The initial moan of 6*2 meq./litre is in any event above the accepted normal range (Figure 9*6)*
No particular trend is evident in the results fox' serum calcium and laagnesium# the values remaining within the normal range thx^oughout the tost period (Figure 9*7)*
As would, toe expected, ooncontx'ations of plasma urea show a steady x'cduction towards normal (Figure 9*8) which in thia grou%3 ia not quite attained during the period of the study. The mean value on the final day was mg*/lOOml.
The values obtained fox total plasma osmolarity are shown in the upper gx'a%xh of Figaro 9*9* A clear drop occurs fx'om 312 mOsm./litre on the first day to 285 inOsm./litx' e on the eighth* When correlated with time this reduction is highly significant (r - -*0.4815»F < 0*01).
If tx*ansfexvof water or sodium is occurring at cellular level, one would expect this to bo indicated by demonstrable changes of oxtracellular osmolarity*The plasma osmolarity cannot truly reflect such changes,

SERUMmeq/1.
ACUTE NEPHRITISEARLY DIURETIC PHASE
Potassium Concn. : 5 Cases
214
4-
Ü R IN Emeq/l.
100-I
80-
60 -
4 0 -
20 -
0 1----8 DAYS

meq
i}'±ur, y.y.
ACUTE NEPHRITISEARLY DIURETIC PHASE
Serum Calcium : 5 Cases
215
5*5 "1
5*0 -
4*5 -
4 0 -
3*5 -
3*0
meq.y/l S erum M a g n e s iu m3*0 “1
2 *5 -
2*0 -
4 5 63 7 82 9 DAYS

F I G . 9 - 8 .
ACUTE NEPHRITISEARLY DIURETIC PHASE
216
PLASMA UREA m g . / 100 ml.
5 Cases
200-1
160 -
120 -
8 DAYS

FIG. 9-9ACUTE NEPHRITIS
EARLY DIURETIC PHASE
217
mOstn
Total Plasma Osmolarity
5 Cases
330 n
310 -
290 -
270 -
250
m Osm/'•O sm o lar ity minus (Urea + Proteins)
330 n
3 1 0 -
290 -
270 -
250
7 8 DAYS6542 31
For explanation see text

. ■ ■ ' \ " ‘ : 218.
since mo3t ot tlio undissociated particles contributing to the observed readings arc distributed equally inside and outside the cells # In the present series the high blood urea must make à particularly notable contribution* Furtheriaoro, the concentration of protein in interstitial fluid is extremely low compared to that of plasma# The calculated millioemolar values for urea and protein have accordingly been substracted from the observed values for osmolarity to derive the lower graph in Figure 9*9#The slight deoi'ease of osmolarity is no Idnger statiatlcally significant (r - ** 0# 3:34, F > 0.1) *
The final results to be presented are the. 'readings of total body haematocrit and plasma protein concentrations (Figure g.io), . If alterations of both are duo largely to changea of the plasma volume,.one would expect the values to show parallel variation# Further, if reduction of ■ the, plasma vbluiao is ' , associated with diuresis- both should progressively rise* The graphs indicate that the pro t e in. ' cone entrâti ons tend to rise from’the third, day but increase, of the haomatoorit ietlolayoci witil the seventh day# - There■ is indeed a total lack of correlation between the results (r ** 0# 0660$ P > 0*1)#. Xt ia clear either .

PIG. 9.10 219
Gm %
ACUTE NEPHRITISEARLY DIURETIC PHASE
5 Cases
PlasmaProteins
Vc7*5n p 36
|- 347 0 —I- 32
28
1 32 4 5 6 7 8
Total Body Hct.
DAYS
Plasma protein concentrations (solid) compared with, haematocrit determinations (broken).There is no correlation (r = - 0,066). Cf. Figure 9*18

220
that additional faotore must bo pro^ont at this phase of dittrosiuS » or that increase of the plasma volnme is only commencing towards the end of the study period in this group#
Late 33iu%'0tic Phase.When we turn to the results obtained from the
second group# a rather different picture is presented. Other than the fact that the oxcretiori of sodium# chloride and water is maintained at high levels# no ^progressive pattern is discernible (Figures 9*11 and9as).
The total urinary potassium excretion again remains virtually constant until the last three days, when a slight rise is seen, A very slight decrease of urinary potassium concentration from a moan of h6 meq,/litre to 27 meq,/litre occura during the first four days (Figure 9*13)> but the change is sufficiently consistent to be statistically significant when correlated with time (r - 0,4783, P < 0,050
One of the most striking foatitx'es occurring in this group is the steady doercase of serum sodium illustrated in Figure 9*14, The moan change is from 143 to 132 moq,/litre and is highly significant

ml.
FIG. 9.11
ACUTE NEPHRITISLATE DIURETIC PHASE
Urine Volume : 5 Cases
221
2000-1
1600-
1200-
8 0 0 -
4 0 0 -
Urine Total Sodiummeq
200 1
6 0 -
120-
8 0 -
4 0 -
2 3 4 5 6 7 8 9 DAYS
As compared with the early diuretic phase, no overall pattern is here evident.

FIG. 9.12ACUTE NEPHRITISLATE D IU R E T IC P H A S E
S e ru m C h lo r id e Concn. ; 5 C ases
222
meq./1.
00 -
meq U r in e C h lo r id e Co ncn .
160-1
120-
80 -
4 0 -
meq.
I20n
80 —
4 0 “
0
U rine T o ta l C h l o r i d e
1---------- 1------------ 1-----------r-
2 3 4 5
T----1----1----1-----6 7 8 9 DAYS
Note progressive fall in serum cliloridelevel

FIG. 9.13
ACUTE NEPHRITISLATE DIURETIC PHASE
Serum Potassium Concn. 5 Cases
2 2 3
meq
7-1
5 -
3 -
meq Urine Potassium Concn.
8 0 -
4 0 -
meq. Urine Total Potassium120-1
8 0 -
40 -
3 72 4 5 6 8 9 DAYS

meq.^l
148
140-
132-
124-
FIG. 9.1^ACUTE NEPHRITISLATE DIURETIC PHASE
Serum Sodium Concn. : 5 Cases
Z 2 k
Urine Sodium Concn.meq
60-
120 -
8 0 -
40 -
3 4 5 6 82 7 9 DAYS
Tlie progressive fall in serum sodium concentration shown here is highly significant.

. 225(r îîïï 5973$ .P < O.OOl)* Further, using the same , Analysis ot Variance-'t oohhi que-employ ad in Chapter 5*,. it has been shown that in this group a significant * between days* variance .existS' -(p 2 # 83, F c. 0*05) which affords further confirmation that the progressive decrease of so rum ■ s odium .is si gni f à cant « . > The great estindividual decrease was seen in Case No*19 in whom a level of 145 meq*/litre on days one and two became one of 120 meq#/litre tay day seven* This overall finding contrasts markedly with those of ;the early , diuretic group,-- and,a similar trend is seen to' aff ect the levels of serum chloride (Figure 9*12)* -
No pax’tiouiar trend is evident, when the'serum ■ potasslum'(Figure 9,13)* calcium or'magheaium (Figure 9.15) concentrations' are. considered*
The initial .'plasma urea levels (Figure 9*16) are much lower ' in tliis ■ group ■ - than • in the early diuretic group, the moon here being 55 mg,/ICO ml *' - ' The " pattorxx .- exhibited in the first three days is not unlike, .that of the last throe- days of .the ewly group.
The values for plasma osmolarity aro shown in Figure 9*17* ' Modification of the obsex'ved values by subtaracting from them the calculated millioaraolar, values- for -urea' plus. proteins makes, much'less difference than

FIG. 9 . 1 5
ACUTE NEPHRITISLATE DIURETIC PHASE
226
Serum Calcium : 4 Casesmeq. y I.
6 • 0
5-5
5-0
4-5
4 0
Serum Magnesiumm e q .y I
2-0
15
10
0-5
0
3 42 5 6 87 9 DAYS

FIG. 9.16227
mg.^100 ml.
ACUTE NEPHRITISLATE DIURETIC PHASE
Plasma Urea ; 4 Cases
200-1
160-
120 -
80 -
4 0 -
3 42 5 6 7 8 9 DAYS
The much lower values shown here should he compared with those in Fig. 9.8

FIG. 9.17ACUTE NEPHRITISLATE DIURETIC PHASE
Total Plasma Osmolarity : 4 Cases
228
mOsm330-1
3.10-
290-
270-
250
Osmolarity minus ( Urea + Proteins )mOsm ■/*•
2 9 0 -
2 7 0 -
2 5 0 -
2303 4 5 6 72 8 DAYS
Insuffleient observations were obtained for day k to render meaningful the use of S.D,

229
i,n tîi0 , oarly dltiretlo group siuoo tlio urea levole are much lower* A alight decrease occurs in the first tliree daya $ but there is uo ■statistioally significant- trend* ..
The final point of considerable interest arising from the re oui ta of this group ilea in the closely parallel trend of the values for total body haemàtocrit and-plasma px'’o'tein; concentration (Pigure 9*18)* The correlation is now highly significant (r - 0*75^3*P < 0.00l)f It seems that by the. time this phaoe is reached the factors causing changes to occur in both me a sûrement a have become ttnified* Biminution of the plasma volume represents of the plasma volume ' retires ont s the obvious - 0%%}lanatlon» and it is of interest^ that àuch a change should appear tc be maximal in the late, rather than the early, phase.
Two further points of difference'between the early and late groups x’emain to' be presented.
The pattern of weight change occurring (Figure 9*19) indicates'that loss of weight occurs earlior in the late group than' in the- early, although- the ultimate total losses o f weight are similar. This is presumably acco'tmted for by the greater initial urinary volumes secreted by the later group *

2 3 0
FIG. 9.18
ACUTE NEPHRITISLATE DIURETIC PHASE
CasesGm %7 5-1 r 36
|- 3470 -
6 5-tTPlasma
ProteinsTotal
Body Hct.6 0-
5 5-
5 0-
1 2 3 4 5 6 7 8 9DAYS
Plasma protein concentrations (solid) compared with haematocrit determinations (broken)The correlation is highly significant (r = 0.752)Cf. Figure 9-10

FIG. 9.19ACUTE NEPHRITIS
MEAN °/o WEIGHT CHANGES
231
C U M U L A T IV EW E IG H T-LO S S
(%)
- 2-
Early Group
~ 6 -
Late Group
32 4 5 6 7 8 9 DAYS
While the ultimate total weight loss of the early and late diuretic groups is similar, the timing of the loss is seen here to be markedly different.

232Xt might be rcasenable to suppoeo that the
foataros shown by the late group would in general bo milder than those of the earlier group if for no more profound reason than that the markedly lower plasma uroa levels In the late group suggest that the children are alx'cady further advanced into the rocovex'y phase* Xt is therefore c%tx'omely interesting that the blood pressure readings in the late group should bo no lowox' than in the early group. Indeed, while the highest moan systolic pressxiros show little differoneG (l4l mm. Hg for the early group as against 1 19 for the later group), the inean diastolic pressure rocox'docl in the later group is markedly higher ( 10% mm* Hg as compared with 88 mm. Hg. ) With those small numbers the difforenoe botwoon those means just fails to x'caoli signifioanoe (t - 1.827, 0.1 > P > 0 *05), but it seems %)cs8ible that it could be related to tho generally higher values,for sorurn sodium found initially in tho later group. The implications of those findings will be dis cue a eel in Chapter 12*
In a study of the day*-to*-^day alterations in plasma and urinary electrolytes in thirteen child3?en

233
with AGN, certain basic differences were found necessitating division of the series into two groups,Xt is probable that these groups represent the early and late phases of diuresis in AGN,
Xn the * early* group, hypertonic retention of salt relative to water was demonstrated in the oliguric phase. In the ensuing diuresis the urinary concentrations of salt rose while tho plasma concentrations remained constant, indicating either shift of water into, or sodium out of, body cells during this phase. The total potassium excretion remained almost precisely constant throi%ghout the test period,
Xn the late phase no similax' relative changes of concentration of salt were demonstrated, A significant dro%) of serum sodium did however occur.The haematocrit and plasma protein c one ontrations rose uniformly in this phase* suggesting that the reduction of plasma volume is a late phenomenon.
The values for plasma urea wox’o initially much lower in the late diuretic group, whereas the readings of blood pressure tended to bo higher than in tho patients in the early diuretic phase of AGN,,

234
C'imPTEH 10 OIT-ÏEH ASPECTS OF ACUTE OlOiyffîHUEONEFimXTlS
I * EleGtPophoretiù patterns
Intro dü c t i onXt is strange that tho eloctx‘ophoretio pattern
of serum proteins occurring in AGN should have received little attention. Most clinical x*eview articles on paper electrophoresis do not mention the condition,Prin» in 1961 (l68) drew attention to the typical pattern of moderate reduction of albutrdn and elevation of ganmia-globulin and demonstrated gradual return to normal over peràods which were often prolonged,Ghlostvra (277) and Imperato ( 102) in the Italian literature have ahoim similar findings, but tho ghanges occurring with diuresis, and tho correlation of patterns with the presence or absence of oedema do not appear to have boon previously investigated.
Material and MethodsThis investigation is in two partsj 1. Protein electrophoretic patterns wore carried
out in 39 of the 170 case records analysed in Chapter 7, Xn each case the estimation was carried out within

235
hours of the child*a admission to hospital. This series has boon utmilsod to determine the overall pattern to he expected in AON and for comparing the results between tho oedematous and non-^oedematous cases* Those estimations and those of twenty normal children were carried out by the Biochemistx^y Department, Royal Hospital for Bide Children, Glasgow,
2* Electrophoretic patterns have boon determined before and after diuresis in fourteen children with AGN. Eleven are from the series of patients described in the last two Chapters (Nos 1,3,10,12-16, 18-21). The remaining three are from further typical oases of AGN on whom no other Investigations wore carried out and whose clinical data ere not presented. The time intervals between estimations varied from seven to twelve days.
The methodology of paper electrophoresis employed was described in Chapter 5* The method used by the routine laboratory and by the authox' has been throughout the same.
Results and Comment,Ficçure 10.1 is a block diagram illustrating the
mean electrophoretic pattern obtained from twenty normal children of age-range two to twelve years. The moan values - one S.D, are indicated for each fraction and

F I G . 1 0 . 1 236
ELECTROPHORETIC PATTERN] 20 Normal ChildrenT. P=6-82 to 50
Gm/ioo ml. %
O
y-GlohP -
c x -
A l b u m l n
HO(tO 24 16 II 0160 2 6 ) 1 4 8
l-22(t036) 180
349(±040) 511
Block diagram representing mean normal electrophoretogram.

237
compare well with tho results of published series*Whor*e the degree of separation was sufficient
to allow separate scanning, tho mean -globulin was found to be 0.23 Gm./lOO ml * and the mean
Ï0.99 Gm*/lOO ml., giving a mean ratio of4.3/1.
Tho moan pattern in 39 children with AGN is shown in Figure 10.2. Tho total protein level is moderately reduced as are those of albumin and
a-globulin, the 3-globulin is nomial and thoY-globulin modoi'ately increased* This pattern has
a similarity to that described in a number of acute infections (168 ) except that in these conditions tho reductions of total protein and albmiin are leas than those observed here in AON,
Nhen analysed statistically by t-test the results ares
Total proteins Highly significantly low(t = 4.729, B < 0.001).
Albumins Highly significantly low(t = 7.220, P c 0 ,001).
a-globulins No significant difference(t 0.086, P > 0,?0) .

FIG. 10.2 2 3 8
7
O
ACUTE NEPHRITIS 39 Children
Gm/ioo ml. %b U J
l-50(±0-48) 24 9
0-85(±0-25) 14 2
l23(±0-3!) 2 0 7
2 45 (to 73 4 0 2
Mean electroplaoretogram for 39 children at various stages of AGN. Fractions depicted in same order as in Figure 10.1 Normal pattern is indicated on left.

239
3-globulins Significantly low(t = 2.301, P c 0.05).
Y-globulin: Highly significantly raised(t " 3.119, V < 0.005).
The raised levels of y-globulin are presumably associated with infection. Since estimation of A.S.D. titre was carried out as a routine measure, a direct correlation has been possible and is shown in Figure 10.3. Calculation of linear correlation indicates a highly significant positive relationship (r := 0.602,P < 0 * 001 ) . Owing to the different ways of expressing the results of those two estimations, one would expect a correlation if present to be parabolic instead of linear, and the appearance of the scattcrgram does rather suggest this to be the case. Xt is therefox’e probable that the true correlation is higher than suggested by the above value.
ProBonee of Oedema, Tho results from those 39 childrenhave been separated according to the presence or absence of oedema. The grouping is soon in Figure 10.4, contrasted with the normal pattern. It is clear that the results from the non-oedematous group are considerably

FIG. 10.32 4 0
U/mlj2ooo
looo
5oo
PH H g n g g M g T I ' ' »■■■■■■ — ■■■ ■ ................................................................... ......
^^B^gMJLuuuuimBfflmmmmB8iai;g8»mBgiBaiWB«painBWBiaB»iaoaw
I lit 'tsii
;: r:; iiiliiii B h h
rff-#44
wtr-vm
j ■ '. . . 1
2oo
O 0 5 lO 15 2 0 25Gnï%

FIG. 10.4 241
ACUTE NEPHRITIS
O
Oedema Present
5 83143
0 8 3
I 21
2 36
Oedema Absent
655
Gm./IOOml.
I 69
092
127
2 67
Association with oedema. Normal pattern is shown on left-hand scale.

242
closer to the normal pattern than those of the oedematou» group. Statistical analysis indicates the following difference from the normal pattern (values for *P* bracketed):
: TABLE 10.1GROUP COMPARISONS WITH NOmiAL (t - tests)
Oedema present Oedema absent
Total px’otein n.s. Low(< 0 . 0 0 1 ) N.s.(> 0,2)Albumin H .S . Low (< 0 .0 0 1 ) H .S .L o w (< 0 .0 0 1 )
oHglobulin N.s. (>0.7) N . S . ( > 0 . 6 )
3-globulin S .L o w (> 0 . 0 2 ) N . S . ( > 0 . 4 )
Y-globulin H.S.High(< 0 .0 0 5 ) H.S.Hieh(c O.OOl)
In thirteen of the total of 39 estimations adequate separation of the a-globulin into and fractionswas achieved. These showed a reduction of the ratio to a mean value of 2.6 compared to tho normal value equal to 4,4, and this change appears to be due to a combination of slight increase of tho fraction withreduction of tho Tho numbers of cases is too

243
small for adequate analysis, but with this data the itso of t-tosts has given the following results :
TABLE 10.2 CHANGES XN , RATIO
Mean (i B.B.)
AON (13 cases) • 2.6 (i 0.34)Normals (lO cases) 4.3 (- 0.4?AGN - Oedema present(8 cases) 2.4 (X 0.33)AGN - Oedema absent (3 cases) 2*9 ( 0*74)
FcO.Ol Pc 0.005 N.B.
Alterations with diuresis. Xn the fourteen sets of results estimated by the autlioi , the patterns before and after diuresis are Indicated in Figure 10.3* Xn gonex al the patterns resemble those of the oedematous and non- oedematous grotips, as would be expected. With diuresis, the total protein, albumin, 3- and y-globulins all increase, wliilo the a-globulin decreases slightly.Tho percentage increases of the 3- and Y -globulins aro very similar being and 4ÿ rospoctively. Theincrease of albumin is somewhat greater - 2?/ .

FIG. 1 0 .5 . zhh
ACUTE NEPHRITISChanges with Diuresis
Normal682
Before594y
p
C K
153
078
H7
Alb.2*46
O
lie
1 0 1
122
349
At te r. 6-51
I 57
0*85
098
3*11

. 2 k 5
Xt may be proBumod that a number of factors are Xikoly to be concerned In these chtmgjos* For example the alteration of plasma volume taking place with diuresis is certainly of importance. A reduction of the water dilution factor would be expected to cause a uniform rise of all the protein fractions,Xn the context of the present work it is possible to form an estimate of the magnitude of this factox' using the mean decrease of yxlasma volume shown in ten subjects in Chapter 8* Since only throe of the present series have had their plasma volumes estimated, this application of one set of results to another must nooessax’ily be somewhat speculative.
The average decrease of plasma volume has been shown to be of the ordox* of 18 'L Xf this figux e is applied to the protein fx^actions measured in the %)re- diuretic phase, they may each be expected to increase by the amounts illustrated in Figure 10.6. The actual x'ise with diux'osia shown as the right-hand line for each fraction indicates that tho 3- and
y-globulin fractions rise less than would be expected, albumin rises rather more, but that the behavioux^ of the a-fraction is quite different in that it docroasoB below the level of the %)re^diuretic value.

PIG. 10.6. 246
ACUTE N E P H R IT IS
3 0
ÉO20
l O
O
Plasma Prote in Changes 14 Children
Alb. CK /3 y
For each protein fraction, the left-hand vertical line represents the mean prediuretic level; the right-hand lines represent the levels following diuresis. The broken horizontal lines represent the levels to be expected after diuresis assuming an average plasma volume decrease of 18^.

247
Xt could be argued that the parallel increase of 3- and Y“0lobulins suggests that these fractions are affected by one factor alone, that of plasma dilution* Xf that were the case the increase in albumin above the expected level becomes oven more striking* Why should this fooV One poBsible explanation is that of return of albumin from the interstitial space with diuresis* Xt was stated in Chapter 6 that the px otoin concentration in oedema fluid in AGrN is nox*mal* An incx*eased volume of this space must mean that the total interstitial protein is above normal, and it is not necessary to postulate increased capillary permeability for this to occur*An increase in the volume of interstitial water derived either from the intravascular compartment or from trans-cellular shift is bound to be associated with a certain amount of shift of protein from the plasma to maintain colloid osmotic equilibrium* . Xt would further socm reasonable that albumin should foe involved proforentially owing to the comparatively small size of its molecules,
The relative disappoaranoe of a-globulincannot be explained on the present evidence* Urinary elimination appears to bo the most likely cause, but

248
without turnovox* studies and separation of urinary pro telles further comment is not possible.
Suinmary,The typical electrophoretic pattern occurring
in AGN has been demonstrated* This consists of a moderate reduction of total protein, albumin and
a-globulin together with a raised Y-globulin,the latter correlating positively with the level of A*S,o, titre# These changes decrease in magnitude with diuresis, but it has been shown that reduction of the plasma volume cannot bo the only factor responsible*

249CHAFTKK XI
OTBBH ASPECTS ,0,F ACUTE GLODIERULONEPimiTIS '
JJ# The cheat piotm e and ohangev ooourping in the
radioJogicaJ heant^oZwne,
IntroductionChanges in the appoarances of the chest X-ray
in AGN are common ami sufficiently typical to be of considerable practical diagnostic' value, but have excited a surprisingly small litox aturo* Holzol and Eawcitt in 19oO ( 98 ) described changes in 25 out of 40 cases, noting cardiomegaXy, pleural effusions,* intrapulmonary oedema* and segmental pr lobar collapse and cotiBolidation, All theae signs tended to clear with the onset of diuresis * Substantially the aamo appea,ranoea have been reported more recently in a larger series from America (112), While it is generally agreed that most of the changes are due to rapid expansion of the blood volume, alternative mechanisms have boon suggested, such as allergy to the haemolytic streptococcus ( 234).
Xt has not boon the author’s intention to add to the qualitative information already available. Rather has an attempt fooon made to link the changes

250
quantitatively'witîi the presence or absence of oedema* Further, , the well-.recogriieod -alteration of heart-size suggests itself as a possible tool with which to throw further light on the fluid changes of AGN*
Material and Methods \Similar to the subject matter of the x:>receding
Chapter, this study is also in two parts*1* Chest X^ray examination was carried put in
89 of the -I7O- children whose case-records have-been analysed■in Chapter 7* ' Those were dona in all cases within 24 hours of admitting the child to hospital, and in addition the examination whs repeated at varying times thereafter in 36 patients* This time-iiiterval has been in most instances more than one week and the second X-ray has therefore boon assumed to have been taken in the post’ diuretic ■ phase* The facts noted have'in all eaaos-been abstracted from the radiological report-shctt*
2* Changes in heart voS;ujsie* The case material for this part of the study"has comprised 20 patients. Eighteen havebbaen listed provloualy (Case Nos#2-10, ‘12-16 and 18-21) * The remaining two xiatienta were once again suffering from AON, the appoaranco", of which

251
vjao quite typical and in both subjects associated with oedema* Since determination of* heart volume was the only investigative procedure carried out the . complote clinical details of these two >ationts have hot been specifically recorded*
The method used for doterminâtion of the heart volume has been that of Lind (120), modified later by Domeuot et al* (48 )*
PooterO'-antorior and'lateral filma of the choDt aro taken at focus-film distance using a stationa3?y grid. Three me a sur emon t s are made;
1, Fi;om the Ï?#A film, (a) the long axis (l) from the point of jimetlon of the aorta or superior vena cava to the loft lower polo of the heart.(b) the short axis (s) from the riglit card!o-xYhr(;>nic angle to the junction of the pulmonary conus and the left ventricle or the left atrial appendage.
2, Fro!H the lateral film, the longest diameter (d) of the cardiac shadow in the horizontal plane.
Calculation; whoro 1, s and d are measured in oms., V (heart volume in ml.) - 1 x s x d x K
K is a factor which includes the ellipsoid conversion factor (since the heart ia not an ellipsoid) and also a correction for the effect of radiological

252
magnification* The distances used in the present study have been the same as in the series of Domenet et al.(48), whose V(lue for •K* of 0.4l0 has accordingly been used here. Lind in his extensive and careful study quotes the reproducibility of the method to be - 2.
Determinations were carried out immediately on admission of the child to hospital and following diuresis, the r&mge being 3vl4 days. Where body Water distribution was determined (nine subjects), heart volume was mervsured in each case on the same day. The names and dates on the films were obscured and the series was then presented in random order to a consultant radiologist who made all the measurements in one session. For comparative purposes, cardio- thoraoic ratio was measured at the same time.
RESULTS1. Chest X-ray appearances in AGN.X-ray was carried out on 32 patients who wore
free from oedema. The appeartmces were considered normal in 25 (?8^Q. Xn 57 oedematous children, only 13 (23 4) showed normal appearances. Statistical analysis is not necessary to confirm the significance

F I G . 1 1 . 1253
(a)
r
(b)
(a) Oedematous phase: cardiomegaly andpleural transudates are clearly vi s ible.
(b) Six days later: normal(Case G .R .)
chest x-ray

254
of the8 0 figures# •The. abnoxmali ties re corded were mainly the followings
1 # ' Generali Bed earcliomegaly •2, Xnoreaso of pulmonary vaaoular markings#3* The presence of pleural transudates*
An excellent, if relatively mild, example of these changes, and their disappearance with diuresis, is Bhoim in Figure-11*1 (Gaae No, 4, G*R,)
The. distribution-of abnormalities between, oedematous and non-oedematous children is aeon below:
TABLE 11,1* .
Numbers of Children
Category Oedofiia absent Oedema present
Normal 25 13Heart 4' # .Lungs O# 4 7Heart Or Lungs : Vf 0 3Heart O; Lunge : PF 0 2Heart 0; V4*, O 2Heart Lungs ; Vi- 2 7Heart t; Lungs s 1 8Heart 4; V k 0 15
Totals 32 57
ÛÎ Noarmal* ,vî Abnomml * ¥i Pulmonary vasculaturePF? Pleux’al fluid#

255
From this table it la clear that when oedema ia px’eBcnt, oardiomogaly is the doîmnonèst single abnormal finding (37 out of 44 abnormttl films), and increase of the pulmonary vascular markings and pleux’al transudates appear with approximately equal frequency. Xn the non-oodefuatons group, only seven films wex'e almormal, four of these showing cardiomegaly alone*
Repeat chest X-rays were clone on nine children from the non ooctematoxis group and 35 of the group who had boon originally oedematous• Only one of the first group was re%)orted abnormal ,■ showing slight oardloîiïagaly only. Of the socond group, 29 (83^) were normal, five allowed oardiomogaly as an isolated findiaig, mid a. solitary case showed evidence of a small ploural transudate eight days after admission.
Hacliological abnormalities of the chest In AON jiïiîst obviously bo regarded as a transient phenomenon, clisappearing during diuresis.
2. Ohangos in measured heart volume.xn 19 of the cases in the 3cries, a ma3:'kod
decrease of heart volume was recorded betwoon the first and second determinations. Xn tUo twentieth, a child
C* , Case No. 16) without eithoi* oodoma or hypertension,

256
a very small (3*1/5) incx'aaee was found, wliloîi is probabl)f within the experimental error of the method The mean, changes were as follows ?
TABLE’ 11.2. ? '
0îiàN0ES XN. imART VOLUME (mSAN AND KUNGE)
Heart Voliime I (ml. ) Heart Volume 11 (ml.)
352 (209-352) 885 (192-453)
Moau différence 3 67 ml. (19,1^)
t « 6.921 P< 0,001
The individual changes are-illustrated inFigure 11.2# -The ■ alterationa of curcllo-thoraoio- ratio (Figure 11*3) show a àimilax^ if leas.consistent picture* Xt haa not been the ohjoet in this study to make a formal comparison betweon the relative merits of iftfôaetrraïîîonts of C^T ratio as against heart volume.- This has boon already don© with efficiency by Rosendal (i82 ) who Bhowed’ heart volume to bo considerably the more reliable method* The greater' consistency shown

FIG. 11.2. 257
ACUTE NEPHRITIS
Changes in Heart Volume
Heart Volume 1.
400-
300-
•o>200 -
1 0 0 -
100 200 300 400 500
Heart Volume 2. ( ml . )
Tile open circles represent tliree non-oedematous subjects.The 45° line represents perfect agreement between the two determinations.

PIG. 1 1 .3 .
ACUTE NEPHRITIS Changes in C-T Ratio
C-T Ratio 1 (% )60-1
55-
50-
45-
40-
3 5 -
35 40 45 50 55 60
C-T Ratio 2 (®/o)
Details as in Figure 11.2

259
hex*c would tond to oonrirm this finding,Having shown tUo occurronc© of largo oimnges
of heart volumo to occur in AGN, the results have been employed in an attempt to identify the factor which is most important in causing cardiomegaly#Xu the early litoratux'o hypertension was the caueo most often quoted, while in the past ten years changes in blood volume have boon considered to bo of first importance #
It is in fact difficult to separate these factors 9 since as has boon shown both hypertension and hypérvolaemia tend to pccUx in the same patient#
ChangeB of heart volume have been correlated with the highest diastolic 'pressure recorded in 20 children (Figure 11 #4)# The,results fall into two groups, with diastolic blood prosauros above and below 90 mm# Hg« Xn the hypertensive groux>, there is no aixggoation of correlation# Xt must bo stated immediately that the woaîmoss of such an argtimcnt lies in the failure to to-ho account of the duration of hyx>ortenslon.
Eighteen estimâtos of blood volumo from nine of the patients described in Chapter 8 are ooz^related with heart volume in Figm^o 11#5^ Since both measm'emonta aro of volumes, any correlation may bo

2 6 0
F I G . 1 1 . 4 .
ACUTE NEPHRITIS
A Heart Volume (%)
-35-1
- 30 -
-2 5 “
“ 20 -
- 15 -
— 10 “
- 5 -
0 -
+ 5
#e
30—r 50
— |— 9070 90 110
Diastolic Blood Pressure (mm. Hg.)
130
In general, larger changes in heart volume occur in the hypertensive patients. Nevertheless within this group no correlation is seen.

2 6 1
FIG. 11.5.
ACUTE NEPHRITIS
Heart Volume ml.
600 "1
r = 0*9136 P < 0*0015 0 0 -
4 0 0 -
3 0 0 -
200 -
M E A N
M E A N100
0-4 0 8 1-2 1*6 20 2-4 2*8 3*2 3*6
Blood Volume ( litres )
Determinations carried out in prediuretic phase (closed circles) linked with those done following diuresis (open circles). The mean changes are highly comparable.

2 6 2
oxpeotod to bo linear> and it extremely liigb (r - 0 *9136» P < 0 .001). TUo lines indicating the changea in seven of tUe ssrios lie almost parallel to the rogrossion line. Xn tUe remaining two (Case Nos. 8 and 9) tUo decrease of heart volnme is propox'tionately greater than that of blood volmuo*Those patients both had a marked degree of hype.rtenaion, bitt not more b o than others showing almost perfect correlate cats between changes of heart and blood volume. There are presumably other factors concerned» but it is felt that the results of this study strongly confirm the importanco of changes of the blood volume in this rosx>0ct*
The corollary to this work is suroly the possibility that this technique could be utiXiaed to tie termine at precisely what otage contraction of the blood volume is maximal # The radiation hac ard bars frequent serial observations » but some interim readings were taken in this series* and the signifioanca of those will bo diseussod in Chapter 12*
Abnor^nalitios of the chest X«*ray occur frequei-ktly in A0H, particularly in cases with oedema. They nearly

263always disappear witli diuresis.
Usixig a' mothoci for radiological measurement of the heart volume, a marked dearaaae has been shown to 00our during diuresis. The .ohahgoa correlate well with observed changea in blood volume but not with diastolic hypertension*

264
THE SYNTmSIS
À âiBGuaBton oomapning the Btgnifim m e of aatient peinte ppesmtéd in the preoeding Qhapteps
The oxperimentaX work described iiaa boon designed with a view to ■ throwing light on a number of different aapeota of acute g3.om.ariilonepliritis*’ Xt remains to be --Been if it is possible to, Cons tract a coherent picture from'it ' ' Xt will have been immediately obvious to the reader that certain aspects of■the results given in Chapters eight' and nine are ccmplomentary. Xn Chapter Eight it was shown that body water distribution in the oedematous phase of AGN takes the form of a combination of expansion of the. . oxtracollular apace r.witli contraction of the intracellular. Following diuroBis thee© relationships returned to a x?attom approximating 'momimllty-* During the oliguric phase* renal retention of water and aalt was showi in Chapter Nine ■ to be hypertonic, and it . imediately follows that resulting oxtracellttlar hypertonioity must result in compensatory shift of water out of the oolla* This is illustro,ted diagrammatic ally .in Figure 12*1 • The average daily urinary output of a

F I G . 1 2 . 1 .
ACUTE NEPHRITIS265
Urine
DailyH , 0 :No
40C)ml. 20meq
Plus 2 days
i
E-C
l-C
561140 meq. I
6-01
621152
meq.
601
Proposed mechanism by which extracellular volume is expanded by 1.15 litres following renal retention of 6OO ml. water and 160 meq. sodium. See text for explanation.

266
child weighing 20 kg. is something of the order of 700 ml., which contains perhaps 100 meq. of sodium chloride (190); Xf those ©mounts are decreased following the onset of AGN to, say 400 ml. and 20 meq,, the effects on body water distribution will tend to be as illustrated. It can be seen that the extracellular space is expanded by I.IS litres following a total renal retention of only 6OO ml. water. This would tend to explain two of the features commented upon in Chapter Six. Firstly, the remarkably rapid rate at which oedema seems to form in AGN becomes comprehensible* Secondly, the work of Swann and Merrill (213) and later of Harrison et al. (89) have shown that in AGN the urinary sodium concentration tends to bo loss than 30 meq./litre, whereas in the oliguric phase of acute renal failure due to tubular necrosis a concentration greater than this figure is the rule.The fesuits of the present series accord well with this figure. It would be reasonable to assume that the retention occurring in acute renal failure is likely therefore to be isotonic or hyi^otonic and not accompanied by osmotic withdrawal of intracellular fluid. The difference in the rates of accumulation of

267
oedema in the two conditions could thus bo easily explained.
Xn this connection the work of Hemerchik et al. is of condiderable interest (l?5)* These authors measured body water distribution in adults, one of whom had AGN and the other seven acute renal failure due to tubular necrosis. The indicators used were anti-x>yrine and radio^^sulphate. Xn the seven cases with tubular necrosis both the EOVJ and the XCW were increased, the latter to a slightly greater extent and contracting more noticeably with diuresis. In the eighth case a pattern similar to that described in the present work was found. Somewhat similar findings were reported by Schwartz et al.(189) in a case report of a child with a fatal disease which was probably AGN.
Xt has already been pointed out that at the commencement of diuresis the increasing concentration of urinary sodium in the presence of a constant level of extracellular sodium could only be explained either by the movement of water into the cells or by the transfer of sodium from the cells to the extracellular fluid and hence directly excreted in

2 6 8
the urine. The argumentb as to which solution is oorreet are largely those which were discus sect in connection with the validity of the results of/body watex' distributloti in Chapter Eight* It was concluded that the evidence pointed to little if any sodium transport *
To this must be added evidence obtained from the patterns of urinary potassium in early diuresis.The remarkably conetant output of this ion argues strongly against any considérable alteration of its distribution in the body throughout the period.in question and this in its turn is further evidence against a large degree of sodium shift* Xt is however possible that a small amount of potassituii leaves the cells during the oliguric phase to account for the slight elevation of serum potassium observed* Whether this is due to cellular breakdown-or to transfer,of the ion from the cells- along with, water is problematical * Elkinton and Winkler ( 58 ) showed many years ago that under conditions of experimental water depletion loss of intracellular potassium occurred which was in (exees s of the amount associated with protein catabolism. Such a phenomenon could account to some extent fox’ the

269observation which Is perhaps the strongest single argument against the presence of intracellular clehydx'ation in this disease * The fact to which the author refers is the presence of normal levels of serum sodium in the oliguric phase. These were indeed somewhat lower than those found in the * late diuretic’ group. This appa:rent discrepancy is perhaps occasioned by the higher sodium intake inherent in a normal home diet given presumably to those children for a longer, and indeed the most critical» period of the diseaso,
Ordor of Events.While the order of events leading to the
formation of oedema in AGN can only be surmised from the present data» a faii'ly x reciae picture of the sequence during diuresis is ready to hand.
Figures 12.2 and 12,3 re|jresent a summary of the main findings from M.C, (Case No.13) from the early diuretic grou%), and J.B, (Caso No.XO) from the late group, Xn H.C, initial oliguria associated with a rising level of plasma urea is followed by profound sodium diuresis, the volume of urine rising less dramatically. At this stage cellular rehydration must be occurring* Hypertension was not marked in this case

X^.2ACUTE NEPHRIT IS M.C. Female 8 yrs.
2 7 0
400 -,
HEART 300 - VOLUME 200 -
100 -
125 -B. R
mm.Hg. 100 -
75 -
PI. Prot. Gm. %
80 -
BL. UREA 60 " mg. %
20 H40 -
125 -
T O T A LU R I N ENa
meq.
75 -
25 -
1000 -
URINE 750 -VOLUME 500 _
ml.250 -
27 -
2 5 ' -W EIG H T
kg.
231 2 3 4 5 6 7 8 9
Summary of findings from cliild in early diuretic group.

Fig. 12.3 . A C U T E N E P H R I T I S
271J. B. M a l e 9 yrs.
700-1
B.V. (ml.) p 2 5 0 05 0 0 -
HEARTVO L U M E
3 0 0 -
100 -
1 5 0 -
B. P. mm.Hg. 1 0 0 -
4 0 -Met. %
PI. Prot. 7-5- Gm. % 6*5 -
BL. UREA ^ 0 "mg. % 20 -
2 5 0 -
URINEVOLUME
7 5 0 -
2 5 0 -
45
W E I G H Tkg. 43 -
1 2 3 4 5 6 7 8 9 10 n D AYS
Summary of findings from child in late diuretic group

272
(maximum 140/90 mm. Hg.) but the fall to normal lavais seems to start at tbis time. The plasma protein ebncentration begins to rise also around the third to fourth day. Xt is likely that this is at/first'not du© to diminution of the plasma volume, since the heart volume is unchanged on the 5th day, and the haematoorlt (not shown) did hot start to rise in this cas© until between the sixth and seventh day* Thus •it' would- appeax’ that decrease of the plasma- volume is . almost' the last event in the sequence, - ' '
The évidence fx om J*B, is confirmatory, except that the drop in blood pressure is delayed* The period of:• cellular.r©hydration has presumably'occurred* before th© start of'the‘test, and the rise of the haematocrit occurs between the.third and sixth day of
" this lator period* , / 'The fact., that the plasma protein 'o one entrât ion
starts to rise earlier than the haomatoorlt is /' puzzling,: but probably vex'y'informative* While it • could bo due to prolonged loss of x*ed cells in the urine, the very small change- of total red cell mass in practically all the cases in which this was determined militates strongly against auoh an explanation Xt was shown in Chapter 10 that the rise of serum

273
albumin following diuresla Is probably greater than can be acoomuted for by diminution of the plasma volume alone, Xt has further been alleged that there is an Increase of total albumin present in the interstitial Bpao6 during the oedematous phase* During the very early phase of diuresis the shift of interstitial water to cells would tend to increase the concentration of albumin in this space, diminishing the colloid o’amotic .pressure gradient'between the interstitial ' and plasma spaces and favouring early return;of albumin to thè-plasma* '
■ cm the basis.of -those considerations a pattern of events, surmised.and observed, is proposed and illustrated in. Figure'12 *.4,
S odiixm, and. Hyp art ansi onThe cause of hypertension oocnvt'XnB in AGH
remains unknown, îîypervolaemla per se might well be a contributary cause since a mild degree may be provoked in the normal subject by acute expansion of this compartment ( 2 ), The association, howeverbetween hypertension and sodiuia retention is very well known and merits analysis in the present context*

PmVBli 28,42 J h
AcxmsimsB
OXomorvlar Isaion ----------------------------
A , D ,8, î n a f f e o t i u â ^---- — UyportonÎQitij of r^sruü B!<j<îHXl!al
■ > • Glompuiar fiXtro,to\^
•i
/ilT'SSTOO'C' SODXtMiBimQnatHurta
??#C% , r.a# Oamoiartt!/t
lUO^Spam «■
IOïüDISMâ + HYPERVOLAEKÏÂ -i- IN T IlA C B LLÙ LA R D S inrD lU TIO N
DItfHESISEarly
Vrtm » tiHmry p%i]T « Urinary /fa^\ IinteratitlaJ water -
Interatitiol a^Mmin-
IFiamm protatnaf
PI mrm
Lato H i g h B0A w n o M tmter
omtpnt m a i n t c d m â
P i m m vQlum | ffeartifaemtooritf

275
. Xt lias boon known; for ■ some time that hypertension could bo provoZiod in rats following tZio clironie ingestion of, oxoesaive salt ( 4o ) *■ Xt has furtlxex* been shown timt prolonged renal retention of salt leads to hyp ort ens i on, and an ingenious application of Starling’s Law by Z3orat and Borst de Geus ( 18 ) sitggeats that hypertension is the inevitable cardio- dynamicresponse to tZie necessity - of _ eliminating excessive accumulation of oxtraoellular fluid brought . about by primary sodium rétention. Conversely, the : hypotensive effect of the thiaside group - of'..diuretics is'thought 'to bo due to climinaticn of éodium(30 ),
The dneolmnisBi by which sodium in excess'' ' pro voices Ziyp er t one i on is also unlcno tvn, but in this respect thé...work of Tobian and;Binion , (215) is of interest* These workers demonstrated 'increased sodium ami water content of the media and intima of the /renal arteries of hypertensive human subjects, and suggested that the same plxenomonon occurring in art orioles could cause decrease of luminhr siK:o and an incroaso in'the peripheral vascular real stance* TZioir results give;'no Indication aC to tdictlier. thisextra sodium and water was intra. 'or. extracellular, Some writers ( 94)have assumed the distritoutio.n to bo essentially

276
intracellular, but this ia not neceaaarily ao,in acute glomerulonepiirltia there la no dottbt
about the existence of abnormal sodium retention, and it has been shown hero that it occurs hypertonically with respect to water, Ifhy should so much sodium be retained in this way? One must immediately consider the nature of the renal lesion present# As has been substantiated in an extensive literature, the lesions are largely glomerular, The fact that the majox* fmictional abnoOTality is diminution of the glomerular filtration rate would appear to confirm the importance of this lesion. Tubular abnormalities are indeed present (225)# and some impaixmient of tubular function is also on occasions demonstrable (51)# but the two findings correlate poorly (159)* Marked reduction OÉ the glomerular filtrate must obviously impair the effectiveness of Henle * s loop as a counter current multiplier. Consequently the medullary interstitial fluid is less hypertonic than noxmal, and following adequate sodium reabsorption the response to may well be Inadequate (l38).
Through all this it will have been clear to the reader that while information regarding many facts is

'277
wanting, tîio- pcr îistent silence until now concerning . one-pat*tiouiar' factor i's becoming embarraesing# ' - TZiis factor,, is of-course the possible Influence of sodium*- retaining steroids, of which-, aldoatcrone ia "the most poworfttl, .currently laiown. This important onoo thought-, only .to act. on the renal tubules pausinge sodiuiB. rotoiition and secondary pptassiuiii' excretion, is now loiomi to have a number .of other actions* .■■ Xt causes increased sodium transport-in' gut (1 2 1)# and favours , oontraotion of involuntary muscle in the siiiall intestine (2 0 9) and in the heart (1 8 5)* There is conflictingevidence concerning.its action on the individual cell .membraneI Helme:r (94 ) makes, it clear that it • causes . inorcased pasaage- of sodium .Into, and potassium out of, ■cells. • The work . of Rapp {172-»173 ) ',on experimental ■ adreuEil 'régénération hyperteneion,. would appear to confirm this # : : However:' Conn and' his group (183)recently showed that in bone the amount of sodium,■ whicli in this site is largely intaà aoellular,. was decreased by " aldostex’one, and Spaoli and Street on (202) have demons t rat ad that oodimi exchange in canine erytteocytcB is retarded in vitro by the steroid*The results of Woodbury and Eooh are of particular

278interest. These investigators showed in mice given aldosterone for short periods that the total extraôellhlar sodium of muscle was ■ increased as v;as to a mild degree tlm intracellular potassium, while, the intx'aeelluiar water was slightly reduced, (236) * This pattern could well be similar to that present in AGN,
Xt is curious that assessment of aldosterone secretion in AGN does not appear to have been carried out. The technical ■-•difficulties are of course formidable, as siaggested'by the variable results obtained by Cop©‘and Pearson (31) in a study of cases- suffering from renal failux'© duo to various ' causes,,Xf angiotensin is the - trophic, substance for aldosterone, as now seems almost certain, the obaex-vation' by Helmer " (9 1 ) that renin activity is not increased in the disease may well be of significance,
Furthermore, the circiimstancea which lead to increased secretion of aideaterone aro now well documented,' The most important appear to be disninished blood volume, acting through the secretion of renin from the Juxtamedul-lary apparatus, ■ and axceasive loss of sodium * Neither of those can apply to AON, where the opposite o i r cum s t an ces are p r e s e n t F o r these

279
reasons-it seems,to the that hyporaldosteronism-is not likely to be proBent.in this disease* ; Lastly, ©xoess alclostoron# Is' by xxo.means an c ssontial ingredient in the. pathogenoaia of hypertonsion, ' Xxi nephrosis, as a G elated: aeeondarily .with the production' of largo ' ' maonnts.of-aldosterone, hypertension is generally absent, and, wen, in primary aldoBteroniam- it ia by no means a e one tant.. 'finding (210), ■
' #iat'.:relevance doe# the possible status "ofaidosterone have to the body water distribution . ■ ooburrlng' in AW? If ■ hyperaldosteronisni should bo’ pr o a ont, 'tixen- for the .reasons • stated it'is' at présent difficult to foreeast what ionic shifts could bo -occurring .at - c'ellulax* level * Xf on the other hand this . situation ■"la not px esent, . there is no obvious reason why ionic shifts should take place* Wo are then ■left with tlie situation-'of intraceliular dehydration'demonst-rated in this work* Xa it .'possible "that this could': have a bearing on' the -genesis of . hypertonaion, porhapa..-by such a mechanism as the Induction of tiio'oth mue cl#' spasm? ■■ The less frequent . ocourrenoa of - hypertension in acuta tubixlai* necrosis {213} .in-whioh'iiitracallular .dehydration is probably

280
not present,": oomws. 'immediately to mind. It is also pertinent to inquire as toAth©' offèot of generalieed ,Im t ra e e l i n i are d e h y d ra tio n on re n a l tubulax" fu n c tio n #
Some apeoulativo. comment a on this,, theme will he found in the Bplloguo, 'hut befo'ré-•closing this' Cliapter ■ there aro • two further points .worthy" uf mèntion.
Oedema, ami Ago * , A. " - \-’ ■ ■' Xt will he recalled that in Chapter Sevan it
was shom% that oedema In AGM occurs significantly mord frequently in older children * A curious thing indeed! Xs this hecauae older children tend to hâve the disease - in.a more savoro -form? The results of the same study did not bring out this point $ Or is - oedema more easily recognised in oldcz' children?Again, an unlikely posaibility* ■ Or ooiild it bo- dite to. the increasing length of lienle ’ s 1 ocp with growth making for %%orc complete roabsorption of sodium? ' The matter gives foçcl for further thought but will ■..not bo pursued at .greater leragth here.
Therapeuti.o Xmpli cat ions‘ Acute glomezulonephrltia is in tZie main a
se1f-1Imiting-diaease# ' Xt has often been oonaiderod(2 2)

2 8 1
that the progxiosis bears a relationsZiip to the duration of the pre**diur©tio phase, and the earlier onset of clinresia in,, ohildhood cases may he relevant ; in this respect# Logically, treatment ahouiti primarily bo aimed at promoting early diurosis, the biggest problem being the total ignorance of %dmt really brings this about. The main standby of ti^eatment in the acuta phase, as all authorities are presently agreed, is rigid salt restriction, and tîio present résulta strongly support this vimfpoint * They would indeed :5uggest that the appropriate treatment for the condition is removal of large quantities of sodium thereby rendering the extracellular fluid more hypotonic and encouraging cellular rehydration* The alimentary tract proyides the obvious route for removal of salt, but lon^exclmtige resins available at present are relatively inefficient and liable to introduce additional electrolyte disturbances * In the small proportion of cases which progress rapidly'to complete anuria and in whom the mortality is at present almost 10G;C( 89, 22 ), cellular liydxmtion could conceivably be accomplished by the tecîmique of peritoneal dialysis

2 8 2
xmltis a solution with a hypotonic sodium .and chloridecontent*
Since patients presenting with ’heart^failure* nearly all reapend to conservative measures, one can hardly advocate more heroic treatment. The use of cardiac glycosides is time*"hononred, but since the heart is not abnormal it ia difficult to rationalise© their uee* The author has personally never boon oonvinoed that clinical impz'oycment could be ascribed to those drugs and feels that this treatment la inappropriate#. ' The even ' older measure of venesoption provides & more logical approach by whioîi to tide the patient over the acute phase*

2 8 3
SPECULATIVE EPILOGUE
IntPaooUtûar âehyàraMon mor a chance finding of scant
From this study of acute glGsrneruionepliriti©, let me pick out five features # Four of them areknown from the work of others or have been demonstratedhere, and the fifth le speculative# They are*
1 * Diminiahed glomerular filtration,2. Excessive sodium reahsorption,3* Intracellular dehydration*4, .Absent of minimal increase of ionic shifts
across cell membranes $3* Hox'mal seox'otion of aldosterone and by
inference I of renin.It appears to the aitthoi’ that AGN is px*obably
not the only condition to exhibit all or moat of theseparticular features. The most obvious parallel to be draifn may well be that of toxaemia of pregnancy, In this disorder diminished 0FR has been demonstrated (5 ),and the existence of typical glomerular lesions' (128) ia now well rocogniaod* Xntraoellular dehydration was shown by the studies of Plentl and Gray (l64) to be px esent although results in tlxis context ar*e not unanimous(129).

284
Finally, there is'-strong evidence' that „ hyperaldosteromism ( 9 ) and incx^eased see ret ion of renin aro not implioated( 24 ) and the former may indeed be present in smaller amounts than in normal pregnancy.
Oedema and hypertension'have a strong association'wit|mbo'th toxaemia-and acute glomerulonephritis. Xs a po0sibl0 connection somewhere to be fdmid within 'this pattern?
When we come ■ to'cons Icier - the enormous subject repreeontod by essential îiypertenéd.on'we are faced' % ith a problem of peculiar' complexity# ' In a vast literature there is. conflicting -evidence'over changes in body-water distribution, but on the whole the evidoneo ,,suggests changes to be minimal or -absent* The theory that in primary aodiitm retalniîig. states the . extracellular volume 'is-maintained at noiBmal levels ' only at the expense of a degree of ayatemlo -'hyporteiiBion ('18 ) only, underlines , if true, the problems, of obtaining proof from studiea . on aubjocte with- established hypex^tension* In AGN, %fe have seen that xfc are 'presented with an experimental model' of acute changes occurring within a very shox t ■ space of time and to such a'.gross degree that the alterations have been readily- détectable* .. .This

285
contrasts okàenly with the picture of extremely gradual change occurring In eaaentlal hypertension, Further, the concensus of opinion at present favours the view that hyperaldosteroniam Is absent (43 )# Xt la suggested that the occurrences of variables such as the gradual onset of congestive failure has hitherto clouded this problem { 43). The association between increased tissue sodium and hypertension is well recognised, and it has been suggested that intraoeilular ionic alterations could result in sustained contraction of the smooth muscle cells of artorioles ( 72)* Is it possible that ionic shifts arc in fact minimal, and that a degree of intracellular dehydration in tlio absence of Iiyperaldosteronism could foo the primary factor? This would only be liïçely to occu% if the retention of sodium postulated to occur ( 18) was hypertonic father than isotonic, but the extremely gradual nature of the changes provides a barrier to effective study.
There is a fascinating rider to this hypothesis. It has long been known that experimental animals develop hypertension on a salt«*loaded diet. In the rat, this has been shown by Meneely at al. (137) to result in an

2 8 6
increase of total exclmngeable sodium and, most interestingly in a slight rise of excliangeable potassium* TZieso Investigators found no evidence of a rise of intracellular sodium# An increase in the amount of Intracellular potassium would tend to increase the volume of j.utraoollular water* Xs it possible that one of the primary mammalian homeostatic mechanisms is a do fence of intrac ellular ïiydration?
One further flight of - fancy remains to be aired. Xt is well known that the extracellular concentrations of electrolytes prosont in the baby at birth are identical to that of the mother* For example, maternal hyponatraemia has been shown to bo associated with the oloctrolyto abnoiBnality in the baby and a distinctive clinical picture ( 4 )* Should hypertonic sodium retention in the mother prove to be a factor in the genesis of toxaemia, it would follow that the foetus would bo affoctod in the same way# This could suggest a causative factor in the high incidence of oedema occurring in infants born to oclamptics, a feature so far unexplained# It should bo stated that tho small number of experimental results available do not suggost the presence of a pattern of body water distribution

287
conalstent witîi such an idea ( 28 ). At the same time the range of normal values UBecI for oomparlBon has tended to be so wide that the matter must be considéra at present to be sub indice
, . It is a far cry from the transient aouto dyspnoeaof our patient A.G. to speoulatlon concerning the ultimate nature of a number of important dieoaaea. *The study of patients and their symptoms" wrote Hippocrates, "is the essential basis of all medical knowledge,"

288
1* Albeaux-Fernet, M. , and Romani, J.D., (1,962), Loboedemos, Masson et Ci©,, Paris, p,1?,
2, Albert, R,E,, Smith,¥,W, and Eichna, L#¥., (1935)* Hemodynamic changes associated v/itii fluid retention induced in noncardiac subjects by corticotrophin (ACTH) and cortisone^ comparison with the hemodynamic changes of congestive heart failure. Circulation, 12, lOAy,
3* Allen, T,H,, (l95l)* Extraction of T-1824 in the presence of gross hemolysis and li| amia, Proc,SoG, exp, Biol, N,Y,, 76, 143,
4, Altstatt, L,B,, (1963)* Transplacental hyponatremiain the newborn infant. J. Pediatrics, 66, 983.
3* Alvarez, H.R.de, (i960). The retention of sodiumand water in toxemia of pregnancy, ’Edema *(Ed, Moy er-Fuchs ) • ¥, B, S aunde rs Co, p, Z; '?.3 •
6, Ames, R,0,, (1933)* Urinary water excretion andneurohypophyseal function in full term and premature infants shortly after birth. PediatricsL J vV / 9
7» Anderson R.S* (194 2)> The use of radioactivephosphorus for determining erythrocyte volumes.Am, J, Physiol,, 137, 539.
8, Ann, iut, Med. (Editorial), (1963), Aldosterone secretion and various forms of hypertensive vascular disease, 39, 117.
9 , Barnes, A ,0,, (1960), Edema and electrolyte balance in pregnancy and the toxemias of pregnancy, ’Edema* (Bd, Moyer-Fuchs). ¥,B,Saunders Co, p.439*
10. Barnett, H,L, , Hare, IC, , McNamara, H. and Hare, H, ,(1948), Measurement of glomerular filtration ratein premature infants, J, din. Invest., 27# 691,

289
11. Bartter, F.C., (1963). Regulation of the volume and composition of extracellular and intracellular fluid. Ami, N.y. Acad. Sci., 110, 682.
12. Beckman, K., (I921), Oedem.Boutshe Arch, f. kiln. Med., 135» 39*
13* Bedwoll, O.A., Patterson, J. and Swalo, J., (1955)*The estimation of Evans Blue in plasma. J,olin.Path.,8, 61.
l4. Bertrand, A., (1955)# Blood volume determinationwith Goigy Blue according to Somogyi. Union mod.Canada, 84, 25.
15* Behold, A. von, (1857)* Untersuchungen ubor die Verteilung von Wasser, organiscZi© Materi© und anorganische Vorbindungeu im Tierreiohe. Ztsch. wi senscZi. Zool., 8, 487,
16. Black, D.A.XC., (I962), Renal Disease, Blackwell Scientific Publications, Oxford. p,S4,
17. Blackall, J, , (I8I3). Observations on tlie nature and cur© of dropsies, und paiticularly on the presence of the coagulable part of the blood in dropsical urine ; to which is added an Appendix, containing several cases of angina pectoris, with dissections etc, Longman, Hurst, Rees, Orm and Broim, London, p,86,
18. Borst, J.G.G, and Borst-de Geus, A,, (1963)* Hypertension explained by Starling’s theory of circulatory homeostasis* Lancet, 1, 677»
19. Bowler, R.G,, (1944), The determination of thiooyanato in blood scrum, Biochem, J,, 38, 385.
20. Bright, N.H. and Holliday, M.A ,, (196O).Response of newborns to water loads. A.M.A.J,Dis. Child,, 100, 574,
21. Briglit, R, i (I827). Reports of medical cases selectedwith a view of Illustrating the symptoms and cure ofdiseases by a reference to morbid anatomy. Longman, London, 1, 1,

2 9 0
2 2. Brocî, J. , (1949)* Acute diffuse glomex'tilonephritis• Am. J. Med., 7# 317.
23. Brodio, B.B.* Axelrod, J,, Soberman, R. andLevy# B., (1949)* The estimation of antipyrine in biological materials. J. Biol. Ghem.# 179, 25*
24. Bromi, J. J. , I)£tvi es , D.L# , Doak, F * B. , Love r, A . F. , Robertson, J.X.S. and Trust, P., (1965)»Plasma-renin concentration in hypertensive disease of pregnancy. Lancet, 2, 1219#
25. Chaplin, II., Jr. and Mollison, P.L., (l932). Correction for plasma trapped in the red cell column of the haematocrit* Blood, 7» 122?.
26. Cheek, D.B,, (1961). Extracellular volume;its structure and measurement, and the influence of ago and disease. J# Pediat. , 55B, 10.3.
27. Chiesura, P. , (1955) * Le variai^ioni dello protein©soriche in 001 so di glomorulonefritc acuta ecronioà. Studio elettroforetioo. Min. nefr.,8, 75,
28. Clapp, W.M., Butterfield, L.J, and 0’33rien, D. ,(1962). Body water compartmente in tho premature infant, with special reference to the effects of the respiratory distress syndrom© and of maternal diabetes and toxemia. Pediatrics, 29# 883.
29. Clark, A.G.L. and 0airdner,B., (i960) Postnatal plasma shift in premature infants. Arch. Dis.Ghildh. , 355, 332.
30. Conway, J. and Lauwers, P., (i960). Hemodynamicand hypotensive effects of long-term therapy withchlorothiazide. Circulation, 21, 21.
31. Cop©, C.L. and Pearson, J., (1963). Aldosteronesecretion in severe renal failure. Clin. Soi.,23» 331.
32. Corcoran, A.G., (196I). Pathologic Physiology (Ed. Sodeman)* 3rd. Bd., ¥.B, Saunders Co. p.843#

2 9 1
33* Cort, H.L* and PribyXova, H., (1964). Placental transfusion and fluid metabolism in tlie first day of life. Arch* Bis. Ghildh., 39» 363*
34. Gotlovo, E-., (1954)* Mechanism and extent of distribution of inulin and sucrose in chloride space of tissues. Am. J. Physiol., 176, 396.
35 * Crandal1, L.A , Jr., and Anders son, M.X ., (I9 34). Estimation of the state of hydration of the body by the amount of water available for tho solution of sodium thiooyanato. Am. J. digest* Die., 1,126,
36. Greveld, S. van, (l93^)* Diameter of red bloodcell© of premature infants and of those born at full term# A.M.A.J. Dis. Child,, 44, 7OI.
37* Orofton, J, and Truelove, L*, (1948), Apparent acute glomerulo-nophritis without albuminuria. Lanceti 2, 54.
38, Crook©, Â.C. and Morris, C.J.O., (194%)* Thedetermination of plasma volume by the Evans Blue method, J. Physiol., 101, 217*
39* Baosohner, C.¥., (196O). Factors involved intho pathogenesis of renal edema; the role of aldosterone and posterior pituitary antidiurotic hoz'mon©. ’Edema’ (Ed. Moyer-Fuchs). W.B. Saunders Go* p.516.
40. Dahl, L.K* and Schaokow, E., (1964). Effects of chronic salt ingestion: experimental hypertensionin the rat# Canad* mod# Ass. J., 90» 155*
41. Banowski, T.S., (1944). Use of thiourea as ameasure of change in body water. J* biol, Ghem.,152, 207.
42. David8son, D. and MacIntyre, X., (1956).Estimation of antipyrine in plasma. Biochem. J.,62, 37p *

292
43* Davis, J.O.# (1965)# Aldosteronism andhypertension. Progr. in oard. Dis., 8, 129#
44* Beane, H., Schreiner* G,E* and Robertson, J*S.,(1931)* The velocity of distribution of sucrose between plasma and interstitial fluid, with reference to the use of sucrose for tho measurement of extracellular fluid in man#J * din. Invest* , 30, 1463#
45* Deane, N,, %iff,M. and Smith, H*¥*, (l952).The distribution of body chloride in man.J* din. Invest*, 31, 200.
46. Doan, B F.A. and McOance,R*A., (1949). The renal response of infants and adults to the administration of hypertonic solutions of sodium chloride and urea. J# Physiol*, I09, 81.
47. DeFa îio, V#, Chris t enson, H* G., Began, T* J.,Baer, L.J., Morita, T. and Hellems, H.K.,(1959), Circulatory changes in acute glomerulonephritis. Circulation, 20, 190.
48. Domenet, J#0., Evans, D*¥,, and Howarth, F.H.,(1963). Clinical experience with radiological determination"of heart volume. Brit, Heart J.,25. 575*
49. Doxiadis, S.A, and Gaifdnor,D*, (1948),Estimation of extracellular fluid volume by the thiocyanate method in children mud adults.Clin. Soi*, 6, 257. , : .
50* Dreacher# ’ A*N., Barnett, H.L, and Troupkou,V.,(1962). Water balance in infants during water deprivation. A.M.A.J, Die. Child*, 104, 366,
31, Earle, B.P., Farber, S.J*, Alexander, J.D. andPellegrino, E.D., (l95l)# Renal function and electrolyte metabolism in acute glomerulonephritis.J, Clin. Invest., 30, 421 *
52# Earle, D.P,, (1963)* Textbook of Medicine(Cocil-Loob, 11th* Edition, Ed. Beéaon and McDermott) W.B. Saunders €0 , P.824.

293
53* Edelman, X.S., Loibman, J., O’Meara,M.P.and BirlcenfoXd, L.W., (1958). Interrelations between serum sodium concentration, serum osmolar!tÿ and total exchangeable sodium, total exchangeable potassium, and total body water. J. din. Invest., 37» 1236.
54. Edelman, I. S * , Olney, J. M. , Janies , A . H. ,Brooks, L. and Moore, F.D., (1952). Body compositionÎ studios in the human being by the dilution principle. Science, 115» 447*
55• Fdelraann, C.M.,Jr. and Barnett, H.L., (1960)Role of the kidney in water metabolism in young infants. J. Pediat., 56, 154.
56. Eichna, X .¥. , (i960). Circulatory congestion and heart failure. Circulation, 22, 864.
57* Eisenborg, S., (1959)* Blood volume inpatients with acute glomerulonephritis as determined by radioactive chromium tagged red colls. Amor. J. Med., 27, 241.
58. Elkinton, J.U. and Winkler, A.W., (1944).Transfers of intracellular potassium in experimental dehydration. J. din. Invest.,23, 93*
59* Ellis, A.¥.M*, (1936). Heart failure in acutenephritis. Quart. J. Mod./ 5» 533*
60. Ellis, A.W.M. , (1942). Natural hi atory of Bright’s, -disease. Lancet , 1,1.
61.' Ely, H.S. and Sutow, ¥.W., (l952). Growth of thiooyanato space in infancy and childhood. Pediatrics, 10, 115*
62. Fabre, J., (196I) * Oedema and its treatment, , Documenta Geigy3 Acta Olinica* p.lS.
63. Finberg, h* and Harrison, H.E., (1955)* Hypernatremia in infants. An evaluation of tho clinical and biochemical findings accompanying this state. Pediatrics, 16, 1.

294
64. Fink, C.W. and Choek, D.B., (196O). Thecorrected bromide space (extracellular volume) in the, newborn# Pediatrics, 26, 397*
65. Finley, S.O. and Hare, H.B., (1959)# BromideBpaoe in infants and children, A.M.A.J. Dis Child., 98,
66. Fisher, DiA., Pylo, H.H.Jr., Porter, J.O., Beard, A.G. and Panes, T .C. (1963). Control of water balance in the newborn. A.M.A.J.Dis. Child., 106, 137#
67. FIear, O.T.G. and Grampton, R.F., (i960). Evidence for the entry of chloride into cells in congestive cardiac failure. Clin. Soi.,19» 495.
68. Flexner, L*B., (1947). Estimation of extracellular and total body water in the newborn human infant with radioactive sodium and deuterium oxide. J. Pediat*, 30, 413.
69. Forbes, G.B., (1952). Chemical growth in man. Pediatrics, 9, 5B.
70. Freedman, B.J. and Pennington, D,G., (I963). Erythrocytosis in emphyaema. Brit. J. Haemat., 9, 425.
71. Freinkol, N., Schreiner, G.E# and Athens, J.¥♦, $953). SimultanooUs distribution of T-1B24 and %131 -labelled human serum albumin in man.J. olih. Invest., 32, 138.
72. Friedman, S.M. and Allardyoe, D.B., (I962). Sodium and tension in artery segment. Circulation Res., 11,
73# Fri i a -Bans oh, B.jp Holliday# H. , Stapleton,T.and Wallace, ¥.M., (1951)* Total body water in children* Pediatrics, 7$ 321.
74. Frii8-Hansen, B., (l957). Changes in body watercompaftrnenta during growtZi. Acta paedlat* (Suppl* 110), 46, 1 .

295
73 . Glbsosi, j.G. and*, and Bvans, ¥.A*Jr,, (l937)*Clinloal studies of the blood volume, 1;Clinical application of à method employing the Azo dye *»Evans Blue* and the spectrophotometer, j.din. Invest., lé, 301.
76. Gibson, J.O * 2nd., Feacock, ¥ * C., Seligman,A ,M. and Sack, T., (1946). Circulating red cell volume measured simultaneously by the radioactive iron and dye methods. J. din. invest.,23, 838.- -
77* Gibson, J.O*2nd. , .Seligman,A.M, Peacock, ¥.G.,Aug, J.C., Fine, J. and Evans, R.B., (1946).The distribution of red cells in large andminuté vessels of the normal dog, determined by radioactive isotopes of iron and iodine.J. din. invest., 25, 848,
78. Gilman, A., Philips, F,S. and Eodle, E.S.,(1946). The renal clearance of thiosulfate with observations on its volume of distribution#Am. J. Physiol., l46, 348.
79# Goodhart, J.F., (I679), On acute dilatation ofthe heart as a cause of death in scarlatinaldropsy. Guy’s Hosp. Reports (3rd, Series),24, 153*
80. Goodman, b.S, and Gilman, A., (1955)■ The pharmacological hasia of therapeutics. 2nd.Edition* Macmillan Co.
81. Gore, X. and Saphir, 0*, (1948). Myocarditis associated with acute and subacute glomerulonephritis. Amor* Heart. J., 36, 390.
82. Gregorsan# M.l. and Rawson, R«A., (1943). The disappearance of T-1824 and structurally related dyes from the blood stream* Am. J. Physiol.,
■ 138, 698 * \ ' ■
p.3. Gregorsen,M.X., (1944). Practical method for the determination of blood volume with dye T-1B24.J. Lab. êi clin. Med*, 29, - 1266.

296
84, Grogerséu, M.T* and Raws on, R,A$, (1959) • ' Blood volnmo# Physiol Rev*, 39, 30?.
85, Hahn, L., (1948). Apparent acuteflomerulonephritis without albuminuria letter). Lancet, 2, 120.86* Hanna, F., (i960). Total body water and its
distribution. A.M.A.d* Dis* Child., 100, 723.87. Hansen, J.D.L. and Smith, C.A., (l953). Effects
of withholding fluid in the immediate postnatal period. Pediatrics, 12, 99*
88. Harington, O.R. and Pohin, E.E., (l940). Asimplication of the Evans blue method of blood volume determination* Clin* Soi., 4, 3II*
89* Harrison, G#V,, Loughridge, L,¥* and Milne, M.D.,(1964). Acute oliguric renal failure in acute glomervilonephritis and polyarteritis nodosa.Quart # J, Med *, 33, 39*
90. Hartreft, P.M., Sutherland, L,É. and Hartreft, W .S,,(1964). Juxtaglomerular cells as the source of renin; further studies with the fluorescent antibody technique and the effect of passive transfer of antirenin. Canad* med. Ass. J.,90, 163*
91. Heller, B.X. and Jacobson, W.Bt, (1950). Renalhemodynamics in heart disease. Am, Heart J,,39, 188.
92. Heller, îU , (1949). Effects of dehydration onadult and newborn rats. J. Physiol., 108, 303*
93. Holler, H, and Zainis, E.J., (1949). Theantidiuretic and oxytocic hormones in the posterior pituitary glands of newborn infants and adults. J. Physiol*, I09, 162.
94. Helmer, O.M., (1965). The renin-angiotenain systemand its relation to hypertension. Progr* in card.Dis., 8, 117,

297
9 5 * Henry, J•P *, Gauor, 0.11, and Si ekor, H * 0•,^956). The effect of moderate changes in blood volume on left and right atrial pressures Circulation Rea,, 4, 91.
96. Hovasy, 0# and Hofor, B., (1934), Elimination of water from the himmn body. Nature, 134, 879.
97. Hobsloy, M, and Dew, E,D,, (1958). An extraction technique for the estimation of Evans blue in plasma. J* din. Path. , 11, 451.
98* Holzel, A, and Fawcitt, J,, (196O). Pulmonarychanges in acute glomerulonex:>hritis in childhood J Fedlat 57, 895.
99* Horan, H* (1950), Studies in anaemia of infancyand childhood. The haemoglobin, red cell count, and packed cell volitm© of normal English infants in the first year of life. Arch. Dis. Childh. ,25» 110*
100* Hurst, K.¥., Scheimii, F.R, and Vogel, W.C, ( 1952) *Simultaneous determination of total body water by antipyrina and deutoi^ium oxide ; evaluation of methods on ocdematous subjects* J* Lab* & din,Med,. 39, 36,
101. Hutchison, J.H., (1964)* Practical paediatric problems. Lloyd-Luke, London* P, 285*
102. ICmperato, C* and Landucci, L, , (1952) * Ricerche olettroforotlche nella glomorulo nofrite acuta del bambino. Boll. Soo* Ital* Spor*, 28, 6,
103. Inall, J.A* , BluWi, M,M*, Eerr, M*M,, Douglas, T.A* , Ho%)e, 0*8 * and Hut chi a on, J.H. , (1965) . Blood volume and haematoerit studies in resx>iratory distress syndrome of the newborn. Arch* Dis *Childh*, 40, 480*
104. Jarmtm, S,, (1939)* A Modified extraction method for determination of Evans blue* Scand* J. din.& Lab. Invest., 11, 332*

298
105* Jegior, Maclauriu, J.G, , Blaiikensbip, ¥. andLind, J *, (1964)* Comparatiyo study of blood volume Bstimation in the newborn infant using Xl31-labolled human eerum albumin (iHSA) and T-1824# Scandt J* elin* & Lab. Invest., l6, 125*
106, Ealtrelder, N.L., Menooly, G.R., Allen, J.R. and Bale, ¥,F,, (l$4l). Determination of the volume of the extracoilular fluid of the body with radioactive sodium. J. exper. Med., 74, 56?.
107. Earlberg, P* and Lind, J., (1955)• Dotermination of total haemoglobin and blood volume in normal children. Acta paediat., 44, 17#
108* Eassirer, J*P* and Schwarts-, ¥*B., (1961). Acute glomerulonephritis. New Engl. J. Mod., 265» 666*
109# Katoher, A*L*, Levitt, M.F., Sweet, A.T. and Hodes, H.L. (1953)' Alterations of fluid and electrolyte distribution and renal function in diarrhea of infancy. J. ciin. Invest., 32, 1013.
110* Keitel, H.G., Berman, H,, Jones, H. andHaoLachlan, E., (1955)* The chemical composition of normal human rod blood cells, including variability among centrifuged cells. Blood, 10, 370*
111. Keith, N.M., Rowntree, L.G. and Geraghty, J.T.,(1915), A method for the determination of plasma and blood volume, Arch, int. Mod., I6 , 54?.
112. Kirkpatrick, J.A* and Fleisher, D.S., (1964),The roentgen appearance of the chest in acute glomerulonephritis in children# J. Pediatrics,64, 492.
113* Kruhoffer, P., (1964). Xnulin as an indicator forthe extracellular space* Acta physiol Scand.,11$16.
Il4. LaDue, J.S., (1944), The role of congestivefailure in the production of the edema of acute glomerulonephritis. Ann. int* Med., 20, 405.
113. Landis, B.M., (1934)* Capillary pressure and permeability. Physiol* Rev., l4, 4o4.

299
1X6. Laviétes, P.H. , Bourdillon, J* and IClingîioffer, îl*Â., (1936). The volume of the extracellular fluids of the body* J* clln. Invest*, I5 » 261.
117. Leaf, A. and Mamhy^ A.R., (1952), Antidiuretic mechanism not regulated hy extracellular fluid tonicity. J. din, Inyest.# 31, 60,
118* Levinaky, N.G.j Davidson, D.G* and Berliner, R.W., (1959)* Effects of reduced glomerular filtration on urine concentration in the presence of antidiuretic hormone. J. din. Invest*, 38* 730.
119. Levy* I.J., (1930). The cardiac response in acute diffuse glomerulonephritis♦ Am* Heart J,, 5»277*
120. Lind, J., (1950)* Determinaticn of the roentgenological heart volume, Acta radiol.Suppl. 82, 1.
121. Levitan, R. and Xngdfingcr, F. J, , (1965). Effect of d-aldostorono on salt and water absorption from the Intact human colon. J* clin* Invest,,W, 801.
122. Lobban, M,C., (l?60). The eutrainmont of Circadian rhytïwns in man. Cold, 8pr. Harb, Symp, quant, 'Biol,, 25, 325* " '
123. Lowry, O.H, and Hastings, A*B,, (1942). Hiatoohemioal changes in ageing* Problems of Ageing (Ed, Cowdry* E.V.) Williams and Wilkins, Baltimore, p, 728*
124. Luotscher* J.A, Jr. and Axelrad, B.J., (1954). Increased aldosterone output during sodium depletion in normal man. Proc* Soc, exper,Biol* -& Med,-, 8?, 65O.
125* MacArthur* P,*(1946), The plasma volume in nephritis* Arch, Dis. Childh,, 21 * 235.
126. McOanoe* H.A. and Young* ¥.F,, (1941), Theaccretion of urine by newborn infants. J, Physiol,, 99, 265*

3 0 0
X27* McGaitce, R,A. and Widdowson, E.M. , (l95?).Hypertonic expansion of the extraceiltilar fluids, Acta paediat,, 46, 337#
128, McCartney, C,P, and Sparge, B,$ (i960). An evaluation of tho renal factors in the toxemias of pregnancy, ’Edema* (Ed. Moycr-Fuchs),¥,B. Saunders Co. p.433.
129. MacGillivray, X. and Buchanan, T ,J,, {195B).Total exchangeable sodium and potassium in non- pregnant women and in normal and pro-eclamptic pregnancy. Lancet, 2, 1090.
130, MaciCenzie, A. and Tindlc, J., (1959) * Determination of plasma-volume using intravenous iron doxtran. Lancet, 1, 333.
131. Maclaurin, J.C., (1966). Changes in body water distribution occurring during the first two weeks of life. Arch, Dia. Childh., in press,
132* Maegraith, B.G, and Leithoad, O.S., (1962),Radioisotopes in tropical medicine, Inteinational Atomic Energy Agency, Vienna, P. 184.
133. Maffly, H.H. and Leaf, A., (1938), Water activity of mammalian tissues, Nature, 182, 60.
134. Marshall, E.K. and Davis, D.M,, (l9l4). Urea, its distribution in and elimination from the body.J. biol. Chem., 18, 53*
133, Mondelsoïm, D. and Levin, N.W., (i960). Acolorimetric micro-method for the estimation of autipyriUG in plasma or serum. S. Afr. J. med.Sci., 23, 13.
136. Monoely, O.H., Aleobrook, W.L,, Merrill, J.M.,Balchum, O.J*, Welland, R.L. and Ball, C.O.T.,(1938). Metabolism of the major mineral elements of the animal body. Radiation Biology and Medicine (Ed. Claus, W#D.) Addison-Wcsiey Publishing Co. p.787.

301
137, Memo elyf G.E. , Lemloy-Ston©, J, and Hoy as el,R.M. , (i960). Factors \7hioli influence the amount and distribution of total body sodium and potassium. ’Edema* (Ed. Moyer-Fuchs).W.B, Saunders Go, .p. 14-5.
138, ■ Bier rill# j.P# , (1960), Mechanisms-of retentionof body fluids, ’Edema’ (Bd, Moyer-Fuchs)*¥,B, Saunders Go, p.156,_
139, Mills, J.H,, (1963). In Recent Advances in Physiology. 8th Edition, (Ed. Oroeae, E.)J, & A, Churchill Ltd, p,308.
140, - M.Olliaon, P, , Veale, N,-and Cutbush,. M,>(1950), Red cell and plasma volume in newborn infants. Arch, Dis'-, Childh., 25i 2h 2* . .
141, Morris, C.J.O,H., (1944). Ohromatographio determination of Evans blue in plasma - and serum, Diochem, J., 38, 203#
142, Moulton,, C*E#, ' (1923) * ''Age .and chemical development in mammals. J, biol, Chem,, 57» 79*
143, .Morse, M7, 'Cassels, D.E. and -8chults, ' F.If. ,(1947)• Available and interstitial fluid volumes of normal children. Am. J. Physiol., I5I, 438.
144, Mugrage, E.E, and Androsen, (1936). Valuesfor red blood cells of average infants and children A.M.A.J. Bis. Child*, 51, 775*
143* Muldownoy, F.B., (1957)• The relationship of total rod cell mass to lean body mass in man. Clin, Sci,,16, 163, ■ ■■
'l46, Muldowney, F.P, and WilliamsE,T., (1963),Clinical disturbances in serum sodium and potassium in relation to alteration in total exchangeable sodium, exchangeable potaesium and total body water. Am. J, Mod., 35, 7<S8.
147. Murphy, T.H. and Murphy, F.D#, (1954). The heart in acute glomerulonephritis. Ann. int. Mod., 4l,310.

3 0 2
148. Noifmam, B.V., Bordloy, J, and ¥internitz, J. , (1944), The interrelationship of glomerular filtration rate (mannitol clearance),, extracellular fluid volume, surface area of the body, and plasma c one entrât i on of mahnitol- Bull. Johns Hopkins Hosp,, 75, 253*
149. NicolopoulosI D.A. and Smith, G.A., (1961). Metabolic aspects of idiopathic reapiratory distress (hyaline membrane syndrome) in newbown infants. Podiatrioa, 28, 206.
150* Ôborg, B*, (1963)- Aspects on the reflex control of capillary filtration transfer between blood and interstitial fluid* Med* exp#, (Basel),9, 49.
151* O’Brien, D*, Hansen, J#D*L# and Smith, O.A*,(1954)*, Effect of supersaturated atmospheres on insensible water loss in the newborn infant* Pediatrics, 13, 126*
152* Olmstead, B*G*, (1963). Importance of theextracellular-intracellular water volume ratio ; in mammalian cell water exchange* Lifo Soi*, 10,745.
153# Osman, A.A** (1948), Apparent acuteglomeruloncphritis without albuminuria (letter)* Lancet, 2, 309»
154. Overman, R#% * , (1946), Pex'meability alterations in disease, J* Lab# & din* Med*, 31 II70*
155• Overman, H*R*, Etteldorf, J.H, Bass, A.C, and Horn , G ,B , , (l95l)* Plasma and erythrocyte chemistry of the normal infant from birth to two years of age* Pediatrics, 7, 565#
156, Pace, N# and Hathbun, B*H*, (1945)* Studies on body composition XIX# The body water and chemically combined nitrogen content in relation to fat content* J* biol* Chem,, I5S, 685*
157# Face, N,, Kline, L*, Schachtaan, H#K* andHarfenist, M* , (1947)# Studies 011 body water composition XV, Hse of radioactive hydrogen for measurement in vivo of total body water.J, biol. Chem,, 168, 459#

303
133. Painter, E.E., (lp4o), Total body water in thedog. Am. J. Physiol., 129, 7#.
159 * Parrish, A. E . , Bubonstein, N.H. and How©, J, S.,(1955)# Correlation between renal function and histology. Am, J. med. Soi., 229, 632.
160. Parry, E.H.O. and Tuckman,J., (196I). Dilution characteristics of Coomassi© blue in man. Brit, Heart J., 23, 150.
161. Paxton » Xf. T. ¥ *, (1935) . The red corpuscles inacidosis and alkalosis. Arch. Dis, Childh.,10, 115.
162. Peters, J.P., (l953)* Edema of acute nephritis,Am. J. Med., 14, 443.
163. Pitts, B.F., (1963). Physiology of the kidney and body fluids* Year Book Medical Publishers, Inc., Chicago. P.15.
164. Plentl, A.A. and Gray, M.J., (l959). Total body water, Sodium apace, and total exchangeable sodium in normal and toxemic pregnant women.Am* J. Obst. a Gynec., 73, 472*
165. Poiacek, E*, Voeel, J., Neugebauerova, L.,Sebkova, M, and Vechetova, E,, (I965). The osmotic concentrating ability in healthy infants and children* Arch. Dis. Childh., 4o, 291.
166* Poullain, P. and Piette, M,, (1948). Determination de la masse sanguine par la polyvinylpyrrolidone. Bull, Soc* Chem. Biol., 30, 496.
167. Prentice, T.G., Siri, ¥., Berlin, N.J., Hyde, G.M., Parsons, B.J., Joiner, E.B, and Lawrence, J.H,, (1952). Studies of total body water with tritiusn.J* olin. Invest*, 31, 412.
168. Prin%, ¥., (1961). Das Dlektrophoresebild def akuten Glomerulonephritis im Kindesalter. Z, Einderheilk*,86, 31.

304
169. Proger, S., (l94l). Acute hemorrhagic nephritis with "heart failure": presentation of case with hypothesis as to mechanism*Bull* New Engl, med* Centre, 3,108.
170. Pufanan, J., Barri, J. and Hallman, N*, (1957)*Titrimetric deteimiination of the water content of plasma and erythrocytes. Ann. Paed. Fenn., 3#58.
171. Rm%melkamp, G*H* Jr. and Wearer, R.S., (1953). Acute glomerulonephritis % the significance of the variations in the incidence of the disease.J,din. Invest*, 32, 345.
172. Rapp, J.P., (1964). Electrolyte and Juxtaglomerular changes in adrenal regeneration hypertension* Am* J* physiol., 206, 93#
173. Rapp, J*P*, (1964), Effect of an aldosterone antagonist on electrolytes and Juxtaglomerular granularity in adrenal regeneration hypertension.Endocrinology, 75# 326*
174. Eawsoh, H.A., (1943). The binding of T-1824 and structurally related diaaso dyes by the plasma proteins* Am* J* Physiol*, 138, 70S*
175# Hemerchik, A.P., Schoenberger, J.A* and Dyniewicm, J.M., (1958)* Change» in body water.compartments during the course of acute renal insufficiency and their relation to water and electrolyte excretion* Am. J. mod* Sci., 235, 189*
176* ROmin, E.M. and Pappenheimer, J.R., (1957).Masserdurchlassigkeit und Fermeabllitat dor Caplllarwande* Ergebn* Physiol., 49, 59#
177. Richards, D.W*Jr., (194g)* Dynamics of congestive heart failure. Am. J. Med., 6, 772.
178. Roberts, L.N., (1954)* Evans blue toxicity* Canad* med. Ass* J., 71, 489#

305
179# Hoscoe, M,H*, (1950). Biochemical and haematological changes in type 1 tmd type 2 nephritis. Quart. J. Med., 19, 161.
180. Hoscoe, M.H., (1964). Brine in acute and chronic renal failure. Brit. med. J., 1, 1084.
181. Rosenhaiim, J.D. and Lavietes, P.II,, (1939),Lipoid-thiocyanate in serum. J. biol. Chem., 131,663.
182. Ilosendal, Th., (1966). Radiography in infants with congenital heart disease, Ann. do Radiol., in press,
183# Rovner, D.R., Stroeten, Lotiis, L.H.,Stevenson, C.T, and Conn, J.¥,, (1963), Content and uptake of sodium and potassium in bone.Influence of adrenalectomy, aldosterone, desoxycorticosteron© and spironolactone. J.Clin. Endocr., 23, 93^#
184. Russell, s.J.H., (1949). Blood volume studies in healthy children. Arch. Dis. Childh., 24, 88.
185. Bayers, G. and Solomon, N,, (i960). Work performance of a rat heart-lung prejiarations standardisation and influence of corticosteroids. Endocrinology, 66, 719#
186. Scatchard, G. and Black, E.S., (1949). The effect of salts on the isoionic and isoelectric points of proteins. J. phys. & coll. Chem., 53, 88.
187. Scheinborg, X.H and Kowalski, E.J., (l950).Binding of thiocyanate to albumin in norraal human serum and defibrinated blood with reference to determination of the "thiocyanhte space". J. din. invest., 29, 475.
188. Schloorb, P.H., Friis-Hansen, B.J., Edelman, I.S., Solomon, A.K. and Moore, F.D., (l950). Tho measurement of total body water in the human subject by deuterium oxide dilution. With a consideration of the dynamics of deuterium distribution, J. din. Invest., 29, 1296.

3 0 6
189. Schwaftis, B#, Tonisovic, B.J, and Schwartz, X.L.,(1951)# Hyparpotaaaemla and body water distribution in an anuric child* Pediatrics, 7, 516.
190. Scientific Tables, (1962). 6th Edition, Documenta Géigy.
191. Scott, J.M., (1956). Intramus cular iron therapy in anaemia of pregnancy, Brit. med. J., 2, 635.
192. Scott, T., (1961). The edema of acute glomerulonephritis* J* Kent. M.A., 59, 967*
193# Simpson, A.M., Ezrow, L. and Bapirstein, L.A,, (1954). Measurement of plasma volume with rose bengal (tetraiodo-tetrabrom-fluorescene). Am.J. Physiol., 177, 319.
194. Bisson, T.H.C. and lihaien, L.E., (i960). The blood volume of infants, J. Pediat., 56, 43#
195# Sjostrand, T. » (1948). A method for thedetermination of the total haemoglobin content of the body. Acta Physiol Scand., I6 , 211.
196. Smith, C.A., Yudkin, S., Young, ¥,, Minkowski, A.and Cushman, M., (1949). AdjusW^^^^t of electrolytes and water following premature birth. Pediatrics, 3, 34.
197* Smith, C.A., (lp59)* The physiology of thenewborn infant. 3rd. Edition, Charles C. Thomas, Springfield. P. 139#
198. Smith, H.¥., (1951). The kidney. Oxford University Press, New York. P.493.
199. Smith, HiW*, (1957)# Salt and water volume receptors. Am. J. Med., 23, 625.
200. Small, H.W., (1958). Total body water and bromide space determinations in premature». A.M.A.J. Dis. Child., 96, 494.
201. Boberrîian, a., Brodie, B.B., Levy, B.B., Axelrod,J., Hollander, V. and Steele, J.M*, (1949). The use of antipyrine in the measurement of total body water in man, J. biol, Chem., 179, 31 *

307
aoa. Spach, c. and Streeten, b.H.P., (1964).Retardation of sodium exchange in dog erythrocytes hy physiological concentrations of aldosterone, in vitro* J, din* Invest,,43, 217.
203. Stead, E.A. Jr. and Warren, J.V., (1944). Theprotein content of the extracellular fluid in normal subjects after venous congestion and in patients with cardiac failure, anaemia and fever.J. Clin* Invest*, 23, 283*
204. Stead, B*A* Jr., Durhai*;, H,0* and Warren, J,V* ,(1948), Cardiac output in congestive heart failure* Am. Heart J,, 35, 529*
205. Steele, M,¥* , (1962), Plasma voluine changes in the neonate, A*M*A, J, Dis * Child., 103, 10*
206* Btorling, K* and Gray, S*J*, (l950)* Determination of the circulating red cell volume in man hy radioactive chromitmj, J, din* Invest*, 29,
' 1614*. ;207, Strauss, M*B, and Papper, S., (1959). Sodium and
water retention in chronic congestive heart failure, i* chron. Dis*, 9, 536.
208, Streeten, D*H*P* and Thorn, G.W., (1957). Use of changes in the mean corpuscular hemoglobin concentration as an index of erythrocyte hydration. J, Lab. & din* Med. , 49, 66I*
209* Streeten,- D.H.P,, Hirschowitz, B*I* » Henley, E*B, and Pollard, H.M., (l957)* Effects of adrenocortical steroids on the prapuleive ■ motility of small intestine* Am*- J* Physiol*, I89, 108.
210. Stréeten, É.H.P,, (i960)* Primary and secondary aldosteronism; definition and diagnosis* *Edema*(Ed. Mpyer-Eùchs)* W.B* Saunders Go# P.129*
2.11. StruBJia, M.M,, Sample, A.B* and Hart, E*D,, (1954).An improved micro-hematocrit method. Am* J, din.Path*, 24, 1016.

3 0 8
212. Sutherland, J.M., Oppe, T.E., Lucey, J.P. and Smith, C.À., (l959)^ Leg volume changes observed In hyaline membrane disease. A.M.A.J, Dis, Child., 98, 24.
213. Swann, R.Ç. and Merrill, J.P., (1953). The clinical course of acute renal failure. Medicine (Baltimore), 32, 215.
214. Textbook of Pediatrics, (1964). 6th Edition . Nelson, W.E.) W.B. Saunders Co. P.100?.e TobiaUf Lejr. and Biniohi J.T.# Tiaisua
bationa and water in arterial hypertension* Circulatiohi 5t 754.
216* Ueher, H* , Shephard* H* and Lind* J* * <1963) * The blood volume of the newborn infant and placental tranafuaion* Acta paediat* * 52* 497*
217* Varley* H#* (1962)* Practical clinicalbioohemiatry# 3rd* Edition* William Héinemann Ltd* PelBl*
218. Veall, H* and Vetter* H** (1958)* Hadioisotope technique» in clinical research and diagnosis* Butterworth, London* P*191*
>219* Verger, P. , Martin, C. and Gàroanadé, J*-P* (1964)* Les oedemes tardifs de» prematures*Arch, franc* Pediat*, 21, 44l*
220* Verney, E*B., (1947-8). Antidiuretic hommne and the factors which determine its release. Proo. Hoy* Soo. London B., 13.5, 25*
221* Walker, C*H*M* and Half, C.L*, (1954)*Oapillary resistance studies, 1* The newborn infant., J# Obst. & Gynaeo* Brit* Emp*, 6lj 1*
222* We\11, E*L* , (1958). T|if use of serws proteinelectrophoresis in clinical medicine * Arch* int* Med* » 102, 6l8*

309
222A. Wallace, G.B, aud Brodie, B.B., (1939). Thedistribution of administered bromide in comparison with bhioride and its relation to body fluid * J * Pharmacol« and exp * Therap.,63, ai4.2 2 3 # Wardener, H . E * do, ( I9 6 I ) # The kidney, 2nd.Edition* Jm & Ae Churchill Ltd* I\l67*224* Warren* J.V* and Stead, B.AeJr*, (1944)# The protein content of edema fluid in patients with acute glomerulonephritis* Am# J* med*Sci** 208,618*225* Watt, MeFe* Howe, J*S* and Parrish, A*B*, (1959).Renal tubular changes in acute glomerulonephritis *
Arch* int# Med#, 103, 690*2 2 6 * Welcher, H#, (1854)# Arch* d$ Vor, f, gemeinsoh, Arb# z* Ford* d# wissensch. Heilk* Got ting*, 1,
1 9 5 * Quoted by Gregefsen* M.X# and Rawson, E.Â., (1 9 5 9 )# Blood volume* Physiol# Rev*, 39, 3 0 7 .2 2 7 * Weils, ¥#C#, (1 8 1 2 )* On the presence of the redmatter and serum of blood in the urine of dropsy, which has not originated from scarlet fever. Tr. Boo* improve# med* 4 Ohir* Knowledge, 3 194* Quoted in $Giassic Descriptions of Disease,*
(Major, R*H*)* 3rd* Edition (1945)* Charles C* Thomas. P* 5 2 9 #
2 2 8 * Welt, L.G#, (1 9 6 4 ). Water balance in health anddisease* In ^Diseases of Metabolism* (Ed. Duncan, 0*0.) 4th* Edition, W*B* Saunders Go* P.190*" ■ '
2 2 9 . ,¥esson, J.R* jr., Anslow, ¥*P* and Smith, H*¥*,(1948)* Excrétion of stroaig electrolytes* Bull*\ :N*ir* Acadi Med*, 24,-'.386*2 3Ô* West, J.R., Smith, H*¥* and Ohasie, H*, (l94S).GlomeruiUr filtration rate, effective renal blood flow, and maximal tubulorexoretory capacity in infancy. J* Pediat *, 32, 10*

; 3 1 0
231. Whitehill, M.R., Longoope, ¥.T. and William», H.,(1939)* The oocurrenoe and significance of myocardial failure in acute hemorrhagic nephritis.Bull. Johns Hopkins Hosp*, 64, 83*
232. Widdas, ¥.F., (1963). Recent advances in physiology. 8th Edition (Bd. Qreese, E.) J. 4 A. Churchill Ltd*, P.23
233* Widdowson, E.M* and Spray, O.M., (l95l)* Chemical development in utero. Arch. Dis. Childh., 26, adg,
234. ,Wilson, J.0., (1961)* Pulmonary oedema in acute glomerulonephritis. Arch* Dis. Ohlldh., 36, 661.
235» Winkler, A.¥. , Blkinton, J.R. and Eisenman, A.J.,(1943)* Oomparison of sulfocyanate with radioactive chloride and spdium in the measurement of extracellular fluid* Am* J* Physiol*, 139, 239*
236. Woodbury, D*M. and Koch, A*, (1957)* Effects of aidesterone and dosoxycorticosterohe on tissue eleetrolytes* Proc. Soc. exp. Biol Med*,94, 720.
237. Tamaguchi, T., (1954). Method of estimating circulating blood volume (and effective renal blood flow) by sodim* p-amino-hippurate. Toha%m J. exper* Med*, 60, 209*
238* Ylppo, A., (1924)* Zum Bntstehungsmechanismu» der Blutungên bei Frwhgeburten and Neugeborenen. Eindefheilk.38, 32*
239* Youog. W.F., milum, J.L. and McGance, H.A,,(1941). The secretion of urine by premature infants. Arch. Dia. Ohildh*, I6 , 243.
240. gipf, E.E., Webber, J.M* and Grove, G/a*, (1955). Comparison of routine plasma volume determination methods using fadioiodinated human eerum albmain . and Evans blue dye* J* Lab* ,4 ciin* Med*, 45,. BOO.