10992070.pdf - Enlighten: Theses
186
https://theses.gla.ac.uk/ Theses Digitisation: https://www.gla.ac.uk/myglasgow/research/enlighten/theses/digitisation/ This is a digitised version of the original print thesis. Copyright and moral rights for this work are retained by the author A copy can be downloaded for personal non-commercial research or study, without prior permission or charge This work cannot be reproduced or quoted extensively from without first obtaining permission in writing from the author The content must not be changed in any way or sold commercially in any format or medium without the formal permission of the author When referring to this work, full bibliographic details including the author, title, awarding institution and date of the thesis must be given Enlighten: Theses https://theses.gla.ac.uk/ [email protected]
-
Upload
khangminh22 -
Category
Documents
-
view
3 -
download
0
Transcript of 10992070.pdf - Enlighten: Theses

https://theses.gla.ac.uk/
Theses Digitisation:
https://www.gla.ac.uk/myglasgow/research/enlighten/theses/digitisation/
This is a digitised version of the original print thesis.
Copyright and moral rights for this work are retained by the author
A copy can be downloaded for personal non-commercial research or study,
without prior permission or charge
This work cannot be reproduced or quoted extensively from without first
obtaining permission in writing from the author
The content must not be changed in any way or sold commercially in any
format or medium without the formal permission of the author
When referring to this work, full bibliographic details including the author,
title, awarding institution and date of the thesis must be given
Enlighten: Theses
https://theses.gla.ac.uk/

NUTRITIONAL IMPROVEMENT OF PALM KERNEL CAKE FOR POULTRY DIETS
MOHD. JAAFAR DAUDB.Sc. (Louisiana State University, USA)
M.Sc. (Mississippi State University, USA)
Thesis Submitted for theDegree of Doctor of Philosophy
December, 1992
Agriculture, Food and Environmental Chemistry Department of Chemistry University of Glasgow
Scotland, United Kingdom.
© Mohd. Jaafar, D., 1992.

ProQuest Number: 10992070
All rights reserved
INFORMATION TO ALL USERS The quality of this reproduction is dependent upon the quality of the copy submitted.
In the unlikely event that the author did not send a com p le te manuscript and there are missing pages, these will be noted. Also, if material had to be removed,
a note will indicate the deletion.
uestProQuest 10992070
Published by ProQuest LLC(2018). Copyright of the Dissertation is held by the Author.
All rights reserved.This work is protected against unauthorized copying under Title 17, United States C ode
Microform Edition © ProQuest LLC.
ProQuest LLC.789 East Eisenhower Parkway
P.O. Box 1346 Ann Arbor, Ml 48106- 1346

3T14-GT.un i v y Pi LIBRA k?

Dedicated to those who appreciate the true value of scientific endeavour in utilising fibrous materials as feed for monogastrics

ACKNOWLEDGEMENTS
Sincere appreciation is expressed to Dr M.C. Jarvis for his excellent guidances provided during the planning and execution of this study as well as the preparation of this manuscript.
Appreciation is also extended to the other supervisors, Dr W.K. Smith and Dr H.J. Duncan for all their valuable advice, help and encouragement.
I am grateful to the skilful assistance on various aspects of analysis from staffs and colleagues at MARDI, FRIM, The University of Glasgow, The Scottish Agricultural College, SERC SSNMR (Durham), The Commonwealth Mycological Institute (U.K.) and Institute of Animal Production and Grassland, Edinburgh Station, Roslin.
Gratitude is expressed to my parents and friends for their encouragement and support throughout my educational career.
The financial support of MARDI is gratefully acknowledged.
Gratitude is extended to my wife and children for their great patience and understanding over the many selfish times I have shown in completing this study.

SUMMARY
Palm kernel cake was chosen as a model in an endeavour to utilise Malaysian fibrous materials as poultry feed.
The approaches used were firstly by saccharifying the material before feeding, and secondly by exploring an alternative species capable of utilising pkc efficiently.
The major part of this effort was concentrated on the saccharification objective. This approach required the understanding of the composition and structure of the cell walls of the material.
13C NMR, both solution and solid state, and HPLC were used in characterising the cell wall of pkc. It was confirmed that the major components of pkc were mannan and cellulose to a lesser extent. These two polysaccharides represented 69% or 95% of the total cell wall or the total non-starch polysaccharide (NSP) respectively. The results of hydrolysis and HPLC revealed that mannan comprised 57.8% and cellulose 11.6% of the total cell wall. A small amount (3.7% of the total cell wall) of xylan was detected.
The mannan of pkc is hard and crystalline, with a degree of low substitution of galactosyl residues compared to the seed of galactomannans. As a result the mannan is
insoluble and resistant to enzymic degradation. Therefore it is not expected to be depolymerised in the digestive tract of the fowl.

The attempt to saccharify pkc was focussed on the breakdown of mannan. Selected treatments from the general classes: physical, chemical and biological were employed. Disaggregation of pkc by either heating or alkali treatment alone was not effective but it helped as a pretreatment for enzymic degradation.
Three batches of commercial enzymes were evaluated
for mannan degradation, by viscometry and pkc solubilisation. In the first batch (Olivex, Celluclast and SP 299) Olivex was the most active against galactomannan of guaran. In the second batch (Gamanase, Novozyme 234, Energex and Viscozyme 20L) Energex was the most efficient in solubilising pkc carbohydrate. Both Olivex and Energex were selected for larger scale treatments using the optimum degradation conditions. The products were evaluated by feeding to chicks in two separate feeding trials.
In the Olivex and Energex feeding experiment 20% of the soybean meal and maize components, respectively of the basal diet were substituted with pkc either treated or untreated. Chicks fed with diets containing pkc treated with either of the enzymes showed no improvement in terms of growth rate and feed efficiency over the untreated pkc diets. Their performance was significantly lower than on the control diets. This indicates that untreated pkc is
not capable of replacing either soybean meal or maize up to as much as 20%. The protein content of the diets was the limiting factor in replacing soybean with pkc and

energy (ME) in the case of substitution for maize. The adverse effect was more severe for soybean substitution.
The evaluation was extended to another commercial enzyme, Driselase. Driselase treatment of pkc improved carbohydrate solubilisation by 7%. A similar but nonsignificant improvement in the ME value determined on cockerels was shown.
The improvement in solubilisation indicates that the enzyme was capable of hydrolysing pkc carbohydrate. The non-significant improvement in the growth rate was possibly due to problems in absorption of mannose by the birds. Identification of the carbohydrates produced would be a way to test this hypothesis.
A fungus observed growing on rotting pkc was isolated and identified as Rhizopus oryzae. Enzymes from this fungus were extracted and evaluated. It produced substantial mannanase activity as assessed by solubilisation of pkc carbohydrate and viscosity reduction of guaran. It exhibited strong specificity in apparent induction by the mannan. It was shown to be an endo-enzyme. A small activity of B-mannosidase was also apparent at high concentrations of the enzyme preparation. The optimum reaction conditions were determined as pH 4.5 and temperature 20-30°C. The enzyme seemed to have potential for commercial application.
Geese were not superior to chickens in utilising pkc. The ME value of pkc determined on this species was only6.5 MJ kg"1, which was similar to that on chicken. A

similar approach for the enzymic improvement of pkc could be adopted for geese.

CONTENTS
PageTitle...............................................................i
Dedication........................................................ ii
Acknowledgements.................................................H i
Summary........................................................... iv
List of tables..................................................xiii
List of figures.................................................xvii
Abbreviations ................................................... xix
CHAPTER 1. INTRODUCTION1.1 Feed constraints............................ 11.2 Palm kernel cake............................ 31.2.1 Introduction................................ 31.2.2 General characteristics.....................51.3 Influence of fibre on digestion............ 71.4 Cell wall.................................. 101.4.1 Introduction............................... 101.4.2 Ultra structure and development........... 121.5 Chemical structure......................... 161.5.1 Cellulose.................................. 171.5.2 Mannan..................................... 181.6 Cell wall preparation and analysis........ 211.7 Absorption and metabolism................. 211.8 Treatment of raw materials to improve
their nutritional value................... 231.9 The objectives of the study............... 26
27
27
28
3032333536383839404243
45464747
4749505050
GENERAL METHODSColorimetric methods for carbohydrate Phenol-sulphuric acid method for neutral
sugars ...................................Modified m-hydroxdiphenyl for uronic
acids ....................................Viscometry ...............................Test for lignin by phloroglucinol .......Paper chromatography of sugars ..........Cell wall preparation ....................Detergent method .........................Phenol acetic acid .......................Hydrolysis of cell wall ..................HPLC......................................Fungal culture ...........................Iodine test for starch ...................Buffer ....................................
CHARACTERISATION OF PKCIntroduction .............................Materials and methods ....................Introduction .............................HPLC......................................NMR.......................................Solution-state NMR ......................Solid-state NMR .........................
Results ...................................
Hydrolysed sugar .........................

52545658
60
626262656669
717274747682
85868791
9394
Solution-state NMR .......................Solid-state NMR ..........................Discussion ...............................Conclusions ..............................
TREATMENTS TO IMPROVE THE NUTRITIVE VALUEIntroduction .............................Materials and methods ....................Substrate ................................Commercially prepared enzymes ............Enzyme evaluation ........................Enzyme characterisation ..................Enzymic degradation after pretreatments . . Optimum volume of mixtures for pkcdegradation ..............................Driselase experiments ....................Results ...................................Enzyme evaluation ........................Enzyme characterisation ..................Enzymic degradation after pretreatments . . Optimum volume of mixtures for pkcdegradation ..............................Driselase experiments ....................Discussion ...............................Conclusions ..............................
RHIZOPUS ORYZAE
Introduction .............................Materials and methods ....................

xi
5.2.1 Isolation.................................. 945.2.2 Culture and extraction.....................955.2.3 Evaluation................................. 955.2.4 Characterisation.............. 965.2.4.1 Type of action by the enzyme.............. 965.2.4.2 Optimum reaction conditions............... 985.3 Results.................................... 995.3.1 Evaluation................................. 995.3.2 Characterisation.......................... 1015.3.2.1 Type of action by the enzyme............. 1015. 3 .2 .2 Optimum reaction conditions.............. 1055.4 Discussion................................ 1095.5 Conclusions............................... 113
CHAPTER 6. FEEDING EXPERIMENTS6.1 Introduction.............................. 1146.2 Materials and methods.....................1156.2.1 Feeding trial on diet containing
pkc treated with Olivex.................. 1156.2.2 Feeding trial on diet containing
pkc treated with Energex................. 1256.2.3 ME value of pkc for geese................ 1286.2.4 ME values of pkc treated with Driselase
for poultry...............................1306.3 Results................................... 1326.3.1 Feeding trial on diet containing
pkc treated with Olivex.................. 1326.3.2 Feeding value on diet containing
pkc treated with Energex................. 133

xii
6.3.3 ME value of pkc for geese..................1346.3.4 ME value of pkc treated with Driselase for
adult cockerels.......................... 1346.4 Discussion................................ 1356.5 Conclusions............................... 139
CHAPTER 7. GENERAL DISCUSSION........................................... 140
REFERENCES148

Xlll
LIST OF TABLES
Page1.2 Characteristics of pkc from three
literature sources ...................... 51.4 all components............................... 162.10 Volume of each stock solution and
the molarities of acetate and phosphate ions for each pH level...................... 43
3.1 Quantities of neutral sugars detectedby HPLC as percentages of total cell wall . . 52
3.2 13C data for alkali-extractedgalactomannan in NaOH/D20 solution......... 54
3.3 Solid-state CP-MAS 13C NMR for crystallinemannans (Chemical shifts in ppm downfield from extended TMS: linewidths at half height)...................................... 56
4.2a Composition of treatment mixtures for pkcdegradation by Gamanase, Novozyme,Energex and Viscozyme....................... 66
4.2b Composition of treatments in pkcdegradation by Olivex with or withoutalkali pretreatment......................... 69
4.2c Volumes of acetic acid to neutralisethe aqueous mixtures to pH 5.0-5.5......... 70
4.2d Composition of the treatment mixtures fordifferent volumes used...................... 71
4.2e The volumes of the buffer and Energexfor the various treatments.................. 72
4.2f Composition of treatment mixtures for pkcdegradation by Driselase.................... 73
4.2g Composition of the treatment mixtures fordifferent volumes: pkc degradation by Driselase.................................... 74

xiv
4.3a Specific viscosity of galactomannan solutions incubated with Olivex,Celluclast and SP 299 enzymes at different concentrations measured at 10min intervals............................... 75
4.3b Soluble sugars from pkc degraded by theenzymes, expressed as % of pkc............. 76
4.3c Flow times for various galactomannanconcentrations.............................. 78
4.3d The flow time for galactomannan substrate at 2.0 mg cm”3 degraded by Olivex ofvarious concentrations...................... 79
4.3e Increase in soluble sugar produced abovewater controls from pkc of <0.15 mm and <0.2 mm particle sizes degraded by Olivex enzyme of several concentrationsfor 10 min and 20 h. (% of pkc)............. 82
4.3f Soluble sugar released from pkc with or without NaOH pretreatment incubated withOlivex enzyme overnight at 40°C............. 83
4.3g Monosaccharides and Oligosaccharides released by enzyme and NaOH, mg g”1of pkc....................................... 83
4.3h Soluble sugars produced from pkcdegraded by Olivex after heating at different temperatures and heatingperiods...................................... 84
4.3i Soluble sugars produced from pkcdegraded by Olivex after pretreatmentwith alkali at different concentrations .... 84
4.3j Soluble sugar produced from pkc degraded by Olivex at differentvolumes of mixture.......................... 85
4.3k Soluble sugars released from pkcpretreated with alkali and incubatedwith Energex in different volumes...........86
4.31 Soluble sugars produced from pkc degraded by Driselase at 40°C for 4 h and overnight........................... 86

XV
4.3m Soluble sugars produced from pkc degraded byDriselase of different volumes..............87
5.2a Volumes of the buffer and the enzymes at various concentrations used in theexperiment...................................98
5.3a Carbohydrate released from pkc incubated with dilute and concentrated enzyme preparations from potato dextrose andpkc media - Expressed as % of pkc...........99
5.3b Specific viscosity of galactomannan incubated at 40°C for 4 h with concentrated enzyme preparations from potato dextrose and pkc media and theircontrols....................................100
5.3c The specific viscosities and the s.v.ratio of guar galactomannan incubated with different concentrations of Rhizopusenzyme preparation at 40°C for 4 h .........103
5.3d The s.v. and s.v. ratios for galactomannanincubated with Rhizopus enzyme preparation at 40°C and 4 h at different pH levels .... 105
5.3e The specific viscosities and the ratio(s.v. treatments/s.v. control) of galactomannan substrate incubated with Rhizopus enzyme preparations at differenttemperatures for 4 h ........................107
6.2a Ingredients and chemical compositions ofcontrol chick starter diet (g kg”1) ...... 117
6.2b Percentage composition of experimentaldiets....................................... 118
6.2c Amount of available electrolytes and amount ofsalt to be added to each diet to standardisewith diet 1 in Olivex experiment..........119
6.2d Pattern of the treatment positions in theLSD......................................... 120
6.2e Formulation of chick starter diet ascontrol in Energex feeding experiment .... 126
6.2f Composition of the experimental diets (%) . 127

xvi
6.2g Layout of treatment positions in a 6x6latin square design........................ 127
6.2h Ingredients and chemical composition ofcontrol diet for mature geese.............. 129
6.3a Data on performance of chicks fed withexperimental diets in Olivex feeding trial 132
6.3b The performance of chicks, AMEn and crudeprotein as well as CP digestibility ofthe diets in Energex experiment............133
6.3c ME values of the diets and pkc on geese... 1346.3d Soluble sugars released from pkc treated
with Driselase as compared to that ofthe control (%).............................134
6.3e TME values of pkc treated with Driselaseand control (untreated) pkc ............... 135

xvu
LIST OF FIGURES
Page
1.1 Illustration of an oil palm fruit..............41.3 A realistic system for partioning
nutrients of food and feeds.................... 81.4 Illustration of the different layers in the
plant cell wall............................... 131.5a Structure of cellulose in representing
unit of cellobiose............................ 171.5b Structure of mannan with galactose branching. 20
1.7 Interrelations of fructose, galactose,glucose and mannose metabolism................23
2.2 Ostwald (1) and modified (2) viscometers 313.1 Chromatograms of neutral sugars
detected by HPLC.............................. 513.2 13C solution-state spectra from the
solubilised polysaccharides................... 533.3 Solid-state 13C NMR spectrum for
crystalline polysaccharides................... 554.3a Effect of pH on specific viscosity of
galactomannan degraded by Olivex, at2 min intervals for a period of 10 min....... 77
4.3b The enzymic activity of Olivex degrading galactomannan at different temperaturesand incubation periods........................ 80
4.3c The specific viscosity of galactomannan substrate degraded by Olivex at 0.0001

and 0.0005 mg cm”3 measured at 2 minintervals for a period of 10 m i n .............. 81
5.3a Paper chromatography showing mannoseand galactose released from pkc incubatedwith R. oryzae enzyme preparation............102
5.3b Effect of viscosity ratio of guargalactomannan incubated with different concentrations of R. oryzae enzymepreparation at 45°C for 2 h .................. 104
5.3c Effect of pH on enzyme activity asreflected by s.v. ratio of galactomannanincubated with R. oryzae at 40°C for 4 h . . . . 106
5.3d Effect of temperature on enzyme activity as reflected by s.v. ratio from galactomannan incubated with R . oryzae for 4 h at pH 4.5 . 108
5.4a Rhizopus stolonifer. Showing stolons, rhizoids, and sporangia of young andempty stage................................... 109
6.2a Experimental plots with 20 chicks inone of them................................... 121
6.2b Time schedule of the feeding trialactivities.................................... 122
6.2c Excreta collected in an aluminium tray...... 1236.2d Individual cages for the experiment with
geese......................................... 129

xix
ABBREVIATIONS
13C Carbon isotope 13ADG Average daily gainADP Adenosine diphosphateAME Apparent metabolisable energyATP Adenosine triphosphateBAW n-butanol-acetic acid-waterCP Crude proteinCP/MAS Cross polarisation and magic angle spinningd DayD2O Deuterium waterdl Daltondm DecimetreDNMRT Duncan's new multiple range testDP Degree of polymerisationEEL Endogenous energy lossFCR Feed conversion ratioG.C. Gas chromatographyGal GalactoseGalp GalactopyranosylGDP Guanosine diphosphateGE Gross energyGTP Guanosine triphospahteh HourHPLC High pressure liquid chromatographyi.d. Internal diameterkJ Kilo JouleLSD Latin square designM MolarityMan MannoseMARDI Malaysian Agricultural Research and
Development Institute ME Metabolisable energyMEn Metabolisable energy corrected for Endogenous
nitrogen MHz Mega HertzMJ Mega Joule

XX
ms milli secondNDF Neutral detergent fibreNFE Nitrogen free extractnm Nano metreNMR Nuclear magnetic resonancePAW Phenol acetic acid waterPC Paper chromatographyPDA Potato dextrose agarPkc Palm kernel cakePKCe Pkc treated with enzyme (Olivex)PKCNa+e pkc pretreated with alkali prior to enzyme
(Olivex) degradation PKCNa+Ed pkc pretreated with alkali followed by enzymic
(Energex) degradation PKCNa+Ei pkc pretreated with alkali and mixed enzyme
(Energex)Pkm Palm kernel mealppm Part per millionpsi Pound per square inchR, Rhizopusrpm Round per minutes.d. Standard deviations.v. Specific viscositySAS Scientific analysis systemSDS Sodium dodecyl sulphateTDN Total digestible nutrientTME True metabolisable energyTMS TetramethylsilaneTrt Treatmentts Flow time for solutiontw Flow time for water

CHAPTER 1INTRODUCTION
1.1 Feed constraints
The poultry industry in Malaysia has developed into a modern and highly competitive venture. This achievement is mainly attributed to the application of sophisticated knowledge of the nutrient requirements of commercial stocks and the nutrient content of feed ingredients as well as computer technology to formulate least cost diets for high levels of production.
Although Malaysia is efficient in poultry production and exports poultry products, it is almost totally dependent on imported feedstuffs. The high price paid to import feed ingredients has resulted in high costs of production. As a result the country is less competitive in the poultry world market. The importation of large quantities of grain for stock feeding has resulted in great loss of foreign exchange and this has become a major cause for concern to the Malaysian Government.
Attempts to produce home-grown feed crops, particularly maize and soybean, have not been fruitful. Under the current situation, the production of feed grain is technically feasible but not an economically attractive venture. For these reasons, other feed resources have to be considered.
Marked improvements in the growth and feed efficiency of poultry on diets supplemented with enzymes capable of

2
hydrolysing cereal endosperm cell walls have been reported (Jensen et al., 1957; Fry et al., 1958; Burnett, 1966;White et al., 1981; Boros et al., 1985; Pettersson andAman, 1989; Rotter et al., 1990; Pettersson et al., 1991;Gadient and Broz, 1992). This encouraging development prompted the author to concentrate on the large amount of fibrous by-products from Malaysian crops as a possible source of feed supply. Burt (1976) has proposed the development of methods of saccharification of fibrous wastes and the wider use of the products to contribute to the total pool of available carbohydrate.
The use of enzymes in poultry feeds has predominantly been related to the hydrolysis of fibre or non-starch polysaccharide fractions in the feed ingredients which cannot be digested by the endogenous enzyme secretions of poultry species (Classen and Bedford, 1991). In this connection, it is important to understand and appreciate the chemistry and biochemistry of fibre as well as themetabolism of its intended hydrolysed products.
In considering the various fibrous materials available, palm kernel cake (pkc) seemed to be the most convenient raw material in term of handling, storage and supply for nutritional improvement. Pkc was therefore initially selected for this endeavour.

3
1.2 Palm kernel cake
1.2.1 IntroductionPalm kernel cake is derived from the oil palm fruit.
An individual oil palm fruit is built up rather like a miniature coconut with soft outer skin (epicarp), a pulpy fibrous layer containing the palm oil (mesocarp), and an inner cell (endocarp) that encloses the kernel (endosperm). The endosperm, which makes up one-third to one-half the volume of the fruit, is a white cellular mass covered by a tough black membrane, the testa. A typical endosperm consists of 50% lipid, 9% crude protein, 5.5% 'cellulosic fibre and tissue', and 'digestible starches and sugar' (Crombie, 1956). The various components of the fruit are illustrated in Fig. 1.1.
The extraction of oil from palm kernel results in a heterogeneous residue. The residue is called either palm kernel cake (pkc) or palm kernel meal (pkm) depending on the oil extraction process. Pkc is a cake residue from expeller (press) extraction and pkm is a loose bran-like particulate material from the solvent extraction process. The residue is always contaminated with small amounts of shell fragments and the testa. Thus the composition of pkc does not purely reflect the kernel although that forms a major constituent of the by-product.

4
Fig. 1.1. Illustration of an oil palm fruit.

1.2.2 General Characteristics.General characteristics of pkc from several sources
(Yeong et al., 1981/ Anon., 1988/ INRA, 1987) are listedin Table 1.2. Typically pkc contains about 90% dry matter,20.4 MJ kg"^ gross energy, 16-19% crude protein and 0.8- 6.0% ether extract.
Table 1.2. Characteristics of PKC from three literature sources.
Characteristics 1 2 3Dry matter (%) 90.30 90.00 90.00Gross energy (Mj/kg) n.a. 20.40 16.92Crude protein (%) 16.10 19.00 18.50Ether extract(%) 0.80 6.00 1.70NFE(%) 63.50 52.00 54.80Fibre:(%)Crude fibre 15.70 13.00 15.00NDF n.a. n.a. 52.00ADF n.a. n.a. 31.70Ash:(%) 4.00 4.00 3.90Calcium .29 .25 .28Phosphorus .79 .40 .60Chloride n.a. 0.15 0.13Sodium n.a. 0.10 0.02Potassium n.a. 0.50 0.50Magnesium 0.27 0.25 0.35Iron (mg/kg) 4.05 200.00 n.a.
Trace elements mg/kc Cobalt n.a. 0.20 n.a.Manganese 225.00 220.00 n.a.Zinc 77.00 60.00 n.a.Copper 28.50 40.05 n.a.
1. Yeong et al., (1981) n.a. = not available2. Anon., (1988) 3. INRA, (1987)
Fibre content has been analysed by two methods, crude fibre by the Weende or proximate analysis method and neutral detergent and acid detergent fibre according to Van Soest (1982) . The crude fibre content of pkc ranges

6
from 13 to 15.7% while neutral detergent fibre (NDF) and acid detergent fibre (ADF) have been determined as 52 and 31.7% respectively. The fibre content of pkc may be influenced by the variety of the tree, the region in which it grows, and the method used in processing the fruits (Panigrahi and Powell, 1991). The values for ash content are quite consistent, about 4.0% for the three sources. The high content of phosphorus (0.40-0.79%) as compared to
calcium (0.25-0.29%) poses a calcium:phosphorus imbalance for large inclusion rates of pkc in animal rations (Daud and Hamali, 1987) . The presence of trace minerals are also included in the table.
It appears from the fibre data that the by-product is comprised mainly of cell wall. This is the component that is responsible for the low digestibility of pkc by poultry. Yeong (1985) reported that pkc had a ME value of6.2 MJ kg-1, whereas values of 11.7, 11.1 and 12.55 MJ kg"1 were reported by Nwokolo, et al. (1977); Onwudike (1986) and Ngoupayou (1984), respectively. In establishing the potential of pkc for inclusion in broiler chick diets, Panigrahi and Powell (1991) indicated that the material had approximately 8.35 MJ kg"1 ME. The ME value of pkc was considered very low compared to 15.0 and 13.7 MJ kg"1 for maize and wheat respectively by Bolton and Blair, (1977). In assessing this problem the cell wall will be examined in detail.

7
1.3 Influence of fibre on digestion
Large insoluble molecules in the feed must be broken down to simpler molecules before they can pass through the mucous membrane of the alimentary canal into the blood and lymph. For instance, polysaccharides are broken down into simple sugars, protein into amino acids, and lipids into free fatty acids. The breakdown process is termed 'digestion'. In this respect, the diet of farm animals which normally consists of plants and plant products, is seldom completely digested.
The digestibility of a feed is closely related to its chemical composition. The fibre fraction of a feed has the greatest influence on its digestibility, and both the amount and the chemical composition of the fibre are important (McDonald et al., 1988).
Among the various systems employed in characterising feed, the acid and neutral detergent fibre concept was introduced by Van Soest (1966) to replace the crude fibre method. It was found to be quite effective in distinguishing fractions of cell walls and cell contents. For forages of graminaceous origin Harris (1970) has illustrated the concept as it applies to ruminants as in Fig. 1.3 below.

8
CELL WALLS CELL CONTENTS
NON-NUTRITIVEMATTER
PARTIALLYNUTRITIVEMATTER
NUTRITIVEMATTER
LIGNIN and ACID
INSOL. ASHCELLULOSE HEMI
CELLULOSESOLUBLE CARBOHYDRATE, PROTEIN, ETHER EXTRACT, SOLUBLE ASH
Fig. 1.3. A realistic system for partioning nutrients of foods and feeds.
Plant materials are divided into cell walls and cell contents. The cell walls include partially nutritive matter and nonnutritive matter. The partially nutritive matter in grasses and cereals consists of cell wall carbohydrates, cellulose and hemicellulose, and is digested only by enzymes produced by microorganisms within the digestive tract. The nonnutritive matter includes lignin and acid insoluble ash which is mainly comprised of silica. These constituents have no known nutritive value for animals. For monogastric animals the whole cell walls are not digestible. Thus it is clear that digestibility of any feedstuff is influenced by the nature of its cell wall structure.
The cell contents include the nutritive matter that is digested by enzymes secreted by the digestive system, or is otherwise soluble enough for absorption. This includes soluble carbohydrate, protein, lipids (ether extract) and soluble ash.

9
Van Soest (1982) outlined an alternative approach to crude fibre by using residues from extraction with acid or neutral detergent solution for fibre analysis. Neutral detergent leaves * fibre* that often corresponds fairly closely to the total cell wall content of the material analysed; it gives low values for this in dicot crop materials, when the walls are richer in pectic substances. 'Acid detergent fibre1 is similar in composition to crude fibre, but retains all the lignin, part of the pectic substances and hemicelluloses. As such this method is suitable for a rapid method for forage analysis as was
intended by Van Soest and Wine (1967).PKC contains 52% neutral detergent fibre and 31.7%
acid detergent fibre with only 15% in crude fibre (INRA,1987) . Figures as widely different as these suggest that chemical methods of fibre determination do not work acceptably with pkc. The statement made by Dea and Morrison (1975) 'seeds of most members of the Palmae are known to contain mannans' suggests the presence of mannan in oil palm kernel. Mannan is present in the endosperm of other palms such as coconut (Monro et al., 1985), date (Jarvis, 1990) and ivory nut (Meier, 1958). In view of the high cell wall content and its low digestibility, it is pertinent to focus on the cell wall component in evaluating PKC. Knowledge about the cell wall, specifically its structure would aid one's ability to predict and alter its digestibility (Fry, 1988).
Digestion processes may be grouped into mechanical, biochemical and microbial. The main biochemical action is

10
brought about by enzymes secreted by the animal in the various digestive juices. Microbial digestion of food is brought about by enzymes released by protozoa and bacteria that live in the large intestine of monogastric animals and the rumen of ruminants.
To gain a better understanding of palm kernel characteristics in relation to its nutritive improvement, overall characterisation down to the molecular components with emphasis on the cell wall component is a necessity.
1.4 Cell wall
1.4.1 IntroductionIn plants almost every cell has a cell wall, lying
outside the plasmalemma. The cell wall of palm endosperm is relatively thick (Alang et al., 1988). Cell walls arepredominantly polysaccharide in nature, consisting of fibres in a gel-like matrix, often stiffened by deposition of lignin or silica (Bacon, 1988). The cell wall acts as a formidable barrier to the entry of digestive enzymes.
Many animal feeds are derived from plants and plant residues of which the dry matter is accounted for largely by cell wall polysaccharide. To exploit these resources, some means must be found to degrade them. By developing an association with various microbes that are capable of cell wall digestion, the herbivores alone have managed to use, to a certain extent, these abundant food resources provided by nature. The development of strategies for the utilisation of these resources is dependent on knowledge

11
of the cell wall structure and organisation, and how the structure relates to the behaviour of the wall during mechanical, chemical or biological processing.
Progress in cell wall research has been greatly facilitated by the substantial developments in methods of instrumental analysis that have occurred during the last decade. Plant tissues now can be examined in far greater detail and far more rapidly than was hitherto possible, often without the need for extraction or modification of the cell wall or its component polymers. Research on the structure and properties of plant cell walls has long made use of light and electron microscopy to describe and visualise plant tissues and their individual cells. However such investigations have been largely qualitative in nature.
Chemical techniques used to establish the composition and organisation of cell walls also have been considerably aided by developments in separation methods (high performance liquid chromatography (HPLC), capillary gas chromatography and their associated detection methods, particularly mass-spectrometry. However all such methods involve, at some stage, the disruption and fragmentation of the wall with a consequent loss of structural information. Developments in spectroscopic analysis, notably those based on solid-state nuclear magnetic resonance (NMR) spectroscopy, which allow the sample to be examined in its native state are beginning to supersede many of established chemical methods. In keeping with these

12
developments, both HPLC and NMR were employed in the structural studies in this project.
Although great advances have been made in the study of the structure and chemistry of plant cell walls from high fibre temperate cereal crops such as wheat, barley and rye (Fincher, 1975; Antoniou et al., 1981; M a n andNordkvist, 1983; Fincher et al., 1986), progress on tropical feedstuffs like palm kernel is lagging behind.
1.4.2 Ultra-Structure and DevelopmentThe plant wall comprises a series of layers. The
formation of the layers starts during cell division. During this stage the cell deposits its layers consecutively and it lays down further material between the plasma membrane and the earlier layers. Thus the first formed material is found at the point adjacent to the cell wall of the neighbouring cell, and the latest-formed layers are closest to the plasma membrane (Brett and Waldron, 1990) .
Three clear-cut, major layers can be identified in wood cell walls by electron microscopy and are illustrated in Fig. 1.4. The earliest-formed layer, found at the centre of the double wall formed by two adjacent cells, is called the middle lamella. It is often thickest at the cell corners.

13
M idd le lam ella
Primary wall 1 P)
Secondary wall
Inner layer (S j )
M r id le layer (S 2)
O u te r layer (S i)
Fig. 1.4. Illustration of the different layers in cell wall.
Once the cell plate is completed, the daughter cells proceed to deposit the next major layer, the primary cell wall. Some cell types have only a thin primary wall when mature whereas others may have additional wall layers. If the additional layers are deposited after cells have stopped enlarging, they are defined as secondary wall layers (Bacic et al., 1988). Wall layers are often referred to as secondary by morphological criteria alone; the time at which the cells cease to expand in relation to

14
wall deposition is often not determined (Schubert et al., 1973, cited by Bacic et al., 1988).
The overall composition of palm primary cell walls is suggested to be similar to that of the Gramineae (Bacic et al., 1988). The results of Turnham and Northcote (1982) are consistent with this hypothesis. They found that the undifferentiated callus culture of oil palm (Elaeis
guineensis) had cell walls similar to those of cultures of the Gramineae. The pectin content of primary cell walls of oil palm is low (Jarvis et al., 1988)
The secondary cell wall is variable in structure, both morphologically and chemically, and is indeed the most important diagnostic feature of some cell types. It is normally thicker than the primary cell wall, and may be laid down with varying thicknesses at different parts of the cell surface. The cells of cotyledons and endosperms in seeds of various species, usually made up of parenchyma, develop thick secondary walls with three distinct layers and these characteristic layers are different from those in the wood and elsewhere (Esau, 1977). These unusual walls are not lignified, unlike most other secondary cell walls,and they contain polysaccharides that are mobilised during germination and in many cases probably act as carbohydrate reserves (Bacic et al.,1988) . The major classes of polysaccharides in these walls are varied: mannans, galactomannans, glucomannan,heteroglucans (xyloglucans), galactans, heteroxylans and B-glucans (Meier and Reid, 1982; Monro et al., 1985; Reid, 1985; Halmer, 1985; Fincher and Stone, 1986). The polysac

15
charides in the cell wall of palm endosperm are mobilised during germination (Alang et al., 1988).
All cell wall layers consist of two phases, a microfibrillar phase and a matrix phase (Table 1.4). The microfibrillar phase (Brett and Waldron, 1990) is distinguishable from the matrix phase by its high degree of crystallinity and its relatively homogeneous chemical composition. This phase is readily visible in the electron microscope. The microfibrillar phase is normally made up of cellulose. Morikawa and Senda (1978) have shown orientation not only of cellulose but also of noncellulosic polysaccharides. Chanzy et al. (1982) have shown that glucomannan and cellulose may cocrystallise.
The non-crystalline phase of the cell wall is called the wall matrix and is comprised of noncellulosic polysaccharides. It appears relatively featureless in the electron microscope. During the deposition of the hydro- phobic filler, lignin, water in the wall is displaced. This enhances hydrogen bonding between polysaccharides both at the microfibrillar-matrix interface and between components of the matrix (Northcote, 1972).

16
Table 1.4. Wall components. (Brett and Waldron, 1990)
Phase Components
microfibriller matrix*
acid,
cellulose (151, 4-Glucan)pectins rhamnogalacturonan I
arabangalactanarabinogalactan I homogalacturonan rhamnogalactutonan
hemicelluloses xylanglucomannanmannangalactomannanglucuronomannanxyloglucancallose (151, 3-glucan)151, 3-, 151, 4-glucan arabinogalactan II
proteins extensinarabinogalactan-protein others, including enzymes
phenolics ligninferulic acid others, e.g. coumaric
truxillic acidNB Not all these matrix components are found in all cell walls.
1.5 Chemical structure
Cell walls consist largely of polysaccharide. Endosperms of Palmae are known to contain large proportions of mannan (Dea and Morrison, 1975) . Palm kernel is hypothesised to fall into this group. The second largest component is expected to be cellulose as it is normally present in matured cell walls. Thus it is appropriate to focus on these two polymers in any effort to improve the
degradation of the by-product for animal feed.
17
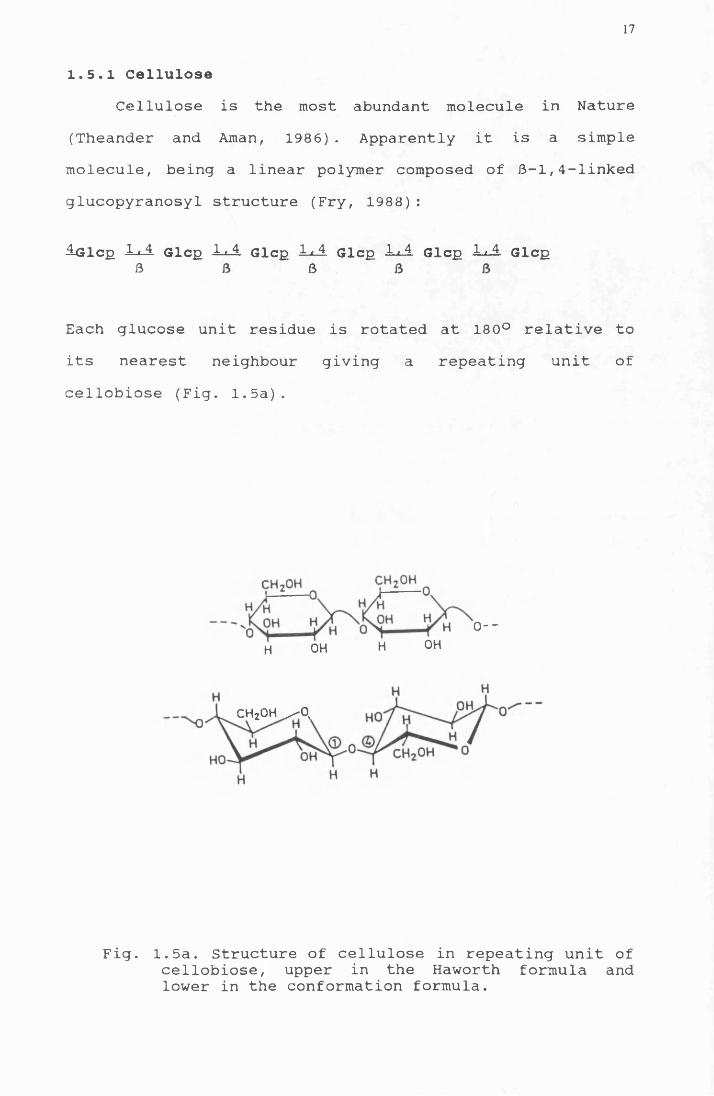
1.5.1 CelluloseCellulose is the most abundant molecule in Nature
(Theander and Aman, 1986). Apparently it is a simple molecule, being a linear polymer composed of 6-1,4-linked glucopyranosyl structure (Fry, 1988):
ilGlcp A A Glcp AA. Glcp AA Glcp AA Glcp A A Glcp
Each glucose unit residue is rotated at 180° relative to its nearest neighbour giving a repeating unit of cellobiose (Fig. 1.5a).
6 6
H OHo - -
H OH
c h 2oh1^-0,
Fig. 1.5a. Structure of cellulose in repeating unit of cellobiose, upper in the Haworth formula and lower in the conformation formula.
18
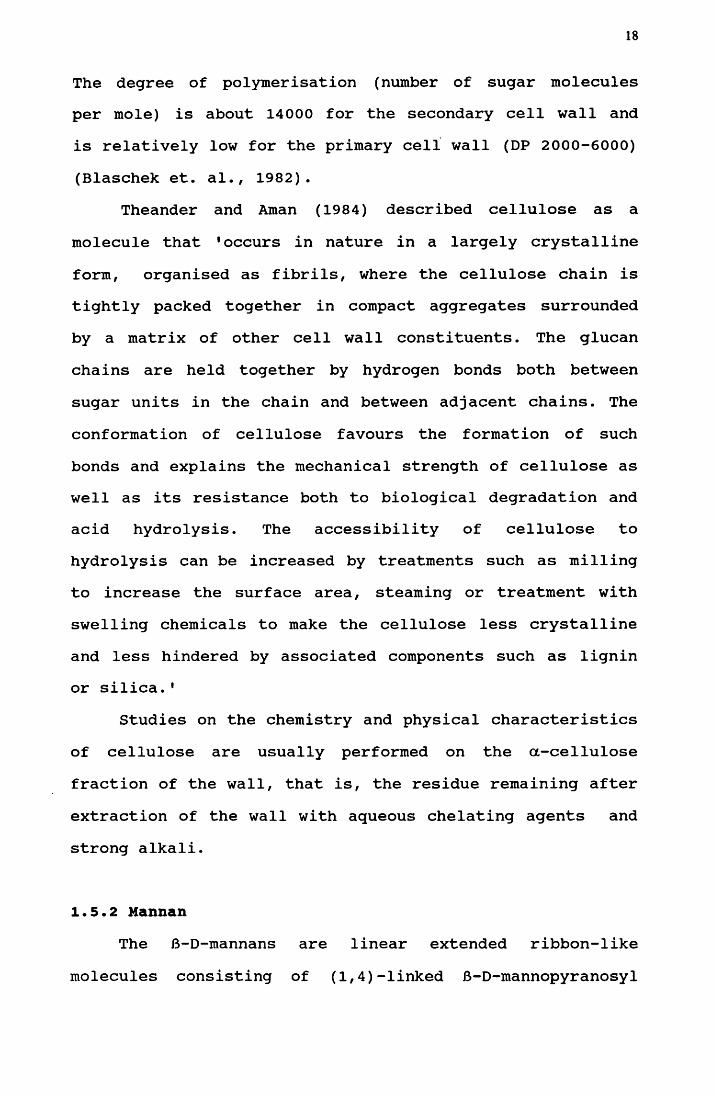
The degree of polymerisation (number of sugar molecules per mole) is about 14000 for the secondary cell wall and is relatively low for the primary cell wall (DP 2000-6000) (Blaschek et. al., 1982).
Theander and Aman (1984) described cellulose as a molecule that 'occurs in nature in a largely crystalline form, organised as fibrils, where the cellulose chain is tightly packed together in compact aggregates surrounded by a matrix of other cell wall constituents. The glucan chains are held together by hydrogen bonds both between sugar units in the chain and between adjacent chains. The conformation of cellulose favours the formation of such bonds and explains the mechanical strength of cellulose as well as its resistance both to biological degradation and acid hydrolysis. The accessibility of cellulose to hydrolysis can be increased by treatments such as milling to increase the surface area, steaming or treatment with swelling chemicals to make the cellulose less crystalline and less hindered by associated components such as lignin or silica.'
Studies on the chemistry and physical characteristics of cellulose are usually performed on the a-cellulose fraction of the wall, that is, the residue remaining after extraction of the wall with aqueous chelating agents and strong alkali.
1.5.2 HannanThe B-D-mannans are linear extended ribbon-like
molecules consisting of (1,4)-linked B-D-mannopyranosyl

19
residues. Several green and blue algae are reported to contain large proportion of B (1,4)-D-mannan in their cell walls (Painter, 1983; Mackie et al., 1985). Mannan molecular size differs, both within and between plants. For example, mannan A (alkali-soluble) from ivory nut has a DP of about 20 whereas mannan B (alkali-insoluble) has a DP of 80 (Meier, 1958)
In ivory nut walls, the mannan occurs as both an alkali-insoluble fibrillar component (mannan II) and alkali-soluble granular encrusting component (mannan I) (Chanzy et al., 1979, 1982, 1984). Like cellulose, the
mannan displays crystalline polymorphism and can undergo mannan I- mannan II transformations which are dependent on chain length (Chanzy et al., 1984). The mannan chain conformation closely resembles that of cellulose, although in contrast to cellulose, it does not have a precise 2- fold screw axis. It allows intramolecular hydrogen bonding (Nieduszynski and Marchessault, 1972).
In nature pure mannans are very rare. The polymers are almost always branched with galactose chains of variable length at an a (1,6) bond (Brett and Waldron, 1990). Aspinall (1959) distinguished mannans with more than 5% galactose residues as galactomannans. McCleary et al. (1976) deduced that, in an aqueous solution of the polymer, a-D-galactosyl stubs, when separated by no, or an even number of D-mannosyl residues, lie on opposite sides of the main chain, and that those separated by an odd number of D-mannosyl residues lie on the same side of the chain as illustrated in Fig. 1.5b. Galactopyranosyl

20
substitution of the mannan chain results in enhanced solubility. The solubility properties depend on the mannose:galactose ratios within the range 1.0 - 5.25.Solution properties also depend on the distribution of the galactopyranosyl substituents on the mannan backbone which is irregular to random (McCleary et al., 1981).
a -D-GalpIc h 2o
\
a-D-Galp
GalI-Man- -Man-
Gal
Man- -Man-
Gal
GalIMan- -Man— Man- -Man-I
Gal
Man-
Fig. 1.5b. Structure of mannan with galactose branching.

21
1.6 Cell wall preparation and analysis
To isolate relatively pure cell walls, Selvendran et al. (1984) suggested that every effort must be made to (i) avoid co-precipitation of intracellular compounds with the cell wall material, (ii) remove the starch and cytoplasmic
proteins quantitatively and (iii) minimise cell-wall enzyme activity as much as possible. Incomplete removal of starch and proteins would seriously interfere with subsequent fractionation and analysis of the cell-wall preparation.
There are several methods available for cell wall preparation specifically for structural studies (Jarvis et al., 1981; Selvendran et al. , 1987; Fry, 1988 and Brettand Waldron, 1990) . It seems that the most convenient method is the one outlined by Jarvis et al. (1981) . However, the low solubility of protein in pkc (Onuora and King, 1985) requires further deproteinising of the material by phenol acetic acid water, the method developed by Selvendran et al. (1985).
1.7 Absorption and metabolism
Assuming mannan is the main component in pkc, then the intended product of its degradation should be mannose. The usefulness of mannose in nutrition depends on its ability to be absorbed from the alimentary canal through
the mucous membrane into the blood and lymph.

22
Mannose is an isomer of glucose having a different configuration at the second carbon atom. Once mannose was considered to be passively transported through theintestinal mucosa (Bogner, 1961). Later studies have shown that at low concentrations mannose is actively transported (Shreeve, 1974).
The rate of absorption of mannose in young chicks is
much slower than glucose and galactose (Bogner, 1961). He added that the rate of absorption of various sugars in the young chick intestine is very much similar to that previously observed in mammalian gut.
'Once in the circulation, mannose is metabolisednearly as readily as glucose and is phosphorylated to mannose 6-phosphate by hexokinase. It is next converted to fructose 6-phosphate by a Zn2+ containing isomerase that is distinct from glucose phosphate isomerase. Mannose 6- phosphate can also be converted to mannose 1-phosphate. This is a very important reaction because the product reacts with GTP to form GDPmannose which is the substrate for transferases which form mannose containingglycoproteins and glycolipids. GDP mannose can also be converted to GDP fucose, another important biological carbohydrate. Mannose can be converted to liver glycogen although not as efficiently as glucose. Orallyadministered mannose does not result in a rise in blood glucose levels because it is slowly absorbed, and it is
not found in the general circulation by the liver. Mannose stimulates liver mannose metabolism' (Roehrig, 1984).

23
Apart from glucose, mannose together with fructose, galactose are considered as significant hexoses of animal metabolism (Beitz and Allen, 1984). The relationship of their metabolism to that of glucose is shown in Fig. 1.7.
ATP
Fructose-
Glucose
Fructose
-Phosphate
Glyceraldeh/de Dlhydroxyacetone ATP '•A Phosphate
ADP
Glycogen
Glucose-1-Phosphat
Clucose-6jPhospha te
Fructose-6-PhosphateI
Fructose-1,6-Dlphosphat
Galactose^-ATP
S aDPGalactose-l-Phospha te
Ur ldlne Diphospho- C1 ucose
Uridine D#phosphogalactose UT?
>-Phosphoglyceraldehyde \ Uridine Diphosphoglucose
Pyruvate ind Others
Hannose-6-Phosphate — ADP
^ ATP Mannose
Fig. 1.7. Interrelations of fructose, galactose, glucose and mannose metabolism
1.8 Treatment of raw materials to improve their nutritional value
The improvement of raw materials for poultry diets may be brought about by several different methods. Burt (1976) broadly classified the methods as follows:
1. Reduction in fibre content and hence improvementin energy value by dehulling or separation into high and low fibre fractions.
2. Increasing the availability of carbohydrate or protein by treatments which partially degrade them.

24
3. Neutralisation, reduction or removal of antinutritive factors or toxins which interfere with the utilisation of nutrients or limit the use of the food material.
Pkc is high in fibre and moderately high in protein (Panigrahi and Powell, 1991). Application of methods 1 and 3 may not be appropriate due to difficulties in removing the fibre and the absence of anti-nutritive factors. Therefore, no. 2 is the most suitable method for nutritive value improvement of pkc as a raw material for poultry diets.
The limiting factor in pkc utilisation is the low ME value associated with the inability of poultry to digest the fibre (Yeong, 1985). Therefore, it is appropriate to improve the nutritive value of the material by improving the digestibility of the fibre fraction. Saccharification of fibrous wastes to contribute to the total pool of available carbohydrate has been suggested by Burt (1976) .
Of late, the use of enzymes for saccharif ication of fibrous materials has been receiving much attention (Chesson, 1987; Classen and Bedford, 1991; Lyons, 1992). The fibre of pkc, if comprised of mannan and cellulose, might be converted to D-mannose and D-glucose respectively by enzymes produced by microbial cells, the cheapest 'chemical factory1 (Biely, 1985).
Polysaccharides can be converted to monosaccharides by acid or enzymic hydrolysis. Acid hydrolysis is faster, but is accompanied by the formation of toxic compounds

25
which can hinder subsequent microbial fermentations. The development of efficient processes of enzymic hydrolysis offers new prospects of treating polysaccharide byproducts such as pkc.
Basic knowledge about the mode of action and application of cell wall modifying or degrading enzymes in
the feed industry has been provided by fundamental research (McCleary 1986, Christensen 1989). However, their use for the treatment of fibrous materials, particularly pkc, has mainly been studied in terms of economic performance indicators such as growth effects and feed efficiency (Broz and Frigg 1986; Onwudike, 1986), and digestibility (Graham et al., 1988; Mes-Hartree et al., 1983; Ongbona et al., 1988; Nwokolo et al., 1977).
Detailed information on the cell wall composition of pkc and on the enzymatic reactions taking place therein is scarce. It is therefore difficult to define specifically the enzyme preparations needed for enhanced breakdown. As a result, attempts to improve the nutritive value of pkc have met with little success (Nwokolo et al., 1976; Suan et al., 1989; Daud and Jarvis, 1991).
Although mannan-degrading enzymes have not been studied extensively in the past, considerable amounts of information are now being accumulated (Reid, 1984, 1985; McCleary, 1988; Alang et al., 1988; Dusterhoft et al. , 1991, 1992; Daud and Jarvis, 1992). The rapid progress inbiochemical methods and equipment in the last decade has facilitated more information becoming available to satisfy the need for the establishment of effective mannan

26
degrading systems. In this connection, Low and Longland (1990) suggested that the way forward is to examine in detail the structures which are resistant to digestion and then to attempt to devise a specific enzyme or mixture of enzymes to hydrolyse them.
1.9 The objectives of the study
To improve the nutritive value of fibrous materials for poultry jdie't^ involves breaking down the fibre into simpler compounds absorbable through the gut into the animal circulatory system, eventually to be metabolised. Any attempt to degrade the fibre component of pkc requires a thorough knowledge and understanding of its carbohydrate composition and structure. Therefore the objectives of the projects described in this thesis were:
1) to characterise the pkc cell wall2) to explore suitable treatments for saccharification
of pkc3) to evaluate potential commercial enzymes for
hydrolysing pkc4) to carry out larger-scale pkc treatment with
selected enzymes and evaluate the product on poultry performance
5) to explore the potential of enzymes extracted from fungi isolated from rotting pkc in hydrolysing the by-product
6) to explore the potential of geese as a better alternative poultry species in utilising pkc.

CHAPTER 2 GENERAL METHODS
2.1 Colorimetric Methods for Carbohydrate2.1.1 Phenol-sulphuric method for neutral sugars (Dubois
et al. 1956)
Virtually all classes of carbohydrate react with this reagent to produce a stable colour. As a rule, separate calibration curves must be constructed for each carbohydrate. The method gives similar responses on a weight basis with galactose, arabinose and rhamnose, and about 5% less with glucose and xylose. Uronic acid gives about 40% of the responses of neutral sugars. The reaction conditions hydrolyse polysaccharides and other carbohydrate containing molecules very effectively, and the response from a polymer may be considered equal to that of its constituent monosaccharides (Nagasawa et al., 1971). The strong acid reagent reacts with all polysaccharide dusts and it is important to exclude the possibility of contaminating the solutions or apparatus with cellulose fibres from paper etc.
Reagents
Phenol. Reagent grade phenol (50 g) is dissolved in water and diluted to 1 dm^ to form a 5% solution.
Sulphuric acid. Concentrated, analar or micrograde reagent grade.

28
Determination
Blanks and standard solutions were carried through with each batch of unknowns. The aqueous sugar solution (0.2 cm^) containing up to 0.1 mg of carbohydrate was pipetted into a 22 mm diameter boiling tube, added to 1.0
o ocmJ 5% phenol solution and mixed. Then 5.0 cmJ H2SO4 wascarefully squirted in from a dispenser, directing it intothe centre of the tube so that the mixing was immediate.The heat of dilution raised the temperature to 140°C with
2s \much Effervescence. A yellow-brown colour developed \
immediately. The solution was allowed to cool for 30 minand transferred to a plastic cuvette immediately beforereading the absorbance at 485 run against a water blank. Areagent blank was included in each run.
A common problem was the development of bubblesinside the cuvettes. This resulted from leaving thesolution in them for more than 10 min or so, or fromtraces of water in them. Assuming a cuvette is to bereused, it should be washed with water like the boilingtubes, rinsed with ethanol and dried overnight upside-downon a piece of metal mesh. The cuvettes should not be leftto the next day before cleaning as they will absorb waterfrom the air and overflow.
2.1.2 Modified m-Hydroxydiphenyl for Uronic Acids(Blumenkrantz and Asboe-Hansen, 1973)
This method gives responses about 10% different for galacturonic and glucuronic acid, whether free or combined

29
in polymers. It is less subject to interference from neutral sugars than the carbazole method; galactose gives response about 0.1 that of galacturonic acid.
Reagents
Met a-Hydroxydiphenyl solution (m-phenylphenol). An0.15% solution of meta-hydroxydiphenyl in ethanol.
Sulphuric acid/sodium tetraborate solution. (0.0125M) . The Na2BO*7lOH20 (4.778 g) was stirred in ca. 900 cm^4of concentrated sulphuric acid until dissolved. The magnetic follower was removed and the volume was made up to 1000 cmJ with sulphuric acid.
Determination
The sample was diluted to contain up to 0.1 mg uronico .acid, with water to 1 cm , in a clean 22 mm boiling-tube.
Meta-Hydroxydiphenyl (0.2 cnr*) reagent was added giving a milky suspension. Borate-sulphuric acid (5.0 cm^) was carefully added from a dispenser, down the centre of the tube, which was swirled briefly. Again, the temperature rose to about 140°C with some efferversence. A red colour developed on standing for 30 min. The solution was then transferred to a dry cuvette as above and the absorbance measured at 525 nm. The absorbance reading was compared with a standard graph. The tubes and cuvettes are best washed and rinsed with ethanol as for the phenol-sulphuric method above.

30
2.2 Viscometry
'Viscosity is considered as the simplest and cheapest technique available for characterising macromolecules1 (Chang, 1981). It is defined as the internal friction of a liquid or other fluid, i.e., it is the resistance experienced by the molecules in moving around in the interior of a substance owing to intermolecular forces. In food analysis it is used in evaluating the desirable physical properties of pectin, gelatin, and natural gums, the moisture content of products like honey and the activity of certain enzymes (Joslyn, 1970).
Measurement of viscosity
The viscosity of fluids is commonly measured by determining the flow time of a measured volume of the fluid through a standardised capillary under a defined difference of pressure.
The principle of Ostwald viscometer (Fig. 2.2a) is described by Joslyn (1970). The time for a fixed volume of liquid to flow through a capillary tube is measured. With some modifications to the Ostwald design, a viscometer was constructed (Fig. 2.23) from two pasteur pipettes. The liquid was introduced into the open left arm a of the U- shaped viscometer and after the viscometer and contents had come to bath temperature, it was blown up into the left arm until it was completely below the lower level c.
oA fluid volume of 2.0 cmJ was used every time. The time

31
(2)Fig. 2.2. Ostwald (1) and modified (2) viscometers

32
taken for the liquid k to flow through the capillary cJb was then determined.
Swenson (1963) lists the following symbols used in viscometry:
Viscosity of solution it ^ t in secondsViscosity of solvent 0̂ — fo in secondsRelative viscosity rt/rjQ = t / t 9 = 7rSpecific viscosity (v - 770)/w - (t - f0)/fo = 7.PReduced viscosity ^ ̂ c — y ̂ y/ cIntrinsic viscosity ( - / c = ( ---— \ / c, =
\ t o / c - o / \ fo / c - o /
7 red
fo]
The efflux time, t and tQ, of solution and solvent, respectively, are expressed in seconds, and c is the concentration in g/100 cm^ (g dl”-1*) . The intrinsic viscosity, [ >7] , is expressed in dl g- .̂
2.3 Test for Lignin by Phloroglucinol
The method is a standard histological colour test for lignin (Scubert, 1965) and is purely qualitative. The reaction with phloroglucinol-HCl is believed to be due to
the presence of coniferyl aldehyde units in lignin (Freudenberg and Neish, 1968). There are certainly some lignin-like structures, phenolic esters for example, which do not react at all. During chlorite delignification the lignin loses its capacity to stain with the reagent quickly, when quite a high level can still be detected by other methods. But this of little importance because cell wall preparations tend to be either lignified, non- lignified or a mixture of both. The method was employed

33
only to determine the presence or absence of lignin in the PKC samples.Reagents
Phloroglucinol. (0.5% in ethanol)Hydrochloric acid. Analar
Procedure
About 0.05 mg of pkc cell wall sample was placed in a watch glass. Three drops of phloroglucinol were added followed by 3 drops of HC1. The change of colour was observed for 15 min. Lignified cell walls turned bright red after about one minute.
2.4 Paper chromatography of sugars
'Descending paper chromatography is still useful for applications in which flexibility and low cost are important1 (Jarvis and Duncan, 1974) . One of the main advantages of paper chromatography is the convenience of carrying out separations on sheets of chromatographic paper which serve as the medium for both separation and support.
Most authors consider the mechanism of separation of sugars on paper to be a partition process (Macek, 1963), although adsorption phenomena may be important in some cases (Hordis and Kowkabany, 1958). In partition, the compounds are partitioned between a largely water- immiscible organic solvent (e.g. n-butanol) and water. The classic solvent mixture, n-butanol-acetic acid-water

34
(4:1:5, top layer) (abbreviated as BAW) was modified to 12:3:5 to improve the separation of mono- or oligosaccharides from pkc hydrolysates.
Reagents
1. Butanol/acetic acid/water (12:3:5 v;v;v)2. Aniline oxalate. Aniline (4.5 cm^) and 6.3 g
oxalic acid were dissolved in water and 5 g trichloroacetic acid and 900 cm^ acetone added.
Preparation of standard_ QMannose and galactose standard solutions of 2 mg cm J
were prepared. Six cmJ of each solution was mixed with0.031 M and 0.039 M 4 cnr* citrate-phosphate buffersolution (pH 4.0), transferred into 25 cmJ pearbottom flask, evaporated to dryness on a rotary evaporator at 70°C and redissolved in 0.2 cm^ water followed by 1.0 cmJ ethanol.
Preparation of sample
The same procedure as for the standard was carriedout for a supernatant from selected pkc experiments ( 2 0 0
mg pkc m 1 0 cmJ volume of aqueous mixture) using a larger volume of supernatant (8 . 0 cm^) instead of 6 . 0 cm^.
Procedure
Whatman no. 1 chromatographic grade paper in sheets 23 by 60 cm was used. The bottom was serrated to prevent the flow of solvent to one side. The developing solvent,

35
butanol/acetic acid/P^O 12:3:5 by volume was poured into a chromatographic glass tank in advance to establish vapour phase equilibrium. Each sample and each sugar standard in ethanol was applied a few applications and the paper was dried in air for 1 h. The spot identifications were marked
with a pencil.The paper was then irrigated in a descending
direction. It took about 20 h to reach the bottom. The sheet was removed from the developing trough, air dried overnight, immersed rapidly and evenly through another trough containing the aniline oxalate reagent and driedfor 30 min in air without heating. The dipped and dried sheet was suspended vertically and heated in a circulating air oven at 90°C for 5 min. Yellow spots indicated the presence of sugar. The spots from the samples wereidentified by comparing with those of the standards.
2.5 Cell Wall Preparation.
The purpose of wall preparation in this study ismainly for structural analysis. Cell wall preparation involves removal of cell contents such as starch, protein, lipid, sugars and organic acids. Lipid is first removed prior to removal of other cell wall content by neutral detergent. Organic solvents such as dichloromethane or hexane are commonly used for lipid extraction by soaking a sample in the solvent for half an hour, filtered and collected the residue. The residue is then air dried over night. In order to facilitate the cell contents removal

36
pkc was ground and sieved through a 100 mesh (0.15 mm)screen.
The cell wall prepared was analysed for starch andprotein to check its purity. The starch content was not detectable but the protein content was not affected by the treatment. Thus for subsequent experiments the prepared cell wall was further treated with phenol acetic acid water to remove the protein component.
2.5.1 Detergent methodUsually, cell wall preparation is done at low
temperature to prevent degradation. For this purpose,sodium deoxycholate is normally used as it does notprecipitate out at temperature< close to zero as doessodium dodecyl sulphate (SDS). Since it was not required for the preparation to be conducted at such a lowtemperature, SDS was preferred because of its cheaper price and because it does not react with acetone during the washing out of the detergent.
Reagents
Sodium dodecyl sulphate or sodium lauryl sulphate.The chemical (5.0 g) is dissolved in 1 dm^ of water.
Dekalln or n-octanol
Acetone
Ethanol. Analar

37
Procedure
Defatted PKC (20 g) was mixed in 500 cm3 5.0 g dm”3 sodium dodecyl sulphate followed by a total of 0.5 cm3 dekalin. The aqueous mixture was homogenised in fourstages of 15 s and poured into a 150 mesh sieve to filterthe solid material. About 100 cm3 of the filtrate was collected in a 150 cm3 beaker. To the filtrate was added 300 cm3 analar ethanol to precipitate any starch molecules in the solution. The precipitate was collected by centrifugation at 480 rpm for 20 min. It was then dissolved in 100 cm3 of water after discarding the supernatant. The dissolved supernatant was analysed for free sugars by phenol sulphuric acid method.
The residue on the sieve was washed into a sinterfunnel with a conical flask connected to a suction hose at the bottom. Acetone was used to further wash the residue four times. The residue was then transferred into filter paper of known weight and dried in an oven at 110°C for 18 h. After cooling for 15 min in a dessicator the dried residue and the filter paper were reweighed and the net weight of the solid calculated. This value is the weight of the cell wall extracted from the sample.
The cell wall is checked for starch, protein and lignin. The protein content in PKC cell wall preparation was found to be quite high indicating the method is not effective in removing protein component of that material. For this reason, a strong method is required to remove the protein component from the prepared cell wall.

38
2.5.2 Phenol acetic acid water.Crystalline mannan may be a hindrance to the release
of cell contents such as protein. Therefore phenol acetic acid water (PAW), a efficient exractant, was employed to remove the protein content effectively.
Reagents
Phenol acetic acid water. 2:1:1 (w:v:v). Phenol (200g) is dissolved in 1 0 0 cm^ acetic acid and 1 0 0 cm^ water with continuous stirring for 4 h under room temperature.
Acetone
Procedure
The prepared cell wall above was ground with a vibrating hammer mill and sieved through a 52 mesh screen. The ground sample (ca. 1.0 g) was treated with 6.0 cnr* of PAW reagent for 24 h with continuous stirring. The solution was then filtered through a sintered funnel, no. 4 porosity, attached to a suction hose, followed by a few washings with acetone. The residue was collected on a watch glass and air-dried. The procedure gave cell walls with less protein.
2.6 Hydrolysis of cell wall
A sample of the prepared cell wall was hydrolysed to determine its monosaccharide composition. The Saeman hydrolysis method as described by Blakeney et al. (1984) was employed in the hydrolysis process.

39
Reagents
72% H2 SO4 (12 M) . Concentrated H 2 SO4 (652.6 cm^) ,ospecific gravity 1.84 is diluted to 1000 craJ .
Procedure
Plant cell wall (20 mg) was weighed into a Sovirelotube with ground glass stopper, added to 0.5 cmJ of 72%
H 2 SO4 and occasionally stirred with a round-ended glass rod for 1 h. Water (5.5 cm^) was added to the solution by introducing half of the volume first, which was stirred to dissolve and then the other half was used to wash the stirrer into the test-tube. This gave 1 M H 2 SO4 ̂ The tube was stoppered lightly and heated on a boiling water bath for 3 h to hydrolyse polysaccharides and remove sulphate groups.
The hydrolysate was allowed to cool down, centrifuged at 2,000 rpm for 15 min and the supernatant collected.
2.7 HPLC
High pressure liquid chromatography (HPLC) is a nondestructive method easy to use in the preparative mode on a small scale. Analysis of individual monosaccharides does not require the lengthy derivatisation into volatile alditol acetates normally used in gas liquid chromatography, as described by Sawardeker et al. (1965); Albersheimet al. (1967); Englyst et al. (1984).
40
Reagents
Acetone.
Procedure
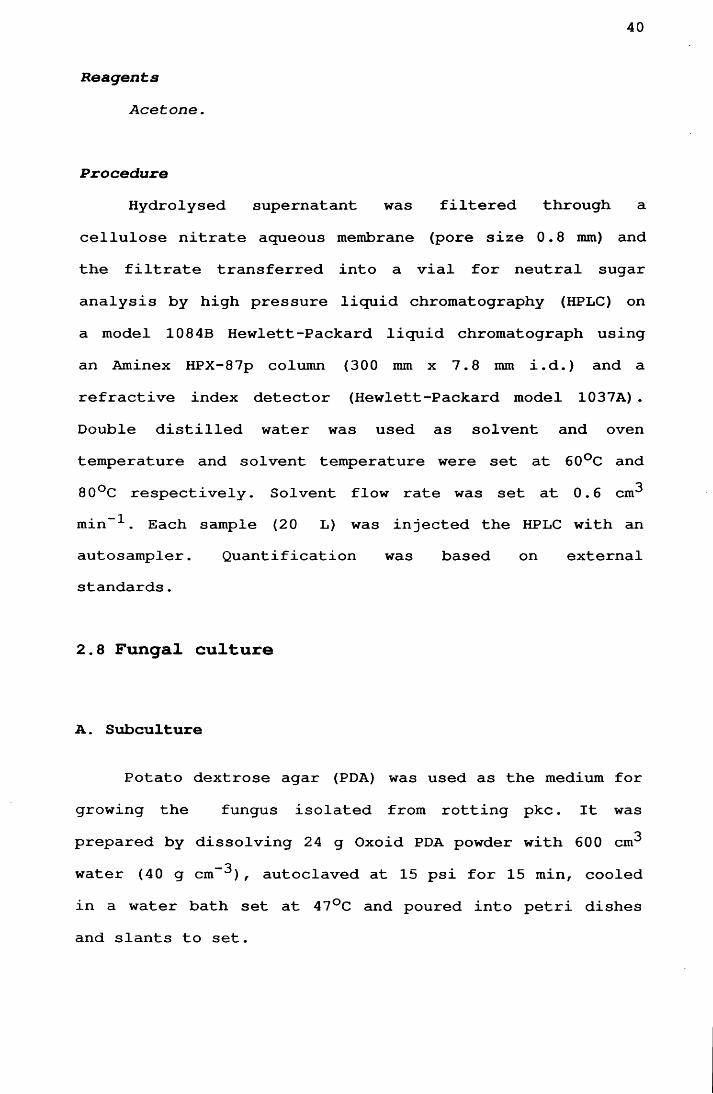
Hydrolysed supernatant was filtered through a cellulose nitrate aqueous membrane (pore size 0 . 8 mm) and the filtrate transferred into a vial for neutral sugar analysis by high pressure liquid chromatography (HPLC) on a model 1084B Hewlett-Packard liquid chromatograph using an Arainex HPX-87p column (300 mm x 7.8 mm i.d.) and a refractive index detector (Hewlett-Packard model 1037A) . Double distilled water was used as solvent and oven temperature and solvent temperature were set at 60°C and 80°C respectively. Solvent flow rate was set at 0.6 cm^ min-1. Each sample (20 L) was injected the HPLC with an autosampler. Quantification was based on external standards.
2.8 Fungal culture
A . Subculture
Potato dextrose agar (PDA) was used as the medium for growing the fungus isolated from rotting pkc. It was prepared by dissolving 24 g Oxoid PDA powder with 600 cm^
_ owater (40 g cm J), autoclaved at 15 psi for 15 min, cooled in a water bath set at 47°C and poured into petri dishes and slants to set.

41
The fungus was subcultured on both plates and slants by the water wash method. The cultures were incubated at 28°C for 7 d.
Two slants were sent to Commonwealth Mycological Institute, Kew, U.K. for genus and species confirmation.
B . Batch culturePotato dextrose and PKC media were prepared for batch
cultures.Potato dextrose was prepared by boiling sliced potato
— Ofor 1 / 2 h, filtering and making up to volume ( 2 0 0 g dm °). Glucose (20 g dm- )̂ was added to the boiling solution. The pH was brought from 6.2 to 6 . 8 by addition of NaOH solution as described by Assante et al. (1977). The mediawas poured into Roux bottles.
Pkc medium was prepared by thoroughly mixing 100 g batches of pkc with 300 cm^ water containing 0.2% casein hydrolysate and autoclaved at 15 psi for 15 min. Cultures were incubated on PKC medium and potato dextrose medium for 7 and 12 d respectively at 28°C. Culture filtrates were collected at 4°C by diluting each culture with water
oto 450 cm , crushing with a spatula to form a homogeneous mixture and separating from the solid substrate and mycelium by squeezing through muslin. The liquid was then filtered through a no. 3 porosity sinter funnel under suction with the help of a small amount of Celite-535. A portion of the filtrate from each of the cultures was treated with 64 g (NH^) 2 SO4 /IOO cm^ of the filtrate to precipitate the enzymes and centrifuged. Most of the

42
supernatant was removed and the saturated residue, about 30OcmJ or 1 0 % of the the volume of original culture filtrate,
was homogenised. Both the culture filtrate and the ammonium sulphate precipitates were stored at 4°C for evaluation.
2.9 Iodine Test for Starch (Arthur, 1962)
This method gives starch sample a deep blue colouration with a dilute solution of iodine in potassium iodide solution, temporarily decolourised by heat or by traces of free alkali, but restored on cooling or upon acidifying.
Reagents
(a) 0.1% iodine. (I2)(b) 0.2% potassium iodide.
(c) Dilute Iodine solution in Potassium Iodide. Equal volumes of (a) and (b) are combined.
ProcedureoThe pkc sample (100 mg) was added to 20 cmJ water in
100 cmJ beaker and boiled for 20 min. The supernatant (1.03 ocmJ) was added to 1 . 0 cmJ dilute iodine solution in
potassium iodide. The lack of deep blue colouration indicated the absence of starch.

43
2.10 B u f f e r
The buffer used in enzyme studies was the citrate- phosphate buffer devised by Mcllvaine (1921) and redetermined by Gomori (1955) . It was prepared by mixing the following two stock solutions.
Stock solutions
A. 0.1 M solution of citric acid (19.21 g in 1000 cm^)
B. 0.2 M solution of dibasic sodium phosphate (53.65 g of Na2HPO4 .7H20 or 71.7 g of Na2HPC>4 .12H20 in 1000 cm^) x cm^ of A + y cm^ of B (Table 2.10), diluted to a total of 100 cm^.
Table 2.10. Volume of each stock solution and the molarities of acetate and phosphate ions for each pH level.
X y PHRequired
Molarity Acetate Phosphate
44.6 5.4 2.6 0.045 0.01139.8 10.2 3.0 0.040 0.02030.7 19.3 4.0 0.031 0.03924.3 25.7 5.0 0.024 0.05117.9 32.1 6.0 0.018 0.0646.5 43.6 7.0 0.007 0.087
The table works at the assumption that thetemperature is at 23°C. This assumption holds true within
0.12 pH unit even at 37°C and at molarities slightly different from those given (Gomori, 1955). The molarities of citrate and phosphate ions for each level were calculated by the folowing formula:

44
Volume (either x or x + y) x Stock Solution’s MM = -------------------------------------------------
Final Volume of Solution

CHAPTER 3
CHARACTERISATION OF PKC
3.1 INTRODUCTION
Until recently, most reports on the fibre content of feeds have been expressed in terms of crude fibre as determined by the proximate analysis procedure. Pkc contains between 13.0 to 15.7% crude fibre (Anon., 1988; INRA, 1987; Yeong et al., 1981). These values may not reflect the actual cell wall content of pkc. The procedure has been severely criticised by many nutritionists as imprecise in quantifying plant cell walls (Van Soest, 196 6). For this reason, neutral detergent fibre (NDF) and acid detergent fibre (ADF) have been used to determine 'cell wall1 and 'cellulose' content. NDF and ADF values of pkc were reported by INRA (1988) as 52% and 31.7%. If taken at face value, these values would indicate a high hemicellulose content in the material. However, the method is not robust enough to estimate the cell wall content of chemically unusual materials.
Using a more appropriate cell wall preparation method, Alang et al., (1988) determined the monosaccharide composition of pkc cell wall by the alditol acetate method. Their results suggested that the 'non-starch' component of pkc \was^ comprised V>f' galactomannan as in other palm species. However, their separation procedure by gas liquid chromatography was not satisfactory due to the apparently unsuccessful reduction of monosaccharides to

46
alditols. Although the identification of the monosaccharide residues in pkc cell wall may be assumed to correct, the identification and quantification of the individual polysaccharides require further investigation. In carrying out this study, high pressure liquid chromatography (HPLC) and nuclear magnetic resonance (NMR) were employed. At the same time as this work was in progress, Dusterhoft, Voragen and coworkers at Wageningen, The Netherlands were also involved in characterising pkc using GLC in identifying neutral sugars from hydrolysed pkc cell wall as alditol acetates, and methylation analysis to characterise the polysaccharide linkages. The results from their study (Dusterhoft, et al. , 1991 and 1992) and thisstudy (Daud and Jarvis, 1992) were published almost simultaneously.
3.2 MATERIALS AND METHODS
It is necessary to be certain of the information on polysaccharides of pkc before any degradation experiment can be conducted effectively, to fulfil/ the core objective of this project. For this purpose experiments were conducted employing three different procedures; high pressure liquid chromatography (HPLC) of the sugars after hydrolysis, alkali extraction and solution-state NMR, and solid-state NMR to determine the chemical composition and structure of pkc's cell wall polysaccharides.

47/
3.2.1 Cell wall preparation jPkc cell wall was prepared by the neutral detergent: '
method and purified further by deproteinising with PAW. These methods were outlined in Chap. 2. Tests for lignin using the phloroglucinol method and starch by the iodine test showed negative results. Thus 1non-starch polysaccharide1 is equivalent to the cell wall as prepared.
3.2.2. Acid hydrolysisHydrolysis by sulphuric acid to split polysaccharides
into individual monosaccharides was utilised in this study to quantify the different monosaccharides in pkc nonstarch polysaccharides. The information complements the results from NMR in confirming the types of polysaccharides present in the sample.
Prepared pkc cell wall was hydrolysed using the Saeman method outlined in chapter 2. The supernatant from the hydrolysate was analysed for free sugars by HPLC using the method described in the same chapter.
3.2.3 NMRi3Carbon NMR has been proven to be a powerful tool in
studies on biopolymers (James, 1975; Williams and Fleming, 1989) yielding information on their composition, sequence and conformation. Solution-state 13C has become a tool in the structural determination of polysaccharides (Perlin et al., 1972) using natural abundance 13C atoms and the Fourier transform mode. An outline of the major methodology in the use of 13C nmr in determining the

48
structure of polysaccharides is given by Jennings and Smith (1980). The interpretation of the 13C NMR spectra of polysaccharides is to a large extent based on the correlation of the chemical shifts of individual carbon atoms of the polysaccharide with those of their previously assigned monosaccharide and oligosaccharide constituents (Bock et al., 1984). Thus the assignments of the signals of the polysaccharides depend on the accuracy of those
previously made on the oligosaccharides. The technique for both solution state and solid-state NMR is non-destructive and can be used on small amounts of material. Therefore NMR has great potential for usage in the study of polysaccharides of biological origin (Gorin, 1975; Hammer and Perlin, 1976; Bhattracharjee et al., 1976).
Spectra from solid polymeric materials with a resolution comparable to or approaching that of the solution state can now be obtained by solid state NMR (Fyfe et al. , 1983). The success of this newer and muchless common technique depends on the physical nature of the solid and the application of related techniques known as magic-angle spinning (MAS), cross-polarisation (CP) , and high-power proton decoupling. Pines et al. (1973) introduced the CP technique to increase the signal to noise ratio of the dilute 13c nucleus which is observed after spin locking the proton and carbon spins for a contact time. Later, a combined CP and MAS experiment first introduced by Schaefer and Stejskal (1976) has been largely responsible for a resurgence of interest in solid- state NMR by chemists. The effects of different parts of

49
the experiment combine to yield the final medium resolution average spectrum. CP-MAS solid state 13C NMR spectra are similar to spectra obtained in the solution state, apart from lower resolution, but assignment of resonances for the solid state solely on the basis of solution spectra is not recommended (Jarvis, 1990a) due to possible conformational (Pease et al., 1981) and packing effects (Terao, et al., 1983). Among the first biological materials to which CP-MAS 13C NMR was applied were intact seeds (Schaefer and Stejskal, 1975; O'Donnell et al., 1981). Solid-state 13C NMR is non-invasive and thus allows direct observation of polysaccharides in intact plant tissues (Jarvis, 1990a, 90b; Jarvis and Apperley, 19 90) .
In this study, spectral assignments were based on published solution-state spectra of galactomannan (Grasdalen and Painter, 1980; Bociek et al., 1981; Manzi et al., 1984) and solid-state spectrum of date mannan (Jarvis, 1990d).
Solution-state NMR
Soluble polysaccharides were extracted in a very small volume of deuterated alkali to allow direct recording of the spectra on the extract and avoid the need to recover and redissolve the polysaccharides. Redissolution is very difficult. Therefore, 150 mg of the purified cell wall was stirred with 1 c m 3 of 17% Na0H/D20,containing 1 mg c m - 3 of sodium borohydride to minimize degradation, in a reaction vial overnight. The solution was centrifuged and its supernatant was used directly at

50
240C for 13C NMR at 50 MHz. A small portion of the supernatant was analysed for soluble carbohydrate by the phenol-sulphuric acid method.
Solid-state NMR
Dry pkc cell wall prepared earlier was packed into the NMR rotor. The intact pkc was examined by natural- abundance CP-MAS 13c NMR spectroscopy at ambient temperature on a Varian VXR-300 spectrometer operating at 75.4MHz, with contact time 1 ms, pulse width 900, acquisition time 28.8 ms, relaxation delay 1 s, spin rate 4.97 KHz.There was no sign of interference from spinning sidebands. The spectrum shown is derived from 2500 transientsand is not artificially resolution-enhanced.
3.3 RESULTS
3.3.1 Hydrolysed sugarChromatograms of the neutral sugars detected by HPLC
are presented in Fig. 3.1 and quantitative data are presented in Table 3.1. expressed in percentages of total cell wall.

51
— Mannose
— xylose
glucose-galactose
-J
-mannose Glucose^
Xylose
Galactose
Fig. 3.1. Chromatograms of neutral sugars detected by HPLC.

52
Table 3.1. Quantities of neutral sugars detected by HPLC as percentages of total cell wall.
Neutral sugar % of total cell wall
Glucose 11.6 + 0.7
Xylose 3.7 + 0.1
Galactose 1.4 + 0.2
Mannose 56.4 + 7.0
Total 73.1 + 7.2t indicates standard deviation of the mean of 3 replicates
In the total cell wall mannose was found to be the principal neutral sugar (56.4%) followed by glucose (11.6%), xylose (3.7%) and galactose (1.4%). The amount represents 73.10% of the original sample. The presence of a large amount of mannose and a small amount of galactose suggests mannans with galactopyranosyl substituents. The appreciable amounts of glucose detected were consistent with the presence of cellulose in pkc.
3.3.2 Solution-state NMRThe 13C NMR spectra from the solubilised
polysaccharides is shown in Fig. 3.2. The peaks are rather low due to the low concentration of the polysaccharides in the solution. Alkali extracted only 1.26% of pkc polysaccharides. Nevertheless, the concentration was large enough for the spectra to be interpreted. The assignment reveals that for every ring carbon atom, the chemical shift corresponds closely to published spectra of galac-

53
C-3
C-2
V
Fig. 3.2. 13c solution-state NMR spectra from the solubilised polysaccharides

54
tomannan (Grasdalen and Painter, 1980; Bociek et al., 1981; Manzi et al. 1984; Bock et al., 1984) shown in Table3.2. Spectra for C-l of the sample was recorded at 101.7 ppm; C-2, 71.9; 03, 73.2 ppm; 04,77.6 ppm; 05, 76.8;and 06, 61.6 ppm to represent the mannan structure.Galactose proportion is about 20%, an overestimated figure based on the resonance intensities. This is due to the short relaxation time of the mannan chain that may reduce its representation in the spectrum (Bociek, et al., 1981). The spectra also showed resonances assignable to protein.
Table 3.2. 13c data for alkali-extracted galactomannan inNaOH/D20 solution.
Residue C-l C-2 C-3 C-4 C-5 C-6
P-D-galactose 100.6 71.8 70.6 71.8 73.1 62.3(3-D-mannose (unsubstituted) 101.4 71.8 73.1 77.3 76.7 61.5(3-D-mannose (substituted) 101.4 71.8 73.1 77.3 75.2 68.5
3.3.3 Solid-state NMRThe solid state CP/MAS 13c spectrum of the intact pkc
is shown in Fig. 3.3 with resonance assignments in Table3.3. The assignments were derived from solid state NMR spectrum of the mannans from date palm endosperm (Jarvis, 1990a) . The chemical shift of the resonance for each ring carbon C-l, 101.7 ppm; C-2, 71.9 ppm; C-3, 73.2 ppm; C-4,77.6 ppm; C-5, 76.8; and C-6, 61.6 ppm), although

172.
378
0
55
Fig. 3.3. Solid-state 13c NMR spectrum from crystalline polysaccharides
30
.25
61

56
slightly downfield, is very much in agreement with resonances assigned to linear B (1,4)-D-mannan (Table 3.3) as a major component of pkc with some cellulose (C-l,105.2 ppm; C-4, 84.0 ppm) and protein. Each of the signals from the mannan resonances is sharp although broadened at the base. The linewidth at half height is only about 1 p.p.m (cf. 3-5 p.p.m. for seed galactomannan and most other cell wall polysaccharides (Jarvis and Apperley, 19 90)). The C-4 resonance shows a distinct downfield displacement and those for C-2 and C-3 show small upfield displacements as compared to the solution assignment (Table 3.2).
Table 3.3. Solid-state CP-MAS 13c NMR data for crystalline mannans. (Chemical shifts in ppm downfield from external TMS: linewidths at half height).
C-l C-2 C-3 C-4 C-5 C-6
Chemical shift Linewidth
101.9 70.2 72.5 1.2
81.31.1
76.2 62.31.7
3.4 DISCUSSION
The two polymers, mannan and cellulose, represented 69% of the total cell wall or 95% of the total non-starch polysaccharide in the pkc cell wall as analysed using HPLC. An earlier report by Alang et al. (1988) suggested that mannan constituted a major portion of the secondary
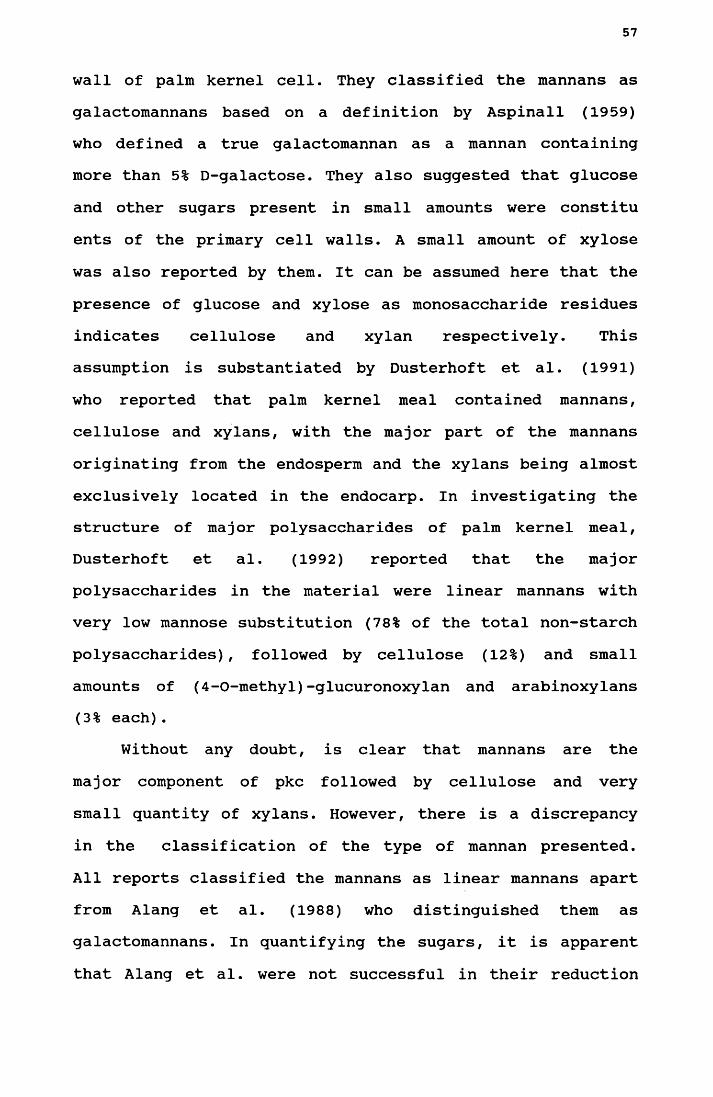
57
wall of palm kernel cell. They classified the mannans as galactomannans based on a definition by Aspinall (1959) who defined a true galactomannan as a mannan containing more than 5% D-galactose. They also suggested that glucose and other sugars present in small amounts were constitu ents of the primary cell walls. A small amount of xylose
was also reported by them. It can be assumed here that the presence of glucose and xylose as monosaccharide residues indicates cellulose and xylan respectively. This assumption is substantiated by Dusterhoft et al. (1991) who reported that palm kernel meal contained mannans, cellulose and xylans, with the major part of the mannans originating from the endosperm and the xylans being almost exclusively located in the endocarp. In investigating the structure of major polysaccharides of palm kernel meal, Dusterhoft et al. (1992) reported that the major polysaccharides in the material were linear mannans with very low mannose substitution (78% of the total non-starch polysaccharides), followed by cellulose (12%) and small amounts of (4-O-methyl)-glucuronoxylan and arabinoxylans (3% each).
Without any doubt, is clear that mannans are the major component of pkc followed by cellulose and very small quantity of xylans. However, there is a discrepancy in the classification of the type of mannan presented. All reports classified the mannans as linear mannans apart from Alang et al. (1988) who distinguished them as galactomannans. In quantifying the sugars, it is apparent
that Alang et al. were not successful in their reduction

58
of monosaccharides to alditols. Thus their finding may not reflect the actual quantity of the neutral sugars in palm kernel cell wall.
Information from NMR complements the results obtained from HPLC method. Both solution-state and solid-state NMR spectra show the presence of a linear 3(1,4)-D-mannan. The narrow line width of the spectrum indicates the mannans are very crystalline which is a characteristic of the mannan I form (Atkins et al., 1988). This must mean that a major portion of the mannan backbone is unsubstituted because the presence of galactose would block the crystallisation. Mannan solubility is increased by galactopyranosyl substituents on its backbone (McCleary et al., 1981). The fact that more galactose is shown in solution-state NMR than the solid-state is becausegalactose substituted mannans are more soluble in alkali than the linear mannans.
The presence of spectral features resemblingcellulose at about a quarter of the amount of mannose confirms the earlier implication from HPLC on the presence of this compound. As expected, due to the difficulty of its removal during the cell wall preparation, protein is also shown in the solid-state NMR.
3.5 CONCLUSIONS
The findings from the two methods, acid hydrolysis and NMR, as well as other evidence (Alang et al., 1988;Dusterhoft et al. , 1991 and 1992) confirmed the major

59
constituent of pkc cell wall as mannan with low residues of galactopyranosyl substitutes and a considerable amount of cellulose. The fact that pkc cell wall is almost totally made up of these two polymers, justifies the decision to concentrate on these, particularly the mannans, in the degradation experiments.
Having established the chemistry of the polysaccharides, the next task, developing a procedure to depoly- merise them into simple sugars that can be absorbed into the fowl's blood stream, looks more promising. The main expected product, mannose, like glucose and galactose is absorbed by birds but at a slower rate (Bogner, 1961) and metabolised (Herman, 1971).

CHAPTER 4
TREATMENTS TO IMPROVE THE NUTRITIVE VALUE
4.1 INTRODUCTION
Birds lack the enzymes necessary to degrade the structural carbohydrates of plants (McNab, 1976). In this connection, the crystalline mannans and cellulose in pkc (Daud and Jarvis, 1992) are not expected to be depolymerised in the gut of the fowl. Thus a form of treatment to degrade the polysaccharides into simple sugars and perhaps a form of pretreatment to induce structural changes in the polysaccharides to make them more susceptible to enzymic attack must be employed (McNab, 1976). The ultimate goal is to release mannose and galactose from the mannans, and glucose from the cellulose for assimilation. To this end, Burt (1976) proposed industrial methods of saccharification as a means of improving nutritive value of fibrous materials for poultry diets.
Basically, there are three general classes of treatments available; physical, chemical and biological, that can be employed to achieve this objective. Encouraging successes in the use of enzymes to improve the nutritive value of fibrous materials have been reported by many researchers (e.g Pettersson et al., 1991; Van Beek, 1991; Classen and Bedford, 1991; Gadient and Broz, 1992). In this study, particular attention is given to the
enzymic treatments, involving both physical and chemical

61
pre-treatments as the means to maximise enzymic degradation efficiency. 'Certain mechanical and chemical pretreatments may help to accelerate the initial process of digestion and expose more material to degradation' (Bacon, 1988) . While this is true for ruminant digestion it is also applicable to the enzymic improvement of monogastric feed.
Highly crystalline mannans are insoluble and resistant to hydrolysis (McCleary, 1988) and closely resemble cellulose which is highly resistant to both biological and acid hydrolysis (Theander and Aman, 1984). However, cellulose has been extensively investigated and significant progress in its degradation has been documented (Bacic et al., 1988). On the other hand, the mannans which comprise a major component of pkc non-starch carbohydrates are less known and may require a novel specific enzyme to degrade them. For these reasons, the treatment to improve the nutritive value of pkc was focused on the enzymic degradation of this particular polysaccharide. The study included evaluation of commercially and laboratory-prepared enzymes. Enzymes with good mannanase activity were selected and characterised
for the study on degradation of solid pkc. Finally the most promising potential enzyme for pkc degradation in each batch was selected for a practical application.

62
4.2 MATERIAL AND METHODS
4.2.1 SubstratesGuar galactomannan (Meyprogat 150). The powder was
dissolved in water to form a solution of 4.0 mg cm”3,boiled for 2 h and allowed to settle in a fridgeovernight. A clear layer formed at the top and wasseparated and used as substrate in the viscometric study.
Pkc. The material was ground to 0.5 mm particle size and used directly for the solubilisation study.
4.2.2 Commercially prepared enzymesCommercial enzyme preparations with 'hemi-cellulase1
activity (Olivex, Celluclast, SP 299, Gamanase, Novozyme 234, Energex and Viscozyme) were supplied by Novo Norsdisk Bioindustries, U.K. Ltd. Driselase preparation was bought from Sigma Chemical Co. The following descriptions of most enzyme preparations were supplied by the relevant producers.
Olivex, Celluclast and SP 299Descriptions of these three enzymes were not supplied
by the manufacturer.
Gamanase
An endoenzyme with hemi-cellulose activity produced by Aspergillus niger. Gamanase breaks down galactomannans found in various seeds, e.g. coffee beans and locust
beans. In manufacturing of instant coffee, the enzyme

63
reduces the viscosity of coffee extract so that the extract can be evaporated to a higher concentration more efficiently. Optimum reaction conditions are pH 3-6 and
60-70°C.
NovoZyme 234
It is a multicomponent lytic enzyme preparation suitable for the production of protoplasts from yeasts and fungi in high yields. NovoZyme 234 is produced by submerged fermentation of a selected strain of the fungus Trichoderma harzinum. It contains a number of enzyme activities. The most important are: 1,3-a-glucanase, 1,3-6-glucanase, laminarinase, xylanase, chitinase and protease. It has been used in the preparation of protoplasts from yeasts and fungi at reaction conditions of pH 5-6 and 25°C.
Energex
Energex is a carbohydrase preparation produced by submerged fermentation of a selected strain of the Aspergillus niger group. It is a multiple enzyme complex hydrolysing a broad range of carbohydrate polymers including arabans, cellulose and hemicellulose and also has activity against the branched pectin-like substances found in the cell walls of soy beans. It is used when pentosan or other hemicellulose-containing cereals are incorporated into feeds for poultry, pigs and other monogastric animals. Energex is claimed to degrade these polysaccharides and thus improve the overall utilization

64
of energy-containing and other nutritional components of the feed. When sorghum is used as a feed component then the enzyme is claimed to improve the conversion efficiency and bring it close to other cereal products. Due to the multi-enzyme nature Energex is also able to improve maize/sorghum blends when added at the recommended dose rate of 0.5-1.0 kg ton”1 final feed.
Viscozyme 120 L
This enzyme preparation is produced from a selected strain of the Aspergillus group. Viscozyme 120 L is a multiple enzyme complex containing a wide range of multi
acarbohydrases including arabinase, cellulase, B-glucanase, hemicellulase and xylanase. The optimum conditions for the activities of this enzyme complex are pH 3.3-5.5 and a temperature of 40-50°C.
Driselase
This enzyme preparation is prepared from the Bacidiomycete, Irpex lacteus. It is been used as a starting material for the purification of B-D-mannanase (McCleary, 1988). Strong activities both in plant tissue maceration and grain cell wall disintegration in vitro by this enzyme have been reported by Noguchi et al. (1978) . Suga et al. (1978) had proposed Driselase as a feed additive enzyme. The crude enzyme powder is claimed to
>V'
Icontain laminarase, xylanase and cellulase. Hydrolysis of carob and L-leucocephala D-galacto-D-mannans by Driselase has been described by McCleary (1982).

65
4.2.3 Enzyme evaluation
Olivex, Celluclast and SPP 299
Galactomannan substrate (5.0 cm3) was mixed with 5.0 cm3 water; and galactomannan substrate (5.0 cm3) + water (4.0 cm3) + 1.0 cm3 of each of the following enzymeconcentrations (5.0 mg cm”3, 0.5 mg cm”3 boiled and 0.5 mg cm”3) in test tubes. The mixing reduced the concentrations of the enzyme by 10 times in the digest. The solutions were incubated in a water bath at 40°C for 10 min and the flow time measured at the same temperature at 10 min intervals for a period of 1.0 h with a viscometer as described in Chap. 2. Flow time of water was also measured at the same temperature for the purpose of calculating the specific viscosity.
Specific viscosity was calculated using the formula, (ts-tw) /tw , where tw is the flow time for water and ts is the flow time for solution.
The most active enzyme in galactomannan degradation was selected based on specific viscosity.
Gamanase, Novozyme, Energex and Viscozyme
Pkc of 0.5 mm (mesh no. 30) was degraded in suspension with these enzymes at 60°C for 2 h. The composition of the mixtures involved in the experiment is tabulated below:

66Table 4.2a. Composition of treatment mixtures for pkc
degradation by Gamanase, Novozyme, Energex and ViscoZyme.
Enzymesource
Pkc(mg)
Buffer(cm3) (mg cm”3) (%) (cm3)
Initial Final of pkcTotal(cm3)
Gamanase 0 3.0 20.0 5.00 0.0 1.0 4.0200 3.8 0.0 0.00 0.0 0.0 4.0200 2.8 0.2 0.05 0.1 1.0 4.0200 2.8 2.0 0.50 1.0 1.0 4.0200 2.8 20.0 5.00 10.0 1.0 4.0
Novozyme 0 3.0 20.0 5.00 0.0 1.0 4.0200 3.8 0.0 0.00 0.0 0.0 4.0200 2.8 0.2 0.05 0.1 1.0 4.0200 2.8 2.0 0.50 1.0 1.0 4.0200 2.8 20.0 5. 00 10.0 1.0 4.0
Energex 0 3.0 20.0 5.00 0.0 1.0 4.0200 3.8 0.0 0.00 0.0 0.0 4.0200 2.8 0.2 0.05 0.1 1.0 4.0200 2.8 2.0 0.50 1.0 1.0 4.0200 2.8 20.0 5. 00 10.0 1.0 4.0
Viscozyme 0 3 . 0 20.0 5.00 0.0 1.0 4.0200 3.8 0.0 0. 00 0.0 0.0 4.0200 2.8 0.2 0.05 0.1 1.0 4.0200 2.8 2.0 0. 50 1.0 1.0 4.0200 2.8 20.0 5. 00 10.0 1.0 4.0
4.2.4 Enzyme characterisationThe Olivex enzyme preparation was characterised as
follows to find its optimum viscometric reaction conditions.
pH
Citrate-phosphate buffer solutions (2.5 cm3) pH 3, 4, 5, 6 and 7 were mixed with 2.5 cm3 of 8.0 mg cm”3galactomannan and 2.5 mg cm-3 of 0.0004 mg cm”3 Olivex enzyme. The mixing diluted the substrate and the enzyme to2.0 mg cm”3 and 0.0002 mg cm”3 respectively. Each solution

67
was incubated in the viscometer and partially immersed in a water bath at 40°C. Flow times were recorded at 2, 4, 6,8 and 10 min.
Concentration of the substrate and the enzyme
Several dilutions of galactomannan (1.0, 2.0, 3.0,4.0 and 5.0 mg cm”3) and Olivex (0.10, 0.02, 0.002, 0.001 and 0.0002 mg cm”3) were prepared from the stocksolutions.
The flow time for each galactomannan concentration was measured to determine the concentration that took about 1.0 min to flow between the marks in the viscometer.
A fixed substrate concentration of 2.0 mg cm”3 wasused in the determination of flow time of about 30 sbetween the marks in the viscometer after Olivex treatment. Each of the galactomannan substrate aliquots (5.0 cm3) was mixed with 5.0 cm3 of each differentconcentration of Olivex enzyme. The solutions wereincubated at 40°C for 10 min and their flow times measured.
Temperature/Several levels of temperature viz. 4.0°C, 22° (room \
temperature), 40°, 60° and 80° were chosen for determiningthe optimum temperature for Olivex activity. At each temperature, 3.5 cm3 of citrate-phosphate buffer solution pH 5.0 was mixed with 3.0 cm3 galactomannan substrate (8.0 mg cm”3) and 1.0 cm3 of 0.0075 mg cm”3 Olivex enzyme. The solutions were incubated for 10 min and the flow time

68
measured. The flow time of water was also measured for each temperature level. Enzyme activity was calculated as: % reduction in specific viscosity divided by incubation time.
Incubation period
Olivex enzyme (5.0 cm3, 0.001 mg cm"3 and 0.0002 mg cm”3) was mixed with galactomannan substrate (5.0 cm3, 4.0 mg cm”3) . The mixing diluted both the enzyme and the substrate concentrations by half. The solution was transferred into a viscometer and incubated in a water bath at 40°C. The flow time was measured at 10 min intervals for a period of 1.0 h.
Pkc degradation (particle size and Olivex concentrations)
Pkc samples (200 mg each) of fine (< 0.15 mm) and coarse (< 0.2 mm) particle sizes were incubated withdifferent Olivex concentrations (0.001, 0.01, 0.1 and 1.0mg cm”3) and citrate-phosphate buffer (pH 5.0) at 45°C for 10 min and 20 h periods. The centrifuged supernatants were measured for their soluble sugars.
Pkc degradation (Individual sugar analysis)
Pkc (200 mg, < 0.5 mm particle size) with or without a pretreatment with 1.0 cm3 2.5 M NaOH overnight followed by neutralisation with HOAc to pH 5.0 was incubated with1.0 cm3 Olivex enzyme (0.001 mg cm”3) in a total volume of 10 cm3 for 20 h at 40°C. The composition of the treatments are shown in Table 4.2b.

69
Table 4.2b. Composition of treatments in pkcdegradation by Olivex with or without alkali pretreatment.
Treatment NaOH(cm3)
HOAc(cm3)
Buffer(cm3)
Olivex(cm3)
I. Control - - 9.80 -
II. Enzyme - - 8.80 1.0III. NaOH + Enzyme 1.0 0.78 6.22 1.0
Solubilised carbohydrates were analysed by the phenol-sulphuric acid method and by HPLC as described in chapter 2 .
4.2.5 Enzymic degradation after pretreatments
Heating
Pkc (100 mg, <0.15 mm or 100 mesh) was weighed into a5.0 cm3 Reacti-vial (Peirce Inc.) and 4.5 cm3 water added. The vial was closed tightly with a teflon cap and heated in an oven at 120°C for 1.0 h. Another 100 mg sample of pkc was weighed into a boiling tube suspended in 4.4 cm3 of the buffer solution. Olivex enzyme (0.5 cm3, 1.0 mg cm-3) was added to each vessel (reaction vial and boiling tube). This gave a total volume of 5.0 cm3 solution in each vessel and the concentration of the enzyme was diluted to 0.1 mg cm”3. Both vessels were incubated in a water bath at 45°C for 20 h. The contents were centrifuged at 3,000 rpm for 10 min. The supernatants were diluted and

70
analysed for soluble sugars by the phenol-sulphuric acid method.
Alkali
Finely ground pkc samples (200 mg, <0.15 mm or 100 mesh particle size) were weighed into 6 boiling tubes of 22 mm dia and suspended in 1.0 cm3 of either NaOH or KOH of concentration 4.25 M, 2.5 M or 1.25 M. The mixtures were stirred overnight. The incubated aqueous mixtures were then neutralised with acetic acid to pH 5.0-5.5 using the following volumes:
Table 4.2c. Volumes of acetic acid to neutralise the aqueous mixtures to pH 5.0-5.5.
Alkali Concentration(M)
Volume(cm3)
1. NaOH 4.25 3.02. NaOH 2.50 2.03. NaOH 1.25 1.34. KOH 4.25 3.55. KOH 2.50 2.06. KOH 1.25 1.3
After neutralisation each mixture was made up to 9.0 cm3 with distilled water followed by another 1.0 cm3 of1.0 mg cm”3 of Olivex enzyme and incubated overnight. The mixture was then centrifuged and the supernatant was measured for neutral sugars.

71
4.2.6 Optimum volume of mixtures for pkc degradation
Alkali and Olivex treatment
The volumes chosen were 10 cm3 (as above), 2.0 cm3 and 1.0 cm3. A pkc sample size of 200 mg and NaOH volume of 0.5 cm3 were used. The alkali was neutralised to pH 5.0 with 0.15 cm3 of acetic acid. The composition of the mixtures used in the experiments are tabulated below:
Table 4.2d. Composition of the treatment mixtures for different volumes used.
ItemsA
TreatmentsB C
Sample (g) 0.20 0.20 0.20NaOH (cm3) 0.50 0.50 0.50Acetic acid (cm3) 0.15 0.15 0.15Enzyme (cm3) 1.00 0.20 0.10Water (cm3) 8.15 0.95 0.05
Total volume (cm3) 10.00 2.00 1.00
The mixtures were centrifuged and the supernatants were analysed for neutral sugars by the phenol-sulphuric acid method.
Alkali and Energex treatment
Each pkc sample (200 mg, < 1.0 mm particle size) was suspended in 0.5 cm3 2.5 M NaOH overnight and neutralised to pH 5-5.5 with 0.15 cm3 HOAc. The neutralised mixtures were added with appropriate volumes of citrate-phosphate buffer pH 5.0 and 1.0 cm3 Energex enzyme to make up the different volumes tested (10, 8, 6, 4 and 2 cm3). The

72
volumes of the buffer and Energex for the various treatments are tabulated below.
Table 4.2e. The volumes of the buffer and Energex for the various treatments.
Treatment(cm3)
Buffer(cm3)
Enzyme(cm3)
10 8.15 1.08 6.15 1.06 4.15 1.04 2.15 1.02 0.75 0.5
The mixtures were incubated overnight at 40°C. Soluble sugars in the centrifuged supernatants were analysed by the phenol-sulphuric method.
4.2.7 Driselase experimentsDriselase came into the picture toward the later part
of this study. The enzyme was included in this study based on the demonstration by McCleary (1988) that Driselase contains a mannanase active against solid mannan, and its strong activities in grain cell wall disintegration and plant tissue maceration (Noguchi et al., 1978) as well as its proven record as good feed additive enzyme (Suga et al., 1978)

73
Evaluation
The enzyme was brought into solution (8.0 mg cm3) and diluted to 2.0 mg cm”3 in the final solution volume of 4.0 cm3. The composition of the mixtures was as follows:
Table 4.2f. Composition of treatment mixtures for pkc degradation by Driselase.
Items Enzymealone
-- Treatments-Pkcalone
Completemixture
Pkc (mg) - 200.0 200.0Buffer (cm3) 3.0 3.8 CO•CM
Enzyme (cm3) 1.0 — 1.0
The mixtures were incubated for 4.0 h and overnight. The centrifuged supernatants were analysed for neutral sugars by the phenol-sulphuric acid method.
Optimum volume of mixture for Driselase degradation of pkc An aqueous solution of the enzyme powder (4.0 mg
cm-3) was prepared and further diluted for respective treatments to contain 2.0 mg of the enzyme. The treatment mixtures are as follows:

74
Table 4.2g. Composition of the treatment mixtures for different volumes: pkc degradation by Driselase.
Treatment pkc(mg) Enzyme
Volume (cm 3) Buffer Total
Pkc alone 200 10.0 10.0Enzyme alone - 0.5 9.5 10.00.5 cm3 200 0.5 - 0.51.0 cm3 200 0.5 0.5 1.02.0 cm3 200 0.5 1.5 2.04.0 cm3 200 0.5 3.5 4.06.0 cm3 200 0.5 5.5 6.0
10.0 cm3 200 0.5 9.5 10.0
The mixtures were incubated at 40°C overnight. After that their volumes were made up to 10 cm3, centrifuged at3,000 rpm for 10 min and the supernatant analysed for neutral sugars by the phenol-sulphuric acid method.
4.3 RESULTS
4.3.1 Enzyme evaluation
Olivex, Celluclast and SP 299
The specific viscosity of the galactomannan solutions after degradation by these enzymes at concentrations of 0.5 and 5.0 mg cm-3 measured at 10 min intervals, are shown in Table 4.3a below. Olivex was clearly the most active enzyme at both concentrations.

75
Table 4.3a. Specific viscosity of galactomannansolutions incubated with Olivex, Celluclast and SP 299 enzymes at different concentrations measured at 10 min intervals.
Incubation Time (min)Enzymes mg cm-3 0 10 20 30 40 50 60
Olivex 5.0 55.79 0.32 0.09 0.07 0.00 0.00 0.00Celluclast 5.0 55.79 0.35 0.06 0.01 0.03 0.02 0.05SP 299 5.0 55.79 0.38 0.08 0.07 0.07 0.05 0.06
Olivex 0 . 5 55.79 0.13 0.11 0.07 0.16 0.06 0.01Celluclast 0 . 5 55.79 27.52 18.70 14.67 11.85 10.35 9.13SP 299 0 . 5 55.79 40.84 27.89 20.48 17.86 14.85 12.88
Values are means of three replicates
Gamanase, Novozyme, Energex and ViscoZyme
The soluble sugars produced from the degradation of pkc with these enzymes are shown in Table 4.3b below. All the treatments produced less than 1.0 percent net soluble sugars.

76Table 4.3b. Soluble sugars from pkc degraded by the
enzymes, expressed as % of pkc.
Treatments Soluble sugars (%)
Net increase due to enzyme (%)
GamanaseEnzyme alone 0.045Pkc alone 0.4310.05 mg cm”3 0.846 0.371 ±0.030.50 mg cm-3 0.641 0.166 ±0.055.00 mg cm-3 1.144 0.648 ±0.13
NovoZymeEnzyme alone 0.124Pkc alone 0.3400.05 mg cm”3 0.414 0.000 ±0.020.50 mg cm"3 0.447 0.000 ±0.035.00 mg cm"3 0.713 0.249 ±0.06
EnergexEnzyme alone 0.205Pkc alone 0. 3030.05 mg cm”3 0.532 0.024 ±0.030.50 mg cm"3 0.705 0.197 ±0.095.00 mg cm"3 1.232 0.724 ±0.18
ViscoZymeEnzyme alone 0.092Pkc alone 0.3480.05 mg cm"3 0.524 0.084 ±0.030.50 mg cm"3 0.746 0.306 ±0.055.00 mg cm"3 1.110 0.670 ±0.16
+ indicates standard deviation of the mean of 3 replicates
4.3.2 Enzyme characterisationBeing the most active enzyme in degradation of guar
galactomannan, Olivex was chosen for further investigation to establish optimum conditions for its activity in solution.
pHThe viscometric data for the pH levels tested are
shown in Fig. 4.3a with best fit curve constructed by the Cricket graph package. At 2.0 min, the lowest specific

Spec
ific
visc
osity
77
50 n|
□ p|^ 2.0 v■ 43 022 • 3-420* ♦ 0.17Sx'2 r‘2 - 0.994
pH 5.0 1.32x ♦ 0.04x'2 0.99
0 . 9 9 1
40
30
20
2 3 4 5 6 7 8 9 10Min
Fig. 4.3a. Specif ic viscosity of solution degraded by Olivex at different pH measured at 2 min intervals. The curves were constructed using Cricket Graph.

78
viscosity was recorded at pH 6.0 followed by pH 4.0, 5.0,3.0 and 7.0. This indicates that the pH optimum at 2 min incubation is 6. Thereafter, the rate of decrease was rather slow for pH 6.0 and 7.0. Thus, after 10 min incubation at these two pH levels the degraded galactomannan showed higher specific viscosity as compared to the rest which gave about the same values (slightly more than 26.0) indicating a wide range (3-5) of pH optimum for this
period of incubation.
Concentration of galactomannan and Olivex
The flow times for galactomannan substrate measured for various concentrations are shown in Table 4.3c. The concentration that gave a convenient flow time of about 1 min was 2.0 mg cm”3.
Table 4.3c. Flow times for various galactomannan concentrations.
Concentrations (g cm”3)
Flow time (s)
1 14.652 55.753 101.204 494.005 900.00
Values are means of three replicates
The flow times for the galactomannan substrate at 2.0 mg cm”3 degraded by the various Olivex concentrations are shown in Table 4.3d. The Olivex concentration that gave a flow time of about 3 0 s was 0.0002 mg cm-3.

79
Table 4.3d. The flow time for galactomannan substrate at 2.0 mg cm”3 degraded by Olivex of various concentrations.
Concentration mq cm"3
Flow time (s)
0.100 6.020.020 6.160.010 7.220.002 11.700.001 18.040.0002 29.96
Values are means of three replicates
Temperature
The enzymic activity for various temperatures and incubation periods are shown in Fig. 4.3 b. The optimum temperatures for 10.0 min and 24.0 h degradation were 60°C and 40°C respectively.
Incubation periods
The specific viscosities of galactomannan substrates degraded by Olivex at 0.0001 and 0.0005 mg cm”3 measured at 2.0 min intervals for a period of 10 min are shown in Fig. 4.3c. The specific viscosities decreased as incubation times increased.
It was assumed that the optimum conditions for activity of Olivex on pkc were similar to those on galactomannan, and that the very high activity on galactomannan suggested that there would be substantial activity on pkc also.

Enzy
mic
ac
tivity
(%
80
0.07
0.010.00x'2
0 10 20 30 40 50 60 70 80 90
Temperature °C
Fig. 4.3b. The enzymic ac t i v i t y of Ol ivex degrading ga lac tomannan at d i f ferent tempera tu res and fermenta t ion per iods. The curves were f i t ted using Cr icke t Graph. The enzymic a c t i v i t y was ca lcu la ted as % reduct ion in s.v. divided by incubat ion t ime.

Spec
ific
visc
osity
81
10 -
9
0.00010.00058
7
6
5
4
3
2
0 2 4 6 8 10
Min
Fig 4.3c The specif ic viscosity of galactomannan substrate degraded by Olivex at 0.0001 and 0.0005 mg cm'-3 measured at 2 min intervals for a period of 10 min.

82
Pkc degradation (particle size and Olivex concentration)
Soluble sugar production from pkc of different particle sizes degraded with Olivex enzyme at different concentrations for 10 min and 20 h is shown in Table 4.3e. There was almost no increase in pkc degradation above the water controls at 10 min incubation for both particle sizes. The longer incubation period (20 h) resulted in a slight increase in the degradation (0.02% to 1.5% of soluble sugar) for both particle sizes and all Olivex concentrations tested, but the amounts solubilised were small.
Table 4.3e. Increase in soluble sugar produced above water controls from pkc of <0.15 mm and <0.2 mm particle sizes degraded by Olivex enzyme of several concentrations for 10 min and 20 h. (% of pkc)
Particle size Concentration (mq cm”3)
Incubation period 10 min 20 h
Fine (0.15 mm) 0.001 0.0 0.20.010 0.0 0.90.100 0.1 1.41.000 0.1 1.9
Coarse (0.20 mm) 0.001 0.0 0.20.010 0.0 0.80.100 0.0 1.21.000 0.1 1.5
Means are values of two replicates
4.3.3 Enzymic degradation after pretreatments
Pkc degradation (individual sugar analysis)
Total carbohydrate solubilised was only 2.7%, 1.0%and 0.5% of the pkc for enzyme+NaOH, enzyme and control, respectively (Table 4.3f).

83
Table 4.3f Soluble sugar released from pkc with orwithout NaOH pretreatment incubated with Olivex enzyme overnight at 40°C.
Treatment Soluble sugars (% of pkc)
I. Control 0.5
II. Enzyme 1.0III. NaOH+Enzyme •CMValues are means of two replicates.
Data on the analysis of mono and disaccharides are shown in Table 4.3g. Most of the monosaccharide released by NaOH+ enzyme was glucose. Small quantities of xylose were released by the NaOH+enzyme and NaOH treatments. Mannose was not released by any of the treatments. Small amounts of cellobiose were released by all the treatments.
Table 4.3g. Monosaccharides and disaccharides released by enzyme and NaOH, mg g”1 of pkc.
Treatment Glucose Cellobiose Xylose Mannose
Enzyme+NaOH 2.0 0.7 0.2 0
NaOH alone 0.2 CO•o CM•O 0
Control 0.2 0.7 0 0
Values are means of at least two replicates
Heating
The soluble sugars produced from pkc degraded by Olivex after preheating at different temperatures and incubation periods are shown in Table 4.3h. The heat treatments failed to increase the sugar production.

84
Table 4.3h. Soluble sugars produced from pkc degraded by Olivex after heating at different temperatures and heating periods.
Pretreatment Soluble sugars(% of pkc)
Control 2.201 h at 120° 2.161 h at 140° 2.25Overnight at 120° 2.15
Values are means of two replicates
Alkali
The soluble sugars produced from pkc degraded by Olivex following pretreatment with either NaOH or KOH of different concentrations at 40°C are shown in Table 4.3i. The amounts of soluble sugars produced are still considered low and they were not much affected by the concentration and type of alkali except for the KOH pretreatment at 1.25 M which lead to much lower soluble sugars released.
Table 4.3i. Soluble sugars produced from pkcdegraded by Olivex after pretreatment with alkali at different concentrations.
Alkali Concentrations (M) (%)
Soluble sugars (%)
NaOH 1.25 5.0 2.262.50 10.0 2.714.25 17.0 2.62
KOH 1.25 6.0 1.782.50 12.0 2.714.25 20.4 2.90
Values are means of two replicates

854.3.4. Optimum volume of mixtures for pkc degradation
Alkali and Olivex treatment
Soluble sugars produced from pkc treated with Olivex following pretreatment with 10% NaOH using three different volumes but keeping the enzyme-substrate ratio constant are shown in Table 4.3j below. The highest value was recorded at 10 cm3 (16.0%) followed by 5.0 cm3 (5.0%) and2.0 cm3 (3.7%).
Table 4.3j. Soluble sugars produced from pkc degraded by Olivex of different volumes of mixtures.
Volume(cm3)
Soluble sugars %)
10.0 1.605.0 0.752.0 0.50
Values are means of two replicates
Alkali and Energex treatment
The soluble sugars produced from pkc pretreated with alkali and incubated with Energex for the various total volumes are shown in Table 4.3k below. The highest value was recorded at 4 cm3 followed by 6, 2, 8 and 10 cm3.

86
Table 4.3k. Soluble sugars released from pkcpretreated with alkali and incubated with Energex in different volumes.
Total volumes (cm3)
Soluble (% of
sugarspkc)
2 6.7 + 0.394 9.3 + 0.126 8.3 + 0.358 5.1 + 0.15
10 2.9 + 0.35+ indicates standard deviation of the mean of 3 replicates.
4.3.5 Driselase experiments
Evaluation
The soluble sugars produced from the degradation of pkc with Driselase are shown in Table 4.31 below. The net increases of 3.74% and 4.18%, compared to the controls, in soluble sugars after incubation at 40°C for 4.0 h and overnight periods respectively are considered quite substantial .
Table 4.31. Soluble sugars produced from pkcdegraded by Driselase at 40°C for 4 h and overnight. (%)
Items4.0 h
TreatmentsOverniqht
Enzyme alone 0.16 0.16Pkc alone 1.40 1.86Pkc+enzyme 5.30 6.20Net increase 3.74 4.18
Values are means of two replicates

87
Optimum volume of mixture for degradation of pkc by Driselase.
The soluble sugars produced from the various incubation volumes in Driselase treatments with constant enzyme:substrate ratio are shown in Table 4.3m. The highest value was recorded at a volume of 4.0 cm3 (4.4%) followed closely by 2.0 cm3 (4.3%) and 6.0 cm3 (4.1%). Other volumes (0.5 cm3, 1.0 cm3, and 10.0 cm3) gave slightly lower values (3.4%, 3.8% and 3.7%) respectively.
Table 4.3m. Soluble sugars produced from pkc degraded by Driselase in different volumes.
Treatments Soluble sugars (%)
Net increase (%)
Enzyme alone 0.22Pkc alone 1.620.5 cm3 5.18 3.351.0 cm3 5.62 3.802.0 cm3 6.08 4.254.0 cm3 6.23 4.406.0 cm3 5.93 4 .10
10.0 cm3 5.53 3.70Values are means of two replicates
4.4 DISCUSSION
Olivex was the most active enzyme in soluble galactomannan degradation among the first three enzymes evaluated. Unlike Celluclast and SP 299, Olivex maintained its activity even at low protein concentration, 0.5 /Ltg cm”3.
Olivex was lacking in the necessary basic information on the mannanase it contained. Therefore, it was pertinent investigate the optimum conditions for its activity. The enzyme was found to be most active on galactomannan

88
between pH 3.0 to 5.0. The optimum temperatures for 10.0 min and 24 h degradations were 60°C and 40°C respectively. The concentration of guar galactomannan substrate and Olivex giving convenient flow times were determined as 2
mg cm”3 and 0.0002 mg cm”3.The Olivex enzyme was active as reflected by the
specific viscosity even at a concentration of 0.0001 mg cm”3 for the enzyme mixture but the activity was much lower than at 0.0005 mg cm”3. This very high specific activity in reducing galactomannan viscosity suggests endo-activity (Hart et al., 1991; Fogarty and Kelly, 1983; Whitaker, 1972). At these enzyme concentrations, the specific viscosities were reduced with incubation time but not linearly.
Pkc was not affected by this enzyme during a 10 min incubation. However, slight degradation occurred during a longer incubation period (20 h) with the fine particle size producing slightly higher soluble sugars than the coarse particle size. The degradability improved marginally as the concentrations of the enzyme increased. In general, the net increase in soluble sugars produced for both particle sizes and both incubation times was very small (less than 2.0%).
Heat pretreatment employed prior to Olivex degradation failed to improve the degradation of pkc. However, alkali (NaOH and KOH) pretreatment did improve the enzyme degradation of pkc by more than 2% of soluble sugar production (Daud and Jarvis, 1991).

In an earlier report, Nwokolo et al. (1976) revealed that metabolisable energy content of palm kernel meal treated with 3, 5 or 7% NaOH was reduced significantly by increasing levels of NaOH as compared to untreated meal. This leads to the assumption that alkali treatment does not itself depolymerise the crystalline mannan of pkc or otherwise make it more available. Results from individual
sugar analysis indicate that mannan was not depolymerised since mannose was absent from the digest although the digest contained about 2.7% soluble carbohydrates.
In the case of cellulose, rupture of intermolecular hydrogen bonding by alkali leads to an overall decrease in crystallinity and such a reduction of order is associated with increased succeptibility to degradation by microorganisms or cell-free cellulase systems (Chesson, 1981; Baker, et al., 1959; Fan et al., 1980). An alkali concentration of 2.5 M is considered the most practical level in pretreating pkc for enzymic degradation.
In the next batch of enzymes evaluated, Energex was found to the most active enzyme in degrading solid pkc. The enzyme has been claimed to degrade hemicellulose- containing cereal incorporated into seeds for monogastric animals. At the manufacturer's recommended rate of 0.5-1.0 kg ton”1, Energex is able to improve maize/sorghum blends. Is degradation of pkc was small (<1.0 % of pkc) except after NaOH pretreatmnet (2.9-9.3% of pkc).
In determining the most practical volumes for pkc degradation by enzymes it was found that the degradation of pkc with the Olivex enzyme decreased in line with the

90
reduction in the volume of the mixture. In the case of Energex, the optimum volume was 4 cm3 for 200 mg pkc.
Commercial pretreatment with alkali would involve additional operations such as preparation of alkali solution, mixing alkali with feed, neutralisation of the alkali and dehydration of the product. These operations obviously would incur a higher cost in the final product. Therefore, other enzymes were also evaluated.
Apart from Driselase, all the enzymes tested without pretreatment showed very little degradation of pkc, producing less than 2.0% soluble sugars. Driselase produced 4.2% net soluble sugars in an overnight incubation period as compared to 3.7% for 4.0 h incubation.
Addition of Driselase to broiler and piglet feeds resulted in significant improvement in weight gain and feed conversion due to better digestibility and higher metabolisable energy of the feed, and increased utilisation of plant material with low TDN (Suga et al. , 1978).These authors suggested that the action of Driselase in the digestive tract of livestock could not be explained only by cellulase activity or pectinase activity but suggested that complex activities of various kinds of enzyme must have been involved, with the possibility of synergistic affects of Driselase with native enzymes produced in the digestive tract of livestock. The substrate studied by them did not include any mannans.
Driselase is widely known to contain a wide range of degradative enzymes (Fry, 1988). McCleary et al. (1982) used NMR, enzymic and chemical techniques to characterise

91
the galactose containing tri- and tetra- saccharides produced on hydrolysis of carob and Leucaena leucocephala D-galacto-D-mannans by Driselase. The Driselase endo-B-D- mannanase and its mechanism of hydrolysis of polysaccharides, including galactomannan, glucomannan and mannan were described by McCleary (1988). He added that insoluble crystalline mannan is quite resistant to hydrolysis. This is the obvious explanation for the poor degradation of pkc by enzymes that are effective on other, soluble, types of mannan.
For practical application, the volume of mixture for incubating pkc with Driselase was determined at 2.0 cm3 for 2 00 mg of pkc.
4.5 CONCLUSIONS
The Olivex enzyme was very active in galactomannan degradation. The optimum conditions for Olivex activity are 40°C for long incubation period and pH 3-5. It was ineffective in pkc degradation unless after preteatment with alkali. Such a process is laborious and would incur additional cost. Pkc pretreated with alkali followed by Olivex degradation may have slightly improved nutritive value for poultry but may not be commercially practical.
On the other hand Driselase has better potential in pkc degradation as it does not require the pretreatment process.

92
In determining the practical volume of this enzyme to be used for larger-scale pkc treatment, the highest level of soluble sugars was produced from 2.0 cm3 total volume.

CHAPTER 5
RHIZOPUS ORYZAE
5.1 INTRODUCTION
Pkc is capable of enzymic breakdown in various circumstances, such as germinating seed, in the rumen, and rotting in the natural environment. Reid (1985) concluded that the haustorium of the germinating date seed secretes enzymes necessary for mannan breakdown. In the endosperm of fenugreek (Trigonella foenum-graecum L. Leguminosae), the galactomannan is depolymerised by hydrolytic cleavage and the enzymes involved are produced within the endosperm itself (Reid and Meier, 1972). During galactomannan breakdown in the endosperm B-mannosidase activity increased fourfold (Reid and Meier, 1973). At least three enzymes; an a-galactosidase, a B-mannanase, and a B- mannosidase are required for complete hydrolytic breakdown of leguminous galactomannan (Reese and Shibata, 1965). B- Mannoside mannohydrolase extraction from guar endosperm is only possible if the galactomannan is first depolymerised (McCleary, 1982). The mannan of palm kernel is mobilized during germination with significant increase in oc- galactosidase and B-mannosidase activity (Alang et al. , 1988).
Palm kernel is also hydrolysed in the rumen (Shibata and Osman, 1988; Miyashige et al., 1987). Several hemicellulolytic microorganisms are reported to produce mannan degrading enzymes (Ratto and Poutanen, 1988).

94
Experiments on fungal enzymes in relation to pkc degradation are covered in Chap. 4.
Moist pkc can be observed to disintegrate slowly, with fungi growing on it, under natural conditions in the tropics. It is postulated that the fungi are capable of producing enzymes with mannanase activity.
All this evidence suggests that pkc degradation by enzymes is possible and that the fungi growing in rotting pkc could be a good source of these enzymes. In line with the objective of this thesis, one of the saprophytic fungi was isolated, cultured and the enzymes extracted. The enzyme preparation was evaluated for its ability to saccharify pkc cell walls.
5.2 MATERIALS AND METHODS
5.2.1 IsolationA bucket containing 20 kg of pkc mixed with water to
70-80% moisture was incubated in the open air, but with protection from rain, at ambient temperature (25-3 3°C) for a minimum period of three days. After this period, the fungus growing in the mixture was isolated on potato dextrose agar (PDA) by Dr. Sepiah Muid*. The PDA plates were incubated at 28 + 2°C and at 40 + 2°C. Only onespecies of the fungus grew on the plates. It grew faster
on the media at 40 + 2°C compared to the lowertemperature. The fungus was identified by the Commonwealth
*Mycologist at MARDI, Serdang, Malaysia.

95
Mycological Institute, Kew, U.K. as Rhizopus oryzae (see Chap. 2).
5.2.2 Culture and extractionThe fungus was cultured in batches on potato dextrose
and pkc media. The crude enzyme preparations are called ‘dilute enzyme1. A major portion of these enzymes was
precipitated with ammonium sulphate and is referred to as 'concentrated enzyme'. Both dilute and concentrated enzyme preparations were stored at 4°C for evaluation. The procedures for these processes were described in Chap. 2.
5.2.3 EvaluationThe enzyme preparations were tested for their ability
to release soluble carbohydrate from pkc and reduce the viscosity of soluble guar galactomannan.
Release of soluble carbohydrate from PKC
Pkc sample (200 mg, <0.5 mm particle size) was suspended in either 8.0 cm3 dilute enzyme or 2.0 cm3 of concentrated enzyme from either potato dextrose or pkc media. Citrate-phosphate buffer of pH 5.0 (refer Chap. 2) was added to give a total volume of 10.0 cm3. The mixture was incubated for 4.0 h at 40°C. Supernatants from these mixtures were measured for soluble sugar by the phenol- sulphuric acid method as described by Whistler and Wolfrom, 1962 (see Chap. 2).

96
Reduction of viscosity of soluble guar galactomannan.
Powder guar galactomannan (Meyprogat 150) was dissolved in water to form a solution of 4.0 mg cm“3, boiled for 2.0 h and allowed to settle in a fridge overnight. A clear layer formed at the top was separated and used as substrate in the following viscometric experiment.
A mixture of 6.0 cm3 substrate, 2.0 cm3 citrate- phosphate buffer (pH 5.0) and 2.0 cm3 of the concentrated enzyme preparation from either potato dextrose or pkc medium was incubated at 40°C for 2.0 h. A fixed amount of this mixture (2.0 cm3) was introduced into a viscometer and the flow time measured.
5.2.4 CharacterisationThe concentrated enzyme preparation from pkc medium
was characterised to find the type of enzyme action and its optimum reaction conditions. The paper chromatography and the viscometric technique described in Chap. 2 were employed for these purposes.
5.2.4.1 Type of action by the enzymeThe type of action by R. oryzae enzyme preparation
was determined from the sugars hydrolysed from pkc and soluble galactomannan, and its effect on the viscosity of the soluble galactomannan substrate.

97
Pkc hydrolysis
Pkc sample (200 mg of <0.5 mm particle size) was suspended in 7.8 cm3 citrate phosphate buffer pH 5 and 2.0 cm3 concentrated Rhizopus enzyme. No enzyme was added in the control group and the volume of buffer was increased to 9.8 cm3. Both mixtures were incubated at 40°C for 4 h. The supernatant was analysed for sugars by paper chromatography (see Chap. 2).
Guar galactomannan hydrolysis
Guar galactomannan (6.0 cm3, 4.0 mg cm”3) was mixed with 3.8 cm3 citrate-phosphate buffer pH 4.0 and 0.1 cm3 Rhizopus enzyme preparation. Toluene (0.1 cm3) was added as preservative. In the control group, no enzyme was added but the volume of the buffer was increased to 3.9 cm3. Both mixtures were incubated at 40°C for 4.0 h. The supernatants were analysed for soluble sugars by paper chromatography as above.
Effect of the enzyme concentration on galactomannan viscosity
Galactomannan substrate (6.0 cm3) was mixed with the buffer solution and the enzyme at various concentrations
giving a total volume of 10.0 cm3. The volumes of the buffer and enzymes used in the experiment are shown in Table 5.2a. Toluene (0.1 cm3) was added to each solution as preservative. The solutions were incubated at 40°C for 4.0 h and the flow times measured.

98
Table 5.2a. Volumes of the buffer and the enzyme at various concentrations used in the experiment.
Enzyme concentration
(mg cm"3)Buffer(cm3)
Enzyme(cm3)
0.001 3.88 0.020.002 3.86 0.040.003 3.84 0.060.004 3.82 0.080.005 3.90 0.10
Enzyme preparation contained 5% dry matter.
5.2.4.2 Optimum reaction conditions
pH
Citrate-buffer solutions (3.9 cm3) of pH 2.4, 3.0-7.0 were each mixed with 6.0 cm3 galactomannan substrate (4.0 mg cm"3) and 0.1 cm3 of the enzyme preparation. The mixture was incubated at 40°C for 4.0 h and the flow time measured.
Temperature
Several temperatures (10, 20, 40, 60 and 80°C) werechosen in determining the optimum temperature for the enzyme reaction. At each temperature, 6.0 cm3 galactomannan substrate was mixed with 3.9 cm3 citrate-phosphate buffer pH 4.0 followed by 0.1 cm3 of the enzyme preparation. The solutions were incubated for 4.0 h at the respective temperatures and their flow time measured. The flow time for water at each temperature was also measured. Enzymic activity was calculated as: % reduction inspecific viscosity divided by incubation time.

99
5.3 RESULTS
5.3.1 Evaluation
The release of soluble carbohydrate from pkc.The soluble carbohydrate released from pkc incubated
with the enzyme preparations, dilute and concentrated, from potato dextrose and pkc media are shown in Table 5.3a. None of the enzyme preparations from the potato dextrose cultures released any carbohydrate from the pkc sample. Significant amounts of soluble carbohydrate were released from pkc incubated with the enzyme preparation from pkc media. The carbohydrate released was 4.35% and6.3 5% for the dilute and concentrated enzyme preparations respectively. The soluble sugars present in dilute enzymes from both media were quite high as compared to the concentrated enzymes.
Table 5.3a. Carbohydrate released from pkc incubatedwith dilute and concentrated enzyme preparations from potato dextrose and pkc-Expressed as % of pkc.
Substrate Concentration
Pkc + enzyme
Enzymecontrol
Pkccontrol
Netincrease
PD dilute 3.50 1.55 2.65 -0.05 +0.002Cone. 1.40 0.00 1.25 0.15 +0.002
Pkc Dilute 21.25 15.50 1.40 4.35 +0.140Cone. 8.50 1.00 1.15 6.35 ±0.083
PD= Potato dextrose, Conc.= Concentrated ± indicates standard deviation.

100
Reduction of viscosity of soluble guar galactomannan.
The specific viscosity of soluble guar galactomannan incubated with the concentrated enzyme preparations from potato dextrose and pkc media, and their controls are shown in Table 5.3b. There was almost no reduction in specific viscosity for guar galactomannan incubated with the enzyme preparation from potato dextrose medium. On the other hand, a large reduction was associated with the enzyme preparation from pkc medium. The specific viscosity was reduced from 2.57 (control:substrate alone) to 0.24 (substrate + buffer + enzyme) in 4 h. The other control (boiled enzyme) also showed a decrease in specific viscosity (1.08).
Table 5.3b. Specific viscosity of galactomannan incubated at 40°C for 4 h with concentrated enzyme preparations from potato dextrose and pkc media and their controls.
Media Substrate(control)
Boiled enzyme (control)
Active enzyme
PD 2.57+0.08 2.56 ±0.02 2.51 ±0.09Pkc 2.15 +0.01 1.08 ±0.01 0.24 ±0.01
PD= Potato dextrose± indicates standard deviation

101
5.3.2 Characterisation
5.3.2.1 Type of action by the enzyme
Pkc hydrolysis
The release of mannose and a small quantity of galactose were detected on the paper chromatogram (Fig. 5.3a). The amounts released were assumed to be less than the standard as the spots on the paper were lighter than those of the standards. There was no sugar released from the control (pkc incubated without the enzyme).

102
Fig. 5.3a. Paper chromatogram showing mannose and galactose released from pkc incubated with R . oryzae enzyme preparation. Column (A) represents standard, column (B) represents the control and (C) represents the hydrolysed pkc.

103
Guar galactomannan hydrolysis
There was no detectable sugar released from guar galactomannan hydrolysed with R . oryzae enzyme preparation.
The effect of R. oryzae enzyme concentration on the viscosity of galactomannan substrate.
The specific viscosities and the ratio (s.v. treatment/s.v. control) of guar galactomannan incubated with different concentrations of Rhizopus enzyme preparation at 45°C for 4 h are shown in Table 5.3c. Increasing enzyme concentrations resulted in a reduction in specific viscosity and s.v. ratio values. The ratios levelled off at an enzyme concentration 0.003 mg cm-3 (Fig. 3b).
Table 5.3c. The specific viscosities and the s.v. ratio of guar galactomannan incubated with different concentrations of Rhizopus enzyme preparation at 40°C for 4 h.
Concentrations (mg cm-3)
Specificviscosity
S.v. ratio
Control 10.83 ±2.610.001 4.80 ±0.61 0.44 ±0.040.002 3.84 ±0.45 0. 35 ±0. 030.003 3.40 ±0.44 0.31 ±0.020.004 3.33 ±0.45 0.31 ±0.030.005 3.24 +0.33 0.30 +0.04
+ indicates standard deviation of the mean.

S.v.
R
atio
104
1.10
1.00
0.90
0.70 S.v. ratio
0.50
0.40
0.30
0.20
0.000 0.001 0.002 0.003 0.004 0.005
Concentration
Fig. 5.3b. E f f ec t on V i s c o s i t y Rat i o of Guar G a i a c t o m a n n a n i n c u b a t e d wi th D i f f e r e n t C o n c e n t r a t i o n s of R. o r yz ae Enzyme P r e p a r a t i o n at 45 C fo r 2 h. E r ro r bars r e p r e s e n t S t a n d a r d Er ro r .
■{•M

105
5.3.2.2 Optimum reaction conditions
pH
The specific viscosity (s.v.) and s.^ratio (s.v. of V treatment/s.v. of control) of galactomannan substrate incubated with different Rhizopus enzyme preparations at different pH levels incubated at 40°C for 4 h are shown in Table 5.3d. The s.v. ratio was used here because some variations in the s.v. of the galactomannan controls with pH was expected and was in fact found.
Table 5.3d. The s.v. and s.v. ratios for galactomannan incubated with Rhizopus enzyme preparation at 40°C for 4 h at different pH levels.
PH Control Treatment Ratio
2.4 8.70 ±0. 67 7.47 ±0.96 0.86 ±0.313.0 7.24 ±1.69 5.31 ±1.01 0.73 ±0.244.0 7.44 ±1.32 2.68 ±0.49 0.36 ±0.115.0 6.57 ±1.68 2.33 ±0.42 0.35 ±0.116.0 8.52 ±0.24 4.11 ±0.67 0.48 ±0.067.0 6.77 ±1.20 5.87 ±0.16 0.87 ±0.14
S.v. = Specific viscosity + indicates standard deviation
The effect of pH on Rhizopus enzyme activity measured by specific viscosity ratio (s.v. of pH level/s.v of the control) is shown in Fig. 5.3c. The activity decreased rapidly at pH higher than 5 and lower than 4.

S.v.
R
atio
106
0.90
0.80
0.70
0.60
0.50
0.40
0.30
0.98x + Q.1Cx*2
a S.v. Ra t i o
pH
Fig. 5 .3c . E f f ec t of pH on Enzyme A c i t i v i t y as R e f l e c t e d by S.v. Ra t i o of G a l a c t o m a n n a n I nc ub a t e d w i th R. o r v z a e at 4 0 ° C f o r 4 h. Er ro r ba rs r e p r e s e n t the s t a n d a r d e r r o r . The c u r v e was c o n s t r u c t e d by C r i c k e t Graph .

107
Temperature
The specific viscosities of galactomannan substrate incubated with Rhizopus enzyme preparation at pH 4.5 for 4 h at different temperatures are shown in Table 5.3e. The effect of temperature on Rhizopus enzyme activity measured by s.v. ratio (s.v. treatment/s.v. control) is shown in
Fig. 5.3d.
Table 5.3e. The specific viscosities and the ratio (s.v. treatment/s.v. control) of galactomannan substrate incubated with Rhizopus enzyme preparation atdifferent temperatures for 4 h.
Temperature(°C)
Control Treatment S.v ratio
10 11.55+0.19 2.25+0.48 0.19 ±0.0720 11.65+0.63 2.15+0.49 0.18+0.0940 10.88+0.52 2.78+0.21 0.26 +0 .0660 7.13+1.09 6.70+1.08 0.94 +0.2380 2.60 +0.21 2.55+0.49 0.98 +0.19
+ indicates standard deviation the mean of 3 replicates

S.v.
R
atio
108
1.00
0.90
0.80
0.70
0.60
0.50
0.40
0.30
0.20
0.10
807010 6020 30 40 50
Temperature
Fig. 5.3d. E f fec t of Temperature on Enzyme Ac t i v i t y as Ref lec ted by S.v. Rat io f rom Galactomannan Incubated wi th R. oryzae for 4 h at pH 4.5. Er ror bars indicate standard er ror .

109
5 . 4 D IS C U S S IO N
The sole fungus isolated from the rotting pkc was identified by the Commonwealth Mycological Institute, Kew, U.K. as Rhizopus oryzae. An example of a Rhizopus sp. is illustrated by Von Arx (1974) as in Fig. 5.4a.
Detailed information on the taxonomy of this fungus is given by Inui et al. (1965). They cited other authors who stated that the fungus shows good growth in the temperature range 2 0-3 0°C at pH 6.8 and poor growth at 10°C and pH 7.7-8.1.
Fig. 5.4a. Rhizopus stolonifer Showing Stolons,Rhizoids, and Sporangia of Young, Ripe and Empty Stage.

110
The fungus is common and has been used for the production of other enzymes. Production of polygalacturonase by R. oryzae using orange finishing pulp as carbon source was conducted at 25°C for 5 days (Hart et al., 1991). The optimal temperature for amylase production by R . oryzae grown on agricultural commodities is 30°C (Yu and Hang, 1990; Seaby et al., 1988). The conditions employed for the culture of R. oryzae in this study were very similar to the optimal growth conditions described above.
The production of enzymes with mannanase activity from fungus grown on pkc medium but not on potato dextrose indicates that the enzymic activity was influenced by the carbon source. Catalytic microbial enzymes which attack exogenous substrates are inducible by specific compounds structurally related to the enzyme's substrate or reaction products (Cooper, 1977). Cell wall polysaccharides are insoluble and require basal levels of constitutive enzyme synthesis to depolymerise them and provide the soluble inducers for the synthesis of catalytic enzymes (Bull, 1972) . Monosaccharides released or already present may act as natural inducers for the production of the enzymes (Albersheim et al., 1969). Fungus grown on mannan-rich carbon source was found to produce enzymes with very high mannanase activity (Torrie et al., 1990). Reese and Shibata (1965) stated that mannanases from Aspergillus giganteus were inducible by the substrate but probably the induction was by mannose. The influence of carbon source on the production of cellulase enzymes by Trichoderma

Ill
harzianum was reported by Mes-Hartee et al. (1988). Similarly, the production of cellulolytic enzymes by Trichoderma reesei was affected by the carbon sources involved (Knapp and Legg, 1986).
The fungal culture filtrate showed moderate activity in reducing viscosity of guaran without release of monosaccharide, which would normally indicate an endo- 13 (1,4)-D-mannanase (Fogarty and Kelly, 1983; Whitaker, 1972) . This activity was concentrated 50% by ammonium sulphate precipitation.
The activity of the enzyme as reflected by specific viscosity ratio, increased as the concentration increased and plateaued at 0.003 mg cm-3 protein.
The enzyme preparation solubilised carbohydrate from PKC, although much higher concentrations were needed than for activity against guaran in solution. Paper chromatography showed that the main low-MW constituent released was mannose. Presumably the mannose was released by exo- mannanase activity present at too low concentration to have a detectable effect on guaran. The activity of the Rhizopus mannanase system against highly crystalline PKC mannans was in contrast to most other fungal enzyme preparations tested, which were highly active against guaran but either released no soluble carbohydrate from PKC without prior alkali treatment or attacked only its minor cellulose component (Olivex). Driselase, however, was active against both guaran and PKC. The results with guaran also suggest that the culture filtrate is an unbalanced enzyme source for mannose production with too

112
much endo-mannanase and not enough exo-mannanase or B- mannosidase: but this is not true on pkc because the endo enzyme was so much less active on the solid substrate.
Paper chromatography of degradation products from guaran showed no detectable mannose, galactose or manno- oligosaccharides at a viscosity reduction of 70% (sensitivity limit 10 /xg g”1 guaran approx.) confirming that the viscosity reduction was not due to an exo-enzyme or galactosidase.
The enzyme to substrate ratio used in releasing soluble sugars from pkc was high (100 mg of protein to 200 mg of pkc) which is not a commercial dose. Typical commercial enzymes are used at between 1.0-10 mg g”1.
The optimum pH for the R. oryzae enzymic activity asreflected by the specific viscosity ratio was 4.5. Theactivity declined sharply as the pH fell below 4 andincreased above 5.
The enzyme was most active at temperatures of less than 40°C. The optimum temperature of 20-30°C seems to be a reasonable assumption from Fig. 5.3b. The activity as reflected by the specific viscosity ratio fell steeplyfrom 40°C to 60°C and plateaued thereafter.
5.5 CONCLUSIONS
The fungus isolated from rotting pkc was confirmed as Rhizopus oryzae. The culture of the fungus was conducted under optimum conditions similar to those employed by
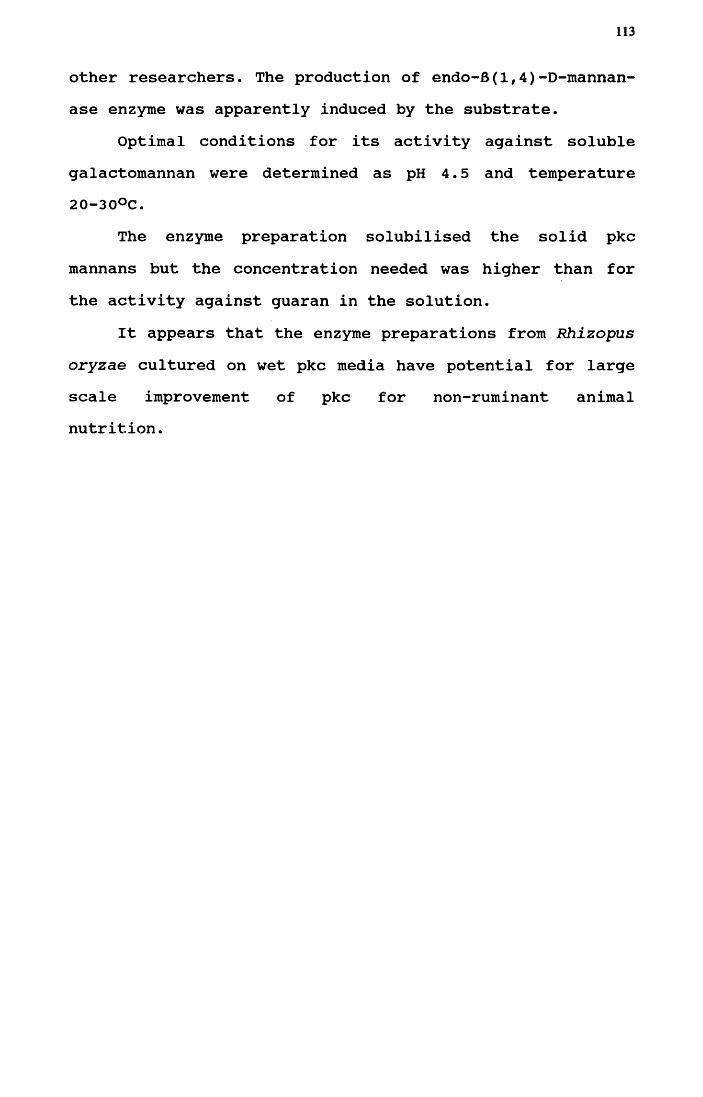
113
other researchers. The production of endo-B(1,4)-D-mannan- ase enzyme was apparently induced by the substrate.
Optimal conditions for its activity against soluble galactomannan were determined as pH 4.5 and temperature 20-30°C.
The enzyme preparation solubilised the solid pkc mannans but the concentration needed was higher than for the activity against guaran in the solution.
It appears that the enzyme preparations from Rhizopus oryzae cultured on wet pkc media have potential for large scale improvement of pkc for non-ruminant animal nutrition.

CHAPTER 6FEEDING EXPERIMENTS
6. 1 INTRODUCTION
Basically this chapter deals with the biologicalevaluation of raw pkc and pkc treated with commercial enzymes for nutritive value improvement. The nutritive values of pkc are reflected in the growth performance of the birds, its digestibility and ME values. In oneexperiment with geese, a possible alternative species in utilizing pkc, only the ME values were determined.
Eight commercial enzymes were evaluated for theirability to degrade palm kernel cell walls. The enzymes were received from the suppliers in batches. Evaluation of them was conducted immediately after their arrival. Olivex, on the basis of viscometry, was found to be the most promising enzyme in the first group and was chosen for large scale treatment of pkc. Energex was selected in the second batch, based on viscometry and soluble sugar measurement. Finally, Driselase was found to be the most promising commercial enzyme evaluated, based on its ability to hydrolyse carbohydrate from pkc.
A total of four feeding experiments were conducted. Two were conventional feeding trials and the other two were ME determinations. Feeding trials were conducted on 7-days old chicks fed with diets containing pkc treated with Olivex and on diets containing pkc treated with Energex. ME
determinations were carried out on raw pkc fed to geese and

115
on pkc treated with Driselase fed to adult cockerels. Geese were selected for evaluation based on their ability to utilize forages, with the prospect of utilizing pkc without enzymic treatment.
The feeding trial on Olivex was carried out at the Scottish Agricultural College, Ayr. The ME determination for pkc treated with Driselase was conducted at Roslin Research Institute, Edinburgh. Both the feeding trial on Energex and the ME determination for pkc on geese were conducted at MARDI, Serdang , Malaysia.
6.2 MATERIALS AND METHODS
6.2.1 Feeding trial on diet containing pkc treated with Olivex
Source of materials
Pkc was supplied by BOCM Silcock Ltd and Olivex enzyme was a gift from Novo Nordisk Bioindustries, U.K. Ltd (refer to Chap. 4) . The pkc was ground in a hammer mill fitted with 2 mm diameter sieves.
Treatment of pkc and preparation of diets
The pkc (5 kg) was treated with 10 1 of 2.5% Olivex enzyme overnight at room temperature. The mixture was evaporated to ca 10% moisture with hot air. The dry product, which will be referred to as PKCe, was stored at room temperature before mixing with a basal diet.

116
Another 5 kg of the pkc was soaked in 5 1 1% NaOH for 5 nights followed by overnight treatment with 10 1 of 2.5% Olivex enzyme at room temperature. The mixture was evaporated with hot air to about 10% moisture and stored as above. This product was referred to as PKCjja+e .
A typical broiler starter diet containing 20% soybean meal and salt was formulated. The ingredients and the chemical composition of the diet are listed in Table 6.2a. This diet was used for the control group.

117
Table 6.2a. Ingredients and chemical composition of control chick starter diet (g kg”1).
IngredientWheat 567.0Maize 73.6Maize gluten meal 39.3Soybean meal 200.0Fish meal 75.5Meat and bone meal 21.8Maize oil 15.5Salt 1.8Methionine supplement 0.5Vitamin and mineral 5.0ilculated compositionME (MJ kg"1) 12.7Crude protein 240.0Digestible protein 188.7Calcium 9.0Phosphorus 5.5Linoleic acid 16.0Sodium 1.5Ether extract 32.0Crude fibre 23.1Methionine 4.9Digestible methionine 4.3Cysteine 3.8Digestible cysteine 3.0Methionine + cysteine 8.5Dig. Methionine + cysteine 7.3Lysine 11.5Digestible lysine 9.9Tryptophan 2.5Digestible tryptophan 2.1Arginine 13.3Digestible arginine 11.3Histidine 5.5Digestible histidine 4.6Isoleucine 10.0Digestible isoleucine 8.5Leucine 18.9Digestible leucine 16.0Tyrosine 7.9Digestible tyrosine 6.5Phenylalanine 0.6Digestible phenylalanine 9.0Threonine 8.7Digestible threonine 6.7Valine 11.6Digestible valine 9.3

118
Four experimental diets or treatments were prepared for this experiment. The control diet (treatment 1) was prepared using the formula in Table 6.2a. The basal diet was prepared by the same formula without soybean meal and salt. The basal diet (80%) was mixed with 20% of either untreated pkc (PKC), enzyme treated pkc (PKCe) or alkali+enzyme treated pkc (PKCjja+e) to form treatments 2, 3, and 4 respectively. The compositions of the diets are
shown in Table 6.2b. The permissible amount of sodium in the diet limited the concentration NaOH that can be used. The amount of electrolytes in each diet was standardised to that of the control (Diet 1) by topping up with the equivalent amount of salt (NaCl). Calculation for the electrolytes and the amount of salt to be added is shown in Table 6.2c.
Table 6.2b. Percentage composition of experimental diets.
Items1
Diets2
(Treatments)3 4
Basal 80 80 80 80Soybean meal 20 - - -
PKC - 20 - -
PKCe - - 20 -
PKCNa+e - - - 20Salt (g kg’1)3 6 6 5
a refer to Table 6.2c.

Table
6.2c.
Amount
of electrolytes
availabile
and
amount
of sal
t to
be added
to eac
h die
t to
standardise
with
die
t 1
in Olivex
expe
rime
nt.
119
in
inCM CN CM
CMCM
CMCM
m
inin mCMCM CMCM CN
in
t—ICMo>m inrH
in rnCM cn
CMCMCN CNCN
CM
<T>CN
cn
cnCM
CM
CMin
CN cnCM(Sen
CN
rH
in ininCN
CNCM
in

120
Experimental design and layout
Day-old female Ross 1 broiler chicks from D. B. Marshall Hatchery, Whitburn, Scotland were subjected to the control diets for 8 days. After culling the unfit birds, the remaining chicks were divided into four groups of 20 birds each. The treatments were randomly assigned to a pattern of treatment positions in a latin square design (LSD). The treatment positions were arranged in the pattern shown in Table 6.2d.
Table 6.2d. Pattern of the treatment positions in the LSD
ReplicationPlot
1 2 3 4
1 A B C D2 B C D A3 D A B C4 C D A B
The result of the randomisation was translated into plots. In this experiment the plots were the cages for the birds receiving the respective diets (Fig. 6.2a). The time schedule of the feeding trial activities is shown in Fig. 6.2b.

121
*'199!If«9 'MlpSSI!ll (HII llL''t H l l I t I t M
Fig. 6.2a. Experimental plots with 20 chicks in each one of them.

122
Hours 0 2 4 6 8 10 12 14 16 18 20 22 24 Rep
T0Day 1 <--------------Tl
Day 2 > <----------------------- 1Day 3 1
Day 4
Day 5 > <----------------------- 2Day 6 2
Day 10
T2 T0
Tl
t2 T0
Tl
t2 T0
Tl
Day 7
Day 8 > <--------------------- 3Day 9 3
Day 11 > <--------------- 4Day 12 4
T2 4Day 13 >
T0 — Start of new diet; — Beginning of data collection; T2 — End of data collection.
Fig. 6.2b Time schedule of the feeding trial activities.
Excreta collection
A clean aluminium tray was placed under each cage for total excreta collection for a period of 48 h (T^ - T2) as shown in Fig. 6.2c, i.e from 24 h after starting the new
diet to the end of the feeding of that particular diet in each replicate. Any spilled diet, scurf and feathers were

123
Fig. 6.2c. Excreta collected on an aluminium tray.

124
vacuumed off from the tray. The excreta collected were diluted with water, homogenised and the total weight recorded. Samples of the homogenised excreta were frozen at -2 0°C, freeze-dried and stored.
Feed intake
Feed intake was measured by total feed given during the actual data collection period (T^ -T2) minus theresidue.
Chemical analysis
Both feedstuffs and experimental diets as well as the faeces collected were analysed for dry matter, gross energy and nitrogen content at the Biochemical Sciences Department, the Scottish Agricultural College, Ayr.
Data analysis
The data were used to calculate nitrogen corrected apparent metabolisable energy (AMEn) and percentage digestible protein. The procedure for AMEn calculation was described by Sibbald (1979) as follows:
[(Fi x GEf) - ( E x GEe)] - (NR x K)AMEn g"1 of feed = ------------------------------------
Fiwhere, NR = (F^ X Nf) - ( E X Ne) ; Nf of nitrogen g”1 offeed (g); Ne is the nitrogen g"1 of excreta (g); and K is a constant, 34.4 kJ.
The percentage nitrogen retention (NR) was calculated using the formula below:

125
(Food eaten x % dietary N)- % Nitrogen (excreta N)retention ------------------------------ — -----
(Food eaten x dietary N)
The calculated values were statistically analysed and the means compared by Duncan*s New Multiple Range Test
(DNMRT) using a SAS package.
6.2.2 Feeding trial on diet containing pkc treated with Energex
Source of materials
Pkc was obtained locally. Energex, a product of Novo- Nordisk was a gift from Enzyme Techniks, Malaysia.
Treatment of pkc and preparation of diets
Pkc samples (A,B,C,D,E) of 5 kg each were weighed into separate 10 dm3 buckets. Sample A (referred as PKC) was kept for mixing with basal diet.
Samples C,D and E were treated with 5 dm3 of 1.0% NaOH for 5 days. Two of the treated samples (C and D) were dried in an oven at 60°C for 3 days and stored at room temperature.
Sample B was treated with 5 dm3 of 1.0 mg cm“3 Energex (referred as PKCe) while the wet alkali treated
sample (E) had 5 g Energex added (referred to as PKCjja+Ed) • Both samples were oven dried at 60°C for 3 days to reduce the moisture content to about 10%. The dried alkali treated sample (D) was thoroughly mixed with 100 cm3 water to wet the sample followed by addition of dried Energex. The

126
sample was air dried overnight before mixing with basal ration. This alkali pretreated pkc with the enzyme added
was referred as PKCjja+Ei*A complete formula for a starter ration was prepared
as in Table 6.2e. A basal diet totalling 50 kg with 20% less of the maize component was also prepared.
Table 6.2e. Formulation of chick starter diet as control in Energex feeding experiment.
Ingredient %
Maize 43.42Soybean meal 44.28Fish meal 10.00Palm oil 1.87DL-methionine 0.13Choline chloride 0.20Premix 0.10Total 100.00Additive
Coccidiostat, ppm 50.00Terramycin (TM-100), ppm 50.00
As well as the control, experimental diets comprising the basal diet with either untreated pkc or one of the treated pkc preparations, substituted for 2 0% of the maize component, were prepared. The compositions of the experimental diets are shown in Table 6i3f below:

127
Table 6.2f. Composition of the experimental diets (%)
Component1 2
/■
Diet 3 4 5 6
i -
Basal 80 80 80 80 80 80
Maize 20 - - - - -
PKC - 20 - - - -
p k c £ | e - - 20 - - -
PKCNa - - - 20 - -
PKCNa+Ei - - - - 20 -
PKCNa+Ed - - - - - 20Salt (g kg”1) 30 30 30
Experimental design and layout
A total of 120 one week old male ORGA chicks were divided into six groups and placed in six different cages. The treatments were randomised in the treatment positions in a 6x6 latin square design as shown in Table 6.2g.
Table 6.2g. Layout of treatment positions in a 6x6 latin square design.
A B C D E FB C D E F AD E F A B CC D E F A BE F A B C DF A B C D E

128
The experimental diets and water were given to all groups ad libitum. For each experimental period the following data were collected: initial weight, finalweight, feed intake and excreta output for a period of 2 days following an adaptation period of 1 day. The experimental schedule was similar to that of 6.2.1 except it was longer by 6 days or 2 experimental periods. Collection of excreta and measurement of feed intake were
carried out similarly to 6.2.1 above.
Chemical analysis of feed and excreta
a) EnergyThe gross energy contents of excreta and feed samples
were measured in an adiabatic bomb calorimeter (PARR model 1241 oxygen bomb calorimeter).
b) NitrogenNitrogen contents were measured by the Kjeldahl
method, using Tecator Digestion system model DS 2 0 followed by distillation in a Kjeltec System Model 1002 Distilling Unit.
6.2.3 ME values of pkc for geeseThree adult Chinese geese were placed in 3 separate
cages (Fig. 6.2d) and subjected to 3 experimental diets; control, 25% substitution with pkc, and 50% substitution with pkc. The composition of the control diet is shown in Table 6.2h.

129
Fig. 6.2d Individual cages for the experiment with geese.
Table 6.2h. Ingredients and chemicalcomposition of control diet for mature geese (%) .
IngredientBroken rice 43.22Maize 23 . 04Soybean meal 24 .15Palm oil 2 . 00Dicalcium phosphate 1. 63Limestone grit 5. 13Salt 0.30DL-Methionine 0. 18Vitamin and mineral (Trimix) 0. 15Choline Chloride 0.20
Calculated compositionME (MJ kg"1) 12 .40Crude protein 16. 00Crude fibre 2.70Ether extract 3 .96Calcium 2 . 50Phosphorus 0.71Lysine 0.86Methionine + cystein 0. 65

130
Treatments were randomised into treatment positions in a 3x3 latin square design. Following five days adaptation, measurements of feed intake and excreta for a period of 3 days per experimental period were conducted. An adaptation period of 2 days was inserted for each experimental period as the birds took time for adjustment to new diets.
Analysis for moisture, GE and nitrogen were carried at MARDI's laboratory as described in 6.2.2.
AMEn values of the feed were calculated by the above formula in 6.2.2 and ME value of pkc was calculated by the formula below,c o m p a r e with Miller (1974) a n d Hill et al. (1960):
ET = EB + (ED - EB)p
where EB , EB and E«j> are the energy values of the test and basal diets and the ingredient respectively and p is the proportion of the diet represented by the test ingredient.
6.2.4 ME values of pkc treated with Driselase for poultry.
Treatment of pkc
Pkc (350 g, particle size <52 mesh or 0.118 mm) was soaked in 1.5 1 aqueous Driselase solution (10 g kg-1 of pkc sample). About 0.1 cm3 dm”3 toluene was added to the mixture as preservative. The mixture was incubated under shaking condition at room temperature (22°C) for 3 d, oven dried at 60°C to a moisture content of about 10%.

131
Solubility
The solubility of the Driselase treated pkc was determined by soaking 200 mg of the material in water for 4 h at 40°C; the centrifuged supernatant was diluted by lOx and the soluble sugars measured by the phenol-sulphuric
acid method.
ME determination
The ME determination was conducted at Institute of Animal Production and Grassland, Edinburgh Research Station, Roslin, under the direction of Dr J.M. McNab using individually caged adult ISA Brown cockerels. The birds were starved for 48 h, except for administration of glucose, and were tube fed 50 g of pkc directly into the crop. The droppings voided during the subsequent 48 h were collected from trays placed under the cages, frozen at -2 0°C, freeze dried, weighed and ground to pass through a 1 mm sieve. A control group of birds were tube fed 50 g of glucose in order to determine the endogenous energy losses and bacterial contribution (EEL) to the excreta. Birds were given access to water and tube fed water twice during the 48 h collection period. Gross energy of diets and excreta were determined in a Parr Adiabatic bomb calorimeter and true metabolisable energy calculated for each bird from the equation
Energy ingested - Energy excreted + EELTME = ------------------------------------------
Food intake
according to McNab and Blair (1987, cited by Longstaff and McNab, 1987)

132
6.3 RESULTS
6.3.1 Feeding trial on diet containing pkc treated with Olivex
The performance during the 1-3 weeks trial period of the chicks, the AMEn, and crude protein of the diets as well as the % NR retention are summarised in Table 6.3a. Diets with pkc, either treated or untreated, substituted for soybean meal were inferior to the control in terms of weight gain and feed conversion ratio (FCR). The amounts of feed consumed and AMEn of the diets were not significantly different (P<0.05) among the treatments. The control diet had the highest CP but the lowest % NR.
Table 6.3a. Data on performance of chicks fed with experimental diets in Olivex feeding trial.
Treatment WeightGain(kg)
FeedConsumed
(kg)
FCR AMEn (MJ Kg”
CP 1) (%)
NR(%)
1. Control 1.174a 1.714a 1. 46a 11.81 24.88a 53.65a2. PKC 0.756b 1.636b 2.16b 12.17 17.74b 56.61b3. PKCe 0.669b 1.574b 2 . 38b 11.96 17.89b 60.46°4. PKCNa+e 0.757b 1.655b 2.19b 12.34 17.78b 60.42°
Means of the same or no letters in the same column are not significantly different.
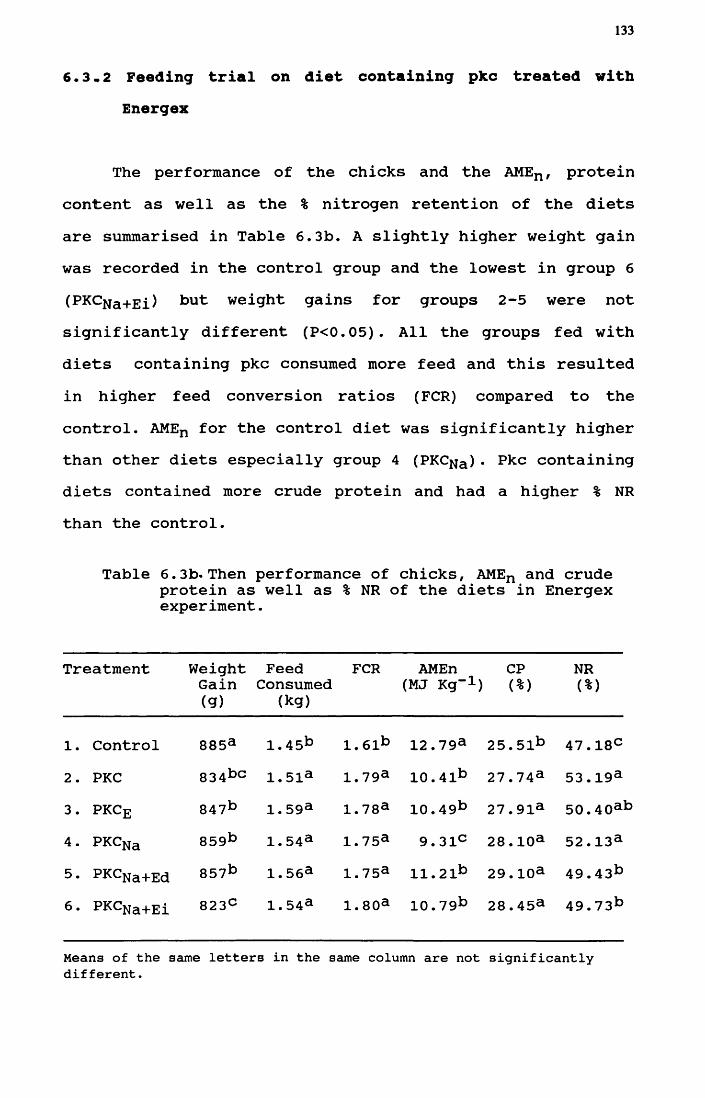
133
6.3.2 Feeding trial on diet containing pkc treated with Energex
The performance of the chicks and the AMEn , protein content as well as the % nitrogen retention of the diets are summarised in Table 6.3b. A slightly higher weight gain was recorded in the control group and the lowest in group 6 (PKCj|a+Ei) but weight gains for groups 2-5 were not significantly different (P<0.05). All the groups fed with diets containing pkc consumed more feed and this resulted in higher feed conversion ratios (FCR) compared to the control. AMEn for the control diet was significantly higher than other diets especially group 4 (PKCjja) • Pkc containing diets contained more crude protein and had a higher % NR than the control.
Table 6.3b. Then performance of chicks, AMEn and crude protein as well as % NR of the diets in Energex experiment.
Treatment WeightGain(g)
FeedConsumed
(kg)
FCR AMEn (MJ Kg"1)
CP(%)
NR(%)
1. Control 885a 1.45b 1. 61b 12.79a 25.51b 47.18c2. PKC 834bc 1.51a 1.79a 10.41b 27.74a 53.19a3. PKCe 847b 1. 59a 1.78a 10.49b 27.91a 50.40al4. PKCNa 859b 1.54a 1.75a 9. 31c 28.10a 52.13a5. PKCNa+Ed 857b 1.56a 1.75a 11.21b 29.10a 49.43b6. PKCNa+Ei 823c 1. 54a 1.80a 10.79b 28.45a 49.73b
Means of the same letters in the same column are not significantly different.

134
6.3.3 HE value of pkc for geese
Metabolisable energy data for diets with three levels of pkc substitution are shown in Table 6.3c. The mean ME value for pkc was 6.50 MJ kg-1.
Table 6.3c ME values of the diets and PKC on geese.
Substitution(%)
ME of diet (MJ kg”1)
ME of PKC (MJ kg”1)
0 14.0725 12.30 6.99 ± 0.2150 10.04 6.01 ± 0 19
Mean 6.50
ME values of the diets are means of three replicates.
6.3.4 ME Values of pkc treated with Driselase for adult cockerels.
Solubility
Data on the solubilisation of carbohydrate from pkc treated with Driselase and the control are shown in Table 6.3d. The soluble sugar released by Driselase was 6.9% as compared to 1.3% in the the control.
Table 6.3d. Soluble sugars released from pkc treated with Driselase as compared to that of the control. (%)
Treatment Soluble sugar (%)
Pkc treated with Driselase 6.9 ±0.19Control (untreated pkc) 1.3 ±0.18
+ indicates standard deviation of the mean.

135
ME determination
The true metabolisable energy (TME) values of pkctreated with Driselase and untreated are shown in Table 6.3e. TME values for treated pkc were higher than theuntreated control but not significantly (P<0.05), asdetermined by a pooled t-test. The difference in the TMEvalues was 7%.
Table 6.3e. TME values of pkc and control (untreated)
treated with Driselase pkc.
Treatment TME (MJ kg”1)
Pkc treated with Driselase 5.53 + 0.27Control (untreated pkc) 5.18 + 0.45% Increase 6.84
+ indicates standard deviation of the mean.
6.4 DISCUSSION
The performance of chicks fed with diets substituted with 20% pkc in place of soybean meal was inferior to the control (unsubstituted). Osei and Amo (1987) reported that inclusion of pkc at 125 and 150 g kg”1 diet reduced growth rate and the efficiency of food utilisation (EFU) of chicks, but other reports suggest that for best broiler growth the dietary pkc inclusion rate should be limited to 200 g kg”1 diet (Gohl, 1981; Ngoupayou, 1984). Inclusion of

136
200 g kg”1 pkc in a poultry diet required supplementation of 90 g palm oil kg”1 for growth to be similar to the control (Yeong and Mukherjee, 1983).
In this experiment with Olivex, soybean meal, a high protein source, was substituted with pkc resulting in a significantly lower crude protein content in the pkc diets but energy contents for all the diets were similar. In the case of the Energex experiment, maize, a high energy source was substituted with pkc resulting in significantly lower energy content of the pkc diets but the protein contents were not significantly different among all the diets.
It seemed that protein content was a contributing factor to the drastically lower performance of the birds in the Olivex experiment and lack of energy was responsible for the slightly lower performance of the chicks in the Energex experiment. It is clear that pkc is not capable of substituting for either soybean or maize directly at the 20% inclusion level without sacrificing performance. This simply means that pkc, even with the various treatments employed, contained insufficient nutrients for such a high level of substitution.
The failure of the the Olivex and Energex treatments to improve the nutritive value of pkc was because the products either were not digested or were not absorbed by the birds. The conditions required for dietary proteins or carbohydrates to be digested or absorbed by poultry were listed by Me Nab (1976) as follows:
1. the digestive tract contains the enzymes necessary for the hydrolysis of the macromolecules;

137
2 . these enzymes can gain access to the potential substrates for reactions to take place;
3. the products of the hydrolysis can be absorbed; and4. the passage time of the ingesta is adequate to
allow hydrolysis and absorption to take place.
Almost the entire carbohydrate content of pkc fails to meet at least one of these conditions. The amount of sugars released in the Olivex degradation (Daud and Jarvis, 1991) was probably too small to have any significant effect in the birds' performance.
The investigation on the ability of geese, a forage- eating bird, as a potential species to utilize pkc did not show any promise. The ME value of pkc 6.5 on geese was merely comparable with that for chickens. Pkc has an ME value of 6.2-8.35 for chickens (Yeong et a., 1982; McDonald et al., 1988 and Panigrahi and Powell, 1991).
Driselase treatment of pkc improved the solubilisation of sugars from the material. This indicates that the crystalline carbohydrate macromolecules, mannan and possibly cellulose, were broken down to simpler sugars. In this experiment both solubility and feeding value were measured on the same material. A positive effect of a commercial enzyme incubated with several ingredients including palm kernel meal on the sugar production was reported by Van Beek (1991).
The 7% increase in the ME value due to Driselase treatment correponded with soluble sugar increase but was too small to be significant, indicating that this enzyme is

138
not very effective in degrading pkc into sugars that can be absorbed and metabolised by poultry. Suga et al. (1978) reported an improvement in the performance of chicks fed diets supplemented with Driselase. The ability of Driselase to degrade plant materials was reported by Noguchi et al., 1978; McCleary, 1988). However, Goh et al. (1982) reported that chicks fed with rations containing either wheat or rapeseed supplemented with Driselase showed no improvement in performance. Perhaps the products of wheat and rapeseed treated with Driselase were not absorbed by the chicks. The anti-nutritional effects of pentosans or arabinoxylans are the primary concern in feeding wheat to chickens (Graham,1991). The pentosans of wheat apparently have an antinutritive activity when present in broiler diets and similar polysaccharides may influence the nutritive value of other cereals (Choct and Annison, 1990). Solubilisation of pentosans requires an enzyme preparation that contains pentosanase (Pettersson and Aman, 1989) which might be lacking in Driselase. The breakdown of glucosinolate, an anti-nutritional compound, from rapeseed by commercial enzyme was reported by March et al. (1973); Marangos et al. (1974); Goh et al. (1982). Pkc has not been reported to contain any such anti-nutritive compounds as are present in wheat and rapeseed. The fact that Driselase is not very effective in improving the nutritive value of pkc is probably due to the problems of absorption or metabolism of the sugar produced which require require further investigation. The possibility of the small amount of xylan

139
present in pkc as an antinutritive factor should not be ruled out.
6.5 CONCLUSIONS
Pkc was not capable of replacing as much as 20% of either maize or soybean meal in poultry rations without affecting the birds' performance. Energy was the limiting factor in maize substitution and protein in soybean bean substitution.
The improvement in the sugar solubilisation from pkc treated with Driselase is proof that degradation of pkc carbohydrate by enzymes is possible. However it was not effective enough to improve the nutritive value of pkc significantly. Increase in nutritive value would be facilitated by improving the knowledge of the mode of action of relevant enzymes in degrading the mannan of pkc so that a specific enzyme can be applied under optimum reaction conditions.
The low ME value of pkc for geese proved that they are no better than chickens in their ability to utilize the material. Therefore, feeding of pkc in treated form to this species should be explored.

CHAPTER 7GENERAL DISCUSSION
Research on pkc as poultry feed has been conducted mainly on the basis of economic performance indicators such as growth effects, feed efficiency (Broz and Frigg, 1986; Onwudike, 1986), and digestibility (Graham et al., 1988; Mes-Hartree et al., 1983; Ongbona et al., 1988; Nwokolo et al., 1977). The only explanation offered for the low digestibility of the material has been the 'fibre1 content.
Pkc is a tropical product and has not been not extensively studied compared to temperate plant products. Little was known about the nature of pkc fibre at the beginning of this study, therefore it was difficult to define specifically the treatments needed to enhance breakdown.
Attempts to improve the nutritive value of the material have been mainly by trial and error, resulting in little or no success. Palm kernel meal treated with 3, 5and 7% sodium hydroxide reduced the ME content from 2.56 to 2.07, 1.95 and 1.30 kcal g"1 (Nwokolo et al., 1976).Suan et al. (1989) reported a slight improvement in the crude protein content of pkc cultured sith Trichoderma reesei QM 9414. A small release of glucose from pkc pretreated with NaOH followed by overnight incubation with Olivex enzyme was found in the present study (Chap. 4).
The approach used to improve the nutritive value of pkc in this study was to concentrate on enzymic treatment.

141
Knowledge of the nature of pkc was necessary for the purpose of choosing enzymes to break down the fibre.
Using both HPLC and 13 C NMR the composition and structure of the polysaccharides in pkc cell wall were determined. At the same time Dusterhoft et al. (1991) were also working on pkc cell wall characterisation. Both sets of results were published almost simultaneously. Both groups concluded that B (1,4)-D-mannan was a major component of pkc, along with a smaller cellulose fraction. The mannan appeared to be crystalline (Daud and Jarvis,1992). A small amount of xylan present was derived from the endocarp (Dusterhoft et al., 1991). Similar structural features have been reported in other palm species (Aspinall et al., 1953; El Khadem and Sallam, 1967). The coconut mannan is more substituted than pkc mannan (Saittagaroon et al., 1983). Mannanase is required to break down pkc mannan.
Mannan of high crystallinity is insoluble (McCleary, 1988) and would not be expected to be depolymerised in the poultry digestive system. Saccharification of the material would be required before it could be solubilised and absorbed through the gut wall of the fowl. Adams (1989) listed two basic ways in which polysaccharide-degrading enzymes can be used in animal nutrition. Firstly, they can be used during the production of animal feeds as an integral part of the manufacturing process. Secondly they can be used as feed additives to help the animal obtain better value from its feed. The procedure used in this study belongs to the first category. The use of enzymes in

142
feed as feed additives to assist the animal in digestion has also been studied in recent years. Extensive research suggests that negative characteristics of barley related to B-glucans (Hesselman and Aman, 198 ; Campbell et al.,1987) and similar characteristics of rye (Fengler et al.,1988) can be alleviated by the use of crude enzyme preparations. Rotter et al. (1989) listed several reasons for adding enzymes to animal feeds:
1. to increase the bioavailability of non-fibre polysaccharides (starch) and proteins;
2. to break down materials (B-glucans, pentosans) with specific antinutritional properties and, consequently, increase the value of poor quality feeds;
3. to break bonds in materials (fibre polysaccharides) not usually degraded by the natural enzymes in the animal, thus releasing more nutrients.
If third of these objectives is fulfilled for pkc, diets which are considered to be low in energy can be converted into higher energy feeds. As a result, the cost of animal feeds can be reduced and more material made available locally for inclusion in animal feeds.
Whatever option is chosen, the development of a mannan degradation system requires specific information on the mode of action of any enzyme involved. A method for determining the specific subsite binding requirements for hydrolysis of galactomannan was described by McCleary and Matheson, 1983. Hydrolysis of galactomannan and galac- toglucomannan is affected by the degree and pattern of

143
substitution of the main chain by a-D-galactosyl residues (McCleary, 1979) and the pattern of distribution of D- galactosyl residues within the main chain (glucomannan and galactoglucomannan). In glucomannan, the pattern of distribution of O-acetyl groups may also affect the susceptibility of the poysaccharide to hydrolysis. These considerations would not apply to linear mannans, but McCleary (1988) added that insoluble, crystalline mannan is quite resistant to hydrolysis. Much effort has been devoted to the study of the degradation of the mechanisms of lignocellulose materials (Coughlan, 1989). Wood (1985) stated that many cellulases solubilise the amorphous portion of cellulose but only a few appear to have the capacity for solubilising the most highly ordered crystalline areas. He added that the rapid dissolution of native cellulose requires the independent and co-operative action of a mixture of enzymes. However, the specific mechanism of a mannanase active on solid mannan has yet to be reported.
When it was decided to concentrate on the mannan, soluble guar galactomannan was chosen as a substrate in the enzymic study. Commercial enzymes that showed good mannanase activity on guaran were assumed to be active on pkc mannan. This assumption was proved wrong when the enzymes failed to degrade the mannan effectively.
Slight degradation of pkc by Olivex was used as the basis for conducting the first feeding trial.
A similar explanation may be valid for the nonsignificant improvement in the performance of chicks fed

144
diets containing pkc treated with Energex. Although this enzyme has been recommended for inclusion in poultry feed containing high fibre grain, the enzyme has never been tested on diets containing pkc. The improvement observed (Table 6.3b) in the performance of chicks consuming diets containing fibre-rich grains supplemented with Energex may not imply that a positive result would be produced on a
diet containing pkc supplemented with the same enzyme. The poor performance of chicks was probably because of poor release of sugars from polysaccharides.
Both feeeding trials confirmed the earlier findings that pkc cannot replace either maize or soybean meal in poultry diets up to as much as 20% without sacrificing performance in the chicks. This applies to both treated and untreated pkc. Therefore, the recommendation to supplement high pkc diets with palm oil to improve the ME value (Yeong and Mukherjee, 1983) should not be disputed.
A more thorough investigation was conducted in connection with the Driselase experiment. The use of NaOH pretreatment may not be a practicable alternative and Driselase require no pretreatment. The products from pkc degraded with the enzyme were tested for solubilisation before determining the ME value by the total collection method. The 7% net solubilisation was encouraging enough to anticipate a small improvement in the ME value. Although the improvement in ME corresponded to the solubilisation figure, it was not significant. This may be attributed to several reasons. First, the soluble sugars released may not have been abundant enough to show any

145
significant effect. Secondly, the carbohydrate released may not have been absorbed by the fowl. It is possible that not all of the carbohydrate released was monosaccharide because the mannanase in Driselase is an endo-enzyme (McCleary, 1988).
Thirdly, there may be an antinutritive factor involved. Pkc contains a small amount of arabinoxylan (Dusterhoft et al., 1992). Arabinoxylans (pentosans) are responsible for inferior productive value in rye (Fengler et al., 1988). The fibre in pkc is totally different from the fibre in all the cereals tested.
All the enzymes evaluated above were not specifically prepared for pkc degradation. Most of them are crude enzyme preparations that include cellulase activity. The range of enzymes produced by a fungus is related to the medium on which the fungus is cultured. It is possible that all the enzymes contain cellulase activity since cellulose is present in all plant cell walls that may have been used as carbon sources in the preparation of the enzymes (Adams, 1989) . It is not surprising that they contain no activity against pkc mannan which is a different substrate. Therefore, the study conducted on the enzyme extracted from Rhizopus oryzae fungus isolated from rotting pkc was appropriate.
The hypothesis the fungus would produce a mannanase was right. The fungus grown on pkc medium produced an enzyme mixture with high mannanase activity against both guaran and pkc media. The mannanase exhibited the endo type of activity like those described by McCleary, 1988.

146
The sugars hydrolysed from pkc by the enzyme preparation from the fungus were determined. A high concentration of the enzyme was required for the release of mannose, the intended product. Not enough Rhizopus mannanase was available for a feeding trial but it seemed the most promising of the enzymes tested. This prompted me to determine the optimum conditions for degradation to facilitate continuation work in MARDI. Subsequent enzymic treatments on pkc for nutritive value improvement will be based on these experiments..
Chemical modification or genetic manipulating of the mannan structure to improve its solubility was given serious thought at the beginning but it seemed to deserve a separate study in itself. A good coverage of the literature on the disordering of molecular structure for enzyme attack has been given by Barker (1983). The highly substituted galactomannans are water soluble: presumablythe galactosyl substituents effectively prevent the self- association of the main chain to give crystalline aggregates (Reid, 1985).
The increased importance of biotechnology has brought along new methods for producing, characterising and using enzymes. This is also reflected in the research on the use of enzymes for animal feed. Over the last couple of years a large number of papers have been published on this subject. In most of these investigations the use of enzymes has given positive responses. Given a strong desire and determination to succeed, the establishment of

147
an effective enzyme system for pkc degradation lookspromising.
Utilisation of pkc by poultry species apart from the chicken was investigated. The low ME value of thematerial on geese, comparable to that of chickensindicated that geese no have special ability to utilise Iv"untreated pkc. Therefore, the same approach as for chicken should be adopted in the feeding of pkc to this species.The possibility of other poultry species utilising the byproduct more efficiently cannot be ruled out and theanswer is wide open.
REFERENCES
Adams, C.A., 1989. The use of Kemzyme in feed manufacturing and animal nutrition. Feed Compounder, 9: 34-37.
Alang, Z.C., Moir, G.F.J. and Jones, L.H., 1988. Composition, degradation and utilization of endosperm during germination of the oil palm (Elaeis guineensis Jacq.). Ann. Bot., 61: 261-268.
Albersheim, P., Jones, T.M. and English, P.D., 1969.Biochemistry of Cell Wall Polysaccharides. (Loweus, F., ed.). Academic Press.
Albersheim, P., Nevins, D.J., English, P.D. and Karr, A., 1967. A method for the analysis of gas-chromatography. Carbohyd. Res., 5: 340-345.
Aman, P. and Nordkvist, E., 1983. Chemical composition and in vitro degradability of botanical fractions of cereal straw. Swedish J. Agric. Res., 13: 61-67.
Anon., 1988. Roche VITEC-and Vitamin News. G2, p. 20/1.Antoniou, T.C. and Marquardt, R.R., 1981. Influence of rye
pentosans on the growth of chicks. Poult. Sci., 60: 1898- 1904.
Arthur, I.V., 1962. Notes on the identification ofpolysaccharides. Practical Organic Chemistry. Longmans, p. 458.
Aspinall, G.O., 1959. Structural chemistry of hemicelluloses. Adv. Carbohyd. Chem., 14: 429-468.
Aspinall, G.O., Hirst, E.L., Percival, E.G.V. and Williamson,I.R., 1953. The mannans of ivory nut (Phytelephas macrocarpa). Part I. The methylation of mannan A and mannan B. J. Chem. Soc./ 3184-3188.
Aspinall, G.O., Rastbrook, R.B. and Kessler, G., 1958. The mannans of ivory nut (Phytelephas macrocarpa). Part II. The partial acid hydrolysis of mannans A and B. J. Chem. Soc., 215-221.
Assante, G., Locci, R., Camarda, L. Merlini, L. and Nasini,G. 1977. Screening of the Genus Cercospora for Secondary Metabolites. Phytochem., 16: 243-247.

149
Atkins, E.D.T., Farnell, S. Burden, C., Mackie, W. andSheldrick, B., 1988. Crystalline structure and packing of mannan I. Biopolymers, 27: 1097-1105.
Bacic, A., Harris, P.J. and Stone, B.A., 1988. Structure and function of plant cell walls. Biochemistry of plants.Vol. 14. Academic Press, London, pp. 297-371.
Bacon, J.S.D. 1988. Structure and chemistry . In: WorldAnimal Science. B. Disciplinary Approach. Feed Science. (Neimann-Sorensen, A. and Tribe. D.E. eds.). Elsevier Science Publishers. Amsterdam-Oxford-New York-Tokyo. Pp. 23-50.
Baker, T.I., Quicke, G.V., Bentley, O.G., Johnson, R.R., Moxon, A.L., 1959. The influence of certain physical properties of purified cellulose and forage celluloses on their digestibility by rumen micro-organisms in vitro. J. Anim. Sci., 18: 655-662.
Barker, S.A., 1983. Disordering Macromolecular structure for enzyme attack. In: Topics in Fermentation Biotechnology 7. (Wiseman, A. ed.). John Wiley and Sons, New York, pp. 76-89.
Beitz, D.C. and Allen, R.S., 1984. Digestion and absorption. In: Physiology of Domestic Animals (Swenson, M.J. ed.). Cornell Univ. Press, Ithaca and London, pp. 3 67-374.
Bhattacharjee, A.K., Jennings, H.J., Kenny, C.P., Martin, A. and Smith, I.C.P., 1976. Structural determination of the polysaccharide antigens of Neisseria meningitis serogroups Y, W-135 and BO. Can. J. Biochem., 54: 1-8.
Biely, P., 1985. Microbial xylanolytic systems. Trends in Biotechnol., 3: 286-290.
Blakeney, A.B., Harris, P.M., Henry, R.J. and Stone, B.A., 1984. Determination of sugars as their alditol acetates. Carbohyd. Res., 127: 59-73.
Blaschek, W., Koehler, H., Semler, U., Franz, G., 1982. Molecular weight distribution of cellulose in primary cell walls. Investigations with regenerating protoplasm suspension cultured cells and mesophyll of tobacco. Planta, 154: 550-555.
Blumenkrantz, N. and Asboe-Hansen, G., 1973. New methods for quantitative determination of uronic acids. Anal. Biochem., 54: 484-489.
Bociek, S.M. Izzard, M.J., Morrison, A. and Welti, D., 1981. The 13C-n.m.r. spectra of (1,6)-a-D-galactosyl-(1,4)-B- D-mannans. Carbohyd. Res., 93: 279-283

150
Bock, K., Pedersen, C.N., Pedersen, H., 1984. 13Carbon nuclear magnetic resonance data for oligosaccharides.Adv. Carbohyd. Chem. Biochem., 42: 193-225.
Bogner, P.H., 1961. Alimentary absorption of reducing sugars by embryo and young chicks. Proc. Soc. Exp. Biol. Med. 107: 263-265.
Bolton, W. and Blair, R., 1977. Poultry Nutrition. 4th edition. MAFF Bull. No. 174, HMSO, London.
Boros, D., Rakowska, M., Racynska-Bojanowska, K. andKozacynski, K., 1985. The response of Japanese quail and chicks to the water soluble antinutritive compounds from rye grain. Nutr. Rept. Intern., 32: 827-836.
Brett, C. and Waldron, K., 1990. Topics in Plant Physiology:2. Physiology and Biochemistry of Plant Cell Walls. J. Unwin Hyman. London. 194 pp.
Broz, J. and Frigg, M., 1986. Effects of cellulolytic enzyme products on the feeding value of various broiler diets. Arch. GeflUgelkd., 50: 104-110.
Bull, A., 1972. Environmental factors influencing thesynthesis and excretion of exocellular molecules. J.Appl. Chem. and Biotechnol., 22: 261-292.
Burnett, G.S., 1966. Studies on viscosity as the probablefactor involved in the improvement of certain barley for chickens by enzyme supplementation. Br. Poult. Sci., 7: 55-75.
Burt, A. W. A., 1976. Processing to improve nutritive value. In: Digestion in the Fowl. (Boorman, K. N. and Freeman,B. M., eds.), British Poultry Science, Edinburgh. Pp. 285-311.
Campbell, G.L., Classen, H.L. and Salmon, R.E., 1984. Enzyme supplementation of barley diets for broiler. Feedstuffs, 56: 26-27.
Campbell, G.L., Sosulsiki, F.W., Classen, H.L. and Ballance,G.M. , 1987. Nutritive value of irradiated and |3- glucanase-treated wild oat groats (Avena fatua L.) for broiler chickens. Anim. Feed Sci. Technol., 16: 243-252.
Chang, R., 1981. Physical chemistry with application tobiological systems. 2nd ed. MacMillan Publishing Co. Inc. New York. Pp. 591-93.
Chanzy, H., Chumpitazi, B. and Peguy, A., 1982. Solutions of polysaccharides in N-methyl morpholine N-oxide (MMNO). Carbohyd. Polym., 2: 35-42.

151Chanzy, H.D., Dube, M., Marchessault, R.H. and Revol, J.F.,
1979. Single crystals and oriented crystallization of ivory nut mannan. Biopolymers, 18: 887-898.
Chanzy, H.D., Grosrenaud, A., Vuong, R., and Mackie, W.,1984. The crystalline polymorphism of mannan in plant cell walls and after recrystallisation. Planta, 161: 320- 329.
Chesson, A., 1981. Effects of sodium hydroxide on cerealstraw in relation to enhanced degradation of structural polysaccharides by rumen micro-organisms. J. Sci. Food Agric., 32: 745-758.
Chesson, A., 1987. Supplementary enzymes to improve theutilisation o fpig and poultry diets. In: Recent Advances in Animal Nutrition- 1987. (Haresign, W, and Cole, D.J.A. eds.). Butterworth, London, pp. 71-89.
Choct, M. and Annison, G., 1990. Anti-nutritive valueactivity of wheat pentosans in broiler diets. Br. Poult. Sci., 31: 809-819
Christensen, F.M., 1989. Enzyme technology versus engineering technology in the food industry. Biotechn. Appl.Biochem., 11: 249-265.
Classen H.L., Campbell, G.L. and Grootwassink, J.W.D., 1988. Improved feeding value of Saskatchewan-grown barley for broiler chickens with dietary enzyme supplementation.Can. J. Anim. Sci., 68: 1253-1259.
Classen, H. L. and Bedford, M. R., 1991. The use of enzymes to improve the nutritive value of poultry feeds. In: Recent Advances in Animal Nutrition-1991. (Haresign, W. and Cole, D.J.A., eds.), Butterworths, London, pp. 95- 116.
Cooper, R.M., 1977. Regulation of synthesis of cell wall- degrading enzymes of plant patogens. Proc. Cell Wall Biochemistry Related to Specificity in Host-Plant Pathogen Interactions, Vol. 1, August, 1976, Univeristitetsforlaget, Tromso-Oslo-Bergen, pp. 163-206.
Coughlan, M.P. (ed)., 1989. Enzyme Systems for Lignicellulose Degradation. Elsevier Sci., London.
Crombie, W.M., 1956. Fat metabolism in the West African oil palm (Elaeis guineensis). I. Fatty acid formation in the maturing kernel. J. Exp. Bot., 7: 181-193.
Daud, M.J. and Ahmad, Y.H., 1989. Palm kernel cake asruminant feed. Proc. World Congress in Vegetable Protein Utilization in Human Food and Animal Feedstuff. (Applewhite, T.H. ed.). Singapore, 1988, pp. 96-102.

152
Daud, M.J. and Jarvis, M.C., 1991. Saccharification of palm kernel cake by alkali and enzymatic treatment. Proc. Recent innovations in animal and animal products industry. MSAP Ann. Conf., Genting Highlands, Malaysia, May 8-9, 1991, pp. 83-86.
Daud, M.J. and Jarvis, M.C., 1992. Mannan of palm kernel. Phytochem., 31: 463-464.
Dea, I.C.M. and Morrison, A., 1975. Chemistry andinteractions of seed galactomannans. In: Advances in Carbohyd. Chem. and Biochem., 31: 241-342.
Dubois, M., Gilles, K.A., Hamilton, J.K., Rebers, P.A. andSmith, F., 1956. Colorimetric method for determination of sugars and related substances. Anal. Chem., 28: 350-56.
Dusterhoft, E.M., Posthumus, M.A. and Voragen, A.G.J., 1992. Non-starch polysaccharide from sunflower (Hellanthus annus) meal and palm kernel (Elaeis guieensis) meal - Investigation of the major polysaccharides. J. Sci. Food Agric. 59: 151-160.
Dusterhoft, E.M., Voragen, A.G.J. and Engels, F.M., 1991. Non-starch polysaccharide from sunflower (Helianthus annuus) meal and palm kernel (Elaeis guineensis) meal: Preparation of cell wall material and extraction of polysaccharide fractions. J. Sci. Food Agric., 55: 411- v 222.
El Khadem, H., and Sallam, M.A.E., 1967. The carbohydrate component of the doum palm kernel: Characterization and identification of the mannan. Carbohyd. Res., 4: 387-391.
Englyst, H.N. and Cummings, J.H., 1984. Simplified method for the measurement of total non-starch polysaccharides by gas-liquid chromatography of constituent sugars as alditol acetates. Analyst, 109: 937-942.
Esau, K., 1977. Anatomy of Seed Plants. J. Wiley & Sons, New York.
Fan, L.T., Lee, Y-H. and Beardmore, D.H., 1980. Mechanism of the enzymatic hydrolysis of cellulose: effects of major structural features of cellulose on enzymatic hydrolysis. Biotechnol. Bioeng., 22: 105-130.
Fengler, I.A. and Marquardt, R.R., 1988. Water-solublepentosans from rye. 1. Isolation, partial-purification, and characterization. Cereal Chem., 65: 298-302.
Fincher, G. B. and Stone, B. A. 1986. Cell walls and their components in cereal grain technology. Adv. Cereal Sci. Technol., 8: 207-295.

153
Fincher, G.B., 1975. Morphology and chemical composition of barley endosperm cell walls. J. Inst. Brew., 81, 116-122.
Fogarty, W.M. and Kelly, C.T., 1983. Pectic enzymes. In:Microbial Enzymes and Biotechnology. (Fogarty, W.M. ed.). Applied Science Publishing, London, p. 131.
Friessen, O.D., Guenter, W., Rotter, B.A. and Marquardt,R.R., 1991. The effects of enzyme supplementation on the nutritive value of rye grain (Secale cereale) for young broiler chick. Poult. Sci., 70: 2501-2508.
Fry, R.E., Allfred, J.B., Jensen, L.S. and McGinnis, J. ,1958. Influence of cereal grain components of the diets on response of chicks and poults to dietary supplements. Poult. Sci., 37: 372-375.
Fry, S. C., 1988. The Growing Plant Cell Wall: Chemical and Metabolic Analysis. Longman. N. York.
Fyfe, C.A., Dudley, R.L., Stephenson, P.J., Deslandes, Y., Hamer, G.K. and Marchessault, R.H., 1983. Application of high-resolution solid-state NMR with cross- polar ization/magic-angle spinning (CP/MAS) techniques to cellulose chemistry. J. Macromol. Sci., Rev. Macromol. Chem. Phy., C23: 187-216.
Gadient, M. and Broz, J., 1992. Efficacy of the enzymecomplex ROXAZYME G in pelleted feed. Feed Compounder 12: 37-38.
Goh, Y.K., Shires, A., Roblee, R. and Clandinin, D.R., 1982. Influence of supplementary cellulolytic enzymes (Driselase) on the performance of broilers fed rations containing rapeseed meal. Can. J. Anim. Sci., 62: 269- 273.
Gohl, B., 1981. In: Tropical Feeds: Feed informationSummaries and Nutritive Values; FAO Animal Production and Health Series No.12. FAO, Rome, pp. 364-366.
Gomori, G., 1955. Preparation of buffers for use in enzyme studies. In: Methods in Enzymology. Volume 1. (S.P.Colowick and N.O. Kaplan eds.) Academic Press, New York.
Gorin, P.A.J., 1975. Assignment of signals of the carbon-13 magnetic resonance spectrum of selected polysaccharide: comments on methodology. Carbohyd. Res., 39: 3-10.
Graham, H., 1991. Development in the application of feedenzymes in layer and turkey diets. Feed Compounder, 11: 19-21.

154
Graham, H., Hesselmann, K., Jonsson, E. and Aman, P., 1986. Influence of 6-glucanase supplementation on digestion of a barley based diet in the pig gastrointestinal tract. Nutr. Rep. Int., 34: 1089-1096.
Hamer, G.K. and Perlin, A.S., 1976. A 13C-N.M.R. spectral study of chondroitin sulfates A,B and C: evidence of heterogeneity. Carbohyd. Res., 49: 37-48.
Harris, L. E., 1970. Nutrition Research Techniques forDomestic and Wild Animals. Eds. Lorin E. Harris. Utah Pp. 3507-1 - 3507-4.
Hart, H.E., Parish, M.E., Burns, J.K. and Wicker, L., 1991. Orange finisher pulp as substrate for polygalacturonase production by Rhizopus oryzae. J. Food Sci., 56: 480-483.
Herman, R.H., 1971. Mannose metabolism. I. Amer. J. Clin. Nutr., 24: 488-498.
Hesselman, K. and Thomke, S., 1982. Influence of increasing levels of B-glucanase on the productive value of barley diets for broiler chickens. Anim. Feed Sci. Technol., 7: 351-358.
Hesselman, K., 1989. The use of enzymes in poultry diets.Proc. 7th European Symposium on Poultry Nutrition, Lloret de Mar, Spain, June 1989, IRTA, Barcelona, pp. 31-48.
Hill, R.W., Anderson, D.L., Renner, R. and Carew, L.B., 1960. Studies of the metabolisable energy of grain and grain products for chickens. Poult. Sci., 39: 573-579.
Hordis, C.K. and Kowkabany, G.N., 1958. Material deposited along path of chromatograph sugar spot. Anal. Chem., 30: 1210-1213.
INRA, 1987. Feeding of Non-Ruminant Livestock. Transl. and Edit. (Wiseman, J., Transl. and ed.), Butterworth,London, p. 173.
INRA., 1987. Feeding of nonruminant livestock (Wiseman, J., ed) Butterworth, London, p.173.
Inui, T., Takeda, Y. and Iizuka, H., 1965. Taxonomicalstudies on genus Rhizopus. J. Gen. Appl. Microbiol., 11, Suppl:, 121 pp.
James, T.L., 1975. Nuclear Magnetic Resonance in Biochemistry. Academic press, New York.
Jarvis, M.C. and Apperley, D.C., 1990. Direct observation of the cell wall structure in living plant tissues by solid- state 13C NMR spectroscopy. Plant Physiol., 92: 61-65.

155
Jarvis, M.C. and Duncan, H.J., 1974. Paper chromatography of plant sugars. J. Chromatography, 92: 454-6.
Jarvis, M.C., 1988. Direct observation of the structure of mycelial cell walls from the potato blight fungus Phytophthora infestans by solid-state l3C nmr. Letts. Appl. Microbiol., 7: 157-159.
Jarvis, M.C., 1990a. The 13C-NMR-spectrum of (1,4)-B-D-mannans in intact endosperm tissue of the date (Phoenix dactylifera). Carbohyd. Res., 197: 276-280.
Jarvis, M.C., 1990b. Solid state 13C-n.m.r. spectra of Vigna primary cell walls and their polysaccharide components. Carbohyd. Res., 201: 327-333.
Jarvis, M.C., Hall, M.A., Threlfall, D.R., Friend, J., 1981. The polysaccharide structure of potato cell walls: chemical fractionation. Planta, 152: 93-100.
Jarvis. M.C., Forsyth, W. and Duncan, H.J., 1988. A survey of the pectic content of nonlignified monocot cell walls. Plant Physiol., 88: 309-314.
Jennings, H. and Smith, C.P., 1980. Determination fpolysaccharide structures with 13C NMR. Methods in Carbohydrate Chemistry, vol VIII. Academic press, New York, pp 39-51.
Jensen, L.S., Fry, R.E., Allfred, J.B. and Me Ginnis J.,1957. Improvement in the nutritional value of barley for chicks by enzyme supplementation. Poult. Sci., 36: 919- 921. (Abstr.)
Joslyn, M. (ed)., 1970. Viscosity, consistency, and texture conductivity measurements and gas Analysis. Methods in Food Analysis- Physical, Chemical, and Instrumental Methods of Analysis. 2nd Ed. Academic Press. New York and London. Pp. 375-400.
Knapp, J.S. and Legg, M., 1986. The effect of differentcellulosic growth substrates and pH on the production of cellulolytic enzymes by Trichoderma reesei. J. Appl. Bacteriol., 61: 319-329.
Longstaff, M. and McNab, J.M., 1987. Digestion of starch and fibre carbohydrates in peas by adult cockerels. Br. Poul. Sci., 28: 261-285.
Low, A.G. and Longland, A.C., 1990. Carbohydrate and dietary fibre predigestion in the pig and possible influence of feed enzymes. Feed Compounder, 10: 37-42.

156
Lyons, T.P., 1992. Enzymes: A world of solutions. Feed compounder, 12: 22-27.
Macek, K., 1963. Sugars In: Paper Chromatography: AComprehensive Treatise. 3rd. edition. (I.M. Hais and K. Macek, eds.) Academic press, New York. Pp. 289-330.
Mackie, W., Sheldrick, B. and Akrigg, D., 1985. Crystal and molecular structure of mannotriose and its relationship to the conformations and packing of mannan and glucomannan chains and mannobiose. Int. J. Biol.Macromol. 8:43-51.
Manzi, A.E., Cerezo, A.S. and Shoolery, J.N., 1984. Thegalactomannan-like oligosaccharides from the endosperm of the seed Gleditsia triacanthos. Carbohyd. Res., 34: 115- 131.
Marangos, A., Hill, R., Laws, B.M. and Muschamp, D., 1974.The influence of three rapeseed meals and a mustard seed meal on egg and broiler production. Br. Poult. Sci., 15: 405-414.
March, B.E., Smith, T. and El-Lakaany, S., 1973. Variation in estimates of the metabolizable energy value of rapeseed meal determined with chickens of different ages. Poult. Sci., 52: 614-618.
McCleary, B.V., 1979. Modes of action of B- mannanase enzymes of diverse origin on legume seed galactomannan. Phytochemistry, 18: 757-763.
McCleary, B.V., 1982. Purification and properties of a B-mannoside mannphydrolase from guar. Carbohydr. Res., 101: 75-92.
McCleary, B.V., 1986. Enzymatic modification of plantpolysaccharides. Int. J. Biol. Macromol., 8: 349-354.
McCleary, B.V., 1988. B-Mannanase. Method in Enzymology. Vol 160, Biomass, Part A, Cellulose and Hemicellulose. (Wood, W.A. and Kellog, S.T., eds.), Academic Press, London, pp. 596-610.
McCleary, B.V., Amado, R., Waibel. R. and Neukom, N., 1981. Effects of galactose contents on the solution and interaction properties of guar and carob galactomannans. Carbohyd. Res., 92: 269-285.
McCleary, B.V., and Matheson, N.K.,1983. Action patterns and substrate-binding requirements of p-D-mannanase with mannosaccharides and mannan-types polysaccharides. Carbohyd. Res., 119: 191-219.

157
McCleary, B.V., Matheson, N.K. and Small, D.M., 1976.Galactomannan and a galactoglucomannan in legume seed endosperms: Structural requirements for B-mannanase hydrolysis. Phytochemistry, 15: 1111-1117.
McCleary, B.V., Taravel, F.R. and Cheetham, N.W.H., 1982.Preparative-scale isolation and characterisation of 6lct- D-galactosyl-(1,4)-B-D-mannobiose and 62-a-D-galactosyl- (1,4)-B-D-mannobiose. Carbohydr. Res., 104: 285-297.
McDonald, P., Edwards, R. A. and Greenhalgh, G. F. D., 1988. Animal Nutrition. 4th edition. Longman, London, p. 130.
Mcllvaine, T.C., 1921. A buffer solution for colorimetric comparison. J. Biol. Chem., 49: 183-186.
McNab, J. M., 1976. Factors affecting digestibility offoodstuffs In: Digestion in the Fowl. (Boorman, K. N. and Freeman, B. M., eds.), British Poultry Science,Edinburgh, pp. 261-283.
Meier, H., 1958. On the structure of cell walls and cell wall mannans from ivory nuts and from dates. Biochem. Biophys. Acta, 28: 229-240.
Meier, H., and Reid, J.S.G., 1992. Reserve polysaccharides other than starch in higher plants. (Loewus, F.A. and Tanner, W., eds). Encylopedia of Plants Physiology New Series, Vol. 13A. Plant Carbohydrates I, pp. 418-471.
Mes-Hartree, M., Hogan, C., Hayes, R.D. and Saddler, J.N. , 1983. Enzymic hydrolysis of agricultural residues by Trichoderma cellulase and the fermentation of the liberated sugars to ethanol. Bio. Techn. Lett., 5: 101- 106.
Mes-Hartree, M., Hogan, C.M. and Saddler, J.N., 1988.Influence of growth substrate on production of cellulase enzymes by Trichoderma harzianum E58. Biotechnol.Bioeng., 31: 725-729.
Miller, W.S., 1974. Energy requirements of poultry. (Morris, T.R. and Freeman, B.M. eds.), British Poultry Science Ltd., Edinburgh, pp. 91-112.
Miyashige, T., Osman, A.H., Daud, M.J., and Wong, H.K., 1987. Digestibility and nutritive values of palm kernel cake palm oil mill effluent, plam press fibre and rice straw by Kedah-Kelantan bulls. Proc. 10th Ann. Conf. Malaysian Society Animal Production, Genting Highlands, Malaysia, 1987, pp. 226-229.

158Monro, J.A., Harding, W.R. and Russel, C.E., 1985. Dietary
fibre of coconuts from a Pacific atoll: soluble and insoluble components in relation to maturity. J. Sci.Food Agric., 36: 1013-1018.
Morikawa, H. and Senda, M., 1978. Infrared analysis of oat cleoptile cell walls and oriented structure of matrix polysaccharides in the walls. Plant Cell Physiol., 19: 327-336.
Nagasawa, K., Tohiro, Y., Tanoura, N., 1971. Reaction between carbohydrates and sulfuric acid. I. Depolymerisation and sulfation of polysaccharides by sulfuric acid. Carbohyd. Res. 18: 95-102.
Ngoupayou, N.J.D., 1984. Nutritional value of palm kernelcake in broiler diets. Poult. Sci. Abstr., 63 (Suppl. 1): 155-156.
Nieduszynski, A.I., and Marchessault, R.H., 1972. Crystalstructure of poly-B-D-(1 4)-mannose, mannan I. Can. J.Chem., 50: 2130-2138.
Noguchi, S., Shimura, G., Kawai, M., Suga, Y. and Samejima,H., 1978. Properties of partially purified cellulolytic and plant tissue macerating enzymes of Irpex lacteus Fr. in special reference to their application. Agric. Biol. Chem., 42: 339-345.
Northcote, D.H., 1972. Chemistry of the plant cell wall. Ann. Rev. Plant Physiol., 23: 113-32.
Nwokolo, E.N., Bragg, D.B. and Saben, H.S., 1977. A nutritive evaluation of palm kernel meal for use in poultry rations. Tropical Sci., 19: 147-154.
Nwokolo, E.N.R., Bragg, D.R. and Tait, R.M., 1976.Metabolizable energy and amino acids of sodium hydroxide treated palm kernel meal. J. Anim. Sci., 42: 1563.
O'Donnell, D.J., Ackerman, J.J.H., Maciel, G.E., 1981. Comparative study of shole seed protein and starch content via cross polarization-magic angle spinning carbon-13 nuclear magnetic resonance spectroscopy. J. Agric. Food Chem., 29: 514-518.
Ongbona, J.U., Longe, O.G. and Legel, S., 1988. Investigation of the digestibility of proximate composition in commercial palm kernel meal in broiler chick rations. Arch. Anim. Nutr. 38: 215-219.
Onuora, J.O. and King, R.D., 1985. Preliminary study of enzymic solubilization of introgenous constituents of palm kernel cake. Food Chem. 17: 297-3 02.

159
Onwudike, O.C., 1986. Palm kernel meal as a feed for poultry.3. Replacement of groundnut cake by palm kernel meal in broiler diets. Feed Sci. and Technol. 16: 195-202.
Painter, T.J., 1983. Residues of D-lyxo-5-hexosulopyra-nuronic acid in Sphagnum holocellulose, and their role in cross-linking. Carbohyd. Res. 124: C18-C21.
Panigrahi, S. and Powell, C.J., 1991. Effects of high rates of inclusion of palm kernel meal in broiler chick diets. Anim. Feed Sci. Technol., 34: 37-47.
Pease, G.L., Frey, M.H. and Opella, S.J., 1981. Observation of conformationally distinct proline in two cyclic peptides by solid state neuclear magnetic resonance. J. Am. Chem. Soc., 103: 467-468.
Perlin, A.S., Kin, N.M., Ng Ying, Bhattacharjee, S.S. andJohnson, L.F., 1972. Carbon-13 Fourier transform spectrum of heparin. Evidence for a biose repeating sequence of residues. Can. J. Chem., 50: 2437-2441.
Pettersson, D. and Aman, P., 1989. Enzyme supplementation of poultry diet containing rye and wheat. Br. J. Nutr., 62: 139-149.
Pettersson, D., Graham, H. and Aman, P., 1991. The nutritive value for broiler chickens of pelleting and enzyme supplementation of diet containing barley, wheat and rye. Anim. Feed Sci. Technol., 33: 1-14
Pines, A., Gibby, M.G. and Waugh, J.S., 1973. Proton-enhanced NMR of dilute spins in solids. J. Chem. Phys., 59: 569- 590.
Ratto, M. and Poutanen, K., 1988. Production of mannan- degrading enzymes. Biotechnol. Lett., 10: 661-664.
Reese, E.T. and Shibata, Y., 1965. B-mannanase fungi. Can. J. Microbiol., 11: 167-183.
Reid, J.S.G. and Meier, H., 1972. The function of the aleurone layer during galactomannan mobilisation in germinating seeds of fenugreek (Trigonella foenum-graecum L.), crimson clover (Trifolium incarnatum L.) and lucerne (Medicago sativa L.): a correlative biochemical and ultrastructural study. Planta, 106: 44-60.
Reid, J.S.G. and Meier, H., 1973. Enzymic activities and galactomannan mobilisation in germinating seeds of fenugreek (Triginella foenum-graecum L. Leguminosae): Planta, 112: 301-308.

160
Reid, J.S.G., 1984. Structure and function in legume-seed polysaccharides. In: Biochemistry of Plant Cell Walls (Brett,C.T., Hillman, J.R., eds). Cambridge University Press, England, pp. 259-268.
Reid, J.S.G., 1985. Cell wall storage carbohydrates in seeds - biochemistry of the seed 'gum' and 'hemicelluloses*. Adv. Bot. Res., 11:125-155.
Roehrig, K.L., 1984. Carbohydrate Biochemistry andMetabolism. AVI Publishing Co., Wesport, Connecticut.
Rotter, B.A. Friesen, O.D., Guenter, W., and Marquardt, R.R., 1990. Influence of enzyme supplementation on the bioavailability energy to barley. Poult. Sci., 69: 1174- 1181.
Rotter, B.A., Neskar, M., Guenter, W. and Marquardt, R.R., 1989. Effect of enzyme supplementation on the nutritive value of hulless barley in chicken diets. Anim. Feed Sci. Technol., 36: 233-245.
Rotter, B.A., Neskar, M., Marquardt, R.R. and Guenter, W., 1989. Effects of different enzyme preparation on the nutritional value of barley in chicken diets. Nutr. Rep. Int., 39: 107-120.
Saittagaroon, S., Kawakishi, S., Namiki, M., 1983.Characterisation of polysaccharides of copra meal. J.Sci. Food Agric., 34: 855-860.
Sawardeker, J.S., Sloneker, J.H. and Jeanes, A., 1965.Quantitative determination of monosaccharides as their alditol acetates by gas-liquid chromatography. Anal. Chem., 37: 1602-1604.
Schaefer, J. and Stejskal, E.O., 1976. Carbon-13 nuclear magnetic resonance of polymers spinning at the magic angle. J. Am. Chem. Soc., 98: 1031-1032.
Schubert, W.J., 1965. Lignin Biochemistry. Academic Press.New York and London, p. 7.
Seaby, D.A., McCracken, A.R. and Blakeman, J.P., 1988.Experimental determination of requirements for the growth of edible Rhizopus species for use in solid substrate fermentation systems. J. Sci. Food Agric., 44: 289-299.
Seeta, R., Deshpande, V. and Rao, M., 1989. Role ofxyloxidase in hemicellulose hydrolysis by xylanase from Penicillium funiculosum. Biotechnol. Appl. Biochem. 11: 128-132.

161
Selvendran, R.R. and O'Neill, M., 1987. Isolation andanalysis of cell walls from plant material. Methods of Biochemical Analysis. Vol. 32. (Glick, D.W. ed.) New York. pp. 125-154.
Selvendran, R.R., 1985. Developments in the chemistry and biochemistry of pectin and hemicellulosic polymers. J. Cell. Sci. (Suppl. 2), 51-88.
Selvendran, R.R., Stevens, B.J.H. and O'Neill, M.A., 1984. Developments in the isolation and analysis of cell walls from edible plants. In: Biochemistry of Plant Cell Walls. (Brett, C.T. and Hillman, J.R., eds.). Cambridge Univ. Press, England, pp. 39-78.
Shibata, M. and Osman, A.H., 1988. Feeding value of oil palm by-products. 1. Nutrient intake and physiological responses of Kedah-Kelantan cattle. JARQ, 22: 77-84.
Shreeve, W.W., 1974. Physiological Chemistry of Carbohydrates in Mammals. Saunders, Philadelphia.
Sibbald, I.R., 1979. Metabolizable energy evaluation ofpoultry diets. In: Recent Advances in Animal Nutrition - 1979. (Haresign, W. and Lewis, D., eds.), Butterworths, London, pp. 35-49.
Snaith, S.M. and Lewy, G.A., 1968. The effect of zinc ion on a-D-Mannosidase. Biochem. J., 106: 53P.
Suan, C.C., Leslie, C.L. and Augustine, S.H.O., 1989.Improvement in the protein content of palm kernel meal by solid state fermentation. Proc. World Congress on Vegetable Protein Utilization in Human Foods and Animal Feedstuff, 1988, Singapore. (Applewhite, T.H. ed.). American Chemists' Society, pp. 96-103.
Suga, Y. , Kawai, M. , Noguchi, S., Shimura, G. and Samejima,H., 1978. Application of cellulolytic and plant macerating enzyme of Irpex lacteus Fr. as feed additive enzyme. Agric. Biol. Chem., 42: 347-350.
Swenson, H.A., 1963. Intrinsic viscosity and its conversion to molecular weight. In: Methods in carbohydrate chemistry. (Whistler, R.L. ed.) Vol. V. Academic Press. New York and London, pp. 84-95.
Terao, T. Meida, S. and Saika, A., 1983. High resolutionsolid state 13C NMR of poly(vinyl alcohol): enhancement of tacticity splitting by intramolecular hydrogen bonds. Macromolecules, 16: 1535-1538.

162
Theander, O. and Aman, P., 1984. Anatomical and chemical characteristics. In: Straw and fibrous by-products as feed. (Sunstol, F. and Owen, E. eds.), Elsevier,. Amsterdam, pp. 45-77.
Torrie, J.P., Senior, D.J. and Saddler, J.N., 1990.Production of 6-mannanase by Trichoderma harzianum E58. Appl. Microbiol. Biotechnol., 34: 303-307.
Van Beek, E., 1991. Kemzyme Dry - Its effect on feed raw materials. Feed Compounder, 11: 35-37.
Van Soest, P. J., 1966. Non-nutritive residues: A system of analysis for the replacement of crude fiber. J. Assoc. Off. Agr. Chem., 49: 546-551.
Van Soest, P.J. 1982. Nutritional ecology of the ruminant (chemistry of forages and plant fibers). Q & B book. Corvalis.
Van Soest, P.J. and Wine, R.H., 1967. Use of detergents inthe analysis of fibrous feeds. IV. Determination of plant cell wall constituents. J. Assoc. Offic. Anal. Chem., 50: 50-56.
Van Soest, P.J., 1967. Development of a comprehensive system of feed analysis and its application to forages. J. Anim. Sci., 26: 119-132.
Van Soest, P.J., 1982. Nutritional ecology of the ruminant (chemistry of forages and plant fibers). Q & B Books, Corvalis.
Von Arx, J.A., 1974. The Genera of Fungi Sporulating in Pure Culture. Cramer, Vaduz, p. 42.
Whitaker, J.R., 1972. Principles of Enzymology for the Food Sciences. Marcel Dekker, New York, p. 65.
White, W.B., Bird, H.R., Sunde, M.L., Prentice, N., Burger, W.C. and Marlett, J.A., 1981. The viscosity interaction of barley B-glucan with Trichoderma viride cellulase in the chick intestine. Poult. Sci., 60: 1043-1048.
Williams, D.H. and Fleming, M.A., 1989. Spectroscopic methods in organic chemistry. Fourth Edition. McGraw-Hill,London, pp. 63-149.
Wolfrom, M.L., Laver, M.L. and Patin, D.L., 1961.Carbohydrates of the coffee bean. II. Isolation and characterization of a mannan. J. Org. Chem., 26: 4533- 4535.
163
Wood, T.M., 1985. Properties of cellulolytic enzymes. Bio. Soc. Trans., 13: 407-410.
Yeong, S. W., 1982. The nutritive value of palm oil byproducts for poultry. Animal Production and Health in the Tropics, pp 217-222.
Yeong, S.W. and Mukerjee, T.K., 1983. The effect of oil palm supplementation in palm kernel cake based diets on the performance of broiler chickens. MARDI Res. Bui., 11: 378-384.
Yeong, S.W., 1985. Palm oil by-products as feed for poultry. Proc. Natl. Symp. on oil palm by-products for agro-based industries, 5-6 Nov. 1965, Malaysia, pp. 175-186.
Yeong, S.W., Mukerjee, T.K. and Hutagalung, R.I., 1981. The nutritive value of palm kernel cake as feedstuffs for poultry. Proc. National Workshop of Oil Palm By-product Utilization. Palm Oil Res. Inst, of Malaysia (PORIM), Kuala Lumpur, pp. 100-107.
Yu, R.C. and Hang, Y.D., 1990. Amylolytic enzyme production by Rhizopus oryzae grown on agricultural commodities. World J. Microbiol. Biotechnol., 6: 15-18.