1. STUDIES ON THE FATE AND MODE OF ACTION OF ...
379
1. STUDIES ON THE FATE AND MODE OF ACTION OF LIPOSOMES AND ENTRAPPED AGENTS Christopher Douglas Valiant BLACK Clinical Research Centre Watford Road Harrow Middlesex and Charing Cross Hospital Medical School Fulham Palace Road London W6.8RF Submitted in partial fulfillment of the requirements of the University of London for the degree of Doctor of Philosophy.
-
Upload
khangminh22 -
Category
Documents
-
view
3 -
download
0
Transcript of 1. STUDIES ON THE FATE AND MODE OF ACTION OF ...
1.
STUDIES ON THE FATE AND MODE OF ACTION OF LIPOSOMES
AND ENTRAPPED AGENTS
Christopher Douglas Valiant BLACK
Clinical Research Centre Watford Road
Harrow Middlesex
and
Charing Cross Hospital Medical School Fulham Palace Road
London W6.8RF
Submitted in partial fulfillment of the requirements of the University of
London for the degree of Doctor of Philosophy.
2.
ABSTRACT
This work was undertaken in an attempt to assess the feasibility
of using liposomes as carriers of anti-tumour agents. Entrapment of
several chemotherapeutic agents (actinomycin D, bleomycin and aspara-
ginase) in liposomes was carried out. At timed intervals after intra-
venous injection into rats, liposomes were found to transport their
drug contents primarily to the liver and spleen.
In general, the distribution of entrapped drugs in tissues was dif-
ferent from that of similary injected free (unentrapped) drugs. Sub-
cellular fractionation of the livers of injected rats showed that lipo-
some entrapped agents mostly localised in the lysosome rich fraction,
whereas free drugs localised in the nuclear fraction. Lysosomal locali-
sation of liposomal drugs posed the question as to whether drugs re-
tained their biological activity in the presence of lysosomal enzymes.
However, the ability of entrapped agents to suppress DNA and/or RNA
synthesis in the liver of partially hepatectomised rats following
intravenous injection suggests that either the drugs are unaffected by
their passage through the lysosomes on their way to the nucleus or that
some other mode of uptake (non-lysosomotropic) by liver cells was
involved.
The interaction of liposomes with plasma proteins was studied to esta-
blish whether the carrier itself was affected by this biological en-
vironment prior to its uptake by the tissues. Electrophoretic mobility
studies on liposomes in plasma suggested that a negatively charged
component was interacting with the liposome surface irrespective of the
initial surface charge of liposomes. This plasma component was identi-
fied as alpha-^-macroglobulin in human plasma (alpha-^-macroglobulin
in the rat).
Furthermore studies on the association of liposomal lipid consti-
tuents with plasma components were carried out in rats.
Plasma lipoprotein fractions were assayed for the presence of liposomal
cholesterol and egg phosphatatidylcholine at timed intervals after
intravenous injection of liposomes. Results obtained suggest that
liposomal cholesterol (but not phosphatidylcholine) is transferred to
low and high-density lipoproteins.

3.
Contents
Page.
Title 1.
Abstract 2.
Contents 3.
Corrections 10-11
Acknowledgements 12.
Abbreviations 14.
Chapter 1 Introduction
i) Purpose of Research 19.
ii) Drug carriers 19.
iii) Liposomes
a) Structure and chemical composition 20.
b) Preparation 23.
c) Stability 25.
iv) Drug used
a) Actinomycin D 25.
b) Bleomycin 26.
c) Asparaginase 27.
v) Liposome interactions in the plasma
a) Plasma clearance 28.
b) Liposome-lipoprotein interactions 31.
c) Other proteins. 33.
vi) Tissue distribution of liposomes.
a) Liver 40.
b) Spleen 43.
c) Kidney and urinary excretion 43.
d) Lung 44.
e) Muscle 44.
f) Brain 44.
g) Intestine 44.
h) Bone marrow 45.
vii) Drug entrapment in liposomes
a) Actinomycin D 45.
b) Bleomycin 46.
c) Asparaginase 46.

4.
Page.
viii) Routes of administration
a) Local 46.
b) Intraperitoneal 47.
c) Oral 47.
d) Other routes 47.
ix) Toxicity of liposomes 47.
x) Liposome-cell interactions 48.
Chapter 2. Materials and Methods : Basic Results
Section 2:0 Materials 51.
Section 2:1 Methods
A. Manufacture of Liposomes
1. General proceedure
i) preparation of liposomes 54.
ii) sonication 54.
iii) column chromatography 55.
iv) concentration of liposomes 55.
2. The standard liposome preparation 56.
3. Drug entrapment in liposomes 56.
B. Preparation of drugs and phospholipids used in liposome manufacture
1. Drugs
i) Actinomycin D 56.
ii) Bleomycin 57.
a) direct iodination of Bleomycin 58.
b) indirect iodination of Bleomycin 58.
iii) Asparaginase 59.
14 2. Preparation of C-labelled Lecithin 59.
C. Drug distribution in rats following injection of either Liposome
entrapped or unentrapped drugs.
i) intravenous injection 61.
ii) plasma concentration of drugs 61.
iii) tissue concentration of drugs (table 2:1) 61.
iv) liver concentration of drugs and subcellular
fractionation. 63.

5.
Page.
D. Biological effect of drugs
i) partial hepatectomy of rats 64.
ii) drug treatment 64.
iii) measurement of nucleic acid synthesis in regenera-
ting liver. 65.
E. Interaction of liposomes with proteins
i) isolation of rat plasma lipoproteins 65.
(table 2:2).
ii) preparation of rat blood for lipoprotein analysis 66.
(table 2:3).
iii) association of plasma proteins with liposomes 67.
iv) immunoelectrophoresis 69.
F. Measurement of radioactivity in samples
i) gamma radioactivity 70.
ii) beta radioactivity 70.
Section 2:2
A. Basic studies on the entrapment of drugs into liposomes
i) Actinomycin D (figure 2:1A) 73.
ii) Bleomycin (figure 2:IB, table 2:4) 74.
iii) leakage of drugs from liposomes (figure 2:2) 76.
iv) microelectrophoresis (table 2:5) 77.
v) microviscosity (table 2:6) 79.
B. Discussion
i) effect of liposome composition on drug entrapment 81.
ii) influence of sonication on drug entrapment and
lipid oxidation in liposomes 84.
iii) leakage of drugs from liposomes 85.
iv) microelectrophoresis 87.
v) microviscosity 89.
vi) general discussion 91.
6.
Page.
Chapter 3.
Plasma clearance of liposomes and their interactions with proteins
Section 3 : 1 : 94.
Plasma clearance of free and liposome-entrapped drugs.
A) Actinomycin-D (figures 3:1 and 3:2). 95.
B) Bleomycins (figure 3:3). 99.
C) Asparaginase (figure 3:4) 102.
D) Discussion. 105.
Section 3:2 :
Interactions of liposomes with plasma lipoproteins. 113.
Introduction, (table 3:1)
A) Cholesterol exchange with lipoproteins (tables 3:2,
3:3 and figure 3:5). 113.
B) Interactions of "^C-EPC with lipoproteins (table 3:4
and fig. 3:6) 124.
C) Discussion :
i) Serum induced drug leakage. 128.
ii) distribution. 131.
iii) Liposome-lipoprotein interactions. 132.
a) Cholesterol. 133.
b) Phosphatidylcholine. 137.
Section 3:3 :
Interactions of liposomes with plasma proteins.
Introduction, (table 3:5) 144.
A) Microelectrophoresis of liposomes (table 3:6). 147.
B) Discussion. 149.
C) Identification of adsorbed proteins (table 3:7,
plates 1-9). 152.
D) Discussion. 164.

Chapter 4.
7.
Page.
Tissue uptake and action of free and entrapped drugs following intra-
venous injection.
Introduction. 175.
Section 4:1 Tissue distribution of free and liposome -
entrapped drugs (doses injected, table 4:1).
i) Actinomycin D (fig.4:1, table 4:2) 175.
ii) Bleomycins ill
a) In-BLM (fig. 4:2, table 4:3) 179. 1 25
b) I-BLM (ICL) (fig. 4:3, table 4:4) 182. 125
c) I-BLM (B/H) (fig. 4:4, table 4:5) and 185.
comparisons between BLMs (table 4:6) 189.
iii) Asparaginase (fig. 4:5, table 4:7) 191.
Section 4:2 Liver uptake of free and liposome-entrapped drugs.
i) Actinomycin D (fig. 4:6) 195.
ii) Bleomycins (fig. 4:7) 195.
a) m
i n - B L M 1 25
b) I-BLM (ICL) 1 25
c) I-BLM (B/H)
iii) Asparaginase.(fig. 4:8) (summary of liver uptake 197.
(table 4:8))
Section 4:3 Discussion of tissue distribution.
A) Free drugs
i) Actinomycin D 202.
ii) Bleomycins 203.
iii) Asparaginase 205.
B) Entrapped drugs. 207.
i) Actinomycin D 208.
ii) Bleomycins 210.
iii) Asparaginase. 212.
8.
Page.
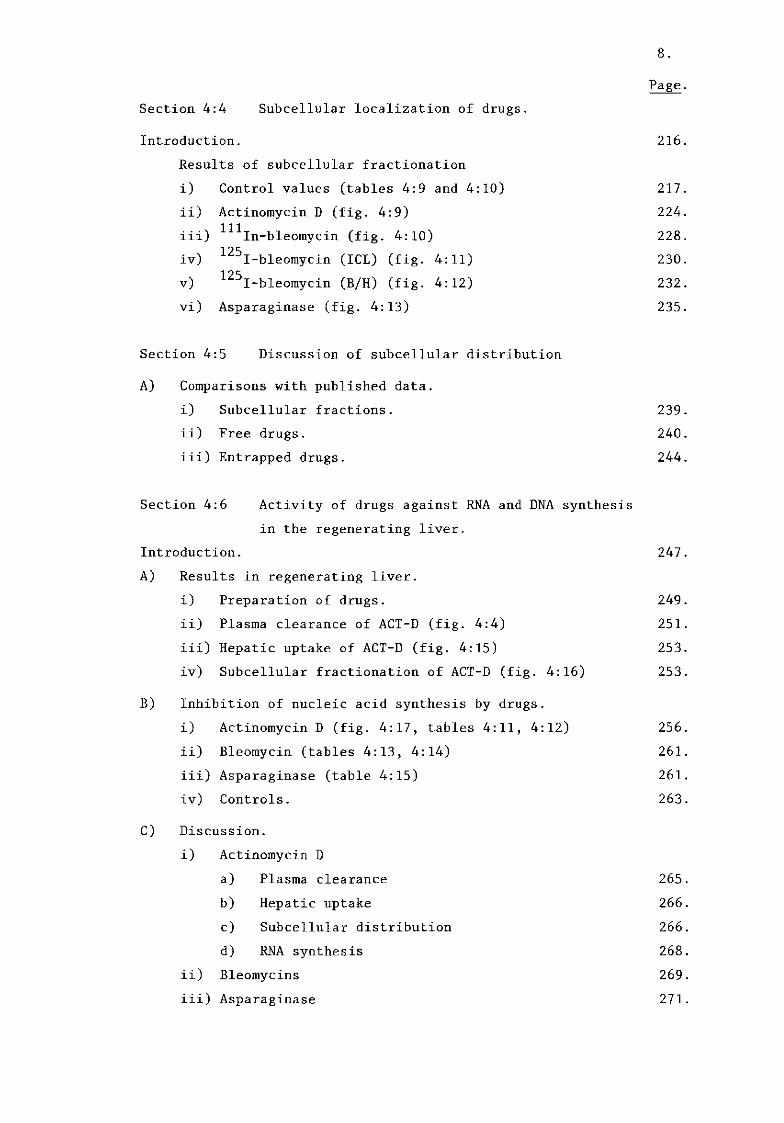
Section 4:4 Subcellular localization of drugs.
Introduction. 216.
Results of subcellular fractionation
i) Control values (tables 4:9 and 4:10) 217.
ii) Actinomycin D (fig. 4:9) 224. ill
iii) In-bleomycin (fig. 4:10) 228.
iv) I-bleomycin (ICL) (fig. 4:11) 230. 1
v) I-bleomycin (B/H) (fig. 4:12) 232.
vi) Asparaginase (fig. 4:13) 235.
Section 4:5 Discussion of subcellular distribution
A) Comparisons with published data.
i) Subcellular fractions.
ii) Free drugs.
iii) Entrapped drugs.
Section 4:6 Activity of drugs against RNA and DNA synthesis
in the regenerating liver.
Introduction. 247.
A) Results in regenerating liver.
i) Preparation of drugs. 249.
ii) Plasma clearance of ACT-D (fig. 4:4) 251.
iii) Hepatic uptake of ACT-D (fig. 4:15) 253.
iv) Subcellular fractionation of ACT-D (fig. 4:16) 253.
B) Inhibition of nucleic acid synthesis by drugs.
i) Actinomycin D (fig. 4:17, tables 4:11, 4:12) 256.
ii) Bleomycin (tables 4:13, 4:14) 261.
iii) Asparaginase (table 4:15) 261.
iv) Controls. 263.
C) Discussion.
i) Actinomycin D
a) Plasma clearance 265.
b) Hepatic uptake 266.
c) Subcellular distribution 266.
d) RNA synthesis 268.
ii) Bleomycins 269.
iii) Asparaginase 271.
239.
240.
244.

9.
Page. Section 4:7 General Discussion.
A) Tissue distribution studies.
i) Factors affecting cell uptake of liposome. 274.
a) Interpretational problems. 275.
b) Size. 276.
c) Composition. 277.
d) Dose. 279.
e) Foreignness of liposome suface. 280.
f) Opsonins in normal serum. 281.
ii) Uptake of liposomes by the liver. 281.
a) Cell type. 282.
b) Size, dose and RES blockade. 285.
c) Composition. 288.
iii) General conclusions on tissue distributions. 291.
B) Mechanisms of liposome uptake.
i) Are liposomes taken up intact ? 293.
ii) Mechanisms of uptake.
a) Endocytosis 294.
aa) Pinocytosis 294.
ab) Receptor-mediated endocytosis 297.
ac) Phagocytosis. 300.
b) Fusion, lipid exchange and adsorbtion. 311.
Chapter 5.
Conclusions and Future Prospects.
Section 5:1 Conclusions 317.
Section 5:2 Future prospects 318.
Appendix
Toxicity of Liposomes. 329.
References 334.
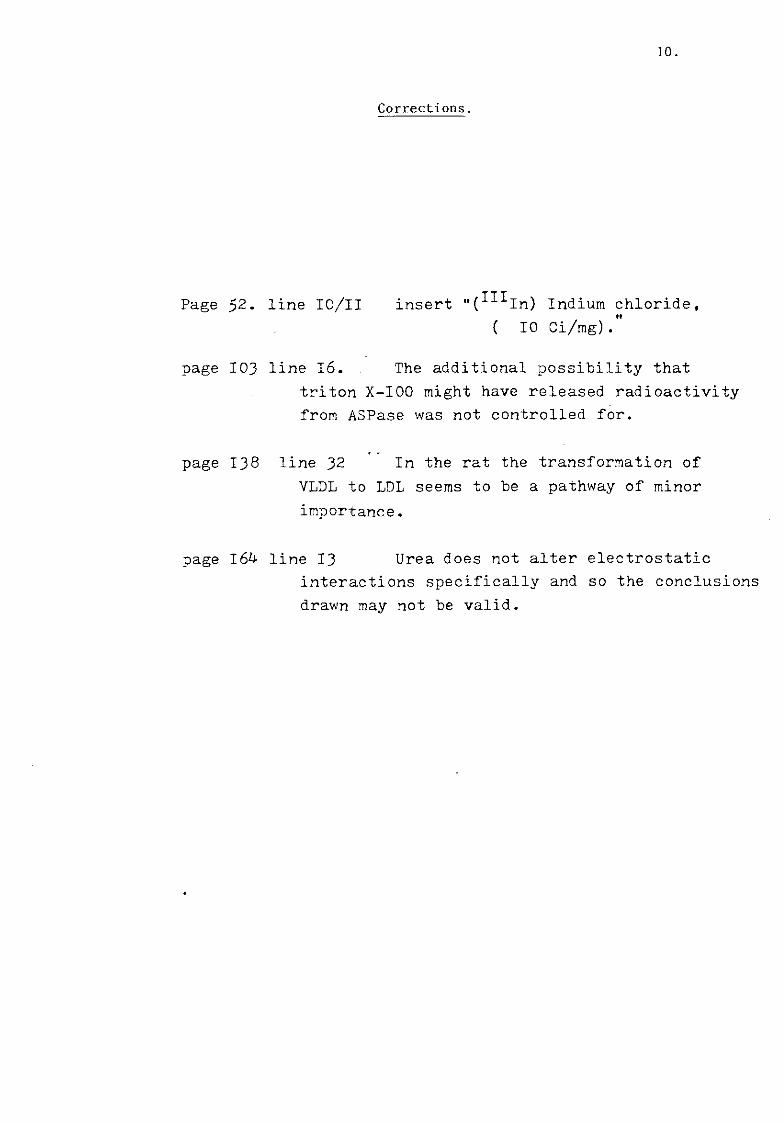
10.
Corrections.
Page 52. line IO/II insert Indium chloride,
( 10 Ci/mg)."
page 103 line I6. The additional possibility that
triton X-I00 might have released radioactivity
from ASPase was not controlled for.
page 138 line 32 In the rat the transformation of
VLDL to LDL seems to be a pathway of minor
importance.
page I64 line 13 Urea does not alter electrostatic
interactions specifically and so the conclusions
drawn may not be valid.

11.
12.
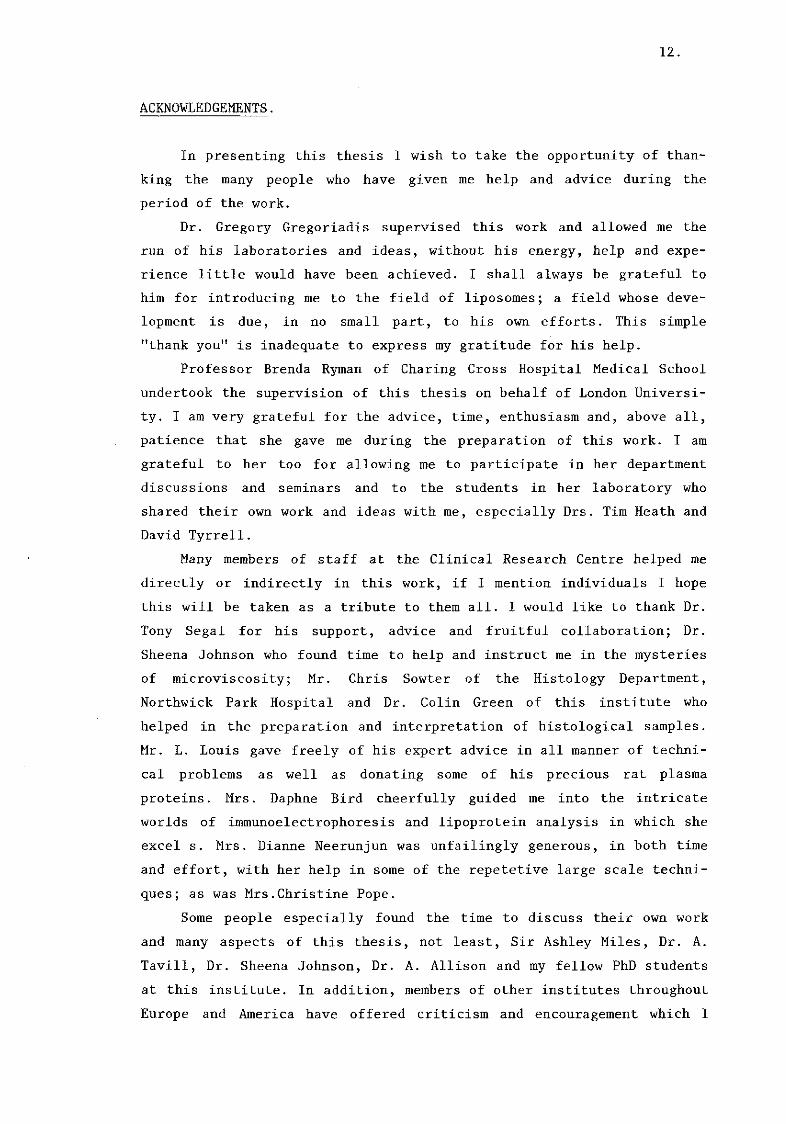
ACKNOWLEDGEMENTS.
In presenting this thesis I wish to take the opportunity of than-
king the many people who have given me help and advice during the
period of the work.
Dr. Gregory Gregoriadis supervised this work and allowed me the
run of his laboratories and ideas, without his energy, help and expe-
rience little would have been achieved. I shall always be grateful to
him for introducing me to the field of liposomes; a field whose deve-
lopment is due, in no small part, to his own efforts. This simple
"thank you" is inadequate to express my gratitude for his help.
Professor Brenda Ryman of Charing Cross Hospital Medical School
undertook the supervision of this thesis on behalf of London Universi-
ty. I am very grateful for the advice, time, enthusiasm and, above all,
patience that she gave me during the preparation of this work. I am
grateful to her too for allowing me to participate in her department
discussions and seminars and to the students in her laboratory who
shared their own work and ideas with me, especially Drs. Tim Heath and
David Tyrrell.
Many members of staff at the Clinical Research Centre helped me
directly or indirectly in this work, if I mention individuals I hope
this will be taken as a tribute to them all. I would like to thank Dr.
Tony Segal for his support, advice and fruitful collaboration; Dr.
Sheena Johnson who found time to help and instruct me in the mysteries
of microviscosity; Mr. Chris Sowter of the Histology Department,
Northwick Park Hospital and Dr. Colin Green of this institute who
helped in the preparation and interpretation of histological samples.
Mr. L. Louis gave freely of his expert advice in all manner of techni-
cal problems as well as donating some of his precious rat plasma
proteins. Mrs. Daphne Bird cheerfully guided me into the intricate
worlds of Immunoelectrophoresis and lipoprotein analysis in which she
excel s. Mrs. Dianne Neerunjun was unfailingly generous, in both time
and effort, with her help in some of the repetetive large scale techni-
ques; as was Mrs.Christine Pope.
Some people especially found the time to discuss their own work
and many aspects of this thesis, not least, Sir Ashley Miles, Dr. A.
Tavill, Dr. Sheena Johnson, Dr. A. Allison and my fellow PhD students
at this institute. In addition, members of other institutes throughout
Europe and America have offered criticism and encouragement which I

13.
have, I hope, heeded; Drs. Len Goodwin, Carsten Gotfredsen, Derek
Layton, Rolf Steiger, Frank Szoka and Professor Andre Trouet.
Financial support for this work was obtained from a MRC Research
Studentship for which I am most grateful.
Finally, I have been very fortunate to have had the personal sup-
port and understanding of Angela, Cathy and Jean who all believed that
this work would be finished one day. To them I give my heartfelt
thanks.

14.
ABBREVIATIONS.
e Note: the terms "liposome" and "vesicle" are used interchangeably
throughout this thesis. Standard chemical symbols are not included.
alpha-l-M : Alpha-1(2)-macroglobulin
alpha-2-M
Ab : Antibody
ACT-D : Actinomycin D
AP : Aqueous phase of the liposome
APB : Aqueous phase buffer
Apo- : Delipidated lipoprotein
apo-A,B,C, etc : Individual proteins of the lipoprotein series
(see table 3:1)
Ara-C : 1-beta-D-arabinofuranosylcytosine
ASPase : Asparaginase (EC : 3.5.1.1)
B/H : Bolton and Hunter method (reagent)
BLM : Bleomycin
^*In-BLM : Indium radiolabelled Bleomycin
-'^I-BLM :
Radioiodinated ("^^1) Bleomycin
BLM-ICL(ICL-BLM) : Bleomycin radiolabelled by iodine monochloride
method.
BLM-B/H(B/H-BLM) : Bleomycin radiolabelled by Bolton and Hunter
method (Bolton and Hunter, 1973).
BSA : Bovine serum albumin
C^-Cg : Components of the "classical" complement
pathway
6-CF : 6-carboxyfluoresceim
CHOI : Cholesterol
CHYL : Chylomicrons
CRP : C-reactive protein
d : Density (g/ml)
d > x < y : Density between x and y
DMF : Dimethylformamide
DMPC : Dimyristoylphosphatidylcholine
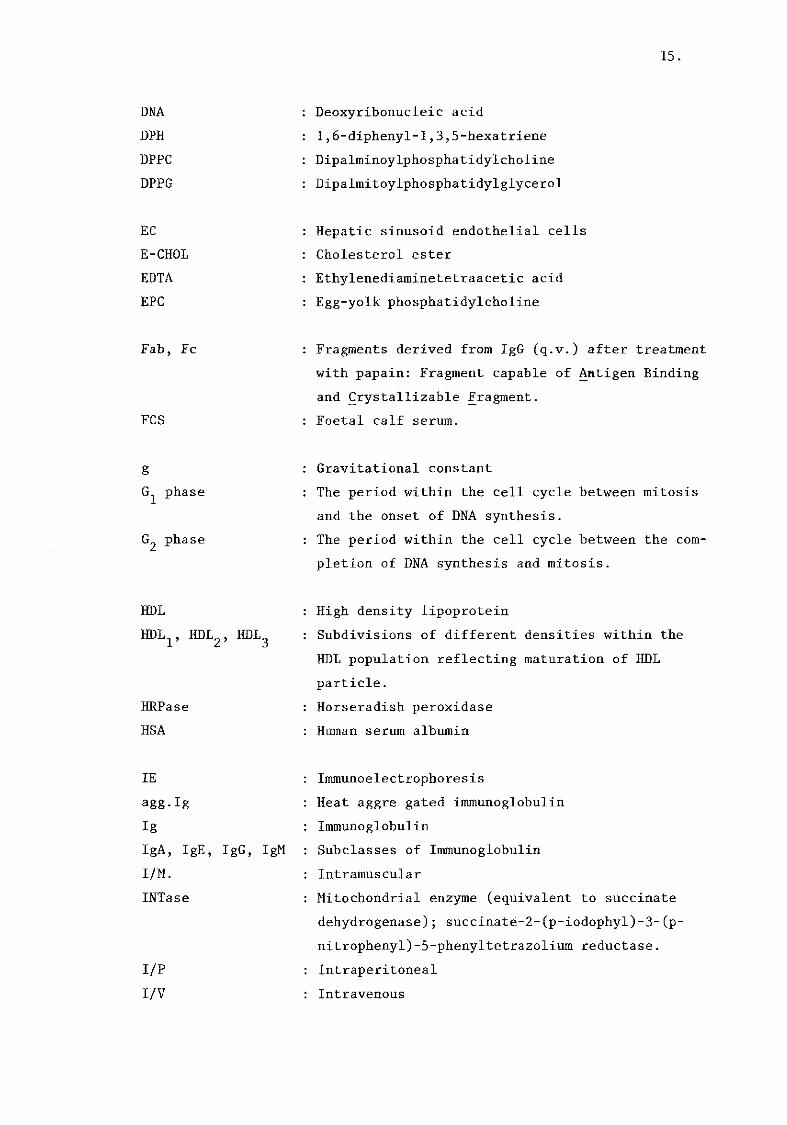
15.
DNA : Deoxyribonucleic acid
DPH : 1,6-diphenyl-l,3,5-hexatriene
DPPC : Dipalminoylphosphatidylcholine
DPPG : Dipalmitoylphosphatidylglycerol
EC : Hepatic sinusoid endothelial cells
E-CHOL : Cholesterol ester
EDTA : Ethylenediaminetetraacetic acid
EPC : Egg-yolk phosphatidylcholine
Fab, Fc : Fragments derived from IgG (q.v.) after treatment
with papain: Fragment capable of Antigen Binding
and Crystallizable Fragment.
FCS : Foetal calf serum.
g : Gravitational constant
G^ phase : The period within the cell cycle between mitosis
and the onset of DNA synthesis.
G^ phase : The period within the cell cycle between the com-
pletion of DNA synthesis and mitosis.
HDL : High density lipoprotein
HDL., , HDL0, HDL
0 : Subdivisions of different densities within the
1 2 3
HDL population reflecting maturation of HDL
particle.
HRPase : Horseradish peroxidase
HSA : Human serum albumin
IE
agg-Ig
Ig
IgA, IgE, IgG, IgM
I/M.
INTase
I/P
I/V
Immunoelectrophoresis
Heat aggre, gated immunoglobulin
Immunoglobulin
Subclasses of Immunoglobulin
Intramuscular
Mitochondrial enzyme (equivalent to succinate
dehydrogenase); succinate-2-(p-iodophyl)-3-(p-
nitrophenyl)-5-phenyltetrazolium reductase.
Intraperitoneal
Intravenous

16.
KC : Klip-ffer cell
LCAT : Lecithin : cholesterol acyl transferase
(EC : 2.3.1.43)
LDL : Low density lipoprotein
LES : Lifetime of the excited state
LP : Lipid phase of liposomes
LPC, LPE, LPS : Lyso derivatives of PC, PE, PS (q.v.)
LUV : Large unilamellar vesicle.
MDP : Muramyldipeptide.
ML : Large granule (mitochondrial/lysosomal) subcel-
lular fraction of the liver.
MLV : Multilamellar vesicle.
N : Nuclear subcellular fraction of the liver,
n. : Number (of values in a mean)
NABGase : Lysosomal enzyme : N-acetyl-beta-glucosaminidase.
OA : Ovalbumin
o.d. : Optical density
P : Small granule (microsomal) subcellular fraction
of the liver.
PA : Phosphatidic acid.
PBS : Phosphate buffered saline (see Materials)
PC : Phosphatidylcholine
PCMC : Hepatic parenchymal cells
PE : Phosphatidylethanolamine
PI : Phosphatidylinositol
pi : Isoelectric point
PL : Phospholipid
POPOP : 1,4-bis-2(5-phenoxazolyl) benzene
PPO : 2,6 diphenyloxazole
PS : Phosphatidylserine
PVP : Polyvinylpyrrolidone
RBC
rbf.
Red blood cells
round-bottomed flask
17.
RES : Reticuloendothelial system
RME : Receptor-mediated endocytosis
RNA : Ribonucleic acid
m-RNA : Messenger - RNA
r-RNA : Ribosomal - RNA
t-RNA : Transfer -RNA
S phase
SA
SE
S / G 2
St.dev.
Sub.Cut
SUV
Solu ble (cytosolic) subcellular fraction of the
liver.
The period within the cell cycle of DNA synthesis
Stearylamine (octadecylamine)
Standard error of the mean
The boundary between the S and G2 phases within
the cell cycle.
Standard deviation
Subcutaneous
Small unilamellar vesicle.
T : Temperature :
Plasma half-life
t : Thermal transition temperature
TCA : Trichloroacetic acid
TCA-ppt (pptable) : Material precipitated by TCA.
TLC : Thin layer chromotography
T-X100 : Triton-XlOO.
U/S : Unsonicated (handshaken) liposomes
UV : Ultraviolet light
VHDL : Very high density lipoproteins
VLDL : Very low density lipoproteins.
WH. : Whole liver homogenate prior to fractionation.

CHAPTER 1
INTRODUCTION

19.
i) PURPOSE OF RESEARCH
The research described in this thesis was performed to assess
liposomes as drug carriers. Particularly, this assessment was made in
relation to the following questions :
i) where do liposome entrapped drugs go after intravenous injection?
ii) what is the subcellular location of liposome entrapped drugs ?
iii) are the liposome drugs active ?
iv) what happens to liposomes when they are in contact with the blood?
v) are liposomes themselves toxic ?
ii) DRUG CARRIERS
Seventy-five years have now passed since Erlich coined the phrase
Chemotherapia specifica (Erlich, 1907). The carrier concept is only an
extension of Erlich's original idea (Albert, 1965) of drug design; he
envisaged the haptophore portion of the haptophore-toxophore drug
molecule as the receptor binding moiety bearing the active toxophore
group. The haptophore gave the toxophore the specificity for the target
tissue (or in Erlich's case, a pathogenic organism) without affecting
the rest. Since this is still the aim of chemotherapy, it follows that
the efficient delivery of the drug to the target is as important as the
molecular action of the drug itself. The discovery of toxophore
moieties has progressed considerably in the last 75 years mostly as the
result of empirical chemical synthesis of drug molecules and their
congeners in attempts to interact these molecules with cell structures,
receptors or biochemical pathways. However, the discovery of haptophore
moieties is still in its teens : many of the molecules and structures
used as drug carriers are no more than 15-20 years old.
Carrier molecules have now come to be regarded as macromolecular
structures in or on which the active drug molecule resides. In the last
ten years the literature on this subject has been steadily increasing,
so that no attempt will be made here to give a comprehensive review of
either drug carriers or even, more specifically, liposomes. Drug car-
riers in general have been the subject of two recent books (Gregoria-
dis, 1979; Juliano, 1980). Liposomes, as carriers of a variety of mo-
lecules, have been the subject of three books (Gregoriadis and Allison,
1980; Knight, 1981; Nicolau and Paraf, 1981); two symposia (Papahadjo-
poulos, 1978a; Tom and Six, 1980) and numerous reviews (Gregoriadis,
1973a; Ryman, 1975; Gregoriadis, 1976a; Poste et al. , 1976; Tyrrell
et al. , 1976a; Fendler and Romero, 1977; Gregoriadis, 1977;

20.
Finkelstein and Weissmann, 1978; Juliano, 1978; Kimelberg and Mayhew,
1978; Pagano and Weinstein, 1978; Papahadjopoulos, 1979; Ryman and
Tyrrell, 1980; Gregoriadis, 1981).
Research involving liposomes as drug carriers will be reviewed in
so far as it affects the work presented in this thesis.
iii) LIPOSOMES
The popularity of liposomes as drug carriers has been, in part,
due to : i) their characteristic morphology, where a relatively imper-
meable lipid bilayer completely encloses an aqueous space, ii) their
ability to encapsulate various solutes present in the aqueous and/or
lipid phases during their formation, and iii) the simplicity of their
preparation. In so far that an ideal multipurpose drug carrier exists,
it may have to conform the specifications proposed by Gregoriadis
(1977) . In terms of these specifications, it would seem that liposo-
mes, whilst by no means ideal carriers, are currently best able to
satisfy these requirements.
a) Structure and chemical composition.
Bangham et al. (1974) have described liposomes as : "All assembla-
g e s of phospho- and other lipids sustaining a biomolecular configura-
tion but which by themselves do not require a mechanical support for
their stability". The original work of Bangham and his co-workers
(Bangham, 1968; Bangham, 1972; Bangham et al. , 1974) and many others,
has established the structure of the liposome which results when dried
phospholipids are allowed to swell in an aqueous environment. The
ordered assembly (more correctly known as a smectic mesophase) that
spontaneously forms in excess water consists of multilamellar concen-
tric bilayers; each lipid bilayer is separated from the adjacent bi-
layer by an aqueous space. The number of bilayers is variable but the
innermost layer surrounds a large central aqueous core. During forma-
tion (rehydration of the polar head groups and the subsequent action of
bulk water to form the smectic mesophase) there is unrestricted entry
of water and solutes (drugs, proteins, etc) into the structure. But
once the closed structure has formed the internal aqueous phase and so-
lutes are trapped inside. If multilamellar liposomes (MLV) are subjec-
ted to ultrasonic irradiation (sonication) (Saunders et al. , 1962;
Hauser,1971) the closed structure is broken up and the lipid assemblies

21.
are fragmented into smaller pieces which themselves reform small
multilamellar or even smaller unilamellar vesicles (SUV). Again
there is unrestricted entry of water during sonication. Thus, any
water soluble compound can be entrapped within the liposome unless
it interferes with liposome formation. In addition, lipid soluble
substances that are not incompatible with liposome formation can
be entrapped in liposomes by adding them to the lipids during
liposome manufacture. Phospholipids usually form the major com-
ponent of liposomes; those most commonly used (Gregoriadis, 1980a;
Szoka and Papahadjopoulos, 1980) are : phosphatidylcholine (PC),
phosphatidylserine (PS), phosphatidylinositol (PI), phosphatidic
acid (PA), sphingomyelin, cardiolipin and synthetic lipids such as
dipalmitoylphosphatidylcholine (DPPC). Phosphatidylethanolamine
(PE) alone will not form the necessary closed structure (Papaha-
djopoulos and Miller, 1967) although it may be used in conjunction
with the other lipids mentioned above. Lipid extracts of cell
membranes (Bangham, 1968) can also be used for liposome manu-
facture .
The chemical composition of the lipids forming the liposome
bilayers has important consequences for the physical state of the
liposomes. Each phospholipid molecule contains fatty acyl chains
of variable length and degree of saturation, depending on the
source of lipid. Liposomes are normally formed at temperatures at
which the fatty acyl chains are fluid (de Gier et at. , 1968) i.e.
above the reversible gel to liquid crystalline phase transition
temperature (t ). Below the t vesicles are "solid"; above it they
are "fluid" but near or at t there is an enhanced release of c
entrapped molecules (Haest et al., 1972; Blok et al. , 1976).
Sonication below the transition temperature results in liposomes
which "leak" through structural defects. These liposomes exhibit a
pronounced tendancy to fuse near their transition temperature
(Lawaczeck et al. , 1975) although heating the liposomes to above
the t anneals the defects. c
The fluidity of the liposome can be modified not only by the
chain length and degree of saturation of the hydrocarbon chains in
the phospholipid, but also by the inclusion of sterol (most com-
monly cholesterol; CHOL) molecules (Chapman and Penkett, 1966). As
the fluidity of the acyl chains is decreased the liposomes become
more "solid" and the permeability of the bilayers to entrapped so-

22.
lutes decreases (Scarper and de Gier, 1971). Once a drug is en-
trapped in the liposome it can only be liberated by leakage
through the bilayers or disruption of the whole vesicle.
Solutes of high molecular weight or large size (e.g. proteins)
which cannot pass through the bilayers are said to be "latent" and
will remain in the liposome until the bilayers are disrupted
(Sessa and Weissmann, 1970; Gregoriadis, 1976b). However, most
drugs are smaller molecules and their leakage from liposomes will
be dependent upon the lipid solubility and degree of ionization of
the molecule at the existing pH. Consideration of these permeabi-
lity factors has resulted in the introduction of a further
variable into the liposome structure, namely the overall charge of
the vesicle.
The net charge of liposomes can be easily altered by incor-
porating a charged lipid ini the lipid phase. Addition of a long
chain amine (usually stearylamine, n-octodecylamine : SA) results
in a positively charged vesicle. Negatively charged vesicles can
be prepared by the addition of PS, PA or dicetyl phosphate; whilst
liposomes containing only PC, with or without CHOL, are neutral.
The separation between the bilayers of pure egg phosphatidyl-
choline (EPC) in water is 2.75 nm (Bangham, 1968). This separation
is determined by the balance of the repulsive forces between the
layers, mainly electrostatic interactions between head groups and
hydration forces of head groups, and attractive forces of van der
Waal's type between the layers (Le Neveu et al., 1976). The intro-
duction of a charged lipid increases the repulsive forces between
the bilayers and thus increases the aqueous interspaces until a
new equilibrium is established with the attractive forces. The
internal volume of a charged vesicle is, therefore, capable of
sequestering higher volumes of the aqueous phase than an uncharged
vesicle (Bangham et al. , 1967). However, there is a limit to the
increase in repulsion between the bilayers and addition of more
than 10 moles percent of a charged lipid has not been shown to
give any further increase in the internal aqueous volume of the
liposome (Bangham et al., 1967).
Moreover, the composition of the aqueous phase itself will have
some effect on the internal volume. At high ionic strength, buf-
fers will quench the repulsive effects of a charged lipid and so
reduce the internal volume (Tyrrell et al. , 1976a); a similar
effect should also be found with drugs which are highly ionized.

23.
A further advantage of adding a charged lipid can be seen
from permeability studies of liposomes. Bangham et al. , (1965)
showed that liposomes were permeable to water and ions, others
have shown permeability to non-electrolytes (de Gier et al. ,
1971). However, cationic liposomes are impermeable to cations
whilst anionic liposomes are permeable. The permeability of hydro-
gen ions through all types of liposome bilayers is small (Scarpa
and de Gier, 1971). Anion permeability is not altered by the
charge on the lipid membrane. It is, therefore, possible to reduce
the leakage of the ionized form of a drug by entrapping it within
liposomes of similar charge; the electrostatic repulsive charges
will retard the passage of the drug through the bilayers.
The total amount of the aqueous phase entrapped within a
liposome preparation is a function of the amount of lipid used,
since more lipid will form a larger number of aqueous spaces. In
this respect multi-compartmental liposomes will entrap a higher
proportion of a given volume of aqueous phase than single com-
partment (unilamellar) liposomes (Gregoriadis, 1973a; Fendler and
Romero, 1976). However, the amount of aqueous phase entrapped per
mole of lipid will be lower in multilamellar than in unilamellar
liposomes (Papahadjopoulos et al. , 1980a), mainly because of the
favorable volume to surface area ratio. For chemotherapeutic
purposes the total drug concentration is more important that the
amount of drug per mole of lipid. For this reason, amongst others
(ease of preparation), the multilamellar vesicle MLV has been used
in this study.
In summary, MLV are suitable for the encapsulation of a
variety of substances and can be made from a wide variety of lipid
compositions. Of all the types of liposome preparation, they are
the simplest to prepare and have been the choice for many
experiments in drug delivery.
b) Preparation of liposomes.
During the course of the work described in this thesis a
number of methods of liposome preparation were described and these
have recently been reviewed (Szoka and Papahadjopoulos, 1980).
These newer methods, whilst contributing to the versatility of the
liposome as a structure, are not, in general, as easy to prepare
as the "standard" method of Bangham (Bangham et al., 1974). Often
further equipment is required for their preparation (Batzari and
24.
Korn, 1973; Barenholz et al. , 1979) or there is a risk that
solvents or detergents will remain associated with the vesicle
after manufacture (Kremer et al. , 1979; Kagawa and Racker, 1971;
Gerritsen et al. , 1978); this would make them unsuitable for use
in vivo.
The exception to this is the manufacture of liposomes of
defined size either by the use of a novel permutation of the
standard method (Szoka and Papahadjopoulos, 1978) or by use of
filters (Olson et al. , 1979) of defined pore size or other means
(Van Renswoude et al. , 1979) to produce homogeneous liposome
preparations. Unfortunately, none of these methods was available
during the research described here and the liposomes used were a
heterogeneously sized population eluted from agarose gel columns
(Huang, 1969).
The standard method liposome preparation (Bangham et al., 1974;
Gregoriadis, 1976b).
A solution of phospholipids, cholesterol and other hydropho-
bic components (e.g. charged lipids, drugs) in organic solvent
(usually chloroform) is rotary evaporated under reduced pressure
to remove the solvent. The thin film of the lipids which is
deposited on the flask walls can be removed by the addition of an
aqueous solution followed by gentle shaking. During this time the
lipid is rehydrated and swells, leaving the flask walls to form an
aqueous suspension of large multilamellar vesicles (handshaken
MLVs) of several microns in diameter. The length of time during
which the lipid is allowed to swell and form the MLVs is important
(Olson et al. , 1979) and it is preferable to leave the suspension
overnight. These large MLVs contain a high proportion of liposomes
which will not absorb into agarose gel columns (but the more
recent method of Fry et al. , 1978, as modified by Layton and
Trouet, 1980, might overcome this problem). So separation of un-
entrapped material from the liposomes is usually carried out by
centrifugation followed by several washes. However, even centri-
fugation at 100,000 g for several hours will leave small unila-
mellar liposomes in the supernatant, and these will be lost on
repeated washing (Roseman et al., 1975).
Smaller MLV preparations and small unilamellar vesicles (SUV)
can be produced by sonication (Huang, 1969; Johnson et al., 1971;
Mason and Huang, 1978) either with a probe or in a bath. Prolonged

25.
sonication will eventually produce a homogeneous population of
SUVs, the so-called "smallest possible" vesicles of 25 nm diameter
(Huang, 1969). Sonication for shorter periods of time will produce
a heterogeneous population containing MLVs and SUVs : this type of
liposome has been used throughout this research. Again, it is
advisable to leave the sonicated preparation for a few hours to
ensure complete hydration and sealing of the liposomes.
The separation of liposomes from unentrapped material is most
easily performed on agarose gel columns, pretreated with liposomes
to prevent irreversible binding of liposomes to the beads (Huang,
1969; Huang and Thompson, 1974). The MLVs elute in the void volume
as a turbid solution but a second peak of SUVs are optically clear
and therefore more difficult to detect. MLVs can be concentrated
and separated from SUVs by centrifugation (100,000 g for one or
more hours) (reviewed in Tyrrell et al., 1976a).
c) Stability of liposomes.
The stability of liposomes to entrapped solutes has been
considered by Kirby et al. (1980b). These authors have shown that
6-carboxyfluorescein remains at least 75 % latent (i.e. entrapped)
during 53 days of storage. This latency remained even after injec-
tion into animals, suggesting that prolonged storage at 4° C has
no effect on lipid bilayers. This was confirmed when 1-beta-D-ara-
binofuranosylcytosine (AraC) liposomes were stored at 4°C under
nitrogen (> 50% latency of AraC after 1 year : as quoted in Szoka
and Papahadjopoulos, 1980). In addition, it has also been reported
that some liposome/drug preparations can be lyophilized and rehy-
drated to retain 60 - 70 % of the entrapped drug (quoted in Szoka
and Papahadjopoulos, 1980).
DRUGS USED IN THIS STUDY
a) Actinomycin D (ACT-D).
The actinomycins are a group of highly toxic, peptide-con-
taining, antibiotics that were discovered in 1940 they were the
first of a series of antibiotics to be isolated from soil Actino-
myces sp.
Following their discovery and the elucidation of their struc-
ture they were subjected to chemical modification and later pre-
pared by total chemical synthesis. The history and chemistry of
the actinomycin molecule has been reviewed by Brockmann (1974).
26.
Actinomycin D has been widely used as an antitumor agent (Frei,
1974; Goldin and Johnson, 1974). However, it has always been known
that ACT-D was very toxic and the sites of toxicity are usually
tissues undergoing renewal or growth, eg: regenerating liver
(Schwarz et al., 1965), or organs involved in the constant produc-
tion of cells, eg : bone marrow, lymphoid organs and germinal
regions in the intestinal epithelium and testis (Schwarz et al. ,
1968). In dividing cells ACT-D has been shown to arrest growth
primarly in the G^ phase (i.e. the period between mitosis and the
onset of DNA synthesis) although effects have also been shown at 9
the S/G^ boundry (at the end of DNA synthesis) and in the G^
period (period between the end of DNA synthesis and mitosis -
Hill, 1978).
Actinomycin is selectively concentrated in the nucleus of
mamalian cells where it is found associated with DNA. The mode of
action of the drug is to totally inhibit DNA-dependent RNA synthe-
sis (especially that of ribosomal RNA) and this is due to the in-
hibition of RNA polymerase (Goldberg, 1975). Sobell (1974) has
crystallized the ACT-D/DNA complex and shown, by x-ray crystallo-
graphy, that the phenoxazone ring system of the drug intercalates
between base pairs of the sequence deoxyguanosine-deoxycytosine in
double-helical DNA. The peptide rings lie in a narrow groove of
the DNA helix and interact with deoxyguanosine residues on the op-
posite chain through specific hydrogen bonds. (See fig.2 :1a for
structure of ACT-D).
The activity of actionomycin D is highly dependent upon its
chemical structure. Thus, it has been found essential to have :
i) a free amino group on position 3 of the chromophore,
ii) the unreduced quinoidal oxygen and
iii) intact, cyclic pentapeptide lactones.
Minor alternations or substitutions in the pentapeptide rings
do not cause loss of activity but modifications which produce
conformational changes in the ring markedly effect the activity of
the drug (Goldberg 1975).
b) Bleomycin
Bleomycin (BLM) is the generic name for a group of antibio-
tics isolated from Steptomyces verticillus. The different bleomy-
cins in the group have been isolated and their structure elucida-

27.
ted. The compounds consist of sulphur containing glycopolypeptides
which differ only in terminal amine groups (Umezawa, 1974). The
drug is marketed as bleomycin sulphate which is predominately the
BLM-A2 glycopeptide. (See fig.2 :1b).
The clinical use and susceptibility of various tumour types
has been reviewed (Blum et al. , 1973; Pietsch, 1975). The drug
seems to affect cells in the G2 stage of the cycle and possibly
during mitosis itself (Hill, 1978). The mode of action of BLM
remains unclear although it is known to bind strongly to DNA.
Early work established that BLM could cause breaks in single
stranded DNA, which could be enhanced by the presence of hydrogen
peroxide. Free bases (especially thymine) were released from DNA
as a result of the strand breaks (Donehower et al., 1979).
The binding of BLM to DNA seems to be via the bi-thiazole
rings and sulphonium groups (fig.2 : lb). The drug/DNA complex 2+
contains iron (Fe ) (Sausville et al., 1978) which is important
for the DNA strand breaking activity and which may (on oxidation 3+
to Fe ) produce free radicals that promote the breakdown of the
nucleic acid (Donehower et al., 1979).
Bleomycin has been shown to inhibit DNA ligase but not DNA-
dependent DNA polymerase. In addition, an enzyme has been found in
animal tissues which hydrolyses part of the BLM molecule and
results in reduced activity of the drug (Umezawa, 1974).
c) Asparaginase (ASPase).
L-Asparaginase (E.C. 3.5.I.I.) catalyses the hydrolysis of
Lasparagine to yield L-aspartic acid and ammonia. The enzyme
has been prepared from a number of different sources including
bacteria (E. coli, Erwinia cartovora) and animals (chickens and
guinea pig). The properties and antitumour activities of the enzy-
me depend upon the source. Asparaginase has a molecular weight of
133,000 and is composed of four sub-units (33,000 mol wt). Each
sub-unit is probably identical and contains an active site for
asparagine hydrolysis (Patterson, 1975).
The enzyme has been used as a treatment for leukaemia (Hill
et al., 1969) and as an addition to other antitumour agents (Bodey
et al. , 1974). Asparaginase also has immunosuppressive effects
(Ohno and Hersh, 1970).
The mode of action of ASPase is not clearly understood.

28.
However, only cells in the ' S' phase are effected by the protein,
suggesting that, in vivo at least, ASPase has little direct
on DNA. Most evidence supports the idea that the basis of the u
antitumor and immunosuppressive effect is starvation of cells by
hydrolysis of L-asparagine. This has been shown to be the case for
tumours which are asparagine sensitive. However, other modes of
action have been suggested (Patterson, 1975) including :
i) the conversion of asparaginyl-t.RNA to aspartyl-t. RNA
causing the wrong amino acid to be inserted into proteins,
ii) increase in alkaline and acid RNase activity,
iii) decrease or inhibition of RNA polymerase activity, and
iv) inhibition of synthesis of enzymes responsible for nucleic
acid metabolism and repair.
LIPOSOME INTERACTIONS IN THE PLASMA.
a) Plasma clearance of liposomes.
It has been clear for some time that entrapment of drugs
within liposomes changes the rate at which the drug is removed
from the plasma if the drug and carrier remain together (Grego-
riadis, 1973b). Subsequently, a large number of studies have
demonstrated that liposome encapsulation changes the plasma half-
life ( T j ^ ) drugs.
However, the T ^ ^ i-s
dependent upon a large number of parameters :
1) Composition
a) Charge. Gregoriadis and Neerunjun (1974) and Juliano and
Stamp (1975) both showed that anionic liposomes were cleared more
rapidly from the plasma than cationic or neutral liposomes. But
Gregoriadis and Neerunjun (1974) also showed that dicetyl phos-
phate anionic liposomes are cleared faster than those containing
PA. This result seems to suggest that, within a particular type,
effects other than charge may be operating. Although there may be
clearance rate differences between neutral and cationic MLV pre-
parations (neutral > cationic) (Gregoriadis and Neerunjun, 1974),
cationic and neutral SUVs are cleared at about the same rate
(Juliano and Stamp, 1975; Kirby et al., 1980b).
b) Cholesterol^ The effects of cholesterol incorporation in .
the lipid bilayers of liposomes has been investigated because of
the evidence that CHOL stabilizes the vesicle and not only pre-

29.
vents the release of entrapped solutes but also reduces the ex-
change of the liposomal lipids with lipoproteins (see stability of
liposomes and lipoprotein interactions and references therein).
Because of the exchange of CHOL, cholesterol esters (E-CHOL) and
phospholipids with lipoproteins it has not been possible to de-
monstrate whether cholesterol per se might change the plasma
clearance rate of liposomes. However, the role of cholesterol as a
liposome stabilizer makes its presence essential.
c) Lipids^ Investigations of the effects of the lipid compo-
sition (i.e.: the major lipid component) on the interactions of
the liposomes with the plasma have not been studied until recently
because most of the vesicles contained low amounts of CHOL and
were therefore unstable. Scherphof et al. , (1978) demonstrated
that SUVs composed solely of EPC were destroyed in the plasma,
, i ; . i .
however, j phosphoUfteG above their t^ ecwC more stable (Scher-
phof et al. , 1979). Recently Gregoriadis and Senior (1980) and
Huang et al (1980) have investigated liposomes made from sphingo-
myelin and have reported very long plasma halflives (I6hrs) for
these stable preparations. However, these long halflives are not
due to the presence of sphingomyelin alone since it has been shown
that, with appropriate CHOL concentrations, a wide variety of T ^ ^
values can be obtained with stable liposomes and this depends upon Senior reaoriailJs
the phospholipid content ( V ' and 0
, 1982a). These
authors believe that liposomal halflife in the circulation is de-
termined by the extent to which phospholipids, alone or in asso-
ciation with CHOL, prevent plasma-induced bilayer permeability
(Senior and Gregoriadis 1982b).
2) Size.
As noted above, the size of the liposomes injected into an
animal also determines the rate of plasma clearance.
The results of Juliano and co-workers (Juliano and Stamp,
1975; Juliano, 1976; Juliano et al. , 1978) and Gregoriadis and
Neerunjun (1974) have demonstrated that liposomes are cleared
biphasically from the plasma. The heterogeneity of size found with
MLV preparations makes analysis of the plasma pharmacokinetics
very difficult but for homogeneous SUV preparations Juliano

30.
(1976) has suggested a function of the form
A = AI e-°'6 9 3
+ A
3
e"°-6 9 3
^ 2
where the rate of clearance, A, at time t after injection depends
on a rapid initial loss A^, with a T^^time ^^ a n
^ a
longer
period of decline A^ with a T ^ ^ time of T^. When MLV preparations
are used, the initial clearance rate (T^) is much more rapid than
with homogeneous SUV preparations. Kirby et al. , (1980b) have
shown that, when the SUVs contain enough cholesterol to stabilize
the bilayers and contents of the vesicle, the initial rapid
phase of clearance is almost completely lost and the log per cent
plasma concentration is a straight line related to the time after
injection.
Since the size of the liposome determines its plasma clear-
ance rate, it follows that even a small size change within a
homogeneous population of SUVs may have an effect on plasma clear-
ance. Thus, a 50 % increase in the diameter of SUVs occurs when 50
mole % CHOL is incorporated in a vesicle made of EPC (Johnson,
1973) and up to 300 % increase in diameter, depending on the chain
length of the acyl groups, in other phosphatidylcholine vesicles
(de Kruijff et al. , 1976). Since both these vesicles are SUVs it
could be expected that their plasma clearance and tissue distribu-
tion would be the same but their sizes are different enough to
make this unlikely.
3) Effect of entrapped solutes.
It has always been assumed that the plasma clearance of truly
entrapped and non-leaky solutes will only be determined by the
liposome carrier (Gregoriadis and Ryman, 1972; Juliano et al. ,
1978). However, in view of the data on size and charge effects on
plasma T ^2 it might be predicted that ionized solutes entrapped
in liposomes could i) decrease or increase the charge separation
between adjacent bilayers by charge interaction thus changing the
size of the liposome; ii) effect the overall final charge of the
liposome and iii) if they are amphipathic, allow hydrophilic
groups to project onto the surface of the liposome which could
interact with blood components (e.g. proteins) and thereby in-
crease the size or change the charge of the vesicle in such a way
31.
that its plasma clearance will be altered.
To date, no study of the effect of entrapped solutes on
liposome plasma clearance has been published.
b) Liposome - Lipoprotein interactions.
1) Plasma lipoproteins and lipids
The major lipids of plasma are, in order of decreasing con-
centration by weight : cholesterol esters, phospholipids, tri-
glycerides, free cholesterol and free fatty acids. These substan-
ces circulate as lipid-protein complexes which have been classi-
fied according to size, density and electrophoretic mobility
(Scanu and Wisdom, 1972). The ratios of lipids to each other and
to the protein are variable even within classes of molecules that
are biologically closely related. This heterogeneity separates
lipoproteins from other classes of plasma or cellular proteins
which are normally quite homogeneous. Yet enough similarities
within lipoprotein types do exist to allow them to be separated
from other types by both physical and chemical methods (Hatch and
Lees, 1968). Lipoprotein types, defined by their density following
ultracentrifugation, are designated as chylomicrons (CHYL); very
low-(VLDL), low-(LDL), high-(HDL) and very high (VHDL) density
lipoproteins.
2) Phospholipids.
It has been known for some time that apoproteins from HDL
will bind to phospholipids (PL) (Scanu, 1967); the PL used were
almost certainly liposome-like (possibly MLVs) in structure. The
reconstituted protein-phospholipid complex behaved like an HDL
particle in centrifugation studies and also in its ability to
activate plasma lipoprotein lipase. Later Forte et al. (1971)
reported that HDL apoproteins recombining with phospholipids can
result in the formation of phospholipid bilayer discs, which
accumulate a core of cholesterol esters when exposed to plasma
lecithin : cholesterol acyltransferase (LCAT) (EC : 2.3.1.43) and
are thus converted into spherical mature HDL particles. When
multilamellar liposomes were incubated with intact HDL, they dis-
played a thermal transition typical of the discoidal apoprotein-PC
complexes (Tall and Small, 1977). These workers postulated that
32.
the HDL particle dissociated in the presence of the liposomes to
give up HDL-apoA to the liposomes. This new discoid PC/apoA com-
plex was characterized by ultracentrifugation and electron micro-
scopy (Tall et al. , 1978). Liposomal lipid was reported to be in-
corporated into the HDL lipid coat (Chobanian et al., 1979).
Another group of workers reported the plasma-induced release
of liposome entrapped solutes (Zborowski et al., 1977) was depen-
dent on HDL-liposome interaction which resulted not only in lipo-
some destruction but also in the transfer of protein to liposomes
(Scherphof et al., 1978). This same group have also shown that the
leakage and lipid transfer to HDL only occurs around the phase
transition temperature of the PL and that CHOL incorporated in
the liposome will abolish the susceptibility of the vesicle to
attack by HDL (Scherphof et al. , 1979). It should be noted that
unilamellar vesicles seem to be much more susceptible to HDL
attack than multilamellar or unsonicated liposomes (Scherphof
et al., 1981). Recently (Kirby et al., 1980a) have also investiga-
ted the transfer of phospholipids and cholesterol esters to lipo-
proteins (see later).
Mechanisms of HDL transformation involving the release of
apoprotein, with subsequent uptake of phospholipid or fusion of PC
with ^ HDL particles, may also occur in vivo. Infusion of
EPC-containing SUVs into rats resulted in an HDL-mediated trans-
formation of the vesicles into particles floating in the HDL
density range (Krupp et al., 1976). Intravenous administration of
"Intralipid" (phospholipid-triglyceride emulsion) into rats re-
sulted in the accumulation of vesicle/protein complexes containing
PL, unesterified CHOL and protein of the LDL type (according to
its density) (Thompson et al., 1975). This process was accompanied
by a depletion of HDL and an increase in the lipid : protein ratio
in HDL. Transfer of PL to purified LDL and VLDL, unlike HDL, does
not seem to occur (Chobanian et al., 1979).
3) Cholesterol.
In contrast to phospholipid-lipoprotein interactions, the
interaction of liposomal cholesterol with lipoproteins has not
received much attention. In a comparison of plasma clearance rates
of liposomes radiolabelled in both CHOL and PC, Scherphof et al.
(1975) suggested that the higher rate of CHOL disappearance might

33.
be due to exchange of cholesterol with red-cell membranes. Later
Black and Gregoriadis (1976 and this work) showed that CHOL was
lost from MLVs to LDL and HDL in rats. At the same time, Krupp
et al. , (1976) showed that cholesteryl-oleate from SUVs was trans-
ferred to HDL in vivo. Subsequently, Kirby et al. (1980) showed
that, in the absence of unesterified cholesterol in SUVs, choles-
teryl-oleate was transferred in vitro to LDL and HDL. However,
although SUVs will co-elute and co-sediment with LDL from serum,
the amount of cholesteryl-oleate found associated with the various
lioprotein fractions was constant even when cholesterol was inclu-
ded in the membrane of the SUVs.
From a series of papers from Gregoriadis' group (Gregoriadis
and Davis, 1979; Kirby and Gregoriadis, 1980; Kirby et al., 1980a,
1980b) it has become clear that the concentration of cholesterol
in the bilayer membrane is of great importance to the stability of
the liposome-entrapped solutes and lipids both in vivo and in
vitro. Thus, increasing amounts of CHOL in SUVs reduced the trans-
fer of both PC and E-CHOL to lipoproteins and prevented the escape
of entrapped 6-carboxyfluorescein both in vivo and in vitro. More-
over, using a larger molecule than 6-carboxyfluorescein, Gregoria-
dis and Davis (1979) showed that proteins like beta-fructofurano-
sidase remain latent in vivo and in vitro although an initial
rapid leakage was more pronounced when lower CHOL concentrations
were used in the liposome bilayers.
c) Interactions of Liposomes with other proteins.
Exchanges between lipoproteins and liposomes are not the only
interactions which take place between proteins and vesicles. Early
studies demonstrated that charge interactions between acidic
phospholipids and basic proteins resulted in a very tight binding
(probably not, finally, electrostatic in character) and alteration
of the electrophoretic-mobility patterns of liposomes. (Kimelberg
and Papahadjopoulos, 1971a). However, many other interactions
studied (Tyrrell et al. , 1976) have been concerned either with
proteins not normally found in the blood or with those which would
not be be expected to affect the in vivo handling and disposition
of intravenously injected liposomes. Nevertheless, it has become
clear that, in general, protein binding to liposomes often results

34.
in the release of entrapped solutes in vitro. (Kitagawa et al. ,
1976 and Tyrrell et al. , 1976a for earlier work). The extent to
which solute release occurs in vivo following protein-liposome
interaction is still the subject of controversy and where liposome
constituents or physical parameters are involved this has been
considered in other sections (effects of cholesterol).
The proteins of direct interest to this study are those which
are known to occur in plasma or serum. There has been relatively
little work concerning the interaction of liposomes with whole
blood plasma; more interest has been shown in the interaction of
individual, purified, plasma proteins with lipid membranes in
vitro.
1) Whole Plasma/Serum.
The presence or absence of serum has been shown by several
authors to influence the uptake of liposomes by cells in vitro.
(Tyrrell et al., 1977; Blumenthal et al. , 1977; Hoekstra and
Scherphof, 1979; Mayhew et al. 1980).
Tyrrell et al. (1977) examined the fraction of whole foetal
calf serum (FCS) responsible for this effect and found that, in
general, the presence of serum caused an increase in the cell
uptake of CHOL from anionic and neutral liposomes and a decrease
in uptake from cationic liposomes. Albumin enhanced the transfer
of CHOL between liposomes and cells but the alpha and beta-globu-
lin fractions of serum decreased the transfer of both lipid and
entrapped methotrexate from cationic liposomes to both cells and
perfused whole rat liver. Finally, although the beta-globulin
fraction caused an increased leakage of entrapped drug from all
types of liposomes, both the alpha and beta-globulin fractions en-
hanced the capture of anionic liposomes by the perfused liver.
Finkelstein and Weissmann (1979) studied the integrity of
liposomes of various compositions in biological fluids and showed
that inulin and horseradish peroxidase (HRPase) were both rapidly
lost from liposomes in the presence of 10 % human serum. However,
if the serum was decomplemented (56° C for 30 min.) this loss was
reduced. In addition, when 50 % serum was used much more entrapped
solute was lost although human serum albumin alone stabilized the
liposomes and prevented leakage.
Juliano and Lin (1980) incubated MLVs with 50 % fresh human

35.
serum, citrated human plasma or blood-bank serum and found that a
wide variety of proteins adsorbed onto liposomes. In general
cationic liposomes adsorbed more protein than either anionic or
neutral MLVs. The bound proteins were sensitive to trypsin diges-
tion but could not be released by high salt concentrations or 5
chelating agents. A large number of high (>2 x 10 ) and interme-4
diate (6-15x10 ) molecular weight proteins of unknown identity
were bound. Of the identifiable proteins, the most abundant was
albumin followed by IgG heavy and light chains, HDL-apoA,
alpha-2-macroglobulin (alpha-^-M) and fibronectin. In addition,
incubation of plasma with liposomes resulted in a depletion of
clotting factors VII, VIII and XII by some or all of the liposo-
mes; depending on their charge.
Finally, Kirby et al. (1980b) have shown that liposome stabi-
lity is dependent on the cholesterol content of the vesicles.
Thus, for the type of liposome used in this study (CHOL poor) the
stability was whole blood > plasma > serum after a rapid initial
loss of about 50 % of the entrapped solute. No explanation has yet
been put forward to explain why there should be differences
between blood, plasma and serum. It has been suggested (Kirby
et al. , 1980a, 1980b) that the packing of cholesterol and phospha-
tidylcholine prevents the loss of phosphatidylcholine by reducing
their mobility within the bilayer (Demel and de Kruyff, 1976). The
fact that red blood cells donate cholesterol to liposomes (Bruck-
dorfer et al. , 1968) and that a preferential interaction of lipo-QCCwS
proteins with red cells rather than liposomes^ (Bruckdorfer and
Graham, 1976; Demel and de Kruyff, 1976) have been suggested as
mechanisms by which liposomes would be (or become) more stable in
blood. The loss of clotting factors and proteins from serum might
account for the differences in stability between plasma and serum;
indeed Juliano and Lin (1980) have shown that loss of these ele-
ments is found when liposomes are incubation with whole blood.
It is possible that the study of liposome/protein inter
actions is best done with plasma since, for example, alpha-2-M has
to be prepared fresh; serum is an inadequate starting material
because alpha-2-M will have already fixed thrombin, kallikrein and
plasmin (Steinbuch et al., 1975).

36.
2) Albumin, Bovine Serum Albumin (BSA) and Ovalbumin.
The original work of Sweet and Zull (1969) demonstrated that
BSA would enhance glucose diffusion from anionic liposomes at acid
pH. This BSA binding to the liposomes, which could not be disrup-
ted at high salt concentrations, was considered to be apolar in
nature although an initial electrostatic interaction was found.
Later Sogor and Zull (1975) showed that binding of albumin also r
occur^bd to cationic liposomes but their low angle x-ray diffrac-
tion studies, whilst demonstrating the lamellae structure of the r
bound liposome, did not show hydrophobic interactions occurring
between lipid and protein. Kitagawa et al. (1976) measured BSA-li-
posome binding at neutral pH and showed that the protein enhanced
the release of entrapped solutes when lysolecithin (LPC) was
present in the liposome membrane, the release was independent of
the charge of the vesicle but CHOL in the liposome reduced the
leakage. Zborowski et al. (1977) showed that not only small so-
lutes but large molecules like inulin and albumin could be re-
leased from liposomes in the presence of plasma or albumin. This
same group (Scherphof et al., 1978) later showed that only the LPC
of the phospholipids was associated with the albumin, but Weiss-
mann et al. (1974) showed that BSA was not active in releasing
anions and glucose from either anionic or cationic liposomes. More
recently, Finkelstein and Weissmann (1979) have shown that human
serum albumin acts to stabilize MLVs against solute leakage.
Ovalbumin has been shown to react with PA-containing, anionic,
liposomes to form aggregates which could be broken up by the 2+
addition of Ca ions or by increasing the pH from 2.5. to 6: no
aggregation occured above pH 4.0. (Oshima and Nagasawa, 1973). 3) Immunoglobins.
The work of Weissmann's group (Weissmann et al. , 1974), on
the introduction of enzymes from liposomes into cells, has shown
that most immunoglobulins (Ig s) and heat aggregated Ig's release
anions and glucose from liposomes. Only heat aggregated I g ^ j
IgA2, IgM and Fab fragments were inactive. These authors suggest
that heat aggregation produces a conformational change in the Fc
regions of the Ig molecules which enhances their binding to the
lipid bilayers. Later this group (Weissmann et al, 1975) showed
that heat aggregated IgM-coated liposomes were taken up better by

37.
phagocytes from Mustelus canis. (the smooth dogfish) and by human
leucocytes (Cohen et al, 1976) but the in vivo distribution of the
coated liposomes showed no differences from uncoated liposomes
(Weissmann et al, 1978).
Extensive work has shown that liposomes prepared from pure
haptenated lipids undergo membrane damage and release entrapped
solutes in the presence of a specific antibody and complement,
(Kinsky, 1972; Kinsky and Nicolotti, 1977) but liposomes composed
of non-haptenated lipids do not appear to be antigenic. The en-
trapment of proteins or mixing of liposomes with proteins in-
creases the immune response to those proteins when compared to
proteins without liposomes (Allison and Gregoriadis, 1974; Heath
et al, 1976) but this adjuvant activity is probably the result of
antigenic protein exposed on the liposome surface (Manesis et al.
1978; Van Rooijen and Van Nieuwmegen, 1980). Entrapped proteins do
not give hypersensitivity reactions (Allison and Gregoriadis,
1974). Other work on entrapped virus antigen and other antigens
has been reviewed by Gregoriadis (1979b; 1980a; 1980b).
4) Complement.
Complement can mediate the lysis of liposomes (Hesketh et al.
1971; Kataoka et al., 1973) and the leakage of entrapped solutes
was found to be inversely proportional to the cholesterol content
of the bilayers (Shin et al. , 1978). Richards et al. (1977, 1979)
have shown that interactions between C-reactive protein (an acute
phase protein) and liposomes sensitize the liposomes to complement
damage. This damage involved all the components of the classical v-
pathway but only occur^sd with cationic liposomes containing a ce-
ramide glycolipid.
Both Finkelstein and Weissmann (1979) and Juliano and Lin
(1980) have shown that liposomes will bind complement components
from serum and Cunningham et al. (1979) demonstrated that catio-
nic, fluid, liposomes would activate the alternate pathway of
human complement.
5) Alpha and beta-Globulins.
The interaction of alpha-2-M with liposomes has been demons-
trated by Black and Gregoriadis (1976 and this work) and Juliano
and Lin (1980). As has been noted above, Tyrrell et al. (1977)

38.
showed that alpha and beta-globulins effect the uptake of lipo-
somes by cells and the perfused rat liver. The alpha-globulin,
alpha-2-M, not only binds to, and is degraded by, fibroblasts (Wil-
lingham and Pastan, 1980; Mosher and Vaheri, 1980) but is also the
major protein taken up by these cells from serum-containing growth
medium, (van Leuven et al., 1977).
6) Alpha2 Macroglobulin.
Alpha-2-macroglobulin is a glycoprotein and one of the major
components of a heterogenous group of serum proteins collectively
known as the alpha-globulins. Many alpha-globulins are acute phase
proteins whose activity is known to increase under certain physio-
logical and pathological conditions (e.g.pregnancy or in foetal
life, malignancy, inflammation) (Gauthier and Mouray, 1975). The
majority of the published work on alpha-2-M has involved its unique
role as binding protein for most of the known endopeptidases
(Starkey and Barrett, 1973; Barrett and Starkey 1973; Werb et al,
1974; Harpel, 1976).
The molecular weight of human alpha-^-M is 725,000 but it may
dissociate into 4 subunits each of 185,000. The interactions of
alpha-2-M with pepidase enzymes causes a conformational shape
change in the alpha-2-M which probably involves covalent bond
formation between the two proteins (James 1980); it does not
involve the active site of the enzyme which, therefore, retains
its enzymatic activity, at least towards small molecules. (Barrett
and Starkey, 1973). These interactions suggest that one of the
physiological roles for alpha-2-M is to act as a defense against
pancreatic, granulocyte-derived or bacterial proteinases released
into the circulation. After binding of the enzyme the complex is
removed from the circulation by the reticuloendothelial system
(Hanna et al, 1967).
In addition to its ability to bind proteases, alpha-2-M also
binds thrombin, kallikrein and plasminogen activator (Gallin and
Kaplan, 1974) suggesting that the protein has a function not only
in the clotting of blood but also in chemotaxis. Other functions
(reviewed by James, 1980) in the immune system involve binding to
lymphokines, soluble la antigens, immune complexes, histones, 2+
mitogenic compounds (some lectins), foreign tissue antigens, Zn
39.
and the control of differentiation in leucopoeisis and eythropoie-
sis. Other workers have shown alpha^-M bound to parasitic worms.
(Kemp et al., 1976).
Finally, Allen et al. (1973) and Blumenstock et al. (1976)
have shown that an alphas-globulin protein with alpha-^-M-like
properties will stimulate the uptake of lipid particles by hepatic
Kupffer cells in vitro. Current work in the field of reception-
mediated endocytosis (reviewed by Goldstein et al., 1979; Willing-
ham and Pastan, 1980; Willingham et al•, 1981; Pastan and Willing-
ham, 1981) has shown that specific receptors for alpha-^-M exist
in large numbers (200,000/cell in fibroblasts) on many types of
cell.
From this discussion it is apparent that alpha-^-M is a very
important plasma protein with a variety of actions on many
different physiological pathways. However, the exact role of
alpha- -M still remains to be established.

40.
vi) TISSUE DISTRIBUTION OF LIPOSOMES.
The clearance of blood-borne particulate matter (Saba, 1970) is an
efficient but complicated mechanism influenced by:
i) particle size,
ii) surface charge,
iii) hepatic bloodflow,
iv) opsonin activity and
v) species and age.
It has long been known that the primary site of localization of
colloids and particles (Wilkins and Myers, 1966) following intravenous
injection are the tissues comprising the reticuloendothelial system
(RES). It was not surprising, therefore to find that liposome entrapped
proteins (Gregoriadis and Ryman, 1972a, 1972b) and drugs (Gregoriadis,
1973b) were deposited in the liver and spleen following intravenous
(I/V) injection. Apart from the RES, there have been comparatively
few studies on the distribution of liposomes and/or entrapped agents to
other tissues (Kimelberg and Mayhew 1978).
a) Liver distribution of liposomes.
1) Effect of charge and lipid composition.
The original work of Gregoriadis and Ryman (1972) and Grego-
riadis (1973b) demonstrated that both anionic and cationic lipo-
somes delivered their contents preferentially to the liver. The
relative uptake of "vesicles" (?small MLVs) of different lipid
composition has been studied by McDougall et al (1974). The addi-
tion of either, PA, PE or PS to a standard vesicle composed of
PC+gangliosides, did not greatly alter the in vivo distribution of 99m
entrapped r a
dioactivity. Incorporation of cholesterol
however, enhanced the hepatic uptake.
Using a similar liposome/radioactivity system, Richardson
et al. (1978) studied the distribution of radioactivity in various
organs of rats following I/V injection. Their results suggest that
the liver uptake 24 hours after injection is not dependent on the
charge of the MLV. However, Jonah et al. (1975) found that large
neutral (handshaken) MLVs were taken up better by the liver than
either anionic or cationic liposomes. Omission of cholesterol from
the vesicle reduced the liver uptake.
41.
2) Effect of size.
As well as charge effects both Richardson et al. (1978) and
McDougall et al. (1974) studied the distribution of different
sized liposomes (produced by increasing the sonication time).
These authors concur that the hepatic uptake is reduced as the
liposomes become smaller. Other workers (Juliano, 1976, and Kimel-
ke r
8 et al., 1976) agree. Finally, Sharma et al (1977) using large
unilamellar vesicles (LUVs) also reported high hepatic uptake.
3) Effect of Entrapped Drug.
Rahman et al. (1975; 1978) have studied the distribution of
liposomal ACT-D in animals. They have shown that if the drug is
entrapped in the lipid phase of liposomes it has a different
hepatic uptake than when it is entrapped within the aqueous phase
of the same liposomes. Three hours after injection the liver con-
tained 2-3 times more lipid entrapped drug than aqueous entrapped
drug. These results are explained by differential leakage of the
drug from the aqueous spaces.
4) Cellular uptake within the liver.
The original work of Gregoriadis and Ryman (1972a) demonstra-3
ted that H-cholesterol-labelled liposomes were localized in both
the Kiipffer cells and the parenchymal cells of the liver as early
as 3 minutes after I/V injection of protein-containing liposomes.
These results can be criticised on the grounds that cholesterol is
able to exchange between liposomes and lipoproteins (Black and
Gregoriadis, 1976) and a specific uptake process for low density
lipoproteins is known to exist (Goldstein et al., 1979). However,
the internalization of LDL molecules takes about 10 minutes so
that the kinetics of uptake may not favour this hypothesis.
Later work (Segal et al.1974) showed that, morphologically,
liposomes can only be found in Kiipffer cells. Gregoriadis et al.
(1974a) showed that only the parenchymal cells had liposome -like
structures inside them. This latter experiment performed in human
cancer patients can be criticised on the grounds that "liposome
like" structures are often found inside cells when viewed by
electron-microscopy. (Scherphof et al. , 1980). In addition, the
human reticuloendothelial system has been shown to be very sensi-
tive to distrurbances caused by infection or neoplasm (Saba,1970).

42.
Wisse et al. (1976) suggested that horseradishperoxidase
(HRPase) entrapped in liposomes localized not only in the Kiipffer
cells but in parenchymal and endothelial cells as well. The amount
of HRPase found in the parenchymal cells increased over time after 125
injection. In similar experiments using HRPase and I-labelled
polyvinylpyrrolidone, Scherphof et al (1981) have reported that
the only cell type involved in liposome uptake is the Kupffer
cell. These authors believe that previous results showing paren-
chymal cell involvement are due to the release of entrapped mate-
rials from the liposomes.
Other reports (Freise et al. , 1980, 1981), using portacaval
shunts in rats, have suggested that liposome location can be
totally accounted for by parenchymal cells with no Kupffer cell
involvement.
These results all suggest that the study of the particular
cell type involved in liposome uptake by the liver is very diffi-
cult. Since much of the work was performed with exchangeable lipid
markers and liposomes which might be leaky in the presence of
plasma proteins, it seems reasonable to await further clarifica-
tion of this complicated issue.
5) Subcellular distribution in the liver.
Liver fractionation studies have demonstrated that liposome
entrapped agents localize mainly in the lysosomes. (Gregoriadis
and Ryman, 1972b; Gregoriadis et al. , 1974b; Black and Gregoria-
dis, 1974 and this work; Segal et al., 1976; Steger and Desnick,
1977). Drugs localized in the lysosomes seem to be able to escape
and enter other cell compartments (Black and Gregoriadis, 1974).
Steger and Desnick (1977) have found a proportion of enzyme from
cationic liposomes associated with the small granule, "post-lyso-
somal-mitochondrial", fraction of the liver. These authors believe
that this demonstrates either fusion of liposomes with hepatic
cells or destabilization of the lysosome membrane by stearylamine.
Indirect evidence for lysosomal localization (and indeed
Kupffer cell uptake) of liposomes comes from the studies of Black
et al., 1977; New et al., 1978; and Alving et al., 1978, 1980) who
showed that liposome entrapped compounds were many hundred-fold
more active than the unentrapped drugs against Leishmania donovani
parasites. These intracellular protozoa are known to parasitize

43.
Kupffer cells and to live and multiply within parasitophorous
vacuoles which are, in effect, secondary lysosomes. Contrary
evidence has been presented by Rahman (1980) who found EDTA l
- liposomes in the cytosol of mouse livers.
Finally, the degradation of liposomes by liver cells has been
reported by Huang et al. , (1980) who have elegantly studied the
hepatic uptake and degradation of SUVs. It was found that the time
to digest the liposomes was 3.6 hours but the time for maximum
release of the liposome-entrapped agent was about 8 hours. The
enzymes necessary to digest liposomes have been located in liver
lysosomes (Fowler and de Duve, 1969).
b) Spleen : Distribution of liposomes.
The spleen comprises part of the RES. Early work on drugs entrap-
ped in liposomes (Gregoriadis 1973b) showed that there was an increased
uptake of liposomal drug into this tissue. Segal et al. , (1974) pre-
sented morphological evidence of liposome entrapped agents in the red
pulp (phagocytic cells) but not the white pulp (lymphoid tissue).
In most respects the uptake of entrapped agents by the spleen is
very similar to that found in the liver. Indeed, if the amount of
entrapped material is calculated as per cent of dose per gram of
tissue, it can be shown (Juliano, 1976; Richardson et al. , 1978;
Kimelberg et al. , 1976) that the spleen takes up more of the entrapped
agent than the liver.
Both Jonah et al., (1975) and Richardson et al., (1978) have shown
that anionic liposomes are taken up into the spleen better than ca-
tionic or neutral liposomes. Moreover, Juliano (1976), Kimbelberg
et al. , (1976) and Richardson et al. , (1978) have shown that unsonica-
ted or large MVLs are taken up to a greater extent than SUVs.
However, using liposomes containing adriamycin, Forssen and Tokes
(1979) failed to find higher drug levels in the spleens of liposome
treated animals. Rahman et al. , (1978) found higher drug levels in the
spleen of animals treated with ACT-D in the lipid phase of liposomes.
c) Kidney and Urinary excretion of Liposomes.
A decrease in the kidney location of liposome-entrapped ACT-D
compared with the free drug was reported by Gregoriadis (1973b) and
this is almost certainly due to the encapsulation of the drug in the

44.
carrier. Sonication reduces the liposome's location in the kidney
(Richardson et al.,1978; Kimelberg et al., 1976).
Kimelberg and Atchison (1978) have studied the urinary excretion
of methotrexate (MTX) entrapped in liposomes and found a very low rate
of urinary drug output. However, Gotfredsen (1982) has identified
metabolites of entrapped BSA in mouse urine following its administra-
tion in liposomes. Urinary excretion of metabolites of liposomal lipid
was found to be very low: the bulk of radiolabelled PC was excreted as
CO^ in expired air (Gotfredsen, 1982).
d) Lung:
Jonah et al. , (1975) and Rahman et al. , (1975) have reported high
levels of liposome-derived radioactivity in the lungs of animals in-
jected I/V with unsonicated liposomes containing EDTA or ACT-D in the
lipid phase. This effect seems to dependent upon the charge of the
carrier (cationic >> anionic or neutral), and, perhaps more likely, the
size of the liposome preparation since others using small sonicated
MVLs and SUVs have found little lung localisation. (Hunt et al., 1979).
e) Muscle tissue:
The work published to date uniformly suggest that uptake of lipo-
somes, of whatever charge or size, by skeletal or heart muscle tissue
is very low. This is an unfortunate result because muscle tissue can be
one of the sites of storage product in lysosomal storage diseases.
f) Brain:
Jonah et al., (1975) and Rahman et al. (1975) have reported uptake
and retention of liposomally entrapped drugs in the brain. Most other
workers do not agree with this finding. Indeed, it seems unlikely that
whole liposomes can cross the blood-brain barrier.
g) Intestinal tissue:
Gregoriadis (1973b) showed that liposome entrapment of ACT-D re-
duced the amount of drug localising in the small intestine. Because li-
posomal drugs normally have longer plasma half lives and higher uptake
by tissues, e.g: the liver and spleen, the amount of drug available to
effect sensitive germinal tissues, like the intestine, is normally less
than for non-entrapped drugs. Rahman et al.,(1978) have also shown that
entrapping ACT-D in liposomes results in a lower intestinal uptake.
45.
h) Bone Marrow:
Rahman et al. , (1978) have studied the liposome uptake and
effects on stem cells in the bone marrow. Kimelberg et al., (1976.
1978) did not find such high levels of entrapped drug in the
tissue.
vii) DRUG ENTRAPMENT IN LIPOSOMES.
Gregoriadis (1980a) has reviewed more than 120 compounds which
have been entrapped in liposomes of various compositions. The entrapped
agents range in size (weight) from viruses and nucleic acids to ions,
via enzymes, immunoglobulins, vitamins and a large number of drug
molecules. This list alone emphasizes the versatility of the liposome
as a carrier.
The antitumour drugs used in the research reported in this thesis
have been ACT-D, BLM and ASPase. Several reports of the liposomal
entrapment and distribution of these drugs have appeared during the
course of the work.
a) Liposome Entrapped Actinomycin D (ACT-D)
Following the initial report of Gregoriadis (1973b) on the plasma
clearance and tissue distribution of liposome entrapped ACT-D, there
have been a number of reports on the distribution and use of this
carrier system.
Black and Gregoriadis (1974 and this work) showed that liposome
entrapped ACT-D localized in the lysosomes of rat liver from where it
could be released in an active form. Segal et al. , (1975) studied the
distribution of ACT-D liposomes of different sizes following local in-
jection. The work of Rahman's group (Rahman et al. , 1974, 1975, 1978)
has shown that the entrapment of ACT-D in liposomes reduces the toxi-
city of the drug (if it is in the aqueous phase) whilst its tumourici-
dal activity is retained. They have also studied the tissue distribu-
tion of the ACT-D liposome carrier. Gregoriadis and Neerunjun (1975)
have shown that liposome entrapped ACT-D prolongs the survival of turn
bearing mice when compared to the non-entrapped ACT-D and Papahadjopou-
l°s e t
al- (1976) demonstrated that SUV-ACT-D preparations could over-
come the resistance to the drug of cultured tumour cells. More recently
Kaye et al. , (1981) have studied the effects of liposome entrapped
ACT-D in the treatment of sensitive and resistant tumors in mice this
will be discussed in more detail later.
u
46.
The plasma and tissue distribution of ACT-D liposomes has been studied
by Juliano and Stamp (1978) and Juliano et al., (1978).
b) Liposome entrapped Bleomycin.
Ill
The uptake of liposomal In-bleomycin into mice liver and tumour
tissue has been reported by Dapergolas et al. , (1976) who found that
smaller liposomes were taken up better by the tumour tissue. In con-
trast, Segal et al., (1976) could find no selective uptake by malignant
tissue in a clinical study of the cellular and sub-cellular distribu-
tion of *"^In-bleomycin liposomes. The radioactivity within the liver
was concentrated in the lysosomes.
In an attempt to improve the localization of liposomes in animal
tumours, Gregoriadis et al. , (1977a) studied the cellular and tumour
uptake of normal BLM-liposomes and antibody to tumour cells co-entrap-
ped in BLM-liposomes. It was found that the normal BLM-liposomes were
taken up by the tumours. Antibody-containing BLM-liposomes were taken
up slightly better by the tumour than the other liposomes but the pre-
sence of antibody in the liposome enhanced the liver uptake of radio-
activity.
c) Liposome entrapped Asparaginase.
Asparaginase has been entrapped in liposomes by Fishman and Citry
(1975) and Neerunjun and Gregoriadis (1976). The latter showed that
liposome-ASPase was not as effective as the free drug against aspara-
gine dependent tumours. However, the tumour levels of asparagine were
lowest in the liposome treated mice (Gregoriadis 1980a). Allergic
reactions and anaphylactic shock occur following free enzyme admini-
stration but this is prevented when the enzyme is liposome entrapped
(Neerunjun and Gregoriadis 1976).
viii) ROUTES OF DRUG ADMINISTRATION.
The work presented thus far has been entirely concerned with li-
posomes administered by the intravenous route. Other routes of admi-
nistration have been used :
a) Local injection.
Segal et al., (1975) showed that small liposomes could escape from
a local injection site and localize, finally, in the liver and spleen.

47.
The route taken was via the lymphatic system. Ryman et al. , (1978) and
Osborne et al. , (1979) havedevelopped this system using small neutral 99m
or cationic Tc-liposomes to visualize lymph nodes. Dapergolas et al.
(1976) and Kirby et al. , (1980 b) have shown that the intramuscular
route can be used to deliver liposome entrapped agents to the plasma
and liver.
b) Intraperitoneal Injection (I/P)
Kirby et al., (1980b) have shown that incorporation of cholesterol
in liposomes renders them stable enough to cross several permeability
barriers from the peritoneum to the plasma whilst retaining their
entrapped solute. Rahman et al. , (1978) have compared the I/V with the
I/P route and found that the deposition of lipid phase ACT-D liposomes
was the same in both spleen and bone marrow.
c) Oral Route.
The work of Patel and Ryman (1976,1977), Gregoriadis et al.,
(1976), Dapergolas et al. , (1976), Dapergolas and Gregoriadis (1977)
and Ryman et al. , (1978) has shown that the oral administration of
liposomal insulin will lower blood glucose levels. Other agents have
also been administered by this route to test the ability of liposomes
to protect molecules during transit through the stomach and to enhance
their uptake in the intestine (Dapergolas and Gregoriadis, 1977; Ryman
et al., 1978), but the results have proved to be variable and generally
disappointing.
d) Other routes.
Kimelberg et al. , (1978) have reported the distribution of
methotrexate-liposomes following cerebral intraventicular injections.
Juliano and McCullough (1980) have used the respiratory system to
deliver drugs to the lungs. Mezei and Gulasekharm (1980) have used the
topical route to deliver liposome entrapped drugs.
ix) TOXICITY OF LIPOSOMES WITHOUT ENTRAPPED DRUG.
A few studies have been carried out on the toxicity per se of
liposomes and their constituent components. Thus, Gregoriadis (1978)
presented the results of a toxicity test carried out by Nattermann
Chemie, Cologne. FDR. No toxicity of soya bean phosphatidylcholine

48.
liposomes was found except for transient rises in the plasma lipid and
sterol levels. The rats and dogs were given lipid up to lOmg/kg over a
period of several weeks. It should also be remembered that a solution
of "Intralipid" used for I/V therapy in humans, and passed as a safe
medicament, contains up to 20g of phospholipid in 500ml.
The charge or lipid composition may be a more important factor in
the toxicity of liposomes. Adams et al. , (1977) demonstrated toxicity
in mice when high (250-500mg lipid/kg) amounts of liposomes containing
stearylamine (cationic) or dicetyl phosphate (anionic) were injected
intracerebrally but other anionic phospholipids were not toxic. However,
Kimelberg and Mayhew (1978) did not find any toxicity in mice injected
I/P with stearylamine containing liposomes (up to 300mg lipid/kg).
Bruni et al., (1976a, 1976b) and Bigon et al., (1979a, 1979b) have
shown that phosphatidylserine liposomes induce glucose accumulation in
the brain of animals injected I/V with these vesicles.
The function of platelets in contact with liposomes has been
studied by Berdichevsky et al., (1979) who demonstrated an effect on
their agglutinability with phosphatidylethanolamine-containing lipo-
somes but this did not effect their clotting functions.
The interaction of liposomes with proteins and clotting factors
has already been considered.
x) LIPOSOME / CELL INTERACTIONS.
The uptake of liposomes by the liver suggests that in vivo at
least some of the injected vesicles are taken up by endocytosis since
their contents can be found associated with lysosomes (see above). In
this sense liposomes can be said to be lysosomotropic (de Duve et al. ,
1974, 1978).
The mechanism of interaction of lipid vesicles with cells in
culture has been studied in detail during the last few years and the
results have been reviewed (Pagano and Weinstein, 1970; Kimelberg and
Mayhew, 1978; Poste and Papahadjopoulos, 1978; Gregoriadis, 1980a,
1980b, 1980c). The evidence has been obtained with various types of
liposomes and cells under varying conditions. It is not surprising,
therefore, that the results often seem contradictory. However, there is
a general agreement that liposomes are taken up quite efficiently by
cells in culture, that the process of uptake is temperature dependent
but does not require metabolic energy in most cases, and that at least

49.
part of the vesicle contents are incorporated along with the lipids. In
cases where the uptake has been quantified, it appears that several
million SUVs can be incorporated per cell within a few hours (Papaha-
djopoulos et al., 1974b).
The exact mechanism of uptake of vesicles by cells remains to be
clarified, the evidence indicates that it could involve any of the fol-
lowing, either singly or in combination : fusion with the (cell) plasma
membrane (Papahadjopoulos et al., 1974a; Pagano and Huang, 1975; Poste
and Papahadjopoulos, 1976a; Martin and MacDonald, 1976a, 1976b, 1976c;
Weissmann et al. , 1977; Schroit and Pagano, 1978; Batzari and Korn,
1975), endocytosis (Poste and Papahadjopoulos, 1976b; Batzari and Korn,
1975; Cohen et al., 1976) and/or receptor mediated endocytosis (Leser-
man et al., 1980a), adsorption to the cell surface (Pagano and Takei-
chi, 1977; Szoka et al. , 1978), followed by liposome destabilization
and leakage (Szoka et al. , 1979; 1980) or molecular exchange (Pagano
and Huang, 1975; Pagano et al., 1978).
The exact role of any of these mechanisms in the uptake of lipo-
somes in whole animals remains to be determined but it is clear that
the presence of serum in the medium profoundly affects the way in which
cells in vitro handle the liposomes (Tyrrell et al., 1976a; Martin and
MacDonald, 1976a; Kimelberg and Mayhew, 1978; Pagano and Weinstein,
1978).

CHAPTER 2.
Materials and Methods : Basic Results.
51.
Section 2:0 MATERIALS
i) CHEMICALS
a) General
Unless stated all chemicals were of 'ANALAR' grade from
BDH Ltd., Poole, Dorset.
Cholesterol (Regent grade) : BDH Ltd.
Phospholipids (EPC and PA) : Lipid Products, Redhill, Surrey.
Stearylamine : K and K Inc., New York, U.S.A.
S epharose 6B and Sephadex G-10 : Pharmacia Ltd., Uppsala, Sweden
Argon and Nitrogen gas : British Oxygen Co, Park Royal, London. 60
Silicic acid and precoated Plastic Silica-gel sheets ( ^254^ :
Merck and Co. at BDH.
p-Nitrophenyl-2-acetamido-2deoxy-beta-D-glucopyranoside, 2-(p-iodo-
phenyl)-3-(p-nitrophenyl)-5-phenyltetrazolium chloride and
Triton-X-100 : Koch-Light Labs., Ltd, Colnbrook. Bucks.
Agarose (Type A37) : L'Institut Biologique Frangais, S.A., Genne-
villiers (Seine), France.
1,6-diphenyl 1,3,5-hexatriene (purist grade) Aldrich Chemical Co.
Milwaukee, Wi.53233, U.S.A.
b) Proteins and Antisera
Bovine Serum Albumin : Sigma Chemical Co, London.
Rat Serum Albumin, Rat alpha^-macroglobulin, Acylated bovine
albumin (stained with Evans blue) : Generous gifts from Mr.
L. Louis, Clinical Research Centre, Harrow.
Sheep anti-whole rat plasma serum and sheep anti-whole human
plasma serum : DAKO-Immunoglobulins; Mercia Diagnostics Ltd.,
Watford, Herts.
Goat Anti-human alpha-2-macroglobulin serum; Behringwerke Antisera;
Hoechst Pharmaceuticals; Hownslow, Middlesex.
c) Drugs.
Actinomycin-D : Merck, Sharp and Dohme. Hoddesdon; Herts.
mixed with mannitol to aid solubility.
Bleomycin Sulphate : Lundbeeck, N.V. Amsterdam, Holland.
ex. Nippon Kayaku Co., Tokyo, Japan.
Asparaginase (From Erwinia carotovora); Gift from Dr. H.E. Wade.
Centre for Microbiological Research. Porton Down. Wiltshire.

52.
d) Radiochemicals
All radiochemicals were supplied by the Radiochemical Centre.
Amersham, Bucks.
( H) Actinomycin-D (5.1 - 7.7 Ci/mmol).
(4-l 4
C) Cholesterol (53 mCi/mmol).
(U-1 4
C) Cyclohexane (2.5 Ci/ml).
(1 4
C ) methyl Iodide (58 mCi/mmol).
(6-*4
C) Orotic acid monohydrate (61 mCi/mmol).
(6-3
H) Thymidine (5 Ci/mmol).
(3
H ) Water (5 Ci/ml). I l l
( In) Bleomycin (1.66 mCi/mg).
Bolton and Hunter reagent (Bolton and Hunter, 1973) : -125
N-succinimidyl 3-(4-hydroxy, 5-( I) iodophenyl) propionate
( > 1700 Ci/mmol of mono-iodoester). 125
( I) Iodine monochloride ( > 1500 Ci/mmol).
e) Solutions
Double distilled (in glass) water was used throughout this work.
PBS-(phosphate buffered saline) : -
28 ml NaHP04 (2.78 g/1) + 72 ml NaHPO^. 12H
20 (7.17 g/1) +
100 ml 0.29 M NaCl. pH 7.2
Saline : - 0.145 M NaCl.
Solutions were sterilized by autoclaving.
ii) EQUIPMENT
Unless otherwise stated, laboratory equipment was provided by
Scientific Supplies Ltd. London. Rotary evaporator : Bucchi S.A. Zurich,
Switzerland. Centrifuges, rotors, centrifuge tubes and caps. Ultrasonic
irradiator, Ultra violet lamp : MSE Scientific Instruments Ltd. Crawley
Sussex. Spectrophometers (SP.500, SP.800) and "Spectrosil" quartz cu-
vettes (1cm) Pye-Unicam Ltd. Cambridge. Water baths and temperature
control systems. Grant Bros. Cambridge. Beta and Gamma radioactivity
counters. Wallac-LKB Ltd. Stockholm, Sweden. Immunoelectrophoresis
tank and power supply (MBI.260/264). Scientific Supplies Ltd.
Refrigerated thermocirculator. Churchill Instrument Co. Perivale, Middx.
Laboratory Jack. Gallenkamp Ltd. London. Glass Plates (5x5cms) for
agarose gels. Ilford Ltd. Southern distribution centre. Basildon, Essex.
Micro-burette and syringe (S1/4LT). Micro-metric Instrument Co.
53.
Cleveland, Ohio 44122 U.S.A. Particle microelectrophoresis equipment,
Platinum electrodes and cylindrical glass cell. Rank Bros. Bottisham,
Cambridge. Microviscometer and control system. Elsint (G.B.) Ltd.,
Crawley, Sussex.
iii) ANIMALS
Male albino Sprague-Dawley rats were used throughout this work.
The animals were bred and maintained until use under specific-pathogen-
free conditions in the laboratory animal unit of this institute.
During use the animals were maintained on "Laboratory Diet 1" (Spratts
Patent Ltd., Barking, Essex) and were given water ad libitum.
54.
Section 2:1 Methods
A. Manufacture of liposomes
1. General proce dure
Throughout this study liposomes were prepared by a single method
although during the course of the work several other methods became
available (Szoka and Papahadjopoulos, 1980). Liposomes (MLV) were pre-
pared according to the method of Bangham et al.(1974) as modified by
Gregoriadis (1976b).
i) Preparation of liposomes
The lipids of the standard liposome mixture (q.v.) were mixed
with 10-20 ml of chloroform in a round bottomed rotary evaporation
flask(rbf: 50 or 100 ml) which was then flushed with nitogen (N2) or
argon (Ar) and stoppered. After flushing the rotary evaporator with N2
the contents of the flask were evaporated to dryness under reduced
pressure at a temperature of 37-40°C. Evaporation was continued for a
further 10 minutes after the last of the solvent had been removed and
the lipids deposited as a dry film on the flask wall. The pressure
inside the rotary evaporator was restored to normal with a stream of
N^ and the flask was removed. The aqueous solution was immediately
added to the dried lipid along with a few clean and dry glass beads.
After flushing the flask again with N^ and tightly stoppering the neck,
the lipids were removed from the flask walls by gentle hand shaking.
The flask, containing the turbid solution, was wrapped in aluminium
foil and kept at room temperature for 30 minutes before being further
treated. Large MLV preparations (handshaken) were left overnight at
room temperature and then centrifuged at 100,000 g for 15 minutes. The
pellet was washed twice with aqueous phase buffer and the final pellet
(hereinafter called unsonicated MLVs) was suspended in an appropriate
volume of buffer and stored in a stoppered rbf under N^ at 4°C until use
ii) Sonication
Smaller MLVs were prepared by sonication of the turbid solution
(Huang, 1969). After an elapse of at least 30 minutes following prepa-
ration, the flask was cooled in a beaker of melting ice whilst the so-( bo vaMHS )
lution was subjected to ultrasonic irradiation^at maximum amplitude
(about 8 um peak to peak) using a titanium vibrator probe of end dia-
meter 19 mm (end ratio 3.5:1) at the frequency of 20-22 Kc.sec
During sonication, which was carried out for 2 1/2 minutes, in 30
55.
seconds bursts followed by 15 second rests, the liposome solution was
kept under an inert atmosphere of N^ or Ar continuously supplied to the
liquid surface. Following sonication the liposome solution appeared
optically clear at the edges. This solution was again flushed with N^
and then left overnight at room temperature protected from light by
aluminium foil.
iii) Column chromatography
The separation of sonicated liposomes from unentrapped material
and other debris was performed by molecular sieve column chromatography
using Sepharose 6B (Huang, 1969). New columns were prepared by packing
Sepharose into a glass column plugged with a small quantity of glass
wool. The final size of the column was 50 x 1 1/2 cms. Columns were
eluted from an overhead reservoir of buffer (50-60 cms above the upper
surface of the Sepharose). The buffer flow was controlled by a teflon
stop cock. Most liposome separations were carried out at room tempera-
ture. Before use for the separation of liposomes from unentrapped ma-
terial, columns of new Sepharose were exhaustively eluted with saline
to remove the sodium azide which is used as a bacteriostatic by the
manufacturers. In addition, each column was pretreated with a solution
of empty liposomes (buffer entrapped) to prevent the adsorption of
lipids onto the surface of Sepharose beads (Huang, 1969). Following
these pretreatments, columns could be used several times without any
noticeable effect in liposome separation. Between uses all columns were
stored at 4° C.
Before use, pretreated columns were eluted for 1-2 hrs with the
same buffer used to prepare the liposomes (aqueous phase buffer; APB).
Sonicated liposome solutions (usually 5 ml) were added to the top of
the column and allowed to sink into the Sepharose. The separated lipo-
somes were eluted from column in the void fluid (20-25 ml) where they
appeared as a milky suspension. The whole of this turbid fraction was
collected in every case. Sonicated liposomes eluted from the column
were stored at 4° C under N2 in the dark until use. After removal of
liposomes from the columns, the elution was continued for at least 4
hrs to remove all the unentrapped material.
iv) Concentration of liposomes
In cases where highly concentrated liposome suspensions were re-
quired, the liposomes eluted from the column were centrifuged at
100,000 g for 1 hr in a high speed centrifuge (Tyrrell et al., 1976a).

56.
2. Standard liposome preparation
Unless otherwise stated a standard mixture (or multiples thereof)
of lipids and cholesterol were used throughout. Before use, a new vial
of EPC or PA was checked for purity by thin layer chromatography (TLC)
on plastic sheets precoated with silica gel using a chloroform:
methanol:water (65:25:4) solvent (Bangham et al. , 1974). The dried
sheets were sprayed with Dittmer spray (Dittmer and Lester, 1964) to
develop the phospholipid spots. Only vials giving single spots on TCL
were used.
The standard lipid mixture consisted of
i) 15.0 mg egg lecithin (EPC) (20 umoles)
ii) 2.17 mg cholesterol (CHOL) (5.7 umoles)
iii) either a) 2.5 mg phosphatidic acid (PA) for negatively charged
MLVs (2.85 umoles)
or b) 0.81 mg stearylamine (SA) for positively charged MLVs
(2.85 umoles).
Neutrally charged MLVs were made by omitting (iii) all together. These
constituents give molar ratios of 7 mols lecithin: 2 mols cholesterol:
1 mol charged lipid. The aqueous phase buffer (APB) used to rehydrate
the lipids was usually 5 mM phosphate buffered saline pH 7.4 unless
otherwise stated. Normally 2.5 ml of buffer was added for each unit
(15.0 mg lecithin) of standard lipid mixture used.
3. Drug entrapment in liposomes
Additions to the standard mixture were made when drugs were to be
entrapped in the liposomes.
i) Drugs to be entrapped in the lipid phase (LP) of the liposomes
were mixed with the lipids in chloroform before rotary evapora-
tion.
ii) Drugs be entrapped in the aqueous phase (AP) were dissolved
in APB before its addition to the dried lipid film.
B. Preparation of drugs and phospholipids used in liposome manufacture
1. Drugs
i) Actinomycin D (ACT-D)
The manufacturers of actinomycin D supply this drug in sterile ampou-
les, containing 500ug powdered drug/vial with mannitol as an aid to
water solubility.

57.
The active drug was removed from the mannitol powder by the addition of
5 ml chloroform to the vial. The resulting orange solution was filtered
through Whatman no.l paper. The insoluble mannitol residue was washed
repeatedly with chloroform and similarly filtered. Finally the filter
paper itself was washed in a large volume of chloroform. All the
washings were pooled and the drug solution in chloroform was rotary
evaporated to a constant volume (4 ml). Standard volumes of ACT-D in
chloroform : methanol (1:1) were prepared. The absorbance at 443 nm was
measured following an initial estimation of the absorbance maximum. A
standard dilution curve proved to be linear when read against a chlo-
roform : methanol blank and, assuming 100 % extraction of the drug, the
extinction coefficient ( E4 4 3
=
23480) was in good agreement with pu-
blished work ( E4 4 3
= 24800 + 200) (Katz and Weissbach, 1963). The
amount of ACT-D extracted (assuming each vial contains 500 ug ACT-D)
was between 85 and 93 %. Each ACT-D solution was made up to 100 ug
drug/ml in chloroform and then stored in the dark at -20° C until use. 3
Radiolabelled H-ACT-D was mixed with the stock solution of the
drug to give 25uCi/mg cold ACT-D in the chloroform in which the lipids
were to be dissolved. ACT-D entrapped in the AP of liposomes was
carried out using the manufacturer's preparation of ACT-D (including
mannitol) which had been dissolved in APB to give a stock solution of
100 ug/ml. Radioactive ACT-D was added to the stock solution in APB,
just before use, to give a final concentration of 10 uCi/mg cold drug.
This stock solution was used as free (unentrapped) drug for animal
experiments.
ii) Bleomycin (BLM)
For indium (^"^In) labelled bleomycin, see Materials.
Iodination of bleomycin
125 Two methods were used to iodinate bleomycin with I :
i) directly in the imidazole ring with iodine monochloride (Meyers
et al., 1975);
ii) indirectly by reaction with the Bolton and Hunter reagent (N-suc-125
cinimidyl 3- (4-hydroxy 5- Iodophenyl) propionate) (Eckelman
et al. , 1976; Bolton and Hunter, 1973).
58.
i) Direct iodination of bleomycin
Iodine monochloride labelling was performed exactly according to
the method described by Meyers et al. , (1975). Briefly, 140 ug (0.1
umol) of bleomycin sulphate was dissolved in 200 ul saline/citrate
buffer (0.15 M NaCl, 0.02 M trisodium citrate pH 7.0). Radioiodine 1 25
(2mCi I) in 250 ul buffer was added to the BLM along with 30 ul of
iodine monochloride (3.3 mM). The reaction mixture was shaken on a
flask shaker for 5 minutes and then left for 2 hrs at room temperature
in the dark. Iodinated BLM was separated from I' 10^ and other re-
actants by preparative chromatography on a Sephadex G-10 column (50 ml
bed volume) eluted with sterile 0.9%NaCl. Fractions (1ml) of the eluant 125
were assayed spectroscopically (280nm) and for I in a gamma-counter.
Fractions with the highest specific activities were pooled and stored
in sterile containers at 4° C until use. ii) Indirect iodination
The Bolton and Hunter reagent (1.1 mCi : 2.0 mCi/ml in benzene and
0.2 % dimethylformamide) was placed in a small test tube kept at 4° C.
The reagent was blown to dryness with a stream of N2« The walls of the
tube were thoroughly washed with more benzene which was also evaporated
with N2« An ice-cold solution of bleomycin sulphate (75 mg/ml in water)
was prepared and 100 ul very gently added to the dry reagent. After
gentle vortex mixing for two minutes the reaction was allowed to pro-
ceed at 4° C for a further 15 minutes. The reaction was stopped by the
addition of 0.5 ml glycine/borate buffer (0.2 M glycine in 0.1 M so-
dium borate buffer, pH 8.5) at 0° C. After 5 minutes the reaction
mixture was chromatographed on a Sephadex G-10 column using sterile
0.9 % NaCl as eluent. The fractions (1ml) were assayed for BLM and 125
I content as before and fractions with the highest specific activity
were pooled and stored at 4° C for use.
The specific activities of the radiolabelled bleomycin solutions
were
125 i) iodine monochloride ( I-ICL-BLM) method 643.13 uCi/umol
125 ii) Bolton and Hunter ( I-BH-BLM) method 354.66 uCi/umol.
Neat aliquots of these iodinated BLMs were used in the preparation of
liposomes for liver subcellular fraction and tissue distribution stu-
dies. Free (unentrapped) drug solutions for these studies were diluted
in 0.9 % NaCl to give the same amount of radioactivity.
59.
125 iii) Preparation of I-labelled asparaginase
Erwinia asparaginase (EC 3.5.1.1) (860 units/mg protein) was
supplied as a lyophilized powder (12,000 units/vial). Sterile distilled
water (1ml) was added to one vial of enzyme and the solution gently
mixed before being allowed to dissolve for 30 minutes at room tempera-
ture. Undissolved material was removed by centrifugation in a bench
centrifuge at 3,000 rpm for 10 minutes. The concentration of the enzyme
was calculated following an estimation of the protein content of the
solution (Lowry et al. , 1951). Asparaginase was radioiodinated by the
iodine monochloride method (McTarlane, 1958; 1963). Briefly, 10,000
units of asparaginase in water were pre-oxidized with iodine in sodium 125
acetate buffer (pH 4.5) before being mixed with 0.55 mCi Iodine.
After the reaction had finished the labelled enzyme was eluted from an
Sephadex G-10 column with sterile 0.9 % NaCl. Fractions (1ml) were
collected and those with high radioactivity were pooled and estimated
for protein content (Lowry et al., 1951). The specific activity of the
final preparation was 72.4 uCi/mg protein (0.084 uCi/unit). Enzyme acti-
vity was not assayed.
Before entrapment in liposomes, a small amount (usually 20 uCi) of 125
I-asparaginase was added to an aqueous solution of cold enzyme to
give a final concentration of 3 mg enzyme/ml. For use as a drug (i.e.
in partial hepatectomy studies) 10 ml of this solution was used with
the standard mixture to make the liposomes. For subcellular fractiona-
tion and tissue distribution studies the radiolabelled preparation was
used without any addition of cold enzyme. Free drug solutions were pre-
pared by dilution with 0.9 % NaCl to give similar radioactive counts
to the liposome solutions.
14 2. Preparation of C-labelled lecithin
Pure egg phosphatidylcholine was radiolabelled on the choline 14 14
moiety with C-methyl groups derived from C-methyl iodide (Stoffel,
1975). Some modifications to the published methods were used since pre-
liminary experiments showed that dimethyl formamide (DMF) continued to
contaminate the phosphatidyl-N, N dimethylethanolamine after the initial
demethylation step. This was overcome by subjecting the demethylated
lipid to the Bligh and Dyer (1959) extraction technique.
One mmole EPC (750 mgs) and 6 mmoles of 1,4-diazobicyclo (2,2,2)
octane were dissolved in 20 ml DMF and then refluxed under a stream of
N9 for 5 hours. The progress of the reaction was followed by removing
60.
20 ul samples from the refluxing mixture at 30 minutes intervals and
subjecting them to TLC (see Standard liposome mixture). Unreacted
samples of EPC in DMF at 36 mgs/ml served as controls. The reaction was
stopped once the treated PC ran as a single spot on the TLC plate. The
refluxing solution was cooled to 4° C in ice and 40 ml of ice cold
1 N HC1 was added. This mixture was then shaken well for 10 minutes on
a flask shaker at 4° C. Finally, 20 mis chloroform was added to the
mixture and the shaking continued for a further 10 minutes. The
contents of the reflux flask was then centrifuged at 3,000 rpm for 10
minutes at 4° C to ensure total separation of the chloroform layer from
the upper DMF layer. The upper layer was extracted twice more with
chloroform and then these extracts were pooled and rotary evaporated to
near dryness.
The residue from this evaporation was then extracted with 10 ml
of a chloroform : methanol (1:1) solvent before water (9ml) was added.
The mixture was again shaken well and after the addition of a further
2 ml of chloroform the mixture was centrifuged, the chloroform phase
removed and the aqueous phase extracted twice more with chloroform.
After pooling the chloroform phase and washes, a sample of the mixture
was spotted onto a filter paper and assayed for contaminating DMF which
could be seen as a deep red spot when viewed in green light. Samples
still contaminated with DMF were rotary evaporated to near dryness and
re-extracted as above.
In initial experiments the demethylated EPC was further purified
on a silicic acid column (25 x 1 1/2 cm, 150 g SiO^) by applying in-
creasing concentrations of methanol in chloroform (Bangham et al,1974).
No further increase in yield, as measured by lipid phosphor us(Baginski
et al., 1967) or purity, as measured by TLC, was gained by this column
chromatography; it was omitted in later preparations.
Remethylation of the phosphatidyl-N, N-dimethylethanolamine was 14
performed at 4° C with 25 umols C-CH^I by the published method
14
(Stoffel, 1975). The C-EPC was purified by silicic acid chromatogra-
phy and the final fractions were pooled and concentrated. The reme-
thylated lipid was compared with pure EPC by TLC. The concentration of
EPC was assayed by measuring lipid phosphor* us (Baginsky et al., 1976)
and the radioactivity of the sample was counted by liquid scintilla-14
tion spectroscopy (q.v). The total recovery of C-EPC was 0.21 mmol
and the specific activity was 16.5 uCi/mmol.

61.
C. Estimation of drug distribution in rats following intravenous
injection of either liposome entrapped or unentrapped drugs
i) Intravenous_ infection
Rats were injected I/V into a tail vein which had previously been
dilated by warming the tail under running water (40-50° C) for about
one minute. The volume of injection was usually 1 ml unless otherwise
stated. No immediate toxicity or death was ever seen in animals follo-
wing injection in this way, either with liposome or free drug solutions.
Animals which accidentally received the injection into the tissues, i.e.
other than I/V, were not used in the experiments.
ii) Plasma concentration of the drugss
Blood was collected from the rats at timed intervals after injec-
tion by rapid exsanguination of the animals into a heparinized (20 ul
heparin(5,000 units/ml)) and graduated test tube (15ml). Exsanguination
was achieved by decapitation of the animals. The blood volume was
measured and the blood was then mixed on a vortex mixer for 10 seconds.
It was stored at 4° C and then later centrifuged at 3,000 rpm for 15
minutes in a bench centrigue. The plasma layer was removed and a sample
taken for scintillation or gamma-counting. The remaining sample was
stored frozen at -20° C for future reference.
iii) Tissue concentration of drugs
a) Removal
Apart from the liver which was treated separately, tissues used
for distribution studies were removed from the animal as soon as pos-
sible after decapitation (usually between 2 and 4 minutes). The tissues
were washed twice in ice cold saline to remove contaminating blood and
then blotted dry on filter paper. The small intestine was flushed out
twice with saline to remove all the faeces. Tissues were then indivi-
dually weighed before being frozen at -20° C (table 2:1).
b) Homogenization
In animals injected with gamma-emitter-labelled drugs, the tissues
were thawed at room temperature by the addition of an appropriate vo-
lume of water for each tissue type (Table 2:1). They were then chopped
into small pieces with scissors and made up to a final concentration
with more water before being counted in a gamma-counter.
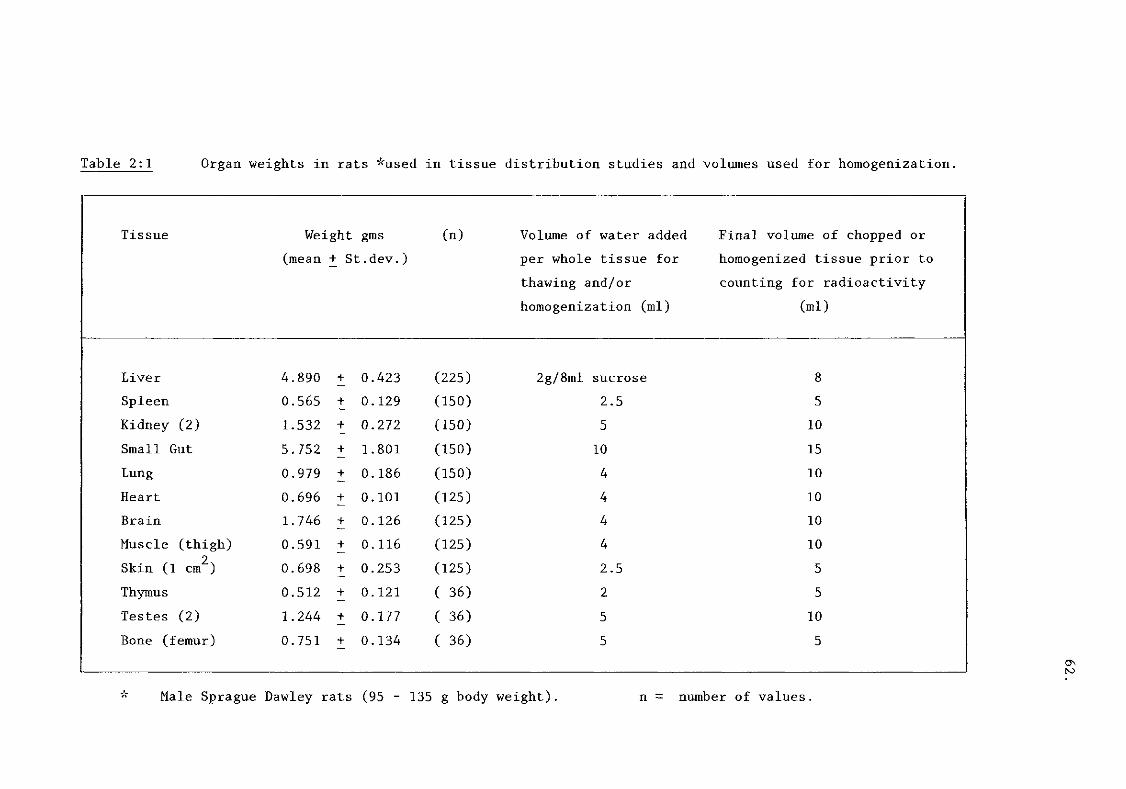
Table 2:1 Organ weights in rats "used in tissue distribution studies and volumes used for homogenization.
Tissue Weight gms (n) Volume of water added Final volume of chopped or
(mean + St.dev.) per whole tissue for homogenized tissue prior to
thawing and/or counting for radioactivity
homogenization (ml) (ml)
Liver 4 890 + 0 .423 (225) 2g/8ml sucrose 8
Spleen 0 565 + 0 .129 (150) 2.5 5
Kidney (2) 1 532 + 0 .272 (150) 5 10
Small Gut 5 752 + 1 .801 (150) 10 15
Lung 0 .979 + 0 .186 (150) 4 10
Heart 0 696 + 0 .101 (125) 4 10
Brain 1 746 + 0 .126 (125) 4 10
Muscle (thigh) 0 .591 + 0 .116 (125) 4 10 2
Skin (1 cm ) 0 698 + 0 .253 (125) 2.5 5
Thymus 0 512 + 0 .121 ( 36) 2 5
Testes (2) 1 244 + 0 .177 ( 36) 5 10
Bone (femur) 0 751 + 0 .134 ( 36) 5 5
Male Sprague Dawley rats (95 - 135 g body weight). n = number of values.

63.
125 In experiments with Iodine-labelled compounds the tissues were
homogenized as described below for beta-emitting compounds. Half of the
final volume of the homogenate was counted for gamma-activity. The
other half was treated with ice cold trichloroacetic acid (TCA) to a
final concentration of 10 %. The resulting protein precipitate was then
centrifuged at 3,000 rpm on a bench centrifuge for 10 min and the
pellet washed once with 10 % TCA. Finally the pellet was suspended in
water to its original volume and then counted for gamma-activity.
Tissues from animals injected with beta-emitting drugs were homo-
genized in a fixed volume of water (Table 2:1) with a Potter-Elvehjem
homogenizer (tight pestle). During homogenization of usually 2 - 3
strokes (but 6 - 1 0 strokes for skeletal muscle, heart and lung tis-
sues) the mortar was cooled in a beaker of melting ice. After homogeni-
zation the solution was decanted into a graduated measuring cylinder,
and the mortar was washed twice with water. Finally the homogenate was
made up to a fixed volume with water. After rapid mixing on a vortex
mixer, a sample of the solution was removed and counted for radioacti-
vity.
iv) Liver concentration of drugs
The rat livers used for drug distribution studies were removed as
quickly as possible following exsanguination of the animal. The whole
excised liver was washed twice in ice cold saline, blotted dry with
filter paper and then weighed. Between 1 and 4g of the liver were
chopped with scissors into ice cold 0.3 M sucrose and homogenized at
once using a Potter-Elvehjem homogenizer (3 strokes - tight teflon
pestle) cooled in a beaker of melting ice. All subsequent steps were
carried out at 4°C.
For control studies a sample of the injected material (usually
0.5 ml) was added to the chopped liver from a normal (i.e. untreated)
rat before homogenization. The livers were then treated exactly as
before.
Subcellular fractionation of the liver was carried out by
differential centrifugation according to the method of Gregoriadis and
Sourkes (1967) which has previously been used for liposome distribution
studies (Gregoriadis and Ryman, 1972a). In brief, the liver homogenate
was centrifuged at 6000 g.min to sediment the cell debris and nuclei.
The supernatant was saved and the pellet washed once with 0.3M sucrose.
64.
125 These supernatants were pooled and recentrifuged at 4.2 x 10 g.mins to
pellet the lysosomal/mitochondrial fraction. Finally, supernatant from
this centrifugation was separated into a post-lysosomal/mitochondrial
pellet (microbodies) and a clear supernatant (cytosol) at 100,000 g for
1 hour.
The purity of the fractions and latency of the enzymes in the
lysosomes and mitochondria was assayed by studying N-acetyl-beta-glu-
cosaminidase (NABGase) (lysosomes) and succinate-2-(p-iodophenyl)-3-
(p-nitrophenyl)-5-phenyltetrazolium-reductase (INTase) (mitochondria).
For the lysosomal marker, the activity in the liver subcellular
fractions of NABGase was measured by the method of Borooah et al.(1961)
in the presence of Triton X-100 (TX-100 : 0.1 % final concentration)
using p-nitrophenyl-2-acetamido-2-deoxy-beta-D-glucopyranoside as sub-
strate and measuring the release of p-nitrophenol following incubation
at 37°C. Similarly, INTase activity, in the presence of TX-100 (0.1%),
was assayed by the methods of Pennington (1961) and Hinton et al.(1969)
using sodium succinate as substrate and 2-(p-iodophenyl)-3-(p-nitrophe-
nyl)-5-phenyltetrazolium as the electron acceptor.
D. BIOLOGICAL EFFECTS OF DRUGS
i) Partial hepatectomy of rats.
Partial hepatectomy refers to the removal of the median and left
lateral lobes of the liver (about 67 % by weight). Male Sprague-Dawley
rats weighing between 100 and 150 g were starved for 24 hours and then
subjected to partial hepatectomy under sterile conditions using ether
anaesthesia (Higgins and Anderson, 1931). Sham-hepatectomy was
performed in the same way but no liver was excised. The peritoneal
cavity was closed with a nylon suture on an atramatic needle and the
skin was sealed using Micheli clips. The animals were allowed to
recover in single cages before being transferred to larger ones. This
method resulted in more than 95 % recovery of the animals after the
operation.
ii) Drug treatment
Unless otherwise stated, drug treatment of the hepatectomised
animals was performed immediately after the operation by a single I/V
dose of either free or liposome entrapped drug into a tail vein.
65.
iii) Measurement of nucleic acid synthesis in the regenerating livers e
The synthesis of DNA and RNA was determined at timed intervals
after partial hepatectomy. The animals were injected I/P. with either
1.5 uCi of (6-l 4
C) orotic acid (61 mCi/mmol) diluted in 0.5 ml 0.9 %
NaCl (for RNA) or 10 uCi of (6-3
H) thymidine (5 Ci/mmol) diluted in
0.5 ml 0.9 % NaCl (for DNA). The radiolabel injections were all made
1 hour before the animal was killed.
The liver was removed from the animal as quickly as possible and
washed. A 20 % homogenate was made in 0.25 M sucrose. An aliquot (1 ml)
of this homogenate was treated according to the method of Schneider
(1957) to extract the nucleic acids according to their differential
solubility in trichloroacetic acid (TCA). The DNA and RNA were separa-
ted by the Schmidt and Thannhauser (1945) method, for solubilizing RNA
in KOH, as modified by Munro and Fleck (1966).
The RNA was assayed by the orcinol reaction (Mejbaum, 1939) using
yeast RNA as a standard. The assay of DNA was carried out by the di-
phenylamine method of Burton (1956) as modified by Giles and Myers
(1965) using calf thymus DNA as a standard. The uptake of radioactivity
into DNA and RNA was calculated following liquid scintillation counting
of the DNA or RNA isolated from the livers of rats. In experiments to
assess the effects of drug treatment on RNA synthesis using ACT-D
liposomes or free ACT-D, the livers of the treated rats were not only
assayed for DNA and RNA synthesis, but also subjected to subcellular
factionation as described previously.
E. INTERACTION OF LIPOSOMES WITH PROTEINS
i) Isolation of rat plasma lipoproteins
Rat plasma lipoproteins were prepared by the standard method of
flo tation ultracentrifugation using KBr to adjust the density of the
plasma (Hatch and Lees, 1968). The plasma was centrifuged sequentially
at densities of 1.006, 1.063 and 1.21 g/ml (Hatch and Lees, 1968).
According to Windmueller and Levy (1967) rat plasma contains the fol-
lowing lipoproteins fractions : first fraction (d < 1.006) contains
chylomicrons and particles, the second fraction (d + 1.006) contains
VLDL. A third fraction (d : 1.006 - 1.035) contains pure low density
lipoproteins although not the total amount. The fourth fraction (d :
1.035 - 1.063) contains a mixture of low and high density lipoproteins;

66.
the next fraction (d : 1.063 - 1.21) contains most of the high density
lipoproteins and the final fractions (d > 1.21) contain VHDL floating
above a viscous plasma protein pellet.
Although it is agreed that rat low and high density lipoproteins
overlap in their densities (Koga et al. , 1969; Lasser et al. , 1973),
the range of densities required to separate these two lipoproteins
fractions has not been established. For this reason the mixed fraction
(d : 1.035 - 1.063) was treated as if it contained only low density
lipoproteins (range 1.040 - 1.050 : Lasser et al., 1973) which were not
isolated separately. The preparation of density solutions for lipopro-•S tf^ S't <~iOn -3
tein^is shown in Table 2:2 and the centrifugation scheme is described
in Table 2:3. Fractions were removed by gentle pipetting of the upper
layers using an Eppendorf pipette (500 ul). After removal the isolated
lipoproteins were dialysed overnight at 4°C. against 10 liters of
phosphate buffer, pH 7.4 containing 0.01 M. N a ^ P O ^ , 0.124 M NaCl and
0.3 mM Na2EDTA. Samples of the isolated fractions were then counted for
beta and gamma radioactivity. Fractions were stored at 4°C or used for
Laurell double Immunoelectrophoresis (q.v.).
ii) Preparation of rat blood for lipoprotein analysis
Only rat plasma was used for lipoprotein fractionation, since
serum is not as good as plasma for the study of some lipoprotein frac-
tions (eg : chylomicrons) (Hatch and Lees, 1968).
At timed intervals following injection of radiolabelled liposomes
containing either l 4
C-cholesterol ( L P ) +m
i n - B M L (AP) or l 4
C-EPC(LP)+
^"^In-BLM (AP) rats were decapitated and bled into graduated glass test
tubes containing 1 mg Na^EDTA and 20 ul of thimerosal (sodium ethylmer-
curithiosalicylate) (15 mg/ml in water, pH 8.0) per millilitre of blood
This anticoagulant system has been reported to be the best for obtain-
ing plasma whilst inhibiting enzymatic activity and improving the re-
producibility of ultracentrifugal patterns of lipoproteins (Hatch and
Lees, 1968).
The blood samples were kept at room temperature and processed as
quickly as possible. The plasma was obtained by a quick centrifugation
(3,000 rpm, 5 min in bench centrifuge). An aliquot (4 ml) of plasma
from each rat was used for analysis of lipoproteins.

67.
Table 2:2
Preparation of density solutions for lipoprotein analysis
Density solutions were prepared according to the methods of Hatch
and Lees (1968). Using NaCl solutions adjusted with NaBr.
i) Density = 1.006 gm/ml
Sodium chloride (11.40 gm), disodium EDTA (100 mgs) and 1 ml 1 N
NaOH were dissolved in 500 ml water. A further 503 ml of water
was added to this solution.
(0.195 moles NaCl/1000 gm H20 : 0.195 molal NaCl)
(stock solution)
ii) Density = 1.182 gm/ml
Sodium bromide (24.98 gm) was added to 100 ml of the above stock
solution (0.195 molal NaCl 2.44 molal NaBr).
iii) Density = 1.478 gm/ml
Sodium bromide (78.32 gm) was added to 100 ml of the above stock
solution (0.195 molal NaCl; 7.65 molal NaBr).
The densities of these solutions were checked by weighing
standard volumes (10 ml) at 20°C.
iii) Association of Plasma Proteins with liposomes
Empty liposomes were prepared in the usual way using four times
the standard quantities (i.e. 80 umol EPC etc) in 10 ml 0.145 M NaCl
pH 7.4. The liposome suspensions were divided into two equal volumes;
one half was sonicated (2.5 min), the other was treated as for hand-
shaken MLVs (see liposome preparation methods).
A sample of each of these preparations (8 umols EPC : 2.28 umols
Choi:1.14 umols charged lipid) was mixed with an equal volume of fresh-
ly drawn rat or human plasma. This mixture (usually 2 ml) was incubated
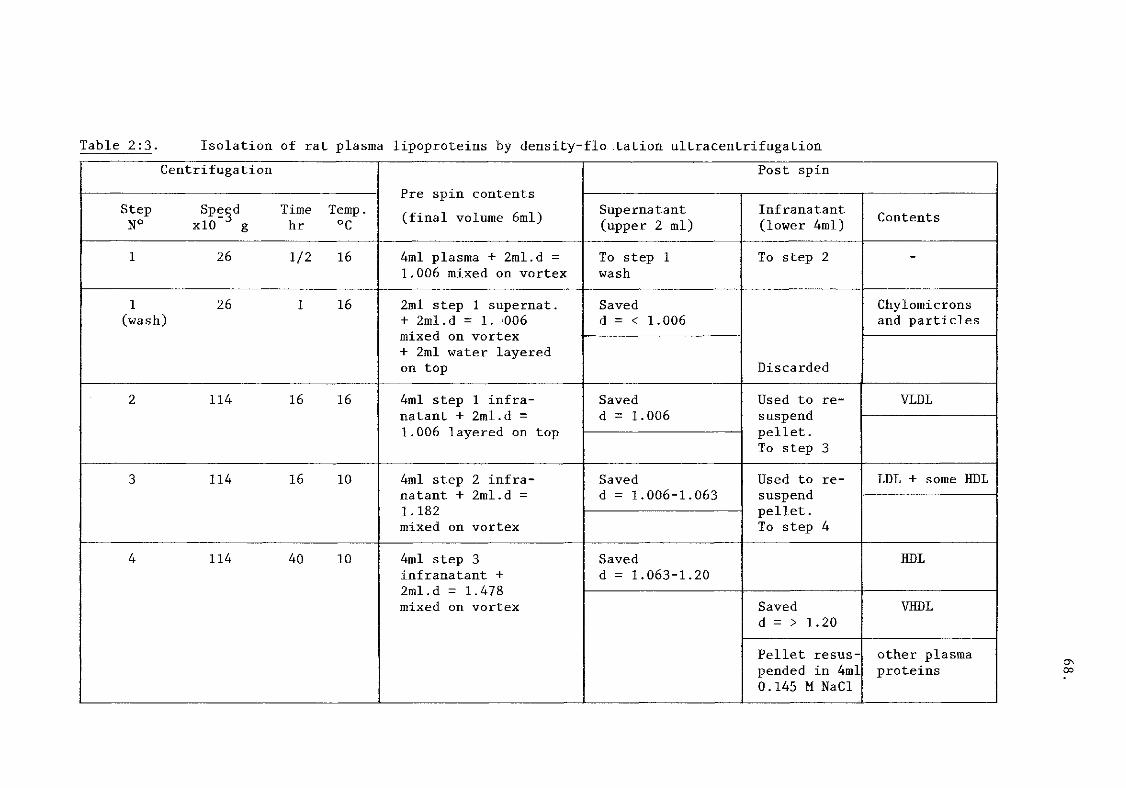
Table 2:3. Isolation of rat plasma lipoproteins by density-flo tation ultracentrifugation
Centrifugation
Pre spin contents
(final volume 6ml)
Post spin
Step Speed Time Temp. N° xlO g hr °C
Pre spin contents
(final volume 6ml) Supernatant (upper 2 ml)
Infranatant (lower 4ml)
Contents
1 26 1/2 16 4ml plasma + 2ml.d = 1.006 mixed on vortex
To step 1 wash
To step 2 -
1 26 1 16 (wash)
2ml step 1 supernat. + 2ml.d = 1. 006 mixed on vortex + 2ml water layered on top
Saved d = < 1.006
Discarded
Chylomicrons and particles
1 26 1 16 (wash)
2ml step 1 supernat. + 2ml.d = 1. 006 mixed on vortex + 2ml water layered on top Discarded
2 114 16 16 4ml step 1 infra-natant + 2ml.d = 1.006 layered on top
Saved d = 1.006
Used to re-suspend pellet. To step 3
VLDL
3 114 16 10 4ml step 2 infra-natant + 2ml.d = 1.182 mixed on vortex
Saved d = 1.006-1.063
Used to re-suspend pellet. To step 4
LDL + some HDL
4 114 40 10 4ml step 3 infranatant + 2ml.d = 1.478 mixed on vortex
Saved d = 1.063-1.20
HDL 4 114 40 10 4ml step 3 infranatant + 2ml.d = 1.478 mixed on vortex Saved
d = > 1.20 VHDL
4 114 40 10 4ml step 3 infranatant + 2ml.d = 1.478 mixed on vortex
Pellet resus-pended in 4ml 0.145 M NaCl
other plasma proteins
69.
for 1 hr in a shaking water bath at 37°C. After incubation the mixture
was centrifuged at 100,000 g for 1 hour six times with a pellet-wash in
0.9 % NaCl between spins. The final pellet was resuspended to 1 ml in
0.9 % NaCl. Samples were then used for Immunoelectrophoresis.
In a further series of experiments, both the liposomes and the
plasma samples were precentrifuged at 100,000 g for 1 hr before mixing
and incubation. In addition, liposomes were mixed with complement
destroyed human plasma (heated at 56° C for 1 hr).
The protein associated with the liposome pellet was estimated by
the method of Lowry et al. (1951) using BSA as a standard. Lipid phos-
phorous was measured by the method of Baginski et al. (1967).
iv) Two-dimensional Immunoelectrophoresis
Antigen-antibody crossed electrophoresis (Laurell electrophoresis)
was performed according to the method of Clarke and Freeman (1968).
This method was used for i) the determination of proteins associated
with liposomes following their incubation with either rat or human
plasma (qv) and ii) checking the purity of rat lipoprotein fractions
following density flo tation.
The first dimension was run on 5 x 5 cm glass plates covered with
1% agarose in 0.03 M veronal buffer pH 8.6. Samples (2-15 ul) were
added with a microburette to 20 ul holes punched into the solidified
gel. Acetylated albumin, stained with Evans blue, was used as a stan-
dard. The electrophoresis was performed in a M.B.I, electrophoresis tank
using 10 volt/cm (at 500 m. Amps) between wicks dipping into 0.03 M ve-
ronal buffer kept at 4° C (Churchill thermocirculator). The electropho-
resis was continued until the stained acetylated albumin had reached
the anode wick (70-90 minutes) and then stopped.
The second dimension was run using strips (0.5 cm wide) from the
first dimension containing the sample proteins. The 5 x 5 cm slab gel
contained 1% agarose in 0.03 M veronal buffer pH 8.6 with the addition 2
of an appropriate antiserum or specific antibody (1-5 ul/cm ). A simi-
lar electrophoresis system was used as for the first dimension except
that the voltage between the wicks was adjusted to 2 1/2 volts/cm. The
gels were electrophoresed at room temperature overnight (> 18 hrs).
The agarose gels were washed for 3 hours in 0.9% NaCl and for 30 minu-
tes in distilled water. After drying, the plates were stained in 0.1%
amidoblack (in methanol: water:glacial acetic acid, 5:5:1) for 2 hours
and then destained in this solvent for 5 minutes until the background

70.
was transparent. Finally, the plates were rinsed twice in 70% methanol
and left to dry. Lipoprotein fractions were stained with Sudan black
(saturated solution in 60% ethanol) (Segal et al., 1973).
The antibodies used were either anti-whole human plasma or anti-
whole rat plasma antiserum (Dako) or, in the case of human alpha2-ma-
croglobulin, specific anti-human alpha-2-macroglobulin antiserum (Beh-
ringwerke).
For identification of rat alpha-macroglobulin, samples of pure rat
alpha-macroglobulin (6 mg/ml) and rat albumin (3 mg/ml) were added to
washed liposome pellets. These rat plasma proteins, which were immuno-
logically pure, were a generous gift from Mr L. Louis of this institute
A typical example of Immunoelectrophoresis is shown in plate 3.1
(chapter 3) where 5 ul of whole rat plasma has been immunoelectropho-
resed in two directions. The agarose gel of the second dimension con-2
tained 1 ul/cm whole rat plasma antiserum.
F) Measurement of Radioactivity in samples.
i) Gamma Radioactivity.
Radioactivity from and ^"^In was counted using a well type
sodium iodide crystal detector constructed in this institute. In
addition, these isotopes were counted in a Wallac-LKB gamma counter
programmed for maximum counting efficiency for each isotope (between
73 and 79%). Samples were normally made up to a fixed volume (2 or
5 ml depending on the sample) in a stoppered plastic tube. Counting
was continued for 100s with a cut-off at 100000 counts.
ii) Beta Radioactivity.
3 14 Beta-emitting isotopes ( H and C) were counted in a Wallac-LKB
3 beta counter with discriminators set to give a maximum number of H
14 counts without any cross-over into the C channel and minimal cross-
14 3 over of C into the H channel.
Aqueous samples (final volume 1ml) were added to 10ml of a liquid
scintillation emulsion containing 2,5 diphenyloxazole (PPO) 0.6% and
1,4.bis-2(5-phenoxyazolyl)benzene (P0P0P) 0.05% in toluene which was
then further mixed with triton X-100 (2:1 v/v) before use (Patterson
and Greene; 1965). Samples were dispensed into low potassium glass
vials, well mixed with scintillant on a vortex mixer and then left

71.
overnight at 4°C in the dark to dissolve the tissue homogenates or
fractions. Counting was carried out for 10 minutes. This system gave 3
counting efficiencies in unquenched samples of 41.78 + 7.1% H and
69.37 + 8.07% 1 4
C (mean + st dev. n=4).
The activities in each sample (dpm) was calculated from the counts
obtained following the addition of an aliquot (lOul) of a standard so-3 3 14 14
lution of either H ( H-water - 25 nCi/sample) or C (U- C cyclohe-
xane-20 nCi/sample) to precounted vials. Where both isotopes were
present samples of both standards were added to each vial at different
times. The method of internal standardization was adopted because of
the variable protein and colour content of the individual tissue
samples.
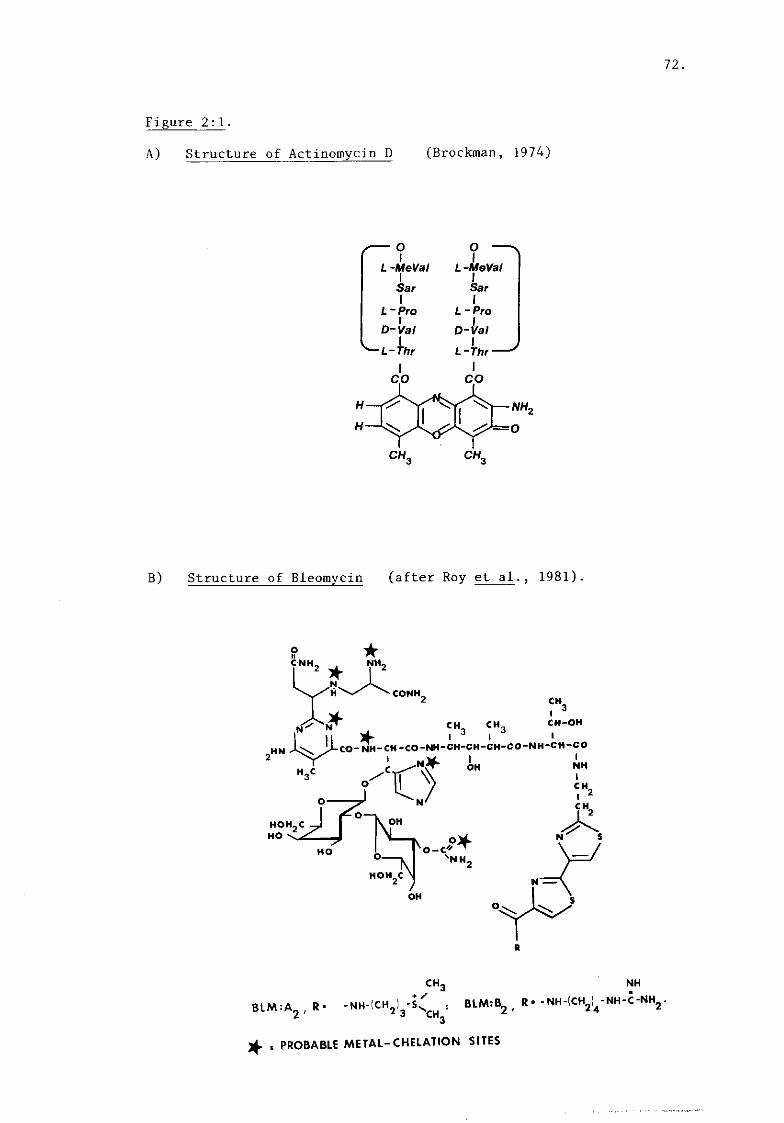
72.
Figure 2:1.
A) Structure of Actinomycin D (Brockman, 1974)
/ — o O N 1 L -MeVal i
L-MeVal i i
Sar I Sar
1 L-Pro
1 L -Pro • 1
D-Val D-Val 1
^— L - Thr 1
L -Thr J
I I
B) Structure of Bleomycin (after Roy et al., 1981).
CH-OH
* l"3
« 3 ' H N ULCO-NH-CH-CO-NH-CH-CH-CH-CO-NH-CH-CO
HO \
CH,
BLM :A , R. -NH-tCH,) < s
BLMfB^ , R" - NH-lCH^-NH-C-NH^
NH
3 CH
J ^ = PROBABLE M E T A L - C H E L A T I O N SITES
73.
Section 2:2
Basic studies on drug entrapment in liposomes.
The drugs used in this study were used in initial investigations
of some of the parameters of drug entrapment. These parameters inclu-
de: lipid composition, aqueous phase buffer (APB) composition and pH,
length of sonication time and the amount of lipid peroxidation. In
addition, some other studies were carried out into the leakage of drugs
from liposomes as well as the microelectrophoresis and microviscosity
of drug-containing liposomes. The major part of the entrapment studies
were performed with H-actinomycinD entrapped in the lipid phase (LP)
or "^"^In-bleomycin entrapped in the aqueous phase (AP) of liposomes.
The additional studies were done using iodinated bleomycin and aspara-
ginase as well. A brief summary and a short discussion of these results
is presented here since this data does not conveniently fit with the in
vivo results of the following chapters.
For both types of drug the term entrapment, in its strictest
sense, means drug sequestered within the vesicle. However, as others
have pointed out (Tyrrell et al. , 1976a; Weissmann et al. , 1978) in
practice entrapment can be considered as the amount of drug associated
with the liposomes (ie: not necessarily inside) ; the measurement of
"real" entrapment and latency of a compound requires the strict appli-
cation of certain criteria. In the case of the drugs entrapped here
these criteria have not been applied so that the drugs used should more
reasonably be termed "liposome-associated" drugs. In addition, without
some degree of care is even possible to find drugs which will coelute
with liposomes from a column or cosediment in a centrifuge and these
drugs will not be even "associated" with the liposome (in the sense of
being, however loosely, "bound" to the lipid structure), this point has
also been discussed by others (Szoka and Papahadjopoulos, 1980).
i) Actinomycin D.
Liposomes were made from egg phosphatidylcholine which was supple-
mented by increasing amounts of cholesterol and/or charged lipid. 3
Overall the amount of H-ACT-D associated with the vesicles did not
appear to be very dependent upon the lipid composition. Slightly higher
entrapments were found in stearylamine-containing liposomes than in
anionic or neutral liposomes but only when the concentration of this
74.
cationic lipid was high (EPC: CHOL : SA molar ratio 7:2:5). Similarly,
slight increases in drug entrapment were found when the concentration
of cholesterol was increased irrespective of the presence or the spe-
cies of charged lipid used. Values for entrapment were in the range
7.6-14.05 ug 3
H-ACT-D/umol EPC used (7.6-14.05% of the original mate-
rial) depending upon the lipid composition. However, since these expe-
riments were not repeated it is possible that the differences are not
significant. During experiments on the entrapment of ACT-D into anionic
liposomes, it was noticed that initial concentrations of between 1.0
and 1.5 mg ACT-D/umol EPC resulted in the formation of aggregates when
the buffer was added to the dried lipid. These aggregates were not
broken up by sonication (5 min) and remained at the top of a Sepharose
column which eluted liposomes and free drug normally. Analysis of the
aggregates on silicic acid columns (see methods) did not reveal any
phospholipid or cholesterol associated with these structures which
remained at the top of these columns also. For this reason liposomes
were made in the future at concentrations of 500 ug ACT-D/umol EPC or
less.
Small changes in the ionic strength of the aqueous phase buffer,
from distilled water up to 15mM phosphate buffered saline, did not
affect the amount of ACT-D entrapped irrespective of the lipid compo-
sition of the liposomes. Similarly, in an experiment which changed the
pH of the buffer, in one or two unit steps, from 2.5 to 10.0 did not
produce any substantial changes in entrapment of ACT-D.
Increases in sonication time of the liposomes from zero up to 60
minutes also failed to change the quantity of ACT-D entrapped in lipo-
somes. The peroxidation of liposomal lipids in the presence and absence
of added ACT-D (LP) was measured by the method of Klein (1970). The
presence of ACT-D slightly increased the initial oxidation of lipids
when compared to empty liposomes but, whilst these empty liposomes con-
tinued to be slightly oxidized during the course of sonication (even in
the presence of nitrogen), the extent of this oxidization was reduced
in the ACT-D liposomes although the differences might not be signifi-
cant with more values.
ii) Bleomycin
The entrapment of ^3
"^In-bleomycin into the aqueous phase of lipo-
somes was also investigated. The quantities of the lipid constituents
(i.e.: the ratio of CHOL and/or charged lipid to EPC) were changed
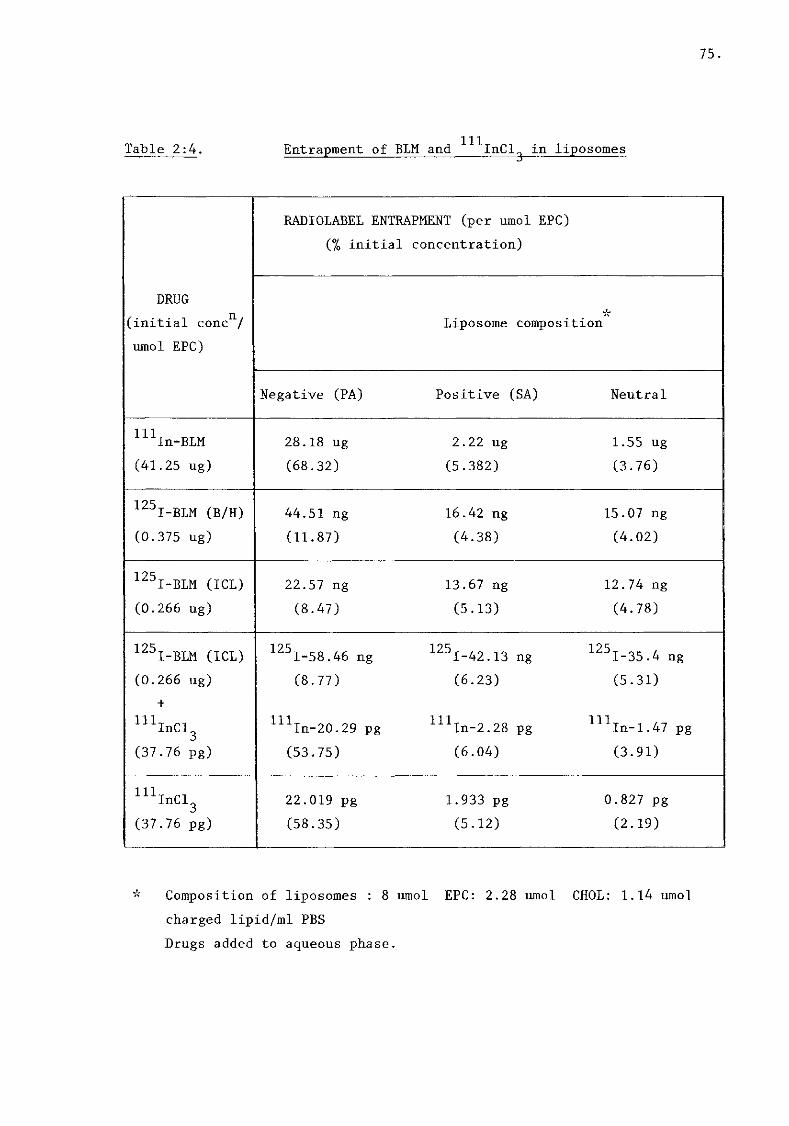
75.
Table 2:4. Entrapment of BLM and in liposomes
DRUG
(initial conc11
/
umol EPC)
RADIOLABEL ENTRAPMENT (per umol EPC)
(% initial concentration)
DRUG
(initial conc11
/
umol EPC)
Liposome composition
DRUG
(initial conc11
/
umol EPC)
Negative (PA) Positive (SA) Neutral
111
In-BLM
(41.25 ug)
28.18 ug 2.22 ug 1.55 ug
(68.32) (5.382) (3.76)
1 25 I-BLM (B/H)
(0.375 ug)
44.51 ng 16.42 ng 15.07 ng
(11.87) (4.38) (4.02)
1 23
I-BLM (ICL)
(0.266 ug)
22.57 ng 13.67 ng 12.74 ng
(8.47) (5.13) (4.78)
125 I-BLM (ICL)
(0.266 ug) +
1 1 1 -r 3
(37.76 pg)
1 2 5
I-58.46 ng 1 2 5
I-42.13 ng 1 2 5
I-35.4 ng
(8.77) (6.23) (5.31)
m
i n - 2 0 . 2 9 pg m
i n - 2 . 2 8 pg m
i n - 1 . 4 7 pg
(53.75) (6.04) (3.91)
1 1 1
I n C l3
(37.76 pg)
22.019 pg 1.933 pg 0.827 pg
(58.35) (5.12) (2.19)
« Composition of liposomes : 8 umol EPC: 2.28 umol CHOL: 1.14 umol
charged lipid/ml PBS
Drugs added to aqueous phase.

76.
whilst the concentration of the drug/mol EPC was kept constant (41.25
ug BLM/umol EPC; 66ug BLM/ml APB). The results uniformly showed that
anionic liposomes (containing phosphatidic acid; PA) entrapped 12-20
fold more drug/mol EPC than cationic or neutral liposomes irrespective 125
of their cholesterol content. However, the entrapment of I-BLMs in
anionic liposomes was very similar to that in; cationic and neutral 111
liposomes and was also similar to the entrapment of In-BLM in >
cationic and neutral liposomes.(Table 2:4). On the other hand the
entrapment of ^^InCl,. in the presence or absence of *3 3
I-BLM in 111
anionic liposomes was similar to that found for In-BLM and substan-
tially higher than that found in cationic or neutral liposomes.
(Table 2:4).
Changes in the ionic strength of the buffer did not change the 111
entrapment of In-BLM neither did changes in pH except that at pH 2.5
the entrapment in all liposome types was substantially reduced.
Increases in sonication time reduced the entrapment of ^"^"^In-BLM
in anionic liposomes so that the quantity (per umol EPC) entrapped
after 60 minutes sonication was only 60% that found after 2 minutes so-
nication. Similar reductions were found with cationic and neutral lipo-
somes. The presence of *^In-BLM (AP) in liposomes did not appear to
affect the oxidation of liposomal lipids during sonication.
iii) Leakage of drugs from liposomes
Three preparations of anionic liposomes containing either 1 111
i) H-ACT-D (0.125 mg/umol EPC) or ii) In-BLM (0.4125 mg/umol EPC) 125
or iii) I-BLM (B/H) (0.5 ug/umol EPC) were made according to the
standard method. Following sonication and column chromatography the
preparations were centrifuged at 100,000g for 1 hour to eliminate SUVs.
The pellets of small MLVs were resuspended in 5 ml PBS to give concen-
trations of 170.2 ug 3
H-ACT-D/ml, 1.13 mg n i
I n - B L M / m l and 0.112 ug
125
I-BLM/ml. These solutions were incubated in stoppered glass tubes
under N2 for 5 hours in a shaking water bath at 37°C. At timed inter-
vals, samples (250 ul and 50 ul) were removed from the tubes which were
then flushed with N^ and restoppered. The larger sample (250 ul) was
immediately added to a Sepharose column (5 ml bed volume eluted with
PBS) at 4°C. The 50 ul sample was counted for radioactivity. The MLVs
eluted from the columns were resuspended into 2.5 ml PBS and 1.0 ml
samples were counted for radioactivity.
After 5 hours of incubation, the tubes of liposome-drugs were
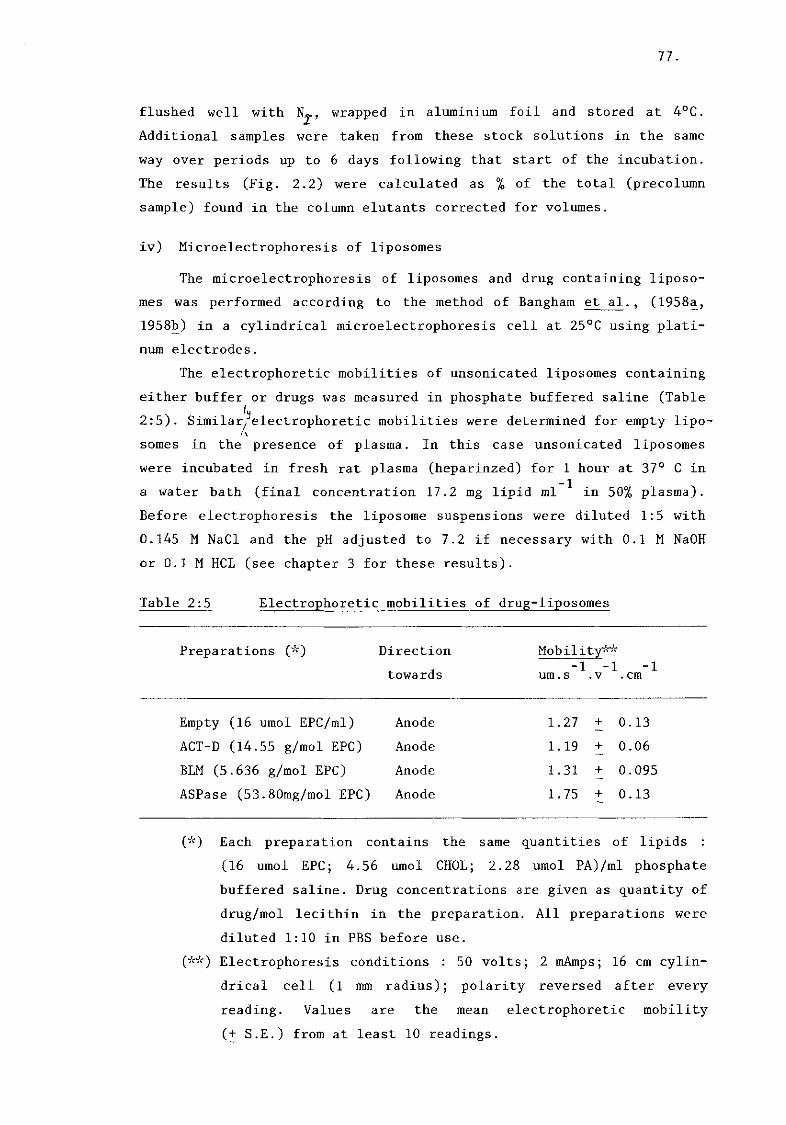
77.
flushed well with N^., wrapped in aluminium foil and stored at 4°C.
Additional samples were taken from these stock solutions in the same
way over periods up to 6 days following that start of the incubation.
The results (Fig. 2.2) were calculated as % of the total (precolumn
sample) found in the column elutants corrected for volumes.
iv) Microelectrophoresis of liposomes
The microelectrophoresis of liposomes and drug containing liposo-
mes was performed according to the method of Bangham et al., (1958a,
1958b) in a cylindrical microelectrophoresis cell at 25°C using plati-
num electrodes.
The electrophoretic mobilities of unsonicated liposomes containing
either buffer or drugs was measured in phosphate buffered saline (Table lu
2:5). Similar/electrophoretic mobilities were determined for empty lipo-A
somes in the presence of plasma. In this case unsonicated liposomes
were incubated in fresh rat plasma (heparinzed) for 1 hour at 37° C in
a water bath (final concentration 17.2 mg lipid ml * in 50% plasma).
Before electrophoresis the liposome suspensions were diluted 1:5 with
0.145 M NaCl and the pH adjusted to 7.2 if necessary with 0.1 M NaOH
or 0.1 M HCL (see chapter 3 for these results).
Table 2:5 Electrophoretic mobilities of drug-liposomes
Preparations (*) Direction Mobility**
towards um.s ^.cm
Empty (16 umol EPC/ml) Anode 1, .27 + 0. .13
ACT-D (14.55 g/mol EPC) Anode 1, .19 + 0. .06
BLM (5.636 g/mol EPC) Anode 1. .31 + 0. .095
ASPase (53.80mg/mol EPC) Anode 1, .75 + 0. .13
(*) Each preparation contains the same quantities of lipids :
(16 umol EPC; 4.56 umol CHOL; 2.28 umol PA)/ml phosphate
buffered saline. Drug concentrations are given as quantity of
drug/mol lecithin in the preparation. All preparations were
diluted 1:10 in PBS before use.
(**) Electrophoresis conditions : 50 volts; 2 mAmps; 16 cm cylin-
drical cell (1 mm radius); polarity reversed after every
reading. Values are the mean electrophoretic mobility
(+ S.E.) from at least 10 readings.

78.
Legend Fig. 2:2. Leakage of drugs from liposomes.
^ 111 1 Liposomes containing
J
H-Act-D (LP), In-BLM (AP) or 1 Z 3
I - B L M
(AP) were prepared by the standard method. After column chromatography
the solutions were centrifuged to remove SUVs and resuspended in 5 ml
PBS at concentrations of 170.2 ug 3
H-ACT-D/ml, 1.13 mg 1 1 1
In-BLM/ml and 125
0.112 ug I-BLM/ml. These solutions were incubated for 5 hours at
37° C and then stored at 4° C for 6 days. Samples of each drug solution
were removed at timed intervals and rechromatographed.
The graph shows % of the initial drug concentrations still lipo-
some-associated during a 6 day period. 3
Circles : H-Act-D (LP) liposomes
Squares : 1 2 5
I-BLM(B/H)(AP)liposomes
Triangles : 3 1 1
In-BLM (AP) liposomes

79.
Some preliminary experiments using washed red blood cells were
carried out in order to establish the stationary phase of the cylindri-
cal capillary tube in the presence of increasing amounts of plasma
using the method outlined by Bangham et al. , (1958a). The results
demonstrated that up to 25% (V/V) plasma in PBS there is little dif-
ference in the position of the stationary phase. However, at 50% plasma
there were increases in the stationary phase value which are perhaps
due to protein buffering of the capillary walls resulting in very slow
movements of the red cells which, in turn, made calculation of the
stationary phase very difficult. For this reason electrophoresis of
liposomes in plasma was restricted to 10 % plasma solutions.
v) Microviscosity of liposomes
The fluidity of the lipid bilayers of liposomes containing entrap-
ped drugs was compared with empty liposomes using an Elscint MV-1
microviscosimeter according to the method of Cogan et al., (1973) using
the fluorescent probe l,6diphenyl l,3,5hexatriene (DPH) (Shinitzky and
Inbar, 1974). Sonicated standard liposome preparations (containing
actinomycin D, bleomycin, asparaginase or buffer) were diluted 1:1 with
2 x 10"6
M DPH in PBS to give a final optical density (od) of about 1.0
at 450 nm. This solution was incubated at 37°C for 1 hour in a water
bath to ensure that the maximum fluorescence intensity (excited at
366nm) was obtained. The liposome preparations were then diluted with
PBS repeatedly to give a range (6) of absorbances at 450nm between 0.1-
1.0 od.units. Samples (5.0 ml) of each of this diluted range were then
cooled or warmed to temperatures between 5 and 50°C. Silica cuvettes
were filled with 2.5 ml of the samples and put into the temperature
controlled chamber of the microviscosimeter.The temperature of each
sample was checked just before measurement of fluorescence polarization
with a thermocouple thermometer.
The degree of fluorescence polarization (460 nm) was quickly
measured (<10 sec) for each dilution of each sample at the different
temperatures. Graphs of the degree of polarization at each temperature
against optical density were linear over the range 0.1-1.0 od.units.
Extrapolation of these lines to intercept the ordinate (o.d. = 0) gave
a range of fluorescence polarization values for each temperature. In
this way light scattering and turbidity of the liposome preparations
was eliminated from the polarization readings.
Thereafter, the method of Cogan et al. , (1973) was followed. The
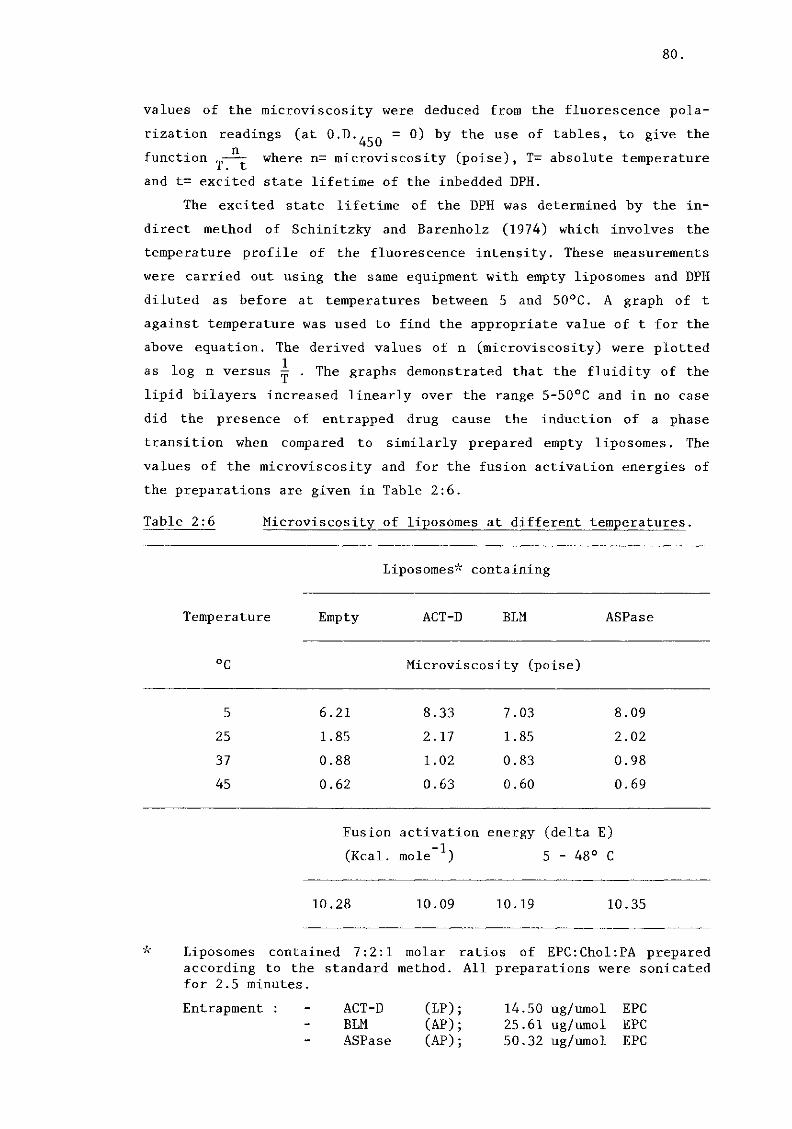
80.
values of the microviscosity were deduced from the fluorescence pola-
rization readings (at O.D.^Q = 0) by the use of tables, to give the
function ^ — - where n= microviscosity (poise), T= absolute temperature
and t= excited state lifetime of the inbedded DPH.
The excited state lifetime of the DPH was determined by the in-
direct method of Schinitzky and Barenholz (1974) which involves the
temperature profile of the fluorescence intensity. These measurements
were carried out using the same equipment with empty liposomes and DPH
diluted as before at temperatures between 5 and 50°C. A graph of t
against temperature was used to find the appropriate value of t for the
above equation. The derived values of n (microviscosity) were plotted
as log n versus ^ . The graphs demonstrated that the fluidity of the
lipid bilayers increased linearly over the range 5-50°C and in no case
did the presence of entrapped drug cause the induction of a phase
transition when compared to similarly prepared empty liposomes. The
values of the microviscosity and for the fusion activation energies of
the preparations are given in Table 2:6.
Table 2:6 Microviscosity of liposomes at different temperatures.
Liposomes* containing
Temperature Empty ACT-D BLM ASPase
°C Microviscosity (poise)
5 6. .21 8.33 7.03 8. .09
25 1. .85 2.17 1.85 2. .02
37 0. .88 1.02 0.83 0. .98
45 0, .62 0.63 0.60 0. .69
Fusion
(Kcal.
activation
mole
energy (delta E)
5 - 48° C
10, .28 10.09 10.19 10, .35
Liposomes contained 7:2:1 molar ratios of EPC:Choi:PA prepared according to the standard method. All preparations were sonicated for 2.5 minutes.
Entrapment : - ACT-D (LP); 14.50 ug/umol EPC BLM (AP); 25.61 ug/umol EPC ASPase (AP); 50.32 ug/umol EPC

81.
DISCUSSION
i) Effect of lipid composition on drug entrapment,
a) Actinomycin-D
The entrapment of ACT-D in, the lipid phase of liposomes did not,
overall, appear to be very dependent upon the lipid composition. There
were differences between charged liposomes on the one hand and neutral
liposomes on the other, but the differences are not large and they may
not be significant. The slightly higher drug entrapment in charged
liposomes is probably a reflection of the greater size and internal
volume of these vesicles when compared to neutral ones (Bangham,
et al., 1974) and this arises from the charge repulsion between the
bilayers. Since ACT-D is soluble both in water and in lipid, the en-
trapment differences between liposomes of the same composition, but
differing in their charge, may be attributed to varying amount of drug
in the aqueous spaces. Lipid phase entrapment does not imply that the
drug is immobilized within the lipid. Indeed, the drug will leak from
the liposomes quite readily (e.g.: fig.2:2). The highest concentration
of entrapped drug was found in liposomes containing the highest amount
of charged lipid. In the cationic liposomes the increase appears to be
directly related to the quantity of SA in the preparation whilst this
does not hold for the PA concentration of anionic liposomes. There is a
suggestion that some interaction may be taking place between the charge
or with stearylamine itself and ACT-D. The nature of this interaction
has not been investigated but it is probably due less to lipid-drug
interactions than a decrease in leakage of cationic ACT-D from the
aqueous spaces through the cationic bilayers.
The liposome entrapment of ACT-D has been studied by Gregoriadis
(1973b) who was the first to entrap ACT-D in liposomes (LP) and he
reported that, in general, entrapment in the lipid phase was higher
than in the aqueous phase. Moreover, cationic liposomes entrapped
more drug (LP) (8.8 %) than anionic liposomes (5.2 %) ; this was attri-
buted to a homologous charge effect retarding drug leakage. In addi-
tion, it was noted that EPC-containing liposomes entrapped less drug
than DPPC-containing liposomes. The values obtained in the present
study are slightly higher than those obtained by Gregoriadis (1973b)
using the same liposomes; however, his liposomes did not leak whereas
in this study liposomes release ACT-D over a period of several days
(fig. 2.2).

82.
Juliano and Stamp (1978) have also studied the effect of the in-
corporation of cholesterol and charged lipids on the entrapment of
ACT-D in , liposomes. In large MVLs the incorporation of ACT-D (LP) was
in the order cationic > anionic > neutral; cholesterol almost doubled
the amount of drug entrapped irrespective of charge. However, sonica-
tion of these liposomes released about 30 % of the captured material
(probably, therefore, from the aqueous phase). Nevertheless, Juliano
and Stamp (1978) reported up to 50 % capture in cationic, cholesterol-
containing, liposomes and 20 % of the drug in similar anionic liposo-
mes. These values must be compared with the average (+ st.Dev.) %
entrapped figures of 8.12 + 0.6 (neutral), 10.82 + 1.33 (anionic) and
10.53 + 1.93 (cationic) found in this study. The most important dif-
ferences between these two investigations are that a greater proportion
of both cholesterol and charged lipid (SA but not PA) was used by
Juliano and Stamp; the liposomes were not sonicated and only trace
amounts of drug were used. This last difference will mean that there
might be less "competition" for sites of interaction with the bilayer
than if an excess of drug is present (as in the current study and that
of Gregoriadis (1973)). Juliano et al., (1978) concluded that ACT-D
intercalates into the hydrocarbon layer.
Sudies by Kaye et al., (1981) on ACT-D (LP) capture by small cati-
onic MLVs gave a value of 15.3 + 1.4 % (mean + S.E) for the entrapment.
The ratio of drug weight to lipid weight was found to be important
(1:100) and is twice as high as that used in this study (1:225). Never-
theless, the capture reported by Kaye et al. , (1981) is similar to the
values found in this study and that of Gregoriadis (1973b) (10.53 % and
8.8 % respectively) and markedly different from the 50 % reported by
Juliano and Stamp (1978).
Rahman et al., (1975; 1978) and Papahadjopoulos et al.(1976) have
also entrapped ACT-D in liposomes. The first group of workers used non-
sonicated neutral MLVs with the ACT-D in both AP and the LP, although
no quantification of entrapment has been given. Papahadjopoulos et al.,
(1976) entrapped ACT-D (AP) in negative (PS) SUVs to obtain up to 60%
entrapment and this was accounted for by electrostatic interaction
between the weakly cationic ACT-D and the anionic PS. Such a high
aqueous phase ACT-D entrapment was not found during the course of this
work (not shown) using the anionic PA in place of PS; nor did Gregoria-
dis (1973b) find such an association. Perhaps the serine in PS is more
important than the charge in determining the amount of drug entrapped.

83.
Explanations for these data are primarily concerned with the
effects of cholesterol and charge on the reduction of leakage of en-
trapped solutes (Scarpa and de Gier, 1971) although, in SUVs at least,
the inclusion of greater than 30 mol % cholesterol in the vesicle pro-
duces a sharp and progressive increase in vesicle diameter (Johnson,
1973), which might also entrap a larger volume. Finally there is the
possibility that ACT-D interacts with cholesterol; such an interaction
has been shown with other cyclic-peptide-containing antibiotics (e.g.:
Valinomycin) (de Gier et al. , 1978) although these are ionophores with
a known specificity for cholesterol. However, in the studies on ACT-D/
lipid aggregate formation, cholesterol could not be found associated
with the aggregate after column chromatography.
b) Bleomycin
111 The high drug association between In-BLM and anionic liposomes
125
was investigated further by the use of I-iodinated BLM in place of
the "^"^In-label. Radioiodination of BLM was carried out by two separate
methods: direct iodination by the iodine monochloride method (ICL-BLM)
and indirect iodination by the acylating agent N-succinimidyl 3-(4-hy-
droxyphenyl) proprionate (B/H-BLM).
Iodination with iodine monochloride is thought to occur in the
modified histidine portion of the BLM molecule (fig. 2.2B) (Meyers, et
al. , 1975) since the drug does not contain tyrosine. Neither the A or B
components were preferentially labelled and so Meyers, et al. , (1975)
assumed that the terminal amine groups do not influence the reaction.
Similarly, the indirect iodination procedure, which is specific for
amino groups, does not appear to iodinate the terminal amines, but more
probably labels these groups in the beta amino-alanine and amino-beta-
(4-amino-6-carboxy-5-methylpyrimidine-2yl) propironic acid residues of
BLM (Eckelman, et al. , 1976). Finally, iodination does not appear to
effect the ability of BLM to chelate di-and trivalent cations (Eckelman
et al. , 1976). These results suggest that iodination does not effect
the overall charge of BLM when compared to the ^"^In-chelated label.
Indeed, Eckelman et al., (1976) found no differences in the profiles of
unlabelled and iodinated BLMs eluted from anion exchange columns.
Yet, the results (Table 2.4) show that iodinated BLM has lost its
ability to interact with anionic liposomes whilst the entrapment into
other liposomes is unchanged and that ^"^InCl^ retains a very high
84.
anionic vesicle entrapment even in the presence of iodinated BLM. Hwang
and Mauk (1977) have also reported that interacts with phospho-
lipid polar head groups. The data suggest ,, therefore, that either BLM
is binding to the anionic liposomes via its chelated cation radiolabel
which may or may not be, finally, still bound to the BLM) or
that the other (i.e.: the noniodinated) amine groups are responsible 111
for the drug/liposome interaction found with the In-labelled spe-
cies. Umezawa (1973) has titrated BLM and shown 3 pKa values in addi-
tion to the terminal guanido groups. The 4-amino group on the beta-(4-
amino-6-carboxy-5-methyl-pyrimidine-2yl) proprionate has a pKa of 2.9,
the pKa of the imidazole ring of histidine is 4.7 and that of the amino
group of beta-aminoalanine is 7.3. Coupled with the guanido group, this
ensures that BLM is strongly cationic at around neutral pHs. However,
if any of these groups are "lost" following iodination, then the charge
interaction may not be strong enough either to support the high entrap-
ment found with *"^In-BLM or to participate in other interactions such
as insertion of the peptide into the lipid layer.
ii) Influence of sonication on drug entrapment and lipid oxidation in
liposomes.
In MLVs the aqueous volume entrapped per mole phospholipid ranges
between 1 and 4 litres (Szoka and Papahadjopoulos, 1980) but this will
be increased when up to 10 mol % of charged lipid and/or cholesterol
are included in the bilayer (Bangham et al. , 1974). For SUVs the cap-
ture volume ranges from 0.2-1.5 L/mole PL depending upon the lipid com-
position (Szoka and Papahadjopoulos, 1980). Obviously the sonication of
MLVs to produce SUVs reduces the capture volume because of a reduction
in the surface area to volume ratio and a reduction in the number of
bilayers; it is not totally compensated for by the increase number of
vesicles.
Damage to liposome lipids during sonication has been previously
described (Klein, 1970; Hauser, 1971); two forms of chemical change
occur: i) oxidation of unsaturated hydrocarbon chains and ii) the clea-
vage of covalent bonds. Although sonication in an inert atmosphere
(e.g.: N2 or Ar) reduces i) (Klein, 1970) it has little effect on ii)
(Hauser, 1971).

85.
a) Actinomycin D
Since the length of sonication time did not substially affect the
amount of ACT-D associated with EPC, it may be concluded that much of
the drug was entrapped in the lipid phase because size reduction leads
to lower aqueous phase volumes.
The slight protective effect of ACT-D entrapment on the oxidation
of liposomal lipids was unexpected and may not be significant. However,
this effect suggests that ACT-D may have the ability to "mop up" the
free radicals, generated during sonication, which are thought to cause
lipid oxidation (Leibowitz and Johnson, 1971; Seligman and Demopoulos,
1973). The portion of the ACT-D molecule responsible for the action is
not known but it has been suggested that macromolecules, such as lipo-
philic proteins and DNA can inhibit free radical reactions (Pietronigro
et al., 1976 and references therein). This latter observation might
mean that parts of the ACT-D molecule can insert into, and perhaps
span, the hydrophobic midzone between the lipid leaflets.
b) Bleomycin
The entrapment of "^"^In-BLM was reduced by increasing the sonica-
tion time of anionic liposomes. It can be expected that at later times
(30, 60 minutes) the majority of liposomes are in the form of SUVs and
that most of the drug is entrapped in the aqueous phase. However, the
amount of reduction in entrapment was not so great as could be expected
from the entrapped volumes of MLVs and SUVs. This fact also argues in
favour of interactions between the drug and the anionic phosphatidic
acid. The oxidation of liposomal lipids was not apparently affected by
the entrapment of ^"^^In-BLM into the aqueous phase of liposomes. This
may mean that portions of the BLM molecule cannot interact with free
radicals (as suggest for ACT-D) and/or are not in close contact with
the lipid chains of the phospholipids.
iii) Leakage of drugs from liposomes
Obviously one important aspect of drug entrapment in liposomes is
the ability of the carrier to maintain the drug in its encapsuled form
over a prolonged period of time. Figure 2.2 shows the leakage of drugs
from anionic liposomes over a period of 6 days (time points during the
first few hours are not shown).
86.
The best liposome preparation can be seen to be those containing 111
In-BLM (triangles). The leakage of the drug was less than 5 % during
the initial incubation in PBS at 37° C for 5 hours. Following storage
at 4°C for 6 days the liposome-associated drug concentration fell
slowly but was never less than 50 % of the starting concentration.
However, in view of the high entrapment of (Table 2:4) and the 125
inability of these liposomes to retain equivalent amounts of I-BLM
(Fig. 2:2 squares) a doubt must remain as to whether the high incorpo-
ration and retention represents actual drug or merely entrapped radio-
label. 125
The leakage of I-BLM (squares fig. 2:2) from liposomes does not 111
follow the same pattern as In-BLM. The amount of radiolabel decrea-
ses rapidly; only 40 % remains liposome-associated 24 hours after
manufacture and 12 % remains after 6 days. Thin layer chromatography of
the iodinated drug did not show any significant loss of radiolabel from
the BLM during prolonged storage at 4° C. It may be assumed therefore 125
that the I-BLM leaks out of the liposome during storage.
A similar picture, although with less overall loss, can be seen in
ACT-D-containing liposomes despite the fact that the drug is in the
lipid phase. One day after manufacture about 50 % of the drug remains
liposome-associated. Since ACT-D is soluble in both lipid and water,
the drug should pass from the interior of the liposome to the outside
as long as there is equilibrium between the two. The lipid solubili-
ty of ACT-D will be determined by the degree of ionization of the
molecule at the pH and ionic strength of the buffer used to make the
liposomes.
Gregoriadis and Neerunjun (1975a) did not find any leakage from
ACT-D (LP)-containing liposomes in a bacterial assay for the drug's
effectiveness. The reasons for this difference between this work and
theirs on drug leakage are unclear, although the incubation time (3
hrs) with the bacteria was quite short ; a leakage rate of only 10 % of
the entrapped material would have shown a significant effect. But if
the liposomes were older than 36 hours it can be calculated from Fig.
2:2 that the 3 hrs leakage rate would be 1.5 % and this reduces as the
age of the vesicle increases. Gregoriadis (1973b), however, reported no
leakage from ACT-D (LP) liposomes even on storage for 45 days.
Juliano et al. (1978) have shown leakage of ACT-D from anionic SUV
preparations of about 1 % per hour over a three hour period. The addi-
tion of serum to the vesicles did not alter the efflux rates. On the

87.
other hand, Rahman et al. (1975) found no significant release of ACT-D
(LP) from neutral hand-shaken MLVs even in the presence of serum this
was in contrast to upto 50 % release of the ACT-D (AP) from the same
vesicles in 1 hour; in this latter case the presence of 15 % serum
retarded the release of ACT-D.
It seems therefore that the leakage of ACT-D from liposomes de-
pends on whether the drug is in the LP of AP and this argues strongly
for some interaction between the drug and the bilayer. It is tempting
to suggest that the initial rapid leakage is due to loss of ACT-D from
the aqueous phase of the liposome and thereafter the slower leakage
(day 2 onwards) is from the lipid phase. The presence of other molecu-
les co-entrapped with ACT-D in AP liposomes can also effect the drug's
leakage. Rahman et al. (1978) suggested that the higher leakage of
ACT-D (AP) as compared with Act-D (LP) was due to the presence of
mannitol in the aqueous solution. Ill
In an experiment to test leakage of In-BLM from liposomes, 111
Gregoriadis and Neerunjun (1975b) re-chromatographed In-BLM liposo-
mes after incubating them at 37° C for 5 hours in the absence or pre-
sence of culture medium (containing 10 % FCS). More than 92 % of the
radioactivity was found to be liposome-associated. This result, there-
fore, confirms the results shown in Fig. 2:2 (triangles) but is at 111
variance with the quite considerable leakage of I-BLM from liposomes
which appears to occur in vivo (see Chapter 3).
These results (Fig. 2:2) demonstrate the need to use freshly
prepared (or freshly separated) liposomes for drug studies. The leakage
of drugs is now considered better studied in the presence of serum or
other biological fluids since various recent reports have emphasized
the enhanced leakage of drugs from vesicles in their presence (see in-
troduction and Chapter 3).
iv) Microelectrophoresis (Table 2:5)
The movement of particles under an applied electric fields is a
phenomenon which has become of increasing importance following the
findings of mobility differences between normal and tumor cells ; these
findings and the general electrophoretic behaviour of cells has been
reviewed (Ambrose, 1966). The surface charge of cells is not
due to charged phospholipid molecules, since proteins also play a part.
In the case of liposomes (Bangham et al., 1958b; Bangham, 1972; Kimel-
berg and Papahadjopoulos, 1971a, 1971b) the electrophoretic mobility is

88.
due to the charged head groups in the plane of sheer. The incorporation
of cationic molecules (ACT-D, BLM) in, . liposomes might be expected to
alter the electrophoretic mobility, since they could interact with the
exposed anionic phospholipid head groups (Bangham et al., 1958b). (The
entrapped drug, within the liposome, will not effect the mobility,
since this depends upon only the exposed, external groups). In view of
the interactions of anionic liposomes with basic proteins (Kimelberg
and Papahadjopoulos, 1971a, 1971b; Bangham, 1971, Papahadjopoulos
et al. , 1975) it was important to establish the overall charge on the
drug-containing liposomes before any vesicle-protein interactions
(Chapter 3) were considered.
The values obtained (Table 2:5) for the electrophoretic mobilities
of empty liposomes are similar to those found by Bangham (1972) for
vesicles containing 10 mol % anionic species and may be contrasted with
values 7-8 fold higher found in vesicles composed of pure phosphatidyl-
serine (Kimelberg and Papahadjopoulos, 1971a). There were apparent dif-
ferences in electrophoretic mobility of liposomes containing drugs when
compared with empty liposomes suggesting that drugs may be located on
the liposome surface after preparation. However, these differences are
not statistically significant (Student's t-test). p
In preparation j-or experiments on the electrophoresis of liposomes
in protein solutions, an investigation was made of the mobility of
washed rat erythrocytes in plasma. Ambrose (1966) has pointed out the
advantages of using erythrocytes to standardise microelectrophoresis
apparatus. The original work by Abramson and co-workers (quoted in
Ambrose, 1966) showed that the presence of non-specific proteins (eg :
albumin, fibrinogen and haemoglobin) did not effect the electrophoretic
mobility of enthrocytes so long as the medium was of high ionic
strength (> 0.1 M). Other workers (Sachterleben et al., 1961) have used
a rectangular electrophoresis cell containing semipermeable membranes
to protect the electrodes from the presence of the suspending medium.
In this way the electrophoresis of blood cells has been carried out in
plasma.
Protection of the platinum electrodes was attempted in the Bangham
cylindrical electrophoresis cell by the use of dialysis tubing, but
undue leakage and the need for much higher voltages caused its abandon-
ment. Instead, liposomes were preincubated in 50 % plasma which was
then diluted to 10 % with 0.145 M NaCl. Electrophoretic conditions were
chosen so that not only was the polarity reversed after every

89.
measurement, but the potential was applied for no more than 30 seconds
at a time.
Increasing the concentration of plasma did not make any
appreciable difference to the position of the stationary phase up to a
concentration of 25 % plasma in 0.145 M NaCl, nor were the electro-
phoretic mobilities (not shown) very different from those found in
saline alone or 10 % plasma. However, at a concentration of 50 % plasma
there was an apparent change in the position of the stationary phase
which was almost certainly due to the very slow mobilities which occur
in 50 % plasma solutions even under high voltage (up to 100 V). The
slow movement made calculation of the electrophoretic mobilities
subject to wide error (50 % in some case) ; in addition, longer times
were needed so that protein could be seen to be depositing on the
electrodes (mostly anode). Since, according to Lamb (1888) and Bangham
et al. (1958a), the velocity of a particle is proportional to the
square of the distance from the axis of the tube and i 5 independent of
the bulk viscosity of the liquid or the hydrostatic pressure along the
tube, it seems likely that these properties of the plasma are not res-
ponsible for this anormalous result.
V) Microviscosity of liposomes (Table 2:6)
The temperature dependence of the lifetime of the excited state
(LES) of 1,6-diphenyl-l, 3, 5-hexatriene (DPH) in anionic liposomes V^S WeA-Suved
(7:2:1 molar ratio)/at 0°c it was calculated to be 11.2 n.sec. which is
within the normal range found by Shinitzky and Barenholz (1974) of
11.4 + 0.2 n.sec. in both liposomes and paraffin oil. Other values
found throughout the temperature range (5 - 50° C) were also similar
despite the fact that liposomes of a different composition were used in
this study. The mathematical justification for the calculations of LES
and the viscosity have been presented by Shinitzky et al. (1971), here
we are only concerned with the fact that measurements of the LES at
temperatures approaching 0° C will give a plateau value equivalent to
its maximum lifetime. Thereafter a graph of LES vs. temperature is
approximately linear until a lower limit is reached at higher tempera-
tures (Shinitzky and Barenholz, 1974 ; Shinitzky and Inbar, 1974).
The microviscosity of liposomes can be calculated by studying the
fluorescence polarization of DPH which simulates a rotating rod (1.3 nm
long^ embedded in the hydrocarbon region of the bilayer. Thus, in their
fluid state, the acyl chains are free to rotate and this is characte-
9.
ristic of the liquid crystalline state, indeed the rotation of probes
in liposome hydrocarbon layers give viscosity values very close to iso-
tropic oils (Cogan et al. , 1973). This fluidity can be decreased
(higher microviscosity) by the presence of cholesterol (Cogan et al. ,
1973), but it is not greatly affected by the presence of anionic polar
headgroups (Shinitzky and Barenholz, 1974). However, charged liposomes
which have slightly less tightly packed acyl chains because of the
charge repulsion between their polar head groups, might be made less
fluid by the presence of oppositely charged molecules .(eg : drugs or
high ionic strength buffers) interacting with polar heads and quenching
the charges (de Gier et al. , 1978). In addition, when the acyl chains
are highly disordered (isotropic) the insertion of molecules (eg : cho-
lesterol or drugs) into the hydrocarbon layers will cause an ordering
(anisotropic state) and so a reduction in the fluidity. It should
therefore be possible to detect the presence of molecules in the bi-
layer during the isotropic state by the increased microviscosity of the
vesicle preparation. Finally, the presence of lysolecithin, either as
the result of lipid impurities or as the result of drug action on the
acyl chains, can be detected in vesicle preparations because, in the
fluid state, these liposomes will have a lower microviscosity than an
uncontaminated preparation (Cogan et al., 1973).
Liposomes composed of EPC and cholesterol (up to 500 mol %) (Cogan
et al. , 1973) or anionic lipids (Shinitzky and Barenholz, 1974) are
known to be above their t at all temperatures between 0 and 60° C.
During the phase transition from liquid crystalline to gel state the
rotation of the probe in the hydrocarbon layer decreases rapidly as the
acyl chains become more ordered. Finally a new viscosity is established
with a slower probe rotation and the new state can be shown to have
lost several kilo calories of activation energy (Shinitzky and
Barenholz, 1974).
The change of microviscosity with temperature has been shown
(Shinitzky et al., 1971) to be a function in a simple exponential form
E/RT n = Ae
ie : similar to the Arrhenius equation. Here n is the microviscosity, A
is the Arrhenius constant, Delta E is the fusion activation energy, T

90.
is the temperature in °K and R is the gas constant. Thus in its logari-
thmic form :
A ^ Delta E . 1
log n = log A + 2 3 Q 3 R
+ f
The slope of the line or a graph of log n vs 1/T will equal Delta
E/2.303R; since 2.303R = 4.576 cal.mole"1
degree"1
the value of Delta E
can be determined from the Arrhenius plot.
Arrhenius plots of the microviscosity - at temperatures between 5
and 48° C - of empty liposomes and liposomes containing the three drugs
(ACT-D, BLM and ASPase) used in the study were made. The lines did not
show any points of departure from linearity (correlation coefficients
were all > 0.98) which suggests that the liposome preparations are in
the liquid crystalline state (Cogan et al. , 1973; Shinitzky and Baren-
holz, 1974; Shinitzky and Inbar, 1974) and the fusion activation
energies (Table 2:6) confirm this.
Although all the lines converged at higher temperatures, the ACT-D
preparation was less fluid at lower temperatures. The slight decrease
in fluidity may be consistant with the insertion of ACT-D into the
hydrocarbon layer, or it may be a reflection of the protective effect
of ACT-D on lipid oxidation noted earlier. The graphs for BLM and
ASPase were very similar to the empty preparation. From these results,
therefore, it would seem that BLM, although it interacts strongly with
anionic PA in the aqueous phase, may not be inserting its peptide
portion into the hydrocarbon layer; nor is the charge interaction
enough to alter the fluidity of the bilayer.
The values calculated for the Delta E's were very similar (Table
2:6) although that for ACT-D vesicles was a little higher than the
others. Shinitzky and Barenholz (1974) have shown that the Delta E at
25° C for empty EPC liposomes is 8 + 2 Kcal/mole, but this increases to
10.1 when an 10 % anionic lipid is present (as is the case in these
preparations) and a similar increase is seen when cholesterol was
incorporated (Cogan et al., 1973). The values for the microviscosities
demonstrate the lower fluidity of the ACT-D-containing liposomes at 5°
C. At 25° C and 37° C the microviscosity measurements are similar to
those found by others (references above) taking into account the pre-
sence of different amount of cholesterol and PA in these preparations.

91.
vi) General Discussion
It must be asked if the drugs used in this study are really en-
trapped within the liposomes. The question is difficult to resolve.
Calculation reveals that approximately 1 mol ACT-D reacts with 125 mols
of phospholipids. Further calculation suggests that all the ACT-D could
be accomodated on the surface of a 350 nm, 10 bilayer, MLV but without
a certain knowledge of the size distribution and number of liposomes,
this cannot be confirmed. However, the electrophoretic mobility of
ACT-D liposome tends to suggest that the surface charge of these lipo-
somes is similar to that of empty liposomes and this would not be the
case if cationic ACT-D was all localized on the outermost bilayers.
Gregoriadis and Neerunjun (1975a) found that ACT-D (LP), associated
with exactly the same liposomes, was not capable of inhibiting bacte-
rial growth even in the presence of 20 % foetal calf serum. This result
suggests that the drug remains latent when entrapped and that there is
no facilitated leakage in the presence of serum (but c.f. Juliano
et al., 1978; and Fig. 2:2).
The insertion of ACT-D into the hydrocarbon region of the liposo-
mal bilayers, which is suggested by the microviscosity data, might be
due to the chomophore group of the drug which is more lipid soluble
than the pentapeptide chains. The exact position of the two penta-
peptide rings is uncertain, if they remain in the aqueous phase they
might be amenable to enzymatic or chemical hydrolysis but they might
also interact with lipids which constitute the liposomes as has been
suggested for other cyclic peptides (eg : ionophores Bangham, 1968; de
Gier et al., 1978; Chapman et al., 1978). Ill
The entrapment of In-BLM in anionic liposomes, which is not
associated with changes in liposome electrophoretic mobility or micro-
viscosity, shows that one BLM molecule is captured for every 5 mols of
111
PA if the In radiolable remains attached to the drug. Since PA only
constitutes 10 mol % of the liposome it seems unlikely that all the
drug could be on the outside of the liposome but theoretically this
might be possible in a 350 nm diameter MLV at concentrations approa-
ching one BLM per PA molecule. The size of this glycopeptide drug might
hinder such a higher concentration but, if the ^"^In radiolabel became
detached, the hydrated volume of the ion could be small enough
to be accomodated at this high ratio. Again, the relatively unchanged 111
electrophoretic mobilities of In-BLM liposomes suggest that surface
charge quenching by either the drug or its radiolabel does not occur.

92.
However, iodinated BLMs, which, have much lower entrapments into anionic
liposomes, could be located on the surface of the carrier.
The capture of ASPase in liposomes was not investigated in such
detail as the other drugs since it was found that anionic liposomes of
the standard preparation gave an adequate entrapment and almost no
leakage on storage (not shown). Fishman and Citri (1975) reported that
liposome-entrapped ASPase was much more thermostable than the unentrap-
ped enzyme ; the entrapped ASPase was not subject to attack by proteo-
lytic enzymes, nor would it react with an asparaginase-specific anti-
serum. Neerunjun and Gregoriadis (1976) demonstrated that in vivo
ASPase in liposomes protected mice against anaphylactic shock and serum
sickness. All these studies suggest that ASPase is largely entrapped
inside the liposome. Confirmation of this can be seen in the unchanged
electrophoretic mobilities of ASPase liposomes presented here. In view
of the large size of ASPase (Mol wt; 130,000 sedimentation coefficient;
7.43; Patterson, 1975) which suggests a globular protein, possibly in
an alpha-helix-like form (Frank et al. , 1970; Miller et al. , 1971) it
seems unlikely that this protein is entering fully into the bilayer
although other helical peptides, eg. the MN glycoprotein of erythrocy-
tes and gramicidin A (Chapman et al. , 1978) are known to span the
membrane. Such a large molecule would be expected to alter the micro-
viscosity of the hydrocarbon chains and this was not found.

93.
CHAPTER 3.
Plasma clearance of liposomes and their interactions with proteins.
94.
INTRODUCTION.
The ultimate goal of chemotherapy is the understanding of the mo-
lecular interaction between a drug and so-called "targets" of a cell
that will eventually bring about alterations in cellular function or
finally the suppression or death of the cell involved. However, the
target is the final destination of the drug and the interval between
administration and effect allows drugs to interact with normal consti-
tuents of the body other than^target. With most drugs only a small
proportion of the total amount in the body is at any time in direct
contact with the target whilst the higher proportion is localized in
parts of the body remote from the target. Yet it is usually this bulk
of the drug that governs the kinetics of the movement of the drug
through the tissues and so determines its ultimate distribution, time
course and intensity of effect. Such considerations also determine
important matters such as toxicity and dosage schedules.
The data presented in this chapter concern the interactions which
occur between intravenously injected liposomes and biological environ-
ment of the blood stream. Specifically, the rate of disappearance of
drug-containing liposomes from the circulation will be considered and
this will be followed by considerations of the stability of the vesicle
in the presence of plasma. Finally, the interactions of plasma proteins
with the vesicles and their effects on the surface charge of the
carrier will be studied.
95.
SECTION 3:1
PLASMA CLEARANCE OF LIPOSOME ENTRAPPED DRUGS
This section considers the clearance of the liposome entrapped
drugs actiomycin D, bleomycin and asparaginase following their intra-
venous injection into rats. The results are given in figures 3:1
(ACT-D) 3:3 (BLM) and 3:4 (ASPase) in most cases the liposome entrapped
drug has a longer plasma half life ( T ^ ^ ) than similar injections of
untrapped drug.
A) Actinomycin D.
The plasma concentration of either free or entrapped ACT-D re-
maining in the rat plasma following a single intravenous injection is
shown in figure 3:1. The animals (100-120 g body wt) were killed at
timed intervals after each injection and cuves A and B show the con-
14 3
centrations of C-cholesterol (A) and H-ACT-D (B) which remain fol-
lowing an injection of a liposome preparation prepared from twice the
standard quantities of lipids. The two cuves A and B show that the two
radiolabels are not cleared from the plasma at the same rate and this
fact is suggestive of leakage of the drug from the liposome and/or
removal of cholesterol from the liposome followed by a slower plasma
clearance of the removed cholesterol (T.. values are approximately A) 3 14
75 min., B) 35 min.). Figure 3:2 shows the ratio H/ C in this experi-3 14
ment where the ratio H: C (dpms) in the injected preparation was
arbitrarily given the value of one. At timed intervals after injection
the ratio was calculated from the percents of radioactivity due to each
isotope which remained in the plasma. As can be seen, the ratio rapidly 3
declines during the first 3 hours indicating either leakage of H or 14
loss of C to a plasma componant which is cleared more slowly, or
perhaps both. The slower decline after 3 hours coincides with the more
linear portion of the plasma clearance curve and is indicative of a
more "stable" liposome population (probably SUVs).
Curves C (open circles) and D (squares) (fig.3:1) represent the
I/V plasma clearance rates for two different preparations of ACT-D
liposomes. Preparation C was similar to B (ACT-D (LP) ) except that
each rat received a 1 ml injection containing 10.0 ug ACT-D and 1.5umol 3
EPC. Preparation D, on the other hand, contained H- ACT-D entrapped in
the aqueous phase.

96.
Figure 3:1.
fig 3:1 PLASMA CLEARANCE OF ACTINOMYCIN D 1001
* , 1 ^ — i -r— 1 r -0 2 5 10 15 20 25
Time after injection (hours).

97.
Legend Fig.3:1.
PLASMA CLEARANCE OF ACTINOMYCIN-D.
The plasma concentration (% of injected dose remaining) of ACT-D,
either free or entrapped in anionic liposomes, was measured at timed
intervals following a single I/V injection into rats.
14 3 Triangles; (A) C-cholesterol and (B) H-ACT-D entrapped in the lipid
phase of liposomes. Each animal received :
2 umol EPC : 0.91 umol CHOL (0.088 uCil 4
C) : 0.18 umol PA : 10.5 ug
ACT-D (25uCi 3
H-ACT-D/mg) in 1 ml PBS.
3 Open circles ; (C) H-ACT-D entrapped in the lipid phase of liposomes;
14 quantities as in B except C-CHOL omitted and each animal received
10.0 ug ACT-D/ml PBS.
3 Squares; (D) H-ACT-D entrapped in the aqueous phase of liposomes. Each
animal received 7.7 umol. EPC : 2.2 umol CHOL : 1.1 umol PA and 25.8 ug
ACT-D (10 uCi 3
H-ACT-D/mg) in 1 ml PBS.
3 Closed circles; (E) H-ACT-D free. Each animal received either 10 ug or
25 ug ACT-D (10 uCi 3
H-ACT-D/mg) in 1 ml PBS. Each point is mean
(+S.E.) from 3 rats.

98.
Legend Fig.3:2.
RATIO OF 3
H: 1 4
C IN THE PLASMA
These values were calculated from curves A and B, figure 3:1. The
) 3
I
value 1.
3 14 ratio H: C in the injected preparation was arbitrary assigned the
fig 3:2. RATIO 3 H / U C in PLASMA.
0 2 A

99.
The clearance curves C and D both show an initial rapid plasma
loss which paralleled the clearance of the free drug (curve E). Between
3 and 5 hours post-injection both preparations reached plateau concen-
tration although the LP-ACT-D had a 10-fold higher plasma concentration
than the aqueous-phase-entrapped drug. Thereafter the plasma values
declined more slowly with the LP drug remaining 5 - 8 fold higher
throughout the 20 hr. period. The plasma half-lives are both
less than 5 minutes.
The clearance of free ACT-D (curve E) dissolved in PBS, was plot-
ted from the plasma concentration values of rats which received either
10 or 25 ug of drug. The very rapid initial clearance (Tjy2
<
5 min.)
was followed by a slight slowing of the clearance rate but by 24 hours 3
post-injection there was no detectable H-radioactivity left in the
plasma.
At 72 hours post-injection (not shown) all the curves for lipo-
somal ACT-D converged and gave values between 0.015 and 0.02 % of the injected dose remaining in the plasma whilst at this time the value for 14
C- cholesterol (curve A) was S~fold higher at 0.11 %.
B) Bleomycins.
The disappearance of BLMs from the blood of rats is shown in
figure 3:3, where the % of the injected dose remaining in the plasma
was measured at timed intervals after I/V injection (1 ml). ^^In-BLM
liposomes (open squares) were made from four times the standard anionic
liposome mixture by the addition of 2 mis of ^^In-BLM solution (0.66
mg BLM/ml and 5.5 uci 1 : l l
In/ml) and 3 ml 0.9 % NaCl. The final liposome
suspension contained 55.70 ug BLM/ml and 4 umoles EPC/ml (83.5 % 1
^ I n -Ill
entrapped). Free In-BLM was diluted with 0.9 % NaCl to give appro-
ximately the same amount of radioactivity/ml (64.00 ug BLM/ml).
Radioiodinated BLMs were also entrapped in anionic liposomes for
injection. Iodine monochloride labelled bleomycin at concentration of
48.57 ug ICL-BLM/ml was entrapped in anionic liposomes (2.5 ml drug + 4
times the standard liposome mixture) to give final concentrations of
0.517 ug BLM/ml and 3.68 umoles EPC/ml (9.26 % D
I entrapped). Free 125
ICL-BLM was diluted with 0.9 % NaCl to give a similar number of I
radioactive counts/ml (0.53 ug ICL-BLM/ml). Bleomycin radioiodinated by
the Bolton and Hunter method at a concentration of 76.69 ug B/H-BLM/ml
was entrapped in anionic liposomes (2.5 ml drug + 4 times the standard
liposome mixture) to give a final liposome solution containing 1.0 ug

100.
Figure 3:3. Plasma Clearance of Bleomycins
Time after injection (hours)
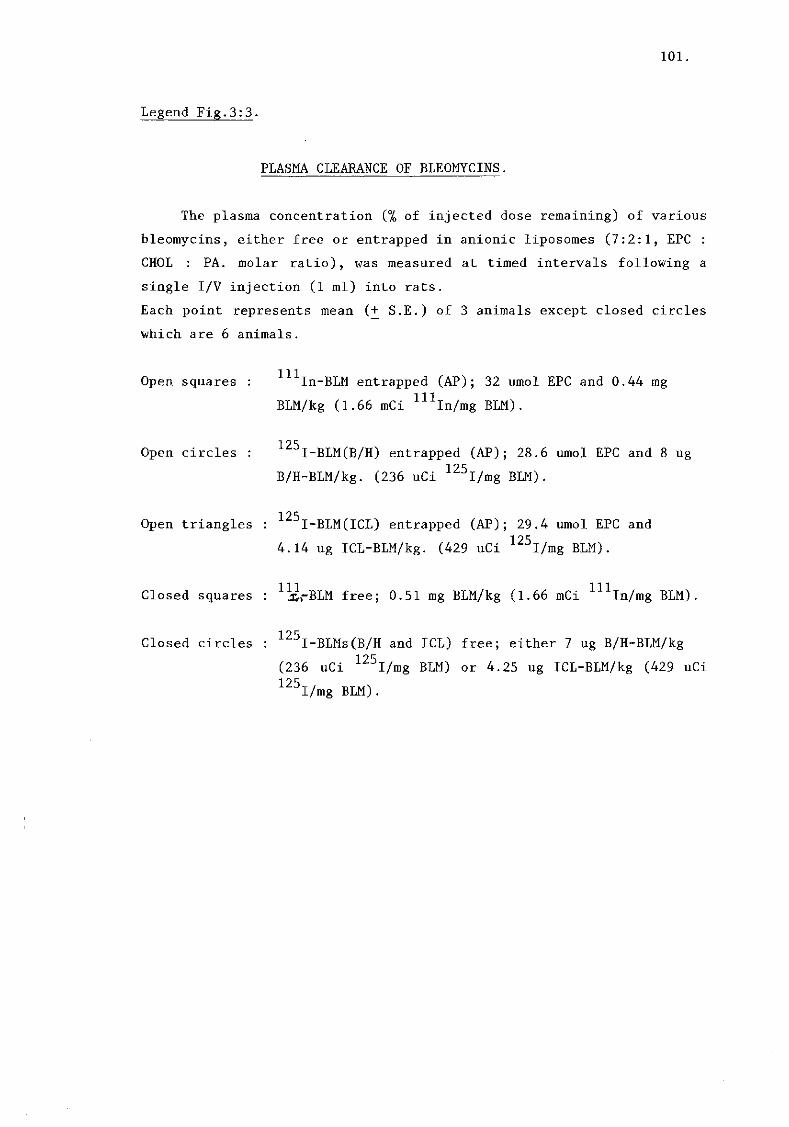
101.
Legend Fig.3:3.
PLASMA CLEARANCE OF BLEOMYCINS.
The plasma concentration (% of injected dose remaining) of various
bleomycins, either free or entrapped in anionic liposomes (7:2:1, EPC :
CHOL : PA. molar ratio), was measured at timed intervals following a
single I/V injection (1 ml) into rats.
Each point represents mean (+ S.E.) of 3 animals except closed circles
which are 6 animals.
Open squares : 111
In-BLM entrapped (AP); 32 umol EPC and 0.44 mg 1 1 1 .
BLM/kg (1.66 mCi In/mg BLM)
Open circles : 125
I-BLM(B/H) entrapped (AP); 28.6 umol EPC and 8 ug 1 25
B/H-BLM/kg. (236 uCi I/mg BLM).
125 Open triangles : I-BLM(ICL) entrapped (AP); 29.4 umol EPC and
1 25 4.14 ug ICL-BLM/kg. (429 uCi I/mg BLM).
Closed squares : *j&rBLM free; 0.51 mg BLM/kg (1.66 mCi "^In/mg BLM)
125 Closed circles :
3
I-BLMs(B/H and ICL) free; either 7 ug B/H-BLM/kg 1 25
(236 uCi I/mg BLM) or 4.25 ug ICL-BLM/kg (429 uCi 1 25
I/mg BLM).

102.
B/H-BLM/ml and 3.58 umoles EPC/ml (11.64 % J
I entrapped). Free B/H-125
BLM was diluted with 0.9 % NaCl to give a similar number of I radio-
active counts/ml (0.875 ug B/H-BLM/ml).
The mean of the plasma clearance values of free ICL/BLM and B/H-
BLM were compared by Students ' t' test and found not to be signifi-
cately different so these values were pooled. The combined plasma
clearance curve for free iodinated BLM is therefore the mean (+ SE)
from six animals at each point.
The clearance characteristics of the liposome entrapped BLMs are
similar to that already described for ACT-D liposomes i.e.: a rapid
initial clearance followed by a more prolonged slower fall in plasma
radioactivity over the period between 5 and 24 hours. The differences 111 125
between the In-containing liposomes and those containing I were
significant (p < 0.005) between 5 hours and 24 hours. The differences
between ICL-BLM liposomes and B/H-BLM liposomes were significant (p <
0.005) between 2 hours and 12 hours. At all times the concentration of
the liposome drug remaining in the plasma was significantly higher (p <
0.002) than its appropriate free drug level. The differences between 111 125
free In-BLM and I-BLM were found to be significant (p < 0.002)
between 5 minutes and 24 hours post injection. L
The approximate values for the plasma ha£-lives of the BLM prepa-^ v 111
rations in fig. 3:3 were calculated to be : - i) entrapped In-BLM, 111
31 minutes, ii) free In-BLM, 1.5 minutes, iii) entrapped ICL-BLM, 5
minutes, iv) entrapped B/H-BLM, 5 minutes and v) free iodinated BLMs
(ICL and B/H) < 1 minute.
C) Asparaginase.
125 125 The plasma clearance of I radioactivity from I-labelled
ASPase entrapped in liposomes or free is shown in figure 3 : 4 . Lipo-125
somes containing I-ASPase were prepared by the standard method from 125
freshly labelled ASPase using 0.3 ml I-ASPase (0.847 ug protein/
ml : 61.36 uCi/ml) and 2.2 ml 0.9 % NaCl added to twice the standard
anionic liposome mixture. The final sonicated liposome suspension
contained 1.349 ng protein/ml and 1.6 umole EPC/ml. Free ASPase was
diluted in NaCl to give an equivalent amount of radioactivity/ml as the
entrapped preparation (1.44 ng protein/ml). 125
The plasma clearance of I-ASPase (figure 3:4) revealed that the
103.
liposome entrapped protein was removed from the plasma in the same
biphasic manner to that found in the cases of ACT-D liposomes and BLM 125
liposomes. However, the free I-ASPase was cleared very differently
from the other free drugs. A rapid initial fall in the plasma concen-
tration of the free ASPase was followed by a very much slower, almost
linear, plasma decay over the following 24 hours.
Precipitation of plasma proteins with trichloroacetic acid (TCA) 125
revealed that most (> 75 % in all cases) of the I counts were pre-125
cipitated by TCA i.e. : the majority of I remained bound to ASPase.
The injected material was also subjected to TCA precipitation. In the
case of the free ASPase, the protein was 95.04 % precipitatable. Lipo-
somes containing entrapped ASPase were first dissolved by the addition
of 0.5 % Triton X-100 (final concentration) before addition of 10 %
TCA. The precipitated material contained 71.63 % of the starting ma-
terial. This loss of radiolabel was probably due to sonication during "* 125
liposome manufacture. Storage of sterile I-ASPase (free) over a
period of two months at 4° C, followed by TCA precipitation, caused the
loss of 9.6 % of radiolabel. No tests were made on the enzymatic acti-
vity of the ASPase. 125
The plasma concentrations of TCA I counts (solid lines : fig.
3:4) were calculated as the percentage of the TCA pptable injected
material. In this way the means of the % remaining in the plasma were
compared and significant differences represent additional loss of
radiolabel from either the vesicles or the free drug. In general, the
TCA material parallels the plasma concentration of the non-precipitated
material for both free and entrapped ASPase. Liposomal ASPase was not
significantly different (p > 0.05) from its TCA.ppt. until 2 hours
post-injection, at which time loss of radiolabel from the vesicle
occured. However, by 24 and 48 hours (not shown) the liposome prepara-
tion had "stabilized" and no further differences were found. Similarly,
the differences between the free ASPase and its TCA.ppt. were different
at one hour (p < 0.02) and 5 hours (p < 0.001) but by 24 and 48 hours
(again not shown) the differences were no longer significant.
At all times, except 5 minutes post-injection, the liposome-en-
trapped ASPase was significantly lower (p < 0.002) than the free ASPase
material whether TCA precipitated or not. Calculation of the T ^2
values gave times of 18 minutes for liposomal ASPase and 60 minutes for
free ASPase (non-precipitated materials).
Cov^-eoGovv<> (0,11.

104.
Legend Fig. 3:4.
PLASMA CLEARANCE OF ASPARAGINASE.
The plasma concentration (% of injected dose remaining) of ASPase,
either free or entrapped in anionic liposomes (7:2:1 EPC:CHOL:PA molar
ratio) was measured at timed intervals following a single I/V injection
(1 ml) into rats. Each point represents the mean (+ S.E.) of 3 animals.
125 Open circles : I-ASPase entrapped (AP); 13.3 umol EPC and
Dotted lines
Solid lines
Closed circles
11.24 ug ASPase/kg (72.4 uCi/mg) 125
I-ASPase free; 12.02 ug ASPase/kg (72.4 uCi/mg) 125
Total I radioactivity.
Radioactivity precipitatable with 10 % trichloro-
acetic acid.
f ig3:4 PLASMA CLEARANCE ASPARAGINASE
100-T 9 0 -
0.1 10 15 20 25
Time after in jec t ion (h i
105.
D) Discussion of plasma clearance.
The mean diameter, surface charge and chemical composition appear
to control the rate of liposome elimination from the blood (see intro-
duction) .
The composition of the vesicle has been shown to have the most
pronounced effects on liposome plasma clearance. This will be dis-
cussed in more detail later in relation to the interactions of liposo-
mes with plasma proteins but these data emphasize the need for caution
when attempting to interpret the plasma clearance rates of liposomes
especially when, i) the liposome contains low ( < 30 mol. %) choleste-
rol, ii) either phospholipid or cholesterol is radiolabelled as a
marker for the bilayer and iii) the entrapped solute is liable to leak
from vesicles. A reinterpretation should be made of the earlier work of
many authors (Gregoriadis and Ryman, 1972a; Juliano and Stamp, 1975;
Gregoriadis et al, 1977a; Kimelberg et al, 1976, 1977) which showed
parallel plasma clearances of both lipid and entrapped drug and which
claimed changes in clearance rates by the alteration of liposome charge
or composition.
The plasma clearance of ACT-D has been studied by several other
investigators. Gregoriadis (1973b) showed that ACT-D(LP)-containing
cationic liposomes were cleared from the plasma at the same rate as
cationic albumin-containing liposomes. The half-life ^x/2^
clearance of these liposomes was approximately 1 hour, whereas the free
drug had a le s s
than 5 minutes. This latter value is in
agreement with the values found by other workers (Schwartz et al. ,
1968b; Rahman et al, 1975; Juliano et al. , 1978) and with this work.
Kaye and Ryman (1980) have suggested that free ACT-D is bound, at least
partially, to plasma albumin and that, following destruction of lipo-
somes in the plasma (q.v.), some phosphatidylcholine is also albumin
bound. If the drug (or lipid) binding does not affect the albumin then
the plasma clearance should, finally, reflect the T ^ ^ of albumin. In
the present study the free ACT-D did not level off after several hours
but continued to fall until there was no detectable radioactivity in
the plasma. Presumably, the drug dissociated from the albumin quite
quickly once the unbound drug was cleared from the circulation.
The Tj/2 l i - Po s o m e
"e n t r a
P Pe
d ACT-D, calculated from Gregoriadis
(1973b) (1 hour) is close to that found by Juliano et al. , (1978) (100
mins) using cationic SUVs. It seems probable, therefore, that the

106.
majority of Gregoriadis' preparation were also SUVs. Using handshaken,
neutral, MLVs Rahman et al (1975) reported very low T ^2 values for
entrapped ACT-D (AP and LP) injected I/V into mice. After 30 minutes
less than 2 % of the injected dose (AP) remained in the plasma and less
than 0.5 % (LP) remained after the same time. The ACT-D (AP) result is
in agreement with this work where a similar value (2.2 %) was found
after 30 minutes. However, curves B and C (fig. 3:1) show that, unlike
the report of Rahman and co-workers, ACT-D (LP) in anionic sonicated
MLVs is cleared much slower than the same liposomes containing the
drug in the aqueous phase. It is possible that these differences can be
explained by a variation in the clearance rates between mouse and rat
(this study) although a comparison of the data of Gregoriadis (1973b)
(rat) with that of Kaye and Rayman (1980) (mouse) does not suggest a
large difference in the small cationic MLVs containing ACT-D
(LP). Moreover, in the only published comparative study (Gregoriadis
et al. , 1977a), the plasma clearance and drug disposition of anionic
MLVs was found to be similar in both rats and mice.
A more likely explanation of these differences is to be found in
the size heterogeneity of the liposome populations and therefore in the
rates of their plasma clearance. Rahman et al., (1978) have shown that,
even in the absence of serum, aqueous phase ACT-D will leak faster from
liposomes than the lipid-phase-entrapped drug and this is the explana-
tion for the differences between curves C and D (fig. 3:1).
In addition to the size heterogen|ity of the liposome populations,
a further factor influencing the clearance rates of liposomes is the
dose of lipid administered. The animals of curve B received 30 % more
lipid than those of curve C. Gregoriadis and Ryman (1972a) reported
that liposome clearance was dose dependent and that, for 10 minutes
post-injection at least, the relationship between dose and % liposomes
remaining the plasma was linear (about 5.7 % increase for each mg total
lipid : calculated from Gregoriadis and Ryman). Later Gregoriadis and
Neerunjun (1974) reported that excess (empty) liposomes substantially
slowed the clearance characteristics of injected liposomes and this was
explained by saturation of the sites responsible for the uptake of
liposomes. This result was confirmed by Tanaka et al (1976) using high
amounts of phospholipid and cholesterol. Mauk and Gamble (1979) and
Souhami et al (1981) have also shown that the liver concentration of
entrapped drug was dependent upon the injected lipid dose.
The values for T ^2 from curves B and A (Fig. 3:1) are close to

107.
that found by Gregoriadis (1973b) and Kaye and Ryman (1980) who both
used soniated cationic MLVs. The cholesterol value emphasis the dif-
ference in clearance rate between the vesicle bilayer and its contents
(figure 3:2). Leakage of ACT-D from the liposome would account for the
lower drug : cholesterol ratios during the first three hours. But this 14
result can also be explained by the loss of C-cholesterol label to
blood components which are cleared more slowly than the vesicle. These
two explanations are not mutually exclusive so that cholesterol loss
might facilitate the leakage of the drug.
The plasma clearance of BLM-liposomes is very similar to that
found for ACT-D. In a study by Gregoriadis et al (1977a) a very similar
plasma clearance of ^^In-BLM liposomes was found to that of this
study. Using liposomes only sonicated for 0.5 min they reported a
of about 10 minutes in rats and mice whereas the value found in this
study was approximately 30 minutes. The values calculated from
Gregoriadis et al (1977a) for 5 hours and 24 hours are 6.0 and 1.4 %
respectively the corresponding values in this study are 14.6 + 2.8 and
2.0 + 0.4 %. These differences can be accounted for by the longer lipo-
some sonication time used in this study. Using SUVs Mauk and Gamble 111
(1979) have shown that about 72 % of the injected dose of In
chelated into liposomes remains in the blood 3 hours after injection,
this falls to about 6 % in 24 hours.
The clearance of free ^^In-BLM presents a different picture from 125
entrapped drug but it was also significantly different from I-BLMs. 125
The T w a s very short, however, unlike the I-BLMs, the plasma
levels stay elevated so that 0.62 + 0.03 % remained in the circulation
after 24 hours. Gregoriadis et al (1977a) report that only 1.0 % of the
injected dose remains plasma associated after 10 minutes. The dif-
ferences between these data and that of Gregoriadis et al., (1977a) are
difficult to explain since the ^^In-BLM was from the same source.
The plasma clearance of free ^^In-BLM has been studied by
several other groups. There is a general agreement that the levels (% 111
injected dose) of In label in the whole blood of mice are of the
order 10 % (1 hour) 2.5 % (6 hours) falling to 1 % (24 hours) (Thakur
et al. , 1973; Robbins et al. , 1974; Konikowski et al. , 1975; Krohn
et al. , 1977) and these are similar to the values of this study in
rats. However, the levels of other BLM radiolabels (cobalt and
technecium; Krohn et al. , 1977 or copper; Ryo et al. , 1975) are lower
than the 1 1 - 1
In levels when injected into mice or rats. Also in rats,
108.
111 Ryo et al., (1975) demonstrated that H-labelled BLM plasma levels were
111 very different from the In labelled material and quite similar to
that of the free iodinated BLMs in this study. Eckelman et al. , (1976)
and Krohn et al. , (1977) have reported on the plasma clearance of
iodinated BLMs. In a comparative study, the former authors found that
10 fold more B/H-labelled BLM remained in rat blood 2 hours after
injection than the ICL-BLM material but these differences were minimal
at 24 hours. The levels of ICL-BLM found by these authors were similar
to th©S^ found in these present studies but the B/H-BLM result is inex-
plicably different. Krohn et al. , (1977) reported very similar free
ICL-BLM levels in mouse blood to those found in this study and to those
of Eckelman et al., (1976) in rats. 2+
Native bleomycin is a copper-containing antibiotic (normally Cu 3+
but occasionally Cu ) (Umezawa, 1974) and it contains natural chela-
ting sites for metals (Nunn, 1976; Dabrowiak et al. , 1978; Takita
et al. , 1978; fig 2:1b). The metal can be removed by chelating agents
and replaced by other metals (Renault et al. , 1972) although some
metals (e.g.: cobalt) bind so tightly that they are difficult to remove
in vitro (Eckelman et al. , 1975). Removal of copper from natural BLM
results in an increase in potency (Takita, 1959) and a reduction in
toxicity (Ischizuka et al. , 1967). However, there have been reports of
instability of BLM-cation chelates. Cobalt-BLM seems to be more stable
in vivo than most of the chelates (Poulose et al., 1975, Rasker et al., 99m
1975) but Tc-BLM dissociates in vivo and the radiolabel binds to 111
serum albumin (Lin et al. , 1974). The In-BLM is also unstable, 2_|_ 1 1 1 3+
Robbins et al. , (1974) reported that Cu will exchange for In
in vitro because the copper chelate is more stable; in vivo they showed
dissociation of the complex following I/V injection into mice. Thakur
et al. , (1973) reported that the 1 : L 1
In was removed from BLM in vivo and
could be found bound to transferrin which probably gave up iron for the
indium; other serum cations (e.g.: zinc and magnesium) might also
displace indium. From the work of Robbins et al. , (1974) it is clear
that unbound "^InCl^ has a very different T /<?
and kinetics from the 111
In-BLM complex. Ill
From the foregoing it is clear that the plasma clearance of In-
BLM entrapped in liposomes will depend upon the quantity of radiolabel
which is removed by competing chelators and the natural exchange of
cations. This probably explains the differences found by various au-111
thors : in the present case the amount of radioactive In-BLM in-

109.
jected was almost twice that used by Gregoriadis et al. , (1977a) so
presumably the chelation/exchange of the radiolabel resulted in a
higher protein labelling and thus a longer T Ill
The discussion on In-BLM clearance raises a further important
question. In chapter 2 it was suggested that the interaction of "^In-
111 BLM with anionic liposomes could have been due to binding of In by
the polar head groups of the lipid but there is no guarantee that the
radiolabel stays attached to BLM. Some free could escape from
the vesicle (the cation permiability of anionic liposomes in high :
Papahadjopoulos and Watkins, 1967). In addition, Hwang and Mauk (1977)
and Mauk and Gamble (1979) have shown that serum will enhance the re-
lease of an In-chelator complex from SUVs containing 33 mol. %
cholesterol although the presence of a cationic charge on the vesicle
membrane reduces this leakage. The plasma clearance rates of ^"^In-BLM
either free or entrapped should, therefore, be treated with caution
since it is very possible that the prolonged clearance rates are due to
"^^In bound to plasma proteins. 125
The plasma clearance of I-BLMs entrapped in liposomes has not
been previously reported. As with other liposome entrapped compounds
the initial clearance rate is rapid but after two hours the ICL-BLM
liposomes are cleared slower that the B/H-BLM liposomes which suggests
that there are size differences between the two preparations because
although the two preparations are similar in all respects, apart from
the entrapped species, it is impossible to control the sonication to
produce homogeneously sized populations. The differences are unlikely
to be due to the quantity of lipid injected since these are very si-
milar. There remains the possibility that the entrapped drug determines
the clearance rate of its liposome. This cannot be ruled out in this
experiment but it seems unlikely since there was no difference in the
clearance rates of the unentrapped iodinated BLMs. Eckelman et al. ,
(1976) did find a difference between directly and indirectly iodinated
free BLMs but in that case the B/H-BLM was cleared more slowly than the 125
ICL-BLM i.e.: the reverse of the results for the I-BLM liposomes.
Interestingly, the addition of cold polycations (cobalt) to BLM
(Eckelman et al. , 1976) did not change the extent of iodination of the
drug but it did retard the plasma clearance. The preparation of a
double labeled BLM chelated + - ^ i indirect iodination) might
provide some clarification of the extent of indium and drug leakage
from liposomes.

110.
The stability of the radioiodinated BLMs in the presence of plasma
was not investigated in detail but an initial experiment in vivo (not
shown) suggested that the plasma radioactivity at 5 hours was > 95%
precipitatable with trichloroacetic acid (TCA ppt). Eckerman et al. ,
(1976) found that ICL-BLM injected into rats had lost 7 % of its radio-
label after 2 hours but almost 50 % was lost in 24 hours in the rabbit; 125
more than 90 % of the I-BLM excreated in rat urine was radiolabeled.
It is possible, therefore, that after 5 hours post-injection there is
some dissociation of radiolabel from the drug.
Studies on the entrapment of asparaginase in liposomes (Fishman
and Citri, 1975; Neerunjun and Gregoriadis, 1976) or in microcapsules
(Chang, 1971, 1973; Mori et al. , 1973) have shown that entrapment
stabilizes the enzyme and protects it from heat denaturation (Fishman
and Citri, 1975; Chang, 1973; Mori et al., 1973) although encapsulation
in microcapsules restricts the pH optimum, changes the temperature
optimum and results in a loss of activity (Mori et al. , 1973). Both
methods protect the entrapped enzyme from attack by proteolytic en-
zymes ; moreover liposome entrapment prevents the enzyme from inter-
acting with specific antisera both in vitro (Fishman and Citri, 1975)
and in vivo (Neerunjun and Gregoriadis, 1976). Furthermore, the en-
trapped enzyme is capable of lowering asparagine levels in the plasma
and tumors (Chang, 1971; Neerunjun and Gregoriadis, 1976).
There has been no report to-date on the plasma clearance of ASPase
entrapped in liposomes. The data presented here show that the now-fa-
miliar, plasma clearance curve of other liposome entrapped drugs is
also found when ASPase is entrapped. The loss of radiolabel from the
liposomes after 2 and 5 hours may represent either loss of non-bound 125
I or leakage of the whole protein followed by breakdown or rapid removal of the leaked protein from the plasma. Gregoriadis and Ryman
(1972a) failed to find evidence for loss of structural integrity of 131
I-albumin-containing liposomes but protein leakage from liposomes in
contact with plasma has been shown by others, especially when the
cholesterol content of the vesicle is low (see discussion below).
The rate of plasma clearance of free ASPase appears to be a very
complicated phenomenon and depends upon a large number of different
factors. Patterson (1975) has summarized the difference in values
obtained in various species of animal; in rodents these values range
between 0.5 and 26 hours (mouse) and 1.5-5 hours (rat). In addition,
the method used to isolate the enzyme will effect the rate of plasma

111.
removal. Frank et al. (1970) found that the enzymes isolated from dif-
ferent strains of E. Coli had different isoelectric points; Mashburn
and Landin (1970) and Rutter and Wade (1971) demonstrated that isoen-
zymes from the same source but with lower isoelectric points (pi) were
cleared from the plasma more slowly than the others. The source of the
enzyme is also an important factor (Hall, 1970). The E. Coli enzyme
(pi; 5.0) is cleared from the plasma of mice more slowly ( T ^ ^ :
^
Mashburn and Landin, 1970) than ASPase from Fusarium tricinctum (pi;
5.2 : hours) (Scheetz et al., 1971), interestingly this latter
enzyme has no antitumour effect. The clearance of ASPase from Erwina o
car^tovora (pi,8.79. Miller et al. , 1971), which was used in this
study, appears to be an exception since its T ^2 i
s a
hout 1.5 hours in
rats (Hall, 1970) and it has potent antitumour activity (Wade et al.,
1968). A further complication arises if the animals used are virus
infected since this markedly impairs the clearance of the enzyme (Riley
et al. , 1970). Finally, the storage of the enzyme also eH&n^es the 0 v
plasma clearance, Hall (1970) reported that the E. ca^tovora enzyme
will spontaneously aggregate (for this reason the enzyme preparation
was centrifuged after rehydration; see methods) and Rauenbusch et al.,
(1970) showed that the enzyme could be slowly inactivated in glass and
plastic containers but that this could be prevented by the addition oP
non-ionic detergents which probably retarded the aggregation and in-
activation.
The very rapid loss (40 %) of free ASPase from the plasma in the
first five minutes following injection could be due to the fast
clearance of aggregated material and equilibration with body fluids.
This also accounts for the fact that the T ^2 values are different from
those of Hall (1970) and, more recently, those of Uren and Ragin (1979)
(T-jy2' l-5h). The plasma clearance reported by Putter (1970) and Uren
and Ragin (1979) follow first order kinetics, at least for the first 8
hours post injection. However, Hall (1970) and Schwartz (1970) reported
both linear and biphasic plasma clearance curves in animals and in man.
In general, foreign protein clearance is determined by such fac-
tors as the state of denaturation and aggregation (Thorbecke et al. ,
1960), the sialic acid content (Morell et al. , 1971) and the carbohy-
drate content (Sly, 1980; Stahl and Schlesinger, 1980). Putter (1970)
has presented evidence that the clearance of ASPase is due to "immune-
elimination" since clearance rates were increased when animals received
a second injection of the enzyme one week after the first although no
112.
serum antibodies could be detected until after a third or forth in-
jection. Other protein-protein interactions may also play a role in the
removal of ASPase from the circulation. Soru (1979) found that the en-
zyme would interact with alpha-2-macroglobulin which prevented the
subunits of the enzyme from dissociating even in the presence of urea
or detergents. The complex retained its asparaginase activity.
Despite the many reports that liposomal lipids and liposome con-
tents are removed from the plasma together it remains true that liposo-
mes of certain compositions become permeable to their entrapped solutes
when in contact with plasma proteins (Gregoriadis, 1973b; Kimelberg et
al. , 1975; Tyrrell et al. , 1977; Zborowski et al. , 1977; Finkelstein
and Weissmann, 1979; Gregoriadis and Davis, 1979; Kirby et al., 1980b;
Scherphof et al., 1980; Allen, 1981) in vivo and in vitro. Initial
observations suggested that the leakage was determined by the molecular
size of the solute, so that proteins (Gregoriadis and Ryman, 1972a;
1972b; Gregoriadis and Allison, 1974; Gregoriadis and Neerunjun, 1974;
Neerunjun and Gregoriadis, 1976) and drugs of a certain size or lipid
solubility (Gregoriadis 1973; Gregoriadis and Neerunjun, 1975a; Colley
and Ryman, 1975; Dapergolas et al. , 1976; Juliano and Stamp, 1978)
remained inside the liposome whilst other drugs (Ryman, 1975; Juliano
and Stamp, 1978) and ions (Kimelberg et al. , 1975), leaked out. Co-en-
trapment of the drug with other agents (Gregoriadis et al. , 1977b) has
been proposed to overcome these problems. However, an ion-chelator com-
plex inside cholesterol-rich vesicles will still leak ions in the pre-
sence of serum (Hwang and Mauk, 1977; Mauk and Gamble, 1979). More re-
cently, it has been shown that even proteins (Scherphof et al. , 1980)
can be released from liposomes in the presence of plasma or serum.
Kirby and Gregoriadis (1981) have suggested that the liposome (SUV)
membrane remains intact during the protein/vesicle interaction but that
pores are opened in the bilayer and the pore-size defines the leakage
of the drug.
It seems probable, therefore, that the plasma clearance of the li-
posomal drugs in this study is a complex compounded from the individual
characteristics of MLVs, SUVs and leaked free drug.
113.
SECTION 3 : 2
INTERACTIONS OF LIPOSOMES WITH PLASMA LIPOPROTEINS.
Introduction.
14 14 The plasma clearance of C-cholesterol from C-cholesterol /
3
H-ACT-D liposomes, shown in the preceeding section (fig 3:1, 3:2),
demonstrated that these two radiolabels were not removed concurrently
from the plasma. The suggestion was made that this might be due to 14
either leakage of ACT-D from the vesicle or transfer of C-cholesterol
to a slower moving plasma component or perhaps both. In this section
data will be presented from studies made on the interaction of radio-XA X A
labelled (4- C) cholesterol or (methyl C-choline) egg phosphata-
dylcholine^ incorporated in liposomal bilayer^with rat plasma lipopro-
teins in vivo. Lipoproteins were chosen as the most likely plasma
constituents involved in interactions with liposomes since they play a
predominant role in the transport and metabolism of lipids in the body
(Scanu and Wisdom, 1972). Following publication of part of this work
(Black and Gregoriadis, 1976) there have been many reports of liposomes
interacting with the plasma proteins involved in lipid metabolism.
Plasma lipoproteins function to transport esssentially insoluble
lipids in a water solu. ble form. The majority of triglycerides, either
endogenously synthesisted or from the diet, are transported by chlo-
microns (CHYL) and very low density lipoproteins (VLDL). Low density
(LDL) and high density (HDL) lipoproteins are the primary vehicles for
the transport of cholesterol usually in the form of cholesterol esters.
It is generally accepted that the neutral (apolar) lipids, triglyce-
rides and cholesterol esters (E-CHOL) occupy a central core of all
lipoprotein particles whereas the more polar lipids, phospholipids (PL)
and cholesterol (CHOL) are in a surface film (unilamellar membrane). In
addition to lipids, lipoprotein class contains specific apoproteins
which also occupy the surface (Table 3:1).
A) Cholesterol exchange with lipoproteins.
The analysis of plasma lipoproteins from rats injected with lipo-14 111
somes containing C-cholesterol(LP) (circles) and In-BLM(AP)
(squares) is shown in figure 3:5. The animals were killed at timed in-

114.
Table 3:1.
LIPOPROTEIN
Apoprotein Major
Component
Minor
Component Function
A-1 CHYL,HDL VHDL
VLDL LCAT Activator
A-11 HDL,VHDL VLDL CHYL LCAT inhibitor? Regu-lator of ApoE binding.
B LDL,VLDL, CHYL.
Lipoprotein biosynthe-sis/secre tion; binds to cell surface recep-tors
C-I VLDL,CHYL LDL, HDL LCAT Activator ?
C-II VLDL,CHYL HDL Lipoprotein lipase activator
C-III VLDL,CHYL HDL Lipoprotein lipase in-hibitor; inhibitor of CHYL remnant uptake by liver.
D(A-III) HDL,VLDL Cholesterol ester transfer protein ?
E VLDL CHYL,HDL Binds to hepatocyte surface receptors.
Modified after Owen and Mclntyre (1982) and Sparrow and Gotto (1980).

115.
tervals after injection. Blood was centrifuged to remove the cells.
Washed blood cells, equivalent to 1 ml of whole blood, were lysed with
an equal volume of 10 % NaCl and the centrifuged to produce a pellet.
The pellet was washed with 5 % NaCl and precipitated with 5 % TCA; the
precipitate was transfered to scintillation fluid for radioactive
counting.
The plasma was taken and an aliquot (4 ml) was subjected to lipo-
protein analysis by density gradient ultracentrifugation. A pre-centri-
fugation sample was stored, frozen at -20°C, for later measurement of
radioactivity.
The quantity of each radiolabel in the lipoprotein fractions (fig.
3:5) was expressed as a percentage of the total plasma radioactivity
measured at the same time. Control samples of liposomes and liposome
constituents were also fractionated under various conditions (table
3:3).
Results
No radioactivity was found associated with erythrocytes at any
time. Table 3:2 (a) shows the total plasma radioactivities of both la-
bels. For comparison the leakage of ^ ^ I n from ^^In-BLM liposomes
(table 3:2b), incubated in PBS at 37°C for similar time intervals, is ••* 111
also shown (taken from data in $«cfc<oo 2:2.«<»>
jThe ratio of In-BLM : 14
C-cholesterol (ratio A) is assumed to be 1 just before injection . In
the case of in vitro incubation, the fraction of the initial ^^In-BLM
remaining liposome-associated (i.e. % remaining in liposomes/100) is
also presented (ratio B). A comparison of ratio A with ratio B (table
3:2c) gives a measure of the spontaneous leakage of the drugs from the
liposomes in the presence of serum (i.e. a value of < 1.0 for Ratio
A/Ratio B indicates the increased drug leakage as a result of injection
into the rat).
These results show that the plasma clearance of entrapped 3 1 1
I n -
BLM was similar to that shown previously in other experiments (fig.
3:3) which implies that the incorporation of l 4
C-CH0L has no effect on
the BLM clearance. Table 3:2 (a) might be taken to imply that these
liposomes were stable in the plasma (i.e. ratio A and Ratio A/Ratio B
are maintained at unity). This cannot, however, be assumed from these 111
data since it is known that In radiolabel will bind to plasma pro-
teins (see previous section and table 3:3.i) and it was not cleared at
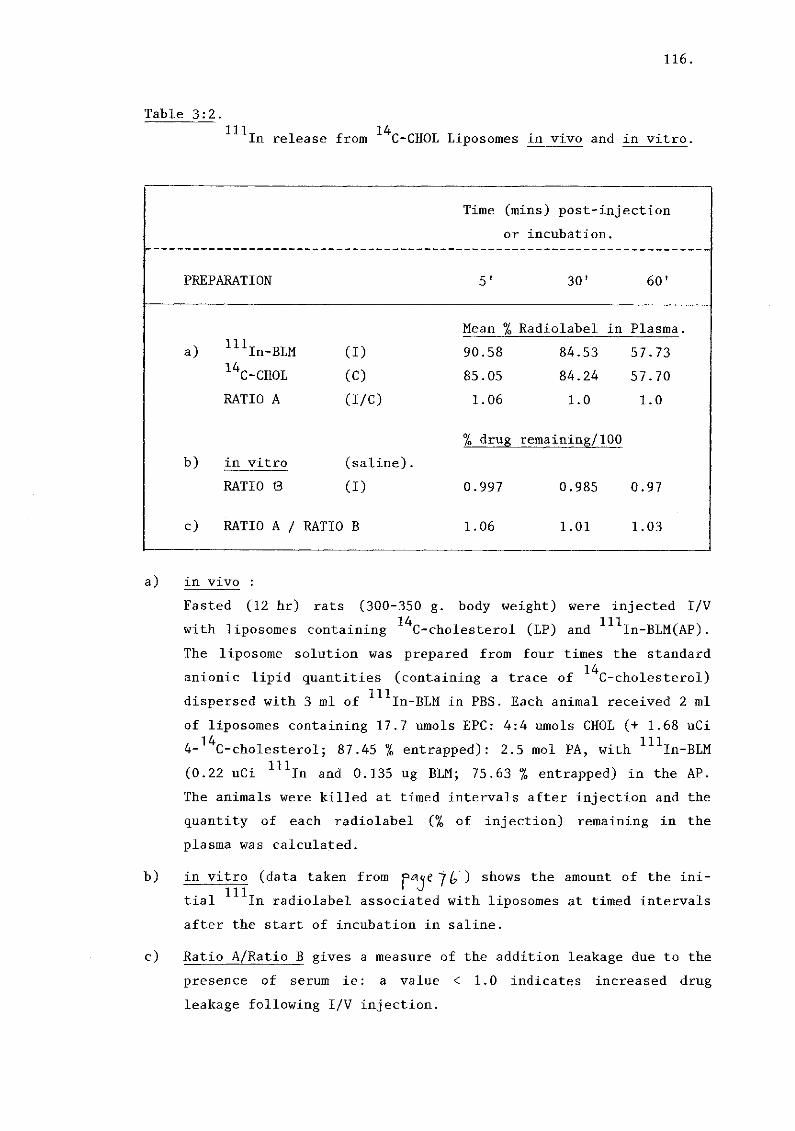
116.
Table 3:2.
"^^In release from "^4
C-CHOL Liposomes in vivo and in vitro.
Time (mins) post-injection
or incubation.
PREPARATION 5' 30' 60'
111 a) In-BLM
14
C-CHOL
RATIO A
(I)
(C)
(I/C)
Mean % Radiolabel in Plasma.
90.58 84.53 57.73
85.05 84.24 57.70
1.06 1.0 1.0
b) in vitro
RATIO e
(saline).
(I)
% drug remaining/100
0.997 0.985 0.97
c) RATIO A / RATIO B 1.06 1.01 1.03
a) in vivo :
Fasted (12 hr) rats (300-350 g. body weight) were injected I/V
with liposomes containing *4
C-cholesterol (LP) and ^^^In-BLM(AP).
The liposome solution was prepared from four times the standard
anionic lipid quantities (containing a trace of *4
C-cholesterol)
dispersed with 3 ml of "^In-BLM in PBS. Each animal received 2 ml
of liposomes containing 17.7 umols EPC: 4:4 umols CHOL (+ 1.68 uCi
4-1 4
C-cholesterol; 87.45 % entrapped): 2.5 mol PA, with m
i n - B L M
(0.22 uCi m
i n and 0.135 ug BLM; 75.63 % entrapped) in the AP.
The animals were killed at timed intervals after injection and the
quantity of each radiolabel (% of injection) remaining in the
plasma was calculated.
b) in vitro (data taken from ) shows the amount of the ini-111 ^
tial In radiolabel associated with liposomes at timed intervals
after the start of incubation in saline.
c) Ratio A/Ratio B gives a measure of the addition leakage due to the
presence of serum ie: a value < 1.0 indicates increased drug
leakage following I/V injection.
117.
the same rate as the bleomycin (see fig.3:3 and discussion). For the
BLM-containing liposomes the Ratio A/Ratio B calculation (table 3:2c),
therefore, cannot be used to estimate the increased drug leakage in the
presence of serum. o -1 /
Similar calculations of the leakage of H-ACT-D(LP) from C-CHOL
liposomes (not shown), taken from data in figs. 2:2 and 3:2, showed a
large increase in the release of the drug when the liposomes were in-
jected into animals (i.e. : Ratio A/Ratio B << 1.0).
Lipoprotein analysis
In view of the leakage of "''In-BLM from liposomes it was impor-111
tant to establish the distribution of free In-BLM in rat lipopro-
teins before using liposomes. A control experiment was performed (Table 111
3:3 i) which showed that 30 minutes after the I/V injection of In-
BLM most of the radioactivity in the plasma was associated with the
protein pellet (d > 1.25) and VHDL or with the CHYL fraction (d <
1.006). A similar distribution was found following the incubation of
the same amount of free m
i n - B L M (0.26 ug BLM; 0.425 uCi m
i n ) with
either 5.0 ml fresh rat plasma (table 3:3 ii) or 5.0 ml bovine serum
albumin (BSA : 50 mgs/ml) (table 3:3 iii) at 37° C for 1 hour.
These results are similar to those found by others (see previous
section) and suggest that BLM, or more likely the " ^ I n radiolabel, is
able to bind to plasma proteins in vivo and in vitro. Alternatively,
the drug might be large enough (mol wt 1500) to sediment with the pro-
teins but this seems unlikely. The protein involved in binding the
drug/radiolabel could be albumin (table 3:3 iii) or transferrin which
contaminates the BSA. In addition, there was a low density (d < 1.006)
component which concentrated either the whole drug or ^"^In (CHYL. Ta-111
ble 3:3 i, ii and iii). In view of the interaction of In-BLM with
anionic phospholipids (section 2:2), it seems possible that the low
density component might also be an anionic phospholipid(s) found at
this density. In the case of BSA (table 3:3 iii), the lipid may have
been associated with the protein before its lyophillisation by the ma-
nufacturers. Two control lipoprotein separations were performed with
*4
C-CHOL/*^In-BLM liposomes (for doses used see table 3:2) : i) lipo-
somes were incubated with BSA (table 3:3 iv) for intervals up to 60 mi-
nutes, and ii) liposomes were mixed with PBS before centrifugation (ta-
ble 3:3 v). These experiments gave similar results and show the distri-
bution of the liposomes on the density gradients in the absence of
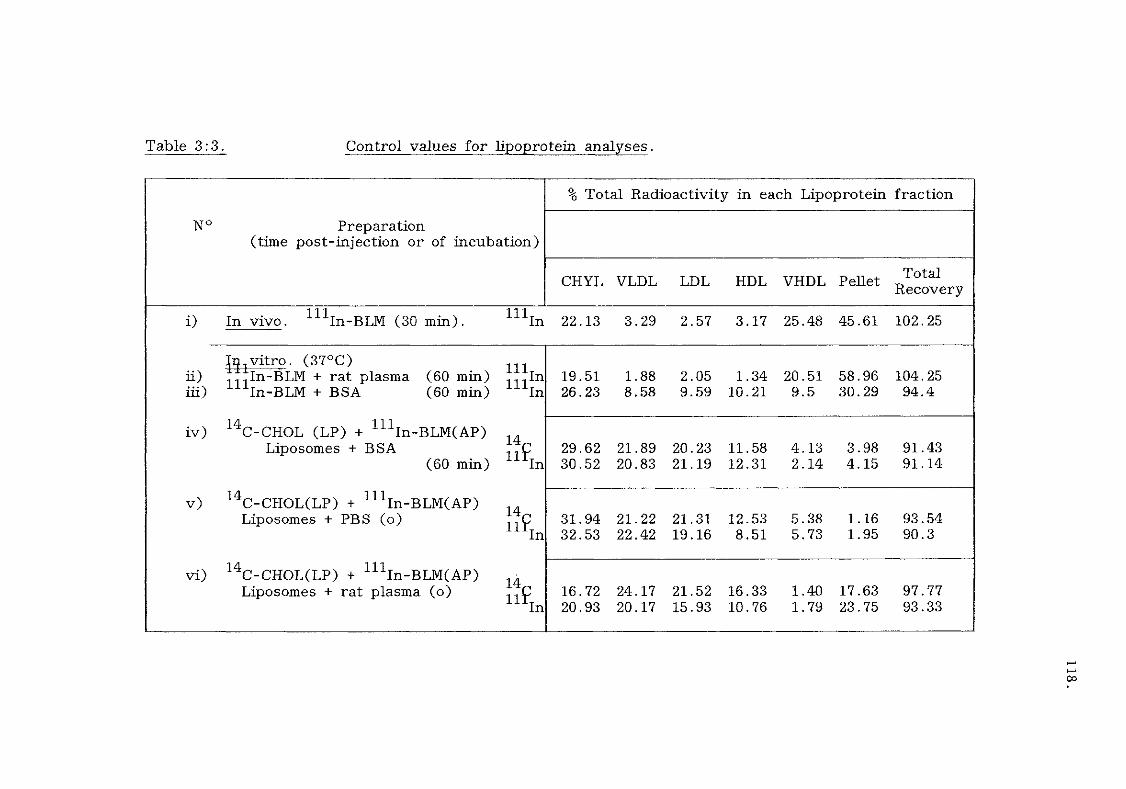
Table 3:3. Control values for lipoprotein analyses.
N° Preparation (time post-injection or of incubation)
% Total Radioactivity in each Lipoprotein fraction
N° Preparation (time post-injection or of incubation)
N° Preparation (time post-injection or of incubation)
CHYL VLDL LDL HDL VHDL Pellet T o t a l Recovery
111 111 i ) In vivo. In-BLM (30 min). 11 In 22.13 3.29 2.57 3.17 25.48 45.61 102.25
^^vitro. (37°C) ii ) ---In-BLM + rat plasma (60 min) . ^ I n iii) In-BLM + BSA (60 min) In
14 111 iv ) C-CHOL (LP) + In-BLM(AP)
Liposomes + BSA (60 min) In
v ) 14C-CHOL(LP) + 111In-BLM(AP) M Liposomes + PBS (o )
In
v i ) 14C-CHOL(LP) + U 1 In-BLM(AP) M Liposomes + rat plasma (o ) ^^p
In
19.51 1.88 2.05 1.34 20.51 58.96 104.25 26.23 8.58 9.59 10.21 9.5 30.29 94.4
^^vitro. (37°C) ii ) ---In-BLM + rat plasma (60 min) . ^ I n iii) In-BLM + BSA (60 min) In
14 111 iv ) C-CHOL (LP) + In-BLM(AP)
Liposomes + BSA (60 min) In
v ) 14C-CHOL(LP) + 111In-BLM(AP) M Liposomes + PBS (o )
In
v i ) 14C-CHOL(LP) + U 1 In-BLM(AP) M Liposomes + rat plasma (o ) ^^p
In
29.62 21.89 20.23 11.58 4.13 3.98 91.43 30.52 20.83 21.19 12.31 2.14 4.15 91.14
^^vitro. (37°C) ii ) ---In-BLM + rat plasma (60 min) . ^ I n iii) In-BLM + BSA (60 min) In
14 111 iv ) C-CHOL (LP) + In-BLM(AP)
Liposomes + BSA (60 min) In
v ) 14C-CHOL(LP) + 111In-BLM(AP) M Liposomes + PBS (o )
In
v i ) 14C-CHOL(LP) + U 1 In-BLM(AP) M Liposomes + rat plasma (o ) ^^p
In
31.94 21.22 21.31 12.53 5.38 1.16 93.54 32.53 22.42 19.16 8.51 5.73 1.95 90.3
^^vitro. (37°C) ii ) ---In-BLM + rat plasma (60 min) . ^ I n iii) In-BLM + BSA (60 min) In
14 111 iv ) C-CHOL (LP) + In-BLM(AP)
Liposomes + BSA (60 min) In
v ) 14C-CHOL(LP) + 111In-BLM(AP) M Liposomes + PBS (o )
In
v i ) 14C-CHOL(LP) + U 1 In-BLM(AP) M Liposomes + rat plasma (o ) ^^p
In 16.72 24.17 21.52 16.33 1.40 17.63 97.77 20.93 20.17 15.93 10.76 1.79 23.75 93.33
119.
Legend table 3:3.
The table shows the percentage of radioactivity found in fractions
corresponding to lipoprotein densities following cen-
trifugation of :
i) 4 ml plasma from a rat injected 30 min. previously with 0.25 ug i n
i n - B L M (1.66 mCi m
i n / m g BLM). Ill
ii) 4 ml rat plasma incubated with free In-BLM (5 ml plasma + 0.5ml m
i n - B L M (0.25 ug/ml)) for 60 minutes at 37°C.
iii) 4 ml BSA incubated with free m
i n - B L M (5 ml BSA (50 mg/ml) +
0.5 ml m
i n - B L M (0.25 ug/ml) for 60 minutes.
iv) 4 ml BSA incubated with l 4
C - C H 0 L /m
i n - B L M liposomes (5 ml BSA
(50 mg/ml) + 0.5 ml liposomes (prepared as in table 3:2)).
v) 4 ml PBS mixed with l 4
C - C H 0 L /m
i n - B L M liposomes (table 3:2) (5 ml
PBS + 0.5 ml liposomes).
vi) 4 ml rat plasma mixed with " ^ C - C H O L / I n - B L M liposomes(table 3:2)
(5 ml plasma + 0.5 ml liposomes).

120.
plasma lipoproteins. From these data it may be calculated that on
average more than 85 % of the recoverable liposomes were found at d <
1.21; of these floating vesicles 37 % have d < 1.006, 25 % have d =
1.006, 24 % have d > 1.006 < 1.063 and 13 % have d > 1.063 < 1.21.
Since others have shown that SUVs concentrate in the d > 1.006 < 1.063
density range (see discussion) the quantities of SUVs in the prepara-
tions used in the in vitro experiments (table 3:3 iv, v, vi) and for
injection into rats (same preparation) contained about 24 % of the to-
tal lipids as SUVs.
In addition, table 3:3 (iv and v) shows that the liposomes re-
mained intact during the fractionation proce dure and did not leak
since little was found associated with the BSA pellet (cf. table
3:3 i, ii, iii) and the ratio of the radioactive markers ( ^4
C /3
^ I n )
was close to unity in all the fractions. The distribution of the two
radiolabels on the BSA gradients after 5 and 30 minutes incubation was
almost identical to that found at 60 minutes (table 3:3 iv).
The extent of liposome interaction with lipoproteins during the
course of the analysis is shown in table 3:3 vi. Comparison of this
data with table 3:3 iv or v shows that the pellet fraction has gained
radioactivity at the expence of CHYL. It is not clear if this result
is due to whole liposomes which sediment into the pellet following
interaction with plasma proteins or if it is due to leakage and/or ly-
sis of MLVs (normally floating with CHYL (table 3:3 v)) followed by
binding of and *4
C-CH0L by proteins of the pellet. Whatever the
reason, these results (table 3:3 vi) were used as a control for the in
vivo experiments (figs. 3:5 and 3:6).
Laurell double Immunoelectrophoresis of isolated rat plasma lipo-
protein fractions from the in vivo studies was performed; samples (20 2
ul) were run against 5 ul/cm whole rat-plasma-protein antiserum and
stained with Sudan black. Very faint immunoprecipitate lines were seen
(not shown) in the lipoprotein fractions but it was clear that the
chylomicron and VLDL fractions, although contaminating each other, were
clearly separated from LDL. However, LDL was partially contaminated
(amount not measured) with some protein which had the characteristics
of HDL. The HDL fraction only contained a single protein peak whilst
the VHDL fraction, despite careful pipetting, always gave protein peaks
similar to those found in the pellet at the tube bottom. 14
The data in fig. 3:5 showing the in vivo results of C CHOL/ 111 In-BLM liposomes will be presented according to lipoprotein type.

121.
The means of radiolabel and radiolabel were compared (Stu-
dents 't' test) for each fraction.
i) Chylomicrons.
Comparisons of the mean values presented for chylomicrons failed 14
to show any significant differences between the amount of C radio-
activity and that of throughout the one hour period. The lipo-
somes found in this density band (d < 1.006) were, therefore, probably
intact liposomes.
The differences and the fall in total radioactivity over the time
period of 1 hour is consistent with the hypothesis that this density
contained the largest liposomes which would be cleared most rapidly
from the circulation. The lack of statistical differences suggests 111
that, if In leakage is occuring during the circulation of these li-111
posomes in the plasma, the In radiolabel is prevented from locali-
zing at this density (cf. Table 3:3 i and vi).
ii) VLDI.
The differences between and "'^In radioactivity in this frac-
tion (d = 1.006) were not significantly different at any of the time
points studied. However, the quantity of liposomes which intrinsically
float at this density (21.3 + 0.6 %. table 3:3, iv,v,vi) was markedly
reduced to between 5 and 10 % of the control values. These liposomes
may, therefore have been totally removed from the plasma or aquired a
different density due to interactions with proteins.
iii) LDL.
The comparison of the means in this fraction were statistically
different at 30 min. (p < 0.01) and 60 min. (p < 0.005). In the absence
of lipoproteins, the quantity of vesicles floating at this density was
found to be 21 % (table 3:3.iv,v) and this was not statistically dif-
ferent from the amount of "'^In radiolabel found at any time in fig. 14
3:5. The quantities of C cholesterol were found to be significantly
higher than those of the controls at 30 min. (p < 0.005) and 60 min. (p
< 0.002). In principle, therefore, this fraction does not represent 14
whole liposomes - it has become enriched with C cholesterol - sug-14
gesting that some C radiolabel is being transfered to LDL. Since no measurement of the total cholesterol of this fraction was made it is
14
impossible to say if the enrichment is the result of exchange of C-
CH0L between the liposome and the lipoprotein or if there is a net
transfer of mass to the LDL which might signify the destruction of the
liposome.
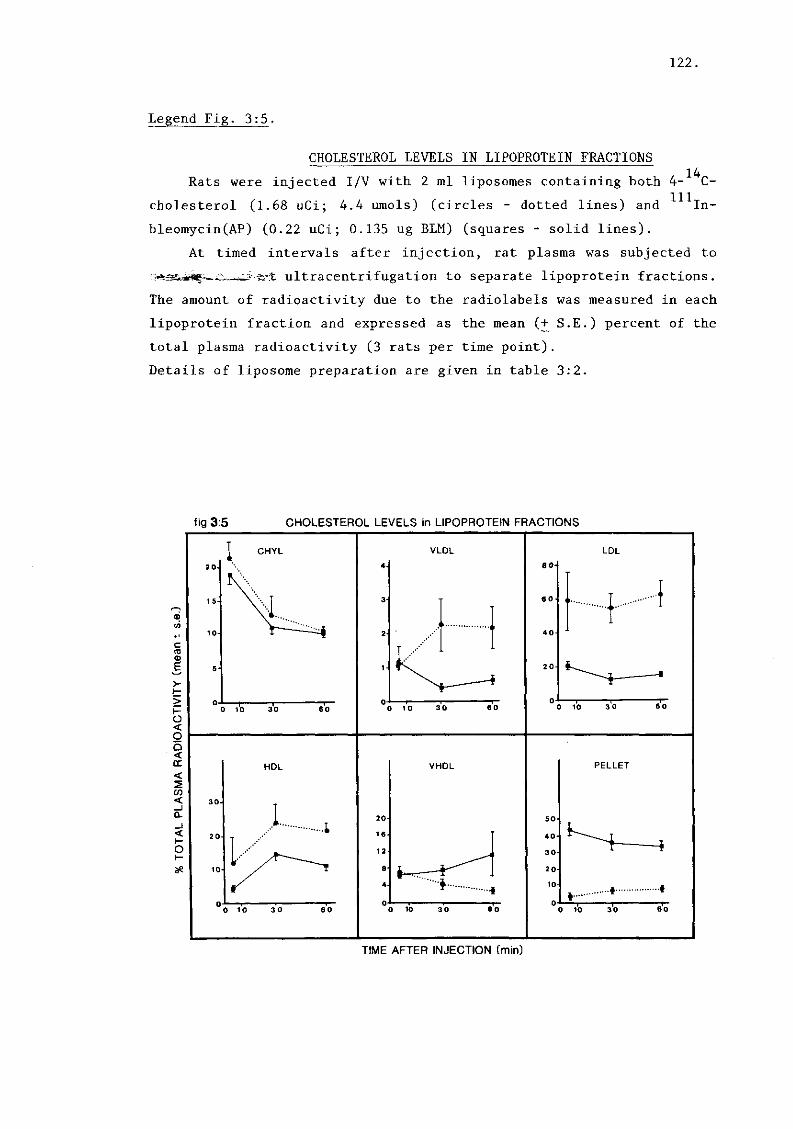
122.
Legend Fig. 3:5.
CHOLESTEROL LEVELS IN LIPOPROTEIN FRACTIONS 14
Rats were injected I/V with 2 ml liposomes containing both 4- C-
cholesterol (1.68 uCi; 4.4 umols) (circles - dotted lines) and "^^In-
bleomycin(AP) (0.22 uCi; 0.135 ug BLM) (squares - solid lines).
At timed intervals after injection, rat plasma was subjected to
S^is^^-isfif ultracentrifugation to separate lipoprotein fractions.
The amount of radioactivity due to the radiolabels was measured in each
lipoprotein fraction and expressed as the mean (+ S.E.) percent of the
total plasma radioactivity (3 rats per time point).
Details of liposome preparation are given in table 3:2.
fig 3:5 CHOLESTEROL LEVELS in LIPOPROTEIN FRACTIONS
TIME AFTER INJECTION (min)

123.
iv) HDL.
The radioactivity associated with the HDL density (1.063 - 1.21)
showed a rise during the first 30 minutes post-injection but differen-
ces between the two radiolabels were not significant(p > 0.05). Sixty
minutes after injection the differences were significant (p < 0.02) and 14
this fraction was also enriched in C-CHOL. The proportion of lipo-
somes (11.25 + 1.41%) normally found at this density was not signifi-
cantly different from the "^^In radioactivity at any time, (p > 0.1).
This result implies that at 60 minutes post-injection there was a 14
transfer of C radioactivity to the HDL density range and this is more
than the in vitro transfer (16.3 %, table 3:3 vi).
vi) VHDL.
These lipoproteins (d > 1.21 < 1.25) contained whole liposomes
(1 4
C : " "'"In radioactivity was not significantly different : p > 0.1)
during the first 30 minutes after injection. One hour post-injection,
the differences were significant (p < 0.02); the fraction had become 111 111
enriched with In and there was significantly more (p < 0.01) In
than was found in the control preparation (table 3:3 iv and v): the 14
C-cholesterol content was similar to the controls. However, in view
of the difficulties of separating VLDL from the pellets and the very
large standard error at 60 minutes, this result should be treated with
some caution as it probably represents "'"" In contamination from the
fraction below.
vi) Pellet.
The control values (table 3:3 i, ii and iii) all showed that free 111
In localized with the pellet of plasma proteins at the tube bottom.
The differences between ^4
C and ^ ^ I n were highly significant through-
out the time period (p < 0.002). The content was very different
(p < 0.001) from the amount of liposomes found normally (table 3:3 iv) 14
although there was no difference between these values and C-CHOL. Ill
There was a similarity between the In values in the pellet and those
found for the in vitro controls (table 3:3 i and vi) or "^In-BLM
incubated in vitro with rat plasma (table 3:3 ii). These results all 111
suggest that the location of In radioactivity in this fraction is 111
due to the presence of either free In-BLM or free, plasma bound,
radiolabel (probably the latter). The presence of this radiolabel in
such quantities strongly suggests that the liposomes leak in vivo. The
leakage rate is very fast (about 41 % in the first 5 minutes) although
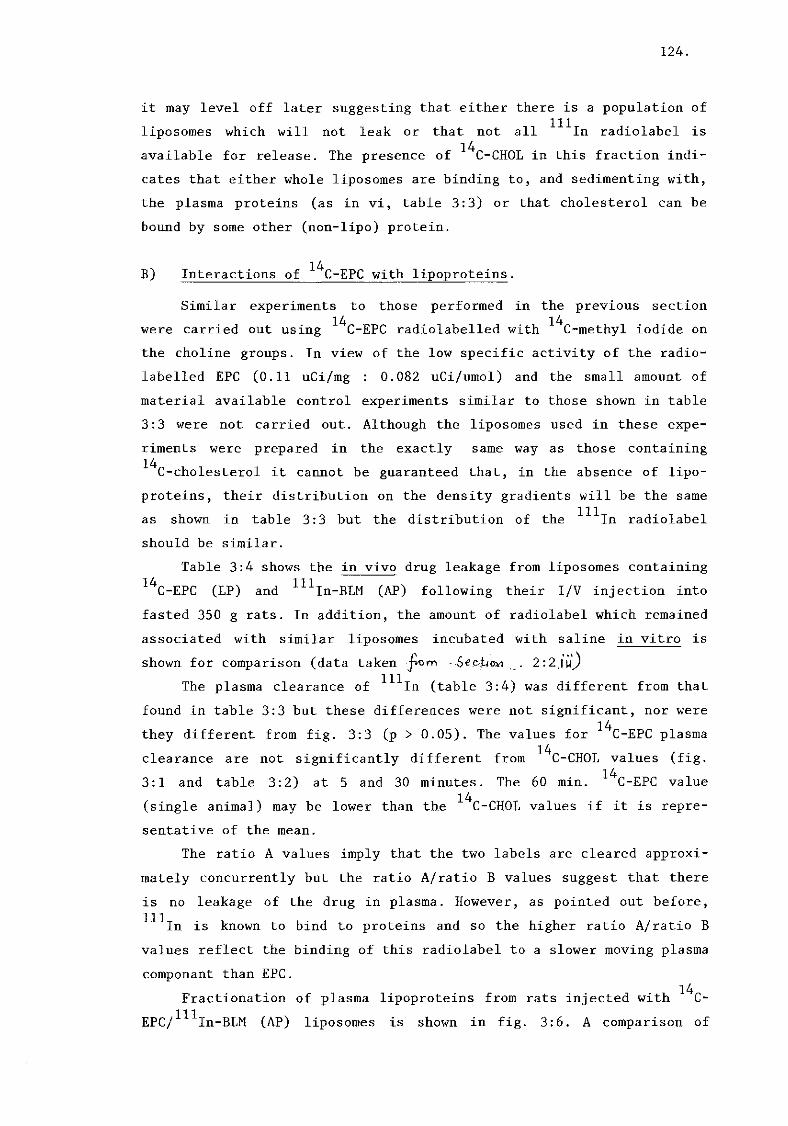
124.
it may level off later suggesting that either there is a population of
liposomes which will not leak or that not all radiolabel is 14
available for release. The presence of C-CHOL in this fraction indi-
cates that either whole liposomes are binding to, and sedimenting with,
the plasma proteins (as in vi, table 3:3) or that cholesterol can be
bound by some other (non-lipo) protein.
B) Interactions of "*"4
C-EPC with lipoproteins.
Similar experiments to those performed in the previous section 14 14
were carried out using C-EPC radiolabelled with C-methyl iodide on
the choline groups. In view of the low specific activity of the radio-
labelled EPC (0.11 uCi/mg : 0.082 uCi/umol) and the small amount of
material available control experiments similar to those shown in table
3:3 were not carried out. Although the liposomes used in these expe-
riments were prepared in the exactly same way as those containing
14
C-cholesterol it cannot be guaranteed that, in the absence of lipo-
proteins, their distribution on the density gradients will be the same
as shown in table 3:3 but the distribution of the radiolabel
should be similar.
Table 3:4 shows the in vivo drug leakage from liposomes containing 1 4
C-EPC (LP) and m
i n - B L M (AP) following their I/V injection into
fasted 350 g rats. In addition, the amount of radiolabel which remained
associated with similar liposomes incubated with saline in vitro is
shown for comparison (data taken jrom -Secpo^ . 2:2.1 uj) 111
The plasma clearance of In (table 3:4) was different from that found in table 3:3 but these differences were not significant, nor were
14 they different from fig. 3:3 (p > 0.05). The values for C-EPC plasma
14 clearance are not significantly different from C-CHOL values (fig.
14
3:1 and table 3:2) at 5 and 30 minutes. The 60 min. C-EPC value
(single animal) may be lower than the *4
C-CH0L values if it is repre-
sentative of the mean.
The ratio A values imply that the two labels are cleared approxi-
mately concurrently but the ratio A/ratio B values suggest that there
is no leakage of the drug in plasma. However, as pointed out before, 111
In is known to bind to proteins and so the higher ratio A/ratio B
values reflect the binding of this radiolabel to a slower moving plasma
componant than EPC. 14
Fractionation of plasma lipoproteins from rats injected with C-
EPC/"^"''In-BLM (AP) liposomes is shown in fig. 3:6. A comparison of

125.
Table 3:4.
Drug release from ^C-EPC/^^In-BLM Liposomes in vivo and in vitro.
Time (mins) post-injection
or incubation.
PREPARATION* 5' 30' 60'
In vivo.
Mean % Radiolabel in Plasma.
1) U 1
I n - B L M (I) 86.01 70.94 40.21 14
C-EPC (E) 74.27 63.95 32.58
RATIO A (I/E) 1.16 1.11 1.23
In vitro (saline) % drug remaining/100
2a) RATIO B (I) 0.997 0.985 0.97
2b) RATIO A / RATIO B 1.16 1.12 1.27
1) In vivo : 14
Liposomes were made from 80 umols (Methyl- C-choline) EPC (1.32
uCi): 22.8 umols CHOL: 11.4 umols PA dispersed with 3 ml of PBS 111
containing 0.425 uCi In (0.26 ug BLM). At injection, 1 ml of
the liposome solution contained 6.4 umols l 4
C-EPC (0.105 uCi)
(93.21 % entrapped): 1.83 umols CHOL: 0.91 umols PA with 0.025 uCi 111
In and 0.015 ug BLM (73.6 % entrapped in AP); each animal re-
ceived I ml of this solution. The animals were killed at 5, 30 and
60 minutes post-injection.
2) In vitro.
The identities and values of ratio B and ratio A/ratio B are the
same as table 3:2 (Data taken from saline leakage Secboo 2:2 0in H )

126.
means (Students 't' test) of l 4
C radioactivity (dotted lines) and ^"^In
radioactivity (solid lines) failed to find any significant differences
(p > 0.05) in any fraction at 5 minutes and 30 minutes post-injection.
Comparisons were not performed for 60 minutes values .
The values of " ^ I n distribution in vivo and in vitro were con-
sidered to be the same as found in table 3:3. In addition, table 3:3
has been used to give an approximate idea of the relative proportions
of whole liposomes, from a MLV preparation, to be found in each frac-
tion. Radioactive recoveries from the fractionations were between 87.5
and 110.2 %.
i) Chylomicrons.
The radioactivity associated with the CHYL density was similar to
that found in the previous fractionation (fig. 3:5). This supports to
view that these are whole liposomes and, moreover, that the size dis-
tribution of this liposome population was not very different from the
previous experiment. The fall in total radioactivity in this fraction
is again probably associated with the removal of these large liposomes
from the plasma or with the relocalization of CHYL at a different
density.
ii) VLDL.
As in the previous experiment the VLDL radioactivity was low com-
pared to the quantity of liposomes which usually float at this density
in the absence of lipoproteins (table 3:3iv). It appears, therefore,
that these liposomes too have been removed from the circulation or
relocated at a different density.
iii) LDL.
The total LDL associated radioactivity was different from the very
high levels of l 4
C-CH0L found before (fig. 3:5). In the case of l 4
C-EPC
and the levels are similar to those of control liposomes (table
3:3 iv, v, vi) and to the level of 1 1 1
I n in fig. 3:5. It appears, 14
therefore, that, unlike C-CHOL, the LDL fraction contains whole
liposomes (probably SUVs) which intrinsically float at this density.
iv) HDL.
As in the previous three fractions, there was no difference be-X XXX
tween the C and In radioactivity in this fraction. Moreover, the 14
total quantity of radioactivity due to C-EPC was found to be about 14
half of that found when C-CHOL was used.

127.
Legend Fig. 3:6
PHOSPHATIDYLCHOLINE LEVELS IN LIPOPROTEIN FRACTIONS.
14
Rats were injected I/V with 2 ml liposomes containing C-EPC
(0.21 uCi : 12.8 umol EPC) (LP) (circles - dotted lines) and m
i n - B L M
(0.05 uCi : 0.03 ug BLM) (AP) (squares - solid lines). At timed inter-
vals after injection, rat plasma was subjected to dssaBRSgg; Shsss -
ultracentrifugation to separate lipoprotein fractions. The amount of
radioactivity due to the radiolabels was measured in each lipoprotein
fraction and expressed as the mean (+ S.E.) percent of the total plasma
radioactivity (3 rats per time point except 60 minutes which is from 1
animal). Details of liposome preparation are given in table 3:A.
TIME AFTER INJECTION (min).

128.
If this value represents whole liposomes then it appears to be in
good agreement with the approximately 10 % of liposomes which can be
floated at this density (table 3:3 v). The quantity of "'^In radiolabel
found was similar to the previous experiments (fig. 3:5) and in vitro
(table 3:3 vi). As with the l 4
C-CH0L radiolabel the 1 4
C-EPC values
increase with time.
v) VHDL.
Although the radioactivities due to each label were not signi-
ficately different, the total radiolabel associated with the VHDL 14
density at 5 minutes is two-fold greater than that found in the C-
CHOL experiments and between 4 and 10 fold higher than the quantity of
whole liposomes which were normally found in this fraction (table 3:
3.iv and vi) . The radioactivity associated with the VHDL fell to these
"normal" values during one hour in the plasma.
vi) Pellet.
Ill The amount of In radiolabel found in the pellet throughout this
experiment was similar (40 %) to that found in the previous experiment
(fig. 3:5, table 3:3 i, ii, and vi). However, there was an equal amount 14
of C-EPC radioactivity associated with the pellet and this has not
been noted before either in vivo or in vitro. The reasons for this 8-10
fold increase are unclear but it seems unlikely that 40 % of the lipo-
somes were bound to plasma proteins (this was one explanation for the 14
small quantity of C-CHOL found in this fraction) and so this may
represent transformation of either whole liposomes or EPC into a more
dense complex following interactions with proteins.
C) Discussion.
i) Serum induced drug leakage
A brief discussion has already been made in relation to the
general leakage of drugs from liposomes (chapter 2, fig. 2:2) and in
relation to the plasma clearance of drugs in the previous section
(3:1). Here the concern is the role that liposome constituents and
lipoproteins play in this effect.
In animal experiments Gregoriadis and Ryman (1972a) demonstrated that
cholesterol and an entrapped protein were removed from the plasma 111
concurrently^this appears to be the case for the CHOL / In and EPC /
In presented here (tables 3:2, 3:4, ratio A).

129.
However, examination of the lipoprotein fractions shows that leakage of
occured in vivo (fig. 3:5) and this illustrates the problems of
using AP markers which are not rapidly removed from the circulation
when released from the liposome; a false impression of liposome inte-
grity will be obtained. Gregoriadis (1973b) showed that for penicillin
(but not ACT-D) entrapped in liposomes there was an accelerated dif-
fusion of the drug out of the carrier in the plasma. The stability
in vivo was apparently assumed in the early work, with good cause since
entrapped proteins were not enzymatically or immunologically active in
the plasma (Gregoriadis et al., 1974b; Gregoriadis and Allison, 1974;
Neerunjun and Gregoriadis, 1976).
This situation was changed when Scherphof et al. , (1975) very
briefly reported that radiolabelled lecithin was cleared from the
plasma at a slower rate than radiolabelled cholesterol co-entrapped in
the same liposome. Immediately afterwards, Black and Gregoriadis (1976
and this work) and Krupp et al. , (1976) simultaneously showed that
MLV-CHOL or SUV-E-CHOL and EPC could be found associated with plasma
lipoproteins in vivo. Thereafter, the stability of the liposome, as an
enclosed structure, could not be assumed when it was in contact with
plasma.
Subsequently, Scherphof et al. , (1978) demonstrated that SUVs
composed of lecithin alone were totally destroyed, and entrapped solute
released, as a result of interactions with HDL. The occurence of such
plasma-induced instability has been confirmed during in vitro incu-
bations with rodent or human plasma (Chobanian et al. , 1979; Grego-
riadis and Davis, 1979; Zirenberg et al. , 1979; Gregoriadis and Kirby,
1980; Kirby et al. , 1980a; 1980b; Scherphof et al., 1980; Damen et al,
1981) although total vesicle destruction does not always occur (Kirby
and Gregoriadis, 1981) nor are lipoproteins the only plasma proteins
involved in the exchange/transfer of radiolabelled lipids to plasma
components (Damen et al., 1980).
There are differences between SUVs and MLVs in their interactions
with plasma components. The MVLs leak entrapped solute (Gregoriadis
and Davis, 1979; Hoekstra and Scherphof, 1979) but they are less sus-
ceptible than SUVs to protein and HDL attack, (possibly because only
the outer bilayer is available for interaction) (Hoekstra and Scher-
phof, 1979; Scherphof et al. , 1979) especially when the quantity of
entrapped cholesterol is high (Gregoriadis and Davis, 1979) or the li-
posomes are above their t (Scherphof et al., 1979).

130.
The role of cholesterol in the stability of liposomes has been
amply demonstrated by the many reports which show that a high (> 33
mol %) CHOL content reduces or arrests the leakage of entrapped agents
in vivo and in vitro (Finkelstein and Weissmann, 1979; Gregoriadis and
Davis, 1979; Scherphof et al. , 1979; Kirby et al. , 1980b; Allen and
Cleland, 1980) also^ at the cholesterol content of the MLV liposomes
used in this study (20 mol. %), Gregoriadis and Davis (1979) reported
that the loss of laten cy in vivo in the first 2 min. post-injection
into rats for a small entrapped molecule (6-carboxyfluorescein: 6-CF)
was 55 % but only 30 % for a large protein (beta-fructofuranosidase);
comparable values at 1 hour were 70 % loss (6-CF) but they remained at
30 % for the enzyme. These latter values are similar to the values (not
shown) found here for ACT-D so that, although ACT-D is very much
smaller than beta-fructofuranosidase, its entrapment in the lipid
phase of liposomes probably retards its release (Juliano and Stamp,
1979). Assuming that most of the released 1 1
^In radiolabel can be found
in the CHYL + pellet fractions after lipoprotein fractionation (table
3:3 i and ii), the calculated release of free 1 1 3
I n from the MLVs in
this study totals between 60 % (5min.) and 40 % (60min.) i.e.: 40-60% 111
loss of laten cy. The quantity of In in the CHYL fraction falls over 111
time so that the In in the pellet may be a better measure of
leakage; in this case leakage is very rapid (40-45 % in the first 5 mi-
nutes) but there is little leakage thereafter. Finkelstein and Weiss-
mann (1979) have shown a leakage rate of 24.4 % hr. of entrapped radio-
labelled inulin from MLVs (10 mol % CHOL) in plasma.
It is not surprising, therefore, to find that liposomes, of the
composition used here (7:2:1), leak entrapped solute. However, this
leakage will affect much of the subsequent data in this thesis because
the study of liposomal drug uptake and distribution in tissues (chap-
ter 4) will be difficult if, in the plasma, the drug is both inside and
outside the carrier.
The identity of the plasma factor(s) responsible for solute lea-
kage was not investigated here. The interactions of proteins with lipo-
somes has already been mentioned (see chapter I) and will be further
discussed in the following section. However, it is apparent that incu-
bation of liposomes with BSA did not cause the release of entrapped
^ ^ I n in vitro. Whole rat plasma in vivo and in vitro can cause leakage
but this has to be separated from the concurrent exchange/transfere of
liposomal lipids to the plasma.

131.
Ill ii) In-distribution.
Before discussing the results of the lipoprotein analyses further
mention must be made of " ^ I n distribution. The interpretation of the
interactions of radiolabelled lipids with lipoproteins depend upon the 111
validity of In as a marker for the aqueous space of the intact
liposomes. Theoretically, removal of non-entrapped ^"^In by predo-
minantly, the plasma protein pellet means that the quantity of " " In
found in each fraction represents the quantity of whole liposomes in
that fraction at the time when they were separated from the rest of the
plasma proteins, irrespective of subsequent leakage of the label from
the whole liposomes which may occur during the course of the analysis;
but unlike the radiolabelled lipids which may bind to or exchange with
lipoprotein fractions in vitro.
Problems arise when phospholipid experiments are performed using 111
In-BLM as a AP marker. As was shown in chapter 2 and by others
(Huang and Mauk 1977) "^^In will bind to phospholipid polar head
groups, especially PA, but it is uncertain whether the BLM is still
attached to the label. Indium chloride will also bind to PA
(chapter 2); the charge interaction is probably a general property of 3+
trivalent cations since it also occurs between lanthanum salts (La ) and PS in liposomes (Hammoudah et al. , 1979). There is, however, no
111 way of telling from these experiments :i) if In-BLM is still present
111 as the radiolabelled material, ii) what proportion of In is in the
aqueous spaces and what proportion is bound to the polar head group(s)
iii) whether plasma proteins (mostly transferrin Thakur et al. , 1973)
can chelate ^"^^In away from the lipid bound material. There is a strong
possibility, therefore, that in these experiments a proportion of the
distribution is due to *"^In-PA as a complex either in whole
liposomes or on lipoproteins. Since does not react with VLDL, LDL
or HDL (table 3:3 i and ii) it seems possible that the radiolabel
cannot interact with lipid already bound to the lipoprotein (but cf.
chylomicrons), alternatively free is removed by other proteins
before it can bind to the lipoproteins. In view of these facts it must 111
be concluded that In is not an ideal marker for aqueous phase in
these experiments although it may be a valid marker for PA.
Evidence against this hypothesis comes from the control experiments 111
where, apart from VLDL, very similar amounts of liposome-derived In
were found in the fractions in the absence of lipoproteins to those
132.
in fig 3:5.
iii) Liposome-lipoprotein interactions.
The metabolism and structure of lipoproteins has been the subject
of several recent reviews (Jackson et al. , 1976; Smith et al. , 1978;
Nicoll et al., 1979; Tall and Small, 1979; Scanu and Landsberger; 1980).
One of the major problems in the study of lipoproteins metabolism is
that the lipoproteins are in a dynamic state in which both apoproteins
and lipids continously exchange between the various lipoprotein classes.
In the normal animal the lipoproteins can be assumed to be in a satura-
ted state, but the addition of liposomal lipid to any individual lipo-
protein may be expected to be reflected in compositional changes
throughout the lipoproteins.
The majority of the published work involving lipoprotein-liposome
interactions has been done using HDL and the major apolipoproteins de-
rived therefrom. In addition, most of the in vitro work has been car-
ried out using human HDL which differs from rat HDL in containing an
extra apo-A lipoprotein (apo-AII) (Osborne and Brewer, 1977; Chapman,
1980) and this probably causes the differences in density flo .tation.
Thus human HDL is more homogeneous, on density centrifugation, than rat
HDL which has a density extending between 1.035 and 1.21g/L (Wind-
mueller and Levy, 1967; Koga et al. , 1969; Lasser et al. , 1973; re-
viewed, Chapman, 1980) (c.f. human HDL: 1.063-1.21 g/L; Tall and Small,
1979). So the density fraction termed LDL in these studies ( d > 1.006
< 1.063) will include some HDL (confirmed by immoelectrophoresis).
In addition, immunoelectrophoresis showed that CHYL and VLDL were not
usually separated by this method and that VHDL was always contiminated
by the pellet proteins.
Studies have indicated that in vivo and in vitro unilamella lipo-
somes can be found in the LDL density range (Krupp et al. , 1976; Kirby
et al. , 1980a; Tall, 1980). Whilst the work of others has shown that
larger liposomes (MLVs) are found in the VLDL density range (Tall
et al. , 1978; Chobanian et al., 1979).
Many published studies have used liposomes (mostly SUVs) as model
membranes in reassembly studies of lipids and apoproteins (Morrisett
et al. , 1977; Tall and Small, 1979). In view of the high avidity of
apoproteins (and apolipoproteins) for lipids it seems unlikely that
free apoproteins are ever found in vivo although they are produced
artifactually by centrifugation (Eisenberg and Levy, 1975). Transfer of

133.
apoproteins between lipoprotein classes and tissues is due to a very
close approach of the individual lipoproteins to each other (so-called
collision complexes). It does not seem, therefore, that apoprotein/li-
posome studies represent credible models for in vivo interactions;
Eisenberg (1980) would agree. Moreover, delipidation of lipoprotein
complexes e.g.: apo HDL (Scanu and Wisdom, 1972), which often results
in conformational changes in the apoproteins (Tall and Small, 1979),
cannot be said to be exact replicas of the situation in vivo either
since in this state the complex will bind to many lipids.
Apolipoproteins, suitably relipidated with radiolabelled liposomal li-
pids, do, however, represent good models for studying exchange phe-
nomena (Barter et al. , 1980; Gottlieb, 1980; Stein et al., 1981). In
parenthesis, it must be noted that to radiolabel purified normal HDL
with cholesterol from liposomes requires cosonication (Scanu et al. ,
1970) or prolonged incubation (24 hrs.) (Rothblat et al., 1978) at very
high liposome: protein ratios; situations which are unlikely to occur
in vivo.
a) CHOLESTEROL
Reports of liposome-CHOL/ lipoprotein interactions have used SUVs
rather than MLVs (Krupp, 1976; Kirby, et al. , 1980a, b; Kirby and
Gregoriadis, 1980; Chobanian et al. , 1979; Tall, 1980), their results
are not directly comparable with these. Several reports by Tall and
co-workers (Tall and Small, 1977; Tall and Lange, 1978a; 1978b; Tall
et al. , 1978) have used MLVs but only the first three reports studied
the CHOL interaction. The accent in these published studies has been on
HDL since this lipoprotein is known to interact with and dissolve
either SUVs or MLVs in the absence of CHOL (see later).
It is clear from the plasma clearance curves of radiolabelled CHOL
and EPC in SUVs (Scherphof et al., 1975; Tall, 1980) and MLVs (Wharton
and Green, 1978) that the two radiolabels are not cleared concurrently
during the first hour after injection. It is unclear which radiolabel
is cleared the fastest since Wharton and Green (1978) claim that EPC is
removed more rapidly than CHOL whilst Tall (1980) and Scherphof et al.,
(1975) reported that CHOL was faster than EPC. If the sizes of the
liposomes used in these two present studies are roughly similar, the
results presented here tend to confirm those of Wharton and Green i.e.:
EPC is faster than CHOL. This may, therefore, represent differences
between SUVs and MLVs. Krupp et al. , (1976) suggested that SUV esteri-
fied cholesterol (E-CH0L) was cleared at the same rate as EPC, which
134.
may mean that E-CHOL is not handled by the plasma in the same way as
CHOL. In the absence of additional CHOL in the SUVs this observation
was confirmed by Kirby and Gregoriadis (1980) who found that the rates
of plasma clearance of PC or E-CHOL were identical.
Other studies (Kirby et al. , 1980a) have demonstrated that in vi-
tro E-CHOL is transfered to HDL even when the SUV-CHOL concentration is
high whilst transfer of PC is inhibited. Chobanian et al., (1979) have
shown that in vitro CHOL-free-SUVs transfer E-CHOL to HDL more rapidly
than EPC. The evidence, therefore, suggests that caution is required in
the interpretation of E-CHOL transfer to lipoproteins not least because
esterified cholesterol is not a good marker of vesicle fate in vivo in
the absence of vesicular CHOL (Kirby and Gregoriadis, 1980).
If, as has been suggested (Krupp et al. , 1976; Scherphof et al. ,
1978; Chobanian et al. , 1979; Tall, 1980) dissolution of SUVs by HDL
occurs (when vesicular CHOL is low or absent) and the lipids are trans-
fered to the same lipoprotein particle it is difficult to explain why
the plasma clearance rates of the two principle liposomal lipids (PC
and CHOL) are so different even 2 minutes after injection (Tall, 1980)
when exchange would be minimal. On the other hand, if CHOL was trans-
fered to a different lipoprotein (with a different clearance rate of
incorporated lipid) or if a system of differential exchange/transfer of
PC to HDL operated (depending upon the CHOL content of the liposomes
(Kirby et al., 1980a; Kirby and Gregoriadis, 1980; Tall, 1980; Damen
et al. , 1981) or their fluidity (Scherphof et al., 1979) with remaining
vesicles becoming enriched with CHOL; (Tall and Lange, 1978a)) then
differences in plasma clearance rates could be expected. 3
The study by Tall (1980) on the distribution of H-CHOL-containing
SUVs into rat lipoproteins showed that little or no cholesterol was exchanged with LDL in one hour. The HDL fraction received most of the 3
H-CHOL from vesicles of similar composition to those used here (but
without PA) but the total HDL content of both CHOL and E-CHOL was not
increased (i.e.:exchange rather than transfere). Chobanian et al. 14
(1979) found the C-E-CHOL in neutral SUVs did not exchange or trans-
fer the label to LDL. Using whole human plasma Kirby et al. (1980a)
also failed to find extra-vesicular E-CHOL associated with LDL although
association with HDL was high; since release of entrapped solute did
not occur in these experiments the authors claimed, and subsequently
proved (Kirby et al. (1980b, 1981)), that complete liposomal lysis was
not involved. Krupp et al. (1976) found approximately equal amounts of

135.
both EPC and £_cjjOL associated with HDL following I/V injection into
rats; unlike their in vitro results, in vivo Kirby and Gregoriadis
(1980) failed to find HDL-associated E-CHOL in mouse lipoprotein frac-
tions .
Interactions of radiolabelled liposomal lipids with lipoprotein
fractions other than LDL and HDL was studied by Kirby et al. (1980a)
and Tall (1980). Cholesterol oleate was found to slightly enrich the
VLDL (d = 1.006) fraction following incubation with human plasma (Kirby
et al. (1980a) but Tall (1980) found only whole vesicles in this frac-
tion. Interestingly, Tall also found PC radioactivity associated with
the d > 1.21 fraction (3 - 13 % depending upon cholesterol content and
time post-injection) but at no time was any cholesterol found there.
Since this result agrees with the findings of Krupp et al. (1976), it
seems possible the the CHOL radioactivity in VHDL and the pellet found
in this study represents a further difference between MLVs and SUVs.
Relatively few studies have been performed on the interaction of
VLDL with liposomes (Morrisett et al., 1977) but a study of VLDL lipids
(not triglycerides) (Chajek and Eisenberg, 1978) in perfused rat hearts
has shown a similar CHOL distribution to that found here. 14
In an analogous situation, the exchange of C-cholesterol between
radiolabelled erythrocytes (RBC) and lipoproteins is a well documented
phenomenon. The mechanism of action of this exchange has yet to be
established, probably because the quantity of cholesterol available for
exchange is difficult to assess. In general, CHOL in RBC will exchange
with both LDL and HDL (d*Hollander and Chevallier, 1972a, 1972b; Gott-
lieb, 1980) and perhaps VLDL as well (Bjornson et al. 1975). The HDL
(but not LDL) exchange rate decreases over incubation time (6-24 hrs)
(d*Hollander and Chevallier, 1972a) but the inital rates are the same
to both HDL and LDL under approximately physiological conditions (Gott-
lieb, 1980). Exchange of cholesterol between RBC and SUVs is also rate
limiting (Girand and Claret, 1979) and this is probably because only
the outermost CHOL of the liposome membrane is available for exchange
under equilibrium conditions (Poznansky and Lange, 1978).
Under non-equilibrium conditions in vitro, all the vesicle CHOL is
available although its loss can be controlled by the fatty acid content
of the SUV lecithin. In the experiments reported here no RBC-associated 14
C-radiolabel was found in any of the in vivo experiments. The reason
for the difference between in vivo and in vitro experimental transfer 14
of C-CHOL from liposomes to RBC is unclear. Apart from the possi-
bility that MLVs act differently from SUVs the difference may reflect
136.
the presence of the lipoproteins in vivo which compete with the RBC for
exchangeable material. Kirby et al. (1980b) reported that the presence
of whole blood (as opposed to plasma or serum) tended to stabilize
leaky SUVs; Gregoriadis and Davis (1979) showed a similar effect using
MLVs. The reasons for this increased stability remain unexplained but
it has been suggested that it could be due to donation of CHOL from
erythrocytes to vesicles (Bruckdorfer et al., 1968).
Donation of free CHOL, adsorbed onto a celite surface, to lipopro-
teins has been observed (Ashworth and Green, 1964) in this way both
human and bovine HDL have been shown (Jonas et al. , 1978) to have a
spare CHOL-binding capacity although the conditions used (37° C; 16
hours) and the HDL-CHOL levels produced are unlikely to be found in vi-
vo . It was reported that LDL adsorbed very large amounts of the immobi-
lized CHOL but this was not investigated further. Ashworth and Green
(1964) cla im that CHOL donated to HDL in this way does not behave in
exactly the same manner as endogenous sterol.
Jonas and Maine (1979) studied the transfer of radiolabelled CHOL
and EPC (2:1 molar ratio) from vesicles to HDL. The bovine HDL had been
heat treated (to destroy LCAT) and then preincubated with SUVs to
produce a larger "supersaturated" HDL particle containing 6 % by weight
more lipid and 4 % by weight less protein than normal. When this
particle was incubated with radiolabelled SUVs no release of protein
from HDL occured nor was there any net transfer of lipid from the SUVs
or from HDL. Exchange reactions took place in both directions and all
the vesicle CHOL (but only 70 % of EPC) was available for exchange ;
equilibrium was established in 5 hours at concentrations of SUV-CHOL :
HDL-CHOL between 1:1 and 1:14 (approx.). Exchange was found to be de-
pendent on the HDL-CHOL concentration.
Despite the in vitro work mentioned above, Sodhi and Gould (1967)
have shown that apoHDL will not bind cholesterol. Presumably, the in-
corporation of CHOL from vesicles (Jonas and Maine, 1979) results from
fusion of the vesicle membrane with the HDL membrane (Tall and Small,
1977, 1979). A study of the interaction of HDL apoproteins (A-I) (Tall
and Lange, 1978a, 1978b) or native HDL (Tall and Small, 1979) with SUVs
and MLVs demonstrated that the cholesterol/phospholipid ratio of the
liposomes increased, these and other studies (Jonas and Kranjnovich,
1978) have led to the conclusion that, whatever the initial CHOL/PL
ratio of the vesicles, HDL can only solubilize CHOL to certain extent.
The CHOL/PL ratio in HDL reflects the initial vesicle concentration

137.
but, as more PL is added to the HDL, cholesterol is actively excluded
from the lipoprotein. The liposomes become more stable as their choles-
terol content increases and less amenable to attack by HDL although
this might make them more susceptable to attack by LCAT (lecithin :
cholesterol acyl transferase) (Glomset and Norum, 1973). 14
Thus far, it has been assumed that the increase in C cholesterol
in the LDL (and HDL) fractions represents an exchange phenomenon.
However, mass transfer of liposomal lipids cannot be ruled out since
the total amounts of PL or CHOL were not measured before and after the
injection into rats. Moreover, the total amounts of lipoproteins were 14
not measured either; it is possible that C cholesterol exchanged with
lipoproteins which were subsequently removed from the plasma.
In summary, the primary sites for CHOL donation or exchange from
RBC or other sources are LDL and HDL but uptake by HDL may be limited
or saturatable. When the vesicle concentration of CHOL is low, SUVs
transfere all their lipid (including CHOL) to HDL because their
structure is unstable. However, MLVs, which are more stable even in the
absence of CHOL, are not dissolved by HDL but are able to exchange CHOL
with both LDL and HDL. The LDL-CHOL may additionally be due to exchange
reactions between the lipoproteins. It seems possible that liposomal
E-CHOL is not handled by lipoproteins in the same way as CHOL.
b) Phosphatidylcholine.
The last decade has seen a large number of reports concerning the
interactions of liposomal PC with lipoproteins (mostly HDL). Only
published results of in vivo experiments or incubations of liposomes
with whole plasma (or serum) will be considered in relation to the
results shown in here. Early reports on the use of phospholipid/trigly-
ceride emulsions (intralipid) in animals (Thompson et al, 1965) and man
(Thompson et al., 1975) demonstrated that the phospholipid could be ex-
changed (without transfer) with LDL phospholipid. Since the intralipid
emulsion contains EPC in liposome-like structures (Thompson et al. ,
1975) the majority of which have a density < 1.006 (i.e. similar to
MLVs) this would seem to indicate that HDL is not the only lipoprotein
involved. This was confirmed later when Scherphof et al. (1978) and
Damen et al. (1980) showed minor amounts of SUV-EPC in other lipopro-
teins fractions. Scherphof et al. (1978) showed that MLVs (composed of
only EPC) would be transformed into a particle with a density similar
to HDL when incubated with rat or human plasma. However, this same

138.
group later (Scherphof et al, 1979; Hoekstra and Scherphof, 1979)
demonstrated that non-CHOL-containing neutral or anionic MLVs, of
exactly the same PC and PA composition as used in the present study
(7:1), when incubated with serum showed almost no transformation into
an "HDL-like" particle although SUVs of similar composition were trans-
formed. To-date the distribution of MLV-EPC in lipoprotein fractions
has not been published but in view of the interactions of SUVs, the
data above indicate that there may be further differences between MLVs
and SUVs apart from those discussed previously.
Here the most surprising result is the finding of 40 % of EPC
associated with the plasma protein pellet. Such high amounts have not
been previously reported by others (Krupp et al. , 1976; Tall, 1980)
although small amounts of SUV-EPC (2.8-13%) were so found. Scherphof
et al. (1978) found 10 % of total EPC radioactivity, from CHOL-free
MLVs, associated with this fraction but this was shown to be due to
free fatty acids probably bound to albumin. This cannot be the case in
this study, however, because the U
C radiolabel is on the choline
moiety of EPC. It is possible that the radioactivity in d > 1.21 repre-
sents lysolecithin (LPC) formed by the action of LCAT on the liposomes.
Nichols and Gong (1971) have shown that MLVs and SUVs can act as sub-
strates for this enzyme. No LPC (as judged by TLC) was present in the
labelled EPC prior to liposome manufacture.
In a study of MLVs injected intramuscularly into rats, Zirenberg
and Betzing (1979) have demonstrated that intact, unmetabolised, lipo-
somes find their way from the injection site to the plasma and liver.
Considerable amounts (40 % of total plasma radioactivity) of intact PC,
LPC and fatty acids were found associated with the d > 1.21 fraction
one hour after injection. Although the MLVs were admininstered by a
different route, th^sedata provide: some confirmation of these present
findings. 14
An explanation for the C-EPC radioactivity in the pellet may
come from studies on VLDL metabolism and transformation of this lipo-
protein to LDL (Reviewed Eisenberg, 1980). Liposomes (MLVs) resemble
CHYL and VLDL in their density at least : it is these fractions which
decrease during the experiment although this may also be due to the
plasma clearance of the liposomes. Chajek and Eisenberg (1978) found
large quantities of PC (20 %) and LPC (30-35 %) from VLDL in the d>1.21
fraction (VHDL + pellet) during perfusion of rat hearts. The transfor-
mation of the VLDL particle was carried out by membrane-bound lipopro-
See Co rec3cttrw<> e <o l!,.

139.
tein lipase and the VLDL membrane lipids were released as discoidal
particles. The role of lipoprotein lipase in lipoprotein metabolism has
been reviewed by Nilsson-Ehle et al. (1980); the enzyme is found in
endothelial cells lining blood vessels, to which liposomes may become
adsorbed (chapter 4), and it has phospholipase as well as lipase acti-
vity. To-date the interaction of liposomes with lipoprotein lipase has
not been studied.
The identity of the protein(s) in the pellet which are responsible 14
for binding the C radioactivity is not clear. If LCAT is involved in
the process it is possible that the LPC so formed is bound by albumin
(see following section). However, it must be remembered that it is the
function of the lipoproteins to transport PC and CHOL. The presence of
LCAT was not tested for in these present experiments but some enzyme
inhibition during the in vitro separations can be expected from the
presence of thimerosal in the plasma (Hatch and Lees, 1968). Tall
(1980) reported that a small amount of LPC was produced following the
injection of SUVs into mice but Chobanian et al. (1979), using human
serum incubated with similar SUVs reported no LCAT activity; this was
confirmed by Kirby et al. (1980a). It is possible that MLVs are better
LCAT substrates than SUVs. An analysis of the lipid content of the
lipoprotein fractions has not been made so it is not possible to state 14
whether the pellet C-radioactivity is due to the presence of EPC, or
LPC.
Other proteins have been shown to bind to liposomes (see following
section) and their presence could have altered the flotation density of
MLVs. Of those which might concern these present experiments, Damen
et al. (1980, 1981) have reported that the d > 1.21 fraction contains a
protein(s) which assists in the transfer of PC to HDL and it also binds
to liposomes; the identity and characteristics of this protein have not
been defined. Scanu (1967) mixed liposomes, made from different HDL
lipids, with apo HDL and found that they formed a complex which floated
at a density of 1.24; the HDL/MLV complexes contained amounts of lipids
proportional to the amount of PC added. However, the density of this
complex has not been confirmed by the more recent work of Tall and
Lange (1978b), using PC alone, who showed that it had d = 1.11 but this
increased slightly when CHOL was incorporated into the MLV bilayers.
Apoproteins released from lipoproteins during centrifugation
(Eisenberg and Levy, 1975) are also found in the d > 1.21 fraction but
the well studied recombinants between these and liposomes do not remain

140.
at the tube bottom (Tall and Small, 1977, 1979; Tall et al., 1978; Tall
and Lange, 1978b). 14
The question must be asked if the C-radioactivity in the pellet
represents intact liposomes because its equivalence to the "^^In counts
111 cannot be ignored; if In did not leak from liposomes this would in-
Ill deed be a logical assumption. On the other hand, the amount of In
14
found in the pellet is almost the same as that in the C-CHOL experi-
ments and in that case very little CHOL was associated with this frac-111
tion. As has already been pointed out In could also be bound to
phospholipid head groups (especially PA) and so, taken together, these
two experiments might indicate that intact MLVs sediment with the
proteins but that CHOL rapidly exchanges with LDL and HDL. Most of the
other evidence is against this hypothesis because normally MLVs float at d < 1.006 (table 3:3), plasma clearance rates suggest that leakage
111
of In occurs in vivo and reports of leakage of entrapped material
from MLVs containing low cholesterol in contact with plasma are very
numerous.
There are, however, certain differences between the MLV prepa-S
ration^* studied by others and those used here. An important, and to-date
unstudied difference involves the use of a charge on the liposome.
Anionic liposomes (MLVs or SUVs) are known to be cleared from the
circulation faster than neutral or positive ones; if liposomal lipids
undergo equivalent exchange/transfer reactions irrespective of charge,
then their CHOL or PC plasma clearance rates could be expected to be
similar. This, however, is not the case (Gregoriadis and Neerunjun,
1974; Juliano and Stamp, 1975). It seems possible that, in addition to
the CHOL content, a further (but not exclusive) reason for these dif-
ferences in lipid plasma clearance rates is the effect of charge on
liposome/lipoprotein interactions.
Recently it has been demonstrated that for MLVs a further im-
portant parameter which determines lipoprotein interactions is the
fluidity of the liposome membrane lipids. Thus, in the absence of CHOL,
erphof et al. (1979) showed that lipids close to their tc, ir-
respective of size, will be destroyed by the effects of plasma. Tali's
group (Tall and Small, 1977; Tall and Lange, 1978b) using pure di-
myristolyphosphatidylcholine (DMPC : t 23°C) incubated with HDL at
27°C found an enhanced dissolution of the liposomes; EPC-MLVs are not
destroyed (Hoekstra and Scherphof, 1979).
141.
It must be strongly stressed, that there is no evidence which
suggests that, above the gel to liquid t of EPC (-15°C), MLVs are
broken down by contact with plasma. Indeed, the evidence suggests that
EPC-MLVs remain intact (Scherphof et al., 1979; Hoekstra and Scherphof,
1979) although they will leak. Whilst increasing CHOL in the bilayer
will reduce the leakage of solutes neither its presence, nor the pre-
sence of charged lipids is necessary for liposome stability. Therefore,
reactions between MLVs and lipoproteins probably only involve exchange
phenomena. The presence of a population of SUVs mixed in with the MLVs
will be treated differently from MLVs and, in this case, the vesicles
may be broken down and EPC transfer (rather than exchange) is expected. Ill
In the EPC experiments, the amount of In, representing whole
liposomes (either entrapped in the aqueous space or bound to the bi-
layer) , found in each fraction was similar to that found in the frac-
tions of the CHOL experiment and in the controls. The equivalence of
"^4
C-EPC and in these fractions, therefore, suggests that these
levels represent whole (unexchanged) liposomes. If, however, exchange
has taken place, it would appear that PA (" " In marked) exchanges (or
transfers) at the same rate as EPC but that the amount of CHOL exchange
is about 5 fold higher into the LDL fraction and 2 fold higher into
HDL.
In view of the fact that the MLV results presented here contradict
much of the published work on the interactions of SUVs with lipopro-
teins, these latter will be outlined here (reviewed by Morrisett et al,
1977; Tall and Small, 1979).
According to Tall and Small (1977, 1979) HDL can solubilize (DPPC)
MLVs and SUVs with the formation of discoidal phospholipid/apoprotein
complexes. The high density HDL^ species can be transformed into lower
density "HDL2-like" particles, enriched in apo A-I; a similar enrich-
ment occured when liposomes were incubated HDL^. The mechanisms of
interaction are complex and depend upon the lipid : protein ratio.
Thus, spherical HDL gives up part of its apo-AI to the liposomes to
form a discoidal PC/apo-A-I particle. In addition it appears that
phospholipid might insert directly into the surface of HDL. (Tall
et al., 1978).
Under conditions of complete incorporation of SUV phospholipid
into HDL (low vesicle PL:HDL ratios), the HDL fraction was found to be
homogeneous by election microscopy and equilibrium density gradient
ultracentrifugation (Chobanian, et al., 1979). At higher ratios, trans-
142.
formation was slower and an apoprotein vesicle complex was isolated
after short incubations. These findings suggest that incorporation of
SUVs into HDL may depend upon dissociation of the apo-A-I and perhaps
instability of the resulting vesicle, but also that the HDL particle
may have a limited capacity for direct uptake of phospholipid into its
surface.
More recently Jonas et al., (1980) have studied the interaction under
rigorous conditions and have found that human apo-A-I interaction with
pure PC SUVs gives only two types of stable complexes at equilibrium:
SUV/apo-AI complexes of about 1000 mols PC and containing 3-4 apopro-
tein monomers/complex, and apo-A-I micellar complexes with PC con-
taining about 100 PC/apo-A-I and 3 protein monomers/particle. The
former complex is formed at high PL/HDL ratios, the latter at low
ratios.
Morrisett et al. , (1977) have reviewed the interaction of the
C-apoproteins with MLVs and SUVs. Unlike the interactions with HDL or
apoprotein-A mentioned above, the C-apoproteins do not cause dissolu-
tion of EPC-containing SUVs or MLVs although they will dissolved DMPC
vesicles. The differences are thought to be primarily due to the degree
of saturation of the acyl chains of the PC (Scherphof et al. , 1979).
The interactions of the apoproteins of the C group suggest that trans-
fer of these proteins from VLDL (where they are the major components)
to EPC-containing MLVs and SUVs, in an analogous manner to that already
described for apo-A-I from HDL, will probably not occur although fusion
of the VLDL and CHYL particles with liposomes may be possible.
Interactions of liposomes with LDL or apo-B have not been studied
to any great extent. Chobanian et al. , (1979) did not find PC associa-
ted with this fraction although a slight association with VLDL did
occur (As also suggested from the work of Kirby et al., 1980a and Tall,
1980). However, Thompson et al. , (1975) and Scherphof et al. , (1978)
have suggested that some MLV-EPC can be found associated with LDL
fractions. Studies on the association and/or dissolution properties of
apo-B with liposomes have been hindered by the total insolubility of
this protein, whose molecular weight remains unknown, in aqueous solu-
tions (Bradley et al. , 1980) and no clear idea of the structure of the
LDL particle although some suggestions have been made (Luzzati et al,
1979).
In summary, the SUVs in the injection are known to interact with
lipoproteins and transfere their EPC to HDL. The MLVs which remain in

143.
the plasma are probably stable perhaps because their multilamella 0
structure or surface charge prevents interaction with lipopyteins. Ex-
change of MLV-EPC with lipoproteins may only be slight. On the other
hand, MLV-EPC appears to interact with other plasma proteins perhaps
through the mediation of lipoprotein lipase or LCAT. An alternative,
but less likely, explanation may be that proteins adsorb to liposomes
and the consequent increase in density causes liposomes to sediment
with the plasma proteins.

144.
SECTION 3 : 3
Interactions of liposomes with plasma proteins.
In addition to the lipoprotein interactions, discussed in the pre-
vious section, it was evident that liposomes interacted with other
plasma proteins. This section describes attempts to identify these
other proteins.
Introduction.
The serum-induced leakage of entrapped solutes has already been
discussed previously. Such leakage presupposes that there is a close
interaction between the protein and the liposomes but binding of pro-
tein to liposomes may not be an absolute prerequirement for solute re-
lease, indeed, the two may not be directly connected (Scherphof et al.,
1981). As a staring point for the discussion of liposome-protein inter-
actions the divisions suggested by Papahadjopoulos et al., (1975), with
some modifications (table 3:5), have been used.
Types 0, I and II interactions are the most likely to occur in
plasma. Type 0 reactions, by definition, tend to be reported less often
than the others. In the absence of binding data and isolation of the
vesicle/protein complexes it is difficult to descriminate between type
0 and type I interactions since no apparent leakage of solute will
occur. Indeed, in studies on the effects of various proteins on the
uptake of liposomes by cells (Tyrrell et al. , 1977; Hoekstra and
Scherphof, 1979; Mayhew et al., 1980) there is always the possibility
that the protein is acting by changing the cell membrane rather than
binding to the liposome and promoting or retarding the uptake of the
liposome/protein complex.
The type III interactions have already been considered previously
in relation to the findings of apoproteins associated with MLVs and
SUVs (Section 3:2).
Reports of type IV reactions are not numerous. Klausner et al. ,
(1980) noted that a hepatic receptor protein for asialoglycoproteins
interacts hydrophobically with lipid but does not induce release of
entrapped solutes. However, since this is essentially a cell protein
rather than a soluble plasma protein, type IV interactions may re-
present a special case in that they are typical of proteins which are
normally membrane bound and these will not be further considered here.
The reactions of plasma proteins with liposomes containing :

145.
Table 3:5.
CLASSIFICATION OF LIPOSOME/PROTEIN INTERACTIONS*
Type of
interaction
Effect on liposomes.
Type of
interaction Permeability A H . Enthalpy A T . Temperature of
of acyl chain acyl chain melting
melting
0
(no action) nil nil nil
I
(electrostatic)
nil or increase none or
small increase increase.
II
electrostatic/
hydrophobic
large increase decrease decrease
III
hydrophobic large increase decrease none
IV
orientated
hydrophobic
nil or decrease decrease
small increase
modified from Papahadjopoulos et al. (1975).

146.
i) hapten sensitized PL s (Kinsky, 1972, 1980; Kinskey and Nicolotti,
1977);
ii) proteins co-valently coupled to liposome surfaces (Heath et al.,
1980; Huang et al., 1980; Leseman et al., 1980a, b; Torchillin
et al., 1980).
iii) adsorbed and entrapped liposomal proteins (Gregoriadis and
Neerunjun, 1975b; Gregoriadis, 1979a, 1980a, 1980b; Gregoriadis
and Meehan, 1981) will not be discussed here since these liposomes
must also be considered to be special cases of reactions not
normally taking place. It must be stressed, however, that drug
containing liposomes may react with proteins in a different manner
to empty liposomes because drug entrapment has the theoretical
capacity to alter such factors as membrane fluidity and surface
characteristics.
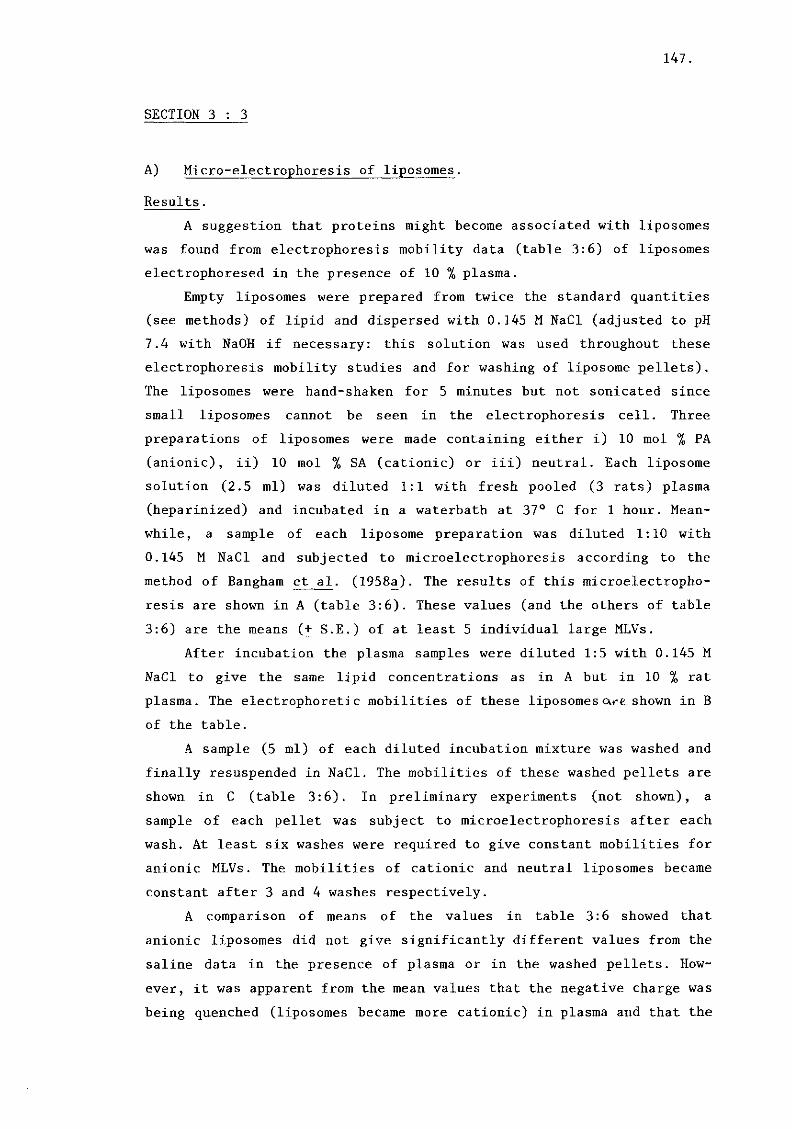
147.
SECTION 3 : 3
A) Micro-electrophoresis of liposomes.
Results.
A suggestion that proteins might become associated with liposomes
was found from electrophoresis mobility data (table 3:6) of liposomes
electrophoresed in the presence of 10 % plasma.
Empty liposomes were prepared from twice the standard quantities
(see methods) of lipid and dispersed with 0.145 M NaCl (adjusted to pH
7.4 with NaOH if necessary: this solution was used throughout these
electrophoresis mobility studies and for washing of liposome pellets).
The liposomes were hand-shaken for 5 minutes but not sonicated since
small liposomes cannot be seen in the electrophoresis cell. Three
preparations of liposomes were made containing either i) 10 mol % PA
(anionic), ii) 10 mol % SA (cationic) or iii) neutral. Each liposome
solution (2.5 ml) was diluted 1:1 with fresh pooled (3 rats) plasma
(heparinized) and incubated in a waterbath at 37° C for 1 hour. Mean-
while, a sample of each liposome preparation was diluted 1:10 with
0.145 M NaCl and subjected to microelectrophoresis according to the
method of Bangham et al. (1958a). The results of this microelectropho-
resis are shown in A (table 3:6). These values (and the others of table
3:6) are the means (+ S.E.) of at least 5 individual large MLVs.
After incubation the plasma samples were diluted 1:5 with 0.145 M
NaCl to give the same lipid concentrations as in A but in 10 % rat
plasma. The electrophoretic mobilities of these liposomesc\rt, shown in B
of the table.
A sample (5 ml) of each diluted incubation mixture was washed and
finally resuspended in NaCl. The mobilities of these washed pellets are
shown in C (table 3:6). In preliminary experiments (not shown), a
sample of each pellet was subject to microelectrophoresis after each
wash. At least six washes were required to give constant mobilities for
anionic MLVs. The mobilities of cationic and neutral liposomes became
constant after 3 and 4 washes respectively.
A comparison of means of the values in table 3:6 showed that
anionic liposomes did not give significantly different values from the
saline data in the presence of plasma or in the washed pellets. How-
ever, it was apparent from the mean values that the negative charge was
being quenched (liposomes became more cationic) in plasma and that the
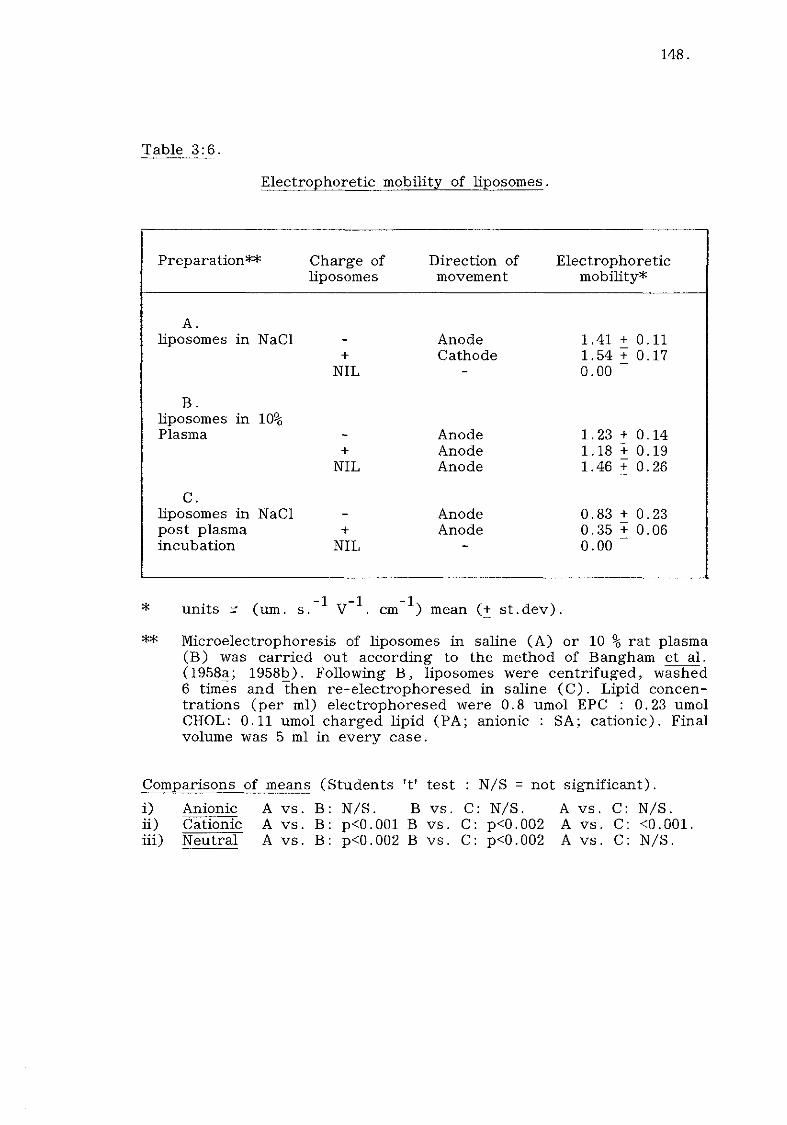
148.
Table 3:6.
Electrophoretic mobility of liposomes.
Preparation** Charge of Direction of Electrophoretic liposomes movement mobility*
A. liposomes in NaCl - Anode 1 41 + 0.11
+ Cathode 1 54 + 0.17 NIL - 0 00
B. liposomes in 10% Plasma - Anode 1 23 + 0.14
+ Anode 1 18 + 0.19 NIL Anode 1 46 + 0.26
C. liposomes in NaCl - Anode 0 83 + 0.23 post plasma + Anode 0 35 + 0.06 incubation NIL 0 00
-1 -1 -1 units r (um. s. V . cm ) mean (+ st.dev).
Microelectrophoresis of liposomes in saline ( A ) or 10 % rat plasma (B) was carried out according to the method of Bangham et al. (1958a; 1958b). Following B, liposomes were centrifuged, washed 6 times and then re-electrophoresed in saline (C ) . Lipid concen-trations (per ml) electrophoresed were 0.8 umol EPC : 0.23 umol CHOL: 0.11 umol charged lipid (PA; anionic : SA; cationic). Final volume was 5 ml in every case.
Comparisons of means (Students 't' test : N/S = not significant). i ) Anionic A vs. B: N/S. B vs. C: N/S. A vs. C: N/S. i i ) Cationic A vs. B: p<0.001 B vs. C: p<0.002 A vs. C: <0.001. iii) Neutral A vs. B: p<0.002 B vs. C: p<0.002 A vs. C: N/S.
149.
washed pellet moved more slowly than the liposomes in NaCl. Cationic
liposomes and neutral liposomes were significantly different from their
saline conterparts in plasma and in the washed pellet (cationic only).
It was also apparent that the neutral liposomes lost their acquired
charge when washed. The cationic liposomes had their charged quenched
and reversed in the presence of plasma and this reversal remained even
after washing.
In 100 % plasma (i.e. in vivo) it can be anticipated that, what-
ever their bilayer charge, all liposomes have the appearance of being
anionic due to the interactions with plasma components but, because of
the charge quenching effects the order of electronegativity is neutral
> anionic > cationic.
Discussion, b)
The results demonstrate that in the presence of plasma, cationic
and neutral liposomes appear to attain a negative charge whilst anionic
liposomes have their charge quenched (not significant).
However, this change in electrophoretic mobility is not permanent in
the case of neutral liposomes since it is removed on washing. This
suggests that for neutral liposomes, at least, the interaction is tran-
sient (probably type I).
Anionic liposomes, in the absence of protein, were found to have a
mobility in NaCl very similar to that found by Bangham (1968) and the
zeta potentials, calculated as suggested by Papahadjopoulos and Watkins
(1967), for the cationic preparation in saline were the same as was
found by these authors using 10 mol % SA.
Microelectrophoresis of liposomes in the presence of plasma has
not been previously reported. However, Bangham et al. , (1958b) have
investigated the plasma coating of clean (acid washed) glass particles.
(10 urn. diameter). At pH 7.4 in NaCl, the clean glass had an electro-
phoretic mobility (-1.55 units) very similar to the anionic liposomes
used in this study. After the glass particles were incubated with
plasma and washed well their electrophoretic mobility proved to be less
than the untreated particles and strikingly similar (-0.8 units) to the
electrophoretic mobilities of the washed anionic liposomes : other
charges were not investigated. These results confirmed that plasma
adsorbtion onto inert particles occurs, as first proposed by Abramson
(1929 : quoted in Bangham et al., 1958b).
Wilkins and Myers (1966) coated polystyrene latex beds with char-
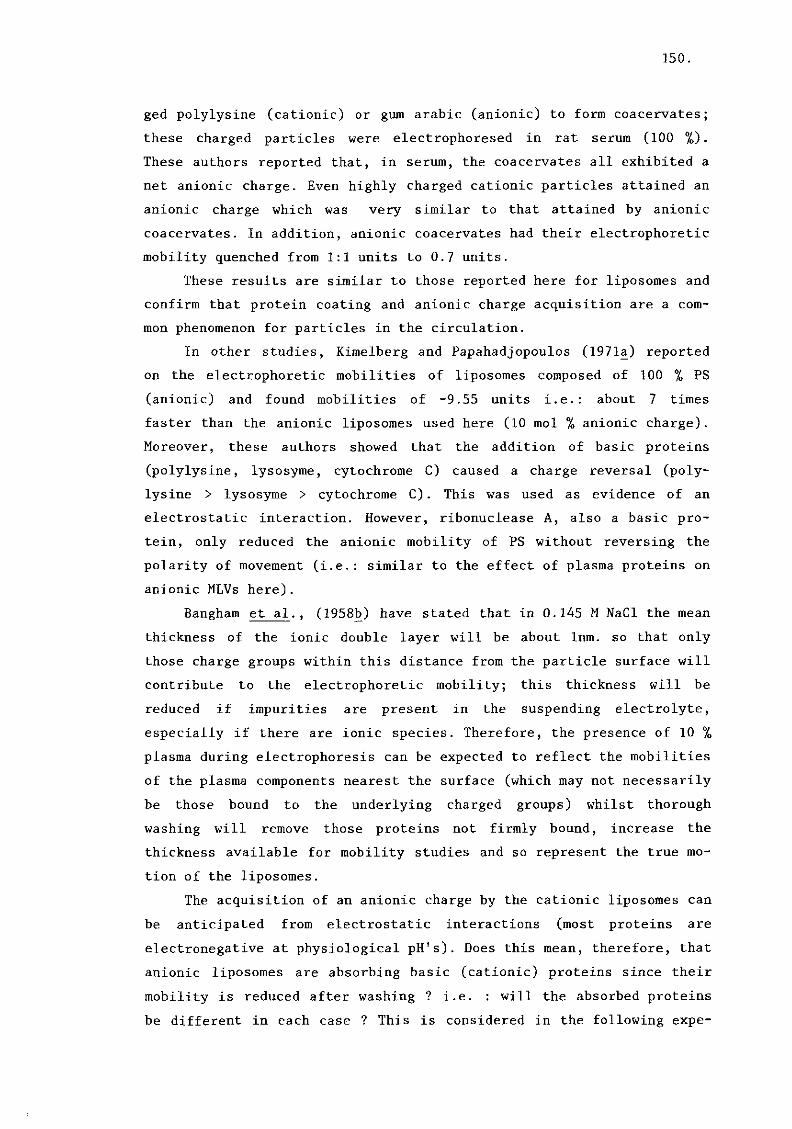
150.
ged polylysine (cationic) or gum arabic (anionic) to form coacervates;
these charged particles were electrophoresed in rat serum (100 %).
These authors reported that, in serum, the coacervates all exhibited a
net anionic charge. Even highly charged cationic particles attained an
anionic charge which was very similar to that attained by anionic
coacervates. In addition, anionic coacervates had their electrophoretic
mobility quenched from 1:1 units to 0.7 units.
These results are similar to those reported here for liposomes and
confirm that protein coating and anionic charge acquisition are a com-
mon phenomenon for particles in the circulation.
In other studies, Kimelberg and Papahadjopoulos (1971a) reported
on the electrophoretic mobilities of liposomes composed of 100 % PS
(anionic) and found mobilities of -9.55 units i.e.: about 7 times
faster than the anionic liposomes used here (10 mol % anionic charge).
Moreover, these authors showed that the addition of basic proteins
(polylysine, lysosyme, cytochrome C) caused a charge reversal (poly-
lysine > lysosyme > cytochrome C). This was used as evidence of an
electrostatic interaction. However, ribonuclease A, also a basic pro-
tein, only reduced the anionic mobility of PS without reversing the
polarity of movement (i.e.: similar to the effect of plasma proteins on
anionic MLVs here).
Bangham et al. , (1958b) have stated that in 0.145 M NaCl the mean
thickness of the ionic double layer will be about lnm. so that only
those charge groups within this distance from the particle surface will
contribute to the electrophoretic mobility; this thickness will be
reduced if impurities are present in the suspending electrolyte,
especially if there are ionic species. Therefore, the presence of 10 %
plasma during electrophoresis can be expected to reflect the mobilities
of the plasma components nearest the surface (which may not necessarily
be those bound to the underlying charged groups) whilst thorough
washing will remove those proteins not firmly bound, increase the
thickness available for mobility studies and so represent the true mo-
tion of the liposomes.
The acquisition of an anionic charge by the cationic liposomes can
be anticipated from electrostatic interactions (most proteins are
electronegative at physiological pH's). Does this mean, therefore, that
anionic liposomes are absorbing basic (cationic) proteins since their
mobility is reduced after washing ? i.e. : will the absorbed proteins
be different in each case ? This is considered in the following expe-

Table 3:7. Amount of protein associated with liposomes.
Liposome
type
Incubation mixture
totals
Washed pellets % Recoveries
ug Protein/
ug P.
ug Protein/
mg PL.*
Liposome
type Lipid P ug
Protein mg
Lipid P ug
Protein ug
Lipid P Protein
ug Protein/
ug P.
ug Protein/
mg PL.*
anionic 301.7 53.06 229.5 397.3 76.06 0.748 1.731 41.872
cationic 248.3 51.08 171.22 500.0 68.95 0.978 2.92 70.63
neutral 261.9 56.65 163.42 462.8 62.4 0.816 2.827 68.38
NIL - 55.82 - 70.61 - 0.126 - -
* Calculated assuming molecular weight of EPC = 750.
Abbrev. Lipid P Lipid phosphorous
P. phosphor us
PL. phospholipid.
Liposomes were prepared as stated in Chapter 2 (methods). The large-(unsonicated)-empty MLVs were incuba-
ted at concentrations of 8 umols EPC: 2.28 umols CHOL: 1.4 umols charged lipid (omitted from neutral) in
50 % rat plasma and then washed as before (microelectrophoresis study). In addition, 50 % plasma without
added liposomes was treated in the same way. After final wash, the amount of lipid phosphr us and protein
associated with the pellets was measured.
152.
riments but here it must be stated that, according to the results of
others (Bangham et al. , 1958b) only if the protein is more than lnm
thick on the surface the liposome will it reflect the mobility of that
protein. Furthermore, if the reaction is of type II an electrostatic
charge reversal is not a necessary phenomenon. In the case of liposomes
it seems possible that a polyvalent protein(s) might bind to phospho-
lipid per se perhaps after an initial electrostatic attraction. Since
it is possible that phospholipid charged head groups are not randomly
arranged in liposome membranes (at least at high levels of anionic
phospholipid) (Papahadjopoulos et al., 1978; Szoka and Papahadjopoulos,
1980) it also seems possible that the influence of polycations and
proteins from the plasma might induce a lateral phase separation of
charged lipid groups into patches of membrane covered with protein and
other patches of anionic lipid. Depending upon the thickness of the
protein (and its relative abundance) some of these anionic patches will
be within the plane of sheer whilst others may be too far away (there-
fore their charges will be apparently quenched). Such liposomes, con-
taining mixed domains of protein and lipid, could be expected to have a
varying electrophoretic mobility. Indeed, this appears to be the case
in this study (not shown) where washing anionic liposomes more than
four times still decreases their anodal electrophoretic mobility
although this has little effect upon the neutral liposomes.
As to the identity of the adsorbed proteins, little can be deduced
from these experiments. However, the electrophoretic mobility of washed
erythocytes is uneffected by the presence of proteins such as:-albumin,
casein, gelatin, fibrinogen or haemoglobin (Ambrose, 1966). Yet, other
proteins e.g.: antibodies (but not those of the Rh system) will adsorb
onto erythocyte surfaces and alter their mobility; similar alterations
can be seen in bacteria incubated with serum (Ambrose, 1966).
c) Identification of absorbed proteins.
Following the discovery that plasma proteins could become adsorbed
onto liposomes, the identity of these protein was sought.
The results (table 3:7) show that, even in the absence of lipo-
somes, some protein can be found in the pellet. The identity of this
protein was not studied further but a preliminary immunoelectrophoresis
(IE) suggested that more than one type of protein (including alpha-^-
macroglobulin) was present (not shown). This protein pellet probably
represents aggregates of proteins, protein bound to the walls of the

153.
Legend : Plate 1.
Double Immunoelectrophoresis (Clarke and Freeman, 1968) of whole
rat plasma (pre-centrifuged for 6 x 10^ g.min) mixed with anionic soni-
cated liposomes (4 mols. EPC : 1.14 mols CHOL : 0.57 mols PA) per ml 2
plasma. Sample (5 ul) run against 1 ul/cm whole rat plasma antiserum
stained with 0.1 % amidoblack.
The overlay identifies the plasma proteins (where known) in com-
parison with similar patterns of human proteins.
Proteins :
1. Albumin. 2. Alpha-l-antitrypsin. 3. G ^ G l o b u l i n s . 4. Alpha-2-HS-
glycoprotein. 5. Alpha-I-acid glycoprotein (orosmucoid). 6. Alpha-1-
macroglobulin. 7. Transferrin. 8. Immunoglobulin (Ig) G. 9. Ig A.
10. Alpha-lipoprotein. 11. Ceruloplasmin.
153.
Legend : Plate 1.
Double Immunoelectrophoresis (Clarke and Freeman, 1968) of whole
rat plasma (pre-centrifuged for 6 x 10^ g.min) mixed with anionic soni-
cated liposomes (4 mols. EPC : 1.14 mols CHOL : 0.57 mols PA) per ml 2
plasma. Sample (5 ul) run against 1 ul/cm whole rat plasma antiserum
stained with 0.1 % amidoblack.
TImp o v e r l a y identifies the plasma proteins (where known) in com-
parison with similar patterns of human proteins.
Protei
1. Albumin. oha-1
glycoprot •
macroglobr
10. Alpha-l.i
J
J O
f \ ^ 5>u]g.ns. 4. Alpha-2-HS-
V ^ » nucoid). 6. Alpha-1-J J
in (Ig) G. 9. Ig A.

154.
Legend : Plate 1.
Immunoelectrophoresis of washed pellets of unsonicated liposomes
previously incubated in rat plasma A - anionic; B - cationic; C - neu-2
tral. Sample (5 ul) run against 2 ul/cm whole rat plasma antiserum
(Negative print).
B

155.
centrifuge tube and/or very high molecular weight proteins. This result
determined that for future experiments plasma was precentrifuged at
100 000 g for 1 hour before incubation with liposomes. This proce dure
did not alter the amount or species of protein found liposome asso-
ciated (not shown).
The results in table 3:7 demonstrate that protein associates with
all liposomes irrespective of charge. Association of protein with
neutral liposomes, which was not inferred from the microelectrophoresis
studies, suggests that this interaction may be of type II. The amount
of protein associated with liposomes was quite constant irrespective of
liposome type. The lowest amount of protein was found with the anionic
liposomes and the highest amount with the cationic liposomes. Lipid
recoveries of unsonicated (U/S) liposomes were not as large as expected
and the differences probably reflect liposomes which do not sediment
following 100.000 g x 1 hour centrifugation.
Laurell double Immunoelectrophoresis (IE) of the washed pellets
from plasma incubations was performed on unsonicated MLVs as well as
sonicated MLVs. Each liposome type was incubated for 1 hour in either
rat or human plasma. The washed pellets were resuspended in 1 ml NaCl.
Identification of rat alpha-1-macroglobulin (alpha-1-M) was made
by the addition of pure rat alpha-1-macroglobulin (6 mg/ml), dissolved
in 0.145 M NaCl, to the washed pellet samples before IE ("spiked"
samples). A sample of this rat-alpha-l-M gave a single protein peak
when run against rat plasma antiserum (not shown).
In one experiment, human plasma was heated at 56° C for 1 hour, to
destroy complement, before being incubated with the liposomes.
Results.
Plate 1 shows the IE pattern of whole rat plasma mixed with anionic
sonicated liposomes and run against rat plasma protein antiserum. The
identity of all the peaks has not yet been firmly established for rat
plasma proteins. The overlay and corresponding foot note to plate I
gives the identity of the known proteins by comparison with published
human IE patterns (Clarke and Freeman, 1966; Crowle, 1973; Kroll, 1968,
1969, 1970; Gregoriadis et al., 1974b) and data supplied by Dako-im-
munoglobulins (antiserum manufacturers).
Plate 2, A, B, C, are prints of negatives showing the IE pattern of
washed pellets of anionic (A), cationic (B) and neutral (C) U/S MLVs
previously incubated in rat plasma. There is only one major protein
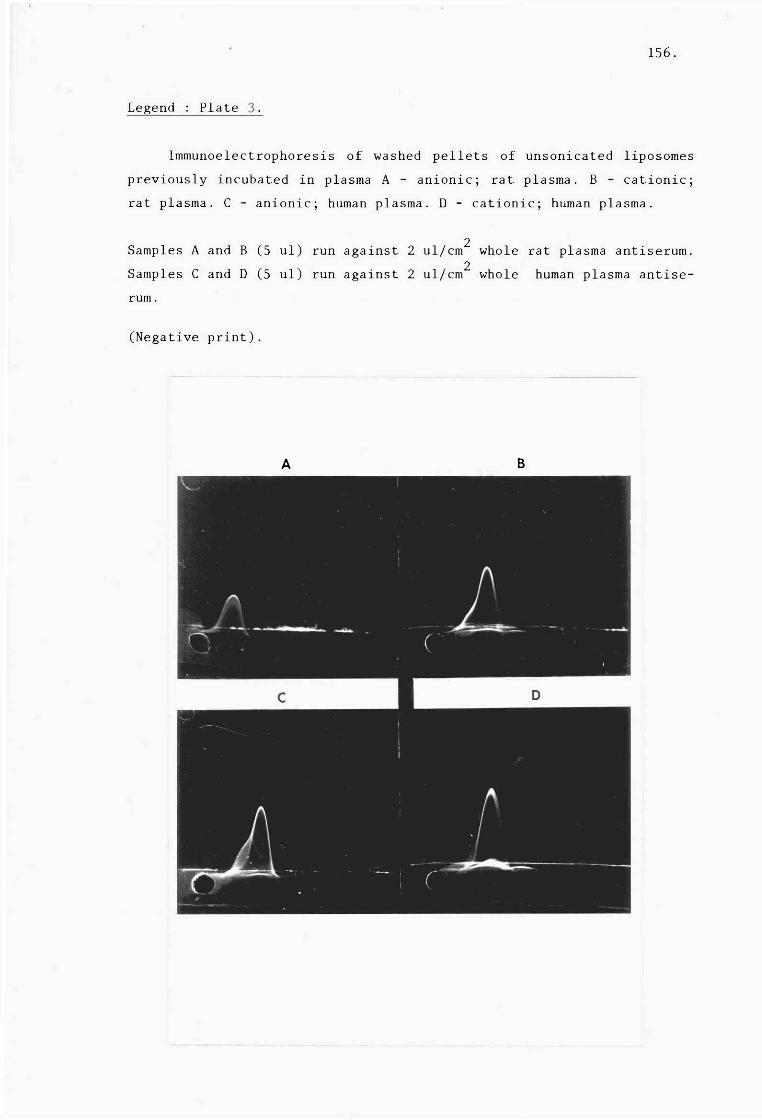
156.
Legend : Plate 1.
Immunoelectrophoresis of washed pellets of unsonicated liposomes
previously incubated in plasma A - anionic; rat plasma. B - cationic;
rat plasma. C - anionic; human plasma. D - cationic; human plasma.
2 Samples A and B (5 ul) run against 2 ul/cm whole rat plasma antiserum.
2 Samples C and D (5 ul) run against 2 ul/cm whole human plasma antise-
rum .
(Negative print).
A B

157.
Legend : Plate 1.
Inpunoelectrophoresis of washed pellets of unsonicated anionic li-
posomes :
2 A) incubated in rat plasma (sample 10 ul run against 2 ul/cm whole
rat plasma antiserum).
B) as for A except 2 ul of pure rat alpha-1-macroglobulin (6 mg/ml in
NaCl) has been added (sample 12 ul).
(Negative print).
A B

158.
peak in each case. Plate 3 shows negative prints of the IE patterns
from washed pellets of anionic U/S MLVs incubated in rat (A) and human
(C) plasma. For cationic U/S MLVs incubated in rat (B) and human (D)
plasma, the IE-patterns are shown alongside. Plate 3D indicates that in
the case of cationic MLVs/human plasma there is some contamination by
other proteins but this is minimal compared to the amount of the major
peak.
Plate 4 (A) is the washed pellet of anionic U/S MLVs in rat plasma and
4B, is exactly the same preparation, run at the same time, except that
pure rat alpha-l-M (6 mg/ml) has been added to the liposomes. These
plates demonstrate that the effect of the alpha-l-M is additive and
does not change the position of the liposome peak nor produce addi-
tional peaks. This, therefore, is direct confirmation that the protein
associated with the liposome pellet behaves in a similar manner to
purified rat alpha-l-M. Exactly the same results were obtained with the
pellets from cationic and neutral U/S MLVs when "spiked" with the pure
protein (not shown). Sonicated MLVs of all types incubated with rat
plasma and run at the time as Plate 4 gave similar results although the
peak hights of the pelleted material were lower (but still obviously
due to the same single protein : not shown). At the same time, some
samples of U/S MLVs pellets were "spiked" with pure rat albumin 5 ul (3
mg/ml) (not shown). These IE patterns showed a clear separation of the
albumin peak from the pellet-protein peak. In a single experiment (not
shown) anionic U/S MLVs were found to associate with the pure rat
alpha-l-M but not the pure albumin solution. Calculation of the peak
areas before and after the addition of rat alpha-l-M (6 mg/ml) allowed
an estimation of the total amount of this protein associated with the
liposome pellets. In each case the addition of the pure protein re-
sulted in an increase of approximately 0.84 square units. Using this
data the amounts of protein calculated for U/S MLV washed pellets were
: -anionic 416.2 ug; cationic 483.9 ug and neutral 439.1 ug. Comparison
of this data with table 3 :7 suggests that at least 94 % of the protein
in every case is alpha-l-macroglobulin. Comparative values for protein
associated with the sonicated preparations were 187.5 ug (anionic), 203
ug (cationic) and 155.4 ug (neutral). The quantities of lipid used in
the incubation with plasma were the same in each case (8 umols EPC :
2.28 umols CHOL : 1.14 umols charged lipid) but there is no guarantee
that the same quantities of sonicated MLVs were pelleted in each case.
Lipid phosphor us was not measured.

159.
Legend : Plate 5.
Immunoelectrophoresis of washed pellets of unsonicated liposomes
previously incubated in human plasma
2 : anionic; 4 : neutral; 6 : cationic;
2 Samples : 10 ul run against 2 ul/cm whole human plasma protein anti-
serum.
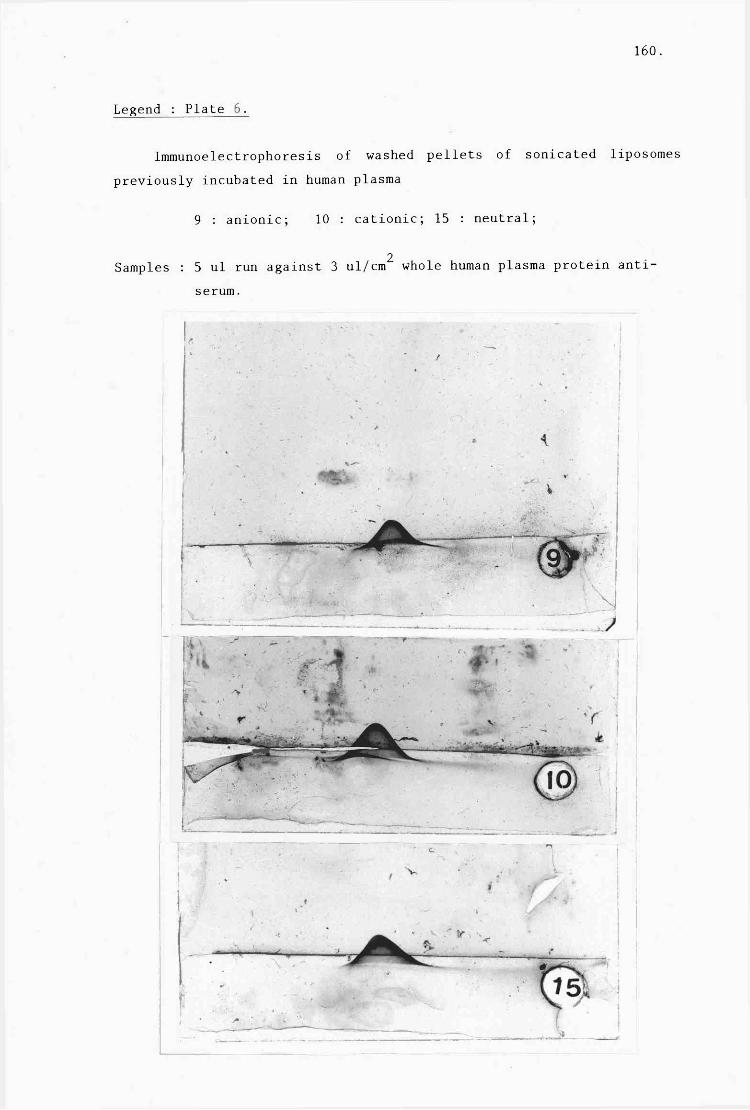
160.
Legend : Plate 5.
Immunoelectrophoresis of washed pellets of unsonicated liposomes
previously incubated in human plasma
9 : anionic; 10 : cationic; 15 : neutral;
2 Samples : 5 ul run against 3 ul/cm whole human plasma protein anti-
serum.
161.
Plate 5 shows the U/S MLV pellets of anionic (2), neutral (4) and
cationic (6) liposomes incubated with human plasma and run against
whole human-plasma-protein antiserum. The results demonstrate that
although there were some differences in peak areas (cationic > anionic
> neutral) only one major protein peak was found (some very mild albu-
min contamination in 2 and 6 can be seen and a very small amount of an
unidentified protein to the left of the alpha-2-M peak in 4). In a
similar experiment using sonicated liposomes (Plate 6) incubated with
human plasma, the peak areas were reduced in comparison to the unsoni-
cated MLVs. In this case, the amount of protein associated is in the
order cationic (10) > neutral (15) > anionic (9). Once again there was
only one major protein peak with no albumin contamination although the
cationic preparation (10) appeared to be very slightly contaminated
with another unidentified protein (below left of peak). The reasons for
the lower amounts of protein seen associated with these sonicated
preparations are probably due to the presence of SUVs in the incubation
mixture. (These smaller vesicles will not be sedimented at 100,000 g).
There ought, therefore, to be less lipid (not tested) in these pellets.
A further factor may be the influence of liposome size on the amount of
protein bound (individual U/S MLVs have a larger surface area than
sonicated MLVs).
Following the identification of the rat liposome-associated
protein, samples of liposome pellets were electrophoresed against an
antiserum specific for human alpha-2-macroglobulin. Plate 7 shows
anionic sonicated MLVs run against whole plasma antiserum (8) and the
same sample run against . ... alpha-2-macroglobulin antiserum (7).
Plate 8 shows the same experiment as in plate 7 using cationic so-
nicated MLVs. In this case the unidentified protein contamination (c.f.
plate 6 (10)) was clearer when the sample was run against whole anti-
serum (11) although it disappears when specific human alpha-2-M anti-
serum was used (12). Similar results were obtained with the neutral
sonicated preparation.
Finally Plate 9 shows neutral U/S - MLVs, which had been incubated
with normal human plasma (14) or complement destroyed human plasma
(16). Samples were run against specific human alpha-2-M antiserum.
Similar results were obtained using anionic and cationic preparations.
The plates show that destruction of complement does not affect the
binding of alpha-2-M to liposomes although the quantity bound may be
affected (peak area 16 is less than 14). However, this lower binding
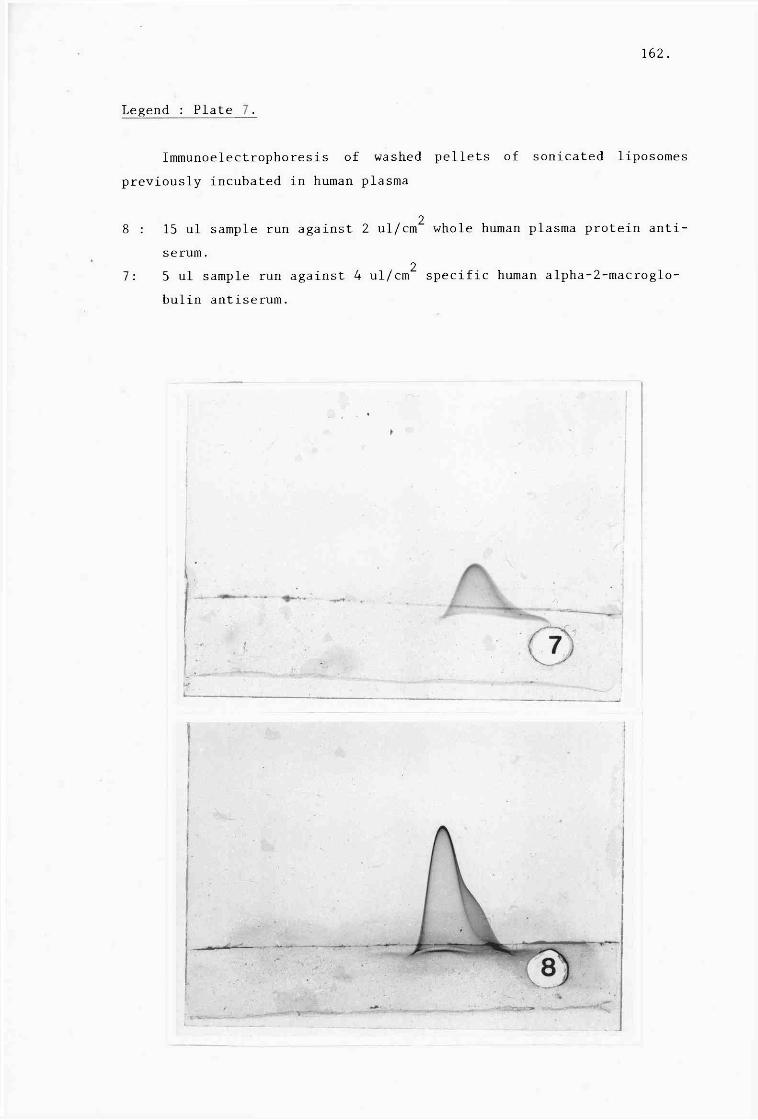
162.
Legend : Plate 5.
Immunoelectrophoresis of washed pellets of unsonicated liposomes
previously incubated in human plasma
2 8 : 15 ul sample run against 2 ul/cm whole human plasma protein anti-
serum . 2
7: 5 ul sample run against 4 ul/cm specific human alpha-2-macroglo-
bulin antiserum.
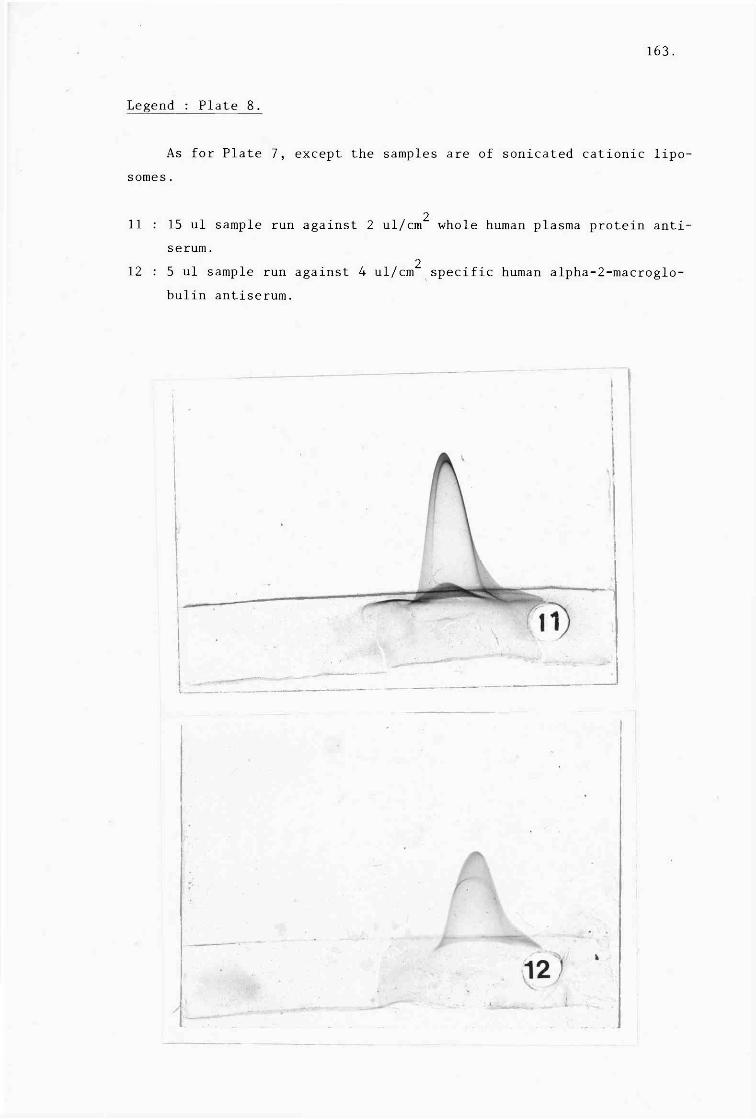
163.
Legend : Plate 8.
As for Plate 7, except the samples are of sonicated cationic lipo
somes.
2 11 : 15 ul sample run against 2 ul/cm whole human plasma protein anti
serum. 2
12 : 5 ul sample run against 4 ul/cm specific human alpha-2-macroglo-
bulin antiserum.

164.
cannot be proved since the lipid content of these pellets was not
measured but a similar reduction was seen with the other liposome
types. The distance moved by the peaks is not the same because the
experiments were not carried out on the same day although the same
liposome preparations were used in each case. This experiment was not
carried out with sonicated preparations.
In other experiments (not shown), which were designed to test the
type of interaction occuring between the liposomes and the protein, the
electrophoresis of U/S MLVs, incubated in human plasma, was carried out
in the presence of 4 M urea (final concentration). Using equivalent
sized samples and antiserum concentration, the presence of this
agent did not increase the peak hights. This result suggests
that either : i) electrostatic binding of the proteins . . .,
does not occur; or ii) electrophoresis of liposomes removes all
the bound protein. In similar experiments, 0.05 % Triton-X-100 (final
concentration) was also used. In this case only cationic liposomes
showed an increase in the alpha-2-M peak area (not found in the con-
taminating protein) but this was very minimal. These experiments do
not, therefore, give any conclusive evidence as to the type of inter-
action occuring.
In summary, sonicated and unsonicated liposomes will bind to pro-
teins of the plasma of both rat and humans irrespective of charge. In
all cases there is only one dominant protein found associated with the
liposomes and this has been identified as an alpha-macroglobulin. In
the case of human proteins, destruction of complement does not effect
this protein association.
d) Discussion.
As can be seen centrifugation does not fully separate liposomes
from contaminating proteins which can also be sedimented. The device of
precentrifuging the plasma, whilst effectively preventing co-sedimenta-
tion of proteins, also runs the risk of removing certain high molecular
weight proteins or complexes which might interact with liposomes
(Juliano and Lin, 1980).
Plate 1 demonstrates 11 major peaks from rat plasma proteins. Un-
fortunately, published data on rat proteins using this IE method is not
common (Gregoriadis et al. , 1974b). Identification of these proteins
has therefore been made by comparison with human plasma proteins. Apart
5 < e C 0 VAv" ^C't iGn.S paM, 1 0 ^

165.
Legend : Plate 9.
Immunoelectrophoresis of washed pellets of unsonicated neutral li-
posomes previously incubated in human normal (14) or complement des-
troyed (16) human plasma.
2 Samples : 15 ul run against 4 ul/cm specific human alpha-2-macroglobu-
lin antiserum.

166.
from albumin, alpha-2-M and lipoproteins (whose IE patterns were inves-
tigated in the course of this work) other identities cannot be assurred
in the absence of specific antiserum. Further, since this plate is for
illustrative purposes only, no attempt was made to examine the less nu-
merous proteins, which undoubtedly exist, but can only be visualized by
sample dilution or other techniques (Crowle, 1973). The failure of the
electrophoretic mobility studies to reflect protein association with
neutral liposomes remains a puzzle since the binding of both rat and
human plasma is obviously not of the type which allows its removal by
simple washing. It must be supposed, therefore, that the alpha-l-M in
contact with neutral liposomes becomes differently charged but the
mechanism remains unclear.
Apart from the general finding that only one major protein is as-
sociated with liposomes, the most surprising fact is the absence of
lipoproteins associated with the vesicles, (see previous section).
Column chromatography of EPC or DMPC vesicles in the presence of plasma
HDL has shown that apo-A-I can be found associated with the liposomes
(see previous references). The contaminating human protein associated
with cationic MLVs (plate 6:10 and plate 8:11) might in fact be HDL
from its electrophoretic position. However, in general the lack of
lipoproteins associated with liposomes serves to confirm the report of
the previous section that EPC-MLVs do not interact with these proteins.
Since SUVs could not be studied in this method, these results are not
incompatible with the results of others (e.g.: Tall and Small, 1977;
Kirby et al. , 1980b; Gregoriadis and Kirby, 1980) who showed HDL-SUV
complexes. Hoekstra and Scherphof (1979) demonstrated that the vast
majority^anionic EPC-MLVs did not contain protein but a small amount of
lipid radioactivity could be found bound to other proteins. It is most
likely that this radioactivity is due to lipid exchange rather than
transfer, however, if this small fraction contains whole liposomes they
may not have the same density as other MLVs and so will not sedimented
in these experiments.
The amount of protein associated with various MLV pellets re-
present very small quantities of the total available material. In rat
plasma the alpha-l-M concentration is about 9.1 mg/ml (Ganrot, 1973 cf.
about 3.0 mg/ml alpha-2-M in humans : Schultze and Heremans, 1966) so
that between 4 and 5 % of the macroglobulin available is liposome
bound. Hoekstra and Scherphof (1979) found approximately 2.5 fold
higher values (per umol PL) of a whole alpha-globulin bovine plasma
167.
fraction bound to liposomes (very similar to those used here) but this
binding was dependent upon the amount of protein available. Thus, using
1.5 umol EPC these authors found about 8 % of the alpha-globulin frac-
tion bound. But in contrast to the results presented here, Hoekstra and
Scherphof also found that albumin, beta-globulins and gamma-globulins
bound to anionic MLVs when incubated with plasma or pure fractions of
these proteins. In the case of albumin, these authors found that, at
the same concentration (3 mg/ml) use in the present experiments, only
very small amounts (13 ug/umol lipid) were bound to the liposomes and
they pointed out that sensitive protein assay methods are needed to
detect this level. Using the above figure, the amount of albumin asso-
ciated with the sample on the IE plate would be approximately 500 ng
and this should be theoricically detectable.
The findings of beta and gamma-globulins bound to liposomes
(Hoekstra and Scherphof, 1979) is not confirmed in the present
findings. Tyrrell et al., (1977) showed that beta-globulins could cause
leakage of entrapped solutes from liposomes but they failed to find
similar effects when whole serum, albumin or gamma-globulins were used.
This result suggests that beta-globulins do not have the same effects
when they are incubated separately as when they are a constituent of
whole plasma serum.
This point raises a major criticism of work which purports to show
protein associated with liposomes. It seems likely that many proteins
will bind liposomes if they are: - i) at a high enough concentration,
ii) incubated for long enough and iii) not subjected to competition
from other plasma proteins of different avidity. A further point must
be considered as well, the type of interaction between liposomes and
the protein is very important. A protein which binds electrostatically
(type I) may not remain bound even in the absence of a dissociating
agent. It may be in equilibrium with unbound material especially when
the number of "binding sites" are limited. Further, these electrostatic
interactions may well be disrupted by mechanical means (such as 7 cen-
trifugations at 100.000 g for 1 hour each!). Whereas an interaction of
the type which involves hydrophobic insertion into the bilayer (type
II) should remain more stable until such time as the bilayer is dis-
rupted (or, as implied earlier, the electrophoretic current is high
enough to "pull" the protein out of the bilayer).
The work of Tyrrell et al. , (1977) suggested that gamma-globulins
and albumin were only type I interactions because no leakage occurs

168.
from the liposomes, in this work these results with albumin were con-
firmed (section 3:1). Hoekstra and Scherphof (1979) state that bovine
serum albumin is only loosely bound since almost half of it is lost
from the vesicle surface when these liposomes are added to serum.
Interactions of liposomes with albumin have been much studied and there
have been conflicting reports of the type of interaction involved. Most
of the work has considered albumin in isolation from other plasma
proteins. At low pH, bovine albumin (BSA) (Sweet and Zull, 1969; Sogor
and Zull, 1975; Bartholow and Greyer, 1981) and ovalbumin (OA) (Oshima
and Nagasawa, 1973) will bind to liposomes although this is dependent
upon the presence of anionic charge (Sweet and Zull, 1969) or the
purity of the albumin (Bartholow and Geyer, 1981). At certain concen-
trations of OA liposomes are aggregated at low pH (Oshima and Nagasawa,
1973) but this is inhibited by increasing the ionic strength or by
cations (i.e.: probably type I). Bound BSA has been shown to perturb
the membrane structure (Sogar and Zull, 1975) as well as causing solute
leakage (Sweet and Zull, 1969) (Type II). At physiological pHs, BSA
(Sweet and Zull, 1969; Weissmann et al., 1974; Kimelberg, 1976;
Kitagawa et al. , 1976; Tyrrell et al. , 1977; Kaye and Ryman, 1980;
Weinstein et al., 1981), 0 A ( Weistein et al., 1981), alpha-lactalbu-
min (Hassens et al., 1979) and human serum albumin (HSA) (Finkelstein
and Weissmann, 1979; Juliano and Lin, 1980) bind strongly to liposomes
and do not cause leakage irrespective of the charge on fluidity of the
vesicles (Tyrrell et al., 1977; Finkelstein and Weissmann, 1979). (Type
I interactions ). However, if the liposomes contain LPC (> 25mol%) then
leakage does occur (although CHOL will protect against this), further-
more, methylated BSA will also cause solute leakage even without LPC in
the membrane but BSA can prevent the leakage induced by the addition of
exogenous LPC (Kitagawa et al. , 1976) (Type II effects). Zborows* ki
et al. , (1977) reported that albumin was capable of binding to, and
causing the destruction of, liposomes composed of rat PC. Later, this
group suggested that this might be due to impurities (lipoproteins) in
their BSA (Scherphof et al. , 1981). Nevertheless, in the single ex-
periment reported here no rat albumin bound to liposomes of any compo-
sition. However, an albumin may be one of the minor proteins seen in a
few of the IE patterns (plate 5 (2 and 6)).
Weissmann et al. , (1974) have shown that liposomes bind lgG molecules
when co-incubated (anionic almost 2 fold higher than cationic) and that
this can be increased if the protein is heat aggregated but this does

169.
not happen with albumin. This gamma-globulin effect seems to be a type
II interaction since it causes solute leakage, however, Tyrrell et al.,
(1977) using a similar system were not able to confirm that leakage oc-
curred. From the results shown here it does not appear that gamma-glo-
bulins, in the presence of other proteins, bind to liposomes.
In a study of MLV binding to human plasma proteins Juliano and Lin
(1980) investigated the effect of charge and fluidity of the liposome
membrane on protein interactions. Since in many respects their in-
vestigations are comparable to those carried out here, this report will
be discussed in some detail.
Firstly, the amount of protein bound per mg lipid was very similar
to that found in this work at least in the case of cationic liposomes
(50ug/mg) but the anionic and neutral liposomes were found to bind
considerably less (12ug/mg and 8ug/mg respectively) than was found
here. The reasons for these differences are unclear although there are
two important differences between this work and that of Juliano and
Lin's (1980); i) the results were obtained with human serum and ii) the
lipid composition (EPC:CHOL = 1:1; anionic charged imparted by PS) is
not the same as used here. It is possible that the increased choles-
terol content changes the binding (probably the type II interactions)
of some proteins (cf. the results of others discussed in the lipo-
protein section).
Secondly, these authors have found differences in the species of
proteins bound by individual types of liposomes. Anionic (PS) liposomes
(EPC or DPPC) bound a random assortment of proteins but few high mo-
lecular weight ( > 200.000 daltons) components. In contrast, cationic
and neutral selectively bound these larger proteins and neutral lipo-
somes apparently failed to bind proteins of the molecular weight range 3
60-150 x 10 daltons. There was only one slight difference between
DPPC and EPC-containing cationic liposomes; cationic DPPC vesicles 3
bound more of an unidentified protein in the 60-150 x 10 dalton
range.
Interestingly, the binding of proteins was found to be temperature a.1
and time dependent. Less protein was bound at 4°C them^37°C. Further,
the high molecular weight proteins bound instantaneously whereas other
proteins (e.g.: albumin) took up to 15 minutes to bind.
As to the identity of the bound proteins, Juliano and Lin (1980)
have shown a wide variety of protein bands on polyacrylamide gels of
liposomes incubated with plasma. A major difference in the methodology

170.
between these two reports is that the MLVs were only washed 3 times
(not considered sufficient in this work) and centrifugation was carried
out at 10000 rpm for 20 minutes which would probably result in the loss
of some smaller MLVs. These authors have identified proteins solely
upon their molecular weight using standard markers.
By this method, it is claimed that only very small amounts of
alpha-2-M are liposome-associated whilst large amounts of albumin
(especially) and 2 (or 3) high molecular weight proteins also bind.
Unfortunately, Juliano and Lin (1980) incorrectly claim that the mole-
cular weight of alpha-2-M is 185000. In fact, the molecular weight of
human alpha-2-M is 7.25 x 10⁵
(Steinbuch, 1971; Harpel, 1973, 1976;
James, 1980) whilst it is generally recognized that the protein con-
sists of 4 subunits each of 185,000 mol.wt (Harpel, 1973, 1976) and at
least 2, but more usually 4, of these subunits are required for total
activity (Starkey and Barrett, 1977). Since, as Juliano and Lin (1980)
point out, there are very few plasma proteins of > 200,000 mol.wt, it
seems possible that one of their high molecular weight liposome-asso-
ciated proteins could be alpha-2-M. These authors also found two other
proteins of high molecular weight and it is conceivable that these
could be dimers or timers of alpha-2-M.
In the lower molecular weight range, in addition to albumin and
immunoglobulin heavy and light chains, Apo-AI and sever other uniden-
tified proteins were also shown to bind. Fibronectin was also shown
to bind to all the types of liposomes tested. Since this assortment was
not found in the present study a further difference between these two
reports must be considered. Juliano and Lin (1980) used human serum for
their studies. In view of the findings on liposome stability (Gregoria-
dis and Davis, 1979; Kirby et al. , 1980b) in the presence of blood,
plasma and serum it is obvious that there are differences between the
interactions of liposomes with plasma and with serum (stability, plasma
> serum). Moreover, it has been known for some time that alpha-2-M must
be isolated from plasma and not serum because, in addition to its well
known ability to bind to proteinases, it will also bind to thrombin,
Hageman factor (clotting factor XII), plasmin and Kallikrein (Steinbuch
et al., 1975).
Finally, Juliano and Lin (1980) having washed the MLVs, then treat
the pellet with ethanol which precipitates the proteins and removes
some of the lipids 0 This
171.
method ensures that even lightly bound proteins (which may be bound to
other proteins - see electrophoretic mobility results) will be preci-
pitated whereas the centrifugal method used here probably removes
these.
The addition of dissociating agents (chaotropic ions, urea), how-
ever, failed to change the gel pattern whilst typsin treatment removed
the high molecular weight proteins (suggesting type II interactions).
The binding of the fibronectin, at least, could not be displaced by in-
cubation of these "coated" liposomes with whole serum.(Juliano and Lin
1980).
Juliano and Lin (1980) also studied the effects of liposomes upon
the clotting characteristics of human plasma. Charged liposomes altered "ine
the clotting times by, it was suggested, bind Jto clotting factors. K
Anionic liposomes apparently caused depletion of serum factors VIII
(antihaemophillic factor), XII (Hageman factor) and possibly others as
well. Several factors (V and VIII) in the clotting cascade are known to 2+
be activated by phospholipids and Ca (Mahler and Cordes, 1971);
Bangham (1961) showed that increased clotting activity was associated
with increased liposome surface charge.This was further investigated by
Papahadjolpoulos et al. (1962) who reported that the in vitro clotting
activity of anionic liposomes at pH 7.4 was low when 10 mol. % PA, PS
or PE were incorporated into the membrane; they concluded that the
activity was due to surface charge density rather than any phospholipid
species. It is surprising therefore that Juliano and Lin (1980) found
that anionic liposomes (10 mol % charge) could deplete the plasma of
factors VIII, XII and possibly VII; the effect on factor VII was also
found with 10 mol % cationic liposomes. It seems possible that the
reversal of the surface charge of cationic liposomes coupled with the
presence of alpha-2-M to remove clotting factors may account for these
results, especially since neutral liposomes had no effect on the
clotting times but did lower factor VII levels in the plasma.
Removal of clotting components does not necessarily mean that the
clotting components are bound to the liposomes. Two plasma proteins,
alpha-2-M (Steinbuch et al. , 1975) and fibronectin (Yamada and Olden,
1978) are known to bind clotting factors. It seems possible that
clotting factor depletion might be due to removal of specific factors
rather than activation of the whole clotting mechanism. In addition,
this removal of factors may not necessarily result in the increased
tendancy to bleed since alpha-2-M also removes plasmin, the enzyme

172.
responsible for the breakdown of clots.
The effects of liposomes on clotting factors (Juliano and Lin
1980) are not in agreement with the findings of Gregoriadis (1978) who
reported no effects of liposome administration on the haematology of
rats and dogs treated with liposomes I/V and, later (Gregoriadis,
1980a), failed to find any effects of liposome administration on either
the clotting mechanism or plasma alpha-2-M levels in a patient treated
over a 3 year period. The differences may be due to the method of
taking the blood or other factors which have yet to be recognised.
Although complement did not appear to play a role in the binding
of alpha-2-M to liposomes in this study and Juliano and Lin (1980) did
not find complement depletion following the addition of liposomes to
human serum, other workers have reported that liposomes can activate
the complement system. Kaplan and Volanakis (1974) and Volanakis and
Kaplan (1974) found that C-reactive protein (CRP), an acute phase re-
actant, interacted with PC/CHOL emulsions (probably liposomes) to
activate the human classical complement pathway with a concomittant
depletion of haemolytic complement ability. More recently, Richards
et al. (1977) reported that CRP will bind to certain liposome types
(i.e. those which are cationic and contain galactosylcerebtosides) and,
in the presence of human serum, this results in the consumption of each
of the components of the classical complement pathway (C^ "Cg) with the
resulting release of liposome entrapped solutes. This reaction appears
to be specific for liposomes containing PC as their major bilayer
constituent.
Liposomes composed of lipids which are not haptenated or do not
contain carbohydrate moieties are not intrinsically immunogenic nor do
they cause depletion of complement (Kinsky, 1972; Kinski and Nicolotti,
1977; Kinsky, 1980). However, it seems highly likely that the incor-
poration of drugs, proteins or other molecules into immunologically
inert liposomes may cause hapten groups to become available on liposome
surfaces; in this case binding of proteins (e.g. immunoglobulins and
complement) may be different from non-hapten-containing liposomes.
In conclusion, whilst alpha-l-macroglobulin (rat) or alpha-2-ma-
croglobulin (human) may not be the only protein bound by liposomes,
it may be one of the major proteins which associates with the vesicles
in vitro.
173.
The presence of an alpha-globulin associating with liposomes has
been confirmed by Tyrrell et al (1977), Hoekstra and ScherphoJ? (1979)
and Juliano and Lin (1980). The extent to which alpha-2-M (and other
plasma non-lipoproteins) associate with liposomes in vivo awaits
determintation. The role that alpha-2-M may play in in vivo inter-
actions will be discussed in the next chapter.

174.
CHAPTER 4.
Tissue uptake and action of free and entrapped drugs following
intravenous injection.

175.
INTRODUCTION
The previous chapter has shown that liposomes will interact with
plasma components following a single intravenous injection. In this
chapter the tissue distribution of the liposome entrapped drugs will be
followed and this will be compared to the distribution found for the
same drug given in its free form. The liver uptake of the entrapped
drugs will be studied in greater detail, since this is the organ which
receives most of the injected dose. An examination of the sub-cellular
distribution of both the free and entrapped agents in this organ will
be made. Finally, the activity of the entrapped agents in the liver will
be examined by studying their affects on nucleic acid synthesis in the
regenerating liver.
Section 4:1.
Tissue distribution of free and liposome entrapped drugs.
The distribution of ACT-D, BLMs and ASPase into tissues other
than the liver (for which see following sections) was followed over
timed periods after the intravenous injection of either non-entrapped
or entrapped drugs into rats (100-125 g body weights). The prepa-
ration of drugs and liposomes has already been mentioned (Chapter 3,
section 1) in relation to the plasma clearance of these compounds.
Since the results in this section and section 4:2 and 4:4 were obtained
from the same animals as in Chapter 3:1 only a summary of the doses
and composition of the liposomes will be given here (Table 4:1). This
will serve as a reference for this section and sections 4:2 and 4:4-
Liposomes and free drugs used in section 4:6 were different and will
be outlined in that section.
The mean weights of tissues removed for the study of drug dis-
tribution were given in table 2:1. Generally, the radioactivities in each
tissue will be expressed as % of the injected dose found per gm of tis-
sue (not corrected for blood contamination).
i) Actinomycin-D.
3
The tissue distribution of free and entrapped H-ACT-D is shown
in fig. 4:1. A comparison of the means was calculated using Student's
't' test. The results of these comparisons are given in table 4:2 which
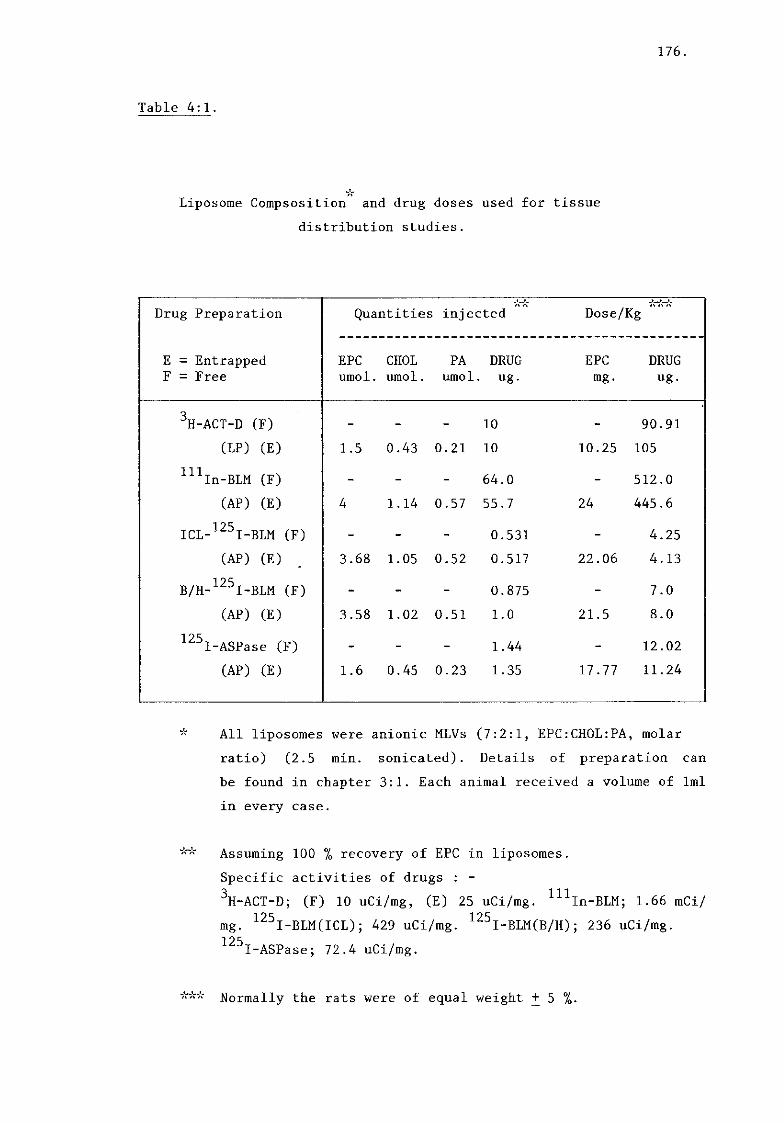
176.
Table 4:1.
Liposome Compsosition and drug doses used for tissue
distribution studies.
Drug Preparation Quantities injected Dose/Kg
E = Entrapped EPC CHOL PA DRUG EPC DRUG F = Free umol. umol. umol ug. mg. ug.
3
H-ACT-D (F) - - - 10 - 90.91
(LP) (E) 1.5 0.43 0.21 10 10.25 105
111 In-BLM (F) - - - 64. 0 - 512.0
(AP) (E) 4 1.14 0.57 55. 7 24 445.6
1 25 ICL-
J
I-BLM (F) - - - 0. 531 - 4.25
(AP) (E) 3.68 1.05 0.52 0. 517 22.06 4.13
1 25 B/H-
J
I-BLM (F) - - - 0. 875 - 7.0
(AP) (E) 3.58 1.02 0.51 1. 0 21.5 8.0
1 25 I-ASPase (F) - - - 1. 44 - 12.02
(AP) (E) 1.6 0.45 0.23 1. 35 17.77 11.24
All liposomes were anionic MLVs (7:2:1, EPC:CHOL:PA, molar
ratio) (2.5 min. sonicated). Details of preparation can
be found in chapter 3:1. Each animal received a volume of 1ml
in every case.
Assuming 100 % recovery of EPC in liposomes.
Specific activities of drugs : -2 ill H-ACT-D; (F) 10 uCi/mg, (E) 25 uCi/mg. In-BLM; 1.66 mCi/
mg. 1 2 5
I-BLM(ICL); 429 uCi/mg. 1 2 5
I-BLM(B/H); 236 uCi/mg. 1 25
I-ASPase; 72.4 uCi/mg.
Normally the rats were of equal weight + 5 %.

177.
Legend F i g . 4 : 1 .
3 Uptake o f H - a c t i n o m y c i n - D i n t o t i s s u e s .
Free (closed bars) or entrapped (open bars) ACT-D was injected I/V
into rats (see table 4:1 for details of doses). The histogram shows the
percentage of the injected dose associated with each gram of tissue at
timed intervals after injection.
Each bar represents the mean (+ st.dev.) from 2 (free) or 3 (en-
trapped) treated animals.
3H-Actinomycin D
4.0 H
1.0
2.5
0
-X Ii l
1
! "i 1 h r u , ^
1.0 "1
0 o E <T3 V_ CD a> a . a>
£Z
2.0
0
0.05 -
0
X
I
E l
X
h
EL
I
X
x
i
I
I & . f i o i .
I
Spleen
Kidney
Small intestine
Lung
Heart
Brain
Muscle
Skin
0.1 0.5 2 5 24
Time after injection (h)

178.
Tab le 4 : 1 .
Significance values (Students 't'-test) for the comparison of
means between free and entrapped drug concentrations in tissues.
3
H-Actinomycin D.
TISSUE Time after Injection
5' 30' 120' 5h. 24h. 72h.
Spleen N/s" N/S N/S < 0 . 0 2 < 0.005 N/S
Kidney < 0.001" N/s" < 0. 05" < 0.01" N/S" N/S"
Small Gut < 0.05" N/s" N/s' < 0.02" N/S" N/S"
Lung N/s" N/s" N/S' N/S" N/S N/S
Brain N/S N/s" N/S' N/S N/S" N/S"
Free drug concentation (% injected dose/gm wet weight tissue) higher than entrapped drug concentration. Otherwise entrapped drug concentration is higher than free.
2 degrees freedom. N/S Not significant (p > 0.01).

179.
also includes addition information at 72 hours post-injection (not
shown in fig. 4:1).
These results demonstrate that there was an increased localisation
of entrapped-ACT-D in the spleen at 5 and 24 hours after injection. In
the kidney the free drug values were always higher than the entrapped
values and significantly higher during the first 24 hours (except 30
min post-injection). Although there was no significant differences
between the free and entrapped values in the lungs and brain at any
time, the levels of the free drug in the small intestine were signifi-
cantly higher 5 minutes and 5 hours after injection.
Free drug levels in the kidney and brain appear to reflect the de-
crease in the plasma concentration of ACT-D (fig 3:1) with time whereas
the liposome ACT-D-levels in spleen and lung suggest that localization r
of the drug is occurring in these tissues although only the levels in
the spleen were significantly higher.
ii) Bleomycins.
a) The tissue distribution of 1 1 1
I n labelled BLM ("^In-BLM) is
shown in fig. 4:2. The results of the 't'-test comparisons
are shown in table 4:3. This table also shows additional dis-
tributions into the femur (bone), testes and thymus; and into
all tissues at 48 hours.
125
b) The tissue distribution of I-BLM (iodine monochloride :
ICL-BLM) is shown in fig. 4:3. The results of the 't' test
comparisons are shown in table 4:4 (data at 48 hours post-in-
jection also shown).
125
c) The tissue distribution of I-BLM (Bolton and Hunter :
B/H-BLM) is shown in fig. 4:4. The results of the 't' test
comparisons are shown in table 4:5 (48 hours post-injection
also shown). A comparison between the tissue levels of the
different entrapped BLMs is shown in table 4:6. Ill
iia) In-BLM. (fig. 4:2, table 4:3) 111
The tissue distribution values of the In entrapped drug were con-
sistently and significantly higher in the spleen throughout the time
period, whereas the values of the free drug found in the kidneys were
always higher than the entrapped drug and significantly higher at most
time intervals (except 2 and 24 hours). Preferential location of the
liposomal-drug into the small intestine, bone and thymus did not start
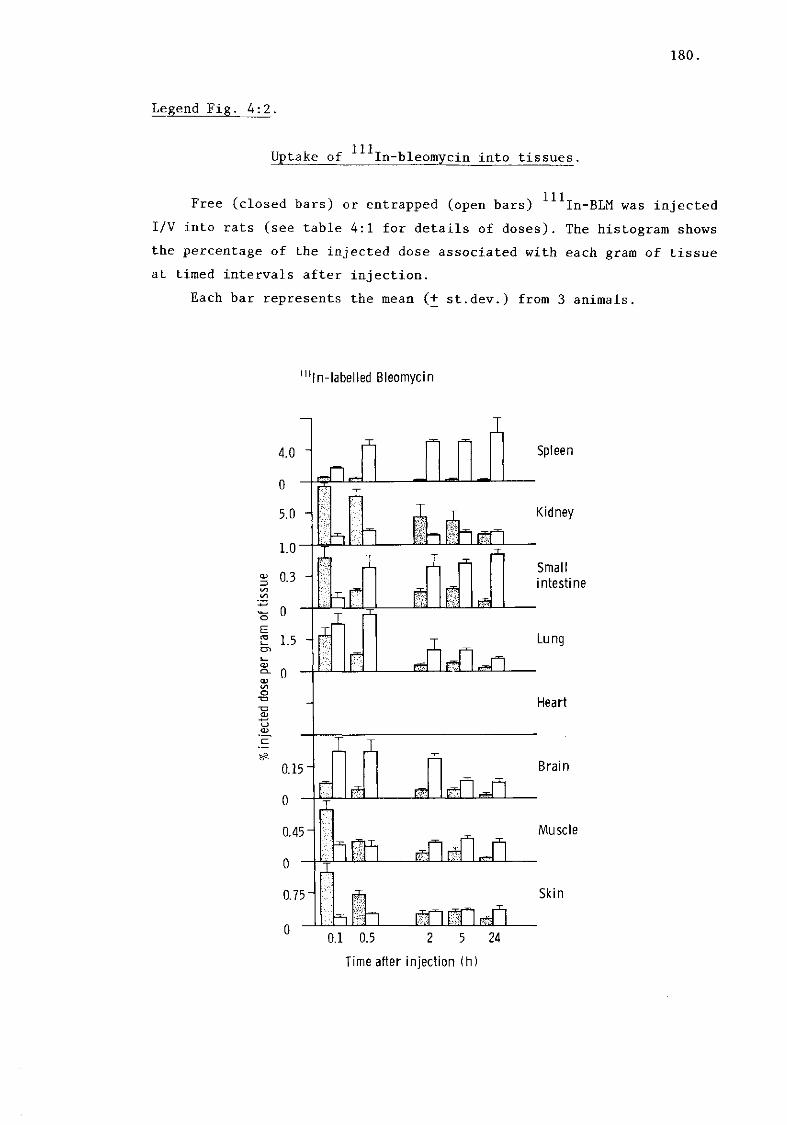
180.
Legend F i g . 4 : 2 .
Uptake o f 1 1 ^ I n - b l e o m y c i n i n t o t i s s u e s .
Free (closed bars) or entrapped (open bars) ^^In-BLM was injected
I/V into rats (see table 4:1 for details of doses). The histogram shows
the percentage of the injected dose associated with each gram of tissue
at timed intervals after injection.
Each bar represents the mean (+ st.dev.) from 3 animals.
^In-labelled Bleomycin
-o -o
4.0 1
0
5.0 H
1.0
0.3 H
0
1.5 H
0
0.15
0 -
0.45"
0
0.75
0 "
X x
J§a
£ LtL
0.1 0.5
I
x
n f f i riififljl
i t n i C l J l 5 24
Time after injection (h)
Spleen
Kidney
Small intestine
Lung
Heart
Brain
Muscle
Skin

181.
Tab le 4 : 3 .
S i g n i f i c a n c e va lues (S tuden ts ' t ' - t e s t ) f o r t h e compar ison o f
means between f r e e and en t rapped d rug c o n c e n t r a t i o n s i n t i s s u e s .
*"^In-Bleomycin.
TISSUE Time after Injection
5' 30' 120' 5h. 24h. 48h.
Spleen < 0. 001 < 0.001 < 0. 001 < 0 001 < 0.01 < 0. 001
Kidney < 0. 001* <0.001* N/S* < 0 01* N/S < 0. 05
Small Gut N/S N/S < 0. 02 < 0 001 < 0.01 < 0. 001
Lung N/S < 0.002 N/S < 0 001 < 0.001 < 0. 001
Brain < 0. 05 < 0 . 0 2 < 0. 001 < 0 01 < 0.001 < 0. 001
Muscle < 0. 01* N/S* < 0. 001 < 0 01 < 0.001 N/S
Skin < 0. 01 N/S* N/S N/S < 0.01 < 0. 001
Bone N/S* N/S < 0. 01 < 0 .001 < 0.005 < 0. 01
Testes < 0. 05* N/S < 0. 001 < 0 .001 < 0.001 < 0 001
Thymus N/S N/S < 0. 05 < 0 .001 < 0.001 < 0 01
Free drug concentation (% injected dose/gm wet weight tissue) higher than entrapped drug concentration. Otherwise entrapped drug concentration is higher than free.
4 degrees freedom. N/S Not significant (p > 0.01).
182.
until after 30 minutes post-injection but thereafter it remained signi-
ficantly higher than the free drug; a similar picture was seen in the
muscle and testes although immediately after injection there were
significantly higher free drug concentrations in these tissues. In the
lungs there was a higher liposome localization of drug throughout the
period, this was significantly greater than the free drug levels at 30
minutes and again after 5 hours. Levels of entrapped drug in the brain
were significantly higher than the free drug thoughout the 48 hours
period.
A comparison of these results with the plasma clearance curve of 3
^3
In-BLM, free and entrapped, suggests that the decline in free drug
values in the tissues (e.g.: kidney, small intestine, lung, brain,
muscle and skin), especially during the first 2 hours post-injection,
was due to removal of free ^^In-BLM (or ^"^In-protein complexes) from
the circulation i.e. these levels can be due to blood contamination of
these organs. Localization of the drug in the tissues would be expected
to give plateau levels in the organs at least for some time after
injection and before metabolism and excretion of the radiolabel com-
menced. The free drug levels in the skin, muscle, brain and perhaps
lung tissue during the period 2-24 hours may reflect these genuine
uptake levels, the plasma concentration of free ^"^"^In-BLM is relatively
constant over this period and so these tissue levels may be due to
radiolabel in the plasma or tissue fluids.
The liposome radiolabelled uptake by many of the tissues also
mirrors the plasma concentration (e.g.: brain, testes, thymus) and is
probably due to blood contamination of the tissues. However, since the
"^^In label leaks from the vesicles, it is difficult to descriminate
between genuine tissue localization of liposome-entrapped "^In-BLM and
the combination of free (protein bound) " " In and liposomal drug.
In four cases (spleen, small intestine, lung and bone (not shown))
there appears to be increasing tissue uptake of radiolabel associated
with the liposome carrier; this is most marked in the spleen and small
intestine. In the lungs the initial localization may be due to larger
liposomes, which are cleared from the plasma first, and the later
concentration due to smaller liposomes alone or in combination with
protein-bound leaked radiolabelled.
125 iib)
3
I-BLM (ICL). (fig. 4:3, table 4:4)
125 The levels of liposome associated I-BLM (ICL) in the spleen,

183.
Legend F i g . 4 : 3 .
125 Uptake o f I - b l e o m y c i n ( i o d i n e m o n o c h l o r i d e ) i n t o t i s s u e s .
125
Free (closed bars) or entrapped (open bars) I-BLM(ICL) was in-
jected I/V into rats (see table 4:1 for details of doses). The histo-
gram shows the percentage of the injected dose associated with each
gram of tissue at timed intervals after injection.
Each bar represents the mean (+ st. dev.) from 3 animals.
125l-labelled Bleomycin (ICL)
•o
1.25
0
4.5 i
0
0.15 H
0
0.75 H
0
0.45 i
0
0.075 i
0
0.15 i
0
0.4
0
X
m n I
E d i
X X
m
m .
X J U l jEL
j L a J±] C&-
X
^ J X mrh f^n
ix,
0.1 0.5 1 2 5 24
Time after injection (h)
Spleen
Kidney
Small intestine
Lung
Heart
Brain
Muscle
I
ilL x skin
r~f~l r-Tl -J~l

184.
Tab le 4 : 1 .
Significance values (Students 't'-test) for the comparison of means between free and entrapped drug concentrations in tissues.
125 I-Bleomycin (ICL).
TISSUE Time after Injection
5* 30' 60' 120' 5h. 24h. 48h.
Spleen <0.001 <0.005 <0.001 <0. 001 <0.001 <0.001 <0.01
Kidney <0.02" <0.05" N/S" <0. 02" N/S" N/S" <0.02"
Small Gut <0.005 <0.05 <0.02 <0. 001 <0.001 <0.005 <0.001
Lung <0.05 <0.01 <0.005 <0. 005 <0.001 <0.001 <0.002
Heart N/S <0.002 <0.001 <0. 001 <0.02 N/S <0.01
Brain <0.05 <0.001 <0.01 <0. 001 N/S N/S <0.01
Muscle <0.05" N/S" <0.005 N/S N/S N/S <0.01
Skin N/S" N/S" <0.05 N/S N/S <0.01 N/S
Free drug concentation (% injected dose/gm wet weight tissue)
higher than entrapped drug concentration. Otherwise entrapped
drug concentration is higher than free.
4 degrees freedom. N/S Not significant (p > 0.01).

185.
small intestine and lung were significantly higher than the free drug
levels throughout the 48 hour period. As in the previous experiment 111
( In-BLM) the levels of the free drug were consistently higher than
the entrapped drug in the kidneys although these differences were not
always significant. In the muscle and skin tissue the drug levels were
very similar at all time intervals although some differences were found
to be significant, notably at 1 hour post-injection where liposome drug
was higher than the free.
Tissue concentration of the liposome entrapped drug in the heart
and brain were usually higher than the corresponding free drug levels
but, at least in the brain, these levels were not maintained over time.
The plasma clearance of ICL-labelled BLM showed a rapid removal of
the free drug compared to the entrapped species. This removal is paral-
leled in the falling free drug concentrations in all the tissues
studied. However, although a similar fall was seen in the tissue levels
of the entrapped drug (e.g.: brain, muscle, skin and perhaps heart),
the other tissues exhibited levels of radiolabel which suggest that
tissue location of liposomes is taking place (i.e.: especially the
spleen but also small intestine and lungs).
l l c ) 1 2 5
I-BLM (B/H). (fig. 4:4, table 4:5)
Distribution of this radiolabelled BLM was similar to that of
ICL-BLM. Some notable exceptions were seen however. In the muscle and
skin differences between free and entrapped drug were much more signi-
ficant so that, unlike the levels in the heart, brain and kidney, the
liposomes appear to be preferentially locating in the former tissues.
Distribution into the spleen, small intestine and lung (at early time
points) also represent localization.
The leakage of a n (
j radiolabels from liposomes has
already been commented upon (fig. 2:2, section 3:2). In the plasma
clearance of free 1 2 5
I-BLM (ICL) and 1 2 5
I-BLM (B/H) it was shown that
there was no significant difference between these levels during 24
hours. A similar comparison of means was made between the levels of
both free drugs in the tissues. No significant difference was found in
the free drug levels in the spleen, small intestine, heart, brain,
muscle or skin at any time. However, in the kidney there were signifi-1 25
cantly higher amounts of free I-BLM (B/H) (p < 0.01-0.001) than free 125
I-BLM (ICL) at 30, 60 and 120 minutes after injection. Similarly, in
the lung the values of the B/H - BLM were significantly higher at 5 and
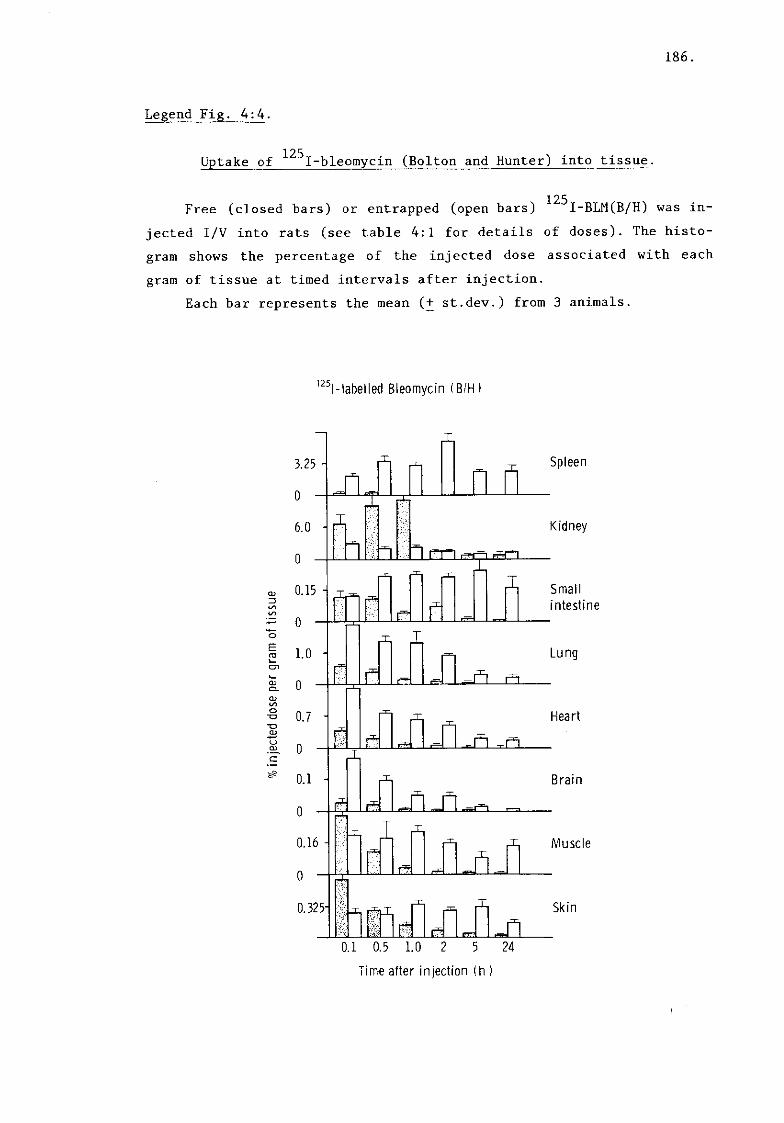
186.
Legend fig. 4:11.
125 Uptake of I-bleomycin (Bolton and Hunter) into tissue.
125
Free (closed bars) or entrapped (open bars) I-BLM(B/H) was in-
jected I/V into rats (see table 4:1 for details of doses). The histo-
gram shows the percentage of the injected dose associated with each
gram of tissue at timed intervals after injection.
Each bar represents the mean (+ st.dev.) from 3 animals.
125 I - label led Bleomycin (B/H
a
3.25 -
0
6.0
0
0.15 H
0
1.0
0
0.7
0
0.1
0
0.16 -I
0
0.325H
J l
n n
I
H m f^rp
X
JO
X
a .
X. ph
ffs —
x fi ^ n
J l J l
I
X X
M - D . 0.1 0.5 1.0 2 5 24
Time after injection (h )
Spleen
Kidney
Small intestine
Lung
Heart
Brain
Muscle
Skin

187.
Table 4:5.
Significance values (Students 't'-test) for the comparison of means between free and entrapped drug concentrations in tissues.
125 I-Bleomycin (B/H).
TISSUE Time after Injection
5' 30' 60' 120' 5h. 24h. 48h.
Spleen <0. 002 <0.001 <0.001 <0. 001 <0. 001 <0. 005 <0 001
Kidney <0. 05 <0.0l" <0.00l" N/S N/S N/S <0 002"
Small Gut N/S <0.001 <0.001 <0. 001 <0. 005 <0. 005 <0 001
Lung <0. 001 <0.001 <0.01 <0. 001 <0. 005 <0. 01 <0 005
Heart <0. 001 <0.001 <0.001 <0. 001 <0. 002 <0. 002 <0 001
Brain <0. 002 <0.002 <0.001 <0. 001 <0. 001 <0. 002 <0 05
Muscle <0. 01" N/S <0.001 <0. 001 <0. 002 <0. 005 <0 .01
Skin <0. 00 r N / s " <0.005 <0. 001 <0. 002 <0. 001 <0 .001
Free drug concentation (% injected dose/gm wet weight tissue)
higher than entrapped drug concentration. Otherwise entrapped
drug concentration is higher than free.
4 degrees freedom. N/S Not significant (p > 0.01).
188.
30 minutes post-injection (p < 0.002 and 0.05, respectively). In a
comparison of means between the tissue distribution of free "^In-BLM 125 111
and I-BLM (B/H), it was found that the In label tissue levels 125
were significantly higher that the I label in all comparable tissues
at most times after injection (overall p < 0.01). Exceptions to this
were found during the first 30 minutes post-injection, where the kidney
and brain the differences were not significant.
In comparison of the liposome entrapped BLMs, the B/H labelled BLM A 111
was compared with the ICL labelled and the In-BLM material. These
results are shown in table 4:6. The B/H material was chosen as the
standard since in general its tissue values fall between the ICL mate-
rial (lowest) and the " "'"In material (highest). The table demonstrates
that the distribution of the three radiolabels were not the same in the tissues studied. In the small intestine, heart, brain, muscle and skin
125 the two I-labelled species have a similar distribution over time although some statistical differences were found. The distribution of
125 the indium labelled material in these tissues was similar to the I-labels but it gave consistently higher amounts of radiolabel. In the
125 111 kidney the levels of B/H- I and In are similar during the first 5
hours post-injection and both of these are very much higher that the 125
entrapped ICL- I levels. This fact, taken in conjunction with the
levels of the free drug in this tissue, tends to suggest that the B/H
material might also leak or loose its radiolabel as has been shown for 111
the In label. The levels of the entrapped compounds in the spleen,
which is known to concentrate liposomes, were lower in the case of 125
I-BLM (ICL) than the other two labels and, initially, these latter
two labels were not very different from each other. Of course, these
differences need not necessarily reflect leaked material but may also
reflect differences in the size of the liposomes in the population
injected. In this respect the lungs, which, like the spleen, take up
more of the larger liposomes (see discussion) showed some similarities 125 111
between the two I-radiolabelled whilst the In labelled liposomes 111 125
were somewhat different ( In higher than I).
In summary, the injection of liposomes containing radiolabelled
bleomycin into rats shows that higher amounts of radiolabel can be
found in the spleen, small intestine and lung than for the free drug;
these levels probably reflect drug uptake rather than blood contamina-
tion. Conversely, the free drug levels in the kidneys and perhaps
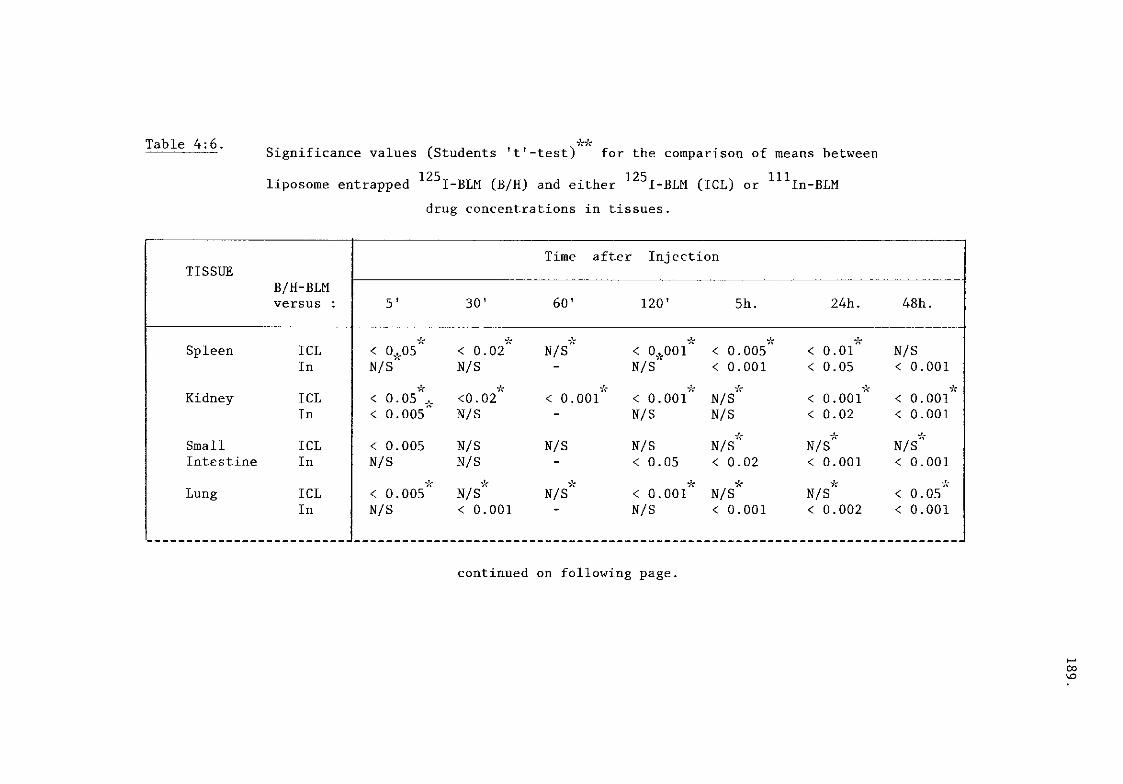
Table 4.6. Significance values (Students 't'-test) for the comparison of means between
liposome entrapped 1 2 5
I-BLM (B/H) and either 1 2 5
I-BLM (ICL) or m
i n - B L M
drug concentrations in tissues.
TISSUE B/H-BLM versus :
Time after Injection TISSUE
B/H-BLM versus : 5 30' 60' 120' 5h. 24h. 48h.
Spleen ICL < 0^05" < 0.02" N/S" < 0^001" < 0 .005" < 0 .01" N/S In N/S N/S - N/S < 0 .001 < 0 .05 < 0.001
Kidney ICL < 0 05 X <0.02" < 0. 001" < 0. OOl" N/S' c
< 0 .00l" < 0.001" In < 0 005 N/S - N/S N/S < 0 .02 < 0.001
Small ICL < 0 005 N/S N/S N/S N/S' \
N/S' \
N/S" Intestine In N/S N/S - < 0. 05 < 0 .02 < 0 .001 < 0.001
Lung ICL < 0 005" N/S" N/S" < 0. OOl" N/S' c
N/S' c
< 0.05" In N/S < 0.001 N/S < 0 .001 < 0 .002 < 0.001
continued on following page.

Table 4:6. (continued)
TISSUE B/H-BLM versus :
Time after Injection TISSUE
B/H-BLM versus : 5' 30' 60' 120' 5h. 24h. 48h.
Heart ICL < 0.002" N/S" N/S" < 0.05" N/S N/S N/S
Brain ICL N/S" N/S" N/S" .X.
N/S" N/s' N/S' N/S" In N/S < 0 . 0 2 - < 0.001 < 0 .001 < 0 .001 < 0.001
Muscle ICL N/S" N/S" < 0 . 0 2 < O.OOl" < 0 .05" N/S \
N/S" In N/S N/S - < 0.001 < 0 .002 < 0 .05 N/S
Skin ICL < 0^05 N/S N/S N/S" N/S' V N/S N/S" In N/S N/S - < 0 . 0 5 N/S N/S N/S
125 * I-BLM (B/H) tissue concentration higher than comparative drug concentration.
Otherwise it is lower *"* 4 degrees freedom. N/S Not significant (p > 0.01).
NO o

191.
muscle and skin are higher than the liposome entrapped drug levels.
Other tissues, e.g.: heart and brain, have drug levels which reflect
the plasma concentration either the free or the entrapped drug.
iii) Asparaginase. (fig. 4:5, table 4:7).
The values in fig. 4:5 are for the total radioactivity of ASPase
(TCA precitatable material not tested). The results of the ' t' test
comparisons are shown in table 4:7 (48 hours time points also included)
The tissue distribution of free and entrapped ASPase showed marked
differences from the ACT-D and BLM results. The major difference was
the fact that the free drug levels were always higher than the entrap-
ped levels in all tissued throughout a 48 hour period. At periods more
than five hours after injection, the majority of tissues (except spleen
and kidney) did not show any significant differences between the two
preparations.
For the free drug the lung, heart, brain, skin and kidney levels
of the radiolabel probably reflect the plasma concentrations of the
drug in that they fall with time. However, the spleen, small intestine
and muscle tissue levels may represent localization of the drug in
these tissues. It might be expected that the very rapid initial plasma 125
clearance of aggregated I-ASPase (which might be reflected in high
levels in the reticuloendothetial system) would also give high initial
levels in the spleen. However, the spleen levels do not reflect this
but continue to rise up to 2 hours post-injection : this uptake is re-
flected, to a certain extent, in the lungs at 5 minutes. In general,
the higher free drug levels of ASPase are probably due to the longer
plasma half-life of this protein in comparison to the liposomes.
In the case of the carrier, the liposomal ASPase was found to be
markedly different from the BLM results discussed previously. In the
spleen, kidney, lung^heart and brain, the liposome levels appear to
fall over time and probably reflect the plasma concentration of the en-
trapped drug. Some localization of the entrapped drug (or radiolabel)
in the small intestine, muscle and perhaps skin may have o c c u ^ d .
The reasons for the differences between drugs are not at all
clear, the proportion of the injected liposomal ASPase associated with
the spleen, kidney, lung and brain are much lower than those found for
ACT-D, 1 2 5
I - B L M (B/H) and m
i n - B L M but not significantly different 125
(overall p < 0.05) from those of I-BLM (ICL). It is possible that

192.
Legend fig. 4:11.
125 Uptake of I-Asparaginase into tissues.
125
Free (closed bars) or entrapped (open bars) I-ASPase was in-
jected I/V into rats (see table 4:1 for details of doses). The histo-
gram shows the percentage of the injected dose associated with each
gram of tissue at timed intervals after injection.
Each bar represents the mean (+ st.dev.) from 3 animals.
125l - labelled Asparaginase
T T
Spleen
Kidney
Small intestine
Lung
Heart
Brain
Mu scle
Skin
0.1 0.5 1 2 5 24
Time after injection (h)

193.
Table 4:7.
Significance values (Student's 't'-test) for comparisons of means between free and entrapped drug concentrations in tissues.
125 I-Asparaginase.
TISSUE" Time after Injection
5' 30' 60' 2h. 5h. 24h. 48h.
Spleen N/S N/S N/S <0. 01 <0.05 <0.02 N/S
Kidney <0.001 <0.05 <0.05 <0. 001 <0.02 <0.02 <0.001
Small Gut N/S <0.02 <0.01 <0. 02 N/S N/S N/S
Lung <0.005 <0.001 N/S <0. 01 N/S N/S N/S
Heart <0.005 <0.02 <0.05 <0. 02 <0.01 N/S N/S
Brain <0.05 <0.002 N/S N/S N/S N/S N/S
Muscle <0.05 <0.02 N/S <0. 01 N/S N/S N/S
Skin <0.001 N/S N/S N/S N/S N/S N/S
Free drug levels higher than entrapped drug levels at all times
and in all tissues.
4 degrees freedom. N/S Not significant (p > 0.1).

194.
the liposome-ASPase preparation contained higher proportions of SUVs
than the other preparations, this would account for the lower spleen
and lung levels, but is similarity to the BLM-ICL preparation (which
was cleared fastest from the plasma) suggest that this may not be the
entire explanation. The possibility of ASPase (or radiolabel) leakage
from the liposomes cannot be ruled out although substantial leakage
(eg: destruction of the liposomes in the plasma) could be expected to
produce very different tissue distributions into most tissues (es-
pecially kidney and lung) at early times post-injection. A possible
explanation for the lack of uptake of entrapped ASPase (by the spleen
especially) is that the presence of entrapped protein in (or on) the
liposome surface may be preventing the interactions of the vesicles
with other plasma components or causing the carrier to be "directed" to
other sites (e.g.: other body fluids).
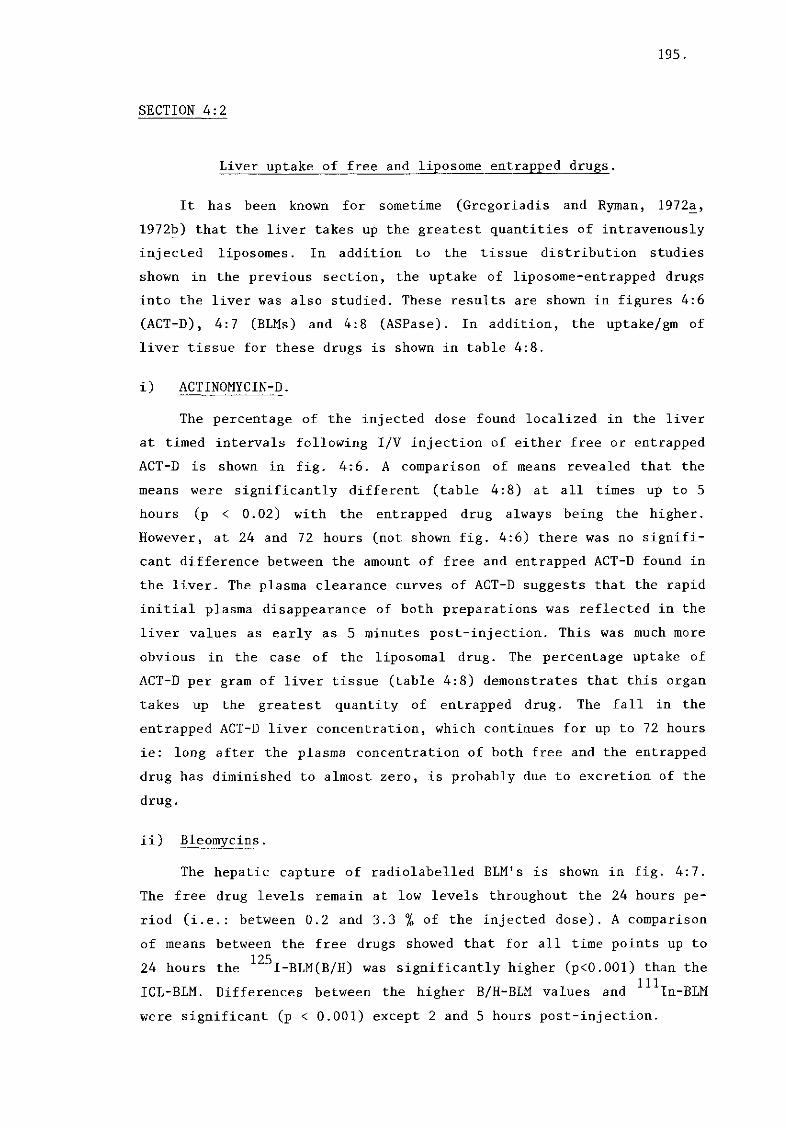
195.
SECTION 4:2
Liver uptake of free and liposome entrapped drugs.
It has been known for sometime (Gregoriadis and Ryman, 1972a,
1972b) that the liver takes up the greatest quantities of intravenously
injected liposomes. In addition to the tissue distribution studies
shown in the previous section, the uptake of liposome-entrapped drugs
into the liver was also studied. These results are shown in figures 4:6
(ACT-D), 4:7 (BLMs) and 4:8 (ASPase). In addition, the uptake/gm of
liver tissue for these drugs is shown in table 4:8.
i) ACTINOMYCIN-D.
The percentage of the injected dose found localized in the liver
at timed intervals following I/V injection of either free or entrapped
ACT-D is shown in fig. 4:6. A comparison of means revealed that the
means were significantly different (table 4:8) at all times up to 5
hours (p < 0.02) with the entrapped drug always being the higher.
However, at 24 and 72 hours (not shown fig. 4:6) there was no signifi-
cant difference between the amount of free and entrapped ACT-D found in
the liver. The plasma clearance curves of ACT-D suggests that the rapid
initial plasma disappearance of both preparations was reflected in the
liver values as early as 5 minutes post-injection. This was much more
obvious in the case of the liposomal drug. The percentage uptake of
ACT-D per gram of liver tissue (table 4:8) demonstrates that this organ
takes up the greatest quantity of entrapped drug. The fall in the
entrapped ACT-D liver concentration, which continues for up to 72 hours
ie: long after the plasma concentration of both free and the entrapped
drug has diminished to almost zero, is probably due to excretion of the
drug.
ii) Bleomycins.
The hepatic capture of radiolabelled BLM's is shown in fig. 4:7.
The free drug levels remain at low levels throughout the 24 hours pe-
riod (i.e.: between 0.2 and 3.3 % of the injected dose). A comparison
of means between the free drugs showed that for all time points up to 125
24 hours the I-BLM(B/H) was significantly higher (p<0.001) than the
ICL-BLM. Differences between the higher B/H-BLM values and 1 1 3
In-BLM
were significant (p < 0.001) except 2 and 5 hours post-injection.
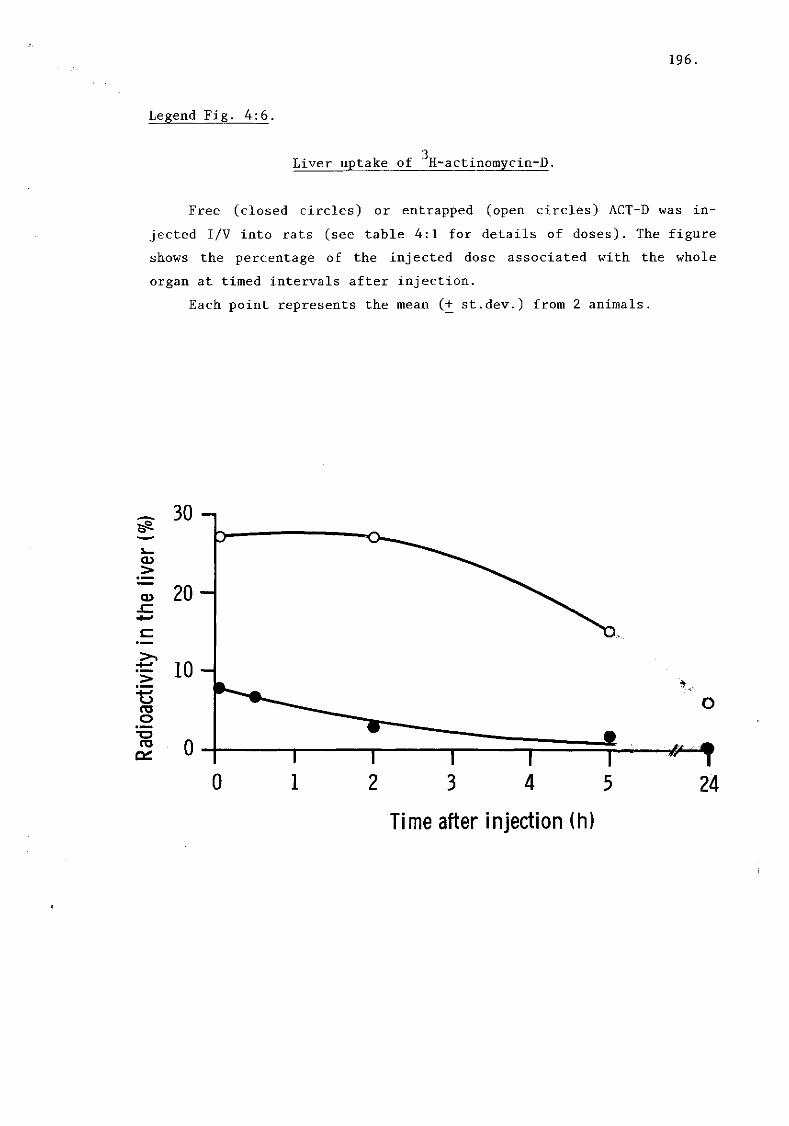
196.
Legend fig. 4:11.
125 Liver uptake of H-actinomycin-D.
Free (closed circles) or entrapped (open circles) ACT-D was in-
jected I/V into rats (see table 4:1 for details of doses). The figure
shows the percentage of the injected dose associated with the whole
organ at timed intervals after injection.
Each point represents the mean (+ st.dev.) from 2 animals.
_ 3 0 -n
3 4 5
Time after injection (h)

197.
The hepatic uptake of the liposome entrapped drugs was signi-
ficantly different (p < 0.001) from their appropriate free drug levels 111
at all times. The uptake of In-BLM was significantly higher (p < 125
0.001) than that of the I-labelled BLMs at all times after 5 minu-
tes. A comparison of the means between the two radioiodinated species
was made and this showed that these entrapped drugs did not have signi-
ficantly different liver uptakes except at 1 and 2 hours post-injection
when the ICL-BLM was significantly higher (p < 0.01, < p 0.001 res-
pectively) . The data on the comparisons between the free and entrapped
species (mean % injected dose/gm liver) is shown in table 4:8.
In general, all the entrapped BLMs demonstrated a rapid initial
uptake to give high levels in the liver. These levels remained elevated
for up to 48 hours post-injection. Peak values did not occur at the
same time for all the preparations and were probably determined by the
proportion of SUVs in the injected preparation and the amount of drug
leakage from the liposomes. The peak levels were obtained at 2 hours 111
for ICL-BLM and 5 hours for In-BLM and B/H-BLM. The fall from the
peak levels was attributable to drug metabolism (i.e.: loss of radio-
label from the drug but not necessarily total breakdown of the BLM nu-
cleus) and excretion.
The higher level of liposomal "^In-BLM in the liver may be due to
the fact that leaked radiolabel escaping from liposomes in the cir-
culation will bind to plasma proteins; these newly-labelled proteins
may also be removed into the liver (see section 4:4), whereas leakage 125
of I-radiolabelled drugs from liposomes probably leads to urinary
excretion. iii) Asparaginase.
125
As may be seen in fig. 4:8, the capture of I-ASPase entrapped
in liposomes was very similar to the uptake of the free drug and dif-
ferent from the liver uptake seen using other liposome-entrapped
agents. In the figure the circles represent the material precipitatable
by trichloroacetic acid (TCA) whilst the squares represent the total 125
I counts. The liver concentration of both the free drug and the
entrapped drug paralleled the plasma clearance curves with the highest
amounts of drug being found at 5 minutes post-injection (c.f. BLMs :
fig. 4:7). This uptake suggests that either the liver levels were due
to blood contamination or that if uptake had occured the protein and/or
its radiolabel were rapidly excreted. A comparison of means between

198.
Legend fig. 4:10.
Uptake of Bleomycins by the liver.
Details of doses are given in table 4:1. Animals were injected I/V
with i) free (closed squares) or entrapped (open squares) ^^In-BLM.
125 ii) free (closed triangles) or entrapped (open triangles) I-BLM-ICL.
125 iii) free (closed circles) or entrapped (open circles) I-BLM-B/H.
The figure shows the percentage of the injected dose associated
with the liver at timed intervals after injection. Each point repre-
sents the mean (+ S.E.) from 3 animals.
Time after injection (hours)

199.
free and entrapped drug levels in the normal material (not shown) and
in the TCA precipitatable (TCA pptable) material (table 4:8) demons-
trated that the liposomal hepatic levels were significantly higher than
the free drug levels during the first hour after injection but not 125
thereafter. In addition, a comparison of means between the I counts 125
per gm liver and the TCA I counts showed that these were not signi-
ficantly different at any time for the livers from the liposome treated 125
animals. However, in the free drug treated animals, the total I counts were significantly higher (p < 0.05 - 0.002) than the TCA ppt
counts at all time intervals except 24 and 48 hours post-injection. The 125
free I-ASPase, which is rapidly cleared from the circulation, ap-
pears to loose its radiolabel in the liver but this may also be due to
uptake of free radiolabel from the plasma at 1 to 5 hours post-in-125
jection although free I would normally be expected to be excreted in
the urine or concentrated in the thyroid gland (Welt and Blythe, 1965).
The liposome preparation, although also rapidly cleared, protects the
entrapped ASPase from loss of radiolabel but its localization in the
liver is not as great as other liposome drugs. Indeed because they
contain a protein these liposomes may not localize in the liver to any
great extent. Taken with the data presented on the tissue distribution
of ASPase (fig. 4:5), these results suggest that liposomal ASPase is
localizing at other sites (eg: small intestine, muscle and perhaps
skin) or in other fluids. Since its distribution to other organs is not
different from the free drug, it seems possible that the presence of
the entrapped protein could be determining the distribution of the li-
posomes. An alternative explanation may be that these vesicles are less
stable in the plasma than other drug-containing liposomes. In the plas-
ma, liposomes did not loose radiolabelled ASPase until about 2 hours
post-injection and after 24 hours this loss no longer occuij^d. In the
liver, the uptake of liposomes was only significantly different from
the free drug up to 1 hour after injection although the liposomes which
are removed from the plasma protected the entrapped protein from loss
of label. In view of the clearance kinetics of different sized liposo-
mes , these data imply that it is the SUV population which is unstable
whilst the MLV population stays relatively more intact.
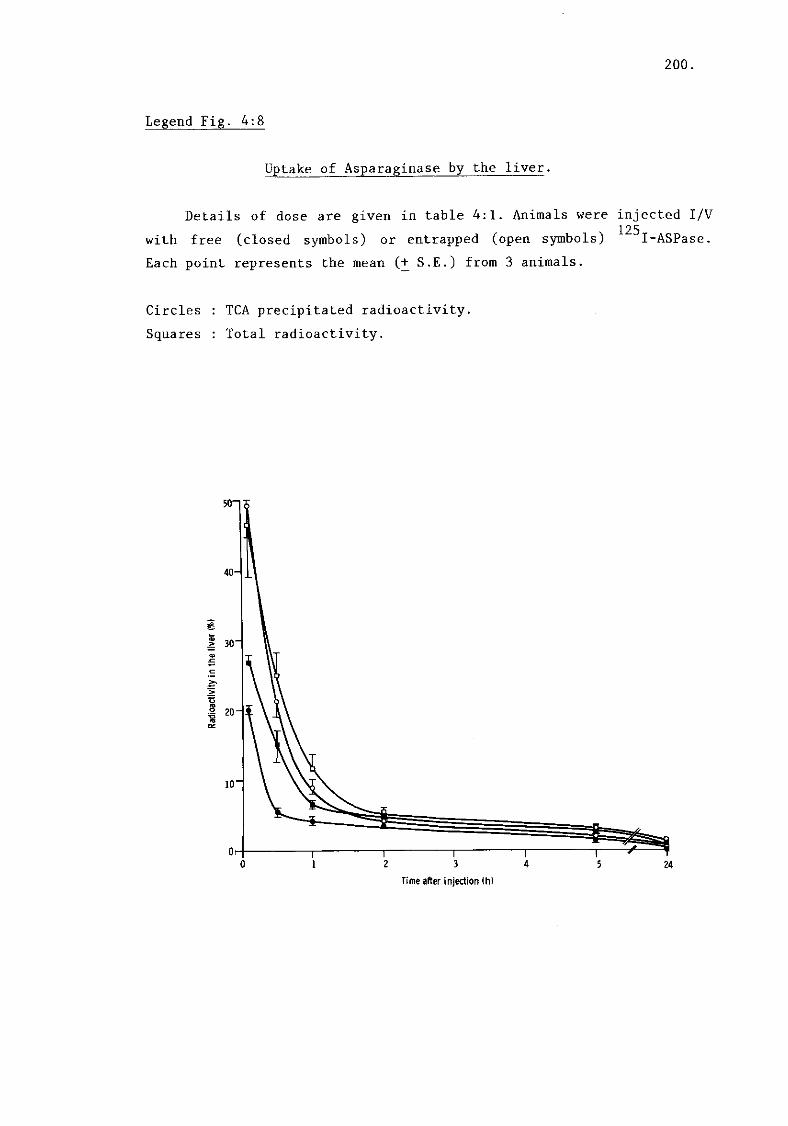
200.
Legend fig. 4:10.
Uptake of Asparaginase by the liver.
Details of dose are given in table 4:1. Animals were injected I/V
125
with free (closed symbols) or entrapped (open symbols) I-ASPase.
Each point represents the mean (+ S.E.) from 3 animals.
Circles : TCA precipitated radioactivity.
Squares : Total radioactivity.
Time after injection (h)

Table 4 :8 . Hepatic uptake of free and entrapped agents following I/V injection.
Preparation Mean % injected dose/gm liver (significance between entrapped and free drug)
F = Free drug E = Entrapped
drug
Time after Injection F = Free drug E = Entrapped
drug 5' 30' 60' 120' 5h. 24h. 48h.
ACT-D
111 In-BLM
125 I-BLM (ICL)
125 I-BLM (B/H)
125,
F E P =
F E P =
F E P =
F E P =
I-ASPase F E
(TCA.ppts ) p =
2.091 1.85 6.158 4.32 (<0.02) (<0.005)
0.295 0.145 2.43 7.32 (<0.001) (<0.001)
0.265 0.121 0.052 2.458 4.037 5.388 (<0.001) (<0.001) (<0.001)
0.554 0.388 0.326 1.912 3.171 3.536 (<0.002) (<0.002) (0.001)
3.288 0.946 0.724 9.456 3.372 1.510 (<0.002) (<0.005) (<0.02)
1.402 0.489 0.128 0.041 4.606 3.987 1.491 0.395 (<0.002) (<0.005 (N/S) (N/S)
0.156 0.191 0.244 0.260 8.178 9.238 8.192 9.548 (<0.001) (<0.001) (<0.001) (<0.001)
0.0057 0.050 0.047 0.042 6.199 5.56 3.391 1.944 (<0.001) (<0.001) (<0.001) (<0.001)
0.236 0.187 0.087 0.052 3.725 4.519 2.745 1.601 (<0.001) (<0.001) ( 0 . 0 0 1 ) ( 0 . 0 0 1 )
0.645 0.297 0.073 0.063 0.685 0.371 0.130 0.091 (N/S) (N/S) (N/S) (N/S)
202.
Section 4:3.
Discussion of tissue distribution.
A) Free drugs.
i) Actinomycin-D.
The tissue distribution of radiolabelled ACT-D has been extensi-
vely studied by Schwartz and co-workers (Schwartz et al, 1968a; 1968b)
and others (Ro and Busch, 1965; Galbraith and Mellet, 1975; Kaye et al,
1981). From these studies and those of others (Weissbach et al., 1966)
there is no evidence that the drug can be metabolised or altered
in vivo.
Following the rapid plasma clearance of an I/V injected dose into
rats, a significant proportion of the drug (15-20 % of the injected
dose in 24 hours) is excreted in the urine, further large quantities
(up to 30 % of the injected dose in 4 hours) are secreted into the bile
(Schwartz et al., 1968a). This biliary ACT-D appears to originate in
the liver because the transport of the drug from the small intestine
via the entro-hepatic circulation is limited. This means that the liver
has an efficient excretory mechanism and indeed may compartment ACT-D
intracellularly to reduce damage to vital functions and enhance biliary
excretion (Schwartz et al, 1968a). Moreover, this also means that the
liver is not a good site as a depot for re-release of ACT-D after
uptake: pace Kaye et al, (1981).
The rapid plasma clearance of ACT-D also ensures that one hour
after injection all the tissues have drug concentrations exceeding the
blood levels (Schwartz et al, 1968a, 1968b) and this is confirmed in
the tissues examined in this work and by Kaye et al. (1981). The prin-
cipal organs involved in the uptake of free ACT-D in this present work
were found to be the spleen (highest uptake per gm tissue) > kidney (up
to 2 hours post-injection) > lung > liver and small intestine (these
latter two tissues were equal initially but the intestine retained the
drug longer). A similar order of distribution was found by Kaye et al.
(1981) and Schwartz et al. (1968a, 1968b). Using l 4
C-ACT-D Ro and Busch
(1965) found higher levels in the kidney and liver than in the spleen
at 15 minutes after injection but this was not confirmed in these
studies since the splenic uptake was consistently the highest even 5
minutes after injection. The amount of ACT-D found by Kaye et al.
(1981) to be sequestered in the spleen, liver, lungs kidney and small

203.
intestine was not reproduced in this study, these authors found more
than twice as much drug per gram of tissue in nearly all the tissues
they studied at both 3 hours and 24 hours after injection. These dif-
ferences are probably due to the fact that Kaye et al. (1981) and
Schwartz et al. (1968b) used mice for their studies. Mice are much less
susceptible than rats to the toxic effects of ACT-D (ED^Q : mice 1.2
mg/kg - rats 0.6 mg/kg) (Schwartz et al. , 1968a) and the same authors
have found differences in ACT-D localization between certain rat and
mouse tissues. Moreover, using rats, Ro and Busch (1965) found quite
similar levels to those of this study 15 minutes after injection.
The toxicity of ACT-D has been equated with the drug concentration
and the time during which susceptible tissues remain in contact with
toxic levels of drug (Schwartz et al. , 1968b). Tissues which normally
undergo cell proliferation as part of their function can be targets
for both chemotherapy and toxicity. In the case of spleen, thymus and
bone marrow, a reduction in organ size has been reported following a
single I/V injection of 0.4 mg/kg ACT-D into rats; this is further
reflected in a progressive depletion of blood cells during the follow-
ing 6 days (Schwartz et al. , 1968a; Rahman et al. , 1978). The small
intestine concentrates free drug to reach a plateau level after 30
minutes (Schwartz et al. , 1968; Rahman et al. , 1975 and this work) and
this level is maintained for some time (3-4 hours), such a period is
long enough to effect the proliferative cells of mucosa.
In a study of other tissues Ro and Busch (1965) showed that both
testis and brain took up lower amounts of ACT-D at 15 minutes than
those found in the brain in this study, the reasons for this difference
are not clear but in mice Rahman et al. (1975) found similar amounts of
ACT-D in the brain as was found in this study.
In general, therefore, the distribution of free ACT-D in rat tis-
sue presented here is not substantially different from the data of
others. Most authors agree that the highest uptake is to be found in
the spleen, liver, small intestine and lung tissue and that is con-
firmed in these studies.
ii) Bleomycins.
The use of BLM as a tumour imaging agent (Rasker et al., 1975) has
meant that tissue distribution studies have been performed in both rats
and mice as well as humans. Only those studies which have administered
the drug by intravenous injection will be considered here.

204.
In mice (Konikowski et al. , 1977) more than 75 % of a "^^In-BLM
injection was excreted in the urine in 2 hours whilst in man (Rasker
et al. , 1975) urinary output of cobalt-labelled BLM accounted for
almost 90 % of the injected dose in a 72 hour period with 54 + 20 % of
unmetabolised drug excreted in the first 6 hours. The excretion of 111
In-BLM in mice is likely to reflect labelled drug rather than re-
leased ^^"^In radiolabel because not only is the plasma clearance of
slower than that of the labelled drug (Robbins et al. , 1974;
Konikowski et al., 1977) but similar excretion rates have been measured
for the unlabelled drug by bioassay procedures (Ohnuma et al., 1974).
Several publications have reported that BLM can be inactivated by
enzymes in tissues (Miiller et al. , 1972; Umezawa, 1974; Ohnuma et al. ,
1974; Onishi et al. , 1975). The enzyme responsible can be found in the
cytoplasm of almost all rat tissues; high activity occurs in the small
intestine, kidneys, liver, spleen (highest) and brain whilst skin,
muscle and uterine tissue have low or absent levels, some inactivation
occurs when the drug is in contact with plasma, erythocytes, lung and
pancreatic tissues. The activity of the enzyme appears to be restricted
to the terminal amidfe group of BLM and so it is similar to an aminopep-
tidase; (Umezawa, 1974).
Following I/V injection, the tissues which took up the maximum 3
amount of H-radiolabelled BLM in rats were kidneys > liver > lung >
intestine > spleen and heart >> muscle and skin (Ryo et al. , 1975).
Over a 72 hour period the order of uptake remained the same but the
levels fall in all tissues except the kidneys. Much higher overall
radioactivity was found by Hayakawa et al. , (1974) in mouse tissues 14
following the administration of C-BLM but bioassays for tissue loca-
ted drug revealed much reduced levels of actual drug in most tissues
especially in the kidneys and liver label on amino groups). In 125
general, the distribution of I-labelled BLMs found in this study was similar to that of H-BLM in rats (Ryo et al, 1975). Some important
exceptions were seen, B/H-BLM had similar kidney concentrations to the 3 H-BLM but ICL-BLM was lower. Much higher levels of both iodinated
drugs were found in the skin and muscle tissue at all times post-in-3
jection than the H-BLM of Ryo et al. , (1975). Since these tissues do
not contain high levels of inactivating enzyme it is possible that
iodination has changed the tissue distribution of BLM, or that the 3
H-label is unstable, although some dissociation of the radiolabel from
BLM in the plasma is also possible (see section 3:1).

205.
Krohn et al. , (1977), using ICL-labelled BLM, have demonstrated
that its. tissue distribution in mice is similar to that found for both
the iodinated BLMs used in this study especially in the skin and
muscle tissue but the kidney distribution of their ICL-BLM was higher
than the ICL-BLM in this study and similar to the B/H-BLM. The reasons
for this difference are unclear.
The distribution of free ^^In-BLM has been studied by several
authors in mice but not in rats. There is general agreement that high
levels of radiolabel can be found in the kidneys at all times post-in-
jection (Robbins et al. , 1974; Konikowski et al. , 1975; Krohn et al. ,
1977) but these are much lower than the levels of ^^InCl^ (Robbins 111
et al., 1974). Uptake of In-BLM by the skin was significantly higher
in the work of Robbins et al.(1974) than that of the other authors, and
than that of the present study. However, since Ryo et al. , (1975) 3
demonstrated that in the rat skin concentrations of both H-BLM and
CU-BLM were the same, it seems possible that the higher 1 1 4
In-BLM le-
vels found in mice are due to species differences . The results of the 111
skin location of iodinated and In-labelled BLMs used in this study
appear to fall between the low levels of Ryo et al. , (1975) and the
almost 50 fold higher levels in mice. I l l
Similarly, higher levels of In-BLM were found in mouse liver,
spleen and small intestine than were found here where values for these
organs are not very different from the rat values of Ryo et al., (1975)
who used two differently radiolabelled BLMs. Data presented here on the
lung disposition agrees with that of Ryo et al. , (1975) in rats but it
is not similar to the studies of Krohn et al. , (1977) and Robbins
et al. , (1974) who found up to five fold higher levels in their mice;
these last authors also reported very much higher lung levels in mice 111 111
injected with InCl^. Levels of In-BLM found in the rat brain agree with the data of Krohn et al., (1977) in mice.
iii) Asparaginase.
Despite its clinical use as an antineoplastic agent, the tissue
distribution of I/V injected APSase has not been fully studied. Broome
(1968) reported that, following I/P injection of ASPase, mice retained
very small amounts of the drug in the blood and spleen whereas the
liver had five times more enzyme activity than untreated controls.
Putter (1970) concluded that ASPase could be found in the extravascular
spaces and in tissues following I/V injection into dogs. Furthermore,
206.
following I/P injection into mice this author reported maximum tissue
uptakes 90 minutes post-injection. At this time the blood contained
about 17.5 % of the injected dose whilst the uptake by other tissues
was : - spleen (6.6 % dose/gm) > kidney (4.5 %) > liver (4.2 %) > heart
muscle (2.2 %), skeletal muscle and brain tissue contained 0.8 and 0.2
% respectively. These levels are similar to those found in this study
for the liver, skeletal muscle and brain but not for the other tissues
examined. These results cannot, however, be directly compared since the
species and the route of administration were different from those of
this study.
A further consequence of the different plasma half-lives of ASPase
from different bacterial species (see chapter 3) was pointed out by
Hall (1970) who reported that, following I/V injections of ASPase into
sheep, the E.coli enzyme was found in high amounts in the lymph 30
minutes post-injection whereas only trace amounts of the Erwinia carp-
toVora enzyme were found in this fluid. Since the lymphatic drug con-
centration may determine the levels of the drug transported to other
tissues, it is clear that the origin of the ASPase will also effect the
tissue distribution.
In clinical studies, Schwartz (1970) failed to find a correlation
between plasma ASPase levels and therapeutic efficacy implying that the
lowering of plasma asparagine levels, which is known to occur following
I/V administration of the enzyme (Rudman et al. , 1971), may not be the
only mechanism of its action. Further, this author reported very low
levels of enzyme activity in cerebrospinal fluid and urine of patients
who had high plasma levels. Moreover, an examination of enzyme levels
in blood cells and in tissues at post-mortem failed to find significant
increases in ASPase content despite high plasma levels.
These data raise a further problem of interpretation of ASPase
results. Numerous studies (reviewed; Patterson, 1975) have reported
that the enzyme will inhibit protein and nucleic acid synthesis and
delay mitosis both in isolated cells and in vivo, however, since ASPase
will hydrolyse asparagine wherever it is found it is extremely diffi-
cult to separate the effects of low asparagine levels in tissue fluids
from the presence of intracellular ASPase. Thus, studies which show,
for example, supression of the functions of both B (bone marrow deri-
ved) and T (thymus derived) lymphocytes and transient necrosis of the
thymus, lymph nodes and spleen germinal centers following ASPase treat-
ment (Patterson, 1975), do not necessarily mean that the administered
207.
enzyme concentrates in these tissues.
Indirect evidence that the reticuloendothelial system (RES) is not
totally responsible for the removal of free ASPase from the circulation
comes from the work of Ho et al. , (1971) who could not find any change
in the plasma clearance of the enzyme when dogs and guinea pigs were
pretreated with the RES partial blocking agent Zymosan; but others
(Wriston and Yellin, 1973) reported a blockade of ASPase capture by
lymphoid tissue in mice pretreated with colloidal carbon or steriod
drugs. In the present study, mention has already been made (chapter 3)
of the tendency of ASPase to aggregate (Hall, 1970), the extent to
which this aggregation will alter the kinetics and distribution of the
free drug has not been assessed but it is likely that higher levels
than normal might be found in RES.
In summary, the data presented here on the tissue distribution of
free ASPase suggests that concentration in the liver, spleen and kid-
neys occurs; lower levels in the heart, skeletal muscle and brain were
found. The data is in general agreement with the published data al-
though additional localization of the drug in the small intestine,
lungs and skin of rats was also found here.
Factors which control the general uptake of proteins by tissues
are still the subject of investigation. Morell et al. , (1971) have
presented evidence of a general mechanism for the hepatic uptake of
glycoproteins and this has recently been further expanded by many
workers (Sly, 1980; Stahl and Schlesinger, 1980). The tissue uptake of
many proteins now appears to be mediated by carbohydrate moieties on
the proteins which interact with receptors on the surfaces of many
cells (particularly hepatocytes). However, the E.coli and the E.caroto-
yora enzymes probably do not contain carbohydrate (Patterson, 1975)
unlike the F.tricinctum enzyme, which its cleared very rapidly from the
plasma and is inactive against tumours.
B) Tissue distribution of liposome entrapped drugs.
The data of this study will be compared with published material
related to the same entrapped species (where this exists) and this will
be followed by a general discussion on the distribution of liposome
entrapped agents.
208.
i) Actinomycin D.
While this work was being carried out Rahman et al. , (1975) pu-
blished the results of a study on the tissue distribution of neutral
unsonicated liposomes containing ACT-D in the AP or LP. These studies
showed that ACT-D (AP) liposomes leaked drug faster than if the drug
was entrapped in the lipid phase. Consequently, the distribution of
ACT-D (AP) was not very different from the free drug in many tissues
and this preparation will not be further considered here. In agreement
with the present studies, using ACT-D (LP) in unsonicated MLVs Rahman
et al. , (1975) also demonstrated high entrapped drug levels in the
liver and spleen throughout a 48 hours period whilst the uptake by the
small intestine and kidneys was lower than the free drug. Unlike th.tst
data, however, these authors reported high liposomal ACT-D levels in
the lungs but this may be due to the larger size of their liposome pre-
paration (Hunt et al. , 1979). This size effect may also influence the
uptake by the brain since Rahman et al. (1975) found more than twice
the drug concentration in this tissue than was found in this present
study but drug leakage from liposomes is a more likely explanation.
In the liver Rahman et al. , (1975) found very similar levels of
liposomal ACT-D as is shown here except that the initial drug concen-
tration reached a value of close to 45% of the injected dose, moreover
after 24 hours the liver concentration had fallen to only 12 % (cf.
fig. 4:6 ; 5 %) this difference may be due to the larger size of the
population or to differences between mice and rats. These authors also
reported that the bone marrow concentrated liposomes a up to a maximum
of about 10 % of the injected dose at 24 hours post-injection.
Previously, Gregoriadis (1973b) had shown that ACT-D (LP) entrap-
ped in cationic liposomes was not concentrated in the rat small intes-
tine or kidney which results in this thesis confirm, however, the
hepatic uptake of these cationic liposomes did not exceed the free drug
until at least 20 minutes after injection, and this is not confirmed by
these results nor by the work of others (Rahman et al. , 1975). It is
unclear if this difference is due to the fact that cationic liposomes
are cleared more slowly than anionic ones (Gregoriadis and Neerunjun,
1974; Juliano and Stamp, 1975) or perhaps due to the presence of a
substantial population of SUVs in Gregoriadis's (1973b) preparation, as
is suggested from its plasma clearance curve.
Juliano and Stamp (1978) and Juliano et al. (1978) studied the
pharmacokinetics of ACT-D (LP) entrapped in cationic SUVs and found a

209.
similar distribution after 3 hours with these vesicles as was found
here; the main exception being that they found negligible levels of
entrapped drug in brain tissue. These authors also found that uptake
by cardiac and skeletal muscle was low in comparison to the free drug.
Finally, Kaye et al., (1981) have recently investigated the tissue
distribution and antitumour activity of ACT-D (LP) in small cationic
MLVs injected into mice. These authors found higher quantities of en-
trapped drug (per gm tissue) at all times (3-72 hours) than were found
in these studies with the exception of splenic tissue. Moreover, at all
times, all the tissues (apart from liver) had higher amounts of free
drug than entrapped drug and this is generally true of the results
presented here. Interestingly, these authors found that the level of
liposomal ACT-D in murine liver and spleen remains high for long pe-
riods and only falls to 50 % of its initial level after 7 days. A
similar effect was not seen in this study where the liver looses 50 %
of its initial level in about 6 hours. These authors were not able to
confirm the preferential uptake of liposomal ACT-D by the bone marrow
which had been reported by Rahman et al., (1975).
Several workers have studied the effects of liposome-entrapped
ACT-D against tumour cells. Papahadjopoulos et al., (1976) demonstrated
that anionic SUVs (ACT-D.LP) enhanced the uptake of drug into a cell
line which was resistant to ACT-D, thus overcoming its resistance.
Gregoriadis and Neerunjun (1975a) demonstrated that liposomal ACT-D
would prolong the survival time of tumour bearing mice beyond that
found with equivalent doses of free drug, and Rahman et al. , (1974)
found a similar effect in mice bearing a different tumour. However,
Kaye et al. , (1981) failed to find preferential (i.e.: > free drug)
location in vivo of liposomal ACT-D in a tumour sensitive to the drug
or in a resistant subline of the same tumour. Moreover, although these
authors confirmed the prolonged survival time of tumorous mice follow-
ing treatment with entrapped ACT-D, they stated that this was due to a ci
general reduction in tissue toxd|ty of the drug when in the entrapped
form since there was no apparent effect upon the tumour weight in long
term survivors. The entrapped drug also failed to effect an ACT-D
resistant tumour subline in vivo.
The toxicity of entrapped ACT-D has been investigated by Rahman
et al. , (1978) and Kaye et al. , (1981). The first report showed that
ACT D(LP) in neutral-handshaken-MVLs was no less toxic than the free
drug to cell proliferation in the bone marrow and intestine. However,

210.
the liposomal ACT-D was less immunosupressive than the free drug. These
authors (Rahman et al. , 1974) had previously shown that I/V adminis-
tered ACT-D was less toxic when given in the entrapped form (LD^Q Free
ACT-D: 0.43mg/kg, ACT-D Liposomes: > 1 mg/kg). Kaye et al., (1981) re-T
ported that no deaths occurred in mice treated with 8 mg/kg ACT-D en-
trapped in cationic small MLVs.
ii) Bleomycins.
Gregoriadis and Neerunjun (1975b) and Dapergolas et al. , (1976)
reported that 3
"^In-BLM MLVs were taken up by both the liver and an
implanted tumour following I/V injection. The smaller SUVs were taken
up by the liver to a lesser extent than the MLVs but the opposite was
true for the tumour tissue. However, these latter authors noted signi-
ficant differences between the liver and tumour localization in dif-
ferent strains of mice.
Gregoriadis et al., (1977a) failed to find differences in the
plasma clearance of "'^In-BLM liposomes injected into rats or mice but
the uptake by tissues was different. Thus, although most of the dose
was recovered in the livers and spleens of mice 20 and 50 hours after
injection, the levels in the same organs in the rats was 4 (liver) and
6 (spleen) times lower. In both species, a reduction in the size of the
liposomes led to a less radioactivity being taken up by the liver and
spleen but to an increase in localization in the lungs, kidney, skele-
tal muscle and brain. At all times and for all tissues studied the
uptake (per gm tissue) was higher in the mouse than the rat. The levels
of radioactivity found in the rat tissues studied by Gregoriadis et al.
(1977a), using the same liposomes, were almost identical to the levels
found in this study. These authors found significantly higher amounts
of liposome derived "^In-BLM in mouse livers and spleens than other
authors have found using similar liposomes containing ACT-D (Rahman 111
et al. , 1975; Kaye et al., 1981). This fact suggests that In-BLM
leaks less rapidly from liposomes than ACT-D and confirms previous
results of this study (section 2:2 and 3:2). However, both Dapergolas
et al., (1976) and Gregoriadis and Neerunjun (1975b) have claimed that 111
In-BLM does not leak from liposomes and, whilst the present data 111
does not agree with this, a contribution by protein-bound In to the distribution of "entrapped" in tissues cannot be ruled out.
I l l Following intravenous injection of In-BLM-containing liposomes
into humans Segal et al. , (1976) failed to find increased radiolabel
211.
localization in hepatic tumour tissue and this is in contradiction to
the tumour location found by others in animals (Dapergolas et al. ,
1976; Gregoriadis et al. , 1977a). Moreover, it did not agree with 131
previous studies in humans using liposomal I-albumin (Gregoriadis
et al. , 1974a). In addition, much of the radioactivity was found to be
present in the bone marrow. At autopsy, 8 days after liposome admini-
stration, significant quantities of radiolabel were found in the liver
and spleen but also in the lungs, kidneys, bone marrow and, in one
patient, the brain and tumour mass (Segal et al., 1976) 111
The distribution of In in SUVs has also been studied by Hwang
and Mauk (1977), Mauk and Gamble (1979) and Hwang et al., (1980). These
results are not strictly comparable to those of this study since the
radiolabel . is chelated to another molecule (nitrilotriacetic acid)
and not BLM. Three hours after I/V injection into mice, Mauk and Gamble
(1979) found that anionic and neutral SUVs concentrated to the greatest
extent in the liver (although the blood levels of these liposomes was
always very high) but cationic SUVs exceeded these liver concentrations
by 2.5 to 3 fold. The uptake . by other tissues was low (e.g.: kidney
and spleen < 3 % of the injected dose) but about 5 % of the dose was
found in the small intestine although lower levels of cationic vesicles
were found in this tissue. After 24 hours, the liver concentration of
the cationic SUVs remained significantly higher than that found with
neutral or anionic liposomes, the spleen levels were lower than at 3
hours whilst the levels in the small intestine had increased. Uptake of
all vesicle types by the tissues of the chest and into the skin was
very similar (7-10% of injected dose) but the cationic preparation
remained lower than the others in all tissues apart from the liver.
Comparison of these data with figs 4:2 and 4:7 confirms the reports of
others (Tyrrell et al. , 1976a; Gregoriadis et al. , 1977a) that the
spleen captures the larger liposomes. The uptake by the small intes-
tine, skin, lungs and brain was less (% dose/gm tissue) in the current
studies in rats than was found at both 3 hours and 24 hours in mice by
Mauk and Gamble (1979) but this may be due to higher blood levels of
radioactivity contaminating these tissues. In a further series of 111
experiments using SUVs containing the In complex but made of
sphingomyelin and CHOL, Hwang et al.,(1980) reported that the plasma
half life of these vesicles was 16.5 hours and that the liver con-
centration of the radiolabel continued to increase over a period of 23
hours (unlike fig. 4:7). Similar, almost linear, increases with time
212.
(up to 23 hours) were found in the kidney, spleen, intestine, skin and
legs (bone marrow ?) whilst levels in lungs fell during the same time
period. Using the gamma-ray perturbed angular correlation technique in
conjunction with these studies, these authors were able to measure tr
intact liposomes in the liver and they found that degradation occu^ed
with a half life of 3.5 hours with maximal intrahepatic release of
entrapped drug occulting after 8 hours. The entrapment of iodinated
BLMs in liposomes and their tissue distribution has not been previously
reported.
iii) Asparaginase.
No published data exist concerning the tissue distribution of
liposome-entrapped ASPase. This enzyme has, however, been entrapped in
homologous red cell ghosts which were slowly cleared by the liver and
spleen (Updike et al., 1976) and were able to lower plasma asparagine
levels (Ihler, 1979). Other proteins entrapped in liposomes have been
studied and these will be used for comparative purposes.
The original reports of Gregoriadis and Ryman (1972a; 1972b) on
the entrapment of albumin, amyloglucosidase and beta-fructofuranosidase
demonstrated that the liver and spleen were the principal sites of
liposomal radioactivity and enzyme activity. These tissues have been
repeatedly implicated as the major organs of uptake for liposomes con-
taining proteins by many authors. Gregoriadis and Ryman (1972a) found
very little liposomal albumin associated with the kidneys and lungs.
Similarly, Gregoriadis and Allison (1974) found entrapped diptheria
toxoid not only in the liver and spleen but also in the kidneys of
mice.
In man Gregoriadis et al. , (1974a) found liposomal radiolabelled
albumin in normal and tumorous tissue of the liver, spleen, kidney and
colon; the uptake by tumour tissue was consistently higher than the
normal tissue in the kidney and colon. These authors also reported ne-
gligable radioactivity in the bone marrow. Tyrrell et al., (1976b) at-
tempted to treat a lysosomal storage disease (Pompes disease:type II
glycogenosis) with amyloglucosidase entrapped in anionic liposomes.
They found that the enzyme had had some activity against the stored
glycogen of the liver but not against muscle glycogen. Similarly,
Belchetz et al. , (1977) and Gregoriadis (1980b) found a reduction in
liver size in a patient given entrapped glucocerebroside: beta-glucosi-

213.
dase for the treatment of Gaucher's disease. No other tissues were
studied.
Steger and Desnick (1977) studied the fate of beta-glucuronidase
entrapped in anionic and cationic liposomes (MLV) following I/V injec-
tion into enzyme-deficient mice. The anionic liposomes were taken up by
the liver (75 % of injected dose) and the enzyme retained its activity
in this organ for up to 8 days. The levels of unentrapped enzyme were
always very much lower than the liposomal enzyme after the first hour
post-injection. This is not confirmed by results in the present work
which do not show persistance of liver ASPase radioactivity nor higher
levels of entrapped enzyme after 1 hour. These authors also found a
long persistance of entrapped enzyme in the kidneys (> 3 days) and some
(lower) levels in the spleen. No enzyme activity was detectable in the
brain, heart, lungs, or bone marrow. Unfortunately no comparative
studies of unentrapped enzyme were made in any tissues apart from the
liver.
Steger and Desnick (1977) also found significant differences
between anionic and cationic liposomes when the latter were used to
entrap the enzyme. A longer liver retention of enzyme activity and
lower and shorter retention of the enzyme in the kidneys was reported.
It is unclear if the differences between the two liposomes types are
due to charge alone or if size (not controlled) of the populations
could account for some of these differences.
The findings of the present study are clearly at variance with the
above description even taking into account that a different enzyme and
species was used, the reported accumulation and retention of protein-
containing liposomes by the liver and spleen is not confirmed with
ASPase entrapped in anionic MLVs. The liver uptake of free ASPase, pro-
bably results in degradation of the enzyme (total radioactivity was
found to be significantly higher than TCA radioactivity) but this is
not the case for the entrapped material. It therefore seems that the
different liver uptake pattern of entrapped ASPase (as compared to
other entrapped drugs) is not due to complete lysis of the circulating
liposomes. Indeed, Neerunjun and Gregoriadis (1976) failed to find
interactions of antibodies with liposomal ASPase or, at least, not high
enough levels of free ASPase to result in anaphylactic shock.
Initially, Neerunjun and Gregoriadis (1976) reported that large
doses of liposome entrapped ASPase were able to profoundly decrease the
214.
levels of plasma asparagine despite the fact that the permeability of
this amino acid into these liposomes can be expected to be low (Naoi
et al. , 1977). Later, (Gregoriadis, 1980b) it was reported that liposo-
mal ASPase was cleared so rapidly from the circulation that lower plas-
ma asparagine levels were not responsible for the antitumour effects
seen with the entrapped enzyme. It was therefore proposed that ASPase
acted in the liver to reduce the output of asparagine. However, it is
known that asparagine synthesis and output by the liver is controlled
by plasma asparagine levels (Woods and Handschumac^er, 1973). The
plasma half-life of asparagine has been reported to be less than 40
minutes in humans but reduction of plasma asparagine to 20 % of the
normal levels does not reduce tumour growth (Cooney et al. , 1970).
Moreover, in the absence of an inhibitor of asparagine synthesis, it is
not possible to deplete the asparagine pool in the liver (Woods and
Handschumacher, 1973) even with asparaginase (Patterson and Orr, 1969).
In view of the forgoing it is, therefore, difficult to see how liposo-
mal ASPase acting intracellulary in the liver can account for lower
tumour levels of asparagine 1 and 3 hours after injection (Gregoriadis,
1980b); especially since other tissues can donate asparagine to the
plasma and to neighbouring cells, e.g. : erythrocytes, which cannot
synthesize asparagine, retain considerable amounts of the amino acid
for days after the plasma asparagine levels are undetectable following
ASPase treatment (Cooney et al., 1970).
The antitumour effect of entrapped ASPase may, therefore, be due,
initially at least, to a direct lowering of intracellular asparagine
levels following uptake of the liposomes by the tissues rather than
indirect effects on the liver ouptput or lower plasma levels of the
amino acid. In this respect, the findings, reported here, that the free
enzyme concentration was higher than the entrapped in all the tissues
examined correlates well with the report of Neerunjun and Gregoriadis
(1976) that a greater than three fold higher dose of the liposomal en-
zyme was required for complete regression of tumours in mice.
The disposition of the entrapped ASPase remains to be fully de-
termined. Two hours after injection, when the liver concentration of
the liposomal and free enzyme are the same, 20.9 % of the injected dose
of entrapped ASPase was recovered in the plasma plus all the tissues
examined whereas the comparative value for the free drug was 44.3 % : a
large proportion of the entrapped enzyme and more than half of the free
enzyme therefore remain unaccounted for. Tissues and body fluids not

215.
examined for radioactivity must concentrate high quantities of the
entrapped enzyme. It is possible that some enzyme and radiolabel could
have been excreted by the urine and in the bile but one site of tissue
accumulation which may account for the remaining protein is the bone
marrow. High levels (up to 10 % of the injected dose at 6 hours in a
sample from both tibias) of liposome entrapped drug have previously
been reported in this tissue in animals (Rahman et al., 1975) although
these high levels were not confirmed by others using smaller liposomes
(Segal et al. , 1974; Car ide et al. , 1976; Kaye et al. , 1981 and this
work; table 4:3). In man both Segal et al. (1976) and Belchetz et al.
(1977) have reported liposomal localization of radioactivity in the
legs (bone marrow ?) of patients by means of whole body scanning al-
though this had not been shown previously by Gregoriadis et al (1974a).
It seems possible, therefore, that some of the "missing" radioactivity
may be concentrated in bone marrow but the extent to which this is
determined by the size of the liposome preparation or the presence of
ASPase entrapped in the liposome remains to be investigated.

216.
Section 4:4
SUBCELLULAR LOCALIZATION OF LIPOSOME-ENTRAPPED DRUGS
Introduction.
The previous section demonstrated that the major site of uptake of
I/V injected liposomes was the liver. In this section the subcellular
localization of liposome entrapped drugs in this organ has been
studied.
In principle, subcellular fractionation should give evidence as to
the mode of uptake of liposome entrapped solutes as well as their final
destination within the cell. Thus, the finding of liposome-entrapped
drugs localized with lysosomes might be used as evidence that endocy-
tosis of the carrier has taken place. However, care must be taken to
compare this localization with the unentrapped material because many
foreign molecules (e.g. : proteins) also find their way into lysosomes
during their metabolism by cells (Gordon and Cohn, 1973). Localization
of entrapped markers (e.g. : cytotoxic drugs) in the nucleus, which may
be their site of action depending upon the type of drug involved, might
suggest that liposomes can deliver their contents to the correct or-
ganelle and that drug degradation during uptake of the carrier is
minimized. On the other hand, concentration of drugs in the microsomal
fraction may be taken as evidence that the compound is in the process
of being metabolized or transformed (Mannering, 1971; Mandel, 1971).
Finally, the localization of entrapped material with the cytosol of the
cells may suggest a variety of different factors depending upon the
timing involved, e.g. : cytosolic localization at times when the plasma
concentration of the drug is high implies that the free drug or carrier
is entering directly into the cytoplasm by a mechanism which probably
does not involve endocytosis. At later times the finding of drug in
this compartment suggests that either the compound is not being meta-
bolised or it has been transfered from another site. Without giving
definite proof, subcellular localization of drugs, therefore, provides
indicators as to the mode of uptake and subsequent fate of the agents
in the cell.
Results of subcellular fractionations.
The results in this section are expressed as the amount (percent)

217.
of the whole liver radioactivity which was found to be associated with
each subcellular compartment studied. However, in the majority of cases
the total hepatic radioactivity was many fold higher for entrapped
drugs than the free agent but this will not be reflected in the subcel-
lular fractions.
i) Control values
The fractionation performed was only a crude separation of the li-
ver cells into four components: nuclei, mitochondrial-lysosomal (large
granules), microsomal (small granules) and soluble (cytosol). No at-
tempt was made to define these fractions any more precisely apart from
the localization of two marker enzymes.
a) Enzyme controls
Tables 4:9A and 4:9B show the activities of two enzymes mea-
sured in the subcellular fractions of rat liver. N-acetyl-B-gluco-
saminidase (NABGase) (Table 4:9A) is known to be a lysosomal enzy-
me and latent until these organelles are lysed by a detergent. The
distribution demonstrates that 46.55 % of the enzyme activity was
found in the large granule (ML) fraction. Moreover, in a single
experiment to test the latency of the enzyme (not shown), it was
found that the enzyme was at least 63.5 % latent in this fraction.
Enzyme activity found in other fractions can be accounted for in
part by variations in lysosome size. The lysosomal contamination
of the nuclear fraction represents large lysosomes and probably
also An insufficient washing of the fraction to separate all these
larger organelles (latency > 73.8 %). Similarly, microsomal (P)
NABGase may represent smaller lysosomes (> 48.2 % latent) and some d
release^ enzyme. Finally, the cytosolic (S) activity represents en-
zyme derived from broken organelles and adequately accounts for
the loss of latency in the large granule fraction.
The mitochondrial enzyme, succinate-2-(p-iodophenyl)-3-(p-ni-
trophenyl)-5-phenyltetrazolium-reductase (Table 4:9B) was found to
have a similar subcellular distribution to that found for the
lysosomal enzymes. The large granule (ML) fraction contained, on
average, more than 55 % of the total activity in the liver and the
majority (> 71.3 %) of this activity was found to be latent (not
shown) until the granules were lysed with detergent. Contamination
of the other subcellular fractions can be explained by lysis, size
differences and inadequate washing as explained previously.

218.
Table 4:9 A.
Activity of N-acetyl-beta-glucosaminidase (NABGase) in whole
liver and liver fractions (n = 50).
Fraction* Mean: ug PNP produced/
mg liver/min. (+ st.dev.)
Mean % activity in whole
liver (+ st.dev.)
total recovery =
WH 0.3383 + 0 0573 99.610 + 16.557
N 0.0627 + 0 0096 18.547 + 2.864
ML 0.1575 + 0 0576 46.554 + 17.021
P 0.0416 + 0 0165 12.311 + 4.876
S 0.0751 + 0 0282 22.198 + 8.355
Table 4:9 B.
Activity of Succinate-INT reductase (INTase) in whole liver and
liver fractions (n = 50).
Fraction* Mean adsorbance value Mean % activity in whole
(490 nm)/mg liver/min. liver (+ st. dev.)
x 103
(+ st.dev.)
total recovery =
WH 3.615 + 0.58 93.76 + 13 24
N 0.804 + 0.261 22.24 + 7 19
ML 2.045 + 0.663 56.58 + 18 263
P 0.401 + 0.134 11.11 + 3 713
S 0.138 + 0.141 3.822 + 3 948
* Abbreviations : WH : whole liver homogenate; N : nuclei.; ML : mi-
tochondria/lysosome; P : microbodies; S : cytoplasm; PNP : p-ni-
trophenol; INT : 2-(p-iodophenyl)-3-(p-nitrophenyl)-5-phenyltetra-
zolium.
Rat livers were removed, weighed and homogenized in sucrose. Homogena-
tes were fractionated into subcellular components by differential cen-
trifugation. The activities of the two enzymes NABGase and INTase were
estimated in the homogenate and each subcellular fraction by published
methods (see chap. 2).

219.
Total homogenate activities of the two marker enzymes were found
to be similar to that found by others (i.e. NABGase : 0.396 ug PNP/mg 3
liver/min (Borooah, et al., 1961) and INTase : 3.9 + 0.14 x 10 extinc-
tion units/mg liver/min. (Hinton, et al., 1969).
In general the enzyme markers found in the individual drug-treated
liver fractionations were not significantly different from the mean re-
sults shown in tables 4:9 A and 4:9 B.
In the case of ASPase there was some contamination of the N frac-
tion from the ML. All these fractionations were carried out at the same
time but only some of the N fractions (from 4 centrifugal runs at 600
g) were contaminated and these are the values at the time points 0 - 5
hours. Both the enzyme markers were effected and the N fraction showed
(on average) 22.3 % higher values for NABGase than the means in table
4:9 A and 25.16 % higher for INTase than the means in table 4:9 B (the
tables do not, therefore, contain these higher values). However, when
the means from this experiment were compared with those in table 4:9 A
and 4:9 B they were not significantly different. The values for the
enzyme markers in ML were slightly lower but the other fractions were
not -effected.
b) Fraction controls
Table 4:10 shows the values obtained in each subcellular fraction
when samples of the injected preparations (except ACT-D) were co-homo-
genised with untreated rat liver which was then fractionated. In most
cases the majority of the radiolabelled drug, whether free or entrap-
ped, was found associated with the S fraction. It is unclear if the
minor amounts of radioactivity found in other fractions are due to
binding of the free drugs to the subcellular structures found in the
fractions or, in the case of the liposomal preparations, due to liposo-
mes which intrinsically sediment with these structures. It seems un-
likely that all the liposomal radioactivity in N, ML and P is due to
drug leakage since, in general, the amounts found are significantly
higher than those of the free drugs.
An exception is seen in the case of ASPase, where much more free
drug associated with the ML and P fractions and this was probably due
to the aggregated nature of the material. In addition, significantly
more liposomes were recovered in the ML fraction than were found for

Table 4:10.
Control values for subcellular fractionation studies
% Total added to whole liver in eac^|raction mean (+ St. dev.) (n = 3 except In-BLM)
PREPARATION F = free E = entrapped
F R A C T I O N Total Recovered (%)
PREPARATION F = free E = entrapped N ML P S
Total Recovered (%)
m
i n - B L M F. E.
125 I-BLM (ICL)
F. E. P =
7.24 15.7 12.43 66.14 101.51 10.70 12.41 8.62 65.68 97.43
9 . 3 1 + 0 . 8 5 2 . 2 5 + 0 . 0 6 3 . 7 0 + 0 . 0 5 83.2 + 4 . 6 2 98.46 9.93 + 0.7 9.35 + 0.5 7.51 + 1.14 75.59 + 2.91 102.38 N/S < 0 . 0 0 1 <0.005 N/S
continued on following page.

Table 4:10. (continued)
% Total added to whole liver in eac h fraction In-BLM) mean (+ St. dev.) (n = 3 except
h fraction In-BLM)
PREPARATION F R A C T I 0 N Total F - free Recovered (%) F - free Recovered (%) E = entrapped N ML P S
125 I-BLM
(B/H) F. 7.76 + 0 5 1.48 + 0.08 2.78 + 0 1 83.08 + 3 41 95 1 E. 4.82 + 2 2 7.63 + 1.36 7.58 + 1. 4 76.57 + 10 4 96 6
P- = < 0 . 0 2 < 0.002 < 0.005 N/S
125 I-ASPase
(TCA ppt) F. 5.23 + 3 .2 10.42 + 1.61 25.36 + 2 58 72.57 + 25 .26 113 58 E. 9.16 + 1 .3 25.52 + 4.15 14.72 + 7 5 43.95 + 9 .6 93 .35
P- = N/S < 0.01 N/S N/S
* A sample (0.5 ml) of the injected material was added to a portion (usually 2 g) of liver from an untreated rat. Subcellular fractionation was carried out as in Chapter 2
p = Probability (Students 't' test) that means are the same. N/S = Not significant.

222.
the other drugs. It is unclear if this is due to a larger population of
big MLVs or to entrapped aggregates or to a mixture of MLVs plus free
aggregated ASPase. The larger mean in P for the entrapped material was
due to one fractionation which contained almost three times more mate-
rial than the other two experiments.
The control values for ASPase present some difficulties in inter-
pretation at later time points. Aggregated free ASPase will be cleared
rapidly from the plasma but some of these aggregates will still be pre-
sent in the blood during the first hour post-injection; it is therefore
appropriate to use this material as a control at this time. However, at
later times (> 2 hr) there should be no aggregated material in the
plasma so to compare these fractions with the control fractionation is
not correct because if the high levels of ASPase associated with the
granular subcellular fractions are due to the aggregates they could
give falsely high control values at later times.
A similar criticism can be leveled at all the liposomal prepara-
tions. At later time points, when only SUVs are available in the plasma
for uptake into the liver, the control values which were carried out
with a mixed population of MLVs and SUVs will be too high. The solution
to this problem will be to use liposomes of defined size,
ii) Results.
The results of the subcellular fractionations are shown in figures
4:9 (ACT-D), 4:10 (l n
i n - B L M ) , 4:11 (1 2 5
I-BLM-ICL), 4:12 (1 2 5
I-BLM-B/H)
and 4:13 (ASPase). Each drug will be considered under the overall
heading of the individual subcellular fractions. Where possible the
means between the free and entrapped drug concentrations in each frac-
tion and between these values and their appropriate controls were
compared by Student's 't' test. Comparisons of means between individual
BLM preparations in each fraction and at each time point were also
made, these comparisons are reported after the B/H-BLM results for each
fraction. In the case of ASPase the individual fractions were further
subjected to precipitation with trichloroacetic acid (TCA pptable
radioactivity) and it is these latter results which are shown in figure
4:13. A comparison of means between the total radioactivity and the TCA
pptable radioactivity in each fraction was made for both the free and
the entrapped injected preparations.
All the comparison data, however, ought to be treated with some
caution, especially where large differences were not found, because the

223.
injected liposome preparations are heterogeneous populations and so
cannot be said to be directly comparable in every respect. Moreover, it
must be remembered that the liposomes will leak entrapped drug in the
plasma (and probably within tissues as well) so that, unless the cor-
responding free drug can be shown to be excluded from the particular
fraction, the liposome data may represent the distribution of leaked
free drug as well as entrapped drug.
Nuclear fraction (N)
i) ACT-D.
This fraction contained the major portion of the free drug and
this is consistent with the binding of ACT-D to DNA. Binding of the
drug to N was very rapid (within 5 minutes) but it then remained rela-
tively constant throughout the 24 hour-period. Much less liposomal drug
was found in N throughout the period suggesting that drug leaked from
liposomes in the plasma was not a significant factor in the total
uptake by the liver. Moreover, liposome derived drug more than doubled
in this fraction over the period suggesting that it was being relocated
in the nuclei from other sites.
ii) m
i n - B L M
The uptake of both the free and the entrapped drug into N was
comparatively low (cf.free ACT-D). Differences between the means were
significant (P< 0.05) at 5 minutes (first time point) post-injection
but at all other times up to 48 hours there were no significant dif-
ferences .
At later times (24 hours and 48 hours : not shown) the entrapped
drug maintained the same concentration whilst the free drug showed a
slight, but not significant, increase to 23 % at 48 hours. The level of
the entrapped drug was always quite close to the control value (table
4:10) whilst that of the free drug was more than double its control
value at all times.
iii) ICL-BLM.
The free ICL-BLM concentration in N at 5 minutes post-injection
was not significantly different from the control values (table 4:10)
but thereafter the values were significantly higher at all times up to
48 hours. The free drug values were also significantly higher than the

224.
Legend fig. 4:11.
125 Subcellular Distribution of H-Actinomycin D.
3
The histogram shows the percentage of total liver H-radioactivity
(fig. 4:6) found in each of four subcellular fractions at timed inter-
vals (hrs) after injection. Each bar represents the mean from two ani-
mals. Solid bars, free ACT-D : open bars, entrapped ACT-D. Quantities
of drug and lipid injected are shown in table 4:1. Total radioactive
recoveries ranged from 70-94 %.
Nuclear Fraction Mitochondrial-Lysosomal Fraction
80 r -
Microsomal Fraction Soluble Fraction
40 r-
30
20
10
1 1 l ; ! i 0.1 0.5 2 5 24 0.1 0.5 2 5 24
Time after injection (h)
225.
entrapped drug values at 30 and 60 minutes post-injection and again at
24 and 48 hours. The increase of free drug radioactivity associated
with N during the first hour post-injection probably reflects binding
of the drug to the nucleus.
The entrapped ICL-BLM levels in N were marginally higher (p< 0.05)
than the control value at early time points (5,30 and 60 minutes) later
they became very much higher and after 5 hours steadily increased up to
48 hours. As was mentioned before (ACT-D) this is probably a reflec-
tion of the slow accumulation of drug following its release from other
compartments.
vi) B/H-BLM.
At all times up to 48 hours post-injection both the free and the
entrapped B/H-BLM were significantly higher (p < 0.02 - 0.001) in N
than their comparative control values (table 4:10).
The free radioactivity in N steadily increased to reach a plateau
value of around 35 % between 2 and 5 hours post-injection. However,
these values (30 min. - 5 hours) were not significantly different from
the entrapped drug radioactivity. Nevertheless, at 24 and 48 hours the
free drug value in N further increased to reach a peak of 55.5 % at 48
hours; these latter values were significantly higher than the corres-
ponding entrapped radioactivity. These results suggest that the free
drug was being slowly accumulated in N at the expence of other frac-
tions .
Liposome entrapped B/H-BLM was always localized in N to a signifi-
cantly greater extent than either the entrapped ^"'"In-BLM or the ICL-
BLM. On the other hand, liposomal ICL-BLM uptake into N was not signi-111
ficantly different from the In-BLM at any time. It is unclear if the
modification made to BLM by succinylation (B/H) results in increased
avidity for DNA but the free drug shows the same effect.
The free B/H-BLM was always significantly higher than the ICL-BLM 111
in N and also higher than free In-BLM between 2 and 48 hours. T^ts^
data a m similar to that found for the liposome preparations. At early
times (5 minutes) the "^In-BLM was significantly higher than the B/H 111
labelled material but at this time the In in the plasma had probably not yet bound to protein and was still partially drug bound. For this
111 reason the early localization of In-BLM in N may be due to BLM
binding to DNA; at later times the " ^ I n label was significantly lower
than the B/H-BLM material.
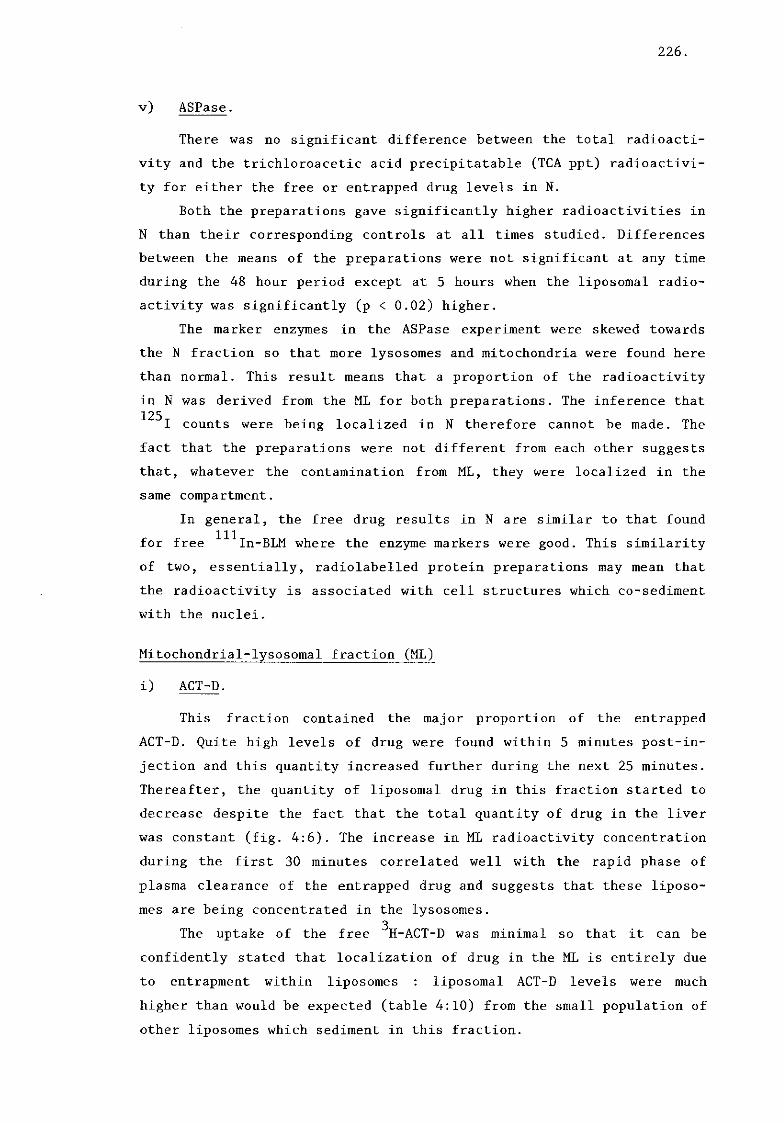
226.
v) ASPase.
There was no significant difference between the total radioacti-
vity and the trichloroacetic acid precipitatable (TCA ppt) radioactivi-
ty for either the free or entrapped drug levels in N.
Both the preparations gave significantly higher radioactivities in
N than their corresponding controls at all times studied. Differences
between the means of the preparations were not significant at any time
during the 48 hour period except at 5 hours when the liposomal radio-
activity was significantly (p < 0.02) higher.
The marker enzymes in the ASPase experiment were skewed towards
the N fraction so that more lysosomes and mitochondria were found here
than normal. This result means that a proportion of the radioactivity
in N was derived from the ML for both preparations. The inference that 125
I counts were being localized in N therefore cannot be made. The
fact that the preparations were not different from each other suggests
that, whatever the contamination from ML, they were localized in the
same compartment.
In general, the free drug results in N are similar to that found
for free ^"^In-BLM where the enzyme markers were good. This similarity
of two, essentially, radiolabelled protein preparations may mean that
the radioactivity is associated with cell structures which co-sediment
with the nuclei.
Mitochondrial-lysosomal fraction (ML)
i) ACT-D.
This fraction contained the major proportion of the entrapped
ACT-D. Quite high levels of drug were found within 5 minutes post-in-
jection and this quantity increased further during the next 25 minutes.
Thereafter, the quantity of liposomal drug in this fraction started to
decrease despite the fact that the total quantity of drug in the liver
was constant (fig. 4:6). The increase in ML radioactivity concentration
during the first 30 minutes correlated well with the rapid phase of
plasma clearance of the entrapped drug and suggests that these liposo-
mes are being concentrated in the lysosomes. 3
The uptake of the free H-ACT-D was minimal so that it can be
confidently stated that localization of drug in the ML is entirely due
to entrapment within liposomes : liposomal ACT-D levels were much
higher than would be expected (table 4:10) from the small population of
other liposomes which sediment in this fraction.

227.
ii) 1 U
I n - B L M .
Both the free and the entrapped 3
In-BLM appeared to be concen-
trated in ML. Over the five hour period shown, both preparations showed
a steady increase (differences not significant) which was maintained in
each case up to 24 hours. At 48 hours the quantity of both preparations
in ML started to fall. The initial values in this fraction for both
preparations were slightly higher than the controls (table 4:10) but
thereafter the control values were very much lower at all times.
iii) ICL-BLM.
In contrast to the results found with "'^In BLM there was a marked
difference between the free and entrapped ICL-BLM in ML. Both prepara-
tions were always significantly (p < 0.02-0.01) higher than their
corresponding controls. The entrapped drug was significantly higher (p<
0.01) than the free at all time points up to 48 hours. The free pre-
paration showed a steady increase in the ML over five hours and this
continued up to 48 hours post-injection to reach a maximum of 28 % at
this time.
The entrapped drug showed a much greater rate of increase to reach
a peak in ML at 2 hours. This time corresponds to the end of the rapid
plasma clearance phase and to the peak of total liver uptake (Fig 4:7).
After 2 hours the ML radioactivity slowly decreased but remained at
more than 55 % of the total liver level for up to 48 hours post-in-
jection despite the fact that the total liver radioactivity had fallen
to 10 % of the injected dose at 48 hours.
iv) B/H-BLM.
Both the free and the entrapped B/H-labelled BLM were significantly
higher than their control values in ML. Moreover, except at 5 hours,
the entrapped drug was significantly higher than the free (p < 0.01 -
0.001) at all times during the 48 hour period. The free drug slowly
increased throughout the 48 hours under study and at no time were the
means significantly different from the ICL-labelled material.
Liposome-entrapped B/H-BLM showed similarities to the entrapped
ICL-labelled BLM since the initial rapid increase in radioactivity (up
to 1 hour) was not significantly different. However, the values at 2
and 5 hours plateau but thereafter the radioactivities at 24 and 48
hours increase to give a maximum at 48 hours of 46.8 %.
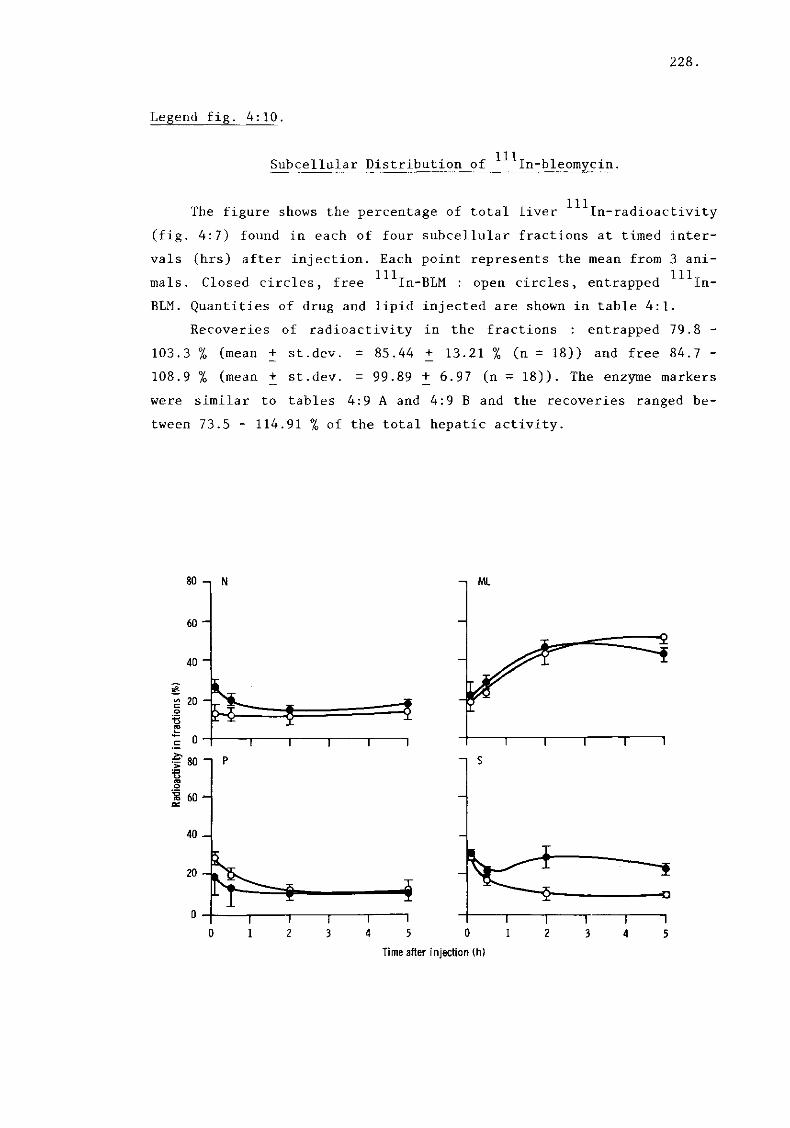
228.
Legend fig. 4:10.
Subcellular Distribution of ^"'"In-bleomycin.
The figure shows the percentage of total liver "^^^In-radioactivity
(fig. 4:7) found in each of four subcellular fractions at timed inter-
vals (hrs) after injection. Each point represents the mean from 3 ani-
mals. Closed circles, free ^^In-BEM : open circles, entrapped "'"^In-
BLM. Quantities of drug and lipid injected are shown in table 4:1.
Recoveries of radioactivity in the fractions : entrapped 79.8 -
103.3 % (mean + st.dev. = 85.44 + 13.21 % (n = 18)) and free 84.7 -
108.9 % (mean + st.dev. = 99.89 + 6.97 (n = 18)). The enzyme markers
were similar to tables 4:9 A and 4:9 B and the recoveries ranged be-
tween 73.5 - 114.91 % of the total hepatic activity.
Time after injection (h)
229.
In general the uptakes of liposomal B/H-BLM and ^^In-BLM into ML
111 were not significantly different but the In-BLM was significantly
higher at 5 hours for unknown reasons. Conversely, the ICL-BLM was
significantly higher in ML than both the other BLMs at all times. One
explanation for this effect could be that the ICL-BLM preparation con-
tains more of the larger liposomes (see plasma clearance and hepatic
uptake data).
Except at 24 hours, when the B/H-labelled BLM showed an anor-
malously higher value, the distribution^ in ML of the two iodinated free
BLMs were not significantly different. This result suggests that there
was little difference in the lysosomal metabolism of the two drugs.
However, the free ^^In-BLM was significantly higher than either of the 111
iodinated drugs. This is probably due to In bound to protein in the
lysosomal fraction and these data reinforce the previous results ob-
tained with this radiolabel which suggested that 1 1 - 1
In is not a good
marker for either BLM tissue localization or for the aqueous phase of
liposomes.
v) ASPase.
The free drug was significantly lower than the entrapped drug in
ML at all points throughout 48 hrs. Further, the free ASPase was not
significantly different from its control value at any time except at 5
minutes when it was higher (p < 0.02). At 24 and 48 hours post-in-
jection the ML levels of free ASPase remained constant and not signi-
ficantly different from the value at 5 hr. There were differences
between the total and TCA-ppt free radioactivity in this fraction at 2
and 5 hours post-injection. This suggested that some ML uptake of the
free drug had occured but, since the TCA-ppt material was not different
from the controls, it is probable that a rapid degradation of the
X> 125 ASPase occured with the release of I label.
Entrapped ASPase demonstrated a marked increase in level in ML
when compared with the free drug. The slight fall at 30 minutes was not
found to be significantly different from the values at either 5 minutes
or 1 hour. The concentration of liposomal radioactivity in the ML
remained constant, between 42 and 53 %, for 48 hours. There was no
significant difference between the total and TCA precipitated radio-
activity for the entrapped drug.
These data show that liposome uptake into this fraction was rapid
at 5 minutes (i.e. similar to ACT-D liposomes) with no increase with
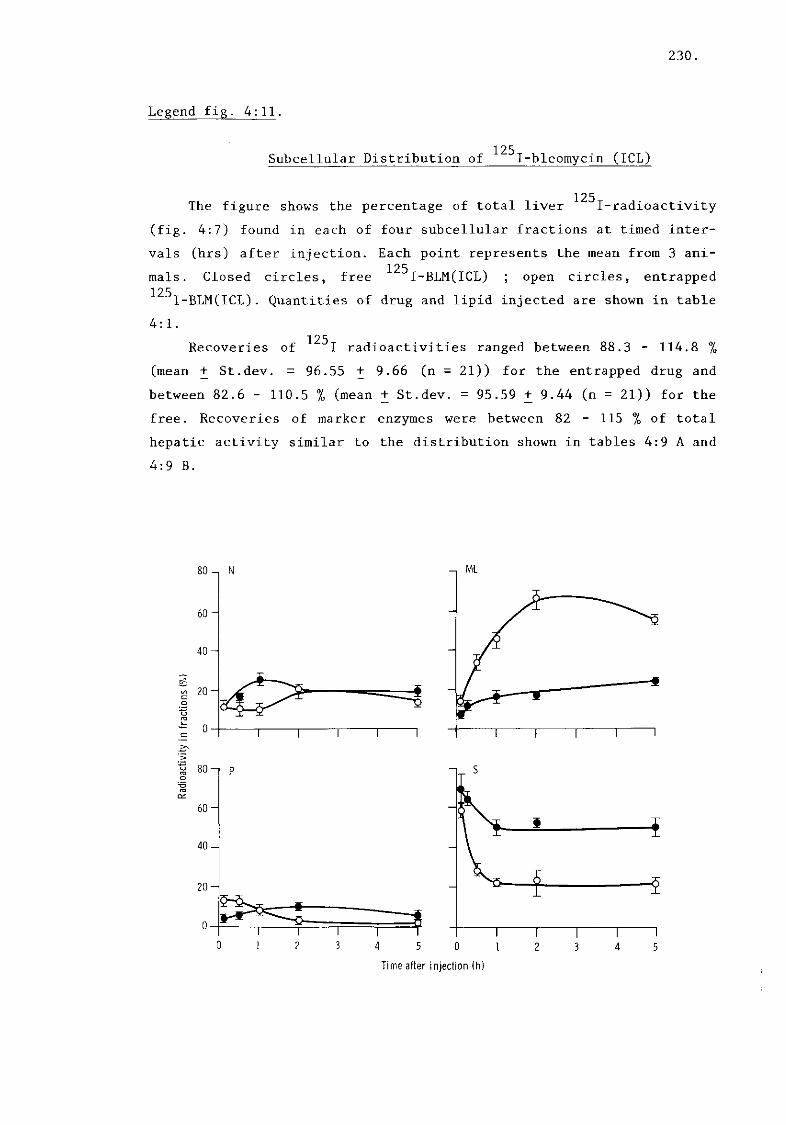
230.
Legend fig. 4:11.
125 Subcellular Distribution of I-bleomycin (ICL)
125
The figure shows the percentage of total liver I-radioactivity
(fig. 4:7) found in each of four subcellular fractions at timed inter-
vals (hrs) after injection. Each point represents the mean from 3 ani-125
mals. Closed circles, free I-BLM(ICL) ; open circles, entrapped 125
I-BLM(ICL). Quantities of drug and lipid injected are shown in table
4:1. 125
Recoveries of I radioactivities ranged between 88.3 - 114.8 %
(mean + St. dev. = 96.55 + 9.66 (n = 21)) for the entrapped drug and
between 82.6 - 110.5 % (mean + St.dev. = 95.59 + 9.44 (n = 21)) for the
free. Recoveries of marker enzymes were between 82 - 115 % of total
hepatic activity similar to the distribution shown in tables 4:9 A and
4:9 B.
Time after injection (h)

231.
125 time (c.f. I-BLMs). This suggests that the ASPase which reaches the
ML was actually entrapped because it was significantly higher than the
free drug at all times.
Microsomal fraction (P).
i) ACT-D.
Liposome association with P was significantly higher than the free
drug at all times. The high association of entrapped ACT-D at 5 and 30
minutes post-injection may have several causes : i) normally about 8 %
of liposomes sedimented in this fraction (table 4:10). ii) at early
times post-injection the blood levels of liposomes were high and it is
know that MLVs can be centrifuged out of plasma using the same g forces
(100.000) as is used to sediment this fraction although the majority of
these might be expected to be found in S (table 4:10). iii) this radio-
activity may represent sedimented liposomes either within vacuoles
(small lysosomes ?) or free in the cytoplasm which have not yet fused
with lysosomes and were released on liver cell lysis. A combination of
these points seems a probable explanation of this data. At later times
(2 and 5 hours) ACT-D liposomes were similar to control levels. The de-
crease in liposomal radioactivity in P may be either a reflection of
falling bood contamination or an increase in vacuole-lysosome fusion.
Free ACT-D levels in P were lower than 10 % of the total through-
out but higher than the levels found in ML. It may be that these levels
represent free drug bound to proteins or nucleic acids in other orga-
nelles or fragments of organelles which co-sediment with microsomes at
this density. In view of the stability of ACT-D in vivo it seems un-
likely that these levels represent drug in the process of being meta-
bolised .
ii) m
i n - B L M .
At no time, up to 48 hours, were there significant differences
between the free and the entrapped "^"'"In-BLM in P. Initially, (5 and 30
minutes) the uptake was higher, for both preparations, than the corres-
ponding controls. The probable reasons for this have been explained
previously (see ACT-D results).

232.
Legend fig. 4:11.
125 Subcellular Distribution of I-bleomycin (B/H)
The figure shows the percentage of total liver I-radioactivity
(fig. 4:7) found in each of four subcellular fractions at timed inter-
vals (hrs) after injection. Each point represents the mean from 3 ani-125
mals. Closed circles, free I-BLM(B/H); open circles, entrapped 125
I-BLM(B/H). Quantities of drug and lipid injected are shown in table
4:1.
Time after inject ion (h )
125
The recoveries of I-BLM (B/H) radioactivity ranged between
87.9 - 115.3 % (mean + St.dev. = 94.51 + 8.54 (n = 21)) for the entrap-
ped drug and between 85.1 - 118.8 % (mean + st.dev. = 102.3 + 8.84
(n = 21)) for the free drug. Enzyme marker disposition was similar to
tables 4:9 A and 4:9 B.

233.
At time intervals between 2 and 48 hours the values in P for both
preparations were unchanged and similar to their control values.
iii) ICL-BLM.
The free ICL-BLM radioactivity at 5 and 30 minutes post-injection
was not significantly higher than the control values, thereafter it was
higher. At all time points between 2 and 48 hours the free drug in P
was higher (p < 0.02) than the entrapped preparation.
The initial (5 and 30 minutes) values of the liposomal radio-
activity were significantly higher than both the free ICL-BLM and the
control values. This latter suggests a localization of released liposo-
mes into this fraction. Later, between 1 and 48 hours, the levels of
liposome radioactivity were not significantly different from the
controls.
iv) B/H-BLM.
The entrapped drug was significantly higher than both the free
drug and the control value at 5 and 30 minutes post-injection there-
after it was significantly lower (p < 0.002) than the control at all
times : at 24 and 48 hours the free B/H-BLM was higher (p < 002) than
the entrapped in P. At the early time points entrapped B/H-BLM was not
significantly different from the liposomal ICL-BLM levels.
Free B/H-BLM was significantly higher (p < 0.02) than the control
value at all time points to 48 hours except 5 hours. The level of the
free drug in P remained relatively constant (2.6 - 5.6 %) during the
period 1 - 2 4 hours but increased slightly (8.2 %) at 48 hours. In
general the free B/H-BLM was significantly lower than the free ICL-BLM
at all time points.
Although there was no significant difference between the entrapped
iodinated preparations at any time^the entrapped ^"^In-BLM was signi-
ficantly higher in P than the iodinated preparations during the first 2
hours. The reasons for this higher "^In-BLM level may be due to a
j^fepondemqce of smaller liposomes in the preparation which sediment with
this fraction. Alternatively, the binding of leaked ^"^^In-radiolabel
to protein may also be the cause but this localization did not occur
with the free drug.
Ill
Free B/H-BLM was not significantly different from the free In-
BLM at any time in P. This result may, therefore, reflect the back-

234.
ground radioactivity associated with this fraction. However, between 1
and 48 hours the ICL-BLM was significantly higher than either of the
other two preparations. The reasons for this result is unclear but it
was also found in the S fraction.
v) ASPase.
The free ASPase level was significantly lower (p < 0.02) than its
control value in P up to 5 hours, thereafter it was not significantly
different. The entrapped ASPase was not significantly different from
its control throughout the 48 hour period. Except at 5 minutes, when
the entrapped radioactivity was significantly higher (p < 0.05), the
comparison of means between the two preparations in P were not signifi-
cantly different.
For the entrapped drug after the initial 30 minutes, the level of
radioactivity in this fraction remained constant for 48 hours (around
11 % of the total). The free drug levels of radioactivity in P also re-
mained constant for 5 hours but were significantly increased over this
value at 48 hours. There was no difference between the total and the
TCA precipitatable radioactivity for either the free or the entrapped
preparation.
Soluble fraction (S).
i) ACT-D.
During the first half hour post-injection, the entrapped ACT-D
content of S was probably due to contamination from whole liposomes in
the blood plus whole vesicles released from their adsorbtion to sinu-
soid lining cells as well as liposomes released from the interior of
the cell following homogenisation. The control values for other lipo-
some preparations (table 4:10) uniformly showed that the major part of
the uninjected preparation was localized in this fraction.
However, it is clear that as the liver and plasma entrapped drug
concentrations fell (i.e. : at 5 and 24 hours) the concentration of 3
H-ACT-D from liposomes in S increased. This may be due to the release
of the entrapped drug from the lysosomal fraction into the cytosol from
where it is able to enter other compartments (e.g.: the nucleus).
For the free drug, the levels in S at 5 minutes post-injection re-
flected the rapid entry of this agent into liver cells. As the levels
of free drug in the plasma fell so, in general, did the level of the
drug in S.

235.
Legend fig. 4:11.
125 Subcellular Distribution of I-Asparaginase
125
The figure shows the percentage of total liver I-radioactivity
(TCA precipitatable) (fig. 4:8) found in each of four subcellular frac-
tions at timed intervals (hrs) after injection. Each point represents 125
the mean from 3 animals. Closed circles, free I-ASPase; open circles, 125
entrapped I-ASPase. Quantities of drug and lipid injected are shown
in table 4:1.
Radioactive recoveries were :
TCA-ppt Free - Range : 85.4 - 104.8 % (mean + St.dev. = 95.22 + 9.16 %)
TCA-ppt Entrapped - Range : 86.4 - 113.9 % (mean + St.dev. = 97.67 +
8.96 %) (number of fractionations = 21 in each case).
80
60 - ,
40
g. 20 -
-f
ML
i I I
> 80 -i
60
40 -
20
0 1
4
-I s
Time after injection (h)
236.
ii) 111
In-BLM.
The quantity of 111
In radioactivity associated with S was lower
than the corresponding control levels for both preparations at all time
points. During the first half hour there was no significant difference
between the means of the two preparations. Thereafter (2-48 hours) the
radioactivity due to each injection remained constant with that of the
free drug being significantly higher (p < 0.01) than the entrapped.
This fraction is the only compartment studied where sustained dif-
ferences between the preparations were found. The fall in entrapped
radioactivity (30 minutes) whilst the total hepatic uptake (fig. 4:7)
was rapidly increasing means that the S fraction was not primarily
involved in liposome uptake. Such a conclusion cannot be drawn for the
free drug since the total hepatic uptake was constant over a 24 hour
period.
iii) ICL-BLM.
The initial values (5 min.) of both free and entrapped ICL-BLM
radioactivity were not significantly different from their corresponding
controls. Similarly at 30 minutes the free radioactivity was still the
same as the control values but thereafter it fell significantly below
the controls. After 5 minutes, the free drug concentration was signi-
ficantly higher than the entrapped (p < 0.01) up to 48 hours. Between 1
and 24 hours the free radioactivity in S remained constant (50-59 % of
total hepatic radioactivity) but at 48 hours it had fallen to 26 % and
this was accompanied by a slow increase into the ML. If the drug was 125
degraded in S the levels of I would be expected to fall over 48
hours. The fact that the level remained constant suggests that either
this degradation is incomplete (i.e.: it does not remove the radio-
label) or it does not occur. The entrapped radioactivity in S rapidly
fell at 30 minutes post-injection, thereafter it remained constant
(around 25 %) for 48 hours and significantly lower than the control
values. Since during the initial period ( 0 - 2 hours) the liver uptake
increased (fig. 4:7) this result again suggests that the hepatic uptake
iv) B/H-BLM.
The entrapped B/H-BLM radioactivity in S was always significantly
lower (p < 0.005) than both the free drug and the entrapped control

237.
value. Except at 5 minutes, when it was lower (p < 0.02), these entrap-
ped values were not significantly different from the corresponding li-
posomal ICL-BLM values and so these data may be taken as being similar.
For the free B/H-BLM following the rapid initial ( 0 - 1 hour)
fall, the levels continued to fall slowly up to 48 hrs. This is unlike
the free ICL-BLM where the concentration is S remained constant during
the period 1 - 2 4 hrs. The free levels were always lower than the
control values (p < 0.001) except at 5 minutes.
There was no real difference between any of the entrapped BLM pre-
parations in S. Perhaps this means that the rate of metabolism of BLM
is unaffected by liposome entrappment. However, this lack of difference
is evidence that the mode of uptake of the liposomes is the same for
all the preparations and this lack of localization of liposomes in S
suggests that uptake is into another fraction (ML).
The quantity of free ICL-BLM in S was greater than free ^"^"^In-BLM
throughout the 48 hr period and this suggests that these two drugs may
be entering the liver by different mechanisms. However, between 2 and
24 hrs post-injection the free ICL-BLM also significantly higher than
the free B/H-BLM. It is possible, therefore, that the ICL material is
more resistant to enzyme inactivation in the cytosol and so persists
for longer than the B/H-BLM. At early times ( 0 - 1 hr) the iodinated
preparations were not significantly different.
v) ASPase.
A comparison of the means of the free drug values with the control
preparation revealed that the two were not significantly different at
any time after 5 minutes. A similar comparison for the entrapped drug
showed that the radioactivity values in S were always (0 - 48 hr)
significantly lower than the controls. Comparisons of means between the
preparations were also carried out and showed that, apart from 5 mi-
nutes, the free drug was always significantly higher than the entrap-
ped.
The free radioactivity in S showed a rapid increase during the
first hour post-injection to reach a peak of 53.7 %. This level was
maintained for the rest of the time studied (48 hr; 32.2 % not signifi-
cantly different from 1 hour value). The results are probably due to
the uptake of free * "I-ASPase into the cytoplasmic compartment.

238.
A comparison of means between the total radioactivity and the TCA
pptable radioactivity due to the free drug in S revealed that they were
not significantly different except at 5 minutes post-injection. This
results suggests that either degradation of the ASPase was minimal or 125
that excretion of the I radiolabel from the liver was rapid.
The entrapped drug also accumulated in the S fraction but the
amount of whole ASPase (i.e. : TCA pptable radioactivity) was signifi-
cantly lower (p < 0.01) than the total radioactivity between 30 minutes
and 5 hours. In view of the apparent lack of breakdown of free ASPase 125
in S, this result suggests that I radiolabel removed from the label-
led entrapped drug may have been transfered to S from other sites (eg.
ML). The amount of liposomal ASPase in S reached a peak at 5 hours.
239.
Section 4:5 DISCUSSION OF SUBCELLULAR DISTRIBUTION RESULTS.
i) Subcellular fractions.
In the results section it has been implied that the fractions are
pure and contain only the organelles mentioned but this is not the
case. An analysis of subcellular components in rat liver and their
localization in the crude fractionation performed in this study is
beyond the scope of this thesis. The following brief resume was taken
from the work of de Duve and his co-workers and is simply meant to
illustrate (non-exhustively) that these fractions contain may more
structures which might also account for the subcellular localization
of drugs (de Duve et al. , 1955; Beaufay et al. , 1964; Baudhuin, 1974;
Beaufay and Amar-Costesec, 1976; Wibo et al, 1981).
Nuclear fraction.
In addition to nuclei, enzyme markers (table 4:9) confirm that
this fraction can become contaminated with both lysosomes and mitochon-
dria. Since this fraction is the first "cut" from the homogenate it
will also contain whole (unbroken) or partially broken cells and all
the cell debris e.g.: large fragments of cytoskeletal components as
well as any larger material which has a tendency to aggregate.
Mitochondrial lysosomal fraction (ML).
Although these two organelles are mostly found in this fraction,
enzyme latency experiments confirm some overlap with N and P. Mito-
chondria account most of the protein content of the ML but this frac-
tion contains about equal proportions (70 % of each) of the total liver
content of : - mitochondria, lysosomes and peroxisomes. These latter
organelles are derived primarily from the PCMC in the liver.
Microsomal fraction (P).
This fraction is the most complex in terms of the number of cell
components which localize in it. As well as some lysosomes the fraction
contains : - Mitochondrial membranes, plasma membranes, phagolysosomes,
endocytic vacuoles, perhaps nuclear membranes, the Golgi complex and
associated membranes and the rough and smooth parts of the endoplasmic
reticulum, which will include the drug-metabolising cytochrome P-450
enzymes, as well as ribosomes and RNA. This heterogeneic mixture,
containing almost all the membrane components, has proved to be dif-
ficult to resolve into pure fractions because of the difficulty in
finding marker enymes to uniquely define each component.

240.
Soluble fraction (S).
This fraction should not contain any cell organelles but, in addi-
tion to its normal enzyme constituents, it will contain enzymes and
other molecules released from fractured particles. So, for example,
broken nuclei or lysosomes which contained radiolabelled drug might be
expected to contribute to S. Other molecules stored in or released from
subcellular structures will also be found in S e.g. : insoluble fats
and fatty acids, in which lipophilic drugs may dissolve either before
or during fractionation, can be located floating on the surface of S.
However, lipophilic drugs released either during fractionation or which
are in the process of uptake by the cell could equally well be found in
the lipid of membrane components in P.
ii) Free drugs.
Actinomycin-D.
The subcellular distribution of free ACT-D in the liver has been
studied by Dingman and Sporn (1965) and Weissbach et al. (1966) amongst
others. The results of these studies indicate that the free drug speci-
fically localized in the nucleus. However, since the drug will bind to
isolated nuclei and DNA (Refs above and Schwartz et al. , 1968a, b) it
is unclear if this is due to true subcellular localization or to arti-
factual redistribution during fractionation. Typically 85 % - 90 % of
I/V administered drug binds to nuclear DNA in rat liver at 30 minutes
post-injection, a further 3 % binds to the nucleoli (Ro, 1967). How-
ever, Dingman and Sporn (1965) reported that 70 minutes after injection
only 55 % of the injected dose was in N with a further 10 % in ML, 3 %
in P and 25 % in S. In general, uptake was independent of the amount of
ACT-D injected. The ACT-D associated with P was not bound and could be
dialysed out of the fraction; similar treatment of the S fraction
revealed that a third of the ACT-D had interacted with a non-dialysable
component (DNA from lysed nuclei ?). These authors suggested that the
ACT-D in ML was due to contamination. The high level found in S at 5
minutes can be accounted for by drug in the cytoplasm en route for the
nucleus. Other workers (Kessel, 1967) reported that ACT-D would also
bind to lipid and since cell lipid floats on the surface of S after
fractionation it is possible that this accounts for some of the S loca-
lization of the drug. Ro (l96/) also reported that, at low doses of
ACT-D, extra nuclear DNA was saturated before binding to the nucleus
occured. This result might account for the small ACT-D levels in the
241.
ML fraction. Finally, as pointed out above, the P fraction contains a
variety of cellular materials in addition to the microbodies, and
includes most of the membrane fragments; it is possible that lipid
soluble ACT-D is associated with this fraction (but c.f. Dingman and
Sporn (1965) above).
In agreement with the work of others, in this work the free ACT-D
is obviously highly concentrated in the nuclei with, overall, decrea-
sing amounts in S over time. The cationic charge on ACT-D in aqueous
solution will probably preclude its permeability through membranes.
However, since ACT-D is also lipid soluble it seems probable that a
substantial amount of the drug will be in the uncharged form which
would allow it to penetrate membranes (Goldman, 1976). Once inside the
drug could become trapped by protonation (see below). It seems reason-
able, therefore, to suppose that free ACT-D could easily become lysoso-
mally localized; perhaps competition from the nucleus prevents this.
Binding to the nucleus is apparently complete at 5 minutes and does not
increase with increasing liver uptake or time. These data suggest, that
the nuclear fraction is artificially high and probably reflects ACT-D
redistribution during homogenization and fractionation : it is unclear
if the low ML levels are the result of active exclusion from lysosomes.
A further mechanism of free drug entry comes from the work of Kaye and 3
Ryman (1980) who found free H-ACT-D bound to albumin in vivo; it is
possible that the drug/ albumin complex could be taken in whole by
pinocytosis or into vacuoles prior to subsequent lysosomal localiza-
tion. Alternatively the drug-protein may bind to membranes and contri-
bute to the P fraction.
Bleomycins.
The subcellular localization of free BLM has not, to this authors
knowledge, been previously studied.
The lysosomal capture of free BLMs is not an unexpected finding;
other antibiotics containing aminosugars (e.g. : Steptomycin) are known
to be lysosomotrophic (Tulkens et al. , 1975) which may account for
their ineffectiveness against intracellular infections. Iodinated BLMs
had an increases localization in the ML fraction suggesting that there
is some lysosomal uptake of the free drug although this was not so
marked as the localization in S. From theoretical considerations (de
Duve et ai. , 1974) , the lysosomal capture of free BLM can be predicted

242.
since at physiological pH the drug is weakly basic. The non-protonized
form (i.e. lipid soluble) of the drug could permeate plasma and other
membranes, however, in vivo the terminal e^rcwps probably prevent the
drug from existing in an uncharged form. In the acid milieu of the
lysosomes BLM could be trapped by protonation and so no longer escape.
As de Duve et al. (1974) have pointed out, drugs with pK s near to 8
are most likely to be so concentrated, however, as the pK increases the
rate of lysosomal uptake and trapping will be reduced by a factor of
ten for every unit increase of pK; bases with pK § below 8 never
achieve a maximum lysosomal concentration ratio with respect to S.
Conversely, weak acids are kept out or driven out of lysosomes with the
maximum effects being with compounds of pK'3 around 6.
The effects of this proton trapping in lysosomes on free BLM are
uncertain. The bulk of the drug, which contains the chelated cations
(e.g. , will probably be effectively uncharged in the cytosol
at pH 7.0 but the ionized guanido groups will still prevent its free
permeability through membranes. However, as discussed previously (chap-
ter 2), lowering the pH removes the chelate so that in the lysosomes
both drug and radiolabel will be trapped but the chelate might later
escape. The enzyme inactivation of BLM in the cytosol occurs at the
amine group on the beta-aminoalamine moiety changing its apparent pKa
from 7.3 to 9.4 (Umezawa, 1974) but this same group has been proposed
as one of the sites where chelates are bound (fig. 2:1b). It is uncer-
tain if the presence of "^^"In at this site will inhibit the action of
the enzyme but released would bind to any anionic structure.
The ML localization of will, in addition, be complicated by the 111
presence of In labelled proteins from the plasma. The extent to
which ^"^In-labelled transferrin or other proteins contribute to the
total uptake of both the free and entrapped drug is uncertain. Free
^"^InClg at pH 6.5 is almost totally cleared from the plasma by mouse
liver (Konikowski et al. , 1975) but this preparation is reported to be
a colloidal suspension. Non-colloidal " ^ I n C X (pH 1.5) was also re-111
ported to be cleared by the liver to give higher amounts than In-Ill
BLM. It seems possible that this w a s
Pr o t e
in
bound and so may account for the ML localization of the radiolabel. Uptake of trans-
59
ferrin labelled with iron ( Fe) has been demonstrated to be due to
receptor mediated endocytosis in rat hepatocytes (Octave et al. , 1982
and personal communication). However, since the rate of accumulation of
labelled iron into lysosomes is 3 times higher than the accumulation of

243.
labelled protein it has been proposed that transferrin remains bound to
the receptosome and is recycled back to the plasma membrane whilst the 59
Fe is preferentially donated to lysosomes. A similar mechanism could
be operating with 1
In-labelled transferrin.
Iodinated BLMs demonstrate much higher S and much lower ML locali-111
zation than the In-BLM. The ICL-BLM species has been reported to be
labelled on the imadazole group (Eckelman et al. , 1976) whilst the
N-succinimidyl-3(4-hydroxyphenyl)proprionate ester is known to react
with free amino groups (Bolton and Hunter, 1973) and alter the charge.
The free drug ML localization does not appear to be affected by the
method of iodination but in S, although the initial capture (first
hour) was similar for both iodinated species, the persistance of ICL-
BLM was higher than the B/H-BLM. Radiolabel in B/H-BLM may be attached
to the beta-aminoalanine amino group and so removeable by enzyme
action, alternatively the terminal amino groups, which might also be
iodinated, could become more susceptible to attack by other enzymes. In
any event, the fact that iodination by this method changes the immuno-
reactivity of some proteins (Bolton and Hunter, 1973) suggests that the
two iodinated BLM drugs might be treated differently by cellular en-
zymes. Such a change in structure may effect the B/H-BLM since it
appears to become localized in N to a greater extent than either ICL-111
BLM or In-BLM. Interestingly, the terminal amine groups of BLM have
been implicated in the binding of this drug to DNA (Kasai et al. ,
1978).
Microsomal (P) localization of free BLMs also appears to be deter-
mined by the method of radiolabelling, and this is further reinforced
by the finding that the difference between the iodinated species dis-
appears when they are entrapped in liposomes. Whilst there is no dif-
ference between free B/H-BLM and ^^In-BLM, the ICL labelled drug con-
centrates here to a greater extent. It seems possible that this is a
genuine difference which cannot be explained by ML contamination of P
because in the former fraction the two iodinated BLMs are not dif-
ferent. The cause of ICL-BLM localization in P is unclear but it may be
due to an increased association with membranes.
Asparaginase.
Free ASPase from E. Caroto^ora is also weakly cationic at neutral
pH although it is uncertain if, following radioiabeiiing and inter-
actions with plasma and/or other proteins, this enzyme remains comple-
tely unchanged. Immunological and enzyme activity studies (Patterson,
244.
1975) suggest that substantial changes to the protein do not occur
following injection, however, Blazek and Benbough (1981) have recently
demonstrated that even slight chemical modification of the amino groups
of ASPase changes not only the enzyme activity but also the pi and thus
the plasma clearance rate. Only the zwitterionic protein could be
expected to freely permeate the cell membranes and it therefore seems
unlikely that, with pi = 8.8 (Miller et al. , 1971), ASPase can enter
organelles or cells by permeation. Since the E. carotovora enzyme does
not appear to contain carbohydrate groups it also appears unlikely, at
present, that ASPase enters cells by methods other than pinocytosis.
However, aggregated material, which was implicated in the initial rapid
plasma clearance, may well be taken up by phagocytosis and so account
for ML localization of the free drug at 5 minutes. Thereafter, the
level of uptake by S is the predominant feature.
The levels of free ASPase in the N and ML fractions, which fall
with time, probably reflect degradation of the protein since in the ML,
at least, total radioactivity was higher than TCA radioactivity at 2
and 5 hours and this degradation was further reflected in the S level 125
of non-precipitable I at 5 hours. If the uptake of the free enzyme 125
had been simply into the ML fraction free I could have been expected
in S throughout the period under study. The constant levels of precipi-
tatable radioactivity in S indicate that little degradation of the
enzyme has occured in this fraction. These results are consistent,
therefore, with the hypothesis that the aggregated enzyme is cleared
via endocytosis whereas the non-aggregated material enters by a mecha-
nism which involves direct localization in the cytosol.
iii) Entrapped Drugs.
The subcellular localization of entrapped drugs was originally
studied by Gregoriadis and Ryman (1972a and b). Liposomes containing
entrapped amyloglucosidase or invertase were shown to be preferentially
located in the ML fraction at time intervals up to 21 hrs post-injec-
tion. For amyloglucosidase the level of the ML-localized radioactivity
fell from 62 % to 47 % of the whole liver level during a 30 minute pe-
riod, while that of invertase remained constant (about 42 %) for 6
hours before falling to 34 % at 21 hours. Both enzymes had high initial
levels of radioactivity in P which fell over time whilst the levels in
S remained relatively constant.
Localization of entrapped invertase in the lysosomes of ML was
245.
made more definitive by the use of density gradient centrifugation to
separate lysosomes from mitochondria (Gregoriadis and Ryman, 1972b) in
rats pretreated with Triton WR-1339. In addition, an ML sample from 131
rats previously injected with I-albumin-containing liposomes was 131
found to release non TCA-pptable I radioactivity on incubation
in vitro suggesting that ML was capable of degrading the entrapped
material.
Lysosomal localization of entrapped neuraminidase (Gregoriadis et
al. , 1974b) and ^^In-BLM (Gregoriadis and Neerunjun, 1975b) has also 111
been found. Moreover, Segal et al. (1976) found In radioactivity
distribution was very similar to a lysosomal enzyme marker following
isopycnic centrifugation of a post-nuclear superatant from a liver 111
biopsy of a patient 90 minutes after I/V injection of In-BLM entrap-
ped in liposomes.
Steger and Desnick (1977) also found liver lysosomal localization
of anionic MLVs containing beta-glucuronidase into mice deficient in
this enzyme. However, the same enzyme entrapped in cationic liposomes
was equidistributed in both the ML and S fraction at early times post-
injection (up to 1 hour). At later times whilst the level of enzyme in
ML decreased the amount in S increased up to a plateau level (24-72
hrs) of about 70 % of the total hepatic activity, thereafter the level
in S started to fall and this was parallelled by an increase again in
ML and N. Moreover, the uptake of the enzyme into S was proportional to
the amount of stearylamine incorporated into the liposomes. These
cationic liposomes were also capable of increasing the release of some
(but not all) lysosomal enzymes into the S fraction particularly
between 1 and 3 days post-injection and this corresponded to the pla-
teau level of the entrapped enzyme in ML. Since this is the only pu-
blished study of the subcellular distribution of cationic liposomes it
is impossible to assess if these differences are due solely to charge.
No control was made of the size of the two populations which might
account for some differences in subcellular distribution patterns,
however, it is tempting to speculate that the increase in S location of
the entrapped enzyme was due to the uptake of SUVs in the population
perhaps into the cytosol of the PCMC via an intracellular fusion mecha-
nism (see later). 14
Finally. Rahman (1980) has reported that C-EDTA entrapped in
large neutral MLVs was located mainly in the S fraction, although, as
she points out, it need not necessarily have been taken up into this

246.
compartment but may have escaped there from the lysosomes. Since this
is the drug's location at all times between 1 and 24 hr post-injection
it is difficult to equate these findings with all the other published
work. It is unlikely that the uptake into S was due to free leaked drug
since hepatic uptake of free EDTA was reported to be very low. It may
be that these liposomes are too big to be instantly delivered to lyso-
somes of the KC and so the drug is released into S by a process of
phagosome stasis followed by leakage through the membranes. Previous
work by this group (Jonah et al. , 1975) tends to support the work of
Steger and Desnick (1977), mentioned above, since the former authors
also reported longer liver EDTA retention times following cationic
liposome administration although whether this is due to S fraction
accumulation is unknown because fractionation studies were not done.
The present work is, therefore, in agreement with the majority of
published data using anionic liposomes. All the entrapped drugs were
concentrated into the ML fraction initially, moreover, all showed sub-
stantial and significantly higher levels in this fraction than the com-
parable free drugs and usually this increase was maintained for periods
up to 1 or 2 days post-injection. Unfortunately, few of the published
papers have compared the distribution of both the entrapped and the
free compounds so it is difficult to assess if others would also have
found high levels of the drug in the ML. Gregoriadis et al.
(1974b) found that uptake of free enzyme (neuraminidase) was unde-
tectable in ML 30 minutes post-injection.
247.
Section 4:6.
ACTIVITY OF DRUGS AGAINST RNA AND DNA SYNTHESIS IN THE REGENERATING
LIVER.
Introduction.
In the previous section it has been shown that liposome-entrapped
drugs reach higher levels in the liver than the corresponding free drug
and that the major portion of the entrapped material can be found in
the lysosomal fraction of this organ. It is possible that the lysosomes
might be able to digest, or at least inactivate, the entrapped drug.
The question must, therefore, be asked whether liposome-entrapped anti-
tumour drugs retain their activity.
Many studies have reported that liposome entrapped agents are
active, or exhibit enhanced activity when compared to the unentrapped
drug, against tumours (Rahman et al. , 1974; Gregoriadis and Neerunjun,
1975a; Mayhew et al. , 1976; Neerunjun and Gregoriadis, 1976; Rutman
et al. , 1976; Kobayashi et al. , 1977; Kosloski et al. , 1978; Rustum
et al., 1979). The mode of action of these entrapped drugs is not well
understood. Several reports (see sections 4:1 and 4:3) have demons-
trated that tumour tissue can preferentially take up liposomes,
however, other workers have suggested that in vivo liposome-entrapped
cytotoxic drugs act by slow release of the agent from a depot site
(Kimelberg and Mayhew, 1978; Mayhew et al. , 1978, 1979; Kotaoka and
Kobayashi, 1978; Rustum et al., 1979; Kaye et al., 1981).
Since the liver is the major site of accumulation of the entrapped
drug it was decided to test the activity of the agents against regene-
rating liver tissue following partial hepatectomy (66 % removal of the
liver) in rats. To minimize the possible effects of leakage of en-
trapped agents in the circulation the drug was administered immediately
after the operation and an assessment of RNA and DNA synthesis made at
sometime later.
The regeneration of rodent liver is a well defined system which
was subjected to much research in the 1960's (Bucher and Malt, 1971).
The following non-exhaustive description summarizes the major morpho-qt
logical and biochemic^events which occur during the first 24-48 hours
aft.pr the operation.
Partial hepatectomy sets in motion an extraordinary active burst
of cell proliferation which reaches its peak near the end of the first
248.
day. The parenchymal cells (90-95 % of total hepatic cell volume) res-
pond first, showing infiltration with lipid and loss of glycogen within
a few hours. The whole cell, the nuclei, nucleoli and the smooth endo-
plasmic reticulum enlarge, lysosomes increase in number and some auto-
phagocytosis can be seen. By 6 hours RNA synthesis has commenced and
DNA synthesis is activated by 16-18 hours although it does not reach a
peak until 4-6 hours later. Nucleic acid synthesis starts in the cells
at the periphery of the surviving liver lobule and spreads towards the
centre. Mitosis follows the same pattern 6-8 hours later, i.e.: about
32 hours post-hepatectomy.
The non-parenchymal cells (KC and EC) lag about 1 day behind the
PCMC in initiating DNA synthesis and mitosis. It is uncertain if the KC
multiply in situ or if they are replaced from the bone marrow.
Whatever the origin of the non-PCMC, it is clear that during the
first 24 hours synthesis of nucleic acids is confined principally to
the hepatocytes. If liposomes are only delivered to KC lysosomes, the
entrapped agent must, therefore, not only escape lysosome digestion but
also be capable of crossing membrane barriers into adjacent PCMC, and
perhaps, of traversing PCMC to reach all parts of the lobule.
During regeneration, the normal liver tissue architecture is
found. The restoration of normal liver weight is extre mly rapid; e.g.:
the remaining liver weight doubles in 48 hours and increases a further
50 % in the next 24 hours. The surviving lobe of the liver enlarges and
later other lobes arise from this. The restoration process is complete
within 2 weeks.
Experiments in vitro on regenerating liver cells have demonstrated
that RNA transcribed in the nucleus subsequently appears in the cy-
toplasm as t-RNA, r-RNA and m-RNA. The overall rate of RNA synthesis
rises by about two-fold within 3-6 hours and this is associated with an
increase in the number of ribosomes. The bulk of the RNA synthesised
appears to remain in the nucleus where it has a very rapid turnover.
Twelve hours after hepatectomy protein synthesis can be detected and
this corresponds to the maximum rate of entry of m-RNA into the cyto-
plasm. Protein synthesis continues at elevated rates for a further 24
hours but it appears that some normal liver functions (e.g.: protein
excretion) may be supressed in favour of enzymes participating in amino
acid, nucleotide, DNA and RNA synthesis.
Replication of DNA may start as early as 12 hours post-hepatectomy
but reaches a peak at 20-24 hours. At this time about 35 % of all the
249.
cells are undergoing replication. The enzymes involved in DNA synthesis
(e.g.: Ribonucleotide reductase, DNA polymerase) which are present in
very small amounts in the normal liver, are increased many-fold during
regeneration probably by de-novo synthesis. These elevated enzyme
levels are maintained even after the peak of DNA synthesis has passed.
A) Results
i) Preparation of drugs.
Liposomes were prepared in the usual manner except that where
necessary the quantity of drug entrapped was increased to enable
an effective dose be given. 3
Actinomycin-D. For liposomal ATC-D, 8 mgs (25 uCi H/mg)
ACT-D was added to four times the standard quantity of lipids. The
final preparation contained 26.4 ug ACT-D and 3 umol EPC per ml
PBS. Immediately post-hepatectomy each animal received either 1 ml
free ACT-D, 1 ml liposomal ACT-D or 1 ml 0.145 M NaCl by I/V
injection. Some animals were sham operated (i.e. the peritoneal
cavity was opened but the liver was not touched) and these also
received the saline injection.
At timed intervals after injection the animals were killed but 14
each animal received C-orotic acid I/P exactly one hour before 3 14
death. The concentration of H-ACT-D (corrected for C counts) in the plasma was measured (fig. 4 : 14) and the livers were sub-
3
jected to sub-cellular fractionation. The concentration of H-
ACT-D was measured in the whole liver (fig. 4:15.) and in the
subcellular fractions (fig.4:16).
Nucleic acids were extracted from the whole liver as outlined
in chapter 2. The ^4
C-orotate incorporation (per hour) (fig.4:17)
was measured in hepatic RNA extracted from rats treated with
saline, entrapped ACT-D or free ACT-D at timed intervals after
injection. The total amount of RNA per gm liver is shown in table 14
4:11. The incorporation of C-orotate into hepatic DNA is shown
in table 4:12.
Bleomycin.
Bleomycin liposomes were made from four times the standard
l i p i d q u a n t i t i e s d ispersed with 15 mg bleomycin sulphate d i s s o l v e d 111
in 2 ml PBS and containing a trace amount of In-BLM to measure
the entrapment. The final solution contained, typically, 0.71 mg
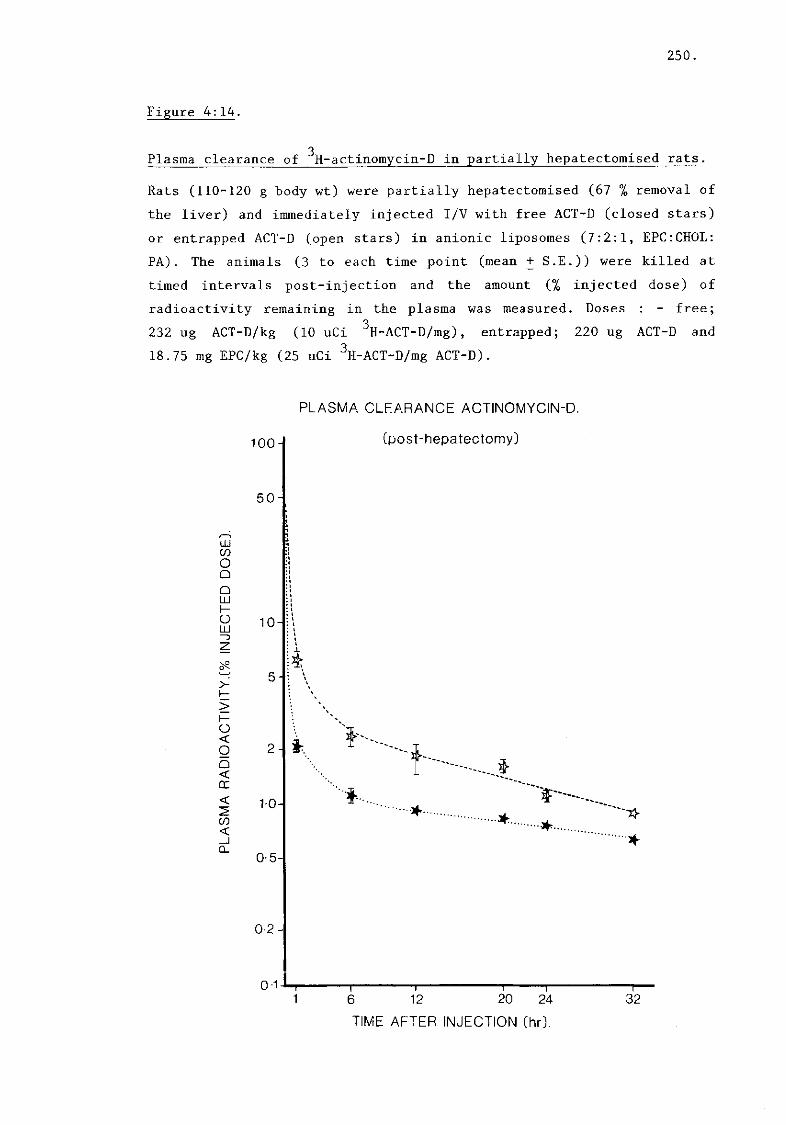
250.
Figure 4:14.
3 Plasma clearance of H-actinomycia-D in partially hepatectomised rats.
Rats (110-120 g body wt) were partially hepatectomised (67 % removal of
the liver) and immediately injected I/V with free ACT-D (closed stars)
or entrapped ACT-D (open stars) in anionic liposomes (7:2:1, EPC:CHOL:
PA). The animals (3 to each time point (mean + S.E.)) were killed at
timed intervals post-injection and the amount (% injected dose) of
radioactivity remaining in the plasma was measured. Doses : - free;
232 ug ACT-D/kg (10 uCi 3
H-ACT-D/mg) , entrapped; 220 ug ACT-D and
18.75 mg EPC/kg (25 uCi 3
H-ACT-D/mg ACT-D).
PLASMA CLEARANCE ACTINOMYCIN-D.
(post-hepatectomy)
50-
UJ CO O o Q LU I— o LU -3
>-
o < o Q < DC
CO <
1 0 -
5-
1 0 -
0-5-
^
>
0-2-
0-1J —r-20 32 12 24
TIME AFTER INJECTION (hr).

251.
BLM and 5.33 umol EPC/ml PBS. To achieve higher amounts of BLM
some preparations were concentrated by centrifugation (100.000 g x
1 hour) to give concentrations of up to 3 mg BLM/ml; the amount of
lipid in these solutions was not measured. Free BLM was made up at 111
concentrations of 5 mg/ml bleomycin sulphate and a trace of In-
BLM in PBS; this was diluted in PBS to match the liposome prepara-
tion.
No previous experiments have been performed using BLM to
inhibit DNA synthesis in partially hepatectomized rats so initial
experiments were performed with free BLM to estimate the dose
required for this effect. In addition, free BLM was given at dif-
ferent periods post-operatively to assess whether the timing of
the injection was a critical factor. These results are summarized
in table 4:13. The effect of entrapped BLM against DNA synthesis
is shown in table 4:14.
Asparaginase.
Liposomes were prepared from 4 times the standard lipid mix-
ture and dispersed with the 10 ml of ASPase solution (see methods)
The final, post-column, preparation contained 270 units and 4
umols EPC/ml. This preparation was concentrated to 672.5 units/ml 125
(0.516 uCi I/ml) by centrigugation.
This liposome-ASPase preparation and free preparation
(matched for radioactivity) was injected at concentrations of 300
or 600 units per animal (860 units/mg protein) to inhibit DNA syn-
thesis in partially hepatectomized rats (table 4:15).
Plasma clearance ACT-D.
Figure 4:14 represents the plasma concentrations (% dose re-
maining in plasma) of free and entrapped ACT-D at timed intervals
after injection; i.e.: timed intervals post-hepatectomy.
Despite the removal of about 67 % of the liver mass, the
plasma clearance of the entrapped drug was very similar to that
found previously in normal animals (fig. 3:.|C) but significantly
different (p < 0.05) from the free drug up to 32 hours post-injec-
tion. However, although the free drug plasma clearance was not
initially ( 0 - 6 hours) significantly different from that of free
drug found previously in intact animals (fig. 3:IE), the plasma
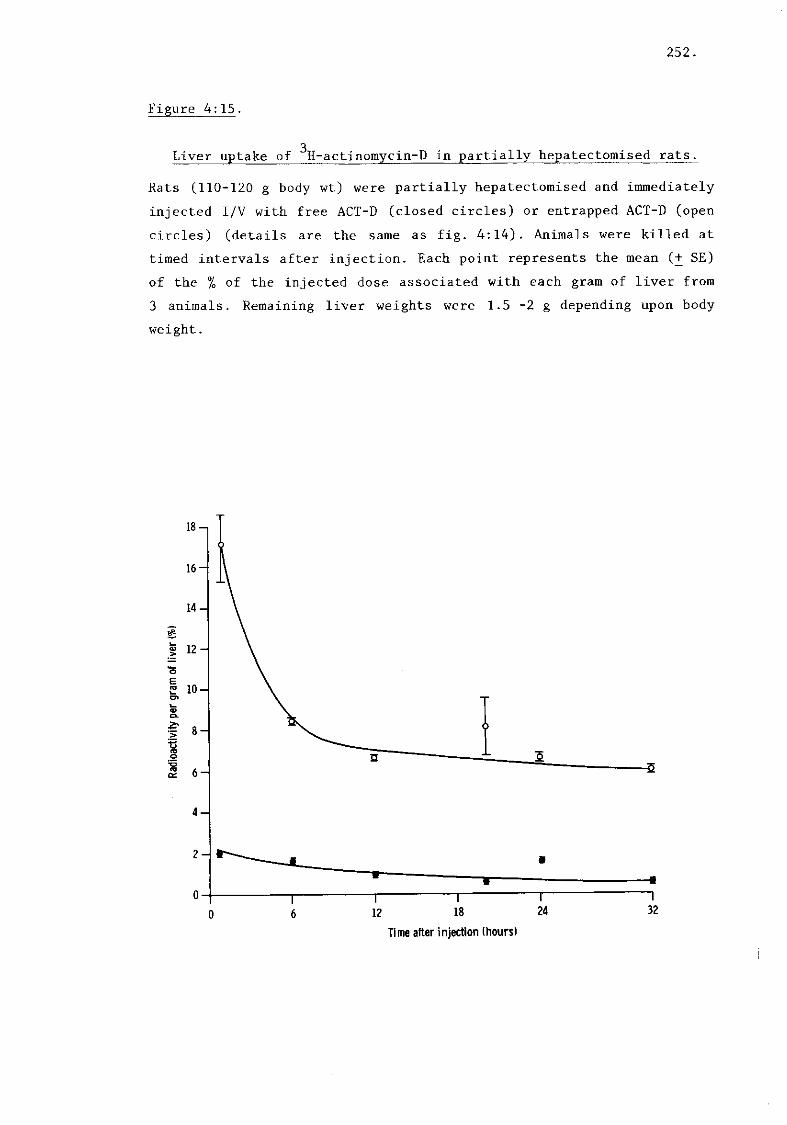
252.
Figure 4:14.
3 Liver uptake of H-actiuomycin-D in partially hepatectomised rats.
Rats (110-120 g body wt) were partially hepatectomised and immediately
injected I/V with free ACT-D (closed circles) or entrapped ACT-D (open
circles) (details are the same as fig. 4:14). Animals were killed at
timed intervals after injection. Each point represents the mean (+ SE)
of the % of the injected dose associated with each gram of liver from
3 animals. Remaining liver weights were 1.5 -2 g depending upon body
weight.
Time after injection (hours)
253.
concentration at later time intervals (12 - 32 hours) was very
much higher in the hepatectomised animals. This latter result
suggests that the operation interferes with the plasma clearance,
perhaps by reducing the excretion of the drug.
iii) Uptake of free and entrapped ACT-D by the liver.
The hepatic uptake of ACT-D by the hepatectomised liver, is
shown in fig. 4:15. A comparison of these results with table 4:8
(% uptake/gm normal liver) reveals that initially ( 0 - 6 hours)
the amount of liposomes taken up by the partial liver was 2.5 -
3.0 times higher than in the total liver and at later times (12 -
32 hours) about 4 times higher. The amount of radioactivity due to
the free drug in the hepatectomised liver was about 2- fold higher
than in the normal liver at later times although initially these
values were similar. The hepatic uptake of the entrapped drug was
always significantly higher (p < 0.001) than the free drug.
iv) Subcellular fractionation of hepatectomised liver.
A 20 % homogenate of the remaining liver was made and this
was separated into the component fractions as before. The results
are shown in figure 4:16.
i) Nuclear fraction (N).
The quantities of both free and entrapped drug in N were not
significantly different from each other at anytime post-injection.
Levels at 24 and 32 hours (not shown) were not significantly
different from the levels at 20 hours. The control levels (table
4:10) from other preparations suggest that the concentrations of
liposome drug in N is about twice as high as might be expected
from localization being due to sedimented liposomes.
Comparison of fig. 4:16 with fig- 4:9 (normal liver sub-cellu-
lar distribution) showed only small differences between the en-
trapped drug levels. At one hour the N level of entrapped drug in
the partial liver was sightly higher than in the whole liver. At
later times there was a slight increase in the entrapped drug
levels as was found in the whole liver.
The free drug levels in N were lower in the partial livers at
all times; levels were about a quarter of those found in the whole
liver preparation. The reasons for this difference will be discus-
sed later but the reduction may be due to the damage caused by the
operation.

254.
Figure 4:14.
3 Subcellular distribution of H-actinomycin-D in partially
hepatectomised rat livers.
The liver remnants from partially hepatectomised rats were subjected to
differential centrifugation to separate their component fractions. The 3
percentage of total liver H radioactivity found in each of the four
fractions at timed intervals (hours) post-injection is shown. Details
may be found in figure 4:15. Each point represents the mean (+ S.E.)
from 3 animals. Closed circles; free ACT-D: open circles; entrapped
ACT-D.
Radioactive recoveries (mean + S.E.; n = 12) were : -
90.35 + 7.05 % entrapped ACT-D and 73.58 + 15.13 % free ACT-D.
1—I—I—I—I—I 1 1 1—I
- I S
1 1 1 1 1 1 1 1 1 I 2 4 6 8 10 12 14 16 18 20 0 2 4 6
Time after injection (hours)
1 — I — I — I — I — I — I 8 10 12 14 16 18 20
255.
Mitochondrial/lysosomal fraction (ML).
Both the free and the entrapped drug accumulated in ML (cf. ML
fig. 4:9). A comparison between the free and entrapped levels revealed
that the means were not significantly different at any time between 1
and 32 hours except at 12 hours (p < 0.02).
The entrapped drug attained a steady concentration of 57 % at 6
hours; despite apparent fluctuations in the curve, this value was not
significantly different from the subsequent entrapped levels at 12, 20
or 24 hours.
The free drug reached a constant level at one hour of around 27 %.
This level was maintained throughout the 32 hour period: the level of
drug at one hour was not significantly different from any subsequent
value. This result is obviously very different from the free drug
levels in ML in the non-hepatectomised liver (fig. 4:9) and cannot be
explained by a poor separation of N from ML since the marker enzymes
were similar to those discussed previously.
Microsomal fraction (P).
Levels of both free and entrapped drug in P were not significantly
different at any time up to 32 hours. The concentrations of both prepa-
rations were very similar to those of the controls (table 4:10) and
suggests that neither localizes in this fraction.
Neither of the preparations were very different from those found
in the whole liver (fig. 4:9).
Soluble fraction (S).
The levels of both preparations were low in S and lower than those
in the unoperated liver (fig.4:9). At early time points (up to 12
hours) there was no significant difference between the means of the
free and entrapped drugs but at 20, 24 and 32 hours the free drug
slowly increased and was significantly higher than the entrapped.
Controls.
In general the marker enzyme distribution was found to be the same
as discussed previously (tables 4:9A, 4:9B). The lysosomal enzyme
content in ML was found to be at the upper limit of the range shown in
table 4:9A (but not significantly different) in all the operated livers
at more than 6 hours post-operation. The mitochondrial enzymes were not
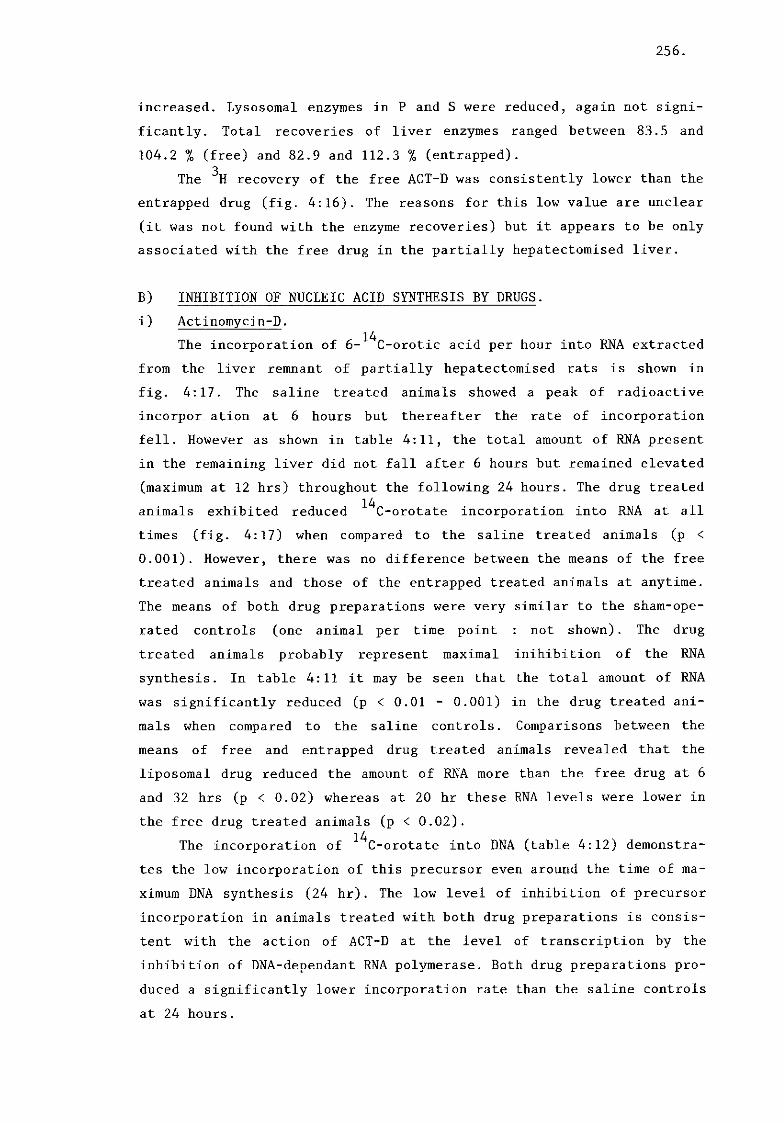
256.
increased. Lysosomal enzymes in P and S were reduced, again not signi-
ficantly. Total recoveries of liver enzymes ranged between 83.5 and
104.2 % (free) and 82.9 and 112.3 % (entrapped). 3
The H recovery of the free ACT-D was consistently lower than the
entrapped drug (fig. 4:16). The reasons for this low value are unclear
(it was not found with the enzyme recoveries) but it appears to be only
associated with the free drug in the partially hepatectomised liver.
B) INHIBITION OF NUCLEIC ACID SYNTHESIS BY DRUGS,
i) Actinomycin-D. 14
The incorporation of 6- C-orotic acid per hour into RNA extracted
from the liver remnant of partially hepatectomised rats is shown in
fig. 4:17. The saline treated animals showed a peak of radioactive
incorpor ation at 6 hours but thereafter the rate of incorporation
fell. However as shown in table 4:11, the total amount of RNA present
in the remaining liver did not fall after 6 hours but remained elevated
(maximum at 12 hrs) throughout the following 24 hours. The drug treated 14
animals exhibited reduced C-orotate incorporation into RNA at all
times (fig. 4:17) when compared to the saline treated animals (p <
0.001). However, there was no difference between the means of the free
treated animals and those of the entrapped treated animals at anytime.
The means of both drug preparations were very similar to the sham-ope-
rated controls (one animal per time point : not shown). The drug
treated animals probably represent maximal inihibition of the RNA
synthesis. In table 4:11 it may be seen that the total amount of RNA
was significantly reduced (p < 0.01 - 0.001) in the drug treated ani-
mals when compared to the saline controls. Comparisons between the
means of free and entrapped drug treated animals revealed that the
liposomal drug reduced the amount of RNA more than the free drug at 6
and 32 hrs (p < 0.02) whereas at 20 hr these RNA levels were lower in
the free drug treated animals (p < 0.02).
The incorporation of C-orotate into DNA (table 4:12) demonstra-
tes the low incorporation of this precursor even around the time of ma-
ximum DNA synthesis (24 hr). The low level of inhibition of precursor
incorporation in animals treated with both drug preparations is consis-
tent with the action of ACT-D at the level of transcription by the
inhibition of DNA-dependant RNA polymerase. Both drug preparations pro-
duced a significantly lower incorporation rate than the saline controls
at 24 hours.

257.
Legend figure 4:17.
14
Incorporation of C-orotic acid into RNA extracted from regenerating
livers of rats treated with actinomycin-D.
-3 14
The histogram shows the incorporation (dpm/mg RNA x 10 /hour) of C-
orotic acid into hepatic RNA at timed intervals (hours) after partial
hepatectomy. Rats were injected I/V with 1 ml of either 0.145 M NaCl
(black bars) or 220 ug/kg entrapped ACT-D (open bars) or 232 ug/kg free
ACT-D (striped bars) immediately after partial hepatectomy. One hour 14
before death each animal received 1.5 uCi 6- C-orotic acid in 0.5 ml
saline by I/P injection. RNA was extracted from the liver homogenates
by published methods. Each bar represents the mean radioactivity from
3 animals.
30 r—
S o 20 °<
.3 * OS •a ^ bfi o e a 3 •as -s £ 3 a o
10
n s. n a I n l l n l 12 20 32
Time after partial hepatectomy (n)

258.
Table 4:11. Total RNA content in remaining liver at timed intervals after partial hepatectomy : effect of
treatment with actinomycin-D.
TREATMENT
Time post-injection
(hrs) Saline
Entrapped ACT-D
Free ACT-D
mg RNA/g liver (wet (mean + SE : n =
weight) = 3)
1 7 21 + 0.25 4.61 + 0. 44 4.67 + 0 17
6 7 38 + 0.35 3.98 + 0. 26 5 . 7 2 + 0 41
12 9 37 + 0.78 4.77 + 0. 36 4.65 + 0 28
20 8 08 + 0.46 5.07 + 0. 17 3.79 + 0 22
32 8 63 + 0.35 3.93 + 0. 24 6.29 + 0 48
RNA was extracted from the liver remnant of partially hepatectomised rats at timed intervals after treatment (I/V) with either saline, en-trapped ACT-D (220 ug/kg) or free ACT-D (232 ug/kg).

259.
Table 4:12. l 4
Incorporation of 6- C-Orotic acid into DNA at timed intervals after partial hepatectomy :
effect of treatment with actinomycin-D.
Time post-injection
(hrs)
TREATMENT
Saline Entrapped ACT-D
Free ACT-D
Incorporation dpm/mg DNA/hr. (mean + SE) n = 3
1
6
12
20
24
32
154. .61 + 14. .57 175. .08 + 41. .41 199. .75 + 16. .74
292. .99 + 47. .41 108. .85 + 27. .78 206. .62 + 30. ,63
118, .54 + 51, .85 112. .82 + 58, .12 149. .17 + 12. .41
234. ,81 + 37. .14 143. .11 + 20. .78 100. .45 + 11. .47
415. .94 + 56. .79 136. .69 + 16, .67 166. .78 + 69. .24
125. .35 + 17. .57 225. .33 + 73, .37 82. .97 + 8. .70
The incorporation of C-orotic acid into DNA extracted from the liver remnant of partially hepatectomised rats was measured at timed inter-vals following treatment (I/V) with either saline, entrapped ACT-D (220 ug/kg) or free ACT-D (232 ug/kg).
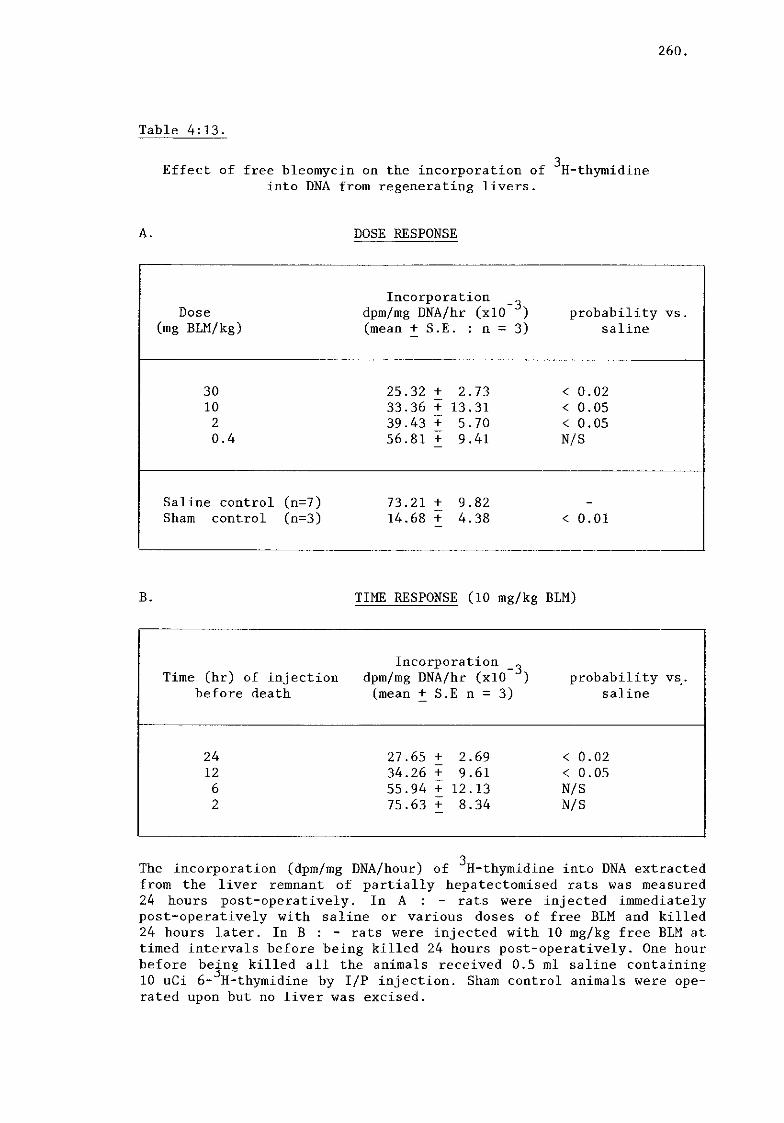
260.
Table 4:13.
3 Effect of free bleomycin on the incorporation of H-thymidine
into DNA from regenerating livers.
A. DOSE RESPONSE
Dose (mg BLM/kg)
Incorporation _ dpm/mg DNA/hr (xlO ) (mean + S.E. : n = 3)
probability vs. saline
30 10 2 0.4
25.32 + 2.73 33.36 + 13.31 39.43 + 5.70 56.81 + 9.41
< 0.02 < 0 . 0 5 < 0 . 0 5 N/S
Saline control (n=7) Sham control (n=3)
73.21 + 9.82 14.68 + 4.38 < 0.01
B. TIME RESPONSE (10 mg/kg BLM)
Time (hr) of injection before death
Incorporation ~ dpm/mg DNA/hr (xlO ) (mean + S.E n = 3)
probability vs. saline
24 12 6 2
27.65 + 2.69 34.26 + 9.61 55.94 + 12.13 75.63 + 8.34
< 0 . 0 2 < 0 . 0 5 N/S N/S
3 The incorporation (dpm/mg DNA/hour) of H-thymidine into DNA extracted from the liver remnant of partially hepatectomised rats was measured 24 hours post-operatively. In A : - rats were injected immediately post-operatively with saline or various doses of free BLM and killed 24 hours later. In B : - rats were injected with 10 mg/kg free BLM at timed intervals before being killed 24 hours post-operatively. One hour before being killed all the animals received 0.5 ml saline containing 10 uCi 6- H-thymidine by I/P injection. Sham control animals were ope-rated upon but no liver was excised.

261.
ii) Bleomycin.
The dose response data (table 4:13A) for the free drug shows that 3 the incorporation of H-thymidine into DNA (24 hr post-operation) in
the regenerating rat liver was inhibited by doses of 2-30 mg BLM/kg
when compared to saline treated controls. A dose of 0.4 mg BLM/kg did
not inhibit the incorporation of the precursor. The sham operated 3
animals also incorporated H-thymidine but this was significantly lower
than the saline control level. Comparisons of means of 30 mg/kg and 10
mg/kg treated animals with the sham controls revealed no significant
difference suggesting that the BLM-induced inhibition was close to the
maximum.
When partially hepatectomised animals were treated with 10 mg/kg
of free BLM at timed intervals before death (24 hr post-operation)
(table 4:13B) the administration of the drug was found to be time
dependent. Thus, injection 12 and 24 hours before death inhibited DNA
synthesis but injection at 2 and 6 hours prior to death did not. These
results may, therefore, mean either that modification of the BLM has to
occur before inhibition takes place or that accumulation of BLM at its
site of activity (presumably the nucleus) takes some time.
Using the data obtained above, liposome entrapped BLM was used in 3
attempts to inhibit H-thymidine incorporation into DNA. The results
(table 4:14) show that, like the free drug, doses of 2 - 30 mg/kg of
liposomal BLM inhibit DNA synthesis whereas a dose of 0.35 mg/kg did
not. A dose of entrapped BLM (8.5 mg/kg) administered 6 hours before
death failed to inhibit DNA synthesis.
A comparison of the means of similar BLM doses between table 4:13A
and table 4:14 was made. At no dose were the means significantly dif-
ferent. Moreover, in the single group of animals treated with 8.5 mg/kg 3
entrapped BLM 6 hours prior to death, the incorporation of H into DNA
was not significantly different from animals treated with 10 mg/kg free
BLM at 6 hours prior to death. The saline control values were not
significantly different.
These results suggest that liposome-entrapped BLM does not offer
any chemotherapeutic advantage over the free drug in this system. iii) Asparaginase.
The doses of free or entrapped ASPase used were similar to those
already found by others to be effective in inhibiting DNA synthesis in
262.
Table 4:14.
Effect of entrapped bleomycin on the incorporation of H-thymidine into DNA from regenerating livers.
Dose mg BLM/kg
Incorporation „ dpm/mg DNA/hr (xlO )
(mean + SE) n=3 probability vs.
saline
28.57 31.46 + 7.49 < 0 .01
8.33 33.21 + 5.87 < 0 .01
8.51 (6 hrs) 45.63 + 11.22 N/S
1.76 41.75 + 10.31 < 0 .05
0.35 56.44 + 15.017 N/S
Saline control (n=4) 76.491 + 7.74
3 The incorporation (dpm/mg DNA/hour) of H-thymidine into DNA extracted
from the liver remnant of partially hepatectomised rats was measured
24 hours post-operatively. Rats were treated immediately post-operati-
vely with saline or BLM entrapped in anionic MLVs (7:2:1 EPC:CHOL:PA)
(approximately 7.5 umol EPC per mg BLM) at the doses shown except for
one group of animals which received 8.5 mg/kg BLM 6 hours before death. 3
All the animals also received 10 uCi H-thymidine in 0.5 ml saline by
I/P injection one hour before being killed.

263.
regenerating rat liver.
Table 4:15 shows the effects of two doses of either free or en-3
trapped ASPase on the incorporation of H-thymidine into DNA. The drugs
were administered at the time of hepatectomy. Both preparations were
effective in inhibiting DNA synthesis : there was no significant dif-
ference between the effects of any of the doses of ASPase probably be-
cause of the high standard deviations. The two preparations appear,
therefore, to be equipotent and in this system there does not appear to
be any advantage for either the free or the entrapped preparation.
In a single experiment (not shown) liposome entrapped ASPase (600
units/animal) was administered to two animals 12 hours after the opera-3
tion. No inhibition of the incorporation of H-thymidine into DNA from
these liver remnants was found.
iv) Controls.
Preliminary experiments (not shown) confirmed that in the regene-
rating livers of untreated rats the incorporation of radioactive pre-14
cursors in; nucleic acids was time dependent. For C-orotic acid, ma-
ximum RNA incorporation occurred at 6 hours post-operation (6.6 + 1.42
4 x 10 dpm/mg RNA/hr (mean + st.dev.: n = 3)) whereas the maximum for DNA occurred at 24 hours and was several orders of magnitute lower
3 (415.9 + 56.8 dpm/mg DNA/hr). For H-thymidine, incorporation into RNA
was low at both 6 hours and 24 hours post-operation (6 hr; 0.43 + 0.28
x 103
dpm/mg RNA/hr : 24 hr; 6.13 + 2.54 x 10³
dpm/mg RNA/hr) when com-
pared to that of DNA (6 hr; 8.44 + 1.53 x 10³
dpm/mg DNA/hr : 24 hr;
78.31 + 8.95 x 10 dpm/mg DNA/hr). In much of the published work (e.g.
Schwartz et al. , 1965 and Becker et al. , 1970) the incorporation of 14 3
C-orotate or H-thymidine was expressed as radioactivity per nucleus
or per cell so that comparison between these values and those obtained
here for the inhibition of RNA or DNA synthesis cannot be directly
made. However, for the control values, i.e. : saline and sham opera-
tions , experiments on the incorporation of dpm per mg DNA (or RNA)
have been performed by others (Fujioka et al., 1963; Miyamoto et al.,
1973). The levels of incorporation of the precursors (per mg nucleic
acid) found in this study are very similar to those found by these
authors. The quantities of total RNA and DNA (not shown) found in un-
operated rats and in sham operated controls were similar to published
normal values (1.92 mg DNA and 5.88 mg KNA/g liver wet weight : Altman
and Dittmer, 1964).

264.
Table 4:14.
Effect of free and entrapped asparaginase on the incorporation of
3 H-thymidine into DNA from regenerating livers.
Dose ASPase units/kg
Incorporation _ dpm/mg DNA/hr (xl0
_ J
) (mean + SE) n=3
probability vs. saline
Free
5350 20.07 + 7.53 < 0.005
2803 29.77 + 9.42 < 0.02
Entrapped.
5825 13.91 + 2.62 < 0.002
2725 31.51 + 12.93 < 0 . 0 5
Control.
Saline (n=4) 76.49 + 7.74
3
The incorporation (dpm/mg DNA/hour) of H-thymidine into DNA extracted
from the liver remnant of partially hepatectomised rats was measured.
Rats were treated immediately post operatively with either saline 125
(control), or free ASPase (860 units/mg protein : 0.66 uCi I/mg) or ASPase entrapped in anionic MLVs (7:2:1, EPC:CHOL:PA) (approximately
125 67 units/umol EPC : 860 units/mg protein : 0.66 uCi I/mg protein)
and killed 24 hours later. One hour before death each animal received 3
10 uCi H-thymidine in 0.5 ml saline by I/P injection.
265.
DISCUSSION.
Actinomycin-D.
a) Plasma Clearance.
Despite partial hepatectomy of the animals, the plasma clear-
ance of liposomal ACT-D (fig. 4:14) was similar to that in whole
animals (fig. 3:1c). However, as has been previously discussed
(chapter 3), the plasma clearance of liposomes can be very varia-
ble depending upon their size and lipid content. The liposomal
ACT-D used in these experiments was not injected into non-operated
animals so that it is not possible to conclude that partial hepa-
tectomy did not change the plasma clearance of liposomes.
If future experiments show that there is, genuinely, no ef-
fect on plasma clearance following partial hepatectomy it may be
because of a large residual capacity of the liver Kup^-fer cells.
It will be recalled that a blockade of murine liver uptake by high
lipid doses of MLVs (500 mg/kg) could not be detected (Souhami
et al., 1981). Nevertheless, Saba (1970) using doses of 500 mg/kg
of a lipid emulsion, showed that in hepatectomized rats the plasma
* 1/2 W a S
in c r e a s e
d 3-fold. Although such differences can be ex-
plained by species variations (Saba, 1970), it is clear that, at
the lipid doses used in this study, removal of 67 % of the liver
would probably not result in blockade of the remaining KC even
when the volume and velocity of liver blood flow is so drastically
changed.
The plasma clearance of free ACT-D was altered by partial
hepatectomy. Again no comparison of the dose used here was made in
non-operated rats but these differences are probably not due to
the dose since no difference was found between doses of 10 ug/ rat
and 25 ug/rat in normal animals (fig. 3:1 E); moreover, the latter
dose is very similar to that used in these partial-hepatectomy
experiments (232 ug/kg). The plateau of free ACT-D in the plasma
of hepatectomised animals is, therefore, probably due to satura-
tion or alteration of normal mechanism of excretion of the drug.
In this respect these data are consistant with the findings of
Schwartz et al (1968a) that the major part of ACT-D is excreted in
the bile. A reduction of biliary output following 67 % removal of
the liver can be anticipated whilst the uptake per gm liver (see
following section) is not changed to compensate for the loss of
tissue.
266.
b) Hepatic Uptake.
The capture of liposomes by the liver was increased 2.5 - 4
fold (% dose/gm) following hepatectomy (c.f. table 4:8 and fig.
4:15). Taken with the results of the plasma clearance (fig. 4:14)
these data suggest a spare capacity in the uptake mechanism for
liposomes but not for the free drug. These results are suggestive
of different modes of uptake for the two preparations, i.e. : KC
for liposomes and PCMC for free drug.
The uptake of liposomal ACT-D confirms the data of Saba
(1970) that, even at high lipid doses, the capture (per gm liver)
is increased following this operation. This author also showed
that lipid emulsion uptake by other organs of the RES (lungs and
spleen) was increased following hepatectomy which probably con-
tributes to the maintainance of the plasma clearance curve of
liposomes at levels similar to non-operated animals.
c) Subcellular Distribution.
The major differences in the sub-cellular localization be-
tween the whole and the partially-removed liver concern the dis-
tribution of free ACT-D in the N and ML fractions. It is tempting
to speculate that these changes are associated with the higher
plasma concentration and also perhaps with the lack of bilary
excretion. In addition, the entrapped drug appears to concentrate
to a lower extent in P and S than in the unoperated liver and this
was associated with less lysosomal enzyme localization in these
fractions.
Given the well known binding of free ACT-D to nuclei (Dingman
and Sporn, 1965; Ro, 1967) discussed previously, it is apparent
that the free ACT-D within the regenerating liver is handled
differently from that in the unoperated liver. The reasons for
this may due to : i) alterations in the nucleus which prevents
binding ii) lysosomal alterations which retard ACT-D escape.
The morphological changes which occur in the nucleus within
hours of partial hepatectomy include enlargement of the nucleus
and especially in the nuclear volume (Bucher and Malt, 1971) and
presumably the unwinding of DNA and the induction of enzymes
preparatory to RNA synthesis. However, from figure 4:17 it is
clear that ACT-D inhibits RNA synthesis as soon as one hour post-
operation so that these changes may not affect the binding of the
267.
drug. Studies on ACT-D binding to DNA (Sobell, 1974) have shown
that the drug binds to double-helical DNA and that the interaction
of ACT-D between one base pair promotes interaction in the oppo-
site strand. If it is assumed that in the normal liver the DNA is
in its normal "supercoiled" structure then ACT-D may bind to a
greater extent than in the regenerating liver where the DNA is
undergoing re-organisation.
On the other hand, as has already been discussed, the very
high levels of free ACT-D in N (fig. 4:9) could have been artifi-
cially produced during homogenization and fractionation. This may
mean that the levels of free ACT-D in fig. 4:16 represent the
"normal" levels of ACT-D binding and the increase concentration
above this level in the whole liver are due to the release of free
ACT-D during the preparation. One possible source of this conta-Comrhcvt
mination may be the bile duct . failure to remove this structure
prior to homogenization of the unoperated liver might release its
contents into the homogenate. Partial hepatectomy, which probably
excises or fractures the b</e duct - , would remove this conta-
minating source.
Even if the io fle otuc fc remains intact the excretion of
ACT-D into the bile is likely to be delayed or arrested following
partial hepatectomy. In addition to the effect on the plasma
clearance, this delay may cause an intracellular redistribution of
the free drug in an attempt to "store" the ACT-D prior to the re-
sumption of normal excretion. It seems possible that this storage
occurs in the lysosomes which therefore trap more ACT-D than in
the normal liver. Against this latter hypothesis are the data in
fig. 4:15 which do not show an increased uptake of the free drug
when compared to the unoperated liver. In addition, the binding of
ACT-D to N in the whole liver may possibly represent a saturation
level; it is difficult to see why saturation of N in the partial
liver does not occur before storage of the excess drug in lysoso-
mes unless the nuclear rearrangement prevents saturation. The
increase in the S fraction at 20 hrs, and thereafter, may be due
to either the release of ACT-D from an intracellular site (al-
though both N and MI remain constant at these times), or addi-
tional capture from extracellular sites (although the plasma
levels also remain constant).

268.
Liposome-entrapped ACT-D appears to have lowers levels in P
and S in the partial liver than in the whole liver. Since
these lower levels may also be associated with lower lysoso-
mal enzyme content of these fractions it is possible that
these results reflect increased phagocytosis. If the drug
concentration in P is due, in part, to liposomes in unfused
phagocytic vacuoles, the lower levels could be due to in-
creased vacuole/lysosome fusion either because of an increase
in the number of lysosomes or because the activity of the
lysosomes is increased (Bucher and Malt, 1971) in response to
injury. These effects may also contribute to the lysosomal
accumulation of free ACT-D. In addition, the lower levels of
entrapped ACT-D in S may be a reflection of intracellular
fusion because of a lower number of phagocytic vacuoles
awaiting lysosome processing. Alternatively, the escape of
both free and entrapped drug from the lysosomes may be re-
tarded because of alterations to the lysosomal (and perhaps
other) membranes in response to the operation.
d) RNA Synthesis.
Despite the fact that a 3-4 fold higher concentration of
liposomal ACT-D was found in the liver, there was no apparent
increase in the entrapped drug's ability to inhibit the incorpo-14
ration of C-orotic acid into RNA. In addition, the same per-
centage of the total liver radioactivity of both preparations was
present in N. These data and those of the sham-operated contols
suggest that, at the doses used, inhibition of RNA synthesis was
maximal. A dose response curve (not done for ACT-D) might de-
monstrate if the liver drug concentration is proportional to the
inhibition of RNA synthesis and whether there is any therapeutic
advantage for the liposome preparation. However, these results do
demonstrate that liposome entrapped drugs are active in vivo in a
cellular compartment removed from the lysosomes. The central
question, which cannot be answered by these experiments, is
whether liposomes are being transfered from Kupffer cells (KC) to
hepatocytes (PCMC) or whether the activity of liposomal ACT-D
against RNA synthesis is due to leaked ACT-D in the plasma or
leaked ACT-D in the KC entering the PCMC or, finally due to the
uptake of SUVs into the PCMC.
Schwartz et al. (1965, 1968a) have shown inhibition by free

269.
ACT-D of C-orotate incorporation into rat partial liver RNA at
doses of 1 mg/kg although the I/V E D ^ in intact rats is 0.60 mg/
kg. These authors also reported that inhibition of RNA synthesis
was reversible i.e. : incorporation of orotate resumed after a 16
hour delay induced by the drug. This result was not confirmed in
these studies where both the free and the entrapped drug supressed
RNA synthesis for at least 32 hours post-operation. The reasons
for this difference are not clear.
Papahadjopoulos et al (1976) reported that liposome-entrapped
ACT-D could overcome the resistance of cells to free ACT-D, proba-
bly by modifying the mode of entry of the drug. But inhibition of
RNA synthesis was not different from that produced by an equiva-
lent dose of free drug in the parent cell line (non ACT-D re-
sistant) : i.e. : there was no therapeutic advantage for the
liposome preparation at the level of nucleic acid synthesis. 3
Inhibition of liver DNA synthesis (as measured by H-thymidi-
ne incorporation) was found to be sensitive to ACT-D (Schwartz
et al. , 1965) but only at dose levels of between 5 and 10 fold
higher than the ED^Q of the drug. Inhibition of protein synthesis
was also found to be partially effected by these ACT-D doses. The
data from this present study failed to show any differential ef-
fect of the liposome drug on DNA synthesis except at 24 hours.
In studies on liposomal ACT-D toxicity, Rahman et al. (1978) 3
showed that H-thymidine incorporation into DNA in proliferating
intestinal cells was inhibited four-fold less by the entrapped
drug despite the fact that the drug uptake into the intestine was
similar for both preparations. These data suggest that the two
preparations are handled differently intracellularly. Yet, of
Schwartz et al. (1968a) have shown that intestinal synthesis^ DNA K
is only inhibited at much higher doses of free ACT-D than used by
Rahman et al.; again it is unclear why these differences exist.
ii) Bleomycin.
Disappointingly the entrapped BLM was no more effective than the
free drug in its action on DNA synthesis in spite of a much higher li-
ver capture, (at least in the intact liver). These results suggest that
only a small proportion of the intracellular entrapped BLM is active.
Several reasons can be advanced for this finding : 1) entrapped BLM

270.
accumulated in the lysosomes may not be able to escape from this orga-
nelle, ii) entrapped BLM in the cytoplasm will be inactivated but this
should be the case for free BLM as well, iii) co-factors involved in
BLM action may only react with free BLM, iv) the cell type involved in
drug accumumation in the liver may be different. This last point also
applies to other entrapped agents and will be discussed later.
In the previous section lysosomal accumulation and degradation of
BLM has already been mentioned. In addition, some of the factors dis-
cussed in relation to ACT-D may also be applicable to BLM eg. : in-
creased phagocytosis and perhaps a decreased premfability of membranes
in the damaged liver.
One area of note in these BLM results is the large variability
(eg. standard errors of means) in the results. Such variability has
been found by others working on the binding of BLM to DNA (reviewed
Pietsch, 1975); it is probably dependent on the stage of cell cycle
during which BLM will bind to DNA. Although BLM acts to arrest the
cycle in both G^ and mitosis (Hill, 1978) its ability to bind to DNA
alters during the cell cycle so that if the receptive binding period is
missed no increase in dose can bring about the inhibition of DNA syn-
thesis. Such variability has been shown in animal cells in culture and
in tumours in vivo (Pietsch, 1975) and is most notably seen in bacte-
rial cultures which continue to multiply in medium which contains a
thousand-fold excess of antibiotic above the dose that inhibited growth
during the receptive period (Pietsch and Clapper, 1969). These data
probably explain the time effects seen with free BLM where only the
doses given within 12 hours post-hepatectomy had any effect on pre-
cursor incorporation into DNA.
More recent studies on the binding to, and action of, BLM at the
level of DNA have been made by Horwitz and co-workers. They have shown
that the bithiazole rings and the terminal dimethyl sulphonium groups
(fig. 2: IB) participate in the binding of BLM to DNA (Chien et al, 2+
1977). They have further shown that Fe forms an integral part of this
complex, binding BLM in a 1:1 ratio (Sausville et al., 1978a). Early
work established that BLM was able to produce breaks in single stranded
DNA (Suzuki et al., 1968), a process which was enhanced by the presence
of sulphydryl compounds and hydrogen perioxide (Nagai et al. , 1969). 2+
Sausville et al. (1978b) have shown that in vitro Fe plays an impor-
tant role in the DNA breakage since substitution of other metals or the
addition of the iron chelator, desferoxamine, leads to loss of the

271.
strand-breaking ability. These authors have proposed that oxidation of 2+ 3+
BLM-bound Fe to Fe produces free radicals which attack the DNA;
such a hypothesis is consistent with the findings of Haidle (1971) that
molecular oxygen is needed for BLM activity and that DNA strand-
breakage is inhibited by superoxide dismutase. However, the addition of
ionizing radiation to BLM treatment, which should enhance the effects
of free radical production, has proved to be inconsistent (Byefield
et al., 1976).
The binding data outlined above raise an important question in
terms of the inhibition of DNA synthesis by entrapped BLM; if iron is
needed for BLM action, will liposome entrapped BLM be able to acquire
the metal ? Thakur et al. (1973) have shown that the indium in BLM can
be displaced by iron from transferrin in vivo and it is, presumably,
this chelated iron which generates the free radical species for
breaking the DNA strands. However, it seems probable that truly en-
trapped BLM cannot remove chelated iron from transferrin through the
liposome membrane; it may therefore be inactive intracellularly unless
it is able to pick up iron after its escape from the liposome and prior
to its binding to DNA. If this proves to be correct, liposome entrapped 2+
BLM chelated to both radiolabelled iron and Fe might prove to be
superior to free BLM in subsequent experiments in partially hepatecto-
mised animals.
In the present experiments, it may be that only the BLM on the
external surface of the liposome or the BLM which has escaped/leaked
from the liposomes in the plasma or within the cell is able to inhibit
DNA synthesis. However, the dose response curves for both free and en-
trapped BLM are similar so that perhaps all the liposomal BLM is avai-
lable in the PCMC or else only a small proportion of the free BLM (ie:
that which escapes cytoplasmic inactivation) reaches the nucleus in an
active form.
iii) Asparaginase.
Becker et al. (1970) have investigated the effects of ASPase on
DNA synthesis in regenerating rat liver. A dose of 600 units/animal (as 3
used in this study) was effective in delaying DNA synthesis ( H-thymi-
dine incorporation into nucleii). In contrast, other dividing cells
(intestinal crypt cells, lymphoid tissue, renal tubular cells, skin
basal epidermal cells and salivary cells) were not affected by this
dose of free ASPase. Moreover, these authors also reported that the
272.
enzyme had to be administered soon after the operation (0-6 hours)
since an increase in asparagine levels, due to enhanced asparagine
synthetase activity (Patterson and Orr, 1969), occurs about 12 hours
post-operation and nullifies the later therapeutic effects of ASPase.
Liposome entrapment of ASPase did not overcome this effect (experiment
not shown).
As in the previous experiments with ACT-D and BLM, there was no
therapeutic advantage in using ASPase entrapped in liposomes : many of
the general points made previously probably also apply to this lack of
enhanced liposomal-ASPase activity. In addition, the poor liver uptake
of entrapped ASPase probably contributes to this lack of enhancement
especially if the hepatectomised liver behaves in a similar manner to
the whole organ and the drug leaks from the liposomes.
iv) General Discussion.
The lack of any increased effect against nucleic acid synthesis
using liposome entrapped drugs when compared to free drugs has already
be discussed in respect to the properties of the individual agents. In
general, liposomes are taken up by the KC of the liver and there is no
reason to suppose that this will be markedly changed in the undamaged
lobe of the liver which remains post-hepatectomy. Yet, it is principal-
ly the PCMC which undergo nucleic acid synthesis during the time period
considered in these experiments (Grisham, 1962; Bucher and Malt, 1971).
It is, therefore, perhaps not surprising that only a small amount of
the liposomal drug appears to be active. Entrapment of drugs in SUVs,
which would probably enhance the PCMC uptake, might increase their
pharmacological activity in the hepatectomised liver when compared to
larger liposomes or the free drug; such an experiment would be relati-
vely easy to perform. Indeed, using high enough doses of precusors, it
is possible to study nucleic acid synthesis in the unoperated liver
(Bucher and Malt, 1971) and such an experiment might help solve the
question of the amount of the injected dose of liposomes accumulated by
each cell type providing that the liposomes carried an appropriate
drug.
Such experiments assume that there is no transfer of drug from KC
to PCMC. This may not, however, be the case. There is evidence for the
transfer of lysosomes from activated macrophages into the cytoplasm of
other cells (Hibbs, 1974; Bucana et al. , 1976) and macrophages have
been proposed as "second carriers" to transport phagocytosed liposomes
273.
to other tissues (Fidler et al. , 1981). In addition, it is clear that
many processes involved in tissue injury, whether induced by infection,
surgery, accident or perhaps iatrogenically, could be responsible for
the leakage of drugs from one cell type to another (Canonico et al. ,
1979). Thus, for example, tissue damage can result in increased capil-
lary permeability by the actions of histamine and 5-hydroxytryptamine
liberated from mast cells; activation of macrophages and leucocytes may
lead to infiltration of the damaged area and increased phagocytosis of
liposomes found therein as well as the release of cellular and lysoso-
mal enzymes which could digest liposomes (and perhaps drugs) extracel-
lularly. The release of hormones and proteins in response to injury
(e.g. : glucocorticoids, insulin, glucagon, thryroxine, actute phase
proteins, alpha-2-macroglobulin) as well as changes in plasma ion
levels may all have unknown effects on drug uptake, disposition and
metabolism.
274.
Section 4:7. : General Discussion
A) Tissue Distribution Studies.
From these present studies and from the many reports of other
workers in the field it is clear that the predominant tissues which
control the distribution of liposomes in vivo are the cells of the
reticuloendothelial system. This involvement was recognised from the
outset (Gregoriadis and Ryman, 1972a, 1972b; Segal et al., 1974).
In an oft-quoted review, Saba (1970) has outlined the historical
aspects of RES research and stressed the role of these cells in the
plasma clearance of all types of particulate matter as well as their
physiological functions in the area of host defense, i.e.: the immu-
nology, detoxification, biotransformation and excretion of foreign and
endogenous matter. The sessile macrophages which are primarily, but not
exclusively, responsible for the clearance of colloidal and particulate
material are to be found lining the sinuses of the liver, spleen, lung,
bone marrow and, often forgotten, in the capillaries of the adrenal and
pituitary glands. In addition macrophages compose the reticular cell
populations of the spleen, lymph nodes, bone marrow and of the central
nervous system but these are not as closely in contact with the blood
as with other body fluids e.g.: lymph and cerebrospinal fluid. Finally,
macrophages can be found in all organs and in connective tissues
(histiocytes) but these are derived from the motile blood macrophages
(monocytes).
Using the other colloidal systems, it has been shown (Saba, 1970)
that the stationary macrophages of the liver and spleen are the major
areas of uptake of injected particles and that uptake is primarily by
endocytosis (Silverstein et al., 1977). Liposomes are no exception to
this general rule (Segal et al. , 1974), however, the finding in this
and many other studies of liposomal solutes localized in many tissues
other than those with substantial macrophage populations raises two
important questions which are the subject of continued debate :
i) is tissue uptake of liposomes entirely mediated by the macrophages
or are other cells involved ?
ii) is endocytosis the only mechanism by which liposomes can gain ac-
cess to the interiors of the cells ?
It will be appreciated that, in terms of drug delivery, the first
question is of paramount importance since if liposomes can only be
275.
"targetted" to macrophages their usefulness will be limited.The
second question is important in terms of drug stability and effect
since, except in very exceptional cases, the metabolic sequal to endo-
cytosis is digestion of the material in the lysosomes of the cells.
Thus drugs which are unstable at the lower pH found in lysosomes or
which contain moieties capable of being attacked by enzymes may be
ineffective when liposome entrapped although the lysosomal milieu can
be used to promote drug activity and stability (de Duve et al, 1974).An
addition question might also be asked which is based on factors in-
volved in the previous two : is it possible to alter the disposition of
liposome entrapped agent by blockade of the RES ?
i) Factors effecting cell uptake of liposomes.
Tissues other than the liver will be discussed here. The special
case of the liver will be considered later.
a) Interpretational problems. (Poste and Papahadjopoulos, 1978;
Poste, 1980).
The tissue disposition of entrapped material is beset by se-
veral different problems of interpretation. These problems revolve
around the use of radioactive markers to describe the location of
the liposomes, e.g.: mention has already been made of the leakage
of entrapped material from liposomes, in the case of pro-
tein bound radioactivity not only changes the apparent plasma
clearance of the radiolabel but may also contribute to the tissue 111
disposition. The uptake of the protein- In complex may be very
different from the liposomal material not only in the mode of
entry into cells but also in the kinetics.
Further problems arise when exchangeable lipid markers are
used to assess the integrity of liposomes, exchange can take place
not only between carrier and lipoproteins but also between carrier
and cell membranes. Other problems involve the mode of uptake of
liposomes by cells, e.g.: adsorbtion of liposomes to cell surfaces
followed by leakage of the entrapped solute through both liposome
and cell membranes has been shown to be a major route of solute
uptake by cells in vitro (Blumenthal et al. , 1977; Weinsteln
et al. , 1978); in such a system, providing that the adsorbtion is
stable, an apparent uptake of both liposome and solute will be
found even though the vesicle might, in vivo, be removed at some
later time by mechanical factors such as blood flow or collision
with blood cells. In the example above, interpretation of the

276.
results might become even more confused if, during adsorbtion,
exchange of liposomal lipid for membrane lipid occured
(Zilversmit, 1978; Wirtz et al., 1980).
Uptake by endocytosis may also cause interpretational pro-
blems depending upon the species of the entrapped solute, e.g.:
the rapid removal of radiolabel from drugs or proteins by lysoso-
mal digestion followed by translocation of either the label or
drug out of the lysosomes back to the blood or into neighbouring
cells might easily be wrongly taken as specific uptake by a par-
ticular tissue or cell type.
b) Liposome size.
The plasma clearance of liposomes according to size is of the
order LUV > MLV > SUV (Juliano and Stamp, 1975; Sharma et al. ,
1977; Hinkle et al. , 1978; Abra and Hunt, 1981). The uptake into
spleen, lung, brain and bone marrow was the highest when larger
liposomes were used (Jonah et al. , 1975; Rahman et al. , 1975;
Kimelberg et al. , 1976; Gregoriadis, 1977a; Sharma et al., 1977;
Richardson et al. , 1978; Ryman et al. , 1978; Hunt et al. , 1979;
Jackson, 1980; Abra and Hunt, 1981), however, Gregoriadis et al.
(1977a) found higher levels in the lungs of mice when smaller
liposomes were used, contrary to most published data. Both
Kimelberg et al. (1976) and Richardson et al. (1978) found higher
levels of the larger liposomes in the kidneys but this latter
group (Sharma et al. , 1977) had previously shown almost no dif-
ferences between the sizes in this organ. However, this last data
14
was obtained using C-cholesterol-containing liposomes which are
known to exchange the radiolabel with lipoproteins (chapter 3) and
labelled HDL will concentrate in the kidneys to a certain extent
(Gotfredsen, 1982). Uptake into myocardial muscle has been repor-
ted to be independent of size (Sharma et al. , 1977) but in the
ischaemic heart MLVs are preferentially accumulated (Caride and
Zaret, 1977) whilst in skeletal muscle the smaller liposomes are
more highly concentrated (Kimelberg et al. , 1976; Gregoriadis
et al., 1977a).
In general tissues which contain large capillary networks or
sinuses seem to accumulate the large liposomes probably because
they can trap them in their terminal branches (Ryman and Tyrrell,
1980). Tissue uptake consists of a balance between the rapid
clearance of large liposomes by the RES and the longer circulatory

277.
time of the smaller liposomes which allows these vesicles a better
chance to interact with cells of limited or slow uptake capacity.
For this reason tissues such as skeletal muscle should be more
susceptible to therapy with the smaller liposomes. Such effects
were reported by Dapergolas et al. (1976) in tumour tissue and
Richardson et al. (1978) found that rat tumour tissue was better 99m
visualized by gamma-camera when smaller liposomes containing Tc
were injected intravenously. However, similar studies in humans
failed to provide visualisation of a variety of tumour tissues
(Segal et al., 1976; Richardson et al., 1979).
c) Liposome composition.
Manipulation of the composition of liposomes (usually the
charge) has been used by several authors in attempts to change the
tissue disposition of liposomes. However, as shown in chapter 3,
in vivo the final charge on the liposomes, after interaction with
plasma proteins, does not necessarily reflect the charge of the
injected preparation. Indeed, anionic liposomes may be less
electronegative than cationic liposomes. Nevertheless, Jonah
et al. (1975) reported that the tissue distribution of unsonicated
MLVs containing EDTA could be altered by changes in charge; catio-
nic liposomes produced the highest levels of EDTA in lung and
brain tissue whilst anionic liposomes gave the highest levels in
the spleen and bone marrow. No control of size or drug leakage was
made in these preparations so that it is unclear how much of the
differences are due to these factors.
Richardson et al. (1978) studied the tissue uptake of heterogenous
small MLVs in rats and found that neutral liposomes were taken up
less well into the kidney than either cationic or anionic vesicles
which were about equal. In agreement with Jonah et al, (1975)
these authors also reported higher spleen levels of anionic lipo-
somes but unlike them they found that the liver uptake was higher
for anionic and neutral liposomes than for cationic ones. Richard-
son et al. , (1978) were also able to confirm the findings of
Gregoriadis et al., (1977a) that small anionic liposomes localize
the best in solid animal tumour tissue. Yet previously, others (Mc
Dougall et al., 1974) using ganglioside-containing vesicles failed
to alter the in vivo disposition by the addition of an anionic
charge and this is consistent with the fact that ganglioside
vesicles have a similar plasma clearance to anionic liposomes
278.
(Gregoriadis and Neerunjun, 1974). These last authors also repor-
ted that the levels of liposomes in the spleen were almost unef-
fected by the presence of charge whereas the initial liver levels
showed that anionic liposomes were accumulated to a higher extent
than neutral or cationic liposomes. Steger and Desnick (1977)
reported lower and less prolonged levels of an entrapped enzyme in
both kidney and spleen when cationic, as opposed to anionic,
liposomes were injected I/V. In the damaged mouse heart Caride and
Zaret (1977) reported that neutral and cationic liposomes accumu-
late in the endocardium to a higher extent than anionic MLVs. This
accumulation is probably due to capillary and cell damage coupled
with changes in blood flow.
The incorporation of cholesterol into liposomes has been dis-
cussed previously and until recently it was assumed that its pre-
sence in the liposome membrane changed the distribution of en-
trapped material by a reduction in either the leakage of entrapped
solutes or in lipid exchange with lipoproteins. However, recently
Senior and Gregoriadis (1982a, b) have suggested that the porosity
of SUVs, as effected by CHOL, controls the plasma half-life of the
carrier. Wharton and Green (1978) studied the tissue distribution 3
of H-PC in liposomes containing different sterols. Two derivati-
ves (3-hydroxycholest-3-en-2-one and l-methyl-10-norcholesta-l, 3,
5 (10)-tirene-3-ol) tended to aggregate the liposomes and were
cleared more rapidly from the plasma to give high tissue concen-
trations in the liver, spleen, intestine and kidneys. Two other
derivatives (3-hydroxycholest-5-en-7 one and cholesta-4, 6 - dien
-3-one) were cleared at the same rate as normal cholesterol-con-
taining liposomes but gave lower tissue levels than the normal. It
is unclear if these data reflect a true direction of liposomes or
if the novel cholesterol derivatives are binding to PC in the
liposome membrane in a different manner and so perhaps preventing
PC exchange with lipoproteins or cells or, finally, if the lipo-
some surface has been altered in such a manner that interaction
with plasma proteins or cell "receptors" is changed.
Recognition that cells contain surface membrane receptors
specific for carbohydrate groups prompted Mauk and Gamble (1979)
to investigate sugar derivatives of cholesterol incorporated into
SUV membranes. They found that the presence of either fucose or
galactose on the surface of cationic SUVs caused no statistically

279.
significant alteration in the tissue distribution of the vesicles
irrespective of the route of administration (I/V, I/P, Sub-Cut,
Oral).
Replacement of liposomal PC by sphingomyelin (Gregoriadis and
Senior, 1980; Hwang et a l . , 1980; Ellens et al., 1981) changes the
plasma T ^ ^ the liposomes to make it slower and more linear.
According to Gregoriadis and Senior (1980) increases in plasma
circulation times reduce the liver uptake of sphingomyelin SUVs
but Hwang et al;, (1980) and Ellens et al. , (1981) consider these
effects to be due to a change in the kinetics of uptake rather
than in the total amount of liposomes captured. Furthermore, since
they appear to be antigenic (Strejan et al., 1979) it would appear
that the use of sphingomyelin liposomes may be limited. Reduction
of liposome fluidity by the replacement of EPC by DPPC failed to
show significant changes in the uptake of liposome entrapped 1 1 3
In-BLM into the lungs, spleen, liver or tumour tissue of rats
(Gregoriadis et al. , 1977a). However, recently Senior and Grego-
riadis (1982b) have produced distearoyl-PC (DSPC) liposomes with
20 hour half-lives and low hepatic capture although it remains to
be seen if the total amount of liposomal lipid finally taken up by
the RES is reduced. Gotfredsen (1982) found little difference
between the hepatic capture of PC:PS vesicles and DSPC:CHOL vesi-
cles. In contrast, mouse tumour tissue took up at least twice the
amount of fluid liposomes (EPC with cis-dichlorobiscylopentylamine
platinum (II) entrapped) as similar DPPC liposomes but uptake by
the liver was highest with this latter preparation. (Deliconstan-
tinos, et al., 1977).
d) Liposome dose
Gregoriadis and Neerunjun (1974) demonstrated that the ini-
tial rapid plasma clearance of MLVs did not occur when large
amounts of lipid were injected into rats. They attributed this
change to immediate saturation of uptake sites. This data was
later confirmed by Tanaka et al. , (1975) and the effect is also
apparent with SUVs (Gregoriadis and Senior 1980, Senior and Grego-
riadis 1982a). The dosage effect has been more thoroughly studied
by Abra and Hunt (1981), Souhami et al. , (1981) and Gotfredsen
(1982). As Gregoriadis and Neerunjun (1974) correctly sumised
these effects are connected with blockade of the RES and this
subject will be discussed in more detail in connection with lipo-

280.
some uptake by the liver. However, RES blockade theoretically
allows a greater time for liposome uptake by other tissues. Unfor-
tunately, blockade prior to subsequent liposome challenge has not
resulted in the expected relocation of liposomes to organs other
than the liver and spleen. At the most only modest increases in
the kidneys and bone marrow have been reported (Caride et al. ,
1976; Kao and Juliano, 1981; Souhami et al. , 1981). In the lungs,
Kao and Juliano (1981) using LUVs and Caride et al., (1976) (MLVs)
have reported an increase uptake of their challenge preparations
but Souhami et al. , (1981) failed to find an increased lung con-
centration with either MLVs or SUVs. This descrepancy is probably
due to the relative sizes of the populations. However, Abra et al.
(1980) reported that blocking doses of liposomes administered 5
and 24 hours prior the challenge dose could depress the latter
doses' uptake into tissues other than the liver and spleen. This
delayed blockade of other tissues might be the same effect that
Kao and Juliano (1981) observed using SUVs to block the liver
uptake of LUVs. If this is so, it is possible that a case could be
made for uptake into other tissues being mediated by saturatable
mechanisms associated with phagocytosis by cells of the RES in
these tissues. On the other hand, these data might also imply that
sites of stable adsorbtion of liposomes are also saturatable.
Souhami et al. , (1981) have suggested that these adsorbtion sites
can account for the 50 % or so of "lost" liposomes which cannot be
found in the liver and spleen after injection. These sites may be
expected to contribute to the "apparent" distribution of liposomes
in tissues.
e) Foreignness of the surface of liposomes.
An extensive review of the role of liposomes as immunogens
and their role in immune reactions is beyond the scope of this
thesis (Tom and Six, 1980; Nicolau and Paraf, 1981). However, as
already stated liposomes can act as immunological adjuvants and
certain compositions result in the formation of antibodies. Most
liposomes used to date were made from natural lipid.- which are ex-K
changeable (discussed chapter 3) or biodegradable (Fowler and de
Duve, 1969): liposome degradation has been demonstrated in vivo
(Zirenberg and Betzing, 1979; Gotfredsen, 1982). Such evidence
does not suggest that liposomes are recognised as non-self in the
same way as might be expected for other particles (e.g.: bacte-
281.
ria). The adsorbtion of proteins to the surface of liposomes
in vitro (chapter 3) further suggest that any "foreignness" might
be covered by these molecules. However, there is evidence (Grego-
riadis, 1980 a,h,c; Gregoriadis et al. , 1981b; Gregoriadis and
Meehan, 1981) that entrapped solutes are detectable in or on the
surface of liposomes. The extent to which entrapped drugs or
proteins contribute to the foreignness of the liposome remains to
be established.
vi) Opsonins in normal serum.
Although this subject has been considered in chapter 3, the role
of proteins (e.g.: alpha-2-M) adsorbed to liposomes in the removal or
uptake of these carriers into cells has not been determined. Opsonini-
zation has been proposed (Black and Gregoriadis, 1976; Souhami et al.,
1981) as a mechanism by which liposomes are directed to the RES.
However, in a recent publication, Kao and Juliano (1981) have shown
that opsonin depletion is probably not the cause of the liposomal
blockade of the RES. This does not, however, rule out the possibility
that proteins adsorbed to liposomes can determine the fate of the
vesicle in vivo.
Uptake of liposomes by the liver.
There is no doubt that the liver is the principal organ involved
in the removal of particulate and colloidal material from the cir-
culation (Saba, 1970). Numerous reports of liposome concentration in
this organ following I/V Sub-Cut, I/P and I/M injection have led to
speculation as to the factors with control liposome removal, the cell
type involved in uptake, the final destination of entrapped solutes and
how liver uptake can be manipulated or modified to enhance uptake by
other tissueX
The liver consists of three major cell types: i) the parenchymal
cells (PCMC) ii) Kupffer cells (KC) and iii) endothelial cells (EC),
but other types of cell (e.g.: fat cells, blood cells: Emeis and
Planque, 1976) may also be present in the sinusoids. The basic archi-
tecture of the liver sinusoids has been extensively studied by Wisse
(1977). In brief, the liver sinusoids and capillaries are lined with
endothelial cells between which extend long protoplasmic processes
containing fenestrae of about lOOnm diameter. The fenestrae lead, via
the space of Diss to the parenchymal cells. Interspersed between the EC
and covering some of their surface are the Kupffer cells which may

282.
extend out into the sinusoidal lumen. The sinusoidal capillaries of the
liver do not contain a continuous basement membrane beneath the EC so
particulate matter can pass out of the capillary via the fenestrae and
come directly into contact with PCMC membranes. In other tissues con-
taining fenestrated endothelial cell linings (e.g.: kidney and intes-
tinal lumen) a continuous basement membrane is present. Yet other
tissues such as the brain, skin and muscle contain tight junctions
between adjacent endothelial cells with little or no fenestration
(although pore formation does occur) so that uptake of particulate
matter into tissue supplied by these capillaries involves the traversal
of the endothelial cells, interstital space, basement membranes and
finally the cell membrane in order to reach the interior of the cell.
Factors effecting liver uptake of liposomes.
It is often impossible to separate the various factors responsible
for the uptake of liposomes into this organ. For this reason such fac-
tors as charge, size, dose and RES blockage will be considered to-
gether. Other compositional changes will be considered separately.
a) Cell type involved.
It is still unclear, despite ten years work, what is the relative
contribution of the three major liver cell types to the uptake of
liposomes in vivo. Other colloids and particles are almost exclusively
concentrated in the phagocytic cells of the spleen and liver (KC) (Saba
1970). Apparently liposomes are different since these organs rarely
account for more than 50-60 % of the injected dose at any time after
injection irrespective of size or liposome composition.
In the original description of the in vivo fate of injected lipo-
somes Gregoriadis and Ryman (1972a, 1972b) demonstrated uptake of
radiolabelled protein and cholesterol into both PCMC and KC; moreover,
they suggested that the mechanism of uptake was by endocytosis because
most of the entrapped protein was localised in the lysosome fraction of
whole liver. Other workers have confirmed morphologically that lipo-
somes of a variety of compositions and entrapped solutes are localized
in these two cell types (Rahman and Wright, 1975; Tanaka et al. , 1975;
de Barsy et al. , 1976). However, Wisse et al., (1976) have emphasized
the kinetics of cell uptake since they demonstrated that horseradish
peroxidase (HRPase) entrapped in liposomes was found associated with
the KC and EC during the first half hour post-injection but at 3 hours
283.
all the cell types appeared to take up the enzyme. This correlates
quite well with the biphasic plasma clearance of liposomes and suggests
that the initial uptake (KC and EC) is due to the rapidly cleared large
MLVs whereas the PCMC uptake ( > 3 hours) may be due to SUVs in the in-
jection which are cleared more slowly and are small enough to pass the
fenestrae to interact with these cells.
Once again problems of interpretation of data play a leading role
in this controversy. Much of this early work has been carried out with
liposomes which are now recognised to be unstable in the plasma (i.e.:
low CHOL: except Tanaka et al. , (1975) who used so much CHOL that it
seems probable that not all the sterol was localized in the liposome
membrane). Exchange of radiolabelled liposomal lipid with lipoproteins
and/ or cell membranes and leakage of entrapped solute can easily
account for many of the observations (Roerdink et al., 1977). Moreover,
the finding of "liposome-like" multilamella structures in cells un-
treated with liposomes is by no means an uncommon feature (Wisse
et al. 1976; Scherphof et al. , 1980); such structures have been attri-
buted to fixation artifacts but they may also be formed by many catio-
nic compounds, particularly amphiphilic drugs, as has been amply de-
monstrated in electronmicrographs by Lullmann-Rauch (1979). These
structures are consistent with a drug-induced polar lipid storage
disease of lysosomes particularly in the liver and this „ suggests
that caution be used not only in the equation of intracellular "lipo-
some-like" strutures with injected liposomes but also in the thera-
peutic use of cationic amphiphiles entrapped in liposomes made from
polar lipids.
Further problems arise when . .. certain entrapped solutes (e.g.:
proteins like albumin or HRPase) are used as markers for the internal
aqueous spaces of the liposome because uptake of free foreign proteins
by liver cells is a well recognised phenomenon (Dean, 1975; Gregoria-
dis, 1975; Wisse et al. , 1976); ideally an entrapped solute should not
concentrate in the liver at all in its free form so that discrimination
of liposomal material from leaked/released free solute can be made.
Using such a discriminating solute Segal et al. , (1974) demonstrated
that a heterogeneous population of liposomes localized entirely in pha-
gocytic cells of the liver and spleen. In contrast, Gregoriadis et al.,
(1974a) found entrapped radiolabelled albumin exclusively in the PCMC
following injection of MLVs into a patient but since the time needed to
digest both liposomes and protein is not known it is possible that the

284.
KC had already digested and removed the liposomal material; this empha-
sises the need for the solute to be relatively inert for true locali-
zation to be evaluated.
Separation of the livers of injected animals into different cell
types has further added to the controversy of hepatic liposome uptake.
Scherphof et al. (1981) have reported that stable liposomes containing
the inert polymer polyvinyl pyrrolidone (PVP) are not taken up by
endothelial cells. Furthermore, using unstable SUVs, which donate PC to
HDL, these authors have demonstrated that the uptake of radiolabelled
PC by PCMC can be accounted for by the capture of the radiolabelled
HDL. However, the finding of MLV-derived PC in hepatocytes cannot be
explained by this process because these liposomes are more stable.
These authors explain this PCMC radiolabelling by assuming transfer of
PC to PCMC from liposomes digested in the KC. Coupled with their pre-
vious in vitro findings of low liposome uptake and phospholipid ex-
change to hepatocytes in the presence of serum, (Hoekstra and Scherp-
hof, 1979) these authors conclude that stable MLVs are removed only by
endocytosis into the KC (Roerdink et al., 1981).
Gotfredsen (1982) does not completely agree with this. Using
smaller unilamella vesicles of sizes below 100 nm he found that uptake
into KC/EC was 3 - 5 times more (per mg protein) than into PCMC but
that PCMC uptake was still substantial. On kinetic grounds, Gotfredsen
suggested that the uptake of radiolabelled PC by PCMC was not only
mediated by a slow donation from HDL but could also be accounted for by
a rapid, and mostly stable, adsorbtion of liposomes to the cell sur-
face. Such adsorbtion results in the release of entrapped solute into
the plasma so that radiolabelled lipid is apparently taken up to a
greater extent. In addition, Gotfredsen(1982) found that aggregated
liposomes were more highly concentrated in non-parenchymal cells sug-
gesting that size is an important parameter. In terms of therapy this
is certainly true since intracellular parasitic diseases of the RES are
more effectively treated with the larger liposomes (Black - unpublished
observations).
In rats Freise et al., (1980, 1981) have studied the uptake of ex-i l q
changeable C-CHOL and leaky H-methotrexate (AP) from MLVs into PCMC
and KC. One hour after injection mostly whole liposomes were found in
KC but at 6 hours the PCMC account for most of the cholesterol and
drug. Results such as this are not surprising since others have shown
that both lipid (Scherphof et al., 1981) and drugs (section 4:6) can be

285.
transfered from PCMC to KC. In addition, one of the final destinations 14
of HDL (containing C-CHOL:chapter 3) is known to be hepatocytes and
high levels of free methotrexate can be found in liver tissue at this
time (Colley and Ryman, 1975; Kimelberg and Atchison, 1978).When rats
received a portacaval shunt, which markedly reduces the activity of KC,
the uptake of both radiolabels in the liver was not reduced (Freise
et al., 1980, 1981) which prompted these authors to suggest that on a
cell to cell basis the PCMC are responsible for the most of the hepatic
uptake of liposomes. Incidentally the portacaval shut operation in rats
does not alter the plasma clearance or tissue distribution of the
liposomes. The liposomes used in this study were, overall, too big to
pass through the endothelial fenestrae. Such an operation would not be
expected to reduce the uptake of non-liposomal CHOL or methotrexate
indeed it might increase their PCMC localization in the liver.
The cell type involved in the uptake of liposomes by the liver
remains to be firmly established. Neither electron microscopy nor
fractionation of the liver into its component cells have provided
irrefutable evidence of liposome localization in PCMC. As a current
working hypothesis it would seem that large MLVs or LUVs are taken up
by KC. Smaller MLVs and SUVs may be found in both PCMC and KC. Uptake
into EC remains to be established although larger vesicles probably do
not locate there.
The endothelial sieve plates appear to act exactly like a sieve
but their cut off, at lOOnm, will not apply to all liposomes of diame-
ter larger than this because vesicles are deformable structures. One
wonders if the hepatic- portal vein blood pressure is high enough to
force quite large liposomes through the fenestrae (in an analagous
manner to the filter sizing method of Olson et al., 1979). This mecha-
nism might account for the finding of large multilamellar structures
associated with parenchymal cells (Rahman and Wright, 1975; de Barsy
et al., 1976).
b) Liposomal size and dose : RES blockade.
Apart from the effects of liposome size on their relative uptake
by the liver cell types, the size of the liposome has an effect on the
total liver uptake. Gregoriadis et al., (1977a) demonstrated that the
total hepatic uptake of large liposomes (0.5 min sonicated) was higher
in mice than smaller (3 min sonicated) liposomes. However, in rats the
uptake was not apparently size dependent. Also using rats, Sharma et
al. , (1977) failed to find differences between SUVs and MLVs or MLVs

286.
and LUVs 2 hours post-injection although calculation of the differences
between SUVs and LUVs suggests that the larger (LUV) preparation gives
the higher liver uptake. In mice, and using liposomes of defined size,
Abra and Hunt (1981) demonstrated that the total uptake (irrespective
of dose) was always lower with the smallest liposomes. Souhami et al.,
(1981) have also demonstrated a lower hepatic uptake of SUVs, irres-
pective of charge, compared to larger MLVs.
The dose and size effects of liposome disposition in vivo have
been studied by Abra and Hunt (1981). These authors have found that the
numbers of vesicles of three different sizes taken up by the liver
cannot account for the difference in size uptake, however, when surface
area was considered similar uptakes were observed irrespective of size.
Using doses of lOmg total lipid/mouse, Souhami et al. , (1981) were
unable to show liver blockade with a mixed population of MLVs but
blockade of the RES may be dependent upon uptake sites which are them-
selves size dependent and low CHOL-containing liposomes give anomolous
results (Abra and Hunt, 1981). The effects of predosing animals with
liposomes or other particulate materials are seen in the plasma
clearance of the liposomes injected at a later time. In general, the
fast initial phase of clearance of MLVs in most Effected by the
blockade (Gregoriadis and Neerunjun, 1974; Souhami et al. , 1981) irres-
pective of the agent used to create the blockade (dextran sulphate
polymer or colloidal carbon). There appears to be a slight difference
in the manner in which charged liposomes are cleared from the circu-
lation since neutral MLVs only have their initial clearance rate
blocked whereas anionic MLVs have both the initial and final rates
blocked. This effect may be due to a homologous charge effect (dextran
sulphate is highly anionic) since cationic liposomes appeared to asso-
ciate with the blocking agent in vivo (Souhami et al. , 1981). Using
carbon particles as the blocking agent an increase in both phases of
the plasma concentration with neutral and positive liposomes was found.
Blockade of the RES effected the plasma clearance of both MLVs and
SUVs. However, Souhami et al. , (1981) have also emphasised the need to
establish that blocking agents really do block the RES before attribu-
ting this process to changes in liposome clearance and uptake.
Predosing animals with liposomes also slows the plasma clearance
of a subsequent dose of radiolabelled liposomes. Abra et al. , (1980)
found that the time of blockade prior to dosing was an important factor,
blockade at 1 hour and 5 hours result in a good or partial (respective-

287.
ly) blockade whereas predosing with liposomes 24 hours before a second
challenge had little effect. Kao and Juliano (1981) reported that pre-
dosing with LUVs, latex particles, xenogeneic red cells and dextran
sulphate could delay the plasma clearance of LUVs injected one hour
later. Predosing animals with SUVs did not effect the plasma clearance
of LUVs if the blocking dose was given at 1 or 4 hours before chal-
lenge, however, predosing at 24 hours before challenge was effective.
These authors explain this by assuming that the uptake of SUVs by the
RES is so slow that 24 hours is needed to establish the blockade.
Others (Abra et al. , 1980) would not agree; several groups of workers
believe that digestion of lipids in KC is quite rapid (e.g.: Hwang
et al. , 1980) so that it is difficult to see how the slow accumulation
of SUVs in KC is totally responsible for blockade at 24 hours. The lack
of effect of SUVs on LUV clearance at 1 and 4 hours can be explained by
the predominant cell uptake site being different (PCMC for SUVs; KC for
REVs) as well as differences in clearance time. Increasing the SUV
loading dose prior to LUV challenge might clarify the issue.
In the liver and spleen liposome uptake is, effected by prior
blockade. Mention has already been made of the work of Gotfredsen
(1982) who showed that high doses of liposomes prefentially blocked KC
and not PCMC. Gregoriadis and Neerunjun (1974) demonstrated that con-
current administration of carbon particles and liposomes actually
increased the liposome concentration in the liver perhaps by causing
more liposomes to be directed towards the PCMC. Blockade by latex
particles (Kao and Juliano, 1981) caused a reduced level of challenging
LUVs in the spleen (where normally the large liposomes have an in-
creased localization: see above) but not in the liver. Blockade with
carbon particles or dextran sulphate caused lower levels in the liver
for MLVs but not SUVs (Souhami et al. , 1981) whereas blockade with
carbon particles produced an increased spleen concentration for MLVs
but not SUVs. Using liposomes to block subsequent liposome uptake
resulted in blockade of MLV uptake by the liver but an increase in
spleen uptake (Caride et al. , 1976; Abra et al. , 1980). These data
suggest that the liver KC are the primary site of blockade; for MLVs
blockade at this site results in transfer of vesicles to the spleen
whilst for SUVs, with longer plasma blockade here probably re-
sults in increased PCMC localization. Pretreatment of animals with
methyl palmitate, which has been reported to inhibit phagocytosis
(Saba, 1970), also blocks liposomes uptake into the liver but not into

288.
the spleen (Tanaka et al. , 1975); a slight increase in lung uptake was
also found following this treatment.
c) Liposome composition.
Much of the published work in this area is overshadowed by the
effects of size and dose on the liver uptake. Without adequate control
of the size of the injected population it is impossible to verify that
charge or other compositional changes make a real difference to hepatic
uptake. Other factors, already mentioned, will include the stability of
the liposomal lipids and entrapped solute in contact with the plasma
and the in vivo adsorbtion of proteins to the liposome surface with its
associated charge reversal phenomenon. Finally, no publication to date
has verified that the entrappment of compounds in either AP or LP of
liposomes does not effect the charge of the injected material, this is
especially important where proteins or other charged molecules are
being used. This procedure has been carried out in this study (section
2:2). Given these limitations and the fact that charge effects may de-
pend not only on the species of charge but also on the degree of charge
within the species, it is apparent that charge effects may be res-
ponsible for some alteration of liver uptake. However, it must be re-
membered that charge also effects the plasma clearance of the material
(cationic liposomes are cleared more slowly than anionic) so that the
timing of the observations will also he important.
Gregoriadis and Neerunjun (1974) showed that anionic liposomes
(MLV) are more rapidly concentrated in the rat liver and to a higher
amount than neutral or cationic liposomes. Moreover, cationic liposomes
persisted at higher levels in the liver than the others. These effects
are probably due to the longer plasma life of the cationic species with
a consequent slower hepatic uptake. Steger and Desnick (1977) also used
MLVs but these authors found similar initial (up to 4 days) levels of
both cationic and anionic liposomes, containing an enzyme, in the
liver. However, at times long after the plasma concentration had fallen
to zero, these authors reported that the liver concentration of the
cationic liposomes persisted for substantially longer (3 days) than the
anionic carrier suggesting cationic liposomes cannot be metabolised as
fast. Anionic liposomes are also less stable than the cationic when
administered locally (Segal et al., 1975; Mauk et al., 1980a).
The liver uptake of large (hand shaken) MLVs of different charges
has been studied by Jonah et al. (1975). These authors failed to find
289.
differences between neutral, anionic or cationic liposomes at short
periods after I/V injection. However, it is evident from their data
that 24 hours post-injection, when the plasma levels are zero, cationic
liposomes were more persistent than the others. By decreasing the
fluidity these authors showed that there was little longterm difference
between DPPC neutral liposomes and EPC ones although initially higher
liver levels were attained with the fluid EPC-containing preparation.
However, Richardson et al. (1978) and Souhami et al. (1981) did
not find very much difference in the liver levels of charged MLVs al-
though at 24 hours post-injection the former authors found less catio-
nic liposomes than anionic or neutral ones but it is unclear if these
differences were significant. Souhami et al. (1981) also studied the
tissue uptake of homogeneous SUV preparations. One hour after injection
the liver concentrations (per cent of injected dose) of the entrapped
solute were : - anionic : 52.5 %, neutral : 27.5 % and cationic:16.5 %.
This hepatic result, whose ranking order is similar to that found with
MLV preparations (Gregoriadis and Neerunjun, 1974), again suggests that
cationic liposomes may be taken up less well by the liver. Interesting-
ly, after incubation with serum the final charge on the cationic lipo-
somes is the most electronegative (section 3:3). However, Mauk and
Gamble (1979), who have made very stable liposomes, reported that
cationic SUVs were taken up to a much greater extent (cationic >>
neutral > anionic). Liposomes containing galactose or fucose deri-
vatives of cholesterol were localized to about the same extent as the
neutral vesicles.
Other compositional changes have been reported to determine the
hepatic uptake of liposomes. Deliconstantinos et al. (1977) reported
that DPPC-containing liposomes were localized in mouse liver to a
greater extent than the fluid EPC-liposomes (c.f. Jonah et al., 1975
and above). Deshmukh et al. (1978) reasoned that circulating or cel-
lular phospholipases were responsible for determining the plasma half-
lives of liposomes and so they made SUVs from dialkyl PC which is
almost completely resistant to phospholipase attack. Using these ve-
sicles these authors found higher liver concentrations of entrapped so-
lute and longer plasma half-lives than EPC-liposomes.
In the field of parasitology it is well known that malaria spo-
rozoites undergo a primary multiplication phase in liver PCMC. Alving
et al. (1979) have reported that glycolipid-containing MLVs (glucosyl,
galactosyl or lactosyl ceramides) prevent the appearance of the ery-

290.
throcytic phase of the malaria infection. The suggestion is that the
glycolipids interact specifically with hepatocytes to prevent the up-
take and/ or release of the parasites perhaps by competition for the
same carbohydrate receptor. That such receptors exist on mammalian
hepatocytes has been known for some time (Ashwell and Morell, 1974;
Sly, 1980), however, they are not unique to the PCMC; other carbo-
hydrate receptors exist for KC and macrophages (Stahl and Schlesinger,
1980) and it is by no means certain that the specificity of all the
receptors has been described. Furthermore, the exact mode of uptake of
sporozoites by the liver (Carter and Diggs, 1977) is a controversial
subject well beyond the scope of this thesis but recent evidence that
their preliminary uptake from the circulation could be mediated by the
KC (Pirson -personal communication) might also explain the results of
Alving et al. (1979). Finally, Surolia and Bachhawat (1977) have de-
monstrated that a "PCMC-specific" glycolipid (GM^-ganglioside) en-
trapped in liposomes could increase their uptake by the liver, pre-
sumably by augmenting the PCMC fraction, but Alving et al (1979) found
this glycolipid ineffective as a liposomal antagonist to malaria in-
fection.
Gregoriadis and Neerunjun (1975b) have demonstrated liposome
homing to target cells by the use of liposome entrapped desialylated
fetuin. This protein was found to be expressed on the liposome surface
where its sialic acid group was removeable by treatment with neurami-
nidase, such a treatment resulted in an increased liver uptake of these
liposomes when compared to the same, untreated, vesicles. Moreover, the
hepatic uptake of the treated liposomes could be partially blocked by
free asialofetuin which did not block the untreated preparation. These
liposomes were, therefore, the forerunners of other carbohydrate-con-
taining liposomes (Mauk and Gamble, 1979; Mauk et al., 1980 a,b).
Finally mention must be made of the recent work by Fidlers group
(Fidler et al. , 1980, 1981; Hart et al. , 1981 and references therein)
which has some relevance to the uptake of liposomes by macrophages.
These authors have found that liposomes (anionic MLV) containing na-
tural or synthetic macrophage activating factors can activate lung
macrophages in vivo rendering them tumouricidal. Moreover, this tu-
mouricidal function extended to sites which were far removed from the
site of macrophage activation. These are important data which may have
a profound effect on the use of liposomes as drug carriers. The impli-
cation is that macrophages either stationary (e.g.: lungs) or wandering

291.
(circulation) may become "loaded" with therapeutic substances and then
allowed to roam throughout the circulation and tissues seeking target
sites.
iii) General conclusions on tissue distributions.
How, then may the three questions posed at the start of this
section be answered ?
i) Is tissue uptake entirely mediated by macrophages or are
other cells involved ?
Data from many different groups suggest that some liposomes
(as much as 50 % of the injected dose) are not found associated
with the liver and spleen where other colloidal material accumu-
lates. The other sites involved are predominately the lungs, bone
marrow and perhaps the intestine and kidneys. In addition, the
liver parenchymal cells, because of their special architecture,
may also taken up smaller liposomes. Unfortunately, most other
cells and tissues do not appear to concentrate liposomes.In tis-
sues which have a low macrophage content (e.g.: muscles) the poor
liposomal localization does not encourage the use of these car-
riers as transporters of e.g.: enzymes for the therapy of storage
diseases, unless extensive manipulation of the vesicle can be
accomplished. Simple manipulation of size or composition would not
appear to be enough. In addition, there is no conclusive evidence
that entrapped compounds are actually located inside the relevant
cell type apart from the RES. Stable adsorbtion of vesicles to
blood vessel walls could account for much of the published data on
tissue distribution especially in highly vascular tissues (e.g. :
the kidneys). If the aim is to introduce a therapeutic substance
into a specific subcellular compartment or into a specific cell
type then stable adsorbtion, even if this accompanied by local
drug leakage, will be of little more use than a local depot of the
drug.
It seems to this author, therefore, that, apart from the
liver parenchymal cells, the uptake of the anionic MLVs used in
this study can be accounted for by : i) localization in tissue
macrophages, ii) adsorbtion to capillary beds or iii) leakage of
liposome-entrapped material.
ii) Is endocytosis the only means by which liposomes can gain
entry into cells?

292.
The short answer to this question is probably : - Yes, if
macrophages are the only cell type involved in the true uptake of
whole liposomes. However, if other cell types are involved then
there are several other mechanisms which could operate none of
which have been conclusively demonstrated to occur in vivo : there
are many problems of interpretation which make it difficult to
establish if liposomes are taken in whole. It is not, of course,
always necessary to have the carrier gain entry into the cell or
tissue for a pharmacological effect to occur but, in terms of
specificity and toxicity, this would be preferable to a general
increase in the local drug concentration. The mode of entry of
liposomes into cells will be considered in the following section,
iii) Is it possible to alter liposome distribution by blockade of
the RES ?
As has been shown the liver and spleen present the biggest
obstacle to intravenous therapy with liposomes. No matter how long
the circulation time of the liposomes, these organs finally cap-
ture the major part of the injected dose and this argues in favor
of there being only limited types of cells which can remove lipo-
somes from the circulation. Further evidence comes from the fact
that at high lipid doses or following blockade of the liver KC the
only organs which show any substantial change in the uptake of
liposome entrapped markers are those (e.g. : spleen and lungs)
which contain elements of the RES.
It could be argued that blockade of the liver would also
automatically enhance the uptake by other tissues (if this uptake
was mediated solely by tissue macrophages) and, since this does
not occur, therefore tissue uptake is not macrophage dependant.
However, there is no evidence that other macrophages cannot be
blocked, especially by liposomes, and it may well be possible to
saturate adsorbtion sites with liposomes too, which might con-
tribute to the longer circulation time of the vesicles. Hence, the
lack of increased liposome uptake by other tissues following liver
blockade does not necessarily mean that the proportion of the dose
unaccounted for in the liver and spleen would normally be taken up
by tissue cells other than the macrophages.
293.
B) Mechanisms of liposome uptake.
Several questions arise from the subcellular fraction data and the
published data on liposome uptake by the liver : -
i) Is the measured radioactivity still entrapped in liposomes, i.e.:
are the liposomes still intact ?
ii) What conclusions can be drawn about the mechanisms involved in li-
posome uptake by the liver ?
iii) Are the lysosomes the only organelle involved in the uptake of li-
posomal radioactivity ? and
iv) Can lysosomally localized drugs escape from the organelle and be
found in other compartments ?
These questions are relevant not only to the uptake and disposi-
tion of both free and entrapped drugs but also to the ways in which
these agents are active in vivo against nucleic acid synthesis.
i) Are liposomes taken up intact ?
A definitive answer to this question cannot be given from this
work. A comparison of the plasma clearance and tissue distribution of
free and entrapped drugs in previous sections has shown that : -
a) Liposomes are not stable in the plasma but may lose both lipid and
entrapped agents during their time in the circulation and
b) several of the drugs in their unentrapped from will concentrate at
least temporarily, in the liver.
It, therefore, seems possible that, at least some of the liver
radioactivity could be due to free (i.e. : released or leaked) drug. It
must be remembered also that some liposomes will be destroyed during
the homogenization procedure whether they are loosely bound to the
outer surface of the liver (i.e. adsorbed to capillaries or membranes :
Gotfredsen, 1982) or are already within the cell. Control values for
the extent of liposome destruction during homogenization cannot be used
since the major part of both the free and the entrapped drugs are
localized in S. On the other hand, the marked differences in some of
the liver fractions (e.g. : free ACT-D in N versus entrapped in ML or 125
free I-BLMs in S versus entrapped in ML) strongly suggests that the
entrapped drug is handled in a different way from the free. In addi-
tion, the well known localization of particulate material in rat liver
lysosomes is totally compatible with the finding of liposome-derived
radioactivity in this fraction. In general, therefore, it may be stated

294.
with confidence that at least some of the liposomes are taken up into
the liver as whole structures. What cannot be ascertained from these or
any other in vivo studies is the extent to which free (i.e. : leaked)
drug, formerly entrapped, contributes to the radioactivity found in the
ML or any other fraction. In this respect the ML results with free
^""^In-BLM serve as a warning against the easy assumption that lysosomal
localization can be equated with entrapment of the drug.
Several investigations in vitro (with or without serum in the
culture medium) have concluded that liposomes do not need to be taken
into cells whole to account for all of the radioactivity found in
sub-cellular fractions. Whilst, in this author's view, a distinction
has to be made between cells which will normally take up particulate
matter whole (e.g. macrophages) and other cell types, it is clear that
the capacity to accumulate particulate material is not a unique func-
tion of "professional endocytosers" but can be found and/or induced in
most cells in culture (facultative endocytosers) (Silversein et al. ,
1977).
ii) Mechanisms of uptake.
The mechanisms of uptake of liposomes by the liver can be divided
into at least four categories (see chapter 1) and the initial locali-
zation of the entrapped solute and liposomal lipid will be different in
most cases. Since the uptake mechanism is intimately connected with the
subsequent fate of the liposomes, questions, ii, iii and iv (see above)
will be considered here,
a) Endocytosis.
It must be stated at the outset that endocytosis does not lead
automatically to lysosomal localization of the vacuolated material. In
this respect the work of Siverstein et al (1977), Goldstein et al.
(1979), Hart (1979), Jacques (e.g. 1981), Pastan and Willingham (1981)
and Willingham et al. (1981) prompts the addition question : "what type
of endocytosis results in liposome uptake" ?
aa) Pinocytosis.
In this mechanism extra-cellular fluid is taken into a cell
non-selectively so that the intracellular concentration is linear-
ly related to the extra-cellular concentration and to the in-
cubation time provided that intracellular digestion and/or release
of labelled material does not occur (Silverstein et al, 1977).
Fluid pinocytosis can be divided into two types, micropinocy-
tosis and macropinocytosis, which may be descriminated by the

295.
quantity (volume) of fluid captured and therefore the size of the
initial pinocytic vesicle formed. This recognises that pinocytic
vesicles may fuse together or break up into smaller structures at
any time (Jacques, 1981). The micropinocytic vesicles are consi-
dered by Pastan and Willingham (1981) to be formed from caveolae
which are present on the surface of cells. These small membrane
invaginations appear to be about 40 nm. in diameter (calculated
from Pastan and Willingham, 1981) but they have a "neck" at the
surface very much smaller (perhaps 10 nm). Poste and Papahadjo-
poulos (1976b, 1978) consider that SUVs are too large to enter
these structures and the resulting intracellular vacuole too small
to accomodate these liposomes, yet Pastan and Willingham (1981)
claim that the micropinosomes have a diameter of 80 nm. which
could accomodate a 25 nm. diameter SUV. It may well be that the
constricted "neck" region will exclude SUVs from entry.
Macropinocytosis (Willingham and Yamada, 1978) occurs when a
cell membrane ruffle falls back onto the surface of the cell
trapping extra-cellular fluid and injecting it into the cell
interior inside a macropinosome (300 - 500 nm diameter). Liposomes
adsorbed onto the cell membrane could become trapped beneath
falling membrane ruffles and so interiorised whole even in cells
which have minimal endocytotic ability.
Pinocytosis in general is not impared by agents which inhibit
phagocytosis (Poste and Papahadjopoulos, 1978) but it is arrested
at 4° C (Silverstein et al., 1977) although adsorbtion of material
to cell surfaces will continue at this temperature.
The fate of the micro or macropinosomes remains unclear.
Pastan and Willingham (1981) claim that these vacuoles fuse rapid-
ly with lysosomes in vitro. However, in certain cell types (e.g.
vascular endothelium and epithelial cells) it has been shown that
these pinosomes can shuttle materials from the capillary lumen to
the tissue spaces and across the walls of the foetal and neonatal
gut (reviewed Silverstein et al. , 1977). In addition, vesicles
containing newly synthesised proteins can traverse hepatocyte cell
interiors to the outside of the cell without fusing with the
lysosomes (Davis and Tai, 1980). The factors which regulate this
vesicular transport remain unknown : the vesicles may be "marked"
in some way (owing to either their contents or the membrane which
surrounds them) which prevents lysosomal recognition.

296.
Some of the free drug or liposomes within pinosomes could, be *
theoretically, escape digestion and^releasee? , -3 ini
the cytoplasm. The capture of free drugs from the plasma is proba-
bly mediated by the pinocytosis system as well as by their lipid
solubility which allows them to traverse cell membranes. Is this
the explanation of the presence of free drugs in the S fraction ?
In the case of ASPase, it is known that other proteins are endocy-
tosed and broken down in the lysosomes (Gordon and Cohn, 1973;
Ryman and Gregoriadis, 1972b; Gotfredsen, 1982). Moreover, the
lysosomal contents are rarely if even regurgitated into the cyto-
plasm and undigestible material stays within the lysosomes which
may continue to function as secondary lysosomes (Silverstein et
al., 1977) or loose their enzymes (Jacques, 1981). It seems unli-
kely, therefore, that ASPase can escape intact from lysosomes.
Equally, it seems that ASPase will probably not be able to
penetrate through cell membranes directly. However, it is known
that both liver and serum ASPase will associate with membranes
(Suld, 1976) and can be found in S in the guinea pig liver possi-
bly associated with small non-sedimentable vesicles. Uptake of
membrane pieces during endocytosis may therefore transport ASPase
bound to its surface into the cell (i.e. into P or S). In this
present study cytosolic localization of free ASPase could be due
to its entrapment in pinosomes which may account for the fact that
most of the of the enzyme is TCA-pptable. It might be asked there-
fore if this S fraction ASPase is biologically active i.e. : could
asparagine enter the vesicle and ammonia and aspartate escape? If
this is possible, as has demonstrated for liposome-entrapped
ASPase (Fishman and Citri, 1975; Neerunjun and Gregoriadis, 1976),
it would appear that this method offers a good intracellular depot
of enzyme.
Similar reasoning could explain the S-fraction localization
of ACT-D and BLMs. However, in the case of ACT-D its lipid solubi-
lity may allow a rapid diffusion from the plasma into the cell and
escape from the pinosomes. The fall in S levels of iodinated BLMs
may be explained by the fact that the vacuolated drug does not
effect the membrane in the same way as ASPase and so the pinosomes
containing these drugs slowly fuse with lysosomes resulting in a
steady increase in drug radioactivity in ML.
Alternatively, the inability of lysosomes to inacativate BLM

297.
(Umezawa, 1974) may induce an pseudo-storage condition in the
organelle which might delay the further fusion of these lysosomes
with pinosomes. It is also possible that the free drug escapes
from the pinosome since it has been shown that inactivation in S
occurs in vivo as well as following the incubation of BLM with
tissue cytosol extracts (Ohnuma et al., 1974).
In summary, the initial concentrations of free drugs in S may
be the result of drug sequestered in pinosomes. At later times the
BLMs probably escape into the cytoplasm and whilst such an escape
may also occur with ASPase this enzyme could also remain membrane
bound. Actinomycin-D probably escapes from the pinosomes as a
result of its lipid solubility which also aids its entry into the
cell. The cells involved may be both PCMC and KC.
Liposomes (primarily SUVs) within pinocytic vacuoles may well
be handled in a similar manner to the free drugs so that some of
the S fraction could contain vesicles within vacuoles. If, how-
ever, only the larger macropinosomes contain liposomes, the
chances are that the S fraction will not contain vacuoled SUVs
because these larger pinosomes may be sedimentable at lOO.OOOg and
will therefore be found in the P fraction along with other (phago-
cytic) vacuoles and membrane-bound free or entrapped drug.
ab) Receptor-mediated endocytosis (RME).
The study of this mechanism of endocytosis of ligands has
recently received much attention (Goldstein et al. , 1979; Pastan
and Willingham, 1981; Sly, 1981; Willingham et al., 1981) and only
a general outline of the proposed mechanisms will be given.
The basic features involve cell membrane receptors specific
for certain ligands (e.g. LDL, Hormones, alpha-2-M, certain carbo-
hydrates and the Fc portion of IgG). The density of these recep-
tors can be very great, e.g. : fibroblasts have been reported to
contain 200,000 receptors specific for alpha-2-M per cell, and
they are diffusely distributed over the cell surface. Binding of a
ligand to its specific receptor appears to result in^lateral
movement of the ligand/receptor complex to cluster in specialized
structures on the membrane termed bristle coated pits. The bristle
coat is composed of the protein clathrin. The whole pit is closed
and interiorized to form a specialized intracellular vesicle
called a "receptosome" which contains the ligand bound to the
receptor on its interior surface but not still surrounded by a

298.
basket of clathrin. Receptosomes do not immediately fuse with
lysosomes but movie towards the GERL complex (GERL : Golgi-endo-
plasmic reticulum-lysosome) close to the nucleus. Eventually fu-
sion between the receptosome and newly synthesised lysosomes
occurs but at some stage the ligand becomes separated from its
receptor; possibly by changes in ionic or pH conditions rather
than by the action of degrative enzymes.
The receptosome membrane appears to be able to escape lysoso-
mal degradation so that the membrane material and receptors are
not lost to the cell, which would necessitate wasteful resynthe-
sis, but are able to recycle back to the plasma membrane
(Schneider et al. , 1979, 1981). It seems clear that the ligand
bound within the receptosome and/or the specificity of the
receptor can determine the fate of the receptosome. Thus LDL,
alpha-2-M, lysosomal enzymes and glycoproteins, containing termi-
nal residues of asialo, mannose or N-acetylglucosamine, interact
with receptors at the cell surface, are endocytosed and end up
inside the lysosomes to be digested. Immunoglobulins (IgG and
polymeric IgA) can escape lysosomal digestion and can be exported
from the cell or later found back on the cell membrane (Schneider
et al., 1981).
The possibility that the digestion of endocytosed material is f
delayed or prevented from occurring has obvious and exciting impli-
cations for drug delivery systems. Liposomes (SUV) bearing speci-
fic antibody have already been shown to enter cells by RME
(Leseman et al. , 1980a) and it seems likely from the work of Gre-
goriadis (reviewed Gregoriadis, 1980 a, b, c ; Gregoriadis and
Meehan, 1981; Gregoriadis et al., 1981b) and Heath et al. (1980),
using IgG in or on liposomes, that they also use this pathway.
However, the manufacture of liposomes bearing ligands on their
surfaces may only alter the mode of uptake (RME vs phagocytosis)
whilst the intracellular handling of the vacuole may depend upon
the presence or absence of the specific markers.
Facets of RME which are of interest are those associated with
all receptor-ligand systems, namely; its saturability at high
ligand concentration and the ability of structurally similar
ligands to compete with or block uptake. The claim that liposomes
are taken up by RME is verifiable by experimentation. Blockade of
uptake by competing IgG or other ligands (which might be co-in-
299.
teriorized in the same coated pit) should be demonstrable and
saturation ought to occur at high liposome doses.
For RME there are some other properties which may have bear-
ing upon possible free or entrapped drug endocytosis. The effect
of charge and in particular cationic amines has already been al-
luded to in relation to their ability to induce lipid storage
diseases (Lullmann - Rauch, 1979). Some amines (methylamine but
not chloroquine) have the ability to inhibit the clustering of the
ligand/receptor complex in coated pits (Maxfield et al. , 1979)
which effectively blocks RME. Other amines (e.g.: chloroquine) are
known to accumulate in lysosomes by the method of proton trapping
(de Duve et al. , 1974) where they raise the intra lysosomal pH
(Ohkuma and Poole, 1978) and thereby inhibit lysosomal enzyme
function (Wilbo and Poole, 1974). Chloroquine and other lipophilic
amines not only promote the lysosomal uptake of some (but not all)
materials from pinosomes and receptosomes but may also inhibit the
release of both the digested material and vacuolar membranes which
cannot recycle back as fast to the plasma membrane (Schneider
et al. , 1981). The mode of action of chloroquine has not been
firmly established in all cases but it may be similar to that
found for other cationic compounds which promote lysosome-phagocy-
tic vacuole fusion (Hart, 1981). It is appropriate to mention here
also that in true endocytic vacuoles anionic and cationic com-
pounds also effect the closeness of the vacuole membranes to their
contents (Hart, 1981). In cells pretreated with anionic compounds
there appears to be a gap between the vacuole contents and the
membrane whereas cationic compounds produce vacuoles whose membra-
ne tightly surrounds the inclusion.
Without a detailed knowledge of the receptor repertoire of
liver cells it is difficult to know whether any of the free drugs
are taken up by RME. In view of the possible harmful damage that
could result from excess circulating ASPase it could be postulated
that a recognition system exists to remove this enzyme from the
plasma but to-date no data is available to prove this. Similarly,
it is possible that BLM or ACT-D might cross-react with some
physiological receptor and so gain entry into the cell's interior
by RME. Mention has already been made of the possibility that 111
In accumulation in the ML is mediated by RME of transferrin.
For the liposome entrapped drugs the situation is somewhat

300.
different. In chapter 3 it was shown that MLVs will interact with
proteins and in this respect the interactions with LDL and alpha-
2-M may be crucial. Receptors for LDL and alpha-2-M have been
demonstrated on the membranes of cells in vitro (Goldstein et al.,
1979; Pastan and Willingham, 1981; Willingham and Pastan, 1980)
and more importantly, it has been demonstrated that colloidal
material (gold) adsorbed to alpha-2-M is taken up by RME in fibro-
blasts (Dickson et al., 1981). The gold particules were 100-200 nm
diameter and each contained about 400 molecules of alpha-2-M. This
demonstration therefore suggests that in vivo smaller liposomes
(100-200 nm) with alpha-2-M on their surface could enter cells by
RME. Although alpha-2-M was only found associated with MLVs in
this study it seems reasonable to suppose that SUVs would also
interact with this protein so that any liposome up to 200 nm might
enter cells in this way (receptosome : 200-400 diameter, Pastan
and Willingham, 1981). However, the larger MLVs are probably too
big to enter the coated pit and it is not yet known if either the
coated pit or the receptosome can enlarge to accomodate bulky
ligands.
In the liver it might be possible, temporarily, to block
(saturate) RME with excess alpha-2-M or other ligands preadminis-
tered or co-admistered with liposomes. Such an experiment might
determine, by comparison with the unblocked state, the extent of
RME. However, since blockade of KC phagocytosis is probably impos-
sible with liposomes (see previous section), the liposomes which
might normally be taken up by RME could simply be redirected to
phagocytosis.
Uptake of LDL-liposome complexes by RME is a more uncertain
process when it is recalled that little or no lipoprotein was
found associated with the MLVs. Exchange of cholesterol between
liposomes and LDL or HDL in the vicinity of cell surface receptors
for these lipoproteins might result in RME of lipoprotein-liposome
complexes. Yet it must be remembered that LDL uptake results in
the loss of the membrane LDL receptors (Goldstein et al. , 1979).
This process is therefore less plausible than that for alpha-2-M
but it could be explored experimentally using LDL and/or HDL to
block RME uptake in the presence of SUVs.
a c) Phagocytosis.
The uptake of particulate material into cells by the process
301.
of phagocytosis has been widely reviewed (for a review of reviews
see Jacques, 1981) and this will not be repeated here. However,
several features of the process are of interest in relation to
liposome uptake and will be discussed in more detail.
The basic features of phagocytosis do not greatly differ from
pinocytosis and include the following steps : attachment, engulf-
ment, fusion and degredation. Two differences can distinguish
pinocytosis from phagocytosis: i) the size of the endocytosed
material, and of the endocytic vacuole, are orders of magnitude
larger in phagocytosis and ii) phagocytosis appears to be a dis-
crete process whereas pinocytosis is continuous.
The uptake of entire liposomes in vivo is probably due, in
large part, to phagocytosis because of their size (for MLVs at
least), particulate nature and phagolysosomal localization. The
regulation of their uptake during the four stages outlined above
remains unexplored.
i) Attachment.
It has been shown; both in vivo and in vitro that ma-
crophages possess receptors which recognise certain proteins
or protein domains (Kaplan, 1981). These receptors are dis-
tinct from those, present on most cells which recognise
specific ligands (i.e. in RME). These receptors are those
which bind the Fc portion of IgG and the C^ component of the
complement cascade. Normally these receptors are removeable
by protease treatment but some Fc receptors are resistant to
this process. In addition, a variety of "non-specific" recep-
tors have been reported for such things as: bacteria, zymo-
san, latex, denatured protein aggregates, DNA and dead or
damaged cells. Phagocytosis of these agents is not dependent
upon the presence of IgG or C^ but it is unlikely that a
"specific" receptor exists for each agent. Some common
binding sites (e.g.: for mannose (bacteria) or galactose (red
blood cells)) may account for some particle phagocytosis.
It will be recalled that IgG was not found on the surfa-
ce of liposomes following their incubation in plasma (chapter
3) although Juliano and Lin (1980) found immunoglobin heavy
and light chains bound. In addition, Weissmann et al., (1974,
1975) found aggregated IgG and IgM would interact with li-
posomes and bind them (via Fc fragments) to macrophages.

302.
However, in vivo liposomes coated with aggregated IgG did not
show any significantly different uptake by the liver (or
other tissues) from similar, uncoated, MLVs following I.P.
injection into rabbits (Weissmann et al• , 1978). Moreover,
the findings of several authors (e.g.: Poste and Papahadjo-
poulos, 1976a,b) that liposomes can be endocytosed in the ab-
sence of serum suggest that although Fc-receptor mediated
uptake can occur it is not an absolute requirement for suces-
sful phagocytosis of liposomes. Yet some such receptor may
exist since Pagano and Takeichi (1977) found that vesicles
adsorbed to cell surfaces could not be removed by washing but
were rapidly detached when the cells were trypsinized, impli-
cating a cell surface protein; others do not agree with these
findings (Magee et al. , 1974; Poste and Papahadjopoulos,
1978).
Attempts to further increase the binding of liposomes to
cells with combinations of glycolipids and lectins, while
successful, do not enhance the intracellular delivery of the
vesicle contents (Juliano and Stamp, 1976; Szoka et al. ,
1981) although this may depend upon the type of cell used
(Suriola and Bachhawat, 1977; Alving et al., 1979).
The function of charge in mediating the attachment of
liposomes to cell surfaces has been suggested as a means by
which phagocytosis is stimulated (Magee et al. , 1974) or
membrane fusion is promoted (Poste et al., 1976; Stendahl and
Tagesson, 1977). However, such interactions are strongly
inhibited by serum (Tyrrell et al. , 1977; Mayhew et al. ,
1980). Moreover, in the light of the acquisition of a net ne-
gative charge by particles (Wilkins and Meyers, 1966) and
liposomes (Black and Gregoriadis, 1976) when in contact with
plasma it seems unlikely that charge interaction is the prin-
c i p s t i m u l u s .
In summary, the factor(s) responsible for the attachment
of liposomes to the cell surface in vivo remain unknown. Some
sort of receptor may well exist but this is unlike to be spe-
cific for liposomes and so it may prove to be blockable by
other materials. Whatever its nature, the receptor must not
only bind the liposome but also transmit a signal to the cell
which either starts the engulfment process or which is some-

303.
how overidden and allows for the stable adsorbtion of ve-
sicles to the cell surface.
ii) Engulfment.
The exact mechanism whereby a cell is induced to extend
its cell membrane (pseudopods) to surround an attached par-
ticle remains unknown. Currently, the "Zipper" hypothesis
(Silverstein et al. , 1977, 1981) has proved to be the best
explanation: following binding of the particle to a macro-
phage membrane, pseudopods are induced to extend possibly by
lateral movements of similar membrane receptors into the
initial area of binding. As more receptors bind the pseudo-
pods advance bearing empty receptors seeking a binding site.
Eventually, the advancing lips of the invagination meet and
fuse having completely surrounded the particle.
Silverstein et al. , (1977, 1981) have suggested that
clustering of cell receptors also results in clustering and
assembly of contractile proteins in the area beneath the mem-
brane where the receptors have bound to the particle surface.
Using the "muscle-like" properties of these proteins (actin
and perhaps myosin) the vacuole is pulled into the cytoplasm
of the cell. Cytochalasins at low concentrations (10 UM)
inhibit actin polymerization and phagocytosis by macrophages.
Colchicine, which depolymerizes cytoplasmic microtubules,
does not inhibit phagocytosis but it has a maginal inhibitory
effect on pinocytosis. The lack of inhibition by colchicine
also implies that phagocytic vacuoles are not guided to 2+
lysosomes by microtubules. Although Ca has been implicated
in the binding of surface receptors to the underlying actin
fibres (Silverstein et al. , 1981) extracellular calcium is
not required for phagocytosis. Depending upon the liposome
composition, Poste and Papahadjopoulos (1976a) found that
cytochalasin B inhibited the uptake of liposomes by endocy-
tosis. Similarly, inhibitors of respiration and glycolysis,
used in tandem, were found to block endocytosis but not if
they were used separately.
The fate of the phagocytic vacuole in the cytoplasm has
been described by Hart (1979) as "the hinge" which determines
the destination of the contents. It is noteworthy that almost
all parasites which survive and multiply intracellularly are

304.
able to subvert the normal course of events (i.e.: fusion of
the vacuole with and digestion in lysosomes) at this stage.
Whilst part of this subversion is undoubtedly due to para-
site-derived factors, it suggests that^phagocytic vacuole is
a vulnerable structure and the question must be asked if
liposomes are also capable of altering the vacuole in some
way.
As has been mentioned previously, endocytic vacuoles
need not interact immediately with lysosomes. Indeed, studies
on particle endocytosis (Munthe-Kaas, 1976), liposomes (Segal
et al., 1974; Rahman and Wright, 1975; de Barsy et al., 1976)
and receptosomes (Willingham and Pastan, 1980) have demons-
trated that vacuoles can be found in the cytoplasm for hours
or even days after phagocytosis. For a drug which leaks from
liposomes and can traverse membranes, these sub-cellular
deposits may well account for the slow release of materials
into the S fraction. It must be stressed that these are not
terminal phagosomes (Jacques, 1981) in the same sense that
parasitophorous vacuoles are a surviving, semipermanent,
sub-cellular structure. Further, interactions between phago-
cytic vacuoles often occur prior to their fusion with lysoso-
mes (Jacques, 1981) and this may result in large endosomes
containing the contents of several smaller phagocytic va-
cuoles .
A second interaction which may occur between the en-
trapped liposome and the vacuole is fusion. (Poste and Papa-
hadjopoulos, 1978). Evidence that fusion between liposome and
cell membranes occurs will be presented below, here the
concern is the consequences of this interaction. It has al-
ready been mentioned that, according to the zipper hypothe-
sis, the psuedopods of the forming vacuole closely follow the
shape of the particle and form a tight seal with its surface
(Silverstein et al. , 1977). Moreover, macrophage uptake of
extracellular fluid is not increased during particle phago-
cytosis (quoted in Silverstein et al. , 1977) suggesting that
fluid is actively "squeezed" out of the vacuole. Therefore,
inside the vacuole the membranes of the liposome and the
phagosome are in very close contact; extracellular fluid
(e.g.: serum), which is know to inhibit fusion, has been

305.
removed so that the only barrier to fusion would be proteins
adsorbed onto the liposome surface (some of which may have
been mechanically removed by the advancing psuedopods) and
cell membrane proteins which, in the absence of serum, do not
appear to present a barrier to fusion (Pagano and Weinstein,
1978). If fusion is a valid method of internalization of
liposomes and their contents then it seems to this author
that the conditions within a phagosome for this to occur may
be more favorable than those which are found when liposomes
interact with cell surfaces. The factors which influence
liposome fusion to cell membranes (e.g.: fluidity of the
liposome phospholipid acylchains and charge on the membrane :
Poste and Papahadjopoulos, 1978; Papahadjopoulos, 1978b) will
also be active within the vacuole.
The consequences of such fusion are interesting since
unilamella vesicles (LUV or SUV) will discharge their con-
tents into the cytoplasm whilst MLVs will be found whole in
the cytoplasm but minus their outermost bilayer. The hypo-
thesis predicts that all of the LUV and SUV membrane lipids
will be found associated with phagocytic vacular membranes.
It also predicts that some MLVs will be found which are not
surrounded by vacuolar membrane. The fate of these MLVs is
unknown but they may be endocytosed by lysosomes as has been
reported for other particles; (Glaumann and Marzella, 1981).
If the phagosome membrane is able to recycle in a similar
fashion to that proposed for receptosomes and pinosomes
(Schneider et al., 1979) the liposome membrane could be
re-incorporated into the plasma membrane at some later time.
In this case the overall picture would be exactly equivalent
to that seen when fusion of liposomes with cell membranes
occurs. Conversely, if the phagosome membrane is digested by
the lysosomes (i.e.: it does not recycle) the distribution
will be similar to that seen during lysosomal breakdown of
the liposomes followed by partial release of the entrapped
solute (radiolabel) into the cytoplasm. Since none of these
mechanisms are mutually exclusive a careful kinetic study of
lipososme lipids and entrapped markers in vacuolar and mem-
brane sub-cellular fractions will be necessary to prove the
hypothesis.

306.
Evidence against the fusion of liposomes with endocytic
vacuoles comes from attempts to inhibit phagocytosis (Poste
and Papahadjopoulos, 1976, 1978) in which membrane associated
lipid and cytoplasmic localization of liposome-entrapped
agents was found following Cytochalasin B treatment. This
suggests that some liposome/plasma membrane fusion had oc-
cured although whether this will happen in the presence of
serum remains in question.
This intracellular fusion hypothesis may explain the
persistence of MLVs in the PCMC cytoplasm for prolonged
periods (Rahman and Wright, 1975). In addition, bearing in
mind that cationic liposomes appear to fuse better than
others (Poste and Papahadjopoulos, 1976a, 1978), this mecha-
nism may also explain the findings of Steger and Desnick
(1977) that enzyme entrapped in cationic liposomes persists
in active form for longer in the cytoplasm than that from
anionic liposomes. If the escape of the liposome from the
vacuole occured during phagosome-lysosome fusion this hypo-
thesis might also explain the increased release of lysosomal
enzymes found by these authors.
iii) Vacuole-lysosome fusion
The exact mechanism underlying this process are not well
understood. The process of fusion between membranes is an
area of active research (Poste and Papahadjopoulos, 1976b;
Lucy, 1978; Papahadjopoulos, 1978; Poste and Pasternak, 1978)
which has resulted in the implication of a variety of factors
(e.g.: fatty acids and lysolecithin) in the event. One must,
however, question whether model systems of cell-cell, cell-
vesicle or virus-cell fusion have direct application to
intracellular fusion. The two surfaces in contact in vacuole-
lysosome fusion are the inner membranes of the cell which are
known to be different from the external membrane surfaces not
only in their protein composition (de Duve and Wattiaux,
1966) but also in their phospholipids (Papahadjopoulos,
1978).
Two other factors which are important for the fate of
the vacuole contents have not received much attention: i) Lo-
cation; how do the vacuoles find the lysosomes(or vice versa)
since it is possible that they are not guided to each other

307.
by microtubules (Colchicine and related alkaloids do not
effect particle phagocytosis) (Silverstein et al. , 1977) and
ii) Recognition; how do vacuoles know that they are in con-
tact with lysosomes? One mechanism, involving carbohydrate
moieties, has been recently proposed following the discovery
that phagosome-lysosome aggregation in vitro was inhibited by
mannose, fucose, lactose, N-acetylglucosamine and fetuin
(Amano and Mizuno, 1981).
The studies of Hart (1979, 1981) have demonstrated that
pretreatment of macrophages with anionic or cationic drugs
can modulate the fusion of vacuoles with lysosomes. Polyani-
onic compounds (dextran sulphate, suramin, polu-D-glutamic
acid) apparently enter the lysosomes by endocytosis and
effect changes which reduces the fusion of these organelles
with vacuoles; secondary or tertiary lipophilic amines (chlo-
roquine, tributylamine and some local anaesthetics) also
accumulate in lysosomes, perhaps by permiation, pretreatment
of macrophages with these compounds results in increased
phagosome -lysosome fusion. It seems possible that charged
liposomes might influence the phagosome-lysosome fusion of
other incoming liposomes. Indeed, an anionic sulphatide has
been isolated from Mycobacteria tuberculosis, an organism
which can evade lysosomal digestion, and medium from M.tuber-
culosis cultures will also inhibit the organelle fusion (Hart,
1979; 1981).
iv) Degredation.
The complete breakdown of complex biological structures
(e.g.: bacteria and other parasites), which is a generally
accepted function of macrophage lysosomes, probably holds
true for most lysosomal systems. It is not surprising, there-
fore, to find that liposomes can be broken down in these or-
ganelles, indeed, the usual method of preparation of substra-
tes for phospholipases involves the formation of liposomes.
Fowler and de Duve (1969) reported that phospholipids
and sphingomyelin could be partially degraded in lysosomes
although the type of degradation and the enzymes involved
were not fully identified. Recently this subject has been re-
viewed by Waite et al.,(1976) and Van den Bosch (1980).

308.
Most cellular and subcellular membrane preparations ex-
hibit some phospholipase activity although how the enzymes
remain inactive whilst surrounded by a sea of substrate re-
mains uncertain. Interestingly, it has been suggested (Van
den Bosh, 1980) that the plasma membrane of hepatocytes
contains phospholipase A, orientated towards the exterior of
the cell. Inclusion of this enzyme on the interior membrane
of a phagocytic vacuole might allow the generation of mono-
acylglycerophophatide (e.g.: LPC ) from liposomes and these
molecules have been proposed as inducers of fusion between
membranes (Lucy, 1978). This may, therefore, explain the
mechanism of intracellular fusion proposed above.
Liposomes composed of dialkyl analogues of PC were re-
ported to be three times more resistant to hepatic breakdown
than the normal diester PC liposomes. The liver half-lives
were of the order 8 hours (diester PC) and 24 hours (dialkyl
PC) with the increase being ascribed to a resistance of the
alkyl-PC to phospholipase hydrolysis (Deshmukh et al.,1978).
The data on diester-PC agree quite well with the breakdown
of labelled liposomal phospholipids reported by Glaumann and
Marzella (1981) who found that the lysosomal half-lives were 32 14
between 4 hours ( P-labelled and C-choline labelled PC) 14
and 6 hours ( C-glycerol labelled PC); cholesterol had a
half life of 9 hours but removal of esters from E-CHOL oc-
cured with a half life of 3 hours. Using the same system un-
entrapped proteins and glycoproteins had half-lives of 0.8-2
hours.
Hwang et al., (1980) found a hepatic degredation (i.e.:
release of entrapped drug) time of 3 1/2 hours for sphingo-
myelin: CHOL SUVs. However, this time probably does not re-
flect degredation of the liposomal lipids since Fowler and
de Duve (1969) found that sphingomyelin was only hydrolysed
to ceramide and phosphorylcholine. Hydrolysis of the ceramide
either in lysosomes or in the whole liver was not found.
Gotfredsen (1982), using larger SUVs containing PC, reported 3
that the digestion products from entrapped H-albumin were
detectable in the plasma 15 minutes after I/V injection. The 3
major portion of the H radiolabel was excreted in the urine.
Conversely, 3 4
C-PC was found to be excreted (as 3 4
C - C 0?) in

309 .
the expired air of mice after a delay of two h o u r s , there-
after excretion increased linearly up to 45 % of the injected
dose at 12 hours; almost no H-H^O (from albumin) was found
in the expired air. This data suggests that rapid hydrolysis
of entrapped proteins preceeds liposome membrane digestion.
The hydrolase enzymes responsible for protein digestion
are mainly present in the lysosomes (Gregoriadis, 1975; Dean
and Barrett, 1976) and they are capable of reducing proteins
and glycoproteins to dipeptide and amino acid units which may
then permiate the lysosomal membrane (Goldman, 1976) to the
outside. The short half-lives of intact proteins in the
lysosomes may well account for the rapid fall in total hepa-
125
tic I-ASPase in this study.
Inhibition of lysosomal enzymes has been reported. The
most relevant case is the effect of cationic amines on the
breakdown of endogenous and exogenous polar phospholipids
(Lixllman - R a u c h , 1979). The mode of action of these drugs
(e.g. chloroquine) remains uncertain but they may either bind
to the phospholipid or the enzyme or act by altering the in-
tra-lysosomal pH(Wibo and Poole, 1974; Ohkuma and Poole,1978)
Larger complex amines (e.g. aminoglycoside antibiotics :
Tulkens, 1979) probably have the same effect and one wonders
if the presence of BLM might also inhibit phospholipid break-
down.
The activity of entrapped drugs against DNA and RNA
synthesis suggests that liposome entrapment protects the drug
from degredation until such time as it has acted. In the case
of ACT-D, which contains two pentapeptide rings of amino
acids (fig. 2:1a) this activity requires that the pentapep-
tide rings remain intact and allows only limited substitution
of one amino acid for another without severe loss of its
ability to bind to DNA (Goldberg, 1975; Sobell, 1974). For
instance, when L-proline is replaced by L-hydroxyproline in
only one of the pentapeptide chains biological activity is
reduced to 5 % of the initial value. Goldman (1976) has sug-
gested that the stereospecificity of the pentapeptide ring
makes the peptide bonds resistant to enzymatic hydrolysis;
probably because of the presence of the D-isomer of valine.
310 .
The carbohydrate moieties are common to all BLMs (Ume-
zawa, 1973, 1974) and the glycosidic bond in 3-0-carbomyl-
alpha-D-mannopyranosyl (1-2) alpha-D-gulopyranose should be
hydrolysable by lysosomal enzymes. Perhaps the presence of
gulose or its beta-1 linkage to hydroxyhistidine hinders
breakdown. On the other hand, the action of cathepsins on the
peptide portion of the BLM molecule should not be inhibited
except perhaps by its unusual amino acid structure.
The stability of ASPase in the presence of lysosomal en-
zymes is unknown but there is no reason to suppose that free
ASPase (i.e. not membrane bound) would be any more resistant
to enzymatic attack than, for example, albumin. The presence
of non TCA-pptable material in the whole liver suggests that
this may be the case.
Finally, the presence of proteins on the liposome sur-
face may have some effects upon liposome lysis and the break-
down of theX contents in lysosomes; in this respect alpha-2-M
is a unique protein. However, on teleological grounds it is
difficult to see why a protein, which apparently acts like an
opsonin in the plasma, should concurrently inhibit the diges-
tion of the opsonized material.
The exact in vivo role of alpha-2-M is not understood.
However, in vitro alpha-2-M will bind to many (perhaps all)
endopeptidases; these include; lysosomal enzymes (cathepsins
B , D and G , elastase, collagenases) and blood enzymes (plas-
m i n , thrombin, kallikrein, plasminogen activator) (Barrett
and Starkey, 1973; Werb et al. , 1974; Harpel, 1976; James,
1980). This has led to the suggestion that alpha-2-M may
operate as a scavenger of damaging enzymes released into the
plasma as the result of cell death, phagocytosis, bacterial
invasion or normal clotting mechanisms. (Harpel, 1976).
Other proposed actions of alpha-2-M have been reviewed
by James (1980) and involve modulation of the immune system.
Thus, alpha-2-M has been shown to bind to lymphokines, endo-
toxin, antigens and immune complexes as well as to colloidal
material such as lipopolysaccharide, dextran sulphate, gold
colloid (Dickson et al., 1981) and liposomes (Black and
Gregoriadis, 1976).

311 .
The extent to which any or all of these effects are me-
diated intracellularly by the receptor-mediated endocytosis
of alpha-2-M and its complexes is unknown but these data
suggest the alpha-2-M may play a role in the control of the
internal and external signalling which effects cell mediated
immunity. The central question is whether alpha-2-M bound to
liposomes might have similar effects. In particular, it would
be important to know if alpha-2-M-liposome complexes can
inhibit lysosomal digestion of lipid and proteins, at least
at higher p H s , by "binding out" lysosomal enzymes : inhibi-
tion of, say, cathepsin B-alpha-2-M binding by SUVs would be
easily testable and might reveal if the same portion of the
alpha-2-M molecule is used for binding both structures.
b ) Other mechanism of uptake: Fusion,lipid exchange and adsorbtion.
The forgoing extended discussion on endocytosis and its sequels
reflects this authors belief that, in vivo at least, the major portion
of liposome entrapped material enters cells by that method. Three other
uptake processes have been suggested although other mechanisms or
combinations of mechanisms may also occur.
Evidence that fusion between liposomes and cell membranes takes
place in vitro has most recently been reviewed by Poste (1980). He has
pointed out that certain criteria (e.g.: the demonstration that all
endocytosis has been blocked and that entrapped material is present
free in the cytoplasm in quantitatively similar amounts to the uptake
of liposomal lipid) must be fulfilled before fusion can be evoked as
the uptake process. The problems of interpreting these data have also
been stressed (Poste and Papahadjopoulos, 1978; Poste, 1980) for, as
has already been pointed out, intracellular fusion of liposomes with
phagocytic vacuoles followed by membrane recycling would give similar
results to those who claim that fusion has taken place extracellularly.
It is worth stressing again that in the presence of serum, or in
v i v o , unequivocable evidence that fusion takes place is lacking. Since
we are concerned here with the possibility that the S fraction radioac-
tivity is the result of liposome fusion in vivo, results which report
the delivery of pharmacological molecules to cells or tissues, and
which are subsequently found to be active, must be examined. Such a
study presumes that : i) the unentrapped material will not normally
enter cells;
312 .
ii) normally all endocytosed material is delivered to the lysosomes;
iii) the material is sensitive to lysosomal digestion and cannot escape
from these organelles and iv) the mode of action of the agent is not
mediated by and does not act within the lysosomal compartment.
Data conforming to these criteria are not plentiful and often do
not satisfy all the conditions. Examples in vivo come from the work of
Gregoriadis and Ryman (1972b) who found an increased S fraction acti-
vity of entrapped invertase when compared with the same enzyme mixed
in vitro with the whole liver prior to fractionation. Unfortunately,
the distribution in vivo of unentrapped enzyme was not studied but
these data suggest that it might bind to membranes. Similarly, Grego-
riadis et al., (1974b) showed that although some neuraminidase activity
could be found in the ML fraction this did not account for the total
hepatic activity in mice injected with liposome-entrapped neuramini-
dase. Steger and Desnick (1977) found liposome entrapped enzyme in the
S fraction for many days after injection.
These results (and those of this present study) are complicated by
the fact that leakage of entrapped material from CHOL-poor liposomes
may occur. Such may not be the case with macrophage activating agents
entrapped in liposomes (Fogler et al. , 1980; Hart et al., 1981; Fidler
et al., 1981) which may have to bind to a surface receptor to be active
(Poste e t a l . , 1979). However, it is unclear if simple binding to this
receptor is enough to activate the macrophage or if internalization
(perhaps to the lysososmes?) is also required. Whatever the mechanism
the liposome entrapped material released into the cytoplasm by either
extracellular or intracellular fusion may be the active agent. Rahman
(1979) has reported that EDTA is found almost exclusively within the S
fraction when delivered to the liver by large MLVs despite the fact
that normally EDTA does not enter this organ. It is possible that EDTA
had entered and rapidly left the lysosomes or leaked from the liposomes
intracellularly but its presence in S could also be due to fusion.
However, it is difficult to equate this S fraction location with EDTA's
action in removing heavy metals from the lysosomes unless the cytosolic
drug is that which has already chelated its target.
Finally, liposome entrapment of polynucleotides results in inter-
feron production in vivo and in vitro (reviewed M a g e e , 1980). It must
be assumed that polynucleotides are sensitive to lysosomal digestion
and, moreover, that their site of action is ultimately not in lysosomes
because they must induce interferon production. Receptor mediated

313 .
endocytosis of these liposomes might deliver some smaller vesicles to
the golgi-endoplasmic reticulum complex but it is possible that the
finding of undegraded polynucleotides in the liver many hours after
injection (especially when cationic liposomes were used) could also be
due to fusion. Mayhew et al. , (1977) have demonstrated that in vitro
fusion is the mode of entry into the cytoplasm of polynucleotides
entrapped in LUVs. As Magee (1980) has pointed out, the polynucleotides
could induce interferon by acting at surface receptors which may mean
that, like macrophage activators, they must either fuse with the extra-
cellular membranes or else preferentially bind intracellularly to
membranes which might then recycle to the cell surface.
Fusion in vitro has been demonstrated by experiments which have
shown that large molecules sensitive to lysosomal digestion can be in-
serted into the cytoplasm; thus murine and human cell lines have been
shown to translate rabbit globin m-RNA following interaction of lipo-
some entrapped RNA with the cells (Dimitriadis, 1978; Ostro et al. ,
1978). Similarly Papahadjopoulos et al., (1980a) and Fraley and Papa-
hadjopoulos (1981) have reviewed their work on the delivery of R N A , DNA
and intact polio virions. These authors favour fusion as the method of
entry of these large molecules into cells although they do not exclude
other mechanisms. The amount of RNA delivered to the cells was estima-
ted to be only 1 % of the entrapped nucleic acids and only 0.1 % of
this was active; suggesting the fusion process is very inefficient.
Addition of agents which promote fusion, e.g.:glycerol (Fraley et al.,
1980) or lectins plus polyethelene glycol (Szoka et al. , 1981), in-
crease the uptake of molecules into the cytoplasm (but see Ralston
et al., 1980 for contrary evidence).
Nevertheless, fusion has been suggested as the method of choice,
because of its mild biologocal effects, for introducing plasmids
(Fraley et al. , 1979), DNA (Fraley et al. , 1980) or whole chromosomes
(Mukherjee et al. , 1978) into cells of bacterial, plant or animal
origin (Fraley and Papahadjopoulos, 1981). Szoka et al. , (1979) have
calculated that the increase in cell surface area would be up to 60 %
if 1 % of SUVs fused with cells. (4 x 10⁵
SUV per cell). This data was
used to suggest that fusion did not take place because such extreme
alterations in cell morphology have not been observed. In view of the
recent recognition that fibroblastic L cells and macrophages (Steinman
et al. , 1976) can interiorize the equivalent (per hour) of 48% and 186%,
respectively, of their membranes, it would seem that this may not be

314 .
a valid argument.
The incorporation of liposomal lipids or liposomal membrane-asso-
ciated proteins (Poste et al., 1980; Poste, 1980; Gregoriadis, 1980a,b)
has also been taken as evidence of fusion. As far as the latter are
concerned, the recent work on the recycling of pinosome and receptosome
membrane containing externally applied proteins (antibodies); (Tulkens
et al. , 1978; Tulkens, 1979; Schneider et al. , 1979; 1981) would seem
to indicate caution in this interpretation.
The known ability of lipids to exchange from liposomes to cell
membranes (Pagano and Huang, 1975; Pagano and Weinstein, 1978; Sandra
and Pagano, 1979) and thence to internal membranes suggests that,
currently, these are not good indicies of fusion either. Using cultured
fibroblasts, in the presence of serum, Mayhew et al., (1980) found most
of the liposomal lipids and entrapped marker which were cell associated
to be in the membrane fraction and no entrapped marker in the lysoso-
mes; such a result is consistent with adsorbtion of the liposomes to
the cell membrane.
Other workers have studied the uptake of liposomes, which have
been in contact with cells, and then cultured with a second cell popu-
lation. Papahadjopoulos et al. , (1980b) reported that on second expo-
sure the amount of membrane associated liposomal lipid was the same as
in the primary exposure whilst the incorporation of entrapped marker
(RNA) was reduced 10 fold. These authors take this to mean that less
RNA leaked from the vesicle than before. On the other hand it is also
consistent with the stabilization of the vesicle by prior contact with
cells so that fusion no longer predominates (owing to the presence on
the liposomes of some cell membrane derived lipids and proteins?) but
that lipid exchange can still continue. Similar results had been pre-
viously reported by Dunnick et al., (1976b).
Finally, the adsorbtion of liposomes to cells in vivo and in vitro
must be considered as a mode of cell/vesicle association. As has been
previously mentioned, liposomes adsorbed in this manner may become
detached during later proce lures (e.g.: homogenization) and give false
intracellular distribution patterns. Mayhew et al. , (1980) consider
that, in the presence of serum, neither fusion nor endocytosis are of
major importance in determining the total cell association of both LP
and AP markers in cultured fibroblasts although they do not rule out
some contribution from these mechanisms. These authors favor stable
adsorbtion followed by phospholipid exchange and/or leakage of the

315 .
entrapped solute at the cell surface. In their initial study, Weinstein
et al.,(1977) seemed to favour fusion as the method of liposome uptake
by human lymphocytes but more recently (Blumenthal et al. , 1979) they
consider this less likely particularly in view of the lack of enhance-
ment of solute uptake when known fusogens (LPC) were incorporated into
the liposome (Ralston et al. , 1980). Szoka et al. , (1980) have also
produced convincing evidence that in vitro SUVs adsorb to, but do not
fuse with, various murine and human cells. Interestingly solid vesicles
(e.g.: those with t > incubation temperature) adsorbed to a greater
extent than fluid liposomes. The effects of charge on this adsorbtion
were cationic >> neutral > anionic; fluid liposomes adsorbed to the
same extent irrespective of charge. Similar results, i.e.: solid lipo-
somes adsorb more avidly than fluid, have been reported by Mayhew et
a l . , (1980) in the presence of serum.
Adsorbtion, in v i v o , has been suggested as one mechanism which
might account for the fact that only 50 % of injected liposomes were
taken up by the liver (Souhami et al. , 1981); Gotfredsen (1982) has
shown that livers from liposome treated animals release liposomes when
perfused. About 6 % of the injected dose of liposomes were loosely ad-
sorbed to liver cells and were released by buffer and a further 2 %
were released by collagenase perfusion.
In summary, the evidence in vivo points to the fact that much of
uptake by the liver is due to endocytosis of intact liposomes and their
contents. A smaller proportion of liposomes may become adsorbed to
liver cell surfaces but it remains to be established if these liposomes
will subsequently undergo fusion or lipid exchange or if they are ad-
sorbed as a prelude to endocytosis.

CHAPTER 5 .
Conclusions and future prospects.

Section 5:1. Conclusions
From the results presented in the previous chapters, the in vivo
fate of liposome-entrapped agents following intravenous injection into
rats may be summarised as follows :
i) Liposome preparations may contain a proportion of their entrapped
agent outside (i.e.: leaked) of the bilayer structure depending upon
the composition of the vesicle and this determines the rate of the re-
lease of the drug into the solution to be injected. In addition, some
of the entrapped drug may reside on the outer surface of the liposome.
Entrapment of the drugs used here does not appear to affect the over-
all anionic charge of liposomes but drugs sequestered in the lipid
phase m a y , at high drug : lipid ratios, cause changes in the fluidity
of the bilayers and aggregation of the preparation.
ii) Following injection (I/V), the entrapped drug is cleared from the
circulation in a biphasic manner and this usually results in a longer
plasma half-life of the liposomal agent when compared to the same dose
of the free drug (but not in the case of ASPase).
During the first hour post-injection anionic M L V s , containing low
amounts (20 mol % ) of cholesterol, lose radiolabelled cholesterol to
lipoproteins (LDL and HDL) whilst they are in the plasma but loss to
erythrocytes does not appear to occur. The loss of CHOL is probably an
exchange phenomenon rather than a net transfer.
Radiolabelled EPC in MLVs does not appear to transfer from MLVs to
lipoproteins in vivo although some loss m a y occur from the SUV popula-
tion.
iii) Other (non-lipo) proteins probably become adsorbed to MLVs during
their sejour in the plasma. Experiments in vitro demonstrated that
liposomes adsorb predominantly alpha-^-macroglobulin from rat plasma
and a l p h a ^ - m a c r o g l o b u l i n from human plasma. Liposome/protein inter-
actions in plasma results in the donation of a net negative charge to
the vesicle irrespective of its initial charge.
iv) The tissue localization of drugs entrapped in anionic MLVs is, in
general, different from that of the corresponding free drug. The liver
and spleen capture most of the liposomal agents whilst other organs,
e.g. : lung and small intestine, take up modest amounts. In tissues
that do not contain substantial populations of phagocytosing cells,
e.g. : kidney, muscle and brain, the uptake of liposome-entrapped drugs

318 .
is low or may be ascribed to blood contamination or leakage of en-
trapped drug. Except in phagocytosing cells or in tissues of particular
architecture (e.g.: liver parenchymal cells), the ability of liposomes
and their associated drug to escape from the bloodstream remains in
doubt.
v ) The mechanism of in vivo uptake of the liposomes used in this
study is probably largely by endocytosis although other means cannot be
ruled out. Intracellularly, liposomal drugs accumulate primarily in the
lysosomal fraction of the liver from where some escape into other
organelles (e.g.: nuclei) or compartments (e.g.: cytosol) is possible.
Drugs which are either unable to escape from the lysosomes or are
sensitive to lysosomal digestion may not be suitable as lipo-
some-entrapped chemotherapeutic agents unless they can be released,
e.g.: by intracellular fusion or other means, before reaching these
organelles.
vi) Liposome-entrapped anti-tumour agents retain their ability to in-
hibit hepatic nucleic acid synthesis in vivo. However, only a propor-
tion of the liposomal drug appears to be active, this may represent
drug which has either leaked from liposomes or escaped lysosomal accu-
mulation or entered the cell by a different mechanism. It seems possi-
ble that transfer of entrapped drug from one cell type to another may
be limited and that the drug's activity against parenchymal cell
nucleic acid synthesis is due either to capture of liposomes by these
cells or to drug which has been released from the carrier at sometime.
Section 5:2 Future Prospects
i) In vivo uses of liposomes.
The initial reports of enzyme entrapment in liposomes (Sessa and
Weissmann, 1970; Gregoriadis et al. , 1971) and the subsequent demons-
tration that these liposomes could alleviate model storage diseases
(Gregoriadis and Buckland, 1973; Colley and Ryman, 1974, 1976) raised
the possibility that liposomes might be a universal carrier capable of
delivering many types of therapeutic agents to diseased cells
(Gregoriadis, 1973b, Gregoriadis et al. , 1974a). These expectations
have not been realised to any great extent mainly for the reasons
discussed in this thesis, i.e. : i) leakage of entrapped agents from
319 .
liposomes, ii) instability of the carrier in the circulation with
unwanted interactions with plasma components (e.g. : lipoproteins), and
iii) a lack of tissue specificity or augmented tissue uptake into
organs which do not have phagocytosing ability.
Nevertheless, early attempts at what might be termed "passive
targetting", i.e. : allowing injected liposomes to find their own
tissue distribution unaided, have produced much useful information on
the characteristics of liposome disposition in vivo. This knowledge led
to the design of a rational chemotherapy for Leishmania donovani infec-
tions in animals using liposome-entrapped antimonial drugs targetted to
the liver and spleen lysosomes in which the parasites reside (Black
et al. , 1977). Similarly, the removal of toxic heavy metals, which also
tend to accumulate in liver and spleen lysosomes, has proved to be
possible using liposome-entrapped chelating agents whose distribution,
in the free form, does not normally include these organs (Rahman, 1979,
1980). To-date neither of these useful applications have been applied
to m a n . However, encouraging results have been reported by Gregoriadis
(1979b, 1980a, b , 1981) on the use of a liposome-entrapped enzyme
(human glucocerebroside : beta-glucosidase) in the therapy of a patient
suffering from Gaucher's disease (a lysosomal storage disease) over a
five year period. Clinically no untoward effects of this treatment have
been reported and the liver size has not increased as would be expected
in an untreated case. Similar clinical results have been reported by
Tyrrell et al. 1976b) in another lysosomal storage disease. As yet it
is uncertain if sites other than the liver have been affected by the
liposome/enzyme therapy.
Other chemotherapeutic applications of liposome-entrapped drugs,
e.g.: in the treatment of animal tumours, have not proved to be nearly
so successful probably because of a lack of specificity for the tis-
sues or subcellular sites. Although some augmented curative activity
has been found in certain animal tumours using drugs entrapped in
liposomes (reviewed : Gregoriadis, 1980a, 1980b; Ryman and Tyrrell,
1980) the 500-1000 fold increase in activity demonstrated against
intracellular parasites has not been reproduced against tumours. If the
antiparasitic activity of liposomal drugs is taken as a measure of the
targetting capacity of liposomes then it is clear that the tumour
results have hardly achieved any targetting at all. Indeed, current
thinking now recognises that liposomes may be acting as circulating or
stationary depots for the slow release of anti-tumour drugs (Mayhew

320 .
et al. , 1979; Kaye et al., 1981) and that their anti-tumour effect will
depend upon the co-incidence of this slow release with the phase in the
tumour cell cycle sensitive to the drug's effect.
On the other hand, liposomes often reduce the acute toxicity of
the entrapped drug (Black and Watson, . 1980; Rahman et al. , 1978)
probably by preventing the interaction of the agent with sensitive
tissues which would normally take up the unentrapped drug. Care must be
taken, however, since if the site of drug toxicity is the liver or
spleen entrapment of the drug in liposomes may increase its acute
toxicity, for example : one site of toxicity for antimony-containing
drugs is, like most heavy metals, the liver (Harvey, 1965); pentavalent
antimony entrapped in liposomes has a 4-fold higher acute toxicity than
the unentrapped drug and that of the entrapped trivalent drug is 10-
fold higher : despite the fact that MLVs containing antimony are better
than SUVs therapeutically against intracellular parasites, their acute
toxicities are the same (Black; unpublished). Other workers have repor-
ted increased toxicity for antitumour drugs when in the liposome form
(Rustum et al. , 1979; Kaye et al. , 1981). However, in some cases a
reduced acute toxicity allows higher, curative, doses of the liposomal
drug to be administered (Pirson et al. , 1980; Pirson, 1982). Treatment
of parasitic diseases in vivo with liposomal drugs is not always suc-
cessful. Intracellular parasites in tissues other than the RES (e.g.:
Trypanosoma cruzi infections of heart and skeletal muscle) are not
amenable to treatment with liposome (MLV or SUV)- entrapped drugs even
at doses which are several-fold higher than toxic dose of the unentrap-
ped drug. In addition, parasites of the bloodstream (e.g.: protozoa,
Tyrpanosoma brucei or metazoa, Schistosoma mansoni) which are treatable
by liposomal agents do not appear to be more susceptible to the entrap-
ped agent (whether in MLVs or SUVs) than the equivalent dose of free
drug (Black and W a t s o n , 1980 and Black and unpublished).
Passive targetting has proved useful in some other fields where
advantage has been taken of the apparent inability of liposomes to
escape from body cavities and so transport their contents to other tis-
sues. Intra-articular therapy for treatment of experimental rheumatoid
arthritis has been studied extensively using liposome-entrapped anti-
inflammatory steroids (Knight and Shaw, 1979; Page-Thomas and Phillips,
1979). By administering liposomes directly into joint cavities these
authors have overcome two problems simultaneously, i.e.: i) the carrier
is administered directly at the site of required action and so does not

321 .
need to escape from the circulation, and ii) Uptake of liposomes by the
RES is circumvented. Similar results have been obtained by Juliano and
McCullough (1980) who administered liposomes as an aerosol into rabbit
lungs and found no escape of entrapped drug into the circulation. Such
data may be taken as good evidence that the liposome has very little
capacity to directly traverse the cells lining a cavity. As discussed
below and by Gotfredsen (1982), liposome escape from bodycavities or
from local sites (Segal et al. , 1975) may be by means of the lymphatic
system. Other uses of phospholipids in the lungs of infants suffering
from respiratory distress has been suggested by Morley et al. , (1978)
who proposed that the inhalation of dry phospholipids might relieve
this condition.
An analogous situation to direct injection into body cavities is
the local administration of liposomes by sub-cutaneous or intramuscular
injection. Initial experiments on intra-testicular injection (Segal
et al. , 1975) demonstrated that small liposomes could localize in the
lymph nodes draining the site of injection. These observations have
been followed up by other groups of workers (Ryman et al. , 1978;
Osborne et al. , 1979; Ryman and Tyrrell, 1980; Kaledin et al., 1981)
who have shown that liposomes, containing an appropriate agent, can be
used to outline the lymphatic system using imaging techniques. Of
particular importance in this respect is the finding that liposomes can
descriminate between normal and cancerous lymph nodes (Osborne et al.,
1979). Again, local administration of liposomes circumvents RES uptake,
at least initially, but still relies upon passive transport and uptake
by the lymphatic system. Lymph node imaging may prove to be one area of
potential for liposomes in clinical work. Without any specificity for
tumour tissue, it seems unlikely that liposomes administered by other
routes will be any better than other particle or colloidal systems for
tumour imaging (Segal et al., 1976; Richardson et al., 1979).
Changes in the composition of liposomes have overcome some of the
problems of passive targetting, e.g.: the incorporation of equimolar
concentrations of CHOL into the phospholipid bilayers has reduced the
leakage of entrapped solutes and the interactions of the carrier with
lipoproteins (Gregoriadis and Davis, 1979; Kirby and Gregoriadis, 1980;
Kirby et al. , 1980a, 1980b). But in most cases these changes, whilst
increasing the stability and prolonging the plasma half-life of the

322 .
vesicles, do not appear to result in marked changes to the passive
targetting to the liver and spleen (Hwang and Mauk, 1977; Gotfredsen,
1982). However, recently Senior and Gregoriadis (1980,1982a,b) have
made stable SUVs with long plasma half-lives. The authors state that
the hepatic capture of these vesicles is reduced with increasing half-
life. Blockade of the RES does not appear to substantially change the
tissue distribution of MLVs or SUVs (Souhami et al, 1981).
Other alterations to the lipid composition of liposomes have been
proposed by Yatvin et al., (1978; 1981) and Weinstein et al., (1979).
In this case the vesicles were composed of a mixture of phospholipids
such that the overall t of the carrier was a few degrees higher than
the body temperature of the animals. Following injection, these liposo-
mes circulate in the plasma but when they encounter an area of higher
than normal temperature, supplied by the application of local hyper-
thermia, the lipid chains melt and release the liposome contents. This
method does not prevent either unwanted protein interactions or the
uptake of liposomes by the R E S , indeed because they do not contain CHOL
these liposomes may be more unstable in the plasma than some other
preparations.
For the future, passive targetting may become restricted to cer-
tain areas of use:
i) Treatment of disease states with involve elements of the RES
(e.g.: liver, spleen, lungs and perhaps bone marrow) where the disease
can be shown to involve the stationary macrophages; although SUVs may
have some applicability to liver parenchymal cells.
ii) local application into body cavities where RES uptake is mini-
mised or where use is made of the lymphatic system to transport the
Vesicle.
iii) as protective carriers which reduce drug toxicity to sen-
sitive tissues and/or which permit the slow general (or local) release
of entrapped drug.
Consideration of many of the problems involved in "passive tar-
getting" showed that a better recognition system was required than
simply allowing the liposomes to find their own way. Obviously the re-
cognition system should enable the carrier to interact specifically
with a particular cell or tissue type and none other (i.e.: active
targetting). Although theoretically molecules capable of specific
recognition exist in large numbers (e.g.: certain glycolipids, glyco-
323 .
proteins, antibodies and some carbohydrates) it must be remembered that
the uptake and clearance mechanisms of the RES appear to be mediated
p r i m a r y by the physical, rather than chemical, nature of the material.
For this reason, amongst others, convincing demonstrations of active
targetting has been mostly restricted to in vitro work.
Liposomes containing antibody (Ab) raised against a specific cell
type are able to select this type out of a mixed population of similar
cells (Gregoriadis and Neerunjun, 1975b; Gregoriadis et al. , 1977a;
Magee et al. , 1980). Similarly, specific antibodies either entrapped
within, or covalently coupled to, liposomes have shown an increased
avidity in various cell systems when compared to normal (non Ab-con-
taining) liposomes. (Heath et al. , 1980; Huang et al. , 1980; Leserman
et al. , 1980a, 1980b; Gregoriadis and Meehan, 1981). However, some
doubt remains as to whether increased attachment of liposomes to cells
results in increased interiorization of the carrier or its contents
(Weinstein et al., 1978; Leserman et al., 1979). Several factors appear
to determine the interiorization of liposomes (discussed: chapter 4)
b u t , in addition, in the case of active targetting such parameters as :
i) the availability of the recognition molecule (Ab) on the liposome
surface (Gregoriadis and Neerunjun, 1975b; Van Rooijen and Van Nieuw-
megan, 1980; Huang and Kennel, 1979); ii) the density (Gregoriadis and
Meehan, 1981) and/or the mobility (Humphries, 1980) of the Ab in the
bilayer, and iii) the physiological capabilities of the target cell
(chapter 4) will all have some effects on the uptake process. The type
of protein used will also affect the results; Weissmann et al., (1975)
showed that interiorization of IgG coated liposomes was efficient into
phagocycles whilst albumin coated liposomes are not apparently captured
by macrophages (Torchilin et al., 1980).
The success of these directional methods in vivo will ultimately
depend upon three major factors : i) the reduction or blockade of up-
take by the RES resulting in the subsequent prolongation of the plasma
T j ^ ii) the ability of liposomes to escape from the circulation
whilst retaining the specificity due to the associated directional
molecules and iii) the ability of immunologists to produce antibodies
of high enough specificity which can recognise the diseased tissue or
target site.
Application of active targetting in vivo has been attempted using
Ab as the directional molecule. Gregoriadis et al., (1977a) attempted
to follow up their initial in vitro work (Gregoriadis and Neerunjun,

324 .
1975b) by using anti-tumour Ab to increase tumour uptake of co-en-
trapped * ^ I n - B L M . These attempts were not successful apparently be-
cause of increased RES uptake. Using desialylated fetuin, however, an
increased liver uptake was found for liposomes coated with this protein
presumably because of its interaction with glycoprotein receptors known
to exist on hepatocytes (Morell et al. , 1971). Similar increased hepa-
tic uptake has been reported using glycolipids in liposomes (Surolia
and Bachhwat, 1980). Torchillin et al. , (1979) administered antibody-
bearing liposomes (Ab raised against cannine cardiac myosin) to dogs
with myocardial infarctions. These liposomes appeared to concentrate to
a higher extent in the damaged heart muscle than either normal (non-Ab)
liposomes or liposomes bearing non-specific Abs. These results, there-
fore, suggest that some active targetting is possible in v i v o . Much
work will be needed to improve these prelimary results but the princi-
ple has been established.
Many of these same problems may also apply to other directional
molecules (e.g.: carbohydrates) fixed to liposome (Mauk et al., 1980a, A
1980b). In this case, although the range of specificities may be more
limited than that of A b , the specificity also resides in the "receptor"
on the cells. Many of these receptors remain unexplored so that this
method relies upon further advances in membrane biology and differences
between cell types may be less than those described by A b .
Other directional systems have been used, e.g.: the use of lectin
subunits in liposomes to introduce ricin into ricin-resistant cells
(Dimitriadis and Butters, 1979; Gardas and McPherson, 1979) and viral
spike proteins have been used to increase the fusion of liposomes with
cells (Uchida et al., 1979).
In addition to their directional properties, antibody-bearing
liposomes have also been used to remove proteins from the blood stream.
Gregoriadis et al. , (1981) have shown that liposomes carrying anti-IgM
IgG can bind IgM in vivo. A similar system using anti-IgE IgG might
prove very useful for the relief of acute anaphylactoid responses. Such
a system has already proved useful in the case of digoxin overload
(Tyrrell et al. , 1978; Cambell et al. , 1980) and to improve tumour de-
tection (Barratt et al., 1981).
In the field of immunology it has long been recognised that many
antigens require an adjuvant to exert their maximal effect as inducers
of A b . The original work of Gregoriadis and Allison (1974) and Heath
et al. , (1976) established that in some cases liposomes containing, or

325 .
mixed w i t h , antigens could provide a safe adjuvant. More recently the
adjuvant effect of liposomes has attracted more attention (Gregoriadis,
1980a, 1980b; Gregoriadis and Manesis, 1980; van Rooijen and van Nieuw-
megan, 1980) and will no doubt continue to do so.
In one case liposomes containing a lipid soluble muramyldipeptide
(MDP) derivative were shown to enhance the immunizing capacity of human
malaria sporozoites in monkeys. (Siddiqui et al. , 1978). However, care
must be taken not to assume that liposomes are universal adjuvants. We
subsequently showed (Mitchell et al., 1980), when a more severe test of
adjuvancy was used (Mitchell et al. , 1975), that the same liposome
preparation mixed with a merozoite vaccine would not protect monkeys
against a uniformly-fatal simian-malaria infection. Moreover, we also
found that the best adjuvant results were found when the MDP was lipid
soluble and entrapped in the LP of liposomes whose bilayers were above
their t . From these results we were persuaded that the physical pro-
perties of an adjuvant may be as important as its chemical composition.
Other workers have used MDP and macrophage activating agents
entrapped in liposomes in the chemotherapy of lung metastasis in mice
as discussed previously (Fidler et al., 1980, 1981; Hart et al., 1981).
Quite apart from being an exciting use of liposomes and an important
area of research for the future, one wonders if the ability of MDP-li-
posomes to activate macrophages may not be intimately connected with
the general property of these and other liposomes to act as immunologi-
cal adjuvants (Tom, 1980). One further disquieting observation may
nullify many of the attempts to use liposomes as adjuvants; Schuster
et al. , (1979) have reported that liposomes containing a lipid soluble
antigen (lipid A ) are able to induce Ab not only against the lipid A
but also against the PC or sphingomyelin of the liposome carrier itself
Empty liposomes or liposomes containing water soluble antigens do not
apparently have this property. It seems possible that other lipid
soluble agents entrapped in the LP (e.g.: drugs and some MDPs (?))
could have similar effects perhaps because membrane-bound agents can
activate bone-marrow-derived lymphocytes (Kinsky, 1980) as well as
macrophages. Nevertheless, the in vivo activation of macrophages by
liposomal agents and/or the use of macrophages to transport liposomes
and their contents across capillary and tissue barriers may prove to be
an important use of liposomes which justifies the risk of antigenicity.
A final in vivo use of liposomes, which has been suggested but not
developed as y e t , is that of the circulating enzyme depot (Neerunjun
326 .
and Gregoriadis, 1976). Stable liposomes, with long T ^ ^ s , which con-
tain an enzyme or other molecule, could be used to breakdown or chelate
substrates in the circulation (and perhaps intracellularly too) so
providing a circulating detoxifying system. Obviously a judicious ba-
lance must be stuck between the capacity of the entrapped molecule to
leak and the ability of the substrate to enter the liposome but current
knowledge allows this to be done (Kirby and Gregoriadis, 1981).
ii) In vitro uses of liposomes.
Because of their close similarity to cell membranes and their com-
positional versatility, liposomes have been, and will continue to b e ,
used as model membranes but the major part of these studies are not di-
rectly concerned with the use of liposomes as carriers. However, in-
teractions between proteins, especially lipoproteins, and liposomes
will continue to add insight into the jigsaw which makes up the cell
membrane as well as clarifying the structure and function of lipopro-
tein particles; all of which are relevant to the in vivo use of lipo-
somes (chapter 3). In addition, our current knowledge of the mechanisms
by which liposomes and/or their contents can enter cells (chapter 4)
suggests that these uptake problems will have to be investigated in
vitro because of the complexity of the in vivo situation. Studies on
the mechanism of liposome uptake may prove to have implications beyond
the use of carriers and will, in turn, perhaps illuminate some aspects
of cell biology especially those concerned with membrane - membrane
interactions in growth, differentiation and disease.
For the present, liposomes of various sizes and compositions have
proved to be good vehicles for the introduction of molecules into
cells, even if the mode of entry is not understood. The ability of
liposomal agents to overcome cellular drug resistance (Papahadjopoulos
et al., 1976; Mayhew et al., 1978; 1979; Dimitriadis and Butters, 1979)
and to protect cells against virus infection (Magee and Miller, 1972;
La Bonnardiere, 1978) suggests that these carriers may have important
uses of their own in cell cultures.
An interesting current use of the liposome is to introduce "infor-
mational" molecules into cells of both animal and plant origin (Papaha-
djopoulos et al., 1980a, 1980b; Fraley and Papahadjopoulos, 1981). The
most important fact is that molecules introduced in this manner can be
"expressed" i.e.: they appear to be genetically active (Dimitriadis,
1978; M a g e e , 1978; Ostro et al. , 1978; Papahadjopoulos et a l . , 1980a,

327 .
1980b). The use of liposomes to introduce nucleic acids into cells
in vivo and so modify their functions, cannot be far away if these
results can be translated into the whole animal.
The work of Kinsky and co-workers (Kinsky, 1972, 1977, 1978, 1980,
Kinsky and Nicolotti 1977) has demonstrated that liposomal membranes
can be rendered immunogenic by the incorporation of lipid haptens.
These liposomes elicit humoral responses exclusively and can be lysed
by the action of appropriate antibody and complement. With some advan-
ces in understanding of antigen presentation and mobility it should be
possible to test for and quantify Ab raised against any liposome-im-
mobilized antigen, in the presence of complement, by the release of an
entrapped AP marker (radiolabel or other detectable molecule). Similar-
ly, work on cell mediated immunity has demonstrated that liposomes
bearing antigens can act as targets for cell-mediated immune attack
(Hale et al. , 1980; Henney, 1980). As well as advancing the knowledge
of liposomes as immunological adjuvants, these data might lead to
screening proceedures for diagnosis.
iii) General.
The initial enthusiasm of many workers for the concept of a uni-
versal drug carrier now appears to have abated to be replaced by a more
sober assessment of the capabilities of both liposomes (Gregoriadis,
1980a, 1980b, 1981; Ryman and Tyrell, 1980) and other drug carriers
(Gregoriadis ed. , 1979a). There is no doubt that for diseases of the
RES liposomes (and other particulate carriers) offer a very good vehi-
cle for drug delivery : liposomes are probably the best primarily
because they are normally non-toxic and biodegradable. (See Appendix).
For other tissues, real advances in targetting await convincing de-
monstration that liposomes, bearing appropriate specificity, can evade
the R E S , escape from the circulation and be recognised by and taken up
by the target tissue. Even should this be possible, modification of the
subcellular distribution of the carrier, or its entrapped solute, may
be necessary to ensure efficient delivery to its intracellular target.
Advances in liposomal stability, structure and directional mole-
cules suggest that these problems could be overcome in the near future.
If this does occur, the 75 year-old predictions of Paul Erhlich (1907)
may truely come of age.

APPENDIX
TOXICITY OF LIPOSOMES.
329 .
TOXICITY OF LIPOSOMES.
Introduction.
The subject of liposome toxicity, i.e.: the toxicity of the lipo-
some compor^ints in the absence of entrapped drug, is considered in this
short appendix since it does not easily fit into the previous studies.
Methods.
Liposomes were prepared according to the standard method using EPC
: CHOL : PA (7 : 2 : 1 molar ratio) with sterile 0.9 % NaCL entrapped
in the aqueous phase. The quantities of lipid used depended upon the
experiment but up to 50 times the standard quantities were used with
one fifth or one tenth appropriate volume of saline (see methods).
Where necessary rotary evaporation was performed in 1 litre flasks.
Sonication was carried out for up to 30 minutes, depending upon the
volume. In order not to overload the Sepharose 6 B columns, large
quantities of liposomes were separated on a series of columns of equal e flight and volume. Finally, the quantity of lipid phosphor* us was as-
sayed in each preparation (Baginski et al., 1967) before use.
Animal experiments.
Male weanling rats (85-100 g) were injected I/V with either the
empty liposomes or saline.
Two experiments were performed :
i) Rats received 50 mg/kg phospholipid (as judged by lipid phospho-
r us) daily for up to 3 weeks, the volume depending upon the body
weight. Control rats received a similar volume of 0.9 % NaCl (short
test).
ii) Some rats received weekly injections of 50 mg/kg phospholipid for
periods up to 6 months (long test).
Animals participating in the short test were killed at weekly in-
tervals; 6 animals (3 test, 3 control) were used for each time point.
Animal body weights were measured daily and liver weights were taken at
death.
In the longer test, animals were killed at monthly intervals (3
treated and 3 control animals at each point). Body weights were moni-
tored weekly and liver weights were recorded at the time of death.
At death, tissues were removed for histological examination (li-
v e r , spleen, heart, lung, right kidney, whole ileum, pancreas, bone

330 .
marrow and brain). These tissues were fixed in 10 % formaldehyde for 24
hours. Paraffin embedded sections of each tissue were stained with
haemotoxalin and eosin : kidney sections were stained with the PAS
technique and bone marrow with Leishman's stain as used previously
(Segal et al. , 1974) for liposomes. Samples of each stained tissue
section were examined by light microscopy.
Results.
Comparisons of means (Students ' t' test) of body weights through-
out the test between liposome and saline treated animals did not reveal
any significant differences at any time. Similarly, there was no diffe-
rence in liver weights between treated and untreated animals at death.
No animal exhibited any untoward symptoms throughout the tests; no
animals died.
Histological examination of the tissues (very kindly performed by
D r . Colin Green of the Animal Unit at this Centre) failed to find any
tissues of abnormal appearance in any of the animals of either the long
or the short term test. Of special interest was the lack of any in-
creases in obvious fatty deposits of either the livers or the spleens
of liposome treated animals when compared to the saline treated ani-
mals. Nor was there any apparent cellular infiltration of lung, spleen
or liver tissues.
Discussion.
Until recently it has been assumed that liposomes, especially
those composed of natural phospholipids and cholesterol, were not
toxic. In general this is still the case (Gregoriadis, 1978; Kimelberg
and Mayhew, 1978; Hart et al., 1981 and this work) although some excep-
tions have been reported.
Gregoriadis (1978) reported on the results obtained by Natterman
Chemie who used, sonicated, pure soya-PC liposomes to test their to-
xicity in rats and dogs. Doses of up to lg PC/kg were administered I/V
to rats daily for 4 weeks. No acute toxicity was noted and no changes
in health, behaviour or histology were found. Transient increases in
plasma total fat, phospholipids and cholesterol were reported in rats
receiving the highest dose.
Hart et al. , (1981) treated (I/V) dogs and mice with empty MLVs
containing P C , PS and E P C . Some increases above normal in serum enzyme
levels (alkaline phosphatase, glutamine : oxaloacetic transaminase,

331 .
glutamic : pyruvic transaminase) and serum bilirubin levels were found
in treated dogs but no evidence of liver damage was found during histo-
logical examinations. The authors attribute the changes to repeated
venipucture of the animals. However, canine serum globulin levels were
raised in one animal and one wonders if this could be in response to
the removal of plasma alpha-2-macroglobulin by liposomes. Y e t , Grego-
riadis (1980a) reported that anionic liposome administration (100 mg
lipid) to humans (I/V) did not change serum alpha-2-M levels for up to
3 days post-injection. In m i c e , Hart et al. , (1981) failed to find any
effects of liposome administration in the live animals and there were
no inexplicable changes in the whole organs or in their histology.
Kimelberg and Mayhew (1978) reported that cationic liposomes
(containing SA) were not toxic to mice when administered IP over a pe-
riod of 3 months. Anionic liposomes (200 mg lipid/kg) have been in-
jected (I/V) into rats with no ill effects (Colley and Ryman, 1976).
Exceptions to the general rule of non-toxicity have been found in
the case of specific liposome constituents notably those used to impart
charge to the vesicles.
Adams et al., (1977) reported that MLVs injected into the cerebral
tissue of mice at high concentrations (250-500 mg lipid/kg) could cause
epileptic seizures and tissue necrosis. This effect was most pronounced
when SA or dicetylphosphate were used in the preparation. Other anionic
phospholipids (e.g.: PA) or PC and CHOL alone were not toxic to rats
when injected into the lateral cerebroventricals at 10-fold lower doses
(Kimbelberg et al. , 1978). The toxicity of cationic enzyme-containing
liposomes (Steger and Desnick, 1977) has already been discussed
(chapter 4).
The effect of liposomes of various compositions or clotting fac-
tors has also been discussed (chapter 3; Bangham, 1961; Papahadjopoulos
et al., 1962; Juliano and Lin, 1980). Berdichevsky et al., (1979) have
shown that liposomes composed of PE are more likely to decrease the
aggregibity of platelets than EPC liposomes : platelet function was not
altered. However, Gregoriadis (1980a) found no effects on clotting me-
chanisms in a patient injected with liposomes. Cationic liposomes have
been reported to cause the agglutination and haemolysis of red blood
cells (Martin and Mac Donald, 1976a).
Magee et al. , (1974) found visible toxic effects when HeLa cells
were exposed to cationic (SA) liposomes (2 mg lipid / 2 x 10 ^ cells)
but lower doses were not toxic. Using similar (SA) liposomes, Papaha-

332 .
djopoulos et al. , (1974b) reported no effect upon the growth of 3T3
5 6
cells at doses of 0.2 mg lipid / 10 - 10 cells. The incorporation of
SA or PS into ganglioside-containing DPPC : CHOL liposomes caused a
reduction in the plating efficiency and growth of EMT-6 cells (Dunnick
et al., 1976b). Finally, Chen and Keenan (1977) reported that liposomes
containing EPC alone inhibited lymphocyte activation by attracting CHOL
and reducing cellular CHOL levels.
In addition to SA, a large amount of work has been done on the
toxicity of PS. This work followed initial reports (Bruni et al. ,
1976a, 1976b) that liposomes made from mixed brain phospholipids (main-
ly PS) markedly decreased brain energy metabolism in mice resulting in
hyperglycaemia and accumulation of glucose in the brain : PS also
caused the release of adrenaline from the adrenal medulla (Bruni et al.
1976b). Later, PS was implicated in increased catecholamine turnover in
the hypothalamus (Toffano et al. , 1978) of mice, a stimulation of
acetylcholine release from mouse brain cortex (Mantovani et al., 1976),
increases in both the dopamine-sensitive adenylate cyclase activity and
the cyclic-AMP content of mouse brain (Leon et al., 1978) and changes
in human pituatory function at the level of dopamine-mediated prolactin
regulation (Masturzo et al. , 1977). These effects could only be produ-
ced by brain PS (other sources of PS were not active; hence the compo-
sition of the acyl chains may be of crucial importance), other natural-
ly occuring phospholipids (PC,PE,PI, DPPG) did not reproduce these
effects. Furthermore, in order to be effective the liposomes had to be
composed solely of PS; sonicated to produce SUVs and injected I/V(Bruni
et al., 1976a, 1976b).
Since it is unlikely that liposomes cross the bloodbrain barrier
the causes of these effects were assumed to be secondary to a metabolic
transformation of the liposomes. Bigon et al., (1979a,b; 1980) have now
shown that incubating PS with rat serum is followed by a strong in-
crease in the toxic effects of PS and that these are due to lysophos-
phatidylserine (LPS). Identical effects can be produced by incubating
PS with phospholipase k^ from the pancreas. Other lysophospholipids
(LPC, LPE) are not toxic. The action of LPS is apparently due to its
ability to release intracellular catecholamines and histamine, an ef-
fect which is blockable by antihistamine and anti-adrenoceptor drugs;
it is these released compounds that inhibit glycolysis. Isolated mast
cells have also been reported to release histamine in the presence of
LPS (Martin and Lagunoff, 1979). Chen et al., (1976) have reported that
333 .
liposomes composed to PC and PS can induce morphological differentia-
tion in cultured neuroblastoma cells although it is not known if LPS is
responsible.
Despite the fact that some liposome preparations can be toxic,
there are some areas of physiology where the administration of empty
liposomes might prove to be beneficial. Gregoriadis et al. , (1977c)
have reviewed this subject and have found several reports of the bene-
ficial effects of liposomes, (e.g.: correction of liver phospholipid
content to overcome dysfunction of the organ; reduction of plasma
CHOL-levels, E-CHOL turnover and lipase activity in hypercholesterol-
aemic rabbits; and a reduction in aortic atherosclerosis in Japaneese
quail).
The findings in this present work are in accord with other studies
showing that in vivo EPC : CHOL : PA liposomes are not toxic. From the
brief review it would seem that the liposome structure per se is not
toxic b u t , as might be expected, individual components may cause un-
toward effects. In general, liposomes composed of PS, SA or dicetyl-
phosphate should be avoided for in vivo and clinical work. Owing to the
lack of alternatives to SA it is not known if cationic liposomes are
toxic because of their charge or because of their composition.
The processes involved in liposome toxicity (apart from PS) are
not understood. One might suspect that the exchange/transfer reactions
between liposomes on the one hand and lipoproteins or cell membranes on
the other hand are involved in the production of toxicity. Alterations
in cell membrane composition and fluidity can be expected to have
profound effects on cell or tissue viability.
Similarly relatively few studies have investigated the mechanisms
of toxicity of liposomes containing entrapped agents apart from the
measurement of the acute response. Liposomes containing drugs or pro-
teins cannot be assumed to be non-toxic as shown by the adjuvanticity
of some otherwise "non-toxic" liposome preparations.
3 3 4 .
R E F E R E N C E S
A b r a , R . , & H u n t A . ( 1 9 8 1 ) . B i o c h i m . B i o p h y s . A c t a .
6 6 6 : 4 9 3 - 5 0 3 .
A b r a , R . , B o s w o r t h , H . & H u n t . R . ( 1 9 8 0 ) . R e s . C o m m u n . C h e m .
P a t h o l . P h a r m a c o l . 2_9 : 3 4 9 - 3 6 0 .
A d a m s , D . , J o y c e , G . , R i c h a r d s o n , V . , R y m a n , B . & W i s n i e w s k i , H
( 1 9 7 7 ) . J . N e u r o l . S c i . 3J_ :
1 7 3 - 1 7 9 .
A l b e r t , A . ( 1 9 6 5 ) . in " S e l e c t i v e t o x i c i t y " . ( 3 r d E d i t i o n )
M e t h u e n a n d C o . L o n d o n , p p . 6 9 - 7 4 .
A l l e n , T . M . ( 1 9 8 1 ) . B i o c h i m . B i o p h y s . A c t a . 6 4 0 : 3 8 5 - 3 9 7 .
A l l e n , T . & C l e l a n d , L . ( 1 9 8 0 ) . B i o c h i m . B i o p h y s . A c t a . 5 9 7
4 1 8 - 4 2 6 .
A l l e n , C . , S ab a , T . & M o l n a r , J . ( 1 9 7 3 ) . J . R e t i c u 1 o e n d o t h e 1 .
S o c . J_3 : 4 1 0 - 4 2 3 .
A l l i s o n , A . , & G r e g o r i a d i s , G . ( 1 9 7 4 ) . N a t u r e . 2 5 2 : 2 5 2
A l t m a n , P . L . & D i t t m e r , D . S . ( 1 9 6 4 ) in " B i o l o g y D a t a B o o k " .
p . 3 9 9 . F e d . A m e r . S o c . E x p t l . B i o l . W a s h i n g t o n D . C .
A l v i n g , C . , S t e c k , E . , C h a p m a n , W . , W a i t s , S . , H e n d r i c k s , L . ,
S w a r t z , G . & H a n s o n , W . ( 1 9 7 8 ) . P r o c . N a t l . A c a d . S c i .
U S A . : 2 9 5 3 - 2 9 5 9 .
A l v i n g , C . , S c h n e i d e r , I . , S w a r t z , G . & S t e c k , C . ( 1 9 7 9 ) .
S c i e n c e . 2 0 5 : 1 1 4 2 - 1 1 4 4 .
A m a n o , F . & M i z u n o , D . ( 1 9 8 1 ) . J . B i o c h e m . 8_9 : 1 1 4 9 - 1 1 5 4 .
A m b r o s e , E . ( 1 9 6 6 ) . P r o g r . B i o p h y s . M o l . B i o l . 16 : 2 4 1 - 2 6 5

A s h w e 1 1 , G . & M o r e 1 1 , A . ( 1 9 7 4 ) .
A s h w o r t h , L . & G r e e n , C . ( 1 9 6 4 ) .
84 : 1 8 2 - 1 8 7 .
B a g i n s k i , E . , Foa , P . & Z a k , B . ( 1 9 6 7 ) . C l i n . C h e m . J_3 :
3 2 6 - 3 3 2 .
A d v . E n z y m o l . 4J_ : 9 9 - 1 2 8
B i o c h i m . B i o p h y s . A c t a .
B a n g h a m , A . D . ( 1 9 6 1 ) . N a t u r e . 192 : 1 1 9 7 - 1 1 9 8 .
B a n g h a m , A . D . ( 1 9 6 8 ) . P r o g , i n B i o p h y s . a n d M o l . B i o l
J_8 : 2 9 - 9 5 .
B a n g h a m , A . D . ( 1 9 7 2 ) . A n n . R e v . B i o ch e m . _4J_ : 7 5 3 - 7 76 .
B a n g h a m , A . , F l e m a n s , R . , H e a r d , D . & S e a m a n , G . ( 1 9 5 8 a ) .
N a t u r e . 182 : 6 4 2 - 6 4 4 .
B a n g h a m , A . , P e t h i c a , B . , & S e a m a n , G . ( 1 9 5 8 b ) B i o c h e m . J .
69 : 1 2 - 1 9 .
B a n g h a m , A . , S t a n d i s h , M . & W a t k i n s , J . ( 1 9 6 5 ) . J . M o l .
B i o l . 2 1 :
2 3 8 - 2 5 2 .
B a n g h a m , A . , de G i e r , J . & G r e v i l l e , C . ( 1 9 6 7 ) . C h e m . P h y s .
L i p i d s . 2 :
2 2 5 - 2 4 6 .
B a n g h a m , A . D . , H i l l , M . W . & M i l l e r , N . G . ( 1 9 7 4 ) in :
" M e t h o d s i n M e m b r a n e B i o l o g y " 2 : 1
~ 6 8 . ( K o r n . E . D .
e d ) . P l e n u m P r e s s L o n d o n .
B a r r a t t , G . , R y m a n , B . , B o d e n , J . , K e e p , P . , S e a r l e , F . ,
B e g e n t , R . & B a g s h a w e , K . ( 1 9 8 1 ) . B i o c h e m . S o c . T r a n s
9 : 5 6 4 - 5 6 5 .
B a r r e n h o 1 z , Y . , A m s e l e m , S . & L i c h t e n b e r g , D . ( 1 9 7 9 ) . FEBS.
L e t t . 99 : 2 1 0 - 2 1 4 .

3 3 6 .
B a r r e t t , A . & S t a r k e y , P . ( 1 9 7 3 ) . B i o c h e m . J . 133 : 7 0 9 - 7 2 4 .
B a r t e r , P . & L a l l y , J . ( 1 9 7 8 ) . B i o c h i m . B i o p h y s . A c t a . 53 1 :
2 3 3 - 2 3 6 .
B a r t e r , P . , G o r j a t s c h k o , L . & C a l v e r t , D . ( 1 9 8 0 ) . B i o c h i m .
B i o p h y s . A c t a . 619 : 4 3 6 - 4 3 9 .
B a t z a r i , S & K o r n . E . D . ( 1 9 7 3 ) . B i o c h i m . B i o p h y s . A c t a . 2 9 8 :
10 1 5 - 1 0 1 9 .
B a t zr i , S & K o r n , E . ( 1 9 7 5 ) . J . C e l l . B i o l . 66 : 62 1 - 6 3 5 .
B a u d h u i n , P . ( 1 9 7 4 ) . M e t h o d s in E n z y m o l . 32 . B : 3 - 2 0 .
B e a u f a y , H . & A m a r - C o s t e s e c , A . ( 1 9 7 6 ) . M e t h o d s in M e m b r .
B i o l . 6 : 1 - 1 0 0 . ( K o r n , E . ed_) . P l e n u m P r e s s . N e w Y o r k .
B e a u f a y , H . , J a c q u e s , P . , B a u d h u i n , P . S e 1 1 i n g e r , D . , B e r t h e t , J .
& de D u v e , C . ( 1 9 6 4 ) . B i o c h e m . J . 9_2 : 1 8 4 - 2 0 5 .
B e c k e r , F . , B a s e r g a , R . & B r o o m e , J . ( 1 9 7 0 ) . C a n c e r . R e s . 22. :
1 3 3 - 1 3 7 .
B e l c h e t z , P . , B r a i d m a n , I . , C r a w l e y , J . & G r e g o r i a d i s , G . ( 1 9 7 7 ) .
L a n c e t . 2 : 1 1 6 - 1 1 7 .
B e r d i c h e v s k y , V . , M a r k o s y a n , R . , P o z i n , E . , S m i r n o v , V . , S u v o r o v ,
A . , T o r c h i l i n , V . & C h a z o v , E . ( 1 9 7 9 ) . B u l l . E x p . B i o l .
M e d . 88 : 14 1 - 1 4 3 .
B i g o n , E . , B o a r a t o , E . , B r u n i , A . L e o n , A . & T o f f a n o , G . ( 1 9 7 9 a ) .
B r i t . J . P h a r m a c o l . 66_ : 1 6 7 - 1 74 .
B i g o n , E . , B o a r a t o , E . , B r u n i , A . , L e o n , A . & T o f f a n o , G . ( 1 9 7 9 b ) .
B r i t . J . P h a r m a c o l . 67_ : 6 1 1 - 6 1 6 .
B i g o n , E . , B r u n i , A . , M i e t t o , L . & T o f f a n o , G . ( 1 9 8 0 ) . B r i t . J .
P h a r m a c o l . 69 : 1 1 - 1 2 .

3 3 7 .
B j o r n s o n , L . , G n i e w k o w s k i , C . & K a y d e n , H . ( 1 9 7 5 ) .
J . L i p . R e s . J_6 : 3 9 - 5 3 .
B l a c k , C . & G r e g o r i a d i s , G . ( 1 9 7 4 ) . B i o c h e m . S o c . T r a n s .
2 : 8 6 9 - 8 7 1 .
B l a c k , C . & G r e g o r i a d i s , G . ( 1 9 7 6 ) . B i o c h e m . S o c . T r a n s .
4 : 2 5 4 - 2 5 6 .
B l a c k , C . & W a t s o n , G . ( 1 9 8 0 ) . J . Z o o l . ( L o n d . ) 190 : 5 6 0 - 5 6 2 .
B l a c k , C . , W a t s o n , G . & W a r d , R . ( 1 9 7 7 ) . T r a n s . R o y . S o c .
T r o p . M e d . H y g . 7J_ : 5 5 0 - 5 5 2 .
B 1 a z e k , R . & B e n b o u g h , J . ( 1 9 8 1 ) . B i o c h i m . B i o p h y s . A c t a .
6 7 7 : 2 2 0 - 2 2 4 .
B 1 i g h , E . & D y e r , W . ( 1 9 5 9 ) . C a n . J . B i o c h e m . P h y s i o l .
3 7 : 9 1 1 - 9 1 7 .
B 1 o k , M . , v a n D e e n e n , L . & de G i e r J . ( 1 9 7 6 ) . B i o c h i m .
B i o p h y s . A c t a . 4 3 3 : 1 - 1 2 .
B 1 urn, R . , C a r t e r , S . & A g r e , K . ( 1 9 7 3 ) . C a n c e r . 3_1_ : 9 0 3 - 9 1 3 .
B l u m e n s t o c k , F . , S a b a , T . , W e b e r , P . & C h o , E . ( 1 9 7 6 ) .
J . R e t i c u l o e n d o t b e l . S o c . J_9 : 1 5 7 - 1 72 .
B l u m e n t h a l , R . , W e i n s t e i n , J . S h a r r o w , S . & H e n k a r t , P . ( 1 9 7 7 ) .
P r o c . N a t l . A c a d . S c i . U S A . : 5 6 0 3 - 5 6 0 7 .
B l u m e n t h a l , R . , R a l s t o n , E . , D r a g s t e n , P . & W e i n s t e i n , J . ( 1 9 7 9 ) .
B i o p h y s . J . 25_ : 2 9 1 .
B o d e y , G . , H e w l e t t , J . , C o l t m a n , C . , R o d r i g u e z , V . & F r e i r e i c h , E .
( 1 9 7 4 ) . C a n c e r . 33 : 6 2 6 - 6 3 0 .

7 7 P sj ^J »
B o l t o n , A . & H u n t e r , S . ( 1 9 7 3 ) . B i o c h e m . J . 8_9 : 1 1 4 - 1 2 3 .
B o r o o a h , J . , L e a b a c k , D & W a l k e r , P . ( 1 9 6 1 ) . B i o c h e m . J .
78 : 1 0 6 - 1 1 6 .
B r a d l e y , W . , R o h d e , M . & G o t t o . A . ( 1 9 8 0 ) . A n n . N . Y . A c a d .
S c i . 3 4 8 : 8 7 - 1 0 3 .
B r o c k m a n n , H . ( 1 9 7 4 ) . C a n c e r C h e m o t h e r R e p . 58^ : 9 - 2 0 .
B r o o m e , J . D . ( 1 9 6 8 ) . J . E x p . M e d . 127 : 1 0 5 5 - 1 0 7 2 .
B r u c k d o r f e r , K . & G r a h a m , S . ( 1 9 7 6 ) . in " B i o l o g i c a l
M e m b r a n e s " . : p p . 1 0 3 - 1 5 2 . ( C h a p m a n . D . e d . )
J o h n W i l e y a n d S o n s . C h i c h e s t e r .
B r u c k d o r f e r , K . , E d w a r d s , P . & G r e e n , C . ( 1 9 6 8 ) . E u r . J .
B i o c h e m . :
5 0 6 - 5 1 1 .
B r u n i , A . , T o f f a n o , G . , L e o n , A . & B o a r a t o , E . ( 1 9 7 6 a ) .
N a t u r e : 2 6 0 : 3 3 1 - 3 3 3 .
B r u n i , A . , L e o n , A . & B o a r a t o , E . ( 1 9 7 6 b ) . A d v . E x p . M e d . B i o l .
72 : 27 1 - 2 8 3 .
B u c a n a , C . , H o y e r , L . , H o b b s , B . , B r e e s m a n , S . , M c D a n i e l , M .
& H a n n a , M . ( 1 9 7 6 ) . C a n c e r . R e s . 3_6 : 4 4 4 4 - 4 4 5 8 .
B u c h e r , N . L . & M a l t , R . ( 1 9 7 1 ) . " R e g e n e r a t i o n of l i v e r a n d
kidney". Chapters 3,4,5,6. Little, Brown and Co. Boston.
M a s s . U S A .
B u r t o n , K . ( 1 9 5 6 ) . B i o c h e m J . 62^ : 3 1 5 - 3 2 3 .
B y e f i e 1 d , J . , L e e , Y . , T u , L . & F u l h a n i a n , F . ( 1 9 7 6 ) . C a n c e r
R e s . 3_6 : 1 1 3 8 - 1 1 4 3 .
C a m b e 1 1 , P . , H a r d i n g , N . , R y m a n , B . & T y r r e l l , D . ( 1 9 8 0 ) . E u r .
J . B i o c h e m . 109 : 8 7 - 9 2 .
X-Z.Q
C a n o n i c o , P . , M c M a n u s , A . & P o w a n d a . M . ( 1 9 7 9 ) . in :
" L y s o s o m e s i n A p p l i e d B i o l o g y a n d T h e r a p e u t i c s " .
V o l . 6_ c h a p . 1 1 p p . 2 8 7 - 3 2 6 . ( D i n g l e , J . , J a c q u e s , P .
a n d S h a w , I . e d s ) . N o r t h H o l l a n d . P u b . c o . A m s t e r d a m .
C a r i d e , V . & Z a r e t , B . ( 1 97 7 ) . S c i e n c e . 198 : 7 3 5 - 7 3 8 .
C a r i d e , V . , T a y l o r , W . , C r a m e r , J . & G o 1 1 s c h a l k , A . ( 1 9 7 6 ) .
J . N u c . M e d . J_7 : 1 0 6 7 - 1 0 7 2 .
C a r t e r , R . & D i g g s , C . ( 1 9 7 7 ) . in " P a r a s i t i c P r o t o z o a " .
V o l . I l l pp. 359-465.
( K r e i e r , J . e d . ) . A c a d e m i c P r e s s . N e w Y o r k .
Ch aj e k , T . & E i s e n b e r g , S . ( 1 9 7 8 ) . J . C l i n . I n v e s t . H2 :
1 6 5 4 - 1 6 6 5 .
C h a n g , T . M . ( 1 9 7 1 ) . N a t u r e . 2 2 9 : 1 1 7 - 1 1 8 .
C h a n g , T . M . ( 1 9 7 3 ) . E n z y m e . J_4 : 9 5 - 1 0 4 .
C h a p m a n , M . J . ( 1 9 8 0 ) . J . L i p . R e s . 2_1_ : 7 8 9 - 8 5 3 .
C h a p m a n , D . & P e n k e t t , S . A . ( 1 9 6 6 ) . N a t u r e . 211 : 1 3 0 4 - 1 3 0 5
C h a p m a n , D . , P e e l , W . & Q u i n n , P . ( 1 9 7 8 ) . A n n . N . Y . A c a d . S c i
3 0 8 : 6 7 - 8 4 .
C h e n , J . , D e l F a , A . , D i l u z i o , A . & C a l i s s a n o , P . ( 1 9 7 6 ) .
N a t u r e . 2 6 3 : 6 0 4 - 6 0 6 .
C h e n , S . & K e e n a n , R . ( 1 9 7 7 ) . B i o c h e m . B i o p h y s . R e s . C o m m u n
79 : 8 5 2 - 8 5 8 .
C h i e n , M . , G r o l l m a n , A . , H o r w i t z , S . ( 1 9 7 7 ) . B i o c h e m i s t r y .
_1_6 : 3 6 4 1 - 3 6 4 6 .
C h o b a n i a n , J . T a l l , A . , B r e c h e r , P . ( 1 9 7 9 ) . B i o c h e m i s t r y .
18 : 1 8 0 - 1 8 7 .
4 0 .
C l a r k e , H . & F r e e m a n , T . ( 1 9 6 6 ) . i n " P r o t i d e s of B i o l o g i c a l
F l u i d s " . V o l u m e J_4 : 5 0 3 - 5 0 9 . ( P e e t e r s . H . e_d) .
P e r g a m o n P r e s s . L o n d o n . N e w Y o r k .
C l a r k e , H . & F r e e m a n , T . ( 1 9 6 8 ) . C l i n . S c i . 35_ : 4 0 3 - 4 1 3 .
C o g a n , U . , S h i n i t z k y , M . , W e b e r , G . & N i s h i d a , T . ( 1 9 7 3 ) .
B i o c h e m i s t r y . J_2_ : 5 2 1 - 5 2 8 .
C o h e n , C . , W e i s s m a n n , G . , H o f f s t e i n , S . , A w a s t h i , Y . &
Sr i v a s t r v a , S . ( 1 9 7 6 ) . B i o c h e m i s t r y . J_5 : 4 5 2 - 4 5 5 .
Co 1 1 e y , C . & R y m a n , B . ( 1 9 7 4 ) . B i o c h e m . S o c . T r a n s .
2 : 87 1 - 8 7 2 .
C o 1 1 e y , C . & R y m a n , B . ( 1 9 7 5 ) . B i o c h e m . S o c . T r a n s .
3 : 1 5 7 - 1 5 9 .
C o 1 l e y , C . & R y m a n , B . ( 1 9 7 6 ) . B i o c h i m . B i o p h y s . A c t a .
45 1 : 4 1 7 - 4 2 5 .
C o o n e y , D . , C a p i z z i , R . & H a n d s c h u m a c h e r , R . ( 1 9 7 0 ) . C a n c e r
R e s . 30 : 9 2 9 - 9 3 5 .
C r o w l e , A . J . ( 1 9 7 3 ) . I m m o d i f f u s i o n ( 2 n d e d i t i o n )
C h a p t e r 6_ : 3 5 3 - 4 0 2 . A c a d e m i c P r e s s . L o n d o n .
C u n n i n g h a m , C . , K i n g z e t t e , M . , R i c h a r d s , R . , A l v i n g , C . ,
L i n t , T . & G e w u r z , H . ( 1 9 7 9 ) . J . I m m u n o l . 122 :
1 2 3 7 - 1 2 4 2 .
D a b r o w i a k , J . , G r e e n a w a y , F . , L o n g o , W . , V a n H u s e n , M . &
C r o o k e , S . ( 1 9 7 8 ) . B i o c h i m . B i o p h y s . A c t a . 5 1 7 :
5 1 7 - 5 2 6 .
D a m e n , J . , D i j k s t r a , J . , R e g t s , J . & S c h e r p h o f , G . ( 1 9 8 0 ) .
B i o c h i m . B i o p h y s . A c t a . 6 2 0 : 9 0 - 9 9 .

341 .
D a m e n , J . , R e g t s , J . & S c h e r p h o f , G . ( 1 9 8 1 ) . B i o c h i m .
B i o p h y s . A c t a . 6 6 5 : 5 3 8 - 5 4 5 .
D a p e r g o 1 as , G . , N e e r u n j u n , E . & G r e g o r i a d i s , G . ( 1 9 7 6 ) .
FEBS . L e t t . 6_3 : 2 3 5 - 2 3 9 .
D a v i s , C . & G r e g o r i a d i s , G . (19 7 9 ) . B i o c h e m . S o c . T r a n s .
I : 6 8 0 - 6 8 2 .
D a v i s , B . & T a i . P . C . ( 1 9 8 0 ) . N a t u r e . 283 : 4 3 3 - 4 3 8 .
D e a n , R . T . ( 1 9 7 5 ) . N a t u r e . 2 5 7 : 4 1 4 - 4 1 6 .
D e a n , R . T .& Barrett,A. ( 1976). E s s a y s B i o c h e m . J_2 : 1 - 4 5 .
de B a r s y , T . , D e v o s . P . & V a n H o o f , F . ( 1 9 7 6 ) . L a b . I n v e s t .
34 : 2 7 3 - 2 8 2 .
de D u v e , C . & W a t t i a u x , R . ( 1 9 6 6 ) . A n n . R e v . P h y s i o l .
2_8 : 4 3 5 - 4 6 2 .
de D u v e , C . , P r e s s m a n , B . , G i a n e t t o , R . , W a t t i a u x , R . &
A p p e l m a n s , F . ( 1 9 5 5 ) . Biochem. J . 60 : 604-617.
de D u v e , C . , de B a r s y , T . , P o o l e , B . , T r o u e t , A . , T u l k e n s , P .
& V a n H o o f , F . ( 1 9 7 4 ) . B i o c h e m . P h a r m a c o l .
23 : 2 4 9 5 - 2 5 3 1 .
d e D u v e , C . , T r o u e t , A . , D e p r e z - d e - C a m p e n e e r e , D .
& B a u r a i n , R . ( 1 9 7 8 ) . A n n . N . Y . A c a d . S c i . 3 0 8 : 2 2 6 - 2 3 4 .
de Gier,J., Mandersloot,J. & van Deenen,L. (1968). Biochim. Biophys.
Acta. 150 : 666-675.
de Gier,J., Mandersloot,J., Hupkes,J., McElhaney,R. & van Beek,W.
(1971). Biochim. Biophys. Acta. 232 :
610-618.
de Gier,J., Blok,M., Van Dijck,P., Mombers,C., Verkley,A.,
Van der Neut-Kok,E., & van Deenen,L. (1978). Ann. N.Y. Acad.
Sci. 308 : 85-100.
3 4 2 .
D e 1 i c o n s t a n t i n o s , G . , G r e g o r i a d i s , G . , A b e l , G . , J o n e s , M .
& R o b e r t s o n , D . ( 1 9 7 7 ) . B i o c h e m . S o c . T r a n s .
2 : 1 3 2 6 - 1 3 2 8 .
D e m e l , R . & de K r u y f f , B . ( 1 9 7 6 ) . B i o c h e m . B i o p h y s . A c t a .
4 5 7 : 1 0 9 - 1 3 2 .
D e s h m u k h , D . , B e a r , W . , W i s n i e w s k i , H . & B r o c k e r h o f f , H .
( 1 9 7 8 ) . B i o c h e m . B i o p h y . R e s . C o m m u n . 8 2 : 3 2 8 - 3 3 4 .
D ' H o l l a n d e r , F . & C h e v a 1 1 i e r , F . ( 1 9 7 2 b ) . J . L i p . R e s .
2 2 : 7 3 3 - 7 4 4 .
D ' H o l l a n d e r , F . & C h e v a l 1 i e r , F . ( 1 9 7 2 a ) . B i o c h i m . B i o p h y s
A c t a . 2 6 0 : 1 1 0 - 1 3 2 .
D i c k s o n , R . , W i 1 1 i n g h a m , M . & P a s t a n , I . ( 1 9 8 1 ) . J . C e l l .
B i o l . 2 2 : 2 9 - 3 4 .
D i m i t r i a d i s , G . ( 1 9 7 8 ) . N a t u r e . 2 7 4 : 9 2 3 - 9 2 4 .
D i m i t r i a d i s , G . & B u t t e r s , T . ( 1 9 7 9 ) . FEBS . L e t t s .
2 8 : 3 3 - 3 6 .
D i n g m a n , C . & S p o r n , M . ( 1 9 6 5 ) . S c i e n c e . 1 49 : 1 25 1 -1 2 5 4 .
D i t t m e r , J . & L e s t e r , R . ( 1 9 6 4 ) . J . L i p . R e s . 2 :
1 2 6 - 1 3 0 .
D o n e h o w e r , R . , M y e r s , C . & C h a b n e r , B . ( 1 9 7 9 ) .
L i f e S c i . 25_ : 1 - 1 4 .
D u n n i c k , J . B a d g e r , R . , T a k e d a , Y . & K r i s s , J . ( 1 9 7 6 a ) .
J . N u c . M e d . 17_ :
1 0 7 3 - 1 0 7 6 .
D u n n i c k , J . K a l i m a n , R . & K r i s s , J . ( 1 9 7 6 b ) . B i o c h e m . B i o -
p h y s . R e s . C o m m u n . 73 : 6 1 9 - 6 2 4 .

3 4 3 .
E c k e l m a n , W . , R z e s z o t a r s k i , W . , S i e g e l , B . , K u b o t a , H . ,
C h e l l i a h , M . , S t e v e n s o n , J . & R e b a , R . ( 1 9 7 5 ) .
J . N u c . M e d . _1_6 : 1 0 3 3 - 1 0 3 7 .
E c k e l m a n , W . , K u b o t a , H . , S i e g e l , B . , K o m a i , T . , R z e s z o t a r s k i ,
W . & R e b a , R . ( 1 9 7 6 ) . J . N u c . M e d . J_7 : 3 8 5 - 3 8 8 .
E i s e n b e r g , S . ( 1 9 8 0 ) . A n n . N . Y . A c a d . S c i . 3 4 8 : 3 0 - 4 4 .
E i s e n b e r g , S . & L e v - y , R . ( 1 9 7 5 ) . A d v . L i p . R e s . J_3 : 1 - 8 9 .
E l l e n s , H . , M o r s e l t , H . & S c h e r p h o f , G . ( 1 9 8 1 ) . B i o c h i m .
B i o p h y s . A c t a . 6 74 : 1 0 - 1 8 .
E m e i s , J . & P l a n q u e , B . ( 1 9 7 6 ) . J . R e t i c u l o e n d o t h . S o c .
20 : 1 1 - 2 9 .
E r 1 i c h , P . ( 1 9 0 7 ) . B e r l i n K l i n . W o c h s c h r . _44 : 2 3 3 - 2 3 6 .
F e n d l e r , J . & R o m e r o , A . ( 1 9 7 7 ) . L i f e S c i . _20 : 1 1 0 9 - 1 1 2 0 .
F i d l e r , I . , R a z , A . , F o g l e r , W . , K i r s h , R . , B u g e l s k i , P . &
P o s t e , G . ( 1 9 8 0 ) . C a n c e r R e s . 40 : 4 4 6 0 - 4 4 6 6 .
F i d 1 e r , I . , S o n e , S . , F o g l e r , W . & B a r n e s , Z . ( 1 9 8 1 ) . P r o c .
N a t l . A c a d . S c i . U S A . 78_ : 1 6 8 0 - 1 6 8 4 .
F i n k e 1 s t e i n , M . & W e i s s m a n n , G . ( 1 9 7 8 ) . J . L i p i d . R e s .
Jl_9 : 2 8 9 - 3 0 3 .
F i n k e l s t e i n , M . & W e i s s m a n n , G . ( 1 9 7 9 ) . B i o c h i m . B i o p h y s .
A c t a . 5 8 7 : 2 0 2 - 2 1 6 .
F i s h m a n , Y . & C i t r i , N . ( 1 9 7 5 ) . F E B S . L e t t . j30 : 1 7 - 2 0 .
F o g 1 e r , W . , R a z , A . & F i d l e r , I . ( 1 9 8 0 ) . C e l l . I m m u n o l .
5 3 : 2 1 4 - 2 1 9 .
F o r s s e n , E . & T o k e s , Z . ( 1 9 7 9 ) , B i o c h e m . B i o p h y s . R e s .
C o m m u n . 91 : 1 2 9 5 - 1 3 0 1 .
344 .
F o w l e r , S . & de D u v e , C . ( 1 9 6 9 ) . J . B i o l . C h e m .
2 4 4 : 47 1 - 4 8 1 .
F r a 1 e y , R . & P a p a h a d j o p o u l o s , D . ( 1 9 8 1 ) . T I B S . : 7 7 - 8 0 .
F r a 1 e y , R . , F o r n a r i , C . & K a p l a n , S . ( 1 9 7 9 ) . P r o c . N a t l .
A c a d . S c i . U S A . 7_6 : 3 3 4 8 - 3 3 5 2 .
F r a l e y , R . , S u b r a m a n i , S . , B e r g , P . & P a p a h a d j o p o u 1 o s , D .
( 1 9 8 0 ) . J . B i o l . C h e m . 2 5 5 : 1 0 4 3 1 - 1 0 4 3 5 .
F r a n k , B . , P e k a r , A . , V e r o s , A . & H o , P . ( 1 9 7 0 ) . J . B i o l .
C h e m . 2 4 5 : 3 7 1 6 - 3 7 2 4 .
F r e i , E . (19 7 4 ) . C a n c e r C h e m o t h e r R e p t s . :
4 9 - 5 4 .
F r e i s e , J . , M u l l e r , W . , B r o l s c h . C . & S c h m i d t , F . ( 1 9 8 0 ) .
B i o m e d i c i n e . 32 : 1 1 8 - 1 2 3 .
F r e i s e , J . , M u l l e r , W . , B r o l s c h . C . & M a g e r s t e d t , P . ( 1 9 8 1 ) .
H e p a t o - G a s t r o e n t e r o l . 2 2 :
9 0 - 9 2 .
F r y , D . , W h i t e , J . & G o l d m a n , I . ( 1 9 7 8 ) . A n a l . B i o c h e m .
90 : 8 0 9 - 8 1 5 .
G a l b r a i t h , W . & M e l l e t t , L . ( 1 9 7 5 ) . C a n c e r C h e m o t h e r . R p t .
5 9 : 1 0 6 1 - 1 0 6 9 .
G a l 1 i n , J . & K a p l a n , A . ( 1 9 7 4 ) . J . I m m u n o l . 1 1 3 : 1 9 2 8 - 1 9 3 4
G a n r o t , K . ( 1 9 7 3 ) . B i o c h i m . B i o p h y s . A c t a . 3 2 2 : 6 2 - 6 7 .
G a r d a s , A . & M c P h e r s o n , I . ( 1 9 7 9 ) , B i o c h i m . B i o p h y s . A c t a .
5 8 4 : 5 3 8 - 5 4 1 .
G a u t h i e r , F . & M o u r a y , H . ( 1 9 7 5 ) . in " P r o t i d e s of t h e
B i o l o g i c a l F l u i d s " . ( 2 3 r d C o l l o q u i u m ) p p . 1 3 9 - 1 4 3 .
( P e e t e r s , H . e_d) • P e r g a m o n P r e s s . O x f o r d .
3 4 5 .
G e r r i t s e n , W . , V e r k l e i j , A . , Z w a a l , R . & v a n D e e n e n , L . ( 1 9 7 8 ) .
E u r . J . B i o c h e m . 8_5 : 2 5 5 - 2 6 1.
G i l e s , K . & M y e r s , A . ( 1 9 6 5 ) . N a t u r e : 2 0 6 : 9 3 .
G i r a n d , F . & C l a r e t , M . ( 1 9 7 9 ) . F E B S L e t t . 103 : 1 8 6 - 1 9 1 .
G 1 a u m a n n , H . & M a r z e l l a , L . ( 1 9 8 1 ) . in " C e l l B i o l o g i c a l
A s p e c t s of D i s e a s e " . C h a p . 1 3 . p p . 1 7 1 - 1 8 4 .
( D a e m s , W . , B u r g e r , H . & A f z e l i u s , B . e d s) . L e i d e n
U n i v e r s i t y P r e s s . T h e H a g u e . H o l l a n d .
G o l d b e r g , I . ( 1 9 7 5 ) . in " H a n d b o o k of E x p e r i m e n t a l P h a r m a -
c o l o g y . 3 2 : 5 8 2 - 5 9 2 . ( S a r t o r e l l i , A . & J o h n s , D . e d s ) .
S p r i n g e r - V e r 1 a g . B e r l i n .
G o l d i n , A . & J o h n s o n , R . ( 1 9 7 4 ) . C a n c e r C h e m o t h e r . R e p t s .
58 : 6 3 - 7 7 .
G o l d m a n , R . ( 1 9 7 6 ) . in " L y s o s o m e s in B i o l o g y a n d P a t h o l o g y " .
2 - C h a p t . 1 0 . p p . 3 0 9 - 3 3 6 . ( D i n g l e , J . & D e a n , R . e d s ) .
N o r t h H o l l a n d P u b . C o . A m s t e r d a m . H o l l a n d .
G o l d s t e i n , J . , A n d e r s o n , R . & B r o w n , M . ( 1 9 7 9 ) . N a t u r e .
2 7 9 : 6 7 9 - 6 8 4 .
G o r d o n , S . & C o h n , Z . ( 1 9 7 3 ) . I n t . R e v . C y t o l . 36 : 1 7 1 - 2 1 4 .
G o t f r e d s e n , C . F . ( 1 9 8 2 ) . P h . D . t h e s i s . U n i v e r s i t e C a t h o l i q u e
de L o u v a i n . B e l g i u m .
G o t t l i e b , M . H . ( 1 9 8 0 ) . B i o c h i m . B i o p h y s . A c t a . 6 0 0 : 5 3 0 - 5 4 1 .
G r e g o r i a d i s , G . ( 1 9 7 3 a ) . N e w S c i e n t i s t . 60 : 8 9 0 - 8 9 3 .
G r e g o r i a d i s , G . ( 1 9 7 3 b ) . F E B S . L e t t . 36 : 2 9 2 - 2 9 6 .

3 4 6 .
G r e g o r i a d i s , G . ( 1 9 7 5 ) . in " L y s o s o m e s in B i o l o g y a n d
P a t h o l o g y " . V o l . 4 . C h a p t . 1 0 . p p . 2 6 5 - 2 9 4 .
( D i n g l e , J . & D e a n , R . e d s ) . E 1 s e v i e r / N o r t h H o l l a n d
P u b . C o r p . A m s t e r d a m .
G r e g o r i a d i s , G . ( 1 9 7 6 a ) . N e w E n g . J . M e d . 2 9 5 : 7 0 4 - 7 1 0
a n d 7 6 5 - 7 7 0
G r e g o r i a d i s , G . ( 1 9 7 6 b ) . M e t h o d s in E n z y m o l , : 4-4_ :
2 1 8 - 2 2 7 . (Mo sb a c h , K .jgX) . A c a d e m i c P r e s s . N e w Y o r k .
G r e g o r i a d i s , G . ( 1 9 7 7 ) . N a t u r e . 2 6 5 : 4 0 7 - 4 1 1 .
G r e g o r i a d i s , G . ( 1 9 7 8 ) . A n n . N Y . A c a d . S c i . 3 0 8 : 3 4 8 - 3 7 0 .
G r e g o r i a d i s , G . ( 1 9 7 9 b ) . i n " D r u g c a r r i e r s in B i o l o g y a n d
M e d i c i n e " . C h a p t . 1 4 . p p . 2 8 7 - 3 4 1. ( G r e g o r i a d i s , G . s X ) •
A c a d e m i c P r e s s . L o n d o n .
G r e g o r i a d i s , G . ( 1 9 7 9 a ) . " D r u g c a r r i e r s in B i o l o g y a n d
M e d i c i n e " . ( G r e g o r i a d i s , G . e d ) . A c a d e m i c P r e s s . L d n .
G r e g o r i a d i s , G . ( 1 9 8 0 a ) . in " L i p o s o m e s in B i o l o g i c a l S y s t e m s "
p p . 2 5 - 8 6 . ( G r e g o r i a d i s , G . & A l l i s o n , A . ,edg_) . J o h n
W i l e y & S o n s L t d . C h i c h e s t e r .
G r e g o r i a d i s , G . ( 1 9 8 0 b ) . i n " L i p o s o m e s in B i o l o g i c a l S y s t e m s "
p p . 3 7 7 - 3 9 8 . ( G r e g o r i a d i s , G . & A l l i s o n , A . e d s ) . J o h n
W i l e y & S o n s L t d . C h i c h e s t e r .
G r e g o r i a d i s , G . ( 1 9 8 0 c ) . i n " T r a n s f e r of C e l l C o n s t i t u e n t s
i n t o E u k a r y o t i c C e l l s " , p p . 1 7 3 - 1 99 . ( C e l i s , J . ,
G r a e s s m a n n , A & L o y t e r , A e d s.) . P l e n u m P u b . C o r p . N Y .
G r e g o r i a d i s , G . ( 1 9 8 1 ) . L a n c e t . II : 2 4 1 - 2 4 7 .
G r e g o r i a d i s , G . & A l l i s o n , A , ( 1 9 7 4 ) . F E B S , L e t t . 45 : 7 1 - 7 4 .
G r e g o r i a d i s , G & A l l i s o n . A . C . ( e d s ) ( 1 9 8 0 ) . " L i p o s o m e s i n
B i o l o g i c a l S y s t e m s " . J o h n W i l e y & S o n s L t d . C h i c h e s t e r .

3 4 7 .
Gregoriadis,G. & Buckland,R. (1973). Nature. 244 : 170-172.
Gregoriadis,G. & Davis,C. (1979). Biochem. Biophys. Res.Commun.
89 : 1287-1293.
Gregoriadis,G. & Manesis,E. (1980). in "Liposomes and Immunobiology"
pp. 271-283. (Tom.B. and Six H . M s ) Elsevier/North Holland.
Amsterdam. Holland.
Gregoriadis,G. & Meehan,A. (1981). Biochem. J. 200 : 211-216.
Gregoriadis,G. & Neerunjun,D. (1974). Eur. J . Biochem. _47 : 179-185.
Gregoriadis,G. & Neerunjun,D. (1975a). R e s . Commun. Pathol, and
Pharmacol. Y0 : 351-362.
Gregoriadis,G. & Neerunjun,D. (1975b). Biochem. Biophys. Res. Commun.
65 : 537-544.
Gregoriadis,G. & Ryman,B. (1972a). E u r . J . Biochem. 24 : 485-491.
Gregoriadis,G. & Ryman,B. (1972b). Biochem. J . 129 : 123-133.
Gregoriadis,G. & Senior,J.(1980). FEBS. Lett. 119 : 43-46.
Gregoriadis,G. & Sourkes,T. (1967). Can. J . Biochem. 45 : 1841-1851.
Gregoriadis,G. & Leathwood,P. & Ryman,B. (1971). F E B S . Lett.
J_4 : 95-99.
Gregoriadis,G. & Swain,C., Willis,E & Tavill,A. (1974a). Lancet.
1_ : 1313-1316.
Gregoriadis,G., Putnam,D., Louis,L. & Neerunjun,D. (1974b).
Biochem,J. 140 : 323-330.
Gregoriadis,G., Dapergolas,G. & Neerunjun,E. (1976). Biochem. Soc.
Trans. 4 : 256-259.
Gregoriadis,G., Neerunjun,D. & Hunt,R. (1977a). Life Sci.
21 : 357-369.

q /, o j -t *-j.
Gregoriadis,G., Davisson,P. & Scott,S. (1 977b). Biochem. Soc. Trans.
2 : 1323-1326.
Gregoriadis,G., Siliprandi,N. & Turchetto,E. (1977c). Life Sci.
20 : 1773-1786.
Gregoriadis,G., Kirby,C., Manesis,E., Clarke,J., Davis,C. &
Neerunjun,D. (1981a). in "Cell Biological Aspects of Disease".
(W.Th. Daems et al; eds). 259-280. Leiden University Press.
The Hague 1981.
Gregoriadis,G., Meehan,A. & M a h , M . (1981b). Biochem. J . 200 :
203-210.
Grisham,J.W.(1962). Cancer. R e s . 22^ : 842-849.
Haest,C.,de Gier,J.,van Es,S., Verkleij,A. & van Deenen,L. (1972).
Biochim. Biophys. A c t a . 288 : 43-53.
Haidle,C. (1971). M o l . Pharmacol. 7_ : 645-652.
Hale,A., Ruebush,M. & Harris,D. (1980). in "Liposomes and Immuno-
biology". p p . 211-224. (Tom.B. and Six,H. eds). Elsevier
North Holland. Biomed. Press Amsterdam. Holland.
Hall,J. (1970). R e c . Res. Cancer R e s . 3 2 : 75-80.
Hammoudah,M., Nir,S., Isac,T., Kornhauser,R., Stewart,T., Hui,S.
& Vaz,W. (1979). Biochim. Biophys. A c t a . 558 : 338-343.
Hanna,M., Nettesheim,P., Fisher,W., Peters,L. & Francis,M. (1967).
Science. 157 : 1458-1461.
Harpel,P. (1973). J . Expt. M e d . 138 : 508-521.
Harpel,P. (1976). Methods in Enzymol. 4 2 : 639-652.
Hart,P. d'A. (1979). in "Lysosomes in Applied Biology and Therapeutics".
2 : 409-423. (Dingle,J., Jacques,P. & Shaw,I. eds). North Holland
Pub. Co. Amsterdam. Holland.

Hart,P. d'A. (1981). in "Cell. Biological Aspects of Disease".
Chap. 17. p p . 215-225. (Daems,W., Burger,E. & A f z e l i u s , B . eds).
Leiden University Press. The Hague. Holland.
Hart,I., Fogler,W., Poste,G. & Fidler,I. (1981). Cancer Immunol.
Immunother. 10 : 157-166.
Harvey,S.C. (1965). in "The Pharmacological basis of Therapeutics".
Chapt. 46. pp. 943-975. (Goodman,L. & Gilman,A. eds). 3rd edition.
Macmillan Co. New York. N . Y . U S A .
Hassens,I. Houthuys,C. & Cauwelaerts,F. (1979). A r c h . Int. Physiol.
Biochem. 87_ : 1017-1018.
Hatch,F. & Lees,R. (1968). A d v . L i p . R e s . 6 : 1-68.
Hauser,H. (1971). Biochem. Biophys. R e s . Commun. 45_ : 1049-1055.
Hayakawa,T., Ushio,Y., Mogami,H. & Horibata,K. (1974). Eur. J . Cancer.
: 137-142.
Heath,T., Edwards,D. & Ryman,B. (1976). Biochem. Soc. Trans. 4- : 129-133
Heath,T., Fraley,R. & Papahadjopoulos,D. (1980). Science 210 : 539-541.
Henney,C. (1980). in "Liposomes and Immunobiology". p p . 167-178.
(Tom.B and Six.H. eds). Elsevier/North Holland. Biomed. Press.
Amsterdam. Holland.
Hesketh,T.R., Dourmashkin,R.R., Payne,S.N., Humphrey,J.H. & Lachman,P.J.
(1971). Nature. 233 : 620-623.
Hibbs, J . (1974). Science. ]_84 : 468-471.
Higgins,G. & Anderson,R. (1931). A r c h . Pathol. 12 : 186-202.
Hill,B.T. (1978). Biochim. Biophys. A c t a . 516 : 389-417.
3 5 0 .
Hill,J., Loeb,E., Maclellan,A., K h a n , A . , Roberts,J., Shields,W. &
Hill,N. (1969). Cancer. R e s . 29. : 1574-1580.
Hinkle,G., Born,G., Kessler,W. & Shaw,S. (1978). J . P h a r m . Sci.
6J_ : 795-798.
Hinton,R., Burge,M. & Hartman,G. (1969). Anal. Biochem. 29_ : 248-256.
Ho,D., Thetford,B., Carter,C. & Frei,E. (1970). Clin. Pharmacol.
Therap. _1_L :
408-417.
Hoekstra,D. & Scherphof,G. (1979). Biochim. Biophys. A c t a . 551 : 109-
121 .
Huang,C.H. (1969). Biochemistry. 8_ : 344-352.
Huang,L. & Kennel,S. (1979). Biochemistry. \8_ : 1702-1707.
Huang,A., Huang,L. & Kennel,S. (1980). J . Biol. Chem. 255 : 8015-8018.
Humphries,G. (1980) in "Liposomes in Biological Systems". Chap.13.
p p . 345-376. (Gregoriadis,G. & Allison,A. eds). John Wiley and
Sons Ltd. Chichester. U K .
Hunt,A., Rustum,Y., Mayhew,E. & Papahadjopoulos,D. (1979). Drug. M e t a b .
Disposit. 7_ : 124-128.
Hwang,K. & M a u k , M . (1977). Proc. N a t l . A c a d . Sci. U S A . 74 :4991-4995.
Hwang,K., Luk,K-F., Beaumier,P. (1980). Proc. Nat. A c a d . Sci. USA.
1J_ : 4030-4034.
Ihler,G. (1979). in "Drug Carriers in Biology and Medicine".
pp. 129-153. (Gregoriadis,G. ed) . Academic Press. London.
Ischizuka,M., Takayama,H., Takeuchi,T. & Umezawa,H. (1967). J . Antibiot.
A 20 : 15-24.
3 5 1 .
Jackson,A.J. (1980). Res. Commun. Chem. Path. Pharmacol.
27 : 293-304.
Jackson,R., Morrisett,J. & Gotto,A. (1976). Physiol. R e v . 56 : 259-316.
Jacques,P.J. (1981). in "Cell Biological Aspects of Disease". Chap.12.
p p . 151-169. (Daems,W., Burger,E. & Afzelius,B. eds). Leiden
University Press. The Hague. Holland.
James,K. (1980). TIBS. 2 = 43-47.
Johnson,S.M. (1973). Biochim. Biophys. A c t a . 307 : 27-41.
Johnson,S., Bangham,A., Hill,M. & Korn,E. (1971). Biochim. Biophys.
A c t a . 233 : 820-826.
Jonah,M., Cerny,E. & Rahman,Y. (1975). Biochim. Biophys. A c t a .
401 : 336-348.
Jonas,A. & Krajnovich,D. (1978). J . Biol. Chem. 253 : 5758-5763.
Jonas,A. & Maine,G. (1979). Biochemistry. _18 : 1722-1728.
Jonas,A., Hesterberg,L. & Drengler,S. (1978). Biochim. Biophys. A c t a .
528 : 47-57.
Juliano,R.L.(1976). in "Membranes and Neoplasia : New approaches and
strategies", p p . 21-32. A . R . Liss inc. New Y o r k .
Juliano,R.L. (1978). Canad. J . Physiol. & Pharmacol. 56 : 683-690.
Juliano,R.L. (ed)(1980). Drug Delivery Systems. Oxford University Press.
New Y o r k .
Juliano,R.L. & Lin,G. (1980). in "Liposomes and Immunobiology".
pp. 49-66. (Tom,B. & Six,H. eds). Elsevier/North Holland. Amster-
dam. Holland.

3 5 2 .
Juliano,R.& McCullough,H. (1980). J . Pharmacol. & E x p t . Therapeut.
214 : 381-387.
Juliano,R.L. & Stamp,D. (1975). Biochim. Biophys. R e s . Commun.
63 : 651-658.
Juliano,R. & Stamp,D. (1976). N a t u r e . 26J_ : 235.
Juliano,R. & Stamp,D. (1978). Biochem. Pharm. 27 : 21-27.
Juliano,R. & Stamp,D. (1979). Biochim. Biophys. A c t a . 589 : 137-145.
Juliano,R., Stamp,D. & McCullough,N. (1978). Ann. N Y . A c a d . Sci.
308 : 411-425.
Kagawa,Y. & Racker,E. (1971). J . B i o l . Chem. 246 : 5477-5487.
Kaledin,V., Matienko,N., Nikolin,V., Gruntenko,Y. & Budker,V. (1981).
J . Natl. Cancer Inst. 6_6 : 881-887.
Kao,Y. & Juliano,R. (1981). Biochim. Biophys. A c t a . 6Y7 : 453-461.
Kaplan,M.H. & Volanakis, J.E. (1974). J . Immunol. _1_1_2 : 2135-2147.
Kaplan,G. (1981). in "Cell Biological Aspects of Disease". Chap.14.
pp. 185-199. (Daems,W., Burger, E . & Afzelius,B. eds). Leiden
University Press. The Hague. Holland.
Kasai,H., Naganawa,H. Takita,T. & Umezawa,H. (1978). J . Antibiot.
37 : 1316-1320.
Kataoka,T., Williamson,J. & Kinsky,S. (1973). Biochim. Biophys. A c t a .
298 : 158-179.
Katz,E. & Weissbach,H. (1963). J . B i o l . Chem. 23!3 : 666-675.
Kaye,S. & Ryman,B. (1980). Biochem. Soc. Trans. <8 : 107-108.
3 5 3 .
Kaye,S., Boden,J. & Ryman,B. (1981). E u r . J . Cancer. J_7 : 279-289.
Kemp, W . , Damian,R., Greene,N. & Lushbaugh,W. (1976). J . Parasitol.
62_ : 413-419.
Kessel,D. (1967). F e d . Proc. 26. : 685.
Kimelberg,H.K. (1976). Biochim. Biophys. Acta. 448 : 531-550.
Kimelberg,H. & Atchison,M. (1978). A n n . N Y . A c a d . Sci. 308_ : 395-409.
Kimelberg,H. & Mayhew,E. (1978). C.R.C. Crit. Rev. Toxicol.
6 : 25-78. (Goldberg,L. ed). CRC Press. New Y o r k .
Kimelberg,H.K. & Papahadjopoulos,D. (1971a). J . Biol. Chem.
246 : 1142-1148.
Kimelberg,H. & Papahadjopoulos,D. (1971b). Biochim. Biophys. A c t a .
233 : 805-809.
Kimelberg,H., Mayhew,E. & Papahadjopoulos,D. (1975). Life Sci.
\1_ : 715-724.
Kimelberg,H. Tracy,T., Biddlecome,S., & Bourke,R. (1976). Cancer. R e s .
36 : 2949-2957.
Kimelberg,H., Biddlecome,S. & Bourke,R. (1977). Cancer. R e s .
37 : 157-165.
Kimelberg,H., Tracy,T., Watson,R., King,D., Reiss,F. & Bourke,R.
(1978). Cancer. R e s . 38 : 706-712.
Kinsky,S.C. (1970). A n n . Rev. Pharmacol. : 119-142.
Kinsky,S.C. (1972). Biochim. Biophys. A c t a . 265 : 1-23.
Kinsky,S.C. (1978). A n n . N Y . A c a d . Sci. 308 : 111-120.

3 5 4 .
Kinsky,S.C. (1980). in "Liposomes and Immunobiology". p p . 79-89.
(Tom,B. & Six,H. eds). Elsevier/North Holland. Biomed. Press.
Amsterdam. Holland.
Kinsky,S.C. & Nicolotti,R.A. (1977). A n n . Rev. Biochem. 46. : 49-67.
Kirby,C. & Gregoriadis,G. (1980). L i f e . Sci. 27 : 2223-2230.
Kirby,C. & Gregoriadis,G. (1981). Biochem. J . 199 : 251-254.
Kirby,C., Clarke, J . & Gregoriadis,G. (1980a). FEBS. L e t t . 1 1 1 :
324-328.
Kirby,C. & Clarke,J. & Gregoriadis,G. (1980b). Biochem. J .
186 : 591-598.
Kitagawa,T. Inoue,K. & Nojima,S. (1976). J . Biochem. J9_ : 1135-1145.
Klausner,R., Bridges,K., Tsunoo,H., Blumenthal,R., Weinstein,J. &
Ashwell,G. (1980). Proc. Natl. A c a d . Sci. U S A . 77. : 5087-5091.
Klein,R. (1970). Biochim. Biophys. A c t a . 210 : 486-489.
Knight,G.C. (ed) (1981). "Liposomes : From Physical Structure to
Therapeutic Applications", pp. 498. Elsevier/ North Holland.
Biomedical Press. Amsterdam. Holland.
Knight,C. & Shaw,I. (1979). in "Lysosomes in Biology and Pathology",
6 . Chapt. 20 pp. 575-599. (Dingle,J. Jacques,P. & Shaw,I. eds),
North Holland, P u b . Corp. Amsterdam. Holland.
Kobayashi,T., Kataoka,T., Tsukagoshi,S. & Sakurai,Y. (1977). Int. J,
Cancer. 20 : 581-587.
Koga,S., Horowitz,D. & Scanu,A. (1969). J . Lip. Res. 10 : 577-588.
Konikowski,T., H a y n i e , T . & Glenn,H. (1975). J . Nuc. M e d . 16 : 738-743.
3 5 5 .
Kosloski,M., Rosen,F., Milholland,R. & Papahadjopoulos,D. (1978).
Cancer. R e s . 38 : 2848-2853.
Kotaoka,T. & Kobayashi,T. (1978). A n n . N Y . Acad. Sci. 308 : 387-394.
Kremer,J., Esker,M., Pathmamanoharan,C. & Wiersma,P. (1977).
Biochemistry. ]_6 : 3932-3935.
Krohn,K., Meyers,J., DeNardo,G. & DeNardo,S. (1977). J . N u c . M e d .
J_8 : 276-281 .
K r 8 H , J . (1968). Scand. J . Clin. L a b . Invest. 22_ : 79-81 .
Kr^ll.J. (1969). Scand. J . Clin. L a b . Invest. 23 : 227-230.
Kr^ll,J• (1970). in "Protides of Biological Fluids". Volume 17.
p p . 529-532. (Peeters,H. eel). Pergamon. Press. L o n d o n . New York.
de Kruijff,B., Cullis,P.R. & Radda,G.K. (1976). Biochim Biophys. A c t a .
436 : 729-740.
Krupp,L., Chobanian,A. & Bretcher,P. (1976). Biochem. Biophys. Res.
Commun. 72_ : 1251-1258.
La Bonnardiere,C. (1978). A n n . M i c r o b i o l . (Paris). L29 : 397-402.
Lamb,H. (1888). P h i l . M a g . 25 : 52-70.
Lasser,N., Roheim,P., Edelstein,D., & Eder,H. (1973). J . L i p . Res.
J A : 1 _ 8
-
Lawaczeck,R., Kainosho,M., Girandet,J,L. & Chan,S. (1975). Nature.
256 : 584-586.
Lay ton,D. & Trouet,A. (1980). E u r . J . Cancer. ]_6 : 945-950.
Leibowitz,M. & Johnson,M. (1971). J . Lipid. Res. 12 : 662-666.

Le Neveu,D., Rand,R. & Parsegian,V. (1976). Nature. 259 : 601-603.
Leon,A., Benvegnu,D., Toffano,G. & Massari,P. (1978). J . Neurochem.
30 : 23-26.
Leserman,J., Weinstein,J., Blumenthal,R., Sharrow,S. & Terry,W.
(1979). J . Immunol. 122 : 585-591.
Leserman,L., Weinstein,J., Blumenthal,R. & Terry,W. (1980a). Proc.
Natl. Acad. Sci. U S A . 77 : 4089-4093.
Leserman,L., Barbet,J., Kourilsky,F., & Weinstein,J. (1980b). Nature
288 : 602-604.
Lin,M., Goodwin,D. & Kruse,B. (1974). J . N u c . Med. L5 : 338-342.
Lowry,0., Rosebrough,N., Farr,A. & Randall,R. (1951). J . Biol. Chem.
193 : 265-275.
Lucy,J. (1978). in "Membrane fusion". Chapt. 6. p p . 267-304.
(Poste,G. & Nicholson,G. eds). Elsevier/North Holland. Biomedic
Press. Amsterdam. Holland.
Lullmann-Rauch,R. (1979) in "Lysosomes in Biology and Pathology".
Chapt. 3. 49-130. (Dingle,J., Jacques,P. & Shaw,I. eds). North
Holland. P u b . Corp. Amsterdam.
Luzzati,V. , Tardieu,A. & Aggerbeck,L. (1979). J. M o l . Biol. \3\_ :
435-473.
Magee,W.E. (1978). A n n . N.Y. A c a d . Sci. 308 : 308-324.
Magee,W.E. (1980). in "Liposomes in Biological Systems". Chapt. 9.
p p . 249-263. (Gregoriadis,G. & Allison,A. eds). John Wiley and
Sons. Chichester. U K .
Magee,W. & Miller,0. (1972). Nature. 235 : 339-341.

M a g e e , W . , G e o f f , C . , S c h o k n e c h t , J . , S m i t h , M . & C h e r i a n , K .
( 1 9 7 4 ) . J . C e l l . B i o l . 63_ : 4 9 2 - 5 0 4 .
M a g e e , W . , C r o n e n b e r g e r , J . , T h o r , D . & P a q u e , R . ( 1 9 8 0 ) . i n
" L i p o s o m e s a n d I m m u n o b i o l o g y " . p p . 1 3 3 - 1 4 9 . ( T o m , B .
& S i x , H . e d s ) . E 1 s e v i er ./ N o r th H o l l a n d . Pub. Corp.
A m s t e r d a m . H o l l a n d .
M a h l e r , H . & C o r d e s , E . ( 1 9 7 1 ) . in " B i o l o g i c a l C h e m i s t r y " ,
p p . 8 1 9 - 8 3 9 . 2 n d e d i t i o n . H a r p e r a n d R o w . L o n d o n .
M a n d e l , H . G . ( 1 9 7 1 ) . in " F u n d a m e n t a l s o f D r u g M e t a b o l i s m
a n d D r u g D i s p o s i t i o n " . C h a p t e r 1 0 . p p . 1 4 9 - 1 8 6 .
( L a D u . B , M a n d e l , H . , W a y , L . e d s ) . W i l l i a m s a n d
W i l k i n s C o . B a l t i m o r e U S A .
M a n e s i s , E . , C a m e r o n , C . & G r e g o r i a d i s , G . ( 1 9 7 8 ) . B i o c h e m .
S o c . T r a n s . 6 : 9 2 5 - 9 2 8 .
M a n n e r i n g , G . ( 1 9 7 1 ) . in " F u n d a m e n t a l s of D r u g M e t a b o l i s m
a n d D r u g D i s p o s i t i o n " . C h a p t e r 1 2 . p p . 2 0 6 - 2 5 2 .
(La D u , B . , M a n d e l , H . , W a y , L . e d s ) . W i l l i s m s a n d
W i l k i n s C o . B a l t i m o r e . U S A .
M a n t o v a n i , P . P e p e u , G . & A m a d u c c i , L . ( 1 9 7 6 ) . A d v . e x p . M e d .
B i o l . 72 : 2 8 5 - 2 9 2 .
& L a g u n o f f , D . ( 1 9 7 9 ) . N a t u r e . 2 7 9 : 2 5 0 - 2 5 2 .
& M a c D o n a l d , R . ( 1 9 7 6 a ) . J . C e l l . B i o l .
4 9 5 - 5 0 5 .
a n d M a c D o n a l d , R . ( 1 9 7 6 b ) . J . C e l l . B i o l .
5 0 6 - 5 1 4 .
& M a c D o n a l d , R . ( 1 9 7 6 c ) . J . C e l l . B i o l .
5 1 5 - 5 2 6 .
M a r t i n , T .
M a r t i n , F .
12 :
M a r t i n ,F .
12 -
M a r t i n , F .
7 0 :
M a s h b u r n , L . & L a n d i n , L . ( 1 9 7 0 ) . R e c . R e s . C a n c e r . R e s .
3 3 : 4 8 - 5 7 .
3 5 8 .
M a s o n , J . & H u a n g , C . ( 1 9 7 8 ) . A n n . N Y . A c a d . S c i .
3 0 8 : 2 9 - 4 9 .
M a s t u r z o , P . , G a 1 l a m i n i , A . , M u r i a l d o , G . , N i z z o , M . , &
T o f f a n o , G . ( 1 97 7 ) . N e w E n g . J . M e d . 2 9 7 : 3 3 8 - 3 3 9 .
M a u k , M . & G a m b l e , R . ( 1 9 7 9 ) . P r o c . N a t l . A c a d . S c i . U S A .
7J> : 7 6 5 - 7 6 9 .
M a u k , M . , G a m b l e , R . , B a 1 d e s c h w i e 1 e r , J . ( 1 9 8 0 a ) . S c i e n c e .
2 0 7 : 3 0 9 - 3 1 1 .
M a u k , M . , G a m b l e , R . & B a l d e s c h w i e l e r , J . ( 1 9 8 0 b ) . P r o c ,
N a t l . A c a d . S c i . U S A . 7_7 : 4 4 3 0 - 4 4 3 4 .
M a y h e w , E . , P a p a h a d j o p o u l o s , D . , R u s t u m , Y . & D a v e , C . ( 1 9 7 6 ) .
C a n c e r . R e s . 36_ : 4 4 0 6 - 4 4 1 1 .
M a y h e w , E . , P a p a h a d j o p o u l o s , D . , 0 ' M a l l e y , J . , C a r t e r , W . &
V a i l , W . ( 1 9 7 7 ) . M o l . P h a r m . 13 : 4 8 8 - 4 9 5 .
M a y h e w , E . , P a p a h a d j o p o u l o s , D . ,
A n n . N Y . A c a d . S c i . 3 0 8 :
M a y h e w , E . , R u s t u m , Y . , S z o k a , F .
C a n c e r . T r e a t . R p t s . 63 :
R u s turn,Y. & D a v e , C . ( 1 9 7 8 ) .
37 1 - 3 8 6 .
& P a p a h a d j o p o u l o s , D . ( 1 9 7 9 ) .
1 9 2 3 - 1 9 2 8 .
M a y h e w , E . , G o t f r e d s e n , C . , S c h n e i d e r , Y - J . & T r o u e t , A . ( 1 9 8 0 ) .
B i o c h e m . P h a r m a c o l . 2_9 : 8 7 7 - 8 8 6 .
M a x f i e I d , F . , W i 1 1 i n g h a m , M . , D a v i e s , P . & P a s t a n , I . ( 1 9 7 9 ) .
N a t u r e . 2 7 7 : 6 6 1 - 6 6 3 .
M e j b a u m , W . ( 1 9 3 9 ) . Z . P h y s i o l . C h e m . _258 : 1 1 7 - 1 2 0 .
M e y e r s , J . , K r o h n , K . & D e N a r d o , G . ( 1 9 7 5 ) . J . N u c . M e d . JUS :
8 3 5 - 8 3 8 .
3 5 9 .
Mezei ,M. & Gulasekharm,V. (1980). Life Sci. 26 : 1473-1477 .
Miller,D., Marlborough,D. & Cammack,K. (1971). I n t . C o l l o q .
Centre National de Recherche Scientifique (CNRS) Paris. France.
197 : 55-71.
Mitchell,G., Butcher,G. & Cohen,S. (1975). Immunol. 29 : 397-407.
Mitchell,G., Cohen,S., Black,C., Voller,A., Dietrich,F. &
Dukor,P. (1980). in "The Host Invader Interplay", p p . 629-632.
(Van den Bossche,H. e d ) . Elsevier/North Holland. Biomed. P r e s s .
Amsterdam. Holland.
Morell,A., Gregoriadis,G., Scheinberg,1., Hickman,J. & Ashwell,G.
(1971). J . B i o l . Chem. 246 : 1461-1467.
Mori,T., Tosa,T. & Chibata,I. (1973). Biochim. Biophys. A c t a .
321 : 653-661.
Morley,C., Bangham,A., Johnson,P., Thorburn,G. & J e n k i n , G . (1978).
Nature; 271 : 162-163.
Morrisett,J., Jackson,R. & Gotto,A. (1977). Biochim. Biophys. A c t a .
472 : 93-133.
Mukherjee,A., 0rloff,S., Butler,J., Triche,T., Lalley,P. &
Schulman,J. (1978). P r o c . N a t l . A c a d . Sci. U S A . 75_ : 1361-1365.
Muller,W., Yamazaki,Z., Breter,H.J., Zahn,R. (1972). E u r . J . Biochem.
3J_ : 518-525.
Munro,H. & Fleck,A. (1966). A n a l y s t . 9j_ :
78-88.
Munthe-Kaas , A . C . (1976). E x p . C e l l . Res . 99_ : 319-327.
McDougall,1., Dunnick,J., M c N a m e e , M . & Kriss,J. (1974). P r o c . N a t l .
A c a d . Sci. U S A . 7J_ : 3487-3491.
McFarlane,A. (1958). Nature. _182 : 5 3 .
McFarlane,A. (1963). J . Clin. Invest. 42 :
346-361.

360 .
Nagai,K., Suzuki,H., Tanaka,N. & Umezawa,H. (1969). J . A n t i b i o t .
(Tokyo). 22 : 569-573 and 624-628.
N a o i , M . , Naoi,M., Shimizu,T., M a l v i y a , A . & Yagi,K. (1977). Biochim.
Biophys. A c t a . 471 : 305-310.
Neerunjun,E. & Gregoriadis,G. (1976). Biochem. Soc. T r a n s .
4 : 133-134.
New,R., Chance,M., Thomas,S. & P e t e r s , W . (1978). N a t u r e .
272 : 55-56.
Nichols,A. & Gong,E. (1971). Biochim. Biophys. A c t a . 231 : 175-184.
Nicolau,C. & Paraf,A. (eds) (1981). in "Liposomes, Drugs and
Immunocompetent cell functions", p p . 193. Academic P r e s s . L d n .
Nicoll,A., Miller,N. & Lewis,B. (1979). A d v . L i p . R e s . \7_ : 53-106.
Nilsson-Ehle,P., Garfinkel,A., Schotz,M. (1980). A n n . R e v . Biochem.
49 : 667-693.
N u n n , A . D . (1976). J . Antibiot. 22. : 1102-1108.
Octave,J., Schneider,Y-J., Crichton,R. & T r o u e t , A . (1982). in :
"Protides of the biological fluids". 29) : 447-450.
Ohkuma,S. & Poole,B. (1978). P r o c . N a t l . A c a d . Sci. U S A . 73 :
2781-2787.
Ohno,R. & Hersh,E. (1970). Cancer R e s . 30 : 1605-1611.
Ohnuma,T., Holland,J., Musada,H., Waligunda,J. & Goldberg,G. (1974).
Cancer. 33 : 1230-1238.
Olson,F., Hunt,C., Szoka,F., Vail,W., & Papahadjopoulos,D. (1979).
Biochim. Biophys. A c t a . 557. : 9 - 2 3 .
Onishi,T., Iwata,H & Takagi,Y. (1975). Biochim. Biophys. A c t a .
378 : 439-449.

351 .
Osborne,J. & Brewer,H. (1977). A d v . P r o t e i n . Chem. 3\_ : 253-337.
Osborne,M., Richardson,V., Jehasingh,K. & Ryman,B. (1979). J . N u c l .
M e d . Biol. 6_ : 75-83.
Oshima,G. & Nagasawa,K. (1973). Biochim. Biophys. Acta.291 : 1-14.
Ostro,M., Giacomoni,D., Lavelle,D., Paxton,W. & D r a y , S . (1978).
N a t u r e . 274 : 921-923.
Owen, J . & Mclntyre ,N . (1982). TIBS. : 95-98.
Pagano,R. & Huang,L. (1975). J . C e l l . B i o l . 67 : 49-60.
Pagano,R. & Takeichi,M. (1977). J . C e l l . B i o l . 74 : 531-546.
Pagano,R.E. & Weinstein,J.N. (1978). A n n . R e v . Biophys. Bioengin.
1_ : 435-468.
Pagano,R., Sandra,A. & Takeichi,M. (1978). A n n . N Y . A c a d . Sci.
308 : 185-199.
Page-Thomas,D. & Phillips,N. (1979). in "Lysosomes in Biology and
Pathology". 6^. Chapt. 21. p p . 601-624. (Dingle, J . , Jacques,P.
and Shaw,I. eds) . North Holland. P u b . Corp. Amsterdam.Hoiland.
Papahadjopoulos,D. (1978a). A n n . N Y . A c a d . Sci. 308_ : 1-462.
Papahadjopoulos,D. (1978b). in "Membrane fusion". C h a p t . 14.
p p . 765-790. (Poste. G . and N i c h o l s o n , G . eds) . Elsevier/North
Holland. Biomedical Press. A m s t e r d a m . Holland.
Papahadjopoulos,D. (1979). A n n . R e p . M e d . Chem. U ^ : 250-273.
Papahadjopoulos,D. & Miller,N. (1967). Biochim. Biophys. A c t a .
135 : 624-638.
Papahadjopoulos,D. & Watkins,J. (1967). Biochim. Biophys. A c t a .
135 : 639-652.
Papahadjopoulos,D., Hohgie,C. & Hanahan,D. (1962). P r o c . S o c . Exptl.
B i o l . M e d . Ill : 412-423.
3 6 2 .
Papahadjopoulos,D., Poste,G. & Mayhew,E. (1974b). Biochim. Biophys.
A c t a . 363 : 404-418.
Papahadjopoulos,D., Moscarello,M., Eylar,E. & Isac,T. (1975). Biochim.
Biophys. A c t a . 401 : 317-335.
Papahadjopoulos,D., Poste,G., V a i l , J . & Biedler,J. (1976). Cancer.
R e s . 36 : 2988-2994.
Papahadjopoulos,D., Portis,A. & Pangborn,W. (1978). A n n . N Y . A c a d .
Sci. 308 : 50-66.
Papahadjopoulos,D., Wilson,T. & T a b e r , R . (1980a). in "Transfer of
cell constituents into Eukar.yotic cells", p p . 155-172 . (Celis
J . E . , Graessman,A. & Loyter,A. e d s ) . Plenum P r e s s . New Y o r k .
Papahadjopoulos,D., Fraley,R. & H e a t h , T . (1980b). in "Liposomes and
Immunol) io logy". p p . 151-164. (Tom,B. and Six,H. eds) . Elsevier/
North Holland. Amsterdam.
Pastan,!. & Willingham,M. (1981). A n n . R e v . Physiol. 43 : 239-250.
Patel,H. & Ryman,B. (1976). FEBS. L e t t . 62 : 60-63.
Patel,H. & Ryman,B. (1977a). Biochem. Soc. Trans. 2 : 1739-1741.
Patel,H. & Ryman,B. (1977b). Biochem. Soc. Trans. 2 : 1054-1055.
Patterson,M. (1975). in "Handbook of Experimental Pharmacology".
38 : 695-722. (Sartorelli,A. & Johns,D. eds). Springer-Verlag.
B e r l i n .
Patterson,M. & Greene, R . (1965). A n a l . C h e m . 37_ : 854-857.
Patterson,M. & 0rr,G. (1969). Cancer R e s . 29_ : 1179-1183.
Pennington,R. (1961). Biochem.J. 80 : 649-654.
Pietronigro,D., Seligman,M., Jones,B. & Demopoulos,H. (1976). Lipids.
11 : 808-813.
363 .
Pietsch,P. (1975). in "Handbook of Experimental Pharmacology".
38 : 850-876. (Sartorelli,A. & Johns,D. eds). Springer-Verlag.
Berlin.
Pietsch,P. & Clapper,G. (1969). Cytobios. I : 145-152 .
Pirson,P. (1982). PhD thesis. Universite Catholique de Louvain.
Brussels. Belgium.
Pirson,P., Steiger,R., Trouet,A., Gillet,J. & Herman,F. (1980).
A n n . T r o p . M e d . Parasitol. 74_ : 383-391 .
Poste,G. (1980). in "Liposomes in Biological Systems". Chapt. 4 .
p p . 101-151. (Gregoriadis,G. & Allison,A. e d s ) . John Wiley and
Sons L t d . Chichester. U K . _
Poste,G., & Papahadjopoulos ,D . (1976a). Proc.Nat. Acad.Sci. U S A .
73 : 1603-1607.
Poste,G. & Papahadjopoulos,D. (1976b). in "Methods in Cell Biology".
14 : 23-32. (Prescott,D. ed) . Academic Press. L o n d o n .
Poste,G. & Papahadjopoulos,D. (1978). A n n . N Y . A c a d . S c i . 308 :
164-184.
Poste,G. & Pasternak,C. (1978). in "Membrane Fusion". Chapt. 7 .
p p . 305-367. (Poste,G. & N i c h o l s o n , G . eds). Elsevier/North
Holland. Biomedical Press. A m s t e r d a m . Holland.
Poste,G., Papahadjopoulos,D. & V a i l , G . (1976). Methods in Cell. Biol.
14 : 33-71.(Prescott,D. e d ) . Academic Press. London.
Poste,G., Kirsh,R., Fogler,W. & F i d l e r , I . (1979). Cancer. R e s .
2 9 : 881-892.
Poste,G., Lyon,N., Macander,P., Porter,C., Reeve,P. & Bachmeyer,H.
(1980). E x p . C e l l . R e s . 129 : 393-408.

364 .
Poulose,K., Watkins,A., Reba,R., Eckelman,W. & Goodyear,M. (1975).
J . N u c . M e d . 2 A : 839-841.
Poznansky,M. and Lange,Y. (1978). Biochim. Biophys. A c t a .
506 : 256-264.
Putter,J. (1970). Rec. R e s . Cancer. R e s . 33_ : 64-74.
Rahman,Y. (1980). in "Liposomes in Biological Systems", p p . 265-297.
(Gregoriadis,G. & Allison,A. e d s ) . John Wiley & Sons. Chichester.
R a h m a n , Y . & Wright,B. (1975). J . C e l l . Biol. 65 : 112-122.
Rahman,Y., Cerny,S., Tollaksen,B., Wright,S., Nance,S. & Thompson,J.
(1974). Proc. Soc. E x p . Biol. M e d . _[46 : 1173-1176.
Rahman,Y., Kisieleski,W., Buess,E. & Cerny,E. (1975). E u r . J . C a n c e r .
_ U : 883-889.
Rahman,Y. Hanson,W., Bharucha,J., Ainsworth,E. & Jaroslow,B. (1978).
A n n . N Y . A c a d . Sci. 308 : 325-343.
Ralston,E., Blumenthal,R., Weinstein,J., Sharrow,S, & Henkart,P.
(1980). Biochim. Biophys. A c t a . 59_7 : 543-551 .
Rasker,J. v a n de Poll,M., Beekhuis,H., Woldring,M. & Nieweg,H. (1975).
J . N u c . M e d . : 1058-1069.
Rauenbush,E., Bauer,K., Kaufmann,W & Wager,0. (1970). R e c . R e s .
Cancer R e s . 33^ : 31-38.
Renault,H,, Rapin,J., Rudler,M. (1972). Chim. Therapeutique.
]_ : 232-235.
Richards,R., Gewurz,H., 0smand,A. & A l v i n g , C . (1977). P r o c . N a t l .
A c a d . Sci. U S A . 74 : 5672-5676.
Richards,R., Gewurz,H., Siegel,J. & Alving,C. (1979). J . Immunol.
122 : 1185-1189.
3 6 5 .
Richardson,V., Jeyasingh,K., Jewkes,R., Ryman,B. & Tattersall,M.
(1978). J . N u c . M e d . \9_ : 1049-1054.
Richardson,V., Ryman,B., Jewkes,R., Jayasingh,K., Tattersall,M.,
Newlands,E. & Kaye,S. (1979). B r . J . Cancer. 40 : 35-43.
Riley,V., Campbell,H. & Stock,C. (1970). P r o c . Soc. Exp. Biol.
M e d . 133 : 38-42.
Ro,T. (1967). F e d . Proc. 26. : 685.
Ro,T.K. & Busch,H. (1965). Biochim. Biophys. A c t a . K>2 : 317-318.
Robbins,P., Silberstein,E. & Fortman,D. (1974). J . N u c . M e d .
15_ : 273-278.
Roerdink,F., Wisse,E., Morselt,H., van der Meulen,J.,& Scherphof,G.
(1977). in "Kupffer cells and other Liver Sinusoid cells",
p p . 263-272. (Wisse,E. & K n o o k , D . e d s ) . Elsevier/North H o l l a n d .
Amsterdam.
Roerdink,F., Dijkstra,J., Hartman,G., Bolsher,B. & Scherphof,G.
(1981). Biochim. Biophys. A c t a . 677 : 79-89.
Roseman,M., Litman,B. & Thompson,T. (1975). Biochemistry.
: 4826-4830.
Rothblat ,G., Arbrogast,L. & R a y , E . (1978). J . L i p . R e s . 19^: 350-358.
Roy, S., O r r . G . . Brewer ,F. & Horwitz,S. (1981). Cancer. R e s . :
4471-4477.
Rudman,D., Vogler,W., Howard,C. & Gerron,G. (1971). Cancer R e s .
3j_ : 1 159-1 165.
Rustum,Y.,Dave,C., Mayhew,E. & Papahadjopoulos,D. (1979). Cancer
Res. 39 : 1390-1395.

3 6 6 .
Rutman,R., Ritter,C., Avadhani,N. & Hansel,J. (1976). Cancer. T r e a t .
R e p t . 60 : 617-618.
Rutter,D. & W a d e , H . (1971). B r . J . E x p . Pathol. 52^ : 610-614.
Ryman,B.E. (1975). Proc. 6th. Int. Congr. Pharmacol. Helsinki,
Finland. Volume 5_ : 91-103. (Mattila,M. jid) . Pergamon P r e s s .
L o n d o n .
Ryman,B. & Tyrrell,D. (1979). in "Lysosomes in Biology and
PathologyV. 6 . Chapt. 19. p p . 549-574. (Dingle,J., Jacques,P.
& Shaw,I. eds). North H o l l a n d . P u b . C o r p . Amsterdam.
Ryman,B.E. & Tyrrell,D.A. (1980). Essays Biochem. ±6 : 49-98.
Ryman,B., Jewkes,R., Jeyasingh,K., Osborne,M., Patel,H., Richardson,
V . , Tattersall,M. & Tyrrell,D. (1978). A n n . N Y . A c a d . Sci.
308 : 281-306.
Ryo,Y., Ice,R., Jones,J. & Beierwaltes,W. (1975). J . N u c . M e d .
26 : 127-131.
Saba,T.M. (1970). A r c h . Intern. M e d . \26_ : 1031-1056.
Sachterleben,P., Fuhrmann,G., Straube,E. & Ruhenstroth-Bauer,G.
(1961). Klin-Ther. W s c h r . 39 : 839-844.
Sandra,A. & Pagano,R. (1979). J . B i o l . C h e m . 254 : 2244-2249.
Saunders,L., Perrin, J . & Gammack,D. (1962). J . P h a r m . P harmacol.
24 : 567-572.
Sausville^E.,Stein,R., Peisach,J. & H o r w i t z , S . (1978a). Biochem.
27 : 2746-2754.
Sausville,E., Peisach,J. & H o r w i t z , S . (1978b). Biochemistry.
17 : 2740-2746.
3 6 7 .
Scanu,A. (1967). J . Biol. C h e m . 2A2 : 711-719.
Scanu,A. & Landsberger,F. (eds) (1980). A n n . N . Y . A c a d . Sci.
348 : 1-436.
Scanu,A. & Wisdom,C. (1972). A n n . R e v . Biochem. 4J_ : 703-730.
Scanu,A., Cump,E., Toth,J., Koga,S., Stiller,E. & A l b e r s , L . (1970).
Biochemistry. 9_ : 1327-1335.
Scarpa,A. & de Gier,J. (1971). Biochim. Biophys. A c t a . 24J_ : 789-797.
Scheetz,R., Whelan,H. & Wriston,J. (1971). A r c h . Biochem. Biophys.
142 : 184-189.
Scherphof,G., Roerdink,F. & Zborowski,J. (1975). Histochem. J .
7_ : 508-510.
Scherphof,G., Roerdink,F. W a i t e , M . & Parks,J. (1978). Biochim.
Biophys. A c t a . 542 : 296-307.
Scherphof,G., Morselt,H., Regts,J. & W i l s c h u t , J . (1979). Biochim.
Biophys. A c t a . 55_6 : 196-207.
Scherphof,G., Roerdink,F., Hoekstra,D., Zborowski,J. & Wisse,E.
(1980). in "Liposomes in Biological Systems", p p . 179-209.
(Gregoriadis,G. & Allison,A. eds). John Wiley and Sons.
Chichester. U K .
Scherphof,G., Damen,J., Hoekstra,D., Van Renswoude,A. & Roerdink,F.
(1981). in "Cell Biological Aspects of Disease." p p . 281-297.
(Daems,W., Burger,E. & Afzelius,B. eds) . Leiden University
P r e s s . The Hague. Holland.
Schmidt,G. & Thannhauser,S. (1945). J . Biol. Chem. : 83-87.
Schneider,W. (1957). Methods i n E n z y m o l . 3 : 680-684.
Schneider,Y-J., Tulkens,P. de Duve,C.& Trouet,A. (1979). J . Cell.
B i o l . 82 : 449-465 and 466-474.
Schneider,Y-J., Octave,J-N., Limet,J. & Trouet.A. (1981). in
"International Cell Biology, 1980-1981". p p . 590-600. (Schweige
H . ed). Springer-Verlag. Berlin. W . Germany.
Schroit,A. & Pagano,R. (1978). P r o c . Natl. Acad. Sci. U S A .
75 : 5529-5533.
Schultze,H. & Heremans,J. (eds) (1966). in "Molecular Biology of
Human Proteins". J_ : 204-205. Elsevier and Co. London.
Schuster,B., Neidig,M., Alving,B. & Alving,C. (1979). J . Immunol.
122 : 900-905.
Schwartz,M. (1970). Rec. R e s . Cancer. R e s . 33 : 58-63.
Schwartz,H., Sodergreen,J., Garofalo,M. & Sternberg,S. (1965).
Cancer. R e s . 25 : 307-317.
Schwartz,H., Sternberg,S. & Philips,F. (1968a). in "Actimomycin;
Nature, Formation and Activities", p p . 101-121. (Waksman,S. ed)
J . Wiley Interscience. New-York.
Schwartz,H., Sodergren,J. & Ambaye,R. (1968b). Atherosclerosis.
28 : 499-504.
Segal,A,, Putnam,D, & Minchin-Clarke,H. (1973). Atherosclerosis.
_1_8 : 499-504.
Segal,A., Wills,E., Richmond,J., Slavin,G., Black,C. & Gregoriadis,G
(1974). Brit. J . E x p . Path. 55 : 320-327.
Segal,A., Gregoriadis,G. & Black,C. (1975). Clin. Sci. M o l . M e d .
49 : 99-106.
Segal,A., Gregoriadis,G., Lavender,J., Tarin,D. & Peters,T. (1976).
C l i n . Sci. M o l . M e d . 51^ : 421-425.
Seligman,M. & Demopoulos,H. (1973). A n n . N Y . A c a d . Sci. 222_ : 640-655
Senior,J. & Gregoriadis,G. (1982a). Life Sci. 30 : 2123-2136.
Senior,J. & Gregoriadis,G. (1982b). F E B S . Lett. 145 : 109-114.
Sessa,G. & Weissmann,G. (1970). J . B i o l . Chem. 245. : 3295-3301.
Sharma,P., Tyrrell,D. & Ryman,B. (1977). Biochem. S o c . T r a n s .
5 : 1146-1149.
Shin,M., Paznekas,W. & Mayer,M. (1978). J . Immunol. 120 : 1996-2002.
Shinitzky,M., Dianoux,A-C., Gitler,C. & Weber,G. (1971). Biochemistry
2 0 : 2106-2113.
Shinitzky,M. & Barrenholz,Y.(1974). J . B i o l . chem. 249 : 2652-2657.
Shinitzky,M. & Inbar,M. (1974). J . M o l . Biol. 85_ : 603-615.
Siddiqui,W., Taylor,0., Kan,S~C., Kramer,K., Richmond-Cram,S.,
Kotani,S., Shina,T. & K u s u m o t o , S . (1978). Science.
201 : 1237-1239.
Silverstein,S., Steinman,R. & C o h n , Z . (1977). A n n . R e v . Biochem.
46 : 669-722.
Silverstein,J. Michl.J. & Loike,J. (1981). in "International.
Cell Biology, 1980-1981". p p . 604-612. (Schweiger,H. ed).
Springer-Verlag. Berlin. W . Germany.

3 7 0 .
Sly,W.S. (1980). in "Structure and Function of the Gangliosides".
pp. 433-451. (Svennerholm,L., Mandel,P., Dreyfus,H. & Urban,P-F.
eds). Plenum Publishing C o r p . New Y o r k .
Sobell,H.M. (1974). Cancer chemothr. Rpts; 58 : 101-116.
Sodhi,H. & Gould,R. (1967). J . B i o l . Chem. 242 : 1205-1210.
Sogor,B.V. & Zull,J ,E . (1975). Biochim. Biophys. A c t a .
375 : 363-380.
Soru,E. (1979). M o l . Cell. Biochem. 23^ : 185-92.
Souhami,R. P a tel , H . & Ryman,B. (1981). Biochim. Biophys. A c t a .
674 : 354-371.
Sparrow,J. & Gotto,A. (1980). A n n . N Y . Acad. Sci. 3413 : 187-21 1 .
Stahl ,P. & Schlesinger ,P. (1980). T I B S . _5 : 194-196.
Starkey ,P. & Barrett,A. (1973). Biochem.J. : 8 2 3 - 8 3 1
•
Starkey,P. & Barrett,A. (1977). in "Proteinases of Mammalian cells",
pp. 663-696. (Barrett,A. M ) . North Holland. Amsterdam. Holland.
Steger,L. & Desnick,R. (1977). Biochim. Biophys. A c t a . 464 : 530-546.
Stein,Y., Halperin,G. & Stein,0. (1981). Biochim. Biophys. A c t a .
663:569-574.
Steinbuch ,M. (1971). Rev. Fr. Transfus. 14 : 61-82.
Steinbuch,M., Audran,R., Lambin,P., & Fine,J. (1975). in
"The protides of the Biological Fluids". (23rd Colloquium),
pp. 133-138. (Peeters,H. ed)• Pergamon Press. Oxford.

371 .
Steinman,R., Brodie,S. & Cohn,Z. (1976). J. Cell. Biol. 68_ : 665-687.
Stendahl,0. & Tagesson,C. (1977). Exp. Cell. Res. J08 : 167-174.
Stoffel,W. (1975). Methods in Enzymol . 75 : 533-541.
Strejan,G., Smith,P., Grant,C., & Surlan,D. (1979). J. Immunol.
123 : 370-378.
Suld,H. (1976). J . Biol. Chem. 25l_ : 2530-2535.
Surolia,A. & Bachhwat,B. (1977). Biochim. Biophys. Acta. 497_ : 760-765.
Suzuki,H., Nagai,K., Yamaki,H. & Umezawa,H. (1968). J . Antibiotic
(Tokyo). ^ L :
379-386.
Sweet,C. & Zull,J .E. (1969). Biochim. Biophys. Acta. : 94-103.
Sweet,C. & Zull,J.E. (1970). Biochim. Biophys. Acta. 2 1 2 :
253-262.
Szoka,F. & Papahadjopoulos,D. (1978). Proc. Natl. Acad. Sci. USA.
75 : 4194-4198.
Szoka,F. & Papahadjopoulos,D. (1980). Ann. Rev. Biophys.and Bioeng.
2 : 467-508.
Szoka,F., Jacboson,K. & Derzko,Z. (1978). Ann. NY: Acad. Sci.
308 : 437.
Szoka,F., Jacboson,K. & Papahadjopoulos,D. (1979). Biochim. Biophys.
Acta. 552 :
295-303.
Szoka,F., Jacobson,K., Derzko,Z. & Papahadjopoulos,D. (1980). Biochim.
Biophys. Acta. 600 : 1-18.
Szoka,F., Magnusson,K.E., Wojcieszyn,J., Hou,Y., Derzko,Z. &
Jacobson,K. (1981). Proc.Natl.Acad.Sci. USA. 78 : 1685-1689.

372 .
Takita,T. (1959). J. Antibiot. A 12 : 285-289,
Takita,T., Muraoka,Y., Nakatani,T., Fujii,A., Iitaka,Y. & Umezawa,H.
(1978). J. Antibiot. 2 1 :
1073-1077.
Tall,A.R. (1980). J. Lip. Res. 2_L :
354-363.
Tall,A. & Lange,Y. (1978a). Biochim. Biophys. Acta. : 185-197.
Tall,A. & Lange,Y. (1978b). Biochim. Biophys. Res. Commun.
80 : 206-212.
Tall,A. & Small,D. (1977). Nature. 265 : 163-164.
Tall,A. & Small,D. (1979). Adv. Lip. Res. \T : 1-51.
Tall,A., Hogan,L., Askinazi,L. & Small,D. (1978). Biochemistry.
27 : 322-326.
Tanaka,T., Taneda,K., Kobayashi,H., 0kumura,K., Muranishi,S. &
Sezaki,H. (1975). Chem. Pharm. Bull. 23 : 3069-3074.
Thakur,M., Merrick,M. & Gunasekera,S. (1973). in "Radiopharma-
ceuticals and labelled compounds'.'. 2 : 183-193. IAEA.Vienna.
Austria.
Thompson,S.W., Jones,L., Ferrell,J., Hunt,R., Meng,H., Kuyama,T.,
Sasaki,H., Schaffner,F., Singleton,W. & Cohn,I. (1965).
Amer. J. Clin. Nutr. 2 2 : 43-51.
Thompson,G.R,, Segura,R., Hoff,H. & Gotto,A. (1975). Eur. J . Clin.
Invest. 2 :
373-384.
Thorbecke,G., Maurer,P. & Benacerraf,B. (1960). Br. J. Exp. Pathol.
4J_ : 190-197.
Toffano,G., Leon,A., Mazzari,S., Savoini,G., Teolato,S. & Orlando,P.
(1978). Life Sci. (Oxford) 23 : 1093-1102.

3 3 7 3 .
Tom,B.H. (1980). in "Liposomes and Immunobiology". pp. 3-22.
(Tom,B. & Six,H. eds). Elsevier, North Holland. Biomed. Press.
Amsterdam, Holland.
Tom,B.H. & Six,H.R. (eds) (1980). "Liposomes and Immunobiology".
Elsevier North Holland. Biomedical Press. Amsterdam. Holland.
Torchilin,V., Khan,B., Smirnov,V. & Haber,E. (1979). Biochem. Biophys.
Res. Commun. £9 : 1114-1119.
Torchilin,V., Berdichevsky,V., Barsukov,A. & Smirnov,V. (1980). FEBS.
Lett. Ill : 184-188.
Tulkens,P. (1979). Thesis (Agrege de 1'Enseignement Superieur).
Universite Catholique de Louvain. Belgium.
Tulkens, P., Van Hoof,F. & Trouet,A. (1975). Arch. Intern. Physiol.
Biochim. 83 : 1004-1006.
Tulkens,P., Schneider,Y-J. & Trouet,A. (1978). in "Protein Turnover
and Lysosomal Function", pp. 719-738. (Segal,H. & Doyle,D. eds).
Academic Press. New York.
Tyrrell,D.A., Heath, T.D., Colley,C.M. & Ryman,B.E. (1976a). Biochim.
Biophys. Acta. 457 : 259-302.
Tyrrell,D., Ryman,B., Keeton,B. & Dubowitz,V. (1976b). Brit. Med. J .
2 : 88-89.
Tyrrell,D., Richardson,V. & Ryman,B. (1977). Biochim. Biophys. Acta.
457 : 295-302.
Tyrrell,D., Campbell,P., Harding,N., Munroe,A. & Ryman,B. (1978).
Biochem. Soc. Trans. £ : 1239-1241.
Uchida,T., Kim,J., Yamaizumi,M., Mikake,Y. & Okada,Y. (1979). J. Cell.
Biol. 80 : 10-20.
Umezawa,H. (1973). Biomedicine. J_8 : 459-475.
7 7/' O I —t .
Umezawa,H. (1974). Fed. Proc. 73 : 2296-2302.
Updike,S., Wakamiya,R. & Lightfoot,E. (1976). Science.
193 : 681-683.
Uren,J. & Ragin,R. (1979). Cancer Res. 39. :
1927-1933.
Van den Bosch,H. (1980). Biochim. Biophys. Acta. 604 : 191-246.
Van Leuven,F., Verbrugghen,R., Cassiman,J-J. & van den Berghe,H.
(1977). Exp. Cell. Res. j09 : 468-471.
van Renswoude,A., Blumenthal,R. & Weinstein,J; (1980). Biochim.
Biophys. Acta. 595 : 151-156.
van Rooijen,J. & van Nieuwmegan,R. (1977). Immunol. Comm.
6 : 489-498.
van Rooijen,N. & van Nieuwmegan,R. (1980). Cell. Immunol.
49 : 402-407.
Volanakis,J. & Kaplan,M. (1974). J . Immunol. _ m : 9-17.
Wade,H., Elsworth,R., Herbert,D., Keppie,J., & Sargeant,K. (1968).
Lancet ri : 776-777.
Waite,M., Griffin,H. & Franson,R. (1976). in "Lysosomes in Biology
and Pathology". 5_. Chapt. 9. pp.257-305. (Dingle,J. & Dean. R. eds) .
North Holland Pub. Co. Amsterdam. Holland.
Weinstein,J., Yoshikami,S., Henkart,P., Blumenthal,R. & Hagins,W.
(1977). Science. \95_ : 489-491 .
Weinstein,J., Blumenthal,R., Sparrow,S. & Henkart,P. (1978). Biochim.
Biophys. Acta. 509 : 289-299.

3 3 7 5 .
Weinstein,J., Magin,R. , Yatviri,M. & Zaharko,D. (1979). Science.
204 : 188-191.
Weinstein,J., Klausner,R., Innerarity,T., Ralston,E. & Blumenthal,R.
(1981). Biochim. Biophys. Acta. 647 : 270-284.
Weissbach,H., Redfiled,B., O'Connor,T. & Chirigos,M. (1966). Cancer
Res. 26 : 1832-1838.
Weissmann,G., Brand,A. & Franklin,E.C. (1974). J. Clin. Invest.
531 : 536-543.
Weissmann,G., Bloomgarden,D., Kaplan,R., Cohen,C., Hoffstein,S .,
Collins,T., Gotlieb,A. & Nagle,D. (1975). Proc. Nat. Acad. Sci.
USA. 72 : 88-92.
Weissmann,G., Cohen,C. & Hoffstein,S. (1977). Biochim. Biophys. Acta.
498 : 375-385.
Weissmann,G., Korchak,H., Finkelstein,M., Smolen,J. & Hoffstein,S.
(1978). Ann. NY. Acad. Sci. 308 : 235-249.
Welt,L. & Blythe,W. (1965). in "The Pharmacological basis of Therapeu-
tics". (Goodman,L. & Gilman,A. eds). pp. 809-819. 3rd edition.
The Macmillan Co. New York. 1965.
Werb ,Z ., Burleigh,M., Barrett,A. & Starkey,P. (1974). Biochem. J.
139 : 359-368.
Wharton,S. & Green,C. (1978). Biochem. Soc. Trans. 6 : 781-783.
Wibo,M. & Poole,B. (1974). J. Cell. Biol. 63 : 430-440.
Wibo,M., Thines-Sempoux,D., Amar-Costesec,A., Beaufay,H. &
Godelaine,D. (1981). J. Cell. Biol. 89 : 456-474.

3 3 7 6 .
Wilkins ,D. & Meyers,P. (1966). Brit. J. Exp. Path. 47 : 568-576.
Willingham,M. & Pastan,I. (1980). Cell. 2_1_ : 67-77.
Willingham,M. & Yamada,S. (1978). J. Cell. Biol. 78 : 480-487.
Willingham,M., Haigler,H., Dickson,R. & Pastan,I; (1981). in
"International Cell Biology 1980-1981". pp. 613-621. (Schweiger,
H.G. ed). Springer-Verlag. Berlin. W. Germany.
Windmeuller,H.G. & Levy,R.I. (1967). J. Biol. Chem. 242. : 2246-2254.
Wirtz,K., Moonen,P., Van Deenen,L., Radhakrishnan,R. & Khorana,H.
(1980). Ann. NY. Acad. Sci. 34£ : 244-255.
Wisse ,E. (1977). in "Kiipffer Cells and Other Liver Sinusoidal Cells",
pp. 33-60. (Wisse,E. & Knook,D. eds). Elsevier/North Holland.
Biomedical Press. Amsterdam.
Wisse,E., Gregoriadis, & Daems,W. (1976). Adv. in Exptl. Med. and
Biol. 72:237-245.
Woods,J. & Handschumacher,R. (1973). Am. J. Physiol. 224_ : 740-745.
Wriston,J. & Yellin,T. (1973). Adv. in Enzymol. 39^ : 185-248.
Yamada,K.& Olden,K. (1978). Nature. 275^ : 179-184.
Yatvin,M., Weinstein,J., Dennis,W. & Blumenthal,R. (1978). Science.
202 : 1290-1293.
Yatvin,M., Miihlensiepen,H., Porschen,W., Weinstein,J. & Feinendegen,
L. (1981). Cancer Res. 41 : 1602-1607.
3 7 7 .
Zborowski,J., Roerdink, F. & Scherphof,G. (1977). Biochim. Biophys.
Acta. 497 : 183-191.
Zilversmit,D. (1978). Ann. NY. Acad. Sci. 308 : 149-163.
Zirenberg,0. & Betzing,H. (1979). Artzneim. Forsch. £9 : 494-498.
Zirenberg,0., Odenthal,J. & Betzing,H. (1979). Atherosclerosis.
34 : 259-276.