Mode of Action Studies: Basis for the Search of New Antifungal Drugs
17
PART III. ANTIFUNGAL AGENTS BIOCHEMICAL STUDIES AND MECHANISM OF ACTION OF Mode of Action Studies Basis for the Search of New Antifungal Drugs HUGO VANDEN BOSSCHE,' PATRICK MARICHAL, JOS GORRENS, HUGO GEERTS, AND PAUL A. J. JANSSEN Janssen Research Foundation B-2340 Beerse, Belgium INTRODUmION The orally active imidazole, ketoconazole (the chemical structures of the azole derivatives discussed are shown in FIG. l), not only enlarged the antifungal arma- mentarium,'*2 it also was of great help in the study of cytochrome P-450 i~ozymes..'.~ The N-substituted azoles (for example, miconazole,' cl~trimazole,~ and ketoconazole7) interfere with the cytochrome P-450-dependent 14a-demethylation of lanosterol or 24-methylenedihydrolanosterol, a key step in the biosynthesis of ergos- terol. Ergosterol, the main sterol in most yeasts and fungi, is an irreplaceable requisite for cell proliferation and an indispensable component of cellular membranes. Therefore, the azole-induced ergosterol depletion and the concomitant accumulation of mem- brane-disturbing 14a-methylsterols may be at the origin of their antifungal properties? The cytochrome P-450 isozyme P-450 ,4DM is so designated because it is involved in the 14a-demethylation step of the ergosterol biosynthetic pathway. It is also a prerequisite in the synthesis of cholesterol, the main sterol in mammalian cells. Studies by Trzaskos and colleague^^-^" proved that in liver microsomes, as in Succharomyces cerevisiae microsomes,l' a single cytochrome P-450 species catalyzes the three oxidative steps in the removal of the (2-32 methyl group (that is, the 14a-methyl group) as formic acid during lanosterol demethylation. These three steps are as follows: 1) the hydroxylation of the (2-32 methyl group with the formation of an alcohol; 2) the oxidation of the alcohol to an aldehyde; 3) the oxidative elimination of the aldehyde as formic acid. Evaluating the effects of miconazole and ketoconazole on these de- methylation steps in rat liver microsomes, Trzaskos and colleagues found 50% in- hibition (IC5,,) at 9 X M, respectively." IC,, values of 6 x lo-" M (miconazole) and 2 X M (ketoconazole) were found when the effects of cholesterol synthesis from mevalonate were measured in subcellular fractions (cy- tosol + microsomes) from rat liver.'2 When similar fractions from Candida albicans M and 4 X 'Address for correspondence: Department of Comparative Biochemistry, Janssen Research Foundation, Turnhoutseweg 30, B-2340 Beerse, Belgium. 191
-
Upload
independent -
Category
Documents
-
view
1 -
download
0
Transcript of Mode of Action Studies: Basis for the Search of New Antifungal Drugs

PART III. ANTIFUNGAL AGENTS
BIOCHEMICAL STUDIES AND MECHANISM OF ACTION OF
Mode of Action Studies
Basis for the Search of New Antifungal Drugs
HUGO VANDEN BOSSCHE,' PATRICK MARICHAL, JOS GORRENS, HUGO GEERTS, AND
PAUL A. J. JANSSEN
Janssen Research Foundation B-2340 Beerse, Belgium
INTRODUmION
The orally active imidazole, ketoconazole (the chemical structures of the azole derivatives discussed are shown in FIG. l), not only enlarged the antifungal arma- mentarium,'*2 it also was of great help in the study of cytochrome P-450 i~ozymes..'.~
The N-substituted azoles (for example, miconazole,' cl~trimazole,~ and ketoconazole7) interfere with the cytochrome P-450-dependent 14a-demethylation of lanosterol or 24-methylenedihydrolanosterol, a key step in the biosynthesis of ergos- terol. Ergosterol, the main sterol in most yeasts and fungi, is an irreplaceable requisite for cell proliferation and an indispensable component of cellular membranes. Therefore, the azole-induced ergosterol depletion and the concomitant accumulation of mem- brane-disturbing 14a-methylsterols may be at the origin of their antifungal properties?
The cytochrome P-450 isozyme P-450 ,4DM is so designated because it is involved in the 14a-demethylation step of the ergosterol biosynthetic pathway. It is also a prerequisite in the synthesis of cholesterol, the main sterol in mammalian cells. Studies by Trzaskos and colleague^^-^" proved that in liver microsomes, as in Succharomyces cerevisiae microsomes,l' a single cytochrome P-450 species catalyzes the three oxidative steps in the removal of the (2-32 methyl group (that is, the 14a-methyl group) as formic acid during lanosterol demethylation. These three steps are as follows: 1) the hydroxylation of the (2-32 methyl group with the formation of an alcohol; 2) the oxidation of the alcohol to an aldehyde; 3) the oxidative elimination of the aldehyde as formic acid. Evaluating the effects of miconazole and ketoconazole on these de- methylation steps in rat liver microsomes, Trzaskos and colleagues found 50% in- hibition (IC5,,) at 9 X M, respectively." IC,, values of 6 x lo-" M (miconazole) and 2 X M (ketoconazole) were found when the effects of cholesterol synthesis from mevalonate were measured in subcellular fractions (cy- tosol + microsomes) from rat liver.'2 When similar fractions from Candida albicans
M and 4 X
'Address for correspondence: Department of Comparative Biochemistry, Janssen Research Foundation, Turnhoutseweg 30, B-2340 Beerse, Belgium.
191

192 ANNALS NEW YORK ACADEMY OF SCIENCES
( 6 ) (71
(10) FIGURE 1. Chemical structures of ( 1) miconazole, (2) clotrimazole, (3) 1-methylimidazole, (4) N-phenylimidazole, (5) ketoconazole, (6) tnadimefon, (7) triadimenol, (8) R 42 164, (9) itraconazole, and (10) R 49 960.

VANDEN BOSSCHE et al.: MODE OF ACTION STUDIES 193
and S. cerevisiae were used, IC,, values of 9 x M (miconazole) and 7 X lo-’ M (ketoconazole) were found.12,” When administered to rats infected with C. albicans, a ketoconazole dose that was six times higher was required to inhibit cholesterol synthesis in the liver compared with the dose needed to inhibit ergosterol synthesis in C. albicans collected from the vagina.’ All these results suggest that ketoconazole and miconazole are more potent inhibitors of the cytochrome P-450-dependent de- methylation in fungi than of the enzyme system in mammals. It is of interest to note that in liver microsomes ketoconazole seems to inhibit the removal of formic acid (that is, the C-14-32 lyase step”) whereas in S. cerevisiae the hydroxylation of C-32 seems to be more vulnerable to inhibition.” This remains an important subject for investigations.
Studies with testicular and adrenal membranes revealed that the cytochrome P- 450-dependent lyases are also sensitive to relatively high concentrations of ketocon- azole. When the effects of ketoconazole on cytochrome P-450 isozymes present in piglet or dog testes microsomes were measured, a 50% decrease in the adsorption increment between 450 nm and 490 nm of the reduced cytochrome P-450-carbon monoxide complex was achieved at 3.9 X lo-’ M and 1.3 x M, re~pective1y.l~”~ (To obtain a similar effect with C. albicons microsomes, only 3.1 X M was needed.I6) Incubation of a subcellular fraction of rat testes in the presence of preg- nenolone or progesterone, NADPH, and increasing concentrations of ketoconazole resulted in an accumulation of 17a-OH,20-dihydropregnenolone or 17a-OH-20-dihy- droproge~terone.”-’~ Fifty percent inhibition of the C-17,20 lyase was found at 2 X lo-’ M.” This cytochrome P-450-dependent enzyme was also inhibited in bovine adrenal microsomes; 50% inhibition was reached at 4 x lo-’ M.4 Higher concen- trations were needed to inhibit the cholesterol side-chain cleavage enzyme from adrenal (IC50 value: 1.7 x M) mitochondria.” Fifty percent inhibition of the aromatase in human placental microsomes was reached at 6 x lo-’ M ketoconazole.21
The above-summarized effects of ketoconazole on the C- 17,20 lyase activity in both testicular and adrenal microsomes are at the origin of the reported effects of ketoconazole on testosterone biosymthesis22 and make ketoconazole a suitable candidate for the treatment of androgen-dependent diseases, mainly prostate carcinoma!
The knowledge gathered with ketoconazole not only gave us a prototypal com- pound in the search for steroid biosynthesis inhibitors, but also provided us with tools to select compounds that selectively interfere with the cytochrome P-450 isozyme involved in the 14a-demethylation of ergosterol precursors.
The study of a number of cytochrome P-450-dependent enzymes was of help in the selection of an orally active broad-spectrum triazole antifungal drug, itraconazole. Itraconazole has an extremely large spectrum of activity. It has, for example, high activity in vaginal candidosis, dermatophytosis, cryptococcosis, aspergillosis, histo- plasmosis, and sporotrich~sis.~~ In contrast with ketoconazole, this triazole antifungal drug has almost no effect on the cytochrome P-450-dependent enzymatic reactions in testes microsomes, adrenal microsomes, and mito~hondria.’~.’’.~~ Itraconazole has al- most no effect on the P-450-dependent aromatase or on the l-hydroxylation of 25- hydroxyvitamin D, when below lo-, M; does not affect the regio- and stereospecific hydroxylation of testosterone; and must be present at concentrations 2 M to obtain 50% inhibition of the p-nitroanisole-0-demethylase, N,N-dimethylaniline-N- demethylase, or aniline hydroxylase in untreated, 3-methylcholanthrene-induced, or phenobarbital-induced liver microsomes from male Wistar rats?, Itraconazole, how- ever, is a highly potent inhibitor of the cytochrome P-450 demethylase in, for example, S. cerevisiae, C albicans, 3~14~16.2b and Aspergillus fumigatu~~’~~~ microsomes and of the purified P-450,,,, of S. cerev is i~e .~~
M ) or testis (3 x

194 ANNALS NEW YORK ACADEMY OF SCIENCES
Of interest is itraconazole's high activity against A. fumigatus and C. lusitaniae. For example, in A. fumigatus grown for 24 hr in Sabouraud broth, more than 125 times more ketoconazole than itraconazole is needed to reach 50% inhibition of ergosterol synthesi~.~'.~* In C. lusitaniae (B 40 171) grown in yeast nitrogen base glucose, 400 times more ketoconazole than itraconazole was needed to reach the IC,, value."
Several working hypotheses can be formulated to explain the differences in activity between ketoconazole and itraconazole. Examples are listed below:
1. The affinity of itraconazole for P-45OI4,, might be greater. 2. At the cellular level ketoconazole might be more prone to metabolism. 3. The uptake and/or efflux might be different. 4. The intracellular pH might influence the interaction with P-450,,,,.
It is the aim of this paper to present and evaluate some of these working hypotheses.
EXPERIMENTAL PROCEDURES
Microsomal Cytochrome P-450 of C. albicans
The isolation of microsomes from semi anaerobically grown C. albicans (ATCC 285 16) was as previously described.'6,26 Microsomes were suspended in 0.1 M potas- sium phosphate buffer (pH 7.4) and stored under nitrogen at -70 "C.
For the spectrophotometric studies, the microsomal fraction was diluted in 0.1 M potassium phosphate buffer (final pH: 7.4, 6.1) or in McIlvaine buffer, that is, a citric acid (0.1 M)-Na2HP04 (0.2 M) buffer (final pH: 5.6, 5.4), to obtain a cytochrome P-450 content of 0.1 nmol/ml. The content was determined by measuring the reduced CO difference spectrum using 91 cm-I as an extinction ~oefficient.'~ To measure the pH dependence of the affinity of ketoconazole, itraconazole, R 42 164, or R 49 960 for cytochrome P-450, drugs were added at concentrations from lo-' M up to 5 x lo-' M. Stock solutions containing 6 X lo-' M of drug were prepared in dimethyl sulfoxide (DMSO) containing 15 pl of 6 M HCl per millimeter. Dilutions were made in DMSO. The microsomal suspension was divided between the reference and sample cuvettes, and a baseline of equal light absorbance was established. Azole antifungal drugs and/or DMSO were added to both cuvettes. One minute later, the cytochrorne P-450 isozymes were reduced for 35 sec with a few grains of dithionite. Then the sample cuvette was bubbled with CO for 30 sec and tightly closed. The difference spectrum was recorded using an Aminco DW-2C UV-visible spectrophotometer cou- pled with an IBM-AT. IC,, values [SO% decrease in AOD (448 nm-490 nm)] were determined by interpolation. To measure the stability of the azole-cytochrome com- plexes, the microsomal suspensions (0.1 nmol cytochrome P-450/ml; pH 7.4) were divided between reference and sample cuvettes and lo-' M of ketoconazole, itracon- azole, R 42 164, or R 49 960 was added to the sample cuvette. Equal amounts of DMSO were added to the reference cuvette, and the resulting difference spectra were recorded. The same amounts of azole antifungal drugs or DMSO were added to the reference and sample cuvettes, and the cytochrome P-450 isozymes were reduced as

VANDEN BOSSCHE et nl.: MODE OF ACTION STUDIES 195
described above. The sample cuvette was bubbled for 30 sec with CO and tightly closed. The difference spectrum was recorded 45 sec later and at different time intervals up to 60 min after the addition of the reductant. Control spectra were obtained in the presence of DMSO.
Cellular Contents of Ketoconazole and Itraconazole
C. lusitaniae
Two isolates of C. lusitaniae B 40 170 and B 40 171 were used. Cells were grown in 100 ml of yeast nitrogen base-glucose (YNBG) medium for 24 hr at 37 "C by shaking." [ 'H]Ketoconazole (specific activity: 446 mCi/mmol) or [ 'H]itraconazole (71.3 mCi/mmol) and/or solvent were added. After 1 hr of incubation, cells were collected by centrifugation and washed five times with 0.15 M NaCl containing unlabeled ketoconazole or itraconazole to remove the nonspecific bound radioactivity. Cells were homogenized as previously described: digested with a mixture of H,02 and HCIO, (2:1, v:v) at 70 "C for 3 hr, and mixed with Insta Gel I1 (Packard). Radioactivity was determined in a liquid scintillation counter.
In a second series of experiments, C. lusitaniae (B 40 171) was grown for 16 hr in YNBG medium buffered at pH 3 or pH 6.5 (buffer used: 10 g sodium citrate, 1 g NaH,PO,, and 1 g Na,HPO, per liter; pH adjusted with HCl). Cultures were diluted (1:1, v:v) with fresh medium (pH 3 or pH 6.5) and incubated for 2 hr. Cells were counted in a Coulter counter and diluted to lo7 cells per milliliter. [ 3H]Ketoconazole or [ 'H]itraconazole and/or DMSO were added (final concentration: 5 X lo-' M), and cells were collected after 1 hr of incubation at 37 "C, digested with H,O, and HCIO,, and treated as described above.
A. fumigatus
[ 'H]Ketoconazole or [ 'H]itraconazole and/or DMSO were added to A. fumigatus cultures2' after 24 hr of growth at 37 "C in Sabouraud broth. After 1 hr of incubation, the Aspergilli were collected, washed five times with 0.15 M NaCl containing 5 X
M unlabeled ketoconazole or itraconazole, homogenized, and further treated as described for C. lusitaniae.
Effects of Ketoconazole or Ztraconazole on ["CIAcetate Zncorporation into Ergosterol
C. lusifaniae ( B 40 171) was grown for 16 hr in 100 ml ofbuffered YNBG medium at 37 "C with shaking. Cultures were diluted as described above, incubated for 2 hr, and diluted to l o7 cells per milliliter. [ I4C]Acetate (2.5 pCi) and increasing concen-

196 ANNALS NEW YORK ACADEMY OF SCIENCES
trations of the azole derivatives and/or DMSO were added to 10 ml of cell suspensions. After 1 hr at 37 "C, the cells were washed and homogenized and the lipids were extracted with CHCl ,:CH ,OH and separated by thin-layer chromatography as de- scribed previously.'
Measurements of the Intracellular pH
Cells (C. ulbicuns grown in medium containing casein hydrolysate, yeast extract, and glucose (CYG)5; C. lusituniae grown in YNBG medium; or A. fumigatus grown in Sabouraud broth) were washed and incubated for 10-20 min with M of the nonfluorescent, membrane-permeable fluorescein diacetate (Janssen Chimica 19.166.57) and/or the solvent, acetone (final concentration: 1%). Inside the cells, fluorescein diacetate is deesterified by nonspecific esterases to fluorescein, a fluorescence probe, the spectral properties of which are pH dependent. The ratio of the absorption at 490 nm to that measured at the isosbectic point (446 nm) is pH dependent. A standard curve is made by measuring the 490:446 ratio of fluorescein buffered with 0.1 M potassium phosphate (FIG. 2). Yeast cells were washed with 0.15 M NaCl, and difference spectra between 360 nm and 550 nm (after baseline subtraction) were recorded with an Aminco DW-2C spectrophotometer. The reference cuvette contained a cell suspension incubated with solvent only.
Mycelium was collected and washed on SCWP Millipore filters (8 pm), resus- pended in 0.15 M NaCI, incubated for 10-20 min with fluorescein diacetate and/or acetone, washed again, mounted on 10 X 40 mm glass strips, and covered with a cover glass. The strips were placed in the cuvette holder, and the difference spectra were recorded as above.
Fluorescence Ratio Imaging
A. fumigutus was grown on sterile cover glasses immersed in Sabouraud dextrose broth at 37 "C in multiwell dishes. At the end of the incubation period, the cover glasses with the adhered Aspergilli were thoroughly rinsed with H,O to remove the medium. Fluorescein diacetate M) dissolved in acetone was added, and the samples were incubated for 10 min at room temperature. The cover glasses were rinsed, to remove the excess of fluorescein diacetate, and mounted on a microscope glass. The pH-dependent properties of fluorescein were used to visualize the pH gradient in the hyphae.
A Polyvar microscope equipped with epifluorescence is used. The ratio of the fluorescent intensities-obtained after excitation of the sample with a Hg lamp, filtered at wavelengths 435 and 480 nm, and measured through a long-pass cut-off filter ( 5 0 0 nm)-is dependent on the pH. The fluorescence of the sample excited at 435 nm is amplified with an image intensifier (Delnocta-TS, Old Delft) and recorded with a sensitive videocamera. The image from the videocamera is processed in the Hamamatsu image processor (C1966). Processing includes digitalization at 8-bit resolution of 5 12 X 512 picture elements (pixels) and averaging over a number of images to increase the signal-to-noise ratio. Another image is obtained in the same way after changing
VANDEN BOSSCHE et al.: MODE OF ACTION STUDIES 197
to the 480 mm filter. The total process takes only a few seconds. Both digital images are sent to a Micro Vax I1 computer, which calculates the ratio for the fluorescence intensity in every pixel after subtraction of the background at the appropriate wave- lengths. When the intensity of a certain pixel at 480 nm is less than a certain threshold, the ratio is put to zero, indicating that this pixel belongs to the background. To enhance the visual contrast, a pseudocolor output is provided. The range of intensities covered in the picture is evenly divided into eight classes. Each class is represented by a different color. This color image is visualized on a color monitor.
A-490 D H - ~ * -
490
nm
FIGURE 2. Spectra of fluorescein at different pH values recorded between 360 nm and 550 nm. The inset shows that the ratio of the absorption at 490 nm to that at the isosbectic point is pH dependent. This curve was used to calculate the intracellular pH.
RESULTS AND DISCUSSION
Aflnity of Ztraconazole and Ketoconazole for the Target Cytochrome P-450
Yoshida and A ~ y a m a ~ ~ deduce from their spectral analysis with P-450 14DM purified from S. cerevisiae microsomes that the N-substituted imidazoles ( 1 -methylimidazole and ketoconazole) and the triazole derivatives (itraconazole, triadimefon, and tria- dimenol) interact differently with ferric P-45OI4,,. Indeed, the Soret band of the ketoconazole and 1-methylimidazole complexes was observed at 424 nm, and that of the itraconazole, triadimefon, and triadimenol was at 420 nm. These spectral properties of an azole-ferric P-450 ,4DM complex are dependent on the azole species coordinating

198 ANNALS NEW YORK ACADEMY OF SCIENCES
to the heme iron ion. The nonligand part at N-1 does not influence the spectral properties of the oxidized complexes. Converting the azole-ferric P-450,,,, complexes to the corresponding ferrous complexes indicates that the complexes formed with the triazole antifungal drugs itraconazole and triadimefon are different from those formed with the imidazole derivatives 1-methylimidazole and ketoconazole and the triazole triadimenol. Indeed, spectral analysis of the complexes formed with itraconazole and triadimefon are characterized by the red-shifted Soret band at 442 nm and a sharp a peak at 567 nm. Neither the Soret band at 442 nm nor the a peak at 567 nm are observed with the reduced complexes of the two imidazole derivatives and triadimenol. This reflects different geometric orientations of the N-substituted nitrogen heterocycles to the ferrous heme iron.” These differences may be determined by the interaction of the nonligand part with the apoprotein of the P-450,,,,.
Further evidence for the role of the nonligand part in the interaction of azole derivatives with cytochrome P-450 was obtained by studying the reactivity of reduced azole-cytochrome P-450 complexes with CO. When P-450,,,, purified from S cere- visiae microsomes was used, it was found that the 1-methylimidazole, triadimefon, and triadimenol complexes of ferrous P-450 were rapidly and completely converted to the reduced CO complexes.29 Similar results were obtained with N-phenylimidazole and intact or solubilized microsomal preparations of C. ulbicans. ’‘ The conversion of the cytochrome P-450-ketoconazole complex in both preparations was much slower and incomplete, whereas the itraconazole-cytochrome P-450 complex was almost unaffected by C0.24.29,31
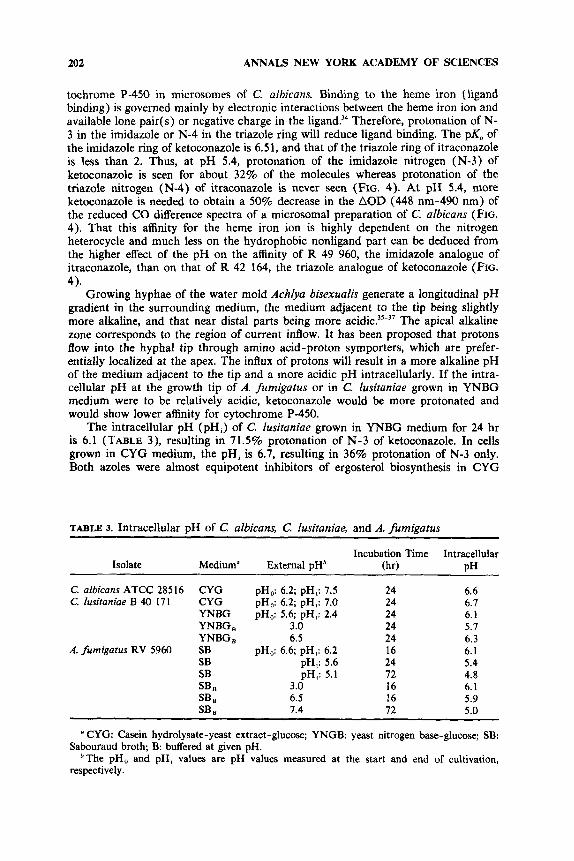
The results shown in FIGURE 3 indicate that the stability of the azole-cytochrome P-450 complexes is determined by their nonligand hydrophobic portion. Indeed, when the imidazole of ketoconazole is replaced by a triazole ring (R 42 164), a similar conversion to the CO complex is observed as with ketoconazole. Furthermore, the stability of the itraconazole-cytochrome P-450 complex does not differ from that formed with R 49 960 containing an imidazole instead of a triazole ring (structures of R 42 164 and R 49 960 are shown in FIG. 1).
In both S. cerevisiue and the yeast form of C. albicans, itraconazole shows a higher affinity for cytochrome P-450 than does ketoconazole. This might explain itraconazole’s 2- 10-fold higher activity against C. albicuns. 32 Studies are underway to compare the affinity of both azole antifungal drugs for cytochrome P-450 in A. fumigutus and C. lusitaniae. The results obtained with yeasts already suggest that a difference in affinity for P-450 might be involved in itraconazole’s higher antifungal activity. It should be noted that in rabbit liver microsomes and pig testes mitochondria or microsomes the itraconazole-cytochrome P-450 complex is readily converted into the CO com- p l e ~ . ’ ~ This suggests a low affinity of the nonligand hydrophobic portion of itrawnazole for the apoprotein of cytochrome P-450 isozymes in mammalian membranes and is in accordance with itraconazole’s low effect on mammalian cytochrome P-450-depen- dent enzyme systems.
Metabolism of Itraconazole and Ketoconazole in Fungi
The possibility that ketoconazole might be more prone to metabolic inactivation was evaluated in C. lusitaniae grown in different media and in A. fumigatus grown in Sabouraud broth. In all circumstances, however, only the parent compounds, ketoconazole and itraconazole, were found in medium and cells?’ Thus, the hypothesis

VANDEN BOSSCHE et al.: MODE OF ACTION STUDIES 199
that the lower activity of ketoconazole or the higher activity of itraconazole might be due to either metabolic inactivation or activation (formation of a more active itra- conazole metabolite) can be excluded.
IntraceNular Content of the Azole Derivatives
The results presented in TABLE 1 clearly indicate that A. fumigatus and C. lusitaniae absorb and/or retain higher levels of itraconazole. Note that when cells were collected from cultures of A. fumigQtus or C. hsitaniae containing [ 3H]itraconazole or [3H]ketoconazole that had been added at a concentration of 5 X M or lo-’ M (the cultures having been incubated for 24 hr before and 1 hr after the addition
FIGURE 3. Data taken from different spectra obtained with microsomal prep- arations of C. albicans. The azoles and/ or DMSO were added to the oxidized cytochrome P-450 preparation and re- duced with dithionite. The sample cu- vette was then bubbled with CO. The differences in absorption (AOD) at 448 nm (maximal absorption of the yeast cy- tochrome P-450-CO complex). and 490 nm are plotted against time. The AOD values obtained in the presence of DMSO ( 0 ) are stable over the 60-min measurement period. : itraconazole; A: R 49 960; A: R 42 164; 0: keto- conazole. The azole concentration used was 1 X lo-’ M.
lime (minutes)
of the azoles), 3 to about 14 times more itraconazole than ketoconazole was found intracellularly. In C. lusitaniae, the cellular ketoconazole content measured after 1 hr of incubation with M [3H]ketoconazole was similar to that found in cells incubated in the presence of lo-’ M [ 3H]itraconazole.
The higher intracellular content might explain, at least in part, itraconazole’s higher antifungal activity. This explanation fits for C. lusitaniae grown in YNBG medium buffered at pH 6.5. Under these conditions, the cells contain 2.8 times more itraconazole and are 3.5 times more sensitive to this triazole antifungal drug (TABLE 2). At pH 3, however, the ability of itraconazole to inhibit ergosterol synthesis is almost 2600 times greater; on the other hand, the cellular content is only 11 times higher. These results suggest that the higher cellular itraconazole contents reached (TABLES 1 & 2) are not high enough to explain the huge differences in activity between itraconazole and ketoconazole observed under some experimental conditions.
Of course, measurements of the cellular content give only a rough estimate of the drug concentration available for binding to cytochrome P-450. The characteristics

200 ANNALS NEW YORK ACADEMY OF SCIENCES
that determine the entry of ketoconazole into C. olbicans cells were studied by Boiron et al.” These investigators found that C. albicans markedly concentrated the drug: 30% of the final 80-fold intracellular concentration was attained in less than 1 min and more than 60% was attained in 10 min. At concentrations above 1.8 X lo-’ M, penetration occurred by simple diffusion. At lower extracellular concentrations, ac- cumulation of ketoconazole was found to be an energy-requiring process and to be pH dependent. The latter can also be deduced from the results in TABLE 2, where the cellular content of both ketoconazole and itraconazole is shown to be higher at pH 6.5 than at pH 3. Surprisingly, the uptake of ketoconazole was found to be maximal at pH 6.6,32 that is, at about the pK. value (6.51) of the imidazole of ketoconazole. Thus, at about 50% protonation of this imidazole and at zero protonation of the piperazine ring (pK,: 2.94), maximum absorption and /or retention of ketoconazole occurred. Of interest is that the intracellular ketoconazole content at pH 7.4 is almost similar to that at pH 5.6,33 whereas C. albicans is almost 10 times more sensitive to
TABLE 1. Cellular Content of Ketoconazole and Itraconazole
Cellular Contentb (pmols of Azole/mg Protein)
Isolate Medium (M) Ketoconazole Itraconazole Concentration”
C lusitaniae B 40 170 YNBG 5 x 1 0 - 9 1.2
10 --O 248.6 lo-’ 29.6
C. lusitaniae B 40 171 YNBG 5 x 1.5 10 -’ 49.6 10--O 392.7
A. fumigatus RV 5960 Sabouraud broth 5 x 10- 41.0 10 -’ 201.0
7.2 303.2 ND‘
20.8 393.1 ND 129.0
1730.0
Different concentrations of [’H]ketoconazole or [’H]itraconazole were added after 24 hr of
Results are mean values of at least two experiments. growth, and cells were collected 1 hr later.
‘ ND: not determined.
ketoconazole at pH 7.4 than at pH 5.6.’* This supports the idea that the measured intracellular content is not a direct measure for antifungal activity. The study of intracellular distribution and of possible vectorial transport systems for ketoconazole and/or itraconazole might give a better approach to elucidate the differences in activity observed at different pH values between itraconazole and ketoconazole. Both the distribution and transport in the cell remain important subjects for investigation.
Intracellular pH
The results presented in TABLE 2 indicate that, in contrast with itraconazole, the interaction of ketoconazole with ergosterol biosynthesis is pH dependent. As shown in FIGURE 4, this pH dependency is also reflected in ketoconazole’s affinity for cy-

VANDEN BOSSCHE et al.: MODE OF ACTION STUDIES 201
TABLE 2. Effects of Ketoconazole and Itraconazole on [I4C]Acetate Incorporation into Ergosterol by C. lusituniue (B 40 171)/Effect of pH
Cellular Content‘ (pMols of Azole/106 Cells) IC,, Values (M)b
PH“ Ketoconazole Intraconazole Ketoconazole Itraconazole
3.0 1.9 X lo-’ 7.3 x 10⁻⁹ 0.06 2 0.02 (26) 0.66 2 0.1 1 (26) 4.0 1.0 x 5.3 x 1 0 - 9 5.0 9.9 x 9.5 x 10-9 5.5 5.3 x lo -@ 9.3 x lo-’ 6.0 3.0 x 9.5 x lo-’ 6.5 2.8 X lo-’ 7.9 x lo-’ 0.32 2 0.05 (20) 1.61 2 0.40 (20) 7.0 3.0 X 9.4 x
Buffered YNBG medium was used. ’ Azoles and/or solvent (DMSO final concentration: 0.1%) and [ “Clacetate were added to
exponentially growing C. lusifuniue. Cells were collected 1 hr later. Azoles labeled with ’H were added at a final concentration of 5 x 10 -’ M to exponentially
growing cells. Cells were collected after 1 hr of growth. Each result is a mean t SD. The number of experiments is given in parentheses.
80-
60-
LO-
20 -
0- 5 6 7
- 80
n L
c 0 - C
-60 ;
2 n - L O
0 . z s
- 20
- 0
PH
FIGURE 4. Protonation profile of the imidazole of ketoconazole ( 0- - - -0) and of the triazole of itraconazole ( M- - - -. ) and pH dependency of the affinity of ketoconazole ( 0-o), R 49 960 (A-A), R 42 164 (A-A), and itraconazole ( M-.) for cytochrome P-450 in C. ulbicuns microsomes. Increasing concentrations ( - 5 x lo-’ M ) of azoles and/or DMSO were added to the microsomal fraction. Cytochrome P-450 was reduced, and the sample cuvette bubbled with CO. The AOD (448 nm-490 nm) was measured. The IC,, value is the azole concentration needed to obtain a 50% reduction of the AOD (448 nm-490 nm) obtained in the presence of DMSO.
202 ANNALS NEW YORK ACADEMY OF SCIENCES
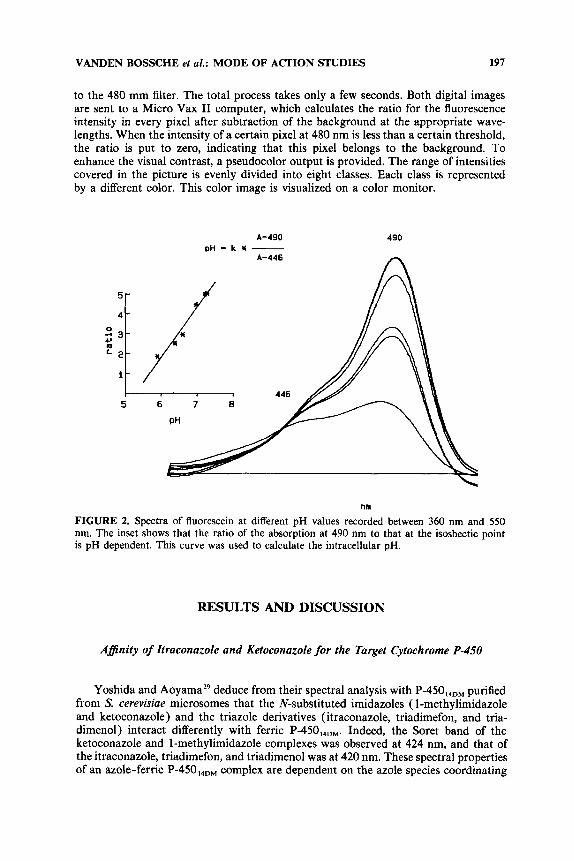
tochrome P-450 in microsomes of C. albicans. Binding to the heme iron (ligand binding) is governed mainly by electronic interactions between the heme iron ion and available lone pair( s) or negative charge in the ligand?4 Therefore, protonation of N- 3 in the imidazole or N-4 in the triazole ring will reduce ligand binding. The pK, of the imidazole ring of ketoconazole is 6.51, and that of the triazole ring of itraconazole is less than 2. Thus, at pH 5.4, protonation of the imidazole nitrogen (N-3) of ketoconazole is seen for about 32% of the molecules whereas protonation of the triazole nitrogen (N-4) of itraconazole is never seen (FIG. 4). At pH 5.4, more ketoconazole is needed to obtain a 50% decrease in the AOD (448 nm-490 nm) of the reduced CO difference spectra of a microsomal preparation of C. afbicans (FIG. 4). That this affinity for the heme iron ion is highly dependent on the nitrogen heterocycle and much less on the hydrophobic nonligand part can be deduced from the higher effect of the pH on the affinity of R 49 960, the imidazole analogue of itraconazole, than on that of R 42 164, the triazole analogue of ketoconazole (FIG.
Growing hyphae of the water mold Achlya bisexualis generate a longitudinal pH gradient in the surrounding medium, the medium adjacent to the tip being slightly more alkaline, and that near distal parts being more The apical alkaline zone corresponds to the region of current inflow. It has been proposed that protons flow into the hyphal tip through amino acid-proton symporters, which are prefer- entially localized at the apex. The influx of protons will result in a more alkaline pH of the medium adjacent to the tip and a more acidic pH intracellularly. If the intra- cellular pH at the growth tip of A. fumigatus or in C. lusitaniae grown in YNBG medium were to be relatively acidic, ketoconazole would be more protonated and would show lower affinity for cytochrome P-450.
The intracellular pH (pH,) of C. lusitaniae grown in YNBG medium for 24 hr is 6.1 (TABLE 3), resulting in 71.5% protonation of N-3 of ketoconazole. In cells grown in CYG medium, the pH, is 6.7, resulting in 36% protonation of N-3 only. Both azoles were almost equipotent inhibitors of ergosterol biosynthesis in CYG
4).
TABLE 3. Intracehlar pH of c. albicans, c. lusitaniae, and A. fumigatus
Isolate Medium"
C. albicans ATCC 28516 CYG C. lusitaniae B 40 171 CYG
YNBG YNBG, YNBG,
A. fumigatus RV 5960 SB SB SB SB B SB B
SB B
External pHb
pH,: 6.2; pH,: 7.5 pH,: 6.2; pH,: 7.0 pH,: 5.6; pH,: 2.4
3.0 6.5
pH,: 6.6; pH,: 6.2 pH,: 5.6 pH,: 5.1
3.0 6.5 7.4
~
Incubation Time Intracellular (hr) PH
24 6.6 24 6.7 24 6.1 24 5.7 24 6.3 16 6.1 24 5.4 72 4.8 16 6.1 16 5.9 72 5.0
CYG: Casein hydrolysate-yeast extract-glucose; YNGB: yeast nitrogen base-glucose; SB:
bThe pH, and pH, values are pH values measured at the start and end of cultivation, Sabouraud broth; B: buffered at given pH.
respectively.

VANDEN BOSSCHE et ol.: MODE OF ACTION STUDIES 203
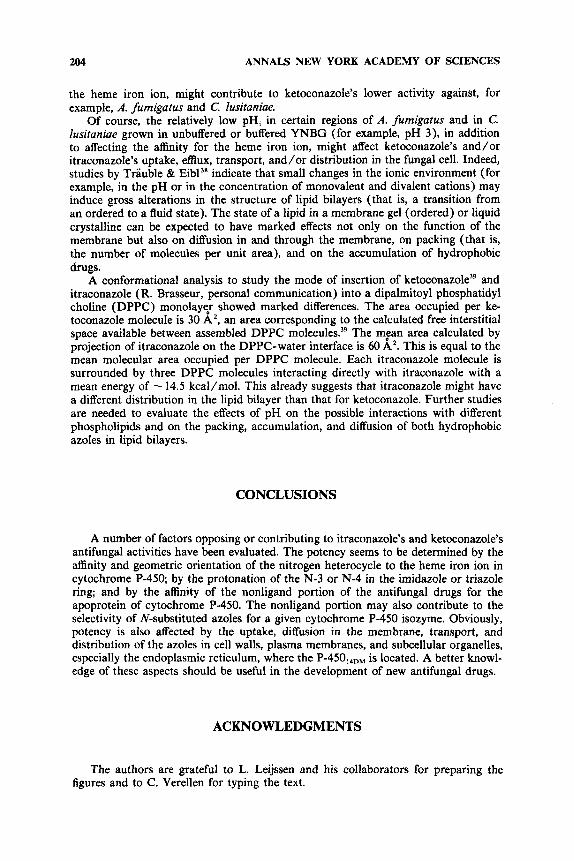
FIGURE 5. Images of fluorescence ratios in A. fumigatus grown in unbuffered Sabouraud broth for 24 hr. The brighter regions have a lower pH than the dark areas. A more acidic pH at the hyphal apex can be seen.
medium, showing IC,, values of 3 X lo -* M (ketoconazole) and 2 X lo-@ M (itraconazole), whereas IC,, values of 7.5 x M and lo-* M, respectively, were noted in YNBG medium.-” In YNBG medium buffered at pH 3, the pH, was 5.7; at pH 6.5, the pH, was 6.3. As shown in TABLE 2, itraconazole at pH 3 is almost as potent as it is at pH 6.5, whereas ketoconazole is 633 times less active at pH 3 than it is at pH 6.5. At a pH, of 5.7, the protonation of the imidazole of ketoconazole is seen for 86% of the molecules whereas protonation for itraconazole is still not seen. The results shown in TABLE 3 also indicate that the pH, values of A. fumigatus grown in Sabouraud broth are below 6.2 after 16 hr of growth and are as low as 5.4 after 24 hr of growth. After 72 hr the pH, decreases to 4.8. Note that in Sabouraud broth, buffered at pH 6.5 or pH 7.4, pH, values of 5.9 and 5.0 are found after 16 hr and 72 hr of growth, respectively. Thus, in all circumstances, ketoconazole will be at least partly protonated and, consequently, less active.
The pH, values measured in A. fumigatus represent the mean of the pHi values of the complete Aspergilli. To get a better idea of the pH at the growing tip, where most metabolic activity can be expected, and by analogy with the results obtained with Achha, where a more acidic pH in the growth tip can be assumed, the pH gradient was studied microscopically. FIGURE 5 represents the images of fluorescence ratios in A. fumigatus grown in unbuffered Sabouraud broth for 24 hr. The brighter regions have a lower pH than the dark areas.
A pH gradient from the apex toward the distal region can be seen. A more acidic pH, at the hyphal apex means that after 24 hr of growth, for example, the pH in that region should be lower than 5.4 At this pH, protonation of the imidazole nitrogen (N-3) of ketoconazole is seen for more than 92.7% of the molecules, and is seen to result in a diminished affinity for the heme iron ion. This property, together with ketoconazole’s lower affinity for the apoprotein and different geometric orientation to
204 ANNALS NEW YORK ACADEMY OF SCIENCES
the heme iron ion, might contribute to ketoconazole’s lower activity against, for example, A. fumigatus and C lusitaniae.
Of course, the relatively low pHi in certain regions of A. fumigatus and in C. lusitaniae grown in unbuffered or buffered YNBG (for example, pH 3), in addition to affecting the affinity for the heme iron ion, might affect ketoconazole’s and/or itraconazole’s uptake, emux, transport, and/or distribution in the fungal cell. Indeed, studies by Trauble & Eib13’ indicate that small changes in the ionic environment (for example, in the pH or in the concentration of monovalent and divalent cations) may induce gross alterations in the structure of lipid bilayers (that is, a transition from an ordered to a fluid state). The state of a lipid in a membrane gel (ordered) or liquid crystalline can be expected to have marked effects not only on the function of the membrane but also on diffusion in and through the membrane, on packing (that is, the number of molecules per unit area), and on the accumulation of hydrophobic drugs.
A conformational analysis to study the mode of insertion of ketocona~ole~~ and itraconazole (R. Brasseur, personal communication) into a dipalmitoyl phosphatidyl choline (DPPC) monolayqr showed marked differences. The area occupied per ke- toconazole molecule is 30 A’, an area corresponding to the calculated free interstitial space available between assembled DPPC molecule^."^ The m,ean area calculated by projection of itraconazole on the DPPC-water interface is 60 A*. This is equal to the mean molecular area occupied per DPPC molecule. Each itraconazole molecule is surrounded by three DPPC molecules interacting directly with itraconazole with a mean energy of - 14.5 kcal/mol. This already suggests that itraconazole might have a different distribution in the lipid bilayer than that for ketoconazole. Further studies are needed to evaluate the effects of pH on the possible interactions with different phospholipids and on the packing, accumulation, and diffusion of both hydrophobic azoles in lipid bilayers.
CONCLUSIONS
A number of factors opposing or contributing to itraconazole’s and ketoconazole’s antifungal activities have been evaluated. The potency seems to be determined by the affinity and geometric orientation of the nitrogen heterocycle to the heme iron ion in cytochrome P-450; by the protonation of the N-3 or N-4 in the imidazole or triazole ring; and by the affinity of the nonligand portion of the antifungal drugs for the apoprotein of cytochrome P-450. The nonligand portion may also contribute to the selectivity of N-substituted azoles for a given cytochrome P-450 isozyme. Obviously, potency is also affected by the uptake, diffusion in the membrane, transport, and distribution of the azoles in cell walls, plasma membranes, and subcellular organelles, especially the endoplasmic reticulum, where the P-450,,,, is located. A better knowl- edge of these aspects should be useful in the development of new antifungal drugs.
ACKNOWLEDGMENTS
The authors are grateful to L. Leijssen and his collaborators for preparing the figures and to C. Verellen for typing the text.

VANDEN BOSSCHE et aL: MODE OF ACTION STUDIES 205
REFERENCES
1. SYMOENS, J., M. MOENS, J. DOM, H. SCHEYGROND, J. DONY, V. SCHUERMANS, R. LEGENDRE & M. FINESTINE. 1980. An evaluation of two years of clinical experience with ketoconazole. Rev. Infect. Dis. 2: 674-691.
DISMUKES, W. E. (and the Mycoses Study Group). 1985. Treatment of blastomycosis and histoplasmosis with ketoconazole: Results of a prospective randomized clinical trial. Ann. intern. Med. 103(6): 861-872.
VANDEN BOSSCHE, H. 1985. Biochemical targets for antifungal azole derivatives: Hypothesis on the mode of action. In Current Topics in Medical Mycology. M. R. McGinnis, Ed. Vol. 1: 313-351. Springer-Verlag. New York, NY.
VANDEN BOSSCHE, H., R. DE COSTER & K. AMERY. 1987. Pharmacology and clinical uses of ketoconazole. In Pharmacology and Clinical Uses of Inhibitors of Hormone Secretion and Action. B. J. A. Furr & A. E. Wakeling, Eds.: 288-307. Bailliere Tindall. London.
5 . VANDEN BOSSCHE, H., G. WILLEMSENS, W. COOLS, W. F. J. LAUWERS & L. LE JEUNE. 1978. Biochemical effects of miconazole on fungi. 11. Inhibition of ergosterol biosynthesis in Candida albicans. Chem. Biol. Interact. 21: 59-78.
6. MARRIOTT, M. S. 1980. Inhibition of sterol biosynthesis in Candida albicans by imidazole- containing antifungals. J. Gen. Microbiol. 117: 253-255.
7. VANDEN BOSSCHE, H., G. WILLEMSENS, W. COOLS, F. CORNELISSEN, W. F. LAUWERS & J. M. VAN CUTSEM. 1980. In v i m and in vivo effects of the antimycotic drug keto- conazole on sterol synthesis. Antimicrob. Agents Chemother. 17: 922-928.
8. TRZASKOS, I. M., W. D. BOWEN, A. SHAFICE, R. T. FISCHER & I. L. GAYLOR. 1984. Cytochrome P-450-dependent oxidation of lanosterol in cholesterol biosynthesis: Micro- soma1 electron transport and C-32 demethylation. J. Biol. Chem. 259 13402-13412.
9. TRZASKOS, J., S. KAWATA & I. L. GAYLOR. 1986. Microsomal enzymes of cholesterol biosynthesis: Purification of lanosterol 14a-methyl demethylase cytochrome P-450 from hepatic microsomes. I. Biol. Chem. 261: 1465 1 - 14657.
TRZASKOS, J. M., R. T. FISCHER & M. F. FAVATA. 1986. Mechanistic studies of lanosterol C-32 demethylation: Conditions which promote oxysterol intermediate accumulation during the demethylation process. J. Biol. Chem. 261: 16937- 16942.
11. AOYAMA, Y., Y. YOSHIDA, Y. SONODA & Y. SATO. 1987. Metabolism of 32-hydroxy- 24,25-dihydrolanosterol by purified cytochrome P-450 , lDM from yeast. J. Biol. Chem.
WILLEMSENS, G., W. COOLS & H. VANDEN BOSSCHE. 1980. Effects of miconazole and ketoconazole on sterol synthesis in a subcellular fraction of yeast and mammalian cells. In The Host Invader Interplay. H. Vanden Bossche, Ed.: 691-694. Elsevier/North- Holland. Amsterdam.
JANSSEN, P. A. J. & H. VANDEN BOSSCHE. 1987. Mode of action of cytochrome P-450 monooxygenase inhibitors: Focus on azole derivatives. Arch. Pharm. Chem. Sci. Edit. 15 23-40.
14. VANDEN BOSSCHE, H., G. WILLEMSENS, P. MARICHAL, W. COOLS & W. LAUWERS. 1984. The molecular basis for the antifungal activities of N-substituted azole derivatives: Focus on R 5 1 211. In Mode of Action of Antifungal Agents. A. P. J. Trinci & J. E. Ryley, Eds.: 321 -341. Cambridge University Press. Cambridge.
15. VANDEN BOSSCHE, H., W. LAUWERS, G. WILLEMSENS, P. MARICHAL, F. CORNELISSEN & W. COOLS. 1984. Molecular basis for the antimycotic and antibacterial activity of N- substituted imidazoles and triazoles: The inhibition of isoprenoid biosynthesis. Pestic. Sci. 1 5 188-198.
16. VANDEN BOSSCHE, H., D. BELLENS, J. GORRENS, P. MARICHAL, H. VERHOEVEN & G. WILLEMSENS. 1985. Yeast and plant cytochrome P-450 enzymes: Targets for azole derivatives. In Cytochrome P-450 Biochemistry, Biophysics and Induction. L. Vereczkey & K. Magyar, Eds.: 423-429. Akademiai Kiadb. Budapest.
VANDEN BOSSCHE, H., W. LAUWERS, G. WILLEMSENS & W. COOLS. 1985. The cytochrome P-450-dependent C17,20-lyase in subcellular fractions of the rat testis: Differences in sensitivity of ketoconazole and itraconazole. In Microsomes and Drug Oxidations. A.
2.
3.
4.
10.
262(3): 1239-1243. 12.
13.
17.

206 ANNALS NEW YORK ACADEMY OF SCIENCES
18.
19.
20.
21.
22.
23.
24.
25.
26.
27.
28.
29.
30.
31.
32.
33.
34.
35.
R. Boobis, J. Caldwell, F. de Matteis & C. R. Elcombe, Eds.: 63-73. Taylor & Francis. London.
VANDEN BOSSCHE, H., W. LAUWERS, G. WILLEMSENS & W. COOLS. 1985. Ketoconazole, an inhibitor of the cytochrome P-450-dependent testosterone biosynthesis. In Progress in Clinical and Biological Research. F. H. Schroeder & B. Richards, Eds. Vol. 185A: 187-196. Alan R. Liss. New York, NY.
LAUWERS, W. F. J., L. LE JEUNE, H. VANDEN BOSSCHE & G. WILLEMSENS. 1985. Identification of 17a,20a-dihydroxyprogesterone in testicular extracts after incubation with ketoconazole. Biomed. Mass. Spectrom. 12: 296-301.
WILLEMSENS, G. & H. VANDEN BOSSCHE. 1985. Effects of ketoconazole on the testicular and adrenal cholesterol side-chain cleavage. In Cytochrome P-450: Biochemistry, Bio- physics and Induction. L. Vereczkey & K. Magyar, Eds.: 203-206. Akademiai Kiad6. Budapest.
MASON, J. I., B. A. MURRY, M. OLCOTT & J. J. SHEETS. 1985. Imidazole antimycotics: Inhibitors of steroid aromatase. Biochem. Pharmacol. 34: 1087- 1092.
FELDMAN, D. 1986. Ketoconazole and other imidazole derivatives as inhibitors of steroi- dogenesis. Endocr. Rev. 7: 409-420.
VAN CUTSEM, J., F. VAN GERVEN & P. A. J. JANSSEN. 1987. The in vitro and in vivo antifungal activity of itraconazole. In Recent Trends in the Discovery, Development and Evaluation of Antifungal Agents. R. A. Fromtling, Ed.: 177- 192. J. R. Prous. Barcelona.
VANDEN BOSSCHE, H., D. BELLENS, W. COOLS, J. GORRENS, P. MARICHAL, H. VER- HOEVEN, G. WILLEMSENS, R. DE COSTER, D. BEERENS, C. HAELTERMAN, M.-C. COENE, W. LAUWERS & L. LE JEUNE. 1986. Cytochrome P-450: Target for itraconazole. Drug Dev. Res. 8: 287-298.
LAVRIISEN, K., J. VAN HOUDT & D. THIJS. 1987. Interaction of miconazole, ketoconazole and itraconazole with rat liver microsomes. Xenobiotica 17: 45-47.
VANDEN BOSSCHE, H., P. MARICHAL, J. GORRENS, D. BELLENS, H. VERHOEVEN, M.- C. COENE, W. LAUWERS & P. A. J. JANSSEN. 1987. Interaction of azole derivatives with cytochrome P-450 isozymes in yeast, fungi, plants and mammalian cells. Pestic. Sci. 21: 289-306.
MARICHAL, P., J. GORRENS & H. VANDEN BOSSCHE. 1985. The action of itraconazole and ketoconazole on growth and sterol synthesis in Aspergillus fumigatus and Aspergillus niger. Sabouraudia/J. Med. Vet. Mycol. 23 13-21.
VANDEN BOSSCHE, H., P. MARICHAL, H. GEERTS & P. A. J. JANSSEN. 1988. The molecular basis for itraconazole’s activity against Aspergillus fumigatus. In Aspergillus and Asper- gillosis. H. Vanden Bossche, D. W. R. Mackenzie & G. Cauwenbergh, Eds.: 171-197. Plenum. New York, NY.
YOSHIDA, Y. & Y. AOYAMA. 1987. Interaction of azole antifungal agents with cytochrome P-450 I,DM purificd from Saccharornyces cerevisiae microsomes. Biochem. Pharmacol. 36 229 -235.
VANDEN BOSSCHE, H., P. MARICHAL & J. GORRENS. 1986. Molecular basis for the antifungal activity of the azole derivatives ketoconazole and itraconazole: Model: Candida lusitaniae. In In Vitro and in Vivo Evaluation of Antifungal Agents. K. Iwata & H. Vanden Bossche, Eds.: 101 - 109. Elsevier. Amsterdam.
YOSHIDA, Y. & Y. AOYAMA. 1986. Interaction of azole fungicides with yeast cytochrome P-450 which catalyzes lanosterol 14a-demethylation. In In Vitro and in Vivo Evaluation of Antifungal Agents. K. Iwata & H. Vanden Bossche, Eds.: 123-134. Elsevier. Am- sterdam.
VAN CUTSEM, J., F. VAN GERVEN & P. A. J. JANSSEN. 1986. The in vitro evaluation of azoles. In In Yitro and in Viva Evaluation of Antifungal Agents. K. Iwata & H. Vanden Bossche, Eds.: 5 1-64. Elsevier. Amsterdam.
BOIRON, P., E. DROUHET, B. DUPONT & L. IMPROVISI. 1987. Entry of ketoconazole into Candida albicans. Antimicrob. Agents Chemother. 31(2): 244-248.
TESTA, B. & P. JENNER. 1981. Inhibitors of cytochrome P-450s and their mechanism of action. Drug. Metab. Rev. 12( 1): 1 - 117.
Gow, N. A. R., D. L. KROPF & F. M. HAROLD. 1984. Growing hyphae of Achlya bisexualis generate a longitudinal pH gradient in the surrounding medium. J. Gen. Microbiol. 130 2967 - 2974.

VANDEN BOSSCHE et al.: MODE OF ACTION STUDIES 207
36. KROPF, D., J. H. CALDWELL, N. A. R. Gow & F. M. HAROLD. 1984. Transcellular ion currents in the water mold Achlya: Amino acid proton symport as a mechanism of current entry. J. Cell Biol. 9 9 486-496.
37. HAROLD, F. M., W. J. A. SCHREURS & J. H. CALDWELL. 1986. Transcellular ion currents in the water mold Achlyu. Prog. Clin. Biol. Res. 210 89-96.
38. TRAUBLE, H. & H. EIBL. 1974. Electrostatic effects on lipid phase transitions: Membrane structure and ionic environment. Proc. Natl. Acad. Sci. USA 71( 1): 214-219.
39. BRASSEUR, R., C. VANDENBOSCH, H. VANDEN BOSSCHE & J. M. RUYSSCHAERT. 1983. Mode of insertion of rniconazole, ketoconazole and deacylated ketoconazole in lipid layers. Biochem. Pharmacol. 32: 2175-2180.