Understanding corporate social responsibility of the corporate ...
Upload
khangminh22Category
view
4download
0
INDEX
1 COMMUNITY PLAN 2011-2021
2 CORPORATE PLAN 2012-2017
3 OPERATIONAL PLAN 2012-2013
4
MAYOR’S BUDGET SUMMARY REPORT
5
WORKS PROGRAM 2012-2017
CAPITAL WORKS PROGRAM
GENERAL REVENUE WORKS PROGRAM
6
BUDGET FINANCIAL STATEMENTS
SHIRE ONCOSTS 2012-2017
REVENUE AND EXPENDITURE STATEMENT
7
10 YEAR LONG TERM FINANCIAL FORECAST
10 YEAR CAPITAL WORKS PROGRAM
8 REVENUE POLICY 2012-2017
DEBT POLICY 2012-2017
REVENUE STATEMENT 2012-2017
RATES AND CHARGES 2012-2017
PENSIONER RATE CONCESSIONS POLICY
CODE OF COMPETITIVE CONDUCT
INVESTMENT POLICY
9
ASSET MANAGEMENT PLAN
10 FEES AND CHARGES
APPENDIX A RATE CATEGORY - HUGHENDEN TOWNSHIP
APPENDIX B RATE CATEGORY – PRAIRIE VILLAGE
APPENDIX C RATE CATEGORY – TORRENS CREEK VILLAGE
APPENDIX D RATE CATEGORY – STAMFORD VILLAGE
APPENDIX E PLANT REPLACEMENT PROGRAM 2012-2017

Flinders Shire Council
Community Plan
‘Our Future’
2011 - 2021
Community Plan - ‘Our Future’ adopted 17th November 2011 2
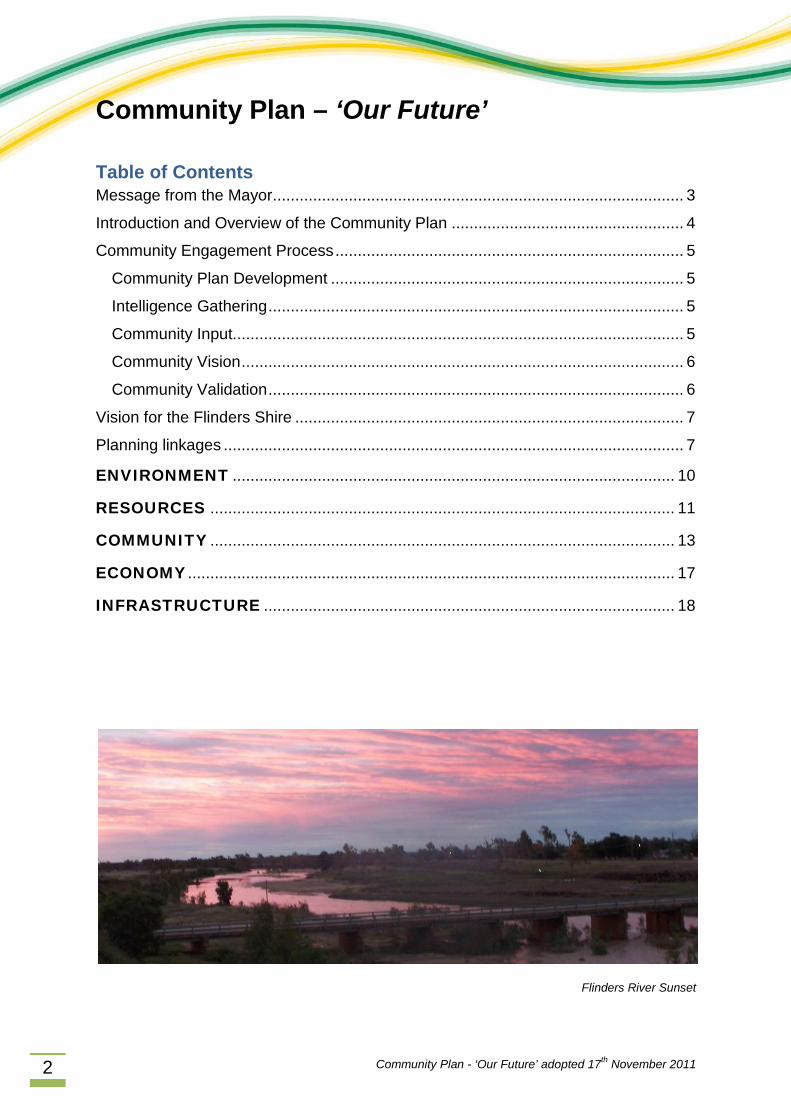
Community Plan – ‘Our Future’
Table of Contents Message from the Mayor ............................................................................................ 3
Introduction and Overview of the Community Plan .................................................... 4
Community Engagement Process .............................................................................. 5
Community Plan Development ............................................................................... 5
Intelligence Gathering ............................................................................................. 5
Community Input..................................................................................................... 5
Community Vision ................................................................................................... 6
Community Validation ............................................................................................. 6
Vision for the Flinders Shire ....................................................................................... 7
Planning linkages ....................................................................................................... 7
ENVIRONMENT ................................................................................................... 10
RESOURCES ........................................................................................................ 11
COMMUNITY ........................................................................................................ 13
ECONOMY ............................................................................................................. 17
INFRASTRUCTURE ............................................................................................ 18
Flinders River Sunset
Community Plan - ‘Our Future’ adopted 17th November 2011 3
Message from the Mayor
Welcome to Flinders Shire Community Plan – ‘Our Future’, this plan has been developed though various forms of community consultation and therefore is a plan for the whole of community.
The Flinders Shire Community Plan – ‘Our Future’ provides direction for Council, the community, government, stakeholders, non-government organisations’, business’ and industry to strategically plan for the future. Through this planning process it will guide appropriate roles for Council, community groups and other agencies highlighting the responsibilities each have towards the sustainable future of the Flinders Shire region.
Development of the Community Plan is important as it sets the direction for the Shire and ensures that Council’s limited resources are allocated to meet legislated obligations and community expectations.
Our community has shown throughout the community consultation, a passion towards the ongoing development and improvement of our lifestyle, community heritage and natural environment. These have been highlighted in the themes of
environment, resources, community, economy and infrastructure, all of which are vital to a happy healthy community.
Council thanks the community for being involved in determining the future direction and priorities of Council. Together we shall forge partnerships and alliances to ensure the ongoing future of the Flinders Shire.
Cr Brendan McNamara Mayor Flinders Shire Council
Community Plan - ‘Our Future’ adopted 17th November 2011 4
Introduction and Overview of the Community Plan Flinders Shire Community Plan - ‘Our Future’ is a high level plan that identifies community needs and articulates the Council and community's long-term vision, aspirations and priorities. The Community Plan is for the whole community, not just for Local Government.
The Community Plan is intended to be long-term, providing a future focused planning and action framework to support Council in strengthening the assets of the community whilst identifying strategies and systems required to effectively manage growth and change.
The Purpose of the Community Plan is to:
• Inform longer-term decisions to be made by Council in relation to policy, planning and resource allocation.
• Compliment, guide and inform Council's other strategic planning systems and decision-making.
• Capture the expertise, interests and views of stakeholders representing the whole of the community (Government, business, interest groups, individuals and community organisations) into a framework that describes how a community aspires to reach its full potential.
• Provide a basis for transparency and accountability for the development and implementation of other operational and action plans of Local Government.
So in short a Community Plan is the communities vision which will guide Council within Councils limited resources to make our community what we, the residents want, or would like to see happen, in Flinders Shire to ensure our future. Why Develop a Community Plan? The Local Government Act 2009 has an increased emphasis on planning and accountability, requiring every Council to develop a long-term community plan. The Act also places an importance on community engagement. As a legislative principle, community engagement is required in all Council processes and across all Council business, including the development of the long term community plan. The Principles of the Act state that Local Government must ensure "transparent and effective processes and decision making in the public interest" and "democratic representation, social inclusion and meaningful community engagement." The Local Government (Finance, Plans and Reporting) Regulation 2010 requires every Council to prepare and adopt a Community Engagement Policy. The Community Plan, when supported by a reliable Long Term Financial Plan and Long Term Asset Management Plan will be the key driver for the Corporate Plan and will influence all other plans of Council, whether they are strategic, operational or action plans. The Community Plan will also bring other benefits to Council. Community planning:
• Is good business practice. • Connects Council with the community. • Allows community members to contribute to planning. • Shares responsibility for a positive future.
Community Plan - ‘Our Future’ adopted 17th November 2011 5
Community Engagement Process Community Plan Development The community engagement element of the process consisted of a number of the elements in the Intelligence gathering, Community Input, Community Vision and Community Validation phases as detailed in the project plan.
Council utilised four elements of the IAP2 Public Participation Spectrum in its community engagement activities being inform, consult, involve and collaborate.
Intelligence Gathering Having recently completed a review of its Corporate Plan, Council had access to significant data on community views regarding medium term Council strategy. An engagement activity by the Department of Communities also provided quality insight into the needs and aspirations of the Flinders Shire indigenous community.
Community Input Council conducted two surveys of the community to gather data and collect input from as wide a range of demographics as possible.
The first survey involved seeking responses to questions across the range of themes to be included in the community plan. These surveys provided detailed response data and were very useful in the validation of the more general trend data collected in the second survey. 29 responses to this survey were recorded.
The second survey was made available in both hard copy and on line and sought to establish base line data on community issues and needs as well as recording detailed responses to 5, 10 and 20 year goals and aspirations.
The survey was promoted in the local media, through a stand at the local Show and was sent out to all households outside of the town of Hughenden. Local schools were encouraged to engage students in the process which ensured that all targets groups were involved.
At the close of survey responses 99 respondents had completed the survey.
Both the residential location and age group spread of respondents is quite balanced and reasonably reflective of the community.
This response represents a good level of survey participation, (6% of residents and 9% of voters) from across the community.
Community Plan - ‘Our Future’ adopted 17th November 2011 6
Community Vision During the community input phase, survey respondents were invited to nominate to be involved in a community focus group workshop to review and provide feedback on the pre-draft plan. A number of other key community group representatives were also invited to participate.
The community focus group workshop was conducted on the 19th August 2011 and included the following representative groups within the Shire.
Youth, indigenous, grazing, education, business, small communities, aged, recreation, emergency services and general community.
The group reviewed the pre-draft plan and provided feedback and suggestions. The participants also workshopped ideas around the community vision statement for consideration by Council.
Community Validation Having considered all feedback and suggestions, then reviewing the work conducted to date, Council prepared and adopted a draft community plan on the 15th September 2011 for circulation for validation by the community.
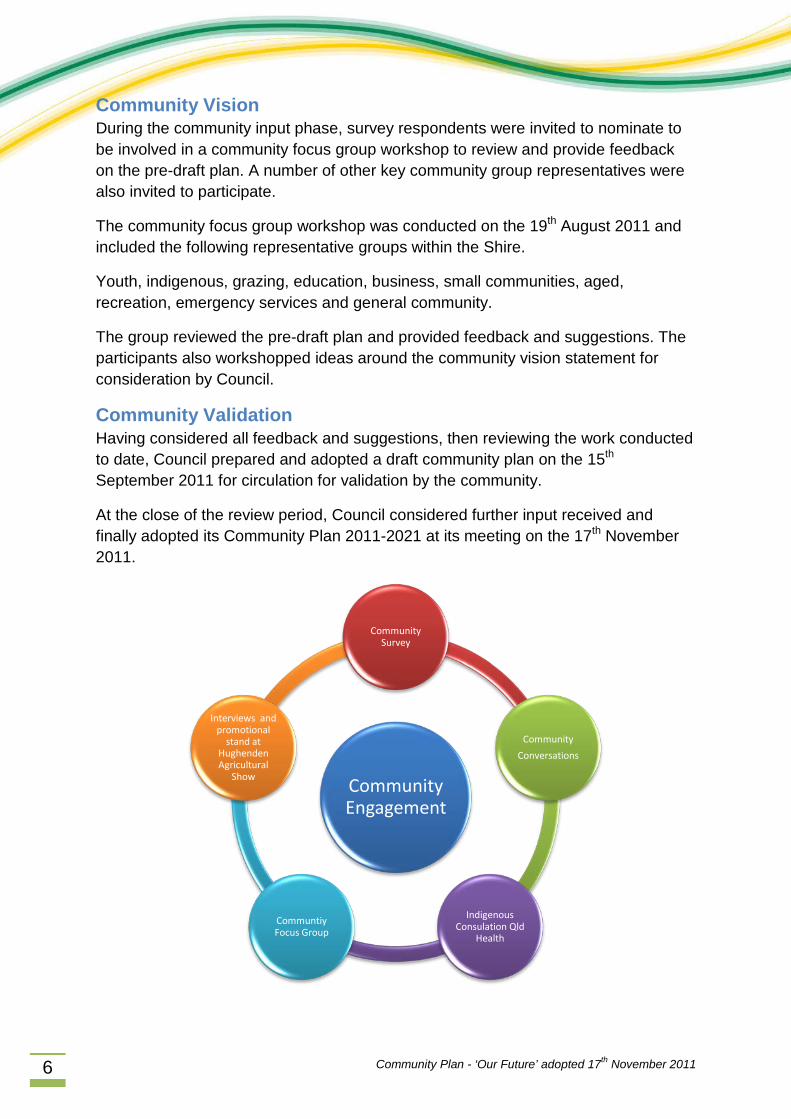
At the close of the review period, Council considered further input received and finally adopted its Community Plan 2011-2021 at its meeting on the 17th November 2011.
Community Engagement
Community Survey
Community
Conversations
Indigenous Consulation Qld
Health
Communtiy Focus Group
Interviews and promotional
stand at Hughenden Agricultural
Show
Community Plan - ‘Our Future’ adopted 17th November 2011 7
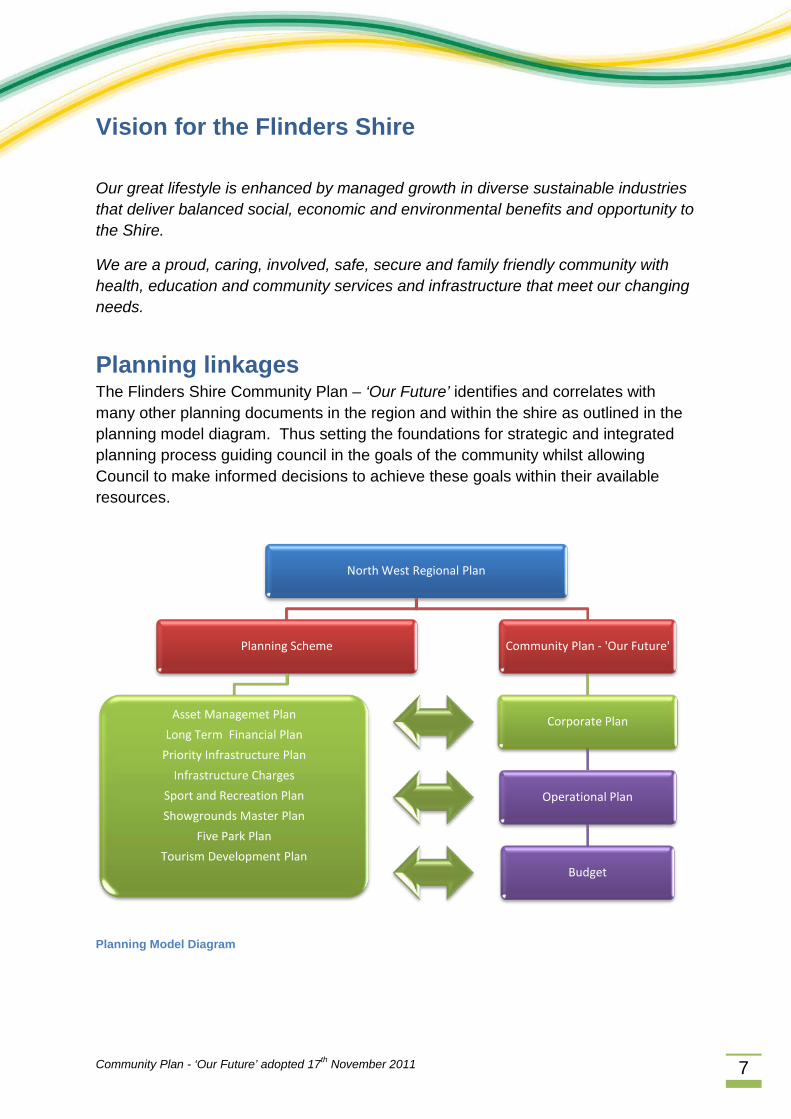
Vision for the Flinders Shire
Our great lifestyle is enhanced by managed growth in diverse sustainable industries that deliver balanced social, economic and environmental benefits and opportunity to the Shire.
We are a proud, caring, involved, safe, secure and family friendly community with health, education and community services and infrastructure that meet our changing needs.
Planning linkages The Flinders Shire Community Plan – ‘Our Future’ identifies and correlates with many other planning documents in the region and within the shire as outlined in the planning model diagram. Thus setting the foundations for strategic and integrated planning process guiding council in the goals of the community whilst allowing Council to make informed decisions to achieve these goals within their available resources.
Planning Model Diagram
North West Regional Plan
Planning Scheme
Asset Managemet Plan
Long Term Financial Plan
Priority Infrastructure Plan
Infrastructure Charges
Sport and Recreation Plan
Showgrounds Master Plan
Five Park Plan
Tourism Development Plan
Community Plan - 'Our Future'
Corporate Plan
Operational Plan
Budget
Community Plan - ‘Our Future’ adopted 17th November 2011 8
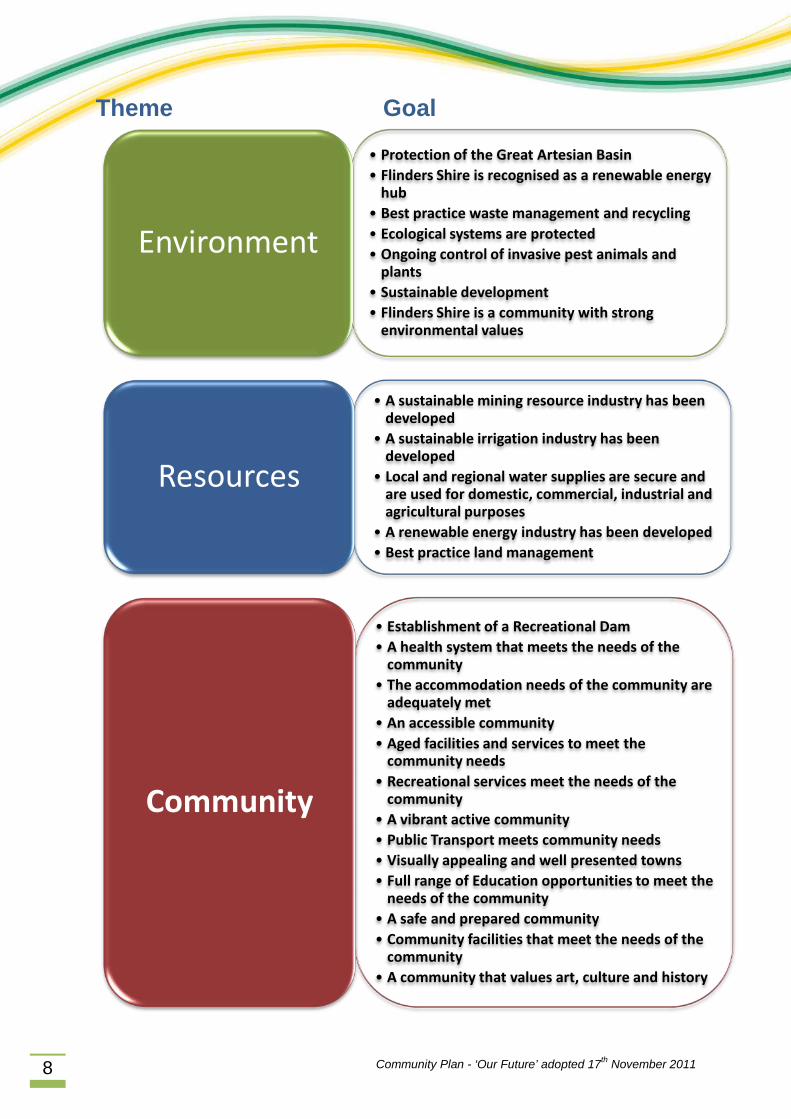
Theme Goal
• Protection of the Great Artesian Basin • Flinders Shire is recognised as a renewable energy
hub • Best practice waste management and recycling • Ecological systems are protected • Ongoing control of invasive pest animals and
plants • Sustainable development • Flinders Shire is a community with strong
environmental values
Environment
• A sustainable mining resource industry has been developed
• A sustainable irrigation industry has been developed
• Local and regional water supplies are secure and are used for domestic, commercial, industrial and agricultural purposes
• A renewable energy industry has been developed • Best practice land management
Resources
• Establishment of a Recreational Dam • A health system that meets the needs of the
community • The accommodation needs of the community are
adequately met • An accessible community • Aged facilities and services to meet the
community needs • Recreational services meet the needs of the
community • A vibrant active community • Public Transport meets community needs • Visually appealing and well presented towns • Full range of Education opportunities to meet the
needs of the community • A safe and prepared community • Community facilities that meet the needs of the
community • A community that values art, culture and history
Community
Community Plan - ‘Our Future’ adopted 17th November 2011 9
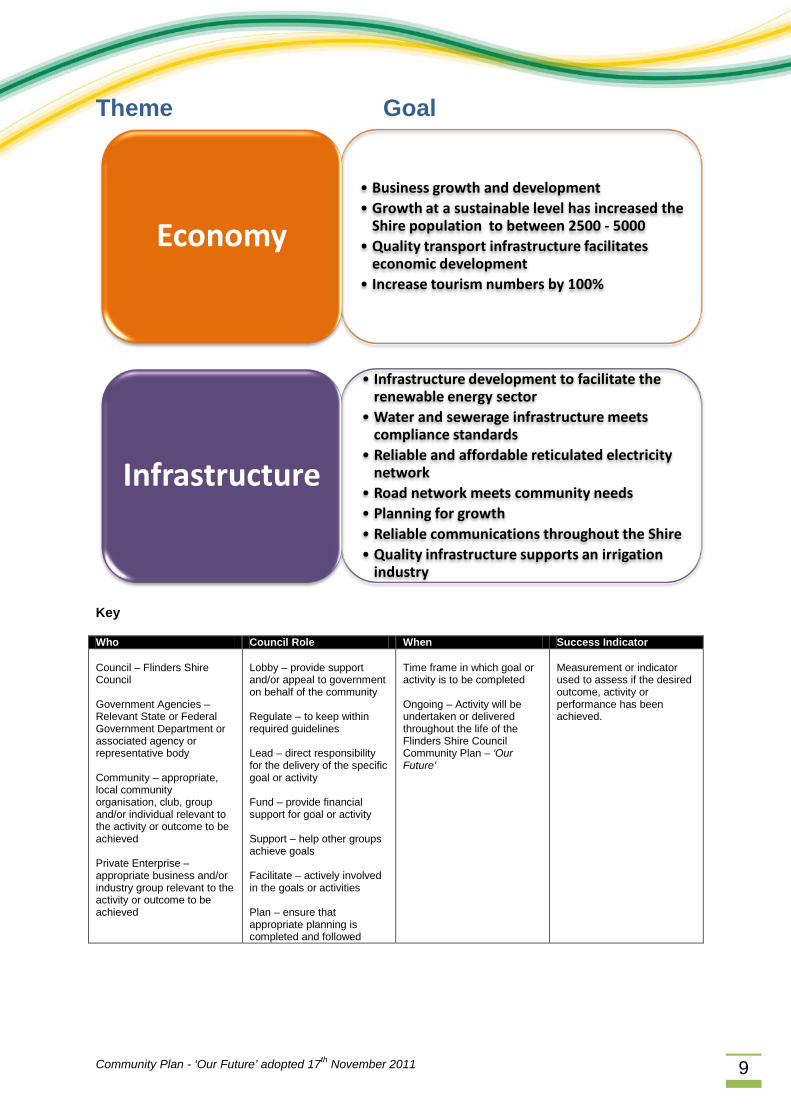
Theme Goal
Key
Who Council Role When Success Indicator Council – Flinders Shire Council Government Agencies – Relevant State or Federal Government Department or associated agency or representative body Community – appropriate, local community organisation, club, group and/or individual relevant to the activity or outcome to be achieved Private Enterprise – appropriate business and/or industry group relevant to the activity or outcome to be achieved
Lobby – provide support and/or appeal to government on behalf of the community Regulate – to keep within required guidelines Lead – direct responsibility for the delivery of the specific goal or activity Fund – provide financial support for goal or activity Support – help other groups achieve goals Facilitate – actively involved in the goals or activities Plan – ensure that appropriate planning is completed and followed
Time frame in which goal or activity is to be completed Ongoing – Activity will be undertaken or delivered throughout the life of the Flinders Shire Council Community Plan – ‘Our Future’
Measurement or indicator used to assess if the desired outcome, activity or performance has been achieved.
• Business growth and development • Growth at a sustainable level has increased the
Shire population to between 2500 - 5000 • Quality transport infrastructure facilitates
economic development • Increase tourism numbers by 100%
Economy
• Infrastructure development to facilitate the renewable energy sector
• Water and sewerage infrastructure meets compliance standards
• Reliable and affordable reticulated electricity network
• Road network meets community needs • Planning for growth • Reliable communications throughout the Shire • Quality infrastructure supports an irrigation
industry
Infrastructure
Community Plan - ‘Our Future’ adopted 17th November 2011 10
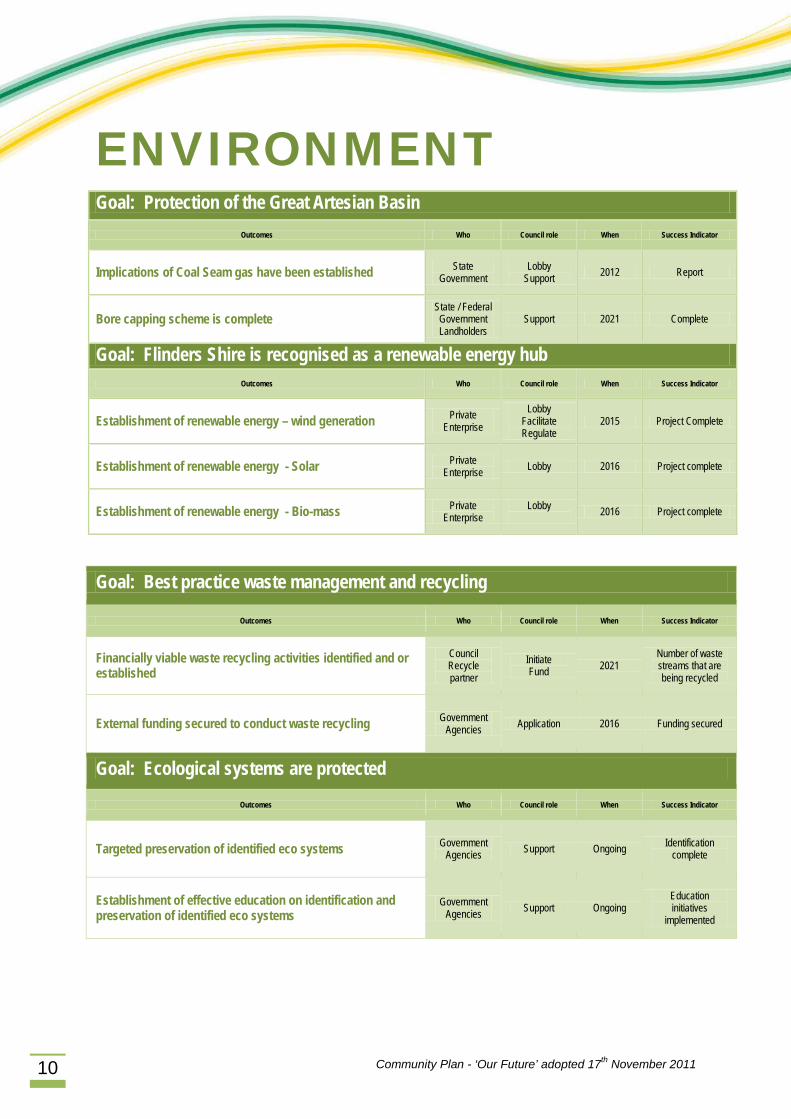
ENVIRONMENT Goal: Protection of the Great Artesian Basin
Outcomes Who Council role When Success Indicator
Implications of Coal Seam gas have been established State Government
Lobby Support 2012 Report
Bore capping scheme is complete State / Federal Government Landholders
Support 2021 Complete
Goal: Flinders Shire is recognised as a renewable energy hub Outcomes Who Council role When Success Indicator
Establishment of renewable energy – wind generation Private Enterprise
Lobby Facilitate Regulate
2015 Project Complete
Establishment of renewable energy - Solar Private Enterprise Lobby 2016 Project complete
Establishment of renewable energy - Bio-mass Private Enterprise
Lobby 2016 Project complete
Goal: Best practice waste management and recycling
Outcomes Who Council role When Success Indicator
Financially viable waste recycling activities identified and or established
Council Recycle partner
Initiate Fund 2021
Number of waste streams that are being recycled
External funding secured to conduct waste recycling Government Agencies Application 2016 Funding secured
Goal: Ecological systems are protected Outcomes Who Council role When Success Indicator
Targeted preservation of identified eco systems Government Agencies Support Ongoing Identification
complete
Establishment of effective education on identification and preservation of identified eco systems
Government Agencies Support Ongoing
Education initiatives
implemented
Community Plan - ‘Our Future’ adopted 17th November 2011 11
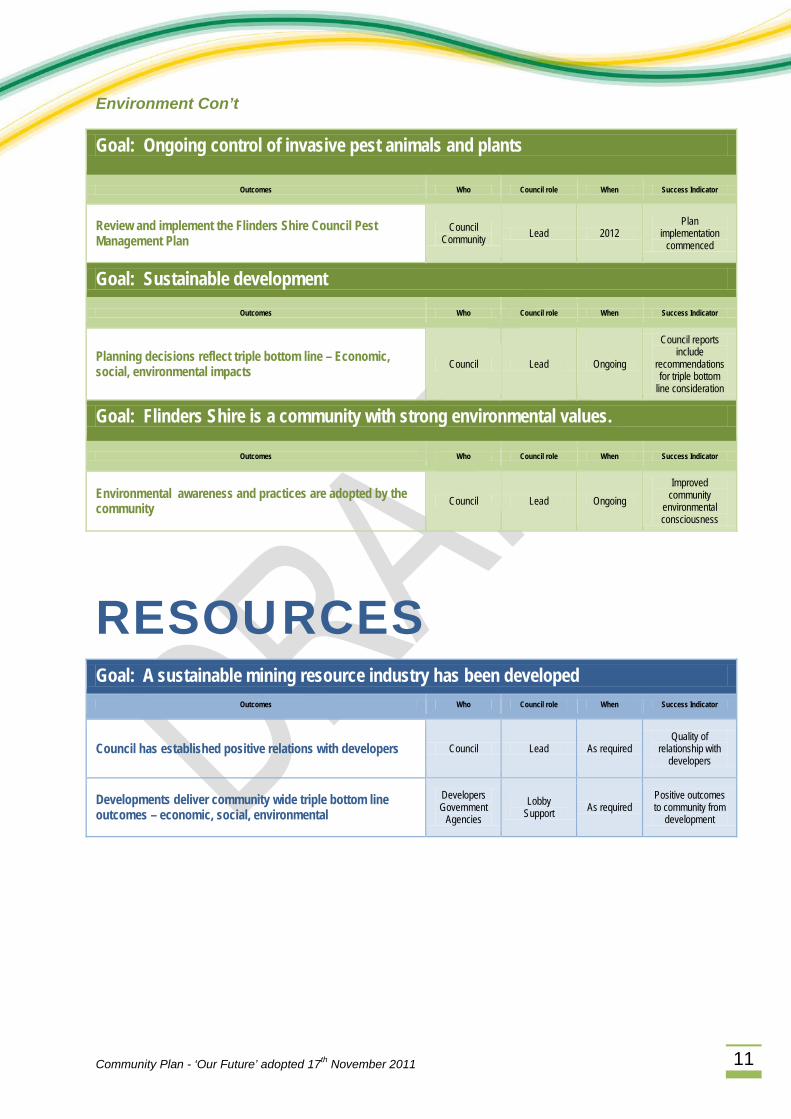
Environment Con’t
Goal: Ongoing control of invasive pest animals and plants
Outcomes Who Council role When Success Indicator
Review and implement the Flinders Shire Council Pest Management Plan
Council Community Lead 2012
Plan implementation
commenced
Goal: Sustainable development Outcomes Who Council role When Success Indicator
Planning decisions reflect triple bottom line – Economic, social, environmental impacts Council Lead Ongoing
Council reports include
recommendations for triple bottom
line consideration
Goal: Flinders Shire is a community with strong environmental values.
Outcomes Who Council role When Success Indicator
Environmental awareness and practices are adopted by the community Council Lead Ongoing
Improved community
environmental consciousness
RESOURCES Goal: A sustainable mining resource industry has been developed
Outcomes Who Council role When Success Indicator
Council has established positive relations with developers Council Lead As required Quality of
relationship with developers
Developments deliver community wide triple bottom line outcomes – economic, social, environmental
Developers Government
Agencies Lobby
Support As required Positive outcomes to community from
development
Community Plan - ‘Our Future’ adopted 17th November 2011 12
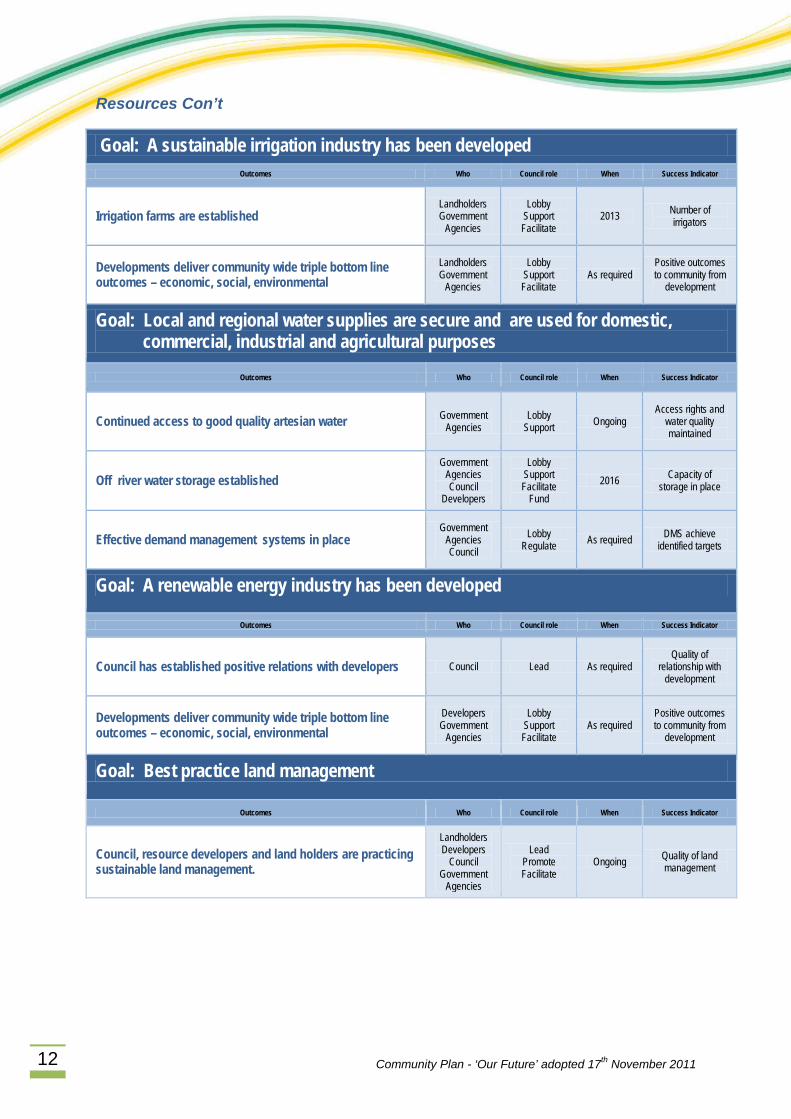
Resources Con’t
Goal: A sustainable irrigation industry has been developed Outcomes Who Council role When Success Indicator
Irrigation farms are established Landholders Government
Agencies
Lobby Support Facilitate
2013 Number of irrigators
Developments deliver community wide triple bottom line outcomes – economic, social, environmental
Landholders Government
Agencies
Lobby Support Facilitate
As required Positive outcomes to community from
development
Goal: Local and regional water supplies are secure and are used for domestic, commercial, industrial and agricultural purposes
Outcomes Who Council role When Success Indicator
Continued access to good quality artesian water Government Agencies
Lobby Support Ongoing
Access rights and water quality maintained
Off river water storage established Government
Agencies Council
Developers
Lobby Support Facilitate
Fund 2016 Capacity of
storage in place
Effective demand management systems in place Government
Agencies Council
Lobby Regulate As required DMS achieve
identified targets
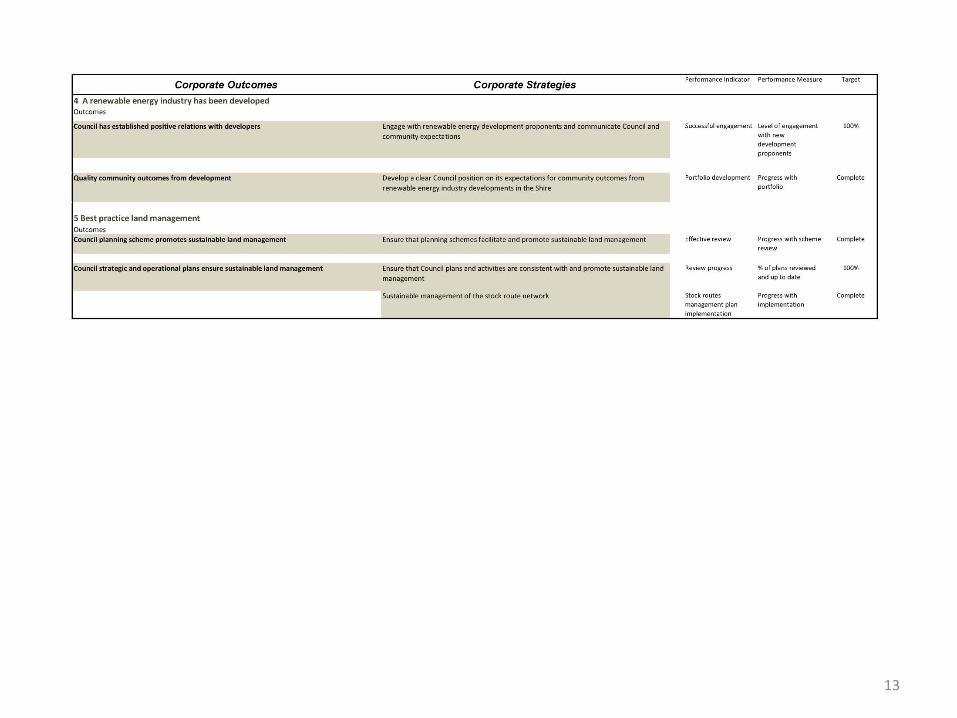
Goal: A renewable energy industry has been developed
Outcomes Who Council role When Success Indicator
Council has established positive relations with developers Council Lead As required Quality of
relationship with development
Developments deliver community wide triple bottom line outcomes – economic, social, environmental
Developers Government
Agencies
Lobby Support Facilitate
As required Positive outcomes to community from
development
Goal: Best practice land management
Outcomes Who Council role When Success Indicator
Council, resource developers and land holders are practicing sustainable land management.
Landholders Developers
Council Government
Agencies
Lead Promote Facilitate
Ongoing Quality of land management
Community Plan - ‘Our Future’ adopted 17th November 2011 13
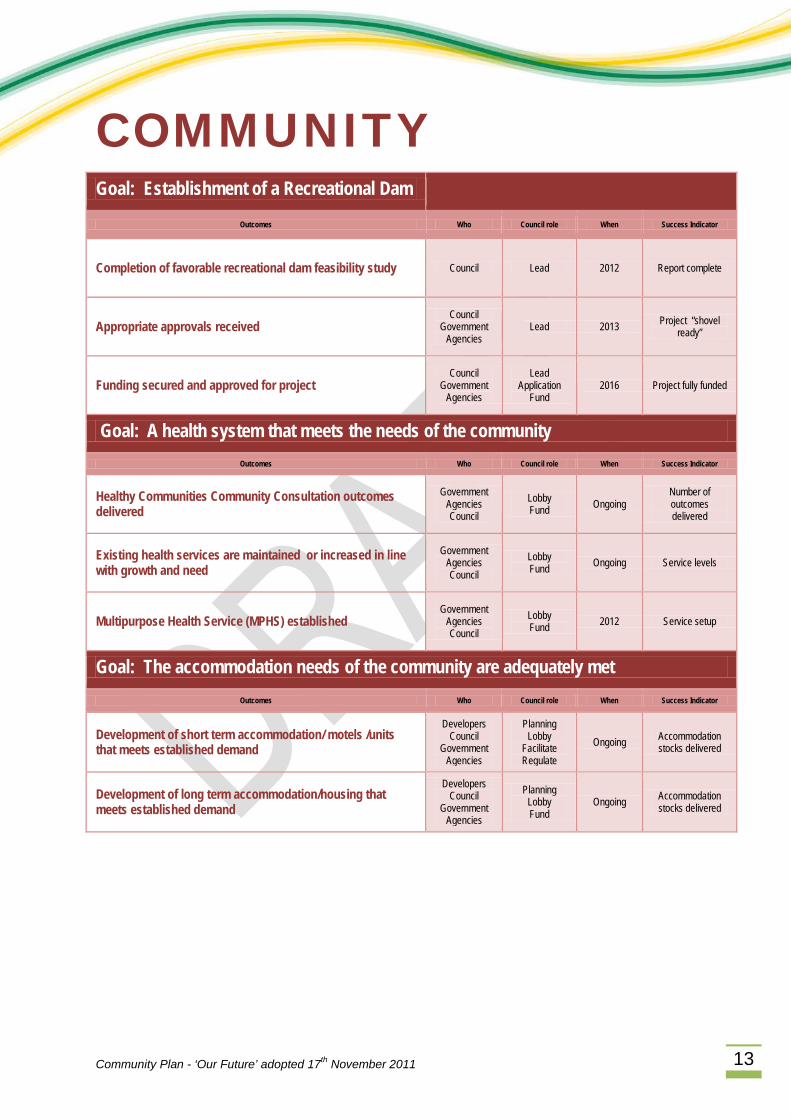
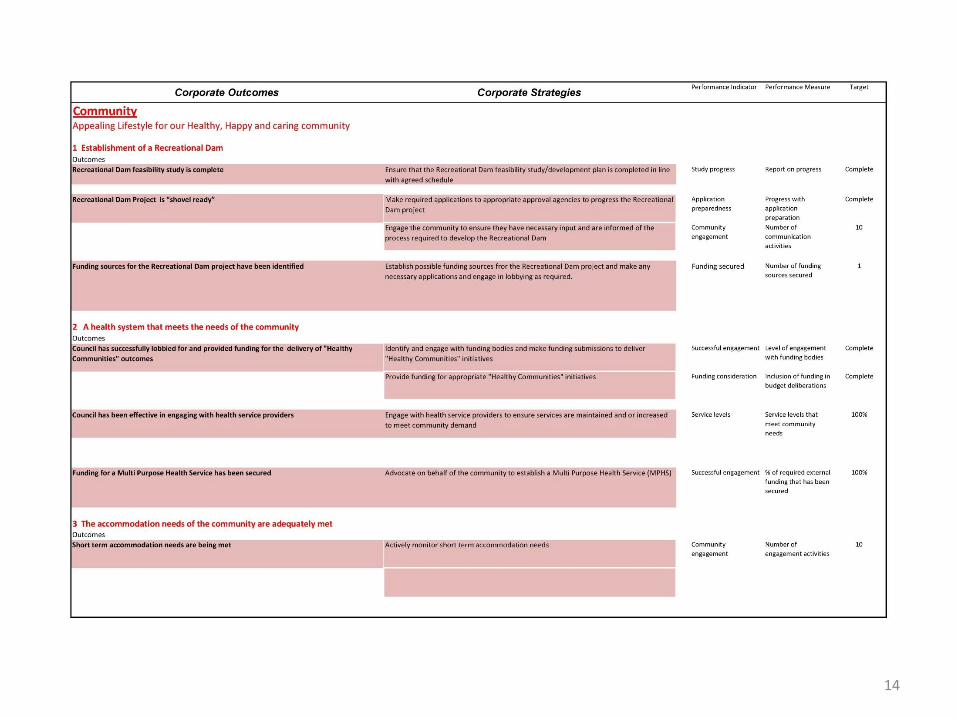
COMMUNITY Goal: Establishment of a Recreational Dam
Outcomes Who Council role When Success Indicator
Completion of favorable recreational dam feasibility study Council Lead 2012 Report complete
Appropriate approvals received Council
Government Agencies
Lead 2013 Project “shovel ready”
Funding secured and approved for project Council
Government Agencies
Lead Application
Fund 2016 Project fully funded
Goal: A health system that meets the needs of the community Outcomes Who Council role When Success Indicator
Healthy Communities Community Consultation outcomes delivered
Government Agencies Council
Lobby Fund Ongoing
Number of outcomes delivered
Existing health services are maintained or increased in line with growth and need
Government Agencies Council
Lobby Fund Ongoing Service levels
Multipurpose Health Service (MPHS) established Government
Agencies Council
Lobby Fund 2012 Service setup
Goal: The accommodation needs of the community are adequately met Outcomes Who Council role When Success Indicator
Development of short term accommodation/ motels /units that meets established demand
Developers Council
Government Agencies
Planning Lobby
Facilitate Regulate
Ongoing Accommodation stocks delivered
Development of long term accommodation/housing that meets established demand
Developers Council
Government Agencies
Planning Lobby Fund
Ongoing Accommodation stocks delivered
Community Plan - ‘Our Future’ adopted 17th November 2011 14
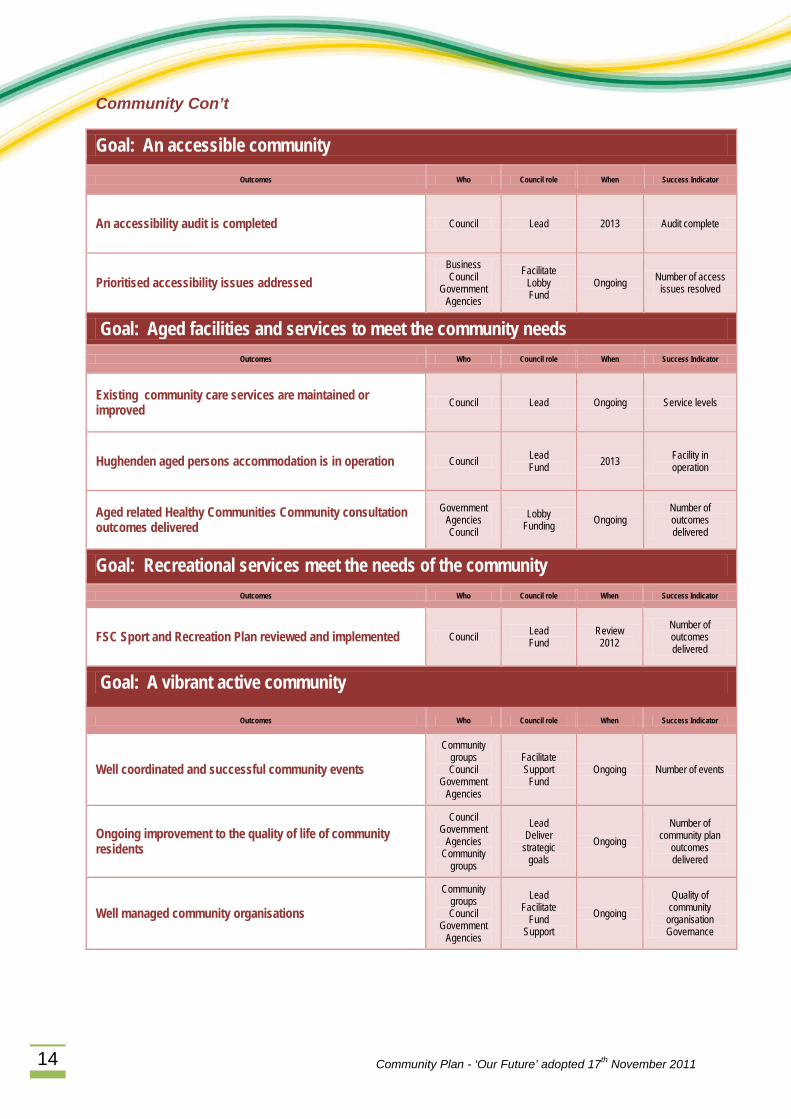
Community Con’t
Goal: An accessible community Outcomes Who Council role When Success Indicator
An accessibility audit is completed Council Lead 2013 Audit complete
Prioritised accessibility issues addressed Business Council
Government Agencies
Facilitate Lobby Fund
Ongoing Number of access issues resolved
Goal: Aged facilities and services to meet the community needs Outcomes Who Council role When Success Indicator
Existing community care services are maintained or improved Council Lead Ongoing Service levels
Hughenden aged persons accommodation is in operation Council Lead Fund 2013 Facility in
operation
Aged related Healthy Communities Community consultation outcomes delivered
Government Agencies Council
Lobby Funding Ongoing
Number of outcomes delivered
Goal: Recreational services meet the needs of the community Outcomes Who Council role When Success Indicator
FSC Sport and Recreation Plan reviewed and implemented Council Lead Fund
Review 2012
Number of outcomes delivered
Goal: A vibrant active community
Outcomes Who Council role When Success Indicator
Well coordinated and successful community events
Community groups Council
Government Agencies
Facilitate Support
Fund Ongoing Number of events
Ongoing improvement to the quality of life of community residents
Council Government
Agencies Community
groups
Lead Deliver
strategic goals
Ongoing Number of
community plan outcomes delivered
Well managed community organisations
Community groups Council
Government Agencies
Lead Facilitate
Fund Support
Ongoing Quality of
community organisation Governance
Community Plan - ‘Our Future’ adopted 17th November 2011 15
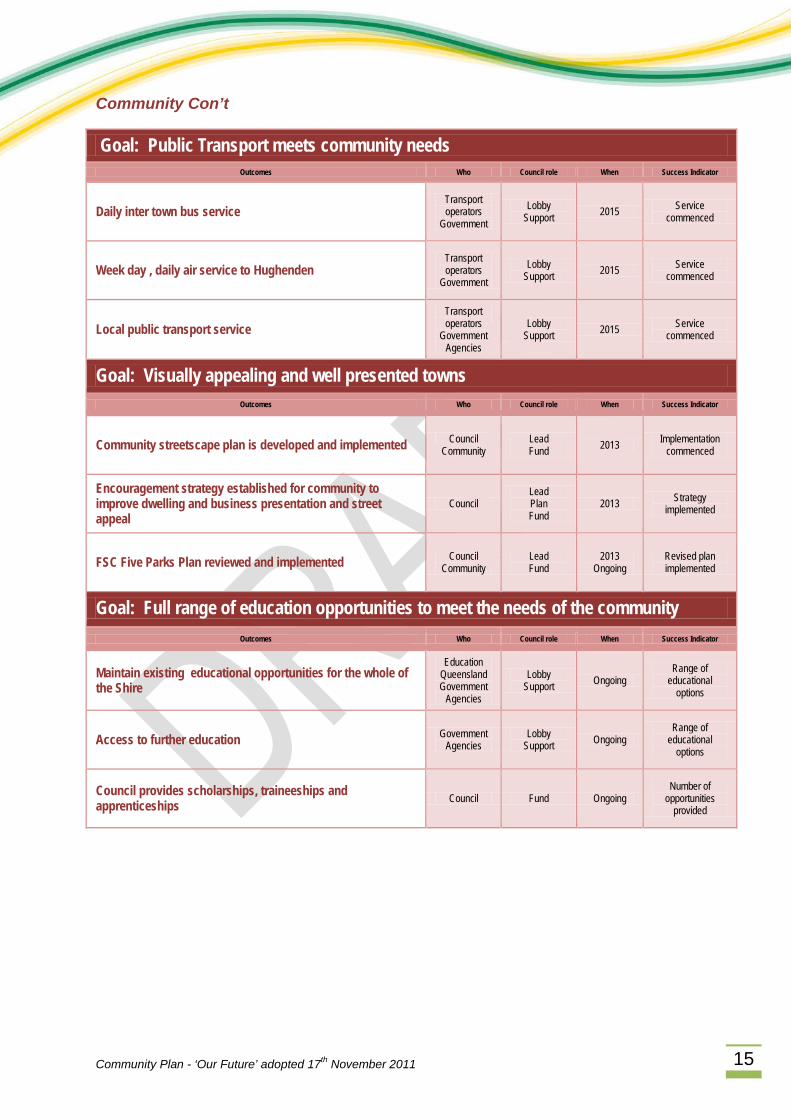
Community Con’t
Goal: Public Transport meets community needs Outcomes Who Council role When Success Indicator
Daily inter town bus service Transport operators
Government Lobby
Support 2015 Service commenced
Week day , daily air service to Hughenden Transport operators
Government Lobby
Support 2015 Service commenced
Local public transport service Transport operators
Government Agencies
Lobby Support 2015 Service
commenced
Goal: Visually appealing and well presented towns Outcomes Who Council role When Success Indicator
Community streetscape plan is developed and implemented Council Community
Lead Fund 2013 Implementation
commenced
Encouragement strategy established for community to improve dwelling and business presentation and street appeal
Council Lead Plan Fund
2013 Strategy implemented
FSC Five Parks Plan reviewed and implemented Council Community
Lead Fund
2013 Ongoing
Revised plan implemented
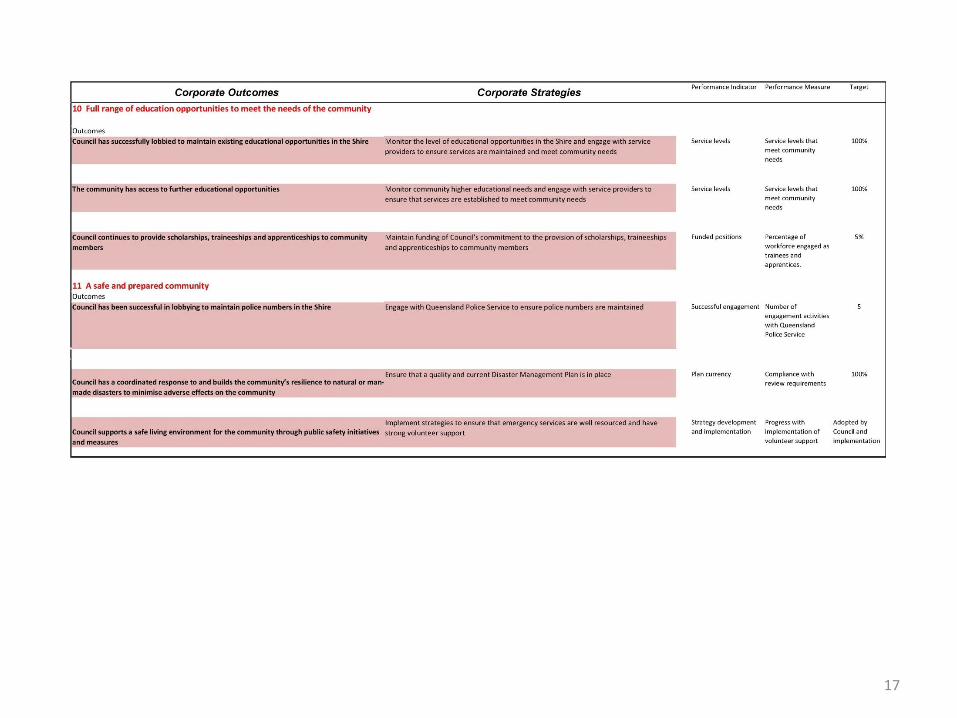
Goal: Full range of education opportunities to meet the needs of the community Outcomes Who Council role When Success Indicator
Maintain existing educational opportunities for the whole of the Shire
Education Queensland Government
Agencies
Lobby Support Ongoing
Range of educational
options
Access to further education Government Agencies
Lobby Support Ongoing
Range of educational
options
Council provides scholarships, traineeships and apprenticeships Council Fund Ongoing
Number of opportunities
provided
Community Plan - ‘Our Future’ adopted 17th November 2011 16
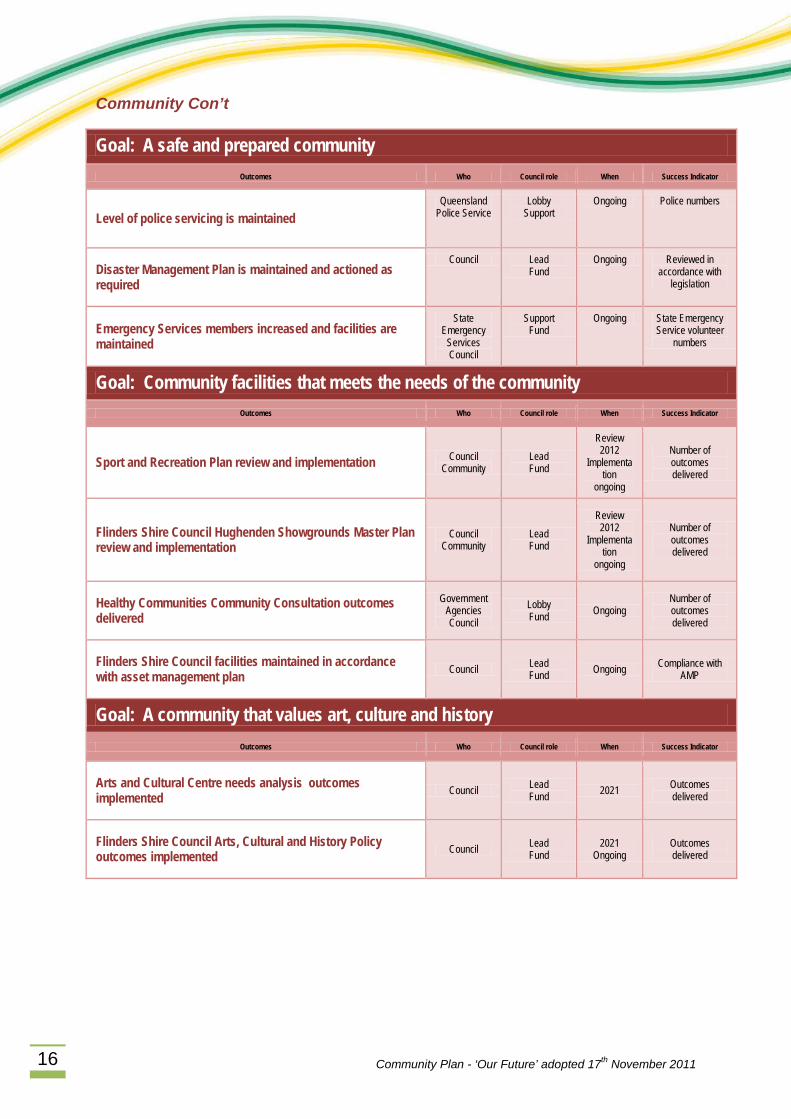
Community Con’t
Goal: A safe and prepared community Outcomes Who Council role When Success Indicator
Level of police servicing is maintained Queensland
Police Service Lobby
Support Ongoing Police numbers
Disaster Management Plan is maintained and actioned as required
Council Lead Fund
Ongoing Reviewed in accordance with
legislation
Emergency Services members increased and facilities are maintained
State Emergency
Services Council
Support Fund
Ongoing State Emergency Service volunteer
numbers
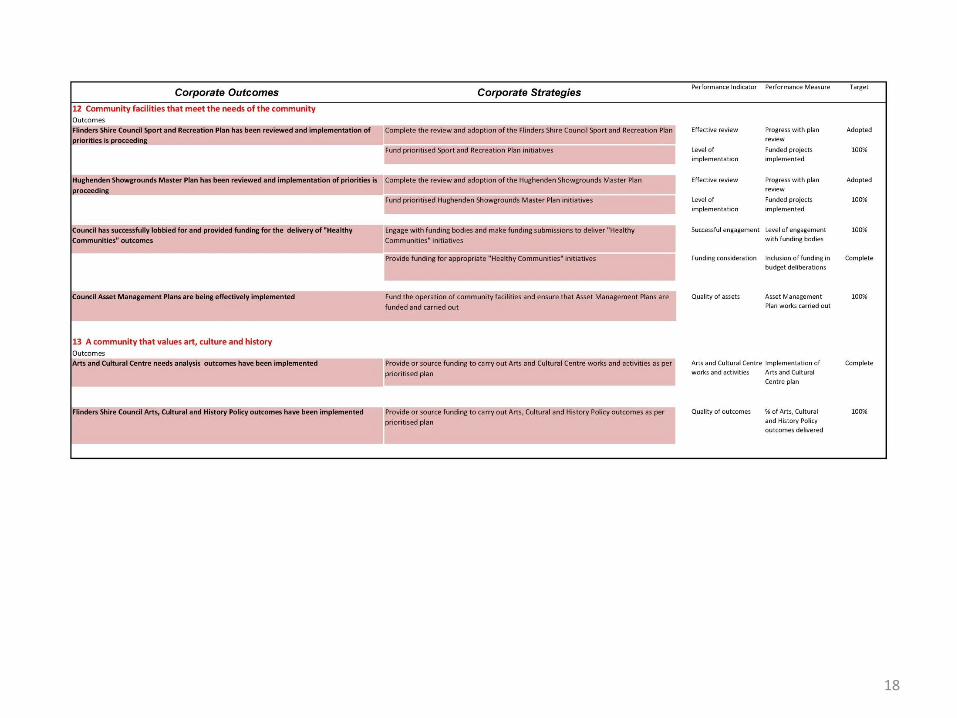
Goal: Community facilities that meets the needs of the community Outcomes Who Council role When Success Indicator
Sport and Recreation Plan review and implementation Council Community
Lead Fund
Review 2012
Implementation
ongoing
Number of outcomes delivered
Flinders Shire Council Hughenden Showgrounds Master Plan review and implementation
Council Community
Lead Fund
Review 2012
Implementation
ongoing
Number of outcomes delivered
Healthy Communities Community Consultation outcomes delivered
Government Agencies Council
Lobby Fund Ongoing
Number of outcomes delivered
Flinders Shire Council facilities maintained in accordance with asset management plan Council Lead
Fund Ongoing Compliance with AMP
Goal: A community that values art, culture and history Outcomes Who Council role When Success Indicator
Arts and Cultural Centre needs analysis outcomes implemented Council Lead
Fund 2021 Outcomes delivered
Flinders Shire Council Arts, Cultural and History Policy outcomes implemented Council Lead
Fund 2021
Ongoing Outcomes delivered
Community Plan - ‘Our Future’ adopted 17th November 2011 17
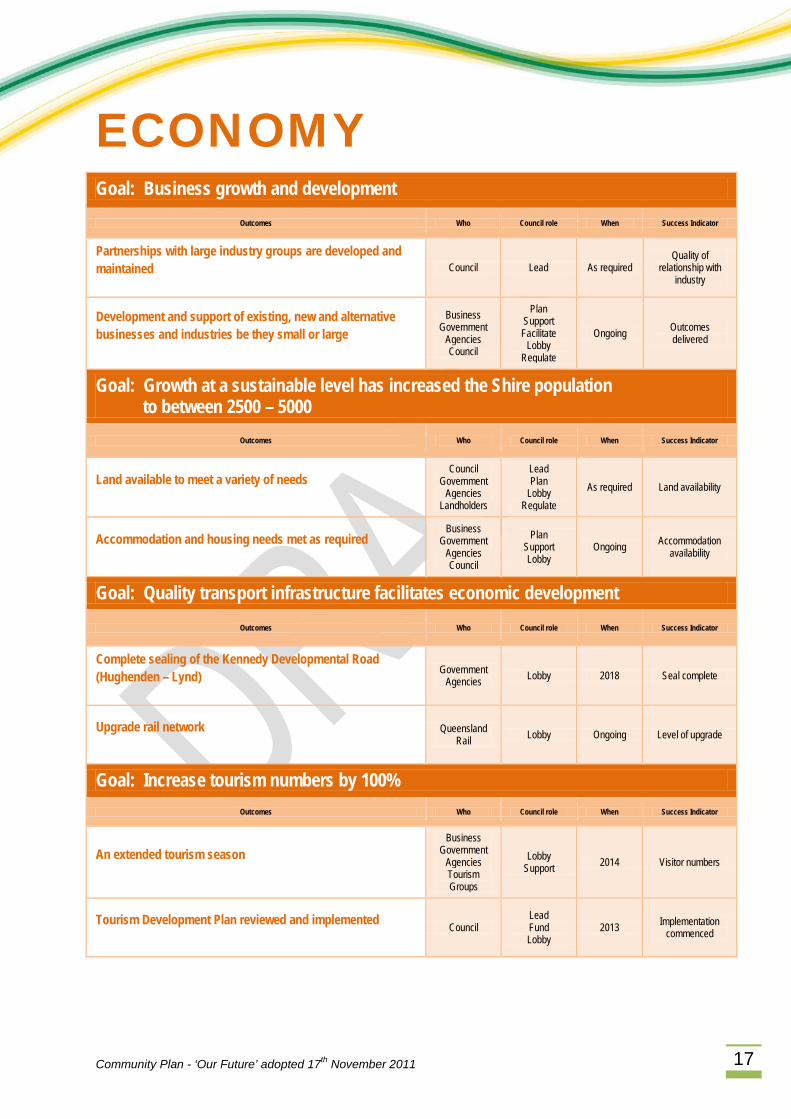
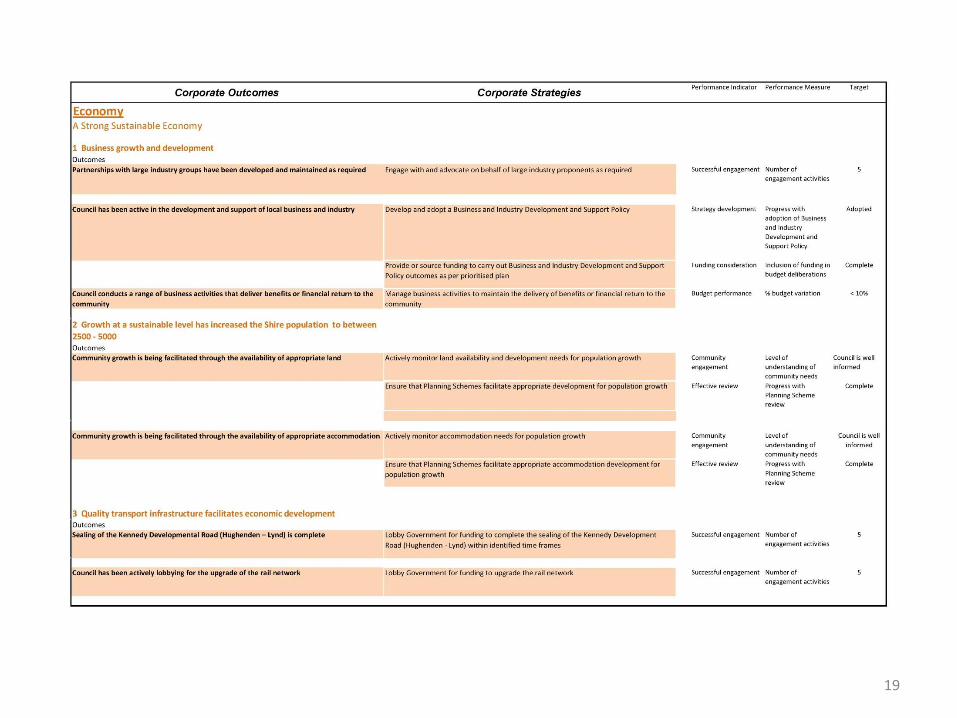
ECONOMY Goal: Business growth and development
Outcomes Who Council role When Success Indicator
Partnerships with large industry groups are developed and maintained Council Lead As required
Quality of relationship with
industry
Development and support of existing, new and alternative businesses and industries be they small or large
Business Government
Agencies Council
Plan Support Facilitate
Lobby Regulate
Ongoing Outcomes delivered
Goal: Growth at a sustainable level has increased the Shire population to between 2500 – 5000
Outcomes Who Council role When Success Indicator
Land available to meet a variety of needs Council
Government Agencies
Landholders
Lead Plan
Lobby Regulate
As required Land availability
Accommodation and housing needs met as required Business
Government Agencies Council
Plan Support Lobby
Ongoing Accommodation availability
Goal: Quality transport infrastructure facilitates economic development Outcomes Who Council role When Success Indicator
Complete sealing of the Kennedy Developmental Road (Hughenden – Lynd) Government
Agencies Lobby 2018 Seal complete
Upgrade rail network Queensland Rail Lobby Ongoing Level of upgrade
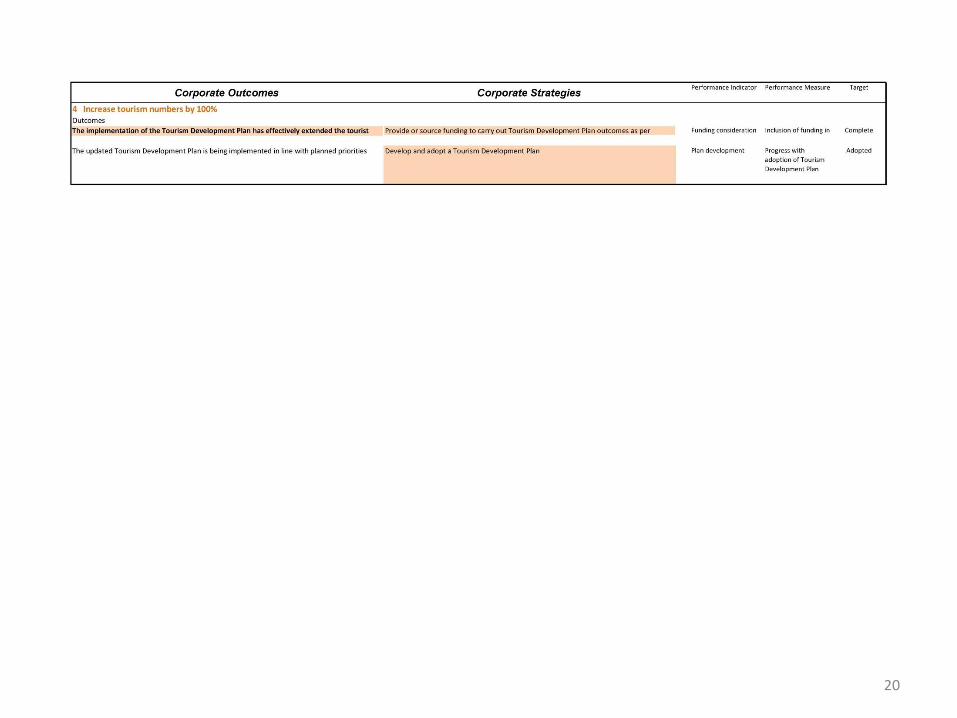
Goal: Increase tourism numbers by 100% Outcomes Who Council role When Success Indicator
An extended tourism season Business
Government Agencies Tourism Groups
Lobby Support 2014 Visitor numbers
Tourism Development Plan reviewed and implemented Council Lead Fund Lobby
2013 Implementation commenced
Community Plan - ‘Our Future’ adopted 17th November 2011 18
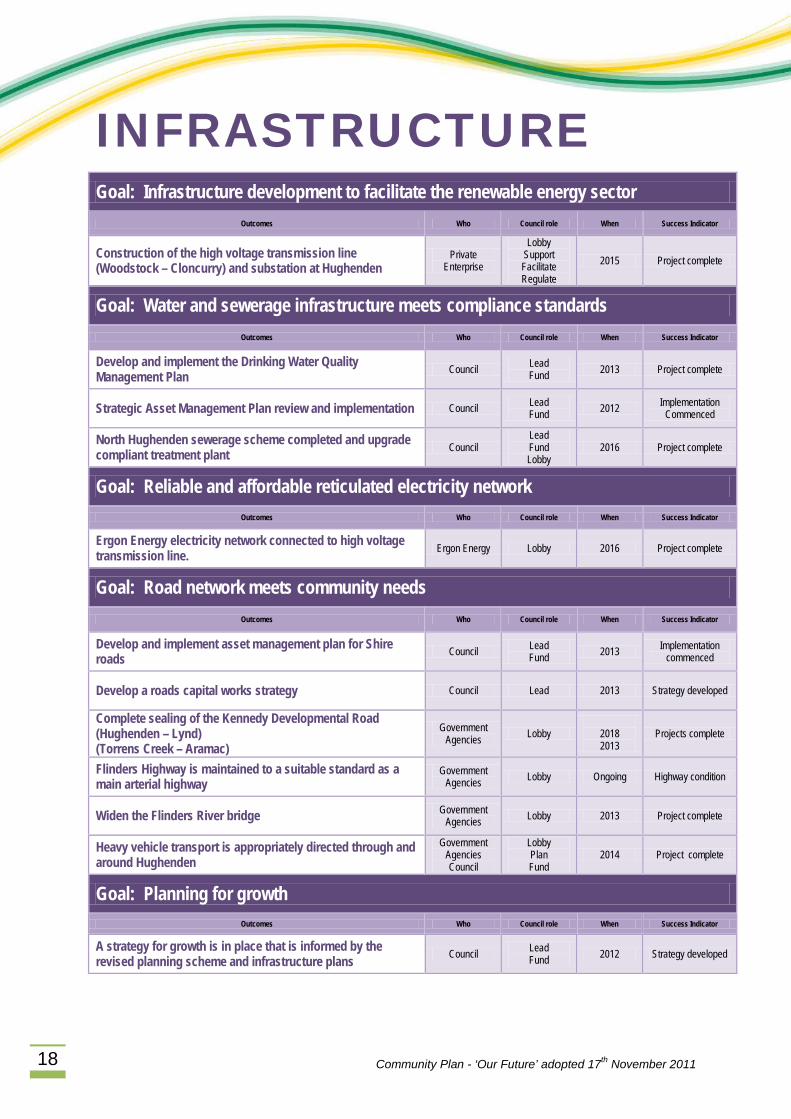
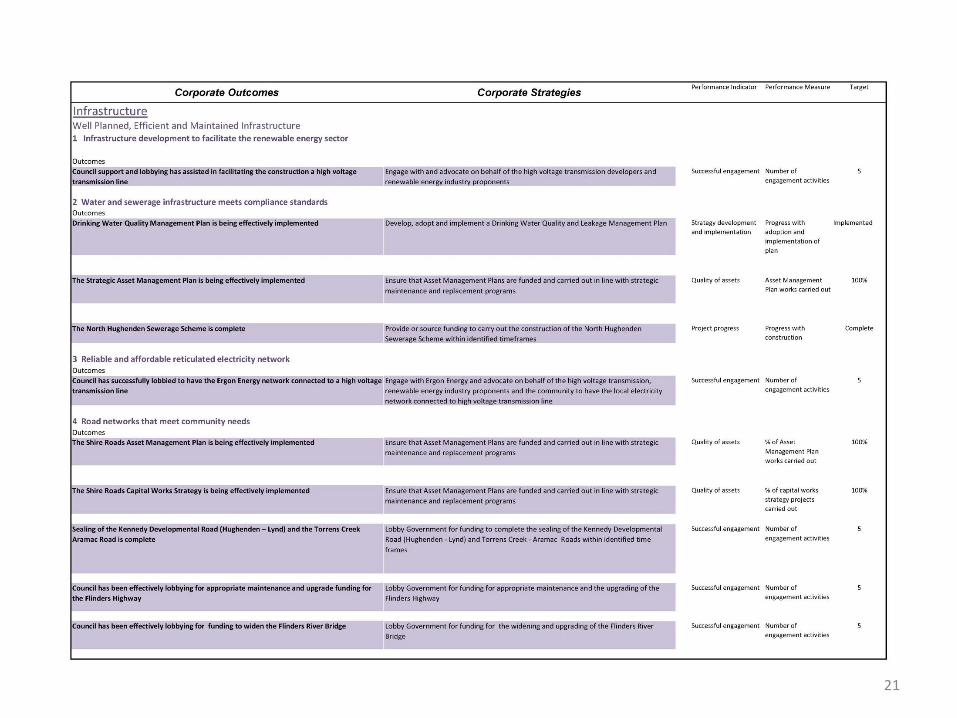
INFRASTRUCTURE Goal: Infrastructure development to facilitate the renewable energy sector
Outcomes Who Council role When Success Indicator
Construction of the high voltage transmission line (Woodstock – Cloncurry) and substation at Hughenden
Private Enterprise
Lobby Support Facilitate Regulate
2015 Project complete
Goal: Water and sewerage infrastructure meets compliance standards Outcomes Who Council role When Success Indicator
Develop and implement the Drinking Water Quality Management Plan Council Lead
Fund 2013 Project complete
Strategic Asset Management Plan review and implementation Council Lead Fund 2012 Implementation
Commenced
North Hughenden sewerage scheme completed and upgrade compliant treatment plant Council
Lead Fund Lobby
2016 Project complete
Goal: Reliable and affordable reticulated electricity network Outcomes Who Council role When Success Indicator
Ergon Energy electricity network connected to high voltage transmission line. Ergon Energy Lobby 2016 Project complete
Goal: Road network meets community needs Outcomes Who Council role When Success Indicator
Develop and implement asset management plan for Shire roads Council Lead
Fund 2013 Implementation commenced
Develop a roads capital works strategy Council Lead 2013 Strategy developed
Complete sealing of the Kennedy Developmental Road (Hughenden – Lynd) (Torrens Creek – Aramac)
Government Agencies Lobby
2018 2013
Projects complete
Flinders Highway is maintained to a suitable standard as a main arterial highway
Government Agencies Lobby Ongoing Highway condition
Widen the Flinders River bridge Government Agencies Lobby 2013 Project complete
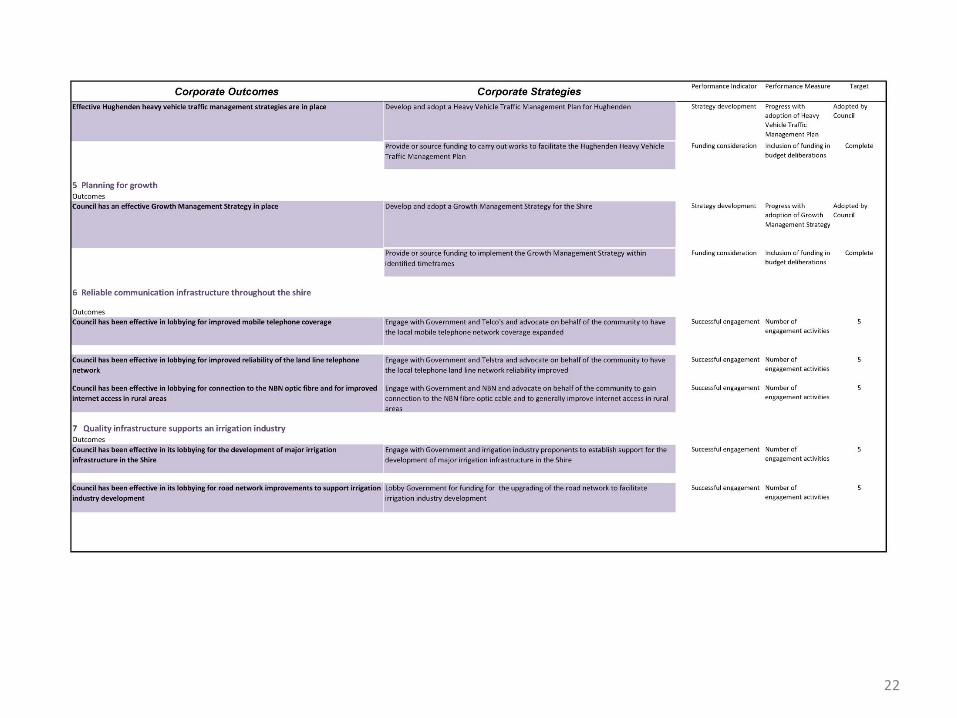
Heavy vehicle transport is appropriately directed through and around Hughenden
Government Agencies Council
Lobby Plan Fund
2014 Project complete
Goal: Planning for growth Outcomes Who Council role When Success Indicator
A strategy for growth is in place that is informed by the revised planning scheme and infrastructure plans Council Lead
Fund 2012 Strategy developed
Community Plan - ‘Our Future’ adopted 17th November 2011 19
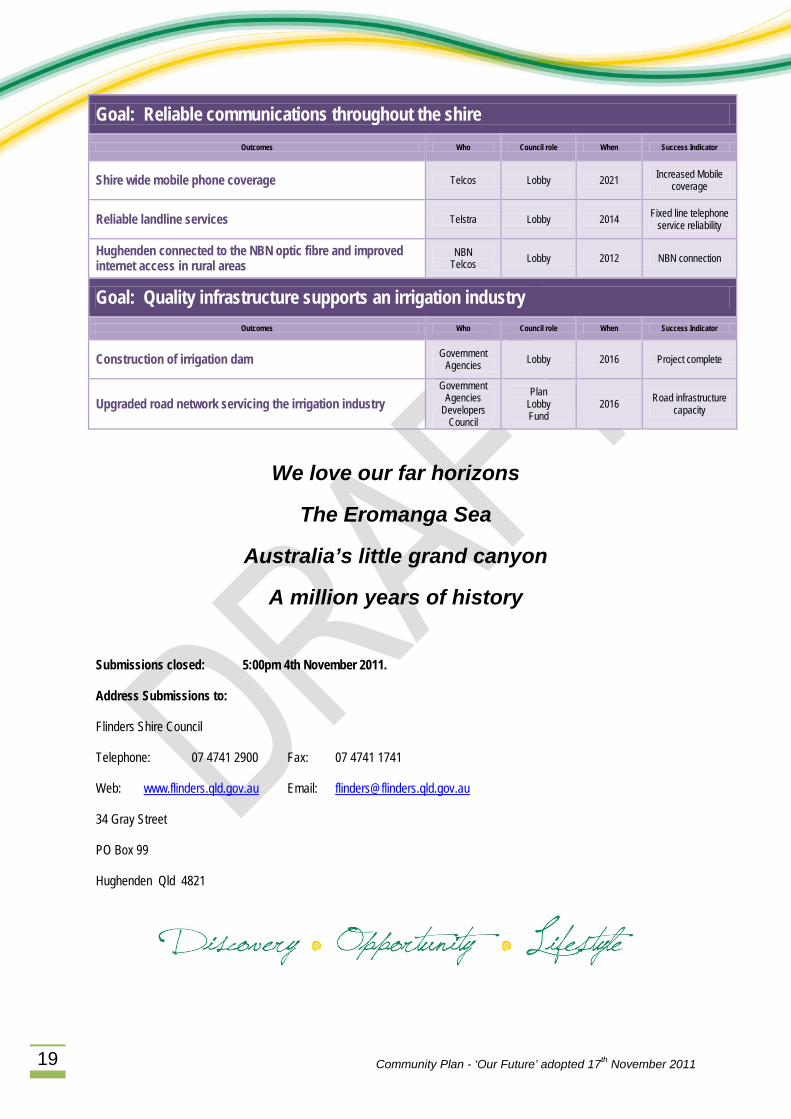
Goal: Reliable communications throughout the shire Outcomes Who Council role When Success Indicator
Shire wide mobile phone coverage Telcos Lobby 2021 Increased Mobile coverage
Reliable landline services Telstra Lobby 2014 Fixed line telephone service reliability
Hughenden connected to the NBN optic fibre and improved internet access in rural areas
NBN Telcos Lobby 2012 NBN connection
Goal: Quality infrastructure supports an irrigation industry Outcomes Who Council role When Success Indicator
Construction of irrigation dam Government Agencies Lobby 2016 Project complete
Upgraded road network servicing the irrigation industry Government
Agencies Developers
Council
Plan Lobby Fund
2016 Road infrastructure capacity
We love our far horizons
The Eromanga Sea
Australia’s little grand canyon
A million years of history
Submissions closed: 5:00pm 4th November 2011.
Address Submissions to:
Flinders Shire Council
Telephone: 07 4741 2900 Fax: 07 4741 1741
Web: www.flinders.qld.gov.au Email: [email protected]
34 Gray Street
PO Box 99
Hughenden Qld 4821

SHIRE OF FLINDERS
Corporate Plan 2012 –2017
Discovery, Opportunity, Lifestyle 1
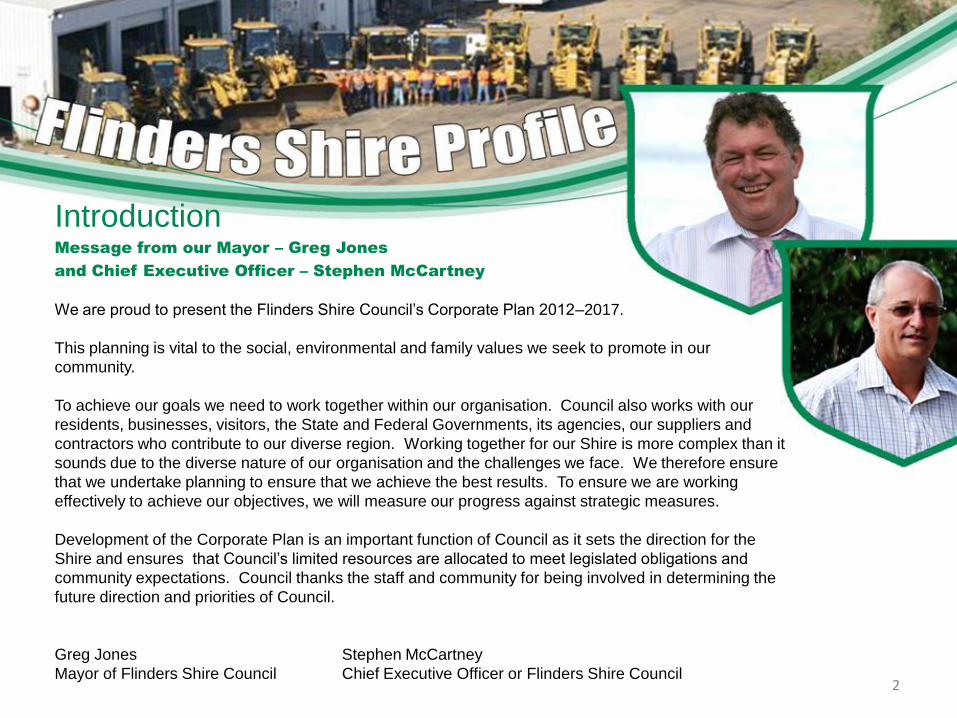
Introduction Message from our Mayor – Greg Jones
and Chief Executive Officer – Stephen McCartney
We are proud to present the Flinders Shire Council’s Corporate Plan 2012–2017.
This planning is vital to the social, environmental and family values we seek to promote in our
community.
To achieve our goals we need to work together within our organisation. Council also works with our
residents, businesses, visitors, the State and Federal Governments, its agencies, our suppliers and
contractors who contribute to our diverse region. Working together for our Shire is more complex than it
sounds due to the diverse nature of our organisation and the challenges we face. We therefore ensure
that we undertake planning to ensure that we achieve the best results. To ensure we are working
effectively to achieve our objectives, we will measure our progress against strategic measures.
Development of the Corporate Plan is an important function of Council as it sets the direction for the
Shire and ensures that Council’s limited resources are allocated to meet legislated obligations and
community expectations. Council thanks the staff and community for being involved in determining the
future direction and priorities of Council.
Greg Jones Stephen McCartney
Mayor of Flinders Shire Council Chief Executive Officer or Flinders Shire Council
2
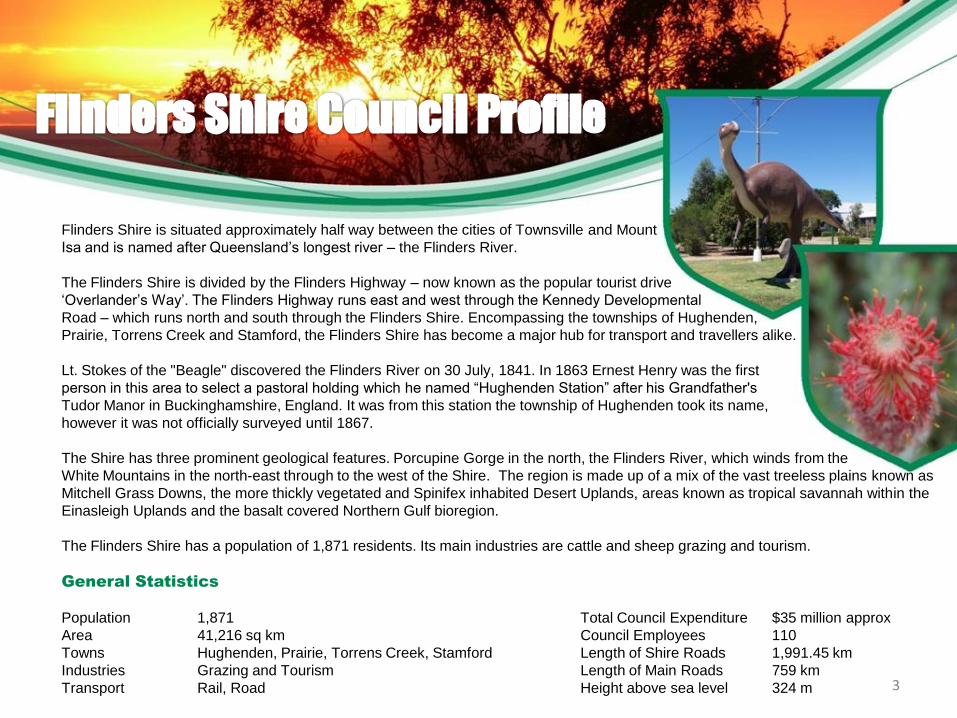
Flinders Shire is situated approximately half way between the cities of Townsville and Mount
Isa and is named after Queensland’s longest river – the Flinders River.
The Flinders Shire is divided by the Flinders Highway – now known as the popular tourist drive
‘Overlander’s Way’. The Flinders Highway runs east and west through the Kennedy Developmental
Road – which runs north and south through the Flinders Shire. Encompassing the townships of Hughenden,
Prairie, Torrens Creek and Stamford, the Flinders Shire has become a major hub for transport and travellers alike.
Lt. Stokes of the "Beagle" discovered the Flinders River on 30 July, 1841. In 1863 Ernest Henry was the first
person in this area to select a pastoral holding which he named “Hughenden Station” after his Grandfather's
Tudor Manor in Buckinghamshire, England. It was from this station the township of Hughenden took its name,
however it was not officially surveyed until 1867.
The Shire has three prominent geological features. Porcupine Gorge in the north, the Flinders River, which winds from the
White Mountains in the north-east through to the west of the Shire. The region is made up of a mix of the vast treeless plains known as
Mitchell Grass Downs, the more thickly vegetated and Spinifex inhabited Desert Uplands, areas known as tropical savannah within the
Einasleigh Uplands and the basalt covered Northern Gulf bioregion.
The Flinders Shire has a population of 1,871 residents. Its main industries are cattle and sheep grazing and tourism.
General Statistics
Population 1,871 Total Council Expenditure $35 million approx
Area 41,216 sq km Council Employees 110
Towns Hughenden, Prairie, Torrens Creek, Stamford Length of Shire Roads 1,991.45 km
Industries Grazing and Tourism Length of Main Roads 759 km
Transport Rail, Road Height above sea level 324 m 3
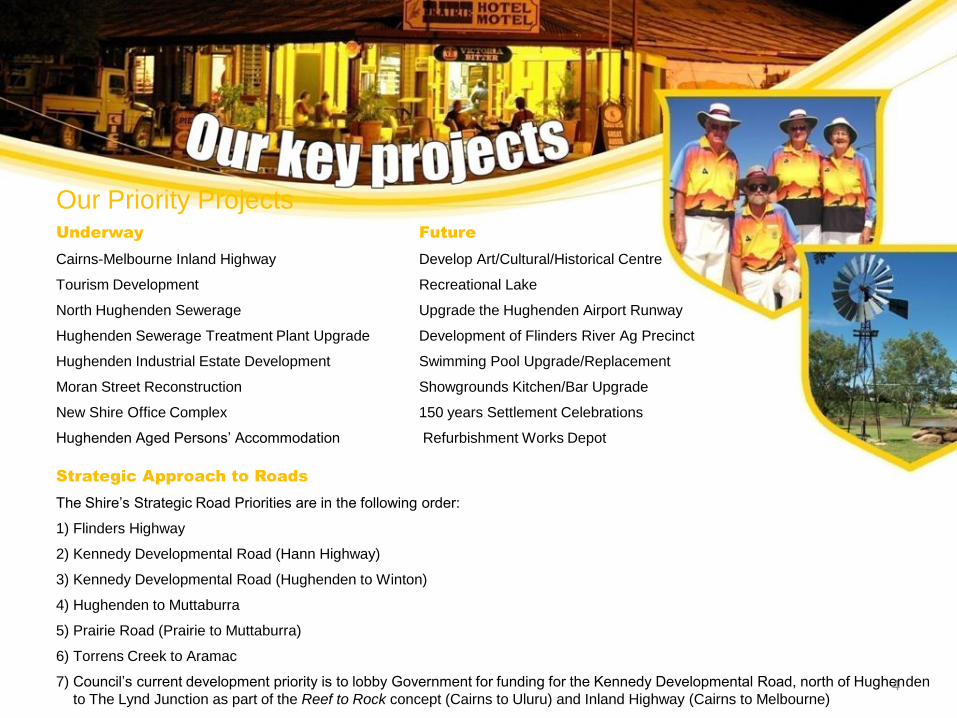
Our Priority Projects Underway Future
Cairns-Melbourne Inland Highway Develop Art/Cultural/Historical Centre
Tourism Development Recreational Lake
North Hughenden Sewerage Upgrade the Hughenden Airport Runway
Hughenden Sewerage Treatment Plant Upgrade Development of Flinders River Ag Precinct
Hughenden Industrial Estate Development Swimming Pool Upgrade/Replacement
Moran Street Reconstruction Showgrounds Kitchen/Bar Upgrade
New Shire Office Complex 150 years Settlement Celebrations
Hughenden Aged Persons’ Accommodation Refurbishment Works Depot
Strategic Approach to Roads
The Shire’s Strategic Road Priorities are in the following order:
1) Flinders Highway
2) Kennedy Developmental Road (Hann Highway)
3) Kennedy Developmental Road (Hughenden to Winton)
4) Hughenden to Muttaburra
5) Prairie Road (Prairie to Muttaburra)
6) Torrens Creek to Aramac
7) Council’s current development priority is to lobby Government for funding for the Kennedy Developmental Road, north of Hughenden
to The Lynd Junction as part of the Reef to Rock concept (Cairns to Uluru) and Inland Highway (Cairns to Melbourne)
4
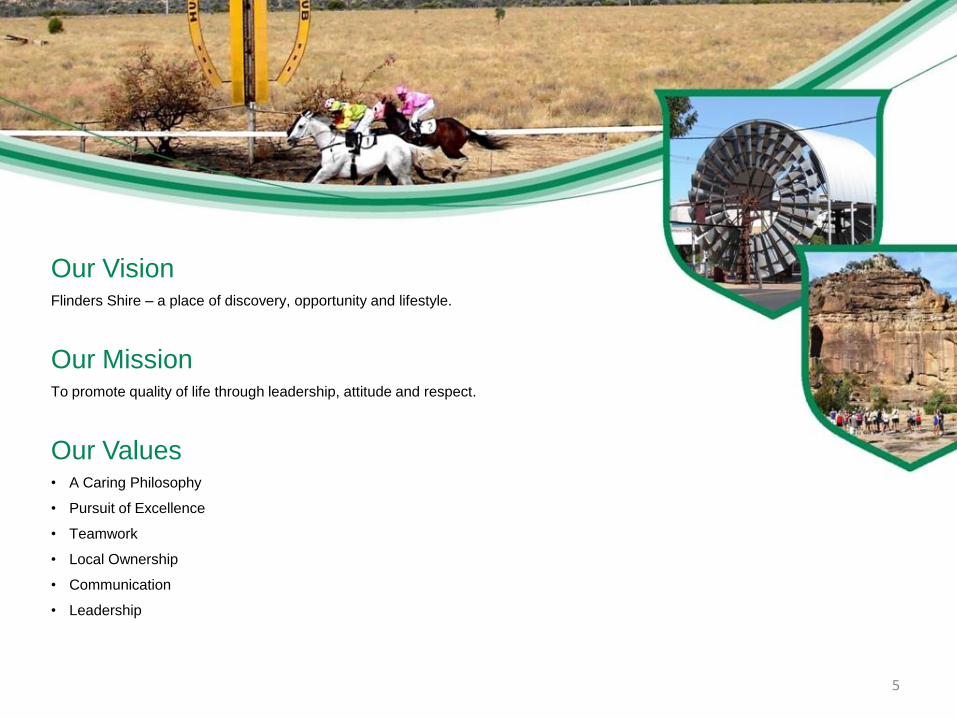
Our Vision Flinders Shire – a place of discovery, opportunity and lifestyle.
Our Mission To promote quality of life through leadership, attitude and respect.
Our Values • A Caring Philosophy
• Pursuit of Excellence
• Teamwork
• Local Ownership
• Communication
• Leadership
5
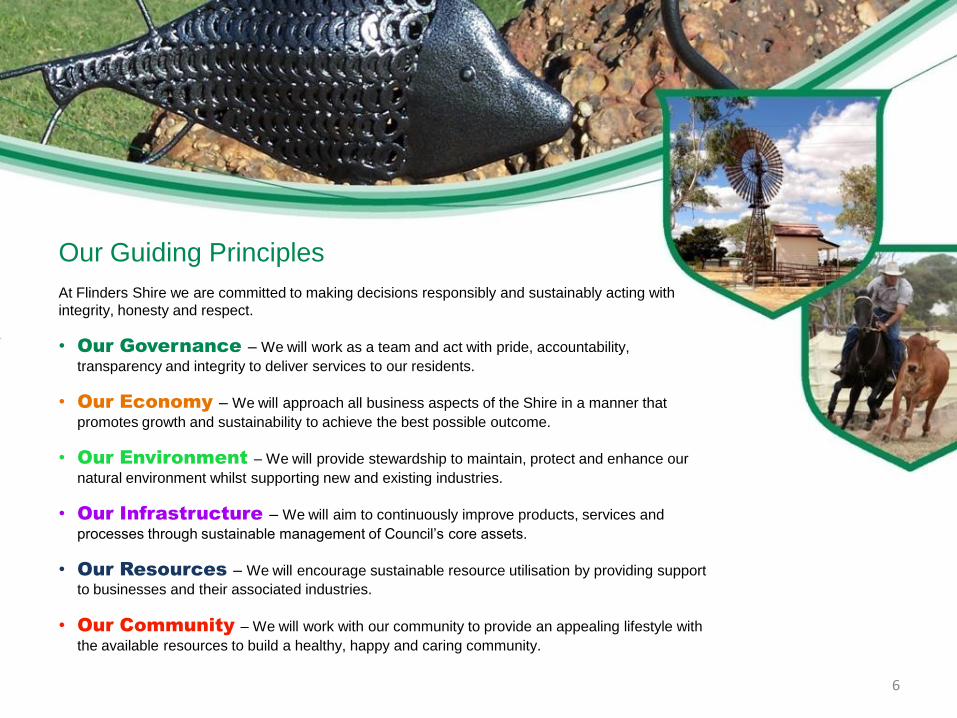
Our Guiding Principles
At Flinders Shire we are committed to making decisions responsibly and sustainably acting with
integrity, honesty and respect.
• Our Governance – We will work as a team and act with pride, accountability,
transparency and integrity to deliver services to our residents.
• Our Economy – We will approach all business aspects of the Shire in a manner that
promotes growth and sustainability to achieve the best possible outcome.
• Our Environment – We will provide stewardship to maintain, protect and enhance our
natural environment whilst supporting new and existing industries.
• Our Infrastructure – We will aim to continuously improve products, services and
processes through sustainable management of Council’s core assets.
• Our Resources – We will encourage sustainable resource utilisation by providing support
to businesses and their associated industries.
• Our Community – We will work with our community to provide an appealing lifestyle with
the available resources to build a healthy, happy and caring community.
6
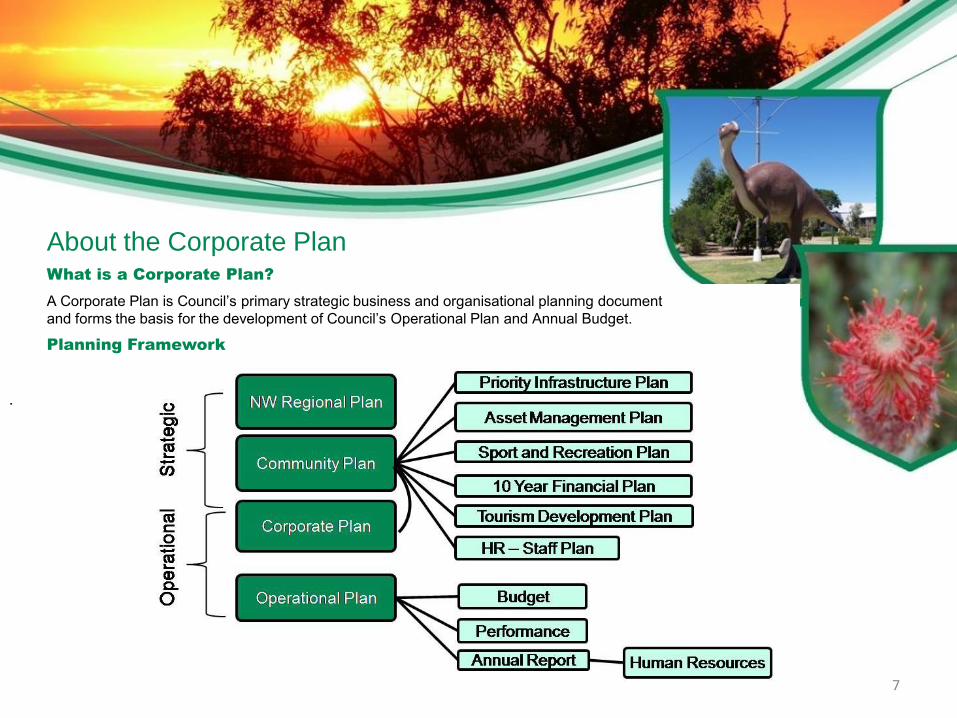
About the Corporate Plan What is a Corporate Plan?
A Corporate Plan is Council’s primary strategic business and organisational planning document
and forms the basis for the development of Council’s Operational Plan and Annual Budget.
Planning Framework
.
7
Council’s Planning Processes In 2011, Council developed its `Ten Year Community Plan’. We undertook a community
consultation process to seek the community’s input. The Community Plan is aligned to the North
West Regional Plan developed for our region by the State Government.
Each financial year, Council prepares an Annual Budget and Operational Plan and revises its
`Five Year Corporate Plan’ and `Ten Year Financial Forecast’.
The Operational Plan includes all of the services and projects that Council is undertaking to
provide the community with services to achieve the Corporate Plan outcomes and align with the
Vision. The Annual Budget provides the resources to achieve the Operational Plan objectives.
The Council has a Community Engagement Policy and has followed these principles when
developing the Corporate Plan.
Corporate Plan Statutory Requirements
The Local Government (Finance, Plans and Reporting) Regulation 2010 Section 120 requires that
a Corporate Plan be prepared and adopted. It must outline the strategic direction of the Local
Government. The Corporate Plan comes from the Community Plan. Council’s Corporate
Strategies to achieve its tasks in the Community Plan are detailed in the Corporate Plan.
8
Corporate Plan Consultation Public Consultation
This Corporate Plan is based on the community consultation as part of the community planning process
which was used to develop the Community Plan 2011-2021. Information collated has been used in the
development of this plan.
Councillor and Staff Consultation
Council’s elected members and senior staff were consulted to ensure direct input into the Corporate Plan
development and the community consultation information was also considered.
Council’s elected members, senior executives, staff and community were given opportunities to contribute
to the development of the Corporate Plan as members of the community.
Corporate Plan Adoption
The final Corporate Plan was adopted by Council on
Key Outcomes and Strategies Outcomes are the goals Council plans to achieve in moving towards its Vision.
Strategies are the tactics we intend to use to help us achieve its Outcomes. These strategies are
supported by the Operational Plan and Budget.
9
10
11
12
13
14
15
16
17
18
19
20
21
22
23
24
How will we know whether our Corporate Plan
Outcomes are being achieved?
• Our Vision, Mission and Values will be widely publicised by our staff.
• We will regularly measure and publicly report on our progress each year in our Annual Report to ensure
we are accountable to our community.
• We will link our annual Operational Plan and Budget to Corporate Plan outcomes and strategies to ensure
they become a continuous focus of attention.
• Financial Management will provide reporting, analysis and review of performance against our Annual Budget.
Contact Us
Please contact us if you would like more information regarding Flinders Shire Council’s Strategic Planning
Framework or access to other documents referred to.
Phone: 07 4741 2900 Fax: 07 4741 1741
Write to: Visit your Council Office at:
The Chief Executive Officer 34 Gray Street
Flinders Shire Council Hughenden QLD 4821
PO Box 274
Hughenden Q 4821
Email: [email protected] Website: www.flinders.qld.gov.au
25
Corporate Strategies Responsibility Operational Activities Budget
Performance
Indicator
Performance
Measure Target
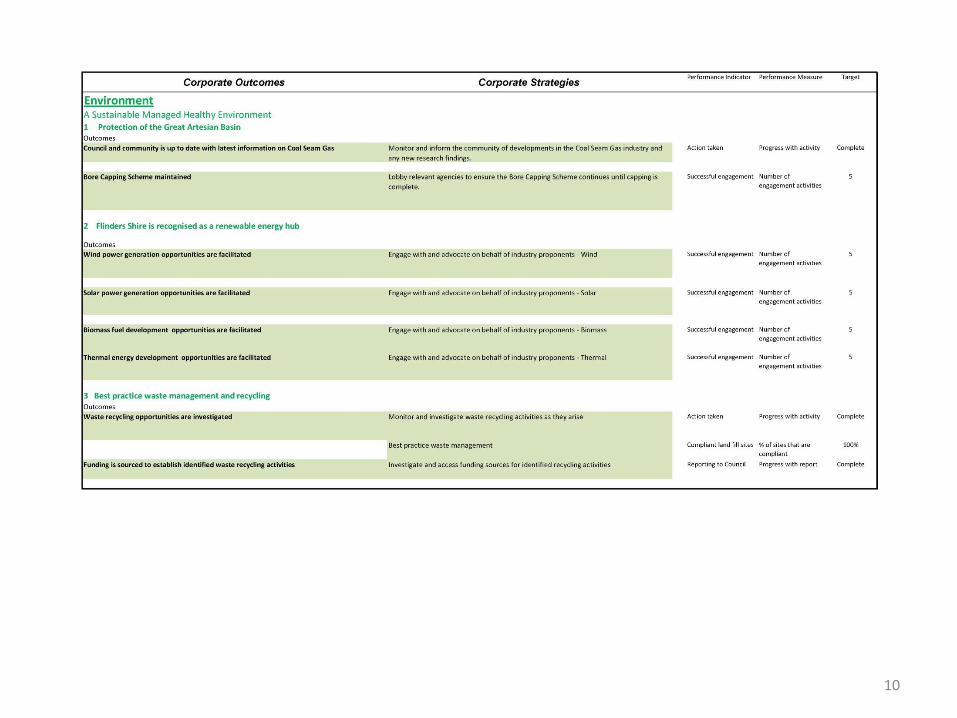
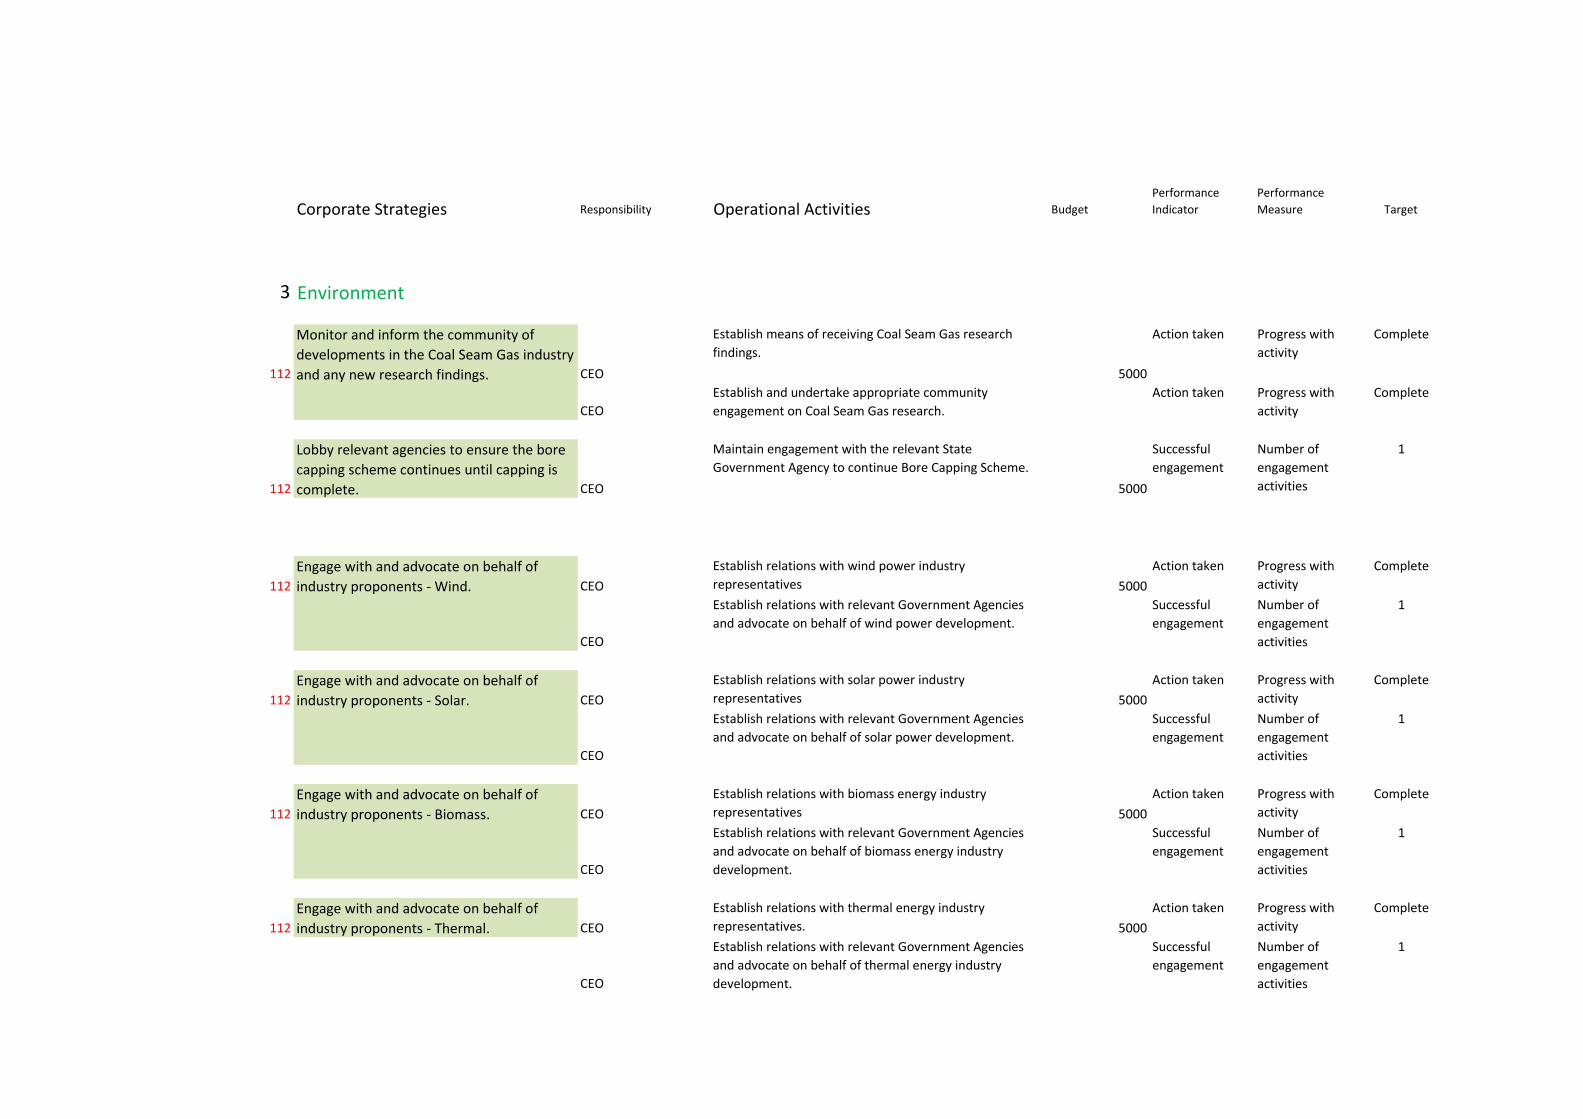
3 Environment
112
Monitor and inform the community of
developments in the Coal Seam Gas industry
and any new research findings. CEO
Establish means of receiving Coal Seam Gas research
findings.
5000
Action taken Progress with
activity
Complete
CEO
Establish and undertake appropriate community
engagement on Coal Seam Gas research.
Action taken Progress with
activity
Complete
112
Lobby relevant agencies to ensure the bore
capping scheme continues until capping is
complete. CEO
Maintain engagement with the relevant State
Government Agency to continue Bore Capping Scheme.
5000
Successful
engagement
Number of
engagement
activities
1
112
Engage with and advocate on behalf of
industry proponents - Wind. CEO
Establish relations with wind power industry
representatives 5000
Action taken Progress with
activity
Complete
CEO
Establish relations with relevant Government Agencies
and advocate on behalf of wind power development.
Successful
engagement
Number of
engagement
activities
1
112
Engage with and advocate on behalf of
industry proponents - Solar. CEO
Establish relations with solar power industry
representatives 5000
Action taken Progress with
activity
Complete
CEO
Establish relations with relevant Government Agencies
and advocate on behalf of solar power development.
Successful
engagement
Number of
engagement
activities
1
112
Engage with and advocate on behalf of
industry proponents - Biomass. CEO
Establish relations with biomass energy industry
representatives 5000
Action taken Progress with
activity
Complete
CEO
Establish relations with relevant Government Agencies
and advocate on behalf of biomass energy industry
development.
Successful
engagement
Number of
engagement
activities
1
112
Engage with and advocate on behalf of
industry proponents - Thermal. CEO
Establish relations with thermal energy industry
representatives. 5000
Action taken Progress with
activity
Complete
CEO
Establish relations with relevant Government Agencies
and advocate on behalf of thermal energy industry
development.
Successful
engagement
Number of
engagement
activities
1

132
Monitor and investigate waste recycling
activities as they arise. DCS/EHO
Review and report on current waste recycling practices
and opportunities. 100000
Report
development
Report on
Progress
Complete
132
Best practice waste management.
DCS/EHO
Manage Shire land fill sites.
100000
Compliant land
fill sites
Number of
compliant sites
1
132
Investigate and access funding sources for
identified recycling activities.
DCS/EHO
Source funding where possible for approved recycling
activities.
100000
Number of
funding sources
identified
Report on
Progress
Complete
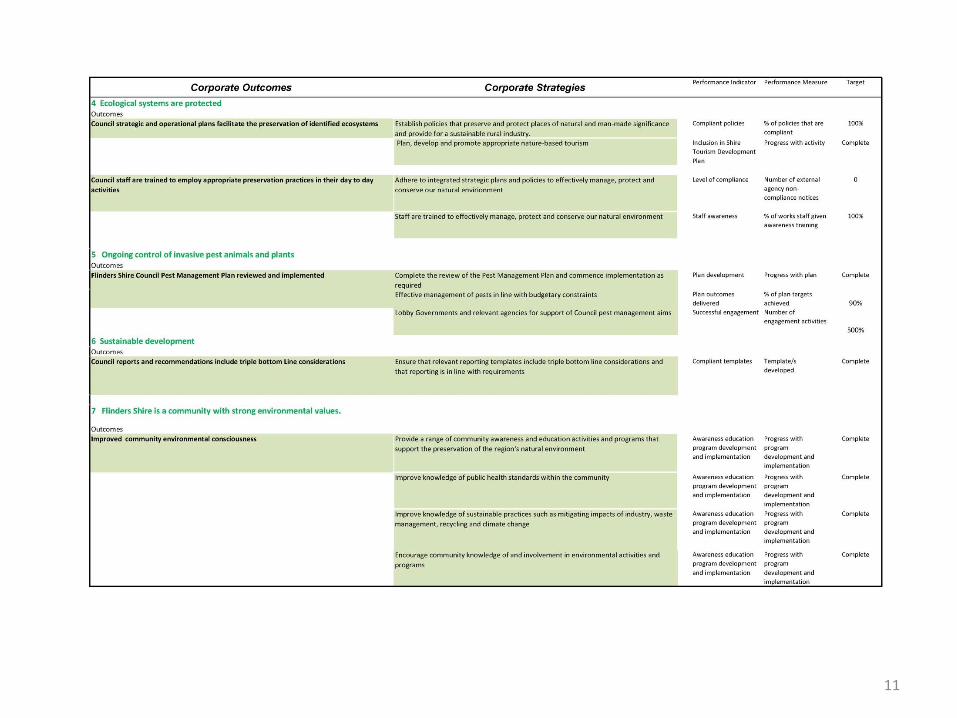
117
Establish policies that preserve and protect
places of natural and man-made significance
and provide for a sustainable rural industry.DCS
Review existing Council policies to ensure that they are
consistent with or promote the protection of ecological
systems.
130000
Compliant
policies
% of policies
reviewed
100%
DCS
Ensure all policy development includes environmental and
cultural consideration.
Compliant
policies
Number of non-
compliant
policies adopted
nil
151
Plan, develop and promote appropriate
nature-based tourism.
DCS/CDO
Include the development of nature based tourism in the
Shire Tourism Development Plan.
20000
Inclusion in Shire
Tourism
Development
Plan
Progress with
activity
Complete
159
Adhere to integrated strategic plans and
policies to effectively manage, protect and
conserve our natural envirionment.CEO
Ensure staff are aware of and act in accordance with
adopted plans, policies and procedures.
25000
Level of
compliance
Number of
external agency
non-compliance
notices
0%
112
Staff are trained to effectively manage,
protect and conserve our natural
environment.CEO
Include appropriate environmental and cultural heritage
protection training in Council works staff training
program.
5000
Staff awareness % of works staff
given awareness
training
100%
6241
Complete the review of the Pest
Management Plan and commence
implementation as required. CEO/ATO
Review and renew Council Pest Management Plan as per
legislation and present to Council for adoption.
20000
Plan
development
Progress with
plan
Complete
6241
Effective management of pests in line with
budgetary constraints.
CEO/ATO
Implement Pest Management Plan.
20000
Plan
implementation
Progress with
implementation
of annual plan
activities
Complete
112
Lobby Governments and relevant agencies
for support of Council pest management
aims. CEO/ATO
Establish relations with relevant Government Agencies
and advocate for support for pest management aims.
5000
Successful
engagement
Number of
engagement
activities
1
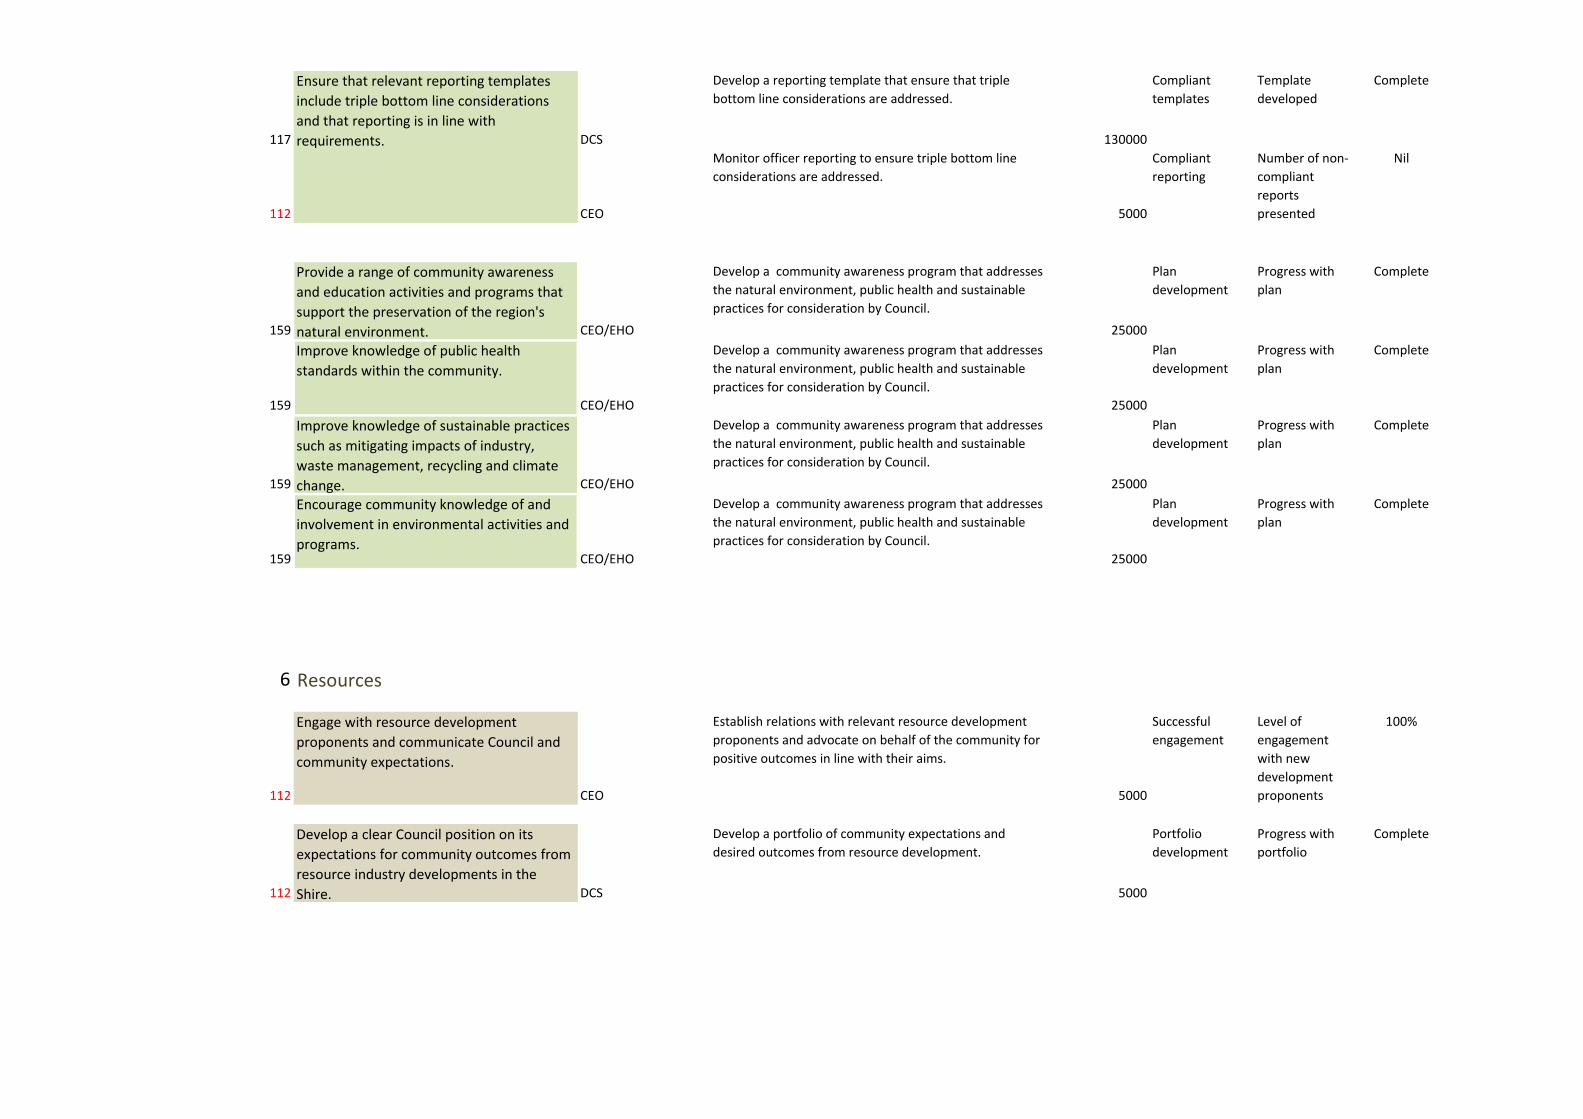
117
Ensure that relevant reporting templates
include triple bottom line considerations
and that reporting is in line with
requirements. DCS
Develop a reporting template that ensure that triple
bottom line considerations are addressed.
130000
Compliant
templates
Template
developed
Complete
112 CEO
Monitor officer reporting to ensure triple bottom line
considerations are addressed.
5000
Compliant
reporting
Number of non-
compliant
reports
presented
Nil
159
Provide a range of community awareness
and education activities and programs that
support the preservation of the region's
natural environment. CEO/EHO
Develop a community awareness program that addresses
the natural environment, public health and sustainable
practices for consideration by Council.
25000
Plan
development
Progress with
plan
Complete
159
Improve knowledge of public health
standards within the community.
CEO/EHO
Develop a community awareness program that addresses
the natural environment, public health and sustainable
practices for consideration by Council.
25000
Plan
development
Progress with
plan
Complete
159
Improve knowledge of sustainable practices
such as mitigating impacts of industry,
waste management, recycling and climate
change. CEO/EHO
Develop a community awareness program that addresses
the natural environment, public health and sustainable
practices for consideration by Council.
25000
Plan
development
Progress with
plan
Complete
159
Encourage community knowledge of and
involvement in environmental activities and
programs.CEO/EHO
Develop a community awareness program that addresses
the natural environment, public health and sustainable
practices for consideration by Council.
25000
Plan
development
Progress with
plan
Complete
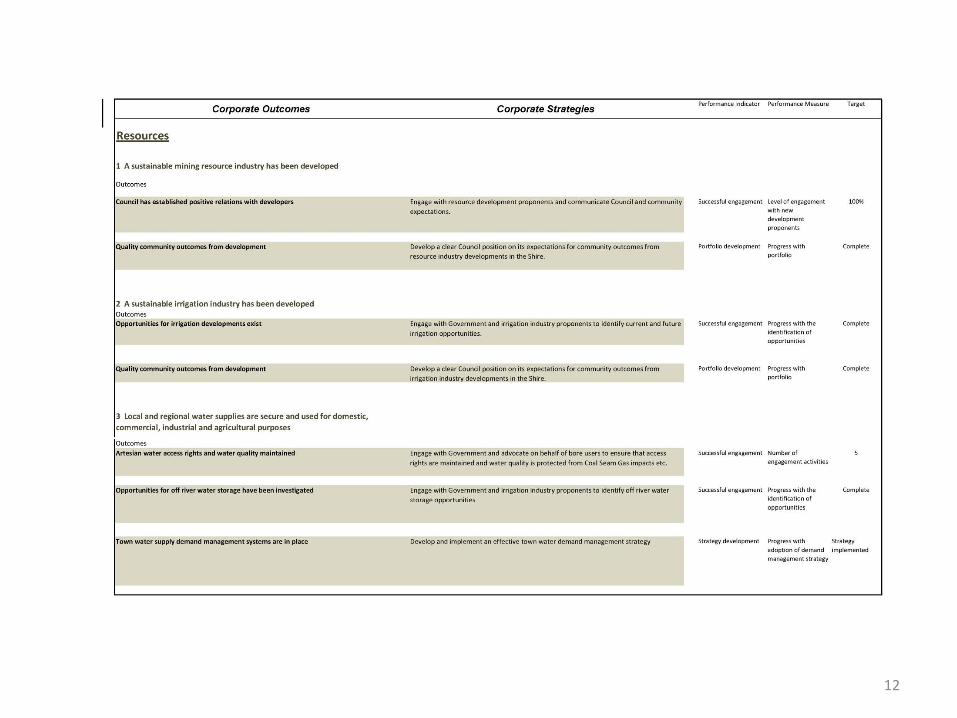
6 Resources
112
Engage with resource development
proponents and communicate Council and
community expectations.
CEO
Establish relations with relevant resource development
proponents and advocate on behalf of the community for
positive outcomes in line with their aims.
5000
Successful
engagement
Level of
engagement
with new
development
proponents
100%
112
Develop a clear Council position on its
expectations for community outcomes from
resource industry developments in the
Shire. DCS
Develop a portfolio of community expectations and
desired outcomes from resource development.
5000
Portfolio
development
Progress with
portfolio
Complete
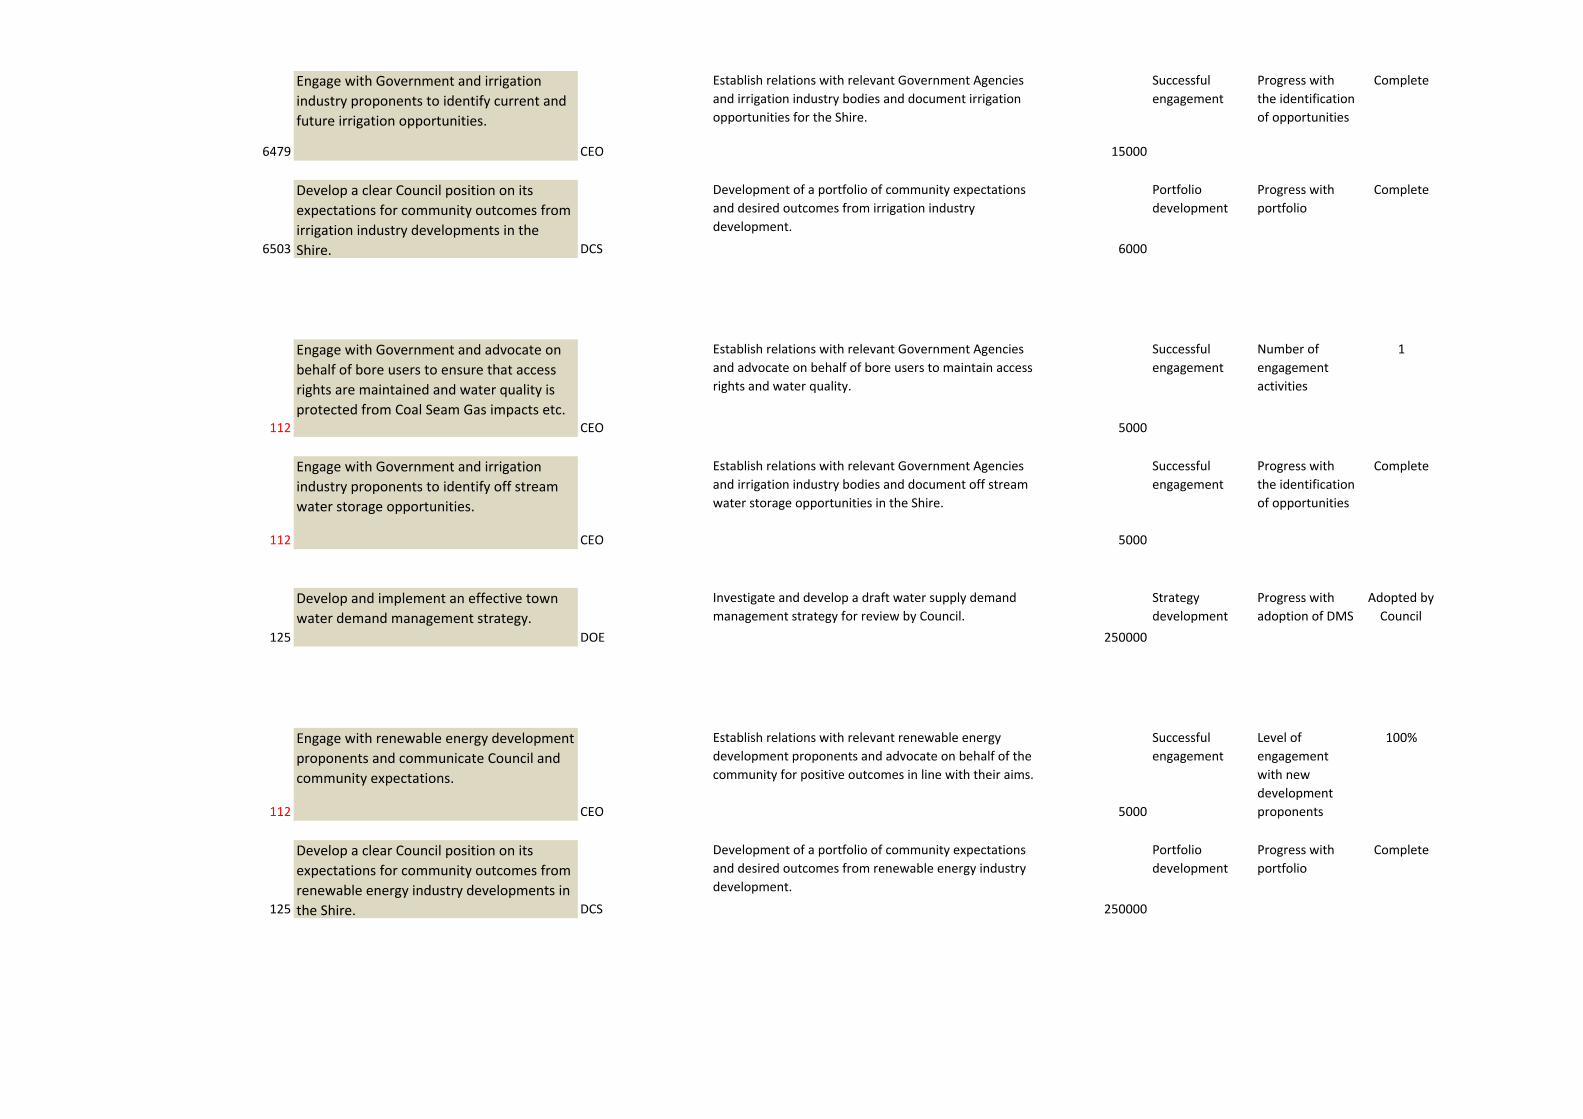
6479
Engage with Government and irrigation
industry proponents to identify current and
future irrigation opportunities.
CEO
Establish relations with relevant Government Agencies
and irrigation industry bodies and document irrigation
opportunities for the Shire.
15000
Successful
engagement
Progress with
the identification
of opportunities
Complete
6503
Develop a clear Council position on its
expectations for community outcomes from
irrigation industry developments in the
Shire. DCS
Development of a portfolio of community expectations
and desired outcomes from irrigation industry
development.
6000
Portfolio
development
Progress with
portfolio
Complete
112
Engage with Government and advocate on
behalf of bore users to ensure that access
rights are maintained and water quality is
protected from Coal Seam Gas impacts etc.CEO
Establish relations with relevant Government Agencies
and advocate on behalf of bore users to maintain access
rights and water quality.
5000
Successful
engagement
Number of
engagement
activities
1
112
Engage with Government and irrigation
industry proponents to identify off stream
water storage opportunities.
CEO
Establish relations with relevant Government Agencies
and irrigation industry bodies and document off stream
water storage opportunities in the Shire.
5000
Successful
engagement
Progress with
the identification
of opportunities
Complete
125
Develop and implement an effective town
water demand management strategy.DOE
Investigate and develop a draft water supply demand
management strategy for review by Council.
250000
Strategy
development
Progress with
adoption of DMS
Adopted by
Council
112
Engage with renewable energy development
proponents and communicate Council and
community expectations.
CEO
Establish relations with relevant renewable energy
development proponents and advocate on behalf of the
community for positive outcomes in line with their aims.
5000
Successful
engagement
Level of
engagement
with new
development
proponents
100%
125
Develop a clear Council position on its
expectations for community outcomes from
renewable energy industry developments in
the Shire. DCS
Development of a portfolio of community expectations
and desired outcomes from renewable energy industry
development.
250000
Portfolio
development
Progress with
portfolio
Complete
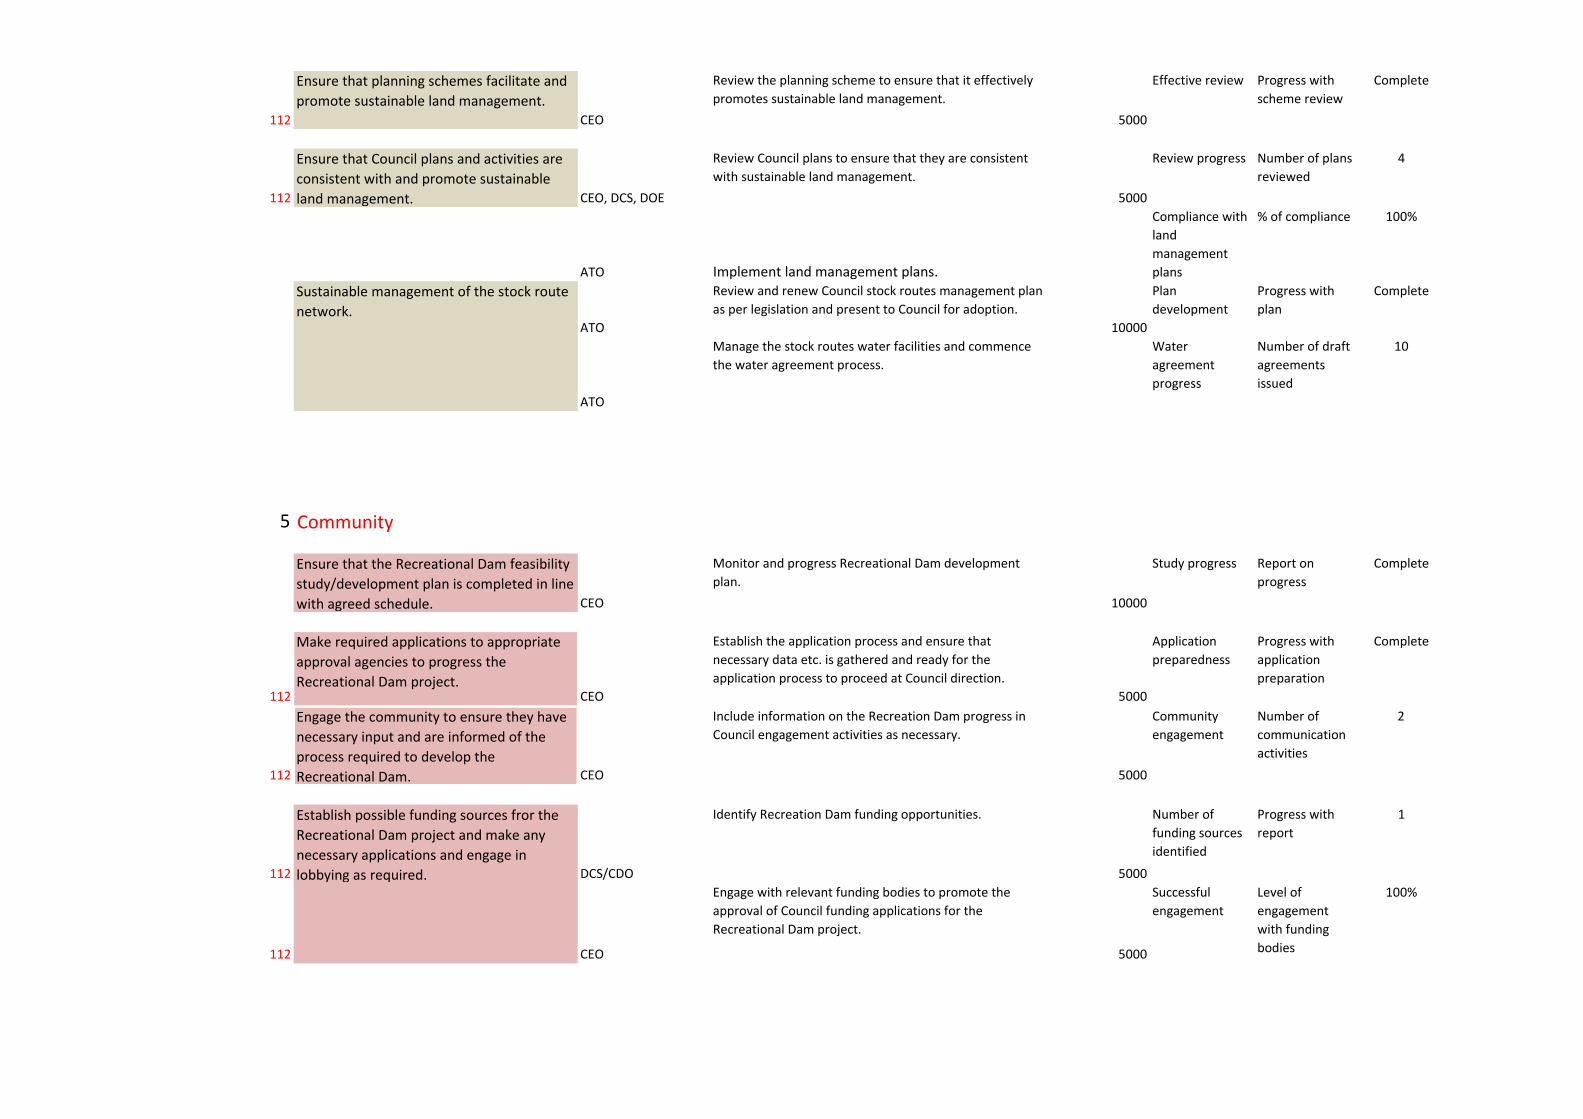
112
Ensure that planning schemes facilitate and
promote sustainable land management.CEO
Review the planning scheme to ensure that it effectively
promotes sustainable land management.
5000
Effective review Progress with
scheme review
Complete
112
Ensure that Council plans and activities are
consistent with and promote sustainable
land management. CEO, DCS, DOE
Review Council plans to ensure that they are consistent
with sustainable land management.
5000
Review progress Number of plans
reviewed
4
ATO Implement land management plans.
Compliance with
land
management
plans
% of compliance 100%
Sustainable management of the stock route
network.ATO
Review and renew Council stock routes management plan
as per legislation and present to Council for adoption.
10000
Plan
development
Progress with
plan
Complete
ATO
Manage the stock routes water facilities and commence
the water agreement process.
Water
agreement
progress
Number of draft
agreements
issued
10
5 Community
Ensure that the Recreational Dam feasibility
study/development plan is completed in line
with agreed schedule. CEO
Monitor and progress Recreational Dam development
plan.
10000
Study progress Report on
progress
Complete
112
Make required applications to appropriate
approval agencies to progress the
Recreational Dam project.CEO
Establish the application process and ensure that
necessary data etc. is gathered and ready for the
application process to proceed at Council direction.
5000
Application
preparedness
Progress with
application
preparation
Complete
112
Engage the community to ensure they have
necessary input and are informed of the
process required to develop the
Recreational Dam. CEO
Include information on the Recreation Dam progress in
Council engagement activities as necessary.
5000
Community
engagement
Number of
communication
activities
2
112
Establish possible funding sources fror the
Recreational Dam project and make any
necessary applications and engage in
lobbying as required. DCS/CDO
Identify Recreation Dam funding opportunities.
5000
Number of
funding sources
identified
Progress with
report
1
112 CEO
Engage with relevant funding bodies to promote the
approval of Council funding applications for the
Recreational Dam project.
5000
Successful
engagement
Level of
engagement
with funding
bodies
100%

6482
Identify and engage with funding bodies and
make funding submissions to deliver
"Healthy Communities" initiatives.DCS/CDO
Identify and engage with relevant funding bodies to
promote the approval of Council funding applications for
"Healthy Community" initiatives.
2500
Successful
engagement
Level of
engagement
with funding
bodies
Complete
6482
Provide funding for appropriate "Healthy
Communities" initiatives.DCS/CDO
Include the delivery of "Healthy Community" initiatives in
budget deliberations.2500
Funding
consideration
Inclusion of
funding in
budget
Complete
6482
Engage with health service providers to
ensure services are maintained and or
increased to meet community demand.DCS
Engage with relevant health service providers to ensure
that services continue to meet community needs.
2500
Successful
engagement
Number of
engagement
activities with
service providers
2
DCS
Monitor and engage with the community as required to
ensure that health service needs are understood.
Community
engagement
Number of
engagement
activities
2
6367
Advocate on behalf of the community to
establish a Multi Purpose Health Service
(MPHS). CEO
Maintain involvement on the Hughenden Multi Purpose
Health Service Committee.
0
Level of
involvement
Meetings
attended
100%
151
Actively monitor short term accommodation
needs.DCS/CDO
Monitor and engage with the community as required to
ensure that short term accommodation needs are
understood. 20000
Community
engagement
Number of
engagement
activities
2
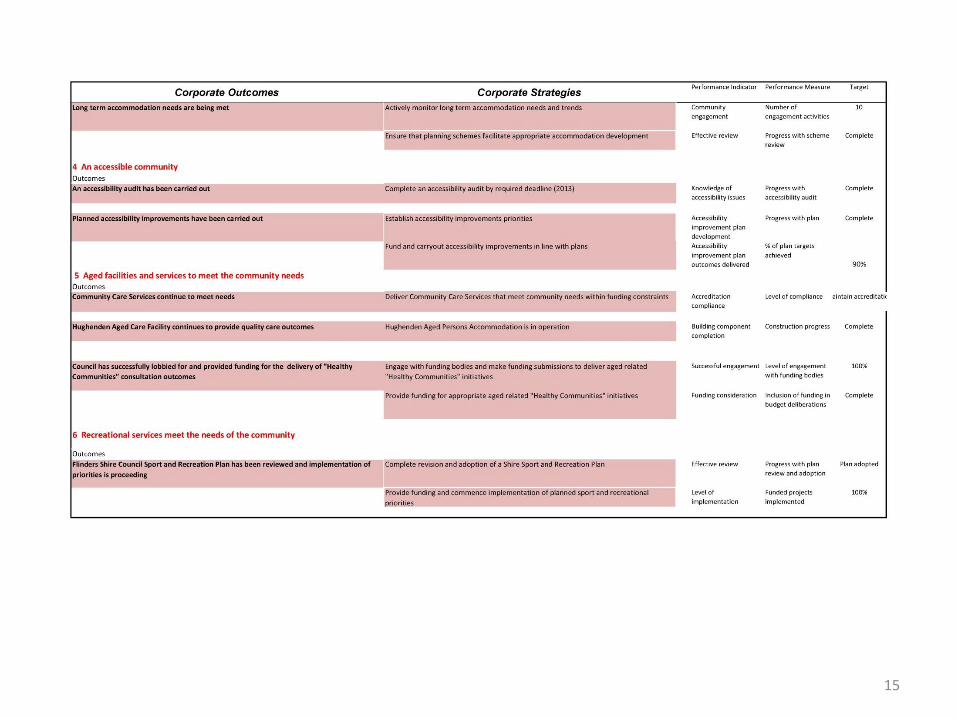
151
Actively monitor long term accommodation
needs and trends.DCS/CDO
Monitor and engage with the community as required to
ensure that long term accommodation needs are
understood. 20000
Community
engagement
Number of
engagement
activities
2
112
Ensure that planning schemes facilitate
appropriate accommodation development.CEO
Review planning scheme to ensure that it effectively
promotes appropriate accommodation development.
5000
Effective review Progress with
scheme review
Complete
151
Complete an accessibility audit by required
deadline (2013).DCS/CDO
Conduct a public facilities accessibility audit and establish
and implement an inspection program.
20000
Knowledge of
accessibility
issues
Progress with
accessibility
audit
Complete
151
Establish accessibility improvements
priorities. DCS/CDO
2013/14 Operational Plan.
20000
151
Fund and carryout accessibility
improvements in line with plans. DCS/CDO
2013/14 Operational Plan.
20000
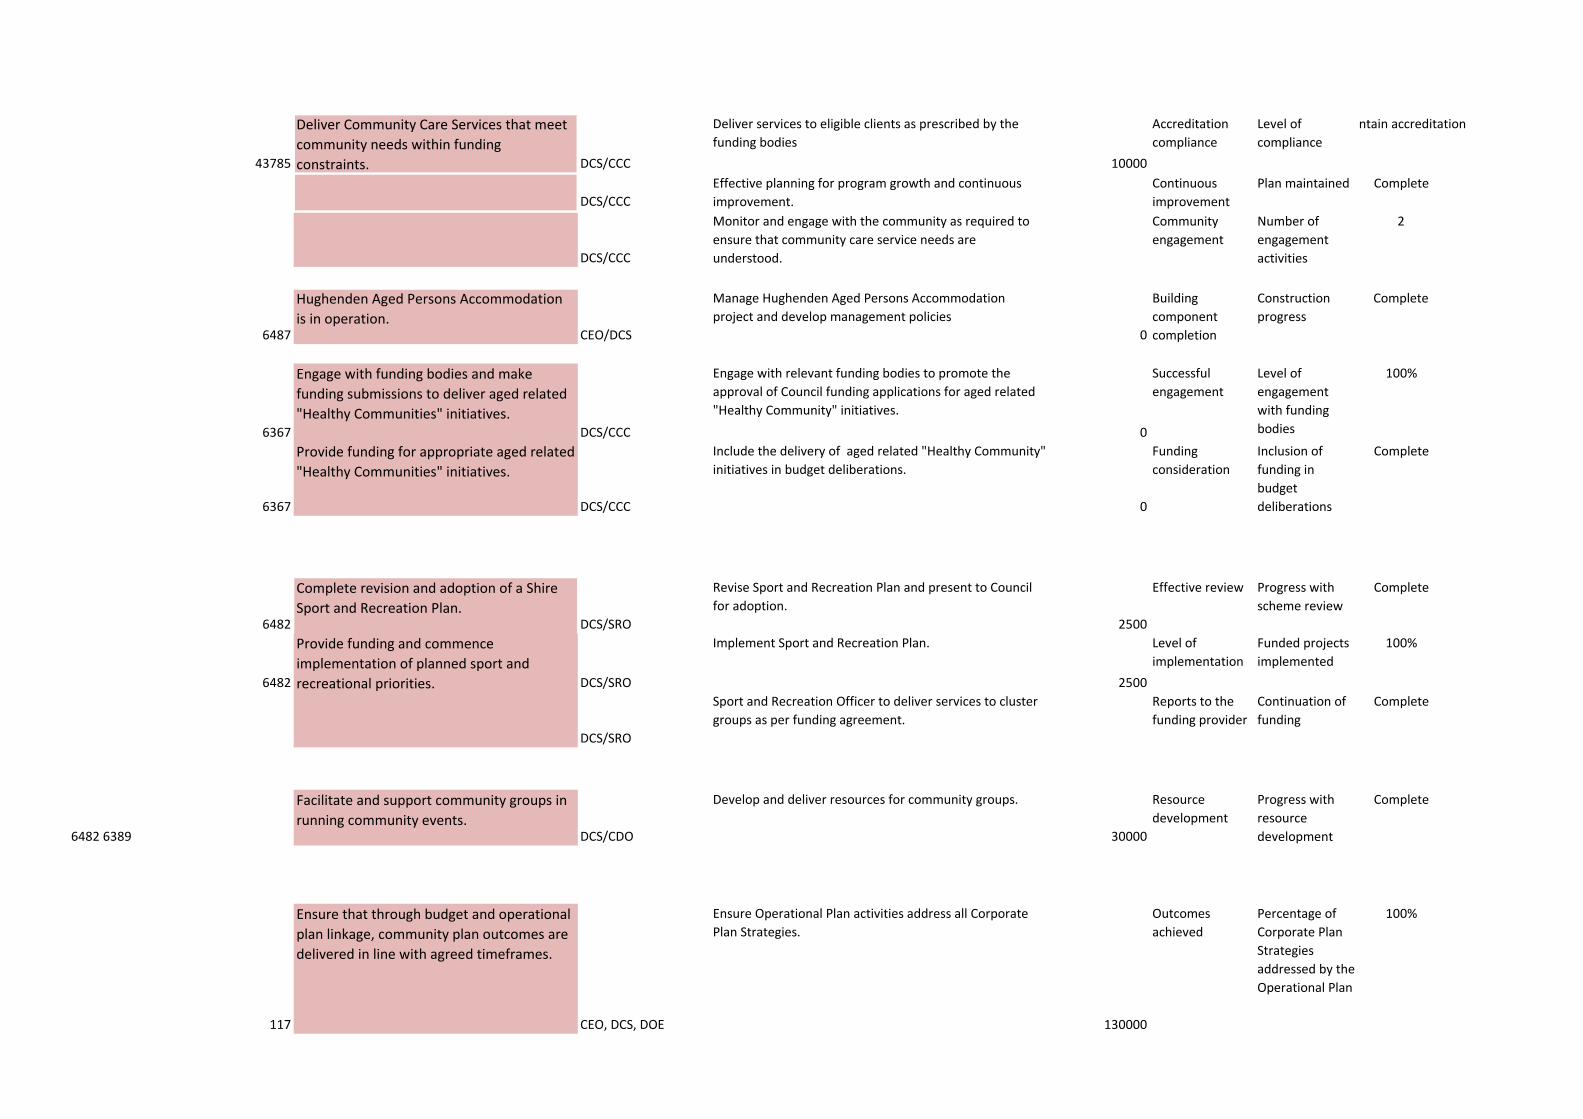
43785
Deliver Community Care Services that meet
community needs within funding
constraints. DCS/CCC
Deliver services to eligible clients as prescribed by the
funding bodies
10000
Accreditation
compliance
Level of
compliance
Maintain accreditation
DCS/CCC
Effective planning for program growth and continuous
improvement.
Continuous
improvement
Plan maintained Complete
DCS/CCC
Monitor and engage with the community as required to
ensure that community care service needs are
understood.
Community
engagement
Number of
engagement
activities
2
6487
Hughenden Aged Persons Accommodation
is in operation.CEO/DCS
Manage Hughenden Aged Persons Accommodation
project and develop management policies
0
Building
component
completion
Construction
progress
Complete
6367
Engage with funding bodies and make
funding submissions to deliver aged related
"Healthy Communities" initiatives.DCS/CCC
Engage with relevant funding bodies to promote the
approval of Council funding applications for aged related
"Healthy Community" initiatives.
0
Successful
engagement
Level of
engagement
with funding
bodies
100%
6367
Provide funding for appropriate aged related
"Healthy Communities" initiatives.
DCS/CCC
Include the delivery of aged related "Healthy Community"
initiatives in budget deliberations.
0
Funding
consideration
Inclusion of
funding in
budget
deliberations
Complete
6482
Complete revision and adoption of a Shire
Sport and Recreation Plan.DCS/SRO
Revise Sport and Recreation Plan and present to Council
for adoption.
2500
Effective review Progress with
scheme review
Complete
6482
Provide funding and commence
implementation of planned sport and
recreational priorities. DCS/SRO
Implement Sport and Recreation Plan.
2500
Level of
implementation
Funded projects
implemented
100%
DCS/SRO
Sport and Recreation Officer to deliver services to cluster
groups as per funding agreement.
Reports to the
funding provider
Continuation of
funding
Complete
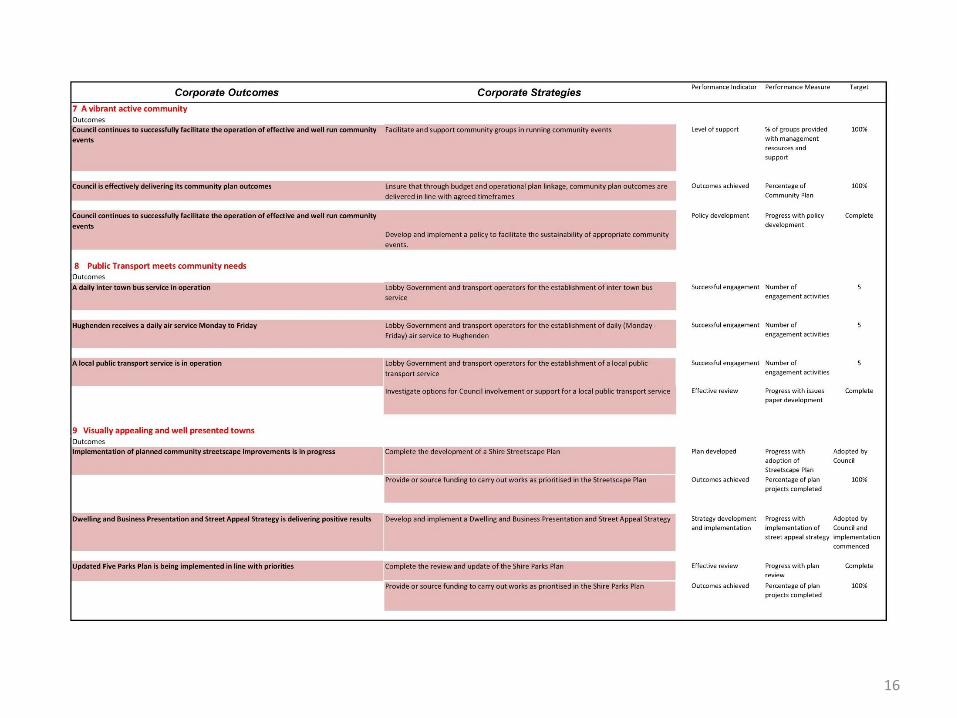
6482 6389
Facilitate and support community groups in
running community events.DCS/CDO
Develop and deliver resources for community groups.
30000
Resource
development
Progress with
resource
development
Complete
117
Ensure that through budget and operational
plan linkage, community plan outcomes are
delivered in line with agreed timeframes.
CEO, DCS, DOE
Ensure Operational Plan activities address all Corporate
Plan Strategies.
130000
Outcomes
achieved
Percentage of
Corporate Plan
Strategies
addressed by the
Operational Plan
100%
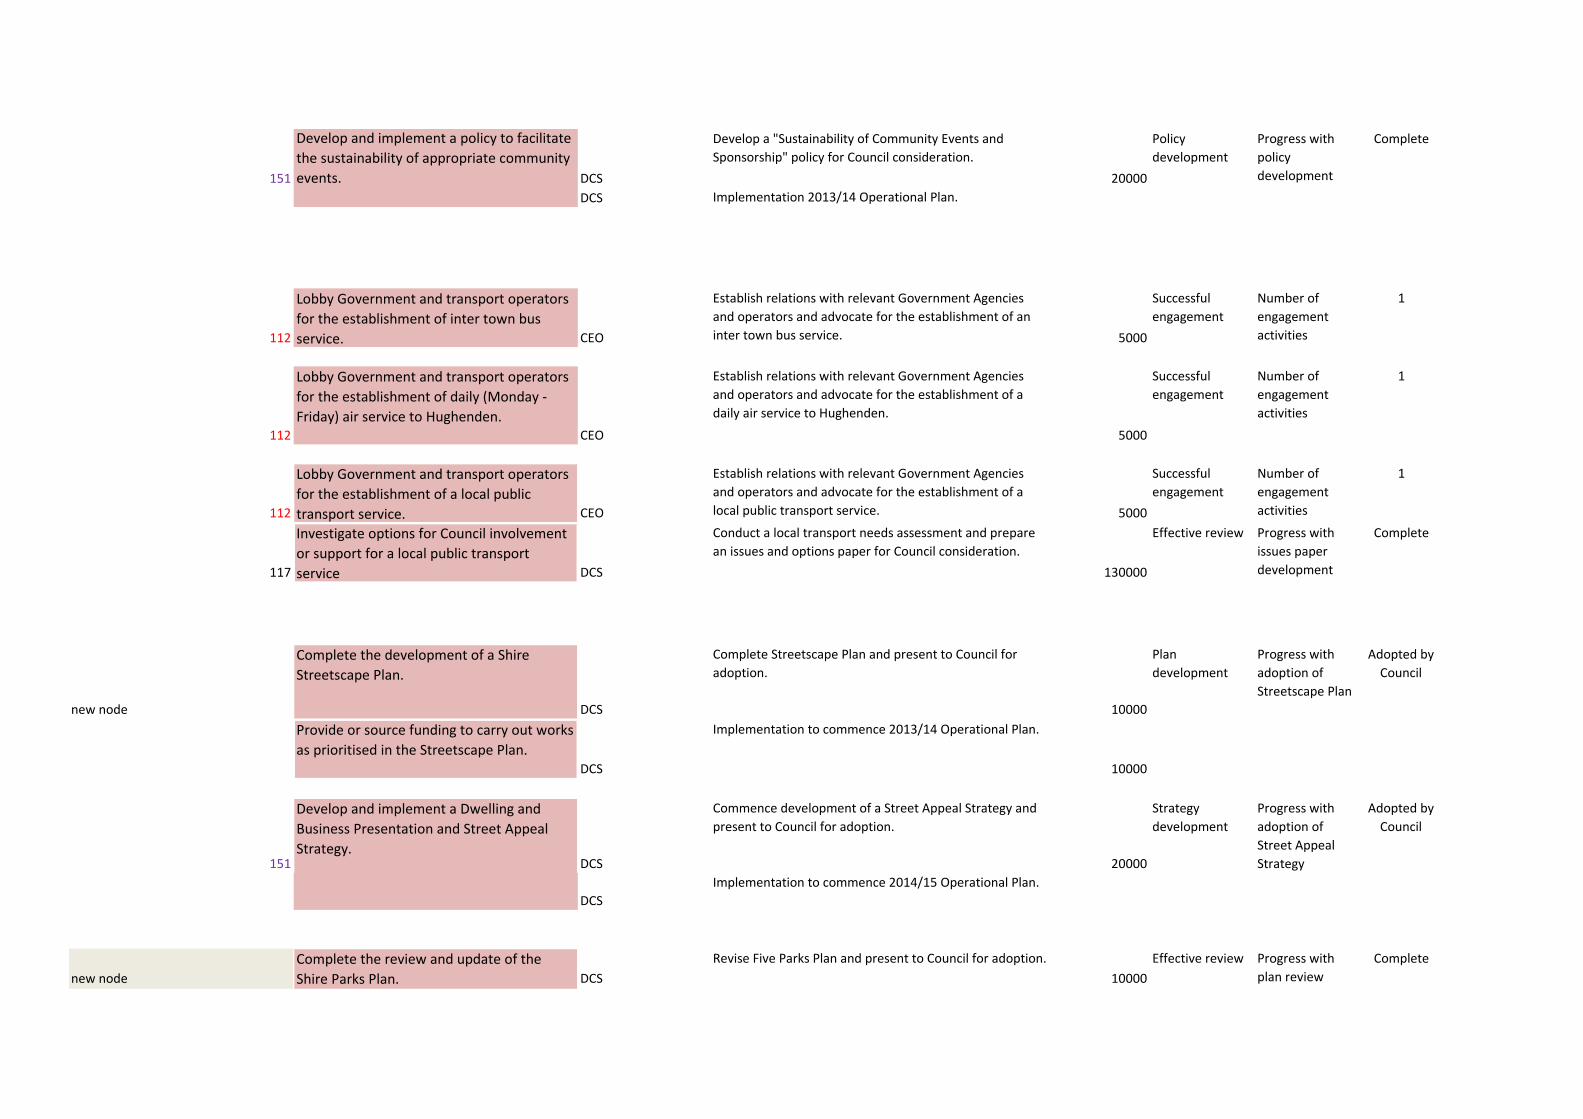
151
Develop and implement a policy to facilitate
the sustainability of appropriate community
events. DCS
Develop a "Sustainability of Community Events and
Sponsorship" policy for Council consideration.
20000
Policy
development
Progress with
policy
development
Complete
DCS Implementation 2013/14 Operational Plan.
112
Lobby Government and transport operators
for the establishment of inter town bus
service. CEO
Establish relations with relevant Government Agencies
and operators and advocate for the establishment of an
inter town bus service. 5000
Successful
engagement
Number of
engagement
activities
1
112
Lobby Government and transport operators
for the establishment of daily (Monday -
Friday) air service to Hughenden.CEO
Establish relations with relevant Government Agencies
and operators and advocate for the establishment of a
daily air service to Hughenden.
5000
Successful
engagement
Number of
engagement
activities
1
112
Lobby Government and transport operators
for the establishment of a local public
transport service. CEO
Establish relations with relevant Government Agencies
and operators and advocate for the establishment of a
local public transport service. 5000
Successful
engagement
Number of
engagement
activities
1
117
Investigate options for Council involvement
or support for a local public transport
service DCS
Conduct a local transport needs assessment and prepare
an issues and options paper for Council consideration.
130000
Effective review Progress with
issues paper
development
Complete
new node
Complete the development of a Shire
Streetscape Plan.
DCS
Complete Streetscape Plan and present to Council for
adoption.
10000
Plan
development
Progress with
adoption of
Streetscape Plan
Adopted by
Council
Provide or source funding to carry out works
as prioritised in the Streetscape Plan.DCS
Implementation to commence 2013/14 Operational Plan.
10000
151
Develop and implement a Dwelling and
Business Presentation and Street Appeal
Strategy.DCS
Commence development of a Street Appeal Strategy and
present to Council for adoption.
20000
Strategy
development
Progress with
adoption of
Street Appeal
Strategy
Adopted by
Council
DCS
Implementation to commence 2014/15 Operational Plan.
new node
Complete the review and update of the
Shire Parks Plan. DCS
Revise Five Parks Plan and present to Council for adoption.
10000
Effective review Progress with
plan review
Complete
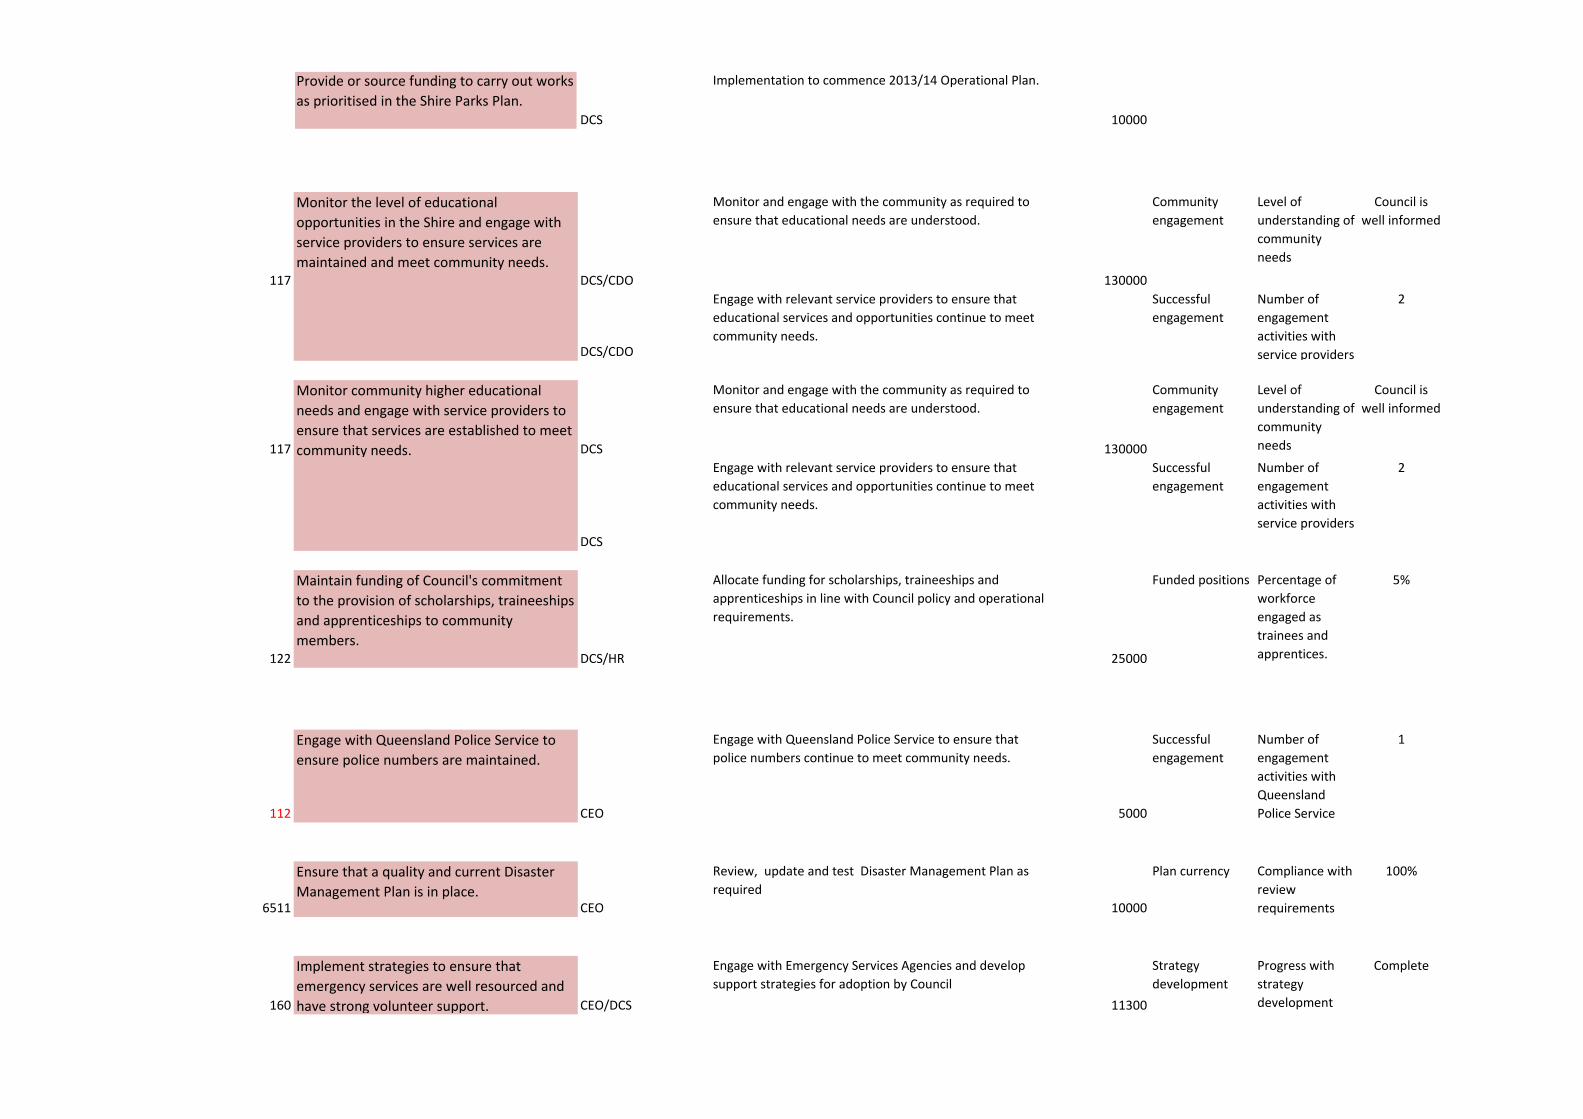
Provide or source funding to carry out works
as prioritised in the Shire Parks Plan.DCS
Implementation to commence 2013/14 Operational Plan.
10000
117
Monitor the level of educational
opportunities in the Shire and engage with
service providers to ensure services are
maintained and meet community needs.DCS/CDO
Monitor and engage with the community as required to
ensure that educational needs are understood.
130000
Community
engagement
Level of
understanding of
community
needs
Council is
well informed
DCS/CDO
Engage with relevant service providers to ensure that
educational services and opportunities continue to meet
community needs.
Successful
engagement
Number of
engagement
activities with
service providers
2
117
Monitor community higher educational
needs and engage with service providers to
ensure that services are established to meet
community needs. DCS
Monitor and engage with the community as required to
ensure that educational needs are understood.
130000
Community
engagement
Level of
understanding of
community
needs
Council is
well informed
DCS
Engage with relevant service providers to ensure that
educational services and opportunities continue to meet
community needs.
Successful
engagement
Number of
engagement
activities with
service providers
2
122
Maintain funding of Council's commitment
to the provision of scholarships, traineeships
and apprenticeships to community
members.DCS/HR
Allocate funding for scholarships, traineeships and
apprenticeships in line with Council policy and operational
requirements.
25000
Funded positions Percentage of
workforce
engaged as
trainees and
apprentices.
5%
112
Engage with Queensland Police Service to
ensure police numbers are maintained.
CEO
Engage with Queensland Police Service to ensure that
police numbers continue to meet community needs.
5000
Successful
engagement
Number of
engagement
activities with
Queensland
Police Service
1
6511
Ensure that a quality and current Disaster
Management Plan is in place.CEO
Review, update and test Disaster Management Plan as
required
10000
Plan currency Compliance with
review
requirements
100%
160
Implement strategies to ensure that
emergency services are well resourced and
have strong volunteer support. CEO/DCS
Engage with Emergency Services Agencies and develop
support strategies for adoption by Council
11300
Strategy
development
Progress with
strategy
development
Complete
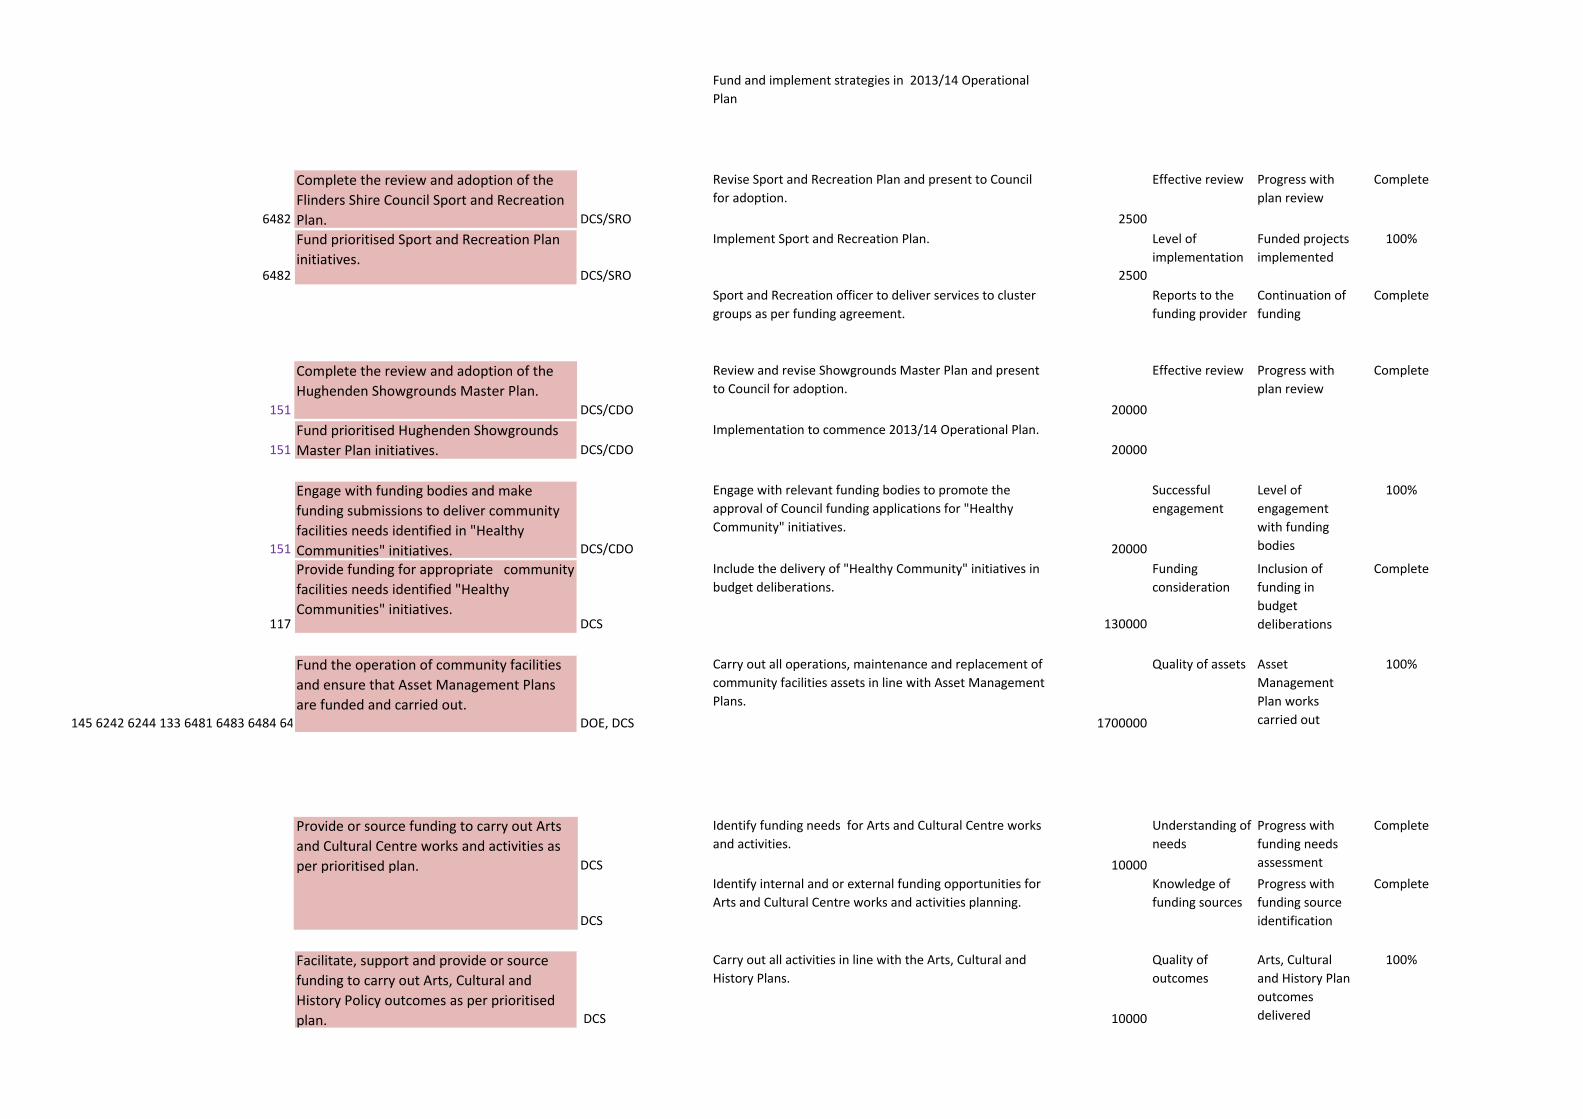
Fund and implement strategies in 2013/14 Operational
Plan
6482
Complete the review and adoption of the
Flinders Shire Council Sport and Recreation
Plan. DCS/SRO
Revise Sport and Recreation Plan and present to Council
for adoption.
2500
Effective review Progress with
plan review
Complete
6482
Fund prioritised Sport and Recreation Plan
initiatives.DCS/SRO
Implement Sport and Recreation Plan.
2500
Level of
implementation
Funded projects
implemented
100%
Sport and Recreation officer to deliver services to cluster
groups as per funding agreement.
Reports to the
funding provider
Continuation of
funding
Complete
151
Complete the review and adoption of the
Hughenden Showgrounds Master Plan.DCS/CDO
Review and revise Showgrounds Master Plan and present
to Council for adoption.
20000
Effective review Progress with
plan review
Complete
151
Fund prioritised Hughenden Showgrounds
Master Plan initiatives. DCS/CDO
Implementation to commence 2013/14 Operational Plan.
20000
151
Engage with funding bodies and make
funding submissions to deliver community
facilities needs identified in "Healthy
Communities" initiatives. DCS/CDO
Engage with relevant funding bodies to promote the
approval of Council funding applications for "Healthy
Community" initiatives.
20000
Successful
engagement
Level of
engagement
with funding
bodies
100%
117
Provide funding for appropriate community
facilities needs identified "Healthy
Communities" initiatives.DCS
Include the delivery of "Healthy Community" initiatives in
budget deliberations.
130000
Funding
consideration
Inclusion of
funding in
budget
deliberations
Complete
145 6242 6244 133 6481 6483 6484 6485 6486 126 130 150 149 4091
Fund the operation of community facilities
and ensure that Asset Management Plans
are funded and carried out.DOE, DCS
Carry out all operations, maintenance and replacement of
community facilities assets in line with Asset Management
Plans.
1700000
Quality of assets Asset
Management
Plan works
carried out
100%
Provide or source funding to carry out Arts
and Cultural Centre works and activities as
per prioritised plan. DCS
Identify funding needs for Arts and Cultural Centre works
and activities.
10000
Understanding of
needs
Progress with
funding needs
assessment
Complete
DCS
Identify internal and or external funding opportunities for
Arts and Cultural Centre works and activities planning.
Knowledge of
funding sources
Progress with
funding source
identification
Complete
Facilitate, support and provide or source
funding to carry out Arts, Cultural and
History Policy outcomes as per prioritised
plan. DCS
Carry out all activities in line with the Arts, Cultural and
History Plans.
10000
Quality of
outcomes
Arts, Cultural
and History Plan
outcomes
delivered
100%
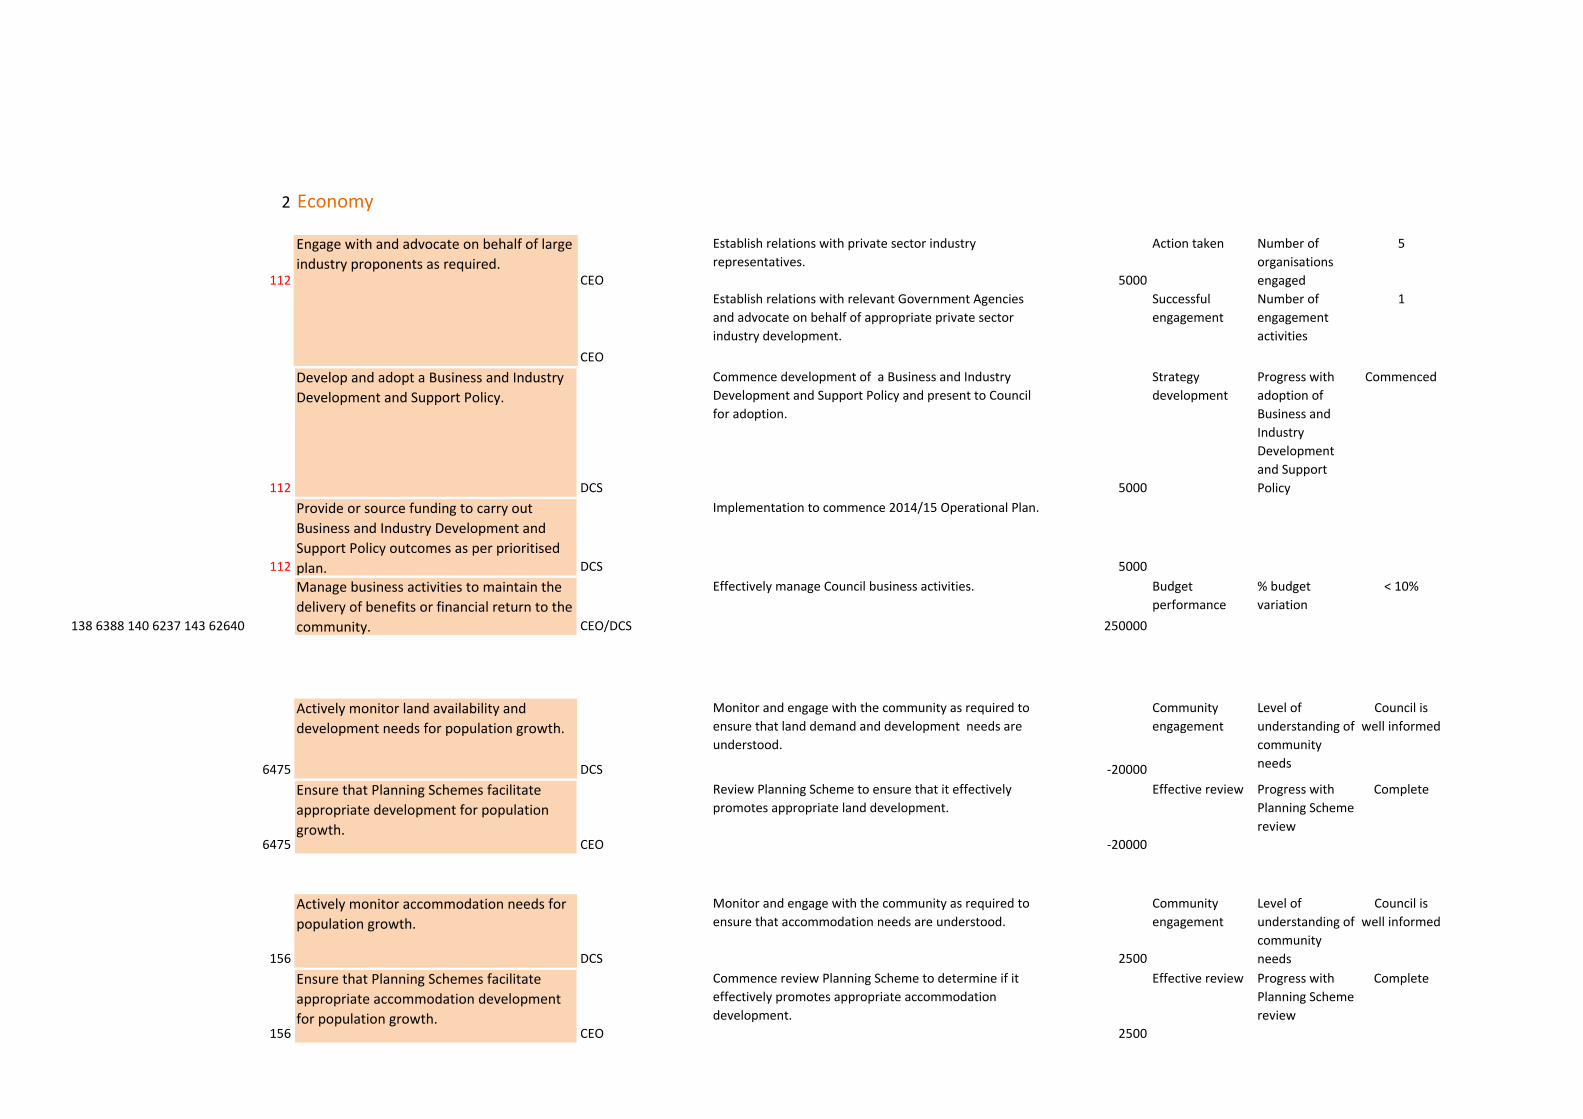
2 Economy
112
Engage with and advocate on behalf of large
industry proponents as required.CEO
Establish relations with private sector industry
representatives.
5000
Action taken Number of
organisations
engaged
5
CEO
Establish relations with relevant Government Agencies
and advocate on behalf of appropriate private sector
industry development.
Successful
engagement
Number of
engagement
activities
1
112
Develop and adopt a Business and Industry
Development and Support Policy.
DCS
Commence development of a Business and Industry
Development and Support Policy and present to Council
for adoption.
5000
Strategy
development
Progress with
adoption of
Business and
Industry
Development
and Support
Policy
Commenced
112
Provide or source funding to carry out
Business and Industry Development and
Support Policy outcomes as per prioritised
plan. DCS
Implementation to commence 2014/15 Operational Plan.
5000
138 6388 140 6237 143 62640
Manage business activities to maintain the
delivery of benefits or financial return to the
community. CEO/DCS
Effectively manage Council business activities.
250000
Budget
performance
% budget
variation
< 10%
6475
Actively monitor land availability and
development needs for population growth.
DCS
Monitor and engage with the community as required to
ensure that land demand and development needs are
understood.
-20000
Community
engagement
Level of
understanding of
community
needs
Council is
well informed
6475
Ensure that Planning Schemes facilitate
appropriate development for population
growth.CEO
Review Planning Scheme to ensure that it effectively
promotes appropriate land development.
-20000
Effective review Progress with
Planning Scheme
review
Complete
156
Actively monitor accommodation needs for
population growth.
DCS
Monitor and engage with the community as required to
ensure that accommodation needs are understood.
2500
Community
engagement
Level of
understanding of
community
needs
Council is
well informed
156
Ensure that Planning Schemes facilitate
appropriate accommodation development
for population growth.CEO
Commence review Planning Scheme to determine if it
effectively promotes appropriate accommodation
development.
2500
Effective review Progress with
Planning Scheme
review
Complete
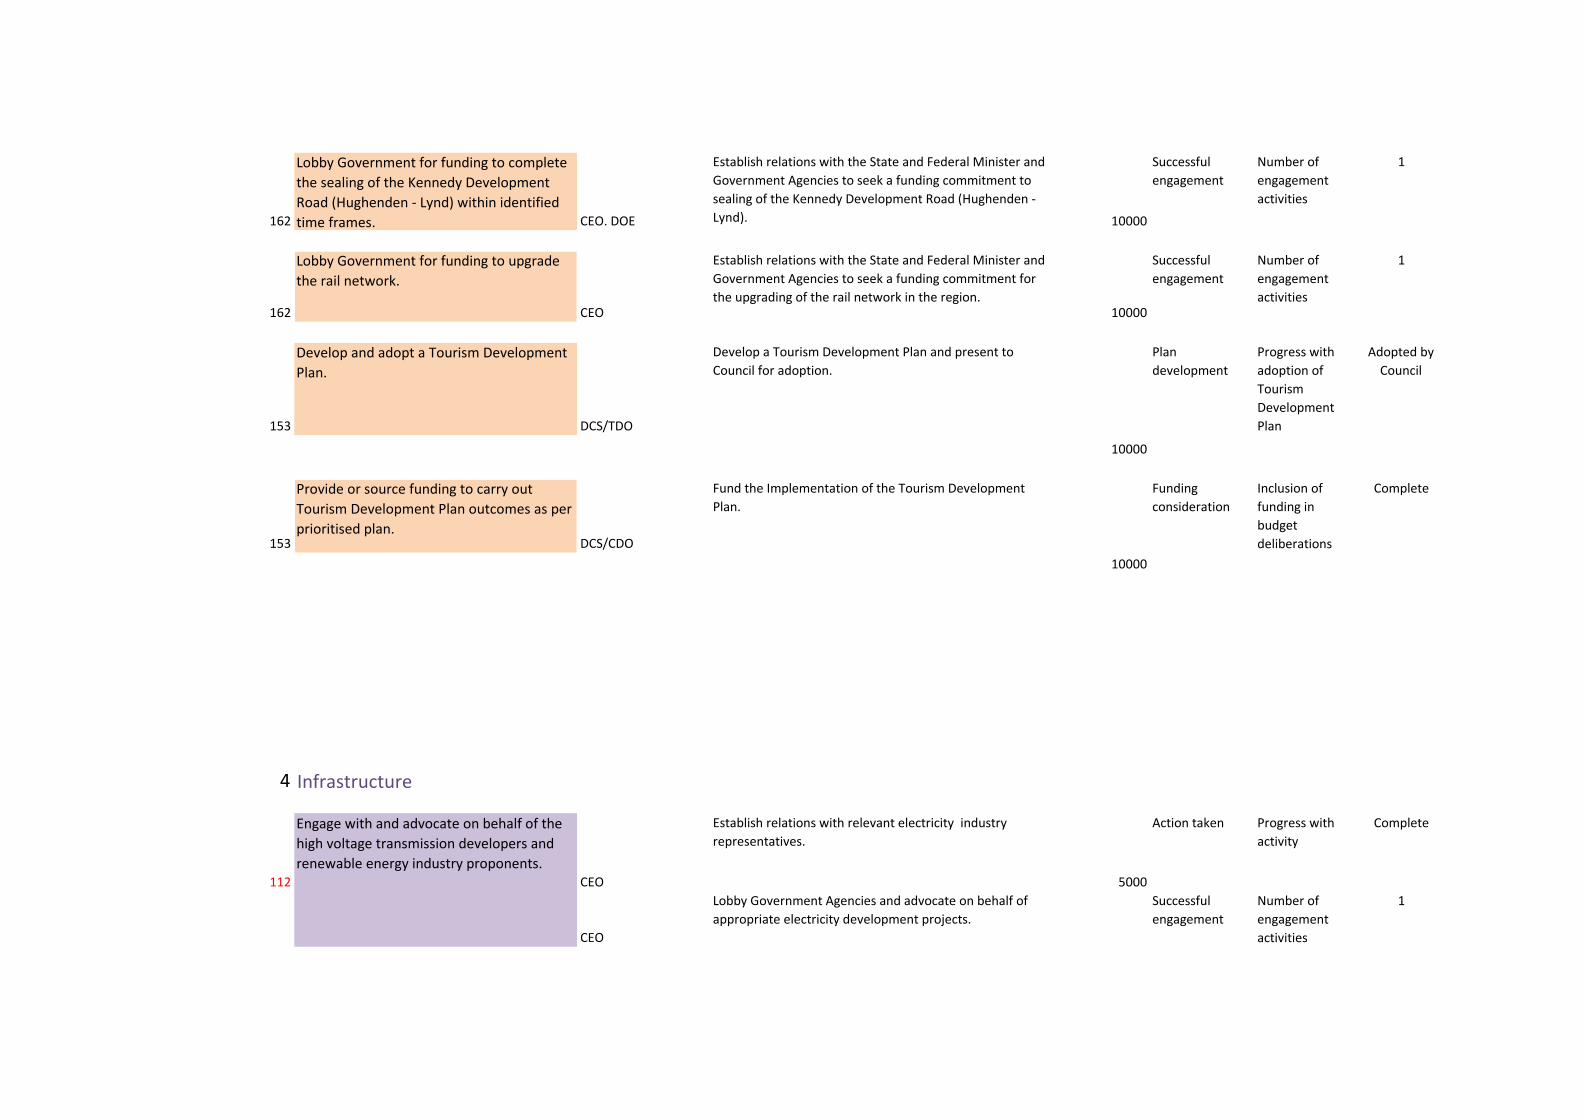
162
Lobby Government for funding to complete
the sealing of the Kennedy Development
Road (Hughenden - Lynd) within identified
time frames. CEO. DOE
Establish relations with the State and Federal Minister and
Government Agencies to seek a funding commitment to
sealing of the Kennedy Development Road (Hughenden -
Lynd). 10000
Successful
engagement
Number of
engagement
activities
1
162
Lobby Government for funding to upgrade
the rail network.
CEO
Establish relations with the State and Federal Minister and
Government Agencies to seek a funding commitment for
the upgrading of the rail network in the region.10000
Successful
engagement
Number of
engagement
activities
1
153
Develop and adopt a Tourism Development
Plan.
DCS/TDO
Develop a Tourism Development Plan and present to
Council for adoption.
Plan
development
Progress with
adoption of
Tourism
Development
Plan
Adopted by
Council
10000
153
Provide or source funding to carry out
Tourism Development Plan outcomes as per
prioritised plan. DCS/CDO
Fund the Implementation of the Tourism Development
Plan.
Funding
consideration
Inclusion of
funding in
budget
deliberations
Complete
10000
4 Infrastructure
112
Engage with and advocate on behalf of the
high voltage transmission developers and
renewable energy industry proponents.CEO
Establish relations with relevant electricity industry
representatives.
5000
Action taken Progress with
activity
Complete
CEO
Lobby Government Agencies and advocate on behalf of
appropriate electricity development projects.
Successful
engagement
Number of
engagement
activities
1
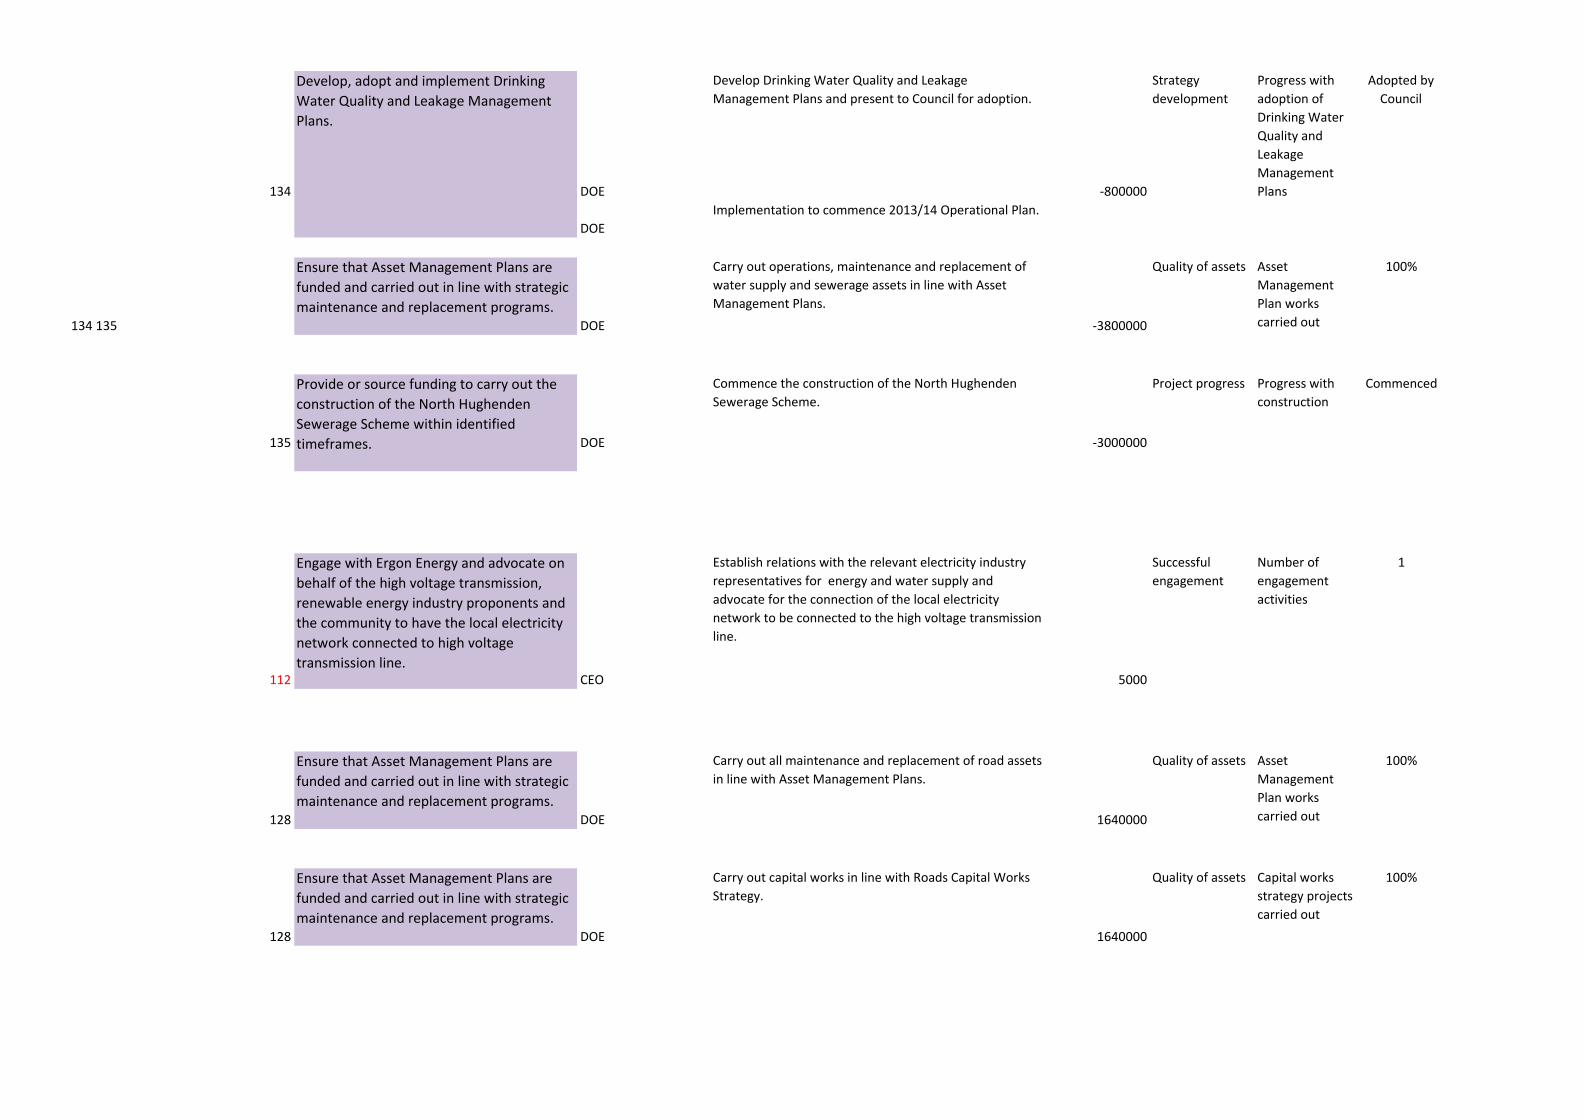
134
Develop, adopt and implement Drinking
Water Quality and Leakage Management
Plans.
DOE
Develop Drinking Water Quality and Leakage
Management Plans and present to Council for adoption.
-800000
Strategy
development
Progress with
adoption of
Drinking Water
Quality and
Leakage
Management
Plans
Adopted by
Council
DOE
Implementation to commence 2013/14 Operational Plan.
134 135
Ensure that Asset Management Plans are
funded and carried out in line with strategic
maintenance and replacement programs.DOE
Carry out operations, maintenance and replacement of
water supply and sewerage assets in line with Asset
Management Plans.
-3800000
Quality of assets Asset
Management
Plan works
carried out
100%
135
Provide or source funding to carry out the
construction of the North Hughenden
Sewerage Scheme within identified
timeframes. DOE
Commence the construction of the North Hughenden
Sewerage Scheme.
-3000000
Project progress Progress with
construction
Commenced
112
Engage with Ergon Energy and advocate on
behalf of the high voltage transmission,
renewable energy industry proponents and
the community to have the local electricity
network connected to high voltage
transmission line.CEO
Establish relations with the relevant electricity industry
representatives for energy and water supply and
advocate for the connection of the local electricity
network to be connected to the high voltage transmission
line.
5000
Successful
engagement
Number of
engagement
activities
1
128
Ensure that Asset Management Plans are
funded and carried out in line with strategic
maintenance and replacement programs.DOE
Carry out all maintenance and replacement of road assets
in line with Asset Management Plans.
1640000
Quality of assets Asset
Management
Plan works
carried out
100%
128
Ensure that Asset Management Plans are
funded and carried out in line with strategic
maintenance and replacement programs.DOE
Carry out capital works in line with Roads Capital Works
Strategy.
1640000
Quality of assets Capital works
strategy projects
carried out
100%
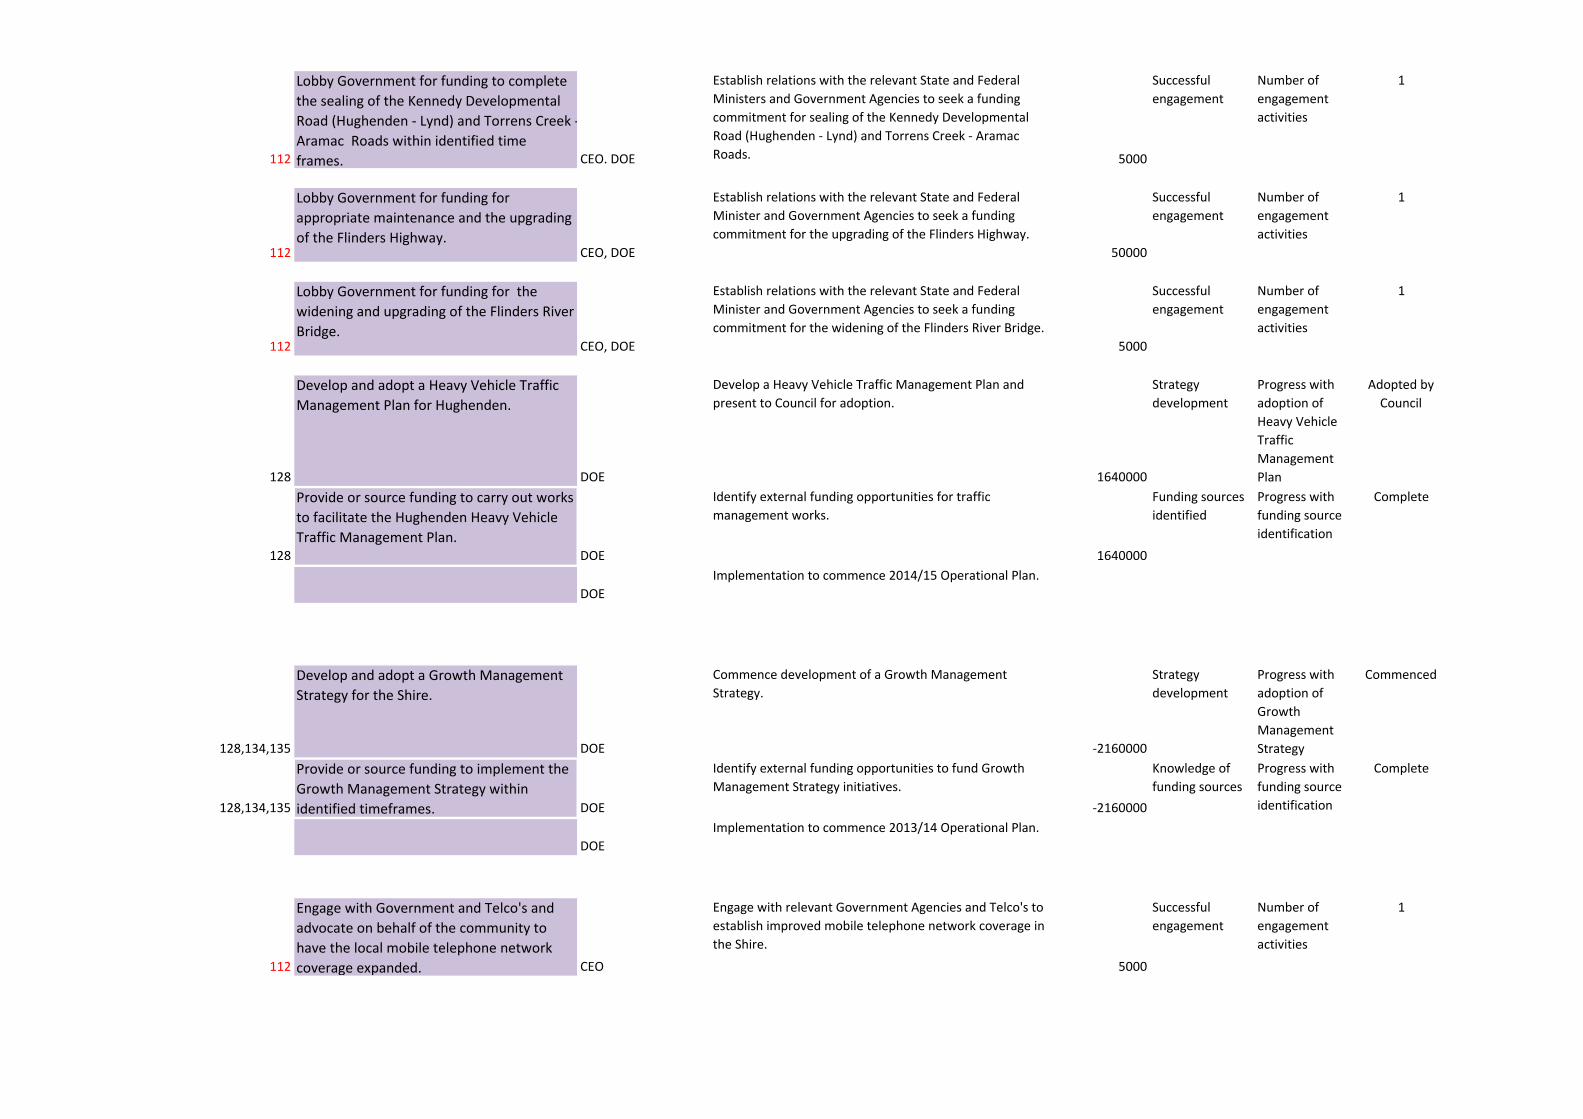
112
Lobby Government for funding to complete
the sealing of the Kennedy Developmental
Road (Hughenden - Lynd) and Torrens Creek -
Aramac Roads within identified time
frames. CEO. DOE
Establish relations with the relevant State and Federal
Ministers and Government Agencies to seek a funding
commitment for sealing of the Kennedy Developmental
Road (Hughenden - Lynd) and Torrens Creek - Aramac
Roads. 5000
Successful
engagement
Number of
engagement
activities
1
112
Lobby Government for funding for
appropriate maintenance and the upgrading
of the Flinders Highway.CEO, DOE
Establish relations with the relevant State and Federal
Minister and Government Agencies to seek a funding
commitment for the upgrading of the Flinders Highway.
50000
Successful
engagement
Number of
engagement
activities
1
112
Lobby Government for funding for the
widening and upgrading of the Flinders River
Bridge.CEO, DOE
Establish relations with the relevant State and Federal
Minister and Government Agencies to seek a funding
commitment for the widening of the Flinders River Bridge.
5000
Successful
engagement
Number of
engagement
activities
1
128
Develop and adopt a Heavy Vehicle Traffic
Management Plan for Hughenden.
DOE
Develop a Heavy Vehicle Traffic Management Plan and
present to Council for adoption.
1640000
Strategy
development
Progress with
adoption of
Heavy Vehicle
Traffic
Management
Plan
Adopted by
Council
128
Provide or source funding to carry out works
to facilitate the Hughenden Heavy Vehicle
Traffic Management Plan. DOE
Identify external funding opportunities for traffic
management works.
1640000
Funding sources
identified
Progress with
funding source
identification
Complete
DOE
Implementation to commence 2014/15 Operational Plan.
128,134,135
Develop and adopt a Growth Management
Strategy for the Shire.
DOE
Commence development of a Growth Management
Strategy.
-2160000
Strategy
development
Progress with
adoption of
Growth
Management
Strategy
Commenced
128,134,135
Provide or source funding to implement the
Growth Management Strategy within
identified timeframes. DOE
Identify external funding opportunities to fund Growth
Management Strategy initiatives.
-2160000
Knowledge of
funding sources
Progress with
funding source
identification
Complete
DOE
Implementation to commence 2013/14 Operational Plan.
112
Engage with Government and Telco's and
advocate on behalf of the community to
have the local mobile telephone network
coverage expanded. CEO
Engage with relevant Government Agencies and Telco's to
establish improved mobile telephone network coverage in
the Shire.
5000
Successful
engagement
Number of
engagement
activities
1
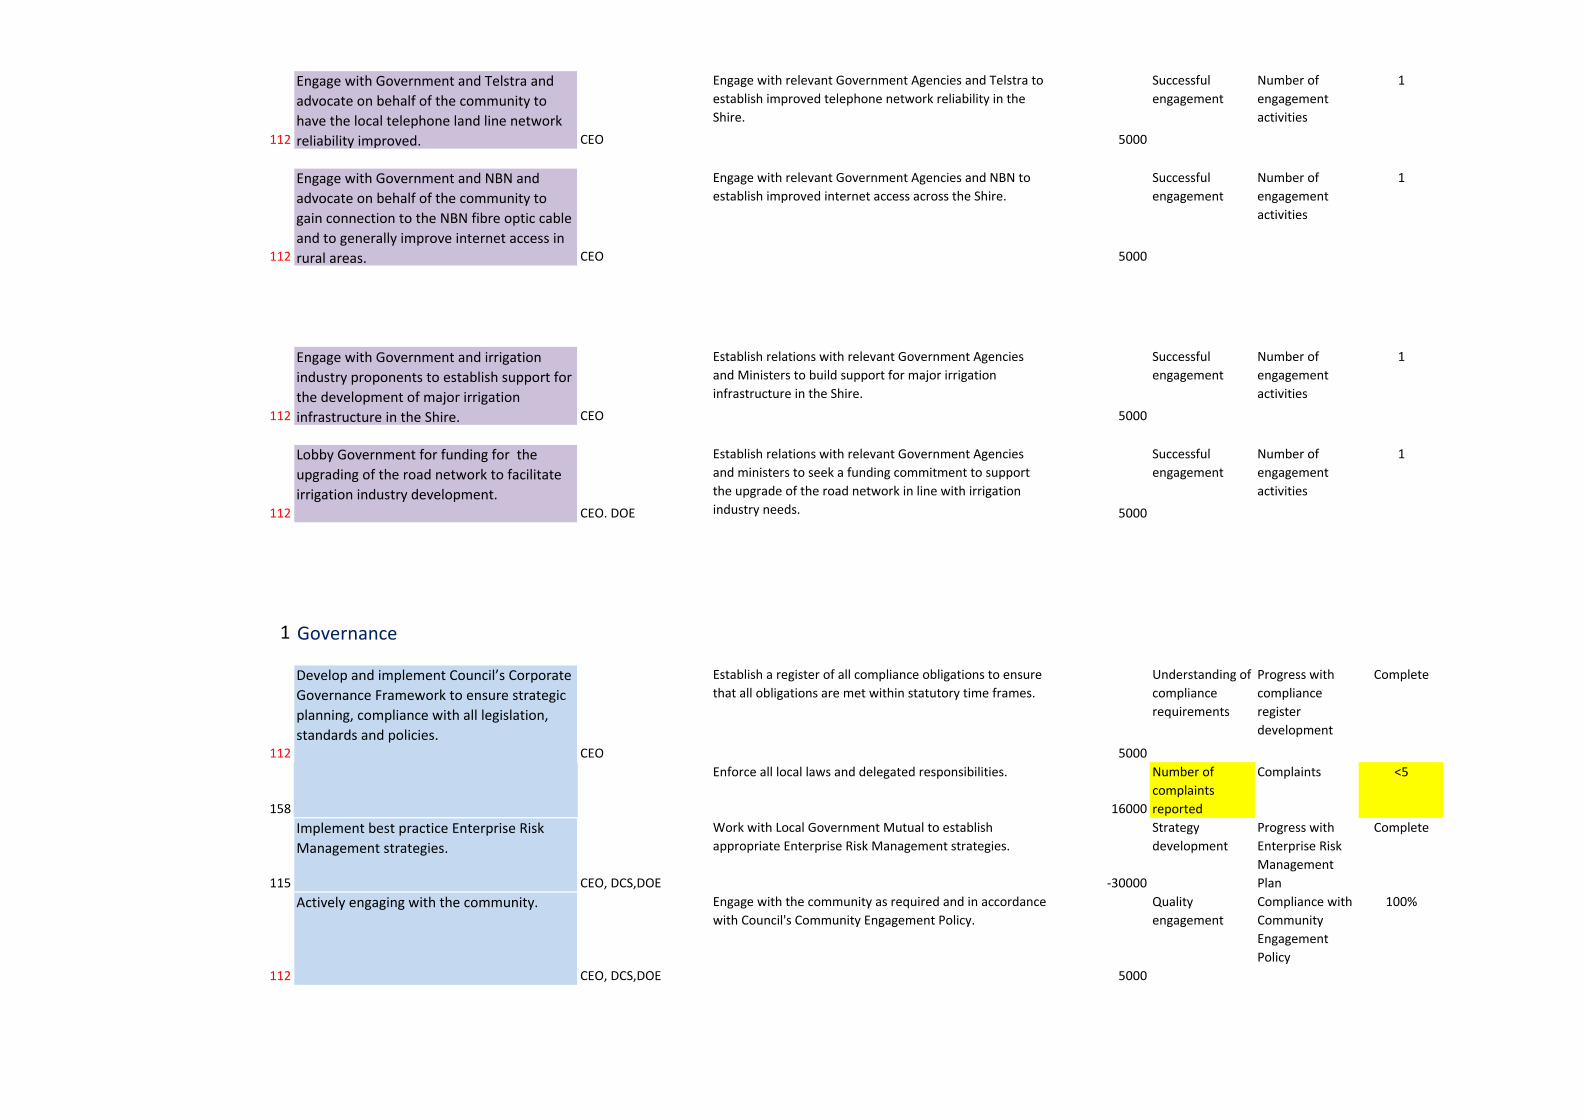
112
Engage with Government and Telstra and
advocate on behalf of the community to
have the local telephone land line network
reliability improved. CEO
Engage with relevant Government Agencies and Telstra to
establish improved telephone network reliability in the
Shire.
5000
Successful
engagement
Number of
engagement
activities
1
112
Engage with Government and NBN and
advocate on behalf of the community to
gain connection to the NBN fibre optic cable
and to generally improve internet access in
rural areas. CEO
Engage with relevant Government Agencies and NBN to
establish improved internet access across the Shire.
5000
Successful
engagement
Number of
engagement
activities
1
112
Engage with Government and irrigation
industry proponents to establish support for
the development of major irrigation
infrastructure in the Shire. CEO
Establish relations with relevant Government Agencies
and Ministers to build support for major irrigation
infrastructure in the Shire.
5000
Successful
engagement
Number of
engagement
activities
1
112
Lobby Government for funding for the
upgrading of the road network to facilitate
irrigation industry development.CEO. DOE
Establish relations with relevant Government Agencies
and ministers to seek a funding commitment to support
the upgrade of the road network in line with irrigation
industry needs. 5000
Successful
engagement
Number of
engagement
activities
1
1 Governance
112
Develop and implement Council’s Corporate
Governance Framework to ensure strategic
planning, compliance with all legislation,
standards and policies.CEO
Establish a register of all compliance obligations to ensure
that all obligations are met within statutory time frames.
5000
Understanding of
compliance
requirements
Progress with
compliance
register
development
Complete
158
Enforce all local laws and delegated responsibilities.
16000
Number of
complaints
reported
Complaints <5
115
Implement best practice Enterprise Risk
Management strategies.
CEO, DCS,DOE
Work with Local Government Mutual to establish
appropriate Enterprise Risk Management strategies.
-30000
Strategy
development
Progress with
Enterprise Risk
Management
Plan
Complete
112
Actively engaging with the community.
CEO, DCS,DOE
Engage with the community as required and in accordance
with Council's Community Engagement Policy.
5000
Quality
engagement
Compliance with
Community
Engagement
Policy
100%
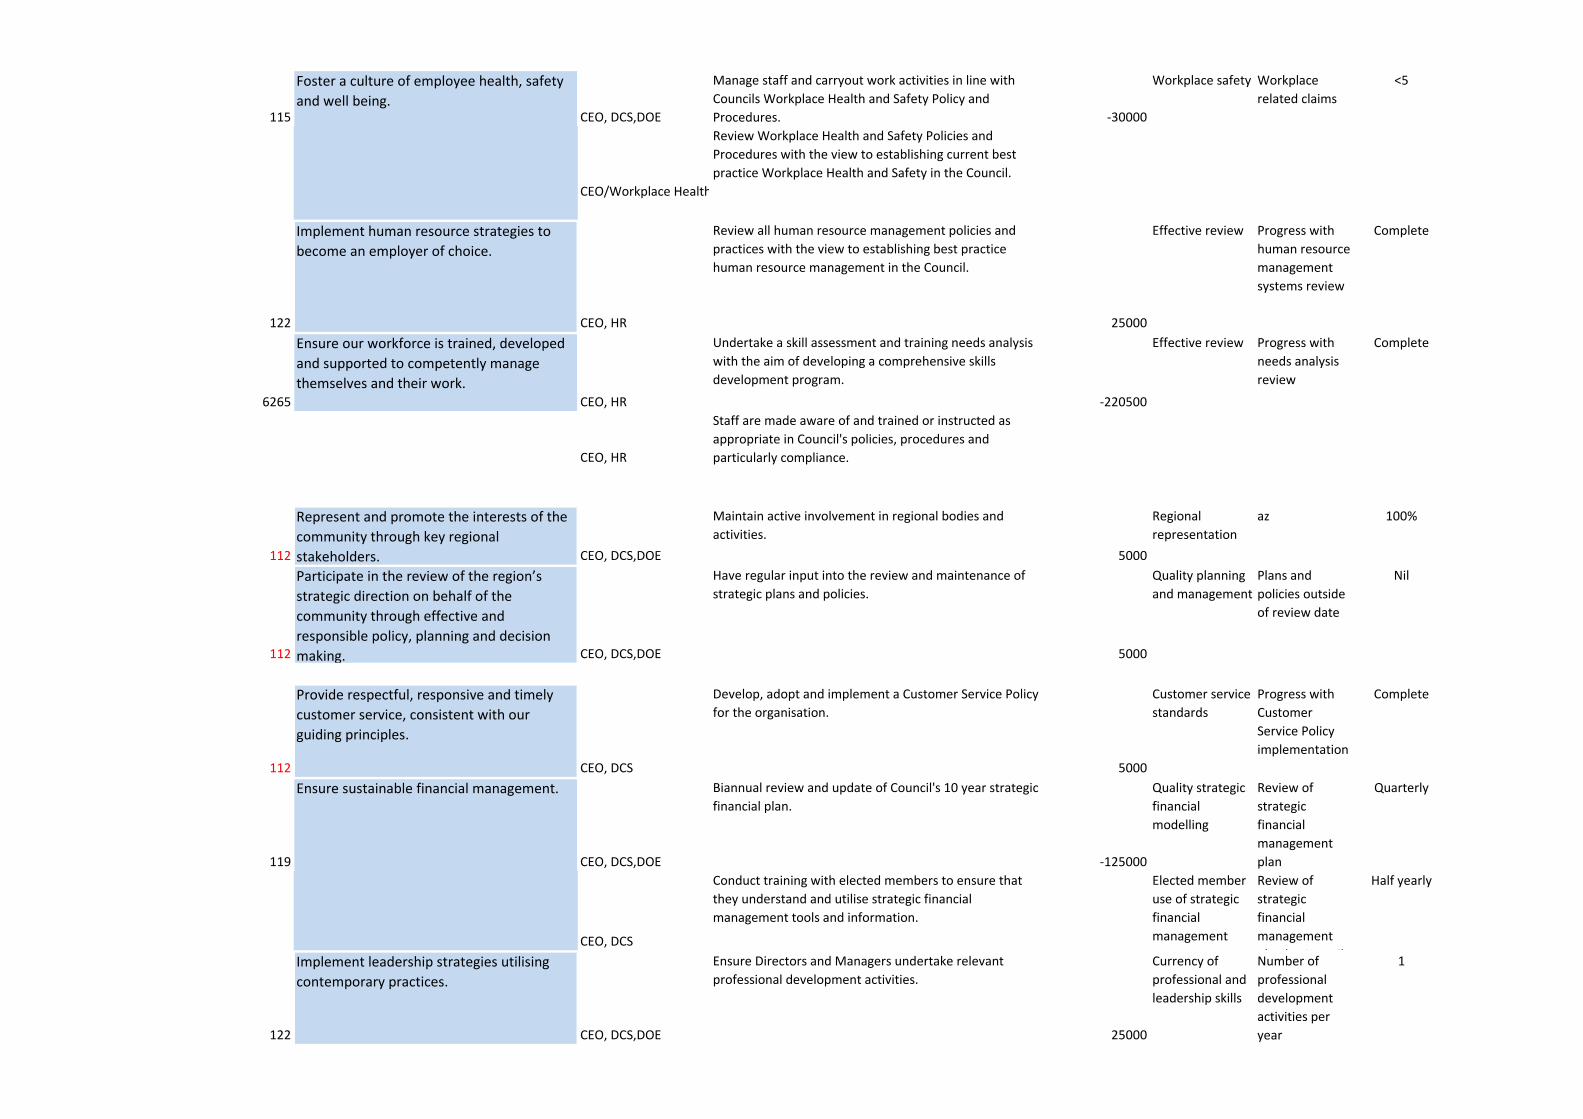
115
Foster a culture of employee health, safety
and well being.CEO, DCS,DOE
Manage staff and carryout work activities in line with
Councils Workplace Health and Safety Policy and
Procedures. -30000
Workplace safety Workplace
related claims
<5
CEO/Workplace Health and Safety
Review Workplace Health and Safety Policies and
Procedures with the view to establishing current best
practice Workplace Health and Safety in the Council.
122
Implement human resource strategies to
become an employer of choice.
CEO, HR
Review all human resource management policies and
practices with the view to establishing best practice
human resource management in the Council.
25000
Effective review Progress with
human resource
management
systems review
Complete
6265
Ensure our workforce is trained, developed
and supported to competently manage
themselves and their work.CEO, HR
Undertake a skill assessment and training needs analysis
with the aim of developing a comprehensive skills
development program.
-220500
Effective review Progress with
needs analysis
review
Complete
CEO, HR
Staff are made aware of and trained or instructed as
appropriate in Council's policies, procedures and
particularly compliance.
112
Represent and promote the interests of the
community through key regional
stakeholders. CEO, DCS,DOE
Maintain active involvement in regional bodies and
activities.
5000
Regional
representation
az 100%
112
Participate in the review of the region’s
strategic direction on behalf of the
community through effective and
responsible policy, planning and decision
making. CEO, DCS,DOE
Have regular input into the review and maintenance of
strategic plans and policies.
5000
Quality planning
and management
Plans and
policies outside
of review date
Nil
112
Provide respectful, responsive and timely
customer service, consistent with our
guiding principles.
CEO, DCS
Develop, adopt and implement a Customer Service Policy
for the organisation.
5000
Customer service
standards
Progress with
Customer
Service Policy
implementation
Complete
119
Ensure sustainable financial management.
CEO, DCS,DOE
Biannual review and update of Council's 10 year strategic
financial plan.
-125000
Quality strategic
financial
modelling
Review of
strategic
financial
management
plan
Quarterly
CEO, DCS
Conduct training with elected members to ensure that
they understand and utilise strategic financial
management tools and information.
Elected member
use of strategic
financial
management
Review of
strategic
financial
management
plan by Council
Half yearly
122
Implement leadership strategies utilising
contemporary practices.
CEO, DCS,DOE
Ensure Directors and Managers undertake relevant
professional development activities.
25000
Currency of
professional and
leadership skills
Number of
professional
development
activities per
year
1
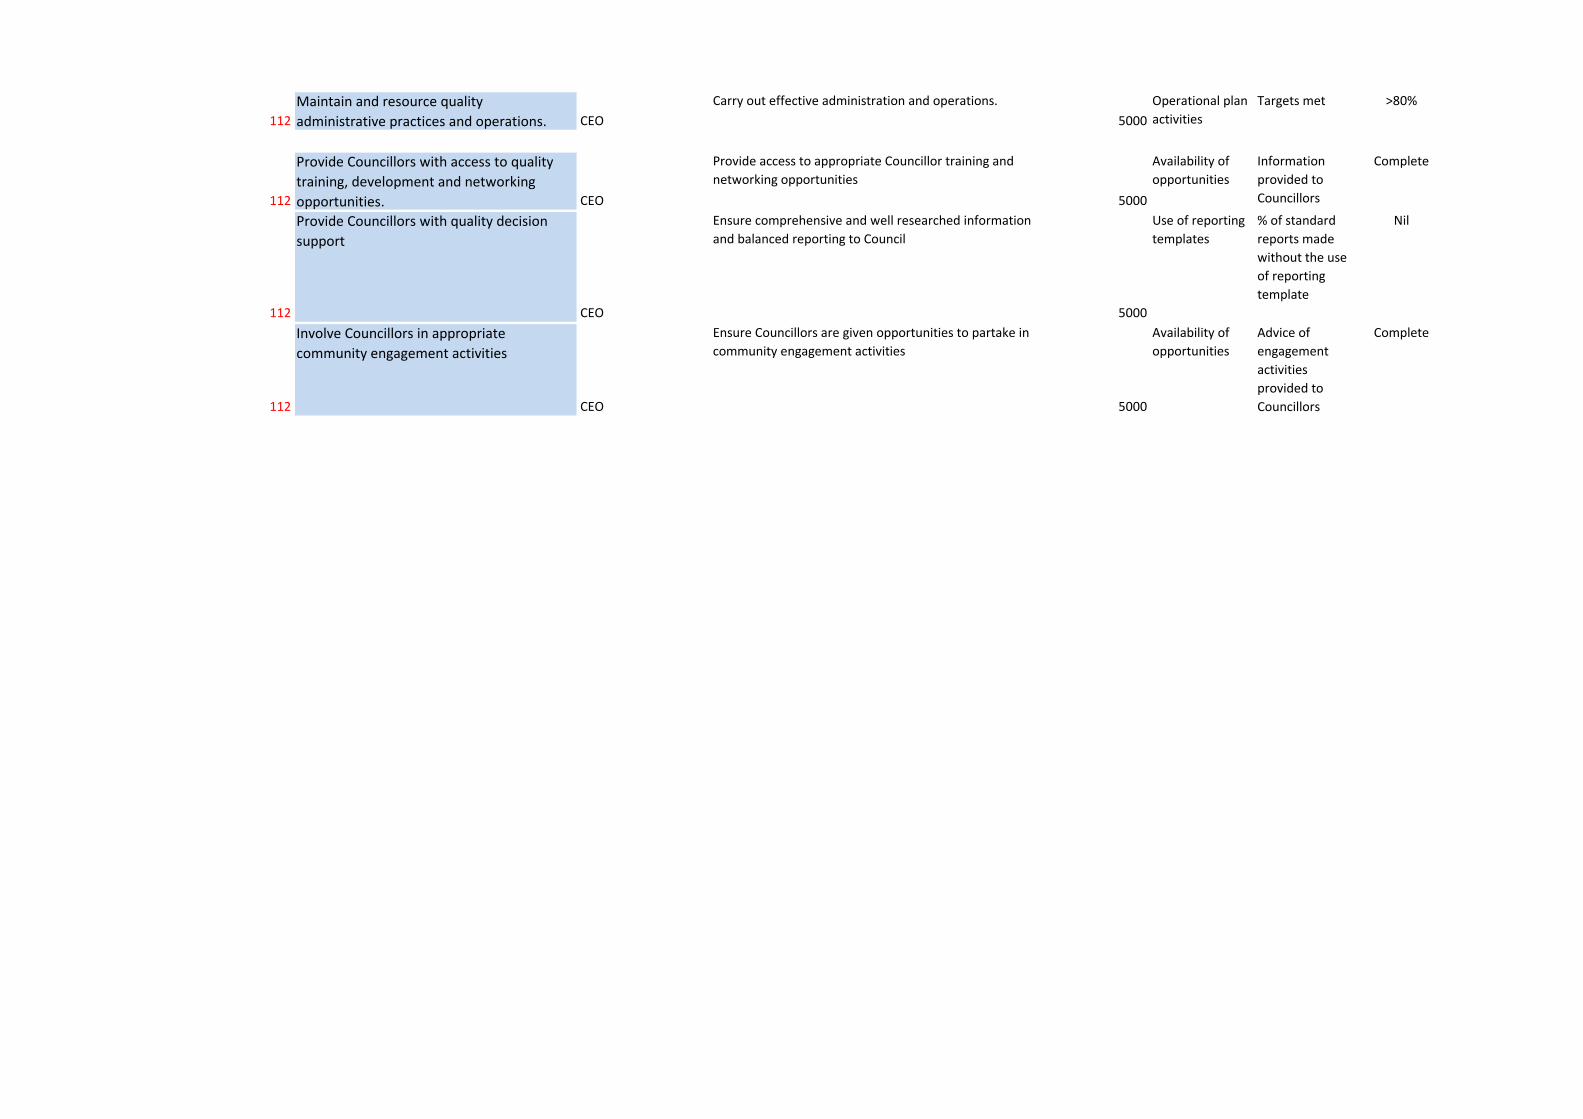
112
Maintain and resource quality
administrative practices and operations. CEO
Carry out effective administration and operations.
5000
Operational plan
activities
Targets met >80%
112
Provide Councillors with access to quality
training, development and networking
opportunities. CEO
Provide access to appropriate Councillor training and
networking opportunities
5000
Availability of
opportunities
Information
provided to
Councillors
Complete
112
Provide Councillors with quality decision
support
CEO
Ensure comprehensive and well researched information
and balanced reporting to Council
5000
Use of reporting
templates
% of standard
reports made
without the use
of reporting
template
Nil
112
Involve Councillors in appropriate
community engagement activities
CEO
Ensure Councillors are given opportunities to partake in
community engagement activities
5000
Availability of
opportunities
Advice of
engagement
activities
provided to
Councillors
Complete
0
FLINDERS SHIRE COUNCIL
BUDGET 2012-2013 HELD IN THE BOARDROOM COUNCIL CHAMBERS 34 GRAY STREET HUGHENDEN
13 SEPTEMBER 2012
1
1 MAYOR’S BUDGET SUMMARY REPORT
(Pursuant to Section 12 (4) (b) of the Local Government Act 2009) I now propose the following Budget as presented to this Council Meeting and as worked through by Council
at other Council forums. Council will formally adopt the Budget for 2012-2013 at the Council meeting Thursday 13th September 2012 in the Director Corporate Services Report. All items referred to the Budget during the previous twelve months or listed in our planning processes have been considered in the preparation of the Budget. The Budget provides an extensive Works Program for all areas of the Shire and its workforce with a significant roadworks program throughout the Shire, building construction works, growth of Community Care Services, community facilities and industrial land development. This year’s Budget continues to put in place some of the key building blocks for our community’s future. MAJOR CONSIDERATIONS Major Capital Project budget $32.864m include –
The Hughenden Aged Persons Accommodation Facility that will be built on Council freehold land in Betts Street, Hughenden. This $5.3m project, that has commenced and will be completed in this years budget, will be funded through Federal Government Grants ($4.4m), local fundraising funds ($0.55m) and a Council contribution of $0.35m;
New Shire Office Complex - a facility that includes the relocation of Community Care. This $5.5m project was funded with Council funds (depreciation/revenue). This project was commenced in the 2011-2012 financial year and will be completed in the current year. Costs to complete in the current year are $2.65m that includes all furnishing, car parking and landscaping. Project due for completion early October 2012;
New North Hughenden Sewerage Scheme and the upgraded Sewerage Treatment Plant at an estimated cost of $8.572m with the project due to be complete and fully operational by late 2013. The project is to be funded through a State grant of 75% to a maximum of $6.429m with the balance funded through loans, depreciation funds and general revenue. Costs in 2012-2013 are estimated at $6.1m. This will be the only loan borrowings Council has and will spread the cost of essential public infrastructure over future years;
Upgrade of the Hughenden water reticulation network is programmed at a cost of $1.437m. This project will provide Council with the capability to treat the water supply at one central point. This project is fully funded by the State and is subject to final State approval;
Plant Fleet Program with net purchases of $1.98m funded through trades, depreciation and general revenue from plant operating surplus;
Major roadworks such as town streets and rural roads funded via Transport Infrastructure Development Scheme (TIDS), Roads to Recovery ( RTR) and general revenue. These include projects like the new Gray Street underground drain, Completion of Brodie Street, Moran Street, Walkcege Wall completion and resealing of the Glendower and Spring Valley Walls.
Building works such as the Depot workshop and staff accommodation building upgrades. Major Contract Works –
Shire Road Flood Damage $13.32m;
Main Roads Flood Damage $18.54m;
Main Roads contract works on the Hann Highway valued at approximately $5.07m; and
Road Maintenance contracts with Transport Main Roads (TMR) valued at $1.9m. Assumptions
Ergon power costs have increased with plans for ongoing rises;
General employee wages increase 2% as part of Council’s over award payments program;
Increasing fuel costs that are difficult to predict;
CPI Brisbane 12 months ending June 2012 was 1.9%
Predicted CPI Brisbane 3%; and
LGAQ Local Government cost index (combination of CPI & Road Bridge Construction) for previous 12 months of 3.6%.
2
MAYORS BUDGET SUMMARY REPORT
Shire Revaluation
The revaluation return for the whole of the Shire has been returned by the Department of Natural Resource
Management (NRM) and will be affective from 1 July 2012 for our rates in 2012-2013. The following summary
is provided for Councillors –
The previous valuation came into affect 1 July 2012;
The new valuation comes into effect for the 2012-2013 rates;
Valuations only effect the General rate and Wild Dog Levy;
Rates will NOT increase by the change in the revaluation;
Town revaluations increased by an average of-: Hughenden 0%, Prairie 72.5%, Torrens Creek 100.36% and Stamford 0%);
Rural valuations decreased by an average of 5.04% (Hughenden area -3.28%, Dutton River -2.11%, Porcupine area 0%, Prairie area -0.64%, Tangorin area -8.44%, Torrens Creek area 0.13% and Stamford area -10.07%;
Rate Implications
Council will adjust the rate in the dollar to receive the same total level of General rates from each category e.g. Rural, Wild Dog Levy and Urban;
Assuming a nil rate increase, properties that had valuations go up/down by the average
increase/decrease (Rural 5.04% decrease, Urban Hughenden Nil increase, Small towns 83% increase) will see no change in their General rates. Properties that went up above the average will have an increase in rates and those that went down or less than the average will have a reduction in rates.
The estimated balance of the Operating Statement for 2012-2013 is a $19,465,865 surplus with the balance of the Appropriation Statement (allowing for capital grants, sale of assets, transfers to reserves and revenue used for capital) of $1,855 surplus. This is based on the below level of rate increase. The following rate increases are recommended-:. General Rate Increase 4.0% Cleansing Rate Increase 6.0% Water Rate Increase 2.0% Sewerage Rate Increase 6.0% Wild Dog Levy Increase NIL% The major works (capital and operational) items that Council prioritised have been included in the Works Program and will allow Council to finish the financial year in sound financial position. A Budget review will be undertaken mid-year to review operations.
A summary of the Capital Works Program (expenditure and grants) in the categories of new, upgraded or renewal has been provided in General Ledger number order. Note these items of capital expenditure are not included in the Budgeted Revenue/Expenditure General Ledger print-out. A separate summary of the major items and projects within the revenue/expenditure operations has been provided in the General Works Program (expenditure and grants) in General Ledger number order and are included within the Budgeted Revenue/Expenditure General Ledger print-out. A summary of the transfers to and from Council Reserves is also included.
Assuming the budget is adopted as presented then a surplus of $1,855 in the Appropriation Statement has been presented with the above rate increases included. Items not funded in the current Budget have been included in the deferred Capital and General Works Projects as listed.
3
MAYORS BUDGET SUMMARY REPORT
This Budget allows Council to fund a significant Capital Works Program of $32.874m through the use of capital grants, depreciation funds, Loans, special reserves, asset sales and general revenue as per the Capital Funding Statement. Any additions/deletions or changes to the Budget will be amended at the forum meeting. It should be noted that an estimate of the surplus for 2011-2012 of $3,285,946 has been included and when the final audited accounts for 2011-2012 are known, a Budget review can be undertaken.
WATER ALLOWANCES
It is recommended that excess water charges remain at their current level of $1.00 per kilolitre. It is recommended that bulk water from standpipes remain at $5.00 per kilolitre. It is recommended that allowance water remain unaltered as follows –
- Currently allowance water is one unit equals 120KL;
- Recommend that allowance water be reduced to one unit equals 100KL in future years.
Recommended that Council leave the water allowances at one unit equals 120KL for 2012-2013.
COUNCIL PENSIONER RATE CONCESSIONS
Council’s current level of Pensioner Rate Concessions on General, Garbage, Sewerage and Water Rates is currently set at 50% of rates and charges to a maximum of $475pa. This was last increased in 2008-2009 from the previous level of $450 maximum rebate. It had not previously been reviewed since 1995. Comment - It is recommended that Council leave the Pensioner Rate Concession at $475 for 2012-2013. THE FOLLOWING SUMMARY OF RATE CHANGES OVER PREVIOUS YEARS IS PROVIDED FOR COUNCILLOR’S INFORMATION - GENERAL RATES
In the period 1990-1991 to 1997-1998, General Rate Income decreased by 2.13%. 1998-1999 Rate Increased by 2.76% 1999-2000 Rate Increased by 2.00% 2000-2001 Rate Increased by 3.50% 2001-2002 Rate Increased by 5.00% 2002-2003 Rate Increased by 3.50% 2003-2004 Rate Increased by 3.40% 2004-2005 Rate Increased by 3.00% 2005-2006 Rate Increased by 3.00% 2006-2007 Rate Increased by 4.00% 2007-2008 Rate Increased by 4.50% 2008-2009 Rate Increased by 7.00% 2009-2010 Rate Increased by 7.00% 2010-2011 Rate Increased by 5.00% 2011-2012 Rate increased by 5.00%
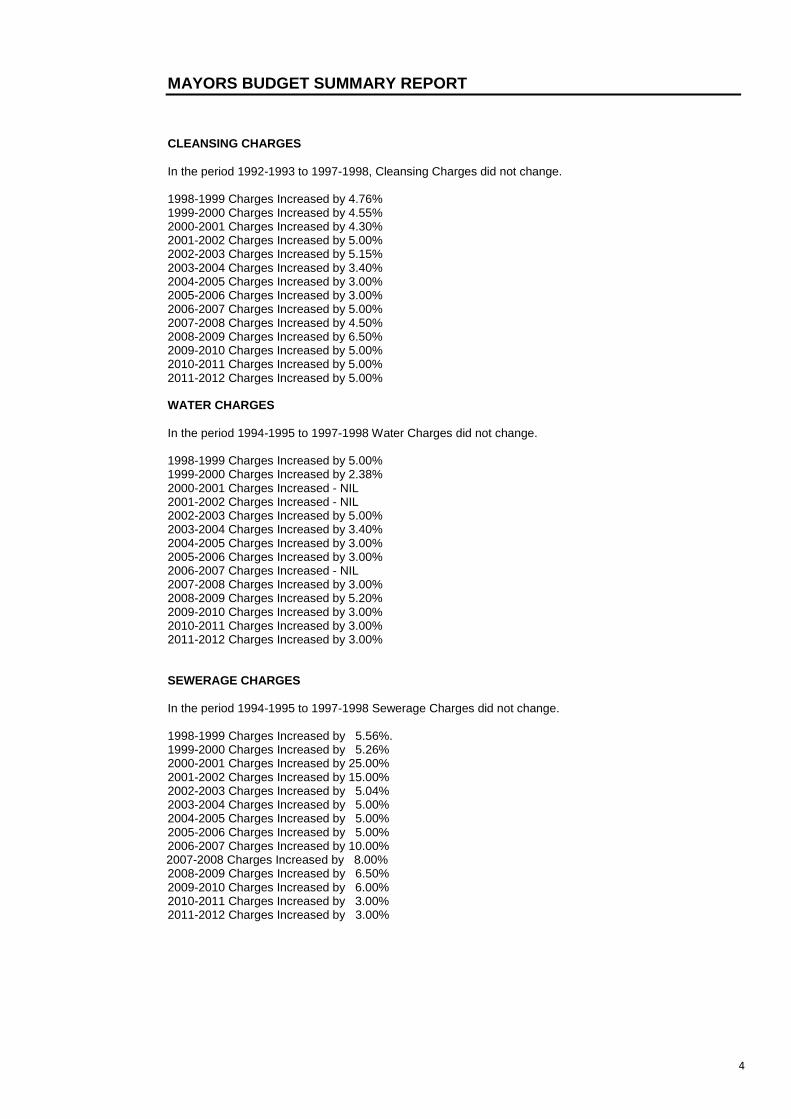
4
MAYORS BUDGET SUMMARY REPORT
CLEANSING CHARGES
In the period 1992-1993 to 1997-1998, Cleansing Charges did not change. 1998-1999 Charges Increased by 4.76% 1999-2000 Charges Increased by 4.55% 2000-2001 Charges Increased by 4.30% 2001-2002 Charges Increased by 5.00% 2002-2003 Charges Increased by 5.15% 2003-2004 Charges Increased by 3.40% 2004-2005 Charges Increased by 3.00% 2005-2006 Charges Increased by 3.00% 2006-2007 Charges Increased by 5.00% 2007-2008 Charges Increased by 4.50% 2008-2009 Charges Increased by 6.50% 2009-2010 Charges Increased by 5.00% 2010-2011 Charges Increased by 5.00% 2011-2012 Charges Increased by 5.00% WATER CHARGES
In the period 1994-1995 to 1997-1998 Water Charges did not change. 1998-1999 Charges Increased by 5.00% 1999-2000 Charges Increased by 2.38% 2000-2001 Charges Increased - NIL 2001-2002 Charges Increased - NIL 2002-2003 Charges Increased by 5.00% 2003-2004 Charges Increased by 3.40% 2004-2005 Charges Increased by 3.00% 2005-2006 Charges Increased by 3.00% 2006-2007 Charges Increased - NIL 2007-2008 Charges Increased by 3.00% 2008-2009 Charges Increased by 5.20% 2009-2010 Charges Increased by 3.00% 2010-2011 Charges Increased by 3.00% 2011-2012 Charges Increased by 3.00%
SEWERAGE CHARGES
In the period 1994-1995 to 1997-1998 Sewerage Charges did not change. 1998-1999 Charges Increased by 5.56%. 1999-2000 Charges Increased by 5.26% 2000-2001 Charges Increased by 25.00% 2001-2002 Charges Increased by 15.00% 2002-2003 Charges Increased by 5.04% 2003-2004 Charges Increased by 5.00% 2004-2005 Charges Increased by 5.00% 2005-2006 Charges Increased by 5.00% 2006-2007 Charges Increased by 10.00%
2007-2008 Charges Increased by 8.00% 2008-2009 Charges Increased by 6.50% 2009-2010 Charges Increased by 6.00% 2010-2011 Charges Increased by 3.00% 2011-2012 Charges Increased by 3.00%
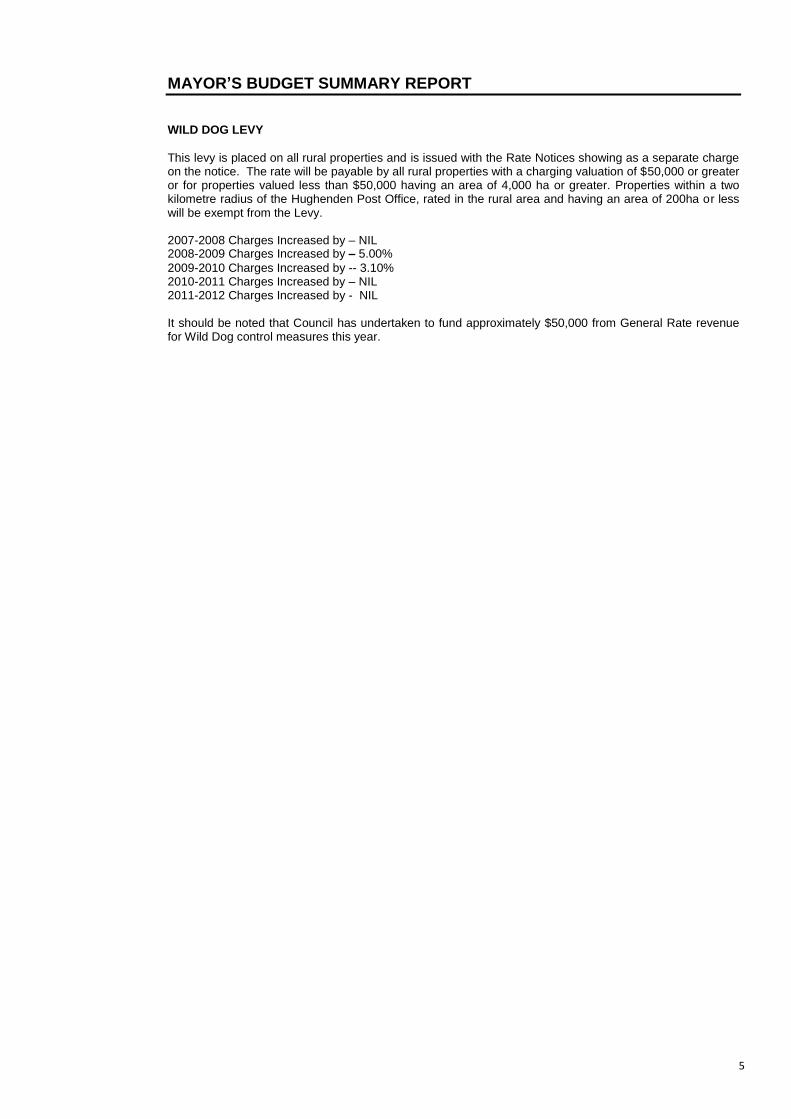
5
MAYOR’S BUDGET SUMMARY REPORT WILD DOG LEVY
This levy is placed on all rural properties and is issued with the Rate Notices showing as a separate charge on the notice. The rate will be payable by all rural properties with a charging valuation of $50,000 or greater or for properties valued less than $50,000 having an area of 4,000 ha or greater. Properties within a two kilometre radius of the Hughenden Post Office, rated in the rural area and having an area of 200ha or less will be exempt from the Levy. 2007-2008 Charges Increased by – NIL 2008-2009 Charges Increased by – 5.00%
2009-2010 Charges Increased by -- 3.10% 2010-2011 Charges Increased by – NIL 2011-2012 Charges Increased by - NIL It should be noted that Council has undertaken to fund approximately $50,000 from General Rate revenue for Wild Dog control measures this year.
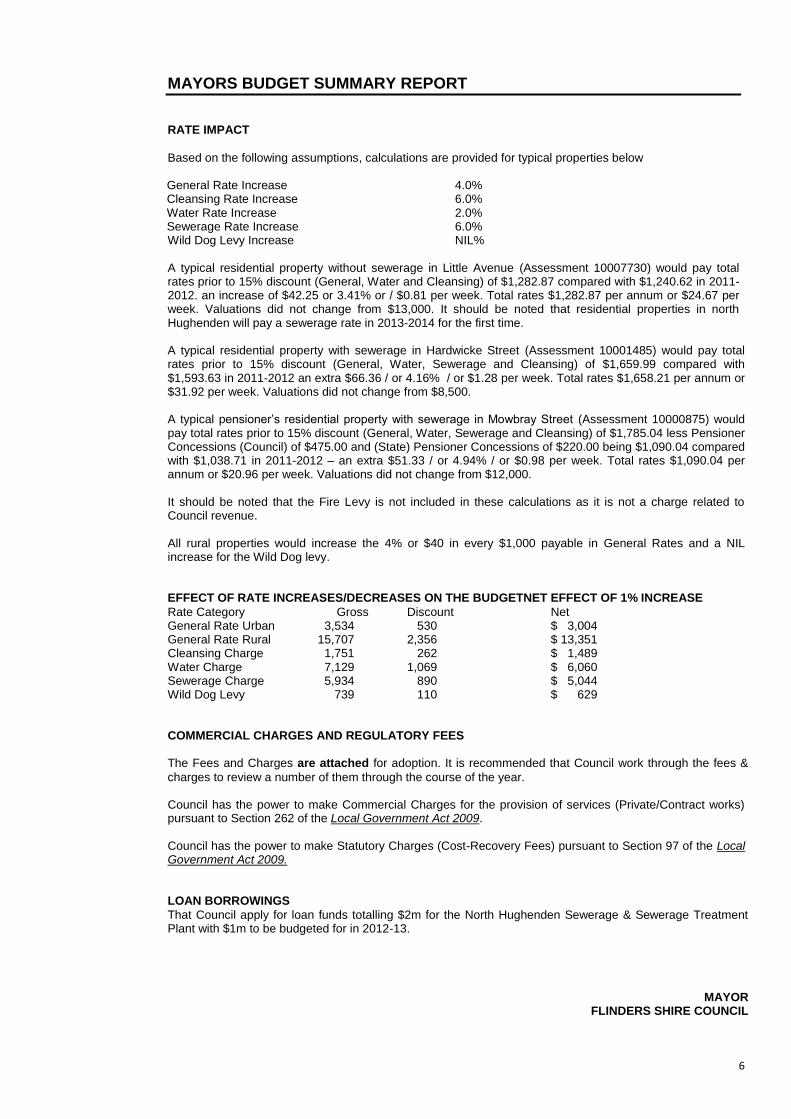
6
MAYORS BUDGET SUMMARY REPORT RATE IMPACT
Based on the following assumptions, calculations are provided for typical properties below General Rate Increase 4.0% Cleansing Rate Increase 6.0% Water Rate Increase 2.0% Sewerage Rate Increase 6.0% Wild Dog Levy Increase NIL% A typical residential property without sewerage in Little Avenue (Assessment 10007730) would pay total rates prior to 15% discount (General, Water and Cleansing) of $1,282.87 compared with $1,240.62 in 2011-2012. an increase of $42.25 or 3.41% or / $0.81 per week. Total rates $1,282.87 per annum or $24.67 per week. Valuations did not change from $13,000. It should be noted that residential properties in north Hughenden will pay a sewerage rate in 2013-2014 for the first time. A typical residential property with sewerage in Hardwicke Street (Assessment 10001485) would pay total rates prior to 15% discount (General, Water, Sewerage and Cleansing) of $1,659.99 compared with $1,593.63 in 2011-2012 an extra $66.36 / or 4.16% / or $1.28 per week. Total rates $1,658.21 per annum or $31.92 per week. Valuations did not change from $8,500. A typical pensioner’s residential property with sewerage in Mowbray Street (Assessment 10000875) would pay total rates prior to 15% discount (General, Water, Sewerage and Cleansing) of $1,785.04 less Pensioner Concessions (Council) of $475.00 and (State) Pensioner Concessions of $220.00 being $1,090.04 compared with $1,038.71 in 2011-2012 – an extra $51.33 / or 4.94% / or $0.98 per week. Total rates $1,090.04 per annum or $20.96 per week. Valuations did not change from $12,000. It should be noted that the Fire Levy is not included in these calculations as it is not a charge related to Council revenue. All rural properties would increase the 4% or $40 in every $1,000 payable in General Rates and a NIL increase for the Wild Dog levy.
EFFECT OF RATE INCREASES/DECREASES ON THE BUDGETNET EFFECT OF 1% INCREASE
Rate Category Gross Discount Net General Rate Urban 3,534 530 $ 3,004 General Rate Rural 15,707 2,356 $ 13,351 Cleansing Charge 1,751 262 $ 1,489 Water Charge 7,129 1,069 $ 6,060 Sewerage Charge 5,934 890 $ 5,044 Wild Dog Levy 739 110 $ 629
COMMERCIAL CHARGES AND REGULATORY FEES
The Fees and Charges are attached for adoption. It is recommended that Council work through the fees &
charges to review a number of them through the course of the year. Council has the power to make Commercial Charges for the provision of services (Private/Contract works) pursuant to Section 262 of the Local Government Act 2009.
Council has the power to make Statutory Charges (Cost-Recovery Fees) pursuant to Section 97 of the Local Government Act 2009.
LOAN BORROWINGS
That Council apply for loan funds totalling $2m for the North Hughenden Sewerage & Sewerage Treatment Plant with $1m to be budgeted for in 2012-13.
MAYOR
FLINDERS SHIRE COUNCIL
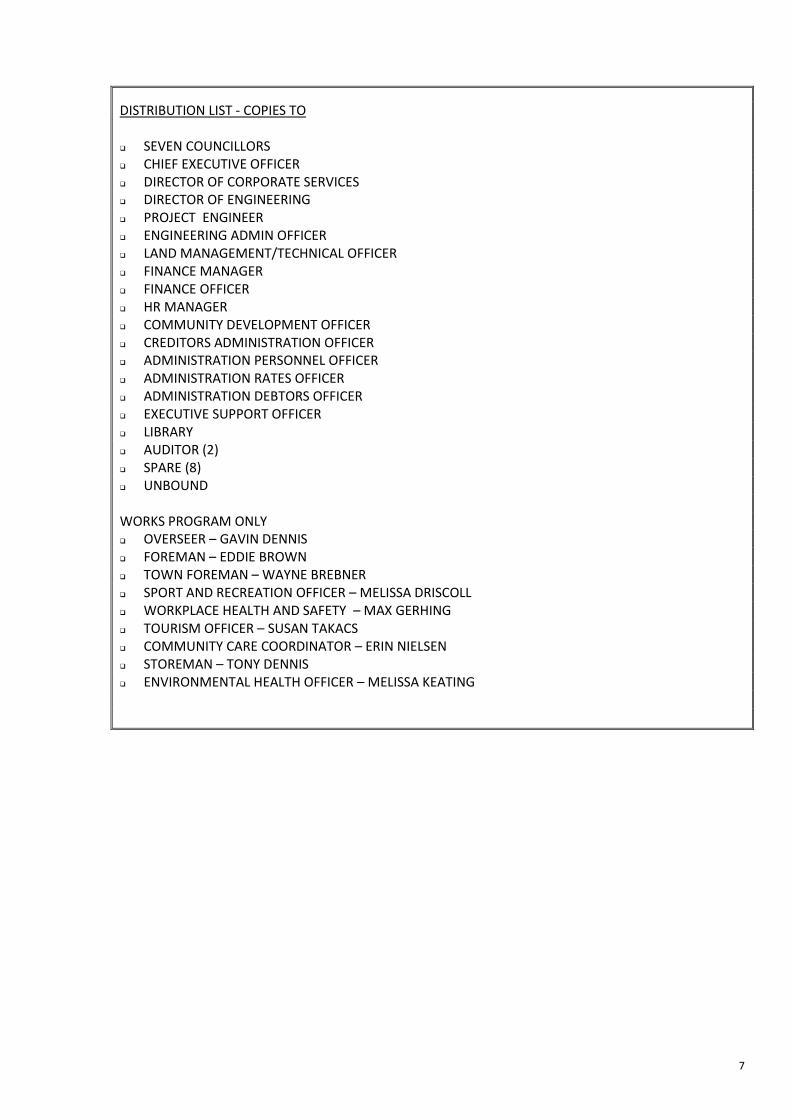
7
DISTRIBUTION LIST - COPIES TO SEVEN COUNCILLORS CHIEF EXECUTIVE OFFICER DIRECTOR OF CORPORATE SERVICES DIRECTOR OF ENGINEERING PROJECT ENGINEER ENGINEERING ADMIN OFFICER LAND MANAGEMENT/TECHNICAL OFFICER FINANCE MANAGER FINANCE OFFICER HR MANAGER COMMUNITY DEVELOPMENT OFFICER CREDITORS ADMINISTRATION OFFICER ADMINISTRATION PERSONNEL OFFICER ADMINISTRATION RATES OFFICER ADMINISTRATION DEBTORS OFFICER EXECUTIVE SUPPORT OFFICER LIBRARY AUDITOR (2) SPARE (8) UNBOUND WORKS PROGRAM ONLY OVERSEER – GAVIN DENNIS FOREMAN – EDDIE BROWN TOWN FOREMAN – WAYNE BREBNER SPORT AND RECREATION OFFICER – MELISSA DRISCOLL WORKPLACE HEALTH AND SAFETY – MAX GERHING TOURISM OFFICER – SUSAN TAKACS COMMUNITY CARE COORDINATOR – ERIN NIELSEN STOREMAN – TONY DENNIS ENVIRONMENTAL HEALTH OFFICER – MELISSA KEATING
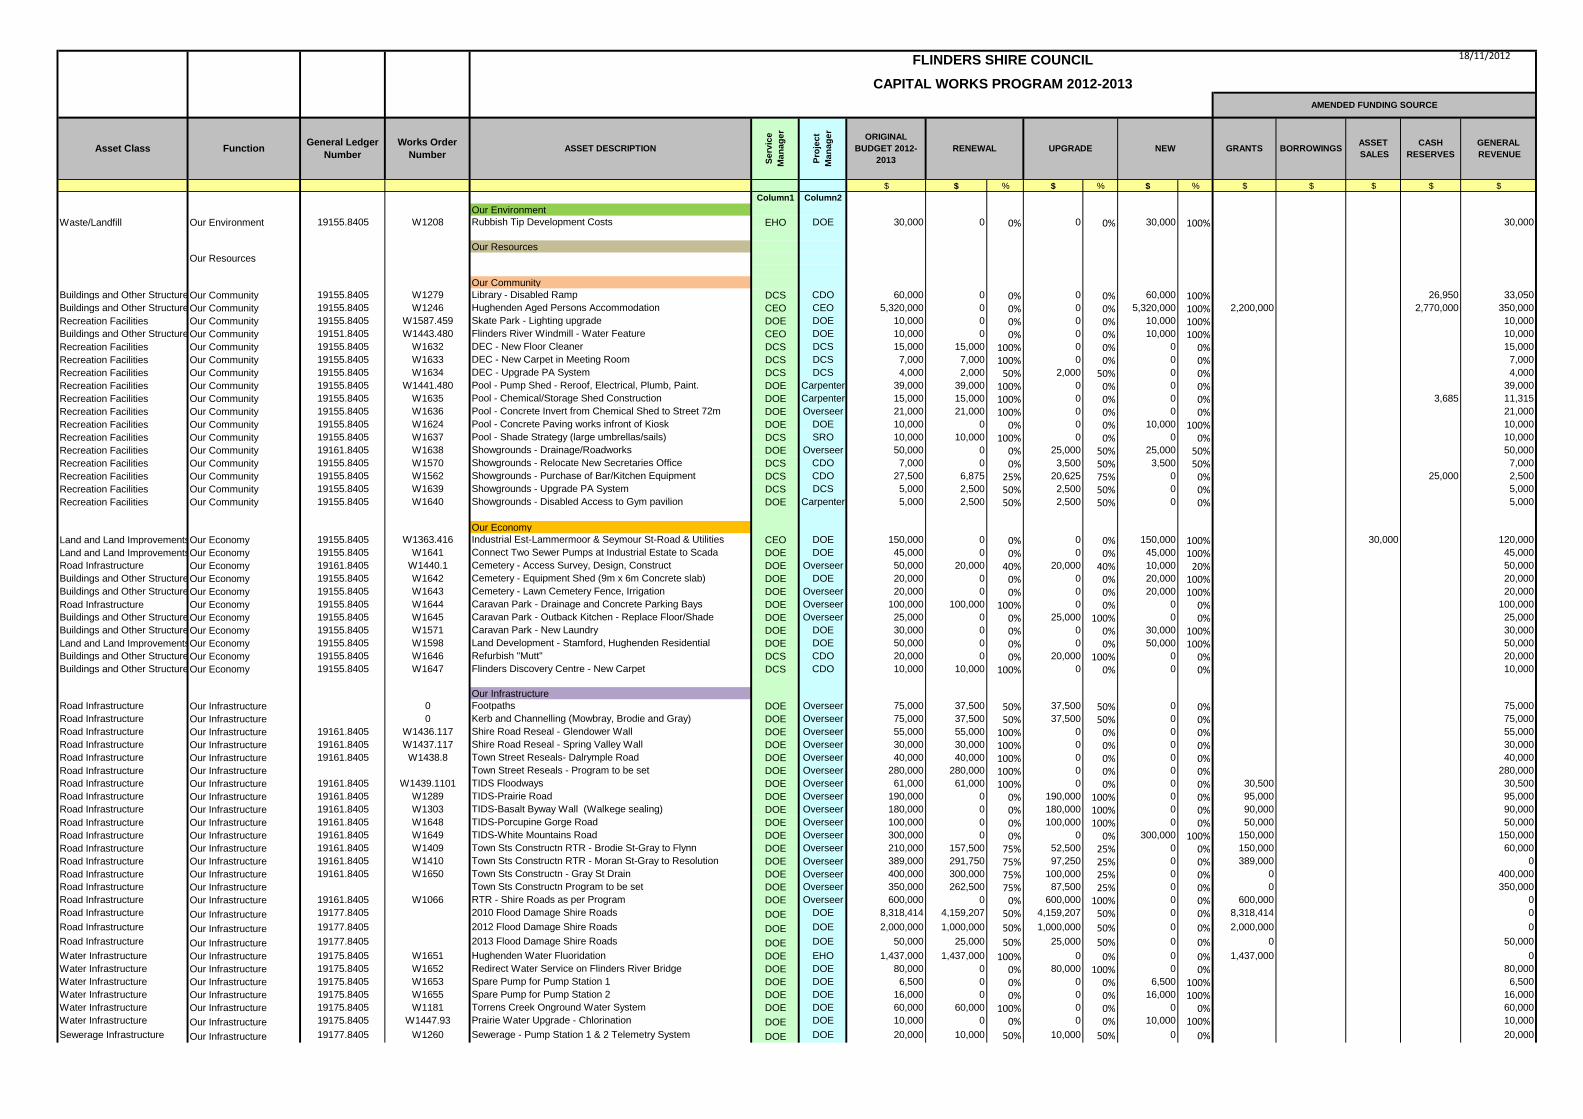
18/11/2012
$ $ % $ % $ % $ $ $ $ $
Column1 Column2
Our Environment
Waste/Landfill Our Environment 19155.8405 W1208 Rubbish Tip Development Costs EHO DOE 30,000 0 0% 0 0% 30,000 100% 30,000
Our ResourcesOur Resources
Our Community
Buildings and Other StructuresOur Community 19155.8405 W1279 Library - Disabled Ramp DCS CDO 60,000 0 0% 0 0% 60,000 100% 26,950 33,050
Buildings and Other StructuresOur Community 19155.8405 W1246 Hughenden Aged Persons Accommodation CEO CEO 5,320,000 0 0% 0 0% 5,320,000 100% 2,200,000 2,770,000 350,000
Recreation Facilities Our Community 19155.8405 W1587.459 Skate Park - Lighting upgrade DOE DOE 10,000 0 0% 0 0% 10,000 100% 10,000
Buildings and Other StructuresOur Community 19151.8405 W1443.480 Flinders River Windmill - Water Feature CEO DOE 10,000 0 0% 0 0% 10,000 100% 10,000
Recreation Facilities Our Community 19155.8405 W1632 DEC - New Floor Cleaner DCS DCS 15,000 15,000 100% 0 0% 0 0% 15,000
Recreation Facilities Our Community 19155.8405 W1633 DEC - New Carpet in Meeting Room DCS DCS 7,000 7,000 100% 0 0% 0 0% 7,000
Recreation Facilities Our Community 19155.8405 W1634 DEC - Upgrade PA System DCS DCS 4,000 2,000 50% 2,000 50% 0 0% 4,000
Recreation Facilities Our Community 19155.8405 W1441.480 Pool - Pump Shed - Reroof, Electrical, Plumb, Paint. DOE Carpenter 39,000 39,000 100% 0 0% 0 0% 39,000
Recreation Facilities Our Community 19155.8405 W1635 Pool - Chemical/Storage Shed Construction DOE Carpenter 15,000 15,000 100% 0 0% 0 0% 3,685 11,315
Recreation Facilities Our Community 19155.8405 W1636 Pool - Concrete Invert from Chemical Shed to Street 72m DOE Overseer 21,000 21,000 100% 0 0% 0 0% 21,000
Recreation Facilities Our Community 19155.8405 W1624 Pool - Concrete Paving works infront of Kiosk DOE DOE 10,000 0 0% 0 0% 10,000 100% 10,000
Recreation Facilities Our Community 19155.8405 W1637 Pool - Shade Strategy (large umbrellas/sails) DCS SRO 10,000 10,000 100% 0 0% 0 0% 10,000
Recreation Facilities Our Community 19161.8405 W1638 Showgrounds - Drainage/Roadworks DOE Overseer 50,000 0 0% 25,000 50% 25,000 50% 50,000
Recreation Facilities Our Community 19155.8405 W1570 Showgrounds - Relocate New Secretaries Office DCS CDO 7,000 0 0% 3,500 50% 3,500 50% 7,000
Recreation Facilities Our Community 19155.8405 W1562 Showgrounds - Purchase of Bar/Kitchen Equipment DCS CDO 27,500 6,875 25% 20,625 75% 0 0% 25,000 2,500
Recreation Facilities Our Community 19155.8405 W1639 Showgrounds - Upgrade PA System DCS DCS 5,000 2,500 50% 2,500 50% 0 0% 5,000
Recreation Facilities Our Community 19155.8405 W1640 Showgrounds - Disabled Access to Gym pavilion DOE Carpenter 5,000 2,500 50% 2,500 50% 0 0% 5,000
Our Economy
Land and Land ImprovementsOur Economy 19155.8405 W1363.416 Industrial Est-Lammermoor & Seymour St-Road & Utilities CEO DOE 150,000 0 0% 0 0% 150,000 100% 30,000 120,000
Land and Land ImprovementsOur Economy 19155.8405 W1641 Connect Two Sewer Pumps at Industrial Estate to Scada
System
DOE DOE 45,000 0 0% 0 0% 45,000 100% 45,000
Road Infrastructure Our Economy 19161.8405 W1440.1 Cemetery - Access Survey, Design, Construct DOE Overseer 50,000 20,000 40% 20,000 40% 10,000 20% 50,000
Buildings and Other StructuresOur Economy 19155.8405 W1642 Cemetery - Equipment Shed (9m x 6m Concrete slab) DOE DOE 20,000 0 0% 0 0% 20,000 100% 20,000
Buildings and Other StructuresOur Economy 19155.8405 W1643 Cemetery - Lawn Cemetery Fence, Irrigation DOE Overseer 20,000 0 0% 0 0% 20,000 100% 20,000
Road Infrastructure Our Economy 19155.8405 W1644 Caravan Park - Drainage and Concrete Parking Bays DOE Overseer 100,000 100,000 100% 0 0% 0 0% 100,000
Buildings and Other StructuresOur Economy 19155.8405 W1645 Caravan Park - Outback Kitchen - Replace Floor/Shade DOE Overseer 25,000 0 0% 25,000 100% 0 0% 25,000
Buildings and Other StructuresOur Economy 19155.8405 W1571 Caravan Park - New Laundry DOE DOE 30,000 0 0% 0 0% 30,000 100% 30,000
Land and Land ImprovementsOur Economy 19155.8405 W1598 Land Development - Stamford, Hughenden Residential DOE DOE 50,000 0 0% 0 0% 50,000 100% 50,000
Buildings and Other StructuresOur Economy 19155.8405 W1646 Refurbish "Mutt" DCS CDO 20,000 0 0% 20,000 100% 0 0% 20,000
Buildings and Other StructuresOur Economy 19155.8405 W1647 Flinders Discovery Centre - New Carpet DCS CDO 10,000 10,000 100% 0 0% 0 0% 10,000
Our Infrastructure
Road Infrastructure Our Infrastructure 0 Footpaths DOE Overseer 75,000 37,500 50% 37,500 50% 0 0% 75,000
Road Infrastructure Our Infrastructure 0 Kerb and Channelling (Mowbray, Brodie and Gray) DOE Overseer 75,000 37,500 50% 37,500 50% 0 0% 75,000
Road Infrastructure Our Infrastructure 19161.8405 W1436.117 Shire Road Reseal - Glendower Wall DOE Overseer 55,000 55,000 100% 0 0% 0 0% 55,000
Road Infrastructure Our Infrastructure 19161.8405 W1437.117 Shire Road Reseal - Spring Valley Wall DOE Overseer 30,000 30,000 100% 0 0% 0 0% 30,000
Road Infrastructure Our Infrastructure 19161.8405 W1438.8 Town Street Reseals- Dalrymple Road DOE Overseer 40,000 40,000 100% 0 0% 0 0% 40,000
Road Infrastructure Our Infrastructure Town Street Reseals - Program to be set DOE Overseer 280,000 280,000 100% 0 0% 0 0% 280,000
Road Infrastructure Our Infrastructure 19161.8405 W1439.1101 TIDS Floodways DOE Overseer 61,000 61,000 100% 0 0% 0 0% 30,500 30,500
Road Infrastructure Our Infrastructure 19161.8405 W1289 TIDS-Prairie Road DOE Overseer 190,000 0 0% 190,000 100% 0 0% 95,000 95,000
Road Infrastructure Our Infrastructure 19161.8405 W1303 TIDS-Basalt Byway Wall (Walkege sealing) DOE Overseer 180,000 0 0% 180,000 100% 0 0% 90,000 90,000
Road Infrastructure Our Infrastructure 19161.8405 W1648 TIDS-Porcupine Gorge Road DOE Overseer 100,000 0 0% 100,000 100% 0 0% 50,000 50,000
Road Infrastructure Our Infrastructure 19161.8405 W1649 TIDS-White Mountains Road DOE Overseer 300,000 0 0% 0 0% 300,000 100% 150,000 150,000
Road Infrastructure Our Infrastructure 19161.8405 W1409 Town Sts Constructn RTR - Brodie St-Gray to Flynn DOE Overseer 210,000 157,500 75% 52,500 25% 0 0% 150,000 60,000
Road Infrastructure Our Infrastructure 19161.8405 W1410 Town Sts Constructn RTR - Moran St-Gray to Resolution DOE Overseer 389,000 291,750 75% 97,250 25% 0 0% 389,000 0
Road Infrastructure Our Infrastructure 19161.8405 W1650 Town Sts Constructn - Gray St Drain DOE Overseer 400,000 300,000 75% 100,000 25% 0 0% 0 400,000
Road Infrastructure Our Infrastructure Town Sts Constructn Program to be set DOE Overseer 350,000 262,500 75% 87,500 25% 0 0% 0 350,000
Road Infrastructure Our Infrastructure 19161.8405 W1066 RTR - Shire Roads as per Program DOE Overseer 600,000 0 0% 600,000 100% 0 0% 600,000 0
Road Infrastructure Our Infrastructure 19177.8405 2010 Flood Damage Shire Roads DOE DOE 8,318,414 4,159,207 50% 4,159,207 50% 0 0% 8,318,414 0
Road Infrastructure Our Infrastructure 19177.8405 2012 Flood Damage Shire Roads DOE DOE 2,000,000 1,000,000 50% 1,000,000 50% 0 0% 2,000,000 0
Road Infrastructure Our Infrastructure 19177.8405 2013 Flood Damage Shire Roads DOE DOE 50,000 25,000 50% 25,000 50% 0 0% 0 50,000
Water Infrastructure Our Infrastructure 19175.8405 W1651 Hughenden Water Fluoridation DOE EHO 1,437,000 1,437,000 100% 0 0% 0 0% 1,437,000 0
Water Infrastructure Our Infrastructure 19175.8405 W1652 Redirect Water Service on Flinders River Bridge DOE DOE 80,000 0 0% 80,000 100% 0 0% 80,000
Water Infrastructure Our Infrastructure 19175.8405 W1653 Spare Pump for Pump Station 1 DOE DOE 6,500 0 0% 0 0% 6,500 100% 6,500
Water Infrastructure Our Infrastructure 19175.8405 W1655 Spare Pump for Pump Station 2 DOE DOE 16,000 0 0% 0 0% 16,000 100% 16,000
Water Infrastructure Our Infrastructure 19175.8405 W1181 Torrens Creek Onground Water System DOE DOE 60,000 60,000 100% 0 0% 0 0% 60,000
Water Infrastructure Our Infrastructure 19175.8405 W1447.93 Prairie Water Upgrade - Chlorination DOE DOE 10,000 0 0% 0 0% 10,000 100% 10,000
Sewerage Infrastructure Our Infrastructure 19177.8405 W1260 Sewerage - Pump Station 1 & 2 Telemetry System DOE DOE 20,000 10,000 50% 10,000 50% 0 0% 20,000
ASSET
SALES
CASH
RESERVES
FLINDERS SHIRE COUNCIL
CAPITAL WORKS PROGRAM 2012-2013
GRANTSNEWUPGRADE
ORIGINAL
BUDGET 2012-
2013
RENEWAL
Pro
jec
t
Ma
na
ge
r
BORROWINGS
AMENDED FUNDING SOURCE
GENERAL
REVENUEAsset Class Function ASSET DESCRIPTION
Se
rvic
e
Ma
na
ge
r
Works Order
Number
General Ledger
Number
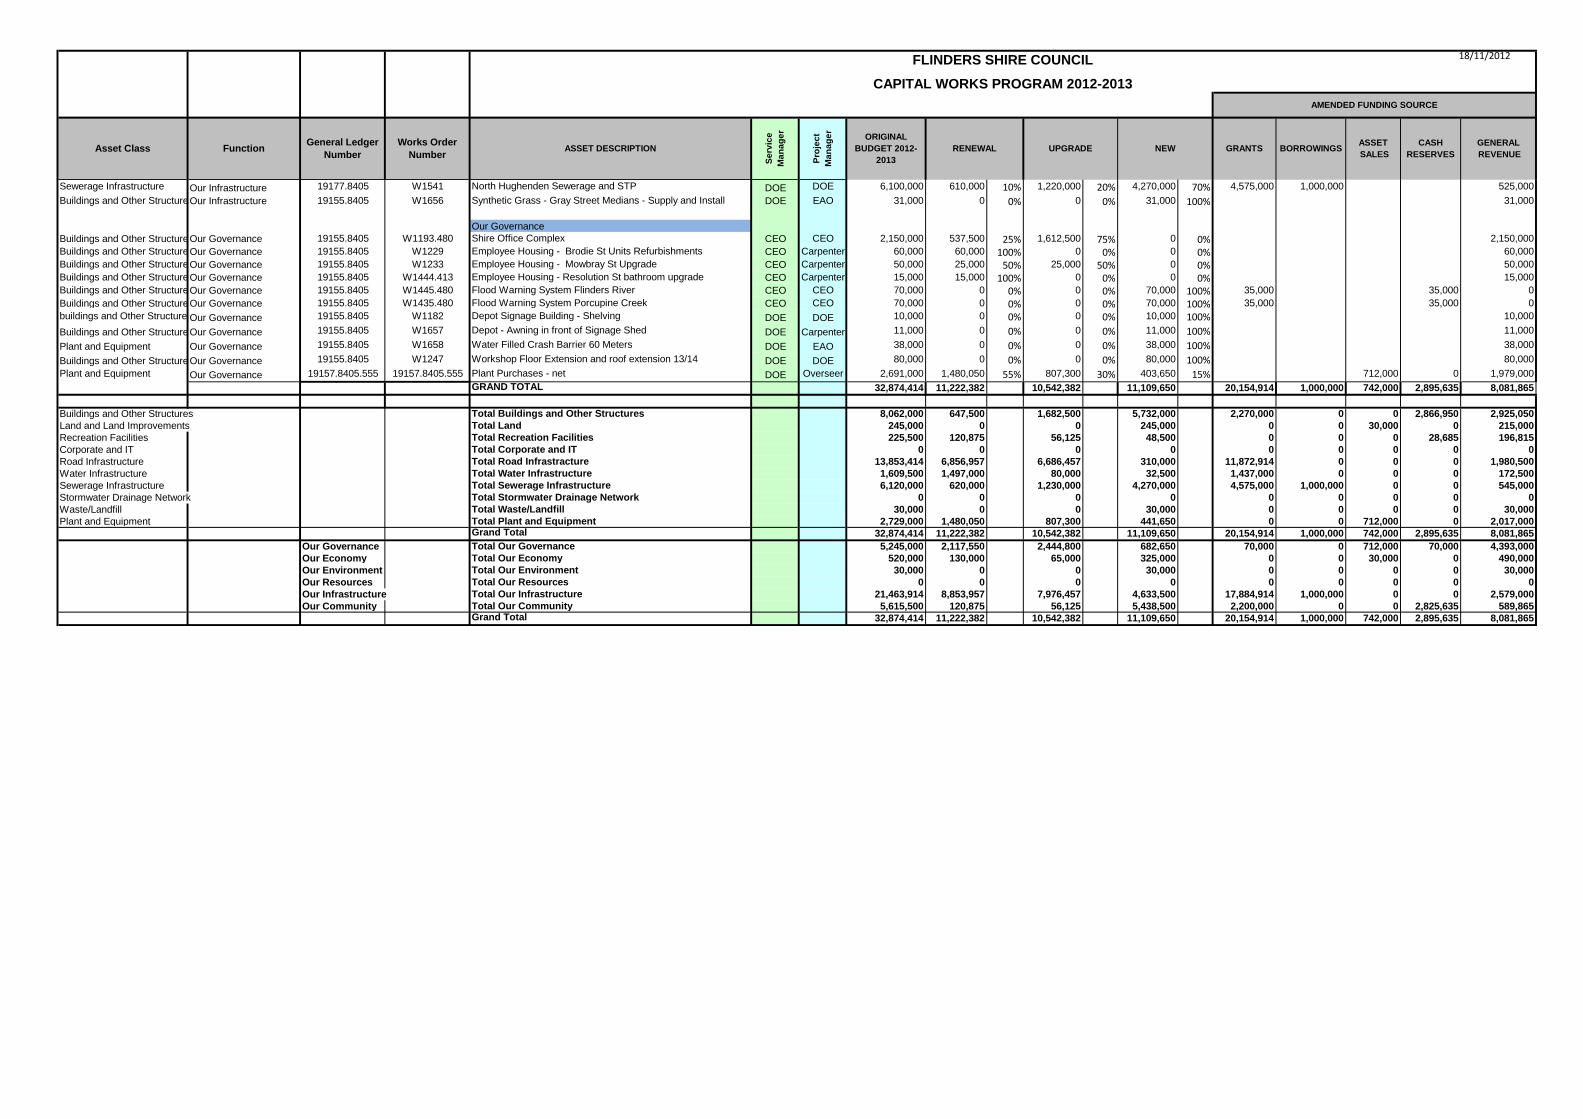
18/11/2012
ASSET
SALES
CASH
RESERVES
FLINDERS SHIRE COUNCIL
CAPITAL WORKS PROGRAM 2012-2013
GRANTSNEWUPGRADE
ORIGINAL
BUDGET 2012-
2013
RENEWAL
Pro
jec
t
Ma
na
ge
r
BORROWINGS
AMENDED FUNDING SOURCE
GENERAL
REVENUEAsset Class Function ASSET DESCRIPTION
Se
rvic
e
Ma
na
ge
r
Works Order
Number
General Ledger
Number
Sewerage Infrastructure Our Infrastructure 19177.8405 W1541 North Hughenden Sewerage and STP DOE DOE 6,100,000 610,000 10% 1,220,000 20% 4,270,000 70% 4,575,000 1,000,000 525,000
Buildings and Other StructuresOur Infrastructure 19155.8405 W1656 Synthetic Grass - Gray Street Medians - Supply and Install DOE EAO 31,000 0 0% 0 0% 31,000 100% 31,000
Our Governance
Buildings and Other StructuresOur Governance 19155.8405 W1193.480 Shire Office Complex CEO CEO 2,150,000 537,500 25% 1,612,500 75% 0 0% 2,150,000
Buildings and Other StructuresOur Governance 19155.8405 W1229 Employee Housing - Brodie St Units Refurbishments CEO Carpenter 60,000 60,000 100% 0 0% 0 0% 60,000
Buildings and Other StructuresOur Governance 19155.8405 W1233 Employee Housing - Mowbray St Upgrade CEO Carpenter 50,000 25,000 50% 25,000 50% 0 0% 50,000
Buildings and Other StructuresOur Governance 19155.8405 W1444.413 Employee Housing - Resolution St bathroom upgrade CEO Carpenter 15,000 15,000 100% 0 0% 0 0% 15,000
Buildings and Other StructuresOur Governance 19155.8405 W1445.480 Flood Warning System Flinders River CEO CEO 70,000 0 0% 0 0% 70,000 100% 35,000 35,000 0
Buildings and Other StructuresOur Governance 19155.8405 W1435.480 Flood Warning System Porcupine Creek CEO CEO 70,000 0 0% 0 0% 70,000 100% 35,000 35,000 0
buildings and Other StructuresOur Governance 19155.8405 W1182 Depot Signage Building - Shelving DOE DOE 10,000 0 0% 0 0% 10,000 100% 10,000
Buildings and Other StructuresOur Governance 19155.8405 W1657 Depot - Awning in front of Signage Shed DOE Carpenter 11,000 0 0% 0 0% 11,000 100% 11,000
Plant and Equipment Our Governance 19155.8405 W1658 Water Filled Crash Barrier 60 Meters DOE EAO 38,000 0 0% 0 0% 38,000 100% 38,000
Buildings and Other StructuresOur Governance 19155.8405 W1247 Workshop Floor Extension and roof extension 13/14 DOE DOE 80,000 0 0% 0 0% 80,000 100% 80,000
Plant and Equipment Our Governance 19157.8405.555 19157.8405.555 Plant Purchases - net DOE Overseer 2,691,000 1,480,050 55% 807,300 30% 403,650 15% 712,000 0 1,979,000
GRAND TOTAL 32,874,414 11,222,382 10,542,382 11,109,650 20,154,914 1,000,000 742,000 2,895,635 8,081,865
Buildings and Other Structures Total Buildings and Other Structures 8,062,000 647,500 1,682,500 5,732,000 2,270,000 0 0 2,866,950 2,925,050
Land and Land Improvements Total Land 245,000 0 0 245,000 0 0 30,000 0 215,000
Recreation Facilities Total Recreation Facilities 225,500 120,875 56,125 48,500 0 0 0 28,685 196,815
Corporate and IT Total Corporate and IT 0 0 0 0 0 0 0 0 0
Road Infrastructure Total Road Infrastracture 13,853,414 6,856,957 6,686,457 310,000 11,872,914 0 0 0 1,980,500
Water Infrastructure Total Water Infrastructure 1,609,500 1,497,000 80,000 32,500 1,437,000 0 0 0 172,500
Sewerage Infrastructure Total Sewerage Infrastructure 6,120,000 620,000 1,230,000 4,270,000 4,575,000 1,000,000 0 0 545,000
Stormwater Drainage Network Total Stormwater Drainage Network 0 0 0 0 0 0 0 0 0
Waste/Landfill Total Waste/Landfill 30,000 0 0 30,000 0 0 0 0 30,000
Plant and Equipment Total Plant and Equipment 2,729,000 1,480,050 807,300 441,650 0 0 712,000 0 2,017,000Grand Total 32,874,414 11,222,382 10,542,382 11,109,650 20,154,914 1,000,000 742,000 2,895,635 8,081,865
Our Governance Total Our Governance 5,245,000 2,117,550 2,444,800 682,650 70,000 0 712,000 70,000 4,393,000
Our Economy Total Our Economy 520,000 130,000 65,000 325,000 0 0 30,000 0 490,000
Our Environment Total Our Environment 30,000 0 0 30,000 0 0 0 0 30,000
Our Resources Total Our Resources 0 0 0 0 0 0 0 0 0
Our Infrastructure Total Our Infrastructure 21,463,914 8,853,957 7,976,457 4,633,500 17,884,914 1,000,000 0 0 2,579,000
Our Community Total Our Community 5,615,500 120,875 56,125 5,438,500 2,200,000 0 0 2,825,635 589,865Grand Total 32,874,414 11,222,382 10,542,382 11,109,650 20,154,914 1,000,000 742,000 2,895,635 8,081,865
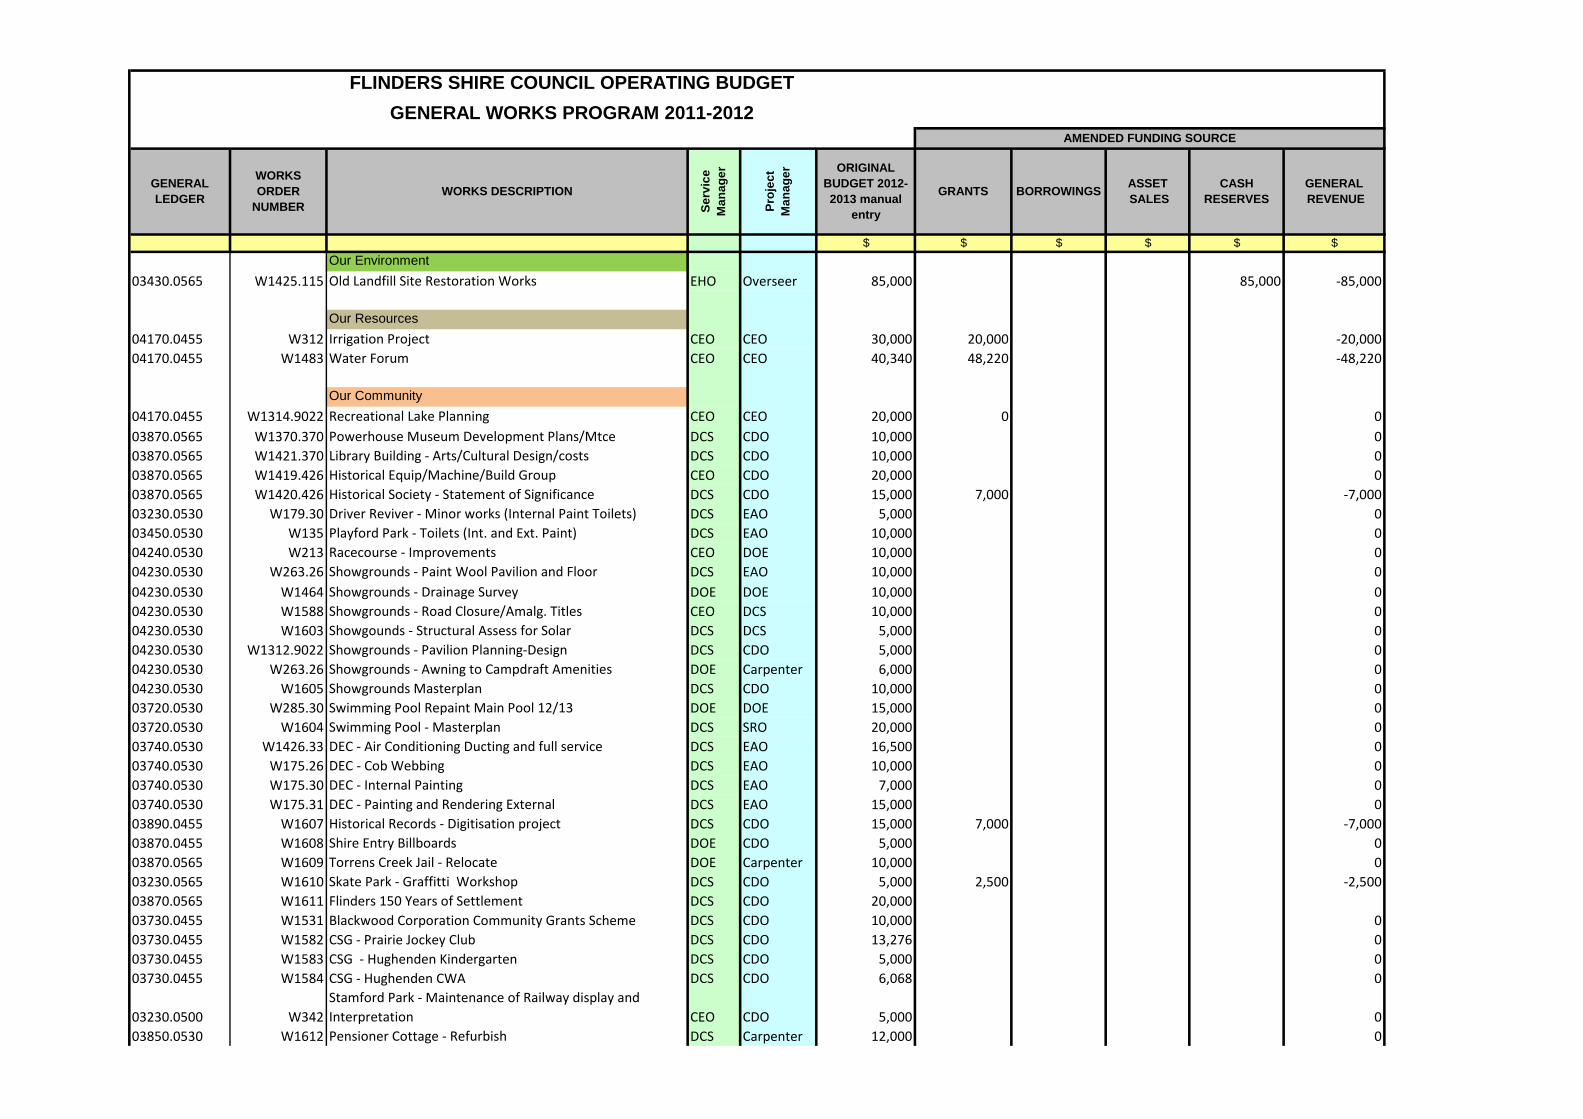
$ $ $ $ $ $
Our Environment
03430.0565 W1425.115 Old Landfill Site Restoration Works EHO Overseer 85,000 85,000 -85,000
Our Resources
04170.0455 W312 Irrigation Project CEO CEO 30,000 20,000 -20,000
04170.0455 W1483 Water Forum CEO CEO 40,340 48,220 -48,220
Our Community
04170.0455 W1314.9022 Recreational Lake Planning CEO CEO 20,000 0 0
03870.0565 W1370.370 Powerhouse Museum Development Plans/Mtce DCS CDO 10,000 0
03870.0565 W1421.370 Library Building - Arts/Cultural Design/costs DCS CDO 10,000 0
03870.0565 W1419.426 Historical Equip/Machine/Build Group CEO CDO 20,000 0
03870.0565 W1420.426 Historical Society - Statement of Significance DCS CDO 15,000 7,000 -7,000
03230.0530 W179.30 Driver Reviver - Minor works (Internal Paint Toilets) DCS EAO 5,000 0
03450.0530 W135 Playford Park - Toilets (Int. and Ext. Paint) DCS EAO 10,000 0
04240.0530 W213 Racecourse - Improvements CEO DOE 10,000 0
04230.0530 W263.26 Showgrounds - Paint Wool Pavilion and Floor DCS EAO 10,000 0
04230.0530 W1464 Showgrounds - Drainage Survey DOE DOE 10,000 0
04230.0530 W1588 Showgrounds - Road Closure/Amalg. Titles CEO DCS 10,000 0
04230.0530 W1603 Showgounds - Structural Assess for Solar DCS DCS 5,000 0
04230.0530 W1312.9022 Showgrounds - Pavilion Planning-Design DCS CDO 5,000 0
04230.0530 W263.26 Showgrounds - Awning to Campdraft Amenities DOE Carpenter 6,000 0
04230.0530 W1605 Showgrounds Masterplan DCS CDO 10,000 0
03720.0530 W285.30 Swimming Pool Repaint Main Pool 12/13 DOE DOE 15,000 0
03720.0530 W1604 Swimming Pool - Masterplan DCS SRO 20,000 0
03740.0530 W1426.33 DEC - Air Conditioning Ducting and full service DCS EAO 16,500 0
03740.0530 W175.26 DEC - Cob Webbing DCS EAO 10,000 0
03740.0530 W175.30 DEC - Internal Painting DCS EAO 7,000 0
03740.0530 W175.31 DEC - Painting and Rendering External DCS EAO 15,000 0
03890.0455 W1607 Historical Records - Digitisation project DCS CDO 15,000 7,000 -7,000
03870.0455 W1608 Shire Entry Billboards DOE CDO 5,000 0
03870.0565 W1609 Torrens Creek Jail - Relocate DOE Carpenter 10,000 0
03230.0565 W1610 Skate Park - Graffitti Workshop DCS CDO 5,000 2,500 -2,500
03870.0565 W1611 Flinders 150 Years of Settlement DCS CDO 20,000
03730.0455 W1531 Blackwood Corporation Community Grants Scheme DCS CDO 10,000 0
03730.0455 W1582 CSG - Prairie Jockey Club DCS CDO 13,276 0
03730.0455 W1583 CSG - Hughenden Kindergarten DCS CDO 5,000 0
03730.0455 W1584 CSG - Hughenden CWA DCS CDO 6,068 0
03230.0500 W342
Stamford Park - Maintenance of Railway display and
Interpretation CEO CDO 5,000 0
03850.0530 W1612 Pensioner Cottage - Refurbish DCS Carpenter 12,000 0
GENERAL
LEDGER
WORKS
ORDER
NUMBER
WORKS DESCRIPTION
Se
rvic
e
Ma
na
ge
r ORIGINAL
BUDGET 2012-
2013 manual
entry
BORROWINGSASSET
SALES
CASH
RESERVES
GENERAL
REVENUEGRANTS
Pro
jec
t
Ma
na
ge
r
FLINDERS SHIRE COUNCIL OPERATING BUDGET
GENERAL WORKS PROGRAM 2011-2012
AMENDED FUNDING SOURCE
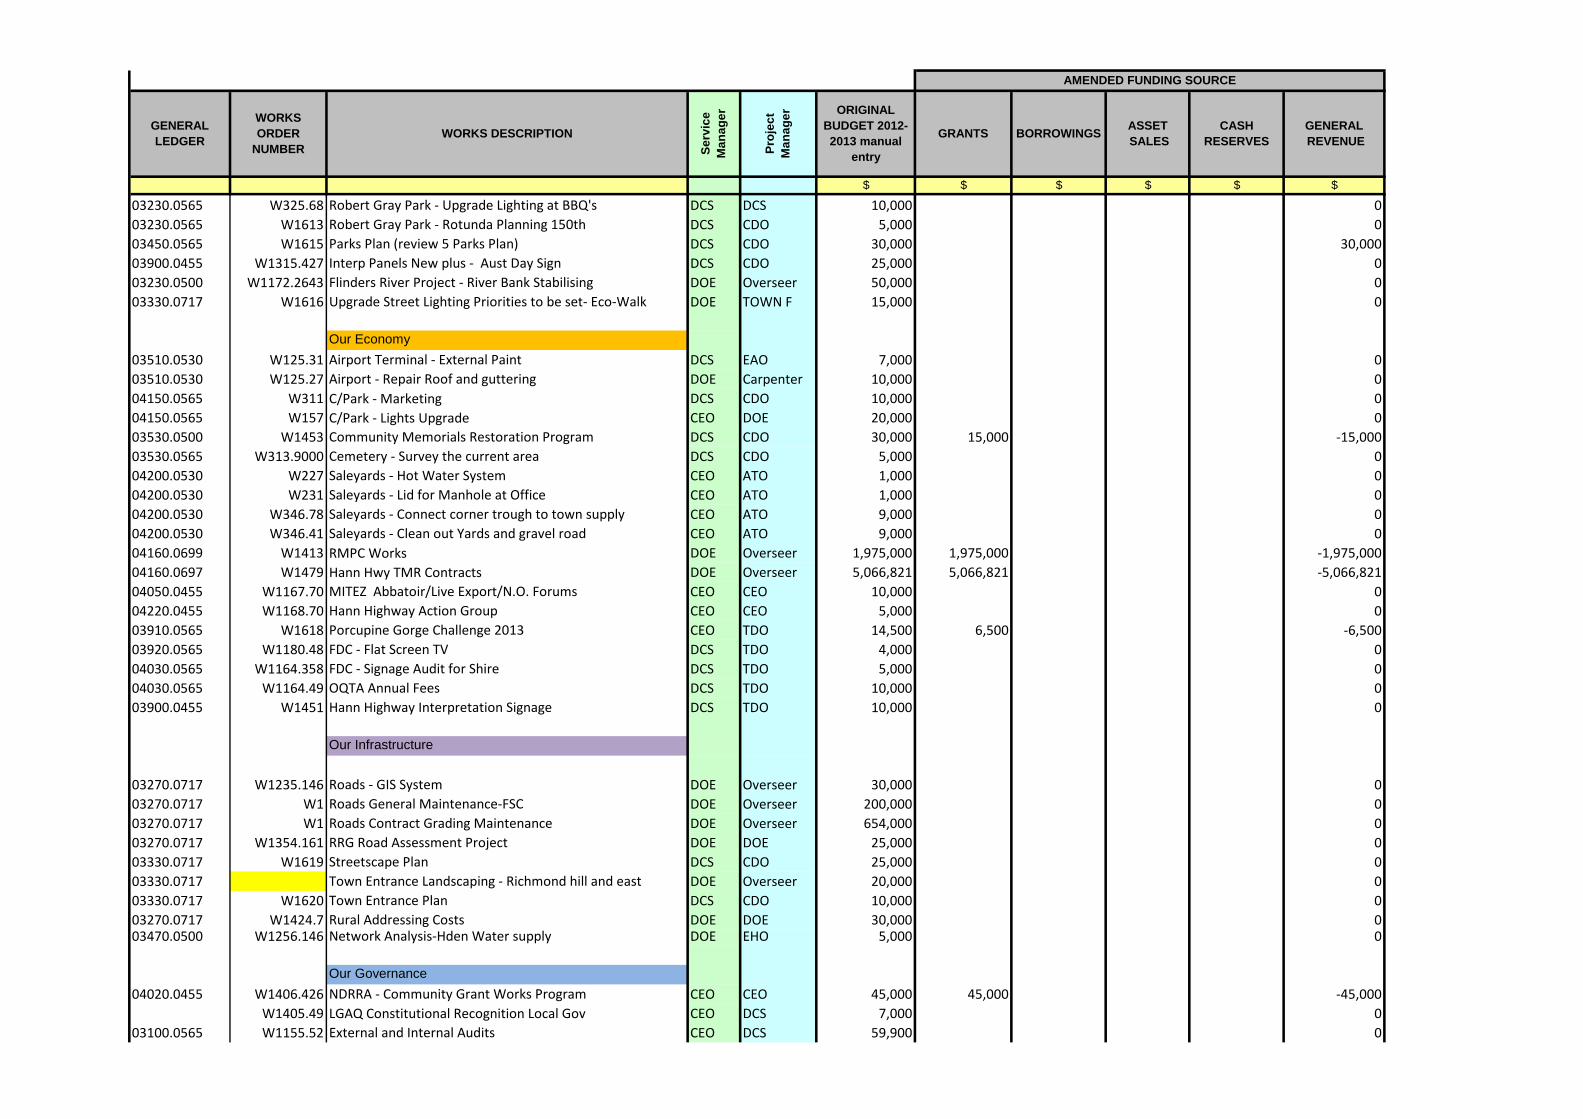
$ $ $ $ $ $
GENERAL
LEDGER
WORKS
ORDER
NUMBER
WORKS DESCRIPTION
Se
rvic
e
Ma
na
ge
r ORIGINAL
BUDGET 2012-
2013 manual
entry
BORROWINGSASSET
SALES
CASH
RESERVES
GENERAL
REVENUEGRANTS
Pro
jec
t
Ma
na
ge
r
AMENDED FUNDING SOURCE
03230.0565 W325.68 Robert Gray Park - Upgrade Lighting at BBQ's DCS DCS 10,000 0
03230.0565 W1613 Robert Gray Park - Rotunda Planning 150th DCS CDO 5,000 0
03450.0565 W1615 Parks Plan (review 5 Parks Plan) DCS CDO 30,000 30,000
03900.0455 W1315.427 Interp Panels New plus - Aust Day Sign DCS CDO 25,000 0
03230.0500 W1172.2643 Flinders River Project - River Bank Stabilising DOE Overseer 50,000 0
03330.0717 W1616 Upgrade Street Lighting Priorities to be set- Eco-Walk DOE TOWN F 15,000 0
Our Economy
03510.0530 W125.31 Airport Terminal - External Paint DCS EAO 7,000 0
03510.0530 W125.27 Airport - Repair Roof and guttering DOE Carpenter 10,000 0
04150.0565 W311 C/Park - Marketing DCS CDO 10,000 0
04150.0565 W157 C/Park - Lights Upgrade CEO DOE 20,000 0
03530.0500 W1453 Community Memorials Restoration Program DCS CDO 30,000 15,000 -15,000
03530.0565 W313.9000 Cemetery - Survey the current area DCS CDO 5,000 0
04200.0530 W227 Saleyards - Hot Water System CEO ATO 1,000 0
04200.0530 W231 Saleyards - Lid for Manhole at Office CEO ATO 1,000 0
04200.0530 W346.78 Saleyards - Connect corner trough to town supply CEO ATO 9,000 0
04200.0530 W346.41 Saleyards - Clean out Yards and gravel road CEO ATO 9,000 0
04160.0699 W1413 RMPC Works DOE Overseer 1,975,000 1,975,000 -1,975,000
04160.0697 W1479 Hann Hwy TMR Contracts DOE Overseer 5,066,821 5,066,821 -5,066,821
04050.0455 W1167.70 MITEZ Abbatoir/Live Export/N.O. Forums CEO CEO 10,000 0
04220.0455 W1168.70 Hann Highway Action Group CEO CEO 5,000 0
03910.0565 W1618 Porcupine Gorge Challenge 2013 CEO TDO 14,500 6,500 -6,500
03920.0565 W1180.48 FDC - Flat Screen TV DCS TDO 4,000 0
04030.0565 W1164.358 FDC - Signage Audit for Shire DCS TDO 5,000 0
04030.0565 W1164.49 OQTA Annual Fees DCS TDO 10,000 0
03900.0455 W1451 Hann Highway Interpretation Signage DCS TDO 10,000 0
Our Infrastructure
03270.0717 W1235.146 Roads - GIS System DOE Overseer 30,000 0
03270.0717 W1 Roads General Maintenance-FSC DOE Overseer 200,000 0
03270.0717 W1 Roads Contract Grading Maintenance DOE Overseer 654,000 0
03270.0717 W1354.161 RRG Road Assessment Project DOE DOE 25,000 0
03330.0717 W1619 Streetscape Plan DCS CDO 25,000 0
03330.0717 Town Entrance Landscaping - Richmond hill and east DOE Overseer 20,000 0
03330.0717 W1620 Town Entrance Plan DCS CDO 10,000 0
03270.0717 W1424.7 Rural Addressing Costs DOE DOE 30,000 003470.0500 W1256.146 Network Analysis-Hden Water supply DOE EHO 5,000 0
Our Governance
04020.0455 W1406.426 NDRRA - Community Grant Works Program CEO CEO 45,000 45,000 -45,000
W1405.49 LGAQ Constitutional Recognition Local Gov CEO DCS 7,000 0
03100.0565 W1155.52 External and Internal Audits CEO DCS 59,900 0
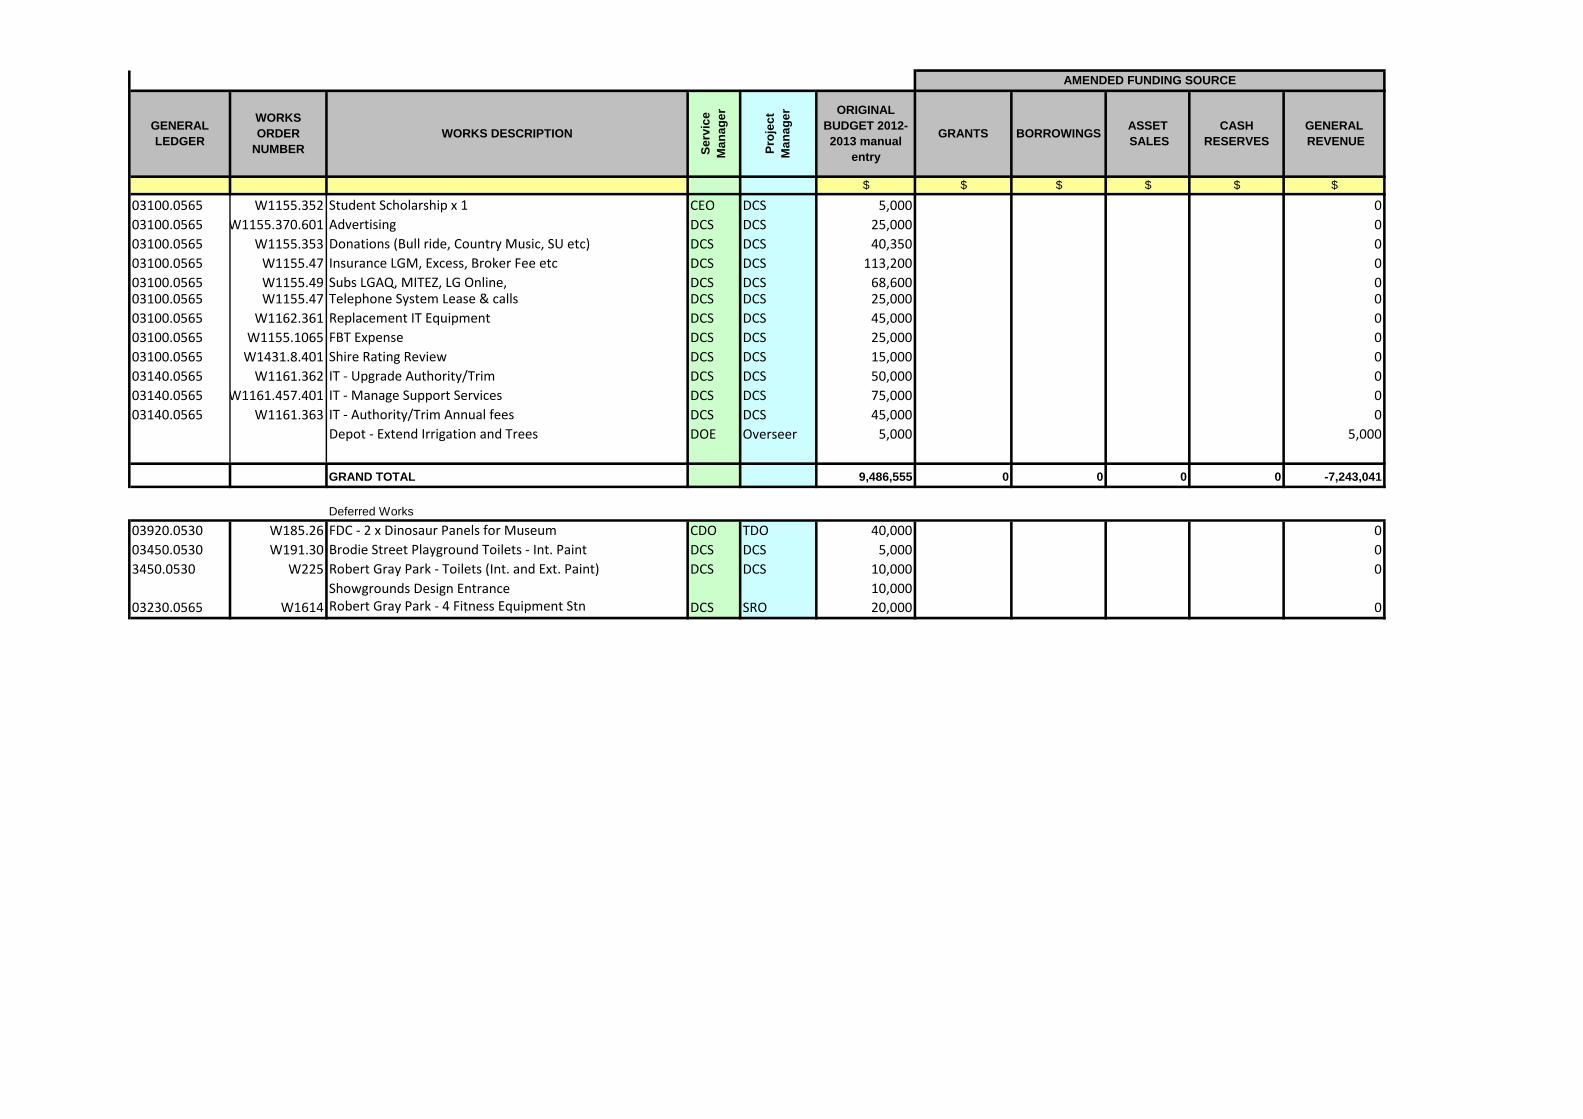
$ $ $ $ $ $
GENERAL
LEDGER
WORKS
ORDER
NUMBER
WORKS DESCRIPTION
Se
rvic
e
Ma
na
ge
r ORIGINAL
BUDGET 2012-
2013 manual
entry
BORROWINGSASSET
SALES
CASH
RESERVES
GENERAL
REVENUEGRANTS
Pro
jec
t
Ma
na
ge
r
AMENDED FUNDING SOURCE
03100.0565 W1155.352 Student Scholarship x 1 CEO DCS 5,000 0
03100.0565 W1155.370.601 Advertising DCS DCS 25,000 0
03100.0565 W1155.353 Donations (Bull ride, Country Music, SU etc) DCS DCS 40,350 0
03100.0565 W1155.47 Insurance LGM, Excess, Broker Fee etc DCS DCS 113,200 0
03100.0565 W1155.49 Subs LGAQ, MITEZ, LG Online, DCS DCS 68,600 003100.0565 W1155.47 Telephone System Lease & calls DCS DCS 25,000 0
03100.0565 W1162.361 Replacement IT Equipment DCS DCS 45,000 0
03100.0565 W1155.1065 FBT Expense DCS DCS 25,000 0
03100.0565 W1431.8.401 Shire Rating Review DCS DCS 15,000 0
03140.0565 W1161.362 IT - Upgrade Authority/Trim DCS DCS 50,000 0
03140.0565 W1161.457.401 IT - Manage Support Services DCS DCS 75,000 0
03140.0565 W1161.363 IT - Authority/Trim Annual fees DCS DCS 45,000 0
Depot - Extend Irrigation and Trees DOE Overseer 5,000 5,000
GRAND TOTAL 9,486,555 0 0 0 0 -7,243,041
Deferred Works
03920.0530 W185.26 FDC - 2 x Dinosaur Panels for Museum CDO TDO 40,000 0
03450.0530 W191.30 Brodie Street Playground Toilets - Int. Paint DCS DCS 5,000 0
3450.0530 W225 Robert Gray Park - Toilets (Int. and Ext. Paint) DCS DCS 10,000 0
Showgrounds Design Entrance 10,000
03230.0565 W1614 Robert Gray Park - 4 Fitness Equipment Stn DCS SRO 20,000 0
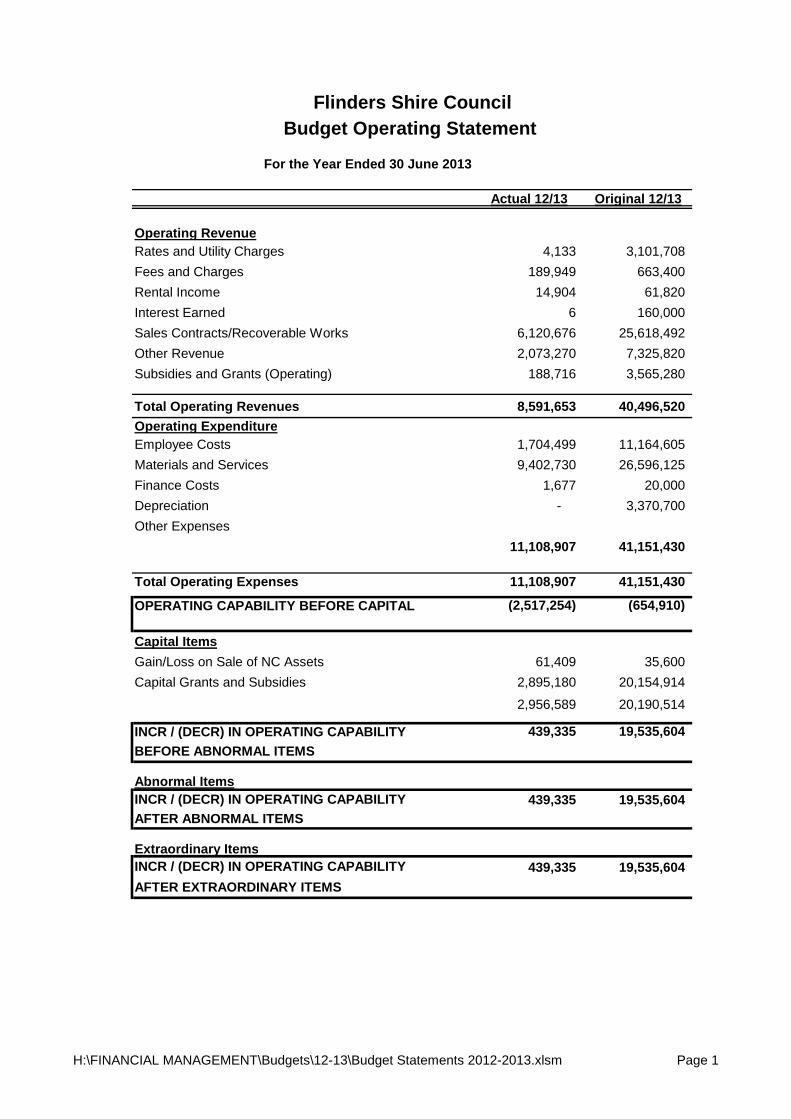
Actual 12/13 Original 12/13
Operating RevenueRates and Utility Charges 4,133 3,101,708 Fees and Charges 189,949 663,400 Rental Income 14,904 61,820 Interest Earned 6 160,000 Sales Contracts/Recoverable Works 6,120,676 25,618,492 Other Revenue 2,073,270 7,325,820 Subsidies and Grants (Operating) 188,716 3,565,280
Total Operating Revenues 8,591,653 40,496,520 Operating ExpenditureEmployee Costs 1,704,499 11,164,605 Materials and Services 9,402,730 26,596,125 Finance Costs 1,677 20,000 Depreciation - 3,370,700 Other Expenses
11,108,907 41,151,430
Total Operating Expenses 11,108,907 41,151,430
OPERATING CAPABILITY BEFORE CAPITAL (2,517,254) (654,910)
Capital ItemsGain/Loss on Sale of NC Assets 61,409 35,600 Capital Grants and Subsidies 2,895,180 20,154,914
2,956,589 20,190,514
INCR / (DECR) IN OPERATING CAPABILITY 439,335 19,535,604 BEFORE ABNORMAL ITEMS
Abnormal ItemsINCR / (DECR) IN OPERATING CAPABILITY 439,335 19,535,604 AFTER ABNORMAL ITEMS
Extraordinary ItemsINCR / (DECR) IN OPERATING CAPABILITY 439,335 19,535,604 AFTER EXTRAORDINARY ITEMS
Flinders Shire CouncilBudget Operating Statement
For the Year Ended 30 June 2013
H:\FINANCIAL MANAGEMENT\Budgets\12-13\Budget Statements 2012-2013.xlsm Page 1
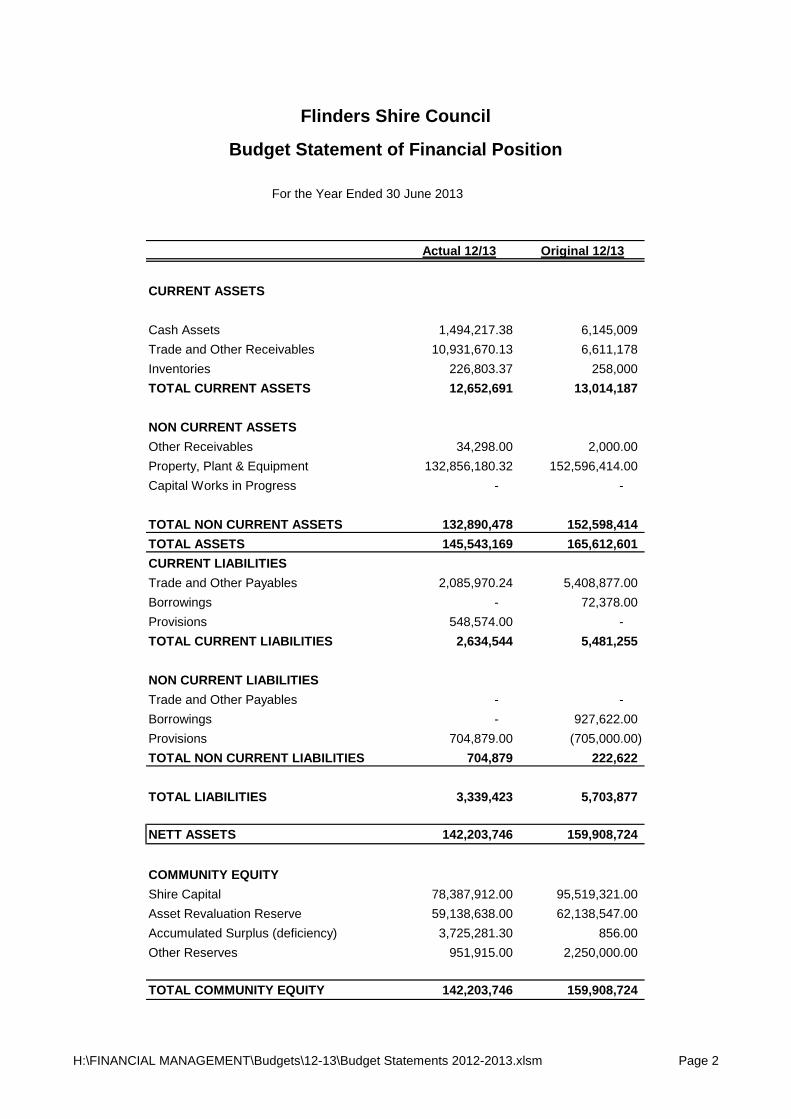
Actual 12/13 Original 12/13
CURRENT ASSETS
Cash Assets 1,494,217.38 6,145,009 Trade and Other Receivables 10,931,670.13 6,611,178 Inventories 226,803.37 258,000 TOTAL CURRENT ASSETS 12,652,691 13,014,187
NON CURRENT ASSETSOther Receivables 34,298.00 2,000.00 Property, Plant & Equipment 132,856,180.32 152,596,414.00 Capital Works in Progress - -
TOTAL NON CURRENT ASSETS 132,890,478 152,598,414 TOTAL ASSETS 145,543,169 165,612,601 CURRENT LIABILITIESTrade and Other Payables 2,085,970.24 5,408,877.00 Borrowings - 72,378.00 Provisions 548,574.00 - TOTAL CURRENT LIABILITIES 2,634,544 5,481,255
NON CURRENT LIABILITIESTrade and Other Payables - - Borrowings - 927,622.00 Provisions 704,879.00 (705,000.00) TOTAL NON CURRENT LIABILITIES 704,879 222,622
TOTAL LIABILITIES 3,339,423 5,703,877
NETT ASSETS 142,203,746 159,908,724
COMMUNITY EQUITYShire Capital 78,387,912.00 95,519,321.00 Asset Revaluation Reserve 59,138,638.00 62,138,547.00 Accumulated Surplus (deficiency) 3,725,281.30 856.00 Other Reserves 951,915.00 2,250,000.00
TOTAL COMMUNITY EQUITY 142,203,746 159,908,724
Flinders Shire Council
Budget Statement of Financial Position
For the Year Ended 30 June 2013
H:\FINANCIAL MANAGEMENT\Budgets\12-13\Budget Statements 2012-2013.xlsm Page 2
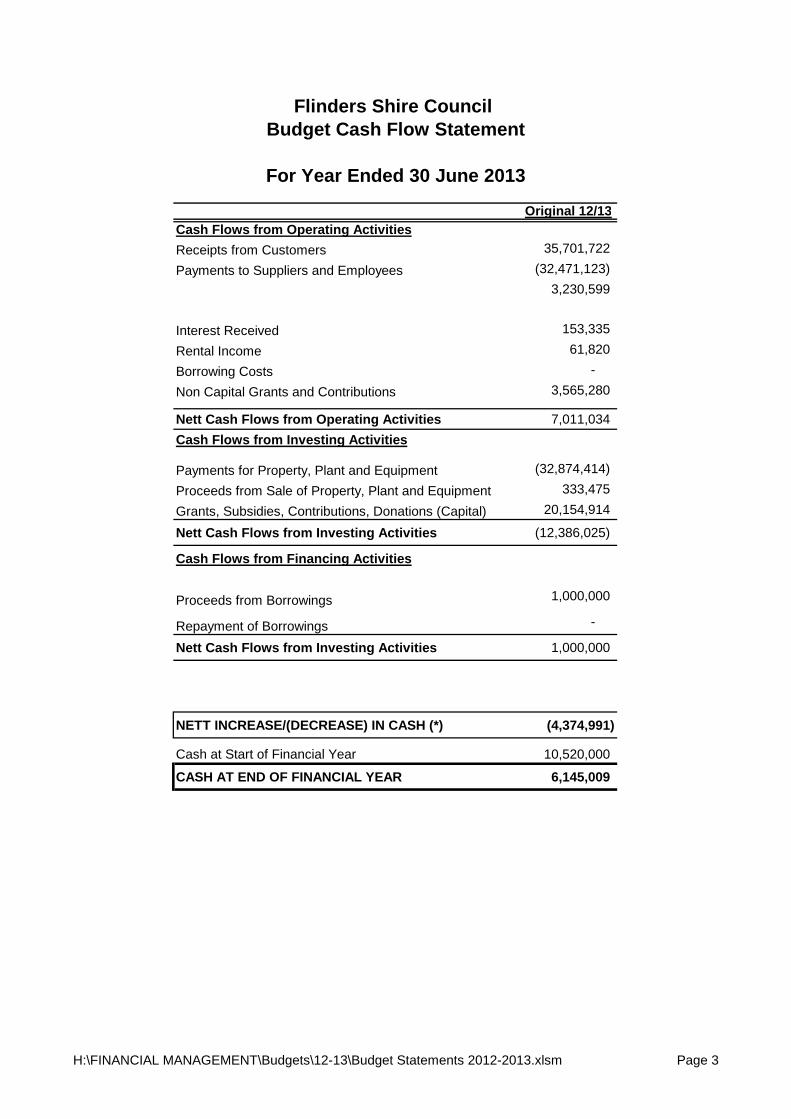
Original 12/13Cash Flows from Operating ActivitiesReceipts from Customers 35,701,722
Payments to Suppliers and Employees (32,471,123)3,230,599
Interest Received 153,335
Rental Income 61,820
Borrowing Costs -
Non Capital Grants and Contributions 3,565,280
Nett Cash Flows from Operating Activities 7,011,034 Cash Flows from Investing Activities
Payments for Property, Plant and Equipment (32,874,414)
Proceeds from Sale of Property, Plant and Equipment 333,475
Grants, Subsidies, Contributions, Donations (Capital) 20,154,914
Nett Cash Flows from Investing Activities (12,386,025)
Cash Flows from Financing Activities
Proceeds from Borrowings 1,000,000
Repayment of Borrowings -
Nett Cash Flows from Investing Activities 1,000,000
NETT INCREASE/(DECREASE) IN CASH (*) (4,374,991)
Cash at Start of Financial Year 10,520,000
CASH AT END OF FINANCIAL YEAR 6,145,009
Flinders Shire Council Budget Cash Flow Statement
For Year Ended 30 June 2013
H:\FINANCIAL MANAGEMENT\Budgets\12-13\Budget Statements 2012-2013.xlsm Page 3
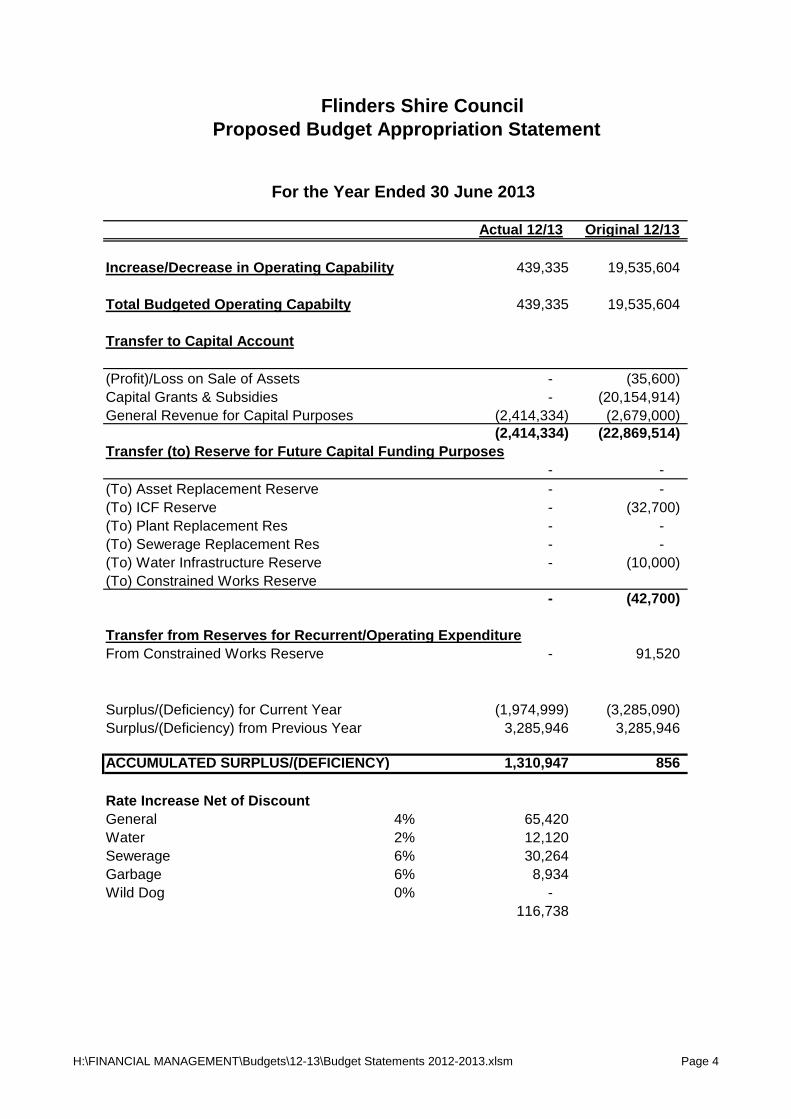
Actual 12/13 Original 12/13
Increase/Decrease in Operating Capability 439,335 19,535,604
Total Budgeted Operating Capabilty 439,335 19,535,604
Transfer to Capital Account
(Profit)/Loss on Sale of Assets - (35,600)Capital Grants & Subsidies - (20,154,914)General Revenue for Capital Purposes (2,414,334) (2,679,000)
(2,414,334) (22,869,514)Transfer (to) Reserve for Future Capital Funding Purposes
- - (To) Asset Replacement Reserve - - (To) ICF Reserve - (32,700)(To) Plant Replacement Res - - (To) Sewerage Replacement Res - - (To) Water Infrastructure Reserve - (10,000)(To) Constrained Works Reserve
- (42,700)
Transfer from Reserves for Recurrent/Operating ExpenditureFrom Constrained Works Reserve - 91,520
Surplus/(Deficiency) for Current Year (1,974,999) (3,285,090)Surplus/(Deficiency) from Previous Year 3,285,946 3,285,946
ACCUMULATED SURPLUS/(DEFICIENCY) 1,310,947 856
Rate Increase Net of DiscountGeneral 4% 65,420 Water 2% 12,120 Sewerage 6% 30,264 Garbage 6% 8,934 Wild Dog 0% -
116,738
Flinders Shire Council Proposed Budget Appropriation Statement
For the Year Ended 30 June 2013
H:\FINANCIAL MANAGEMENT\Budgets\12-13\Budget Statements 2012-2013.xlsm Page 4
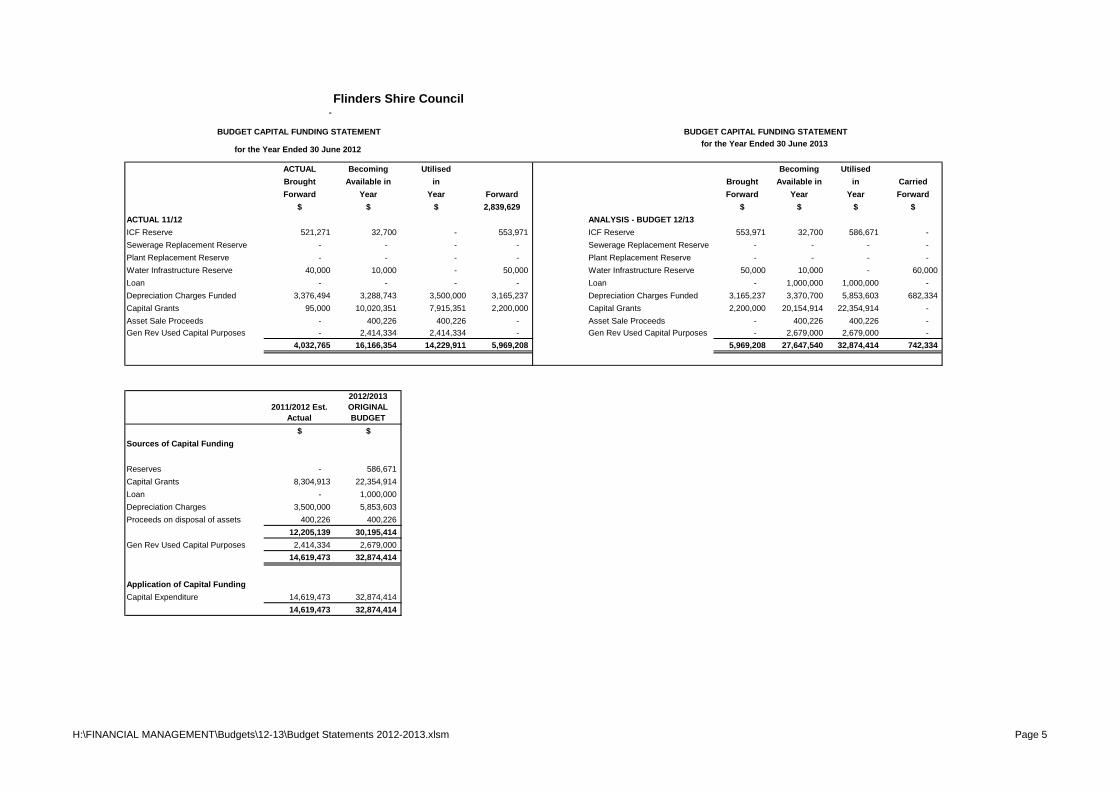
ACTUAL Becoming Utilised Becoming UtilisedBrought Available in in Brought Available in in CarriedForward Year Year Forward Forward Year Year Forward
$ $ $ 2,839,629 $ $ $ $ACTUAL 11/12 ANALYSIS - BUDGET 12/13ICF Reserve 521,271 32,700 - 553,971 ICF Reserve 553,971 32,700 586,671 - Sewerage Replacement Reserve - - - - Sewerage Replacement Reserve - - - - Plant Replacement Reserve - - - - Plant Replacement Reserve - - - - Water Infrastructure Reserve 40,000 10,000 - 50,000 Water Infrastructure Reserve 50,000 10,000 - 60,000 Loan - - - - Loan - 1,000,000 1,000,000 - Depreciation Charges Funded 3,376,494 3,288,743 3,500,000 3,165,237 Depreciation Charges Funded 3,165,237 3,370,700 5,853,603 682,334 Capital Grants 95,000 10,020,351 7,915,351 2,200,000 Capital Grants 2,200,000 20,154,914 22,354,914 - Asset Sale Proceeds - 400,226 400,226 - Asset Sale Proceeds - 400,226 400,226 - Gen Rev Used Capital Purposes - 2,414,334 2,414,334 - Gen Rev Used Capital Purposes - 2,679,000 2,679,000 -
4,032,765 16,166,354 14,229,911 5,969,208 5,969,208 27,647,540 32,874,414 742,334
2011/2012 Est. Actual
2012/2013 ORIGINAL BUDGET
$ $Sources of Capital Funding
Reserves - 586,671 Capital Grants 8,304,913 22,354,914 Loan - 1,000,000 Depreciation Charges 3,500,000 5,853,603 Proceeds on disposal of assets 400,226 400,226
12,205,139 30,195,414 Gen Rev Used Capital Purposes 2,414,334 2,679,000
14,619,473 32,874,414
Application of Capital FundingCapital Expenditure 14,619,473 32,874,414
14,619,473 32,874,414
Flinders Shire Council
BUDGET CAPITAL FUNDING STATEMENTfor the Year Ended 30 June 2013
BUDGET CAPITAL FUNDING STATEMENT
for the Year Ended 30 June 2012
H:\FINANCIAL MANAGEMENT\Budgets\12-13\Budget Statements 2012-2013.xlsm Page 5
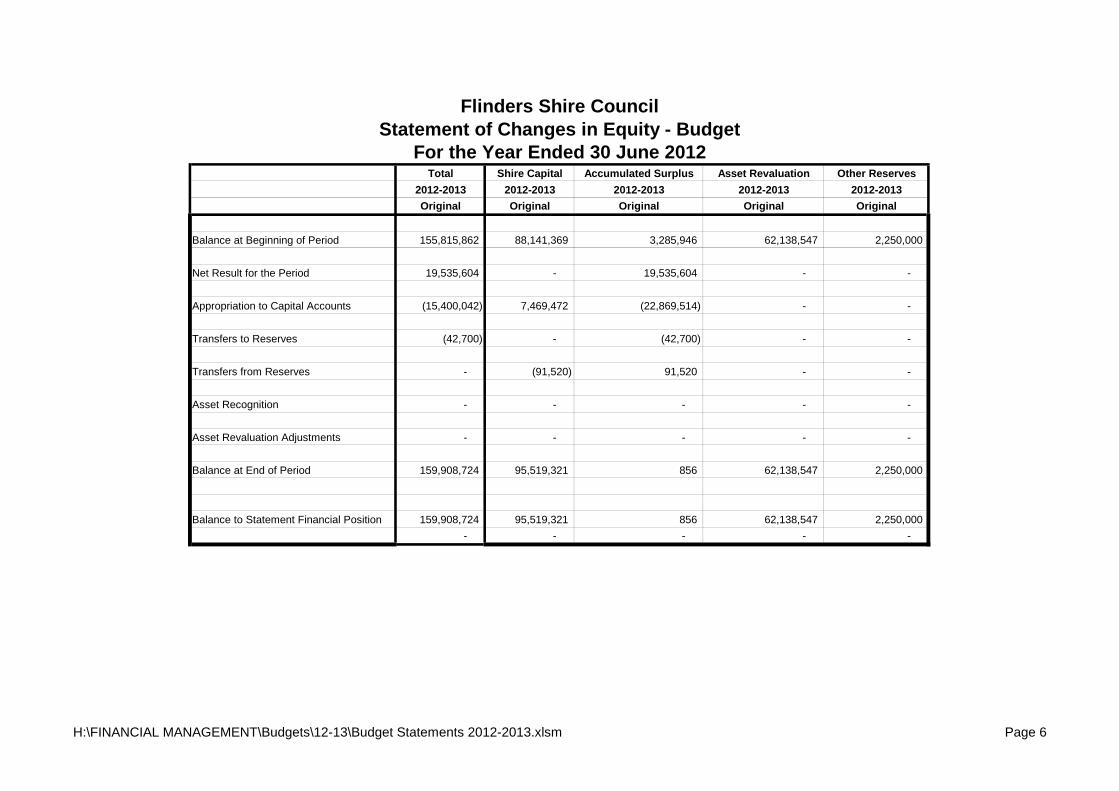
Total Shire Capital Accumulated Surplus Asset Revaluation Other Reserves2012-2013 2012-2013 2012-2013 2012-2013 2012-2013Original Original Original Original Original
Balance at Beginning of Period 155,815,862 88,141,369 3,285,946 62,138,547 2,250,000
Net Result for the Period 19,535,604 - 19,535,604 - -
Appropriation to Capital Accounts (15,400,042) 7,469,472 (22,869,514) - -
Transfers to Reserves (42,700) - (42,700) - -
Transfers from Reserves - (91,520) 91,520 - -
Asset Recognition - - - - -
Asset Revaluation Adjustments - - - - -
Balance at End of Period 159,908,724 95,519,321 856 62,138,547 2,250,000
Balance to Statement Financial Position 159,908,724 95,519,321 856 62,138,547 2,250,000 - - - - -
Flinders Shire CouncilStatement of Changes in Equity - Budget
For the Year Ended 30 June 2012
H:\FINANCIAL MANAGEMENT\Budgets\12-13\Budget Statements 2012-2013.xlsm Page 6
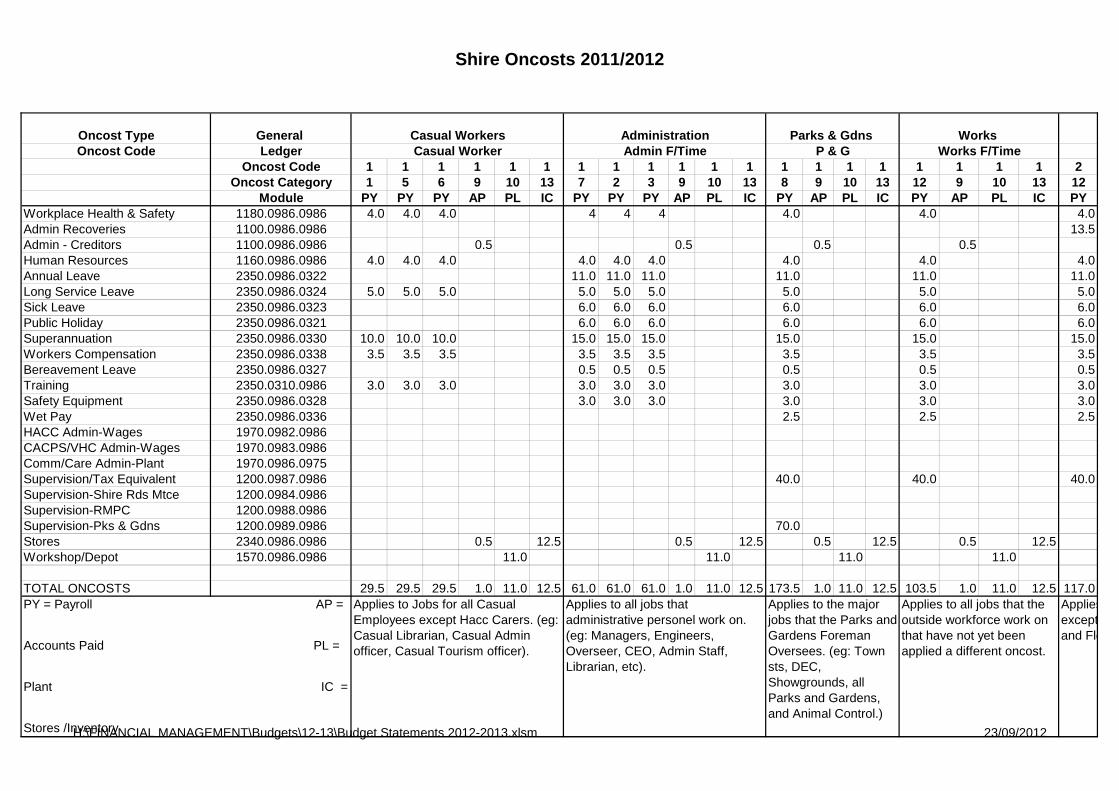
Shire Oncosts 2011/2012
Oncost Type General Oncost Code Ledger
Oncost Code 1 1 1 1 1 1 1 1 1 1 1 1 1 1 1 1 1 1 1 1 2Oncost Category 1 5 6 9 10 13 7 2 3 9 10 13 8 9 10 13 12 9 10 13 12
Module PY PY PY AP PL IC PY PY PY AP PL IC PY AP PL IC PY AP PL IC PYWorkplace Health & Safety 1180.0986.0986 4.0 4.0 4.0 4 4 4 4.0 4.0 4.0Admin Recoveries 1100.0986.0986 13.5Admin - Creditors 1100.0986.0986 0.5 0.5 0.5 0.5Human Resources 1160.0986.0986 4.0 4.0 4.0 4.0 4.0 4.0 4.0 4.0 4.0Annual Leave 2350.0986.0322 11.0 11.0 11.0 11.0 11.0 11.0Long Service Leave 2350.0986.0324 5.0 5.0 5.0 5.0 5.0 5.0 5.0 5.0 5.0Sick Leave 2350.0986.0323 6.0 6.0 6.0 6.0 6.0 6.0Public Holiday 2350.0986.0321 6.0 6.0 6.0 6.0 6.0 6.0Superannuation 2350.0986.0330 10.0 10.0 10.0 15.0 15.0 15.0 15.0 15.0 15.0Workers Compensation 2350.0986.0338 3.5 3.5 3.5 3.5 3.5 3.5 3.5 3.5 3.5Bereavement Leave 2350.0986.0327 0.5 0.5 0.5 0.5 0.5 0.5Training 2350.0310.0986 3.0 3.0 3.0 3.0 3.0 3.0 3.0 3.0 3.0Safety Equipment 2350.0986.0328 3.0 3.0 3.0 3.0 3.0 3.0Wet Pay 2350.0986.0336 2.5 2.5 2.5HACC Admin-Wages 1970.0982.0986CACPS/VHC Admin-Wages 1970.0983.0986Comm/Care Admin-Plant 1970.0986.0975Supervision/Tax Equivalent 1200.0987.0986 40.0 40.0 40.0Supervision-Shire Rds Mtce 1200.0984.0986Supervision-RMPC 1200.0988.0986Supervision-Pks & Gdns 1200.0989.0986 70.0Stores 2340.0986.0986 0.5 12.5 0.5 12.5 0.5 12.5 0.5 12.5Workshop/Depot 1570.0986.0986 11.0 11.0 11.0 11.0
TOTAL ONCOSTS 29.5 29.5 29.5 1.0 11.0 12.5 61.0 61.0 61.0 1.0 11.0 12.5 173.5 1.0 11.0 12.5 103.5 1.0 11.0 12.5 117.0PY = Payroll AP =
Accounts Paid PL =
Plant IC =
Stores /Inventory
Applies to Jobs for all Casual Employees except Hacc Carers. (eg: Casual Librarian, Casual Admin officer, Casual Tourism officer).
Applies to all jobs that administrative personel work on. (eg: Managers, Engineers, Overseer, CEO, Admin Staff, Librarian, etc).
Applies to the major jobs that the Parks and Gardens Foreman Oversees. (eg: Town sts, DEC, Showgrounds, all Parks and Gardens, and Animal Control.)
Applies to all jobs that the outside workforce work on that have not yet been applied a different oncost.
Applies to all Main Roads and Private Works Jobs except RMPC. Applies to Roads to Recovery Jobs and Flood Damage Jobs (Shire and Main Rds).
Casual Worker Admin F/Time P & G Works F/TimeCasual Workers Administration Parks & Gdns Works
H:\FINANCIAL MANAGEMENT\Budgets\12-13\Budget Statements 2012-2013.xlsm 23/09/2012
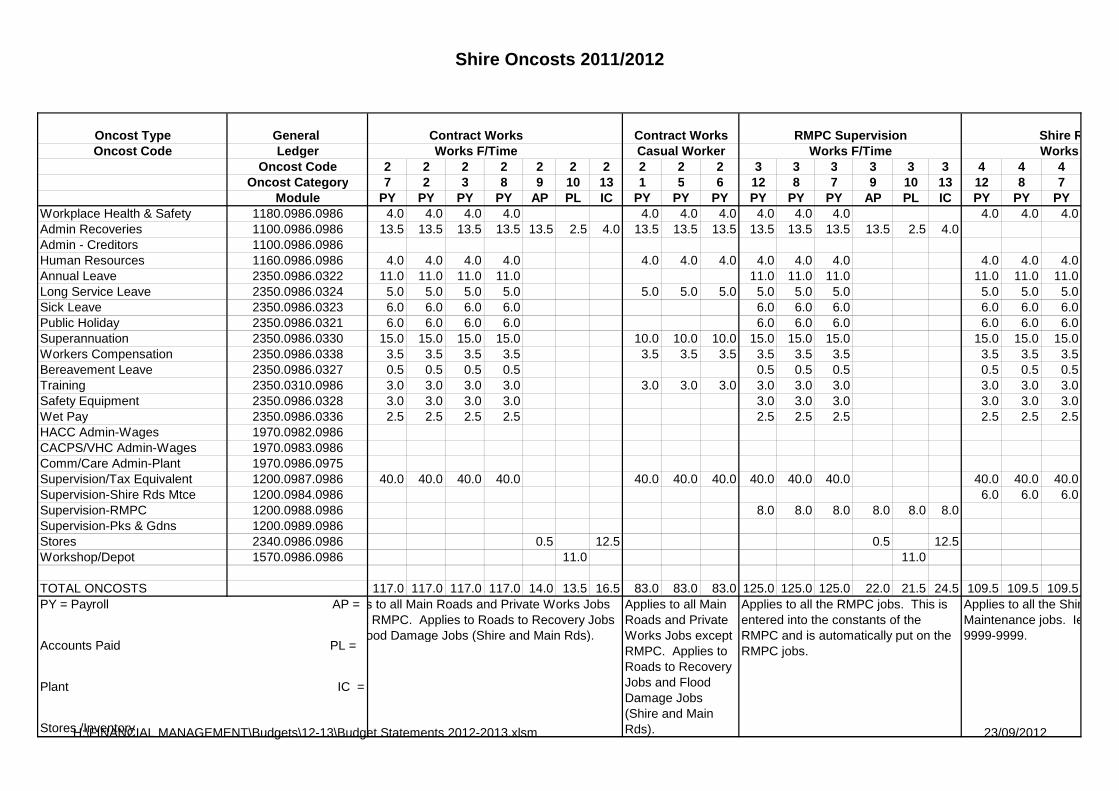
Shire Oncosts 2011/2012
Oncost Type General Oncost Code Ledger
Oncost CodeOncost Category
ModuleWorkplace Health & Safety 1180.0986.0986Admin Recoveries 1100.0986.0986Admin - Creditors 1100.0986.0986Human Resources 1160.0986.0986Annual Leave 2350.0986.0322Long Service Leave 2350.0986.0324Sick Leave 2350.0986.0323Public Holiday 2350.0986.0321Superannuation 2350.0986.0330Workers Compensation 2350.0986.0338Bereavement Leave 2350.0986.0327Training 2350.0310.0986Safety Equipment 2350.0986.0328Wet Pay 2350.0986.0336HACC Admin-Wages 1970.0982.0986CACPS/VHC Admin-Wages 1970.0983.0986Comm/Care Admin-Plant 1970.0986.0975Supervision/Tax Equivalent 1200.0987.0986Supervision-Shire Rds Mtce 1200.0984.0986Supervision-RMPC 1200.0988.0986Supervision-Pks & Gdns 1200.0989.0986Stores 2340.0986.0986Workshop/Depot 1570.0986.0986
TOTAL ONCOSTSPY = Payroll AP =
Accounts Paid PL =
Plant IC =
Stores /Inventory
2 2 2 2 2 2 2 2 2 2 3 3 3 3 3 3 4 4 47 2 3 8 9 10 13 1 5 6 12 8 7 9 10 13 12 8 7
PY PY PY PY AP PL IC PY PY PY PY PY PY AP PL IC PY PY PY4.0 4.0 4.0 4.0 4.0 4.0 4.0 4.0 4.0 4.0 4.0 4.0 4.0
13.5 13.5 13.5 13.5 13.5 2.5 4.0 13.5 13.5 13.5 13.5 13.5 13.5 13.5 2.5 4.0
4.0 4.0 4.0 4.0 4.0 4.0 4.0 4.0 4.0 4.0 4.0 4.0 4.011.0 11.0 11.0 11.0 11.0 11.0 11.0 11.0 11.0 11.05.0 5.0 5.0 5.0 5.0 5.0 5.0 5.0 5.0 5.0 5.0 5.0 5.06.0 6.0 6.0 6.0 6.0 6.0 6.0 6.0 6.0 6.06.0 6.0 6.0 6.0 6.0 6.0 6.0 6.0 6.0 6.0
15.0 15.0 15.0 15.0 10.0 10.0 10.0 15.0 15.0 15.0 15.0 15.0 15.03.5 3.5 3.5 3.5 3.5 3.5 3.5 3.5 3.5 3.5 3.5 3.5 3.50.5 0.5 0.5 0.5 0.5 0.5 0.5 0.5 0.5 0.53.0 3.0 3.0 3.0 3.0 3.0 3.0 3.0 3.0 3.0 3.0 3.0 3.03.0 3.0 3.0 3.0 3.0 3.0 3.0 3.0 3.0 3.02.5 2.5 2.5 2.5 2.5 2.5 2.5 2.5 2.5 2.5
40.0 40.0 40.0 40.0 40.0 40.0 40.0 40.0 40.0 40.0 40.0 40.0 40.06.0 6.0 6.0
8.0 8.0 8.0 8.0 8.0 8.0
0.5 12.5 0.5 12.5 11.0 11.0
117.0 117.0 117.0 117.0 14.0 13.5 16.5 83.0 83.0 83.0 125.0 125.0 125.0 22.0 21.5 24.5 109.5 109.5 109.5Applies to all Main Roads and Private Works Jobs except RMPC. Applies to Roads to Recovery Jobs and Flood Damage Jobs (Shire and Main Rds).
Applies to all the RMPC jobs. This is entered into the constants of the RMPC and is automatically put on the RMPC jobs.
Applies to all the Shire Roads Maintenance jobs. Ie: 7-0000-0000 to 7-9999-9999.
Applies to all Main Roads and Private Works Jobs except RMPC. Applies to Roads to Recovery Jobs and Flood Damage Jobs (Shire and Main Rds).
Works F/Time Works F/TimeWorks F/Time Casual WorkerContract Works Contract Works RMPC Supervision Shire Rd Mtce
H:\FINANCIAL MANAGEMENT\Budgets\12-13\Budget Statements 2012-2013.xlsm 23/09/2012
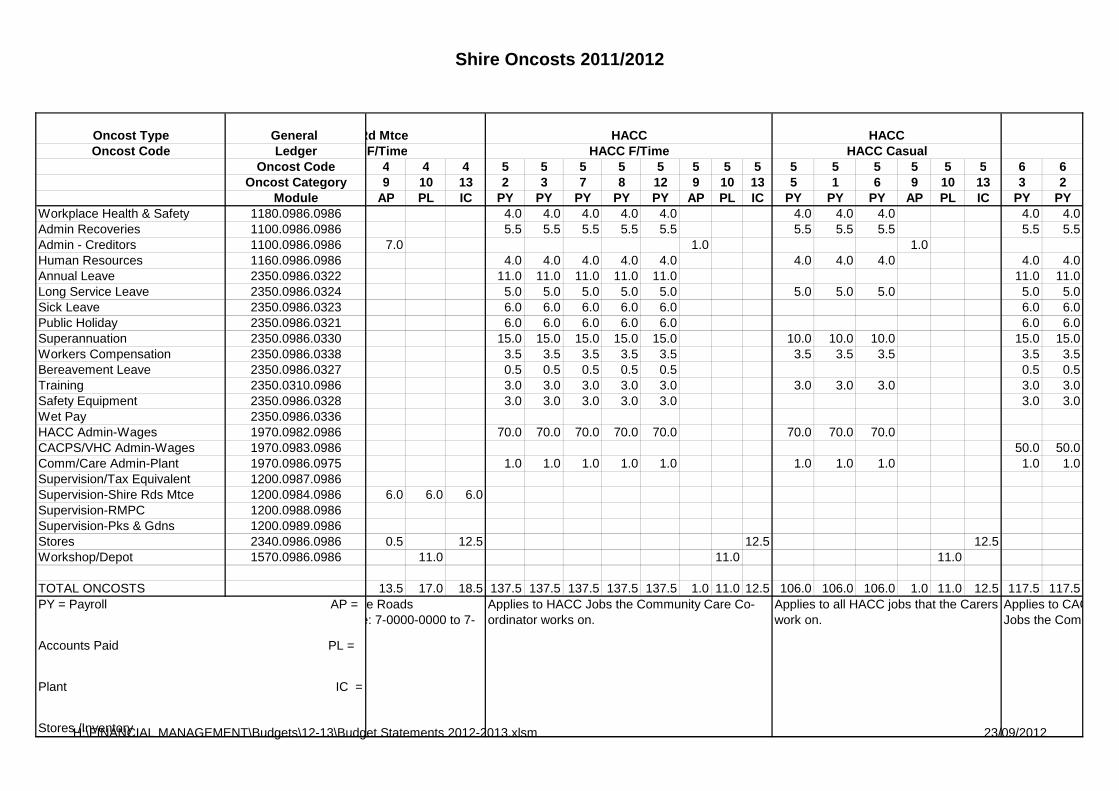
Shire Oncosts 2011/2012
Oncost Type General Oncost Code Ledger
Oncost CodeOncost Category
ModuleWorkplace Health & Safety 1180.0986.0986Admin Recoveries 1100.0986.0986Admin - Creditors 1100.0986.0986Human Resources 1160.0986.0986Annual Leave 2350.0986.0322Long Service Leave 2350.0986.0324Sick Leave 2350.0986.0323Public Holiday 2350.0986.0321Superannuation 2350.0986.0330Workers Compensation 2350.0986.0338Bereavement Leave 2350.0986.0327Training 2350.0310.0986Safety Equipment 2350.0986.0328Wet Pay 2350.0986.0336HACC Admin-Wages 1970.0982.0986CACPS/VHC Admin-Wages 1970.0983.0986Comm/Care Admin-Plant 1970.0986.0975Supervision/Tax Equivalent 1200.0987.0986Supervision-Shire Rds Mtce 1200.0984.0986Supervision-RMPC 1200.0988.0986Supervision-Pks & Gdns 1200.0989.0986Stores 2340.0986.0986Workshop/Depot 1570.0986.0986
TOTAL ONCOSTSPY = Payroll AP =
Accounts Paid PL =
Plant IC =
Stores /Inventory
4 4 4 5 5 5 5 5 5 5 5 5 5 5 5 5 5 6 69 10 13 2 3 7 8 12 9 10 13 5 1 6 9 10 13 3 2
AP PL IC PY PY PY PY PY AP PL IC PY PY PY AP PL IC PY PY4.0 4.0 4.0 4.0 4.0 4.0 4.0 4.0 4.0 4.05.5 5.5 5.5 5.5 5.5 5.5 5.5 5.5 5.5 5.5
7.0 1.0 1.04.0 4.0 4.0 4.0 4.0 4.0 4.0 4.0 4.0 4.0
11.0 11.0 11.0 11.0 11.0 11.0 11.05.0 5.0 5.0 5.0 5.0 5.0 5.0 5.0 5.0 5.06.0 6.0 6.0 6.0 6.0 6.0 6.06.0 6.0 6.0 6.0 6.0 6.0 6.0
15.0 15.0 15.0 15.0 15.0 10.0 10.0 10.0 15.0 15.03.5 3.5 3.5 3.5 3.5 3.5 3.5 3.5 3.5 3.50.5 0.5 0.5 0.5 0.5 0.5 0.53.0 3.0 3.0 3.0 3.0 3.0 3.0 3.0 3.0 3.03.0 3.0 3.0 3.0 3.0 3.0 3.0
70.0 70.0 70.0 70.0 70.0 70.0 70.0 70.050.0 50.0
1.0 1.0 1.0 1.0 1.0 1.0 1.0 1.0 1.0 1.0
6.0 6.0 6.0
0.5 12.5 12.5 12.5 11.0 11.0 11.0
13.5 17.0 18.5 137.5 137.5 137.5 137.5 137.5 1.0 11.0 12.5 106.0 106.0 106.0 1.0 11.0 12.5 117.5 117.5Applies to all the Shire Roads Maintenance jobs. Ie: 7-0000-0000 to 7-
Applies to HACC Jobs the Community Care Co-ordinator works on.
Applies to all HACC jobs that the Carers work on.
Applies to CACPS, VHC, SOLAS and DISABILITY Jobs the Community Care Co-ordinator works on.
Works F/Time HACC F/Time HACC CasualShire Rd Mtce HACC HACC
H:\FINANCIAL MANAGEMENT\Budgets\12-13\Budget Statements 2012-2013.xlsm 23/09/2012
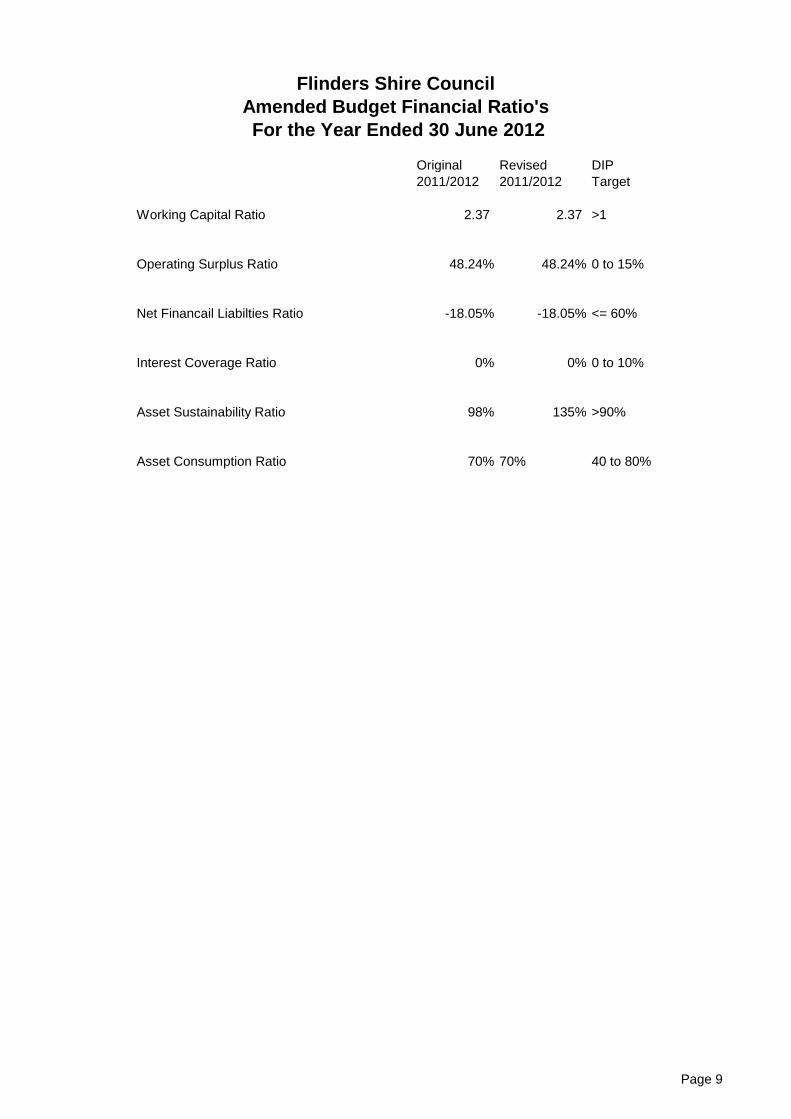
Original 2011/2012
Revised 2011/2012
DIP Target
Working Capital Ratio 2.37 2.37 >1
Operating Surplus Ratio 48.24% 48.24% 0 to 15%
Net Financail Liabilties Ratio -18.05% -18.05% <= 60%
Interest Coverage Ratio 0% 0% 0 to 10%
Asset Sustainability Ratio 98% 135% >90%
Asset Consumption Ratio 70% 70% 40 to 80%
Flinders Shire CouncilAmended Budget Financial Ratio's For the Year Ended 30 June 2012
Page 9
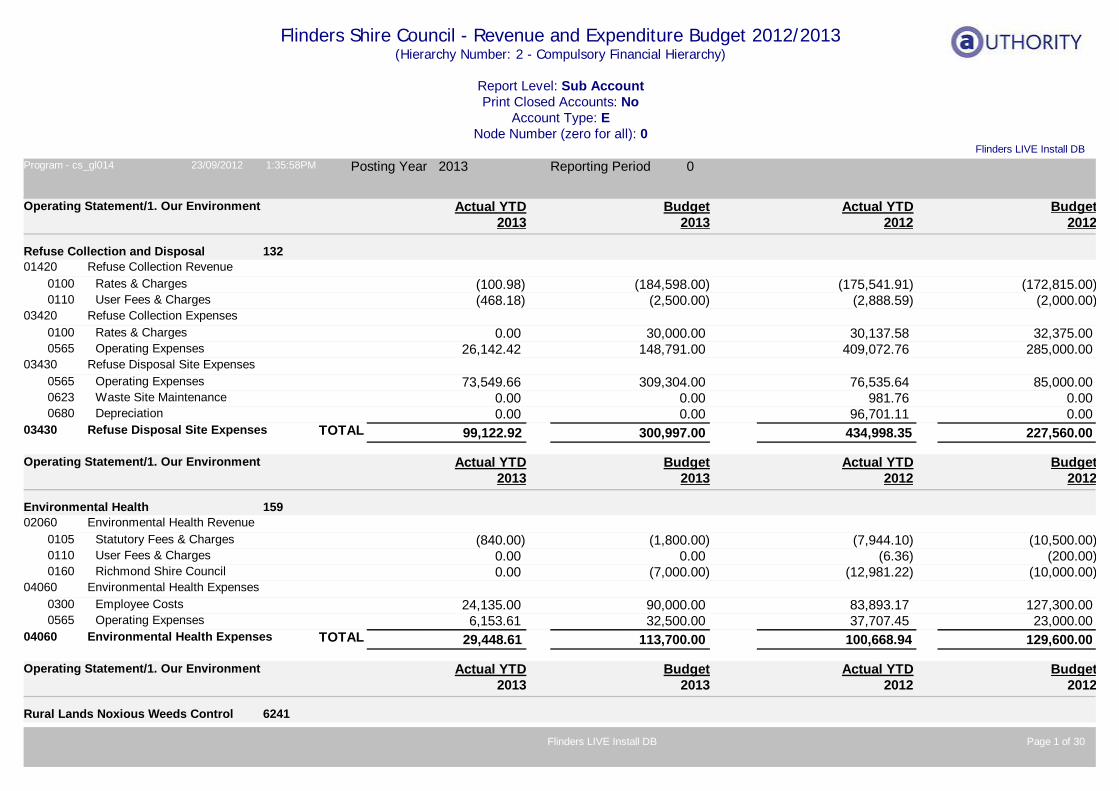
Flinders Shire Council - Revenue and Expenditure Budget 2012/2013(Hierarchy Number: 2 - Compulsory Financial Hierarchy)
Report Level: Sub AccountPrint Closed Accounts: No
Account Type: ENode Number (zero for all): 0
Flinders LIVE Install DBProgram - cs_gl014 23/09/2012 1:35:58PM Posting Year 2013 Reporting Period 0
132Refuse Collection and Disposal
Operating Statement/1. Our Environment Budget2013
Actual YTD2013
Budget2012
Actual YTD2012
Refuse Collection Revenue01420Rates & Charges )(100.980100 )(184,598.00 )(175,541.91 )(172,815.00User Fees & Charges )(468.180110 )(2,500.00 )(2,888.59 )(2,000.00
Refuse Collection Expenses03420Rates & Charges 0.000100 30,000.00 30,137.58 32,375.00Operating Expenses 26,142.420565 148,791.00 409,072.76 285,000.00
Refuse Disposal Site Expenses03430Operating Expenses 73,549.660565 309,304.00 76,535.64 85,000.00Waste Site Maintenance 0.000623 0.00 981.76 0.00Depreciation 0.000680 0.00 96,701.11 0.00
99,122.9203430 Refuse Disposal Site Expenses 300,997.00TOTAL 434,998.35 227,560.00
159Environmental Health
Operating Statement/1. Our Environment Budget2013
Actual YTD2013
Budget2012
Actual YTD2012
Environmental Health Revenue02060Statutory Fees & Charges )(840.000105 )(1,800.00 )(7,944.10 )(10,500.00User Fees & Charges 0.000110 0.00 )(6.36 )(200.00Richmond Shire Council 0.000160 )(7,000.00 )(12,981.22 )(10,000.00
Environmental Health Expenses04060Employee Costs 24,135.000300 90,000.00 83,893.17 127,300.00Operating Expenses 6,153.610565 32,500.00 37,707.45 23,000.00
29,448.6104060 Environmental Health Expenses 113,700.00TOTAL 100,668.94 129,600.00
6241Rural Lands Noxious Weeds Control
Operating Statement/1. Our Environment Budget2013
Actual YTD2013
Budget2012
Actual YTD2012
Page 1 of 30Flinders LIVE Install DB
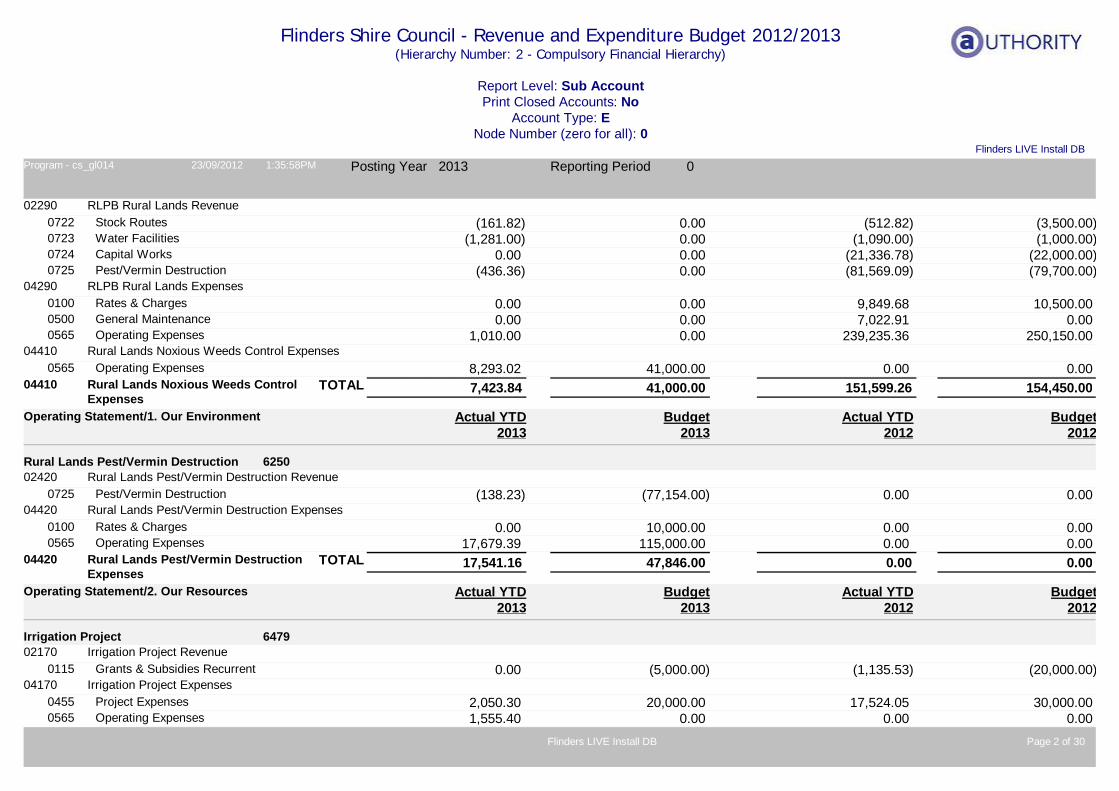
Flinders Shire Council - Revenue and Expenditure Budget 2012/2013(Hierarchy Number: 2 - Compulsory Financial Hierarchy)
Report Level: Sub AccountPrint Closed Accounts: No
Account Type: ENode Number (zero for all): 0
Flinders LIVE Install DBProgram - cs_gl014 23/09/2012 1:35:58PM Posting Year 2013 Reporting Period 0
RLPB Rural Lands Revenue02290Stock Routes )(161.820722 0.00 )(512.82 )(3,500.00Water Facilities )(1,281.000723 0.00 )(1,090.00 )(1,000.00Capital Works 0.000724 0.00 )(21,336.78 )(22,000.00Pest/Vermin Destruction )(436.360725 0.00 )(81,569.09 )(79,700.00
RLPB Rural Lands Expenses04290Rates & Charges 0.000100 0.00 9,849.68 10,500.00General Maintenance 0.000500 0.00 7,022.91 0.00Operating Expenses 1,010.000565 0.00 239,235.36 250,150.00
Rural Lands Noxious Weeds Control Expenses04410Operating Expenses 8,293.020565 41,000.00 0.00 0.00
7,423.8404410 Rural Lands Noxious Weeds Control Expenses
41,000.00TOTAL 151,599.26 154,450.00
6250Rural Lands Pest/Vermin Destruction
Operating Statement/1. Our Environment Budget2013
Actual YTD2013
Budget2012
Actual YTD2012
Rural Lands Pest/Vermin Destruction Revenue02420Pest/Vermin Destruction )(138.230725 )(77,154.00 0.00 0.00
Rural Lands Pest/Vermin Destruction Expenses04420Rates & Charges 0.000100 10,000.00 0.00 0.00Operating Expenses 17,679.390565 115,000.00 0.00 0.00
17,541.1604420 Rural Lands Pest/Vermin Destruction Expenses
47,846.00TOTAL 0.00 0.00
6479Irrigation Project
Operating Statement/2. Our Resources Budget2013
Actual YTD2013
Budget2012
Actual YTD2012
Irrigation Project Revenue02170Grants & Subsidies Recurrent 0.000115 )(5,000.00 )(1,135.53 )(20,000.00
Irrigation Project Expenses04170Project Expenses 2,050.300455 20,000.00 17,524.05 30,000.00Operating Expenses 1,555.400565 0.00 0.00 0.00
Page 2 of 30Flinders LIVE Install DB
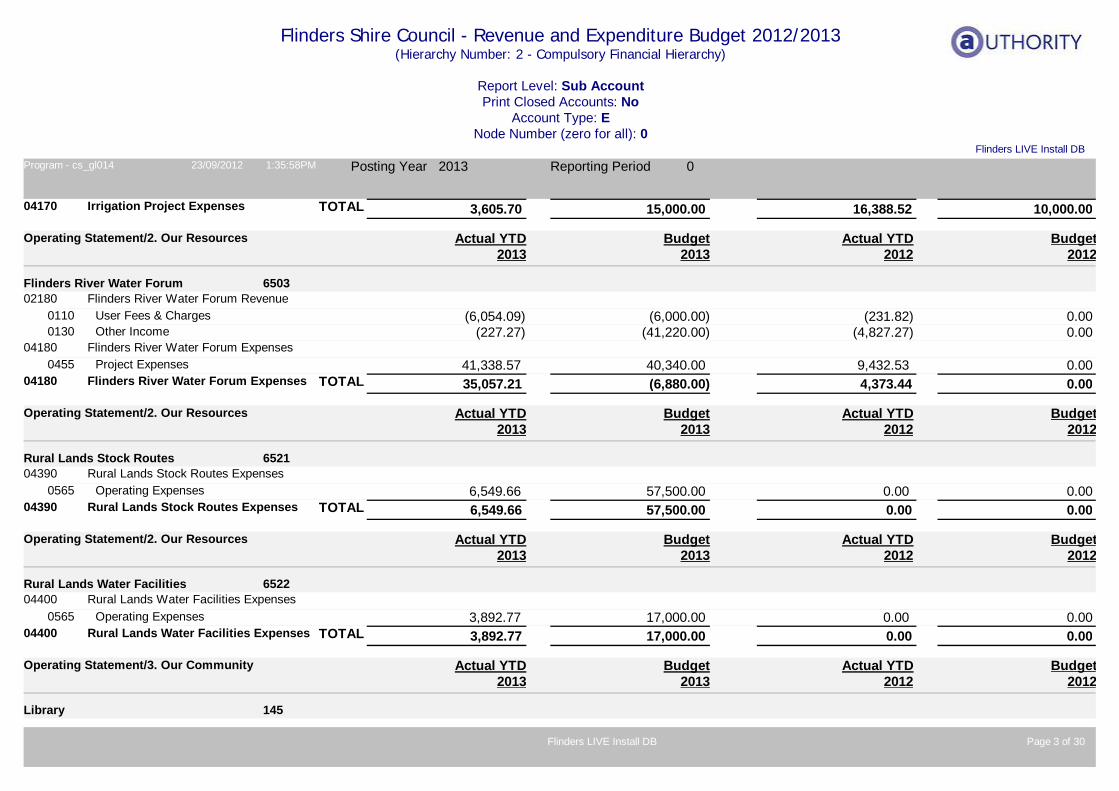
Flinders Shire Council - Revenue and Expenditure Budget 2012/2013(Hierarchy Number: 2 - Compulsory Financial Hierarchy)
Report Level: Sub AccountPrint Closed Accounts: No
Account Type: ENode Number (zero for all): 0
Flinders LIVE Install DBProgram - cs_gl014 23/09/2012 1:35:58PM Posting Year 2013 Reporting Period 0
3,605.7004170 Irrigation Project Expenses 15,000.00TOTAL 16,388.52 10,000.00
6503Flinders River Water Forum
Operating Statement/2. Our Resources Budget2013
Actual YTD2013
Budget2012
Actual YTD2012
Flinders River Water Forum Revenue02180User Fees & Charges )(6,054.090110 )(6,000.00 )(231.82 0.00Other Income )(227.270130 )(41,220.00 )(4,827.27 0.00
Flinders River Water Forum Expenses04180Project Expenses 41,338.570455 40,340.00 9,432.53 0.00
35,057.2104180 Flinders River Water Forum Expenses )(6,880.00TOTAL 4,373.44 0.00
6521Rural Lands Stock Routes
Operating Statement/2. Our Resources Budget2013
Actual YTD2013
Budget2012
Actual YTD2012
Rural Lands Stock Routes Expenses04390Operating Expenses 6,549.660565 57,500.00 0.00 0.00
6,549.6604390 Rural Lands Stock Routes Expenses 57,500.00TOTAL 0.00 0.00
6522Rural Lands Water Facilities
Operating Statement/2. Our Resources Budget2013
Actual YTD2013
Budget2012
Actual YTD2012
Rural Lands Water Facilities Expenses04400Operating Expenses 3,892.770565 17,000.00 0.00 0.00
3,892.7704400 Rural Lands Water Facilities Expenses 17,000.00TOTAL 0.00 0.00
145Library
Operating Statement/3. Our Community Budget2013
Actual YTD2013
Budget2012
Actual YTD2012
Page 3 of 30Flinders LIVE Install DB
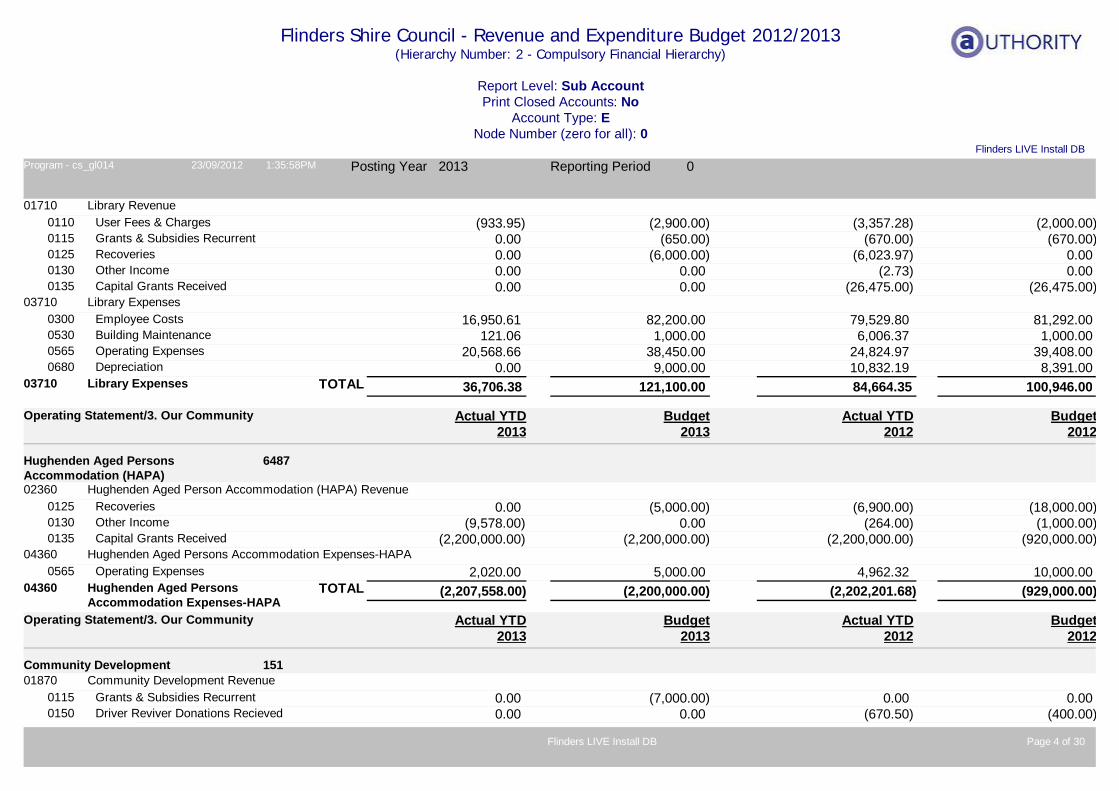
Flinders Shire Council - Revenue and Expenditure Budget 2012/2013(Hierarchy Number: 2 - Compulsory Financial Hierarchy)
Report Level: Sub AccountPrint Closed Accounts: No
Account Type: ENode Number (zero for all): 0
Flinders LIVE Install DBProgram - cs_gl014 23/09/2012 1:35:58PM Posting Year 2013 Reporting Period 0
Library Revenue01710User Fees & Charges )(933.950110 )(2,900.00 )(3,357.28 )(2,000.00Grants & Subsidies Recurrent 0.000115 )(650.00 )(670.00 )(670.00Recoveries 0.000125 )(6,000.00 )(6,023.97 0.00Other Income 0.000130 0.00 )(2.73 0.00Capital Grants Received 0.000135 0.00 )(26,475.00 )(26,475.00
Library Expenses03710Employee Costs 16,950.610300 82,200.00 79,529.80 81,292.00Building Maintenance 121.060530 1,000.00 6,006.37 1,000.00Operating Expenses 20,568.660565 38,450.00 24,824.97 39,408.00Depreciation 0.000680 9,000.00 10,832.19 8,391.00
36,706.3803710 Library Expenses 121,100.00TOTAL 84,664.35 100,946.00
6487Hughenden Aged Persons Accommodation (HAPA)
Operating Statement/3. Our Community Budget2013
Actual YTD2013
Budget2012
Actual YTD2012
Hughenden Aged Person Accommodation (HAPA) Revenue02360Recoveries 0.000125 )(5,000.00 )(6,900.00 )(18,000.00Other Income )(9,578.000130 0.00 )(264.00 )(1,000.00Capital Grants Received )(2,200,000.000135 )(2,200,000.00 )(2,200,000.00 )(920,000.00
Hughenden Aged Persons Accommodation Expenses-HAPA04360Operating Expenses 2,020.000565 5,000.00 4,962.32 10,000.00
)(2,207,558.0004360 Hughenden Aged Persons Accommodation Expenses-HAPA
)(2,200,000.00TOTAL )(2,202,201.68 )(929,000.00
151Community Development
Operating Statement/3. Our Community Budget2013
Actual YTD2013
Budget2012
Actual YTD2012
Community Development Revenue01870Grants & Subsidies Recurrent 0.000115 )(7,000.00 0.00 0.00Driver Reviver Donations Recieved 0.000150 0.00 )(670.50 )(400.00
Page 4 of 30Flinders LIVE Install DB
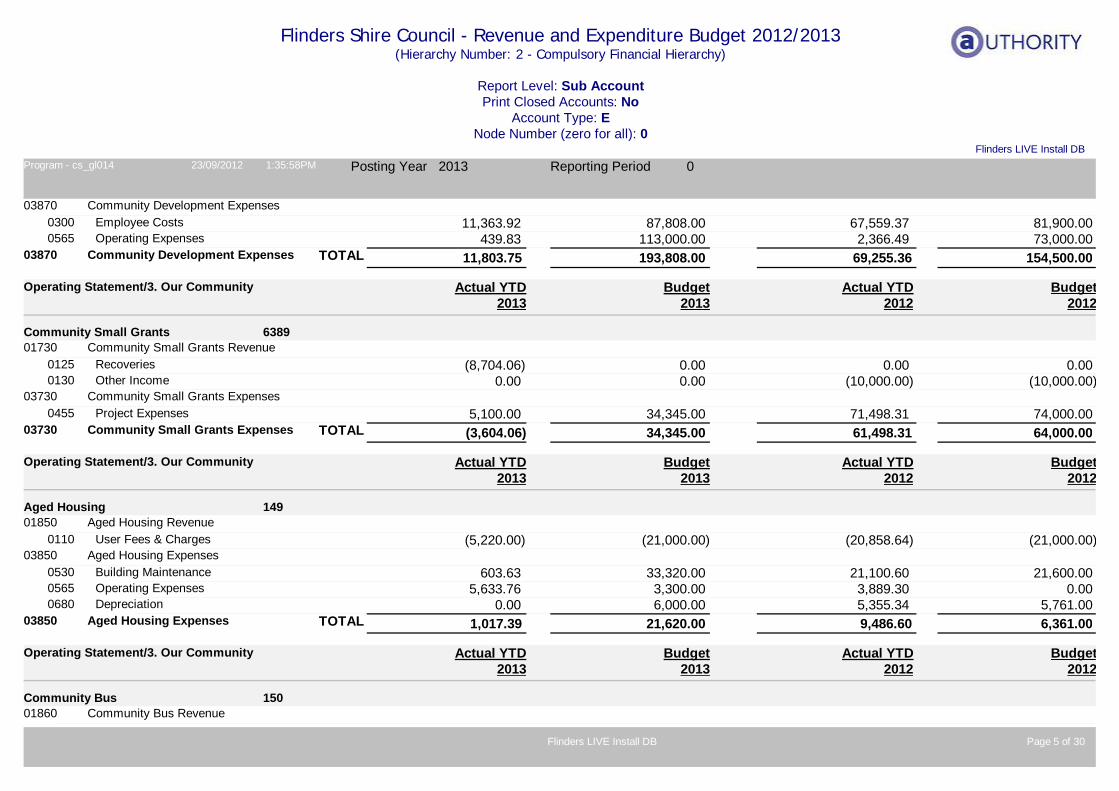
Flinders Shire Council - Revenue and Expenditure Budget 2012/2013(Hierarchy Number: 2 - Compulsory Financial Hierarchy)
Report Level: Sub AccountPrint Closed Accounts: No
Account Type: ENode Number (zero for all): 0
Flinders LIVE Install DBProgram - cs_gl014 23/09/2012 1:35:58PM Posting Year 2013 Reporting Period 0
Community Development Expenses03870Employee Costs 11,363.920300 87,808.00 67,559.37 81,900.00Operating Expenses 439.830565 113,000.00 2,366.49 73,000.00
11,803.7503870 Community Development Expenses 193,808.00TOTAL 69,255.36 154,500.00
6389Community Small Grants
Operating Statement/3. Our Community Budget2013
Actual YTD2013
Budget2012
Actual YTD2012
Community Small Grants Revenue01730Recoveries )(8,704.060125 0.00 0.00 0.00Other Income 0.000130 0.00 )(10,000.00 )(10,000.00
Community Small Grants Expenses03730Project Expenses 5,100.000455 34,345.00 71,498.31 74,000.00
)(3,604.0603730 Community Small Grants Expenses 34,345.00TOTAL 61,498.31 64,000.00
149Aged Housing
Operating Statement/3. Our Community Budget2013
Actual YTD2013
Budget2012
Actual YTD2012
Aged Housing Revenue01850User Fees & Charges )(5,220.000110 )(21,000.00 )(20,858.64 )(21,000.00
Aged Housing Expenses03850Building Maintenance 603.630530 33,320.00 21,100.60 21,600.00Operating Expenses 5,633.760565 3,300.00 3,889.30 0.00Depreciation 0.000680 6,000.00 5,355.34 5,761.00
1,017.3903850 Aged Housing Expenses 21,620.00TOTAL 9,486.60 6,361.00
150Community Bus
Operating Statement/3. Our Community Budget2013
Actual YTD2013
Budget2012
Actual YTD2012
Community Bus Revenue01860
Page 5 of 30Flinders LIVE Install DB
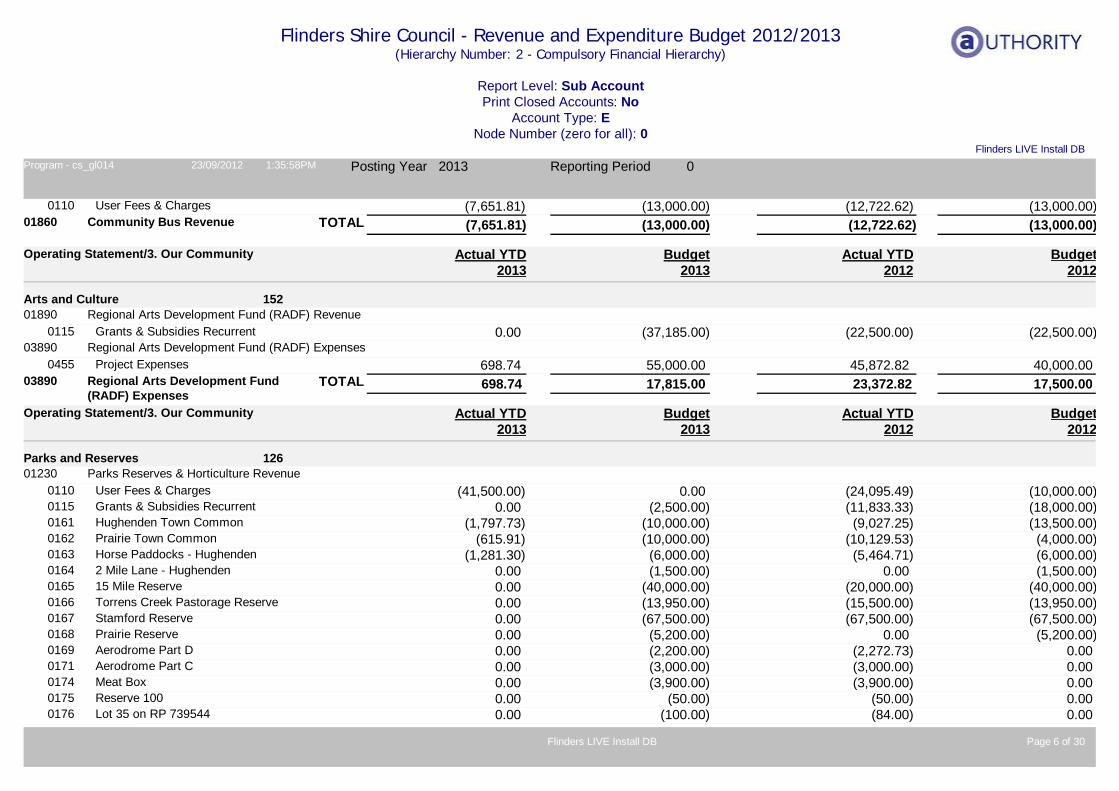
Flinders Shire Council - Revenue and Expenditure Budget 2012/2013(Hierarchy Number: 2 - Compulsory Financial Hierarchy)
Report Level: Sub AccountPrint Closed Accounts: No
Account Type: ENode Number (zero for all): 0
Flinders LIVE Install DBProgram - cs_gl014 23/09/2012 1:35:58PM Posting Year 2013 Reporting Period 0
User Fees & Charges )(7,651.810110 )(13,000.00 )(12,722.62 )(13,000.00)(7,651.8101860 Community Bus Revenue )(13,000.00TOTAL )(12,722.62 )(13,000.00
152Arts and Culture
Operating Statement/3. Our Community Budget2013
Actual YTD2013
Budget2012
Actual YTD2012
Regional Arts Development Fund (RADF) Revenue01890Grants & Subsidies Recurrent 0.000115 )(37,185.00 )(22,500.00 )(22,500.00
Regional Arts Development Fund (RADF) Expenses03890Project Expenses 698.740455 55,000.00 45,872.82 40,000.00
698.7403890 Regional Arts Development Fund (RADF) Expenses
17,815.00TOTAL 23,372.82 17,500.00
126Parks and Reserves
Operating Statement/3. Our Community Budget2013
Actual YTD2013
Budget2012
Actual YTD2012
Parks Reserves & Horticulture Revenue01230User Fees & Charges )(41,500.000110 0.00 )(24,095.49 )(10,000.00Grants & Subsidies Recurrent 0.000115 )(2,500.00 )(11,833.33 )(18,000.00Hughenden Town Common )(1,797.730161 )(10,000.00 )(9,027.25 )(13,500.00Prairie Town Common )(615.910162 )(10,000.00 )(10,129.53 )(4,000.00Horse Paddocks - Hughenden )(1,281.300163 )(6,000.00 )(5,464.71 )(6,000.002 Mile Lane - Hughenden 0.000164 )(1,500.00 0.00 )(1,500.0015 Mile Reserve 0.000165 )(40,000.00 )(20,000.00 )(40,000.00Torrens Creek Pastorage Reserve 0.000166 )(13,950.00 )(15,500.00 )(13,950.00Stamford Reserve 0.000167 )(67,500.00 )(67,500.00 )(67,500.00Prairie Reserve 0.000168 )(5,200.00 0.00 )(5,200.00Aerodrome Part D 0.000169 )(2,200.00 )(2,272.73 0.00Aerodrome Part C 0.000171 )(3,000.00 )(3,000.00 0.00Meat Box 0.000174 )(3,900.00 )(3,900.00 0.00Reserve 100 0.000175 )(50.00 )(50.00 0.00Lot 35 on RP 739544 0.000176 )(100.00 )(84.00 0.00
Page 6 of 30Flinders LIVE Install DB
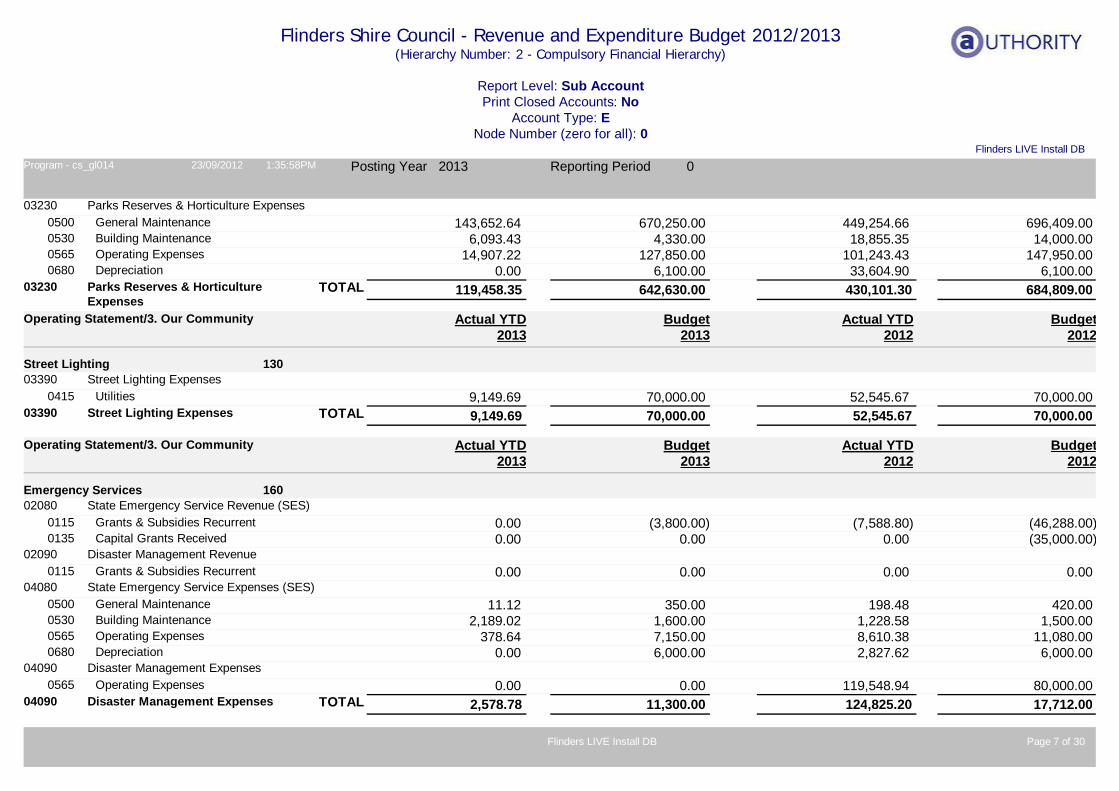
Flinders Shire Council - Revenue and Expenditure Budget 2012/2013(Hierarchy Number: 2 - Compulsory Financial Hierarchy)
Report Level: Sub AccountPrint Closed Accounts: No
Account Type: ENode Number (zero for all): 0
Flinders LIVE Install DBProgram - cs_gl014 23/09/2012 1:35:58PM Posting Year 2013 Reporting Period 0
Parks Reserves & Horticulture Expenses03230General Maintenance 143,652.640500 670,250.00 449,254.66 696,409.00Building Maintenance 6,093.430530 4,330.00 18,855.35 14,000.00Operating Expenses 14,907.220565 127,850.00 101,243.43 147,950.00Depreciation 0.000680 6,100.00 33,604.90 6,100.00
119,458.3503230 Parks Reserves & Horticulture Expenses
642,630.00TOTAL 430,101.30 684,809.00
130Street Lighting
Operating Statement/3. Our Community Budget2013
Actual YTD2013
Budget2012
Actual YTD2012
Street Lighting Expenses03390Utilities 9,149.690415 70,000.00 52,545.67 70,000.00
9,149.6903390 Street Lighting Expenses 70,000.00TOTAL 52,545.67 70,000.00
160Emergency Services
Operating Statement/3. Our Community Budget2013
Actual YTD2013
Budget2012
Actual YTD2012
State Emergency Service Revenue (SES)02080Grants & Subsidies Recurrent 0.000115 )(3,800.00 )(7,588.80 )(46,288.00Capital Grants Received 0.000135 0.00 0.00 )(35,000.00
Disaster Management Revenue02090Grants & Subsidies Recurrent 0.000115 0.00 0.00 0.00
State Emergency Service Expenses (SES)04080General Maintenance 11.120500 350.00 198.48 420.00Building Maintenance 2,189.020530 1,600.00 1,228.58 1,500.00Operating Expenses 378.640565 7,150.00 8,610.38 11,080.00Depreciation 0.000680 6,000.00 2,827.62 6,000.00
Disaster Management Expenses04090Operating Expenses 0.000565 0.00 119,548.94 80,000.00
2,578.7804090 Disaster Management Expenses 11,300.00TOTAL 124,825.20 17,712.00
Page 7 of 30Flinders LIVE Install DB
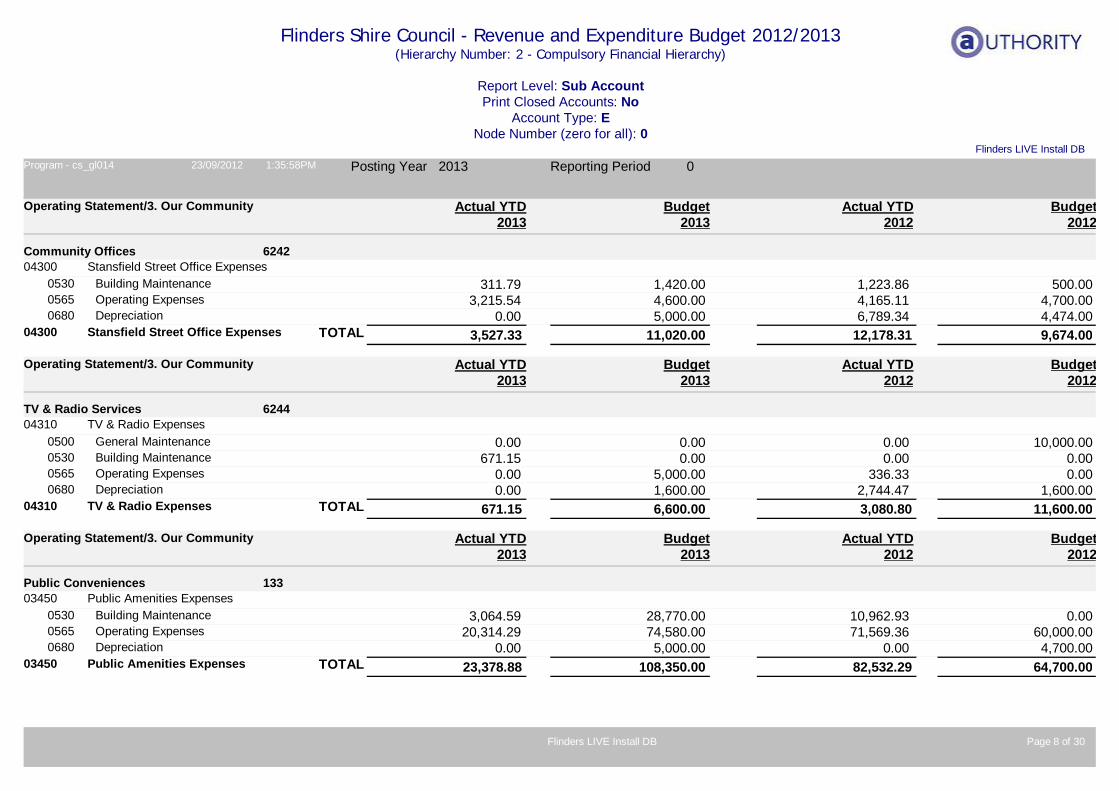
Flinders Shire Council - Revenue and Expenditure Budget 2012/2013(Hierarchy Number: 2 - Compulsory Financial Hierarchy)
Report Level: Sub AccountPrint Closed Accounts: No
Account Type: ENode Number (zero for all): 0
Flinders LIVE Install DBProgram - cs_gl014 23/09/2012 1:35:58PM Posting Year 2013 Reporting Period 0
6242Community Offices
Operating Statement/3. Our Community Budget2013
Actual YTD2013
Budget2012
Actual YTD2012
Stansfield Street Office Expenses04300Building Maintenance 311.790530 1,420.00 1,223.86 500.00Operating Expenses 3,215.540565 4,600.00 4,165.11 4,700.00Depreciation 0.000680 5,000.00 6,789.34 4,474.00
3,527.3304300 Stansfield Street Office Expenses 11,020.00TOTAL 12,178.31 9,674.00
6244TV & Radio Services
Operating Statement/3. Our Community Budget2013
Actual YTD2013
Budget2012
Actual YTD2012
TV & Radio Expenses04310General Maintenance 0.000500 0.00 0.00 10,000.00Building Maintenance 671.150530 0.00 0.00 0.00Operating Expenses 0.000565 5,000.00 336.33 0.00Depreciation 0.000680 1,600.00 2,744.47 1,600.00
671.1504310 TV & Radio Expenses 6,600.00TOTAL 3,080.80 11,600.00
133Public Conveniences
Operating Statement/3. Our Community Budget2013
Actual YTD2013
Budget2012
Actual YTD2012
Public Amenities Expenses03450Building Maintenance 3,064.590530 28,770.00 10,962.93 0.00Operating Expenses 20,314.290565 74,580.00 71,569.36 60,000.00Depreciation 0.000680 5,000.00 0.00 4,700.00
23,378.8803450 Public Amenities Expenses 108,350.00TOTAL 82,532.29 64,700.00
Page 8 of 30Flinders LIVE Install DB
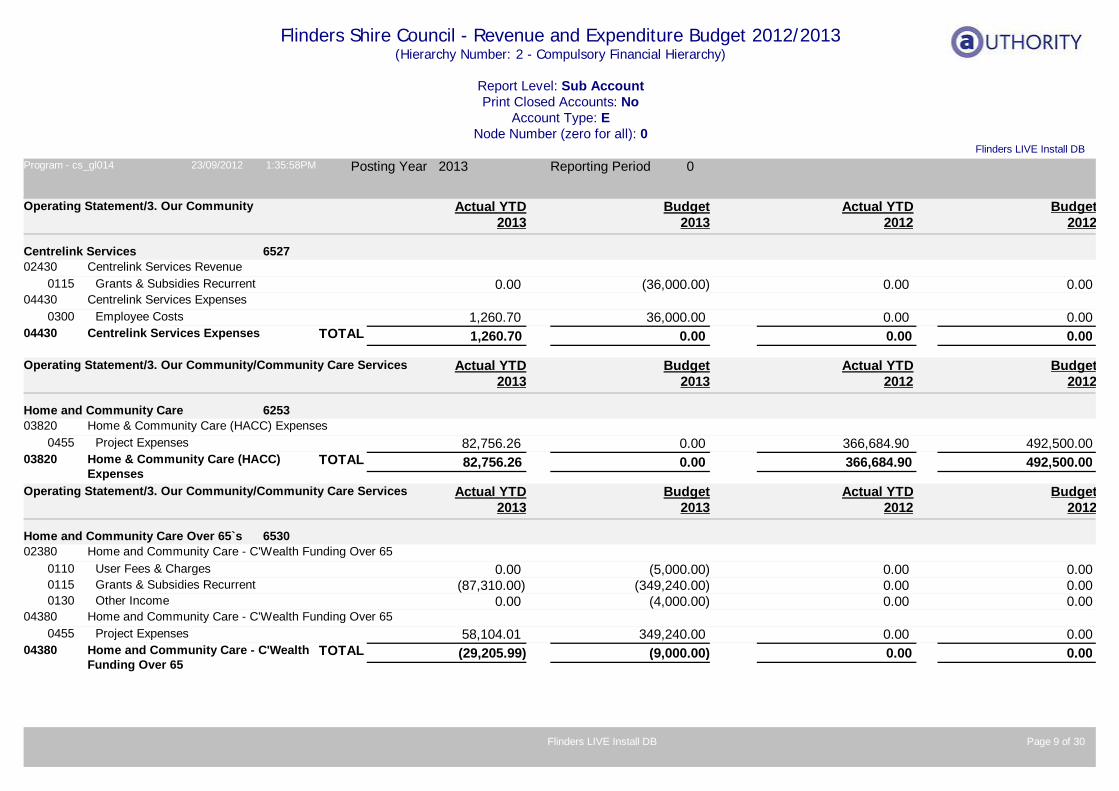
Flinders Shire Council - Revenue and Expenditure Budget 2012/2013(Hierarchy Number: 2 - Compulsory Financial Hierarchy)
Report Level: Sub AccountPrint Closed Accounts: No
Account Type: ENode Number (zero for all): 0
Flinders LIVE Install DBProgram - cs_gl014 23/09/2012 1:35:58PM Posting Year 2013 Reporting Period 0
6527Centrelink Services
Operating Statement/3. Our Community Budget2013
Actual YTD2013
Budget2012
Actual YTD2012
Centrelink Services Revenue02430Grants & Subsidies Recurrent 0.000115 )(36,000.00 0.00 0.00
Centrelink Services Expenses04430Employee Costs 1,260.700300 36,000.00 0.00 0.00
1,260.7004430 Centrelink Services Expenses 0.00TOTAL 0.00 0.00
6253Home and Community Care
Operating Statement/3. Our Community/Community Care Services Budget2013
Actual YTD2013
Budget2012
Actual YTD2012
Home & Community Care (HACC) Expenses03820Project Expenses 82,756.260455 0.00 366,684.90 492,500.00
82,756.2603820 Home & Community Care (HACC) Expenses
0.00TOTAL 366,684.90 492,500.00
6530Home and Community Care Over 65`s
Operating Statement/3. Our Community/Community Care Services Budget2013
Actual YTD2013
Budget2012
Actual YTD2012
Home and Community Care - C'Wealth Funding Over 6502380User Fees & Charges 0.000110 )(5,000.00 0.00 0.00Grants & Subsidies Recurrent )(87,310.000115 )(349,240.00 0.00 0.00Other Income 0.000130 )(4,000.00 0.00 0.00
Home and Community Care - C'Wealth Funding Over 6504380Project Expenses 58,104.010455 349,240.00 0.00 0.00
)(29,205.9904380 Home and Community Care - C'Wealth Funding Over 65
)(9,000.00TOTAL 0.00 0.00
Page 9 of 30Flinders LIVE Install DB
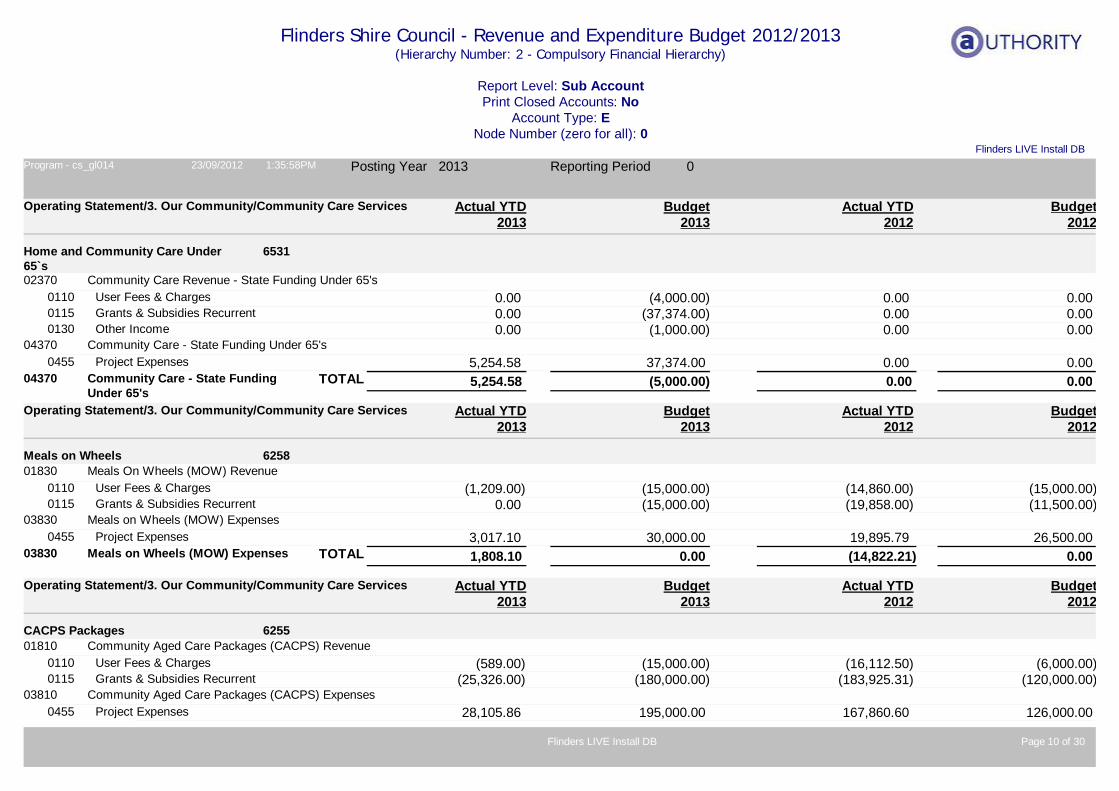
Flinders Shire Council - Revenue and Expenditure Budget 2012/2013(Hierarchy Number: 2 - Compulsory Financial Hierarchy)
Report Level: Sub AccountPrint Closed Accounts: No
Account Type: ENode Number (zero for all): 0
Flinders LIVE Install DBProgram - cs_gl014 23/09/2012 1:35:58PM Posting Year 2013 Reporting Period 0
6531Home and Community Care Under 65`s
Operating Statement/3. Our Community/Community Care Services Budget2013
Actual YTD2013
Budget2012
Actual YTD2012
Community Care Revenue - State Funding Under 65's02370User Fees & Charges 0.000110 )(4,000.00 0.00 0.00Grants & Subsidies Recurrent 0.000115 )(37,374.00 0.00 0.00Other Income 0.000130 )(1,000.00 0.00 0.00
Community Care - State Funding Under 65's04370Project Expenses 5,254.580455 37,374.00 0.00 0.00
5,254.5804370 Community Care - State Funding Under 65's
)(5,000.00TOTAL 0.00 0.00
6258Meals on Wheels
Operating Statement/3. Our Community/Community Care Services Budget2013
Actual YTD2013
Budget2012
Actual YTD2012
Meals On Wheels (MOW) Revenue01830User Fees & Charges )(1,209.000110 )(15,000.00 )(14,860.00 )(15,000.00Grants & Subsidies Recurrent 0.000115 )(15,000.00 )(19,858.00 )(11,500.00
Meals on Wheels (MOW) Expenses03830Project Expenses 3,017.100455 30,000.00 19,895.79 26,500.00
1,808.1003830 Meals on Wheels (MOW) Expenses 0.00TOTAL )(14,822.21 0.00
6255CACPS Packages
Operating Statement/3. Our Community/Community Care Services Budget2013
Actual YTD2013
Budget2012
Actual YTD2012
Community Aged Care Packages (CACPS) Revenue01810User Fees & Charges )(589.000110 )(15,000.00 )(16,112.50 )(6,000.00Grants & Subsidies Recurrent )(25,326.000115 )(180,000.00 )(183,925.31 )(120,000.00
Community Aged Care Packages (CACPS) Expenses03810Project Expenses 28,105.860455 195,000.00 167,860.60 126,000.00
Page 10 of 30Flinders LIVE Install DB
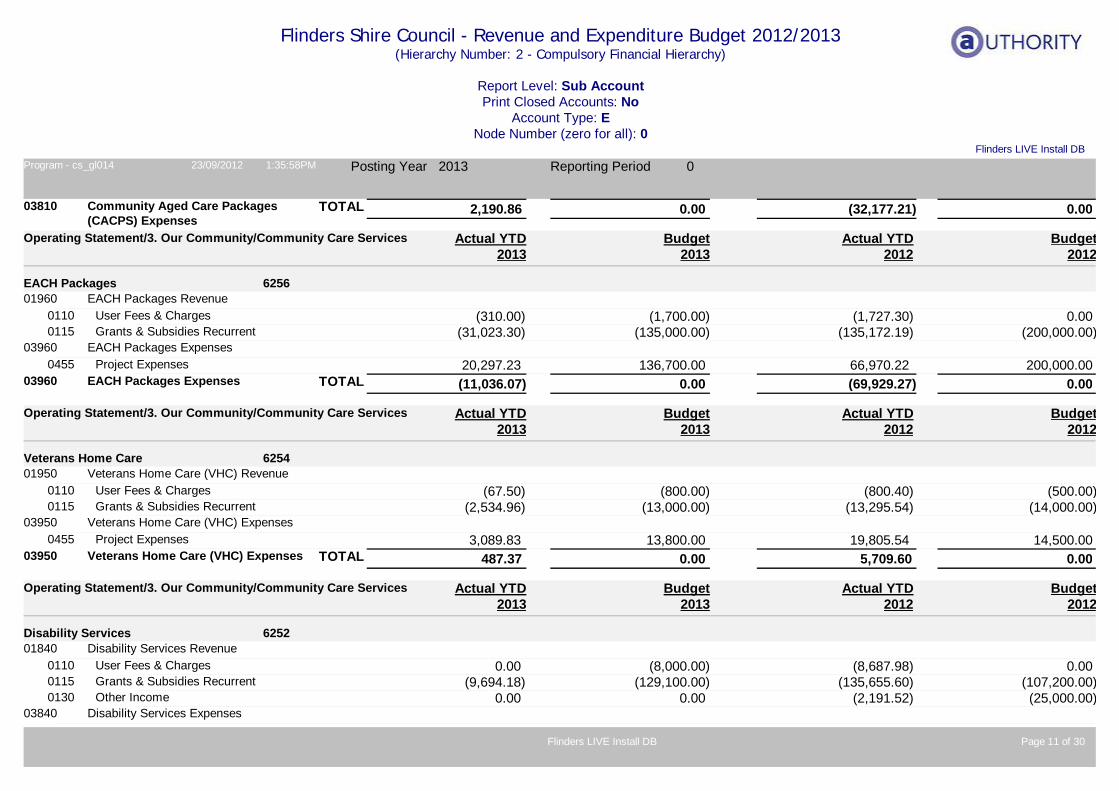
Flinders Shire Council - Revenue and Expenditure Budget 2012/2013(Hierarchy Number: 2 - Compulsory Financial Hierarchy)
Report Level: Sub AccountPrint Closed Accounts: No
Account Type: ENode Number (zero for all): 0
Flinders LIVE Install DBProgram - cs_gl014 23/09/2012 1:35:58PM Posting Year 2013 Reporting Period 0
2,190.8603810 Community Aged Care Packages (CACPS) Expenses
0.00TOTAL )(32,177.21 0.00
6256EACH Packages
Operating Statement/3. Our Community/Community Care Services Budget2013
Actual YTD2013
Budget2012
Actual YTD2012
EACH Packages Revenue01960User Fees & Charges )(310.000110 )(1,700.00 )(1,727.30 0.00Grants & Subsidies Recurrent )(31,023.300115 )(135,000.00 )(135,172.19 )(200,000.00
EACH Packages Expenses03960Project Expenses 20,297.230455 136,700.00 66,970.22 200,000.00
)(11,036.0703960 EACH Packages Expenses 0.00TOTAL )(69,929.27 0.00
6254Veterans Home Care
Operating Statement/3. Our Community/Community Care Services Budget2013
Actual YTD2013
Budget2012
Actual YTD2012
Veterans Home Care (VHC) Revenue01950User Fees & Charges )(67.500110 )(800.00 )(800.40 )(500.00Grants & Subsidies Recurrent )(2,534.960115 )(13,000.00 )(13,295.54 )(14,000.00
Veterans Home Care (VHC) Expenses03950Project Expenses 3,089.830455 13,800.00 19,805.54 14,500.00
487.3703950 Veterans Home Care (VHC) Expenses 0.00TOTAL 5,709.60 0.00
6252Disability Services
Operating Statement/3. Our Community/Community Care Services Budget2013
Actual YTD2013
Budget2012
Actual YTD2012
Disability Services Revenue01840User Fees & Charges 0.000110 )(8,000.00 )(8,687.98 0.00Grants & Subsidies Recurrent )(9,694.180115 )(129,100.00 )(135,655.60 )(107,200.00Other Income 0.000130 0.00 )(2,191.52 )(25,000.00
Disability Services Expenses03840
Page 11 of 30Flinders LIVE Install DB
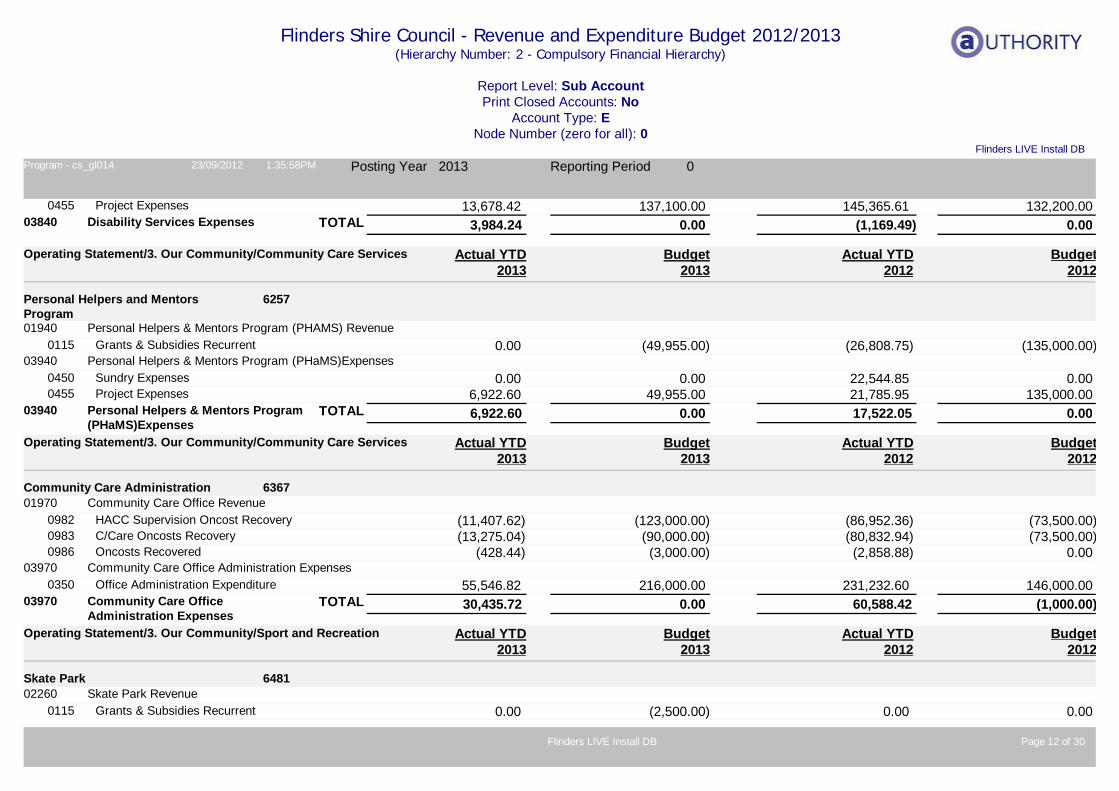
Flinders Shire Council - Revenue and Expenditure Budget 2012/2013(Hierarchy Number: 2 - Compulsory Financial Hierarchy)
Report Level: Sub AccountPrint Closed Accounts: No
Account Type: ENode Number (zero for all): 0
Flinders LIVE Install DBProgram - cs_gl014 23/09/2012 1:35:58PM Posting Year 2013 Reporting Period 0
Project Expenses 13,678.420455 137,100.00 145,365.61 132,200.003,984.2403840 Disability Services Expenses 0.00TOTAL )(1,169.49 0.00
6257Personal Helpers and Mentors Program
Operating Statement/3. Our Community/Community Care Services Budget2013
Actual YTD2013
Budget2012
Actual YTD2012
Personal Helpers & Mentors Program (PHAMS) Revenue01940Grants & Subsidies Recurrent 0.000115 )(49,955.00 )(26,808.75 )(135,000.00
Personal Helpers & Mentors Program (PHaMS)Expenses03940Sundry Expenses 0.000450 0.00 22,544.85 0.00Project Expenses 6,922.600455 49,955.00 21,785.95 135,000.00
6,922.6003940 Personal Helpers & Mentors Program (PHaMS)Expenses
0.00TOTAL 17,522.05 0.00
6367Community Care Administration
Operating Statement/3. Our Community/Community Care Services Budget2013
Actual YTD2013
Budget2012
Actual YTD2012
Community Care Office Revenue01970HACC Supervision Oncost Recovery )(11,407.620982 )(123,000.00 )(86,952.36 )(73,500.00C/Care Oncosts Recovery )(13,275.040983 )(90,000.00 )(80,832.94 )(73,500.00Oncosts Recovered )(428.440986 )(3,000.00 )(2,858.88 0.00
Community Care Office Administration Expenses03970Office Administration Expenditure 55,546.820350 216,000.00 231,232.60 146,000.00
30,435.7203970 Community Care Office Administration Expenses
0.00TOTAL 60,588.42 )(1,000.00
6481Skate Park
Operating Statement/3. Our Community/Sport and Recreation Budget2013
Actual YTD2013
Budget2012
Actual YTD2012
Skate Park Revenue02260Grants & Subsidies Recurrent 0.000115 )(2,500.00 0.00 0.00
Page 12 of 30Flinders LIVE Install DB

Flinders Shire Council - Revenue and Expenditure Budget 2012/2013(Hierarchy Number: 2 - Compulsory Financial Hierarchy)
Report Level: Sub AccountPrint Closed Accounts: No
Account Type: ENode Number (zero for all): 0
Flinders LIVE Install DBProgram - cs_gl014 23/09/2012 1:35:58PM Posting Year 2013 Reporting Period 0
Skate Park Expenses04260Building Maintenance 2,742.990530 4,000.00 1,070.25 7,000.00Depreciation 0.000680 8,000.00 8,213.73 8,000.00
2,742.9904260 Skate Park Expenses 9,500.00TOTAL 9,283.98 15,000.00
6482Sport and Recreation Officer
Operating Statement/3. Our Community/Sport and Recreation Budget2013
Actual YTD2013
Budget2012
Actual YTD2012
Sport & Recreation Officer Revenue02250Grants & Subsidies Recurrent )(27,149.090115 )(25,000.00 )(58,038.23 )(52,000.00Recoveries 0.000125 0.00 )(605.86 0.00
Sport & Recreation Officer Expenses04250Employee Costs 14,447.250300 50,000.00 63,836.26 92,682.00Operating Expenses 739.330565 1,818.00 13,958.83 1,818.00
)(11,962.5104250 Sport & Recreation Officer Expenses 26,818.00TOTAL 19,151.00 42,500.00
6483Racecourse
Operating Statement/3. Our Community/Sport and Recreation Budget2013
Actual YTD2013
Budget2012
Actual YTD2012
Racecourse Expenses04240General Maintenance 1,508.210500 8,650.00 17,555.20 11,000.00Building Maintenance 2,626.930530 13,800.00 3,165.15 16,600.00Operating Expenses 4,476.780565 5,000.00 2,699.98 10,000.00Depreciation 0.000680 10,000.00 6,240.24 10,354.00
8,611.9204240 Racecourse Expenses 37,450.00TOTAL 29,660.57 47,954.00
6484Showgrounds
Operating Statement/3. Our Community/Sport and Recreation Budget2013
Actual YTD2013
Budget2012
Actual YTD2012
Showgrounds Revenue02230
Page 13 of 30Flinders LIVE Install DB
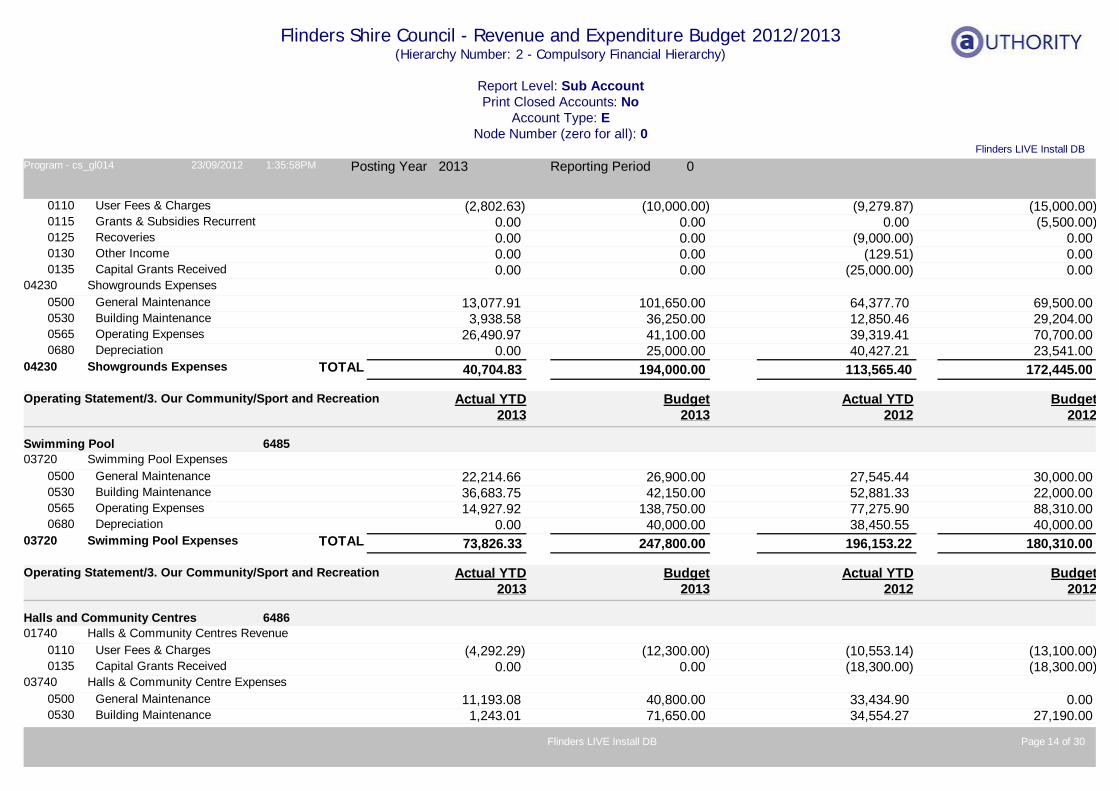
Flinders Shire Council - Revenue and Expenditure Budget 2012/2013(Hierarchy Number: 2 - Compulsory Financial Hierarchy)
Report Level: Sub AccountPrint Closed Accounts: No
Account Type: ENode Number (zero for all): 0
Flinders LIVE Install DBProgram - cs_gl014 23/09/2012 1:35:58PM Posting Year 2013 Reporting Period 0
User Fees & Charges )(2,802.630110 )(10,000.00 )(9,279.87 )(15,000.00Grants & Subsidies Recurrent 0.000115 0.00 0.00 )(5,500.00Recoveries 0.000125 0.00 )(9,000.00 0.00Other Income 0.000130 0.00 )(129.51 0.00Capital Grants Received 0.000135 0.00 )(25,000.00 0.00
Showgrounds Expenses04230General Maintenance 13,077.910500 101,650.00 64,377.70 69,500.00Building Maintenance 3,938.580530 36,250.00 12,850.46 29,204.00Operating Expenses 26,490.970565 41,100.00 39,319.41 70,700.00Depreciation 0.000680 25,000.00 40,427.21 23,541.00
40,704.8304230 Showgrounds Expenses 194,000.00TOTAL 113,565.40 172,445.00
6485Swimming Pool
Operating Statement/3. Our Community/Sport and Recreation Budget2013
Actual YTD2013
Budget2012
Actual YTD2012
Swimming Pool Expenses03720General Maintenance 22,214.660500 26,900.00 27,545.44 30,000.00Building Maintenance 36,683.750530 42,150.00 52,881.33 22,000.00Operating Expenses 14,927.920565 138,750.00 77,275.90 88,310.00Depreciation 0.000680 40,000.00 38,450.55 40,000.00
73,826.3303720 Swimming Pool Expenses 247,800.00TOTAL 196,153.22 180,310.00
6486Halls and Community Centres
Operating Statement/3. Our Community/Sport and Recreation Budget2013
Actual YTD2013
Budget2012
Actual YTD2012
Halls & Community Centres Revenue01740User Fees & Charges )(4,292.290110 )(12,300.00 )(10,553.14 )(13,100.00Capital Grants Received 0.000135 0.00 )(18,300.00 )(18,300.00
Halls & Community Centre Expenses03740General Maintenance 11,193.080500 40,800.00 33,434.90 0.00Building Maintenance 1,243.010530 71,650.00 34,554.27 27,190.00
Page 14 of 30Flinders LIVE Install DB
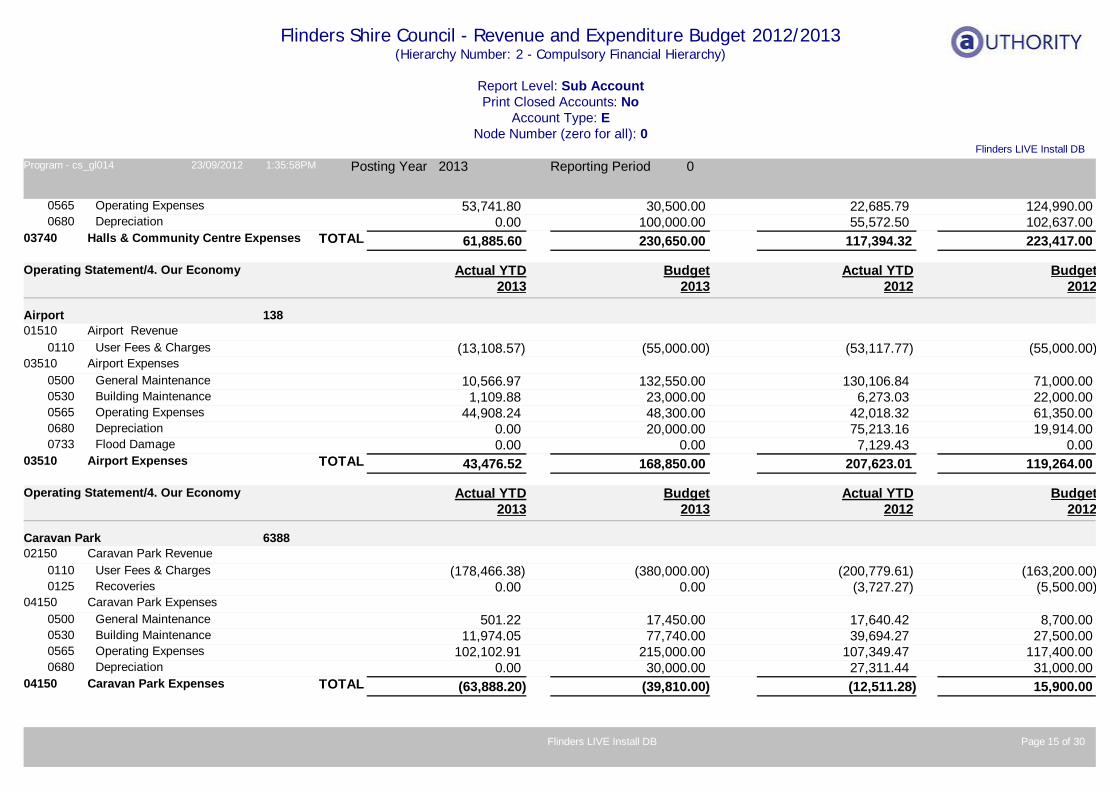
Flinders Shire Council - Revenue and Expenditure Budget 2012/2013(Hierarchy Number: 2 - Compulsory Financial Hierarchy)
Report Level: Sub AccountPrint Closed Accounts: No
Account Type: ENode Number (zero for all): 0
Flinders LIVE Install DBProgram - cs_gl014 23/09/2012 1:35:58PM Posting Year 2013 Reporting Period 0
Operating Expenses 53,741.800565 30,500.00 22,685.79 124,990.00Depreciation 0.000680 100,000.00 55,572.50 102,637.00
61,885.6003740 Halls & Community Centre Expenses 230,650.00TOTAL 117,394.32 223,417.00
138Airport
Operating Statement/4. Our Economy Budget2013
Actual YTD2013
Budget2012
Actual YTD2012
Airport Revenue01510User Fees & Charges )(13,108.570110 )(55,000.00 )(53,117.77 )(55,000.00
Airport Expenses03510General Maintenance 10,566.970500 132,550.00 130,106.84 71,000.00Building Maintenance 1,109.880530 23,000.00 6,273.03 22,000.00Operating Expenses 44,908.240565 48,300.00 42,018.32 61,350.00Depreciation 0.000680 20,000.00 75,213.16 19,914.00Flood Damage 0.000733 0.00 7,129.43 0.00
43,476.5203510 Airport Expenses 168,850.00TOTAL 207,623.01 119,264.00
6388Caravan Park
Operating Statement/4. Our Economy Budget2013
Actual YTD2013
Budget2012
Actual YTD2012
Caravan Park Revenue02150User Fees & Charges )(178,466.380110 )(380,000.00 )(200,779.61 )(163,200.00Recoveries 0.000125 0.00 )(3,727.27 )(5,500.00
Caravan Park Expenses04150General Maintenance 501.220500 17,450.00 17,640.42 8,700.00Building Maintenance 11,974.050530 77,740.00 39,694.27 27,500.00Operating Expenses 102,102.910565 215,000.00 107,349.47 117,400.00Depreciation 0.000680 30,000.00 27,311.44 31,000.00
)(63,888.2004150 Caravan Park Expenses )(39,810.00TOTAL )(12,511.28 15,900.00
Page 15 of 30Flinders LIVE Install DB
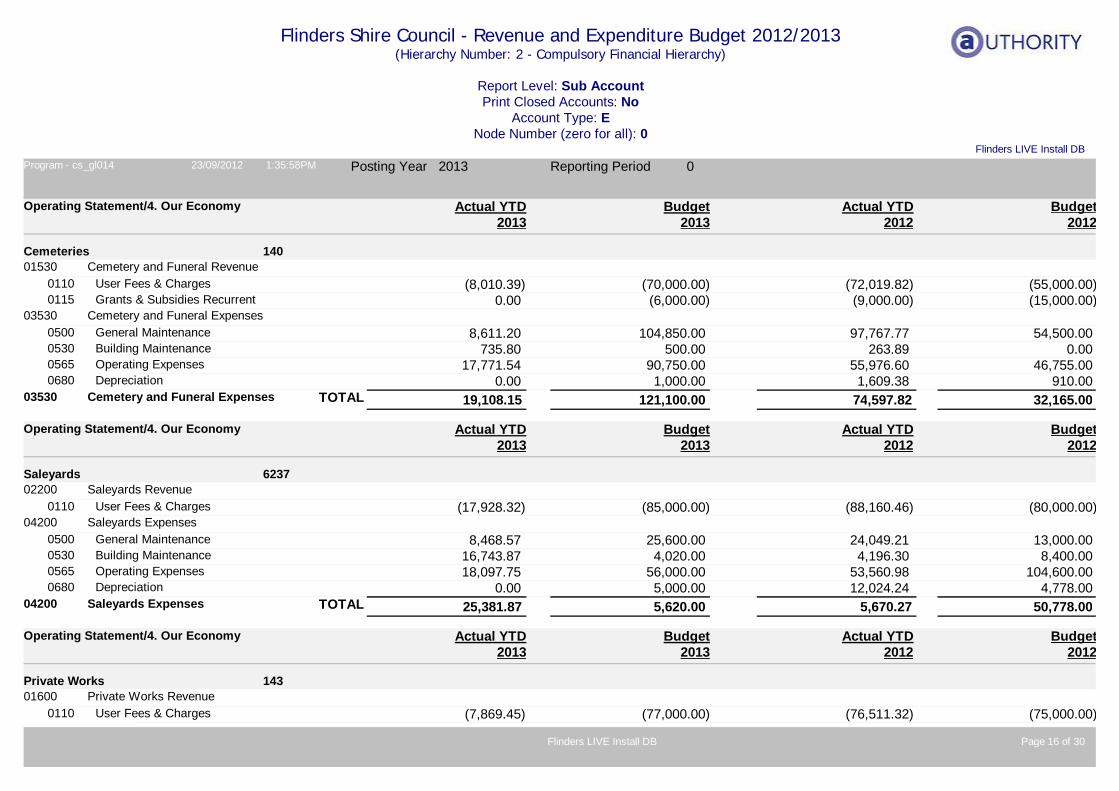
Flinders Shire Council - Revenue and Expenditure Budget 2012/2013(Hierarchy Number: 2 - Compulsory Financial Hierarchy)
Report Level: Sub AccountPrint Closed Accounts: No
Account Type: ENode Number (zero for all): 0
Flinders LIVE Install DBProgram - cs_gl014 23/09/2012 1:35:58PM Posting Year 2013 Reporting Period 0
140Cemeteries
Operating Statement/4. Our Economy Budget2013
Actual YTD2013
Budget2012
Actual YTD2012
Cemetery and Funeral Revenue01530User Fees & Charges )(8,010.390110 )(70,000.00 )(72,019.82 )(55,000.00Grants & Subsidies Recurrent 0.000115 )(6,000.00 )(9,000.00 )(15,000.00
Cemetery and Funeral Expenses03530General Maintenance 8,611.200500 104,850.00 97,767.77 54,500.00Building Maintenance 735.800530 500.00 263.89 0.00Operating Expenses 17,771.540565 90,750.00 55,976.60 46,755.00Depreciation 0.000680 1,000.00 1,609.38 910.00
19,108.1503530 Cemetery and Funeral Expenses 121,100.00TOTAL 74,597.82 32,165.00
6237Saleyards
Operating Statement/4. Our Economy Budget2013
Actual YTD2013
Budget2012
Actual YTD2012
Saleyards Revenue02200User Fees & Charges )(17,928.320110 )(85,000.00 )(88,160.46 )(80,000.00
Saleyards Expenses04200General Maintenance 8,468.570500 25,600.00 24,049.21 13,000.00Building Maintenance 16,743.870530 4,020.00 4,196.30 8,400.00Operating Expenses 18,097.750565 56,000.00 53,560.98 104,600.00Depreciation 0.000680 5,000.00 12,024.24 4,778.00
25,381.8704200 Saleyards Expenses 5,620.00TOTAL 5,670.27 50,778.00
143Private Works
Operating Statement/4. Our Economy Budget2013
Actual YTD2013
Budget2012
Actual YTD2012
Private Works Revenue01600User Fees & Charges )(7,869.450110 )(77,000.00 )(76,511.32 )(75,000.00
Page 16 of 30Flinders LIVE Install DB
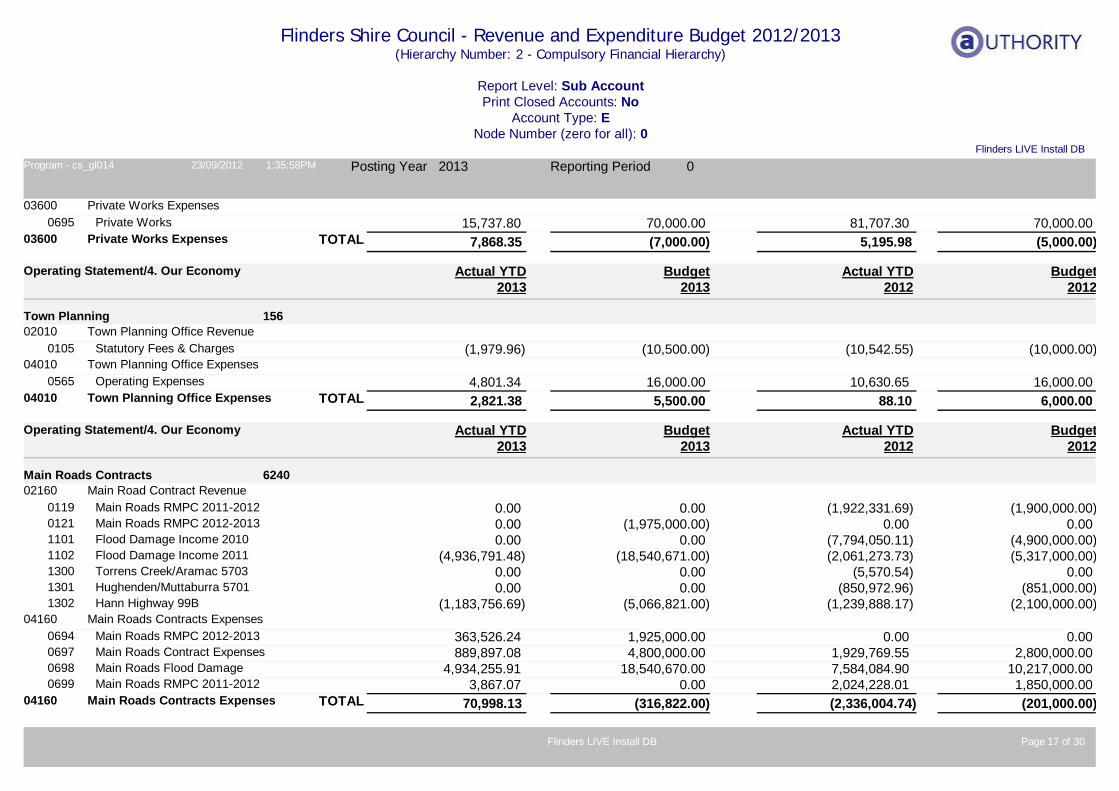
Flinders Shire Council - Revenue and Expenditure Budget 2012/2013(Hierarchy Number: 2 - Compulsory Financial Hierarchy)
Report Level: Sub AccountPrint Closed Accounts: No
Account Type: ENode Number (zero for all): 0
Flinders LIVE Install DBProgram - cs_gl014 23/09/2012 1:35:58PM Posting Year 2013 Reporting Period 0
Private Works Expenses03600Private Works 15,737.800695 70,000.00 81,707.30 70,000.00
7,868.3503600 Private Works Expenses )(7,000.00TOTAL 5,195.98 )(5,000.00
156Town Planning
Operating Statement/4. Our Economy Budget2013
Actual YTD2013
Budget2012
Actual YTD2012
Town Planning Office Revenue02010Statutory Fees & Charges )(1,979.960105 )(10,500.00 )(10,542.55 )(10,000.00
Town Planning Office Expenses04010Operating Expenses 4,801.340565 16,000.00 10,630.65 16,000.00
2,821.3804010 Town Planning Office Expenses 5,500.00TOTAL 88.10 6,000.00
6240Main Roads Contracts
Operating Statement/4. Our Economy Budget2013
Actual YTD2013
Budget2012
Actual YTD2012
Main Road Contract Revenue02160Main Roads RMPC 2011-2012 0.000119 0.00 )(1,922,331.69 )(1,900,000.00Main Roads RMPC 2012-2013 0.000121 )(1,975,000.00 0.00 0.00Flood Damage Income 2010 0.001101 0.00 )(7,794,050.11 )(4,900,000.00Flood Damage Income 2011 )(4,936,791.481102 )(18,540,671.00 )(2,061,273.73 )(5,317,000.00Torrens Creek/Aramac 5703 0.001300 0.00 )(5,570.54 0.00Hughenden/Muttaburra 5701 0.001301 0.00 )(850,972.96 )(851,000.00Hann Highway 99B )(1,183,756.691302 )(5,066,821.00 )(1,239,888.17 )(2,100,000.00
Main Roads Contracts Expenses04160Main Roads RMPC 2012-2013 363,526.240694 1,925,000.00 0.00 0.00Main Roads Contract Expenses 889,897.080697 4,800,000.00 1,929,769.55 2,800,000.00Main Roads Flood Damage 4,934,255.910698 18,540,670.00 7,584,084.90 10,217,000.00Main Roads RMPC 2011-2012 3,867.070699 0.00 2,024,228.01 1,850,000.00
70,998.1304160 Main Roads Contracts Expenses )(316,822.00TOTAL )(2,336,004.74 )(201,000.00
Page 17 of 30Flinders LIVE Install DB
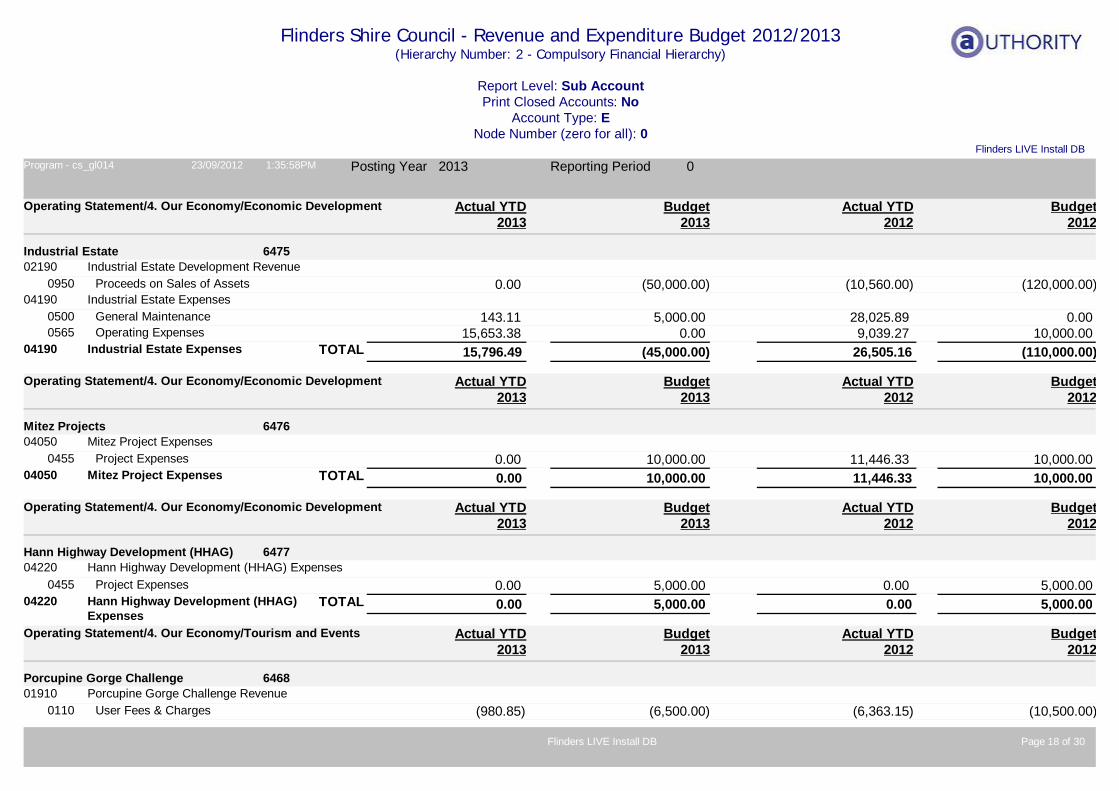
Flinders Shire Council - Revenue and Expenditure Budget 2012/2013(Hierarchy Number: 2 - Compulsory Financial Hierarchy)
Report Level: Sub AccountPrint Closed Accounts: No
Account Type: ENode Number (zero for all): 0
Flinders LIVE Install DBProgram - cs_gl014 23/09/2012 1:35:58PM Posting Year 2013 Reporting Period 0
6475Industrial Estate
Operating Statement/4. Our Economy/Economic Development Budget2013
Actual YTD2013
Budget2012
Actual YTD2012
Industrial Estate Development Revenue02190Proceeds on Sales of Assets 0.000950 )(50,000.00 )(10,560.00 )(120,000.00
Industrial Estate Expenses04190General Maintenance 143.110500 5,000.00 28,025.89 0.00Operating Expenses 15,653.380565 0.00 9,039.27 10,000.00
15,796.4904190 Industrial Estate Expenses )(45,000.00TOTAL 26,505.16 )(110,000.00
6476Mitez Projects
Operating Statement/4. Our Economy/Economic Development Budget2013
Actual YTD2013
Budget2012
Actual YTD2012
Mitez Project Expenses04050Project Expenses 0.000455 10,000.00 11,446.33 10,000.00
0.0004050 Mitez Project Expenses 10,000.00TOTAL 11,446.33 10,000.00
6477Hann Highway Development (HHAG)
Operating Statement/4. Our Economy/Economic Development Budget2013
Actual YTD2013
Budget2012
Actual YTD2012
Hann Highway Development (HHAG) Expenses04220Project Expenses 0.000455 5,000.00 0.00 5,000.00
0.0004220 Hann Highway Development (HHAG) Expenses
5,000.00TOTAL 0.00 5,000.00
6468Porcupine Gorge Challenge
Operating Statement/4. Our Economy/Tourism and Events Budget2013
Actual YTD2013
Budget2012
Actual YTD2012
Porcupine Gorge Challenge Revenue01910User Fees & Charges )(980.850110 )(6,500.00 )(6,363.15 )(10,500.00
Page 18 of 30Flinders LIVE Install DB
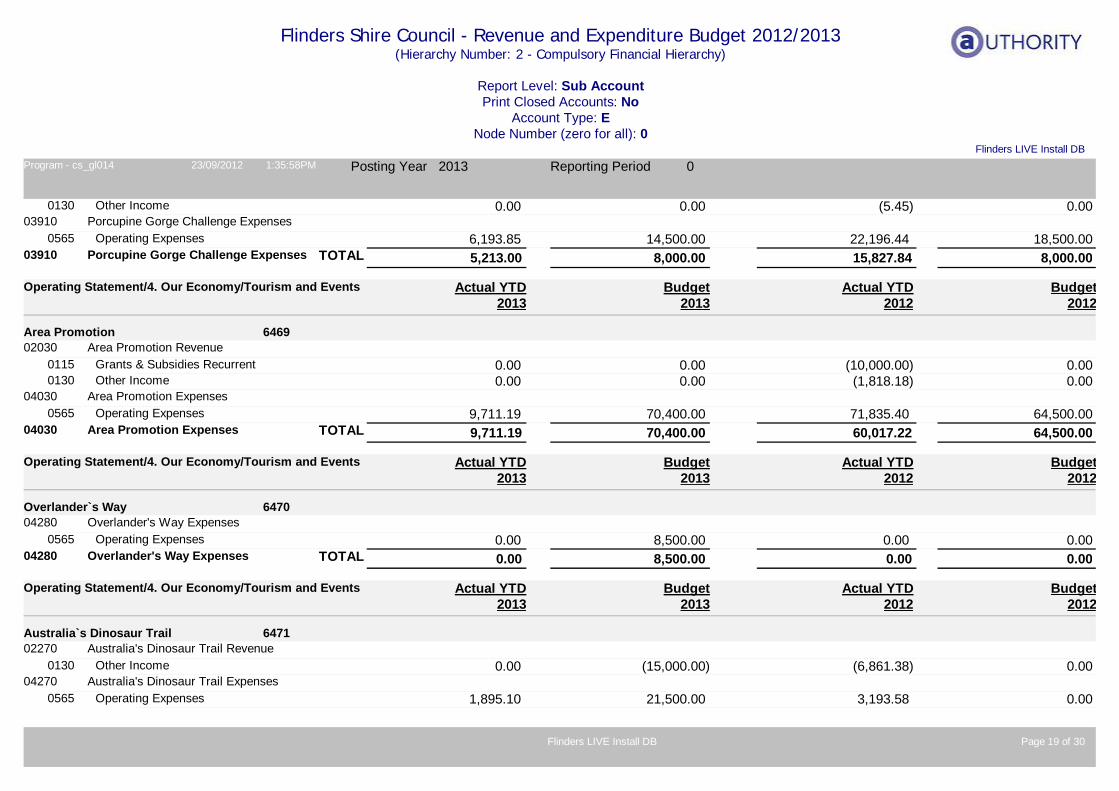
Flinders Shire Council - Revenue and Expenditure Budget 2012/2013(Hierarchy Number: 2 - Compulsory Financial Hierarchy)
Report Level: Sub AccountPrint Closed Accounts: No
Account Type: ENode Number (zero for all): 0
Flinders LIVE Install DBProgram - cs_gl014 23/09/2012 1:35:58PM Posting Year 2013 Reporting Period 0
Other Income 0.000130 0.00 )(5.45 0.00Porcupine Gorge Challenge Expenses03910
Operating Expenses 6,193.850565 14,500.00 22,196.44 18,500.005,213.0003910 Porcupine Gorge Challenge Expenses 8,000.00TOTAL 15,827.84 8,000.00
6469Area Promotion
Operating Statement/4. Our Economy/Tourism and Events Budget2013
Actual YTD2013
Budget2012
Actual YTD2012
Area Promotion Revenue02030Grants & Subsidies Recurrent 0.000115 0.00 )(10,000.00 0.00Other Income 0.000130 0.00 )(1,818.18 0.00
Area Promotion Expenses04030Operating Expenses 9,711.190565 70,400.00 71,835.40 64,500.00
9,711.1904030 Area Promotion Expenses 70,400.00TOTAL 60,017.22 64,500.00
6470Overlander`s Way
Operating Statement/4. Our Economy/Tourism and Events Budget2013
Actual YTD2013
Budget2012
Actual YTD2012
Overlander's Way Expenses04280Operating Expenses 0.000565 8,500.00 0.00 0.00
0.0004280 Overlander's Way Expenses 8,500.00TOTAL 0.00 0.00
6471Australia`s Dinosaur Trail
Operating Statement/4. Our Economy/Tourism and Events Budget2013
Actual YTD2013
Budget2012
Actual YTD2012
Australia's Dinosaur Trail Revenue02270Other Income 0.000130 )(15,000.00 )(6,861.38 0.00
Australia's Dinosaur Trail Expenses04270Operating Expenses 1,895.100565 21,500.00 3,193.58 0.00
Page 19 of 30Flinders LIVE Install DB
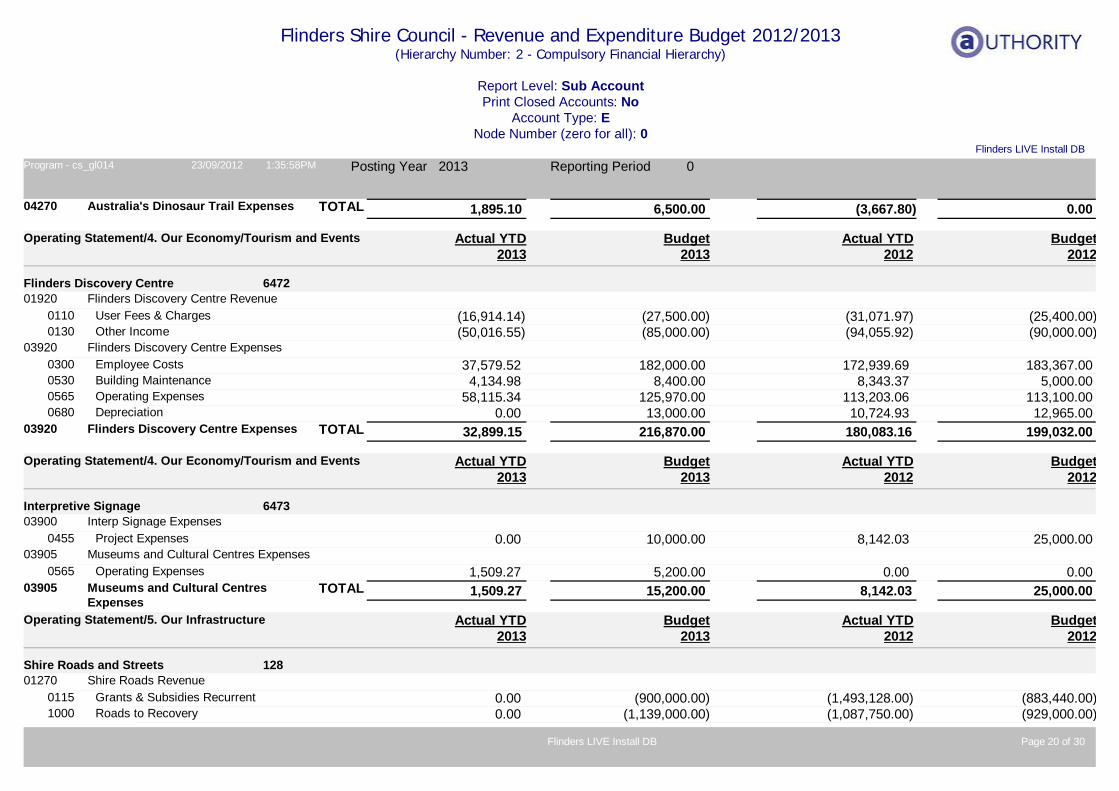
Flinders Shire Council - Revenue and Expenditure Budget 2012/2013(Hierarchy Number: 2 - Compulsory Financial Hierarchy)
Report Level: Sub AccountPrint Closed Accounts: No
Account Type: ENode Number (zero for all): 0
Flinders LIVE Install DBProgram - cs_gl014 23/09/2012 1:35:58PM Posting Year 2013 Reporting Period 0
1,895.1004270 Australia's Dinosaur Trail Expenses 6,500.00TOTAL )(3,667.80 0.00
6472Flinders Discovery Centre
Operating Statement/4. Our Economy/Tourism and Events Budget2013
Actual YTD2013
Budget2012
Actual YTD2012
Flinders Discovery Centre Revenue01920User Fees & Charges )(16,914.140110 )(27,500.00 )(31,071.97 )(25,400.00Other Income )(50,016.550130 )(85,000.00 )(94,055.92 )(90,000.00
Flinders Discovery Centre Expenses03920Employee Costs 37,579.520300 182,000.00 172,939.69 183,367.00Building Maintenance 4,134.980530 8,400.00 8,343.37 5,000.00Operating Expenses 58,115.340565 125,970.00 113,203.06 113,100.00Depreciation 0.000680 13,000.00 10,724.93 12,965.00
32,899.1503920 Flinders Discovery Centre Expenses 216,870.00TOTAL 180,083.16 199,032.00
6473Interpretive Signage
Operating Statement/4. Our Economy/Tourism and Events Budget2013
Actual YTD2013
Budget2012
Actual YTD2012
Interp Signage Expenses03900Project Expenses 0.000455 10,000.00 8,142.03 25,000.00
Museums and Cultural Centres Expenses03905Operating Expenses 1,509.270565 5,200.00 0.00 0.00
1,509.2703905 Museums and Cultural Centres Expenses
15,200.00TOTAL 8,142.03 25,000.00
128Shire Roads and Streets
Operating Statement/5. Our Infrastructure Budget2013
Actual YTD2013
Budget2012
Actual YTD2012
Shire Roads Revenue01270Grants & Subsidies Recurrent 0.000115 )(900,000.00 )(1,493,128.00 )(883,440.00Roads to Recovery 0.001000 )(1,139,000.00 )(1,087,750.00 )(929,000.00
Page 20 of 30Flinders LIVE Install DB
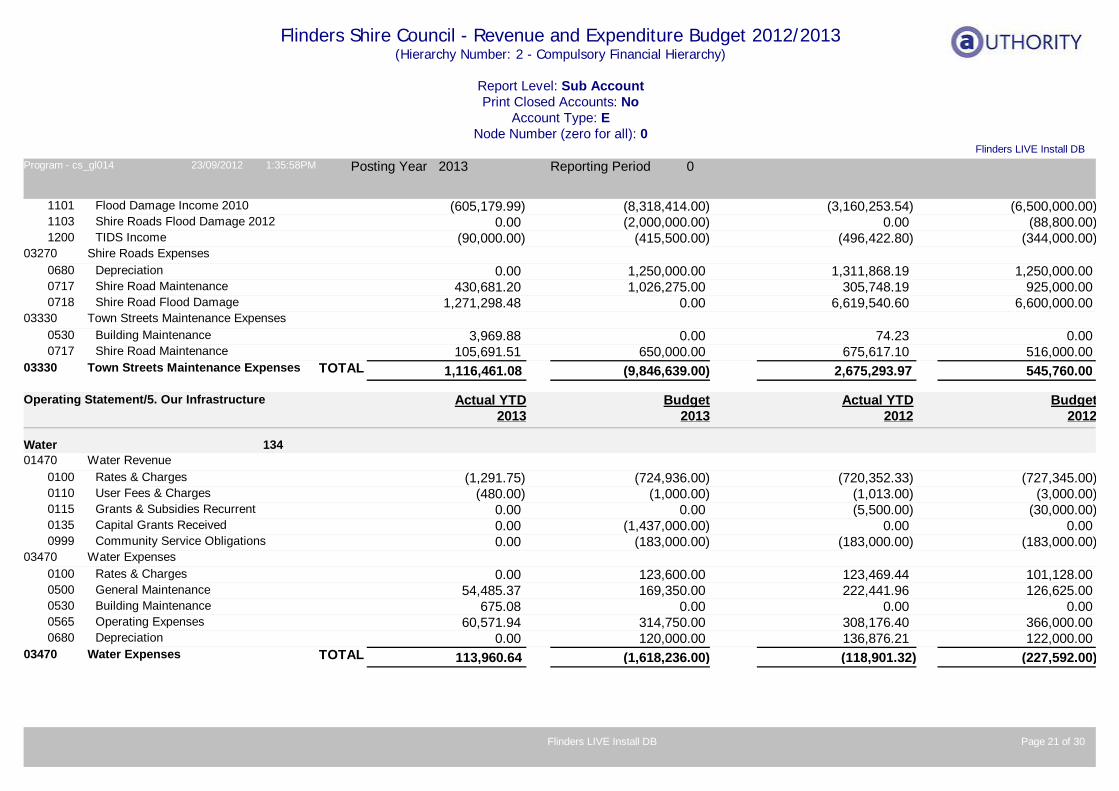
Flinders Shire Council - Revenue and Expenditure Budget 2012/2013(Hierarchy Number: 2 - Compulsory Financial Hierarchy)
Report Level: Sub AccountPrint Closed Accounts: No
Account Type: ENode Number (zero for all): 0
Flinders LIVE Install DBProgram - cs_gl014 23/09/2012 1:35:58PM Posting Year 2013 Reporting Period 0
Flood Damage Income 2010 )(605,179.991101 )(8,318,414.00 )(3,160,253.54 )(6,500,000.00Shire Roads Flood Damage 2012 0.001103 )(2,000,000.00 0.00 )(88,800.00TIDS Income )(90,000.001200 )(415,500.00 )(496,422.80 )(344,000.00
Shire Roads Expenses03270Depreciation 0.000680 1,250,000.00 1,311,868.19 1,250,000.00Shire Road Maintenance 430,681.200717 1,026,275.00 305,748.19 925,000.00Shire Road Flood Damage 1,271,298.480718 0.00 6,619,540.60 6,600,000.00
Town Streets Maintenance Expenses03330Building Maintenance 3,969.880530 0.00 74.23 0.00Shire Road Maintenance 105,691.510717 650,000.00 675,617.10 516,000.00
1,116,461.0803330 Town Streets Maintenance Expenses )(9,846,639.00TOTAL 2,675,293.97 545,760.00
134Water
Operating Statement/5. Our Infrastructure Budget2013
Actual YTD2013
Budget2012
Actual YTD2012
Water Revenue01470Rates & Charges )(1,291.750100 )(724,936.00 )(720,352.33 )(727,345.00User Fees & Charges )(480.000110 )(1,000.00 )(1,013.00 )(3,000.00Grants & Subsidies Recurrent 0.000115 0.00 )(5,500.00 )(30,000.00Capital Grants Received 0.000135 )(1,437,000.00 0.00 0.00Community Service Obligations 0.000999 )(183,000.00 )(183,000.00 )(183,000.00
Water Expenses03470Rates & Charges 0.000100 123,600.00 123,469.44 101,128.00General Maintenance 54,485.370500 169,350.00 222,441.96 126,625.00Building Maintenance 675.080530 0.00 0.00 0.00Operating Expenses 60,571.940565 314,750.00 308,176.40 366,000.00Depreciation 0.000680 120,000.00 136,876.21 122,000.00
113,960.6403470 Water Expenses )(1,618,236.00TOTAL )(118,901.32 )(227,592.00
Page 21 of 30Flinders LIVE Install DB
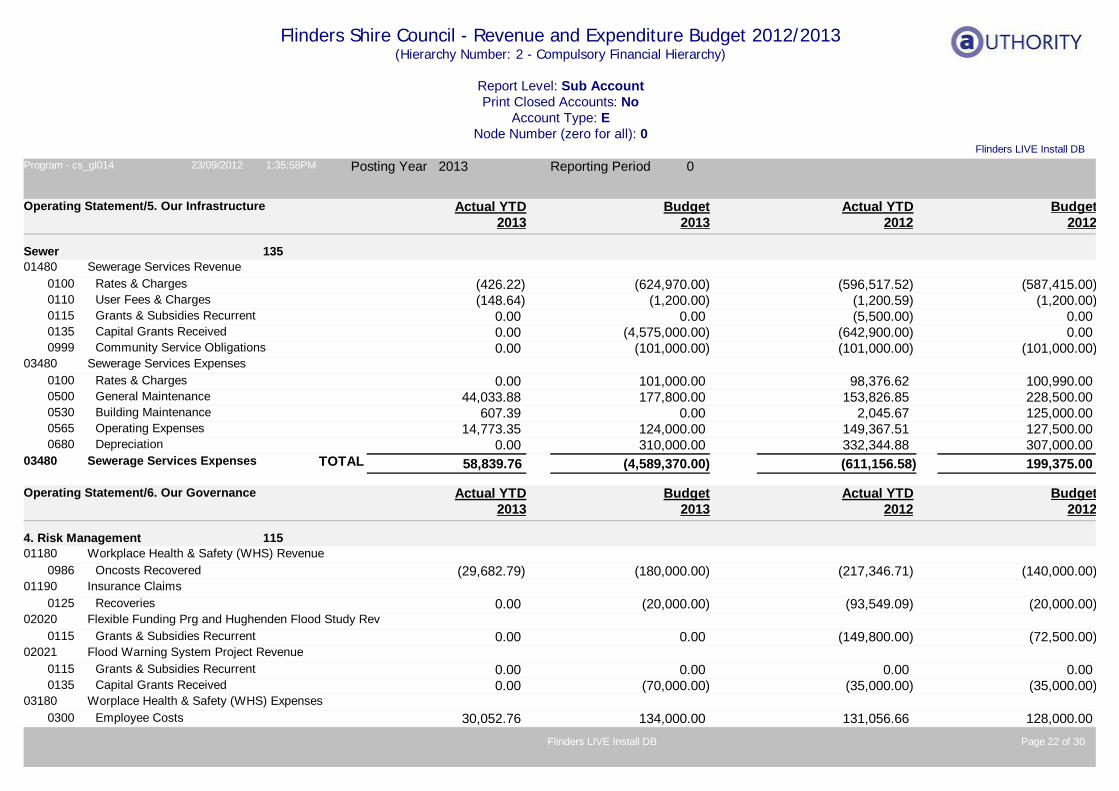
Flinders Shire Council - Revenue and Expenditure Budget 2012/2013(Hierarchy Number: 2 - Compulsory Financial Hierarchy)
Report Level: Sub AccountPrint Closed Accounts: No
Account Type: ENode Number (zero for all): 0
Flinders LIVE Install DBProgram - cs_gl014 23/09/2012 1:35:58PM Posting Year 2013 Reporting Period 0
135Sewer
Operating Statement/5. Our Infrastructure Budget2013
Actual YTD2013
Budget2012
Actual YTD2012
Sewerage Services Revenue01480Rates & Charges )(426.220100 )(624,970.00 )(596,517.52 )(587,415.00User Fees & Charges )(148.640110 )(1,200.00 )(1,200.59 )(1,200.00Grants & Subsidies Recurrent 0.000115 0.00 )(5,500.00 0.00Capital Grants Received 0.000135 )(4,575,000.00 )(642,900.00 0.00Community Service Obligations 0.000999 )(101,000.00 )(101,000.00 )(101,000.00
Sewerage Services Expenses03480Rates & Charges 0.000100 101,000.00 98,376.62 100,990.00General Maintenance 44,033.880500 177,800.00 153,826.85 228,500.00Building Maintenance 607.390530 0.00 2,045.67 125,000.00Operating Expenses 14,773.350565 124,000.00 149,367.51 127,500.00Depreciation 0.000680 310,000.00 332,344.88 307,000.00
58,839.7603480 Sewerage Services Expenses )(4,589,370.00TOTAL )(611,156.58 199,375.00
1154. Risk Management
Operating Statement/6. Our Governance Budget2013
Actual YTD2013
Budget2012
Actual YTD2012
Workplace Health & Safety (WHS) Revenue01180Oncosts Recovered )(29,682.790986 )(180,000.00 )(217,346.71 )(140,000.00
Insurance Claims01190Recoveries 0.000125 )(20,000.00 )(93,549.09 )(20,000.00
Flexible Funding Prg and Hughenden Flood Study Rev02020Grants & Subsidies Recurrent 0.000115 0.00 )(149,800.00 )(72,500.00
Flood Warning System Project Revenue02021Grants & Subsidies Recurrent 0.000115 0.00 0.00 0.00Capital Grants Received 0.000135 )(70,000.00 )(35,000.00 )(35,000.00
Worplace Health & Safety (WHS) Expenses03180Employee Costs 30,052.760300 134,000.00 131,056.66 128,000.00
Page 22 of 30Flinders LIVE Install DB
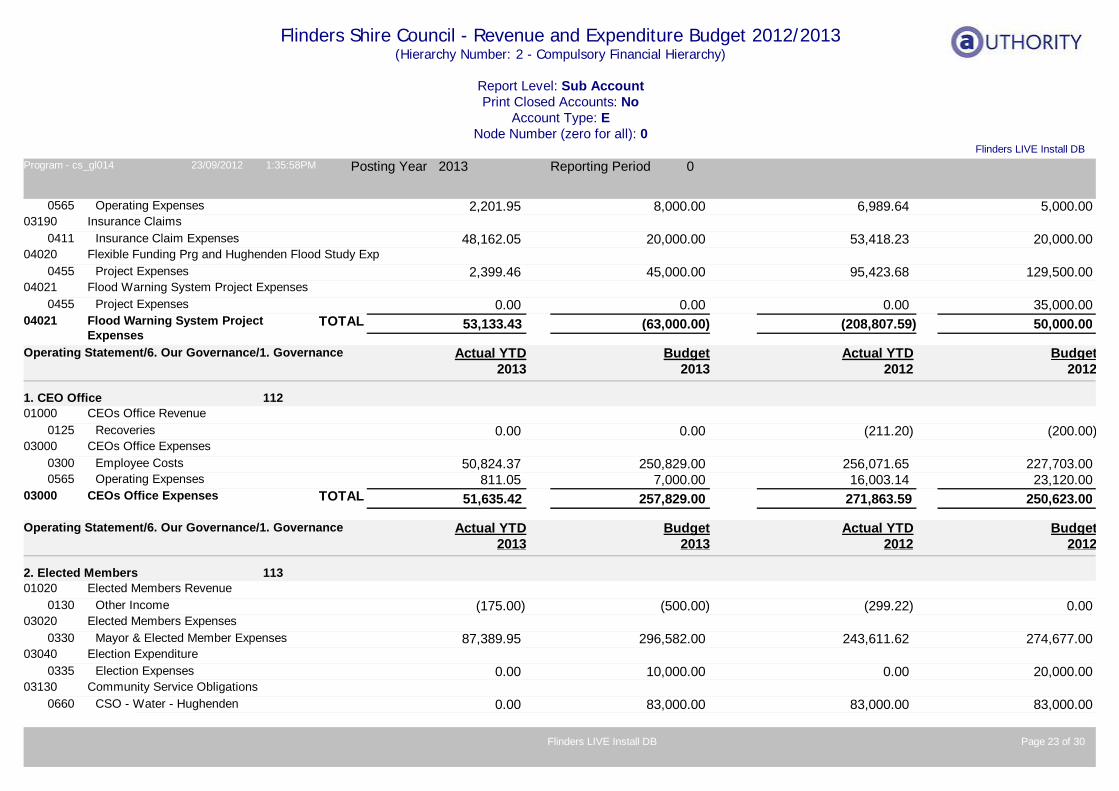
Flinders Shire Council - Revenue and Expenditure Budget 2012/2013(Hierarchy Number: 2 - Compulsory Financial Hierarchy)
Report Level: Sub AccountPrint Closed Accounts: No
Account Type: ENode Number (zero for all): 0
Flinders LIVE Install DBProgram - cs_gl014 23/09/2012 1:35:58PM Posting Year 2013 Reporting Period 0
Operating Expenses 2,201.950565 8,000.00 6,989.64 5,000.00Insurance Claims03190
Insurance Claim Expenses 48,162.050411 20,000.00 53,418.23 20,000.00Flexible Funding Prg and Hughenden Flood Study Exp04020
Project Expenses 2,399.460455 45,000.00 95,423.68 129,500.00Flood Warning System Project Expenses04021
Project Expenses 0.000455 0.00 0.00 35,000.0053,133.4304021 Flood Warning System Project
Expenses)(63,000.00TOTAL )(208,807.59 50,000.00
1121. CEO Office
Operating Statement/6. Our Governance/1. Governance Budget2013
Actual YTD2013
Budget2012
Actual YTD2012
CEOs Office Revenue01000Recoveries 0.000125 0.00 )(211.20 )(200.00
CEOs Office Expenses03000Employee Costs 50,824.370300 250,829.00 256,071.65 227,703.00Operating Expenses 811.050565 7,000.00 16,003.14 23,120.00
51,635.4203000 CEOs Office Expenses 257,829.00TOTAL 271,863.59 250,623.00
1132. Elected Members
Operating Statement/6. Our Governance/1. Governance Budget2013
Actual YTD2013
Budget2012
Actual YTD2012
Elected Members Revenue01020Other Income )(175.000130 )(500.00 )(299.22 0.00
Elected Members Expenses03020Mayor & Elected Member Expenses 87,389.950330 296,582.00 243,611.62 274,677.00
Election Expenditure03040Election Expenses 0.000335 10,000.00 0.00 20,000.00
Community Service Obligations03130CSO - Water - Hughenden 0.000660 83,000.00 83,000.00 83,000.00
Page 23 of 30Flinders LIVE Install DB
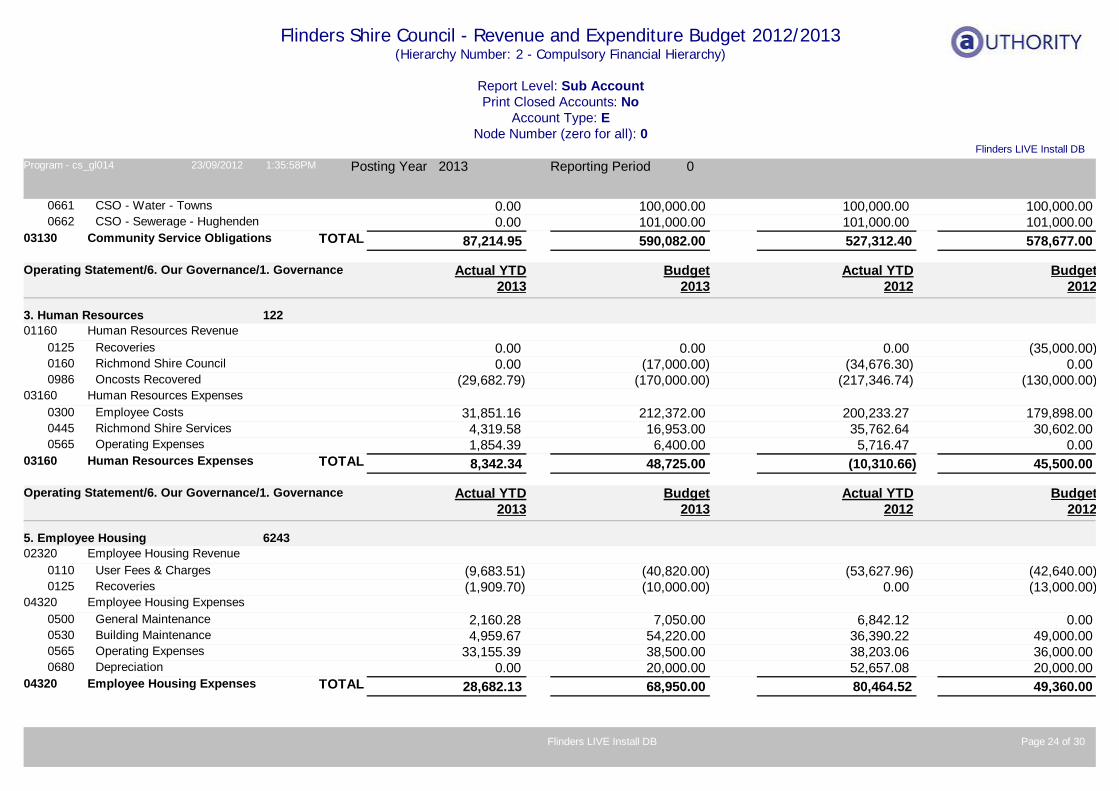
Flinders Shire Council - Revenue and Expenditure Budget 2012/2013(Hierarchy Number: 2 - Compulsory Financial Hierarchy)
Report Level: Sub AccountPrint Closed Accounts: No
Account Type: ENode Number (zero for all): 0
Flinders LIVE Install DBProgram - cs_gl014 23/09/2012 1:35:58PM Posting Year 2013 Reporting Period 0
CSO - Water - Towns 0.000661 100,000.00 100,000.00 100,000.00CSO - Sewerage - Hughenden 0.000662 101,000.00 101,000.00 101,000.00
87,214.9503130 Community Service Obligations 590,082.00TOTAL 527,312.40 578,677.00
1223. Human Resources
Operating Statement/6. Our Governance/1. Governance Budget2013
Actual YTD2013
Budget2012
Actual YTD2012
Human Resources Revenue01160Recoveries 0.000125 0.00 0.00 )(35,000.00Richmond Shire Council 0.000160 )(17,000.00 )(34,676.30 0.00Oncosts Recovered )(29,682.790986 )(170,000.00 )(217,346.74 )(130,000.00
Human Resources Expenses03160Employee Costs 31,851.160300 212,372.00 200,233.27 179,898.00Richmond Shire Services 4,319.580445 16,953.00 35,762.64 30,602.00Operating Expenses 1,854.390565 6,400.00 5,716.47 0.00
8,342.3403160 Human Resources Expenses 48,725.00TOTAL )(10,310.66 45,500.00
62435. Employee Housing
Operating Statement/6. Our Governance/1. Governance Budget2013
Actual YTD2013
Budget2012
Actual YTD2012
Employee Housing Revenue02320User Fees & Charges )(9,683.510110 )(40,820.00 )(53,627.96 )(42,640.00Recoveries )(1,909.700125 )(10,000.00 0.00 )(13,000.00
Employee Housing Expenses04320General Maintenance 2,160.280500 7,050.00 6,842.12 0.00Building Maintenance 4,959.670530 54,220.00 36,390.22 49,000.00Operating Expenses 33,155.390565 38,500.00 38,203.06 36,000.00Depreciation 0.000680 20,000.00 52,657.08 20,000.00
28,682.1304320 Employee Housing Expenses 68,950.00TOTAL 80,464.52 49,360.00
Page 24 of 30Flinders LIVE Install DB
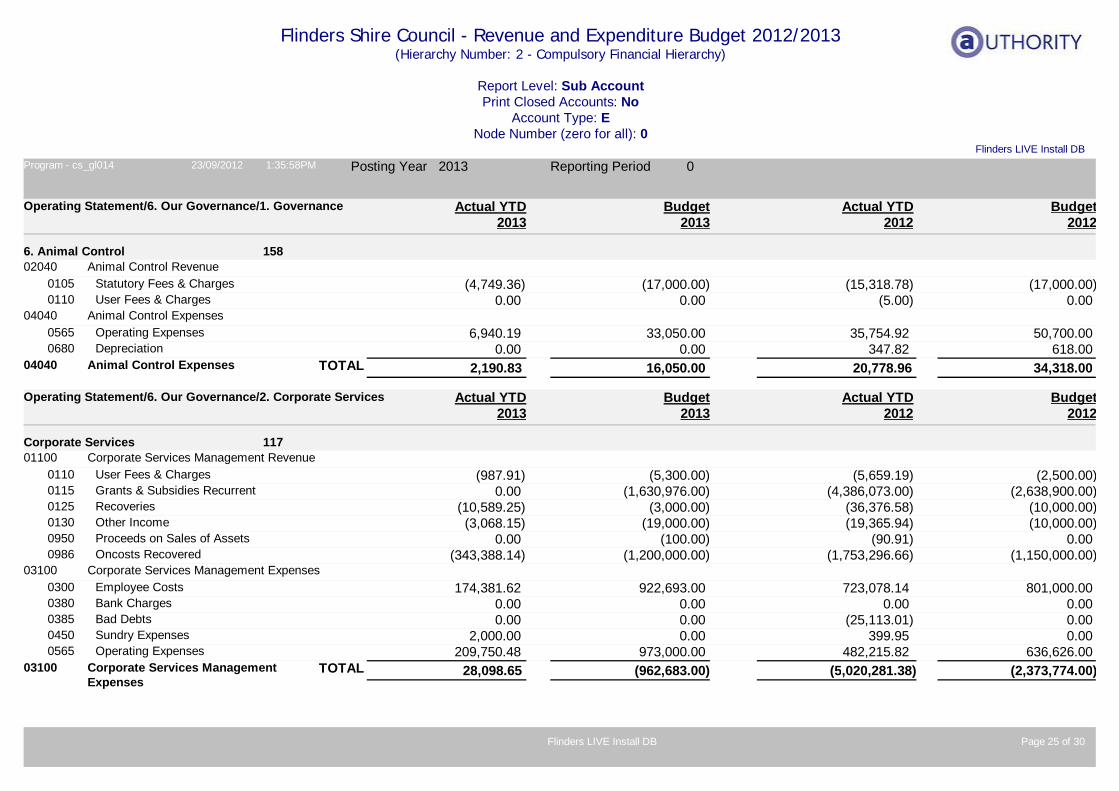
Flinders Shire Council - Revenue and Expenditure Budget 2012/2013(Hierarchy Number: 2 - Compulsory Financial Hierarchy)
Report Level: Sub AccountPrint Closed Accounts: No
Account Type: ENode Number (zero for all): 0
Flinders LIVE Install DBProgram - cs_gl014 23/09/2012 1:35:58PM Posting Year 2013 Reporting Period 0
1586. Animal Control
Operating Statement/6. Our Governance/1. Governance Budget2013
Actual YTD2013
Budget2012
Actual YTD2012
Animal Control Revenue02040Statutory Fees & Charges )(4,749.360105 )(17,000.00 )(15,318.78 )(17,000.00User Fees & Charges 0.000110 0.00 )(5.00 0.00
Animal Control Expenses04040Operating Expenses 6,940.190565 33,050.00 35,754.92 50,700.00Depreciation 0.000680 0.00 347.82 618.00
2,190.8304040 Animal Control Expenses 16,050.00TOTAL 20,778.96 34,318.00
117Corporate Services
Operating Statement/6. Our Governance/2. Corporate Services Budget2013
Actual YTD2013
Budget2012
Actual YTD2012
Corporate Services Management Revenue01100User Fees & Charges )(987.910110 )(5,300.00 )(5,659.19 )(2,500.00Grants & Subsidies Recurrent 0.000115 )(1,630,976.00 )(4,386,073.00 )(2,638,900.00Recoveries )(10,589.250125 )(3,000.00 )(36,376.58 )(10,000.00Other Income )(3,068.150130 )(19,000.00 )(19,365.94 )(10,000.00Proceeds on Sales of Assets 0.000950 )(100.00 )(90.91 0.00Oncosts Recovered )(343,388.140986 )(1,200,000.00 )(1,753,296.66 )(1,150,000.00
Corporate Services Management Expenses03100Employee Costs 174,381.620300 922,693.00 723,078.14 801,000.00Bank Charges 0.000380 0.00 0.00 0.00Bad Debts 0.000385 0.00 )(25,113.01 0.00Sundry Expenses 2,000.000450 0.00 399.95 0.00Operating Expenses 209,750.480565 973,000.00 482,215.82 636,626.00
28,098.6503100 Corporate Services Management Expenses
)(962,683.00TOTAL )(5,020,281.38 )(2,373,774.00
Page 25 of 30Flinders LIVE Install DB
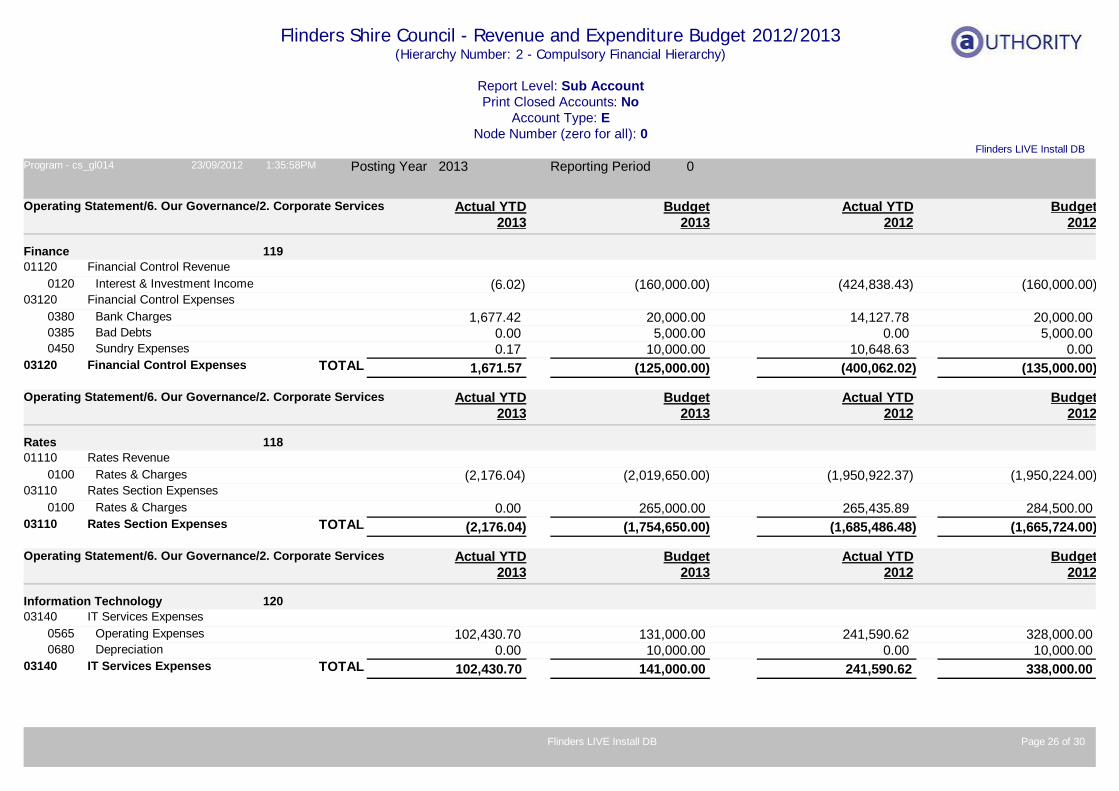
Flinders Shire Council - Revenue and Expenditure Budget 2012/2013(Hierarchy Number: 2 - Compulsory Financial Hierarchy)
Report Level: Sub AccountPrint Closed Accounts: No
Account Type: ENode Number (zero for all): 0
Flinders LIVE Install DBProgram - cs_gl014 23/09/2012 1:35:58PM Posting Year 2013 Reporting Period 0
119Finance
Operating Statement/6. Our Governance/2. Corporate Services Budget2013
Actual YTD2013
Budget2012
Actual YTD2012
Financial Control Revenue01120Interest & Investment Income )(6.020120 )(160,000.00 )(424,838.43 )(160,000.00
Financial Control Expenses03120Bank Charges 1,677.420380 20,000.00 14,127.78 20,000.00Bad Debts 0.000385 5,000.00 0.00 5,000.00Sundry Expenses 0.170450 10,000.00 10,648.63 0.00
1,671.5703120 Financial Control Expenses )(125,000.00TOTAL )(400,062.02 )(135,000.00
118Rates
Operating Statement/6. Our Governance/2. Corporate Services Budget2013
Actual YTD2013
Budget2012
Actual YTD2012
Rates Revenue01110Rates & Charges )(2,176.040100 )(2,019,650.00 )(1,950,922.37 )(1,950,224.00
Rates Section Expenses03110Rates & Charges 0.000100 265,000.00 265,435.89 284,500.00
)(2,176.0403110 Rates Section Expenses )(1,754,650.00TOTAL )(1,685,486.48 )(1,665,724.00
120Information Technology
Operating Statement/6. Our Governance/2. Corporate Services Budget2013
Actual YTD2013
Budget2012
Actual YTD2012
IT Services Expenses03140Operating Expenses 102,430.700565 131,000.00 241,590.62 328,000.00Depreciation 0.000680 10,000.00 0.00 10,000.00
102,430.7003140 IT Services Expenses 141,000.00TOTAL 241,590.62 338,000.00
Page 26 of 30Flinders LIVE Install DB
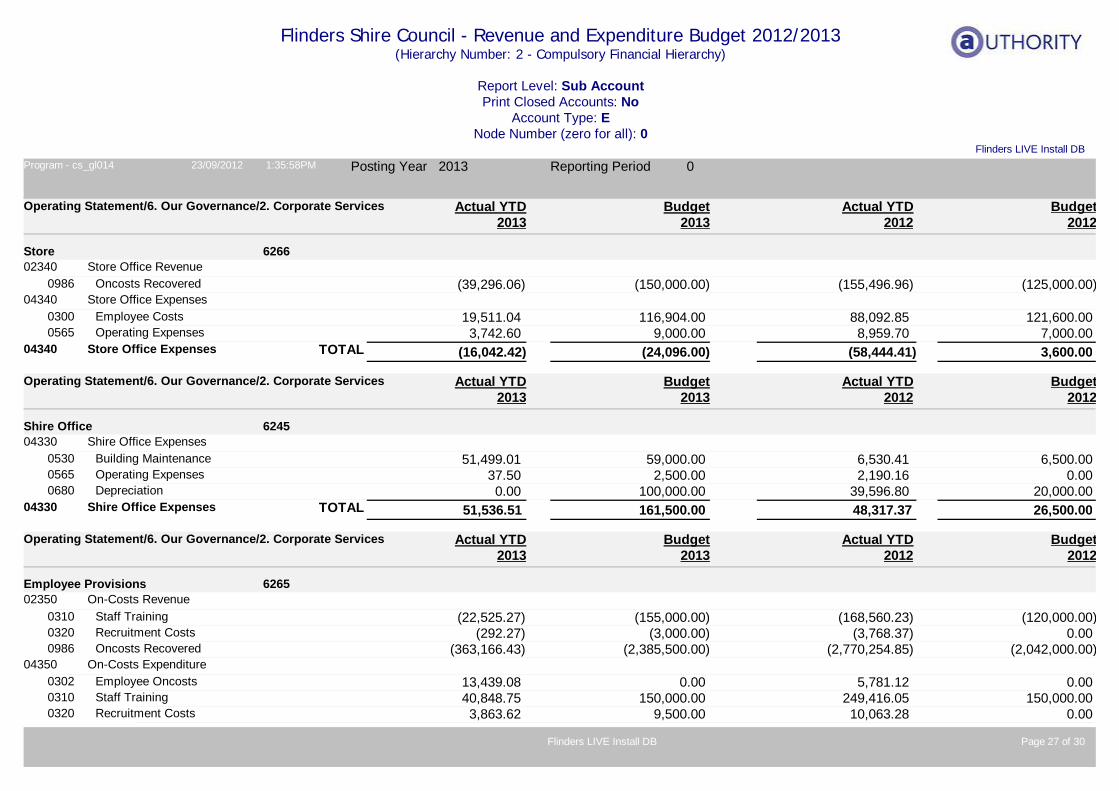
Flinders Shire Council - Revenue and Expenditure Budget 2012/2013(Hierarchy Number: 2 - Compulsory Financial Hierarchy)
Report Level: Sub AccountPrint Closed Accounts: No
Account Type: ENode Number (zero for all): 0
Flinders LIVE Install DBProgram - cs_gl014 23/09/2012 1:35:58PM Posting Year 2013 Reporting Period 0
6266Store
Operating Statement/6. Our Governance/2. Corporate Services Budget2013
Actual YTD2013
Budget2012
Actual YTD2012
Store Office Revenue02340Oncosts Recovered )(39,296.060986 )(150,000.00 )(155,496.96 )(125,000.00
Store Office Expenses04340Employee Costs 19,511.040300 116,904.00 88,092.85 121,600.00Operating Expenses 3,742.600565 9,000.00 8,959.70 7,000.00
)(16,042.4204340 Store Office Expenses )(24,096.00TOTAL )(58,444.41 3,600.00
6245Shire Office
Operating Statement/6. Our Governance/2. Corporate Services Budget2013
Actual YTD2013
Budget2012
Actual YTD2012
Shire Office Expenses04330Building Maintenance 51,499.010530 59,000.00 6,530.41 6,500.00Operating Expenses 37.500565 2,500.00 2,190.16 0.00Depreciation 0.000680 100,000.00 39,596.80 20,000.00
51,536.5104330 Shire Office Expenses 161,500.00TOTAL 48,317.37 26,500.00
6265Employee Provisions
Operating Statement/6. Our Governance/2. Corporate Services Budget2013
Actual YTD2013
Budget2012
Actual YTD2012
On-Costs Revenue02350Staff Training )(22,525.270310 )(155,000.00 )(168,560.23 )(120,000.00Recruitment Costs )(292.270320 )(3,000.00 )(3,768.37 0.00Oncosts Recovered )(363,166.430986 )(2,385,500.00 )(2,770,254.85 )(2,042,000.00
On-Costs Expenditure04350Employee Oncosts 13,439.080302 0.00 5,781.12 0.00Staff Training 40,848.750310 150,000.00 249,416.05 150,000.00Recruitment Costs 3,863.620320 9,500.00 10,063.28 0.00
Page 27 of 30Flinders LIVE Install DB
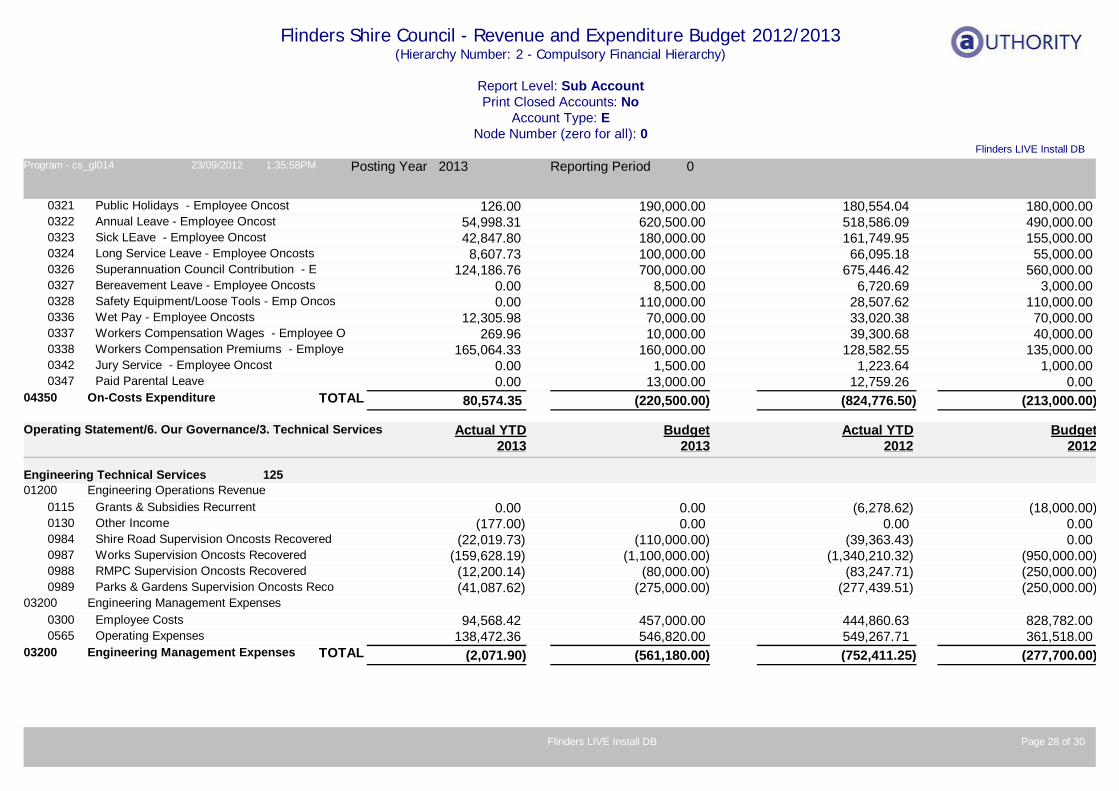
Flinders Shire Council - Revenue and Expenditure Budget 2012/2013(Hierarchy Number: 2 - Compulsory Financial Hierarchy)
Report Level: Sub AccountPrint Closed Accounts: No
Account Type: ENode Number (zero for all): 0
Flinders LIVE Install DBProgram - cs_gl014 23/09/2012 1:35:58PM Posting Year 2013 Reporting Period 0
Public Holidays - Employee Oncost 126.000321 190,000.00 180,554.04 180,000.00Annual Leave - Employee Oncost 54,998.310322 620,500.00 518,586.09 490,000.00Sick LEave - Employee Oncost 42,847.800323 180,000.00 161,749.95 155,000.00Long Service Leave - Employee Oncosts 8,607.730324 100,000.00 66,095.18 55,000.00Superannuation Council Contribution - E 124,186.760326 700,000.00 675,446.42 560,000.00Bereavement Leave - Employee Oncosts 0.000327 8,500.00 6,720.69 3,000.00Safety Equipment/Loose Tools - Emp Oncos 0.000328 110,000.00 28,507.62 110,000.00Wet Pay - Employee Oncosts 12,305.980336 70,000.00 33,020.38 70,000.00Workers Compensation Wages - Employee O 269.960337 10,000.00 39,300.68 40,000.00Workers Compensation Premiums - Employe 165,064.330338 160,000.00 128,582.55 135,000.00Jury Service - Employee Oncost 0.000342 1,500.00 1,223.64 1,000.00Paid Parental Leave 0.000347 13,000.00 12,759.26 0.00
80,574.3504350 On-Costs Expenditure )(220,500.00TOTAL )(824,776.50 )(213,000.00
125Engineering Technical Services
Operating Statement/6. Our Governance/3. Technical Services Budget2013
Actual YTD2013
Budget2012
Actual YTD2012
Engineering Operations Revenue01200Grants & Subsidies Recurrent 0.000115 0.00 )(6,278.62 )(18,000.00Other Income )(177.000130 0.00 0.00 0.00Shire Road Supervision Oncosts Recovered )(22,019.730984 )(110,000.00 )(39,363.43 0.00Works Supervision Oncosts Recovered )(159,628.190987 )(1,100,000.00 )(1,340,210.32 )(950,000.00RMPC Supervision Oncosts Recovered )(12,200.140988 )(80,000.00 )(83,247.71 )(250,000.00Parks & Gardens Supervision Oncosts Reco )(41,087.620989 )(275,000.00 )(277,439.51 )(250,000.00
Engineering Management Expenses03200Employee Costs 94,568.420300 457,000.00 444,860.63 828,782.00Operating Expenses 138,472.360565 546,820.00 549,267.71 361,518.00
)(2,071.9003200 Engineering Management Expenses )(561,180.00TOTAL )(752,411.25 )(277,700.00
Page 28 of 30Flinders LIVE Install DB
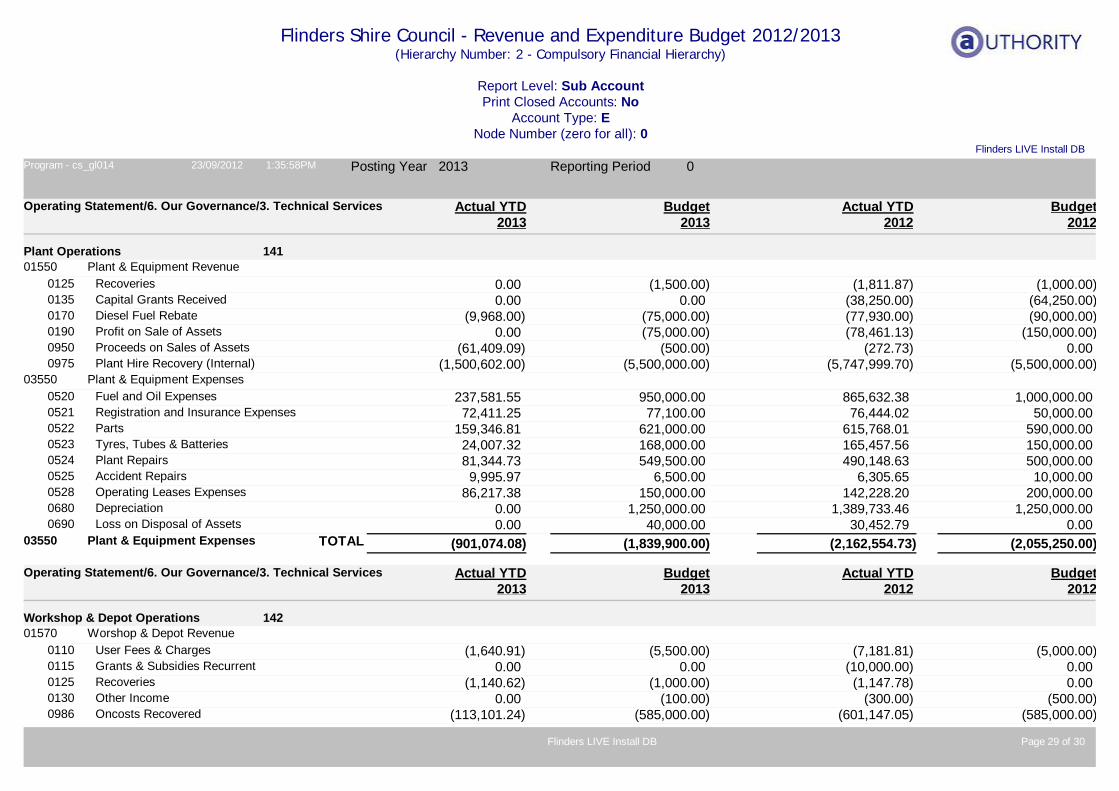
Flinders Shire Council - Revenue and Expenditure Budget 2012/2013(Hierarchy Number: 2 - Compulsory Financial Hierarchy)
Report Level: Sub AccountPrint Closed Accounts: No
Account Type: ENode Number (zero for all): 0
Flinders LIVE Install DBProgram - cs_gl014 23/09/2012 1:35:58PM Posting Year 2013 Reporting Period 0
141Plant Operations
Operating Statement/6. Our Governance/3. Technical Services Budget2013
Actual YTD2013
Budget2012
Actual YTD2012
Plant & Equipment Revenue01550Recoveries 0.000125 )(1,500.00 )(1,811.87 )(1,000.00Capital Grants Received 0.000135 0.00 )(38,250.00 )(64,250.00Diesel Fuel Rebate )(9,968.000170 )(75,000.00 )(77,930.00 )(90,000.00Profit on Sale of Assets 0.000190 )(75,000.00 )(78,461.13 )(150,000.00Proceeds on Sales of Assets )(61,409.090950 )(500.00 )(272.73 0.00Plant Hire Recovery (Internal) )(1,500,602.000975 )(5,500,000.00 )(5,747,999.70 )(5,500,000.00
Plant & Equipment Expenses03550Fuel and Oil Expenses 237,581.550520 950,000.00 865,632.38 1,000,000.00Registration and Insurance Expenses 72,411.250521 77,100.00 76,444.02 50,000.00Parts 159,346.810522 621,000.00 615,768.01 590,000.00Tyres, Tubes & Batteries 24,007.320523 168,000.00 165,457.56 150,000.00Plant Repairs 81,344.730524 549,500.00 490,148.63 500,000.00Accident Repairs 9,995.970525 6,500.00 6,305.65 10,000.00Operating Leases Expenses 86,217.380528 150,000.00 142,228.20 200,000.00Depreciation 0.000680 1,250,000.00 1,389,733.46 1,250,000.00Loss on Disposal of Assets 0.000690 40,000.00 30,452.79 0.00
)(901,074.0803550 Plant & Equipment Expenses )(1,839,900.00TOTAL )(2,162,554.73 )(2,055,250.00
142Workshop & Depot Operations
Operating Statement/6. Our Governance/3. Technical Services Budget2013
Actual YTD2013
Budget2012
Actual YTD2012
Worshop & Depot Revenue01570User Fees & Charges )(1,640.910110 )(5,500.00 )(7,181.81 )(5,000.00Grants & Subsidies Recurrent 0.000115 0.00 )(10,000.00 0.00Recoveries )(1,140.620125 )(1,000.00 )(1,147.78 0.00Other Income 0.000130 )(100.00 )(300.00 )(500.00Oncosts Recovered )(113,101.240986 )(585,000.00 )(601,147.05 )(585,000.00
Page 29 of 30Flinders LIVE Install DB
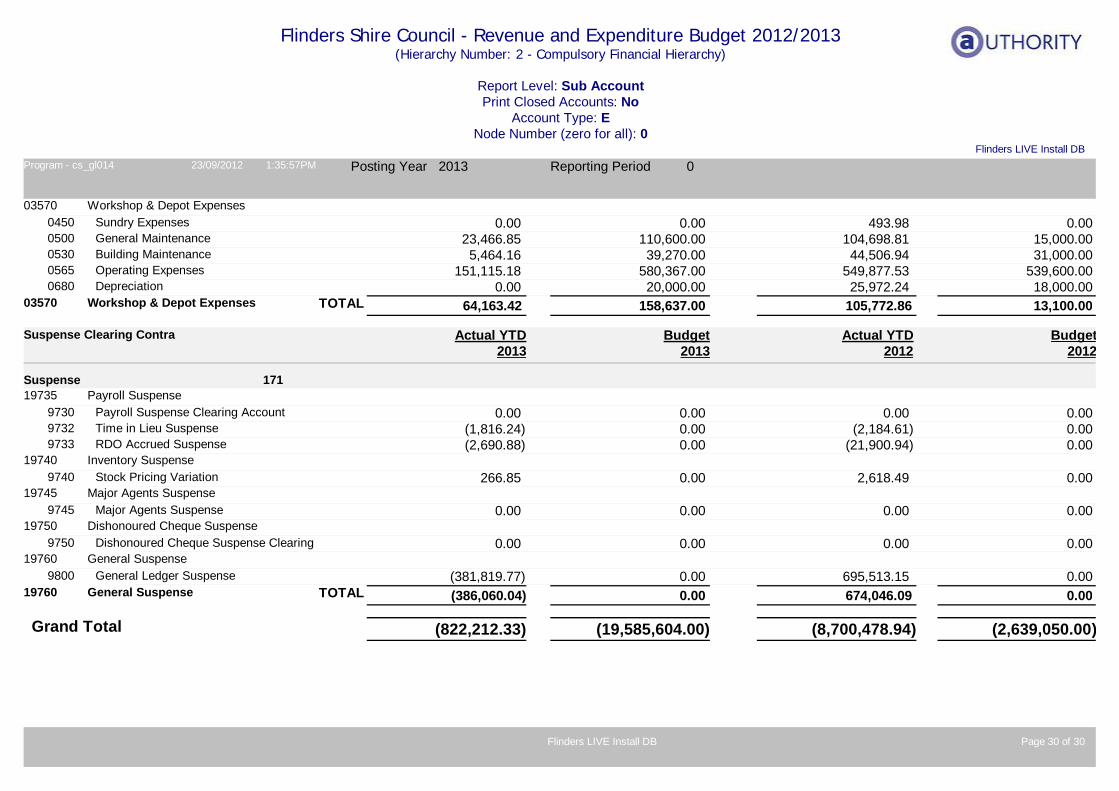
Flinders Shire Council - Revenue and Expenditure Budget 2012/2013(Hierarchy Number: 2 - Compulsory Financial Hierarchy)
Report Level: Sub AccountPrint Closed Accounts: No
Account Type: ENode Number (zero for all): 0
Flinders LIVE Install DBProgram - cs_gl014 23/09/2012 1:35:57PM Posting Year 2013 Reporting Period 0
Workshop & Depot Expenses03570Sundry Expenses 0.000450 0.00 493.98 0.00General Maintenance 23,466.850500 110,600.00 104,698.81 15,000.00Building Maintenance 5,464.160530 39,270.00 44,506.94 31,000.00Operating Expenses 151,115.180565 580,367.00 549,877.53 539,600.00Depreciation 0.000680 20,000.00 25,972.24 18,000.00
64,163.4203570 Workshop & Depot Expenses 158,637.00TOTAL 105,772.86 13,100.00
171Suspense
Suspense Clearing Contra Budget2013
Actual YTD2013
Budget2012
Actual YTD2012
Payroll Suspense19735Payroll Suspense Clearing Account 0.009730 0.00 0.00 0.00Time in Lieu Suspense )(1,816.249732 0.00 )(2,184.61 0.00RDO Accrued Suspense )(2,690.889733 0.00 )(21,900.94 0.00
Inventory Suspense19740Stock Pricing Variation 266.859740 0.00 2,618.49 0.00
Major Agents Suspense19745Major Agents Suspense 0.009745 0.00 0.00 0.00
Dishonoured Cheque Suspense19750Dishonoured Cheque Suspense Clearing 0.009750 0.00 0.00 0.00
General Suspense19760General Ledger Suspense )(381,819.779800 0.00 695,513.15 0.00
)(386,060.0419760 General Suspense 0.00TOTAL 674,046.09 0.00
)(822,212.33 )(19,585,604.00Grand Total )(8,700,478.94 )(2,639,050.00
Page 30 of 30Flinders LIVE Install DB
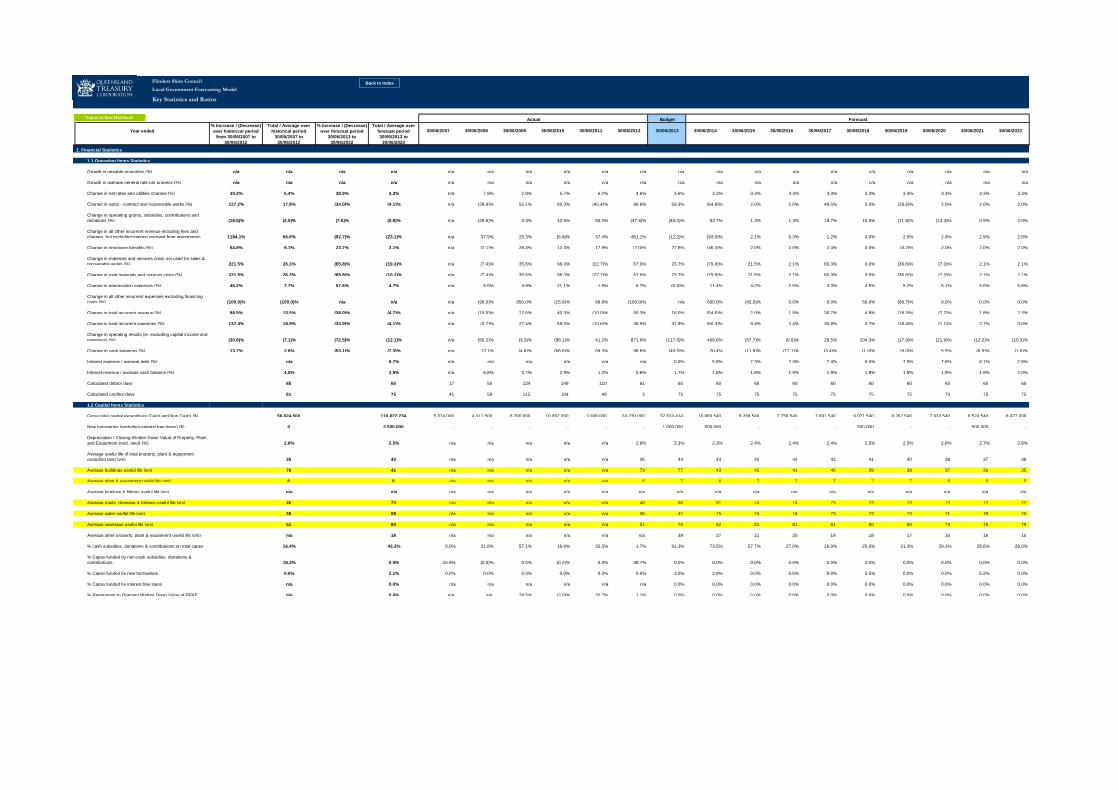
Budget
Year ended 30/06/2007 30/06/2008 30/06/2009 30/06/2010 30/06/2011 30/06/2012 30/06/2013 30/06/2014 30/06/2015 30/06/2016 30/06/2017 30/06/2018 30/06/2019 30/06/2020 30/06/2021 30/06/2022
1. Financial Statistics \
1.1 Operating Items Statistics
Growth in rateable properties (%) n/a n/a n/a n/a n/a n/a n/a n/a n/a n/a n/a n/a n/a n/a n/a n/a n/a n/a n/a n/a
Growth in average general rate per property (%) n/a n/a n/a n/a n/a n/a n/a n/a n/a n/a n/a n/a n/a n/a n/a n/a n/a n/a n/a n/a
Change in net rates and utilities charges (%) 30.2% 5.4% 38.9% 3.3% n/a 7.8% 2.9% 5.7% 6.2% 4.6% 3.6% 3.3% 3.3% 3.3% 3.3% 3.3% 3.3% 3.3% 3.3% 3.3%
Change in sales - contract and recoverable works (%) 127.2% 17.8% (34.0)% (4.1)% n/a (28.4)% 55.1% 90.3% (45.4)% 96.6% 59.3% (64.9)% 2.0% 2.0% 49.5% 0.0% (28.6)% 2.0% 2.0% 2.0%
Change in operating grants, subsidies, contributions and
donations (%) (18.6)% (4.0)% (7.6)% (0.8)% n/a (28.6)% 6.3% 10.5% 55.2% (37.4)% (46.0)% 53.7% 1.3% 1.3% 19.7% 16.0% (11.8)% (13.4)% 0.5% 2.0%
Change in all other recurrent revenue including fees and
charges, but excluding interest received from investments 1184.1% 66.6% (92.7)% (23.1)% n/a 37.9% 25.3% (6.9)% 37.4% 481.1% (12.2)% (93.0)% 2.1% 0.3% 1.2% 3.0% 2.0% 2.9% 2.9% 2.8%
Change in employee benefits (%) 54.8% 9.1% 23.7% 2.1% n/a (2.1)% 28.4% 12.3% 17.9% (7.0)% 77.8% (36.4)% 2.0% 2.0% 2.4% 0.0% (3.2)% 2.0% 2.0% 2.0%
Change in materials and services costs not used for sales &
recoverable works (%) 221.5% 26.3% (65.8)% (19.3)% n/a (7.4)% 35.6% 98.3% (22.7)% 67.0% 23.7% (79.8)% 21.5% 2.1% 80.3% 0.0% (36.6)% (7.3)% 2.1% 2.1%
Change in total materials and services costs (%) 221.5% 26.3% (65.8)% (10.2)% n/a (7.4)% 35.6% 98.3% (22.7)% 67.0% 23.7% (79.8)% 21.5% 2.1% 80.3% 0.0% (36.6)% (7.3)% 2.1% 2.1%
Change in depreciation expenses (%) 45.2% 7.7% 57.6% 4.7% n/a 5.5% 4.9% 21.1% 1.5% 6.7% (0.6)% 11.4% 4.2% 2.5% 3.3% 4.5% 5.2% 5.1% 5.6% 5.8%
Change in all other recurrent expenses excluding financing
costs (%) (100.0)% (100.0)% n/a n/a n/a (96.0)% 850.0% (15.8)% 68.8% (100.0)% n/a 600.0% (42.9)% 0.0% 0.0% 50.0% (66.7)% 0.0% 0.0% 0.0%
Change in total recurrent revenue (%) 88.5% 13.5% (38.0)% (4.7)% n/a (19.0)% 22.6% 40.3% (10.0)% 50.3% 16.0% (54.6)% 2.0% 1.9% 30.7% 4.8% (18.3)% (2.7)% 1.8% 2.3%
Change in total recurrent expenses (%) 137.4% 18.9% (33.9)% (4.1)% n/a (3.7)% 27.4% 58.5% (10.6)% 36.5% 31.9% (60.3)% 9.4% 2.4% 30.8% 0.7% (18.4)% (1.1)% 2.7% 3.0%
Change in operating results (ie. excluding capital income and
expenses) (%) (30.8)% (7.1)% (72.5)% (12.1)% n/a (56.2)% (3.3)% (88.1)% 41.2% 871.6% (117.6)% 408.6% (57.7)% (9.6)% 28.5% 104.3% (17.9)% (21.9)% (12.2)% (10.3)%
Change in cash balances (%) 13.7% 2.6% (53.1)% (7.3)% n/a 13.1% (4.8)% (68.6)% 69.3% 98.6% (40.5)% 20.4% (11.8)% (12.1)% (3.4)% (1.0)% (9.0)% 5.5% (6.5)% (1.6)%
Interest expense / average debt (%) n/a 6.7% n/a n/a n/a n/a n/a n/a 0.0% 5.8% 7.3% 7.3% 7.4% 6.0% 7.5% 7.6% 6.1% 7.8%
Interest revenue / average cash balance (%) 4.0% 1.9% n/a 6.8% 5.7% 2.9% 1.2% 0.6% 1.7% 1.8% 1.8% 1.9% 1.9% 1.8% 1.9% 1.9% 1.9% 2.0%
Calculated debtor days 85 60 17 50 124 149 110 61 60 60 60 60 60 60 60 60 60 60
Calculated creditor days 61 75 41 59 112 104 49 2 75 75 75 75 75 75 75 75 75 75
1.2 Capital Items Statistics
Gross total capital expenditure (Cash and Non Cash) ($) 56,924,500 116,822,734 5,074,000 4,311,500 8,700,000 10,662,000 3,938,000 24,239,000 32,874,414 16,960,540 8,268,540 7,758,540 7,691,540 9,071,540 8,262,540 7,933,540 9,524,540 8,477,000
New borrowings (excluding interest free loans) ($) 0 2,500,000 - - - - - - 1,000,000 500,000 - - - 500,000 - - 500,000 -
Depreciation / Closing Written Down Value of Property, Plant
and Equipment (excl. land) (%) 2.8% 2.5% n/a n/a n/a n/a n/a 2.8% 2.3% 2.3% 2.4% 2.4% 2.4% 2.5% 2.5% 2.6% 2.7% 2.8%
Average useful life of total property, plant & equipment
excluding land (yrs) 35 40 n/a n/a n/a n/a n/a 35 44 43 42 42 42 41 40 38 37 36
Average buildings useful life (yrs) 79 41 n/a n/a n/a n/a n/a 79 77 43 42 41 40 39 38 37 36 35
Average plant & equipment useful life (yrs) 6 6 n/a n/a n/a n/a n/a 6 7 6 7 7 7 7 7 6 6 5
Average furniture & fittings useful life (yrs) n/a n/a n/a n/a n/a n/a n/a n/a n/a n/a n/a n/a n/a n/a n/a n/a n/a n/a
Average roads, drainage & bridges useful life (yrs) 46 73 n/a n/a n/a n/a n/a 46 66 81 74 74 73 73 73 73 72 72
Average water useful life (yrs) 36 69 n/a n/a n/a n/a n/a 36 47 75 74 74 73 72 72 71 70 70
Average sewerage useful life (yrs) 51 80 n/a n/a n/a n/a n/a 51 76 82 81 81 81 80 80 79 79 79
Average other property, plant & equipment useful life (yrs) n/a 18 n/a n/a n/a n/a n/a n/a 39 27 21 20 19 18 17 16 16 15
% cash subsidies, donations & contributions on total capex 16.4% 43.3% 0.0% 21.8% 57.1% 16.6% 32.5% 1.7% 61.3% 73.5% 27.7% 27.0% 26.8% 25.6% 21.3% 29.1% 28.6% 28.0%
% Capex funded by non-cash subsidies, donations &
contributions 18.3% 0.0% 15.9% (0.0)% 0.0% (0.2)% 0.0% 39.7% 0.0% 0.0% 0.0% 0.0% 0.0% 0.0% 0.0% 0.0% 0.0% 0.0%
% Capex funded by new borrowings 0.0% 2.1% 0.0% 0.0% 0.0% 0.0% 0.0% 0.0% 3.0% 2.9% 0.0% 0.0% 0.0% 5.5% 0.0% 0.0% 5.2% 0.0%
% Capex funded by interest free loans n/a 0.0% n/a n/a n/a n/a n/a n/a 0.0% 0.0% 0.0% 0.0% 0.0% 0.0% 0.0% 0.0% 0.0% 0.0%
% Revaluation to Opening Written Down Value of PP&E n/a 0.0% n/a n/a 24.5% (2.0)% 32.7% 1.1% 0.0% 0.0% 0.0% 0.0% 0.0% 0.0% 0.0% 0.0% 0.0% 0.0%
Forecast
Total / Average over
forecast period
30/06/2013 to
30/06/2022
% Increase / (Decrease)
over forecast period
30/06/2013 to
30/06/2022
% Increase / (Decrease)
over historical period
from 30/06/2007 to
30/06/2012
Actual
Total / Average over
historical period
30/06/2007 to
30/06/2012
F
Back to Index
Local Government Forecasting Model
Key Statistics and Ratios
Flinders Shire Council
Export to New Workbook
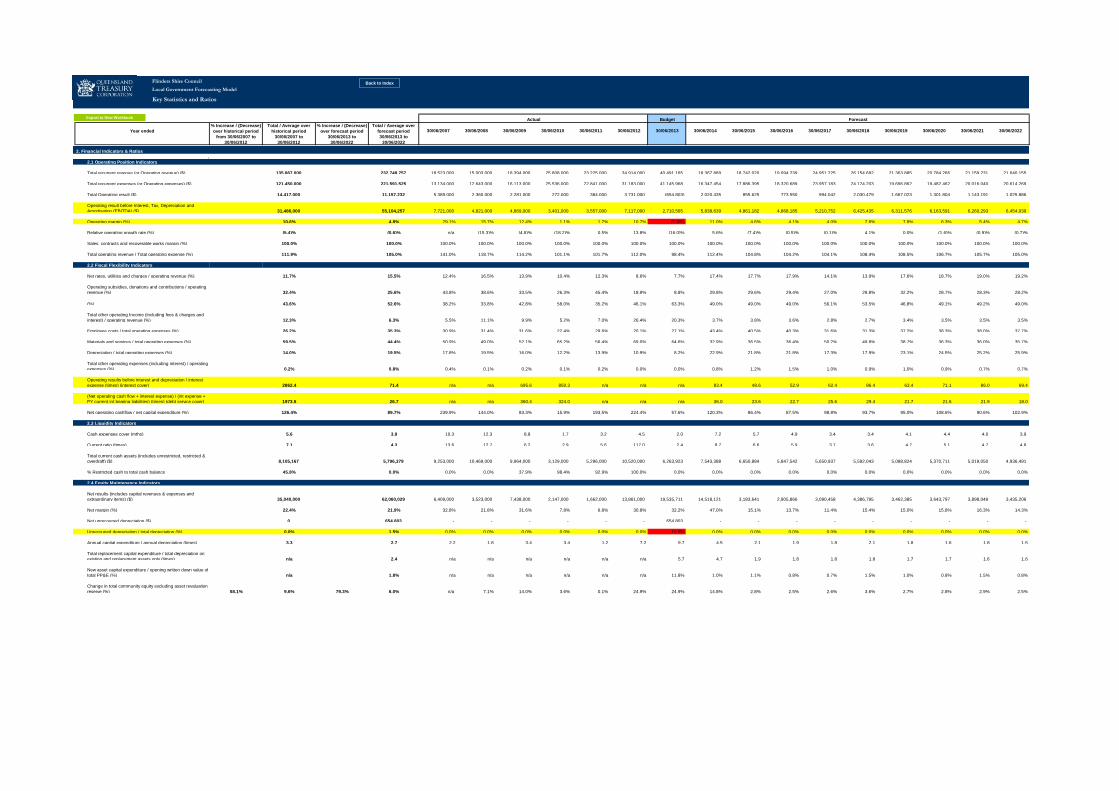
Budget
Year ended 30/06/2007 30/06/2008 30/06/2009 30/06/2010 30/06/2011 30/06/2012 30/06/2013 30/06/2014 30/06/2015 30/06/2016 30/06/2017 30/06/2018 30/06/2019 30/06/2020 30/06/2021 30/06/2022
Forecast
Total / Average over
forecast period
30/06/2013 to
30/06/2022
% Increase / (Decrease)
over forecast period
30/06/2013 to
30/06/2022
% Increase / (Decrease)
over historical period
from 30/06/2007 to
30/06/2012
Actual
Total / Average over
historical period
30/06/2007 to
30/06/2012
Back to Index
Local Government Forecasting Model
Key Statistics and Ratios
Flinders Shire Council
Export to New Workbook
2. Financial Indicators & Ratios
2.1 Operating Position Indicators
Total recurrent revenue (or Operating revenue) ($) 135,867,000 232,748,757 18,523,000 15,003,000 18,394,000 25,808,000 23,225,000 34,914,000 40,491,165 18,367,889 18,742,020 19,094,239 24,951,225 26,154,682 21,363,885 20,784,266 21,159,231 21,640,155
Total recurrent expenses (or Operating expenses) ($) 121,450,000 221,591,525 13,134,000 12,643,000 16,113,000 25,536,000 22,841,000 31,183,000 41,145,968 16,347,454 17,886,395 18,320,689 23,957,183 24,124,203 19,696,862 19,482,462 20,016,040 20,614,269
Total Operating result ($) 14,417,000 11,157,232 5,389,000 2,360,000 2,281,000 272,000 384,000 3,731,000 (654,803) 2,020,435 855,625 773,550 994,042 2,030,479 1,667,023 1,301,804 1,143,191 1,025,886
Operating result before Interest, Tax, Depreciation and
Amortisation (EBITDA) ($) 31,486,000 55,104,257 7,721,000 4,821,000 4,869,000 3,401,000 3,557,000 7,117,000 2,710,565 5,838,639 4,861,182 4,868,185 5,210,752 6,425,435 6,311,576 6,163,591 6,260,293 6,454,039
Operating margin (%) 10.6% 4.8% 29.1% 15.7% 12.4% 1.1% 1.7% 10.7% (1.6)% 11.0% 4.6% 4.1% 4.0% 7.8% 7.8% 6.3% 5.4% 4.7%
Relative operating growth rate (%) (5.4)% (0.6)% n/a (15.3)% (4.8)% (18.2)% 0.5% 13.8% (16.0)% 5.6% (7.4)% (0.5)% (0.1)% 4.1% 0.0% (1.6)% (0.9)% (0.7)%
Sales, contracts and recoverable works margin (%) 100.0% 100.0% 100.0% 100.0% 100.0% 100.0% 100.0% 100.0% 100.0% 100.0% 100.0% 100.0% 100.0% 100.0% 100.0% 100.0% 100.0% 100.0%
Total operating revenue / Total operating expense (%) 111.9% 105.0% 141.0% 118.7% 114.2% 101.1% 101.7% 112.0% 98.4% 112.4% 104.8% 104.2% 104.1% 108.4% 108.5% 106.7% 105.7% 105.0%
2.2 Fiscal Flexibility Indicators
Net rates, utilities and charges / operating revenue (%) 11.7% 15.5% 12.4% 16.5% 13.9% 10.4% 12.3% 8.6% 7.7% 17.4% 17.7% 17.9% 14.1% 13.9% 17.6% 18.7% 19.0% 19.2%
Operating subsidies, donations and contributions / operating
revenue (%) 32.4% 25.6% 43.8% 38.6% 33.5% 26.3% 45.4% 18.9% 8.8% 29.8% 29.6% 29.4% 27.0% 29.8% 32.2% 28.7% 28.3% 28.2%
Sales - contract and recoverable works / operating revenue
(%) 43.6% 52.6% 38.2% 33.8% 42.8% 58.0% 35.2% 46.1% 63.3% 49.0% 49.0% 49.0% 56.1% 53.5% 46.8% 49.1% 49.2% 49.0%
Total other operating Income (including fees & charges and
interest) / operating revenue (%) 12.3% 6.3% 5.5% 11.1% 9.9% 5.2% 7.0% 26.4% 20.3% 3.7% 3.8% 3.6% 2.8% 2.7% 3.4% 3.5% 3.5% 3.5%
Employee costs / total operating expenses (%) 26.2% 35.3% 30.9% 31.4% 31.6% 22.4% 29.6% 20.1% 27.1% 43.4% 40.5% 40.3% 31.6% 31.3% 37.2% 38.3% 38.0% 37.7%
Materials and services / total operating expenses (%) 59.5% 44.4% 50.9% 49.0% 52.1% 65.2% 56.4% 69.0% 64.6% 32.9% 36.5% 36.4% 50.2% 49.8% 38.7% 36.3% 36.0% 35.7%
Depreciation / total operating expenses (%) 14.0% 19.5% 17.8% 19.5% 16.0% 12.2% 13.9% 10.9% 8.2% 22.9% 21.8% 21.8% 17.3% 17.9% 23.1% 24.5% 25.2% 25.9%
Total other operating expenses (including interest) / operating
expenses (%) 0.2% 0.8% 0.4% 0.1% 0.2% 0.1% 0.2% 0.0% 0.0% 0.8% 1.2% 1.5% 1.0% 0.9% 1.0% 0.9% 0.7% 0.7%
Operating results before interest and depreciation / interest
expense (times) (interest cover) 2862.4 71.4 n/a n/a 695.6 850.3 n/a n/a n/a 83.4 48.6 52.9 62.4 86.4 63.4 71.1 86.0 69.4
(Net operating cash flow + interest expense) / (int expense +
PY current int bearing liabilities) (times) (debt service cover) 1973.5 26.7 n/a n/a 360.4 324.0 n/a n/a n/a 36.0 23.6 22.7 25.6 29.4 21.7 21.6 21.9 18.0
Net operating cashflow / net capital expenditure (%) 126.4% 89.7% 239.9% 144.0% 83.3% 15.9% 193.5% 224.4% 57.6% 120.3% 86.4% 87.5% 98.8% 93.7% 95.0% 108.6% 90.6% 102.9%
2.3 Liquidity Indicators
Cash expenses cover (mths) 5.6 3.9 10.3 12.3 8.8 1.7 3.2 4.5 2.0 7.2 5.7 4.9 3.4 3.4 4.1 4.4 4.0 3.9
Current ratio (times) 7.1 4.3 13.6 12.7 6.2 2.9 5.6 117.0 2.4 8.7 6.6 5.9 3.7 3.6 4.7 5.1 4.7 4.8
Total current cash assets (includes unrestricted, restricted &
overdraft) ($) 8,105,167 5,796,379 9,253,000 10,469,000 9,964,000 3,129,000 5,296,000 10,520,000 6,263,923 7,543,388 6,650,884 5,847,542 5,650,937 5,592,043 5,088,824 5,370,711 5,019,050 4,936,491
% Restricted cash to total cash balance 45.8% 0.0% 0.0% 0.0% 37.9% 98.4% 92.9% 100.0% 0.0% 0.0% 0.0% 0.0% 0.0% 0.0% 0.0% 0.0% 0.0% 0.0%
2.4 Equity Maintenance Indicators
Net results (includes capital revenues & expenses and
extraordinary items) ($) 35,040,000 62,060,029 6,409,000 3,523,000 7,438,000 2,147,000 1,662,000 13,861,000 19,535,711 14,518,121 3,183,641 2,905,866 3,090,458 4,386,795 3,462,385 3,643,797 3,898,049 3,435,206
Net margin (%) 22.4% 21.9% 32.8% 21.8% 31.6% 7.8% 6.8% 30.8% 32.2% 47.0% 15.1% 13.7% 11.4% 15.4% 15.0% 15.8% 16.3% 14.3%
Net unrecouped depreciation ($) 0 654,803 - - - - - - 654,803 - - - - - - - - -
Unrecouped depreciation / total depreciation (%) 0.0% 1.5% 0.0% 0.0% 0.0% 0.0% 0.0% 0.0% 19.5% 0.0% 0.0% 0.0% 0.0% 0.0% 0.0% 0.0% 0.0% 0.0%
Annual capital expenditure / annual depreciation (times) 3.3 2.7 2.2 1.8 3.4 3.4 1.2 7.2 9.7 4.5 2.1 1.9 1.8 2.1 1.8 1.6 1.8 1.5
Total replacement capital expenditure / total depreciation on
existing and replacement assets only (times) n/a 2.4 n/a n/a n/a n/a n/a n/a 5.7 4.7 1.9 1.8 1.8 1.8 1.7 1.7 1.6 1.6
New asset capital expenditure / opening written down value of
total PP&E (%) n/a 1.8% n/a n/a n/a n/a n/a n/a 11.8% 1.0% 1.1% 0.8% 0.7% 1.5% 1.0% 0.8% 1.5% 0.8%
Change in total community equity excluding asset revaluation
reserve (%) 58.1% 9.6% 79.3% 6.0% n/a 7.1% 14.0% 3.6% 0.1% 24.9% 24.9% 14.8% 2.8% 2.5% 2.6% 3.6% 2.7% 2.8% 2.9% 2.5%
E
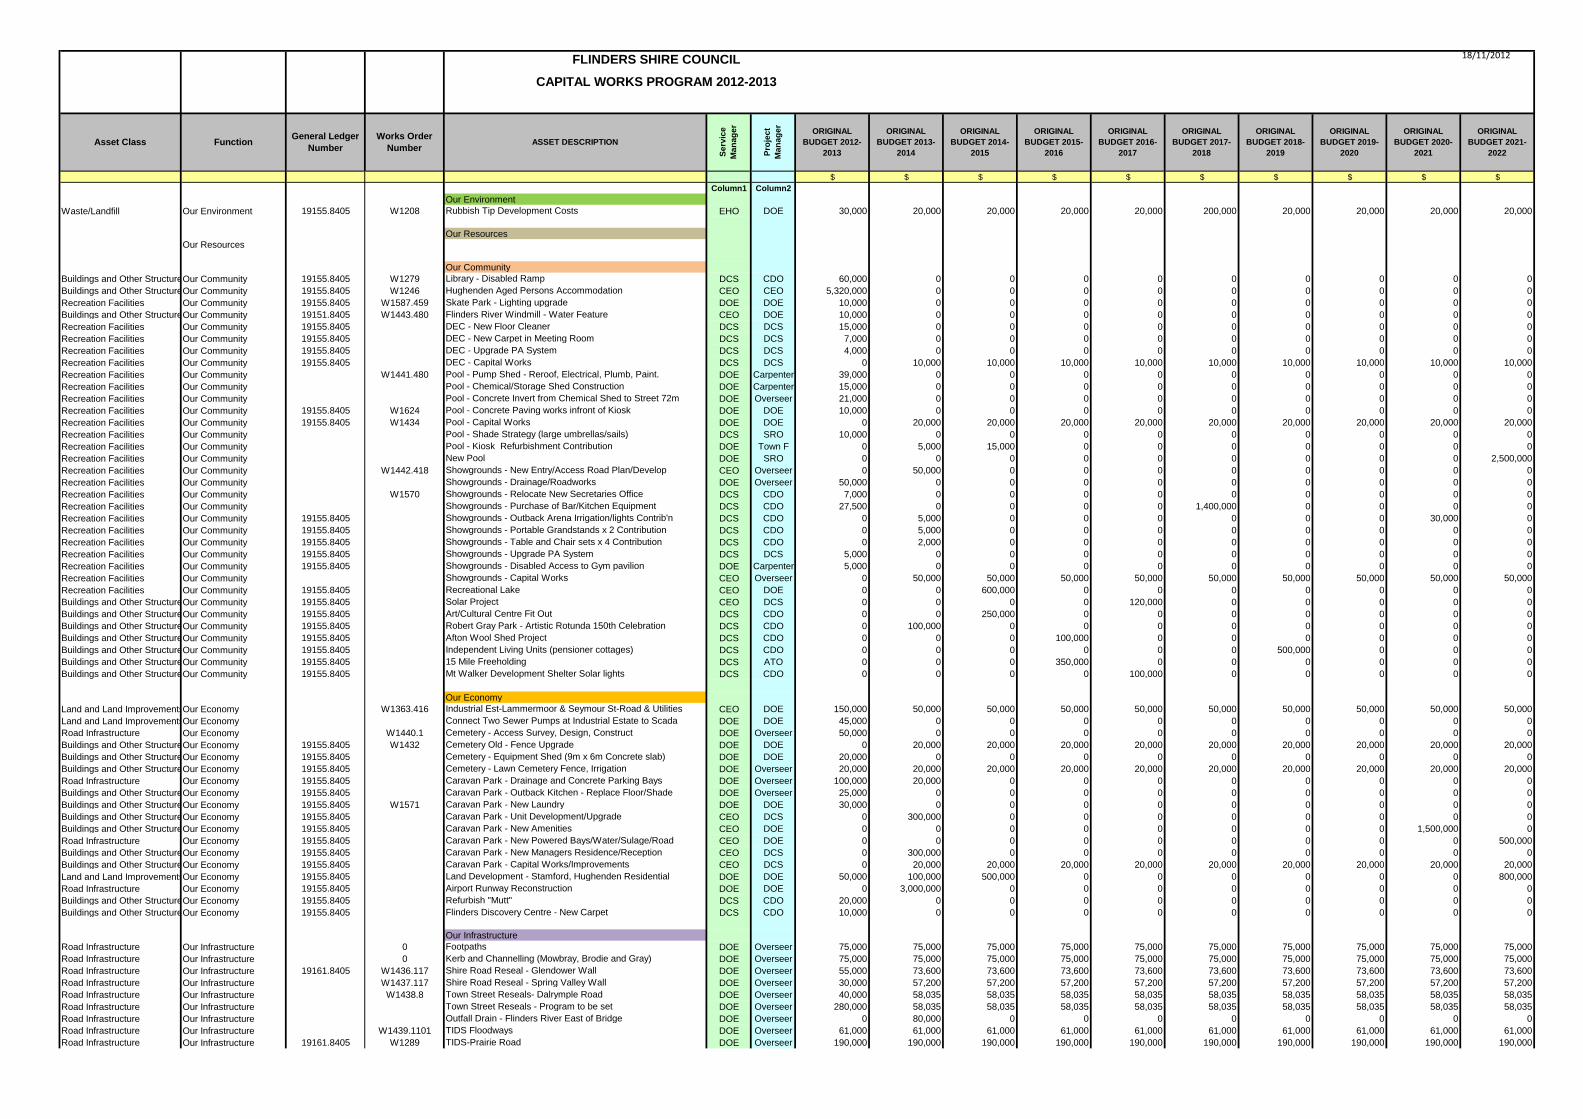
18/11/2012
$ $ $ $ $ $ $ $ $ $
Column1 Column2
Our Environment
Waste/Landfill Our Environment 19155.8405 W1208 Rubbish Tip Development Costs EHO DOE 30,000 20,000 20,000 20,000 20,000 200,000 20,000 20,000 20,000 20,000
Our ResourcesOur Resources
Our Community
Buildings and Other StructuresOur Community 19155.8405 W1279 Library - Disabled Ramp DCS CDO 60,000 0 0 0 0 0 0 0 0 0
Buildings and Other StructuresOur Community 19155.8405 W1246 Hughenden Aged Persons Accommodation CEO CEO 5,320,000 0 0 0 0 0 0 0 0 0
Recreation Facilities Our Community 19155.8405 W1587.459 Skate Park - Lighting upgrade DOE DOE 10,000 0 0 0 0 0 0 0 0 0
Buildings and Other StructuresOur Community 19151.8405 W1443.480 Flinders River Windmill - Water Feature CEO DOE 10,000 0 0 0 0 0 0 0 0 0
Recreation Facilities Our Community 19155.8405 DEC - New Floor Cleaner DCS DCS 15,000 0 0 0 0 0 0 0 0 0
Recreation Facilities Our Community 19155.8405 DEC - New Carpet in Meeting Room DCS DCS 7,000 0 0 0 0 0 0 0 0 0
Recreation Facilities Our Community 19155.8405 DEC - Upgrade PA System DCS DCS 4,000 0 0 0 0 0 0 0 0 0
Recreation Facilities Our Community 19155.8405 DEC - Capital Works DCS DCS 0 10,000 10,000 10,000 10,000 10,000 10,000 10,000 10,000 10,000
Recreation Facilities Our Community W1441.480 Pool - Pump Shed - Reroof, Electrical, Plumb, Paint. DOE Carpenter 39,000 0 0 0 0 0 0 0 0 0
Recreation Facilities Our Community Pool - Chemical/Storage Shed Construction DOE Carpenter 15,000 0 0 0 0 0 0 0 0 0
Recreation Facilities Our Community Pool - Concrete Invert from Chemical Shed to Street 72m DOE Overseer 21,000 0 0 0 0 0 0 0 0 0
Recreation Facilities Our Community 19155.8405 W1624 Pool - Concrete Paving works infront of Kiosk DOE DOE 10,000 0 0 0 0 0 0 0 0 0
Recreation Facilities Our Community 19155.8405 W1434 Pool - Capital Works DOE DOE 0 20,000 20,000 20,000 20,000 20,000 20,000 20,000 20,000 20,000
Recreation Facilities Our Community Pool - Shade Strategy (large umbrellas/sails) DCS SRO 10,000 0 0 0 0 0 0 0 0 0
Recreation Facilities Our Community Pool - Kiosk Refurbishment Contribution DOE Town F 0 5,000 15,000 0 0 0 0 0 0 0
Recreation Facilities Our Community New Pool DOE SRO 0 0 0 0 0 0 0 0 0 2,500,000
Recreation Facilities Our Community W1442.418 Showgrounds - New Entry/Access Road Plan/Develop CEO Overseer 0 50,000 0 0 0 0 0 0 0 0
Recreation Facilities Our Community Showgrounds - Drainage/Roadworks DOE Overseer 50,000 0 0 0 0 0 0 0 0 0
Recreation Facilities Our Community W1570 Showgrounds - Relocate New Secretaries Office DCS CDO 7,000 0 0 0 0 0 0 0 0 0
Recreation Facilities Our Community Showgrounds - Purchase of Bar/Kitchen Equipment DCS CDO 27,500 0 0 0 0 1,400,000 0 0 0 0
Recreation Facilities Our Community 19155.8405 Showgrounds - Outback Arena Irrigation/lights Contrib'n DCS CDO 0 5,000 0 0 0 0 0 0 30,000 0
Recreation Facilities Our Community 19155.8405 Showgrounds - Portable Grandstands x 2 Contribution DCS CDO 0 5,000 0 0 0 0 0 0 0 0
Recreation Facilities Our Community 19155.8405 Showgrounds - Table and Chair sets x 4 Contribution DCS CDO 0 2,000 0 0 0 0 0 0 0 0
Recreation Facilities Our Community 19155.8405 Showgrounds - Upgrade PA System DCS DCS 5,000 0 0 0 0 0 0 0 0 0
Recreation Facilities Our Community 19155.8405 Showgrounds - Disabled Access to Gym pavilion DOE Carpenter 5,000 0 0 0 0 0 0 0 0 0
Recreation Facilities Our Community Showgrounds - Capital Works CEO Overseer 0 50,000 50,000 50,000 50,000 50,000 50,000 50,000 50,000 50,000
Recreation Facilities Our Community 19155.8405 Recreational Lake CEO DOE 0 0 600,000 0 0 0 0 0 0 0
Buildings and Other StructuresOur Community 19155.8405 Solar Project CEO DCS 0 0 0 0 120,000 0 0 0 0 0
Buildings and Other StructuresOur Community 19155.8405 Art/Cultural Centre Fit Out DCS CDO 0 0 250,000 0 0 0 0 0 0 0
Buildings and Other StructuresOur Community 19155.8405 Robert Gray Park - Artistic Rotunda 150th Celebration DCS CDO 0 100,000 0 0 0 0 0 0 0 0
Buildings and Other StructuresOur Community 19155.8405 Afton Wool Shed Project DCS CDO 0 0 0 100,000 0 0 0 0 0 0
Buildings and Other StructuresOur Community 19155.8405 Independent Living Units (pensioner cottages) DCS CDO 0 0 0 0 0 0 500,000 0 0 0
Buildings and Other StructuresOur Community 19155.8405 15 Mile Freeholding DCS ATO 0 0 0 350,000 0 0 0 0 0 0
Buildings and Other StructuresOur Community 19155.8405 Mt Walker Development Shelter Solar lights DCS CDO 0 0 0 0 100,000 0 0 0 0 0
Our Economy
Land and Land ImprovementsOur Economy W1363.416 Industrial Est-Lammermoor & Seymour St-Road & Utilities CEO DOE 150,000 50,000 50,000 50,000 50,000 50,000 50,000 50,000 50,000 50,000
Land and Land ImprovementsOur Economy Connect Two Sewer Pumps at Industrial Estate to Scada
SystemDOE DOE 45,000 0 0 0 0 0 0 0 0 0
Road Infrastructure Our Economy W1440.1 Cemetery - Access Survey, Design, Construct DOE Overseer 50,000 0 0 0 0 0 0 0 0 0
Buildings and Other StructuresOur Economy 19155.8405 W1432 Cemetery Old - Fence Upgrade DOE DOE 0 20,000 20,000 20,000 20,000 20,000 20,000 20,000 20,000 20,000
Buildings and Other StructuresOur Economy 19155.8405 Cemetery - Equipment Shed (9m x 6m Concrete slab) DOE DOE 20,000 0 0 0 0 0 0 0 0 0
Buildings and Other StructuresOur Economy 19155.8405 Cemetery - Lawn Cemetery Fence, Irrigation DOE Overseer 20,000 20,000 20,000 20,000 20,000 20,000 20,000 20,000 20,000 20,000
Road Infrastructure Our Economy 19155.8405 Caravan Park - Drainage and Concrete Parking Bays DOE Overseer 100,000 20,000 0 0 0 0 0 0 0 0
Buildings and Other StructuresOur Economy 19155.8405 Caravan Park - Outback Kitchen - Replace Floor/Shade DOE Overseer 25,000 0 0 0 0 0 0 0 0 0
Buildings and Other StructuresOur Economy 19155.8405 W1571 Caravan Park - New Laundry DOE DOE 30,000 0 0 0 0 0 0 0 0 0
Buildings and Other StructuresOur Economy 19155.8405 Caravan Park - Unit Development/Upgrade CEO DCS 0 300,000 0 0 0 0 0 0 0 0
Buildings and Other StructuresOur Economy 19155.8405 Caravan Park - New Amenities CEO DOE 0 0 0 0 0 0 0 0 1,500,000 0
Road Infrastructure Our Economy 19155.8405 Caravan Park - New Powered Bays/Water/Sulage/Road CEO DOE 0 0 0 0 0 0 0 0 0 500,000
Buildings and Other StructuresOur Economy 19155.8405 Caravan Park - New Managers Residence/Reception CEO DCS 0 300,000 0 0 0 0 0 0 0 0
Buildings and Other StructuresOur Economy 19155.8405 Caravan Park - Capital Works/Improvements CEO DCS 0 20,000 20,000 20,000 20,000 20,000 20,000 20,000 20,000 20,000
Land and Land ImprovementsOur Economy 19155.8405 Land Development - Stamford, Hughenden Residential DOE DOE 50,000 100,000 500,000 0 0 0 0 0 0 800,000
Road Infrastructure Our Economy 19155.8405 Airport Runway Reconstruction DOE DOE 0 3,000,000 0 0 0 0 0 0 0 0
Buildings and Other StructuresOur Economy 19155.8405 Refurbish "Mutt" DCS CDO 20,000 0 0 0 0 0 0 0 0 0
Buildings and Other StructuresOur Economy 19155.8405 Flinders Discovery Centre - New Carpet DCS CDO 10,000 0 0 0 0 0 0 0 0 0
Our Infrastructure
Road Infrastructure Our Infrastructure 0 Footpaths DOE Overseer 75,000 75,000 75,000 75,000 75,000 75,000 75,000 75,000 75,000 75,000
Road Infrastructure Our Infrastructure 0 Kerb and Channelling (Mowbray, Brodie and Gray) DOE Overseer 75,000 75,000 75,000 75,000 75,000 75,000 75,000 75,000 75,000 75,000
Road Infrastructure Our Infrastructure 19161.8405 W1436.117 Shire Road Reseal - Glendower Wall DOE Overseer 55,000 73,600 73,600 73,600 73,600 73,600 73,600 73,600 73,600 73,600
Road Infrastructure Our Infrastructure W1437.117 Shire Road Reseal - Spring Valley Wall DOE Overseer 30,000 57,200 57,200 57,200 57,200 57,200 57,200 57,200 57,200 57,200
Road Infrastructure Our Infrastructure W1438.8 Town Street Reseals- Dalrymple Road DOE Overseer 40,000 58,035 58,035 58,035 58,035 58,035 58,035 58,035 58,035 58,035
Road Infrastructure Our Infrastructure Town Street Reseals - Program to be set DOE Overseer 280,000 58,035 58,035 58,035 58,035 58,035 58,035 58,035 58,035 58,035
Road Infrastructure Our Infrastructure Outfall Drain - Flinders River East of Bridge DOE Overseer 0 80,000 0 0 0 0 0 0 0 0
Road Infrastructure Our Infrastructure W1439.1101 TIDS Floodways DOE Overseer 61,000 61,000 61,000 61,000 61,000 61,000 61,000 61,000 61,000 61,000
Road Infrastructure Our Infrastructure 19161.8405 W1289 TIDS-Prairie Road DOE Overseer 190,000 190,000 190,000 190,000 190,000 190,000 190,000 190,000 190,000 190,000
ORIGINAL
BUDGET 2021-
2022
ORIGINAL
BUDGET 2019-
2020
ORIGINAL
BUDGET 2020-
2021
ORIGINAL
BUDGET 2018-
2019
ORIGINAL
BUDGET 2017-
2018
ORIGINAL
BUDGET 2016-
2017
ORIGINAL
BUDGET 2014-
2015
ORIGINAL
BUDGET 2015-
2016
Asset Class Function ASSET DESCRIPTION
Se
rvic
e
Ma
na
ge
r
Works Order
Number
General Ledger
Number
FLINDERS SHIRE COUNCIL
CAPITAL WORKS PROGRAM 2012-2013
ORIGINAL
BUDGET 2012-
2013Pro
jec
t
Ma
na
ge
r
ORIGINAL
BUDGET 2013-
2014
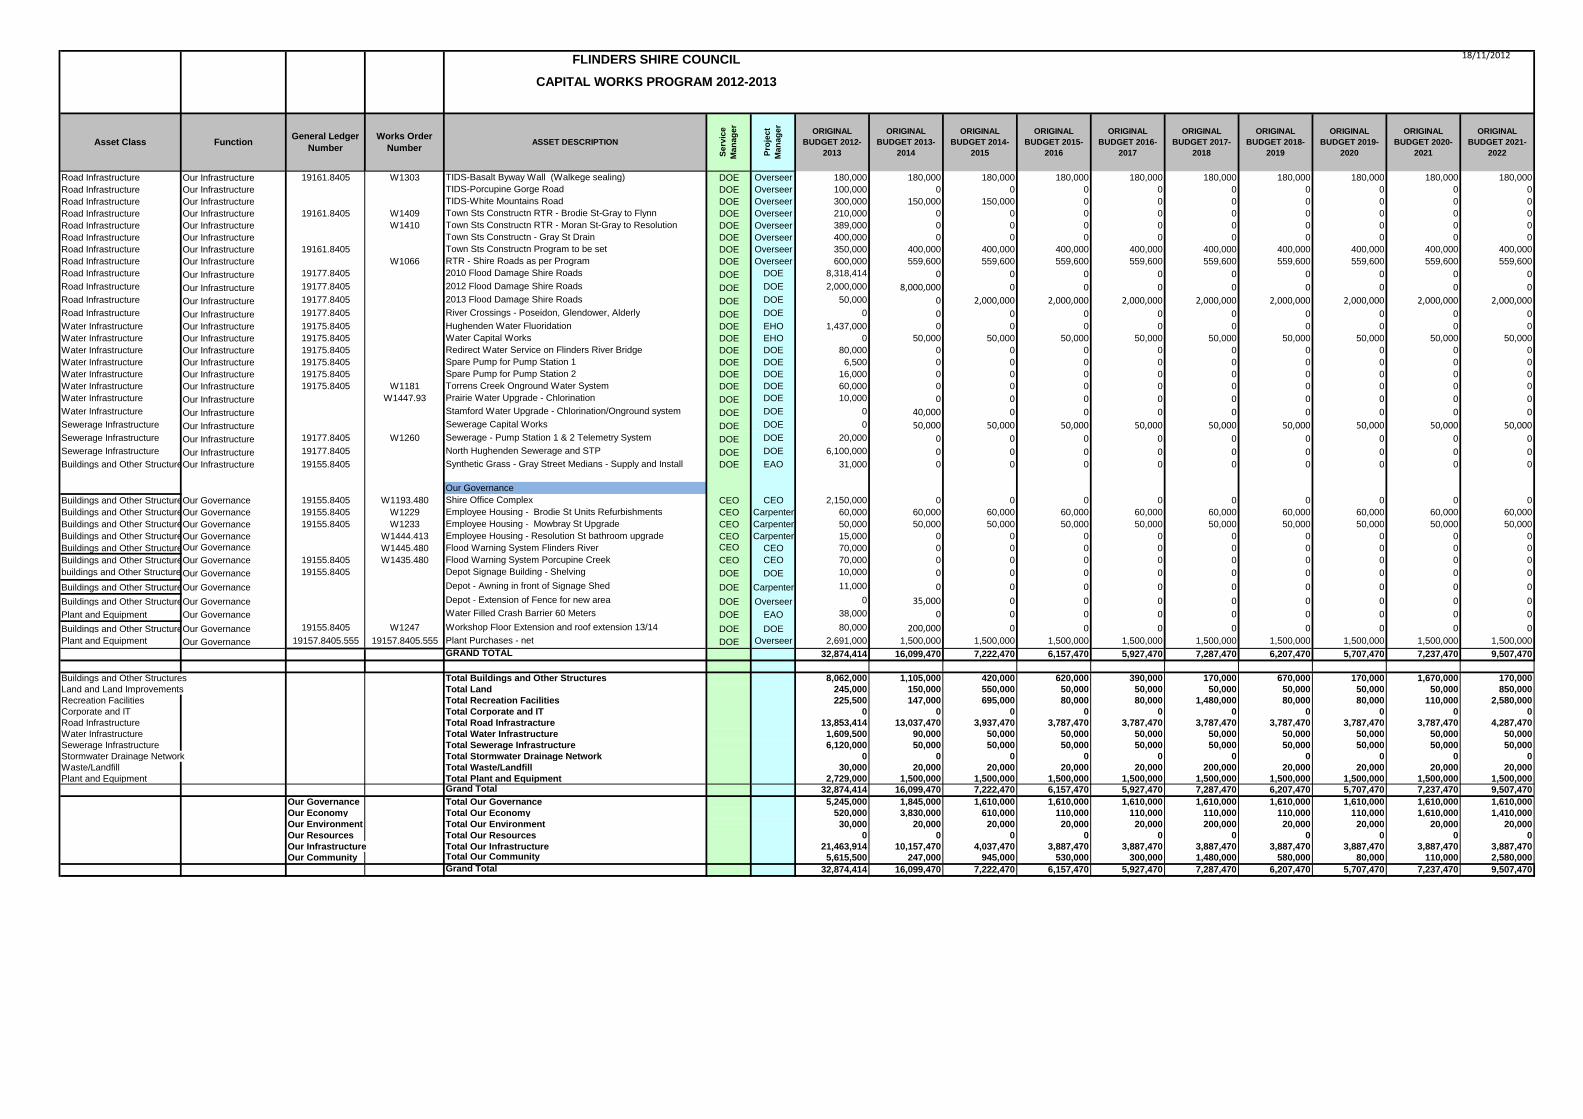
18/11/2012
ORIGINAL
BUDGET 2021-
2022
ORIGINAL
BUDGET 2019-
2020
ORIGINAL
BUDGET 2020-
2021
ORIGINAL
BUDGET 2018-
2019
ORIGINAL
BUDGET 2017-
2018
ORIGINAL
BUDGET 2016-
2017
ORIGINAL
BUDGET 2014-
2015
ORIGINAL
BUDGET 2015-
2016
Asset Class Function ASSET DESCRIPTION
Se
rvic
e
Ma
na
ge
r
Works Order
Number
General Ledger
Number
FLINDERS SHIRE COUNCIL
CAPITAL WORKS PROGRAM 2012-2013
ORIGINAL
BUDGET 2012-
2013Pro
jec
t
Ma
na
ge
r
ORIGINAL
BUDGET 2013-
2014
Road Infrastructure Our Infrastructure 19161.8405 W1303 TIDS-Basalt Byway Wall (Walkege sealing) DOE Overseer 180,000 180,000 180,000 180,000 180,000 180,000 180,000 180,000 180,000 180,000
Road Infrastructure Our Infrastructure TIDS-Porcupine Gorge Road DOE Overseer 100,000 0 0 0 0 0 0 0 0 0
Road Infrastructure Our Infrastructure TIDS-White Mountains Road DOE Overseer 300,000 150,000 150,000 0 0 0 0 0 0 0
Road Infrastructure Our Infrastructure 19161.8405 W1409 Town Sts Constructn RTR - Brodie St-Gray to Flynn DOE Overseer 210,000 0 0 0 0 0 0 0 0 0
Road Infrastructure Our Infrastructure W1410 Town Sts Constructn RTR - Moran St-Gray to Resolution DOE Overseer 389,000 0 0 0 0 0 0 0 0 0
Road Infrastructure Our Infrastructure Town Sts Constructn - Gray St Drain DOE Overseer 400,000 0 0 0 0 0 0 0 0 0
Road Infrastructure Our Infrastructure 19161.8405 Town Sts Constructn Program to be set DOE Overseer 350,000 400,000 400,000 400,000 400,000 400,000 400,000 400,000 400,000 400,000
Road Infrastructure Our Infrastructure W1066 RTR - Shire Roads as per Program DOE Overseer 600,000 559,600 559,600 559,600 559,600 559,600 559,600 559,600 559,600 559,600
Road Infrastructure Our Infrastructure 19177.8405 2010 Flood Damage Shire Roads DOE DOE 8,318,414 0 0 0 0 0 0 0 0 0Road Infrastructure Our Infrastructure 19177.8405 2012 Flood Damage Shire Roads DOE DOE 2,000,000 8,000,000 0 0 0 0 0 0 0 0Road Infrastructure Our Infrastructure 19177.8405 2013 Flood Damage Shire Roads DOE DOE 50,000 0 2,000,000 2,000,000 2,000,000 2,000,000 2,000,000 2,000,000 2,000,000 2,000,000Road Infrastructure Our Infrastructure 19177.8405 River Crossings - Poseidon, Glendower, Alderly DOE DOE 0 0 0 0 0 0 0 0 0 0Water Infrastructure Our Infrastructure 19175.8405 Hughenden Water Fluoridation DOE EHO 1,437,000 0 0 0 0 0 0 0 0 0
Water Infrastructure Our Infrastructure 19175.8405 Water Capital Works DOE EHO 0 50,000 50,000 50,000 50,000 50,000 50,000 50,000 50,000 50,000
Water Infrastructure Our Infrastructure 19175.8405 Redirect Water Service on Flinders River Bridge DOE DOE 80,000 0 0 0 0 0 0 0 0 0
Water Infrastructure Our Infrastructure 19175.8405 Spare Pump for Pump Station 1 DOE DOE 6,500 0 0 0 0 0 0 0 0 0
Water Infrastructure Our Infrastructure 19175.8405 Spare Pump for Pump Station 2 DOE DOE 16,000 0 0 0 0 0 0 0 0 0
Water Infrastructure Our Infrastructure 19175.8405 W1181 Torrens Creek Onground Water System DOE DOE 60,000 0 0 0 0 0 0 0 0 0
Water Infrastructure Our Infrastructure W1447.93 Prairie Water Upgrade - Chlorination DOE DOE 10,000 0 0 0 0 0 0 0 0 0Water Infrastructure Our Infrastructure Stamford Water Upgrade - Chlorination/Onground system DOE DOE 0 40,000 0 0 0 0 0 0 0 0Sewerage Infrastructure Our Infrastructure Sewerage Capital Works DOE DOE 0 50,000 50,000 50,000 50,000 50,000 50,000 50,000 50,000 50,000Sewerage Infrastructure Our Infrastructure 19177.8405 W1260 Sewerage - Pump Station 1 & 2 Telemetry System DOE DOE 20,000 0 0 0 0 0 0 0 0 0Sewerage Infrastructure Our Infrastructure 19177.8405 North Hughenden Sewerage and STP DOE DOE 6,100,000 0 0 0 0 0 0 0 0 0Buildings and Other StructuresOur Infrastructure 19155.8405 Synthetic Grass - Gray Street Medians - Supply and Install DOE EAO 31,000 0 0 0 0 0 0 0 0 0
Our Governance
Buildings and Other StructuresOur Governance 19155.8405 W1193.480 Shire Office Complex CEO CEO 2,150,000 0 0 0 0 0 0 0 0 0
Buildings and Other StructuresOur Governance 19155.8405 W1229 Employee Housing - Brodie St Units Refurbishments CEO Carpenter 60,000 60,000 60,000 60,000 60,000 60,000 60,000 60,000 60,000 60,000
Buildings and Other StructuresOur Governance 19155.8405 W1233 Employee Housing - Mowbray St Upgrade CEO Carpenter 50,000 50,000 50,000 50,000 50,000 50,000 50,000 50,000 50,000 50,000
Buildings and Other StructuresOur Governance W1444.413 Employee Housing - Resolution St bathroom upgrade CEO Carpenter 15,000 0 0 0 0 0 0 0 0 0
Buildings and Other StructuresOur Governance W1445.480 Flood Warning System Flinders River CEO CEO 70,000 0 0 0 0 0 0 0 0 0
Buildings and Other StructuresOur Governance 19155.8405 W1435.480 Flood Warning System Porcupine Creek CEO CEO 70,000 0 0 0 0 0 0 0 0 0
buildings and Other StructuresOur Governance 19155.8405 Depot Signage Building - Shelving DOE DOE 10,000 0 0 0 0 0 0 0 0 0
Buildings and Other StructuresOur Governance Depot - Awning in front of Signage Shed DOE Carpenter 11,000 0 0 0 0 0 0 0 0 0
Buildings and Other StructuresOur Governance Depot - Extension of Fence for new area DOE Overseer 0 35,000 0 0 0 0 0 0 0 0
Plant and Equipment Our Governance Water Filled Crash Barrier 60 Meters DOE EAO 38,000 0 0 0 0 0 0 0 0 0
Buildings and Other StructuresOur Governance 19155.8405 W1247 Workshop Floor Extension and roof extension 13/14 DOE DOE 80,000 200,000 0 0 0 0 0 0 0 0Plant and Equipment Our Governance 19157.8405.555 19157.8405.555 Plant Purchases - net DOE Overseer 2,691,000 1,500,000 1,500,000 1,500,000 1,500,000 1,500,000 1,500,000 1,500,000 1,500,000 1,500,000
GRAND TOTAL 32,874,414 16,099,470 7,222,470 6,157,470 5,927,470 7,287,470 6,207,470 5,707,470 7,237,470 9,507,470
Buildings and Other Structures Total Buildings and Other Structures 8,062,000 1,105,000 420,000 620,000 390,000 170,000 670,000 170,000 1,670,000 170,000
Land and Land Improvements Total Land 245,000 150,000 550,000 50,000 50,000 50,000 50,000 50,000 50,000 850,000
Recreation Facilities Total Recreation Facilities 225,500 147,000 695,000 80,000 80,000 1,480,000 80,000 80,000 110,000 2,580,000
Corporate and IT Total Corporate and IT 0 0 0 0 0 0 0 0 0 0
Road Infrastructure Total Road Infrastracture 13,853,414 13,037,470 3,937,470 3,787,470 3,787,470 3,787,470 3,787,470 3,787,470 3,787,470 4,287,470
Water Infrastructure Total Water Infrastructure 1,609,500 90,000 50,000 50,000 50,000 50,000 50,000 50,000 50,000 50,000
Sewerage Infrastructure Total Sewerage Infrastructure 6,120,000 50,000 50,000 50,000 50,000 50,000 50,000 50,000 50,000 50,000
Stormwater Drainage Network Total Stormwater Drainage Network 0 0 0 0 0 0 0 0 0 0
Waste/Landfill Total Waste/Landfill 30,000 20,000 20,000 20,000 20,000 200,000 20,000 20,000 20,000 20,000
Plant and Equipment Total Plant and Equipment 2,729,000 1,500,000 1,500,000 1,500,000 1,500,000 1,500,000 1,500,000 1,500,000 1,500,000 1,500,000Grand Total 32,874,414 16,099,470 7,222,470 6,157,470 5,927,470 7,287,470 6,207,470 5,707,470 7,237,470 9,507,470
Our Governance Total Our Governance 5,245,000 1,845,000 1,610,000 1,610,000 1,610,000 1,610,000 1,610,000 1,610,000 1,610,000 1,610,000
Our Economy Total Our Economy 520,000 3,830,000 610,000 110,000 110,000 110,000 110,000 110,000 1,610,000 1,410,000
Our Environment Total Our Environment 30,000 20,000 20,000 20,000 20,000 200,000 20,000 20,000 20,000 20,000
Our Resources Total Our Resources 0 0 0 0 0 0 0 0 0 0
Our Infrastructure Total Our Infrastructure 21,463,914 10,157,470 4,037,470 3,887,470 3,887,470 3,887,470 3,887,470 3,887,470 3,887,470 3,887,470
Our Community Total Our Community 5,615,500 247,000 945,000 530,000 300,000 1,480,000 580,000 80,000 110,000 2,580,000
Grand Total 32,874,414 16,099,470 7,222,470 6,157,470 5,927,470 7,287,470 6,207,470 5,707,470 7,237,470 9,507,470
7
TITLE REVENUE POLICY 2012-2013 DATE OF ADOPTION 19 JULY 2012
REVIEW DATE 30 JUNE 2013 (Prior to 2013-2014 Budget Meeting)
PURPOSE The purpose of this Revenue Policy is to set out the principles used by Council in 2012-2013 for-
The making of rates and charges;
The levying of rates;
The recovery of rates and charges; and
Concessions for rates and charges.
PRINCIPLES a) Principles used for the making of rates and charges. In general, Council will be guided by the principle of user pays in the making of rates and charges so as to minimise the impact of rating on the efficiency of the local economy.
Council will also have regard to the principles of -
transparency in the making of rates and charges;
having in place a rating regime that is simple and inexpensive to administer;
equity by taking account of the different levels of capacity to pay within the local community; and
flexibility to take account of changes in the local economy.
b) Principles used for the levying of rates.
In levying rates Council will apply the principles of –
making clear what is Council’s and each ratepayers’ responsibility to the rating system;
Council levies once a year;
making the levying system simple and inexpensive to administer;
timing the levy of rates to take into account the financial cycle of local economic activity in order to assist smooth running of the local economy; and
equity through flexible payment arrangements for ratepayers with a lower capacity to pay.
c) Principles used for the recovery of rates and charges. Council will exercise its rate recovery powers in order to reduce the overall rate burden on ratepayers. It will be guided by the principles of –
Transparency by making clear the obligations of ratepayers and the processes used by Council in assisting them meet their financial obligations;
Making the processes used to recover outstanding rates and charges clear, simple to administer and cost effective;
Capacity to pay in determining appropriate arrangements for different sectors of the community;
Equity by having regard to providing the same treatment for ratepayers with similar circumstances; and
Flexibility by responding where necessary to changes in the local economy.
8
REVENUE POLICY
BUDGET 2012-2013
d) Concessions for rates and charges In considering the application of concessions, Council will be guided by the principles of –
Equity by having regard to the different levels of capacity to pay within the local community;
The same treatment for ratepayers with similar circumstances;
Transparency by making clear the requirements necessary to receive concessions; and
Flexibility to allow Council to respond to local economic issues.
Consideration may be given by Council to granting a class concession in the event all or part of the local government area is declared a natural disaster area by the State Government.
Stephen McCartney
Chief Executive Officer
9
SHIRE OF FLINDERS
BUDGET 2012-2013
2 DEBT POLICY That, in accordance with Section 133 of the Local Government (Finance, Plans & Reporting) Regulation 2010 that Council adopt as its Debt Policy - Flinders Shire Council will – (a) in the case of operating expenditure, rely on current income being rates, charges and grants to fund such expenditures and establish and maintain an overdraft/revolving line of credit to fund short term cash flow requirements; and (b) in the case of capital expenditure, rely on current income, capital grants, sale of assets, funded depreciation and cash backed reserves to fund such expenditures, except where Council resolves to borrow in order to provide a new facility or extend a service and Council reasonably considers the benefits will be enjoyed by and the burden should be shared by current and future ratepayers / residents, or where Council expects to undertake works over a number of years and Council considers initial capital expenditures should be funded by / recovered from the discrete funding sources identified with the works in question over the life of the works. Flinders Shire Council will show, in its Capital Works Program, its proposed program for new borrowing and debt redemption.
3 REVENUE STATEMENT That in accordance with the Local Government Act 2009 & Section 107, Division 6, of the Local Government (Finance,
Plans & Reporting) Regulation 2010 Council adopt as its Revenue Statement -
GENERAL RATES
Physical and Social infrastructure costs for new development are to be funded by General Rates, Grants, Loans and User
Pay charges for the development.
It is intended to maintain the current operating capability of the Flinders Shire to ensure current services are maintained
for the community.
Depreciation and other non-cash expenses are fully funded by Council.
Council generally increases rates in line with the CPI, LGAQ and Construction Index and doesn’t limit rate changes via
rate capping.
Flinders Shire Council has a policy of making and levying Differential General Rates for the 2012-2013 financial year.
The Council will levy Differential General Rates on all rateable properties in each category of land where the minimum
General rate does not apply.
The Council is required to raise an amount of revenue it sees as being appropriate to maintain and provide services to the
Shire as a whole. In deciding how that revenue is raised, the Council is able to take into account the following factors -
the rateable value of the land and the rates that would be payable if only one General Rate were adopted;
the level of services provided to that land and the cost of providing the services compared to the rate burden that
would apply under a single General Rate;
the use of the land in so far as it relates to the extent of utilisation of Council services; and
the economic circumstances affecting the land.
The scheme will have six categories of land, namely -
Category l All land within the township of Hughenden as defined in Appendix A.
Category 2 All land within the townships of Prairie, Torrens Creek and Stamford as defined in Appendix B, C & D.
Category 3 All land within the Shire which the Valuer-General has identified as Rural land.

10
BUDGET 2012-2013
Category 4 All lands within the Shire which are outside the Townships of Hughenden, Prairie and Torrens Creek
identified (Refer Appendix A,B,C & D) as follows -
NAME ON RATE CARD TOWN ASSESSMENT NO
Cemetery Reserve Prairie 10009371
Cemetery Reserve Prairie 10009363
Prairie Jockey Club Prairie 10008647
Sanitary Reserve Prairie 10008670
Pound Reserve Prairie 10008688
FSC - Prairie Cricket Field Prairie 10008662
FSC - Rubbish Tip Torrens Creek 10010114
Cemetery Reserve Torrens Creek 10010171
Sanitary Reserve Torrens Creek 10010189
FSC - Reserve Recreation Torrens Creek 10010163
Rubbish Depot Reserve Torrens Creek 10009561
Flinders River Nursery Hughenden 10007599
FSC - Saleyards Hughenden 10004836
Vacant Crown Land (Dip) Hughenden 10004844
NTL Australia Pty Ltd (4HU Radio Station) Hughenden 10007227
Category 5 All lands within the Shire which are outside the townships of Hughenden, Prairie and Torrens
Creek identified as follows –
(Refer Appendix A)
ON RATE CARD TOWN ASSESSMENT NO
(Vacant) Hughenden 10007581
(Dwelling) Hughenden 10007573
(Dwelling and Shed) Hughenden 10007565
(Dwelling) Hughenden 10007557
(Dwelling) Hughenden 10007532
Category 6 All land in the Hughenden Industrial Estate as described in Appendix A.
The minimum General Rate will be determined at a level that takes into account the minimum cost of
providing common services that are provided to every ratepayer as well as basic general
administration costs.
WATER CHARGES
Flinders Shire Council will levy a Water Charge on each consumer / property, whether vacant or occupied that Council has
or is able to provide with water services. Where a property is within 100 metres of a water main or a road in which mains
are laid and Council deems that the property is able to be provided with a water service.
The charge will be based on the size of the water connection together with Council’s estimate of demand patterns and
measured in units as detailed below:
a) HUGHENDEN WATER SUPPLY
Description Units Annual Allowance (kL)
Dwellings 10 1,200
Ambulance Centre 15 1,800
Boarding Houses 15 1,800
Building Depots 10 1,200
Butchers 19 2,280
Bulk Fuel Depots 18 2,160
Business Premises - Permanently Unoccupied 10 1,200
Boy Scout and Girl Guides 5 600
Cafes and Milk Bars 16 1,920
Church properties and Charitable Organisations
(excluding Minister’s residence) 5 600
Clubs – Railway Social Club *** 89 10,680
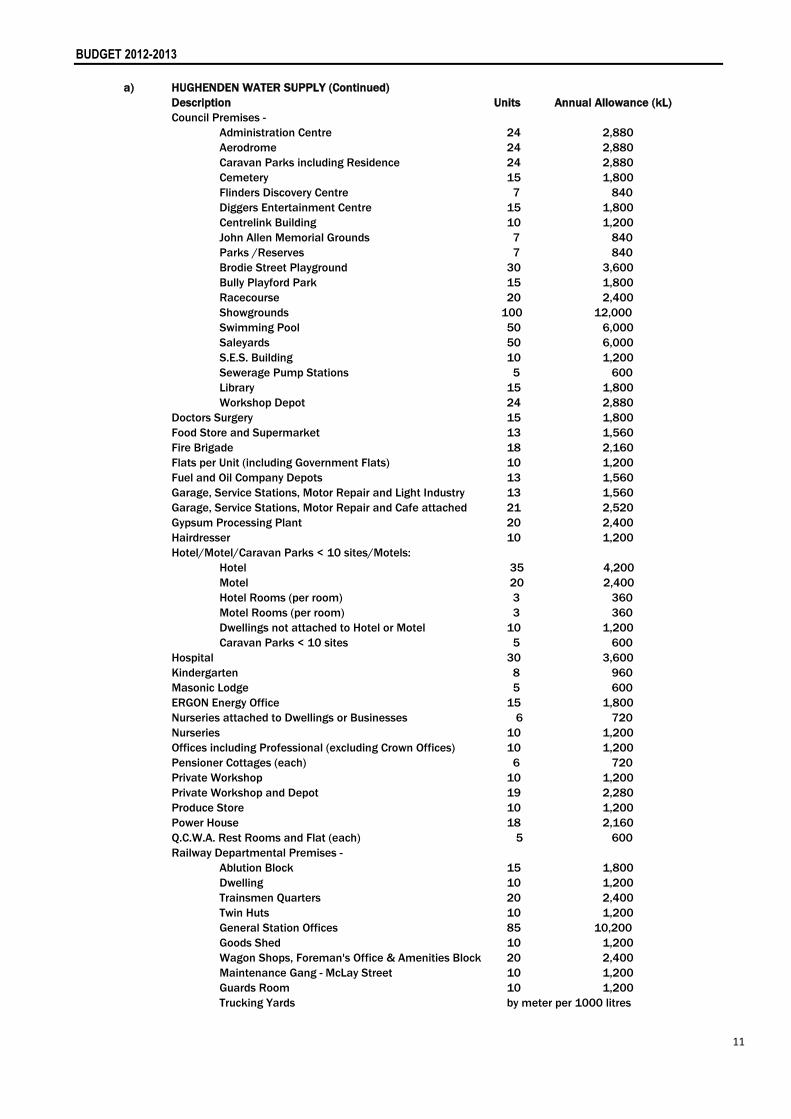
11
BUDGET 2012-2013
a) HUGHENDEN WATER SUPPLY (Continued)
Description Units Annual Allowance (kL)
Council Premises -
Administration Centre 24 2,880
Aerodrome 24 2,880
Caravan Parks including Residence 24 2,880
Cemetery 15 1,800
Flinders Discovery Centre 7 840
Diggers Entertainment Centre 15 1,800
Centrelink Building 10 1,200
John Allen Memorial Grounds 7 840
Parks /Reserves 7 840
Brodie Street Playground 30 3,600
Bully Playford Park 15 1,800
Racecourse 20 2,400
Showgrounds 100 12,000
Swimming Pool 50 6,000
Saleyards 50 6,000
S.E.S. Building 10 1,200
Sewerage Pump Stations 5 600
Library 15 1,800
Workshop Depot 24 2,880
Doctors Surgery 15 1,800
Food Store and Supermarket 13 1,560
Fire Brigade 18 2,160
Flats per Unit (including Government Flats) 10 1,200
Fuel and Oil Company Depots 13 1,560
Garage, Service Stations, Motor Repair and Light Industry 13 1,560
Garage, Service Stations, Motor Repair and Cafe attached 21 2,520
Gypsum Processing Plant 20 2,400
Hairdresser 10 1,200
Hotel/Motel/Caravan Parks < 10 sites/Motels:
Hotel 35 4,200
Motel 20 2,400
Hotel Rooms (per room) 3 360
Motel Rooms (per room) 3 360
Dwellings not attached to Hotel or Motel 10 1,200
Caravan Parks < 10 sites 5 600
Hospital 30 3,600
Kindergarten 8 960
Masonic Lodge 5 600
ERGON Energy Office 15 1,800
Nurseries attached to Dwellings or Businesses 6 720
Nurseries 10 1,200
Offices including Professional (excluding Crown Offices) 10 1,200
Pensioner Cottages (each) 6 720
Private Workshop 10 1,200
Private Workshop and Depot 19 2,280
Produce Store 10 1,200
Power House 18 2,160
Q.C.W.A. Rest Rooms and Flat (each) 5 600
Railway Departmental Premises -
Ablution Block 15 1,800
Dwelling 10 1,200
Trainsmen Quarters 20 2,400
Twin Huts 10 1,200
General Station Offices 85 10,200
Goods Shed 10 1,200
Wagon Shops, Foreman's Office & Amenities Block 20 2,400
Maintenance Gang - McLay Street 10 1,200
Guards Room 10 1,200
Trucking Yards by meter per 1000 litres
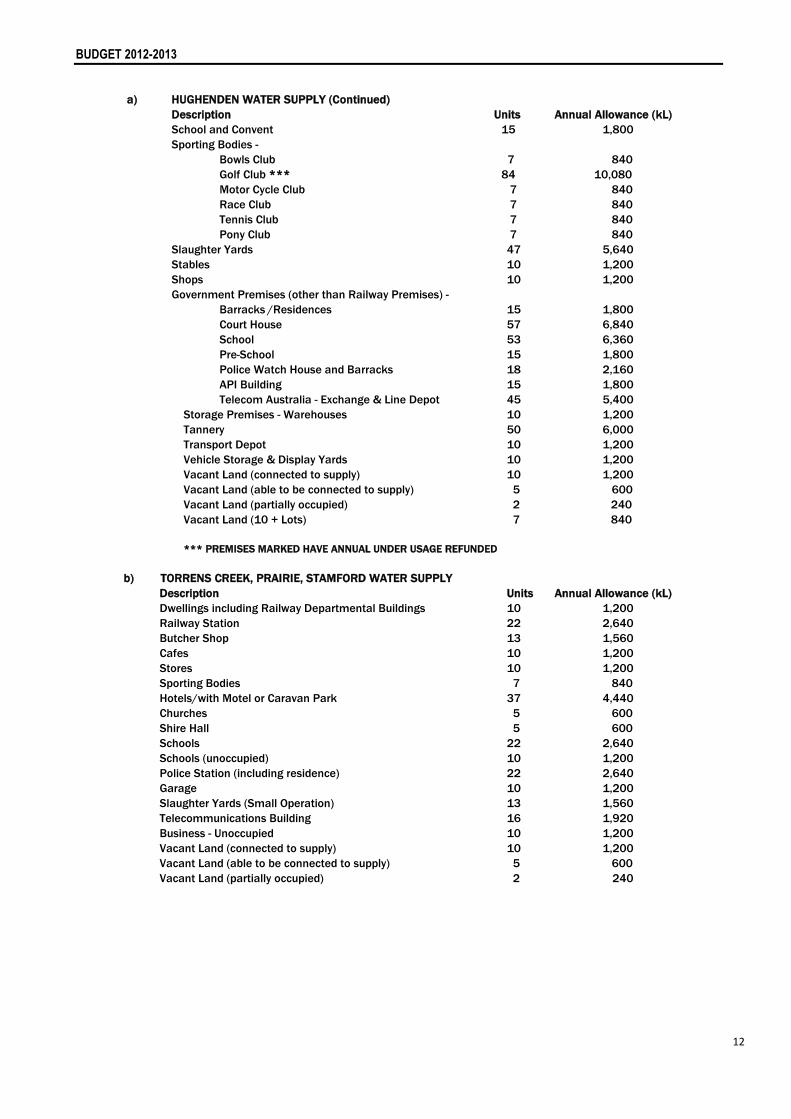
12
BUDGET 2012-2013
a) HUGHENDEN WATER SUPPLY (Continued)
Description Units Annual Allowance (kL)
School and Convent 15 1,800
Sporting Bodies -
Bowls Club 7 840
Golf Club *** 84 10,080
Motor Cycle Club 7 840
Race Club 7 840
Tennis Club 7 840
Pony Club 7 840
Slaughter Yards 47 5,640
Stables 10 1,200
Shops 10 1,200
Government Premises (other than Railway Premises) -
Barracks /Residences 15 1,800
Court House 57 6,840
School 53 6,360
Pre-School 15 1,800
Police Watch House and Barracks 18 2,160
API Building 15 1,800
Telecom Australia - Exchange & Line Depot 45 5,400
Storage Premises - Warehouses 10 1,200
Tannery 50 6,000
Transport Depot 10 1,200
Vehicle Storage & Display Yards 10 1,200
Vacant Land (connected to supply) 10 1,200
Vacant Land (able to be connected to supply) 5 600
Vacant Land (partially occupied) 2 240
Vacant Land (10 + Lots) 7 840
*** PREMISES MARKED HAVE ANNUAL UNDER USAGE REFUNDED
b) TORRENS CREEK, PRAIRIE, STAMFORD WATER SUPPLY
Description Units Annual Allowance (kL)
Dwellings including Railway Departmental Buildings 10 1,200
Railway Station 22 2,640
Butcher Shop 13 1,560
Cafes 10 1,200
Stores 10 1,200
Sporting Bodies 7 840
Hotels/with Motel or Caravan Park 37 4,440
Churches 5 600
Shire Hall 5 600
Schools 22 2,640
Schools (unoccupied) 10 1,200
Police Station (including residence) 22 2,640
Garage 10 1,200
Slaughter Yards (Small Operation) 13 1,560
Telecommunications Building 16 1,920
Business - Unoccupied 10 1,200
Vacant Land (connected to supply) 10 1,200
Vacant Land (able to be connected to supply) 5 600
Vacant Land (partially occupied) 2 240
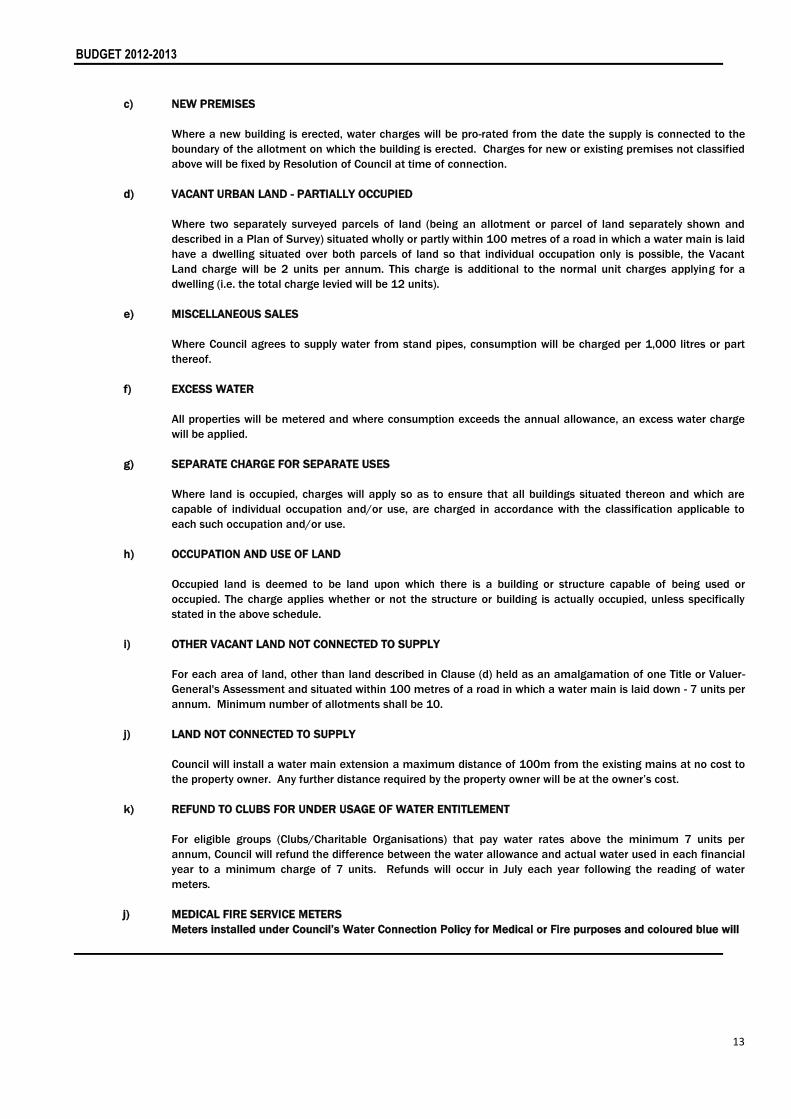
13
BUDGET 2012-2013
c) NEW PREMISES
Where a new building is erected, water charges will be pro-rated from the date the supply is connected to the
boundary of the allotment on which the building is erected. Charges for new or existing premises not classified
above will be fixed by Resolution of Council at time of connection.
d) VACANT URBAN LAND - PARTIALLY OCCUPIED
Where two separately surveyed parcels of land (being an allotment or parcel of land separately shown and
described in a Plan of Survey) situated wholly or partly within 100 metres of a road in which a water main is laid
have a dwelling situated over both parcels of land so that individual occupation only is possible, the Vacant
Land charge will be 2 units per annum. This charge is additional to the normal unit charges applying for a
dwelling (i.e. the total charge levied will be 12 units).
e) MISCELLANEOUS SALES
Where Council agrees to supply water from stand pipes, consumption will be charged per 1,000 litres or part
thereof.
f) EXCESS WATER
All properties will be metered and where consumption exceeds the annual allowance, an excess water charge
will be applied.
g) SEPARATE CHARGE FOR SEPARATE USES
Where land is occupied, charges will apply so as to ensure that all buildings situated thereon and which are
capable of individual occupation and/or use, are charged in accordance with the classification applicable to
each such occupation and/or use.
h) OCCUPATION AND USE OF LAND
Occupied land is deemed to be land upon which there is a building or structure capable of being used or
occupied. The charge applies whether or not the structure or building is actually occupied, unless specifically
stated in the above schedule.
i) OTHER VACANT LAND NOT CONNECTED TO SUPPLY
For each area of land, other than land described in Clause (d) held as an amalgamation of one Title or Valuer-
General's Assessment and situated within 100 metres of a road in which a water main is laid down - 7 units per
annum. Minimum number of allotments shall be 10.
j) LAND NOT CONNECTED TO SUPPLY
Council will install a water main extension a maximum distance of 100m from the existing mains at no cost to
the property owner. Any further distance required by the property owner will be at the owner’s cost.
k) REFUND TO CLUBS FOR UNDER USAGE OF WATER ENTITLEMENT
For eligible groups (Clubs/Charitable Organisations) that pay water rates above the minimum 7 units per
annum, Council will refund the difference between the water allowance and actual water used in each financial
year to a minimum charge of 7 units. Refunds will occur in July each year following the reading of water
meters.
j) MEDICAL FIRE SERVICE METERS
Meters installed under Council’s Water Connection Policy for Medical or Fire purposes and coloured blue will
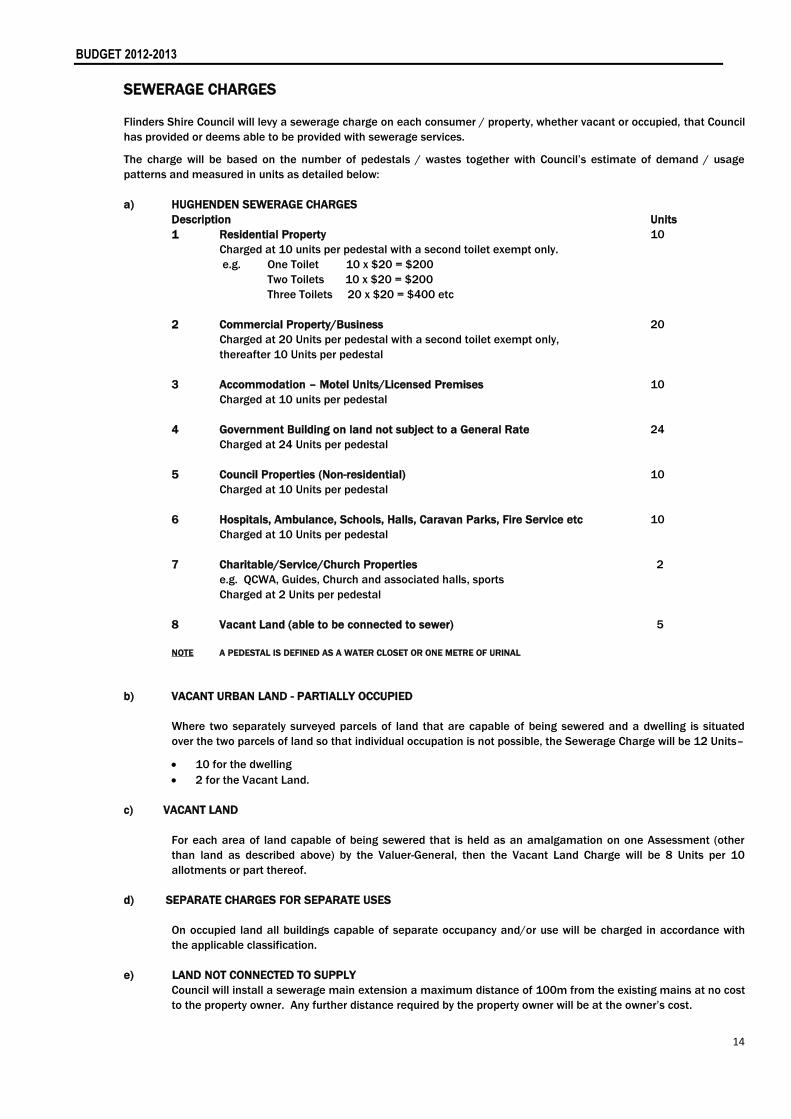
14
BUDGET 2012-2013
SEWERAGE CHARGES
Flinders Shire Council will levy a sewerage charge on each consumer / property, whether vacant or occupied, that Council
has provided or deems able to be provided with sewerage services. The charge will be based on the number of pedestals / wastes together with Council’s estimate of demand / usage
patterns and measured in units as detailed below:
a) HUGHENDEN SEWERAGE CHARGES
Description Units
1 Residential Property 10
Charged at 10 units per pedestal with a second toilet exempt only.
e.g. One Toilet 10 x $20 = $200
Two Toilets 10 x $20 = $200
Three Toilets 20 x $20 = $400 etc
2 Commercial Property/Business 20
Charged at 20 Units per pedestal with a second toilet exempt only,
thereafter 10 Units per pedestal
3 Accommodation – Motel Units/Licensed Premises 10
Charged at 10 units per pedestal
4 Government Building on land not subject to a General Rate 24
Charged at 24 Units per pedestal
5 Council Properties (Non-residential) 10
Charged at 10 Units per pedestal
6 Hospitals, Ambulance, Schools, Halls, Caravan Parks, Fire Service etc 10
Charged at 10 Units per pedestal
7 Charitable/Service/Church Properties 2
e.g. QCWA, Guides, Church and associated halls, sports
Charged at 2 Units per pedestal
8 Vacant Land (able to be connected to sewer) 5
NOTE A PEDESTAL IS DEFINED AS A WATER CLOSET OR ONE METRE OF URINAL
b) VACANT URBAN LAND - PARTIALLY OCCUPIED
Where two separately surveyed parcels of land that are capable of being sewered and a dwelling is situated
over the two parcels of land so that individual occupation is not possible, the Sewerage Charge will be 12 Units–
10 for the dwelling
2 for the Vacant Land.
c) VACANT LAND
For each area of land capable of being sewered that is held as an amalgamation on one Assessment (other
than land as described above) by the Valuer-General, then the Vacant Land Charge will be 8 Units per 10
allotments or part thereof.
d) SEPARATE CHARGES FOR SEPARATE USES
On occupied land all buildings capable of separate occupancy and/or use will be charged in accordance with
the applicable classification.
e) LAND NOT CONNECTED TO SUPPLY
Council will install a sewerage main extension a maximum distance of 100m from the existing mains at no cost
to the property owner. Any further distance required by the property owner will be at the owner’s cost.
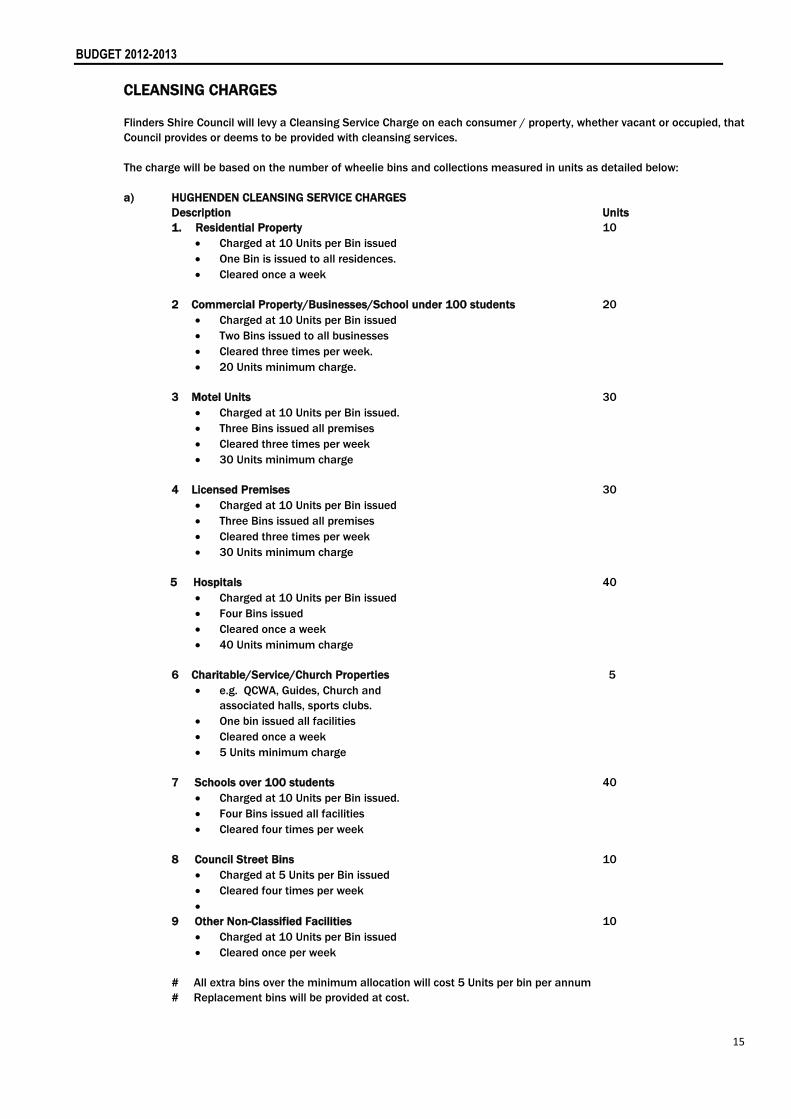
15
BUDGET 2012-2013
CLEANSING CHARGES
Flinders Shire Council will levy a Cleansing Service Charge on each consumer / property, whether vacant or occupied, that
Council provides or deems to be provided with cleansing services.
The charge will be based on the number of wheelie bins and collections measured in units as detailed below:
a) HUGHENDEN CLEANSING SERVICE CHARGES
Description Units
1. Residential Property 10
Charged at 10 Units per Bin issued
One Bin is issued to all residences.
Cleared once a week
2 Commercial Property/Businesses/School under 100 students 20
Charged at 10 Units per Bin issued
Two Bins issued to all businesses
Cleared three times per week.
20 Units minimum charge.
3 Motel Units 30
Charged at 10 Units per Bin issued.
Three Bins issued all premises
Cleared three times per week
30 Units minimum charge
4 Licensed Premises 30
Charged at 10 Units per Bin issued
Three Bins issued all premises
Cleared three times per week
30 Units minimum charge
5 Hospitals 40
Charged at 10 Units per Bin issued
Four Bins issued
Cleared once a week
40 Units minimum charge
6 Charitable/Service/Church Properties 5
e.g. QCWA, Guides, Church and
associated halls, sports clubs.
One bin issued all facilities
Cleared once a week
5 Units minimum charge
7 Schools over 100 students 40
Charged at 10 Units per Bin issued.
Four Bins issued all facilities
Cleared four times per week
8 Council Street Bins 10
Charged at 5 Units per Bin issued
Cleared four times per week
9 Other Non-Classified Facilities 10
Charged at 10 Units per Bin issued
Cleared once per week
# All extra bins over the minimum allocation will cost 5 Units per bin per annum
# Replacement bins will be provided at cost.
16
BUDGET 2012-2013
This system will provide flexibility for Council to adjust Cleansing Charges based on the number of wheelie bins issued to
each property. A minimum unit charge and minimum number of bins allocated will then be based on the property
classification. All extra bins over the minimum allocation will be charged on a pre-determined basis as listed.
SPECIAL RATE WILD DOG CONTROL LEVY
Pursuant to Section 92 (3) of the Local Government Act 2009, a Special Rate will be levied on rural properties (per
assessment) classified as Category 3 being all land within the Shire which the Valuer-General has identified as Rural
Land. The Council is of the opinion that all rural properties will derive a benefit from the Wild Dog Levy. The rate will be
levied on the basis of a rate in the dollar on the Unimproved Capital Value of each property. The minimum rate will be
determined at a level that takes into account the minimum cost of providing the service to all rural ratepayers.
WILD DOG CONTROL PLAN
The Special Rate will be utilised for the control of wild dogs on rural properties throughout the Shire. The rate will partly
fund the costs of undertaking co-ordinated baiting including the Rural Lands Officer’s and the supporting Administration
Officer’s time, plant and equipment, supply of meat/prepared baits and payment of bounties.
The Special Rate will be levied on –
1. All Category 3 Rural Land within the Shire with a charging valuation greater than $50,000;
2. All properties valued less than $50,000 having an area greater than 4,000ha; and
3. All properties (assessments) having an area less than 200ha are exempt from the levy.
The estimated cost of implementing the wild dog control measures is approximately $115,000 per annum with the levy
raising approximately $65,500 net and the balance funded by the Shire General Rates and payments directly from
properties for special services.
A Wild Dog Advisory Group will provide advice to Council and help coordinate control measures throughout the Shire. The
Advisory Group will consist of Councillors, Council Officers and rural property owners throughout the Shire.
ADDITIONAL REVENUE POLICIES
If a change in the valuation of a property results in raising a supplementary levy to the rate payer of an amount less than
$50.00, Council will not raise the notice to the rate payer.
Council Administration has the discretion to write-off rate amounts less than $20.00. Any amounts over $20.00 must be
referred to Council for their decision.
Any Council errors/mistakes in levy charges will only be back dated for the current financial year with a supplementary
notice.
4 RATES AND CHARGES
a) CATEGORISATION OF LAND
That in accordance with the Local Government Act 2009 & the Local Government (Finance, Plans & Reporting)
Regulation 2010, Division 6, Section 107 the Flinders Shire Council adopt the following Categorisation of land
for differential rating purposes -
The categories of land are –
Category l All land within the Township of Hughenden as defined in Appendix A.
Category 2 All land within the Townships of Prairie, Torrens Creek and Stamford as defined in Appendix
B, C & D.
Category 3 All land within the Shire which the Valuer-General has identified as Rural land.
17
BUDGET 2012-2013
Category 4 All land within the Shire which is outside the Townships of Hughenden, Prairie and Torrens
Creek identified (Refer Appendix A, B, C & D) as follows -
Name on Rate Card Town Assessment No
Cemetery Reserve Prairie 10009371
Cemetery Reserve Prairie 10009363
Prairie Jockey Club Prairie 10008647
Sanitary Reserve Prairie 10008670
Pound Reserve Prairie 10008688
FSC - Prairie Cricket Field Prairie 10008662
FSC - Rubbish Tip Torrens Creek 10010114
Cemetery Reserve Torrens Creek 10010171
Sanitary Reserve Torrens Creek 10010189
FSC - Reserve Recreation Torrens Creek 10010163
Rubbish Depot Reserve Torrens Creek 10009561
Austam Australia Pty Ltd Hughenden 10007599
FSC - Saleyards Hughenden 10004836
Vacant Crown Land (Dip) Hughenden 10004844
NTL Australia Pty Ltd (4HU Radio Station) Hughenden 10007227
Category 5 All land within the Shire which is outside the townships of Hughenden, Prairie and
Torrens Creek identified as follows –
(REFER APPENDIX A)
NAME ON RATE CARD
TOWN
ASSESSMENT
NUMBER
(Vacant) Hughenden 10007581
(Dwelling) Hughenden 10007573
(Dwelling and Shed) Hughenden 10007565
(Dwelling) Hughenden 10007557
(Dwelling) Hughenden 10007532
Category 6 All land included in the Hughenden Industrial Estate as described in Appendix A.
b) DIFFERENTIAL GENERAL RATES
That, in accordance with Section 92 & 94 of the Local Government Act 2009, Flinders Shire Council makes
Differential General Rates for the year ending 30 June 2013 for the reasons and for the categories set out
hereunder -
the valuation of the Shire applying to the 2012-2013 financial year would lead to rating inequities and a
distortion of relativities in the amount of rates paid in the various areas of the Local Government area if only
one General Rate were adopted;
the level of services provided to that land and the cost of providing the services compared to the rate burden
that would apply under a single general rate; and
six categories of land have been identified in accordance with criteria determined by Council and in
accordance with Section 92 of the Local Government Act 2009. Owners of rateable land will be informed
that they have the right of objection to the category their land is included in. All objections shall be to the
Chief Executive Officer, Flinders Shire Council and the only basis for objection shall be that at the date of
issue of the rate notice having regard to the criteria adopted by Council the land should be in another
category. The level of rate adopted for each category as described above is –
CATEGORY 2011-2012
Old Valuation Rates
2012-2013
New Valuation Rates
Adjusted for Nil
Increase
2012-2013
4% Increase
1 3.4309 3.4309 3.568136
2 3.4309 1.65022 1.716229
3 0.5430 0.57237 0.595265
4 0.5430 0.54300 0.564720
5 3.4309 3.4309 3.568136
6 4.1953 4.1953 4.363112
18
BUDGET 2012-2013
c) MINIMUM GENERAL RATE
That in accordance with Section 94 of the Local Government Act 2009 and Section 11 of the Local Government
(Finance, Plans & Reporting) Regulation 2010 Flinders Shire Council makes a minimum General Rate of
$282.00 (from $271 2011-2012) on all rateable land within the Shire for the year ended 30 June 2013.
d) LAST DAY FOR PAYMENTS OF RATES
That, in accordance with Section 94 of the Local Government Act 2009 and Section 52 of the Local Government
(Finance, Plans & Reporting) Regulation 2010 Flinders Shire Council makes the 31st October 2012 (Wednesday)
the last day by which Rates and Utility Charges are to be paid. Payment must be received in the Official Office
of the Council, 34 Gray Street, Hughenden on or before the due date by the close of business (5.00pm) or
electronically in Council’s nominated bank account by 12 midnight.
e) INTEREST ON RATES AND CHARGES
That, in accordance with Section 94 of the Local Government Act 2009 and Section 67 of the Local Government
(Finance, Plans & Reporting) Regulation 2010 Flinders Shire Council fixes the interest for overdue rates and
utility charges at 11 per cent (11%) per annum Compound Interest, for the year ending 30 June 2013 to be
charged monthly in arrears. Interest to be charged on the current levy from the last day of the discount period.
f) DISCOUNT ON RATES AND CHARGES
That, in accordance with Section 94 of the Local Government Act 2009 and Section 64 of the Local Government
(Finance, Plans & Reporting) Regulation 2010 Flinders Shire Council fixes the discount on rates and utility
charges levied for the year ending 30 June 2013 excluding the Fire Service Levy, at 15 per cent (15%) provided
payment in full of any outstanding rates are made on or before the due date for payment. The due date is 31st
October 2012. If amounts are outstanding with Council for works completed (including interest) for the owner
in accordance with the Local Government Act 2009, and all other rates and charges are paid then, in
accordance with Section 64 of the Local Government (Finance, Plans & Reporting) Regulation 2010 the
discount will not be allowed unless all moneys are received before the discount period closes.
g) WATER CHARGES
That, in accordance with Section 94 of the Local Government Act 2009, Flinders Shire Council makes Water
Charges for the year ending 30 June 2013 and the level of charges adopted for items described in the revenue
policy is –
ITEM
2012-2013
2% INCREASE
2011-2012
Unit of Water $60.99 per unit $59.79 per unit
Excess Water $1.00 per kilolitre $ 1.00 per kilolitre
Miscellaneous Sales $5.00 per kilolitre $ 5.00 per kilolitre
Water Allowance One (1) Unit=120Kl One (1) Unit=120Kl
h) SEWERAGE CHARGES
That, in accordance with Section 94 of the Local Government Act 2009, Flinders Shire Council makes Sewerage
Charges for the year ending 30 June 2013 and the level of charges adopted for items described in the revenue
policy is –
ITEM
2012-2013
6% INCREASE
2011-2012
Unit of Sewerage
$53.79 per unit
$50.74 per unit
19
BUDGET 2012-2013
i) CLEANSING SERVICE CHARGES
That, in accordance with Section 94 of the Local Government Act 2009, Flinders Shire Council makes Cleansing
Service Charges for the year ending 30 June 2013 and the level of charges adopted for items described in the
revenue policy is -
ITEM
2012-2013
6% INCREASE
2011-2012
Unit of Cleansing
$20.85 per unit
$19.67 per unit
j) SPECIAL RATE – WILD DOG CONTROL
That, in accordance with Section 94 of the Local Government Act 2009, Flinders Shire Council makes a
Wild Dog Control Charge for the year ending 30 June 2012 and the level of charges adopted for items
described in the revenue Policy is –
ITEM
2011-2012
OLD VALUATION RATES
2011-2012
New Valuation Rates
Adjusted for Nil
Increase
2012-2013
NIL INCREASE
Rate Category
3
Rural Land
0.0002490 cents in
$UCV
0.00026210
$UCV
0.00026210 cents in
$UCV
Minimum
Charge
$162.50 per
Assessment
$162.50 per
Assessment
$162.50 per
Assessment
5 PENSIONER RATE CONCESSIONS
In accordance with Section 94 of the Local Government Act 2009 and Part 10 Concessions under the Local Government
(Finance, Plans & Reporting) Regulation 2010 Flinders Shire Council adopt the following Pensioner Rate Rebate and
Concessions Policy -
1 PURPOSE OF SCHEME
To provide assistance to pensioners of Flinders Shire who apply for the Council Pensioner Rate Concession. The
policy will enable Council to process applications for concessions on Council rates in a fair and equitable
manner.
2 DEFINITIONS
The Scheme will be administered and eligibility criteria shall be on the same basis as the Queensland
Government Pensioner Rate Subsidy Scheme Policy Number 2-5 as amended unless otherwise stated below.
Council’s Policy will apply as follows -
2.1 Approved Pensioner -
2.1.1 A pensioner who is eligible under the State Scheme with the exception of sole parents and
new start; and
2.1.2 The pensioner must be a resident of Flinders Shire and the property is his/her principal place
of residence.
2.2 Rates and Charges -
General, Special, Separate, Sewerage, Environmental, Cleansing and Water Rates and/or charges
(excluding Fire Services Levy) as described in Section 94 of the Local Government Act 2009.
OWNERSHIP/TENANCIES/RESIDENTIAL REQUIREMENTS AND TRUSTEESHIPS
The same requirements as the Queensland Government Pensioner Rate Subsidy Scheme apply.
20
BUDGET 2012-2013
APPLICATION FOR RATE REMISSION
The application must be made on the prescribed form available at the Council Office.
The application must be made by 30 June of each year.
Late applications will be received provided the rate of eligibility for the pension is prior to 30 June of the
year.
LAPSED SUBSIDY
The Council subsidy is not available where –
The pensioner defaults on the payment of rates on their assessment;
On the death of the pensioner; and
Where the pensioner is in arrears or fails to pay the rates in full by the end of the discount period.
6 PENSIONER REMISSION AMOUNT
Council’s remission will be 50% on Council Rates and Charges (does not include State Fire Levy) to a maximum
rebate of $475 per annum.
7 PRIVACY PROVISION
Council respects and protects people’s privacy and collects, stores, uses and discloses personal information
responsibly and transparently when delivering Council services and business.
6 CODE OF COMPETITIVE CONDUCT
During the 2012-2013 financial year Council will apply the code of competitive conduct to the following activities which
where identified in Council’s annual review of its business activities.
a) WATER SUPPLY
(Refer Appendix F) Water Supply Budget
Community service obligations in regard to this activity relate to -
The necessity for Council to provide water supply systems which provide a reasonable quality service at an
equitable price. Because of the small size of the rural community’s water supply schemes, it would be
inequitable set rates at a level which would recover the full cost of the service. In order to ensure equity,
Council prices its rural community’s water supply in line with the Hughenden scheme (which operates on
full cost recovery). Council has resolved that the cost of the resulting short fall in revenue is to be met from
general revenue.
Council’s obligation to ensure that personnel are available at all times to deal with water supply problems
and an obligation to strengthen the community through the employment and training of local residents.
Council meets this obligation by employing and training an Apprentice Plumber and an Assistant Water
Supply and Sewerage Officer. In light of these factors, Council considers that the cost of the Apprentice
Plumbers and the Water Supply and Sewerage Assistant’s time spent on the water supply activity should
be treated as a community service obligation and therefore funded from general revenue.
Council considers that it is vital that for the well being of the community that residents remain in the shire
after retirement and sees that it has an obligation to encourage and facilitate this. In meeting this
obligation, Council provides a subsidy to pensioners on their rates and charges including water. As this loss
of revenue is the result of a non-commercial decision made at the direction of Council, the cost of the
rebate is to be treated as a community service obligation and funded from general revenue.
Full details relating to these Community Service Obligation’s and details of the method used to calculate
these Full Cost Pricing budgets are available in Council’s Water Supply - Full Cost Pricing Processes.
21
BUDGET 2012-2013
b) SEWERAGE
(Refer Appendix F) Sewerage Supply Budget
Community service obligations in regard to this activity relate to -
Council’s obligation to ensure that personnel are available at all times to deal with problems associated
with aging Hughenden sewerage scheme and an obligation to strengthen the community through the
employment and training of local residents. Council meets this obligation by employing and training a
second Sewerage Maintenance Officer. In light of these factors, Council considers that the cost of this
officer’s time spent on the sewerage supply activity should be treated as a community service obligation
and therefore funded from general revenue.
Council considers that it is vital that for the well being of the community that residents remain in the shire
after retirement and sees that it has an obligation to encourage and facilitate this. In meeting this
obligation, Council provides a subsidy to pensioners on their rates and charges, including sewerage. As this
loss of revenue is the result of a non-commercial decision made at the direction of Council, the cost of the
rebate is to be treated as a community service obligation and funded from general revenue.
Full details relating to these CSOs and details of the method used to calculate these Full Cost Pricing
budgets are available in Councils Sewerage - Full Cost Pricing Processes.
c) OTHER ROADS
Estimated Estimated Surplus
Revenue Expenditure (Deficit)
Operational Costs
Wages $ 0.00
Materials and services $ 0.00
* Plant Hire $ 0.00
Tax Equivalents $ 0.00
Debt Guarantee Adjustment $ 0.00
Competitive Neutrality Adjustment $ 0.00
Revenue from Council $ 0.00
Revenue from other than Council
Community Service Obligation
TOTAL $ 0.00 $ 0.00 $ 0.00
____________________________________
Details of the method used to calculate this Full Cost Pricing Budget is available in Council’s Road Works Pricing
Policy.
* Plant Hire (includes depreciation and return on capital)
No community service obligations are applicable to this activity.
Details of the application of Full Cost Pricing and the elimination of the advantages and disadvantages of public
ownership are available in Council’s roadworks pricing policy.
FINANCIAL REPORTING
Financial information on the operation of its Water Supply and Sewerage and Roadworks activities is provided
to Council on a monthly basis in the statements. This report provides a comparison of actual and budgeted
revenue and expenditure. All Code of Competitive Conduct elements, other than tax equivalents are included in
this information.
For the report in the Annual Report the same information is required but showing actual and estimated figures.
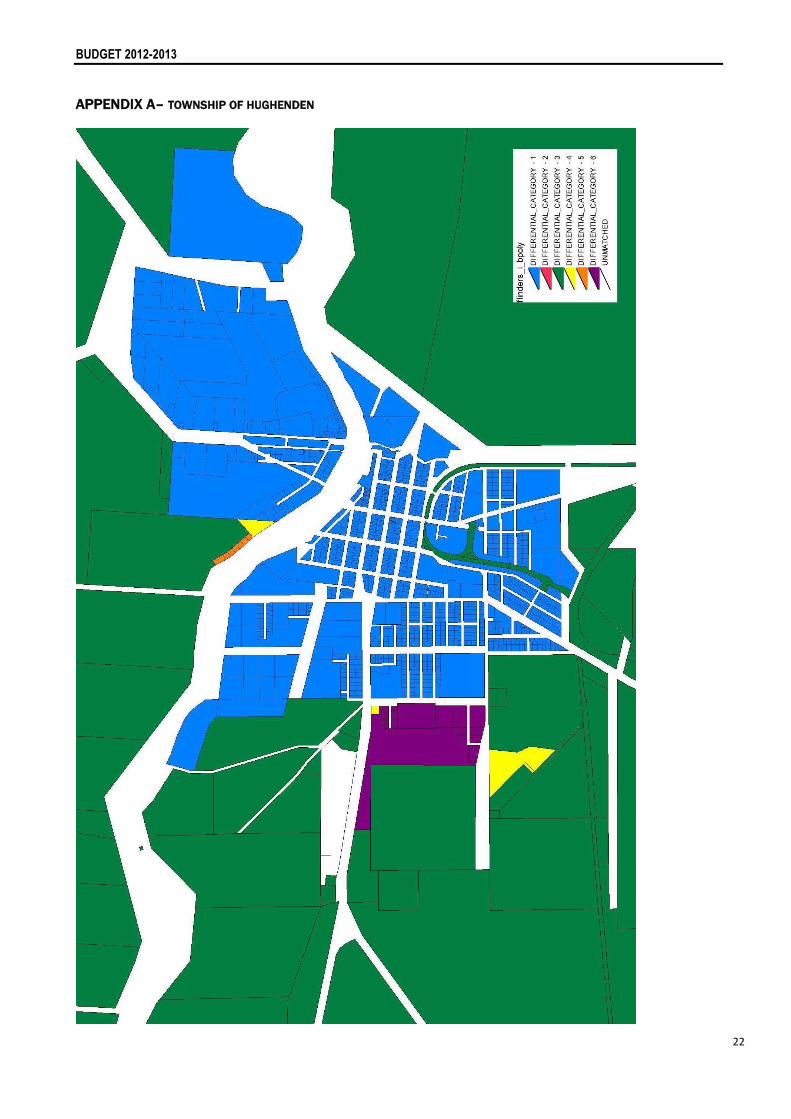
22
BUDGET 2012-2013
APPENDIX A– TOWNSHIP OF HUGHENDEN
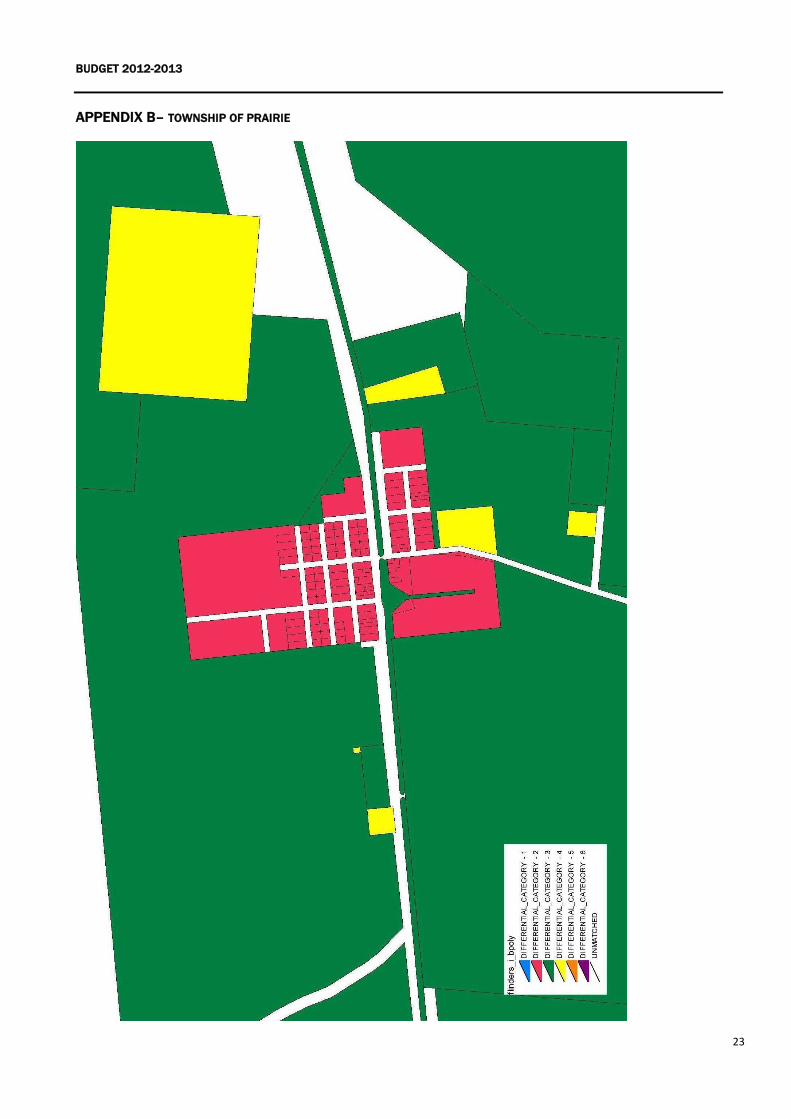
23
BUDGET 2012-2013
APPENDIX B– TOWNSHIP OF PRAIRIE
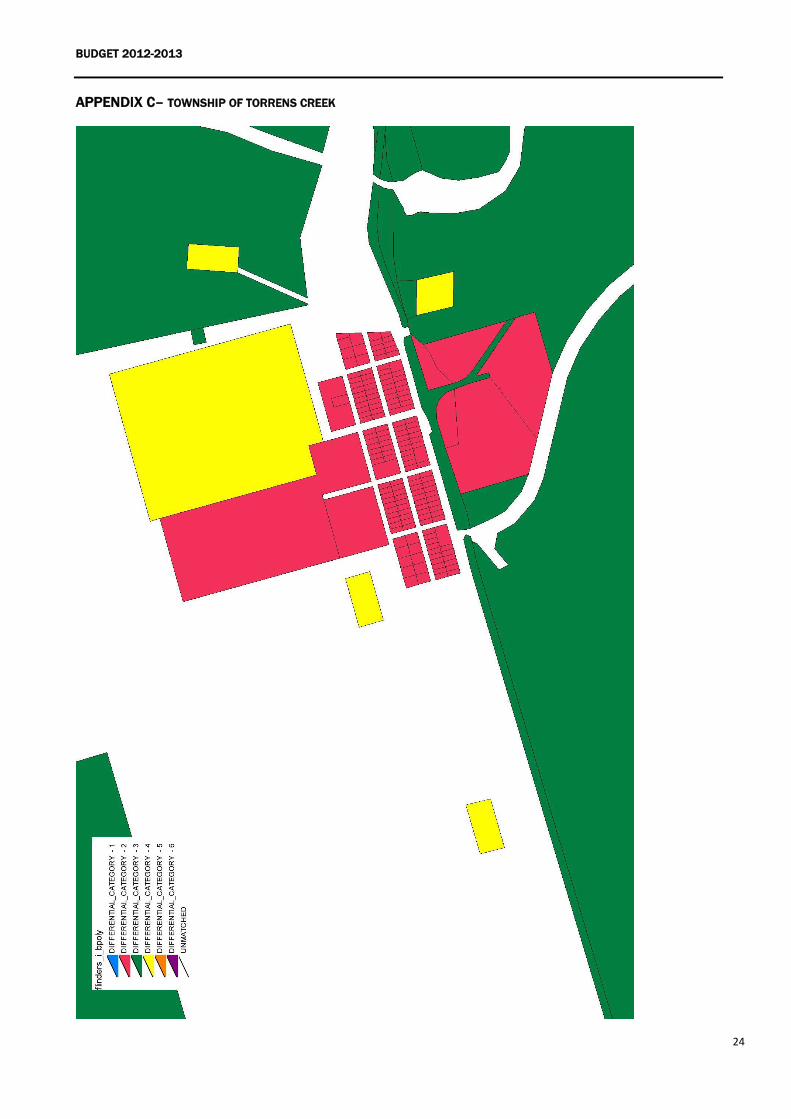
24
BUDGET 2012-2013
APPENDIX C– TOWNSHIP OF TORRENS CREEK
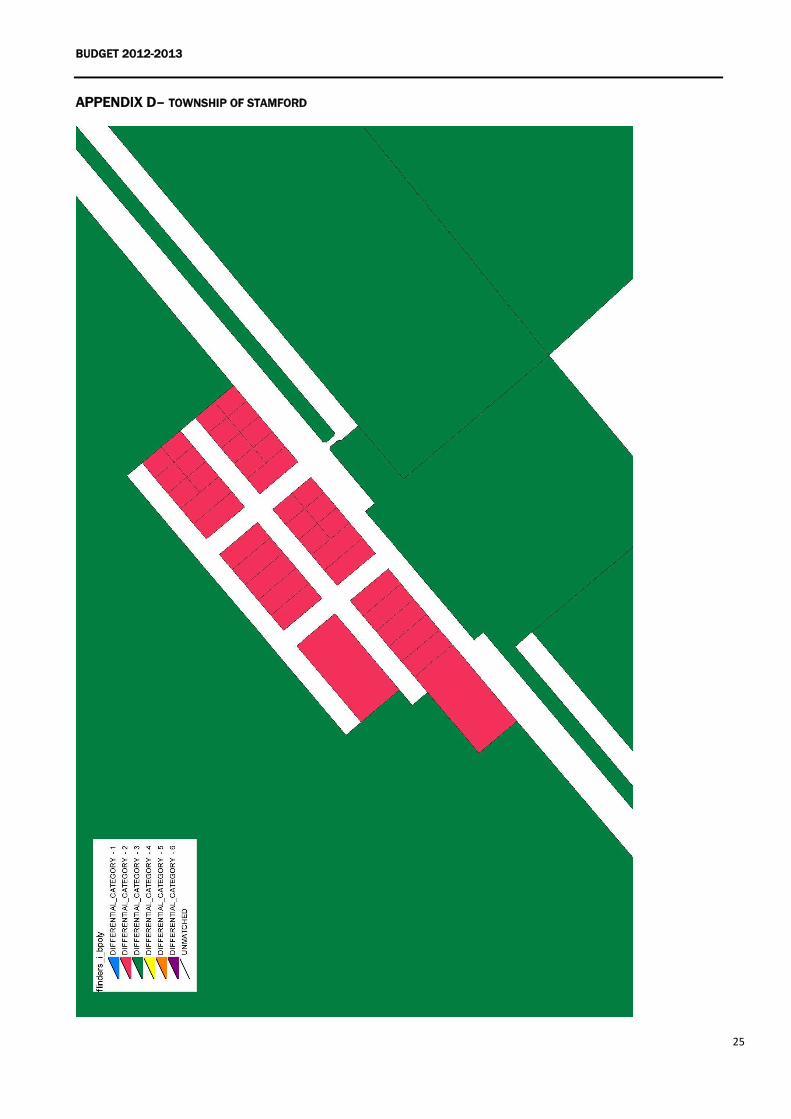
25
BUDGET 2012-2013
APPENDIX D– TOWNSHIP OF STAMFORD

26
BUDGET 2012-2013
APPENDIX F
PLANT REPLACEMENT PROGRAM BUDGET
ITEM 2.2.1.16 FEBRUARY 2011 COUNCIL MEETING
TITLE INVESTMENT POLICY 2012-2013
DATE OF ADOPTION 13 SEPTEMBER 2012
REVIEW DATE 30 JUNE, 2013
STATUTORY REFERENCES Statutory Bodies Financial Arrangements Regulation 2007 Statutory Bodies Financial Arrangements Act 1982 Local Government (Finance, Plans and Reporting) Regulation 2010 Local Government Act 2009
PURPOSE
The intent of this document is to outline Flinders Shire Council’s investment policy and guidelines regarding the investment of surplus funds and operating funds, with the objective to maximise earnings within approved risk guidelines and to ensure the security of funds.
SCOPE
Flinders Shire Council is required under Local Government Act 2009 to have an investment policy. For the purpose of this policy, investments are defined as arrangements that are undertaken or acquired for producing income and apply only to the cash investments of Flinders Shire Council. This policy applies to the investment of all surplus and operating cash held by Flinders Shire Council.
Flinders Shire Council has been granted authority to exercise Category 1 investment power under Part 6 of the Statutory Bodies Financial Arrangement Act 1982 (the Act). Category 1 investments include a range of investments either at call or for a fixed term of not more than one year. At call refers to simple investments where the investment can be redeemed and the monies invested can be retrieved by the investor from the financial institution within thirty days without penalty.
INVESTMENT OBJECTIVES AND EXPECTATIONS
Flinders Shire Council is risk averse and therefore adopts a passive investment approach where the overall objective is to ensure a return on capital commensurate with the risk taken. In priority, the order of investment activities shall be preservation of capital, liquidity and return.
The performance of Flinders Shire Council’s investments shall be reported to Council via the Operational Plan and breaches of policy shall be reported to Chief Executive Officer (CEO) or Director Corporate Services (DCS) immediately.
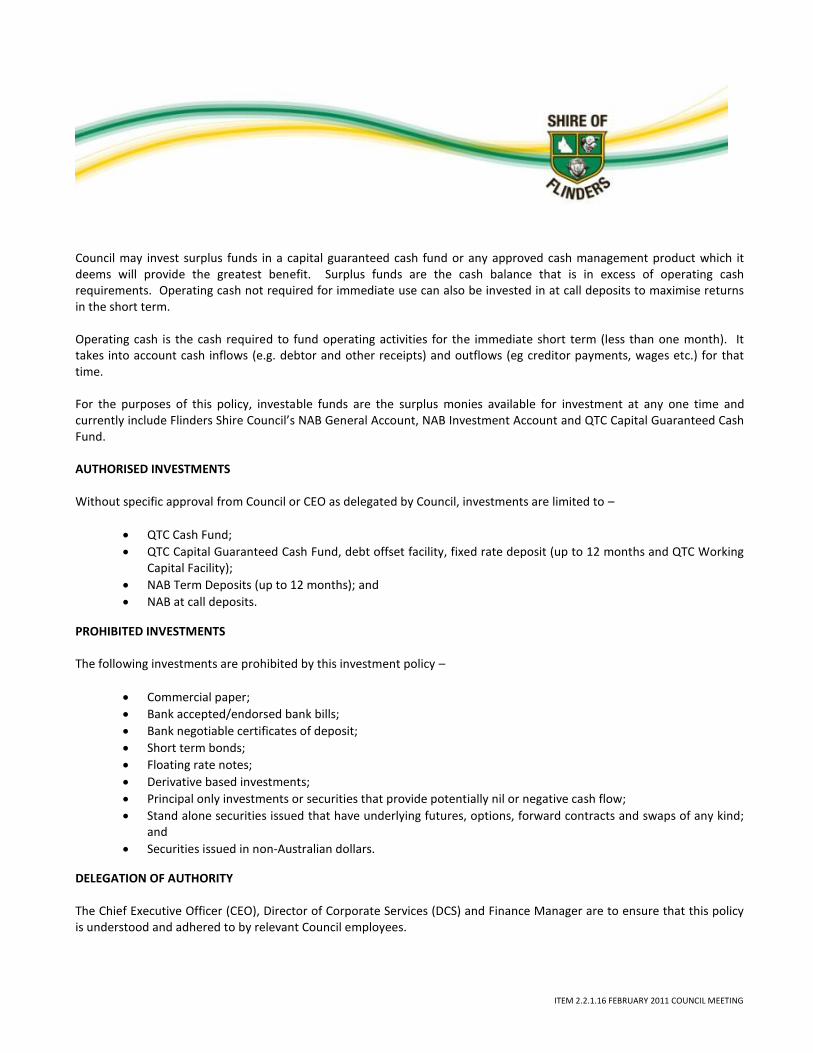
ITEM 2.2.1.16 FEBRUARY 2011 COUNCIL MEETING
Council may invest surplus funds in a capital guaranteed cash fund or any approved cash management product which it deems will provide the greatest benefit. Surplus funds are the cash balance that is in excess of operating cash requirements. Operating cash not required for immediate use can also be invested in at call deposits to maximise returns in the short term.
Operating cash is the cash required to fund operating activities for the immediate short term (less than one month). It takes into account cash inflows (e.g. debtor and other receipts) and outflows (eg creditor payments, wages etc.) for that time. For the purposes of this policy, investable funds are the surplus monies available for investment at any one time and currently include Flinders Shire Council’s NAB General Account, NAB Investment Account and QTC Capital Guaranteed Cash Fund.
AUTHORISED INVESTMENTS
Without specific approval from Council or CEO as delegated by Council, investments are limited to –
QTC Cash Fund;
QTC Capital Guaranteed Cash Fund, debt offset facility, fixed rate deposit (up to 12 months and QTC Working Capital Facility);
NAB Term Deposits (up to 12 months); and
NAB at call deposits.
PROHIBITED INVESTMENTS The following investments are prohibited by this investment policy –
Commercial paper;
Bank accepted/endorsed bank bills;
Bank negotiable certificates of deposit;
Short term bonds;
Floating rate notes;
Derivative based investments;
Principal only investments or securities that provide potentially nil or negative cash flow;
Stand alone securities issued that have underlying futures, options, forward contracts and swaps of any kind; and
Securities issued in non-Australian dollars.
DELEGATION OF AUTHORITY The Chief Executive Officer (CEO), Director of Corporate Services (DCS) and Finance Manager are to ensure that this policy is understood and adhered to by relevant Council employees.
ITEM 2.2.1.16 FEBRUARY 2011 COUNCIL MEETING
The activities of the CEO, DCS, Finance Manager, Finance Officer or other staff so delegated responsible for stewardship of Flinders Shire Council’s investments will be measured against the standards in this Policy and its objectives. Activities that defy the spirit and intent of this Policy will be deemed contrary to the Policy.
Financial delegation is the power to authorise the investing of money, by signing and authorising electronic transfers of money as authorised by Council. Transfers to/from the NAB Investment may be authorised by the CEO or DCS. Transfers to/from QTC must be authorised with any two signatories including the CEO, DCS or Councillors. The Payroll Officer may sign the QTC letter as a secondary signatory.
PROCEDURES When making a decision to invest monies in a term deposit, a cash flow analysis should be prepared to separate surplus and operational funds to ensure the investment will agree with the cash flow needs of Council.
NAB General Account (non interest bearing)
The NAB General Account is a cheque account and does not pay interest. It is necessary that the balance of this account is checked each day by 9.00am and any funds in excess of daily operating funds be transferred to the NAB Investment account by 3.30pm. If there has been a substantial deposit of more than $500,000, it would be preferable to transfer the funds direct to QTC. If the deposit is more than $1,000,000, the possibility of a term deposit could also be considered. Generally a minimum balance of $20,000 should be kept in the NAB General Account plus any unpresented payments and expected direct debits. A list of direct debits is maintained in the Investment Register and details are kept in the FSC Direct Payments folder.
NAB Investment Account (interest bearing)
Funds are transferred to and from the NAB Investment Account via the NAB General Account regularly to maximise the return on operating funds. Generally any surplus funds should be transferred to QTC or a NAB Term Deposit depending on the amount. Preference is given to QTC as the interest rate is usually higher. A minimum balance of $20,000 is to be maintained in the NAB Investment Account as per NAB agreement. It is preferable that a balance of up to $200,000 is maintained in this account for operational purposes. It is easier and quicker to do an internal transfer between NAB Accounts than it is to draw from QTC as the 10.00 am deadline to draw funds is sometimes not met. E.g. If Council makes creditor payments on Thursday it may hold the required funds in the NAB Investment account on Wednesday so it can enact an internal transfer the following day.
Queensland Treasury Corporation (QTC)
If investing or drawing funds from QTC they must be notified by 10.00 am. The funds can be withdrawn as a real time payment to Council or the next day for the same fee.

ITEM 2.2.1.16 FEBRUARY 2011 COUNCIL MEETING
QTC usually offer a higher rate of interest than the NAB Investment account so if there is more than $200,000 in the NAB Investment Account that is not required for operational purposes - the excess should be invested in QTC.
Reference can be made to the Investment Register folder for more detailed procedures on how to conduct the transfers to/from QTC and between NAB Accounts.
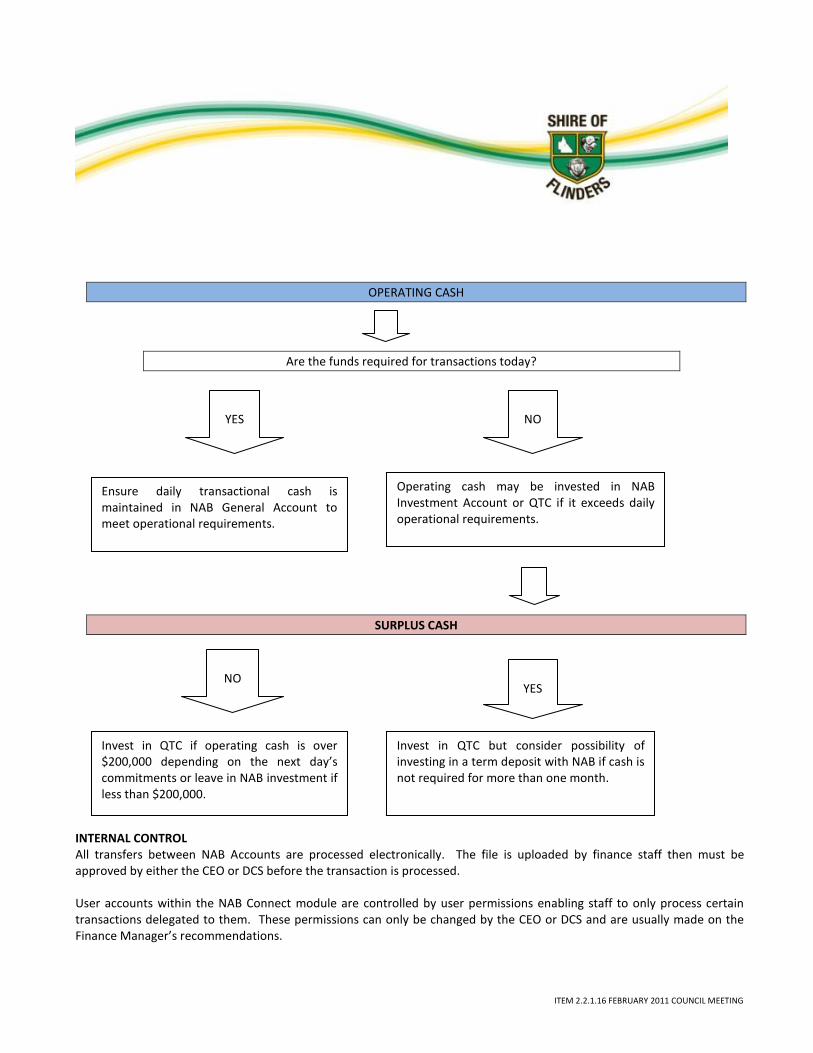
ITEM 2.2.1.16 FEBRUARY 2011 COUNCIL MEETING
OPERATING CASH
Are the funds required for transactions today?
SURPLUS CASH
INTERNAL CONTROL All transfers between NAB Accounts are processed electronically. The file is uploaded by finance staff then must be approved by either the CEO or DCS before the transaction is processed.
User accounts within the NAB Connect module are controlled by user permissions enabling staff to only process certain transactions delegated to them. These permissions can only be changed by the CEO or DCS and are usually made on the Finance Manager’s recommendations.
Ensure daily transactional cash is maintained in NAB General Account to meet operational requirements.
Operating cash may be invested in NAB Investment Account or QTC if it exceeds daily operational requirements.
YES
NO
YES
Invest in QTC if operating cash is over $200,000 depending on the next day’s commitments or leave in NAB investment if less than $200,000.
Invest in QTC but consider possibility of investing in a term deposit with NAB if cash is not required for more than one month.
NO
ITEM 2.2.1.16 FEBRUARY 2011 COUNCIL MEETING
QTC transfers require a prior phone call to QTC and a faxed letter with two authorised signatures before the transaction is processed. Authorised signatories for QTC are CEO, DCS, Payroll Officer and Councillors. Hard copies of all bank transactions are kept in the Investment Register.
Stephen McCartney CHIEF EXECUTIVE OFFICER
ASSET & SERVICES MANAGEMENT PLAN
Prepared by
CT Management Group
for
Flinders Shire Council
October 2011
Flinders Shire Council - Asset and Services Management Plan
CT Management Group i
DOCUMENT CONTROL
CT Management Group (Qld) P/L
PO Box 3302
VICTORIA POINT WEST QLD 4165
Mobile: 0421 312 410
Email: [email protected]
Web : www.ctman.com.au
Document:
Project Manager: Dennis Kirby
Author: Dennis Kirby
Date: 24/11/2011
Synopsis: This plan records the management framework for the following asset classes:
transport (including roads, airports, drainage, culverts, floodways, bridges, grids, gates and road furniture),
buildings and other structures,
parks & recreation facilities
sewerage
water supply
waste (landfill)
communications / corporate / IT
plant and equipment
CONSULTANTS DISTRIBUTION SCHEDULE
Version No.
Date Distribution Reference
v1 19/09/2011 Draft Asset and Services Management Plan
v2 6/10/2011 Draft Core Asset and Services Management Plan
V3 24/11/2011 Draft Core Asset and Services Management Plan
V4 27/11/2011 Draft Core Asset and Services Management Plan
SCHEDULE OF ADOPTION
Version No.
Date Comment TRIM Reference
V4 29/11/2011 D11/4766
Click here to enter a date.
Disclaimer and information statement
This report is issued by the CT Management Group Pty Ltd and the above information is current as at the date of publication. The information and/or the recommendations in this report have been compiled
from the information, records, data and any other sources of information supplied by you. Accordingly, the accuracy of the information and/or recommendations in this report depends upon the supplied
information and material. Whilst we have exercised all due care and skill in compiling the report, you should confirm the accuracy and reliability of the information and material we have relied upon in
producing the report.
The information contained in this report is confidential and you should only read, disclose, re-transmit, copy, distribute or act in reliance on the information if you are authorised to do so. This report may also
contain information, systems or data which is the property of the CT Management Group Pty Ltd. In these circumstances, the property referred to will remain the property of CT Management Group Pty Ltd
and the company has in no way waived its ownership rights or provided consent for use by the report recipient, unless expressly provided in the report.
Flinders Shire Council - Asset and Services Management Plan – Table of Contents
CT Management Group ii
TABLE OF CONTENTS
PART A – GENERIC PLAN (GENERAL INFORMATION) ..................................................................... 1
1. EXECUTIVE SUMMARY ..................................................................................................................... 2 1.1 Road Network .......................................................................................................................................... 4 1.2 Buildings and Other Structures ................................................................................................................ 5 1.3 Recreation Facilities ................................................................................................................................ 6 1.4 Sewer Network ........................................................................................................................................ 6 1.5 Water Network ......................................................................................................................................... 7 1.6 Waste / Landfill ........................................................................................................................................ 7 1.7 Corporate / IT .......................................................................................................................................... 7 1.8 Plant and Equipment ............................................................................................................................... 8 1.9 Financial Summary .................................................................................................................................. 8 1.10 Improvement Plan.................................................................................................................................. 10 1.11 Summary ............................................................................................................................................... 13
2. INTRODUCTION .............................................................................................................................. 14 2.1 Background ........................................................................................................................................... 14 2.2 Asset and Services Management Plan .................................................................................................. 15 2.3 Purpose and Scope of the Plan ............................................................................................................. 16 2.4 Links to Corporate Strategies ................................................................................................................ 18 2.5 Key Stakeholders................................................................................................................................... 19 2.6 Plan Format ........................................................................................................................................... 20 2.7 Core and Advanced Asset Management ............................................................................................... 20 2.8 Function and Hierarchy .......................................................................................................................... 21 2.9 Customer Research ............................................................................................................................... 26
3. LEVELS OF SERVICE ...................................................................................................................... 27 3.1 Introduction - The Asset and Services Management Framework .......................................................... 27 3.2 The Framework...................................................................................................................................... 28 3.3 Strategic Levels of Service .................................................................................................................... 32 3.4 Current Levels of Service ...................................................................................................................... 33 3.5 Agreed Levels of Service ....................................................................................................................... 33 3.6 Performance Management .................................................................................................................... 34 3.7 Asset Hierarchy ..................................................................................................................................... 34 3.8 Recognising Changes in the Service Potential of Assets ...................................................................... 34
4. FUTURE DEMAND ........................................................................................................................... 36 4.1 Demand Forecasts ................................................................................................................................ 36 4.2 Priority Infrastructure Planning .............................................................................................................. 37 4.3 Stage 1 Gap Analysis – Capital / New / Upgrade .................................................................................. 37 4.4 Demand Planning .................................................................................................................................. 38 4.5 Demand Management Strategy ............................................................................................................. 39 4.6 Stage 2 Gap Analysis – Operations and Maintenance .......................................................................... 39
5. RISK MANAGEMENT ....................................................................................................................... 40 5.1 Risk Principles and Process .................................................................................................................. 40 5.2 Risk Management Framework ............................................................................................................... 40 5.3 Risk Management Framework within Council ........................................................................................ 42 5.4 Conclusion ............................................................................................................................................. 43
6. LIFE CYCLE MANAGEMENT PLAN .................................................................................................... 46 6.1 Physical Parameters .............................................................................................................................. 46 6.2 Asset Owner / Custodianship / Service and Maintenance / Responsibility Matrix ................................. 47 6.3 Asset Capacity / Performance ............................................................................................................... 49 6.4 Condition ............................................................................................................................................... 49 6.5 Valuation ................................................................................................................................................ 50 6.6 Revaluation ............................................................................................................................................ 50
Flinders Shire Council - Asset and Services Management Plan – Table of Contents
CT Management Group iii
6.7 Work Category Definitions ..................................................................................................................... 50 6.8 Maintenance .......................................................................................................................................... 51 6.9 Renewals and Replacements ................................................................................................................ 52 6.10 New, Upgrade and Disposal .................................................................................................................. 53 6.11 Planning Criteria and Assumptions ........................................................................................................ 54
7. FINANCIAL PROJECTIONS ............................................................................................................... 55 7.1 Current Financial Position ...................................................................................................................... 55 7.2 Funding Capacity ................................................................................................................................... 57 7.3 Funding Options and Strategy ............................................................................................................... 57 7.4 Renewal Gap ......................................................................................................................................... 57 7.5 10 Year Expenditure Projections ........................................................................................................... 59
8. ASSET MANAGEMENT PRACTICES, PERFORMANCE MONITORING AND IMPPROVEMENT ....................... 61 8.1 Asset Management Practices ................................................................................................................ 61 8.2 Data Systems ........................................................................................................................................ 64 8.3 Asset and Services Management Improvement .................................................................................... 65 8.4 Monitoring and Review Procedures ....................................................................................................... 65
Flinders Shire Council - Asset and Services Management Plan – Part A: Core Plan
CT Management Group Page 1 / 71
PART A – GENERIC PLAN (GENERAL INFORMATION)
Flinders Shire Council - Asset and Services Management Plan – Part A: Core Plan
CT Management Group Page 2 / 71
1. EXECUTIVE SUMMARY The Shire of Flinders is a located in north western Queensland. It covers an area of 41,422 square kilometres and has a road network length of 2,280 kms of sealed and unsealed roads, including 30.6 kms of urban streets for which Council is responsible. This network serves a local population of 1,911, (2006 census). Flinders Shire has existed as a Local Government entity since 1903.
Hughenden is the main business centre for the Shire which also encompasses the smaller communities of Prairie, Torrens Creek and Stamford. Hughenden is situated on the banks of the Flinders River, Queensland’s longest river. Hughenden has direct road access to a number of major centres and tourist attractions within the region. The Flinders Highway runs through Hughenden connecting to Townsville, (376km) in the east and Mount Isa, (519km) in the west, with a southern sealed road access via the Dinosaur Way to Winton and Longreach.
The Flinders Shire is predominantly a grazing area, with some emerging irrigation pockets. North of the Flinders River is predominately red and black volcanic basalt country and to the south of Hughenden is black soil downs country with open natural grass lands.
Flinders Shire Council’s goal is to provide the services that the community needs and to provide and manage the assets required to meet agreed Levels of Service for the community, in the most cost effective manner. The range of services is not meant to completely mirror those in more populated centres, but to be relevant for the local communities and offer the lifestyle choices and accessibility options that are relevant for this region across the typical demographic profile.
The Australian Centre of Excellence for Local Government recently noted in their publication related to these matters, as follows:
“Rural-remote Councils are commonly expected to provide a greater range of services than their regional and urban counterparts. More so, Indigenous Councils often carry the burden of administering social programs and operating essential services and enterprises that would otherwise be the responsibility of government agencies, non-government organisations and the private sector.
“Rural-remote and Indigenous Local Government has often assumed a ‘provider of last resort’ role in order to ensure the sustainability of small communities. Councils are typically the central institution within those communities and so are expected to fill the gap when services are not adequately provided by the normal mainstream providers”.’1
A significant proportion of the Flinders Shire Council infrastructure assets have been in existence for many years. The assets originated from a combination of Council construction and development activity within the region.
This Asset and Services Management Plan records the management framework for the following asset classes:
Roads Network
Buildings and Other Structures
Recreation Facilities
Sewer Network
Water Network
Waste – Landfill
Corporate / IT
Plant and Equipment
1 Australian Centre of Excellence for Local Government – A Capacity Building Strategy for Rural-Remote and
Indigenous Local Government, March 2011.
Flinders Shire Council - Asset and Services Management Plan – Part A: Core Plan
CT Management Group Page 3 / 71
The plan is a single document which builds on a common front end of corporate and statutory directions common to all asset classes and the associated services. Separate chapters / parts are recorded for the major asset classes, using the criteria from the common management principles to develop the planning frameworks for those asset classes.
The plan is intended as the simplest possible representation of the needs of the community for Levels of Service and the management of the incumbent assets, because Flinders Shire Council has limited capacity to provide a comprehensive management framework. The key aspects of the plan are to be recorded in summary form to provide the information for the sustainability management and reporting.
The document is quite deliberately an ‘Asset and Services Management Plan’ because it is essential to combine those elements for Councils like Flinders Shire Council – the same planning and management framework and resources are applied to all of the assets and services, and this is the most pragmatic approach to the management framework.
At the same time, the plan properly acknowledges the considerable legislative framework which underpins the planning and management processes, including the substantial impetus from both the Federal and State Government to improve the understanding of the sustainability of the current Levels of Service and the management of the assets on behalf of the community, having regard to the current state of the assets and services.
The Local Government industry is also pursuing the improvement process for asset and services management. Flinders Shire Council is an active member of the Local Government Association of Queensland’s LG Asset Advanced program which was designed as a ‘capacity building’ program for Local Government. The third phase of the program is supported by funding from the Commonwealth Government’s LG Reform Fund program.
This plan is the first or ‘core’ Asset and Services Management Plan for Flinders Shire Council, but with leads to significant gains in the ‘advanced’ maturity stakes.
More detailed information for the asset classes is recorded below.
The infrastructure assets held by Flinders Shire Council and the current valuations are described in Table A1 below. The valuations are current to 30 June 2011. At that time, the valuation process recorded condition ratings for the infrastructure assets at individual and network level.
The buildings and other structures assets were valued independently, and are also recorded in Table A1.1.
Infrastructure Development, Maintenance and Replacement
Flinders Shire is serviced by the nationally significant Northern Territory-Townsville corridor (road, rail, power, and telecommunications), and underdeveloped regional transport links, but the Hughenden township sewerage reticulation network is relatively new.
Council is committed to ensuring that a standard of infrastructure is developed and maintained for the use of all residents and visitors. Priority areas of activity include:
Improvement of infrastructure within the Northern Territory-Townsville corridor;
Development of water infrastructure for irrigation;
Sealing of Kennedy Developmental Road North;
Development of Hughenden Aged Persons’ Accommodation;
Development of Waste / Refuse Tip to ‘best practice’ standards;
Upgrading of Town Streets and Shire Roads;
Development and sale of land;
Improvement of Telecommunications and Information Technology infrastructure;
Upgrading of infrastructure services provided to the community including pursuit of innovative technology such as green power;
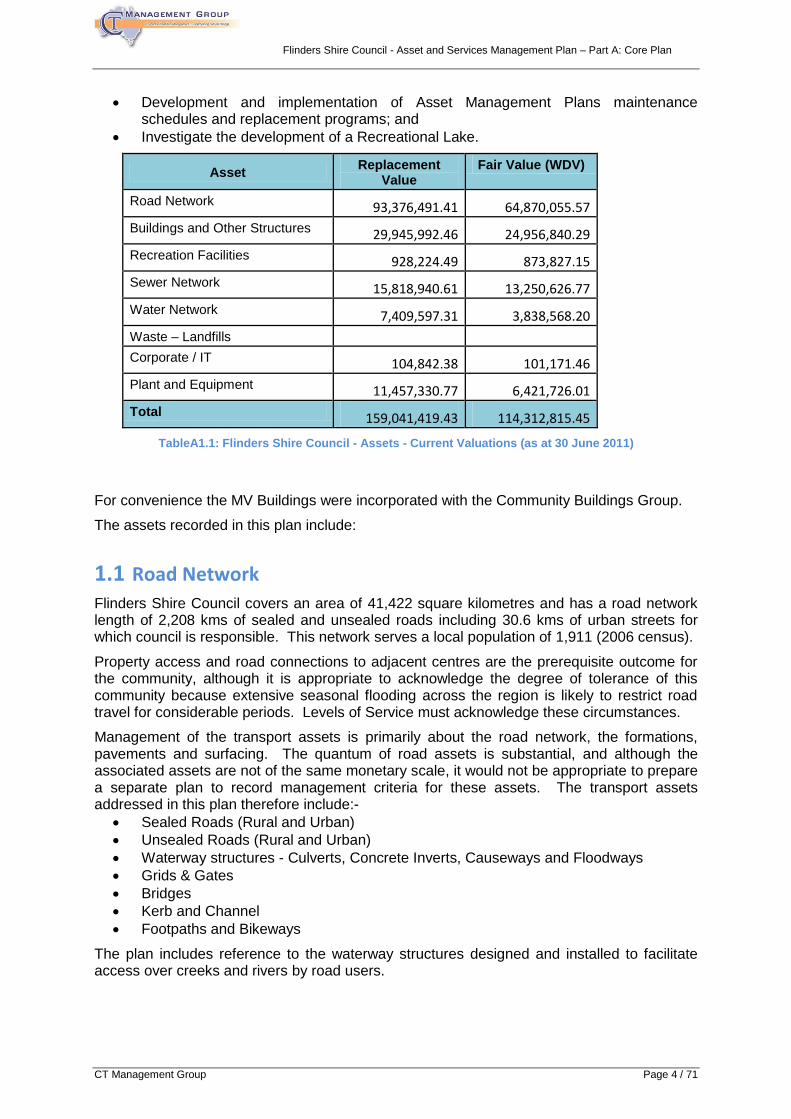
Flinders Shire Council - Asset and Services Management Plan – Part A: Core Plan
CT Management Group Page 4 / 71
Development and implementation of Asset Management Plans maintenance schedules and replacement programs; and
Investigate the development of a Recreational Lake.
Asset Replacement
Value Fair Value (WDV)
Road Network 93,376,491.41 64,870,055.57
Buildings and Other Structures 29,945,992.46 24,956,840.29
Recreation Facilities 928,224.49 873,827.15
Sewer Network 15,818,940.61 13,250,626.77
Water Network 7,409,597.31 3,838,568.20
Waste – Landfills Corporate / IT 104,842.38 101,171.46
Plant and Equipment 11,457,330.77 6,421,726.01
Total 159,041,419.43 114,312,815.45
TableA1.1: Flinders Shire Council - Assets - Current Valuations (as at 30 June 2011)
For convenience the MV Buildings were incorporated with the Community Buildings Group.
The assets recorded in this plan include:
1.1 Road Network
Flinders Shire Council covers an area of 41,422 square kilometres and has a road network length of 2,208 kms of sealed and unsealed roads including 30.6 kms of urban streets for which council is responsible. This network serves a local population of 1,911 (2006 census).
Property access and road connections to adjacent centres are the prerequisite outcome for the community, although it is appropriate to acknowledge the degree of tolerance of this community because extensive seasonal flooding across the region is likely to restrict road travel for considerable periods. Levels of Service must acknowledge these circumstances.
Management of the transport assets is primarily about the road network, the formations, pavements and surfacing. The quantum of road assets is substantial, and although the associated assets are not of the same monetary scale, it would not be appropriate to prepare a separate plan to record management criteria for these assets. The transport assets addressed in this plan therefore include:-
Sealed Roads (Rural and Urban)
Unsealed Roads (Rural and Urban)
Waterway structures - Culverts, Concrete Inverts, Causeways and Floodways
Grids & Gates
Bridges
Kerb and Channel
Footpaths and Bikeways
The plan includes reference to the waterway structures designed and installed to facilitate access over creeks and rivers by road users.
Flinders Shire Council - Asset and Services Management Plan – Part A: Core Plan
CT Management Group Page 5 / 71
The plan also includes the kerb and channel and footpath assets in the town areas. This is done because it is likely that the Council will need to address sustainability and affordability issues for these assets and the associated services.
The stormwater drainage network for both the town and rural areas is designed to mitigate risks associated with flooding to protect private property and to increase personal safety of residents using the road network. These assets and services are typically contiguous with the transport assets and services and have been grouped accordingly. However, the stormwater drainage network can be a substantial investment for the Council which warrants consideration in the total asset and services management framework, and an endeavour is to be made to capture the relevant information to address these assets in detail.
The geography and nature of the Shire is an important factor for the transport assets. North of the Flinders River is predominately red and black volcanic basalt country and to the south of Hughenden is black soil downs country with open natural grass lands. Road making materials are affected accordingly.
When linked with the likely flooding events during the wet season, services can be disrupted for long periods, and fast flowing sheet water can cause considerable damage to the road and associated assets. The condition of the assets can change over short periods, but can require considerable time, and funding, to restore services. Seal road extensions are desirable to enable continuous transport services to and within the region, as well as to continue infill sealing of town streets to reduce dust and mud nuisance.
The Council also uses TIDS and R2R funding for asset upgrades and new works to reduce the impact on rate funding / income.
Depreciation funds are applied the renewal of the transport assets, including the reseal program.
The regular rebuild of transport assets funded by Natural Disaster Relief and Recovery Arrangements, (NDRRA), must be factored into the condition assessments and financial projections, and acknowledged with the ‘effort’ that is made to maintain the condition profiles for transport assets, particularly for the unsealed road network.
1.2 Buildings and Other Structures
Council is the custodian of a range of corporate and community buildings and other structures that facilitate the delivery of services to the community.
The plan provides the management criteria for the following Asset Groups:-
Corporate Buildings
Community Buildings
Other structures are also recorded in this section of the plan, including:
Shelters
Airport fixtures, eg lighting, fencing, etc.
Swimming Pool and Surrounds
Skate Park
TV and Radio Antenna
Artwork and monuments
The buildings assets are typically well ‘recorded’ with the required revaluations for annual audit and insurance purposes. The revaluation conducted for 30 June 2011 included a condition assessment of the major building assets and attributes.
This information will need to be supported by good financial data to enable formulation of a complete Long Term Financial Plan. Work has commenced to capture and describe this information.
Flinders Shire Council - Asset and Services Management Plan – Part A: Core Plan
CT Management Group Page 6 / 71
Flinders Shire has a shortage of housing despite the availability of a significant number of fully serviced vacant lots.
Council is committed to development of appropriate housing to meet employee and community requirements. Priority areas of activity include:
Development of Hughenden Aged Persons’ Accommodation;
Active role on the Greater Gundii Group, the regional community housing advisory panel; and
Construction/relocation of appropriate housing.
1.3 Recreation Facilities
One of Council’s core functions is to provide safe, appropriate parks, playgrounds and facilities in accordance with standards and planning objectives. A well planned park network providing attractive places for play, rest and relaxation is seen by the community as essential infrastructure.
This asset and services management plan relates to:
Operations, maintenance expenditures and capital investment in assets and infrastructure at parks owned and maintained by Council. (This will typically include children’s playgrounds, major and minor park structures, pathways, associated car park areas, barbeques and other related services including irrigation and lighting);
Operations at various open space natural reserves; and
Operations and maintenance in street gardens (streetscapes).
Operations of cemeteries
The plan excludes the following assets which are considered in other chapters of this plan:
Road side picnic reserves and wayside stops;
Footpaths adjacent to parks and open space;
Toilets, amenities and other substantial buildings within park areas.
Council currently manages a number of parks and recreation area assets across the shire. These dedicated open space areas have various levels of improvements including play equipment, shelters, park furniture, lighting, and irrigation services.
Playground equipment is high risk and must be treated somewhat differently to normal open space assets such as playing fields, irrigation equipment, lighting, etc.
The only practicable means of identifying risk is by implementing an inspection regime of the various open space assets, particularly high risk items such as children’s play spaces and playground equipment. This process should enable significant risks to be identified and remedied in advance of possible injury, damage or inconvenience to the public.
Council has a legal duty of care to the residents and the community to ensure that its assets are funded and maintained in a sustainable way, both in the short and long term. Generally the courts enforce a greater duty of care for children.
A four-tier inspection regime should be implemented covering routine for obvious hazards, operational maintenance, safety & compliance (2 types) and incidents.
There is a need to quantify recreation assets for which council is responsible and address the management of the various components within this Plan.
1.4 Sewer Network
Hughenden township has a sewerage collection and disposal reticulation system, and sewerage treatment plant.
Flinders Shire Council - Asset and Services Management Plan – Part A: Core Plan
CT Management Group Page 7 / 71
The asset groups included under the sewerage asset class include:
Sewer Mains
Sewer Manholes
Rising Mains
Equipment – Civil
Treatment Plant
Pump Stations
Equipment – Mechanical and Electrical
A Total Asset Management Plan, (TAMP), is available for the water and sewerage assets and services because of the need to observe a separate set of legislative provisions. The TAMP can be simply managed independently of this plan.
It is intended to further align the formats of this plan and the TAMP as part of the progress to advanced status for asset and services management, particularly in relation to the financial forecasts. It is understood that the TAMP format may be adjusted to reflect the simpler format of this plan.
The financial summaries from the Water and Sewerage TAMP are referenced with this plan to provide the complete picture of the drive toward sustainability for all assets and services in a single document. It is important that the financial forecasts be translated through this plan into the Long Term Financial Plan, (all renewal, upgrade and new project and program work).
1.5 Water Network
Hughenden and the other townships in the Shire have water storage and reticulation systems supplied from the subsurface bores.
The water infrastructure assets have been listed by the following groups:
Water Mains
Bores
Water Storage Facilities
Equipment – Civil
Equipment – Mechanical and Electrical
Details of the management criteria for water assets and services are recorded in the TMP, (as for the sewerage assets), and are therefore not replicated in this document.
1.6 Waste / Landfill
Council operates a solid waste / landfill sites in Hughenden and for the other townships. Township garbage collections are dumped at the Hughenden landfill site.
The landfill site is maintained according to local conditions, providing access for residents for rubbish dumping most of the time. Council is committed to development of Waste/Refuse Tip to ‘best practice’ standards, (Corporate Plan 2008-2013).
The Asset and Services Management Plan will reference the need for the restoration and long term management of the landfill sites.
1.7 Corporate / IT
The Council has a substantial investment in technology and stored data. This investment deserves to be managed in a structured manner using asset and services management
Flinders Shire Council - Asset and Services Management Plan – Part A: Core Plan
CT Management Group Page 8 / 71
principles to enable structured equipment renewal and maintenance programs. These programs will facilitate technology upgrades, security enhancements and acquisition of new technology to maintain pace with information storage, transfer and management demands.
The plan typically caters for the higher value items, e.g. servers, however, the considerable number of assets below the threshold means that a collective program is appropriate, and that program should be included with the Capital Works Program, including evaluation of the overall priority for asset renewals.
The plan also includes provision for replacement and renewal of electronic systems, (corporate systems and specific systems).
These services are primarily intended for internal customers.
The Shire’s rural-remote location means that it is important to maintain reliable systems and system support, because repairs and service are typically undertaken electronically – the need for local repair and maintenance services, eg to a photocopier, may involve considerable cost.
1.8 Plant and Equipment
Council operates major plant and equipment for road maintenance and construction, with a range of plant and equipment items to support the various Council programs, plus small equipment to assist with the maintenance of parks and gardens, etc.
Plant and equipment items have been identified and categorised into the following groups:
Road Plant and Equipment
Motor Vehicles
Other Plant and Equipment
Plant and equipment is a major investment for the Council and it is appropriate to provide a management regime for renewal, maintenance and operations that is consistent with the total asset and services management framework, particularly having regard for the imperatives of reliability and capacity for the typical seasonal work volumes. Specific plant items are contracted in to support the scale of operations from time to time, eg NDRRA program works.
1.9 Financial Summary
This compilation plan has enabled a first assessment of the financial liability for the renewal and maintenance of all assets and services. The calculations will be refined as the data integrity improves and stronger financial links are forged with the management regime.
The financial compilation is for the 10 year period, 2011/12 to 2021/22. The figures start to become much less predictable after that period. It is intended to progressively improve confidence in the forecasts by continually improving the quality of the data used to calculate the forecasts.
Table ES1.9.1 provides the Financial Summary is the key element for the Long Term Financial Plan and to support the demonstration of the sustainability and affordability of the assets and services. Information for the summary is from the 10-year financial projections of each of the group Asset and Services Asset Management Plans.
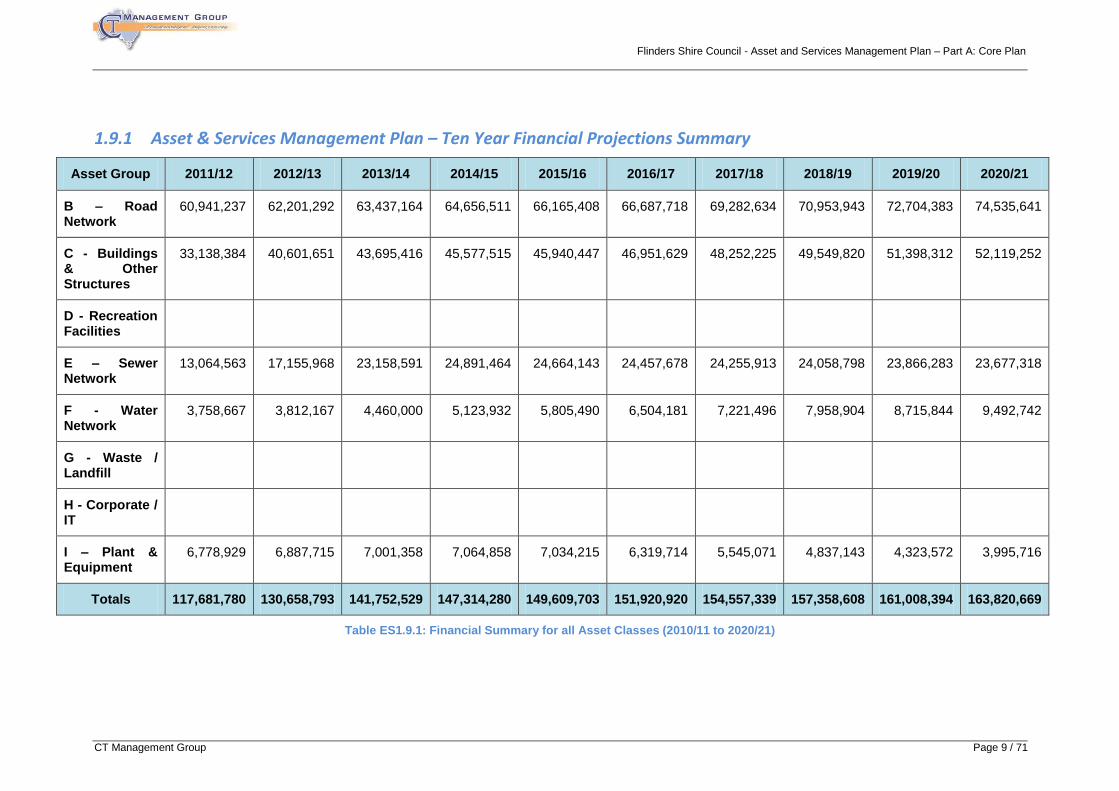
Flinders Shire Council - Asset and Services Management Plan – Part A: Core Plan
CT Management Group Page 9 / 71
1.9.1 Asset & Services Management Plan – Ten Year Financial Projections Summary
Asset Group 2011/12 2012/13 2013/14 2014/15 2015/16 2016/17 2017/18 2018/19 2019/20 2020/21
B – Road Network
60,941,237 62,201,292 63,437,164 64,656,511 66,165,408 66,687,718 69,282,634 70,953,943 72,704,383 74,535,641
C - Buildings & Other Structures
33,138,384 40,601,651 43,695,416 45,577,515 45,940,447 46,951,629 48,252,225 49,549,820 51,398,312 52,119,252
D - Recreation Facilities
E – Sewer Network
13,064,563 17,155,968 23,158,591 24,891,464 24,664,143 24,457,678 24,255,913 24,058,798 23,866,283 23,677,318
F - Water Network
3,758,667 3,812,167 4,460,000 5,123,932 5,805,490 6,504,181 7,221,496 7,958,904 8,715,844 9,492,742
G - Waste / Landfill
H - Corporate / IT
I – Plant & Equipment
6,778,929 6,887,715 7,001,358 7,064,858 7,034,215 6,319,714 5,545,071 4,837,143 4,323,572 3,995,716
Totals 117,681,780 130,658,793 141,752,529 147,314,280 149,609,703 151,920,920 154,557,339 157,358,608 161,008,394 163,820,669
Table ES1.9.1: Financial Summary for all Asset Classes (2010/11 to 2020/21)
Flinders Shire Council - Asset and Services Management Plan – Part A: Core Plan
CT Management Group Page 10 / 71
1.10 Improvement Plan
The plan development process identified and recorded the Improvement Opportunities that would increase the integrity of asset and services data, improve quality processes and risk management, and strengthen the financial links with the operational aspects of assets and services to improve confidence in the financial forecasting to be included in the Long Term Financial Plan. The improvements are recorded in Table ES1.10.2 at the end of Part A of the plan, and individually for each asset class.
The Improvement Plan has also been validated against the outputs from the National Asset Management Assessment Framework findings, (NAMAF). The NAMAF process records the status of the Council against 11 Key Elements for asset and services management, including:
Community Plan / Corporate Plan
Annual Budget
Annual Report
Asset and Services Management Policy
Asset and Services Management Strategy
Asset and Services Management Plans
Governance and Management
Levels of Service
Data and Systems
Skills and Processes
Evaluation
The first assessment undertaken on 12 May 2010 is displayed in Figure ES1.10.1 below:
The assessment process was also used to identify the essential Improvement Opportunities and develop a prioritised Action Plan for the organisation to ensure continuous improvement. The challenge for the organisation is to resource the improvements.
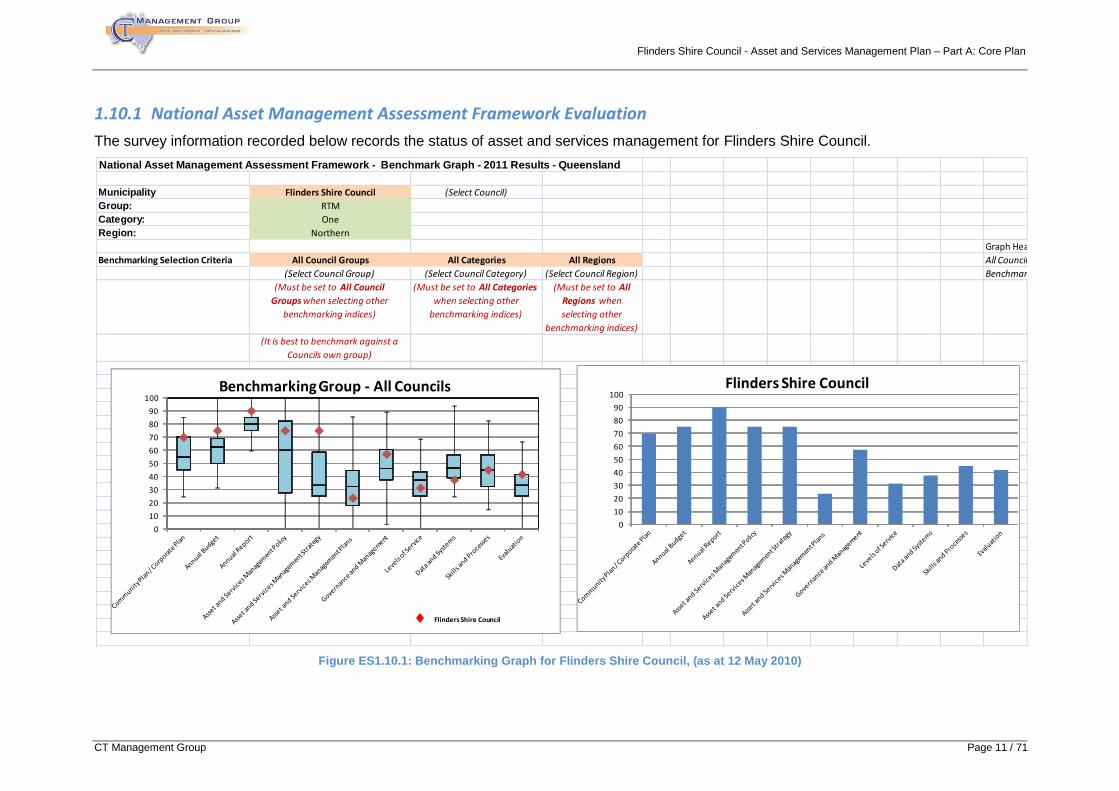
Flinders Shire Council - Asset and Services Management Plan – Part A: Core Plan
CT Management Group Page 11 / 71
1.10.1 National Asset Management Assessment Framework Evaluation
The survey information recorded below records the status of asset and services management for Flinders Shire Council.
Figure ES1.10.1: Benchmarking Graph for Flinders Shire Council, (as at 12 May 2010)
National Asset Management Assessment Framework - Benchmark Graph - 2011 Results - Queensland
Municipality Flinders Shire Council (Select Council)
Group: RTM
Category: One
Region: Northern
Graph Headings
Benchmarking Selection Criteria All Council Groups All Categories All Regions All Councils
(Select Council Group) (Select Council Category) (Select Council Region) Benchmarking Group - All Councils
(Must be set to All Council
Groups when selecting other
benchmarking indices)
(Must be set to All Categories
when selecting other
benchmarking indices)
(Must be set to All
Regions when
selecting other
benchmarking indices)
(It is best to benchmark against a
Councils own group)
0
10
20
30
40
50
60
70
80
90
100Benchmarking Group - All Councils
Flinders Shire Council
0
10
20
30
40
50
60
70
80
90
100Flinders Shire Council
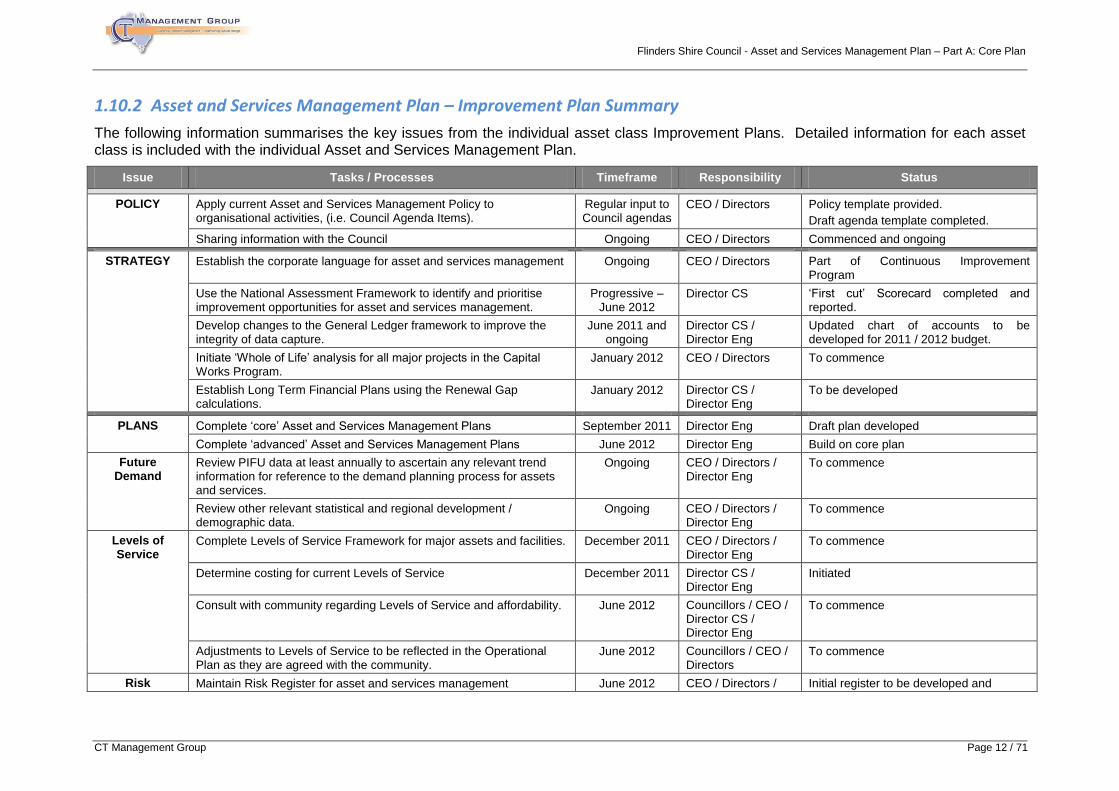
Flinders Shire Council - Asset and Services Management Plan – Part A: Core Plan
CT Management Group Page 12 / 71
1.10.2 Asset and Services Management Plan – Improvement Plan Summary
The following information summarises the key issues from the individual asset class Improvement Plans. Detailed information for each asset class is included with the individual Asset and Services Management Plan.
Issue Tasks / Processes Timeframe Responsibility Status
POLICY Apply current Asset and Services Management Policy to organisational activities, (i.e. Council Agenda Items).
Regular input to Council agendas
CEO / Directors Policy template provided.
Draft agenda template completed.
Sharing information with the Council Ongoing CEO / Directors Commenced and ongoing
STRATEGY Establish the corporate language for asset and services management Ongoing CEO / Directors Part of Continuous Improvement Program
Use the National Assessment Framework to identify and prioritise improvement opportunities for asset and services management.
Progressive – June 2012
Director CS ‘First cut’ Scorecard completed and reported.
Develop changes to the General Ledger framework to improve the integrity of data capture.
June 2011 and ongoing
Director CS / Director Eng
Updated chart of accounts to be developed for 2011 / 2012 budget.
Initiate ‘Whole of Life’ analysis for all major projects in the Capital Works Program.
January 2012 CEO / Directors To commence
Establish Long Term Financial Plans using the Renewal Gap calculations.
January 2012 Director CS / Director Eng
To be developed
PLANS Complete ‘core’ Asset and Services Management Plans September 2011 Director Eng Draft plan developed
Complete ‘advanced’ Asset and Services Management Plans June 2012 Director Eng Build on core plan
Future Demand
Review PIFU data at least annually to ascertain any relevant trend information for reference to the demand planning process for assets and services.
Ongoing CEO / Directors / Director Eng
To commence
Review other relevant statistical and regional development / demographic data.
Ongoing CEO / Directors / Director Eng
To commence
Levels of Service
Complete Levels of Service Framework for major assets and facilities. December 2011 CEO / Directors / Director Eng
To commence
Determine costing for current Levels of Service December 2011 Director CS / Director Eng
Initiated
Consult with community regarding Levels of Service and affordability. June 2012 Councillors / CEO / Director CS / Director Eng
To commence
Adjustments to Levels of Service to be reflected in the Operational Plan as they are agreed with the community.
June 2012 Councillors / CEO / Directors
To commence
Risk Maintain Risk Register for asset and services management June 2012 CEO / Directors / Initial register to be developed and
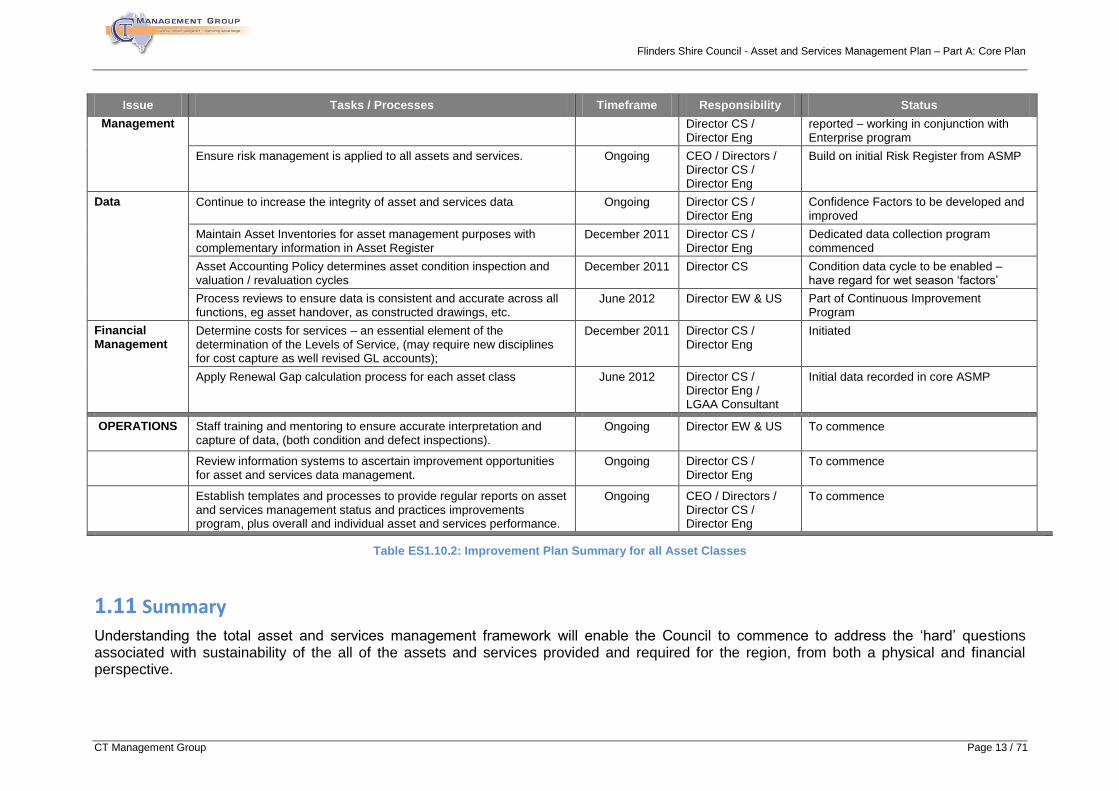
Flinders Shire Council - Asset and Services Management Plan – Part A: Core Plan
CT Management Group Page 13 / 71
Issue Tasks / Processes Timeframe Responsibility Status
Management Director CS / Director Eng
reported – working in conjunction with Enterprise program
Ensure risk management is applied to all assets and services. Ongoing CEO / Directors / Director CS / Director Eng
Build on initial Risk Register from ASMP
Data Continue to increase the integrity of asset and services data Ongoing Director CS / Director Eng
Confidence Factors to be developed and improved
Maintain Asset Inventories for asset management purposes with complementary information in Asset Register
December 2011 Director CS / Director Eng
Dedicated data collection program commenced
Asset Accounting Policy determines asset condition inspection and valuation / revaluation cycles
December 2011 Director CS Condition data cycle to be enabled – have regard for wet season ‘factors’
Process reviews to ensure data is consistent and accurate across all functions, eg asset handover, as constructed drawings, etc.
June 2012 Director EW & US Part of Continuous Improvement Program
Financial Management
Determine costs for services – an essential element of the determination of the Levels of Service, (may require new disciplines for cost capture as well revised GL accounts);
December 2011 Director CS / Director Eng
Initiated
Apply Renewal Gap calculation process for each asset class June 2012 Director CS / Director Eng / LGAA Consultant
Initial data recorded in core ASMP
OPERATIONS Staff training and mentoring to ensure accurate interpretation and capture of data, (both condition and defect inspections).
Ongoing
Director EW & US To commence
Review information systems to ascertain improvement opportunities for asset and services data management.
Ongoing
Director CS / Director Eng
To commence
Establish templates and processes to provide regular reports on asset and services management status and practices improvements program, plus overall and individual asset and services performance.
Ongoing CEO / Directors / Director CS / Director Eng
To commence
Table ES1.10.2: Improvement Plan Summary for all Asset Classes
1.11 Summary
Understanding the total asset and services management framework will enable the Council to commence to address the ‘hard’ questions associated with sustainability of the all of the assets and services provided and required for the region, from both a physical and financial perspective.
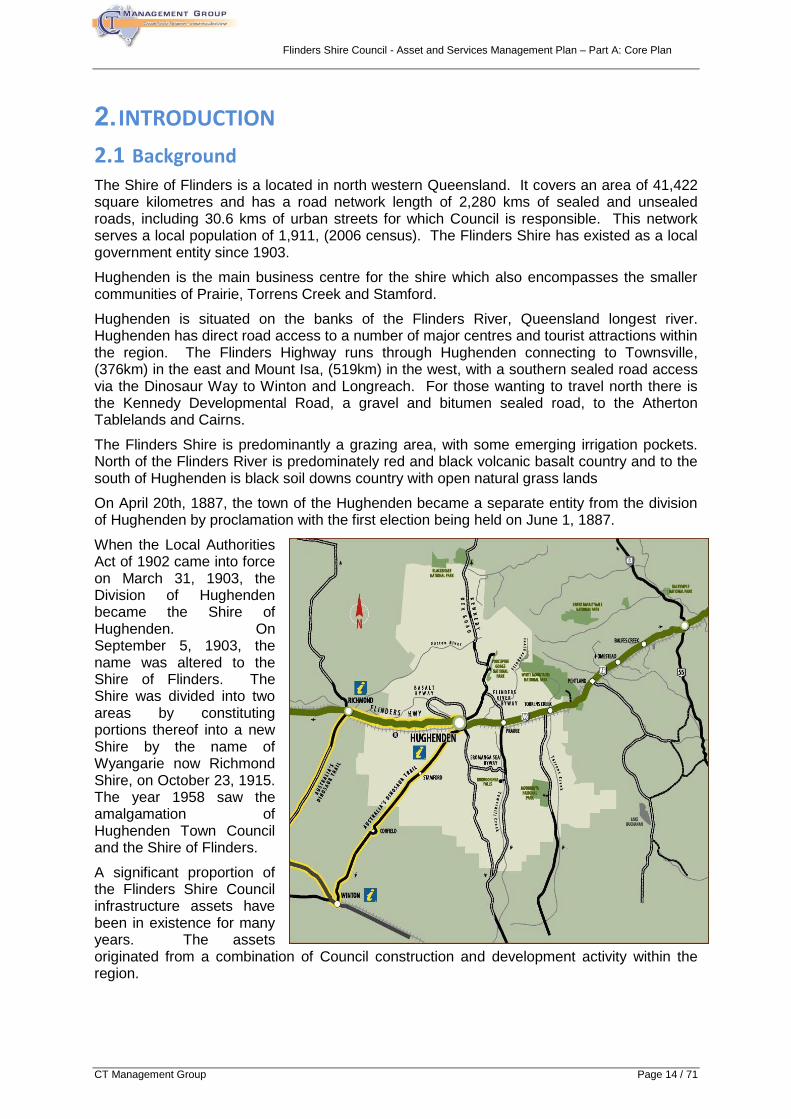
Flinders Shire Council - Asset and Services Management Plan – Part A: Core Plan
CT Management Group Page 14 / 71
2. INTRODUCTION
2.1 Background
The Shire of Flinders is a located in north western Queensland. It covers an area of 41,422 square kilometres and has a road network length of 2,280 kms of sealed and unsealed roads, including 30.6 kms of urban streets for which Council is responsible. This network serves a local population of 1,911, (2006 census). The Flinders Shire has existed as a local government entity since 1903.
Hughenden is the main business centre for the shire which also encompasses the smaller communities of Prairie, Torrens Creek and Stamford.
Hughenden is situated on the banks of the Flinders River, Queensland longest river. Hughenden has direct road access to a number of major centres and tourist attractions within the region. The Flinders Highway runs through Hughenden connecting to Townsville, (376km) in the east and Mount Isa, (519km) in the west, with a southern sealed road access via the Dinosaur Way to Winton and Longreach. For those wanting to travel north there is the Kennedy Developmental Road, a gravel and bitumen sealed road, to the Atherton Tablelands and Cairns.
The Flinders Shire is predominantly a grazing area, with some emerging irrigation pockets. North of the Flinders River is predominately red and black volcanic basalt country and to the south of Hughenden is black soil downs country with open natural grass lands
On April 20th, 1887, the town of the Hughenden became a separate entity from the division of Hughenden by proclamation with the first election being held on June 1, 1887.
When the Local Authorities Act of 1902 came into force on March 31, 1903, the Division of Hughenden became the Shire of Hughenden. On September 5, 1903, the name was altered to the Shire of Flinders. The Shire was divided into two areas by constituting portions thereof into a new Shire by the name of Wyangarie now Richmond Shire, on October 23, 1915. The year 1958 saw the amalgamation of Hughenden Town Council and the Shire of Flinders.
A significant proportion of the Flinders Shire Council infrastructure assets have been in existence for many years. The assets originated from a combination of Council construction and development activity within the region.
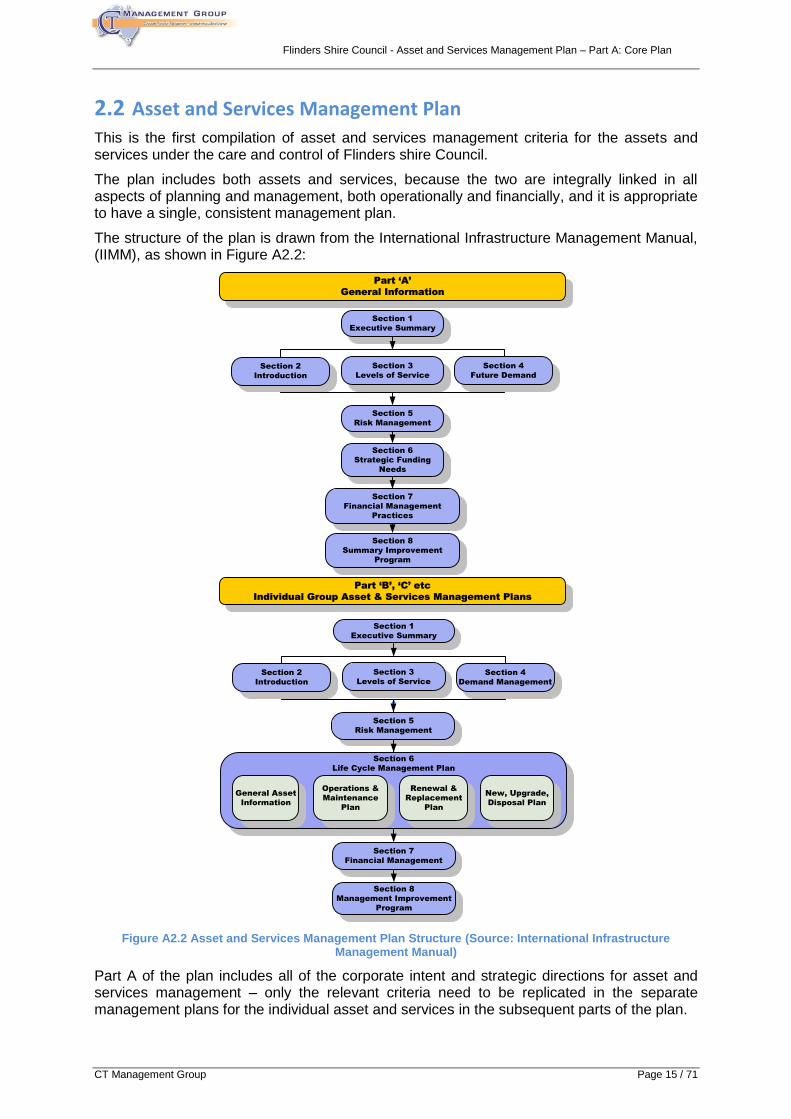
Flinders Shire Council - Asset and Services Management Plan – Part A: Core Plan
CT Management Group Page 15 / 71
2.2 Asset and Services Management Plan
This is the first compilation of asset and services management criteria for the assets and services under the care and control of Flinders shire Council.
The plan includes both assets and services, because the two are integrally linked in all aspects of planning and management, both operationally and financially, and it is appropriate to have a single, consistent management plan.
The structure of the plan is drawn from the International Infrastructure Management Manual, (IIMM), as shown in Figure A2.2:
Figure A2.2 Asset and Services Management Plan Structure (Source: International Infrastructure Management Manual)
Part A of the plan includes all of the corporate intent and strategic directions for asset and services management – only the relevant criteria need to be replicated in the separate management plans for the individual asset and services in the subsequent parts of the plan.
Section 6
Life Cycle Management Plan
Section 1
Executive Summary
Section 3
Levels of Service
Section 2
Introduction
Section 4
Future Demand
Section 5
Risk Management
Renewal &
Replacement
Plan
New, Upgrade,
Disposal Plan
General Asset
Information
Section 7
Financial Management
Section 7
Financial Management
Practices
Part ‘B’, ‘C’ etc
Individual Group Asset & Services Management Plans
Part ‘A’
General Information
Section 6
Strategic Funding
Needs
Operations &
Maintenance
Plan
Section 8
Management Improvement
Program
Section 1
Executive Summary
Section 3
Levels of Service
Section 2
Introduction
Section 4
Demand Management
Section 5
Risk Management
Section 8
Summary Improvement
Program
Flinders Shire Council - Asset and Services Management Plan – Part A: Core Plan
CT Management Group Page 16 / 71
The total plan provides the management framework for the following asset classes:
Part B Road Network
Part C Buildings and Other Structures
Part D Recreation Facilities
Part E Sewer Network
Part F Water Network
Part G Waste / Landfill
Part H Corporate / IT
Part I Plant and Equipment
Summary information from the individual plans for inclusion in the Long Term Financial Plan and Improvement Plan is recorded in Part A.
2.3 Purpose and Scope of the Plan
Council’s primary goal in managing assets is to meet the required Level of Service in the most cost effective manner for present and future residents, and visitors. The key elements of asset and services management are therefore:
Providing defined Levels of Service for all services, (linked with the relevant asset class);
Taking a ‘whole of life’ costing approach;
Developing cost-effective management strategies for assets and services for the long term;
Understanding and meeting the demands of growth through management and infrastructure investment;
Continuous improvement in asset and services management practices; Preparation of this plan followed a defined process of identifying:
The corporate commitment to the management of the assets and services;
Determining the current community needs, (Levels of Service);
Forecasting future demand for the individual asset classes;
Identifying the risks associated with ownership and management of the assets;
Identifying the operating parameters of the assets and services;
Sequencing renewal and replacement of the assets;
Deciding issues such as whether to create new assets, upgrade existing assets and when to dispose of underperforming assets;
Understanding the current financial position and forecasting future finance requirements; and
Reviewing the whole process, before commencing again, in order to achieve continuous improvements to the processes.
The full planning process is displayed in Figure A2.3 shown below.
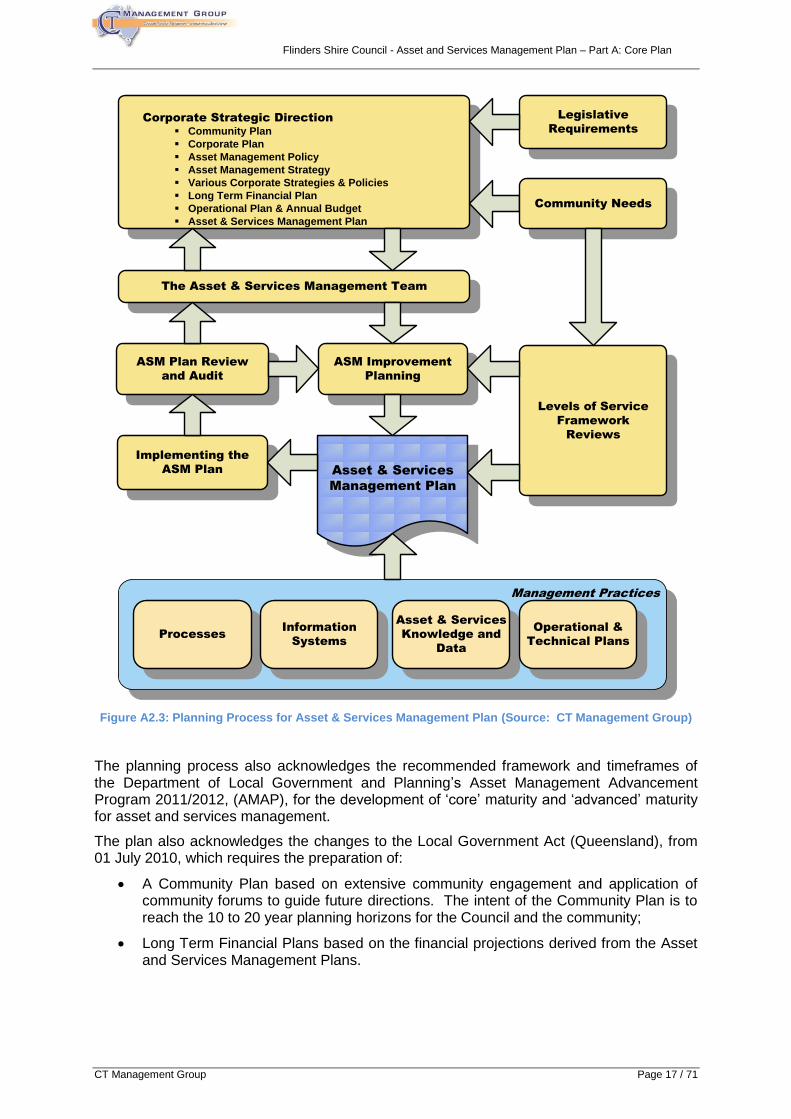
Flinders Shire Council - Asset and Services Management Plan – Part A: Core Plan
CT Management Group Page 17 / 71
Figure A2.3: Planning Process for Asset & Services Management Plan (Source: CT Management Group)
The planning process also acknowledges the recommended framework and timeframes of the Department of Local Government and Planning’s Asset Management Advancement Program 2011/2012, (AMAP), for the development of ‘core’ maturity and ‘advanced’ maturity for asset and services management.
The plan also acknowledges the changes to the Local Government Act (Queensland), from 01 July 2010, which requires the preparation of:
A Community Plan based on extensive community engagement and application of community forums to guide future directions. The intent of the Community Plan is to reach the 10 to 20 year planning horizons for the Council and the community;
Long Term Financial Plans based on the financial projections derived from the Asset and Services Management Plans.
Corporate Strategic Direction
§ Community Plan
§ Corporate Plan
§ Asset Management Policy
§ Asset Management Strategy
§ Various Corporate Strategies & Policies
§ Long Term Financial Plan
§ Operational Plan & Annual Budget
§ Asset & Services Management Plan
Legislative
Requirements
Community Needs
Levels of Service
Framework
Reviews
Implementing the
ASM Plan
The Asset & Services Management Team
ASM Plan Review
and Audit
ASM Improvement
Planning
Asset & Services
Management Plan
Management Practices
ProcessesInformation
Systems
Asset & Services
Knowledge and
Data
Operational &
Technical Plans
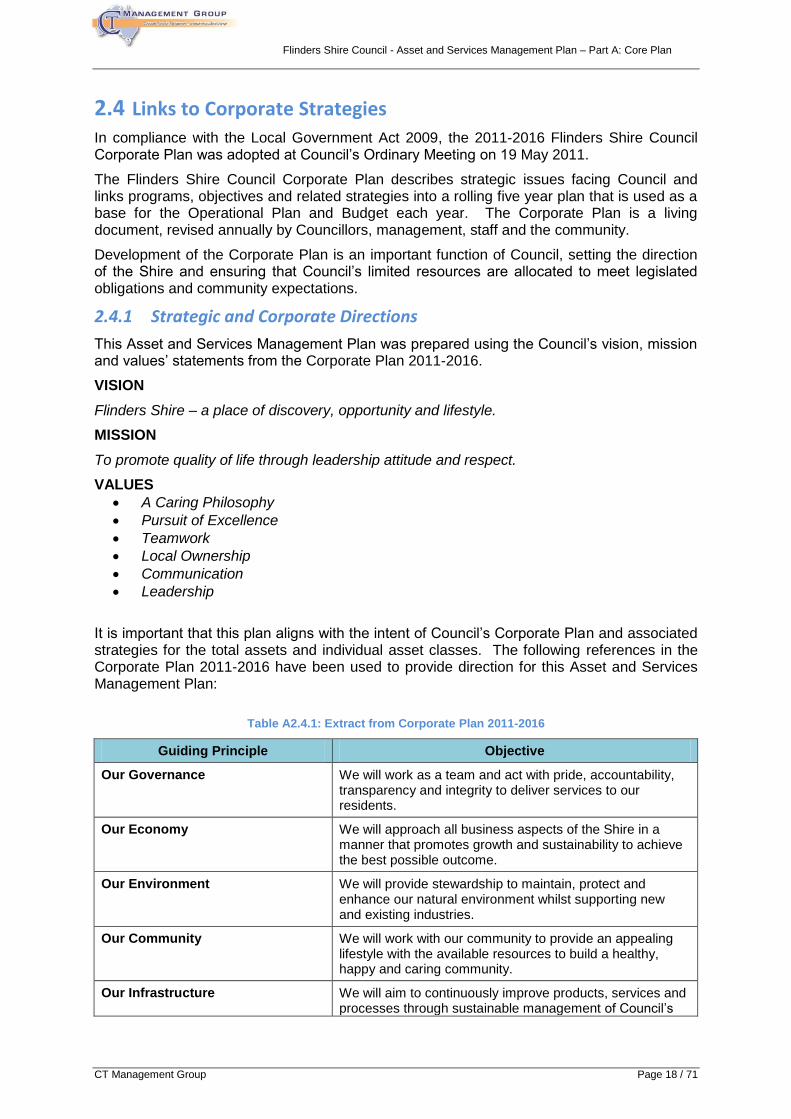
Flinders Shire Council - Asset and Services Management Plan – Part A: Core Plan
CT Management Group Page 18 / 71
2.4 Links to Corporate Strategies
In compliance with the Local Government Act 2009, the 2011-2016 Flinders Shire Council Corporate Plan was adopted at Council’s Ordinary Meeting on 19 May 2011.
The Flinders Shire Council Corporate Plan describes strategic issues facing Council and links programs, objectives and related strategies into a rolling five year plan that is used as a base for the Operational Plan and Budget each year. The Corporate Plan is a living document, revised annually by Councillors, management, staff and the community.
Development of the Corporate Plan is an important function of Council, setting the direction of the Shire and ensuring that Council’s limited resources are allocated to meet legislated obligations and community expectations.
2.4.1 Strategic and Corporate Directions
This Asset and Services Management Plan was prepared using the Council’s vision, mission and values’ statements from the Corporate Plan 2011-2016.
VISION
Flinders Shire – a place of discovery, opportunity and lifestyle.
MISSION
To promote quality of life through leadership attitude and respect.
VALUES
A Caring Philosophy
Pursuit of Excellence
Teamwork
Local Ownership
Communication
Leadership
It is important that this plan aligns with the intent of Council’s Corporate Plan and associated strategies for the total assets and individual asset classes. The following references in the Corporate Plan 2011-2016 have been used to provide direction for this Asset and Services Management Plan:
Table A2.4.1: Extract from Corporate Plan 2011-2016
Guiding Principle Objective
Our Governance We will work as a team and act with pride, accountability, transparency and integrity to deliver services to our residents.
Our Economy We will approach all business aspects of the Shire in a manner that promotes growth and sustainability to achieve the best possible outcome.
Our Environment We will provide stewardship to maintain, protect and enhance our natural environment whilst supporting new and existing industries.
Our Community We will work with our community to provide an appealing lifestyle with the available resources to build a healthy, happy and caring community.
Our Infrastructure We will aim to continuously improve products, services and processes through sustainable management of Council’s
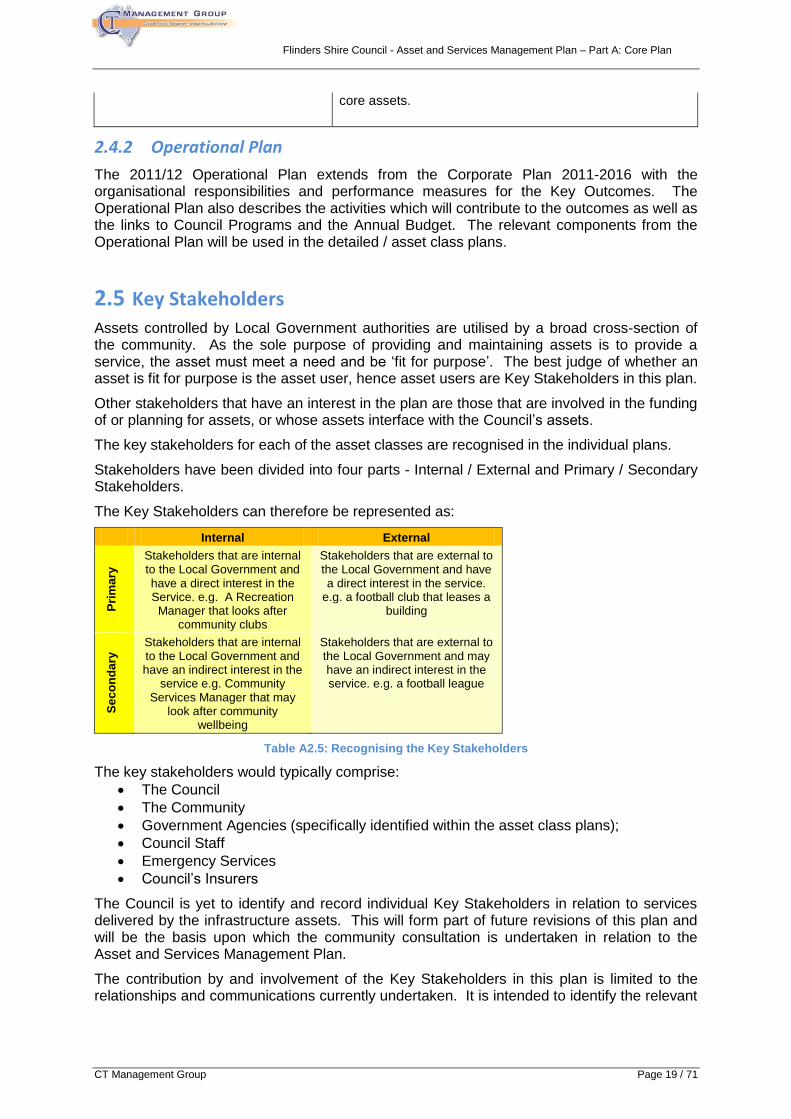
Flinders Shire Council - Asset and Services Management Plan – Part A: Core Plan
CT Management Group Page 19 / 71
core assets.
2.4.2 Operational Plan
The 2011/12 Operational Plan extends from the Corporate Plan 2011-2016 with the organisational responsibilities and performance measures for the Key Outcomes. The Operational Plan also describes the activities which will contribute to the outcomes as well as the links to Council Programs and the Annual Budget. The relevant components from the Operational Plan will be used in the detailed / asset class plans.
2.5 Key Stakeholders
Assets controlled by Local Government authorities are utilised by a broad cross-section of the community. As the sole purpose of providing and maintaining assets is to provide a service, the asset must meet a need and be ‘fit for purpose’. The best judge of whether an asset is fit for purpose is the asset user, hence asset users are Key Stakeholders in this plan.
Other stakeholders that have an interest in the plan are those that are involved in the funding of or planning for assets, or whose assets interface with the Council’s assets.
The key stakeholders for each of the asset classes are recognised in the individual plans.
Stakeholders have been divided into four parts - Internal / External and Primary / Secondary Stakeholders.
The Key Stakeholders can therefore be represented as:
Internal External
Pri
ma
ry
Stakeholders that are internal to the Local Government and have a direct interest in the Service. e.g. A Recreation Manager that looks after
community clubs
Stakeholders that are external to the Local Government and have a direct interest in the service.
e.g. a football club that leases a building
Se
co
nd
ary
Stakeholders that are internal to the Local Government and have an indirect interest in the
service e.g. Community Services Manager that may
look after community wellbeing
Stakeholders that are external to the Local Government and may have an indirect interest in the service. e.g. a football league
Table A2.5: Recognising the Key Stakeholders
The key stakeholders would typically comprise:
The Council
The Community
Government Agencies (specifically identified within the asset class plans);
Council Staff
Emergency Services
Council’s Insurers
The Council is yet to identify and record individual Key Stakeholders in relation to services delivered by the infrastructure assets. This will form part of future revisions of this plan and will be the basis upon which the community consultation is undertaken in relation to the Asset and Services Management Plan.
The contribution by and involvement of the Key Stakeholders in this plan is limited to the relationships and communications currently undertaken. It is intended to identify the relevant
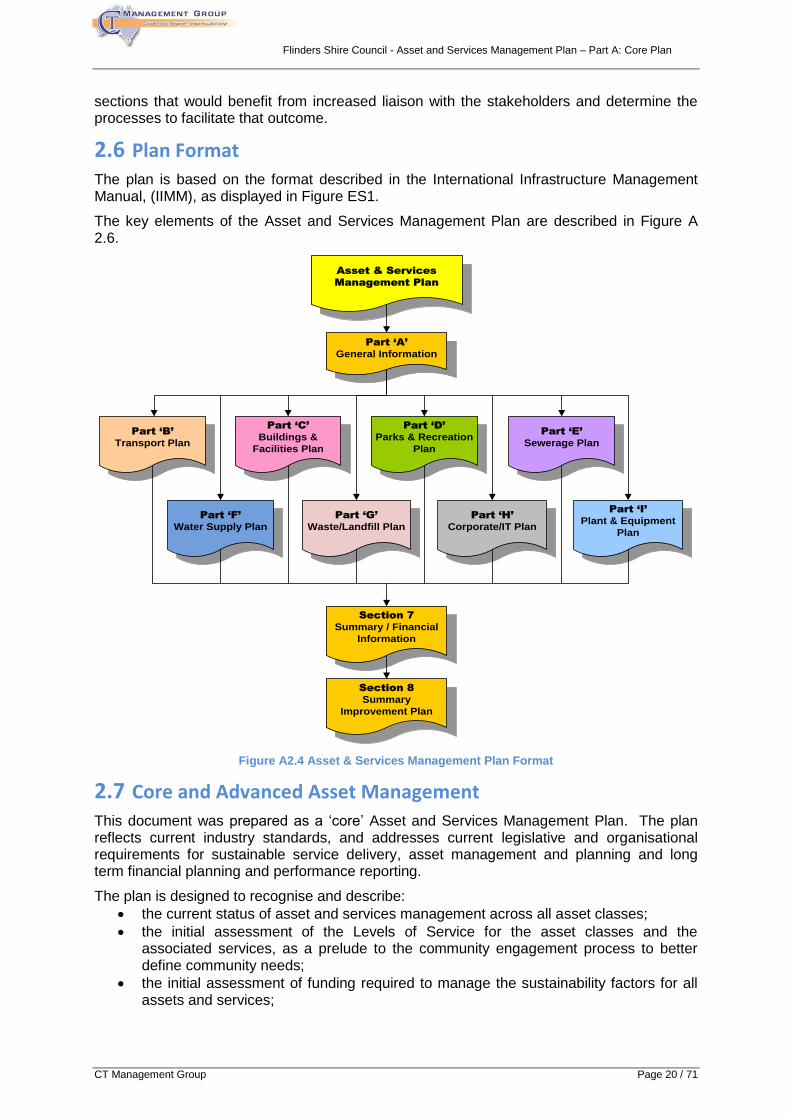
Flinders Shire Council - Asset and Services Management Plan – Part A: Core Plan
CT Management Group Page 20 / 71
sections that would benefit from increased liaison with the stakeholders and determine the processes to facilitate that outcome.
2.6 Plan Format
The plan is based on the format described in the International Infrastructure Management Manual, (IIMM), as displayed in Figure ES1.
The key elements of the Asset and Services Management Plan are described in Figure A 2.6.
Asset & Services
Management Plan
Part ‘A’
General Information
Part ‘B’
Transport Plan
Part ‘C’
Buildings &
Facilities Plan
Part ‘G’
Waste/Landfill Plan
Part ‘D’
Parks & Recreation
Plan
Part ‘E’
Sewerage Plan
Part ‘F’
Water Supply Plan
Part ‘H’
Corporate/IT Plan
Part ‘I’
Plant & Equipment
Plan
Section 7
Summary / Financial
Information
Section 8
Summary
Improvement Plan
Figure A2.4 Asset & Services Management Plan Format
2.7 Core and Advanced Asset Management
This document was prepared as a ‘core’ Asset and Services Management Plan. The plan reflects current industry standards, and addresses current legislative and organisational requirements for sustainable service delivery, asset management and planning and long term financial planning and performance reporting.
The plan is designed to recognise and describe:
the current status of asset and services management across all asset classes;
the initial assessment of the Levels of Service for the asset classes and the associated services, as a prelude to the community engagement process to better define community needs;
the initial assessment of funding required to manage the sustainability factors for all assets and services;
Flinders Shire Council - Asset and Services Management Plan – Part A: Core Plan
CT Management Group Page 21 / 71
the improvements required to meet ‘advanced’ status, (as defined in the International Infrastructure Management Manual), and
the improvements required to ensure the integrity of the plan and processes.
Future revisions of this Asset and Services Management Plan will move towards an ‘advanced’ status using outputs derived from high quality data for individual asset classes to optimise programs and functions to test against agreed Levels of Service.
The National Assessment Framework will be regularly engaged during the program to assess the status of asset and services management against nominated industry standards, to be used to interpret best appropriate practice for Flinders Shire Council.
The intention is to reach ‘advanced’ status for asset and services management by 30 June 2012.
2.8 Function and Hierarchy
Flinders Shire Council manages a comprehensive suite of asset classes as shown in the tables below. The tables record the assets as Asset Class, Asset Group, Asset Type and all Components.
The Levels of Service are recorded for the individual asset classes, (in the separate chapters), to reflect the service needs assessed for this core plan.
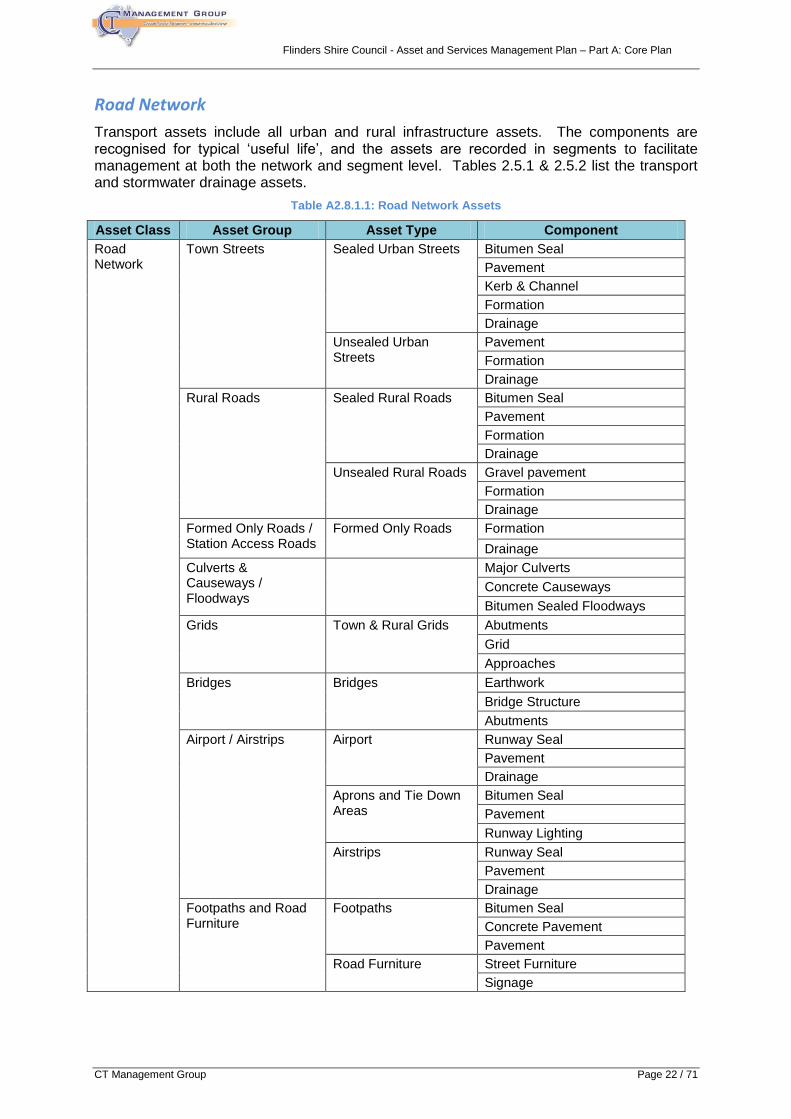
Flinders Shire Council - Asset and Services Management Plan – Part A: Core Plan
CT Management Group Page 22 / 71
Road Network
Transport assets include all urban and rural infrastructure assets. The components are recognised for typical ‘useful life’, and the assets are recorded in segments to facilitate management at both the network and segment level. Tables 2.5.1 & 2.5.2 list the transport and stormwater drainage assets.
Table A2.8.1.1: Road Network Assets
Asset Class Asset Group Asset Type Component
Road Network
Town Streets Sealed Urban Streets Bitumen Seal
Pavement
Kerb & Channel
Formation
Drainage
Unsealed Urban Streets
Pavement
Formation
Drainage
Rural Roads Sealed Rural Roads Bitumen Seal
Pavement
Formation
Drainage
Unsealed Rural Roads Gravel pavement
Formation
Drainage
Formed Only Roads / Station Access Roads
Formed Only Roads Formation
Drainage
Culverts & Causeways / Floodways
Major Culverts
Concrete Causeways
Bitumen Sealed Floodways
Grids Town & Rural Grids Abutments
Grid
Approaches
Bridges Bridges Earthwork
Bridge Structure
Abutments
Airport / Airstrips Airport Runway Seal
Pavement
Drainage
Aprons and Tie Down Areas
Bitumen Seal
Pavement
Runway Lighting
Airstrips Runway Seal
Pavement
Drainage
Footpaths and Road Furniture
Footpaths Bitumen Seal
Concrete Pavement
Pavement
Road Furniture Street Furniture
Signage
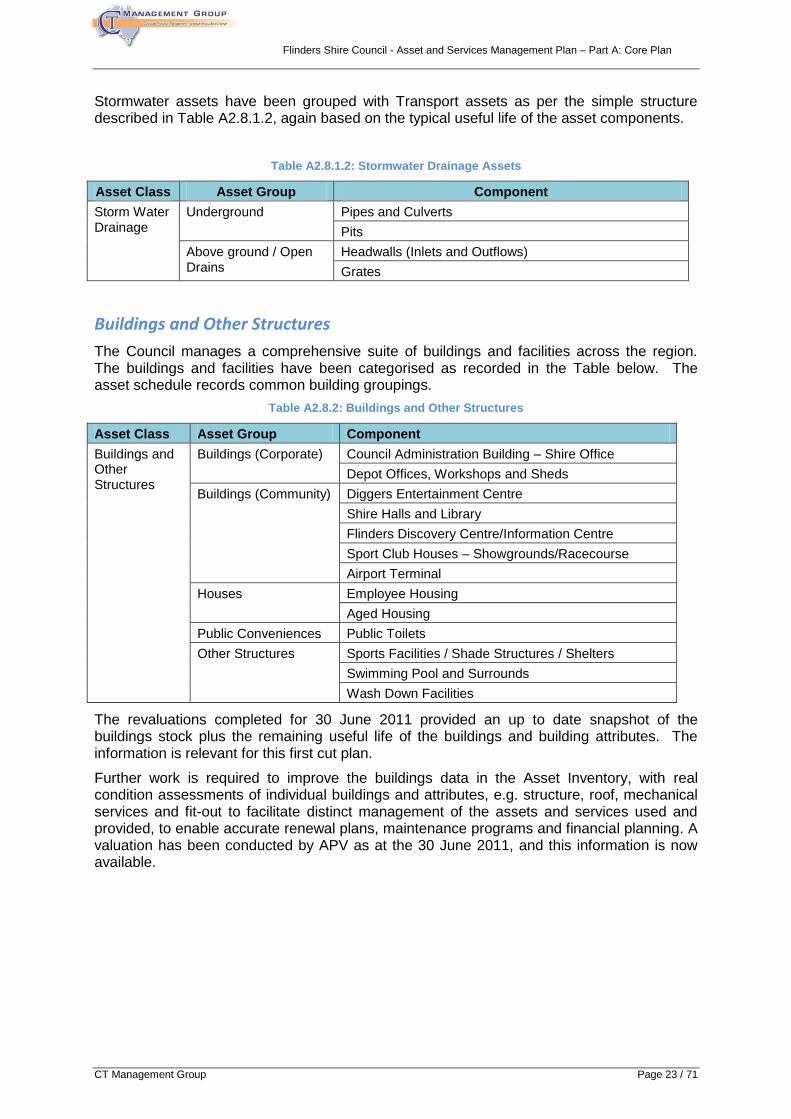
Flinders Shire Council - Asset and Services Management Plan – Part A: Core Plan
CT Management Group Page 23 / 71
Stormwater assets have been grouped with Transport assets as per the simple structure described in Table A2.8.1.2, again based on the typical useful life of the asset components.
Table A2.8.1.2: Stormwater Drainage Assets
Asset Class Asset Group Component
Storm Water Drainage
Underground Pipes and Culverts
Pits
Above ground / Open Drains
Headwalls (Inlets and Outflows)
Grates
Buildings and Other Structures
The Council manages a comprehensive suite of buildings and facilities across the region. The buildings and facilities have been categorised as recorded in the Table below. The asset schedule records common building groupings.
Table A2.8.2: Buildings and Other Structures
Asset Class Asset Group Component
Buildings and Other Structures
Buildings (Corporate) Council Administration Building – Shire Office
Depot Offices, Workshops and Sheds
Buildings (Community) Diggers Entertainment Centre
Shire Halls and Library
Flinders Discovery Centre/Information Centre
Sport Club Houses – Showgrounds/Racecourse
Airport Terminal
Houses Employee Housing
Aged Housing
Public Conveniences Public Toilets
Other Structures Sports Facilities / Shade Structures / Shelters
Swimming Pool and Surrounds
Wash Down Facilities
The revaluations completed for 30 June 2011 provided an up to date snapshot of the buildings stock plus the remaining useful life of the buildings and building attributes. The information is relevant for this first cut plan.
Further work is required to improve the buildings data in the Asset Inventory, with real condition assessments of individual buildings and attributes, e.g. structure, roof, mechanical services and fit-out to facilitate distinct management of the assets and services used and provided, to enable accurate renewal plans, maintenance programs and financial planning. A valuation has been conducted by APV as at the 30 June 2011, and this information is now available.
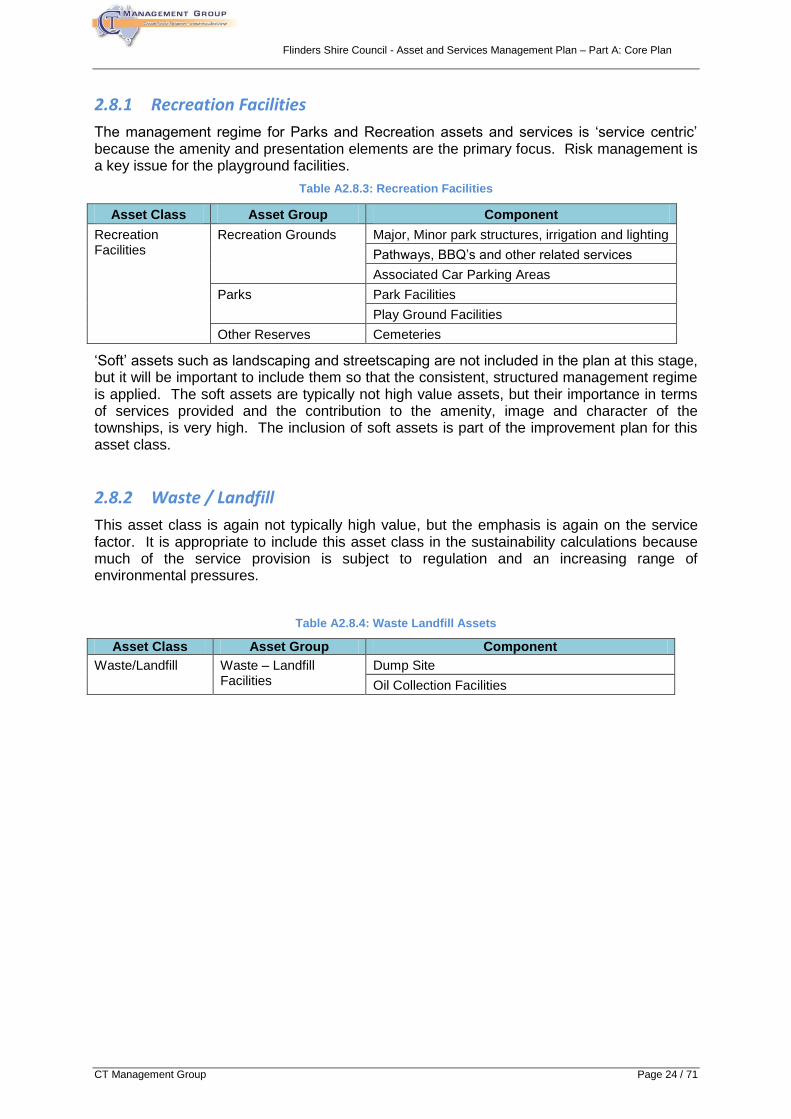
Flinders Shire Council - Asset and Services Management Plan – Part A: Core Plan
CT Management Group Page 24 / 71
2.8.1 Recreation Facilities
The management regime for Parks and Recreation assets and services is ‘service centric’ because the amenity and presentation elements are the primary focus. Risk management is a key issue for the playground facilities.
Table A2.8.3: Recreation Facilities
Asset Class Asset Group Component
Recreation Facilities
Recreation Grounds Major, Minor park structures, irrigation and lighting
Pathways, BBQ’s and other related services
Associated Car Parking Areas
Parks Park Facilities
Play Ground Facilities
Other Reserves Cemeteries
‘Soft’ assets such as landscaping and streetscaping are not included in the plan at this stage, but it will be important to include them so that the consistent, structured management regime is applied. The soft assets are typically not high value assets, but their importance in terms of services provided and the contribution to the amenity, image and character of the townships, is very high. The inclusion of soft assets is part of the improvement plan for this asset class.
2.8.2 Waste / Landfill
This asset class is again not typically high value, but the emphasis is again on the service factor. It is appropriate to include this asset class in the sustainability calculations because much of the service provision is subject to regulation and an increasing range of environmental pressures.
Table A2.8.4: Waste Landfill Assets
Asset Class Asset Group Component
Waste/Landfill Waste – Landfill Facilities
Dump Site
Oil Collection Facilities
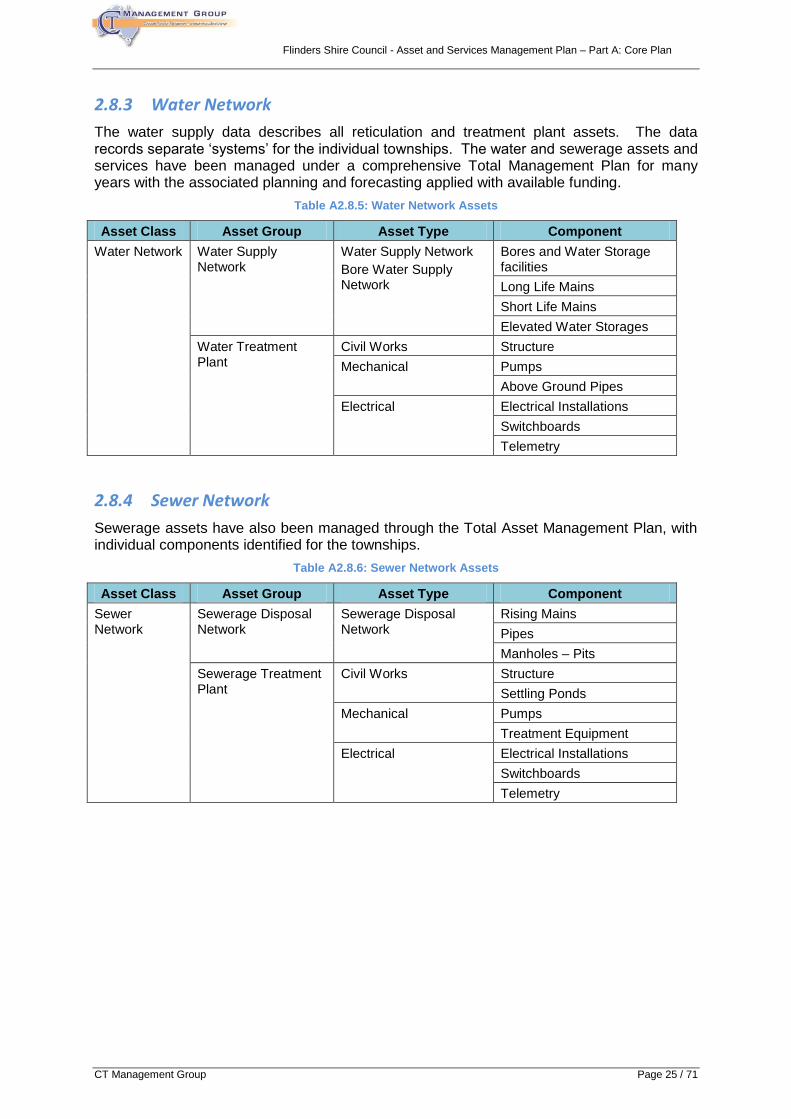
Flinders Shire Council - Asset and Services Management Plan – Part A: Core Plan
CT Management Group Page 25 / 71
2.8.3 Water Network
The water supply data describes all reticulation and treatment plant assets. The data records separate ‘systems’ for the individual townships. The water and sewerage assets and services have been managed under a comprehensive Total Management Plan for many years with the associated planning and forecasting applied with available funding.
Table A2.8.5: Water Network Assets
Asset Class Asset Group Asset Type Component
Water Network Water Supply Network
Water Supply Network
Bore Water Supply Network
Bores and Water Storage facilities
Long Life Mains
Short Life Mains
Elevated Water Storages
Water Treatment Plant
Civil Works Structure
Mechanical Pumps
Above Ground Pipes
Electrical Electrical Installations
Switchboards
Telemetry
2.8.4 Sewer Network
Sewerage assets have also been managed through the Total Asset Management Plan, with individual components identified for the townships.
Table A2.8.6: Sewer Network Assets
Asset Class Asset Group Asset Type Component
Sewer Network
Sewerage Disposal Network
Sewerage Disposal Network
Rising Mains
Pipes
Manholes – Pits
Sewerage Treatment Plant
Civil Works Structure
Settling Ponds
Mechanical Pumps
Treatment Equipment
Electrical Electrical Installations
Switchboards
Telemetry
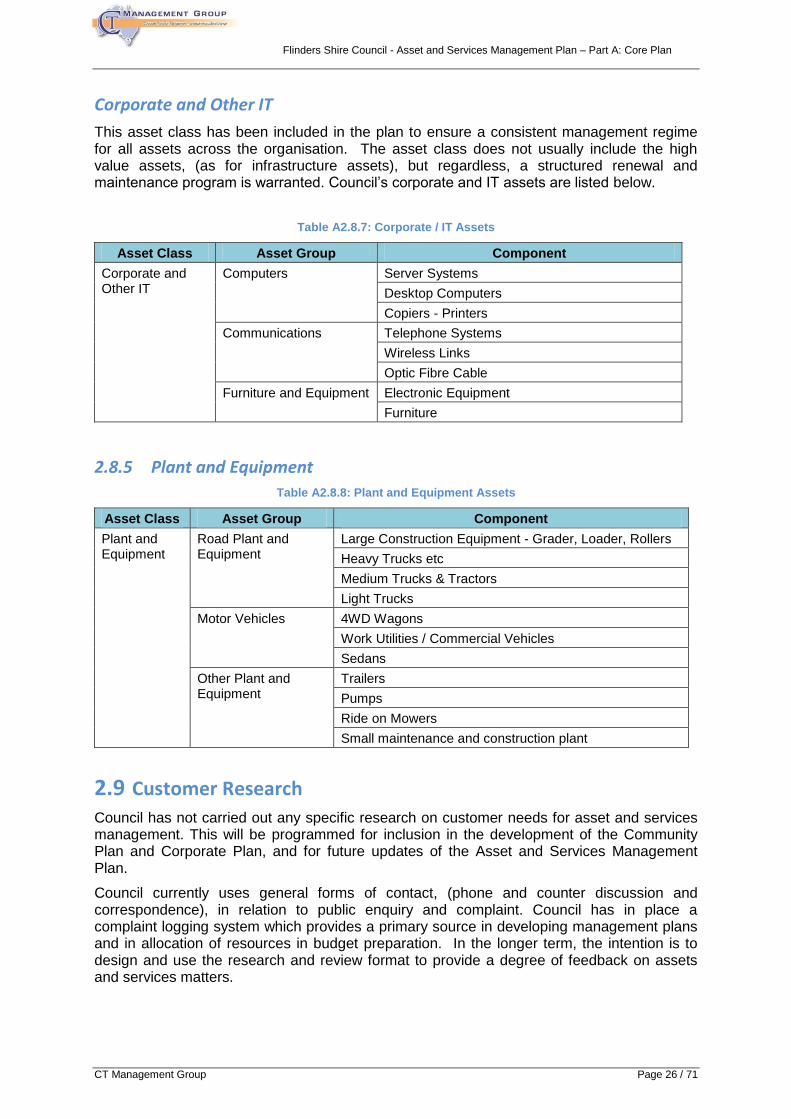
Flinders Shire Council - Asset and Services Management Plan – Part A: Core Plan
CT Management Group Page 26 / 71
Corporate and Other IT
This asset class has been included in the plan to ensure a consistent management regime for all assets across the organisation. The asset class does not usually include the high value assets, (as for infrastructure assets), but regardless, a structured renewal and maintenance program is warranted. Council’s corporate and IT assets are listed below.
Table A2.8.7: Corporate / IT Assets
Asset Class Asset Group Component
Corporate and Other IT
Computers Server Systems
Desktop Computers
Copiers - Printers
Communications Telephone Systems
Wireless Links
Optic Fibre Cable
Furniture and Equipment Electronic Equipment
Furniture
2.8.5 Plant and Equipment
Table A2.8.8: Plant and Equipment Assets
Asset Class Asset Group Component
Plant and Equipment
Road Plant and Equipment
Large Construction Equipment - Grader, Loader, Rollers
Heavy Trucks etc
Medium Trucks & Tractors
Light Trucks
Motor Vehicles 4WD Wagons
Work Utilities / Commercial Vehicles
Sedans
Other Plant and Equipment
Trailers
Pumps
Ride on Mowers
Small maintenance and construction plant
2.9 Customer Research
Council has not carried out any specific research on customer needs for asset and services management. This will be programmed for inclusion in the development of the Community Plan and Corporate Plan, and for future updates of the Asset and Services Management Plan.
Council currently uses general forms of contact, (phone and counter discussion and correspondence), in relation to public enquiry and complaint. Council has in place a complaint logging system which provides a primary source in developing management plans and in allocation of resources in budget preparation. In the longer term, the intention is to design and use the research and review format to provide a degree of feedback on assets and services matters.
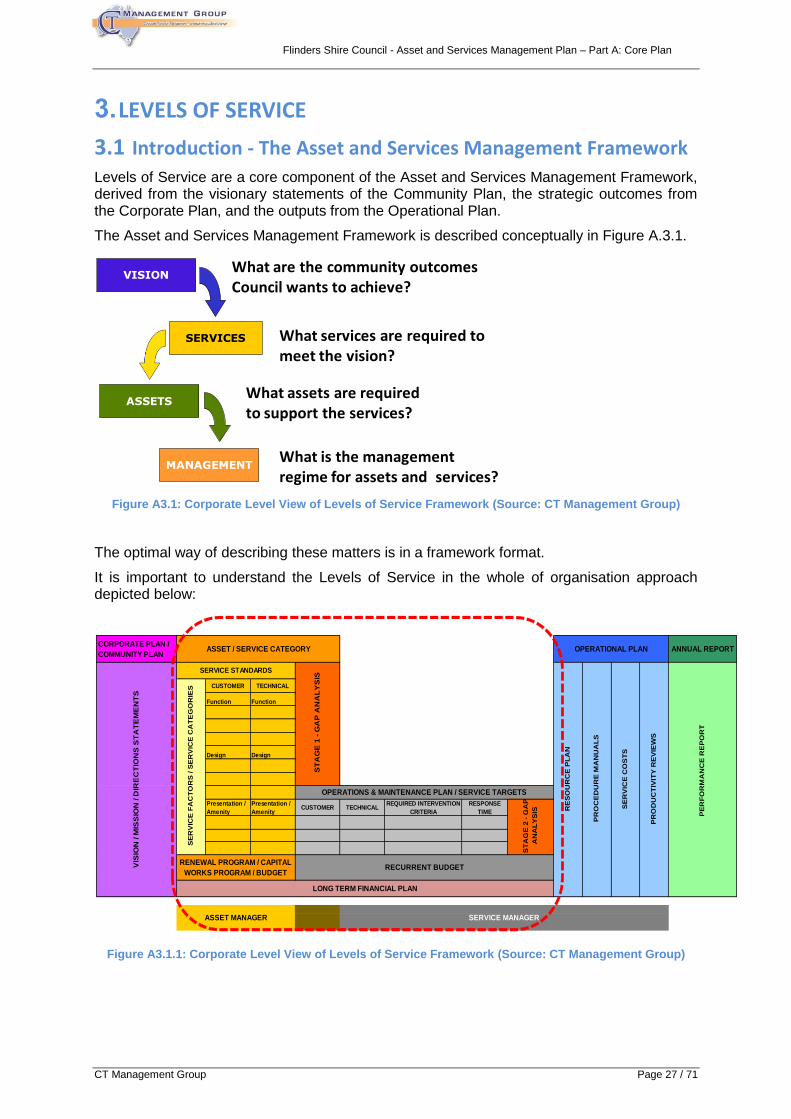
Flinders Shire Council - Asset and Services Management Plan – Part A: Core Plan
CT Management Group Page 27 / 71
3. LEVELS OF SERVICE
3.1 Introduction - The Asset and Services Management Framework
Levels of Service are a core component of the Asset and Services Management Framework, derived from the visionary statements of the Community Plan, the strategic outcomes from the Corporate Plan, and the outputs from the Operational Plan.
The Asset and Services Management Framework is described conceptually in Figure A.3.1.
Figure A3.1: Corporate Level View of Levels of Service Framework (Source: CT Management Group)
The optimal way of describing these matters is in a framework format.
It is important to understand the Levels of Service in the whole of organisation approach depicted below:
Figure A3.1.1: Corporate Level View of Levels of Service Framework (Source: CT Management Group)
VISION
SERVICES
ASSETS
What are the community outcomes Council wants to achieve?
What services are required to meet the vision?
What assets are required to support the services?
What is the management regime for assets and services?
MANAGEMENT
CORPORATE PLAN /
COMMUNITY PLANANNUAL REPORT
CUSTOMER TECHNICAL
Function Function
Design Design
Presentation /
Amenity
Presentation /
AmenityCUSTOMER TECHNICAL
REQUIRED INTERVENTION
CRITERIA
RESPONSE
TIME
ASSET / SERVICE CATEGORY OPERATIONAL PLAN
VIS
ION
/ M
ISS
ION
/ D
IRE
CT
ION
S S
TA
TE
ME
NT
S
SERVICE STANDARDS
ST
AG
E 1
- G
AP
AN
AL
YS
IS
RE
SO
UR
CE
PL
AN
PR
OC
ED
UR
E M
AN
UA
LS
SE
RV
ICE
CO
ST
S
PR
OD
UC
TIV
ITY
RE
VIE
WS
LONG TERM FINANCIAL PLAN
ASSET MANAGER SERVICE MANAGER
PE
RF
OR
MA
NC
E R
EP
OR
T
SE
RV
ICE
FA
CT
OR
S / S
ER
VIC
E C
AT
EG
OR
IES
OPERATIONS & MAINTENANCE PLAN / SERVICE TARGETS
ST
AG
E 2
- G
AP
AN
AL
YS
IS
RENEWAL PROGRAM / CAPITAL
WORKS PROGRAM / BUDGETRECURRENT BUDGET
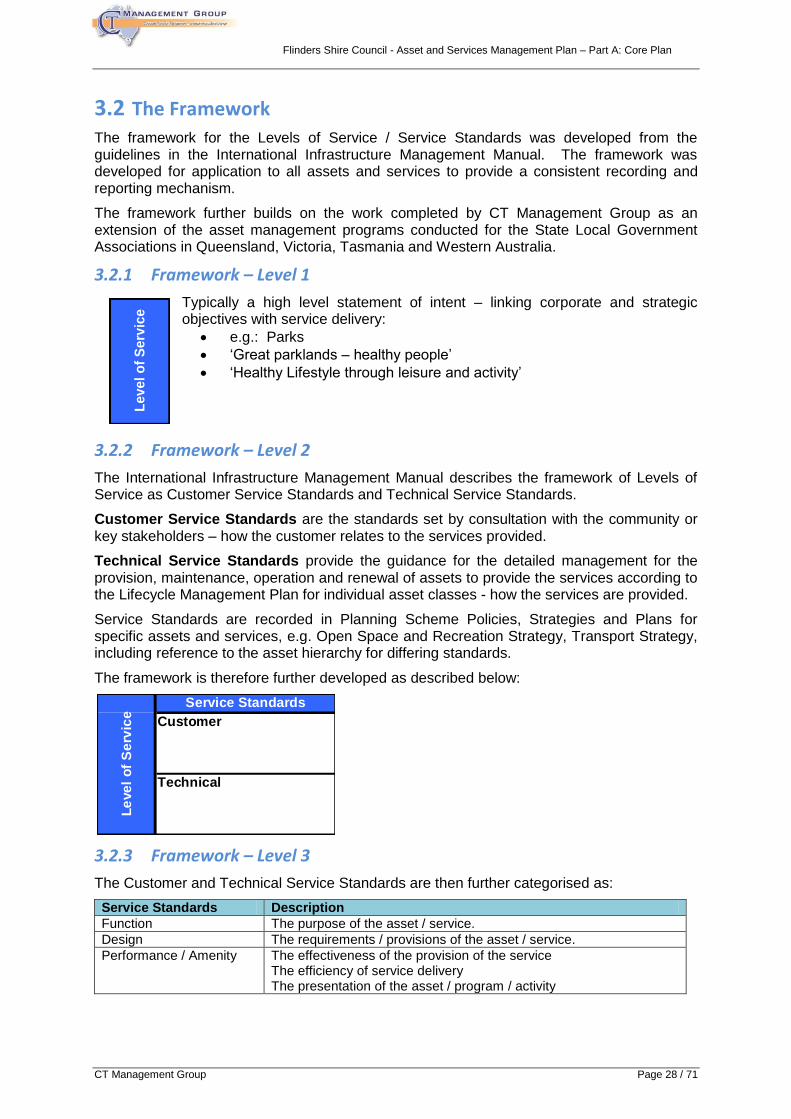
Flinders Shire Council - Asset and Services Management Plan – Part A: Core Plan
CT Management Group Page 28 / 71
Le
ve
l o
f S
erv
ice
3.2 The Framework
The framework for the Levels of Service / Service Standards was developed from the guidelines in the International Infrastructure Management Manual. The framework was developed for application to all assets and services to provide a consistent recording and reporting mechanism.
The framework further builds on the work completed by CT Management Group as an extension of the asset management programs conducted for the State Local Government Associations in Queensland, Victoria, Tasmania and Western Australia.
3.2.1 Framework – Level 1
Typically a high level statement of intent – linking corporate and strategic objectives with service delivery:
e.g.: Parks
‘Great parklands – healthy people’
‘Healthy Lifestyle through leisure and activity’
3.2.2 Framework – Level 2
The International Infrastructure Management Manual describes the framework of Levels of Service as Customer Service Standards and Technical Service Standards.
Customer Service Standards are the standards set by consultation with the community or key stakeholders – how the customer relates to the services provided.
Technical Service Standards provide the guidance for the detailed management for the provision, maintenance, operation and renewal of assets to provide the services according to the Lifecycle Management Plan for individual asset classes - how the services are provided.
Service Standards are recorded in Planning Scheme Policies, Strategies and Plans for specific assets and services, e.g. Open Space and Recreation Strategy, Transport Strategy, including reference to the asset hierarchy for differing standards.
The framework is therefore further developed as described below:
3.2.3 Framework – Level 3
The Customer and Technical Service Standards are then further categorised as:
Service Standards Description
Function The purpose of the asset / service.
Design The requirements / provisions of the asset / service.
Performance / Amenity The effectiveness of the provision of the service The efficiency of service delivery The presentation of the asset / program / activity
Customer
Technical
Le
ve
l o
f S
erv
ice
Service Standards
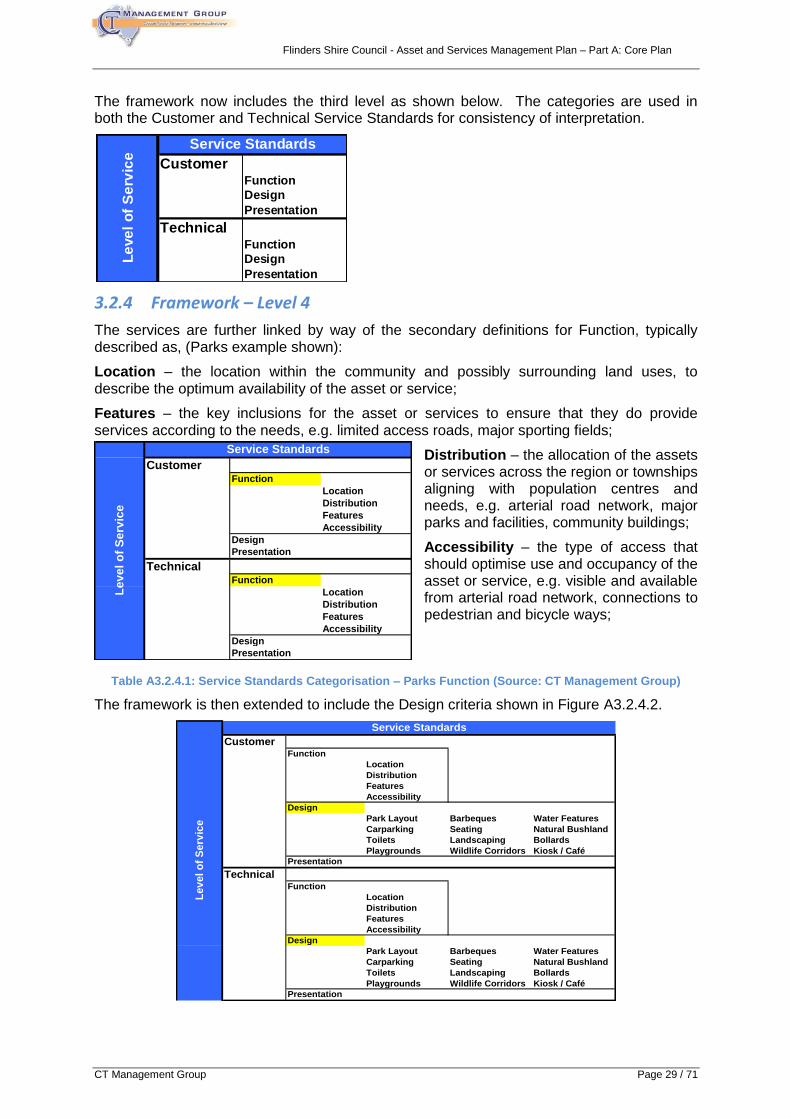
Flinders Shire Council - Asset and Services Management Plan – Part A: Core Plan
CT Management Group Page 29 / 71
The framework now includes the third level as shown below. The categories are used in both the Customer and Technical Service Standards for consistency of interpretation.
3.2.4 Framework – Level 4
The services are further linked by way of the secondary definitions for Function, typically described as, (Parks example shown):
Location – the location within the community and possibly surrounding land uses, to describe the optimum availability of the asset or service;
Features – the key inclusions for the asset or services to ensure that they do provide services according to the needs, e.g. limited access roads, major sporting fields;
Distribution – the allocation of the assets or services across the region or townships aligning with population centres and needs, e.g. arterial road network, major parks and facilities, community buildings;
Accessibility – the type of access that should optimise use and occupancy of the asset or service, e.g. visible and available from arterial road network, connections to pedestrian and bicycle ways;
Table A3.2.4.1: Service Standards Categorisation – Parks Function (Source: CT Management Group)
The framework is then extended to include the Design criteria shown in Figure A3.2.4.2.
CustomerFunction
Design
Presentation
TechnicalFunction
Design
Presentation
Le
ve
l o
f S
erv
ice
Service Standards
CustomerFunction
Location
Distribution
Features
Accessibility
Design
Park Layout Barbeques Water Features
Carparking Seating Natural Bushland
Toilets Landscaping Bollards
Playgrounds Wildlife Corridors Kiosk / Café
Presentation
TechnicalFunction
Location
Distribution
Features
Accessibility
Design
Park Layout Barbeques Water Features
Carparking Seating Natural Bushland
Toilets Landscaping Bollards
Playgrounds Wildlife Corridors Kiosk / Café
Presentation
Le
ve
l o
f S
erv
ice
Service Standards
CustomerFunction
Location
Distribution
Features
Accessibility
Design
Presentation
TechnicalFunction
Location
Distribution
Features
Accessibility
Design
Presentation
Le
ve
l o
f S
erv
ice
Service Standards
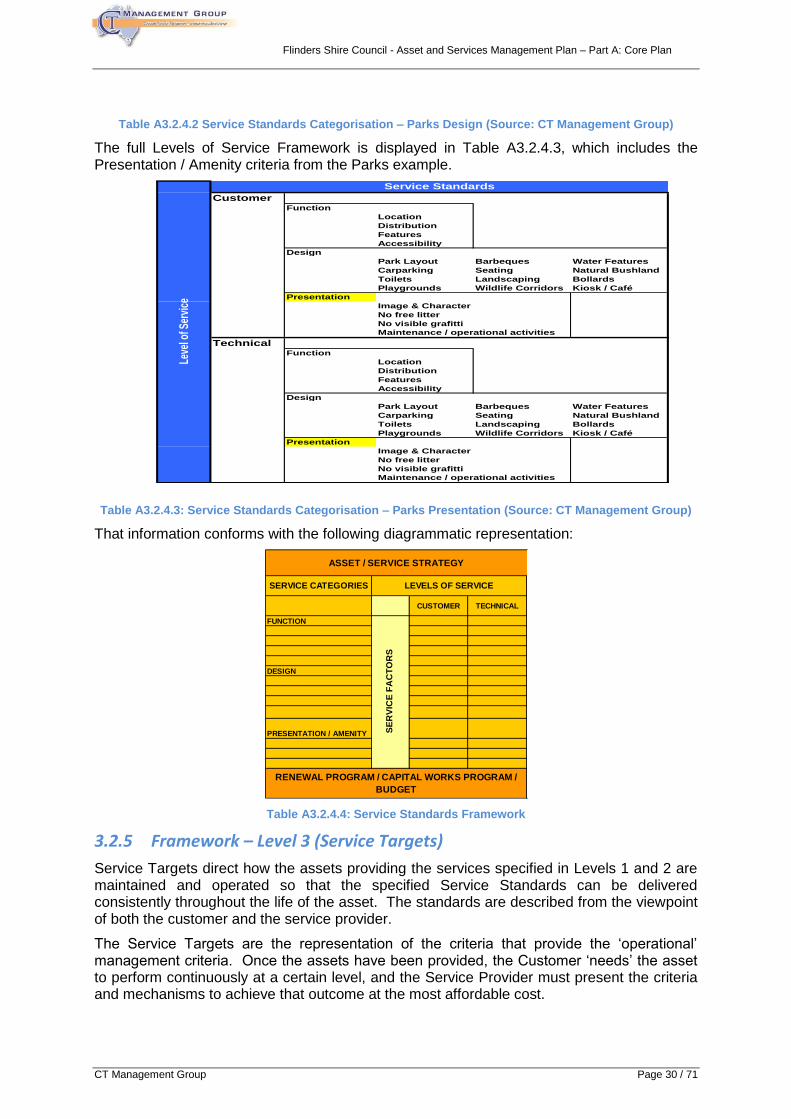
Flinders Shire Council - Asset and Services Management Plan – Part A: Core Plan
CT Management Group Page 30 / 71
Table A3.2.4.2 Service Standards Categorisation – Parks Design (Source: CT Management Group)
The full Levels of Service Framework is displayed in Table A3.2.4.3, which includes the Presentation / Amenity criteria from the Parks example.
Table A3.2.4.3: Service Standards Categorisation – Parks Presentation (Source: CT Management Group)
That information conforms with the following diagrammatic representation:
Table A3.2.4.4: Service Standards Framework
3.2.5 Framework – Level 3 (Service Targets)
Service Targets direct how the assets providing the services specified in Levels 1 and 2 are maintained and operated so that the specified Service Standards can be delivered consistently throughout the life of the asset. The standards are described from the viewpoint of both the customer and the service provider.
The Service Targets are the representation of the criteria that provide the ‘operational’ management criteria. Once the assets have been provided, the Customer ‘needs’ the asset to perform continuously at a certain level, and the Service Provider must present the criteria and mechanisms to achieve that outcome at the most affordable cost.
CUSTOMER TECHNICAL
FUNCTION
DESIGN
PRESENTATION / AMENITY
SERVICE CATEGORIES LEVELS OF SERVICE
ASSET / SERVICE STRATEGY
RENEWAL PROGRAM / CAPITAL WORKS PROGRAM /
BUDGET
SE
RV
ICE
FA
CT
OR
S
Customer
Function
Location
Distribution
Features
Accessibility
Design
Park Layout Barbeques Water Features
Carparking Seating Natural Bushland
Toilets Landscaping Bollards
Playgrounds Wildlife Corridors Kiosk / Café
Presentation
Image & Character
No free litter
No visible grafitti
Maintenance / operational activities
TechnicalFunction
Location
Distribution
Features
Accessibility
Design
Park Layout Barbeques Water Features
Carparking Seating Natural Bushland
Toilets Landscaping Bollards
Playgrounds Wildlife Corridors Kiosk / Café
Presentation
Image & Character
No free litter
No visible grafitti
Maintenance / operational activities
Leve
l of S
ervi
ceService Standards
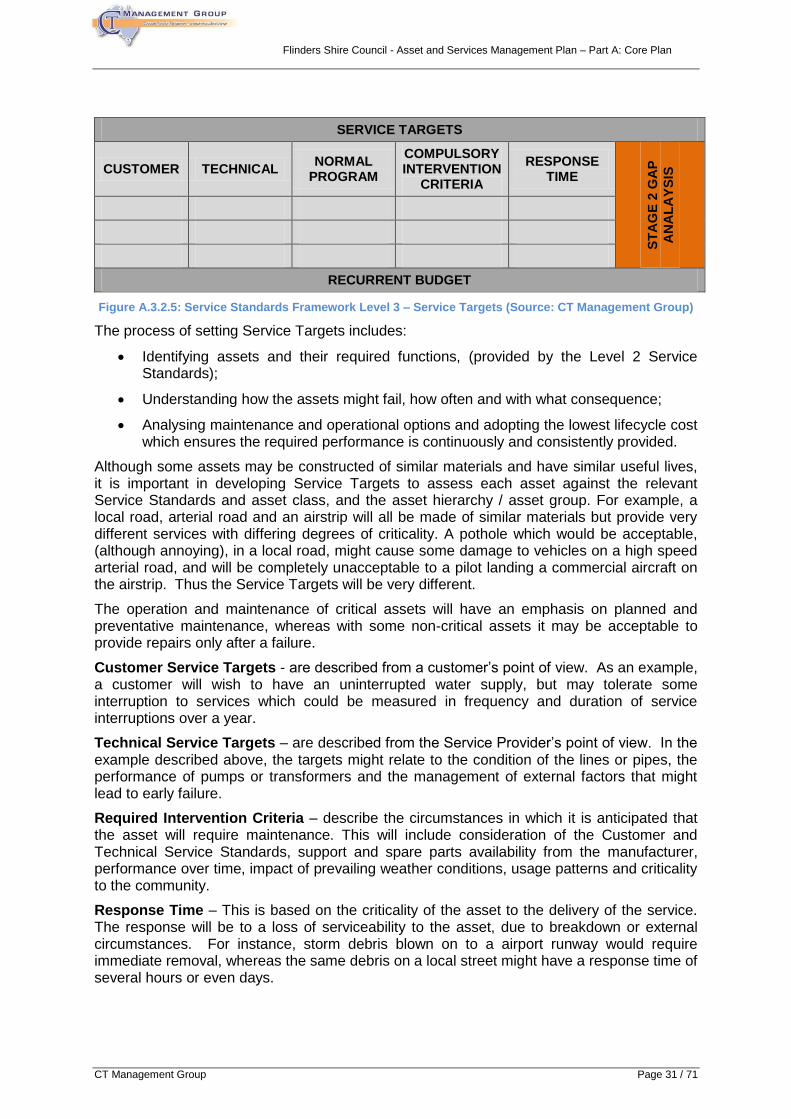
Flinders Shire Council - Asset and Services Management Plan – Part A: Core Plan
CT Management Group Page 31 / 71
SERVICE TARGETS
CUSTOMER TECHNICAL NORMAL
PROGRAM
COMPULSORY INTERVENTION
CRITERIA
RESPONSE TIME
ST
AG
E 2
GA
P
AN
AL
AY
SIS
RECURRENT BUDGET
Figure A.3.2.5: Service Standards Framework Level 3 – Service Targets (Source: CT Management Group)
The process of setting Service Targets includes:
Identifying assets and their required functions, (provided by the Level 2 Service Standards);
Understanding how the assets might fail, how often and with what consequence;
Analysing maintenance and operational options and adopting the lowest lifecycle cost which ensures the required performance is continuously and consistently provided.
Although some assets may be constructed of similar materials and have similar useful lives, it is important in developing Service Targets to assess each asset against the relevant Service Standards and asset class, and the asset hierarchy / asset group. For example, a local road, arterial road and an airstrip will all be made of similar materials but provide very different services with differing degrees of criticality. A pothole which would be acceptable, (although annoying), in a local road, might cause some damage to vehicles on a high speed arterial road, and will be completely unacceptable to a pilot landing a commercial aircraft on the airstrip. Thus the Service Targets will be very different.
The operation and maintenance of critical assets will have an emphasis on planned and preventative maintenance, whereas with some non-critical assets it may be acceptable to provide repairs only after a failure.
Customer Service Targets - are described from a customer’s point of view. As an example, a customer will wish to have an uninterrupted water supply, but may tolerate some interruption to services which could be measured in frequency and duration of service interruptions over a year.
Technical Service Targets – are described from the Service Provider’s point of view. In the example described above, the targets might relate to the condition of the lines or pipes, the performance of pumps or transformers and the management of external factors that might lead to early failure.
Required Intervention Criteria – describe the circumstances in which it is anticipated that the asset will require maintenance. This will include consideration of the Customer and Technical Service Standards, support and spare parts availability from the manufacturer, performance over time, impact of prevailing weather conditions, usage patterns and criticality to the community.
Response Time – This is based on the criticality of the asset to the delivery of the service. The response will be to a loss of serviceability to the asset, due to breakdown or external circumstances. For instance, storm debris blown on to a airport runway would require immediate removal, whereas the same debris on a local street might have a response time of several hours or even days.
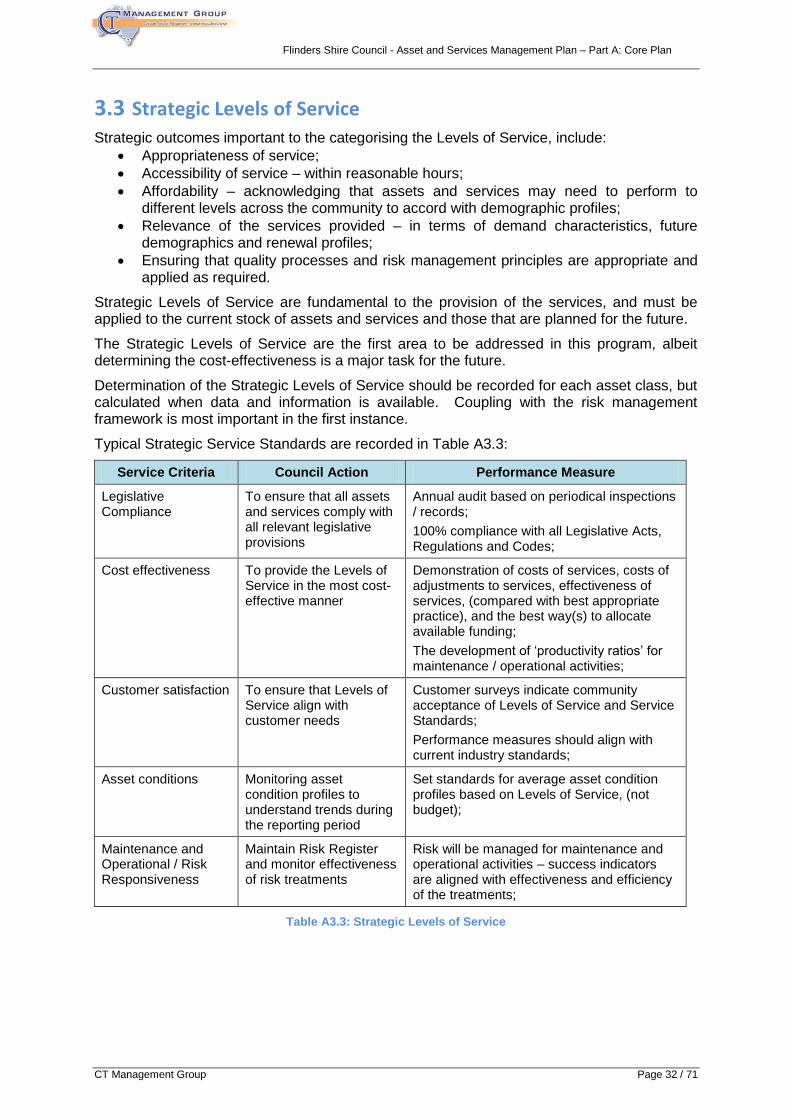
Flinders Shire Council - Asset and Services Management Plan – Part A: Core Plan
CT Management Group Page 32 / 71
3.3 Strategic Levels of Service
Strategic outcomes important to the categorising the Levels of Service, include:
Appropriateness of service;
Accessibility of service – within reasonable hours;
Affordability – acknowledging that assets and services may need to perform to different levels across the community to accord with demographic profiles;
Relevance of the services provided – in terms of demand characteristics, future demographics and renewal profiles;
Ensuring that quality processes and risk management principles are appropriate and applied as required.
Strategic Levels of Service are fundamental to the provision of the services, and must be applied to the current stock of assets and services and those that are planned for the future.
The Strategic Levels of Service are the first area to be addressed in this program, albeit determining the cost-effectiveness is a major task for the future.
Determination of the Strategic Levels of Service should be recorded for each asset class, but calculated when data and information is available. Coupling with the risk management framework is most important in the first instance.
Typical Strategic Service Standards are recorded in Table A3.3:
Service Criteria Council Action Performance Measure
Legislative Compliance
To ensure that all assets and services comply with all relevant legislative provisions
Annual audit based on periodical inspections / records;
100% compliance with all Legislative Acts, Regulations and Codes;
Cost effectiveness To provide the Levels of Service in the most cost-effective manner
Demonstration of costs of services, costs of adjustments to services, effectiveness of services, (compared with best appropriate practice), and the best way(s) to allocate available funding;
The development of ‘productivity ratios’ for maintenance / operational activities;
Customer satisfaction To ensure that Levels of Service align with customer needs
Customer surveys indicate community acceptance of Levels of Service and Service Standards;
Performance measures should align with current industry standards;
Asset conditions Monitoring asset condition profiles to understand trends during the reporting period
Set standards for average asset condition profiles based on Levels of Service, (not budget);
Maintenance and Operational / Risk Responsiveness
Maintain Risk Register and monitor effectiveness of risk treatments
Risk will be managed for maintenance and operational activities – success indicators are aligned with effectiveness and efficiency of the treatments;
Table A3.3: Strategic Levels of Service
Flinders Shire Council - Asset and Services Management Plan – Part A: Core Plan
CT Management Group Page 33 / 71
3.4 Current Levels of Service
The plan development process uses the conceptual framework for Levels of Service, with an initial assessment of ‘current’ Service Standards. This conceptual framework will be progressively updated with actual inputs from the field, as well as from the community engagement processes. As financial data related to performance of the assets and services and the associated costs matures, it will become possible to confirm the ‘current’ Levels of Service.
It is important that the Levels of Service reflect the community needs for services, and the assets are provided to meet the needs. Therefore, when the Council is confident that it has an accurate assessment of the current Levels of Service and the cost of provision of the services, plus the sustainability of the services to those standards, then the community will be engaged to ascertain the suitability of the services and potential changes to the services and standards. That first cut of information is important to enable meaningful engagement with the community.
Once the community input has been assessed against the services and costs, then adjustments can be made to the Levels of Service and included in the Operational Plan. The ‘agreed’ Levels of Service will apply from that time, and be continuously monitored and reviewed, both internally and with the community. The process will be managed as part of the Community Plan and regular community surveys.
The conceptual framework also provides for improved resource planning for the services required, as well as productivity reviews as part of the Continuous Improvement Program. The ultimate outcome is to enable meaningful performance reporting, related to both services (effectiveness and efficiency) and assets (sustainability and affordability).
The framework deliberately leads to the need for increased strategic and tactical planning for assets and services.
3.5 Agreed Levels of Service
The community consultation program provides guidance regarding the community ‘satisfaction’ with the current Levels of Service, or highlights where changes need to be made to the standards to match ‘needs’, (not expectations). Decisions regarding fixing of Levels of Service must be based on the full picture including the costs of the services and the forward projections for the cost of renewal of the assets plus the cost of the proper operation and maintenance of the assets to sustain the services. The community are to be involved with the determination of ‘affordability’ of the total asset and services management / Levels of Service framework.
The planning process may realise that the current Levels of Service are not affordable.
Once there is consensus on the standards and costs / sustainability / affordability, the framework will be endorsed by the Council as the ‘agreed’ Levels of Service.
The agreed Levels of Service will apply from that date, with regular monitoring and review to maintain their validity.
Where the agreed Levels of Service do include reductions from current Levels of Service, then the changes will be incrementally implemented.
Flinders Shire Council - Asset and Services Management Plan – Part A: Core Plan
CT Management Group Page 34 / 71
3.6 Performance Management
The Levels of Service have been defined in a way which facilitates assessment of actual performance against both the Customer and Technical Service Standards.
It is important that the initial performance framework describe the ‘gap’ between current Service Standards and the agreed Service Standards, and the endeavours to bridge the gap with new, upgraded or donated assets, or changes to the Levels of Service.
This will ensure that priorities are allocated for the immediate and medium term needs rather than fuelling the expectations which are beyond the capacity of the specified Service Standards, and the community affordability.
Measurement of asset performance, (including the Technical Service Standards), will be based on a history of condition data collection and financial information to enable calculation of meaningful outputs, (e.g. productivity, the right equipment for the job, trends in asset condition profiles and customer service requests). Customer surveys undertaken within the corporate framework and for specific projects will provide information regarding performance against Customer Service Standards.
Performance will be assessed against the Service Standards, the Service Targets, the condition profiles of the assets, and the costs for services – all used to determine the sustainability of the assets and services.
The Improvement Plan records the process to achieve that degree of performance management.
3.7 Asset Hierarchy
Levels of Service relate directly to the asset hierarchy, albeit, the Service Categories remain the same – it is the quality and quantity of the assets and services that may vary, e.g. a Regional Park and a District park may both include barbeque facilities, but a Local Park normally would not.
For the road network, the pavement area and the type and quality of road furniture may vary across the asset hierarchy.
3.8 Recognising Changes in the Service Potential of Assets
The service potential describes the output or service capacity of an asset. Decline in service potential is usually a function of asset usage, (consumption), or time. Service potential can change through the following factors:
Nominated changes in the Levels of Service to be provided;
The impact of technical or commercial obsolescence;
The maintenance provided for the asset, (or lack of maintenance); and
Improvements in the technology applied to maintain the asset.
The Levels of Service must account for these factors and the conceptual changes which occur for these assets, including:
Historically customer requests drove Levels of Service - the best fit for the community may no longer be represented by those standards;
Decision making is integrated with risk management; and
Any review of service provision needs to build in redundancy provisions.
Assets may be relatively long-lived, with different management criteria, e.g. some assets are managed to failure or to such condition that renewal is essential, compared with other major
Flinders Shire Council - Asset and Services Management Plan – Part A: Core Plan
CT Management Group Page 35 / 71
assets which have a ‘Retreatment Intervention Condition Level’, (RICL), i.e. the condition at which serious risk management intervention or maintenance management is required to prevent the asset from declining to a condition where it cannot support the specified Level of Service.
Simple examples such as building spouting / drainage blockages may be able to be remedied by short term repairs or replacement of sections of spout / drain, but the integrity of the system may only be able to be provided with a renewal or replacement program.
Equipment is another asset which goes through ‘trends’ of colours and styles, and it is important to recognise the amenity or ‘appeal’ factors for such assets.
Condition monitoring is an important factor for the assets, but for these assets, continuing performance is the key to providing services.
The application of the risk management and whole of life asset management philosophy will determine the best appropriate practice for the individual circumstance. This methodology will support the continuous improvement process which is critical for demonstrating value for money services.
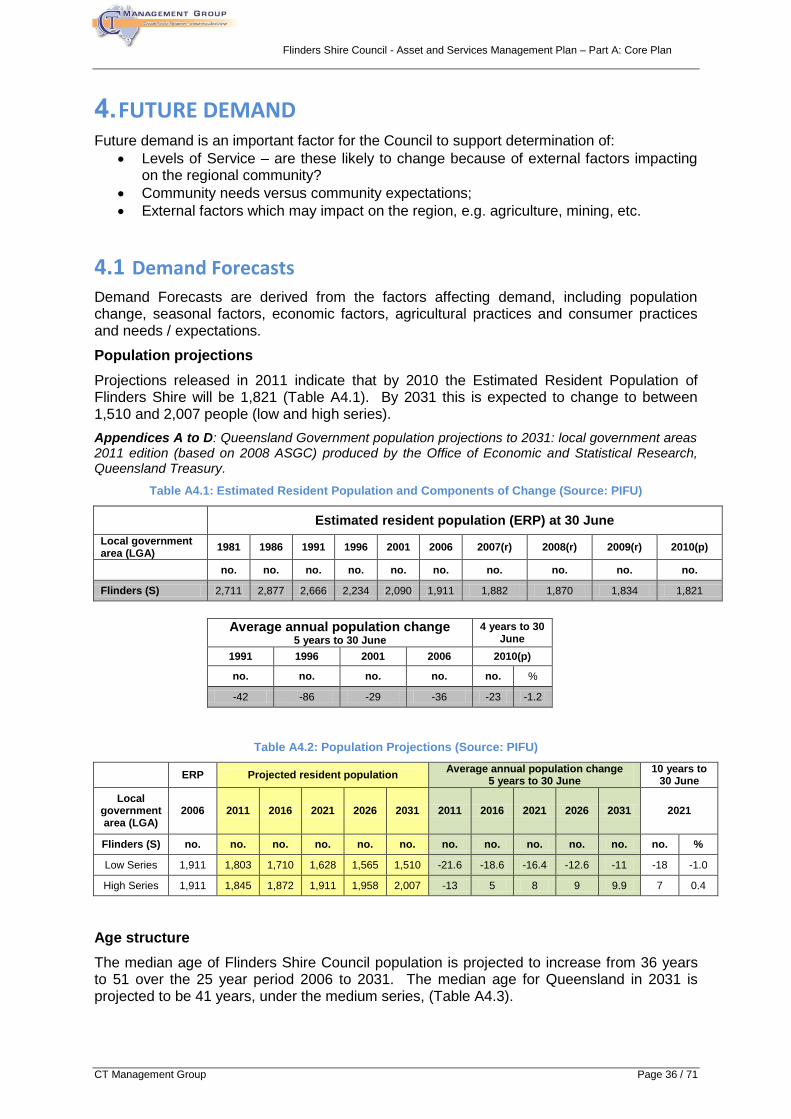
Flinders Shire Council - Asset and Services Management Plan – Part A: Core Plan
CT Management Group Page 36 / 71
4. FUTURE DEMAND Future demand is an important factor for the Council to support determination of:
Levels of Service – are these likely to change because of external factors impacting on the regional community?
Community needs versus community expectations;
External factors which may impact on the region, e.g. agriculture, mining, etc.
4.1 Demand Forecasts
Demand Forecasts are derived from the factors affecting demand, including population change, seasonal factors, economic factors, agricultural practices and consumer practices and needs / expectations.
Population projections
Projections released in 2011 indicate that by 2010 the Estimated Resident Population of Flinders Shire will be 1,821 (Table A4.1). By 2031 this is expected to change to between 1,510 and 2,007 people (low and high series).
Appendices A to D: Queensland Government population projections to 2031: local government areas 2011 edition (based on 2008 ASGC) produced by the Office of Economic and Statistical Research, Queensland Treasury.
Table A4.1: Estimated Resident Population and Components of Change (Source: PIFU)
Estimated resident population (ERP) at 30 June
Local government area (LGA)
1981 1986 1991 1996 2001 2006 2007(r) 2008(r) 2009(r) 2010(p)
no. no. no. no. no. no. no. no. no. no.
Flinders (S) 2,711 2,877 2,666 2,234 2,090 1,911 1,882 1,870 1,834 1,821
Average annual population change
5 years to 30 June
4 years to 30 June
1991 1996 2001 2006 2010(p)
no. no. no. no. no. %
-42 -86 -29 -36 -23 -1.2
Table A4.2: Population Projections (Source: PIFU)
ERP Projected resident population
Average annual population change 5 years to 30 June
10 years to 30 June
Local government area (LGA)
2006 2011 2016 2021 2026 2031 2011 2016 2021 2026 2031 2021
Flinders (S) no. no. no. no. no. no. no. no. no. no. no. no. %
Low Series 1,911 1,803 1,710 1,628 1,565 1,510 -21.6 -18.6 -16.4 -12.6 -11 -18 -1.0
High Series 1,911 1,845 1,872 1,911 1,958 2,007 -13 5 8 9 9.9 7 0.4
Age structure
The median age of Flinders Shire Council population is projected to increase from 36 years to 51 over the 25 year period 2006 to 2031. The median age for Queensland in 2031 is projected to be 41 years, under the medium series, (Table A4.3).
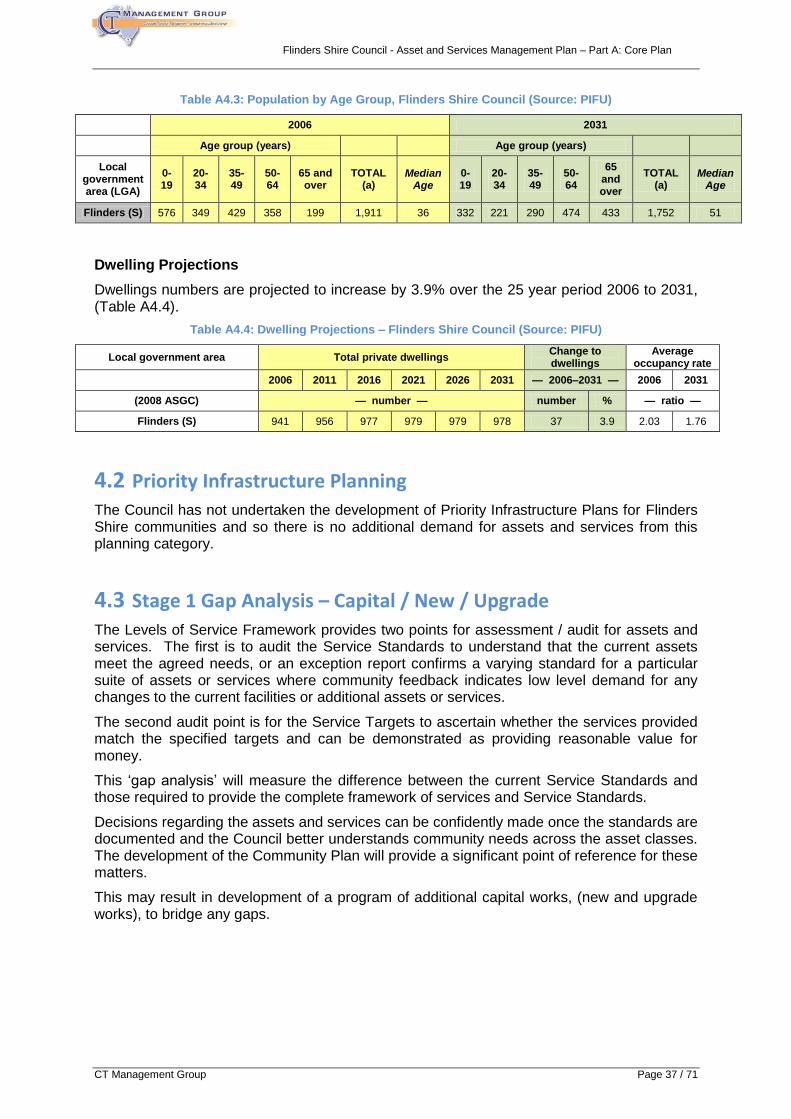
Flinders Shire Council - Asset and Services Management Plan – Part A: Core Plan
CT Management Group Page 37 / 71
Table A4.3: Population by Age Group, Flinders Shire Council (Source: PIFU)
2006 2031
Age group (years)
Age group (years)
Local
government area (LGA)
0-19
20-34
35-49
50-64
65 and over
TOTAL (a)
Median Age
0-19
20-34
35-49
50-64
65 and over
TOTAL (a)
Median Age
Flinders (S) 576 349 429 358 199 1,911 36 332 221 290 474 433 1,752 51
Dwelling Projections
Dwellings numbers are projected to increase by 3.9% over the 25 year period 2006 to 2031, (Table A4.4).
Table A4.4: Dwelling Projections – Flinders Shire Council (Source: PIFU)
Local government area Total private dwellings Change to dwellings
Average occupancy rate
2006 2011 2016 2021 2026 2031 — 2006–2031 — 2006 2031
(2008 ASGC) — number — number % — ratio —
Flinders (S) 941 956 977 979 979 978 37 3.9 2.03 1.76
4.2 Priority Infrastructure Planning
The Council has not undertaken the development of Priority Infrastructure Plans for Flinders Shire communities and so there is no additional demand for assets and services from this planning category.
4.3 Stage 1 Gap Analysis – Capital / New / Upgrade
The Levels of Service Framework provides two points for assessment / audit for assets and services. The first is to audit the Service Standards to understand that the current assets meet the agreed needs, or an exception report confirms a varying standard for a particular suite of assets or services where community feedback indicates low level demand for any changes to the current facilities or additional assets or services.
The second audit point is for the Service Targets to ascertain whether the services provided match the specified targets and can be demonstrated as providing reasonable value for money.
This ‘gap analysis’ will measure the difference between the current Service Standards and those required to provide the complete framework of services and Service Standards.
Decisions regarding the assets and services can be confidently made once the standards are documented and the Council better understands community needs across the asset classes. The development of the Community Plan will provide a significant point of reference for these matters.
This may result in development of a program of additional capital works, (new and upgrade works), to bridge any gaps.
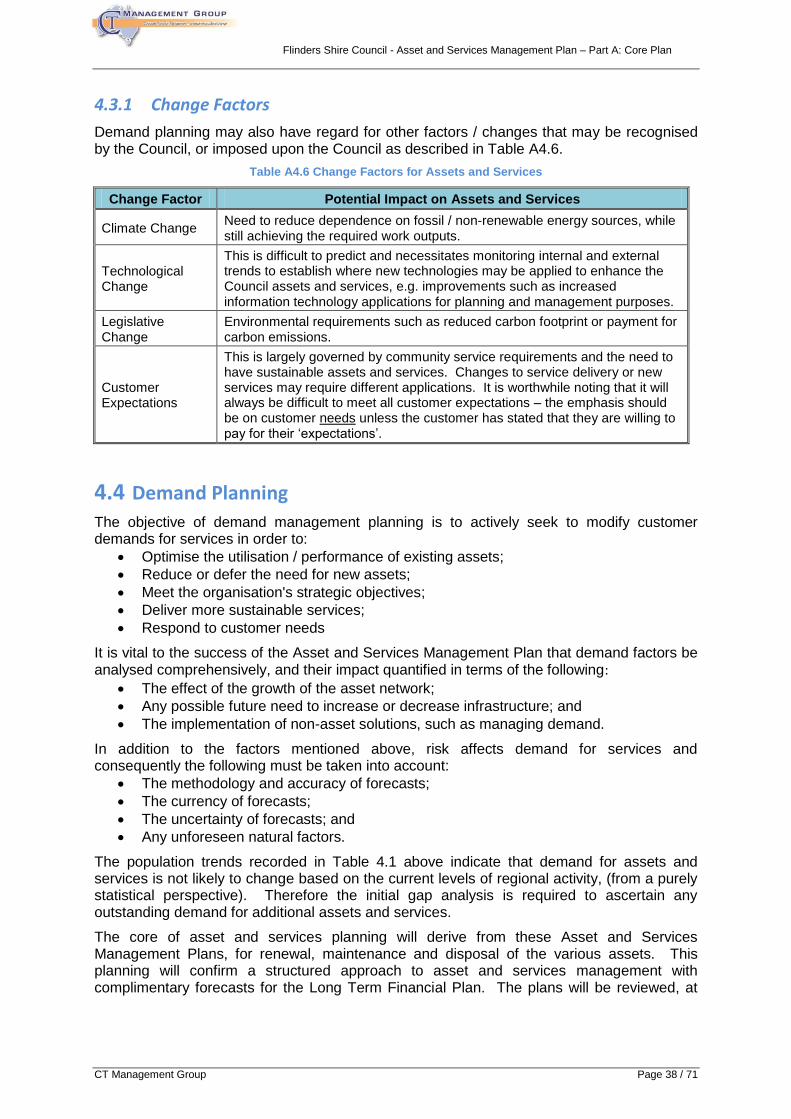
Flinders Shire Council - Asset and Services Management Plan – Part A: Core Plan
CT Management Group Page 38 / 71
4.3.1 Change Factors
Demand planning may also have regard for other factors / changes that may be recognised by the Council, or imposed upon the Council as described in Table A4.6.
Table A4.6 Change Factors for Assets and Services
Change Factor Potential Impact on Assets and Services
Climate Change Need to reduce dependence on fossil / non-renewable energy sources, while still achieving the required work outputs.
Technological Change
This is difficult to predict and necessitates monitoring internal and external trends to establish where new technologies may be applied to enhance the Council assets and services, e.g. improvements such as increased information technology applications for planning and management purposes.
Legislative Change
Environmental requirements such as reduced carbon footprint or payment for carbon emissions.
Customer Expectations
This is largely governed by community service requirements and the need to have sustainable assets and services. Changes to service delivery or new services may require different applications. It is worthwhile noting that it will always be difficult to meet all customer expectations – the emphasis should be on customer needs unless the customer has stated that they are willing to pay for their ‘expectations’.
4.4 Demand Planning
The objective of demand management planning is to actively seek to modify customer demands for services in order to:
Optimise the utilisation / performance of existing assets;
Reduce or defer the need for new assets;
Meet the organisation's strategic objectives;
Deliver more sustainable services;
Respond to customer needs
It is vital to the success of the Asset and Services Management Plan that demand factors be analysed comprehensively, and their impact quantified in terms of the following:
The effect of the growth of the asset network;
Any possible future need to increase or decrease infrastructure; and
The implementation of non-asset solutions, such as managing demand.
In addition to the factors mentioned above, risk affects demand for services and consequently the following must be taken into account:
The methodology and accuracy of forecasts;
The currency of forecasts;
The uncertainty of forecasts; and
Any unforeseen natural factors.
The population trends recorded in Table 4.1 above indicate that demand for assets and services is not likely to change based on the current levels of regional activity, (from a purely statistical perspective). Therefore the initial gap analysis is required to ascertain any outstanding demand for additional assets and services.
The core of asset and services planning will derive from these Asset and Services Management Plans, for renewal, maintenance and disposal of the various assets. This planning will confirm a structured approach to asset and services management with complimentary forecasts for the Long Term Financial Plan. The plans will be reviewed, at
Flinders Shire Council - Asset and Services Management Plan – Part A: Core Plan
CT Management Group Page 39 / 71
least on a half-yearly basis, to provide a manageable, sustainable profile for asset renewal and maintenance as well as services operations.
The Council will continually re-establish and review the strategic plans guiding the provision of services and facilities to the community, which may realise the need for new, additional or upgraded assets.
Future planning may also identify the need for new assets to meet growth or changing regional circumstances.
4.5 Demand Management Strategy
The objective of demand management is to actively seek to modify customer demands for services in order to:
Optimise the utilisation / performance of existing assets;
Reduce or defer the need for new assets;
Meet the organisation's strategic objectives;
Deliver more sustainable services;
Respond to customer needs.
Demand for new services will be managed through a combination of managing existing assets, upgrading of existing assets and providing new assets to meet demand. Demand management practices may also include:
non asset solutions;
insuring against risks; and
managing failures.
A complete Business Case is required to justify the need for the additional assets or service. The Business case will have regard to:
the demand for the asset or service as interpreted from the Community Plan, Corporate Plan and any formal strategy or plan;
a determination against the Levels of Service relevant to the asset or service under consideration;
any community consultation process observed for the asset or service;
all funding details, capital and recurrent, and short term and long term, specifically relating to the whole of life costs for the asset or service.
The determination regarding the asset or service must also have regard to the alternative practices recorded above.
4.6 Stage 2 Gap Analysis – Operations and Maintenance
The second stage of the gap analysis is the review of the operations and maintenance activities to provide an overview of the effectiveness and efficiency of the services against budgets and long term plans. This analysis should be based on financial and service data to ensure that Levels of Service are acknowledged.
The analysis requires strong disciplines to achieve reasonably accurate results, and may be best supported by electronic systems linked with the GIS to support demonstrations of the performance.
Flinders Shire Council - Asset and Services Management Plan – Part A: Core Plan
CT Management Group Page 40 / 71
5. RISK MANAGEMENT Risk management is one of the fundamentals of asset and services management, and is observed to the highest possible level using industry standard practices. It is appropriate that the formal process of risk management processes be applied to support decision making in all areas and at all levels of the organisation.
Risks can typically be categorised as:
Natural Events. Council has virtually no control over the timing or extent of the event, however, the probabilities may be understood;
External Impacts. Council has some control over these risks, associated with other organisations providing goods and services to Council;
Physical Failure Risk. Where conditions or performance of an asset could lead to failure. Council can control these risks through maintenance and renewal funding levels;
Operational Risk. Where management of the asset or asset management activities might impact on an asset. Council can control these risks through maintenance and renewal funding levels.
The structured planning process is designed primarily to address the risks associated with ‘physical failure risk’ and ‘operational risk’. The risk management structure records primary risks and critical risks associated with the assets and services.
5.1 Risk Principles and Process
For Flinders Shire Council, three primary risks have been identified for the assets and services, namely:
Risks associated with the loss of service by the failure of critical assets;
Financial risks from a lack of due diligence in the management of funding for the renewal, maintenance and operation of the assets to provide agreed Levels of Service; and
Physical risks where data and information are not maintained to standards which enable competent management outputs.
The structured management process is designed to address these risks in to standards which provide that the organisation and the community can be confident of consistent functional outcomes required from the assets and services.
5.2 Risk Management Framework
This risk management framework for this plan is based on the provisions of AS / NZS ISO 130 31000 Risk Management – Principles and Guidelines. The principles and processes described in the standard are displayed in Figure A5.2 below. The elements are further described as:
Risk Management Context. Establishes the objectives, stakeholders, key issues and criteria against which risks will be evaluated;
Identify the Risk. Identifies what risk events are likely to impact on assets and services;
Analyse the Risk. Reviews the existing controls and then analyses the likelihood of an event occurring and the consequence of the event to determine the level of risk;
Assess the Risk. Assesses and ranks the identified risks in a Risk Register;
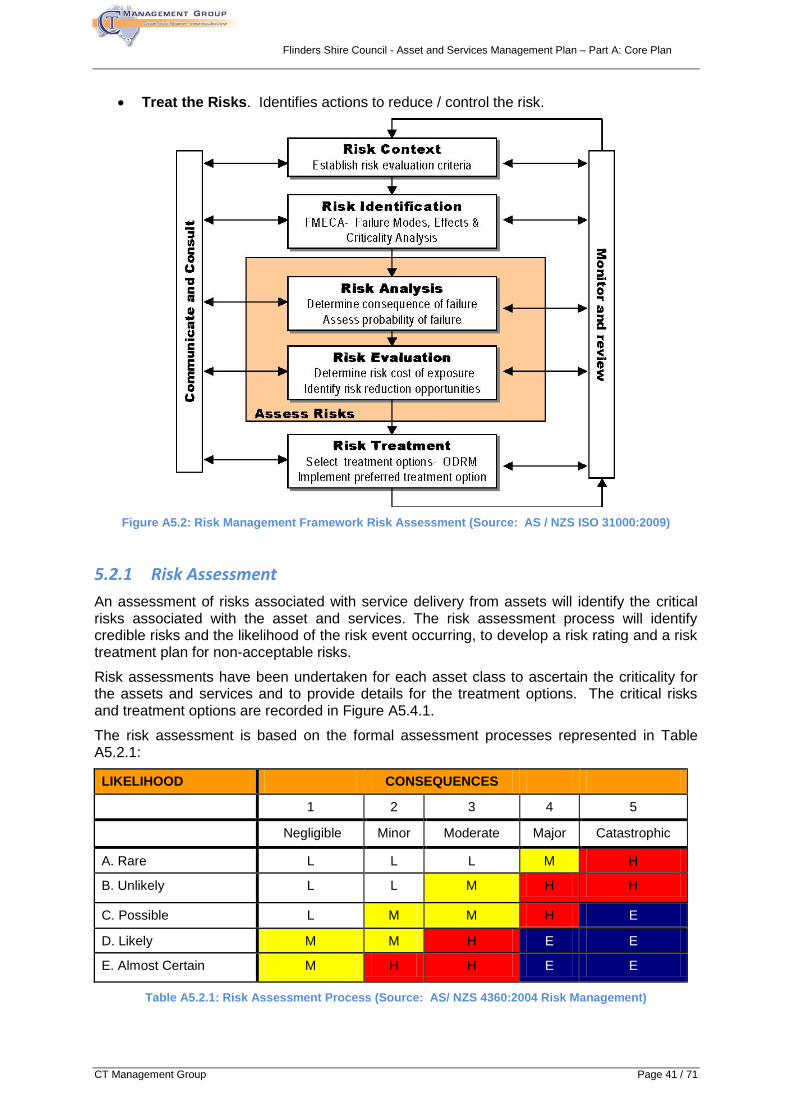
Flinders Shire Council - Asset and Services Management Plan – Part A: Core Plan
CT Management Group Page 41 / 71
Treat the Risks. Identifies actions to reduce / control the risk.
Figure A5.2: Risk Management Framework Risk Assessment (Source: AS / NZS ISO 31000:2009)
5.2.1 Risk Assessment
An assessment of risks associated with service delivery from assets will identify the critical risks associated with the asset and services. The risk assessment process will identify credible risks and the likelihood of the risk event occurring, to develop a risk rating and a risk treatment plan for non-acceptable risks.
Risk assessments have been undertaken for each asset class to ascertain the criticality for the assets and services and to provide details for the treatment options. The critical risks and treatment options are recorded in Figure A5.4.1.
The risk assessment is based on the formal assessment processes represented in Table A5.2.1:
LIKELIHOOD CONSEQUENCES
1 2 3 4 5
Negligible Minor Moderate Major Catastrophic
A. Rare L L L M H
B. Unlikely L L M H H
C. Possible L M M H E
D. Likely M M H E E
E. Almost Certain M H H E E
Table A5.2.1: Risk Assessment Process (Source: AS/ NZS 4360:2004 Risk Management)
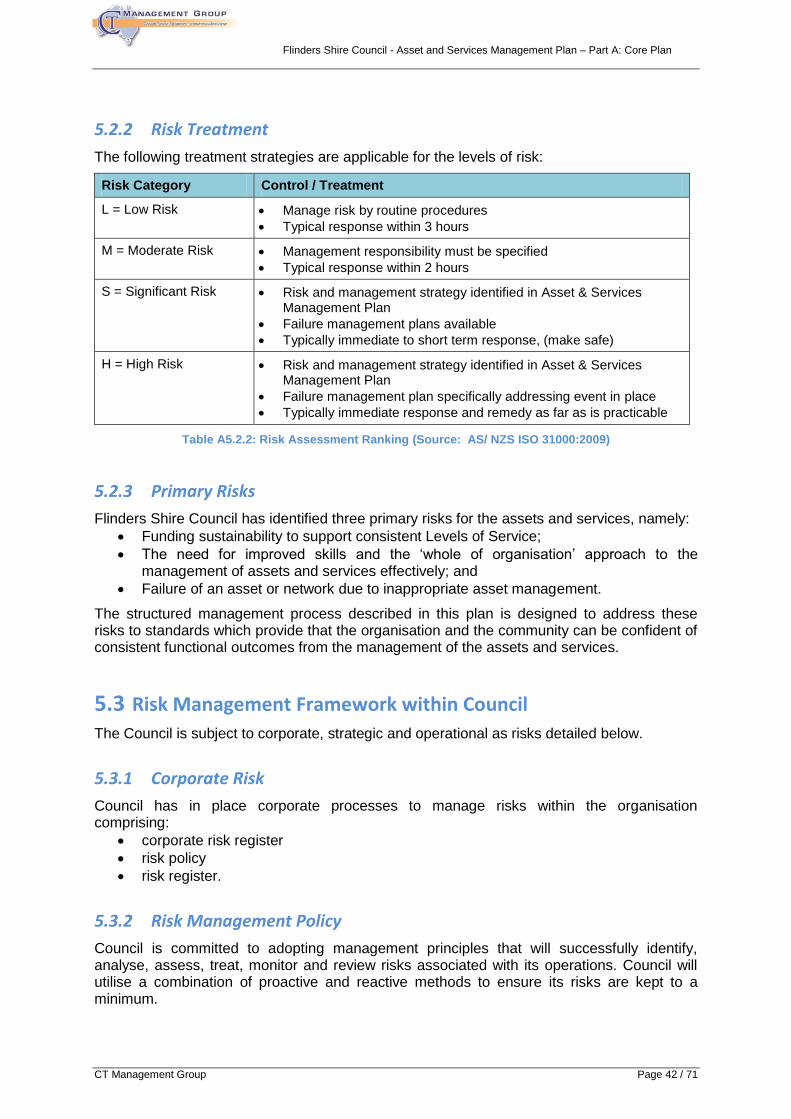
Flinders Shire Council - Asset and Services Management Plan – Part A: Core Plan
CT Management Group Page 42 / 71
5.2.2 Risk Treatment
The following treatment strategies are applicable for the levels of risk:
Risk Category Control / Treatment
L = Low Risk Manage risk by routine procedures
Typical response within 3 hours
M = Moderate Risk Management responsibility must be specified
Typical response within 2 hours
S = Significant Risk Risk and management strategy identified in Asset & Services Management Plan
Failure management plans available
Typically immediate to short term response, (make safe)
H = High Risk Risk and management strategy identified in Asset & Services Management Plan
Failure management plan specifically addressing event in place
Typically immediate response and remedy as far as is practicable
Table A5.2.2: Risk Assessment Ranking (Source: AS/ NZS ISO 31000:2009)
5.2.3 Primary Risks
Flinders Shire Council has identified three primary risks for the assets and services, namely:
Funding sustainability to support consistent Levels of Service;
The need for improved skills and the ‘whole of organisation’ approach to the management of assets and services effectively; and
Failure of an asset or network due to inappropriate asset management.
The structured management process described in this plan is designed to address these risks to standards which provide that the organisation and the community can be confident of consistent functional outcomes from the management of the assets and services.
5.3 Risk Management Framework within Council
The Council is subject to corporate, strategic and operational as risks detailed below.
5.3.1 Corporate Risk
Council has in place corporate processes to manage risks within the organisation comprising:
corporate risk register
risk policy
risk register.
5.3.2 Risk Management Policy
Council is committed to adopting management principles that will successfully identify, analyse, assess, treat, monitor and review risks associated with its operations. Council will utilise a combination of proactive and reactive methods to ensure its risks are kept to a minimum.
Flinders Shire Council - Asset and Services Management Plan – Part A: Core Plan
CT Management Group Page 43 / 71
Council’s enterprise Risk Policy was adopted on 23 November 2010
5.3.3 Risk Management Implementation Plan
Council maintains risk management implementation plans for principal infrastructure and services to minimise the likelihood of non-achievement of critical business objectives. The risk management implementation plan is designed to ensure that:
All significant operational and organisational risks are understood and identified.
The highest risks within a one year planning horizon are identified and addressed.
Risk reduction treatments are implemented which best meet business needs.
Responsibilities for implementing and managing risks are allocated to specific staff.
5.3.4 Risk Assessment Process
Council has undertaken a review for potential risks. The risks identified have been described and their potential impacts and current controls assessed in the corporate Risk Register.
Defects identified during programmed inspections are manually recorded into a database. The risk analysis considers both the likelihood and consequences of events and asset risk.
5.4 Conclusion
Despite the increasingly challenging risk environment, the observation of these principles will address the key issues for the organisation and provide the framework of remedial actions to ensure that assets and services can be sustained and the organisation and the community are not unnecessarily exposed to risk situations.
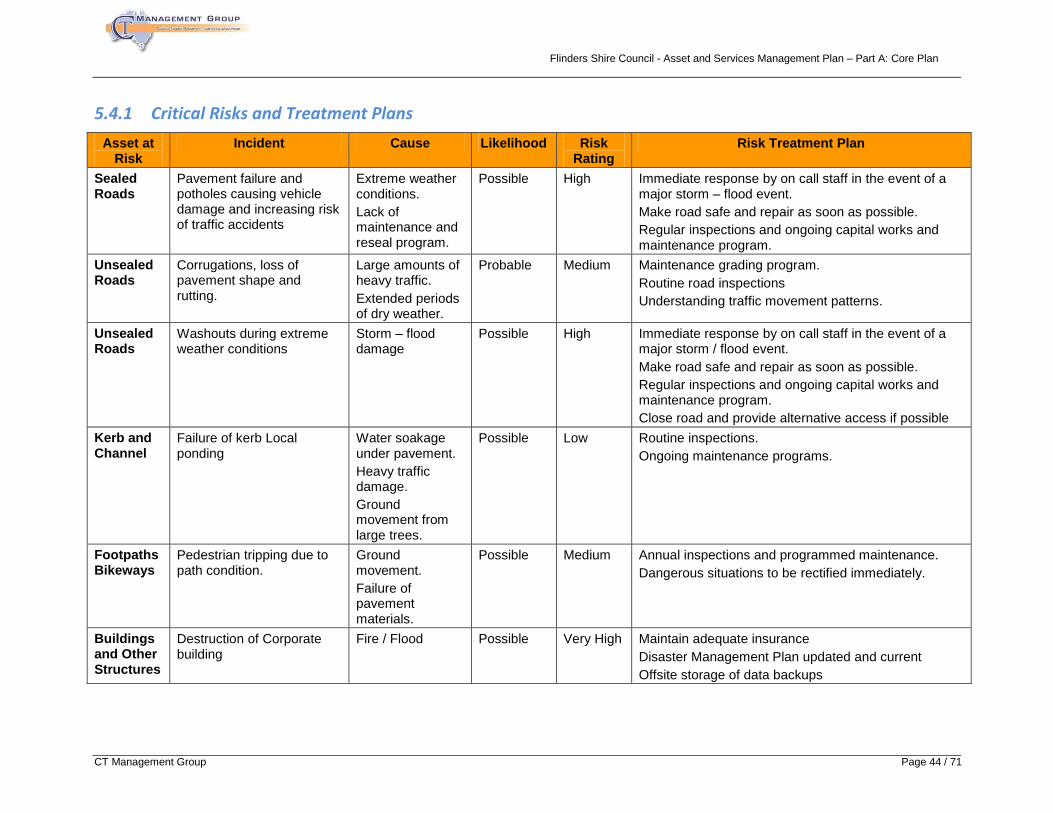
Flinders Shire Council - Asset and Services Management Plan – Part A: Core Plan
CT Management Group Page 44 / 71
5.4.1 Critical Risks and Treatment Plans
Asset at Risk
Incident Cause Likelihood Risk Rating
Risk Treatment Plan
Sealed Roads
Pavement failure and potholes causing vehicle damage and increasing risk of traffic accidents
Extreme weather conditions.
Lack of maintenance and reseal program.
Possible High Immediate response by on call staff in the event of a major storm – flood event.
Make road safe and repair as soon as possible.
Regular inspections and ongoing capital works and maintenance program.
Unsealed Roads
Corrugations, loss of pavement shape and rutting.
Large amounts of heavy traffic.
Extended periods of dry weather.
Probable Medium Maintenance grading program.
Routine road inspections
Understanding traffic movement patterns.
Unsealed Roads
Washouts during extreme weather conditions
Storm – flood damage
Possible High Immediate response by on call staff in the event of a major storm / flood event.
Make road safe and repair as soon as possible.
Regular inspections and ongoing capital works and maintenance program.
Close road and provide alternative access if possible
Kerb and Channel
Failure of kerb Local ponding
Water soakage under pavement.
Heavy traffic damage.
Ground movement from large trees.
Possible Low Routine inspections.
Ongoing maintenance programs.
Footpaths Bikeways
Pedestrian tripping due to path condition.
Ground movement.
Failure of pavement materials.
Possible Medium Annual inspections and programmed maintenance.
Dangerous situations to be rectified immediately.
Buildings and Other Structures
Destruction of Corporate building
Fire / Flood Possible Very High Maintain adequate insurance
Disaster Management Plan updated and current
Offsite storage of data backups
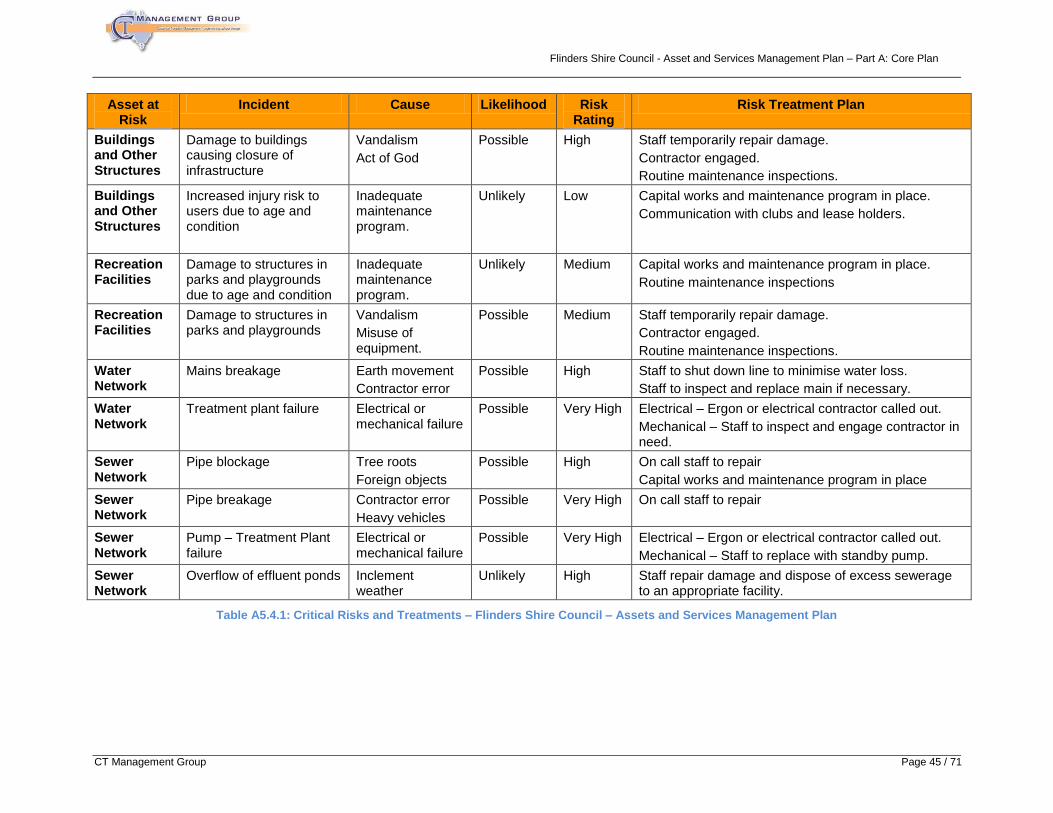
Flinders Shire Council - Asset and Services Management Plan – Part A: Core Plan
CT Management Group Page 45 / 71
Asset at Risk
Incident Cause Likelihood Risk Rating
Risk Treatment Plan
Buildings and Other Structures
Damage to buildings causing closure of infrastructure
Vandalism
Act of God
Possible High Staff temporarily repair damage.
Contractor engaged.
Routine maintenance inspections.
Buildings and Other Structures
Increased injury risk to users due to age and condition
Inadequate maintenance program.
Unlikely Low Capital works and maintenance program in place.
Communication with clubs and lease holders.
Recreation Facilities
Damage to structures in parks and playgrounds due to age and condition
Inadequate maintenance program.
Unlikely Medium Capital works and maintenance program in place.
Routine maintenance inspections
Recreation Facilities
Damage to structures in parks and playgrounds
Vandalism
Misuse of equipment.
Possible Medium Staff temporarily repair damage.
Contractor engaged.
Routine maintenance inspections.
Water Network
Mains breakage Earth movement
Contractor error
Possible High Staff to shut down line to minimise water loss.
Staff to inspect and replace main if necessary.
Water Network
Treatment plant failure Electrical or mechanical failure
Possible Very High Electrical – Ergon or electrical contractor called out.
Mechanical – Staff to inspect and engage contractor in need.
Sewer Network
Pipe blockage Tree roots
Foreign objects
Possible High On call staff to repair
Capital works and maintenance program in place
Sewer Network
Pipe breakage Contractor error
Heavy vehicles
Possible Very High On call staff to repair
Sewer Network
Pump – Treatment Plant failure
Electrical or mechanical failure
Possible Very High Electrical – Ergon or electrical contractor called out.
Mechanical – Staff to replace with standby pump.
Sewer Network
Overflow of effluent ponds Inclement weather
Unlikely High Staff repair damage and dispose of excess sewerage to an appropriate facility.
Table A5.4.1: Critical Risks and Treatments – Flinders Shire Council – Assets and Services Management Plan
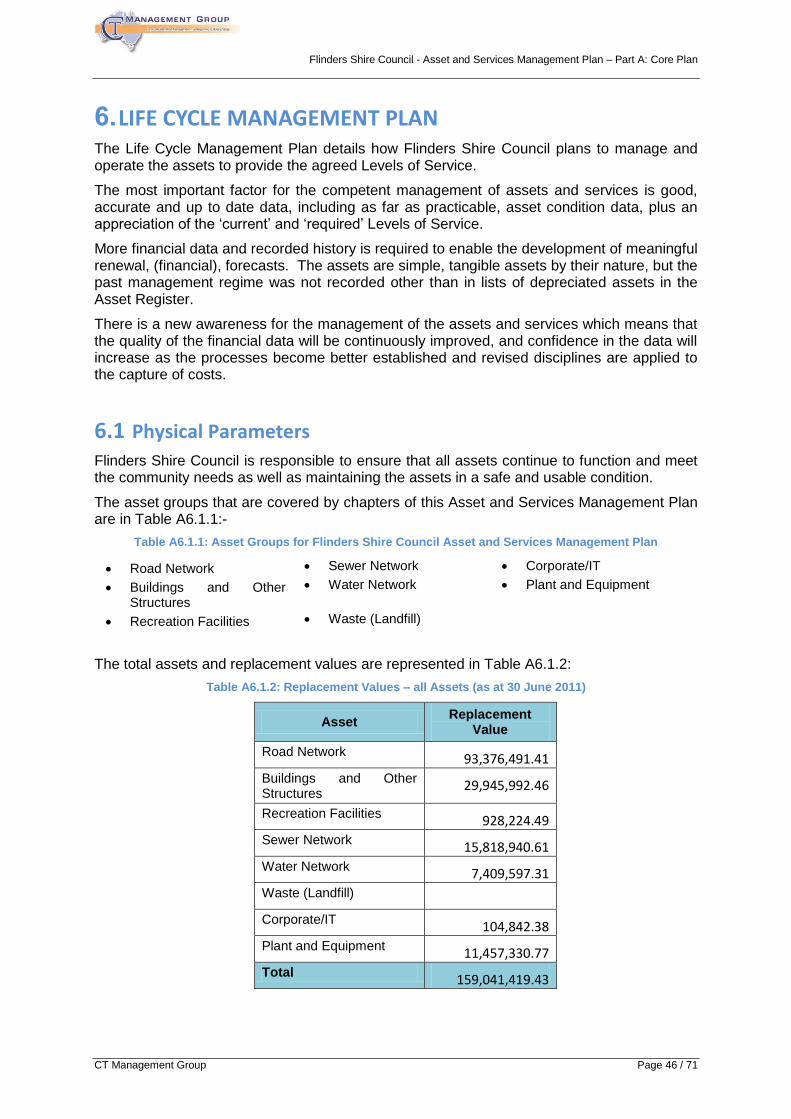
Flinders Shire Council - Asset and Services Management Plan – Part A: Core Plan
CT Management Group Page 46 / 71
6. LIFE CYCLE MANAGEMENT PLAN The Life Cycle Management Plan details how Flinders Shire Council plans to manage and operate the assets to provide the agreed Levels of Service.
The most important factor for the competent management of assets and services is good, accurate and up to date data, including as far as practicable, asset condition data, plus an appreciation of the ‘current’ and ‘required’ Levels of Service.
More financial data and recorded history is required to enable the development of meaningful renewal, (financial), forecasts. The assets are simple, tangible assets by their nature, but the past management regime was not recorded other than in lists of depreciated assets in the Asset Register.
There is a new awareness for the management of the assets and services which means that the quality of the financial data will be continuously improved, and confidence in the data will increase as the processes become better established and revised disciplines are applied to the capture of costs.
6.1 Physical Parameters
Flinders Shire Council is responsible to ensure that all assets continue to function and meet the community needs as well as maintaining the assets in a safe and usable condition.
The asset groups that are covered by chapters of this Asset and Services Management Plan are in Table A6.1.1:-
Table A6.1.1: Asset Groups for Flinders Shire Council Asset and Services Management Plan
Road Network Sewer Network Corporate/IT
Buildings and Other Structures
Water Network Plant and Equipment
Recreation Facilities Waste (Landfill)
The total assets and replacement values are represented in Table A6.1.2:
Table A6.1.2: Replacement Values – all Assets (as at 30 June 2011)
Asset Replacement
Value
Road Network 93,376,491.41
Buildings and Other Structures
29,945,992.46
Recreation Facilities 928,224.49
Sewer Network 15,818,940.61
Water Network 7,409,597.31
Waste (Landfill)
Corporate/IT 104,842.38
Plant and Equipment 11,457,330.77
Total 159,041,419.43
Flinders Shire Council - Asset and Services Management Plan – Part A: Core Plan
CT Management Group Page 47 / 71
The physical parameters for the individual asset classes are described in the separate chapters.
6.2 Asset Owner / Custodianship / Service and Maintenance / Responsibility Matrix
Allocating responsibility for the management, renewal, maintenance and operation of the assets and services is a critical function, so that the organisation is assured that all asset and services management responsibilities will be effectively discharged and the appropriate level of expertise is available for the functions to be discharged.
Implementation of this Asset and Services Management Plan will be the responsibility of a number of Council Officers.
Chief Executive Officer (CEO) - will be responsible for ensuring that the actions are coordinated and that the major strategic objectives are achieved. The CEO will report progress against the strategic objectives on an annual basis to Council.
Directors and functional Managers - will be responsible for the assets and services allocated to them, plus the update and review of the relevant chapter of the Asset and Services Management Plan, as well as:
the essential strategic and tactical planning for the assets and services, including maintenance of the asset class inventory based on regular review, plus programmed condition and defect inspections;
the implementation of asset and services management, development and improvement actions;
day-to-day operation and maintenance of the asset and services networks and programs;
operational planning and scheduling to meet the Service Targets;
monitoring and reporting on operational parameters detailed in the Asset and Services Management Plan for the individual asset classes.
Director of Corporate Services - will be responsible for:
overseeing the annual update of the total Asset and Services Management Plan and a comprehensive review of the document every three years;
half-yearly reporting to the CEO on the progress and performance of asset and services management;
the overall budget control and performance of assets and services;
population and implementation of the Long Term Financial Plan; and
provision of financial management support for Council’s asset and services undertakings.
The lines of accountability for implementation of the Asset and Services Management Plan are outlined in the Organisational Chart outlined in figure A6.1.2.
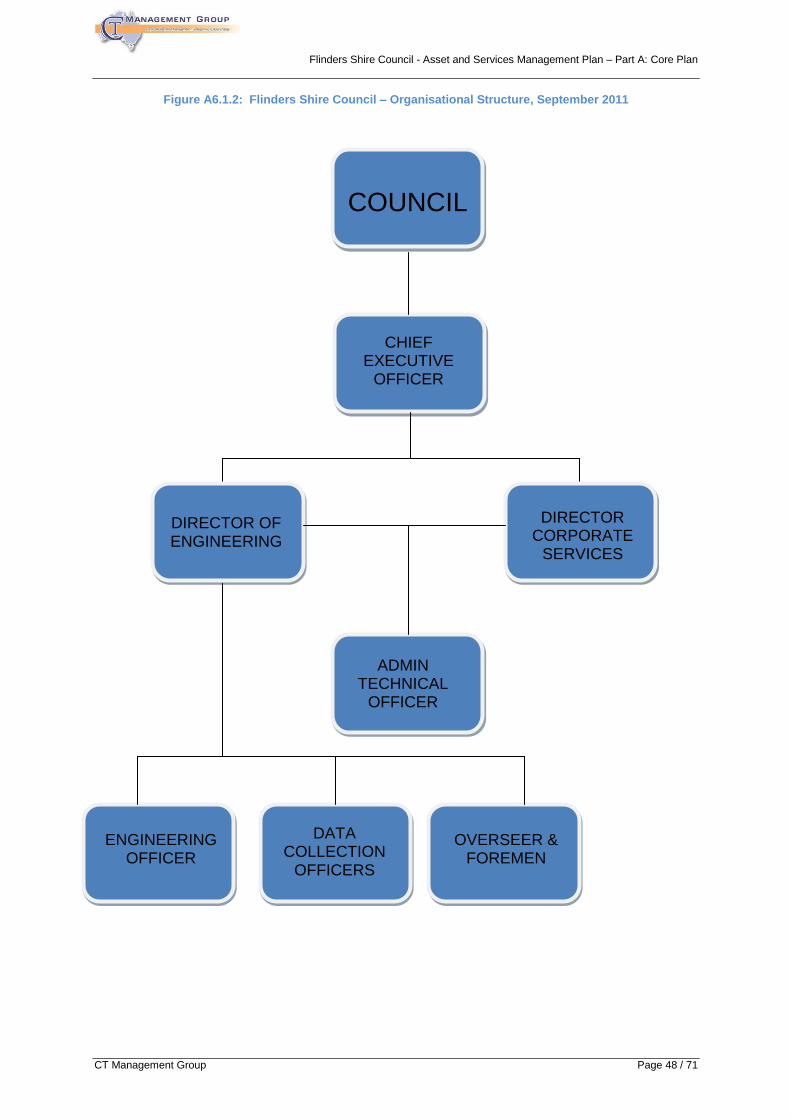
Flinders Shire Council - Asset and Services Management Plan – Part A: Core Plan
CT Management Group Page 48 / 71
Figure A6.1.2: Flinders Shire Council – Organisational Structure, September 2011
COUNCIL
CHIEF EXECUTIVE
OFFICER
DIRECTOR OF ENGINEERING
DIRECTOR CORPORATE
SERVICES
ADMIN TECHNICAL
OFFICER
ENGINEERING OFFICER
DATA COLLECTION
OFFICERS
OVERSEER & FOREMEN
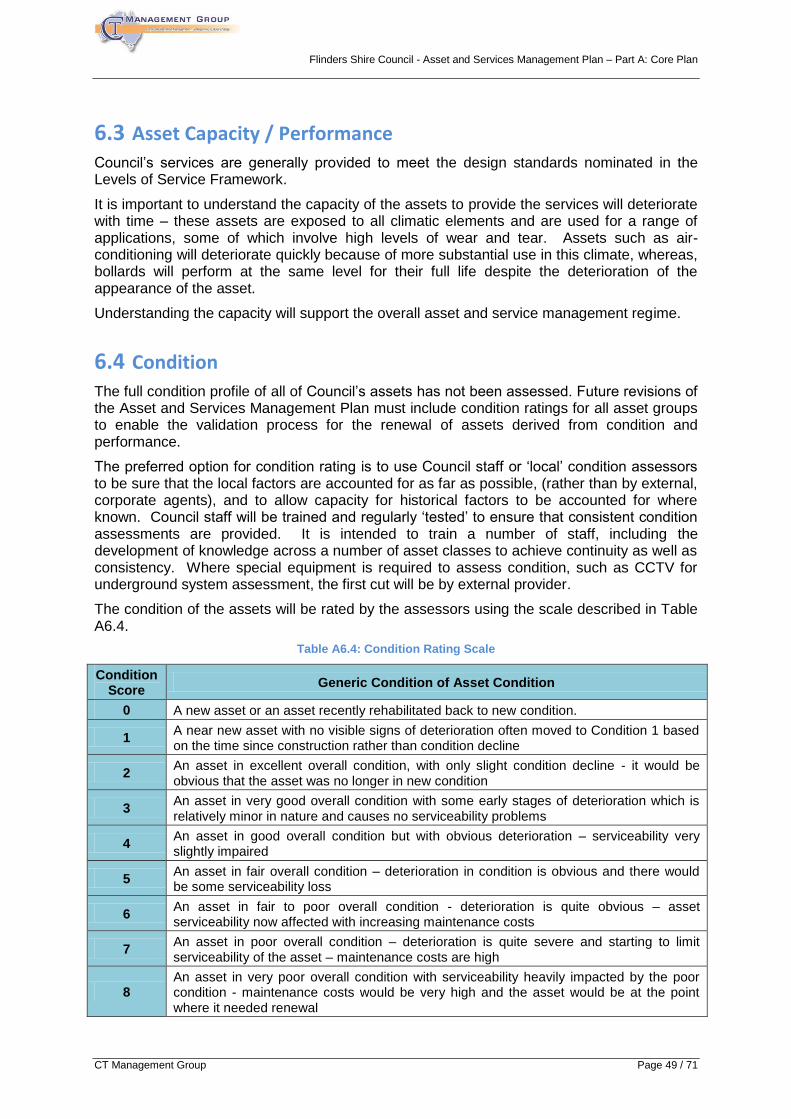
Flinders Shire Council - Asset and Services Management Plan – Part A: Core Plan
CT Management Group Page 49 / 71
6.3 Asset Capacity / Performance
Council’s services are generally provided to meet the design standards nominated in the Levels of Service Framework.
It is important to understand the capacity of the assets to provide the services will deteriorate with time – these assets are exposed to all climatic elements and are used for a range of applications, some of which involve high levels of wear and tear. Assets such as air-conditioning will deteriorate quickly because of more substantial use in this climate, whereas, bollards will perform at the same level for their full life despite the deterioration of the appearance of the asset.
Understanding the capacity will support the overall asset and service management regime.
6.4 Condition
The full condition profile of all of Council’s assets has not been assessed. Future revisions of the Asset and Services Management Plan must include condition ratings for all asset groups to enable the validation process for the renewal of assets derived from condition and performance.
The preferred option for condition rating is to use Council staff or ‘local’ condition assessors to be sure that the local factors are accounted for as far as possible, (rather than by external, corporate agents), and to allow capacity for historical factors to be accounted for where known. Council staff will be trained and regularly ‘tested’ to ensure that consistent condition assessments are provided. It is intended to train a number of staff, including the development of knowledge across a number of asset classes to achieve continuity as well as consistency. Where special equipment is required to assess condition, such as CCTV for underground system assessment, the first cut will be by external provider.
The condition of the assets will be rated by the assessors using the scale described in Table A6.4.
Table A6.4: Condition Rating Scale
Condition Score
Generic Condition of Asset Condition
0 A new asset or an asset recently rehabilitated back to new condition.
1 A near new asset with no visible signs of deterioration often moved to Condition 1 based on the time since construction rather than condition decline
2 An asset in excellent overall condition, with only slight condition decline - it would be obvious that the asset was no longer in new condition
3 An asset in very good overall condition with some early stages of deterioration which is relatively minor in nature and causes no serviceability problems
4 An asset in good overall condition but with obvious deterioration – serviceability very slightly impaired
5 An asset in fair overall condition – deterioration in condition is obvious and there would be some serviceability loss
6 An asset in fair to poor overall condition - deterioration is quite obvious – asset serviceability now affected with increasing maintenance costs
7 An asset in poor overall condition – deterioration is quite severe and starting to limit serviceability of the asset – maintenance costs are high
8 An asset in very poor overall condition with serviceability heavily impacted by the poor condition - maintenance costs would be very high and the asset would be at the point where it needed renewal
Flinders Shire Council - Asset and Services Management Plan – Part A: Core Plan
CT Management Group Page 50 / 71
9 An asset in extremely poor condition with severe serviceability problems and needing renewal immediately – may pose a risk to remain in service
10 An asset that has failed and is no longer serviceable and should not remain in service – there would be an extreme risk in leaving the asset in service.
The condition rating is based on remaining useful life and condition as a measurement of capability to effectively and consistently provide services.
6.5 Valuation
A revaluation of all Flinders Shire Council total infrastructure assets, was conducted by valuers, Australian Pacific Valuers and Shire Engineers, as at the 30th June 2011. The current valuation of assets is summarised below:-
Gross Current Replacement Value (Adopted) $159,041,419.43
Fair Value (Adopted) $114,312,815.45
The major infrastructure assets of transport, water supply and sewerage comprise the majority of that investment. It is appropriate therefore that the major effort is directed toward the management of those assets.
6.6 Revaluation
The Asset Accounting Policy includes an asset revaluation schedule which accounts for the Asset Classes, Asset Groups and components, with specific reference to the timeframes and local and environmental factors that influence the deterioration / consumption of the assets.
It is important also to ensure that the processes for recording assets / the condition of assets are robust and provide updated information in a timely manner so that Asset Inventories and the Asset Register are maintained current, and revaluations reflect current and actual circumstances. Timely capture of ‘as constructed’ details is important to ensure that the capitalisation process accounts for the actual assets.
The process for capture of all asset data is important to ensure up to date information for depreciation calculations and long term financial planning.
6.7 Work Category Definitions
Work categories have been broken down into the following criteria:-
Operations: Operations have no effect on the assets condition but are necessary to keep the asset properly utilised.
Maintenance: The day to day work required to keep operating at required service levels and falls into 4 broad categories:-
Preventative
Reactive
Planned
Routine / Cyclic
Renewals: The replacement of the asset or a significant asset component to its original size and capacity.
New Works: The extension or upgrading of assets required to cater for growth or additional Levels of Service.
Flinders Shire Council - Asset and Services Management Plan – Part A: Core Plan
CT Management Group Page 51 / 71
Asset Disposal: The removal or disposal of decommissioned assets.
6.8 Maintenance
Maintenance is work undertaken to ensure that an asset continues to meet the required performance and standard throughout its useful life.
Maintenance includes preventative, reactive, planned and cyclic maintenance work activities as described.
Preventive Maintenance – maintenance performed to retain an asset in its original condition as far as practicable by performing inspections to detect and prevent failure.
The emphasis for future maintenance for the Flinders Shire Council should be of a preventative regime. Maintenance programs are aligned to the Asset and Services Management Plan to ensure the most efficient and effective means to optimise the lifecycle cost for assets and services.
Reactive Maintenance – maintenance performed as a result of failure, to restore, as far as practical, an asset to its original condition.
This unplanned repair work is carried out in response to service requests and in line with management or supervisory direction.
Planned Maintenance – repair work that is identified and managed through a maintenance management system. These activities include inspections, condition assessment, scheduling and prioritising work and reporting the work completed to develop a maintenance history record.
Cyclic / Routine Maintenance – is the replacement or upgrade of asset components undertaken on a regular cycle, e.g. building repainting or roof replacement.
6.8.1 Maintenance Strategy
Each of the specific Asset and Services Management Plans includes an Operations and Maintenance Plan for the asset class. This plan records the Customer and Technical Service Targets to be provided to maintain the asset and Levels of Service to be provided.
The Resource Plan, describing the staff and resources required to provide the asset maintenance and operations services at the specified frequency and standards is extracted from the Operations and Maintenance Plan.
The Resource Plan is used to support detailed costing for the provision of services, as well as one of the lead documents in the performance management framework, specifically related to the non-financial parameters.
The plan should also have reference to the typical materials components for the services.
It is important to develop costing structures to ensure that maintenance costs are not contaminated with operating costs. Operational costs do not impact on asset consumption but do impact on the presentation and amenity Service Factors and are an important component of the Levels of Service.
6.8.2 Maintenance Agreement
Flinders Shire Council contracts out only a small portion of its maintenance works to access specialist services which are not normally available locally. The management of these contracts is undertaken in-house by the Director of the relevant business unit.
Flinders Shire Council - Asset and Services Management Plan – Part A: Core Plan
CT Management Group Page 52 / 71
6.8.3 Inspections
Inspections are an important activity in the total management program, and are categorised into two activities:
1. Condition inspections – programmed inspections to assess the condition of the assets, at asset class level, asset group level and component level – the frequency of inspections may vary for these elements. The intention is to record data which supports an appreciation of the status of the asset / component in its useful life;
2. Defect inspections – programmed inspections to assess the current level of defects affecting the asset, specifically directed at addressing the maintenance requirements to be undertaken in the immediate to short term. The necessary remedial work is programmed and undertaken in accordance with current maintenance standards and best practice. Where defects are assessed that have the potential to create the risk of injury, or inconvenience to the public, the timeframe for remedial works must be much shorter. The quality and type of work undertaken is dependent on the needs of the network, maintenance strategies, maintenance intervention levels and available funding.
The type and frequency of defects does impact on maintenance trends and can be used as an indicator of asset consumption. Likewise, the remedial works for defects need to account for programmed renewal, so that funds are not wasted.
Where possible, the inspection categories will complement each other – the records from both inspection rounds need to be available for the other category. This advantage is best realised by using Council staff for all inspections as appropriate.
The Council GIS is the ideal repository for the data from both categories of inspections to enable spatial assessment of the renewal and maintenance factors.
The inspection categories are complemented by customer and stakeholder requests and comments – again dealt within the framework of defect management and maintenance and the program for asset renewal. The Levels of Service are the principal criteria for this exchange.
6.9 Renewals and Replacements
This Asset and Services Management Plan is primarily about the renewal and replacement of assets to sustain Levels of Service. The intent is to understand the framework for renewal of assets based on consumption of the current stock and the varying factors that influence the useful life and deterioration of the assets.
The renewal and replacement program is then structured around these factors plus reference to the financial parameters, and perhaps constraints, that the Council must acknowledge on behalf of the community.
6.9.1 Renewal Strategy and Plan
Renewal expenditure is major work which does not increase the assets design capacity but restores, replaces or renews an existing asset to its original service potential. Work over and above restoring an asset to original service potential is considered an upgrade or an expansion / augmentation of service.
Assets requiring renewal are currently identified by reference to the remaining useful life estimates obtained from the Asset Register. Works identified by this method are ranked by priority and scheduled in future works programs.
Flinders Shire Council - Asset and Services Management Plan – Part A: Core Plan
CT Management Group Page 53 / 71
As the confidence in the data available increases, it is intended to improve the renewal evaluation process by including consideration of condition ratings as well as the remaining useful life of the asset, to enable increased reference to the service potential of the individual and network level assets.
Wherever practical renewal will be undertaken using ‘low cost’ renewal methods. The aim of ‘low-cost’ renewals is to restore the service potential of the asset by means other than replacement.
6.10 New, Upgrade and Disposal
The following definitions are relevant to this plan:
New works create a new asset and / or service in such cases as:
the asset or service did not previously exist;
new, additional works which add to an existing asset or service beyond its current capacity to increase the Level of Service.
Upgraded assets and services may result from regional or local needs for higher Levels of Service to meet changes in population profiles, industry needs or environmental requirements.
The demand for new and upgraded assets and services may originate from various sources, including:
demographic profile changes, growth and changing social and environmental requirements;
the gap analysis of strategic plans or specific programs applied to various locations, identifying the assets required to meet agreed Levels of Service;
community requests or proposals linked with Operational Plan;
new Federal and State Government or local community programs;
funding initiatives from external sources.
The acquisition of new assets and services commits Council to ongoing operations and maintenance costs for the period that the service provided from the assets is required. The costs are calculated from historical costs for similar services and forward projections / estimates for changed Levels of Service.
Proposals for new assets and services must be supported by Business Case documentation, including reference to:
the justification for the new project or program based on achieving Community Plan and Corporate Plan outcomes;
initial ‘whole of life’ costing estimates;
community consultation processes and outcomes.
Fully costed and confirmed proposals are evaluated against the ‘quadruple bottom line’ for alignment with the relevant social, economic, environmental and governance factors, as well as having regard to the appropriate risk elements and funding availability, to establish the ranking and priority for the proposals. All proposals are then recorded in the appropriate year of the Capital Works Program and Long Term Financial Plan.
Disposals include any activity associated with the disposal of a decommissioned asset including demolition or relocation. Prior to disposal the asset should be further investigated to determine if any other options are available for an alternate service delivery.
Sales include any activity associated with receiving money in return for an asset.
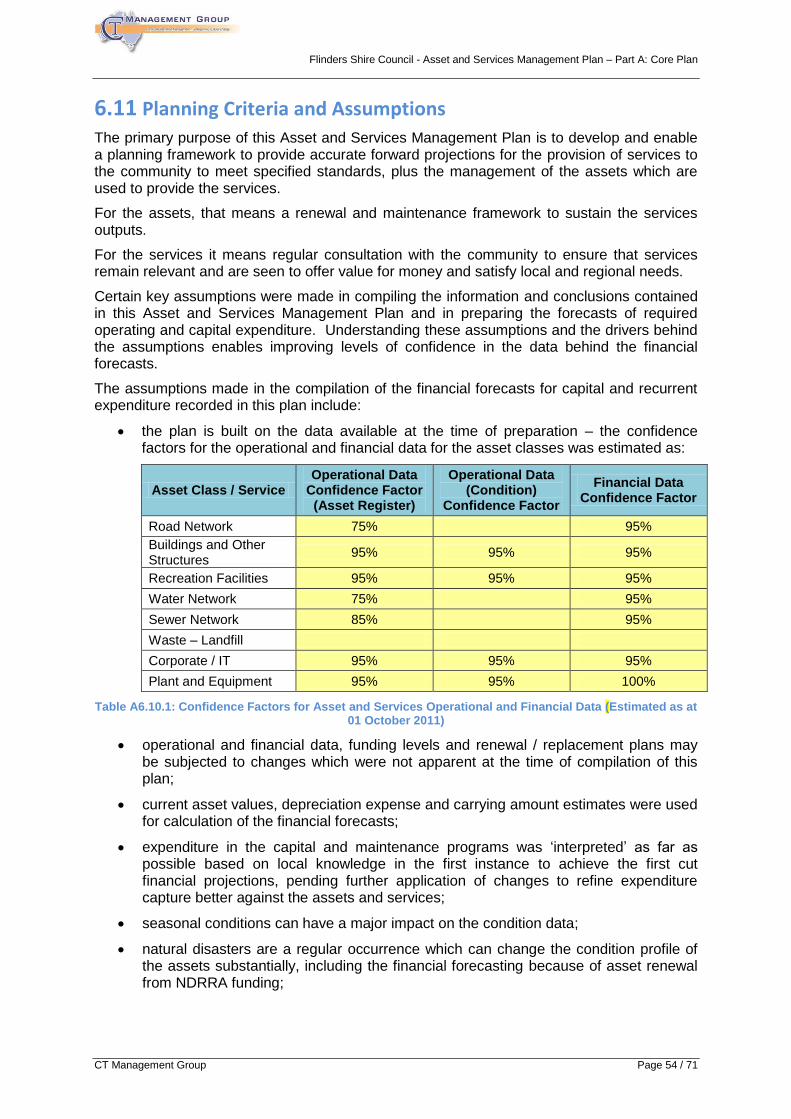
Flinders Shire Council - Asset and Services Management Plan – Part A: Core Plan
CT Management Group Page 54 / 71
6.11 Planning Criteria and Assumptions
The primary purpose of this Asset and Services Management Plan is to develop and enable a planning framework to provide accurate forward projections for the provision of services to the community to meet specified standards, plus the management of the assets which are used to provide the services.
For the assets, that means a renewal and maintenance framework to sustain the services outputs.
For the services it means regular consultation with the community to ensure that services remain relevant and are seen to offer value for money and satisfy local and regional needs.
Certain key assumptions were made in compiling the information and conclusions contained in this Asset and Services Management Plan and in preparing the forecasts of required operating and capital expenditure. Understanding these assumptions and the drivers behind the assumptions enables improving levels of confidence in the data behind the financial forecasts.
The assumptions made in the compilation of the financial forecasts for capital and recurrent expenditure recorded in this plan include:
the plan is built on the data available at the time of preparation – the confidence factors for the operational and financial data for the asset classes was estimated as:
Asset Class / Service Operational Data
Confidence Factor (Asset Register)
Operational Data (Condition)
Confidence Factor
Financial Data Confidence Factor
Road Network 75% 95%
Buildings and Other Structures
95% 95% 95%
Recreation Facilities 95% 95% 95%
Water Network 75% 95%
Sewer Network 85% 95%
Waste – Landfill
Corporate / IT 95% 95% 95%
Plant and Equipment 95% 95% 100%
Table A6.10.1: Confidence Factors for Asset and Services Operational and Financial Data (Estimated as at 01 October 2011)
operational and financial data, funding levels and renewal / replacement plans may be subjected to changes which were not apparent at the time of compilation of this plan;
current asset values, depreciation expense and carrying amount estimates were used for calculation of the financial forecasts;
expenditure in the capital and maintenance programs was ‘interpreted’ as far as possible based on local knowledge in the first instance to achieve the first cut financial projections, pending further application of changes to refine expenditure capture better against the assets and services;
seasonal conditions can have a major impact on the condition data;
natural disasters are a regular occurrence which can change the condition profile of the assets substantially, including the financial forecasting because of asset renewal from NDRRA funding;
Flinders Shire Council - Asset and Services Management Plan – Part A: Core Plan
CT Management Group Page 55 / 71
the organisation has and retains the capacity to provide the maintenance to the required standards, (some renewal by contract).
The planning is reflected in the succeeding parts of the plan representing the individual asset classes.
The improvement plan records the opportunities for improved planning and building capability to increase confidence in and accuracy of the outputs from the plans.
7. FINANCIAL PROJECTIONS Initial capital cost for assets constitutes a significant up-front cost and often dominates the decision making process when acquiring new assets, however ongoing recurrent expenses, (including depreciation), usually represent a higher portion of the total life cycle costs of many assets. It is important that they be included in the financial analysis undertaken to evaluate asset investment options. There may also be substantial costs associated with disposal at the end of the assets useful life, (e.g. demolition costs).
Asset accounting policies will guide the activities and processes necessary to support appropriate corporate reporting.
The following Australian Accounting Regulations currently apply to Local Government in Queensland:
Local Government (Finance and Reporting) Regulation 2010
AASB 116 Property, Plant & Equipment – prescribes requirements for recognition and depreciation of property, plant and equipment assets
AASB 136 Impairment of Assets – aims to ensure that assets are carried at amounts that are not in excess of their recoverable amounts
AASB 1021 Depreciation of Non-Current Assets – specifies how depreciation is to be calculated
AAS 1001 Accounting Policies – specifies the policies that Council is to have for recognition of assets and depreciation
AASB 1041 Accounting for the reduction of Non-Current Assets – specifies the frequency and basis of calculating depreciation and revaluation basis used for assets
AAS 1015 Accounting for acquisition of assets – method of allocating the value to new assets on acquisition
AAS 27 Financial reporting by Local Government
AAS 1010 Recoverable Amounts of Non-Current Assets – specifies requirement to test the reasonableness of valuations.
The financial processes and systems acknowledged in this plan are developed within the framework set by these standards and policies.
7.1 Current Financial Position
Council is currently fully funding the depreciation on behalf of all asset classes, based on the information in the Asset Register. Straight line depreciation is used for all asset classes except Plant and Equipment which is depreciated by Reducing Balance method.
Assets are depreciated from the date of acquisition or, in respect of internally constructed assets, from the time an asset is completed and commissioned ready for use.
Where assets have separately identifiable components that are subject to regular replacement, these components are assigned useful lives distinct from the asset to which they relate. Any expenditure that increases the originally assessed capacity or service

Flinders Shire Council - Asset and Services Management Plan – Part A: Core Plan
CT Management Group Page 56 / 71
potential of an asset is capitalised and the new depreciable amount is depreciated over the remaining useful life of the asset to the Council.
Major spares purchased specifically for particular assets that are above the asset recognition threshold are capitalised and depreciated on the same basis as the asset to which they relate.
Flinders Shire Council - Asset and Services Management Plan – Part A: Core Plan
CT Management Group Page 57 / 71
7.2 Funding Capacity
Council’s capacity to fund the plans to provide consistent and sustainable Levels of Service across the community is determined by the financial forecasts of this plan, read in conjunction with the asset condition profiles and consumption trends.
The current program of data collection, condition ratings and revaluations will increase the integrity of the information available to enable consolidation of this position.
Review of the Asset Register indicates that there may be opportunities to revise some parameters for the assets, such as extended useful lives, higher retreatment intervention condition criteria, and reference to the renewal programs that occur regularly with the impact of natural disasters on the transport assets.
Other factors that need to be accounted for include:
Remoteness factors – transport costs and reduced material options mean that renewal and maintenance programs are more expensive;
Limited competition for contractors to undertake specialised functions results in higher costs;
Travel distances within the region add to function costs.
Review of the Asset Register indicates that there may be opportunities to revise some parameters for the assets, such as extended useful lives, higher retreatment intervention condition criteria, and reference to the renewal programs that occur regularly with the impact of natural disasters on the transport assets.
7.3 Funding Options and Strategy
The focus of this Asset and Services Management Plan is to identify the optimum investment level for the maintenance of Council’s assets and services to produce the desired Level of Service. How the maintenance is funded is a matter for Council under separate consideration.
Current funding sources available to Council include:- - Rates (General, Special, Differential) - Federal Government Funding - Roads to Recovery - State Government Grants - Financial Assistance Grants - Direct Grants - Main Roads Funding - Private Contributions - Developer Contributions
Projects that these funding sources support may not necessarily contribute to asset renewal and maintenance. New works will effectively increase maintenance and renewal responsibilities for Council, and the whole of life cost approach must be taken into consideration under before such projects are undertaken.
7.4 Renewal Gap
The Renewal Gap calculations will be completed for all asset classes, to demonstrate any gap between the current expenditure for renewal and the required expenditure. The Moloney
Flinders Shire Council - Asset and Services Management Plan – Part A: Core Plan
CT Management Group Page 58 / 71
software also provides the option to review maintenance costs and expenditure to understand that the asset serviceability can be sustained.
This will be the starting point for the next phase of analysis to ensure that:
All assumptions used to establish and reconcile the data and financial inputs have been fully tested;
The management criteria and processes supporting the calculations are robust;
All possible options for funding the renewal of assets are evaluated.

Flinders Shire Council - Asset and Services Management Plan – Part A: Core Plan
CT Management Group Page 59 / 71
7.5 10 Year Expenditure Projections
Estimates of expenditure for operations and maintenance, planned renewals, planned capital upgrade / expansion and planned disposals for a 10 year period are provided in the following tables:
7.5.1 Disposals
Asset Group 2011/12 2012/13 2013/14 2014/15 2015/16 2016/17 2017/18 2018/19 2019/20 2020/21
Plant and equipment 414,000 400,000 400,000 400,000 400,000 1,023,286 1,064,143 1,106,857 1,151,429 1,197,857
Buildings and other Structures
Other Infrastructure
Total 414,000 400,000 400,000 400,000 400,000 1,023,286 1,064,143 1,106,857 1,151,429 1,197,857
7.5.2 Operational and Maintenance Expenses
Asset Group 2011/12 2012/13 2013/14 2014/15 2015/16 2016/17 2017/18 2018/19 2019/20 2020/21
Road Network 1,441,000 1409,000 1,467,603 1,472,603 1,477,603 1,490,000 1,500,000 1,510,000 1,520,000 1,530,000
Buildings and Other Structures
929,660 971,726 1,014,399 1,058,838 1,115,222 1,163,745 1,214,619 1,288,081 1,344,389 1,403,828
Recreation Facilities
Sewer Network 383,500 383,500 345,000 350,000 355,000 360,000 365,000 370,000 375,000 380,000
Water Network 492,625 492,625 470,625 470,625 470,625 480,000 490,000 500,000 515,000 520,000
Waste - Landfill
Corporate / IT
Plant and Equipment 2,500,000 2,500,000 2,500,000 2,510,000 2,520,000 2,530,000 2,540,000 2,540,000 2,550,000 2,560,000
Total 5,746,785 5,756,851 5,797,627 5,862,066 5,938,450 6,023,745 6,109,619 6,208,081 6,304,389 6,393,828
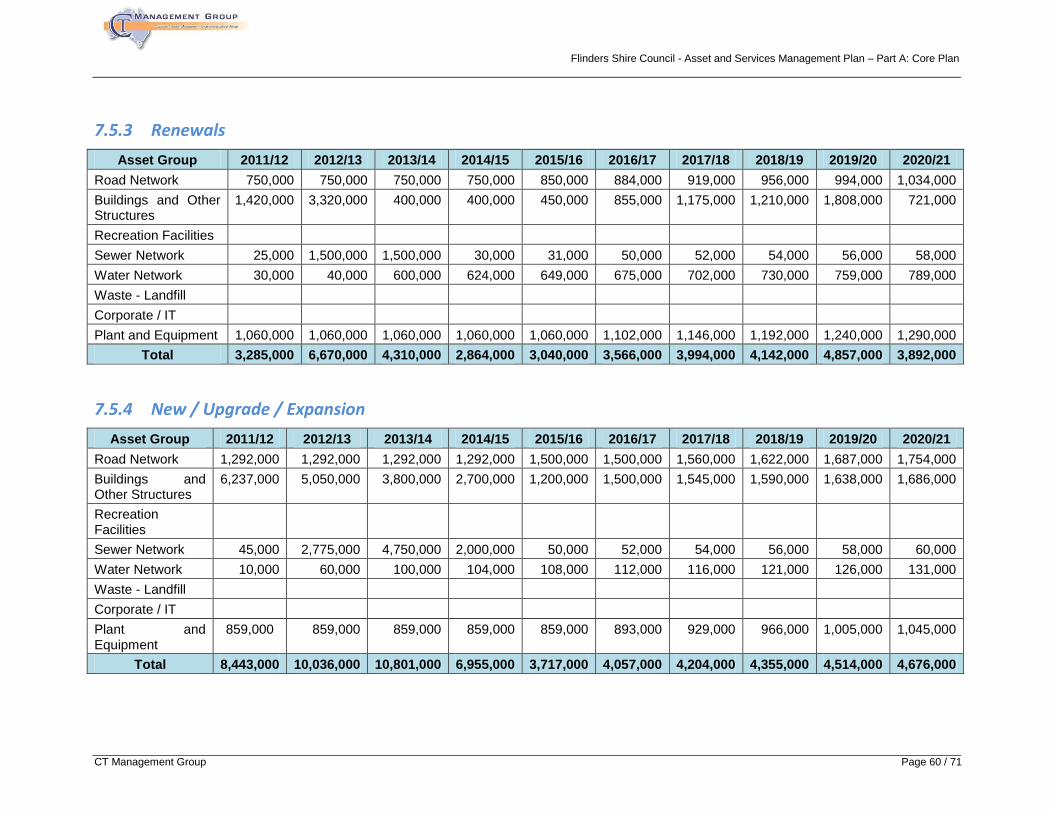
Flinders Shire Council - Asset and Services Management Plan – Part A: Core Plan
CT Management Group Page 60 / 71
7.5.3 Renewals
Asset Group 2011/12 2012/13 2013/14 2014/15 2015/16 2016/17 2017/18 2018/19 2019/20 2020/21
Road Network 750,000 750,000 750,000 750,000 850,000 884,000 919,000 956,000 994,000 1,034,000
Buildings and Other Structures
1,420,000 3,320,000 400,000 400,000 450,000 855,000 1,175,000 1,210,000 1,808,000 721,000
Recreation Facilities
Sewer Network 25,000 1,500,000 1,500,000 30,000 31,000 50,000 52,000 54,000 56,000 58,000
Water Network 30,000 40,000 600,000 624,000 649,000 675,000 702,000 730,000 759,000 789,000
Waste - Landfill
Corporate / IT
Plant and Equipment 1,060,000 1,060,000 1,060,000 1,060,000 1,060,000 1,102,000 1,146,000 1,192,000 1,240,000 1,290,000
Total 3,285,000 6,670,000 4,310,000 2,864,000 3,040,000 3,566,000 3,994,000 4,142,000 4,857,000 3,892,000
7.5.4 New / Upgrade / Expansion
Asset Group 2011/12 2012/13 2013/14 2014/15 2015/16 2016/17 2017/18 2018/19 2019/20 2020/21
Road Network 1,292,000 1,292,000 1,292,000 1,292,000 1,500,000 1,500,000 1,560,000 1,622,000 1,687,000 1,754,000
Buildings and Other Structures
6,237,000 5,050,000 3,800,000 2,700,000 1,200,000 1,500,000 1,545,000 1,590,000 1,638,000 1,686,000
Recreation Facilities
Sewer Network 45,000 2,775,000 4,750,000 2,000,000 50,000 52,000 54,000 56,000 58,000 60,000
Water Network 10,000 60,000 100,000 104,000 108,000 112,000 116,000 121,000 126,000 131,000
Waste - Landfill
Corporate / IT
Plant and Equipment
859,000 859,000 859,000 859,000 859,000 893,000 929,000 966,000 1,005,000 1,045,000
Total 8,443,000 10,036,000 10,801,000 6,955,000 3,717,000 4,057,000 4,204,000 4,355,000 4,514,000 4,676,000
Flinders Shire Council - Asset and Services Management Plan – Part A: Core Plan
CT Management Group Page 61 / 71
8. ASSET MANAGEMENT PRACTICES, PERFORMANCE MONITORING AND IMPPROVEMENT
8.1 Asset Management Practices
8.1.1 National Framework for Sustainability
The Commonwealth and State Governments signed an “Inter-Governmental Agreement Establishing Principles Guiding Intergovernmental relations on Local Government Matters” in April 2006.
Amongst the principles enshrined in the agreement, local governments commit to sound public governance through:
good fiscal management by working towards: o prudent management of assets and liabilities; o ensuring that revenue and spending decisions have regard to their effect on
future generations and ongoing financial sustainability; o ensuring that its decisions on service delivery and the provision and maintenance
of infrastructure are made with due regard to available, existing and anticipated future financial resources and competing priorities.
improving its practices including strategic planning at local and regional levels, prudent borrowing and appropriate pricing regimes; and
being responsible for funding functions it chooses to undertake in an area of responsibility of other spheres of government, in addition to funding its existing core functions.
In March 2007, the Local Government and Planning Minister’s Council (LGPMC) endorsed national frameworks for assessing financial sustainability, asset planning and management and financial planning and reporting. It is proposed that these frameworks for (i) assessing financial sustainability; (ii) asset planning and management; and (iii) financial planning and reporting be applied within each jurisdiction.
According to LGPMC, the development of these draft frameworks has demonstrated that, in the main, local governments in Australia have robust reporting, planning and asset management frameworks in place. The draft frameworks therefore complement current practices of each State and Territory. A national framework in each area will:
assist States and Territories to achieve a consistent approach to assessing financial sustainability of councils, including the ability to assess where councils may require additional assistance; and
provide a basis for States and Territories to assist councils to fulfil their commitment to sound public governance under Clause 11 of the Intergovernmental Agreement on local government matters.
The national frameworks provide a basis for all local governments in Australia to adopt relatively similar practices in a number of key areas. For the most part, the frameworks represent a minimum standard and do not represent more complete standards of good practice.
The National Framework promotes three principles;
long term asset management and reporting,
financial management and reporting; and
integrated planning, including budgeting.
Progress on the implementation of the national frameworks is reported to the Local Government and Planning Ministers’ Council on a regular basis.
Flinders Shire Council - Asset and Services Management Plan – Part A: Core Plan
CT Management Group Page 62 / 71
Queensland intends to incorporate the national frameworks within an evaluation process that will focus on sustainable councils, sustainable communities and good governance. Indigenous local councils will also be subject to evaluation.
8.1.2 Local Government Act 2009
The new Local Government Act 2009 introduces a new range of financial, planning and accountability documents to assist with the achievement of the objectives of the national frameworks in Section104 which outlines the requirements for financial, planning and accountability documents.
The following documents of a local government must comply with the requirements prescribed under a regulation:
the financial management documents;
the planning and accountability documents.
The financial management documents include the following documents:
an annual budget;
a general purpose financial report;
a financial forecast;
an asset register that records: o capital expenditure; and o depreciation charges; and o revaluation increments and decrements;
a revenue statement.
The planning and accountability documents include the following documents:
an annual report;
a 5 year corporate plan;
an annual operational plan;
a long-term community plan;
a long-term financial plan;
a long-term asset management plan; and
a report on the results of an annual review of the implementation of the long term plans mentioned in this section.
A long-term community plan is a document that:
outlines the local government’s goals, strategies and policies for implementing the local government’s vision for the future of the local government area, during the period covered by the plan; and
covers a period of at least 10 years after the commencement of the plan.
A long-term financial plan is a document that:
outlines the local government’s goals, strategies and policies for managing the local government’s finances, during the period covered by the plan, including the following policies: o an investment policy; o a debt policy; o a procurement policy; o a revenue policy; and
covers a period of at least 10 years after the commencement of the plan.
A long-term asset management plan is a document that:
outlines the local government’s policies and strategies for ensuring the sustainable management of the local government’s assets and infrastructure, during the period covered by the plan; and
Flinders Shire Council - Asset and Services Management Plan – Part A: Core Plan
CT Management Group Page 63 / 71
covers a period of at least 10 years after the commencement of the plan.
A local government must annually conduct, and report on the results of, a review of the implementation of the local government’s long-term plans mentioned in this section.
The interrelationships of all of these documents are illustrated in the Table in Section 2.3 – Purpose and Scope of the Plan.
8.1.3 Department of Local Government and Planning Requirements
The Department of Local Government and Planning (DLGP) asset management framework for Local Government, (Asset Management Advancement Program – AMAP), nominates a clear direction to provide that ten year financial plans are underpinned by robust estimates and forecasts produced from Asset Management Strategies and Asset Management Plans.
The service delivery strategy incorporating the asset management strategy must align with the Council’s Corporate Plan, goals and objectives, and include a gap analysis of the current and expected future infrastructure asset status and an assessment of the activities to be undertaken to achieve that future state.
The Asset Management Plans provide the detail of actions to manage the asset base in order to provide the desired Levels of Service over the timeframe of the plan. The DLGP requirements for this plan are shown in the table below.
Figure A8.1.3: DLGP Requirements (Source: Local Government Act 2009 / DLGP AMAP 2011 – 2012)
Service Function
Sub-Function DLGP Requirements
Stakeholder Management
Stakeholder engagement
§ Active community engagement
Asset Management
Service Standards
§ The expected or required Levels of Service for the included assets;
§ The actual Levels of Service being achieved by the asset / asset class
System Overview
§ The classes and sub-classes of assets included in the plan
§ Quantitative data with respect to the asset classes and sub-classes
§ Strategic Framework
§ Gap Analysis
Maintaining Current Services
§ Description of program
§ Timing of program
§ Maintenance expense per asset class and sub-class
New and Upgraded Services
§ Future requirements associated with Corporate Plan and Operational Plan
§ Known or possible areas for expansion
Asset classes and potential acquisition dates
Cost estimates
Impact on Levels of Service, asset lifecycle and financial considerations
§ New or upgrade capital expenditure
Renewal and Replacement of Current Services
§ Renewals capital expenditure
§ Proposed timing of asset retirement or disposal
§ Estimated residual values at retirement or disposal
Sustainability Management
Financial Management
§ Useful life
Estimated useful life for each asset class and sub-class
Estimated remaining useful life for each asset class and sub-class
Annual depreciation expense per asset class and sub-class
§ Valuation of each asset class and sub-class
Valuation
Date of valuation and valuation methodology employed
§ 10 year financial plan
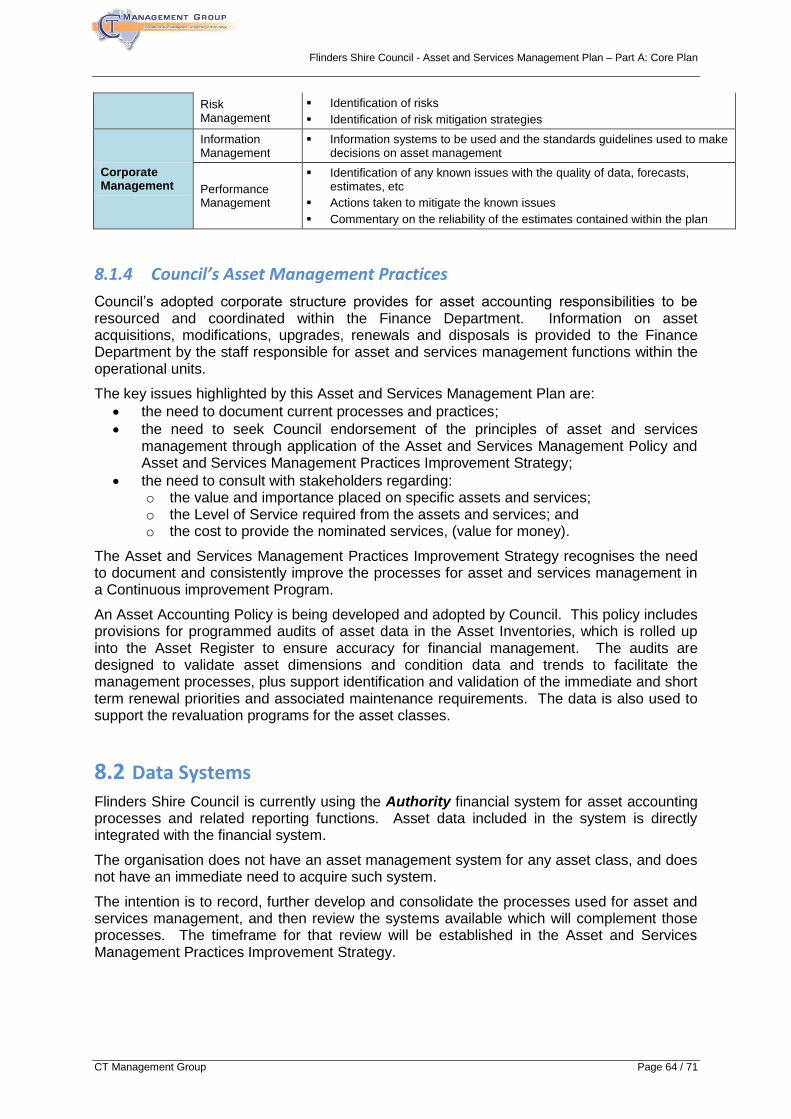
Flinders Shire Council - Asset and Services Management Plan – Part A: Core Plan
CT Management Group Page 64 / 71
Risk Management
§ Identification of risks
§ Identification of risk mitigation strategies
Corporate Management
Information Management
§ Information systems to be used and the standards guidelines used to make decisions on asset management
Performance Management
§ Identification of any known issues with the quality of data, forecasts, estimates, etc
§ Actions taken to mitigate the known issues
§ Commentary on the reliability of the estimates contained within the plan
8.1.4 Council’s Asset Management Practices
Council’s adopted corporate structure provides for asset accounting responsibilities to be resourced and coordinated within the Finance Department. Information on asset acquisitions, modifications, upgrades, renewals and disposals is provided to the Finance Department by the staff responsible for asset and services management functions within the operational units.
The key issues highlighted by this Asset and Services Management Plan are:
the need to document current processes and practices;
the need to seek Council endorsement of the principles of asset and services management through application of the Asset and Services Management Policy and Asset and Services Management Practices Improvement Strategy;
the need to consult with stakeholders regarding: o the value and importance placed on specific assets and services; o the Level of Service required from the assets and services; and o the cost to provide the nominated services, (value for money).
The Asset and Services Management Practices Improvement Strategy recognises the need to document and consistently improve the processes for asset and services management in a Continuous improvement Program.
An Asset Accounting Policy is being developed and adopted by Council. This policy includes provisions for programmed audits of asset data in the Asset Inventories, which is rolled up into the Asset Register to ensure accuracy for financial management. The audits are designed to validate asset dimensions and condition data and trends to facilitate the management processes, plus support identification and validation of the immediate and short term renewal priorities and associated maintenance requirements. The data is also used to support the revaluation programs for the asset classes.
8.2 Data Systems
Flinders Shire Council is currently using the Authority financial system for asset accounting processes and related reporting functions. Asset data included in the system is directly integrated with the financial system.
The organisation does not have an asset management system for any asset class, and does not have an immediate need to acquire such system.
The intention is to record, further develop and consolidate the processes used for asset and services management, and then review the systems available which will complement those processes. The timeframe for that review will be established in the Asset and Services Management Practices Improvement Strategy.
Flinders Shire Council - Asset and Services Management Plan – Part A: Core Plan
CT Management Group Page 65 / 71
8.3 Asset and Services Management Improvement
Council has an Asset and Services Management Practices Improvement Strategy designed to improve asset and services management outcomes to accord with the directions of Council’s Corporate Plan 2011-2016 and the Asset and Services Management Policy. The strategy is the ‘roadmap’ for the organisation to improve and progress asset and services management and improve confidence in the outputs and outcomes.
A key benefit of implementing this strategy is the resultant ability for the organisation to align resources and needs against a key set of actions to implement asset and services management planning techniques that can also be monitored for their performance and cost effectiveness.
The strategy includes a capability building program for the organisation, staff and Councillors to ensure that the intent of these plans is competently delivered. The program uses the LG Asset Advanced program to access best appropriate practice for Flinders Shire Council.
Council agenda items for changes and updates to programs and projects are presented in a report template which must have regard to:
Fit against Corporate Plan
Fit against Asset and Services Management Policy
Compliance with Asset and Services Management Plan criteria
Fit against Levels of Service
Inclusion in Capital Works Program / Long Term Financial Plan
Degree of community consultation and results
Whole of life costing
Risk management
Capability and capacity
GIS is the most appropriate system to be used to record and demonstrate assets, asset attributes and associated factors.
The improvement opportunities identified in the planning process are recorded in Table A8.3:
8.4 Monitoring and Review Procedures
This core plan will be reviewed and replaced with an advanced plan by 30 June 2012.
The Plan will be then be reviewed annually during budget preparations and amended in need to recognise any changes in Levels of Service and resources as a result of the budget decision process.
Performance reporting will be developed to demonstrate achievements, including:
Annual Report
Services provided
Value for money
Effectiveness
Efficiency
Asset condition profiles / trends (have regard for useful life / reporting period).
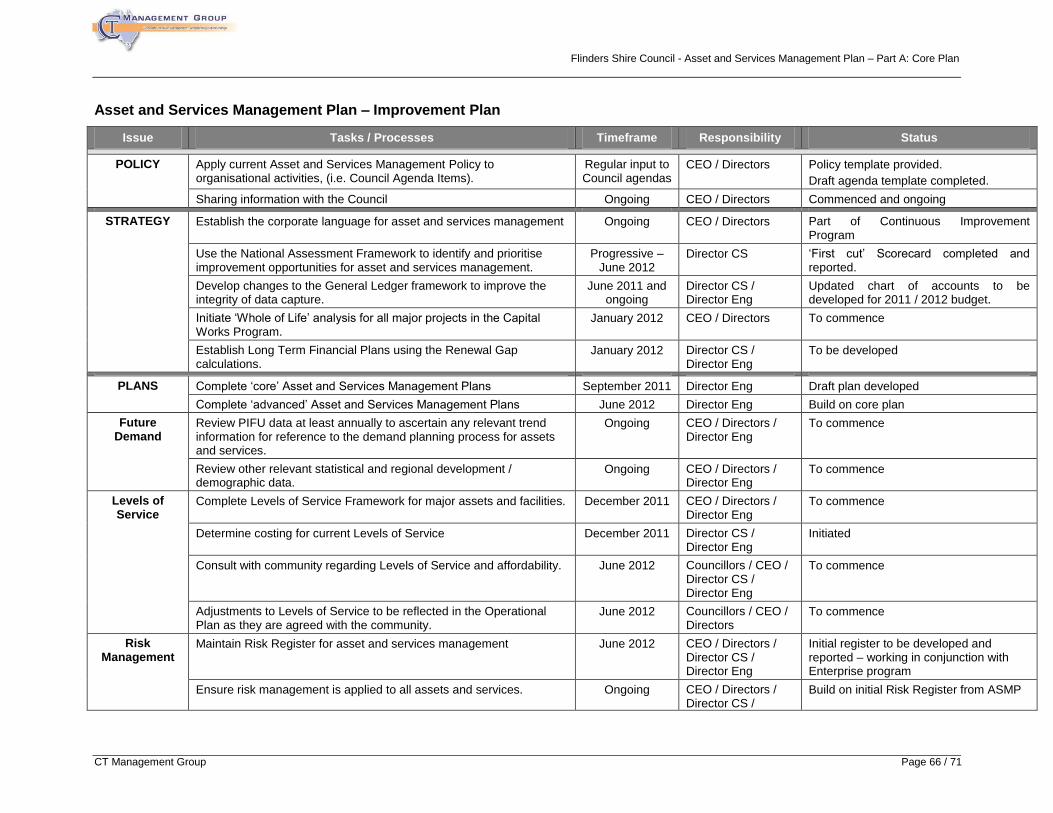
Flinders Shire Council - Asset and Services Management Plan – Part A: Core Plan
CT Management Group Page 66 / 71
Asset and Services Management Plan – Improvement Plan
Issue Tasks / Processes Timeframe Responsibility Status
POLICY Apply current Asset and Services Management Policy to organisational activities, (i.e. Council Agenda Items).
Regular input to Council agendas
CEO / Directors Policy template provided.
Draft agenda template completed.
Sharing information with the Council Ongoing CEO / Directors Commenced and ongoing
STRATEGY Establish the corporate language for asset and services management Ongoing CEO / Directors Part of Continuous Improvement Program
Use the National Assessment Framework to identify and prioritise improvement opportunities for asset and services management.
Progressive – June 2012
Director CS ‘First cut’ Scorecard completed and reported.
Develop changes to the General Ledger framework to improve the integrity of data capture.
June 2011 and ongoing
Director CS / Director Eng
Updated chart of accounts to be developed for 2011 / 2012 budget.
Initiate ‘Whole of Life’ analysis for all major projects in the Capital Works Program.
January 2012 CEO / Directors To commence
Establish Long Term Financial Plans using the Renewal Gap calculations.
January 2012 Director CS / Director Eng
To be developed
PLANS Complete ‘core’ Asset and Services Management Plans September 2011 Director Eng Draft plan developed
Complete ‘advanced’ Asset and Services Management Plans June 2012 Director Eng Build on core plan
Future Demand
Review PIFU data at least annually to ascertain any relevant trend information for reference to the demand planning process for assets and services.
Ongoing CEO / Directors / Director Eng
To commence
Review other relevant statistical and regional development / demographic data.
Ongoing CEO / Directors / Director Eng
To commence
Levels of Service
Complete Levels of Service Framework for major assets and facilities. December 2011 CEO / Directors / Director Eng
To commence
Determine costing for current Levels of Service December 2011 Director CS / Director Eng
Initiated
Consult with community regarding Levels of Service and affordability. June 2012 Councillors / CEO / Director CS / Director Eng
To commence
Adjustments to Levels of Service to be reflected in the Operational Plan as they are agreed with the community.
June 2012 Councillors / CEO / Directors
To commence
Risk Management
Maintain Risk Register for asset and services management June 2012 CEO / Directors / Director CS / Director Eng
Initial register to be developed and reported – working in conjunction with Enterprise program
Ensure risk management is applied to all assets and services. Ongoing CEO / Directors / Director CS /
Build on initial Risk Register from ASMP
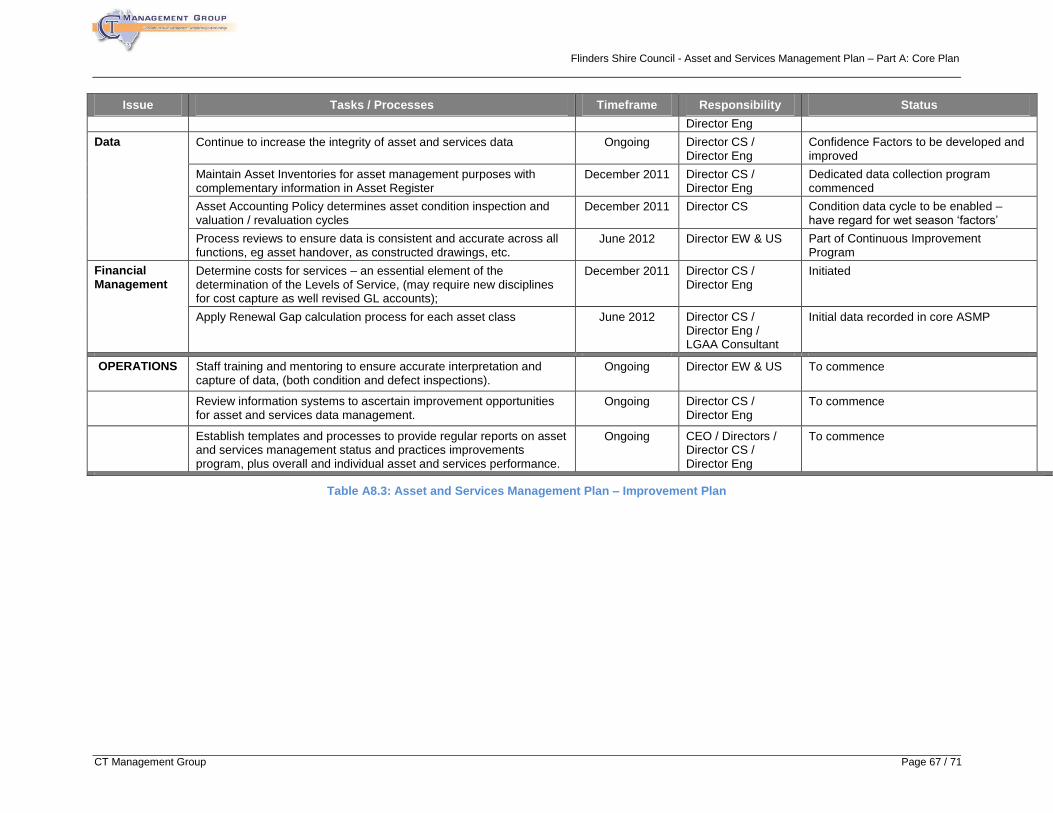
Flinders Shire Council - Asset and Services Management Plan – Part A: Core Plan
CT Management Group Page 67 / 71
Issue Tasks / Processes Timeframe Responsibility Status
Director Eng
Data Continue to increase the integrity of asset and services data Ongoing Director CS / Director Eng
Confidence Factors to be developed and improved
Maintain Asset Inventories for asset management purposes with complementary information in Asset Register
December 2011 Director CS / Director Eng
Dedicated data collection program commenced
Asset Accounting Policy determines asset condition inspection and valuation / revaluation cycles
December 2011 Director CS Condition data cycle to be enabled – have regard for wet season ‘factors’
Process reviews to ensure data is consistent and accurate across all functions, eg asset handover, as constructed drawings, etc.
June 2012 Director EW & US Part of Continuous Improvement Program
Financial Management
Determine costs for services – an essential element of the determination of the Levels of Service, (may require new disciplines for cost capture as well revised GL accounts);
December 2011 Director CS / Director Eng
Initiated
Apply Renewal Gap calculation process for each asset class June 2012 Director CS / Director Eng / LGAA Consultant
Initial data recorded in core ASMP
OPERATIONS Staff training and mentoring to ensure accurate interpretation and capture of data, (both condition and defect inspections).
Ongoing
Director EW & US To commence
Review information systems to ascertain improvement opportunities for asset and services data management.
Ongoing
Director CS / Director Eng
To commence
Establish templates and processes to provide regular reports on asset and services management status and practices improvements program, plus overall and individual asset and services performance.
Ongoing CEO / Directors / Director CS / Director Eng
To commence
Table A8.3: Asset and Services Management Plan – Improvement Plan
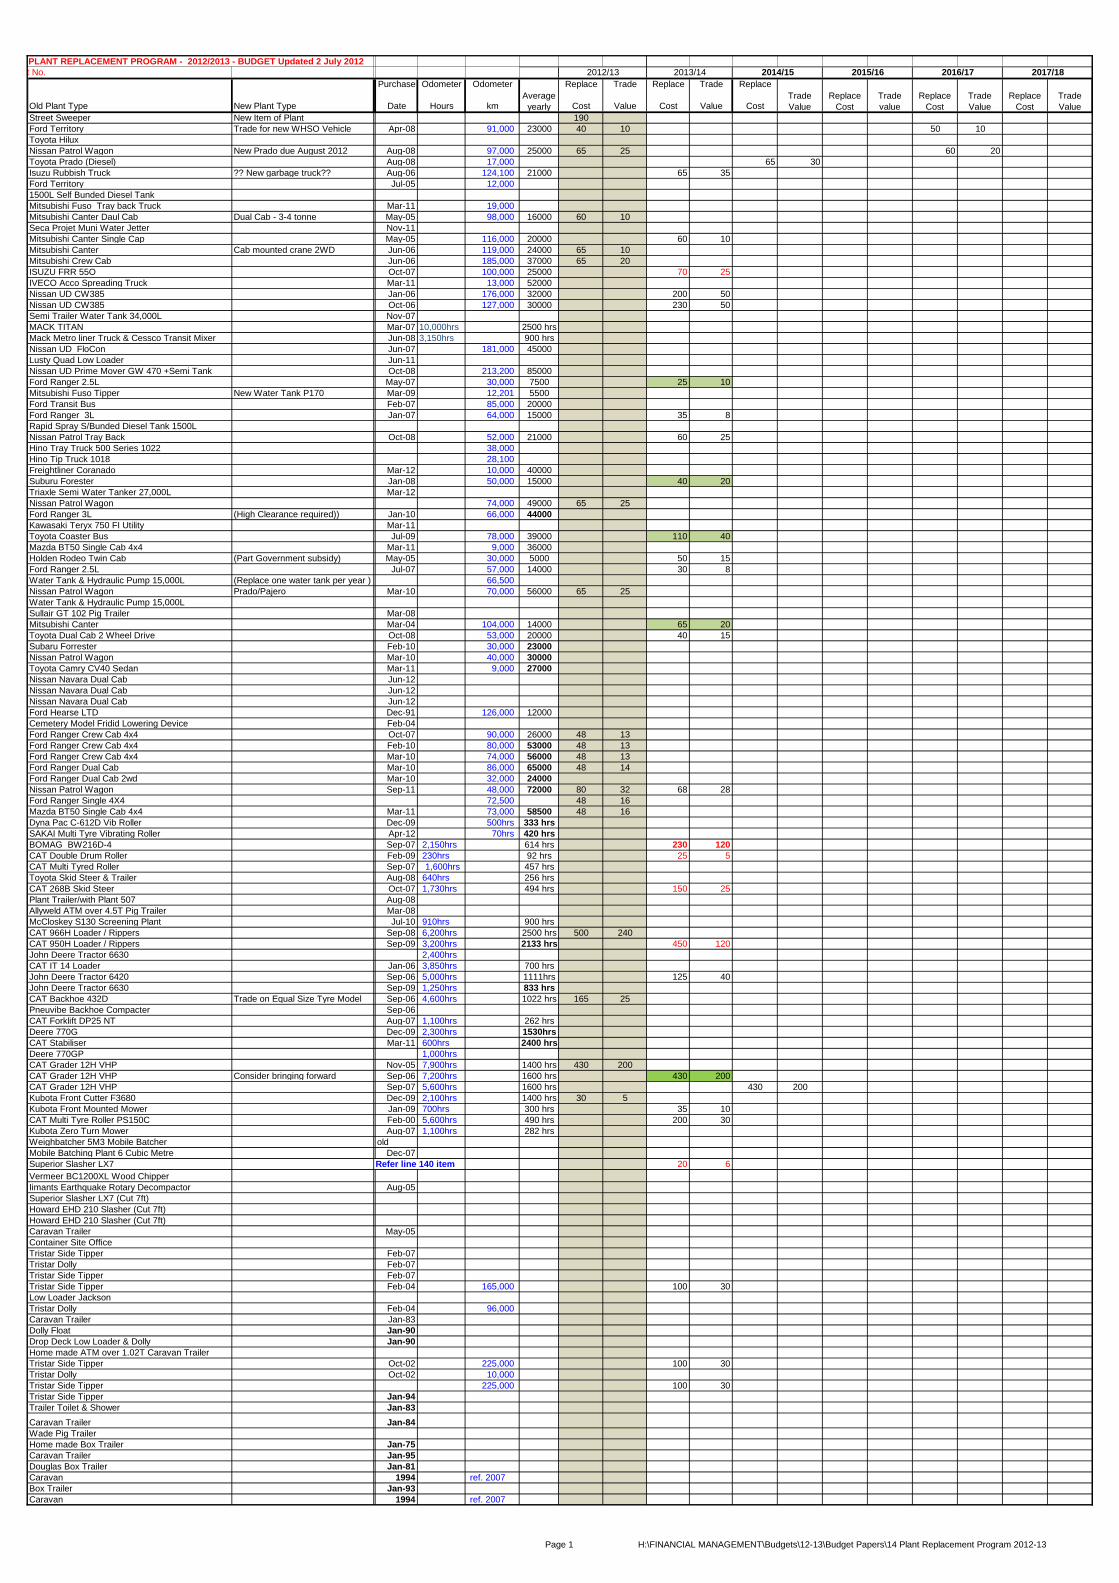
PLANT REPLACEMENT PROGRAM - 2012/2013 - BUDGET Updated 2 July 2012
Plant No. 2014/15 2015/16 2016/17 2017/18
Purchase Odometer Odometer Replace Trade Replace Trade Replace
Old Plant Type New Plant Type Date Hours kmAverage
yearly Cost Value Cost Value Cost
Street Sweeper New Item of Plant 190
Ford Territory Trade for new WHSO Vehicle Apr-08 91,000 23000 40 10 50 10
Toyota Hilux
Nissan Patrol Wagon New Prado due August 2012 Aug-08 97,000 25000 65 25 60 20
Toyota Prado (Diesel) Aug-08 17,000 65 30
Isuzu Rubbish Truck ?? New garbage truck?? Aug-06 124,100 21000 65 35
Ford Territory Jul-05 12,000 Plant 152 maintenance job truck
1500L Self Bunded Diesel Tank
Mitsubishi Fuso Tray back Truck Mar-11 19,000
Mitsubishi Canter Daul Cab Dual Cab - 3-4 tonne May-05 98,000 16000 60 10
Seca Projet Muni Water Jetter Nov-11
Mitsubishi Canter Single Cap May-05 116,000 20000 60 10
Mitsubishi Canter Cab mounted crane 2WD Jun-06 119,000 24000 65 10
Mitsubishi Crew Cab Jun-06 185,000 37000 65 20 Plant 127 RMPC Job Truck
ISUZU FRR 55O Oct-07 100,000 25000 70 25
IVECO Acco Spreading Truck Mar-11 13,000 52000
Nissan UD CW385 Jan-06 176,000 32000 200 50
Nissan UD CW385 Oct-06 127,000 30000 230 50
Semi Trailer Water Tank 34,000L Nov-07
MACK TITAN Mar-07 10,000hrs 2500 hrs
Mack Metro liner Truck & Cessco Transit Mixer Jun-08 3,150hrs 900 hrs
Nissan UD FloCon Jun-07 181,000 45000
Lusty Quad Low Loader Jun-11
Nissan UD Prime Mover GW 470 +Semi Tank Oct-08 213,200 85000
Ford Ranger 2.5L May-07 30,000 7500 25 10
Mitsubishi Fuso Tipper New Water Tank P170 Mar-09 12,201 5500
Ford Transit Bus Feb-07 85,000 20000
Ford Ranger 3L Jan-07 64,000 15000 35 8 Plant 131 Concrete team job truck
Rapid Spray S/Bunded Diesel Tank 1500L
Nissan Patrol Tray Back Oct-08 52,000 21000 60 25
Hino Tray Truck 500 Series 1022 38,000
Hino Tip Truck 1018 28,100
Freightliner Coranado Mar-12 10,000 40000
Suburu Forester Jan-08 50,000 15000 40 20
Triaxle Semi Water Tanker 27,000L Mar-12
Nissan Patrol Wagon 74,000 49000 65 25
Ford Ranger 3L (High Clearance required)) Jan-10 66,000 44000
Kawasaki Teryx 750 FI Utility Mar-11
Toyota Coaster Bus Jul-09 78,000 39000 110 40
Mazda BT50 Single Cab 4x4 Mar-11 9,000 36000
Holden Rodeo Twin Cab (Part Government subsidy) May-05 30,000 5000 50 15
Ford Ranger 2.5L Jul-07 57,000 14000 30 8
Water Tank & Hydraulic Pump 15,000L (Replace one water tank per year ) 66,500
Nissan Patrol Wagon Prado/Pajero Mar-10 70,000 56000 65 25
Water Tank & Hydraulic Pump 15,000L
Sullair GT 102 Pig Trailer Mar-08
Mitsubishi Canter Mar-04 104,000 14000 65 20
Toyota Dual Cab 2 Wheel Drive Oct-08 53,000 20000 40 15
Subaru Forrester Feb-10 30,000 23000
Nissan Patrol Wagon Mar-10 40,000 30000
Toyota Camry CV40 Sedan Mar-11 9,000 27000
Nissan Navara Dual Cab Jun-12
Nissan Navara Dual Cab Jun-12
Nissan Navara Dual Cab Jun-12
Ford Hearse LTD Dec-91 126,000 12000
Cemetery Model Fridid Lowering Device Feb-04
Ford Ranger Crew Cab 4x4 Oct-07 90,000 26000 48 13
Ford Ranger Crew Cab 4x4 Feb-10 80,000 53000 48 13
Ford Ranger Crew Cab 4x4 Mar-10 74,000 56000 48 13
Ford Ranger Dual Cab Mar-10 86,000 65000 48 14
Ford Ranger Dual Cab 2wd Mar-10 32,000 24000
Nissan Patrol Wagon Sep-11 48,000 72000 80 32 68 28
Ford Ranger Single 4X4 72,500 48 16
Mazda BT50 Single Cab 4x4 Mar-11 73,000 58500 48 16
Dyna Pac C-612D Vib Roller Dec-09 500hrs 333 hrs
SAKAI Multi Tyre Vibrating Roller Apr-12 70hrs 420 hrs
BOMAG BW216D-4 Sep-07 2,150hrs 614 hrs 230 120
CAT Double Drum Roller Feb-09 230hrs 92 hrs 25 5
CAT Multi Tyred Roller Sep-07 1,600hrs 457 hrs
Toyota Skid Steer & Trailer Aug-08 640hrs 256 hrs
CAT 268B Skid Steer Oct-07 1,730hrs 494 hrs 150 25
Plant Trailer/with Plant 507 Aug-08
Allyweld ATM over 4.5T Pig Trailer Mar-08
McCloskey S130 Screening Plant Jul-10 910hrs 900 hrs
CAT 966H Loader / Rippers Sep-08 6,200hrs 2500 hrs 500 240
CAT 950H Loader / Rippers Sep-09 3,200hrs 2133 hrs 450 120
John Deere Tractor 6630 2,400hrs
CAT IT 14 Loader Jan-06 3,850hrs 700 hrs
John Deere Tractor 6420 Sep-06 5,000hrs 1111hrs 125 40
John Deere Tractor 6630 Sep-09 1,250hrs 833 hrs
CAT Backhoe 432D Trade on Equal Size Tyre Model Sep-06 4,600hrs 1022 hrs 165 25
Pneuvibe Backhoe Compacter Sep-06
CAT Forklift DP25 NT Aug-07 1,100hrs 262 hrs
Deere 770G Dec-09 2,300hrs 1530hrs
CAT Stabiliser Mar-11 600hrs 2400 hrs
Deere 770GP 1,000hrs
CAT Grader 12H VHP Nov-05 7,900hrs 1400 hrs 430 200
CAT Grader 12H VHP Consider bringing forward Sep-06 7,200hrs 1600 hrs 430 200
CAT Grader 12H VHP Sep-07 5,600hrs 1600 hrs 430 200
Kubota Front Cutter F3680 Dec-09 2,100hrs 1400 hrs 30 5
Kubota Front Mounted Mower Jan-09 700hrs 300 hrs 35 10
CAT Multi Tyre Roller PS150C Feb-00 5,600hrs 490 hrs 200 30
Kubota Zero Turn Mower Aug-07 1,100hrs 282 hrs
Weighbatcher 5M3 Mobile Batcher old
Mobile Batching Plant 6 Cubic Metre Dec-07
Superior Slasher LX7 Refer line 140 item 20 6
Vermeer BC1200XL Wood Chipper
Iimants Earthquake Rotary Decompactor Aug-05
Superior Slasher LX7 (Cut 7ft)
Howard EHD 210 Slasher (Cut 7ft)
Howard EHD 210 Slasher (Cut 7ft)
Caravan Trailer May-05
Container Site Office
Tristar Side Tipper Feb-07
Tristar Dolly Feb-07
Tristar Side Tipper Feb-07
Tristar Side Tipper Feb-04 165,000 100 30
Low Loader Jackson
Tristar Dolly Feb-04 96,000
Caravan Trailer Jan-83
Dolly Float Jan-90
Drop Deck Low Loader & Dolly Jan-90
Home made ATM over 1.02T Caravan Trailer
Tristar Side Tipper Oct-02 225,000 100 30
Tristar Dolly Oct-02 10,000
Tristar Side Tipper 225,000 100 30
Tristar Side Tipper Jan-94
Trailer Toilet & Shower Jan-83
Caravan Trailer Jan-84
Wade Pig Trailer
Home made Box Trailer Jan-75
Caravan Trailer Jan-95
Douglas Box Trailer Jan-81
Caravan 1994 ref. 2007
Box Trailer Jan-93
Caravan 1994 ref. 2007
Trade
Value
Replace
Cost
Trade
Value
2013/142012/13
Replace
Cost
Trade
Value
Trade
value
Replace
Cost
Page 1 H:\FINANCIAL MANAGEMENT\Budgets\12-13\Budget Papers\14 Plant Replacement Program 2012-13
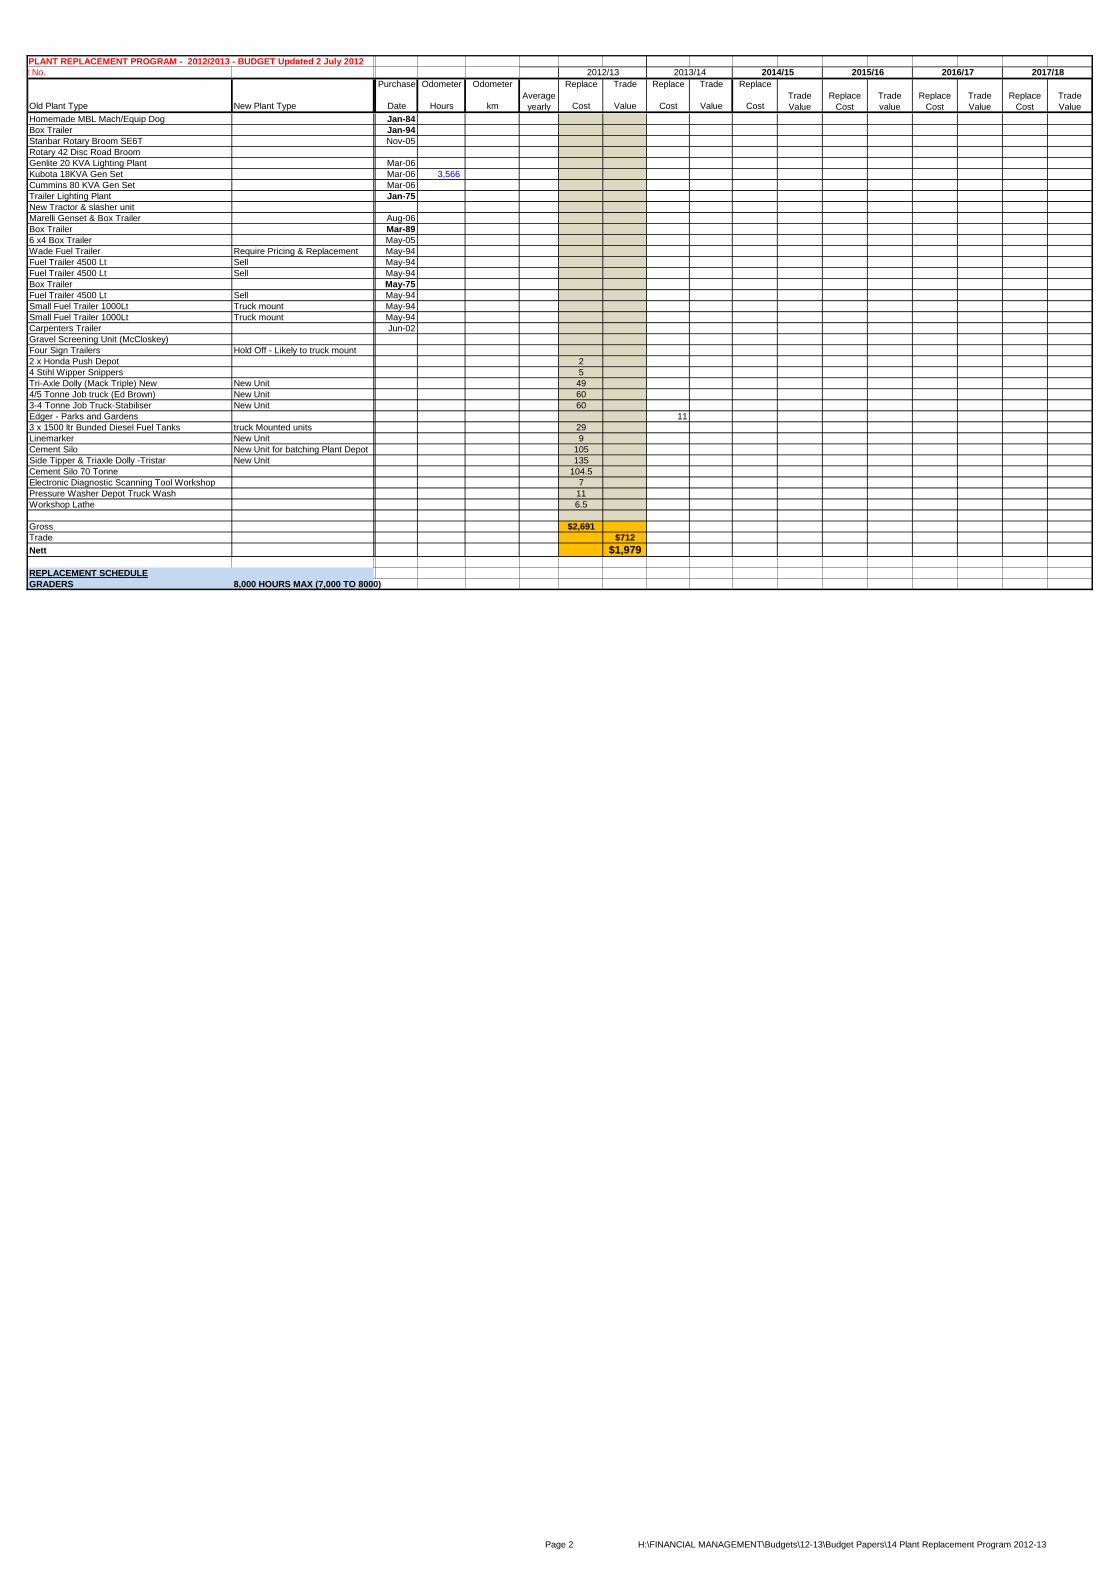
PLANT REPLACEMENT PROGRAM - 2012/2013 - BUDGET Updated 2 July 2012
Plant No. 2014/15 2015/16 2016/17 2017/18
Purchase Odometer Odometer Replace Trade Replace Trade Replace
Old Plant Type New Plant Type Date Hours kmAverage
yearly Cost Value Cost Value CostTrade
Value
Replace
Cost
Trade
Value
2013/142012/13
Replace
Cost
Trade
Value
Trade
value
Replace
Cost
Homemade MBL Mach/Equip Dog Jan-84
Box Trailer Jan-94
Stanbar Rotary Broom SE6T Nov-05
Rotary 42 Disc Road Broom
Genlite 20 KVA Lighting Plant Mar-06
Kubota 18KVA Gen Set Mar-06 3,566
Cummins 80 KVA Gen Set Mar-06
Trailer Lighting Plant Jan-75
New Tractor & slasher unit
Marelli Genset & Box Trailer Aug-06
Box Trailer Mar-89
6 x4 Box Trailer May-05
Wade Fuel Trailer Require Pricing & Replacement May-94
Fuel Trailer 4500 Lt Sell May-94
Fuel Trailer 4500 Lt Sell May-94
Box Trailer May-75
Fuel Trailer 4500 Lt Sell May-94
Small Fuel Trailer 1000Lt Truck mount May-94
Small Fuel Trailer 1000Lt Truck mount May-94
Carpenters Trailer Jun-02
Gravel Screening Unit (McCloskey)
Four Sign Trailers Hold Off - Likely to truck mount
2 x Honda Push Depot 2
4 Stihl Wipper Snippers 5
Tri-Axle Dolly (Mack Triple) New New Unit 49
4/5 Tonne Job truck (Ed Brown) New Unit 60
3-4 Tonne Job Truck-Stabiliser New Unit 60
Edger - Parks and Gardens 11
3 x 1500 ltr Bunded Diesel Fuel Tanks truck Mounted units 29
Linemarker New Unit 9
Cement Silo New Unit for batching Plant Depot 105
Side Tipper & Triaxle Dolly -Tristar New Unit 135
Cement Silo 70 Tonne 104.5
Electronic Diagnostic Scanning Tool Workshop 7
Pressure Washer Depot Truck Wash 11
Workshop Lathe 6.5
Gross $2,691
Trade $712
Nett $1,979
REPLACEMENT SCHEDULE
GRADERS 8,000 HOURS MAX (7,000 TO 8000)
Page 2 H:\FINANCIAL MANAGEMENT\Budgets\12-13\Budget Papers\14 Plant Replacement Program 2012-13
FLINDERS SHIRE
COUNCIL
FEES AND CHARGES
2012 – 2013
UPDATED: 9 AUGUST 2012
DOCUMENT NUMBER: D12/
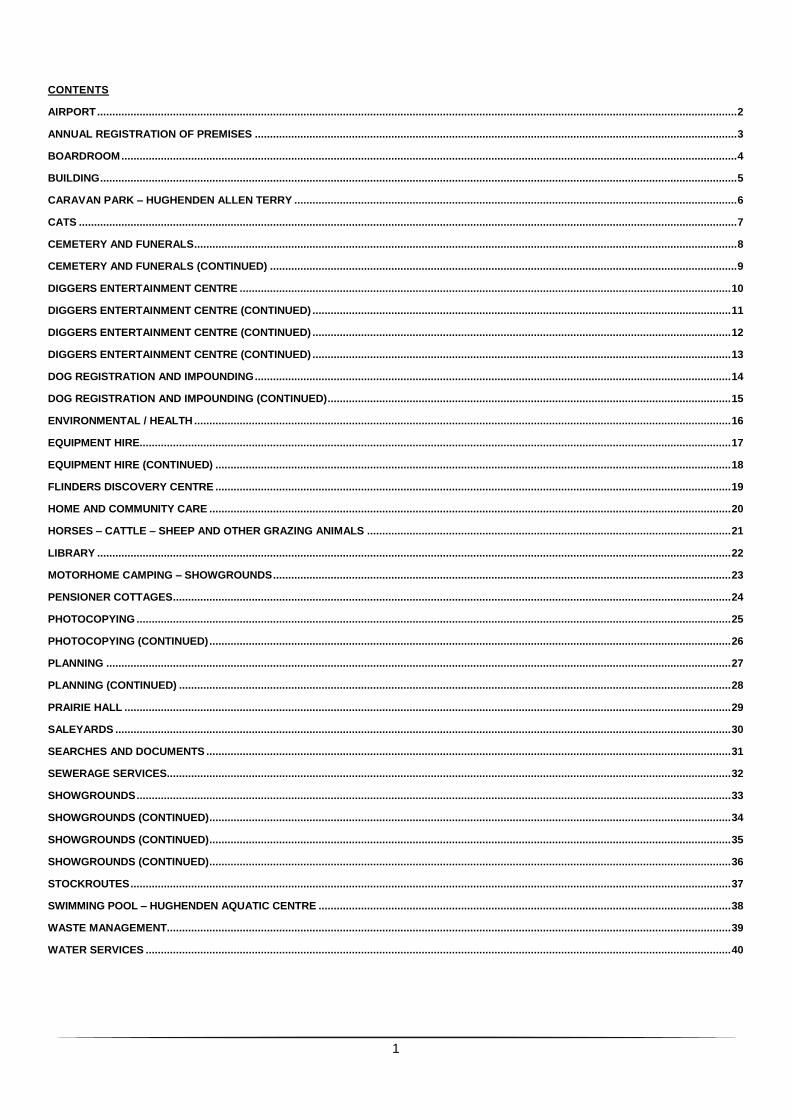
1
CONTENTS
AIRPORT ................................................................................................................................................................................................................... 2
ANNUAL REGISTRATION OF PREMISES ............................................................................................................................................................... 3
BOARDROOM ........................................................................................................................................................................................................... 4
BUILDING .................................................................................................................................................................................................................. 5
CARAVAN PARK – HUGHENDEN ALLEN TERRY .................................................................................................................................................. 6
CATS ......................................................................................................................................................................................................................... 7
CEMETERY AND FUNERALS ................................................................................................................................................................................... 8
CEMETERY AND FUNERALS (CONTINUED) .......................................................................................................................................................... 9
DIGGERS ENTERTAINMENT CENTRE .................................................................................................................................................................. 10
DIGGERS ENTERTAINMENT CENTRE (CONTINUED) .......................................................................................................................................... 11
DIGGERS ENTERTAINMENT CENTRE (CONTINUED) .......................................................................................................................................... 12
DIGGERS ENTERTAINMENT CENTRE (CONTINUED) .......................................................................................................................................... 13
DOG REGISTRATION AND IMPOUNDING ............................................................................................................................................................. 14
DOG REGISTRATION AND IMPOUNDING (CONTINUED) ..................................................................................................................................... 15
ENVIRONMENTAL / HEALTH ................................................................................................................................................................................. 16
EQUIPMENT HIRE................................................................................................................................................................................................... 17
EQUIPMENT HIRE (CONTINUED) .......................................................................................................................................................................... 18
FLINDERS DISCOVERY CENTRE .......................................................................................................................................................................... 19
HOME AND COMMUNITY CARE ............................................................................................................................................................................ 20
HORSES – CATTLE – SHEEP AND OTHER GRAZING ANIMALS ........................................................................................................................ 21
LIBRARY ................................................................................................................................................................................................................. 22
MOTORHOME CAMPING – SHOWGROUNDS ....................................................................................................................................................... 23
PENSIONER COTTAGES ........................................................................................................................................................................................ 24
PHOTOCOPYING .................................................................................................................................................................................................... 25
PHOTOCOPYING (CONTINUED) ............................................................................................................................................................................ 26
PLANNING .............................................................................................................................................................................................................. 27
PLANNING (CONTINUED) ...................................................................................................................................................................................... 28
PRAIRIE HALL ........................................................................................................................................................................................................ 29
SALEYARDS ........................................................................................................................................................................................................... 30
SEARCHES AND DOCUMENTS ............................................................................................................................................................................. 31
SEWERAGE SERVICES.......................................................................................................................................................................................... 32
SHOWGROUNDS .................................................................................................................................................................................................... 33
SHOWGROUNDS (CONTINUED) ............................................................................................................................................................................ 34
SHOWGROUNDS (CONTINUED) ............................................................................................................................................................................ 35
SHOWGROUNDS (CONTINUED) ............................................................................................................................................................................ 36
STOCKROUTES ...................................................................................................................................................................................................... 37
SWIMMING POOL – HUGHENDEN AQUATIC CENTRE ........................................................................................................................................ 38
WASTE MANAGEMENT .......................................................................................................................................................................................... 39
WATER SERVICES ................................................................................................................................................................................................. 40
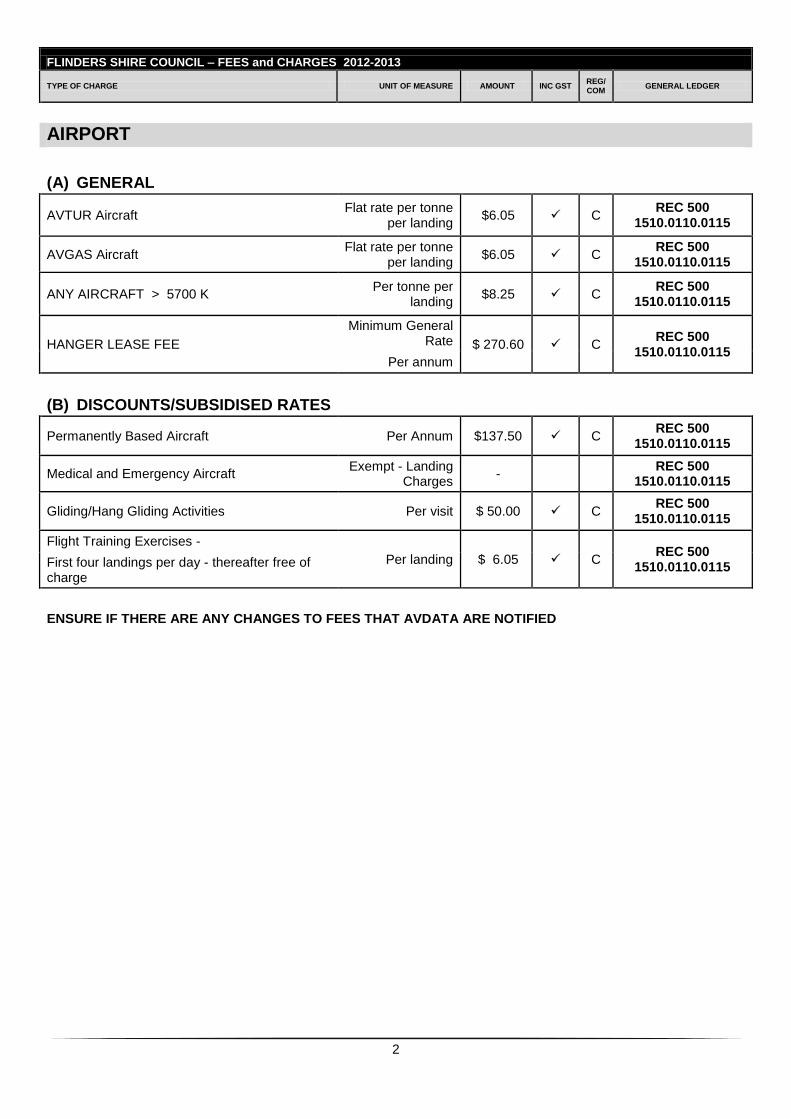
2
FLINDERS SHIRE COUNCIL – FEES and CHARGES 2012-2013
TYPE OF CHARGE UNIT OF MEASURE AMOUNT INC GST REG/ COM
GENERAL LEDGER
AIRPORT
(A) GENERAL
AVTUR Aircraft Flat rate per tonne
per landing $6.05 C
REC 500 1510.0110.0115
AVGAS Aircraft Flat rate per tonne
per landing $6.05 C
REC 500 1510.0110.0115
ANY AIRCRAFT > 5700 K Per tonne per
landing $8.25 C
REC 500 1510.0110.0115
HANGER LEASE FEE
Minimum General Rate $ 270.60 C
REC 500 1510.0110.0115
Per annum
(B) DISCOUNTS/SUBSIDISED RATES
Permanently Based Aircraft Per Annum $137.50 C REC 500
1510.0110.0115
Medical and Emergency Aircraft Exempt - Landing
Charges -
REC 500 1510.0110.0115
Gliding/Hang Gliding Activities Per visit $ 50.00 C REC 500
1510.0110.0115
Flight Training Exercises -
Per landing $ 6.05 C REC 500
1510.0110.0115 First four landings per day - thereafter free of charge
ENSURE IF THERE ARE ANY CHANGES TO FEES THAT AVDATA ARE NOTIFIED
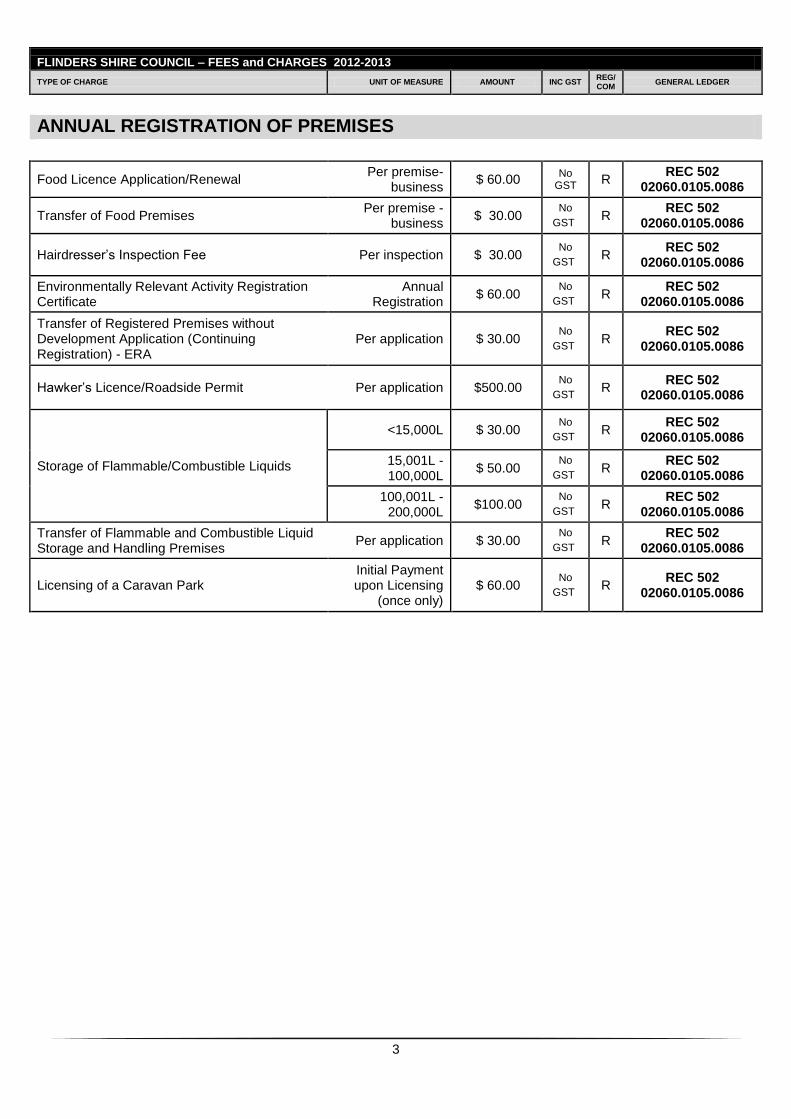
3
FLINDERS SHIRE COUNCIL – FEES and CHARGES 2012-2013
TYPE OF CHARGE UNIT OF MEASURE AMOUNT INC GST REG/ COM
GENERAL LEDGER
ANNUAL REGISTRATION OF PREMISES
Food Licence Application/Renewal Per premise-
business $ 60.00
No GST R
REC 502 02060.0105.0086
Transfer of Food Premises Per premise -
business $ 30.00
No
GST R
REC 502 02060.0105.0086
Hairdresser’s Inspection Fee Per inspection $ 30.00 No
GST R
REC 502 02060.0105.0086
Environmentally Relevant Activity Registration Certificate
Annual Registration
$ 60.00 No
GST R REC 502
02060.0105.0086
Transfer of Registered Premises without Development Application (Continuing Registration) - ERA
Per application $ 30.00 No
GST R
REC 502 02060.0105.0086
Hawker’s Licence/Roadside Permit Per application $500.00 No
GST R
REC 502 02060.0105.0086
Storage of Flammable/Combustible Liquids
<15,000L $ 30.00 No
GST R REC 502
02060.0105.0086
15,001L - 100,000L
$ 50.00 No
GST R REC 502
02060.0105.0086
100,001L - 200,000L
$100.00 No
GST R REC 502
02060.0105.0086
Transfer of Flammable and Combustible Liquid Storage and Handling Premises
Per application $ 30.00 No
GST R REC 502
02060.0105.0086
Licensing of a Caravan Park Initial Payment upon Licensing
(once only) $ 60.00
No
GST R REC 502
02060.0105.0086
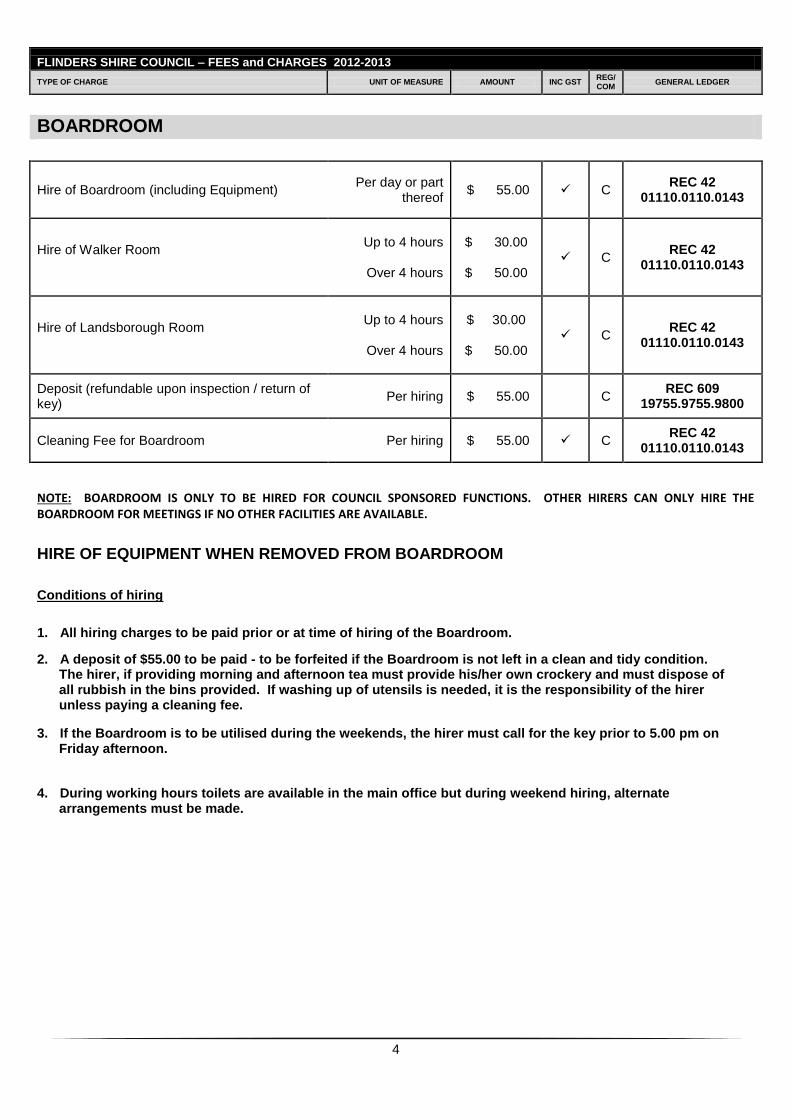
4
FLINDERS SHIRE COUNCIL – FEES and CHARGES 2012-2013
TYPE OF CHARGE UNIT OF MEASURE AMOUNT INC GST REG/ COM
GENERAL LEDGER
BOARDROOM
Hire of Boardroom (including Equipment) Per day or part
thereof $ 55.00 C
REC 42 01110.0110.0143
Hire of Walker Room
Up to 4 hours
Over 4 hours
$ 30.00
$ 50.00 C
REC 42 01110.0110.0143
Hire of Landsborough Room
Up to 4 hours
Over 4 hours
$ 30.00
$ 50.00 C
REC 42 01110.0110.0143
Deposit (refundable upon inspection / return of key)
Per hiring $ 55.00 C REC 609
19755.9755.9800
Cleaning Fee for Boardroom Per hiring $ 55.00 C REC 42
01110.0110.0143
NOTE: BOARDROOM IS ONLY TO BE HIRED FOR COUNCIL SPONSORED FUNCTIONS. OTHER HIRERS CAN ONLY HIRE THE BOARDROOM FOR MEETINGS IF NO OTHER FACILITIES ARE AVAILABLE.
HIRE OF EQUIPMENT WHEN REMOVED FROM BOARDROOM
Conditions of hiring
1. All hiring charges to be paid prior or at time of hiring of the Boardroom.
2. A deposit of $55.00 to be paid - to be forfeited if the Boardroom is not left in a clean and tidy condition. The hirer, if providing morning and afternoon tea must provide his/her own crockery and must dispose of all rubbish in the bins provided. If washing up of utensils is needed, it is the responsibility of the hirer unless paying a cleaning fee.
3. If the Boardroom is to be utilised during the weekends, the hirer must call for the key prior to 5.00 pm on Friday afternoon.
4. During working hours toilets are available in the main office but during weekend hiring, alternate arrangements must be made.
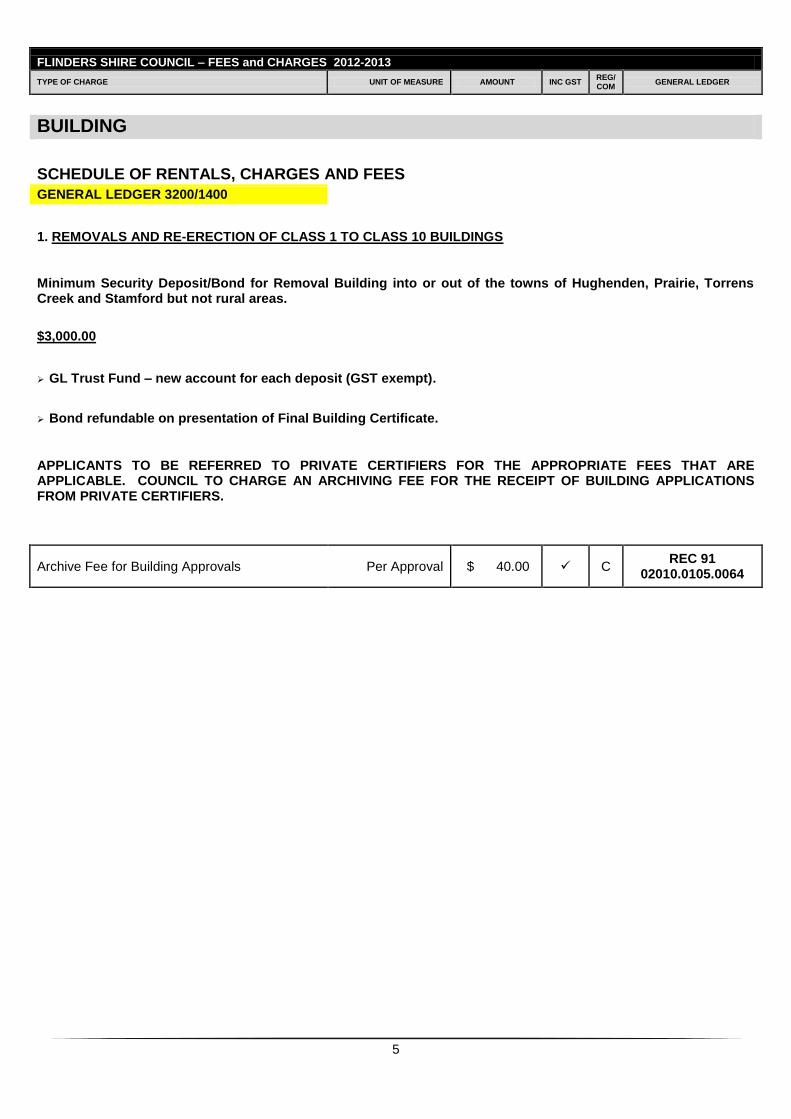
5
FLINDERS SHIRE COUNCIL – FEES and CHARGES 2012-2013
TYPE OF CHARGE UNIT OF MEASURE AMOUNT INC GST REG/ COM
GENERAL LEDGER
BUILDING
SCHEDULE OF RENTALS, CHARGES AND FEES
GENERAL LEDGER 3200/1400
1. REMOVALS AND RE-ERECTION OF CLASS 1 TO CLASS 10 BUILDINGS
Minimum Security Deposit/Bond for Removal Building into or out of the towns of Hughenden, Prairie, Torrens Creek and Stamford but not rural areas.
$3,000.00
GL Trust Fund – new account for each deposit (GST exempt).
Bond refundable on presentation of Final Building Certificate.
APPLICANTS TO BE REFERRED TO PRIVATE CERTIFIERS FOR THE APPROPRIATE FEES THAT ARE APPLICABLE. COUNCIL TO CHARGE AN ARCHIVING FEE FOR THE RECEIPT OF BUILDING APPLICATIONS FROM PRIVATE CERTIFIERS.
Archive Fee for Building Approvals Per Approval $ 40.00 C REC 91
02010.0105.0064
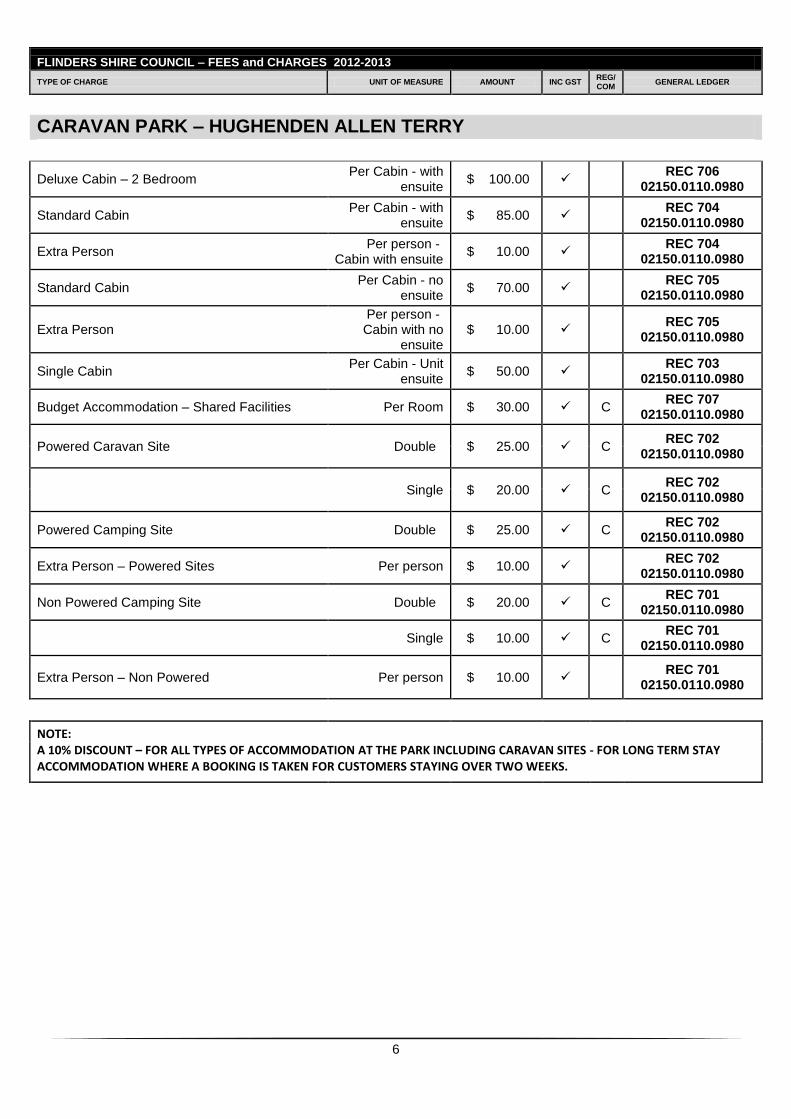
6
FLINDERS SHIRE COUNCIL – FEES and CHARGES 2012-2013
TYPE OF CHARGE UNIT OF MEASURE AMOUNT INC GST REG/ COM
GENERAL LEDGER
CARAVAN PARK – HUGHENDEN ALLEN TERRY
Deluxe Cabin – 2 Bedroom Per Cabin - with
ensuite $ 100.00
REC 706 02150.0110.0980
Standard Cabin Per Cabin - with
ensuite $ 85.00
REC 704 02150.0110.0980
Extra Person Per person -
Cabin with ensuite $ 10.00
REC 704 02150.0110.0980
Standard Cabin Per Cabin - no
ensuite $ 70.00
REC 705 02150.0110.0980
Extra Person Per person - Cabin with no
ensuite $ 10.00
REC 705 02150.0110.0980
Single Cabin Per Cabin - Unit
ensuite $ 50.00
REC 703 02150.0110.0980
Budget Accommodation – Shared Facilities Per Room $ 30.00 C REC 707
02150.0110.0980
Powered Caravan Site Double $ 25.00 C REC 702
02150.0110.0980
Single $ 20.00 C REC 702
02150.0110.0980
Powered Camping Site Double $ 25.00 C REC 702
02150.0110.0980
Extra Person – Powered Sites Per person $ 10.00 REC 702
02150.0110.0980
Non Powered Camping Site Double $ 20.00 C REC 701
02150.0110.0980
Single $ 10.00 C REC 701
02150.0110.0980
Extra Person – Non Powered Per person $ 10.00 REC 701
02150.0110.0980
NOTE: A 10% DISCOUNT – FOR ALL TYPES OF ACCOMMODATION AT THE PARK INCLUDING CARAVAN SITES - FOR LONG TERM STAY ACCOMMODATION WHERE A BOOKING IS TAKEN FOR CUSTOMERS STAYING OVER TWO WEEKS.
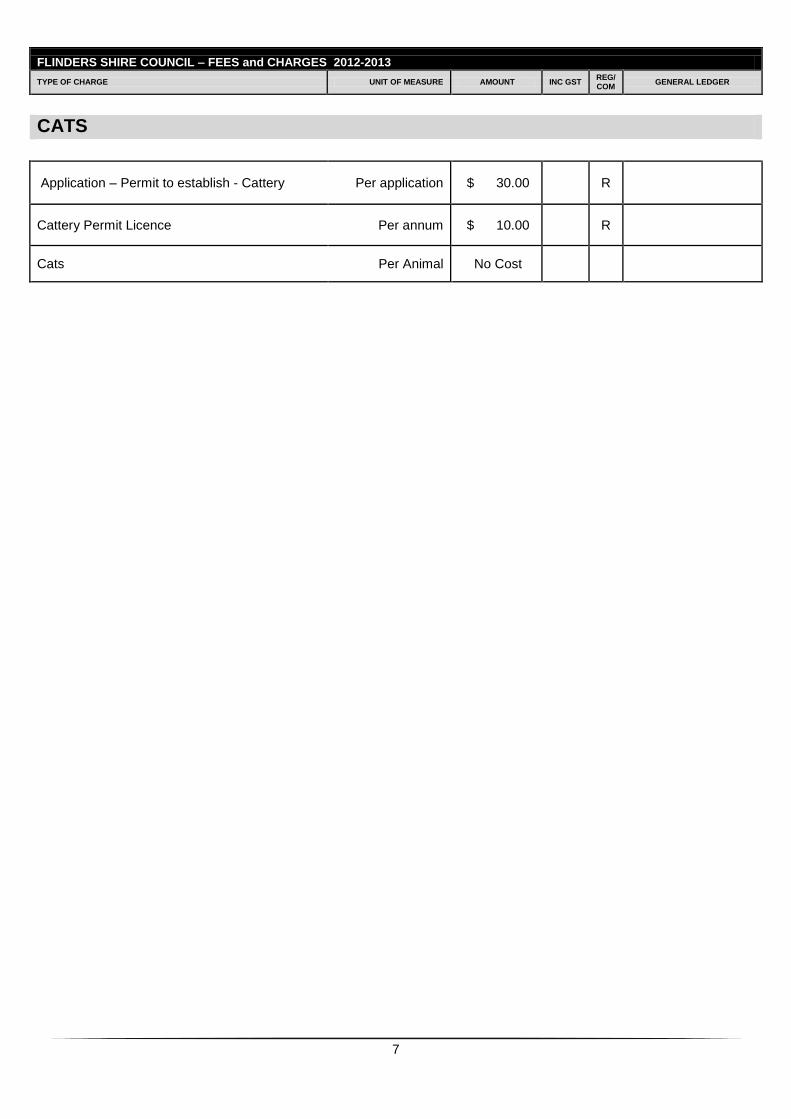
7
FLINDERS SHIRE COUNCIL – FEES and CHARGES 2012-2013
TYPE OF CHARGE UNIT OF MEASURE AMOUNT INC GST REG/ COM
GENERAL LEDGER
CATS
Application – Permit to establish - Cattery Per application $ 30.00 R
Cattery Permit Licence Per annum $ 10.00 R
Cats Per Animal No Cost
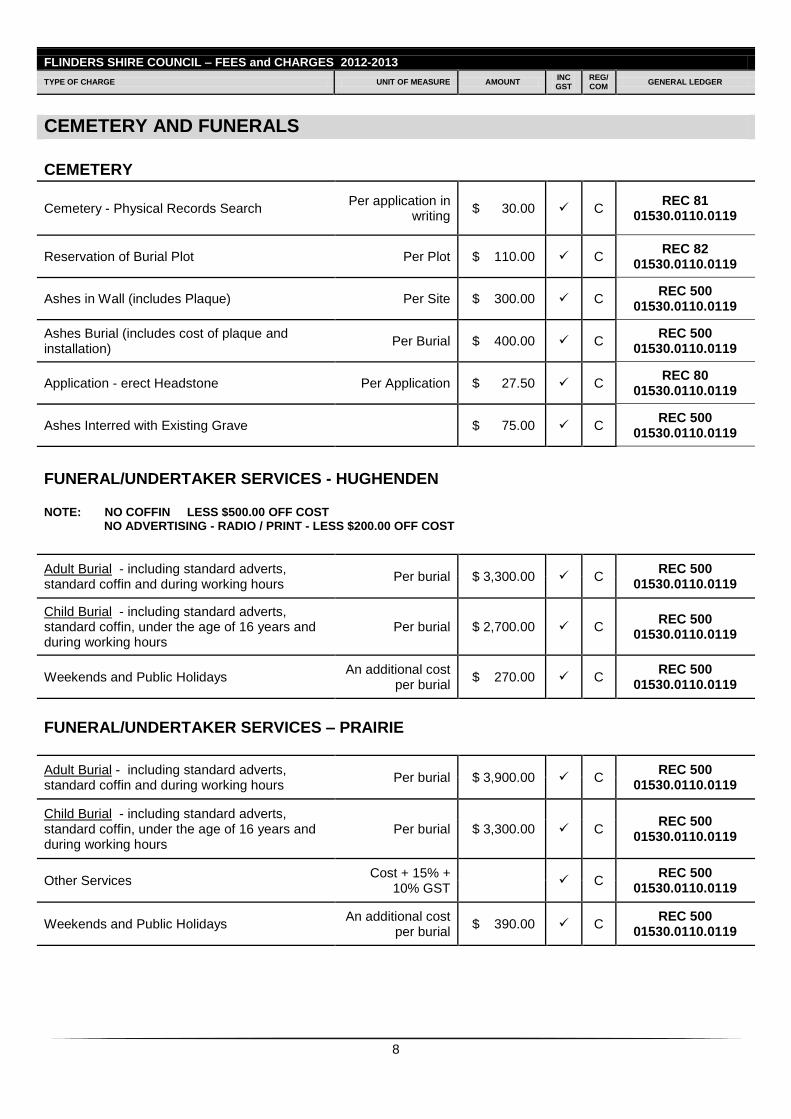
8
FLINDERS SHIRE COUNCIL – FEES and CHARGES 2012-2013
TYPE OF CHARGE UNIT OF MEASURE AMOUNT INC GST
REG/ COM
GENERAL LEDGER
CEMETERY AND FUNERALS
CEMETERY
Cemetery - Physical Records Search Per application in
writing $ 30.00 C
REC 81 01530.0110.0119
Reservation of Burial Plot Per Plot $ 110.00 C REC 82
01530.0110.0119
Ashes in Wall (includes Plaque) Per Site $ 300.00 C REC 500
01530.0110.0119
Ashes Burial (includes cost of plaque and installation)
Per Burial $ 400.00 C REC 500
01530.0110.0119
Application - erect Headstone Per Application $ 27.50 C REC 80
01530.0110.0119
Ashes Interred with Existing Grave $ 75.00 C REC 500
01530.0110.0119
FUNERAL/UNDERTAKER SERVICES - HUGHENDEN
NOTE: NO COFFIN LESS $500.00 OFF COST NO ADVERTISING - RADIO / PRINT - LESS $200.00 OFF COST
Adult Burial - including standard adverts, standard coffin and during working hours
Per burial $ 3,300.00 C REC 500
01530.0110.0119
Child Burial - including standard adverts, standard coffin, under the age of 16 years and during working hours
Per burial $ 2,700.00 C REC 500
01530.0110.0119
Weekends and Public Holidays An additional cost
per burial $ 270.00 C
REC 500 01530.0110.0119
FUNERAL/UNDERTAKER SERVICES – PRAIRIE
Adult Burial - including standard adverts, standard coffin and during working hours
Per burial $ 3,900.00 C REC 500
01530.0110.0119
Child Burial - including standard adverts, standard coffin, under the age of 16 years and during working hours
Per burial $ 3,300.00 C REC 500
01530.0110.0119
Other Services Cost + 15% +
10% GST C
REC 500 01530.0110.0119
Weekends and Public Holidays An additional cost
per burial $ 390.00 C
REC 500 01530.0110.0119
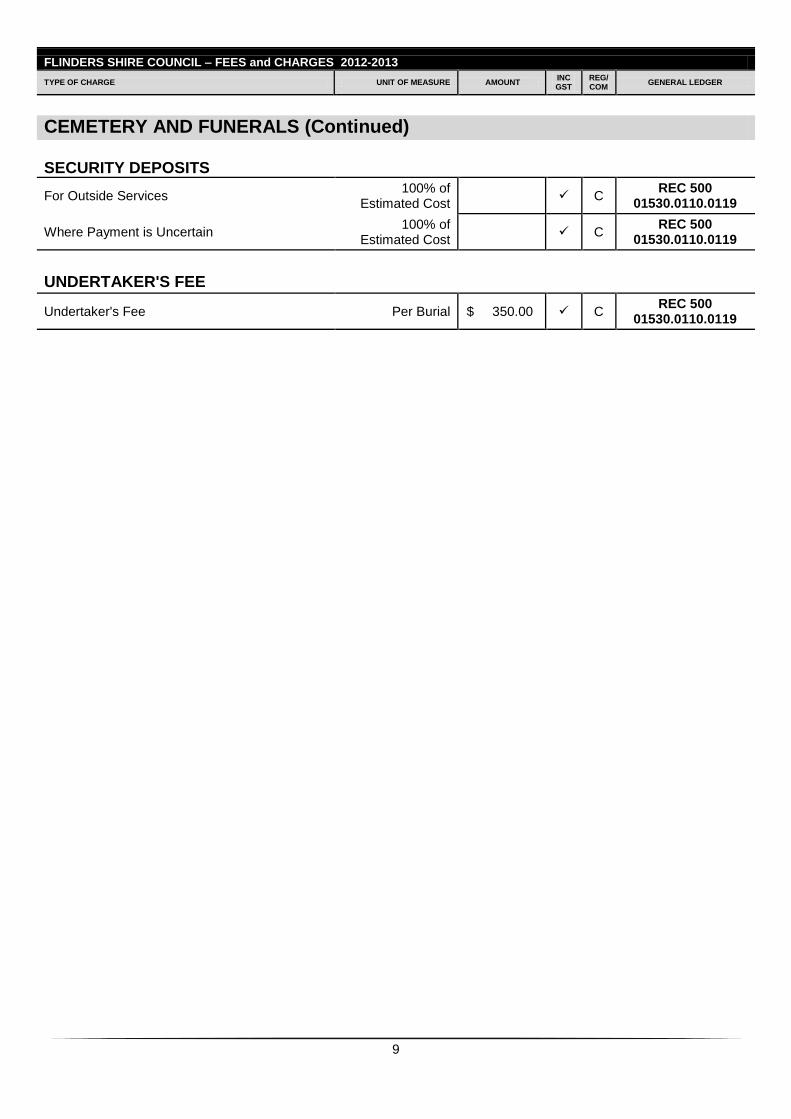
9
FLINDERS SHIRE COUNCIL – FEES and CHARGES 2012-2013
TYPE OF CHARGE UNIT OF MEASURE AMOUNT INC GST
REG/ COM
GENERAL LEDGER
CEMETERY AND FUNERALS (Continued)
SECURITY DEPOSITS
For Outside Services 100% of
Estimated Cost C
REC 500 01530.0110.0119
Where Payment is Uncertain 100% of
Estimated Cost C
REC 500 01530.0110.0119
UNDERTAKER'S FEE
Undertaker's Fee Per Burial $ 350.00 C REC 500
01530.0110.0119
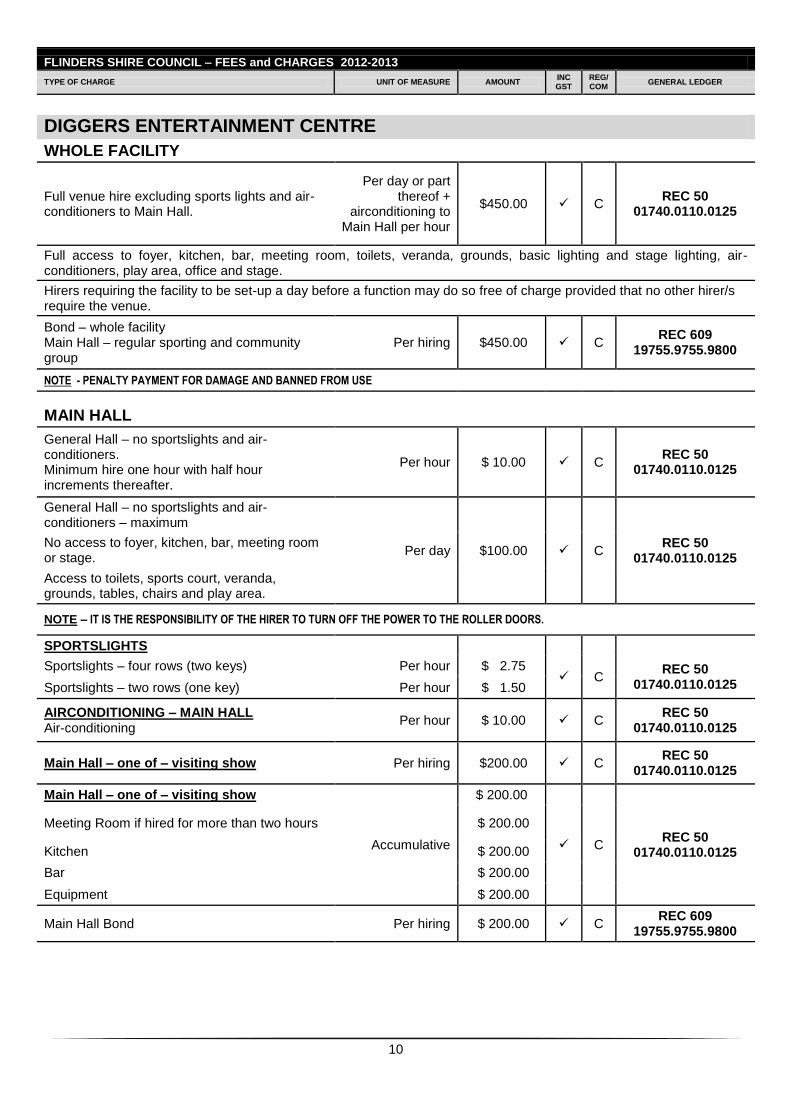
10
FLINDERS SHIRE COUNCIL – FEES and CHARGES 2012-2013
TYPE OF CHARGE UNIT OF MEASURE AMOUNT INC GST
REG/ COM
GENERAL LEDGER
DIGGERS ENTERTAINMENT CENTRE
WHOLE FACILITY
Full venue hire excluding sports lights and air-conditioners to Main Hall.
Per day or part thereof +
airconditioning to Main Hall per hour
$450.00 C REC 50
01740.0110.0125
Full access to foyer, kitchen, bar, meeting room, toilets, veranda, grounds, basic lighting and stage lighting, air-conditioners, play area, office and stage.
Hirers requiring the facility to be set-up a day before a function may do so free of charge provided that no other hirer/s require the venue.
Bond – whole facility Main Hall – regular sporting and community group
Per hiring $450.00 C REC 609
19755.9755.9800
NOTE - PENALTY PAYMENT FOR DAMAGE AND BANNED FROM USE
MAIN HALL
General Hall – no sportslights and air-conditioners. Minimum hire one hour with half hour increments thereafter.
Per hour $ 10.00 C REC 50
01740.0110.0125
General Hall – no sportslights and air-conditioners – maximum
Per day $100.00 C REC 50
01740.0110.0125
No access to foyer, kitchen, bar, meeting room or stage.
Access to toilets, sports court, veranda, grounds, tables, chairs and play area.
NOTE – IT IS THE RESPONSIBILITY OF THE HIRER TO TURN OFF THE POWER TO THE ROLLER DOORS.
SPORTSLIGHTS
Sportslights – four rows (two keys) Per hour $ 2.75 C
REC 50 01740.0110.0125 Sportslights – two rows (one key) Per hour $ 1.50
AIRCONDITIONING – MAIN HALL Air-conditioning
Per hour $ 10.00 C REC 50
01740.0110.0125
Main Hall – one of – visiting show Per hiring $200.00 C REC 50
01740.0110.0125
Main Hall – one of – visiting show
Accumulative
$ 200.00
C REC 50
01740.0110.0125
Meeting Room if hired for more than two hours $ 200.00
Kitchen $ 200.00
Bar $ 200.00
Equipment $ 200.00
Main Hall Bond Per hiring $ 200.00 C REC 609
19755.9755.9800
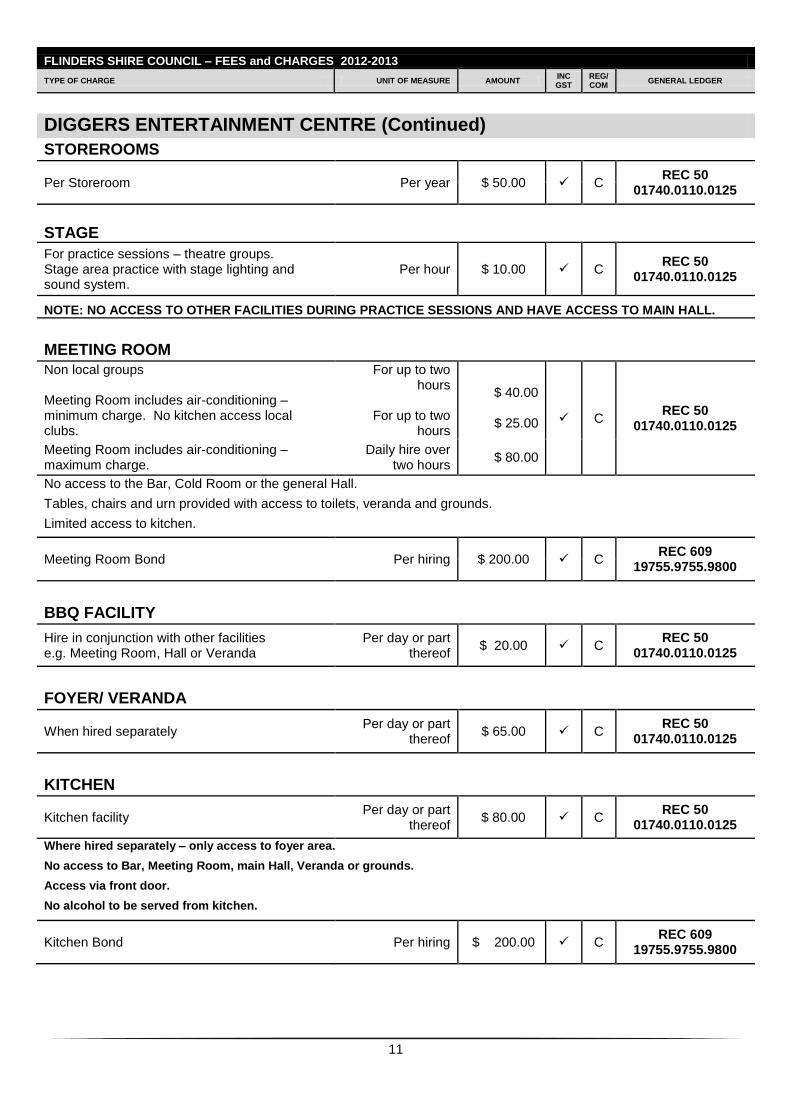
11
FLINDERS SHIRE COUNCIL – FEES and CHARGES 2012-2013
TYPE OF CHARGE UNIT OF MEASURE AMOUNT INC GST
REG/ COM
GENERAL LEDGER
DIGGERS ENTERTAINMENT CENTRE (Continued)
STOREROOMS
Per Storeroom Per year $ 50.00 C REC 50
01740.0110.0125
STAGE
For practice sessions – theatre groups. Stage area practice with stage lighting and sound system.
Per hour $ 10.00 C REC 50
01740.0110.0125
NOTE: NO ACCESS TO OTHER FACILITIES DURING PRACTICE SESSIONS AND HAVE ACCESS TO MAIN HALL.
MEETING ROOM
Non local groups Meeting Room includes air-conditioning – minimum charge. No kitchen access local clubs.
For up to two hours
For up to two
hours
$ 40.00
$ 25.00 C
REC 50 01740.0110.0125
Meeting Room includes air-conditioning – maximum charge.
Daily hire over two hours
$ 80.00
No access to the Bar, Cold Room or the general Hall.
Tables, chairs and urn provided with access to toilets, veranda and grounds.
Limited access to kitchen.
Meeting Room Bond Per hiring $ 200.00 C REC 609
19755.9755.9800
BBQ FACILITY
Hire in conjunction with other facilities e.g. Meeting Room, Hall or Veranda
Per day or part thereof
$ 20.00 C REC 50
01740.0110.0125
FOYER/ VERANDA
When hired separately Per day or part
thereof $ 65.00 C
REC 50 01740.0110.0125
KITCHEN
Kitchen facility Per day or part
thereof $ 80.00 C
REC 50 01740.0110.0125
Where hired separately – only access to foyer area.
No access to Bar, Meeting Room, main Hall, Veranda or grounds.
Access via front door.
No alcohol to be served from kitchen.
Kitchen Bond Per hiring $ 200.00 C REC 609
19755.9755.9800
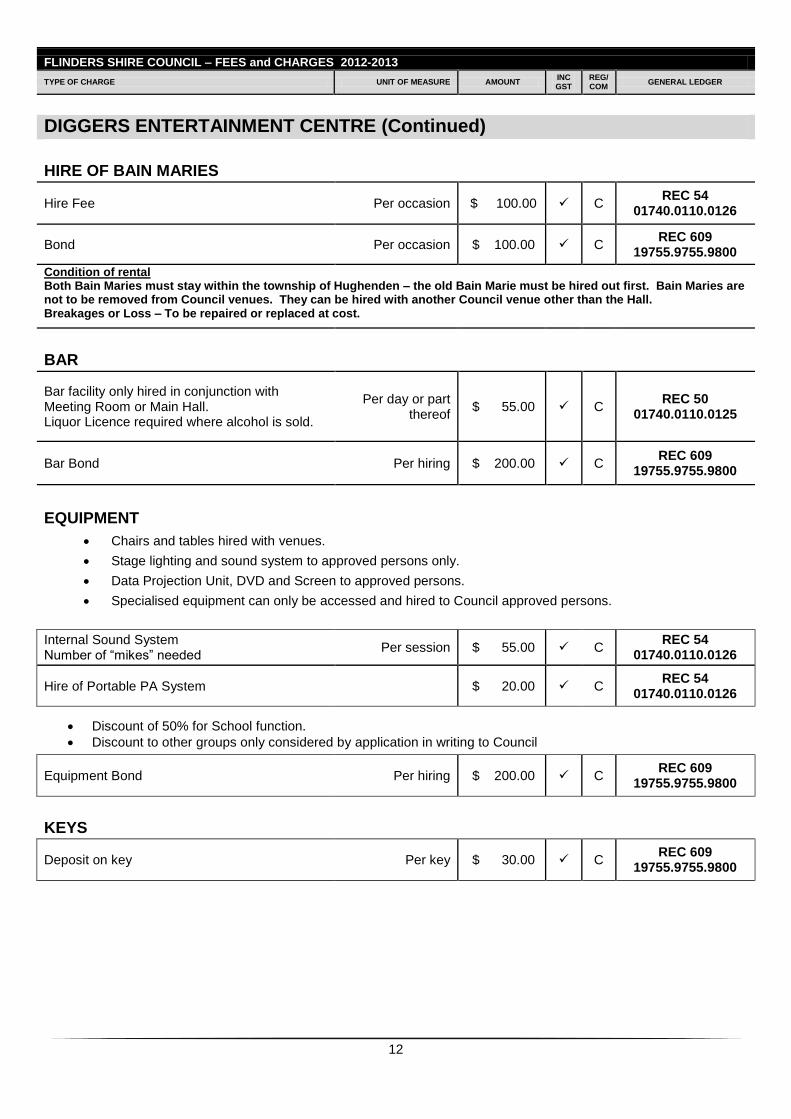
12
FLINDERS SHIRE COUNCIL – FEES and CHARGES 2012-2013
TYPE OF CHARGE UNIT OF MEASURE AMOUNT INC GST
REG/ COM
GENERAL LEDGER
DIGGERS ENTERTAINMENT CENTRE (Continued)
HIRE OF BAIN MARIES
Hire Fee Per occasion $ 100.00 C REC 54
01740.0110.0126
Bond Per occasion $ 100.00 C REC 609
19755.9755.9800
Condition of rental Both Bain Maries must stay within the township of Hughenden – the old Bain Marie must be hired out first. Bain Maries are not to be removed from Council venues. They can be hired with another Council venue other than the Hall. Breakages or Loss – To be repaired or replaced at cost.
BAR
Bar facility only hired in conjunction with Meeting Room or Main Hall. Liquor Licence required where alcohol is sold.
Per day or part thereof
$ 55.00 C REC 50
01740.0110.0125
Bar Bond Per hiring $ 200.00 C REC 609
19755.9755.9800
EQUIPMENT
Chairs and tables hired with venues.
Stage lighting and sound system to approved persons only.
Data Projection Unit, DVD and Screen to approved persons.
Specialised equipment can only be accessed and hired to Council approved persons.
Internal Sound System Number of “mikes” needed
Per session $ 55.00 C REC 54
01740.0110.0126
Hire of Portable PA System $ 20.00 C REC 54
01740.0110.0126
Discount of 50% for School function.
Discount to other groups only considered by application in writing to Council
Equipment Bond Per hiring $ 200.00 C REC 609
19755.9755.9800
KEYS
Deposit on key Per key $ 30.00 C REC 609
19755.9755.9800
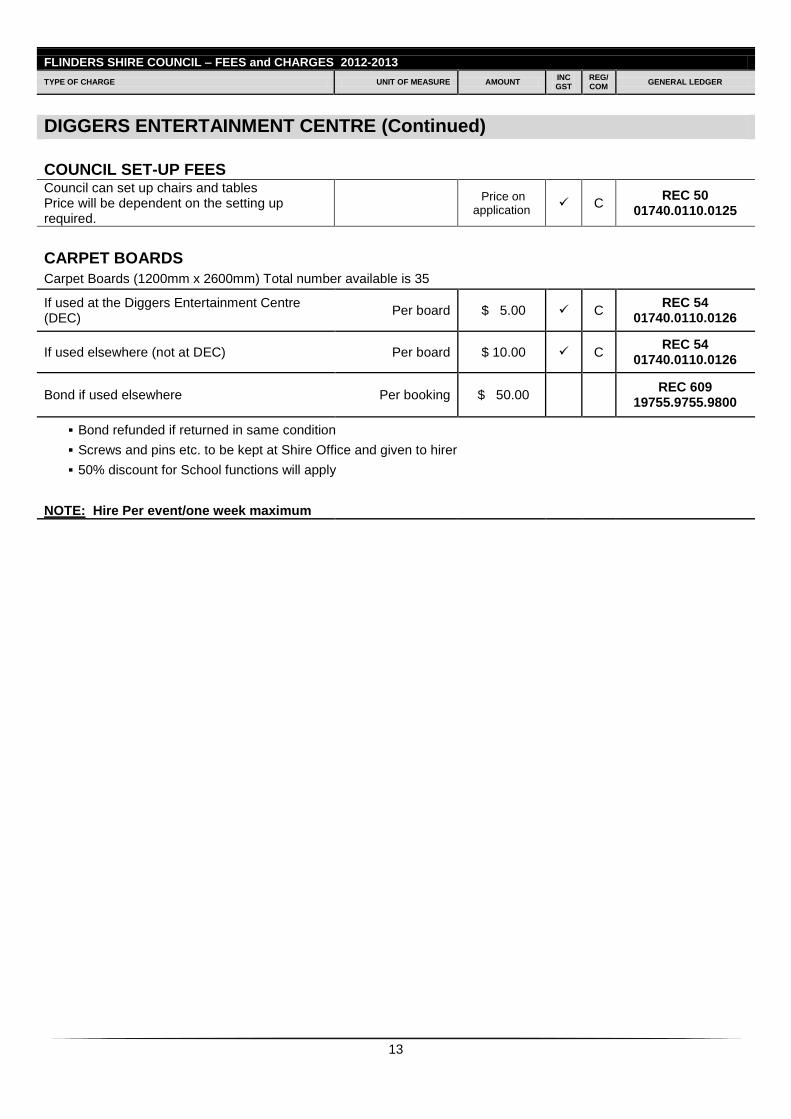
13
FLINDERS SHIRE COUNCIL – FEES and CHARGES 2012-2013
TYPE OF CHARGE UNIT OF MEASURE AMOUNT INC GST
REG/ COM
GENERAL LEDGER
DIGGERS ENTERTAINMENT CENTRE (Continued)
COUNCIL SET-UP FEES
Council can set up chairs and tables Price will be dependent on the setting up required.
Price on
application C
REC 50 01740.0110.0125
CARPET BOARDS
Carpet Boards (1200mm x 2600mm) Total number available is 35
If used at the Diggers Entertainment Centre (DEC)
Per board $ 5.00 C REC 54
01740.0110.0126
If used elsewhere (not at DEC) Per board $ 10.00 C REC 54
01740.0110.0126
Bond if used elsewhere Per booking $ 50.00 REC 609
19755.9755.9800
Bond refunded if returned in same condition
Screws and pins etc. to be kept at Shire Office and given to hirer
50% discount for School functions will apply
NOTE: Hire Per event/one week maximum
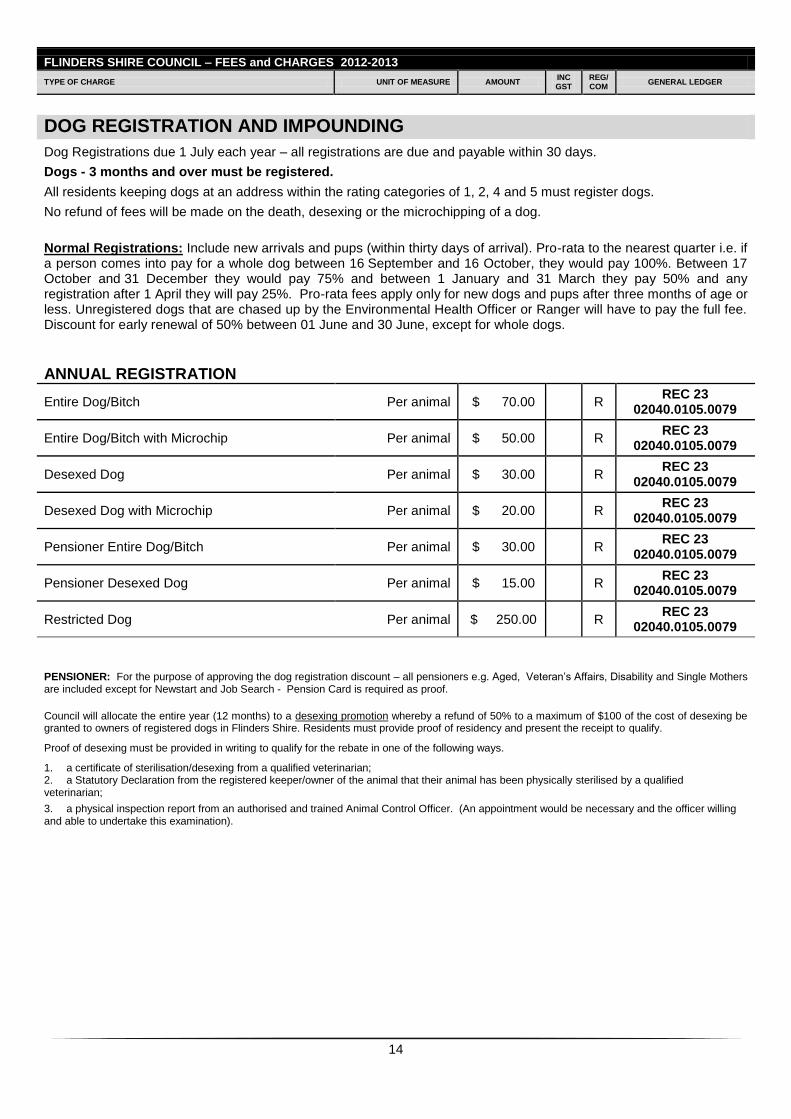
14
FLINDERS SHIRE COUNCIL – FEES and CHARGES 2012-2013
TYPE OF CHARGE UNIT OF MEASURE AMOUNT INC GST
REG/ COM
GENERAL LEDGER
DOG REGISTRATION AND IMPOUNDING
Dog Registrations due 1 July each year – all registrations are due and payable within 30 days.
Dogs - 3 months and over must be registered.
All residents keeping dogs at an address within the rating categories of 1, 2, 4 and 5 must register dogs.
No refund of fees will be made on the death, desexing or the microchipping of a dog.
Normal Registrations: Include new arrivals and pups (within thirty days of arrival). Pro-rata to the nearest quarter i.e. if a person comes into pay for a whole dog between 16
September and 16 October, they would pay 100%. Between 17
October and 31 December they would pay 75% and between 1 January and 31 March they pay 50% and any registration after 1 April they will pay 25%. Pro-rata fees apply only for new dogs and pups after three months of age or less. Unregistered dogs that are chased up by the Environmental Health Officer or Ranger will have to pay the full fee. Discount for early renewal of 50% between 01 June and 30 June, except for whole dogs.
ANNUAL REGISTRATION
Entire Dog/Bitch Per animal $ 70.00 R REC 23
02040.0105.0079
Entire Dog/Bitch with Microchip Per animal $ 50.00 R REC 23
02040.0105.0079
Desexed Dog Per animal $ 30.00 R REC 23
02040.0105.0079
Desexed Dog with Microchip Per animal $ 20.00 R REC 23
02040.0105.0079
Pensioner Entire Dog/Bitch Per animal $ 30.00 R REC 23
02040.0105.0079
Pensioner Desexed Dog Per animal $ 15.00 R REC 23
02040.0105.0079
Restricted Dog Per animal $ 250.00 R REC 23
02040.0105.0079
PENSIONER: For the purpose of approving the dog registration discount – all pensioners e.g. Aged, Veteran’s Affairs, Disability and Single Mothers are included except for Newstart and Job Search - Pension Card is required as proof.
Council will allocate the entire year (12 months) to a desexing promotion whereby a refund of 50% to a maximum of $100 of the cost of desexing be granted to owners of registered dogs in Flinders Shire. Residents must provide proof of residency and present the receipt to qualify.
Proof of desexing must be provided in writing to qualify for the rebate in one of the following ways.
1. a certificate of sterilisation/desexing from a qualified veterinarian; 2. a Statutory Declaration from the registered keeper/owner of the animal that their animal has been physically sterilised by a qualified veterinarian;
3. a physical inspection report from an authorised and trained Animal Control Officer. (An appointment would be necessary and the officer willing and able to undertake this examination).
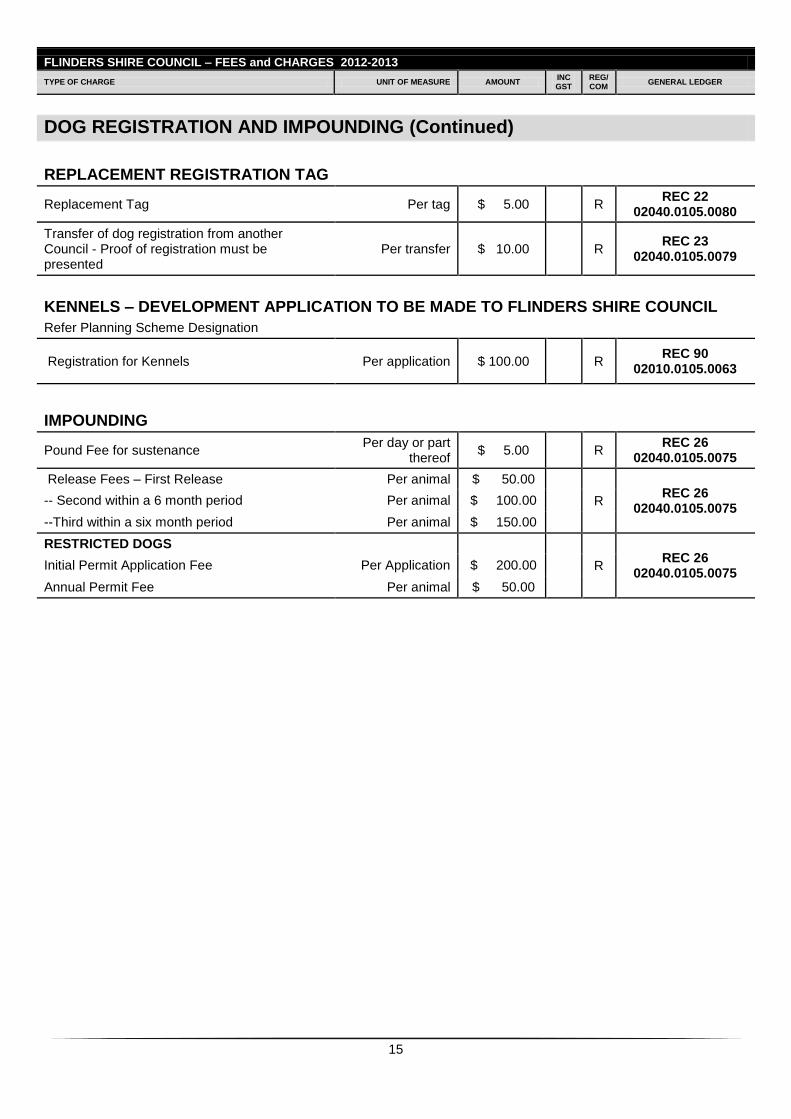
15
FLINDERS SHIRE COUNCIL – FEES and CHARGES 2012-2013
TYPE OF CHARGE UNIT OF MEASURE AMOUNT INC GST
REG/ COM
GENERAL LEDGER
DOG REGISTRATION AND IMPOUNDING (Continued)
REPLACEMENT REGISTRATION TAG
Replacement Tag Per tag $ 5.00 R REC 22
02040.0105.0080
Transfer of dog registration from another Council - Proof of registration must be presented
Per transfer $ 10.00 R REC 23
02040.0105.0079
KENNELS – DEVELOPMENT APPLICATION TO BE MADE TO FLINDERS SHIRE COUNCIL
Refer Planning Scheme Designation
Registration for Kennels Per application $ 100.00 R REC 90
02010.0105.0063
IMPOUNDING
Pound Fee for sustenance Per day or part
thereof $ 5.00 R
REC 26 02040.0105.0075
Release Fees – First Release Per animal $ 50.00
R REC 26
02040.0105.0075 -- Second within a 6 month period Per animal $ 100.00
--Third within a six month period Per animal $ 150.00
RESTRICTED DOGS
R REC 26
02040.0105.0075 Initial Permit Application Fee Per Application $ 200.00
Annual Permit Fee Per animal $ 50.00
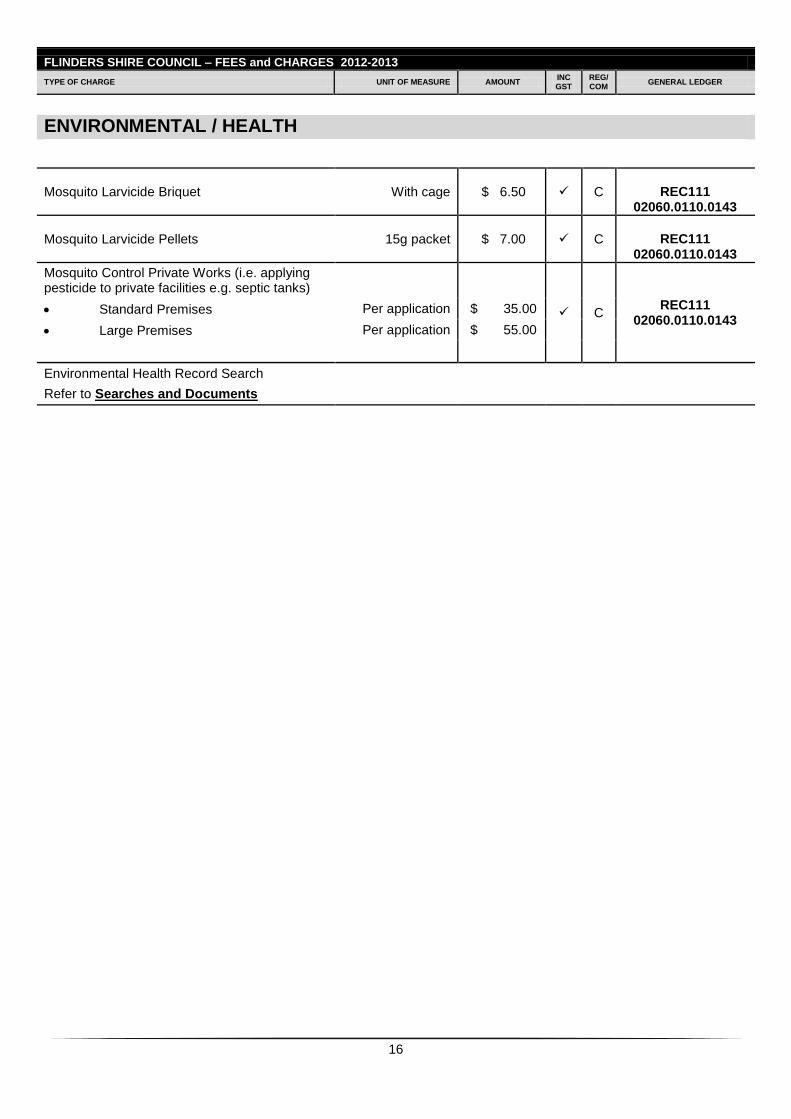
16
FLINDERS SHIRE COUNCIL – FEES and CHARGES 2012-2013
TYPE OF CHARGE UNIT OF MEASURE AMOUNT INC GST
REG/ COM
GENERAL LEDGER
ENVIRONMENTAL / HEALTH
Mosquito Larvicide Briquet With cage $ 6.50 C
REC111 02060.0110.0143
Mosquito Larvicide Pellets 15g packet $ 7.00 C
REC111 02060.0110.0143
Mosquito Control Private Works (i.e. applying pesticide to private facilities e.g. septic tanks)
C REC111
02060.0110.0143 Standard Premises Per application $ 35.00
Large Premises Per application $ 55.00
Environmental Health Record Search
Refer to Searches and Documents
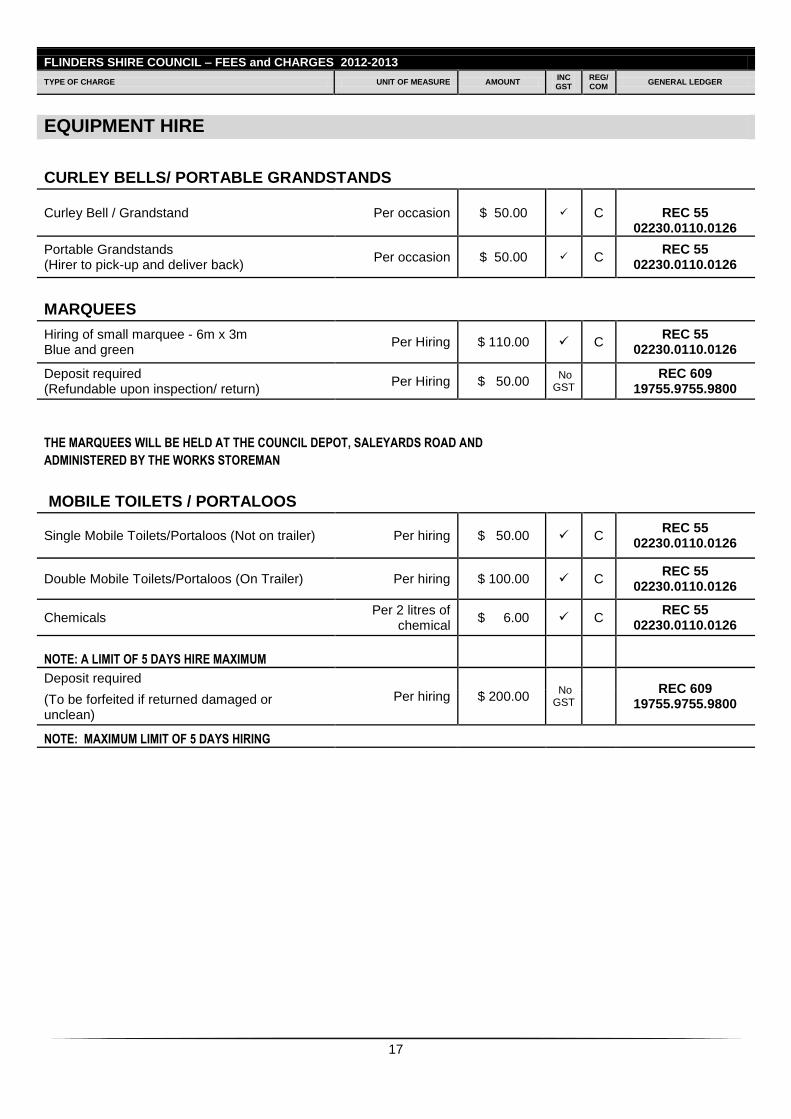
17
FLINDERS SHIRE COUNCIL – FEES and CHARGES 2012-2013
TYPE OF CHARGE UNIT OF MEASURE AMOUNT INC GST
REG/ COM
GENERAL LEDGER
EQUIPMENT HIRE
CURLEY BELLS/ PORTABLE GRANDSTANDS
Curley Bell / Grandstand Per occasion $ 50.00 C
REC 55 02230.0110.0126
Portable Grandstands (Hirer to pick-up and deliver back)
Per occasion $ 50.00 C REC 55
02230.0110.0126
MARQUEES
Hiring of small marquee - 6m x 3m Blue and green
Per Hiring $ 110.00 C REC 55
02230.0110.0126
Deposit required (Refundable upon inspection/ return)
Per Hiring $ 50.00 No GST
REC 609
19755.9755.9800
THE MARQUEES WILL BE HELD AT THE COUNCIL DEPOT, SALEYARDS ROAD AND ADMINISTERED BY THE WORKS STOREMAN
MOBILE TOILETS / PORTALOOS
Single Mobile Toilets/Portaloos (Not on trailer) Per hiring $ 50.00 C REC 55
02230.0110.0126
Double Mobile Toilets/Portaloos (On Trailer) Per hiring $ 100.00 C REC 55
02230.0110.0126
Chemicals Per 2 litres of
chemical $ 6.00 C
REC 55 02230.0110.0126
NOTE: A LIMIT OF 5 DAYS HIRE MAXIMUM
Deposit required
Per hiring $ 200.00 No GST
REC 609
19755.9755.9800 (To be forfeited if returned damaged or unclean)
NOTE: MAXIMUM LIMIT OF 5 DAYS HIRING
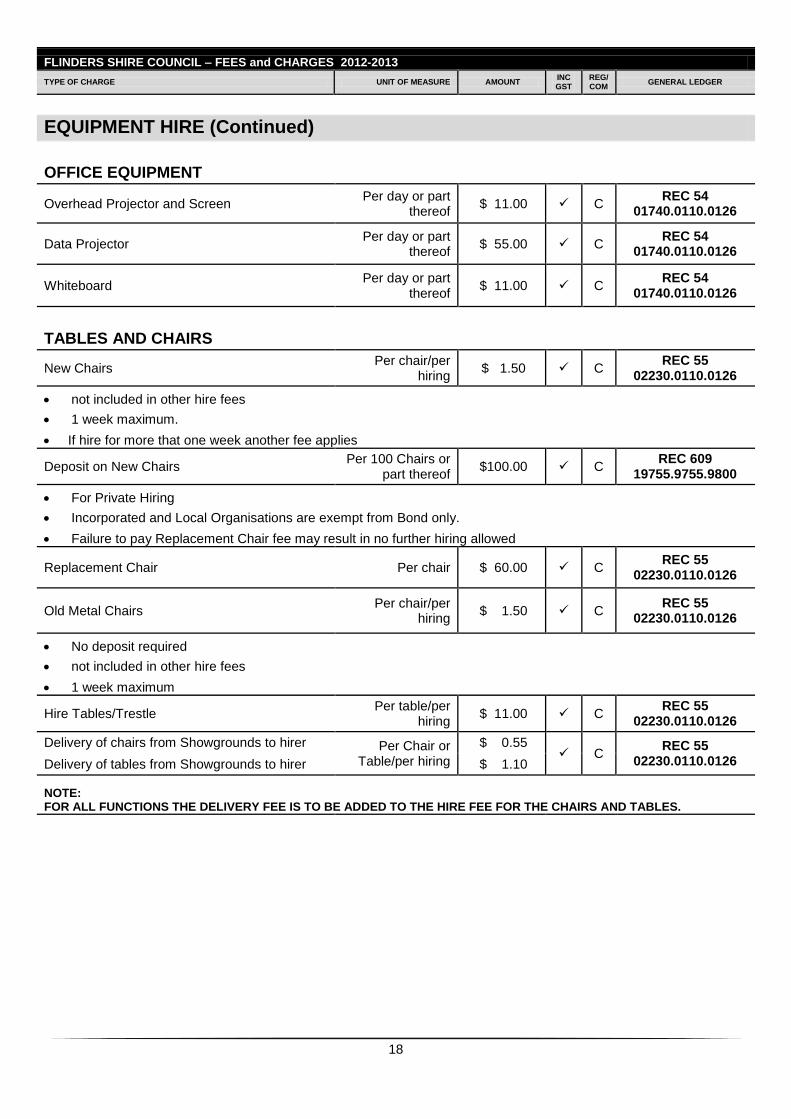
18
FLINDERS SHIRE COUNCIL – FEES and CHARGES 2012-2013
TYPE OF CHARGE UNIT OF MEASURE AMOUNT INC GST
REG/ COM
GENERAL LEDGER
EQUIPMENT HIRE (Continued)
OFFICE EQUIPMENT
Overhead Projector and Screen Per day or part
thereof $ 11.00 C
REC 54 01740.0110.0126
Data Projector Per day or part
thereof $ 55.00 C
REC 54 01740.0110.0126
Whiteboard Per day or part
thereof $ 11.00 C
REC 54 01740.0110.0126
TABLES AND CHAIRS
New Chairs Per chair/per
hiring $ 1.50 C
REC 55 02230.0110.0126
not included in other hire fees
1 week maximum.
If hire for more that one week another fee applies
Deposit on New Chairs Per 100 Chairs or
part thereof $100.00 C
REC 609 19755.9755.9800
For Private Hiring
Incorporated and Local Organisations are exempt from Bond only.
Failure to pay Replacement Chair fee may result in no further hiring allowed
Replacement Chair Per chair $ 60.00 C REC 55
02230.0110.0126
Old Metal Chairs Per chair/per
hiring $ 1.50 C
REC 55 02230.0110.0126
No deposit required
not included in other hire fees
1 week maximum
Hire Tables/Trestle Per table/per
hiring $ 11.00 C
REC 55 02230.0110.0126
Delivery of chairs from Showgrounds to hirer Per Chair or Table/per hiring
$ 0.55 C
REC 55 02230.0110.0126 Delivery of tables from Showgrounds to hirer $ 1.10
NOTE: FOR ALL FUNCTIONS THE DELIVERY FEE IS TO BE ADDED TO THE HIRE FEE FOR THE CHAIRS AND TABLES.
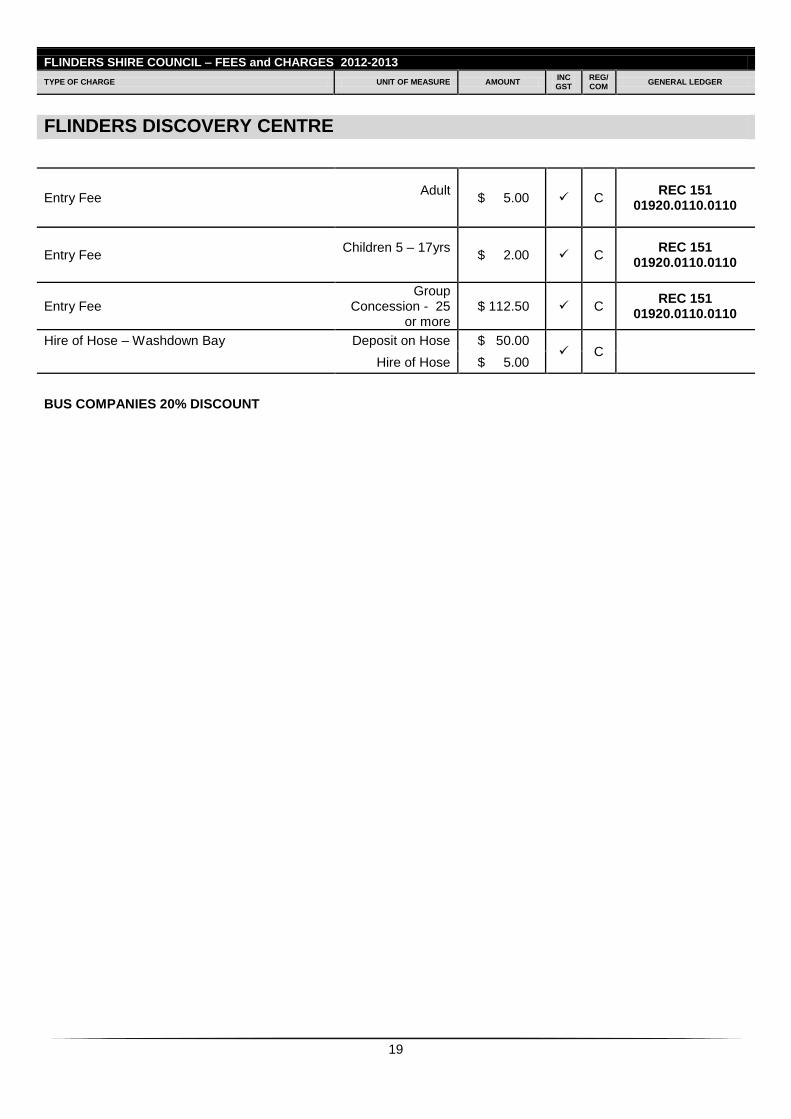
19
FLINDERS SHIRE COUNCIL – FEES and CHARGES 2012-2013
TYPE OF CHARGE UNIT OF MEASURE AMOUNT INC GST
REG/ COM
GENERAL LEDGER
FLINDERS DISCOVERY CENTRE
Entry Fee Adult
$ 5.00 C
REC 151 01920.0110.0110
Entry Fee Children 5 – 17yrs
$ 2.00 C
REC 151 01920.0110.0110
Entry Fee Group
Concession - 25 or more
$ 112.50 C REC 151
01920.0110.0110
Hire of Hose – Washdown Bay Deposit on Hose $ 50.00 C
Hire of Hose $ 5.00
BUS COMPANIES 20% DISCOUNT
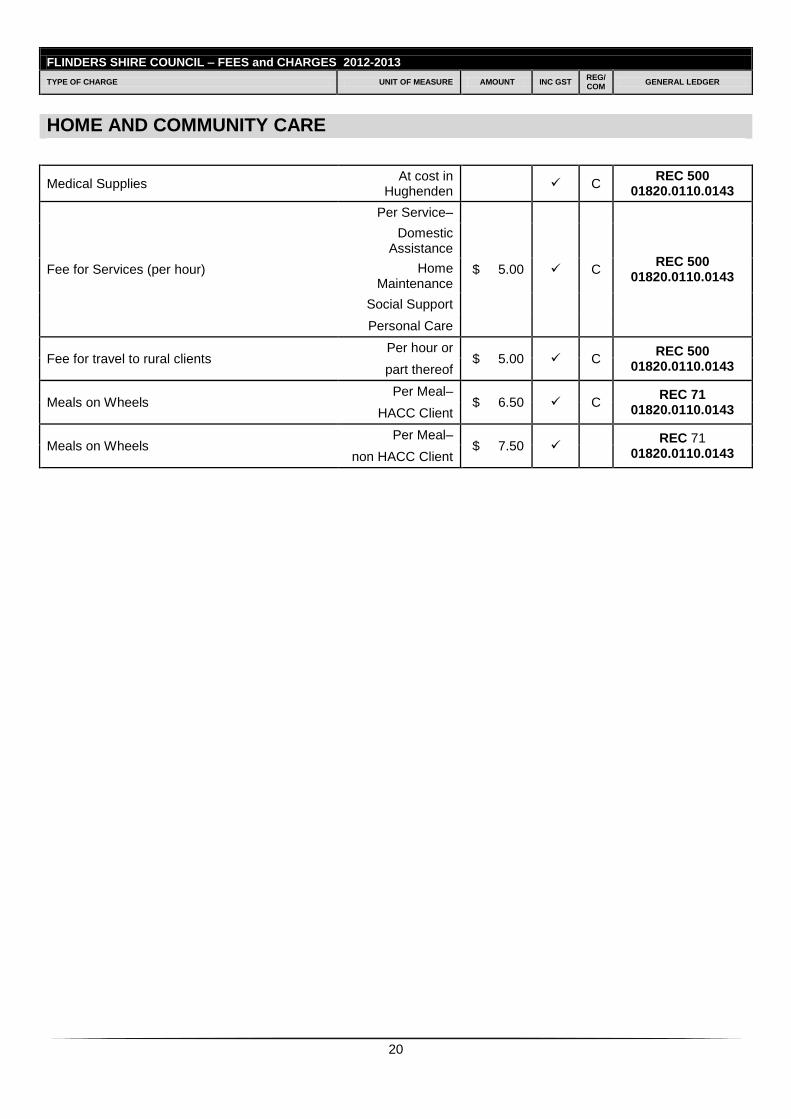
20
FLINDERS SHIRE COUNCIL – FEES and CHARGES 2012-2013
TYPE OF CHARGE UNIT OF MEASURE AMOUNT INC GST REG/ COM
GENERAL LEDGER
HOME AND COMMUNITY CARE
Medical Supplies At cost in
Hughenden C
REC 500 01820.0110.0143
Fee for Services (per hour)
Per Service–
$ 5.00 C REC 500
01820.0110.0143
Domestic Assistance
Home Maintenance
Social Support
Personal Care
Fee for travel to rural clients Per hour or
$ 5.00 C REC 500
01820.0110.0143 part thereof
Meals on Wheels Per Meal–
$ 6.50 C REC 71
01820.0110.0143 HACC Client
Meals on Wheels Per Meal–
$ 7.50 REC 71
01820.0110.0143 non HACC Client
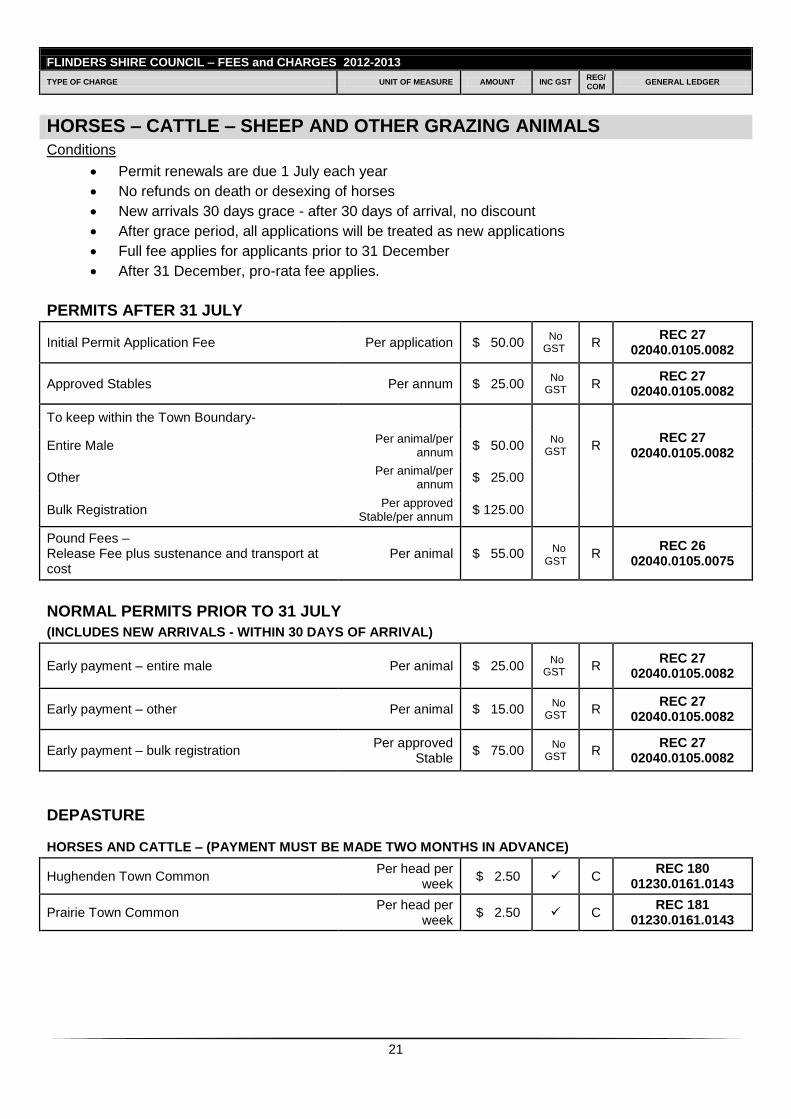
21
FLINDERS SHIRE COUNCIL – FEES and CHARGES 2012-2013
TYPE OF CHARGE UNIT OF MEASURE AMOUNT INC GST REG/ COM
GENERAL LEDGER
HORSES – CATTLE – SHEEP AND OTHER GRAZING ANIMALS
Conditions
Permit renewals are due 1 July each year
No refunds on death or desexing of horses
New arrivals 30 days grace - after 30 days of arrival, no discount
After grace period, all applications will be treated as new applications
Full fee applies for applicants prior to 31 December
After 31 December, pro-rata fee applies.
PERMITS AFTER 31 JULY
Initial Permit Application Fee Per application $ 50.00 No
GST R
REC 27 02040.0105.0082
Approved Stables Per annum $ 25.00 No GST R
REC 27 02040.0105.0082
To keep within the Town Boundary-
Entire Male Per animal/per
annum $ 50.00
No GST R
REC 27 02040.0105.0082
Other Per animal/per
annum $ 25.00
Bulk Registration Per approved
Stable/per annum $ 125.00
Pound Fees – Release Fee plus sustenance and transport at cost
Per animal $ 55.00 No
GST R
REC 26 02040.0105.0075
NORMAL PERMITS PRIOR TO 31 JULY
(INCLUDES NEW ARRIVALS - WITHIN 30 DAYS OF ARRIVAL)
Early payment – entire male Per animal $ 25.00 No
GST R
REC 27 02040.0105.0082
Early payment – other Per animal $ 15.00 No GST
R REC 27
02040.0105.0082
Early payment – bulk registration Per approved
Stable $ 75.00
No GST
R REC 27
02040.0105.0082
DEPASTURE
HORSES AND CATTLE – (PAYMENT MUST BE MADE TWO MONTHS IN ADVANCE)
Hughenden Town Common Per head per
week $ 2.50 C
REC 180 01230.0161.0143
Prairie Town Common Per head per
week $ 2.50 C
REC 181 01230.0161.0143
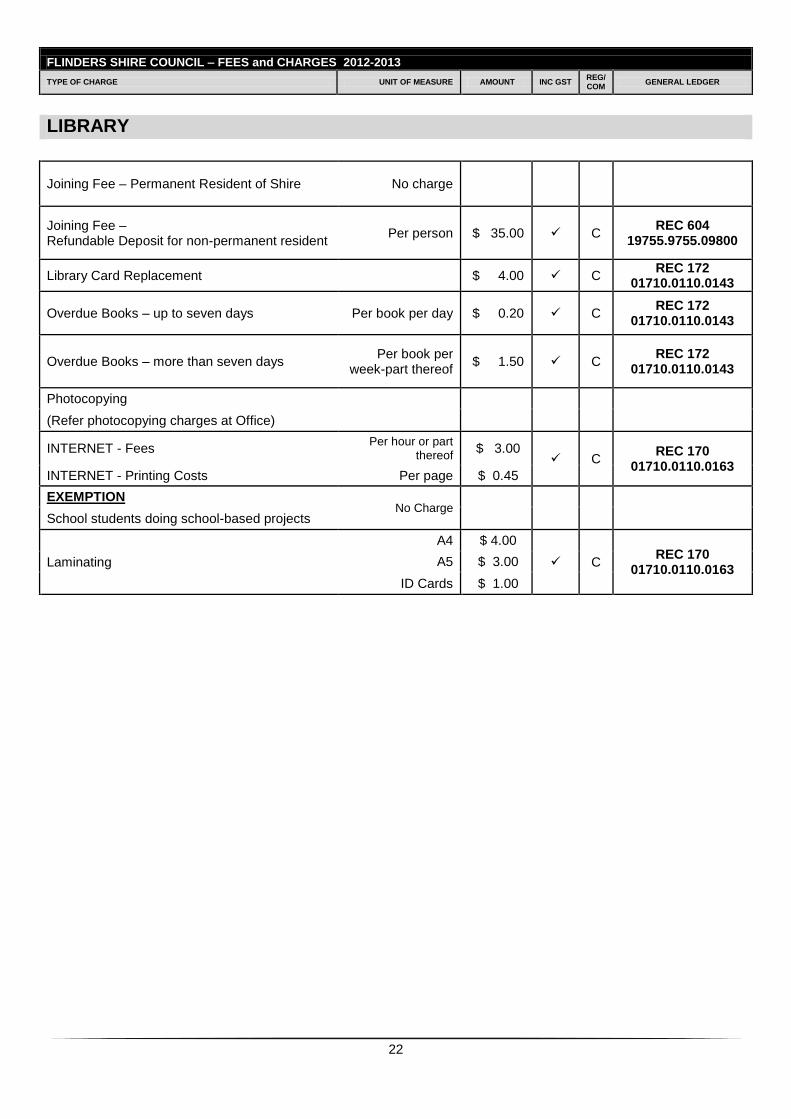
22
FLINDERS SHIRE COUNCIL – FEES and CHARGES 2012-2013
TYPE OF CHARGE UNIT OF MEASURE AMOUNT INC GST REG/ COM
GENERAL LEDGER
LIBRARY
Joining Fee – Permanent Resident of Shire No charge
Joining Fee – Refundable Deposit for non-permanent resident
Per person $ 35.00 C REC 604
19755.9755.09800
Library Card Replacement $ 4.00 C REC 172
01710.0110.0143
Overdue Books – up to seven days Per book per day $ 0.20 C REC 172
01710.0110.0143
Overdue Books – more than seven days Per book per
week-part thereof $ 1.50 C
REC 172 01710.0110.0143
Photocopying
(Refer photocopying charges at Office)
INTERNET - Fees Per hour or part
thereof $ 3.00
C REC 170
01710.0110.0163 INTERNET - Printing Costs Per page $ 0.45
EXEMPTION No Charge
School students doing school-based projects
Laminating
A4 $ 4.00
C REC 170
01710.0110.0163 A5 $ 3.00
ID Cards $ 1.00
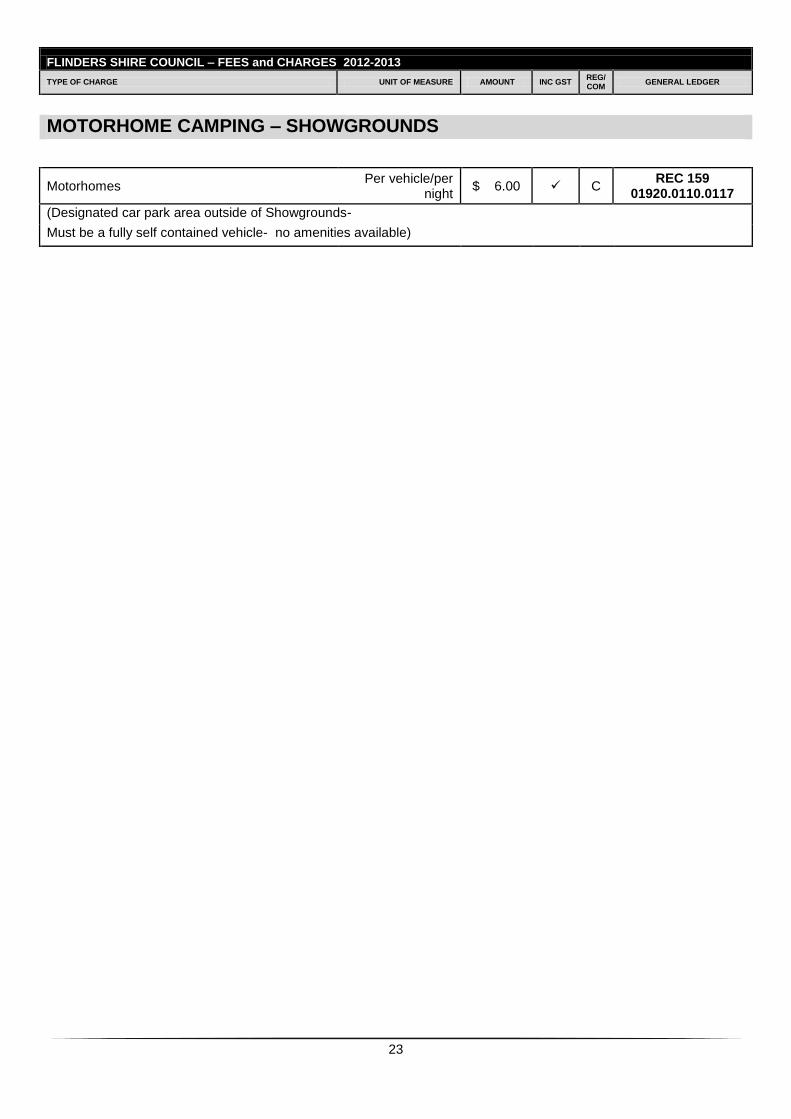
23
FLINDERS SHIRE COUNCIL – FEES and CHARGES 2012-2013
TYPE OF CHARGE UNIT OF MEASURE AMOUNT INC GST REG/ COM
GENERAL LEDGER
MOTORHOME CAMPING – SHOWGROUNDS
Motorhomes Per vehicle/per
night $ 6.00 C
REC 159 01920.0110.0117
(Designated car park area outside of Showgrounds-
Must be a fully self contained vehicle- no amenities available)
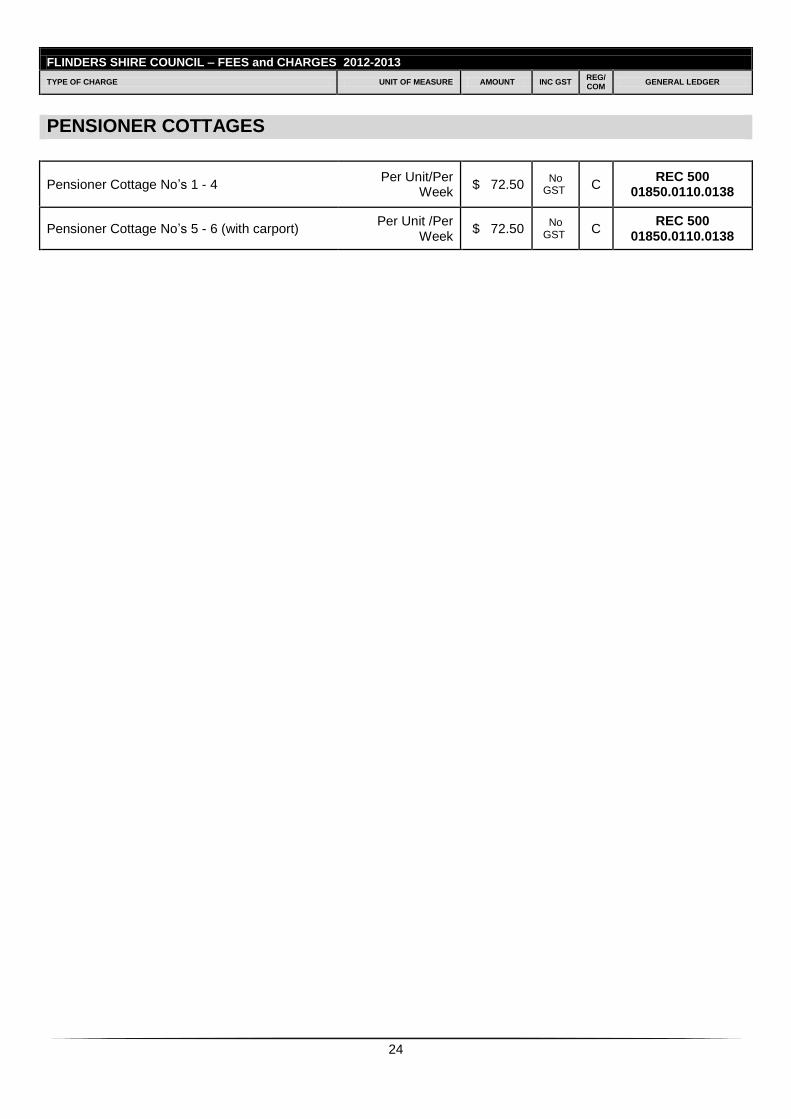
24
FLINDERS SHIRE COUNCIL – FEES and CHARGES 2012-2013
TYPE OF CHARGE UNIT OF MEASURE AMOUNT INC GST REG/ COM
GENERAL LEDGER
PENSIONER COTTAGES
Pensioner Cottage No’s 1 - 4 Per Unit/Per
Week $ 72.50
No GST C
REC 500 01850.0110.0138
Pensioner Cottage No’s 5 - 6 (with carport) Per Unit /Per
Week $ 72.50
No GST
C REC 500
01850.0110.0138
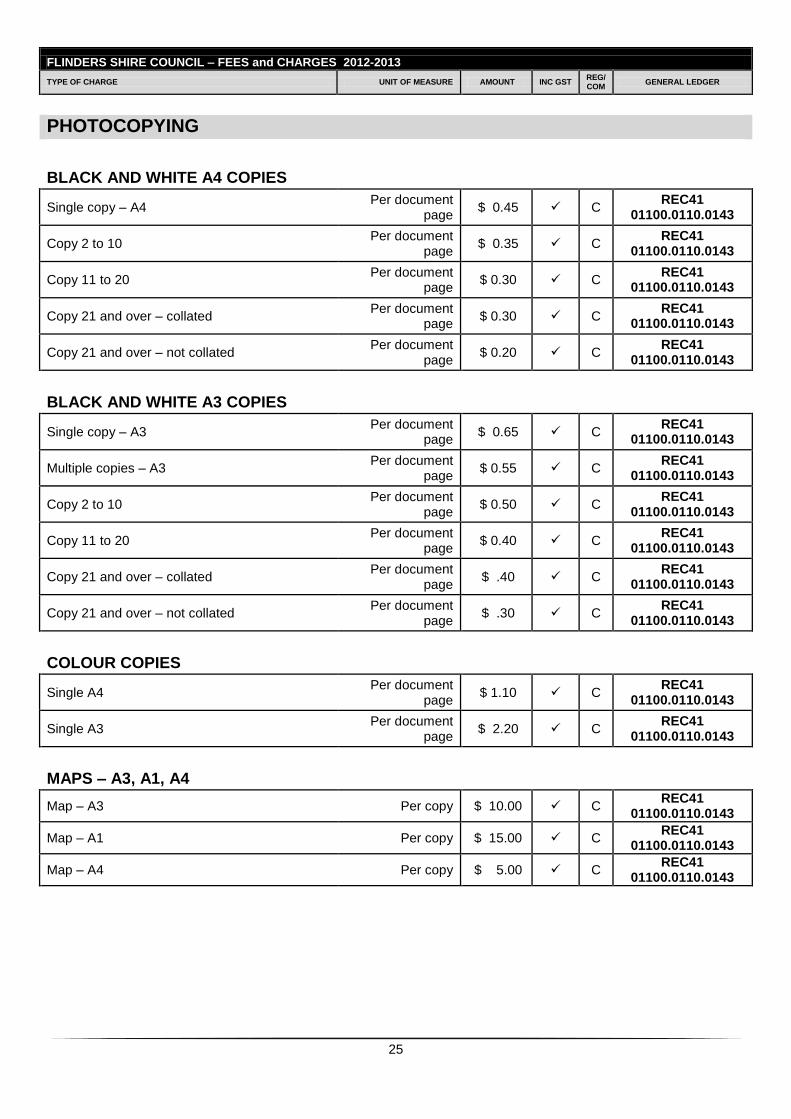
25
FLINDERS SHIRE COUNCIL – FEES and CHARGES 2012-2013
TYPE OF CHARGE UNIT OF MEASURE AMOUNT INC GST REG/ COM
GENERAL LEDGER
PHOTOCOPYING
BLACK AND WHITE A4 COPIES
Single copy – A4 Per document
page $ 0.45 C
REC41 01100.0110.0143
Copy 2 to 10 Per document
page $ 0.35 C
REC41 01100.0110.0143
Copy 11 to 20 Per document
page $ 0.30 C
REC41 01100.0110.0143
Copy 21 and over – collated Per document
page $ 0.30 C
REC41 01100.0110.0143
Copy 21 and over – not collated Per document
page $ 0.20 C
REC41 01100.0110.0143
BLACK AND WHITE A3 COPIES
Single copy – A3 Per document
page $ 0.65 C
REC41 01100.0110.0143
Multiple copies – A3 Per document
page $ 0.55 C
REC41 01100.0110.0143
Copy 2 to 10 Per document
page $ 0.50 C
REC41 01100.0110.0143
Copy 11 to 20 Per document
page $ 0.40 C
REC41 01100.0110.0143
Copy 21 and over – collated Per document
page $ .40 C
REC41 01100.0110.0143
Copy 21 and over – not collated Per document
page $ .30 C
REC41 01100.0110.0143
COLOUR COPIES
Single A4 Per document
page $ 1.10 C
REC41 01100.0110.0143
Single A3 Per document
page $ 2.20 C
REC41 01100.0110.0143
MAPS – A3, A1, A4
Map – A3 Per copy $ 10.00 C REC41
01100.0110.0143
Map – A1 Per copy $ 15.00 C REC41
01100.0110.0143
Map – A4 Per copy $ 5.00 C REC41
01100.0110.0143
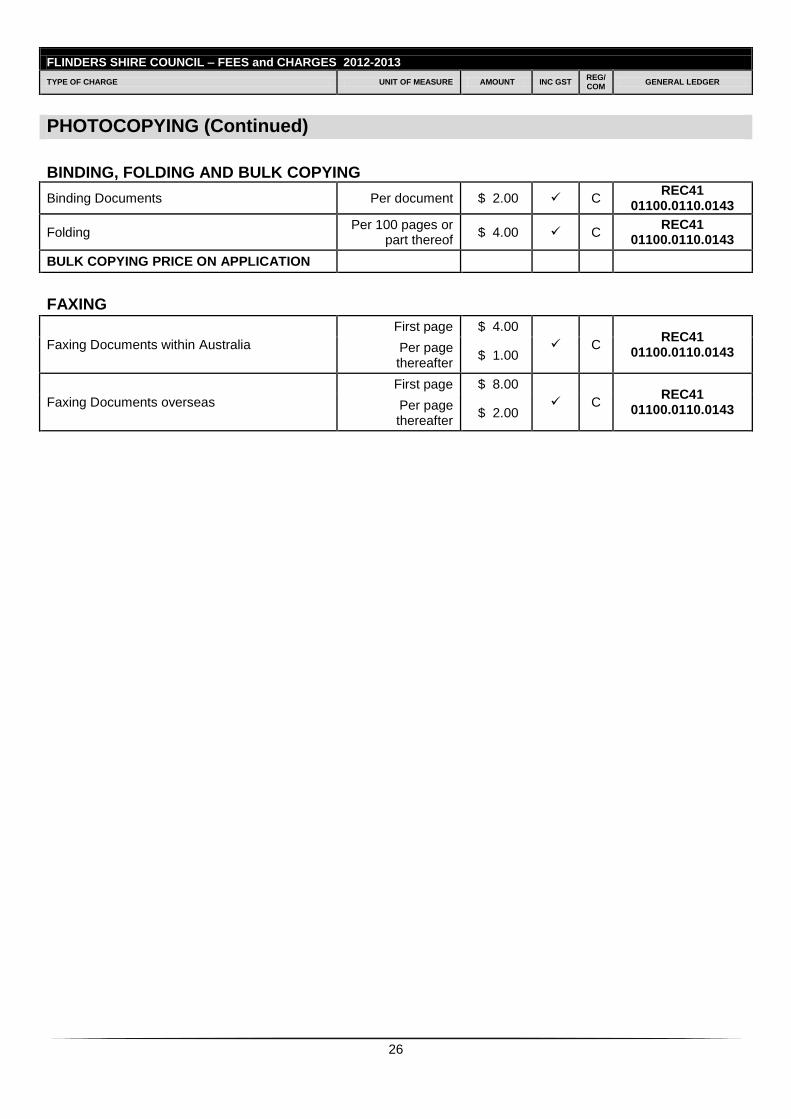
26
FLINDERS SHIRE COUNCIL – FEES and CHARGES 2012-2013
TYPE OF CHARGE UNIT OF MEASURE AMOUNT INC GST REG/ COM
GENERAL LEDGER
PHOTOCOPYING (Continued)
BINDING, FOLDING AND BULK COPYING
Binding Documents Per document $ 2.00 C REC41
01100.0110.0143
Folding Per 100 pages or
part thereof $ 4.00 C
REC41 01100.0110.0143
BULK COPYING PRICE ON APPLICATION
FAXING
Faxing Documents within Australia
First page $ 4.00
C REC41
01100.0110.0143 Per page thereafter
$ 1.00
Faxing Documents overseas
First page $ 8.00
C REC41
01100.0110.0143 Per page thereafter
$ 2.00
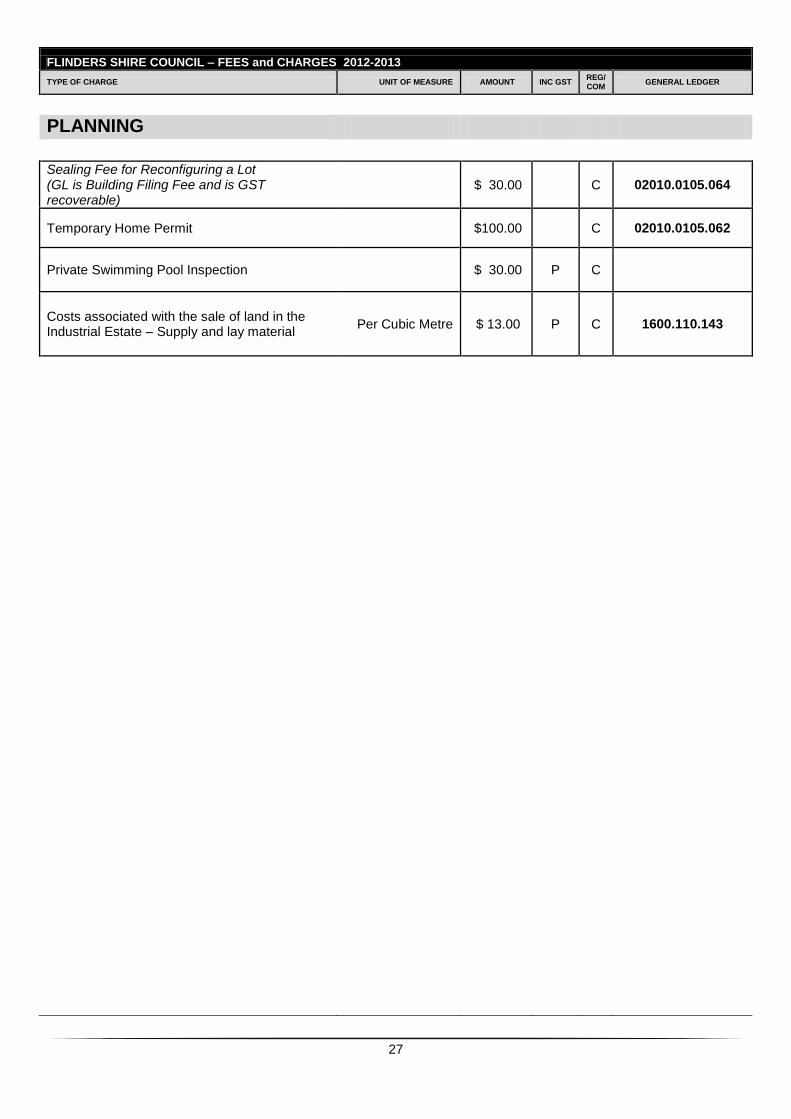
27
FLINDERS SHIRE COUNCIL – FEES and CHARGES 2012-2013
TYPE OF CHARGE UNIT OF MEASURE AMOUNT INC GST REG/ COM
GENERAL LEDGER
PLANNING
Sealing Fee for Reconfiguring a Lot (GL is Building Filing Fee and is GST recoverable)
$ 30.00 C 02010.0105.064
Temporary Home Permit $100.00 C 02010.0105.062
Private Swimming Pool Inspection $ 30.00 P C
Costs associated with the sale of land in the Industrial Estate – Supply and lay material
Per Cubic Metre $ 13.00 P C 1600.110.143
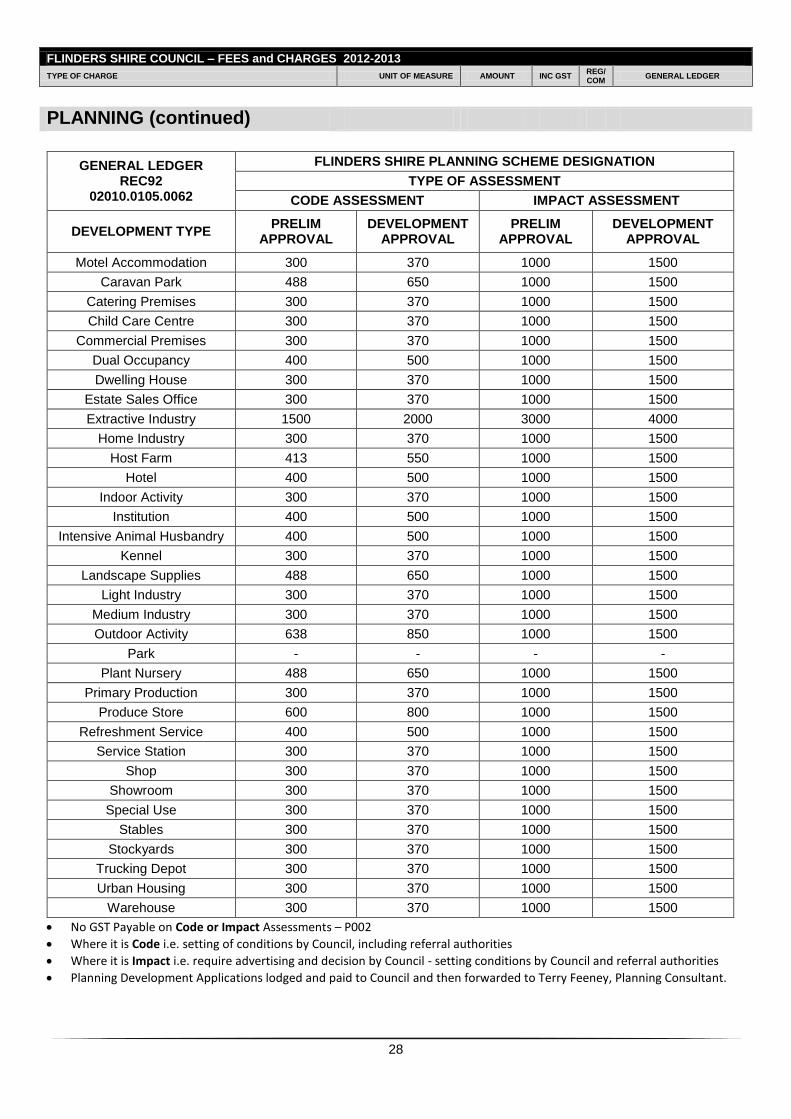
28
FLINDERS SHIRE COUNCIL – FEES and CHARGES 2012-2013 TYPE OF CHARGE UNIT OF MEASURE AMOUNT INC GST
REG/ COM
GENERAL LEDGER
PLANNING (continued)
GENERAL LEDGER
REC92 02010.0105.0062
FLINDERS SHIRE PLANNING SCHEME DESIGNATION
TYPE OF ASSESSMENT
CODE ASSESSMENT IMPACT ASSESSMENT
DEVELOPMENT TYPE PRELIM
APPROVAL DEVELOPMENT
APPROVAL PRELIM
APPROVAL DEVELOPMENT
APPROVAL
Motel Accommodation 300 370 1000 1500
Caravan Park 488 650 1000 1500
Catering Premises 300 370 1000 1500
Child Care Centre 300 370 1000 1500
Commercial Premises 300 370 1000 1500
Dual Occupancy 400 500 1000 1500
Dwelling House 300 370 1000 1500
Estate Sales Office 300 370 1000 1500
Extractive Industry 1500 2000 3000 4000
Home Industry 300 370 1000 1500
Host Farm 413 550 1000 1500
Hotel 400 500 1000 1500
Indoor Activity 300 370 1000 1500
Institution 400 500 1000 1500
Intensive Animal Husbandry 400 500 1000 1500
Kennel 300 370 1000 1500
Landscape Supplies 488 650 1000 1500
Light Industry 300 370 1000 1500
Medium Industry 300 370 1000 1500
Outdoor Activity 638 850 1000 1500
Park - - - -
Plant Nursery 488 650 1000 1500
Primary Production 300 370 1000 1500
Produce Store 600 800 1000 1500
Refreshment Service 400 500 1000 1500
Service Station 300 370 1000 1500
Shop 300 370 1000 1500
Showroom 300 370 1000 1500
Special Use 300 370 1000 1500
Stables 300 370 1000 1500
Stockyards 300 370 1000 1500
Trucking Depot 300 370 1000 1500
Urban Housing 300 370 1000 1500
Warehouse 300 370 1000 1500
No GST Payable on Code or Impact Assessments – P002
Where it is Code i.e. setting of conditions by Council, including referral authorities
Where it is Impact i.e. require advertising and decision by Council - setting conditions by Council and referral authorities
Planning Development Applications lodged and paid to Council and then forwarded to Terry Feeney, Planning Consultant.
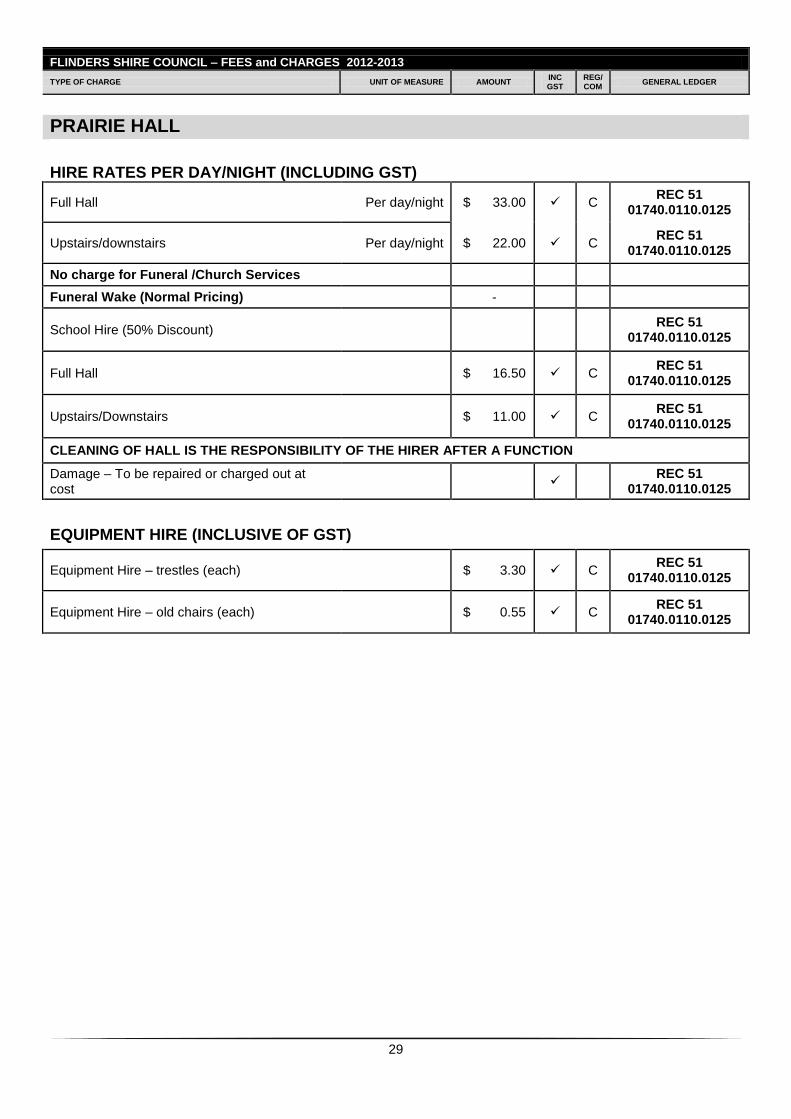
29
FLINDERS SHIRE COUNCIL – FEES and CHARGES 2012-2013
TYPE OF CHARGE UNIT OF MEASURE AMOUNT INC GST
REG/ COM
GENERAL LEDGER
PRAIRIE HALL
HIRE RATES PER DAY/NIGHT (INCLUDING GST)
Full Hall Per day/night $ 33.00 C REC 51
01740.0110.0125
Upstairs/downstairs Per day/night $ 22.00 C REC 51
01740.0110.0125
No charge for Funeral /Church Services
Funeral Wake (Normal Pricing) -
School Hire (50% Discount)
REC 51
01740.0110.0125
Full Hall $ 16.50 C REC 51
01740.0110.0125
Upstairs/Downstairs $ 11.00 C REC 51
01740.0110.0125
CLEANING OF HALL IS THE RESPONSIBILITY OF THE HIRER AFTER A FUNCTION
Damage – To be repaired or charged out at cost
REC 51
01740.0110.0125
EQUIPMENT HIRE (INCLUSIVE OF GST)
Equipment Hire – trestles (each) $ 3.30 C REC 51
01740.0110.0125
Equipment Hire – old chairs (each) $ 0.55 C REC 51
01740.0110.0125
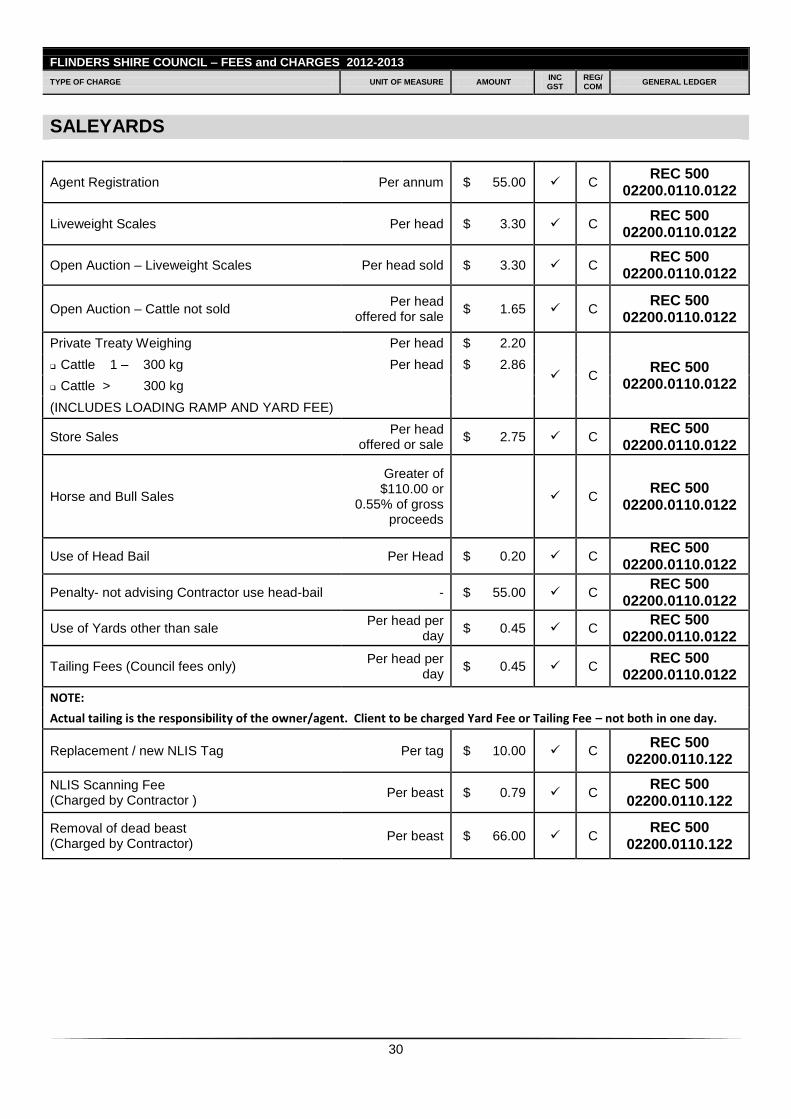
30
FLINDERS SHIRE COUNCIL – FEES and CHARGES 2012-2013
TYPE OF CHARGE UNIT OF MEASURE AMOUNT INC GST
REG/ COM
GENERAL LEDGER
SALEYARDS
Agent Registration Per annum $ 55.00 C REC 500
02200.0110.0122
Liveweight Scales Per head $ 3.30 C REC 500
02200.0110.0122
Open Auction – Liveweight Scales Per head sold $ 3.30 C REC 500
02200.0110.0122
Open Auction – Cattle not sold Per head
offered for sale $ 1.65 C
REC 500 02200.0110.0122
Private Treaty Weighing Per head $ 2.20
C REC 500
02200.0110.0122
Cattle 1 – 300 kg Per head $ 2.86
Cattle > 300 kg
(INCLUDES LOADING RAMP AND YARD FEE)
Store Sales Per head
offered or sale $ 2.75 C
REC 500 02200.0110.0122
Horse and Bull Sales
Greater of $110.00 or
0.55% of gross proceeds
C REC 500
02200.0110.0122
Use of Head Bail Per Head $ 0.20 C REC 500
02200.0110.0122
Penalty- not advising Contractor use head-bail - $ 55.00 C REC 500
02200.0110.0122
Use of Yards other than sale Per head per
day $ 0.45 C
REC 500 02200.0110.0122
Tailing Fees (Council fees only) Per head per
day $ 0.45 C
REC 500 02200.0110.0122
NOTE:
Actual tailing is the responsibility of the owner/agent. Client to be charged Yard Fee or Tailing Fee – not both in one day.
Replacement / new NLIS Tag Per tag $ 10.00 C REC 500
02200.0110.122
NLIS Scanning Fee (Charged by Contractor )
Per beast $ 0.79 C REC 500
02200.0110.122
Removal of dead beast (Charged by Contractor)
Per beast $ 66.00 C REC 500
02200.0110.122
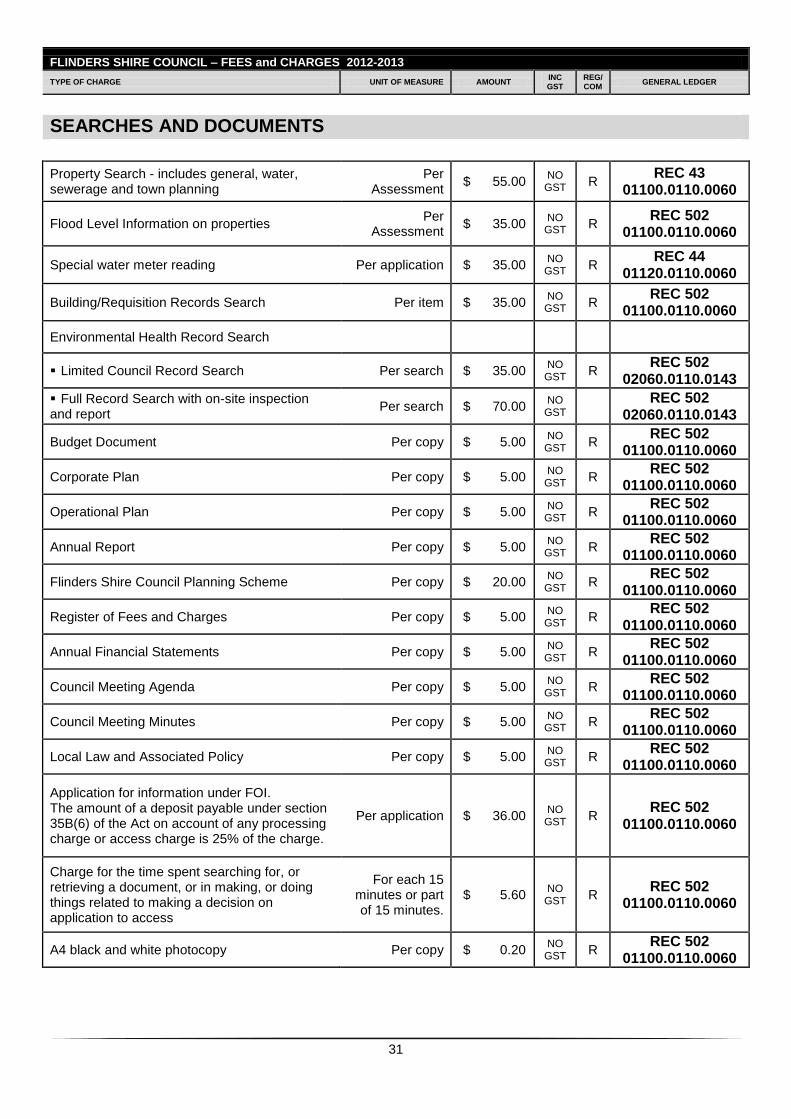
31
FLINDERS SHIRE COUNCIL – FEES and CHARGES 2012-2013
TYPE OF CHARGE UNIT OF MEASURE AMOUNT INC GST
REG/ COM
GENERAL LEDGER
SEARCHES AND DOCUMENTS
Property Search - includes general, water, sewerage and town planning
Per Assessment
$ 55.00 NO
GST R
REC 43 01100.0110.0060
Flood Level Information on properties Per
Assessment $ 35.00
NO GST
R REC 502
01100.0110.0060
Special water meter reading Per application $ 35.00 NO
GST R
REC 44 01120.0110.0060
Building/Requisition Records Search Per item $ 35.00 NO
GST R REC 502
01100.0110.0060
Environmental Health Record Search
Limited Council Record Search Per search $ 35.00 NO
GST R
REC 502 02060.0110.0143
Full Record Search with on-site inspection and report
Per search $ 70.00 NO
GST
REC 502 02060.0110.0143
Budget Document Per copy $ 5.00 NO
GST R
REC 502 01100.0110.0060
Corporate Plan Per copy $ 5.00 NO
GST R
REC 502 01100.0110.0060
Operational Plan Per copy $ 5.00 NO
GST R
REC 502 01100.0110.0060
Annual Report Per copy $ 5.00 NO
GST R REC 502
01100.0110.0060
Flinders Shire Council Planning Scheme Per copy $ 20.00 NO
GST R
REC 502 01100.0110.0060
Register of Fees and Charges Per copy $ 5.00 NO
GST R
REC 502 01100.0110.0060
Annual Financial Statements Per copy $ 5.00 NO
GST R
REC 502 01100.0110.0060
Council Meeting Agenda Per copy $ 5.00 NO
GST R
REC 502 01100.0110.0060
Council Meeting Minutes Per copy $ 5.00 NO
GST R
REC 502 01100.0110.0060
Local Law and Associated Policy Per copy $ 5.00 NO
GST R
REC 502 01100.0110.0060
Application for information under FOI. The amount of a deposit payable under section 35B(6) of the Act on account of any processing charge or access charge is 25% of the charge.
Per application $ 36.00 NO
GST R
REC 502 01100.0110.0060
Charge for the time spent searching for, or retrieving a document, or in making, or doing things related to making a decision on application to access
For each 15 minutes or part of 15 minutes.
$ 5.60 NO
GST R
REC 502 01100.0110.0060
A4 black and white photocopy Per copy $ 0.20 NO
GST R
REC 502 01100.0110.0060
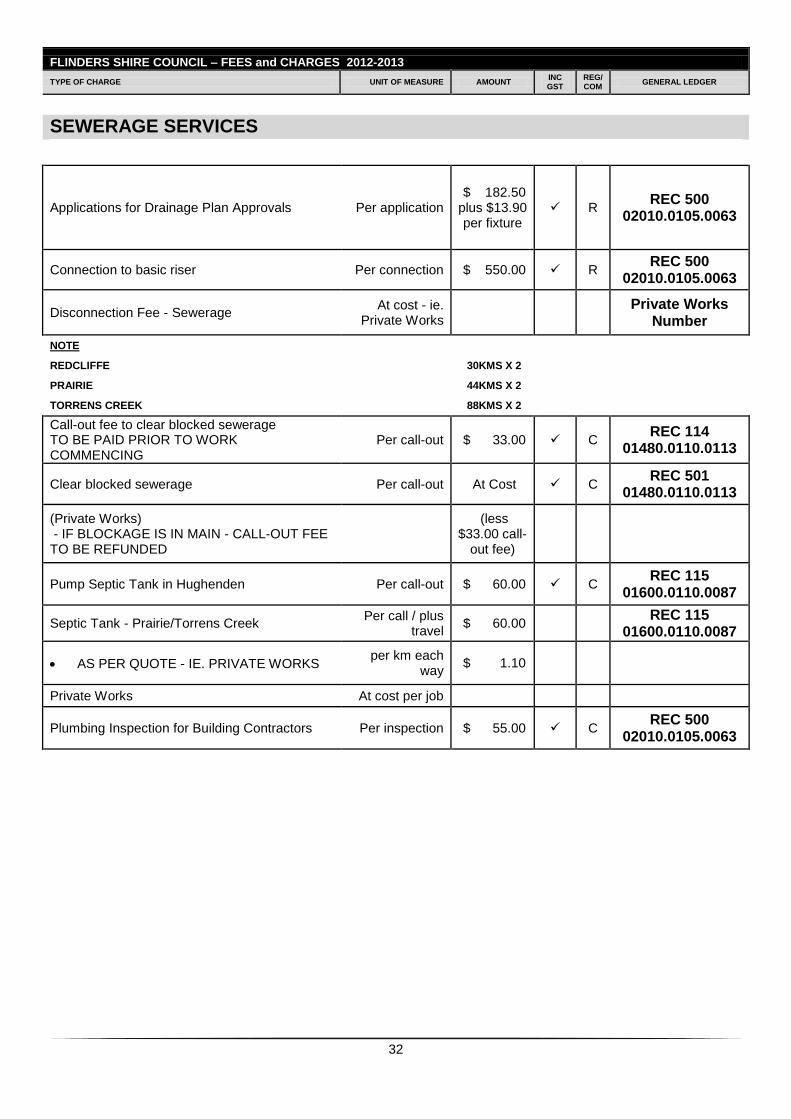
32
FLINDERS SHIRE COUNCIL – FEES and CHARGES 2012-2013
TYPE OF CHARGE UNIT OF MEASURE AMOUNT INC GST
REG/ COM
GENERAL LEDGER
SEWERAGE SERVICES
Applications for Drainage Plan Approvals Per application $ 182.50 plus $13.90 per fixture
R REC 500
02010.0105.0063
Connection to basic riser Per connection $ 550.00 R REC 500
02010.0105.0063
Disconnection Fee - Sewerage At cost - ie.
Private Works
Private Works Number
NOTE
REDCLIFFE
30KMS X 2
PRAIRIE
44KMS X 2
TORRENS CREEK
88KMS X 2
Call-out fee to clear blocked sewerage TO BE PAID PRIOR TO WORK COMMENCING
Per call-out $ 33.00 C REC 114
01480.0110.0113
Clear blocked sewerage Per call-out At Cost C REC 501
01480.0110.0113
(Private Works) - IF BLOCKAGE IS IN MAIN - CALL-OUT FEE TO BE REFUNDED
(less
$33.00 call-out fee)
Pump Septic Tank in Hughenden Per call-out $ 60.00 C REC 115
01600.0110.0087
Septic Tank - Prairie/Torrens Creek Per call / plus
travel $ 60.00
REC 115 01600.0110.0087
AS PER QUOTE - IE. PRIVATE WORKSper km each
way $ 1.10
Private Works At cost per job
Plumbing Inspection for Building Contractors Per inspection $ 55.00 C REC 500
02010.0105.0063
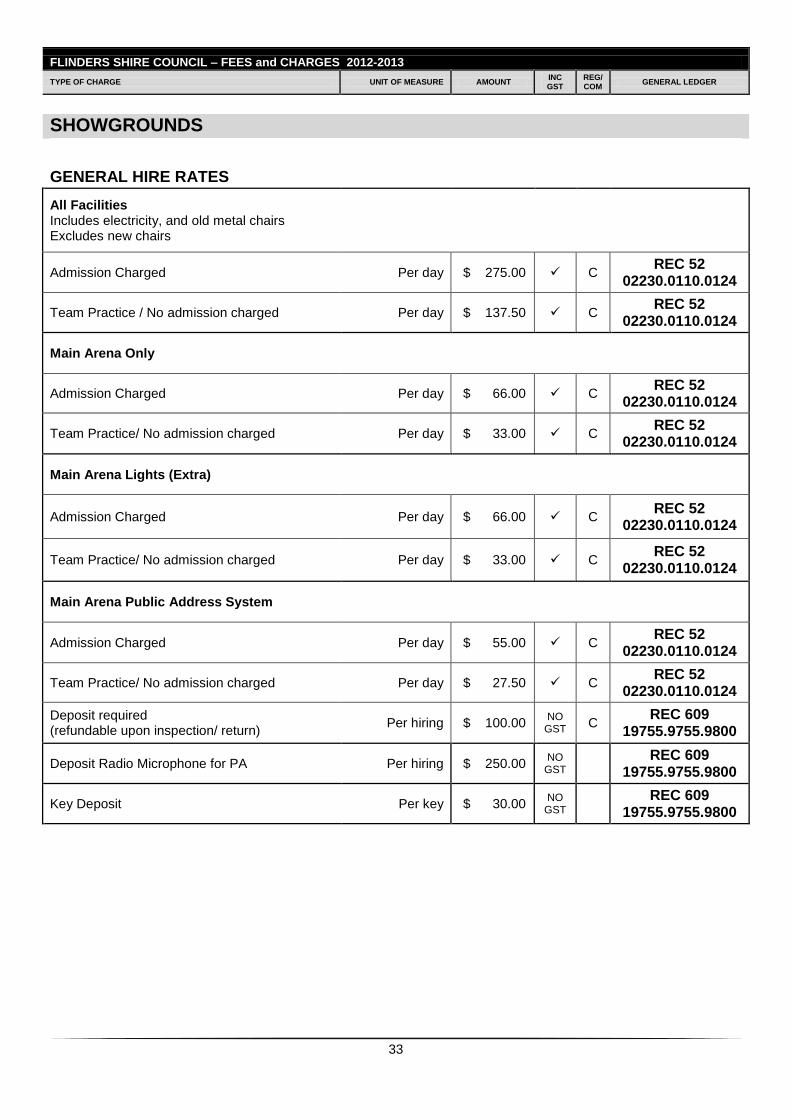
33
FLINDERS SHIRE COUNCIL – FEES and CHARGES 2012-2013
TYPE OF CHARGE UNIT OF MEASURE AMOUNT INC GST
REG/ COM
GENERAL LEDGER
SHOWGROUNDS
GENERAL HIRE RATES
All Facilities Includes electricity, and old metal chairs Excludes new chairs
Admission Charged Per day $ 275.00 C REC 52
02230.0110.0124
Team Practice / No admission charged Per day $ 137.50 C REC 52
02230.0110.0124
Main Arena Only
Admission Charged Per day $ 66.00 C REC 52
02230.0110.0124
Team Practice/ No admission charged Per day $ 33.00 C REC 52
02230.0110.0124
Main Arena Lights (Extra)
Admission Charged Per day $ 66.00 C REC 52
02230.0110.0124
Team Practice/ No admission charged Per day $ 33.00 C REC 52
02230.0110.0124
Main Arena Public Address System
Admission Charged Per day $ 55.00 C REC 52
02230.0110.0124
Team Practice/ No admission charged Per day $ 27.50 C REC 52
02230.0110.0124
Deposit required (refundable upon inspection/ return)
Per hiring $ 100.00 NO
GST C
REC 609 19755.9755.9800
Deposit Radio Microphone for PA Per hiring $ 250.00 NO
GST
REC 609 19755.9755.9800
Key Deposit Per key $ 30.00 NO
GST
REC 609 19755.9755.9800
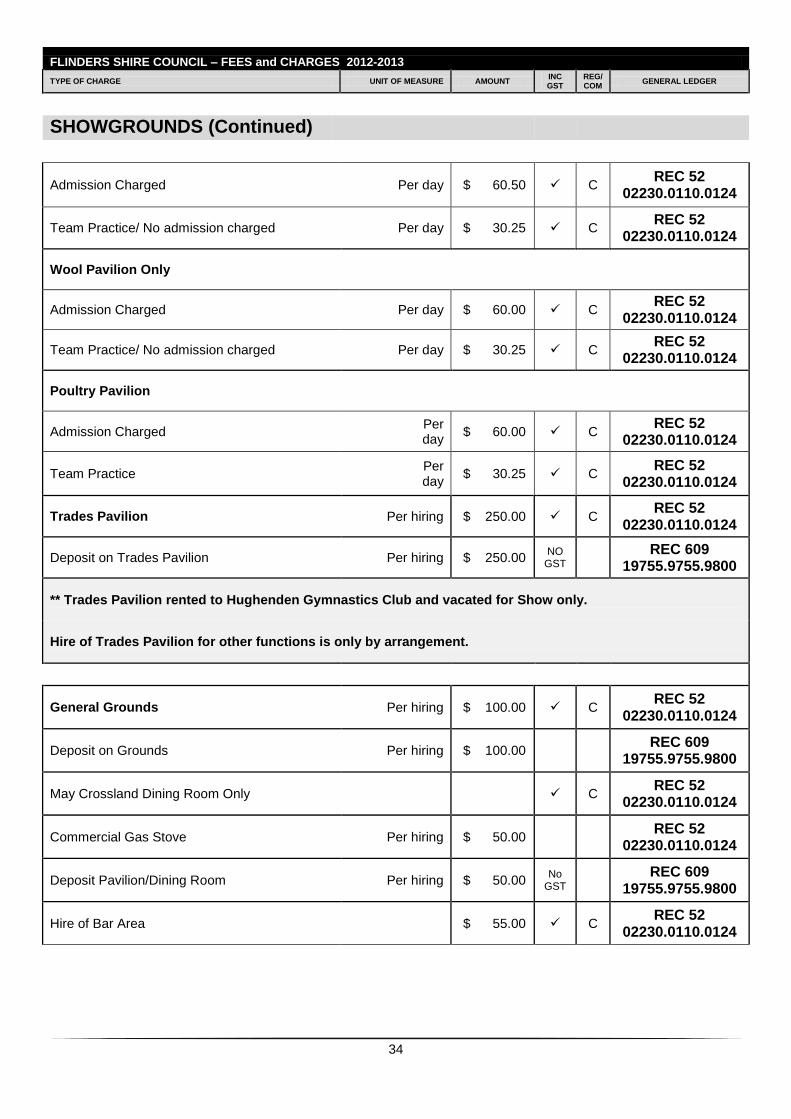
34
FLINDERS SHIRE COUNCIL – FEES and CHARGES 2012-2013 TYPE OF CHARGE UNIT OF MEASURE AMOUNT
INC GST
REG/ COM
GENERAL LEDGER
SHOWGROUNDS (Continued)
Admission Charged Per day $ 60.50 C REC 52
02230.0110.0124
Team Practice/ No admission charged Per day $ 30.25 C REC 52
02230.0110.0124
Wool Pavilion Only
Admission Charged Per day $ 60.00 C REC 52
02230.0110.0124
Team Practice/ No admission charged Per day $ 30.25 C REC 52
02230.0110.0124
Poultry Pavilion
Admission Charged Per
day $ 60.00 C
REC 52 02230.0110.0124
Team Practice Per
day $ 30.25 C
REC 52 02230.0110.0124
Trades Pavilion Per hiring $ 250.00 C REC 52
02230.0110.0124
Deposit on Trades Pavilion Per hiring $ 250.00 NO
GST
REC 609 19755.9755.9800
** Trades Pavilion rented to Hughenden Gymnastics Club and vacated for Show only.
Hire of Trades Pavilion for other functions is only by arrangement.
General Grounds Per hiring $ 100.00 C REC 52
02230.0110.0124
Deposit on Grounds Per hiring $ 100.00 REC 609
19755.9755.9800
May Crossland Dining Room Only C REC 52
02230.0110.0124
Commercial Gas Stove Per hiring $ 50.00 REC 52
02230.0110.0124
Deposit Pavilion/Dining Room Per hiring $ 50.00 No
GST
REC 609 19755.9755.9800
Hire of Bar Area $ 55.00 C REC 52
02230.0110.0124
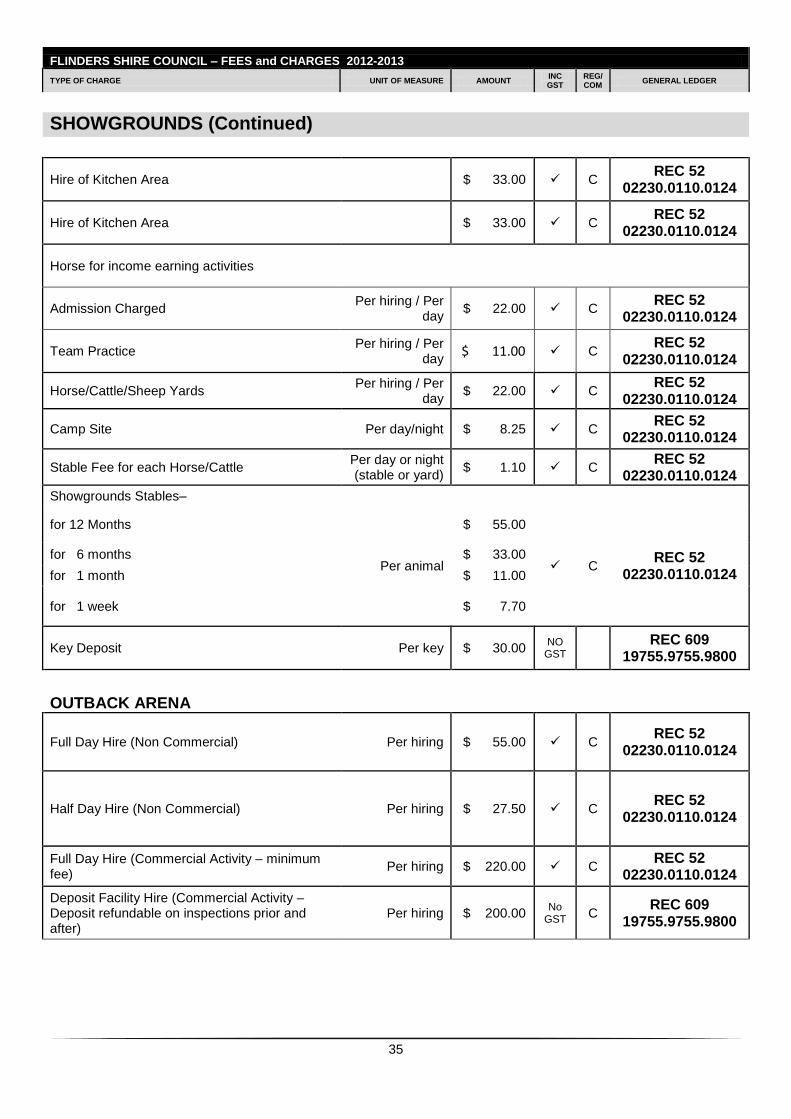
35
FLINDERS SHIRE COUNCIL – FEES and CHARGES 2012-2013
TYPE OF CHARGE UNIT OF MEASURE AMOUNT INC GST
REG/ COM
GENERAL LEDGER
SHOWGROUNDS (Continued)
Hire of Kitchen Area
$ 33.00 C
REC 52 02230.0110.0124
Hire of Kitchen Area
$ 33.00 C REC 52
02230.0110.0124
Horse for income earning activities
Admission Charged Per hiring / Per
day $ 22.00 C
REC 52 02230.0110.0124
Team Practice Per hiring / Per
day $ 11.00 C
REC 52 02230.0110.0124
Horse/Cattle/Sheep Yards Per hiring / Per
day $ 22.00 C
REC 52 02230.0110.0124
Camp Site Per day/night $ 8.25 C REC 52
02230.0110.0124
Stable Fee for each Horse/Cattle Per day or night (stable or yard)
$ 1.10 C REC 52
02230.0110.0124
Showgrounds Stables–
for 12 Months
Per animal
$ 55.00
C REC 52
02230.0110.0124
for 6 months $ 33.00
for 1 month $ 11.00
for 1 week $ 7.70
Key Deposit Per key $ 30.00 NO
GST
REC 609 19755.9755.9800
OUTBACK ARENA
Full Day Hire (Non Commercial) Per hiring $ 55.00 C REC 52
02230.0110.0124
Half Day Hire (Non Commercial) Per hiring $ 27.50 C REC 52
02230.0110.0124
Full Day Hire (Commercial Activity – minimum fee)
Per hiring $ 220.00 C REC 52
02230.0110.0124
Deposit Facility Hire (Commercial Activity – Deposit refundable on inspections prior and after)
Per hiring $ 200.00 No
GST C
REC 609 19755.9755.9800
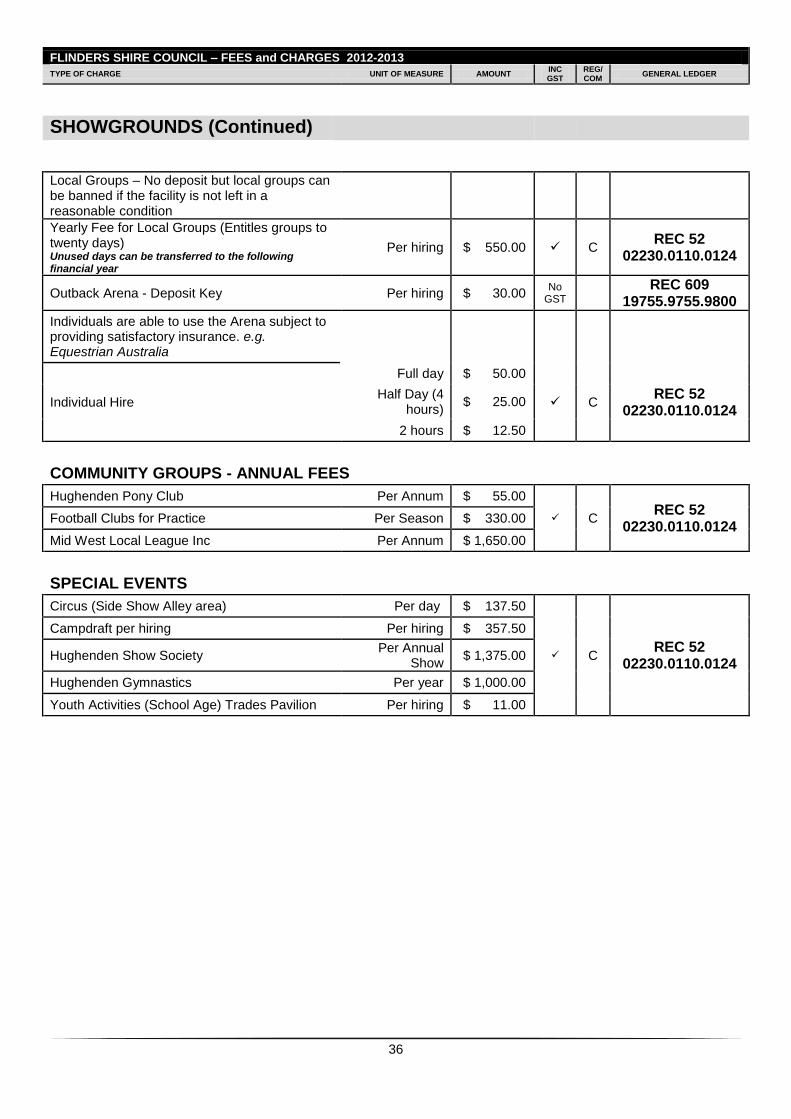
36
FLINDERS SHIRE COUNCIL – FEES and CHARGES 2012-2013 TYPE OF CHARGE UNIT OF MEASURE AMOUNT
INC GST
REG/ COM
GENERAL LEDGER
SHOWGROUNDS (Continued)
Local Groups – No deposit but local groups can be banned if the facility is not left in a reasonable condition
Yearly Fee for Local Groups (Entitles groups to twenty days) Unused days can be transferred to the following financial year
Per hiring $ 550.00 C REC 52
02230.0110.0124
Outback Arena - Deposit Key Per hiring $ 30.00 No
GST REC 609
19755.9755.9800
Individuals are able to use the Arena subject to providing satisfactory insurance. e.g. Equestrian Australia
Individual Hire
Full day $ 50.00
C REC 52
02230.0110.0124 Half Day (4
hours) $ 25.00
2 hours $ 12.50
COMMUNITY GROUPS - ANNUAL FEES
Hughenden Pony Club Per Annum $ 55.00
C REC 52
02230.0110.0124 Football Clubs for Practice Per Season $ 330.00
Mid West Local League Inc Per Annum $ 1,650.00
SPECIAL EVENTS
Circus (Side Show Alley area) Per day $ 137.50
C REC 52
02230.0110.0124
Campdraft per hiring Per hiring $ 357.50
Hughenden Show Society Per Annual
Show $ 1,375.00
Hughenden Gymnastics Per year $ 1,000.00
Youth Activities (School Age) Trades Pavilion Per hiring $ 11.00
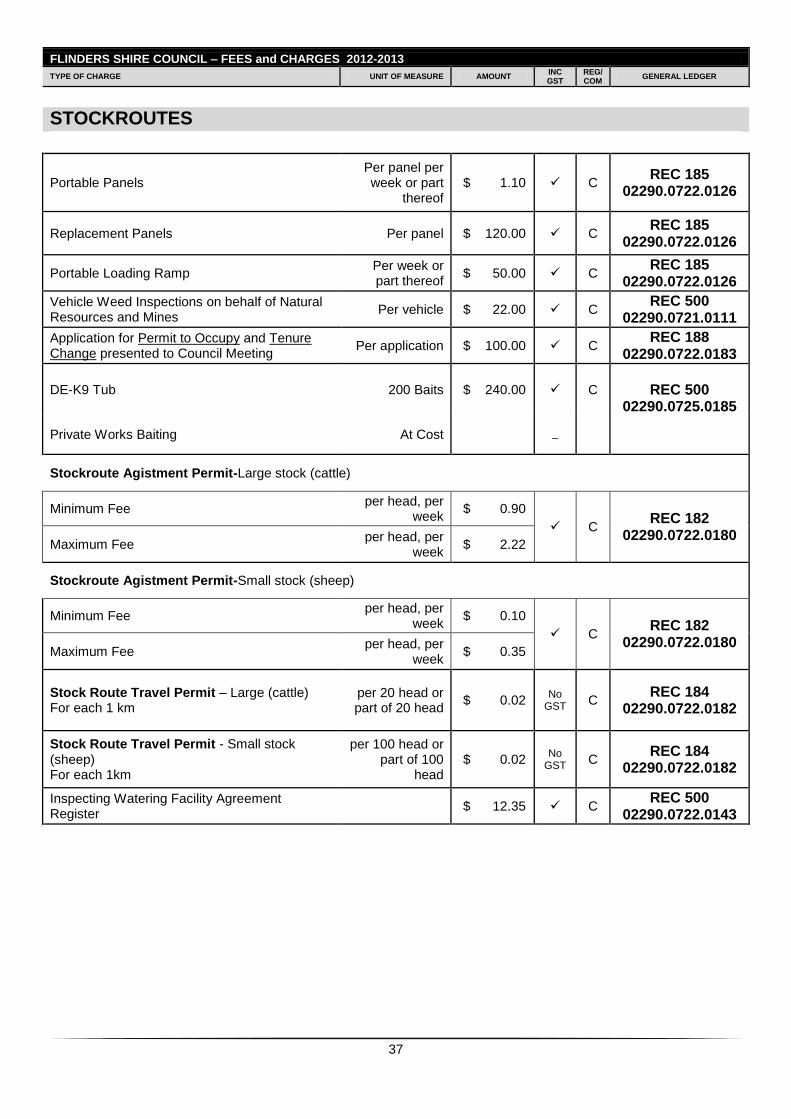
37
FLINDERS SHIRE COUNCIL – FEES and CHARGES 2012-2013
TYPE OF CHARGE UNIT OF MEASURE AMOUNT INC GST
REG/ COM
GENERAL LEDGER
STOCKROUTES
Portable Panels Per panel per week or part
thereof $ 1.10 C
REC 185 02290.0722.0126
Replacement Panels Per panel $ 120.00 C REC 185
02290.0722.0126
Portable Loading Ramp Per week or part thereof
$ 50.00 C REC 185
02290.0722.0126
Vehicle Weed Inspections on behalf of Natural Resources and Mines
Per vehicle $ 22.00 C REC 500
02290.0721.0111
Application for Permit to Occupy and Tenure Change presented to Council Meeting
Per application $ 100.00 C REC 188
02290.0722.0183
DE-K9 Tub 200 Baits $ 240.00 C
REC 500
02290.0725.0185
Private Works Baiting At Cost
Stockroute Agistment Permit-Large stock (cattle)
Minimum Fee per head, per
week $ 0.90
C REC 182
02290.0722.0180 Maximum Fee
per head, per week
$ 2.22
Stockroute Agistment Permit-Small stock (sheep)
Minimum Fee per head, per
week $ 0.10
C REC 182
02290.0722.0180 Maximum Fee
per head, per week
$ 0.35
Stock Route Travel Permit – Large (cattle) For each 1 km
per 20 head or part of 20 head
$ 0.02 No
GST C
REC 184 02290.0722.0182
Stock Route Travel Permit - Small stock (sheep) For each 1km
per 100 head or part of 100
head $ 0.02
No GST
C REC 184
02290.0722.0182
Inspecting Watering Facility Agreement Register
$ 12.35 C REC 500
02290.0722.0143
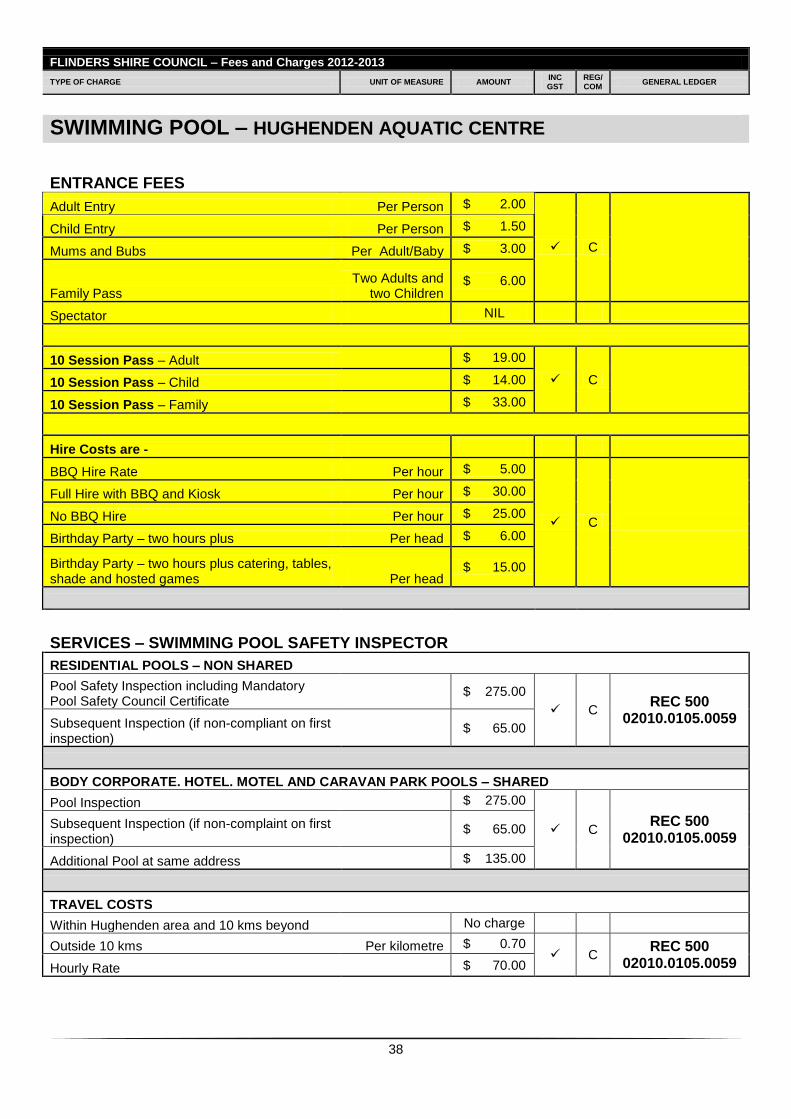
38
FLINDERS SHIRE COUNCIL – Fees and Charges 2012-2013
TYPE OF CHARGE UNIT OF MEASURE AMOUNT INC GST
REG/ COM
GENERAL LEDGER
SWIMMING POOL – HUGHENDEN AQUATIC CENTRE
ENTRANCE FEES
Adult Entry Per Person $ 2.00
C
Child Entry Per Person $ 1.50
Mums and Bubs Per Adult/Baby $ 3.00
Family Pass Two Adults and
two Children $ 6.00
Spectator NIL
10 Session Pass – Adult
$ 19.00
C 10 Session Pass – Child
$ 14.00
10 Session Pass – Family
$ 33.00
Hire Costs are -
BBQ Hire Rate Per hour $ 5.00
C
Full Hire with BBQ and Kiosk Per hour $ 30.00
No BBQ Hire Per hour $ 25.00
Birthday Party – two hours plus Per head $ 6.00
Birthday Party – two hours plus catering, tables, shade and hosted games Per head
$ 15.00
SERVICES – SWIMMING POOL SAFETY INSPECTOR
RESIDENTIAL POOLS – NON SHARED
Pool Safety Inspection including Mandatory Pool Safety Council Certificate
$ 275.00
C REC 500
02010.0105.0059 Subsequent Inspection (if non-compliant on first inspection)
$ 65.00
BODY CORPORATE. HOTEL. MOTEL AND CARAVAN PARK POOLS – SHARED
Pool Inspection $ 275.00
C REC 500
02010.0105.0059 Subsequent Inspection (if non-complaint on first inspection)
$ 65.00
Additional Pool at same address $ 135.00
TRAVEL COSTS
Within Hughenden area and 10 kms beyond No charge
Outside 10 kms Per kilometre $ 0.70 C
REC 500 02010.0105.0059 Hourly Rate $ 70.00
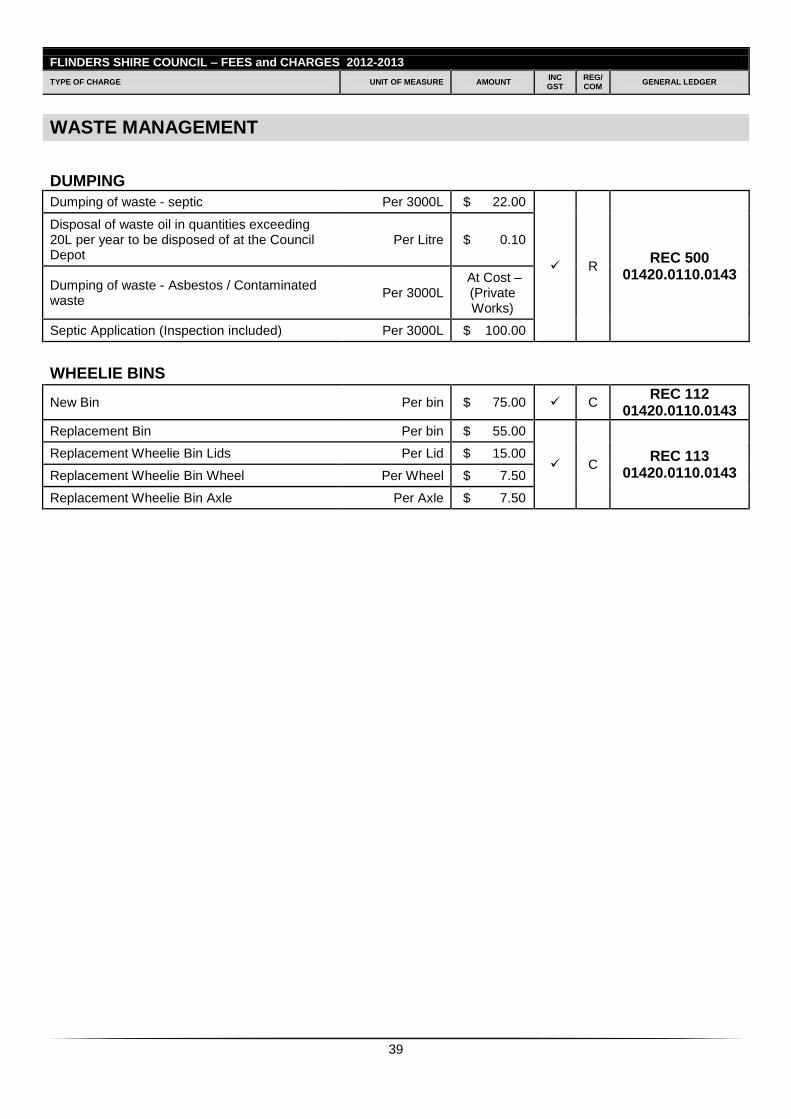
39
FLINDERS SHIRE COUNCIL – FEES and CHARGES 2012-2013
TYPE OF CHARGE UNIT OF MEASURE AMOUNT INC GST
REG/ COM
GENERAL LEDGER
WASTE MANAGEMENT
DUMPING Dumping of waste - septic Per 3000L $ 22.00
R REC 500
01420.0110.0143
Disposal of waste oil in quantities exceeding 20L per year to be disposed of at the Council Depot
Per Litre $ 0.10
Dumping of waste - Asbestos / Contaminated waste
Per 3000L At Cost – (Private Works)
Septic Application (Inspection included) Per 3000L $ 100.00
WHEELIE BINS
New Bin Per bin $ 75.00 C REC 112
01420.0110.0143
Replacement Bin Per bin $ 55.00
C REC 113
01420.0110.0143
Replacement Wheelie Bin Lids Per Lid $ 15.00
Replacement Wheelie Bin Wheel Per Wheel $ 7.50
Replacement Wheelie Bin Axle Per Axle $ 7.50
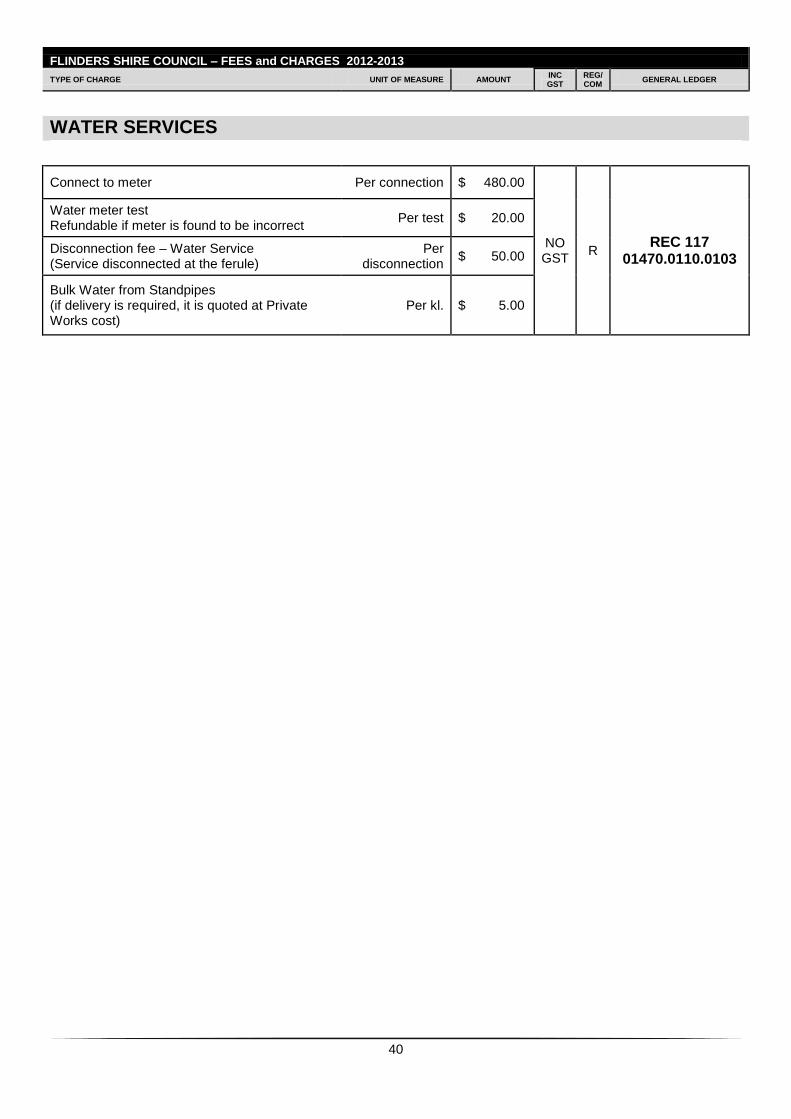
40
FLINDERS SHIRE COUNCIL – FEES and CHARGES 2012-2013
TYPE OF CHARGE UNIT OF MEASURE AMOUNT INC GST
REG/ COM
GENERAL LEDGER
WATER SERVICES
Connect to meter Per connection $ 480.00
NO GST
R REC 117
01470.0110.0103
Water meter test Refundable if meter is found to be incorrect
Per test $ 20.00
Disconnection fee – Water Service (Service disconnected at the ferule)
Per disconnection
$ 50.00
Bulk Water from Standpipes (if delivery is required, it is quoted at Private Works cost)
Per kl. $ 5.00
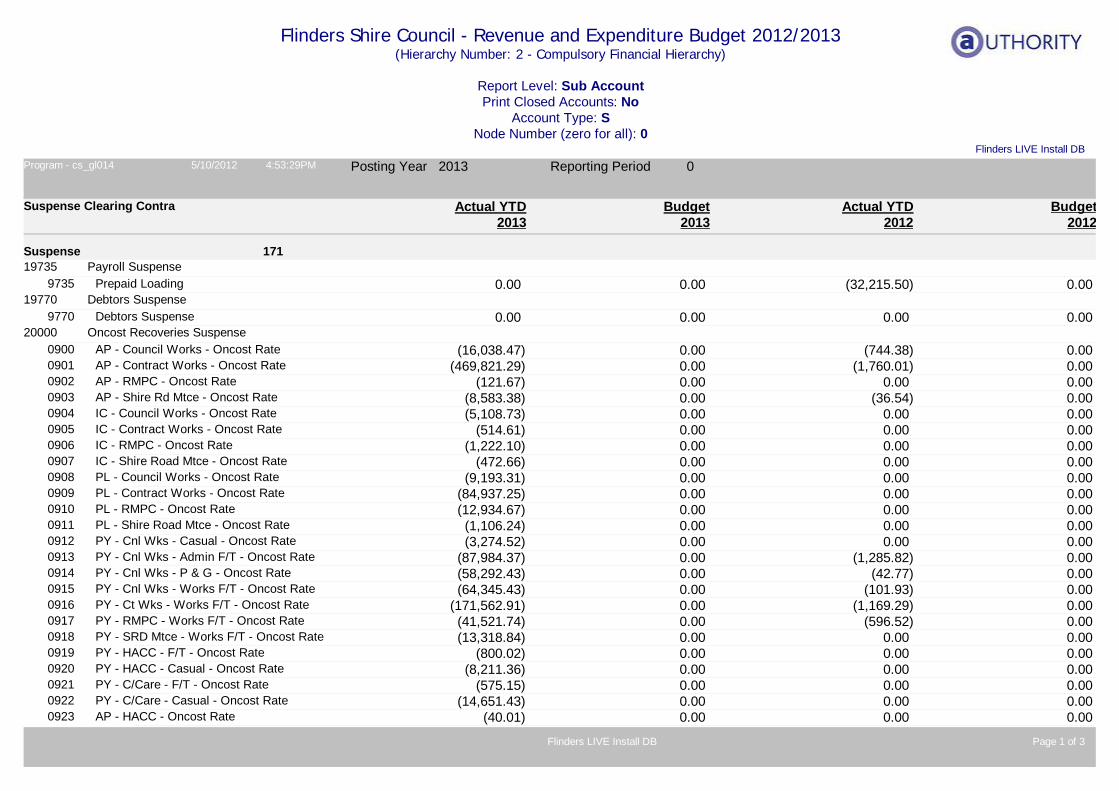
Flinders Shire Council - Revenue and Expenditure Budget 2012/2013(Hierarchy Number: 2 - Compulsory Financial Hierarchy)
Report Level: Sub AccountPrint Closed Accounts: No
Account Type: SNode Number (zero for all): 0
Flinders LIVE Install DBProgram - cs_gl014 5/10/2012 4:53:29PM Posting Year 2013 Reporting Period 0
171Suspense
Suspense Clearing Contra Budget2013
Actual YTD2013
Budget2012
Actual YTD2012
Payroll Suspense19735Prepaid Loading 0.009735 0.00 )(32,215.50 0.00
Debtors Suspense19770Debtors Suspense 0.009770 0.00 0.00 0.00
Oncost Recoveries Suspense20000AP - Council Works - Oncost Rate )(16,038.470900 0.00 )(744.38 0.00AP - Contract Works - Oncost Rate )(469,821.290901 0.00 )(1,760.01 0.00AP - RMPC - Oncost Rate )(121.670902 0.00 0.00 0.00AP - Shire Rd Mtce - Oncost Rate )(8,583.380903 0.00 )(36.54 0.00IC - Council Works - Oncost Rate )(5,108.730904 0.00 0.00 0.00IC - Contract Works - Oncost Rate )(514.610905 0.00 0.00 0.00IC - RMPC - Oncost Rate )(1,222.100906 0.00 0.00 0.00IC - Shire Road Mtce - Oncost Rate )(472.660907 0.00 0.00 0.00PL - Council Works - Oncost Rate )(9,193.310908 0.00 0.00 0.00PL - Contract Works - Oncost Rate )(84,937.250909 0.00 0.00 0.00PL - RMPC - Oncost Rate )(12,934.670910 0.00 0.00 0.00PL - Shire Road Mtce - Oncost Rate )(1,106.240911 0.00 0.00 0.00PY - Cnl Wks - Casual - Oncost Rate )(3,274.520912 0.00 0.00 0.00PY - Cnl Wks - Admin F/T - Oncost Rate )(87,984.370913 0.00 )(1,285.82 0.00PY - Cnl Wks - P & G - Oncost Rate )(58,292.430914 0.00 )(42.77 0.00PY - Cnl Wks - Works F/T - Oncost Rate )(64,345.430915 0.00 )(101.93 0.00PY - Ct Wks - Works F/T - Oncost Rate )(171,562.910916 0.00 )(1,169.29 0.00PY - RMPC - Works F/T - Oncost Rate )(41,521.740917 0.00 )(596.52 0.00PY - SRD Mtce - Works F/T - Oncost Rate )(13,318.840918 0.00 0.00 0.00PY - HACC - F/T - Oncost Rate )(800.020919 0.00 0.00 0.00PY - HACC - Casual - Oncost Rate )(8,211.360920 0.00 0.00 0.00PY - C/Care - F/T - Oncost Rate )(575.150921 0.00 0.00 0.00PY - C/Care - Casual - Oncost Rate )(14,651.430922 0.00 0.00 0.00AP - HACC - Oncost Rate )(40.010923 0.00 0.00 0.00
Page 1 of 3Flinders LIVE Install DB
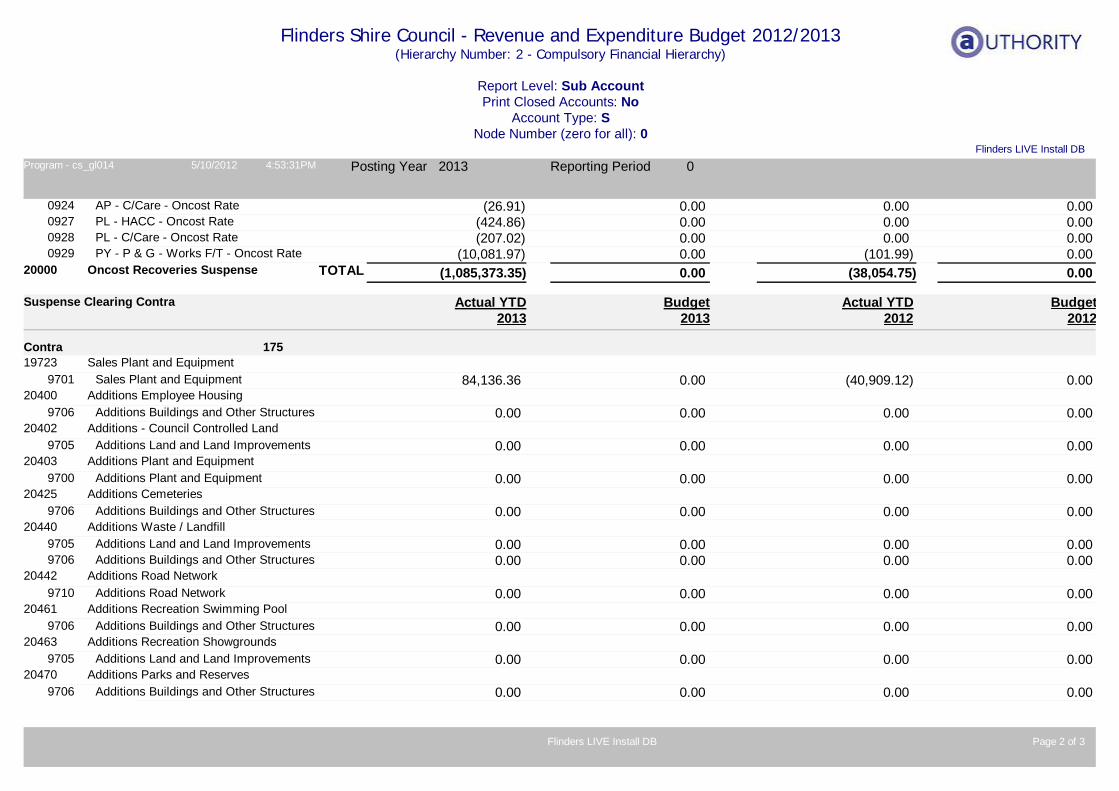
Flinders Shire Council - Revenue and Expenditure Budget 2012/2013(Hierarchy Number: 2 - Compulsory Financial Hierarchy)
Report Level: Sub AccountPrint Closed Accounts: No
Account Type: SNode Number (zero for all): 0
Flinders LIVE Install DBProgram - cs_gl014 5/10/2012 4:53:31PM Posting Year 2013 Reporting Period 0
AP - C/Care - Oncost Rate )(26.910924 0.00 0.00 0.00PL - HACC - Oncost Rate )(424.860927 0.00 0.00 0.00PL - C/Care - Oncost Rate )(207.020928 0.00 0.00 0.00PY - P & G - Works F/T - Oncost Rate )(10,081.970929 0.00 )(101.99 0.00
)(1,085,373.3520000 Oncost Recoveries Suspense 0.00TOTAL )(38,054.75 0.00
175Contra
Suspense Clearing Contra Budget2013
Actual YTD2013
Budget2012
Actual YTD2012
Sales Plant and Equipment19723Sales Plant and Equipment 84,136.369701 0.00 )(40,909.12 0.00
Additions Employee Housing20400Additions Buildings and Other Structures 0.009706 0.00 0.00 0.00
Additions - Council Controlled Land20402Additions Land and Land Improvements 0.009705 0.00 0.00 0.00
Additions Plant and Equipment20403Additions Plant and Equipment 0.009700 0.00 0.00 0.00
Additions Cemeteries20425Additions Buildings and Other Structures 0.009706 0.00 0.00 0.00
Additions Waste / Landfill20440Additions Land and Land Improvements 0.009705 0.00 0.00 0.00Additions Buildings and Other Structures 0.009706 0.00 0.00 0.00
Additions Road Network20442Additions Road Network 0.009710 0.00 0.00 0.00
Additions Recreation Swimming Pool20461Additions Buildings and Other Structures 0.009706 0.00 0.00 0.00
Additions Recreation Showgrounds20463Additions Land and Land Improvements 0.009705 0.00 0.00 0.00
Additions Parks and Reserves20470Additions Buildings and Other Structures 0.009706 0.00 0.00 0.00
Page 2 of 3Flinders LIVE Install DB
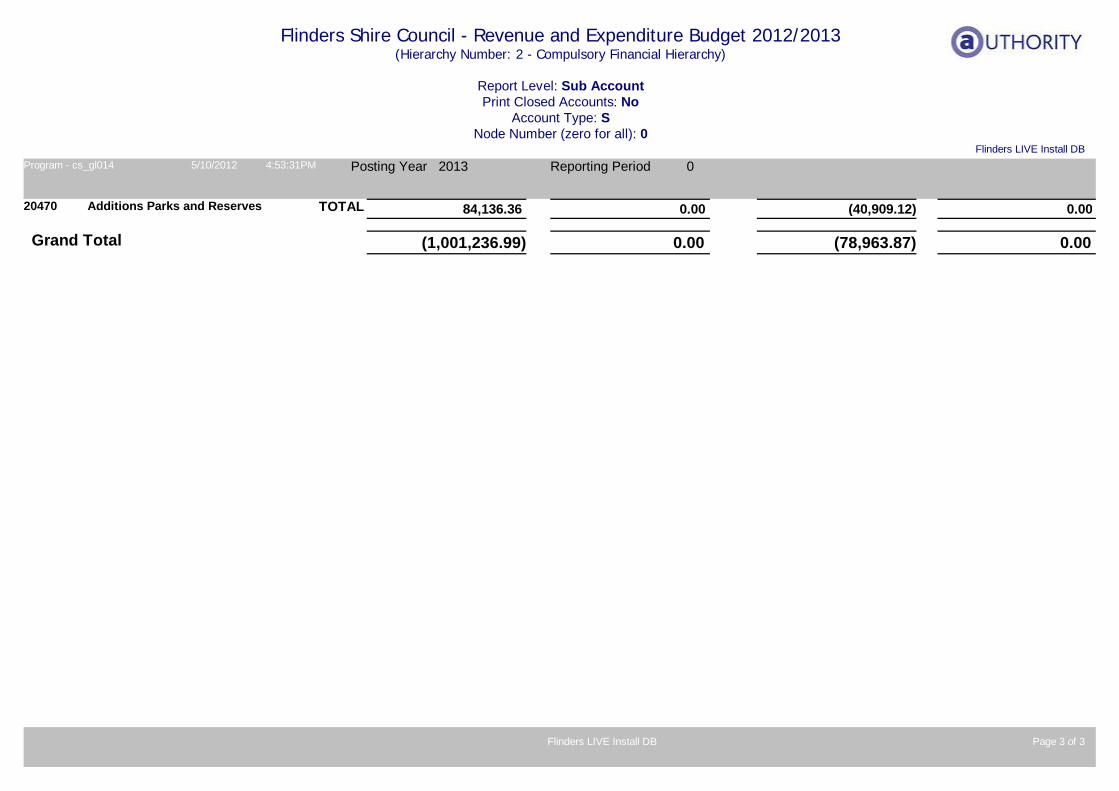
Flinders Shire Council - Revenue and Expenditure Budget 2012/2013(Hierarchy Number: 2 - Compulsory Financial Hierarchy)
Report Level: Sub AccountPrint Closed Accounts: No
Account Type: SNode Number (zero for all): 0
Flinders LIVE Install DBProgram - cs_gl014 5/10/2012 4:53:31PM Posting Year 2013 Reporting Period 0
84,136.3620470 Additions Parks and Reserves 0.00TOTAL )(40,909.12 0.00
)(1,001,236.99 0.00Grand Total )(78,963.87 0.00
Page 3 of 3Flinders LIVE Install DB
Copyright © 2022 FDOKUMEN